Spatial diStribution and morphometry of the Succineid Snail ...
Catastrophic Floods May Pave the Way for IncreasedGenetic Diversity in Endemic Artesian Spring SnailPopulationsJessica Worthington Wilmer1*, Lynde Murray1,2¤a, Che Elkin2¤b, Chris Wilcox3, Darren Niejalke4, Hugh
Possingham2
1 Biodiversity and Geosciences Program, Queensland Museum, Brisbane, Queensland, Australia, 2 School of Biological Sciences, University of Queensland, Brisbane,
Queensland, Australia, 3 Marine and Atmospheric Research Division, Commonwealth Scientific and Industrial Research Organisation (CSIRO), Hobart, Tasmania, Australia,
4 Olympic Dam Expansion Project, BHP Billiton, Adelaide, South Australia, Australia
Abstract
The role of disturbance in the promotion of biological heterogeneity is widely recognised and occurs at a variety ofecological and evolutionary scales. However, within species, the impact of disturbances that decimate populations areneither predicted nor known to result in conditions that promote genetic diversity. Directly examining the populationgenetic consequences of catastrophic disturbances however, is rarely possible, as it requires both longitudinal genetic datasets and serendipitous timing. Our long-term study of the endemic aquatic invertebrates of the artesian spring ecosystem ofarid central Australia has presented such an opportunity. Here we show a catastrophic flood event, which caused a neartotal population crash in an aquatic snail species (Fonscochlea accepta) endemic to this ecosystem, may have led toenhanced levels of within species genetic diversity. Analyses of individuals sampled and genotyped from the same springssampled both pre (1988–1990) and post (1995, 2002–2006) a devastating flood event in 1992, revealed significantly higherallelic richness, reduced temporal population structuring and greater effective population sizes in nearly all post floodpopulations. Our results suggest that the response of individual species to disturbance and severe population bottlenecks islikely to be highly idiosyncratic and may depend on both their ecology (whether they are resilient or resistant todisturbance) and the stability of the environmental conditions (i.e. frequency and intensity of disturbances) in which theyhave evolved.
Citation: Worthington Wilmer J, Murray L, Elkin C, Wilcox C, Niejalke D, et al. (2011) Catastrophic Floods May Pave the Way for Increased Genetic Diversity inEndemic Artesian Spring Snail Populations. PLoS ONE 6(12): e28645. doi:10.1371/journal.pone.0028645
Editor: Dirk Steinke, Biodiversity Insitute of Ontario - University of Guelph, Canada
Received September 1, 2011; Accepted November 11, 2011; Published December 20, 2011
Copyright: � 2011 Worthington Wilmer et al. This is an open-access article distributed under the terms of the Creative Commons Attribution License, whichpermits unrestricted use, distribution, and reproduction in any medium, provided the original author and source are credited.
Funding: This research was supported by a collaborative Australian Research Council (http://www.arc.gov.au/) Linkage Grant (LP0560890) to the University ofQueensland, the Queensland Museum and BHP Billiton (formerly Western Mining Corporation). The Australian Research Council (ARC) had no role in study design,data collection and analysis, decision to publish, or preparation of the manuscript. BHP Billiton and the Queensland Museum as industry partners contributedboth cash and in-kind support to the ARC Linkage Grant. Researchers (authors) working for these organisations participated in study design, data collection andanalysis, decision to publish, or preparation of the manuscript.
Competing Interests: The authors have read the journal’s policy and have the following conflicts: One of the authors (D. Niejalke) is affiliated to (e.g. employee)the commercial funders of this research BHP Billiton. This does not alter the authors’ adherence to all the PLoS ONE policies on sharing and materials.
* E-mail: [email protected]
¤a Current address: Ecology Division, Lambert and Rehbein, Brisbane, Queensland, Australia¤b Current address: Forest Ecology, Swiss Federal Institute of Technology, Zurich, Switzerland
Introduction
Despite the immediate and seemingly far reaching devastation
that follows intense natural disturbances, there is an extensive
literature showing that such events can ultimately generate
environmental conditions favourable to the survival, growth and
diversification of living organisms and ecosystems, at least as
measured by species diversity [1–7]. Recently, studies have shown
parallel responses to disturbance between species and genetic
diversity with variation between-sites (beta diversity) increasing
and within-sites (alpha diversity) decreasing [8–10]. However,
within species the impact of catastrophes which result in severe
reductions in population sizes are neither predicted nor known to
result in the promotion of genetic diversity. Rather, the outcome of
such population bottlenecks is usually the loss of genetic variation,
the severity of which depends on both the intensity and duration of
the crash and the subsequent rate of recovery and immigration
[11–16]. Furthermore, while genetic diversity has been shown to
enhance species and even ecosystem resilience to catastrophic
disturbances [17–19], the reverse i.e. catastrophes enhancing
genetic diversity, is yet to be demonstrated.
Circumstances allowing for testing the impact of catastrophes
on any aspect of ecosystem and evolutionary dynamics are highly
unusual due to the longitudinal nature of the work required
combined with serendipitous timing. Some notable exceptions are
studies of droughts and Darwin’s finches in the Galapagos [20],
hurricanes and spider and lizard communities on Caribbean
islands [21–23] and cyclones and silvereye populations on Heron
Is in the Great Barrier Reef [24]. However, having the
complementary longitudinal genetic datasets to directly test
population genetic consequences of natural disasters is even more
exceptional.
PLoS ONE | www.plosone.org 1 December 2011 | Volume 6 | Issue 12 | e28645
Our study of the artesian spring ecosystem of the Great Artesian
Basin (GAB) in arid central Australia has provided an unparalleled
opportunity to examine the impact of periodic, catastrophic
disturbances on the genetic diversity of the endemic fauna that
inhabit the springs. Australia’s GAB is one of the largest artesian
systems in the world, covering 22% of the continent [25] and is of
national cultural, economic and biological significance. Artesian
springs form when geological structures allow water from the GAB
to reach the surface, forming freshwater spring pools in an
otherwise inhospitable desert environment [25]. This is a naturally
patchy and fragmented ecosystem with the springs likened to
‘‘aquatic islands in an arid sea’’ [26] and they support a wealth of
endemic species including plants, arachnids, crustaceans, molluscs
and fish [27–30].
Arid central Australia is subject to recurrent but irregular
significant floods due to unpredictable heavy rainfall events.
Native vegetation is highly responsive to such rainfall variations
and the rivers, creeks and terminal drainage lakes, which are
intermittent to ephemeral, are transformed by floodwaters into
vast inland seas often extending thousands of square kilometres
[31]. Such events are the focus of well-documented and
spectacular ‘‘boom’’ and ‘‘bust’’ cycles in many animal popula-
tions [32–34]. However, for the endemic fauna of the artesian
springs the impact of such flood events is hitherto unknown.
Here we investigate for the first time the effect of a catastrophic
flood event on the artesian spring ecosystem of arid central
Australia. Long term monitoring of the springs in our study area
has allowed us to directly test the population genetic consequences
of the flood by examining how genetic diversity and divergence
estimates and effective population sizes of one of the endemic
spring invertebrates (the hydrobiid snail, Fonscochlea accepta),
changed through time.
Materials and Methods
Artesian springs and our study siteAn archetypal artesian spring is comprised of three parts: a
shallow vent or pool where artesian water first reaches the surface,
an outflow tail of shallow water and wetland vegetation which
grows around the pool and tail and where the substrate allows
successive layers of carbonate. Springs can range from simple
damp mounds and surface seeps to large deep pools with rapidly
flowing drainages that support extensive wetland areas. Springs
can be no higher than a few centimetres above ground level or rise
up to over 10 m in height and up to 30 m in diameter. Whether or
not springs form mounds depends on a variety of factors including
water discharge rates, the sediment composition and the nature
and concentration of dissolved mineral salts; wind blown debris
and plant materials can also contribute to mound formation [26].
Since the springs are produced by faults or where the aquifer
outcrops at the surface the springs tend to be spatially clustered.
Due to this clustering, springs have previously been arranged
along a fine to broad scale spatial hierarchy as individual springs,
spring groups, spring complexes and then spring supergroups [25].
This hierarchy is derived solely from an assessment of the spatial
patterns of the physical location of the springs, and is not based on
empirical measurement of connectivity among springs for
organisms.
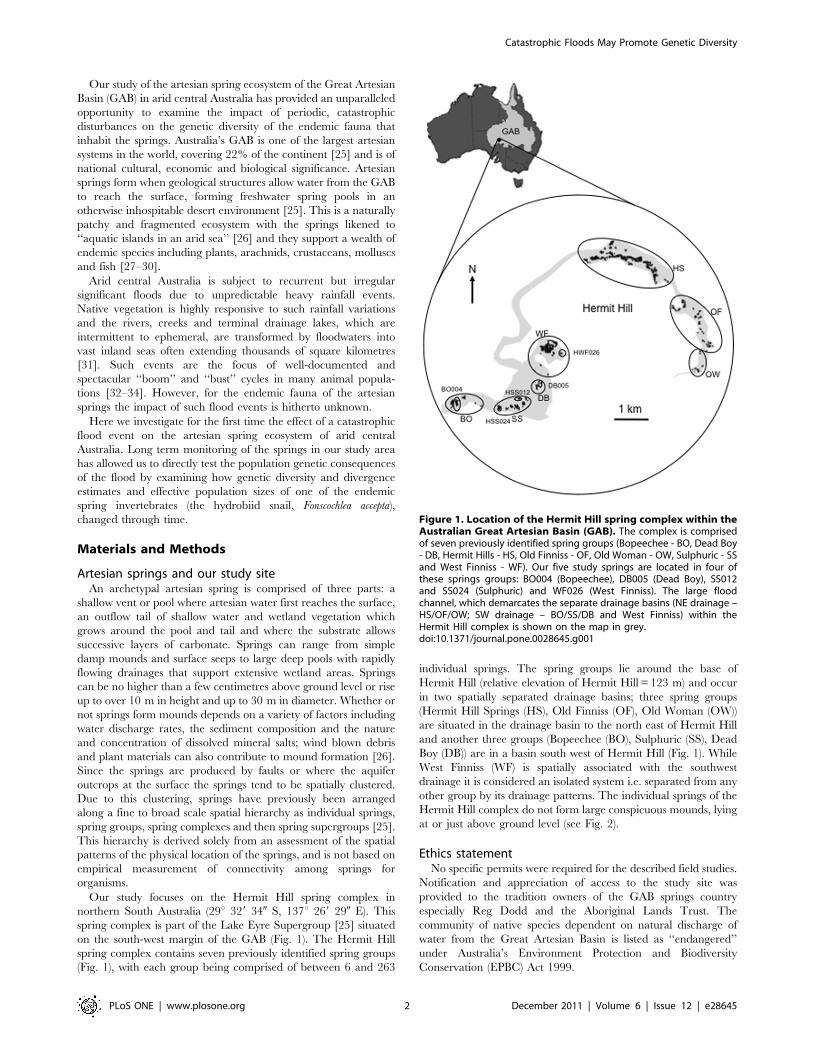
Our study focuses on the Hermit Hill spring complex in
northern South Australia (29u 329 340 S, 137u 269 290 E). This
spring complex is part of the Lake Eyre Supergroup [25] situated
on the south-west margin of the GAB (Fig. 1). The Hermit Hill
spring complex contains seven previously identified spring groups
(Fig. 1), with each group being comprised of between 6 and 263
individual springs. The spring groups lie around the base of
Hermit Hill (relative elevation of Hermit Hill = 123 m) and occur
in two spatially separated drainage basins; three spring groups
(Hermit Hill Springs (HS), Old Finniss (OF), Old Woman (OW))
are situated in the drainage basin to the north east of Hermit Hill
and another three groups (Bopeechee (BO), Sulphuric (SS), Dead
Boy (DB)) are in a basin south west of Hermit Hill (Fig. 1). While
West Finniss (WF) is spatially associated with the southwest
drainage it is considered an isolated system i.e. separated from any
other group by its drainage patterns. The individual springs of the
Hermit Hill complex do not form large conspicuous mounds, lying
at or just above ground level (see Fig. 2).
Ethics statementNo specific permits were required for the described field studies.
Notification and appreciation of access to the study site was
provided to the tradition owners of the GAB springs country
especially Reg Dodd and the Aboriginal Lands Trust. The
community of native species dependent on natural discharge of
water from the Great Artesian Basin is listed as ‘‘endangered’’
under Australia’s Environment Protection and Biodiversity
Conservation (EPBC) Act 1999.
Figure 1. Location of the Hermit Hill spring complex within theAustralian Great Artesian Basin (GAB). The complex is comprisedof seven previously identified spring groups (Bopeechee - BO, Dead Boy- DB, Hermit Hills - HS, Old Finniss - OF, Old Woman - OW, Sulphuric - SSand West Finniss - WF). Our five study springs are located in four ofthese springs groups: BO004 (Bopeechee), DB005 (Dead Boy), SS012and SS024 (Sulphuric) and WF026 (West Finniss). The large floodchannel, which demarcates the separate drainage basins (NE drainage –HS/OF/OW; SW drainage – BO/SS/DB and West Finniss) within theHermit Hill complex is shown on the map in grey.doi:10.1371/journal.pone.0028645.g001
Catastrophic Floods May Promote Genetic Diversity
PLoS ONE | www.plosone.org 2 December 2011 | Volume 6 | Issue 12 | e28645
Long term ecological monitoring and temporal samplesLocal draw-down of artesian water can result in the extinction
of local springs. Major concerns for the maintenance of the springs
in the study area arose during the development of the Olympic
Dam mine project (BHP Billiton formerly Western Mining
Corporation) because of the potential for draw-down effects from
the mine’s water supply borefields and their proximity to the
Hermit Hill spring complex [35,36]. These concerns prompted the
establishment of major hydrogeological, botanical and zoological
monitoring programs on a set of individual springs, which have
been ongoing since baseline studies were carried out in 1983. In
the Hermit Hill complex, 16 springs from the seven previously
defined spring groups were chosen as monitoring springs.
In conjunction with these monitoring programs, recent large
scale population genetic and ecological studies have focused
intensively on a subset of four of the seven spring groups
incorporating 5 of the 16 monitoring springs (Bopeechee
(HBO004), Dead Boy (HDB005), Sulphuric (HSS012 and
HSS024) and West Finniss (HWF026)) [37–39]. These studies
have allowed temporally continuous sampling from 2002–2006. In
addition to these years, historical samples from the long term
monitoring programs were available from these 5 springs for the
years 1988–1990 and 1995, though not all springs had samples for
each of those years.
Study species and samplingThe springs in our study area support at least six species of
hydrobiid snails in two genera (Trochidrobia and Fonscochlea). We
have focused our analysis on the species Fonscochlea accepta as it is
both widespread and abundant in the springs at our study site, its
life cycle and natural history are relatively well described and is
found in both the spring vents and outflows [27].
Springs are sampled in late winter/early spring (August/
September), when temperatures in the Australian arid interior
are cooler and evaporative water loss from the springs is lowest. In
order to obtain a representative sample of snails from each spring
we collected sediment samples along a transect passing from the
spring vent to the bottom of the main outflow tail. The number of
samples taken was proportional to spring size with a minimum of
ten taken in each spring. Sediment samples for each individual
spring were aggregated together (eliminating any differences that
might be due to microspatial variation within a spring) then
preserved in the field using ethanol. Samples were returned to the
lab where they were sorted and F. accepta identified using a
dissecting microscope. Where contemporary and historical
sampling allowed, 25 snails per spring per year were genotyped
resulting in an overall total of approximately 900 genotyped
individuals from the 5 monitoring springs (Table 1).
Severe flood event and its ecological impactConsistent with regional arid Australia, flooding in our study
area is periodic with a major flood occurring approximately every
10–25 years and significant local flooding every 8–10 years [40].
In late 1992 (October–December) the region received almost 3.5
times the median annual rainfall (long term average = 126 mm,
1992 = 425 mm) [41], which resulted in large scale flooding
throughout the Hermit Hill spring complex and surrounds in
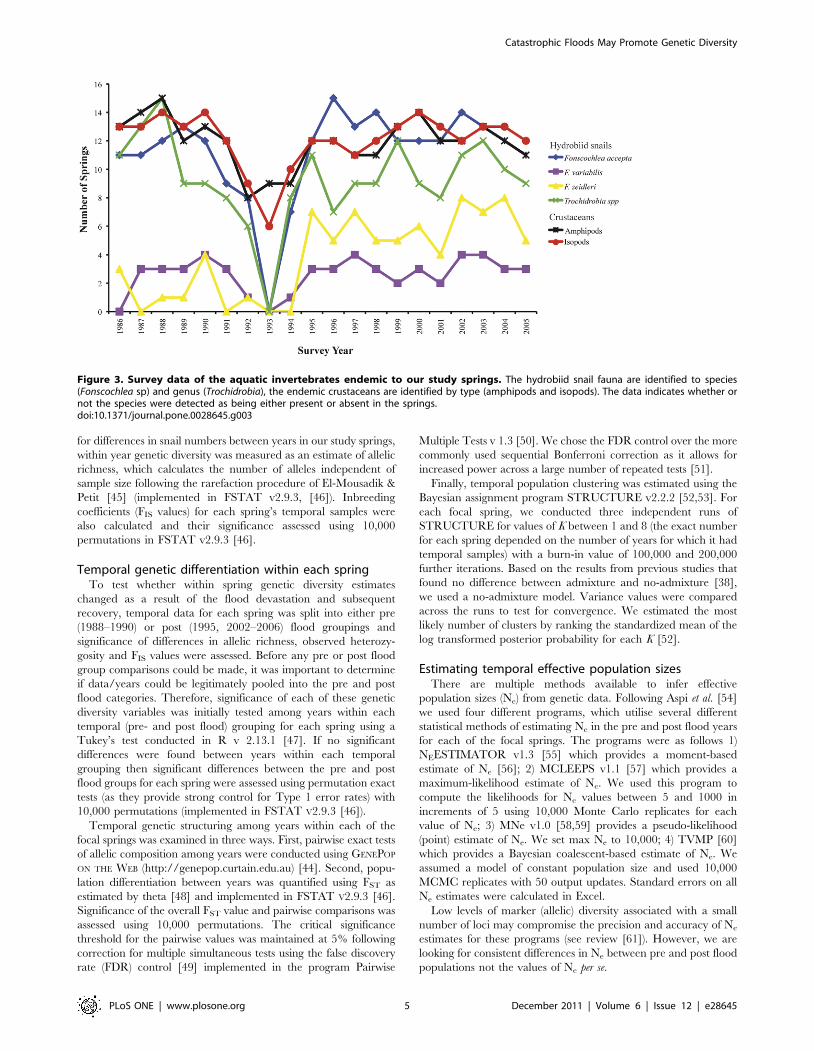
December 1992. The long term faunal monitoring program of the
springs’ endemic invertebrates revealed a catastrophic decrease in
the occurrence of all hydrobiid snail species from the Hermit Hill
springs in 1993, the year immediately following the flood (see
Fig. 3). Recovery of hydrobiid populations following the flood (i.e.
presence in springs) of all but one species was observed to begin by
1994 (Fig. 3). The impact of the December 1992 flood was not
limited to just the hydrobiid fauna with declines also observed in
the endemic crustacean species (amphipods and isopods, Fig. 3).
Our genetic sampling incorporates years both pre (1988–1990)
and post (1995, 2002–2006) this devastating flood event. Sampling
gaps exist immediately prior to (1991) and following (1994) the
1992 flood and post flood sampling was most intense 10 years after
the flood. Apart from 1988–1990 and 1995, no other historical
genetic samples exist for these springs. Despite these gaps, the first
year sampled after the flood (i.e. 1995) enables post flood
consequences to be clearly defined.
DNA extraction and microsatellite genotypingTotal genomic DNA was extracted from homogenates of entire
snails (approx. 3 mm diameter) using either DNeasy Tissue Kits
(QIAGEN) or NucleoSpin Tissue Kits (Macherey-Nagel). All
DNA samples were screened with a panel of nine variable
microsatellite markers described in Worthington Wilmer et al. [42]
and using protocols described in Worthington Wilmer et al. [39].
Samples were run on a GE Healthcare MegaBACETM 4000
automated capillary sequencer and visualised and scored using
MegaBACE Fragment Profiler v 1.2 software (GE Healthcare).
Due to the condition of snails collected from 1988–1990 and
1995 and potentially degraded DNA, all individuals from these
years (and a subset of modern samples) were genotyped twice
independently to ensure consistency of amplification and scoring.
Loci and/or individuals for which there were amplification
inconsistencies or scoring problems were excluded from the final
data set.
Statistical analysesPrior to general analysis the data set was checked for genotyping
and typographic errors using MICRO-CHECKER [43]. Observed and
expected heterozygosity and deviations from Hardy-Weinberg
equilibrium (HWE) were calculated using GENEPOP ON THE WEB
(http://genepop.curtain.edu.au) [44]. The observed number of
alleles in a sample is highly dependent on sample size. To account
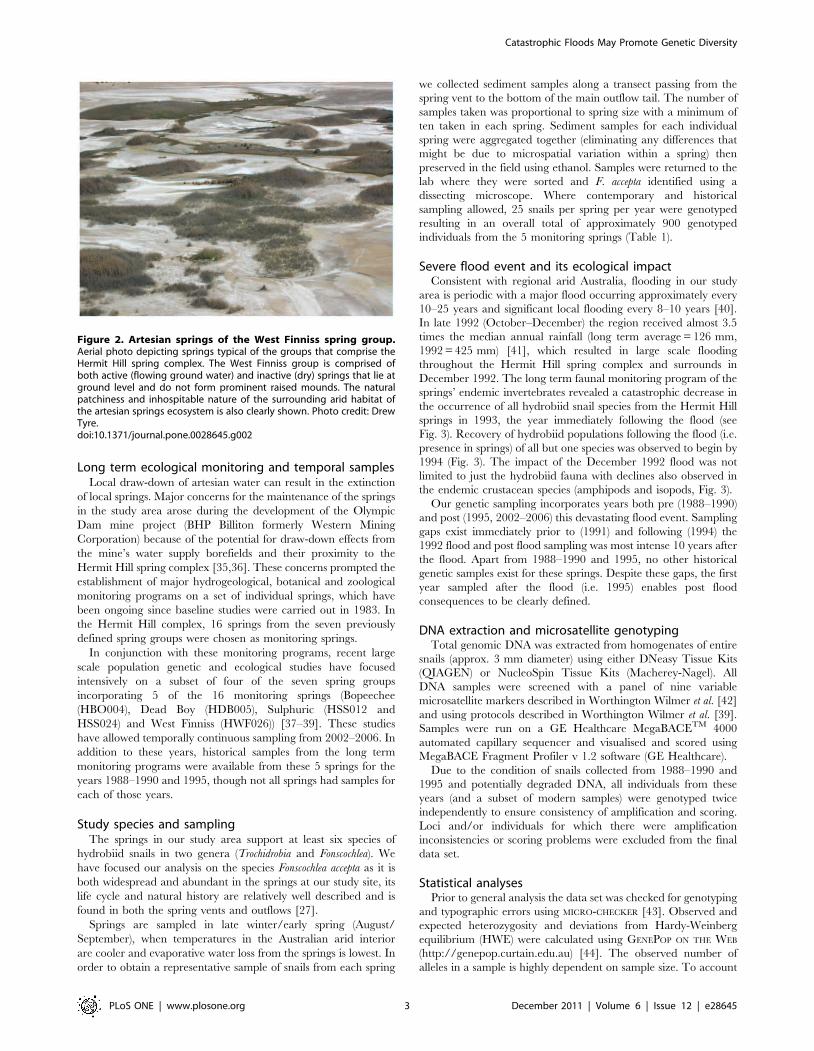
Figure 2. Artesian springs of the West Finniss spring group.Aerial photo depicting springs typical of the groups that comprise theHermit Hill spring complex. The West Finniss group is comprised ofboth active (flowing ground water) and inactive (dry) springs that lie atground level and do not form prominent raised mounds. The naturalpatchiness and inhospitable nature of the surrounding arid habitat ofthe artesian springs ecosystem is also clearly shown. Photo credit: DrewTyre.doi:10.1371/journal.pone.0028645.g002
Catastrophic Floods May Promote Genetic Diversity
PLoS ONE | www.plosone.org 3 December 2011 | Volume 6 | Issue 12 | e28645
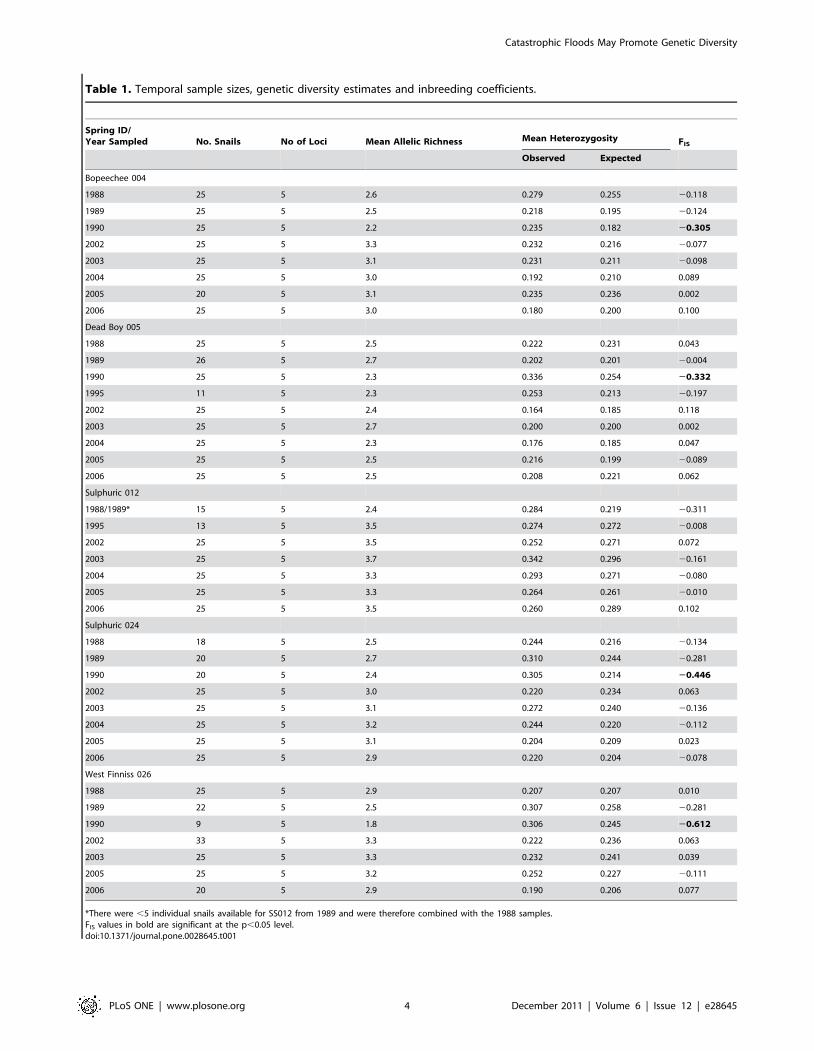
Table 1. Temporal sample sizes, genetic diversity estimates and inbreeding coefficients.
Spring ID/Year Sampled No. Snails No of Loci Mean Allelic Richness Mean Heterozygosity FIS
Observed Expected
Bopeechee 004
1988 25 5 2.6 0.279 0.255 20.118
1989 25 5 2.5 0.218 0.195 20.124
1990 25 5 2.2 0.235 0.182 20.305
2002 25 5 3.3 0.232 0.216 20.077
2003 25 5 3.1 0.231 0.211 20.098
2004 25 5 3.0 0.192 0.210 0.089
2005 20 5 3.1 0.235 0.236 0.002
2006 25 5 3.0 0.180 0.200 0.100
Dead Boy 005
1988 25 5 2.5 0.222 0.231 0.043
1989 26 5 2.7 0.202 0.201 20.004
1990 25 5 2.3 0.336 0.254 20.332
1995 11 5 2.3 0.253 0.213 20.197
2002 25 5 2.4 0.164 0.185 0.118
2003 25 5 2.7 0.200 0.200 0.002
2004 25 5 2.3 0.176 0.185 0.047
2005 25 5 2.5 0.216 0.199 20.089
2006 25 5 2.5 0.208 0.221 0.062
Sulphuric 012
1988/1989* 15 5 2.4 0.284 0.219 20.311
1995 13 5 3.5 0.274 0.272 20.008
2002 25 5 3.5 0.252 0.271 0.072
2003 25 5 3.7 0.342 0.296 20.161
2004 25 5 3.3 0.293 0.271 20.080
2005 25 5 3.3 0.264 0.261 20.010
2006 25 5 3.5 0.260 0.289 0.102
Sulphuric 024
1988 18 5 2.5 0.244 0.216 20.134
1989 20 5 2.7 0.310 0.244 20.281
1990 20 5 2.4 0.305 0.214 20.446
2002 25 5 3.0 0.220 0.234 0.063
2003 25 5 3.1 0.272 0.240 20.136
2004 25 5 3.2 0.244 0.220 20.112
2005 25 5 3.1 0.204 0.209 0.023
2006 25 5 2.9 0.220 0.204 20.078
West Finniss 026
1988 25 5 2.9 0.207 0.207 0.010
1989 22 5 2.5 0.307 0.258 20.281
1990 9 5 1.8 0.306 0.245 20.612
2002 33 5 3.3 0.222 0.236 0.063
2003 25 5 3.3 0.232 0.241 0.039
2005 25 5 3.2 0.252 0.227 20.111
2006 20 5 2.9 0.190 0.206 0.077
*There were ,5 individual snails available for SS012 from 1989 and were therefore combined with the 1988 samples.FIS values in bold are significant at the p,0.05 level.doi:10.1371/journal.pone.0028645.t001
Catastrophic Floods May Promote Genetic Diversity
PLoS ONE | www.plosone.org 4 December 2011 | Volume 6 | Issue 12 | e28645
for differences in snail numbers between years in our study springs,
within year genetic diversity was measured as an estimate of allelic
richness, which calculates the number of alleles independent of
sample size following the rarefaction procedure of El-Mousadik &
Petit [45] (implemented in FSTAT v2.9.3, [46]). Inbreeding
coefficients (FIS values) for each spring’s temporal samples were
also calculated and their significance assessed using 10,000
permutations in FSTAT v2.9.3 [46].
Temporal genetic differentiation within each springTo test whether within spring genetic diversity estimates
changed as a result of the flood devastation and subsequent
recovery, temporal data for each spring was split into either pre
(1988–1990) or post (1995, 2002–2006) flood groupings and
significance of differences in allelic richness, observed heterozy-
gosity and FIS values were assessed. Before any pre or post flood
group comparisons could be made, it was important to determine
if data/years could be legitimately pooled into the pre and post
flood categories. Therefore, significance of each of these genetic
diversity variables was initially tested among years within each
temporal (pre- and post flood) grouping for each spring using a
Tukey’s test conducted in R v 2.13.1 [47]. If no significant
differences were found between years within each temporal
grouping then significant differences between the pre and post
flood groups for each spring were assessed using permutation exact
tests (as they provide strong control for Type 1 error rates) with
10,000 permutations (implemented in FSTAT V2.9.3 [46]).
Temporal genetic structuring among years within each of the
focal springs was examined in three ways. First, pairwise exact tests
of allelic composition among years were conducted using GENEPOP
ON THE WEB (http://genepop.curtain.edu.au) [44]. Second, popu-
lation differentiation between years was quantified using FST as
estimated by theta [48] and implemented in FSTAT V2.9.3 [46].
Significance of the overall FST value and pairwise comparisons was
assessed using 10,000 permutations. The critical significance
threshold for the pairwise values was maintained at 5% following
correction for multiple simultaneous tests using the false discovery
rate (FDR) control [49] implemented in the program Pairwise
Multiple Tests v 1.3 [50]. We chose the FDR control over the more
commonly used sequential Bonferroni correction as it allows for
increased power across a large number of repeated tests [51].
Finally, temporal population clustering was estimated using the
Bayesian assignment program STRUCTURE v2.2.2 [52,53]. For
each focal spring, we conducted three independent runs of
STRUCTURE for values of K between 1 and 8 (the exact number
for each spring depended on the number of years for which it had
temporal samples) with a burn-in value of 100,000 and 200,000
further iterations. Based on the results from previous studies that
found no difference between admixture and no-admixture [38],
we used a no-admixture model. Variance values were compared
across the runs to test for convergence. We estimated the most
likely number of clusters by ranking the standardized mean of the
log transformed posterior probability for each K [52].
Estimating temporal effective population sizesThere are multiple methods available to infer effective
population sizes (Ne) from genetic data. Following Aspi et al. [54]
we used four different programs, which utilise several different
statistical methods of estimating Ne in the pre and post flood years
for each of the focal springs. The programs were as follows 1)
NEESTIMATOR v1.3 [55] which provides a moment-based
estimate of Ne [56]; 2) MCLEEPS v1.1 [57] which provides a
maximum-likelihood estimate of Ne. We used this program to
compute the likelihoods for Ne values between 5 and 1000 in
increments of 5 using 10,000 Monte Carlo replicates for each
value of Ne; 3) MNe v1.0 [58,59] provides a pseudo-likelihood
(point) estimate of Ne. We set max Ne to 10,000; 4) TVMP [60]
which provides a Bayesian coalescent-based estimate of Ne. We
assumed a model of constant population size and used 10,000
MCMC replicates with 50 output updates. Standard errors on all
Ne estimates were calculated in Excel.
Low levels of marker (allelic) diversity associated with a small
number of loci may compromise the precision and accuracy of Ne
estimates for these programs (see review [61]). However, we are
looking for consistent differences in Ne between pre and post flood
populations not the values of Ne per se.
Figure 3. Survey data of the aquatic invertebrates endemic to our study springs. The hydrobiid snail fauna are identified to species(Fonscochlea sp) and genus (Trochidrobia), the endemic crustaceans are identified by type (amphipods and isopods). The data indicates whether ornot the species were detected as being either present or absent in the springs.doi:10.1371/journal.pone.0028645.g003
Catastrophic Floods May Promote Genetic Diversity
PLoS ONE | www.plosone.org 5 December 2011 | Volume 6 | Issue 12 | e28645

Spatial genetic differentiation within each yearIn order to examine the population dynamics of the snails pre
and post flood, spatial genetic structuring among the focal springs
within each of the sample years was also investigated. If extensive
mixing occurred due the flood, then pre flood population structure
is predicted to be stronger than that post flood. If founder events
are important in post flood population dynamics then we
anticipate spatial structure will be stronger following the flood
rather than before. We estimated spatial population structure by
assessing the significance of pairwise FST values among springs
within years using the same method described above for temporal
estimates.
Results
Amplification success and exclusion of lociAll contemporary post flood snails (2002–2006) were success-
fully amplified and scored at the nine loci. Independent repeat
amplifications of a subset of contemporary samples revealed no
amplification inconsistencies or allelic drop out. In the pre flood
(1988–1990) and 1995 snails four out of the nine loci either failed
to amplify successfully (all Hex labelled primers) or produced
inconsistent results across independent runs and were excluded
from the analysis. For consistent pre and post flood group data
comparisons, we excluded these 4 loci from the 2002–2006 data
sets. All subsequent analyses and results presented therefore
pertain to the reduced (5) loci datasets. However, summary genetic
diversity statistics (allelic richness, observed and expected hetero-
zygosity and inbreeding coefficients) for the contemporary samples
across all 9 loci are provided (Supporting Information Table S1).
Genetic diversity estimatesIndividual springs all years. Estimates of allelic richness
within individual springs and years ranged from 1.9 (West Finniss
026, 1990)–3.7 (Sulphuric 012, 2003), observed heterozygosities
ranged from 0.180 (Bopeechee 004, 2006)–0.336 (Dead Boy 005,
1990) and FIS values ranged from 20.612 (West Finniss 026, 1990)
to 0.311 (Sulphuric 012, 1988/89) (Table 1). There was no
evidence for linkage between any of the pairs of loci. Significant
deviations from HWE were detected in one locus in 2 years in
Bopeechee 004, Dead Boy 005 and West Finniss 026 and at one
locus in a single year in Sulphuric 012 and 026 with there being no
consistent pattern as to either the locus or sampling year in which
the deviations were found. Detailed anatomical studies have
shown that F. accepta is a dioecious species [27] and taken with the
HWE results supports an outcrossing breeding system.
Pre and Post Flood Group Comparisons. Results of the
Tukey’s tests showed that there were no significant differences for
any of the three genetic diversity estimates between years within
either the pre and post flood categories for any of the five springs.
Therefore testing for significant differences between the pre and
post flood groups for each spring could continue. Permutation
testing of genetic diversity statistics showed highly significant
differences in pre and post flood estimates of both allelic richness
and inbreeding coefficients in four of the five focal springs
(Table 2). In those four springs mean allelic richness was higher in
post flood samples. Similarly, inbreeding coefficients were
consistently closer to zero in post flood years. Overall these
results suggest a trend of increasing genetic diversity and a
potentially more stable random mating structure in snail
populations following the flood event. No significant differences
in heterozygosity estimates in pre and post flood years were
observed in any of the springs. The lack of any definitive change in
heterozygosity even though there has been a change in allelic
diversity is not unexpected. Heterozygosity is not as sensitive to the
sampling effects caused by the loss or gain of rare alleles [12] and
has been shown to be resistant to change by either single or
multiple founder events (see [62] and references therein).
Temporal genetic differentiationPairwise exact tests of allele frequencies among years within
springs showed highly significant differences among all pre flood
years in all springs where a temporal series was available (Table 3).
Highly significant differences were also found among all but two
pre and post flood year pairwise comparisons (Table 3). The only
non-significant comparisons were between the years 1988 v 2005
and 2006 in the spring West Finniss 026. Furthermore, no
significant differences in allele frequencies were recorded among
any of the post flood years in any spring with the exception of one
year (2003) for West Finniss 026.
Pairwise estimates of FST values showed a near identical pattern
to the allele frequency comparisons with highly significant
differences in population structure recorded among all pre flood
years and between all but one pre and post flood comparison in all
springs (Table 4). In all springs, levels of differentiation were at
least an order of magnitude higher in pre flood years (mean FST
range 0.059–0.173) than post flood years (mean FST range 0.004–
0.011) though four springs did record 1–2 significant post flood
pairwise comparisons. The highest values were consistently
between comparisons pre and post the flood (range 0.076–0.275)
in all springs.
These results indicate substantial changes in the allelic
composition and genetic structure in the snails in the years
preceding the flood and in particular between pre and post flood
Table 2. Mean genetic diversity and inbreeding coefficients(FIS) between pre and post flood snail populations.
Pre Flood Post Flood P value
Bopeechee 004
Allelic Richness 2.4 3.1 0.01
Het Obs 0.475 0.426 0.85
FIS 20.161 0.002 0.03
Dead Boy 005
Allelic Richness 2.5 2.4 0.26
Het Obs 0.508 0.395 0.09
FIS 20.118 0.01 0.15
Sulphuric 012
Allelic Richness 2.1 2.8 0.01
Het Obs 0.568 0.563 0.64
FIS 20.4 20.016 0.02
Sulphuric 024
Allelic Richness 2.6 3.1 0.01
Het Obs 0.577 0.464 0.053
FIS 20.287 20.048 0.02
West Finniss 026
Allelic Richness 2.4 3.2 0.02
Het Obs 0.536 0.451 0.21
FIS 20.192 0.017 0.049
Significant values highlighted in bold.Het Obs = observed heterozygosity.doi:10.1371/journal.pone.0028645.t002
Catastrophic Floods May Promote Genetic Diversity
PLoS ONE | www.plosone.org 6 December 2011 | Volume 6 | Issue 12 | e28645
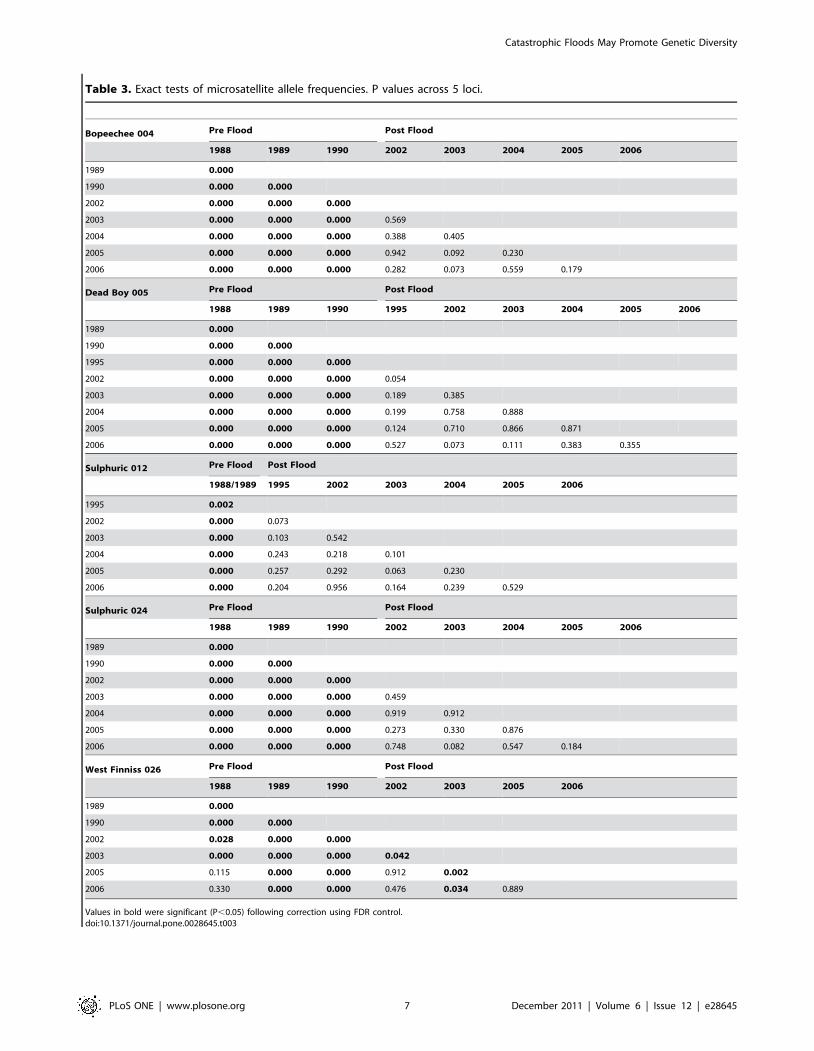
Table 3. Exact tests of microsatellite allele frequencies. P values across 5 loci.
Bopeechee 004 Pre Flood Post Flood
1988 1989 1990 2002 2003 2004 2005 2006
1989 0.000
1990 0.000 0.000
2002 0.000 0.000 0.000
2003 0.000 0.000 0.000 0.569
2004 0.000 0.000 0.000 0.388 0.405
2005 0.000 0.000 0.000 0.942 0.092 0.230
2006 0.000 0.000 0.000 0.282 0.073 0.559 0.179
Dead Boy 005 Pre Flood Post Flood
1988 1989 1990 1995 2002 2003 2004 2005 2006
1989 0.000
1990 0.000 0.000
1995 0.000 0.000 0.000
2002 0.000 0.000 0.000 0.054
2003 0.000 0.000 0.000 0.189 0.385
2004 0.000 0.000 0.000 0.199 0.758 0.888
2005 0.000 0.000 0.000 0.124 0.710 0.866 0.871
2006 0.000 0.000 0.000 0.527 0.073 0.111 0.383 0.355
Sulphuric 012 Pre Flood Post Flood
1988/1989 1995 2002 2003 2004 2005 2006
1995 0.002
2002 0.000 0.073
2003 0.000 0.103 0.542
2004 0.000 0.243 0.218 0.101
2005 0.000 0.257 0.292 0.063 0.230
2006 0.000 0.204 0.956 0.164 0.239 0.529
Sulphuric 024 Pre Flood Post Flood
1988 1989 1990 2002 2003 2004 2005 2006
1989 0.000
1990 0.000 0.000
2002 0.000 0.000 0.000
2003 0.000 0.000 0.000 0.459
2004 0.000 0.000 0.000 0.919 0.912
2005 0.000 0.000 0.000 0.273 0.330 0.876
2006 0.000 0.000 0.000 0.748 0.082 0.547 0.184
West Finniss 026 Pre Flood Post Flood
1988 1989 1990 2002 2003 2005 2006
1989 0.000
1990 0.000 0.000
2002 0.028 0.000 0.000
2003 0.000 0.000 0.000 0.042
2005 0.115 0.000 0.000 0.912 0.002
2006 0.330 0.000 0.000 0.476 0.034 0.889
Values in bold were significant (P,0.05) following correction using FDR control.doi:10.1371/journal.pone.0028645.t003
Catastrophic Floods May Promote Genetic Diversity
PLoS ONE | www.plosone.org 7 December 2011 | Volume 6 | Issue 12 | e28645
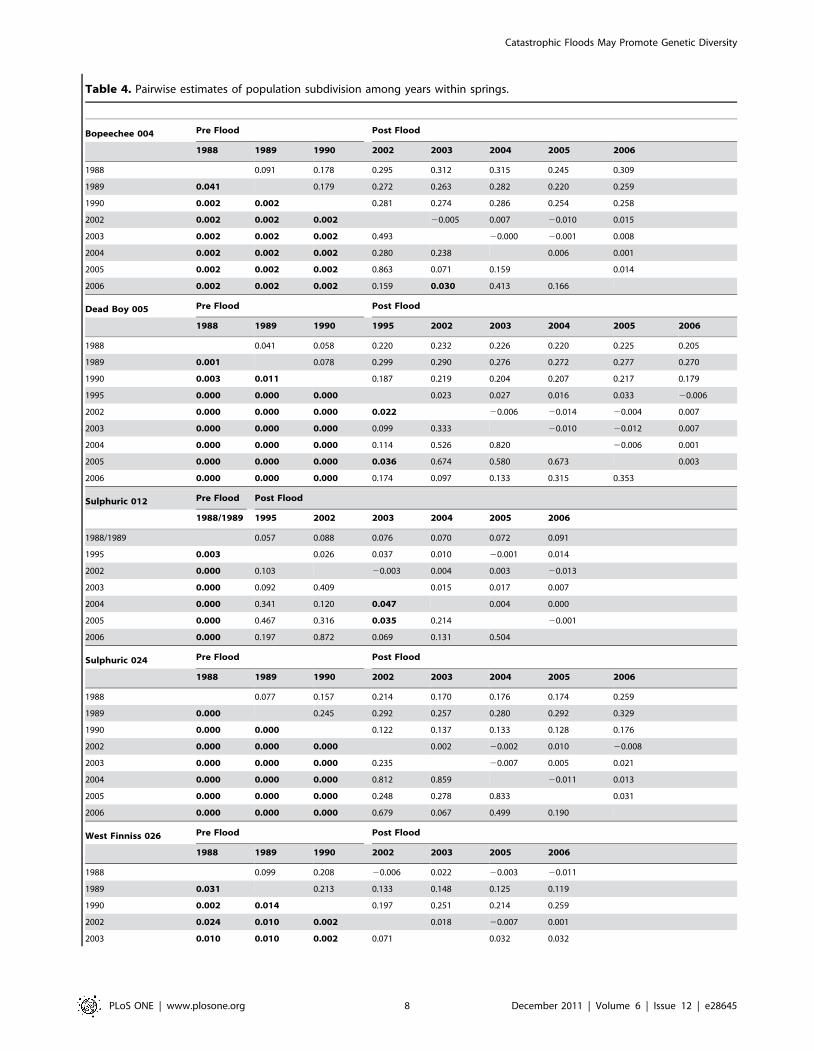
Table 4. Pairwise estimates of population subdivision among years within springs.
Bopeechee 004 Pre Flood Post Flood
1988 1989 1990 2002 2003 2004 2005 2006
1988 0.091 0.178 0.295 0.312 0.315 0.245 0.309
1989 0.041 0.179 0.272 0.263 0.282 0.220 0.259
1990 0.002 0.002 0.281 0.274 0.286 0.254 0.258
2002 0.002 0.002 0.002 20.005 0.007 20.010 0.015
2003 0.002 0.002 0.002 0.493 20.000 20.001 0.008
2004 0.002 0.002 0.002 0.280 0.238 0.006 0.001
2005 0.002 0.002 0.002 0.863 0.071 0.159 0.014
2006 0.002 0.002 0.002 0.159 0.030 0.413 0.166
Dead Boy 005 Pre Flood Post Flood
1988 1989 1990 1995 2002 2003 2004 2005 2006
1988 0.041 0.058 0.220 0.232 0.226 0.220 0.225 0.205
1989 0.001 0.078 0.299 0.290 0.276 0.272 0.277 0.270
1990 0.003 0.011 0.187 0.219 0.204 0.207 0.217 0.179
1995 0.000 0.000 0.000 0.023 0.027 0.016 0.033 20.006
2002 0.000 0.000 0.000 0.022 20.006 20.014 20.004 0.007
2003 0.000 0.000 0.000 0.099 0.333 20.010 20.012 0.007
2004 0.000 0.000 0.000 0.114 0.526 0.820 20.006 0.001
2005 0.000 0.000 0.000 0.036 0.674 0.580 0.673 0.003
2006 0.000 0.000 0.000 0.174 0.097 0.133 0.315 0.353
Sulphuric 012 Pre Flood Post Flood
1988/1989 1995 2002 2003 2004 2005 2006
1988/1989 0.057 0.088 0.076 0.070 0.072 0.091
1995 0.003 0.026 0.037 0.010 20.001 0.014
2002 0.000 0.103 20.003 0.004 0.003 20.013
2003 0.000 0.092 0.409 0.015 0.017 0.007
2004 0.000 0.341 0.120 0.047 0.004 0.000
2005 0.000 0.467 0.316 0.035 0.214 20.001
2006 0.000 0.197 0.872 0.069 0.131 0.504
Sulphuric 024 Pre Flood Post Flood
1988 1989 1990 2002 2003 2004 2005 2006
1988 0.077 0.157 0.214 0.170 0.176 0.174 0.259
1989 0.000 0.245 0.292 0.257 0.280 0.292 0.329
1990 0.000 0.000 0.122 0.137 0.133 0.128 0.176
2002 0.000 0.000 0.000 0.002 20.002 0.010 20.008
2003 0.000 0.000 0.000 0.235 20.007 0.005 0.021
2004 0.000 0.000 0.000 0.812 0.859 20.011 0.013
2005 0.000 0.000 0.000 0.248 0.278 0.833 0.031
2006 0.000 0.000 0.000 0.679 0.067 0.499 0.190
West Finniss 026 Pre Flood Post Flood
1988 1989 1990 2002 2003 2005 2006
1988 0.099 0.208 20.006 0.022 20.003 20.011
1989 0.031 0.213 0.133 0.148 0.125 0.119
1990 0.002 0.014 0.197 0.251 0.214 0.259
2002 0.024 0.010 0.002 0.018 20.007 0.001
2003 0.010 0.010 0.002 0.071 0.032 0.032
Catastrophic Floods May Promote Genetic Diversity
PLoS ONE | www.plosone.org 8 December 2011 | Volume 6 | Issue 12 | e28645
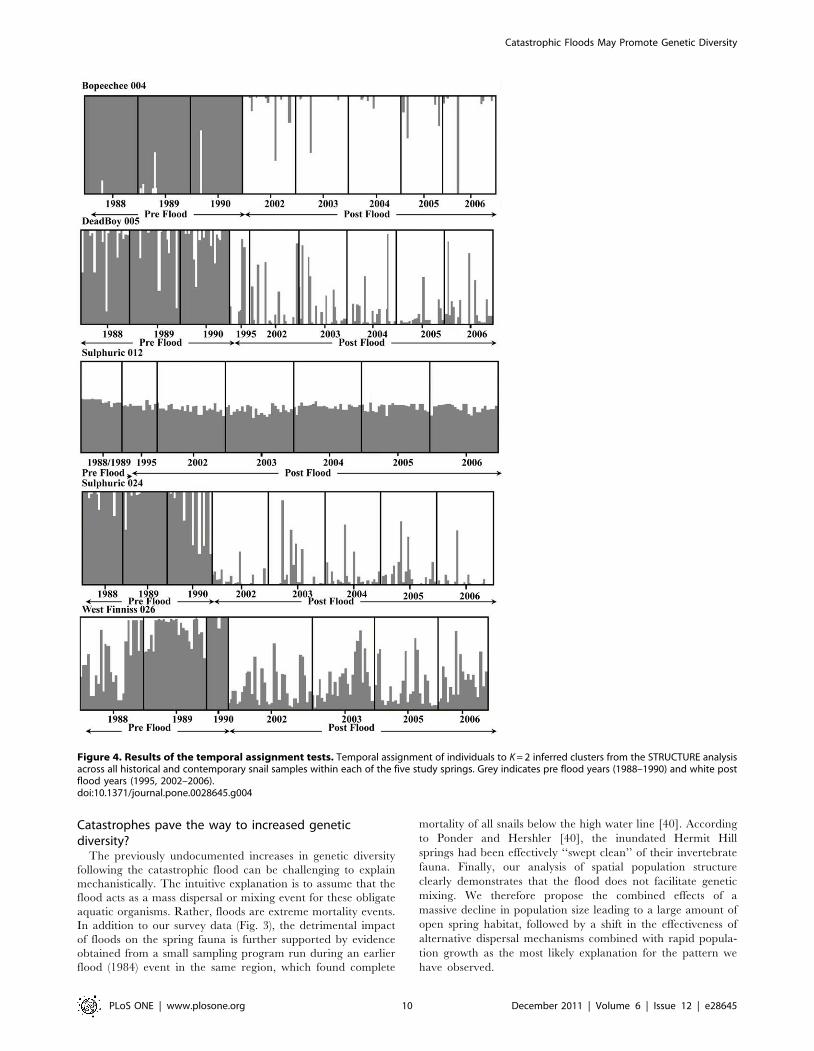
populations. Results of the temporal assignment tests further
support this scenario with individuals sampled in the years 1988–
1990 assigned with an average probability of $90% to a pre
flood cluster in four of the five focal springs (Figure 4, Supporting
Information Table S2). Similarly individuals sampled in years
1995, 2002–2006 are assigned with an equally high probability
(ave$86%) to a contemporary post flood cluster in those same
four springs. In three of these four springs the greatest increase in
the posterior probability of the number of genetic clusters was
found for K = 2 (Supporting Information Table S2). There are
two notable exceptions to this pattern. Individual assignment tests
for the spring Sulphuric 012 showed that all snails, regardless of
sampling year could be being assigned to either a pre or post
flood cluster with equal probability indicating (and supported by
the estimates of K) a single non-differentiated population (Figure 4,
Supporting Information Table S2). This is despite, however, the
highly significant differences in allele frequencies and population
structure that was found for this spring between the pre flood
sample (1988/1989) and the contemporary post flood years using
traditional frequentist estimates. This result for Sulphuric 012
most likely reflects the poor performance of assignment tests
when FST values are low albeit significant (,0.1 between pre and
post flood years, Table 4), samples size of the pre flood group is
small and there are few loci involved [63]. The other exception
was for the year 1988 in West Finniss 026, which can be assigned
equally to either the pre and post flood clusters. As mentioned
above this year is not significantly different in allelic frequencies
or genetically differentiated from the last two contemporary
sampling years (2005, 2006) and may indicate a return of this
spring’s F. accepta population to its earliest pre flood genetic
composition.
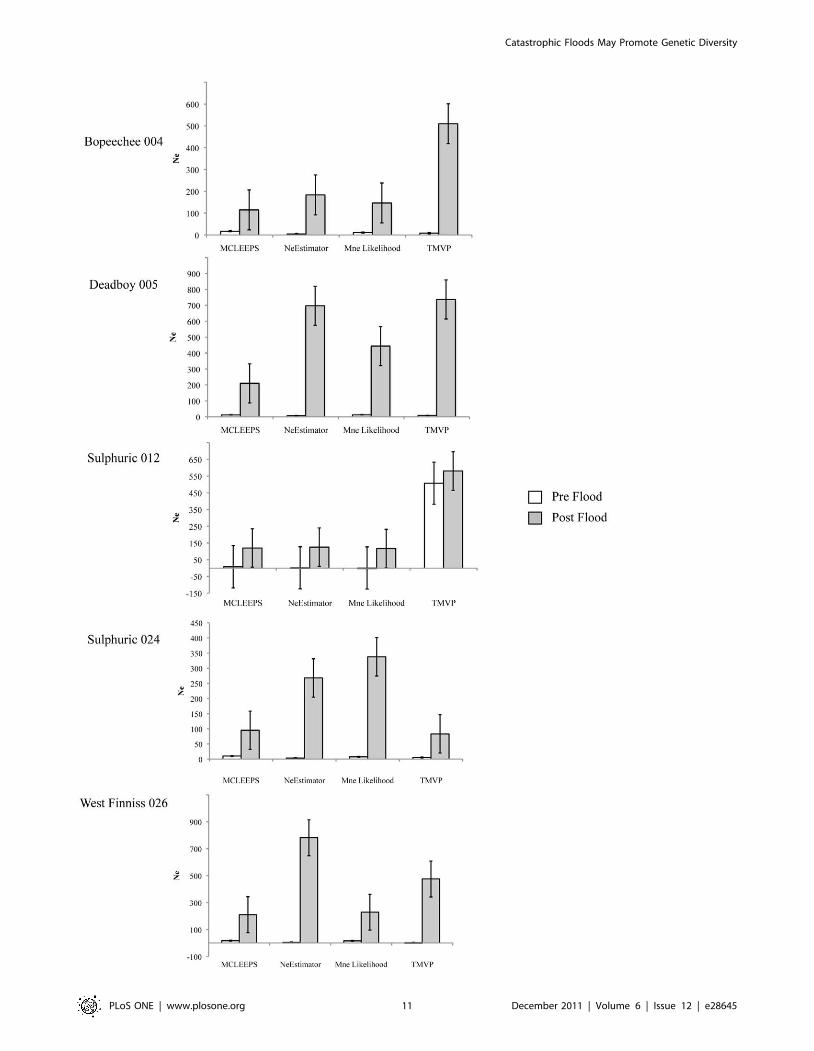
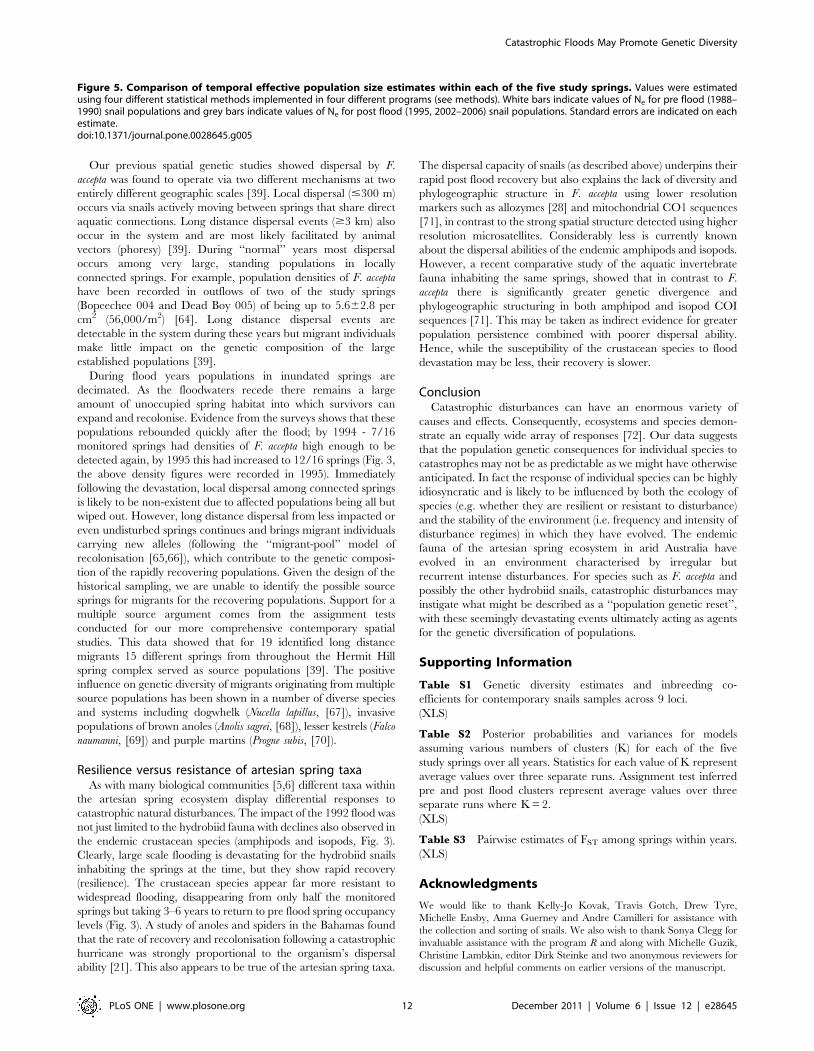
Temporal effective population sizesAs anticipated due to the low level of allelic diversity for our
markers, each of the four programs gave widely varied estimates of
effective population size between pre and post flood samples
within each of the springs. However, regardless of the actual
estimates the pattern for all programs across four of the five springs
was identical; effective population sizes were found to be
consistently larger after the flood than they were prior (Figure 5).
The exception to this was spring Sulphuric 012 where while the
actual values also mirror this pattern, the standard errors for each
pre and post flood values overlap for all estimates. This is likely
due to the small sample size of the pre flood group (n = 15) for this
spring.
Spatial genetic differentiationPairwise estimates of FST values among springs within years
showed very different patterns of spatial structuring among pre
and post flood populations (Supporting Information Table S3). In
the pre flood years, evidence for spatial structuring among the
springs varies from year to year. In 1988 only two significant
differences in pairwise FST values among the springs were found,
in 1989 significant FST values were found among all but two
pairwise comparisons and in 1990 no significant differences
among populations were recorded. For post flood years, however,
the pattern was completely consistent. Highly significant
differences in FST values were found among all springs in all
years (1995, 2002–2006). The strong genetic structure recorded
among springs in the post flood years, especially in 1995, provides
evidence that founder events rather than mixing are more
important in determining population dynamic processes of the
snails following the flood.
Discussion
This study has produced an intriguing and unexpected result.
Our data clearly demonstrate changes in the levels of genetic
diversity, allelic composition, genetic structure (both temporal and
spatial) and effective population sizes of F. accepta populations
within the same artesian springs. These changes may have been
precipitated by the catastrophic flood that swept through these
springs in 1992. This assertion is supported by the fact that snails
from two springs sampled in 1995 clearly define genetically the
post flood group and that genetic signature remains in populations
sampled 10 years after this catastrophic disturbance. Contrary to
predictions and expectations, our data shows that nearly all post
flood snail populations had significantly higher allelic richness,
inbreeding co-efficients that were closer to zero, little or no
temporal changes in population structure and greater effective
population sizes than their pre flood counterparts. Remarkably,
our results are consistent with the possibility that a catastrophic
disturbance, which resulted in a severe population crash, may have
lead to enhanced levels of within population genetic diversity
within the recovered populations. To our knowledge, this is the
first result of its kind.
An additional finding was that the system may not have been in
equilibrium prior to the flood. Data from the pre flood years
showed annual changes in spatial structure among springs,
increasingly negative inbreeding co-efficients and consistent
significant differences in temporal allele frequencies and genetic
structure. While the survey results (Fig. 3) appear to indicate that
the invertebrate fauna was already in decline prior to the flood, a
regression analysis (data not shown) found that only the
Trochidrobia snail species exhibit a significant decline in the number
of springs occupied during the 1989–1992 time period. While an
earlier flood event was known to have occurred in the region in
1984 [40], the limitations of the historical sampling and the lack of
available information regarding the conditions at our study site
during that time prevents testing of processes influential in shaping
snail population dynamics prior to the flood.
West Finniss 026 Pre Flood Post Flood
1988 1989 1990 2002 2003 2005 2006
2005 0.010 0.005 0.002 0.869 0.002 20.009
2006 0.150 0.010 0.002 0.540 0.055 0.793
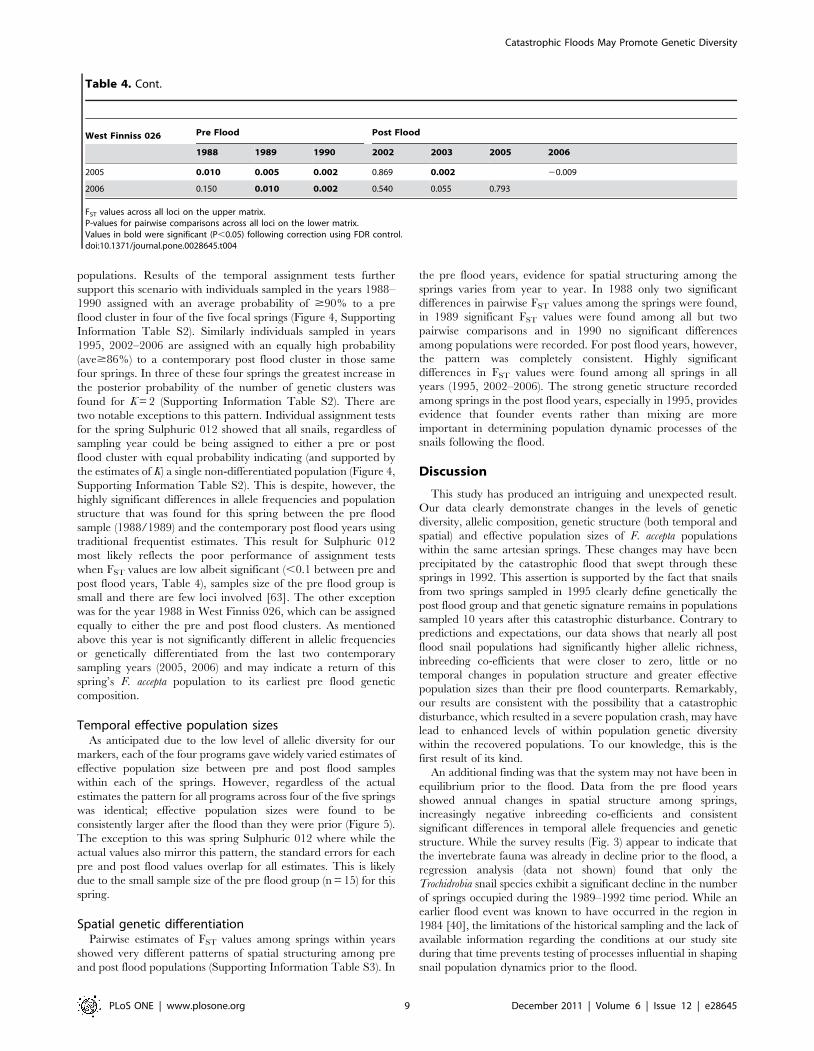
FST values across all loci on the upper matrix.P-values for pairwise comparisons across all loci on the lower matrix.Values in bold were significant (P,0.05) following correction using FDR control.doi:10.1371/journal.pone.0028645.t004
Table 4. Cont.
Catastrophic Floods May Promote Genetic Diversity
PLoS ONE | www.plosone.org 9 December 2011 | Volume 6 | Issue 12 | e28645
Catastrophes pave the way to increased geneticdiversity?
The previously undocumented increases in genetic diversity
following the catastrophic flood can be challenging to explain
mechanistically. The intuitive explanation is to assume that the
flood acts as a mass dispersal or mixing event for these obligate
aquatic organisms. Rather, floods are extreme mortality events.
In addition to our survey data (Fig. 3), the detrimental impact
of floods on the spring fauna is further supported by evidence
obtained from a small sampling program run during an earlier
flood (1984) event in the same region, which found complete
mortality of all snails below the high water line [40]. According
to Ponder and Hershler [40], the inundated Hermit Hill
springs had been effectively ‘‘swept clean’’ of their invertebrate
fauna. Finally, our analysis of spatial population structure
clearly demonstrates that the flood does not facilitate genetic
mixing. We therefore propose the combined effects of a
massive decline in population size leading to a large amount of
open spring habitat, followed by a shift in the effectiveness of
alternative dispersal mechanisms combined with rapid popula-
tion growth as the most likely explanation for the pattern we
have observed.
Figure 4. Results of the temporal assignment tests. Temporal assignment of individuals to K = 2 inferred clusters from the STRUCTURE analysisacross all historical and contemporary snail samples within each of the five study springs. Grey indicates pre flood years (1988–1990) and white postflood years (1995, 2002–2006).doi:10.1371/journal.pone.0028645.g004
Catastrophic Floods May Promote Genetic Diversity
PLoS ONE | www.plosone.org 10 December 2011 | Volume 6 | Issue 12 | e28645
Catastrophic Floods May Promote Genetic Diversity
PLoS ONE | www.plosone.org 11 December 2011 | Volume 6 | Issue 12 | e28645
Our previous spatial genetic studies showed dispersal by F.
accepta was found to operate via two different mechanisms at two
entirely different geographic scales [39]. Local dispersal (#300 m)
occurs via snails actively moving between springs that share direct
aquatic connections. Long distance dispersal events ($3 km) also
occur in the system and are most likely facilitated by animal
vectors (phoresy) [39]. During ‘‘normal’’ years most dispersal
occurs among very large, standing populations in locally
connected springs. For example, population densities of F. accepta
have been recorded in outflows of two of the study springs
(Bopeechee 004 and Dead Boy 005) of being up to 5.662.8 per
cm2 (56,000/m2) [64]. Long distance dispersal events are
detectable in the system during these years but migrant individuals
make little impact on the genetic composition of the large
established populations [39].
During flood years populations in inundated springs are
decimated. As the floodwaters recede there remains a large
amount of unoccupied spring habitat into which survivors can
expand and recolonise. Evidence from the surveys shows that these
populations rebounded quickly after the flood; by 1994 - 7/16
monitored springs had densities of F. accepta high enough to be
detected again, by 1995 this had increased to 12/16 springs (Fig. 3,
the above density figures were recorded in 1995). Immediately
following the devastation, local dispersal among connected springs
is likely to be non-existent due to affected populations being all but
wiped out. However, long distance dispersal from less impacted or
even undisturbed springs continues and brings migrant individuals
carrying new alleles (following the ‘‘migrant-pool’’ model of
recolonisation [65,66]), which contribute to the genetic composi-
tion of the rapidly recovering populations. Given the design of the
historical sampling, we are unable to identify the possible source
springs for migrants for the recovering populations. Support for a
multiple source argument comes from the assignment tests
conducted for our more comprehensive contemporary spatial
studies. This data showed that for 19 identified long distance
migrants 15 different springs from throughout the Hermit Hill
spring complex served as source populations [39]. The positive
influence on genetic diversity of migrants originating from multiple
source populations has been shown in a number of diverse species
and systems including dogwhelk (Nucella lapillus, [67]), invasive
populations of brown anoles (Anolis sagrei, [68]), lesser kestrels (Falco
naumanni, [69]) and purple martins (Progne subis, [70]).
Resilience versus resistance of artesian spring taxaAs with many biological communities [5,6] different taxa within
the artesian spring ecosystem display differential responses to
catastrophic natural disturbances. The impact of the 1992 flood was
not just limited to the hydrobiid fauna with declines also observed in
the endemic crustacean species (amphipods and isopods, Fig. 3).
Clearly, large scale flooding is devastating for the hydrobiid snails
inhabiting the springs at the time, but they show rapid recovery
(resilience). The crustacean species appear far more resistant to
widespread flooding, disappearing from only half the monitored
springs but taking 3–6 years to return to pre flood spring occupancy
levels (Fig. 3). A study of anoles and spiders in the Bahamas found
that the rate of recovery and recolonisation following a catastrophic
hurricane was strongly proportional to the organism’s dispersal
ability [21]. This also appears to be true of the artesian spring taxa.
The dispersal capacity of snails (as described above) underpins their
rapid post flood recovery but also explains the lack of diversity and
phylogeographic structure in F. accepta using lower resolution
markers such as allozymes [28] and mitochondrial CO1 sequences
[71], in contrast to the strong spatial structure detected using higher
resolution microsatellites. Considerably less is currently known
about the dispersal abilities of the endemic amphipods and isopods.
However, a recent comparative study of the aquatic invertebrate
fauna inhabiting the same springs, showed that in contrast to F.
accepta there is significantly greater genetic divergence and
phylogeographic structuring in both amphipod and isopod COI
sequences [71]. This may be taken as indirect evidence for greater
population persistence combined with poorer dispersal ability.
Hence, while the susceptibility of the crustacean species to flood
devastation may be less, their recovery is slower.
ConclusionCatastrophic disturbances can have an enormous variety of
causes and effects. Consequently, ecosystems and species demon-
strate an equally wide array of responses [72]. Our data suggests
that the population genetic consequences for individual species to
catastrophes may not be as predictable as we might have otherwise
anticipated. In fact the response of individual species can be highly
idiosyncratic and is likely to be influenced by both the ecology of
species (e.g. whether they are resilient or resistant to disturbance)
and the stability of the environment (i.e. frequency and intensity of
disturbance regimes) in which they have evolved. The endemic
fauna of the artesian spring ecosystem in arid Australia have
evolved in an environment characterised by irregular but
recurrent intense disturbances. For species such as F. accepta and
possibly the other hydrobiid snails, catastrophic disturbances may
instigate what might be described as a ‘‘population genetic reset’’,
with these seemingly devastating events ultimately acting as agents
for the genetic diversification of populations.
Supporting Information
Table S1 Genetic diversity estimates and inbreeding co-
efficients for contemporary snails samples across 9 loci.
(XLS)
Table S2 Posterior probabilities and variances for models
assuming various numbers of clusters (K) for each of the five
study springs over all years. Statistics for each value of K represent
average values over three separate runs. Assignment test inferred
pre and post flood clusters represent average values over three
separate runs where K = 2.
(XLS)
Table S3 Pairwise estimates of FST among springs within years.
(XLS)
Acknowledgments
We would like to thank Kelly-Jo Kovak, Travis Gotch, Drew Tyre,
Michelle Ensby, Anna Guerney and Andre Camilleri for assistance with
the collection and sorting of snails. We also wish to thank Sonya Clegg for
invaluable assistance with the program R and along with Michelle Guzik,
Christine Lambkin, editor Dirk Steinke and two anonymous reviewers for
discussion and helpful comments on earlier versions of the manuscript.
Figure 5. Comparison of temporal effective population size estimates within each of the five study springs. Values were estimatedusing four different statistical methods implemented in four different programs (see methods). White bars indicate values of Ne for pre flood (1988–1990) snail populations and grey bars indicate values of Ne for post flood (1995, 2002–2006) snail populations. Standard errors are indicated on eachestimate.doi:10.1371/journal.pone.0028645.g005
Catastrophic Floods May Promote Genetic Diversity
PLoS ONE | www.plosone.org 12 December 2011 | Volume 6 | Issue 12 | e28645
Author Contributions
Conceived and designed the experiments: JWW. Performed the experi-
ments: JWW LM. Analyzed the data: JWW LM CE. Contributed
reagents/materials/analysis tools: JWW CW DN HP. Wrote the paper:
JWW LM CE CW DN HP.
References
1. Connell JH (1978) Diversity in tropical rainforests and coral reefs. Science 199:
1302–1310.
2. Sousa WP (1984) The role of disturbance in natural communities. AnnualReview of Ecology and Systematics 15: 353–391.
3. Pickett S, White P, eds. (1985) The Ecology of Natural Disturbance and PatchDynamics. San Diego: Academic.
4. Petraitis P, Latham R, Nisenbaum R (1989) The maintenance of species
diversity by disturbance. Quarterly Review of Biology 64: 393–418.
5. Attiwill PM (1994) The disturbance of forest ecosystems: the ecological basis for
conservation management. Forest Ecology and Management 63: 247–300.
6. Brawn JD, Robinson SK, Thompson FR (2001) The role of disturbance in theecology and conservation of birds. Annual Review of Ecology and Systematics
32: 251–276.
7. Holt RD (2006) Making a virtue out of a necessity: Hurricanes and the resilience
of community organization. Proceedings of the National Academy of Sciences,USA 103: 2005–2006.
8. Vellend M, Geber MA (2005) Connections between species diversity and genetic
diversity. Ecology Letters 8: 767–781.
9. Cleary DFR, Fauvelot C, Genner MJ, Menken SBJ, Mooers AO (2006) Parallel
responses of species and genetic diversity to El Nino Southern Oscillation-induced environmental destruction. Ecology Letters 9: 304–310.
10. Evanno G, Castella E, Antoine C, Paillat G, Goudet J (2009) Parallel changes ingenetic diversity and species diversity following a natural disturbance. Molecular
Ecology 18: 1137–1144.
11. Wright S (1931) Evolution in Mendelian populations. Genetics 16: 97–159.
12. Nei M, Maruyama T, Chakraborty R (1975) The bottleneck effect and genetic
variability in populations. Evolution 29: 1–10.
13. Chakraborty R, Nei M (1977) Bottleneck effect on average heterozygosity andgenetic distance with the stepwise mutation model. Evolution 31: 347–356.
14. Frankham R, Lees K, Montgomery ME, England PR, Lowe E, et al. (1999) Dopopulation size bottlenecks reduce evolutionary potential? Animal Conservation
2: 255–260.
15. England PR, Osler GHR, Woodworth LM, Montgomery ME, Briscoe DA, et al.(2003) Effects of intense versus diffuse population bottlenecks on microsatellite
genetic diversity and evolutionary potential. Conservation Genetics 4: 595–604.
16. Vignieri S (2010) The genetic effects of ecological disturbance: flooding in
jumping mice. American Naturalist 175: 126–135.
17. Hughes AR, Stachowicz JJ (2004) Genetic diversity enhances the resistance of aseagrass ecosystem to disturbance. Proceedings of the National Academy of
Sciences, USA 101: 8998–9002.
18. Pearman PB, Garner TWJ (2005) Susceptibility of Italian agile frog populations
to an emerging strain of Ranavirus parallels population genetic diversity.Ecology Letters 8: 401–408.
19. Reusch TBH, Ehlers A, Hammerli A, Worm B (2005) Ecosystem recovery afterclimatic extremes enhanced by genotypic diversity. Proceedings of the National
Academy of Sciences, USA 102: 2826–2831.
20. Grant P, Grant B (2002) Unpredictable evolution in a 30-year study of Darwin’sfinches. Science 296: 707–711.
21. Spiller D, Losos J, Schoener T (1998) Impact of a catastrophic hurricane onisland populations. Science 281: 695–697.
22. Schoener T, Spiller D, Losos J (2001) Natural restoration of the species-area
relation for a lizard after a hurricane. Science 294: 1525–1528.
23. Schoener T, Spiller D (2006) Nonsynchronous recovery of community
characteristics in island spiders after a catastrophic hurricane. Proceedings ofthe National Academy of Sciences, USA 103: 2220–2225.
24. Clegg SM, Frentiu FD, Kikkawa J, Tavecchia G, Owens IPF, et al. (2009) 4000
Years of Phenotypic Change in an Island Bird: Heterogeneity of Selection Over
Three Microevolutionary Timescales. Evolution 62: 2393–2410.
25. Habermehl MA (1980) The Great Artesian Basin. BMR Journal of AustralianGeology and Geophysics 5: 9–38.
26. Ponder WF (1995) Mound spring snails of the Australian Great Artesian Basin.
In: Kay A, ed. The Conservation Biology of Molluscs. Gland, Switzerland:
International Union for the Conservation of Nature and Natural Resources. pp13–18.
27. Ponder WF, Hershler R, Jenkins B (1989) An endemic radiation of hydrobiid
snails from artesian springs in northern South Australia - their taxonomy,
physiology, distribution and anatomy. Malacologia 31: 1–140.
28. Ponder WF, Eggler P, Colgan DJ (1995) Genetic differentiation of aquatic snails(Gastropoda: Hydrobiidae) from artesian springs in arid Australia. Biological
Journal of the Linnean Society 56: 553–596.
29. Fensham R, Price R (2004) Ranking spring wetlands in the Great Artesian Basin
of Australia using endemicity and isolation of plant species. BiologicalConservation 119: 41–50.
30. Framenau V, Gotch T, Austin AD (2006) The wolf spiders of artesian springs in
arid South Australia, with a revalidation of Tetralycosa (Aranae, Lycosidae).
Journal of Arachnology 34: 1–36.
31. McMahon T, Murphy R, Little P, Costelloe J, Peel M, et al. (2005) Hydrology of
Lake Eyre Basin. Armadale: Sinclair Knight Merz, University of Melbourne,National Heritage Trust.
32. Kingsford RT, Curtain AL, Porter JL (1999) Water flows on Cooper Creek in
arid Australia determine ‘‘boom’’ and ‘‘bust’’ periods for waterbirds. BiologicalConservation 88: 231–248.
33. Puckridge JT, Walker KF, Costelloe JF (2000) Hydrological persistence and theecology of dryland rivers. Regulated Rivers: Research and Management 16:
385–402.
34. Roshier DA, Robertson AI, Kingsford RT (2002) Responses of waterbirds toflooding in an arid region of Australia and implications for conservation.
Biological Conservation 106: 399–411.
35. Kinhill-Stearns (1984) Olympic Dam Project. Supplementary environmental
studies: mound springs. Prepared for Roxby Management Services Pty Ltd.Adelaide.
36. Fatchen TJ, Fatchen DH (1993) Dynamics of vegetation on mound springs in
the Hermit Hill region, northern South Australia. Report prepared for WMC(Olympic Dam Operations) Pty Ltd. Adelaide.
37. Tyre AJ, Possingham HP, Neijelke DP (2001) Detecting environmental impactson metapopulations of mound spring invertebrates: assessing an incidence
function model. Environment International 27: 225–229.
38. Worthington Wilmer J, Wilcox C (2007) Fine scale patterns of migration and
gene flow in the endangered mound spring snail, Fonscochlea accepta (Mollusca:-
Hydrobiidae) in arid Australia. Conservation Genetics 8: 617–628.
39. Worthington Wilmer J, Elkin C, Wilcox C, Murray L, Niejalke D, et al. (2008)
The influence of multiple dispersal mechanisms and landscape structure onpopulation clustering and connectivity in fragmented artesian spring snail
populations. Molecular Ecology 17: 3733–3751.
40. Ponder WF, Hershler R (1984) The distribution, significance and conservation
of the Hydrobiidae of the South Australian mound springs. A report to Roxby
Management Services and the South Australian Government. Sydney: TheAustralian Museum.
41. BHP Billiton (2006) Olympic Dam Environmental Management and Monitor-ing Report. South Australia.
42. Worthington Wilmer J, Hughes JM, Ma J, Wilcox C (2005) Characterization ofmicrosatellite loci in the endemic mound spring snail, Fonscochlea accepta and cross
species amplification in four other hydrobiid snails. Molecular Ecology Notes 5:
205–207.
43. Van-Oosterhout C, Hutchinson WF, Willis DPM, Shipley P (2004) MICRO-
CHECKER: software for identifying and correcting genotyping errors inmicrosatellite data. Molecular Ecology Notes 4: 535–538.
44. Raymond M, Rousset F (1995) GENEPOP (version 1.2): population genetics
software for exact tests and ecumenicism. Journal of Heredity 86: 248–249.
45. El-Mousadik A, Petit RJ (1996) High levels of genetic differentiation for allelic
richness among populations of the argan tree [Argania spinosa (L.) Skeels] endemicto Morocco. Theoretical and Applied Genetics 92: 832–839.
46. Goudet J (1995) FSTAT (version 1.2): a computer program to calculate F-statistics. Journal of Heredity 86: 485–486.
47. R Development Core Team (2010) R: A language and environment for
statistical computing. Vienna, Austria: R Project for Statistical Computingwebsite. Available: http://www.R-project.org. Accessed 2011 Nov 28.
48. Weir BS, Cockerham CC (1984) Estimating F-statistics for the analysis ofpopulation structure. Evolution 38: 1358–1370.
49. Benjamin Y, Hochberg Y (1995) Controlling the false discovery rate - a practicaland powerful approach to multiple testing. Journal of the Royal Statistical
Society: Series B (Statistical Methodology) 57: 289–300.
50. Watkins MW (2005) Multiple Pairwise Tests v1.3. FYXM.net website. Available:http://download.fyxm.net/Pairwise-Multiple-8790.html. Accessed 2011 Nov
18.
51. Garcia LV (2003) Controlling the false discovery rate in ecological research.
Trends in Ecology & Evolution 18: 553–554.
52. Pritchard JK, Stephens M, Donnelly P (2000) Inference of population structure
using multilocus genotype data. Genetics 155: 945–959.
53. Falush D, Stephens M, Pritchard JK (2003) Inference of population structureusing multilocus genotype data: linked loci and correlated allele frequencies.
Genetics 164: 1567–1587.
54. Aspi J, Roininen E, Ruokonen M, Kojola I, Vila C (2006) Genetic diversity,
population structure, effective population size and demographic history of theFinnish wolf population. Molecular Ecology 15: 1561–1576.
55. Peel D, Ovenden J, Peel S (2004) NEESTIMATOR: software for estimating
effective population size. Version 1.3. Queensland Government, Department ofPrimary Industries and Fisheries.
56. Waples R (1989) A generalized approach for estimating effective population sizefrom temporal changes in allele frequency. Genetics 121: 379–391.
57. Anderson EC, Williamson EG, Thompson EA (2000) Monte Carlo evaluation ofthe likelihood for Ne from temporally spaced samples. Genetics 156: 2109–2118.
Catastrophic Floods May Promote Genetic Diversity
PLoS ONE | www.plosone.org 13 December 2011 | Volume 6 | Issue 12 | e28645
58. Wang J (2001) A pseudo-likelihood method for estimating effective population
size from temporally spaced samples. Genetical Research 78: 243–257.59. Wang J, Whitlock M (2003) Estimating effective population size and migration
rates from genetic samples over space and time. Genetics 163: 429–446.
60. Beaumont MA (2003) Estimation of population growth or decline in geneticallymonitored populations. Genetics 164: 1139–1160.
61. Palstra F, Ruzzante D (2008) Genetic estimates of contemporary population size:what can they tell us about the importance of genetic stochasticity for wild
population persistence? Molecular Ecology 17: 3428–3447.
62. Clegg SM (2009) Evolutionary changes following island colonizations in birds:empirical insights into the roles of microevolutionary processes. In: Losos J,
Ricklefs R, eds. The Theory of Island Biogeography Revisited. Princeton, NJ:Princeton University Press. pp 293–325.
63. Cornuet JM, Piry S, Luikart G, Estoup A, Solignac M (1999) New methodsemploying multilocus genotypes to select or exclude populations as origins of
individuals. Genetics 153: 1989–2000.
64. Niejalke D, Richards J (1998) Population biology of some spring snails. In:Niejalke D, ed. Proceedings of the Second Mound Spring Researchers Forum
and Spring Management Workshop Adelaide. Great Artesian Basin Consulta-tive Council. pp 25–26.
65. Slatkin M (1977) Gene flow and genetic drift in a species subject to frequent local
extinctions. Theoretical Population Biology 12: 253–262.
66. Whitlock M, McCauley D (1990) Some population genetic consequences of
colony formation and extinction: genetic correlations within founding groups.Evolution 44: 1717–1724.
67. Colson I, Hughes RN (2004) Rapid recovery of genetic diversity of dogwhelk
(Nucella lapillus L.) populations after local extinction and recolonizationcontradicts predictions from life-history characteristics. Molecular Ecology 13:
2223–2233.68. Kolbe JJ, Glor RE, Schettino LR, Lara AC, Larson A, et al. (2004) Genetic
variation increases during biological invasion by a Cuban lizard. Nature 431:
177–181.69. Ortego J, Aparicio JM, Calabuig G, Cordero PJ (2007) Increase of
heterozygosity in a growing population of lesser kestrels. Biology Letters 3:585–588.
70. Baker AJ, Greenslade AD, Darling LM, Finlay JC (2008) High genetic diversityin the blue-listed British Columbia population of the purple martin maintained
by multiple sources of immigrants. Conservation Genetics 9: 495–505.
71. Murphy NP, Guzik MT, Worthington Wilmer J (2010) Understanding theinfluence of landscape and dispersal on species distributions in fragmented
groundwater dependent springs. Freshwater Biology 55: 2499–2509.72. White PS, Jentsch A (2001) The search for generality in studies of disturbance
and ecosystem dynamics. In: Esser K, Luttge U, Kadereit JW, Beyschlag W, eds.
Progress in Botany. BerlinHeidelberg: Springer-Verlag. pp 399–450.
Catastrophic Floods May Promote Genetic Diversity
PLoS ONE | www.plosone.org 14 December 2011 | Volume 6 | Issue 12 | e28645
Copyright © 2022 FDOKUMEN