
Assessment of Corrosion Performance of Steel Rebar in Snail ...
24
materials Article Assessment of Corrosion Performance of Steel Rebar in Snail Shell Ash Blended Cements under Marine Environments Muralidharan Raghav 1 , Subbiah Karthick 2, * , Taejoon Park 3 and Han-Seung Lee 2, * Citation: Raghav, M.; Karthick, S.; Park, T.; Lee, H.-S. Assessment of Corrosion Performance of Steel Rebar in Snail Shell Ash Blended Cements under Marine Environments. Materials 2021, 14, 7286. https:// doi.org/10.3390/ma14237286 Academic Editor: Frank Collins Received: 28 October 2021 Accepted: 24 November 2021 Published: 28 November 2021 Publisher’s Note: MDPI stays neutral with regard to jurisdictional claims in published maps and institutional affil- iations. Copyright: © 2021 by the authors. Licensee MDPI, Basel, Switzerland. This article is an open access article distributed under the terms and conditions of the Creative Commons Attribution (CC BY) license (https:// creativecommons.org/licenses/by/ 4.0/). 1 Department of Civil Engineering, PSG Institute of Technology and Applied Research, Neelambur, Coimbatore 641062, India; [email protected] 2 Department of Architectural Engineering, Hanyang University, 55 Hanyangdaehak-ro, Sangrok-gu, Ansan-si 15588, Gyeonggi-do, Korea 3 Department of Robotics Engineering, Hanyang University, 55 Hanyangdaehak-ro, Ansan-si 15588, Gyeonggi-do, Korea; [email protected] * Correspondence: [email protected] (S.K.); [email protected] (H.-S.L.); Tel.: +82-31-436-8159 (H.-S.L.); Fax: +82-31-436-8169 (H.-S.L.) Abstract: An attempt has been made on a constructive approach to evaluate the performance of snail shell ash (SSA) for its corrosion performance under marine environments. Corrosion performance of steel rebar in chloride-contaminated SSA with (0% to 50%) replacement levels of cement extract medium was examined through electrochemical and weight loss techniques. Initially, snail shell powder (SSP) is made by pulverizing and subsequently SSA is by thermal decomposition methods. Both SSP and SSA were characterized by X-ray diffraction, Fourier transforms infrared spectroscopy, scanning electron microscopy, and energy dispersion X-ray spectroscopy. Concrete cubes with 0% to 50% replacement levels of cement by SSA were evaluated for their mechanical properties. A critical level of 20 to 30% SSA improved both corrosion resistance and strength of concrete. Extrapolation modeling for the strength and corrosion rate with respect to later age were made. SSA is a suitable replacement material for natural limestone in cement productions. Keywords: snail shell ash; reinforcement corrosion; corrosion resistance property; mechanical property 1. Introduction Concrete structures have played a predominant role in the modernization of devel- oping countries and cement is an essential material in construction industries. Ordinary Portland cement (OPC) is one of the essential ingredients for concrete production, which is one of the second most-used material in the world next to water [1]. With every country increasing infrastructure for global urbanization, this has increased the demand of cement within the construction industry every day. Worldwide cement production is approxi- mately 4.4 million metric tons in 2020 [2], which is set to increase by 12–23% by 2050 from the present level [3]. Commonly, 1.5 to 1.8 tonnes of natural limestone and 0.4 tonnes of clay were used for each tone of cement production [4], reducing the natural resource and also around 5–8% of CO 2 was emitted from the cement industry [1,5], which leads to an environmental problem. Furthermore, the current consumption of natural resources could create a problem that will affect the entire cement industry due to the scarcity of natural resources in the future. In addition, the restrain of industrial, agriculture, and animal food waste is one of the major problems to maintain a clean environment in every country. Therefore, considering environmental sustainability and life of future generations, the cement industry is reducing the consumption of natural limestone by using various industrial and agricultural waste materials (supplementary cementitious materials) as par- tially reducing the cement content in construction [6]. This might prevent the depletion of natural resources and maintain the ecological balance. For example, industrial byproducts like fly ash (FA) [7–9], granulated blast furnace slag (GGBS) [10,11], silica fume [12], and Materials 2021, 14, 7286. https://doi.org/10.3390/ma14237286 https://www.mdpi.com/journal/materials
-
Upload
khangminh22 -
Category
Documents
-
view
0 -
download
0
Transcript of Assessment of Corrosion Performance of Steel Rebar in Snail ...

materials
Article
Assessment of Corrosion Performance of Steel Rebar in SnailShell Ash Blended Cements under Marine Environments
Muralidharan Raghav 1, Subbiah Karthick 2,* , Taejoon Park 3 and Han-Seung Lee 2,*
Citation: Raghav, M.; Karthick, S.;
Park, T.; Lee, H.-S. Assessment of
Corrosion Performance of Steel Rebar
in Snail Shell Ash Blended Cements
under Marine Environments.
Materials 2021, 14, 7286. https://
doi.org/10.3390/ma14237286
Academic Editor: Frank Collins
Received: 28 October 2021
Accepted: 24 November 2021
Published: 28 November 2021
Publisher’s Note: MDPI stays neutral
with regard to jurisdictional claims in
published maps and institutional affil-
iations.
Copyright: © 2021 by the authors.
Licensee MDPI, Basel, Switzerland.
This article is an open access article
distributed under the terms and
conditions of the Creative Commons
Attribution (CC BY) license (https://
creativecommons.org/licenses/by/
4.0/).
1 Department of Civil Engineering, PSG Institute of Technology and Applied Research, Neelambur,Coimbatore 641062, India; [email protected]
2 Department of Architectural Engineering, Hanyang University, 55 Hanyangdaehak-ro, Sangrok-gu,Ansan-si 15588, Gyeonggi-do, Korea
3 Department of Robotics Engineering, Hanyang University, 55 Hanyangdaehak-ro,Ansan-si 15588, Gyeonggi-do, Korea; [email protected]
* Correspondence: [email protected] (S.K.); [email protected] (H.-S.L.);Tel.: +82-31-436-8159 (H.-S.L.); Fax: +82-31-436-8169 (H.-S.L.)
Abstract: An attempt has been made on a constructive approach to evaluate the performance of snailshell ash (SSA) for its corrosion performance under marine environments. Corrosion performanceof steel rebar in chloride-contaminated SSA with (0% to 50%) replacement levels of cement extractmedium was examined through electrochemical and weight loss techniques. Initially, snail shellpowder (SSP) is made by pulverizing and subsequently SSA is by thermal decomposition methods.Both SSP and SSA were characterized by X-ray diffraction, Fourier transforms infrared spectroscopy,scanning electron microscopy, and energy dispersion X-ray spectroscopy. Concrete cubes with 0% to50% replacement levels of cement by SSA were evaluated for their mechanical properties. A criticallevel of 20 to 30% SSA improved both corrosion resistance and strength of concrete. Extrapolationmodeling for the strength and corrosion rate with respect to later age were made. SSA is a suitablereplacement material for natural limestone in cement productions.
Keywords: snail shell ash; reinforcement corrosion; corrosion resistance property; mechanical property
1. Introduction
Concrete structures have played a predominant role in the modernization of devel-oping countries and cement is an essential material in construction industries. OrdinaryPortland cement (OPC) is one of the essential ingredients for concrete production, which isone of the second most-used material in the world next to water [1]. With every countryincreasing infrastructure for global urbanization, this has increased the demand of cementwithin the construction industry every day. Worldwide cement production is approxi-mately 4.4 million metric tons in 2020 [2], which is set to increase by 12–23% by 2050 fromthe present level [3]. Commonly, 1.5 to 1.8 tonnes of natural limestone and 0.4 tonnesof clay were used for each tone of cement production [4], reducing the natural resourceand also around 5–8% of CO2 was emitted from the cement industry [1,5], which leads toan environmental problem. Furthermore, the current consumption of natural resourcescould create a problem that will affect the entire cement industry due to the scarcity ofnatural resources in the future. In addition, the restrain of industrial, agriculture, andanimal food waste is one of the major problems to maintain a clean environment in everycountry. Therefore, considering environmental sustainability and life of future generations,the cement industry is reducing the consumption of natural limestone by using variousindustrial and agricultural waste materials (supplementary cementitious materials) as par-tially reducing the cement content in construction [6]. This might prevent the depletion ofnatural resources and maintain the ecological balance. For example, industrial byproductslike fly ash (FA) [7–9], granulated blast furnace slag (GGBS) [10,11], silica fume [12], and
Materials 2021, 14, 7286. https://doi.org/10.3390/ma14237286 https://www.mdpi.com/journal/materials
Materials 2021, 14, 7286 2 of 24
agricultural waste rice husk ash (RHA) [13,14], sugarcane bagasse ash (SBA) [15], and palmoil ash [16] were used as a partial replacement of cement in the construction of concretestructures, which will reduce the consumption of natural limestone for cement productionand helps to maintain the natural resources.
One such food waste is snail shell (SS), which is obtained from a coastal area; peopleconsume the edible part (50%) as seafood and the remaining 50% of the shell is disposed ofas a waste product, with the seafood industry producing approximately 45.3 million kg ofsnail shell waste [17], which is finally disposed to landfills. The chemical composition ofsnail shells is greater than 90% of calcium carbonate (CaCO3), which is nearly equal to lime-stone powder [18]. A considerable amount of research has been reported that the reuse ofSS waste was used in biomedical [19], catalyst [20], wastewater purification [21], removal ofheavy metals in wastewater [22], and construction materials [23–25]. Lertwattanaruk et al.made cement mortar with 5%, 10%, 15%, and 20% SSP as partial replacements of cementand they conclude that the cement mortar with snail shell increased setting time, lowerdrying shrinkage, decrease in thermal conductivity, and good compressive strength [18].Nkrumah and Dankwah studied the blending of rice husk ash and snail shells as partialreplacements for Portland cement for making blocks [26]. Snail shell was used as a fineaggregate at various replacement levels from 20% to 100% and the result was comparedwith river sand [27]. Adeala and Olaoye studied the strength properties of snail shell ash(SSA) produced after the heat treatment of African giant snail shells with various replace-ment levels of cement [28]. The measured compressive strength values were 25.17 N/mm2,23.92 N/mm2, and 24.63 N/mm2 at 0% (control), 15%, and 20% replacement levels ofcement with SSA, respectively. The better physical and mechanical properties were ob-served up to a 20% replacement level of OPC. Snail shell, clamshell, and the snail-clammixture was tried as a partial replacement of cement in construction. The maximumpartial replacement by weight of cement with SSA is 20% with compressive strength at20 N/mm2, clamshell ash at 25% with compressive strength at 30 N/mm2, and snail-clamshell ash mix at 25% with compressive strength at 40 N/mm2 [29]. The snail shell containsa large amount of CaCO3 which may be considered as an alternative material for cementproduction instead of natural limestone [18]. The heat treatment of snail shells at 1000 Cform snail shell ash (SSA), which mostly contains CaO. The major compounds of CaCO3(SS) are decomposed to form CaO (SSA) at a temperature of 1000 C. The SSA enrichedwith CaO is a major constituent in Portland cement, which is considered a sustainablebinder material in concrete construction. The utilization of SSA reduces the consumptionof OPC in concrete construction, which leads to prevent the depletion of natural resourcesand also reduce environmental pollution by utilizing the large tons of landfill waste snailshells. A considerable number of studies have focused on the improvement of physicaland mechanical properties of concrete but systematic and detailed studies on the corrosionperformance of steel rebar in cement replaced by SSA are rare. Therefore, the identificationof optimum replacement level of cement with SSA is important for concrete preparationwithout affecting traditional concrete properties and a realistic assessment of the corrosionperformance of reinforced steel rebar in SSA-blended concrete.
The objective of the present investigation is to study the influence of SSA on thecorrosion resistance of steel rebar and the strength of concrete. In this direction, this paperis divided into three parts. The first part details the preparation and characterization of SSAfrom raw snail shell, the second part is to evaluate the corrosion performance of steel rebarin chloride contaminated cement containing various replacement levels of SSA extracts(0, 10, 20, 30, 40, and 50% of SSA), which is examined by electrochemical methods andgravimetric weight loss methods. The corroded surfaces are examined using XRD andSEM-EDS. The third part is to study the mechanical properties of concrete with differentreplacement levels of SSA (0, 10, 20, 30, 40, and 50%).
Materials 2021, 14, 7286 3 of 24
2. Materials and Methods2.1. Materials Used
In the present investigation, ordinary Portland cement (OPC) and thermomechanicaltreated (TMT) steel rebars were used. OPC used is as per ASTM C150 [30]. The chemicalcompositions of the OPC and TMT steel rebar are given in Table 1. The local clean riversand (fineness modulus of medium sand equal to 2.6) was used as fine aggregate andlocally available well-graded aggregates (blue metal jelly) of a normal size greater than12 mm and less than 16 mm was used as a coarse aggregate. The fineness modulus of fineand coarse aggregates used were 2.75 and 7.25, respectively. The specific gravity of fineand coarse aggregates is 2.69 and 2.85, respectively. Water absorption of fine and coarseaggregates are 0.5% and 0.1%, respectively.
Table 1. Chemical composition of ordinary Portland cement (OPC) and Thermomechanical treated(TMT) steel rebar.
OPC Steel Rebar
Constituents wt (%) Constituents wt (%)
CaO 63.41 Iron (Fe) 98.498SiO2 21.96 Carbon (C) 0.236
Al2O3 5.27 Silica (Si) 0.249Fe2O3 3.44 Chromium (Cr) 0.037MgO 2.13 Nickel (Ni) 0.028Na2O 0.12 Manganese (Mn) 0.90K2O 0.43 Molybdenum (Mo) 0.009SO3 2.45 Copper (Cu) 0.018
LOI 0.79Phosphorous (P) 0.014
Tin (Sn) 0.002Sulphur (S) 0.009
Physical properties
Specific gravity (g/cm3) 3.15 Density (g/cm3) 7.85
2.2. Preparation and Characterization of SSA2.2.1. Preparation Methodology of SSA from Raw Snail Shell
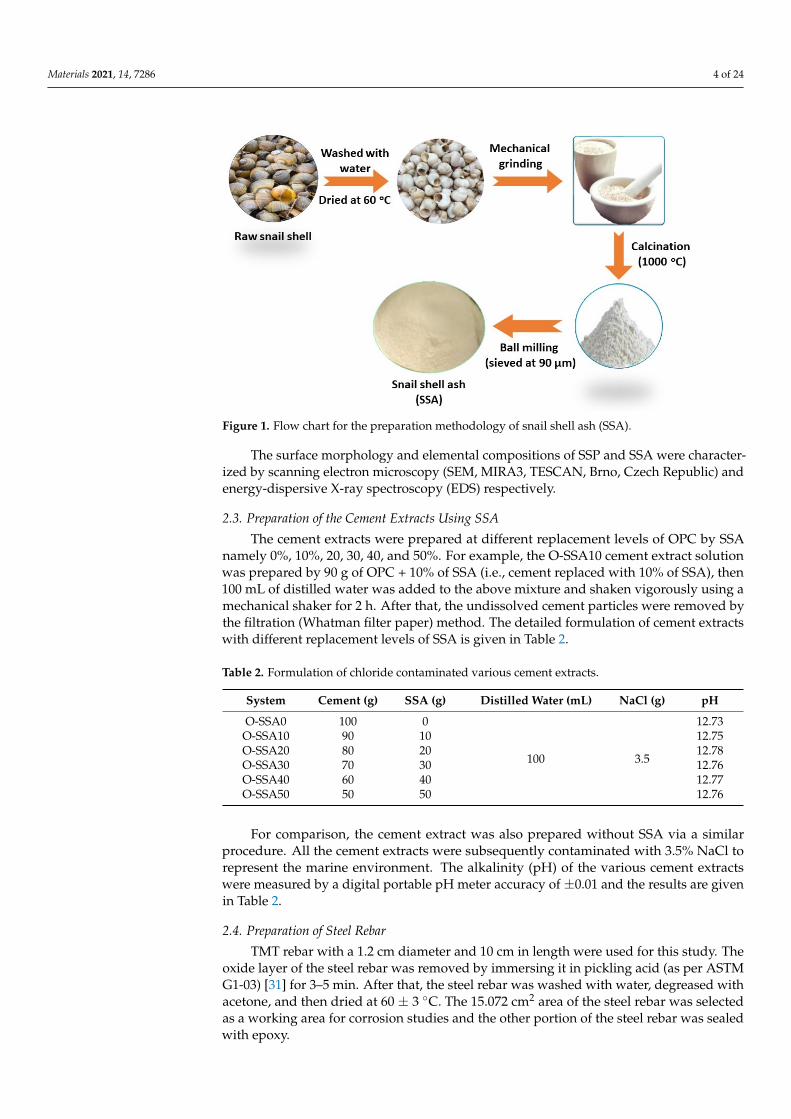
Raw snail shells were collected from a local sea area in Tamil Nadu, India. The snailshells were cleaned in tap water several times to remove organic and other foreign matters.Finally, the washed snail shells were immersed in acetone and washed with distilled water,thereafter dried at 60 ± 3 C. The snail shell must be free from chlorides and sulphates,since the aggressive anions that accelerate the corrosion of reinforced concrete structures.After drying, the snail shell was mechanically crushed into fine pieces, which is called SSP.Then, the SSP was calcined at the muffle furnace at 1000 ± 20 C for 3 h. After calcination,the obtained snail shell ash (SSA) was pulverized and obtained fine SSA sieving through a90-micron sieve. The preparation methodology of SSA is given in Figure 1.
2.2.2. Characterization of SSA
The crystal phase structure of the SSP and SSA were characterized using X-ray diffrac-tion spectroscopy. A computer-controlled XRD system, D/MAX-2500, Rigaku, Japan withCuαK radiation (λ = 1.54059 Å) generated at 40 kV and 20 A, was used for recordingXRD patterns. The identification of diffraction peaks was performed by employing ‘peaksearch’ and ‘search match’ programs in the software (version 2.0, PA Analytical, X’pertHigh score plus).
SSP and SSA were subjected to Fourier transform infrared spectroscopy (FTIR) (FT-IR,Perkin Elmer UATR Two, Akron, OH, USA) spectroscopy and the FTIR spectrum wasrecorded in the transmittance mode in the range of 4000–400 cm−1.
Materials 2021, 14, 7286 4 of 24Materials 2021, 14, x FOR PEER REVIEW 4 of 25
Figure 1. Flow chart for the preparation methodology of snail shell ash (SSA).
2.2.2. Characterization of SSA The crystal phase structure of the SSP and SSA were characterized using X-ray dif-
fraction spectroscopy. A computer-controlled XRD system, D/MAX-2500, Rigaku, Japan with CuαK radiation (λ = 1.54059 Å) generated at 40 kV and 20 A, was used for recording XRD patterns. The identification of diffraction peaks was performed by employing ‘peak search’ and ‘search match’ programs in the software (version 2.0, PA Analytical, X’pert High score plus).
SSP and SSA were subjected to Fourier transform infrared spectroscopy (FTIR) (FT-IR, Perkin Elmer UATR Two, Akron, Ohio, USA) spectroscopy and the FTIR spectrum was recorded in the transmittance mode in the range of 4000–400 cm-1.
The surface morphology and elemental compositions of SSP and SSA were charac-terized by scanning electron microscopy (SEM, MIRA3, TESCAN, Brno, Czech Republic) and energy-dispersive X-ray spectroscopy (EDS) respectively.
2.3. Preparation of the Cement Extracts Using SSA The cement extracts were prepared at different replacement levels of OPC by SSA
namely 0%, 10%, 20, 30, 40, and 50%. For example, the O-SSA10 cement extract solution was prepared by 90 g of OPC + 10% of SSA (i.e., cement replaced with 10% of SSA), then 100 mL of distilled water was added to the above mixture and shaken vigorously using a mechanical shaker for 2 h. After that, the undissolved cement particles were removed by the filtration (Whatman filter paper) method. The detailed formulation of cement extracts with different replacement levels of SSA is given in Table 2.
Table 2. Formulation of chloride contaminated various cement extracts.
System Cement (g) SSA (g) Distilled Water (mL)
NaCl (g) pH
O-SSA0 100 0
100 3.5
12.73 O-SSA10 90 10 12.75 O-SSA20 80 20 12.78 O-SSA30 70 30 12.76 O-SSA40 60 40 12.77 O-SSA50 50 50 12.76
Figure 1. Flow chart for the preparation methodology of snail shell ash (SSA).
The surface morphology and elemental compositions of SSP and SSA were character-ized by scanning electron microscopy (SEM, MIRA3, TESCAN, Brno, Czech Republic) andenergy-dispersive X-ray spectroscopy (EDS) respectively.
2.3. Preparation of the Cement Extracts Using SSA
The cement extracts were prepared at different replacement levels of OPC by SSAnamely 0%, 10%, 20, 30, 40, and 50%. For example, the O-SSA10 cement extract solutionwas prepared by 90 g of OPC + 10% of SSA (i.e., cement replaced with 10% of SSA), then100 mL of distilled water was added to the above mixture and shaken vigorously using amechanical shaker for 2 h. After that, the undissolved cement particles were removed bythe filtration (Whatman filter paper) method. The detailed formulation of cement extractswith different replacement levels of SSA is given in Table 2.
Table 2. Formulation of chloride contaminated various cement extracts.
System Cement (g) SSA (g) Distilled Water (mL) NaCl (g) pH
O-SSA0 100 0
100 3.5
12.73O-SSA10 90 10 12.75O-SSA20 80 20 12.78O-SSA30 70 30 12.76O-SSA40 60 40 12.77O-SSA50 50 50 12.76
For comparison, the cement extract was also prepared without SSA via a similarprocedure. All the cement extracts were subsequently contaminated with 3.5% NaCl torepresent the marine environment. The alkalinity (pH) of the various cement extractswere measured by a digital portable pH meter accuracy of ±0.01 and the results are givenin Table 2.
2.4. Preparation of Steel Rebar
TMT rebar with a 1.2 cm diameter and 10 cm in length were used for this study. Theoxide layer of the steel rebar was removed by immersing it in pickling acid (as per ASTMG1-03) [31] for 3–5 min. After that, the steel rebar was washed with water, degreased withacetone, and then dried at 60 ± 3 C. The 15.072 cm2 area of the steel rebar was selectedas a working area for corrosion studies and the other portion of the steel rebar was sealedwith epoxy.

Materials 2021, 14, 7286 5 of 24
2.5. Evaluation of Corrosion Performance of Steel Rebars in Various Cement Extracts
The prepared steel rebars were immersed in chloride-contaminated O-SSA0, O-SSA10,O-SSA20, O-SSA30, O-SSA40, and O-SSA50 cement extract solutions as per the ASTMG31-12a [32] standard procedure for laboratory corrosion testing of metals. The corrosionbehavior of steel rebar immersed in O-SSA0, O-SSA10, O-SSA20, O-SSA30, O-SSA40, andO-SSA50 cement extract solutions was evaluated by electrochemical methods as well as agravimetric weight loss method.
2.5.1. Electrochemical Methods
The corrosion behavior of the steel rebar immersed in chloride contaminated O-SSA0, O-SSA10, O-SSA20, O-SSA30, O-SSA40, and O-SSA50 cement extracts solution weremonitored by chrono-potential studies. The open circuit potential (OCP) of the steel rebarswas measured with respect to saturated calomel electrode (SCE) using a digital very highimpedance multimeter for an exposure period of 30 days. The OCP measurement of thesteel rebar was done according to the ASTM C876-15 [33].
The potentiostat (VersaSTAT Princeton Applied Research, Oak Ridge, TN, USA) wasused for carried out potentiodynamic polarization and electrochemical impedance spec-troscopy (EIS) experiments using a conventional three-electrode cell assembly. Duplicateexperiments were carried out for electrochemical studies. The stainless steel and SCEwere used as a counter electrode and a reference electrode, respectively. The steel rebar(15.072 cm2) was used as a working electrode. The chloride contaminated O-SSA0, O-SSA10, O-SSA20, O-SSA30, O-SSA40, and O-SSA50 cement extract solutions were usedas an electrolyte. The potentiodynamic polarization of steel rebars was carried out byapplying the potential ranges from −200 mV to +200 mV from the OCP of the steel rebarand the potential scan rate was 0.1 mV/s. The EIS measurements were carried out atthe OCP of steel rebars by applying an AC signal 10-mV amplitude in frequency rangesfrom 100 kHz to 0.01 Hz. The impedance parameters and corrosion kinetic parameterswere evaluated by fitting the experimental data in the constant phase element and Tafelregion. The system in-built software of Metrohm Autolab Nova 1.10 (VersaSTAT (Princetonapplied Research, Oak Ridge, TN, USA)) was used for curve fitting analysis. The Tafelplots, Nyquist plots, and Bode plots were recorded at different exposure periods namely1 day (initial), 15 days, and 30 days at a room temperature of 25 ± 3 C.
2.5.2. Gravimetric Weight Loss Method
The gravimetric weight loss measurements were performed as per the ASTM standard.The surface cleaned steel rebars were taken for this study. The initial weight and dimensionof the steel rebars were noted, then the steel rebars were immersed in chloride contaminatedOSSA, OSSA10, OSSA20, OSSA30, OSSA40, and OSSA50 cement extract solutions (ASTMG31-12a) [32] for an exposure period of 30 days. After 30 days of exposure, the steel rebarswere taken and visually examined for any corrosion spots on the steel surface. Subsequently,the formation of corrosion products on the steel rebar surface was cleaned by acid pickling(ASTM G1-03) [32] and washed with distilled water, degreased with acetone, and thendried at 60 ± 3 C. The initial and final weight of the steel rebars were recorded usingthe Mettler Toledo balance (Torunska 5, 26-600, Radom, Poland) and accuracy of 0.0001 g.The corrosion rate of the steel rebar immersed in chloride contaminated OSSA, OSSA10,OSSA20, OSSA30, OSSA40, and OSSA50 cement extract solutions were determined usingthe equation as follows [34]:
Corrosion rate =87.6 (Wi −Wf)
DAt(1)
where Wf and Wi are the final and initial weight of the steel rebar (mg):‘D’ is the density of the steel rebar (g/cm3);‘A’ denotes the exposure area of the steel rebar (cm2);‘t’ represents the exposure time (h).
Materials 2021, 14, 7286 6 of 24
2.6. Characterization of Corrosion Products
After an exposure period of 30 days, the steel rebars were taken and the formation ofcorrosion products were examined and rinsed with distilled water then wiped with tissuepaper. After that, the formation of corrosion products on the steel rebar surface was char-acterized by X-ray diffraction (XRD), scanning electron microscope (SEM), coupled withenergy-dispersive X-ray spectroscopy (EDS); (TESCAN MIRA3, Brno, Czech Republic).
2.7. Casting of Concrete Specimens
The mix ratio of cement, fine, and coarse aggregates were 1:1.71:3.1 respectively, with a0.5 water to cement (w/c) ratio was used. The size of the concrete cubes(150 mm × 150 mm × 150 mm) and cylinders (15 mm dia × 100 mm length) were castwith different replacements level of cement using SSA (10% to 50%). The detailed concretemix proportion used for casting concrete specimens is given in Table 3. During casting, theconcrete specimen molds were adequately compacted using a table vibrator to avoid thevoids. After 24 h, the concrete specimens were demolded and subjected to water curing for28 days.
Table 3. Mix proportions of concrete with SSA.
System Cement(kg/m3)
SSA(kg/m3)
Fine Aggregates(kg/m3)
Coarse Aggregates(kg/m3)
Water/CementRatio
O-SSA0 415.0 0 710 1287
0.5
O-SSA10 373.5 41.5 710 1287O-SSA20 332.0 83.0 710 1287O-SSA30 290.5 124.5 710 1287O-SSA40 249.0 166.0 710 1287O-SSA50 207.5 207.5 710 1287
Evaluation of Mechanical Properties
The compressive and split tensile strengths of the concrete were performed as perASTM: C39/C39M-21 [35] and ASTM:C496/C496M-17 [36], respectively. After 28 daysof curing, the compressive and split tensile strength tests were carried out for the con-crete specimens using a compression testing machine of 2000 kN capacity. The test wascarried out on triplicate specimens and average compressive and split tensile strengthvalues were noted. The compressive and split tensile strength was calculated from thefollowing equations:
For compressive strength:
Fcs (N/mm2) =fa
(2)
where f = ultimate load/force (N); a is the area of the concrete specimen (mm2).For split tensile strength:
Fsp (N/mm2) =2Pπdl
(3)
where P = failure load (N); d and l are the diameter and length of the concrete specimen (mm).
3. Results and Discussion3.1. Characterization of SSP and SSA3.1.1. X-ray Diffraction
Figure 2 shows the XRD pattern of SSP and SSA. The XRD pattern of SSP (beforecalcination) shows the high-intensity crystal plane of calcite (CaCO3) diffraction peaks. Thediffraction peaks observed at 22.8, 29.31, 31.26, 35.92, 39.28, 43.20, 47.41, 48.50, and65.63 corresponds to the hexagonal crystal phase of calcite (JCPDS: 05-0586). Furthermore,the low-intensity diffraction peaks of calcium oxide (CaO) are also observed in Figure 2
Materials 2021, 14, 7286 7 of 24
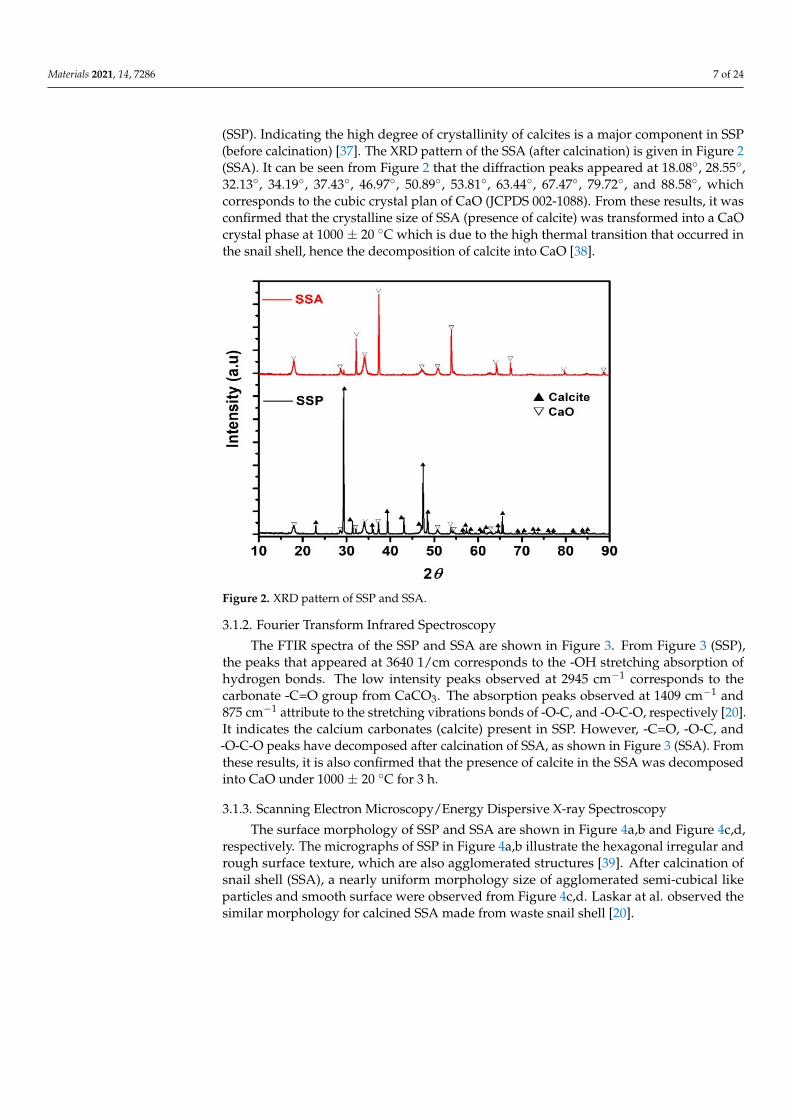
(SSP). Indicating the high degree of crystallinity of calcites is a major component in SSP(before calcination) [37]. The XRD pattern of the SSA (after calcination) is given in Figure 2(SSA). It can be seen from Figure 2 that the diffraction peaks appeared at 18.08, 28.55,32.13, 34.19, 37.43, 46.97, 50.89, 53.81, 63.44, 67.47, 79.72, and 88.58, whichcorresponds to the cubic crystal plan of CaO (JCPDS 002-1088). From these results, it wasconfirmed that the crystalline size of SSA (presence of calcite) was transformed into a CaOcrystal phase at 1000 ± 20 C which is due to the high thermal transition that occurred inthe snail shell, hence the decomposition of calcite into CaO [38].
Materials 2021, 14, x FOR PEER REVIEW 7 of 25
Fcs (N/mm2) = (2)
where f = ultimate load/force (N); a is the area of the concrete specimen (mm2). For split tensile strength:
Fsp (N/mm2) = (3)
where P = failure load (N); d and l are the diameter and length of the concrete specimen (mm).
3. Results and Discussion 3.1. Characterization of SSP and SSA 3.1.1. X-ray Diffraction
Figure 2 shows the XRD pattern of SSP and SSA. The XRD pattern of SSP (before calcination) shows the high-intensity crystal plane of calcite (CaCO3) diffraction peaks. The diffraction peaks observed at 22.8°, 29.31°, 31.26°, 35.92°, 39.28°, 43.20°, 47.41°, 48.50°, and 65.63° corresponds to the hexagonal crystal phase of calcite (JCPDS: 05-0586). Fur-thermore, the low-intensity diffraction peaks of calcium oxide (CaO) are also observed in Figure 2 (SSP). Indicating the high degree of crystallinity of calcites is a major component in SSP (before calcination) [37]. The XRD pattern of the SSA (after calcination) is given in Figure 2 (SSA). It can be seen from Figure 2 that the diffraction peaks appeared at 18.08°, 28.55°, 32.13°, 34.19°, 37.43°, 46.97°, 50.89°, 53.81°, 63.44°, 67.47°, 79.72°, and 88.58°, which corresponds to the cubic crystal plan of CaO (JCPDS 002-1088). From these results, it was confirmed that the crystalline size of SSA (presence of calcite) was transformed into a CaO crystal phase at 1000 ± 20 °C which is due to the high thermal transition that occurred in the snail shell, hence the decomposition of calcite into CaO [38].
Figure 2. XRD pattern of SSP and SSA.
3.1.2. Fourier Transform Infrared Spectroscopy The FTIR spectra of the SSP and SSA are shown in Figure 3. From Figure 3 (SSP), the
peaks that appeared at 3640 1/cm corresponds to the -OH stretching absorption of hydro-gen bonds. The low intensity peaks observed at 2945 cm-1 corresponds to the carbonate -C=O group from CaCO3. The absorption peaks observed at 1409 cm-1 and 875 cm-1 attribute
Figure 2. XRD pattern of SSP and SSA.
3.1.2. Fourier Transform Infrared Spectroscopy
The FTIR spectra of the SSP and SSA are shown in Figure 3. From Figure 3 (SSP),the peaks that appeared at 3640 1/cm corresponds to the -OH stretching absorption ofhydrogen bonds. The low intensity peaks observed at 2945 cm−1 corresponds to thecarbonate -C=O group from CaCO3. The absorption peaks observed at 1409 cm−1 and875 cm−1 attribute to the stretching vibrations bonds of -O-C, and -O-C-O, respectively [20].It indicates the calcium carbonates (calcite) present in SSP. However, -C=O, -O-C, and-O-C-O peaks have decomposed after calcination of SSA, as shown in Figure 3 (SSA). Fromthese results, it is also confirmed that the presence of calcite in the SSA was decomposedinto CaO under 1000 ± 20 C for 3 h.
3.1.3. Scanning Electron Microscopy/Energy Dispersive X-ray Spectroscopy
The surface morphology of SSP and SSA are shown in Figure 4a,b and Figure 4c,d,respectively. The micrographs of SSP in Figure 4a,b illustrate the hexagonal irregular andrough surface texture, which are also agglomerated structures [39]. After calcination ofsnail shell (SSA), a nearly uniform morphology size of agglomerated semi-cubical likeparticles and smooth surface were observed from Figure 4c,d. Laskar at al. observed thesimilar morphology for calcined SSA made from waste snail shell [20].

Materials 2021, 14, 7286 8 of 24
Materials 2021, 14, x FOR PEER REVIEW 8 of 25
to the stretching vibrations bonds of -O-C, and -O-C-O, respectively [20]. It indicates the calcium carbonates (calcite) present in SSP. However, -C=O, -O-C, and -O-C-O peaks have decomposed after calcination of SSA, as shown in Figure 3 (SSA). From these results, it is also confirmed that the presence of calcite in the SSA was decomposed into CaO under 1000 ± 20 °C for 3 h.
Figure 3. FTIR spectra of SSP and SSA.
3.1.3. Scanning Electron Microscopy/Energy Dispersive X-ray Spectroscopy The surface morphology of SSP and SSA are shown in Figure 4a,b and Figure 4c,d,
respectively. The micrographs of SSP in Figure 4a,b illustrate the hexagonal irregular and rough surface texture, which are also agglomerated structures [39]. After calcination of snail shell (SSA), a nearly uniform morphology size of agglomerated semi-cubical like particles and smooth surface were observed from Figure 4c,d. Laskar at al. observed the similar morphology for calcined SSA made from waste snail shell [20].
Figure 4. SEM micrographs of SSP (a,b) and SSA (c,d).
Figure 3. FTIR spectra of SSP and SSA.
Materials 2021, 14, x FOR PEER REVIEW 8 of 25
to the stretching vibrations bonds of -O-C, and -O-C-O, respectively [20]. It indicates the calcium carbonates (calcite) present in SSP. However, -C=O, -O-C, and -O-C-O peaks have decomposed after calcination of SSA, as shown in Figure 3 (SSA). From these results, it is also confirmed that the presence of calcite in the SSA was decomposed into CaO under 1000 ± 20 °C for 3 h.
Figure 3. FTIR spectra of SSP and SSA.
3.1.3. Scanning Electron Microscopy/Energy Dispersive X-ray Spectroscopy The surface morphology of SSP and SSA are shown in Figure 4a,b and Figure 4c,d,
respectively. The micrographs of SSP in Figure 4a,b illustrate the hexagonal irregular and rough surface texture, which are also agglomerated structures [39]. After calcination of snail shell (SSA), a nearly uniform morphology size of agglomerated semi-cubical like particles and smooth surface were observed from Figure 4c,d. Laskar at al. observed the similar morphology for calcined SSA made from waste snail shell [20].
Figure 4. SEM micrographs of SSP (a,b) and SSA (c,d). Figure 4. SEM micrographs of SSP (a,b) and SSA (c,d).
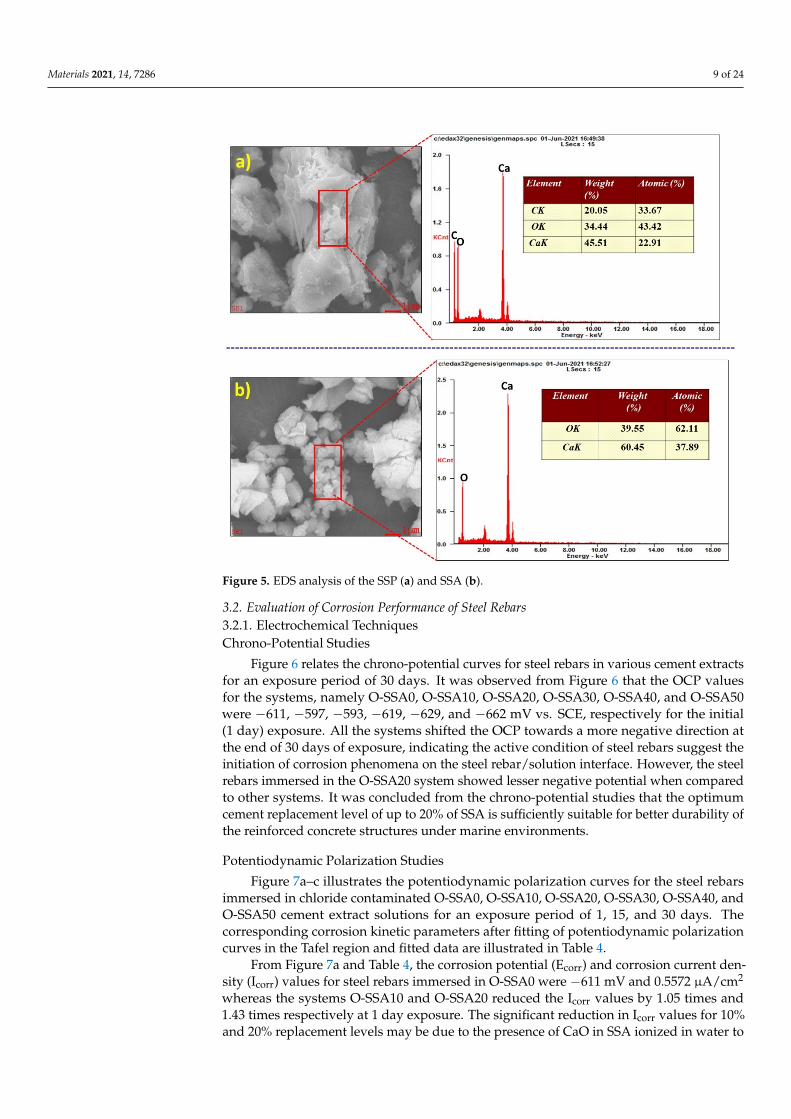
Furthermore, the EDS analysis of the SSP and SSA are shown in Figure 5a and Figure 5b,respectively. It can be seen from Figure 5a that the SSP contains major components ofcalcium (Ca), carbon (C), and oxygen (O). The wt.% of Ca, C, and O were found to be45.51%, 20.05%, and 34.44%, respectively, indicating the SSP is composed of CaCO3. Thisis in agreement with XRD results as shown in Figure 2 (SSP). Figure 5b shows the EDSanalysis of SSA (after calcination) and it can be seen from the figure that higher wt.% of Ca(60.45%) and O (39.55%) in the SSA. These results confirm that the presence of calcite in theSSA was decomposed to form CaO under 1000 ± 20 C for 3 h.
Materials 2021, 14, 7286 9 of 24
Materials 2021, 14, x FOR PEER REVIEW 9 of 25
Furthermore, the EDS analysis of the SSP and SSA are shown in Figure 5a and Figure 5b, respectively. It can be seen from Figure 5a that the SSP contains major components of calcium (Ca), carbon (C), and oxygen (O). The wt.% of Ca, C, and O were found to be 45.51%, 20.05%, and 34.44%, respectively, indicating the SSP is composed of CaCO3. This is in agreement with XRD results as shown in Figure 2 (SSP). Figure 5b shows the EDS analysis of SSA (after calcination) and it can be seen from the figure that higher wt.% of Ca (60.45%) and O (39.55%) in the SSA. These results confirm that the presence of calcite in the SSA was decomposed to form CaO under 1000 ± 20 °C for 3 h.
Figure 5. EDS analysis of the SSP (a) and SSA (b).
3.2. Evaluation of Corrosion Performance of Steel Rebars 3.2.1. Electrochemical Techniques Chrono-Potential Studies
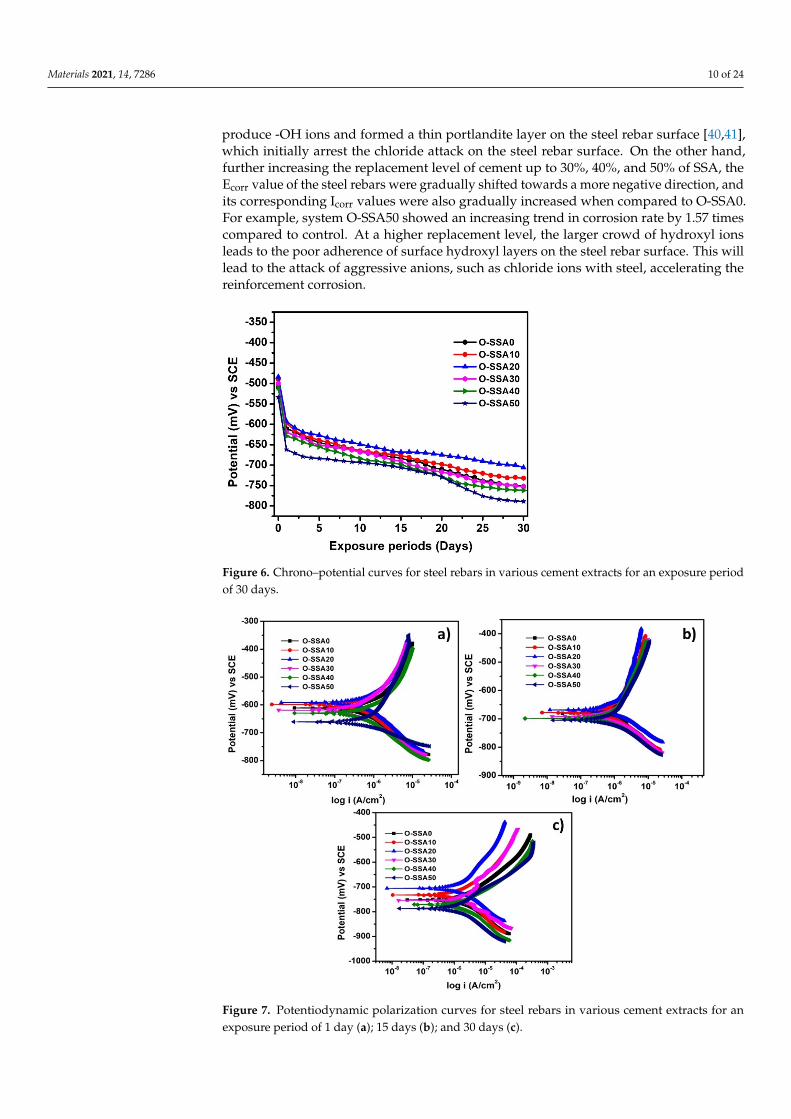
Figure 6 relates the chrono-potential curves for steel rebars in various cement extracts for an exposure period of 30 days. It was observed from Figure 6 that the OCP values for the systems, namely O-SSA0, O-SSA10, O-SSA20, O-SSA30, O-SSA40, and O-SSA50 were −611, −597, −593, −619, −629, and −662 mV vs. SCE, respectively for the initial (1 day) ex-posure. All the systems shifted the OCP towards a more negative direction at the end of 30 days of exposure, indicating the active condition of steel rebars suggest the initiation of corrosion phenomena on the steel rebar/solution interface. However, the steel rebars immersed in the O-SSA20 system showed lesser negative potential when compared to other systems. It was concluded from the chrono-potential studies that the optimum ce-ment replacement level of up to 20% of SSA is sufficiently suitable for better durability of the reinforced concrete structures under marine environments.
Figure 5. EDS analysis of the SSP (a) and SSA (b).
3.2. Evaluation of Corrosion Performance of Steel Rebars3.2.1. Electrochemical TechniquesChrono-Potential Studies
Figure 6 relates the chrono-potential curves for steel rebars in various cement extractsfor an exposure period of 30 days. It was observed from Figure 6 that the OCP valuesfor the systems, namely O-SSA0, O-SSA10, O-SSA20, O-SSA30, O-SSA40, and O-SSA50were −611, −597, −593, −619, −629, and −662 mV vs. SCE, respectively for the initial(1 day) exposure. All the systems shifted the OCP towards a more negative direction atthe end of 30 days of exposure, indicating the active condition of steel rebars suggest theinitiation of corrosion phenomena on the steel rebar/solution interface. However, the steelrebars immersed in the O-SSA20 system showed lesser negative potential when comparedto other systems. It was concluded from the chrono-potential studies that the optimumcement replacement level of up to 20% of SSA is sufficiently suitable for better durability ofthe reinforced concrete structures under marine environments.
Potentiodynamic Polarization Studies
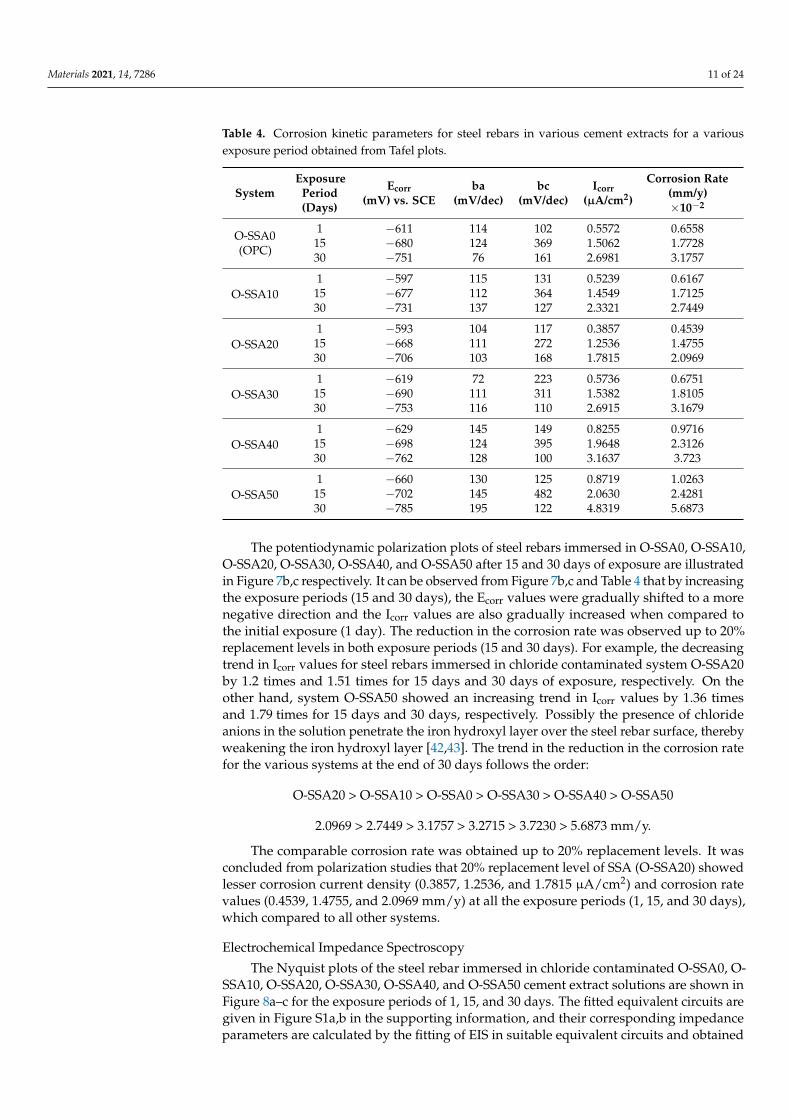
Figure 7a–c illustrates the potentiodynamic polarization curves for the steel rebarsimmersed in chloride contaminated O-SSA0, O-SSA10, O-SSA20, O-SSA30, O-SSA40, andO-SSA50 cement extract solutions for an exposure period of 1, 15, and 30 days. Thecorresponding corrosion kinetic parameters after fitting of potentiodynamic polarizationcurves in the Tafel region and fitted data are illustrated in Table 4.
From Figure 7a and Table 4, the corrosion potential (Ecorr) and corrosion current den-sity (Icorr) values for steel rebars immersed in O-SSA0 were −611 mV and 0.5572 µA/cm2
whereas the systems O-SSA10 and O-SSA20 reduced the Icorr values by 1.05 times and1.43 times respectively at 1 day exposure. The significant reduction in Icorr values for 10%and 20% replacement levels may be due to the presence of CaO in SSA ionized in water to
Materials 2021, 14, 7286 10 of 24
produce -OH ions and formed a thin portlandite layer on the steel rebar surface [40,41],which initially arrest the chloride attack on the steel rebar surface. On the other hand,further increasing the replacement level of cement up to 30%, 40%, and 50% of SSA, theEcorr value of the steel rebars were gradually shifted towards a more negative direction, andits corresponding Icorr values were also gradually increased when compared to O-SSA0.For example, system O-SSA50 showed an increasing trend in corrosion rate by 1.57 timescompared to control. At a higher replacement level, the larger crowd of hydroxyl ionsleads to the poor adherence of surface hydroxyl layers on the steel rebar surface. This willlead to the attack of aggressive anions, such as chloride ions with steel, accelerating thereinforcement corrosion.
Materials 2021, 14, x FOR PEER REVIEW 10 of 25
Figure 6. Chrono–potential curves for steel rebars in various cement extracts for an exposure period of 30 days.
Potentiodynamic Polarization Studies Figure 7a–c illustrates the potentiodynamic polarization curves for the steel rebars
immersed in chloride contaminated O-SSA0, O-SSA10, O-SSA20, O-SSA30, O-SSA40, and O-SSA50 cement extract solutions for an exposure period of 1, 15, and 30 days. The corre-sponding corrosion kinetic parameters after fitting of potentiodynamic polarization curves in the Tafel region and fitted data are illustrated in Table 4.
Figure 7. Potentiodynamic polarization curves for steel rebars in various cement extracts for an ex-posure period of 1 day (a); 15 days (b); and 30 days (c).
From Figure 7a and Table 4, the corrosion potential (Ecorr) and corrosion current den-sity (Icorr) values for steel rebars immersed in O-SSA0 were −611 mV and 0.5572 µA/cm2
Figure 6. Chrono–potential curves for steel rebars in various cement extracts for an exposure periodof 30 days.
Materials 2021, 14, x FOR PEER REVIEW 10 of 25
Figure 6. Chrono–potential curves for steel rebars in various cement extracts for an exposure period of 30 days.
Potentiodynamic Polarization Studies Figure 7a–c illustrates the potentiodynamic polarization curves for the steel rebars
immersed in chloride contaminated O-SSA0, O-SSA10, O-SSA20, O-SSA30, O-SSA40, and O-SSA50 cement extract solutions for an exposure period of 1, 15, and 30 days. The corre-sponding corrosion kinetic parameters after fitting of potentiodynamic polarization curves in the Tafel region and fitted data are illustrated in Table 4.
Figure 7. Potentiodynamic polarization curves for steel rebars in various cement extracts for an ex-posure period of 1 day (a); 15 days (b); and 30 days (c).
From Figure 7a and Table 4, the corrosion potential (Ecorr) and corrosion current den-sity (Icorr) values for steel rebars immersed in O-SSA0 were −611 mV and 0.5572 µA/cm2
Figure 7. Potentiodynamic polarization curves for steel rebars in various cement extracts for anexposure period of 1 day (a); 15 days (b); and 30 days (c).
Materials 2021, 14, 7286 11 of 24
Table 4. Corrosion kinetic parameters for steel rebars in various cement extracts for a variousexposure period obtained from Tafel plots.
SystemExposure
Period(Days)
Ecorr(mV) vs. SCE
ba(mV/dec)
bc(mV/dec)
Icorr(µA/cm2)
Corrosion Rate(mm/y)×10−2
O-SSA0(OPC)
1 −611 114 102 0.5572 0.655815 −680 124 369 1.5062 1.772830 −751 76 161 2.6981 3.1757
O-SSA101 −597 115 131 0.5239 0.6167
15 −677 112 364 1.4549 1.712530 −731 137 127 2.3321 2.7449
O-SSA201 −593 104 117 0.3857 0.4539
15 −668 111 272 1.2536 1.475530 −706 103 168 1.7815 2.0969
O-SSA301 −619 72 223 0.5736 0.6751
15 −690 111 311 1.5382 1.810530 −753 116 110 2.6915 3.1679
O-SSA401 −629 145 149 0.8255 0.9716
15 −698 124 395 1.9648 2.312630 −762 128 100 3.1637 3.723
O-SSA501 −660 130 125 0.8719 1.0263
15 −702 145 482 2.0630 2.428130 −785 195 122 4.8319 5.6873
The potentiodynamic polarization plots of steel rebars immersed in O-SSA0, O-SSA10,O-SSA20, O-SSA30, O-SSA40, and O-SSA50 after 15 and 30 days of exposure are illustratedin Figure 7b,c respectively. It can be observed from Figure 7b,c and Table 4 that by increasingthe exposure periods (15 and 30 days), the Ecorr values were gradually shifted to a morenegative direction and the Icorr values are also gradually increased when compared tothe initial exposure (1 day). The reduction in the corrosion rate was observed up to 20%replacement levels in both exposure periods (15 and 30 days). For example, the decreasingtrend in Icorr values for steel rebars immersed in chloride contaminated system O-SSA20by 1.2 times and 1.51 times for 15 days and 30 days of exposure, respectively. On theother hand, system O-SSA50 showed an increasing trend in Icorr values by 1.36 timesand 1.79 times for 15 days and 30 days, respectively. Possibly the presence of chlorideanions in the solution penetrate the iron hydroxyl layer over the steel rebar surface, therebyweakening the iron hydroxyl layer [42,43]. The trend in the reduction in the corrosion ratefor the various systems at the end of 30 days follows the order:
O-SSA20 > O-SSA10 > O-SSA0 > O-SSA30 > O-SSA40 > O-SSA50
2.0969 > 2.7449 > 3.1757 > 3.2715 > 3.7230 > 5.6873 mm/y.
The comparable corrosion rate was obtained up to 20% replacement levels. It wasconcluded from polarization studies that 20% replacement level of SSA (O-SSA20) showedlesser corrosion current density (0.3857, 1.2536, and 1.7815 µA/cm2) and corrosion ratevalues (0.4539, 1.4755, and 2.0969 mm/y) at all the exposure periods (1, 15, and 30 days),which compared to all other systems.
Electrochemical Impedance Spectroscopy
The Nyquist plots of the steel rebar immersed in chloride contaminated O-SSA0, O-SSA10, O-SSA20, O-SSA30, O-SSA40, and O-SSA50 cement extract solutions are shown inFigure 8a–c for the exposure periods of 1, 15, and 30 days. The fitted equivalent circuits aregiven in Figure S1a,b in the supporting information, and their corresponding impedanceparameters are calculated by the fitting of EIS in suitable equivalent circuits and obtained
Materials 2021, 14, 7286 12 of 24
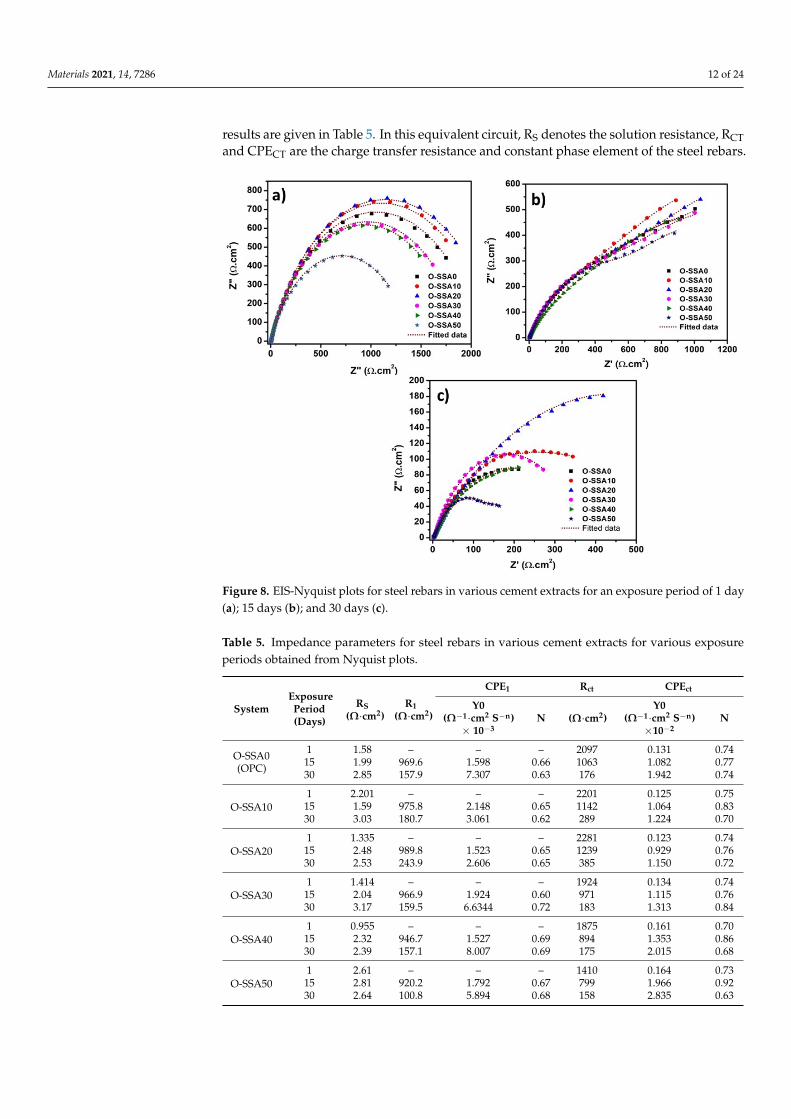
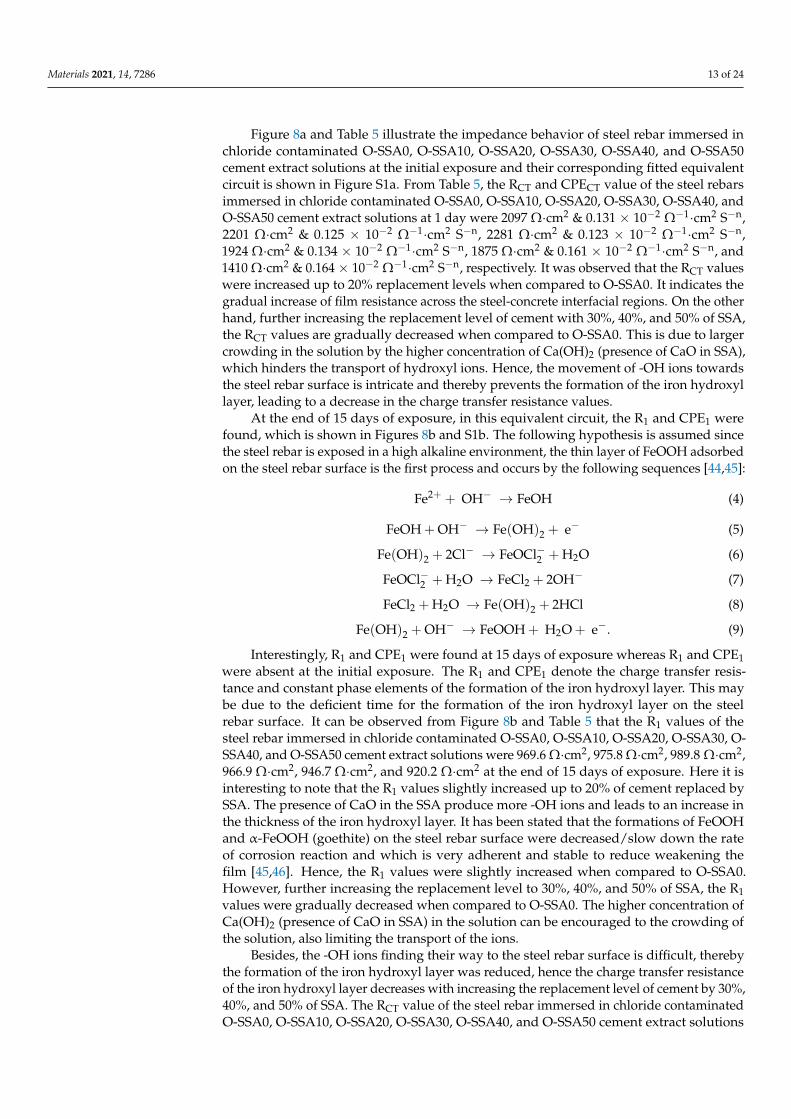
results are given in Table 5. In this equivalent circuit, RS denotes the solution resistance, RCTand CPECT are the charge transfer resistance and constant phase element of the steel rebars.
Materials 2021, 14, x FOR PEER REVIEW 13 of 25
Figure 8. EIS-Nyquist plots for steel rebars in various cement extracts for an exposure period of 1 day (a); 15 days (b); and 30 days (c).
At the end of 15 days of exposure, in this equivalent circuit, the R1 and CPE1 were found, which is shown in Figure 8b and S1b. The following hypothesis is assumed since the steel rebar is exposed in a high alkaline environment, the thin layer of FeOOH ad-sorbed on the steel rebar surface is the first process and occurs by the following sequences [44,45]: Fe + OH → FeOH (4) FeOH + OH → Fe(OH) + e (5)
Fe(OH) + 2Cl → FeOCl + H O (6) FeOCl + H O → FeCl + 2OH (7) FeCl + H O → Fe(OH) + 2HCl (8)
Fe(OH) + OH → FeOOH + H O + e . (9)
Interestingly, R1 and CPE1 were found at 15 days of exposure whereas R1 and CPE1 were absent at the initial exposure. The R1 and CPE1 denote the charge transfer resistance and constant phase elements of the formation of the iron hydroxyl layer. This may be due to the deficient time for the formation of the iron hydroxyl layer on the steel rebar surface. It can be observed from Figure 8b and Table 5 that the R1 values of the steel rebar im-mersed in chloride contaminated O-SSA0, O-SSA10, O-SSA20, O-SSA30, O-SSA40, and O-SSA50 cement extract solutions were 969.6 Ω·cm2, 975.8 Ω·cm2, 989.8 Ω·cm2, 966.9 Ω·cm2, 946.7 Ω·cm2, and 920.2 Ω·cm2 at the end of 15 days of exposure. Here it is interesting to note that the R1 values slightly increased up to 20% of cement replaced by SSA. The pres-ence of CaO in the SSA produce more -OH ions and leads to an increase in the thickness of the iron hydroxyl layer. It has been stated that the formations of FeOOH and α-FeOOH
Figure 8. EIS-Nyquist plots for steel rebars in various cement extracts for an exposure period of 1 day(a); 15 days (b); and 30 days (c).
Table 5. Impedance parameters for steel rebars in various cement extracts for various exposureperiods obtained from Nyquist plots.
SystemExposurePeriod(Days)
RS(Ω·cm2)
R1(Ω·cm2)
CPE1 Rct CPEct
Y0(Ω−1·cm2 S−n)× 10−3
N (Ω·cm2)Y0
(Ω−1·cm2 S−n)×10−2
N
O-SSA0(OPC)
1 1.58 – – – 2097 0.131 0.7415 1.99 969.6 1.598 0.66 1063 1.082 0.7730 2.85 157.9 7.307 0.63 176 1.942 0.74
O-SSA101 2.201 – – – 2201 0.125 0.7515 1.59 975.8 2.148 0.65 1142 1.064 0.8330 3.03 180.7 3.061 0.62 289 1.224 0.70
O-SSA201 1.335 – – – 2281 0.123 0.7415 2.48 989.8 1.523 0.65 1239 0.929 0.7630 2.53 243.9 2.606 0.65 385 1.150 0.72
O-SSA301 1.414 – – – 1924 0.134 0.7415 2.04 966.9 1.924 0.60 971 1.115 0.7630 3.17 159.5 6.6344 0.72 183 1.313 0.84
O-SSA401 0.955 – – – 1875 0.161 0.7015 2.32 946.7 1.527 0.69 894 1.353 0.8630 2.39 157.1 8.007 0.69 175 2.015 0.68
O-SSA501 2.61 – – – 1410 0.164 0.7315 2.81 920.2 1.792 0.67 799 1.966 0.9230 2.64 100.8 5.894 0.68 158 2.835 0.63
Materials 2021, 14, 7286 13 of 24
Figure 8a and Table 5 illustrate the impedance behavior of steel rebar immersed inchloride contaminated O-SSA0, O-SSA10, O-SSA20, O-SSA30, O-SSA40, and O-SSA50cement extract solutions at the initial exposure and their corresponding fitted equivalentcircuit is shown in Figure S1a. From Table 5, the RCT and CPECT value of the steel rebarsimmersed in chloride contaminated O-SSA0, O-SSA10, O-SSA20, O-SSA30, O-SSA40, andO-SSA50 cement extract solutions at 1 day were 2097 Ω·cm2 & 0.131 × 10⁻² Ω−1·cm2 S−n,2201 Ω·cm2 & 0.125 × 10⁻² Ω−1·cm2 S−n, 2281 Ω·cm2 & 0.123 × 10⁻² Ω−1·cm2 S−n,1924 Ω·cm2 & 0.134 × 10⁻² Ω−1·cm2 S−n, 1875 Ω·cm2 & 0.161 × 10⁻² Ω−1·cm2 S−n, and1410 Ω·cm2 & 0.164 × 10⁻² Ω−1·cm2 S−n, respectively. It was observed that the RCT valueswere increased up to 20% replacement levels when compared to O-SSA0. It indicates thegradual increase of film resistance across the steel-concrete interfacial regions. On the otherhand, further increasing the replacement level of cement with 30%, 40%, and 50% of SSA,the RCT values are gradually decreased when compared to O-SSA0. This is due to largercrowding in the solution by the higher concentration of Ca(OH)2 (presence of CaO in SSA),which hinders the transport of hydroxyl ions. Hence, the movement of -OH ions towardsthe steel rebar surface is intricate and thereby prevents the formation of the iron hydroxyllayer, leading to a decrease in the charge transfer resistance values.
At the end of 15 days of exposure, in this equivalent circuit, the R1 and CPE1 werefound, which is shown in Figures 8b and S1b. The following hypothesis is assumed sincethe steel rebar is exposed in a high alkaline environment, the thin layer of FeOOH adsorbedon the steel rebar surface is the first process and occurs by the following sequences [44,45]:
Fe2+ + OH− → FeOH (4)
FeOH + OH− → Fe(OH)2 + e− (5)
Fe(OH)2 + 2Cl− → FeOCl−2 + H2O (6)
FeOCl−2 + H2O → FeCl2 + 2OH− (7)
FeCl2 + H2O → Fe(OH)2 + 2HCl (8)
Fe(OH)2 + OH− → FeOOH + H2O + e−. (9)
Interestingly, R1 and CPE1 were found at 15 days of exposure whereas R1 and CPE1were absent at the initial exposure. The R1 and CPE1 denote the charge transfer resis-tance and constant phase elements of the formation of the iron hydroxyl layer. This maybe due to the deficient time for the formation of the iron hydroxyl layer on the steelrebar surface. It can be observed from Figure 8b and Table 5 that the R1 values of thesteel rebar immersed in chloride contaminated O-SSA0, O-SSA10, O-SSA20, O-SSA30, O-SSA40, and O-SSA50 cement extract solutions were 969.6 Ω·cm2, 975.8 Ω·cm2, 989.8 Ω·cm2,966.9 Ω·cm2, 946.7 Ω·cm2, and 920.2 Ω·cm2 at the end of 15 days of exposure. Here it isinteresting to note that the R1 values slightly increased up to 20% of cement replaced bySSA. The presence of CaO in the SSA produce more -OH ions and leads to an increase inthe thickness of the iron hydroxyl layer. It has been stated that the formations of FeOOHand α-FeOOH (goethite) on the steel rebar surface were decreased/slow down the rateof corrosion reaction and which is very adherent and stable to reduce weakening thefilm [45,46]. Hence, the R1 values were slightly increased when compared to O-SSA0.However, further increasing the replacement level to 30%, 40%, and 50% of SSA, the R1values were gradually decreased when compared to O-SSA0. The higher concentration ofCa(OH)2 (presence of CaO in SSA) in the solution can be encouraged to the crowding ofthe solution, also limiting the transport of the ions.
Besides, the -OH ions finding their way to the steel rebar surface is difficult, therebythe formation of the iron hydroxyl layer was reduced, hence the charge transfer resistanceof the iron hydroxyl layer decreases with increasing the replacement level of cement by 30%,40%, and 50% of SSA. The RCT value of the steel rebar immersed in chloride contaminatedO-SSA0, O-SSA10, O-SSA20, O-SSA30, O-SSA40, and O-SSA50 cement extract solutions
Materials 2021, 14, 7286 14 of 24
were 1063 Ω·cm2, 1142 Ω·cm2, 1239 Ω·cm2, 971 Ω·cm2, 894 Ω·cm2, and 799 Ω·cm2 at theexposure period of 15 days. The RCT values were decreased at 15 days exposure whencompared to the initial exposure, which is due to the presence of chloride ions decreasingthe coverage of the iron hydroxyl layer, thus increasing the charge transfer between steelrebar and solutions. Hence the R1 and RCT values are decreased while increasing theexposure periods.
For example, at the end of 30 days, the Nyquist plots for the steel rebar immersedin chloride contaminated O-SSA0, O-SSA10, O-SSA20, O-SSA30, O-SSA40, and O-SSA50cement extract solutions are shown in Figure 8c. The R1 and RCT values of the steelrebar immersed in chloride contaminated O-SSA0, O-SSA10, O-SSA20, O-SSA30, O-SSA40,and O-SSA50 were 157.9 Ω·cm2 & 176 Ω·cm2, 180.7 Ω·cm2 & 289 Ω·cm2, 243.9 Ω·cm2
& 385 Ω·cm2, 159.5 Ω·cm2 & 183 Ω·cm2, 157.1 Ω·cm2 & 175 Ω·cm2, and 100.8 Ω·cm2 &158 Ω·cm2 respectively, at a 30-day exposure period. The R1 and RCT values of the steelrebar were decreased when compared to 15 days. This might be indicating the presenceof chloride ions continuous attack on the iron hydroxyl layer, breaking down the ironhydroxyl layer, thus leading to decreased charge transfer resistance. As a result, the anodicdissolution of the metal was increased by the following sequence [47–49]:
4FeOOH + 12Cl− → 4FeCl3 + 2H2O + 3O2 (10)
2FeCl3 + 6H2O → 2Fe(OH)3 + 6Cl− + 6H+ (11)
2Fe(OH)3 → Fe2O3 + 3H2O (12)
Fe2+ + 2Fe(OH)3 +12
O2 + 2e− → Fe3O4 + 3H2O (13)
The continuous attack of Cl− ions on the iron hydroxyl layer (FeOOH) to form asoluble FeCl3 product, and then FeCl3 is further hydrolyzed to form a very porous Fe(OH)3formed on the steel rebar surface. The Fe(OH)3 product is not stable and cannot protect thesteel rebar against corrosion [48,49] and it is further to form porous Fe2O3 and Fe3O4 on thesteel rebar surface [50]. Therefore, the R1 and RCT values decreased further when increasingexposure periods. Besides, the CPECT values of the steel rebars were gradually increaseddue to the increase of the local dielectric constant [51], this might be due to the replacementof -OH ions by chlorides ions on the steel rebar surface while increasing the exposureperiods. For example, the CPECT values of the steel rebar immersed in O-SSA20 were0.123 × 10−2 Ω−1·cm2 S−n, 0.929 × 10⁻² Ω−1·cm2 S−n, and 1.150 × 10⁻² Ω−1·cm2 S−n forthe exposure period of 1, 15, and 30 days, respectively. However, these values are slightlylower than OSSA0, which is due to the presence of CaO in the SSA to produce -OH ionsand adsorb on the steel surface and reduce the speed of the corrosion reaction [52]. Hence,this result confirms that the optimum replacement level of cement up to 20% SSA is suitablefor concrete structures for the betterment of steel rebars.
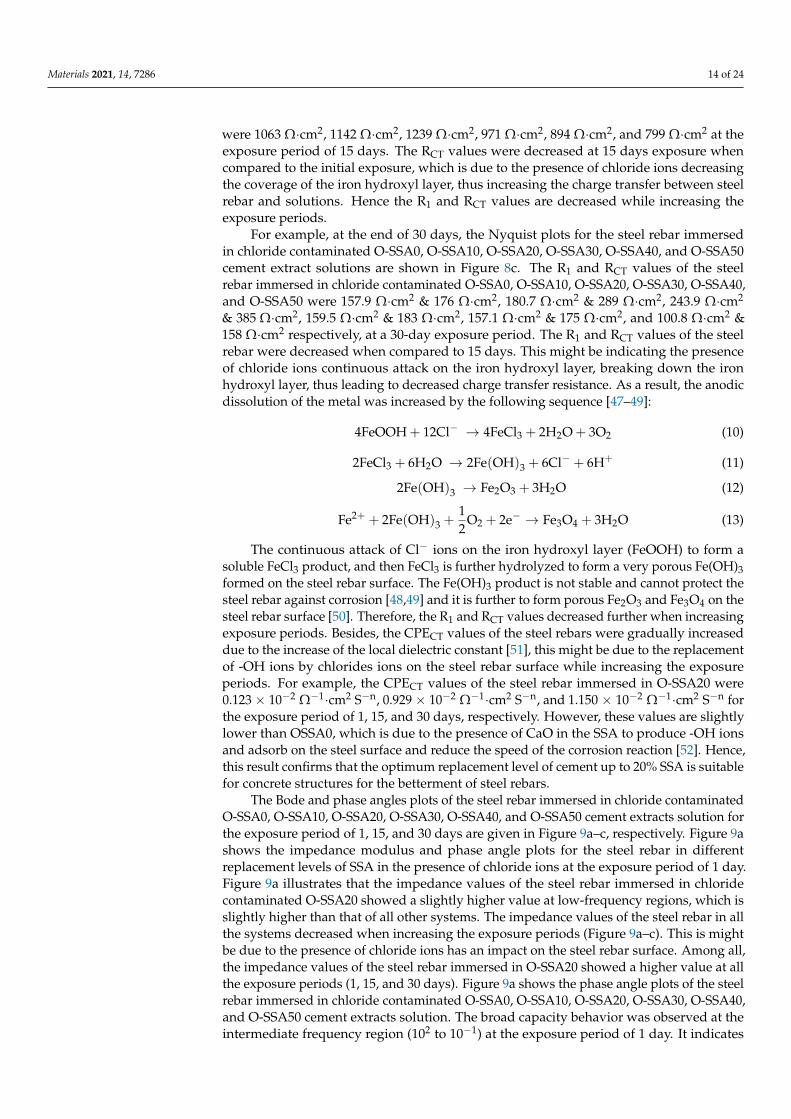
The Bode and phase angles plots of the steel rebar immersed in chloride contaminatedO-SSA0, O-SSA10, O-SSA20, O-SSA30, O-SSA40, and O-SSA50 cement extracts solution forthe exposure period of 1, 15, and 30 days are given in Figure 9a–c, respectively. Figure 9ashows the impedance modulus and phase angle plots for the steel rebar in differentreplacement levels of SSA in the presence of chloride ions at the exposure period of 1 day.Figure 9a illustrates that the impedance values of the steel rebar immersed in chloridecontaminated O-SSA20 showed a slightly higher value at low-frequency regions, which isslightly higher than that of all other systems. The impedance values of the steel rebar in allthe systems decreased when increasing the exposure periods (Figure 9a–c). This is mightbe due to the presence of chloride ions has an impact on the steel rebar surface. Among all,the impedance values of the steel rebar immersed in O-SSA20 showed a higher value at allthe exposure periods (1, 15, and 30 days). Figure 9a shows the phase angle plots of the steelrebar immersed in chloride contaminated O-SSA0, O-SSA10, O-SSA20, O-SSA30, O-SSA40,and O-SSA50 cement extracts solution. The broad capacity behavior was observed at theintermediate frequency region (102 to 10−1) at the exposure period of 1 day. It indicates
Materials 2021, 14, 7286 15 of 24
the growth of iron hydroxide layer [53] and lower corrosion rate of the steel rebar surface.Further increasing the exposure periods, the phase angle values and capacity behavior asthe capacity loop width were decreased at the middle frequency region (102 to 10−1). Forexample, the phase angle values of steel rebars at the middle frequency range (102 to 10−1)were around −66.5 to −63.2 for an exposure period of 1 day and around −57.6 to −55
(except O-SSA50) for an exposure period of 15 days (Figure 9b).
Materials 2021, 14, x FOR PEER REVIEW 16 of 25
Figure 9. EIS−Bode plots for steel rebars in chloride contaminated various cement extracts for an exposure period of 1 day (a); 15 days (b); and 30 days (c).
It indicates the presence of chloride ions continually attacking the iron hydroxide layer of the steel rebar surface as well as the increased corrosion phenomena on the steel rebar surface. At the exposure periods of 30 days (Figure 9c), the width of the phase angle degree plots was decreased or sharp capacity behavior was observed at the middle fre-quency range of (101 to 10−1) for the steel rebar immersed in the O-SSA0, O-SSA40, and O-SSA30, which may indicate the breakdown of the iron hydroxyl layer and also which means that higher corrosion rate obtained on the steel rebar surface [54]. At the same ex-posure conditions, the broad capacity behavior observed at the middle frequency regions (102 to 10−1) for the steel rebar immersed in the O-SSA10, O-SSA-20, and O-SSA30, which may indicate that the iron hydroxide layer may be present on the steel rear surface and it has become diffused/porous, thus lowering the speed of corrosion rate on the steel rebar surface. This result also confirms that the replacement level of cement with 20% of SSA (O-SSA20) showed better performance at all the exposure periods (1, 15, and 30 days).
3.2.2. Gravimetric Weight Loss Method At the end of 30 days of exposure, steel rebars were taken from chloride contami-
nated O-SSA0, O-SSA10, O-SSA20, O-SSA30, O-SSA40, and O-SSA50 cement extracts so-lution. The corrosion products on the steel rebar surface are visually examined. The pho-tographic image of steel rebars in the chloride contaminated O-SSA0, O-SSA10, O-SSA20, O-SSA30, O-SSA40, and O-SSA50 cement extracts solution are given in Figure S2 in the supporting information. Furthermore, the corrosion products were cleaned using pickling acid (as per ASTM G1-03) [31], then washed with distilled water as well as degreased with
Figure 9. EIS−Bode plots for steel rebars in chloride contaminated various cement extracts for anexposure period of 1 day (a); 15 days (b); and 30 days (c).
It indicates the presence of chloride ions continually attacking the iron hydroxidelayer of the steel rebar surface as well as the increased corrosion phenomena on the steelrebar surface. At the exposure periods of 30 days (Figure 9c), the width of the phaseangle degree plots was decreased or sharp capacity behavior was observed at the middlefrequency range of (101 to 10−1) for the steel rebar immersed in the O-SSA0, O-SSA40, andO-SSA30, which may indicate the breakdown of the iron hydroxyl layer and also whichmeans that higher corrosion rate obtained on the steel rebar surface [54]. At the sameexposure conditions, the broad capacity behavior observed at the middle frequency regions(102 to 10−1) for the steel rebar immersed in the O-SSA10, O-SSA-20, and O-SSA30, whichmay indicate that the iron hydroxide layer may be present on the steel rear surface and ithas become diffused/porous, thus lowering the speed of corrosion rate on the steel rebarsurface. This result also confirms that the replacement level of cement with 20% of SSA(O-SSA20) showed better performance at all the exposure periods (1, 15, and 30 days).
3.2.2. Gravimetric Weight Loss Method
At the end of 30 days of exposure, steel rebars were taken from chloride contaminatedO-SSA0, O-SSA10, O-SSA20, O-SSA30, O-SSA40, and O-SSA50 cement extracts solution.The corrosion products on the steel rebar surface are visually examined. The photographicimage of steel rebars in the chloride contaminated O-SSA0, O-SSA10, O-SSA20, O-SSA30,
Materials 2021, 14, 7286 16 of 24
O-SSA40, and O-SSA50 cement extracts solution are given in Figure S2 in the supportinginformation. Furthermore, the corrosion products were cleaned using pickling acid (as perASTM G1-03) [31], then washed with distilled water as well as degreased with acetoneand dried at 60 ± 3 C. The final weight of the rebar was noted and the corrosion ratewas calculated as per Equation (1) and given in Table 6. It was observed from Table 6 thatthe average corrosion rate values of steel rebars immersed in O-SSA0, O-SSA10, O-SSA20,O-SSA30, O-SSA40, and O-SSA50 were 0.7998 mm/y, 0.6913 mm/y, 0.5679 mm/y, 0.7983mm/y, 0.8586 mm/y, and 0.8869 mm/y, respectively. The steel rebar immersed in O-SSA20showed a lesser corrosion rate when compared to all other systems. Here, it was concludedthat the comparable corrosion rate with control was noticed up to a 30% replacement level.Hence, these results confirm the fact that a cement replacement level of 30% by SSA issafely used for steel rebar in concrete under marine environments.
Table 6. Corrosion rate for steel rebars in various cement extracts obtained from gravimetric weightloss measurements.
System Number ofSpecimens
Weight Loss(g)
CorrosionRate
(mm/y)
AverageCorrosion Rate
(mm/y)
pH
Initial Final
O-SSA0(OPC)
1 0.7753 0.79730.7998
12.73 10.142 0.7801 0.8022 12.75 10.43
O-SSA101 0.6746 0.6937
0.691312.75 10.85
2 0.6698 0.6888 12.74 10.29
O-SSA201 0.5499 0.5655
0.567912.78 11.21
2 0.5546 0.5703 12.76 11.35
O-SSA301 0.7747 0.7966
0.798312.76 10.37
2 0.7779 0.7999 12.77 10.41
O-SSA401 0.8301 0.8536
0.858612.77 10.08
2 0.8398 0.8636 12.77 10.12
O-SSA501 0.8662 0.8907
0.886912.76 9.92
2 0.8589 0.8832 12.77 10.07
At the end of 30 days of exposure, the alkalinity of the O-SSA0, O-SSA10, O-SSA20,O-SSA30, O-SSA40, and O-SSA50 cement extracts were measured and given in Table 6. Thealkalinity of the cement extract solution was decreased due to the action with atmosphericCO2 as follows:
CaO + CO2 → CaCO3 (14)
The pH was greatly affected for 40% and 50% replacement levels. However, themeasured pH values were 10.14, 10.85, 11.21, and 10.37 for 0%, 10%, 20%, and 30% levelsrespectively. Here again, it was proved that the alkalinity (pH 10.14 to 11.21) was not muchaffected up to the 30%.
3.3. Surface Characterization of Steel Rebars
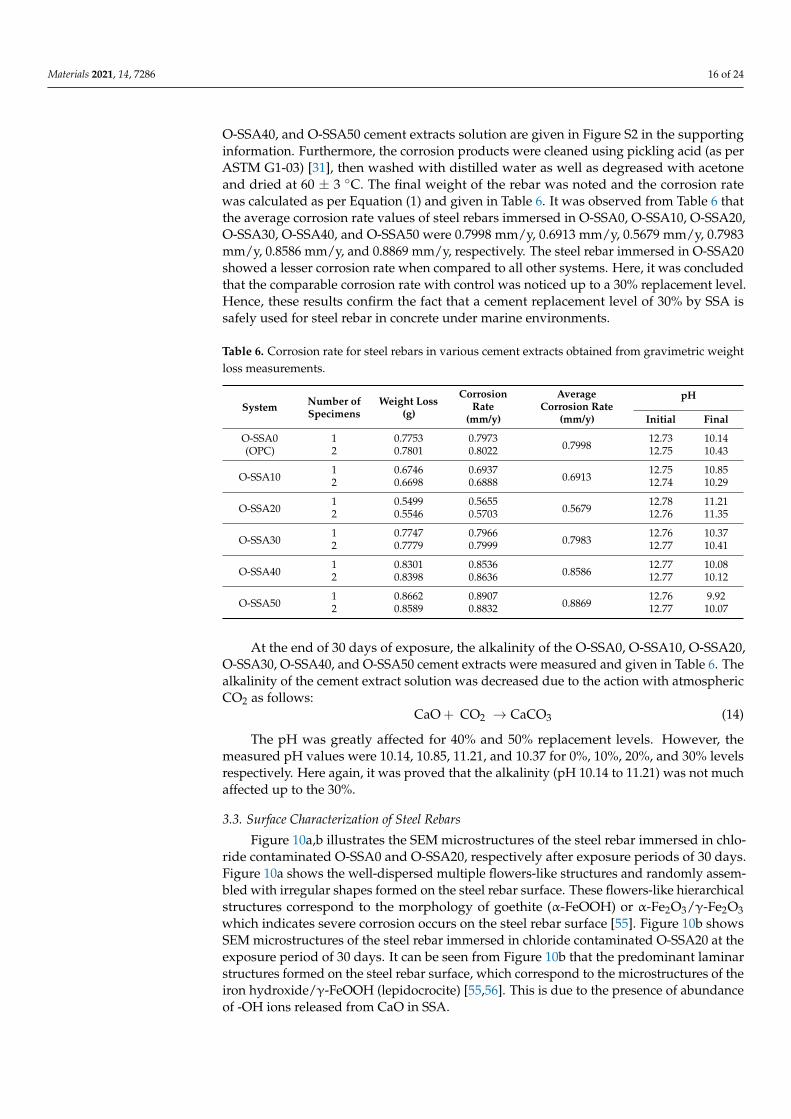
Figure 10a,b illustrates the SEM microstructures of the steel rebar immersed in chlo-ride contaminated O-SSA0 and O-SSA20, respectively after exposure periods of 30 days.Figure 10a shows the well-dispersed multiple flowers-like structures and randomly assem-bled with irregular shapes formed on the steel rebar surface. These flowers-like hierarchicalstructures correspond to the morphology of goethite (α-FeOOH) or α-Fe2O3/γ-Fe2O3which indicates severe corrosion occurs on the steel rebar surface [55]. Figure 10b showsSEM microstructures of the steel rebar immersed in chloride contaminated O-SSA20 at theexposure period of 30 days. It can be seen from Figure 10b that the predominant laminarstructures formed on the steel rebar surface, which correspond to the microstructures of theiron hydroxide/γ-FeOOH (lepidocrocite) [55,56]. This is due to the presence of abundanceof -OH ions released from CaO in SSA.
Materials 2021, 14, 7286 17 of 24Materials 2021, 14, x FOR PEER REVIEW 18 of 25
Figure 10. SEM micrographs of the corrosion products on the steel rebar surface after an exposure period of 30 days [O-SSSA0 (a); and O-SSA20 (b)].
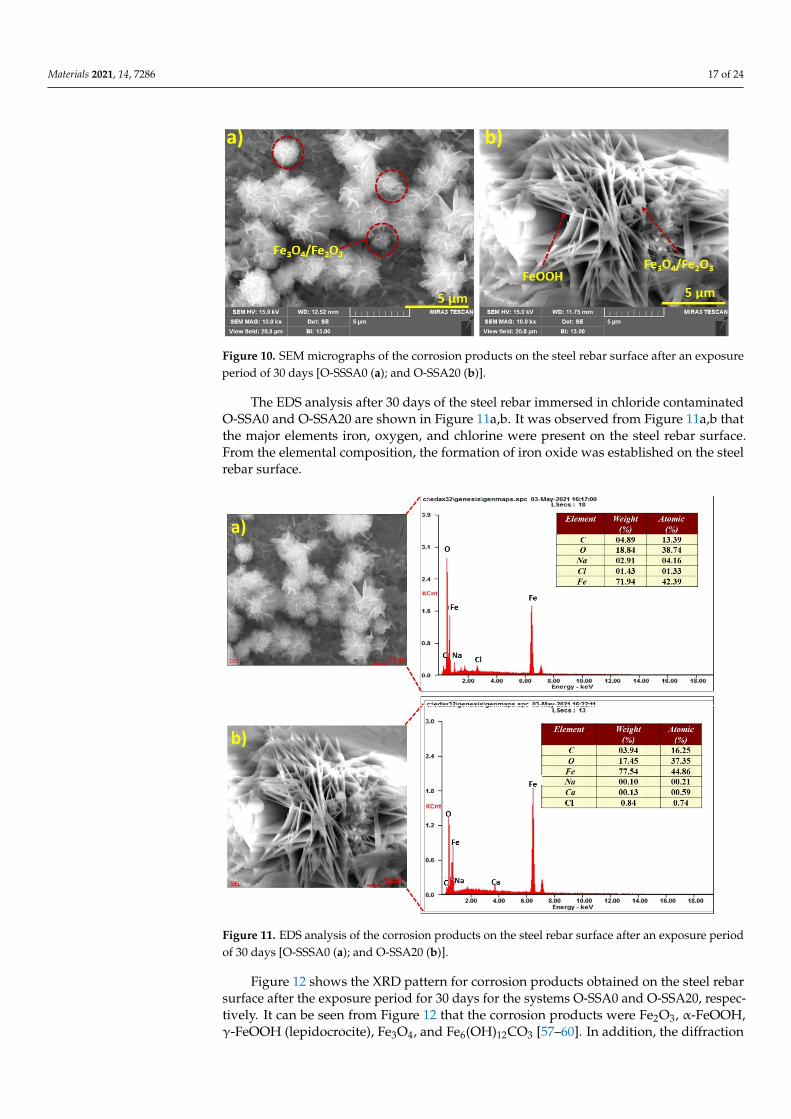
The EDS analysis after 30 days of the steel rebar immersed in chloride contaminated O-SSA0 and O-SSA20 are shown in Figure 11a,b. It was observed from Figure 11a,b that the major elements iron, oxygen, and chlorine were present on the steel rebar surface. From the elemental composition, the formation of iron oxide was established on the steel rebar surface.
Figure 11. EDS analysis of the corrosion products on the steel rebar surface after an exposure period of 30 days [O-SSSA0 (a); and O-SSA20 (b)].
Figure 12 shows the XRD pattern for corrosion products obtained on the steel rebar surface after the exposure period for 30 days for the systems O-SSA0 and O-SSA20, re-spectively. It can be seen from Figure 12 that the corrosion products were Fe2O3, α-
Figure 10. SEM micrographs of the corrosion products on the steel rebar surface after an exposureperiod of 30 days [O-SSSA0 (a); and O-SSA20 (b)].
The EDS analysis after 30 days of the steel rebar immersed in chloride contaminatedO-SSA0 and O-SSA20 are shown in Figure 11a,b. It was observed from Figure 11a,b thatthe major elements iron, oxygen, and chlorine were present on the steel rebar surface.From the elemental composition, the formation of iron oxide was established on the steelrebar surface.
Materials 2021, 14, x FOR PEER REVIEW 18 of 25
Figure 10. SEM micrographs of the corrosion products on the steel rebar surface after an exposure period of 30 days [O-SSSA0 (a); and O-SSA20 (b)].
The EDS analysis after 30 days of the steel rebar immersed in chloride contaminated O-SSA0 and O-SSA20 are shown in Figure 11a,b. It was observed from Figure 11a,b that the major elements iron, oxygen, and chlorine were present on the steel rebar surface. From the elemental composition, the formation of iron oxide was established on the steel rebar surface.
Figure 11. EDS analysis of the corrosion products on the steel rebar surface after an exposure period of 30 days [O-SSSA0 (a); and O-SSA20 (b)].
Figure 12 shows the XRD pattern for corrosion products obtained on the steel rebar surface after the exposure period for 30 days for the systems O-SSA0 and O-SSA20, re-spectively. It can be seen from Figure 12 that the corrosion products were Fe2O3, α-
Figure 11. EDS analysis of the corrosion products on the steel rebar surface after an exposure periodof 30 days [O-SSSA0 (a); and O-SSA20 (b)].
Figure 12 shows the XRD pattern for corrosion products obtained on the steel rebarsurface after the exposure period for 30 days for the systems O-SSA0 and O-SSA20, respec-tively. It can be seen from Figure 12 that the corrosion products were Fe2O3, α-FeOOH,γ-FeOOH (lepidocrocite), Fe3O4, and Fe6(OH)12CO3 [57–60]. In addition, the diffraction

Materials 2021, 14, 7286 18 of 24
intensity of the Fe3O4/Fe2O3 is higher for the steel rebar immersed in a control system(O-SSA0) when compared to O-SSA20.
Materials 2021, 14, x FOR PEER REVIEW 19 of 25
FeOOH, γ-FeOOH (lepidocrocite), Fe3O4, and Fe6(OH)12CO3 [57–60]. In addition, the dif-fraction intensity of the Fe3O4/Fe2O3 is higher for the steel rebar immersed in a control system (O-SSA0) when compared to O-SSA20.
Figure 12. XRD patterns of the corrosion products on the steel rebar surface after an exposure period of 30 days [O-SSSA0 and O-SSA20].
3.4. Mechanical Properties of Concrete 3.4.1. Compressive Strength Test
The average compressive strength vs. replacement level for control and OPC re-placed by a SSA system at 10%, 20%, 30%, 40%, and 50% replacement levels are shown in Figure 13a.
Figure 13. Mechanical properties of the concrete with a different replacement level of SSA. Compressive strength test (a); and split tensile strength test (b).
Figure 12. XRD patterns of the corrosion products on the steel rebar surface after an exposure periodof 30 days [O-SSSA0 and O-SSA20].
3.4. Mechanical Properties of Concrete3.4.1. Compressive Strength Test
The average compressive strength vs. replacement level for control and OPC re-placed by a SSA system at 10%, 20%, 30%, 40%, and 50% replacement levels are shownin Figure 13a.
Materials 2021, 14, x FOR PEER REVIEW 19 of 25
FeOOH, γ-FeOOH (lepidocrocite), Fe3O4, and Fe6(OH)12CO3 [57–60]. In addition, the dif-fraction intensity of the Fe3O4/Fe2O3 is higher for the steel rebar immersed in a control system (O-SSA0) when compared to O-SSA20.
Figure 12. XRD patterns of the corrosion products on the steel rebar surface after an exposure period of 30 days [O-SSSA0 and O-SSA20].
3.4. Mechanical Properties of Concrete 3.4.1. Compressive Strength Test
The average compressive strength vs. replacement level for control and OPC re-placed by a SSA system at 10%, 20%, 30%, 40%, and 50% replacement levels are shown in Figure 13a.
Figure 13. Mechanical properties of the concrete with a different replacement level of SSA. Compressive strength test (a); and split tensile strength test (b).
Figure 13. Mechanical properties of the concrete with a different replacement level of SSA. Compressive strength test (a);and split tensile strength test (b).
It was interesting to note that the comparable compressive strength with OPC wasobserved up to 40% replacement levels. For example, the compressive strength for OPC
Materials 2021, 14, 7286 19 of 24
(control) at 28 days was found to be 37.3 N/mm2 whereas the compressive strength for thesystem OPC + 40% SSA was found to be 35.03 N/mm2. However, the maximum compres-sive strength was noted for the system OPC + 20% SSA was found to be 40 N/mm2. Therewas a 1.07-time increase in compressive strength was observed at the 20% replacementlevel. A decrease in compressive strength was observed at the 50% replacement level. Thecompressive strength value was found to be 33.12 N/mm2 for the system OPC + 50% SSA.These data clearly illustrate that SSA blending well improved the strength of concrete.Here, it was worthwhile to mention that up to 30% of SSA can be safely replaced with theOPC in concrete constructions.
3.4.2. Split Tensile Strength Test
Figure 13b shows the split tensile strength of O-SSA0, O-SSA10, O-SSA20, O-SSA30,O-SSA40, and O-SSA50, after 28 days cured samples. The split tensile strength for O-SSA0,O-SSA10, O-SSA20, O-SSA30, O-SSA40, and O-SSA50 were found to be 2.87, 3.09, 3.6,3.37, 2.55, and 2.26 N/mm2, respectively. It was observed that the split tensile strengthof O-SSA20 concrete showed higher split tensile strength than the O-SSA0. However, itwas observed that the comparable split tensile strength with OPC was noted up to 40%replacement levels. For example, the split tensile strength for O-SSA0 (without SSA) at28 days was found to be 2.87 N/mm2 whereas the split tensile strength for the systemO-SSA40 (OPC + 40% SSA) was found to be 2.55 N/mm2. The gain in strength in SSAblended concrete is because the presence of CaO in SSA readily reacts with water to formCa(OH)2 and further reacts with silica and alumina to form C-S-H gel and C-A-S-H. Thecement hydration reactions are described below [61].
SAA(3Cao) + 3H2O→ 3Ca(OH)2 (15)
SSA(4CaO) + 2SiO2 + 4H2O→ 3CaO·2SiO2·3H2O (C–S–H) + Ca(OH)2 (16)
SSA(4CaO) + 2SiO2 + Al2O3 + 4H2O→ 3Cao·Al2O3·2SiO2·3H2O(C–A–S–H) + Ca(OH)2 (17)
The formation of C-S-H and C-A-S-H can improve the strength and durability ofconcrete [62]. It is a fact that SSA possesses a small mean particle size (90–150 µm), itpermits Ca2+ ions which can diffuse internally, and therefore hydration of cement andpozzolanic reactions are continued for a long time.
3.5. Extrapolation Modeling3.5.1. Extrapolation Modeling for Compressive Strength with Later Age
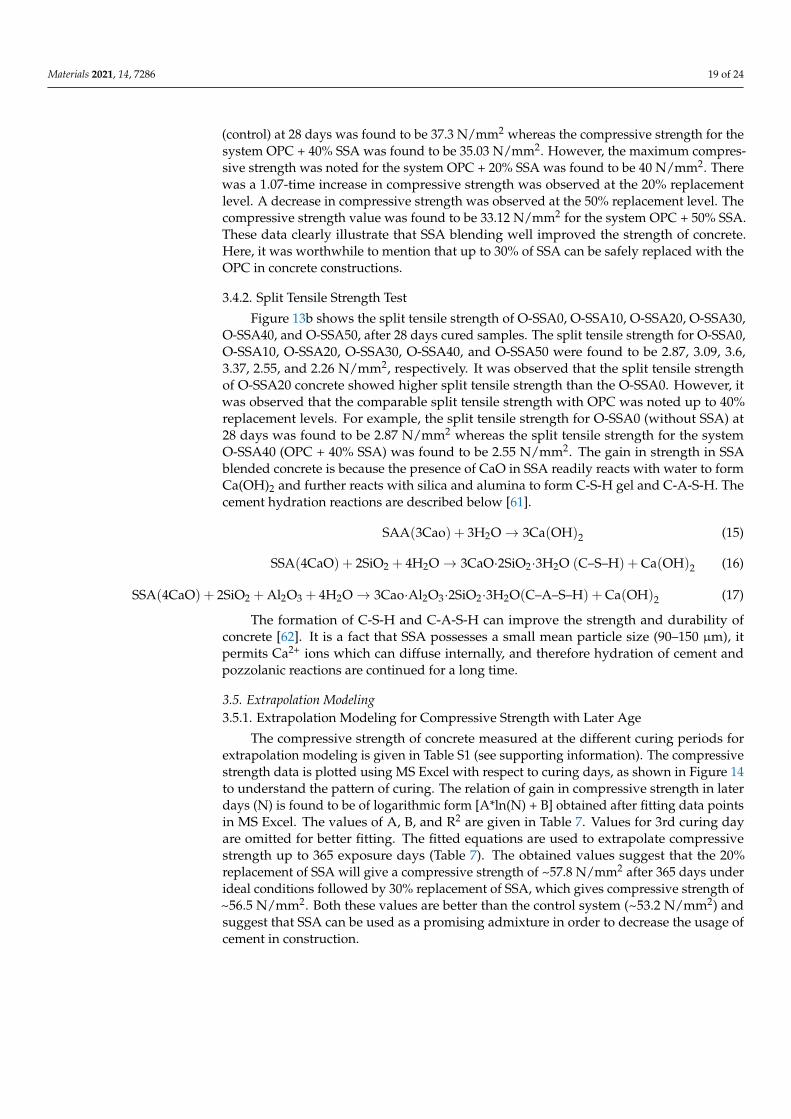
The compressive strength of concrete measured at the different curing periods forextrapolation modeling is given in Table S1 (see supporting information). The compressivestrength data is plotted using MS Excel with respect to curing days, as shown in Figure 14to understand the pattern of curing. The relation of gain in compressive strength in laterdays (N) is found to be of logarithmic form [A*ln(N) + B] obtained after fitting data pointsin MS Excel. The values of A, B, and R2 are given in Table 7. Values for 3rd curing dayare omitted for better fitting. The fitted equations are used to extrapolate compressivestrength up to 365 exposure days (Table 7). The obtained values suggest that the 20%replacement of SSA will give a compressive strength of ~57.8 N/mm2 after 365 days underideal conditions followed by 30% replacement of SSA, which gives compressive strength of~56.5 N/mm2. Both these values are better than the control system (~53.2 N/mm2) andsuggest that SSA can be used as a promising admixture in order to decrease the usage ofcement in construction.
Materials 2021, 14, 7286 20 of 24Materials 2021, 14, x FOR PEER REVIEW 21 of 25
Figure 14. Compressive strength data vs. time (days).
Table 7. Values of A, B, R2, and compressive strength at the 365th day with respect to a different replacement level.
Replacement Level (%)
A B R2 Compressive Strength at 365th
Day (N/mm2)
O-SSA0 6.0585 17.403 0.9964 53.15 O-SSA10 6.8661 15.818 0.9977 56.33 O-SSA20 7.0229 16.372 0.9994 57.81 O-SSA30 7.0118 15.092 0.9963 56.46 O-SSA40 6.9946 10.763 0.9926 52.03 O-SSA50 6.9208 9.5042 0.9977 50.33
An attempt is made to obtain a curing rate in terms of change in compressive strength with the help of a difference method. In this method, compressive strength value is sub-tracted by its next value and % change is obtained. The formula can be written as: 𝐶ℎ𝑎𝑛𝑔𝑒 𝑖𝑛 𝑐𝑜𝑚𝑝𝑟𝑒𝑠𝑠𝑖𝑣𝑒 𝑠𝑡𝑟𝑒𝑛𝑔𝑡ℎ (%) = 𝐶𝑆 − 𝐶𝑆𝐶𝑆 100 (18)
where CS = compressive strength and n = number of day. The dataset is extrapolated up to 700 days (Figure S3 and Table S2 in the Supporting
Information). It was found that the change in compressive strength start decreasing with time and falls below one percent after 150 days.
3.5.2. Extrapolation Modelling for Corrosion Rate of Steel Rebar in Chloride Contami-nated Various Cement Extracts
The corrosion rate calculated using electrochemical method is plotted with respect to exposure days is given in Figure 15. Here, 20% SSA blending was found to give the best corrosion resistance. It was also observed that all the systems follow a linear pattern and relation in the corrosion rate and number of exposure days (NE) can be written as equa-tion, A*NE +B. The data is fitted to linear equation using MS Excel and the equation is used to extrapolate a corrosion rate after 365 days of exposure. The comparison for various
Figure 14. Compressive strength data vs. time (days).
Table 7. Values of A, B, R2, and compressive strength at the 365th day with respect to a differentreplacement level.
ReplacementLevel(%)
A B R2Compressive Strength at
365th Day(N/mm2)
O-SSA0 6.0585 17.403 0.9964 53.15O-SSA10 6.8661 15.818 0.9977 56.33O-SSA20 7.0229 16.372 0.9994 57.81O-SSA30 7.0118 15.092 0.9963 56.46O-SSA40 6.9946 10.763 0.9926 52.03O-SSA50 6.9208 9.5042 0.9977 50.33
An attempt is made to obtain a curing rate in terms of change in compressive strengthwith the help of a difference method. In this method, compressive strength value issubtracted by its next value and % change is obtained. The formula can be written as:
Change in compressive strength (%) =
[CSn+1 − CSn
CSn
]× 100 (18)
where CS = compressive strength and n = number of day.The dataset is extrapolated up to 700 days (Figure S3 and Table S2 in the Supporting
Information). It was found that the change in compressive strength start decreasing withtime and falls below one percent after 150 days.
3.5.2. Extrapolation Modelling for Corrosion Rate of Steel Rebar in Chloride ContaminatedVarious Cement Extracts
The corrosion rate calculated using electrochemical method is plotted with respectto exposure days is given in Figure 15. Here, 20% SSA blending was found to give thebest corrosion resistance. It was also observed that all the systems follow a linear patternand relation in the corrosion rate and number of exposure days (NE) can be written asequation, A*NE +B. The data is fitted to linear equation using MS Excel and the equation isused to extrapolate a corrosion rate after 365 days of exposure. The comparison for variouscompositions is given in Table S3 in the supporting information. The obtained values
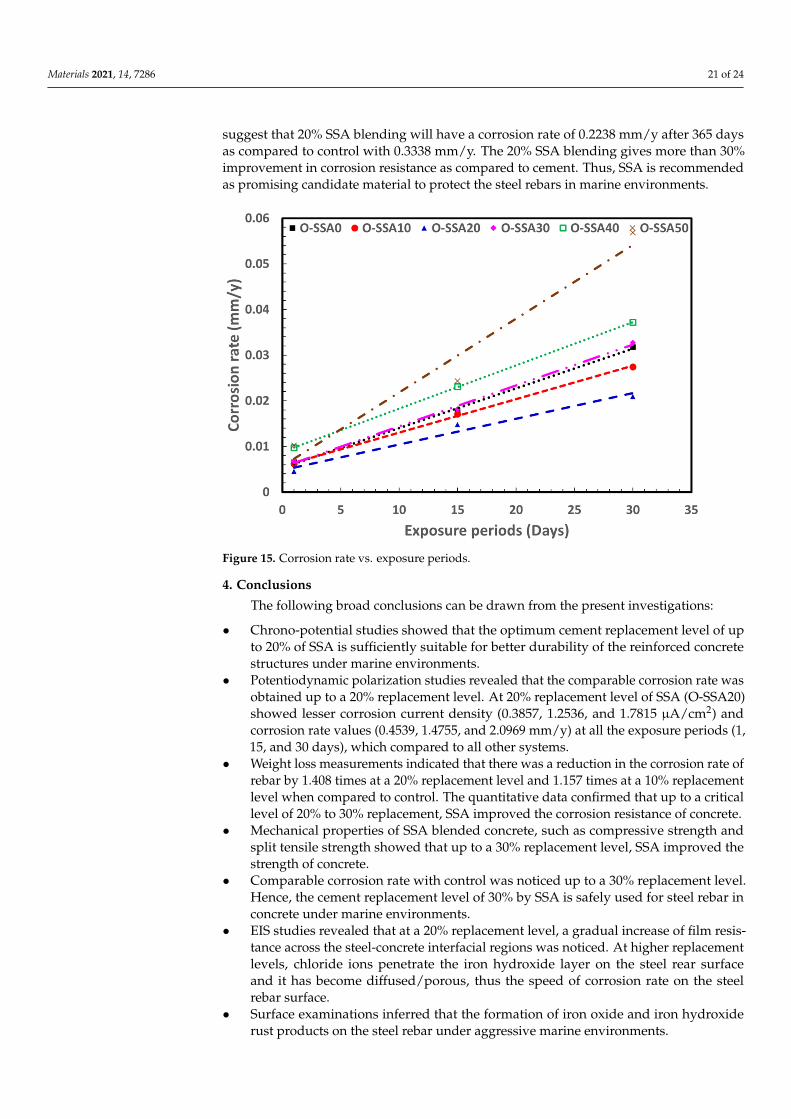
Materials 2021, 14, 7286 21 of 24
suggest that 20% SSA blending will have a corrosion rate of 0.2238 mm/y after 365 daysas compared to control with 0.3338 mm/y. The 20% SSA blending gives more than 30%improvement in corrosion resistance as compared to cement. Thus, SSA is recommendedas promising candidate material to protect the steel rebars in marine environments.
Materials 2021, 14, x FOR PEER REVIEW 22 of 25
compositions is given in Table S3 in the supporting information. The obtained values sug-gest that 20% SSA blending will have a corrosion rate of 0.2238 mm/y after 365 days as compared to control with 0.3338 mm/y. The 20% SSA blending gives more than 30% im-provement in corrosion resistance as compared to cement. Thus, SSA is recommended as promising candidate material to protect the steel rebars in marine environments.
Figure 15. Corrosion rate vs. exposure periods.
4. Conclusions The following broad conclusions can be drawn from the present investigations:
• Chrono-potential studies showed that the optimum cement replacement level of up to 20% of SSA is sufficiently suitable for better durability of the reinforced concrete structures under marine environments.
• Potentiodynamic polarization studies revealed that the comparable corrosion rate was obtained up to a 20% replacement level. At 20% replacement level of SSA (O-SSA20) showed lesser corrosion current density (0.3857, 1.2536, and 1.7815 µA/cm2) and corrosion rate values (0.4539, 1.4755, and 2.0969 mm/y) at all the exposure peri-ods (1, 15, and 30 days), which compared to all other systems.
• Weight loss measurements indicated that there was a reduction in the corrosion rate of rebar by 1.408 times at a 20% replacement level and 1.157 times at a 10% replace-ment level when compared to control. The quantitative data confirmed that up to a critical level of 20% to 30% replacement, SSA improved the corrosion resistance of concrete.
• Mechanical properties of SSA blended concrete, such as compressive strength and split tensile strength showed that up to a 30% replacement level, SSA improved the strength of concrete.
• Comparable corrosion rate with control was noticed up to a 30% replacement level. Hence, the cement replacement level of 30% by SSA is safely used for steel rebar in concrete under marine environments.
• EIS studies revealed that at a 20% replacement level, a gradual increase of film re-sistance across the steel-concrete interfacial regions was noticed. At higher replace-ment levels, chloride ions penetrate the iron hydroxide layer on the steel rear surface and it has become diffused/porous, thus the speed of corrosion rate on the steel rebar surface.
Figure 15. Corrosion rate vs. exposure periods.
4. Conclusions
The following broad conclusions can be drawn from the present investigations:
• Chrono-potential studies showed that the optimum cement replacement level of upto 20% of SSA is sufficiently suitable for better durability of the reinforced concretestructures under marine environments.
• Potentiodynamic polarization studies revealed that the comparable corrosion rate wasobtained up to a 20% replacement level. At 20% replacement level of SSA (O-SSA20)showed lesser corrosion current density (0.3857, 1.2536, and 1.7815 µA/cm2) andcorrosion rate values (0.4539, 1.4755, and 2.0969 mm/y) at all the exposure periods (1,15, and 30 days), which compared to all other systems.
• Weight loss measurements indicated that there was a reduction in the corrosion rate ofrebar by 1.408 times at a 20% replacement level and 1.157 times at a 10% replacementlevel when compared to control. The quantitative data confirmed that up to a criticallevel of 20% to 30% replacement, SSA improved the corrosion resistance of concrete.
• Mechanical properties of SSA blended concrete, such as compressive strength andsplit tensile strength showed that up to a 30% replacement level, SSA improved thestrength of concrete.
• Comparable corrosion rate with control was noticed up to a 30% replacement level.Hence, the cement replacement level of 30% by SSA is safely used for steel rebar inconcrete under marine environments.
• EIS studies revealed that at a 20% replacement level, a gradual increase of film resis-tance across the steel-concrete interfacial regions was noticed. At higher replacementlevels, chloride ions penetrate the iron hydroxide layer on the steel rear surfaceand it has become diffused/porous, thus the speed of corrosion rate on the steelrebar surface.
• Surface examinations inferred that the formation of iron oxide and iron hydroxiderust products on the steel rebar under aggressive marine environments.
Materials 2021, 14, 7286 22 of 24
• It was concluded that the animal origin from the marine was found to be a sustainableengineering material for construction industries and also for the marine environment.SSA is a suitable replacement material for natural limestone in cement productions.
• The fitting equations are used to extrapolate compressive strength up to 365 cur-ing days. The obtained values suggest that the 20% replacement of SSA will givea compressive strength of ~57.8 N/mm2 after 365 days of curing under ideal con-ditions followed by 30% replacement of SSA, which gives compressive strength of~56.5 N/mm2.
Supplementary Materials: The following are available online at https://www.mdpi.com/article/10.3390/ma14237286/s1, Figure S1: Equivalent circuit model fit for EIS analysis of the steel rebarimmersed in chloride contaminated 30 various cement extracts for an exposure period of 1 day(a); 15 days and 30 days (b); Figure S2: Photographic image of steel rebars immersed in chloridecontaminated various cement extracts 35 after exposure periods of 30 days; Figure S3: Change incompressive strength vs. Time (Days) (Extrapolation modelling); Table S1: Compressive strength atdifferent curing periods (days); Table S2: Change in compressive strength vs. Time (days); Table S3:Value of A, B, R2 and estimated corrosion rate from linear extrapolation (Equation: A * NE + B).
Author Contributions: Data curation, M.R. and S.K.; formal analysis, M.R. and S.K.; funding acqui-sition, T.P and H.-S.L.; investigation, S.K.; methodology, M.R. and S.K.; supervision, H.-S.L. and T.P.;validation, M.R. and S.K.; writing—original draft, M.R., S.K., H.-S.L. and T.P.; writing—review andediting, M.R., S.K., H.-S.L. and T.P. All authors have read and agreed to the published version ofthe manuscript.
Funding: This research was supported by MSIT (Ministry of Science and ICT), Korea, under theGrand Information & Communication Technology Research Center support program (IITP-2020-0-101741) supervised by the IITP (Institute for Information & communications Technology Planning &Evaluation) and research fund of Hanyang University (HY-2021).
Institutional review Board statement: Not applicable.
Informed Consent Statement: Not applicable.
Data Availability Statement: The raw/processed data required to reproduce these findings cannotbe shared at this time as the data also forms part of an ongoing study.
Acknowledgments: One of the authors (M.R.) thanks the Management and Principal, PSGiTech,Coimbatore, Tamilnadu, India for their encouragement and motivation.
Conflicts of Interest: All authors declare that there is no conflict of interest.
References1. Environment, U.; Scrivener, K.L.; John, V.M.; Gartner, E.M. Eco-efficient cements: Potential economically viable solutions for a
low-CO2 cement-based materials industry. Cem. Concr. Res. 2018, 114, 2–26.2. Lim, C.; Jung, E.; Lee, S.; Jang, C.; Oh, C.; Shin, K.N. Global trend of cement production and utilization of circular resources.
J. Energy Eng. 2020, 29, 57–63.3. International Energy Agency. Low-Carbon Transition in the Cement Industry. Available online: https://docs.wbcsd.org/2018/0
4/Cement_RM_Summary.pdf (accessed on 27 October 2021).4. British Geological Survey. Cement Raw Materials; British Geological Survey: Nottingham, UK, 2005; pp. 1–20.5. Farfan, J.; Fasihi, M.; Breyer, C. Trends in the global cement industry and opportunities for long-term sustainable CCU potential
for Power-to-X. J. Clean. Prod. 2019, 217, 821–835. [CrossRef]6. Schmidt, W.; Commeh, M.; Olonade, K.; Schiewer, G.L.; Dodoo-Arhin, D.; Dauda, R.; Fataei, S.; Tawiah, A.T.; Mohamed, F.;
Thiedeitz, M. Sustainable circular value chains: From rural waste to feasible urban construction materials solutions. Dev. BuiltEnviron. 2021, 6, 100047. [CrossRef]
7. Golewski, G.L. The influence of microcrack width on the mechanical parameters in concrete with the addition of fly ash:Consideration of technological and ecological benefits. Constr. Build. Mater. 2019, 197, 849–861. [CrossRef]
8. Saraswathy, V.; Muralidharan, S.; Thangavel, K.; Srinivasan, S. Activated fly ash cements: Tolerable limit of replacement fordurable steel reinforced concrete. Adv. Cem. Res. 2002, 14, 9–16. [CrossRef]
9. Kathirvel, P.; Saraswathy, V.; Karthik, S.; Sekar, A. Strength and durability properties of quaternary cement concrete made withfly ash, rice husk ash and limestone powder. Arab. J. Sci. Eng. 2013, 38, 589–598. [CrossRef]
Materials 2021, 14, 7286 23 of 24
10. Duraman, S.B.; Richardson, I.G. Microstructure & properties of steel-reinforced concrete incorporating Portland cement andground granulated blast furnace slag hydrated at 20 C. Cem. Concr. Res. 2020, 137, 106193.
11. Jang, S.-Y.; Karthick, S.; Kwon, S.-J. Investigation on durability performance in early aged high-performance concrete containingGGBFS and FA. Adv. Mater. Sci. Eng. 2017. [CrossRef]
12. Wu, Z.; Khayat, K.H.; Shi, C. Changes in rheology and mechanical properties of ultra-high performance concrete with silica fumecontent. Cem. Concr. Res. 2019, 123, 105786. [CrossRef]
13. Kang, S.-H.; Hong, S.-G.; Moon, J. The use of rice husk ash as reactive filler in ultra-high performance concrete. Cem. Concr. Res.2019, 115, 389–400. [CrossRef]
14. Jung, S.-H.; Saraswathy, V.; Karthick, S.; Kathirvel, P.; Kwon, S.-J. Microstructure characteristics of fly ash concrete with rice huskash and lime stone powder. Int. J. Concr. Struct. Mater. 2018, 12, 1–9. [CrossRef]
15. Quedou, P.G.; Wirquin, E.; Bokhoree, C. Sustainable concrete: Potency of sugarcane bagasse ash as a cementitious material in theconstruction industry. Case Stud. Constr. Mater. 2021, 14, e00545. [CrossRef]
16. Hamada, H.M.; Jokhio, G.A.; Yahaya, F.M.; Humada, A.M.; Gul, Y. The present state of the use of palm oil fuel ash (POFA) inconcrete. Constr. Build. Mater. 2018, 175, 26–40. [CrossRef]
17. Hart, A. Mini-review of waste shell-derived materials’ applications. Waste Manag. Res. 2020, 38, 514–527. [CrossRef] [PubMed]18. Lertwattanaruk, P.; Makul, N.; Siripattarapravat, C. Utilization of ground waste seashells in cement mortars for masonry and
plastering. J. Environ. Manag. 2012, 111, 133–141. [CrossRef] [PubMed]19. Leelatawonchai, P.; Laonapakul, T. Preparation and characterization of calcium sources from golden apple snail shell for naturally
based biomaterials. Adv. Mater. Res. 2014, 931–932, 370–374. [CrossRef]20. Laskar, I.B.; Rajkumari, K.; Gupta, R.; Chatterjee, S.; Paul, B.; Rokhum, L. Waste snail shell derived heterogeneous catalyst for
biodiesel production by the transesterification of soybean oil. RSC Adv. 2018, 8, 20131–20142. [CrossRef]21. Gumus, R.H.; Okpeku, I. Production of activated carbon and characterization from snail shell waste (Helix pomatia). Adv. Chem.
Eng. Sci. 2014, 5, 51. [CrossRef]22. Tamjidi, S.; Ameri, A. A review of the application of sea material shells as low cost and effective bio-adsorbent for removal of
heavy metals from wastewater. Environ. Sci. Pollut. Res. 2020, 27, 31105–31119. [CrossRef]23. Yang, E.-I.; Yi, S.-T.; Leem, Y.-M. Effect of oyster shell substituted for fine aggregate on concrete characteristics: Part I. Fundamental
properties. Cem. Concr. Res. 2005, 35, 2175–2182. [CrossRef]24. Yoon, G.-L.; Kim, B.-T.; Kim, B.-O.; Han, S.-H. Chemical–mechanical characteristics of crushed oyster-shell. Waste Manag. 2003,
23, 825–834. [CrossRef]25. Yoon, H.; Park, S.; Lee, K.; Park, J. Oyster shell as substitute for aggregate in mortar. Waste Manag. Res. 2004, 22, 158–170.
[CrossRef] [PubMed]26. Dankwah, J.R.; Nkrumah, E. Recycling blends of rice husk ash and snail shells as partial replacement for Portland cement in
building block production. Ghana J. Technol. 2016, 1, 67–74.27. Mohanalakshmi, V.; Indhu, S.; Hema, P.; Prabha, V. Developing concrete using sea shell as a fine aggregate. IJIRST 2017, 3,
282–286.28. Adeala, A.; Olaoye, J. Structural properties of snail shell ash concrete (SSAC). J. Emerg. Technol. Innov. Res. (JETIR) 2019, 6, 24–31.29. Ketebu, O.; Farrow, S.T. Comparative study on cementitious content of ground mollusc snail and clam shell and their mixture as
an alternative to cement. Int. J. Eng. Trends Technol. (IJETT) 2017, 50, 8–11. [CrossRef]30. ASTM. Standard Specification for Portland Cement; ASTM: West Conshohocken, PA, USA, 2021.31. ASTM. Standard Practice for Preparing, Cleaning, and Evaluating Corrosion Test Specimens; ASTM: West Conshohocken, PA, USA, 2003.32. ASTM. Standard Guide for Laboratory Immersion Corrosion Testing of Metals; ASTM: West Conshohocken, PA, USA, 2012.33. ASTM. Standard Test Method for Corrosion Potentials of Uncoated Reinforcing Steel in Concrete; ASTM: West Conshohocken, PA,
USA, 2015.34. Kwon, S.-J.; Lee, H.-S.; Karthick, S.; Saraswathy, V.; Yang, H.-M. Long-term corrosion performance of blended cement concrete in
the marine environment–A real-time study. Constr. Build. Mater. 2017, 154, 349–360. [CrossRef]35. ASTM. Standard Test Method for Compressive Strength of Cylindrical Concrete Specimens; ASTM: West Conshohocken, PA, USA, 2021.36. ASTM. Standard Test Method for Splitting Tensile Strength of Cylindrical Concrete Specimens; ASTM: West Conshohocken, PA,
USA, 2017.37. Lécuyer, C.; Hutzler, A.; Amiot, R.; Daux, V.; Grosheny, D.; Otero, O.; Martineau, F.; Fourel, F.; Balter, V.; Reynard, B. Carbon
and oxygen isotope fractionations between aragonite and calcite of shells from modern molluscs. Chem. Geol. 2012, 332, 92–101.[CrossRef]
38. Hu, S.; Wang, Y.; Han, H. Utilization of waste freshwater mussel shell as an economic catalyst for biodiesel production. BiomassBioenergy 2011, 35, 3627–3635. [CrossRef]
39. Seesanong, S.; Laosinwattana, C.; Chaiseeda, K.; Boonchom, B. A simple and rapid transformation of golden apple snail (Pomaceacanaliculata) shells to calcium carbonate, monocalcium and tricalcium phosphates. Asian J. Chem. 2019, 31, 2522–2526. [CrossRef]
40. Abd El Haleem, S.; Abd El Wanees, S.; Bahgat, A. Environmental factors affecting the corrosion behaviour of reinforcing steel. V.Role of chloride and sulphate ions in the corrosion of reinforcing steel in saturated Ca(OH)2 solutions. Corros. Sci. 2013, 75, 1–15.[CrossRef]
Materials 2021, 14, 7286 24 of 24
41. Rodrigues, R.; Gaboreau, S.; Gance, J.; Ignatiadis, I.; Betelu, S. Reinforced concrete structures: A review of corrosion mechanismsand advances in electrical methods for corrosion monitoring. Constr. Build. Mater. 2020, 121240. [CrossRef]
42. Angst, U.M.; Geiker, M.R.; Michel, A.; Gehlen, C.; Wong, H.; Isgor, O.B.; Elsener, B.; Hansson, C.M.; François, R.; Hornbostel, K.The steel–concrete interface. Mater. Struct. 2017, 50, 1–24. [CrossRef]
43. Subbiah, K.; Velu, S.; Kwon, S.-J.; Lee, H.-S.; Rethinam, N.; Park, D.-J. A novel in-situ corrosion monitoring electrode for reinforcedconcrete structures. Electrochim. Acta 2018, 259, 1129–1144. [CrossRef]
44. Miyamoto, S. On the oxidation of ferrous hydroxide by air. Bull. Chem. Soc. Jpn. 1929, 4, 65–68. [CrossRef]45. Leidheiser, H., Jr.; Czakó-Nagy, I. A Mössbauer spectroscopic study of rust formed during simulated atmospheric corrosion.
Corros. Sci. 1984, 24, 569–577. [CrossRef]46. Keiser, J.T.; Brown, C.W.; Heidersbach, R.H. Characterization of the passive film formed on weathering steels. Corros. Sci. 1983,
23, 251–259. [CrossRef]47. Dufour, J.; Marrón, J.; Negro, C.; Latorre, R.; Formoso, A.; López-Mateos, F. Mechanism and kinetic control of the oxyprecipitation
of sulphuric liquors from steel pickling. Chem. Eng. J. 1997, 68, 173–187. [CrossRef]48. Hamzah, E.; Hussain, M.; Ibrahim, Z.; Abdolahi, A. Influence of Pseudomonas aeruginosa bacteria on corrosion resistance of 304
stainless steel. Corros. Eng. Sci. Technol. 2013, 48, 116–120. [CrossRef]49. Abdolahi, A.; Hamzah, E.; Ibrahim, Z.; Hashim, S. Microbially influenced corrosion of steels by Pseudomonas aeruginosa. Corros.
Rev. 2014, 32, 129–141. [CrossRef]50. Wei, J.; Fu, X.; Dong, J.; Ke, W. Corrosion evolution of reinforcing steel in concrete under dry/wet cyclic conditions contaminated
with chloride. J. Mater. Sci. Technol. 2012, 28, 905–912. [CrossRef]51. Galai, M.; Rbaa, M.; Ouakki, M.; Abousalem, A.S.; Ech-chihbi, E.; Dahmani, K.; Dkhireche, N.; Lakhrissi, B.; EbnTouhami, M.
Chemically functionalized of 8-hydroxyquinoline derivatives as efficient corrosion inhibition for steel in 1.0 M HCl solution:Experimental and theoretical studies. Surf. Interfaces 2020, 21, 100695. [CrossRef]
52. Ahmad, Z. Principles of Corrosion Engineering and Corrosion Control; Elsevier: Amsterdam, The Netherlands, 2006.53. Assis, S.; Wolynec, S.; Costa, I. The electrochemical behaviour of Ti-13Nb-13Zr alloy in various solutions. Mater. Corros. 2008, 59,
739–743. [CrossRef]54. Curioni, M.; Scenini, F.; Monetta, T.; Bellucci, F. Correlation between electrochemical impedance measurements and corrosion
rate of magnesium investigated by real-time hydrogen measurement and optical imaging. Electrochim. Acta 2015, 166, 372–384.[CrossRef]
55. Dhaiveegan, P.; Elangovan, N.; Nishimura, T.; Rajendran, N. Weathering steel in industrial-marine-urban environment: Fieldstudy. Mater. Trans. 2016, 57, 148–155. [CrossRef]
56. Repo, E.; Mäkinen, M.; Rengaraj, S.; Natarajan, G.; Bhatnagar, A.; Sillanpää, M. Lepidocrocite and its heat-treated forms aseffective arsenic adsorbents in aqueous medium. Chem. Eng. J. 2012, 180, 159–169. [CrossRef]
57. Guo, Y.; Meng, T.; Wang, D.; Tan, H.; He, R. Experimental research on the corrosion of X series pipeline steels under alternatingcurrent interference. Eng. Fail. Anal. 2017, 78, 87–98. [CrossRef]
58. Wang, X.; Chen, Y.-l.; Niu, G. The study on corrosion resistance of high-strength spring steel. Corros. Eng. Sci. Technol. 2018, 53,54–64. [CrossRef]
59. Zhang, Y.-X.; Yu, X.-Y.; Jin, Z.; Jia, Y.; Xu, W.-H.; Luo, T.; Zhu, B.-J.; Liu, J.-H.; Huang, X.-J. Ultra high adsorption capacity of friedegg jellyfish-like γ-AlOOH (Boehmite)@ SiO2/Fe3O4 porous magnetic microspheres for aqueous Pb (II) removal. J. Mater. Chem.2011, 21, 16550–16557. [CrossRef]
60. Xue, F.; Wei, X.; Dong, J.; Etim, I.-I.N.; Wang, C.; Ke, W. Effect of residual dissolved oxygen on the corrosion behavior of lowcarbon steel in 0.1 M NaHCO3 solution. J. Mater. Sci. Technol. 2018, 34, 1349–1358. [CrossRef]
61. Kashef-Haghighi, S.; Shao, Y.; Ghoshal, S. Mathematical modeling of CO2 uptake by concrete during accelerated carbonationcuring. Cem. Concr. Res. 2015, 67, 1–10. [CrossRef]
62. Chindaprasirt, P.; Phoo-ngernkham, T.; Hanjitsuwan, S.; Horpibulsuk, S.; Poowancum, A.; Injorhor, B. Effect of calcium-richcompounds on setting time and strength development of alkali-activated fly ash cured at ambient temperature. Case Stud. Constr.Mater. 2018, 9, e00198. [CrossRef]