CASTNET Field Standard Operating Procedures October 2020
553
Appendix 1: Field Standard Operating Procedures Revision 9.4
-
Upload
khangminh22 -
Category
Documents
-
view
6 -
download
0
Transcript of CASTNET Field Standard Operating Procedures October 2020

Appendix 1: Field Standard Operating Procedures
Revision 9.4

Clean Air Status and Trends Network
Quality Assurance Project Plan
Revision 9.4
Appendix 1:
CASTNET Field Standard Operating Procedures
October 2020

i Wood Environment & Infrastructure Solutions, Inc.
Appendix 1 Table of Contents
PDF Page Numbers
Introduction ................................................................................................................................... 5
Calibration Folder Logistics .......................................................................................................... 8
Field Standard Operating Procedure: Acceptance Testing ..................................................... 14
I. Site Selection Procedures ..................................................................................................... 18 A) Site Installation, Initiation, and Operator Training ............................................................................ 18
II. Site Operations ...................................................................................................................... 30 A) Site Operator Handbook (Site Operator Overview)
1) Overview: Site Operator Procedures ................................................................................................ 30 2) Overview of CASTNET Site Instruments and Equipment ........................................................... 39
B) Site Operator Instructions ........................................................................................................................... 63 1) Small Footprint Sites ................................................................................................................................ 74
C) Field Operations Manual ............................................................................................................................. 79 1) Site Data Acquisition System ................................................................................................................ 79
Attachment: Manual Data Collection .............................................................................................. 90 2) Filter Sampling ........................................................................................................................................ 104 3) Ozone Monitoring ................................................................................................................................. 113 Attachment: Thermo Scientific (Thermo) Model 49i UV Photometric Ozone Analyzer .............................................................................................................................................. 124 4) Tipping Bucket Rain Gauge ................................................................................................................ 133 5) Wetness Sensor ...................................................................................................................................... 137 6) R.M. Young Meteorological System ................................................................................................ 141 7) Model T200U Total Reactive Oxides of Nitrogen (NOY) ......................................................... 146
Attachment: Model T200U Nitrogen Oxide/Total Reactive Oxides Of Nitrogen/Total Reduced Reactive Nitrogen (NO/NOy/TNx) Analyzer ............................. 185
III. Field Calibrations Manual ................................................................................................... 230 Field Calibrations Manual ........................................................................................................................ 230
Appendix A – Magnetic Declination Adjustments ....................................................................... 293 Appendix B – Instructions for Photo Documentation ................................................................ 298 Attachment: Small Footprint Filter Pack Site Installation .......................................................... 308 Attachment: Sampling Tower Installation ....................................................................................... 321
IV. Calibration Laboratory ........................................................................................................ 326 A) Stationary/Primary Transfer Standards
1) Ozone ......................................................................................................................................................... 326 2) Bios Flow Meter ...................................................................................................................................... 337 3) Pyranometers .......................................................................................................................................... 344 4) Thermometers Traceable to the National Institute of Standards and Technology
(NIST) ..................................................................................................................................................... 350
ii Wood Environment & Infrastructure Solutions, Inc.
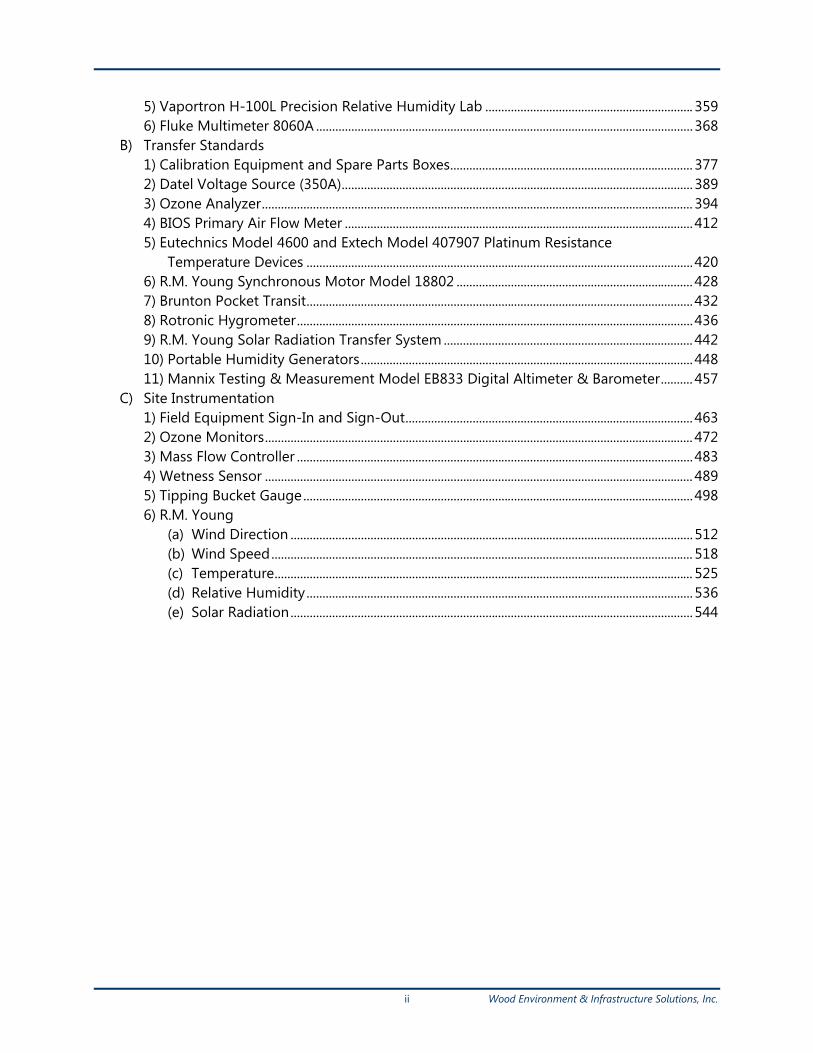
5) Vaportron H-100L Precision Relative Humidity Lab ................................................................. 359 6) Fluke Multimeter 8060A ...................................................................................................................... 368
B) Transfer Standards 1) Calibration Equipment and Spare Parts Boxes ............................................................................ 377 2) Datel Voltage Source (350A) .............................................................................................................. 389 3) Ozone Analyzer ....................................................................................................................................... 394 4) BIOS Primary Air Flow Meter ............................................................................................................. 412 5) Eutechnics Model 4600 and Extech Model 407907 Platinum Resistance
Temperature Devices ......................................................................................................................... 420 6) R.M. Young Synchronous Motor Model 18802 .......................................................................... 428 7) Brunton Pocket Transit ......................................................................................................................... 432 8) Rotronic Hygrometer ............................................................................................................................ 436 9) R.M. Young Solar Radiation Transfer System .............................................................................. 442 10) Portable Humidity Generators ........................................................................................................ 448 11) Mannix Testing & Measurement Model EB833 Digital Altimeter & Barometer .......... 457
C) Site Instrumentation 1) Field Equipment Sign-In and Sign-Out .......................................................................................... 463 2) Ozone Monitors ...................................................................................................................................... 472 3) Mass Flow Controller ............................................................................................................................ 483 4) Wetness Sensor ...................................................................................................................................... 489 5) Tipping Bucket Gauge .......................................................................................................................... 498 6) R.M. Young
(a) Wind Direction .............................................................................................................................. 512 (b) Wind Speed .................................................................................................................................... 518 (c) Temperature ................................................................................................................................... 525 (d) Relative Humidity ......................................................................................................................... 536 (e) Solar Radiation .............................................................................................................................. 544

1 Wood Environment & Infrastructure Solutions, Inc.
CASTNET Field Operation Standard Operating Procedures (SOP)
Introduction CASTNET monitoring sites were selected to support the investigation of relationships between pollutant emissions and atmospheric concentrations/depositions using the procedure described in Section 1.1 of the CASTNET Quality Assurance Project Plan (QAPP). Ambient measurements of atmospheric pollutants are performed at each site. CASTNET Field Operations staff ensure that each EPA site is maintained and operated to meet project objectives. Field Operations personnel are trained to perform their designated functions so that data collection meets or exceeds established measurement criteria. Training procedures are discussed in Sections 1.6 and 2.3 of the QAPP. The field operations portion of the project can be divided into four groups. The first group describes the Site Installation and Initiation Procedures for CASTNET sites. These procedures are discussed shown in Section I of these SOP. The second group is Site Operations, which includes the functions performed by the site operators. These functions are described in Section II. The main function of the site operator is to collect the exposed filter pack and replace it with a new, unexposed filter pack each week. The operator also performs a reasonableness check of the recorded measurements and completes the Site Status Report Form (SSRF). Additional investigation, repair, or replacement of any site instrument is performed only through direct instructions from Wood Field Operations personnel. The third group is Field Calibrations. The functions included in this group are described in Section III of these SOP and include calibration and maintenance procedures performed every 6 months at each site. These procedures are performed by Wood technicians or qualified subcontractors. The fourth group includes the functions that are performed in the CASTNET Calibration Laboratory. These procedures are described in Section IV of these SOP. Calibration Laboratory personnel provide support for the entire network of sites and the field technicians by repairing, rebuilding, calibrating, and distributing the sensors and equipment used throughout CASTNET. Figure I-1 provides a work flow diagram. All calibrations are performed using standards traceable to a national certified standard. Each measurement parameter has a designated set of procedures and work stations which have been developed and documented to handle the routine requirements of repair, maintenance, calibration and post-calibration1 of that measurement system.
1 Post-calibration refers to a procedure wherein a sensor, instrument, or system is removed from a remote site and tested at the Field Calibration Laboratory to support or verify the remote field calibration results. The device is tested via comparison with a known and traceable standard without performing any adjustment prior to testing.

2 Wood Environment & Infrastructure Solutions, Inc.
The operation and maintenance of site instruments is common among the four groups introduced above. Sections II thought IV provides separate descriptions of the instruments and related equipment. The subsections that detail the instruments are listed in Table I-1. Section II.A.2 provides a general overview of the instruments. Section II.C furnishes instructions for site operators. Section III gives calibration procedures for Wood and subcontractor field technicians. Table I-1. Appendix 1 Sections that Describe the Site Instruments and Related Equipment
Instrument Overview
Instruments Section II.A.2
Site Operations Field Operations
Section II.C
Field Calibrations Field Manual
Section III Data Acquisition 3.2 II.C.1 6.1 & 6.2 Regulatory O
3 3.3 II.C.3 6.3 Trace Gas* 3.4 Filter Sampling 3.5 II.C.2 6.4 Precipitation Gauge** 3.6 II.C.4 6.6.1 Wetness 3.7 II.C.5 6.6.2 Solar Radiation 3.8 6.6.7, 6.6.8
Meteorological Systems
RM Young 3.9 II.C.6 6.6.1 – 6.6.8
* See QAPP Appendix 10 for details of trace gas measurements. ** Meteorological measurements have been discontinued at all but four EPA sites.

3 Wood Environment & Infrastructure Solutions, Inc.
Figure I-1. CASTNET Field Calibration Laboratory Procedural Flowchart
Stickered items and equipment
are received.
Items are inspected.
Item segregated. Property
Manager notified.
Item “retired damaged” or
stored.
Items signed out.
Tag and place on post
cal shelf.
Testing/Repair Stations
Fabrication lab Ozone calibration lab Meteorology/ continuous flow lab
Successfully tested/repaired?
Tag, place on ready-to-ship shelf, and
update the field ready equipment list.
No
No
Yes
Monitoring Site
Calibration Box
Field Technician
Yes
No
Yes
Items irreparably
damaged or worn?
Need routine service or
repair?
Need post calibration?
Tag and place on repair shelf.
Yes


CALIBRATION FOLDER LOGISTICS
Revision No. 0
January 2019
Page 2 of 6
CALIBRATION FOLDER LOGISTICS Wood Environment & Infrastructure Solutions, Inc.
CALIBRATION FOLDER LOGISTICS
PURPOSE
The purpose of this Standard Operating procedure (SOP) is to provide consistent guidance, for
the assembly, shipping, and handling of calibration folder packages to Clean Air Status and
Trends Network (CASTNET) field calibration and data operations personnel.
SCOPE
This SOP applies to assembly, shipping, and handling of calibration folder packages by CASTNET
Field personnel.
SUMMARY
CASTNET remote monitoring sites are visited for routine maintenance and calibration every 6
months on a staggered schedule (sites that perform trace-level gas monitoring are visited every
3 months - see Table 1). A packet of official forms used to document and support field activities
is shipped with the calibration kits associated with each effort. These forms are completed by
field calibration personnel during the effort and returned to the CASTNET Field Calibration
Laboratory upon conclusion. The completed forms are then distributed to field and data
personnel for review and subsequent archiving. See Table 2 for the logistics schedule.
MATERIALS AND SUPPLIES
Field calibration schedule
Manila folders
Calibration Folder Checklist
*Notes and instructions to the calibrator
Tailgate Safety Meeting form
Maintenance Checklist
Site Inventory
Site Condition Checklist
Previous calibration summary
Open problem tickets
Magnetic declination (from the NOAA Site – for meteorological monitoring sites only)
Site Photo Instructions and Placard
*Portable flash drive that includes transfer standard certifications
*These items are added by a calibration technician. All others are added by the logistics
technician.
REPAIR AND MAINTENANCE
N/A
CALIBRATION FOLDER LOGISTICS
Revision No. 0
January 2019
Page 3 of 6
CALIBRATION FOLDER LOGISTICS Wood Environment & Infrastructure Solutions, Inc.
Table 1 Field Calibration Schedule for 2018
Calibration
Group
Months
Calibrated
Sites
Calibrated
Eastern Sites (23 Total)
E-1
(8 Sites)
February/August BEL116, MD WSP144, NJ ARE 128, PA PED108, VA
BWR139, MD CTH110, NY PSU106, PA VPI120, VA
E-2
(10 Sites)
April/October ABT147, CT WST109, NH NIC001, NY UND002, VT
ASH135, ME CAT175, NY WFM105, NY
HOW191, ME HWF187, NY2 EGB181, ON
E-3
(5 Sites)
May/November KEF112, PA LRL117, PA CDR119, WV
MKG113, PA PAR107, WV
Southeastern Sites (11 Total)
SE-4
(6 Sites)
January/July SND152, AL BFT142, NC COW137, NC
GAS153, GA CND125, NC SPD111, TN
SE-5
(5 Sites)
February/August CAD150, AR SUM156, FL DUK008, NC1
IRL141, FL CVL151, MS
Midwestern Sites (19 Total)
MW-6
(6 Sites)
January/July CDZ171, KY MCK131, KY PNF126, NC2
CKT136, KY MCK231, KY ESP127, TN
MW-7
(9 Sites)
March/September ALH157, IL VIN140, IN OXF122, OH
BVL130, IL3 RED004, MN QAK172, OH
STK138, IL DCP114, OH PRK134, WI
MW-8
(4 Sites)
April/October SAL133, IN ANA115, MI
HOX148, MI UVL124, MI
Western Sites (11 Total)
W-9
(5 Sites)
March/September KNZ184, KS CHE185, OK ALC188, TX
KIC003, KS SAN189, NE
W-10
(6 Sites)
May/November GTH161, CO NPT006, ID PND165, WY1
ROM206, CO1 CNT169, WY PAL190, TX
Notes: 1 Trace-level gas calibrations are performed quarterly in February, May, August, and November.
2 Trace-level gas calibrations are performed quarterly in January, April, July, and October.
3 Trace-level gas calibrations are performed quarterly in March, June, September, and December.
PROCEDURE
Calibration Package Assembly
The CASTNET Field Calibration Laboratory logistics technician gathers the materials listed in
section 4.0 for the appropriate number of sites during the third week of the month prior to the
scheduled calibrations (e.g. materials are gathered during the third week in February for
calibrations scheduled in March).

CALIBRATION FOLDER LOGISTICS
Revision No. 0
January 2019
Page 4 of 6
CALIBRATION FOLDER LOGISTICS Wood Environment & Infrastructure Solutions, Inc.
6.1.1 A Calibration Folder Checklist (Figure 1) is completed as items are added by the logistics
and calibration technicians for each site represented in the package.
6.1.2 The checklist items are provided for each site in the package with the exception of the
flash drive. A single flash drive will be shipped with each calibration kit – e.g. if 5 sites are
scheduled for the field effort there will be 5 sets of checklist items and 1 flash drive.
6.1.3 The gathered materials are placed in a resealable plastic bag and delivered to the Assistant
Field Operations Manager (AFOM) or designee.
Package Shipment
6.2.1 Upon receipt of the hardcopy package the AFOM reviews the documents, adds notes and
instructions to the calibrator as appropriate, adds the flash drive with the electronic
calibration forms and certifications for the transfer standards in the associated calibration
kit, then clears the package for shipment.
6.2.2 The finalized package is packed with the kit and shipped to the calibrator responsible for
the associated field effort.
Package Return
The completed forms are returned with the calibration kits upon conclusion of the field
effort. The logistics technician delivers the forms and flash drive to the data operations
representative for review.
The data reviewer sequesters the site inventory and completed Tailgate Safety Meeting
forms for review by the propery manager and AFOM respectively, files the photo
placards in the field laboratory for re-use, and retains the rest of the package for review
and subsequent filing in the CASTNET Library
Archiving
The various records are archived as listed in the following subsections.
6.4.1 CASTNET Library
The following are filed in a calibration folder in the CASTNET library in the commons
area:
Calibration Folder Checklist
Electronic calibration forms - printed by the data reviewer, signed and dated
individually upon review
Transfer standard certifications - printed by the data reviewer
Notes and instructions to the calibrator
Maintenance Checklist
Site Condition Checklist
Previous calibration summary
Open problem tickets

CALIBRATION FOLDER LOGISTICS
Revision No. 0
January 2019
Page 5 of 6
CALIBRATION FOLDER LOGISTICS Wood Environment & Infrastructure Solutions, Inc.
Site Narrative Log (if returned by the calibrator with the package)
6.4.2 Other Filing Locations
Tailgate Safety Meeting forms - hardcopy signed by the AFOM, filed in Tailgate
Safety folder. Provide evidence of routine forms completion to the office health
and safety manager.
Site Inventory Forms – filed by the Property Manager in the inventory notebook
by site.
Photo documentation worksheet and field sketch - digitized and saved in the site
directory.
Table 2 Logistics Schedule
Action Responsible Personnel Schedule
Package Assembly Logistics Technician Third week of the month preceding
the field effort
Package Shipment Calibration Laboratory Technician Ship to arrive by Monday of the first
week of the field effort
Internal Dissemination
Upon Return*
Logistics Technician, Data Operations
Reviewer
Disseminate within one working day
of receipt
External
Dissemination**
Assistant Field Operations Manager Disseminate by the end of the
month of the field effort
Archiving Logistics Technician, Calibration
Laboratory Technician, Data Operations
Reviewer, Assistant Field Operations
Manager
Archive within one month of receipt
of completed records
Notes: *Dissemination of records to data reviewer, Property Manager, and AFOM.
**Dissemination of copies of Tailgate Meeting forms to the office health and safety representative.
REFERENCES
There are no references cited for this document.

CALIBRATION FOLDER LOGISTICS
Revision No. 0
January 2019
Page 6 of 6
CALIBRATION FOLDER LOGISTICS Wood Environment & Infrastructure Solutions, Inc.
FIGURES
Figure 1. Calibration Folder Checklist
FIELD STANDARD OPERATING PROCEDURE: ACCEPTANCE TESTING
Revision No. 1 October 2018
Page 2 of 4
ACCEPTANCE TESTING Wood Environment & Infrastructure Solutions, Inc.
FIELD STANDARD OPERATING PROCEDURE: ACCEPTANCE TESTING
PURPOSE
The purpose of this Standard Operating Procedure (SOP) is to provide consistent guidance for acceptance testing and periodic performance verification of quality affecting items to Clean Air Status and Trends Network (CASTNET) Field Calibration Laboratory personnel.
SCOPE
This procedure applies to acceptance testing and periodic performance verification for quality affecting instruments, sensors, and consumable items utilized at CASTNET field sites and in the Field Calibration Laboratory for direct collection or generation of client-deliverable CASTNET data or metadata and the devices and consumable items used for their calibration.
SUMMARY
Items shall be accepted by inspection upon receipt and prior to use for conformance with established project requirements. The inspection may include verification of configuration or physical requirements, conformance with catalog descriptions, receipt of certifications, and freedom from shipping damage that would affect performance. The inspection may also include the calibration and/or setup of equipment and/or demonstration of satisfactory performance (i.e. acceptance testing and performance verification).
MATERIALS AND SUPPLIES
Materials and supplies will vary according to the item(s) received. They may include: • Procurement documents • Reference standards • Certificates of analysis or calibration1
SAFETY
Follow the safety precautions listed by the manufacturer for handling and using a specific item. Use grounded power. Use personal protective equipment appropriate to the items under test and the activities performed.
PROCEDURE
The acceptance testing/inspection shall be accomplished where appropriate by personnel trained in applicable technical procedures.
1 Reference standards must have metrological traceability of calibration (devices) or concentration (chemicals) wherever possible, through the National Institute for Standards and Technology or another National Metrology Institute to the International System of Units.

FIELD STANDARD OPERATING PROCEDURE: ACCEPTANCE TESTING
Revision No. 1 October 2018
Page 3 of 4
ACCEPTANCE TESTING Wood Environment & Infrastructure Solutions, Inc.
Items shall be acceptance tested/inspected in the laboratory: • Within 5 business days of receipt (newly purchased, returning from vendor service, or
returning from use in the field) • Prior to use in the collection/generation of data or metadata • Prior to shipment or transport offsite • Following in-house service or repair
Results of testing and inspection must be documented in sufficient detail to allow someone with a basic understanding of technical inspections to understand and reproduce the results. Testing and inspection shall be performed as listed in Table 1. Table 1 – Testing and Inspection of Quality Affecting Items
Vendor Calibrated or Certified Wood Calibrated Inspect the item for damage and document results
Inspect the item for damage and document results
Review procurement documents and/or certificate(s) of calibration/analysis
Review intake documents (e.g. field notes, attached return tags, etc.)
Confirm operation Audit and/or service as appropriate Verify performance using a traceable reference and the appropriate established procedure*
Verify performance using a traceable reference and the appropriate established procedure
Document actions performed and results of verification
Document actions performed and results of verification
*This action is not required when the item itself is a reference standard. Testing shall be performed using established test methods, regulatory standards, and/or manufacturer’s recommended procedures and associated criteria. Routine schedules can and should be established as appropriate to ensure that items receive documented verification prior to use at the bench or in the field.

FIELD STANDARD OPERATING PROCEDURE: ACCEPTANCE TESTING
Revision No. 1 October 2018
Page 4 of 4
ACCEPTANCE TESTING Wood Environment & Infrastructure Solutions, Inc.
REFERENCES
U.S. Environmental Protection Agency (EPA). 1994. Quality Assurance Handbook for Air Pollution Measurement Systems, Vol. I. A Field Guide to Environmental Quality Assurance. EPA/600/R-94/038a.
U.S. Environmental Protection Agency (EPA). 2008. Quality Assurance Handbook for Air Pollution
Measurement Systems, Vol. IV, Meteorological Measurements Version 2.0 (Final). EPA-454/B-08-002.
U.S. Environmental Protection Agency (EPA). 2013a. Quality Assurance Handbook for Air
Pollution Measurement Systems, Vol. II, Ambient Air Quality Monitoring Program. EPA-454/B-13-003.
U.S. Environmental Protection Agency (EPA). 2013b. Transfer Standards for the Calibration of
Ambient Air Monitoring Analyzers for Ozone. Technical Assistance Document. EPA-454/B-13-004.
ATTACHMENTS
No attachments

11/2/2020

SITE INSTALLATION, INITIATION, AND OPERATOR TRAINING Revision No. 7.1
October 2020 Page 2 of 12
SITE INSTALLATION, INITIATION, AND OPERATOR TRAINING Wood Environment & Infrastructure Solutions, Inc.
I. A. SITE INSTALLATION, INITIATION, AND OPERATOR TRAINING
PURPOSE
The purpose of this Standard Operating procedure (SOP) is to provide consistent guidance to the Field Installation Team and the Station Initiation Team or a combined Installation/Initiation Team.
SCOPE
This SOP applies to all CASTNET site installation and initiation activities.
SUMMARY
The procedures discussed in this section were prepared to support the installation and initiation of a new site at a new geographic location. New CASTNET sites have sometimes been located at existing monitoring sites or sites with other operations. These sites already included much of the logistics required for air quality monitoring. Consequently, only one team was needed for both installation and initiation. However, the procedures herein apply to site installation and initiation activities or both. The general approach employed in site installation and initiation minimizes travel and shipment of equipment while maximizing the efficiency of field installation and initiation teams. When possible, sites are scheduled for installation in geographic clusters. Field equipment is drop-shipped to or near each site, further minimizing travel time and shipping costs. Installation of the shelters and towers (Figure 1) does not require onsite power. Therefore, two teams of Wood employees might be involved. The first team on site is the Field Installation Team, and the second is the Station Initiation Team. As noted above, an installation may only require a combined installation/initiation team. In such cases, the work scope is more limited than discussed in Section 6.0. The composition and responsibilities of each team is discussed in the following sections.
MATERIALS AND SUPPLIES
Site materials will include all necessary site sensors and sampling equipment plus the tools and hardware necessary for the specific site installation. Refer to Figure 2 for an example of the “Site Installation Materials Kit”
REPAIR AND MAINTENANCE
N/A
PROCEDURES
Field Installation Team
The Field Installation Team consists of two technicians. The technicians are knowledgeable in the use of electrical and hydraulic equipment, as well as utility installation requirements.

SITE INSTALLATION, INITIATION, AND OPERATOR TRAINING Revision No. 7.1
October 2020 Page 3 of 12
SITE INSTALLATION, INITIATION, AND OPERATOR TRAINING Wood Environment & Infrastructure Solutions, Inc.
Additionally, the technicians are familiar with land surveying equipment and the CASTNET equipment siting requirements. The Field Installation Team is responsible for delivery of the shelter, towers, support materials, and all monitoring equipment procured and tested in accordance with the Property Control Procedures Manual in Appendix 9 of this Quality Assurance Project Plan (QAPP). The team typically requires 2 to 3 days to install all pilings, footers, conduits, towers, and internal hardware, and to confirm final arrangements for electricity and telephone service. When the team leaves, all necessary materials are installed onsite and awaiting the arrival of the Station Initiation Team. Occasionally, the field installation work is subcontracted to a contractor experienced with CASTNET sites. Station Initiation Team
The Station Initiation Team consists of one senior and one junior or trainee technician. The Station Initiation Team installs and calibrates onsite equipment and brings the station up to full operational status. The Station Initiation Team is responsible for ensuring proper alignment of all meteorological sensors (if necessary), configuring the data acquisition system (DAS)/CR3000 data logger, and performing initial calibrations prior to the arrival of the independent field audit personnel. The Station Initiation Team is also responsible for establishing initial modem communications between the site and the Wood Data Management Center (DMC). Please refer to Section 1, “Project Overview,” of this QAPP for the list of sites performing meteorological measurements.
Pre-installation Activities
Considerable work must be completed after the selection of a site for installation but prior to mobilizing the installation and initiation teams. These activities include arranging utilities installation, site security, shipping of major equipment and support materials, and ensuring compliance with local codes. 6.1.1 Electricity, Telephone, and Communications Requirements
As part of the initial site survey, the names, addresses, and telephone numbers of providers of electrical and telephone/communications service for the area are recorded. These include NL-116 ethernet port for cellular service or a COM 220 telephone modem for sites which lack reliable cellular phone service. The DAS includes a laptop computer with the software package PC200W. Initial determinations of right-of-way requirements are also made during the site-selection visit. If the site is located within a state or National Park; on university, commercial, or research property; information including the name, telephone number, and address of the point of contact for the agency will be obtained. In the majority of installations, it is also necessary to have from 50 feet (ft) to approximately 2,000 ft of telephone and electrical service line installed.

SITE INSTALLATION, INITIATION, AND OPERATOR TRAINING Revision No. 7.1
October 2020 Page 4 of 12
SITE INSTALLATION, INITIATION, AND OPERATOR TRAINING Wood Environment & Infrastructure Solutions, Inc.
Whether such installation can be provided by the utility company, private contractor, or by the host agency must be determined early in the process.
6.1.1.1 Electrical Requirements
The electrical requirement is 220 volts alternating current (VAC) consisting of two 110-VAC single-phase lines. The maximum load requirement for the existing equipment is approximately 50 amperes (amps). To accommodate any future additions to the demand, 100-amp service is installed at all sites. The 220-VAC service is required for provision of separate 120-VAC legs to ensure isolation of monitoring equipment from heating, ventilation, and air-conditioning (HVAC) equipment. All equipment is 120 VAC, 60 Hertz (Hz).
6.1.1.2 Telephone Line Requirements
Telecommunication with the data logger by way of telephone modem (cellular or land line) is an integral part of network operations and data collection. A connection of sufficient quality must be available. A good indication of the quality of service to be expected can be obtained by talking with the applications personnel from the company that services the area. 6.1.2 Fees, Deposits, and Billings
All fees, deposits, and billings are handled directly by Wood. Installation fees and deposits are identified and paid as quickly as possible to minimize time between placement of the work order request and power or telephone installation. Documentation is retained for all deposits made. All monthly utility billings are handled by Wood. Billings are checked for reasonableness in rates, consumption, and documented adjustments. 6.1.3 Utility Installation Schedule
Utility installation is scheduled (and tracked) to ensure timely provision of services. Such scheduling is coordinated with the Field Installation Team, Station Initiation Team, and providers of utility services so that power is available prior to the arrival of the Station Initiation Team. 6.1.4 Site Operator Assistance
Prospective site operators are required to assist in the selection of local contractors, as needed, and to assist in the arrangement of utility installation. The site operator provides the utility personnel with access to the site should utility installation take place in the interim between onsite Field Installation Team and Station Initiation Team activities. 6.1.5 Drop-Shipment of Equipment
Arrangements are made with the manufacturers of the towers, shelters, other equipment (e.g., rain gauges, wet-dry collectors, if necessary) and numerous electrical components to have the equipment shipped directly to the sites or a nearby Wood office. However, sensors, analyzers, and sensitive equipment which must undergo acceptance testing are first shipped to Wood’s Gainesville, Florida office.

SITE INSTALLATION, INITIATION, AND OPERATOR TRAINING Revision No. 7.1
October 2020 Page 5 of 12
SITE INSTALLATION, INITIATION, AND OPERATOR TRAINING Wood Environment & Infrastructure Solutions, Inc.
6.1.6 Advance Installation
Where possible, the services of the host agency or a local contractor are sought for preparation of shelter foundations and tower bases prior to arrival of the Field Installation Team. Local services are also enlisted for trenching and installing power and telephone cables. Provision of such advance services further minimize the time required onsite by the Field Installation Team the availability of such services are determined with assistance from the site operator. 6.1.7 Building Codes and Rights-of-Way
Prior to the initial planning of any installation, the applicability of local building and electrical codes, right-of-way requirements, and requirements for use of union labor are determined. In many instances, such an installation is considered temporary and code applicability is minimal or nonexistent. In other cases, footers must be poured below the frost line, towers guyed, and the electrical configuration inspected prior to initiation of service. Requirements for right-of-way authorization are also highly variable and will be determined early in the site-selection process.
Site Installation
A typical site configuration is shown in Figure 1. All physical components shown will be installed, as necessary, either prior to arrival of or by the Field Installation Team using procedures described in the Appendix to this section. Variations will occur as a function of existing facilities, security, or other site-specific considerations. 6.2.1 Site Preparation
Trees, low-lying vegetation, and overgrowth are cleared at most sites. Host agencies or institutions are requested to provide such services where possible. If such assistance is not available or has not been arranged in advance, the Field Installation Team accomplishes as much clearing as possible and flags larger trees and areas for subsequent clearing by local contractors. The Field Installation Team arranges for such services prior to the arrival of the Station Initiation Team, if possible. 6.2.2 Tower Installation
A CASTNET station will include an air quality tower for sampling atmospheric pollutants and may include a meteorological instrument tower if required. A third, minor structure is a 1-meter (m) tubular aluminum “T”, which supports the tipping-bucket rain gauge and solar pyranometer, if required. Alternatively, these instruments may be mounted on separate 1-m masts. 6.2.3 Arrangement of Internal Equipment
All required monitoring equipment is stored inside the shelter upon arrival at the site. Prior to departure of the Field Installation Team, the equipment is unpacked and placed in the positions that they will occupy during normal operation. All EPA barcodes and serial numbers are verified
SITE INSTALLATION, INITIATION, AND OPERATOR TRAINING Revision No. 7.1
October 2020 Page 6 of 12
SITE INSTALLATION, INITIATION, AND OPERATOR TRAINING Wood Environment & Infrastructure Solutions, Inc.
and any equipment shortage noted so that needed materials may be shipped with, or prior to the arrival of, the Station Initiation Team. 6.2.4 Data Logger
Each piece of equipment that provides either a continuous analog or digital output is connected to the CR3000. This includes outputs from all flow meters and controllers. The following parameters have recordable outputs: precipitation, wind speed (scalar and vector) and direction, temperature 1 (T1 at 9m), temperature 2 (T2 at 2m), relative humidity, solar radiation, wetness, filter pack flow, shelter temperature, and gas analyzers including ozone (O
3) and trace gases. 6.2.5 Installation of External Monitoring Components
All instruments are installed following recommendations and requirements specified in EPA Prevention of Significant Deterioration (PSD) Monitoring Guidelines and the QA Handbook for Air Quality Measurement Systems, Volumes I through IV. Wind, temperature, and humidity sensors are installed on the meteorological tower. 6.2.6 Site Security
At certain CASTNET monitoring sites, security is a major consideration. In those cases, additional measures are taken, such as the installation of a 6-ft chain-link fence (with barbed-wire top, if deemed necessary). The exact dimensions of the fenced area may vary from site to site. Where there is existing fencing, tie-ins are made to share a common run and reduce costs. In all cases, local contractors or installers are employed and fencing materials acquired locally.
Station Initiation
The site initiation task is accomplished by the Station Initiation Team and requires the final installation and calibration of all monitoring and data acquisition equipment. 6.3.1 Site Operator Assistance
It is essential that the site operator(s) be onsite during the configuration and installation of the equipment. The system as a whole is covered in detail during installation. The site operator's assistance expedites the initiation process and provides valuable training. During such onsite assistance, the Station Initiation Team reviews all phases of training, with the site operator. Following training, the Station Initiation Team requires the site operator to perform all site tasks as if routine operations were underway. 6.3.2 Initial Equipment Calibration
All equipment installed is carefully calibrated by the Station Initiation Team prior to departure. Summaries of field calibration procedures for each respective device are discussed in Section III, Field Calibrations. All instruments are installed, tested, and calibrated following these SOPs.

SITE INSTALLATION, INITIATION, AND OPERATOR TRAINING Revision No. 7.1
October 2020 Page 7 of 12
SITE INSTALLATION, INITIATION, AND OPERATOR TRAINING Wood Environment & Infrastructure Solutions, Inc.
6.3.3 Data Logger
The CR3000 data logger is checked and all operations verified prior to departure of the Station Initiation Team. The programmed zero, span, and precision control sequence for the gas analyzers, and other instruments are exercised and recorded. The programmed actuation of the various flow sampling systems are tested, and the resultant flows are measured on the respective sample lines. All channels on the data logger are properly sequenced and initialized. The communications equipment is tested to ensure proper functioning. After all systems are calibrated and all equipment is operating, the telephone and modems connections are tested. The data logger is equipped with a cellular modem and a network router, both of which are mounted to a second metal plate. This assembly is referred to as the “communications backplane”. It is mounted near the data logger backplane. The modem allows Wood remote access to the data logger, stored data, ozone analyzer and site laptop computer. The router allows these devices to communicate with one another and the modem. 6.3.4 Support Materials
Prior to departure of the Station Initiation Team, all onsite support materials are inventoried. The quantity of materials onsite should be sufficient to ensure uninterrupted operation for at least one calendar quarter. The site operator is familiarized with the mailing and shipping protocols, FedEx account and procedures, U.S. Postal Service Return Merchandise account, and contact points (work and home telephone numbers) for key personnel on the CASTNET project. In addition, a large calendar showing sample dates, maintenance schedules, data shipment dates, and site visit dates is installed in the shelter. 6.3.5 Site Initiation Closeout Session
Prior to departure of the Station Initiation Team, all site operations are reviewed with the site operator providing a hands-on demonstration of performance of all tasks. The Station Initiation Team documents and evaluates the site operator's performance and assists as necessary. The Station Initiation Team checks all electronic calibration forms for completeness and make entries in the site narrative log to document the calibrations and other significant installation-related tasks performed. Copies of all calibration forms and property inventories are maintained both onsite and at the Wood Gainesville office. Equipment shortages or discrepancies, if any, are noted and corrective actions initiated. Site-specific inventory forms, which documents model numbers and the EPA barcodes (generated for each site prior to mobilization of equipment), are verified prior to departure of the Station Initiation Team. Upon return to the Wood office, the Station Initiation Team Leader submits the verified inventory document for cross checking with the database inventory file, which is maintained by the Custodial Property Manager.

SITE INSTALLATION, INITIATION, AND OPERATOR TRAINING Revision No. 7.1
October 2020 Page 8 of 12
SITE INSTALLATION, INITIATION, AND OPERATOR TRAINING Wood Environment & Infrastructure Solutions, Inc.
6.3.6 Site Collocation
To determine precision of the CASTNET measurements, a site may be designated as a collocated. All instruments are installed in identical configurations and carefully calibrated. Sensors are located so that they will not interfere with each other's operation or response, yet are expected to provide identical results (i.e., wind speed and direction sensors separated so as not to create turbulence).
Operator Training
6.4.1 Initial Site Operator Training
Potential site operators are required to attend and successfully complete a training seminar provided onsite. The details of the training are discussed in Section II, Site Operations, in the subsection titled “Site Operator’s Instructions.” The training topics include a CASTNET overview, the operations of sampling equipment and procedures, and the importance of documentation. The CASTNET site operator training plan consists of an overview of general project operations and goals, and provides intensive instruction in specific site operator responsibilities. The project overview orients the trainee as to his/her role within the network and stresses the importance of proper site operation in the accomplishment of project goals. The instructional session provides the means for producing proficient site operators. 6.4.2 Follow-up Training
During the site initiation, the site operator training continues. Site operators observe instrument installation and initial calibration. It is essential for site operators to be able to change out equipment or components, if necessary. Once the station is completely operational, the Site Initiation Team members thoroughly cover the operations of the site as configured with the site operator. They then observe the site operator's performance on all tasks that are required to operate a site without assistance. The Site Initiation Team repeats tasks as required until both the site operator and trainer feel comfortable with the site operator's performance. Emphasis is placed on instrument maintenance, repair, and sample change-out procedures. Site operators may be required to visit sites during semi-annual calibrations for additional training as necessary. 6.4.3 Verification of Training
The Site Initiation Team assesses the abilities of the site operator before departing the site. The team's evaluation of the site operator's performance is discussed with the Project Manager and/or Field Operations Manager.

SITE INSTALLATION, INITIATION, AND OPERATOR TRAINING Revision No. 7.1
October 2020 Page 9 of 12
SITE INSTALLATION, INITIATION, AND OPERATOR TRAINING Wood Environment & Infrastructure Solutions, Inc.
REFERENCES
U.S. Environmental Protection Agency (EPA). 1994. Quality Assurance Handbook for Air Pollution Measurement Systems, Vol. I. A Field Guide to Environmental Quality Assurance. EPA/600/R-94/038a.
U.S. Environmental Protection Agency (EPA). 2008. Quality Assurance Handbook for Air Pollution
Measurement Systems, Vol. IV, Meteorological Measurements Version 2.0 (Final). EPA-454/B-08-002.
U.S. Environmental Protection Agency (EPA). 2017. Quality Assurance Handbook for Air Pollution
Measurement Systems, Vol. II, Ambient Air Quality Monitoring Program. EPA-454/B-17-001.
U.S. Environmental Protection Agency (EPA). 2000. Meteorological Monitoring Guidance for
Regulatory Modeling Applications. EPA-454/R-99-005. U.S. Environmental Protection Agency (EPA). 2019. Appendix A to Part 58 – Quality Assurance
Requirements for State and Local Air Monitoring Stations (SLAMS), Special Purpose Monitors (SPMs), and Prevention of Significant Deterioration (PSD) Air Monitoring. 40 CFR Part 58.
SITE INSTALLATION, INITIATION, AND OPERATOR TRAINING Revision No. 7.1
October 2020 Page 10 of 12
SITE INSTALLATION, INITIATION, AND OPERATOR TRAINING Wood Environment & Infrastructure Solutions, Inc.
FIGURES
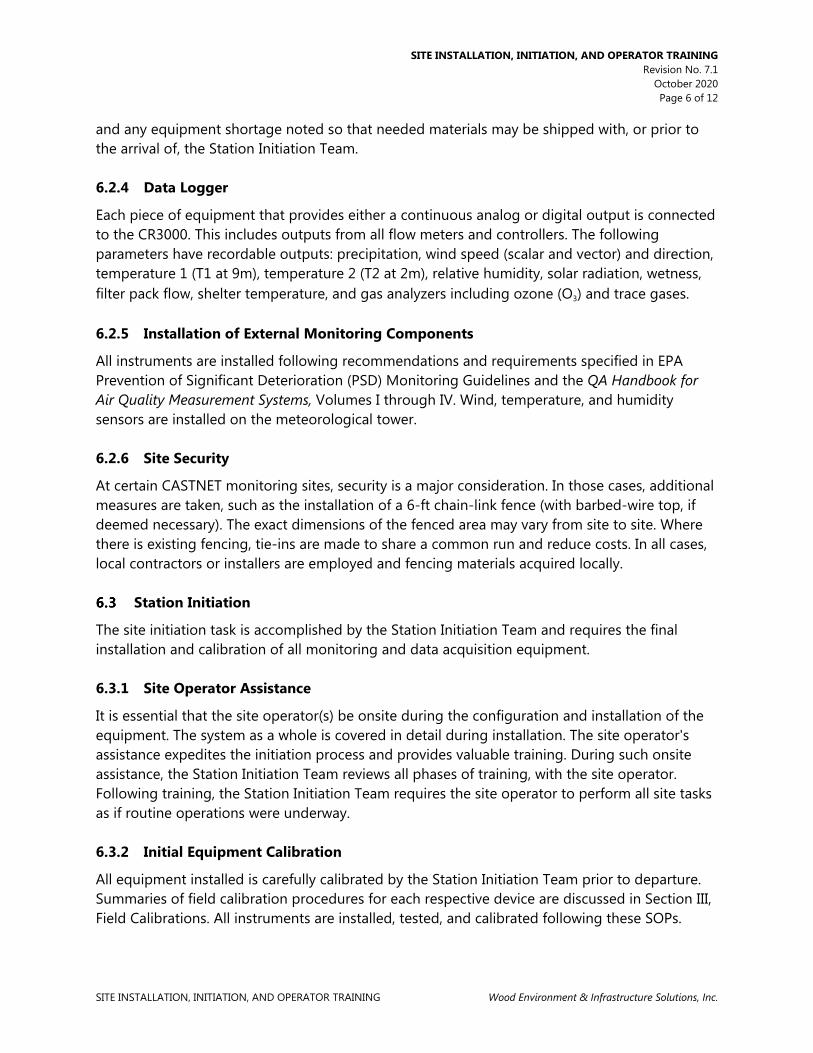
Figure 1. Typical EPA-Sponsored CASTNET Site Configuration with Full Suite
A – Site Perimeter B – Stub Pole, Disconnect, Electric Meter C – 220 VAC/100 amp and Telephone Line (underground for at least the final 15 to 35 meters) D – 8’ x 10’ Aluminum Environmental Shelter (Temperature Controlled) E – Air Sampling Tower F – Approximate Position of Tower Tops when lowered G – Meteorological Tower H – Tipping Bucket Rain Gauge (> 15m from shelter) I – Solar Radiation Sensor (>15 m from shelter) J – Wet/Dry Collection (optional) K – Belfort Weighing Rain Gauge (optional) L – Wetness Sensor
D
KJ
I
H
G
E
X
C
B
All signals input through lightning
protection
N
X
F
30 m
A
30 m
>15 m>15 m
L
D
KJ
I
H
G
E
X
C
B
All signals input through lightning
protection
N
X
F
30 m
A
30 m
>15 m>15 m
L

SITE INSTALLATION, INITIATION, AND OPERATOR TRAINING Revision No. 7.1
October 2020 Page 11 of 12
SITE INSTALLATION, INITIATION, AND OPERATOR TRAINING Wood Environment & Infrastructure Solutions, Inc.
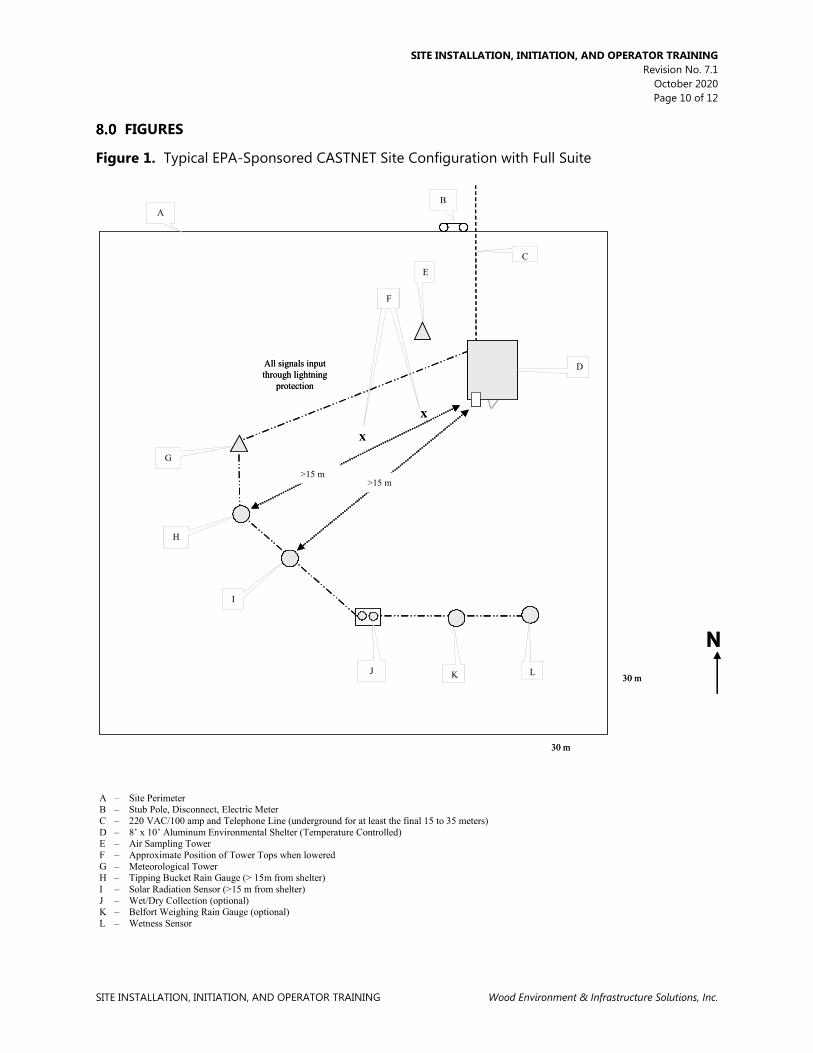
Figure 2. Site Installation Materials Kit (Page 1 of 2)
SITE INSTALLATION KIT - MASTER FILE - CODE 25 DATE
PULLED PART NAME
HESE NUMBER
QTY DESCRIPTION MANUFACT
URE MODEL
NUMBER VENDOR PART NUMBER
601-022 2 CAP SCREW, HEX 3/8-16 MCMASTER CARR 92198A632
601-038 15 CRIMPS, 1/8" MCMASTER CARR 3897T5
601-049 2 NUT, LOCKING 3/8-16 N/A 90099A031
601-058 4 CABLE CLAMPS MCMASTER CARR 3465T11
601-059 4 CABLE CLAMPS MCMASTER CARR 3465T12
601-060 4 CABLE THIMBLE MCMASTER CARR 8914T13
601-064 2 CLAMP, GROUNDING TO ROD ACE ELEC SUPPLY BLKBG5
601-065 2 CLAMP, GROUNDING PIPE 1/2 TO 3/4 ACE ELEC SUPPLY BLKBJJR
601-066 2 CLAMP, GROUNDING PIPE 1 TO 1 1/2 ACE ELEC SUPPLY BLKBJ2
601-072 3 TURNBUCKLE, SS TOWERS MCMASTER CARR 30095T33
601-073 3 ANCHOR SHACKLES MCMASTER CARR 3558T46
701-021 1 training FILTER ASBLY 47mm SAVILLEX 4-147-4
701-075 3 PVC 1 1/2" SWEEP CAMERON & BARKLEY 502-405
701-088 1 ROD, GROUNDING N/A ACE ELEC SUPPLY BLKBGR-6258
701-094 250 WIRE, GUY SS MCMASTER CARR 8908T662
901-002 2 SILICONE TUBES CLEAR MCMASTER CARR 7587A37
SITE INSTALLATION, INITIATION, AND OPERATOR TRAINING Revision No. 7.1
October 2020 Page 12 of 12
SITE INSTALLATION, INITIATION, AND OPERATOR TRAINING Wood Environment & Infrastructure Solutions, Inc.
Figure 2. Site Installation Materials Kit (Page 2 of 2)
SITE INSTALLATION KIT - MASTER FILE - CODE 25
DATE PULLED PART NAME HESE NUMBER QTY DESCRIPTION MANUFACTURE MODEL NUMBER VENDOR PART
NUMBER
901-003 1 TEFLON TAPE MCMASTER CARR 4591K13
901-005 1 DUCT TAPE MCMASTER CARR 7612A1
901-006 1 ELECTRICAL TAPE MCMASTER CARR 76455A11
N/A 1 FISH TAPE MCMASTER CARR 7313K11
N/A 1 ASSORTED NAILS N/A N/A
N/A 1 ASSORTED SCREWS N/A N/A
N/A 1 EXTENSION CORD 50' N/A
N/A 1 GUY WIRE CRIMPER MCMASTER CARR N/A
N/A 1 GUY WIRE CUTTER MCMASTER CARR N/A
N/A 1 dewalt kit N/A
N/A 1 10 lb hammer N/A N/A
N/A 1 2 inch fence post driver ESE N/A
shovel
post-hole digger
cement mixing tub

11/2/2020

SITE OPERATION HANDBOOK (SITE OPERATOR OVERVIEW) Revision No. 4.1
October 2020 Page 2 of 9
SITE OPERATION HANDBOOK (SITE OPERATOR OVERVIEW) Wood Environment & Infrastructure Solutions, Inc.
II.A.1. OVERVIEW: SITE OPERATOR PROCEDURES
PURPOSE
The purpose of this Standard Operating procedure (SOP) is to provide consistent guidance to each site operator in performance of weekly site visits.
SCOPE
This SOP applies to all CASTNET site operators.
SUMMARY
Each Tuesday the site operator visits the site, performs routine checks and maintenance, reports results to the Field Operations Manager (FOM), Field Operations Coordinator (FOC), or their designee by telephone, and installs a fresh filter pack (Figure 1). The exposed filter pack is shipped to the Gainesville office along with documentation of the site visit.
Figure 1. CASTNET Tuesday Site Visit Procedures
Record arrival date and time along with current conditions in the site narrative logbook.
Remove the previous week’s filter pack (FP) and install the new FP.
Perform routine data checks and scheduled maintenance.
Call Wood (See Attachment A)
Report any equipment requests, instrument malfunctions or unusual situations.
Describe to Wood personnel if troubleshooting is required. Perform and report results as per instructions.
Restore data logger and site instrumentation to normal operating status.
Prepare FP and appropriate documentation for shipment to Wood.
Report departure time in site narrative logbook.
SITE OPERATION HANDBOOK (SITE OPERATOR OVERVIEW) Revision No. 4.1
October 2020 Page 3 of 9
SITE OPERATION HANDBOOK (SITE OPERATOR OVERVIEW) Wood Environment & Infrastructure Solutions, Inc.
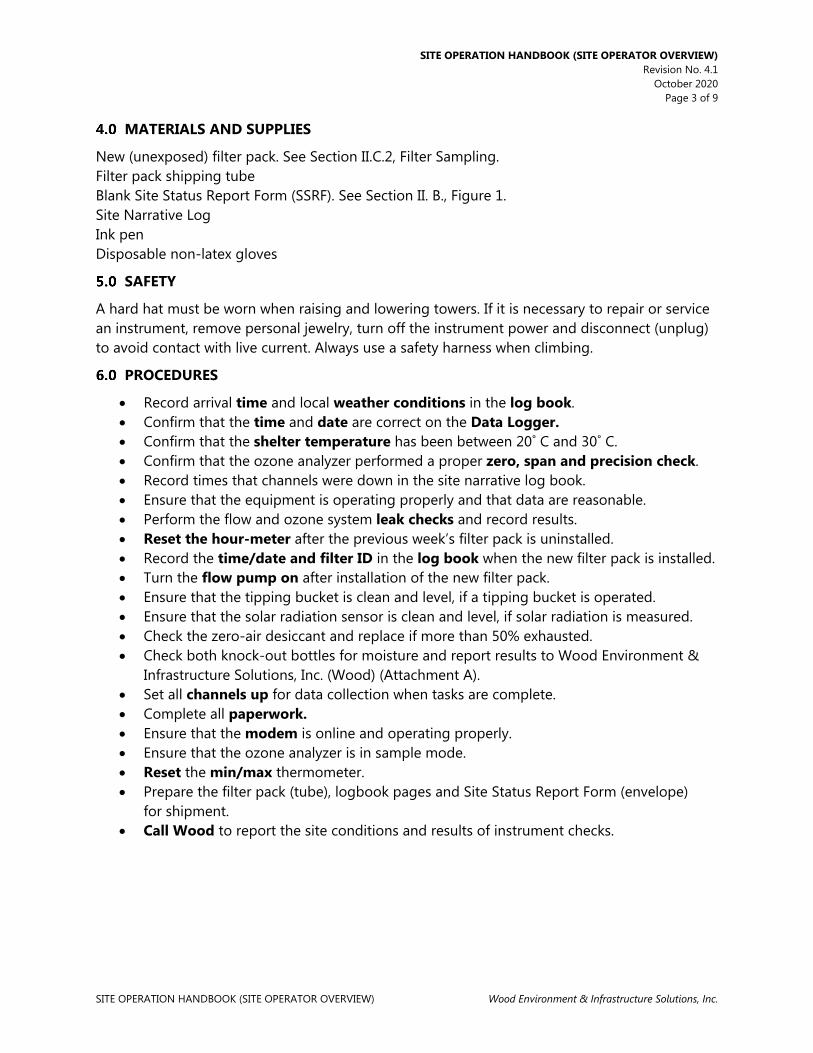
MATERIALS AND SUPPLIES
New (unexposed) filter pack. See Section II.C.2, Filter Sampling. Filter pack shipping tube Blank Site Status Report Form (SSRF). See Section II. B., Figure 1. Site Narrative Log Ink pen Disposable non-latex gloves
SAFETY
A hard hat must be worn when raising and lowering towers. If it is necessary to repair or service an instrument, remove personal jewelry, turn off the instrument power and disconnect (unplug) to avoid contact with live current. Always use a safety harness when climbing.
PROCEDURES
• Record arrival time and local weather conditions in the log book. • Confirm that the time and date are correct on the Data Logger. • Confirm that the shelter temperature has been between 20˚ C and 30˚ C. • Confirm that the ozone analyzer performed a proper zero, span and precision check. • Record times that channels were down in the site narrative log book. • Ensure that the equipment is operating properly and that data are reasonable. • Perform the flow and ozone system leak checks and record results. • Reset the hour-meter after the previous week’s filter pack is uninstalled. • Record the time/date and filter ID in the log book when the new filter pack is installed. • Turn the flow pump on after installation of the new filter pack. • Ensure that the tipping bucket is clean and level, if a tipping bucket is operated. • Ensure that the solar radiation sensor is clean and level, if solar radiation is measured. • Check the zero-air desiccant and replace if more than 50% exhausted. • Check both knock-out bottles for moisture and report results to Wood Environment &
Infrastructure Solutions, Inc. (Wood) (Attachment A). • Set all channels up for data collection when tasks are complete. • Complete all paperwork. • Ensure that the modem is online and operating properly. • Ensure that the ozone analyzer is in sample mode. • Reset the min/max thermometer. • Prepare the filter pack (tube), logbook pages and Site Status Report Form (envelope)
for shipment. • Call Wood to report the site conditions and results of instrument checks.

SITE OPERATION HANDBOOK (SITE OPERATOR OVERVIEW) Revision No. 4.1
October 2020 Page 4 of 9
SITE OPERATION HANDBOOK (SITE OPERATOR OVERVIEW) Wood Environment & Infrastructure Solutions, Inc.
• Complete Wood Site Call-In Log • All telephone conversations between site operators and the Wood field operations staff
are logged at the Wood office in Gainesville using the electronic site call-in log. Every Tuesday, when site operators call the field FOM, FOC or other assigned personnel to report the status of their sites, the reported data are entered in the log shown below in Figure 2. After entry, data are available to all CASTNET personnel for review. The form provides areas for: Entering data, equipment status and supply requests provided by the operators, Reviewing open problems and equipment recently shipped to the site, and Viewing the results from previous calls.
Figure 2. Site Call-In Log
Note: Site Call-In Log serves to document site operator communications, including questions or suggestions from the site operator and onsite troubleshooting performed.
• Field operation problems and related actions detected and/or discussed during the telephone call will be entered into the problem tracking system (PTS) database. The PTS allows staff to ticket documented observations as problems requiring follow-on action (see Figure 3). The open ticket, labeled by site ID and a ticket sequence number, will be used by Wood staff to monitor known problems and document follow-on actions as well
SITE OPERATION HANDBOOK (SITE OPERATOR OVERVIEW) Revision No. 4.1
October 2020 Page 5 of 9
SITE OPERATION HANDBOOK (SITE OPERATOR OVERVIEW) Wood Environment & Infrastructure Solutions, Inc.
as problem resolution when the ticket is officially closed. The PTS also serves to document the time required to resolve a given problem by the number of days a ticket is open.
Figure 3. Example Ticket Report for CTH110, NY

SITE OPERATION HANDBOOK (SITE OPERATOR OVERVIEW) Revision No. 4.1
October 2020 Page 6 of 9
SITE OPERATION HANDBOOK (SITE OPERATOR OVERVIEW) Wood Environment & Infrastructure Solutions, Inc.
REFERENCES
U.S. Environmental Protection Agency (EPA). 1994. Quality Assurance Handbook for Air Pollution Measurement Systems, Vol. I. A Field Guide to Environmental Quality Assurance. EPA/600/R-94/038a.
U.S. Environmental Protection Agency (EPA). 2008. Quality Assurance Handbook for Air Pollution
Measurement Systems, Vol. IV, Meteorological Measurements Version 2.0 (Final). EPA-454/B-08-002.
U.S. Environmental Protection Agency (EPA). 2017. Quality Assurance Handbook for Air Pollution
Measurement Systems, Vol. II, Ambient Air Quality Monitoring Program. EPA-454/B-17-001.
U.S. Environmental Protection Agency (EPA). 2000. Meteorological Monitoring Guidance for
Regulatory Modeling Applications. EPA-454/R-99-005. U.S. Environmental Protection Agency (EPA). 2019. Appendix A to Part 58 – Quality Assurance
Requirements for State and Local Air Monitoring Stations (SLAMS), Special Purpose Monitors (SPMs), and Prevention of Significant Deterioration (PSD) Air Monitoring. 40 CFR Part 58.

SITE OPERATION HANDBOOK (SITE OPERATOR OVERVIEW) Revision No. 4.1
October 2020 Page 7 of 9
SITE OPERATION HANDBOOK (SITE OPERATOR OVERVIEW) Wood Environment & Infrastructure Solutions, Inc.
ATTACHMENTS
Attachment A – Wood Contact Information Attachment B – Purpose of CASTNET

SITE OPERATION HANDBOOK (SITE OPERATOR OVERVIEW) Revision No. 4.1
October 2020 Page 8 of 9
SITE OPERATION HANDBOOK (SITE OPERATOR OVERVIEW) Wood Environment & Infrastructure Solutions, Inc.
ATTACHMENT A WOOD CONTACT INFORMATION
Field Coordination Center at: • 1-352-332-5770* or
• 352-333-6611
*This is a direct line to all calibrator desks. It may be busy for long periods of time, and calls to this line cannot be transferred between technicians once it is answered. To use the automated central phone system call: • 1-352-332-3318 or
• 1-888-224-5663
• Field Operations Phone ext. 6611
For urgent assistance, and if above numbers are busy, please dial:
CONTACT Office Phone E-mail Cell Phone
In order of whom you should contact first:
Mike Smith Field Coordinator
(352) 333-6620 Michael.J.Smith@@woodplc.com N/A
Kevin Mishoe Field Operations Manager
(352) 333-6629 Kevin.Mishoe@@woodplc.com (352) 339-5394
Selma Isil Data Analyst
(352) 333-6607 Selma.Isil@@woodplc.com (518) 593-9814
Kemp Howell Project Manager
(352) 333-6612 Kemp.Howell@@woodplc.com (352) 317-7524

SITE OPERATION HANDBOOK (SITE OPERATOR OVERVIEW) Revision No. 4.1
October 2020 Page 9 of 9
SITE OPERATION HANDBOOK (SITE OPERATOR OVERVIEW) Wood Environment & Infrastructure Solutions, Inc.
ATTACHMENT B PURPOSE OF CASTNET
The Clean Air Status and Trends Network (CASTNET) is a national long-term environmental monitoring program administered and operated by the Environmental Protection Agency and the National Park Service. The network was developed from the National Dry Deposition Network (NDDN) which was established in 1987. CASTNET was established in 1991 under the 1990 Clean Air Act Amendments. The network was created to assess trends in air quality, atmospheric deposition, and ecological effects that result from air pollutant emission reduction regulations, such as the Acid Rain Program (ARP) and NOx Budget Trading Program (NBP). CASTNET has since become the nation’s primary monitoring network for measuring concentrations of air pollutants involved in acidic deposition affecting regional ecosystems and rural ambient ozone levels. Additionally, CASTNET provides data needed to assess and report on geographic patterns and long-term temporal trends in ambient air pollution and dry atmospheric deposition. As of October 2017, meteorological parameters are measured at only five of the EPA-sponsored CASTNET sites: PND165, WY; IRL141, FL; CHE185, OK; BVL130, IL; and BEL116, MD.
CASTNET monitors air quality and deposition in cooperation with the National Atmospheric Deposition Program (including the National Trends Network, Atmospheric Mercury Network, and Ammonia Monitoring Network), EPA’s National Core Monitoring (NCore), BLM’s Wyoming Air Resources Monitoring System (WARMS), the Canadian Air and Precipitation Monitoring Network, and Interagency Monitoring of Protected Visual Environments (IMPROVE).

11/2/2020

SITE OPERATOR’S HANDBOOK, OVERVIEW OF CASTNET SITE INSTRUMENTS AND EQUIPMENT Revision No. 9
October 2020 Page 2 of 24
SITE OPERATOR’S HANDBOOK Wood Environment & Infrastructure Solutions, Inc.
II.A.2. OVERVIEW OF CASTNET SITE INSTRUMENTS AND EQUIPMENT
PURPOSE
The purpose of this Standard Operating procedure (SOP) is to provide an identification guide for monitoring equipment and sensors utilized at Clean Air Status and Trends Network (CASTNET) sites.
SCOPE
This SOP applies to all CASTNET sites and all CASTNET site operators.
SUMMARY
CASTNET Site Overview
Figure 1 shows the instrument and communication system at a CASTNET site. This figure includes the meteorological instruments even though meteorological parameters are currently measured at only four EPA-sponsored CASTNET sites. Meteorological measurements continue at all NPS-sponsored and BLM-sponsored sites. Figure 1. CASTNET Site Overview

SITE OPERATOR’S HANDBOOK, OVERVIEW OF CASTNET SITE INSTRUMENTS AND EQUIPMENT Revision No. 9
October 2020 Page 3 of 24
SITE OPERATOR’S HANDBOOK Wood Environment & Infrastructure Solutions, Inc.
Data Acquisition System/Data Logger
CASTNET sites are equipped with an array of instruments and software collectively known as the data acquisition system or DAS. The primary purpose of the DAS/data logger is to record sensor and analyzer measurements. Additionally, the DAS includes hardware and software which allows stored data to be retrieved and provides the site operator means to perform weekly checks. Sensor and analyzer measurements are processed and recorded by a Campbell Scientific Instruments, Inc. (Campbell) CR3000 data logger. The CR3000 data logger is mounted on a metal plate along with a wiring terminal block assembly designed to accommodate necessary sensor wiring and provide electrical surge protection to the data logger. The data logger incorporates an NL-116 ethernet port which is mounted directly to the CR3000. Sites which lack reliable cellular phone signal will also include a COM 220 telephone modem. The entire assembly is referred to as the “data logger back plane” (Figure 2). The data logger backplane is mounted inside the shelter either on the wall or on a 19” rack if the site is so equipped. The DAS is also equipped with a Digi transport LR54 cellular modem and network router mounted to a second metal plate. This assembly is referred to as the “communications backplane”. It is mounted near the data logger backplane. The modem allows Wood Environment & Infrastructure Solutions, Inc. (Wood) remote access to the data logger, stored data, ozone analyzer and site laptop computer. The router allows these devices to communicate with one another and the modem. Figure 2. DAS System: Data logger and Communications Backplane

SITE OPERATOR’S HANDBOOK, OVERVIEW OF CASTNET SITE INSTRUMENTS AND EQUIPMENT Revision No. 9
October 2020 Page 4 of 24
SITE OPERATOR’S HANDBOOK Wood Environment & Infrastructure Solutions, Inc.
The DAS includes a laptop computer with the software package PC200W. Through PC200W the site operator is able to monitor measurement data, enable and disable data recording channels enable data logger functions such as the weekly wetness sensor check and precipitation gauge “ten-tip” check and enter numerical correction coefficients when replacing failed sensors.
Figure 3. DAS System: Laptop Computer Figure 4. DAS System: Yagi Cellular Antenna Mounted on Folding Tower

SITE OPERATOR’S HANDBOOK, OVERVIEW OF CASTNET SITE INSTRUMENTS AND EQUIPMENT Revision No. 9
October 2020 Page 5 of 24
SITE OPERATOR’S HANDBOOK Wood Environment & Infrastructure Solutions, Inc.
Regulatory Ozone Monitoring
CASTNET was not originally designed to operate as a regulatory network. However, as of May 2011, CASTNET O
3 monitoring systems at EPA-sponsored sites comply with regulatory monitoring requirements described in 40 CFR Part 58, Appendix A (EPA 2010), and data collected since the 2011 ozone season have been submitted to the EPA Air Quality System (AQS). The O
3 monitoring systems at NPS-sponsored sites comply with regulatory requirements and data collected are routinely submitted to AQS. Ozone monitoring at CASTNET sites is comprised of two distinct processes. The first process is ambient ozone sampling. The purpose of ambient sampling is to measure the concentration of ozone present in the air. The second process is called a zero, span and precision check, although it is often referred to as a ZSP check or auto-calibration report. The purpose of the ZSP check is to verify that the analyzer is making accurate measurements and that the ozone sample plumbing is not compromised. A single ozone analyzer is used for ambient monitoring and a separate 49i is used as the transfer standard (Figure 5) and the ZSP check. The data logger controls ambient monitoring and ZSP check processes automatically while recording ozone concentration and the analyzer’s operational status. During normal operation the data logger instructs the analyzer to perform ambient sampling. Once per day the data logger instructs the analyzer to perform a ZSP check. During ambient sampling, the parameter “Ozone_ZSP” as displayed in the “1. Site Operator” grid will be reported as “false”. During a ZSP check “Ozone_ZSP” will be reported as “true”. The process of ambient sampling is to draw air from ten meters above the ground into the analyzer. From the inlet port on the flow tower “pot head” the air passes through a 47mm Teflon filter membrane then travels through tubing into the shelter where it passes through a bottle designed to separate water from the air (knock out or K/O bottle). The air then enters the analyzer where the amount of ozone present is measured and reported in units of parts per billion (ppb). Each day a few minutes prior to midnight the data logger tells the ozone analyzer to perform a ZSP check. During the ZSP check the analyzer stops sampling ambient ozone. The zero air system is activated whereby air is forced through a desiccant, reducing agent, and carbon canisters by either a diaphragm pump or in some cases a compressor. The desiccant, reducing agent, and carbon dry the air and remove pollutants including ozone. The carbon canister contains a blend of activated carbon (black pellets), and sodium permanganate (purple pellets). The resulting air stream is known as “zero air” because it has been purified and contains no ozone. The zero air passes into the analyzer and some of it is routed through the transfer standard where ozone is created within the zero air sample. The sample is then forced out of the analyzer and up to the ozone inlet filter in the flow tower pot head through tubing known as the integrity

SITE OPERATOR’S HANDBOOK, OVERVIEW OF CASTNET SITE INSTRUMENTS AND EQUIPMENT Revision No. 9
October 2020 Page 6 of 24
SITE OPERATOR’S HANDBOOK Wood Environment & Infrastructure Solutions, Inc.
line. The sample floods the inlet filter and is drawn back to the analyzer’s detector and the concentration of ozone is measured. During the ZSP check the transfer standard produces three different concentrations of ozone for a period of seven minutes each. These concentrations are the zero, span and precision points and correspond to 0 ppb, 225 ppb and 60 ppb respectively. At the end of each phase of the ZSP check the data logger records the concentration of ozone reaching the detector. Following the ZSP check the zero air system and transfer standard are deactivated. The analyzer reverts to sampling ambient air and the data logger records the zero, span and precision values and displays them in the “1. Site Operator Grid of PC200W”. Figure 5. Ozone Certification
Traveling Transfer Standards(Level 2)
BBAA
D
CASTNET Station Analyzer
CASTNET Station Transfer Standard(Level 3)
Stationary Transfer Standard at the Gainesville FL Facility
(Level 2)
National Performance Audit Program (NPAP) 40CFR58
Appendix A Section 2.4Traveling Transfer Standard
(Level 2)
Third Party Auditor Traveling Transfer Standard
(Level 2)
EPA SRP(Level 1)
EPA SRP(Level 1)*
EPA SRP(Level 1)
EPA SRP(Level 1)
E
F
G
C
Legend
A = Annual ReverificationB = Quarterly ReverificationC = Audited ˜1/6 weeksD = Reverification 1/6 monthsE = Zero, Span and single Point QC check dailyF = Audited AnnuallyG = Audited 1/5 years
Level 2 O3Transfer Standard
Level 3 O3Transfer Standard
Level 4 O3Transfer Standard
NISTSRP2 EPA SRP1 or SRP7
Regional EPA SRPs
Level 1Standard Ref. Photometers
Site or Field Ozone Analyzer
1234St
eps
from
SR
P
*Traceability

SITE OPERATOR’S HANDBOOK, OVERVIEW OF CASTNET SITE INSTRUMENTS AND EQUIPMENT Revision No. 9
October 2020 Page 7 of 24
SITE OPERATOR’S HANDBOOK Wood Environment & Infrastructure Solutions, Inc.
If the measured concentrations differ significantly from the targets and prior ZSP check, then diagnostics are performed to assess the measurement system. A leak or analyzer malfunction may be indicated. Table 1 illustrates ozone data quality objectives. Table 1. Ozone Measurement Quality Objectives
Type of check Measurement Criteria
Corrective Action* Multi-Point Calibration
Criteria Field Data
Zero < ± 3.1 ppb Perform adjusted calibration
Invalid from the last good check until the next good check or adjusted calibration completed
Between 0.0 and ± 1.5 ppb
Precision/Span < ± 7.1 percent between supplied and observed concentrations
Contact the field coordinator
Invalid from the last good check until the next good check or adjusted calibration completed
All points on calibration curve within ± 2% of full scale as compared to the best fit straight line
linearity error < 5%
Correlation Coefficient
≥ 0.995
Frequency of analyzer checks One ZSP every day ZSP** On demand to facilitate trouble shooting Following a multipoint calibration prior to leaving the site Minimum one multipoint calibration verification every 6 months Calibration As required per QC results
When performing the semi-annual multipoint verification, calibration adjustment – if needed - must occur within 24 hours of verification
General Verification does not have to be followed by calibration adjustment if all analyzer responses are in a 2 percent of full scale range. Shelter temperature acceptable range: 20 – 30 degrees C
Notes: * Display drifts are frequently due to leaks in the system or lamp degradation/ageing. Verify lamp intensity settings against previously documented values. Perform internal and external leak checks by plugging inlet line in back of the instrument (internal) or tower inlet port (external). A line plug should reduce the internal pressure down to 250 mm Hg or so. Verify external ozone generator pump function and internal pressure using the manual pressure gauge located inside the instrument.
** Zero, Span, Precision automated QC check

SITE OPERATOR’S HANDBOOK, OVERVIEW OF CASTNET SITE INSTRUMENTS AND EQUIPMENT Revision No. 9
October 2020 Page 8 of 24
SITE OPERATOR’S HANDBOOK Wood Environment & Infrastructure Solutions, Inc.
Model 49i analyzers communicate with the data logger serially via internet protocol. They are connected to the site router by an Ethernet cable. This allows the data logger to record all of the vital operating parameters except the electronic noise. Noise must be checked manually by the site operator. They are also wired so that the measured ozone concentration is sent to the data logger as an analog voltage signal in the event of communication failure. The ZSP check however will not run automatically if communication fails. Two modes of operation are possible with the 49i: “Sample Mode” and “Service Mode”. During normal operation the unit is in “Sample Mode”. If left in “Service Mode” for any reason the analyzer will not receive instructions from the data logger. Most zero air systems utilize a diaphragm pump to supply air to the cartridges and finally the ozone analyzer. In some instances however a compressor may be used instead of a pump. With either type system the normal zero air pressure as indicated by the pressure gauge within the analyzer should be 15 psi when zero air is being used. If not 15 psi, the cause requires investigation. Zero air is introduced into the analyzer only during a ZSP check. In compressor based systems zero air is always available and a solenoid within the analyzer controls airflow. Diaphragm pump based systems utilize a relay within the analyzer to activate another relay which switches power to the electrical outlet into which the pump is plugged. For Model 49i analyzers the relay and power outlet are located in a black box wired to the rear of the analyzer. The zero air pump for Model 49i systems will switch on anytime the analyzer is not in “Sample Mode”. Ozone analyzers are verified every 6 months in the field by Wood or authorized subcontractor personnel during routine site calibration visits. Inoperative analyzers may be replaced or may be repaired by site operators with the assistance of Wood Field Operations Personnel. Zero air systems are replaced or repaired as necessary. Routine maintenance of the ozone monitoring system includes replacement of the sample train 47mm Teflon filter membrane. The inlet filter membrane is changed every other week. The K/O bottle is emptied of water as necessary and analyzer electronic noise is checked and recorded weekly. The zero air system desiccant is inspected weekly and replaced when 50 percent exhausted. Wood Personnel will assist site operators in troubleshooting and repair of an ozone monitoring system that fails to meet ZSP check requirements or if any other form of failure occurs or is suspected. The SOP for AQS-compliant ozone monitoring is given in Section II.C.3 of this appendix.
Trace Level Gas Monitoring
Several CASTNET sites are outfitted with trace level gas monitoring equipment (QAPP Appendix 11). For example, BVL130, IL operates three trace gas analyzers and a separate gas calibrator, which performs calibration checks on the three site monitors. The Teledyne API T700U Dynamic Dilution Calibrator provides a challenge gas to each of the three analyzers every other day to
SITE OPERATOR’S HANDBOOK, OVERVIEW OF CASTNET SITE INSTRUMENTS AND EQUIPMENT Revision No. 9
October 2020 Page 9 of 24
SITE OPERATOR’S HANDBOOK Wood Environment & Infrastructure Solutions, Inc.
determine whether they are responding properly given a certain concentration of a species. The three site analyzers are Teledyne API Models T200U, T100U and T300U that monitor NO/NOy, SO
2, and CO, respectively. These analyzers require little maintenance by the Field Site Operators unless given instruction to do so by Wood Field Personnel. In addition, NO/NOy is measured at DUK008, NC, HWF187, NY, PNF126, NC, ROM206, CO, and PND165, WY.
Filter Sampling
Filter sampling of ambient air is performed at all CASTNET sites. The purpose of filter sampling is to determine the concentrations of various pollutants in the air. The process of filter sampling is to continuously draw air through a filter pack at a specific, recorded rate for one week. A new, unexposed filter is then installed and the exposed filter pack is then shipped back to Wood where the pollutants trapped by the filters are analyzed. The filter pack is attached (Figure 6) to a quick connect fitting in the “pot head” of the flow tower. This arrangement places the sampling location at 10 meters above the ground. Air is pulled through the filter and then passes through tubing down the tower and into the shelter, terminating at a K/O bottle to separate water from the air. The air travels from the K/O bottle to a cylindrical Balston filter located at the bottom of a rotameter. After passing through the Balston filter the air exits the top of the rotameter and travels to the inlet side of a mass flow controller. This device controls the rate at which air flows through the filter pack and it includes a display to indicate the airflow in liters per minute. Along with the rotameter, the display provides a means to cross-check the rate of airflow against the value recorded by the data logger. The air exits the mass flow controller and travels to a pump, which provides the vacuum necessary to move the air. An electromechanical hour-meter with a reset button is installed in the shelter to measure the time that the filter pack is in place with the pump turned on. The hour meter is not automatic and must be turned on and off manually. The hour meter should be turned off anytime the pump is turned off and the hour-meter and pump should be turned off anytime the flow tower is lowered. The mass flow controller continuously controls the rate of airflow in the system based on the set point it receives from the datalogger. To properly calculate standard flow rate each mass flow controller utilizes unique calibration factors which must be input into the data logger upon installation and subsequent field calibration. These factors; “Flow_Offset” and “Flow_FullScale” are unique to each mass flow controller. They are found on the calibration certification form that accompanies the mass flow controller. The sample train of the filter pack sampling system is checked for leaks weekly. The MFC units and power supplies are field calibrated every 6 months. The Balston filter is replaced every 6 months and as needed. The system pump is serviced every 6 months and replaced upon failure. Water collected in the K/O bottle is emptied weekly.

SITE OPERATOR’S HANDBOOK, OVERVIEW OF CASTNET SITE INSTRUMENTS AND EQUIPMENT Revision No. 9
October 2020 Page 10 of 24
SITE OPERATOR’S HANDBOOK Wood Environment & Infrastructure Solutions, Inc.
In the Eastern U.S. air is drawn through the filter at a rate of 1.5 liters per minute all but nine sites. The rate is 3.0 liters per minute at all western and eastern sites. Figure 6. Filter Sampling System: Sample Train of Alicat Mass Flow System
Precipitation Gauge (Tipping Bucket)
CASTNET sites utilize either a Climatronics or Texas Electronics manufactured precipitation gauge to measure rainfall. Regardless of manufacturer they are essentially identical. This gauge is typically mounted atop a 1 meter mast which utilizes studs to allow leveling (Figure 7). Rainwater and snow entering the gauge are funneled to a tipping mechanism containing two reservoirs (Figure 8). As one reservoir fills to capacity, the tipping mechanism tips over and makes contact with a switch which increments the data logger precipitation count. The rainwater then spills and the tipping mechanism is re-positioned by gravity to fill the opposing reservoir. Each time the unit tips the data logger records 0.01 inches of rain. The gauge must be level to properly measure rainfall. A bulls-eye bubble level is mounted on the tipping mechanism for this purpose.

SITE OPERATOR’S HANDBOOK, OVERVIEW OF CASTNET SITE INSTRUMENTS AND EQUIPMENT Revision No. 9
October 2020 Page 11 of 24
SITE OPERATOR’S HANDBOOK Wood Environment & Infrastructure Solutions, Inc.
Figure 7. Precipitation Gauge Figure 8. Precipitation Gauge Tipping Mechanism and Wiring.
The gauge is equipped with a screen to reduce fouling of the funnel and tipping mechanism. Because the precipitation gauge measures snowfall, the screen should be removed in winter if the location receives snow. The gauge is equipped with a thermostat and a 120 VAC heater to melt accumulated snow and allow accurate measurement of snowfall volume (Figure 9). Thermostat wires are line voltage. Caution must be exercised when removing the lid of the gauge because damaged heater wires may present an electrical hazard. When reassembling the gauge, all wires are tucked away neatly to not interfere with operation of the tipping mechanism. Figure 9. Precipitation Gauge Heater
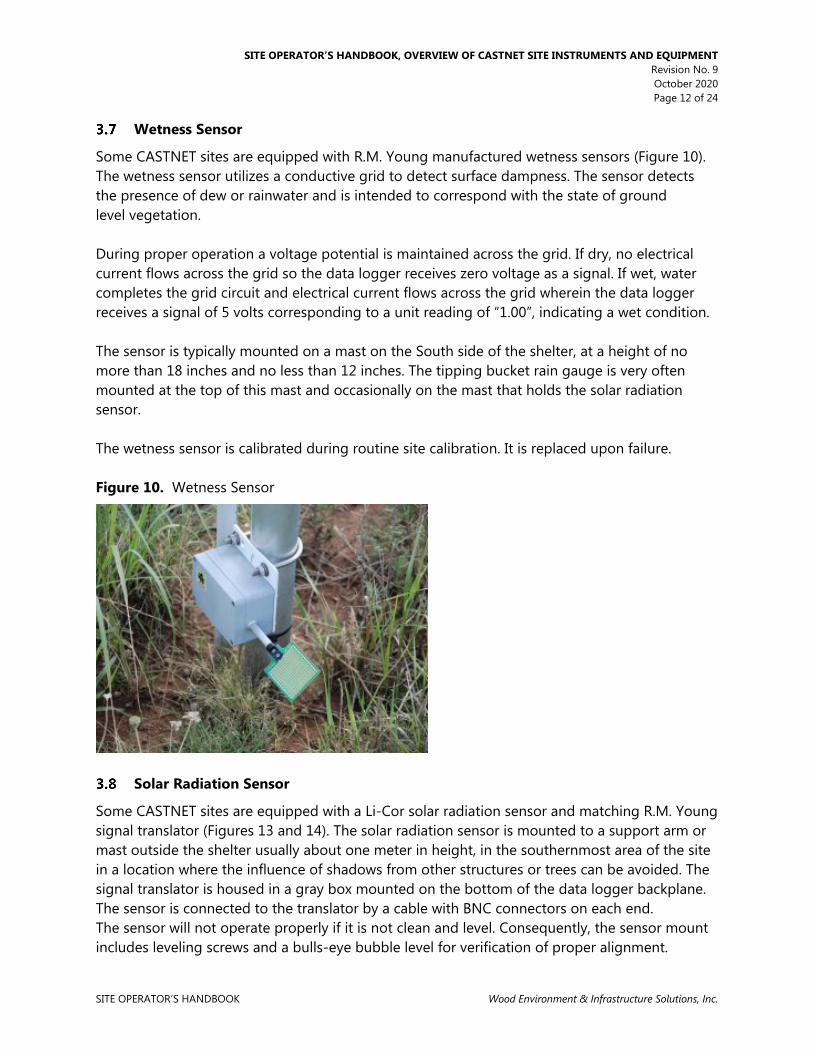
SITE OPERATOR’S HANDBOOK, OVERVIEW OF CASTNET SITE INSTRUMENTS AND EQUIPMENT Revision No. 9
October 2020 Page 12 of 24
SITE OPERATOR’S HANDBOOK Wood Environment & Infrastructure Solutions, Inc.
Wetness Sensor
Some CASTNET sites are equipped with R.M. Young manufactured wetness sensors (Figure 10). The wetness sensor utilizes a conductive grid to detect surface dampness. The sensor detects the presence of dew or rainwater and is intended to correspond with the state of ground level vegetation. During proper operation a voltage potential is maintained across the grid. If dry, no electrical current flows across the grid so the data logger receives zero voltage as a signal. If wet, water completes the grid circuit and electrical current flows across the grid wherein the data logger receives a signal of 5 volts corresponding to a unit reading of “1.00”, indicating a wet condition. The sensor is typically mounted on a mast on the South side of the shelter, at a height of no more than 18 inches and no less than 12 inches. The tipping bucket rain gauge is very often mounted at the top of this mast and occasionally on the mast that holds the solar radiation sensor. The wetness sensor is calibrated during routine site calibration. It is replaced upon failure. Figure 10. Wetness Sensor
Solar Radiation Sensor
Some CASTNET sites are equipped with a Li-Cor solar radiation sensor and matching R.M. Young signal translator (Figures 13 and 14). The solar radiation sensor is mounted to a support arm or mast outside the shelter usually about one meter in height, in the southernmost area of the site in a location where the influence of shadows from other structures or trees can be avoided. The signal translator is housed in a gray box mounted on the bottom of the data logger backplane. The sensor is connected to the translator by a cable with BNC connectors on each end. The sensor will not operate properly if it is not clean and level. Consequently, the sensor mount includes leveling screws and a bulls-eye bubble level for verification of proper alignment.

SITE OPERATOR’S HANDBOOK, OVERVIEW OF CASTNET SITE INSTRUMENTS AND EQUIPMENT Revision No. 9
October 2020 Page 13 of 24
SITE OPERATOR’S HANDBOOK Wood Environment & Infrastructure Solutions, Inc.
The solar radiation sensor produces a small electrical current proportional to the amount of sunlight incident upon it. When dark, no current is produced. The signal translator conditions and amplifies the sensor current signal to output a voltage to the data logger. The data logger records this voltage in units of watts per square meter. The solar radiation sensor and translator are a matched set calibrated as a single unit. The individual parts are not interchangeable. They are replaced as a unit anytime either component fails. Figure 11. Solar Radiation System and
Sensor Mast Figure 12. Solar Radiation System Translator
R.M. Young Meteorological System
R.M. Young meteorological systems (Figures 15 and 16) include: Wind Monitor AQ wind speed and direction sensor, upper (9 m) aspirated shield and lower (2 m) aspirated shield, relative humidity sensor, upper (9 m) temperature probe, lower (2 m) temperature probe. At sites with this meteorological system the “climatronics_site” parameter must always be set to “false” in PC200W interface for proper operation (Figure 15).

SITE OPERATOR’S HANDBOOK, OVERVIEW OF CASTNET SITE INSTRUMENTS AND EQUIPMENT Revision No. 9
October 2020 Page 14 of 24
SITE OPERATOR’S HANDBOOK Wood Environment & Infrastructure Solutions, Inc.
Figure 13. R.M. Young Meteorological System
R.M. Young Meteorological
System
9 Meter Aspirated
Shield
2 Meter Aspirated
Shield Wind Mast
Gill Aspirator
T2 Temperature Probe
Blower Motor
T1 Temperature Probe
Blower Motor
RH Probe Wind Monitor
AQ

SITE OPERATOR’S HANDBOOK, OVERVIEW OF CASTNET SITE INSTRUMENTS AND EQUIPMENT Revision No. 9
October 2020 Page 15 of 24
SITE OPERATOR’S HANDBOOK Wood Environment & Infrastructure Solutions, Inc.
Figure 14. R.M. Young Meteorological System: (from top to bottom) Meteorological Tower with Wind AQ, Directional Cross-Arm, Gill Aspirated Shield for RH Probe, 9-m Aspirated Temperature Sensor Shield and Waterproof RH Circuit Card "Otter" box.

SITE OPERATOR’S HANDBOOK, OVERVIEW OF CASTNET SITE INSTRUMENTS AND EQUIPMENT Revision No. 9
October 2020 Page 16 of 24
SITE OPERATOR’S HANDBOOK Wood Environment & Infrastructure Solutions, Inc.
Figure 15. R.M. Young Meteorological System, "Climatronics_Site" parameter always Set to "False" for R.M. Young Equipped Sites
3.9.1 Wind Monitor AQ
The wind sensor is mounted on a mast at the top of the meteorological tower (Figure 16). A rod beneath the sensor is attached to the tower and aligned to either north or south as a directional reference. The sensor has both a lightweight propeller and vane to measure wind speed and direction simultaneously. The wind direction measurement is made electro-mechanically. As the vane rotates into the wind, it turns a potentiometer shaft and thereby changes the electrical resistance of the potentiometer. The data logger measures this resistance and determines and records the appropriate wind direction. The wind speed sensor operates by sending a pulsed signal to the data logger. The signal frequency is directly proportional to the rotational speed of the cups. The data logger converts the signal frequency to a speed measurement in units of meters per second. There is no circuit to provide heat to the sensor to prevent icing in freezing conditions. The design of the monitor is such that icing should not occur unless extreme conditions are encountered.

SITE OPERATOR’S HANDBOOK, OVERVIEW OF CASTNET SITE INSTRUMENTS AND EQUIPMENT Revision No. 9
October 2020 Page 17 of 24
SITE OPERATOR’S HANDBOOK Wood Environment & Infrastructure Solutions, Inc.
The Wind Monitor AQ is replaced annually during routine calibration or is replaced as needed following failure. The nose cone is replaced every 6 months during routine calibration or is replaced as needed following failure. Figure 16. R.M. Young Wind AQ wind monitor
3.9.2 Aspirated Shields, 9 Meter and 2 Meter
Two aspirated shields are located on the meteorological tower. These shields protect the temperature probes from sunlight and are equipped with blower motors to draw air across each probe to allow acceptable precision and accuracy in measuring temperature. The uppermost shield is mounted at 9 meters high and contains a blower motor and the T1 probe. The lower shield is mounted at two meters height and contains a blower motor (Figure 17) and the T2 probe. Sensors are mounted in the opposite end of the shield from the blower. The data logger records the rpm of each blower motor continuously and will invalidate temperature measurements if the rpm is low. During normal operation the parameters “Temp1_Blower_Bad” and “Temp2_Blower_Bad” found in the Site Operator grid will both be reported as “false”, indicating that no failure is observed. Blower motors are cleaned routinely and replaced upon failure.
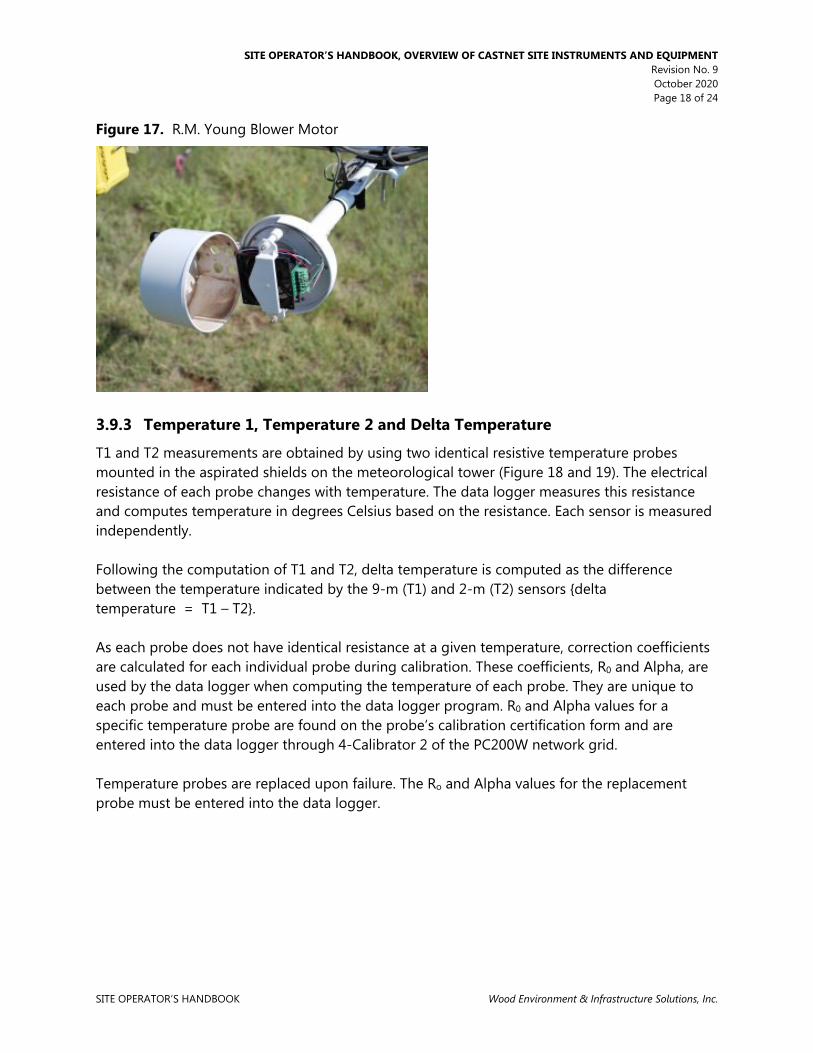
SITE OPERATOR’S HANDBOOK, OVERVIEW OF CASTNET SITE INSTRUMENTS AND EQUIPMENT Revision No. 9
October 2020 Page 18 of 24
SITE OPERATOR’S HANDBOOK Wood Environment & Infrastructure Solutions, Inc.
Figure 17. R.M. Young Blower Motor
3.9.3 Temperature 1, Temperature 2 and Delta Temperature
T1 and T2 measurements are obtained by using two identical resistive temperature probes mounted in the aspirated shields on the meteorological tower (Figure 18 and 19). The electrical resistance of each probe changes with temperature. The data logger measures this resistance and computes temperature in degrees Celsius based on the resistance. Each sensor is measured independently. Following the computation of T1 and T2, delta temperature is computed as the difference between the temperature indicated by the 9-m (T1) and 2-m (T2) sensors delta temperature = T1 – T2. As each probe does not have identical resistance at a given temperature, correction coefficients are calculated for each individual probe during calibration. These coefficients, R0 and Alpha, are used by the data logger when computing the temperature of each probe. They are unique to each probe and must be entered into the data logger program. R0 and Alpha values for a specific temperature probe are found on the probe’s calibration certification form and are entered into the data logger through 4-Calibrator 2 of the PC200W network grid. Temperature probes are replaced upon failure. The Ro and Alpha values for the replacement probe must be entered into the data logger.

SITE OPERATOR’S HANDBOOK, OVERVIEW OF CASTNET SITE INSTRUMENTS AND EQUIPMENT Revision No. 9
October 2020 Page 19 of 24
SITE OPERATOR’S HANDBOOK Wood Environment & Infrastructure Solutions, Inc.
Figure 18. R.M. Young Temperature Probe Figure 19. R.M. Young Temperature Probe Installed in Aspirated Shield.
Relative Humidity
Sites may use either a Rotronics Model MP101A or Vaisala Model 102425 relative humidity sensor (Figure 20). The sensor is mounted in a naturally aspirated shield near the top of the tower. No air is forced past the sensor. The Vaisala probe uses a mounting adapter in the shield. The Rotronics probe does not. The sensor is wired to a circuit card inside a waterproof box mounted on the meteorological tower. The circuit card provides a fuse to protect the data logger and probe from transient voltage. Regardless of model used the relative humidity sensor operates based upon the electrical capacitance of the sensor element. The capacitance varies with temperature and humidity. The data logger records the probe output voltage as unit of percent relative humidity. During times of light winds, fog, or extended rain, the sensor may become saturated with water and require several hours to respond to decreased humidity levels.

SITE OPERATOR’S HANDBOOK, OVERVIEW OF CASTNET SITE INSTRUMENTS AND EQUIPMENT Revision No. 9
October 2020 Page 20 of 24
SITE OPERATOR’S HANDBOOK Wood Environment & Infrastructure Solutions, Inc.
Figure 20. Vaisala RH Probe
Shelter Temperature / HVAC
The temperature within a CASTNET site shelter must be maintained between 68˚ F and 86˚ F (20˚ C and 30˚ C) or O
3 data collected must be invalidated. Each site is equipped with a Campbell Model 107 temperature probe which is used in continuously monitoring the performance of the site heating, ventilating, and air conditioning (HVAC) system. This sensor is connected to the data logger backplane terminal block strip and either hangs from the ceiling at a height of about seven feet near the center of the shelter or is located beside the site analyzer (Figure 21). The temperature sensor is used to record the shelter temperature and also in controlling the shelter temperature. Most CASTNET sites utilize a window mounted air-conditioner (Figure 22) for cooling and a resistive strip heater for heating. If the shelter temperature falls below the shelter temperature minimum (STemp-MIN) data logger setting, the thermostat activates a heater relay which switches power to the heater. If the shelter temperature rises above the shelter temperature maximum (STemp-MAX) data logger setting, the thermostat activates an air-conditioner relay which switches power to electrical receptacle directly below the air-conditioner (Figure 23-24). This arrangement assures that the heater and air-conditioner are never operating at the same time but for the system to work properly the air-conditioner must be plugged into the switched receptacle. Because the air-conditioner is simply switched on or off the coldness setting of the air-conditioner may need to be adjusted seasonally by the site operator to maintain proper shelter temperature. Normal maintenance includes cleaning the air-conditioner filters. Failed components of the HVAC system are replaced as necessary. The temperature probes are

SITE OPERATOR’S HANDBOOK, OVERVIEW OF CASTNET SITE INSTRUMENTS AND EQUIPMENT Revision No. 9
October 2020 Page 21 of 24
SITE OPERATOR’S HANDBOOK Wood Environment & Infrastructure Solutions, Inc.
calibrated biannually during routine site calibration visits. Inoperative probes are replaced upon failure. Sites may use either 240 VAC or 120 VAC air-conditioners (Figures 25 through 26) depending upon the individual site electrical wiring. In all cases repairs to the HVAC system should only be attempted by qualified personnel due to the potential for electrocution. A limited number of sites use an integrated furnace and air-conditioner system manufactured by Bard Industries. With this arrangement adjustments are generally not necessary. Maintenance consists of changed fouled air return filters as necessary. Figure 21. Shelter Temperature Probe

SITE OPERATOR’S HANDBOOK, OVERVIEW OF CASTNET SITE INSTRUMENTS AND EQUIPMENT Revision No. 9
October 2020 Page 22 of 24
SITE OPERATOR’S HANDBOOK Wood Environment & Infrastructure Solutions, Inc.
Figure 22. Typical CASTNET Air Conditioner (Note that unit is plugged into outlet directly below. This outlet is switched on and off by the temperature control system.)
Figure 23. 120VAC Power Outlet switched by temperature control system

SITE OPERATOR’S HANDBOOK, OVERVIEW OF CASTNET SITE INSTRUMENTS AND EQUIPMENT Revision No. 9
October 2020 Page 23 of 24
SITE OPERATOR’S HANDBOOK Wood Environment & Infrastructure Solutions, Inc.
Figure 24. 220VAC Air-Conditioner Power Outlet
Site Physical Maintenance
It is the responsibility of the site operator to ensure that the site is in good working condition, the exterior meets standard site criteria and that the interior is neat and free of clutter. If the site operator is not able to complete part of these responsibilities due to lack of knowledge or material, it is their duty to notify a Wood field technician so proper action may be taken.
MATERIALS AND SUPPLIES
A generalized list is provided in 3.0 above.
SAFETY
Please see Section III, Attachment 5.
PROCEDURES
This document provides an overview of CASTNET site instruments and equipment.

SITE OPERATOR’S HANDBOOK, OVERVIEW OF CASTNET SITE INSTRUMENTS AND EQUIPMENT Revision No. 9
October 2020 Page 24 of 24
SITE OPERATOR’S HANDBOOK Wood Environment & Infrastructure Solutions, Inc.
REFERENCES
U.S. Environmental Protection Agency (EPA). 1994. Quality Assurance Handbook for Air Pollution Measurement Systems, Vol. I. A Field Guide to Environmental Quality Assurance. EPA/600/R-94/038a.
U.S. Environmental Protection Agency (EPA). 2008. Quality Assurance Handbook for Air Pollution
Measurement Systems, Vol. IV, Meteorological Measurements Version 2.0 (Final). EPA-454/B-08-002.
U.S. Environmental Protection Agency (EPA). 2017. Quality Assurance Handbook for Air Pollution
Measurement Systems, Vol. II, Ambient Air Quality Monitoring Program. EPA-454/B-17-001.
U.S. Environmental Protection Agency (EPA). 2000. Meteorological Monitoring Guidance for
Regulatory Modeling Applications. EPA-454/R-99-005. U.S. Environmental Protection Agency (EPA). 2019. Appendix A to Part 58 – Quality Assurance
Requirements for State and Local Air Monitoring Stations (SLAMS), Special Purpose Monitors (SPMs), and Prevention of Significant Deterioration (PSD) Air Monitoring. 40 CFR Part 58.
ATTACHMENTS
This SOP does not contain attachments.
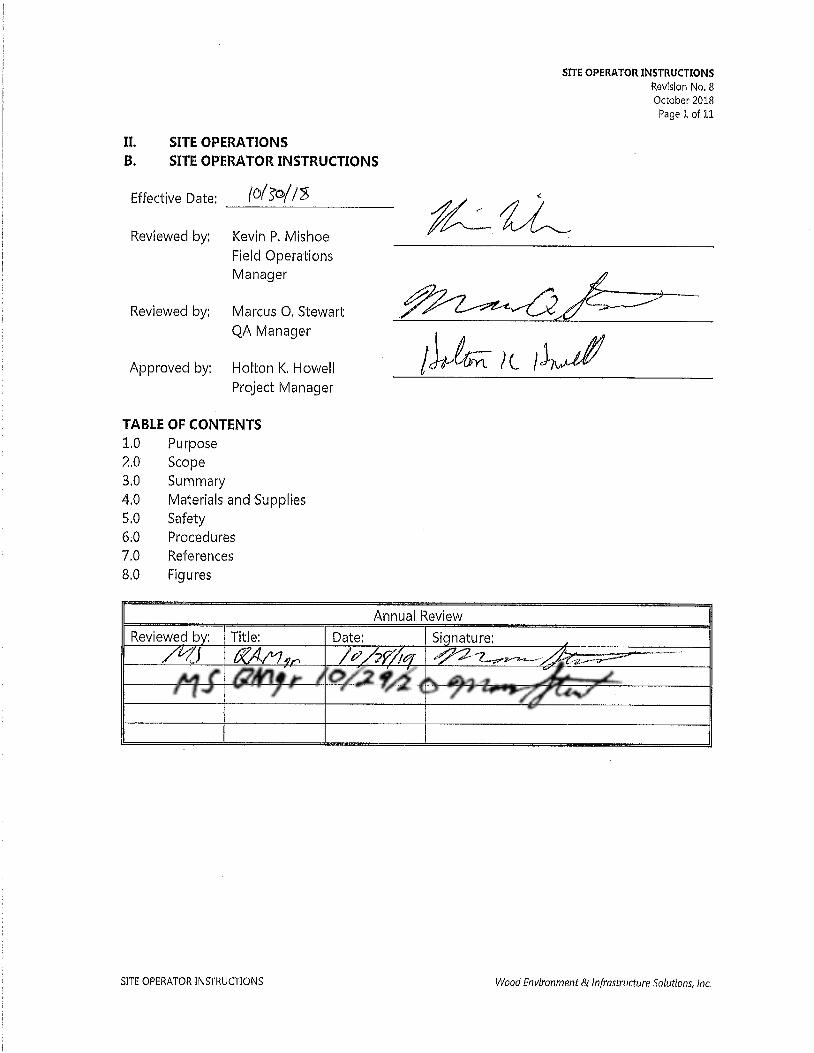

SITE OPERATOR INSTRUCTIONS Revision No. 8 October 2018 Page 2 of 11
SITE OPERATOR INSTRUCTIONS Wood Environment & Infrastructure Solutions, Inc.
II. B. SITE OPERATOR INSTRUCTIONS
PURPOSE
The purpose of this Standard Operating procedure (SOP) is to provide consistent guidance to each site operator.
SCOPE
This SOP applies to all CASTNET sites.
SUMMARY
Each Tuesday the site operator visits the site, performs routine checks and maintenance, reports results to the Field Operations Manager (FOM) by telephone, and installs a fresh filter pack. The exposed filter pack is shipped to the Gainesville office along with documentation of the site visit.
MATERIALS AND SUPPLIES
New (unexposed) filter pack Filter pack shipping tube Blank Site Status Report Form (SSRF), see Figure 1. Site Narrative Log Ink pen Disposable latex gloves
SAFETY
A hard hat must be worn when raising and lowering towers. If it is necessary to repair or service an instrument, remove personal jewelry, turn off the instrument power and disconnect (unplug) to avoid contact with live current. Always use a safety harness when climbing.
PROCEDURES
Every Site Visit: 1. Begin Site Narrative Log entry by documenting time and date of arrival, purpose of site
visit and all visitors present. Continue narrative during the site visit. 2. Turn site laptop computer on. The application “PC200” will start automatically. 3. From the PC200 main screen DOUBLE-CLICK the icon on the left labeled “1 Site Operator”.
This is the top (first) icon in the column.

SITE OPERATOR INSTRUCTIONS Revision No. 8 October 2018 Page 3 of 11
SITE OPERATOR INSTRUCTIONS Wood Environment & Infrastructure Solutions, Inc.
4. If the icon is only clicked once, PC200 will respond with a Pop-Up window “Do you want to
connect?” CLICK “Yes” or “Connect”.
5. SINGLE CLICK on the “Monitor Data” Tab at the top. PC200 will open a new window which
displays real time data, channel status, Five Minute Averages, the last Ozone auto-calibration results and current Ozone diagnostic parameters as required for the SSRF. See below for screen shot. The channel status displayed indicates whether a channel is “up” or “down”. A channel status of “FALSE” indicates that the channel is “up” and data are being recorded. This is the normal operating condition.

SITE OPERATOR INSTRUCTIONS Revision No. 8 October 2018 Page 4 of 11
SITE OPERATOR INSTRUCTIONS Wood Environment & Infrastructure Solutions, Inc.
6. Locate the “Five Minute Average” data column and record the Five Minute Averages as
required on the SSRF. 7. To down a channel: CLICK the button to the right of the word “False” to down the channel.
The “False” indication will change to “True”; indicating that the channel has been downed successfully.
8. Down both the Precipitation and Wetness channels. Downing these two channels will
initiate a counter that will count tips of the Tipping Bucket and display your wetness check result.

SITE OPERATOR INSTRUCTIONS Revision No. 8 October 2018 Page 5 of 11
SITE OPERATOR INSTRUCTIONS Wood Environment & Infrastructure Solutions, Inc.
9. Perform a ten-tip check of the tipping bucket and pour water on the Wetness Sensor. Note
that you no longer need to wait fifteen seconds between tips – Simply actuate the tipping mechanism ten times.
10. Record the displayed results on the SSRF. Then CLICK the button to the right of the word
“TRUE” on each channel to “Up” both the Precipitation and Wetness channels. 11. If the Tipping Bucket actuator is accidentally tipped other than ten times, or if the result is
not ten, then reset the counter and perform the check again. To reset the counter “Up” the channel and then “Down” the channel according to the previously described procedures.
12. Locate the Ozone data displayed at the bottom right of the PC200 data table. Record the
Ozone auto-calibration results (Zero, Span and Precision) on the SSRF. Record the auto-calibration date on the SSRF. Record the diagnostic parameters (Pressure, Temperature, Flow Rates and Intensities) on the SSRF.

SITE OPERATOR INSTRUCTIONS Revision No. 8 October 2018 Page 6 of 11
SITE OPERATOR INSTRUCTIONS Wood Environment & Infrastructure Solutions, Inc.
13. CLICK the button to the right of the word “FALSE” next to the channel to “Down” both
OZONE and FLOW channels. Both status indicators will change to “True”. 14. Turn the Flow hour-meter off. Record the time of day, as indicated by the data-logger and
the hour-meter count, in the site logbook. Lower the Flow Tower wearing hard hat. With gloved hands remove, cap and package the Filter Pack for shipping using the resealable plastic bags in which they arrived.
15. With the Flow pump on and after letting the value stabilize, record the Flow rate as
indicated by the Mass Flow Controller (MFC) Display in the “Leak Check” (Pump On) box on the SSRF. The MFC display is either a black box with digital display or a tan box with digital display.
16. Turn the Flow pump off, let the Flow value stabilize and record the MFC Display Flow value
in the “Pump Off” box on the SSRF. Verify that there is no water in lines or knockout bottle. If water is present, clear lines and bottle and report the event to Wood.
17. If scheduled, replace the Savillex filter in the Ozone Inlet Filter and/or in the filter housing
inside the shelter near the knock-out (water collection) bottle. Verify that there is no water in lines or knock-out bottle. If water is present, clear lines and bottle and report the event to Wood.
18. With gloved hands, uncap and install the unexposed Flow filter pack for the new sampling
week.

SITE OPERATOR INSTRUCTIONS Revision No. 8 October 2018 Page 7 of 11
SITE OPERATOR INSTRUCTIONS Wood Environment & Infrastructure Solutions, Inc.
19. Raise the flow tower. Turn the flow pump on. Turn the hour-meter on and reset it. “Up” the Ozone and Flow channels. Record the time of day indicated by the data-logger in the site log book.
20. Remember do not turn off the laptop before you leave the site
Site Observations: 1. Check site communications. Re-establish if off-line. Call Wood if necessary. 2. Complete all parts of the SSRF in SITE OBSERVATIONS DURING FILTER INSTALLATION
block regarding vegetation and moisture. Evaluating Meteorological Measurements: 1. Assess the reasonableness of the current meteorological measurements. If needed,
evaluate wind speed data using the Beaufort Wind Scale (NWS, 2018). Data logger output of wind speed should be consistent with the wind effects listed in Table 1. For example, a wind speed of 6.0 m/sec should be manifested by the movement of small tree branches.
Table 1. Beaufort Wind Scale
Wind Speed (m/sec) Classification
Sigma Theta (degrees) Appearance of Wind Effects
0.0 to 1.5 Light Air 32.7 Still wind vane.
2.0 to 3.0 Light Breeze 25.4 Wind felt on face, leaves rustle, vane begins to move.
3.5 to 5.0 Gentle Breeze 17.3 Leaves and small twigs constantly moving.
5.5 to 8.0 Moderate Breeze 11.0 Dust, leaves, and loose paper lifted, small tree branches move.
8.5 to 10.5 Fresh Breeze 8.1 Small trees in leaf begin to sway. 10.8 to 13.8 Strong Breeze 7.1 Large branches in motion. Whistling in overhead
wires. Umbrella use becomes difficult. 13.9 to 17.1 Near Gale 7.4 Whole trees in motion. Resistance felt walking
against the wind. 17.2 to 20.7 Gale 7.3 Twigs broken from trees. Progress generally
impeded. Note: Mean sigma theta values were calculated from 2002 measurements at Death Valley National Monument (DEV412), CA, which has been discontinued.

SITE OPERATOR INSTRUCTIONS Revision No. 8 October 2018 Page 8 of 11
SITE OPERATOR INSTRUCTIONS Wood Environment & Infrastructure Solutions, Inc.
2. The evaluation of sigma theta, the standard deviation of changes in horizontal wind direction within one hour, is more subtle. Observe the behavior of the wind vane and review 1-minute averages of sigma theta. A fluctuating wind vane should be manifested by relatively large values of sigma theta. Sigma theta values can range from a few degrees to almost 90 degrees. A completely still vane should show a sigma theta value of 0.0. Larger values of sigma theta typically occur during stable conditions with light, but fluctuating, winds and decrease with increasing wind speed. Note the mean sigma theta measurements in the Beaufort table.
3. High RH occurs when dew and/or precipitation are present. A feeling of humidity in the air
also suggests high values of RH. 4. Wind direction measurements can be evaluated by comparing the orientation of the vane
(i.e., using the instrument tower’s North-South cross-arm as a guide) with 1-minute values from the data logger.
5. Temperature values should be evaluated for reasonableness. Confirm that the blowers for
both the upper and lower sensors are functioning. Feel for proper directional air flow at the opening of the lower housing. To convert data logger values from degrees Celsius (C) to degrees Fahrenheit (F) use the following equation:
C * ( 59 ) + 32 = F
6. Delta temperature is defined as the difference in temperature between the 9 m (T1) and
the 2 m (T2) sensors. The normal delta temperature range is -5°C to 5°C. The pattern for delta temperature values in a 24-hour period should generally be negative or smaller at nighttime and positive or larger during the daytime hours. Values should approach 0°C under high wind conditions or during significant rainfall events.
7. Tuesday: Call the Field Coordination Center at 1-352-332-5770* or 352-333-6611. Give the
site ID number, and report the following: 8. Mass flow reading, 9. Rotameter reading,
NOTE: * This is a direct line to all calibrator desks. It may be busy for long periods of time, and calls to this line cannot be transferred between technicians once it is answered. To use the automated central phone system call:
1-352-332-3318 or 1-888-224-5663 Field Operations Phone ext. 6611

SITE OPERATOR INSTRUCTIONS Revision No. 8 October 2018 Page 9 of 11
SITE OPERATOR INSTRUCTIONS Wood Environment & Infrastructure Solutions, Inc.
10. Leak check reading, 11. 10-tip check value, 12. Wetness sensor response, 13. Ozone automatic calibration results, and 14. Any problems. Ship the Following to Wood: 1. In a PVC TUBE: a. Filter packs and the SSRF (white copy). Securely cap the PVC tube, tape the tube shut, put
a return label on the tube, and put your initials on the label. 2. In a LARGE ENVELOPE: a. SSRF (yellow copy) and completed logbook copies (white and yellow copies). 3. Verify that channels are up, flow pump is on, and data are reasonable. 4. Sign out in the logbook. Note the time.

SITE OPERATOR INSTRUCTIONS Revision No. 8 October 2018 Page 10 of 11
SITE OPERATOR INSTRUCTIONS Wood Environment & Infrastructure Solutions, Inc.
REFERENCES
Manufacturer Instructions U.S. Environmental Protection Agency (EPA). 1994. Quality Assurance Handbook for Air Pollution
Measurement Systems, Vol. I. A Field Guide to Environmental Quality Assurance. EPA/600/R-94/038a.
U.S. Environmental Protection Agency (EPA). 2008. Quality Assurance Handbook for Air Pollution
Measurement Systems, Vol. IV, Meteorological Measurements Version 2.0 (Final). EPA-454/B-08-002.
U.S. Environmental Protection Agency (EPA). 2013. Quality Assurance Handbook for Air Pollution
Measurement Systems, Vol. II, Ambient Air Quality Monitoring Program. EPA-454/B-13-003.
U.S. Environmental Protection Agency (EPA). 2000. Meteorological Monitoring Guidance for
Regulatory Modeling Applications. EPA-454/R-99-005. U.S. Environmental Protection Agency (EPA). 2015. Appendix A to Part 58 – Quality Assurance
Requirements for State and Local Air Monitoring Stations (SLAMS), Special Purpose Monitors (SPMs), and Prevention of Significant Deterioration (PSD) Air Monitoring. 40 CFR Part 58.

SITE OPERATOR INSTRUCTIONS Revision No. 8 October 2018 Page 11 of 11
SITE OPERATOR INSTRUCTIONS Wood Environment & Infrastructure Solutions, Inc.
FIGURES
Figure 1. Site Status Report Form (SSRF)


SITE OPERATOR INSTRUCTIONS SMALL FOOTPRINT SITES Revision No. 0 October 2018
Page 2 of 5
SITE OPERATOR INSTRUCTIONS SMALL FOOTPRINT SITES Wood Environment & Infrastructure Solutions, Inc.
II. B. 1. SMALL FOOTPRINT SITES
PURPOSE
The purpose of this Standard Operating procedure (SOP) is to provide consistent guidance to each site operator for small footprint sites.
SCOPE
This SOP applies to all CASTNET small footprint sites.
SUMMARY
Each Tuesday the site operator visits the site, performs routine checks and maintenance, reports results to the Field Operations Manager (FOM) by telephone, and installs a fresh filter pack. The exposed filter pack is shipped to the Gainesville office along with documentation of the site visit.
MATERIALS AND SUPPLIES
New (unexposed) filter pack Filter pack shipping tube Blank Site Status Report Form (SSRF), see Figure 1 for a completed form. Site Narrative Log Ink pen Disposable latex gloves
SAFETY
A hard hat must be worn when raising and lowering towers. If it is necessary to repair or service an instrument, remove personal jewelry, turn off the instrument power and disconnect (unplug) to avoid contact with live current. Always use a safety harness when climbing.
PROCEDURES
Data Logger Data Access
• From a blank screen, press any soft key to light the display. • From the main screen, press the Enter soft key. • With the > next to Data, press the Enter soft key. • Enter the Security Code, and press the Enter soft key. • With the > next to Real Time Tables, press the Enter soft key. • With the > next to Public, press the Enter soft key. • To get back in the menu tree, press the ESC soft key.
Field Site Operator Procedures
6.2.1 Upon arrival:
Record the date, time, personnel onsite and any equipment/site modifications performed in the site narrative log. Check the current flow rate reported by the MFC and data logger and the
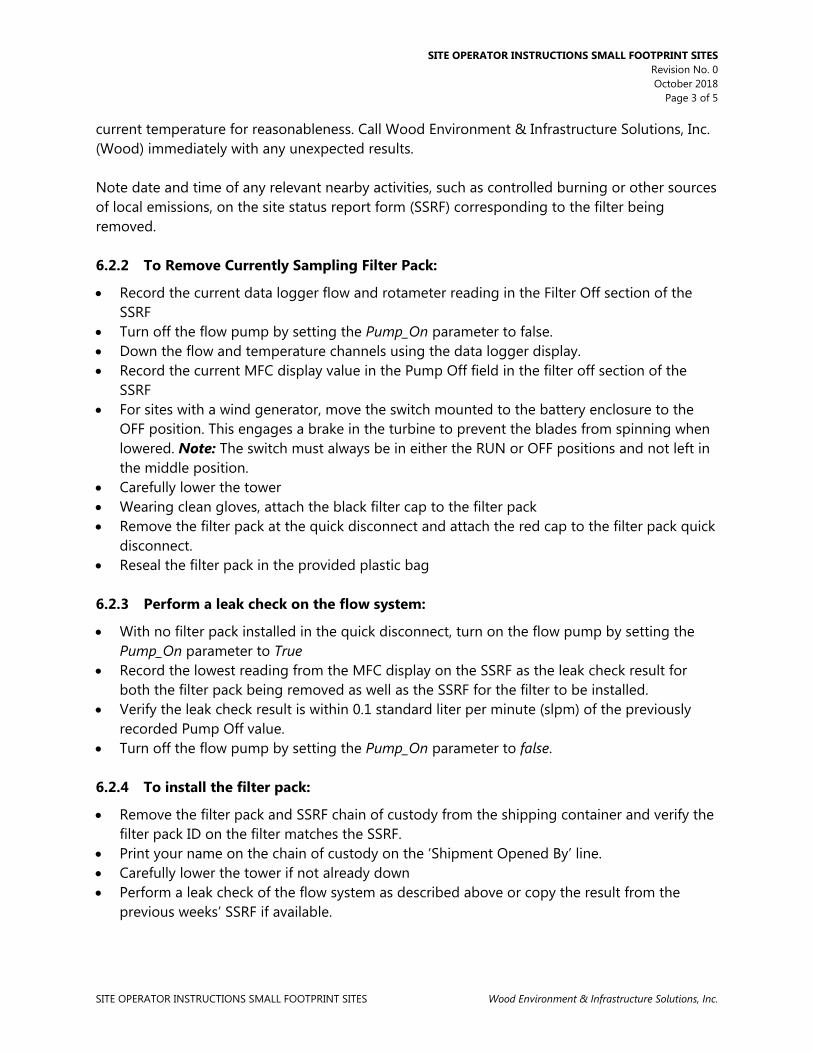
SITE OPERATOR INSTRUCTIONS SMALL FOOTPRINT SITES Revision No. 0 October 2018
Page 3 of 5
SITE OPERATOR INSTRUCTIONS SMALL FOOTPRINT SITES Wood Environment & Infrastructure Solutions, Inc.
current temperature for reasonableness. Call Wood Environment & Infrastructure Solutions, Inc. (Wood) immediately with any unexpected results. Note date and time of any relevant nearby activities, such as controlled burning or other sources of local emissions, on the site status report form (SSRF) corresponding to the filter being removed. 6.2.2 To Remove Currently Sampling Filter Pack:
• Record the current data logger flow and rotameter reading in the Filter Off section of the SSRF
• Turn off the flow pump by setting the Pump_On parameter to false. • Down the flow and temperature channels using the data logger display. • Record the current MFC display value in the Pump Off field in the filter off section of the
SSRF • For sites with a wind generator, move the switch mounted to the battery enclosure to the
OFF position. This engages a brake in the turbine to prevent the blades from spinning when lowered. Note: The switch must always be in either the RUN or OFF positions and not left in the middle position.
• Carefully lower the tower • Wearing clean gloves, attach the black filter cap to the filter pack • Remove the filter pack at the quick disconnect and attach the red cap to the filter pack quick
disconnect. • Reseal the filter pack in the provided plastic bag 6.2.3 Perform a leak check on the flow system:
• With no filter pack installed in the quick disconnect, turn on the flow pump by setting the Pump_On parameter to True
• Record the lowest reading from the MFC display on the SSRF as the leak check result for both the filter pack being removed as well as the SSRF for the filter to be installed.
• Verify the leak check result is within 0.1 standard liter per minute (slpm) of the previously recorded Pump Off value.
• Turn off the flow pump by setting the Pump_On parameter to false. 6.2.4 To install the filter pack:
• Remove the filter pack and SSRF chain of custody from the shipping container and verify the filter pack ID on the filter matches the SSRF.
• Print your name on the chain of custody on the ‘Shipment Opened By’ line. • Carefully lower the tower if not already down • Perform a leak check of the flow system as described above or copy the result from the
previous weeks’ SSRF if available.

SITE OPERATOR INSTRUCTIONS SMALL FOOTPRINT SITES Revision No. 0 October 2018
Page 4 of 5
SITE OPERATOR INSTRUCTIONS SMALL FOOTPRINT SITES Wood Environment & Infrastructure Solutions, Inc.
• Wearing clean gloves, remove the filter pack from the plastic bag and remove the red cap from the filter pack quick disconnect
• Leaving the black inlet side cap in place, install the filter pack in the quick connect fitting until the locking ring clicks into place and the filter pack cannot be pulled free
• Remove the black inlet side cap and reseal both the red and black caps in the plastic bag • Raise and secure the tower • For sites with a wind generator, move the switch mounted to the battery enclosure to the
RUN position. This allows the turbine generate power. Note: The switch must always be in either the RUN or OFF positions and not left in the middle position.
• Record the current MFC display value in the Pump Off field in the Filter On section of the SSRF
• Up the flow and temperature channels using the data logger display. • Turn on the flow pump by setting the Pump_On parameter to true. • Record the current data logger flow in the filter on section of the SSRF • Record the current rotameter value in the Filter On section of the SSRF
REFERENCES
Manufacturer Instructions U.S. Environmental Protection Agency (EPA). 1994. Quality Assurance Handbook for Air Pollution
Measurement Systems, Vol. I. A Field Guide to Environmental Quality Assurance. EPA/600/R-94/038a.
U.S. Environmental Protection Agency (EPA). 2008. Quality Assurance Handbook for Air Pollution
Measurement Systems, Vol. IV, Meteorological Measurements Version 2.0 (Final). EPA-454/B-08-002.
U.S. Environmental Protection Agency (EPA). 2013. Quality Assurance Handbook for Air Pollution
Measurement Systems, Vol. II, Ambient Air Quality Monitoring Program. EPA-454/B-13-003.
U.S. Environmental Protection Agency (EPA). 2000. Meteorological Monitoring Guidance for
Regulatory Modeling Applications. EPA-454/R-99-005. U.S. Environmental Protection Agency (EPA). 2015. Appendix A to Part 58 – Quality Assurance
Requirements for State and Local Air Monitoring Stations (SLAMS), Special Purpose Monitors (SPMs), and Prevention of Significant Deterioration (PSD) Air Monitoring. 40 CFR Part 58.

SITE OPERATOR INSTRUCTIONS SMALL FOOTPRINT SITES Revision No. 0 October 2018
Page 5 of 5
SITE OPERATOR INSTRUCTIONS SMALL FOOTPRINT SITES Wood Environment & Infrastructure Solutions, Inc.
FIGURES
Figure 1. Site Status Report Form (SSRF)


FIELD OPERATIONS MANUAL SITE DATA ACQUISITION SYSTEM Revision No. 9 October 2019 Page 2 of 11
FIELD OPERATIONS MANUAL SITE DATA ACQUISITION SYSTEM Wood Environment & Infrastructure Solutions, Inc.
II. C. 1. SITE DATA ACQUISITION SYSTEM
PURPOSE
The purpose of this Standard Operating Procedure (SOP) is to provide consistent guidance to each site operator for operating the site data logger.
SCOPE
This SOP applies to the operation of all EPA sponsored CASTNET sites equipped with Campbell Scientific Model CR3000 data loggers.
SUMMARY
The data acquisition system (DAS) used at EPA sponsored CASTNET sites includes a Campbell Scientific Model CR3000 data logger, Campbell Scientific NL115 or NL116 Ethernet Module, Laptop Computer and Modem, either Digi TransPort LR54, cellular Raven or telephone COM220. The specific instructions used by the site operator while performing routine site operations are described in Section II.B. This section is intended to provide a general description of the data logger operation and proper data collection configuration as pertinent to CASTNET operations. A detailed description can be found in the Campbell Scientific Model CR3000 Operating Manual. A photo of the wall mounted data logger and communications backplane is showing in Figure 1. Other photos of the data logger system are provided in Section II.A.2, Subsection 3.2. Figure 1. DAS System: Wall Mounted Data logger and Communications Backplane
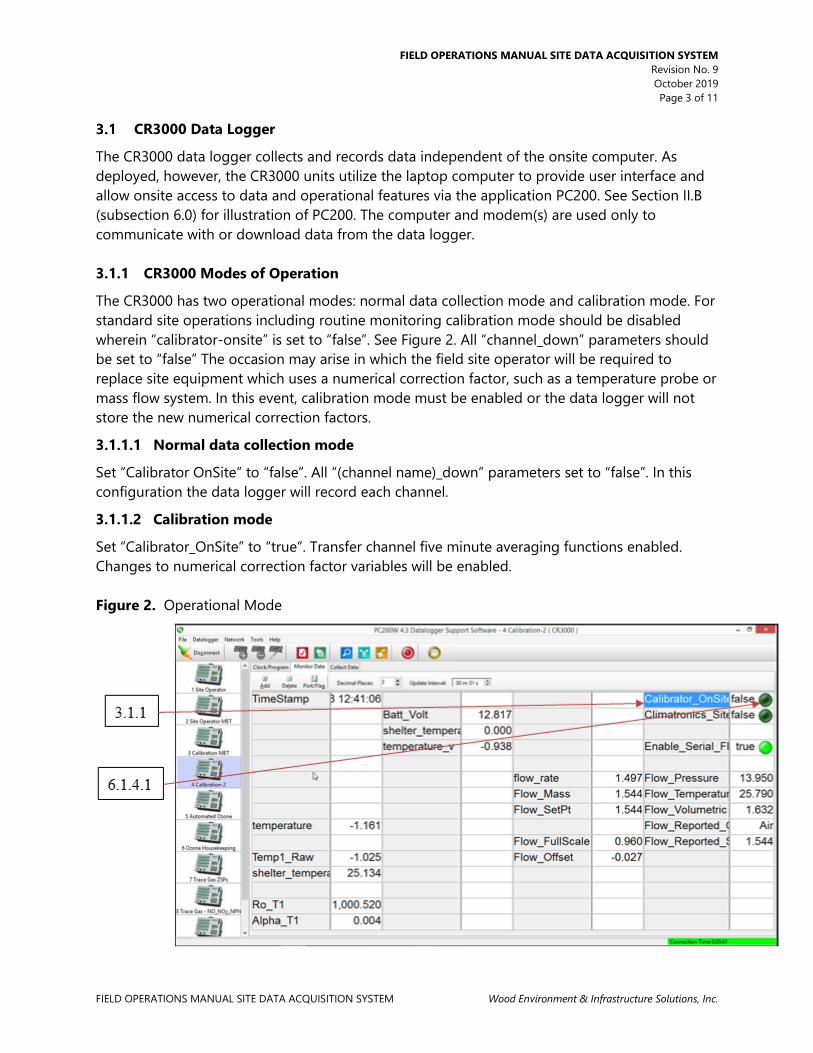
FIELD OPERATIONS MANUAL SITE DATA ACQUISITION SYSTEM Revision No. 9 October 2019 Page 3 of 11
FIELD OPERATIONS MANUAL SITE DATA ACQUISITION SYSTEM Wood Environment & Infrastructure Solutions, Inc.
CR3000 Data Logger
The CR3000 data logger collects and records data independent of the onsite computer. As deployed, however, the CR3000 units utilize the laptop computer to provide user interface and allow onsite access to data and operational features via the application PC200. See Section II.B (subsection 6.0) for illustration of PC200. The computer and modem(s) are used only to communicate with or download data from the data logger. 3.1.1 CR3000 Modes of Operation
The CR3000 has two operational modes: normal data collection mode and calibration mode. For standard site operations including routine monitoring calibration mode should be disabled wherein “calibrator-onsite” is set to “false”. See Figure 2. All “channel_down” parameters should be set to “false” The occasion may arise in which the field site operator will be required to replace site equipment which uses a numerical correction factor, such as a temperature probe or mass flow system. In this event, calibration mode must be enabled or the data logger will not store the new numerical correction factors.
3.1.1.1 Normal data collection mode
Set “Calibrator OnSite” to “false”. All “(channel name)_down” parameters set to “false”. In this configuration the data logger will record each channel.
3.1.1.2 Calibration mode
Set “Calibrator_OnSite” to “true”. Transfer channel five minute averaging functions enabled. Changes to numerical correction factor variables will be enabled. Figure 2. Operational Mode

FIELD OPERATIONS MANUAL SITE DATA ACQUISITION SYSTEM Revision No. 9 October 2019 Page 4 of 11
FIELD OPERATIONS MANUAL SITE DATA ACQUISITION SYSTEM Wood Environment & Infrastructure Solutions, Inc.
3.1.2 Site Type: Climatronics or R.M. Young Meteorological Equipment
Each data logger is programmed for deployment at sites utilizing either Climatronics or R.M. Young equipment. However, all EPA sites currently use R.M. Young instruments and, consequently, “Climatronics_Site” must be set to “false”. See Figure 3. Figure 3. Site Instrumentation
3.1.3 PC200 Application
Features of the CR3000 and its associated software are available through the pushbutton and LCD display interface on the data logger front panel. However, site operators and field calibrators use a laptop computer and the software application PC200 to access data, up/down channels, and assess the operational status of the data logger and site instrumentation. The CR3000 Primary interface for site operations consists of an array of “network configuration grids”. The available grids are displayed within the PC200 application default window on the left side following the establishment of communications with the data logger. See Figure 4. The function of each network configuration grid is detailed in the following table below:

FIELD OPERATIONS MANUAL SITE DATA ACQUISITION SYSTEM Revision No. 9 October 2019 Page 5 of 11
FIELD OPERATIONS MANUAL SITE DATA ACQUISITION SYSTEM Wood Environment & Infrastructure Solutions, Inc.
PC200 Network Configuration Grids Network Configuration Grid Function(s) & Parameters
1 Site Operator
Julian Date and Time (Columns 1&2) Instantaneous data in engineering units (Columns 1&2) Five-minute average data in engineering units (Columns 3&4) Blower status indications (Columns 5&6) Channel up/down controls (Columns 5&6) Ozone ZSP control (Columns 5&6) Ozone housekeeping parameters (Columns 7&8) Precipitation and Wetness check controls (Columns 7&8) Precipitation and Wetness check values (Columns 7&8) Ozone ZSP results (Columns 7&8)
2 Site Operator 2 Trace gas instantaneous engineering units (Columns 1&2) Trace gas channel up/down controls (Columns 3&4) Trace gas ZSP results (Columns 5&6, 7&8)
3 Calibration
Instantaneous data in engineering units (Columns 1&2) Instantaneous transfer data in engineering units (Columns 1&2) Instantaneous data channel voltages (Columns 3&4) Channel up/down controls (Columns 5&6) Calibrator on site toggle (Columns 7&8) Site type RMY toggle (Columns 7&8) Wetness/Precipitation Check values (Columns 7&8) Transfer average engineering unit values (columns 7&8)
4 Calibration-2
Raw and Corrected temperature values (Columns 1&2) Temperature Correction Coefficients: ρ & α (Columns 1&2) Flow rate units and voltage (Columns 5&6) Flow rate Full Scale and Offset values (Columns 5&6) Blower status indicators (Columns 7&8) Calibrator on site toggle (Columns 7&8) Site type RMY toggle (Columns 7&8) Ozone and ozone transfer value and averages (Columns 5&6,7&8)
5 Continuous Analyzers Continuous gas analyzer instantaneous units (Columns 1&2) Continuous gas analyzer ZSP status (Columns 3&4, 5&6, 7&8) Continuous gas analyzer ZSP toggles (Columns 3&4, 5&6, 7&8)
6 Trace Gas
Continuous gas analyzer instantaneous units (Columns 1&2) Continuous gas analyzer averages (Columns 3&4) Continuous gas analyzer voltages & flags (Columns 5&6, 7&8) Continuous gas analyzer variable conditions (Columns 5&6, 7&8)
Network configuration grid files are stored locally on the site laptop as well as on Wood Environment & Infrastructure Solutions, Inc. (Wood) data collection/operations server(s).
Campbell Scientific NL115/116 Ethernet/Compact Flash Module
The data logger NL115 or NL116 module is not user serviceable. In the event of failure contact Wood Field Operations Personnel and replace the unit as instructed.

FIELD OPERATIONS MANUAL SITE DATA ACQUISITION SYSTEM Revision No. 9 October 2019 Page 6 of 11
FIELD OPERATIONS MANUAL SITE DATA ACQUISITION SYSTEM Wood Environment & Infrastructure Solutions, Inc.
Figure 4. PC200 Grids
Laptop Computer
The site laptop computer should be left on at all times. It is not user serviceable. In the event of failure contact Wood Field Operations Personnel and replace the unit as instructed.
Network Router
The site router should be operational at all times. It is not user serviceable In the event of failure contact Wood Field Operations Personnel and replace the unit as instructed.
Campbell Scientific COM220 Modem
The COM220 should be operational at all times, where applicable. It is not user serviceable. In the event of failure contact Wood Field Operations Personnel and replace the unit as instructed.
AirLink RAVEN X Modem: All models
RAVEN modems should be operational at all times. In the event of failure power unit should be cycled to reset the connection to the ISP prior to making the determination to replace the unit. Wood field operations personnel will contact site operators at sites with Raven modem failures. 3.6.1 Normal operation of Raven modem
All of the LED indicators on the Raven should be ON during normal operation. See Figure 5. The “Activity” and “Service” lights typically blink during normal operation. In the event that the modem loses communication with the ISP cycle the power.

FIELD OPERATIONS MANUAL SITE DATA ACQUISITION SYSTEM Revision No. 9 October 2019 Page 7 of 11
FIELD OPERATIONS MANUAL SITE DATA ACQUISITION SYSTEM Wood Environment & Infrastructure Solutions, Inc.
Figure 5. Raven LED Indicators
3.6.2 Power cycle the Raven modem
Unplug the grey power cord on the rear of the modem housing by depressing the lever clip and pull the connector straight out of its port. Wait ten seconds then plug the connector back into the same port.
Digi TransPort LR54
The Digi TransPort LR54 is a high performance LTE-Advanced high-speed cellular router in an extended operating temperature enclosure. In the event of failure power unit should be cycled to reset the connection to the ISP prior to making the determination to replace the unit. Wood field operations personnel will contact site operators at sites with LR54 router failures.
MATERIALS, SUPPLIES, REPAIR AND MAINTENANCE
Campbell Scientific Model CR3000 data logger Laptop computer with RS232 serial port or USB to RS232 adaptor Campbell Scientific PC200 Windows XP SP3 executable application Campbell Scientific COM220 phone modem and/or AirLink Communications Raven X H4223-C
and/or Digi TransPort LR54 cellular router. Campbell Scientific CR3000 data loggers cannot be calibrated in the field. Replace the unit
if necessary. Maintenance includes battery replacement as necessary. Replace Terminal Block if necessary Replace NL115 or NL116 if necessary. Replace power adapter if necessary.
SAFETY
The same level of care and caution should be exercised while using the laptop/computer as would be taken when using any electrically powered device. Keep all cords out of walkways. If needed, use appropriately rated extension cords and surge protectors, and do not overload the electrical circuit. Keep liquids and food away from the computer and keyboard.
PROCEDURES
CR3000 Data Logger Operation through PC200 Interface via Site Laptop
Note: See Section II.B for depictions of the PC200 interface.

FIELD OPERATIONS MANUAL SITE DATA ACQUISITION SYSTEM Revision No. 9 October 2019 Page 8 of 11
FIELD OPERATIONS MANUAL SITE DATA ACQUISITION SYSTEM Wood Environment & Infrastructure Solutions, Inc.
6.1.1 Starting the PC200 application
PC200 will load automatically upon start up of the site laptop. PC200 may also be started through the MS Windows start button>all programs>PC200W>PC200 menu structure. 6.1.2 Recovery of Corrupted PC200 Network Configuration Grids
Note: Corruption of Network Configuration grid most often occurs when a cell or cells on the grid are “dragged and dropped” onto adjacent cells or simply deleted from the grid. Recovery of the proper Network Grid configuration may be accomplished remotely through Wood Field Operations or Data Operations Personnel, or locally through the PC200 interface. To recover a Network Configuration remotely call Wood Field Operations. To perform the task onsite: 1. In the PC200 application click “Network” 2. Click “Backup/Restore Network” 3. On the pop-up dialog box click “Restore”.

FIELD OPERATIONS MANUAL SITE DATA ACQUISITION SYSTEM Revision No. 9 October 2019 Page 9 of 11
FIELD OPERATIONS MANUAL SITE DATA ACQUISITION SYSTEM Wood Environment & Infrastructure Solutions, Inc.
6.1.3 Enabling and Disabling Data Collection Channels
In normal operation all “channel_down” parameters should be set to “false” for proper data collection. To Down (or disable) a channel set the appropriate channel “channel_down” parameter to “true”. Click the “false” indication button in the cell to the right of the “channel_down” parameter. The “false” indication will toggle to “true” and the channel will be offline.

FIELD OPERATIONS MANUAL SITE DATA ACQUISITION SYSTEM Revision No. 9 October 2019 Page 10 of 11
FIELD OPERATIONS MANUAL SITE DATA ACQUISITION SYSTEM Wood Environment & Infrastructure Solutions, Inc.
To Up (or enable) a channel set the appropriate “channel_down” parameter to “false”. Click the “true” indication in the cell to the right of the “channel_down” parameter. The “true” indication will toggle to “false” and the channel will be enabled.
Note: ALWAYS ENSURE THAT ALL CHANNELS ARE ENABLED PRIOR TO LEAVING SITE.
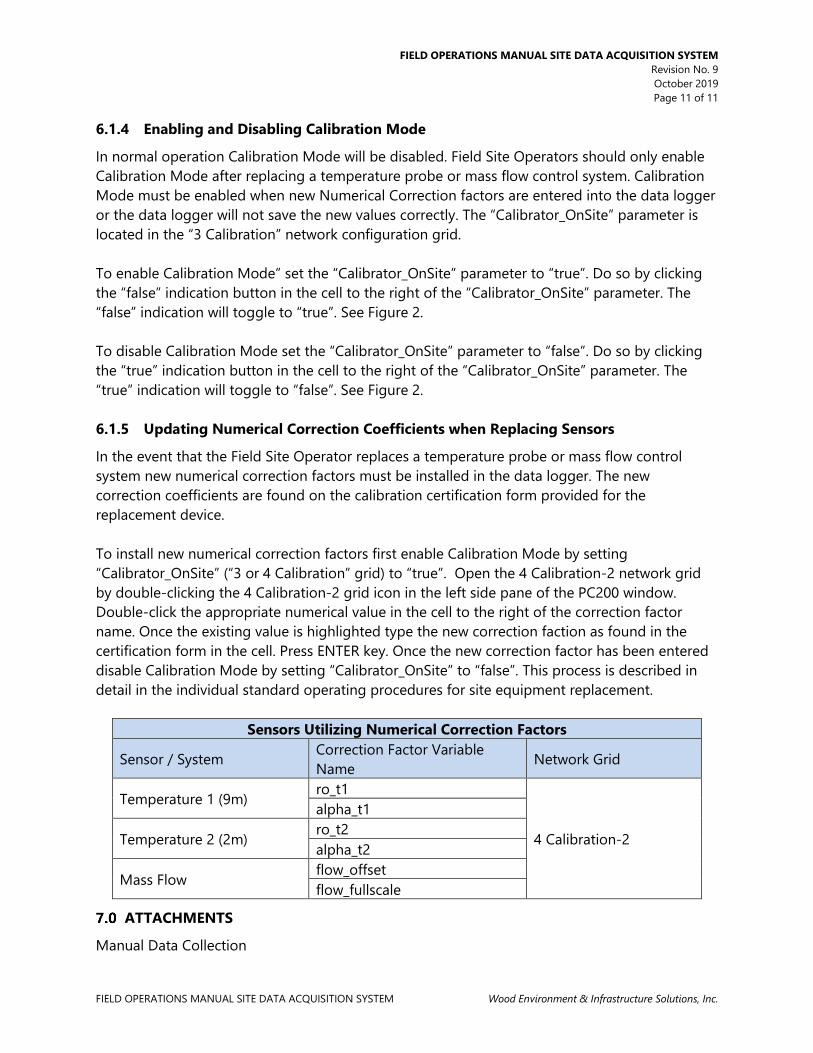
FIELD OPERATIONS MANUAL SITE DATA ACQUISITION SYSTEM Revision No. 9 October 2019 Page 11 of 11
FIELD OPERATIONS MANUAL SITE DATA ACQUISITION SYSTEM Wood Environment & Infrastructure Solutions, Inc.
6.1.4 Enabling and Disabling Calibration Mode
In normal operation Calibration Mode will be disabled. Field Site Operators should only enable Calibration Mode after replacing a temperature probe or mass flow control system. Calibration Mode must be enabled when new Numerical Correction factors are entered into the data logger or the data logger will not save the new values correctly. The “Calibrator_OnSite” parameter is located in the “3 Calibration” network configuration grid. To enable Calibration Mode” set the “Calibrator_OnSite” parameter to “true”. Do so by clicking the “false” indication button in the cell to the right of the “Calibrator_OnSite” parameter. The “false” indication will toggle to “true”. See Figure 2. To disable Calibration Mode set the “Calibrator_OnSite” parameter to “false”. Do so by clicking the “true” indication button in the cell to the right of the “Calibrator_OnSite” parameter. The “true” indication will toggle to “false”. See Figure 2. 6.1.5 Updating Numerical Correction Coefficients when Replacing Sensors
In the event that the Field Site Operator replaces a temperature probe or mass flow control system new numerical correction factors must be installed in the data logger. The new correction coefficients are found on the calibration certification form provided for the replacement device. To install new numerical correction factors first enable Calibration Mode by setting “Calibrator_OnSite” (“3 or 4 Calibration” grid) to “true”. Open the 4 Calibration-2 network grid by double-clicking the 4 Calibration-2 grid icon in the left side pane of the PC200 window. Double-click the appropriate numerical value in the cell to the right of the correction factor name. Once the existing value is highlighted type the new correction faction as found in the certification form in the cell. Press ENTER key. Once the new correction factor has been entered disable Calibration Mode by setting “Calibrator_OnSite” to “false”. This process is described in detail in the individual standard operating procedures for site equipment replacement.
Sensors Utilizing Numerical Correction Factors
Sensor / System Correction Factor Variable Name Network Grid
Temperature 1 (9m) ro_t1
4 Calibration-2
alpha_t1
Temperature 2 (2m) ro_t2 alpha_t2
Mass Flow flow_offset flow_fullscale
ATTACHMENTS
Manual Data Collection

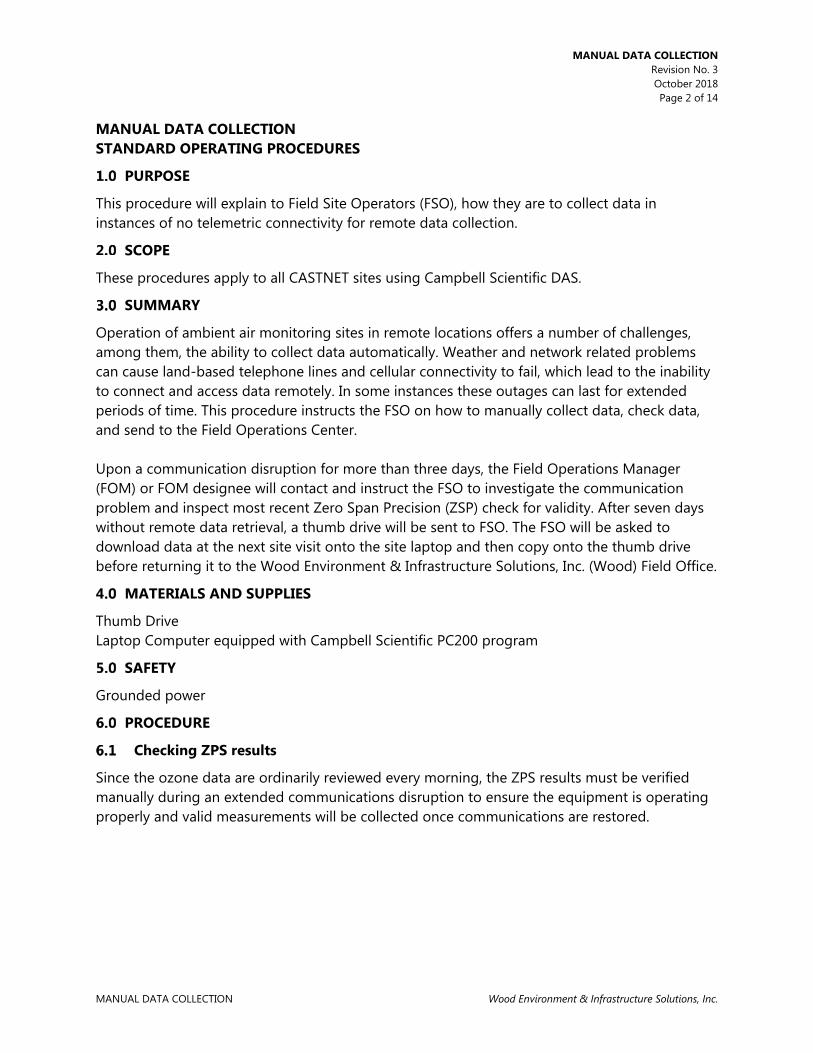
MANUAL DATA COLLECTION Revision No. 3
October 2018 Page 2 of 14
MANUAL DATA COLLECTION Wood Environment & Infrastructure Solutions, Inc.
MANUAL DATA COLLECTION STANDARD OPERATING PROCEDURES
PURPOSE
This procedure will explain to Field Site Operators (FSO), how they are to collect data in instances of no telemetric connectivity for remote data collection.
SCOPE
These procedures apply to all CASTNET sites using Campbell Scientific DAS.
SUMMARY
Operation of ambient air monitoring sites in remote locations offers a number of challenges, among them, the ability to collect data automatically. Weather and network related problems can cause land-based telephone lines and cellular connectivity to fail, which lead to the inability to connect and access data remotely. In some instances these outages can last for extended periods of time. This procedure instructs the FSO on how to manually collect data, check data, and send to the Field Operations Center. Upon a communication disruption for more than three days, the Field Operations Manager (FOM) or FOM designee will contact and instruct the FSO to investigate the communication problem and inspect most recent Zero Span Precision (ZSP) check for validity. After seven days without remote data retrieval, a thumb drive will be sent to FSO. The FSO will be asked to download data at the next site visit onto the site laptop and then copy onto the thumb drive before returning it to the Wood Environment & Infrastructure Solutions, Inc. (Wood) Field Office.
MATERIALS AND SUPPLIES
Thumb Drive Laptop Computer equipped with Campbell Scientific PC200 program
SAFETY
Grounded power
PROCEDURE
Checking ZPS results
Since the ozone data are ordinarily reviewed every morning, the ZPS results must be verified manually during an extended communications disruption to ensure the equipment is operating properly and valid measurements will be collected once communications are restored.

MANUAL DATA COLLECTION Revision No. 3
October 2018 Page 3 of 14
MANUAL DATA COLLECTION Wood Environment & Infrastructure Solutions, Inc.
6.1.1 Make sure the Campbell Scientific PC200W program is running on the site laptop and is located on the 1 Site Operator grid or the 2 Site Operator MET grid for sites with meteorological equipment of the Monitor Data tab (Figure 1).
Figure 1. 1 Site Operator Page of the Monitor Data Tab
6.1.2 Click the Collect Data tab (Figure 2)
6.1.3 New data from datalogger button should be selected (Figure 2)
6.1.4 Verify the OzoneAudit checkbox is checked (Figure 2)
6.1.5 Click the Start Data Collection button (Figure 2)
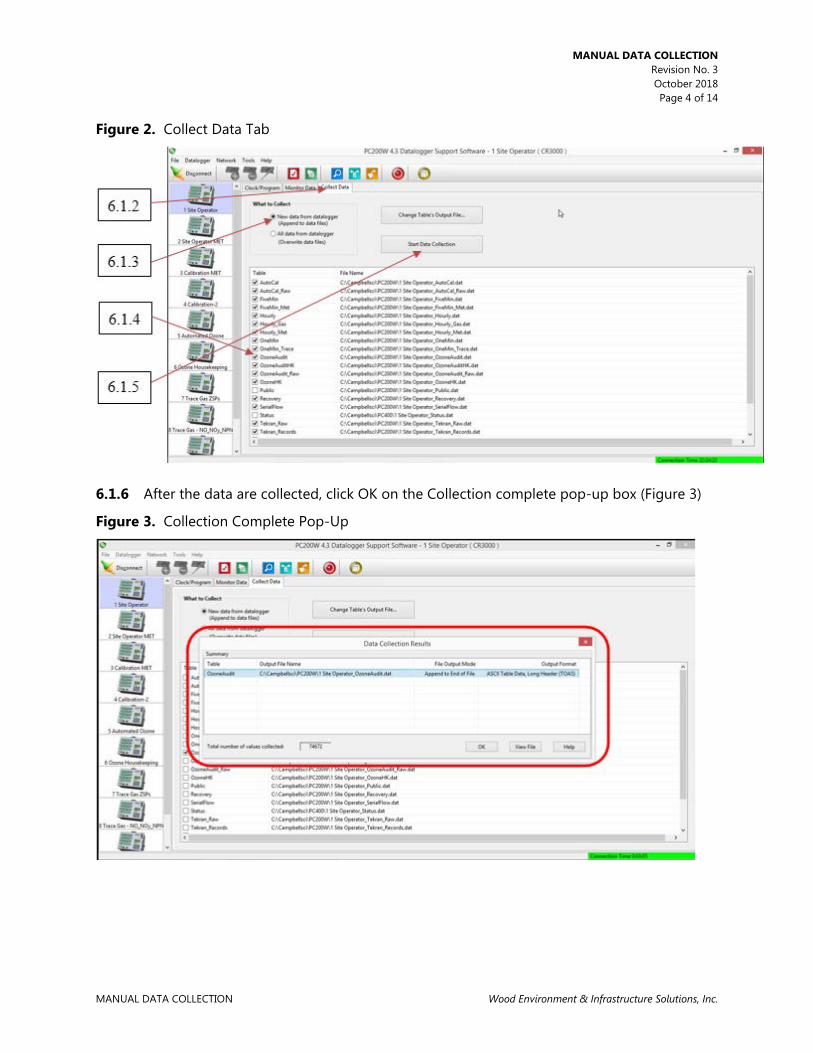
MANUAL DATA COLLECTION Revision No. 3
October 2018 Page 4 of 14
MANUAL DATA COLLECTION Wood Environment & Infrastructure Solutions, Inc.
Figure 2. Collect Data Tab
6.1.6 After the data are collected, click OK on the Collection complete pop-up box (Figure 3)
Figure 3. Collection Complete Pop-Up

MANUAL DATA COLLECTION Revision No. 3
October 2018 Page 5 of 14
MANUAL DATA COLLECTION Wood Environment & Infrastructure Solutions, Inc.
6.1.7 Click the View icon at the top of the page (Figure 4)
Figure 4. View Window Open
6.1.8 To view the data files, click the Open icon on the View32-Data Panel window (Figure 5)
Figure 5. Open Icon

MANUAL DATA COLLECTION Revision No. 3
October 2018 Page 6 of 14
MANUAL DATA COLLECTION Wood Environment & Infrastructure Solutions, Inc.
6.1.9 Click the 1Site Operator_OzoneAudit file to highlight it, then click Open (Figure 6)
Figure 6. Opening the OzoneAudit File
6.1.10 Call the Field Office 1-888-224-5663 ext6611 and discuss the recent ZSP results (Figure 7)
Figure 7. ZSP Results
Downloading Data
After a period of seven days without remote data collection, all the data must be collected manually and the data files are sent to the Field Office

MANUAL DATA COLLECTION Revision No. 3
October 2018 Page 7 of 14
MANUAL DATA COLLECTION Wood Environment & Infrastructure Solutions, Inc.
6.2.1 Perform steps 6.1.1, 6.1.2, and 6.1.3
6.2.2 All sites should have the FiveMin, Hourly, and Recovery checkboxes checked
6.2.3 If the following equipment is operating at the site, their associated checkboxes must be checked in addition to the checkboxes in the previous step (see Figure 8 for an example):
• Ozone – OzoneAudit, OzoneAudit_Raw and OzoneHK checkboxes • Trace analyzers (NOy, SO
2 or CO) – AutoCal and OneMin_Trace checkboxes • Meteorological – FivMin_Met and Hourly_Met checkboxes • Tekran – Tekran_Raw and Tekran_Records
Note: For a site with a filter pack, the data will be collected with check boxes selected in step 6.2.2. Figure 8. Eight Checkboxes for a Site Operating Filter Pack, Ozone Analyzer, and NOy Trace Gas
Analyzer

MANUAL DATA COLLECTION Revision No. 3
October 2018 Page 8 of 14
MANUAL DATA COLLECTION Wood Environment & Infrastructure Solutions, Inc.
6.2.4 Click on Start Data Collection button (Figures 2 and 8)
6.2.5 Perform step 6.1.6
6.2.6 Insert the supplied thumb drive into a USB port on the site laptop (Figures 9 and 10)
Figure 9. Site Laptop USB Ports
Figure 10. Thumb Drive in USB Port
6.2.7 Click File Explorer icon at the bottom of the site laptop screen (Figure 11)

MANUAL DATA COLLECTION Revision No. 3
October 2018 Page 9 of 14
MANUAL DATA COLLECTION Wood Environment & Infrastructure Solutions, Inc.
Figure 11. File Explorer Icon
6.2.8 Double click the PC200W folder (Figure 12)
Figure 12. C:\Campbellsci\PC200W
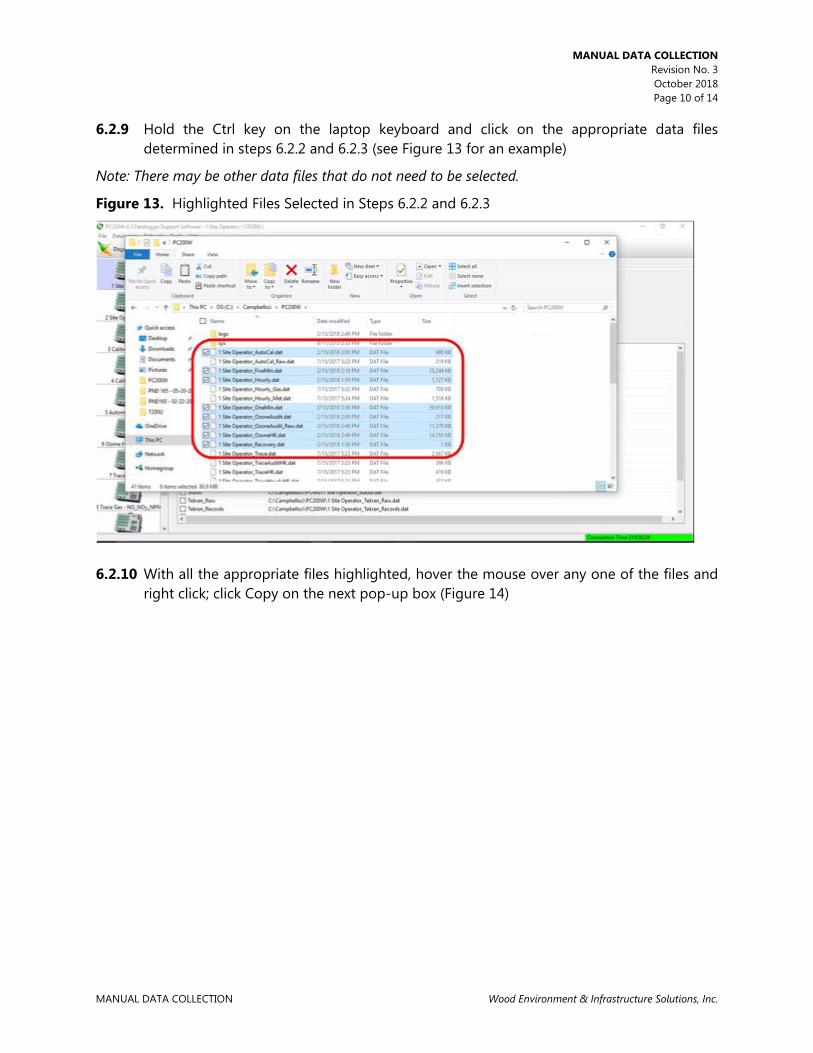
MANUAL DATA COLLECTION Revision No. 3
October 2018 Page 10 of 14
MANUAL DATA COLLECTION Wood Environment & Infrastructure Solutions, Inc.
6.2.9 Hold the Ctrl key on the laptop keyboard and click on the appropriate data files determined in steps 6.2.2 and 6.2.3 (see Figure 13 for an example)
Note: There may be other data files that do not need to be selected.
Figure 13. Highlighted Files Selected in Steps 6.2.2 and 6.2.3
6.2.10 With all the appropriate files highlighted, hover the mouse over any one of the files and
right click; click Copy on the next pop-up box (Figure 14)

MANUAL DATA COLLECTION Revision No. 3
October 2018 Page 11 of 14
MANUAL DATA COLLECTION Wood Environment & Infrastructure Solutions, Inc.
Figure 14. Click Copy
6.2.11 Click This PC in the address bar (Figure 15) to get back to the File Explorer main menu
Figure 15. Back Button

MANUAL DATA COLLECTION Revision No. 3
October 2018 Page 12 of 14
MANUAL DATA COLLECTION Wood Environment & Infrastructure Solutions, Inc.
6.2.12 Move the mouse to the drive letter that corresponds to the thumb drive and right click; click paste on the pop-up (Figure 16)
Figure 16. Pasting (copying) Data Files to the Thumb Drive
6.2.13 Double click the thumb drive icon to open it and verify the files are present (Figure 17)
Figure 17. Data Files Thumb Drive

MANUAL DATA COLLECTION Revision No. 3
October 2018 Page 13 of 14
MANUAL DATA COLLECTION Wood Environment & Infrastructure Solutions, Inc.
6.2.14 To return to the 1 Site Operator page on the Monitor Data tab, click the X on the thumb drive page to close it and then click the Monitor Data Tab (Figure 18)
Figure 18. Close Thumb Drive Page and Click Monitor Data Tab
Data Delivery
Upon successful data collection and storage, e-mail a copy of the data files to the FOM or FOM designee. The thumb drive with data files must be mailed to the Wood Field Office using the return envelope if one is provided or it can be included with the next filter pack shipment.

MANUAL DATA COLLECTION Revision No. 3
October 2018 Page 14 of 14
MANUAL DATA COLLECTION Wood Environment & Infrastructure Solutions, Inc.
REFERENCES
ATTACHMENTS
No attachments

FIELD OPERATIONS MANUAL FILTER SAMPLING Revision No. 8
October 2018 Page 2 of 9
FIELD OPERATIONS MANUAL FILTER SAMPLING Wood Environment & Infrastructure Solutions, Inc.
II. C. 2. FILTER SAMPLING
PURPOSE
The purpose of this Standard Operating procedure (SOP) is to provide consistent guidance for Filter Pack Sampling Operations to each Site Operator.
SCOPE
This SOP applies to all routine CASTNET filter pack sample handling and associated activities in the field, including installation, removal, and inspection. CASTNET site configurations vary from filter pack sampling only to sites that also monitor atmospheric gases with automated analyzers and those that include meteorological measurements. Please adhere to the procedures pertinent to the equipment installed onsite.
SUMMARY
Atmospheric sampling for sulfur and nitrogen species is performed at each CASTNET site integrated over weekly collection periods using a three-stage filter pack (Figure 1). Filter packs are prepared by the Wood Environment & Infrastructure Solutions, Inc. (Wood) analytical laboratory and shipped to the field weekly. The filter packs are exchanged at each site every Tuesday by the local site operator. The operator replaces the exposed filter pack and ships it to the analytical laboratory. The site operator also evaluates equipment status and performance and performs preventative maintenance. All supporting paperwork is completed. Figure 1. Three-Stage Filter Pack
Cellulose = Gaseous: SO 2
Nylon = Gaseous: HNO 3, SO
2 Teflon = Particulate: SO2-
4 , NO- 3, NH +
4 , K+ , Ca2+
, Mg2+ , Na+
, Cl-
Two Cellulose Filters
Nylon Filter
Teflon Filter Shipping Cap
(removed during sampling)
Teflon Spacers Direction of Air Flow
Quick Disconnect

FIELD OPERATIONS MANUAL FILTER SAMPLING Revision No. 8
October 2018 Page 3 of 9
FIELD OPERATIONS MANUAL FILTER SAMPLING Wood Environment & Infrastructure Solutions, Inc.
Tilt Tower
A filter pack is mounted on a sample head at the top of a 10-meter (m) tilt tower (Figure 2). This tower is separate from the 10-m meteorological tower. The tower is made of heavy weight aluminum and is essentially a 10-m pole hinged to a brace. The ozone (O
3) inlet and the sample filter connections are enclosed in protective aluminum housing at the top of the tower. The 10-m mast is hinged at its midpoint and rotates at the hinge to lower the sample head to ground level for service and maintenance. The tower is counterbalanced to minimize acceleration while being lowered and is controlled by a rope attached to the mast. When the tower is in the upright position, it is latched to prevent inadvertent lowering.
Filter Pack Cassette Holder
The filter pack cassette holder consists of a three-stage Teflon assembly containing four filters. It is attached to the sample inlet port via a quick connect Swagelock fitting. The filter pack's first stage contains a Teflon filter that removes particulate sulfate (SO2-
4 ), nitrate (NO- 3), and other ions.
The second stage contains a Nylon filter that removes nitric acid (HNO 3), and the third stage
contains two cellulose fiber filters impregnated with potassium carbonate (K 2CO
3) which remove sulfur dioxide (SO
2). Filter packs are prepared by the Wood laboratory in Gainesville, Florida, and are sent to the site each week. Filter packs are capped at each end, sealed in a plastic bag, and shipped in a protective container.
Filter Pack Flow System
Air flow through the filter pack is generated by a vacuum pump and controlled by a mass flow controller (MFC). The MFC is calibrated against a transfer standard mass flow meter traceable to a primary standard. The MFC is set to 1.50 liters per minute (Lpm) at sites in the eastern United States, and 3.00 Lpm in the western states. The flow rate is greater in the western states because of the expected lower concentrations of SO2-
4 and NO- 3; therefore, a greater volume of air must
be sampled to achieve the desired analytical detection limits. The mass flow controller display and rotameter serve as visual indications of the flow rate. An elapsed time indicator is present to record the duration of the sample interval. Figure 8 in Section II.A.2, Subsection 3.5 illustrates the sampling train for the filter pack sampling system.
Note: After receiving a filter pack, site operators should check the filter pack for damage or contamination. The chain-of-custody label that accompanies all filter packs must also be checked. If a filter pack arrives without a chain-of-custody label, contact the Field Operations Coordinator immediately. Site operators should compare the identification number on the filter pack to the number written on the chain-of-custody label. Contact the Field Operations Coordinator if the filter pack number or the site identification number is incorrect.

FIELD OPERATIONS MANUAL FILTER SAMPLING Revision No. 8
October 2018 Page 4 of 9
FIELD OPERATIONS MANUAL FILTER SAMPLING Wood Environment & Infrastructure Solutions, Inc.
Figure 2. Typical CASTNET Air and Meteorological Sampling Towers and Instruments
Ozone Inlet/Filter Pack Shield
Air Sampling Tower
Wind Direction Sensor
Blower Fan
Blower FanEquipment Shelter
Tower Fold-Down Point
Meteorological Tower
Wind Speed Sensor
RH and Temperature Sensor Aspirated Shield
Temperature Sensor Aspirated Shield
Sampling Heights Filter pack and ozone at 10 m Wind speed and direction at 10 m Temperature at 2 m and 9 m Relative Humidity at 9 m
Bondville, IL (BVL130) March 2010

FIELD OPERATIONS MANUAL FILTER SAMPLING Revision No. 8
October 2018 Page 5 of 9
FIELD OPERATIONS MANUAL FILTER SAMPLING Wood Environment & Infrastructure Solutions, Inc.
Lowering the Tower
The filter pack and the O 3 systems sample continuously at the 10-m level. Therefore, both
systems must be taken offline and the filter pack sample pump turned off before the tower is lowered. All operations are recorded in the appropriate section of the Site Status Report Form (SSRF) and the site logbook.
Weekly Filter Pack Cassette Exchange
Filter pack exchanges are performed each Tuesday and are documented on the SSRF (see Section II.B, Figure 1). Since the O
3 sample inlet is accessible during the filter pack exchange, changing the O
3 inlet filter is also described in this section. Use the procedures in Section 6.0 to access the filter pack.
MATERIALS AND SUPPLIES
Unexposed filter pack cassette for proper sample week Filter pack cassette shipping tube Clean zip sealing bag Clean filter pack cassette caps Clean unexposed 47mm Savillex Teflon filter membrane Clean Vinyl or Nitrile gloves Writing implement SSRF form for installed filter pack SSRF form for unexposed filter pack Site narrative log book
SAFETY
A hard hat must be worn when raising and lowering towers. If it is necessary to repair or service an instrument, remove personal jewelry, turn off the instruments power and disconnect (unplug) to avoid contact with live current. Always use a safety harness when climbing.
PROCEDURES
Prior to Lowering Tower
6.1.1 Record the 5-minute average “flow_rate_Avg” value as found on the “1 Site Operator” grid (1.50 or 3.00) as the Filter Off, DAS Flow (LPM) on the SSRF for the filter pack that is being removed as well as the site log book. Record the existing rotameter reading as the Filter Off, Rotameter (LPM) in the appropriate section of the SSRF and site log book. See Figure 3.
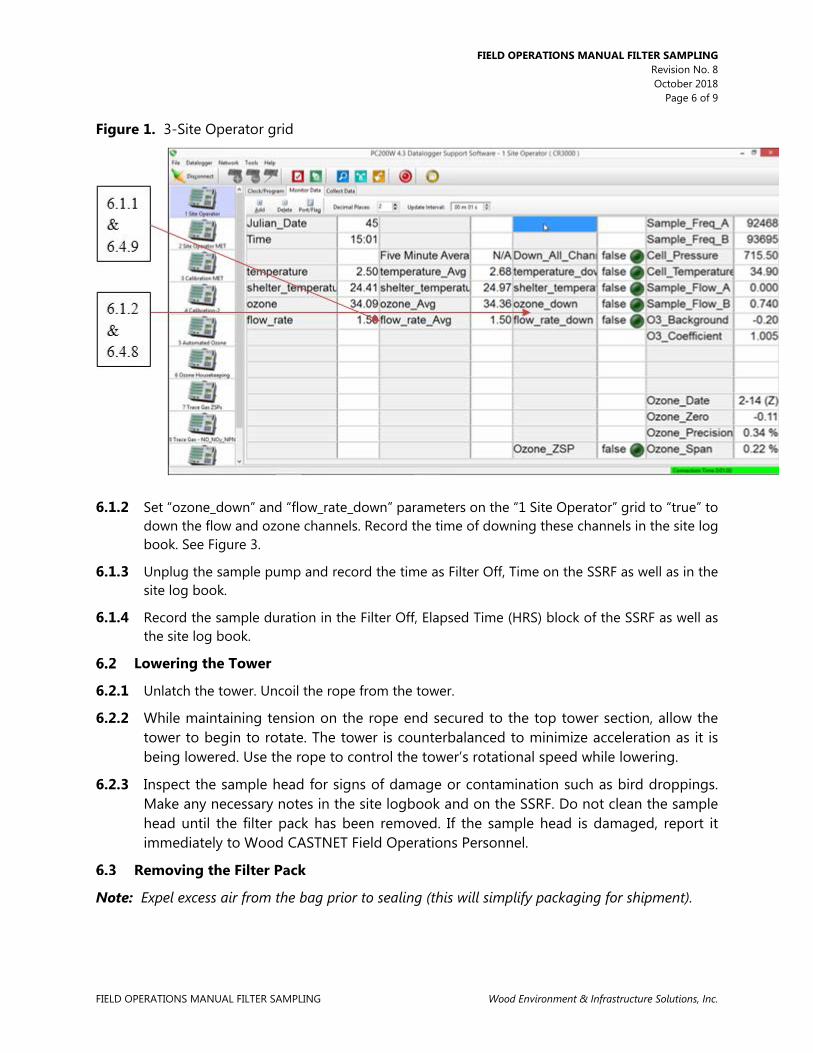
FIELD OPERATIONS MANUAL FILTER SAMPLING Revision No. 8
October 2018 Page 6 of 9
FIELD OPERATIONS MANUAL FILTER SAMPLING Wood Environment & Infrastructure Solutions, Inc.
Figure 1. 3-Site Operator grid
6.1.2 Set “ozone_down” and “flow_rate_down” parameters on the “1 Site Operator” grid to “true” to
down the flow and ozone channels. Record the time of downing these channels in the site log book. See Figure 3.
6.1.3 Unplug the sample pump and record the time as Filter Off, Time on the SSRF as well as in the site log book.
6.1.4 Record the sample duration in the Filter Off, Elapsed Time (HRS) block of the SSRF as well as the site log book.
Lowering the Tower
6.2.1 Unlatch the tower. Uncoil the rope from the tower.
6.2.2 While maintaining tension on the rope end secured to the top tower section, allow the tower to begin to rotate. The tower is counterbalanced to minimize acceleration as it is being lowered. Use the rope to control the tower’s rotational speed while lowering.
6.2.3 Inspect the sample head for signs of damage or contamination such as bird droppings. Make any necessary notes in the site logbook and on the SSRF. Do not clean the sample head until the filter pack has been removed. If the sample head is damaged, report it immediately to Wood CASTNET Field Operations Personnel.
Removing the Filter Pack
Note: Expel excess air from the bag prior to sealing (this will simplify packaging for shipment).

FIELD OPERATIONS MANUAL FILTER SAMPLING Revision No. 8
October 2018 Page 7 of 9
FIELD OPERATIONS MANUAL FILTER SAMPLING Wood Environment & Infrastructure Solutions, Inc.
6.3.1 Put on a pair of clean vinyl gloves. Remove the large end cap from the filter pack plastic bag and insert the cap into (or over) the inlet end of the filter pack. To remove the filter pack from the sampling head, pull up on the collar of the quick-connect fitting. Cap the other end of the filter pack with the small orange end cap from the bag. Place the filter pack in the plastic bag and seal. Discard the gloves.
6.3.2 Use only water and paper towels to clean the sample head. After the filter pack has been removed, clean the sample head of any excessive dirt or bird droppings. Inspect the sample head for damage, and make any notes in the site logbook and on the SSRF.
6.3.3 Record the MFC display reading while the pump is off in the Filter Off, MFC (Pump Off) section of the SSRF. Replace the O
3 inlet filter on the sampler head by unscrewing the Teflon filter holder, removing the filter, and replacing with a new filter. When replacing the O
3 inlet filter, make sure that only one filter is placed in the filter holder. Use tweezers to handle the clean filter and avoid contamination. In the SSRF DAS and Ozone section, check the appropriate box for the O
3 filter replacement.
6.3.4 Test the O 3 sample system for leaks following O
3 inlet filter changes and servicing zero air system canisters.
Note: Sites with ozone dryers will perform an On-Demand ZSP instead of a leak check.
6.3.4.1 Screw the Teflon end cap onto the inlet of the in-line filter assembly.
6.3.4.2 Observe the cell flow rates for cells A and B on the O 3 analyzer. When the reading reaches
0.1 Lpm, slowly remove the Teflon end cap from the filter assembly.
Note: Removing the cap must be done carefully to prevent a destructive flow surge through the O
3 analyzer.
6.3.4.3 Contact Wood CASTNET Field Operations Personnel if the flow readings do not reach 0.1 Lpm or if readings on cells A and B differ by more than 0.1 Lpm.
6.3.5 Leak test the filter pack system: PERFORMED EACH WEEK.
6.3.5.1 Plug in the filter pack sample pump.
6.3.5.2 After the mass flow controller readout has stabilized, record the mass flow controller display reading in the appropriate section of the SSRF, Filter Off, MFC Leak Check.
6.3.5.3 Turn off the sample pump.
6.3.5.4 Complete the SSRF for the sample being removed by recording the Filter Off, Date, signing and dating the form, and recording the expected shipment date. All information of the SSRF should be complete at this point. Include the appropriate copy of the SSRF in the filter shipping container.
6.3.5.5 Report the leak check reading to Wood Field Operations Personnel during the Tuesday call-in.
FIELD OPERATIONS MANUAL FILTER SAMPLING Revision No. 8
October 2018 Page 8 of 9
FIELD OPERATIONS MANUAL FILTER SAMPLING Wood Environment & Infrastructure Solutions, Inc.
Installing the Unexposed Filter Pack
6.4.1 Record the new Filter Pack ID# (identification number) on the SSRF, which was shipped with the filter pack. Record the date of installation as the Filter On, Date. Record the mass flow controller pump off and leak check readings obtained previously for the Filter Off information, which was completed on the SSRF for the previous week’s sample, as the Filter On information for the sample being installed.
6.4.2 Put on a new pair of disposable gloves. Remove the end caps from the new filter pack and store them in the plastic bag. Place the plastic bag back in the filter pack mailer.
6.4.3 Install the new filter pack by inserting the color-coded fitting on the base of the filter pack into the matching quick connect fitting on the tower until it locks into place.
6.4.4 Double check the security of the filter pack by pulling on it to be sure that it is locked in place. Be careful not to contaminate or damage the exposed filter.
6.4.5 After installing the filter pack, raise the tower and lock into place. Inspect the sample lines to ensure that they are not crimped at the tower hinge.
6.4.6 Reset the elapsed time indicator.
6.4.7 Turn on the sample pump, and enter the time as Filter On, Time in the appropriate box on the SSRF. Allow the MFC display to stabilize (1 or 2 minutes), then verify that the display reads the predetermined value equivalent to 1.50 or 3.00 Lpm established from the most recent calibration data.
6.4.8 Set “ozone_down” and “flow_rate_down” parameters on the “1 Site Operator” grid to “false” to enable the flow and ozone channels. Record the time of enabling these channels in the site log book. See Figure 3.
6.4.9 After the sample pump has been running for 5 minutes record the 5-minute average “flow_rate_Avg” value as found on the “1 Site Operator” grid as the Filter On, DAS Flow (LPM) on this week's SSRF as well as in site log book. See Figure 3.
6.4.10 Record the Filter On, Rotameter (LPM) in the appropriate box on the SSRF and site log book. Inspect the inlet lines, water trap, and inline filter for evidence of water. Report water/ice in the system or any unusual conditions to Wood CASTNET Field Operations Personnel. Note accordingly in site log book.
6.4.11 Complete the remaining sections of the SSRF. The only information not recorded on the SSRF, which was received with the filter being installed, should be the Filter Off information, which will be completed when the filter is removed.
Warning! Be sure the filter pack is secure; if not, it may fall from the tower causing injury. Wear a hard hat.

FIELD OPERATIONS MANUAL FILTER SAMPLING Revision No. 8
October 2018 Page 9 of 9
FIELD OPERATIONS MANUAL FILTER SAMPLING Wood Environment & Infrastructure Solutions, Inc.
REFERENCES
U.S. Environmental Protection Agency (EPA). 1994. Quality Assurance Handbook for Air Pollution Measurement Systems, Vol. I. A Field Guide to Environmental Quality Assurance. EPA/600/R-94/038a.
U.S. Environmental Protection Agency (EPA). 2008. Quality Assurance Handbook for Air Pollution
Measurement Systems, Vol. IV, Meteorological Measurements Version 2.0 (Final). EPA-454/B-08-002.
U.S. Environmental Protection Agency (EPA). 2013. Quality Assurance Handbook for Air Pollution
Measurement Systems, Vol. II, Ambient Air Quality Monitoring Program. EPA-454/B-13-003.
U.S. Environmental Protection Agency (EPA). 2000. Meteorological Monitoring Guidance for
Regulatory Modeling Applications. EPA-454/R-99-005.


FIELD OPERATIONS MANUAL OZONE MONITORING Revision No. 8 October 2018 Page 2 of 11
FIELD OPERATIONS MANUAL OZONE MONITORING Wood Environment & Infrastructure Solutions, Inc.
II. C. 3. FIELD OPERATIONS MANUAL OZONE MONITORING
PURPOSE
The purpose of this Standard Operating procedure (SOP) is to provide consistent guidance for Manual Ozone (O
3) Monitoring to each Site Operator.
SCOPE
This SOP applies to CASTNET onsite monitoring activities. Please refer to Section III.A (Field Manual, Site Operators Handbook, Section 6.12) for further details.
SUMMARY
O 3 analyzer operation is based on the principle that O
3 molecules absorb ultraviolet (UV) light at a wavelength of 254 nanometers (nm). The degree to which the UV light is absorbed is directly related to the O
3 concentration as described by the Beer-Lambert Law:
eII klc−=
0 where: k = molecular absorption coefficient, 308 cm-1 (at 0o C and 1 atmosphere) l = length of cell, 38 cm c = O
3 concentration in parts per million (ppm) I = UV light intensity of sample with O
3 (sample gas) Io = UV light intensity of sample without O
3 (reference gas) An ambient air sample is drawn through a 10-meter high Teflon© inlet. The sample is drawn into the analyzer through the sample bulkhead and is split into two gas streams. One gas stream flows through an O
3 scrubber to become the reference gas (Io). The reference gas then flows to the reference solenoid valve. The sample gas (I) flows directly to the sample solenoid valve. The solenoid valves alternate the reference and sample gas streams between cells A and B. When cell A contains reference gas, cell B contains sample gas and vice versa. The UV light intensities of each cell are measured by detectors A and B. When the solenoid valves switch the reference and sample gas streams to opposite cells, the light intensities are ignored for several seconds to allow the cells to be flushed. The analyzer calculates the O
3 concentration for each cell and outputs the average concentration to both the front panel display as well as the electronic outputs. The O
3 inlet filters are to be replaced every other week, inspected each week and replaced if necessary. Site operators are required to perform additional duties, which include calling Wood Environment & Infrastructure Solutions, Inc. (Wood) during every Tuesday site visit and troubleshooting as requested by Wood personnel.

FIELD OPERATIONS MANUAL OZONE MONITORING Revision No. 8 October 2018 Page 3 of 11
FIELD OPERATIONS MANUAL OZONE MONITORING Wood Environment & Infrastructure Solutions, Inc.
MATERIALS AND SUPPLIES
Campbell Scientific Model CR3000 Data logger Thermo Fisher Model 49i O
3 Analyzer O
3 Pump Site Status Report Form (SSRF) for appropriate sampling week Site Narrative Log for appropriate sampling week Writing implement
REPAIR AND MAINTENANCE
N/A
PROCEDURES
The air pressure of the zero-air system used to generate the test concentrations has been set to approximately 15 pounds per square inch (psi). A minimum pressure of 15 psi must be maintained for the concentrations to be accurate. The pressure regulator may be adjusted if the pressure is below 15 psi. Some reasons pressure is not at 15 psi are: 1) a leak in the charcoal or desiccant canisters, 2) a leak in a fitting or tubing line between the pump and the analyzer, 3) a weak pump, or 4) a failed regulator. Wood CASTNET field operations personnel will help to determine the cause of the problem. Please call and ask Wood CASTNET field operations personnel any questions concerning the procedures described.
O 3 Zero, Span and Precision Checks
O 3 zero, span, and precision checks are normally performed each night automatically. The
concentrations corresponding to Span 1, Precision and Zero are automatically initiated at 23:46, 23:53 and 24:00 respectively with duration of 7 minutes each. Manual operation may be required in the event of the failure of the automatic operation. The most recent zero, span, and precision check results will be found on the “1 Site Operator” or “2 Site Operator MET” grid of the PC200 application. They will be labeled “Ozone_Zero”, “Ozone_Span” and “Ozone_Precision” corresponding to target concentrations of 0, 225 & 60 ppb respectively. Record the results in the appropriate section of the SSRF as done previously. These values should be reported to Wood during the routine Tuesday call-in. See Figure 1.

FIELD OPERATIONS MANUAL OZONE MONITORING Revision No. 8 October 2018 Page 4 of 11
FIELD OPERATIONS MANUAL OZONE MONITORING Wood Environment & Infrastructure Solutions, Inc.
Figure 1. 1-Site Operator Grid
THE FOLLOWING MANUAL PROCEDURES ARE TO BE DONE AT THE REQUEST OF WOOD PERSONNEL ONLY!
Local Triggering of the Zero, Span and Precision Check
In the event of the data logger failing to perform the automatic ZSP check call Wood Field Operations. When instructed to do so, perform the following procedure to locally trigger the automatic sequence while in contact with Wood CASTNET Field Operations Personnel:
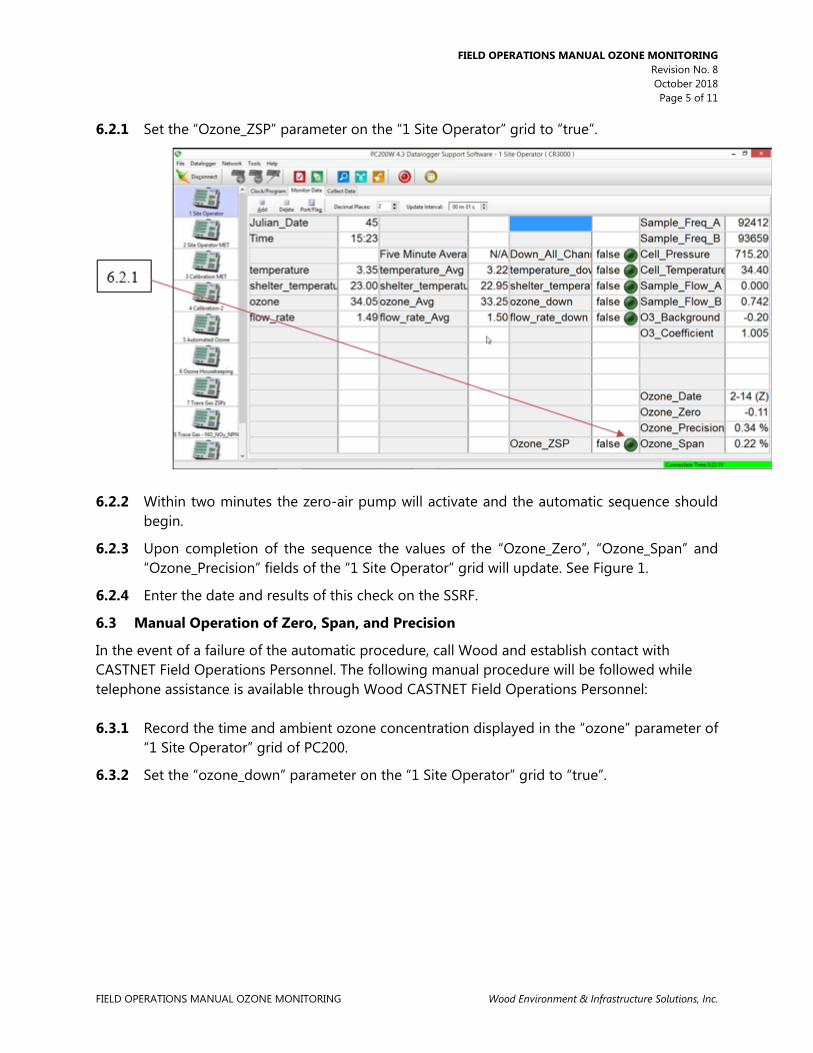
FIELD OPERATIONS MANUAL OZONE MONITORING Revision No. 8 October 2018 Page 5 of 11
FIELD OPERATIONS MANUAL OZONE MONITORING Wood Environment & Infrastructure Solutions, Inc.
6.2.1 Set the “Ozone_ZSP” parameter on the “1 Site Operator” grid to “true”.
6.2.2 Within two minutes the zero-air pump will activate and the automatic sequence should
begin.
6.2.3 Upon completion of the sequence the values of the “Ozone_Zero”, “Ozone_Span” and “Ozone_Precision” fields of the “1 Site Operator” grid will update. See Figure 1.
6.2.4 Enter the date and results of this check on the SSRF.
Manual Operation of Zero, Span, and Precision
In the event of a failure of the automatic procedure, call Wood and establish contact with CASTNET Field Operations Personnel. The following manual procedure will be followed while telephone assistance is available through Wood CASTNET Field Operations Personnel: 6.3.1 Record the time and ambient ozone concentration displayed in the “ozone” parameter of
“1 Site Operator” grid of PC200.
6.3.2 Set the “ozone_down” parameter on the “1 Site Operator” grid to “true”.

FIELD OPERATIONS MANUAL OZONE MONITORING Revision No. 8 October 2018 Page 6 of 11
FIELD OPERATIONS MANUAL OZONE MONITORING Wood Environment & Infrastructure Solutions, Inc.
6.3.3 Put the 49i ozone site transfer in “Service Mode”.
• Press the “Menu” button • Scroll down to Instrument Controls
• Press the “Enter” button and scroll down to Service Mode

FIELD OPERATIONS MANUAL OZONE MONITORING Revision No. 8 October 2018 Page 7 of 11
FIELD OPERATIONS MANUAL OZONE MONITORING Wood Environment & Infrastructure Solutions, Inc.
• Press the “Enter” button twice to place transfer in Service Mode
6.3.4 Turn on the transfer sample pump
• Press the “Menu” button to go back to Instrument Controls
• Press the “Enter” button and scroll down to Pump
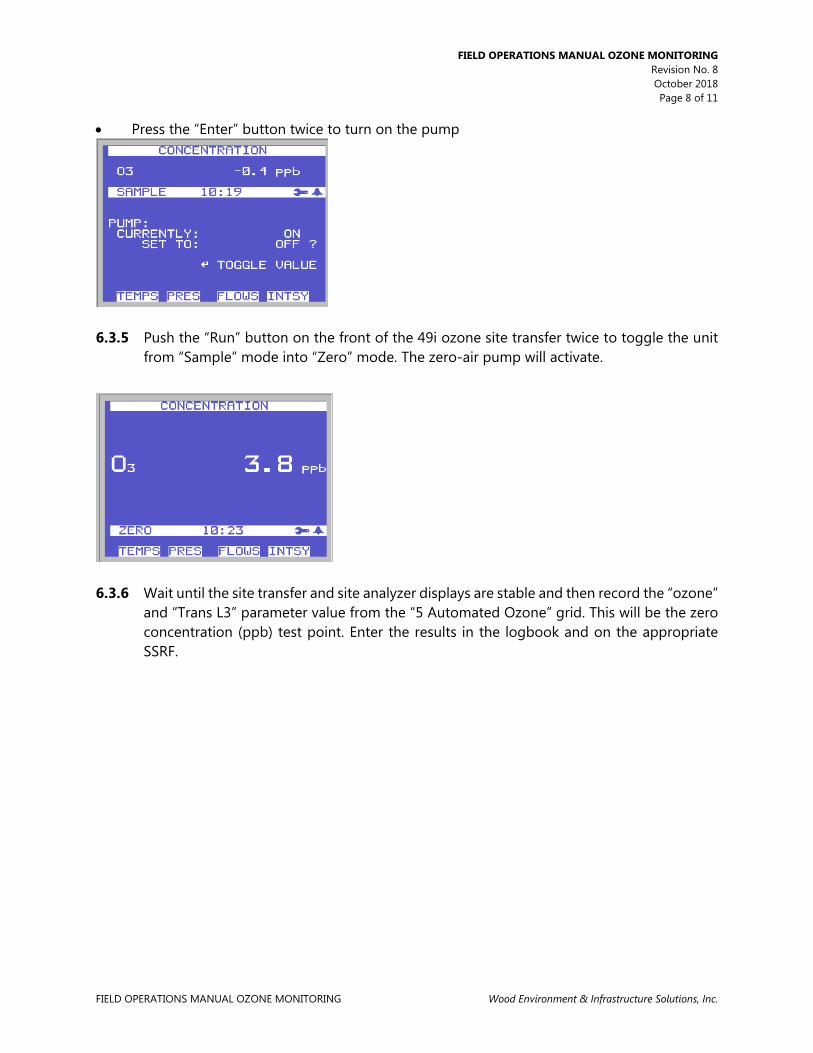
FIELD OPERATIONS MANUAL OZONE MONITORING Revision No. 8 October 2018 Page 8 of 11
FIELD OPERATIONS MANUAL OZONE MONITORING Wood Environment & Infrastructure Solutions, Inc.
• Press the “Enter” button twice to turn on the pump
6.3.5 Push the “Run” button on the front of the 49i ozone site transfer twice to toggle the unit
from “Sample” mode into “Zero” mode. The zero-air pump will activate.
6.3.6 Wait until the site transfer and site analyzer displays are stable and then record the “ozone”
and “Trans L3” parameter value from the “5 Automated Ozone” grid. This will be the zero concentration (ppb) test point. Enter the results in the logbook and on the appropriate SSRF.

FIELD OPERATIONS MANUAL OZONE MONITORING Revision No. 8 October 2018 Page 9 of 11
FIELD OPERATIONS MANUAL OZONE MONITORING Wood Environment & Infrastructure Solutions, Inc.
6.3.7 Push the “Run” button one time to toggle the unit into “Level1” mode. Repeat the steps
above. This will be the “Span 1” Span point corresponding to 225 ppb.
6.3.8 Push the “Run” button three times to toggle the unit from “Level 1” mode to “Level 4”
mode. Again repeat the steps above. This will be the “Span 2” Precision point corresponding to 60 ppb.

FIELD OPERATIONS MANUAL OZONE MONITORING Revision No. 8 October 2018 Page 10 of 11
FIELD OPERATIONS MANUAL OZONE MONITORING Wood Environment & Infrastructure Solutions, Inc.
6.3.9 When complete and all data is recorded press the “Run” button twice to toggle the unit into “Sample” mode. The zero-air pump will deactivate.
6.3.10 Turn “Service Mode” off using steps in 6.3.3.
6.3.11 Once the unit displays ambient concentrations set the “ozone_down” parameter on the “1 Site Operator” grid to “false” and record the time in the log book.
REFERENCES
Thermo Fisher Scientific. 2006. Model 49i Instruction Manual, UV Photometric O 3 Analyzer
U.S. Environmental Protection Agency (EPA). 1994. Quality Assurance Handbook for Air Pollution
Measurement Systems, Vol. I. A Field Guide to Environmental Quality Assurance. EPA/600/R-94/038a.
U.S. Environmental Protection Agency (EPA). 2008. Quality Assurance Handbook for Air Pollution
Measurement Systems, Vol. IV, Meteorological Measurements Version 2.0 (Final). EPA-454/B-08-002.
U.S. Environmental Protection Agency (EPA). 2013. Quality Assurance Handbook for Air Pollution
Measurement Systems, Vol. II, Ambient Air Quality Monitoring Program. EPA-454/B-13-003.
U.S. Environmental Protection Agency (EPA). 2000. Meteorological Monitoring Guidance for
Regulatory Modeling Applications. EPA-454/R-99-005. U.S. Environmental Protection Agency (EPA). 2015. Appendix A to Part 58 – Quality Assurance
Requirements for State and Local Air Monitoring Stations (SLAMS), Special Purpose Monitors (SPMs), and Prevention of Significant Deterioration (PSD) Air Monitoring. 40 CFR Part 58.

FIELD OPERATIONS MANUAL OZONE MONITORING Revision No. 8 October 2018 Page 11 of 11
FIELD OPERATIONS MANUAL OZONE MONITORING Wood Environment & Infrastructure Solutions, Inc.
FIGURES
Figure 1. Site Status Report Form
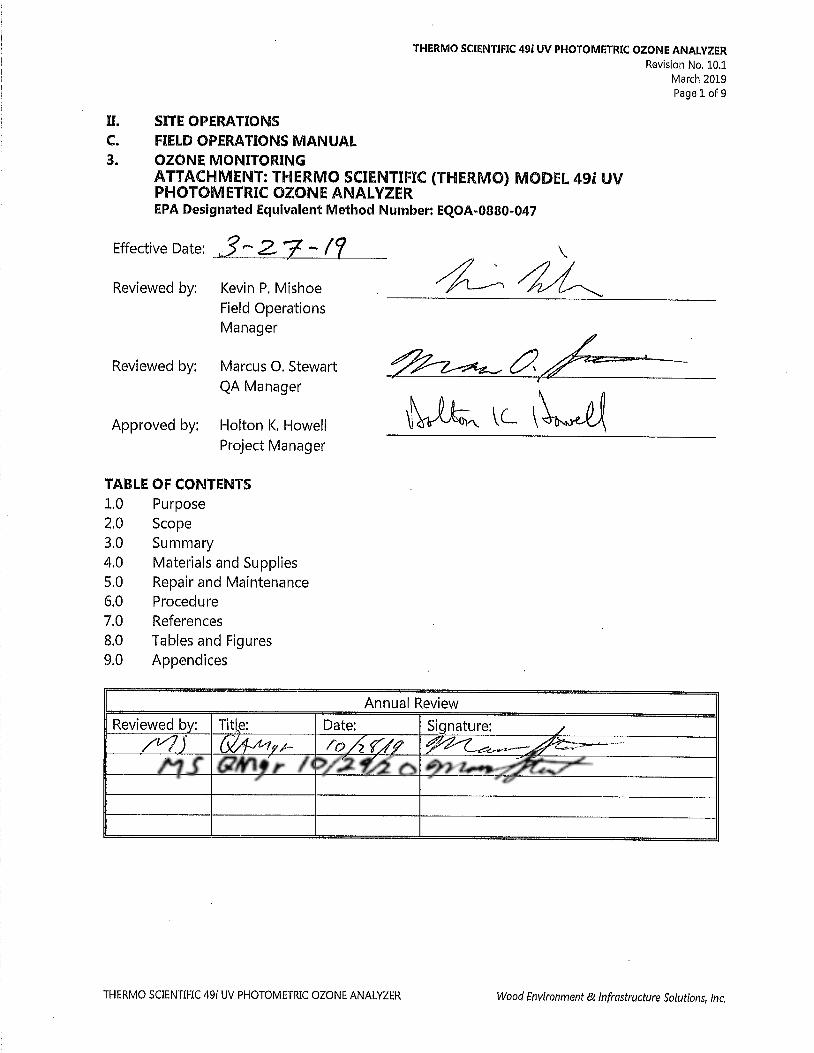

THERMO SCIENTIFIC 49i UV PHOTOMETRIC OZONE ANALYZER
Revision No. 10.1
March 2019
Page 2 of 9
THERMO SCIENTIFIC 49i UV PHOTOMETRIC OZONE ANALYZER Wood Environment & Infrastructure Solutions, Inc.
II. C. 3. FIELD OPERATIONS MANUAL OZONE MONITORING
ATTACHMENT: THERMO SCIENTIFIC (THERMO) MODEL 49iUV PHOTOMETRIC
OZONE ANALYZER
EPA DESIGNATED EQUIVALENT METHOD NUMBER: EQOA-0880-047
PURPOSE
The purpose of this Standard Operating procedure (SOP) is to provide consistent guidance for
the operation of the Thermo Scientific (Thermo) Model 49i Photometric Ozone (O
3) Analyzer for
regulatory monitoring at Clean Air Status and Trends Network (CASTNET) sites.
SCOPE
This SOP applies to O
3 monitoring compliant with the Code of Federal Regulations, Title 40, Part
58, the guidance in “Quality Assurance Handbook for Air Pollution Measurement Systems”,
Volumes I, and II; “Technical Assistance Document Transfer Standards for Calibration of Air
Monitoring Analyzers for Ozone” (EPA-600/4-79-056); and “Technical Assistance Document for
the Calibration of Ambient Ozone Monitors” (EPA-600/4-79-057) performed at CASTNET sites.
SUMMARY
The Model 49i operation is based on the principle that O
3 molecules absorb ultraviolet (UV) light
at a wavelength of 254 nanometers (nm). The degree to which the UV light is absorbed is
directly related to the O
3 concentration as described by the Beer-Lambert Law.
An ambient air sample is drawn through a 10-meter high Teflon© inlet. The sample is drawn into
the Model 49i through the SAMPLE bulkhead and is split into two gas streams, as depicted in
Figure 1-1 on page 1-3 of the Thermo instruction manual (May 26, 2006 P/N 102434-00). One
gas stream flows through an O
3 scrubber to become the reference gas (Io). The reference gas
then flows to the reference solenoid valve. The sample gas (I) flows directly to the sample
solenoid valve. The solenoid valves alternate the reference and sample gas streams between
cells A and B every 10 seconds. Longer intervals are also possible. When cell A contains
reference gas, cell B contains sample gas and vice versa.
The UV light intensities of each cell are measured by detectors A and B. When the solenoid
valves switch the reference and sample gas streams to opposite cells, the light intensities are
ignored for several seconds to allow the cells to be flushed. The Model 49i calculates the O
3
concentration for each cell and outputs the average concentration to both the front panel
display as well as the analog and digital outputs.
THERMO SCIENTIFIC 49i UV PHOTOMETRIC OZONE ANALYZER
Revision No. 10.1
March 2019
Page 3 of 9
THERMO SCIENTIFIC 49i UV PHOTOMETRIC OZONE ANALYZER Wood Environment & Infrastructure Solutions, Inc.
MATERIALS AND SUPPLIES
Campbell Scientific Inc. Model CR3000 Data logger
Thermo Scientific Model 49i O
3 Analyzer
Zero air system
Site Narrative Log for appropriate sampling week (and/or other forms as needed)
Writing implement
Site Tool Kit
REPAIR AND MAINTENANCE
N/A
PROCEDURE
The O
3 inlet filter isto be replaced every other week and inspected each week and replaced if
necessary. Site operators are required to perform additional duties, which include performing
manual checks if required.
Page 1-3 of the manual presents the analyzer specifications. Refer to page 3-2 of the instrument
manual for a graphic representation of the front panel controls and indicators. The controls and
indicators on the front of the Thermo 49i analyzer (from left to right) are as follows: Display
panel, RUN pushbutton, MENU pushbutton, pushbutton, ENTER pushbutton, HELP
pushbutton, pushbutton, pushbutton, and the pushbutton. Four additional buttons are
located just under the screen. These are programmable and at CASTNET sites they are typically
configured as: Temperature, Pressure, Flow, and Intensity (lamp). The POWER switch is located at
the bottom right corner of the front panel.
Refer to page 2-4 of the instrument manual for a graphic representation of the rear panel of the
onsite transfer standard. A series of connectors are located on the left side. These are: external
accessory (15 pin female), 2 RS-232/485 (9-pin male), I/O expansion (blank cover), Ethernet,
power fail relay/digital inputs/analogue voltage outputs (37-pin male), digital outputs (37-pin
female), 120 VAC power socket and 2 fuses (3 amp). Pin identifications are available on pp. 3-9
through 3-13 and 7-14 in the manual. To the right of these, items are as follows: from left to
right, the cooling fan/filter, Vent and Ozone (top row) bulkhead connectors. These are Teflon
fittings connected to same internal manifold. The Ozone port is connected to the sample
integrity line that runs to the sample inlet. Below these are the SAMPLE (Teflon, sample input,
plugged) and Zero air bulkhead connectors (stainless steel, zero air input). Between these and
just below, there is an unidentified Teflon bulkhead connector with a short piece of ¼ inch
Teflon tubing to another Teflon bulkhead connector below labeled “IN”.
Refer to page 3-5 of the Model 49i instrument manual for the flowchart of the menu-driven
software. This flowchart gives a quick reference to all the menus and submenus available to the
operator.

THERMO SCIENTIFIC 49i UV PHOTOMETRIC OZONE ANALYZER
Revision No. 10.1
March 2019
Page 4 of 9
THERMO SCIENTIFIC 49i UV PHOTOMETRIC OZONE ANALYZER Wood Environment & Infrastructure Solutions, Inc.
Thermo 49i Settings
6.1.1 Mode Setting - Mode for the onsite transfer standard should be set on SAMPLE
with the O
3 concentration and the time displayed. If not, correct and mark in site
log and appropriate calibration or report form. The CR3000 data logger is not
capable of running periodic ZPS checks if the onsite transfer standard is left in
SERVICE mode. Data communication or program error should be suspected if ZPS
checks fail to operate as these are encoded the logger’s program.
6.1.2 Range Setting - Press MENU, select RANGE and press ENTER. Select GAS UNITS and press
ENTER. CURRENTLY: displays actual setting. SET TO: shows options. The up and down
arrows are used to toggle through the options. Set to PPB and save by pressing ENTER.
Press the MENU button to return. With the arrows select Range. This should be set at
250 parts per billion (ppb); if not, correct the setting and note in site log and appropriate
calibration or report form. Any data recorded in other than the 0.0 to 250 ppb range must
be clearly identified.
Note: Range settings assign a voltage range to a concentration range. This is only relevant when
collecting in analogue mode.
6.1.3 Averaging Time - Press MENU twice to return to the main menu, scroll to AVERAGING
TIME and press ENTER. Averaging time should be set on 10 seconds; if not, correct the
setting and document the observation as described above.
6.1.4 Voltages - Press the MENU pushbutton, scroll to DIAGNOSTICS and press ENTER, scroll to
VOLTAGES and press ENTER, scroll to INTERFACE BOARD VOLTAGES and press ENTER.
Observe the voltage readings on the front panel and document the observation. In
particular, please note the "3.3 SUPPLY" reading as it represents the instruments battery
voltage.
Note: Each actuation of the MENU button within the DIAGNOSTICS submenu will move you up
one level in the submenu.
6.1.5 Temperatures* - Press the MENU pushbutton, scroll to DIAGNOSTICS and press enter.
Scroll to TEMPERATURE and press ENTER. Alternatively you may press run to access the
preprogrammed “soft keys” under screen buttons. The leftmost is TEMPS. Observe the
temperature readings on the front panel and document. The internal temperature should
be between 5 C and 40 C. The bench lamp temperature should be between 45 C and
55 C. The O
3 lamp temperature should be between 60 C and 75 C.
6.1.6 Pressure* - Press MENU, scroll to DIAGNOSTICS and press ENTER. Scroll to PRESSURE and
press ENTER. Alternatively, push the PRESSURE hotkey button under the LCD display.
Observe the pressure reading on the display panel and document. If not within limits (400
mm Hg – 1000 mm Hg), corrective action must be taken. A pressure of less than 400 mm
Hg indicates a blocked sample line. Document initial and corrected pressure.
6.1.7 Flow* - Press MENU, scroll to DIAGNOSTICS and press ENTER. Scroll to FLOW and press
ENTER. Alternatively, push the FLOWS hotkey button under the LCD display. Observe the

THERMO SCIENTIFIC 49i UV PHOTOMETRIC OZONE ANALYZER
Revision No. 10.1
March 2019
Page 5 of 9
THERMO SCIENTIFIC 49i UV PHOTOMETRIC OZONE ANALYZER Wood Environment & Infrastructure Solutions, Inc.
Cell (A and B) flows on the screen and record the values. The 49i operates typically at a
flow rate of 0.75 liters per minute (LPM) per cell.
Note: The total flow rate under EPA Designated Equivalent Method Number EQOA-0880-047
must be at least 1.00 LPM and not greater than 3.00 LPM.
* These parameters and others (see Alarms Menu p. 3-72 of the instrument manual) can be
programmed to display an alert message if they drift out of a predetermined range.
The total flow rate is the sum of the Cell A and Cell B flows indicated by the analyzer.
This value is not indicated by the analyzer. Either cell exhibiting a flow rate less than or
equal to 0.5 LPM is cause for immediate investigation. For normal operation both A and
B flow rates should be approximately 0.75 LPM each for a total flow rate of 1.5 LPM. If
the flow is unacceptable, corrective action must be taken following a six point audit.
Document the initial and corrected flow and recalibrate the machine.
6.1.8 Cell A/B O
3 - Press MENU, scroll to DIAGNOSTICS and press ENTER. Scroll to CELL A/B O
3
and press ENTER. Observe the readings and document. The two cell readings should
average out to the ambient reading.
6.1.9 Intensity and Noise - Down the O
3 channel. The noise check will corrupt the
measurement. Press MENU, scroll to INSTRUMENT CONTROLS and press ENTER. Scroll to
SERVICE MODE and press ENTER. Press ENTER to toggle SERVICE MODE to ON. Press the
MENU button twice to return to the main menu. Scroll to SERVICE and press ENTER.
Scroll to INTENSITY CHECK and press ENTER. Scroll to INT A SAMPLE GAS and press
ENTER. Wait at least sixty seconds for noise to stabilize. Record Cell A Intensity and Noise
to the nearest thousand. Press MENU then scroll to INT B SAMPLE GAS. Wait at least
sixty seconds for the Noise to stabilize and repeat as before. Sometimes a low frequency
condition can be corrected by cleaning the cell tubes. Noise on both cells should be
below 4.0 Hz. When done, press the RUN button to return the unit to SAMPLE mode.
Ozone site configuration
CASTNET sites configured for compliance monitoring feature a separate analyzer used as an
onsite transfer standard paired with the site analyzer where the transfer standard is used to
generate the concentrations for routine checks. The onsite transfer standard’s photometer must
first have a 6-day certification and then a 1-day certification every six months by an O
3 transfer
standard that is traceable to an EPA standard reference photometer Please see Figure 1.
Analyzer set up
The transfer and site analyzers need to be plumbed in and turned on for at least an hour before
the initial checks are performed. This will allow adequate warm-up. The analyzer will display an
alarm message on the front panel until all conditions are within limits. The data logger utilizes
Ethernet connections for both the transfer and site analyzers. The site analyzer must be verified
via comparison to a certified transfer standard once installed via a 1-day certification procedure.

THERMO SCIENTIFIC 49i UV PHOTOMETRIC OZONE ANALYZER
Revision No. 10.1
March 2019
Page 6 of 9
THERMO SCIENTIFIC 49i UV PHOTOMETRIC OZONE ANALYZER Wood Environment & Infrastructure Solutions, Inc.
Routine Operation and Observations
6.4.1 The following describe routine monitoring:
Standard local time is used for monitoring and is updated by the data logger.
Logger controlled zero, precision (60 ppb), and span (225 ppb) checks will be
performed each day.
Span checks must be within ± 7 percent of reference value and zero checks must be
± 3.0 ppb for data to be considered as valid.
Please refer to Table 1 for measurement quality objectives and actions required when
indicators are outside of criteria. Please note that the site operator should only
perform adjustments under the guidance of a CASTNET field technician.
Data are collected via data logger, polled remotely and uploaded to AIRNow
every hour.
6.4.2 During each weekly visit, the site operator will perform the following checks:
6.4.2.1 Automatic ZPS checks are performed each day by the data logger. Span checks must be
within ± 7 percent of reference value and zero checks must be ± 3.0 ppb. Checks outside
of these criteria will alert the site operator to investigate the system and call Wood for
instructions. Wood personnel will guide the site operator through troubleshooting and
corrective action. Span checks greater than ±7 percent of reference value or zero checks
outside of ± 3.0 ppb are outside of established criteria and data falling between
consecutive failed checks are considered invalid. Please refer to Table 1 of this SOP.
6.4.2.2 Physical integrity of the analyzer will be checked and the findings documented.
6.4.2.3 All routine site checks requested on the Site Status Report Form (SSRF) and Site Operator
Checklist will be completed.
6.4.2.4 All site activities and observations will be documented in the Site Narrative logbook and
SSRF.
THERMO SCIENTIFIC 49i UV PHOTOMETRIC OZONE ANALYZER
Revision No. 10.1
March 2019
Page 7 of 9
THERMO SCIENTIFIC 49i UV PHOTOMETRIC OZONE ANALYZER Wood Environment & Infrastructure Solutions, Inc.
REFERENCES
Thermo Fisher Scientific. 2006. Model 49i Instruction Manual, UV Photometric O
3 Analyzer
U.S. Environmental Protection Agency (EPA). 1994. Quality Assurance Handbook for Air Pollution
Measurement Systems, Vol. I. A Field Guide to Environmental Quality Assurance.
EPA/600/R-94/038a.
U.S. Environmental Protection Agency (EPA). 2008. Quality Assurance Handbook for Air Pollution
Measurement Systems, Vol. IV, Meteorological Measurements Version 2.0 (Final). EPA-
454/B-08-002.
U.S. Environmental Protection Agency (EPA). 2013. Quality Assurance Handbook for Air Pollution
Measurement Systems, Vol. II, Ambient Air Quality Monitoring Program. EPA-454/B-13-
003.
U.S. Environmental Protection Agency (EPA). 2000. Meteorological Monitoring Guidance for
Regulatory Modeling Applications. EPA-454/R-99-005.
U.S. Environmental Protection Agency (EPA). 2013. Transfer Standards for the Calibration of
Ambient Air Monitoring Analyzers for Ozone. Technical Assistance Document. EPA-
454/B-13-004.
U.S. Environmental Protection Agency (EPA). 2015. Appendix A to Part 58 – Quality Assurance
Requirements for State and Local Air Monitoring Stations (SLAMS), Special Purpose
Monitors (SPMs), and Prevention of Significant Deterioration (PSD) Air Monitoring. 40
CFR Part 58.

THERMO SCIENTIFIC 49i UV PHOTOMETRIC OZONE ANALYZER
Revision No. 10.1
March 2019
Page 8 of 9
THERMO SCIENTIFIC 49i UV PHOTOMETRIC OZONE ANALYZER Wood Environment & Infrastructure Solutions, Inc.
TABLES AND FIGURES
Figure 1. Ozone Certification
Traveling Transfer Standards (Level 2)
B B A A
D
CASTNET Station Analyzer
CASTNET Station Transfer Standard (Level 3)
Stationary Transfer Standard at the Gainesville FL Facility
(Level 2)
National Performance Audit Program (NPAP) 40CFR58
Appendix A Section 2.4 Traveling Transfer Standard
(Level 2)
Third Party Auditor Traveling Transfer Standard
(Level 2)
EPA SRP (Level 1)
NIST SRP (Level 1)*
NIST SRP (Level 1)
EPA SRP (Level 1)
E
F
G
C
Steps from SR P
AMEC Traveling Transfer Standards(Level 2)
BBAA
D
CASTNET Station Analyzer
CASTNET Station Transfer Standard(Level 3)
Stationary Transfer Standard at the AMEC Gainesville FL Facility
(Level 2)
National Performance Audit Program (NPAP) 40CFR58
Appendix A Section 2.4Traveling Transfer Standard
(Level 2)
Third Party Auditor Traveling Transfer Standard
(Level 2)
EPA SRP(Level 1)
NIST SRP(Level 1)*
NIST SRP(Level 1)
EPA SRP(Level 1)
E
F
G
C
Legend
A = Annual ReverificationB = Quarterly ReverificationC = Audited 1/6 weeks
D = Reverification 1/6 monthsE = Zero, Span and single Point QC check dailyF = Audited AnnuallyG = Audited 1/5 years
Level 2 O3Transfer Standard
Level 3 O3Transfer Standard
Level 4 O3Transfer Standard
NISTSRP2 EPA SRP1 or SRP7
Regional EPA SRPs
Level 1Standard Ref. Photometers
Site or Field Ozone Analyzer
1234S
teps
from
SR
P*Traceability

THERMO SCIENTIFIC 49i UV PHOTOMETRIC OZONE ANALYZER
Revision No. 10.1
March 2019
Page 9 of 9
THERMO SCIENTIFIC 49i UV PHOTOMETRIC OZONE ANALYZER Wood Environment & Infrastructure Solutions, Inc.
Table 1. Ozone Measurement Quality Objectives
Type of check
Measurement
Criteria
Corrective Action* Multi-Point
Calibration
Criteria Field Data
Zero 3.0 ppb Perform
adjusted
calibration
Invalid from the last
good check until
the next good
check or adjusted
calibration
completed
Between 0.0 and
3.0 ppb
Precision/Span 7 percent
between supplied
and observed
concentrations
Contact the
field
coordinator
Invalid from the last
good check until
the next good
check or adjusted
calibration
completed
All points on
calibration curve
within 2% of
full scale as
compared to the
best fit straight
line
linearity error < 5%
Correlation
Coefficient 0.995
Frequency of analyzer checks
One ZSP every day
ZSP** On demand to facilitate trouble shooting
Following a multipoint calibration prior to leaving the site
Minimum one multipoint calibration every 6 months
Calibration As required per QC results
When performing the semi-annual multipoint verification, calibration adjustment – if
needed - must occur within 24 hours of verification
General
Unadjusted calibration does not have to be followed by an adjusted calibration only if all analyzer
responses are in a 2 percent of full scale range.
Shelter temperature acceptable range: 20 – 30 degrees C
Notes: * Display drifts are frequently due to leaks in the system or lamp degradation/ageing. Verify lamp intensity settings against
previously documented values. Perform internal and external leak checks by plugging inlet line in back of the instrument
(internal) or tower inlet port (external). A line plug should reduce the internal pressure down to 250 mm Hg or so. Verify
external ozone generator pump function and internal pressure using the manual pressure gauge located inside the
instrument.
** Zero, Span, Precision automated QC check


FIELD OPERATIONS MANUAL TIPPING BUCKET RAIN GAUGE Revision No. 6 October 2018
Page 2 of 4
FIELD OPERATIONS MANUAL TIPPING BUCKET RAIN GAUGE Wood Environment & Infrastructure Solutions, Inc.
II. C. 4. TIPPING BUCKET RAIN GAUGE
PURPOSE
The purpose of this Standard Operating procedure (SOP) is to provide consistent guidance for verifying proper operation of the tipping bucket rain gauge to each site operator.
SCOPE
This SOP applies to tipping bucket rain gauges used at all CASTNet sites.
SUMMARY
The tipping bucket rain gauge, Climatronics Model 100508 or equivalent, consists of an 8-inch-diameter funnel-shaped collection basin and a measuring apparatus. Precipitation enters the collection basin and is funneled through a small hole in the center to the measuring apparatus (Figures 9 and 10 in II.A.2 Section 3.6). The collection basin is equipped with a thermostatically controlled heater to melt snow for collection purposes. The liquid precipitation is directed into one of two “buckets” balanced on the measuring apparatus. As one bucket fills, the weight of the liquid causes it to tip and bring the other bucket into place for collection of additional precipitation. The gauge is calibrated so that the weight of 0.01 inch (0.25 mm) of collected liquid causes the apparatus to tip. The tipping motion empties the measured liquid out of the bucket into a drain tube. When the apparatus tips, the swinging motion passes a magnet across a frictionless reed, or proximity switch, causing a momentary closure of the switch. This contact closure sends a signal to the DAS, which records the closure as a precipitation event. The amount of precipitation measured by the tipping bucket rain gauge directly corresponds to the number of tips the bucket makes. The rate of precipitation correlates to the number of tips per unit of time.
A clear and unobstructed mounting location is necessary to obtain accurate precipitation data. Normally, mast mounting is the simplest method. The gauge is mounted in a level position and in a location free from vibration. The funnel and tipping mechanism must be checked weekly and cleaned if necessary. An accumulation of dirt and bugs on the tipping bucket will adversely affect the calibration.
MATERIALS AND SUPPLIES
Tipping Bucket Rain Gauge Campbell Model CR3000 Data Logger, IBM-compatible PC Site Status Report Form (SSRF) Writing implement
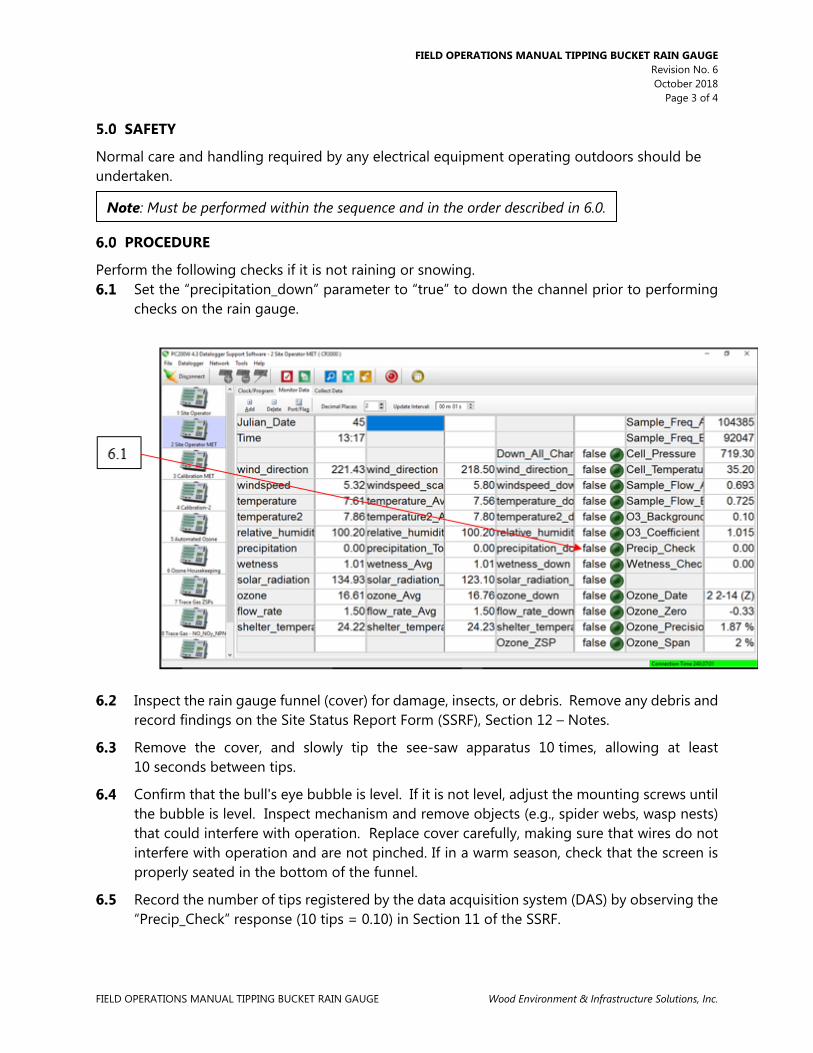
FIELD OPERATIONS MANUAL TIPPING BUCKET RAIN GAUGE Revision No. 6 October 2018
Page 3 of 4
FIELD OPERATIONS MANUAL TIPPING BUCKET RAIN GAUGE Wood Environment & Infrastructure Solutions, Inc.
SAFETY
Normal care and handling required by any electrical equipment operating outdoors should be undertaken.
PROCEDURE
Perform the following checks if it is not raining or snowing. Set the “precipitation_down” parameter to “true” to down the channel prior to performing
checks on the rain gauge.
Inspect the rain gauge funnel (cover) for damage, insects, or debris. Remove any debris and record findings on the Site Status Report Form (SSRF), Section 12 – Notes.
Remove the cover, and slowly tip the see-saw apparatus 10 times, allowing at least 10 seconds between tips.
Confirm that the bull's eye bubble is level. If it is not level, adjust the mounting screws until the bubble is level. Inspect mechanism and remove objects (e.g., spider webs, wasp nests) that could interfere with operation. Replace cover carefully, making sure that wires do not interfere with operation and are not pinched. If in a warm season, check that the screen is properly seated in the bottom of the funnel.
Record the number of tips registered by the data acquisition system (DAS) by observing the “Precip_Check” response (10 tips = 0.10) in Section 11 of the SSRF.
Note: Must be performed within the sequence and in the order described in 6.0.

FIELD OPERATIONS MANUAL TIPPING BUCKET RAIN GAUGE Revision No. 6 October 2018
Page 4 of 4
FIELD OPERATIONS MANUAL TIPPING BUCKET RAIN GAUGE Wood Environment & Infrastructure Solutions, Inc.
Set the “precipitation_down” parameter to “false” to enable the channel. This action will also reset the precipitation counter to zero. If additional testing is required go back to step 6.3.
REFERENCES
Climatronics Corporation. Climatronics Precipitation Gauges Manual U.S. Environmental Protection Agency (EPA). 1994. Quality Assurance Handbook for Air Pollution
Measurement Systems, Vol. I. A Field Guide to Environmental Quality Assurance. EPA/600/R-94/038a.
U.S. Environmental Protection Agency (EPA). 2008. Quality Assurance Handbook for Air Pollution
Measurement Systems, Vol. IV, Meteorological Measurements Version 2.0 (Final). EPA-454/B-08-002.
U.S. Environmental Protection Agency (EPA). 2013. Quality Assurance Handbook for Air Pollution
Measurement Systems, Vol. II, Ambient Air Quality Monitoring Program. EPA-454/B-13-003.
U.S. Environmental Protection Agency (EPA). 2000. Meteorological Monitoring Guidance for
Regulatory Modeling Applications. EPA-454/R-99-005.


FIELD OPERATIONS MANUAL WETNESS SENSOR Revision No. 6 October 2018
Page 2 of 4
FIELD OPERATIONS MANUAL WETNESS SENSOR Wood Environment & Infrastructure Solutions, Inc.
II. C. 5 WETNESS SENSOR
PURPOSE
The purpose of this Standard Operating procedure (SOP) is to provide consistent guidance for checking the Surface wetness sensor to each site operator.
SCOPE
This SOP applies to routine wetness sensor checks at all CASTNET sites.
SUMMARY
The CASTNET sites are equipped with a R.M. Young Model 58101 wetness sensor. The operation of the sensor is based on a detection of a predetermined change in capacitance. Surface wetness is indicated when water droplets cover approximately 0.2 square centimeter (cm2) of the sensor grid. The grid is designed from low-density fiber to represent a leaf surface. The grid is mounted at least 2 inches away from the sensor housing which contains the circuitry to convert the signal to voltage. See Figure 12 in II.A.2, Section 3.7. When the sensor is wet, it registers 1.00 V, and when dry, it registers 0.00 V. The wetness sensor is mounted at the height of the natural ground-level vegetation. Site operators inspect the sensor and verify its operation every Tuesday.
MATERIALS AND SUPPLIES
R.M. Young Model 58101 Wetness Sensor Campbell Model CR3000 data logger Deionized water Squeeze bottle Kimwipes IBM-compatible PC Site Status Report Form (SSRF)
SAFETY
Normal care and handling required by any electrical equipment operating outdoors should be taken.
PROCEDURE
Always perform in the order listed. Inspect the wetness sensor for cracks or other signs of damage. Ensure that the sensor
height is within 6 inches of the top of the surrounding vegetation. If not, then the vegetation should be trimmed or the height of the sensor should be adjusted.
If it is not snowing, remove any accumulated snow from the sensor and its protective flange, unless it would normally be under the snow-pack.
Observe the wetness sensor voltage (“wetness” parameter) reported by the CR3000 data logger. If there is no evidence of moisture on the sensor and it is not foggy, misty, raining, or snowing, then the response should be 0.000 ± 0.020 volt (V). If moisture is apparent on

FIELD OPERATIONS MANUAL WETNESS SENSOR Revision No. 6 October 2018
Page 3 of 4
FIELD OPERATIONS MANUAL WETNESS SENSOR Wood Environment & Infrastructure Solutions, Inc.
the sensor, or it is misty, foggy, raining or snowing, then the response should be 1.000 ± 0.010 V. Based on these criteria, determine whether the sensor response is reasonable and enter the result on the SSRF.
If the current sensor reading is 0.000 ± 0.1 V, then the following checks should be performed:
Set the “wetness_down” parameter to “true”.

FIELD OPERATIONS MANUAL WETNESS SENSOR Revision No. 6 October 2018
Page 4 of 4
FIELD OPERATIONS MANUAL WETNESS SENSOR Wood Environment & Infrastructure Solutions, Inc.
Place a few drops of water on the wetness sensor using the squeeze bottle provided.
Observe the wetness sensor voltages as displayed on the Site Operator Grid and enter the reported value on the SSRF.
Moisten a Kimwipe with water and carefully wipe the sensor plate clean. Be sure to remove any accumulated dust and debris, as this may affect sensor response. Dry the sensor plate by wiping gently with a clean, dry Kimwipe.
Observe the wetness sensor voltage displayed on the Site Operator Grid. When the response returns to 0.000 ± 0.020 V, then the wetness channel can be marked up again, as follows: Set the “wetness_down” parameter on the Site Operator Grid to “false”.
Enter the appropriate answer to "sensor cleaned?" on the SSRF.
REFERENCES
R.M. Young Model 58101 Wetness Sensor Manual U.S. Environmental Protection Agency (EPA). 1994. Quality Assurance Handbook for Air Pollution
Measurement Systems, Vol. I. A Field Guide to Environmental Quality Assurance. EPA/600/R-94/038a.
U.S. Environmental Protection Agency (EPA). 2008. Quality Assurance Handbook for Air Pollution
Measurement Systems, Vol. IV, Meteorological Measurements Version 2.0 (Final). EPA-454/B-08-002.
U.S. Environmental Protection Agency (EPA). 2013. Quality Assurance Handbook for Air Pollution
Measurement Systems, Vol. II, Ambient Air Quality Monitoring Program. EPA-454/B-13-003.
U.S. Environmental Protection Agency (EPA). 2000. Meteorological Monitoring Guidance for
Regulatory Modeling Applications. EPA-454/R-99-005.
CAUTION: The sensor plate is fragile and can be cracked easily. Apply very gentle pressure while cleaning and drying
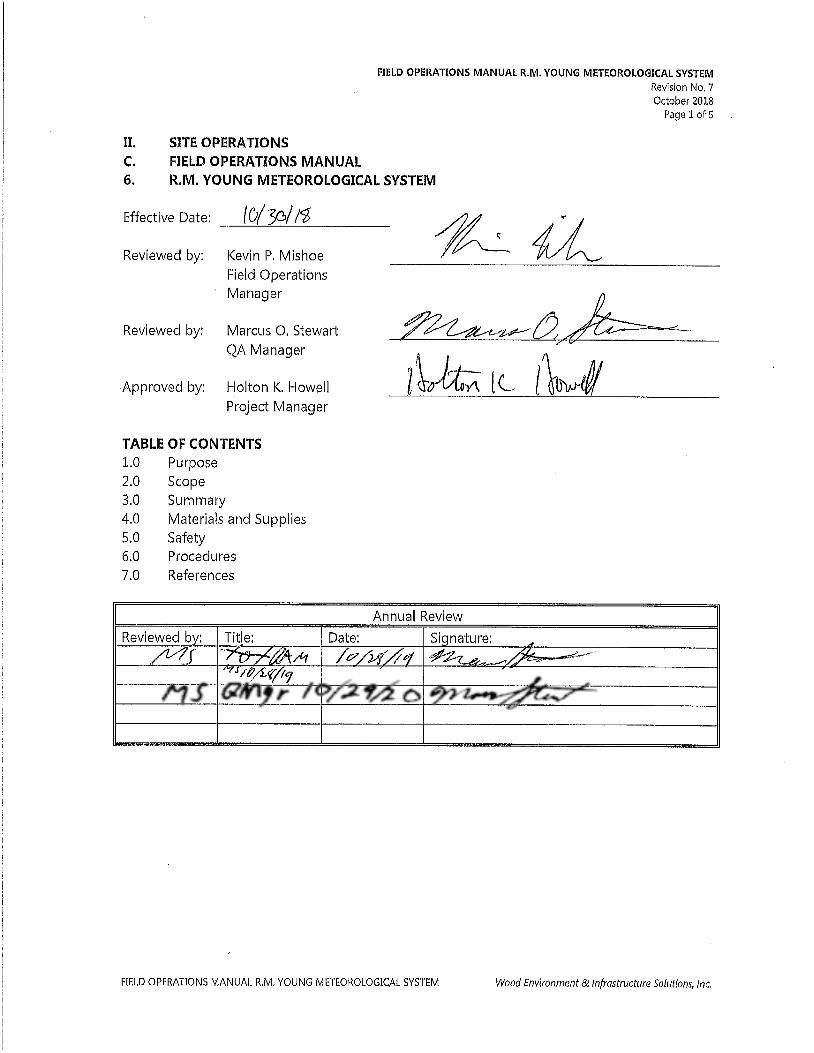

FIELD OPERATIONS MANUAL R.M. YOUNG METEOROLOGICAL SYSTEM Revision No. 7 October 2018
Page 2 of 5
FIELD OPERATIONS MANUAL R.M. YOUNG METEOROLOGICAL SYSTEM Wood Environment & Infrastructure Solutions, Inc.
II. C. 6. R.M. YOUNG METEOROLOGICAL SYSTEM
PURPOSE
The purpose of this Standard Operating procedure (SOP) is to provide an overview of R.M. Young Site meteorological equipment and operation to each site operator.
SCOPE
This SOP applies to routine site visits performed by the operators of R.M. Young equipped CASTNET sites.
SUMMARY
The R. M. Young meteorological system consists of sensors for wind direction and speed, temperatures T1 and T2, relative humidity (RH), and solar radiation. The sensors are mounted on the meteorological tower, and 1-m solar radiation support. Signal cables connect the solar radiation sensor to an individual translator located on the data-logger backplane. All of the individual sensors receive operating power from the Campbell CR3000 data-logger, which has a regulated 12-volt output. The site operator performs routine checks on this equipment every Tuesday.
MATERIALS AND SUPPLIES
A brief list is provided in 3.0 above.
SAFETY
A hard hat must be worn when raising and lowering towers. If it is necessary to repair or service an instrument, remove personal jewelry, turn off the instrument’s power and disconnect (unplug) to avoid contact with live current. Always use a safety harness when climbing.
PROCEDURES
The following is a brief description of each parameter. Figure 1 provides a photo of the system. There are no operating instructions other than those provided in Section II.B, “Site Operator Instructions.” Those instructions, the manufacturer’s manual, and troubleshooting direction given by the Wood Environment & Infrastructure Solutions, Inc. (Wood) field operations group, should be sufficient to perform the required site operator’s duties.
Wind Monitor
The wind sensor is mounted at the top of the meteorological tower. A rod beneath the sensor is attached to the tower and aligned to either north or south as a reference point. The sensor has both a lightweight propeller and vane to measure wind speed and direction simultaneously. There is no circuit to provide heat to the sensor to prevent icing in freezing conditions. The design of the monitor is such that icing should not occur unless extreme conditions are encountered. The vane should be free of obstructions and able to move in a light breeze. In general, if there is enough wind to move the wind speed propeller, the wind direction vane should also be moving, and vice-versa. The sensor should be in a vertical position on the tower,

FIELD OPERATIONS MANUAL R.M. YOUNG METEOROLOGICAL SYSTEM Revision No. 7 October 2018
Page 3 of 5
FIELD OPERATIONS MANUAL R.M. YOUNG METEOROLOGICAL SYSTEM Wood Environment & Infrastructure Solutions, Inc.
and the vane should not be damaged or bent. Perform the current condition checks as described in Section II.B. Wind speed in miles per hour (mph) is somewhat more than 2 times wind speed in meters per second (m/s). Therefore, if the data logger is recording wind speed as 2 m/s, the equivalent wind speed is about 5 mph. Figure 1. R.M. Young Meteorological System: (from top to bottom) Meteorological Tower with
Wind AQ, Directional Cross-Arm, Gill Aspirated Shield for RH Probe, 9-m Aspirated Temperature Sensor Shield and Waterproof RH Circuit Card "Otter" box.
T1, T2, and Delta Temperature
T1 and T2 measurements are obtained by using two identical sensors mounted in aspirated shields on the meteorological tower. Both sensors measure temperature by measuring changes in resistance. Each sensor is operated independently. A correction is applied to the reported temperatures and Delta Temperature is then computed as the difference between the temperature indicated by the T1 and T2 sensors (Delta Temperature = T1 – T2). Ensure both blowers are functioning by direct observation and confirm by reviewing the “blower_rpm” parameter. Perform the current condition checks as described in Section II.B. As a general rule, the ground should heat up during bright sunny days with moderate to light winds. Therefore, during the day the delta temperature should be a negative number (upper sensor temperature is lower than the lower sensor temperature). At night the ground should cool down and the

FIELD OPERATIONS MANUAL R.M. YOUNG METEOROLOGICAL SYSTEM Revision No. 7 October 2018
Page 4 of 5
FIELD OPERATIONS MANUAL R.M. YOUNG METEOROLOGICAL SYSTEM Wood Environment & Infrastructure Solutions, Inc.
delta temperature should be positive. Under overcast, rainy, or well-mixed conditions, the delta temperature should be near zero.
Relative Humidity
The RH sensor is mounted in a naturally aspirated shield near the upper temperature housing. No air is forced past the sensor. During times of light winds, fog, or extended rain, the sensor may become saturated and require several hours to respond to decreased humidity levels. Perform the current condition checks as described in Section II.B. Generally, humidity increases at night as the temperature approaches the dew point, with maximum humidity before sunrise. Also, warm air can hold more moisture; and if a dry air mass is present and a bright sunny day is encountered, the humidity level relative to the diurnal increase in temperature will be low.
Solar Radiation
The solar radiation sensor is mounted on a support (Figure 2) usually about one meter in height in the southernmost area of the site. It should be in a location where the influence of shadows from other structures or trees can be avoided. Be sure the sensor is clean and level. Avoid shading the sensor when inspecting or performing required maintenance. Perform the current condition checks as described in Section II.B. A bright, sunny, cloudless day, in the U.S. mid latitudes will produce solar radiation values of about seven to eight hundred watts per square meter. The values can increase and decrease rapidly during cloudy conditions. Figure 2. R.M. Young Solar Radiation Sensor

FIELD OPERATIONS MANUAL R.M. YOUNG METEOROLOGICAL SYSTEM Revision No. 7 October 2018
Page 5 of 5
FIELD OPERATIONS MANUAL R.M. YOUNG METEOROLOGICAL SYSTEM Wood Environment & Infrastructure Solutions, Inc.
REFERENCES
U.S. Environmental Protection Agency (EPA). 1994. Quality Assurance Handbook for Air Pollution Measurement Systems, Vol. I. A Field Guide to Environmental Quality Assurance. EPA/600/R-94/038a.
U.S. Environmental Protection Agency (EPA). 2008. Quality Assurance Handbook for Air Pollution
Measurement Systems, Vol. IV, Meteorological Measurements Version 2.0 (Final). EPA-454/B-08-002.
U.S. Environmental Protection Agency (EPA). 2013. Quality Assurance Handbook for Air Pollution
Measurement Systems, Vol. II, Ambient Air Quality Monitoring Program. EPA-454/B-13-003.
U.S. Environmental Protection Agency (EPA). 2000. Meteorological Monitoring Guidance for
Regulatory Modeling Applications. EPA-454/R-99-005.

FIELD OPERATIONS MANUAL MODEL T200U TOTAL REACTIVE OXIDES OF NITROGEN (NOY) Revision No. 2.1
January 2020 Page 2 of 39
MODEL T200U TOTAL REACTIVE OXIDES OF NITROGEN (NOY) Wood Environment & Infrastructure Solutions, Inc.
II. C. 7. MODEL T200U TOTAL REACTIVE OXIDES OF NITROGEN (NOY)
PURPOSE
The purpose of this SOP is to provide consistent guidance for maintenance and handling of the Teledyne Advanced Pollution Instrumentation (API) Model T200U NO/NOy Analyzer. This SOP is designed to be used by the Clean Air Status and Trends Network (CASTNET) field calibration laboratory and field personnel.
SCOPE
This SOP applies to all CASTNET sites operating trace level Teledyne API T200U NO/NOy analyzers. The reader must also be familiar with five documents listed in Section 7.0 (References) of this SOP. The documents include the EPA (2005) Technical Assistance Document (TAD) for National Core (NCore) Monitoring, the API T200U Operation Manual (Manual), the T200U Addendum to the Manual, the NOy Addendum and EPA (2008) Quality Assurance (QA) Handbook for Air Pollution Measurement Systems, Volume II, Appendix D (QA Handbook). The various sections throughout this SOP cross-reference the five documents. CASTNET is mandated to use trace gas instruments that are based on Federal Equivalent Methods. The following settings and operational parameters must be used to maintain equivalency (Manual Section 2.2, pp. 28-29):
• Ambient temperature 5 degrees Celsius (°C) to 40°C • 1 micrometer (µm) Teflon [polytetrafluoroethylene (PTFE)] filter in internal assembly • Gas flow of 2 standard liters per minute (slpm) or greater supplied by external vacuum
pump capable of 10 inches of mercury absolute (in Hg-A) • Dynamic Span = OFF • Dynamic Zero = OFF or ON • CAL-ON-NO
2 = OFF • Pressure/Temperature compensation = ON

FIELD OPERATIONS MANUAL MODEL T200U TOTAL REACTIVE OXIDES OF NITROGEN (NOY) Revision No. 2.1
January 2020 Page 3 of 39
MODEL T200U TOTAL REACTIVE OXIDES OF NITROGEN (NOY) Wood Environment & Infrastructure Solutions, Inc.
SUMMARY
CASTNET Site Overview Figure 1. CASTNET Site Overview
Figure 1 shows the instrument communication system at a CASTNET site. The instruments include the NCore trace gas analyzers and the standard CASTNET sensors. Flow Chart Figure 2 provides NO
2 validation criteria based on the tables in QA Handbook, Volume II, Appendix D.
LaptopComputer
PC 200W
AMEC
Internet
Raven CellularModem
Raven Antenna& Booster
Trace Gas Serial
Adapter
Shelter Temp.Probe
Special Studies
Filter SamplingMFC System
Solar RadiationSensor
PrecipitationGauge
Wetness Sensor
Site OzoneAnalyzer
Model 49iLevel 3
Transfer OzoneAnalyzer COM 220
Phone Modem
Phone &Phone System
API T200U NOyAnalyzer
API T300UCO Analyzer
API T100USO2 Analyzer
API T700UDynamic Dilution
Calibrator
NL-115Ethernet Port
Site ElectricalHVAC SystemClimatronics or R.M. Young
Meteorological System
NetworkRouter(s)
CampbellCR3000 Data
logger
Wood
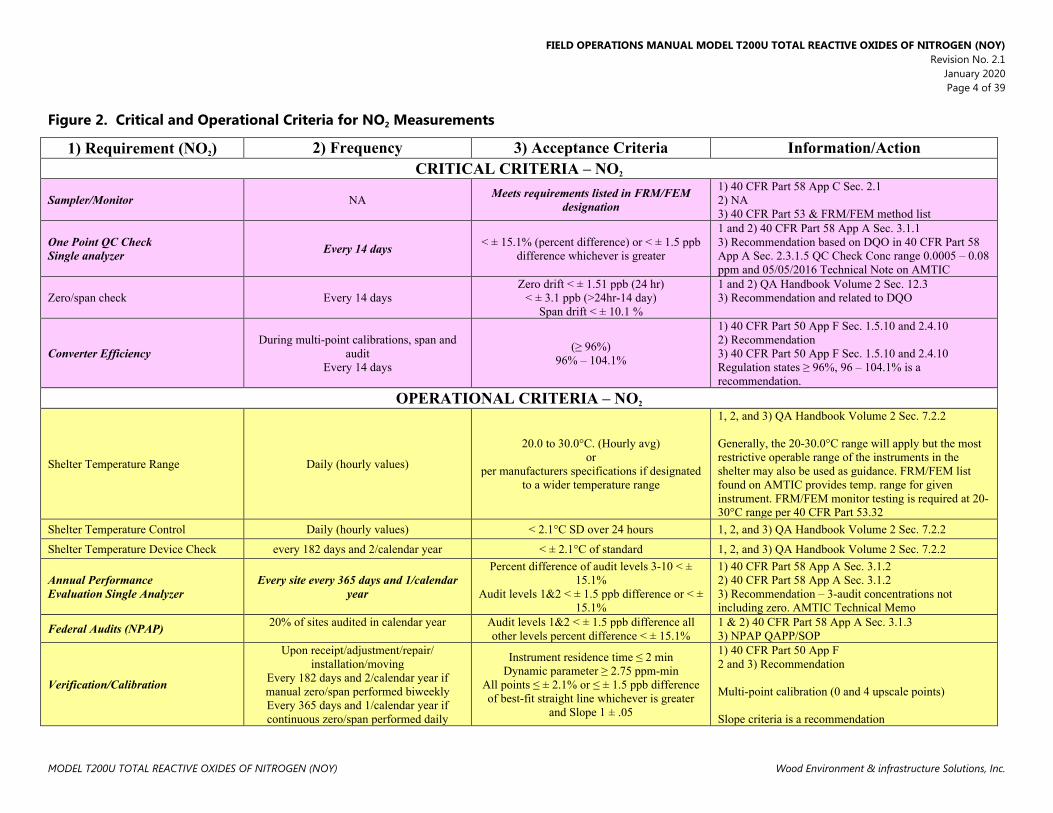
FIELD OPERATIONS MANUAL MODEL T200U TOTAL REACTIVE OXIDES OF NITROGEN (NOY) Revision No. 2.1
January 2020 Page 4 of 39
MODEL T200U TOTAL REACTIVE OXIDES OF NITROGEN (NOY) Wood Environment & infrastructure Solutions, Inc.
Figure 2. Critical and Operational Criteria for NO 2 Measurements
1) Requirement (NO 2) 2) Frequency 3) Acceptance Criteria Information/Action
CRITICAL CRITERIA – NO 2
Sampler/Monitor NA Meets requirements listed in FRM/FEM designation
1) 40 CFR Part 58 App C Sec. 2.1 2) NA 3) 40 CFR Part 53 & FRM/FEM method list
One Point QC Check Single analyzer Every 14 days < ± 15.1% (percent difference) or < ± 1.5 ppb
difference whichever is greater
1 and 2) 40 CFR Part 58 App A Sec. 3.1.1 3) Recommendation based on DQO in 40 CFR Part 58 App A Sec. 2.3.1.5 QC Check Conc range 0.0005 – 0.08 ppm and 05/05/2016 Technical Note on AMTIC
Zero/span check Every 14 days Zero drift < ± 1.51 ppb (24 hr)
< ± 3.1 ppb (>24hr-14 day) Span drift < ± 10.1 %
1 and 2) QA Handbook Volume 2 Sec. 12.3 3) Recommendation and related to DQO
Converter Efficiency During multi-point calibrations, span and
audit Every 14 days
(≥ 96%) 96% – 104.1%
1) 40 CFR Part 50 App F Sec. 1.5.10 and 2.4.10 2) Recommendation 3) 40 CFR Part 50 App F Sec. 1.5.10 and 2.4.10 Regulation states ≥ 96%, 96 – 104.1% is a recommendation.
OPERATIONAL CRITERIA – NO 2
Shelter Temperature Range Daily (hourly values)
20.0 to 30.0°C. (Hourly avg) or
per manufacturers specifications if designated to a wider temperature range
1, 2, and 3) QA Handbook Volume 2 Sec. 7.2.2 Generally, the 20-30.0°C range will apply but the most restrictive operable range of the instruments in the shelter may also be used as guidance. FRM/FEM list found on AMTIC provides temp. range for given instrument. FRM/FEM monitor testing is required at 20-30°C range per 40 CFR Part 53.32
Shelter Temperature Control Daily (hourly values) < 2.1°C SD over 24 hours 1, 2, and 3) QA Handbook Volume 2 Sec. 7.2.2
Shelter Temperature Device Check every 182 days and 2/calendar year < ± 2.1°C of standard 1, 2, and 3) QA Handbook Volume 2 Sec. 7.2.2
Annual Performance Evaluation Single Analyzer
Every site every 365 days and 1/calendar year
Percent difference of audit levels 3-10 < ± 15.1%
Audit levels 1&2 < ± 1.5 ppb difference or < ± 15.1%
1) 40 CFR Part 58 App A Sec. 3.1.2 2) 40 CFR Part 58 App A Sec. 3.1.2 3) Recommendation – 3-audit concentrations not including zero. AMTIC Technical Memo
Federal Audits (NPAP) 20% of sites audited in calendar year Audit levels 1&2 < ± 1.5 ppb difference all other levels percent difference < ± 15.1%
1 & 2) 40 CFR Part 58 App A Sec. 3.1.3 3) NPAP QAPP/SOP
Verification/Calibration
Upon receipt/adjustment/repair/ installation/moving
Every 182 days and 2/calendar year if manual zero/span performed biweekly Every 365 days and 1/calendar year if continuous zero/span performed daily
Instrument residence time ≤ 2 min Dynamic parameter ≥ 2.75 ppm-min
All points ≤ ± 2.1% or ≤ ± 1.5 ppb difference of best-fit straight line whichever is greater
and Slope 1 ± .05
1) 40 CFR Part 50 App F 2 and 3) Recommendation Multi-point calibration (0 and 4 upscale points) Slope criteria is a recommendation

FIELD OPERATIONS MANUAL MODEL T200U TOTAL REACTIVE OXIDES OF NITROGEN (NOY) Revision No. 2.1
January 2020 Page 5 of 39
MODEL T200U TOTAL REACTIVE OXIDES OF NITROGEN (NOY) Wood Environment & infrastructure Solutions, Inc.
1) Requirement (NO 2) 2) Frequency 3) Acceptance Criteria Information/Action
Gaseous Standards All gas cylinders
NIST Traceable (e.g., EPA Protocol Gas)
50-100 ppm of NO in Nitrogen with < 1 ppm NO2
1) 40 CFR Part 50 App F Sec. 1.3.1 2) NA Green Book 3) 40 CFR Part 50 App F Sec. 1.3.1 Gas producer used must participate in EPA Ambient Air Protocol Gas Verification Program 40 CFR Part 58 App A Sec. 2.6.1
Zero Air/Zero Air Check Every 365days and 1/calendar year Concentrations below LDL 1) 40 CFR Part 50 App F Sec. 1.3.2 2 and 3) Recommendation
Gas Dilution Systems Every 365 days and 1/calendar year or after failure of 1 point QC check or performance
evaluation Accuracy < ± 2.1%
1, 2, and 3) Recommendation based on SO2 requirement in 40 CFR Part 50 App A-1 Sec. 4.1.2
Detection (FEM/FRMs) Noise and Lower Detectable Limits (LDL) are part of the FEM/FRM requirements. It is recommended that monitoring organizations perform the LDL test to minimally confirm and establish the LDL of their monitor. Performing the LDL test will provide the noise information.
Noise Every 365 days and 1/calendar year ≤ 0.005 ppm 1) 40 CFR Part 53.23 (b) (definition & procedure) 2) Recommendation- info can be obtained form LDL 3) 40 CFR Part 53.20 Table B-1
Lower detectable level Every 365 days and 1/calendar year ≤ 0.01 ppm 1) 40 CFR Part 53.23 (c) (definition & procedure) 2) Recommendation 3) 40 CFR Part 53.20 Table B-1
SYSTEMATIC CRITERIA – NO 2
Standard Reporting Units All data ppb (final units in AQS) 1, 2, and 3) 40 CFR Part 50 App S Sec. 2 (c)
Rounding convention for data reported to AQS All routine concentration data 1 place after decimal with digits to right
truncated
1, 2, and 3) 40 CFR Part 50 App S Sec. 4.2 (a) The rounding convention is for averaging values for comparison to NAAQS not for reporting individual hourly values.
Completeness
Annual Standard ≥ 75% hours in year 1) 40 CFR Part 50 App S Sec. 3.1 (b) 2) 40 CFR Part 50 App S Sec. 3.1 (a) 3) 40 CFR Part 50 App S Sec. 3.1 (b)
1-hour standard
1) 3 consecutive calendar years of complete data
2) 4 quarters complete in each year 3) ≥ 75% sampling days in quarter
4) ≥ 75% of hours in a day
1) 40 CFR Part 50 App S Sec. 3.2 (b) 2) 40 CFR Part 50 App S Sec. 3.2 (a) 3) 40 CFR Part 50 App S Sec. 3.2 (b) More details in 40 CFR Part 50 App S
Sample Residence Time Verification Every 365 days and 1/calendar year ≤ 20 Seconds
1) 40 CFR Part 58 App E Sec. 9 (c) 2) Recommendation 3) 40 CFR Part 58 App E Sec. 9 (c)
Sample Probe, Inlet, Sampling train All sites Borosilicate glass (e.g., Pyrex ®) or Teflon®
1, 2, and 3) 40 CFR Part 58 App E Sec. 9 (a) FEP and PFA have been accepted as equivalent material to Teflon. Replacement or cleaning is suggested as 1/year and more frequent if pollutant load or contamination dictate.

FIELD OPERATIONS MANUAL MODEL T200U TOTAL REACTIVE OXIDES OF NITROGEN (NOY) Revision No. 2.1
January 2020 Page 6 of 39
MODEL T200U TOTAL REACTIVE OXIDES OF NITROGEN (NOY) Wood Environment & infrastructure Solutions, Inc.
1) Requirement (NO 2) 2) Frequency 3) Acceptance Criteria Information/Action
Siting Every 365 days and 1/calendar year Meets siting criteria or waiver documented 1) 40 CFR Part 58 App E Sec. 2-6 2) Recommendation 3) 40 CFR Part 58 App E Sec. 2-6
Precision (using 1-point QC checks) Calculated annually and as appropriate for design value estimates 90% CL CV < 15.1%
1) 40 CFR Part 58 App A Sec. 2.3.1.5 & 3.1.1 2) 40 CFR Part 58 App A Sec. 4 (b) 3) 40 CFR Part 58 App A Sec. 4.1.2
Bias (using 1-point QC checks) Calculated annually and as appropriate for design value estimates 95% CL < ± 15.1%
1) 40 CFR Part 58 App A Sec. 2.3.1.5 & 3.1.1 2) 40 CFR Part 58 App A Sec. 4 (b) 3) 40 CFR Part 58 App A Sec. 4.1.3

FIELD OPERATIONS MANUAL MODEL T200U TOTAL REACTIVE OXIDES OF NITROGEN (NOY) Revision No. 2.1
January 2020 Page 7 of 39
MODEL T200U TOTAL REACTIVE OXIDES OF NITROGEN (NOY) Wood Environment & Infrastructure Solutions, Inc.
MATERIALS AND SUPPLIES
The operation of the T200U analyzer requires a sample inlet made of Teflon perfluoroalkoxy (PFA) (TAD Section 4.3.4.3, p. 24 of 40). The system utilizes a dynamic dilution gas calibrator (T700U) with a compressed nitric oxide (NO) gas cylinder with at least a ± 2% certification. The T200U system also requires:
• Assorted fittings comprised of Teflon or stainless steel • gas lines comprised of Teflon [PTFE or fluorinated ethylene propylene (FEP)] • 47 millimeter (mm), 1 µm Teflon inlet filler • Zero air with concentrations lower than the lower detection limit (LDL) of NO, nitrogen
dioxide (NO 2), and ammonia (NH
3).
SAFETY
The T200U is a heavy, high voltage instrument. With a weight of about 45 pounds with the pump, it is recommended that two people lift and carry the instrument. High voltages are present inside the instrument case. Consequently, the power connection must have a functioning ground connection. The power must be off before disconnecting subassemblies. The instrument must not be operated with the cover off. NO
2 is extremely toxic by inhalation. Consequently, the material safety data sheet (MSDS) for the NO cylinder must be posted onsite. Exhaust must be vented outside the shelter.
PROCEDURES
Set-Up/Installation The first step is to unpack the analyzer from its shipping container and visually inspect the instrument for any damage. Then, identity loose fittings, screws, or items that may appear to be out of place. Internal damage to the analyzers and their components occurs occasionally during shipment.
6.1.1 Remove Shipping Screws Remove the two red shipping screws from the top of the sensor base before operating the instrument.
6.1.2 Ventilate Instrument Before powering on the T200U, the instrument must be properly ventilated. Minimum ventilation clearances are as follows (Manual Section 3.3.1, p. 41):
• Back -- 4 inches • Sides -- 1 inch • Above and Below -- 1 inch
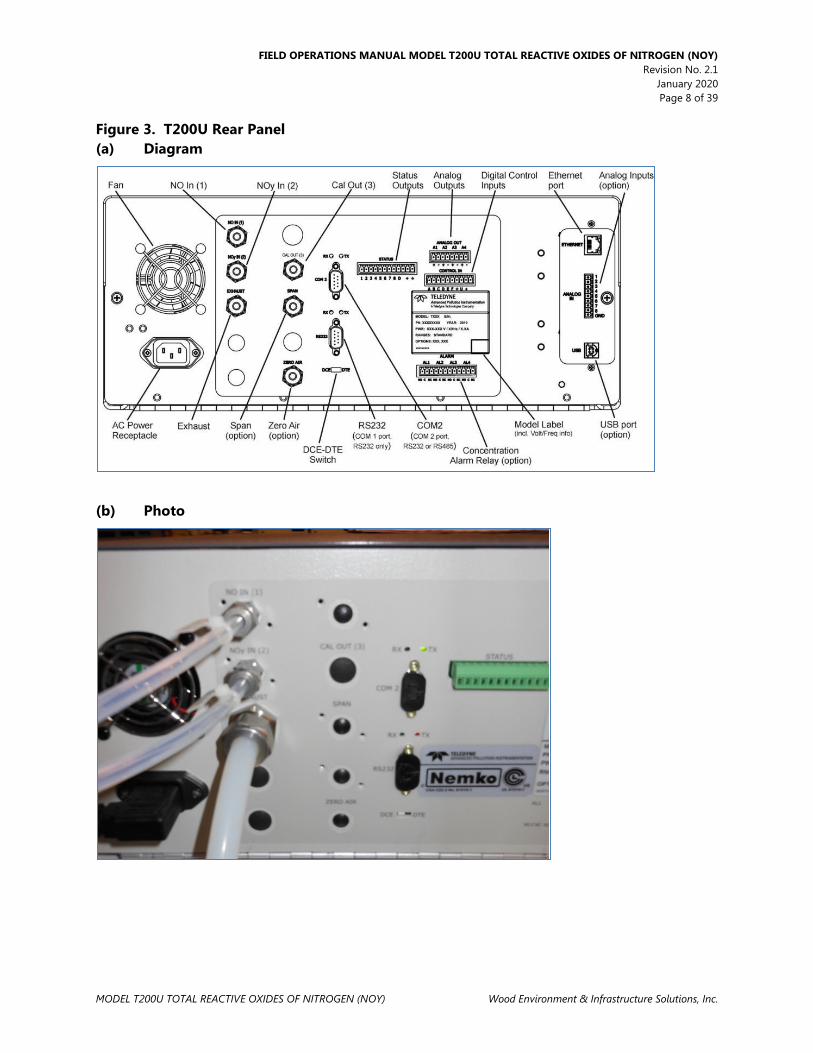
FIELD OPERATIONS MANUAL MODEL T200U TOTAL REACTIVE OXIDES OF NITROGEN (NOY) Revision No. 2.1
January 2020 Page 8 of 39
MODEL T200U TOTAL REACTIVE OXIDES OF NITROGEN (NOY) Wood Environment & Infrastructure Solutions, Inc.
Figure 3. T200U Rear Panel (a) Diagram
(b) Photo

FIELD OPERATIONS MANUAL MODEL T200U TOTAL REACTIVE OXIDES OF NITROGEN (NOY) Revision No. 2.1
January 2020 Page 9 of 39
MODEL T200U TOTAL REACTIVE OXIDES OF NITROGEN (NOY) Wood Environment & Infrastructure Solutions, Inc.
6.1.3 Use Teflon Tubing and Fittings Only FEP or PTFE tubing and fittings should be used for the T200U (TAD Section 4.3.2, p. 15 of 40). No stainless steel or brass fitting are allowed.
6.1.4 Implement Rear Panel Connections • Connect Ethernet cable to Ethernet port (Figure 3) • Connect the external exhaust pump to the exhaust port • Connect the “NO In (1)” on the T200U to the “NO Out (1)” on the bypass box
(Figure 3) • Connect the “NOy In (2)” on the T200U to the “NOy Out (2)” on the bypass box
6.1.5 Connect Bypass and Converter Boxes On the bypass box (Figure 4):
• Connect the power cord to the alternating current (AC) power receptacle • Connect the converter power cable from the converter box • Connect the thermocouple cable from the converter box • Connect the “Cal In (3)” to the Output B on the Teledyne T700U gas calibrator, or
equivalent source of calibration gas. • Connect the “NOy In (4)”, “NO In (5)”, and “Cal Out (6)” to their respective lines
coming from the converter box

FIELD OPERATIONS MANUAL MODEL T200U TOTAL REACTIVE OXIDES OF NITROGEN (NOY) Revision No. 2.1
January 2020 Page 10 of 39
MODEL T200U TOTAL REACTIVE OXIDES OF NITROGEN (NOY) Wood Environment & Infrastructure Solutions, Inc.
Figure 4. Bypass Box (a) Diagram
(b) Photo

FIELD OPERATIONS MANUAL MODEL T200U TOTAL REACTIVE OXIDES OF NITROGEN (NOY) Revision No. 2.1
January 2020 Page 11 of 39
MODEL T200U TOTAL REACTIVE OXIDES OF NITROGEN (NOY) Wood Environment & Infrastructure Solutions, Inc.
Figure 5. Converter box Figure 6. External sample pump
On the converter box • Install additional 5µm filters on the inlet side of the NO and NOy channels within the
converter box (Figure 5). • A leak check should be performed once pneumatic connections have all been made and
the machine has been turned on (Manual Section 11.3.12, pp. 258-259). Cap sample inlet on the NOy converter box, SAMP (sample pressure) and RCEL (reaction cell) on the T200U should fall below 4in-Hg
6.1.6 Complete Start-Up Procedures • Pump (Figure 6) and exhaust fan should start immediately (Manual Section 3.4.1, p. 75)) • Allow 60 minutes of warm-up (Manual Section 3.4.1, pp. 75-76) • Upon initial startup warning messages may appear on the display (Figure 7). If after
30 minutes of the warm-up period, warning messages still appear, their cause warrants further investigation.
• A list of common warning messages can be viewed in Table 3-12 of the Manual (p. 77) • Check test functions using worksheet from Manual Appendix C, p. C-1, and Trace Gas
Maintenance Forms 1 and 2 (Figure 6 and 7 in QAPP Appendix 11).

FIELD OPERATIONS MANUAL MODEL T200U TOTAL REACTIVE OXIDES OF NITROGEN (NOY) Revision No. 2.1
January 2020 Page 12 of 39
MODEL T200U TOTAL REACTIVE OXIDES OF NITROGEN (NOY) Wood Environment & Infrastructure Solutions, Inc.
Figure 7. Operating Screen
Acceptance Testing Complete the following checks, tests, and calculations as the bases for instrument acceptance.
• Perform vacuum leak check as described in SOP Section 6.10. • Verify precision (also performed quarterly). Analyzer should have a 95% probability limit
for precision of ± 15% or less (TAD Section 3.3.1.1, p. 5 of 31) based on Equations 1 and 2 in the TAD section.
• Verify bias (also performed quarterly). Analyzer should have an upper bound for average bias of ± 15% (TAD Section 3.3.1.2, p. 6 of 31)
• Calculate method detection limit (MDL) according to the procedure in 40 CFR 136 Appendix B. The MDL should be 0.2 parts per billion (ppb) or lower over an averaging time of no more than 5 minutes.
• Estimate LDL according to the procedure in 40 CFR 53.23 (c). The Addendum indicates the LDL is 50 parts per trillion (ppt).
• Verify linear range by demonstrating all points recorded during the multipoint audit are within 1% of full scale of the best fit straight line.
• Estimate zero/span drift (TAD Section 3.3.1.9, p. 10 of 31) over 12- and 24-hour periods of continuous unadjusted operation. Zero drift should be less than 0.1 ppb for 12 and 24 hours and less than 1% full scale for 24-hour span drift. The Addendum indicates span drift (24-hr) should be less than 0.5% of full scale or 50 ppt root mean square (RMS), whichever is greater.

FIELD OPERATIONS MANUAL MODEL T200U TOTAL REACTIVE OXIDES OF NITROGEN (NOY) Revision No. 2.1
January 2020 Page 13 of 39
MODEL T200U TOTAL REACTIVE OXIDES OF NITROGEN (NOY) Wood Environment & Infrastructure Solutions, Inc.
• Test the conversion efficiency of the molybdenum converter (TAD Section 4.4.2, pp. 26-28).
• Verify test functioning using Forms 1 and 2 (Figures 6 and 7 in QAPP Appendix 11).
Configuration
• Set clock to current date and time of day (standard time) (Manual Section 5.6.1, p. 110) The clock will automatically be set by the site data logger and only needs to be set manually if the instrument is to be operated independently. Setup → Clk → Time → (Set to current local standard time) → ENTR* Setup → Clk → Date → (Set to current date) → ENTR
*The T200U uses abbreviations to show parameters on its display screen. The abbreviations are defined in Section 9.0 of this SOP.
• Analog range configuration is not applicable for digital communications. • Range units = ppb (Manual Section 5.4.3.4, p. 105)
To check: Sample → Test → RNGE
To change: Setup → Rnge → Unit → PPB ENTR
• Range concentration = 0100.0 To check:
Sample → Test → RNGE To Change:
Setup → Rnge → Set → 00100.0 ENTR • Range mode = Single (SNGL) (Manual Section 5.4.3, p. 98)
To check: Setup → Rnge → Mode → RANGE MODE
To Change: Setup → Rnge → Mode → SNGL
• Set Machine ID (Manual Section 5.7.1, pp. 112-113) To check: Setup → More → Comm → ID To change: Setup → More → Comm → ID → (Set to desired value) → ENTR
• Set Ethernet settings (Manual Section 6.5.1, pp. 143-145) Setup → More → Comm → Inet DHCP = Off INST IP = 192.168.0.42 GATEWAY IP = 192.168.0.1 SUBNET MASK = 255.255.255.0 TCP PORT 1 = 3000 TCP PORT 2 = 502
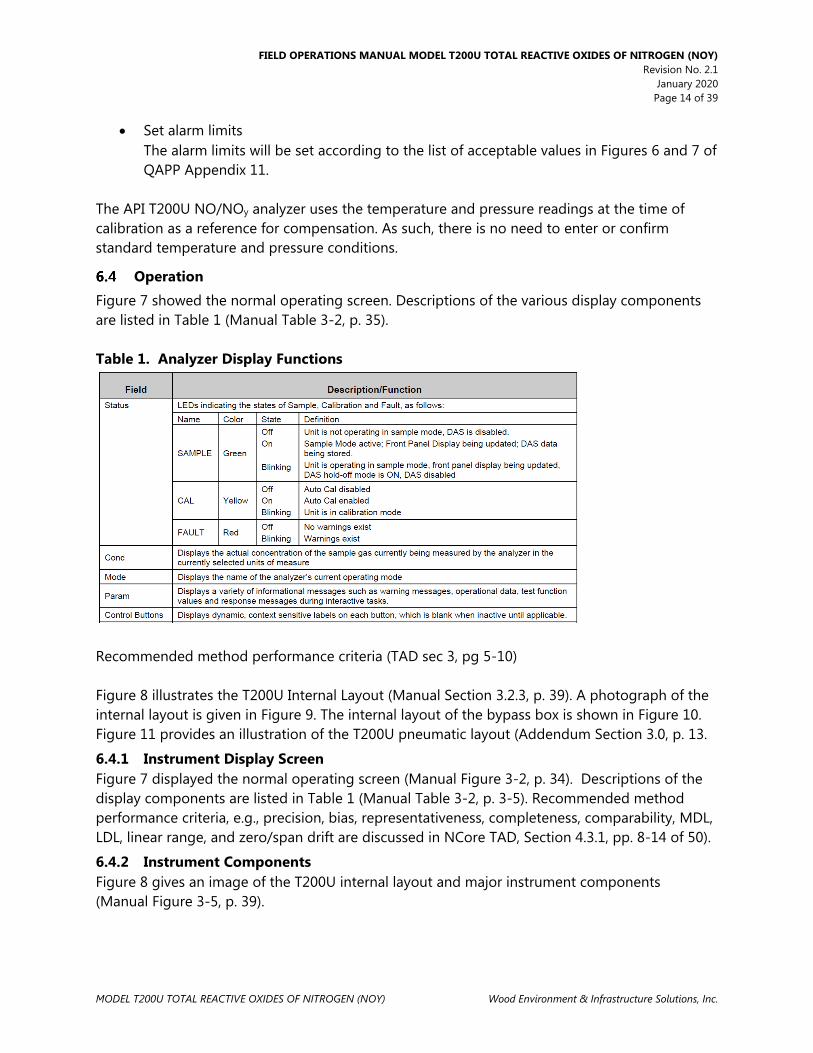
FIELD OPERATIONS MANUAL MODEL T200U TOTAL REACTIVE OXIDES OF NITROGEN (NOY) Revision No. 2.1
January 2020 Page 14 of 39
MODEL T200U TOTAL REACTIVE OXIDES OF NITROGEN (NOY) Wood Environment & Infrastructure Solutions, Inc.
• Set alarm limits The alarm limits will be set according to the list of acceptable values in Figures 6 and 7 of QAPP Appendix 11.
The API T200U NO/NOy analyzer uses the temperature and pressure readings at the time of calibration as a reference for compensation. As such, there is no need to enter or confirm standard temperature and pressure conditions.
Operation Figure 7 showed the normal operating screen. Descriptions of the various display components are listed in Table 1 (Manual Table 3-2, p. 35). Table 1. Analyzer Display Functions
Recommended method performance criteria (TAD sec 3, pg 5-10) Figure 8 illustrates the T200U Internal Layout (Manual Section 3.2.3, p. 39). A photograph of the internal layout is given in Figure 9. The internal layout of the bypass box is shown in Figure 10. Figure 11 provides an illustration of the T200U pneumatic layout (Addendum Section 3.0, p. 13.
6.4.1 Instrument Display Screen Figure 7 displayed the normal operating screen (Manual Figure 3-2, p. 34). Descriptions of the display components are listed in Table 1 (Manual Table 3-2, p. 3-5). Recommended method performance criteria, e.g., precision, bias, representativeness, completeness, comparability, MDL, LDL, linear range, and zero/span drift are discussed in NCore TAD, Section 4.3.1, pp. 8-14 of 50).
6.4.2 Instrument Components Figure 8 gives an image of the T200U internal layout and major instrument components (Manual Figure 3-5, p. 39).

FIELD OPERATIONS MANUAL MODEL T200U TOTAL REACTIVE OXIDES OF NITROGEN (NOY) Revision No. 2.1
January 2020 Page 15 of 39
MODEL T200U TOTAL REACTIVE OXIDES OF NITROGEN (NOY) Wood Environment & Infrastructure Solutions, Inc.
Figure 8. T200U Internal Chassis Layout

FIELD OPERATIONS MANUAL MODEL T200U TOTAL REACTIVE OXIDES OF NITROGEN (NOY) Revision No. 2.1
January 2020 Page 16 of 39
MODEL T200U TOTAL REACTIVE OXIDES OF NITROGEN (NOY) Wood Environment & Infrastructure Solutions, Inc.
Figure 9. T200U Internal Layout Figure 10. Bypass Box Internal Layout

FIELD OPERATIONS MANUAL MODEL T200U TOTAL REACTIVE OXIDES OF NITROGEN (NOY) Revision No. 2.1
January 2020 Page 17 of 39
MODEL T200U TOTAL REACTIVE OXIDES OF NITROGEN (NOY) Wood Environment & Infrastructure Solutions, Inc.
Figure 11. T200U Pneumatic Layout
6.4.3 Weekly Site Operator Activities Weekly site operator activities are provided in Figure 12 (instrument suites may vary per site). They include:
• Leak checks • Checking sample lines (moisture, dirt, and obstructions) • Review of shelter temperature • Review of operational settings and checks • Site logbook entries • Changing particulate filters
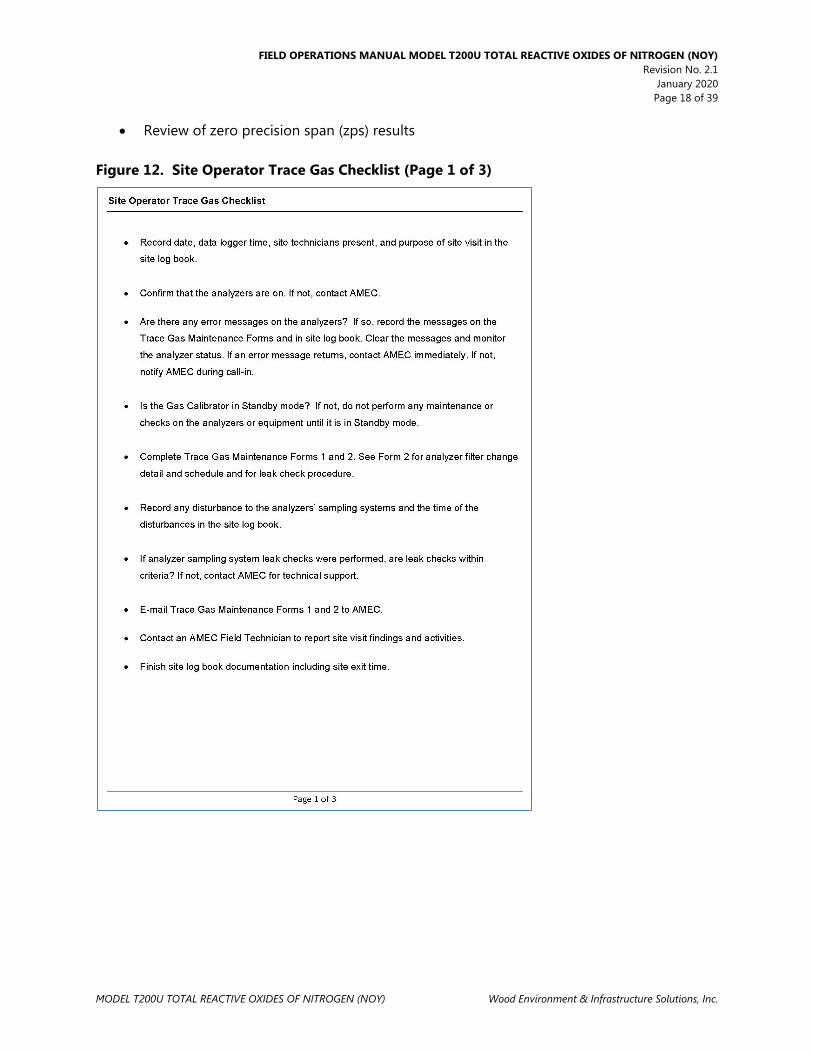
FIELD OPERATIONS MANUAL MODEL T200U TOTAL REACTIVE OXIDES OF NITROGEN (NOY) Revision No. 2.1
January 2020 Page 18 of 39
MODEL T200U TOTAL REACTIVE OXIDES OF NITROGEN (NOY) Wood Environment & Infrastructure Solutions, Inc.
• Review of zero precision span (zps) results Figure 12. Site Operator Trace Gas Checklist (Page 1 of 3)

FIELD OPERATIONS MANUAL MODEL T200U TOTAL REACTIVE OXIDES OF NITROGEN (NOY) Revision No. 2.1
January 2020 Page 19 of 39
MODEL T200U TOTAL REACTIVE OXIDES OF NITROGEN (NOY) Wood Environment & Infrastructure Solutions, Inc.
Figure 12. Site Operator Trace Gas Checklist (Page 2 of 3)

FIELD OPERATIONS MANUAL MODEL T200U TOTAL REACTIVE OXIDES OF NITROGEN (NOY) Revision No. 2.1
January 2020 Page 20 of 39
MODEL T200U TOTAL REACTIVE OXIDES OF NITROGEN (NOY) Wood Environment & Infrastructure Solutions, Inc.
Figure 12. Site Operator Trace Gas Checklist (Page 3 of 3)
6.4.4 Changing Particulate Filters Change the external sample particulate filter every two weeks by completing the following steps:
• Using the data logger, ‘Down’ all parameters on the affected tower • Lower the tower containing the external sample particulate filter • Either remove or cap the CASTNET filter pack • Unscrew the orange retaining ring. The green filter wrenches may be required • Install new 5 µm, PTFE 47 mm diameter filter and discard the used filter

FIELD OPERATIONS MANUAL MODEL T200U TOTAL REACTIVE OXIDES OF NITROGEN (NOY) Revision No. 2.1
January 2020 Page 21 of 39
MODEL T200U TOTAL REACTIVE OXIDES OF NITROGEN (NOY) Wood Environment & Infrastructure Solutions, Inc.
• Reinstall the retaining ring and tighten 1/8 turn past hand tight using green filter wrenches
• Perform a sample train leak check as described in Section 6.7 of this SOP Change the internal sample particulate filter (Figure 13) monthly by completing the following steps (Manual Section 11.3.1, pp. 242-243)
• ‘Down’ the NO, NOy, and NOy diff channels • Turn off the analyzer to prevent particulates from being drawn into the sample line • Open the hinged front panel and unscrew the knurled retaining ring on the filter
assembly • Replace the filter element with a 1 µm, PTFE 47 mm diameter filter • Reinstall the PTFE O-ring with the notches facing up, otherwise sample flow will be
restricted • Replace the glass window and hand-tighten the retaining ring • Restart the analyzer • Perform a vacuum leak check
Figure 13. Internal Sample Particulate Filter
Calibration Audit the NO/NOy monitoring system quarterly or if required for other reasons. A 4 to 5 hour warm-up period is recommended before any calibrations are performed. Calibrate the zero and span if the relative percent difference (RPD) for any point is > 5%. All points must be < 1% of best fit line or else recalibration or other maintenance and troubleshooting are required. Estimate precision based on the procedures in Section 6.2.
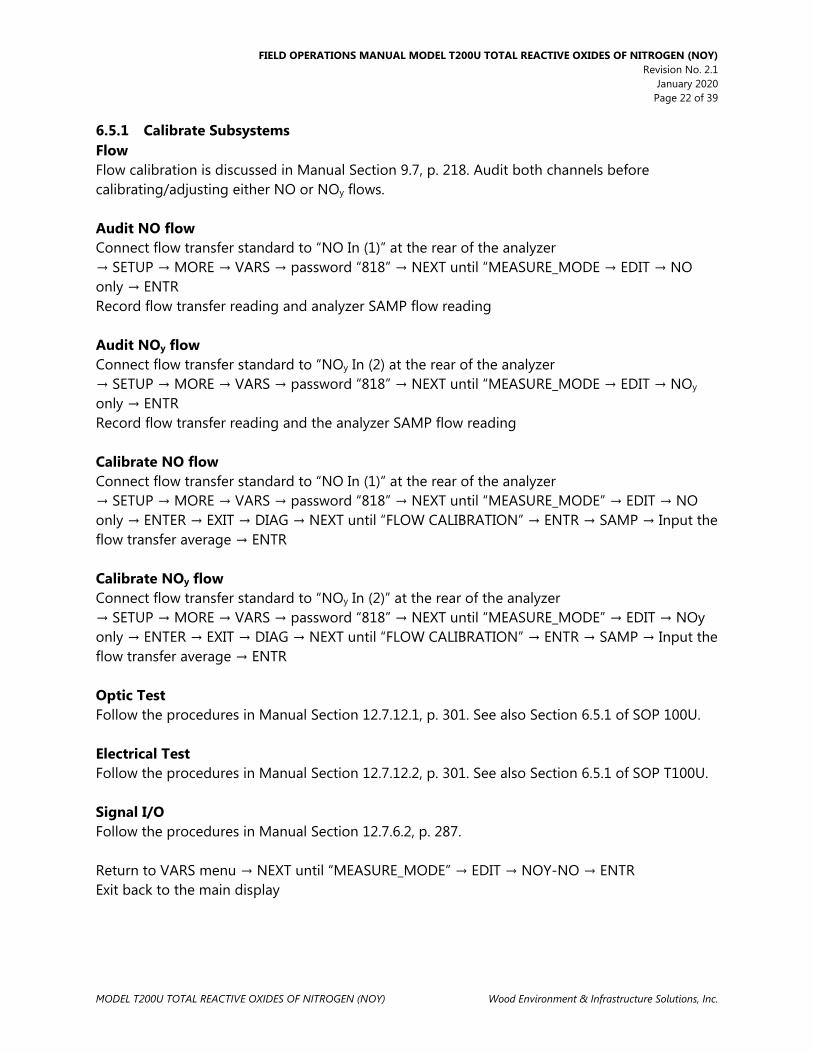
FIELD OPERATIONS MANUAL MODEL T200U TOTAL REACTIVE OXIDES OF NITROGEN (NOY) Revision No. 2.1
January 2020 Page 22 of 39
MODEL T200U TOTAL REACTIVE OXIDES OF NITROGEN (NOY) Wood Environment & Infrastructure Solutions, Inc.
6.5.1 Calibrate Subsystems Flow Flow calibration is discussed in Manual Section 9.7, p. 218. Audit both channels before calibrating/adjusting either NO or NOy flows. Audit NO flow Connect flow transfer standard to “NO In (1)” at the rear of the analyzer → SETUP → MORE → VARS → password “818” → NEXT until “MEASURE_MODE → EDIT → NO only → ENTR Record flow transfer reading and analyzer SAMP flow reading Audit NOy flow Connect flow transfer standard to “NOy In (2) at the rear of the analyzer → SETUP → MORE → VARS → password “818” → NEXT until “MEASURE_MODE → EDIT → NOy only → ENTR Record flow transfer reading and the analyzer SAMP flow reading Calibrate NO flow Connect flow transfer standard to “NO In (1)” at the rear of the analyzer → SETUP → MORE → VARS → password “818” → NEXT until “MEASURE_MODE” → EDIT → NO only → ENTER → EXIT → DIAG → NEXT until “FLOW CALIBRATION” → ENTR → SAMP → Input the flow transfer average → ENTR Calibrate NOy flow Connect flow transfer standard to “NOy In (2)” at the rear of the analyzer → SETUP → MORE → VARS → password “818” → NEXT until “MEASURE_MODE” → EDIT → NOy only → ENTER → EXIT → DIAG → NEXT until “FLOW CALIBRATION” → ENTR → SAMP → Input the flow transfer average → ENTR Optic Test Follow the procedures in Manual Section 12.7.12.1, p. 301. See also Section 6.5.1 of SOP 100U. Electrical Test Follow the procedures in Manual Section 12.7.12.2, p. 301. See also Section 6.5.1 of SOP T100U. Signal I/O Follow the procedures in Manual Section 12.7.6.2, p. 287. Return to VARS menu → NEXT until “MEASURE_MODE” → EDIT → NOY-NO → ENTR Exit back to the main display

FIELD OPERATIONS MANUAL MODEL T200U TOTAL REACTIVE OXIDES OF NITROGEN (NOY) Revision No. 2.1
January 2020 Page 23 of 39
MODEL T200U TOTAL REACTIVE OXIDES OF NITROGEN (NOY) Wood Environment & Infrastructure Solutions, Inc.
6.5.2 NO and NOy Audits NO audit Connect the flow transfer to “NO In (1)” → SETUP → MORE → VARS → password “818” → NEXT until “MEASURE_MODE” → EDIT → NOY only → ENTR Record flow transfer reading and the analyzer SAMP flow reading NOy audit Connect the flow transfer to “NOy In (2)” → SETUP → MORE → VARS → password “818” → NEXT until “MEASURE_MODE” → EDIT → NO only → ENTR Record flow transfer reading and the analyzer SAMP flow reading O
3 Generator Flow Audit → SETUP → MORE → DIAG → NEXT until “OZONE GEN OVERIDE” → ENTR → toggle to “OFF” → lower the front panel on the analyzer. Connect the flow transfer to the O
3 generator tubing at the union (Figure 14). → SETUP → MORE → DIAG → NEXT until “OZONE GEN OVERIDE” → ENTR → toggle to “ON” → EXIT to main screen → TEST to O
3 flow Record the flow transfer reading and the analyzer O
3 flow reading Return to “OZONE GEN OVERIDE” → Toggle to OFF → Disconnect flow transfer and reconnect O
3 generator union → Toggle to ON → EXIT to main screen Figure 14. Union for Ozone Generator
O
3 Generator Flow Calibration → SETUP → MORE → DIAG → NEXT until “OZONE GEN OVERIDE” → ENTR → toggle to “OFF” Lower the front panel on the analyzer. Connect the flow transfer to the O
3 generator tubing at the union (Figure 14).

FIELD OPERATIONS MANUAL MODEL T200U TOTAL REACTIVE OXIDES OF NITROGEN (NOY) Revision No. 2.1
January 2020 Page 24 of 39
MODEL T200U TOTAL REACTIVE OXIDES OF NITROGEN (NOY) Wood Environment & Infrastructure Solutions, Inc.
→ SETUP → MORE → DIAG → NEXT until “OZONE GEN OVERIDE” → ENTR → toggle to “ON” → EXIT → NEXT until “FLOW CALIBRATION” → ENTR → OZONE → Input average flow from flow transfer → ENTR Return to “OZONE GEN OVERIDE” → Toggle to OFF → Disconnect flow transfer and reconnect O
3 generator union → Toggle to ON → EXIT to main screen Pressure Audit Disconnect the clear tubing (Figure 15) directly from the sample pressure sensor assembly Connect the pressure transfer directly to the sample pressure sensor Figure 15. Sample pressure transducer
SAMPLE → TEST → PRES Record the ambient pressure readings from both the pressure standard and the analyzer’s sample pressure Set the pressure transfer standard to vacuum using the + - knob. Close the vent of the pressure transfer using the • knob. Press “PUMP” on the pressure transfer until the pressure is lowered to approximately 5 inches mercury absolute (inHg-A). Record the readings from both the pressure standard and the analyzer’s pressure sensor Slowly open the pressure transfer vent (the • knob) to adjust the pressure to approximately 15 inHg-A. Record the readings from both the pressure standard and the analyzer’s pressure standard.

FIELD OPERATIONS MANUAL MODEL T200U TOTAL REACTIVE OXIDES OF NITROGEN (NOY) Revision No. 2.1
January 2020 Page 25 of 39
MODEL T200U TOTAL REACTIVE OXIDES OF NITROGEN (NOY) Wood Environment & Infrastructure Solutions, Inc.
Disconnect the pressure transfer from the pressure sensor and reconnect the analyzer’s tubing to the pressure sensor. Calibrate pressure sensor if absolute difference of any reading is greater than 0.5 inHg-A. It is recommended to perform a leak check whenever any pneumatic connection is altered Reaction Cell/Vacuum Pressure Sensor Audit Repeat procedure for the reaction cell/vacuum pressure sensor (Figure 16). The reaction cell/vacuum pressure is listed as RCELL on the analyzer. Audit the reaction cell pressure sensor audit in the same manner as the sample pressure. The analyzer’s external sample pump must be disconnected from the power supply to complete the audit. Figure 16. RCELL pressure transducer
Pressure Calibration Turn off instrument sample pump by disconnecting the pump power connector from the power supply. → SETUP → MORE → DIAG → password “929” → NEXT until “PRESSURE CALIBRATION” → ENTR → Input pressure transfer value for ambient pressure → ENTR The T200U pressure calibration procedure calibrates both the sample pressure sensor and the reaction cell/vacuum pressure assembly simultaneously to ambient pressure. It is recommended to perform post calibration pressure audits to confirm proper calibration.
NO/NOy Audit
Perform multi-point NO/NOy audit using a Teledyne T700U gas calibrator or equivalent to produce concentrations of calibration gas. Calibration gases supplied to the T700U must be from a certified pressurized (28 to 32 psi) cylinder. Cylinders must be traceable to National Institute of Standards and Technology (NIST)-standard reference methods (SRM) and meet

FIELD OPERATIONS MANUAL MODEL T200U TOTAL REACTIVE OXIDES OF NITROGEN (NOY) Revision No. 2.1
January 2020 Page 26 of 39
MODEL T200U TOTAL REACTIVE OXIDES OF NITROGEN (NOY) Wood Environment & Infrastructure Solutions, Inc.
limits in traceability protocol for accuracy and stability (QA Handbook Section 12.1.2, pp. 3-6 of 11 and Manual Section 10.2, p. 221). From the T700U
• Generate zero air and send to the sample inlet on the T200U • Recommended flow rate supplied to T200U is 4.5 liters per minute (LPM) or greater • Allow the concentration to stabilize until STABIL on the T200U reads less than 0.10 • Record 5 min concentration average and 5 minute expected concentration average • Record the stability • Repeat for each of the 5 levels below
Audit Level Concentration, ppb Level 1 90 Level 2 40 Level 3 15 Level 4 7.5 Level 5 4
If any point is greater than a RPD of 5%, then a zero/span calibration must be performed. NO/NOy Calibration Record the analyzer’s original NO/NOy slope and offset before calibration. Zero Calibration From T700U gas calibrator or equivalent, generate zero air at a flow of 4.5 LPM. Allow the analyzer reading to stabilize; STABIL should be less than 0.1 → CAL → ZERO → ENTR Span Calibration From the T700U gas calibrator or equivalent, generate span gas at a concentration of 90 ppb NO Flow rate should be 4.5 LPM at a minimum Allow the analyzer reading to stabilize; STABIL should be less than 0.1 → CAL → SPAN → ENTR If the SPAN option is not displayed while sampling 90 ppb NO/NOy, then the span range concentration must be changed on the analyzer.
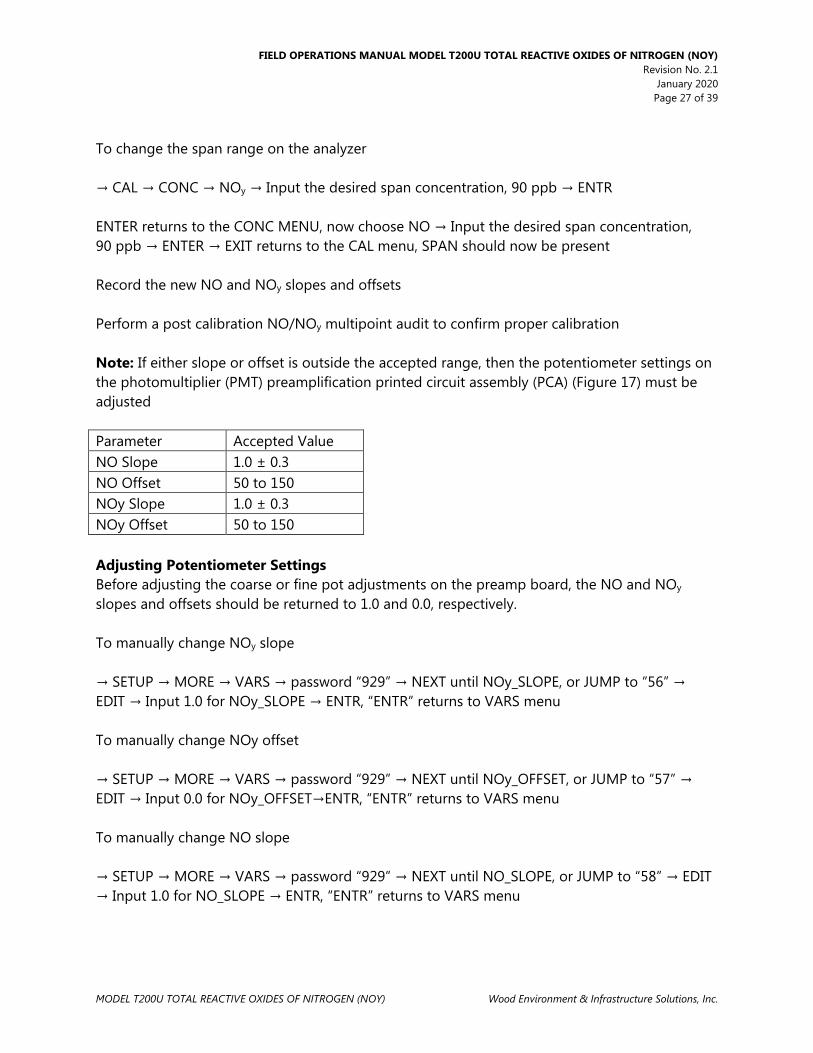
FIELD OPERATIONS MANUAL MODEL T200U TOTAL REACTIVE OXIDES OF NITROGEN (NOY) Revision No. 2.1
January 2020 Page 27 of 39
MODEL T200U TOTAL REACTIVE OXIDES OF NITROGEN (NOY) Wood Environment & Infrastructure Solutions, Inc.
To change the span range on the analyzer → CAL → CONC → NOy → Input the desired span concentration, 90 ppb → ENTR ENTER returns to the CONC MENU, now choose NO → Input the desired span concentration, 90 ppb → ENTER → EXIT returns to the CAL menu, SPAN should now be present Record the new NO and NOy slopes and offsets Perform a post calibration NO/NOy multipoint audit to confirm proper calibration Note: If either slope or offset is outside the accepted range, then the potentiometer settings on the photomultiplier (PMT) preamplification printed circuit assembly (PCA) (Figure 17) must be adjusted Parameter Accepted Value NO Slope 1.0 ± 0.3 NO Offset 50 to 150 NOy Slope 1.0 ± 0.3 NOy Offset 50 to 150 Adjusting Potentiometer Settings Before adjusting the coarse or fine pot adjustments on the preamp board, the NO and NOy slopes and offsets should be returned to 1.0 and 0.0, respectively. To manually change NOy slope → SETUP → MORE → VARS → password “929” → NEXT until NOy_SLOPE, or JUMP to “56” → EDIT → Input 1.0 for NOy_SLOPE → ENTR, “ENTR” returns to VARS menu To manually change NOy offset → SETUP → MORE → VARS → password “929” → NEXT until NOy_OFFSET, or JUMP to “57” → EDIT → Input 0.0 for NOy_OFFSET→ENTR, “ENTR” returns to VARS menu To manually change NO slope → SETUP → MORE → VARS → password “929” → NEXT until NO_SLOPE, or JUMP to “58” → EDIT → Input 1.0 for NO_SLOPE → ENTR, “ENTR” returns to VARS menu

FIELD OPERATIONS MANUAL MODEL T200U TOTAL REACTIVE OXIDES OF NITROGEN (NOY) Revision No. 2.1
January 2020 Page 28 of 39
MODEL T200U TOTAL REACTIVE OXIDES OF NITROGEN (NOY) Wood Environment & Infrastructure Solutions, Inc.
To manually change NO offset → SETUP → MORE → VARS → password “929” → NEXT until NO_OFFSET, or JUMP to “59” → EDIT → Input 0.0 for NO_OFFSET → ENTR, “ENTR” returns to VARS menu From the T700U gas calibrator or equivalent, generate span gas at a concentration of 90 ppb NO Flow rate should be 4.5LPM at a minimum Allow the analyzer reading to stabilize; STABIL should be less than 0.1 Remove the cover on the T200U Locate the fine (Figure 18) and coarse (Figure 19) adjustments on the PMT preamp PCA (Figure 17). Figure 17. PMT Preamp PCA Figure 18. Fine Adjustment Figure 19. Coarse
Adjustment
Start with the fine adjustment. Using a small screw driver, turn the fine adjustment pot in increments of 1. With each adjustment allow the analyzer’s new reading to stabilize. Attempt to bring the analyzer’s readings as close as possible to the desired 90 ppb for NO and NOy. Clockwise rotation will increase the analyzer’s reading. Counterclockwise rotation will decrease the analyzer’s reading. Do not leave the fine adjustment pot on the maximum settings. If the fine adjustment pot is unable to bring the analyzer’s reading near the desired 90 ppb, then the coarse adjustment pot may need to be altered. The coarse adjustment can be made in the same manner as the fine adjustment. Clockwise rotation will raise the analyzer response, and

FIELD OPERATIONS MANUAL MODEL T200U TOTAL REACTIVE OXIDES OF NITROGEN (NOY) Revision No. 2.1
January 2020 Page 29 of 39
MODEL T200U TOTAL REACTIVE OXIDES OF NITROGEN (NOY) Wood Environment & Infrastructure Solutions, Inc.
counterclockwise will lower the analyzer response. After coarse adjustment, it is recommended to perform a fine adjustment. After adjusting either of the fine or coarse adjustments, a NO/NOy zero and span calibration should be performed. GPT/GPTZ Audit Gas Phase Titration (GPT) determines the amount of NO
2 generated by titration using the analyzer’s NO channel. The principle of the GPT is based on the rapid reaction that occurs between NO and O
3 to produce NO 2. With known NO and O
3 concentrations and known residence time, a known NO
2 concentration can be determined. The GPTZ is the same as GPT except the O
3 generator is off. The Teledyne gas calibrator model T700U is designed to perform a GPT/GPTZ. From the T700U or equivalent gas calibrator perform a multi-point audit on the following points
Audit Level GPT/GPTZ NO ppb O 3 ppb
Level 1 GPT 90 80 Level 2 GPTZ 90 0 Level 3 GPT 50 40 Level 4 GPTZ 50 0 Level 5 GPT 20 15 Level 6 GPTZ 20 0 Level 7 GPT 20 7 Level 8 GPTZ 20 0 Level 9 GPT 20 4 Level 10 GPTZ 20 0 Record the NO, NOy, and resulting NO
2 concentrations. Calculated NO
2 responses are obtained using the following equation
[𝑁𝑁𝑁𝑁2]𝑂𝑂𝑂𝑂𝑂𝑂 = [𝑁𝑁𝑁𝑁]𝑂𝑂𝑂𝑂𝑂𝑂𝑂𝑂 − [𝑁𝑁𝑁𝑁]𝑂𝑂𝑅𝑅𝑅𝑅 +𝐹𝐹𝑁𝑁𝑂𝑂 ∗ [𝑁𝑁𝑁𝑁2]𝑂𝑂𝑅𝑅𝐼𝐼
𝐹𝐹
[NO]ORIG= NO concentration analyzer response during the GPTZ [NO]REM= NO concentration analyzer response during the GPT Plot the NO
2 analyzer response concentration against the calculated NO 2 concentration. The plot
should yield a straight line. All analyzer response concentrations should be within 2% of the best-fit line. If the plot does not yield a straight line, the converter should be inspected or replaced.
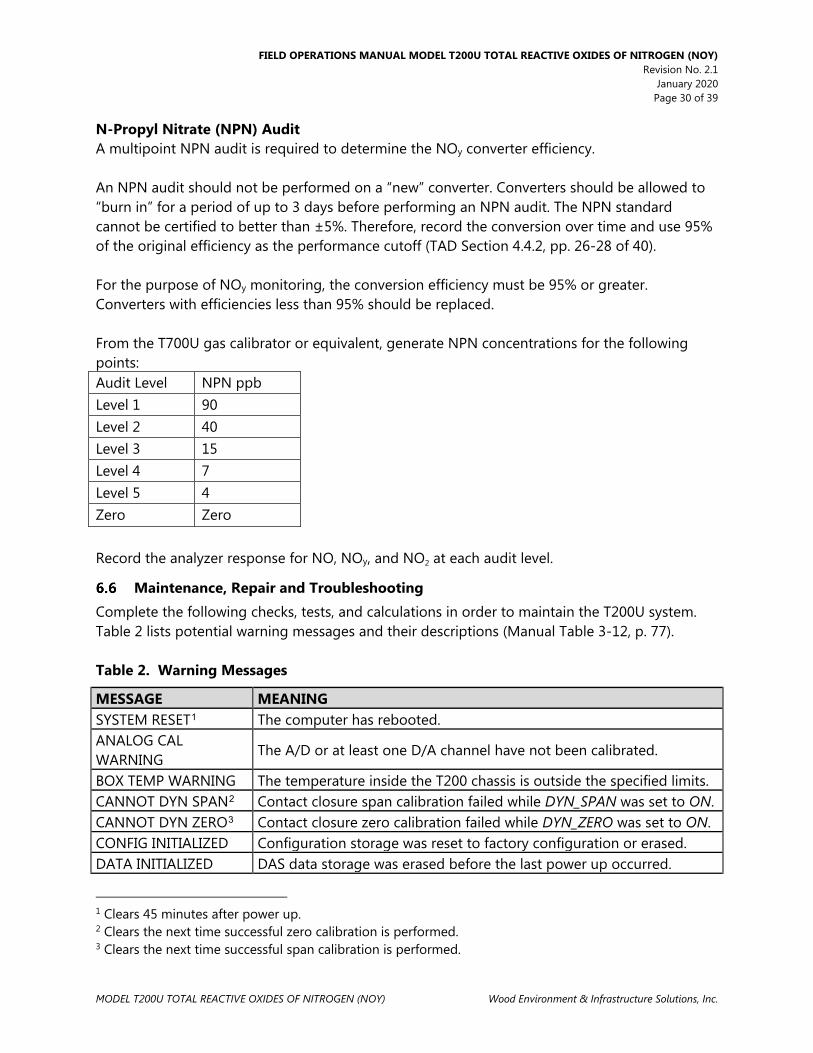
FIELD OPERATIONS MANUAL MODEL T200U TOTAL REACTIVE OXIDES OF NITROGEN (NOY) Revision No. 2.1
January 2020 Page 30 of 39
MODEL T200U TOTAL REACTIVE OXIDES OF NITROGEN (NOY) Wood Environment & Infrastructure Solutions, Inc.
N-Propyl Nitrate (NPN) Audit A multipoint NPN audit is required to determine the NOy converter efficiency. An NPN audit should not be performed on a “new” converter. Converters should be allowed to “burn in” for a period of up to 3 days before performing an NPN audit. The NPN standard cannot be certified to better than ±5%. Therefore, record the conversion over time and use 95% of the original efficiency as the performance cutoff (TAD Section 4.4.2, pp. 26-28 of 40). For the purpose of NOy monitoring, the conversion efficiency must be 95% or greater. Converters with efficiencies less than 95% should be replaced. From the T700U gas calibrator or equivalent, generate NPN concentrations for the following points: Audit Level NPN ppb Level 1 90 Level 2 40 Level 3 15 Level 4 7 Level 5 4 Zero Zero Record the analyzer response for NO, NOy, and NO
2 at each audit level.
Maintenance, Repair and Troubleshooting Complete the following checks, tests, and calculations in order to maintain the T200U system. Table 2 lists potential warning messages and their descriptions (Manual Table 3-12, p. 77). Table 2. Warning Messages
MESSAGE MEANING SYSTEM RESET1 The computer has rebooted. ANALOG CAL WARNING
The A/D or at least one D/A channel have not been calibrated.
BOX TEMP WARNING The temperature inside the T200 chassis is outside the specified limits. CANNOT DYN SPAN2 Contact closure span calibration failed while DYN_SPAN was set to ON. CANNOT DYN ZERO3 Contact closure zero calibration failed while DYN_ZERO was set to ON. CONFIG INITIALIZED Configuration storage was reset to factory configuration or erased. DATA INITIALIZED DAS data storage was erased before the last power up occurred.
1 Clears 45 minutes after power up. 2 Clears the next time successful zero calibration is performed. 3 Clears the next time successful span calibration is performed.

FIELD OPERATIONS MANUAL MODEL T200U TOTAL REACTIVE OXIDES OF NITROGEN (NOY) Revision No. 2.1
January 2020 Page 31 of 39
MODEL T200U TOTAL REACTIVE OXIDES OF NITROGEN (NOY) Wood Environment & Infrastructure Solutions, Inc.
MESSAGE MEANING OZONE FLOW WARNING
Ozone gas flow is too high or too low for accurate NOx, NO and NO 2
readings.
OZONE GEN OFF4
Ozone generator is off. This is the only warning message that automatically clears itself. It clears itself when the ozone generator is turned on. Upon power up the Ozone generator will remain off for 30 minutes. This allows the perma-pure dryer to reach its working dew point.
RCELL PRESS WARN Reaction cell pressure is too high or too low for accurate NOx, NO and NO
2 readings.
RCELL TEMP WARNING Reaction cell temperature is too high or too low for accurate NOx, NO and NO
2 readings. IZS TEMP WARNING5 IZS temperature is too high or too low for efficient O
3 production.
CONV TEMP WARNING NO
2 to NO Converter temperature too high or too low to efficiently convert NO
2 to NO.
PMT TEMP WARNING PMT temperature outside of warning limits specified by PMT_SET variable.
AZERO WARN [XXXX] MV
AutoZero reading too high. The value shown in message indicates auto-zero reading at time warning was displayed.
HVPS WARNING High voltage power supply output is too high or too low for proper operation of the PMT.
REAR BOARD NOT DET CPU unable to communicate with motherboard. RELAY BOARD WARN CPU is unable to communicate with the relay PCA. SAMPLE FLOW WARN The flow rate of the sample gas is outside the specified limits. Table 3 lists available test functions and their descriptions (Manual Table 4.2, p. 89). Table 3. Available Test Functions
DISPLAY PARAMETER UNITS DESCRIPTION
RANGE RANGE PPB, PPM, UGM & MGM
The Full Scale limit at which the reporting range of the analyzer’s ANALOG OUTPUTS is currently set. THIS IS NOT the Physical Range of the instrument. See Section 5.4.1 for more information.
RANGE1 RANGE2
If AUTO Range mode has been selected, two RANGE functions will appear, one for each range:
4 Clears 30 minutes after power up. 5 Only Appears if the IZS option is installed.
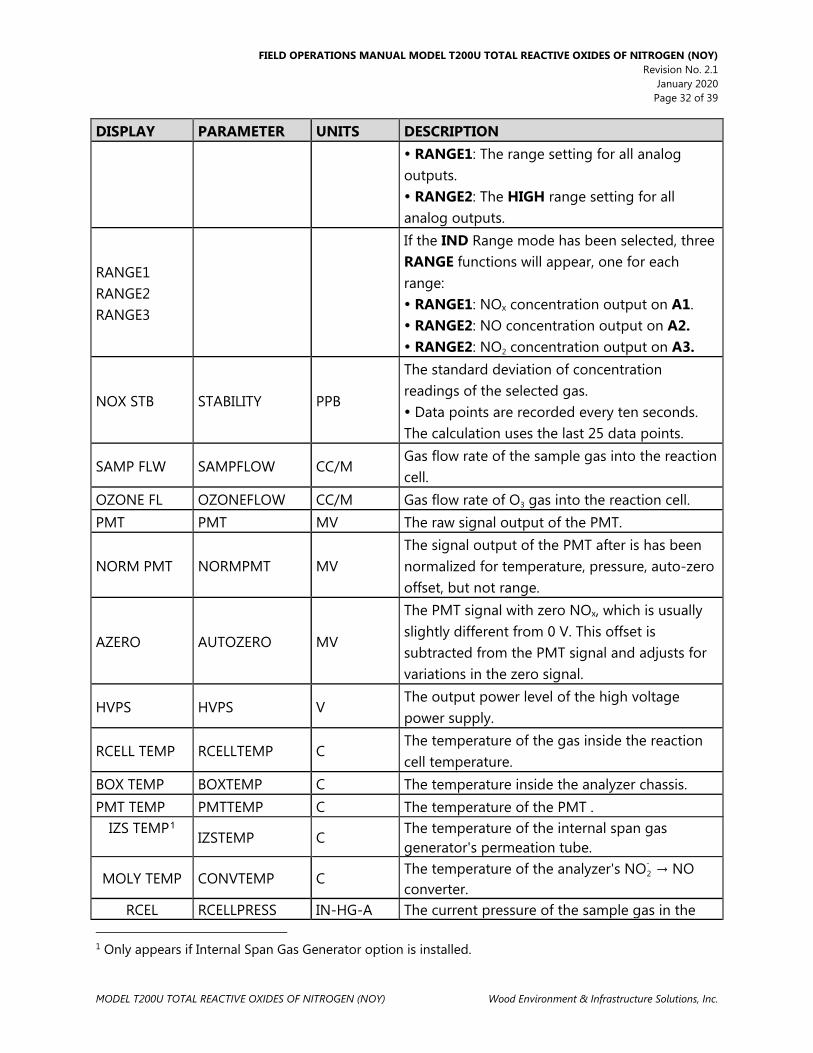
FIELD OPERATIONS MANUAL MODEL T200U TOTAL REACTIVE OXIDES OF NITROGEN (NOY) Revision No. 2.1
January 2020 Page 32 of 39
MODEL T200U TOTAL REACTIVE OXIDES OF NITROGEN (NOY) Wood Environment & Infrastructure Solutions, Inc.
DISPLAY PARAMETER UNITS DESCRIPTION RANGE1: The range setting for all analog outputs. RANGE2: The HIGH range setting for all analog outputs.
RANGE1 RANGE2 RANGE3
If the IND Range mode has been selected, three RANGE functions will appear, one for each range: RANGE1: NOx concentration output on A1. RANGE2: NO concentration output on A2. RANGE2: NO
2 concentration output on A3.
NOX STB STABILITY PPB
The standard deviation of concentration readings of the selected gas. Data points are recorded every ten seconds. The calculation uses the last 25 data points.
SAMP FLW SAMPFLOW CC/M Gas flow rate of the sample gas into the reaction cell.
OZONE FL OZONEFLOW CC/M Gas flow rate of O 3 gas into the reaction cell.
PMT PMT MV The raw signal output of the PMT.
NORM PMT NORMPMT MV The signal output of the PMT after is has been normalized for temperature, pressure, auto-zero offset, but not range.
AZERO AUTOZERO MV
The PMT signal with zero NOx, which is usually slightly different from 0 V. This offset is subtracted from the PMT signal and adjusts for variations in the zero signal.
HVPS HVPS V The output power level of the high voltage power supply.
RCELL TEMP RCELLTEMP C The temperature of the gas inside the reaction cell temperature.
BOX TEMP BOXTEMP C The temperature inside the analyzer chassis. PMT TEMP PMTTEMP C The temperature of the PMT .
IZS TEMP1 IZSTEMP C
The temperature of the internal span gas generator's permeation tube.
MOLY TEMP CONVTEMP C The temperature of the analyzer's NO-
2 → NO converter.
RCEL RCELLPRESS IN-HG-A The current pressure of the sample gas in the
1 Only appears if Internal Span Gas Generator option is installed.

FIELD OPERATIONS MANUAL MODEL T200U TOTAL REACTIVE OXIDES OF NITROGEN (NOY) Revision No. 2.1
January 2020 Page 33 of 39
MODEL T200U TOTAL REACTIVE OXIDES OF NITROGEN (NOY) Wood Environment & Infrastructure Solutions, Inc.
reaction cell as measured at the vacuum manifold.
SAMP SAMPPRESS IN-HG-A The current pressure of the sample gas as it enters the reaction cell, measured between the NO/NOx and Auto-Zero valves.
NOX SLOPE NOXSLOPE The slope calculated during the most recent NOx
zero/span calibration. DISPLAY PARAMETER UNITS DESCRIPTION
NOX OFFS NOXOFFSET MV The offset calculated during the most recent NOx zero/span calibration.
NO SLOPE NOSLOPE The slope calculated during the most recent NO
zero/span calibration.
NO OFFS NOOFFSET MV The offset calculated during the most recent NO zero/span calibration.
DISPLAY PARAMETER UNITS DESCRIPTION
TEST TESTCHAN MV Displays the signal level of the Test Function that is currently being produced by the Analog Output Channel A4.
TIME CLOCKTIME HH:MM:SS The current time. This is used to create a time stamp on DAS readings, and by the AutoCal feature to trigger calibration events.
Table 4 lists common warning messages (Manual Table 4.3, p. 91). Table 4. Common Warning Messages
MESSAGE MEANING ANALOG CAL WARNING The A/D or at least one D/A channel has not been calibrated. AZERO WARN Auto-zero reading above limit specified by AZERO_LIMIT variable.
Value shown in message indicates auto-zero reading at time warning was displayed.
BOX TEMP WARNING The temperature inside the T200 chassis is outside the specified limits.
CANNOT DYN SPAN Contact closure span calibration failed while DYN_SPAN was set to ON.
CANNOT DYN ZERO Contact closure zero calibration failed while DYN_ZERO was set to ON.
CONFIG INITIALIZED Configuration storage was reset to factory configuration or erased.
CONV TEMP WARNING NO- 2 → NO converter temperature outside of warning limits
specified by CONV_SET variable.
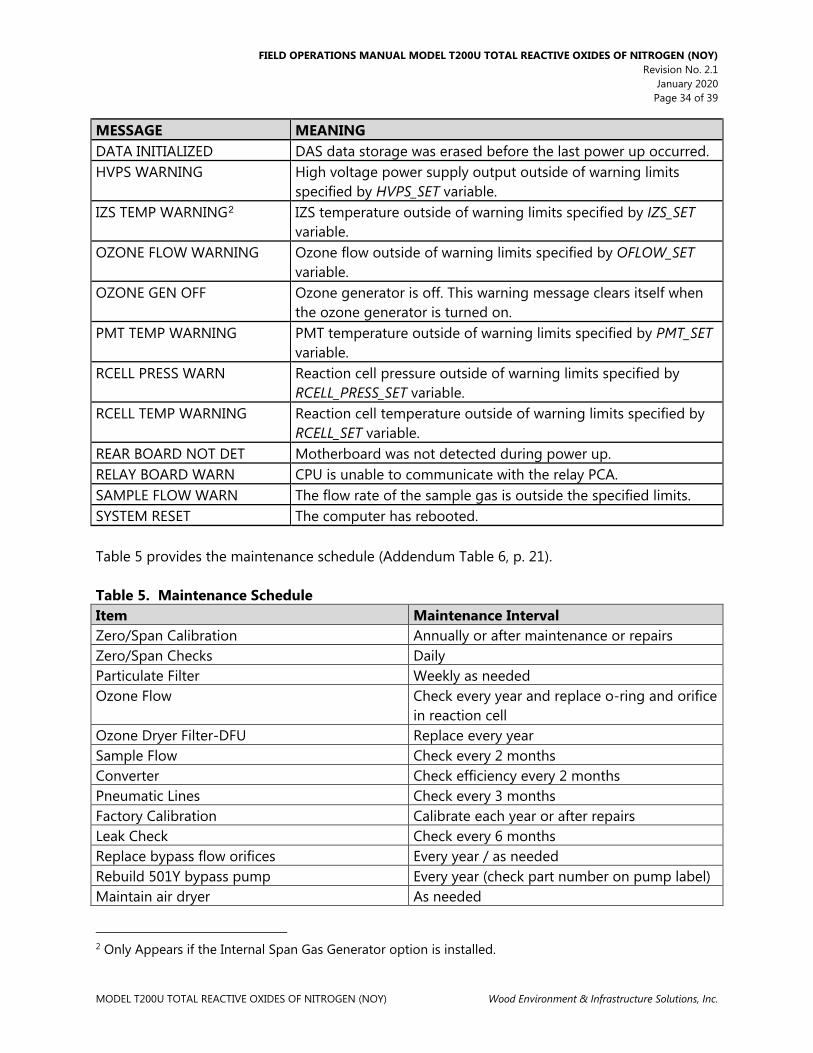
FIELD OPERATIONS MANUAL MODEL T200U TOTAL REACTIVE OXIDES OF NITROGEN (NOY) Revision No. 2.1
January 2020 Page 34 of 39
MODEL T200U TOTAL REACTIVE OXIDES OF NITROGEN (NOY) Wood Environment & Infrastructure Solutions, Inc.
MESSAGE MEANING DATA INITIALIZED DAS data storage was erased before the last power up occurred. HVPS WARNING High voltage power supply output outside of warning limits
specified by HVPS_SET variable. IZS TEMP WARNING2 IZS temperature outside of warning limits specified by IZS_SET
variable. OZONE FLOW WARNING Ozone flow outside of warning limits specified by OFLOW_SET
variable. OZONE GEN OFF Ozone generator is off. This warning message clears itself when
the ozone generator is turned on. PMT TEMP WARNING PMT temperature outside of warning limits specified by PMT_SET
variable. RCELL PRESS WARN Reaction cell pressure outside of warning limits specified by
RCELL_PRESS_SET variable. RCELL TEMP WARNING Reaction cell temperature outside of warning limits specified by
RCELL_SET variable. REAR BOARD NOT DET Motherboard was not detected during power up. RELAY BOARD WARN CPU is unable to communicate with the relay PCA. SAMPLE FLOW WARN The flow rate of the sample gas is outside the specified limits. SYSTEM RESET The computer has rebooted. Table 5 provides the maintenance schedule (Addendum Table 6, p. 21). Table 5. Maintenance Schedule Item Maintenance Interval Zero/Span Calibration Annually or after maintenance or repairs Zero/Span Checks Daily Particulate Filter Weekly as needed Ozone Flow Check every year and replace o-ring and orifice
in reaction cell Ozone Dryer Filter-DFU Replace every year Sample Flow Check every 2 months Converter Check efficiency every 2 months Pneumatic Lines Check every 3 months Factory Calibration Calibrate each year or after repairs Leak Check Check every 6 months Replace bypass flow orifices Every year / as needed Rebuild 501Y bypass pump Every year (check part number on pump label) Maintain air dryer As needed
2 Only Appears if the Internal Span Gas Generator option is installed.

FIELD OPERATIONS MANUAL MODEL T200U TOTAL REACTIVE OXIDES OF NITROGEN (NOY) Revision No. 2.1
January 2020 Page 35 of 39
MODEL T200U TOTAL REACTIVE OXIDES OF NITROGEN (NOY) Wood Environment & Infrastructure Solutions, Inc.
Replace particle filter Weekly Perform pneumatic system leak check At least quarterly Inspect internal, external tubing; replace if necessary
Inlet, weekly; other, quarterly
Clean optical bench As needed Monitor NO-
2 conversion efficiency At least every 6 months Monitor NPN conversion efficiency At least every month Table 6 provides the preventative maintenance schedule (Manual Table 11-1, p. 240). Table 6. Preventative Maintenance Schedule
ITEM ACTION FREQ CAL CHECK REQ’D TEST functions Review and evaluate Weekly No Particulate filter Change particle filter Weekly No Zero/span check Evaluate offset and slope Weekly No
Zero/span calibration
Zero and span calibration
Every 3 months Yes
External zero air scrubber option
Exchange chemical Every 3 months No
External dryer option
Replace chemical When indicator color changes
No
Ozone cleanser Change chemical Annually Yes Reaction cell
window Clean Annually or as
necessary Yes
DFU filters Change particle filter Annually No Pneumatic sub-
system Check for leaks in gas
flow paths Annually or after repairs involving
pneumatics
Yes if a leak is repaired
Reaction cell O-rings and
sintered filters
Replace Annually Yes
PMT Sensor Hardware Calibration
Low-level hardware calibration
On PMT/preamp changes or if slope is
outside of 1.0±0.3
Yes
Pump Rebuild head When RCELL pressure exceeds
10in-Hg
Yes
Inline Exhaust Scrubber
Replace Annually No
NO 2 converter Replace Converter Every 3 years or if
conversion efficiency drops below 96%
Yes
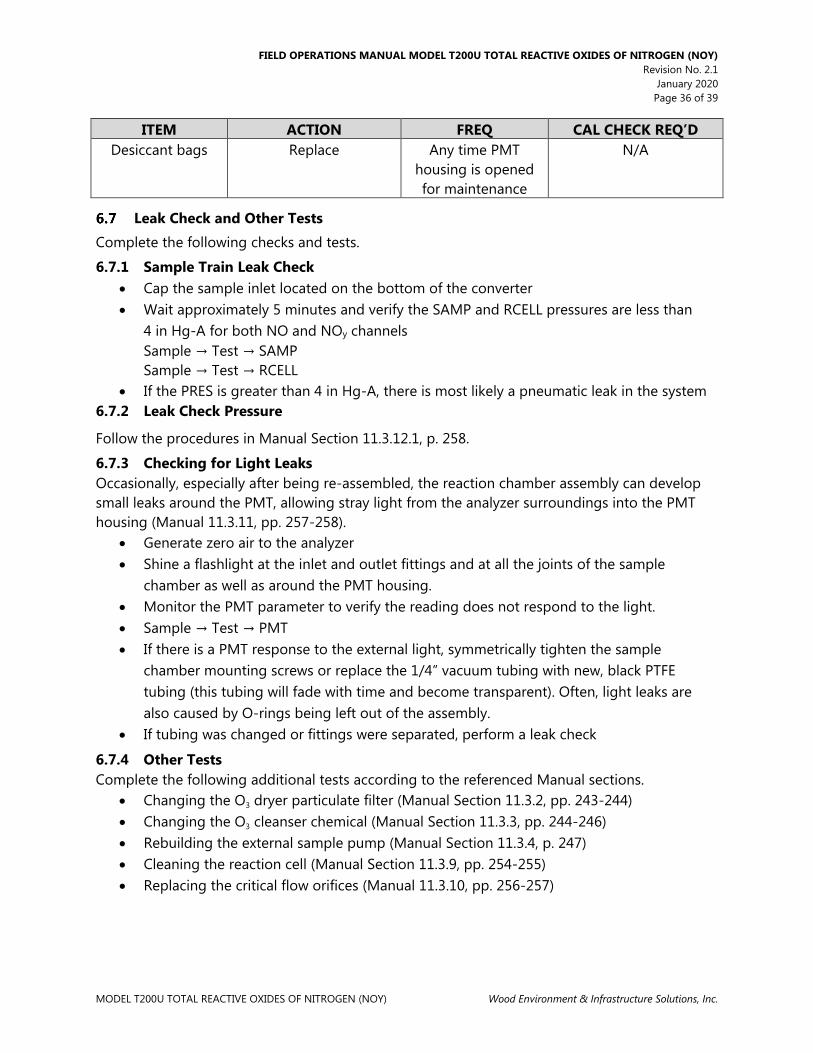
FIELD OPERATIONS MANUAL MODEL T200U TOTAL REACTIVE OXIDES OF NITROGEN (NOY) Revision No. 2.1
January 2020 Page 36 of 39
MODEL T200U TOTAL REACTIVE OXIDES OF NITROGEN (NOY) Wood Environment & Infrastructure Solutions, Inc.
ITEM ACTION FREQ CAL CHECK REQ’D Desiccant bags Replace Any time PMT
housing is opened for maintenance
N/A
Leak Check and Other Tests Complete the following checks and tests.
6.7.1 Sample Train Leak Check • Cap the sample inlet located on the bottom of the converter • Wait approximately 5 minutes and verify the SAMP and RCELL pressures are less than
4 in Hg-A for both NO and NOy channels Sample → Test → SAMP Sample → Test → RCELL
• If the PRES is greater than 4 in Hg-A, there is most likely a pneumatic leak in the system 6.7.2 Leak Check Pressure
Follow the procedures in Manual Section 11.3.12.1, p. 258.
6.7.3 Checking for Light Leaks Occasionally, especially after being re-assembled, the reaction chamber assembly can develop small leaks around the PMT, allowing stray light from the analyzer surroundings into the PMT housing (Manual 11.3.11, pp. 257-258).
• Generate zero air to the analyzer • Shine a flashlight at the inlet and outlet fittings and at all the joints of the sample
chamber as well as around the PMT housing. • Monitor the PMT parameter to verify the reading does not respond to the light. • Sample → Test → PMT • If there is a PMT response to the external light, symmetrically tighten the sample
chamber mounting screws or replace the 1/4” vacuum tubing with new, black PTFE tubing (this tubing will fade with time and become transparent). Often, light leaks are also caused by O-rings being left out of the assembly.
• If tubing was changed or fittings were separated, perform a leak check
6.7.4 Other Tests Complete the following additional tests according to the referenced Manual sections.
• Changing the O 3 dryer particulate filter (Manual Section 11.3.2, pp. 243-244)
• Changing the O 3 cleanser chemical (Manual Section 11.3.3, pp. 244-246)
• Rebuilding the external sample pump (Manual Section 11.3.4, p. 247) • Cleaning the reaction cell (Manual Section 11.3.9, pp. 254-255) • Replacing the critical flow orifices (Manual 11.3.10, pp. 256-257)

FIELD OPERATIONS MANUAL MODEL T200U TOTAL REACTIVE OXIDES OF NITROGEN (NOY) Revision No. 2.1
January 2020 Page 37 of 39
MODEL T200U TOTAL REACTIVE OXIDES OF NITROGEN (NOY) Wood Environment & Infrastructure Solutions, Inc.
Remote Communications

FIELD OPERATIONS MANUAL MODEL T200U TOTAL REACTIVE OXIDES OF NITROGEN (NOY) Revision No. 2.1
January 2020 Page 38 of 39
MODEL T200U TOTAL REACTIVE OXIDES OF NITROGEN (NOY) Wood Environment & Infrastructure Solutions, Inc.

FIELD OPERATIONS MANUAL MODEL T200U TOTAL REACTIVE OXIDES OF NITROGEN (NOY) Revision No. 2.1
January 2020 Page 39 of 39
MODEL T200U TOTAL REACTIVE OXIDES OF NITROGEN (NOY) Wood Environment & Infrastructure Solutions, Inc.
REFERENCES
Teledyne Advanced Pollution Instrumentation (API). 2012. Manual Addendum. Ultra Sensitivity Model T200U NO/NO
2/NOx. 06861B DCN6275. Teledyne Advanced Pollution Instrumentation (API). 2012. Operation Manual. Model T200
Nitrogen Oxide Analyzer. 06858C DCN6213. Teledyne Advanced Pollution Instrumentation (API). 2013. T200U–NOy Analyzer. 07303C
DCN6646. U.S. Environmental Protection Agency (EPA). 2005. Technical Assistance Document for NCore
Monitoring. Version 4. EPA-454/R-05-003. U.S. Environmental Protection Agency (EPA). 2008. QA Handbook for Air Pollution Measurement
Systems, Volume II, Ambient Air Quality Monitoring Program, Appendix D. EPA-454/B-08-003.
ATTACHMENTS
Model T200U Nitrogen Oxide/Total Reactive Oxides of Nitrogen/Total Reduced Reactive Nitrogen (NO/NOy/TNx) Analyzer Standard Operating Procedure (SOP)
ABBREVIATIONS
CAL calibration COMM communications CONC concentration DIAG diagnosis ENTR enter GEN generator ID identification INET internet PMT photomultiplier tube PRES pressure RCELL reaction cell RNGE range SAMP sample SNGL single STABIL stability VARS variables

T200U ENHANCED Revision No. 1
February 2020 Page 2 of 45
T200U ENHANCED Wood Environment & Infrastructure Solutions, Inc.
T200U ENHANCED SOP
1.0 PURPOSE
The purpose of this SOP is to provide consistent guidance for maintenance and handling of the Teledyne Advanced Pollution Instrumentation (API) Model T200U NO/NOy analyzers enhanced with additional converters and associated data logger programming to include TNx measurements. This SOP is designed to be used by the Clean Air Status and Trends Network (CASTNET) field calibration laboratory and field personnel.
2.0 SCOPE
This SOP applies to all CASTNET sites operating trace level Teledyne API T200U Enhanced NO/NOy/TNx analyzers. The reader must also be familiar with five documents listed in Section 7.0 (References) of this SOP. The documents include the EPA (2005) Technical Assistance Document (TAD) for National Core (NCore) Monitoring, the API T200 Operation Manual (Manual), the T200U Addendum to the Manual, the NOy Addendum and EPA (2017) Quality Assurance (QA) Handbook for Air Pollution Measurement Systems, Volume II, Appendix D (QA Handbook). The various sections throughout this SOP cross-reference the five documents. CASTNET is mandated to use trace gas instruments that utilize Federal Equivalent Methods. The following settings and operational parameters must be used to maintain equivalency:
• Ambient temperature 20 degrees Celsius (°C) to 30°C • 1 micrometer (µm) Teflon [polytetrafluoroethylene (PTFE)] filter in internal assembly • Gas flow of 1 standard liters per minute (slpm) or greater supplied by external vacuum
pump capable of 4 inches of mercury absolute (in Hg-A) • Dynamic Span = OFF • Dynamic Zero = OFF or ON • CAL-ON-NO
2 = OFF • Pressure/Temperature compensation = ON
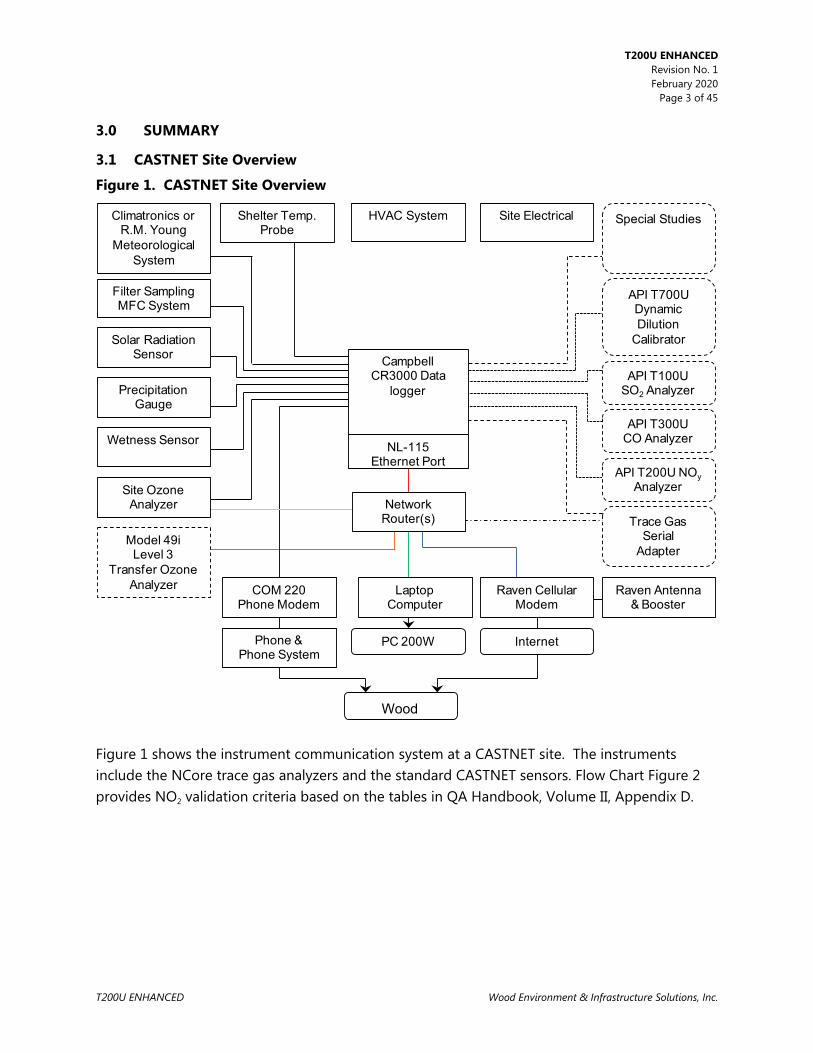
T200U ENHANCED Revision No. 1
February 2020 Page 3 of 45
T200U ENHANCED Wood Environment & Infrastructure Solutions, Inc.
3.0 SUMMARY
3.1 CASTNET Site Overview
Figure 1. CASTNET Site Overview
Figure 1 shows the instrument communication system at a CASTNET site. The instruments include the NCore trace gas analyzers and the standard CASTNET sensors. Flow Chart Figure 2 provides NO
2 validation criteria based on the tables in QA Handbook, Volume II, Appendix D.
LaptopComputer
PC 200W
AMEC
Internet
Raven CellularModem
Raven Antenna& Booster
Trace Gas Serial
Adapter
Shelter Temp.Probe
Special Studies
Filter SamplingMFC System
Solar RadiationSensor
PrecipitationGauge
Wetness Sensor
Site OzoneAnalyzer
Model 49iLevel 3
Transfer OzoneAnalyzer COM 220
Phone Modem
Phone &Phone System
API T200U NOyAnalyzer
API T300UCO Analyzer
API T100USO2 Analyzer
API T700UDynamic Dilution
Calibrator
NL-115Ethernet Port
Site ElectricalHVAC SystemClimatronics or R.M. Young
Meteorological System
NetworkRouter(s)
CampbellCR3000 Data
logger
Wood

T200U ENHANCED Revision No. 1
February 2020 Page 4 of 45
T200U ENHANCED Wood Environment & infrastructure Solutions, Inc.
Figure 2. Critical and Operational Criteria for NO 2 Measurements
1) Requirement (NO 2) 2) Frequency 3) Acceptance Criteria Information/Action
CRITICAL CRITERIA – NO/NOy
Sampler/Monitor NA Meets requirements listed in FRM/FEM designation
1) 40 CFR Part 58 App C Sec. 2.1 2) NA 3) 40 CFR Part 53 & FRM/FEM method list
One Point QC Check Single analyzer Every 14 days < ± 15.1% (percent difference) or < ± 1.5 ppb
difference whichever is greater
1 and 2) 40 CFR Part 58 App A Sec. 3.1.1 3) Recommendation based on DQO in 40 CFR Part 58 App A Sec. 2.3.1.5 QC Check Conc range 0.005 – 0.08 ppm and 05/05/2016 Technical Note on AMTIC
Zero/span check Every 14 days Zero drift < ± 1.51 ppb (24 hr)
< ± 3.1 ppb (>24hr-14 day) Span drift < ± 10.1 %
1 and 2) QA Handbook Volume 2 Sec. 12.3 3) Recommendation and related to DQO
Converter Efficiency During multi-point calibrations, span and
audit Every 14 days
(≥ 96%) 96% – 104.1%
1) 40 CFR Part 50 App F Sec. 1.5.10 and 2.4.10 2) Recommendation 3) 40 CFR Part 50 App F Sec. 1.5.10 and 2.4.10 Regulation states ≥ 96%, 96 – 104.1% is a recommendation.
OPERATIONAL CRITERIA – NO/NOy
Shelter Temperature Range Daily (hourly values)
20.0 to 30.0°C. (Hourly avg) or
per manufacturers specifications if designated to a wider temperature range
1, 2, and 3) QA Handbook Volume 2 Sec. 7.2.2 Generally, the 20-30.0°C range will apply but the most restrictive operable range of the instruments in the shelter may also be used as guidance. FRM/FEM list found on AMTIC provides temp. range for given instrument. FRM/FEM monitor testing is required at 20-30°C range per 40 CFR Part 53.32
Shelter Temperature Control Daily (hourly values) < 2.1°C SD over 24 hours 1, 2, and 3) QA Handbook Volume 2 Sec. 7.2.2
Shelter Temperature Device Check every 182 days and 2/calendar year < ± 2.1°C of standard 1, 2, and 3) QA Handbook Volume 2 Sec. 7.2.2
Annual Performance Evaluation Single Analyzer
Every site every 365 days and 1/calendar year
Percent difference of audit levels 3-10 < ± 15.1%
Audit levels 1&2 < ± 1.5 ppb difference or < ± 15.1%
1) 40 CFR Part 58 App A Sec. 3.1.2 2) 40 CFR Part 58 App A Sec. 3.1.2 3) Recommendation – 3-audit concentrations not including zero. AMTIC Technical Memo
Federal Audits (NPAP) 20% of sites audited in calendar year Audit levels 1&2 < ± 1.5 ppb difference all other levels percent difference < ± 15.1%
1 & 2) 40 CFR Part 58 App A Sec. 3.1.3 3) NPAP QAPP/SOP
Verification/Calibration
Upon receipt/adjustment/repair/ installation/moving
Every 182 days and 2/calendar year if manual zero/span performed biweekly Every 365 days and 1/calendar year if continuous zero/span performed daily
Instrument residence time ≤ 2 min Dynamic parameter ≥ 2.75 ppm-min
All points ≤ ± 2.1% or ≤ ± 1.5 ppb difference of best-fit straight line whichever is greater
and Slope 1 ± .05
1) 40 CFR Part 50 App F 2 and 3) Recommendation Multi-point calibration (0 and 4 upscale points) Slope criteria is a recommendation

T200U ENHANCED Revision No. 1
February 2020 Page 5 of 45
T200U ENHANCED Wood Environment & infrastructure Solutions, Inc.
1) Requirement (NO 2) 2) Frequency 3) Acceptance Criteria Information/Action
Gaseous Standards All gas cylinders
NIST Traceable (e.g., EPA Protocol Gas)
50-100 ppm of NO in Nitrogen with < 1 ppm NO2
1) 40 CFR Part 50 App F Sec. 1.3.1 2) NA Green Book 3) 40 CFR Part 50 App F Sec. 1.3.1 Gas producer used must participate in EPA Ambient Air Protocol Gas Verification Program 40 CFR Part 58 App A Sec. 2.6.1
Zero Air/Zero Air Check Every 365days and 1/calendar year Concentrations below LDL 1) 40 CFR Part 50 App F Sec. 1.3.2 2 and 3) Recommendation
Gas Dilution Systems Every 365 days and 1/calendar year or after failure of 1 point QC check or performance
evaluation Accuracy < ± 2.1%
1, 2, and 3) Recommendation based on SO2 requirement in 40 CFR Part 50 App A-1 Sec. 4.1.2
Detection (FEM/FRMs) Noise and Lower Detectable Limits (LDL) are part of the FEM/FRM requirements. It is recommended that monitoring organizations perform the LDL test to minimally confirm and establish the LDL of their monitor. Performing the LDL test will provide the noise information.
Noise Every 365 days and 1/calendar year ≤ 0.005 ppm 1) 40 CFR Part 53.23 (b) (definition & procedure) 2) Recommendation- info can be obtained form LDL 3) 40 CFR Part 53.20 Table B-1
Lower detectable level Every 365 days and 1/calendar year ≤ 0.01 ppm 1) 40 CFR Part 53.23 (c) (definition & procedure) 2) Recommendation 3) 40 CFR Part 53.20 Table B-1
SYSTEMATIC CRITERIA – NO/NOy Standard Reporting Units All data ppb (final units in AQS) 1, 2, and 3) 40 CFR Part 50 App S Sec. 2 (c)
Rounding convention for data reported to AQS All routine concentration data 1 place after decimal with digits to right
truncated
1, 2, and 3) 40 CFR Part 50 App S Sec. 4.2 (a) The rounding convention is for averaging values for comparison to NAAQS not for reporting individual hourly values.
Completeness
Annual Standard ≥ 75% hours in year 1) 40 CFR Part 50 App S Sec. 3.1 (b) 2) 40 CFR Part 50 App S Sec. 3.1 (a) 3) 40 CFR Part 50 App S Sec. 3.1 (b)
1-hour standard
1) 3 consecutive calendar years of complete data
2) 4 quarters complete in each year 3) ≥ 75% sampling days in quarter
4) ≥ 75% of hours in a day
1) 40 CFR Part 50 App S Sec. 3.2 (b) 2) 40 CFR Part 50 App S Sec. 3.2 (a) 3) 40 CFR Part 50 App S Sec. 3.2 (b) More details in 40 CFR Part 50 App S
Sample Residence Time Verification Every 365 days and 1/calendar year ≤ 20 Seconds
1) 40 CFR Part 58 App E Sec. 9 (c) 2) Recommendation 3) 40 CFR Part 58 App E Sec. 9 (c)
Sample Probe, Inlet, Sampling train All sites Borosilicate glass (e.g., Pyrex ®) or Teflon®
1, 2, and 3) 40 CFR Part 58 App E Sec. 9 (a) FEP and PFA have been accepted as equivalent material to Teflon. Replacement or cleaning is suggested as 1/year and more frequent if pollutant load or contamination dictate.

T200U ENHANCED Revision No. 1
February 2020 Page 6 of 45
T200U ENHANCED Wood Environment & infrastructure Solutions, Inc.
1) Requirement (NO 2) 2) Frequency 3) Acceptance Criteria Information/Action
Siting Every 365 days and 1/calendar year Meets siting criteria or waiver documented 1) 40 CFR Part 58 App E Sec. 2-6 2) Recommendation 3) 40 CFR Part 58 App E Sec. 2-6
Precision (using 1-point QC checks) Calculated annually and as appropriate for design value estimates 90% CL CV < 15.1%
1) 40 CFR Part 58 App A Sec. 2.3.1.5 & 3.1.1 2) 40 CFR Part 58 App A Sec. 4 (b) 3) 40 CFR Part 58 App A Sec. 4.1.2
Bias (using 1-point QC checks) Calculated annually and as appropriate for design value estimates 95% CL < ± 15.1%
1) 40 CFR Part 58 App A Sec. 2.3.1.5 & 3.1.1 2) 40 CFR Part 58 App A Sec. 4 (b) 3) 40 CFR Part 58 App A Sec. 4.1.3

T200U ENHANCED Revision No. 1
February 2020 Page 7 of 45
T200U ENHANCED Wood Environment & Infrastructure Solutions, Inc.
4.0 MATERIALS AND SUPPLIES
The operation of the T200U analyzer requires a sample inlet made of Teflon perfluoroalkoxy (PFA) for the NOy channel (TAD Section 4.3.4.3, p. 24 of 40) and stainless steel for the TNx sample inlet. Inlet materials are chosen for the chemical composition of the sample prior to the NOy and TNx converters and should be as short as possible. Following the converters, a wider selection of materials can be used. The system utilizes a dynamic dilution gas calibrator (T700U) with a compressed nitric oxide (NO) gas cylinder with at least a ± 2% certification. The T200U system also requires:
• Assorted fittings comprised of Teflon or stainless steel • gas lines comprised of Teflon [PTFE or fluorinated ethylene propylene (FEP)] • 47 millimeter (mm), 1 µm Teflon inlet filler • Additional 47 millimeter (mm), 5 µm Teflon filters to protect the integrity of the sample
lines • Zero air with concentrations lower than the lower detection limit (LDL) of NO, nitrogen
dioxide (NO 2), and ammonia (NH
3).
5.0 SAFETY
The T200U is a heavy, high voltage instrument with multiple components having weights between 15 and 75 pounds. It is recommended that two people lift and carry the components heavier than 45 pounds. High voltages are present inside the instrument case. Consequently, the power connection must have a functioning ground connection. The power must be off before disconnecting subassemblies. The instrument must not be operated with the cover off. Many of the calibration and process gases are extremely toxic by inhalation. Consequently, the safety data sheet (SDS) for all cylinders must be posted onsite. Exhaust must be vented outside the shelter.
6.0 PROCEDURES
6.1 Set-Up/Installation
The first step is to unpack the analyzer from its shipping container and visually inspect the instrument for any damage. Then, identity loose fittings, screws, or items that may appear to be out of place. Internal damage to the analyzers and their components occurs occasionally during shipment.
6.1.1 Remove Shipping Screws Remove the two red shipping screws from the top of the sensor base before operating the instrument.
6.1.2 6.1.2 Install Internal Converters and Components NOx Photolytic

T200U ENHANCED Revision No. 1
February 2020 Page 8 of 45
T200U ENHANCED Wood Environment & Infrastructure Solutions, Inc.
Install the photolytic converter using the supplied mounting plate over the pre-reactor in the front right of the analyzer. Mount the photolytic power supply on the power supply support. The position of the existing power supplies may have to be adjusted to fit the photolytic power supply. Replace the existing power supply coupling from the main switch to power supplies with the supplied coupling having a third branch to all three power supplies. Connect the photolytic power supply coupling to the photolytic converter board. Solenoids Install the additional solenoid rack between the photolytic converter and the photomultiplier (PMT). Install the solenoid DC control module on the rear of the analyzer. Route the solenoid wires out the rear panel of the analyzer and connect them to the DC control module Connect the pre-reactor monitoring solenoid wires to the data logger. Pneumatics Install the additional exhaust manifold in the rear of the analyzer between the original exhaust manifold and the insulated container containing the NOx converter and the ozone destruct catalyst. Install the appropriate sized flow restrictors on the new manifold for the Moly NOx, photolytic, and TNx converters. Reroute the internal tubing to the additional converters, solenoids, and exhaust manifold as demonstrated in Figure 11.
6.1.3 Ventilate Instrument Install the Enhanced T200U analyzer, bypass box and 702SS NH3 calibrator in the instrument equipment rack. Before powering on the T200U, the instrument must be properly ventilated. Minimum ventilation clearances are as follows (Manual Section 3.3.1, p. 32):
• Back -- 4 inches • Sides -- 1 inch • Above and Below -- 1 inch
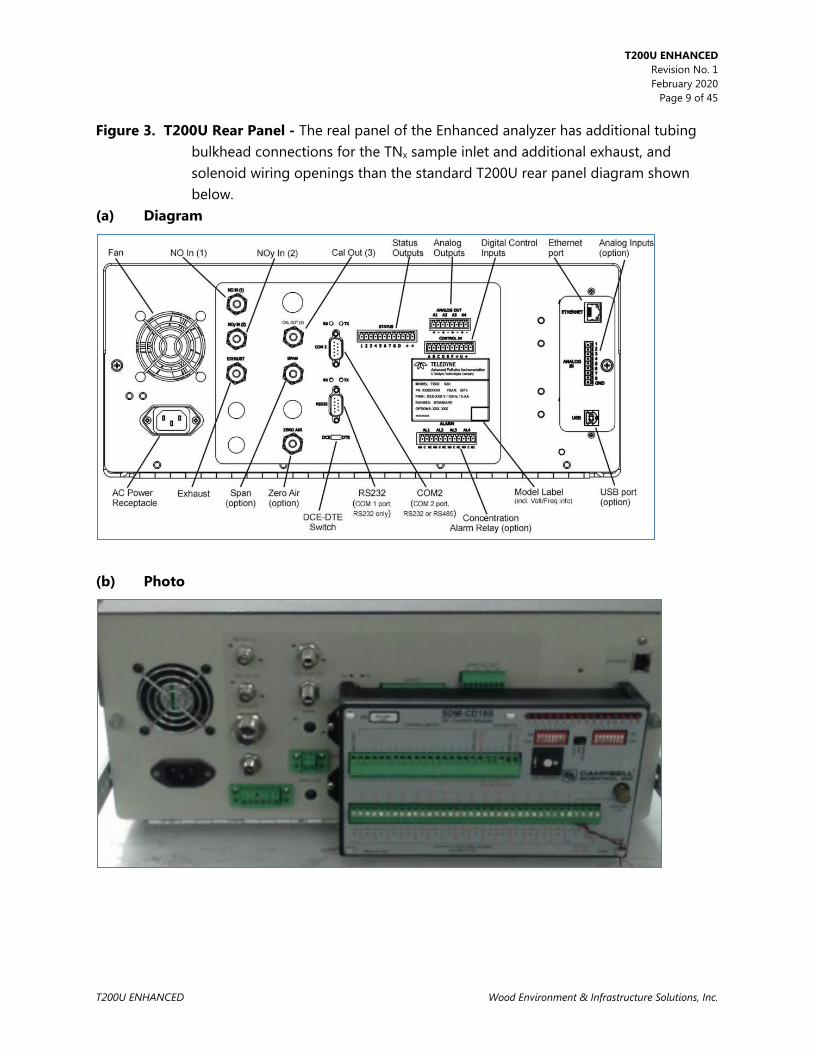
T200U ENHANCED Revision No. 1
February 2020 Page 9 of 45
T200U ENHANCED Wood Environment & Infrastructure Solutions, Inc.
Figure 3. T200U Rear Panel - The real panel of the Enhanced analyzer has additional tubing bulkhead connections for the TNx sample inlet and additional exhaust, and solenoid wiring openings than the standard T200U rear panel diagram shown below.
(a) Diagram
(b) Photo
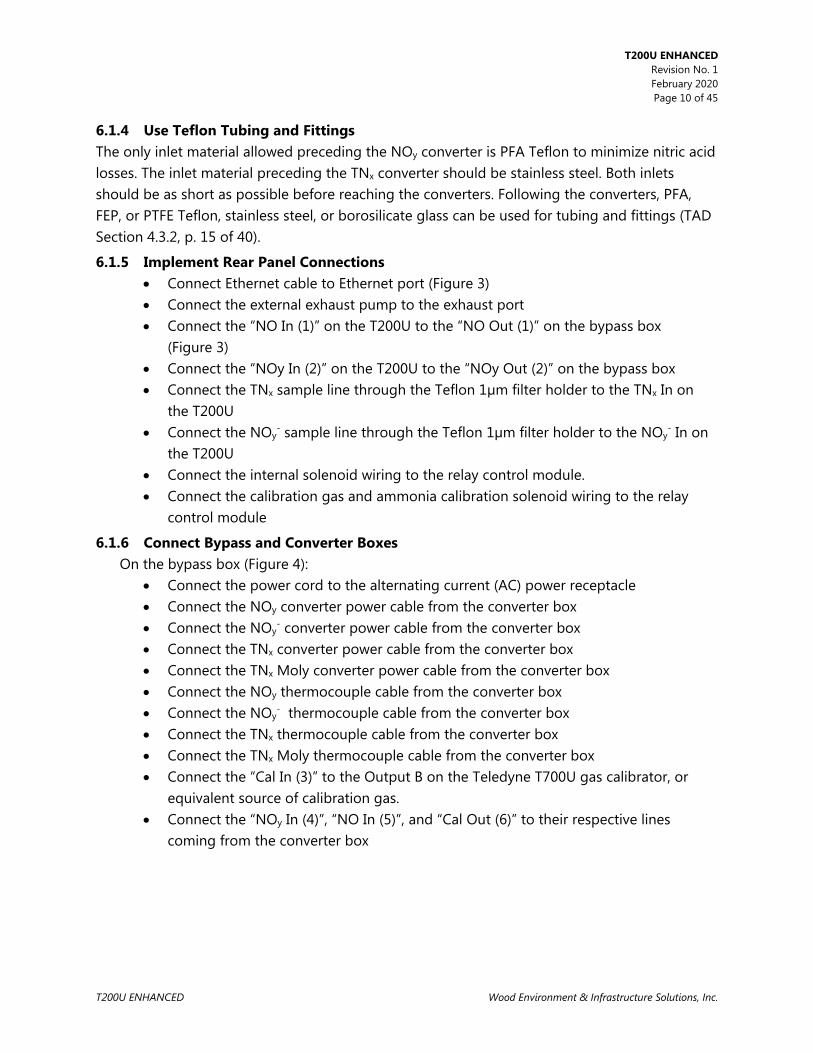
T200U ENHANCED Revision No. 1
February 2020 Page 10 of 45
T200U ENHANCED Wood Environment & Infrastructure Solutions, Inc.
6.1.4 Use Teflon Tubing and Fittings The only inlet material allowed preceding the NOy converter is PFA Teflon to minimize nitric acid losses. The inlet material preceding the TNx converter should be stainless steel. Both inlets should be as short as possible before reaching the converters. Following the converters, PFA, FEP, or PTFE Teflon, stainless steel, or borosilicate glass can be used for tubing and fittings (TAD Section 4.3.2, p. 15 of 40).
6.1.5 Implement Rear Panel Connections • Connect Ethernet cable to Ethernet port (Figure 3) • Connect the external exhaust pump to the exhaust port • Connect the “NO In (1)” on the T200U to the “NO Out (1)” on the bypass box
(Figure 3) • Connect the “NOy In (2)” on the T200U to the “NOy Out (2)” on the bypass box • Connect the TNx sample line through the Teflon 1µm filter holder to the TNx In on
the T200U • Connect the NOy
- sample line through the Teflon 1µm filter holder to the NOy- In on
the T200U • Connect the internal solenoid wiring to the relay control module. • Connect the calibration gas and ammonia calibration solenoid wiring to the relay
control module
6.1.6 Connect Bypass and Converter Boxes On the bypass box (Figure 4):
• Connect the power cord to the alternating current (AC) power receptacle • Connect the NOy converter power cable from the converter box • Connect the NOy
- converter power cable from the converter box • Connect the TNx converter power cable from the converter box • Connect the TNx Moly converter power cable from the converter box • Connect the NOy thermocouple cable from the converter box • Connect the NOy
- thermocouple cable from the converter box • Connect the TNx thermocouple cable from the converter box • Connect the TNx Moly thermocouple cable from the converter box • Connect the “Cal In (3)” to the Output B on the Teledyne T700U gas calibrator, or
equivalent source of calibration gas. • Connect the “NOy In (4)”, “NO In (5)”, and “Cal Out (6)” to their respective lines
coming from the converter box
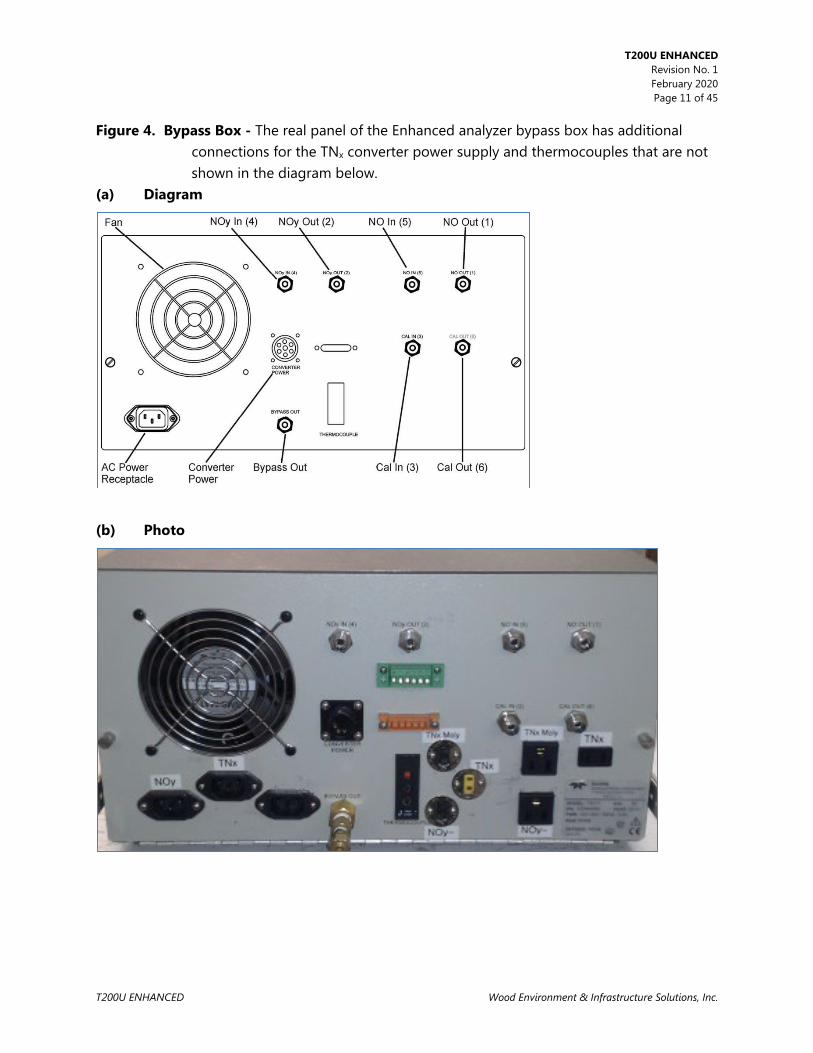
T200U ENHANCED Revision No. 1
February 2020 Page 11 of 45
T200U ENHANCED Wood Environment & Infrastructure Solutions, Inc.
Figure 4. Bypass Box - The real panel of the Enhanced analyzer bypass box has additional connections for the TNx converter power supply and thermocouples that are not shown in the diagram below.
(a) Diagram
(b) Photo
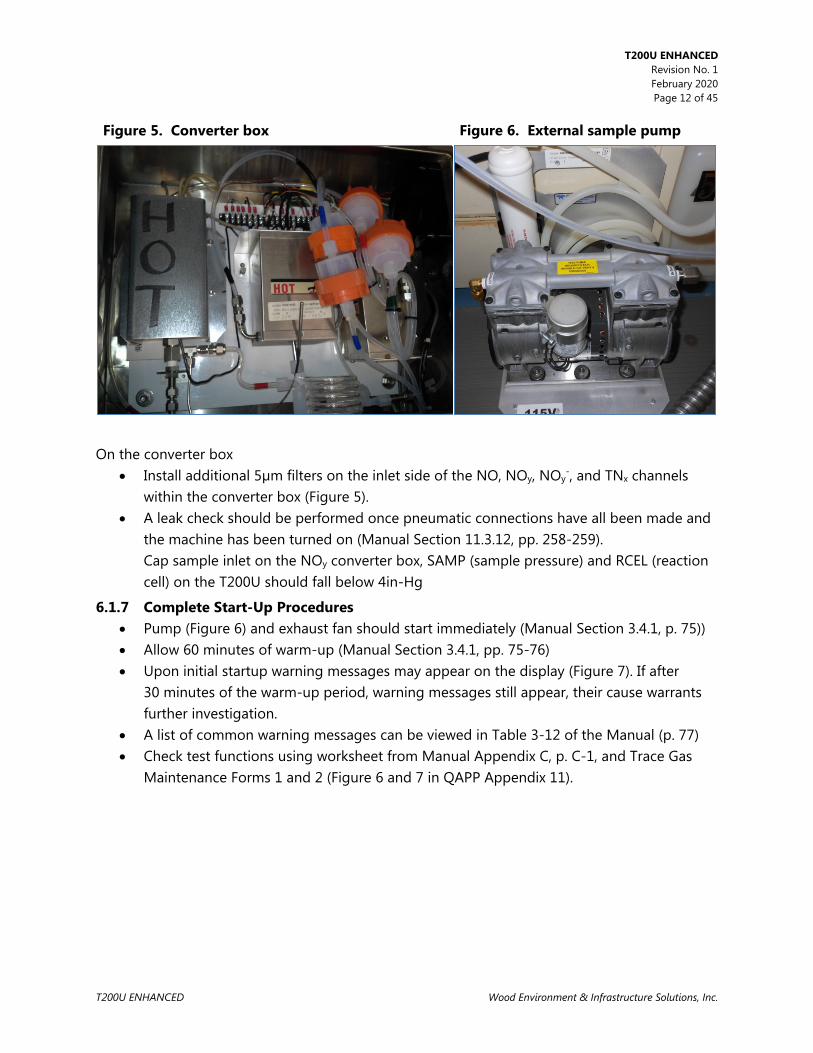
T200U ENHANCED Revision No. 1
February 2020 Page 12 of 45
T200U ENHANCED Wood Environment & Infrastructure Solutions, Inc.
Figure 5. Converter box Figure 6. External sample pump
On the converter box
• Install additional 5µm filters on the inlet side of the NO, NOy, NOy-, and TNx channels
within the converter box (Figure 5). • A leak check should be performed once pneumatic connections have all been made and
the machine has been turned on (Manual Section 11.3.12, pp. 258-259). Cap sample inlet on the NOy converter box, SAMP (sample pressure) and RCEL (reaction cell) on the T200U should fall below 4in-Hg
6.1.7 Complete Start-Up Procedures • Pump (Figure 6) and exhaust fan should start immediately (Manual Section 3.4.1, p. 75)) • Allow 60 minutes of warm-up (Manual Section 3.4.1, pp. 75-76) • Upon initial startup warning messages may appear on the display (Figure 7). If after
30 minutes of the warm-up period, warning messages still appear, their cause warrants further investigation.
• A list of common warning messages can be viewed in Table 3-12 of the Manual (p. 77) • Check test functions using worksheet from Manual Appendix C, p. C-1, and Trace Gas
Maintenance Forms 1 and 2 (Figure 6 and 7 in QAPP Appendix 11).
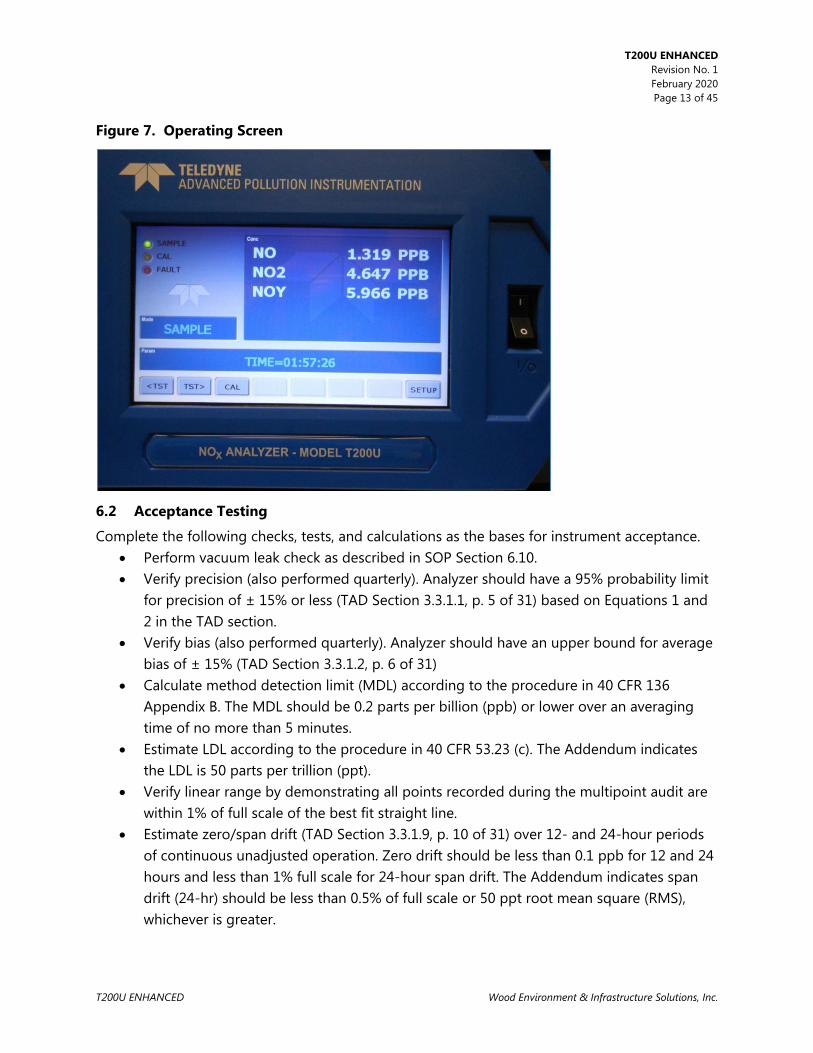
T200U ENHANCED Revision No. 1
February 2020 Page 13 of 45
T200U ENHANCED Wood Environment & Infrastructure Solutions, Inc.
Figure 7. Operating Screen
6.2 Acceptance Testing
Complete the following checks, tests, and calculations as the bases for instrument acceptance. • Perform vacuum leak check as described in SOP Section 6.10. • Verify precision (also performed quarterly). Analyzer should have a 95% probability limit
for precision of ± 15% or less (TAD Section 3.3.1.1, p. 5 of 31) based on Equations 1 and 2 in the TAD section.
• Verify bias (also performed quarterly). Analyzer should have an upper bound for average bias of ± 15% (TAD Section 3.3.1.2, p. 6 of 31)
• Calculate method detection limit (MDL) according to the procedure in 40 CFR 136 Appendix B. The MDL should be 0.2 parts per billion (ppb) or lower over an averaging time of no more than 5 minutes.
• Estimate LDL according to the procedure in 40 CFR 53.23 (c). The Addendum indicates the LDL is 50 parts per trillion (ppt).
• Verify linear range by demonstrating all points recorded during the multipoint audit are within 1% of full scale of the best fit straight line.
• Estimate zero/span drift (TAD Section 3.3.1.9, p. 10 of 31) over 12- and 24-hour periods of continuous unadjusted operation. Zero drift should be less than 0.1 ppb for 12 and 24 hours and less than 1% full scale for 24-hour span drift. The Addendum indicates span drift (24-hr) should be less than 0.5% of full scale or 50 ppt root mean square (RMS), whichever is greater.

T200U ENHANCED Revision No. 1
February 2020 Page 14 of 45
T200U ENHANCED Wood Environment & Infrastructure Solutions, Inc.
• Test the conversion efficiency of the molybdenum converters (TAD Section 4.4.2, pp. 26-28).
• Verify test functioning using Forms 1 and 2 (Figures 6 and 7 in QAPP Appendix 11).
6.3 Configuration
• Set clock to current date and time of day (standard time) (Manual Section 5.6.1, p. 110) The clock will automatically be set by the site data logger and only needs to be set manually if the instrument is to be operated independently. Setup → Clk → Time → (Set to current local standard time) → ENTR* Setup → Clk → Date → (Set to current date) → ENTR
*The T200U uses abbreviations to show parameters on its display screen. The abbreviations are defined in Section 9.0 of this SOP.
• Analog range configuration is not applicable for digital communications. • Range units = ppb (Manual Section 5.4.3.4, p. 105)
To check: Sample → Test → RNGE
To change: Setup → Rnge → Unit → PPB ENTR
• Range concentration = 0100.0 To check:
Sample → Test → RNGE To Change:
Setup → Rnge → Set → 00100.0 ENTR • Range mode = Single (SNGL) (Manual Section 5.4.3, p. 98)
To check: Setup → Rnge → Mode → RANGE MODE
To Change: Setup → Rnge → Mode → SNGL
• Set Machine ID (Manual Section 5.7.1, pp. 112-113) To check: Setup → More → Comm → ID To change: Setup → More → Comm → ID → (Set to desired value) → ENTR
• Set Ethernet settings (Manual Section 6.5.1, pp. 143-145) Setup → More → Comm → Inet DHCP = Off INST IP = 192.168.0.42 GATEWAY IP = 192.168.0.1

T200U ENHANCED Revision No. 1
February 2020 Page 15 of 45
T200U ENHANCED Wood Environment & Infrastructure Solutions, Inc.
SUBNET MASK = 255.255.255.0 TCP PORT 1 = 3000 TCP PORT 2 = 502
• Set alarm limits The alarm limits will be set according to the list of acceptable values in Figures 6 and 7 of QAPP Appendix 11.
• Set / Verify Instrument Settings Setup → More → Vars 1) MEASURE_MODE = NOY-NO 2) STABIL_GAS = NOY 11) DAYLIGHTSAVING_ENABLE = OFF 33) FILT_DELAY = 200 Seconds 34) SG_FILT_DELAY = 200 Seconds 100) PASS_ENABLE = ON
• For Enhanced NOy analyzer only, set the following instrument settings (the value in parentheses shows the setting for regular operation of the T200U Setup → More → Vars 24) FILT_SIZE = 1 (20) 25) SG_FILT_SIZE = 1 (60) : Filter size in single gas mode 27) FILT_OMIT_DELTA = 0.100 PPM (0.030 PPM) : Consecutive measurement change
to omit from reporting. Must be analyzer full scale for Enhanced NOy or else measurements can be skipped.
28) FILT_OMIT_PCT = 100.0 % (8.0 %) : Percent change in consecutive measurements to omit from reporting.
31) FILT_ASIZE = 1 (4) : Moving average filter size in adaptive mode 32) SG_FILT_ASIZE = 1 (4) : Moving average filter size in single gas adaptive mode 35) NOY_DWELL = 4.9 Seconds (4.0 Seconds) : Dwell time after switching solenoids
to the NOy sampling position 36) SG_NOY_DWELL = 4.9 Seconds (4.0 Seconds) : Dwell time in single gas mode 37) NOY_SAMPLE = 5 (2) : Number of samples to perform during each measurement 38) SG_NOY_SAMPLE = 5 (2) : Number of samples to perform during each
measurement in single gas mode 39) NO_DWELL = 4.7 Seconds (1.5 Seconds) : Dwell time after switching solenoids to
the NO sampling position 40) SG_NO_DWELL = 4.7 Seconds (1.5 Seconds) : Dwell time in single gas mode 41) NO_SAMPLE = 5 (2) : Number of samples to perform during each measurement 42) SG_NO_SAMPLE = 5 (2) : Number of samples to perform during each
measurement in single gas mode

T200U ENHANCED Revision No. 1
February 2020 Page 16 of 45
T200U ENHANCED Wood Environment & Infrastructure Solutions, Inc.
47) AZERO_DWELL = 5.0 Seconds (3.0 Seconds) : Dwell time after switching solenoids to the pre-reactor sampling position.
48) AZERO_POST_DWELL = 5.0 Seconds (3.0 Seconds) : Dwell time after concluding the pre-reactor measurement to flush the pre-reactor before initiating the timer of the next measurement cycle.
The Enhanced API T200U NO/NOy/TNx analyzer uses the temperature and pressure readings at the time of calibration as a reference for compensation. As such, there is no need to enter or confirm standard temperature and pressure conditions.
6.4 Operation
Figure 7 showed the normal operating screen. Descriptions of the various display components are listed in Table 1 (Manual Table 3-2, p. 35). Table 1. Analyzer Display Functions
Recommended method performance criteria (TAD sec 3, pg 5-10) Figure 8 illustrates the T200U Internal Layout (Manual Section 3.2.3, p. 39). A photograph of the internal layout is given in Figure 9. The internal layout of the bypass box is shown in Figure 10. Figure 11 provides an illustration of the T200U pneumatic layout (Addendum Section 3.0, p. 13).
6.4.1 Instrument Display Screen Figure 7 displayed the normal operating screen (Manual Figure 3-2, p. 34). Descriptions of the display components are listed in Table 1 (Manual Table 3-2, p. 3-5). Recommended method performance criteria, e.g., precision, bias, representativeness, completeness, comparability, MDL, LDL, linear range, and zero/span drift are discussed in NCore TAD, Section 4.3.1, pp. 8-14 of 50).

T200U ENHANCED Revision No. 1
February 2020 Page 17 of 45
T200U ENHANCED Wood Environment & Infrastructure Solutions, Inc.
6.4.2 Instrument Components Figure 8 gives an image of the T200U internal layout and major instrument components (Manual Figure 3-5, p. 39). Figure 8. T200U Internal Chassis Layout - The internal layout of the Enhanced analyzer contains additional components, pneumatic tubing and wiring than the standard T200U internal layout shown below.

T200U ENHANCED Revision No. 1
February 2020 Page 18 of 45
T200U ENHANCED Wood Environment & Infrastructure Solutions, Inc.
Figure 9. Enhanced T200U Internal Layout Figure 10. Bypass Box Internal Layout

T200U ENHANCED Revision No. 1
February 2020 Page 19 of 45
T200U ENHANCED Wood Environment & Infrastructure Solutions, Inc.
Figure 11. Enhanced Nitrogen T200U Pneumatic Layout
6.4.3 Weekly Site Operator Activities Weekly site operator activities are provided in Figure 12 (instrument suites may vary per site). They include:
• Leak checks • Checking sample lines (moisture, dirt, and obstructions) • Review of shelter temperature • Review of operational settings and checks • Site logbook entries • Changing particulate filters • Review of zero precision span (zps) results

T200U ENHANCED Revision No. 1
February 2020 Page 20 of 45
T200U ENHANCED Wood Environment & Infrastructure Solutions, Inc.
Figure 12. Site Operator Trace Gas Checklist (Page 1 of 4)

T200U ENHANCED Revision No. 1
February 2020 Page 21 of 45
T200U ENHANCED Wood Environment & Infrastructure Solutions, Inc.
Figure 12. Site Operator Trace Gas Checklist (Page 2 of 4)

T200U ENHANCED Revision No. 1
February 2020 Page 22 of 45
T200U ENHANCED Wood Environment & Infrastructure Solutions, Inc.
Figure 12. Site Operator Trace Gas Checklist (Page 3 of 4)
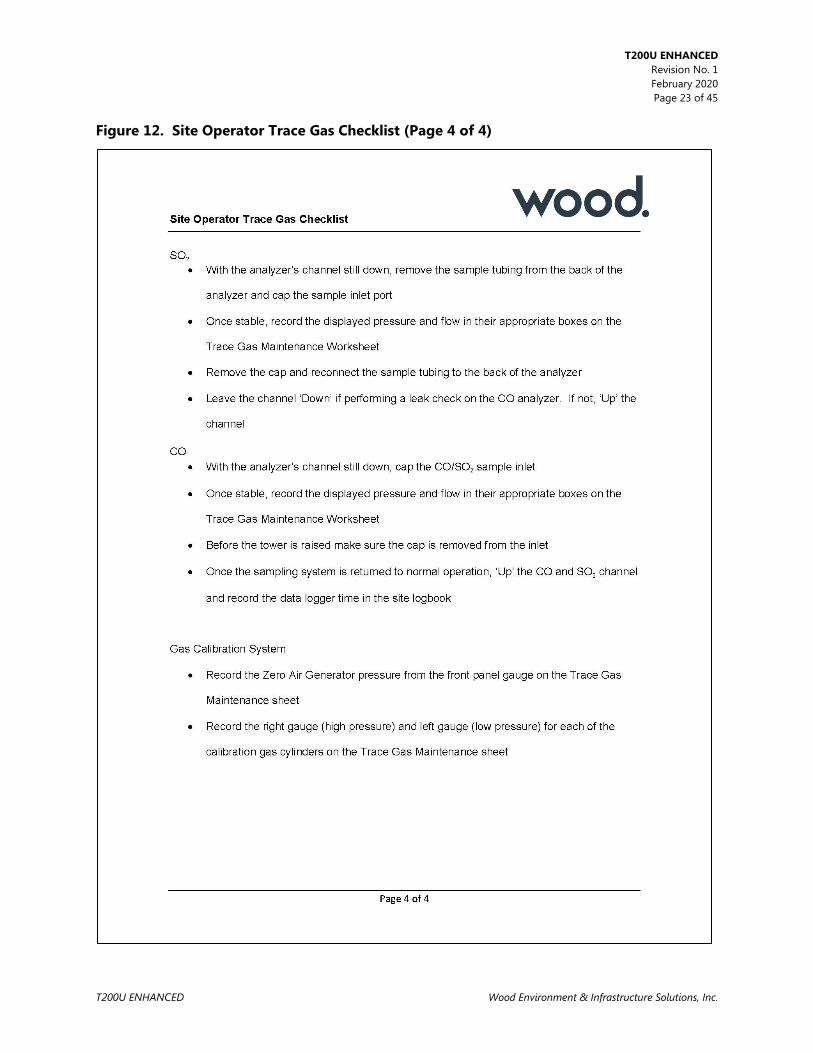
T200U ENHANCED Revision No. 1
February 2020 Page 23 of 45
T200U ENHANCED Wood Environment & Infrastructure Solutions, Inc.
Figure 12. Site Operator Trace Gas Checklist (Page 4 of 4)
T200U ENHANCED Revision No. 1
February 2020 Page 24 of 45
T200U ENHANCED Wood Environment & Infrastructure Solutions, Inc.
6.4.4 Changing Particulate Filters Change the external sample particulate filter every two weeks by completing the following steps:
• Using the data logger, ‘Down’ all parameters on the affected tower. ‘no_down’ and ‘noy_down’ are sufficient to flag all Enhanced Nitrogen analyzer parameters
• Lower the tower containing the external sample particulate filter • Either remove or cap the CASTNET filter pack, if applicable • Unscrew the orange retaining ring. The green filter wrenches may be required • Using clean gloves, install new 5 µm, PTFE 47 mm diameter filter and discard the used
filter • Reinstall the retaining ring and tighten 1/8 turn past hand tight using green filter
wrenches • Repeat for all external particulate filters. The Enhanced Nitrogen analyzer uses four. • Perform a sample train leak check as described in Section 6.7 of this SOP
Change the internal sample particulate filter (Figure 13) monthly by completing the following steps (Manual Section 11.3.1, pp. 242-243)
• ‘Down’ the NO, NOy, and NOy diff channels • Turn off the analyzer sample and bypass pumps to prevent particulates from being
drawn into the sample line • Turn off the ‘NOy’ switch on the bypass box to power off the primary bypass pump. The
other temperature controllers will remain on • Unplug the external sample pump and secondary bypass pump • Open the hinged front panel and unscrew the knurled retaining ring on the filter
assembly • Using clean gloves, replace the filter element with a 1 µm, PTFE 47 mm diameter filter • Reinstall the PTFE O-ring with the notches facing up, otherwise sample flow will be
restricted • Replace the glass window and hand-tighten the retaining ring • The TNx channel has two additional ‘internal’ filters at the rear of the analyzer. Using the
same procedures as the external particulate filters, unscrew the orange retaining ring • Install a new 1 µm, PTFE 47 mm diameter filter. NOTE: 1 µm is REQUIRED • Reinstall the retaining ring and tighten 1/8 turn past hand tight using green filter
wrenches • Restart the analyzer pumps • Perform a vacuum leak check

T200U ENHANCED Revision No. 1
February 2020 Page 25 of 45
T200U ENHANCED Wood Environment & Infrastructure Solutions, Inc.
Figure 13. Internal Sample Particulate Filter
6.5 Calibration
Audit the NO/ NOy-/NOy/TNx monitoring system quarterly or if required for other reasons. A 4 to
5 hour warm-up period is recommended before any calibrations are performed. Calibrate the zero and span if the relative percent difference (RPD) for any point is > 5%. All points must be < 1% of best fit line or else recalibration or other maintenance and troubleshooting are required. Estimate precision based on the procedures in Section 6.2.
6.5.1 Calibrate Subsystems Flow Flow calibration is discussed in Manual Section 9.7, p. 218. Audit both channels before calibrating/adjusting either NO or NOy flows. Audit NO flow Connect flow transfer standard to “NO In (1)” at the rear of the analyzer → SETUP → MORE → VARS → password “818” → NEXT until “MEASURE_MODE → EDIT → NO only → ENTR Record flow transfer reading and analyzer SAMP flow reading Audit NOy flow Connect flow transfer standard to “NOy In (2) at the rear of the analyzer → SETUP → MORE → VARS → password “818” → NEXT until “MEASURE_MODE → EDIT → NOy only → ENTR Record flow transfer reading and the analyzer SAMP flow reading

T200U ENHANCED Revision No. 1
February 2020 Page 26 of 45
T200U ENHANCED Wood Environment & Infrastructure Solutions, Inc.
Calibrate NO flow Connect flow transfer standard to “NO In (1)” at the rear of the analyzer → SETUP → MORE → VARS → password “818” → NEXT until “MEASURE_MODE” → EDIT → NO only → ENTER → EXIT → DIAG → NEXT until “FLOW CALIBRATION” → ENTR → SAMP → Input the flow transfer average → ENTR Calibrate NOy flow Connect flow transfer standard to “NOy In (2)” at the rear of the analyzer → SETUP → MORE → VARS → password “818” → NEXT until “MEASURE_MODE” → EDIT → NOy only → ENTER → EXIT → DIAG → NEXT until “FLOW CALIBRATION” → ENTR → SAMP → Input the flow transfer average → ENTR Optic Test Follow the procedures in Manual Section 12.7.12.1, p. 301. See also Section 6.5.1 of SOP 100U. Electrical Test Follow the procedures in Manual Section 12.7.12.2, p. 301. See also Section 6.5.1 of SOP T100U. Signal I/O Follow the procedures in Manual Section 12.7.6.2, p. 287. Return to VARS menu → NEXT until “MEASURE_MODE” → EDIT → NOY-NO → ENTR Exit back to the main display
6.5.2 NO and NOy Audits NO audit Connect the flow transfer to “NO In (1)” → SETUP → MORE → VARS → password “818” → NEXT until “MEASURE_MODE” → EDIT → NOY only → ENTR Record flow transfer reading and the analyzer SAMP flow reading NOy audit Connect the flow transfer to “NOy In (2)” → SETUP → MORE → VARS → password “818” → NEXT until “MEASURE_MODE” → EDIT → NO only → ENTR Record flow transfer reading and the analyzer SAMP flow reading

T200U ENHANCED Revision No. 1
February 2020 Page 27 of 45
T200U ENHANCED Wood Environment & Infrastructure Solutions, Inc.
O 3 Generator Flow Audit
→ SETUP → MORE → DIAG → NEXT until “OZONE GEN OVERIDE” → ENTR → toggle to “OFF” → lower the front panel on the analyzer. Connect the flow transfer to the O
3 generator tubing at the union (Figure 14). → SETUP → MORE → DIAG → NEXT until “OZONE GEN OVERIDE” → ENTR → toggle to “ON” → EXIT to main screen → TEST to O
3 flow Record the flow transfer reading and the analyzer O
3 flow reading Return to “OZONE GEN OVERIDE” → Toggle to OFF → Disconnect flow transfer and reconnect O
3 generator union → Toggle to ON → EXIT to main screen Figure 14. Union for Ozone Generator
O
3 Generator Flow Calibration → SETUP → MORE → DIAG → NEXT until “OZONE GEN OVERIDE” → ENTR → toggle to “OFF” Lower the front panel on the analyzer. Connect the flow transfer to the O
3 generator tubing at the union (Figure 14). → SETUP → MORE → DIAG → NEXT until “OZONE GEN OVERIDE” → ENTR → toggle to “ON” → EXIT → NEXT until “FLOW CALIBRATION” → ENTR → OZONE → Input average flow from flow transfer → ENTR Return to “OZONE GEN OVERIDE” → Toggle to OFF → Disconnect flow transfer and reconnect O
3 generator union → Toggle to ON → EXIT to main screen Pressure Audit Disconnect the clear tubing (Figure 15) directly from the sample pressure sensor assembly Connect the pressure transfer directly to the sample pressure sensor

T200U ENHANCED Revision No. 1
February 2020 Page 28 of 45
T200U ENHANCED Wood Environment & Infrastructure Solutions, Inc.
Figure 15. Sample pressure transducer
SAMPLE → TEST → PRES Record the ambient pressure readings from both the pressure standard and the analyzer’s sample pressure Set the pressure transfer standard to vacuum using the + - knob. Close the vent of the pressure transfer using the • knob. Press “PUMP” on the pressure transfer until the pressure is lowered to approximately 5 inches mercury absolute (inHg-A). Record the readings from both the pressure standard and the analyzer’s pressure sensor Slowly open the pressure transfer vent (the • knob) to adjust the pressure to approximately 15 inHg-A. Record the readings from both the pressure standard and the analyzer’s pressure standard. Disconnect the pressure transfer from the pressure sensor and reconnect the analyzer’s tubing to the pressure sensor. Calibrate pressure sensor if absolute difference of any reading is greater than 0.5 inHg-A. It is recommended to perform a leak check whenever any pneumatic connection is altered Reaction Cell/Vacuum Pressure Sensor Audit Repeat procedure for the reaction cell/vacuum pressure sensor (Figure 16). The reaction cell/vacuum pressure is listed as RCELL on the analyzer. Audit the reaction cell pressure sensor

T200U ENHANCED Revision No. 1
February 2020 Page 29 of 45
T200U ENHANCED Wood Environment & Infrastructure Solutions, Inc.
audit in the same manner as the sample pressure. The analyzer’s external sample pump must be disconnected from the power supply to complete the audit. Figure 16. RCELL pressure transducer
Pressure Calibration Turn off instrument sample pump by disconnecting the pump power connector from the power supply. → SETUP → MORE → DIAG → password “929” → NEXT until “PRESSURE CALIBRATION” → ENTR → Input pressure transfer value for ambient pressure → ENTR The T200U pressure calibration procedure calibrates both the sample pressure sensor and the reaction cell/vacuum pressure assembly simultaneously to ambient pressure. It is recommended to perform post calibration pressure audits to confirm proper calibration.
NO/ NOy-/NOy/TNx Audit
Perform multi-point NO/ NOy-/NOy/TNx audit using a Teledyne T700U gas calibrator or
equivalent to produce concentrations of calibration gas. Calibration gases supplied to the T700U must be from a certified pressurized (28 to 32 psi) cylinder. Cylinders must be traceable to National Institute of Standards and Technology (NIST)-standard reference methods (SRM) and meet limits in traceability protocol for accuracy and stability (QA Handbook Section 12.1.2, pp. 3-6 of 11 and Manual Section 10.2, p. 221). From the T700U
• Generate zero air and send to the sample inlet on the T200U • Recommended flow rate supplied to the Enhanced T200U is 7 liters per minute (LPM) or
greater • Allow the concentration to stabilize until STABIL on the T200U reads less than 0.10

T200U ENHANCED Revision No. 1
February 2020 Page 30 of 45
T200U ENHANCED Wood Environment & Infrastructure Solutions, Inc.
• Record 5 min concentration average and 5 minute expected concentration average • Record the stability • Repeat for each of the 5 levels below
Audit Level Concentration, ppb Level 1 90 Level 2 60 Level 3 30 Level 4 15 Level 5 7
If any point is greater than a RPD of 5%, then a zero/span calibration must be performed. NO/ NOy
-/NOy/TNx Calibration Record the analyzer’s original NO/NOy slope and offset before calibration. Zero Calibration From T700U gas calibrator or equivalent, generate zero air at a flow of 7 LPM or greater. Allow the analyzer reading to stabilize; STABIL should be less than 0.1 → CAL → ZERO → ENTR Span Calibration To calibrate span, the NO and NOy channels are adjusted using the analyzer and the remaining channels are calibrated using correction coefficients stored in the data logger. From the T700U gas calibrator or equivalent, generate span gas at a concentration of 90 ppb NO Flow rate should be 7 LPM at a minimum Allow the analyzer reading to stabilize; STABIL should be less than 0.1 → CAL → SPAN → ENTR If the SPAN option is not displayed while sampling 90 ppb NO/NOy, then the span range concentration must be changed on the analyzer. To change the span range on the analyzer

T200U ENHANCED Revision No. 1
February 2020 Page 31 of 45
T200U ENHANCED Wood Environment & Infrastructure Solutions, Inc.
→ CAL → CONC → NOy → Input the desired span concentration, 90 ppb → ENTR ENTER returns to the CONC MENU, now choose NO → Input the desired span concentration, 90 ppb → ENTER → EXIT returns to the CAL menu, SPAN should now be present Record the new NO and NOy slopes and offsets Adjust the NOx_True_Span_Correction, NOy_minus_Span_Correction and TNx_Span_Correction parameters using PC200 or LoggerNet until the NOx_True, NOy
- and TNx report a stable 90 ppb. Perform a post calibration NO/NOy multipoint audit to confirm proper calibration Note: If either slope or offset is outside the accepted range, then the potentiometer settings on the PMT preamplification printed circuit assembly (PCA) (Figure 17) must be adjusted Parameter Accepted Value NO Slope 1.0 ± 0.3 NO Offset 50 to 150 NOy Slope 1.0 ± 0.3 NOy Offset 50 to 150
Adjusting Potentiometer Settings Before adjusting the coarse or fine pot adjustments on the preamp board, the NO and NOy slopes and offsets should be returned to 1.0 and 0.0, respectively. To manually change NOy slope → SETUP → MORE → VARS → password “929” → NEXT until NOy_SLOPE, or JUMP to “56” → EDIT → Input 1.0 for NOy_SLOPE → ENTR, “ENTR” returns to VARS menu To manually change NOy offset → SETUP → MORE → VARS → password “929” → NEXT until NOy_OFFSET, or JUMP to “57” → EDIT → Input 0.0 for NOy_OFFSET→ENTR, “ENTR” returns to VARS menu To manually change NO slope → SETUP → MORE → VARS → password “929” → NEXT until NO_SLOPE, or JUMP to “58” → EDIT → Input 1.0 for NO_SLOPE → ENTR, “ENTR” returns to VARS menu

T200U ENHANCED Revision No. 1
February 2020 Page 32 of 45
T200U ENHANCED Wood Environment & Infrastructure Solutions, Inc.
To manually change NO offset → SETUP → MORE → VARS → password “929” → NEXT until NO_OFFSET, or JUMP to “59” → EDIT → Input 0.0 for NO_OFFSET → ENTR, “ENTR” returns to VARS menu From the T700U gas calibrator or equivalent, generate span gas at a concentration of 90 ppb NO Flow rate should be 4.5LPM at a minimum Allow the analyzer reading to stabilize; STABIL should be less than 0.1 Remove the cover on the T200U Locate the fine (Figure 18) and coarse (Figure 19) adjustments on the PMT preamp PCA (Figure 17). Figure 17. PMT Preamp
PCA Figure 18. Fine Adjustment Figure 19. Coarse
Adjustment
Start with the fine adjustment. Using a small screw driver, turn the fine adjustment potentiometer in increments of 1. With each adjustment allow the analyzer’s new reading to stabilize. Attempt to bring the analyzer’s readings as close as possible to the desired 90 ppb for NO and NOy. Clockwise rotation will increase the analyzer’s reading. Counterclockwise rotation will decrease the analyzer’s reading. Do not leave the fine adjustment pot on the maximum settings.
T200U ENHANCED Revision No. 1
February 2020 Page 33 of 45
T200U ENHANCED Wood Environment & Infrastructure Solutions, Inc.
If the fine adjustment potentiometer is unable to bring the analyzer’s reading near the desired 90 ppb, then the coarse adjustment potentiometer may need to be altered. The coarse adjustment can be made in the same manner as the fine adjustment. Clockwise rotation will raise the analyzer response, and counterclockwise will lower the analyzer response. After coarse adjustment, it is recommended to perform a fine adjustment. After adjusting either of the fine or coarse adjustments, a NO/ NOy
-/NOy/TNx zero and span calibration should be performed. GPT/GPTZ Audit Gas Phase Titration (GPT) determines the amount of NO
2 generated by titration using the analyzer’s NO channel. The principle of the GPT is based on the rapid reaction that occurs between NO and O
3 to produce NO 2. With known NO and O
3 concentrations and known residence time, a known NO
2 concentration can be determined. The GPTZ is the same as GPT except the O
3 generator is off. The Teledyne gas calibrator model T700U is designed to perform a GPT/GPTZ.
T200U ENHANCED Revision No. 1
February 2020 Page 34 of 45
T200U ENHANCED Wood Environment & Infrastructure Solutions, Inc.
From the T700U or equivalent gas calibrator perform a multi-point audit on the following points
Audit Level GPT/GPTZ NO ppb O 3 ppb
Level 1 GPT 90 70 Level 2 GPTZ 90 45 Level 3 GPT 90 15 Level 4 GPTZ 90 0 Level 5 GPTZ 45 0 Level 6 GPT 45 30 Level 7 GPT 45 15 Level 8 GPT 45 7
Record the NO, NOy, and resulting NO
2 concentrations. Calculated NO
2 responses are obtained using the following equation
[𝑁𝑁𝑁𝑁2]𝑂𝑂𝑂𝑂𝑂𝑂 = [𝑁𝑁𝑁𝑁]𝑂𝑂𝑂𝑂𝑂𝑂𝑂𝑂 − [𝑁𝑁𝑁𝑁]𝑂𝑂𝑅𝑅𝑅𝑅 +𝐹𝐹𝑁𝑁𝑂𝑂 ∗ [𝑁𝑁𝑁𝑁2]𝑂𝑂𝑅𝑅𝐼𝐼
𝐹𝐹
[NO]ORIG= NO concentration analyzer response during the GPTZ [NO]REM= NO concentration analyzer response during the GPT Plot the NO
2 analyzer response concentration against the calculated NO 2 concentration. The plot
should yield a straight line. All analyzer response concentrations should be within 2% of the best-fit line. If the plot does not yield a straight line, the converter should be inspected or replaced. N-Propyl Nitrate (NPN) Audit A multipoint NPN audit is required to determine the NOy, NOy
-, and TNx converter efficiency. An NPN audit should not be performed on a “new” converter. Converters should be allowed to “burn in” for a period of up to 3 days before performing an NPN audit. The NPN standard cannot be certified to better than ±5%. Therefore, record the conversion over time and use 95% of the original efficiency as the performance cutoff (TAD Section 4.4.2, pp. 26-28 of 40). For the purpose of NOy monitoring, the conversion efficiency must be 95% or greater. Converters with efficiencies less than 95% should be replaced.

T200U ENHANCED Revision No. 1
February 2020 Page 35 of 45
T200U ENHANCED Wood Environment & Infrastructure Solutions, Inc.
From the T700U gas calibrator or equivalent, generate NPN concentrations for the following points: Audit Level NPN ppb Level 1 90 Level 2 60 Level 3 30 Level 4 15 Level 5 7 Zero Zero
Record the analyzer response for NO, NOx_True, NOy
-, NOy, and TNx at each audit level. Ammonia (NH3) Efficiency Check The API 702 SS NH3 calibrator has the capability to deliver calibration gas at a limited range of concentrations by adjusting the operating pressure to two flow restrictors. Because of the highly adsorptive nature of NH3 gas, the T700U cannot be used to perform NH3 efficiency checks. Connect a flow transfer standard to the calibration gas output on the rear of the 702SS. Using zero air, measure the flow rates for a single pressure using only the dilution inlet, Qd followed by only the cylinder inlet Qc. Using these flow rates determine the expected NH3 concentration using the following formula: NH3 = Tank Conc (ppm) * Qc / (Qd+Qc) Without adjusting the pressure regulators, deliver at least 5 lpm of desired concentration of NH3 to the inlet. Be prepared to wait up to 6 hours for a stable response. For new SS tubing, it can take 24 hours or longer. If desired, the NH3 calibration line can be supplied with gas and allowed to stabilize without connecting to the converter inlet to allow additional tasks to be performed. Once a stable concentration is recorded, additional concentrations can be evaluated by adjusting the delivery pressure on the 702 SS and repeating the flow verification process. Performing additional checks beyond a 85-95% FS check are optional. Record the NH3 converter efficiency check for the NOy
- and NOy moly converters. While not expected to convert NH3, efficiencies can be highly variable, particularly as converters age.

T200U ENHANCED Revision No. 1
February 2020 Page 36 of 45
T200U ENHANCED Wood Environment & Infrastructure Solutions, Inc.
6.6 Maintenance, Repair and Troubleshooting
Complete the following checks, tests, and calculations in order to maintain the T200U system. Table 2 lists potential warning messages and their descriptions (Manual Table 3-12, p. 77). Table 2. Warning Messages
MESSAGE MEANING SYSTEM RESET1 The computer has rebooted. ANALOG CAL WARNING
The A/D or at least one D/A channel have not been calibrated.
BOX TEMP WARNING The temperature inside the T200 chassis is outside the specified limits.
CANNOT DYN SPAN2 Contact closure span calibration failed while DYN_SPAN was set to ON.
CANNOT DYN ZERO3 Contact closure zero calibration failed while DYN_ZERO was set to ON.
CONFIG INITIALIZED Configuration storage was reset to factory configuration or erased. DATA INITIALIZED DAS data storage was erased before the last power up occurred. OZONE FLOW WARNING
Ozone gas flow is too high or too low for accurate NOx, NO and NO 2
readings.
OZONE GEN OFF4
Ozone generator is off. This is the only warning message that automatically clears itself. It clears itself when the ozone generator is turned on. Upon power up the Ozone generator will remain off for 30 minutes. This allows the perma-pure dryer to reach its working dew point.
RCELL PRESS WARN Reaction cell pressure is too high or too low for accurate NOx, NO and NO
2 readings. RCELL TEMP WARNING
Reaction cell temperature is too high or too low for accurate NOx, NO and NO
2 readings. IZS TEMP WARNING5 IZS temperature is too high or too low for efficient O
3 production. CONV TEMP WARNING
NO 2 to NO Converter temperature too high or too low to efficiently
convert NO 2 to NO.
PMT TEMP WARNING PMT temperature outside of warning limits specified by PMT_SET variable.
AZERO WARN [XXXX] MV
AutoZero reading too high. The value shown in message indicates auto-zero reading at time warning was displayed.
1 Clears 45 minutes after power up. 2 Clears the next time successful zero calibration is performed. 3 Clears the next time successful span calibration is performed. 4 Clears 30 minutes after power up. 5 Only Appears if the IZS option is installed.

T200U ENHANCED Revision No. 1
February 2020 Page 37 of 45
T200U ENHANCED Wood Environment & Infrastructure Solutions, Inc.
MESSAGE MEANING
HVPS WARNING High voltage power supply output is too high or too low for proper operation of the PMT.
REAR BOARD NOT DET CPU unable to communicate with motherboard. RELAY BOARD WARN CPU is unable to communicate with the relay PCA. SAMPLE FLOW WARN The flow rate of the sample gas is outside the specified limits.
Table 3 lists available test functions and their descriptions (Manual Table 4.2, p. 89). Table 3. Available Test Functions
DISPLAY PARAMETER UNITS DESCRIPTION
RANGE RANGE PPB, PPM, UGM & MGM
The Full Scale limit at which the reporting range of the analyzer’s ANALOG OUTPUTS is currently set. THIS IS NOT the Physical Range of the instrument. See Section 5.4.1 for more information.
RANGE1 RANGE2
If AUTO Range mode has been selected, two RANGE functions will appear, one for each range: RANGE1: The range setting for all analog outputs. RANGE2: The HIGH range setting for all analog outputs.
RANGE1 RANGE2 RANGE3
If the IND Range mode has been selected, three RANGE functions will appear, one for each range: RANGE1: NOx concentration output on A1. RANGE2: NO concentration output on A2. RANGE2: NO
2 concentration output on A3.
NOX STB STABILITY PPB
The standard deviation of concentration readings of the selected gas. Data points are recorded every ten seconds. The calculation uses the last 25 data points.
SAMP FLW SAMPFLOW CC/M Gas flow rate of the sample gas into the reaction cell.
OZONE FL OZONEFLOW CC/M Gas flow rate of O 3 gas into the reaction cell.
PMT PMT MV The raw signal output of the PMT. NORM PMT NORMPMT MV The signal output of the PMT after is has been

T200U ENHANCED Revision No. 1
February 2020 Page 38 of 45
T200U ENHANCED Wood Environment & Infrastructure Solutions, Inc.
DISPLAY PARAMETER UNITS DESCRIPTION normalized for temperature, pressure, auto-zero offset, but not range.
AZERO AUTOZERO MV
The PMT signal with zero NOx, which is usually slightly different from 0 V. This offset is subtracted from the PMT signal and adjusts for variations in the zero signal.
HVPS HVPS V The output power level of the high voltage power supply.
RCELL TEMP RCELLTEMP C The temperature of the gas inside the reaction cell temperature.
BOX TEMP BOXTEMP C The temperature inside the analyzer chassis. PMT TEMP PMTTEMP C The temperature of the PMT .
IZS TEMP1 IZSTEMP C
The temperature of the internal span gas generator's permeation tube.
MOLY TEMP CONVTEMP C The temperature of the analyzer's NO-
2 → NO converter.
RCEL RCELLPRESS IN-HG-A The current pressure of the sample gas in the reaction cell as measured at the vacuum manifold.
SAMP SAMPPRESS IN-HG-A The current pressure of the sample gas as it enters the reaction cell, measured between the NO/NOx and Auto-Zero valves.
NOX SLOPE NOXSLOPE The slope calculated during the most recent
NOx zero/span calibration. DISPLAY PARAMETER UNITS DESCRIPTION
NOX OFFS NOXOFFSET MV The offset calculated during the most recent NOx zero/span calibration.
NO SLOPE NOSLOPE The slope calculated during the most recent
NO zero/span calibration.
NO OFFS NOOFFSET MV The offset calculated during the most recent NO zero/span calibration.
DISPLAY PARAMETER UNITS DESCRIPTION
TEST TESTCHAN MV Displays the signal level of the Test Function that is currently being produced by the Analog Output Channel A4.
1 Only appears if Internal Span Gas Generator option is installed.

T200U ENHANCED Revision No. 1
February 2020 Page 39 of 45
T200U ENHANCED Wood Environment & Infrastructure Solutions, Inc.
DISPLAY PARAMETER UNITS DESCRIPTION
TIME CLOCKTIME HH:MM:SS The current time. This is used to create a time stamp on DAS readings, and by the AutoCal feature to trigger calibration events.
Table 4 lists common warning messages (Manual Table 4.3, p. 91). Table 4. Common Warning Messages
MESSAGE MEANING ANALOG CAL WARNING The A/D or at least one D/A channel has not been calibrated. AZERO WARN Auto-zero reading above limit specified by AZERO_LIMIT
variable. Value shown in message indicates auto-zero reading at time warning was displayed.
BOX TEMP WARNING The temperature inside the T200 chassis is outside the specified limits.
CANNOT DYN SPAN Contact closure span calibration failed while DYN_SPAN was set to ON.
CANNOT DYN ZERO Contact closure zero calibration failed while DYN_ZERO was set to ON.
CONFIG INITIALIZED Configuration storage was reset to factory configuration or erased.
CONV TEMP WARNING NO- 2 → NO converter temperature outside of warning limits
specified by CONV_SET variable. DATA INITIALIZED DAS data storage was erased before the last power up occurred. HVPS WARNING High voltage power supply output outside of warning limits
specified by HVPS_SET variable. IZS TEMP WARNING1 IZS temperature outside of warning limits specified by IZS_SET
variable. OZONE FLOW WARNING Ozone flow outside of warning limits specified by OFLOW_SET
variable. OZONE GEN OFF Ozone generator is off. This warning message clears itself when
the ozone generator is turned on. PMT TEMP WARNING PMT temperature outside of warning limits specified by
PMT_SET variable. RCELL PRESS WARN Reaction cell pressure outside of warning limits specified by
RCELL_PRESS_SET variable. RCELL TEMP WARNING Reaction cell temperature outside of warning limits specified by
RCELL_SET variable.
1 Only Appears if the Internal Span Gas Generator option is installed.
T200U ENHANCED Revision No. 1
February 2020 Page 40 of 45
T200U ENHANCED Wood Environment & Infrastructure Solutions, Inc.
MESSAGE MEANING REAR BOARD NOT DET Motherboard was not detected during power up. RELAY BOARD WARN CPU is unable to communicate with the relay PCA. SAMPLE FLOW WARN The flow rate of the sample gas is outside the specified limits. SYSTEM RESET The computer has rebooted.
Table 5 provides the maintenance schedule (Addendum Table 6, p. 21). Table 5. Maintenance Schedule Item Maintenance Interval Zero/Span Calibration Annually or after maintenance or repairs Zero/Span Checks Daily Particulate Filter Weekly as needed Ozone Flow Check every year and replace o-ring and
orifice in reaction cell Ozone Dryer Filter-DFU Replace every year Sample Flow Check every 2 months Converter Check efficiency every 2 months Pneumatic Lines Check every 3 months Factory Calibration Calibrate each year or after repairs Leak Check Check every 6 months Replace bypass flow orifices Every year / as needed Rebuild 501Y bypass pump Every year (check part number on pump label) Maintain air dryer As needed Replace particle filter Weekly Perform pneumatic system leak check At least quarterly Inspect internal, external tubing; replace if necessary
Inlet, weekly; other, quarterly
Clean optical bench As needed Monitor NO-
2 conversion efficiency At least every 6 months Monitor NPN conversion efficiency At least every month
Table 6 provides the preventative maintenance schedule (Manual Table 11-1, p. 240). Table 6. Preventative Maintenance Schedule
ITEM ACTION FREQ CAL CHECK REQ’D TEST functions Review and evaluate Weekly No Particulate filter Change particle filter Bi-Weekly No Zero/span check Evaluate offset and
slope Weekly No
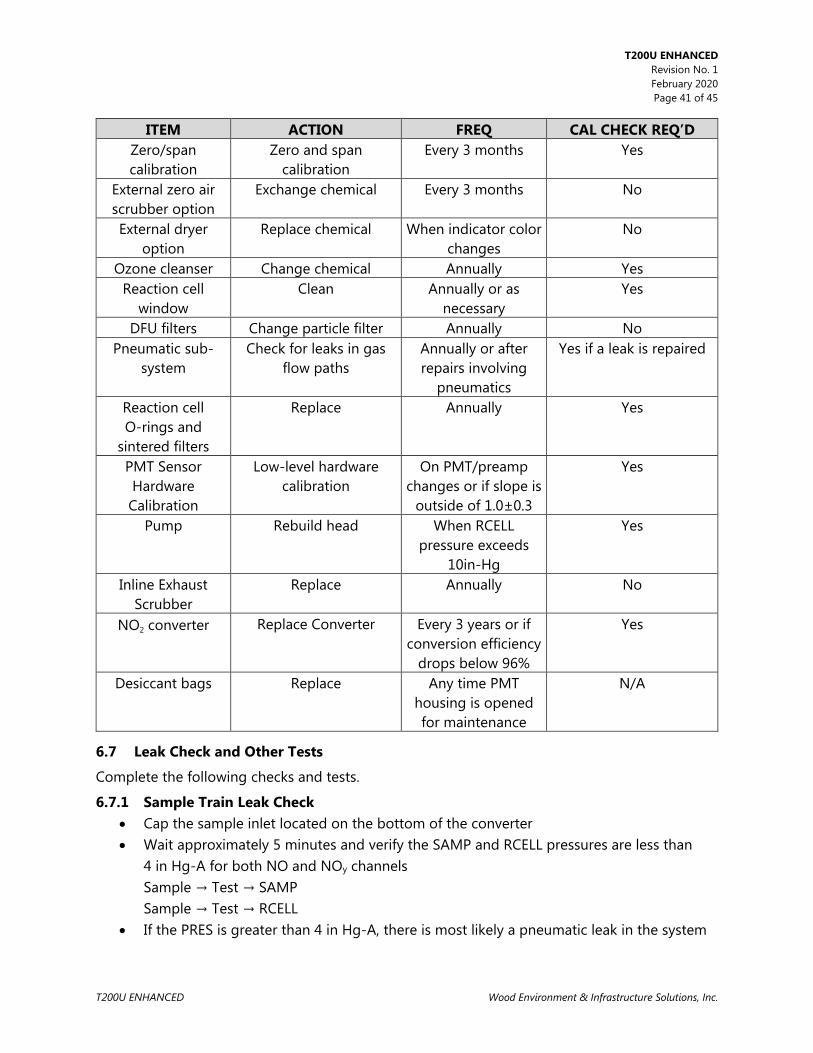
T200U ENHANCED Revision No. 1
February 2020 Page 41 of 45
T200U ENHANCED Wood Environment & Infrastructure Solutions, Inc.
ITEM ACTION FREQ CAL CHECK REQ’D Zero/span calibration
Zero and span calibration
Every 3 months Yes
External zero air scrubber option
Exchange chemical Every 3 months No
External dryer option
Replace chemical When indicator color changes
No
Ozone cleanser Change chemical Annually Yes Reaction cell
window Clean Annually or as
necessary Yes
DFU filters Change particle filter Annually No Pneumatic sub-
system Check for leaks in gas
flow paths Annually or after repairs involving
pneumatics
Yes if a leak is repaired
Reaction cell O-rings and
sintered filters
Replace Annually Yes
PMT Sensor Hardware Calibration
Low-level hardware calibration
On PMT/preamp changes or if slope is
outside of 1.0±0.3
Yes
Pump Rebuild head When RCELL pressure exceeds
10in-Hg
Yes
Inline Exhaust Scrubber
Replace Annually No
NO 2 converter Replace Converter Every 3 years or if
conversion efficiency drops below 96%
Yes
Desiccant bags Replace Any time PMT housing is opened for maintenance
N/A
6.7 Leak Check and Other Tests
Complete the following checks and tests.
6.7.1 Sample Train Leak Check • Cap the sample inlet located on the bottom of the converter • Wait approximately 5 minutes and verify the SAMP and RCELL pressures are less than
4 in Hg-A for both NO and NOy channels Sample → Test → SAMP Sample → Test → RCELL
• If the PRES is greater than 4 in Hg-A, there is most likely a pneumatic leak in the system

T200U ENHANCED Revision No. 1
February 2020 Page 42 of 45
T200U ENHANCED Wood Environment & Infrastructure Solutions, Inc.
6.7.2 Leak Check Pressure Leaks are the most common cause of analyzer malfunction. This section presents a simple leak check, whereas the next section details a more thorough procedure. The method described here is easy, fast and detects, but does not locate, most leaks. It also verifies the sample pump condition. 1. Turn the analyzer ON, and allow at least 30 minutes for flows to stabilize. 2. Cap the sample inlet port. 3. After several minutes, when the pressures have stabilized, note the SAMP (sample pressure) and the RCEL (vacuum pressure) readings. If both readings are < 4 in-Hg-A, the instrument is free of leaks and the pump is in good condition.
6.7.3 Checking for Light Leaks Occasionally, especially after being re-assembled, the reaction chamber assembly can develop small leaks around the PMT, allowing stray light from the analyzer surroundings into the PMT housing (Manual 11.3.11, pp. 257-258).
• Generate zero air to the analyzer • Shine a flashlight at the inlet and outlet fittings and at all the joints of the sample
chamber as well as around the PMT housing. • Monitor the PMT parameter to verify the reading does not respond to the light. • Sample → Test → PMT • If there is a PMT response to the external light, symmetrically tighten the sample
chamber mounting screws or replace the 1/4” vacuum tubing with new, black PTFE tubing (this tubing will fade with time and become transparent). Often, light leaks are also caused by O-rings being left out of the assembly.
• If tubing was changed or fittings were separated, perform a leak check
6.7.4 Other Tests Complete the following additional tests according to the referenced Manual sections.
• Changing the O 3 dryer particulate filter (Manual Section 11.3.2, pp. 243-244)
• Changing the O 3 cleanser chemical (Manual Section 11.3.3, pp. 244-246)
• Rebuilding the external sample pump (Manual Section 11.3.4, p. 247) • Cleaning the reaction cell (Manual Section 11.3.9, pp. 254-255) • Replacing the critical flow orifices (Manual 11.3.10, pp. 256-257)
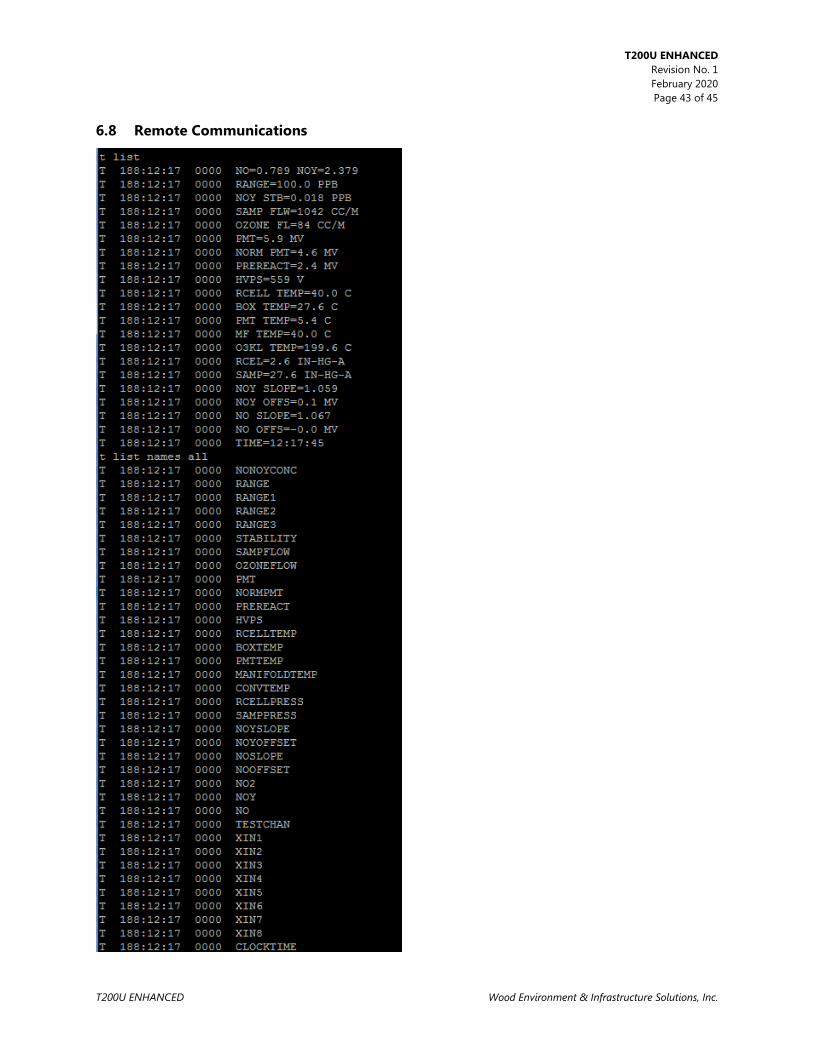
T200U ENHANCED Revision No. 1
February 2020 Page 43 of 45
T200U ENHANCED Wood Environment & Infrastructure Solutions, Inc.
6.8 Remote Communications

T200U ENHANCED Revision No. 1
February 2020 Page 44 of 45
T200U ENHANCED Wood Environment & Infrastructure Solutions, Inc.

T200U ENHANCED Revision No. 1
February 2020 Page 45 of 45
T200U ENHANCED Wood Environment & Infrastructure Solutions, Inc.
7.0 REFERENCES
Teledyne Advanced Pollution Instrumentation (API). 2012. Manual Addendum. Ultra Sensitivity Model T200U NO/NO
2/NOx. 06861B DCN6275. Teledyne Advanced Pollution Instrumentation (API). 2012. Operation Manual. Model T200
Nitrogen Oxide Analyzer. 06858C DCN6213. Teledyne Advanced Pollution Instrumentation (API). 2013. T200U–NOy Analyzer. 07303C
DCN6646. U.S. Environmental Protection Agency (EPA). 2005. Technical Assistance Document for NCore
Monitoring. Version 4. EPA-454/R-05-003. U.S. Environmental Protection Agency (EPA). 2017. QA Handbook for Air Pollution Measurement
Systems, Volume II, Ambient Air Quality Monitoring Program, Appendix D. EPA-454/B-17-001.
8.0 ATTACHMENTS
This SOP does not contain attachments.
9.0 ABBREVIATIONS
CAL calibration COMM communications CONC concentration DIAG diagnosis ENTR enter GEN generator ID identification INET internet PMT photomultiplier tube PRES pressure RCELL reaction cell RNGE range SAMP sample SNGL single STABIL stability VARS variables

11/2/2020

FIELD CALIBRATIONS MANUAL Revision No. 13
October 2020 Page 2 of 82
FIELD CALIBRATIONS MANUAL Wood Environment & Infrastructure Solutions, Inc.
III. FIELD CALIBRATIONS MANUAL
PURPOSE
The purpose of this Standard Operating procedure (SOP) is to provide consistent guidance to field technicians for calibration of site instruments and equipment.
SCOPE
This SOP applies to the semi-annual calibration of ambient air monitoring equipment at all EPA sponsored Clean Air Status and Trends Network (CASTNET) sites. All procedures are performed by technicians approved by the CASTNET Field Operations Manager (FOM).
SUMMARY
Network Overview
The goal of CASTNET is to measure concentrations of selected air pollutants at approximately 90 locations throughout the United States to evaluate the effectiveness of national and regional emission control programs and to determine compliance with ozone (O
3) National Ambient Air Quality Standards. CASTNET is also designed to determine trends in rural atmospheric O
3, nitrogen, and sulfur concentrations and deposition fluxes of nitrogen and sulfur pollutants. CASTNET data are used to provide input to the Total Deposition (TDEP) Model and also for regional air quality model evaluation. Wood’s analytical chemistry laboratory analyzes the exposed filters from the filter packs, which sample the pollutants in air, and provides concentration-on-filter data to the Data Management Center (DMC) for the calculation of 7-day average ambient concentrations of sulfate (SO2-
4 ), nitrate (NO- 3), ammonium (NH+
4 ), sulfur dioxide (SO
2), and nitric acid (HNO 3), magnesium (Mg2+
), calcium (Ca2+ ), sodium (Na+
), potassium (K+ ),
chloride (Cl-). In 2012, CASTNET developed a small-footprint monitoring station that does not require a temperature-controlled shelter. The new type of monitoring station includes a 10-m sampling tower, 3-stage filter pack, pump, flow meter, data logger (CR1000), and cellular modem. Small-footprint monitoring is performed at several rural sites and is expected to expand to other new sites over the next few years. Approximately 80 O
3 analyzers are operated throughout the network to determine compliance with O
3 NAAQS. Teledyne API analyzers are deployed at several EPA-sponsored CASTNET sites to take measurements of trace-level gas pollutant concentrations. These data are sampled continuously and archived as 1-hour values. QAPP Table 1-1 provides the location of each site by state and includes information on start date, latitude, longitude, elevation, land use, terrain type, and measurements. Meteorological parameters are measured at only five EPA-sponsored CASTNET sites: IRL141, FL (sponsored by SJRWMD); PND165, WY (sponsored by BLM); CHE185, OK; BVL130, IL; and BEL116, MD. These EPA monitoring sites include measurements for:

FIELD CALIBRATIONS MANUAL Revision No. 13
October 2020 Page 3 of 82
FIELD CALIBRATIONS MANUAL Wood Environment & Infrastructure Solutions, Inc.
• Precipitation • Temperature • Shelter temperature • Wind direction • Wind speed (scalar and vector averaging) • Relative humidity • Solar radiation
Ozone, filter pack flow, and temperature at 9 meters are measured continuously at most other EPA-sponsored sites where meteorological data are not measured. Calibration and repair activities are limited to these three parameters plus shelter temperature. Measurements are recorded using Campbell Scientific CR3000 data loggers at most EPA-sponsored sites. An ESC8816 data logger is used at CHE185, OK. CR850 data loggers are deployed at the small footprint sites. Data are collected hourly from each site via an automated polling system at Wood. The data are processed, validated, and delivered to EPA quarterly by the Wood CASTNET Data Management Center (DMC). In addition, O
3 data are submitted monthly to the EPA Air Quality System (AQS). O
3 data and meteorological measurements are submitted daily to AirNow.
Biannual Calibration Process
Table 1 summarizes the annual schedule of site calibrations. The biannual calibration is a two-step process. As discussed in QAPP Section 5.0, one step is a technical systems audit (TSA). The purpose of the TSA is to evaluate compliance with QAPP requirements. The field technician will determine whether the monitoring equipment is operating according to its design parameters, and whether data previously collected meet quality assurance criteria as defined in the QAPP. In TSA equipment performance is observed, recorded and reported. Additionally, site conditions with regard to siting criteria, overall site condition and infrastructure are recorded.
The second step is a performance evaluation (PE). Sensor performance is assessed through comparison with measurements by a certified transfer standard with a calibration traceable to a recognized national or international standard such as those maintained by the National Institute of Standards and Technology (NIST). This step consists of the audit and subsequent repair, replacement or adjustment of all sensors found to be noncompliant with the performance standards as defined in the QAPP with the express purpose to bring the measurement capacity of the entire site into full compliance with the acceptance criteria defined in Table 2. No calibration, repair, adjustment or replacement activity is performed until the full nature of site operation “as found” is recorded.

FIELD CALIBRATIONS MANUAL Revision No. 13
October 2020 Page 4 of 82
FIELD CALIBRATIONS MANUAL Wood Environment & Infrastructure Solutions, Inc.
Table 1. Example Field Calibration Schedule for 2015
Calibration Group
Months Calibrated
Sites Calibrated
Eastern Sites (23 Total) E-1
(8 Sites) February/August BEL116, MD WSP144, NJ ARE 128, PA PED108, VA
BWR139, MD CTH110, NY PSU106, PA VPI120, VA E-2
(10 Sites) April/October ABT147, CT WST109, NH WFM105, NY UND002, VT
ASH135, ME CAT175, NY NIC001, NY HOW191, ME HWF187, NY EGB181, ON
E-3 (5 Sites)
May/November KEF112, PA LRL117, PA CDR119, WV MKG113, PA PAR107, WV
Southeastern Sites (10 Total) SE-4
(6 Sites) January/July SND152, AL BFT142, NC COW137, NC
GAS153, GA CND125, NC SPD111, TN SE-5
(4 Sites) February/August CAD150, AR IRL141, FL
CVL151, MS SUM156, FL Midwestern Sites (19 Total)
MW-6 (6 Sites)
January/July CDZ171, KY MCK131, KY PNF126, NC CKT136, KY MCK231, KY ESP127, TN
MW-7 (9 Sites)
March/September ALH157, IL VIN140, IN OXF122, OH BVL130, IL RED004, MN QAK172, OH STK138, IL DCP114, OH PRK134, WI
MW-8 (5 Sites)
April/October SAL133, IN ANA115, MI WFM007, NY HOX148, MI UVL124, MI
Western Sites (10 Total) W-9
(5 Sites) March/September KNZ184, KS CHE185, OK ALC188, TX
KIC003, KS SAN189, NE W-10
(6 Sites) May/November GTH161, CO CNT169, WY PAL190, TX
ROM206, CO PND165, WY NPT006, ID
The Role of Calibrators
The EPA requires that the data be accurate within standard criteria. In order to attain this accuracy, the sites are periodically checked and calibrated by Wood or subcontractor personnel. Transfer standards, certified at the Wood laboratory, are used for comparison of all site parameters. Any inaccuracy is corrected by either careful adjustment of existing equipment or replacement of sensors. During the Wood site calibrations, extensive scrutiny is focused on all systems, and routine preventive maintenance is performed. The calibrator first documents the existing accuracy of site systems using certified transfer standards. Criteria for quality have been established that are guidelines for action. If the parameter in question is outside the tolerance listed in Table 2, the system must be adjusted, or replaced. Field site personnel are under no circumstances authorized to leave a site with any inoperative parameter without the express consent of Wood field operations.

FIELD CALIBRATIONS MANUAL Revision No. 13
October 2020 Page 5 of 82
FIELD CALIBRATIONS MANUAL Wood Environment & Infrastructure Solutions, Inc.
Table 2. Measurement Acceptance Criteria
DAS Voltage ± 0.003 VDC Wind speed ± 0.2 m/s (< 5 m/s) ± 5% (> 5m/s) Wind direction ± 3° at all points Temperature ± 0.15° C (± 0.3° C if only one probe is calibrated) Delta Temperature ± 0.30° C Shelter Temperature
± 0.30° C
Relative Humidity ± 10% RH units Precipitation ± 5% (0.48 to 0.52 in.) Solar Radiation ± 5% of transfer at highest hour and daily average Ozone All points on calibration curve within ± 2% of full scale as
compared to the best fit straight line linearity error < 5% Flow ± 2.0% of transfer target value Wetness Correct response for wet/dry conditions ± 0.1 VDC
Calibrator Responsibilities
The purpose of the network is to collect data of the highest quality. The calibrator’s role is critical in this endeavor. The following steps should be completed while calibrating site. • Data recovery, validation, and completeness are the relevant quality measures. Data
transparency after site TSA and PE is very important so that data validators can make informed decisions about data quality and validity.
• If the data are not accurate or of known quality, there are no valid data. Therefore, calibrators should document existing accuracy, and then adjust/replace sensors if out of specifications.
• Write relevant observations in the logbook. Complete all paperwork and iForms. • Make sure transfer standards are calibrated before and after a site visit. • Plan trip, call site operators, and call Wood FOM or Field Coordinator every day. • Quality is more important than quantity; do all required maintenance. • Be careful and safety conscious. • Do a final hard look around, verify data acquisition. • Call Wood if there are any questions or difficulties prior to leaving the site.
MATERIALS AND SUPPLIES
Figures 1 and 2 in Section IV.B.1 provide a complete listing of calibration equipment. In addition, a current Site Equipment Inventory List (Figure 1), a complete set of calibration iForms, other necessary forms (Sections 6.0 and 8.0), and a copy of this manual are required for a site calibration. A compact disc with the HASP and Site Operator Handbook (QAPP Appendix 1, Section II) is provided in the shelter. Completed iForms with transfer certifications for the last three years are stored on the site laptop. Vendor instrument manuals are available to the calibrators either as hard copies or electronic copies on the laptop. Blank iForms are located on
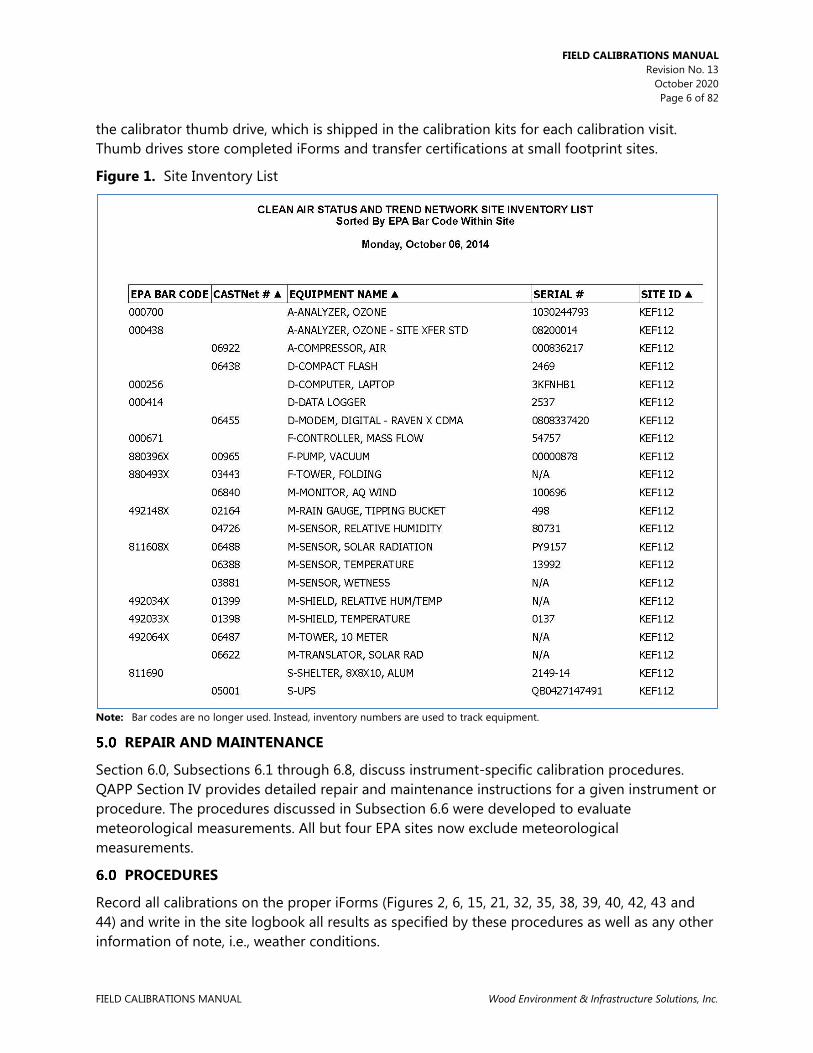
FIELD CALIBRATIONS MANUAL Revision No. 13
October 2020 Page 6 of 82
FIELD CALIBRATIONS MANUAL Wood Environment & Infrastructure Solutions, Inc.
the calibrator thumb drive, which is shipped in the calibration kits for each calibration visit. Thumb drives store completed iForms and transfer certifications at small footprint sites.
Figure 1. Site Inventory List
Note: Bar codes are no longer used. Instead, inventory numbers are used to track equipment.
REPAIR AND MAINTENANCE
Section 6.0, Subsections 6.1 through 6.8, discuss instrument-specific calibration procedures. QAPP Section IV provides detailed repair and maintenance instructions for a given instrument or procedure. The procedures discussed in Subsection 6.6 were developed to evaluate meteorological measurements. All but four EPA sites now exclude meteorological measurements.
PROCEDURES
Record all calibrations on the proper iForms (Figures 2, 6, 15, 21, 32, 35, 38, 39, 40, 42, 43 and 44) and write in the site logbook all results as specified by these procedures as well as any other information of note, i.e., weather conditions.

FIELD CALIBRATIONS MANUAL Revision No. 13
October 2020 Page 7 of 82
FIELD CALIBRATIONS MANUAL Wood Environment & Infrastructure Solutions, Inc.
If anomalous readings are observed for calibration data or metadata they must be investigated, understood, and corrected before finalizing a calibration adjustment. Anomalous readings may include, but are not limited to, those that are outside of the expected range for instrument response or statistical calculation (e.g. calibration points or calculated slope and intercept) even if these are within established measurement criteria. The anomaly and results of investigation must be documented. Contact the Wood FOM or designee before proceeding if this requirement cannot be met.
Arrival at Site
Upon arriving at a site, examine the site and nearby conditions. In the site narrative logbook record any and all conditions that may affect the measurement process. These include initial status of sensors, site conditions, nearby atmospheric conditions such as earthwork, burning of debris, prescribed burns, wild fires, or other events that could affect measurements. Compare the equipment and instruments in the shelter with the Site Inventory List (Figure 1). Update the Site Information Form (Figure 2) if necessary.
Turn site laptop computer on. The application “PC200” will start automatically.
Record the following parameters in the site narrative logbook.
• Time of arrival • Name of all personnel on site • Time of “Calibrator_OnSite” set to “true”. • Time and parameter of any channels disabled. • Atmospheric conditions
Using a logger interface, review data collected over one week. Record any anomalies in the site log book.
Set “Calibrator_OnSite” to “true” (Figure 3) and record the data logger timestamp in the site log book.

FIELD CALIBRATIONS MANUAL Revision No. 13
October 2020 Page 8 of 82
FIELD CALIBRATIONS MANUAL Wood Environment & Infrastructure Solutions, Inc.
Figure 2. Site Information Form

FIELD CALIBRATIONS MANUAL Revision No. 13
October 2020 Page 9 of 82
FIELD CALIBRATIONS MANUAL Wood Environment & Infrastructure Solutions, Inc.
Figure 3. Screen Shot Indicating Calibrator is Onsite
Note: Before any sensor, analyzer, or measurement system accessory is repaired, adjusted replaced or modified, the sensor performance must be documented and the DAS voltage accuracy must be verified.
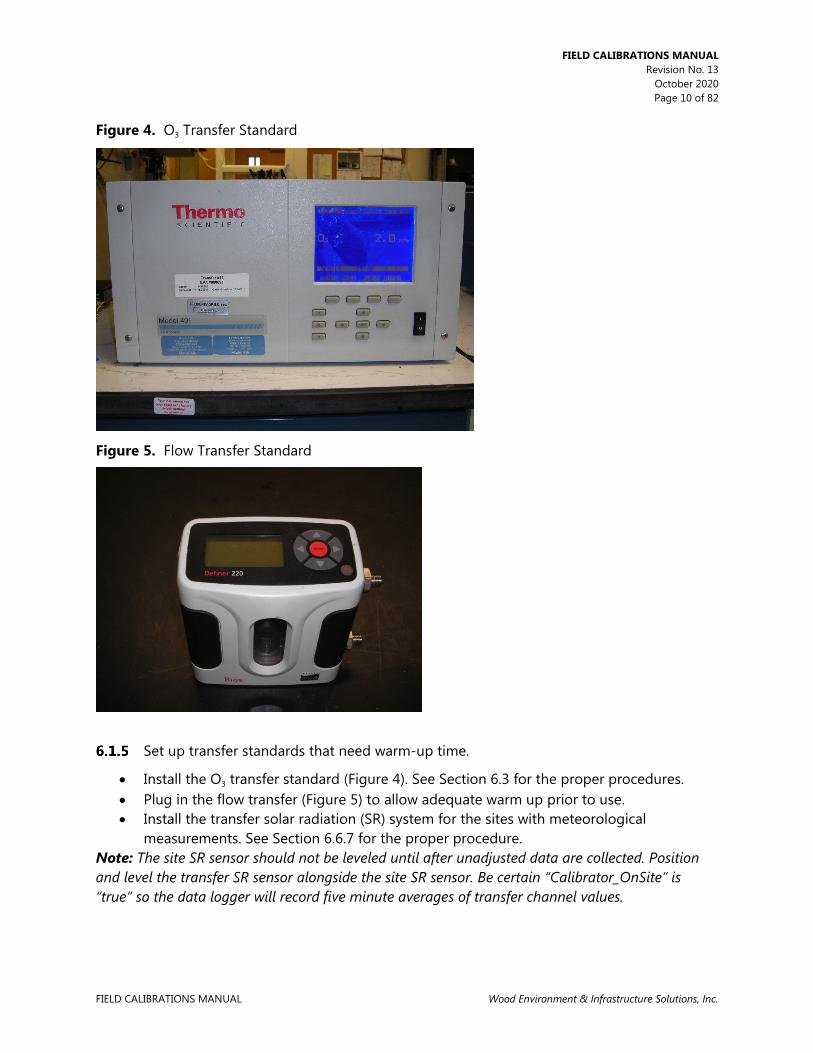
FIELD CALIBRATIONS MANUAL Revision No. 13
October 2020 Page 10 of 82
FIELD CALIBRATIONS MANUAL Wood Environment & Infrastructure Solutions, Inc.
Figure 4. O 3 Transfer Standard
Figure 5. Flow Transfer Standard
Set up transfer standards that need warm-up time.
• Install the O 3 transfer standard (Figure 4). See Section 6.3 for the proper procedures.
• Plug in the flow transfer (Figure 5) to allow adequate warm up prior to use. • Install the transfer solar radiation (SR) system for the sites with meteorological
measurements. See Section 6.6.7 for the proper procedure. Note: The site SR sensor should not be leveled until after unadjusted data are collected. Position and level the transfer SR sensor alongside the site SR sensor. Be certain “Calibrator_OnSite” is “true” so the data logger will record five minute averages of transfer channel values.
FIELD CALIBRATIONS MANUAL Revision No. 13
October 2020 Page 11 of 82
FIELD CALIBRATIONS MANUAL Wood Environment & Infrastructure Solutions, Inc.
Measure the cross-arm alignment of the wind system for the sites with meteorological measurements. See Section 6.6.4.
Data Logger
Record the ID and certification date of the certified precision voltmeter and certified voltmeter on the data logger/DAS iForm (Figure 6). Record the data logger ID as well. Ensure that the site laptop computer has been configured for use with the CR3000 data logger (Section IV, xxx).
Identify the correct transfer electronic certification form found on the root directory of the calibration flash drive. Make sure the certification form is complete and that the transfer ID number matches the ID number on the certification form. Place a copy of the electronic certification form in the site calibration folder on the calibration flash drive to be copied to the site laptop at the completion of the site audit.
Disable the data logger measurement channels by setting “Down_All_Channels” to “true” (Figure 7). Enable the proper measurement process by setting “Calibrator_OnSite” to “true”.

FIELD CALIBRATIONS MANUAL Revision No. 13
October 2020 Page 12 of 82
FIELD CALIBRATIONS MANUAL Wood Environment & Infrastructure Solutions, Inc.
Figure 6. Data Logger Calibration Form

FIELD CALIBRATIONS MANUAL Revision No. 13
October 2020 Page 13 of 82
FIELD CALIBRATIONS MANUAL Wood Environment & Infrastructure Solutions, Inc.
Figure 7. Screen Shot Indicating all Sensor Channels are down
Using a certified voltmeter, determine and record the voltage outputs of the 12VDC and 5VDC ports on terminal block four of the data logger (see Figures 2 through 4 in Section II.A.2, Subsection 3.2, for photos of the data logger system). Record the results in the remarks section of the DAS iForm. Remove the analog input terminal blocks – the top two terminal blocks on the data logger. Install the data logger calibration jig included in the calibration equipment box.
Connect the jig leads (Figure 8) to a certified precision voltage supply, such as a Datel DVC350A and a certified voltmeter to the calibration jig. Set the data interface display resolution to four decimal places.
Input voltages from 0.000 to 1.000 volts direct current (VDC) in increments of 0.1000 VDC for temperature and shelter temperature. For each input voltage value record on the DAS iForm the voltmeter response and the channel name and voltage value of the channel on the data logger with the greatest deviation from the Datel voltage.
Record the full set of data for the two channels if any channel differs by 3mV or more from the Datel voltage. Perform the same check at 2, 3 4 and 5 VDC for the shelter temperature.
FIELD CALIBRATIONS MANUAL Revision No. 13
October 2020 Page 14 of 82
FIELD CALIBRATIONS MANUAL Wood Environment & Infrastructure Solutions, Inc.
Simultaneously record the voltmeter response on the data logger iForm for each input voltage.
Note that the data logger is not field serviceable. If the data logger is found out of specification, an entire site audit should be performed. The data logger should then be replaced and a full audit/calibration of the new system should be performed. No sensor should be adjusted or modified prior to full documentation of site performance and data logger replacement. Upon replacement, tag the defective data logger and return to Wood.
6.2.8 Data Logger Back-up Battery Check. Record the data logger operational voltage on the data logger iForm (Figure 6). It should be above 12.7 VDC. Unplug the unit from the wall outlet. Wait one minute and then record the operational voltage again. The voltage should remain above 11.9 VDC. If not the internal batteries should be replaced.
Figure 8a. Connection to Voltage Supply
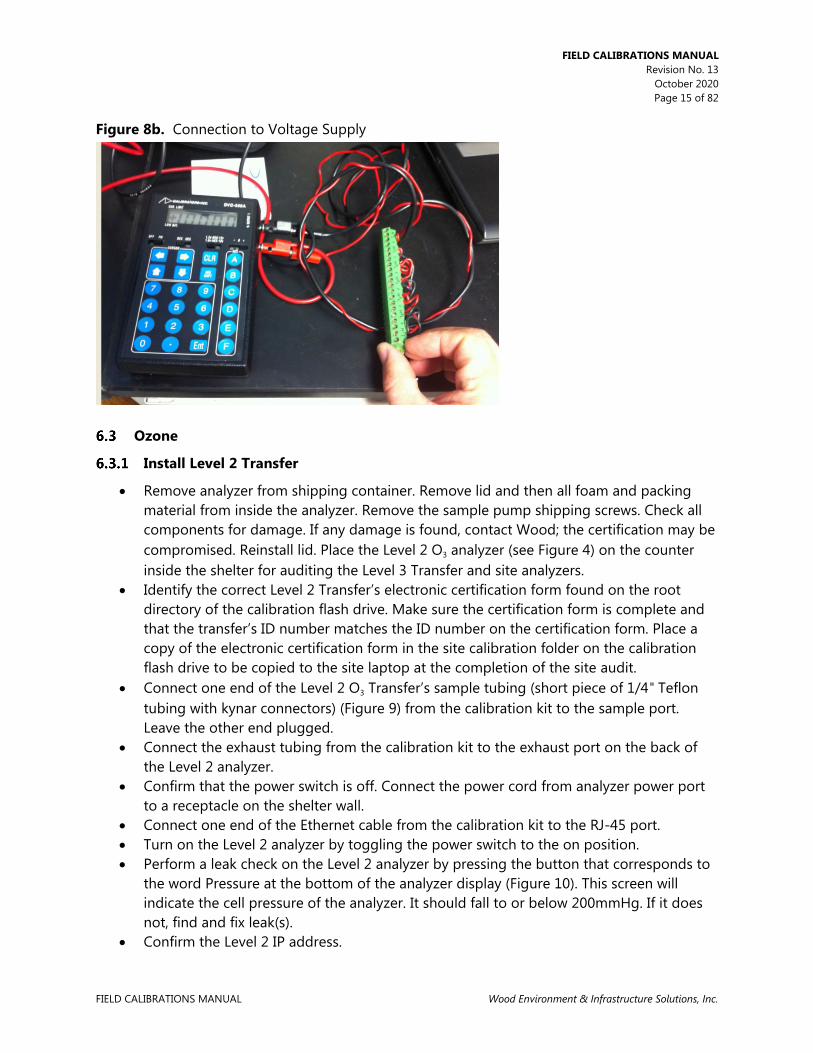
FIELD CALIBRATIONS MANUAL Revision No. 13
October 2020 Page 15 of 82
FIELD CALIBRATIONS MANUAL Wood Environment & Infrastructure Solutions, Inc.
Figure 8b. Connection to Voltage Supply
Ozone
Install Level 2 Transfer
• Remove analyzer from shipping container. Remove lid and then all foam and packing material from inside the analyzer. Remove the sample pump shipping screws. Check all components for damage. If any damage is found, contact Wood; the certification may be compromised. Reinstall lid. Place the Level 2 O
3 analyzer (see Figure 4) on the counter inside the shelter for auditing the Level 3 Transfer and site analyzers.
• Identify the correct Level 2 Transfer’s electronic certification form found on the root directory of the calibration flash drive. Make sure the certification form is complete and that the transfer’s ID number matches the ID number on the certification form. Place a copy of the electronic certification form in the site calibration folder on the calibration flash drive to be copied to the site laptop at the completion of the site audit.
• Connect one end of the Level 2 O 3 Transfer’s sample tubing (short piece of 1/4" Teflon
tubing with kynar connectors) (Figure 9) from the calibration kit to the sample port. Leave the other end plugged.
• Connect the exhaust tubing from the calibration kit to the exhaust port on the back of the Level 2 analyzer.
• Confirm that the power switch is off. Connect the power cord from analyzer power port to a receptacle on the shelter wall.
• Connect one end of the Ethernet cable from the calibration kit to the RJ-45 port. • Turn on the Level 2 analyzer by toggling the power switch to the on position. • Perform a leak check on the Level 2 analyzer by pressing the button that corresponds to
the word Pressure at the bottom of the analyzer display (Figure 10). This screen will indicate the cell pressure of the analyzer. It should fall to or below 200mmHg. If it does not, find and fix leak(s).
• Confirm the Level 2 IP address.

FIELD CALIBRATIONS MANUAL Revision No. 13
October 2020 Page 16 of 82
FIELD CALIBRATIONS MANUAL Wood Environment & Infrastructure Solutions, Inc.
• Turn off Level 2 analyzer by toggling the power switch to the off position.
Figure 9. O 3 Transfer Sample Tubing
Figure 10. O
3 Analyzer Display
Figure 11. Air Compressor

FIELD CALIBRATIONS MANUAL Revision No. 13
October 2020 Page 17 of 82
FIELD CALIBRATIONS MANUAL Wood Environment & Infrastructure Solutions, Inc.
Figure 12. Screen Shot: Automated O 3 Page
Set the air compressor regulator (Figure 11) to 30 psi.
• Gently pull up on the regulator knob to unlock. Turn the knob clockwise and set the regulator gauge to 30 psi. Push in on the regulator knob to lock.
Set the Level 3 Transfer’s level 1 target concentration to 225 ppb.
• Using established procedures, from PC200W on the site laptop, connect to the Automated Ozone page. In the fourth column, double click the cTrans_L3_Span1 cell (Figure 12) to highlight and activate the cell. Type 225 into the cell and press the enter key on the laptop keyboard to accept the value.
Enter calibrator’s initials
• From the Automated Ozone page, in the second column, double click the Calibrator_Initials cell to highlight and activate the cell. Type your initials into the cell and press the enter key on the laptop keyboard to accept the value.

FIELD CALIBRATIONS MANUAL Revision No. 13
October 2020 Page 18 of 82
FIELD CALIBRATIONS MANUAL Wood Environment & Infrastructure Solutions, Inc.
Set Calibrator Onsite to “true”.
• Using established procedures, from the Automated Ozone page, set Calibrator Onsite to “true” if not already performed. Record the date and time in the site log book.
Down the Ozone channel.
• Using established procedures, from PC200W on the site laptop, connect to the Site Operator-1 page. In the second column, double click the ozone_down cell to highlight and activate the cell. Double click the cell again to toggle the value to “true”. Figure 13. Record the date and time in the site log book.
Figure 13. Screen Shot: Indicating O 3 Channel is Down
Turn on Level 2 Transfer by toggling the power switch to the on position.
Establish and confirm communication between the data logger and the Level 2 Transfer.
• Connect the loose end of the Ethernet cable that is connected to the Level 2 Transfer to an open RJ-45 port on the switch. The switch is on the communications backplane. On the switch, confirm that the light is on for the Ethernet port that the Level 2 Transfer’s

FIELD CALIBRATIONS MANUAL Revision No. 13
October 2020 Page 19 of 82
FIELD CALIBRATIONS MANUAL Wood Environment & Infrastructure Solutions, Inc.
Ethernet cable is connected to. The cable may have to be gently adjusted on the Level 2 Transfer Ethernet port to ensure contact.
• Using established procedures given on PC200W on the site laptop, connect to the ozone housekeeping page. Confirm that the transfer’s housekeeping values have populated.
Audit the Level 3 Site Transfer and the Site analyzer.
• Using established procedures given on PC200W on the site laptop, connect to the Automated Ozone page.
• In the first column, if the WarmUp_Transfer cell is “false”, double click the WarmUp_Transfer cell to highlight and activate the cell (Figure 14). Double click the cell again to toggle the value to “true”.
Figure 14. Screen Shot: Indicating O 3 Transfer is Warming up
Note: If the Level 2 Transfer has already been warmed up 1 hour, this cell can be left at or toggled to “false”.
• In the first column, double click the Run_Audit cell to highlight and activate the cell. Double click the cell again to toggle the value to “true”.
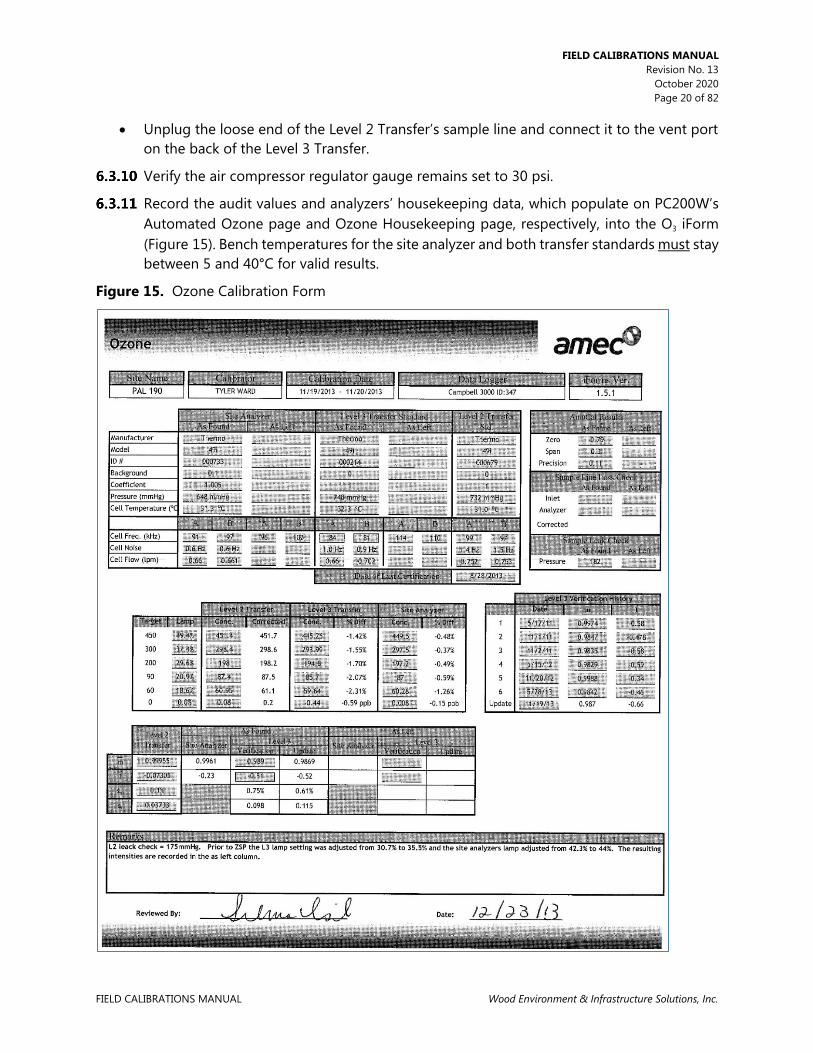
FIELD CALIBRATIONS MANUAL Revision No. 13
October 2020 Page 20 of 82
FIELD CALIBRATIONS MANUAL Wood Environment & Infrastructure Solutions, Inc.
• Unplug the loose end of the Level 2 Transfer’s sample line and connect it to the vent port on the back of the Level 3 Transfer.
Verify the air compressor regulator gauge remains set to 30 psi.
Record the audit values and analyzers’ housekeeping data, which populate on PC200W’s Automated Ozone page and Ozone Housekeeping page, respectively, into the O
3 iForm (Figure 15). Bench temperatures for the site analyzer and both transfer standards must stay between 5 and 40°C for valid results.
Figure 15. Ozone Calibration Form
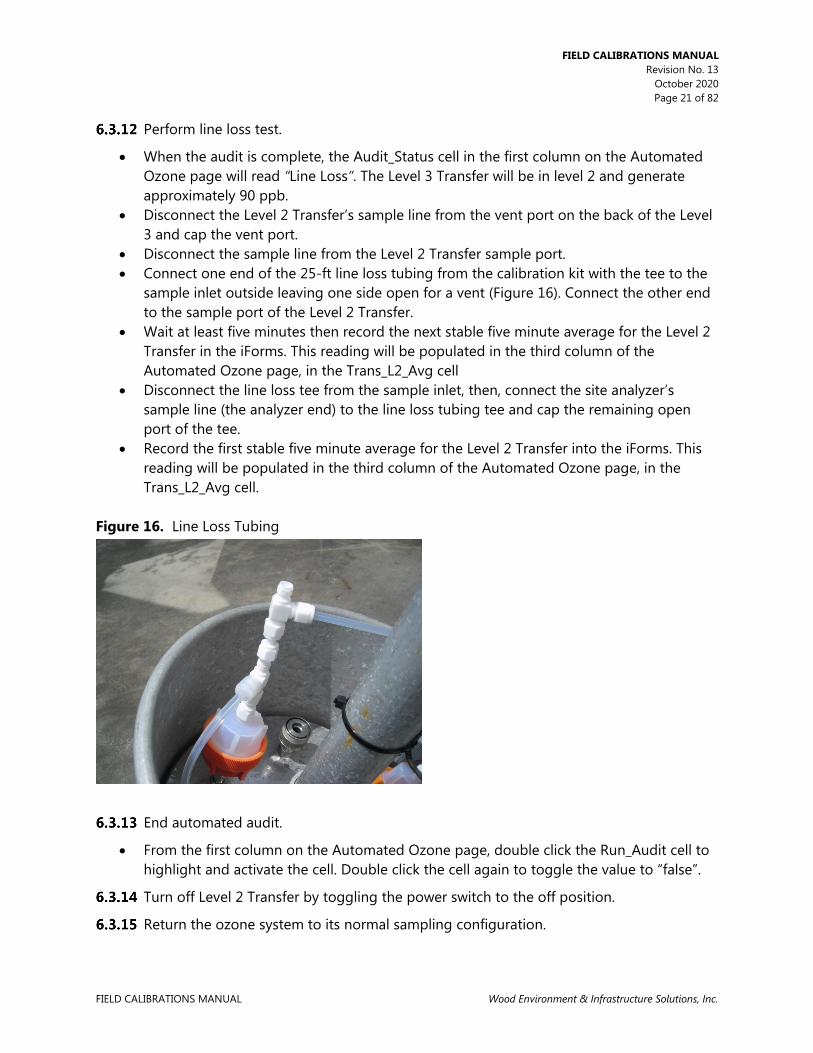
FIELD CALIBRATIONS MANUAL Revision No. 13
October 2020 Page 21 of 82
FIELD CALIBRATIONS MANUAL Wood Environment & Infrastructure Solutions, Inc.
Perform line loss test.
• When the audit is complete, the Audit_Status cell in the first column on the Automated Ozone page will read “Line Loss”. The Level 3 Transfer will be in level 2 and generate approximately 90 ppb.
• Disconnect the Level 2 Transfer’s sample line from the vent port on the back of the Level 3 and cap the vent port.
• Disconnect the sample line from the Level 2 Transfer sample port. • Connect one end of the 25-ft line loss tubing from the calibration kit with the tee to the
sample inlet outside leaving one side open for a vent (Figure 16). Connect the other end to the sample port of the Level 2 Transfer.
• Wait at least five minutes then record the next stable five minute average for the Level 2 Transfer in the iForms. This reading will be populated in the third column of the Automated Ozone page, in the Trans_L2_Avg cell
• Disconnect the line loss tee from the sample inlet, then, connect the site analyzer’s sample line (the analyzer end) to the line loss tubing tee and cap the remaining open port of the tee.
• Record the first stable five minute average for the Level 2 Transfer into the iForms. This reading will be populated in the third column of the Automated Ozone page, in the Trans_L2_Avg cell.
Figure 16. Line Loss Tubing
End automated audit.
• From the first column on the Automated Ozone page, double click the Run_Audit cell to highlight and activate the cell. Double click the cell again to toggle the value to “false”.
Turn off Level 2 Transfer by toggling the power switch to the off position.
Return the ozone system to its normal sampling configuration.

FIELD CALIBRATIONS MANUAL Revision No. 13
October 2020 Page 22 of 82
FIELD CALIBRATIONS MANUAL Wood Environment & Infrastructure Solutions, Inc.
Ozone system leak check
Note: If this is an initial installation for regulatory ozone monitoring, this step has been completed. • With the site analyzer and the Level 3 Transfer in normal operation, cap the sample
probe inlet. • From the front of the site analyzer, press the button that corresponds to the word
Pressure at the bottom of the display. This screen will indicate the cell pressure (Figure 17) of the site analyzer. The cell pressure should fall to or below 225 mmHg. Record this value on the iForms for “As Found” leak check.
• If the cell pressure does not fall to or below 225 mmHg, find and fix leak(s). Record the location of the leak in the remarks section of the iForms.
• Record the final leak check in the iForms for “As Left” leak check. Figure 17. O
3 Analyzer Display of Cell Pressure
Follow the Ozone AQS Audit Flow Chart on the supplied flash drive to determine the next course of action.
• To calibrate the site analyzer, proceed to step 6.3.23. Then, start at the third bullet of 6.3.1 to re-audit analyzers and record the results in the “As Left” section.
Note: The line loss test is only required to be performed once per audit unless the sample tubing length has been changed and the Level 3 analyzer is only to be audited once.
FIELD CALIBRATIONS MANUAL Revision No. 13
October 2020 Page 23 of 82
FIELD CALIBRATIONS MANUAL Wood Environment & Infrastructure Solutions, Inc.
Remove the Level 2 Transfer
• Cap the sample port with a Teflon cap from the calibration kit. Disconnect the exhaust tubing from the exhaust port on the back of the Level 2 Transfer. Cap the exhaust port with a red cap from the calibration kit.
• Disconnect the Ethernet cable from the port on the back of the analyzer and from the switch.
• Disconnect the power cord from analyzer power port on the back of the analyzer and from the receptacle on the shelter wall.
• Place all disconnected tubing and cables from the Level 2 Transfer into the calibration kit. • If the analyzer is to be shipped, remove the lid and use foam to pack the inside of the
analyzer and install the sample pump shipping screws. Make sure inside components are secure and protected. Secure analyzer in the shipping container.
Set the air compressor regulator to 20 psi.
• Gently pull up on the regulator knob to unlock. Turn the knob counter-clockwise and set the regulator gauge to 20 psi. Push in on the regulator knob to lock.
Perform required maintenance.
Note: If this is an initial installation for regulatory ozone monitoring, this step has been completed. • Refer to the site maintenance sheet in the Calibration Folder for required maintenance.
Enter the Level 3 Transfer’s updated corrections, found on the iForm, into the logger through PC200W.
• From the Automated Ozone page, in the second column, double click the L3_Slope cell to highlight and activate the cell. Type the Level 3 Transfer’s updated six audit average slope (Figure 18), from the O
3 iForm, into the cell and press the enter key on the laptop keyboard to accept the value.

FIELD CALIBRATIONS MANUAL Revision No. 13
October 2020 Page 24 of 82
FIELD CALIBRATIONS MANUAL Wood Environment & Infrastructure Solutions, Inc.
Figure 18. Screen Shot: Indicating Average Slope from Audit Results
• From the Automated Ozone page, in the second column, double click the L3_Intercept
cell to highlight and activate the cell (Figure 20). Type the Level 3 Transfer’s updated six audit average intercept, from the iForms, into the cell and press the enter key on the laptop keyboard to accept the value.

FIELD CALIBRATIONS MANUAL Revision No. 13
October 2020 Page 25 of 82
FIELD CALIBRATIONS MANUAL Wood Environment & Infrastructure Solutions, Inc.
Figure 19. Screen Shot: Indicating Intercept Value from Audit Results
Run ZSP.
• Confirm the air compressor regulator gauge remains set to 20 psi. From the Automated Ozone page, in the first column, double click the Ozone_ZSP cell to highlight and activate the cell. Double click again to toggle the cell to “true”. The results will populate into the Ozone_Zero, Ozone_Precision, and Ozone_Span cells in the third column. Record the results in the iForms.

FIELD CALIBRATIONS MANUAL Revision No. 13
October 2020 Page 26 of 82
FIELD CALIBRATIONS MANUAL Wood Environment & Infrastructure Solutions, Inc.
Figure 20. Screen Shot: Indicating ZSP is Running
Note: The Zero result will be displayed as the ppb difference of the site analyzer from the Level 3 Transfer. The Precision and Span results will be displayed as the percent difference of the Site analyzer from the Level 3 Transfer. Acceptable criteria for the Zero result is ± 1.5 ppb. Acceptable criteria for the Precision and Span results are ± 7%.
Site Analyzer Calibration
When calibrating the site analyzer to the Level 2 Transfer, the corrections for the Level 2 Transfer must be applied to its concentrations for accurate transfer concentrations. Bench temperatures for the transfer standard and site analyzer must stay between 5 and 40°C for results to be considered valid.
• Prior to calibration and following the audit, perform any repairs necessary and required maintenance.
• Using established procedures, activate Service mode on the Level 3 Transfer. • Activate the Level 3 Transfer sample pump. • Press the Run button on the Level 3 Transfer to activate “Zero” mode. Allow the
concentrations to stabilize.

FIELD CALIBRATIONS MANUAL Revision No. 13
October 2020 Page 27 of 82
FIELD CALIBRATIONS MANUAL Wood Environment & Infrastructure Solutions, Inc.
• Plumb the Level 2 Transfer in its normal audit configuration. See step 6.3.1. • Using established procedures, activate Service mode on the Level 2 Transfer. • Activate the Level 2 Transfer sample pump. • Once the concentrations are stable, adjust the site analyzer “Background” so the site
analyzer concentration matches the transfer unit’s corrected response at zero. • With the Level 3 Transfer in “Zero” mode, use its push buttons and navigate to Custom
Level 1. • Adjust the percent lamp drive to produce a 225 ppb response from the Level 2 Transfer. • Once stable at 225 ppb adjust the “Coefficient” of the site analyzer until the site analyzer
response matches the transfer unit’s corrected response. • Repeat the previous two steps if necessary to produce consistent concentrations of 0 and
225 ppb responses of the transfer. • When the calibration is complete, turn off the Level 2 Transfer. Record the new
“Background” and “Coefficient” values for the site analyzer in the O 3 iForm (Figure 15).
• Turn “Service Mode” off on the Level 3 Transfer and return to step 6.13.17.
Flow
Record the as-found “Flow_FullScale” and “Flow_Offset” values on the Flow iForm (Figure 22) for Flow Full Scale and Zero, respectively. These values are found on the 3 Calibration MET grid or the 4 Calibration-2 grid on the site laptop. From its tag record the Bios Definer 220 ID and certification date on the iForm. Identify the correct transfer electronic certification form on the root directory of the calibration flash drive. Make sure the certification form is complete and that the transfer’s ID number matches the ID number on the certification form. Place a copy of the electronic certification form in the site calibration folder on the calibration flash drive to be copied to the site laptop at the completion of the site audit. Record the as-found rotameter value, MFC model ID, and flow set point on Flow iForm (Figure 21). The flow set point is found on the 3 Calibration MET grid or the 4 Calibration-2 grid (Figure 22) on the site laptop. Figure 8 in Section II.A.2, Subsection 3.5 illustrate the filter sampling systems and mass flow controllers.
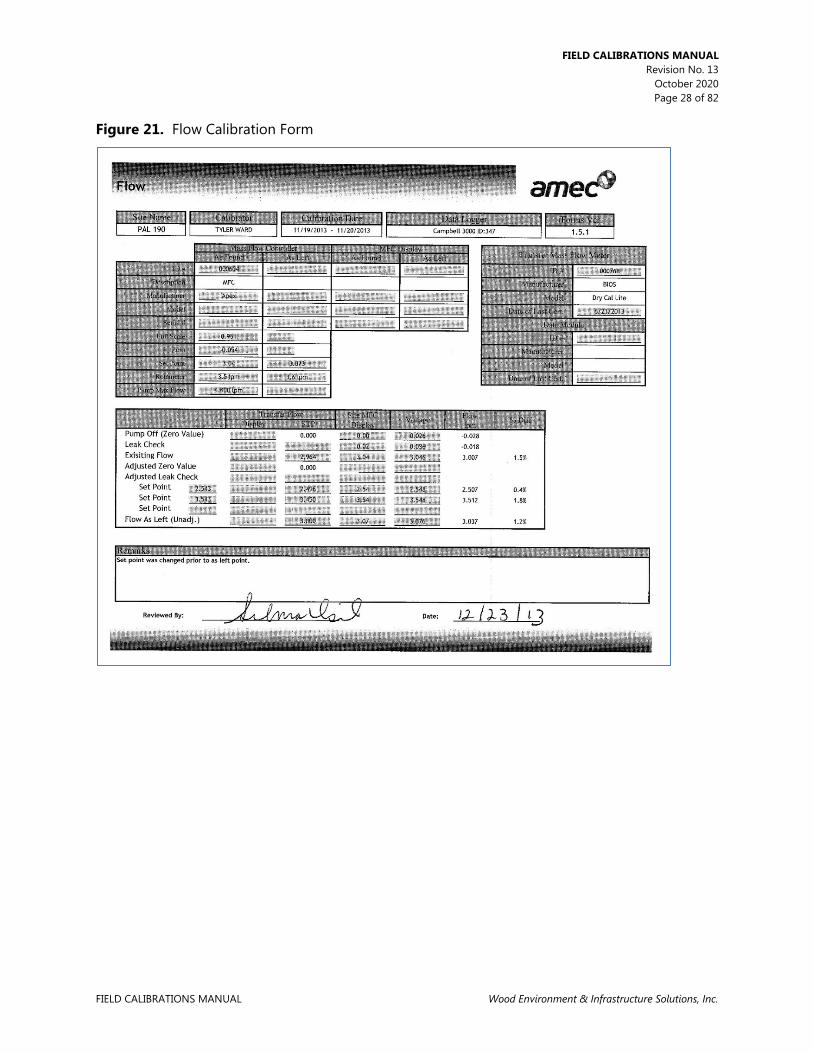
FIELD CALIBRATIONS MANUAL Revision No. 13
October 2020 Page 28 of 82
FIELD CALIBRATIONS MANUAL Wood Environment & Infrastructure Solutions, Inc.
Figure 21. Flow Calibration Form

FIELD CALIBRATIONS MANUAL Revision No. 13
October 2020 Page 29 of 82
FIELD CALIBRATIONS MANUAL Wood Environment & Infrastructure Solutions, Inc.
Figure 22. Screen Shot: Full Scale and Offset (Zero) Values
Allow the Definer to warm up for at least 30 minutes without the charger attached since
the internal battery heats up during charging, resulting in error in measuring the air temperature. It may be necessary to charge the Definer beforehand to ensure there is sufficient capacity remaining for the duration of the audit.
Verify the flow controller is set to mass flow control by confirming the mass reading in the lower middle of the display (Figure 23) matches the set point in the upper right hand corner. An alternative method is to bring up the Control Setup display by pressing the right hand corner button below the word Main and then the top middle button above the word Control and confirming the caret is next to the word Mass in the center column. If the flow controller is found to be set to anything other than mass, record the current and updated setting in the Remarks section of the Flow iForm.

FIELD CALIBRATIONS MANUAL Revision No. 13
October 2020 Page 30 of 82
FIELD CALIBRATIONS MANUAL Wood Environment & Infrastructure Solutions, Inc.
Figure 23. Screen Shot: Flow Controller Data Display
Set “ozone_down” and “flow_rate_down” to “true” on the 1 Site Operator grid or the 2 Site Operator MET grid on the site laptop. Unplug or turn off the flow pump and hour-meter. Note the time and hour-meter reading in the log book.
Once the MFC Display reading is stable, record the value on the Flow iForm for pump off.
Note: Make sure to record the standard flow rate in SLPM. The mass flow rate is displayed at the bottom middle of the main display or can be displayed in the larger primary position by pressing the lower middle button below the word mass.
Lower the flow tower (Figure 24). Remove the filter pack (using clean gloves or a clean plastic bag). Cap and store the filter pack carefully in a clean plastic bag.

FIELD CALIBRATIONS MANUAL Revision No. 13
October 2020 Page 31 of 82
FIELD CALIBRATIONS MANUAL Wood Environment & Infrastructure Solutions, Inc.
Figure 24. Lowered Flow Tower
Plug in or turn on the flow pump. Once the MFC Display reading is stable, record the value on the Flow iForm for leak check.
Unplug or turn off the flow pump.
Connect the Flow transfer tubing (Figure 25) supplied in the calibration kit to the filter pack quick connect fitting in the pothead. Connect the remaining end to the top (suction) fitting of the Definer. If the supplied tubing is not long enough to reach the shelter with the tower lowered, call Wood for next steps; DO NOT use a different tubing length unless instructed by Wood.
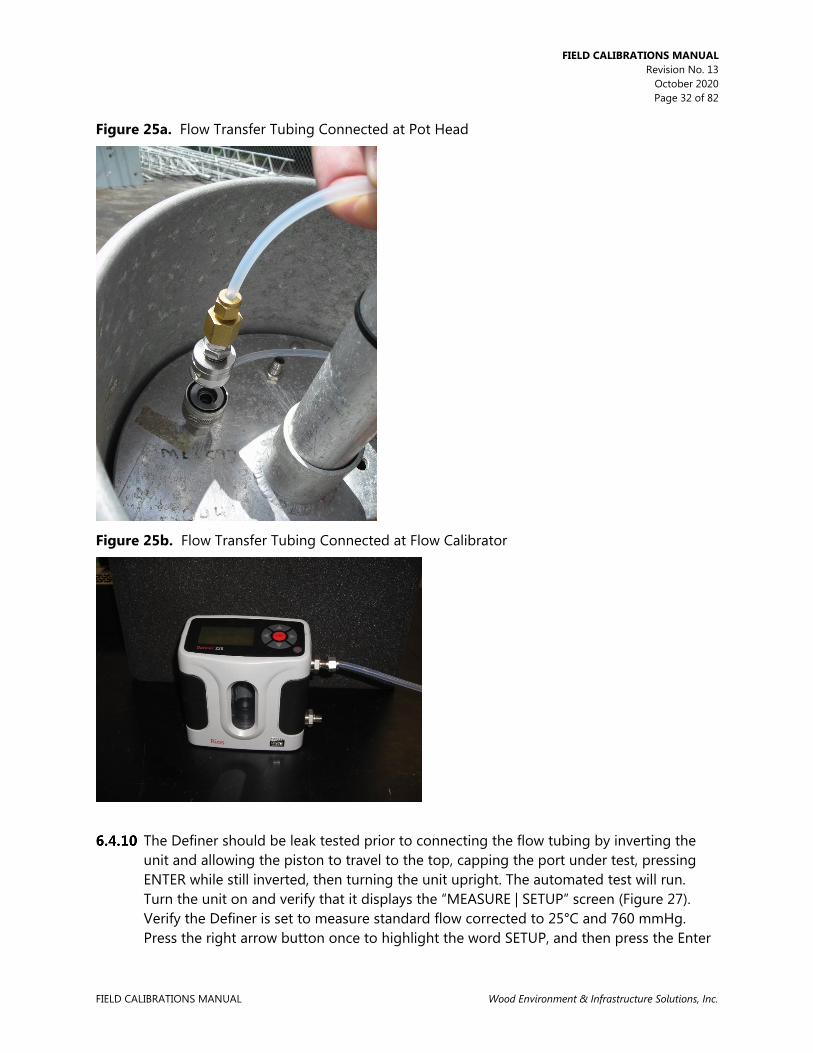
FIELD CALIBRATIONS MANUAL Revision No. 13
October 2020 Page 32 of 82
FIELD CALIBRATIONS MANUAL Wood Environment & Infrastructure Solutions, Inc.
Figure 25a. Flow Transfer Tubing Connected at Pot Head
Figure 25b. Flow Transfer Tubing Connected at Flow Calibrator
The Definer should be leak tested prior to connecting the flow tubing by inverting the unit and allowing the piston to travel to the top, capping the port under test, pressing ENTER while still inverted, then turning the unit upright. The automated test will run. Turn the unit on and verify that it displays the “MEASURE | SETUP” screen (Figure 27). Verify the Definer is set to measure standard flow corrected to 25°C and 760 mmHg. Press the right arrow button once to highlight the word SETUP, and then press the Enter

FIELD CALIBRATIONS MANUAL Revision No. 13
October 2020 Page 33 of 82
FIELD CALIBRATIONS MANUAL Wood Environment & Infrastructure Solutions, Inc.
button once to bring up the Setup Definer 200 M menu display. With the word Readings highlighted press the Enter button once to bring up the Setup Readings menu (Figure 28) display. The Type: value should be set to Std. If not, press the right or left arrow button to change the value to Std. With the Type: value set to Std, press the down arrow four times to highlight the word Confirm, and then press the Enter button once. After the setting is confirmed by the transfer, the display will return to the Setup Definer 200 M menu. Press the down arrow once to highlight the word Units, and then press the Enter button once to bring up the Setup Units menu display. The Flow in: value should be set to sL/min. If not, press the right or left arrow button to change the value to sL/min. Once the Flow in: value is set to sL/min, press the down arrow three times to highlight the Std To: value. The Std To: value should be set to 25.0. If not, press the right or left arrow button to change the value to 25.0. With the Flow in: value set to sL/min and the Std To: value set to 25.0, press the down arrow at least once highlight the word Confirm. Press the Enter button once for the transfer to confirm the settings. If any of the Definer settings require changes, record the original and updated value in the Remarks section of the iForm.
Figure 26. Definer Data Display
Figure 27. Definer Setup Readings
Plug in or turn on the flow pump.
With the word MEASURE highlighted on the Definer (If MEASURE is not highlighted, press the down arrow until it is), press the Enter button once. Press the right arrow button once to highlight CONT, and then press the Enter button once to start measuring flow rates and auditing the MFC.
Once stable readings are obtained and the count has reached 10 of 10 on the Definer, press the Enter button. Record the average existing STP corrected flow (Avg) in the STP column on the iForm as reported by the Definer. The Display column on the iForm will remain blank.

FIELD CALIBRATIONS MANUAL Revision No. 13
October 2020 Page 34 of 82
FIELD CALIBRATIONS MANUAL Wood Environment & Infrastructure Solutions, Inc.
Record the MFC Display as well as the data logger flow mass “Flow Mass” in the Existing Flow row of the iForm. “flow rate v” is found on 4 Calibration-2 grid on the site laptop.
Repeat the above procedure at one point 0.5 lpm above and one point 0.5 lpm below the target MFC flow. Record the set point for these flows for Pot. Setting on the iForm
Change the MFC set point (Figure 29) to obtain the desired lpm by using the data logger or logger interface parameter “Flow_SetPt”. Double click the set point value to highlight it, type in the new set point value, and press the enter key.
Figure 28. MFC Data Exhibit
Set the MFC set point to 5.00. Record SAvg (or Avg for the Definer) as reported by the transfer standard for the Pump Max Flow value on the iForm.
Unplug flow pump and perform required maintenance on the flow system. Replace the inline filter behind the rotameter and the flow pump diaphragm. Record the maintenance performed in the remarks section of the Flow iForm.
If any of the MFC flow rates vary from the STP value by 2 percent or more as indicated by a red box in the % Diff column, the following steps for a six point calibration must be performed. Otherwise proceed to step 6.4.25.
On the Flow iForm, click the Show As Left checkbox to open the As Left section of the iForm.
Plug in flow pump and perform flow rate audits at six set points to obtain the desired flow rates in the table below.
Target Calibration Flow Points (lpm) for CASTNET Sites 1.5 Nominal Flow 1.00 1.25 1.50 1.75 2.00 2.25
3.0 Nominal Flow 2.25 2.50 2.75 3.00 3.25 3.50

FIELD CALIBRATIONS MANUAL Revision No. 13
October 2020 Page 35 of 82
FIELD CALIBRATIONS MANUAL Wood Environment & Infrastructure Solutions, Inc.
During the As Left calibration, flow rates in SLPM can be previewed by entering Full Scale and Zero values in the left half of the As Left section of the Flow iForm.
Following a six point audit in the As Left section of the Flow iForm, the iForm will compute new Full Scale and Zero values as shown in the As Left column in the Full Scale and Zero rows. Record the new full-scale and zero values in the site log book.
Transfer the new computed values to the data logger through the 4 Calibration-2 grid by double clicking the word “Flow_Full Scale” (Figure 29) to highlight it, typing in the new value, and pressing the Enter key on the keyboard. Repeat for the new Zero by double clicking on the word “Flow_Offset”.
Figure 29. Screen Shot: Flow Set Point
If the flow pump is off, plug it back in or turn it on and perform one final audit at the target flow rate. Using the Avg for the Definer, adjust the MFC set point to achieve a flow rate of 1.50 or 3.00 for the particular site. Record the result on the Flow iForm in the Flow As Left (Unadj.) row or the Post Calibration row if a six point calibration was required.
Record the set point for the As Left Pot Setting and the As Left rotameter value on the iForm.

FIELD CALIBRATIONS MANUAL Revision No. 13
October 2020 Page 36 of 82
FIELD CALIBRATIONS MANUAL Wood Environment & Infrastructure Solutions, Inc.
Unplug or turn off the flow pump.
Disconnect transfer tubing from the filter pack quick connect on the flow tower.
Reinstall the filter pack (using clean gloves or a clean plastic bag). Raise the flow tower.
Set “ozone_down” and “flow_rate_down” to “false” on the 1 Site Operator grid (Figure 30) on the site laptop. Plug in or turn on the flow pump and hour-meter. Note the time and hour-meter reading in the log book.
Figure 30. Screen Shot: Reestablishing O 3 and Flow Sampling
Trace Gas Concentrations
QAPP Appendix 10 describes trace gas concentration instruments, their specifications, data processing and QC requirements, and SOP for each instrument.
Meteorological Measurements
Tipping Bucket Rain Gauge
• Set “precipitation_down” parameter to “true” (available on 1 Site Operator MET and 3 Calibration MET grids). Note time in logbook.
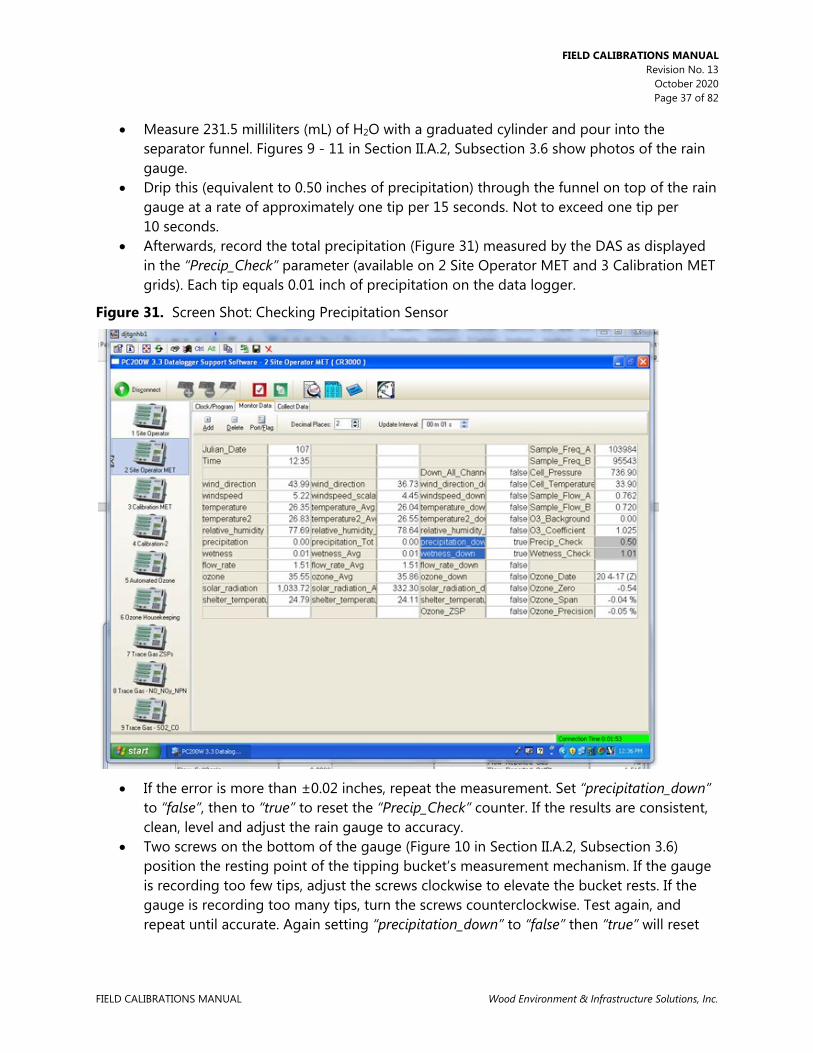
FIELD CALIBRATIONS MANUAL Revision No. 13
October 2020 Page 37 of 82
FIELD CALIBRATIONS MANUAL Wood Environment & Infrastructure Solutions, Inc.
• Measure 231.5 milliliters (mL) of H2O with a graduated cylinder and pour into the separator funnel. Figures 9 - 11 in Section II.A.2, Subsection 3.6 show photos of the rain gauge.
• Drip this (equivalent to 0.50 inches of precipitation) through the funnel on top of the rain gauge at a rate of approximately one tip per 15 seconds. Not to exceed one tip per 10 seconds.
• Afterwards, record the total precipitation (Figure 31) measured by the DAS as displayed in the “Precip_Check” parameter (available on 2 Site Operator MET and 3 Calibration MET grids). Each tip equals 0.01 inch of precipitation on the data logger.
Figure 31. Screen Shot: Checking Precipitation Sensor
• If the error is more than ±0.02 inches, repeat the measurement. Set “precipitation_down” to “false”, then to “true” to reset the “Precip_Check” counter. If the results are consistent, clean, level and adjust the rain gauge to accuracy.
• Two screws on the bottom of the gauge (Figure 10 in Section II.A.2, Subsection 3.6) position the resting point of the tipping bucket’s measurement mechanism. If the gauge is recording too few tips, adjust the screws clockwise to elevate the bucket rests. If the gauge is recording too many tips, turn the screws counterclockwise. Test again, and repeat until accurate. Again setting “precipitation_down” to “false” then “true” will reset
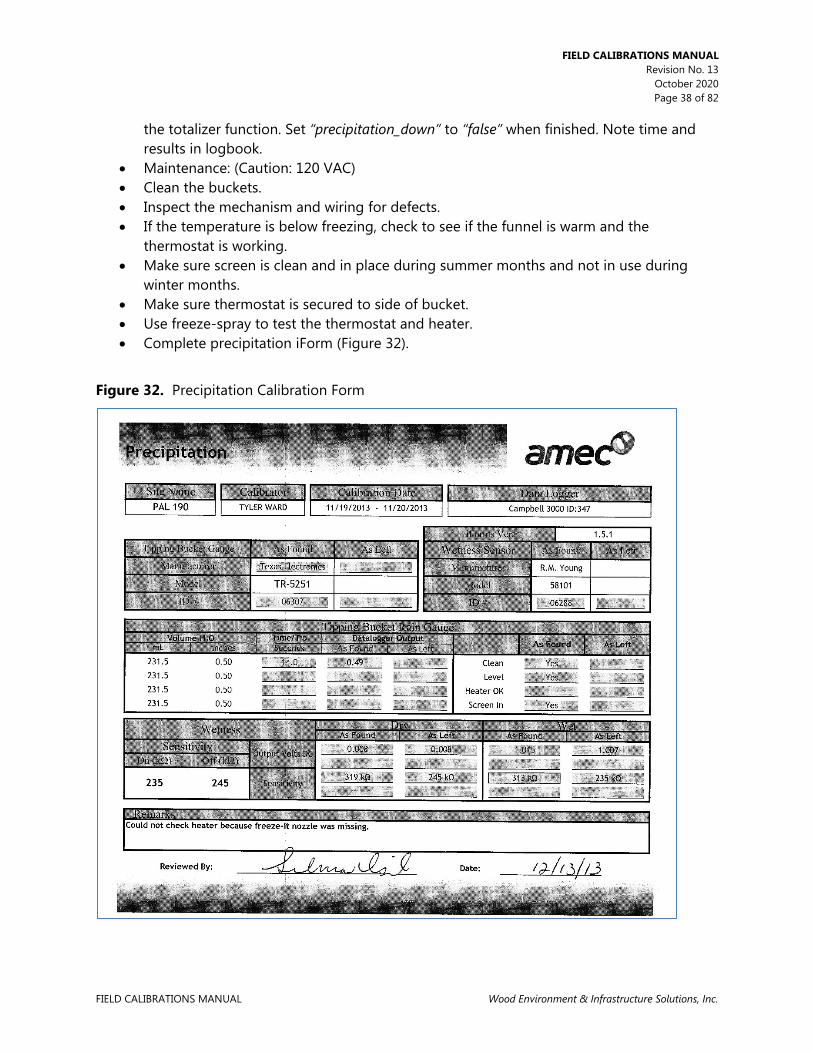
FIELD CALIBRATIONS MANUAL Revision No. 13
October 2020 Page 38 of 82
FIELD CALIBRATIONS MANUAL Wood Environment & Infrastructure Solutions, Inc.
the totalizer function. Set “precipitation_down” to “false” when finished. Note time and results in logbook.
• Maintenance: (Caution: 120 VAC) • Clean the buckets. • Inspect the mechanism and wiring for defects. • If the temperature is below freezing, check to see if the funnel is warm and the
thermostat is working. • Make sure screen is clean and in place during summer months and not in use during
winter months. • Make sure thermostat is secured to side of bucket. • Use freeze-spray to test the thermostat and heater. • Complete precipitation iForm (Figure 32).
Figure 32. Precipitation Calibration Form
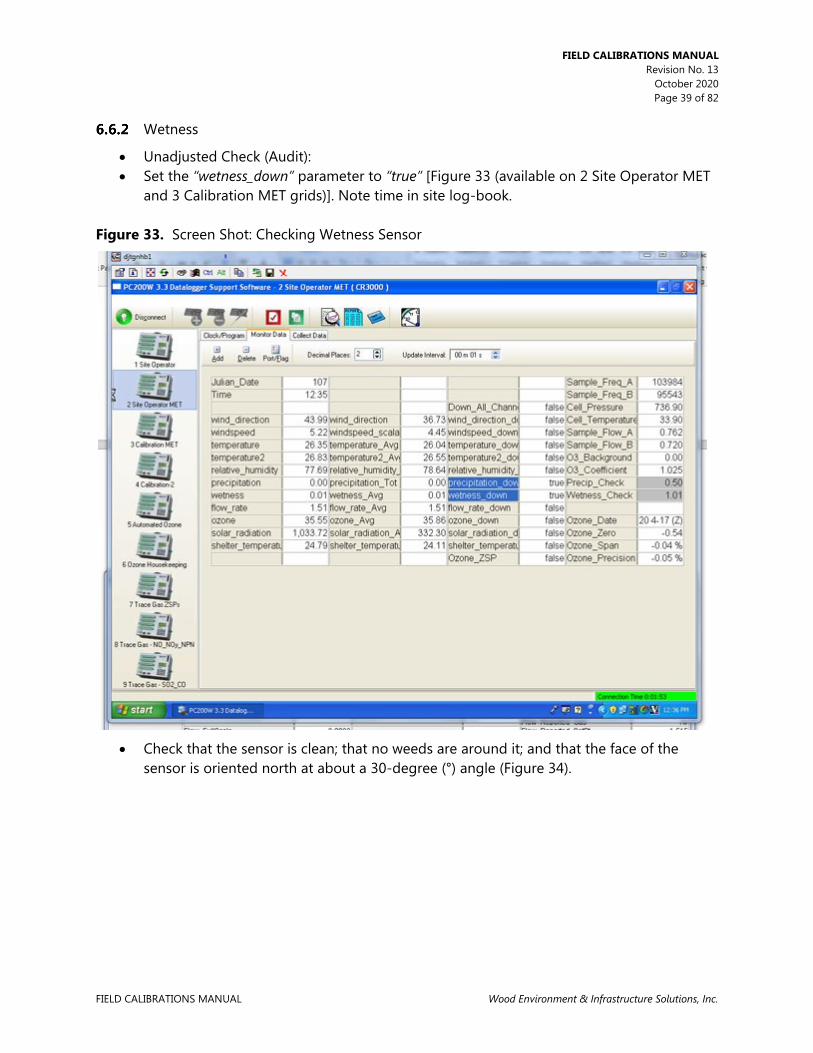
FIELD CALIBRATIONS MANUAL Revision No. 13
October 2020 Page 39 of 82
FIELD CALIBRATIONS MANUAL Wood Environment & Infrastructure Solutions, Inc.
Wetness
• Unadjusted Check (Audit): • Set the “wetness_down” parameter to “true” [Figure 33 (available on 2 Site Operator MET
and 3 Calibration MET grids)]. Note time in site log-book. Figure 33. Screen Shot: Checking Wetness Sensor
• Check that the sensor is clean; that no weeds are around it; and that the face of the
sensor is oriented north at about a 30-degree (°) angle (Figure 34).

FIELD CALIBRATIONS MANUAL Revision No. 13
October 2020 Page 40 of 82
FIELD CALIBRATIONS MANUAL Wood Environment & Infrastructure Solutions, Inc.
Figure 34. Wetness Sensor
• Record the DAS voltage for the ambient condition of wet or dry as reported in the
“Wetness_Check” parameter (available on 1 Site Operator and 3 Calibration grids). • Induce the opposite condition by either drying or wetting the leaf sensor grid and record
DAS output again for the appropriate condition. Return the sensor to ambient conditions.
• When dry, the sensor should report 0.00±0.02 VDC. When wet the sensor should report 1.00 ± 0.10 VDC.
• Test the dry sensitivity of the sensor by plugging in the decade resistance box into the calibration jack inside the wetness sensor circuit box and beginning at least 4 kilo ohms (kΩ) below the final value, increase the resistance in 1 kΩ intervals until the sensor turns off. Record the lowest resistance at which the sensor remains off.
• Test the wet sensitivity of the sensor by beginning at least 4 kΩ above the final value, decrease the resistance in 1 kΩ intervals until the sensor turns on. Record the highest resistance at which the sensor remains on.
• Additional Check and Adjustment Procedures: • Insert decade box test jack in the connector labeled test jack. • If the sensor does not turn on at 235 kΩ, adjust the sensitivity potentiometer until it
turns on while the decade box is set at 240 kΩ. Recheck at 245 kΩ that the LED also turns off. Continue to adjust until both of these criteria are met.
• Set the sensor voltage response to 1.000 V using the output or gain potentiometer as recorded by the DAS when the sensor is on. Replace the sensor cover. If the sensor cannot be made to output 1.000 ±0.10 VDC while wet, replace it and perform a full audit of the as left sensor response on the calibration form.
• Set “wetness_down” parameter to “False” and note time in the logbook. Record all results on the calibration form.
• In winter months, at some sites, snow accumulation may prevent access to the sensor.

FIELD CALIBRATIONS MANUAL Revision No. 13
October 2020 Page 41 of 82
FIELD CALIBRATIONS MANUAL Wood Environment & Infrastructure Solutions, Inc.
Temperature*
• Items needed: ice, water, re-sealable plastic bags, thermos (x2), Styrofoam thermos lid (x2), magnetic stir bar (x2), stir plate, water heater, certified Resistance Temperature Device (RTD), and rubber mallet.
• Identify the correct transfer’s electronic certification form found on the root directory of the calibration flash drive. Make sure the certification form is complete and that the transfer’s ID number matches the ID number on the certification form. Place a copy of the electronic certification form in the site calibration folder on the calibration flash drive to be copied to the site laptop at the completion of the site audit.
• Record the following on the Temperature iForm (Figure 35): the RTD Transfer ID and certification date, the site probe ID(s), and the “as found” temperature R0 and alpha values for each site probe. If the site has three ambient temperature probes, a second Temperature iForm must be used. The existing temperature probe’s individual R0 and alpha values are found on either the 3 Calibration MET or 4 Calibration-2 data grid on the site laptop. They are labeled as “R0_T1” and “Alpha_T1” for the 9 meter temperature probe (“temperature”), and for met stations”R0_T2” and “Alpha_T2” for the 2 meter temperature probe (“temperature2”). The shelter temperature probe does not use R0 and alpha values.
• Record the existing R0 and alpha values in the site narrative logbook. • Input the Correction Factors into the Temperature iForm for the RTD transfer. The
correction factors are found on the RTD transfer certification form. • Down all temperature channels to be audited by changing their status to “true” on the
1 Site Operator grid or the 2 Site Operator MET for sites with meteorological measurements (Figure 36). If the site includes meteorological measurements, then also down the wind speed, wind direction, and relative humidity (RH) channels. If the site has a temperature3 probe or temperature probe on the flow tower, also down the flow and ozone channels. Note time and action in logbook.
*Climatronics instruments are no longer used at EPA-sponsored CASTNET sites.

FIELD CALIBRATIONS MANUAL Revision No. 13
October 2020 Page 42 of 82
FIELD CALIBRATIONS MANUAL Wood Environment & Infrastructure Solutions, Inc.
Figure 35. Temperature Calibration Form

FIELD CALIBRATIONS MANUAL Revision No. 13
October 2020 Page 43 of 82
FIELD CALIBRATIONS MANUAL Wood Environment & Infrastructure Solutions, Inc.
Figure 36. Screen Shot: Auditing Temperature Sensors
• For sites with no meteorological measurements skip to step 6.7. • Lower the meteorological tower and verify that both temperature blower motors are
operational (Figure 19 in Section II.A.2, Subsection 3.9). If not, replace. • Locate the power cord for the blower motor power supply. This power supply is the
green unit located on the data logger backplane terminal interface strip. The power cord emerges from behind the backplane and is plugged in near the data logger.
• Unplug the power supply and observe that the green indicator light on the unit goes out. • Inspect temperature sensors, aspirated and/or nonaspirated shield(s), and blowers, if
applicable, conditions; note whether sensors are touching the housings and whether airflow is obstructed and if the temperature probes are installed with the correct length adaptors. Clean blower motors if necessary. Any installation discrepancies and repair activities including cleaning should be documented in the Remarks section of the iForms.
• Crush some ice (in plastic bag with rubber mallet) to a fine consistency. It is very important not to have large pieces of ice to achieve a smooth circulation when temperature probes are immersed in the ice bath. Set up a stirring ice bath by placing one of the magnetic stir bars into one of the thermoses and then, fill this thermos about

FIELD CALIBRATIONS MANUAL Revision No. 13
October 2020 Page 44 of 82
FIELD CALIBRATIONS MANUAL Wood Environment & Infrastructure Solutions, Inc.
three quarters full with the crushed ice. Add water to the ice filled thermos to within about an inch and a half of the top of the thermos. Place the filled thermos on the stir plate. Plug in the stir plate and turn on the magnet to spin the magnetic stir bar as to mix the ice and water.
• Insert the “shelter_temperature” [Campbell model 107 temperature sensor (Figure 23 in Section II.A.2, Subsection 3.10)] attached to data logger backplane), “temperature” (9m tagged yellow), and, if operational, “temperature2” (2m tagged red) probes along with the Transfer RTD through the polystyrene foam thermos lid and into the bath. At least three-quarters of the Transfer RTD and site probes should be immersed in the bath water. The shelter temperature probe should be immersed to the bottom of the rubber boot. The probes must not be touching the container or one another.
• If using an EXTECH brand RTD transfer, make sure the reported units are in Celsius by pressing the left side of the green highlighted °C/°F button and make sure the correct range, 0.01, is selected by pressing the left side of the button above the OFF/ON switch.
• Boil water in an electric kettle in preparation for the next steps. • Allow sufficient time for the probes to equilibrate near 0±0.05 °C, stirring bath as
reported by the RTD transfer. Note: The shelter temperature probe will generally respond less quickly than the meteorological probes and may require additional time to reach equilibrium.
• Record simultaneous data logger and transfer RTD measurements in °C on the Temperature iForm (Figure 35).
Note: The relevant instantaneous data logger measurements to be recorded are the “Temp1_Raw”, “Temp2_Raw”, and “shelter_temperature” as found on the 3 Calibration MET or 4 Calibration-2 grid on the site laptop (Figure 37). Record the transfer RTD value as displayed on the Temperature iForm.

FIELD CALIBRATIONS MANUAL Revision No. 13
October 2020 Page 45 of 82
FIELD CALIBRATIONS MANUAL Wood Environment & Infrastructure Solutions, Inc.
Figure 37. Screen shot: Evaluating Temperature Measurements
• The iForm will automatically correct the transfer standard values if the proper calibration
factors have been input. • Transfer all probes to a stirring bath of ambient temperature (use the second thermos).
Ambient is defined as between 20 °C and 30 °C to ensure data quality for the “shelter_temperature” probe measurement. Repeat the measurement process described previously, simultaneously recording “Temp1_Raw”, “Temp2_Raw”, “shelter_temperature” and the transfer RTD output in °C on the Temperature iForm.
• Transfer all probes into a bath temperature of 50± 0.5 °C. Allow to equilibrate. In general, 120 -150mL of boiling water will raise the thermos bath temperature ~10 °C.
• Again repeat the measurement process described above, simultaneously recording “Temp1_Raw”, “Temp2_Raw”, “shelter_temperature” and the transfer RTD output. All recorded units must be in °C.
• Following the temperature audit, examine the iForm results. If the “temperature”, “temperature2” or “temperature3” probe measurements vary from the transfer probe value by more than ±0.15 °C, then that probe variance will result in a flagged value indicated by a red box in the Temperature iForm and the audit must be extended to

FIELD CALIBRATIONS MANUAL Revision No. 13
October 2020 Page 46 of 82
FIELD CALIBRATIONS MANUAL Wood Environment & Infrastructure Solutions, Inc.
include 0, 10, 20, 30, 40 and 50 °C. Likewise if the computed “delta_temperature” value varies from the corrected transfer RTD measurement by more than 0.3 °C the audit must as well be extended.
Note: If the site has only the “temperature” probe, the probe measurements are allowed to vary from the transfer probe value up to ±0.3 °C.
• If the “shelter_temperature” probe measurement varies from the corrected Transfer RTD values by more than 0.3 °C at audit points below 36 °C, the audit must be extended to include three points between 20 °C and 30 °C.
Note: If only the “shelter_temperature” fails audit criterion extend the audit as instructed but do not input “temperature” or “temperature2” measurement data on the iForm. This will allow the iForm to contain the proper information for data validation without computing a new R0 and alpha value for the meteorological probes.
• If six values for the transfer RTD probe and six values for either the “temperature” or “temperature2” probe are entered into the iForm a new R0 and alpha value will be computed for that site probe. This will only occur if the values are entered into the “As Left” section of the iForm.
• If an extended audit is necessary, click the “Show As Left” check box on the iForm and record the audit findings in both the “As Found” and “As Left” sections of the iForm. Following the extended audit of six points of data, which includes both the meteorological probes measurements and the transfer measurements, the iForm will compute new R0 and alpha values for the “temperature”, and “temperature2” probes. This will only occur if the six points are recorded in the “As Left” section of the iForm. The new R0 and alpha values for each probe must be entered into the data logger through the 3 Calibration MET grid or the 4 Calibration-2 grid on the site laptop by double clicking the values, one at a time, entering the new value and pressing Enter on the keyboard. If either probe does not meet criterion with a new R0 or alpha value, the probe must be replaced. Record any new R0 and alpha values and the associated data logger parameter names (“temperature” or “temperature2”) in the site log book.
• If probe replacement is necessary, continue to the next step. Otherwise, skip the next step (bullet) and go to subsequent step (bullet).
• Replace the probe with an Wood certified probe. Enter the R0 and alpha value for that probe as recorded on its certification form into the data logger and into the As Left section of the iForms. Repeat the three point audit on that probe which includes 0 °C, ambient temperature (°C) and 50 °C. Record all data and probe ID in the “As Left” section of the Temperature iForm.
• Re-install the probes on the tower. Make sure the sensors are not touching housings. Inspect wiring and connections. Secure the cables to the tower. Perform required maintenance.
• Enable channels by changing their downed status to “false” on the 1 Site Operator grid or the 2 Site Operator MET grid on the site laptop after audit is complete and tower is raised.

FIELD CALIBRATIONS MANUAL Revision No. 13
October 2020 Page 47 of 82
FIELD CALIBRATIONS MANUAL Wood Environment & Infrastructure Solutions, Inc.
Wind Direction†
• Identify the correct transfer electronic certification form found on the root directory of the calibration flash drive. Make sure the certification form is complete and that the transfer ID number matches the ID number on the certification form. Place a copy of the electronic certification form in the site calibration folder on the calibration flash drive to be copied to the site laptop at the completion of the site audit.
• Record the ID and certification date of the synchronous drive motor on the Wind iForm (Figure 38). Record the site wind sensor ID and propeller (Figure 18 in Section II.A.2, Subsection 3.9) serial number on the Wind iForm.
• Record the ID and certification date of the Brunton compass on the iForm. • Set the certified Brunton compass to the correct declination for the site (Appendix A,
Magnetic Declination Adjustments). • With the meteorological tower standing, position the compass directly under the cross-
arm. Orient the compass such that when fully opened the mirror is between the compass dial and the meteorological tower.
• Level the compass using the bulls-eye level in the dial face. Rotate the compass until the sight line in the mirror is parallel to the cross-arm. In this condition the entire length of the cross-arm will appear centered down the alignment line in the mirror. Ensure the compass is still level.
• Record the degree measure indicated by the NORTH (arrow) end of the compass needle in the “cross-arm alignment” field of the iForm. This measurement will depend on the direction the cross-arm points away from the tower and may read any value in degrees, but most likely near 0 or 180 degrees.
• Make sure all the meteorological tower sensor channels are down. Lower the meteorological tower.
• Assess the condition of the wind sensor alignment ring making sure that it is tight and will not move.
• Remove the sensor from the tower by loosening the hose clamp at the sensor base. DO NOT LOOSEN THE ALIGNMENT RING. Install the rose compass wheel on the mast, mating it to the alignment ring.
• Hold the wind sensor in a vertical position and torque test the wind sensor’s wind direction bearing using the included strain gauge. Record the measured torque on the iForm. Wind direction bearing torque must be less than 10 g/cm
† Climatronics instruments are no longer used at EPA-sponsored CASTNET sites.
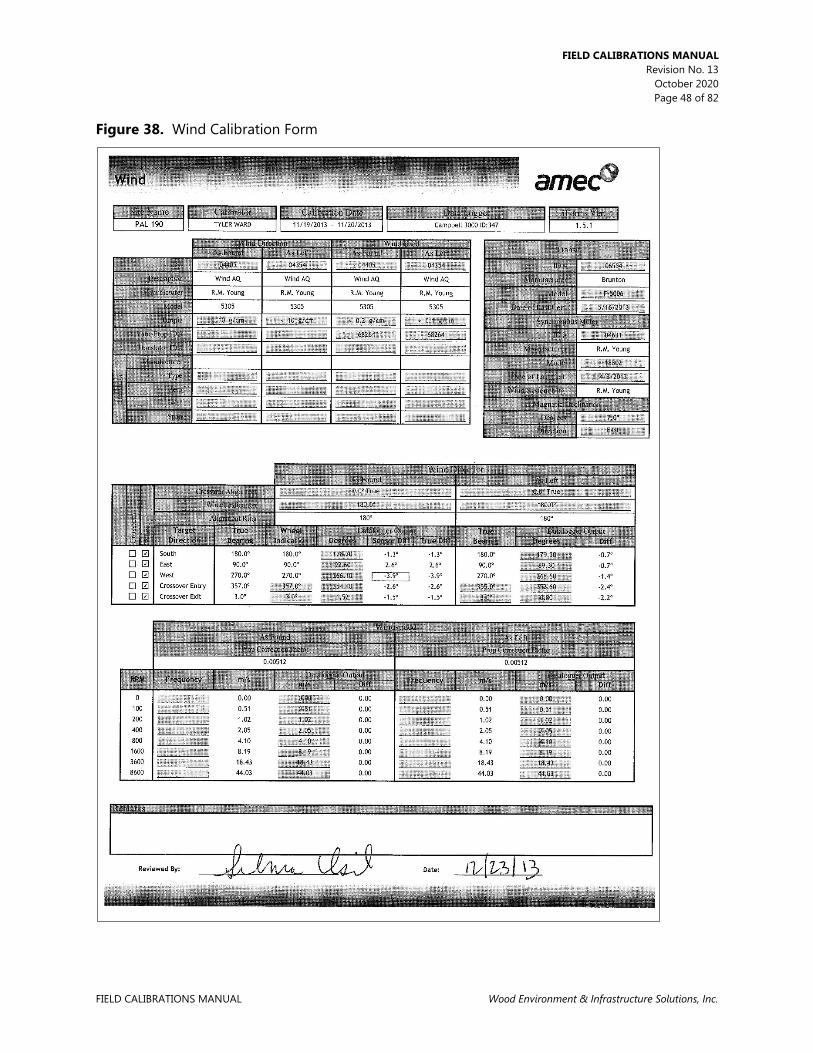
FIELD CALIBRATIONS MANUAL Revision No. 13
October 2020 Page 48 of 82
FIELD CALIBRATIONS MANUAL Wood Environment & Infrastructure Solutions, Inc.
Figure 38. Wind Calibration Form

FIELD CALIBRATIONS MANUAL Revision No. 13
October 2020 Page 49 of 82
FIELD CALIBRATIONS MANUAL Wood Environment & Infrastructure Solutions, Inc.
Note: If conditions are too windy to properly test bearing torque wait until after the audit and then remove the sensor from the wiring and perform the torque test in the shelter out of the wind. At the same time test the nose cone bearing torque.
• Install the wind sensor on the rose compass wheel and tighten. • Rotate the tail of the wind sensor vane over the cross-arm. Align it with the cross-arm
using parallax sighting the tail. Affix the rose compass jig to hold tail in position directly over the cross-arm.
• Record the degree measure indicated by the rose compass wheel on the iForm in the “wheel indication” field.
• The “Alignment ring” orientation will then be calculated by the iForm and the “Alignment Ring” field will be automatically populated. The South, East and West values of the “Wheel Bearing” column of the Wind iForm will be automatically populated with the correct target wheel values for the audit. These alignment values are to be used for the next step.
• Align the wind sensor so the “Wheel Bearing” value for SOUTH as indicated on the iForm matches the degree indication on the rose compass wheel and affix the wind sensor vane in place. Record the data logger degree measure output, as found in either the “2 Site Operator MET” or “3 Calibration MET” grid on the iForm in the “Degrees” column of the “Data Logger Output” field.
Note: Do not align the wind sensor to 90, 180 and 270 degrees as indicated on the rose compass wheel. Align the sensor on the rose compass wheel to the degree values computed by the iForm in the “Wheel Bearing” Column.
• Repeat the procedure above for the “Wheel Bearing” values as indicated on the iForm (Figure 38) for EAST and WEST. For each point record the data logger degree measure output in the corresponding row of the “Degrees” column of the “Data Logger Output” field.
• Upon completion of the SOUTH, EAST and WEST points, affix the wind sensor vane approximately 80 degrees NORTH of the WEST target bearing (as indicated on the iForm) on the rose compass wheel.
• Rotate the wind sensor toward the NORTH (clockwise from the top) in one degree increments as indicated by the rose compass wheel until the maximum degree value as output by the data logger is determined.
• Note: This maximum will occur immediately prior to the wind sensor’s directional potentiometer entering the dead band and should occur at or near 355 degrees for a calibrated and aligned sensor.
• At the maximum degree output reported by the data logger, record the rose compass wheel degree measure in the “Crossover Entry” row of the “Wheel Indication” column. Record the corresponding maximum degree of data logger output in the “Crossover Entry” row in the “Degrees” column of the “Data logger Output” field.
• Rotate the wind vane one more degree and verify that the wind sensor’s direction potentiometer enters the dead band. At this point the data logger degree output will drop to very near zero.

FIELD CALIBRATIONS MANUAL Revision No. 13
October 2020 Page 50 of 82
FIELD CALIBRATIONS MANUAL Wood Environment & Infrastructure Solutions, Inc.
• Continue to rotate the wind sensor vane in one degree increments until the directional potentiometer exits the dead band.
Note: This will occur approximately five degrees clockwise of the entry point (on the rose compass wheel as from the top). In general terms exit from the dead-band will occur at a data logger degree output of approximately 0.016 degrees. Rotating one more degree will produce a near zero valid measurement. Rotating one more degree will increase the measurement.
Wind Speed
• Remove propeller and record propeller serial number and sensor ID number on the Wind iForm (Figure 38).
• If not done so already install the torque wheel on the propeller shaft. Test and record the bearing torque on the iForm.
• Attach a variable speed synchronous motor to the propeller shaft. Run the motor at the following rpm: 0, 100, 200, 400, 800, 1600, 3600, and 8600. Record the corresponding data logger wind speeds on the iForm in units of m/s.
Note: If the propeller serial number is less than 53404, it will need to be replaced following the audit.
• If the wind speed is not within specifications, replace the sensor and re-audit both the wind speed and wind direction parameters of the replacement sensor. If the nose cone is replaced, inspect to ensure it is not bent. No repeat of wind direction calibration is required. This is also true if just the wind speed bearings are replaced.
• Check bearing and wiring condition and replace if necessary, even if not scheduled for routine maintenance. Be sure the unit is properly assembled and everything is tight. Lubricate the nose cone o-ring with a small amount of high vacuum grease. Note if any future replacements will be needed, such as the vane or signal cable.
Note: Bearing torque should be < 0.2 gm/cm.
Relative Humidity (RH)
• CASTNET sites employ either a Rotronic or Vaisala hygrometer for relative humidity measurements. Both sensors require 12VDC input and have a 0 to 1 VDC output signal directly proportional to units of percent relative humidity. RH sensors can only be audited in the field. They cannot be calibrated. Malfunctioning sensors or those not meeting criteria must be replaced. Any RH sensor replaced in the field should be tagged for post calibration prior to return to Wood.
• Identify the correct transfer’s electronic certification form found on the root directory of the calibration flash drive. Make sure the certification form is complete and that the transfer’s ID number matches the ID number on the certification form. Place a copy of the electronic certification form in the site calibration folder on the calibration flash drive to be copied to the site laptop at the completion of the site audit.
• Record the laboratory correction factors of the RH transfer sensor on the RH iForm. (Figure 39). Record the transfer and site probe ID’s on the RH iForm.
• Set the “RH_Down” parameter to “true” on the DAS. Note the time in the log.

FIELD CALIBRATIONS MANUAL Revision No. 13
October 2020 Page 51 of 82
FIELD CALIBRATIONS MANUAL Wood Environment & Infrastructure Solutions, Inc.
• Unpack the portable humidity lab. Inspect the unit for proper water level, kinks in attached tubing, and for functional desiccant. Silica desiccant should be used in the Rense Instruments S503. Inspect the chamber for foreign matter. If necessary add distilled water and new desiccant.
• Install the RH Transfer probe arm into the appropriate port on the portable humidity generator. If necessary, wrap Teflon tape or Parafilm one inch from the transfer probe tip to ensure an airtight seal is formed. A leaky seal here will allow high deviations between the sensor, transfer sensor and humidity generator readings. This is particularly true in windy conditions. If necessary, place the portable humidity generator in a Pelican case and close the lid gently to shield from wind.
• Install site probe in proper fixed port atop unit. Leave all other ports sealed. • Set the portable humidity generator for 20 percent RH and power the unit on. Always
start the portable units at low RH and increase to high RH to avoid condensation forming in the chamber.
• Let the unit run at a point below 50 percent until the transfer and the site probe both stabilize. Once stable, record the site sensor units “relative_humidity” as found in either the “2 Site Operator MET” or “3 Calibration MET” grid. Record the RH Transfer sensor value in the RH Calibration iForm. The iForm will then numerically correct the transfer measurements.
• Repeat the above procedure for “relative_humidity” for a total of at least three points detailed below, allowing both the transfer and site sensors to fully stabilize at each point.
RH Field Audit Points Target RH Transfer Value Acceptable Site RH Sensor Response Value Less than 50 percent
All points ±10 percentage units Between 50 percent and 85 percent Approximately 95 percent
• If the site sensor is not within ±10 percentage units, replace it. Repeat the audit to include the new sensor in the “as left” section of the RH iForm. Tag the sensor that was removed and specify the need for a post calibration check.
• Perform required scheduled maintenance. • Upon completion of the audit turn the RH setting to 0 on the portable humidity
generator and let the unit dry prior to re-packing. • Set the “RH_Down” parameter to “false” upon raising the tower.

FIELD CALIBRATIONS MANUAL Revision No. 13
October 2020 Page 52 of 82
FIELD CALIBRATIONS MANUAL Wood Environment & Infrastructure Solutions, Inc.
Figure 39. Relative Humidity Calibration Form
Solar Radiation (SR)
Note: Do not adjust the SR Sensor gain potentiometer when solar radiation values are less than 300 Watts per square meter (W/m2). Adjustments should be made at the time corresponding to peak incident solar radiation for the day. Ideally, adjustment should occur when incident SR is at or above 700 W/m2. Doing so will reduce the likelihood of overshoot in the gain only sensor conditioner. If adjustment does not produce acceptable results, replace the SR sensor and translator with a spare unit calibrated by Wood. Document the use of the spare parts on the spare parts kit inventory sheet. At times it may not be possible to collect adequate solar radiation data to perform a useful audit. It is suggested in such cases that the site sensor be replaced with a calibrated spare unit. The removed system must be tagged for post-calibration off site. The tag should include the sensor and translator number, site ID, date of removal, reason for removal, date and name of technician.
• Install the SR transfer sensor next to the site sensor (Figure 13 in Section II.A.2, Subsection 3.8). The transfer sensor must be level, secure and unobstructed. The BNC connector should not contact metal. Do not level or clean the site sensor prior to a full as-found audit.

FIELD CALIBRATIONS MANUAL Revision No. 13
October 2020 Page 53 of 82
FIELD CALIBRATIONS MANUAL Wood Environment & Infrastructure Solutions, Inc.
• Connect the SR transfer signal wire (usually red on the translator) to terminal #37 on the data logger surge protection terminal strip (adjacent to brown wire). Connect the transfer signal reference wire (usually black on the translator) to terminal #38 (adjacent to white wire with brown stripe). Plug the transfer sensor cable BNC connector into the transfer translator box.
• Plug the translator power cord into an available wall outlet. • Ensure that “Calibrator_OnSite” is “true”. • Check for five-minute averages recorded by logger after five minutes have elapsed. • Collect two hours and thirty five minutes of data: thirty-one consecutive data points of
five-minute averages. The data point values should be above 300W/m2. Note: Solar Radiation values less than 300 W/m2 should not be used in the audit process if possible.
• Collect the calibration data (W/m2) and use the data interface display to access the measurements. Omit the first five-minute average. Instead use at least the last thirty values. Record the timestamp of the first average entered and the SR iForm (Figure 40) will populate the time values for consecutive measurements. Record the data on the SR Calibration iForm.
• Identify the correct transfer’s electronic certification form found on the root directory of the calibration flash drive. Make sure the certification form is complete and that the transfer’s ID number matches the ID number on the certification form. Place a copy of the electronic certification form in the site calibration folder on the calibration flash drive to be copied to the site laptop at the completion of the site audit.
• Record the Transfer SR sensor slope, intercept, ID number and calibration date on the SR Calibration iForm. The iForm will automatically correct the SR transfer values.
• The SR iForm will automatically calculate the maximum percent difference, and the percent difference of the two sensors at max insolation. If either exceeds 5 percent, the value will be flagged in the iForm and the site SR sensor must be adjusted.
• If weather conditions prohibit collection of peak level data, then the DMC may be contacted to determine whether the solar radiation system has been matching satellite data. Also, consult previous calibrations and audits to determine if any questions have arisen in regards to sensor accuracy.
• If all indications suggest proper sensor calibration and solar radiation levels are under 300 W/m2, do not adjust the system. If the accuracy of the system is questionable and the light levels are too low for adjustment, replace the system with a system that was calibrated at Wood.

FIELD CALIBRATIONS MANUAL Revision No. 13
October 2020 Page 54 of 82
FIELD CALIBRATIONS MANUAL Wood Environment & Infrastructure Solutions, Inc.
Figure 40. Solar Radiation Calibration Form

FIELD CALIBRATIONS MANUAL Revision No. 13
October 2020 Page 55 of 82
FIELD CALIBRATIONS MANUAL Wood Environment & Infrastructure Solutions, Inc.
Calibration/Adjustment
• Level and clean the site SR sensor as necessary. • Remove the site SR sensor translator housing cover. The site SR translator is located on
the data logger backplane (Figures 2 - 4, Section II.A.2, Subsection 3.2). • Remove the two screws that hold the translator PCB card in place. • Lift and fold the translator card out and down (from the top), out of the housing to
expose the gain potentiometer on the card’s backside. Use caution to avoid damaging the solder connection to the BNC bulkhead inside the translator housing (located at bottom left).
Note: Adjustment should ideally be performed at or above 700W/m2. If the system does not meet the calibration criteria, then adjust at the highest light levels possible, preferably at mid-day when readings are >400 W/m2. If daytime values are <400 W/m2 adjustment, decision is left to the calibrator’s professional discretion. The adjustment potentiometer is a gain potentiometer, so the higher the light level during the time of adjustment, the more accurate the calibration will be at all light levels.
• Adjust the gain potentiometer screw until the site sensor output is equal to the Corrected Transfer SR sensor value. The site solar radiation instantaneous value “solar_radiation” and “Transfer_SR” are found in the “3-Calibration” grid (Figure 41); however, the SR transfer value “Transfer_SR” displayed should be corrected to Corrected Transfer SR value for the best adjustment. To correct “Transfer_SR” to the actual SR value use the following formula: Corrected Transfer SR = (Transfer SR – Transfer Intercept) / (Transfer Slope) Eq. 1.
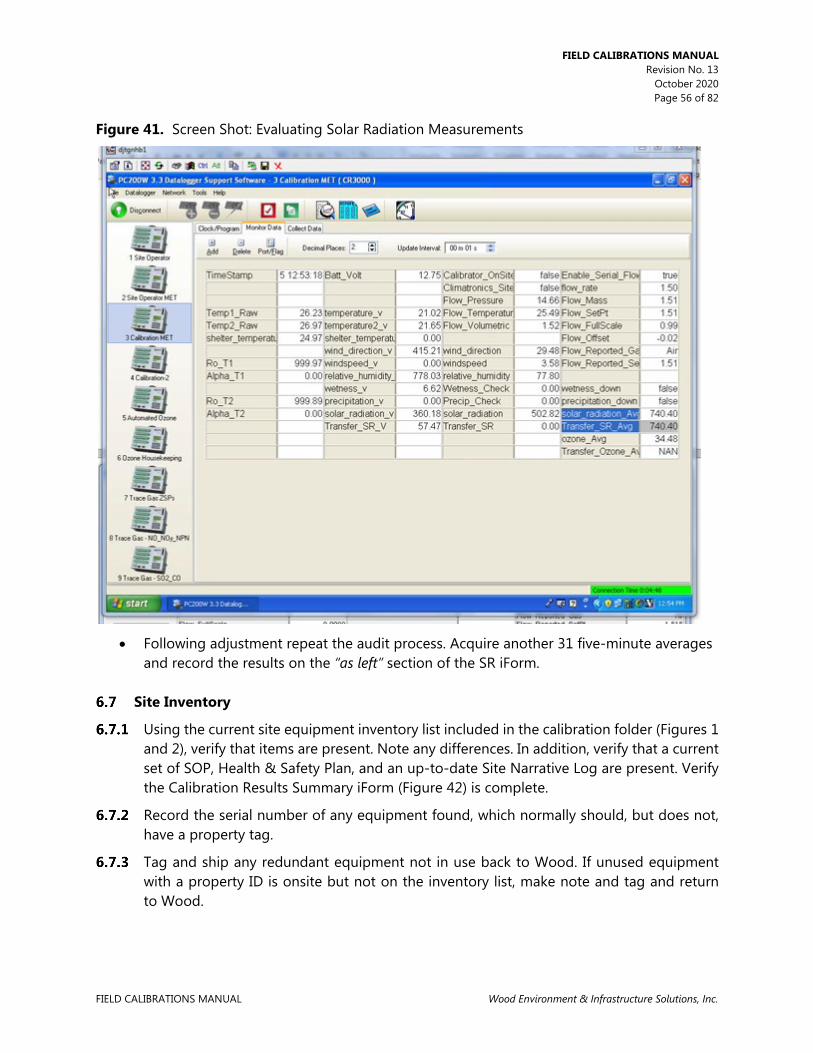
FIELD CALIBRATIONS MANUAL Revision No. 13
October 2020 Page 56 of 82
FIELD CALIBRATIONS MANUAL Wood Environment & Infrastructure Solutions, Inc.
Figure 41. Screen Shot: Evaluating Solar Radiation Measurements
• Following adjustment repeat the audit process. Acquire another 31 five-minute averages
and record the results on the “as left” section of the SR iForm.
Site Inventory
Using the current site equipment inventory list included in the calibration folder (Figures 1 and 2), verify that items are present. Note any differences. In addition, verify that a current set of SOP, Health & Safety Plan, and an up-to-date Site Narrative Log are present. Verify the Calibration Results Summary iForm (Figure 42) is complete.
Record the serial number of any equipment found, which normally should, but does not, have a property tag.
Tag and ship any redundant equipment not in use back to Wood. If unused equipment with a property ID is onsite but not on the inventory list, make note and tag and return to Wood.

FIELD CALIBRATIONS MANUAL Revision No. 13
October 2020 Page 57 of 82
FIELD CALIBRATIONS MANUAL Wood Environment & Infrastructure Solutions, Inc.
Figure 42. Calibration Results Summary Form
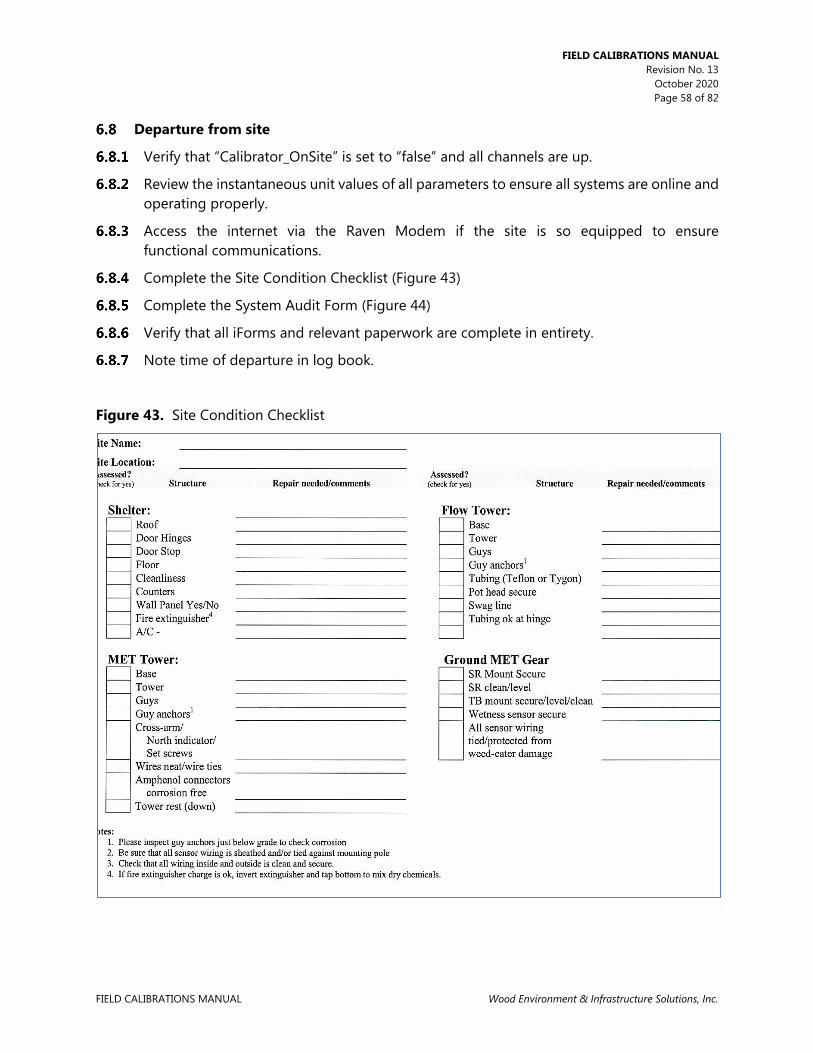
FIELD CALIBRATIONS MANUAL Revision No. 13
October 2020 Page 58 of 82
FIELD CALIBRATIONS MANUAL Wood Environment & Infrastructure Solutions, Inc.
Departure from site
Verify that “Calibrator_OnSite” is set to “false” and all channels are up.
Review the instantaneous unit values of all parameters to ensure all systems are online and operating properly.
Access the internet via the Raven Modem if the site is so equipped to ensure functional communications.
Complete the Site Condition Checklist (Figure 43)
Complete the System Audit Form (Figure 44)
Verify that all iForms and relevant paperwork are complete in entirety.
Note time of departure in log book.
Figure 43. Site Condition Checklist
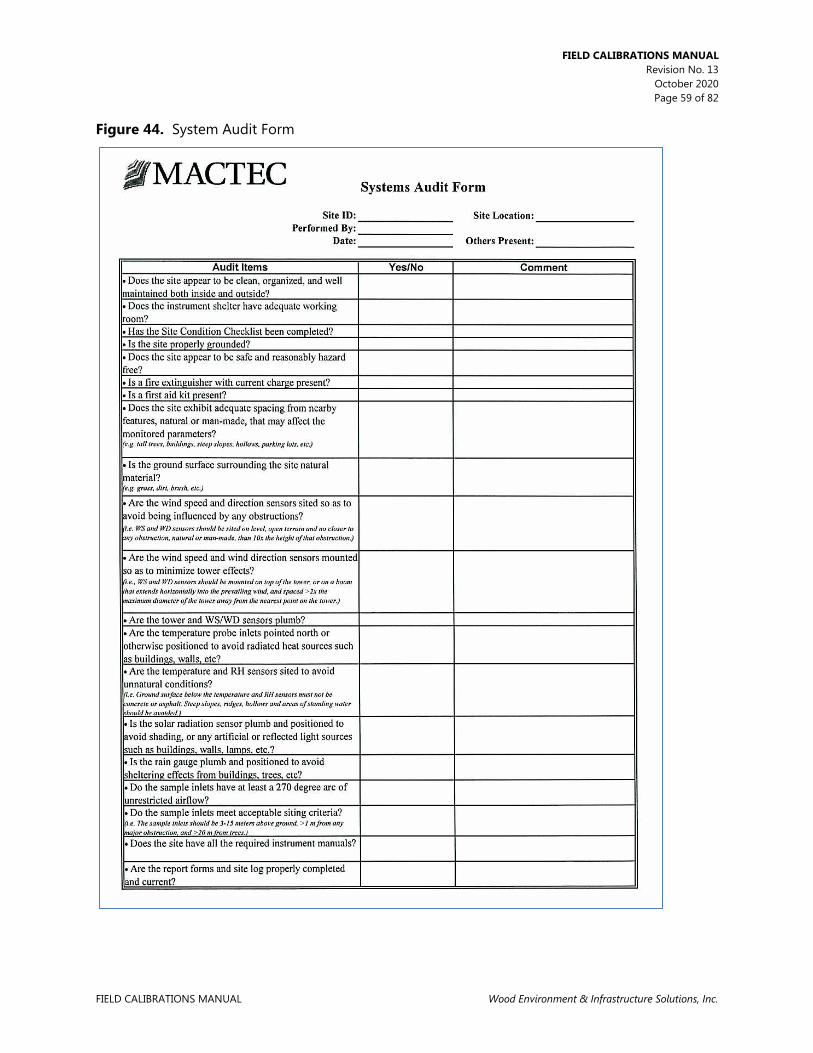
FIELD CALIBRATIONS MANUAL Revision No. 13
October 2020 Page 59 of 82
FIELD CALIBRATIONS MANUAL Wood Environment & Infrastructure Solutions, Inc.
Figure 44. System Audit Form

FIELD CALIBRATIONS MANUAL Revision No. 13
October 2020 Page 60 of 82
FIELD CALIBRATIONS MANUAL Wood Environment & Infrastructure Solutions, Inc.
REFERENCES
U.S. Environmental Protection Agency (EPA). 1994. Quality Assurance Handbook for Air Pollution Measurement Systems, Vol. I. A Field Guide to Environmental Quality Assurance. EPA/600/R-94/038a.
U.S. Environmental Protection Agency (EPA). 2008. Quality Assurance Handbook for Air Pollution
Measurement Systems, Vol. IV, Meteorological Measurements Version 2.0 (Final). EPA-454/B-08-002.
U.S. Environmental Protection Agency (EPA). 2017. Quality Assurance Handbook for Air Pollution
Measurement Systems, Vol. II, Ambient Air Quality Monitoring Program. EPA-454/B-17-001.
U.S. Environmental Protection Agency (EPA). 2000. Meteorological Monitoring Guidance for
Regulatory Modeling Applications. EPA-454/R-99-005. U.S. Environmental Protection Agency (EPA). 2013. Transfer Standards for the Calibration of
Ambient Air Monitoring Analyzers for Ozone. Technical Assistance Document. EPA-454/B-13-004.
U.S. Environmental Protection Agency (EPA). 2019. Appendix A to Part 58 – Quality Assurance
Requirements for State and Local Air Monitoring Stations (SLAMS), Special Purpose Monitors (SPMs), and Prevention of Significant Deterioration (PSD) Air Monitoring. 40 CFR Part 58.

FIELD CALIBRATIONS MANUAL Revision No. 13
October 2020 Page 61 of 82
FIELD CALIBRATIONS MANUAL Wood Environment & Infrastructure Solutions, Inc.
FIGURES
Figure 1. Site Inventory List Figure 2. Site Information Form Figure 3. Screen Shot Indicating Calibrator is Onsite Figure 4. O
3 Transfer Standard Figure 5. Flow Transfer Standard Figure 6. Data Logger Calibration Form Figure 7. Screen Shot Indicating all Sensor Channels are down Figure 8a. Connection to Voltage Supply Figure 8b. Connection to Voltage Supply Figure 9. O
3 Transfer Sample Tubing Figure 10. O
3 Analyzer Display Figure 11. Air Compressor Figure 12. Screen Shot: Automated O
3 Page Figure 13. Screen Shot Indicating O
3 Channel is down Figure 14. Screen Shot Indicating O
3 Transfer is warming up Figure 15. Ozone Calibration Form Figure 16. Line Loss Tubing Figure 17. O
3 Analyzer Display of Cell Pressure Figure 18. Screen Shot Indicating Average Slope from Audit Results Figure 19. Screen Shot Indicating Intercept Value from Audit Results Figure 20. Screen Shot Indicating ZSP is Running Figure 21. Flow Calibration Form Figure 22. Screen Shot: Full Scale and Offset (Zero) Values Figure 23. Screen Shot: Flow Controller Data Display Figure 24. Lowering Flow Tower Figure 25a. Flow Transfer Tubing Connected at Pot Head Figure 25b. Flow Transfer Tubing Connected at Flow Calibrator Figure 26. Definer Data Display Figure 27. Definer Setup Readings Figure 28. MFC Data Exhibit Figure 29. Screen Shot: Flow Set Point Figure 30. Screen Shot: Reestablishing O
3 and Flow Sampling Figure 31. Screen Shot: Checking Precipitation Sensor Figure 32. Precipitation Calibration Form Figure 33. Screen Shot: Checking Wetness Sensor Figure 34. Wetness Sensor Figure 35. Temperature Calibration Form Figure 36. Screen Shot: Auditing Temperature Sensors Figure 37. Screen shot: Evaluating Temperature Measurements Figure 38. Wind Calibration Form

FIELD CALIBRATIONS MANUAL Revision No. 13
October 2020 Page 62 of 82
FIELD CALIBRATIONS MANUAL Wood Environment & Infrastructure Solutions, Inc.
Figure 39. Relative Humidity Calibration Form Figure 40. Solar Radiation Calibration Form Figure 41. Screen Shot: Evaluating Solar Radiation Measurements Figure 42. Calibration Results Summary Form Figure 43. Site Condition Checklist Figure 44. System Audit Form

FIELD CALIBRATIONS MANUAL Revision No. 13
October 2020 Page 63 of 82
FIELD CALIBRATIONS MANUAL Wood Environment & Infrastructure Solutions, Inc.
APPENDICES
Appendix A – Magnetic Declination Adjustments Appendix B – Instructions for Photo Documentation of CASTNET Monitoring Stations Appendix C – Nafion Dryer Install
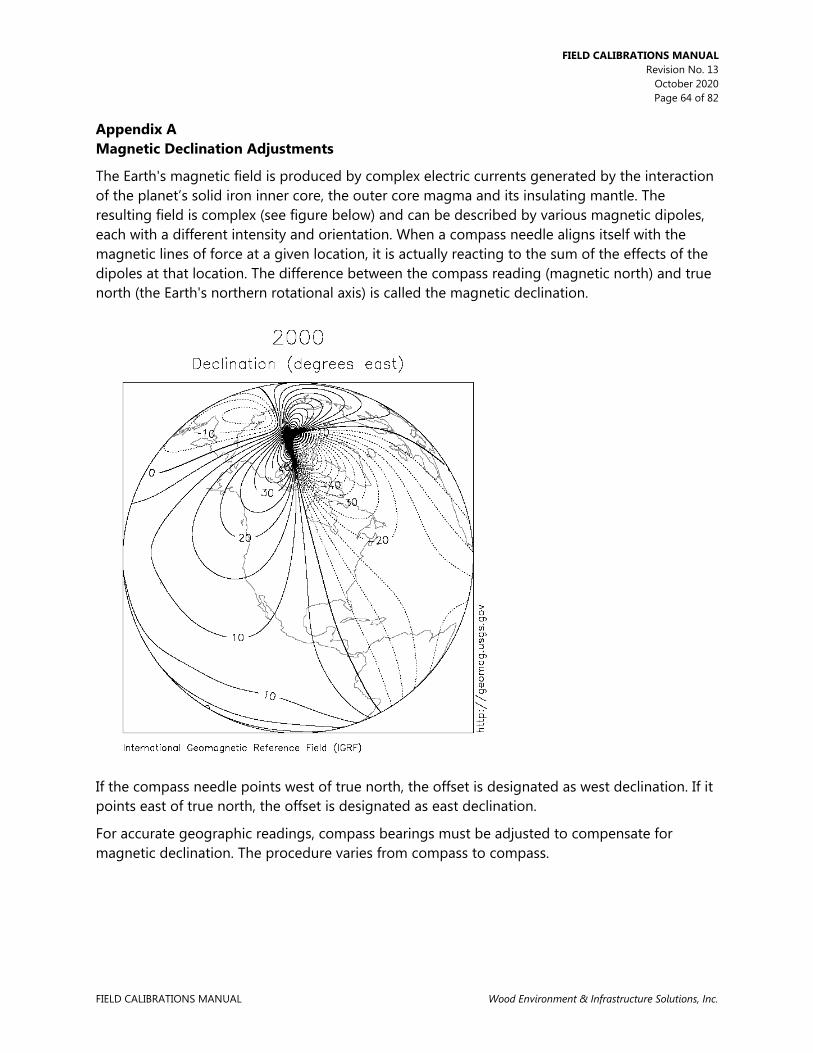
FIELD CALIBRATIONS MANUAL Revision No. 13
October 2020 Page 64 of 82
FIELD CALIBRATIONS MANUAL Wood Environment & Infrastructure Solutions, Inc.
Appendix A Magnetic Declination Adjustments
The Earth's magnetic field is produced by complex electric currents generated by the interaction of the planet’s solid iron inner core, the outer core magma and its insulating mantle. The resulting field is complex (see figure below) and can be described by various magnetic dipoles, each with a different intensity and orientation. When a compass needle aligns itself with the magnetic lines of force at a given location, it is actually reacting to the sum of the effects of the dipoles at that location. The difference between the compass reading (magnetic north) and true north (the Earth's northern rotational axis) is called the magnetic declination.
If the compass needle points west of true north, the offset is designated as west declination. If it points east of true north, the offset is designated as east declination.
For accurate geographic readings, compass bearings must be adjusted to compensate for magnetic declination. The procedure varies from compass to compass.

FIELD CALIBRATIONS MANUAL Revision No. 13
October 2020 Page 65 of 82
FIELD CALIBRATIONS MANUAL Wood Environment & Infrastructure Solutions, Inc.
For the Brunton compass, CASTNET procedure is to leave the compass ring with the index pin at north on the dial and 0° on the alignment ring and add or subtract according to the site location’s known declination. In the example below the index pin is aligned with true north and the compass needle is pointed toward magnetic north at a site with 15° east magnetic declination (counterclockwise | add‡):
‡ i.e., add to magnetic compass reading to find true (azimuth) geographic direction. In the example provided, magnetic north is at 345° and true north is +15° away at 0°.

FIELD CALIBRATIONS MANUAL Revision No. 13
October 2020 Page 66 of 82
FIELD CALIBRATIONS MANUAL Wood Environment & Infrastructure Solutions, Inc.
In the next example the index pin is aligned with true north and the compass needle is pointed toward magnetic north at a site with 15° west magnetic declination (clockwise | subtract):

FIELD CALIBRATIONS MANUAL Revision No. 13
October 2020 Page 67 of 82
FIELD CALIBRATIONS MANUAL Wood Environment & Infrastructure Solutions, Inc.
When performing wind direction calibrations, the compass reading will show the expected magnetic declination when the cross-arm is aligned with the sight line on the mirror and if the cross-arm is properly aligned with true north. The cross arm at each CASTNET site should be aligned with true north-south. See the figure below for an example of correct cross-arm alignment at a site with 10° west magnetic declination:
Cross-arm with correct orientation to true north-south

FIELD CALIBRATIONS MANUAL Revision No. 13
October 2020 Page 68 of 82
FIELD CALIBRATIONS MANUAL Wood Environment & Infrastructure Solutions, Inc.
The figure below shows an example of incorrect cross-arm alignment at a site with 10° west magnetic declination. In this example the cross-arm requires adjustment 5° toward the west to be properly aligned with true north.

FIELD CALIBRATIONS MANUAL Revision No. 13
October 2020 Page 69 of 82
FIELD CALIBRATIONS MANUAL Wood Environment & Infrastructure Solutions, Inc.
Appendix B Instructions for Photo Documentation of CASTNET Monitoring Stations
Verify that there is sufficient memory available on the memory card for recording the site photographs – nominally 300 megabytes (MB), which will allow for extra photo documentation of site problems, if any. See the last page - “Photos 2–17 (Directional Photos used for Panorama)” - before taking photos.
1) Take photographs during daylight hours. Do not take photos during precipitation events (rain, snow, fog, etc.).
2) Photo 1, site ID card: Remove site ID card from the calibration folder. Place it between the top of the door and the door jam, and close door, so that the ID card is held in place at the top of the door.
3) Set up and level the camera/tripod assembly at a position 8–10 meters directly in front of the shelter door. Take photograph number 1 (see Table 1, Photo Documentation Worksheet) facing the door. Make sure the site ID card is visible. Move closer if it is not legible from that distance. Be sure to fill out the worksheet.
4) For the remaining directional photographs (photos 2–17), do not focus the camera on the white monitoring shelter as this will cause a “bleaching” of other areas of the photograph.
5) IMPORTANT: Set up and LEVEL the camera/tripod assembly at a position 25–40 meters south, about 180° from the shelter pointed at 0° (north). Prior to taking the photographs, verify that all vehicles (including yours) will not be in the frame. If it is not possible to take the directional photographs directly south of the shelter (obstructions, landscape, would result in non-representative pictures, etc.) indicate in the comments of the Photo Documentation Worksheet and on the site sketch the location where the pictures were taken. (e.g., 35 meters northeast of shelter). In all cases, begin directional photographs facing 0° (north). Take photograph number 2 (see Table 1), then advancing in 22.5° increments, swivel the camera clockwise taking photographs 3 through 17.
6) Photo 18, view behind the shelter: This should be taken while you are standing behind the shelter, on the same radial used to photograph the shelter. This photograph will provide coverage of the area obscured by the shelter in the series of directional photographs.
7) Photo 19: shelter 8) Photo 20, flow tower: Pictures should be taken with the camera turned to vertical
format to include the full vertical length of the tower. If a meteorological tower is present, include both towers in the frame. If the towers are too far separated for this to be practical, include a photograph of the meteorological tower in frames A–Z.
9) Photos 21–27, inside the shelter and exterior of shelter door: Include the entire area stated. These pictures are used frequently for troubleshooting.
10) Photo 28: Include a picture of the site operator (and backup operator) if possible.

FIELD CALIBRATIONS MANUAL Revision No. 13
October 2020 Page 70 of 82
FIELD CALIBRATIONS MANUAL Wood Environment & Infrastructure Solutions, Inc.
11) A–Z: Within reason, take as many photographs as may be necessary to document site or equipment-related problems. These pictures are not submitted to EPA, but are critical for future troubleshooting to verify pneumatic connections, wiring, placement, etc., and as such, should be as detailed as possible to convey this information.
12) Photo 29, Scenic photo of the general area: Additional scenic photographs can be recorded in frames A–Z. These photos are frequently used in reports. Please include the shelter and towers that are not leaning, and omit vehicles and people.
13) Photo 30, site ID card: photograph it again to show the end of the series of photographs
It is extremely important that the photos be taken in the order listed. On completion of the photo documentation procedures, review the frames on the camera viewer to verify that each photograph is clear, representative of site conditions, and in accordance with Table 1.
Before leaving the site, use Figure 1 to produce a reasonably accurate plan drawing of the CASTNET site out to approximately 50 yards radius. This drawing will be useful in correlating photographs with site layout. See Figure 2 (Sample Site Plan Field Sketch) for an example.

FIELD CALIBRATIONS MANUAL Revision No. 13
October 2020 Page 71 of 82
FIELD CALIBRATIONS MANUAL Wood Environment & Infrastructure Solutions, Inc.
Table 1: Photo Documentation Worksheet Site Name and Number: Calibrator: Date:
Photo Taken? Check for Yes
Frame Number Direction Azimuth Comments
1 Site ID card 2 North 0° 3 North Northeast 22° 4 Northeast 45° 5 East Northeast 67° 6 East 90° 7 East Southeast 112° 8 Southeast 135° 9 South Southeast 157° 10 South 180° 11 South Southwest 202° 12 Southwest 225° 13 West Southwest 247° 14 West 270° 15 West Northwest 292° 16 Northwest 315° 17 North Northwest 337° 18 View behind shelter 19 Shelter 20 Tower (incl. met if applicable) Inside Shelter 21 Left 22 Center 23 Right 24 Ceiling 25 Floor 26 Door inside 27 Door outside 28 Site operator Photos of any equipment or conditions you feel should be brought to the attention of Wood A Compressor & canisters B Back of ozone analyzer C Back of ozone transfer D Pothead (ozone & filter pack inlets) E Logger and Communications
Backplanes
F NADP AMoN bucket G NADP rain gauge H NADP precip collector I J K L M N O 29 Scenic view of site 30 Site ID card (again)

FIELD CALIBRATIONS MANUAL Revision No. 13
October 2020 Page 72 of 82
FIELD CALIBRATIONS MANUAL Wood Environment & Infrastructure Solutions, Inc.
Figure 1. CASTNET Site Plan Drawing – Field Sketch (use the air sampling tower as the mid-point of the sketch)
5 10 15 20 25 30 35 40 45 50 yards5 10 15 20 25 30 35 40 45 50 yards
Air Sampling (Filter Pack) Tower
meters

FIELD CALIBRATIONS MANUAL Revision No. 13
October 2020 Page 73 of 82
FIELD CALIBRATIONS MANUAL Wood Environment & Infrastructure Solutions, Inc.
Figure 2. Sample CASTNET Site Plan Drawing – Field Sketch (air sampling tower is mid-point of the sketch)
5 10 15 20 25 30 35 40 45 50 yards
Access Road (Gravel)
Pine TreesApprox. 20 feet high
Oak TreesApprox. 50 feet high
Shed
Fence Line
Open Pasture
Bean Field
Low Scrub
5 10 15 20 25 30 35 40 45 50 yards5 10 15 20 25 30 35 40 45 50 yards
Access Road (Gravel)
Pine TreesApprox. 20 feet high
Oak TreesApprox. 50 feet high
Shed
Fence Line
Open Pasture
Bean Field
Low Scrub
Air Sampling (Filter Pack) Tower
meters
Photo location
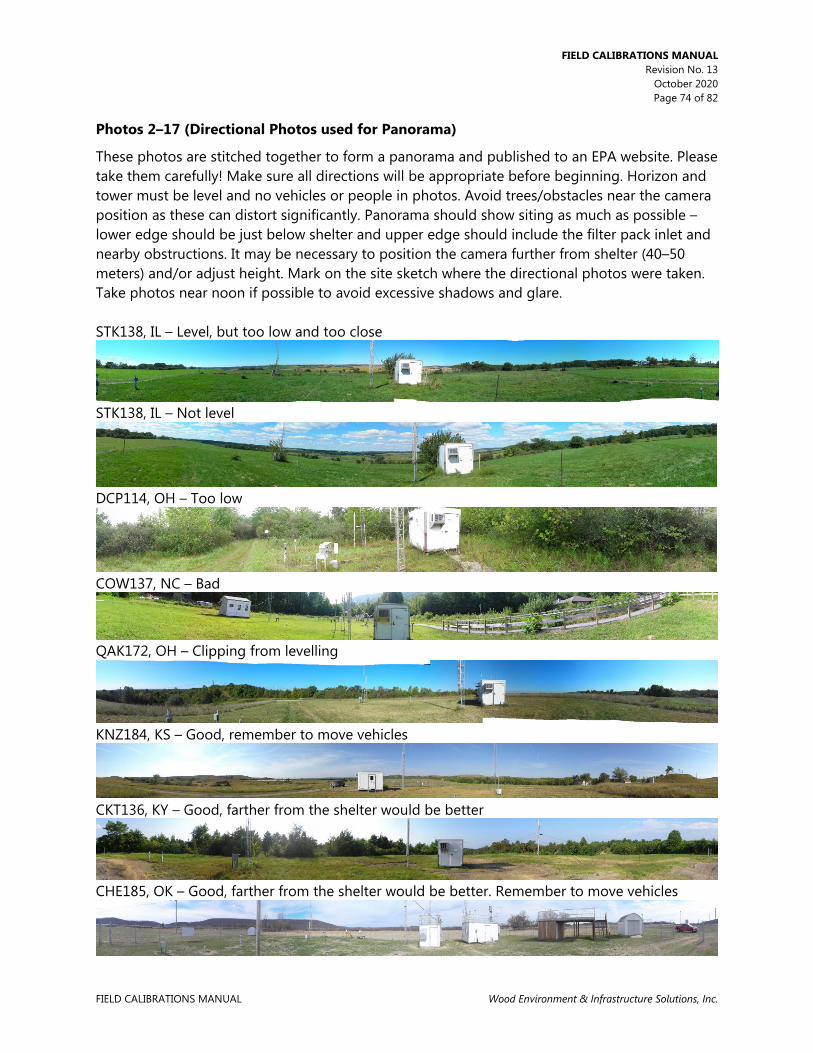
FIELD CALIBRATIONS MANUAL Revision No. 13
October 2020 Page 74 of 82
FIELD CALIBRATIONS MANUAL Wood Environment & Infrastructure Solutions, Inc.
Photos 2–17 (Directional Photos used for Panorama)
These photos are stitched together to form a panorama and published to an EPA website. Please take them carefully! Make sure all directions will be appropriate before beginning. Horizon and tower must be level and no vehicles or people in photos. Avoid trees/obstacles near the camera position as these can distort significantly. Panorama should show siting as much as possible – lower edge should be just below shelter and upper edge should include the filter pack inlet and nearby obstructions. It may be necessary to position the camera further from shelter (40–50 meters) and/or adjust height. Mark on the site sketch where the directional photos were taken. Take photos near noon if possible to avoid excessive shadows and glare. STK138, IL – Level, but too low and too close
STK138, IL – Not level
DCP114, OH – Too low
COW137, NC – Bad
QAK172, OH – Clipping from levelling
KNZ184, KS – Good, remember to move vehicles
CKT136, KY – Good, farther from the shelter would be better
CHE185, OK – Good, farther from the shelter would be better. Remember to move vehicles

FIELD CALIBRATIONS MANUAL Revision No. 13
October 2020 Page 75 of 82
FIELD CALIBRATIONS MANUAL Wood Environment & Infrastructure Solutions, Inc.
Appendix C Nafion Dryer Install
When the CASTNET ozone (O 3) analyzers are subject to excessive amounts of moisture in their
ambient air sample stream, they exhibit a slower than normal response and suffer repeated failing quality assurance/quality control checks. In an effort to remove and prevent moisture in the ambient air sample from reaching the analyzer, AMEC will be installing approved Nafion dryers in the sample line.
Nafion is a selectively permeable material that can be used to remove water vapor from a gas stream. The sample gas will flow through the Nafion tubing while a purge/bypass gas stream will flow counter-current to the sample stream and subsequently remove the water vapor from the sample stream.
After the as found O 3 multipoint audit, as found O
3 leak test, and as found sample line loss test have been performed, the Nafion dryer can be installed.
The Nafion dryer at CASTNET O 3 sites will be installed in the sample line after the knockout (KO)
bottle before the sample line enters the analyzer. It is important that liquid water does not come in contact with the Nafion material. IT IS ALSO VERY IMPORTANT NOT TO OVERTIGHTEN THE FITTINGS as the inner Nafion tube can easily become twisted or kinked.
Each dryer will have a bypass flow orifice and balston filter pre-installed. The grey push-connect flow orifice ensures that the bypass flow pressure is less than that of the sample pressure. When installing the dryer, note that the run side of each tee on the dryer connects to the O
3 sample line. The existing O
3 sample line will be connected directly to the drier and approximately 1 additional meter will be added to connect the other side of the dryer to the O
3 analyzer sample in port. The branch sides of the dryer's tees are for the bypass or purge gas flow. One branch will have the balston filter and orifice preinstalled. The other tee's branch will be connected to the flow pump.
Use the provided 1/4" Teflon tubing to connect the branch side of the tee on the dryer to the existing Thomas flow pump. A brass union tee with 1/8"mpt fitting is provided to replace the existing inlet union on the Thomas flow pump. The flow pump will be used for both the existing filter pack system and the new Nafion dryer bypass flow. There will be no changes to the filter pack system or flow audit procedures. Note that by using this pump as the bypass/purge air for the Nafion dryer, if the flow pump is turned off, the ozone analyzer will be sampling as usual and the Nafion will not be drying the sample air. The flow pump must be turned on for the Nafion to perform as a dryer. Use the provided red electrical tape to mark both ends of the bypass/purge gas line that goes from the dryer branch tee to the Thomas flow pump. This is to distinguish the filter pack flow tubing from the Nafion dryer bypass flow tubing.
Once the dryer is installed an as left O 3 leak check, sample line loss test, and as left multipoint
audit will need to be performed.
Make sure to keep tubing as clean as possible. The included mounts are to be screwed to the shelter paneling. Using zip ties, attach the dryer to the mounts in a clean, professional manner.

FIELD CALIBRATIONS MANUAL Revision No. 13
October 2020 Page 76 of 82
FIELD CALIBRATIONS MANUAL Wood Environment & Infrastructure Solutions, Inc.
On the following pages example of properly installed Nafion dryers can be seen
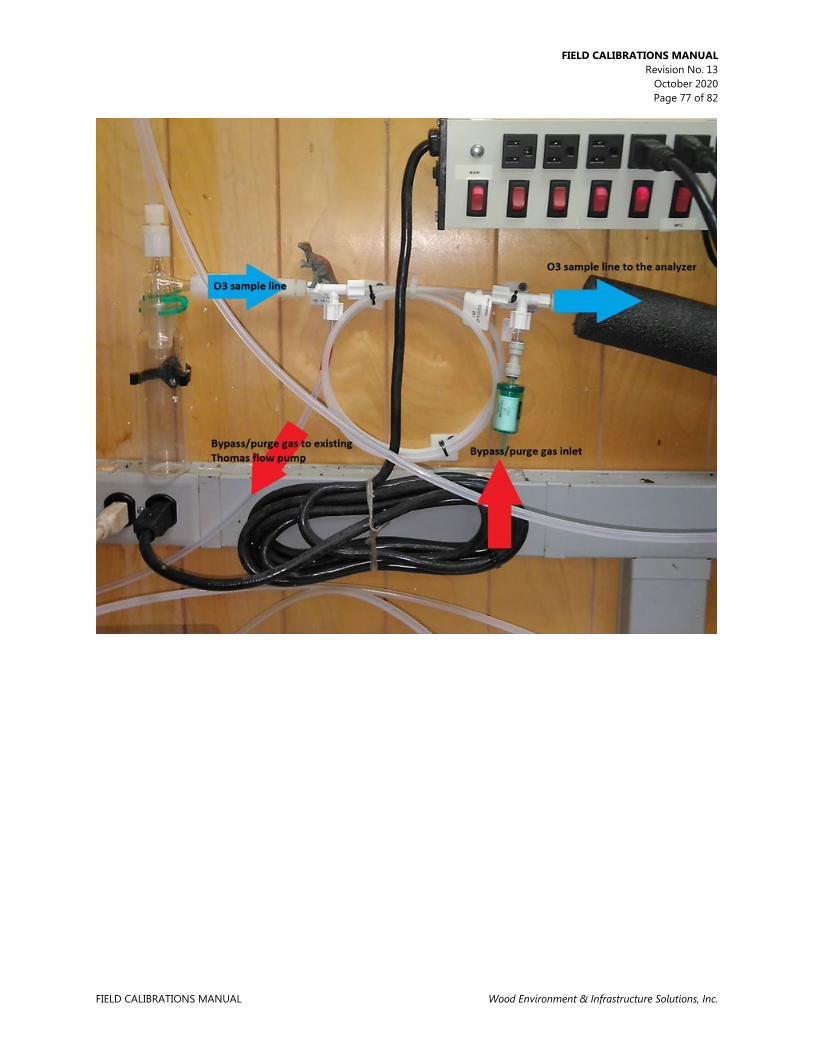
FIELD CALIBRATIONS MANUAL Revision No. 13
October 2020 Page 77 of 82
FIELD CALIBRATIONS MANUAL Wood Environment & Infrastructure Solutions, Inc.

FIELD CALIBRATIONS MANUAL Revision No. 13
October 2020 Page 78 of 82
FIELD CALIBRATIONS MANUAL Wood Environment & Infrastructure Solutions, Inc.

FIELD CALIBRATIONS MANUAL Revision No. 13
October 2020 Page 79 of 82
FIELD CALIBRATIONS MANUAL Wood Environment & Infrastructure Solutions, Inc.
ATTACHMENTS

FIELD CALIBRATIONS MANUAL Revision No. 13
October 2020 Page 80 of 82
FIELD CALIBRATIONS MANUAL Wood Environment & Infrastructure Solutions, Inc.
Attachment 1

FIELD CALIBRATIONS MANUAL Revision No. 13
October 2020 Page 81 of 82
FIELD CALIBRATIONS MANUAL Wood Environment & Infrastructure Solutions, Inc.
Attachment 2

FIELD CALIBRATIONS MANUAL Revision No. 13
October 2020 Page 82 of 82
FIELD CALIBRATIONS MANUAL Wood Environment & Infrastructure Solutions, Inc.
Attachment 3


SMALL FOOTPRINT FILTER PACK SITE INSTALLATION Revision No. 1
October 2018 Page 2 of 13
SMALL FOOTPRINT INSTALLATION Wood Environment & Infrastructure Solutions, Inc.
III. FIELD CALIBRATION MANUAL ATTACHMENT: SMALL FOOTPRINT FILTER PACK SITE INSTALLATION
PURPOSE
The purpose of this Standard Operating Procedure (SOP) is to provide consistent guidance for installation and calibration of a small footprint filter pack sampling site. This SOP is designed to be used by the Clean Air Status and Trends Network (CASTNET) Field Calibration Laboratory and field personnel.
SCOPE
Applies to all CASTNET sites operating a filter pack sampling system without an enclosed shelter.
SUMMARY
Small footprint sites are defined as monitoring sites without an enclosed shelter. This document describes the procedures and equipment for installation, calibration and normal operation of a CASTNET small footprint monitoring site.
MATERIALS AND SUPPLIES
A complete site parts list is maintained in the Field Calibration Laboratory. The following materials and supplies are required for auditing the site: • National Institute of Standards and Technology (NIST) traceable flow transfer standard • NIST traceable temperature transfer standard • Temperature water bath (insulated container, stir plate, ice, water heater) • Certified multi-meter The following materials and supplies are required for acceptance testing: • Adjustable flow restriction (e.g., needle valve or flow controller)
SAFETY
Electrical Shock – Always ensure equipment is disconnected or power is turned off at the outlet before performing any wiring tasks. Weather – Always review weather forecasts before arriving onsite to reduce the risk of being trapped onsite by severe weather. If weather conditions prevent working safely onsite, leave the site and return when conditions have improved. Tower Safety – The tilt down flow tower is NOT designed to be climbed. NEVER climb the tower. Use care when raising and lowering the tower to ensure the folding section does not fall out of control. NEVER erect the tower during installation without help.

SMALL FOOTPRINT FILTER PACK SITE INSTALLATION Revision No. 1
October 2018 Page 3 of 13
SMALL FOOTPRINT INSTALLATION Wood Environment & Infrastructure Solutions, Inc.
PROCEDURE
Acceptance Testing
Upon receipt of the major components at the field calibration laboratory, use the following procedures to verify proper operation before the equipment is installed in a field setting.
6.1.1 Mass Flow Controller (MFC)
a) Configure the MFC settings as described in Section 6.2.2 b) Connect the MFC to a data logger using the following connections (See Section 6.3.1.4):
o Red wire to C1 o Yellow wire to C2 o Blue wire to 12V o Purple wire to G
c) Calibrate the MFC using the standard 6 point procedure as described in the CASTNET Quality Assurance Project Plan (QAPP Appendix 1 Field SOP, Section III Field Calibration Manual, 6.15 Flow) and (QAPP Appendix 1 Field SOP, Section IV Calibration Laboratory, C Site Instrumentation, 4 Mass Flow Controller)
d) Verify all points audited are within 2% of expected e) Include a copy of the acceptance testing form with the MFC
6.1.2 Pump
a) Connect the pump to the suction output of a flow meter with a range of at least 20 lpm, with an inline restriction and pressure gage as shown in Figure 1. Measure and record the flow rate and operating pressure at the pump maximum flow rate.
b) Adjust the needle valve or similar adjustable restriction between the flow meter and pump, adjust the flow rate to obtain at least three additional flow rates and operating pressures, including one point at the intended set point of the site (1.5 or 3.0 lpm).
c) Close the adjustable restriction fully and record the maximum pump vacuum at zero flow as a final point.
d) Using the measured test points, generate a pump curve similar to Figure 2 and compare to the manufacturers supplied pump curve. In addition, verify the operating load for the MFC at the target set point and the operating pressure at the target flow rate is greater than 4 in Hg. The target set point is the difference between the expected operating pressure at the site and site ambient pressure minus 2 in Hg.

SMALL FOOTPRINT FILTER PACK SITE INSTALLATION Revision No. 1
October 2018 Page 4 of 13
SMALL FOOTPRINT INSTALLATION Wood Environment & Infrastructure Solutions, Inc.
Figure 1. Pump Test Pneumatic Setup
Figure 2. Pump Curve

SMALL FOOTPRINT FILTER PACK SITE INSTALLATION Revision No. 1
October 2018 Page 5 of 13
SMALL FOOTPRINT INSTALLATION Wood Environment & Infrastructure Solutions, Inc.
6.1.3 Data logger
a) Audit the temperature voltage channel (SE2) as described in QAPP Appendix 1 Field SOP, Section III Field Calibration Manual, 6.2 Data Logger
b) Verify the connected MFC receives data and is able to update the MFC set point using Com1 (C1/C2)
c) Verify control port 3 (C3) is functioning by ensuring the ‘Door_Open’ parameter corresponds to the door position.
d) Verify control port 4 (C4) is functioning by ensuring the relay is closed when ‘Pump_ON’ is set to True and open when ‘Pump_ON’ is set to False.
e) Verify the 12V port is functioning by ensuring the Raven and MFC are powered when the data logger is powered.
6.1.4 Temperature
a) Adjust the zero potentiometer until the sensor reads 0ºC±0.2ºC in an ice bath. (See QAPP Appendix 1 Field SOP, Section IV Calibration Laboratory, C Site Instrumentation, c. temperature.
b) Adjust the span potentiometer until the sensor reads within 0.2ºC of the transfer standard near 50ºC.
c) Repeat steps a and b until no further adjustments are required d) Blend the 50ºC and 0ºC temperature baths to generate three additional points spaced
across the range.
Configuration
6.2.1 Cellular Modem
Because the small footprint sites do not utilize an Ethernet network, the incoming connection to the cellular modem must be passed to the serial port of the data logger. Connections to the data logger can be made from a local computer by connecting to the cellular modem’s WiFi access point. Instructions for configuring the cellular modem for these uses are described in the Cellular Modem Configuration Instructions included on the USB drive in the calibration kit.
6.2.2 MFC
The mass flow controller must be configured to use serial communications for the flow set point. From the main display, press the lower right hand soft key (may say ‘Mode’). Then press the top center soft key labeled ‘Control Setup’ or ‘Select’. Press top right soft key labeled ‘Input’ until the caret ‘>’ is next to ‘Serial’. Press the bottom right soft key twice to return to the main display. See QAPP Appendix 1 Field SOP, Section III Field Calibration Manual, 6.4 Flow.
Set-Up/Installation
6.3.1 Site Preparation
Before arriving onsite for installation, perform the following tasks:

SMALL FOOTPRINT FILTER PACK SITE INSTALLATION Revision No. 1
October 2018 Page 6 of 13
SMALL FOOTPRINT INSTALLATION Wood Environment & Infrastructure Solutions, Inc.
6.3.1.1 Pour the Concrete for the Tower Base
For the Aluma Tower AT-516B 10 meter tilt-down tower that will typically be used, a minimum pad size of 18" square by the greater of 2 feet or to the local frost line is needed. The larger capacity Aluma Tower AT-516D requires a minimum pad size of 30" square and the greater of 2 feet or to the local frost line. The frost line for the area can be determined by calling a local construction contractor. If possible, contact a local contractor to pour and set the concrete footer for the tower before arriving onsite for the equipment installation. Six 3/8" diameter anchor bolts must be embedded a minimum depth of 12" to secure the tower base plate. The base plate should be used to position the bolts. For the larger capacity tower, use six (6), 1/2" diameter bolts embedded to a minimum depth of 16".
6.3.1.2 Install Electrical Supply
Contact a local certified electrical contractor to install an electrical connection (with a minimum of 5A capacity if shared circuit) within two feet of the tower pad. The outlet must be weatherproof while in-use. Note: Low power installations will not need the connection.
6.3.1.3 Coordinate with Field Site Operator
Contact the field site operator and coordinate a time to meet onsite after installation is completed for training.
6.3.1.4 Assemble and pre-wire enclosure
Install the data logger, cellular modem, flow pump, rotameter and MFC as shown in the following Figures 3 and 4. The major component locations are identical for both the small footprint and low power sites. Figure 3. Enclosure Figure 4. Low Power Enclosure

SMALL FOOTPRINT FILTER PACK SITE INSTALLATION Revision No. 1
October 2018 Page 7 of 13
SMALL FOOTPRINT INSTALLATION Wood Environment & Infrastructure Solutions, Inc.
Connect the equipment according to the wiring diagram (Figure 5) shown below for the small footprint site. Figure 5. Wiring Diagram

SMALL FOOTPRINT FILTER PACK SITE INSTALLATION Revision No. 1
October 2018 Page 8 of 13
SMALL FOOTPRINT INSTALLATION Wood Environment & Infrastructure Solutions, Inc.
Connect the equipment according to the wiring diagram (Figure 6) for the low power site. Figure 6. Low Power Data Logger Connections

SMALL FOOTPRINT FILTER PACK SITE INSTALLATION Revision No. 1
October 2018 Page 9 of 13
SMALL FOOTPRINT INSTALLATION Wood Environment & Infrastructure Solutions, Inc.
Figure 7. Low Power Enclosure Diagram
6.3.2 Tower Installation
• Assemble the tower sections horizontally with the base near the concrete pad and clearance overhead to later raise the tower.
• Attach the following equipment to tower: o Flow tubing o Temperature wiring o Antenna cable o Upper guy wires
• Erect tower At least two people are required to erect the tower. Align two legs of the tower with two of the supports in the tower base. Ensure the base is securely attached to the concrete pad and level. While one person holds the tower legs aligned with the base plate, ‘walk’ the tower upright. Once all three tower legs are in the base plate, immediately secure the legs with the provided bolts and lock nuts. DO NOT release the tower until the legs are completely secured.

SMALL FOOTPRINT FILTER PACK SITE INSTALLATION Revision No. 1
October 2018 Page 10 of 13
SMALL FOOTPRINT INSTALLATION Wood Environment & Infrastructure Solutions, Inc.
• Install ground anchors Install the ground anchors as closely as possible to the following diagram. Occasionally, it is necessary to move the anchors slightly because of landscape (e.g., rocks, grade, etc). Verify the tower will be able to tilt without interfering with the front guy wire. The front anchor might have to be moved slightly offset from center and slightly closer to the tower base. Tilt the tower to the correct position to use as a guide.
• Attach lower guy wire attachment Attach the guy wires to the ground anchors using the supplied turnbuckles (fully loosened) and wire clamps. Flag the wires if they are near walking paths. Tighten the turnbuckles to level the tower vertically in all directions. The intended tension in the guy wire is around 200 lbs. While an exact measurement is not important, there should be no slack in any wire and they should offer strong resistance to pressure from the side. Note: The guy wires will stretch slightly and the turnbuckles may have to be loosened and reattached.
• Attach remaining equipment to tower o Enclosure o Pot head with wind generator o Temperature Shield o Antenna o Battery Enclosure
• Connect flow tubing and temperature wiring – See Figure 5. • Connect antenna • Standard Installations
o Connect main power supply to surge suppression terminals – See Figure 5 o Connect main power supply to outlet Ensure the outlet is weatherproof while in-use and GFCI protected.
Low Power Installations o Install the solar panel facing due south (not magnetic south) o Tilt the angle of the panel according to the location, between 25 and 50 degrees.
A steeper tilt is needed in northern locations and a shallower tilt is needed in southern locations. Likewise, a steeper tilt is needed during winter months and a shallower tilt is needed in summer months.
o Record the estimated tilt angle to be verified and seasonally adjusted during the semi-annual audit.
o Connect the output of the solar panels to the charge controller. o Connect the output of the charge controller to the battery bank. o Connect the output of the wind generator directly to the battery bank. A separate
charge controller is not needed.

SMALL FOOTPRINT FILTER PACK SITE INSTALLATION Revision No. 1
October 2018 Page 11 of 13
SMALL FOOTPRINT INSTALLATION Wood Environment & Infrastructure Solutions, Inc.
o Connect the positive and negative terminals of the battery bank to the data logger power supply input.
o Connect the output monitoring leads from the negative (-) terminal of the solar charge controller and the negative output of the solar panel to the data logger terminals 2H and 2L as shown in Figures 5, 6 and 7.
o Connect the output monitoring leads from the negative (-) terminal of the battery bank and the negative output of the wind generator to the data logger terminals 3H and 3L
• Perform equipment audit as described in section 6.5
Operation
6.4.1 Data Logger Data Access
• From a blank screen, press any soft key to light the display. • From the main screen, press the Enter soft key. • With the > next to Data, press the Enter soft key. • Enter the Security Code, and press the Enter soft key. • With the > next to Real Time Tables, press the Enter soft key. • With the > next to Public, press the Enter soft key. • To back in the menu tree, press the ESC soft key.
6.4.2 Field Site Operator Procedures
6.4.2.1 Upon arrival:
Record the date, time, personnel onsite and any equipment/site modifications performed in the site narrative log. Check the current flow rate reported by the MFC and data logger and the current temperature for reasonableness. Call Wood Environment & Infrastructure Solutions, Inc. (Wood) immediately with any unexpected results. Note date and time of arrival, personnel onsite and any relevant nearby activities, such as controlled burning or other source of local emissions, on the site status report form (SSRF) corresponding to the filter being removed.
6.4.2.2 To Remove Currently Sampling Filter Pack:
• Record the current data logger flow and rotameter reading in the Filter Off section of the SSRF
• Turn off the flow pump by setting the Pump_On parameter to false. • Down the flow and temperature channels using the data logger display. • Record the current MFC display value in the Pump Off field in the filter off section of
the SSRF • For sites with a wind generator, move the switch mounted to the battery enclosure to the
OFF position. This engages a brake in the turbine to prevent the blades from spinning when lowered. Note: The switch must always be in either the RUN or OFF positions and not left in the middle position.

SMALL FOOTPRINT FILTER PACK SITE INSTALLATION Revision No. 1
October 2018 Page 12 of 13
SMALL FOOTPRINT INSTALLATION Wood Environment & Infrastructure Solutions, Inc.
• Carefully lower the tower • Wearing clean gloves, attach the black filter cap to the filter pack • Remove the filter pack at the quick disconnect and attach the red cap to the filter pack
quick disconnect. • Reseal the filter pack in the provided plastic bag
6.4.2.3 Perform a leak check on the flow system:
• With no filter pack installed in the quick disconnect, turn on the flow pump by setting the Pump_On parameter to True
• Record the lowest reading from the MFC display on the SSRF as the leak check result for both the filter pack being removed as well as the SSRF for the filter to be installed.
• Verify the leak check result is within 0.1 standard liter per minute (slpm) of the previously recorded Pump Off value.
• Turn off the flow pump by setting the Pump_On parameter to false.
6.4.2.4 To install the filter pack:
• Remove the filter pack and SSRF chain of custody from the shipping container and verify the filter pack ID on the filter matches the SSRF.
• Print your name on the chain of custody on the ‘Shipment Opened By’ line. • Carefully lower the tower if not already down • Perform a leak check of the flow system as described above or copy the result from the
previous weeks’ SSRF if available. • Wearing clean gloves, remove the filter pack from the plastic bag and remove the red cap
from the filter pack quick disconnect • Leaving the black inlet side cap in place, install the filter pack in the quick connect fitting
until the locking ring clicks into place and the filter pack cannot be pulled free • Remove the black inlet side cap and reseal both the red and black caps in the plastic bag • Raise and secure the tower • For sites with a wind generator, move the switch mounted to the battery enclosure to the
RUN position. This allows the turbine generate power. Note: The switch must always be in either the RUN or OFF positions and not left in the middle position.
• Record the current MFC display value in the Pump Off field in the Filter On section of the SSRF
• Up the flow and temperature channels using the data logger display. • Turn on the flow pump by setting the Pump_On parameter to true. • Record the current data logger flow in the filter on section of the SSRF • Record the current rotameter value in the Filter On section of the SSRF
Calibration
Perform an “as found” audit of the data logger using the acceptance testing procedure described in section 6.1. Record all results in the electronic calibration forms.

SMALL FOOTPRINT FILTER PACK SITE INSTALLATION Revision No. 1
October 2018 Page 13 of 13
SMALL FOOTPRINT INSTALLATION Wood Environment & Infrastructure Solutions, Inc.
Perform an “as found” audit of the flow system as described in QAPP Appendix 1 Field SOP, Section III Field Calibration Manual, 6.4 Flow and QAPP Appendix 1 Field SOP, Section IV Calibration Laboratory, C Site Instrumentation, 4 Mass Flow Controller. Record all results in the electronic calibration forms. Perform an “as found” audit of the temperature system as described in QAPP Appendix 1 Field SOP, Section IV Calibration Laboratory, C Site Instrumentation, 5 temperature sensor. Note: An “as found” audit is not required if the sensor has not been operating (e.g., during the initial installation or installation of a replacement sensor). Calibrate the temperature sensor and perform a multipoint audit as described in Section 6.1.4. Record all results in the electronic calibration forms.
Maintenance, Repair and Troubleshooting
After the “as found” MFC audit, but before the final flow verification check, replace the Balston filter preceding the MFC during the semi-annual audit. Annually, following the “as found” MFC audit, but before the final flow verification check, replace the flow pump during the semi-annual audit. The pump will be rebuilt upon return to the field laboratory. Clean the surface of the solar panels as accumulated dust and debris can significantly reduce output.
REFERENCES
Cellular Modem Configuration Instructions
ATTACHMENTS
This SOP has no attachments.


SAMPLING TOWER INSTALLATION
Revision No. 2
June 2020
Page 2 of 5
SAMPLING TOWER INSTALLATION Wood Environment & Infrastructure Solutions, Inc.
III. FIELD CALIBRATION MANUAL
ATTACHMENT: SAMPLING TOWER INSTALLATION
PURPOSE
The purpose of this Standard Operating procedure (SOP) is to provide consistent guidance for
the installation of sampling towers at Clean Air Status and Trends Network (CASTNET)
monitoring sites.
SCOPE
This SOP applies to the installation and replacement of sampling towers (folding flow/ozone
towers) at CASTNET monitoring sites.
MATERIALS
Equipment and materials needed include:
• New sampling tower for installation – Aluma Tower FOT-10 10-meter aluminium tower
or equivalent
• Support pads
o Concrete flow tower pad
18” x 18” square or 24” round pad
The pad needs to be at least 2” below the frost depth
The top of the pad must be level
The top of the pad can be, at maximum, 4 inches above grade/ground
level
o Ozone enclosure pad (for small footprint installations with ozone monitoring)
Minimum 36”x48”x4” pad, such as a pre-formed HVAC pad
The top of the pad must be level
A 20A 120V outlet within 10’ of the pad
• Tower base
• Guy wiring – 3/16-inch diameter meeting ASTM Specification A475, with appropriately
sized:
o Clamps
o Turnbuckles
o Eye bolts
• Rope – 1-inch diameter manila, 20 feet
• Tools for assembly from the standard CASTNET field service tool kit
SAFETY
This procedure requires a minimum of two people using safe lifting practices. This procedure
should not be performed in challenging weather conditions (e.g. gusty winds, rain events). Stay
alert. Take care to secure pinch points. Call a supervisor with questions or concerns before
proceeding. Hard hats should be worn until the installed tower is secure.

SAMPLING TOWER INSTALLATION
Revision No. 2
June 2020
Page 3 of 5
SAMPLING TOWER INSTALLATION Wood Environment & Infrastructure Solutions, Inc.
PROCEDURE
The following steps should be performed in order and after any as-found audits. Steps 4 – 6 are
exclusive to tower replacements.
1. Inspect the new tower to ensure that it is the correct size and type and is undamaged
2. Inform the Field Operations Manager or designee if any damage is found
3. Down channels on the data logger
4. Remove the attached equipment from the existing tower ( e.g. pothead/rain shield,
tubing, wiring, cables, antenna, temperature sensor, temperature shield from existing
tower, or any other equipment) and set aside for use with the new tower
5. Remove existing guy wires from the ground anchors
6. Disassemble the existing tower and store onsite
7. Layout and assemble the new tower, securing the sections in the extended (not folded)
position
8. Attach new guy wires (3) to the new tower at the proper connection points, see Figure 1.
Figure 1. Tower guy wire attachment points (2 of 3 attachment points)

SAMPLING TOWER INSTALLATION
Revision No. 2
June 2020
Page 4 of 5
SAMPLING TOWER INSTALLATION Wood Environment & Infrastructure Solutions, Inc.
9. Run wiring and/or tubing and secure to tower using supplied zip ties
10. Move rope from the old tower to the new tower (for flow tower only)
11. Attach the supplied installation rope to the top of the tower
12. If a hinged base plate is not in place, install a new hinged base plate on to the concrete
tower pad (for flow tower only)
13. Align the holes on the bottom of the two marked tower legs with the marked holes on
the base, see Figure 2.
Figure 2. Marked tower legs and base aligned.
14. Once the holes are aligned, attach the two legs to the base using the supplied bolts and
nuts
15. To erect the tower, one technician will lift the top section of the tower and walk it upright
while another technician will pull the tower up from the opposite side using the rope
attached to the top of the tower t
16. Once the tower is upright, the technician that walked the tower up will attach the third
leg to the to the base using the supplied bolt and nut
17. Attach the tower guy wires (3) to ground anchors and tighten while using a level to
plumb the tower. See Figure 3.

SAMPLING TOWER INSTALLATION
Revision No. 2
June 2020
Page 5 of 5
SAMPLING TOWER INSTALLATION Wood Environment & Infrastructure Solutions, Inc.
Figure 3. Guy wire attached to ground anchor
18. If ground anchors are not lined up or there is another issue with the anchors, screw in
new ground anchors
19. The tower guy wires should be tightened to have no more than one inch of deflection
when measured approximately 1.5 meters from the turnbuckle
20. Install all designated equipment to the tower and tower mast
21. A flow and ozone leak check must be performed, if applicable
22. If any instrument tubing or cable was lengthened or replaced, an as-left audit must be
performed (any new ozone tubing will need to be conditioned)
23. Up channels on the data logger
REFERENCES
ASTM A475-03(2014), Standard Specification for Zinc-Coated Steel Wire Strand, ASTM
International, West Conshohocken, PA, 2014, www.astm.org
ATTACHMENTS
This SOP includes no attachments.


PRIMARY STANDARDS - OZONE Revision No. 10
October 2018 Page 2 of 11
PRIMARY STANDARDS - OZONE Wood Environment & Infrastructure Solutions, Inc.
IV.A.1. OZONE
PURPOSE
The purpose of this Standard Operating procedure (SOP) is to provide consistent guidance for the routine repair, maintenance, and certification of Ozone (O
3) Level 2 stationary transfer standards by Clean Air Status and Trends Network (CASTNET) Field Certification Laboratory personnel. A stationary transfer standard is also called a primary standard in this QAPP.
SCOPE
This SOP applies to the repair, maintenance, and certification of all Thermo Electron and Thermo Fisher Scientific (Thermo) model 49C PS and Model 49i PS, Primary Standard Ultraviolet (UV) Photometric O
3 Calibrators.
SUMMARY
The CASTNET Field Calibration Laboratory employs four Thermo Primary Standard UV Photometric O
3 Calibrators, two model 49C PS, and two 49i PS. These are sent annually to the EPA Kansas City Science and Technology Center (EPA Region 7) or another EPA Region where they are certified against a National Institute of Standards and Technology (NIST) reference photometer. These PS units are used to verify and maintain the accuracy of the O
3 Level 2 transfer standards (Figure 2-11 in QAPP Section 2.0), site O
3 analyzers that have been returned to the calibration lab for repairs or new units being tested for the first time. These units are not plumbed to receive ambient air samples. Figure 1 gives an overview of the maintenance process.
MATERIALS AND SUPPLIES
Refer to the Thermo 49i PS Manual, Chapter 7 (See Section 7.0, References).
MAINTENANCE AND CALIBRATION
The following list delineates the steps used in a comprehensive maintenance overhaul. Refer to Ozone Maintenance and Calibration Schedule to determine required maintenance.
Fan and Fan Filter Cleaning
• Turn off the calibrator and unplug the power cord. • Remove fan filter holder and clean holder and foam element in soap and water. Use
compressed air to dry these parts. • Use compressed air to flush debris out of fan and internal parts of unit. • Reinstall fan foam and holder.
Optical Bench Cleaning (Manual Section 4-2)
5.2.1 Turn off power, disconnect the power cable, and remove cover.
5.2.2 Loosen the knurled nut around tube and carefully slide out the tube.
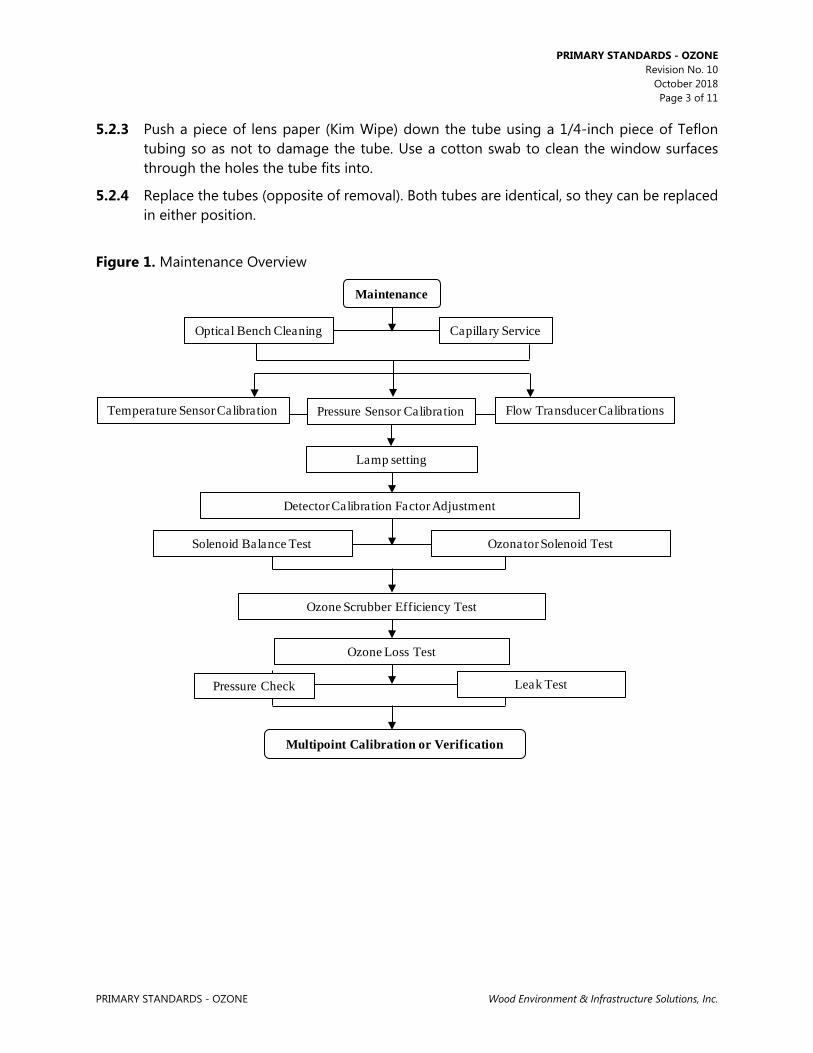
PRIMARY STANDARDS - OZONE Revision No. 10
October 2018 Page 3 of 11
PRIMARY STANDARDS - OZONE Wood Environment & Infrastructure Solutions, Inc.
5.2.3 Push a piece of lens paper (Kim Wipe) down the tube using a 1/4-inch piece of Teflon tubing so as not to damage the tube. Use a cotton swab to clean the window surfaces through the holes the tube fits into.
5.2.4 Replace the tubes (opposite of removal). Both tubes are identical, so they can be replaced in either position.
Figure 1. Maintenance Overview
Maintenance
Optical Bench Cleaning Capillary Service
Temperature Sensor Calibration Pressure Sensor Calibration Flow Transducer Calibrations
Solenoid Balance Test Ozonator Solenoid Test
Detector Calibration Factor Adjustment
Multipoint Calibration or Verification
Ozone Scrubber Efficiency Test
Ozone Loss Test
Pressure Check Leak Test
Lamp setting

PRIMARY STANDARDS - OZONE Revision No. 10
October 2018 Page 4 of 11
PRIMARY STANDARDS - OZONE Wood Environment & Infrastructure Solutions, Inc.
Capillary Service (Manual Section 4-5)
5.3.1 Turn off power, disconnect the power cable, and remove cover.
5.3.2 Remove purple 15 mil capillaries by loosening nuts around the “T” fitting on top of sample pump. Remove capillaries from tubing.
5.3.3 Clear any blockage with a wire less than 0.015-inch OD, or replace.
5.3.4 Replace capillaries.
5.3.5 Repeat steps 2-4 for orange 24 mil capillary upstream of ozone generation chamber if applicable.
Bench Temperature Sensor Calibration (Manual Sections 6-17 and 3-76)
Note: The analyzer must be in service mode to perform this adjustment. 5.4.1 Remove bench thermistor signal cable from the Measurement Interface Board.
5.4.2 Unscrew thermistor from the optical bench.
5.4.3 Reconnect signal cable to Measurement Interface Board.
5.4.4 Place thermistor through foam in an empty insulated thermos with temperature primary standard.
5.4.5 After the readings equilibrate, adjust bench calibration if the deviation is > 2°C.
5.4.6 Press the Main Menu button to display the Main Menu.
5.4.7 Use the down arrow button to scroll to Service and press the enter button to display the Service menu.
5.4.8 Use the down arrow button to scroll to Temperature Calibration and press the enter button to display the Temperature Calibration screen.
5.4.9 Enter corrected temperature standard reading and press ↵ (Enter) to save.
Pressure Sensor Calibration (Manual Sections 6-32 and 3-72)
The pressure sensor calibration requires a high vacuum pump capable of < 1mmHg (≈1 torr). If such a pump is unavailable, only adjust the pressure span setting. Note: The analyzer must be in service mode to perform this adjustment. 5.5.1 Connect reference pressure sensor and vacuum pump to pressure transducer.
5.5.2 Turn on vacuum pump until reference pressure sensor reads < 1mmHg.
5.5.3 Adjust zero setting if deviation is > 5 mmHg.
5.5.4 Press the Main Menu button to display the Main Menu.
5.5.5 Use the down arrow button to scroll to Service and press the enter button to display the Service menu.

PRIMARY STANDARDS - OZONE Revision No. 10
October 2018 Page 5 of 11
PRIMARY STANDARDS - OZONE Wood Environment & Infrastructure Solutions, Inc.
5.5.6 Use the down arrow button to scroll to Pressure Calibration and press the enter button to display the Pressure Calibration screen.
5.5.7 From the zero menu, press enter to set the zero setting.
5.5.8 Turn off vacuum pump and open the relief valve.
5.5.9 After the readings equilibrate, adjust span concentration if deviation > 5mmHg.
5.5.10 Press the menu button to return to the pressure calibration menu.
5.5.11 From the span menu, enter the reference pressure reading and press ↵ (Enter) to save.
Flow Transducer Calibrations (Manual Sections 6-35 and 3-74)
The flow readings are not used to calculate ozone concentration. Since they are only diagnostic, a precise calibration is not critical. Note: The analyzer must be in service mode to perform this adjustment. 5.6.1 Turn off the instrument sample pump.
5.6.2 Press the Main Menu button to display the Main Menu.
5.6.3 Use the down arrow button to scroll to Service and press the enter button to display the Service menu.
5.6.4 Select Flow A Calibration and then zero.
5.6.5 Press ↵ (Enter) to set the flow zero setting.
5.6.6 Repeat steps 4 and 5 for Flow B.
5.6.7 Connect the reference flow meter to the exhaust bulkhead.
5.6.8 From the Flow A Calibration menu, select Span.
5.6.9 Disconnect the tubing from the cell B flow transducer to the sample pump and cap both cell B pump inlet and transducer output. Leaving either uncapped will produce erroneous readings.
5.6.10 Enter the reference flow meter reading and press ↵ (Enter) to save.
5.6.11 Repeat steps 8 – 10 for Flow B.
Leak Check (Manual Section 4-7)
5.7.1 Turn off zero air and disconnect the zero air tubing from the primary.
5.7.2 Cap the vent, ozone, and zero air bulkheads. Cap the zero air dump inside the analyzer.
5.7.3 Press the Pressure soft key.
5.7.4 The pressure reading should drop less than 200 mm Hg.
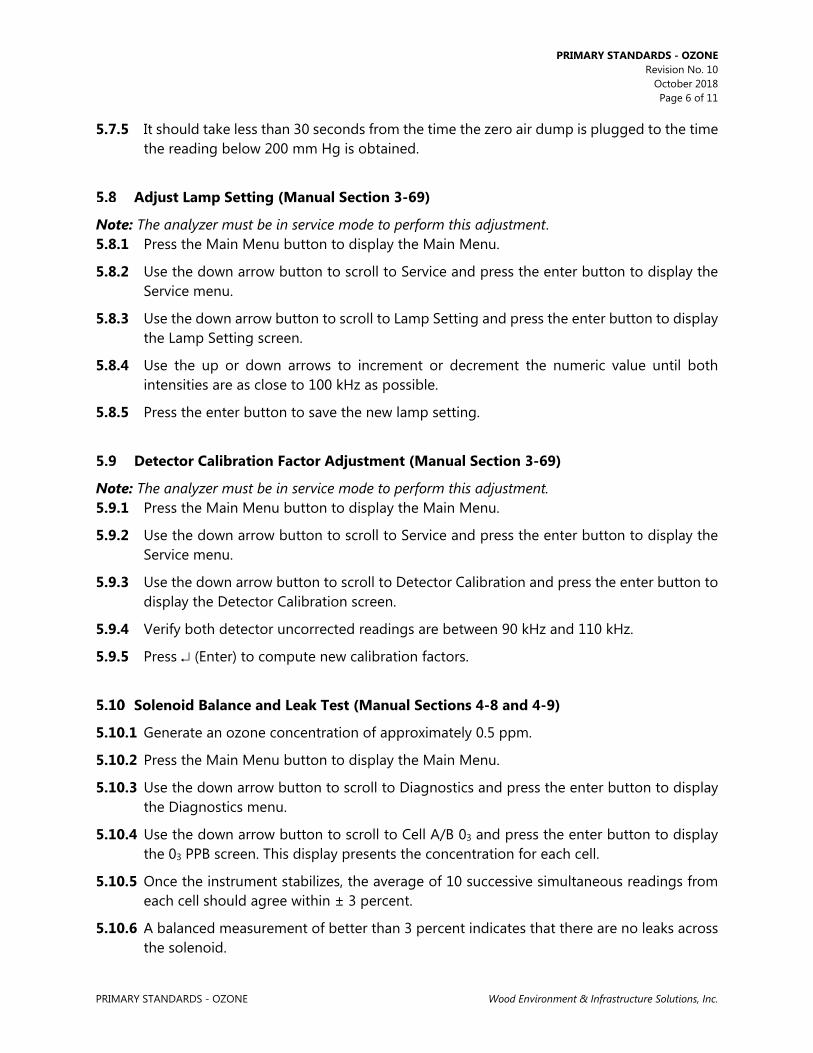
PRIMARY STANDARDS - OZONE Revision No. 10
October 2018 Page 6 of 11
PRIMARY STANDARDS - OZONE Wood Environment & Infrastructure Solutions, Inc.
5.7.5 It should take less than 30 seconds from the time the zero air dump is plugged to the time the reading below 200 mm Hg is obtained.
Adjust Lamp Setting (Manual Section 3-69)
Note: The analyzer must be in service mode to perform this adjustment. 5.8.1 Press the Main Menu button to display the Main Menu.
5.8.2 Use the down arrow button to scroll to Service and press the enter button to display the Service menu.
5.8.3 Use the down arrow button to scroll to Lamp Setting and press the enter button to display the Lamp Setting screen.
5.8.4 Use the up or down arrows to increment or decrement the numeric value until both intensities are as close to 100 kHz as possible.
5.8.5 Press the enter button to save the new lamp setting.
Detector Calibration Factor Adjustment (Manual Section 3-69)
Note: The analyzer must be in service mode to perform this adjustment. 5.9.1 Press the Main Menu button to display the Main Menu.
5.9.2 Use the down arrow button to scroll to Service and press the enter button to display the Service menu.
5.9.3 Use the down arrow button to scroll to Detector Calibration and press the enter button to display the Detector Calibration screen.
5.9.4 Verify both detector uncorrected readings are between 90 kHz and 110 kHz.
5.9.5 Press ↵ (Enter) to compute new calibration factors.
Solenoid Balance and Leak Test (Manual Sections 4-8 and 4-9)
5.10.1 Generate an ozone concentration of approximately 0.5 ppm.
5.10.2 Press the Main Menu button to display the Main Menu.
5.10.3 Use the down arrow button to scroll to Diagnostics and press the enter button to display the Diagnostics menu.
5.10.4 Use the down arrow button to scroll to Cell A/B 03 and press the enter button to display the 03 PPB screen. This display presents the concentration for each cell.
5.10.5 Once the instrument stabilizes, the average of 10 successive simultaneous readings from each cell should agree within ± 3 percent.
5.10.6 A balanced measurement of better than 3 percent indicates that there are no leaks across the solenoid.

PRIMARY STANDARDS - OZONE Revision No. 10
October 2018 Page 7 of 11
PRIMARY STANDARDS - OZONE Wood Environment & Infrastructure Solutions, Inc.
5.10.7 A constant low reading from one cell indicates an imbalance. The imbalance can be caused by a dirty cell, dirty lines to that cell, or by a leaky valve.
5.10.8 To check if the imbalance is caused by a dirty cell, interchange the cells. If the imbalanced side switches, the imbalance is caused by the cell.
5.10.9 Perform the following test to check the solenoid for a leak.
• Remove the solenoid valve that appears to be faulty. • Connect the solenoid cell test tubing to the test pump. The other end of the tubing
will be connected to a tee fitting. • Cap one open port on the tee fitting. • Connect a pressure transducer to the open tee fitting port. • Turn on the test pump. • After the pressure has stabilized, record the reading as PC. • Turn off the test pump. • Uncap the capped the tee fitting port. • Connect the open tee fitting port to the common solenoid port. • Cap the normally open solenoid port. • Turn on the test pump. • After the pressure has stabilized, record the pressure reading as PNO. • Turn off the test pump • Uncap the normally open solenoid port. • Cap the normally closed solenoid port. • Plug the solenoid power line into the appropriate connector on the measurement
interface board. Make sure the solenoid is activated. • After the pressure has stabilized, record the pressure reading as PNC. • The solenoid is faulty if either PNO or PNC is greater than PC.
5.10.1 If an imbalance is found, repair and return to step 5.8, adjusting the detector lamp setting
Pump Pressure Check (Manual Section 3-83)
Note: The analyzer must be in service mode to perform this test. 5.11.1 Turn off zero air and disconnect the zero air tubing from the primary.
5.11.2 Cap the vent, ozone, and zero air bulkheads. Cap the zero air dump inside the analyzer.
5.11.3 Press the Main Menu button to display the Main Menu.
5.11.4 Use the down arrow button to scroll to Service and press the enter button to display the Service menu.
5.11.5 Use the down arrow button to scroll to Pressure Check and press the enter button to display the Pressure Check menu.
5.11.6 Use the down arrow button to scroll to Pump Pressure and press the enter button to display the Pump Pressure screen.

PRIMARY STANDARDS - OZONE Revision No. 10
October 2018 Page 8 of 11
PRIMARY STANDARDS - OZONE Wood Environment & Infrastructure Solutions, Inc.
5.11.7 The pressure reading should drop below 390 mmHg in less than 20 seconds. This indicates the effectiveness of the sample pump.
5.11.8 After 20 seconds, if the pressure is greater than 390 mmHg or the flow is greater than 0.010 LPM, the words “PUMP PROBLEM DETECTED” appear. Otherwise the words “PUMP OK” appear.
If the pump or pump diaphragm need to be replaced refer to step 5.13.
Leak Test (Manual Section 4-7)
5.12.1 Refer to step 5.7.
Sample Pump Maintenance.
5.13.1 Replace the sample pump if, during a leak check, the pressure remains between 200 and 250 mm Hg, the diaphragm is in good condition, and a leak is not suspected. The sample pump may not be strong enough to pull more vacuum.
• Turn off the analyzer and unplug the power cord. • Remove the cover. • Unplug power lead of pump from Power Supply Board. • Loosen fittings and remove all 1/4-inch Teflon lines from pump. • Remove four screws holding pump bracket to shock mounts and remove pump. • Install new pump by following the above procedure in reverse. • Re-install the cover, plug in the power cord, and turn the instrument on. • Refer to step 5.7 and perform leak test. • Return to step 5.6, flow transducer calibration.
5.13.2 Sample Pump Diaphragm Removal Procedure
• The sample pump diaphragm may need to be replaced if the pressure exceeds 200 mm Hg and a leak is not suspected.
• Remove the four screws on the top of the sample pump and place the block with the vacuum and pressure ports to one side.
• Remove the screw and collar from the diaphragm and inspect the diaphragm for tears or excessive wear and / or cracking. Replace if necessary.
• The valve body (if the pump is an ASF pump) and the Teflon gasket may need to be replaced as well.
• Reinstall the top block and screws. • Refer to step 5.7 and perform a leak test. • Return to step 5.6, flow transducer calibration.
Pressure Transducer Adjustment (49C-PS) (Manual Section 6-12)
The pressure sensor calibration requires a high vacuum pump capable of < 1mmHg (≈1 torr). If such a pump is unavailable, only adjust the pressure span setting.

PRIMARY STANDARDS - OZONE Revision No. 10
October 2018 Page 9 of 11
PRIMARY STANDARDS - OZONE Wood Environment & Infrastructure Solutions, Inc.
Note: The analyzer must be in service mode to perform this adjustment. • From the Run screen, choose Menu to display the Main menu. Press the ↓ button to move
the cursor to Instrument Control. Press <Enter> to display the Instrument Control menu. Press the ↓ button to move the cursor to Pressure Correction. Press <Enter> to display the pressure reading.
• Adjust the zero potentiometer on the pressure transducer for a reading of 0 mm Hg. • Disconnect the vacuum pump. After the readings equilibrate, adjust span potentiometer if
deviation > 5mmHg.
Temperature Sensor Adjustment (49C-PS) (Manual Section 6-13)
Note: The analyzer must be in service mode to perform this adjustment. • Remove bench thermistor signal cable from the mother board. • Unscrew thermistor from the optical bench. • Reconnect signal cable to mother board. • Place thermistor through foam in an empty insulated thermos with temperature primary
standard. • After the readings equilibrate, if the deviation is > 2°C, adjust the gain potentiometer on the
Analog to Digital Board until the sensor agrees with the primary.
PROCEDURES
The Thermo model 49C and 49i Primary Standards are certified annually by comparison with the NIST Standard Reference Photometer (SRP). All procedures for this comparison are performed under the direction of the NIST SRP operator. An example of a calibration produced by this process is provided in Figure 2.
Annual Certification Preparation
Prior to the annual certification the following procedures should be performed: • Check battery voltage (49C-PS only). If it is lower than 3.0 vdc replace; • Internal pressure regulators should read 10 psi, and instruct technician with NIST to operate
unit at this pressure. • Pack inside of calibrator with foam pieces to reduce jarring during shipment. Be sure to
attach tag to unit informing NIST technician to remove packing prior to turning calibrator on. Also include a pre-addressed return FedEx air bill.

PRIMARY STANDARDS - OZONE Revision No. 10
October 2018 Page 10 of 11
PRIMARY STANDARDS - OZONE Wood Environment & Infrastructure Solutions, Inc.
REFERENCES
Thermo Electron Corporation. 1997. Model 49C UV Photometric Analyzer Instrument Manual Thermo Fisher Scientific. 2006. Model 49i Instruction Manual, UV Photometric O
3 Analyzer Part number 102434-00
U.S. Environmental Protection Agency (EPA). 1994. Quality Assurance Handbook for Air Pollution
Measurement Systems, Vol. I. A Field Guide to Environmental Quality Assurance. EPA/600/R-94/038a.
U.S. Environmental Protection Agency (EPA). 2008. Quality Assurance Handbook for Air Pollution
Measurement Systems, Vol. IV, Meteorological Measurements Version 2.0 (Final). EPA-454/B-08-002.
U.S. Environmental Protection Agency (EPA). 2013. Quality Assurance Handbook for Air Pollution
Measurement Systems, Vol. II, Ambient Air Quality Monitoring Program. EPA-454/B-13-003.
U.S. Environmental Protection Agency (EPA). 2000. Meteorological Monitoring Guidance for
Regulatory Modeling Applications. EPA-454/R-99-005. U.S. Environmental Protection Agency (EPA). 2013. Transfer Standards for the Calibration of
Ambient Air Monitoring Analyzers for Ozone. Technical Assistance Document. EPA-454/B-13-004.
U.S. Environmental Protection Agency (EPA). 2015. Appendix A to Part 58 – Quality Assurance
Requirements for State and Local Air Monitoring Stations (SLAMS), Special Purpose Monitors (SPMs), and Prevention of Significant Deterioration (PSD) Air Monitoring. 40 CFR Part 58.

PRIMARY STANDARDS - OZONE Revision No. 10
October 2018 Page 11 of 11
PRIMARY STANDARDS - OZONE Wood Environment & Infrastructure Solutions, Inc.
FIGURES
Figure 2. Example of O 3 EPA Region 7 Calibration Form
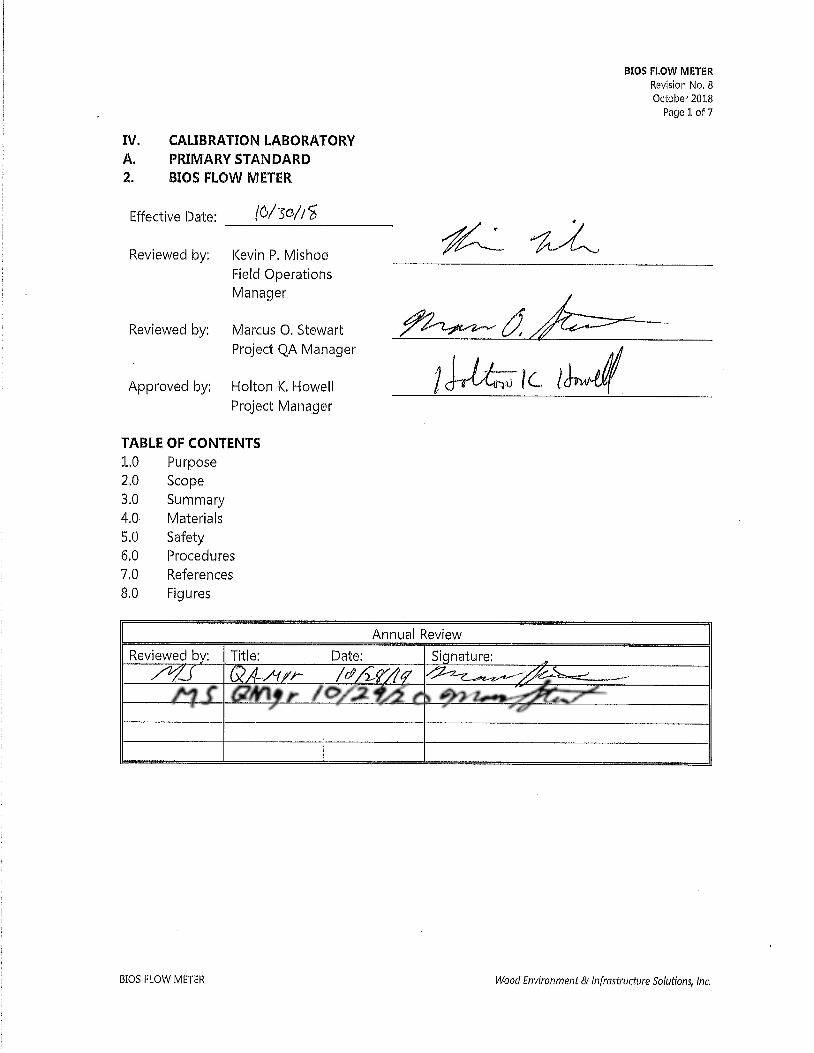

BIOS FLOW METER Revision No. 8 October 2018
Page 2 of 7
BIOS FLOW METER Wood Environment & Infrastructure Solutions, Inc.
IV.A.2. BIOS FLOW METER
PURPOSE
The purpose of this Standard Operating procedure (SOP) is to provide consistent guidance for repair, maintenance, and certification of the Bios Flow Meter to Clean Air Status and Trends Network (CASTNET) Field Certification Laboratory personnel.
SCOPE
This SOP applies to the repair, maintenance, and certification of all Bios Flow Meters administered by the CASTNET Field Certification Laboratory.
SUMMARY
The Bios Flow meters administered by the CASTNET Field Certification Laboratory are leak tested and recharged on a quarterly basis. Each meter is returned to the manufacturer annually for routine maintenance and certification.
MATERIALS
Bios Model DCL-MH DC-Lite Flow Meter and Bios DryCal NEXUS flow cell, or Bios Model Definer 220 Bios 12 volts direct current (VDC) charger or Bios Air PRO 4000D charger Latex flow tubing
SAFETY
As with all electronic equipment, take precautions to avoid electric shock.
PROCEDURES
The Bios Primary Air Flow Meter (Bios) is returned to the manufacturer annually for routine cleaning, maintenance, calibration, and certification (see sample factory certificates in Figures 1 and 2).
Repair and Maintenance
All repairs and adjustments are performed by the manufacturer. When not in use, store in a clean, dry environment with the inlet/outlet caps installed. Every quarter, fully charge the battery pack, and perform a leak test.
Charging the Battery
Before using your Bios, be sure that the battery system has been fully charged to ensure that the unit will perform to specifications and maintain proper operation for the required time period. The Bios is equipped with a battery indicator that displays battery charge. When the battery indicator on the display is empty, the unit will continue to operate for a short period of time before shutting itself off.
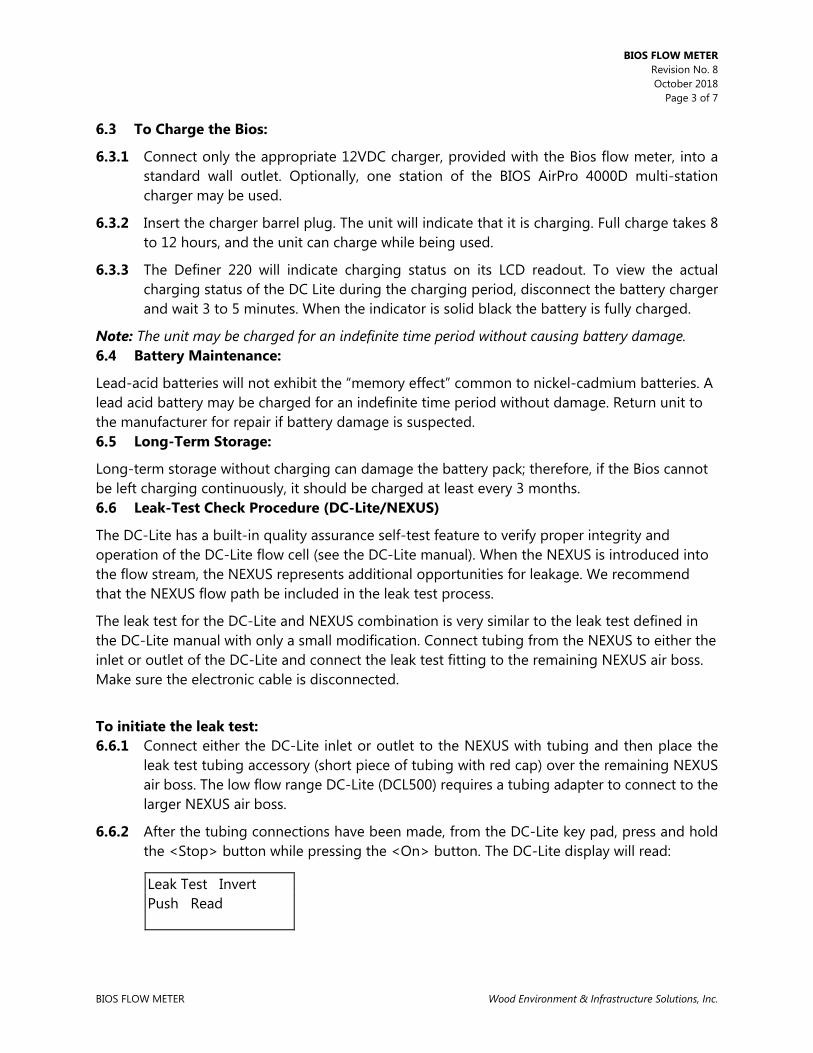
BIOS FLOW METER Revision No. 8 October 2018
Page 3 of 7
BIOS FLOW METER Wood Environment & Infrastructure Solutions, Inc.
To Charge the Bios:
6.3.1 Connect only the appropriate 12VDC charger, provided with the Bios flow meter, into a standard wall outlet. Optionally, one station of the BIOS AirPro 4000D multi-station charger may be used.
6.3.2 Insert the charger barrel plug. The unit will indicate that it is charging. Full charge takes 8 to 12 hours, and the unit can charge while being used.
6.3.3 The Definer 220 will indicate charging status on its LCD readout. To view the actual charging status of the DC Lite during the charging period, disconnect the battery charger and wait 3 to 5 minutes. When the indicator is solid black the battery is fully charged.
Note: The unit may be charged for an indefinite time period without causing battery damage. Battery Maintenance:
Lead-acid batteries will not exhibit the “memory effect” common to nickel-cadmium batteries. A lead acid battery may be charged for an indefinite time period without damage. Return unit to the manufacturer for repair if battery damage is suspected.
Long-Term Storage:
Long-term storage without charging can damage the battery pack; therefore, if the Bios cannot be left charging continuously, it should be charged at least every 3 months.
Leak-Test Check Procedure (DC-Lite/NEXUS)
The DC-Lite has a built-in quality assurance self-test feature to verify proper integrity and operation of the DC-Lite flow cell (see the DC-Lite manual). When the NEXUS is introduced into the flow stream, the NEXUS represents additional opportunities for leakage. We recommend that the NEXUS flow path be included in the leak test process.
The leak test for the DC-Lite and NEXUS combination is very similar to the leak test defined in the DC-Lite manual with only a small modification. Connect tubing from the NEXUS to either the inlet or outlet of the DC-Lite and connect the leak test fitting to the remaining NEXUS air boss. Make sure the electronic cable is disconnected.
To initiate the leak test: 6.6.1 Connect either the DC-Lite inlet or outlet to the NEXUS with tubing and then place the
leak test tubing accessory (short piece of tubing with red cap) over the remaining NEXUS air boss. The low flow range DC-Lite (DCL500) requires a tubing adapter to connect to the larger NEXUS air boss.
6.6.2 After the tubing connections have been made, from the DC-Lite key pad, press and hold the <Stop> button while pressing the <On> button. The DC-Lite display will read:
Leak Test Invert Push Read

BIOS FLOW METER Revision No. 8 October 2018
Page 4 of 7
BIOS FLOW METER Wood Environment & Infrastructure Solutions, Inc.
Note: If the DC-Lite is already “ON”, press and hold the <Stop> button while pressing the <Hard Reset> button on the back of the DC-Lite unit. 6.6.3 Invert the DC-Lite so the piston moves to the top of the cell. While the piston is resting at
the top of the cell press the <Read> button and the internal valve will close. Return the DC-Lite to an upright position and it will time the descent of the piston.
Note: The test may take as long as 15-20 minutes. Observe the location of the piston to ensure that it is at the top of the cell when the test begins. If the test is completed successfully, the display will read:
6.6.4 Press the <Read> button as directed and the internal valve will open and the piston will fall.
6.6.5 Repeat the test with the leak test tubing accessory connected to air boss not connected to the NEXUS.
Note: If the unit fails the leak-test, the display will read message below. Check connections to ensure no setup failure has occurred and if not, return to manufacturer for repair:
Leak Test Procedure (Definer 220)
The Definer Leak Test is designed only to verify the internal integrity of the instrument and alert you to an internal leak. We recommend performing the Leak Test only as an intermediate quality control check or whenever the integrity of the instrument is questioned due to misuse or accidental damage.
Please note that a leak test is not a substitute for a comprehensive examination of the unit’s overall performance and it does not ensure that the Definer is operating accurately. • Invert the Definer and allow the piston to travel to the top. • Cap the port under test using the Bios supplied leak test cap. Leave the other port
uncapped. • Press Enter on the control panel while the unit is still inverted. • Return the unit upright. The leak test will progress.
Test OK Push Read
Maintenance Reqd Push Read
BIOS FLOW METER Revision No. 8 October 2018
Page 5 of 7
BIOS FLOW METER Wood Environment & Infrastructure Solutions, Inc.
REFERENCES
U.S. Environmental Protection Agency (EPA). 1994. Quality Assurance Handbook for Air Pollution Measurement Systems, Vol. I. A Field Guide to Environmental Quality Assurance. EPA/600/R-94/038a.
U.S. Environmental Protection Agency (EPA). 2008. Quality Assurance Handbook for Air Pollution
Measurement Systems, Vol. IV, Meteorological Measurements Version 2.0 (Final). EPA-454/B-08-002.
U.S. Environmental Protection Agency (EPA). 2013. Quality Assurance Handbook for Air Pollution
Measurement Systems, Vol. II, Ambient Air Quality Monitoring Program. EPA-454/B-13-003.
U.S. Environmental Protection Agency (EPA). 2000. Meteorological Monitoring Guidance for
Regulatory Modeling Applications. EPA-454/R-99-005. Bios International Corporation. 2002. DryCal DC-Lite Manual

BIOS FLOW METER Revision No. 8 October 2018
Page 6 of 7
BIOS FLOW METER Wood Environment & Infrastructure Solutions, Inc.
FIGURES
Figure 1 Sample Certification

BIOS FLOW METER Revision No. 8 October 2018
Page 7 of 7
BIOS FLOW METER Wood Environment & Infrastructure Solutions, Inc.
Figure 2 Sample Certification
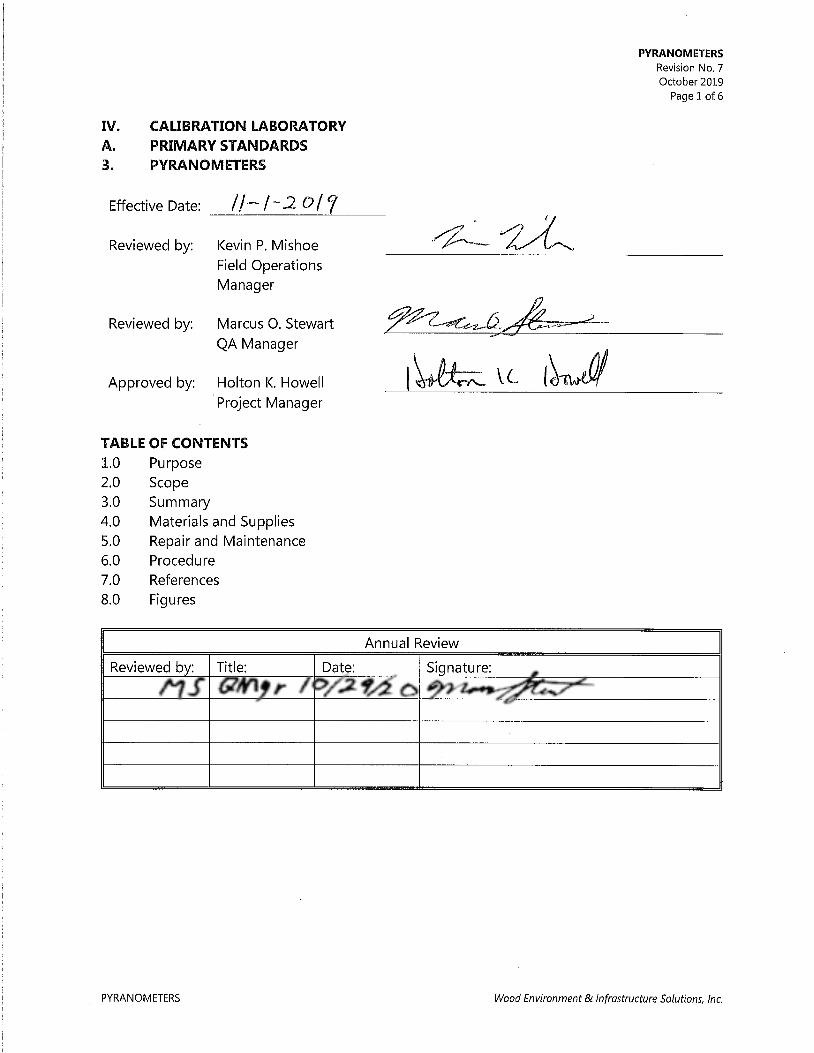

PYRANOMETERS Revision No. 7
October 2019 Page 2 of 6
PYRANOMETERS Wood Environment & Infrastructure Solutions, Inc.
IV.A.3. PYRANOMETERS
PURPOSE
The purpose of this Standard Operating Procedure (SOP) is to provide consistent guidance for repair, maintenance, and certification of pyranometers used as laboratory primary standards to Clean Air Status and Trends Network (CASTNET) Field Calibration Laboratory personnel.
SCOPE
This SOP applies to the repair, maintenance, and certification of pyranometers used as laboratory primary standards administered by the CASTNET Field Calibration Laboratory.
SUMMARY
The pyranometers administered by the CASTNET Field Calibration Laboratory are checked for level, moisture control, translator card adjustment, and cleanliness biweekly. Each unit is returned to the manufacturer annually for maintenance and certification.
MATERIALS AND SUPPLIES
Eppley Model PSP Precision Spectral Pyranometer or Hukseflux Model LP02 pyranometer Electronically matched translator card Desiccant (mesh grade 48) Soft, lint-free cloth Screwdriver
REPAIR AND MAINTENANCE
All repairs and adjustments are performed by the manufacturer. Inspect the pyranometer twice a week for being level, silica gel condition, and wipe (DAILY) clean the hemisphere. (See Figure 1 for characteristics of the pyranometers.) Note: Record all maintenance in the logbook in the solar radiation trailer.
Leveling the pyranometer
A circular spirit level is located on the base ring of the pyranometer and can be viewed through the hole in the radiation shield. Adjust the three leveling screws on the base ring of the pyranometer to center the level’s bubble in the bull’s eye ring.
Changing the silica gel
The desiccator is installed in the side case of the pyranometer and should be replaced whenever the silica gel drying agent is pinkish in color. To remove desiccator, unscrew the silver ring using a small pair of pliers. Separate the small black vial from silver ring and replace the silica gel with fresh product. Re-assemble in reverse order.

PYRANOMETERS Revision No. 7
October 2019 Page 3 of 6
PYRANOMETERS Wood Environment & Infrastructure Solutions, Inc.
Lens Cleaning
With a clean, dry lint-free soft cloth, very gently clean the glass hemisphere of the pyranometer.
CERTIFICATION PROCEDURE
The pyranometers are returned annually to the manufacturer for routine maintenance, calibration, and certification. Upon receipt following annual certification the correct sensitivity constant must be entered into the solar radiation calibration data-logger. (Figure 2 is a sample annual calibration certification from the manufacturer).
REFERENCES
The Eppley Laboratory, Inc., Model PSP Radiometer Sensor Manual. Hukseflux LP02 User Manual v1606. U.S. Environmental Protection Agency (EPA). 1994. Quality Assurance Handbook for Air Pollution
Measurement Systems, Vol. I. A Field Guide to Environmental Quality Assurance. EPA/600/R-94/038a.
U.S. Environmental Protection Agency (EPA). 2008. Quality Assurance Handbook for Air Pollution
Measurement Systems, Vol. IV, Meteorological Measurements Version 2.0 (Final). EPA-454/B-08-002.
U.S. Environmental Protection Agency (EPA). 2017. Quality Assurance Handbook for Air Pollution
Measurement Systems, Vol. II, Ambient Air Quality Monitoring Program. EPA-454/B-17-001.
U.S. Environmental Protection Agency (EPA). 2000. Meteorological Monitoring Guidance for
Regulatory Modeling Applications. EPA-454/R-99-005.

PYRANOMETERS Revision No. 7
October 2019 Page 4 of 6
PYRANOMETERS Wood Environment & Infrastructure Solutions, Inc.
FIGURES
Figure 1 (1 of 2). Eppley Model PSP Characteristics

PYRANOMETERS Revision No. 7
October 2019 Page 5 of 6
PYRANOMETERS Wood Environment & Infrastructure Solutions, Inc.
Figure 1 (2 of 2). Hukseflux Model LP02 Characteristics
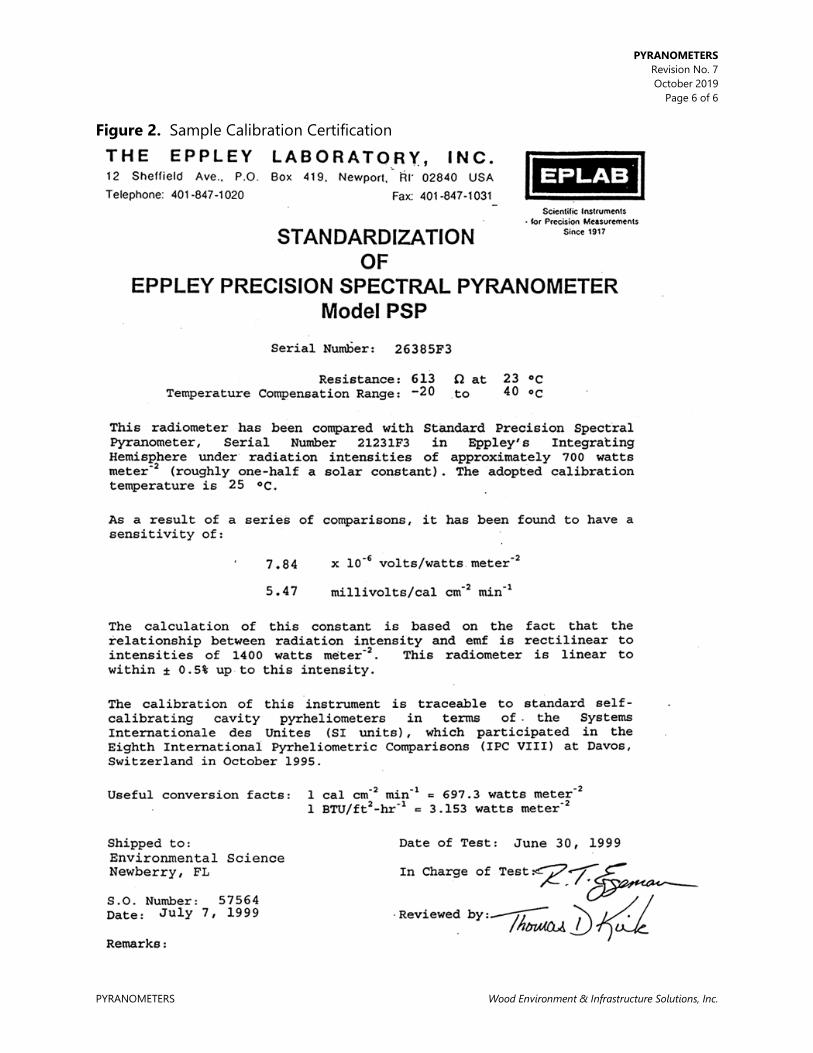
PYRANOMETERS Revision No. 7
October 2019 Page 6 of 6
PYRANOMETERS Wood Environment & Infrastructure Solutions, Inc.
Figure 2. Sample Calibration Certification


NIST THERMOMETERS Revision No. 6 October 2018
Page 2 of 9
NIST THERMOMETERS Wood Environment & Infrastructure Solutions, Inc.
IV. A. 4. THERMOMETERS TRACEABLE TO THE NATIONAL INSTITUTE OF STANDARDS AND TECHNOLOGY (NIST)
PURPOSE
The purpose of this Standard Operating Procedure (SOP) is to provide consistent guidance to Clean Air Status and Trends Network (CASTNET) Field Equipment Calibration Laboratory technicians in the maintenance and handling of liquid in glass thermometers with certification traceable to the National Institute of Standards and Technology (NIST).
SCOPE
This SOP applies to the maintenance and handling of NIST traceable thermometers administered by the CASTNET Field Equipment Calibration Laboratory.
SUMMARY
See Sections 5.0 and 6.0.
MATERIALS AND SUPPLIES
Liquid in glass thermometer(s) certified for the appropriate temperature range(s).
REPAIR AND MAINTENANCE
Before each use, inspect the column to ensure that there is no mercury separation. If separation is observed, eliminate it prior to use by shaking, heating, or cooling the thermometer.
CERTIFICATION PROCEDURE
NIST thermometers are returned to the manufacturer annually for calibration and certification. All primary standard thermometers are certified as traceable to the NIST. Separate thermometers are certified for each of 6 different temperature ranges. (See Figures 1-6 for sample certifications.)

NIST THERMOMETERS Revision No. 6 October 2018
Page 3 of 9
NIST THERMOMETERS Wood Environment & Infrastructure Solutions, Inc.
REFERENCES
U.S. Environmental Protection Agency (EPA). 1994. Quality Assurance Handbook for Air Pollution Measurement Systems, Vol. I. A Field Guide to Environmental Quality Assurance. EPA/600/R-94/038a.
U.S. Environmental Protection Agency (EPA). 2008. Quality Assurance Handbook for Air Pollution
Measurement Systems, Vol. IV, Meteorological Measurements Version 2.0 (Final). EPA-454/B-08-002.
U.S. Environmental Protection Agency (EPA). 2013. Quality Assurance Handbook for Air Pollution
Measurement Systems, Vol. II, Ambient Air Quality Monitoring Program. EPA-454/B-13-003.
U.S. Environmental Protection Agency (EPA). 2000. Meteorological Monitoring Guidance for
Regulatory Modeling Applications. EPA-454/R-99-005.

NIST THERMOMETERS Revision No. 6 October 2018
Page 4 of 9
NIST THERMOMETERS Wood Environment & Infrastructure Solutions, Inc.
FIGURES
Figure 1: Sample Certificate

NIST THERMOMETERS Revision No. 6 October 2018
Page 5 of 9
NIST THERMOMETERS Wood Environment & Infrastructure Solutions, Inc.
Figure 2: Sample Certificate
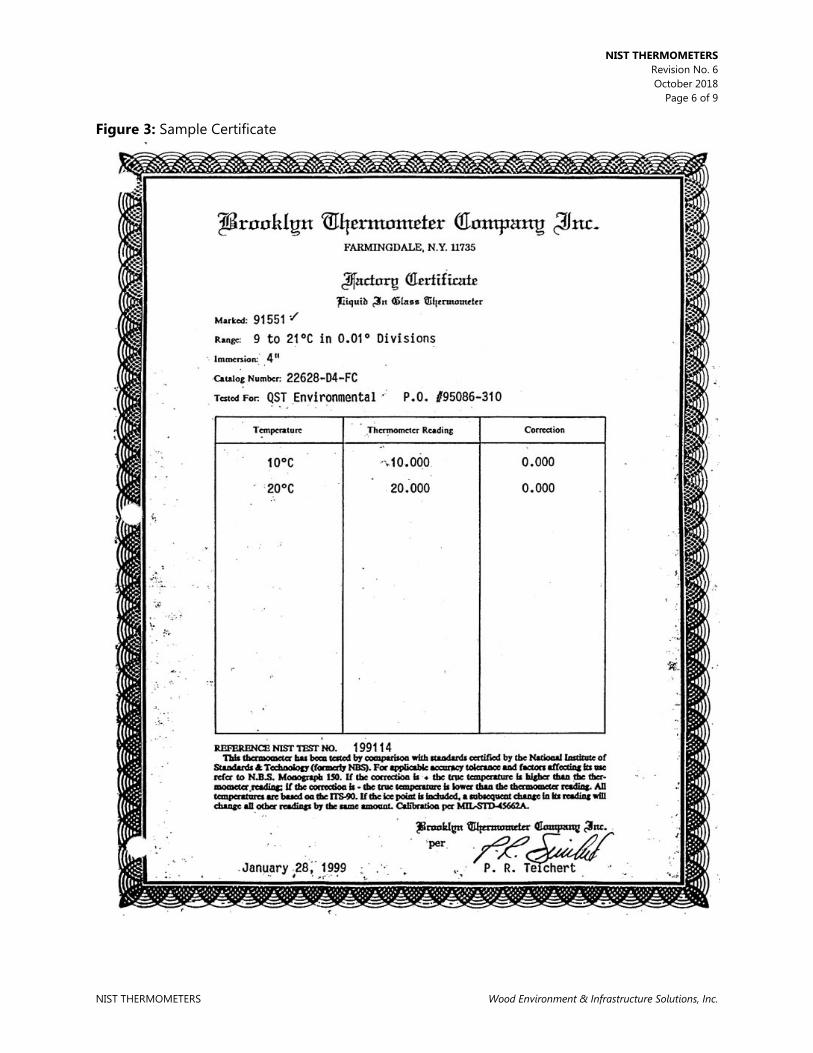
NIST THERMOMETERS Revision No. 6 October 2018
Page 6 of 9
NIST THERMOMETERS Wood Environment & Infrastructure Solutions, Inc.
Figure 3: Sample Certificate

NIST THERMOMETERS Revision No. 6 October 2018
Page 7 of 9
NIST THERMOMETERS Wood Environment & Infrastructure Solutions, Inc.
Figure 4: Sample Certificate

NIST THERMOMETERS Revision No. 6 October 2018
Page 8 of 9
NIST THERMOMETERS Wood Environment & Infrastructure Solutions, Inc.
Figure 5: Sample Certificate

NIST THERMOMETERS Revision No. 6 October 2018
Page 9 of 9
NIST THERMOMETERS Wood Environment & Infrastructure Solutions, Inc.
Figure 6: Sample Certificate


VAPORTRON H-100L PRECISION RELATIVE HUMIDITY LAB Revision No. 7 October 2018
Page 2 of 9
VAPORTRON H-100L PRECISION RELATIVE HUMIDITY LAB Wood Environment & Infrastructure Solutions, Inc.
IV.A.5. VAPORTRON H-100L PRECISION RELATIVE HUMIDITY LAB
PURPOSE
The purpose of this Standard Operating procedure (SOP) is to provide consistent guidance for maintenance and handling of the Vaportron H-100L Precision Relative Humidity Lab to Clean Air Status and Trends Network (CASTNET) Field Calibration Laboratory personnel.
SCOPE
This SOP applies to the maintenance and handling of Vaportron H-100L Precision Relative Humidity Lab units administered by the CASTNET Field Calibration Laboratory.
SUMMARY
The Vaportron’s internal water reservoir is emptied and refilled routinely every 1 to 6 weeks and is returned to the manufacturer annually for routine maintenance and certification.
MATERIALS
Vaportron Model H-100L Precision Relative Humidity Lab Distilled water Desiccant - spherical indicating silica gel, mesh grade 48
SAFETY
Electrical components inside the machine are an electrocution hazard. Take necessary precautions, such as wearing an antistatic wristband and gloves, while working inside of the machine.
PROCEDURE
The Vaportron H-100L Precision Humidity is returned to the manufacturer annually for routine maintenance, cleaning, calibration, and certification.
Water Reservoir Check and Water Service Procedure
The Vaportron internal vapor saturator/water reservoir is designed for long service between re-fills. Depending on the amount of use, the normal refill of water should last from 4 to 6 weeks to only 1 week for continuous use or heavy cycling from high to low relative humidity (RH) levels. To check the water level, remove the desiccant cartridge and look into the large window near the left desiccant hanger hook (Figure 1). Use the small inspection lamp as supplied in the service kit. If necessary, tilt the Vaportron chassis fore/aft or left/right about 20 degrees. This can help to visually locate the water level.

VAPORTRON H-100L PRECISION RELATIVE HUMIDITY LAB Revision No. 7 October 2018
Page 3 of 9
VAPORTRON H-100L PRECISION RELATIVE HUMIDITY LAB Wood Environment & Infrastructure Solutions, Inc.
The water level must be between the lower and upper red lines on the fill level decal. NEVER ADD MORE THAN 30 CC OF WATER. Use distilled water, if available. Use clean tap water (or bottled water) if distilled water is not available. The blunt-needled syringe from the service kit should be used for easiest fill. Always reinstall the small red cap after adding water. Figure 1 Water Gauge Window
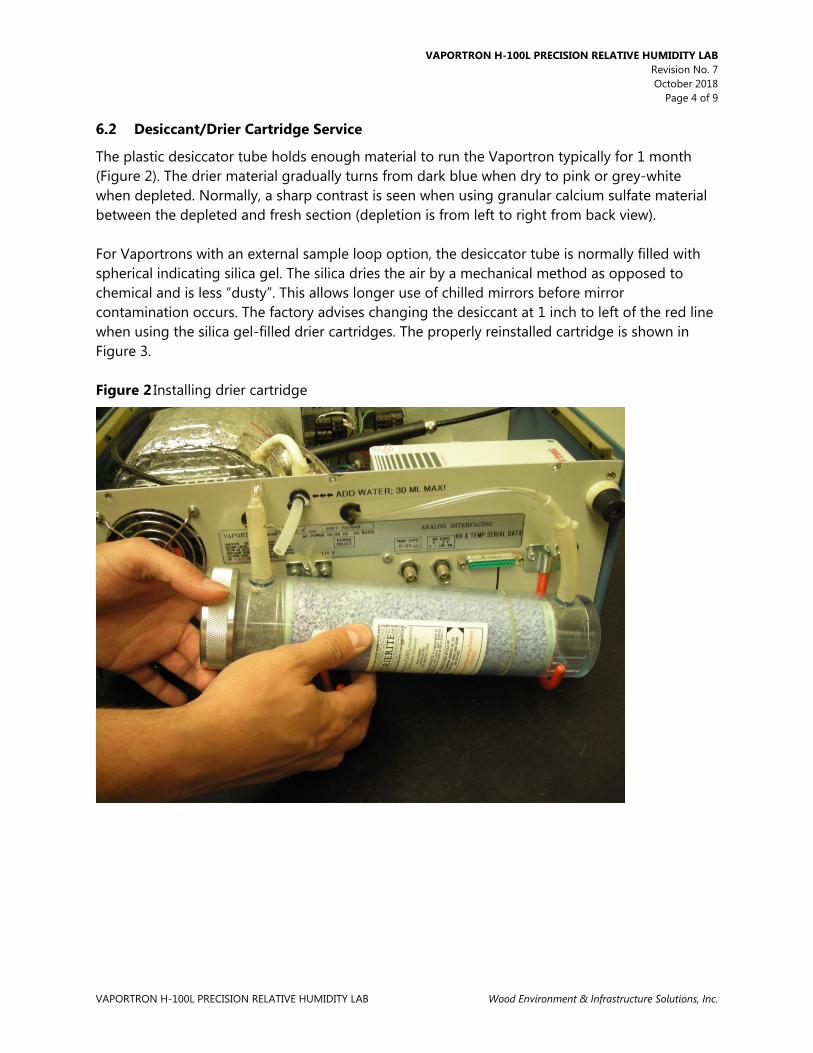
VAPORTRON H-100L PRECISION RELATIVE HUMIDITY LAB Revision No. 7 October 2018
Page 4 of 9
VAPORTRON H-100L PRECISION RELATIVE HUMIDITY LAB Wood Environment & Infrastructure Solutions, Inc.
Desiccant/Drier Cartridge Service
The plastic desiccator tube holds enough material to run the Vaportron typically for 1 month (Figure 2). The drier material gradually turns from dark blue when dry to pink or grey-white when depleted. Normally, a sharp contrast is seen when using granular calcium sulfate material between the depleted and fresh section (depletion is from left to right from back view). For Vaportrons with an external sample loop option, the desiccator tube is normally filled with spherical indicating silica gel. The silica dries the air by a mechanical method as opposed to chemical and is less “dusty”. This allows longer use of chilled mirrors before mirror contamination occurs. The factory advises changing the desiccant at 1 inch to left of the red line when using the silica gel-filled drier cartridges. The properly reinstalled cartridge is shown in Figure 3. Figure 2 Installing drier cartridge

VAPORTRON H-100L PRECISION RELATIVE HUMIDITY LAB Revision No. 7 October 2018
Page 5 of 9
VAPORTRON H-100L PRECISION RELATIVE HUMIDITY LAB Wood Environment & Infrastructure Solutions, Inc.
Figure 3 Vaportron front and rear panels

VAPORTRON H-100L PRECISION RELATIVE HUMIDITY LAB Revision No. 7 October 2018
Page 6 of 9
VAPORTRON H-100L PRECISION RELATIVE HUMIDITY LAB Wood Environment & Infrastructure Solutions, Inc.
REFERENCES
Digilog Instruments. 1997. Vaportron H-100L Precision Relative Humidity Lab Provisory Users Guide
U.S. Environmental Protection Agency (EPA). 1994. Quality Assurance Handbook for Air Pollution
Measurement Systems, Vol. I. A Field Guide to Environmental Quality Assurance. EPA/600/R-94/038a.
U.S. Environmental Protection Agency (EPA). 2008. Quality Assurance Handbook for Air Pollution
Measurement Systems, Vol. IV, Meteorological Measurements Version 2.0 (Final). EPA-454/B-08-002.
U.S. Environmental Protection Agency (EPA). 2013. Quality Assurance Handbook for Air Pollution
Measurement Systems, Vol. II, Ambient Air Quality Monitoring Program. EPA-454/B-13-003.
U.S. Environmental Protection Agency (EPA). 2000. Meteorological Monitoring Guidance for
Regulatory Modeling Applications. EPA-454/R-99-005.
VAPORTRON H-100L PRECISION RELATIVE HUMIDITY LAB Revision No. 7 October 2018
Page 7 of 9
VAPORTRON H-100L PRECISION RELATIVE HUMIDITY LAB Wood Environment & Infrastructure Solutions, Inc.
ATTACHMENTS
The Factory ASTM Calibration Reference System
Each Vaportron reference sensor is calibrated against the Laboratory ASTM multiple point saturated salt chambers. The salt chambers are operated in accordance with Salt/Hydrate literature in ASTM 1991, E 104-85. The values of Greenspan, L., 1977 #81A [National Bureau of Standards (NBS)/National Institute for Standards and Technology (NIST), Journal of Research] are used.
The following salt/hydrate types are used:
Salt Type RH Value at 25°C STD Deviation at 25°C
Lithium-Chloride 11.4 0.27
Magnesium-
Chloride
32.7 0.16
Potassium-Nitrate 48.2 0.21 (est)
Sodium-Bromide 57.6 0.40
Sodium-Chloride 75.3 0.12
Potassium-Chloride 84.3 0.26
Potassium-Sulfate 97.3 0.45 Note: °C = degrees Celsius.
The performance of the reference sensor supplied in the Vaportron has been recorded at each of these points, and a certificate of accuracy is shipped with each chamber system. Figure 4 is a sample factory calibration certification. Figure 5 is a flow diagram representing the Vaportron traceability, and certification frequency. To qualify for use in a Vaportron unit, each sensor must have a less than 1% average error when calibrated over this range and no single point can exceed 1.5% RH. The sensor is calibrated at a mid-level RH value of 20 to 50% RH using a GEI Model 1500 (or better) Chilled Mirror Hygrometer. The hygrometer supports an approximate 1% RH accuracy in this range. This comparison allows NIST/NBS traceability for the systems. Other salt/hydrate values are available to extend the comparison coverage in a given area or to gain more points at the dry end. A “zero” point check is also available at an RH level of 0.4% RH.

VAPORTRON H-100L PRECISION RELATIVE HUMIDITY LAB Revision No. 7 October 2018
Page 8 of 9
VAPORTRON H-100L PRECISION RELATIVE HUMIDITY LAB Wood Environment & Infrastructure Solutions, Inc.
ATTACHMENT A Sample Factory Calibration Certification
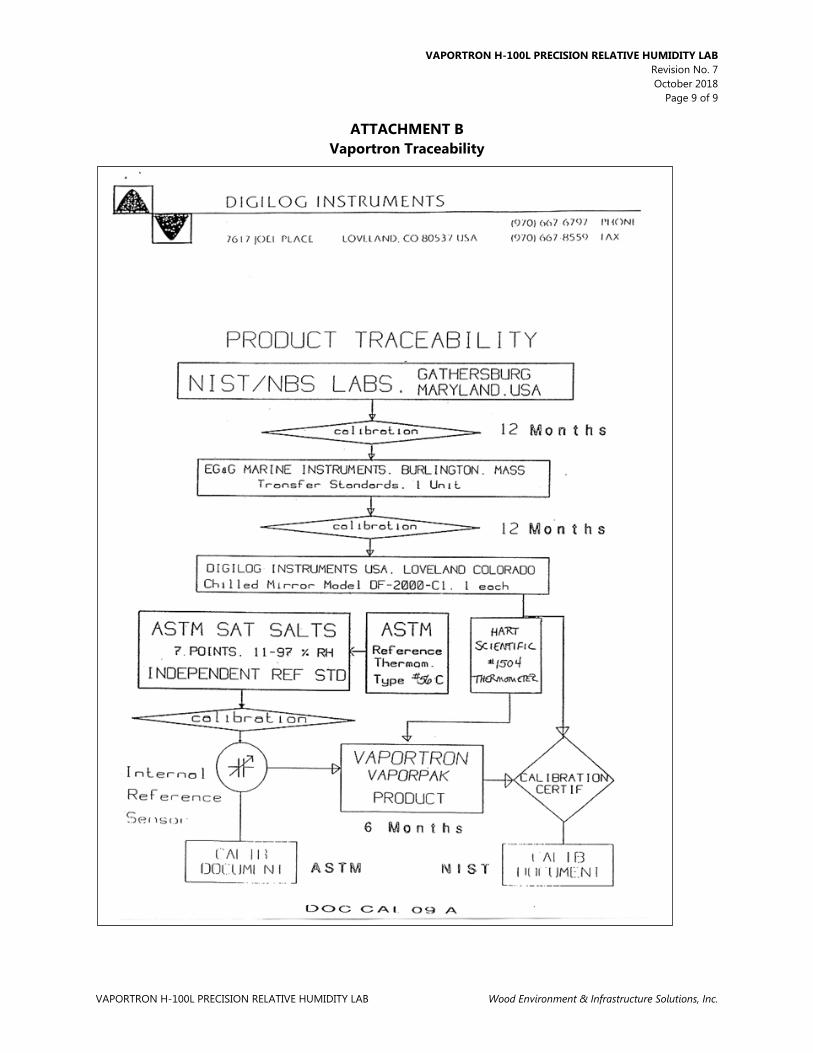
VAPORTRON H-100L PRECISION RELATIVE HUMIDITY LAB Revision No. 7 October 2018
Page 9 of 9
VAPORTRON H-100L PRECISION RELATIVE HUMIDITY LAB Wood Environment & Infrastructure Solutions, Inc.
ATTACHMENT B Vaportron Traceability


FLUKE MULTIMETER 8060A Revision No. 8 October 2018
Page 2 of 9
FLUKE MULTIMETER 8060A Wood Environment & Infrastructure Solutions, Inc.
IV.A.6. FLUKE MULTIMETER 8060A
PURPOSE
The purpose of this Standard Operating procedure (SOP) is to provide consistent guidance for maintenance and handling of the Fluke Multimeter 8060A to Clean Air Status and Trends Network (CASTNET) Field Equipment Calibration Laboratory personnel.
SCOPE
This SOP applies to the maintenance and handling of all the Fluke Multimeter 8060A units administered by the CASTNET Field Calibration Laboratory.
SUMMARY
Fluke Model 8060A multi-meters are calibrated and certified annually or following repair by the manufacturer. Repairs are conducted only by the manufacturer. Battery and fuse maintenance is performed as needed. Self tests are documented quarterly. See Figure 1.
Figure 1. Quarterly Test Procedure
Fluke multi-meter Quarterly Test
Procedure
Install new battery and turn on power.
Passes “Power On” self test?
Passes “Ratio Self Test”?
Passes “Switch Decoding” self test?
Annual certification is valid?
Return to manufacturer for repair, calibration and certification.
Unit is operational.
Yes
Yes
Yes
Yes
No
No
No
No
FLUKE MULTIMETER 8060A Revision No. 8 October 2018
Page 3 of 9
FLUKE MULTIMETER 8060A Wood Environment & Infrastructure Solutions, Inc.
MATERIALS
Fluke Model 8060A Multi-meter 9-Volt (V) battery, if needed Fluke Model A81 battery Eliminator, if needed
SAFETY
Use standard precautions when using the 120 VAC power adapter with the Fluke 8060A. To avoid possible electrical shock, turn the unit off and remove leads prior to battery or fuse replacement.
PROCEDURES
6.1 Repair
All repairs and adjustments are performed by the manufacturer.
Maintenance
6.2.1 Replace the internal 9-V battery when indicated by the meter. Replace fuse as necessary.
Perform and document self test quarterly.
Battery Installation or Replacement
When the battery has exhausted about 80% of its useful life, the BT indicator will appear at the far left of the display. The 8060A also may be operated from a standard AC power line outlet when used with the optional A81 Battery Eliminator (refer to Chapter 7 of the Manufacturer’s Instruction Manual for a description). Use the following procedure to install or replace the battery. See Figure 2 for details. WARNING: To avoid electrical shock, turn off the instrument and remove the test leads and any input signals before replacing the battery.

FLUKE MULTIMETER 8060A Revision No. 8 October 2018
Page 4 of 9
FLUKE MULTIMETER 8060A Wood Environment & Infrastructure Solutions, Inc.
Figure 2. Fluke 8060A battery replacement
Set the 8060A power switch to Off.
Remove test leads from external connections and from the 8060A input terminals.
Turn the instrument over and remove screw from battery cover as shown in Figure 2.
Use your thumbs to push off the battery cover as shown in Figure 2.
Slide the battery out of the compartment as shown in Figure 3.
Figure 3. Fluke 8060A fuse replacement

FLUKE MULTIMETER 8060A Revision No. 8 October 2018
Page 5 of 9
FLUKE MULTIMETER 8060A Wood Environment & Infrastructure Solutions, Inc.
Carefully pull the battery clip free from the battery terminals (if replacing the battery) and attach the new battery.
Slide the battery and its leads into the compartment, slide the cover into place, and install the screw.
Fuse replacement
With battery compartment cover removed, pull fuse ribbon to free fuse from terminals.
Remove and discard fuse. Refer to Figures 2 and 3 for details.
Place fuse ribbon between fuse terminals and push new fuse into terminals.
Self-Tests
Perform the Ratio and Switch Decoding self-test once each calendar quarter. Document and file the results of the test.
The 8060A offers three self-tests: power-on self-test, ratio self-test, and switch decoding self-test. The power-on self-test is automatically performed whenever the instrument is turned on. It is described in Chapters 2 and 4 of the Manufacturer’s Instruction Manual. The other two tests function as follows:
Ratio Self-Test
The ratio self-test is an operating mode of the 8060A in which the reference voltage for the analog/digital (a/d) converter is applied to the a/d converter during both the integrate and the read periods. If the instrument is functioning properly, the display should read 10000 +10 counts (the decimal point location depends on the range, and does not affect the number of counts).
To select the ratio self-test, select a voltage or current function. Hold down the →←))))) button while you turn on the instrument. After the power-on self-test has been completed (the display is .8.8.8.8), release the →←))))) button. The instrument should now be in the ratio self-test mode. To cancel the ratio self test, press the →←))))) button or turn off the instrument.
A proper ratio self-test count indicates that the a/d converter is working properly. If the count deviates more than 10 counts from 10000, the probable causes are as follows (in order of probability) a/d converter in U3, leakage around or failure of C16, 18, Z3, R8, or the power supply. U3, C16, C18, Z3, and R8 are locations on the main printed circuit board.
Switch Decoding Self-Test
To select the switch decoding self-test, hold down the REL button while you turn on the instrument. After the power-on self-test has been completed (the display is .8.8.8.8),

FLUKE MULTIMETER 8060A Revision No. 8 October 2018
Page 6 of 9
FLUKE MULTIMETER 8060A Wood Environment & Infrastructure Solutions, Inc.
release the REL button. The instrument should now indicate the switch decoding. To cancel the switch decoding self-test, turn off the instrument.
The switch decoding self-test indicates how the software in the microcomputer interprets the configuration of the eight switches and four push buttons. Each function or range that may be selected corresponds to a number that appears in one of the digit positions on the display (see the table below). Notice that if no range is selected, the microcomputer assumes the 200 (µA, mV, Σ) range is selected. See Table 1 for details.
Table 1 Switch de-coding self test display results
Range Display Digit 0* 200 (µA, mV, or Σ)
2 20 200 2000
0 (default if no range selected) 1 2 3 4
Push Button Display Digit 1* none REL
→←)))) dB Hz
0 1 2 4 8
Function Display Digit 3* AC voltage DC voltage AC current DC current Resistance
Conductance Diode Test
1 2 3 4 5 6 7
*Display digits are numbered 0 through 4 from right (LSD) to left (MSD).
In some cases, it may be helpful to know that the microcomputer scans the switches in order from SW5 to SW8 (there is no input for switch SW4, the default range). The microcomputer assumes the first range switch detected as being pushed in is the desired range. For example, if you press in both the 200V and 1000V switches while in dc voltage, the microcomputer assumes you want the 200V range. There are two exceptions: diode test and conductance. If the microcomputer detects that the 2 kΣ switch is selected, it checks for the 20 kΣ switch (indicating diode test selection). If the

FLUKE MULTIMETER 8060A Revision No. 8 October 2018
Page 7 of 9
FLUKE MULTIMETER 8060A Wood Environment & Infrastructure Solutions, Inc.
microcomputer detects the 200 kΣ switch is selected, it checks for the MΣ switch (indicating conductance selection).
Also during the switch decoding self-test, the continuity indicator (the long bar across the top of the display) indicates the state of the continuity/frequency comparator. When the voltage at U3-4 (CM-) is less than at U3-3 (CM+), the continuity indicator is off. You can use this feature to check the comparator when troubleshooting the continuity or the frequency functions. R9 controls the setting of the comparator offset.
Calibration
All Fluke Multi-meters are returned to the manufacturer annually for calibration and certification. See Attachment A for example of Annual Certificate of Calibration.
REFERENCES
Fluke Multi-meter 8060A Operation Manual U.S. Environmental Protection Agency (EPA). 1994. Quality Assurance Handbook for Air Pollution
Measurement Systems, Vol. I. A Field Guide to Environmental Quality Assurance. EPA/600/R-94/038a.
U.S. Environmental Protection Agency (EPA). 2008. Quality Assurance Handbook for Air Pollution
Measurement Systems, Vol. IV, Meteorological Measurements Version 2.0 (Final). EPA-454/B-08-002.
U.S. Environmental Protection Agency (EPA). 2013. Quality Assurance Handbook for Air Pollution
Measurement Systems, Vol. II, Ambient Air Quality Monitoring Program. EPA-454/B-13-003.
U.S. Environmental Protection Agency (EPA). 2000. Meteorological Monitoring Guidance for
Regulatory Modeling Applications. EPA-454/R-99-005.

FLUKE MULTIMETER 8060A Revision No. 8 October 2018
Page 8 of 9
FLUKE MULTIMETER 8060A Wood Environment & Infrastructure Solutions, Inc.
ATTACHMENTS
Attachment A – Certificate of Annual Calibration

FLUKE MULTIMETER 8060A Revision No. 8 October 2018
Page 9 of 9
FLUKE MULTIMETER 8060A Wood Environment & Infrastructure Solutions, Inc.
ATTACHMENT A Certificate of Annual Calibration


TRANSFER STANDARDS - CALIBRATION EQUIPMENT AND SPARE PARTS BOX Revision No. 7 October 2018 Page 2 of 12
TRANSFER STANDARDS - CALIBRATION EQUIPMENT AND SPARE PARTS BOX Wood Environment & Infrastructure Solutions, Inc.
IV. B. 1. CALIBRATION EQUIPMENT AND SPARE PARTS BOXES
PURPOSE
The purpose of this Standard Operating procedure (SOP) is to provide consistent guidance, for the maintenance and handling of the Calibration Equipment and Spare Parts Boxes to Clean Air Status and Trends Network (CASTNET) Field Calibration Laboratory personnel.
SCOPE
This SOP applies to the maintenance and handling of Calibration Equipment and Spare Parts Boxes units administered by the CASTNET Field Calibration Laboratory.
SUMMARY
When Calibration and Spare Parts Boxes are returned from the field their inventories are verified and replenished. All necessary service and repair of equipment is performed prior to restocking. Inventory lists for both equipment and consumable items are updated and verified. Problems are reported to the Property Manager and Field Operations Coordinator as appropriate. Four sets of boxes are maintained complete and ready for CASTNET field use at a given time (3 active, 1 spare). Calibration boxes are due for return on a 6-week cycle primarily due to the calibration frequency requirement for the Wood transfer standards (every 6-weeks).
MATERIALS AND SUPPLIES
Calibration Box Calibration Box Inventory Form Spare Parts Box Spare Parts Box A or B forms Spare Parts Box Equipment Inventory List Status Tags (yellow)
REPAIR AND MAINTENANCE
N/A
PROCEDURE
Calibration Box
Upon receipt of the calibration box from the field, check the Calibration Box Inventory Form to ensure that all the transfer equipment has returned from the field. Report any missing equipment to the Property Manager and Field Operations Coordinator. 6.1.1 Complete post-calibration of the transfer equipment that receives in-house certification
rather than annual factory certification; and record the results on the proper forms. If the post-calibrations are within transfer equipment acceptance criteria, use the post-calibration as a pre-calibration for the next deployment. Repair any transfer equipment

TRANSFER STANDARDS - CALIBRATION EQUIPMENT AND SPARE PARTS BOX Revision No. 7 October 2018 Page 3 of 12
TRANSFER STANDARDS - CALIBRATION EQUIPMENT AND SPARE PARTS BOX Wood Environment & Infrastructure Solutions, Inc.
that fails a post-calibration and recalibrate. Or, remove the transfer equipment from service and replace it with a properly working calibrated transfer standard.
6.1.2 After the post- or pre-calibrations of the transfer equipment are completed, repack, restock, and inventory the box using the Calibration Box Inventory Form (Figure 1).
6.1.3 Give a copy of the new Calibration Box Inventory Form to the Property Manager for review. After review, the Property Manager updates the equipment inventory list on the property database.
6.1.4 After the Property Manager finalizes the Calibration Box Inventory Form, secure the calibration box and tag with a green tag showing that it is field ready.
Spare Parts Box
6.2.1 Upon receipt of the spare parts box(es) from the field, use Spare Parts Box A or B forms (Figure 2), to perform a checkout of the Spare Parts Box Equipment and equipment calibration forms. Inspect the condition of all parts (used or unused) and replace as necessary with tested and tagged parts. EPA numbers sensors are accompanied by complete calibration forms.
6.2.2 Update the Spare Parts Box Equipment Inventory List and equipment calibration forms as necessary when replacing equipment.
6.2.3 Give a copy of the updated Spare Parts Box Equipment Inventory List to the Property Manager for review. After review, the Property Manager updates the equipment inventory list on the property database.
6.2.4 After the Property Manager finalizes the equipment property list, lock the spare parts box and tag with a green tag showing that it is field ready.
Consumable Items
The consumable material log is updated based on the First In, First Out (FIFO) principle. As such, this log is not necessarily updated each time a calibration or spare parts box is processed. It is rather, updated as items are “consumed” from the storage area per FIFO.

TRANSFER STANDARDS - CALIBRATION EQUIPMENT AND SPARE PARTS BOX Revision No. 7 October 2018 Page 4 of 12
TRANSFER STANDARDS - CALIBRATION EQUIPMENT AND SPARE PARTS BOX Wood Environment & Infrastructure Solutions, Inc.
REFERENCES
U.S. Environmental Protection Agency (EPA). 1994. Quality Assurance Handbook for Air Pollution Measurement Systems, Vol. I. A Field Guide to Environmental Quality Assurance. EPA/600/R-94/038a.
U.S. Environmental Protection Agency (EPA). 2008. Quality Assurance Handbook for Air Pollution
Measurement Systems, Vol. IV, Meteorological Measurements Version 2.0 (Final). EPA-454/B-08-002.
U.S. Environmental Protection Agency (EPA). 2013. Quality Assurance Handbook for Air Pollution
Measurement Systems, Vol. II, Ambient Air Quality Monitoring Program. EPA-454/B-13-003.
U.S. Environmental Protection Agency (EPA). 2000. Meteorological Monitoring Guidance for
Regulatory Modeling Applications. EPA-454/R-99-005.

TRANSFER STANDARDS - CALIBRATION EQUIPMENT AND SPARE PARTS BOX Revision No. 7 October 2018 Page 5 of 12
TRANSFER STANDARDS - CALIBRATION EQUIPMENT AND SPARE PARTS BOX Wood Environment & Infrastructure Solutions, Inc.
FIGURES

TRANSFER STANDARDS - CALIBRATION EQUIPMENT AND SPARE PARTS BOX Revision No. 7 October 2018 Page 6 of 12
TRANSFER STANDARDS - CALIBRATION EQUIPMENT AND SPARE PARTS BOX Wood Environment & Infrastructure Solutions, Inc.
Figure 1. Calibration Box Inventory Form (Page 1 of 2)

TRANSFER STANDARDS - CALIBRATION EQUIPMENT AND SPARE PARTS BOX Revision No. 7 October 2018 Page 7 of 12
TRANSFER STANDARDS - CALIBRATION EQUIPMENT AND SPARE PARTS BOX Wood Environment & Infrastructure Solutions, Inc.
Figure 1. Calibration Box Inventory Form (Page 2 of 2)

TRANSFER STANDARDS - CALIBRATION EQUIPMENT AND SPARE PARTS BOX Revision No. 7 October 2018 Page 8 of 12
TRANSFER STANDARDS - CALIBRATION EQUIPMENT AND SPARE PARTS BOX Wood Environment & Infrastructure Solutions, Inc.
Figure 2. Spare Parts Inventory Forms (Page 1 of 5)

TRANSFER STANDARDS - CALIBRATION EQUIPMENT AND SPARE PARTS BOX Revision No. 7 October 2018 Page 9 of 12
TRANSFER STANDARDS - CALIBRATION EQUIPMENT AND SPARE PARTS BOX Wood Environment & Infrastructure Solutions, Inc.
Figure 2. Spare Parts Inventory Forms (Page 2 of 5)

TRANSFER STANDARDS - CALIBRATION EQUIPMENT AND SPARE PARTS BOX Revision No. 7 October 2018 Page 10 of 12
TRANSFER STANDARDS - CALIBRATION EQUIPMENT AND SPARE PARTS BOX Wood Environment & Infrastructure Solutions, Inc.
Figure 2. Spare Parts Inventory Forms (Page 3 of 5)
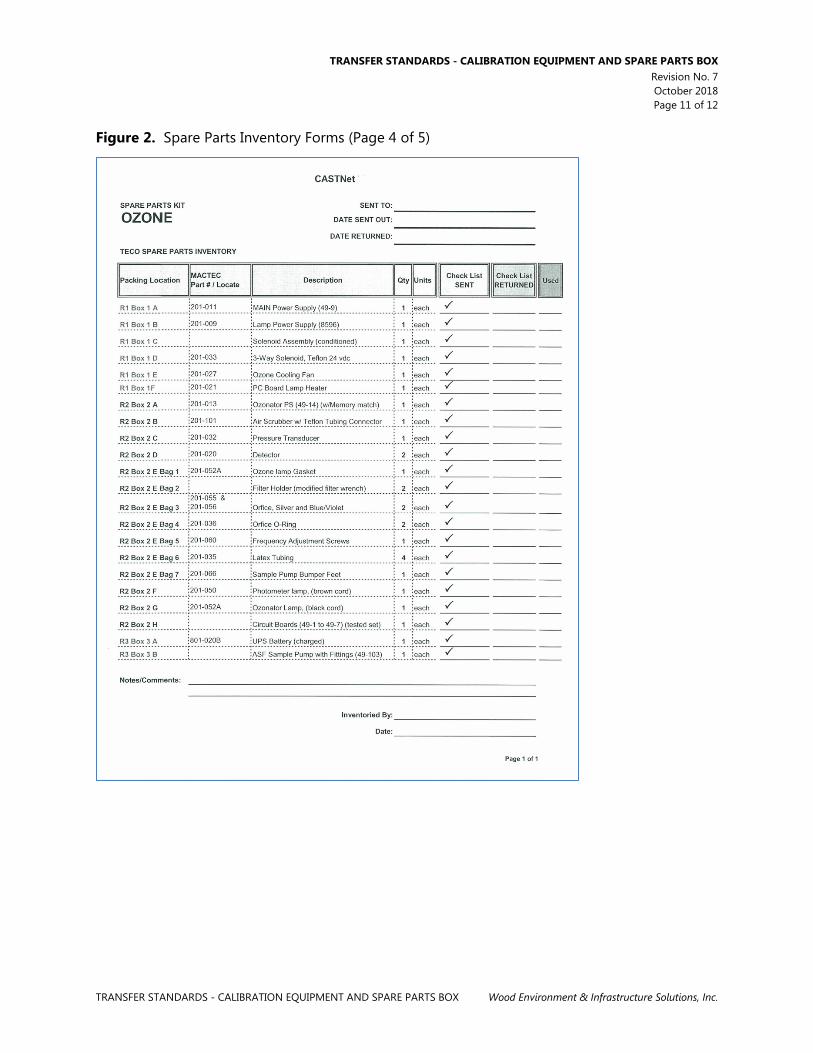
TRANSFER STANDARDS - CALIBRATION EQUIPMENT AND SPARE PARTS BOX Revision No. 7 October 2018 Page 11 of 12
TRANSFER STANDARDS - CALIBRATION EQUIPMENT AND SPARE PARTS BOX Wood Environment & Infrastructure Solutions, Inc.
Figure 2. Spare Parts Inventory Forms (Page 4 of 5)
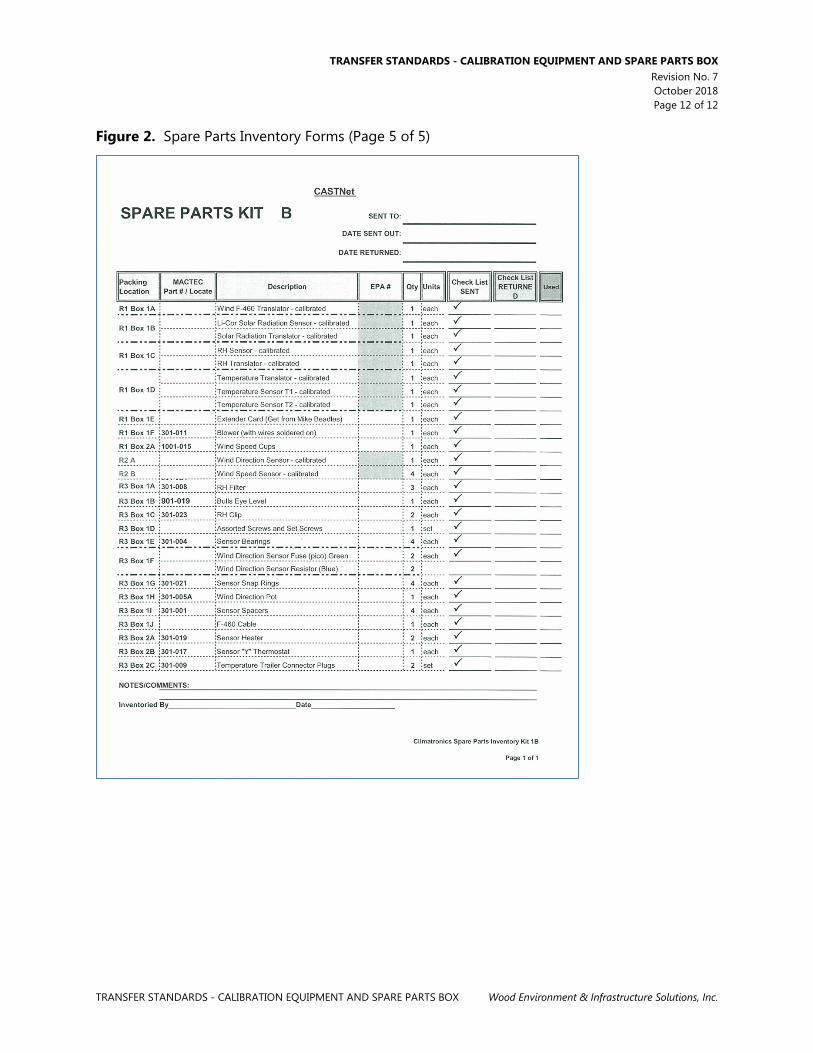
TRANSFER STANDARDS - CALIBRATION EQUIPMENT AND SPARE PARTS BOX Revision No. 7 October 2018 Page 12 of 12
TRANSFER STANDARDS - CALIBRATION EQUIPMENT AND SPARE PARTS BOX Wood Environment & Infrastructure Solutions, Inc.
Figure 2. Spare Parts Inventory Forms (Page 5 of 5)
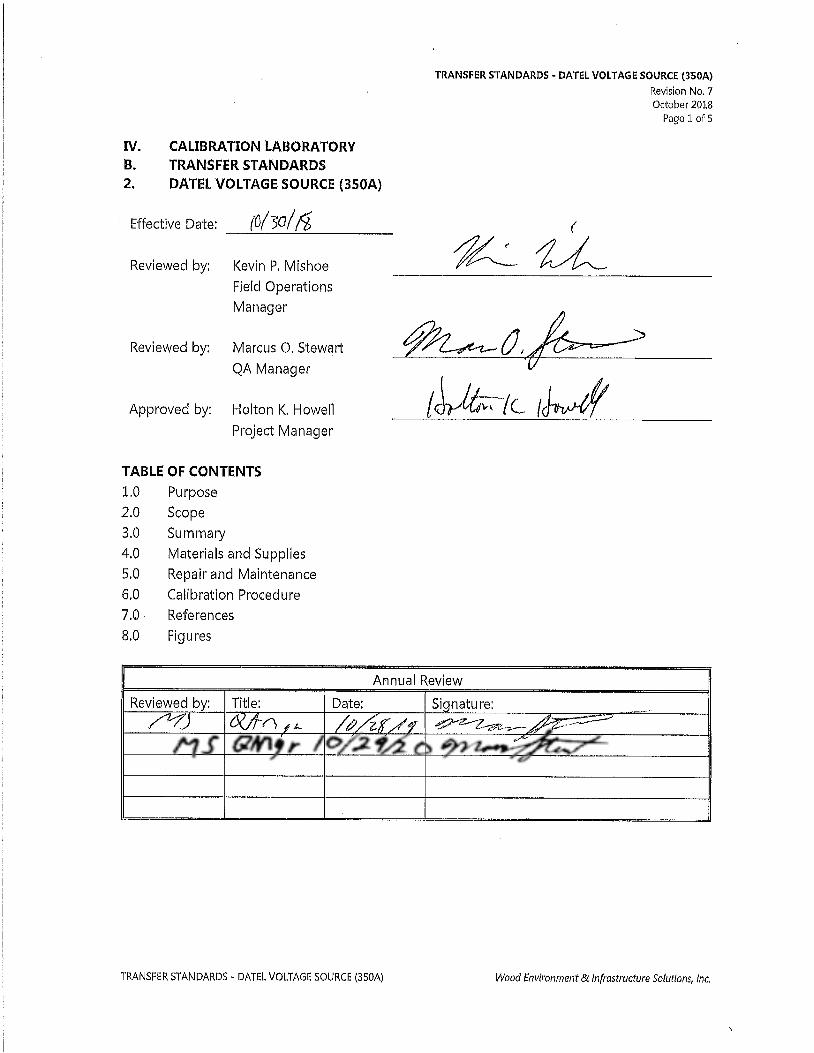

TRANSFER STANDARDS - DATEL VOLTAGE SOURCE (350A) Revision No. 7 October 2018
Page 2 of 5
TRANSFER STANDARDS - DATEL VOLTAGE SOURCE (350A) Wood Environment & Infrastructure Solutions, Inc.
IV. B. 2. DATEL VOLTAGE SOURCE (350A)
1.0 PURPOSE
The purpose of this Standard Operating Procedure (SOP) is to provide consistent guidance for the maintenance and handling of the Datel Voltage Source (350A) to Clean Air Status and Trends Network (CASTNET) Field Calibration Laboratory personnel.
2.0 SCOPE
This SOP applies to the maintenance and handling of Datel Voltage Source (350A) units administered by the CASTNET Field Equipment Calibration Laboratory.
3.0 SUMMARY
Each unit is recertified according to the procedure described in Section 6.0 at least every six months.
4.0 MATERIALS AND SUPPLIES
4.1 Fluke Multimeter 4.2 Data Acquisition System (DAS) Calibration Form
5.0 REPAIR AND MAINTENANCE
5.1 All repairs are performed by the manufacturer. 5.2 Replace the 9-volt (V) battery when the unit’s Low Batt. arrow is lit.
6.0 CALIBRATION PROCEDURE
6.1 Obtain certified Fluke multimeter traceable to National Institute of Standards and Technology (NIST).
6.2 Connect output of Datel voltage source (+ / -) to the test jacks of the multimeter (+ / -). Maintain proper polarity.
6.3 Obtain a DAS Calibration form (Figure 1) and record the serial number of the voltage source and the serial number of the Fluke on the DAS Calibration Form. The Fluke should be recorded as the Primary DAS.
6.4 With the Fluke set to the range of DCV 2 V, increment the Datel from 0.0000 to 1.0000. The Datel should be set to the 1.2 V range. Record the results.
6.5 If the Datel is not within ±0.3 millivolts at the set point (Fluke is actual voltage), then adjust the Datel (Figure 2) and repeat the certification.
6.6 Switch the Datel to 12 V DC range and check the output with the Fluke at 1.000 V, 2.000 V, 3.000 V, 4.000 V, 5.000 V and 10.000 V.

TRANSFER STANDARDS - DATEL VOLTAGE SOURCE (350A) Revision No. 7 October 2018
Page 3 of 5
TRANSFER STANDARDS - DATEL VOLTAGE SOURCE (350A) Wood Environment & Infrastructure Solutions, Inc.
6.7 Reverse the polarity switch on the Datel and check the output of the Fluke for a negative response.
6.8 Record any necessary maintenance or adjustments on form. 6.9 Attach the completed DAS Calibration Form to the instrument. 6.10 Sign and date the form
7.0 REFERENCES
U.S. Environmental Protection Agency (EPA). 1994. Quality Assurance Handbook for Air Pollution Measurement Systems, Vol. I. A Field Guide to Environmental Quality Assurance. EPA/600/R-94/038a.
U.S. Environmental Protection Agency (EPA). 2008. Quality Assurance Handbook for Air Pollution
Measurement Systems, Vol. IV, Meteorological Measurements Version 2.0 (Final). EPA-454/B-08-002.
U.S. Environmental Protection Agency (EPA). 2013. Quality Assurance Handbook for Air Pollution
Measurement Systems, Vol. II, Ambient Air Quality Monitoring Program. EPA-454/B-13-003.
U.S. Environmental Protection Agency (EPA). 2000. Meteorological Monitoring Guidance for
Regulatory Modeling Applications. EPA-454/R-99-005.

TRANSFER STANDARDS - DATEL VOLTAGE SOURCE (350A) Revision No. 7 October 2018
Page 4 of 5
TRANSFER STANDARDS - DATEL VOLTAGE SOURCE (350A) Wood Environment & Infrastructure Solutions, Inc.
8.0 FIGURES
Figure 1. DAS Calibration Form

TRANSFER STANDARDS - DATEL VOLTAGE SOURCE (350A) Revision No. 7 October 2018
Page 5 of 5
TRANSFER STANDARDS - DATEL VOLTAGE SOURCE (350A) Wood Environment & Infrastructure Solutions, Inc.
Figure 2. Calibration Procedure -- Page from Datel Manual


TRANSFER STANDARDS - OZONE ANALYZER Revision No. 9 October 2018 Page 2 of 18
TRANSFER STANDARDS - OZONE ANALYZER Wood Environment & Infrastructure Solutions, Inc.
IV.B.3. THERMO-FISHER MODEL 49I ANALYZER
1.0 PURPOSE
The purpose of this Standard Operating Procedure (SOP) is to provide consistent guidance for the maintenance and handling of the Thermo Ozone (O
3) Monitors Model 49i used as transfer standards to Clean Air Status and Trends Network (CASTNET) Field Calibration Laboratory personnel.
2.0 SCOPE
This SOP applies to the maintenance and handling of Thermo O3 Monitors Model 49i units administered by the CASTNET Field Calibration laboratory.
3.0 SUMMARY
CASTNET O 3 transfer standards are calibrated and certified prior to installation at a remote
monitoring site. See Figure 1. Note: Procedures for traveling transfer standards are discussed in III.6.12. Figure 1. O
3 Transfer
Connect unit to a level 2 or 3 O 3
transfer. Does it turn on?
N Y
Troubleshoot and repair. Allow unit to warm up then check operating parameters and perform a leak check. Is leak check <200mmHg and are operating parameters within
proper range?
N Y
Troubleshoot and repair Run a comparison with the level 2 or 3 O
3 transfer. Is the percent difference between them within ±3%?
N Y
Troubleshoot, repair and run a comparison with the level 2
or 3 O 3 transfer.
Unit is “Field Ready” for the next 6 weeks.

TRANSFER STANDARDS - OZONE ANALYZER Revision No. 9 October 2018 Page 3 of 18
TRANSFER STANDARDS - OZONE ANALYZER Wood Environment & Infrastructure Solutions, Inc.
4.0 MATERIALS AND SUPPLIES
Thermo Model 49i O3 Analyzer Short ¼” exhaust tube Local primary O3 standard (PS) with ¼” Teflon sample line Data logger Computer ¼” T Kynar plug Maintenance Form Writing implement Multimeter with clip leads I/O Terminal Board (Thermo pn102888) with 6 foot 2-cond cable Kimwipes Compressed air blower
5.0 SAFETY
Always use a third ground wire on all instruments.
Always unplug the analyzer when servicing or replacing parts.
If it is mandatory to work inside an analyzer while it is in operation, use extreme caution to avoid contact with high voltages. The analyzer has a 110 VAC power supply. Refer to the manufacturer's instruction manual and know the precise locations of the VAC components before working on the instrument.
Avoid electrical contact with jewelry. Remove rings, watches, bracelets, and necklaces to prevent electrical burns.
6.0 CERTIFICATION PROCEDURE OF STANDARDS
All ozone analyzers used as transfer standards are calibrated and certified in accordance with the EPA document titled “Transfer Standards for Calibration of Air Monitoring Analyzers for Ozone”, EPA-545/B-10-001. Initial certification requires 6 comparison runs between transfer and PS that include 6 concentrations including zero and 85 percent to 95 percent of upper range. This procedure is to be performed on 6 separate days over a period no longer than 14 days. Ongoing recertification requires one new comparison, performed as described above, on a single day twice per calendar quarter. The transfer standards are calibrated, and certified before and after each field calibration trip, and at a minimum of once every 6 weeks. A record of the most recent six calibrations of the transfer standard is kept as part of the certification process. The average of the six slopes and the average of the six intercepts are used as the correction factor for the transfer standard.
TRANSFER STANDARDS - OZONE ANALYZER Revision No. 9 October 2018 Page 4 of 18
TRANSFER STANDARDS - OZONE ANALYZER Wood Environment & Infrastructure Solutions, Inc.
Transfer standard certifications and traceability documents are maintained in the network coordination center files. See Attachment A for an example of a 6-day certification of an ozone transfer standard.
6.1 Calibrating the Detector, Model 49i Allow the instrument to warm up for approximately 1 hour, sampling ONLY zero air. Transfer should NEVER sample ambient room air. (Check to see if desiccant or charcoal canisters in the zero air system are due to be changed.) Connect the output of the Thermo 49PS primary to the sample inlet of the sampler (transfer). Connect an Ethernet cable to the back of 49i model analyzers. Using the laptop connected to the CR3000 data logger, determine which primary standard is being used, 2 or 3, and ensure that page is selected. Only two (2) analyzers can be attached to single primary standard at any time. The data logger has a program built into it that runs a full audit or calibration on an analyzer. However, the instrument must be set up in the program for it to run and record the data properly. For a 49i analyzer, certain parameters need to entered and enabled. For instance, if using PS1, its page should already have the PS slope and intercept entered into the program. Check to make sure these agree with the sticker on the PS, as well as all other parameters match the PS being used. Under Analyzer 1, the parameters of iSeries, SerialNum, Comport and IP_Addr need to be adjusted to match the machine being hooked up. For a 49i, the iSeries parameter should read “true”. If it does not say “true”, double click on the box and double click again to change the logic statement. The serial number of the Transfer Analyzer should be input into the parameter labeled SerialNum. Double click inside the box, type in the serial number and then hit enter to save it. The Comport parameter should read “TCP”. If it does not say “TCP”, double click inside the box, type in TCP and then hit enter to save it. The IP address of the Transfer Analyzer should be entered into the IP_Addr parameter. This can be found in the machine by going into the Menu, down to Instrument Controls, down to Communications and then to TCP/IP Settings. Record this IP address into the table, inputting similar to the serial number. Repeat for all analyzers being calibrated. It is important to make sure that unique IP addresses are entered for each analyzer connected to the logger. To begin an audit of a transfer machine, set “CalStart” under the PS parameters to “true”. The data-logger will then perform and record an automatic six level audit that takes approximately 2 hours to run. A report can be generated through an Access script loaded

TRANSFER STANDARDS - OZONE ANALYZER Revision No. 9 October 2018 Page 5 of 18
TRANSFER STANDARDS - OZONE ANALYZER Wood Environment & Infrastructure Solutions, Inc.
on to the Loggernet computer which can be accessed from any of the other computers in the shop.
6.2 Adjusting the levels 6.2.1 If the transfer was found to be out of criteria (more than ± 3% of target), it is necessary to
perform a full calibration. To do so, connect the transfer as in steps 1 through 5, if not already connected. Once the parameters are adjusted for the particular analyzer set the “CalAdjust” parameter to “true” under the appropriate analyzer’s setting. Next set the “CalStart” parameter to “true”. This performs an automatic sequence that adjusts the Background and Coefficient variables. A report can be generated through an Access script loaded on to the Loggernet computer which can be accessed from any of the other computers in the shop.
6.2.2 Below are equations to check the accuracy of the analyzers. 6.2.3 Correct the PS averages to actual (observed average minus the y-intercept and divided by
the slope generated when the PS was certified).
−=
slopereadingaverageactual intercept
Calculate percent differences (%∆) and perform a regression analysis of the transfer averages versus the 49PS values.
100% ×
−
=∆known
knownunknown
After 6 days, calculate the average for all 6 days from the printed reports.
6.3 Repair and Maintenance See Chapter 7 in the Thermo Manufacturer’s Manuals for repair procedures for both models.
7.0 MAINTENANCE AND CALIBRATION
Perform any detector audits or post calibrations prior to beginning the following procedure. The following list is the comprehensive maintenance overhaul. Refer to Ozone Maintenance and Calibration Schedule to determine required maintenance. Please see Figure 2 for an overview of the maintenance process.
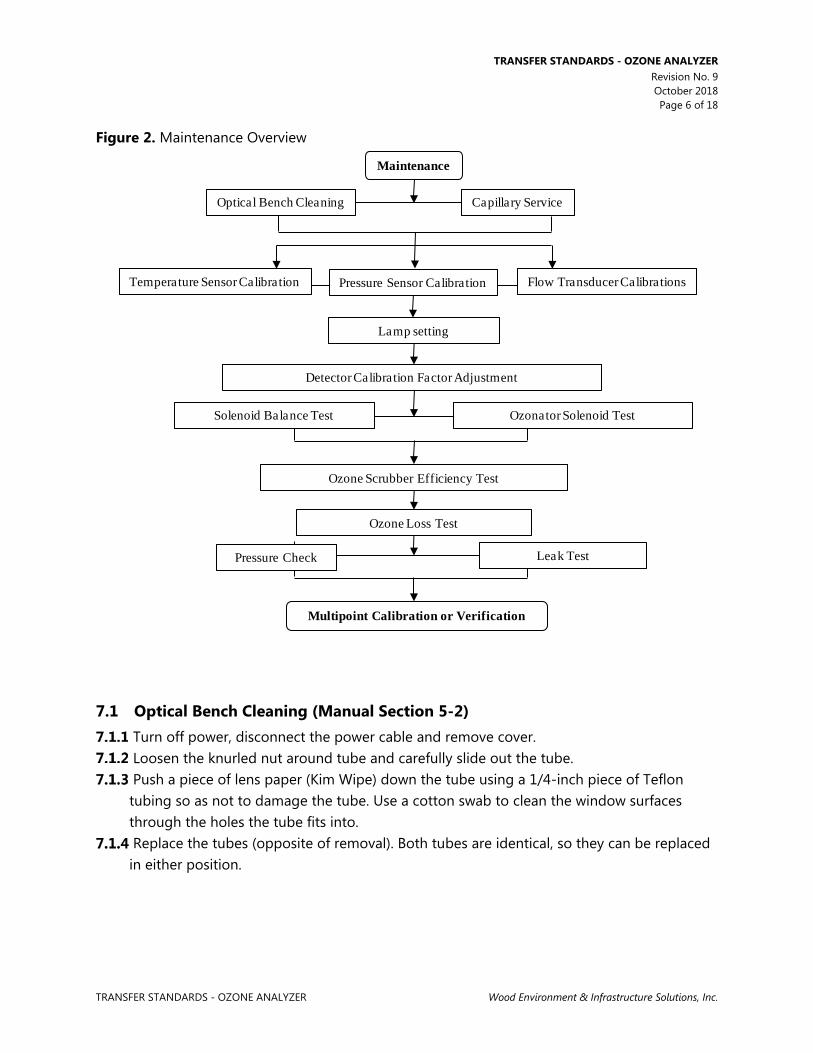
TRANSFER STANDARDS - OZONE ANALYZER Revision No. 9 October 2018 Page 6 of 18
TRANSFER STANDARDS - OZONE ANALYZER Wood Environment & Infrastructure Solutions, Inc.
Figure 2. Maintenance Overview
7.1 Optical Bench Cleaning (Manual Section 5-2) Turn off power, disconnect the power cable and remove cover. Loosen the knurled nut around tube and carefully slide out the tube. Push a piece of lens paper (Kim Wipe) down the tube using a 1/4-inch piece of Teflon tubing so as not to damage the tube. Use a cotton swab to clean the window surfaces through the holes the tube fits into. Replace the tubes (opposite of removal). Both tubes are identical, so they can be replaced in either position.
Maintenance
Optical Bench Cleaning Capillary Service
Temperature Sensor Calibration Pressure Sensor Calibration Flow Transducer Calibrations
Solenoid Balance Test Ozonator Solenoid Test
Detector Calibration Factor Adjustment
Multipoint Calibration or Verification
Ozone Scrubber Efficiency Test
Ozone Loss Test
Pressure Check Leak Test
Lamp setting

TRANSFER STANDARDS - OZONE ANALYZER Revision No. 9 October 2018 Page 7 of 18
TRANSFER STANDARDS - OZONE ANALYZER Wood Environment & Infrastructure Solutions, Inc.
7.2 Capillary Service (Manual Section 5-5) Turn off power, disconnect the power cable, and remove cover. Remove purple 15 mil capillaries by loosening nuts around the Tee fitting on top of sample pump. Remove capillaries from tubing. Clear any blockage with a wire less than 0.015-inch OD, or replace. Replace capillaries (opposite of removal). Repeat steps 2-4 for orange 24 mil capillary upstream of ozone generation chamber if applicable.
7.3 Bench Temperature Sensor Calibration (Manual Sections 7-26 and 3-92) Note: The analyzer must be in service mode to perform this adjustment.
Remove bench thermistor signal cable from the Measurement Interface Board. Unscrew thermistor from the optical bench. Reconnect signal cable to Measurement Interface Board. Place thermistor through foam in an empty insulated thermos with temperature primary standard. After the readings equilibrate, adjust bench calibration if the deviation is > 2°C. Press the Main Menu button to display the Main Menu. Use the down arrow button to scroll to Service and press the enter button to display the Service menu. Use the down arrow button to scroll to Temperature Calibration and press the enter button to display the Temperature Calibration screen. Enter corrected temperature standard reading and press ↵ (Enter) to save.
7.4 Pressure Sensor Calibration (Manual Sections 7-34 and 3-88) The pressure sensor calibration requires a high vacuum pump capable of < 1mmHg (≈1 torr). If such a pump is unavailable, only adjust the pressure span setting. Note: The analyzer must be in service mode to perform this adjustment.
Connect reference pressure sensor and vacuum pump to pressure transducer. Turn on vacuum pump until reference pressure sensor reads < 1mmHg. Adjust zero setting if deviation is > 5 mmHg. Press the Main Menu button to display the Main Menu. Use the down arrow button to scroll to Service and press the enter button to display the Service menu. Use the down arrow button to scroll to Pressure Calibration and press the enter button to display the Pressure Calibration screen. From the zero menu, press enter to set the zero setting. Turn off vacuum pump and open the relief valve. After the readings equilibrate, adjust span concentration if deviation > 5mmHg.

TRANSFER STANDARDS - OZONE ANALYZER Revision No. 9 October 2018 Page 8 of 18
TRANSFER STANDARDS - OZONE ANALYZER Wood Environment & Infrastructure Solutions, Inc.
Press the menu button to return to the pressure calibration menu. From the span menu, enter the reference pressure reading and press ↵ (Enter) to save.
7.5 Flow Transducer Calibrations (Manual Sections 7-37 and 3-90) The flow readings are not used to calculate ozone concentration. Since they are only diagnostic, a precise calibration is not critical. Note: The analyzer must be in service mode to perform this adjustment.
Turn off the instrument sample pump. Press the Main Menu button to display the Main Menu. Use the down arrow button to scroll to Service and press the enter button to display the Service menu. Select Flow A Calibration and then zero. Press ↵ (Enter) to set the flow zero setting. Repeat steps 4 and 5 for Flow B. Connect the reference flow meter to the sample bulkhead. From the Flow A Calibration menu, select Span. Disconnect the tubing from the cell B flow transducer to the sample pump and cap both cell B pump inlet and transducer output. Leaving either uncapped will produce erroneous readings. Enter the reference flow meter reading and press ↵ (Enter) to save. Repeat steps 8 – 10 for Flow B.
7.6 Leak Check (Manual Section 5-7) Turn off zero air and disconnect the zero air tubing from the primary. Cap the sample inlet bulkhead. Press the Pressure soft key. The pressure reading should drop less than 200 mm Hg. It should take less than 30 seconds from the time the zero air dump is plugged to the time the reading below 200 mm Hg is obtained
7.7 Adjust Lamp Setting (Manual Section 3-85) Note: The analyzer must be in service mode to perform this adjustment.
Press the Main Menu button to display the Main Menu. Use the down arrow button to scroll to Service and press the enter button to display the Service menu. Use the down arrow button to scroll to Lamp Setting and press the enter button to display the Lamp Setting screen. Use the up or down arrows to increment or decrement the numeric value until both intensities are as close to 100 kHz as possible. Press the enter button to save the new lamp setting.
TRANSFER STANDARDS - OZONE ANALYZER Revision No. 9 October 2018 Page 9 of 18
TRANSFER STANDARDS - OZONE ANALYZER Wood Environment & Infrastructure Solutions, Inc.
7.8 Detector Calibration Factor Adjustment (Manual Section 3-86) Note: The analyzer must be in service mode to perform this adjustment.
Connect zero air to the sample bulkhead connector. Press the Main Menu button to display the Main Menu. Use the down arrow button to scroll to Service and press the enter button to display the Service menu. Use the down arrow button to scroll to Detector Calibration and press the enter button to display the Detector Calibration screen. Verify both detector uncorrected readings are between 90 kHz and 110 kHz. Press ↵ (Enter) to compute new calibration factors.
7.9 Solenoid Balance and Leak Test (Manual Sections 5-8 and 5-9) Generate an ozone concentration of approximately 0.5 ppm and connect to the sample bulkhead connector. Press the Main Menu button to display the Main Menu. Use the down arrow button to scroll to Diagnostics and press the enter button to display the Diagnostics menu. Use the down arrow button to scroll to Cell A/B O
3 and press the enter button to display the O
3 PPB screen. This display presents the concentration for each cell. Once the instrument stabilizes, the average of 10 successive simultaneous readings from each cell should agree within ± 3 percent. A balanced measurement of better than 3 percent indicates that there are no leaks across the solenoid. A constant low reading from one cell indicates an imbalance. The imbalance can be caused by a dirty cell, dirty lines to that cell, or by a leaky valve. To check if the imbalance is caused by a dirty cell, interchange the cells. If the imbalanced side switches, the imbalance is caused by the cell. To check if the imbalance is caused by dirty lines to a cell, perform the ozone loss test.
To check the solenoid for a leak perform the following test. • Remove the solenoid valve that appears to be faulty. • Connect the solenoid cell test tubing to the test pump. The other end of the tubing
will be connected to a tee fitting. • Cap one open port on the tee fitting. • Connect a pressure transducer to the open tee fitting port. • Turn on the test pump. • After the pressure has stabilized, record the reading as PC. • Turn off the test pump. • Uncap the capped the tee fitting port. • Connect the open tee fitting port to the common solenoid port.

TRANSFER STANDARDS - OZONE ANALYZER Revision No. 9 October 2018 Page 10 of 18
TRANSFER STANDARDS - OZONE ANALYZER Wood Environment & Infrastructure Solutions, Inc.
• Cap the normally open solenoid port. • Turn on the test pump. • After the pressure has stabilized, record the pressure reading as PNO. • Turn off the test pump • Uncap the normally open solenoid port. • Cap the normally closed solenoid port. • Plug the solenoid power line into the appropriate connector on the measurement
interface board. Make sure the solenoid is activated. • After the pressure has stabilized, record the pressure reading as PNC. • The solenoid is faulty if either PNO or PNC is greater than PC.
If an imbalance is found, repair and return to step 3, adjusting the detector lamp setting
7.10 Ozone Scrubber Efficiency Test (Manual Section 5-10) To obtain accurate results using this test, it is critical to measure all readings precisely. In most cases, the entire range of the instrument is represented by 500-600 Hz. Make sure the instrument has sufficiently warmed up and the cover is on. Any limitations in ambient temperature control, test zone concentration, intensity stability, or temperature and pressure measurements should be understood when evaluating the test results. Note: The analyzer must be in service mode to perform this test.
Generate an ozone concentration of approximately 0.5 ppm and connect to the sample bulkhead connector. The exact concentration is not important, but the accuracy of this test is directly affected by how accurately the test concentration is known. Press the Main Menu button to display the Main Menu. Use the down arrow button to scroll to Service and press the enter button to display the
Service menu. Use the down arrow button to scroll to Intensity Check and press the enter button to
display the Intensity Check menu. Press the enter button to display the Int A Reference Gas screen. When the frequency stabilizes, record the frequency to the nearest 5 Hz as FREQ 1. Press the menu button to return to the Intensity Check menu and select Int A Sample
Gas. When the frequency stabilizes, record the frequency to the nearest 5 Hz as FREQ 2. Press the Pressure soft key and record as P.
Press the Temperature soft key and record as T. The approximate efficiency is given as follows:

TRANSFER STANDARDS - OZONE ANALYZER Revision No. 9 October 2018 Page 11 of 18
TRANSFER STANDARDS - OZONE ANALYZER Wood Environment & Infrastructure Solutions, Inc.
Repeat steps 5-11 for Cell B (choose Int B Reference Gas). If the analyzer passed the balance test of the “Solenoid Balance and Leak Test”
performed previously and the measured efficiency is low, replace the ozone scrubber.
7.11 Ozone Loss Test (Manual Section 4-4) Only perform as necessary as indicated by the results of the Solenoid Balance and Leak Test.
With the instrument running, generate an ozone concentration of approximately 0.5 ppm and connect to the sample bulkhead connector. The internal generator can be used since concentration will be measured later. Using a certified ozone detector, measure the concentration at the test instrument
sample bulkhead as C, the inlet of cell A as CaIN, the exhaust of cell A as CaOUT, the inlet of cell B as CbIN and the exhaust of cell B as CbOUT. The percent ozone loss is given as follows:
7.12 Pump Pressure Check (Manual Section 3-83) Note: The analyzer must be in service mode to perform this test.
Press the Main Menu button to display the Main Menu. Use the down arrow button to scroll to Service and press the enter button to display the
Service menu. Use the down arrow button to scroll to Pressure Check and press the enter button to
display the Pressure Check menu. Use the down arrow button to scroll to Pump Pressure and press the enter button to
display the Pump Pressure screen. The pressure reading should drop below 390 mmHg in less than 20 seconds. This
indicates the effectiveness of the sample pump. After 20 seconds, if the pressure is greater than 390 mmHg or the flow is greater than
0.010 LPM, the words “PUMP PROBLEM DETECTED” appear. Otherwise the words “PUMP OK” appear.
7.13 Leak Test (Manual Section 5-7) Plug the sample inlet port. Press the Pressure soft key. The pressure reading should drop less than 200 mm Hg. It should take less than 30 seconds from the time the sample inlet port is plugged to the
time the reading below 200 mm Hg is obtained.
TRANSFER STANDARDS - OZONE ANALYZER Revision No. 9 October 2018 Page 12 of 18
TRANSFER STANDARDS - OZONE ANALYZER Wood Environment & Infrastructure Solutions, Inc.
Continue only for instruments with ozone generators. Plug the vent port, ozone port, zero air port, and the integrity/cal gas outlet port on the
tee fitting. Press the button to return to the home screen. Press the button to activate zero mode. Press the Pressure soft key.
The pressure reading should drop less than 200 mm Hg. It should take less than 30 seconds from the time the sample inlet port is plugged to
the time the reading below 200 mm Hg is obtained. Lift the lid and remove any packing material used for shipping. Inspect interior for
obvious damage (i.e., broken fittings, cracked tubing and loose parts) and repair if necessary.
Remove cell chambers and clean with a Kimwipe and compressed air. Replace cells in their previous positions (Note: Do not interchange cell positions as this affects frequency values. Work on only one cell at a time.) Excessive debris inside cells may be indicative of deterioration of the 3-way valves.
Connect the sample port to one of the three level 2 or 3 ozone transfer standards. Add a short exhaust line and check and other connections (i.e., in/out loop, exhaust) are properly attached for a tight connection.
Turn the unit on. (It must be connected to a running level 2 or 3 ozone transfer standard before operating). Allow to warm up for at least one hour.
Perform a leak check. To do so turn the unit off, remove the sample tubing and install a Kynar plug. Turn the unit on and wait for it to reboot. Press the Pres soft key. Note the pressure on the front of analyzer – it should drop to below 200 mmHg for a good leak check. Turn the unit off and replace the sample line before turning on again. A pressure drop above 200 mmHg may indicate a leak in the system or a weak sample pump and requires investigation prior to sampling.
Check intensity and noise levels. With unit in Service Mode press Menu, Service and Lamp Setting. If necessary, adjust the intensities (also known as frequencies) to around 100,000 Hertz. Record the lamp percentage on the Maintenance Form. While in the Service menu, toggle down to Intensity Check, press enter, press enter again on Int A Reference Gas or Int A Sample Gas. Record the intensity and noise level. Allow at least one minute for the noise level to stabilize. It should be below 4.0 and not ramp above that level. Press Menu once and then press enter on Int B Reference Gas or Int B Reference Sample to obtain the intensity and noise level for cell B. Press the Run button to return to sample mode.
Check the temperature, flows and ambient pressure by pressing the “soft” keys (Temp, Flow, and Pres respectively) which are located directly under the display screen (Figure 3). Record their values on the Maintenance Form.

TRANSFER STANDARDS - OZONE ANALYZER Revision No. 9 October 2018 Page 13 of 18
TRANSFER STANDARDS - OZONE ANALYZER Wood Environment & Infrastructure Solutions, Inc.
Figure 3. Model 49i Soft keys.
Set voltage output. In the Main Menu, choose Instrument Controls, I/O
Configuration then Analog Output Config. Select All Current Channels, Select Range and use the cursor to select 0-1V and press enter to save.
Calibrate analog output. Attach I/O Terminal board (Thermo pn102888) to Analog Voltage Output port in back of the analyzer (Figure 4). Connect the certified multi-meter’s positive wire to terminal #20 and the negative wire to terminal #21 respectively on the I/O terminal board. Set the multi-meter to read to three decimal places. Return to Main Menu and scroll the cursor down to Service. Choose Analog Output Calibration, Voltage Channel 1, Calibrate Zero. Use the cursor to increment or decrement the numeric value and produce 0.000 VDC as indicated by the multi-meter. Press Enter to save when multi-meter reads 0.000. Record the value and exact voltage on the Maintenance Form. Return to Analog Out Cal menu, choose Calibrate Full Scale, and use cursor to increment or decrement the numeric value to produce 1.000 VDC indicated by the multi-meter. Press Enter to save when multi-meter reads 1.000. Record the value and exact voltage on the Maintenance Form.

TRANSFER STANDARDS - OZONE ANALYZER Revision No. 9 October 2018 Page 14 of 18
TRANSFER STANDARDS - OZONE ANALYZER Wood Environment & Infrastructure Solutions, Inc.
Figure 4. Model 49i analog output calibration.
Take the unit out of Service Mode. Press Run, Main Menu, Instrument Controls, Service Mode, Enter and then Run again.

TRANSFER STANDARDS - OZONE ANALYZER Revision No. 9 October 2018 Page 15 of 18
TRANSFER STANDARDS - OZONE ANALYZER Wood Environment & Infrastructure Solutions, Inc.
8.0 REFERENCES
U.S. Environmental Protection Agency (EPA). 1994. Quality Assurance Handbook for Air Pollution Measurement Systems, Vol. I. A Field Guide to Environmental Quality Assurance. EPA/600/R-94/038a.
U.S. Environmental Protection Agency (EPA). 2008. Quality Assurance Handbook for Air Pollution
Measurement Systems, Vol. IV, Meteorological Measurements Version 2.0 (Final). EPA-454/B-08-002.
U.S. Environmental Protection Agency (EPA). 2013. Quality Assurance Handbook for Air Pollution
Measurement Systems, Vol. II, Ambient Air Quality Monitoring Program. EPA-454/B-13-003.
U.S. Environmental Protection Agency (EPA). 2000. Meteorological Monitoring Guidance for
Regulatory Modeling Applications. EPA-454/R-99-005. U.S. Environmental Protection Agency (EPA). 2013. Transfer Standards for the Calibration of
Ambient Air Monitoring Analyzers for Ozone. Technical Assistance Document. EPA-454/B-13-004.
U.S. Environmental Protection Agency (EPA). 2015. Appendix A to Part 58 – Quality Assurance
Requirements for State and Local Air Monitoring Stations (SLAMS), Special Purpose Monitors (SPMs), and Prevention of Significant Deterioration (PSD) Air Monitoring. 40 CFR Part 58.

TRANSFER STANDARDS - OZONE ANALYZER Revision No. 9 October 2018 Page 16 of 18
TRANSFER STANDARDS - OZONE ANALYZER Wood Environment & Infrastructure Solutions, Inc.
9.0 ATTACHMENTS
Attachment A – Example Ozone Detection Calibration Report
Attachment B – Certification Procedures for CASTNET Traveling Transfer Standards

TRANSFER STANDARDS - OZONE ANALYZER Revision No. 9 October 2018 Page 17 of 18
TRANSFER STANDARDS - OZONE ANALYZER Wood Environment & Infrastructure Solutions, Inc.
ATTACHMENT A Example Ozone Detection Calibration Report
TRANSFER STANDARDS - OZONE ANALYZER Revision No. 9 October 2018 Page 18 of 18
TRANSFER STANDARDS - OZONE ANALYZER Wood Environment & Infrastructure Solutions, Inc.
ATTACHMENT B Certification Procedures for CASTNET Traveling Transfer Standards
CASTNET sites that are configured for compliance monitoring are most often configured with a site analyzer without an onboard ozone generator paired with a separate analyzer equipped with both a photometer and an onboard ozone generator. The analyzer with the onboard ozone generator is used as an onsite transfer standard to generate the ozone concentrations for routine checks. The transfer standard’s photometer must first have a 6-day certification and then a 1-day certification every six months by an O
3 transfer standard that is traceable to an EPA standard reference photometer (SRP). SRP are considered Level 1 standards. Any commercial analyzer designated as a reference or equivalent method compared with a Level 1 standard is considered a Level 2 standard. Initial verification of the site transfer standards will be performed at the CASTNET field equipment laboratory using its Level 2 standards, giving the site transfers Level 3 authority when installed at a site configured with a separate analyzer for compliance monitoring. In order to maintain Level 3 authority for the site transfer standards, the traveling transfer standards must have Level 2 authority. To accomplish this authority traveling transfer standards are shipped to an SRP operated by the National Institute of Standards and Technology once per year. In addition to sending traveling transfer standards to an SRP annually, after each calibration trip, the traveling transfer standards will be compared to the Level 2 standards in the CASTNET field equipment laboratory as a quality control check. However, the comparison will be a quality control check only; the traveling transfer standards will not be adjusted. If a problem is found based on these checks or a major repair is required due to mechanical failure or shipping damage, the traveling standard will be returned to an SRP for verification before it is redeployed to the field.


TRANSFER STANDARDS - BIOS PRIMARY AIR FLOW METER Revision No. 7 October 2018
Page 2 of 8
TRANSFER STANDARDS - BIOS PRIMARY AIR FLOW METER Wood Environment & Infrastructure Solutions, Inc.
IV.B.4. BIOS PRIMARY AIR FLOW METER
1.0 PURPOSE
The purpose of this Standard Operating Procedure (SOP) is to provide consistent guidance for the maintenance and handling of the BIOS Definer 220 and BIOS DryCal Primary Air Flow Meters to Clean Air Status and Trends Network (CASTNET) Field Calibration Laboratory personnel.
2.0 SCOPE
This SOP applies to the maintenance and handling of BIOS Air Flow Meters administered by the CASTNET Field Calibration Laboratory.
3.0 SUMMARY
The BIOS Definer 220 and BIOS DryCal DC-Lite Flow Meter with NEXUS Data/ Communication Module (both hereafter referred to as mass flow meters or MFM) are recharged and leak tested at least quarterly by laboratory personnel. Repairs and certifications are performed by the manufacturer.
4.0 MATERIALS AND SUPPLIES
MFM Battery charger Lead-acid batteries
5.0 REPAIR AND MAINTENANCE
All repairs and adjustments are performed by the manufacturer.
When not in use, store in a clean, dry environment with the inlet/outlet caps installed. Every quarter, fully charge the battery pack, and perform a leak test.
5.1 Charging the Battery
Before using your MFM, be sure that the battery system has been fully charged to ensure that the unit will perform to specifications and maintain proper operation for the required time period.
The MFM is equipped with a battery indicator that provides battery charge indication at three levels. When the battery indicator on the display is empty, the unit will continue to operate for a short period of time before shutting itself off.

TRANSFER STANDARDS - BIOS PRIMARY AIR FLOW METER Revision No. 7 October 2018
Page 3 of 8
TRANSFER STANDARDS - BIOS PRIMARY AIR FLOW METER Wood Environment & Infrastructure Solutions, Inc.
5.2 To Charge the MFM:
5.2.1 Connect only the appropriate BIOS 12VDC charger, provided with the MFM, into a standard wall outlet. Optionally, one station of the BIOS AirPro 4000D multi-station charger may be used.
5.2.2 Insert the charger barrel plug into the charging jack. Full charge takes 8 to 12 hours, and the unit can charge while being used.
5.2.3 The Definer 220 will indicate charging status on its LCD readout.To view the actual charging status of the DC Lite during the charging period, disconnect the battery charger and wait 3 to 5 minutes. When the indicator is solid black the battery is fully charged.
5.3 Battery Maintenance and Storage
5.3.1 Battery Maintenance: Lead-acid batteries will not exhibit the “memory effect” common to nickel-cadmium batteries. A lead acid battery may be charged for an indefinite time period without damage.
5.3.2 Long-Term Storage: Long-term storage without charging can damage the battery pack, therefore, if the DC-Lite cannot be left charging continuously, it should be charged at least every 3 months.
5.4 Leak-Test Check Procedure (DC-Lite/NEXUS)
The DC-Lite has a built-in quality assurance self-test feature to verify proper integrity and operation of the DC-Lite flow cell (see the DC-Lite manual). When the NEXUS is introduced into the flow stream, the NEXUS represents additional opportunities for leakage. We recommend that the NEXUS flow path be included in the leak test process.
The leak test for the DC-Lite and NEXUS combination is very similar to the leak test defined in the DC-Lite manual with only a small modification. Connect tubing from the NEXUS to either the inlet or outlet of the DC-Lite and connect the leak test fitting to the remaining NEXUS air boss. Make sure the electronic cable is disconnected. To initiate the leak test:
5.4.1 Connect either the DC-Lite inlet or outlet to the NEXUS with tubing and then place the leak test tubing accessory (short piece of tubing with red cap) over the remaining NEXUS air boss. The low flow range DC-Lite (DCL500) requires a tubing adapter to connect to the larger NEXUS air boss.
5.4.2 After the tubing connections have been made, from the DC-Lite key pad, press and hold the <Stop> button while pressing the <On> button. The DC-Lite display will read:
Leak Test Invert & Push Read

TRANSFER STANDARDS - BIOS PRIMARY AIR FLOW METER Revision No. 7 October 2018
Page 4 of 8
TRANSFER STANDARDS - BIOS PRIMARY AIR FLOW METER Wood Environment & Infrastructure Solutions, Inc.
Note: If the DC-Lite is already “ON”, press and hold the <Stop> button while pressing the <Hard Reset> button on the back of the DC-Lite unit.
5.4.3 Invert the DC-Lite so the piston moves to the top of the cell. While the piston is resting at the top of the cell press the <Read> button and the internal valve will close. Return the DC-Lite to an upright position and it will time the descent of the piston.
Note: The test may take as long as 15-20 minutes. Observe the location of the piston to ensure that it is at the top of the cell when the test begins.
If the test is completed successfully, the display will read:
5.4.4 Press the <Read> button as directed and the internal valve will open and the piston will fall.
5.4.5 Repeat the test with the leak test tubing accessory connected to air boss not connected to the NEXUS.
Note: If the unit fails the leak-test, the display will read:
5.5 Leak Test Procedure (Definer 220)
The Definer Leak Test is designed only to verify the internal integrity of the instrument and alert you to an internal leak. We recommend performing the Leak Test only as an intermediate quality control check or whenever the integrity of the instrument is questioned due to misuse or accidental damage.
Please note, that a leak test is not a substitute for a comprehensive examination of the unit’s overall performance and it does not ensure that your Definer is operating accurately. • Invert your Definer and allow the piston to travel to the top • Cap the port under test using the Bios supplied leak test cap. Leave the other port uncapped • Press Enter on the control panel while the unit is still inverted • Return the unit upright. The leak test will progress.
6.0 CERTIFICATION PROCEDURE
The BIOS Primary Air Flow Meter is returned to the manufacturer annually for routine cleaning, maintenance, calibration, and certification (see Figures 1 and 2 Sample Factory Certificates).
Test OK Push Read
Maintenance Reqd Push Read

TRANSFER STANDARDS - BIOS PRIMARY AIR FLOW METER Revision No. 7 October 2018
Page 5 of 8
TRANSFER STANDARDS - BIOS PRIMARY AIR FLOW METER Wood Environment & Infrastructure Solutions, Inc.
7.0 REFERENCES
U.S. Environmental Protection Agency (EPA). 1994. Quality Assurance Handbook for Air Pollution Measurement Systems, Vol. I. A Field Guide to Environmental Quality Assurance. EPA/600/R-94/038a.
U.S. Environmental Protection Agency (EPA). 2008. Quality Assurance Handbook for Air Pollution
Measurement Systems, Vol. IV, Meteorological Measurements Version 2.0 (Final). EPA-454/B-08-002.
U.S. Environmental Protection Agency (EPA). 2013. Quality Assurance Handbook for Air Pollution
Measurement Systems, Vol. II, Ambient Air Quality Monitoring Program. EPA-454/B-13-003. U.S. Environmental Protection Agency (EPA). 2000. Meteorological Monitoring Guidance for
Regulatory Modeling Applications. EPA-454/R-99-005. Bios International Corporation. 2002. DryCal® DC-Lite Manual

TRANSFER STANDARDS - BIOS PRIMARY AIR FLOW METER Revision No. 7 October 2018
Page 6 of 8
TRANSFER STANDARDS - BIOS PRIMARY AIR FLOW METER Wood Environment & Infrastructure Solutions, Inc.
8.0 FIGURES

TRANSFER STANDARDS - BIOS PRIMARY AIR FLOW METER Revision No. 7 October 2018
Page 7 of 8
TRANSFER STANDARDS - BIOS PRIMARY AIR FLOW METER Wood Environment & Infrastructure Solutions, Inc.
Figure 1. Sample Certification
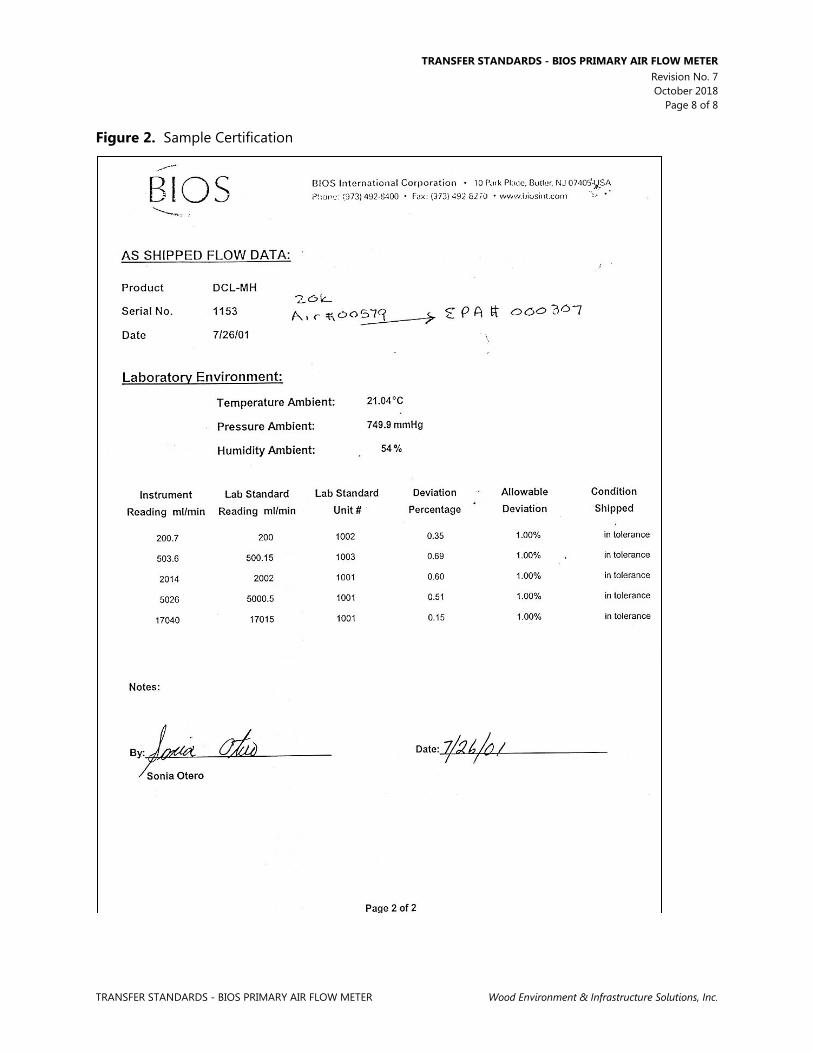
TRANSFER STANDARDS - BIOS PRIMARY AIR FLOW METER Revision No. 7 October 2018
Page 8 of 8
TRANSFER STANDARDS - BIOS PRIMARY AIR FLOW METER Wood Environment & Infrastructure Solutions, Inc.
Figure 2. Sample Certification


TRANSFER STANDARDS - EUTECHNICS MODEL 4600 AND HY-CAL BA500AUCXI PLATINUM RESISTANCE TEMPERATURE DEVICES
Revision No. 8 October 2018
Page 2 of 8
TRANSFER STANDARDS - EUTECHNICS MODEL 4600 AND HY-CAL BA500AUCXI Wood Environment & Infrastructure Solutions, Inc. PLATINUM RESISTANCE TEMPERATURE DEVICES
IV.B.5. EUTECHNICS MODEL 4600 AND HY-CAL BA500AUCXI PLATINUM RESISTANCE TEMPERATURE DEVICES
1.0 PURPOSE
The purpose of this Standard Operating Procedure (SOP) is to provide consistent guidance for the maintenance and handling of the Eutechnics Model 4600 and Extech Model 407907 platinum Resistance Temperature Devices (RTD) to Clean Air Status and Trends Network (CASTNET) Field Calibration Laboratory personnel.
2.0 SCOPE
This SOP applies to the maintenance and handling of Eutechnics Model 4600 and Extech Model 407907 platinum RTD units administered by the CASTNET Field Equipment Calibration Laboratory.
3.0 SUMMARY
Transfer platinum RTD units used in field calibration activities are certified at a minimum of once every 6 weeks via comparison with an independently certified NIST traceable Dostmann Model P600 platinum RTD. See Figure 1.
Figure 1. RTD Transfer certification, maintenance and repair process
Turn unit on. Does it turn on and display temperature?
N Y
Ensure that probe connection is fully inserted into unit. Does it turn on and
display temperature?
Prepare ice water bath.
Compare PDT and RTD at 0°C. N Y
Replace battery. Does it turn on and display temperature?
N Y
Send to manufacturer for repair.
Repeat comparison at 10, 20, 30, 40 and 50°C every six months and at 0, 25 and
50°C every six weeks.
Record data on paper form. Does RTD meet specifications?
Send to manufacturer for repair.
Transfer RTD is “Field Ready” for the next
6 weeks.
N Y

TRANSFER STANDARDS - EUTECHNICS MODEL 4600 AND HY-CAL BA500AUCXI PLATINUM RESISTANCE TEMPERATURE DEVICES
Revision No. 8 October 2018
Page 3 of 8
TRANSFER STANDARDS - EUTECHNICS MODEL 4600 AND HY-CAL BA500AUCXI Wood Environment & Infrastructure Solutions, Inc. PLATINUM RESISTANCE TEMPERATURE DEVICES
4.0 MATERIALS AND SUPPLIES
Dostmann P600 temperature probe and meter with NIST traceable certification EUTECHNICS 4600 RTD Temperature transfer or EXTECH 407907 Temperature transfer RTD Calibration form Stir plate Stirring magnet Device to heat water to 50˚C Large syringe Crushed ice Water Insulated vessel large enough to accommodate temperature probes, with fitted lid 9-Volt battery
5.0 SAFETY
Exercise standard laboratory precautions when handling electrical heating appliances and hot water.
6.0 PROCEDURES
6.1 Certification
6.1.1 Heat approximately one half liter of water to at least 50˚C.
6.1.2 Locate the correction factor chart for the Dostmann NIST RTD being used to certify the transfer RTD(s). Verify that the Dostmann display unit displays the proper calibration code for the probe attached to it.
6.1.3 Record the serial number and correction factors for the Dostmann NIST traceable handheld display on an RTD Calibration form. See attachment A.
6.1.4 The Eutechnics RTD or Extech RTD needs only to be turned on (be sure it is reading in °C and recording to two decimal places); it will read and display values on its screen.
6.1.5 Place a stir bar, finely crushed ice and water in the insulated vessel and place on the stir plate.
6.1.6 Turn the stir plate on and verify active stirring of the bath water.
6.1.7 Place the foam lid in the vessel and insert the Dostmann probe and the transfer probe through the lid to immerse to a depth of 3 to 4 inches. None of the probes should be touching each other or the sides of the Thermos (Figure 2).

TRANSFER STANDARDS - EUTECHNICS MODEL 4600 AND HY-CAL BA500AUCXI PLATINUM RESISTANCE TEMPERATURE DEVICES
Revision No. 8 October 2018
Page 4 of 8
TRANSFER STANDARDS - EUTECHNICS MODEL 4600 AND HY-CAL BA500AUCXI Wood Environment & Infrastructure Solutions, Inc. PLATINUM RESISTANCE TEMPERATURE DEVICES
Figure 2. Transfer certification apparatus
Figure 3. Dostmann probe (left), Eutechnics transfer probe (middle) and Extech probe (right)
immersed in stirring bath. More than one temperature transfer device may be certified simultaneously.
TRANSFER STANDARDS - EUTECHNICS MODEL 4600 AND HY-CAL BA500AUCXI PLATINUM RESISTANCE TEMPERATURE DEVICES
Revision No. 8 October 2018
Page 5 of 8
TRANSFER STANDARDS - EUTECHNICS MODEL 4600 AND HY-CAL BA500AUCXI Wood Environment & Infrastructure Solutions, Inc. PLATINUM RESISTANCE TEMPERATURE DEVICES
6.1.8 Allow the RTDs to stabilize then record the Dostmann output at the 0˚C target temperature. Simultaneously record the transfer probe measurement to two decimal places. If more than one transfer is being certified use separate RTD Calibration forms for each and record the Dostmann output on each form. Correct the Dostmann measured reading using its’ NIST traceable certification correction factors.
6.1.9 Repeat the above procedure to obtain five measurements at 0˚, simultaneaously recording the Dostmann and each transfer probe measurement. Correct each value measured with the Dostmann unit.
6.1.10 Using a syringe to mix hot and room temperature water make stirring baths at 10°C, 20°C, 30°C, 40°C, and 50°C, ±1 ºC
6.1.11 Repeat the procedure to obtain five total measurements from each unit at each temperature target.
6.1.12 Average the five measurements of each unit, at each target temperature and record on the calibration form.
6.1.13 Using the NIST traceable certification form values calculate and record the corrected average temperature for the Dostmann measurements.
6.1.14 Calculate the difference between the Dostmann and the transfer RTD in units of Celsius degrees and record on the form. The RTD must be within ±0.3˚ of the Dostmann RTD to meet specification.
6.1.15 Calculate the slope, intercept, and correlation coefficient for the NIST RTD and record on the form.
6.1.16 Sign and date the form and have a qualified technician or supervisor review it. Secure the form to the RTD.
6.2 Repair
All repairs and adjustments are performed by the manufacturer.
6.3 Maintenance
6.3.1 Replace the 9-volt (V) alkaline battery as needed:
6.3.2 Turn the unit over onto its face and remove the battery door at the bottom of the case.
6.3.3 Pry the old battery out from the mounting terminals using thumb and/or forefinger.
6.3.4 When putting in the new 9-V battery, be sure that the terminals line up and snap firmly into the terminal on the circuit board.
Note: The unit will not be damaged if you accidentally try to put the battery in backwards. Replace the battery door. Note: To extend the battery life, a 9V lithium battery may be used.
6.3.5 Insert probe connector, ensure a good connection and remove.

TRANSFER STANDARDS - EUTECHNICS MODEL 4600 AND HY-CAL BA500AUCXI PLATINUM RESISTANCE TEMPERATURE DEVICES
Revision No. 8 October 2018
Page 6 of 8
TRANSFER STANDARDS - EUTECHNICS MODEL 4600 AND HY-CAL BA500AUCXI Wood Environment & Infrastructure Solutions, Inc. PLATINUM RESISTANCE TEMPERATURE DEVICES
7.0 REFERENCES U.S. Environmental Protection Agency (EPA). 1994. Quality Assurance Handbook for Air Pollution
Measurement Systems, Vol. I. A Field Guide to Environmental Quality Assurance. EPA/600/R-94/038a.
U.S. Environmental Protection Agency (EPA). 2008. Quality Assurance Handbook for Air Pollution
Measurement Systems, Vol. IV, Meteorological Measurements Version 2.0 (Final). EPA-454/B-08-002.
U.S. Environmental Protection Agency (EPA). 2013. Quality Assurance Handbook for Air Pollution
Measurement Systems, Vol. II, Ambient Air Quality Monitoring Program. EPA-454/B-13-003.
U.S. Environmental Protection Agency (EPA). 2000. Meteorological Monitoring Guidance for
Regulatory Modeling Applications. EPA-454/R-99-005.

TRANSFER STANDARDS - EUTECHNICS MODEL 4600 AND HY-CAL BA500AUCXI PLATINUM RESISTANCE TEMPERATURE DEVICES
Revision No. 8 October 2018
Page 7 of 8
TRANSFER STANDARDS - EUTECHNICS MODEL 4600 AND HY-CAL BA500AUCXI Wood Environment & Infrastructure Solutions, Inc. PLATINUM RESISTANCE TEMPERATURE DEVICES
8.0 ATTACHMENTS
Attachment A – Sample Calibration Form

TRANSFER STANDARDS - EUTECHNICS MODEL 4600 AND HY-CAL BA500AUCXI PLATINUM RESISTANCE TEMPERATURE DEVICES
Revision No. 8 October 2018
Page 8 of 8
TRANSFER STANDARDS - EUTECHNICS MODEL 4600 AND HY-CAL BA500AUCXI Wood Environment & Infrastructure Solutions, Inc. PLATINUM RESISTANCE TEMPERATURE DEVICES
ATTACHMENT A Sample Calibration Form


TRANSFER STANDARDS - R.M. YOUNG SYNCHRONOUS MOTOR MODEL 18802 Revision No. 7
October 2018 Page 2 of 4
TRANSFER STANDARDS - R.M. YOUNG SYNCHRONOUS MOTOR MODEL 18802 Wood Environment & Infrastructure Solutions, Inc.
IV. B. 6. R.M. YOUNG SYNCHRONOUS MOTOR MODEL 18802
1.0 PURPOSE
The purpose of this Standard Operating Procedure (SOP) is to provide consistent guidance for maintenance and handling of the R.M. Young Synchronous Motor Model 18802 to Clean Air Status and Trends Network (CASTNET) Field Calibration Laboratory personnel.
2.0 SCOPE
This SOP applies to the maintenance and handling of R.M. Young Synchronous Motor Model 18802 units administered by the CASTNET Field Calibration laboratory.
3.0 SUMMARY
The synchronous motors are used to calibrate wind speed systems onsite and in the laboratory by mathematically relating shaft rotation frequency to wind speed.
4.0 MATERIALS AND SUPPLIES
R.M. Young Synchronous Motor Model 18802 9-volt (V) batteries
5.0 REPAIR AND MAINTENANCE
5.1 Repair
All repairs and adjustments are performed by the manufacturer when necessary.
5.2 Maintenance
5.2.1 Check all cables for cuts or breaks before each use.
5.2.2 Check the batteries before each calibration trip.
5.2.3 Replace the two 9-V internal batteries when the motor stops and alerts the user on the display.
6.0 CALIBRATION/CERTIFICATION PROCEDURE
The R.M. Young Synchronous Motor is returned to the factory annually for calibration and certification. See Figure 1 for a sample certification form.

TRANSFER STANDARDS - R.M. YOUNG SYNCHRONOUS MOTOR MODEL 18802 Revision No. 7
October 2018 Page 3 of 4
TRANSFER STANDARDS - R.M. YOUNG SYNCHRONOUS MOTOR MODEL 18802 Wood Environment & Infrastructure Solutions, Inc.
7.0 REFERENCES
U.S. Environmental Protection Agency (EPA). 1994. Quality Assurance Handbook for Air Pollution Measurement Systems, Vol. I. A Field Guide to Environmental Quality Assurance. EPA/600/R-94/038a.
U.S. Environmental Protection Agency (EPA). 2008. Quality Assurance Handbook for Air Pollution
Measurement Systems, Vol. IV, Meteorological Measurements Version 2.0 (Final). EPA-454/B-08-002.
U.S. Environmental Protection Agency (EPA). 2013. Quality Assurance Handbook for Air Pollution
Measurement Systems, Vol. II, Ambient Air Quality Monitoring Program. EPA-454/B-13-003.
U.S. Environmental Protection Agency (EPA). 2000. Meteorological Monitoring Guidance for
Regulatory Modeling Applications. EPA-454/R-99-005.
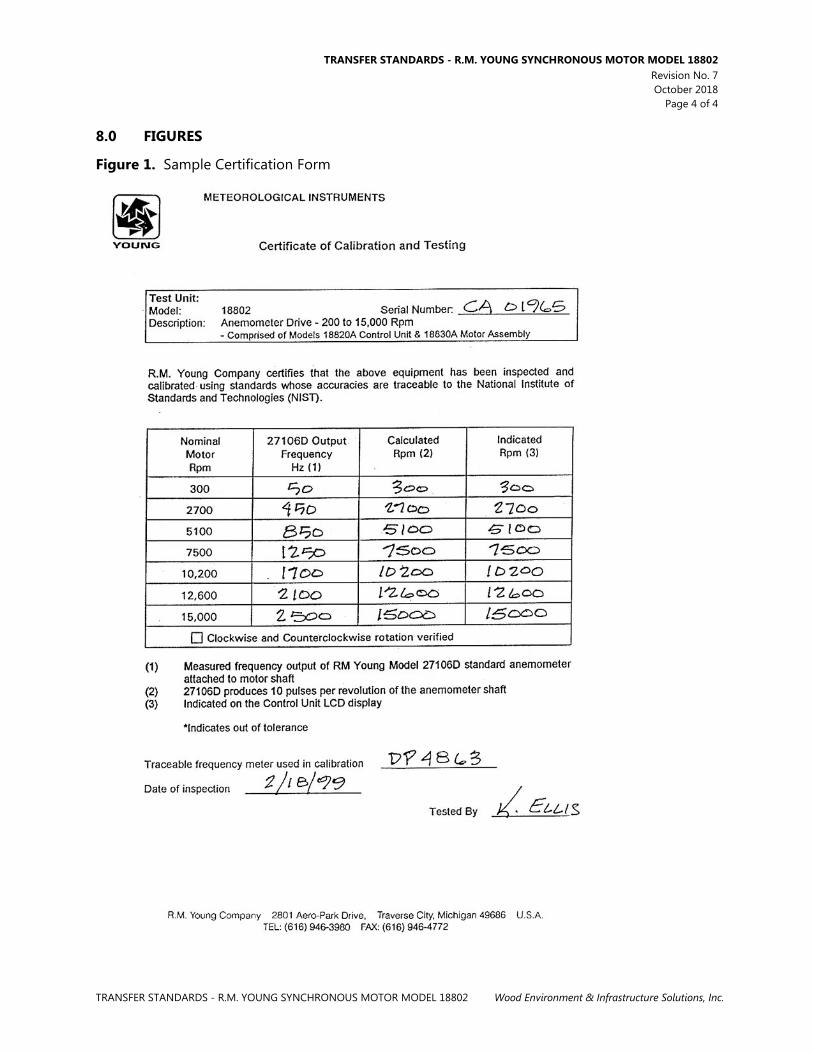
TRANSFER STANDARDS - R.M. YOUNG SYNCHRONOUS MOTOR MODEL 18802 Revision No. 7
October 2018 Page 4 of 4
TRANSFER STANDARDS - R.M. YOUNG SYNCHRONOUS MOTOR MODEL 18802 Wood Environment & Infrastructure Solutions, Inc.
8.0 FIGURES
Figure 1. Sample Certification Form

TRANSFER STANDARDS - BRUNTON POCKET TRANSIT Revision No. 6 October 2018
Page 2 of 4
TRANSFER STANDARDS - BRUNTON POCKET TRANSIT Wood Environment & Infrastructure Solutions, Inc.
IV. B. 7. BRUNTON POCKET TRANSIT
1.0 PURPOSE
The purpose of this Standard Operating Procedure (SOP) is to provide consistent guidance for maintenance and handling of the Brunton Pocket Transit to Clean Air Status and Trends Network (CASTNET) Field Equipment Calibration Laboratory personnel.
2.0 SCOPE
This SOP applies to the maintenance and handling of Brunton Pocket Transit units administered by the CASTNET Field Calibration laboratory.
3.0 SUMMARY
See Sections 5.0 and 6.0.
4.0 MATERIALS AND SUPPLIES
Soft dry cloth
5.0 REPAIR AND MAINTENANCE
5.1 Repair Any necessary repairs and adjustments are performed by the manufacturer at the factory when needed.
5.2 Maintenance Clean the case, mirror, and glass with a soft, dry, cloth, as needed. When not in use store the unit in the leather transit case.
6.0 CALIBRATION/CERTIFICATION PROCEDURES
The Brunton Pocket Transit is returned to the factory annually for calibration and certification. See Figure 1 for a sample certification.

TRANSFER STANDARDS - BRUNTON POCKET TRANSIT Revision No. 6 October 2018
Page 3 of 4
TRANSFER STANDARDS - BRUNTON POCKET TRANSIT Wood Environment & Infrastructure Solutions, Inc.
7.0 REFERENCES
U.S. Environmental Protection Agency (EPA). 1994. Quality Assurance Handbook for Air Pollution Measurement Systems, Vol. I. A Field Guide to Environmental Quality Assurance. EPA/600/R-94/038a.
U.S. Environmental Protection Agency (EPA). 2008. Quality Assurance Handbook for Air Pollution
Measurement Systems, Vol. IV, Meteorological Measurements Version 2.0 (Final). EPA-454/B-08-002.
U.S. Environmental Protection Agency (EPA). 2013. Quality Assurance Handbook for Air Pollution
Measurement Systems, Vol. II, Ambient Air Quality Monitoring Program. EPA-454/B-13-003.
U.S. Environmental Protection Agency (EPA). 2000. Meteorological Monitoring Guidance for
Regulatory Modeling Applications. EPA-454/R-99-005.

TRANSFER STANDARDS - BRUNTON POCKET TRANSIT Revision No. 6 October 2018
Page 4 of 4
TRANSFER STANDARDS - BRUNTON POCKET TRANSIT Wood Environment & Infrastructure Solutions, Inc.
8.0 FIGURES
Figure 1. Sample Certification Form


TRANSFER STANDARDS - ROTRONIC HYGROMETER Revision No. 8 October 2019
Page 2 of 8
TRANSFER STANDARDS - ROTRONIC HYGROMETER Wood Environment & Infrastructure Solutions, Inc.
IV. B. 8. ROTRONIC HYGROMETER
1.0 PURPOSE The purpose of this Standard Operating procedure (SOP) is to provide consistent guidance for maintenance and handling of the Rotronic Hygrometer Model A1 to Clean Air Status and Trends Network (CASTNET) Field Calibration Laboratory personnel.
2.0 SCOPE This SOP applies to the maintenance and handling of Rotronic Hygrometer Model A1 units administered by the CASTNET Field Calibration laboratory.
3.0 SUMMARY CASTNET hygrometer transfer standards are calibrated, and certified at a minimum of once every 6 months.
4.0 MATERIALS AND SUPPLIES Rotronic Hygrometer Model A1 Vaportron H-100L Humidity Lab Aqueous Saturated salts (Note: Use only as a last resort) Kimwipes® RH iForm 9-volt battery
5.0 REPAIR AND MAINTENANCE 5.1 Repair All repairs and adjustments are performed by the manufacturer. 5.2 Maintenance 5.2.1 Replace the 9-V battery when needed. 5.2.2 Clean the dust filter prior to each calibration/certification procedure: Cleaning should be
done without removing the filter from the probe. 5.2.2.1 Gently wipe the filter with a solution of water and mild detergent. 5.2.2.2 If cleaning does not remove most of the stains, the filter should be replaced. To do this,
unscrew the filter from the probe. When removing the filter, make sure that the sensors are not damaged. The humidity sensor is sometimes mistaken for a “white paper tag.” Do not remove from the probe!
5.2.2.3 Before putting on a new dust filter, check the alignment of both sensors with the probe. The wires that connect the sensors to the probe are very thin and bend easily. If this happens, correct the alignment by holding the sensor very gently with a pair of small flat-nosed pliers. Do not use sharp pliers or tweezers as this could puncture the sensor. Do not pull on the sensor.

TRANSFER STANDARDS - ROTRONIC HYGROMETER Revision No. 8 October 2019
Page 3 of 8
TRANSFER STANDARDS - ROTRONIC HYGROMETER Wood Environment & Infrastructure Solutions, Inc.
6.0 CALIBRATION /CERTIFICATION PROCEDURE 6.1 Rotronic A1 Transfer Sensor Using the Vaportron H-100L Series Precision Humidity
Lab 6.1.1 Check the desiccant cartridge located on back of unit; the indicating silica gel must be a
blue color above the red line on the cartridge. If the indicating silica gel is pink at or below the red line on the cartridge, refer to the Vaportron Manual for instructions on changing indicating silica gel.
6.1.2 Check the water level by lifting up on cap end of cartridge and looking into the large window near the left desiccant hanger hook (See Figure 1). Use a small flashlight to locate the water level. The water level must be between the lower and upper red lines on the fill level decal. If water level is not between lines, refer to the Vaportron Section (IV.A.5) of these Standard Operating Procedures (SOP) for instructions on water level service procedure.
6.1.3 Switch on Power (lower left). Both RH LCD (center top) and Temperature display should come on and read the approximate room conditions.
6.1.4 Set the Temperature display using the up or down arrows to 22.5°C. 6.1.5 Set the RH LCD display using the up or down arrows to the first point of 5.0 % RH. 6.1.6 Replace the white chamber access door (right side) with the clear access door which has
a black strain relief port. Insert the Rotronic A1 probe so approximately 3.5 inches of the probe is inside the Vaportron chamber. Lightly tighten the port fitting to hold the probe securely in the chamber. Bend the hand-held part of the unit down to rest on the counter top.
6.1.7 Turn the unit on and check that the battery condition is greater than 50%; if not, replace the battery. Obtain a Temperature/ Relative Humidity Data Form (See Figure 2 which is a completed sample form) and record the serial number of the sensor.
6.1.8 Switch on Control. A faint, high-pitched sound should indicate proper operation of the air circulator fan inside the chamber. The Vaportron displays should begin to ramp toward the values that were set. Normally, the RH and temperature readings will stabilize within 2 to 5 minutes.
6.1.9 Allow the A1 sensor to equilibrate for 1 hour at the set point, and then record the output from the Vaportron RH controller and Rotronic A1 on the calibration form.
6.1.10 Set the RH LCD display using the up arrow to the next point of 25.0% RH and repeat step number 9.
6.1.11 Repeat step number 10 for set points of: 50.0%, 75.0%, and 95.0%. 6.1.12 After completion of the final set point, loosen the black port fitting on the door and
remove the A1 sensor, and then remove the clear door from chamber. 6.1.13 Install the white chamber access door with yellow port plug in place. Set the RH LCD
display using the down arrow to 50.0 % RH. Let the unit run for 5 minutes at this setting. 6.1.14 Switch off Control and then switch off Power (lower left). 6.1.15 Check that the calibration form is completed. (NOTE: Be sure to calculate slope and
intercept.) Then, see Calibration Lab Manager for review of the calibration form

TRANSFER STANDARDS - ROTRONIC HYGROMETER Revision No. 8 October 2019
Page 4 of 8
TRANSFER STANDARDS - ROTRONIC HYGROMETER Wood Environment & Infrastructure Solutions, Inc.
6.1.16 After review, tag the sensor, place it in a plastic bag and put it in the appropriate calibration box on the “ready to ship” shelf.
6.2 Rotronic Model Al Sensor Using Aqueous Saturated Salts [Use aqueous salts for calibration/certification only as a last resort]
6.2.1 Turn the unit on and check that the battery condition is greater than 50%; if not, replace the battery. Obtain a Temperature/Relative Humidity Data form (See Figure 3 which is a completed sample form) and record the serial number of the sensor.
6.2.2 Carefully remove the filter cap from the sensor. Using a Climatronics sensor support cap, insert the Rotronic A1 probe approximately 1.25 inches into the rubber grommet (just above sensor inlet screens). Starting with Silica Gel (0.0%) gently screw Climatronics sensor support cap and sensor, into the opening of the bottle (use great caution not to bump or contaminate the sensor tip when inserting in bottle). Place the bottle/sensor into the blue bottle caddy.
6.2.3 Allow the Rotronic A1 sensor to equilibrate for 1 hour at the set point and record its output on the Temperature/Relative Humidity Data Form.
6.2.4 Repeat steps 2 and 3 for salt solutions of: MgCl2 (32.8%), Mg(NO3)2 (52.9%), NaCl (75.3%), and KNO3 (93.6%). Lightly swirl the solution of deionized (DI) water and salt, being careful not to get salt solution into the bottle neck. If salt solution gets in the bottleneck, clean with a Kimwipe® before inserting the probe.
6.2.5 After the completion of the final point, remove the A1 sensor from the bottle and wipe the sensor housing with a clean Kimwipe®.
6.2.6 Check to see that the calibration form is completed. (NOTE: be sure to calculate slope and intercept.) See Calibration Laboratory Manager for review of the calibration form. After review, tag the sensor, place it in a plastic bag and put it in the appropriate calibration box on the “ready to ship” shelf.

TRANSFER STANDARDS - ROTRONIC HYGROMETER Revision No. 8 October 2019
Page 5 of 8
TRANSFER STANDARDS - ROTRONIC HYGROMETER Wood Environment & Infrastructure Solutions, Inc.
7.0 REFERENCES U.S. Environmental Protection Agency (EPA). 1994. Quality Assurance Handbook for Air Pollution
Measurement Systems, Vol. I. A Field Guide to Environmental Quality Assurance. EPA/600/R-94/038a.
U.S. Environmental Protection Agency (EPA). 2008. Quality Assurance Handbook for Air Pollution
Measurement Systems, Vol. IV, Meteorological Measurements Version 2.0 (Final). EPA-454/B-08-002.
U.S. Environmental Protection Agency (EPA). 2013. Quality Assurance Handbook for Air Pollution
Measurement Systems, Vol. II, Ambient Air Quality Monitoring Program. EPA-454/B-13-003. U.S. Environmental Protection Agency (EPA). 2000. Meteorological Monitoring Guidance for
Regulatory Modeling Applications. EPA-454/R-99-005.

TRANSFER STANDARDS - ROTRONIC HYGROMETER Revision No. 8 October 2019
Page 6 of 8
TRANSFER STANDARDS - ROTRONIC HYGROMETER Wood Environment & Infrastructure Solutions, Inc.
8.0 FIGURES Figure 1. Water Gauge Window


TRANSFER STANDARDS - R.M. YOUNG SOLAR RADIATION TRANSFER SYSTEM Revision No. 7 October 2018
Page 2 of 6
TRANSFER STANDARDS - R.M. YOUNG SOLAR RADIATION TRANSFER SYSTEM Wood Environment & Infrastructure Solutions, Inc.
IV. B. 9. R.M. YOUNG SOLAR RADIATION TRANSFER SYSTEM
1.0 PURPOSE
The purpose of this Standard Operating Procedure (SOP) is to provide consistent guidance for maintenance and handling of the R.M. Young Solar Radiation Transfer System to Clean Air Status and Trends Network (CASTNET) Field Calibration Laboratory personnel.
2.0 SCOPE
This SOP applies to the maintenance and handling of R.M. Young Solar Radiation Transfer System units administered by the CASTNET Field Equipment Calibration Laboratory.
3.0 SUMMARY
R.M. Young solar radiation systems are calibrated upon receipt and at the request of field technicians. Repairs and maintenance are performed as necessary.
4.0 MATERIALS AND SUPPLIES
Li-Cor Model LI-2000SA pyranometer (transfer standard) Eppley Precision Spectral Pyranometer (certified primary standard) Fluke Multimeter and cable Light source Huxseflux Model LP02 Pyranometer (Certified Primary Standard) Tool kit including screwdriver, soldering flux, soldering iron, and wire cutters
5.0 REPAIR AND MAINTENANCE
5.1 Repair
5.1.1 Testing the Photodiode 5.1.1.1 Connect the Fluke multimeter using the double banana-style cable with BNC connector
on the other end. 5.1.1.2 Insert the double banana-style cable into the µ Amp (A) and common receptacles on
the multimeter. 5.1.1.3 Connect the BNC end of the cable to the Li-Cor sensor BNC connection (use a barrel
connector as a union). 5.1.1.4 Set the multimeter for Amps (A), DC, and 200 µ A. 5.1.1.5 Shine a flashlight or other light source directly on the sensor. The multimeter readout
should be at least ~35 µA. If there is little or no response, repair the sensor as follows:
5.1.2 Replacing the Photodiode 5.1.2.1 Remove the back of the sensor housing. Unscrew the small set screw near the top of
the sensor housing to release the sensor eye inside. Cut off the old photodiode.

TRANSFER STANDARDS - R.M. YOUNG SOLAR RADIATION TRANSFER SYSTEM Revision No. 7 October 2018
Page 3 of 6
TRANSFER STANDARDS - R.M. YOUNG SOLAR RADIATION TRANSFER SYSTEM Wood Environment & Infrastructure Solutions, Inc.
5.1.2.2 Strip approximately 1/2 inch of insulation from the cable end. Unwrap the shield and wind it into a single strand. Strip approximately 1/8 inch of plastic covering on central wire. Slip a 2-inch piece of shrink-wrap onto cable.
5.1.2.3 Bend the terminals on the new sensor eye at approximately 1/4 inch. Solder the shield to the terminal marked with the black dot. Solder the central wire to the other terminal. Be sure the wires do not touch. Move the heat shrink as close to the new sensor as possible and heat it so that it tightens around the cable.
5.1.2.4 Test the new sensor eye with the multimeter as described in the Testing the Photodiode section (5.1.1).
5.1.2.5 Install old (or new) indulating ring on the new photodiode. Insert photodiode pin legs into miniature PC board. Solder and snip excess. The pin leg closest to the tab on the rim of the photodiode housing is the shield. Solder the woven wire of the coaxial cable to the trace in continuity with this pin. Solder the signal (core wire) of the coaxial cable to the trace in continuity to the other pin.
5.1.2.6 Clean the housing inside first, being sure not to touch the surface of the new sensor eye with your fingers. Insert the new photodiode.
5.1.2.7 Be sure the new photodiode is flush with the inside surface of the housing, then tighten the set screw.
5.1.2.8 Seal the back cover of the housing with silicone sealant before screwing it back on. Put a dab of sealant in the set screw hole as well.
5.1.2.9 Retest with the multimeter as described in 5.1.1 above.
5.2 Maintenance Routinely clean the sensor housing. Inspect the 75-foot cable for damage; repair if necessary.
5.3 Retire housing when lens becomes crazed, cracked, or chipped.
6.0 CALIBRATION/CERTIFICATION PROCEDURE
6.1 Calibration/Certification
6.1.1 Install the Li-Cor sensor on the solar radiation sensor stand outside of the solar radiation test facility. Ensure that it is level.
6.1.2 Run the 75-foot cable supplied with the transfer unit through the PVC elbow opening in the shelter wall to connect it to the translator box on one of the stations on the bench.
6.1.3 Connect the translator box to one of the stations inside the shelter.
6.1.4 Allow the transfer to operate for at least 1 full day. Be sure to wipe dew and dust from the lens of each primary every morning. Record data on a sunny day with high solar radiation values if possible.
6.1.5 Record the identification (ID) number of the primary sensor and data logger.
6.1.6 Total the columns of the primary and the transfer using the values from the morning (values ~ 0 watts) until the evening when the values return to ~ 0.

TRANSFER STANDARDS - R.M. YOUNG SOLAR RADIATION TRANSFER SYSTEM Revision No. 7 October 2018
Page 4 of 6
TRANSFER STANDARDS - R.M. YOUNG SOLAR RADIATION TRANSFER SYSTEM Wood Environment & Infrastructure Solutions, Inc.
6.1.7 Average the totals of each column by the number of hourly averages being used.
6.1.8 Calculate the percent differences between the primary and transfer for the total averages and the hour at which the highest hourly averages occurred.
6.1.9 Perform a linear regression on the two columns. If the slope falls between .95 and 1.05 and the intercept falls between ±10, the unit will not require recalibration prior to being used again in the field. If the unit does not meet the above specifications, recalibrate as follows:
6.1.9.1 Unscrew the translator card from the box and expose the voltage adjustment potentiometer on the back side of the card.
6.1.9.2 Compare the transfer’s values against the primary’s values during the day at moderate light levels and at peak solar radiation levels. Adjust the transfer’s voltage adjustment potentiometer as necessary.
6.1.9.3 Calculate the percent differences between the two units and perform a linear regression as outlined in steps 5 and 6.

TRANSFER STANDARDS - R.M. YOUNG SOLAR RADIATION TRANSFER SYSTEM Revision No. 7 October 2018
Page 5 of 6
TRANSFER STANDARDS - R.M. YOUNG SOLAR RADIATION TRANSFER SYSTEM Wood Environment & Infrastructure Solutions, Inc.
7.0 REFERENCES
U.S. Environmental Protection Agency (EPA). 1994. Quality Assurance Handbook for Air Pollution Measurement Systems, Vol. I. A Field Guide to Environmental Quality Assurance. EPA/600/R-94/038a.
U.S. Environmental Protection Agency (EPA). 2008. Quality Assurance Handbook for Air Pollution
Measurement Systems, Vol. IV, Meteorological Measurements Version 2.0 (Final). EPA-454/B-08-002.
U.S. Environmental Protection Agency (EPA). 2013. Quality Assurance Handbook for Air Pollution
Measurement Systems, Vol. II, Ambient Air Quality Monitoring Program. EPA-454/B-13-003.
U.S. Environmental Protection Agency (EPA). 2000. Meteorological Monitoring Guidance for
Regulatory Modeling Applications. EPA-454/R-99-005. Li-Cor, Inc., Environmental Division. LI-200SA Pyranometer Sensor Manual.

TRANSFER STANDARDS - R.M. YOUNG SOLAR RADIATION TRANSFER SYSTEM Revision No. 7 October 2018
Page 6 of 6
TRANSFER STANDARDS - R.M. YOUNG SOLAR RADIATION TRANSFER SYSTEM Wood Environment & Infrastructure Solutions, Inc.
8.0 FIGURES
Figure 1. Solar Radiation Data Form


TRANSFER STANDARDS – PORTABLE HUMIDITY GENERATORS Revision No.8 October 2018
Page 2 of 9
TRANSFER STANDARDS – PORTABLE HUMIDITY GENERATORS Wood Environment & Infrastructure Solutions, Inc.
IV.B.10. PORTABLE HUMIDITY GENERATORS
1.0 PURPOSE The purpose of this Standard Operating procedure (SOP) is to provide consistent guidance for the preparation, maintenance, and handling of the Rense Instruments Model S-503 to Clean Air Status and Trends Network (CASTNET) Field Certification Laboratory personnel.
2.0 SCOPE This SOP applies to the preparation, maintenance, and handling of all Rense Instruments Model S-503 administered by CASTNET Field Equipment Certification Laboratory personnel.
3.0 SUMMARY The portable humidity generators are calibrated and serviced by the manufacturer once per year and verified as functional at least every 6 weeks. Typically, these portable humidity generators are not used as a transfer instrument, but are certified as such to provide a redundant transfer instrument in the event of transfer hygrometer failure. In general these devices are used to generate a common atmosphere for testing sensors against transfer standards in the field. Figure 1. Calibration of Portable Humidity Generators
Enter appropriate information into RH iForm, including correction factors for transfer.
Check silica and water reservoirs for proper levels and correct media.
Insert transfer standard into appropriate size hole, using Parafilm to seal if necessary.
Allow both units to stabilize and record values on iForm. Repeat for 30, 50, 70, 85 and 95%.
Set target RH value to 10% and turn machine on.
Note: Return setting to 50% after completion and allow to stabilize to reduce the risk of damage to machine by excess moisture in the chamber.

TRANSFER STANDARDS – PORTABLE HUMIDITY GENERATORS Revision No.8 October 2018
Page 3 of 9
TRANSFER STANDARDS – PORTABLE HUMIDITY GENERATORS Wood Environment & Infrastructure Solutions, Inc.
4.0 MATERIALS Rense Instruments Model SA-503 and User’s Manual Calibrated hygrometer certified using Primary Standard Nalgene Screw-capped bottles Deionized (DI) water Fresh silica gel desiccant (S-503) Rubber stopper and/or Parafilm (to seal access ports) RH iForm
5.0 SAFETY Exercise standard laboratory precautions when handling powered equipment.
6.0 CALIBRATION PROCEDURE The proper amounts of DI water and fresh desiccant should be maintained when in operation. The unit should be packed and transported for use in the field according to the manufacturer's instrument manual.
The instrument should be able to produce stable values between 20 percent and 100 percent relative humidity (RH).
6.1 Rense Instruments Model S-503 6.1.1 Note in the “remarks” section of the iForm (Figure 2) that the unit is a full calibration of
Rense Instrument Model S-503. Record the ID of the S-503 in the site instrument ID field.

TRANSFER STANDARDS – PORTABLE HUMIDITY GENERATORS Revision No.8 October 2018
Page 4 of 9
TRANSFER STANDARDS – PORTABLE HUMIDITY GENERATORS Wood Environment & Infrastructure Solutions, Inc.
Figure 2. Relative Humidity Generator Certification iForm
6.1.2 Enter the correction factors for the transfer Hygrometer into the iForm. 6.1.3 Remove the clear port plugs on the top of the S-503 to verify proper water level and
desiccant condition (Figure 3). Add new desiccant and DI water as necessary.
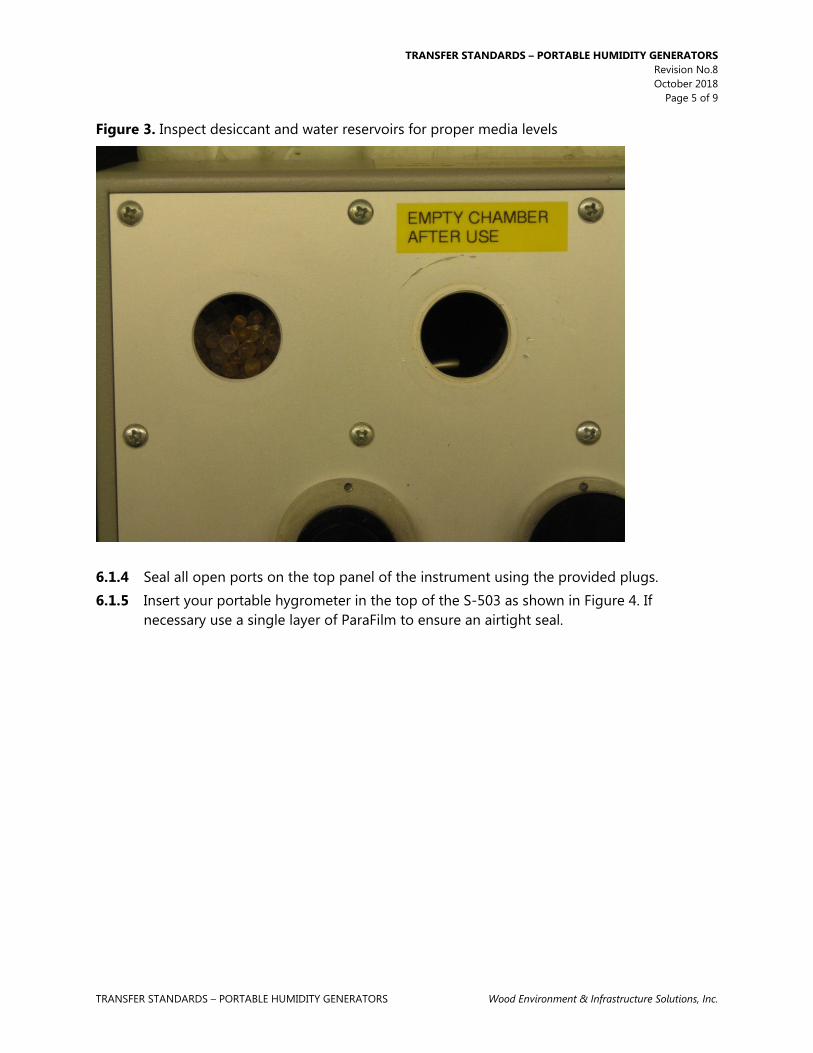
TRANSFER STANDARDS – PORTABLE HUMIDITY GENERATORS Revision No.8 October 2018
Page 5 of 9
TRANSFER STANDARDS – PORTABLE HUMIDITY GENERATORS Wood Environment & Infrastructure Solutions, Inc.
Figure 3. Inspect desiccant and water reservoirs for proper media levels
6.1.4 Seal all open ports on the top panel of the instrument using the provided plugs. 6.1.5 Insert your portable hygrometer in the top of the S-503 as shown in Figure 4. If
necessary use a single layer of ParaFilm to ensure an airtight seal.

TRANSFER STANDARDS – PORTABLE HUMIDITY GENERATORS Revision No.8 October 2018
Page 6 of 9
TRANSFER STANDARDS – PORTABLE HUMIDITY GENERATORS Wood Environment & Infrastructure Solutions, Inc.
Figure 4. Rense Instruments s-503 Humidity Calibrator
6.1.6 Set the target RH value to 10% using the pushbutton potentiometer, Figure 5.
Figure 5. Adjust push button setting to 10% and ensure dial is set to RH
TRANSFER STANDARDS – PORTABLE HUMIDITY GENERATORS Revision No.8 October 2018
Page 7 of 9
TRANSFER STANDARDS – PORTABLE HUMIDITY GENERATORS Wood Environment & Infrastructure Solutions, Inc.
6.1.7 Turn the set switch to RH. 6.1.8 Plug the S-503 into an outlet and turn the power switch on. 6.1.9 Allow both units to fully stabilize. Record the test data on the RH iForm. Record the S-
503 display in the DAS column and the Certified Transfer display in the Transfer column. 6.1.10 Repeat the procedure outlined above for RH values of approximately 30%, 50%, 70%,
85% and 95%. Adjustments should be made from low to high RH values. 6.1.11 Upon completion return the RH set-point to 50% and allow it to stabilize. 6.1.12 Print two copies of the humidity generator calibration. One will remain with the S-503
along with the transfer certification, the other will be filed in the instrument file along with the transfer certification.
6.2 Calibration Criteria 6.2.1 If the unit in question tests within five percent at each point tested it may be used as a
backup transfer in the event the regular transfer fails. 6.2.2 If the unit in question tests within ten percent at each point tested it may be used as a
backup transfer in the event the regular transfer fails, however the unit must receive post calibration upon return to the lab to validate performance and accuracy.
6.2.3 Otherwise the unit must be returned to the manufacturer for repair. 6.2.4 Figure 2 depicts a completed certification form.
6.3 Three point periodic check.
Between full audits performed at six-month intervals, a three point check may be performed in lieu of a full audit to assess the validity of the previous full six point performance audit. This check must be performed every six weeks at a minimum.
6.3.1 Using the same procedure as for a full six point biannual audit, test the humidity generator at the following points: 10%, 50% and 95%.
6.3.2 Document the results (Figure 6) just as for the full audit and print two copies of the check form.

TRANSFER STANDARDS – PORTABLE HUMIDITY GENERATORS Revision No.8 October 2018
Page 8 of 9
TRANSFER STANDARDS – PORTABLE HUMIDITY GENERATORS Wood Environment & Infrastructure Solutions, Inc.
Figure 6. RH Translator Humidity Generator – 6-Week Update Form
6.3.3 File one copy in the instrument file, and attach one copy to the original certification. 6.3.4 If the unit is found to not meet specification, return to the manufacturer for repair.
TRANSFER STANDARDS – PORTABLE HUMIDITY GENERATORS Revision No.8 October 2018
Page 9 of 9
TRANSFER STANDARDS – PORTABLE HUMIDITY GENERATORS Wood Environment & Infrastructure Solutions, Inc.
7.0 REFERENCES American Society for Testing and Materials (ASTM). 1985. ASTM Book of Standards, Vol. 11.03 E
104-85. Rense Instruments BV. 2008. S-503 series User’s Manual ©2008. www.renseinstruments.com U.S. Environmental Protection Agency (EPA). 1994. Quality Assurance Handbook for Air Pollution
Measurement Systems, Vol. I. A Field Guide to Environmental Quality Assurance. EPA/600/R-94/038a.
U.S. Environmental Protection Agency (EPA). 2008. Quality Assurance Handbook for Air Pollution
Measurement Systems, Vol. IV, Meteorological Measurements Version 2.0 (Final). EPA-454/B-08-002.
U.S. Environmental Protection Agency (EPA). 2013. Quality Assurance Handbook for Air Pollution
Measurement Systems, Vol. II, Ambient Air Quality Monitoring Program. EPA-454/B-13-003. U.S. Environmental Protection Agency (EPA). 2000. Meteorological Monitoring Guidance for
Regulatory Modeling Applications. EPA-454/R-99-005.
8.0 ATTACHMENTS This SOP does not contain attachments.


MANNIX TESTING & MEASUREMENT MODEL EB833 DIGITAL ALTIMETER & BAROMETER Revision No. 5 October 2018
Page 2 of 6
MANNIX TESTING & MEASUREMENT MODEL EB833 DIGITAL ALTIMETER & BAROMETER Wood Environment & Infrastructure, Inc.
IV.B.11. MANNIX TESTING & MEASUREMENT MODEL EB33 DIGITAL ALTIMETER & BAROMETER
1.0 PURPOSE
The purpose of this Standard Operating procedure (SOP) is to provide consistent guidance for the calibration of the Mannix Testing & Measurement Model EB833 Digital Altimeter & Barometer.
2.0 SCOPE
The Mannix EB833 is used in the field to facilitate the calibration of continuous gas analyzers.
3.0 SUMMARY
The Mannix Testing & Measurement Model EB833 Digital Altimeter & Barometer can be calibrated using a certified mercury barometer. This is accomplished by reading the certified mercury barometer standard and adjusting the settings on the digital unit.
Figure 1. Calibration of Mannix Digital Barometer
Adjust reservoir of mercury barometer standard till it touches the cone.
Adjust reading mechanism of barometer until the top of the meniscus is level with
the bottom of the slide.
Press and hold “BARO” and “Time” key together for ~2 seconds until “Cal_Po” appears
If this reading matches the digital barometer setting, no adjustment is necessary.
Press “BARO” key one more time to accept new calibration
Using the “+” and “-” keys adjust reading as close as possible to standard value
If this reading does not match what is on digital barometer, adjustment is necessary

MANNIX TESTING & MEASUREMENT MODEL EB833 DIGITAL ALTIMETER & BAROMETER Revision No. 5 October 2018
Page 3 of 6
MANNIX TESTING & MEASUREMENT MODEL EB833 DIGITAL ALTIMETER & BAROMETER Wood Environment & Infrastructure, Inc.
4.0 MATERIALS
EUTECHNICS 4600 RTD or HY-CAL BA500AUCXI RTD National Institute of Standards and Technology (NIST) Certified Princo Model 453 Barometer Princo Model 453 Barometer Manual Princo Model 453 Barometer Certificate Mannix Testing & Measurement Model EB833 Digital Altimeter & Barometer Mannix Testing & Measurement Model EB833 Digital Altimeter & Barometer Manual
5.0 SAFETY
Replace battery as necessary.
6.0 PROCEDURE
Calibration of this instrument is necessary to ensure the proper calibration of field trace gas instruments. Refer to the Princo manual and Figures 2 and 3 of this SOP for operation of the Princo Barometer. Refer to page 10 of the Mannix Testing & Measurement Model EB833 Digital Altimeter & Barometer Manual for more information regarding calibration of the digital instrument.
6.1 Configuring the Princo Barometer To begin, the mercury in the reservoir at the bottom of the barometer must be touching
the small white cone, making a very small dimple in the mercury. To adjust, slowly turn the dial on the bottom of the reservoir until the mercury touches the cone. Refer to Figure 2.
Figure 2. Adjust dial at bottom of barometer so mercury just touches the point of the triangle
Adjust Here

MANNIX TESTING & MEASUREMENT MODEL EB833 DIGITAL ALTIMETER & BAROMETER Revision No. 5 October 2018
Page 4 of 6
MANNIX TESTING & MEASUREMENT MODEL EB833 DIGITAL ALTIMETER & BAROMETER Wood Environment & Infrastructure, Inc.
To read the barometer, adjust the dial on the side of the barometer to move the indicator up and down (Figure 3). The bottom of the indicator should be just “touching” the top of the meniscus of the mercury. The side of the barometer has numbers marking the hundreds, tens and ones of the barometric reading and the numbers on the indicator slide show the tenths of the reading. Ensure that you are taking the reading at eye level. When the indicator is at the meniscus, observe where the lines from the side of the barometer match up with those of the indicator lines. This will give the value of the current barometric reading.
Figure 3. Adjusting and reading the mercury meniscus from the top of the bubble
Read from top of

MANNIX TESTING & MEASUREMENT MODEL EB833 DIGITAL ALTIMETER & BAROMETER Revision No. 5 October 2018
Page 5 of 6
MANNIX TESTING & MEASUREMENT MODEL EB833 DIGITAL ALTIMETER & BAROMETER Wood Environment & Infrastructure, Inc.
6.2 Adjusting the Digital Barometer to the Princo To input the reading found on the Princo standard, make sure the digital barometer is in
the barometric mode by hitting the “BARO” soft key button. Next, hold down the “BARO” and “TIME” keys together for about 2 seconds (Figure 4). “CAL Po” will display on the screen and the current pressure reading will flash. Press either the "+" or "-" keys to adjust the display reading to that found on the Princo barometer (Figure 5). Press the “BARO” key once again to accept the new reading.
Figure 4. Press Baro and Time together for 2 seconds to start calibration
Figure 5. Press “+” or “-” to adjust the pressure reading up and down
6.3 Calibration of Temperature on Digital Barometer The temperature of the Digital Barometer cannot be adjusted, so a simple check against a temperature transfer standard is sufficient. Place the devices next to each other and allow for stabilization, ~ 20 minutes, and record values (Figure 6). When the application calls for it, an adjustment can be added to account for any difference in the RTD and barometer readings.

MANNIX TESTING & MEASUREMENT MODEL EB833 DIGITAL ALTIMETER & BAROMETER Revision No. 5 October 2018
Page 6 of 6
MANNIX TESTING & MEASUREMENT MODEL EB833 DIGITAL ALTIMETER & BAROMETER Wood Environment & Infrastructure, Inc.
Figure 6. Place digital barometer next to RTD to check temperature accuracy
7.0 REFERENCES
Mannix Testing & Measurement Eb833 Altimeter and Barometer Manual Princo Model 453 Barometer Manual
8.0 ATTACHMENTS
This SOP does not contain attachments.


SITE INSTRUMENTATION - FIELD EQUIPMENT SIGN-IN AND SIGN-OUT Revision No. 7
October 2018 Page 2 of 7
SITE INSTRUMENTATION - FIELD EQUIPMENT SIGN-IN AND SIGN-OUT Wood Environment & Infrastructure Solutions, Inc.
IV. C. 1. FIELD EQUIPMENT SIGN-IN AND SIGN-OUT
1.0 PURPOSE
The purpose of this Standard Operating Procedure (SOP) is to provide consistent guidance for field equipment sign-in and sign-out to Clean Air Status and Trends Network (CASTNET) Field Calibration Laboratory personnel.
2.0 SCOPE
This SOP applies to field equipment sign-in and sign-out for the CASTNET Field Calibration Laboratory.
3.0 SUMMARY
All CASTNET field equipment is treated such that their current location or intended destination is documented at all times.
4.0 MATERIALS AND SUPPLIES
CASTNET V Receiving/Sign-In Log CASTNET V Shipping/Sign-Out Log Networked computer with access to the CASTNET Data Management Application (CDMSA)
5.0 REPAIR AND MAINTENANCE
N/A
6.0 PROCEDURE
6.1 Field Equipment Sign-In Sign-in all equipment received from the field in the “CASTNET V Receiving Sign-In Log” (Figure 1). If the system is tagged for post-calibration, note that in the Action column of the sign-in log. 6.1.1 Any equipment requiring post-calibration is given to a Calibration Laboratory Technician
for a complete post-calibration test. 6.1.2 Testing of equipment requiring post-calibration includes:
Do not make adjustments or changes to the piece of equipment before post-calibration.
All normal calibration test points will be tested and recorded on the proper form with additional test points for relative humidity and wind direction (see III. Figures 6, 15, 21, 32, 35, 38-40).
If the post-calibration tag indicates a problem point, obtain additional test points at and around this area.
After testing of post-calibrated equipment, the form must be reviewed by the Calibration Laboratory Manager or the Field Operations Coordinator.

SITE INSTRUMENTATION - FIELD EQUIPMENT SIGN-IN AND SIGN-OUT Revision No. 7
October 2018 Page 3 of 7
SITE INSTRUMENTATION - FIELD EQUIPMENT SIGN-IN AND SIGN-OUT Wood Environment & Infrastructure Solutions, Inc.
6.1.3 Upon completion, give post-calibration forms to the Field Operations Coordinator along with the Post Calibration Request (Figure 3) tag for final review and for filing in the proper site file.
6.1.4 After the post-calibration form is reviewed and filed, move the equipment to the repair area for repair/rebuild and calibration.
6.2 Field Equipment Sign-Out Sign-out all CASTNET equipment either being shipped or hand-carried to a site in the “CASTNET V Shipping/Sign-Out Log” (Figure 2). Pay particular attention to the equipment serial number and its destination. This information will be required when the equipment inventory database is updated. 6.2.1 Equipment Sign-Out and Shipping Procedure: to a Site If a CASTNET monitoring site requires an equipment shipment, an electronic Equipment
Request Form (ERF) must first be generated from the CDMSA.
If item has an EPA or a CASTNET ID number: 1. Enter equipment ID in Sign-Out Log Book.
a. The six digit EPA ID is written in the third column from the left. b. The five digit CASTNET number is written in the fourth column.
2. Pack securely in appropriate sized box using adequate packing material. 3. Include a pre-printed FedEx return air bill that has the Wood address and
correct project number on it. a. Write the site name and number on the “Company” line. b. Include a pre-printed yellow tag with site and equipment filled in.
(This tag will be returned with the equipment). 4. Find ERF form in CASTNET database.
a. Enter equipment ID # in appropriate line under Sent column. b. Add equipment type in Comments. c. Type Project number and Requested Mode of Shipment. d. Fill in Date and Initials (person filling out ERF form). e. Save and print.
5. Attach the ERF to the box. 6. Take the box to the shipping trailer. Leave it for the regular shipping person
or ship it yourself (use the FedEx computer that is the leftmost of the three computers in the shipping trailer).
7. Remove the ERF and affix the tracking number portion of the FedEx shipping label to a place on the form such that information is not obscured.
8. Adhere the FedEx shipping label to the box. 9. File the ERF in the SHIPPING drawer (top drawer in Deborah’s office) in the

SITE INSTRUMENTATION - FIELD EQUIPMENT SIGN-IN AND SIGN-OUT Revision No. 7
October 2018 Page 4 of 7
SITE INSTRUMENTATION - FIELD EQUIPMENT SIGN-IN AND SIGN-OUT Wood Environment & Infrastructure Solutions, Inc.
folder with the appropriate site ID. If the item does not have a CASTNET or EPA number: 1. Pack appropriately. There will be no return air-bill or yellow tag. 2. Attach ERF if provided and continue with step 5) above. 3. If there is no ERF, write the site ID and shipping method on the box or on the
“Shipping Request” form. 4. Continue with above steps 5), 7), and 8) above.
6.2.2 Equipment Sign-Out and Shipping Procedure: to a Vendor If item has an EPA or a CASTNET ID number: 1. Enter equipment ID in Repair Log Book.
a. Write the date item is shipped. b. Leave the "Date Rt’d" column blank. c. Enter the vendor’s name, then the item description. d. Enter the equipment’s serial number provided by the manufacturer. e. Write the EPA or CASTNET number next. f. Most vendors will provide an RMA # or RA # to put on the box and
the authorization letter. Also enter this number in the log book. g. The PO # may be available at time of shipping, but most likely not. If
available, enter this number in the log book. 2. Pack well in appropriate sized box with adequate packing material. 3. Include a signed copy of the authorization letter inside the box and a signed
copy in a see-through packing slip sleeve to be adhered to the outside of the box.
4. Take the box to the shipping trailer. Leave it for the regular shipping person or ship it yourself (use the FedEx computer that is the leftmost of the three computers in the shipping trailer).
5. Adhere the FedEx shipping label to the box. 6. Put the box in the shelter outside the trailer’s roll up door.

SITE INSTRUMENTATION - FIELD EQUIPMENT SIGN-IN AND SIGN-OUT Revision No. 7
October 2018 Page 5 of 7
SITE INSTRUMENTATION - FIELD EQUIPMENT SIGN-IN AND SIGN-OUT Wood Environment & Infrastructure Solutions, Inc.
7.0 REFERENCES
U.S. Environmental Protection Agency (EPA). 1994. Quality Assurance Handbook for Air Pollution Measurement Systems, Vol. I. A Field Guide to Environmental Quality Assurance. EPA/600/R-94/038a.
U.S. Environmental Protection Agency (EPA). 2008. Quality Assurance Handbook for Air Pollution
Measurement Systems, Vol. IV, Meteorological Measurements Version 2.0 (Final). EPA-454/B-08-002.
U.S. Environmental Protection Agency (EPA). 2013. Quality Assurance Handbook for Air Pollution
Measurement Systems, Vol. II, Ambient Air Quality Monitoring Program. EPA-454/B-13-003.
U.S. Environmental Protection Agency (EPA). 2000. Meteorological Monitoring Guidance for
Regulatory Modeling Applications. EPA-454/R-99-005.

SITE INSTRUMENTATION - FIELD EQUIPMENT SIGN-IN AND SIGN-OUT Revision No. 7
October 2018 Page 6 of 7
SITE INSTRUMENTATION - FIELD EQUIPMENT SIGN-IN AND SIGN-OUT Wood Environment & Infrastructure Solutions, Inc.
8.0 FIGURES
Figure 1. CASTNET V Receiving/Sign-In Log
Note: For Figures 1 and 2:
Update on Computer = Indicates whether equipment inventory database was updated. Name = Name of individual receiving/shipping the item. EPA Number = Tracking number supplied by the EPA. NDDN Number = Tracking number supplied by Wood. Sent From Location/ Location Sent
= Name of location from/to which the item was sent. May be a monitoring site (site ID number), a field technician (name or initials) or a designated calibration kit.
Date In/Out = Date received/shipped. Description = Short description of item. Action = Primarily describes post-calibration requests. May also provide other explanation of why item was sent. Mode of Shipping = Shipping company or field technician. Reason = Brief explanation of why item was sent.

SITE INSTRUMENTATION - FIELD EQUIPMENT SIGN-IN AND SIGN-OUT Revision No. 7
October 2018 Page 7 of 7
SITE INSTRUMENTATION - FIELD EQUIPMENT SIGN-IN AND SIGN-OUT Wood Environment & Infrastructure Solutions, Inc.
Figure 2. CASTNET V Shipping/Sign-Out Log
EXAMPLE
Figure 3: Post-Calibration Request Tag

TRANSFER STANDARDS - ROTRONIC HYGROMETER Revision No. 8 October 2019
Page 7 of 8
TRANSFER STANDARDS - ROTRONIC HYGROMETER Wood Environment & Infrastructure Solutions, Inc.
Figure 2. Sample Temperature/Relative Humidity Data Form Using Vaportron
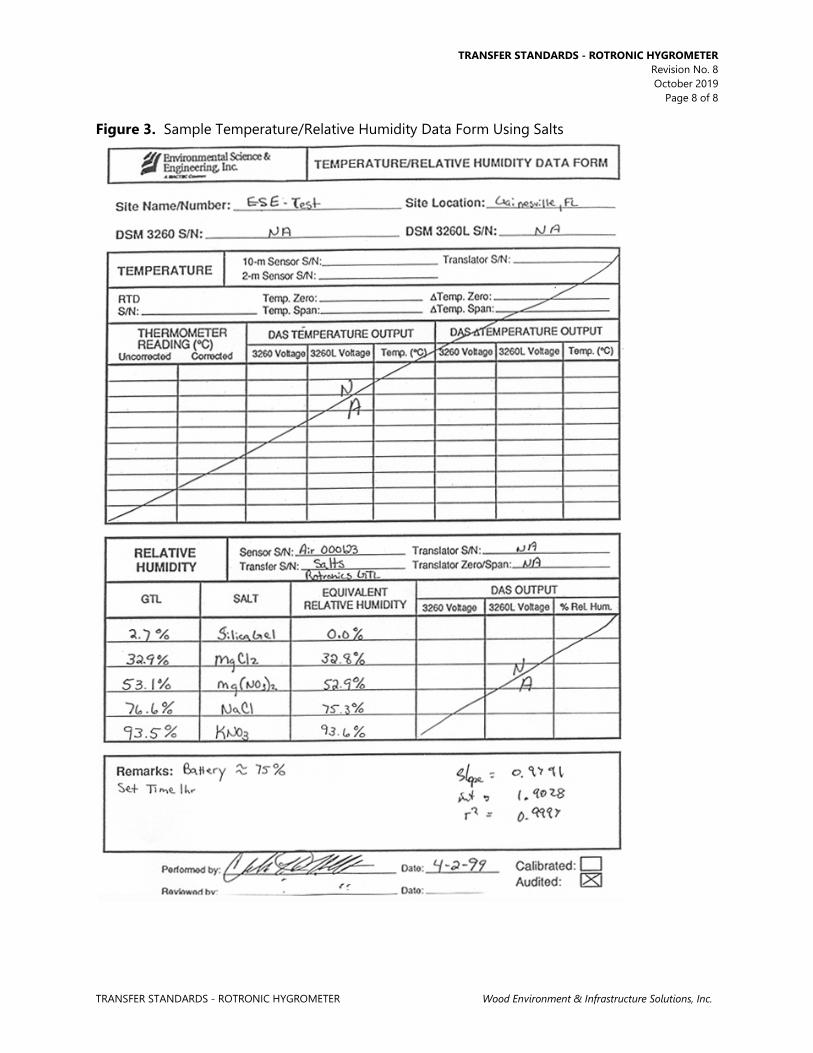
TRANSFER STANDARDS - ROTRONIC HYGROMETER Revision No. 8 October 2019
Page 8 of 8
TRANSFER STANDARDS - ROTRONIC HYGROMETER Wood Environment & Infrastructure Solutions, Inc.
Figure 3. Sample Temperature/Relative Humidity Data Form Using Salts


SITE INSTRUMENTATION - O3 MONITORS Revision No. 7
October 2018 Page 2 of 11
SITE INSTRUMENTATION - O3 MONITORS Wood Environment & Infrastructure Solutions, Inc.
IV. C. 2. OZONE MONITORS
1.0 PURPOSE
The purpose of this Standard Operating Procedure (SOP) is to provide consistent guidance for maintenance and handling of the Thermo Fisher Scientific (Thermo) Ozone (O3) monitors to Clean Air Status and Trends Network (CASTNET) Field Calibration Laboratory personnel.
2.0 SCOPE
This SOP applies to the maintenance and handling of Thermo O3 monitors administered by the CASTNET Field Calibration Laboratory.
3.0 SUMMARY
CASTNET field equipment technicians repair and calibrate O3 monitors during the routine calibration visits, at the request the site operator, upon receipt from the manufacturer, prior to use in the field, or otherwise as needed.
Maintenance
Optical Bench Cleaning Capillary Service
Temperature Sensor Calibration Pressure Sensor Calibration Flow Transducer Calibrations
Solenoid Balance Test Ozonator Solenoid Test
Detector Calibration Factor Adjustment
Multipoint Calibration or Verification
Ozone Scrubber Efficiency Test
Ozone Loss Test
Pressure Check Leak Test
Lamp setting
SITE INSTRUMENTATION - O3 MONITORS Revision No. 7
October 2018 Page 3 of 11
SITE INSTRUMENTATION - O3 MONITORS Wood Environment & Infrastructure Solutions, Inc.
4.0 MATERIALS AND SUPPLIES
Thermo Models 49i O3 Analyzers Multimeter Kimwipes Compressed air blower Insulated screwdriver Teflon tape
5.0 MAINTENANCE AND CALIBRATION
Perform any detector audits or post calibrations prior to beginning the following procedure. The following list is the comprehensive maintenance overhaul. Refer to Ozone Maintenance and Calibration Schedule to determine required maintenance.
5.1 Optical Bench Cleaning (Manual Section 5-2) 5.1.1 Turn off power, disconnect the power cable, and remove cover. 5.1.2 Loosen the knurled nut around tube and carefully slide out the tube. 5.1.3 Push a piece of lens paper (Kim Wipe) down the tube using a 1/4-inch piece of Teflon
tubing so as not to damage the tube. Use a cotton swab to clean the window surfaces through the holes the tube fits into.
5.1.4 Replace the tubes (opposite of removal). Both tubes are identical, so they can be replaced in either position.
5.2 Capillary Service (Manual Section 5-5) 5.2.1 Turn off power, disconnect the power cable, and remove cover. 5.2.2 Remove purple 15 mil capillaries by loosening nuts around the Tee fitting on top of
sample pump. Remove capillaries from tubing. 5.2.3 Clear any blockage with a wire less than 0.015-inch OD, or replace. 5.2.4 Replace capillaries (opposite of removal). 5.2.5 Repeat steps 2-4 for orange 24 mil capillary upstream of ozone generation chamber if
applicable.
5.3 Bench Temperature Sensor Calibration (Manual Section 7-26, 3-92) Note: The analyzer must be in service mode to perform this adjustment. 5.3.1 Remove bench thermistor signal cable from the Measurement Interface Board. 5.3.2 Unscrew thermistor from the optical bench. 5.3.3 Reconnect signal cable to Measurement Interface Board. 5.3.4 Place thermistor through foam in an empty insulated thermos with temperature primary
standard. 5.3.5 After the readings equilibrate, adjust bench calibration if the deviation is > 2°C.

SITE INSTRUMENTATION - O3 MONITORS Revision No. 7
October 2018 Page 4 of 11
SITE INSTRUMENTATION - O3 MONITORS Wood Environment & Infrastructure Solutions, Inc.
5.3.6 Press the Main Menu button to display the Main Menu. 5.3.7 Use the down arrow button to scroll to Service and press the enter button to display the
Service menu. 5.3.8 Use the down arrow button to scroll to Temperature Calibration and press the enter
button to display the Temperature Calibration screen.
5.3.9 Enter corrected temperature standard reading and press ↵ (Enter) to save.
5.4 Pressure Sensor Calibration (Manual Section 7-34, 3-88) The pressure sensor calibration requires a high vacuum pump capable of < 1mmHg (≈1 torr). If such a pump is unavailable, only adjust the pressure span setting. Note: The analyzer must be in service mode to perform this adjustment. 5.4.1 Connect reference pressure sensor and vacuum pump to pressure transducer. 5.4.2 Turn on vacuum pump until reference pressure sensor reads < 1mmHg. 5.4.3 Adjust zero setting if deviation is > 5 mmHg. 5.4.4 Press the Main Menu button to display the Main Menu. 5.4.5 Use the down arrow button to scroll to Service and press the enter button to display the
Service menu. 5.4.6 Use the down arrow button to scroll to Pressure Calibration and press the enter button
to display the Pressure Calibration screen. 5.4.7 From the zero menu, press enter to set the zero setting. 5.4.8 Turn off vacuum pump and open the relief valve. 5.4.9 After the readings equilibrate, adjust span concentration if deviation > 5mmHg. 5.4.10 Press the menu button to return to the pressure calibration menu.
5.4.11 From the span menu, enter the reference pressure reading and press ↵ (Enter) to save.
5.5 Flow Transducer Calibrations (Manual Section 7-37, 3-90) The flow readings are not used to calculate ozone concentration. Since they are only diagnostic, a precise calibration is not critical. Note: The analyzer must be in service mode to perform this adjustment. 5.5.1 Turn off the instrument sample pump. 5.5.2 Press the Main Menu button to display the Main Menu. 5.5.3 Use the down arrow button to scroll to Service and press the enter button to display the
Service menu. 5.5.4 Select Flow A Calibration and then zero.
5.5.5 Press ↵ (Enter) to set the flow zero setting.
5.5.6 Repeat steps 4 and 5 for Flow B.

SITE INSTRUMENTATION - O3 MONITORS Revision No. 7
October 2018 Page 5 of 11
SITE INSTRUMENTATION - O3 MONITORS Wood Environment & Infrastructure Solutions, Inc.
5.5.7 Connect the reference flow meter to the sample bulkhead. 5.5.8 From the Flow A Calibration menu, select Span. 5.5.9 Disconnect the tubing from the cell B flow transducer to the sample pump and cap both
cell B pump inlet and transducer output. Leaving either uncapped will produce erroneous readings.
5.5.10 Enter the reference flow meter reading and press ↵ (Enter) to save.
5.5.11 Repeat steps 8 – 10 for Flow B.
5.6 Leak Check (Manual Section 5-7) 5.6.1 Turn off zero air and disconnect the zero air tubing from the primary. 5.6.2 Cap the sample inlet bulkhead. 5.6.3 Press the Pressure soft key. 5.6.4 The pressure reading should drop less than 200 mm Hg. \ 5.6.5 It should take less than 30 seconds from the time the zero air dump is plugged to the
time the reading below 200 mm Hg is obtained
5.7 Adjust Lamp Setting (Manual Section 3-85) Note: The analyzer must be in service mode to perform this adjustment. 5.7.1 Press the Main Menu button to display the Main Menu. 5.7.2 Use the down arrow button to scroll to Service and press the enter button to display the
Service menu. 5.7.3 Use the down arrow button to scroll to Lamp Setting and press the enter button to
display the Lamp Setting screen. 5.7.4 Use the up or down arrows to increment or decrement the numeric value until both
intensities are as close to 100 kHz as possible. 5.7.5 Press the enter button to save the new lamp setting.
5.8 Detector Calibration Factor Adjustment (Manual Section 3-86) Note: The analyzer must be in service mode to perform this adjustment. 5.8.1 Connect zero air to the sample bulkhead connector. 5.8.2 Press the Main Menu button to display the Main Menu. 5.8.3 Use the down arrow button to scroll to Service and press the enter button to display the
Service menu. 5.8.4 Use the down arrow button to scroll to Detector Calibration and press the enter button
to display the Detector Calibration screen. 5.8.5 Verify both detector uncorrected readings are between 90 kHz and 110 kHz.

SITE INSTRUMENTATION - O3 MONITORS Revision No. 7
October 2018 Page 6 of 11
SITE INSTRUMENTATION - O3 MONITORS Wood Environment & Infrastructure Solutions, Inc.
5.8.6 Press ↵ (Enter) to compute new calibration factors.
5.9 Solenoid Balance and Leak Test (Manual Section 5-8, 5-9) 5.9.1 Generate an ozone concentration of approximately 0.5 ppm and connect to the sample
bulkhead connector. 5.9.2 Press the Main Menu button to display the Main Menu. 5.9.3 Use the down arrow button to scroll to Diagnostics and press the enter button to display
the Diagnostics menu.
5.9.4 Use the down arrow button to scroll to Cell A/B O 3 and press the enter button to display
the O 3 PPB screen. This display presents the concentration for each cell.
5.9.5 Once the instrument stabilizes, the average of 10 successive simultaneous readings from each cell should agree within ± 3 percent.
5.9.6 A balanced measurement of better than 3 percent indicates that there are no leaks across the solenoid.
5.9.7 A constant low reading from one cell indicates an imbalance. The imbalance can be caused by a dirty cell, dirty lines to that cell, or by a leaky valve.
5.9.8 To check if the imbalance is caused by a dirty cell, interchange the cells. If the imbalanced side switches, the imbalance is caused by the cell.
5.9.9 To check if the imbalance is caused by dirty lines to a cell, perform the ozone loss test. 5.9.10 To check the solenoid for a leak perform the following test.
• Remove the solenoid valve that appears to be faulty. • Connect the solenoid cell test tubing to the test pump. The other end of the tubing
will be connected to a tee fitting. • Cap one open port on the tee fitting. • Connect a pressure transducer to the open tee fitting port. • Turn on the test pump. • After the pressure has stabilized, record the reading as PC. • Turn off the test pump. • Uncap the capped the tee fitting port. • Connect the open tee fitting port to the common solenoid port. • Cap the normally open solenoid port. • Turn on the test pump. • After the pressure has stabilized, record the pressure reading as PNO. • Turn off the test pump • Uncap the normally open solenoid port. • Cap the normally closed solenoid port. • Plug the solenoid power line into the appropriate connector on the measurement
interface board. Make sure the solenoid is activated. • After the pressure has stabilized, record the pressure reading as PNC. • The solenoid is faulty if either PNO or PNC is greater than PC.
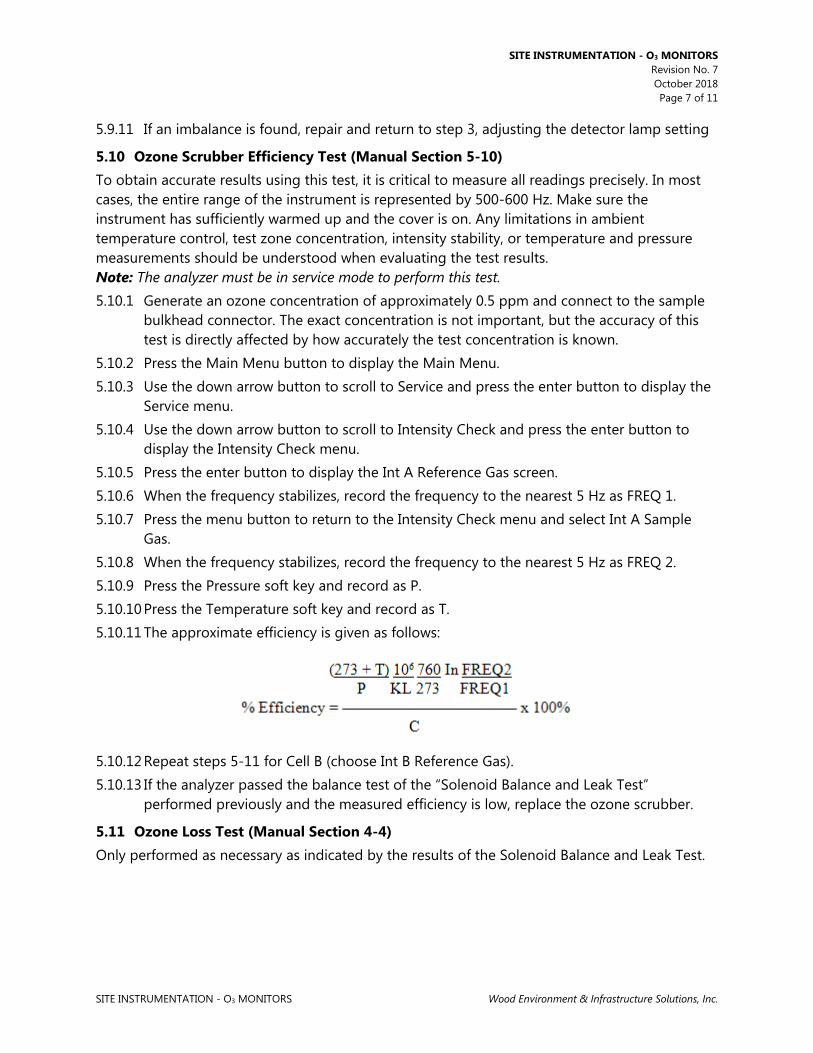
SITE INSTRUMENTATION - O3 MONITORS Revision No. 7
October 2018 Page 7 of 11
SITE INSTRUMENTATION - O3 MONITORS Wood Environment & Infrastructure Solutions, Inc.
5.9.11 If an imbalance is found, repair and return to step 3, adjusting the detector lamp setting
5.10 Ozone Scrubber Efficiency Test (Manual Section 5-10) To obtain accurate results using this test, it is critical to measure all readings precisely. In most cases, the entire range of the instrument is represented by 500-600 Hz. Make sure the instrument has sufficiently warmed up and the cover is on. Any limitations in ambient temperature control, test zone concentration, intensity stability, or temperature and pressure measurements should be understood when evaluating the test results. Note: The analyzer must be in service mode to perform this test. 5.10.1 Generate an ozone concentration of approximately 0.5 ppm and connect to the sample
bulkhead connector. The exact concentration is not important, but the accuracy of this test is directly affected by how accurately the test concentration is known.
5.10.2 Press the Main Menu button to display the Main Menu. 5.10.3 Use the down arrow button to scroll to Service and press the enter button to display the
Service menu. 5.10.4 Use the down arrow button to scroll to Intensity Check and press the enter button to
display the Intensity Check menu. 5.10.5 Press the enter button to display the Int A Reference Gas screen. 5.10.6 When the frequency stabilizes, record the frequency to the nearest 5 Hz as FREQ 1. 5.10.7 Press the menu button to return to the Intensity Check menu and select Int A Sample
Gas. 5.10.8 When the frequency stabilizes, record the frequency to the nearest 5 Hz as FREQ 2. 5.10.9 Press the Pressure soft key and record as P. 5.10.10 Press the Temperature soft key and record as T. 5.10.11 The approximate efficiency is given as follows:
5.10.12 Repeat steps 5-11 for Cell B (choose Int B Reference Gas). 5.10.13 If the analyzer passed the balance test of the “Solenoid Balance and Leak Test”
performed previously and the measured efficiency is low, replace the ozone scrubber.
5.11 Ozone Loss Test (Manual Section 4-4) Only performed as necessary as indicated by the results of the Solenoid Balance and Leak Test.

SITE INSTRUMENTATION - O3 MONITORS Revision No. 7
October 2018 Page 8 of 11
SITE INSTRUMENTATION - O3 MONITORS Wood Environment & Infrastructure Solutions, Inc.
5.11.1 With the instrument running, generate an ozone concentration of approximately 0.5 ppm and connect to the sample bulkhead connector. The internal generator can be used since concentration will be measured later.
5.11.2 Using a certified ozone detector, measure the concentration at the test instrument sample bulkhead as C, the inlet of cell A as CaIN, the exhaust of cell A as CaOUT, the inlet of cell B as CbIN and the exhaust of cell B as CbOUT.
5.11.3 The percent ozone loss is given as follows:
5.12 Pump Pressure Check (Manual Section 3-83) Note: The analyzer must be in service mode to perform this test. 5.12.1 Press the Main Menu button to display the Main Menu. 5.12.2 Use the down arrow button to scroll to Service and press the enter button to display the
Service menu. 5.12.3 Use the down arrow button to scroll to Pressure Check and press the enter button to
display the Pressure Check menu. 5.12.4 Use the down arrow button to scroll to Pump Pressure and press the enter button to
display the Pump Pressure screen. 5.12.5 The pressure reading should drop below 390 mmHg in less than 20 seconds. This
indicates the effectiveness of the sample pump. 5.12.6 After 20 seconds, if the pressure is greater than 390 mmHg or the flow is greater than
0.010 LPM, the words “PUMP PROBLEM DETECTED” appear. Otherwise the words “PUMP OK” appear.
5.13 Leak Test (Manual Section 5-7) 5.13.1 Plug the sample inlet port. 5.13.2 Press the Pressure soft key. 5.13.3 The pressure reading should drop less than 200 mm Hg. 5.13.4 It should take less than 30 seconds from the time the sample inlet port is plugged to the
time the reading below 200 mm Hg is obtained. 5.13.5 Continue only for instruments with ozone generators. 5.13.6 Plug the vent port, ozone port, zero air port, and the integrity/cal gas outlet port on the
tee fitting. 5.13.7 Press the button to return to the home screen. 5.13.8 Press the button to activate zero mode. 5.13.9 Press the Pressure soft key. 5.13.10 The pressure reading should drop less than 200 mm Hg.

SITE INSTRUMENTATION - O3 MONITORS Revision No. 7
October 2018 Page 9 of 11
SITE INSTRUMENTATION - O3 MONITORS Wood Environment & Infrastructure Solutions, Inc.
5.13.11 It should take less than 30 seconds from the time the sample inlet port is plugged to the time the reading below 200 mm Hg is obtained.
5.14 Repair See Chapter 7 in the Thermo Manufacturer’s Manual for repair procedures for all models. 5.14.1.1
6.0 CALIBRATION PROCEDURE
6.1 Calibrating the Detector, Model 49i Allow the instrument to warm up for approximately 1 hour. Check to see if desiccant or charcoal canisters in the zero air system are due to be changed. 6.1.1 Connect the output of the Thermo 49PS primary to the sample inlet of the site analyzer. 6.1.2 Connect an Ethernet cable to the back of 49i model analyzers. 6.1.3 Using the laptop connected to the CR3000 datalogger, determine which primary
standard is being used, 1, 2 or 3, and ensure that page is selected. Only three (3) analyzers can be attached to single primary standard at any time. The datalogger has a program built into it that runs a full audit or calibration on an analyzer. However, the instrument must be set up in the program for it to run and record the data properly.
Under each Primary Standard page, three analyzers can be set up. PS1is associated with Analyzer 1, Analyzer 2, and Analyzer 3. PS2 is associated with Analyzer 4, Analyzer 5, and Analyzer 6. PS3 is associated with Analyzer 7, Analyzer 8, and Analyzer 9. All parameters are the same on each page, but their values change depending on the analyzers being used. 6.1.4 For a 49i analyzer, certain parameters need to entered and enabled. For instance, if using
PS1, its page should already have the PS slope and intercept entered into the program. Check to make sure these agree with the sticker on the PS, as well as all other parameters match the PS being used. Under Analyzer 1, the parameters of iSeries, SerialNum, Comport and IP_Addr need to be adjusted to match the machine being hooked up. For a 49i, the iSeries parameter should read “true”. If it does not say “true”, double click on the box and double click again to change the logic statement. The serial number of the machine should be input into the parameter labeled SerialNum. Double click inside the box, type in the serial number and then hit enter to save it. The Comport parameter should read “TCP”. If it does not say “TCP”, double click inside the box, type in TCP and then hit enter to save it. The IP address of the machine should be entered into the IP_Addr parameter. This can be found in the machine by going into the Menu, down to Instrument Controls, down to Communications and then to TCP/IP Settings. Record this IP address into the table, inputting similar to the serial number. Repeat for all analyzers being calibrated.
It is important to make sure that unique IP addresses are entered for each analyzer connected to the logger.

SITE INSTRUMENTATION - O3 MONITORS Revision No. 7
October 2018 Page 10 of 11
SITE INSTRUMENTATION - O3 MONITORS Wood Environment & Infrastructure Solutions, Inc.
6.1.5 To begin an audit of a transfer machine, select the CalStart under the PS parameters and change the logic to “true”. This will begin a sequence that cycles through all six target levels automatically. The sequence takes approximately 2 hours to run. A report can be generated through an Access script loaded on to the Loggernet computer which can be accessed from any of the other computers in the shop.
6.2 Adjusting the levels 6.2.1 If the was analyzer is found to be out of criteria, it is necessary to perform a full
calibration. To do so, connect the transfer as in steps 1 through 5, if not already connected. Once the parameters are adjusted for the particular analyzer, first, turn the CalAdjust parameter to “true” under the appropriate analyzer’s setting. Next, turn on the CalStart parameter to “true”. This performs an automatic sequence that adjusts the Background and Coefficient variables. A report can be generated through an Access script loaded on to the Loggernet computer which can be accessed from any of the other computers in the shop.
Below are equations to check the accuracy of the analyzers. Correct the PS averages to actual (observed average minus the y-intercept and divided by the slope generated when the PS was certified).
−=
slopeinterceptreadingaverage
actual
Calculate percent differences (%∆) and perform a regression analysis of the transfer averages versus the 49PS values.
100% ×
−
=∆known
knownunknown
Note: After completing the calibration, place the calibration form, and O3 analyzer on the “ready to ship” shelf.

SITE INSTRUMENTATION - O3 MONITORS Revision No. 7
October 2018 Page 11 of 11
SITE INSTRUMENTATION - O3 MONITORS Wood Environment & Infrastructure Solutions, Inc.
7.0 REFERENCES
Thermo Fisher Scientific. 2006. Model 49i Instruction Manual, UV Photometric O 3 Analyzer
U.S. Environmental Protection Agency (EPA). 1994. Quality Assurance Handbook for Air Pollution
Measurement Systems, Vol. I. A Field Guide to Environmental Quality Assurance. EPA/600/R-94/038a.
U.S. Environmental Protection Agency (EPA). 2008. Quality Assurance Handbook for Air Pollution
Measurement Systems, Vol. IV, Meteorological Measurements Version 2.0 (Final). EPA-454/B-08-002.
U.S. Environmental Protection Agency (EPA). 2013. Quality Assurance Handbook for Air Pollution
Measurement Systems, Vol. II, Ambient Air Quality Monitoring Program. EPA-454/B-13-003.
U.S. Environmental Protection Agency (EPA). 2000. Meteorological Monitoring Guidance for
Regulatory Modeling Applications. EPA-454/R-99-005. U.S. Environmental Protection Agency (EPA). 2013. Transfer Standards for the Calibration of
Ambient Air Monitoring Analyzers for Ozone. Technical Assistance Document. EPA-454/B-13-004.
U.S. Environmental Protection Agency (EPA). 2015. Appendix A to Part 58 – Quality Assurance
Requirements for State and Local Air Monitoring Stations (SLAMS), Special Purpose Monitors (SPMs), and Prevention of Significant Deterioration (PSD) Air Monitoring. 40 CFR Part 58.


SITE INSTRUMENTATION - MASS FLOW CONTROLLER Revision No. 9 October 2019
Page 2 of 6
SITE INSTRUMENTATION - MASS FLOW CONTROLLER Wood Environment & Infrastructure Solutions, Inc.
IV.C.3. MASS FLOW CONTROLLER
1.0 PURPOSE
The purpose of this Standard Operating Procedure (SOP) is to provide consistent guidance for maintenance and handling of all mass flow control (MFC) units to Clean Air Status and Trends Network (CASTNET) Field Calibration Laboratory personnel.
2.0 SCOPE
This SOP applies to the maintenance and handling of MFC units administered by the CASTNET Field Calibration Laboratory.
3.0 SUMMARY
All mass flow control systems are inspected and calibrated prior to site installation according to the procedure listed in Section 5.0. Upon receipt of MFC system from the field post calibration should always be attempted and the results documented and delivered to data validation.
Figure 1. Summary of Procedure
MFC Received from Field
Is post calibration possible?
Audit the MFC and deliver results to data validation. Calibrate MFC
Return to manufacturer for repair or replacement.
Place MFC on RTS shelf with one copy of calibration form. Place an electronic copy on the local
network drive.
No Yes
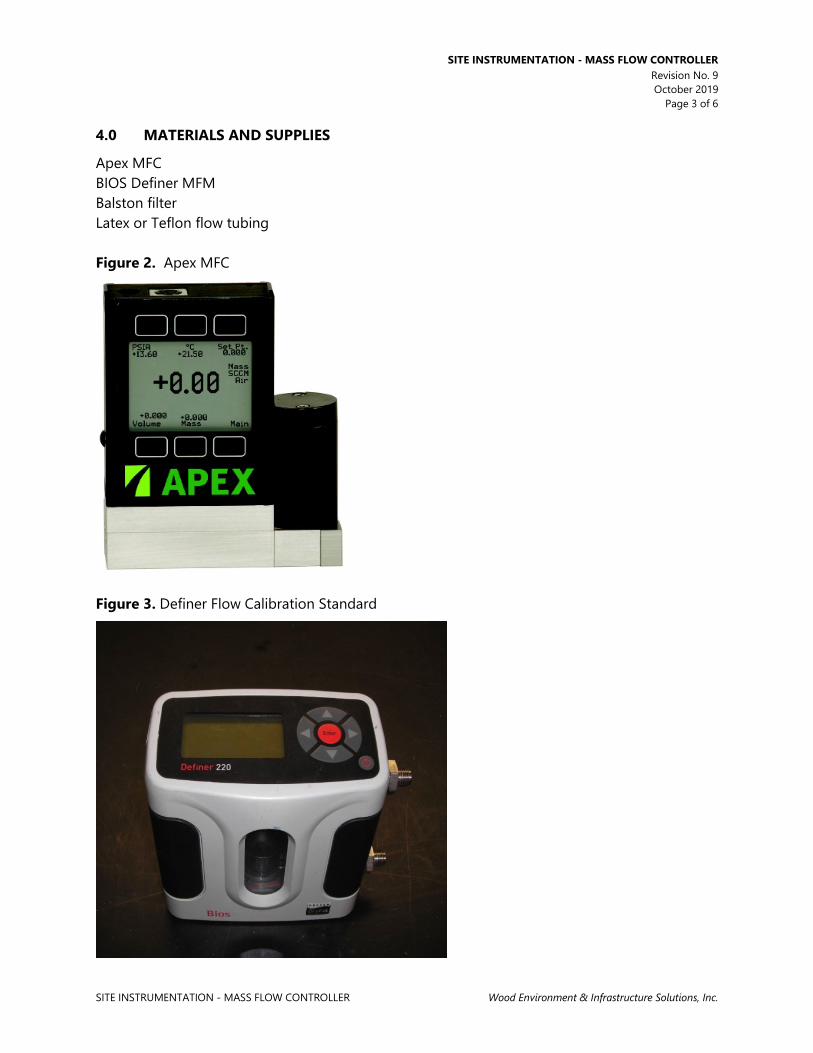
SITE INSTRUMENTATION - MASS FLOW CONTROLLER Revision No. 9 October 2019
Page 3 of 6
SITE INSTRUMENTATION - MASS FLOW CONTROLLER Wood Environment & Infrastructure Solutions, Inc.
4.0 MATERIALS AND SUPPLIES
Apex MFC BIOS Definer MFM Balston filter Latex or Teflon flow tubing Figure 2. Apex MFC
Figure 3. Definer Flow Calibration Standard

SITE INSTRUMENTATION - MASS FLOW CONTROLLER Revision No. 9 October 2019
Page 4 of 6
SITE INSTRUMENTATION - MASS FLOW CONTROLLER Wood Environment & Infrastructure Solutions, Inc.
5.0 REPAIR AND MAINTENANCE
5.1 Repair MFC’s are returned to the manufacturer for repair.
5.2 Maintenance MFC’s are returned to the manufacturer for maintenance.
6.0 CALIBRATION / POST-CALIBRATION
6.1.1 Allow the MFM and the MFC to warm up for at least 30 minutes without the charger attached to the MFM.
6.1.2 Install a Balston filter on the pressure port of the Definer. 6.1.3 Connect the Suction port of the Definer to the MFC inlet port using latex or Teflon
tubing. 6.1.4 Connect a vacuum source such as standard diaphragm pump to the outlet port of the
MFC. 6.1.5 With the vacuum pump off record the MFC display. 6.1.6 Turn on the flow pump. 6.1.7 Using the “Flow_SetPt” variable in the data logger, generate a range of flows around the
expected flow setting for that instrument. For MFCs to be used at 1.5 Lpm, for example, do respective flows at 1.00, 1.25, 1.50, 1.75, 2.00, and 2.25 Lpm. At each level of flow, record the MFC display, the “Flow_Mass” (entered into the voltage column), and the MFM measurement (average of ten good runs, entered into the STP column) on the Mass Flow Data Form in the As Left section (Figure 4).

SITE INSTRUMENTATION - MASS FLOW CONTROLLER Revision No. 9 October 2019
Page 5 of 6
SITE INSTRUMENTATION - MASS FLOW CONTROLLER Wood Environment & Infrastructure Solutions, Inc.
Figure 4. Example - Flow Calibration Form
SITE INSTRUMENTATION - MASS FLOW CONTROLLER Revision No. 9 October 2019
Page 6 of 6
SITE INSTRUMENTATION - MASS FLOW CONTROLLER Wood Environment & Infrastructure Solutions, Inc.
6.1.8 Following a six point audit in the As Left section of the flow calibration form, the form will compute a Full Scale and Zero value for the MFC. Enter the computed values to the data logger.
6.1.9 Using the average of ten good runs for the Definer, adjust the MFC set point to achieve a flow rate of 1.50 or 3.00 for the particular site. Record the result on the flow calibration form in the Post Calibration row of the As Left section.
6.1.10 After completing the calibration, tag the MFC, place it in a plastic bag and put it on the “ready to ship” shelf.
7.0 REFERENCES
U.S. Environmental Protection Agency (EPA). 1994. Quality Assurance Handbook for Air Pollution Measurement Systems, Vol. I. A Field Guide to Environmental Quality Assurance. EPA/600/R-94/038a.
U.S. Environmental Protection Agency (EPA). 2008. Quality Assurance Handbook for Air Pollution
Measurement Systems, Vol. IV, Meteorological Measurements Version 2.0 (Final). EPA-454/B-08-002.
U.S. Environmental Protection Agency (EPA). 2013. Quality Assurance Handbook for Air Pollution
Measurement Systems, Vol. II, Ambient Air Quality Monitoring Program. EPA-454/B-13-003.
U.S. Environmental Protection Agency (EPA). 2000. Meteorological Monitoring Guidance for
Regulatory Modeling Applications. EPA-454/R-99-005.
8.0 ATTACHMENTS
This SOP does not contain attachments.

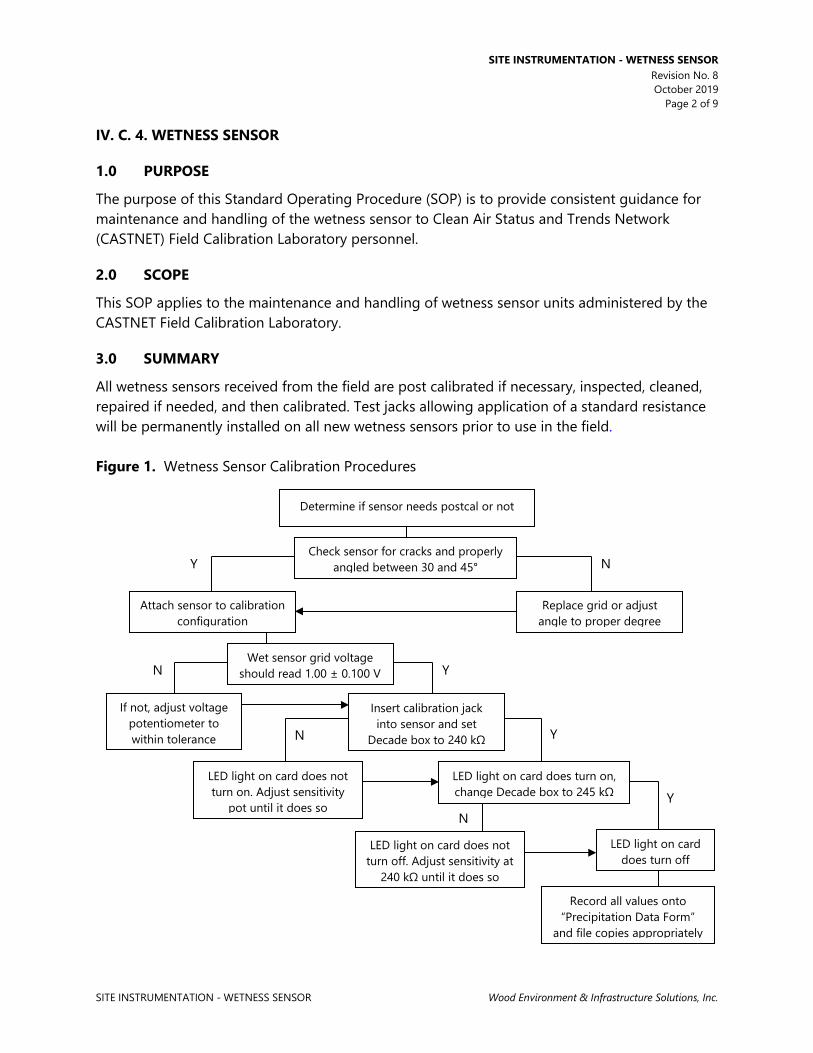
SITE INSTRUMENTATION - WETNESS SENSOR Revision No. 8 October 2019
Page 2 of 9
SITE INSTRUMENTATION - WETNESS SENSOR Wood Environment & Infrastructure Solutions, Inc.
IV. C. 4. WETNESS SENSOR
1.0 PURPOSE
The purpose of this Standard Operating Procedure (SOP) is to provide consistent guidance for maintenance and handling of the wetness sensor to Clean Air Status and Trends Network (CASTNET) Field Calibration Laboratory personnel.
2.0 SCOPE
This SOP applies to the maintenance and handling of wetness sensor units administered by the CASTNET Field Calibration Laboratory.
3.0 SUMMARY
All wetness sensors received from the field are post calibrated if necessary, inspected, cleaned, repaired if needed, and then calibrated. Test jacks allowing application of a standard resistance will be permanently installed on all new wetness sensors prior to use in the field. Figure 1. Wetness Sensor Calibration Procedures
Check sensor for cracks and properly angled between 30 and 45°
Attach sensor to calibration configuration
Replace grid or adjust angle to proper degree
Wet sensor grid voltage should read 1.00 ± 0.100 V
If not, adjust voltage potentiometer to within tolerance
Insert calibration jack into sensor and set
Decade box to 240 kΩ
LED light on card does not turn on. Adjust sensitivity
pot until it does so
LED light on card does turn on, change Decade box to 245 kΩ
LED light on card does not turn off. Adjust sensitivity at
240 kΩ until it does so
LED light on card does turn off
Record all values onto “Precipitation Data Form”
and file copies appropriately
Y N
N Y
Y
Y
N
N
Determine if sensor needs postcal or not

SITE INSTRUMENTATION - WETNESS SENSOR Revision No. 8 October 2019
Page 3 of 9
SITE INSTRUMENTATION - WETNESS SENSOR Wood Environment & Infrastructure Solutions, Inc.
4.0 MATERIALS
Wetness sensor grid Integrated circuit (IC) chips Electronics tool kit including: Soldering tool Solder Screwdriver Wire cutters
5.0 SAFETY
5.1.1 When working with the soldering iron, it is recommended to wear gloves to avoid getting burned. Electricity and water are present together while performing the calibration, so care should be taken to avoid electrocution.
6.0 PROCEDURE
Post Calibration/Calibration 6.1.1 Voltage Calibration 6.1.2 Connect wetness sensor to the CR3000 calibration station as shown in Figure 2.
Attachment A provides a wiring diagram for the R.M. Young Wetness probe. Figure 2. Wiring sensor to wall jacks
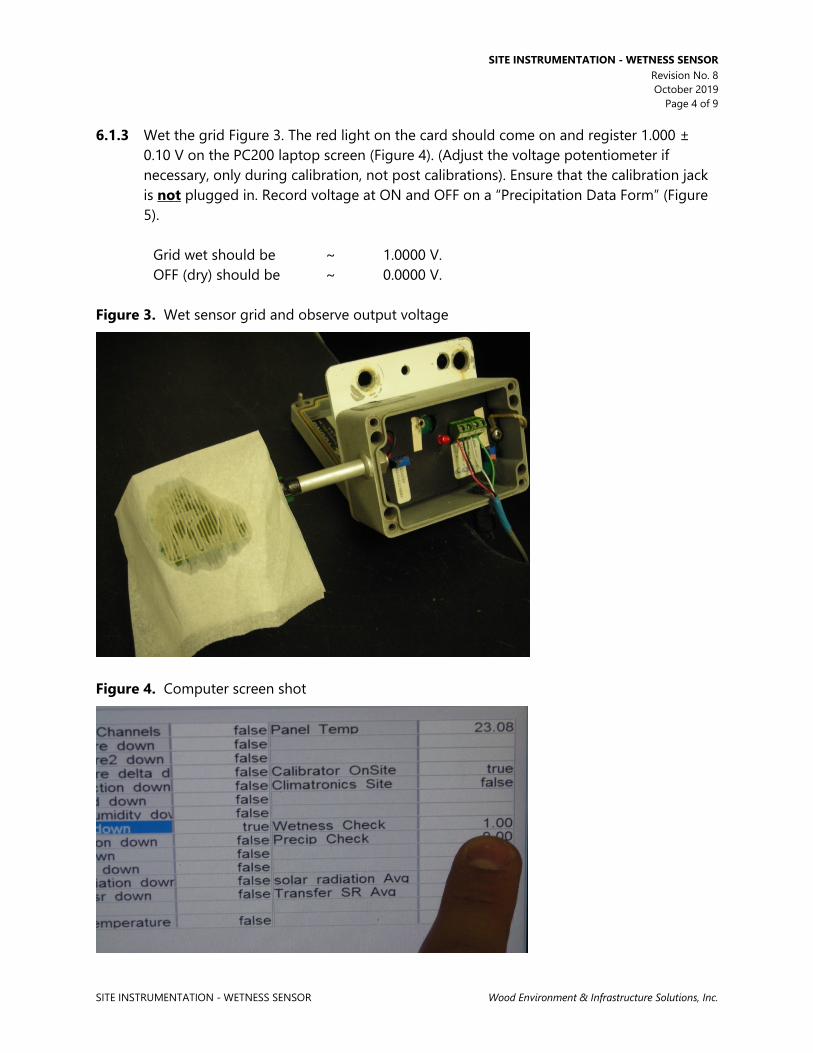
SITE INSTRUMENTATION - WETNESS SENSOR Revision No. 8 October 2019
Page 4 of 9
SITE INSTRUMENTATION - WETNESS SENSOR Wood Environment & Infrastructure Solutions, Inc.
6.1.3 Wet the grid Figure 3. The red light on the card should come on and register 1.000 ± 0.10 V on the PC200 laptop screen (Figure 4). (Adjust the voltage potentiometer if necessary, only during calibration, not post calibrations). Ensure that the calibration jack is not plugged in. Record voltage at ON and OFF on a “Precipitation Data Form” (Figure 5).
Grid wet should be ~ 1.0000 V. OFF (dry) should be ~ 0.0000 V.
Figure 3. Wet sensor grid and observe output voltage
Figure 4. Computer screen shot

SITE INSTRUMENTATION - WETNESS SENSOR Revision No. 8 October 2019
Page 5 of 9
SITE INSTRUMENTATION - WETNESS SENSOR Wood Environment & Infrastructure Solutions, Inc.
Figure 5. Precipitation record sheet for wetness sensors
Sensitivity Calibration 6.2.1 During a post calibration, push the test jack from the decade box into the test jack
socket. Beginning at least 4 kΩ above the final value, decrease the resistance in 1 kΩ intervals until the sensor turns on. Record the highest resistance at which the sensor remains on. Likewise, Beginning at least 4 kΩ below the final value, increase the resistance in 1 kΩ intervals until the sensor turns off. Record the lowest resistance at which the sensor remains off.
6.2.2 For calibration, set the decade box to 240 kΩ and adjust the sensitivity potentiometer as shown in Figure 6, (the light should come on) as seen in Figure 7. Set the decade box to 235 kΩ (the light should remain on). Then set the decade box to 245 kΩ (the light should go off).

SITE INSTRUMENTATION - WETNESS SENSOR Revision No. 8 October 2019
Page 6 of 9
SITE INSTRUMENTATION - WETNESS SENSOR Wood Environment & Infrastructure Solutions, Inc.
Figure 6. Using a decade box to test sensitivity

SITE INSTRUMENTATION - WETNESS SENSOR Revision No. 8 October 2019
Page 7 of 9
SITE INSTRUMENTATION - WETNESS SENSOR Wood Environment & Infrastructure Solutions, Inc.
Figure 7. Adjusting sensitivity potentiometer
6.2.3 If calibrated, document results, all repair, and maintenance actions on calibration form.
Tag the sensor and place it on the “Ready to Ship” shelf. Place the calibration form in the sensor file.
6.2.4 If post-calibration, document results on calibration form and place calibration form in sensor file and deliver copy to data validation group. Then perform repair, maintenance and calibration of sensor.
Maintenance and Repair 6.3.1 Clean and inspect the sensor grid. Adjust the grid angle to between 30° and 45° with
respect to the top edge of the sensor box. 6.3.2 Clean and inspect all solder joints and wire connections. 6.3.3 Clean and inspect the box lid seal and replace if necessary, see 6.3.4 for details. 6.3.4 Replace damaged grid by removing the screws attached to the base of the grid, which
secures the grid to the support arm. Unsolder the circuit board wires from the base of the grid. Install a new grid using the reverse of this procedure. Before replacing the screws to secure the grid, add silicon sealant underneath the grid at the end of the arm to waterproof the wires and prevent insects from entering the sensor.
6.3.5 To replace damaged or failing IC chips, remove the circuit board from the box by taking out the retainer screws on either side of the board. Flip the board over to locate the IC chips and with a chip lifter, remove the defective piece. Pay close attention to which chip performs what function. Chips labeled with LM1830N control the sensitivity, while chips

SITE INSTRUMENTATION - WETNESS SENSOR Revision No. 8 October 2019
Page 8 of 9
SITE INSTRUMENTATION - WETNESS SENSOR Wood Environment & Infrastructure Solutions, Inc.
labeled with LM2902N control the voltage. It is also important to pay attention to the outline on the circuit board which will show which direction the new chips should be installed, indicated by a notch on one side of the chip. • Seal translator box with silicon sealant where the arm enters the box and also around
the base of the grid where it attaches to the arm • Remove old lid seal with small screwdriver or needle nose pliers. Place a small
amount of vacuum grease on a few points of the new seal and press down into box lid.
6.3.6 Installing a Test Jack • Disconnect wires from grid to board.
Note: It will be necessary to remove the nut from the grid arm to unscrew one side of the sensor card from the box. When reinstalling the grid arm, set at a 45º angle to the box top.
• Solder a short red wire (about 2 inches long) from the “sensor +” to the single tab on top of the jack.
• Solder a short black wire to the “sensor return” on the card. Solder the other end of the short black wire and the black wire from the grid to the bottom tab of the jack.
• Solder the red wire from the grid to the top tab on the side of the jack with two tabs. Note: Use the heat sink on the jack tabs when soldering wires, as plastic on the jack melts easily. In addition, ensure that the calibration jack hole in the faceplate is large enough for the jack to fit properly.
7.0 REFERENCES
U.S. Environmental Protection Agency (EPA). 1994. Quality Assurance Handbook for Air Pollution Measurement Systems, Vol. I. A Field Guide to Environmental Quality Assurance. EPA/600/R-94/038a.
U.S. Environmental Protection Agency (EPA). 2008. Quality Assurance Handbook for Air Pollution
Measurement Systems, Vol. IV, Meteorological Measurements Version 2.0 (Final). EPA-454/B-08-002.
U.S. Environmental Protection Agency (EPA). 2013. Quality Assurance Handbook for Air Pollution
Measurement Systems, Vol. II, Ambient Air Quality Monitoring Program. EPA-454/B-13-003.
U.S. Environmental Protection Agency (EPA). 2000. Meteorological Monitoring Guidance for
Regulatory Modeling Applications. EPA-454/R-99-005.

SITE INSTRUMENTATION - WETNESS SENSOR Revision No. 8 October 2019
Page 9 of 9
SITE INSTRUMENTATION - WETNESS SENSOR Wood Environment & Infrastructure Solutions, Inc.
8.0 ATTACHMENTS
Attachment A: Wetness sensor card wiring diagram
Wall Wiring

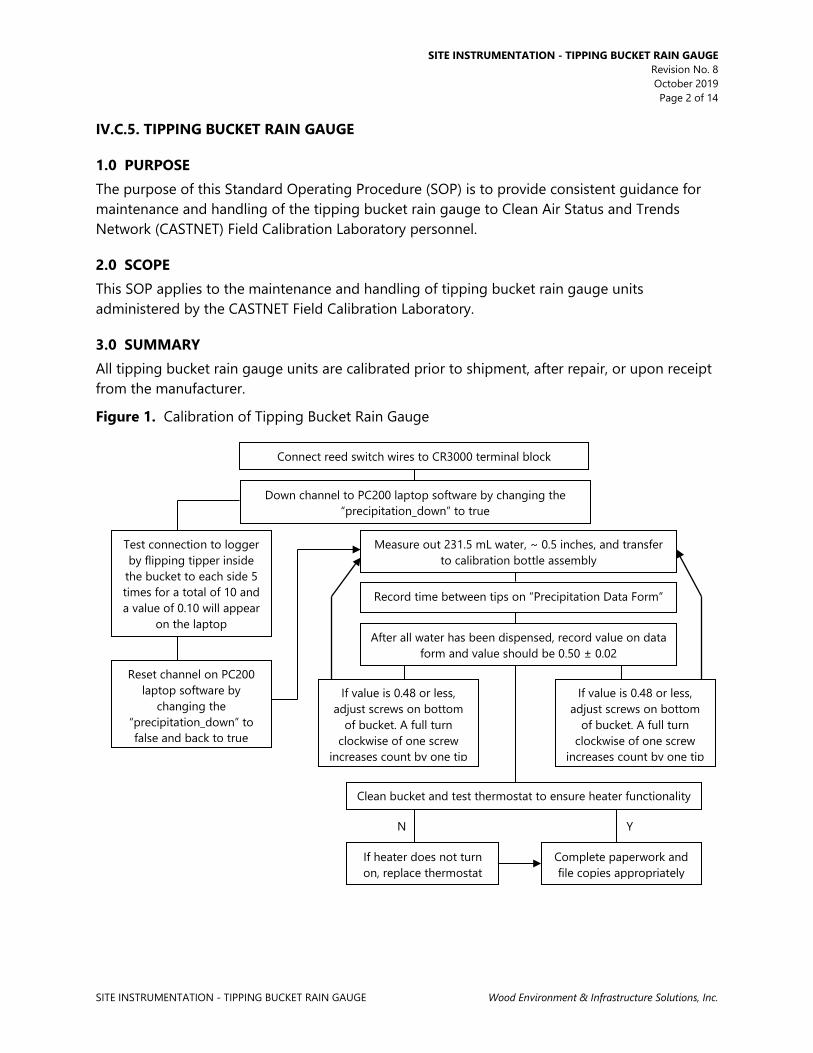
SITE INSTRUMENTATION - TIPPING BUCKET RAIN GAUGE Revision No. 8 October 2019 Page 2 of 14
SITE INSTRUMENTATION - TIPPING BUCKET RAIN GAUGE Wood Environment & Infrastructure Solutions, Inc.
IV.C.5. TIPPING BUCKET RAIN GAUGE
1.0 PURPOSE The purpose of this Standard Operating Procedure (SOP) is to provide consistent guidance for maintenance and handling of the tipping bucket rain gauge to Clean Air Status and Trends Network (CASTNET) Field Calibration Laboratory personnel.
2.0 SCOPE This SOP applies to the maintenance and handling of tipping bucket rain gauge units administered by the CASTNET Field Calibration Laboratory.
3.0 SUMMARY All tipping bucket rain gauge units are calibrated prior to shipment, after repair, or upon receipt from the manufacturer.
Figure 1. Calibration of Tipping Bucket Rain Gauge
Connect reed switch wires to CR3000 terminal block
Down channel to PC200 laptop software by changing the “precipitation_down” to true
Test connection to logger by flipping tipper inside
the bucket to each side 5 times for a total of 10 and a value of 0.10 will appear
on the laptop
Reset channel on PC200 laptop software by
changing the “precipitation_down” to false and back to true
Measure out 231.5 mL water, ~ 0.5 inches, and transfer to calibration bottle assembly
Record time between tips on “Precipitation Data Form”
After all water has been dispensed, record value on data form and value should be 0.50 ± 0.02
If value is 0.48 or less, adjust screws on bottom
of bucket. A full turn clockwise of one screw
increases count by one tip
If value is 0.48 or less, adjust screws on bottom
of bucket. A full turn clockwise of one screw
increases count by one tip
Clean bucket and test thermostat to ensure heater functionality
If heater does not turn on, replace thermostat
Complete paperwork and file copies appropriately
Y N
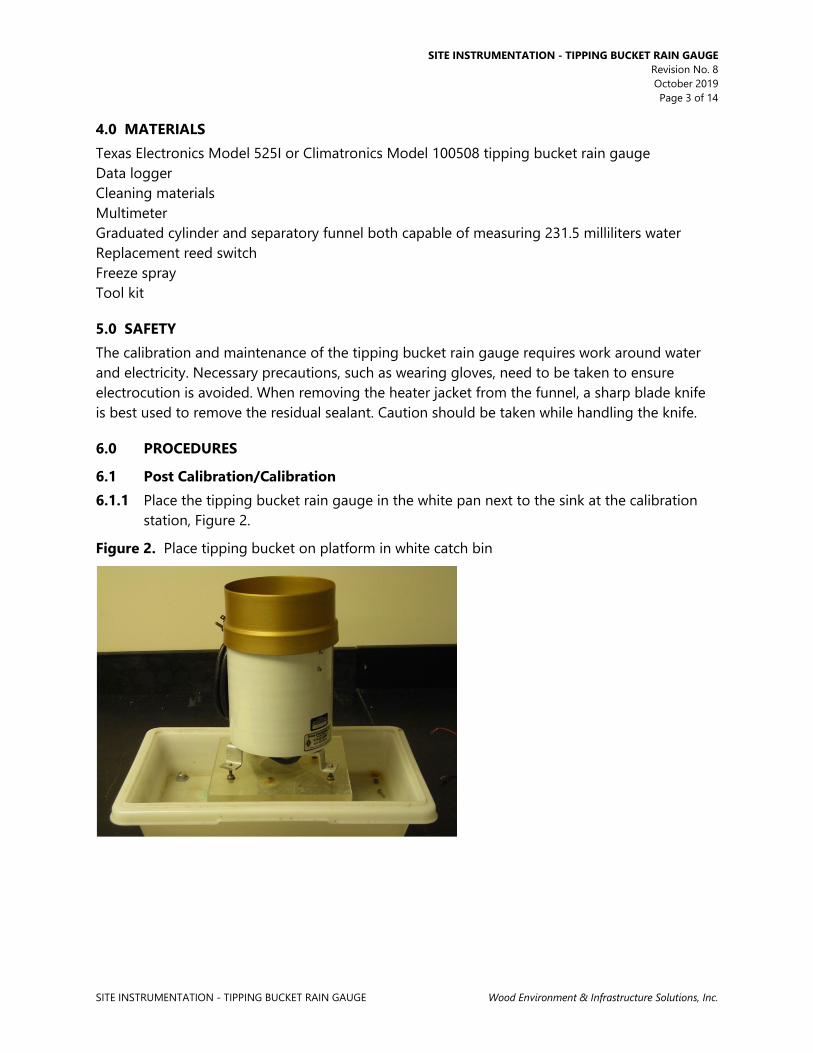
SITE INSTRUMENTATION - TIPPING BUCKET RAIN GAUGE Revision No. 8 October 2019 Page 3 of 14
SITE INSTRUMENTATION - TIPPING BUCKET RAIN GAUGE Wood Environment & Infrastructure Solutions, Inc.
4.0 MATERIALS Texas Electronics Model 525I or Climatronics Model 100508 tipping bucket rain gauge Data logger Cleaning materials Multimeter Graduated cylinder and separatory funnel both capable of measuring 231.5 milliliters water Replacement reed switch Freeze spray Tool kit
5.0 SAFETY The calibration and maintenance of the tipping bucket rain gauge requires work around water and electricity. Necessary precautions, such as wearing gloves, need to be taken to ensure electrocution is avoided. When removing the heater jacket from the funnel, a sharp blade knife is best used to remove the residual sealant. Caution should be taken while handling the knife.
6.0 PROCEDURES
6.1 Post Calibration/Calibration 6.1.1 Place the tipping bucket rain gauge in the white pan next to the sink at the calibration
station, Figure 2.
Figure 2. Place tipping bucket on platform in white catch bin
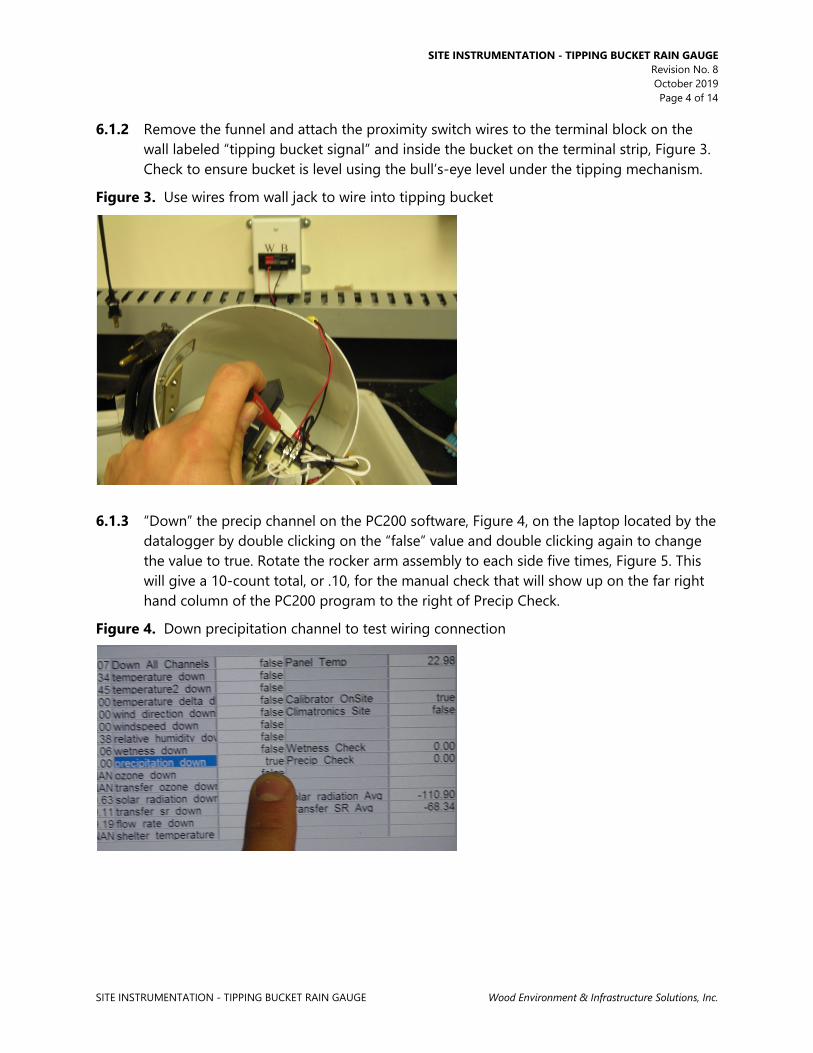
SITE INSTRUMENTATION - TIPPING BUCKET RAIN GAUGE Revision No. 8 October 2019 Page 4 of 14
SITE INSTRUMENTATION - TIPPING BUCKET RAIN GAUGE Wood Environment & Infrastructure Solutions, Inc.
6.1.2 Remove the funnel and attach the proximity switch wires to the terminal block on the wall labeled “tipping bucket signal” and inside the bucket on the terminal strip, Figure 3. Check to ensure bucket is level using the bull’s-eye level under the tipping mechanism.
Figure 3. Use wires from wall jack to wire into tipping bucket
6.1.3 “Down” the precip channel on the PC200 software, Figure 4, on the laptop located by the
datalogger by double clicking on the “false” value and double clicking again to change the value to true. Rotate the rocker arm assembly to each side five times, Figure 5. This will give a 10-count total, or .10, for the manual check that will show up on the far right hand column of the PC200 program to the right of Precip Check.
Figure 4. Down precipitation channel to test wiring connection

SITE INSTRUMENTATION - TIPPING BUCKET RAIN GAUGE Revision No. 8 October 2019 Page 5 of 14
SITE INSTRUMENTATION - TIPPING BUCKET RAIN GAUGE Wood Environment & Infrastructure Solutions, Inc.
Figure 5. Tip mechanism 10 times and check for accuracy on PC200 screen
6.1.4 Measure 231.5 ml of water into a graduated cylinder and transfer to calibration funnel, Figure 6. (This will equal .5 inch of rain.)
Figure 6. Measure 231.5 ml of water into a graduated cylinder and transfer to calibration funnel
6.1.5 Pour the water into the calibration funnel. 6.1.6 Reset the Precip Check value by toggling the precip_down value from false back to true.
Then, quickly flip the calibration funnel over the precipitation bucket funnel and allow water to begin to drip, Figure 7. As the tipping bucket rocker arm assembly rotates, count the intervals in seconds. Each interval should be approximately 9-12 seconds with a 1second difference between each side. For instance, one side tips at 11 seconds, the other side should tip between 10 and 12 seconds. Allow the calibration funnel to dispense the 231.5-ml of water.

SITE INSTRUMENTATION - TIPPING BUCKET RAIN GAUGE Revision No. 8 October 2019 Page 6 of 14
SITE INSTRUMENTATION - TIPPING BUCKET RAIN GAUGE Wood Environment & Infrastructure Solutions, Inc.
Figure 7. Flip calibration funnel on top of tipping bucket lid and allow all water to dispense
6.1.7 When the water is dispensed, record the value to the right of the Precip Check label,
Figure 8.
Figure 8. After dispensing is complete, locate “Precip_Check” on PC200 screen
6.1.8 A total of 0.50 ± 0.02, should be achieved, record on Precipitation Cal Form, Figure 9.
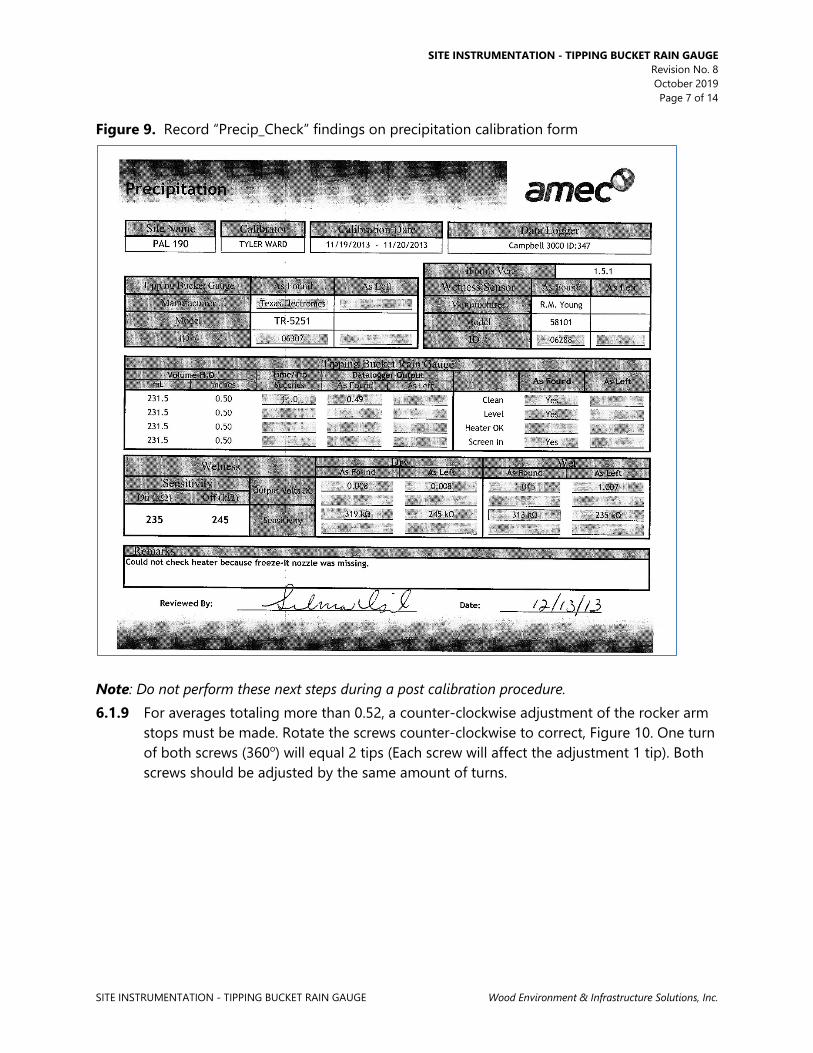
SITE INSTRUMENTATION - TIPPING BUCKET RAIN GAUGE Revision No. 8 October 2019 Page 7 of 14
SITE INSTRUMENTATION - TIPPING BUCKET RAIN GAUGE Wood Environment & Infrastructure Solutions, Inc.
Figure 9. Record “Precip_Check” findings on precipitation calibration form
Note: Do not perform these next steps during a post calibration procedure. 6.1.9 For averages totaling more than 0.52, a counter-clockwise adjustment of the rocker arm
stops must be made. Rotate the screws counter-clockwise to correct, Figure 10. One turn of both screws (360o) will equal 2 tips (Each screw will affect the adjustment 1 tip). Both screws should be adjusted by the same amount of turns.

SITE INSTRUMENTATION - TIPPING BUCKET RAIN GAUGE Revision No. 8 October 2019 Page 8 of 14
SITE INSTRUMENTATION - TIPPING BUCKET RAIN GAUGE Wood Environment & Infrastructure Solutions, Inc.
Figure 10. If needed, adjust screws on bottom of bucket to increase or decrease tips
6.1.10 For averages totaling less than 0.48, a clock-wise adjustment must be made. A clockwise
rotation of either rocker arm stop of 360° equals 1 tip. 6.1.11 Repeat steps 4 through 11; when 0.50 ± 0.02 is achieved, the unit is calibrated. 6.1.12 If calibration, document results, all repair, and maintenance actions on calibration form.
Tag the sensor and place it on the “Ready to Ship” shelf. Place the calibration form in the sensor file.
6.1.13 If post-calibration, document results on calibration form and place calibration form in sensor file and deliver copy to data validation group. Then perform repair, maintenance and calibration of sensor.
6.2 Maintenance 6.2.1 Clean the internal bucket area by removing the tipping bucket mechanism with the two
screws on the bottom of the bucket. With a firm brush and/or water, clean the inside of the bucket to remove dirt build-up and evidence of insects. (Spiders can stop the rocker arm from its rotation.)
6.2.2 Ensure the summer screen is not clogged; clean if needed with a firm brush and/or water.
6.2.3 Clean the funnel and ensure that the lower opening is not clogged. 6.2.4 Inspect the feet of the bucket to ensure they will provide a proper platform when
installed at a site. 6.2.5 Check the bull’s eye level to ensure that it has not frozen and cracked the site glass.
Replace if necessary.

SITE INSTRUMENTATION - TIPPING BUCKET RAIN GAUGE Revision No. 8 October 2019 Page 9 of 14
SITE INSTRUMENTATION - TIPPING BUCKET RAIN GAUGE Wood Environment & Infrastructure Solutions, Inc.
6.2.6 Check the proximity switch for +5 VDC by connecting the signal wires from the datalogger to the terminal strip located on top of the tipping mechanism. With a multimeter, test that +5 VDC is being sent through the switch.
6.2.7 Inspect the power cord for any frays, cuts or other abrasions that could potentially be a hazard. If any such defect exists, replace the cord.
6.2.8 Check the 120-volt (V) thermostat with freeze spray to activate the heat wrap.
6.3 Repair 6.3.1 If 5 volts direct current (VDC) is not registered at the reed switch, the CR3000 status
terminals P2 and Ground should be checked to verify if 5 VDC is being sent. If the 5 VDC is present at the CR3000, a voltage break has occurred and should be traced line by line to the destination until the break or bad spot is found.
6.3.2 To replace the tipping mechanism, remove the screws on the bottom of the bucket that secure the old mechanism and replace with a new one (tipping mechanisms come preassembled).
6.3.3 To replace the proximity switch see the manufacturer’s manual (included with every installation kit, Attachments A and B).
6.3.4 Replace the power cord with a new one without any splices. Strip the jacket of the power cord back approximately 3 inches. Strip a quarter inch off each of the three inner wires. Crimp a spade connector onto the ground wire, green and yellow. Crimp a blue (16-14 gauge) male bullet connector onto the brown power wire and crimp a female blue bullet connector onto the blue power wire. Refer to attachment C for proper electrical connections.
6.3.5 Remove old thermostat from side of bucket wall. Strip the ends of the new thermostat back a quarter inch. Crimp a blue female bullet connector to one of the thermostat wires and crimp a blue male bullet connector to the other. Refer to attachment C for proper electrical connections.
6.3.6 Remove old heater jacket from funnel. Using a sharp knife or other tool, remove as much of the heat resistant sealant as possible from the funnel surface. Strip a quarter inch of the ends of the wires from the new heater jacket. Place a red (22-18 gauge) female bullet connector on one of the wires and place a red male bullet connector on the other wire. Using heat resistant silicon sealant, coat the back of the heater jacket in a zigzag pattern to ensure even coverage. Wrap heater jacket around funnel and hold in place until sealant begins to dry and jacket starts to adhere to funnel surface. Refer to attachment C for proper electrical connections.
6.3.7 Replace the feet when they become too loose to act as a steady base. If feet are riveted into the bucket, use a drill to punch out the rivets. Replace feet with a #6 nut and screw to attach feet back to bucket.

SITE INSTRUMENTATION - TIPPING BUCKET RAIN GAUGE Revision No. 8 October 2019 Page 10 of 14
SITE INSTRUMENTATION - TIPPING BUCKET RAIN GAUGE Wood Environment & Infrastructure Solutions, Inc.
7.0 REFERENCES U.S. Environmental Protection Agency (EPA). 1994. Quality Assurance Handbook for Air Pollution
Measurement Systems, Vol. I. A Field Guide to Environmental Quality Assurance. EPA/600/R-94/038a.
U.S. Environmental Protection Agency (EPA). 2008. Quality Assurance Handbook for Air Pollution
Measurement Systems, Vol. IV, Meteorological Measurements Version 2.0 (Final). EPA-454/B-08-002.
U.S. Environmental Protection Agency (EPA). 2013. Quality Assurance Handbook for Air Pollution
Measurement Systems, Vol. II, Ambient Air Quality Monitoring Program. EPA-454/B-13-003. U.S. Environmental Protection Agency (EPA). 2000. Meteorological Monitoring Guidance for
Regulatory Modeling Applications. EPA-454/R-99-005.

SITE INSTRUMENTATION - TIPPING BUCKET RAIN GAUGE Revision No. 8 October 2019 Page 11 of 14
SITE INSTRUMENTATION - TIPPING BUCKET RAIN GAUGE Wood Environment & Infrastructure Solutions, Inc.
8.0 ATTACHMENTS Attachment A – Model 525 Switch Conversion
Attachment B – Model 525 Switch Conversion Diagram
Attachment C – Electrical connections for tipping bucket

SITE INSTRUMENTATION - TIPPING BUCKET RAIN GAUGE Revision No. 8 October 2019 Page 12 of 14
SITE INSTRUMENTATION - TIPPING BUCKET RAIN GAUGE Wood Environment & Infrastructure Solutions, Inc.
ATTACHMENT A Model 525 Switch Conversion

SITE INSTRUMENTATION - TIPPING BUCKET RAIN GAUGE Revision No. 8 October 2019 Page 13 of 14
SITE INSTRUMENTATION - TIPPING BUCKET RAIN GAUGE Wood Environment & Infrastructure Solutions, Inc.
ATTACHMENT B Model 525 Switch Conversion Diagram
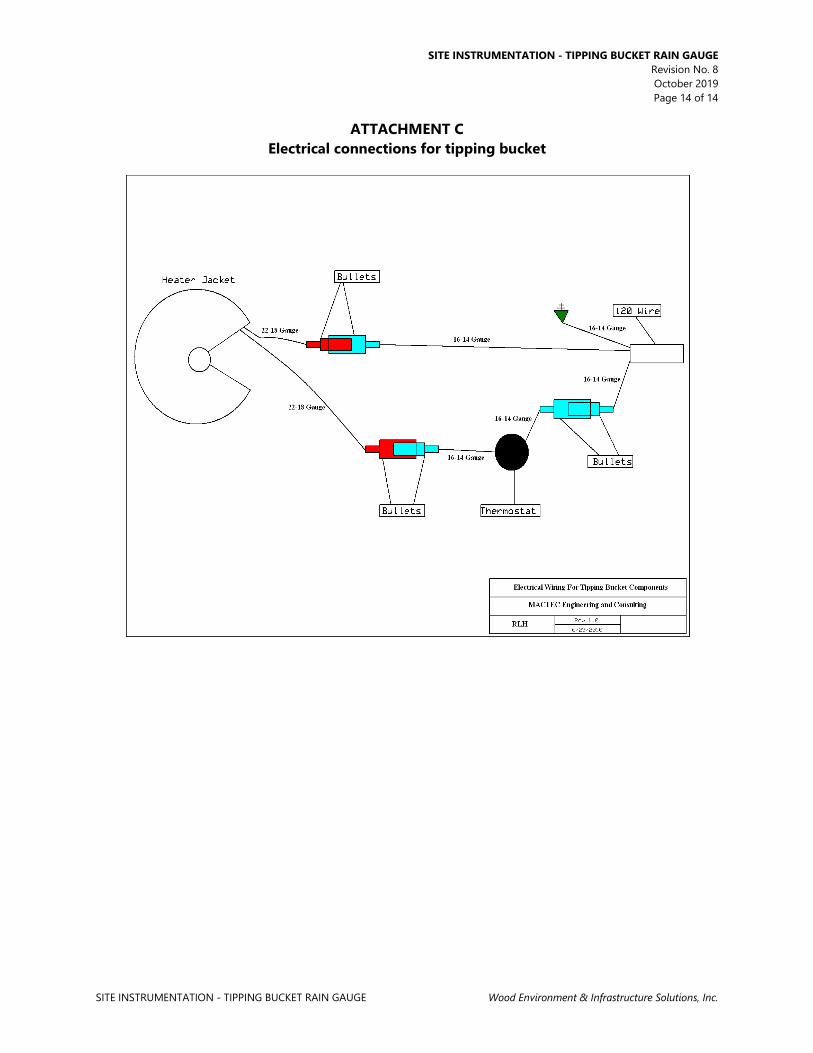
SITE INSTRUMENTATION - TIPPING BUCKET RAIN GAUGE Revision No. 8 October 2019 Page 14 of 14
SITE INSTRUMENTATION - TIPPING BUCKET RAIN GAUGE Wood Environment & Infrastructure Solutions, Inc.
ATTACHMENT C Electrical connections for tipping bucket


R.M. YOUNG WIND DIRECTION Revision No. 8 October 2019
Page 2 of 6
R.M. YOUNG WIND DIRECTION Wood Environment & Infrastructure Solutions, Inc.
IV. C. 6. a. R.M. YOUNG – WIND DIRECTION
1.0 PURPOSE
The purpose of this Standard Operating Procedure (SOP) is to provide consistent guidance for maintenance, handling, and calibration of the R.M. Young Wind Monitor Model AQ wind direction sensor (AQ) to Clean Air Status and Trends Network (CASTNET) Field Equipment Calibration Laboratory personnel.
2.0 SCOPE
This SOP applies to the maintenance, handling, and calibration of AQ wind direction sensor units administered by the CASTNET Field Equipment Calibration Laboratory.
3.0 SUMMARY
Wind direction sensors are calibrated upon receipt from the manufacturer and at the request of field technicians. Repairs and maintenance are performed as necessary.
4.0 MATERIALS AND SUPPLIES
Wind direction sensor Wind direction calibration form Multimeter Data logger Soldering tool Solder/flux Insulated screwdriver Allen wrench set Vacuum grease Wire cutters 24 and 22 gauge wire
5.0 REPAIR AND MAINTENANCE
5.1 Remove potentiometer coupling on top of the AQ. Remove the thumbwheel.
5.2 Take the cover off the terminal housing. Unscrew the terminal bracket. For the new model, just remove the wires from the terminal.
5.3 Cut the wires close to the terminal, and then de-solder the wires from the terminal.
5.4 Remove the transducer from the shaft.
5.5 Remove the old bearings (two) and replace with new ones.
5.6 Unscrew the top of the transducer and push out the old potentiometer. Remove the shaft extender and discard the old potentiometer.

R.M. YOUNG WIND DIRECTION Revision No. 8 October 2019
Page 3 of 6
R.M. YOUNG WIND DIRECTION Wood Environment & Infrastructure Solutions, Inc.
5.7 Put the shaft extender on the new potentiometer.
5.8 Using the modified ty-wrap (with the hole on the end) as a tool, pull the potentiometer wires through the bottom of the transducer housing. Screw the transducer and housing back together, coating the threads and bottom with silicon sealant where the wires come through the housing.
5.9 Insert the ty-wrap through the hole at the top of the terminal housing and pull the wires through, placing the transducer back on the top of the unit. Using the R.M. Young gauge, set the distance between the transducer and the housing to 0.5 mm. Tighten the set screws.
5.10 Set the distance between the thumbscrew and the transducer to 0.030 inch using a feeler gauge. Tighten the set screws.
5.11 Place the potentiometer coupling on top of the thumbscrew, but do not tighten (this will be done during calibration).
5.12 Solder the wires to the circuit card as shown on Figure 1.
5.13 Screw the circuit card back onto the terminal housing.
5.14 Replace the housing cover. The unit is now ready for calibration.
6.0 PROCEDURES
6.1 Installation/Setup 6.1.1 Loosen the potentiometer coupling on top of the wind unit. 6.1.2 Mount on the vane angle bench stand. 6.1.3 Set the vane, aligning the potentiometer coupling to the back. (Note: It will click when
properly in place.) 6.1.4 Loosen the V-support and drop it down so it does not hamper the movement of the
vane. 6.1.5 Torque test the AQ by setting the torque gauge on the top with the pivot point of the
sensor and gauge aligned, and gently pull the string to one side and then to the other side. Apply enough force to move the vane. The gauge should not exceed 10 grams per centimeter (g/cm). Be sure that air currents in the room do not influence this procedure.
6.1.6 Raise the V-support to firmly hold the vane and tighten the thumbscrew.
6.2 Calibration 6.2.1 Use test data logger to view values. 6.2.2 Attach the RMY wind wires from test data logger to Wind AQ, as shown in Figure 1.

R.M. YOUNG WIND DIRECTION Revision No. 8 October 2019
Page 4 of 6
R.M. YOUNG WIND DIRECTION Wood Environment & Infrastructure Solutions, Inc.
6.2.3 Turn the vane to 180° as indicated by the calibration disk. Reach inside the vane (where the nose cone would attach to the vane) and turn the potentiometer coupling thumbwheel until the degrees reads 180 on the data logger. Tighten the set screw on the potentiometer coupling. If the degree reading changes while doing this, remove the vane from the wind AQ; remove the potentiometer coupling; remove the thumbwheel; and revolve it slightly. Reset the thumbwheel with a 0.030-inch feeler gauge. Reset the potentiometer coupling (without tightening). Replace the vane and repeat the procedure to set the thumbwheel to 180 degrees on data logger at 180º.
6.2.4 Revolve the vane to 90º. Record the value from the data logger on the data form. 6.2.5 Swing the vane to 180º (south). Record the degrees as above. 6.2.6 Turn the vane to 270º (west). Record the degrees as above. 6.2.7 Turn the vane to 355º. Record the degrees as above. 6.2.8 Slowly revolve the vane toward 360° (north). When readings drop to near zero, this is the
crossover point. Record the degrees. 6.2.9 The recorded output should not exceed ±2° of the desired values. 6.2.10 After completing the calibration, tag and place the sensor and translator card into a
plastic bag and place the bag on the “Ready to Ship” shelf.

R.M. YOUNG WIND DIRECTION Revision No. 8 October 2019
Page 5 of 6
R.M. YOUNG WIND DIRECTION Wood Environment & Infrastructure Solutions, Inc.
7.0 REFERENCES
Climatronics Corporation. Climatronics F460 Ten Meter Meteorological Monitoring System Manual
U.S. Environmental Protection Agency (EPA). 1994. Quality Assurance Handbook for Air Pollution
Measurement Systems, Vol. I. A Field Guide to Environmental Quality Assurance. EPA/600/R-94/038a.
U.S. Environmental Protection Agency (EPA). 2008. Quality Assurance Handbook for Air Pollution
Measurement Systems, Vol. IV, Meteorological Measurements Version 2.0 (Final). EPA-454/B-08-002.
U.S. Environmental Protection Agency (EPA). 2013. Quality Assurance Handbook for Air Pollution
Measurement Systems, Vol. II, Ambient Air Quality Monitoring Program. EPA-454/B-13-003.
U.S. Environmental Protection Agency (EPA). 2000. Meteorological Monitoring Guidance for
Regulatory Modeling Applications. EPA-454/R-99-005.

R.M. YOUNG WIND DIRECTION Revision No. 8 October 2019
Page 6 of 6
R.M. YOUNG WIND DIRECTION Wood Environment & Infrastructure Solutions, Inc.
8.0 FIGURES
Figure 1. R.M. Young Wind Monitor Cable and Wiring Diagram Model 05103V/05305V/05701V


R.M. Young Wind Speed Revision No. 7 October 2018
Page 2 of 7
R.M. YOUNG WIND SPEED Wood Environment & Infrastructure Solutions, Inc.
IV. C. 6. b. R.M. YOUNG WIND SPEED
1.0 PURPOSE
The purpose of this Standard Operating Procedure (SOP) is to provide consistent guidance for maintenance, handling, and calibration of the R.M. Young wind speed sensor to Clean Air Status and Trends Network (CASTNET) Field Equipment Calibration Laboratory personnel.
2.0 SCOPE
This SOP applies to the calibration, maintenance, and handling and calibration of R.M. Young wind speed sensor units administered by the CASTNET Field Equipment Calibration Laboratory.
3.0 SUMMARY
R.M. Young Wind Speed Sensors are calibrated upon receipt from the manufacturer and at the request of field technicians. Repairs and maintenance are performed as necessary.
4.0 MATERIALS AND SUPPLIES
R.M. Young wind speed sensor Wind direction calibration form Factory certified synchronous motor Data logger Screwdriver Vacuum grease Thread-locking compound Soldering tool Solder/flux Wire cutters 24 and 22 gauge wire Spare screws and o-rings
5.0 REPAIR AND MAINTENANCE
5.1 Coil 5.1.1 Remove junction box cover to expose terminal block, unscrew terminal block from
housing and cut the two larger wires (black and red). 5.1.2 Unscrew the two set screws at the base of the coil which hold it to the transducer
assembly and remove. 5.1.3 Unscrew the wind direction potentiometer from the top of the coil (these two pieces are
sealed with silicon sealant, so it may be slightly difficult to unscrew). 5.1.4 Slide a modified ty-wrap with a hole in the end up through the new coil, and pull the
potentiometer wires back through the coil. Then screw the potentiometer back onto the coil housing, applying some silicon sealant to the threads.

R.M. Young Wind Speed Revision No. 7 October 2018
Page 3 of 7
R.M. YOUNG WIND SPEED Wood Environment & Infrastructure Solutions, Inc.
5.1.5 Slide the modified ty-wrap up through the back of the terminal block housing and pull all the wires into the terminal block housing. Apply some silicon sealant to the base of the coil, set it onto the base of the transducer assembly, spacing it with the large round end of the R.M. Young spacing tool (0.5mm) and reset the two set screws.
5.1.6 Re-solder the two wires back onto the circuit card. 5.1.7 Screw the terminal block back into the housing and replace the cover.
5.2 Nose Cone 5.2.1 Remove prop nut (if present). 5.2.2 Remove magnet on top of nose cone with 1/16 inch allen wrench and cap front bearing
(plastic ring). Pull shaft out and remove bearings on either side of nose cone housing. 5.2.3 Install new bearings (they will only fit in one way). 5.2.4 Replace cap front bearing (it will only fit in one way) on top of nose cone housing. 5.2.5 Replace shaft and prop nut. 5.2.6 Replace magnet on other side of housing. Set gap with small end (0.5 mm) of R.M.
Young gap tool. 5.2.7 Be sure the O-ring is in place (up inside the housing behind the magnet).
6.0 PROCEDURES
6.1 Attach nose/cone assembly to vane. Be careful not to cross-thread.
6.2 Attach synchronous motor drive unit to vane.
6.3 Record the zero reading on the calibration form with the synchronous motor turned to OFF.
6.4 Turn the motor speed to 200 rpm. Record wind speed in m/s on the calibration form. Perform this step for each of the following speeds: 400, 800, 1600, 3600, and 8600 rpm.
6.5 Remove the synchronous motor drive unit and attach the slow speed synchronous motor drive unit.
6.6 Set synchronous motor for 100 rpm and record the response as above.
6.7 The equivalent wind speed multiplier is determined by the serial number of the propeller being used in the field. If the serial number is 53404 or greater, multiply the rpm by 0.00512. If the serial number is less than 53404, multiply the rpm by 0.0049.
6.8 Nose Cone Torque Test See R.M. Young Manual (Figures 1-3).
Note: Output measurement cannot be off by more than 0.2 m/s at speeds < 5.0 m/s.

R.M. Young Wind Speed Revision No. 7 October 2018
Page 4 of 7
R.M. YOUNG WIND SPEED Wood Environment & Infrastructure Solutions, Inc.
7.0 REFERENCES
R.M. Young Company. Model 05305 Wind Monitor AQ Manual U.S. Environmental Protection Agency (EPA). 1994. Quality Assurance Handbook for Air Pollution
Measurement Systems, Vol. I. A Field Guide to Environmental Quality Assurance. EPA/600/R-94/038a.
U.S. Environmental Protection Agency (EPA). 2008. Quality Assurance Handbook for Air Pollution
Measurement Systems, Vol. IV, Meteorological Measurements Version 2.0 (Final). EPA-454/B-08-002.
U.S. Environmental Protection Agency (EPA). 2013. Quality Assurance Handbook for Air Pollution
Measurement Systems, Vol. II, Ambient Air Quality Monitoring Program. EPA-454/B-13-003.
U.S. Environmental Protection Agency (EPA). 2000. Meteorological Monitoring Guidance for
Regulatory Modeling Applications. EPA-454/R-99-005.

R.M. Young Wind Speed Revision No. 7 October 2018
Page 5 of 7
R.M. YOUNG WIND SPEED Wood Environment & Infrastructure Solutions, Inc.
8.0 FIGURES
Figure 1. Approximate Propeller/Cup Wheel Torque versus Wind Speed

R.M. Young Wind Speed Revision No. 7 October 2018
Page 6 of 7
R.M. YOUNG WIND SPEED Wood Environment & Infrastructure Solutions, Inc.
Figure 2. Typical Torque Values

R.M. Young Wind Speed Revision No. 7 October 2018
Page 7 of 7
R.M. YOUNG WIND SPEED Wood Environment & Infrastructure Solutions, Inc.
Figure 3. Anemometer Torque Disc

R.M. YOUNG TEMPERATURE/TEMPERATURE 2 Revision No. 8 October 2019 Page 2 of 11
R.M. YOUNG TEMPERATURE/TEMPERATURE 2 Wood Environment & Infrastructure Solutions, Inc.
IV.C.6.c. TEMPERATURE
1.0 PURPOSE The purpose of this standard operating procedure (SOP) is to provide consistent guidance to Clean Air Status and Trends Network (CASTNET) Field Instrumentation Laboratory personnel for the calibration, maintenance, and handling of the R.M. Young temperature sensors.
2.0 SCOPE This SOP applies to the calibration, maintenance, and handling of R.M. Young resistance temperature device (RTD) sensors by CASTNET Field Instrumentation Laboratory personnel.
3.0 SUMMARY R.M. Young RTD sensors are calibrated upon receipt and at the request of field technicians. Figure 1 illustrates the calibration process. Maintenance is performed as necessary.
Figure 1. Temperature Sensor Calibration
Note: Criterion = 0.25°C; PDT = precision digital thermometer; RTD = resistance temperature device.
Y
Resistance between 998 5 and 1001 5
Return to manufacturer
Connect RTD to CR3000
Prepare ice water bath
Calibrate PDT and RTD at 0°C
Record data on Temperature iForm
Probe meets specifications
Replace probe
Complete paperwork
N
N
Repeat calibration at 10, 20, 30, 40, and
Y
Probe available for use
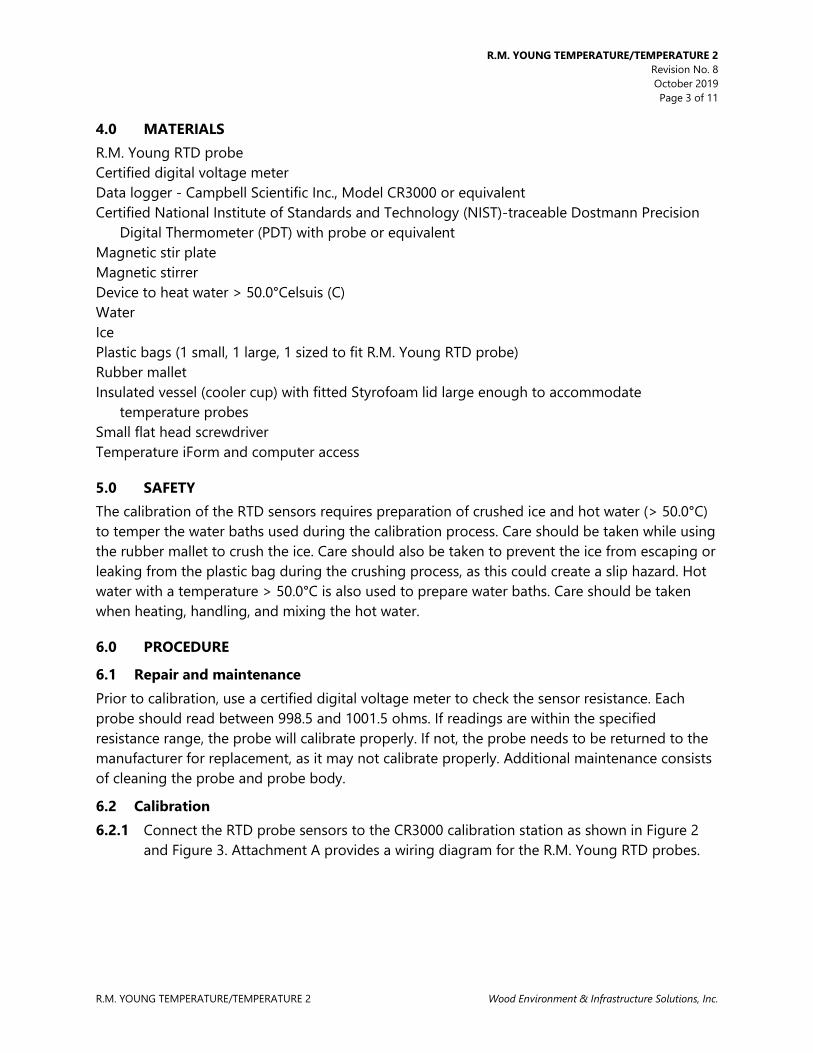
R.M. YOUNG TEMPERATURE/TEMPERATURE 2 Revision No. 8 October 2019 Page 3 of 11
R.M. YOUNG TEMPERATURE/TEMPERATURE 2 Wood Environment & Infrastructure Solutions, Inc.
4.0 MATERIALS R.M. Young RTD probe Certified digital voltage meter Data logger - Campbell Scientific Inc., Model CR3000 or equivalent Certified National Institute of Standards and Technology (NIST)-traceable Dostmann Precision
Digital Thermometer (PDT) with probe or equivalent Magnetic stir plate Magnetic stirrer Device to heat water > 50.0°Celsuis (C) Water Ice Plastic bags (1 small, 1 large, 1 sized to fit R.M. Young RTD probe) Rubber mallet Insulated vessel (cooler cup) with fitted Styrofoam lid large enough to accommodate
temperature probes Small flat head screwdriver Temperature iForm and computer access
5.0 SAFETY The calibration of the RTD sensors requires preparation of crushed ice and hot water (> 50.0°C) to temper the water baths used during the calibration process. Care should be taken while using the rubber mallet to crush the ice. Care should also be taken to prevent the ice from escaping or leaking from the plastic bag during the crushing process, as this could create a slip hazard. Hot water with a temperature > 50.0°C is also used to prepare water baths. Care should be taken when heating, handling, and mixing the hot water.
6.0 PROCEDURE
6.1 Repair and maintenance Prior to calibration, use a certified digital voltage meter to check the sensor resistance. Each probe should read between 998.5 and 1001.5 ohms. If readings are within the specified resistance range, the probe will calibrate properly. If not, the probe needs to be returned to the manufacturer for replacement, as it may not calibrate properly. Additional maintenance consists of cleaning the probe and probe body.
6.2 Calibration 6.2.1 Connect the RTD probe sensors to the CR3000 calibration station as shown in Figure 2
and Figure 3. Attachment A provides a wiring diagram for the R.M. Young RTD probes.

R.M. YOUNG TEMPERATURE/TEMPERATURE 2 Revision No. 8 October 2019 Page 4 of 11
R.M. YOUNG TEMPERATURE/TEMPERATURE 2 Wood Environment & Infrastructure Solutions, Inc.
Figure 2. Sensor connections at sensor Figure 3. Wall station connecting sensor to data logger
Make an ice water bath in large cooler cup. To prepare the ice bath, crush ice cubes using a rubber mallet (Figure 4). The ice should be crushed into very small pieces. The larger bag will contain any ice that might escape when the seams of the inner bag break. Place the cubes in the smaller of the two plastic bags. Place that bag into the larger plastic bag and verify that all excess air has been removed from the large bag, and the bag is sealed.
Figure 4. Crush ice
Insert the magnetic stirrer (Figure 5) before adding ice so it sinks to the bottom. Fill the cup to within 1 inch of the top with the crushed ice. Add only enough cold water to create a slurry.

R.M. YOUNG TEMPERATURE/TEMPERATURE 2 Revision No. 8 October 2019 Page 5 of 11
R.M. YOUNG TEMPERATURE/TEMPERATURE 2 Wood Environment & Infrastructure Solutions, Inc.
Place the cup on the stirring device and turn the stirring device to setting 3 or 4 making sure the magnetic stirrer is in the center of the cup. Place the Styrofoam lid on the cup. The lid has holes for the PDT and RTD probes. Insert the Dostmann PDT into any hole in the lid and keep the black ring at water level. Insert the RTD probes to the same depth as the PDT (Figure 6). The two probes should not touch each other. The black ring should be moved to be the same level as the RTD. Figure 5. Insert magnetic stirrer Figure 6. Insert probes in bath
6.2.2 Allow the temperature of the water bath to stabilize to a temperature of 0.0°C ± 0.1°C. 6.2.3 Activate the iForm by entering site, calibrator, and data logger information under the
“SITE” and “DAS” tabs. Additionally, the corrections for the six PDT values need to be entered on the iForm in the “Transfer Standard” – “Correction Factors” section in the upper right hand corner of the form. The PDT correction factor is provided on its most recent certification form as the “UUT ERROR” associated with the 0.0 °C “SET VALUE” on the form (Attachment B). This correction should be entered in all six ranges.
6.2.4 Record the temperature from the PDT and RTD (Figure 7) in actual degrees C in the columns of the “As Left” – “Temperature Data Logger Output” section of the Temperature iForm (Figure 8):
• Record the PDT output in the RTD “Uncorrected Temp” column of the “As Left” section of the iForm.
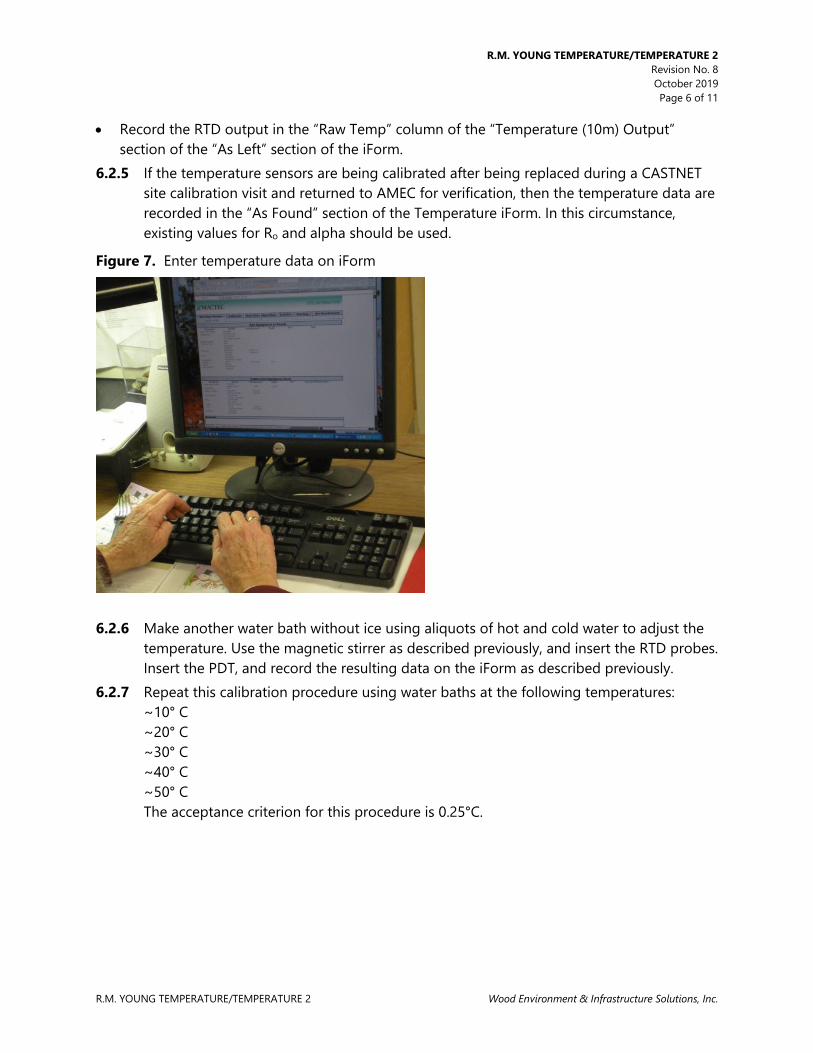
R.M. YOUNG TEMPERATURE/TEMPERATURE 2 Revision No. 8 October 2019 Page 6 of 11
R.M. YOUNG TEMPERATURE/TEMPERATURE 2 Wood Environment & Infrastructure Solutions, Inc.
• Record the RTD output in the “Raw Temp” column of the “Temperature (10m) Output” section of the “As Left” section of the iForm.
6.2.5 If the temperature sensors are being calibrated after being replaced during a CASTNET site calibration visit and returned to AMEC for verification, then the temperature data are recorded in the “As Found” section of the Temperature iForm. In this circumstance, existing values for Ro and alpha should be used.
Figure 7. Enter temperature data on iForm
6.2.6 Make another water bath without ice using aliquots of hot and cold water to adjust the
temperature. Use the magnetic stirrer as described previously, and insert the RTD probes. Insert the PDT, and record the resulting data on the iForm as described previously.
6.2.7 Repeat this calibration procedure using water baths at the following temperatures: ~10° C ~20° C ~30° C ~40° C ~50° C The acceptance criterion for this procedure is 0.25°C.

R.M. YOUNG TEMPERATURE/TEMPERATURE 2 Revision No. 8 October 2019 Page 7 of 11
R.M. YOUNG TEMPERATURE/TEMPERATURE 2 Wood Environment & Infrastructure Solutions, Inc.
6.2.8 Inspect the iForm for computed Ro and alpha values for the probe(s). The Temperature iForm will flag these values if not within specification. If the probes meet specification, continue to the next step.
6.2.9 Print the Temperature iForm for each probe. Tag the probe, place it in a plastic bag and place the bag on the “ready–to–ship” shelf.
6.2.10 File the iForm by property identification number in the instrument file. Figure 8. Temperature iForm for Instrumentation Laboratory

R.M. YOUNG TEMPERATURE/TEMPERATURE 2 Revision No. 8 October 2019 Page 8 of 11
R.M. YOUNG TEMPERATURE/TEMPERATURE 2 Wood Environment & Infrastructure Solutions, Inc.
7.0 REFERENCES R.M. Young Company. 1996. Model 41342 Temperature Probe Instruction Sheet. U.S. Environmental Protection Agency (EPA). 1994. Quality Assurance Handbook for Air Pollution
Measurement Systems, Vol. I. A Field Guide to Environmental Quality Assurance. EPA/600/R-94/038a.
U.S. Environmental Protection Agency (EPA). 2008. Quality Assurance Handbook for Air Pollution
Measurement Systems, Vol. IV, Meteorological Measurements Version 2.0 (Final). EPA-454/B-08-002.
U.S. Environmental Protection Agency (EPA). 2013. Quality Assurance Handbook for Air Pollution
Measurement Systems, Vol. II, Ambient Air Quality Monitoring Program. EPA-454/B-13-003.
U.S. Environmental Protection Agency (EPA). 2000. Meteorological Monitoring Guidance for
Regulatory Modeling Applications. EPA-454/R-99-005.

R.M. YOUNG TEMPERATURE/TEMPERATURE 2 Revision No. 8 October 2019 Page 9 of 11
R.M. YOUNG TEMPERATURE/TEMPERATURE 2 Wood Environment & Infrastructure Solutions, Inc.
8.0 ATTACHMENTS Attachment A − Wiring Diagram − Calibration Wiring, R.M. Young Temperature Probes
Attachment B − PDT Certification

R.M. YOUNG TEMPERATURE/TEMPERATURE 2 Revision No. 8 October 2019 Page 10 of 11
R.M. YOUNG TEMPERATURE/TEMPERATURE 2 Wood Environment & Infrastructure Solutions, Inc.
ATTACHMENT A Wiring Diagram − Calibration Wiring, R.M. Young Temperature Probes

R.M. YOUNG TEMPERATURE/TEMPERATURE 2 Revision No. 8 October 2019 Page 11 of 11
R.M. YOUNG TEMPERATURE/TEMPERATURE 2 Wood Environment & Infrastructure Solutions, Inc.
ATTACHMENT B PDT Certification


RELATIVE HUMIDITY Revision No. 8 October 2019
Page 2 of 8
RELATIVE HUMIDITY Wood Environment & Infrastructure Solutions, Inc.
IV. C. 6. d. RELATIVE HUMIDITY
1.0 PURPOSE The purpose of this Standard Operating procedure (SOP) is to provide consistent guidance maintenance and handling of the Vaportron H-100L Precision Relative Humidity Lab to Clean Air Status and Trends Network (CASTNET) Field Calibration Laboratory personnel.
2.0 SCOPE This SOP applies to the maintenance and handling of Vaportron H-100L Precision Relative Humidity Lab units administered by the CASTNET Field Calibration laboratory.
3.0 SUMMARY The Vaportron’s internal water reservoir is capped and refilled routinely every 1 to 6 weeks and is returned to the manufacture annually for routine maintenance and certification.
4.0 MATERIALS AND SUPPLIES Rotronic RH sensor or Vaisala RH sensor Campbell CR3000 Data logger Vaportron H100CL Precision Humidity Laboratory or Aqueous saturated salts (Note: Use salts only as a last resort) Insulated screwdriver Soldering tool Solder/flux Small flashlight Plastic storage bag DRIERITE desiccant Kimwipes Wire cutters Sonic cleaner Deionized (DI) water Alcohol RH iForm or RH/Temperature Paper Form
5.0 REPAIR AND MAINTENANCE
5.1 Repair Return inoperable sensors to the manufacturer for repair.
5.2 Maintenance 5.2.1 Rotronic Replace filter tip and O-ring, as necessary. Otherwise clean Rotronic filter caps in ultrasonic cleaner.
RELATIVE HUMIDITY Revision No. 8 October 2019
Page 3 of 8
RELATIVE HUMIDITY Wood Environment & Infrastructure Solutions, Inc.
Check and re-solder both ends of signal wire as necessary. 5.2.2 Vaisala Replace filter tip as necessary.
6.0 CALIBRATION PROCEDURE
6.1 Using the Vaportron H100CL Series Precision Humidity Laboratory 6.1.1 Use either iForms or Paper forms for this calibration. If using iForms populate the “Site”
and “Data-Logger” pages to reflect the type of equipment used. Also indicate on the RH iForm what type of sensor is being calibrated and its I.D. If iForm is used record the VAPORTRON I.D. in the “Transfer Standard” column and enter 0 for each correction factor.
6.1.2 Check the desiccant cartridge located on the back of the unit; the DRIERITE must be a blue color above the red line on the cartridge. If the indicating DRIERITE is pink at or below the red line on the cartridge, refer to the maintenance SOP (IV.A.5.1) for instructions on changing DRIERITE. Check the water level by lifting up on cap end of cartridge and looking into the large window near the left desiccant hanger hook. Use a small flashlight to locate the water level. The water level must be between the lower and upper red lines on the fill level decal. If the water level is not between the lines, refer to the maintenance SOP (IV.A.5.1) for instructions on the water level service procedure (see the Figure IV.A.5.1 for help).
6.1.3 Switch the power to ON (lower left). The RH LCD (center top) and TEMPERATURE displays should come on and read the approximate room conditions.
6.1.4 Set the TEMPERATURE display, using the up or down arrows, to 25.0°C (Rotronic) 22.5°C (Vaisala).
6.1.5 Remove the plug from the white chamber access door (right side) and insert the Rotronic RH probe so approximately 1.5 inch of the probe is left outside the aluminum port fitting on the door. Lightly tighten the port fitting to hold the probe securely in the chamber.
Vaisala goes into smaller port on access door – wrap Parafilm around port and sensor to seal.
6.1.6 Set the RH LCD display, using the up or down arrows, to the first point of 10.0 % RH. 6.1.7 Plug the RH sensor into the proper test cable and check the data logger for an output
from the sensor. Obtain a Temperature/ RH Data form or RH iForm and record the serial number of the sensor and all relevant data.
6.1.8 Switch CONTROL to ON. A faint, high-pitched sound should indicate proper operation of the air circulator fan inside the chamber. The Vaportron displays should begin to ramp toward the values that were set. Normally, the RH and Temperature readings will stabilize within 2 to 5 minutes.

RELATIVE HUMIDITY Revision No. 8 October 2019
Page 4 of 8
RELATIVE HUMIDITY Wood Environment & Infrastructure Solutions, Inc.
6.1.9 Let the Rotronic RH sensor equilibrate for 1hour or until stable at the set point, then record the output from the Vaportron RH controller and the data logger on the proper calibration form or iForm. If iForm is used record Vaportron Data in the “Portable Hygrometer” column of the “As Left” block. The iForm will automatically populate the corrections factors with zeros. Record the sensor output as read from the CR3000 in the “% Relative Humidity” column of the “Data-Logger Output” block of the iForm.
6.1.10 Set the RH LCD display, using the up arrow, to the next point of 30 % RH and repeat step 6.1.8.
6.1.11 Repeat step 9 for set points of: 50%, 70%, 85%, and 95.0%. 6.1.12 The sensor output must be within 10% RH. . If these criteria are not met, return the
sensor to the manufacturer for repair along with a copy of the calibration form. 6.1.13 After completion of the final point, loosen the aluminum port fitting on the door and
remove the sensor from the chamber. Install the port plug. Set the RH LCD display, using the down arrow, to 50.0 % RH. Let the unit run for 5 minutes at this setting.
6.1.14 Switch the CONTROL to OFF. Switch the power to OFF (lower left). 6.1.15 Check that the calibration form is completed (see Figure 1) and see Calibration Lab
Manager for review and sign off of the calibration form. After review, tag the sensor, place in a plastic bag, and put it in the appropriate box on the “ready to ship” shelf. Be sure to file the calibration form in the sensor calibration file.
6.2 Using Aqueous Saturated Salts [NOTE: Discontinued practice ] 6.2.1 Plug Rotronic relative humidity (RH) sensor into the proper test cable and check data
logger system for an output from sensor. Obtain a Temperature/RH Data form and record the serial number of the sensor
6.2.2 Carefully remove filter cap from the sensor and, starting with Silica Gel, (0.0%) gently screw sensor into opening of bottle (use great caution not to hit or contaminate strain gauge or RTD when inserting in bottle. Place bottle/sensor in the blue bottle caddy.).
6.2.3 Let the Rotronic RH sensor equilibrate for 1 hour at the set point and then record the output from the data logger on the proper calibration form.
6.2.4 Repeat steps 2 and 3 for the solutions of deionized (DI) water and salt: MgCl2 (32.8%), Mg(NO3)2 (52.9%), NaCl (75.3%), and KNO3 (93.6%). Lightly swirl the solution of DI water and salt, being careful not to get salt solution into the bottleneck. If salt solution gets in bottleneck, clean with a Kimwipe before inserting the probe.
6.2.5 The sensor output must be within 10% at points less than 85% RH and within 3% at points above 85%. If these criteria are not met, return the sensor to the manufacturer for repair.
RELATIVE HUMIDITY Revision No. 8 October 2019
Page 5 of 8
RELATIVE HUMIDITY Wood Environment & Infrastructure Solutions, Inc.
6.2.6 After the completion of the final point, remove RH sensor from bottle and wipe sensor housing and O-ring with a clean Kimwipe and install a clean filter.
6.2.7 Check to see that the calibration form is completed (See Figure 2) and see the Calibration Lab Manager for review and sign off of calibration form. After review, tag the sensor, place it in a plastic bag and put it in the appropriate box on the “ready to ship” shelf.
7.0 REFERENCES R.M. Young Company. Model 41372 Relative Humidity Probe Manual U.S. Environmental Protection Agency (EPA). 1994. Quality Assurance Handbook for Air Pollution
Measurement Systems, Vol. I. A Field Guide to Environmental Quality Assurance. EPA/600/R-94/038a.
U.S. Environmental Protection Agency (EPA). 2008. Quality Assurance Handbook for Air Pollution
Measurement Systems, Vol. IV, Meteorological Measurements Version 2.0 (Final). EPA-454/B-08-002.
U.S. Environmental Protection Agency (EPA). 2013. Quality Assurance Handbook for Air Pollution
Measurement Systems, Vol. II, Ambient Air Quality Monitoring Program. EPA-454/B-13-003.
U.S. Environmental Protection Agency (EPA). 2000. Meteorological Monitoring Guidance for
Regulatory Modeling Applications. EPA-454/R-99-005.

RELATIVE HUMIDITY Revision No. 8 October 2019
Page 6 of 8
RELATIVE HUMIDITY Wood Environment & Infrastructure Solutions, Inc.
8.0 FIGURES Figure 1. Temperature/Relative Humidity Paper Calibration Form Using Vaportron
Example

RELATIVE HUMIDITY Revision No. 8 October 2019
Page 7 of 8
RELATIVE HUMIDITY Wood Environment & Infrastructure Solutions, Inc.
Figure 2. Temperature/Relative Humidity Paper Data Form Using Salts
Example
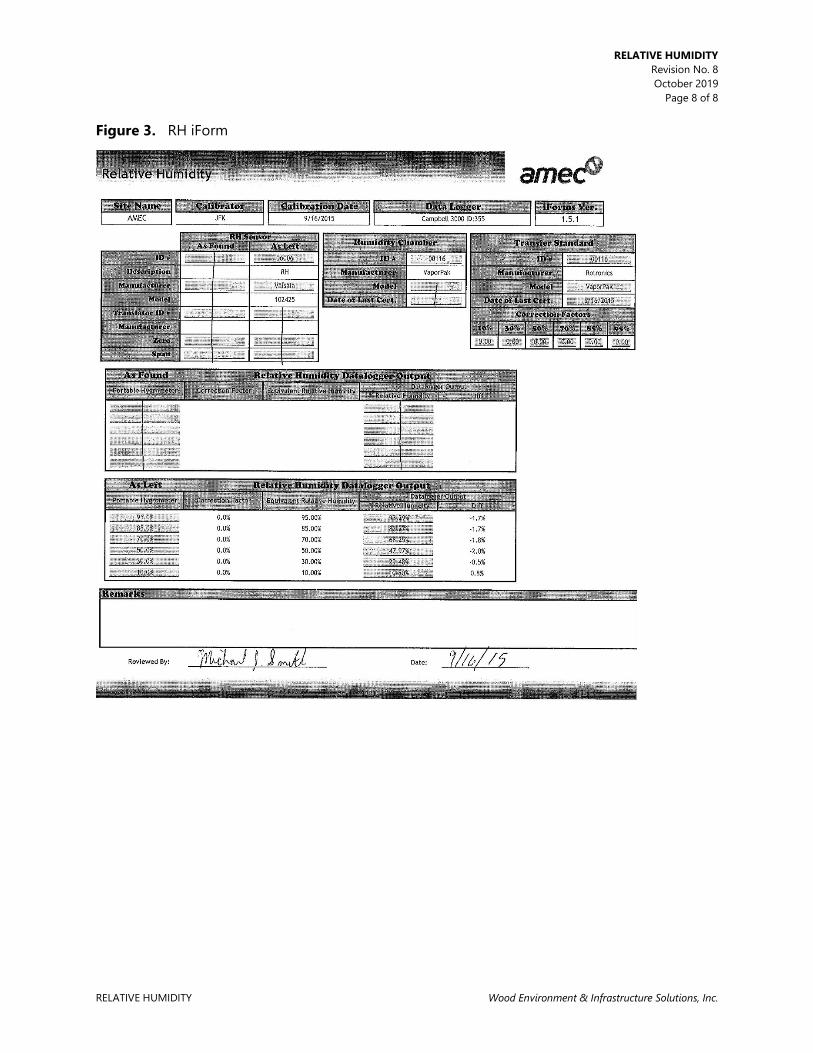
RELATIVE HUMIDITY Revision No. 8 October 2019
Page 8 of 8
RELATIVE HUMIDITY Wood Environment & Infrastructure Solutions, Inc.
Figure 3. RH iForm

R.M. YOUNG SOLAR RADIATION Revision No. 7 October 2019
Page 2 of 6
R.M. YOUNG SOLAR RADIATION Wood Environment & Infrastructure Solutions, Inc.
IV. C. 6. e. SOLAR RADIATION
1.0 PURPOSE
The purpose of this Standard Operating procedure (SOP) is to provide consistent guidance maintenance and handling of the solar radiation (SR) system to Clean Air Status and Trends Network (CASTNET) Field Calibration Laboratory personnel.
2.0 SCOPE
This SOP applies to the maintenance and calibration of the Solar Radiation systems administered by the CASTNET Field Calibration laboratory.
3.0 SUMMARY
R.M. Young SR systems are calibrated upon receipt and at the request of field technicians. Repairs and maintenance are performed as necessary. All CASTNET sites administered by EPA utilize R.M. Young SR sensor systems.
4.0 MATERIALS AND SUPPLIES
Li-Cor Model LI-2000SA pyranometer (transfer standard) Eppley Precision Spectral Pyranometer (certified primary standard) Hukseflux LP02 Pyranometer (certified primary standard) Fluke Multimeter and cable Light source Tool kit including screwdriver, soldering flex, soldering iron, and wire cutters Campbell datalogger, computer with PC200W program SR Calibration Form
5.0 REPAIR AND MAINTENANCE
5.1 Testing the sensor (photodiode and accessories) 5.1.1 Connect the Fluke multimeter to the double banana-style cable with BNC connector on
the other end. Insert the double banana style cable into the µ Amp (A) and common receptacles on the multimeter. Connect the BNC end of the cable to the Li-Cor sensor BNC connect (use a barrel connector as a union). Set the multimeter for Amps, DC, and 200 µA.
5.1.2 Shine a flashlight or other light source directly on the sensor. The multimeter readout should be at least ~ 35µA. If there is little or no response, repair the sensor as follows:
5.2 Repairing the photodiode 5.2.1 Unscrew the back of the sensor housing. Unscrew the small setscrew near the top of the
sensor housing to release the photodiode inside. Cut off the old sensor.
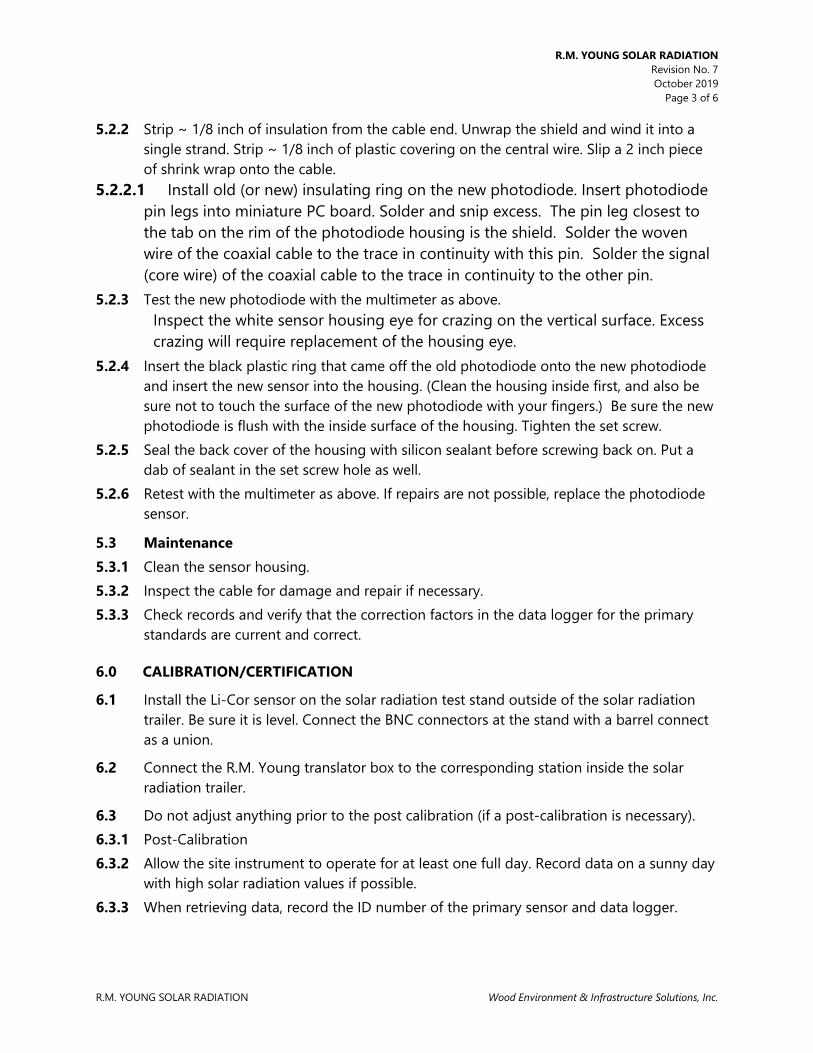
R.M. YOUNG SOLAR RADIATION Revision No. 7 October 2019
Page 3 of 6
R.M. YOUNG SOLAR RADIATION Wood Environment & Infrastructure Solutions, Inc.
5.2.2 Strip ~ 1/8 inch of insulation from the cable end. Unwrap the shield and wind it into a single strand. Strip ~ 1/8 inch of plastic covering on the central wire. Slip a 2 inch piece of shrink wrap onto the cable.
5.2.2.1 Install old (or new) insulating ring on the new photodiode. Insert photodiode pin legs into miniature PC board. Solder and snip excess. The pin leg closest to the tab on the rim of the photodiode housing is the shield. Solder the woven wire of the coaxial cable to the trace in continuity with this pin. Solder the signal (core wire) of the coaxial cable to the trace in continuity to the other pin.
5.2.3 Test the new photodiode with the multimeter as above. Inspect the white sensor housing eye for crazing on the vertical surface. Excess crazing will require replacement of the housing eye.
5.2.4 Insert the black plastic ring that came off the old photodiode onto the new photodiode and insert the new sensor into the housing. (Clean the housing inside first, and also be sure not to touch the surface of the new photodiode with your fingers.) Be sure the new photodiode is flush with the inside surface of the housing. Tighten the set screw.
5.2.5 Seal the back cover of the housing with silicon sealant before screwing back on. Put a dab of sealant in the set screw hole as well.
5.2.6 Retest with the multimeter as above. If repairs are not possible, replace the photodiode sensor.
5.3 Maintenance 5.3.1 Clean the sensor housing. 5.3.2 Inspect the cable for damage and repair if necessary. 5.3.3 Check records and verify that the correction factors in the data logger for the primary
standards are current and correct.
6.0 CALIBRATION/CERTIFICATION
6.1 Install the Li-Cor sensor on the solar radiation test stand outside of the solar radiation trailer. Be sure it is level. Connect the BNC connectors at the stand with a barrel connect as a union.
6.2 Connect the R.M. Young translator box to the corresponding station inside the solar radiation trailer.
6.3 Do not adjust anything prior to the post calibration (if a post-calibration is necessary). 6.3.1 Post-Calibration 6.3.2 Allow the site instrument to operate for at least one full day. Record data on a sunny day
with high solar radiation values if possible. 6.3.3 When retrieving data, record the ID number of the primary sensor and data logger.

R.M. YOUNG SOLAR RADIATION Revision No. 7 October 2019
Page 4 of 6
R.M. YOUNG SOLAR RADIATION Wood Environment & Infrastructure Solutions, Inc.
6.3.4 Total the columns of the primary and the site instrument using the values from the morning (values above ~ 0 watts) until the evening when the values go back to ~ 0.
6.3.5 Average the total of each column by the number of hourly averages being used. 6.3.6 Calculate the percent differences between the primary and site instrument for the total
averages and the hour at which the highest hourly averages occurred. Record on the Solar Radiation Calibration Form.
6.3.7 Perform a linear regression on the two columns. Record the R2 (correlation squared) and intercept on the Solar Radiation Calibration Form.
6.4 Calibration 6.4.1 Following a post calibration, or to calibrate when a post calibration was not possible or
necessary perform the procedure below. 6.4.2 Install the site sensor as outlined above. 6.4.3 Wipe dew from each sensor on a daily basis. 6.4.4 Adjust the gain potentiometer in the translator circuit when total insolation as measured
by the Primary Standard is above 700 w/m2. To adjust the gain potentiometer remove the translator housing cover. Remove the translator PCB retaining screws. Lift up and fold the translator PCB down and out to expose the gain potentiometer. Turn the gain potentiometer screw until the instantaneous Primary Standard values match the site sensor values as displayed by the data-logger. Continue the calibration by recording a full day of data on a sunny day. Maximum insolation values should be above 700w/m2.
6.4.5 Total the columns of the primary and the site instrument using the values from the morning (values above ~ 0 watts) until the evening when the values go back to ~ 0.
6.4.6 Average the Primary and Site Sensor values. 6.4.7 Calculate the percent differences between the primary and site instrument for the total
averages and the hour at which the highest hourly average occurred. Record results on the Solar Radiation Calibration Form. Repeat the procedure or repair as necessary if the sensor does not meet the criteria below.
Site SR Sensor Calibration Criteria Intercept ±10 W/M2 Average Difference ± 5% Difference at Maximum Insolation ± 5%
6.4.8 Perform a linear regression on the two columns. Record the site sensor R2 value (correlation squared) and intercept on Solar Radiation Calibration Form. If the intercept does not meet the criteria above recalibrate the unit.

R.M. YOUNG SOLAR RADIATION Revision No. 7 October 2019
Page 5 of 6
R.M. YOUNG SOLAR RADIATION Wood Environment & Infrastructure Solutions, Inc.
6.4.9 After completing the calibration, remove the sensor and matching translator from the test facility. Tag and place them together in a plastic bag. Place the bag on the “Ready to Ship” shelf in the appropriate box.
6.4.10 Place a copy of the calibration form in the sensor calibration file.
7.0 REFERENCES
U.S. Environmental Protection Agency (EPA). 1994. Quality Assurance Handbook for Air Pollution Measurement Systems, Vol. I. A Field Guide to Environmental Quality Assurance. EPA/600/R-94/038a.
U.S. Environmental Protection Agency (EPA). 2008. Quality Assurance Handbook for Air Pollution
Measurement Systems, Vol. IV, Meteorological Measurements Version 2.0 (Final). EPA-454/B-08-002.
U.S. Environmental Protection Agency (EPA). 2013. Quality Assurance Handbook for Air Pollution
Measurement Systems, Vol. II, Ambient Air Quality Monitoring Program. EPA-454/B-13-003.
U.S. Environmental Protection Agency (EPA). 2000. Meteorological Monitoring Guidance for
Regulatory Modeling Applications. EPA-454/R-99-005. Li-Cor, Inc., Environmental Division. LI-200SA Pyranometer Sensor Manual.

R.M. YOUNG SOLAR RADIATION Revision No. 7 October 2019
Page 6 of 6
R.M. YOUNG SOLAR RADIATION Wood Environment & Infrastructure Solutions, Inc.
8.0 FIGURES
Figure 1. Solar Radiation Data From