Carbon dots obtained using hydrothermal treatment of formaldehyde. Cell imaging in vitro
7
Carbon dots obtained using hydrothermal treatment of formaldehyde. Cell imaging in vitro† M. Algarra, * a M. P ´ erez-Mart ´ ın, b M. Cifuentes-Rueda, bc J. Jim ´ enez-Jim ´ enez, a J. C. G. Esteves da Silva, d T. J. Bandosz, e E. Rodr ´ ıguez-Castell ´ on, a J. T. L ´ opez Navarrete f and J. Casado f Highly photoluminescent carbon dots have been prepared in a one step procedure by hydrothermal treatment of formaldehyde at 180 C. They show green fluorescence under UV light exposure and emission spectra are centered at 440 nm. Fluorescence lifetimes comprise between 0.7 and 2.70 ns, when the synthesis process lasted for 1–7 days. TEM images of nanoparticles showed a homogeneous size/shape distribution. When the thermal treatment process was carried out for a long time (30 days) formation of aggregates occurred. Carbon dots were further analyzed using 1 H and 13 C-NMR, Raman and FTIR spectroscopy techniques and XPS. Cell imaging of nanoparticles was carried out by using mouse MC3T3-E1 pre-osteoblasts as a model. The nanoparticles were selectively localized in the cytoplasm without further functionalization and could be realized by cellular phagocytosis, so that the fluorescence of these can be used for live cell imaging in vitro. Introduction Carbon dots (CDs) have generated a great interest because of their superior water solubility, chemical inertness, low toxicity, ease of functionalization, and resistance to photo-bleaching. 1 CDs are usually composed of nanometre-sized sp 2 hybridized graphitic cores and carbonyl surface moieties. Owing to their low cost, low toxicity, biocompatibility, and reasonable photo- luminescence, CDs offer an alternative to replace traditional semiconductor quantum dots. 2–5 Additionally, CDs show size dependent photoluminescence and upconversion lumines- cence properties due to multiphoton processes, which would eventually lead to anti-Stokes type emission. 6,7 The syntheses of various functionalized and non-functional- ized CDs are very well established. Methods such as microwave irradiation, 8–10 combustion of carbon soot, 11,12 activated carbon, 13 carbon xerogel, 14 and laser ablation of graphite 15,16 or thermal degradation/oxidation of a suitable molecular precursor such as polysaccharides have been applied. 17,18 The latter method is considered as a one-step procedure, which makes it cost efficient and thus attractive. Application of this procedure leads to oxygen functionalized CDs with a good control of the size, shape, and physical properties. These nanoparticles are referred to in the literature as carbogenic nanoparticles because of their oxygen content. 19 An important feature of these CDs is their hydrophilic character, which makes them suitable for bioimaging, biosens- ing and photocatalyst applications. 20–23 CDs are also potential replacements for the conventional cadmium and selenium based quantum dots used in biological imaging in vitro and in vivo. 24–29 The objective of this paper is to introduce a new simple synthesis route for CDs based on hydrothermal treatment of formaldehyde. State of the art techniques are the rst attempt to obtain CDs and present a novelty in the nanochemistry eld. Also, the mecha- nism proposed is based on a full dehydration reaction leading to the formation of carbon nanoparticles. Characterization of these CDs and establishing a relation between their uorescence emission and functional groups formed on the surface is a tar- geted research task. Moreover, an important objective is also a demonstration that the obtained CDs, prepared via a one-pot hydrothermal process, with excellent water dispersion, have promising in vitro cell imaging applications. Results and discussion The synthesis approach follows the controlled hydrothermal treatment (180 C) of formaldehyde for 24 h. Aer this, CDs are a Departamento de Qu´ ımica Inorg´ anica, Facultad de Ciencias, Universidad de M´ alaga, Campus de Teatinos s/n, 29071, M´ alaga, Spain. E-mail: [email protected] b Departamento de Biolog´ ıa Celular, Gen´ etica y Fisiolog´ ıa, Facultad de Ciencias and Instituto de Investigaci´ on Biom´ edica de M´ alaga (IBIMA), Universidad de M´ alaga, Campus de Teatinos s/n, 29071, M´ alaga, Spain c Centro de Investigaciones Biom´ edicas en Red de Bioingenier´ ıa, Biomateriales y Nanomedicina (CIBER-BBN), Spain d Centro de Investigaç˜ ao em Qu´ ımica, Departamento de Qu´ ımica e Bioqu´ ımica, Faculdade de Ciˆ encias da Universidade do Porto, Porto, Portugal e Department of Chemistry, The City College of New York, 160 Convent Ave, New York, NY 10031, USA f Departamento de Qu´ ımica F´ ısica, Facultad de Ciencias, Universidad de M´ alaga, Campus de Teatinos s/n, 29071, M´ alaga, Spain † Electronic supplementary information (ESI) available. See DOI: 10.1039/c4nr01585a Cite this: DOI: 10.1039/c4nr01585a Received 23rd March 2014 Accepted 31st May 2014 DOI: 10.1039/c4nr01585a www.rsc.org/nanoscale This journal is © The Royal Society of Chemistry 2014 Nanoscale Nanoscale PAPER Published on 03 June 2014. Downloaded by Universidade do Porto (UP) on 30/06/2014 13:07:00. View Article Online View Journal
-
Upload
independent -
Category
Documents
-
view
2 -
download
0
Transcript of Carbon dots obtained using hydrothermal treatment of formaldehyde. Cell imaging in vitro

Nanoscale
PAPER
Publ
ishe
d on
03
June
201
4. D
ownl
oade
d by
Uni
vers
idad
e do
Por
to (
UP)
on
30/0
6/20
14 1
3:07
:00.
View Article OnlineView Journal
aDepartamento de Quımica Inorganica, Facu
Campus de Teatinos s/n, 29071, Malaga, SpbDepartamento de Biologıa Celular, Genetic
Instituto de Investigacion Biomedica de M
Campus de Teatinos s/n, 29071, Malaga, SpcCentro de Investigaciones Biomedicas en
Nanomedicina (CIBER-BBN), SpaindCentro de Investigaçao em Quımica, De
Faculdade de Ciencias da Universidade do PeDepartment of Chemistry, The City College
NY 10031, USAfDepartamento de Quımica Fısica, Faculta
Campus de Teatinos s/n, 29071, Malaga, Sp
† Electronic supplementary informa10.1039/c4nr01585a
Cite this: DOI: 10.1039/c4nr01585a
Received 23rd March 2014Accepted 31st May 2014
DOI: 10.1039/c4nr01585a
www.rsc.org/nanoscale
This journal is © The Royal Society of
Carbon dots obtained using hydrothermaltreatment of formaldehyde. Cell imaging in vitro†
M. Algarra,*a M. Perez-Martın,b M. Cifuentes-Rueda,bc J. Jimenez-Jimenez,a
J. C. G. Esteves da Silva,d T. J. Bandosz,e E. Rodrıguez-Castellon,a J. T. LopezNavarretef and J. Casadof
Highly photoluminescent carbon dots have been prepared in a one step procedure by hydrothermal
treatment of formaldehyde at 180 �C. They show green fluorescence under UV light exposure and
emission spectra are centered at 440 nm. Fluorescence lifetimes comprise between 0.7 and 2.70 ns,
when the synthesis process lasted for 1–7 days. TEM images of nanoparticles showed a homogeneous
size/shape distribution. When the thermal treatment process was carried out for a long time (30 days)
formation of aggregates occurred. Carbon dots were further analyzed using 1H and 13C-NMR, Raman
and FTIR spectroscopy techniques and XPS. Cell imaging of nanoparticles was carried out by using
mouse MC3T3-E1 pre-osteoblasts as a model. The nanoparticles were selectively localized in the
cytoplasm without further functionalization and could be realized by cellular phagocytosis, so that the
fluorescence of these can be used for live cell imaging in vitro.
Introduction
Carbon dots (CDs) have generated a great interest because oftheir superior water solubility, chemical inertness, low toxicity,ease of functionalization, and resistance to photo-bleaching.1
CDs are usually composed of nanometre-sized sp2 hybridizedgraphitic cores and carbonyl surface moieties. Owing to theirlow cost, low toxicity, biocompatibility, and reasonable photo-luminescence, CDs offer an alternative to replace traditionalsemiconductor quantum dots.2–5 Additionally, CDs show sizedependent photoluminescence and upconversion lumines-cence properties due to multiphoton processes, which wouldeventually lead to anti-Stokes type emission.6,7
The syntheses of various functionalized and non-functional-ized CDs are very well established. Methods such as microwaveirradiation,8–10 combustion of carbon soot,11,12 activated carbon,13
ltad de Ciencias, Universidad de Malaga,
ain. E-mail: [email protected]
a y Fisiologıa, Facultad de Ciencias and
alaga (IBIMA), Universidad de Malaga,
ain
Red de Bioingenierıa, Biomateriales y
partamento de Quımica e Bioquımica,
orto, Porto, Portugal
of New York, 160 Convent Ave, New York,
d de Ciencias, Universidad de Malaga,
ain
tion (ESI) available. See DOI:
Chemistry 2014
carbon xerogel,14 and laser ablation of graphite15,16 or thermaldegradation/oxidation of a suitable molecular precursor such aspolysaccharides have been applied.17,18 The latter method isconsidered as a one-step procedure, which makes it cost efficientand thus attractive. Application of this procedure leads to oxygenfunctionalized CDs with a good control of the size, shape, andphysical properties. These nanoparticles are referred to in theliterature as carbogenic nanoparticles because of their oxygencontent.19 An important feature of these CDs is their hydrophiliccharacter, which makes them suitable for bioimaging, biosens-ing and photocatalyst applications.20–23 CDs are also potentialreplacements for the conventional cadmium and selenium basedquantum dots used in biological imaging in vitro and in vivo.24–29
The objective of this paper is to introduce a new simple synthesisroute for CDs based on hydrothermal treatment of formaldehyde.State of the art techniques are the rst attempt to obtain CDs andpresent a novelty in the nanochemistry eld. Also, the mecha-nism proposed is based on a full dehydration reaction leading tothe formation of carbon nanoparticles. Characterization of theseCDs and establishing a relation between their uorescenceemission and functional groups formed on the surface is a tar-geted research task. Moreover, an important objective is also ademonstration that the obtained CDs, prepared via a one-pothydrothermal process, with excellent water dispersion, havepromising in vitro cell imaging applications.
Results and discussion
The synthesis approach follows the controlled hydrothermaltreatment (180 �C) of formaldehyde for 24 h. Aer this, CDs are
Nanoscale
Nanoscale Paper
Publ
ishe
d on
03
June
201
4. D
ownl
oade
d by
Uni
vers
idad
e do
Por
to (
UP)
on
30/0
6/20
14 1
3:07
:00.
View Article Online
detectable by either DLS or TEM. The TEM images of CDscollected in (Fig. 1a–d) reveal small and spherical particles, withan average diameter of <30 nm. Dynamic Light Scattering (DLS)measurements showed that the nanoparticles are welldispersed with an average size (diameter) of 12.50 � 4.03 nm
Fig. 1 Representative TEM images of as synthesized CDs showing ahomogeneous size/shape distribution: (a) 1 day (200 nm scale bar); (b)2 days (200 nm scale bar); (c) 7 days, inset is a 3D representation of CDs(50 nm scale bar), (d) as well as particle agglomeration after 30 days ofthe thermal treatment process of formaldehyde at 180 �C, the insetshows a TEM image (100 nm scale bar); (e) size distribution of (a).
Nanoscale
(Fig. 1e), when analyzed the Fig. 1a which has been usedthrough all the experiments. For larger period treatments,aggregates with sizes of about 200 nm are detected in thesamples (Fig. 1b–d). These soluble particles show a negative z
between �0.025 and �0.078 mV.To further elucidate the surface features of the CDs, various
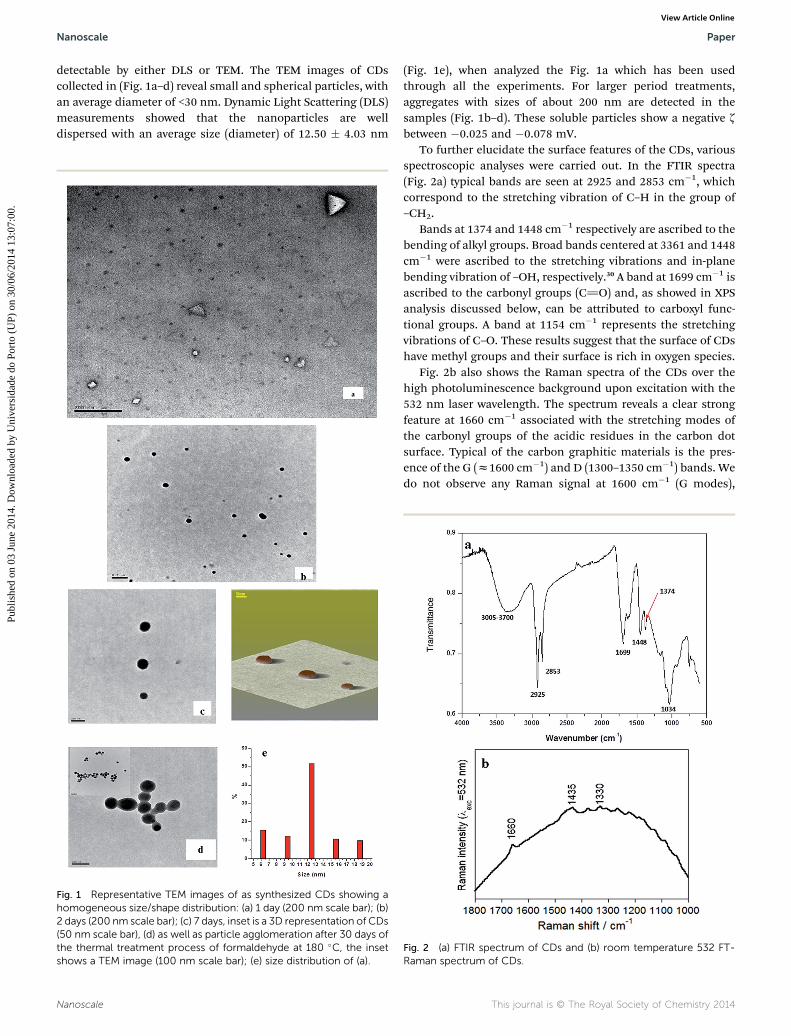
spectroscopic analyses were carried out. In the FTIR spectra(Fig. 2a) typical bands are seen at 2925 and 2853 cm�1, whichcorrespond to the stretching vibration of C–H in the group of–CH2.
Bands at 1374 and 1448 cm�1 respectively are ascribed to thebending of alkyl groups. Broad bands centered at 3361 and 1448cm�1 were ascribed to the stretching vibrations and in-planebending vibration of –OH, respectively.30 A band at 1699 cm�1 isascribed to the carbonyl groups (C]O) and, as showed in XPSanalysis discussed below, can be attributed to carboxyl func-tional groups. A band at 1154 cm�1 represents the stretchingvibrations of C–O. These results suggest that the surface of CDshave methyl groups and their surface is rich in oxygen species.
Fig. 2b also shows the Raman spectra of the CDs over thehigh photoluminescence background upon excitation with the532 nm laser wavelength. The spectrum reveals a clear strongfeature at 1660 cm�1 associated with the stretching modes ofthe carbonyl groups of the acidic residues in the carbon dotsurface. Typical of the carbon graphitic materials is the pres-ence of the G (z1600 cm�1) and D (1300–1350 cm�1) bands. Wedo not observe any Raman signal at 1600 cm�1 (G modes),
Fig. 2 (a) FTIR spectrum of CDs and (b) room temperature 532 FT-Raman spectrum of CDs.
This journal is © The Royal Society of Chemistry 2014
Paper Nanoscale
Publ
ishe
d on
03
June
201
4. D
ownl
oade
d by
Uni
vers
idad
e do
Por
to (
UP)
on
30/0
6/20
14 1
3:07
:00.
View Article Online
however at the position of the D modes, at 1330 cm�1, amedium intensity signal ascribable to the D band is detected.These spectroscopic ngerprints suggest that the hydrothermaltreatment reduces an important fraction of the oxygen groups ofthe formaldehyde precursor but does not lead to a full reductionto sp2 species. Microcrystalline graphite is also not obtained.
The 1H-NMR spectrum (ESI Fig. SI1†) for the sampleobtained aer 1 day of treatment shows the up-eld (1.236 ppm)and down-eld (2.153 ppm) singlet peaks which representmethylene protons of the CDs. The singlet peak at 3.725 ppm islinked to the protons on the hydroxyl–methyl group next to thehydroxyl group. The peak at 63.70 ppm on the 13C-NMR(Fig. SI2) spectrum is due to carbons adjacent to hydroxylgroups, and the peak at 29.68 ppm is due to methylene carbons.All samples, regardless of the synthesis time show the samefeatures.
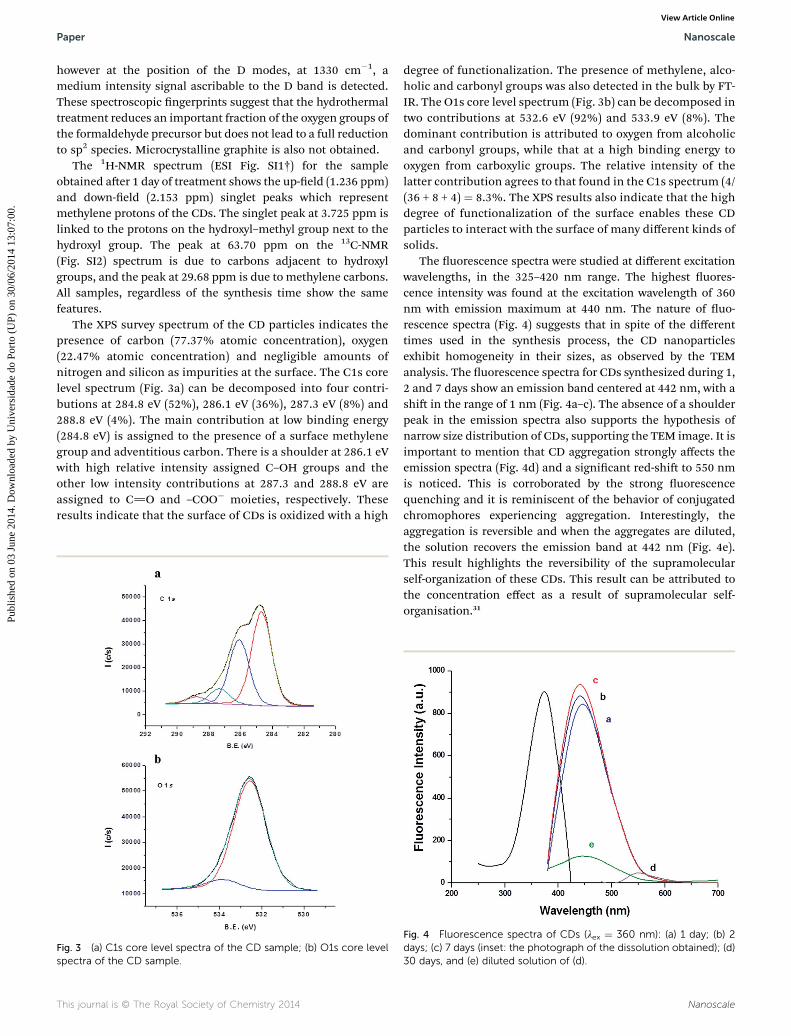
The XPS survey spectrum of the CD particles indicates thepresence of carbon (77.37% atomic concentration), oxygen(22.47% atomic concentration) and negligible amounts ofnitrogen and silicon as impurities at the surface. The C1s corelevel spectrum (Fig. 3a) can be decomposed into four contri-butions at 284.8 eV (52%), 286.1 eV (36%), 287.3 eV (8%) and288.8 eV (4%). The main contribution at low binding energy(284.8 eV) is assigned to the presence of a surface methylenegroup and adventitious carbon. There is a shoulder at 286.1 eVwith high relative intensity assigned C–OH groups and theother low intensity contributions at 287.3 and 288.8 eV areassigned to C]O and –COO� moieties, respectively. Theseresults indicate that the surface of CDs is oxidized with a high
Fig. 3 (a) C1s core level spectra of the CD sample; (b) O1s core levelspectra of the CD sample.
This journal is © The Royal Society of Chemistry 2014
degree of functionalization. The presence of methylene, alco-holic and carbonyl groups was also detected in the bulk by FT-IR. The O1s core level spectrum (Fig. 3b) can be decomposed intwo contributions at 532.6 eV (92%) and 533.9 eV (8%). Thedominant contribution is attributed to oxygen from alcoholicand carbonyl groups, while that at a high binding energy tooxygen from carboxylic groups. The relative intensity of thelatter contribution agrees to that found in the C1s spectrum (4/(36 + 8 + 4) ¼ 8.3%. The XPS results also indicate that the highdegree of functionalization of the surface enables these CDparticles to interact with the surface of many different kinds ofsolids.
The uorescence spectra were studied at different excitationwavelengths, in the 325–420 nm range. The highest uores-cence intensity was found at the excitation wavelength of 360nm with emission maximum at 440 nm. The nature of uo-rescence spectra (Fig. 4) suggests that in spite of the differenttimes used in the synthesis process, the CD nanoparticlesexhibit homogeneity in their sizes, as observed by the TEManalysis. The uorescence spectra for CDs synthesized during 1,2 and 7 days show an emission band centered at 442 nm, with ashi in the range of 1 nm (Fig. 4a–c). The absence of a shoulderpeak in the emission spectra also supports the hypothesis ofnarrow size distribution of CDs, supporting the TEM image. It isimportant to mention that CD aggregation strongly affects theemission spectra (Fig. 4d) and a signicant red-shi to 550 nmis noticed. This is corroborated by the strong uorescencequenching and it is reminiscent of the behavior of conjugatedchromophores experiencing aggregation. Interestingly, theaggregation is reversible and when the aggregates are diluted,the solution recovers the emission band at 442 nm (Fig. 4e).This result highlights the reversibility of the supramolecularself-organization of these CDs. This result can be attributed tothe concentration effect as a result of supramolecular self-organisation.31
Fig. 4 Fluorescence spectra of CDs (lex ¼ 360 nm): (a) 1 day; (b) 2days; (c) 7 days (inset: the photograph of the dissolution obtained); (d)30 days, and (e) diluted solution of (d).
Nanoscale
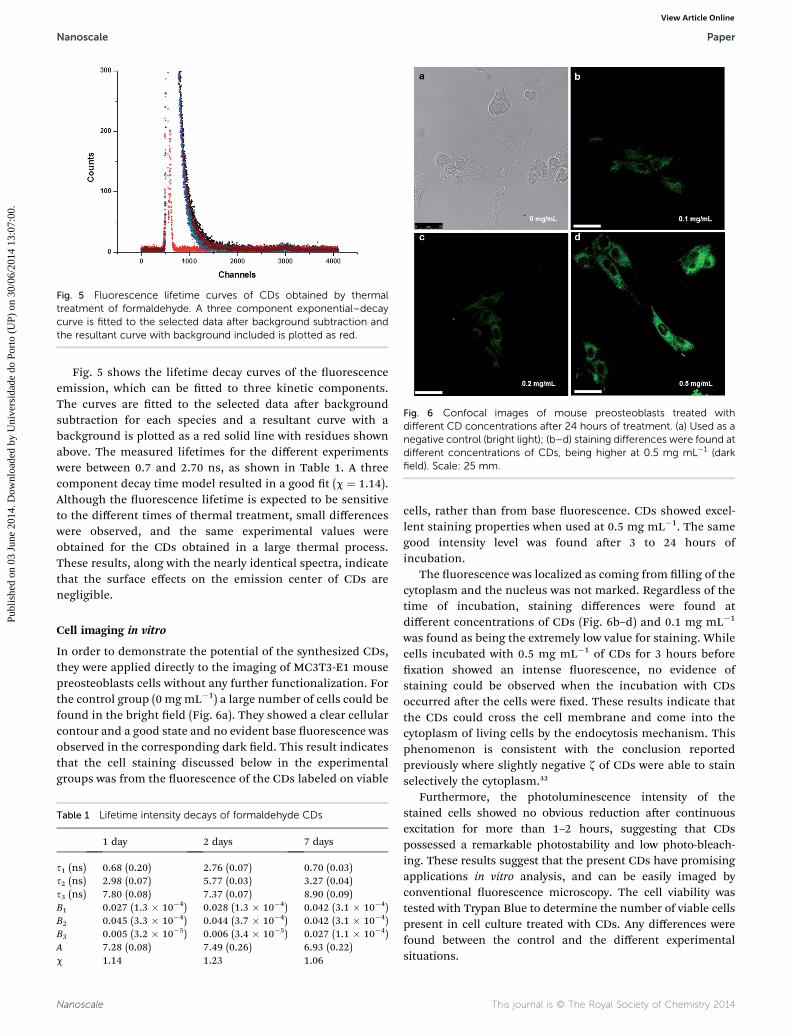
Fig. 5 Fluorescence lifetime curves of CDs obtained by thermaltreatment of formaldehyde. A three component exponential–decaycurve is fitted to the selected data after background subtraction andthe resultant curve with background included is plotted as red.
Fig. 6 Confocal images of mouse preosteoblasts treated withdifferent CD concentrations after 24 hours of treatment. (a) Used as anegative control (bright light); (b–d) staining differences were found atdifferent concentrations of CDs, being higher at 0.5 mg mL�1 (darkfield). Scale: 25 mm.
Nanoscale Paper
Publ
ishe
d on
03
June
201
4. D
ownl
oade
d by
Uni
vers
idad
e do
Por
to (
UP)
on
30/0
6/20
14 1
3:07
:00.
View Article Online
Fig. 5 shows the lifetime decay curves of the uorescenceemission, which can be tted to three kinetic components.The curves are tted to the selected data aer backgroundsubtraction for each species and a resultant curve with abackground is plotted as a red solid line with residues shownabove. The measured lifetimes for the different experimentswere between 0.7 and 2.70 ns, as shown in Table 1. A threecomponent decay time model resulted in a good t (c ¼ 1.14).Although the uorescence lifetime is expected to be sensitiveto the different times of thermal treatment, small differenceswere observed, and the same experimental values wereobtained for the CDs obtained in a large thermal process.These results, along with the nearly identical spectra, indicatethat the surface effects on the emission center of CDs arenegligible.
Cell imaging in vitro
In order to demonstrate the potential of the synthesized CDs,they were applied directly to the imaging of MC3T3-E1 mousepreosteoblasts cells without any further functionalization. Forthe control group (0 mg mL�1) a large number of cells could befound in the bright eld (Fig. 6a). They showed a clear cellularcontour and a good state and no evident base uorescence wasobserved in the corresponding dark eld. This result indicatesthat the cell staining discussed below in the experimentalgroups was from the uorescence of the CDs labeled on viable
Table 1 Lifetime intensity decays of formaldehyde CDs
1 day 2 days 7 days
s1 (ns) 0.68 (0.20) 2.76 (0.07) 0.70 (0.03)s2 (ns) 2.98 (0.07) 5.77 (0.03) 3.27 (0.04)s3 (ns) 7.80 (0.08) 7.37 (0.07) 8.90 (0.09)B1 0.027 (1.3 � 10�4) 0.028 (1.3 � 10�4) 0.042 (3.1 � 10�4)B2 0.045 (3.3 � 10�4) 0.044 (3.7 � 10�4) 0.042 (3.1 � 10�4)B3 0.005 (3.2 � 10�5) 0.006 (3.4 � 10�5) 0.027 (1.1 � 10�4)A 7.28 (0.08) 7.49 (0.26) 6.93 (0.22)c 1.14 1.23 1.06
Nanoscale
cells, rather than from base uorescence. CDs showed excel-lent staining properties when used at 0.5 mg mL�1. The samegood intensity level was found aer 3 to 24 hours ofincubation.
The uorescence was localized as coming from lling of thecytoplasm and the nucleus was not marked. Regardless of thetime of incubation, staining differences were found atdifferent concentrations of CDs (Fig. 6b–d) and 0.1 mg mL�1
was found as being the extremely low value for staining. Whilecells incubated with 0.5 mg mL�1 of CDs for 3 hours beforexation showed an intense uorescence, no evidence ofstaining could be observed when the incubation with CDsoccurred aer the cells were xed. These results indicate thatthe CDs could cross the cell membrane and come into thecytoplasm of living cells by the endocytosis mechanism. Thisphenomenon is consistent with the conclusion reportedpreviously where slightly negative z of CDs were able to stainselectively the cytoplasm.32
Furthermore, the photoluminescence intensity of thestained cells showed no obvious reduction aer continuousexcitation for more than 1–2 hours, suggesting that CDspossessed a remarkable photostability and low photo-bleach-ing. These results suggest that the present CDs have promisingapplications in vitro analysis, and can be easily imaged byconventional uorescence microscopy. The cell viability wastested with Trypan Blue to determine the number of viable cellspresent in cell culture treated with CDs. Any differences werefound between the control and the different experimentalsituations.
This journal is © The Royal Society of Chemistry 2014
Paper Nanoscale
Publ
ishe
d on
03
June
201
4. D
ownl
oade
d by
Uni
vers
idad
e do
Por
to (
UP)
on
30/0
6/20
14 1
3:07
:00.
View Article Online
ExperimentalMaterials and methods
Synthesis of CDs. Formaldehyde (37%, Sigma-Aldrich,Spain) was used as a CD precursor. 100mL were transferred intoa 150 mL Teon lined stainless-steel reactor that was heated at180 �C for 1, 2, 7 and 30 days. Aer completion of the process,the brownish solution was cooled down at room temperature.An excess of acetone was added and the suspension was thencentrifuged (10.000 rpm, 15 min). The solution containing thesynthesized CD nanoparticles obtained was evaporated undervacuum.
Characterization and data analysis. Transmission electronmicroscopy (TEM) of CDs was performed on a Philips CM-200by evaporating one drop on a carbon coated copper grid.Infrared measurements were carried out with a BrukerEquinox 55 FT-IR spectrometer tted with a Golden Gatesingle reection ATR accessory kit from Specac. All spectrawere recorded using a resolution of 2 cm�1; 50 scans werecollected. Resonance FT-Raman spectra with excitation at 532nm were recorded on a Senterra Raman Microscope fromBruker. 1H and 13C-NMR spectra were recorded with a 400MHz ARX 400 Bruker spectrometer by using the residualsolvent peak in CDCl3 (dH ¼ 7.24 ppm for 1H and dC ¼ 77.0ppm for 13C) or CD3SOCD3 (dH¼ 2.50 ppm for 1H and dC¼ 39.5ppm for 13C). X-ray photoelectron spectra (XPS) were recordedusing a Physical Electronics PHI 5700 spectrometer with non-monochromatic Al Ka radiation (300 W, 15 kV, hn ¼ 1486.6 eV)as the excitation source. Spectra were recorded at 45� take-offangles by using a concentric hemispherical analyzer operatingin the constant pass energy mode at 25.9 eV, using a 720 mmdiameter analysis area. Under these conditions the Au 4f7/2line was recorded with 1.16 eV FWHM at a binding energy of84.0 eV. The spectrometer energy scale was calibrated using Cu2p3/2, Ag 3d5/2 and Au 4f7/2 photoelectron lines at 932.7, 368.3and 84.0 eV, respectively. Charge referencing was done againstadventitious carbon (C1s 284.8 eV). Solid surfaces weremounted on a sample holder without an adhesive tape andkept overnight in high vacuum in the preparation chamberbefore they were transferred to the analysis chamber of thespectrometer. Each region was scanned with several sweepsuntil a good signal-to-noise ratio was observed. The pressurein the analysis chamber was maintained at less than 10�9 Torr.A PHI ACCESS ESCA-V6.0 F soware package was used foracquisition data analysis and Multipak supported by MATLABfor data analysis. Spectral decomposition was done usingGaussian–Lorentz curves with similar FWHM values. Theaccuracy of binding energy (BE) values was within�0.1 eV. Thesize and zeta potential (z) of CDs were determined using aZetasizer Nano ZS (Malvern Instruments, U.K.) equipped witha 4 mW HeNe laser operating at l¼ 633 nm. All samples weremeasured at a scattering angle of 173� (for size) and 13� (z) andwere an average of three tests. Size measurements, usingdynamic light scattering (DLS), were performed at 25 �C in apolystyrene cell (ZEN0040). The z measurements were alsoperformed at 25 �C in polycarbonate folded capillary cells,
This journal is © The Royal Society of Chemistry 2014
incorporated with gold plated electrodes (DTS1060C) anddeionized H2O was the dispersion medium. Both, size and z
were automatically obtained by the soware, using the Stokes–Einstein and the Henry equation, with the Smoluchowskiapproximation. The uorescence spectra were studied atdifferent excitation wavelengths, in the 325–420 nm range,recorded with a Horiba Jovin Yvon Fluoromax 4 TCSPC spec-trophotometer with an integration time of 0.1 s and a slit of 5nm. Fluorescence decays were interpreted in terms of a multi-exponential function: I(t) ¼ A + SBiexp
�t/si, where A and Bi arethe pre-exponential factors and si the decay times.
In vitro assay for labeling living cells. A mouse preosteo-blastic cell line, named MC3T3-E1 (ECACC, catalogue number99072810), was used for this assay. Cells were cultured inMinimum Essential Medium, alpha-modication (alpha MEM;Sigma Aldrich) supplemented with 10% heat inactivated FBSand 1.25 mg L�1 amphotericin B, 105 U L�1 penicillin, 100 mgL�1 streptomycin and 2 mM L-glutamine, at 37 �C in a humid-ied atmosphere with 5% CO2 (standard conditions). Cells wereseeded in 24-well plate at a density of 70� 103 cells per mL ontopoly-L-lysine (0.1 mgmL�1) coated coverslips for cell attachmentand cultured for 24 hours in the medium described above. Toassess the ability of CDs to mark living cells, the plates wereincubated with different CD concentrations: 0 mg mL�1 (as anegative control), 0.1, 0.2, and 0.5 mg mL�1, for differentincubation times: 3, 12 and 24 h. In total 12 experimentalconditions, by triplicate. Aer completion of each experimentalperiod, the cells were washed twice with phosphate bufferedsaline (PBS) and xed with 4% paraformaldehyde in water.Fluorescence images were obtained using a Leica TCS SP5 IIconfocal microscope at an excitation laser wavelength of 405nm. To evaluate the ability of CDs to dye xed cells, platescultured in the absence of CDs, were xed with 4% para-formaldehyde and aer washing with PBS were incubated with0.5 mg mL�1 solution of CDs for 3 hours. Then, they werewashed and the labeling was observed under the confocalmicroscope.
Conclusions
The results presented in this paper show that formaldehyde canbe used as a convenient source for CDs obtained by simplehydrothermal treatment. These CDs exhibit hydrophilic char-acter owing to the abundance of oxygen groups. A long synthesisprocess increased the nanoparticle size/aggregation and causeda red shi of the uorescence spectra. Therefore the mostpromising CDs from the view point of their uorescence during1 day were chosen. The cellular localization of CDs was studiedin vitro and applied to MC3T3-E1 mouse preosteoblasts cells.The results showed a strong uorescence coming from the CDspresent in the cytoplasm. This phenomenon was linked to thenegative values of z which follow the nature of some compo-nents of the cytoplasm. The results presented can contribute tothe advances in the cell imaging technique. Moreover, CDnanoparticles can be used as a potential marker of toxic species,for instance heavy atoms, which quench the uorescence, whenpresent in the cytoplasm.
Nanoscale
Nanoscale Paper
Publ
ishe
d on
03
June
201
4. D
ownl
oade
d by
Uni
vers
idad
e do
Por
to (
UP)
on
30/0
6/20
14 1
3:07
:00.
View Article Online
Acknowledgements
The authors would like to thank the Spanish Ministry ofEconomy and Competitiveness (Project CTQ2012-37925-C03-03)and the Andalucıa Tech Program of the University of Malaga.FEDER funds are acknowledged for support of the uorescenceconfocal microscopy analysis.
References
1 Y. P. Sun, B. Zhou, Y. Lin, W. Wang, K. A. S. Fernando,P. Pathak, M. J. Meziani, B. A. Harruff, X. Wang, H. Wang,P. G. Luo, H. Yang, M. E. Kose, B. Chen, L. M. Veca andS. Y. Xie, Quantum-sized carbon dots for bright andcolorful photoluminescence, J. Am. Chem. Soc., 2006,128(4), 7756–7757.
2 W. Kwon and S. W. Rhee, Facile synthesis of graphitic carbonquantum dots with size tunability and uniformity usingreverse micelles, Chem. Commun., 2012, 48(43), 5256–5258.
3 S. N. Baker and G. A. Baker, Luminescent carbon nanodots:emergent nanolights, Angew. Chem., Int. Ed., 2010, 49(38),6726–6744.
4 P. Anilkumar, X. Wang, L. Cao, S. Sahu, J. H. Liu, P. Wang,K. Korch, K. N. Tackett II, A. Parenzan and Y. P. Sun,Toward quantitatively uorescent carbon-based quantumdots, Nanoscale, 2011, 3, 2023–2027.
5 Y. P. Sun, X. Wang, F. Lu, L. Cao, M. J. Meziani, P. G. Luo,L. Gu and L. M. Veca, Doped carbon nanoparticles as anew platform for highly photoluminescent dots, J. Phys.Chem. C, 2008, 112(47), 18295–18298.
6 P. K. Chu and L. Li, Characterization of amorphous andnanocrystalline carbon lms, Mater. Chem. Phys., 2006,96(2–3), 253–277.
7 V. K. A. Sreenivasan, A. V. Zvyagin and E. M. Goldys,Luminescent nanoparticles and their applications in thelife sciences, J. Phys.: Condens. Matter, 2013, 25(19), 194101.
8 J. Jiang, Y. He, S. Li and H. Cui, Amino acids as the source forproducing carbon nanodots: microwave assisted one-stepsynthesis, intrinsic photoluminescence property andintense chemiluminescence enhancement, Chem.Commun., 2012, 48, 9634963–9634966.
9 S. Mitra, S. Chandra, T. Kundu, R. Banerjee, P. Pramanik andA. Goswami, Rapid microwave synthesis of uorescenthydrophobic carbon dots, RSC Adv., 2012, 2, 12129–12131.
10 X. Wang, K. Qu, B. Xu, J. Ren and X. Qu, Microwave assistedone-step green synthesis of cell-permeable multicolorphotoluminescent carbon dots without surface passivationreagents, J. Mater. Chem., 2011, 21, 2445–2450.
11 X. Zhai, P. Zhang, C. Liu, T. Bai, W. Li, L. Dai and W. Liu,Highly luminescent carbon nanodots by microwave-assisted pyrolysis, Chem. Commun., 2012, 48(64), 7955–7957.
12 B. Selvi, D. Jagadeesan, B. Suma, G. Nagashankar, M. Arif,K. Balasubramanyam, M. Eswaramoorthy and T. K. Kundu,Intrinsically uorescent carbon nanospheres as a nucleartargeting vector: Delivery of membrane impermeablemolecule to modulate gene expression in vivo, Nano Lett.,2008, 8(10), 3182–3188.
Nanoscale
13 Z. A. Qiao, Y. Wang, Y. Gao, H. Li, T. Dai, Y. Liu and Q. Huo,Commercially activated carbon as the source for producingmulticolor photoluminescent carbon dots by chemicaloxidation, Chem. Commun., 2010, 46, 8812–8814.
14 S. Chandra, S. Mitra, D. Laha, S. Bag, P. Das, A. Goswami andP. Pramanik, Fabrication of multi-structure nanocarbonsfrom carbon xerogel: a unique scaffold towards bio-imaging, Chem. Commun., 2011, 47(30), 8587–8589.
15 L. Cao, X. Wang, M. Meziani, F. Lu, H. Wang, P. Luo, Y. Lin,B. A. Harruff, L. M. Veca, D. Murray, S. Y. Xie and Y. P. Sun,Carbon Dots for Multiphoton Bioimaging, J. Am. Chem. Soc.,2007, 129(37), 11318–11319.
16 H. Gonçalves, P. A. S. Jorge, J. R. A. Fernandes andJ. C. G. Esteves da Silva, Hg(II) sensing based onfunctionalized carbon dots obtained by direct laserablation, Sens. Actuators, B, 2010, 145(1–2), 702–707.
17 A. B. Bourlinos, A. Stassinopoulos, D. Anglos, R. Zboril,M. Karakassides and E. P. Giannelis, Surfacefunctionalized carbogenic quantum dots, Small, 2008, 4(4),455–458.
18 M. Algarra, B. B. Campos, K. Radotic, D. Mutavdzic,T. Bandosz, J. Jimenez-Jimenez, E. Rodriguez-Castellon andJ. C. G. Esteves da Silva, Luminescent CarbonNanoparticles: Effects of chemical Functionalization, andEvaluation of Ag+ Sensing properties, J. Mater. Chem. A,2014, 2, 8342–8351.
19 J. T. S. Peng, Simple Aqueous Solution Route to LuminescentCarbogenic Dots from Carbohydrates, Chem. Mater., 2009,21(23), 5563–5565.
20 A. B. Bourlinos, R. Zboril, J. Petr, A. Bakandritsos,M. Krysmann and E. P. Giannelis, Luminescent SurfaceQuaternized Carbon Dots, Chem. Mater., 2012, 24(1), 6–8.
21 S. T. Yang, X. Wang, H. Wang, F. Lu, P. G. Luo, L. Cao,M. J. Meziani, J. H. Liu, Y. Liu, Y. Huang and Y. P. Sun,Carbon Dots as Nontoxic and High-PerformanceFluorescence Imaging Agents, J. Phys. Chem. C, 2009,113(42), 18110–18114.
22 S. T. Yang, L. Cao, P. G. Luo, F. Lu, F. Wang, H. Wang,M. J. Meziani, Y. Liu, G. Qi and Y. P. Sun, Carbon dots foroptical imaging in vivo, J. Am. Chem. Soc., 2009, 131(32),11308–11309.
23 J. C. G. Esteves da Silva and H. Gonçalves, Analytical andbioanalytical applications of carbon dots, Trends Anal.Chem., 2011, 30(8), 1327–1336.
24 H. Li, X. He, Z. Kang, H. Huang, Y. Liu, J. Liu, S. Lian,C. H. A. Tsang, X. Yang and S. T. Lee, Water-solubleuorescent carbon quantum dots and photocatalystdesign, Angew. Chem., Int. Ed., 2010, 49(26), 4430–4434.
25 A. Nagy, J. A. Hollingsworth, B. Hu, A. Steinbruck, P. C. Stark,C. Rios-Valdez, M. Vuyisich, M. H. Stewart, D. H. Atha,B. C. Nelson and R. Iyer, Functionalization-dependentinduction of cellular survival pathways by CdSe quantumdots in primary normal human bronchial epithelial cells,ACS Nano, 2013, 7(10), 8397–8411.
26 A. C. A. Silva, S. L. Vieira de Deus, M. J. B. Silva andN. O. Dantas, Highly stable luminescence of CdSe magic-
This journal is © The Royal Society of Chemistry 2014

Paper Nanoscale
Publ
ishe
d on
03
June
201
4. D
ownl
oade
d by
Uni
vers
idad
e do
Por
to (
UP)
on
30/0
6/20
14 1
3:07
:00.
View Article Online
sized quantum dots in HeLa cells, Sens. Actuators, B, 2014,191, 108–114.
27 D. Djikanovic, A. Kalauzi, M. Jeremic, J. Xu, M. Micic,J. D. Whyte, R. M. Leblanc and K. Radotic, Interaction ofthe CdSe quantum dots with plant cell walls, Colloids Surf.,B, 2012, 91, 41–47.
28 K. Pathakoti, H. M. Hwang, H. Xu, Z. P. Aguilar and A. Wang,In vitro cytotoxicity of CdSe/ZnS quantum dots with differentsurface coatings to human keratinocytes HaCaT cells, J.Environ. Sci., 2013, 25(1), 163–171.
29 Corazzari, A. Gilardino, S. Dalmazzo, B. Fubini andD. Lovisolo, Localization of CdSe/ZnS quantum dots in thelysosomal acidic compartment of cultured neurons and its
This journal is © The Royal Society of Chemistry 2014
impact on viability: Potential role of ion release, Toxicol. inVitro, 2013, 27, 752–759.
30 Q. Wang, F. Ye, T. Fang, W. Niu, P. Liu and X. Li, Bovineserum albumin-directed synthesis of biocompatible CdSequantum dots and bacteria labelling, J. Colloid InterfaceSci., 2011, 355, 9–14.
31 Q. Wang, F. Ye, T. Fang, W. Niu, P. Liu, X. Min, X. Li andS. Iijima, Helical microtubules of graphitic carbon, Nature,1991, 354, 56–58.
32 F. Wurthner, T. E. Kaiser and C. R. Saha-Moller, J-Aggregates: From serendipitous discovery tosupramolecular engineering of functional dye materials,Angew. Chem., Int. Ed., 2011, 50(15), 3376–3410.
Nanoscale