Ventilation Rates Estimated from Tracers in the Presence of Mixing
Upload
sorbonne-frCategory
view
0download
0
Carbon and oxygen net community production in the eastern tropicalAtlantic estimated from a moored buoy
Nathalie Lefèvre1 and Liliane Merlivat1
Received 14 December 2010; revised 7 June 2011; accepted 1 November 2011; published 24 January 2012.
[1] A mooring at 6°S, 10°W has been equipped with an oxygen optode and a Cariocasensor for monitoring hourly oxygen (O2) and the fugacity of CO2 (fCO2) at 1.5 mdepth since June 2006. Due to biofouling, the oxygen time series lasted between 72 daysin 2008 to 159 days in 2009. Using an alkalinity-salinity relationship determined forthe area, dissolved inorganic carbon (DIC) is calculated. Short-term and long-term netcommunity productions (NCP) are calculated using a mass balance approach for DICand O2 under the assumption of no mixing conditions. The mooring site is alwayssupersaturated in oxygen except in 2007 when depleted oxygen waters are observed fromJune to September, during the upwelling season. Averaging all the short time events,NCP calculated from the rates of changes of O2 and DIC leads to a NCP of 16.6 �6.1 mmol C m�2d�1, ranging from 14.7 mmol C m�2d�1 in 2008 to 17.4 mmol C m�2d�1
in 2006. The mean daily oxygen biological production rate determined over the wholetime series shows a significant year to year variability with 7.5 mmol C m�2d�1 in 2008 to15.6 mmol C m�2d�1 in 2009. A photosynthetic quotient ranging between 1.0 to 1.3has been determined when both carbon and oxygen NCP values are available.
Citation: Lefèvre, N., and L. Merlivat (2012), Carbon and oxygen net community production in the eastern tropical Atlanticestimated from a moored buoy, Global Biogeochem. Cycles, 26, GB1009, doi:10.1029/2010GB004018.
1. Introduction
[2] The net community production (NCP) is an importantaspect of the carbon cycle because the biological consump-tion of carbon decreases the surface fugacity of CO2 (fCO2)and hence, alters the air-sea exchange of CO2. NCP mea-sures the biota contribution to the marine carbon cycle.[3] Because of the difficulty of measuring NCP, there are
not many measurements available and current NCP rates arepoorly known in many regions of the ocean [Quay et al.,2010]. In addition, the processes that regulate NCP, grossprimary production (GPP) and respiration (R) are poorlyunderstood. The traditional method of determining NCP isby measuring gross production and respiration from in vitrochanges of dissolved oxygen using light and dark incuba-tors. NCP has also been determined by the means of geo-chemical budgets using oxygen or dissolved inorganiccarbon [Neuer et al., 2007]. The similar solubility of oxygenand argon (Ar) gases has been used to determine NCP as Aris not involved in biological processes unlike O2 [e.g.,Emerson et al., 1997; Kaiser et al., 2005; Luz and Barkan,2009; Quay et al., 2010]. The pair O2/N2 has also beenused although the solubility of nitrogen gas is different fromthe one of oxygen [e.g., Emerson et al., 2008].
[4] However, geochemical and biological approaches givedifferent estimates of NCP, which leads to uncertaintiesabout the metabolic state of the ocean [Karl et al., 2003].Tropical and subtropical area are remineralization intensivesystems [Quay et al., 2010], therefore, GPP is close to R anderrors can be made more easily about the autotrophy orheterotrophy of such systems. Mouriño-Carballido andAnderson [2009] determined NCP using in vitro and in situ1-D modeling techniques and found that in vitro estimateswere systematically lower than the model-derived techni-ques so that heterotrophy was observed with in vitro esti-mates but not with the model derived estimates in theSargasso Sea. The geochemical approach integrates NCPover larger temporal and spatial scales than bottle measure-ments made over a few hours at a given location. This is onepossible explanation for the discrepancy between the NCPestimates given by the two approaches. Methodologicalartifacts associated with in vitro techniques have also beensuggested as another explanation [e.g., Mouriño-Carballidoand Anderson, 2009; Quay et al., 2010].[5] The knowledge of NCP in tropical areas is also of
interest because, although NCP fluxes are relatively smallin these regions, they correspond to large area of the oceanso the biological consumption of carbon can represent animportant fraction of the ocean carbon biological pump.[6] The aim of the present work is to provide new NCP
measurements in the eastern tropical Atlantic (6°S, 10°W)based on continuous time series of physical and chemicaldata measured on a moored buoy over the period 2006–2009.This paper provides an in situ estimation of net community
1LOCEAN, UMR7159, Université Pierre et Marie Curie, CNRS, IRD,MNHN, Paris, France.
Copyright 2012 by the American Geophysical Union.0886-6236/12/2010GB004018
GLOBAL BIOGEOCHEMICAL CYCLES, VOL. 26, GB1009, doi:10.1029/2010GB004018, 2012
GB1009 1 of 14
production based on carbon and oxygen measurements. Thecarbon estimated NCP is based on the analysis of the distri-bution of dissolved inorganic carbon (DIC) calculated fromhourly records of fCO2 at the ocean surface (1.5 m depth) asdone by Parard et al. [2010]. Here, we focus on oxygenmeasurements. An oxygen mass balance approach is used toestimate NCP that is directly comparable to the carbon-basedNCP values, and to calculate a mean daily oxygen biologicalproduction over the duration of the time series. The resultsare then discussed and compared with previous estimates ofNCP for the tropical and subtropical ocean.
2. Data and Methods
2.1. Data at the Mooring Site
[7] A CARIOCA CO2 sensor and an Aanderaa 3830optode have been installed on the 6°S, 10°W buoy [N. Lefèvreet al., 2008] of the PIRATA (Prediction and ResearchMoored Array in the Tropical Atlantic) network sinceJune 2006. One objective of this network of moored buoysis to monitor the ocean circulation [Bourlès et al., 2008].Each buoy is equipped with Seabird sensors for measuringtemperature and salinity at different depths. Wind speed isrecorded at a height of 4 m. At 6°S, 10°W, ocean temperatureis measured at 1.5 m, 20 m, 40 m, 60 m, 80 m, 100 m, 120 m,140 m, 180 m, 300 m and 500 m. Salinity is measured at1.5 m, 20 m, 40 m and 120 m. Because of the coarser verticalresolution of salinity measurements, the mixed layer depth isestimated from the temperature profiles at the mooring.Mixed layer depths are also calculated from ARGO floatswhich were within �100 km and �10 days of the mooring.There was no ARGO float meeting these criteria in 2007and in 2008. The mixed layer depth is estimated when thetemperature gradient from the surface exceeds 0.1°C.[8] The fugacity of CO2, the dissolved oxygen concen-
tration, the sea surface temperature and the sea surfacesalinity are measured at a depth of 1.5 m on an hourly basisand are transmitted by Argos. Atmospheric pressure is alsomeasured. The CO2 sensor and the oxygen optode arereplaced every year during the cruise servicing the PIRATAmoorings. The dates of the replacement are 8 June 2006,29 June 2007, 17 September 2008 and 11 July 2009. ThefCO2 data from 2006 to 2009 have been published byParard et al. [2010]. The first sensor lasted one year butelectronic or mechanical failures explain the differentlengths of the time series. In 2008 and 2009, the time seriesare much shorter (Table 1). Total alkalinity was estimatedfrom salinity using seawater samples taken in this region.The error on predicted alkalinity is�11 mmol/ kg [N. Lefèvreet al., 2008]. Dissolved inorganic carbon was then calcu-lated from fCO2, TA, SST and SSS using the dissociationconstants of Mehrbach et al. [1973] refitted by Dickson andMillero [1987]. An error of 1 mmol kg�1 on TA leads to an
error of 0.8 mmol kg�1 on DIC so our value of DIC isaccurate at �8.8 mmol kg�1.
2.2. Oxygen Measurements
[9] The oxygen optode is calibrated in fresh water in thelaboratory before deployment using a zero and 100%oxygen reference points. No drift is detected when the optodeis retrieved. However, absolute oxygen values can be differ-ent from the oxygen measurements made by the Winklermethod. Therefore, the optode data are calibrated againstthe Winkler measurements made during the cruise for ser-vicing the mooring. A constant offset was applied to correctthe data. Johnson [2010] compared the optode measure-ments recorded at a time series off Monterey Bay, California,with shipboard measurements made using theWinkler method.He found an offset between the two techniques, but it remainedconstant over the 5 months period of his record.[10] Oxygen saturation, O2 sat (in mmol kg�1) is calculated
using the equation of García and Gordon [1992]. Thedegree of O2 saturation, in percent, is given by:
% O2 sat ¼ ð½O2�=½O2sat�Þ � 100 ð1Þ
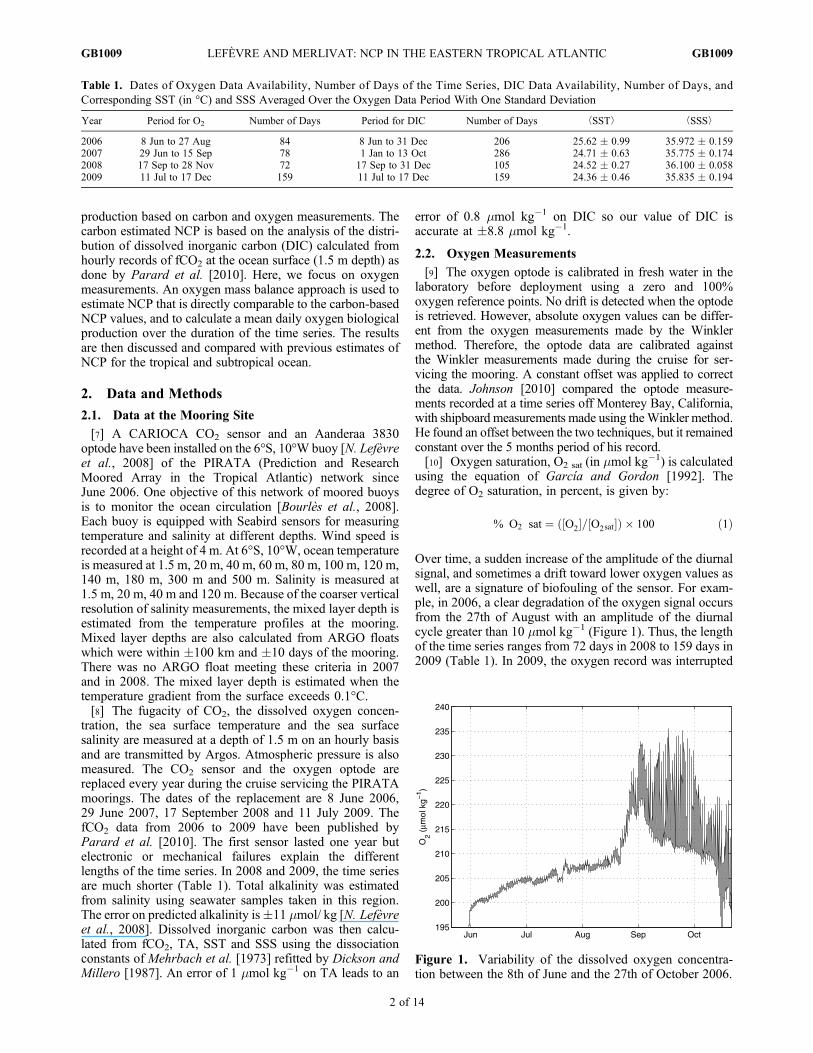
Over time, a sudden increase of the amplitude of the diurnalsignal, and sometimes a drift toward lower oxygen values aswell, are a signature of biofouling of the sensor. For exam-ple, in 2006, a clear degradation of the oxygen signal occursfrom the 27th of August with an amplitude of the diurnalcycle greater than 10 mmol kg�1 (Figure 1). Thus, the lengthof the time series ranges from 72 days in 2008 to 159 days in2009 (Table 1). In 2009, the oxygen record was interrupted
Table 1. Dates of Oxygen Data Availability, Number of Days of the Time Series, DIC Data Availability, Number of Days, andCorresponding SST (in °C) and SSS Averaged Over the Oxygen Data Period With One Standard Deviation
Year Period for O2 Number of Days Period for DIC Number of Days ⟨SST⟩ ⟨SSS⟩
2006 8 Jun to 27 Aug 84 8 Jun to 31 Dec 206 25.62 � 0.99 35.972 � 0.1592007 29 Jun to 15 Sep 78 1 Jan to 13 Oct 286 24.71 � 0.63 35.775 � 0.1742008 17 Sep to 28 Nov 72 17 Sep to 31 Dec 105 24.52 � 0.27 36.100 � 0.0582009 11 Jul to 17 Dec 159 11 Jul to 17 Dec 159 24.36 � 0.46 35.835 � 0.194
Figure 1. Variability of the dissolved oxygen concentra-tion between the 8th of June and the 27th of October 2006.
LEFÈVRE AND MERLIVAT: NCP IN THE EASTERN TROPICAL ATLANTIC GB1009GB1009
2 of 14
because of the general failure of the electronics of the system(seawater in the system), but no biofouling was observedover the 159 period, probably because of the addition of acopper mesh on the optode. Although copper reacts withseawater and can modify the pH, we did not find any sig-nificant difference between optode measurements with orwithout the copper mesh from experiments done in labora-tory. In 2008, a shift of oxygen data of 18 mmol kg�1 in fourdays has been observed, after a period of 10 days, withoutany sign of biofouling. The shift might have been caused byan electronic interference as the amplitude of the diurnalcycle is correct. The data corresponding to the shift weredisregarded. There is neither an increase of diurnal ampli-tude nor a drift. Therefore, we simply apply an offset of18 mmol kg�1 to the data. After applying this offset,the November 2008 data are in good agreement with theNovember 2006 Winkler value.
2.3. Calculation of Air-Sea Fluxes
[11] The air-sea CO2 flux is calculated in mmol m�2d�1
by the following equation:
FCO2 ¼ kCO2aCO2 f CO2sea � f CO2atmð Þ ð2Þ
where aCO2 is the solubility of CO2 [Weiss, 1974], fCO2sea
the fugacity of CO2 in seawater (in matm), fCO2atm thefugacity of CO2 in the atmosphere and kCO2 is the gas transfervelocity (in m d�1) for CO2. fCO2atm is computed from themonthly molar fraction xCO2 at the atmospheric station atAscension Island (7.92°S, 14.92°W) of the NOAA/ESRLGlobal Monitoring Division (http://esrl.noaa.gov/gmd/ccgg/iadv), the water vapor pressure ofWeiss and Price [1980] andthe atmospheric pressure recorded at the mooring.[12] Injection of air bubbles below the air-water interface
is neglected for the calculation of the CO2 flux but thiscontribution to the flux can be relatively important for oxy-gen as it is a less soluble gas. The equation of the O2 flux isthen given by:
FO2 ¼ kO2 r O2½ � � O2 sat½ �ð Þ � Fbub ð3Þ
where kO2 is the gas transfer velocity (in m d�1), r is thedensity of seawater (in kg m�3) and Fbub is the contributionof air bubbles calculated with the formula given by Woolfand Thorpe [1991]:
Fbub ¼ kO2 r 0:01 U=U0
� �2O2 sat½ � ð4Þ
where U is the wind speed at 10m height in ms�1 and U0 amodel-derived constant for O2 of 9 ms�1. Mouriño-Carballido and Anderson [2009] showed that this bubbleflux formula gave similar results to the formula used byStanley et al. [2009]. The total oxygen flux becomes:
FO2 ¼ kO2 r O2½ � � O2 sat½ � 1þ 1:23 10�4 U2� �� � ð5Þ
It results from this equation that the flux is positive whenthere is outgassing to the atmosphere. The fluxes areexpressed in mmol m�2d�1.[13] For both CO2 and O2, the gas transfer velocity (in cm/h)
is calculated using the formula of Sweeney et al. [2007]:
K ¼ 0:27 U2 ð660=ScÞ0:5 ð6Þ
where Sc is the Schmidt number, ScCO2, for CO2 or ScO2 for O2
[Wanninkhof, 1992].[14] The daily wind speed recorded at the mooring at 4 m
is converted to a 10 m wind speed and interpolated at hourlyscale to compute hourly fluxes.
2.4. Calculation of in Situ Net Community Production
[15] NCP has been previously calculated, at daily scale,from daily cycles of DIC on drifting Carioca buoys [Boutinand Merlivat, 2009; Merlivat et al., 2009].[16] Depending on atmospheric forcing conditions, a
warm diurnal layer can be formed during the daylight period[e.g.,McNeil and Farmer, 1995;Merlivat et al., 2009;Wadeet al., 2011]. In particular, it was evidenced at the PIRATAmoorings at 10°W [Wade et al., 2011]. In this surface layer,biological activity occurs from the sunrise to the sunset.During daytime, DIC decreases and O2 increases due toproduction. DIC reaches a minimum and O2 a maximumwhen respiration compensates production. At night, themixed layer deepens and maximum of DIC and minimum ofO2 are observed mainly at the end of nocturnal convection.[17] Biological processes, i.e., photosynthesis and respi-
ration, and air-sea exchange are the mechanisms responsiblefor the change in DIC and O2 during the daylight periodat the sampling depth of the water, 1.5 m. This assumesthat mixing due to lateral advection is negligible, and thatno vertical supply occurs during daylight as the mixedlayer is shoaling. At night, convection mixes the warmlayer, established during daylight, down to the lower levelsof the MLD, bringing cold deeper water, richer in DIC, tothe surface.[18] DDICMax is the change of the maximum of DIC
computed across two consecutive mornings at the end ofthe nocturnal convection within the mixed layer (thick-ness h) as done by Parard et al. [2010]. Net communityproduction and air-sea exchange over one day within themixed layer are the processes responsible for these changesof DIC:
DDICMax
Dt¼ NCPh � 1
rFCO2
hð7Þ
where r is the density of seawater (in kg m�3), NCPh isthe net community production of carbon in the mixed layer(in mmol kg�1).[19] The oxygen concentration in the surface layer is
affected by air-sea exchange, injection of air bubbles,entrainment of water from below during mixed layer deep-ening, lateral advection from surrounding waters and bio-logical activity. Horizontal advection can be neglected foroxygen because of the rapid exchange with the atmosphere.Therefore, a one dimensional model is assumed and thechange of mixed-layer oxygen concentration as a function oftime can be written as follows:
h d O2½ �dt
¼ �kO2r O2½ � � O2 sat½ �ð Þ þ Fbub þ dh
dtO2½ �sub � O2½ �� �þ J
ð8Þ
where h is the mixed layer depth in m, [O2]sub is the oxygenconcentration below the mixed layer and J is the biologicalproduction in mol m�2d�1.
LEFÈVRE AND MERLIVAT: NCP IN THE EASTERN TROPICAL ATLANTIC GB1009GB1009
3 of 14

[20] Assuming a photosynthetic quotient, PQ, equal to 1.4[Laws, 1991], NCP expressed in mmol C m�2d�1 is given by:
NCP ¼ �NCPO2=1:4 ð9Þ
As a decrease of DIC due to biological processes does notchange alkalinity significantly, a change of alkalinity (i.e.,salinity) is the result of advection. Therefore, alkalinity isused to check the assumption of no advection made forthis calculation.
3. Processes Affecting the O2 and CO2
Distribution
[21] The mooring at 6°S, 10°W is located in the westward-flowing South Equatorial Current (SEC). The equatorialupwelling is further north (0–4°S) of the mooring and thecoastal Congo-Gabon upwelling is further east. These twoupwellings merge and form a cold tongue that propagateswithin the SEC, which explains the lower temperature recordedat the mooring [N. Lefèvre et al., 2008; Parard et al., 2010].The Atlantic cold tongue develops between June to Octoberfrom the African coast to about 20°W and shows some spatialand temporal variability [Caniaux et al., 2011]. The satelliteimage of SST for July 2006 highlights the propagation of thecold tongue with cold water of the equatorial upwelling andcold water coming from the eastern southern part of the regionand merging with the equatorial upwelling (Figure 2).[22] The optode worked for different periods of time,
between June and December, from 2006 to 2009 (Table 1).Over the length of each time series, the mean surface tem-perature and salinity are not significantly different from oneyear to another. The amplitude of the seasonal cycle at thissite is relatively small with an average of 5°C.[23] The oxygen distribution at 6°S, 10°W varies from
year to year with lower values observed in June and highervalues from September to December (Figure 3a). Theamplitude of oxygen variations is rather small with a valueof 21 mmol/kg in 2006, and a maximum of 31 mmol/kg overall the years. In 2009, when the longest record of oxygendata is obtained, the difference between the maximum andthe minimum oxygen values is less than 15 mmol/kg.
[24] The mooring site is mostly supersaturated in oxygen,except in 2007 when the water is undersaturated from Juneto September (Figure 3b) during the upwelling season. Oxy-gen increases are caused by biological activity. Upwellingregions are usually characterized by oxygen undersaturation[e.g., Garcia and Keeling, 2001; Najjar and Keeling, 2000]because the subsurface layers, brought to the surface, areoxygen depleted due to respiration and remineralization.However, there is no evidence of a stronger upwelling in 2007compared to 2006 and 2008 [Caniaux et al., 2011] that couldexplain the undersaturation in 2007. This might be due to abias in the optode data but the oxygen measurements madeduring the cruise also show lower oxygen values in 2007.[25] Although strong horizontal gradients of temperature
are observed during the propagation of the cold tongue[Caniaux et al., 2011], the oxygen distribution does notexhibit large variations. From June to September, SSTdecreases by more than 3°C due to the propagation of the coldtongue but the oxygen concentration increases. However, thepropagation of upwelled waters should lead to a decreaseof oxygen as they have lower oxygen content than surfacewaters. This suggests that rapid oxygen exchange occurs withthe atmosphere and counterbalances the decrease of oxygendue to the propagation of upwelled waters. Thus, the impact ofhorizontal advection can be neglected. This assumption wasalso made at the Hawaii Ocean time series station [Emersonet al., 2008]. At other mooring sites, horizontal advectioncan be significant. For example, at station P, Emerson andStump [2010] reported strong horizontal gradients.[26] For fCO2 and DIC, horizontal advection cannot be
neglected, the cold tongue supplies CO2 rich waters and gasexchange is not fast enough to obtain an fCO2 close toequilibrium conditions. During the upwelling season, fCO2
increases. In 2006, fCO2 varied by 90 matm and DIC by70 mmol/kg [Parard et al., 2010]. On the contrary, theamplitude of the oxygen concentration remains small, lessthan 10 mmol/kg.[27] Oxygen concentrations always increase from June to
September during the propagation of the cold tongue whenSST decreases. This suggests that biological activity dom-inates during the upwelling season. Different water massesare observed at the mooring and explain the variability ofthe sea surface salinity (Figure 3d). The high frequencyvariability of the oxygen and SST data are caused by thediurnal cycle.[28] The maximum of solar radiation is observed around
12–13 h local time. The SST maximum is delayed by about2 h, which corresponds to the time it takes to warm up themixed layer. In some cases, such as the period from 6 to11 July 2006, the oxygen maximum is associated with theSST maximum (Figure 4a). Other processes counterbalancethe biological processes on the DIC distribution. During theupwelling season, lateral advection is significant because ofthe propagation of the cold tongue, rich in CO2. A diurnalcycle of oxygen can be observed without a clear DIC signalassociated with it. Some periods of the time series arecharacterized by a maximum of O2 occurring about twohours after the maximum of SST, as illustrated by the dis-tribution of O2 and SST during the 12–16 August 2006period (Figure 4b). However, the time series shows a broadmaximum of oxygen during the daylight period consistent
Figure 2. Three day composite of SST of 1 July 2006 fromthe TRMM (Tropical Rain Mission Measurements) Micro-wave Imager (TMI) with location of the mooring at 6°S,10°W.
LEFÈVRE AND MERLIVAT: NCP IN THE EASTERN TROPICAL ATLANTIC GB1009GB1009
4 of 14

Figure 3. Variability of (a) dissolved oxygen, (b) oxygen saturation, (c) SST and (d) surface salinity at6°S, 10°W as a function of time. The squares, cross, circle and diamonds correspond to the oxygen datamade by Winkler titration in 2006, 2007, 2008 and 2009 respectively.
Figure 4. Diurnal cycles of SST, O2 and DIC for (a) 6–11 July 2006 and (b) 12–16 August 2006 as afunction of the day and time of the year.
LEFÈVRE AND MERLIVAT: NCP IN THE EASTERN TROPICAL ATLANTIC GB1009GB1009
5 of 14

Figure 5. Number of occurrences of the daily maximum of O2 (dotted line with diamonds, in black),maximum of solar radiation (dash dotted line, in blue), maximum of SST (solid line with crosses,in red), minimum of DIC (dash line with triangles, in green) as a function of the hour of the day for(a) 2006, (b) 2007, (c) 2008 and (d) 2009.
Figure 6. (a) Air-sea fluxes of O2, including the bubbles contribution, from 2006 to 2009 as a functionof time. A positive flux corresponds to outgassing of O2. (b) Air-sea fluxes of CO2 from 2006 to 2009(positive for outgassing).
LEFÈVRE AND MERLIVAT: NCP IN THE EASTERN TROPICAL ATLANTIC GB1009GB1009
6 of 14

with production by biological activity. During that Augustperiod, a diurnal cycle of DIC is observed with a minimumof DIC close to the time of the maximum of O2.[29] Using the data over the periods of available oxygen
for the years 2006 to 2009, the daily maxima of O2, SST andsolar radiation, and the daily minimum of DIC are deter-mined and the number of occurrences of these extrema areplotted as a function of the hour of the day for each timeseries (Figure 5). In 2009, there are no solar radiation mea-surements. The maximum of O2 occurs mostly at 16 h whilethe maximum of SST is at 14 h, 7.5 h after sunrise and twohours after the maximum of solar radiation (Figure 5). Thereis no clear minimum of DIC except in 2008 when the min-imum occurs mostly at 14 h at the time of the maximumSST. This suggests that the biological processes duringdaylight are less pronounced on DIC compared to O2. In2008, the period of measurements is after the upwellingseason, from mid-September onwards. Therefore, lateraladvection is less important than during the propagationof the cold tongue. This might explain why the DIC signal ismore visible in 2008, compared to the other years, with aminimum broadly coinciding with the oxygen maximum.[30] In addition to convection and biological activity,
gas exchange affects both O2 and CO2 (hence DIC). O2
exchanges more rapidly with the atmosphere than CO2 sodifferences between DIC and O2 could be due to the differ-ent time constants of the processes involved. The oxygenflux, including the contribution of bubbles, is about tentimes larger than the air-sea CO2 flux (Figure 6) and thediurnal cycle is visible (Figure 6a). A sensitive study can bedone to evaluate the impact of air-sea gas exchange on thediurnal cycling of O2 and DIC. Under the assumption of nomixing, and using the relationship between the NCP based
on O2 and carbon (equation (9)), the mass balance equationsfor O2 and DIC become:
hdDIC
dt¼ NCP � FCO2 ð10Þ
hdO2
dt¼ �1:4NCP � 10FCO2 ð11Þ
Assuming a mean FCO2 of 5 mmol m�2d�1 and a mean NCPof 20 mmol m�2d�1, and after taking the ratio of theseequations, a relationship between the O2 and DIC variationsis obtained:
dO2
dt¼ �5
dDIC
dtð12Þ
The amplitude of the diurnal changes of oxygen is about 5times greater than those of DIC if we take into account theimpact of the gas exchange only.[31] The oxygen flux is mostly toward the atmosphere
(positive values) except in 2007 when it is into the ocean.The mooring site is a source of CO2 except in June 2006where a slight undersaturation is observed before the prop-agation of the cold tongue that supplies CO2 rich waters.
4. Quantification of Biological Processes
4.1. In Situ Net Community Production
[32] When alkalinity variations are less than 1 mmol/kg,we assume that lateral advection and vertical mixing can beneglected. Net community production is calculated usingthe mass balance equations for DIC and O2 (equations (7)and (8)) for short-term biological events. For each year,
Figure 7. (top) O2 distribution between 29 July and 23 August 2009 at the 6°S, 10°W site. The solidlines correspond to the variations of the minima of O2 over the 30 July–3 August, 3–6 August, 6–9 August,11–18 August and 19–23 August 2009 periods. (bottom) DIC (solid line) and alkalinity (dash line) distri-butions over the same period as O2.
LEFÈVRE AND MERLIVAT: NCP IN THE EASTERN TROPICAL ATLANTIC GB1009GB1009
7 of 14
periods of several days are identified when the criteria of noadvection and biological drawdown are met, which corre-sponds to short-term events. The air-sea flux is calculatedand the mixed layer is determined from the temperature
profiles at the PIRATA mooring or nearby Argo floats. Azoom for the month of August 2009 illustrates how thebiological periods are detected from the hourly distributionsof O2 and DIC (Figure 7).
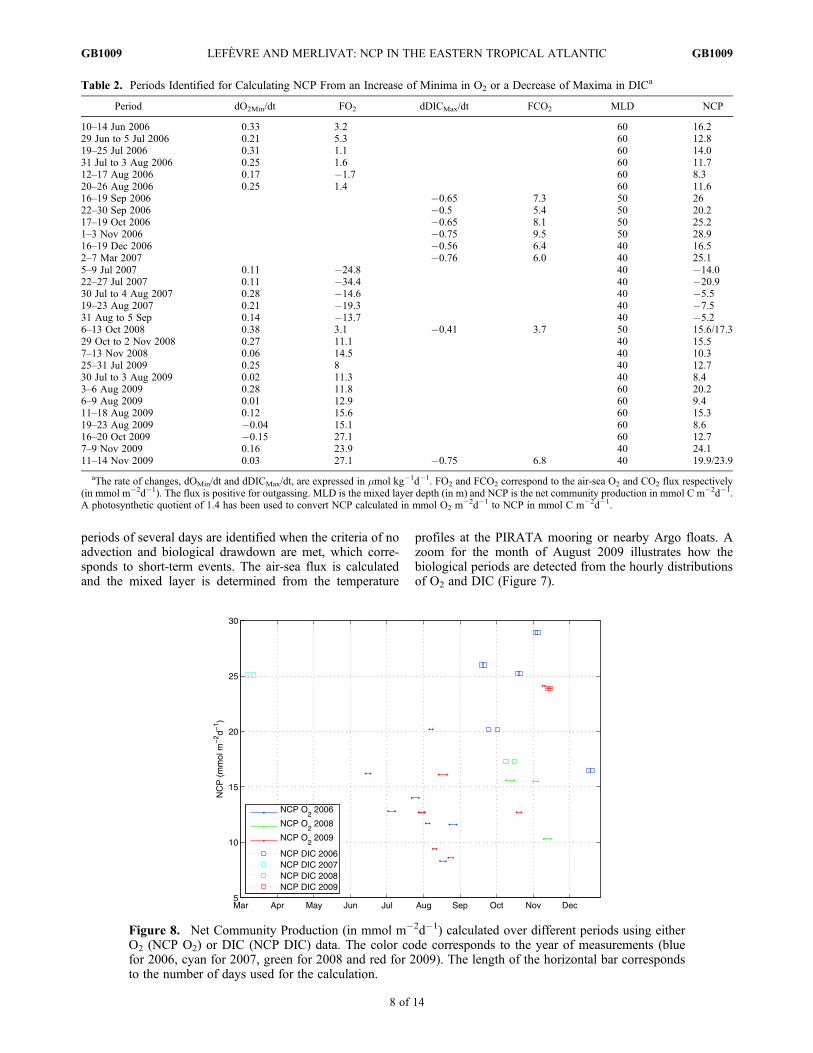
Table 2. Periods Identified for Calculating NCP From an Increase of Minima in O2 or a Decrease of Maxima in DICa
Period dO2Min/dt FO2 dDICMax/dt FCO2 MLD NCP
10–14 Jun 2006 0.33 3.2 60 16.229 Jun to 5 Jul 2006 0.21 5.3 60 12.819–25 Jul 2006 0.31 1.1 60 14.031 Jul to 3 Aug 2006 0.25 1.6 60 11.712–17 Aug 2006 0.17 �1.7 60 8.320–26 Aug 2006 0.25 1.4 60 11.616–19 Sep 2006 �0.65 7.3 50 2622–30 Sep 2006 �0.5 5.4 50 20.217–19 Oct 2006 �0.65 8.1 50 25.21–3 Nov 2006 �0.75 9.5 50 28.916–19 Dec 2006 �0.56 6.4 40 16.52–7 Mar 2007 �0.76 6.0 40 25.15–9 Jul 2007 0.11 �24.8 40 �14.022–27 Jul 2007 0.11 �34.4 40 �20.930 Jul to 4 Aug 2007 0.28 �14.6 40 �5.519–23 Aug 2007 0.21 �19.3 40 �7.531 Aug to 5 Sep 0.14 �13.7 40 �5.26–13 Oct 2008 0.38 3.1 �0.41 3.7 50 15.6/17.329 Oct to 2 Nov 2008 0.27 11.1 40 15.57–13 Nov 2008 0.06 14.5 40 10.325–31 Jul 2009 0.25 8 40 12.730 Jul to 3 Aug 2009 0.02 11.3 40 8.43–6 Aug 2009 0.28 11.8 60 20.26–9 Aug 2009 0.01 12.9 60 9.411–18 Aug 2009 0.12 15.6 60 15.319–23 Aug 2009 �0.04 15.1 60 8.616–20 Oct 2009 �0.15 27.1 60 12.77–9 Nov 2009 0.16 23.9 40 24.111–14 Nov 2009 0.03 27.1 �0.75 6.8 40 19.9/23.9
aThe rate of changes, dOMin/dt and dDICMax/dt, are expressed in mmol kg�1d�1. FO2 and FCO2 correspond to the air-sea O2 and CO2 flux respectively(in mmol m�2d�1). The flux is positive for outgassing. MLD is the mixed layer depth (in m) and NCP is the net community production in mmol C m�2d�1.A photosynthetic quotient of 1.4 has been used to convert NCP calculated in mmol O2 m
�2d�1 to NCP in mmol C m�2d�1.
Figure 8. Net Community Production (in mmol m�2d�1) calculated over different periods using eitherO2 (NCP O2) or DIC (NCP DIC) data. The color code corresponds to the year of measurements (bluefor 2006, cyan for 2007, green for 2008 and red for 2009). The length of the horizontal bar correspondsto the number of days used for the calculation.
LEFÈVRE AND MERLIVAT: NCP IN THE EASTERN TROPICAL ATLANTIC GB1009GB1009
8 of 14
[33] Over the periods of 3–6 August and 11–18 August2009, a regular increase of O2 is detected (Figure 7, top).Over the 30 July–3 August and 6–9 August periods, not-withstanding a clear daylight biological activity as indicatedby the diurnal cycle of O2, the O2 minimum is almost con-stant (Figure 7, top). This indicates that the amount of O2
produced by the biological processes just compensate theloss by air-sea exchange. The DIC variability over theAugust month is different from the O2 distribution (Figure 7,bottom). While over the period 11–18 August, the O2 mea-surements indicate a significant biological activity, DIC atthe opposite increases. During that period, alkalinity (esti-mated from salinity) increases as well, which suggests thatmixing with another water mass occurs. This is probably dueto horizontal advection that affects the DIC distribution to agreater extent than the oxygen distribution. As previouslyreported [e.g., Emerson and Stump, 2010], lateral advectionis of minor importance to the mass balance of major atmo-spheric gases except CO2. After examining the entire timeseries, several periods of diurnal cycles could be identifiedand NCP could be calculated from either the increase of O2
minima or a decrease of DIC maxima over time (Table 2).As expected, NCP is more frequently calculated from O2
than from DIC (Figure 8), even though the time series forDIC is longer than for O2, because of the smaller impact ofadvection on oxygen compared to DIC. A few NCP valuescould be calculated from DIC mainly after the upwellingseason when advection is weaker. During the 6–13 October2008 and 11–14 November 2009, NCP could be determinedfrom both O2 and DIC. For the periods in 2007, the NCP isnegative (Table 2) because of the negative air-sea flux of O2.With the exception of this period, the NCP values rangebetween 8.3 and 28.9 mmol C m�2d�1 and NCP calculatedfrom O2 is in reasonable agreement with those calculated
from DIC but slightly lower. Excluding the NCP valuesof 2007, the mean NCP based on O2 calculation is 13.7 �4.4 mmol C m�2d�1 is slightly lower than the NCP based oncarbon calculation of 22.9 � 4.4 mmol C m�2d�1. Thisleads to an overall NCP of 16.6 � 6.1 mmol C m�2d�1 with17.4 � 6.8 mmol C m�2d�1 in 2006, 14.7 � 3.0 mmol Cm�2d�1 in 2008 and 15.5 � 6.1 mmol C m�2d�1 in 2009.Except for the year 2007 that is very different from the otheryears during the upwelling season, there is no significantvariability from year to year and from month to month. Thesurface NCP values are scattered around the mean withslightly lower estimates for NCP based on oxygen suggest-ing that the PQ value of 1.4 is too high. These NCP valuesare calculated during short periods of time when there isbiological activity. However, there are periods when nobiological activity occurs or when remineralization dom-inates. This implies that these estimates are upper estimatesand that the mean NCP over the whole time series is lower.
4.2. Long-Term Oxygen Biological Production
[34] The detection of O2 or DIC gradients and the con-straint on advection limit the calculation of NCP to a fewperiods over the whole time series. In order to derive anestimate of the mean biological activity in surface waters atthis site, oxygen biological production has been determinedusing the method described by Emerson et al. [2008] andapplied at the Hawaii Ocean time series (HOT) station.Equation (8) is used to estimate the biological productionrate over the whole time series by calculating the other termsof the equation.[35] The coarse vertical resolution of temperature does not
allow an accurate calculation of the mixed layer depth.Using the available profiles, the mixed layer did not changesignificantly so the entrainment is neglected (dh/dt = 0)
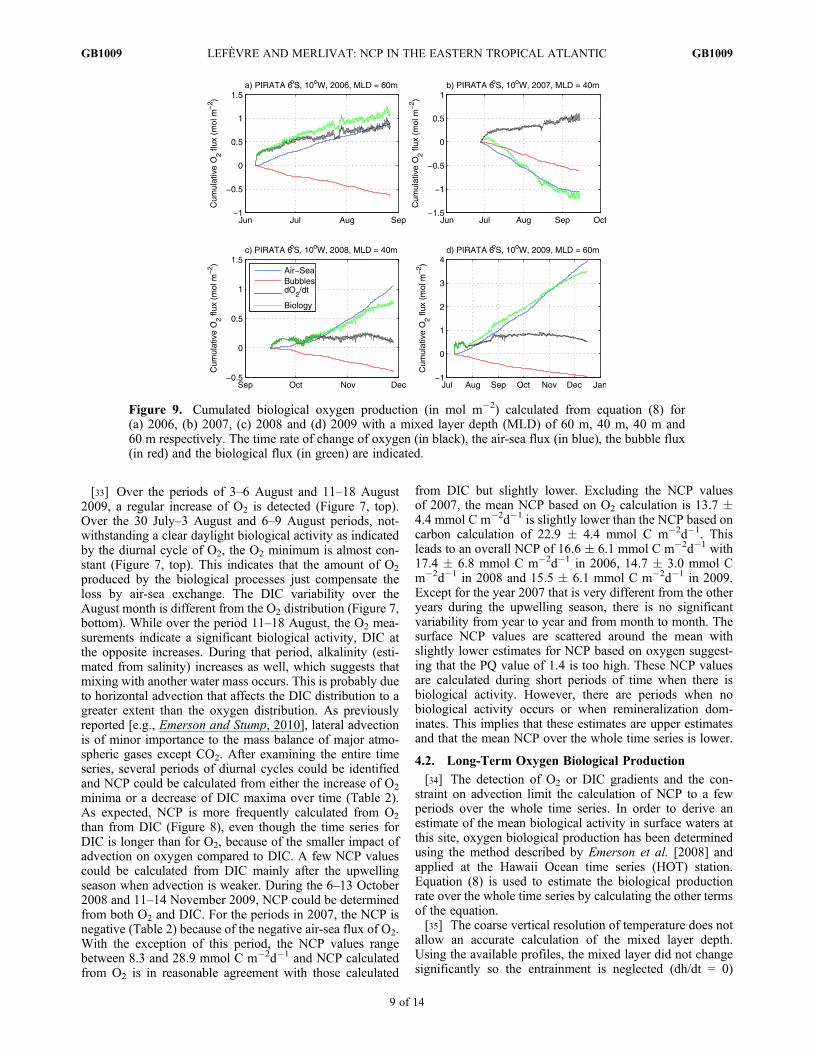
Figure 9. Cumulated biological oxygen production (in mol m�2) calculated from equation (8) for(a) 2006, (b) 2007, (c) 2008 and (d) 2009 with a mixed layer depth (MLD) of 60 m, 40 m, 40 m and60 m respectively. The time rate of change of oxygen (in black), the air-sea flux (in blue), the bubble flux(in red) and the biological flux (in green) are indicated.
LEFÈVRE AND MERLIVAT: NCP IN THE EASTERN TROPICAL ATLANTIC GB1009GB1009
9 of 14

and the change of oxygen concentration is assumed to beaffected by air-sea exchange, bubbles injection and biolog-ical activity. The biological production is then calculated bythe difference of all the terms in equation (11). The mixedlayer depth is set to 60 m for 2006 and 2009, and to 40 m for2007 and 2008. The different terms, air-sea O2 flux, bubblesinjection, biological flux and time rate of change in themeasured oxygen concentration, are presented as cumulativeO2 flux in mol m�2 (Figure 9). The air-sea O2 flux is animportant component but in 2006 it is almost compensatedby the bubbles contribution and the biological flux is sim-ilar to the observed changes of oxygen concentrations. In2007, the situation is unusual with a negative biologicalproduction. For each year, the biological production is asimportant as the air-sea O2 flux. The mean daily net bio-logical oxygen production rates converted to carbon pro-duction, using a ratio of 1.4, are 9.4 mmol C m�2d�1 for
2006,�10.9 mmol C m�2d�1 for 2007, 7.5 mmol C m�2d�1
for 2008 and 15.6 mmol C m�2d�1 for 2009 over the periodof data. In 2008, the oxygen record is after the upwellingseason and the biological production is lower than in 2006and 2009. The net biological oxygen production is signifi-cantly different from year to year at this location.
4.3. Determination of the Photosynthetic Quotient (PQ)
[36] Oxygen production is converted to carbon consump-tion assuming a photosynthetic quotient of 1.4 [Laws, 1991].Simultaneous values of carbon-based and oxygen-basedNCP allow the calculation of the photosynthetic quotient.Biological activity starts at sunrise and a diurnal mixed layeris formed during the day until the temperature maximum isreached. Then, the solar radiation decreases, causing coolingand mixed layer depth deepening as a consequence of noc-turnal convection. Between sunrise and the SST maximum,
Figure 10. (a) Diurnal cycle of O2 and DIC and (b) SST and salinity for the 6–13 October 2008.(c) NCP calculated from O2 (in mmol O2 kg�1), NCPdaylightO2, as a function of NCP calculated fromDIC (in mmol C kg�1), NCPdaylightC. The 10th of October data point is indicated by a square. The solidline corresponds to a ratio of NCPdaylightO2 over NCPdaylightC of 1.4. The dash line corresponds to meanratio obtained using the data, except the 10th of October point, and gives a value of 1.0.
LEFÈVRE AND MERLIVAT: NCP IN THE EASTERN TROPICAL ATLANTIC GB1009GB1009
10 of 14

O2 increases and DIC decreases due to biological activity.During 6–13 October 2008, both O2 and DIC could be usedto calculate NCP during daylight following the method ofBoutin and Merlivat [2009]. The increase of O2 and thedecrease of DIC occur at the same time (Figure 10a) and arein phase with SST (Figure 10b), which suggests that the DICvariability is dominated by biological activity during thatperiod. The maximum SST is observed later than the statis-tical maximum of the time series and SST increases overthe 7 day period. Over this period, no mixing occurs andthe mean alkalinity is constant with a value of 2368.4 �0.1 mmol/kg as salinity is constant (Figure 10b). In additionto biological uptake, air-sea O2 and CO2 exchanges occur atthe air-sea interface. After removing the contribution of gasexchange, the biological uptake corresponds to the NCPduring daylight. For each day, NCPdaylight can be calculatedfrom O2, NCPdaylight O2, and from DIC, NCPdaylight C,between sunrise and the SST maximum. NCPdaylight O2 isplotted as a function of NCPdaylight C to determine the pho-tosynthetic quotient (Figure 10c). The solid line correspondsto a PQ value of 1.4. The data points are scattered below thisline and the 10th of October (indicated by a square) seemsto be an outlier. On the 10th of October, a sudden peak ofDIC is associated with a larger than 1°C increase withina few hours without any salinity change (Figure 10b). TheNCPdaylight C is affected by the anomaly of DIC. A linear
regression with all the data points gives a PQ value of0.98 � 0.22 and 1.0 � 0.2 if the 10th of October value isremoved. In Table 2, NCP is calculated with oxygen andDIC for the 6–13 October 2008 and 11–14 November 2009periods. The NCP based on oxygen is converted in carbonunits using a PQ of 1.4. Using the original values of oxygenNCP, a PQ of 1.3 and 1.2 is calculated for the 2008 and 2009periods respectively.
5. Discussion
[37] Although NCP estimates based on carbon and onoxygen are in reasonable agreement, the NCP based onoxygen tend to be lower values when a PQ of 1.4 is used.From our estimates the PQ ranges from 1.0 to 1.3. TheRedfield ratio O2:DIC is 1.3 (138:106) but the value com-monly used is 1.4 [Laws, 1991]. Johnson [2010], usingsimultaneous measurements of O2 and DIC, at two mooringsM1 and M2 off Monterey Bay, in California, found �0.77�0.02 and �0.93 � 0.03 respectively for the O2: TCO2 ratio.He explains these low values by the different impact of gasexchange on DIC and O2, the gas exchange for O2 being10 times faster than for CO2. Our calculations indicate thateven after taking into account the gas exchange the O2:TCO2
tends to be slightly lower than the Redfield ratio or thanthe PQ of 1.4. During four visits at a station above the
Figure 11. (a) Oxygen and (b) fluorescence profiles at 6°S, 10°W from the CTD on the 7th of June 2006,(c) oxygen and (d) fluorescence profiles on the 23rd of November 2006, (e) oxygen and (f ) fluorescenceprofiles on the 28th of June 2007, and oxygen profiles on (g) the 16th of September 2008 and (h) on the10th of July 2009. The dash line corresponds to the depth of the mixed layer.
LEFÈVRE AND MERLIVAT: NCP IN THE EASTERN TROPICAL ATLANTIC GB1009GB1009
11 of 14
Kerguelen plateau, D. Lefèvre et al. [2008] measured a PQvalue ranging from 0.77 � 0.28 to 1.26 � 0.66. This sug-gests that this ratio is very variable.[38] The NCP calculated over a few days gives higher
values than the mean daily net oxygen production ratededuced from the cumulated fluxes. This is expected as NCPcan vary from day to day depending on the cloud cover, thenutrient supply and the photosynthetic available radiation(PAR). This explains the range of NCP values obtained bythese high frequency net autotrophic events. The cumulatedfluxes correspond to the mean biological production over thelength of the time series. Over the time series, the biologicalproduction does not follow a linear trend, which shows thatthere are periods of no biological activity and periods ofdominant remineralization, i.e., decreasing biological pro-duction (Figure 9). The important contribution to NCP ofhigh frequency events was previously noticed by Karl et al.(2003). In addition, the cumulated fluxes are calculatedassuming no variability of the mixed layer mixing over thewhole time series. Examining the oxygen vertical profilesmade at the time of the deployment of the mooring, the waterbelow the mixed layer appears to have lower oxygen con-centrations (Figure 11) although a subsurface chlorophyllmaximum occurs. A deepening of the mixed layer wouldthen bring oxygen poor water to the surface so the biologicalproduction estimated by the mass balance approach under-estimates the mean daily production rate. In 2008, the MLDwas taken constant at 40 m, a value of 60 m would increasethe biological production from 7.5 mmol C m�2d�1 to8 mmol C m�2d�1. On the contrary, a shoaling of the mixedlayer from 60 m to 40 m would reduce the biological pro-duction by 24% in 2006 and by 4.5% in 2009.[39] Another term that has been neglected in both calcu-
lations is the vertical diffusion flux Kz:
Fz ¼ Kzd O2½ �dz
ð13Þ
where Kz is the diffusion coefficient. Its value for stratifiedwater is about 4.1 10�6 m2 s�1 [Denman and Gargett,1983]. From the available vertical profiles of oxygen downto 120 m (Figure 11), the vertical gradient of oxygen isabout �0.89 mmol m�4. This leads to a diffusion flux of�0.31 mmol m�2d�1, which is small compared to the totalair-sea O2 flux of about 15 mmol m�2d�1 (Figure 6a) andto the mean NCP ranging from 7.5 to 15.6 mmol m�2d�1.
[40] The gas exchange coefficient is also a source ofuncertainty and would have an impact on the air-sea flux.However, as the air-sea flux of O2 and the bubble flux arein opposite direction, the error on the gas exchange coef-ficient would have a smaller impact on the estimate ofthe biological production. For example, decreasing bothfluxes by 10% would lead to a biological production of9.2 mmol m�2d�1 instead of 9.4 mmol m�2d�1 in 2006,whereas decreasing only the air-sea O2 flux by 10% wouldgive 8.6 mmol m�2d�1.[41] In 2007, the mass balance approach gives a negative
biological production rate because the site is undersaturatedin oxygen whereas the oxygen distribution is above thesaturation level for the other years. As there is no significantdifference between the upwelling in 2007 compared to theother years [Caniaux et al., 2011], it is difficult to explainthis feature and it might be due to a problem with the mea-surements. Nevertheless, oxygen concentrations increaseduring the upwelling season showing that biological activityalso occurs in 2007. The site is located in the eastern tropicalAtlantic (ETRA) where Serret et al. [2001] observed het-erotrophy with O2 supersaturated waters along an AtlanticMeridional Transect (15°S-14°N) in May–June 1998. Theymeasured respiration and gross primary production and foundhigher respiration rate than production rate. These measure-ments are necessarily very local and correspond to a situationat a given time. Neuer et al. [2007], sampling at a monthlyscale, from 1994 to 2000, at the European time series sta-tion ESTOC, always found positive NCP, which contradictsreports of a heterotrophic subtropical North East Atlantic.[42] Robinson et al. [2002] tried to provide temporal con-
text to the measurements made along an Atlantic MeridionalTransect by examining oxygen fluxes such as those pub-lished by Najjar and Keeling [2000] and Boyer et al. [1999].However, seasonal and annual patterns of oxygen fluxesdo not allow a differentiation between plankton respirationand upwelling or deep winter mixing.[43] For 2006, 2008 and 2009, when surface waters are
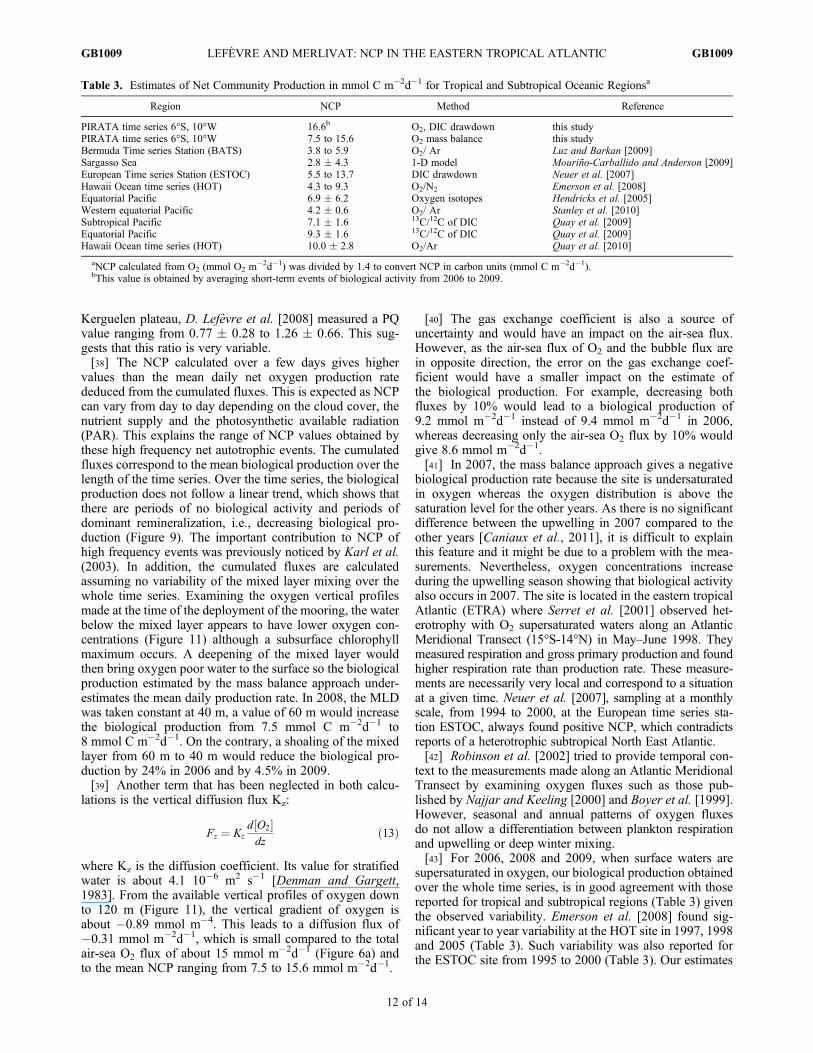
supersaturated in oxygen, our biological production obtainedover the whole time series, is in good agreement with thosereported for tropical and subtropical regions (Table 3) giventhe observed variability. Emerson et al. [2008] found sig-nificant year to year variability at the HOT site in 1997, 1998and 2005 (Table 3). Such variability was also reported forthe ESTOC site from 1995 to 2000 (Table 3). Our estimates
Table 3. Estimates of Net Community Production in mmol C m�2d�1 for Tropical and Subtropical Oceanic Regionsa
Region NCP Method Reference
PIRATA time series 6°S, 10°W 16.6b O2, DIC drawdown this studyPIRATA time series 6°S, 10°W 7.5 to 15.6 O2 mass balance this studyBermuda Time series Station (BATS) 3.8 to 5.9 O2/ Ar Luz and Barkan [2009]Sargasso Sea 2.8 � 4.3 1-D model Mouriño-Carballido and Anderson [2009]European Time series Station (ESTOC) 5.5 to 13.7 DIC drawdown Neuer et al. [2007]Hawaii Ocean time series (HOT) 4.3 to 9.3 O2/N2 Emerson et al. [2008]Equatorial Pacific 6.9 � 6.2 Oxygen isotopes Hendricks et al. [2005]Western equatorial Pacific 4.2 � 0.6 O2/ Ar Stanley et al. [2010]Subtropical Pacific 7.1 � 1.6 13C/12C of DIC Quay et al. [2009]Equatorial Pacific 9.3 � 1.6 13C/12C of DIC Quay et al. [2009]Hawaii Ocean time series (HOT) 10.0 � 2.8 O2/Ar Quay et al. [2010]
aNCP calculated from O2 (mmol O2 m�2d�1) was divided by 1.4 to convert NCP in carbon units (mmol C m�2d�1).
bThis value is obtained by averaging short-term events of biological activity from 2006 to 2009.
LEFÈVRE AND MERLIVAT: NCP IN THE EASTERN TROPICAL ATLANTIC GB1009GB1009
12 of 14
tend to be slightly higher but they are quite close tothose given further north in the eastern Atlantic at ESTOC,29.16°N, 15.5°W. Further west of ESTOC but at the samelatitude, estimates at BATS yield lower values.
6. Summary and Conclusions
[44] Hourly oxygen and CO2 measurements have beenmade since 2006 at the PIRATA mooring at 6°S, 10°W. Thesite is characterized by a decrease in surface temperaturefrom June to September, as a result of equatorial and coastalupwelled water propagating to the mooring site. The surfacewater is supersaturated in oxygen except in 2007 whenundersaturation is observed during the upwelling season.However, the concentration of oxygen increases throughoutthe upwelling period suggesting that biological productiondominates. Using an alkalinity-salinity relationship, dis-solved inorganic carbon can be calculated from the fugacityof CO2 and alkalinity. Net community production is calcu-lated from changes of DIC and/ or O2 over short periods oftime when biological activity is present and no mixing isencountered. Most of the NCP values are obtained from Juneto December and averaging all the values leads to an NCPvalue of 16.6 � 6.1 mmol C m–2d–1. Over the 6–13 October2008 period, concomitant O2 and DIC decreases allowthe calculation of the photosynthetic quotient. The valueof 1.0 � 0.2 is slightly lower than the 1.4 theoretical valuegenerally used.[45] As expected, the mean NCP value corresponding to
short bursts of biological production is higher than the meandaily oxygen production determined over the whole timeseries, assuming negligible vertical mixing and horizontaladvection. As the mooring site is located outside the upwell-ing area, assuming no significant mixed layer deepening isa reasonable assumption. However, the site is affected byhorizontal advection. This process can be neglected foroxygen when air-sea exchange occurs at a faster rate thanhorizontal advection. The mean daily oxygen productionshows a significant year to year variability with values of9.4 mmol C m–2d–1 in 2006, 7.5 mmol C m–2d–1 in 2008 and15.6 mmol C m–2d–1 in 2009. Our estimates are in goodagreement with those determined at ESTOC and tend to beslightly higher than those reported for the Pacific ocean.However, given the year to year variability in all the esti-mates, it is difficult to determine whether this is a permanentfeature. Our NCP measurements as well as the increasingtrend of oxygen concentrations suggest an autotrophic situa-tion at our site. Despite the uncertainties and the assumptionsmade to calculate NCP, the consistency between the estimatesbased on carbon and oxygen data suggests that biologicalproduction can be determined by monitoring O2 and CO2
at this site.
[46] Acknowledgments. This work was funded by the EuropeanIntegrated Project CARBOOCEAN (contract 511176–2), the Institut deRecherche pour le Développement (IRD) and the national program LEFECYBER. Data management for PIRATA moorings is conducted by theTAO project office at NOAA/PMEL in collaboration with many researchinstitutes listed on the PIRATA website (http://www.pmel.noaa.gov/pirata).We are grateful to Laurence Beaumont, Théo Danguy and Antoine Guillotfrom DT INSU for their technical support with the CO2 and O2 sensors, andthe U.S. IMAGO of IRD for their help with mooring deployments. Wethank two anonymous reviewers for their helpful comments that contributedto improve the manuscript.
ReferencesBourlès, B., et al. (2008), The PIRATA program: History, accomplishmentsand future directions, Bull. Am. Meteorol. Soc., 89, 1111–1125,doi:10.1175/2008BAMS2462.1.
Boutin, J., and L. Merlivat (2009), New in situ estimates of carbon biologi-cal production rates in the Southern Ocean from CARIOCA drifter mea-surements, Geophys. Res. Lett., 36, L13608, doi:10.1029/2009GL038307.
Boyer, T., M. E. Conkright, and S. Levitus (1999), Seasonal variability ofdissolved oxygen, percent oxygen saturation, and apparent oxygen utili-zation in the Atlantic and Pacific Oceans, Deep Sea Res., Part I, 46,1593–1613, doi:10.1016/S0967-0637(99)00021-7.
Caniaux, G., H. Giordani, J.-L. Redelsperger, F. Guichard, E. Key, andM. Wade (2011), Coupling between the Atlantic cold tongue and theWest African monsoon in boreal spring and summer, J. Geophys. Res.,116, C04003, doi:10.1029/2010JC006570.
Denman, K. L., and A. E. Gargett (1983), Time and space scales of verticalmixing and advection of phytoplankton in the upper ocean, Limnol.Oceanogr., 28(5), 801–815, doi:10.4319/lo.1983.28.5.0801.
Dickson, A. G., and F. J. Millero (1987), A comparison of the equilibriumconstants for the dissociation of carbonic acid in seawater media, DeepSea Res., 34, 1733–1743, doi:10.1016/0198-0149(87)90021-5.
Emerson, S., and C. Stump (2010), Net biological oxygen production in theocean—II: Remote in situ measurements of O2 and N2 in subarctic pacificsurface waters, Deep Sea Res., Part I, 57, 1255–1265, doi:10.1016/j.dsr.2010.06.001.
Emerson, S., P. D. Quay, D. M. Karl, C. D. Winn, L. Tupas, and M. R.Landry (1997), Experimental determination of the organic carbon flux fromopen-ocean surface waters, Nature, 389, 951–954, doi:10.1038/40111.
Emerson, S., C. Stump, and D. Nicholson (2008), Net biological oxygenproduction in the ocean: Remote in situ measurements of O2 and N2 insurface waters, Global Biogeochem. Cycles, 22, GB3023, doi:10.1029/2007GB003095.
García, H. E., and L. I. Gordon (1992), Oxygen solubility in seawater:Better fitting equations, Limnol. Oceanogr., 37(6), 1307–1312, doi:10.4319/lo.1992.37.6.1307.
Garcia, H. E., and R. F. Keeling (2001), On the global oxygen anomaly andair-sea flux, J. Geophys. Res., 106(C12), 31,155–31,166, doi:10.1029/1999JC000200.
Hendricks, M., M. L. Bender, B. A. Barnett, P. Strutton, and F. P. Chavez(2005), Triple oxygen isotopes composition of dissolved O2 in the equa-torial Pacific: A tracer of mixing, production, and respiration, J. Geophys.Res., 110, C12021, doi:10.1029/2004JC002735.
Johnson, K. S. (2010), Simultaneous measurements of nitrate, oxygen, andcarbon dioxide on oceanographic moorings: Observing the Redfield ratioin real time, Limnol. Oceanogr., 55(2), 615–627, doi:10.4319/lo.2009.55.2.0615.
Kaiser, J., M. K. Reuer, B. A. Barnett, and M. L. Bender (2005), Marineproductivity estimates from continuous O2/Ar ratio measurements bymembrane inlet mass spectrometry, Geophys. Res. Lett., 32, L19605,doi:10.1029/2005GL023459.
Karl, D. M., E. A. Laws, P. Morris, P. J. B. Williams, and S. Emerson (2003),Metabolic balance of the open sea, Nature, 426, 32, doi:10.1038/426032a.
Laws, E. A. (1991), Photosynthetic quotients, new production and net com-munity production in the open ocean, Deep Sea Res., 38, 143–167,doi:10.1016/0198-0149(91)90059-O.
Lefèvre, D., C. Guigue, and I. Obernosterer (2008), The metabolic balanceat two constrasting sites in the Southern Ocean: The iron-fertilizedKerguelen area and HNLC waters, Deep Sea Res., 55(5–7), 766–776,doi:10.1016/j.dsr2.2007.12.006.
Lefèvre, N., A. Guillot, L. Beaumont, and T. Danguy (2008), Variability offCO2 in the Eastern Tropical Atlantic from a moored buoy, J. Geophys.Res., 113, C01015, doi:10.1029/2007JC004146.
Luz, B., and E. Barkan (2009), Net and gross oxygen production fromO2/Ar,
17O/16O and 18O/16O ratios, Aquat. Microb. Ecol., 56, 133–145,doi:10.3354/ame01296.
McNeil, C. L., and D. M. Farmer (1995), Observations of the influenceof diurnal convection on upper ocean dissolved gas measurements,J. Mar. Res., 53, 151–169, doi:10.1357/0022240953213313.
Mehrbach, C., C. H. Culberson, J. E. Hawley, and R. M. Pytkowicz (1973),Measurement of the apparent dissociation constants of carbonic acid inseawater at atmospheric pressure, Limnol. Oceanogr., 18, 897–907,doi:10.4319/lo.1973.18.6.0897.
Merlivat, L., M. Gonzalez Davila, G. Caniaux, J. Boutin, and G. Reverdin(2009), Mesoscale and diel to monthly variability of CO2 and carbonfluxes at the ocean surface in the northeastern Atlantic, J. Geophys.Res., 114, C03010, doi:10.1029/2007JC004657.
Mouriño-Carballido, B., and L. A. Anderson (2009), Net community pro-duction of oxygen derived from in vitro and in situ 1-D modeling
LEFÈVRE AND MERLIVAT: NCP IN THE EASTERN TROPICAL ATLANTIC GB1009GB1009
13 of 14
techniques in a cyclonic mesoscale eddy in the Sargasso Sea, Biogeos-ciences, 6, 1799–1810, doi:10.5194/bg-6-1799-2009.
Najjar, R. G., and R. F. Keeling (2000), Mean annual cycle of the air-seaoxygen flux: A global view, Global Biogeochem. Cycles, 14, 573–584,doi:10.1029/1999GB900086.
Neuer, S., et al. (2007), Biogeochemistry and hydrography in the easternsubtropical NorthAtlantic gyre. Results from the European time-series stationESTOC, Prog. Oceanogr., 72, 1–29, doi:10.1016/j.pocean.2006.08.001.
Parard, G., N. Lefèvre, and J. Boutin (2010), Sea water fugacity of CO2 atthe PIRATA mooring at 6°S, 10°W, Tellus, Ser. B, 62(5), 636–648,doi:10.1111/j.1600-0889.2010.00503.x.
Quay, P. D., J. Stutsman, R. A. Feely, and L. W. Juranek (2009), Net com-munity production rates across the subtropical and equatorial Pacificocean estimated from air-sea d13C disequilibrium, Global Biogeochem.Cycles, 23, GB2006) doi:10.1029/2008GB003193.
Quay, P. D., C. Peacock, K. Björkman, and D. M. Karl (2010), Measuringprimary production rates in the ocean: Enigmatic results between incuba-tion and non-incubation methods at Station ALOHA, Global Biogeo-chem. Cycles, 24, GB3014, doi:10.1029/2009GB003665.
Robinson, C., P. Serret, G. Tilstone, E. Teira, M. V. Zubkov, A. P. Rees,and E. M. S. Woodward (2002), Plankton respiration in the EasternAtlantic Ocean, Deep Sea Res., Part I, 49, 787–813, doi:10.1016/S0967-0637(01)00083-8.
Serret, P., C. Robinson, E. Fernández, E. Teira, and G. Tilstone (2001),Latitudinal variation of the balance between plankton photosynthesisand respiration in the eastern Atlantic Ocean, Limnol. Oceanogr., 46(7),1642–1652, doi:10.4319/lo.2001.46.7.1642.
Stanley, R. H. R., W. J. Jenkins, D. E. Lott III, and S. C. Doney (2009),Noble gas constraints on air-sea gas exchange and bubble fluxes,J. Geophys. Res., 114, C11020, doi:10.1029/2009JC005396.
Stanley, R. H. R., J. B. Kirkpatrick, N. Cassar, B. A. Barnett, andM. L. Bender (2010), Net community production and gross primary pro-duction rates in the western equatorial Pacific, Global Biogeochem.Cycles, 24, GB4001, doi:10.1029/2009GB003651.
Sweeney, C., E. Gloor, A. R. Jacobson, R. M. Key, G. McKinley, J. L.Sarmiento, and R. Wanninkhof (2007), Constraining global air-seagas exchange for CO2 with recent bomb 14C measurements, GlobalBiogeochem. Cycles, 21, GB2015, doi:10.1029/2006GB002784.
Wade, M., G. Caniaux, Y. Dupenhoat, M. Dengler, H. Giordani, andR. Hummels (2011), A one dimensional modelling study of the diurnalcycle in the tropical Atlantic at the PIRATA buoys during the EGEE-3campaign, Ocean Dyn., 61, 1–20, doi:10.1007/s10236-010-0337-8.
Wanninkhof, R. H. (1992), Relationship between wind speed and gasexchange over the ocean, J. Geophys. Res., 97(C5), 7373–7382,doi:10.1029/92JC00188.
Weiss, R. F. (1974), CO2 in water and seawater: The solubility of a non-ideal gas, Mar. Chem., 2, 203–215, doi:10.1016/0304-4203(74)90015-2.
Weiss, R. F., and B. A. Price (1980), Nitrous oxide solubility in water andseawater, Mar. Chem., 8, 347–359, doi:10.1016/0304-4203(80)90024-9.
Woolf, D. K., and S. A. Thorpe (1991), Bubbles and the air-sea exchangeof gases in near-saturation conditions, J. Mar. Res., 49, 435–466,doi:10.1357/002224091784995765.
N. Lefèvre and L. Merlivat, LOCEAN, UMR7159, Université Pierreet Marie Curie, CNRS, IRD, MNHN, 4 Place Jussieu, case 100, Tour 45-46,5ème étage, F-75252 Paris CEDEX 05, France. ([email protected])
LEFÈVRE AND MERLIVAT: NCP IN THE EASTERN TROPICAL ATLANTIC GB1009GB1009
14 of 14
Copyright © 2022 FDOKUMEN


![Astrocytic tracer dynamics estimated from [1-11C]-acetate PET measurements](https://static.fdokumen.com/doc/165x107/6334cca03e69168eaf070c95/astrocytic-tracer-dynamics-estimated-from-1-11c-acetate-pet-measurements.jpg)