Ultrashort Electromagnetic Pulse Radiation from YBCO Thin Films Excited by Femtosecond Optical Pulse
Upload
khangminh22Category
view
2download
0
Kidney Blood Press Res 2017;42:816-826DOI: 10.1159/000484381Published online: October 26, 2017
© 2017 The Author(s). Published by S. Karger AG, Baselwww.karger.com/kbr 816
Seong et al.: Pulse Pressure and eGFR and uACR
Original Paper
Accepted: July 22, 2017
This article is licensed under the Creative Commons Attribution-NonCommercial-NoDerivatives 4.0 Interna-tional License (CC BY-NC-ND) (http://www.karger.com/Services/OpenAccessLicense). Usage and distribution for commercial purposes as well as any distribution of modified material requires written permission.
DOI: 10.1159/000484381Published online: October 26, 2017
© 2017 The Author(s) Published by S. Karger AG, Baselwww.karger.com/kbr
The Relationship Between Pulse Pressure, the Estimated Glomerular Filtration Rate, and Urine Microalbumin/Creatinine Ratio in Korean AdultsJeong Min Seonga Chang Eun Parkb Mi Young Gic Kwang Soon Sunc Yu Jeong Kimd Hyun Yoone
aDepartment of Dental Hygiene, College of Health Science, Kangwon National University, Dogye-eup, Samcheok-si, Gangwon-do, bDepartment of Biomedical Laboratory Science, Namseoul University, Seonghwan-eup, Seobuk-gu, Cheonan-si, Chungcheongnam-do, cDepartment of Nursing, Christian College of Nursing, Nam-gu, Gwangju, dDepartment of Nursing, Chosun Nursing College, Dong-gu, Gwangju, eDepartment of Biomedical Laboratory Science, Hanlyo University, Gwangyang-eup, Gwangyang-si, Jeollanam-do, South Korea
Key WordsPulse pressure • Estimated glomerular filtration rate • Urine microalbumin/creatinine ratio • Chronic kidney disease
AbstractBackground/Aims: Pulse pressure (PP) is a predictor of adverse outcomes in patients on haemodialysis. Thus, the present study was conducted to assess the relationship between PP, estimated glomerular filtration rate (eGFR), and urine microalbumin/creatinine ratio (uACR) in Korean adults. Methods: Data of 9,409 adults (4,206 men and 5,203 women) aged ≥ 20 years from the Sixth Korean National Health and Nutrition Examination Survey (2013–2014) were analyzed. Results: A multivariate analysis revealed that systolic blood pressure (SBP) (β = -0.170, 95% confidence interval [CI], -0.216 to -0.159), diastolic blood pressure (DBP) (β = 0.088, 95% CI 0.108–0.200; p < 0.001), and PP (β = -0.134, 95% CI -0.215 to -0.157) were significant factors determining eGFR. In contrast, SBP (β = 0.152, 95% CI, 0.985–1.456; p < 0.001), DBP (β = -0.062, 95% CI -1.141 to -0.442; p < 0.001), and PP (β = 0.118, 95% CI 0.965–1.436; p < 0.001) were the significant factors determining uACR. The odds ratios (ORs) of a high PP (PP ≥ 60 mmHg) with a normal group [eGFR ≥ 60 ml/min/1.73 m2 and uACR < 30 mg/g] as a reference were significant for decreased eGFR [eGFR < 60 ml/min/1.73 m2, 1.484 (95% CI, 1.003–2.196)], elevated uACR [uACR ≥ 30 mg/g, 2.592 (95% CI, 2.085–3.223)], and decreased eGFR plus elevated uACR [eGFR < 60 ml/min/1.73 m2 and uACR ≥ 30 mg/g, 3.889
Hyun Yoon, Ph.D. Department of Biomedical Laboratory Science, Hanlyo University,94-13, Hallyeodae-gil, Gwangyang-eup, Gwangyang-si, Jeollanam-do, 57764, (South Korea)Tel. +82-10-2635-9076, E-Mail [email protected]

Kidney Blood Press Res 2017;42:816-826DOI: 10.1159/000484381Published online: October 26, 2017
© 2017 The Author(s). Published by S. Karger AG, Baselwww.karger.com/kbr 817
Seong et al.: Pulse Pressure and eGFR and uACR
(95% CI, 2.519–6.004)]. Conclusion: Enhanced PP was associated with a decreased eGFR and an increase in uACR in Korean adults. In addition, the PP increased greatly when a decrease in eGFR and an increase in uACR appeared simultaneously.
Introduction
Chronic kidney disease (CKD) is a global public health problem [1]. CKD is defined by estimated glomerular filtration rate (eGFR) < 60 mL/min/1.73 m2 and a decrease in eGFR significantly increases the risks of cardiovascular disease (CVD) and mortality [2]. Microalbuminuria is associated with atherosclerosis risk factors as well as cardiovascular disease and is most pronounced when predicting renal outcomes in patients with kidney disease [3, 4]. Thus, it is important to monitor eGFR and the urine microalbumin/creatinine ratio (uACR) in patients with CKD and progressive CVD. In particular, when a decrease in eGFR is combined with an increase in uACR, CVD mortality rates in patients with CKD increase greatly [5].
Hypertension is the most prevalent independent risk factor in the progression of CKD and CVD [3]. Higher systolic blood pressure (SBP) is an independent predictor of decline in kidney function [6], whereas a cohort study reported that lower diastolic blood pressure (DBP) is a clinical predictor of death in patients undergoing chronic hemodialysis [7]. Pulse pressure (PP) is the difference between SBP and DBP and is a known risk factor for CVD and mortality. A close relationship has been established between renal function and arterial stiffness. Increased arterial stiffness damages the microvascular structure of the kidney and causes vascular calcification, which are both an important risk factor of arterial stiffness and an independent predictor of both future cardiovascular events and mortality in CKD [8-10]. PP, which reflects arterial stiffness, is a stronger risk factor for heart failure and stroke than SBP or DBP [11, 12]. PP is known to a predictor of increased mortality in patients undergoing hemodialysis for end-stage renal disease [13-15].
Currently, most studies on the relationship between PP and eGFR and uACR have been conducted in populations with diseases such as CKD, diabetes, and cardiovascular disease and the study on general population is rare. In addition, the relationship between PP and renal function is unclear because findings vary across studies. That is, some studies have reported that an increase in PP is inversely associated with renal function [16, 17], whereas other did not [18, 19]. Therefore, our objective in this study was to assess the association between PP and eGFR and uACR in Korean adults using data from the sixth Korean National Health and Nutrition Examination Survey (KNHANES VI; 2013–2014), which is representative of the Korean population [20].
Materials and Methods
Study SubjectsThis study was performed using data from the Sixth Korean National Health and Nutrition Examination
Survey (KNHANES VI). KNHANES VI were each conducted for 2 years (2013–2014), using a rolling sampling survey that involved a complex, stratified, multistage, probability cluster survey of a representative sample of the non-institutionalized civilian population in South Korea. The survey was composed of three parts: a health interview survey, a health examination survey, and a nutrition survey. Each survey was conducted by specially trained interviewers. The interviewers were not provided with any prior information regarding specific participants before conducting the interviews. Participants provided written informed consent to participate in this survey, and we received the data in anonymized form. In the KNHANES VI (2013–2014), 15, 568 individuals over age 1 were sampled for the survey. Among them, of the 11, 925 subjects who participated in the KNHANES VI, we limited the analyses to adults aged ≥ 20 years. We excluded participants 2, 516 subjects whose data were missing for important analytic variables, such as blood pressure, urine microalbumin and creatinine level, various blood chemistry tests, and information about lifestyle. Finally, 9, 409 subjects were included in the statistical analysis. The KNHANES VI study has been conducted according
© 2017 The Author(s)Published by S. Karger AG, Basel

Kidney Blood Press Res 2017;42:816-826DOI: 10.1159/000484381Published online: October 26, 2017
© 2017 The Author(s). Published by S. Karger AG, Baselwww.karger.com/kbr 818
Seong et al.: Pulse Pressure and eGFR and uACR
to the principles expressed in the Declaration of Helsinki. (Institutional Review Board No, 2013-07CON-03-4C; 2013-12EXP-03-5C). All participants in the survey signed an informed written consent form. Further information can be found in “The KNHANES VI Sample”, which is available on the KNHANES website. The data from KNHANES is available on request by email if the applicant logs onto the “Korea National Health and Nutrition Examination Survey” website.
General Characteristics and Blood ChemistryResearch subjects were classified by sex (men or women), smoking (non-smoker or ex-smoker or
current smoker), alcohol drinking (yes or no), and regular exercise (yes or no). In the smoking category, participants who smoked more than one cigarette a day, those who had previously smoked but do not presently smoke, and those who never smoked were classified into the current smoker, ex-smoker, and non-smoker groups, respectively. Alcohol drinking was indicated as “yes” for participants who had consumed at least one glass of alcohol every month over the last year. Regular exercise was indicated as “yes” for participants who had exercised on a regular basis regardless of indoor or outdoor exercise. (Regular exercises was defined as 30 min at a time and 5 times/wk in the case of moderate exercise, such as swimming slowly, doubles tennis, volleyball, badminton, table tennis, and carrying light objects; and for 20 min at a time and 3 times/wk in the case of vigorous exercise, such as running, climbing, cycling fast, swimming fast, football, basketball, jump rope, squash, singles tennis, and carrying heavy objects). Anthropometric measurements included measurement of body mass index (BMI) and waist measurement (WM), as well as final measurements of systolic blood pressure (SBP) and diastolic blood pressure (DBP). Blood chemistries included measurements of total cholesterol (TC), high density lipoprotein cholesterol (HDL-C), triglycerides (TGs), fasting blood glucose (FBG), blood urea nitrogen (BUN), serum creatinine, urine microalbumin, and urine creatinine.
Glomerular filtration rate and urine microalbumin and pulse pressureGlomerular filtration rate (GFR) was estimated from the simplified equation developed using MDRD
data: eGFR = 186.3 × (serum creatinine in mg/dL) -1.154 × age -0.203 × (0.742 for women) × (1.212 if African American) [21]. Decreased eGFR was classified as eGFR < 60 ml/min/1.73 m2. Urine microalbumin was measured with a turbidimetric assay (Albumin; Roche, Germany) using a Hitachi Automatic Analyzer 7600 (Hitachi, Japan). The urine creatinine was measured with a colorimetric assay (CREA; Roche, USA) using a Hitachi Automatic Analyzer 7600 (Hitachi, Japan). Elevated urine microalbumin/creatinine ratio (uACR) was classified as uACR ≥ 30 mg/g. PP was calculated as the difference between SBP and DBP. High PP was classified as PP ≥ 60 mmHg [22].
Data AnalysisThe collected data were statistically analyzed using SPSS WIN version 18.0 (SPSS Inc., Chicago, IL,
USA). The distribution and average difference in clinical characteristics according to normal PP and high PP were calculated using chi-squared and an independent t test. The distribution and average difference in clinical characteristics according to normal, decreased eGFR, elevated uACR, and decreased GFR plus elevated uACR were calculated using chi-squared and an analysis of variance test. We conducted correlation analysis for eGFR and uACR and performed multivariate model adjusted only for confounders that were significantly associated with dependent variable (eGFR and uACR) in the correlation of eGFR and uACR. Multiple linear and logistic regression analysis models were constructed for the uACR levels and odds ratio of elevated uACR: model 1) was adjusted for age, gender, BMI, WM, TGs, HDL-C, FBG, SBP, DBP, eGFR, and either SBP and DBP or PP. Multiple linear and logistic regression analysis models were constructed for the eGFR levels and odds ratio of decreased eGFR: model 2) was adjusted for age, gender, smoking, drinking alcohol, regular exercise, BMI, WM, TC, TGs, HDL-C, FBG, uACR, and either SBP and DBP or PP. In the case of logistic regression for odds ratio of high PP, the 4 models constructed were: 1) non-adjusted; 2) adjusted for age and gender; 3) further adjusted for smoking, alcohol drinking, and regular exercise, BMI, and WM; 4) further adjusted for TC, TGs, HDL-C, and FBG. The significance level for all of the statistical data was set as p < 0.05.
Kidney Blood Press Res 2017;42:816-826DOI: 10.1159/000484381Published online: October 26, 2017
© 2017 The Author(s). Published by S. Karger AG, Baselwww.karger.com/kbr 819
Seong et al.: Pulse Pressure and eGFR and uACR
Results
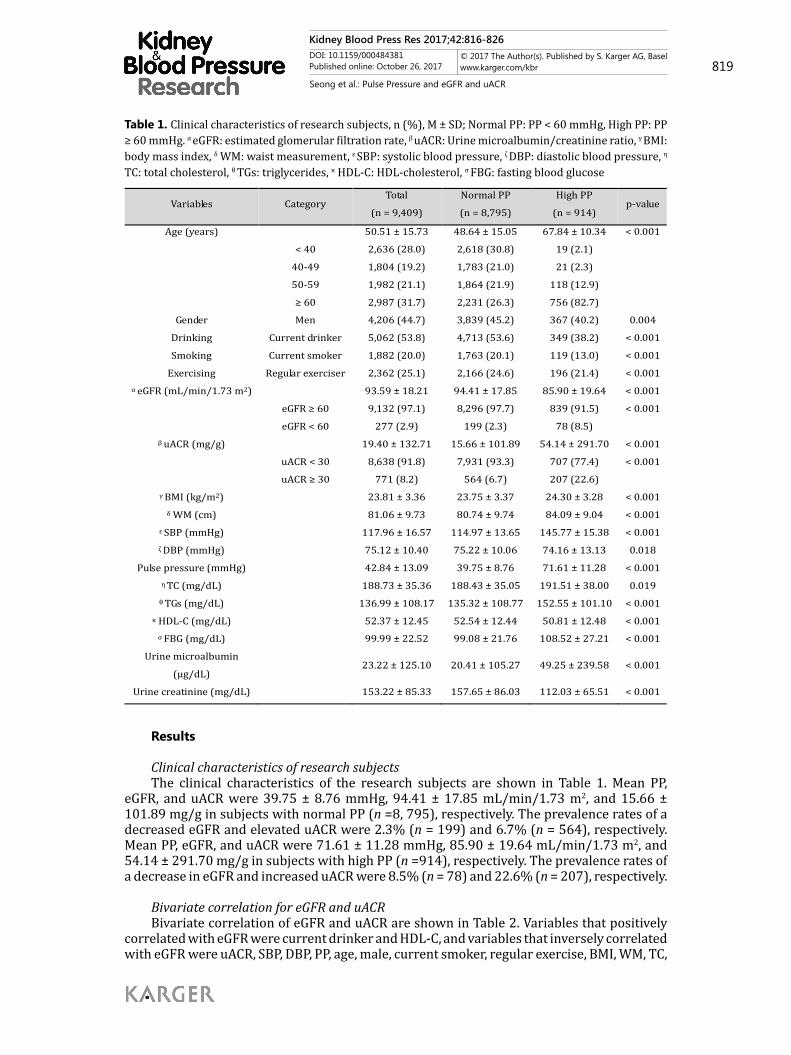
Clinical characteristics of research subjectsThe clinical characteristics of the research subjects are shown in Table 1. Mean PP,
eGFR, and uACR were 39.75 ± 8.76 mmHg, 94.41 ± 17.85 mL/min/1.73 m2, and 15.66 ± 101.89 mg/g in subjects with normal PP (n =8, 795), respectively. The prevalence rates of a decreased eGFR and elevated uACR were 2.3% (n = 199) and 6.7% (n = 564), respectively. Mean PP, eGFR, and uACR were 71.61 ± 11.28 mmHg, 85.90 ± 19.64 mL/min/1.73 m2, and 54.14 ± 291.70 mg/g in subjects with high PP (n =914), respectively. The prevalence rates of a decrease in eGFR and increased uACR were 8.5% (n = 78) and 22.6% (n = 207), respectively.
Bivariate correlation for eGFR and uACRBivariate correlation of eGFR and uACR are shown in Table 2. Variables that positively
correlated with eGFR were current drinker and HDL-C, and variables that inversely correlated with eGFR were uACR, SBP, DBP, PP, age, male, current smoker, regular exercise, BMI, WM, TC,
Table 1. Clinical characteristics of research subjects, n (%), M ± SD; Normal PP: PP < 60 mmHg, High PP: PP ≥ 60 mmHg. α eGFR: estimated glomerular filtration rate, β uACR: Urine microalbumin/creatinine ratio, γ BMI: body mass index, δ WM: waist measurement, ε SBP: systolic blood pressure, ζ DBP: diastolic blood pressure, η
TC: total cholesterol, θ TGs: triglycerides, κ HDL-C: HDL-cholesterol, σ FBG: fasting blood glucose
Variables Category Total
(n = 9,409) Normal PP (n = 8,795)
High PP (n = 914)
p-value
Age (years)
50.51 ± 15.73 48.64 ± 15.05 67.84 ± 10.34 < 0.001
< 40 2,636 (28.0) 2,618 (30.8) 19 (2.1)
40-49 1,804 (19.2) 1,783 (21.0) 21 (2.3)
50-59 1,982 (21.1) 1,864 (21.9) 118 (12.9)
≥ 60 2,987 (31.7) 2,231 (26.3) 756 (82.7)
Gender Men 4,206 (44.7) 3,839 (45.2) 367 (40.2) 0.004 Drinking Current drinker 5,062 (53.8) 4,713 (53.6) 349 (38.2) < 0.001 Smoking Current smoker 1,882 (20.0) 1,763 (20.1) 119 (13.0) < 0.001
Exercising Regular exerciser 2,362 (25.1) 2,166 (24.6) 196 (21.4) < 0.001 α eGFR (mL/min/1.73 m2)
93.59 ± 18.21 94.41 ± 17.85 85.90 ± 19.64 < 0.001
eGFR ≥ 60 9,132 (97.1) 8,296 (97.7) 839 (91.5) < 0.001
eGFR < 60 277 (2.9) 199 (2.3) 78 (8.5)
β uACR (mg/g)
19.40 ± 132.71 15.66 ± 101.89 54.14 ± 291.70 < 0.001
uACR < 30 8,638 (91.8) 7,931 (93.3) 707 (77.4) < 0.001
uACR ≥ 30 771 (8.2) 564 (6.7) 207 (22.6)
γ BMI (kg/m2)
23.81 ± 3.36 23.75 ± 3.37 24.30 ± 3.28 < 0.001
δ WM (cm)
81.06 ± 9.73 80.74 ± 9.74 84.09 ± 9.04 < 0.001 ε SBP (mmHg)
117.96 ± 16.57 114.97 ± 13.65 145.77 ± 15.38 < 0.001
ζ DBP (mmHg)
75.12 ± 10.40 75.22 ± 10.06 74.16 ± 13.13 0.018 Pulse pressure (mmHg)
42.84 ± 13.09 39.75 ± 8.76 71.61 ± 11.28 < 0.001
η TC (mg/dL) 188.73 ± 35.36 188.43 ± 35.05 191.51 ± 38.00 0.019 θ TGs (mg/dL) 136.99 ± 108.17 135.32 ± 108.77 152.55 ± 101.10 < 0.001
κ HDL-C (mg/dL) 52.37 ± 12.45 52.54 ± 12.44 50.81 ± 12.48 < 0.001 σ FBG (mg/dL) 99.99 ± 22.52 99.08 ± 21.76 108.52 ± 27.21 < 0.001
Urine microalbumin (μg/dL)
23.22 ± 125.10 20.41 ± 105.27 49.25 ± 239.58 < 0.001
Urine creatinine (mg/dL) 153.22 ± 85.33 157.65 ± 86.03 112.03 ± 65.51 < 0.001

Kidney Blood Press Res 2017;42:816-826DOI: 10.1159/000484381Published online: October 26, 2017
© 2017 The Author(s). Published by S. Karger AG, Baselwww.karger.com/kbr 820
Seong et al.: Pulse Pressure and eGFR and uACR
TGs, and FBG. Variables that positively correlated with uACR were SBP, DBP, PP, age, men WM, TC, TGs, and FBG, and variables that inversely correlated with uACR were eGFR and HDL-C.
Multiple linear and logistic regression analyses for the independent factors determining eGFR and decreased eGFR or uACR and elevated uACRMultiple linear and
logistic regression analyses for the independent factors determining eGFR and decreased eGFR or uACR and elevated uACR are shown in Table 3, 4, 5, and 6. We performed multivariate model adjusted only for confounders that were significantly associated with dependent variable (eGFR and uACR) in the correlation of eGFR and uACR. eGFR was inversely associated with SBP and PP but was positively associated with DBP in a multiple linear regression analysis for eGFR and uACR, after adjusting for related variables (Table 3). In contrast, uACR was positively associated with SBP and PP but was inversely associated with DBP (Table 4). In the logistic regression analysis, SBP [1.030 (95% confidence interval [CI], 1.022–1.038)], DBP [0.952 (95% CI, 0.940–0.965)], and PP [1.033 (95% CI, 1.025–1.040)] were significant factors determining the odds ratios (ORs) for decreased eGFR (Table 5). SBP [1.030 (95% CI, 1.024–1.036)) and PP [1.029 (95% CI, 1.023–1.035)] were significant factors determining the ORs for elevated uACR, but DBP [1.001 (95% CI, 0.991–1.010)] was not significant (Table 6).
Clinical characteristics of subjects according to decreased eGFR, elevated uACR, and decreased GFR plus elevated uACRThe eGFR and uACR were 95.07 ± 16.53 mL/min/1.73 m2 and 5.92 ± 5.57 mg/g for
the normal group, 53.22 ± 6.69 mL/min/1.73 m2 and 8.49 ± 7.45 mg/g for the decreased eGFR group, 92.60 ± 19.27 mL/min/1.73 m2 and 130.80 ± 269.74 mg/g for the elevated
Table 2. Bivariate correlation of eGFR and uACR, (n = 9,409)
Variables eGFR (mL/min/1.73 m2) uACR (mg/g)
r p-value r p-value eGFR (mL/min/1.73 m2) 1 0.137 < 0.01
uACR (mg/g) -0.137 < 0.01 1 SBP (mmHg) -0.180 < 0.01 0.118 < 0.01 DBP (mmHg) -0.057 < 0.01 0.041 < 0.01
Pulse pressure (mmHg) -0.182 < 0.01 0.117 < 0.01 Age (years) -0.417 < 0.01 0.054 < 0.01
Men -0.132 < 0.01 0.020 < 0.05 Current drinker 0.078 < 0.01 -0.011 0.147 Current smoker -0.038 < 0.01 0.007 0.254
Regular exercising -0.051 < 0.01 0.001 0.482 BMI (kg/m2) -0.114 < 0.01 0.038 < 0.01
WM (cm) -0.165 < 0.01 0.047 < 0.01 TC (mg/dL) -0.058 < 0.01 0.015 0.070 TGs (mg/dL) -0.027 < 0.01 0.024 < 0.05
HDL-C (mg/dL) 0.157 < 0.01 -0.018 < 0.05 FBG (mg/dL) -0.094 < 0.01 0.096 < 0.01
Table 3. Multiple linear regression analysis for the independent factors determining uACR, (n = 9,409)
Variables uACR (mg/g)
β 95% CI p-value β 95% CI p-value
Age (years) -0.087 -0.958 – -0.516 < 0.001 -0.087 -0.955 – -0.512 < 0.001 Men -0.014 -9.844 – 2.588 0.253 - 0.008 -8.135 – 4.131 0.522
BMI (kg/m2) -0.018 -2.268 – 0.885 0.390 -0.008 -1.870– 1.247 0.695 WM (cm) 0.013 -0.405 – 0.761 0.550 0.011 -0.433 – 0.733 0.614
TGs (mg/dL) 0.001 -0.027 – 0.029 0.939 0.006 -0.020 – 0.035 0.594 HDL-C (mg/dL) 0.012 -0.114 – 0.374 0.297 0.015 -0.079 – 0.406 0.187
FBG (mg/dL) 0.082 0.357 – 0.608 < 0.001 0.082 0.358 – 0.609 < 0.001 SBP (mmHg) 0.152 0.985 – 1.456 < 0.001 – DBP (mmHg) -0.062 -1.141 – -0.442 < 0.001 – PP (mmHg) – 0.118 0.965 – 1.436 < 0.001
eGFR (60 mL/min/1.73 m2)
-0.146 1.225 – -0.900 < 0.001 -0.147 -1.231 – -0.907 < 0.001

Kidney Blood Press Res 2017;42:816-826DOI: 10.1159/000484381Published online: October 26, 2017
© 2017 The Author(s). Published by S. Karger AG, Baselwww.karger.com/kbr 821
Seong et al.: Pulse Pressure and eGFR and uACR
uACR group, and 46.32 ± 12.69 mL/min/1.73 m2 and 417.96 ± 933.05 mg/g for the decreased eGFR plus elevated uACR group, respectively (Table 7).
Comparison of PP and high PP odds ratios according to the decreased eGFR, elevated uACR, and decreased GFR plus elevated uACRAfter adjusting for
related variables (age, gender, smoking, alcohol drinking, regular exercise, BMI, WM, TC, TGs, HDL-C, and FPG), the ORs of a high PP with the normal group as a reference were significantly higher in the decreased eGFR group [1.484 (95% CI, 1.003–2.196)], elevated uACR group [2.592 (95% CI, 2.085–3.223)], and decreased eGFR plus elevated uACR group [3.889 (95% CI, 2.519–6.004)] (Table 8).
Discussion
The present study investigated the association between PP and eGFR and uACR in Korean adults using data from the sixth KNHANES conducted in 2013–2014. Several findings of this study were key after adjusting some variables. eGFR was positively associated with SBP and inversely associated with DBP. In contrast, uACR was inversely associated with SBP and positively associated with DBP. In addition, enhanced PP was associated with a decrease in eGFR and an increase in the uACR.
CKD and CVD are closely associated due to clustering of several cardiovascular risk factors, including hypertension, diabetes mellitus, and dyslipidemia in patients with CKD, which results in an increase in CVD in patients with CKD [23, 24]. In a meta-analysis, the decrease in eGFR and increase in ACR were associated with an increased risk for cardiovascular mortality independently of each other and traditional risk factors, such as hypertension, diabetes mellitus, and hypercholesterolemia [25]. In the present study, the risk
Table 4. Multiple linear regression analysis for the independent factors determining eGFR, (n = 9,409)
Variables eGFR (mL/min/1.73 m2)
β 95% CI p-value β 95% CI p-value
Age (years) -0.437 -0.534 – -0.481 < 0.001 -0.438 -0.534 – -0.481 < 0.001 Men -0.139 -6.152 – -4.025 < 0.001 -0.142 -6.266 – -4.156 < 0.001
Current drinker 0.084 2.291 – 3.876 < 0.001 0.083 2.259 – 3.843 < 0.001 Current smoker 0.042 0.353 – 1.532 < 0.001 0.042 0.358 – 1.538 0.002
Regular exercising -0.040 -2.500 – -0.811 < 0.001 -0.040 -2.504 – -0.815 < 0.001 BMI (kg/m2) 0.029 -0.054 – 0.366 0.145 0.024 -0.079 – 0.337 0.224
WM (cm) -0.085 -0.237 – -0.082 < 0.001 -0.084 -0.235 – -0.080 < 0.001 TC (mg/dL) -0.103 -0.065 – -0.042 < 0.001 -0.106 -0.066 – -0.043 < 0.001 TGs (mg/dL) 0.107 0.014 – 0.022 < 0.001 0.105 0.014 – 0.022 < 0.001
HDL-C (mg/dL) 0.143 0.174 – 0.245 < 0.001 0.142 0.173 – 0.244 < 0.001 FBG (mg/dL) -0.030 -0.043 – -0.008 0.005 -0.030 -0.043 – -0.008 0.004 SBP (mmHg) -0.170 -0.216 – -0.159 < 0.001 – DBP (mmHg) 0.088 0.108 – 0.200 < 0.001 – PP (mmHg) – -0.134 -0.215 – -0.157 < 0.001
uACR (mg/g) -0.144 -0.018 – -0.013 < 0.001 -0.115 -0.018 – -0.013 < 0.001
Table 5. Logistic regression analysis for the independent factors determining elevated uACR, (n = 9,409)
Variables Elevated uACR (uACR ≥ 30 mg/g)
Exp(B) 95% CI Exp(B) 95% CI
Age (years) 1.011 1.004 – 1.019 1.009 1.002 – 1.017 Men 0.855 0.656 – 1.113 0.935 0.720 – 1.211
Current drinker 0.934 0.777 – 1.123 0.970 0.809 – 1.164 Current smoker 1.008 0.762 – 1.332 0.994 0.754 – 1.311
Regular exercising 0.876 0.720 – 1.067 0.889 0.731 – 1.080 BMI (kg/m2) 0.979 0.935 – 1.025 1.004 0.960 – 1.051
WM (cm) 1.021 1.004 – 1.038 1.018 1.001 – 1.035 TC (mg/dL) 0.998 0.996 – 1.001 0.999 0.997 – 1.002 TGs (mg/dL) 1.001 1.000 – 1.002 1.001 1.001 – 1.002
HDL-C (mg/dL) 1.005 0.997 – 1.013 1.006 0.998 – 1.014 FBG (mg/dL) 1.016 1.013 – 1.019 1.016 1.013 – 1.018 SBP (mmHg) 1.030 1.024 – 1.036 – DBP (mmHg) 1.001 0.991 – 0.1010 – PP (mmHg) – 1.029 1.023 – 1.035
eGFR (60 mL/min/1.73 m2) 0.985 0.980 – 0.989 0.985 0.980 – 0.990

Kidney Blood Press Res 2017;42:816-826DOI: 10.1159/000484381Published online: October 26, 2017
© 2017 The Author(s). Published by S. Karger AG, Baselwww.karger.com/kbr 822
Seong et al.: Pulse Pressure and eGFR and uACR
factors for CVD, such as SBP, PP, BMI, WM, TGs, and FBG, were higher in the decreased eGFR, elevated uACR, and decreased eGFR plus elevated uACR groups than those in the normal group, and DBP (except the elevated uACR group) and HDL-C were lower. It is important to monitor eGFR and the uACR in patients with progressive CKD. Microalbuminuria is a useful predictor of cardiovascular events [26] and may be useful as an early warning sign of diabetic nephropathy [27]. Diabetic nephropathy is a risk factor for ESRD because prevalence increases to about 40% in patients with ESRD [28, 29].
PP may be an important risk factor in the progression of both CKD and CVD. PP is a powerful predictor of arterial stiffness. Increased arterial stiffness leads to left ventricular hypertrophy [30], and left ventricular hypertrophy is associated with mortality risk and cardiovascular events in patient with CKD and ESRD as demonstrated by higher rates of sudden cardiac death in these patients [31]. Therefore, Fernandez-Fresnedo et al. suggested that increase in PP is a significant predictor of risk for mortality and morbidity in patients with CKD including ESRD [32]. The mechanism linking PP and excretion of urinary albumin remains unclear. However, a long-term increase in PP could lead to endothelial dysfunction caused by microvascular damage in the kidney [33]. Then, endothelial dysfunction modifies glomerular permeability, which could lead to increased excretion of albumin [34].
PP promotes the progression of vascular calcification [35]. Compared with the general population, patients with declining kidney function have a disproportionately high occurrence of vascular calcification. Vascular calcification in patients with CKD occurs
Table 6. Logistic regression analysis for the independent factors determining decreased eGFR, (n = 9,409)
Variables Decresed eGFR (eGFR < 60 mL/min/1.73 m2)
Exp(B) 95% CI Exp(B) 95% CI
Age (years) 1.107 1.090 – 1.125 1.110 1.093 – 1.127 Men 1.003 0.888 – 1.992 1.277 0.854 – 1.911
Current drinker 0.480 0.356 – 0.646 0.469 0.348 – 0.632 Current smoker 0.613 0.381 – 0.985 0.624 0.388 – 1.002
Regular exercising 1.018 0.797 – 1.468 1.064 0.784 – 1.444 BMI (kg/m2) 0.911 0.848 – 0.980 0.895 0.834 – 0.962
WM (cm) 1.063 1.036 – 1.092 1.066 1.038 – 1.094 TC (mg/dL) 0.996 0.992 – 1.000 0.995 0.991 – 0.999 TGs (mg/dL) 1.000 0.998 – 1.001 1.000 0.998 – 1.001
HDL-C (mg/dL) 0.971 0.957 – 0.986 0.971 0.957 – 0.985 FBG (mg/dL) 1.004 0.999 – 1.009 1.004 0.999 – 1.009 SBP (mmHg) 1.030 1.022 – 1.038 – DBP (mmHg) 0.952 0.940 – 0.965 – PP (mmHg) – 1.033 1.025 – 1.040
uACR (mg/g) 1.002 1.001 – 1.003 1.002 1.001 – 1.003
Variables α Normal (n = 8,466) β Decreased eGFR (n = 172) γ Elevated uACR (n = 666) ζ Decreased eGFR plus Elevated uACR (n = 105) p-value
Men 3,753 (44.3) 89 (51.7) 303 (45.5) 61 (58.1) 0.008
Current drinker 4,407 (52.1) 54 (31.4) 314 (47.1) 37 (35.2) < 0.001
Current smoker 1,665 (19.7) 23 (13.4) 126 (18.9) 14 (13.3) < 0.001
Regular exerciser 2,091 (24.7) 38 (22.1) 134 (20.1) 30 (28.6) 0.028
Age (years) 49.36 ± 15.43 70.47 ± 8.06 57.49 ± 14.85 66.48 ± 12.34 < 0.001
SBP (mmHg) 116.81 ± 15.82 122.65 ± 16.14 129.39 ± 19.56 130.82 ± 20.66 < 0.001
DBP (mmHg) 74.93 ± 10.09 71.14 ± 10.66 78.67 ± 12.61 74.39 ± 13.67 < 0.001
PP (mmHg) 41.88 ± 12.25 51.51 ± 16.32 50.72 ± 16.67 56.43 ± 16.78 < 0.001
BMI (kg/m2) 23.69 ± 3.29 24.61 ± 3.04 24.87 ± 3.99 24.69 ± 3.71 < 0.001
WM (cm) 80.61 ± 9.54 85.48 ± 8.52 84.83 ± 11.00 86.05 ± 9.69 < 0.001
TC (mg/dL) 188.55 ± 34.86 182.56 ± 38.48 194.52 ± 38.99 176.47 ± 39.68 < 0.001
TGs (mg/dL) 133.74 ± 104.77 155.47 ± 87.77 171.82 ± 145.86 147.62 ± 83.24 < 0.001
HDL-C (mg/dL) 52.71 ± 12.45 46.08 ± 11.25 50.63 ± 11.99 46.30 ± 12.62 < 0.001
FBG (mg/dL) 98.44 ± 19.64 105.46 ± 22.69 115.99 ± 40.55 115.23 ± 31.65 < 0.001
eGFR (mL/min/1.73 m2) 95.07 ± 16.53 53.22 ± 6.69 92.60 ± 19.27 46.32 ± 12.69 < 0.001
uACR (mg/g) 5.92 ± 5.57 8.49 ± 7.45 130.80 ± 269.74 417.96 ± 933.05 < 0.001 Urine microalbumin (μg/dL) 9.10 ± 10.24 11.76 ± 14.68 151.99 ± 293.13 363.46 ± 786.00 < 0.001
Urine creatinine (mg/dL) 156.26 ± 86.15 131.32 ± 77.90 127.31 ± 72.98 108.31 ± 51.88 < 0.001
Table 7. Clinical characteristics of subjects according to decreased eGFR, elevated uACR, and decreased eGFR plus elevated uACR, (n = 9,409); α Normal: eGFR ≥ 60 mL/min/1.73 m2 and uACR < 30 mg/g. β Decreased eGFR: eGFR < 60 mL/min/1.73 m2, γ Elevated uACR: uACR ≥ 30 mg/g. ζ Decreased eGFR plus Elevated uACR: eGFR < 60 mL/min/1.73 m2 and uACR ≥ 30 mg/g

Kidney Blood Press Res 2017;42:816-826DOI: 10.1159/000484381Published online: October 26, 2017
© 2017 The Author(s). Published by S. Karger AG, Baselwww.karger.com/kbr 823
Seong et al.: Pulse Pressure and eGFR and uACR
via osteoblastic-like cell differentiation of the vascular smooth muscle cells in the kidneys. Some studies reported that cyclic adenosine monophosphate, which is mediated by tumor necrosis factor-α, stimulates the osteoblastic differentiation of vascular smooth muscle cells in kidney [36, 37]. In other studies, high extracellular calcium and phosphate concentrations have induced the transformation of vascular smooth muscle cells into osteoblast-like cells and accelerated the processes of active vascular calcification [38, 39].
Currently, previous studies indicate inconsistent results in the association between PP and renal function. Some studies have shown that eGFR decreases as PP increases [40, 41], whereas other studies have shown that PP and eGFR or albuminuria are unrelated [18, 19, 42]. The reason for these inconsistencies is unclear; however, previous findings may differ according to the race or country and subjects with or without diseases, such as CKD, hypertension, and DM (Supplement 1). For all supplemental material see www.karger.com/doi/10.1159/000484381. Anderson et al. reported that PP > 60 mmHg is associated with the ACR (p < 0.001) in type 2 DM but not with GFR (p = 0.105) [43]. Young et al. reported that SBP (p < 0.001) and PP (p < 0.001), but not DBP (p = 0.19), are associated with decline in kidney function [44]. However, Theilade et al. determined that SBP (p = 0.25), DBP (p = 0.58), and PP (p = 0.36) are not associated with end stage renal disease [42]. In the present study, we found that uACR was positively associated with SBP (β = 0.152; p < 0.001) and was inversely associated with DBP (β = -0.062; p < 0.001). In contrast, eGFR was inversely associated with SBP (β = -0.170; p < 0.001) and was positively associated with DBP (β = 0.088; p < 0.001). Therefore, PP was associated with uACR (β = 0.118; p < 0.001) and eGFR (β = -0.134; p < 0.001) because PP is defined as the value between SBP minus DBP.
We examined the change in PP level and odds ratio of high PP when the decrease in eGFR and increase in uACR occurred simultaneously, and our findings are interesting. Our results show that the ORs of high PP in the decreased eGFR plus elevated uACR group [3.889 (95% CI, 2.519–6.004)] was higher than the decreased eGFR [1.484 (95% CI, 1.003–2.196)] or elevated uACR group [2.592 (95% CI, 2.085–3.223)]. Due to the strong synergistic interaction between decreased eGFR and increased uACR, when the decreased eGFR is combined with the increased uACR, the risk of CKD progression may be accelerated [45]. These results are similar to the study of Levey et al. They reported that the CVD mortality for the decreased eGFR plus elevated uACR group was higher (at least 2.8 times) than the decreased eGFR group (at least 1.5 times) or the elevated uACR group (at least 1.6 times) [5]. They suggested that the OR of ESRD for the decreased eGFR plus elevated uACR group was very much higher (at least 40 times) than the decreased eGFR group (at least 5.2 times) or the elevated uACR group (at least 3.8 times). Increased PP is well known that a strong predictor of mortality in patients with CKD and cardiovascular disease. We consider that PP may be a useful predictor for why mortality greatly increased when a decrease in eGFR was combined with an increase in the uACR. In addition, Increase of PP in general populations is a predictor of prevalence of CKD events. In the present study, increase of PP in general population was associated CKD and its complication. Therefore, if PP increases in general populations, it may be suspected
Table 8. Comparisons of high PP odds ratio according to decreased eGFR, elevated uACR, and decreased eGFR plus elevated uACR, (n = 9,409); High PP: PP ≥ 60 mmHg, eGFR: estimated glomerular filtration rate, uACR: Urine microalbumin/creatinine ratio. Model 1, Non-adjusted; Model 2, adjusted for age and gender; Model 3, Model 2 further adjusted for smoking, drinking, regular exercising, BMI, and WM; Model 4, Model 3 further adjusted for TC, TGs, HDL-C, and FBG
Variables Category High PP odds ratios (95% CI)
Model 1 Model 2 Model 3 Model 4
Normal eGFR ≥ 60 and uACR < 30 1 1 1 1
Decreased eGFR eGFR < 60 2.936 (1.994–4.324) 1.675 (1.138–2.466) 1.494 (1.011–2.207) 1.484 (1.003–2.196)
Elevated uACR uACR ≥ 30 3.813 (3.121–4.658) 2.945 (2.387–3.632) 2.784 (2.251–3.444) 2.592 (2.085–3.223)
Decreased eGFR plus Elevated uACR eGFR < 60 and uACR ≥ 30 6.975 (4.606–10.562) 4.511 (2.947–6.904) 4.084 (2.657–6.275) 3.889 (2.519–6.004)

Kidney Blood Press Res 2017;42:816-826DOI: 10.1159/000484381Published online: October 26, 2017
© 2017 The Author(s). Published by S. Karger AG, Baselwww.karger.com/kbr 824
Seong et al.: Pulse Pressure and eGFR and uACR
the CVD and its events as well as CKD and its complications, and the monitoring of PP in a general population can be useful for early treatment of these diseases.
However, the present study has some limitations. First, parathyroid hormone (PTH) and serum phosphate are important factors in renal function [46-48]. However, the data of the KNHANES VI (2013–2014) study failed to measure the PTH and serum phosphate. Second, because this study was cross-sectional, it had only limited ability to establish a causal relationship between PP and uACR and eGFR. Although the present study had limitations, this is the first study to report on the relationship between PP and eGFR and uACR in Korean adults. Therefore, more accurate results might be obtained by performing a cohort study.
Conclusion
The present study investigated the association between PP and eGFR and uACR in Korean adults using data from the sixth KNHANES conducted in 2013–2014. Enhanced PP was associated with a decreased eGFR and an increase in uACR in Korean adults. In addition, the PP increased greatly when a decrease in eGFR and an increase in uACR appeared simultaneously.
Disclosure Statement
The authors declare that there is no conflict of interest associated with this manuscript.
References
1 Muntner P, He J, Hamm L, Loria C, Whelton PK: Renal insufficiency and subsequent death resulting from cardiovascular disease in the United States. J Am Soc Nephrol 2002;13:745–753.
2 National Kidney Foundation: K/DOQI clinical practice guidelines for chronic kidney disease: evaluation, classification, and stratification. Am J Kidney Dis 2002;39:S1.
3 Gerstein HC, Mann JF, Yi Q, Zinman B, Dinneen SF, Hoogwerf B, Hallé JP, Young J, Rashkow A, Joyce C, Nawaz S, Yusuf S; HOPE Study Investigators: Albuminuria and risk of cardiovascular events, death, and heart failure in diabetic and nondiabetic individuals. JAMA 2001;286:421-426.
4 Ekart R, Bevc S, Hojs N, Knehtl M, Dvoršak B, Hojs R: Albuminuria is Associated With Subendocardial Viability Ratio in Chronic Kidney Disease Patients. Kidney Blood Press Res 2015;40:565–74.
5 Levey AS, de Jong PE, Coresh J, El Nahas M, Astor BC, Matsushita K, Gansevoort RT, Kasiske BL, Eckardt KU: The definition, classification, and prognosis of chronic kidney disease: a KDIGO Controversies Conference report. Kidney Int 2011;80:17–28.
6 Bakris GL, Ritz E. World Kidney Day Steering Committee: The message for World Kidney Day 2009: hypertension and kidney disease: a marriage that should be prevented. J Clin Hypertens (Greenwich) 2009;11:144–147.
7 Anderson AH, Yang W, Townsend RR, Pan Q, Chertow GM, Kusek JW, Charleston J, He J, Kallem R, Lash JP, Miller ER 3rd, Rahman M, Steigerwalt S, Weir M, Wright JT Jr, Feldman HI; Chronic Renal Insufficiency Cohort Study Investigators: Time-updated systolic blood pressure and the progression of chronic kidney disease: a cohort study. Ann Intern Med 2015;162:258–265.
8 Wang MC, Tsai WC, Chen JY, Huang JJ: Stepwise increase in arterial stiffness corresponding with the stages of chronic kidney disease. Am J Kidney Dis 2005;45:494–501.
9 Kim CS, Kim HY, Kang YU, Choi JS, Bae EH, Ma SK, Kim SW: Association of pulse wave velocity and pulse pressure with decline in kidney function. J Clin Hypertens (Greenwich) 2014;16:372–377.
10 Pasch A, Block GA, Bachtler M, Smith ER, Jahnen-Dechent W, Arampatzis S, Chertow GM, Parfrey P, Ma X, Floege J: Blood Calcification Propensity, Cardiovascular Events, and Survival in Patients Receiving Hemodialysis in the EVOLVE Trial. Clin J Am Soc Nephrol 2017;12:315–322.

Kidney Blood Press Res 2017;42:816-826DOI: 10.1159/000484381Published online: October 26, 2017
© 2017 The Author(s). Published by S. Karger AG, Baselwww.karger.com/kbr 825
Seong et al.: Pulse Pressure and eGFR and uACR
11 Vaccarino V, Berger AK, Abramson J, Black HR, Setaro JF, Davey JA, Krumholz HM: Pulse pressure and risk of cardiovascular events in the systolic hypertension in the elderly program. Am J Cardiol 2001;88:980–986.
12 Mazza A, Pessina AC, Gianluca P, Tikhonoff V, Pavei A, Casiglia E: Pulse pressure: an independent predictor of coronary and stroke mortality in elderly females from the general population. Blood Press 2001;10:205–211.
13 Banerjee D, Nabut JL, Pennell P, Walters BAJ, Bosch J: Pulse pressure predicts mortality in haemodialysis patients. J Am Soc Nephrol 2002;13:240A.
14 Wu Z, Wu X, Xing F, Zhou S, Luo B, Wang L: Blood Pressure Characteristics in Moderate to Severe Renal Insufficiency. Kidney Blood Press Res 2015;40:478–89.
15 Tozawa M, Iseki K, Iseki C, Takishita S: Pulse pressure and risk of total mortality and cardiovascular events in patients on chronic hemodialysis. Kidney Int 2002;61:717–726.
16 Tanaka M, Babazono T, Takeda M, Iwamoto Y: Pulse pressure and chronic kidney disease in patients with type 2 diabetes. Hypertens Res 2006;29:345–352.
17 Cirillo M, Stellato D, Laurenzi M, Panarelli W, Zanchetti A, De Santo NG: Pulse pressure and isolated systolic hypertension: association with microalbuminuria. The GUBBIO Study Collaborative Research Group. Kidney Int 2000;58:1211–1218.
18 Nakhjavani M, Nargesi AA, Heidari B, Ghazizadeh Z, Larry M, Esteghamati A: Pulse pressure does not predict the response of diabetic nephropathy to glucose-lowering therapy. Diab Vasc Dis Res 2015;12:150–151.
19 Gordin D, Wadén J, Forsblom C, Thorn L, Rosengård-Bärlund M, Tolonen N, Saraheimo M, Harjutsalo V, Groop PH; FinnDiane Study Group: Pulse pressure predicts incident cardiovascular disease but not diabetic nephropathy in patients with type 1 diabetes (The FinnDiane Study). Diabetes Care 2011;34:886–891.
20 Ministry of Health and Welfare, Korea Centers for Disease Control and Prevention. Korea Health Statistics 2010: Korea National Health and Nutrition Examination Survey (KNHANES V-1), available on: https://knhanes.cdc.go.kr/knhanes/index.do.
21 Levey AS, Stevens LA, Schmid CH, Zhang YL, Castro AF 3rd, Feldman HI, Kusek JW, Eggers P, Van Lente F, Greene T, Coresh J; CKD-EPI (Chronic Kidney Disease Epidemiology Collaboration): A new equation to estimate glomerular filtration rate. Ann Intern Med 2009;150:604–612.
22 Park SY, Oh HJ, Yoon H: Association of Metabolic syndrome, Metabolic syndrome score and Pulse pressure in Korean Adults: Korea National Health and Nutrition Survey, 2012. J Korea Acad Industr Coop Soc 2014;15:5660–5667.
23 Liu M, Li XC, Lu L, Cao Y, Sun RR, Chen S, Zhang PY: Cardiovascular disease and its relationship with chronic kidney disease. Eur Rev Med Pharmacol Sci 2014;18:2918–2926.
24 Ardhanari S, Alpert MA, Aggarwal K: Cardiovascular disease in chronic kidney disease: risk factors, pathogenesis, and prevention. Adv Perit Dial 2014;30:40–53.
25 Chronic Kidney Disease Prognosis Consortium, Matsushita K, van der Velde M, Astor BC, Woodward M, Levey AS, de Jong PE, Coresh J, Gansevoort RT: Association of estimated glomerular filtration rate and albuminuria with all-cause and cardiovascular mortality in general population cohorts: a collaborative meta-analysis. Lancet 2010;375:2073-2081.
26 Dutta D, Choudhuri S, Mondal SA, Mukherjee S, Chowdhury S: Urinary albumin: creatinine ratio predicts prediabetes progression to diabetes and reversal to normoglycemia: role of associated insulin resistance, inflammatory cytokines and low vitamin D. J Diabetes 2014;6:316–322.
27 Gerstein HC, Mann JF, Pogue J, Dinneen SF, Hallé JP, Hoogwerf B, Joyce C, Rashkow A, Young J, Zinman B, Yusuf S: Prevalence and determinants of microalbuminuria in high-risk diabetic and nondiabetic patients in the Heart Outcomes Prevention Evaluation Study. The HOPE Study Investigators. Diabetes Care 2000;23:35–39.
28 Van Dijk PC, Jager KJ, Stengel B, Gronhagen-Riska C, Feest TG, Briggs JD: Renal replacement therapy for diabetic end–stage renal disease: data from 10 registries in Europe (1991–2000). Kidney Int 2005;67:1489–1499.
29 Sarafidis PA, Bakris GL: Microalbuminuria and chronic kidney disease as risk factors for cardiovascular disease. Nephrol Dial Transplant 2006;21:2366–2374.
30 Brunet P, Gondouin B, Duval-Sabatier A, Dou L, Cerini C, Dignat-George F, Jourde-Chiche N, Argiles A, Burtey S: Does uremia cause vascular dysfunction? Kidney Blood Press Res 2011;34:284–290.
31 Di Lullo L, Gorini A, Russo D, Santoboni A, Ronco C: Left Ventricular Hypertrophy in Chronic Kidney Disease Patients: From Pathophysiology to Treatment. Cardiorenal Med 2015;5:254–266.

Kidney Blood Press Res 2017;42:816-826DOI: 10.1159/000484381Published online: October 26, 2017
© 2017 The Author(s). Published by S. Karger AG, Baselwww.karger.com/kbr 826
Seong et al.: Pulse Pressure and eGFR and uACR
32 Fernandez-Fresnedo G, Rodrigo E, de Francisco AL, de Castro SS, Castañeda O, Arias M: Role of pulse pressure on cardiovascular risk in chronic kidney disease patients. J Am Soc Nephrol 2006;17:S246–249.
33 O’Rourke MF, Safar ME: Relationship between aortic stiffening and microvascular disease in brain and kidney: cause and logic of therapy. Hypertension 2005;4:200–204.
34 Stehouwer CD, Smulders YM: Microalbuminuria and risk for cardiovascular disease: Analysis of potential mechanisms. J Am Soc Nephrol 2006;17:2106–2111.
35 Miwa Y, Tsushima M, Arima H, Kawano Y, Sasaguri T: Pulse pressure is an independent predictor for the progression of aortic wall calcification in patients with controlled hyperlipidemia. Hypertension 2004;43:536–540.
36 Aghagolzadeh P, Bachtler M, Bijarnia R, Jackson C, Smith ER, Odermatt A, Radpour R, Pasch A: Calcification of vascular smooth muscle cells is induced by secondary calciprotein particles and enhanced by tumor necrosis factor-α. Atherosclerosis 2016;251:404–414.
37 Mizobuchi M, Towler D, Slatopolsky E: Vascular calcification: the killer of patients with chronic kidney disease. J Am Soc Nephrol 2009;20:1453–1464.
38 Reynolds JL, Joannides AJ, Skepper JN, McNair R, Schurgers LJ, Proudfoot D, Jahnen-Dechent W, Weissberg PL, Shanahan CM: Human vascular smooth muscle cells undergo vesicle-mediated calcification in response to changes in extracellular calcium and phosphate concentrations: A potential mechanism for accelerated vascular calcification in ESRD. J Am Soc Nephrol 2004;15:2857–2867.
39 Chen NX, O’Neill KD, Duan D, Moe SM: Phosphorus and uremic serum up-regulate osteopontin expression in vascular smooth muscle cells. Kidney Int 2002;62:1724–1731.
40 Arulkumaran N, Diwakar R, Tahir Z, Mohamed M, Kaski JC, Banerjee D: Pulse pressure and progression of chronic kidney disease. J Nephrol 2010;23:189–193.
41 Verhave JC, Fesler P, du Cailar G, Ribstein J, Safar ME, Mimran A: Elevated pulse pressure is associated with low renal function in elderly patients with isolated systolic hypertension. Hypertension 2005;45:586–591.
42 Theilade S, Claggett B, Hansen TW, Skali H, Lewis EF, Solomon SD, Parving HH, Pfeffer M, McMurray JJ, Rossing P; TREAT investigators: Pulse pressure is not an independent predictor of outcome in type 2 diabetes patients with chronic kidney disease and anemia—the Trial to Reduce Cardiovascular Events with Aranesp Therapy (TREAT). J Hum Hypertens 2016;30:46–52.
43 Anderson RJ, Bahn GD, Emanuele NV, Marks JB, Duckworth WC; VADT Study Group: Blood pressure and pulse pressure effects on renal outcomes in the Veterans Affairs Diabetes Trial (VADT). Diabetes Care 2014;37:2782–2788.
44 Young JH, Klag MJ, Muntner P, Whyte JL, Pahor M, Coresh J: Blood pressure and decline in kidney function: findings from the Systolic Hypertension in the Elderly Program (SHEP). J Am Soc Nephrol 2002;13:2776–2782.
45 Inker LA, Astor BC, Fox CH, Isakova T, Lash JP, Peralta CA, Kurella Tamura M, Feldman HI: KDOQI US Commentary on the 2012 KDIGO Clinical Practice Guideline for the Evaluation and Management of CKD. Am J Kidney Dis 2014;63:713–735.
46 Tepel M, Armbruster FP, Grön HJ, Scholze A, Reichetzeder C, Roth HJ, Hocher B: Nonoxidized, biologically active parathyroid hormone determines mortality in hemodialysis patients. J Clin Endocrinol Metab 2013;98:4744–4751.
47 Hocher B, Oberthür D, Slowinski T, Querfeld U, Schaefer F, Doyon A, Tepel M, Roth HJ, Grön HJ, Reichetzeder C, Betzel C, Armbruster FP: Modeling of oxidized PTH (oxPTH) and non-oxidized PTH (n-oxPTH) receptor binding and relationship of oxidized to non-oxidized PTH in children with chronic renal failure, adult patients on hemodialysis and kidney transplant recipients. Kidney Blood Press Res 2013;37:240–251.
48 Tseng PY, Yang WC, Yang CY, Tarng DC: Long-term Outcomes of Parathyroidectomy in Kidney Transplant Recipients with Persistent Hyperparathyroidism. Kidney Blood Press Res 2015;40:386–394.
Copyright © 2022 FDOKUMEN