Vehicle safety ratings estimated from police reported crash data
266
VEHICLE SAFETY RATINGS ESTIMATED FROM POLICE REPORTED CRASH DATA: 2009 UPDATE AUSTRALIAN AND NEW ZEALAND CRASHES DURING 1987-2007 by Stuart Newstead Linda Watson & Max Cameron Report No. 287 August 2009
-
Upload
khangminh22 -
Category
Documents
-
view
1 -
download
0
Transcript of Vehicle safety ratings estimated from police reported crash data
VEHICLE SAFETY RATINGS ESTIMATED FROMPOLICE REPORTED CRASH DATA: 2009 UPDATE
AUSTRALIAN AND NEW ZEALAND CRASHES DURING 1987-2007
by
Stuart NewsteadLinda Watson
& Max Cameron
Report No. 287August 2009

ii MONASH UNIVERSITY ACCIDENT RESEARCH CENTRE
Project Sponsored By

VEHICLE SAFETY RATINGS: 2009 UPDATE iii
MONASH UNIVERSITY ACCIDENT RESEARCH CENTREREPORT DOCUMENTATION PAGE
Report No. Report Date ISBN ISSN Pages287 August 2009 0 7326 2357 X 1835-4815 (On-Line) 82 + Appendices
Title and sub-title:VEHICLE SAFETY RATINGS ESTIMATED FROM POLICE REPORTED CRASH DATA: 2009 UPDATEAUSTRALIAN AND NEW ZEALAND CRASHES DURING 1987-2007Author(s) Type of Report & Period CoveredNewstead, S.V., Watson, L.M and Cameron, M.H. Summary Report, 1982-2007Sponsoring Organisations - This project was funded as contract research by the following organisations:Road Traffic Authority of NSW, Royal Automobile Club of Victoria Ltd, NRMA Motoring and Services, VicRoads, RoyalAutomobile Club of Western Australia Ltd, Transport Accident Commission, New Zealand Transport Agency, the NewZealand Automobile Association, Queensland Department of Transport and Main Roads, Royal Automobile Club ofQueensland, Royal Automobile Association of South Australia and by grants from the Australian Government Departmentof Transport, Infrastructure, Regional Development and Local Govenrment and the Road Safety Council of WesternAustraliaAbstract:
This study describes the calculation of updated vehicle safety ratings that measure the relative safety of vehicles inpreventing severe injury to people involved in crashes. Three different aspects of secondary safety are examined:crashworthiness which focuses on drivers of the rated vehicle, aggressivity which focuses on drivers of other vehicles andunprotected road users such as pedestrians, cyclists and motorcyclists colliding with the rated vehicle and total secondarysafety which examines the combined crashworthiness and aggressivity performance of the rated vehicle. Updated ratings for1982-2007 model vehicles were estimated based on data on crashes in Victoria and New South Wales during 1987-2007, inQueensland, Western Australia and New Zealand during 1991-2007 and in South Australia during 1995-2007. Each ratingis measured as a combination of injury severity (the risk of death or serious injury given an injury was sustained) and injuryrisk (the risk of injury given crash involvement). The ratings were adjusted for the sex and age of the person whose injuryoutcome was being measured, speed limit at the crash location, number of vehicles, crash configuration and type or roaduser involved where relevant, the jurisdiction in which the crash occurred and the year in which the crash occurred. Thesefactors were strongly related to injury risk and/or severity. The ratings estimate the risk of being killed or admitted tohospital when involved in a crash, to a degree of accuracy represented by the confidence limits of the rating in each case.
A new method of presenting the ratings for consumer information is introduced. The new rating presentation classifiesvehicles according to where their rating lies in relation to a best performance benchmark. Crashworthiness estimates andtheir associated confidence limits were obtained for 427 vehicle models classified into 10 market groups with 203 modelsof vehicles identified as having ratings of adequate statistical precision to be compared to the crashworthiness benchmarkrating of 1.60%. Aggressivity rating estimates and their associated confidence limits were obtained for 397 vehicle modelswith 154 having ratings of sufficient statistical precision to be compared to the aggressivity benchmark rating of 1.93%. Thetotal secondary safety index estimates and their associated confidence limits were obtained for 484 vehicle models classifiedinto 10 market groups with 239 being of sufficient statistical precision to be compared to the total safety index benchmarkindex of 1.91%.
The relationship between vehicle crashworthiness and the year of manufacture of Australian passenger and lightcommercial vehicles manufactured from 1964 to 2007 was also investigated. Trends were examined by year of manufactureboth for the fleet as a whole and by market group for vehicles manufactured from 1982 to 2007.
The results of this report are based on a number of assumptions and warrant a number of qualifications that should benoted.
Key Words: (IRRD except when marked*)Injury, Vehicle Occupant, Collision, Passenger Car Unit, Passive Safety System, Statistics
Disclaimer:This Report is produced for the purposes of providing information concerning the safety of vehicles involved in crashes. It isbased upon information provided to the Monash University Accident Research Centre by VicRoads, the Transport AccidentCommission, the New South Wales Roads and Traffic Authority, NRMA Ltd, Queensland Transport, the Western AustralianDepartment of Main Roads, South Australian Department of Transport, Energy and Infrastructure and Land Transport NewZealand. Any republication of the findings of the Report whether by way of summary or reproduction of the tables or otherwiseis prohibited unless prior written consent is obtained from the Monash University Accident Research Centre and any conditionsattached to that consent are satisfied. A brochure based on this report is available from the sponsoring organisations and may befreely quoted.
Reproduction of this page is authorised Monash University Accident Research Centre Building 70, Monash UniversityVictoria 3800, Australia. Telephone: +61 3 9905 4371, Fax: +61 3 9905 4363
iv MONASH UNIVERSITY ACCIDENT RESEARCH CENTRE
EXECUTIVE SUMMARY
This report describes the development of further updated vehicle safety ratings for 1982-2007 model vehicles. The ratings produced cover vehicle crashworthiness, aggressivity andtotal secondary safety. Crashworthiness ratings measure the relative safety of vehicles inpreventing severe injury to their own drivers in crashes whilst aggressivity ratings measurethe serious injury risk vehicles pose to other road users with which they collide. Theaggressivity rating measure is based on collisions between the vehicle being rated and bothother vehicles and unprotected road users including pedestrians, bicyclists andmotorcyclists. The total secondary safety index measure integrates into one measure thecombined crashworthiness and aggressivity performance of a vehicle in a way mostrepresentative of the crash population involving the vehicle fleet being rated. It considersrelative injury outcomes in a mix of crashes involving light passenger vehicles includingsingle and multi vehicle crashes, crashes with heavy vehicle and crashes involvingunprotected road users. It was first developed in Newstead et al (2007a) to represent thetotal secondary safety performance of the vehicle across the full range of collision partnersand crash types.
All three measures of vehicle secondary safety performance are estimated from data on realcrashes reported to police. The update is based on crash data from Victoria and New SouthWales during 1987-2007, from Queensland, Western Australia and New Zealand during1991-2007 and from South Australia during 1995-2007. The rating of vehiclecrashworthiness through analysis of real crash data, as carried out here, and through crashtests carried out by consumer groups such as the Australasian New Car Assessment Programis aimed at informing consumers about relative vehicle safety performances as well asencouraging manufacturers to improve vehicle safety.
A new method of presenting the ratings for consumer information is introduced. The newrating presentation classifies vehicles according to where their rating lies in relation to a bestperformance benchmark.
Crashworthiness ratings were measured by a combination of injury severity (of injureddrivers) and injury risk (of drivers involved in crashes). Crashworthiness injury severity wasbased on 348,618 drivers injured in crashes in Victoria during 1987-2007, in New SouthWales during 1987-1998, in South Australia during 1995-2007 and in Queensland, WesternAustralia and New Zealand during 1991-2007. Crashworthiness injury risk was based on1,831,574 drivers involved in crashes in New South Wales during 1987-2007, in SouthAustralia during 1995-2007 and Western Australia and Queensland during 1991-2007where a vehicle was towed away or someone was injured. The crashworthiness ratings wereadjusted for the driver sex and age, the speed limit at the crash location, the year in whichthe crash occurred, the jurisdiction in which the crash occurred and the number of vehiclesinvolved in the crash. These factors were found to be strongly associated with injury riskand injury severity. Adjustments were made with the aim of measuring the effects of vehiclefactors alone, uncontaminated by other non-vehicle related factors available in the data thataffected crash severity and injury susceptibility.
The crashworthiness ratings estimate the risk of a driver of the focus vehicle being killed oradmitted to hospital when involved in a tow-away crash, to a degree of accuracy representedby the confidence limits of the rating in each case. Crashworthiness ratings and their

VEHICLE SAFETY RATINGS: 2009 UPDATE v
associated confidence limits were calculated for 427 individual vehicle modelsmanufactured between the years 1982-2007. The estimates and their associated confidencelimits were sufficiently sensitive that they were able to identify 203 models of passengercars, four wheel drive vehicles, passenger vans and light commercial vehicles with ratingsequal to or worse than the crashworthiness benchmark rating of 1.60%. Vehicles wereclassified into one of 10 market groups for presentation of the ratings with averagecrashworthiness of vehicles in each market group estimated.
The measure of aggressivity was calculated for 397 models of Australian and New Zealandpassenger vehicles manufactured between the years 1982-2007. The aggressivity ratingsestimate the risk of a vehicle driver or unprotected road user impacting with the focusvehicle model being killed or admitted to hospital when involved in a crash. The estimatesand their associated confidence limits were sufficiently sensitive that they were able toidentify 154 models of passenger cars, four wheel drive vehicles, passenger vans and lightcommercial vehicles with ratings equal to or worse than the crashworthiness benchmarkrating of 1.93%. Average aggressivity for vehicles in each of the 10 defined market groupswas also estimated. Estimated vehicle aggressivity towards drivers of other vehicles orunprotected road users was found to have little or no relationship with ratings of vehiclecrashworthiness, demonstrating the independence of the two complementary measures.
Total secondary safety injury severity was based on 585,607 road users injured in crashes inVictoria during 1987-2007, in New South Wales during 1987-1998 and in Queensland,Western Australia and New Zealand during 1991-2007. Injury risk was based on 2,736,290road users involved in crashes in New South Wales during 1987-2007, South Australiaduring 1995-2007 and Western Australia and Queensland during 1991-2007 where a vehiclewas towed away.
The total secondary safety index measures the average risk of death or serious injury to lightpassenger vehicle drivers and unprotected road users (pedestrians, cyclists andmotorcyclists) when involved in a crash with a light passenger vehicle to a degree ofaccuracy represented by the confidence limits of the index in each case. The index wasmeasured by a combination of injury severity (the risk of death or serious injury given aninjury was sustained) and injury risk (the risk of injury given crash involvement).A far aspossible, the index reflects the total secondary safety performance related to vehicle designalone by controlling for a range of non-vehicle related factors known to affect injuryoutcome.
The index was adjusted for the sex and age of the person whose injury outcome was beingmeasured, speed limit at the crash location, number of vehicles involved, the jurisdiction inwhich the crash occurred and the year in which the crash occurred. These factors werestrongly related to injury risk and/or severity. In addition to the above factors this rating wasalso adjusted for the type of crash and road user combination as this factor was stronglyrelated to injury risk and/or severity. Total secondary safety index estimates and theirassociated confidence limits were obtained for 484 vehicle models classified into 10 marketgroups. They were sufficiently sensitive that they were able to identify 239 models ofpassenger cars, four wheel drive vehicles, passenger vans and light commercial vehicleswith ratings equal to or worse than the crashworthiness benchmark rating of 1.91%.
vi MONASH UNIVERSITY ACCIDENT RESEARCH CENTRE
Estimated total secondary safety was found to have a stronger relationship with ratings ofvehicle crashworthiness than with vehicle aggressivity. This reflects that crashworthiness isrelevant to the injury outcome of road users in a wider range of crash types than are coveredby the aggressivity ratings. The index serves as a valuable summary of overall secondarysafety of light passenger vehicles both for consumer information as well as for regulatorsand vehicle safety advocates in identifying and promoting vehicle safety characteristics thatoptimise overall secondary safety characteristics.
For each type of rating estimated, the expanded data set has been able to produce more up-to-date and reliable estimates for individual car models than those published previously.
The crashworthiness of passenger vehicles in the Australian vehicle fleet (cars, stationwagons, four wheel drives and vans), has been estimated by year of manufacture for theyears 1964 to 2007. This study further updates the original one by Cameron et al (1994a) foryears of manufacture 1964 to 1992. Updated trends in Australian crashworthiness by year ofmanufacture show similar patterns as previously obtained with the greatest gains over theyears 1970 to 1979 in which a number of new Australian Design Rules aimed at occupantprotection took effect. Further significant gains in crashworthiness have also been observedover the years 1986 to 2007, with notable steady gains from 1985 to 1995 and since 2000.Trends in crashworthiness by year of vehicle manufacture from 1982 to 2007 for each of the10 vehicle market groups were also estimated showing differential improvement incrashworthiness by market group by year of manufacture.
The results and conclusions are based on a number of assumptions and warrant a number ofqualifications that should be noted.

VEHICLE SAFETY RATINGS: 2009 UPDATE vii
ACKNOWLEDGMENTS
A project as large and complex as this could not have been carried out without the help andsupport of a number of people. The authors particularly wish to acknowledge:
Mr David Attwood of the Transport Accident Commission (TAC) for the provisionof TAC claims data and Ms Samantha Cockfield of the TAC for her support of theproject.
VicRoads Information Services Division for the provision of data from VictorianPolice crash reports.
Mr Geoff Murray, Mr Wesley Soet and Ms Shuk Jin of the Department of MainRoads Western Australia for the provision of data from Western Australia Policecrash reports.
Mr Ken Brandis of the Western Australian Department for Planning andInfrastructure for the provision of Western Australia registration data.
Mr Steve Lippett of the Department for Transport, Energy and Infrastructure ofSouth Australia for the provision of data from South Australia Police crash reportsand Mr Harry McDonald of the Department for Transport, Energy and Infrastructureof South Australia for the matching of registration data to South Australia crash data.
Officers of the Data Analysis Unit of Queensland Transport for the provision of datafrom Queensland Police crash reports and the Queensland vehicle registrationsystem.
Mr Tony Kursius of Queensland Transport for assistance with facilitating theprovision of data from the Queensland vehicle registration system.
Mr Dan Leavy of the New South Wales Roads and Traffic Authority (RTA) for hissupport of the project and the release of data from NSW Police crash reports and theNSW vehicle register.
Mr Jack Haley of NRMA Motoring and Services for his support of the project andfor providing procedures to determine the models of vehicles crashing in NSW,Victoria and Queensland.
Ms Maria Pappas of NRMA who developed and applied the procedures to determinethe models of vehicles recorded in the police crash reports through decoding ofVehicle Identification Numbers.
Mr John Goldsworthy of the Australian Federal Department of Infrastructure,Transport, Regional Development and Local Government for his support of theproject.
Mr Mike Upton of the RACWA for his support for the project and assistance withfacilitating the supply of Western Australian crash data.
Mr Ross McArthur and Chris Jones of VicRoads for their support of the project.
Mr Michael Case and Nick Platt of the RACV for their support of the project and foradvice on substantive changes in designs of specific models over the years.

viii MONASH UNIVERSITY ACCIDENT RESEARCH CENTRE
Mr Jon Gibson, Mr Iain Cameron, Mr Roger Farley and Ms Teresa Rechichi of theWestern Australian Office of Road Safety for their support of the project and MsRechichi for her extensive review of the report manuscript.
Professor Caroline Finch, Mr Tri Minh Le, Mr Michael Skalova and Ms Chau MyLe, all formerly of MUARC, for the development of the analysis methods in earlieryears that formed the basis of the methods used in this report.
Mr David Taranto and Ms Sujanie Pereris of MUARC for their assistance incollecting VIN information and information on vehicle make and model changes forthe decoding and clustering of vehicle model information.
Dr Alan Miller, formerly of the CSIRO Division of Mathematics and Statistics forsuggesting analysis methods used in this report to improve the sensitivity of theresults and to determine the confidence limits of the estimates.
Officers of the Victorian, NSW, Western Australian, Queensland, South Australiaand New Zealand Police Forces and of the Transport Accident Commission whodiligently recorded the information on crashes and injuries which formed the basis ofthis report.
Mr Stuart Worden, Dr Barbara Bibby, Mr John White and Ms Anne Logan of LandTransport NZ for their enthusiastic support of the project.
Mr Stuart Badger of Land Transport NZ for supply of the New Zealand crash dataand advice on its use in the project.
Mrs Carol Hewitt and Kheang Chrun of Land Transport NZ for supply of the NewZealand vehicle registration data and advice on its use in the project.
Mr Tijs Robinson, a former contractor to the former LTSA, for his advice onspecifications and sources of information on New Zealand vehicle models.
Mr Eugene Girardin of Land Transport NZ for advice on the New Zealand usedimport vehicle market and the handling of these vehicles by Land Transport NZ.
Ms Stella Stocks of AA New Zealand for her support of the project.
Mr Steve Spalding of the Royal Automobile Club of Queensland for his support ofthe project.
Mr Mark Borlace of RAA South Australia for his support of the project.
Henry Schleimer, Anant Bellary and Mike Stapleton of Queensland Transport fortheir support of the project.
Mr David Taranto and Ms Sujanie Peiris of MUARC for assistance in assemblinginformation on Vehicle Identification Numbers and significant vehicle model changedates.
VEHICLE SAFETY RATINGS: 2009 UPDATE ix
CONTENTSPage No.
1. INTRODUCTION .......................................................................................................2
1.1 CRASHWORTHINESS RATINGS......................................................................................21.2 AGGRESSIVITY RATINGS .............................................................................................31.3 TOTAL SECONDARY SAFETY INDEX.............................................................................41.4 TRENDS IN VEHICLE SAFETY BY YEAR OF MANUFACTURE AND MARKET GROUP .......61.5 PROJECT AIMS .............................................................................................................7
2. CRASH DATA.............................................................................................................8
2.1 VICTORIAN CRASHES ..................................................................................................82.2 NEW SOUTH WALES CRASHES ..................................................................................102.3 QUEENSLAND CRASHES ............................................................................................112.4 WESTERN AUSTRALIA CRASHES ...............................................................................122.5 SOUTH AUSTRALIA CRASHES ....................................................................................132.6 CRASH AND REGISTRATION DATA FROM NEW ZEALAND ..........................................142.7 COMBINED DATA FROM THE SIX JURISDICTIONS .......................................................15
3. MODELS AND MARKET GROUPS OF VEHICLES .........................................16
3.1 VEHICLE MODEL IDENTIFICATION .............................................................................163.2 POOLED CAR MODELS...............................................................................................173.3 VEHICLE MARKET GROUPS .......................................................................................18
4. ANALYSIS.................................................................................................................20
4.1 OVERVIEW OF ANALYSIS METHODS: CRASHWORTHINESS .........................................204.2 OVERVIEW OF THE ANALYSIS METHODS: AGGRESSIVITY ..........................................214.3 OVERVIEW OF ANALYSIS METHODS: TOTAL SAFETY ................................................22
5. RESULTS...................................................................................................................26
5.1 VEHICLE CRASHWORTHINESS RATINGS .....................................................................265.1.1 Injury Risk..........................................................................................................265.1.2 Injury Severity....................................................................................................275.1.3 Crashworthiness Ratings...................................................................................275.1.4 Comparisons with the Benchmark Rating .........................................................28
5.2 AGGRESSIVITY ..........................................................................................................365.2.1 Aggressivity towards Other Car Drivers and Unprotected Road Users ...........365.2.2 Comparisons with the Benchmark Rating .........................................................385.2.3 Relationship between Aggressivity and Crashworthiness .................................48
5.3 VEHICLE TOTAL SECONDARY SAFETY RATING .........................................................495.3.1 Injury Risk..........................................................................................................495.3.2 Injury Severity....................................................................................................505.3.3 Total secondary safety index .............................................................................515.3.4 Comparisons with the Benchmark Rating .........................................................535.3.5 Comparison of Crashworthiness, Aggressivity and the Total Secondary Safetyindex ...........................................................................................................................62
5.4 PRESENTATION OF TOTAL SECONDARY SAFETY INDEX, CRASHWORTHINESS ANDAGGRESSIVITY RATINGS FOR CONSUMER INFORMATION .....................................................64

x MONASH UNIVERSITY ACCIDENT RESEARCH CENTRE
5.5 CRASHWORTHINESS BY YEAR OF MANUFACTURE OF THE AUSTRALIAN VEHICLEFLEET66
5.5.1 Injury Risk......................................................................................................... 665.5.2 Injury Severity ................................................................................................... 675.5.3 Crashworthiness by Year of Manufacture ........................................................ 68
5.6 CRASHWORTHINESS BY YEAR OF MANUFACTURE AND MARKET GROUP FOR THEAUSTRALIAN VEHICLE FLEET ............................................................................................. 70
5.6.1 Injury Risk......................................................................................................... 705.6.2 Injury Severity ................................................................................................... 715.6.3 Crashworthiness by Year of Manufacture and Market Group ......................... 72
7. CONCLUSIONS ....................................................................................................... 75
8. ASSUMPTIONS AND QUALIFICATIONS.......................................................... 78
8.1 ASSUMPTIONS ........................................................................................................... 788.2 QUALIFICATIONS....................................................................................................... 78
REFERENCES.................................................................................................................... 79
APPENDICES
APPENDIX 1. Makes and models of cars involved in Victorian and New South Walescrashes during 1987-2007, South Australia crashes during 1995-2007 andWestern Australia, Queensland and New Zealand crashes during 1991-2007
APPENDIX 2. Logistic regression estimates of crashworthiness injury risk by model andmarket group
APPENDIX 3. Logistic regression estimates of crashworthiness injury severity by modeland market group
APPENDIX 4. Crashworthiness ratings of 1982-2007 models of cars involved in crashesduring 1987-2007
APPENDIX 5. Aggressivity injury risk aggressivity injury severity and ratings of vehicleaggressivity (with 95% and 90% confidence limits), towards other vehicledrivers
APPENDIX 6. Total safety injury risk, total safety injury severity and ratings of vehicletotal safety (with 90% confidence limits) of 1982-2007 models of carsinvolved in crashes during 1987-2007
APPENDIX 7. Presentation of crashworthiness, aggressivity and total secondary safetyratings for consumer information
APPENDIX 8. Crashworthiness, injury risk and injury severity estimates by year ofvehicle manufacture for the Australian vehicle fleet
APPENDIX 9. Crashworthiness, injury risk and injury severity estimates by year ofvehicle manufacture by market group for the Australian vehicle fleet

VEHICLE SAFETY RATINGS: 2009 UPDATE 1
VEHICLE SAFETY RATINGS ESTIMATED FROMPOLICE REPORTED CRASH DATA: 2009 UPDATE
AUSTRALIAN AND NEW ZEALAND CRASHES DURING 1987-2007

2 MONASH UNIVERSITY ACCIDENT RESEARCH CENTRE
1. INTRODUCTION
For over 18 years the Monash University Accident Research Centre (MUARC) has beeninvolved in a program of research examining issues relating to vehicle safety in both Australiaand New Zealand through the analysis of mass data records on crashes reported to police. Dataon which the research to date is based has come from reports compiled by police in variousStates across Australia and in New Zealand. In Victoria, the police reported crash data has beenaugmented by data on injury compensation claims resulting from transportation crashescompiled by the Victorian Transport Accident Commission (TAC).
A principal focus of the research program has been to produce vehicle secondary safety ratingsfor specific makes and models of vehicles and by market group of vehicle. For many years theratings have focused on two aspects of vehicle safety performance: crashworthiness, being theability of a vehicle to protect its own occupants in the event of a crash, and aggressivity, theability of a vehicle to protect other road users with which it collides. More recently, an overallsecondary safety ratings measure has been developed called the total secondary safety rating. Itmeasures the combined relative crashworthiness and aggressivity performance of various makesand models of vehicles based on exposure to the mix of major crash types on Australasian roadswhere vehicle crashworthiness and/or aggressivity are important in determining injury outcomes.
The ratings have been published annually by the agencies supporting the research as a source ofconsumer information to aid the purchase of safe vehicles. They are marketed as the Used CarSafety Ratings reflecting the fact that ratings can only be produced some time after a vehicle isreleased for sale once sufficient real world crash experience has been accumulated. It alsodifferentiates these ratings from those derived under the Australasian New Car AssessmentProgram based on crash barrier testing results which are targeted largely at new vehicle buyers.
1.1 Crashworthiness Ratings
Crashworthiness ratings rate the relative safety of vehicles in protecting their own occupants byexamining injury outcomes to drivers in real world crashes reported to police. Thecrashworthiness rating of a vehicle in the ratings system used in this report is a measure of therisk of death or serious injury to a driver of that vehicle when it is involved in a crash. This riskis estimated from large numbers of records of injury to drivers of that vehicle type involved inreal crashes on the road. It is measured in two components:
1. Rate of injury for drivers involved in crashes where a vehicle is towed away or someoneis injured (injury risk)
2. Rate of serious injury (death or hospital admission) for injured drivers (injury severity).
Multiplying these two rates together forms the crashworthiness rating. This is a measure of therisk of serious injury for drivers involved in crashes where a vehicle is towed away or someone isinjured. Measuring crashworthiness as a product of two components, reflecting risk and severityof injury respectively, was first developed by Folksam Insurance, which publishes the well-known Swedish ratings (Gustafsson et al 1989) and were first published in Australia in Cameronet al (1994a,b) These ratings use an analysis method that was developed to maximise thereliability and sensitivity of the results from the available data whilst adjusting for the effects oninjury outcome of non-vehicle factors that differ between vehicles. In addition to the speed zone
VEHICLE SAFETY RATINGS: 2009 UPDATE 3
and driver sex, the method of analysis adjusts for the effects of driver age and the number ofvehicles involved, producing results with all those factors taken into account.
The ratings have been updated at regular intervals (Newstead et al 1996, Newstead et al 1997,Newstead et al 1998, Newstead et al 1999, Newstead et al 2000, Newstead et al 2003a, Newsteadet al 2004b, Newstead et al 2005b, Newstead et al 2006, Newstead et al 2007a, 2007b, Newsteadet al 2008a, 2008b). The most recent prior update covered vehicles manufactured over the period1982-2006 and crashing during 1987-2006. Progressive enhancement of the methods ofstatistical analysis has been incorporated through the ratings updates. From 1999 the ratingsincorporated police-reported crash data from Queensland whereas previously only crash datafrom New South Wales and Victoria had been used. From 2003 the ratings also added police-reported crash data from Western Australia. From 2004 the ratings included police-reportedcrash data from New Zealand after a rigorous program of research establishing the comparabilityof vehicles between the Australian and New Zealand vehicle fleets in terms of their specificationand secondary safety performance (Voyce, 2000; Robinson, 2000a,b, Newstead, 2000b,Newstead, 2002, Newstead et al 2003b). From 2007 the ratings also added police-reported crashdata from South Australia. The crashworthiness ratings covered individual models of sedans,station wagons, four wheel drives, passenger vans and light commercial vehicles and are given asestimates of risk of severe injury for each model along with 90% and 95% confidence limits oneach estimate.
1.2 Aggressivity Ratings
The aggressivity measure used in the Australian vehicle safety rating system estimates the risk ofthe driver of another car or an unprotected road user (pedestrian, bicyclist or motorcyclist) beingkilled or seriously injured when involved in a collision with the subject model vehicle. It isrepresentative of the total aggressivity performance of the vehicles being rated across allpotential collision partners that are susceptible to injury. Like the crashworthiness measure, it iscalculated as the product of two component measures, one measuring injury risk the othermeasuring injury severity.
Because an estimate of the risk of injury cannot be calculated for unprotected road users sincecrashes are generally not reported to the police when the unprotected road user is uninjured, themeasure of aggressivity injury risk is based only on the injury risk to the drivers of other vehicles(ROU). It is defined as:
Aggressivity Injury Risk = ROU = proportion of other vehicle drivers involved incrashes who were injured
In contrast, complete records of both other drivers and unprotected road users injured in crashesare available in police reported crash data and can be used to examine injury severity outcomesin the aggressivity measure. The aggressivity injury severity measure (SOU) is defined as:
Aggressivity Injury Severity = SOU = proportion of other vehicle drivers or unprotectedroad users who were killed or admitted tohospital.
The aggressivity measure for each subject car model is then calculated as:
Aggressivity to other driver or unprotected road user = AOU = ROU x SOU.
4 MONASH UNIVERSITY ACCIDENT RESEARCH CENTRE
Like the crashworthiness ratings, the aggressivity measure was adjusted for the effects of non-vehicle factors differing between the subject car models which may have affected injury outcometo the driver of the other vehicle. Non-vehicle factors available in the data included:
speed limit at the crash location subject vehicle driver age (younger drivers may be driving at relatively fast speeds not fully
represented by the speed limit) subject vehicle driver sex (male drivers may be driving at relatively fast speeds or more
aggressively) other car occupant age (older occupants are more susceptible to injury) other car occupant sex (female occupants are more susceptible to injury, but males appear
to be associated with relatively high injury severities) collision partner type (vehicle, pedestrian, bicyclist or motorcyclist) (injury severity
analysis only)
1.3 Total Secondary Safety Index
Past presentations of the crashworthiness and aggressivity ratings for consumer informationsimply present the two ratings side by side. This leaves the consumer to decide the relativeimportance of each rating in making a decision on vehicle safety priority in their purchasingdecision. From a consumer information perspective, this might seem a good strategy as it allowsthe consumer to balance the relative priority they give to their own safety versus the safety ofother road users on an individual basis. However, it may not be ideal from the perspective oftrying to steer the vehicle fleet as a whole in the direction of optimum safety which should be theoverarching priority for safety advocates, regulators and, indeed, the community as a whole. Ifconsumers generally based their vehicle choices only on crashworthiness performance andlargely ignored aggressivity, sub optimal choices on a community wide safety basis may result.Similar sub-optimal choices may result if only aggressivity were considered. A desire to optimisevehicle secondary safety on a whole of community basis highlights the need for an index whichcombines the crashworthiness and aggressivity performance of a vehicle into a single index. Thetotal safety index captures the overall secondary safety of the vehicle in the most meaningful wayfor the environment in which it is driven and hence crash circumstances to which it is exposed.
The international vehicle safety literature shows a paucity of effort in developing such an index.The only group to have given the concept serious consideration are the University of Oulutransport research group in Finland (Huttula et al, 1997). The Finnish group have measures ofvehicle aggressivity and crashworthiness similar in concept to those developed by MUARC.From these they have developed a total passive safety index which is essentially the sum of thecrashworthiness and aggressivity measures for each vehicle. Deriving the total passive safetyindex in this way implicitly assumes that crashworthiness and aggressivity have equal weightingin the overall passive safety performance of a vehicle. Whether this is the most appropriateapproach is questionable since the relative balance of importance between crashworthiness andaggressivity will depend on the mix of crash circumstances the vehicle is exposed to.
A more detailed approach to the issue of estimating total vehicle passive or secondary safety hasbeen explored in Newstead et al (2004a) and Newstead et al (2004b). This work, based onanalysis of Australian crash data, commenced by identifying the four primary crash types in

VEHICLE SAFETY RATINGS: 2009 UPDATE 5
which light passenger vehicles were involved and identifying the principal injury outcomes ofinterest in the crash. The crash types identified were:
1. Crashes between two light passenger vehicles:
2. Single light passenger vehicle crashes.
3. Crashes between a light passenger vehicle and a heavy vehicle (bus, rigid truck orarticulated truck).
4. Crashes between a light passenger vehicle and unprotected road user (pedestrian, bicyclistor motorcyclist).
The total secondary safety index defined by Newstead et al (2004b) was calculated by broadmarket group of vehicle and was a weighted average of four individual crashworthiness oraggressivity based measures. They are:
1. The crashworthiness of the light passenger vehicle in crashes between two light vehiclesas a function of its impact partner market group (embodying both the crashworthiness ofthe focus vehicle market group as well as the aggressivity of the impact partner vehiclemarket group) – Crash type 1.
2. The crashworthiness of the light passenger vehicle in single vehicle crashes – Crash type2.
3. The crashworthiness of the light passenger vehicle in crashes with heavy vehicles as afunction of the heavy vehicle type – Crash type 3
4. The aggressivity of the light passenger vehicle towards unprotected road users – Crashtype 4.
The total secondary safety index was defined as the weighted average of each of the four safetymeasures with the weighting factors used being the proportionate representation of each of thefour crash types. As such, it represented the overall secondary safety performance of a vehicle,classified by market group in this case, in protecting all road users involved in the full range ofcrashes reflecting the relative incidence of each major crash type.
It is evident from examining the form of the total secondary safety index that the traditionalmeasure of overall vehicle crashworthiness performance is embodied in the safety measuresrelating to crash types 1, 2, and 3. The traditional aggressivity measure is embodied in the safetymeasures relating to crash types 1 and 4. Constructing the total secondary safety index in thisway is similar in basic principle to the approach used by the Oulu researchers. However it differsin the fact that it gives appropriate weighting to each aspect of a vehicle’s secondary safetyperformance by weighting each component according to its relevance in Australian real worldcircumstances.
The work of Newstead et al (2004a) and Newstead et al (2004b) was useful in, for the first time,defining an overall secondary safety index for light passenger vehicles relevant to Australiancircumstances. It was then able to use the index effectively to quantify the broad overallsecondary safety effects of changing the mix of vehicles in the fleet. The index did, however,have some limitations related to the manual construction of the index from its components. First,there had to be sufficient data to estimate each of the component safety measures comprising the

6 MONASH UNIVERSITY ACCIDENT RESEARCH CENTRE
index. In the demonstration of the methodology this meant results could only be obtained bybroad market group of vehicle and not for individual makes and models of vehicle. Second,estimates of statistical confidence on the index could not be estimated due to its complex nature.Both these difficulties highlighted the need for development of an integrated total secondarysafety index that could be estimated by vehicle make and model with associated estimates ofstatistical confidence.
Building on the approach to modelling vehicle total secondary safety demonstrated in Newsteadet al (2004a) and Newstead et al (2004b), the study of Newstead et al (2007c) developed andapplied an integrated single index of total secondary safety for light passenger vehicles in theAustralian and New Zealand vehicle fleets. The index measures the average risk of death orserious injury to light passenger vehicle drivers and unprotected road users (pedestrians, cyclistsand motorcyclists) when involved in a crash with a light passenger vehicle to a degree ofaccuracy represented by the confidence limits of the index in each case. It provides an overallsummary of the combined crashworthiness and aggressivity performance of a vehicle. The indexwas measured by a combination of injury severity (the risk of death or serious injury given aninjury was sustained) and injury risk (the risk of injury given crash involvement).As far aspossible, the index reflects the total secondary safety performance related to vehicle design aloneby controlling for a range of non-vehicle related factors known to affect injury outcome. Theindex was adjusted for the sex and age of the person whose injury outcome was being measured,speed limit at the crash location, number of vehicles involved, the jurisdiction in which the crashoccurred and the year in which the crash occurred. These factors were strongly related to injuryrisk and/or severity. In addition to the above factors this rating was also adjusted for the type ofcrash and road user combination as this factor was strongly related to injury risk and/or severity.
The index serves as a valuable summary of overall secondary safety of light passenger vehiclesboth for consumer information as well as for regulators and vehicle safety advocates inidentifying and promoting vehicle safety characteristics that optimise overall secondary safetycharacteristics.
1.4 Trends in Vehicle Safety by Year of Manufacture and Market Group
Another focus of the vehicle crashworthiness ratings study has been to track historicalimprovements in the average crashworthiness of the Australian vehicle fleet since 1964. In 1994,the Royal Automobile Club of Victoria (RACV) commissioned a study to investigate the effectsof the year of manufacture of vehicles (vehicle year) on their road safety (Cameron et al 1994c).This project focused on investigating the relationship between crashworthiness and vehicle yearof manufacture for the years 1964 to 1992. The aim of the original study of Cameron et al(1994c) was, to the extent possible, to measure the crashworthiness of vehicles of different yearsof manufacture. The method employed was designed to eliminate the influence of other keyfactors affecting the risk of injury that might also be associated with vehicle year (e.g. driver ageand sex, use on high speed roads, etc.).
The original study of Cameron et al (1994c) showed that the crashworthiness of passengervehicles in Australia has improved over the years of manufacture 1964 to 1992 with rapidimprovement over the years from about 1970 to 1979. Drivers of vehicles manufactured during1970 to 1979 could be expected to have benefited from the implementation of a number ofAustralian Design Rules (ADRs) for motor vehicle safety which previous research has shown tobe effective in providing occupant protection. The study has been updated with each vehiclecrashworthiness ratings update. The most recent analysis included vehicles with years of

VEHICLE SAFETY RATINGS: 2009 UPDATE 7
manufacture from 1964 to 2006 (Newstead et al 2008a, 2008b). Similar analyses have beenundertaken for the New Zealand vehicle fleet by Newstead and Watson (2005a) showing quitedifferent trends in crashworthiness by year of manufacture to that observed in the Australian fleetreflecting the different regulatory frameworks across the two countries and the significant usedvehicle import program in operation in New Zealand.
Extending the basic analysis, Newstead and Cameron (2001) examined trends in vehiclecrashworthiness by year of manufacture from 1982 to 1998 within specific vehicle marketgroups. Vehicles were grouped into 4 market categories: small cars (<1100kg), medium cars(1100-1400kg), large cars (>1400kg) and four wheel drive vehicles (Sports Utility Vehicles).Results of analysis found statistically significant differences in the trends in crashworthiness byyear of manufacture between different market groups in both the injury risk and injury severitycomponents of the crashworthiness measure. This analysis was most recently updated inNewstead et al (2008a, 2008b) for vehicles manufactured over the years 1982-2006 and groupedinto 10 market classifications.
Using similar methods to those used for investigating trends in crashworthiness by year ofmanufacture, Newstead et al (2004a) has investigated trends in aggressivity by year of vehiclemanufacture for the Australian fleet as a whole as well as by 8 broad market groupclassifications. Although differential trends in aggressivity were found between the variousmarket groups of vehicle analysed, for the Australian vehicle fleet as a whole there has been nosignificant trend to improving or worsening aggressivity over the years of manufacture studiedfrom 1964 to 2000.
1.5 Project Aims
The aim of this project was to update the previously published crashworthiness, aggressivity andtotal safety ratings of Newstead et al (2008a, 2008b) including additional crash data from theyear 2007 for Victoria, New South Wales, Queensland, South Australia, Western Australia andNew Zealand. The updated ratings aimed to cover the drivers of light passenger vehiclesincluding cars, station wagons, four wheel drive vehicles, passenger vans, and light commercialvehicles manufactured during 1982-2007 and crashing in Victoria or NSW during 1987-2007 orSouth Australia during 1995-2007 or Queensland, Western Australia and New Zealand during1991-2007.
This project also aimed to update the estimates of crashworthiness by vehicle year ofmanufacture for the Australian vehicle fleet to include vehicles manufactured over the years1964 to 2007. For vehicle models from 1982 to 2007 that could be classified into a marketgrouping, the project also aimed to further investigate trends in crashworthiness of the Australianvehicle fleet by year of vehicle manufacture within each specific market group.
The study also aimed to further asses the relationships between vehicle crashworthiness and boththe year of manufacture for all vehicles and the year of first registration for used vehicle importsin New Zealand. The study focused on light passenger vehicles manufactured from 1964 to 2007and crashing in New Zealand during 1991 to 2007. The results are published separately in asupplement to this report.
8 MONASH UNIVERSITY ACCIDENT RESEARCH CENTRE
2. CRASH DATA
Data from Victoria, New South Wales, Queensland, South Australia, Western Australia and NewZealand used to produce the crashworthiness ratings of Newstead et al (2008a) covering vehiclesmanufactured over the period 1982-2006 and crashing during the years 1987-2006 was againused here. In addition, data for 2007 from each of the five previously included Australian statesand New Zealand was obtained and integrated bringing the total period of crash data covered to1987-2007. Subsets of these data were taken in order to estimate the aggressivity measures.Similarly, data from Victoria, New South Wales, Queensland, South Australia and WesternAustralia used to produce the crashworthiness by year of manufacture estimates of Newstead etal (2008a) covering vehicles manufactured over the period 1964-2006 and crashing during theyears 1987-2006 was again used here. As for the crashworthiness ratings, data from 2007 fromthese five Australian states were also integrated for this analysis. The methods of selectingappropriate cases from each data source will be detailed here.
2.1 Victorian Crashes
Transport Accident Commission (TAC) injury claims from all types of road users who wereinvolved in crashes in the period 1987 to 1998 had been merged with Police crash reports for theprevious crashworthiness ratings. The Police reports were for all persons involved in crashesregardless of the Police officer recording the person as injured or uninjured. This procedure wasfollowed because it was possible for an injury claim to be made in circumstances where injurywas not apparent at the time of the crash. Crashes are reported to the Police in Victoria if aperson is killed or injured, if property is damaged but names and addresses are not exchanged, orif a possible breach of the Road Traffic Regulations has occurred (Green 1990). The levels ofmatching of TAC claims with persons recorded on Police reports for each year during 1987-1998achieved by Newstead et al (2003a) are shown in Table 1. The methods of matching for the dataare detailed in Cameron et al (1994b).
Due to a breakdown in the matching process from 1999 subsequent updates of the ratings haveused police crash data unmatched with TAC claims, although matched data prior to 1999 wasstill used. Any inconsistencies in injury severity coding introduced by changing from matched tounmatched data were controlled for in the analysis methodology through compensating for yearof crash differences.

VEHICLE SAFETY RATINGS: 2009 UPDATE 9
Table 1: TAC claims for injury compensation from crashes during 1987-1998
Year TAC claims(all types ofinjured road
users)
TAC claimsmatched withPolice reports
Match rate(%)
1987 30,892 17,509 56.71988 28,427 16,672 58.61989 25,399 17,494 66.31990 19,633 13,886 70.71991 19,538 12,774 65.41992 19,251 13,118 68.11993 18,590 12,618 67.81994 19,341 11,927 61.61995 20,189 12,452 61.71996 19,954 14,034 70.31997 18,754 13,036 69.51998 18,561 12,395 66.8
Changes to the police data collection system in Victoria during 2005 meant that only data toabout September 2005 was available for the update of Newstead et al (2007a). In the most recentupdate of Newstead et al (2008a) complete 2005 crash data and 2006 crash data to about the endof September was available. In this update complete 2006 and 2007 crash data was available.Unmatched Victorian crash data for 2006 represented 8,775 injured drivers of 1982-2006 modelvehicles involved in a crash in Victoria. Unmatched Victorian crash data for 2007 represented8,629 injured drivers of 1982-2007 model vehicles involved in a crash in Victoria. Theserecords were combined with the merged files of TAC claims with Police reports for 1987-1998and police reported data only from 1999-2005, which represented 114,352 injured drivers of1982-2005 model vehicles crashing during 1987-2005. The resulting file covered 131,756injured drivers of 1982-2007 model cars. The information on these drivers was combined withdata on drivers injured in the other four jurisdictions (see Section 2.6) to produce the updatedcrashworthiness ratings. For the study of crashworthiness by year of vehicle manufacture themerged TAC claims for injury during 1987-98 and police crash records during 1999-2007covered 177,188 injured drivers of cars, station wagons or taxis manufactured over the years1964-2007.
Calculation of aggressivity ratings required selecting vehicles involved in two car crashesfollowed by matching of the vehicle and occupant injury details for the two cars involved in thecrash. For those vehicles manufactured over the period 1982 to 2007 injury details for the driverof the other vehicle in the crash were matched by returning to the full Victorian Police reportedcrash data files for 1987-2007. The data matching process identified 71,829 vehiclesmanufactured between 1982 and 2007 that had been involved in a crash with one other vehiclewhere the other vehicle had no restriction on its year of manufacture. Of the drivers of theseother vehicles, 39,614 were injured and 32,215 were uninjured. It was not possible to use theuninjured records from the Victorian data, as they are incomplete due to the fact that only crashesinvolving injury are reliably reported in Victoria. Hence only the 39,614 records of other driverinjury were used for calculation of the injury severity component of the vehicle aggressivityratings. Of the 39,614 injured drivers, 8,836 were severely injured.
10 MONASH UNIVERSITY ACCIDENT RESEARCH CENTRE
Collisions between a single vehicle and an unprotected road user where the vehicles wererestricted to those manufactured between 1982 and 2007 were also identified for calculation ofthe aggressivity ratings using a variable identifying accident type from records for the years 1987to 2007. Vehicles were matched with the unprotected road user casualty records to obtain theunprotected road user injury level. For the period 1987 to 2007, 17,601 unprotected road userswere matched with vehicle records with an identified make and model and manufacturedbetween 1982 and 2007. Of these 17,601 unprotected road users, 17,425 were injured, 7,225seriously.
2.2 New South Wales Crashes
The Roads and Traffic Authority (RTA) in New South Wales supplied files covering 1,267,971light passenger vehicles manufactured from 1982 to 2007 involved in Police reported crashesduring 1987-2007 that resulted in death or injury or a vehicle being towed away. Model and yearof manufacture have been added to each vehicle after matching with the NSW vehicle registervia registration number and vehicle make. This was achieved using a procedure developed by theNRMA. The total crash files covered four wheel drive vehicles, passenger vans, and lightcommercial vehicles as well as cars and station wagons of all years of manufacture crashing in1987 to 2007. The method of assembly of this data is given in Cameron et al (1994b).
NSW crash data files from 1987 to 1998 had injury severity of people involved in crashes codedusing a four level scale. Levels used were: fatality, hospital admission, other injury and notinjured. From 1998 onwards, the RTA identified inaccuracies by the Police in reporting injuryseverity that could not be rectified. In response, the RTA changed the injury severity coding inthe NSW crash data to give only three levels: fatality; injury; and not injured. For the purpose ofcomputing crashworthiness ratings, this meant the NSW data for 1999-2007 could not be used toestimate the injury severity measure in the same manner as previous rating updates.
Preparation of the NSW data for final analysis involved merging the files with vehicleinformation, including driver age and gender, with files supplied by NSW RTA covering detailsof the person casualties (killed and injured persons) and the reported crashes for the same years.Each vehicle/driver matched uniquely with the corresponding crash information, but only injureddrivers could match with persons in the casualty files. A driver who did not match wasconsidered to be uninjured. Of the 1,267,971 drivers involved in tow-away crashes, 214,452were injured. Of the injured drivers, 72,678 were injured in crashes from 1987 to 1998 and had avalid injury severity level coded (serious or other injury).
Of the 1,267,971 1982-2007 model year vehicles involved in crashes in NSW, 794,380 werecoded as being involved in crashes with one other traffic unit (i.e. the crash involved a total oftwo traffic units). In order to compare occupant injury levels in crashes involving two vehicles, itwas necessary to match the crash and occupant injury information for each of the two vehiclesinvolved in the crash.
The data used for calculation of the crashworthiness ratings covered only vehicles manufacturedfrom 1982 to 2007. Consequently, initial matching of only the crashworthiness data to determinepairs of vehicles involved in a crash identified both the vehicles in the crash when both vehicleswere manufactured from 1982 to 2007. A second matching stage was then required to identifythe details of drivers of vehicles manufactured before 1982 that had collided with the unmatched1982-2007 model year vehicles in the crashworthiness file. This required retrieval of the

VEHICLE SAFETY RATINGS: 2009 UPDATE 11
remaining crash records in the 1987-2007 NSW crash files not used for crashworthiness ratingsin order to match vehicles manufactured prior to 1982. The two-stage data matching processidentified 356,968 matched records of vehicles manufactured between 1982 and 2007 that hadbeen involved in a crash with one other vehicle where the other vehicle had no restriction on itsyear of manufacture. Of the drivers of these other vehicles, 50,965 were injured. Of the injureddrivers, 19,922 were injured in crashes from 1987 to 1998 and had a valid injury severity levelcoded (serious or other injury).
Calculation of the aggressivity rating also required the identification of crashes between a singlelight vehicle and an unprotected road user where the vehicles were restricted to thosemanufactured between 1982 and 2007. The required crashes were identified using a variableidentifying accident type. Casualty records for the crash years 1987 to 2007 were used toidentify unprotected road users injured in a collision with one vehicle. The vehicles were thenmatched with the unprotected road user casualty records to obtain the pedestrian, bicyclist ormotorcyclist injury level. For the period 1987 to 2007, 52,251 unprotected road users werematched with vehicle records. Of these 52,251 unprotected road users, 26,869 were injured incrashes from 1987 to 1998 and had a valid injury severity level coded. Of these, 8,486 wereseriously injured.
For the study of crashworthiness by vehicle year of manufacture, the NSW data represented1,533,359 drivers of cars, station wagons or taxis manufactured from 1964 to 2007 who wereinvolved in tow-away crashes. Of these drivers, 255,492 were injured, 119,503 of these during1987-1998 and with a valid injury severity code.
The presence of uninjured drivers in the merged data file meant that it was suitable formeasuring the risk of driver injury (in cars sufficiently damaged to require towing). Thiscontrasted with the Victorian and New Zealand data files, which could not be used to measureinjury risk directly because not all uninjured drivers were included.
2.3 Queensland Crashes
Queensland Transport supplied files covering 386,198 light passenger vehicles involved inPolice reported crashes during 1991-June 2007 that resulted in death or injury or a vehicle beingtowed away. The files supplied covered years of vehicle manufacture from 1982-June 2007including models of four wheel drive vehicles, passenger vans, and light commercial vehicles aswell as cars and station wagons for which a model could be identified.
The vehicle files, which also contained links to separate files with driver age and sex, weremerged with files supplied by Queensland Transport covering details of the person casualties(killed and injured persons) and the reported crashes for the same years. Each vehicle/drivermatched uniquely with the corresponding crash information, but only injured drivers couldmatch with persons in the casualty files. As for NSW, a driver who did not match was consideredto be uninjured. Out of the 386,198 drivers involved in tow-away crashes, 102,216 were injured.
Of the 386,198 vehicles reported as crashed in Queensland and used in estimation ofcrashworthiness ratings, 256,521 were coded as being involved in crashes with one other trafficunit (i.e. the crash involved a total of two traffic units). In order to compare occupant injurylevels between two vehicles involved in a crash, it was necessary to match the crash andoccupant injury information for each of the two vehicles involved in the crash in the same
12 MONASH UNIVERSITY ACCIDENT RESEARCH CENTRE
manner as for NSW. Using the same two stage data matching process as used for NSW anddescribed above, the process identified 132,491 vehicles manufactured between 1982 and 2007that had been involved in a crash with one other vehicle where the other vehicle had norestriction on its year of manufacture. Of the drivers of these other vehicles, 35,901 were injured,8,062 seriously. These records were used for calculation of vehicle aggressivity ratings towarddrivers of other vehicles.
Records on unprotected road users involved in a crash with one light vehicle unit were retrievedand identified using variables classifying unit type and number of units in the crash. Singlevehicle collisions were identified using a variable identifying unit type and number of vehicles inthe crash. These vehicles were then matched with the unprotected road user casualty records toobtain the injury level. A total of 20,523 unprotected road users were matched with records on1982-2007 year passenger vehicles with model details identified. Of these 20,523 unprotectedroad users, 20,060 were injured, 8,602 seriously.
For the study of crashworthiness by vehicle year of manufacture, the Queensland datarepresented 342,879 drivers of cars, station wagons or taxis manufactured from 1964 to 2007who were involved in tow-away crashes. Of these drivers, 91,836 were injured. The number ofvehicles crashing in Queensland and available for the year of manufacture analysis was less thanexpected. This is because a large proportion of the vehicles in the Queensland data from 1997and 1998 had year of manufacture missing due to difficulties in accessing the vehicle register todetermine vehicle details at the time of assembling the data from these two years. Some of thevehicles with missing year of manufacture could, however, be assigned an accurate model codethough the VIN decoding process described below despite the missing field.
As with the data from NSW, the presence of uninjured drivers in the data file meant that it wasalso suitable for measuring the risk of driver injury (in cars sufficiently damaged to requiretowing).
2.4 Western Australia Crashes
The Western Australian Department of Main Roads maintains a database of all crashes inWestern Australia reported to the police. Crashes in Western Australia must be reported to policeif anyone involved is killed or injured or the crash results in property damage greater than $3,000(Road Safety Council of Western Australia, 2001). This means that, like New South Wales,South Australia and Queensland, both injury and non-injury crashes are reported making the datasuitable for inclusion in estimating both the injury risk and injury severity components of thevehicle safety ratings. Although the Western Australia crash data is held as a relational database,Western Australia Department of Main Roads supplied the data in a single flat file with a recordfor each person involved in a reported crash. Data covered the period 1991 to 2007. The datawas re-issued in 2005 for the period 1991 to 2003 due to a change in database structure andvariable definitions in 1995 that may have caused some inconsistency in the data over the entiretime period. In 2006 the data was re-issued for the period 1991 to 2005 to include registrationplates of crashed vehicles. This registration plate detail was used for matching to WesternAustralian registration data to obtain VIN data for vehicle decoding as described in Section 3.1.In the most recent update (Newstead et al 2008a) 2006 crash data was supplied with registrationplates of crashed vehicles. In addition matched registration data was provided. The 2007 crashdata for this update was supplied with registration plates of crashed vehicles. This registration

VEHICLE SAFETY RATINGS: 2009 UPDATE 13
plate detail was used for matching to Western Australian registration data to obtain VIN data forvehicle decoding as described in Section 3.1.
The files supplied covered 944,714 light passenger vehicles manufactured between 1982 and2007 involved in Police reported crashes during 1991-2007 that resulted in death or injury or avehicle being towed away. The files supplied covered models of four wheel drive vehicles,passenger vans, and light commercial vehicles as well as cars and station wagons. Out of the944,714 drivers involved in tow-away crashes, 133,172 were injured.
Of the 944,714 vehicles reported as crashed in WA and used in estimation of crashworthinessratings, 710,312 were involved in crashes with one other traffic unit. Of the drivers of thematched vehicles, 69,711 were injured. These records were used for calculation of vehicleaggressivity ratings toward drivers of other vehicles.
Records on unprotected road users involved in a crash with one vehicle unit for the period 1991to 2007 were retrieved and identified using variables classifying unit type and number of units inthe crash. 32,748 unprotected road users in the Western Australia crash records were identifiedas colliding with a 1982-2007 year of manufacture passenger vehicle with model detailsidentified. Of the 22,501 unprotected road users who were injured, 13,866 were severely injured.
For the study of crashworthiness by vehicle year of manufacture, the Western Australia datarepresented 845,904 drivers of cars, station wagons or taxis manufactured from 1964 to 2007who were involved in tow-away crashes. Of these drivers, 115,219 were injured.
2.5 South Australia Crashes
The Road Crash Information Unit of the Department of Transport, Energy and Infrastructuremaintains a database of all crashes in South Australia reported to the South Australian Police viavehicle crash reports. Crashes included involved at least one person being killed or injured, or avehicle towed away, or total property damage of $3,000 or greater. Prior to 01 July 2003 theDepartment processed 'property damage only' crashes with an aggregated damage value of $1000or greater. This change in property damage value occurred as data processing costs and budgetreductions had reached an unsustainable level. The decision was made to process all casualtycrashes, property damage only greater than $3000, and tow-away crashes regardless of value.Crash data was provided for the years 1995 to 2005 with three files provided for each year. Thethree files provided contain detail on the crash, traffic unit and casualties. In addition, data fileshave been provided with road and Local Government Area details. Like NSW, Queensland andWestern Australia, both injury and non-injury crashes are reported making the data suitable forinclusion in estimating both the injury risk and injury severity components of the vehicle safetyratings.
The files supplied covered 611,140 light passenger vehicles manufactured between 1982 and2007 involved in Police reported crashes during 1995-2007 that resulted in death or injury or avehicle being towed away. The files supplied covered models of four wheel drive vehicles,passenger vans, and light commercial vehicles as well as cars and station wagons. Out of the611,140 drivers involved in tow-away crashes, 52,802 were recorded as injured.
Of the 611,140 vehicles reported as crashed in South Australia and used in estimation ofcrashworthiness ratings, 466,263 were involved in crashes with one other traffic unit. Of the

14 MONASH UNIVERSITY ACCIDENT RESEARCH CENTRE
drivers of the matched vehicles, 26,965 were injured. These records were used for calculation ofvehicle aggressivity ratings toward drivers of other vehicles.
Records on unprotected road users involved in a crash with one vehicle unit for the period 1995to 2007 were retrieved and identified using variables classifying unit type and number of units inthe crash. 18,763 unprotected road users in the South Australia crash records were identified ascolliding with a 1982-2007 year of manufacture passenger vehicle with model details identified.Of the 12,454 unprotected road users who were injured, 3,115 were severely injured.
For the study of crashworthiness by vehicle year of manufacture, the SA data represented701,253 drivers of cars, station wagons or taxis manufactured from 1964 to 2007 who wereinvolved in tow-away crashes. Of these drivers, 62,335 were injured.
2.6 Crash and Registration Data from New Zealand
Two sources of data from New Zealand were used in the calculation of vehicle crashworthinessand aggressivity ratings. The first data source provided was a crash file showing the registration,vehicle, driver and various crash characteristics for all police reported crashes in New Zealandfor the years 1991 to 2007. The second data source was registration data giving details of allcrash involved vehicles on the NZ register in each year from 1991 to 2007. Extracts from bothdata sources supplied for estimation of vehicle safety ratings are described below. The method ofassembly of this data is given in Cameron et al (1994b) and in the most recent used car safetyratings of Newstead et al (2007).
After assembling the data, 210,674 light passenger vehicles manufactured between 1982 and2007 were used in the crashworthiness analysis. Of the drivers of these vehicles 100,330 werenot injured or had unknown injury status, whilst the remaining 110,344 were injured to somedegree. The injury details of the 110,344 injured drivers were used for estimation of thecrashworthiness injury severity measure in conjunction with the Australian data. Records on theuninjured drivers in the New Zealand injury crash data could not be used in the calculation of theinjury risk component of the crashworthiness ratings. This was because non-injury crashes inNew Zealand, and hence uninjured drivers involved in these crashes, were not suitable for use inthe analysis and therefore records on all uninjured drivers in all crashes in New Zealand wereincomplete.
A subset of the New Zealand data described above and used for estimation of crashworthinessinjury severity formed the basis of the data used in the calculation of the aggressivity ratings.For calculation of aggressivity ratings, vehicles involved in two vehicle crashes were identified.Of the drivers of vehicles colliding with the vehicles identified, 35,194 were injured whilst28,215 were uninjured. Information on the injury level of the 35,194 injured drivers, 5,594 ofwhom were seriously injured, was used in conjunction with the Australian data to estimate theinjury severity component of the aggressivity ratings.
Records on unprotected road users involved in a crash with one light vehicle unit for the period1991 to 2007 were retrieved and identified using variables classifying unit type and number ofunits in the crash. 22,743 unprotected road users were identified as impacting with a 1982-2007year of manufacture passenger vehicle with model details identified. Of the 22,743 unprotectedroad users who were injured, 6,488 were severely injured.

VEHICLE SAFETY RATINGS: 2009 UPDATE 15
2.7 Combined Data from the Six Jurisdictions
When the data on the injured drivers was combined for analysis, it covered 744,742 drivers of1982-2007 model vehicles who were injured in crashes in Victoria or New South Wales during1987-2007 or in South Australia during 1995-2007 or in Western Australia, Queensland or NewZealand during 1991-2007. Of these 602,968 had a valid injury severity code, with 141,774drivers injured in crashes in NSW during 1999-2007 excluded because of missing injuryseverity. Information on the 602,968 injured drivers was used to assess the injury severity of theinjured drivers of the different makes and models when computing crashworthiness ratings. Theinformation on the 3,654,892 drivers involved in tow-away crashes in NSW during 1987-2007 orSouth Australia during 1995-2007 or Western Australia and Queensland during 1991-2007 wasused to assess the injury rate of drivers of the different makes and models for computingcrashworthiness ratings.
The combined data on drivers injured in crashes between two light vehicles used for estimationof vehicle aggressivity ratings covered 258,350 drivers of vehicles colliding with 1964-2007model vehicles. These drivers were injured in two car crashes in Victoria during 1987-2007 orNSW during 1987-1998 or in South Australia during 1995-2007 or in Western Australia,Queensland and New Zealand during 1991-2007. Excluding the 31,025 injured drivers fromNSW during 1999-2007 without a valid injury severity code left 227,325 cases for analysis. Thisinformation was used to assess the injury severity of the injured drivers colliding with thedifferent makes and models when computing aggressivity ratings. The aggressivity injury riskcomponent was estimated from data including information on the 1,477,523 drivers involved intwo-car tow-away crashes in NSW during 1987-2007, in South Australia during 1995-2007 orWestern Australia and Queensland during 1991-2007.
The combined data on unprotected road users used for estimation of aggressivity covered124,285 injured unprotected road users, of whom 42,482 with valid injury severity codes wereseriously injured. These unprotected road users were involved in a collision with a 1982-2007model vehicle in Victoria or NSW during 1987-2007, or in South Australia during 1995-2007 orin Western Australia or Queensland or New Zealand during 1991-2007.
For the study of crashworthiness by year of vehicle manufacture, the combined data covered566,081 drivers of vehicles manufactured between 1964 and 2007 who were injured in crashes,119,252 severely, in Victoria during 1987-2007, NSW during 1987-1998, in South Australiaduring 1995-2007 and Western Australia and Queensland during 1991-2007. For the assessmentof injury risk by year of vehicle manufacture, the combined data covered 3,423,395 driversinvolved in tow-away crashes in NSW during 1987-2007 or in South Australia during 1995-2007or Western Australia and Queensland during 1991-2007.

16 MONASH UNIVERSITY ACCIDENT RESEARCH CENTRE
3. MODELS AND MARKET GROUPS OF VEHICLES
3.1 Vehicle Model Identification
A procedure initially developed by the NRMA based on decoding Vehicle IdentificationNumbers (VIN) or chassis numbers was extended and used as the primary means to determinethe models of light passenger vehicles. The decoding identified some light truck and unusualcommercial models that were not considered further. Of the light passenger vehiclesmanufactured during 1982-2005 around 95% had their model identified by the VIN decoder.Further details of the VIN decoding process are given by Pappas (1993). The VIN decodingprocedure was used to identify all vehicle models in the New South Wales and Queensland dataand 1989 year of manufacture vehicles onwards in the Victorian data from 1994. For the firsttime VINs were obtained from the Western Australian vehicle register, managed by the WADepartment of Transport. This meant the VIN decoding system used on data from the other fourstates to identify vehicle model details was used for some of the Western Australia crash data.Because only a recent snapshot of the registration file was obtained registration details of expiredregistrations was not available. The VIN decoding system was also used to identify make andmodel details for vehicles sold new in New Zealand with a valid ISO VIN recorded.
For those vehicles in Western Australia without a VIN available, the previous decoding methodbased on make, model and year of manufacture codes held in the vehicle register and describedin Newstead et al (2006) was used. A similar system was used to classify new vehicles in theNew Zealand crash data without a valid ISO VIN and for used imported vehicles from Japan. ForVictorian vehicles in the pre 1994 data without a VIN, a system of decoding based on vehiclemass and power was used. This is also described in Newstead et al (2006).
South Australia registration data was matched to crash data by the Driver and Vehicle Licensingsection of the Department of Transport, Energy and Infrastructure using an extract comprising ofthe crash date and six character plate detail of the crashed vehicle from the crash data provided toMUARC by the Transport Services Division of the same Department. The vehicles were selectedon the basis that the plate was registered as being on the vehicle as at the crash date and thevehicle was registered by the client as at the crash date and was described by the extractedvehicle details. Plate detail in the provided crash data was only six characters whilst the platenumbers on the South Australia register can be longer than six characters, so the numbers wereused "as they are" to extract the data. Plates are identified on the South Australia register usingplate type and plate number. This resulted in some plate/crash date combinations being extractedmore than once. These were excluded from the analysis. Where no match has been possible, theoriginal plate and crash date remain with no extract details populated. Other vehicle detailsincluding make, year of manufacture and model which is a free format field on the register andas such, doesn't contain codified or verified data were supplied. This meant the VIN decodingsystem used on data from the other four states to identify vehicle model details was able to beused for the South Australia crash data.
RACV, NRMA, the Australian Transport Safety Bureau (ATSB, formerly FORS) and VicRoadsprovided advice on the particular models that had experienced substantial changes in design (andhence potential crashworthiness) and in which years the design was relatively constant. Thisresulted in certain models being split into ranges of years of manufacture. Where the new modelwas introduced near the beginning or end of a year (up to two months either way), this process

VEHICLE SAFETY RATINGS: 2009 UPDATE 17
was relatively straightforward (accepting a small mis-classification in some circumstances).However, when the model changed near the middle of the year, the model for that year was keptseparate and potentially treated as a "mixed" model (e.g. the Daihatsu Charade 1987 models).Where exact model decoding was possible from the VIN, without using year of vehiclemanufacture, this was used. They also provided advice on vehicle models that could becombined with each other (sometimes only for specific years) because they were essentially thesame design or construction but registered as having different manufacturers.
As in previous crashworthiness ratings, models were excluded with fewer than 20 injured driversand/or fewer than 100 involved drivers appearing in the crash data. The same selection criteriawere also used for aggressivity ratings except exclusion was based on the number of road userscolliding with the focus vehicle model. These selection criteria were used to ensure stability infitting the logistic regression models along with suitably small confidence limits on the estimatedcrashworthiness ratings.
3.2 Pooled Car Models
Vehicle model sharing amongst manufacturers retailing in the Australian market has beenrelatively common. Because shared models are generally identical, particularly with respect tosafety performance, it is possible to pool such models for safety rating, allowing a more preciseestimate of the safety of models for which data is pooled rather than considering each separately.Pooled models are indicated in Table 2.
Table 2: Pooled Models of Cars
Ford Laser 82-89 with Mazda 323 / Familia 82-88Ford Laser 99-03 with Mazda 323 99-03Ford Telstar 83-87 with Mazda 626 / MX6 / Capella 83-86Ford Telstar 88-91 with Mazda 626 / MX6 / Capella 88-91Ford Telstar 92-97 with Mazda 626 / MX6 / Capella / Cronos 92-97Ford Corsair 89-92 with Nissan Pintara / Bluebird 89-92Holden Commodore VR/VS with Toyota Lexcen 93-97Holden Commodore VN-VP with Toyota Lexcen 89-93Holden Nova 89-92 with Toyota Corolla 88-92Holden Nova 93-96 with Toyota Corolla 93-97Holden Astra 84-86 with Nissan Pulsar / Langley 83-86Holden Astra 88-90 with Nissan Pulsar / Sentra 87-91Holden Barina 85-88 with Suzuki Swift / Cultus 86-88Holden Barina 89-93 with Suzuki Swift / Cultus 89-00Holden Apollo JK/JL 89-92 with Toyota Camry / Vista 90-93Holden Apollo JM/JP 93-97 with Toyota Camry / Sceptor 94-97Ford Maverick 88-97 with Nissan Patrol 88-97Suzuki Scurry 85-87 with Holden Carry 85-90Suzuki Samurai / SJ410 / SJ413 82-00 with Holden Drover 85-87Nissan XFN Utility with Ford Falcon Utility 82-95Ford Festiva WA 91-93 with Mazda 121 87-90Ford Courier 98-02 with Mazda B-Series 98-02Ford Courier 03-06 with Mazda Bravo 03-06Ford Escape 01-06 with Mazda Tribute 01-06Ford Escape 06-07 with Mazda Tribute 06-07

18 MONASH UNIVERSITY ACCIDENT RESEARCH CENTRE
It should be noted that some of the vehicle models identified in the Victorian, New South Wales,South Australia, Western Australia, Queensland and New Zealand crash data have optionalsafety equipment, such as air bags, which could significantly alter the crashworthiness rating ofthe vehicle model when fitted. It is, however, generally not possible to identify which particularvehicles of a model series do and do not have such optional safety equipment installed using themodel decoding procedures described above. Consequently, for those vehicle models withoptional safety equipment, the estimated crashworthiness rating represents an average of thesafety performance for vehicles with and without the optional safety equipment weighted by thenumber of each in the crash data.
As the ratings only measure the outcome of drivers involved in a crash, the effect of fitment ofactive or crash avoidance safety features such as anti-lock braking or electronic stability controlsystems on crash avoidance was not measured by these ratings. As only drivers were considered,optional or standard safety features for the front or rear seat passengers, such as passenger frontalairbag systems, would also not have affected the ratings.
3.3 Vehicle Market Groups
Previous updates of the vehicle safety ratings have classified vehicle models, for the purpose ofpublication, into one of a number of market groups. The market groups defined are based heavilyon those used by the Federal Chamber of Automotive Industries (FCAI) for reporting Australianvehicle sales as part of their VFACTS publication (see www.fcai.com.au for further details). Inthe vehicle safety ratings update of Newstead et al (2006) rated vehicles were classified into oneof 12 market group classifications, comprising 7 classes of regular passenger car, 3 classes offour wheel drive (4WD) vehicle (also known as Sport Utility Vehicles) and 2 classes of lightcommercial vehicle. In the update of Newstead et al 2007a,b of the vehicle safety ratings thepreviously defined luxury and sports market groups were distributed across the remaining 5classes of regular passenger cars, reducing the number of market groups to 10. This classificationinto 10 market groups was again used in the most recent update (Newstead et al 2008a,b) and inthis update. The 10 market groups were defined as follows.
Passenger Cars
Light Passenger car, hatch, sedan, coupe or convertible 3 or 4 cylinder engine,up to1, 500 cc.
Small Passenger car, hatch, sedan, wagon, coupe or convertible 4 cylinderengine, 1,501 cc - 1,900 cc.
Medium Passenger car, hatch, sedan, wagon, coupe or convertible 4 cylinderengine, 1,901 cc upward.
Large Passenger car, hatch, sedan, wagon, coupe or convertible 6 or 8 cylinderengine.
People Movers Passenger usage seating capacity > 5 people.
Four Wheel Drive Vehicles (high ground clearance, off road wagon)
4WD Compact Index rating < 550 (typically less than 1700kg tare mass)4WD Medium Index rating 550 - 700 (typically between 1700kg and 2000kg tare
mass)4WD Large Index rating > 700 (typically greater than 2000kg tare mass)

VEHICLE SAFETY RATINGS: 2009 UPDATE 19
Light Commercial Vehicles
Van Blind & window vans.Utility Two and four wheel drive, normal control (bonnet), utility, cab chassis and
crew-cabs.
The classification of 4WD vehicles is based on an index developed by VFACTS that considersgross vehicle mass, maximum engine torque and the availability of a dual range transmission.The index typically classifies the vehicles roughly by tare mass as indicated on the classificationsabove. Some departures from the VFACTS classification have been made in presenting theratings in this study. VFACTS defines a luxury 4WD category based on vehicle price as well asclassifying sports cars priced above the luxury car tax threshold as luxury vehicles. Here, theluxury 4WDs have been distributed amongst the 3 defined 4WD categories based on tare mass,as the information for computing the classification index used by VFACTS was not available atthe time of the study.
There have also been some departures from the classification principles defined above for certainvehicle models that have a range of engine sizes and hence fall across two different definedcategories. These are typically passenger vehicles and include, for example, cars like somemodels of the Toyota Camry that come fitted with a large 4 cylinder engine in some variants anda 6 cylinder engine in other variants. In these cases, a value judgement has been made for eachvehicle model individually based on the other vehicle models with which each typicallycompetes in the market place.
20 MONASH UNIVERSITY ACCIDENT RESEARCH CENTRE
4. ANALYSIS
4.1 Overview of Analysis Methods: Crashworthiness
The crashworthiness rating (C) is a measure of the risk of serious injury (hospitalisation or death)to a driver of a car when it is involved in a crash. It is defined to be the product of twoprobabilities (Cameron et al, 1992):
i) the probability that a driver involved in a crash is injured (injury risk), denoted by R; andii) the probability that an injured driver is hospitalised or killed (injury severity), denoted by
S.
That isC R S .
Folksam Insurance, who publishes the well-known Swedish ratings, first measuredcrashworthiness in this way (Gustafsson et al, 1989).
In the present report, each of the two components of the crashworthiness rating was obtained bylogistic regression modelling techniques (Hosmer & Lemeshow, 1989). Such techniques are ableto simultaneously adjust for the effect of a number of factors (such as driver age and sex, numberof vehicles involved, etc.) on probabilities such as the injury risk and injury severity whilstestimating the role of vehicle model, market group or year of manufacture in the injury outcome.This method, described fully in Newstead et al (2006), has previously been used to produce theAustralian and New Zealand vehicle fleet crashworthiness ratings. For estimation of thecrashworthiness ratings, factors in the logistic model included the available non-vehicle factorsinfluencing injury outcome as well as the variable indicating vehicle model, market group or yearof manufacture. Newstead et al (2006) details how confidence limits on the regression estimatesof injury risk and severity are calculated with these techniques also being used here.
A stepwise procedure was used to identify which non-vehicle factors and their interactions hadan important influence on driver injury outcome. Logistic models were obtained separately forinjury risk and injury severity because it was likely that the various factors would have differentlevels of influence on these two probabilities. The non-vehicle factors considered in the analysisfor both injury risk and injury severity were
sex: driver sex (male, female) age: driver age (25 years; 26-59 years; 60 years) speedzone: speed limit at the crash location (75 km/h; 80 km/h) nveh: the number of vehicles involved (one vehicle; >1 vehicle) state: jurisdiction of crash (Victoria, NSW, SA, QLD, WA, NZ) year: year of crash (1987, 1988, … , 2007)
These variables were chosen for consideration because they were part of the Victorian,Queensland, New South Wales, South Australia, Western Australia and New Zealand databases.Other variables were only available from one source and their inclusion would have drasticallyreduced the number of cases that could have been included in the analysis. All data wereanalysed using the Logistic Regression procedure of the SAS statistical package (SAS, 1989).
VEHICLE SAFETY RATINGS: 2009 UPDATE 21
Some model exclusions were made from the analysis by make and model of vehicle for vehiclemodel classifications that had no practical interpretation or where there were too few cases forinclusion. This included models in a particular year where there was a change from one series tothe next and year of manufacture was necessary to determine the series break (such as MitsubishiPajero 1991). It also included some groups of highly aggregated models that would be of nointrinsic interest to consumers using the ratings (such as Jeep Others or Mazda Commercials).After exclusion, the regression analyses were performed on 427 individual car models (or pooledsimilar models). A list of all vehicle models considered, with those with sufficient data foranalysis indicated, is given in Appendix 1.
These techniques were applied to produce estimates of injury risk, injury severity andcrashworthiness by vehicle make and model, market group or year of manufacture.
4.2 Overview of the Analysis Methods: Aggressivity
The aggressivity rating estimates the risk of death or admission to hospital to both the drivers ofthe other cars and to unprotected road users when involved in a collision with the subject modelcar. Unprotected road users include pedestrians, bicyclists and motorcyclists. Because anestimate of the risk of injury cannot be calculated for unprotected road users as explained abovethe measure of aggressivity injury risk used was based only on the injury risk to the other driver(ROU). It is defined as:
Aggressivity Injury Risk = ROU = proportion of other vehicle drivers involved incrashes who were injured
In contrast, complete records of both other drivers and unprotected road users injured in crashesare available and can be used to examine injury severity outcomes in the aggressivity measure.The aggressivity injury severity measure (SOU) is defined as:
Aggressivity Injury Severity = SOU = proportion of other vehicle drivers or unprotectedroad users who were killed or admitted tohospital.
Based on the definition of ROU and SOU above, an aggressivity measure for each subject carmodel was then calculated as before:
Aggressivity to other driver or unprotected road user = AOU = ROU x SOU.
Consideration was given to taking into account likely differences between the crashcircumstances of the subject car models, which may result in a distorted view of its aggressivityonly partly related to the characteristics of the subject cars. Factors available in the data toconsider such differences were as follows.
agefcd: age of driver of subject car (<=25 years, 26-59 years, >=60 years) sexfcd: sex of driver of subject car ageoo: other car driver age (<=25 years, 26-59 years, >=60 years) sexoo: other car driver sex (male, female) speedzone: speed limit at the crash location (75 km/h; 80 km/h) state: jurisdiction of crash (Victoria, NSW, SA, QLD, WA, NZ)
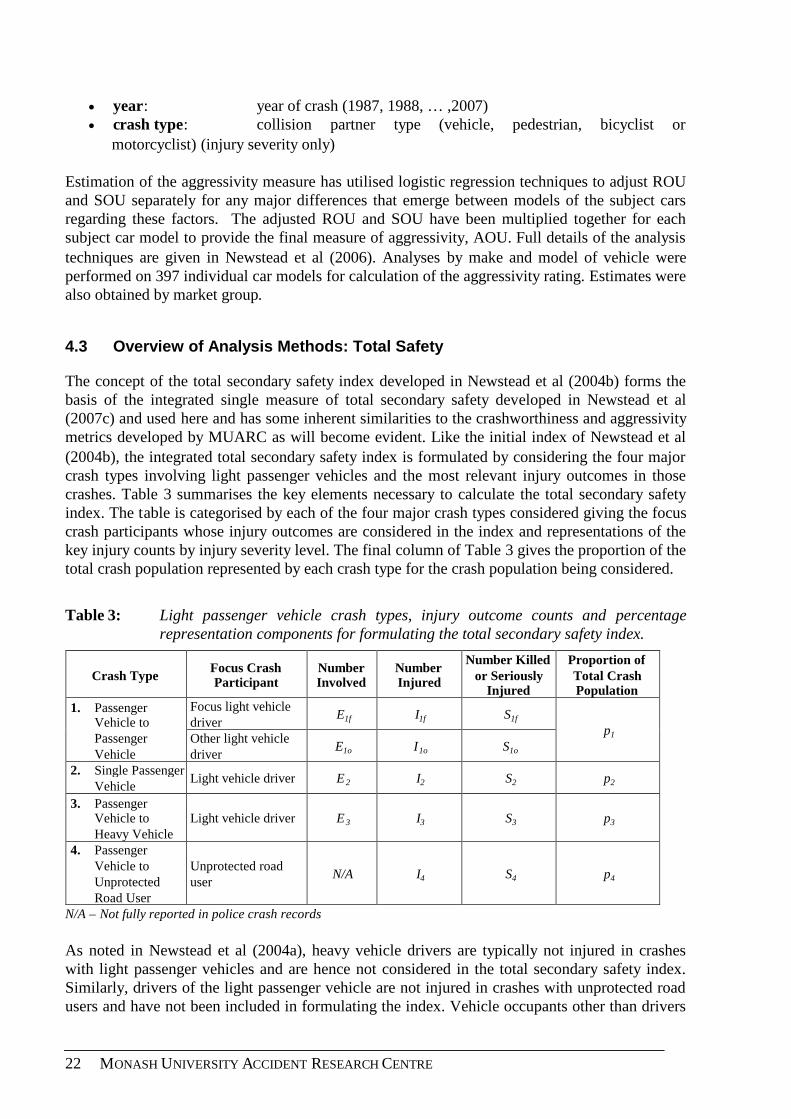
22 MONASH UNIVERSITY ACCIDENT RESEARCH CENTRE
year: year of crash (1987, 1988, … ,2007) crash type: collision partner type (vehicle, pedestrian, bicyclist or
motorcyclist) (injury severity only)
Estimation of the aggressivity measure has utilised logistic regression techniques to adjust ROUand SOU separately for any major differences that emerge between models of the subject carsregarding these factors. The adjusted ROU and SOU have been multiplied together for eachsubject car model to provide the final measure of aggressivity, AOU. Full details of the analysistechniques are given in Newstead et al (2006). Analyses by make and model of vehicle wereperformed on 397 individual car models for calculation of the aggressivity rating. Estimates werealso obtained by market group.
4.3 Overview of Analysis Methods: Total Safety
The concept of the total secondary safety index developed in Newstead et al (2004b) forms thebasis of the integrated single measure of total secondary safety developed in Newstead et al(2007c) and used here and has some inherent similarities to the crashworthiness and aggressivitymetrics developed by MUARC as will become evident. Like the initial index of Newstead et al(2004b), the integrated total secondary safety index is formulated by considering the four majorcrash types involving light passenger vehicles and the most relevant injury outcomes in thosecrashes. Table 3 summarises the key elements necessary to calculate the total secondary safetyindex. The table is categorised by each of the four major crash types considered giving the focuscrash participants whose injury outcomes are considered in the index and representations of thekey injury counts by injury severity level. The final column of Table 3 gives the proportion of thetotal crash population represented by each crash type for the crash population being considered.
Table 3: Light passenger vehicle crash types, injury outcome counts and percentagerepresentation components for formulating the total secondary safety index.
Crash Type Focus CrashParticipant
NumberInvolved
NumberInjured
Number Killedor Seriously
Injured
Proportion ofTotal CrashPopulation
1. PassengerVehicle toPassengerVehicle
Focus light vehicledriver E1f I1f S1f
p1Other light vehicledriver E1o I1o S1o
2. Single PassengerVehicle Light vehicle driver E2 I2 S2 p2
3. PassengerVehicle toHeavy Vehicle
Light vehicle driver E3 I3 S3 p3
4. PassengerVehicle toUnprotectedRoad User
Unprotected roaduser N/A I4 S4 p4
N/A – Not fully reported in police crash records
As noted in Newstead et al (2004a), heavy vehicle drivers are typically not injured in crasheswith light passenger vehicles and are hence not considered in the total secondary safety index.Similarly, drivers of the light passenger vehicle are not injured in crashes with unprotected roadusers and have not been included in formulating the index. Vehicle occupants other than drivers
VEHICLE SAFETY RATINGS: 2009 UPDATE 23
have not been considered as they are often not recorded by police in their crash reports unlessinjured. Similarly, crashes involving uninjured unprotected road users are generally not reportedto police and hence the total number of unprotected road users involved in crashes is unknown.The ‘focus’ light vehicle driver in Table 3 refers to the driver of the vehicle being rated whilstthe ‘other’ vehicle is the collision partner.
Like the crashworthiness and aggressivity measure, the total secondary safety index is defined asthe product of an injury risk component and an injury severity component. The need to define atwo component measure is necessary to be able to make best use of the police reported crashdatabases in New Zealand and Victoria that record only crashes involving injury. It is notpossible to determine the total number of crash involved people in these jurisdictions sincerecords on crashes where no one is injured are not available. Hence these two data sets are onlyuseful for measuring relative injury severity and not injury risk.
The measure of total secondary safety injury risk, RT, is defined as follows:
3
33
2
22
11
111 )(
EI
pEI
pEEII
pRof
ofT
It measures the average risk of injury across all key participants in a crash involving a lightpassenger vehicle weighted by the relative exposure of each participant type across the entirecrash population. Since unprotected road users are generally injured crashes reported to police,they are not included in the injury risk measure. The corresponding total secondary safety injuryseverity measure, ST, is defined as follows:
4
44
3
33
2
22
11
111 )(
IS
pIS
pIS
pIISS
pSof
ofT
It measures the average risk of death or serious injury given some injury was sustained across allkey participants in a crash weighted again by the relative exposure of each participant type acrossthe entire crash population. The integrated total secondary safety index, T, is defined to be theproduct of the injury risk and injury severity components:
TT SRT .
It measures the average risk of death or serious injury in crash involving a light passenger vehicleacross all key participants in a crash weighted again by the relative exposure of each participanttype across the entire crash population. It can be estimated for individual vehicle models, byvehicle market groups or for the fleet as a whole as desired with a table of the form of Table 3being derived for each entity at the level of disaggregation desired.
The description of the total secondary safety index has defined 5 key focus crash participantswhose injury outcome forms the basis of the index. Depending on the available data, it ispossible to define a more detailed index that further breaks down the categories of keyparticipants. Further breakdowns considered in developing the index were:

24 MONASH UNIVERSITY ACCIDENT RESEARCH CENTRE
Unprotected road user into BicyclistPedestrianCyclist
Heavy vehicle collision partner into Rigid TruckArticulated TruckBus
This made a total of 9 key participant categories considered in the total secondary safety index.The final number of categories that were able to be sustained in practical application of the indexdepended on the amount of crash data available from each category and the level of vehicleaggregation at which the index was being calculated (e.g. make and model of vehicle vs marketgroup).
Like the crashworthiness and aggressivity indices developed by MUARC, the aim for theintegrated total secondary safety index was that it reflect only the influence of the vehicle oninjury outcome and not factors external to the vehicle such as key participant or crashcharacteristics. Consequently, there was a need to compensate for differences in these key nonvehicle related factors that existed form vehicle model to vehicle model or by market group.Logistic regression analysis was utilised to produce total secondary safety ratings appropriatelyadjusted for the influence on non-vehicle related factors on injury outcome. For estimation of thetotal secondary safety ratings, factors in the logistic model included the available non-vehiclefactors influencing injury outcome, such as driver or unprotected road user age and gender, yearand jurisdiction of crash and crash configuration, as well as the variable indicating vehicle modelor market group.
Since the analysis potentially included 2 drivers from the same crash in a light vehicle to lightvehicle crash, an assumption implicit in the logistic modelling process was that, given the levelof impact severity of the crash represented by non-vehicle factors in the logistic model, it wasassumed that the injury outcome of the two drivers was independent. This assumption wasconsidered reasonable since the estimated crashworthiness and aggressivity of vehicles rated byNewstead et al (2007a and 2008a) appear to be essentially independent and each of thesemeasure focuses heavily on the injury outcome of each driver in a two vehicle crash.
In the present report, as with the crashworthiness and aggressivity ratings each of the twocomponents of the total secondary safety index was obtained by logistic regression modellingtechniques (Hosmer & Lemeshow, 1989). Such techniques are able to simultaneously adjust forthe effect of a number of factors on probabilities such as the injury risk and injury severity whilstestimating the role of vehicle model, market group or year of manufacture in the injury outcome.Only the average total secondary safety across a standardised set of crash circumstances andoccupant characteristics was of interest. This method is described fully in Newstead et al (2007c)along with details on how confidence limits on the regression estimates of injury risk andseverity are calculated.
The factors considered during this stage of the analysis for both injury risk and injury severitywere
sex: driver or unprotected road user sex (male, female) age: driver or unprotected road user age (25 years; 26-59 years; 60 years)
VEHICLE SAFETY RATINGS: 2009 UPDATE 25
speedzone: speed limit at the crash location (75 km/h; 80 km/h) nveh: the number of vehicles involved (one vehicle; >1 vehicle) state: jurisdiction of crash (Victoria, NSW, QLD, WA, NZ) year: year of crash (1987, 1988, … ,2007)
A further critical factor that is likely to vary between vehicle models is the mix of collisionsbetween light passenger vehicles and both other vehicles of various types and unprotected roadusers. The injury severity (ST) and injury risk (RT) components of the new total secondary safetymeasure (T) is an average of injury severity or injury risk outcomes respectively across the mixof crash types involving the focus vehicle. Since injury outcomes will vary considerably acrossthe mix of crash types it is necessary to adjust the new total secondary safety injury severitymeasure and injury risk measure to account for differences in the proportion of crash typecombinations between vehicle models. To adjust for potential differences a further factor wasincluded in the logistic regression models for both total secondary safety injury risk and injuryseverity. The factor used was:
crashtyp crash combination type,
For the injury risk analysis the crash combination types consisted of:
two vehicle – focus vehicle driver two vehicle – other vehicle driver single vehicle heavy vehicle collisions (including collisions with articulated trucks, rigid trucks or
buses)
For the injury severity analysis an additional collision combination type was included beingcollisions between a light passenger vehicle and unprotected road users (pedestrians, bicyclists ormotorcyclists). This additional collision combination type was excluded from the injury riskanalysis because in general crashes involving pedestrians, bicyclists and motorcyclists areseldom reported to the Police unless someone is killed or injured which is usually theunprotected road user. This means that an estimate of the risk of injury cannot be calculated forthe unprotected road user.
Although heavy collisions could be further categorised into rigid truck, articulated truck or buscollisions and unprotected road users could be further categorised into pedestrians, bicyclists andmotorcyclists it was important to ensure that the logistic model adequately described the data anddid not yield coefficients that were imprecise or unstable. For this reason, for both heavy vehiclecollisions and unprotected road user collisions, the sub type classifications were pooled to ensuresufficient data for precise and stable results.

26 MONASH UNIVERSITY ACCIDENT RESEARCH CENTRE
5. RESULTS
5.1 Vehicle Crashworthiness Ratings
5.1.1 Injury Risk
Injury risk was estimated from the data on 3,654,892 drivers involved in tow-away crashes inNew South Wales, South Australia, Queensland and Western Australia during 1987-2007. Thisdata set is referred to as the "involved drivers". Because of missing values in one or more of thecovariates driver sex and age, speed zone and number of vehicles involved in the crash amongstthe 3,654,892 involved drivers and vehicle models of interest, the final file used for analysisconsisted of the 1,831,574 drivers for which all the covariate data was complete. Of these drivers308,509 were injured. The following non-vehicle related factors and their interactions weresignificantly associated with injury risk and were included in the logistic model:
Base effect terms First orderinteractions
Second orderinteractions
Sex Speedzone*Nveh Age*Speedzone*NvehSpeedzone Sex*Nveh Sex*Speedzone*NvehAge Sex*Age Speedzone*Year*NvehNveh Age*Nveh Sex*State*NvehState Speedzone*Age Speedzone*Nveh*StateYear State*Year State*Year*Nveh
Nveh*State Age*State*NvehYear*Nveh Age*Speedzone*StateAge*State Age*Sex*SpeedzoneAge*Year Speedzone*State*YearSpeedzone*YearSpeedzone*StateSex*SpeedzoneSex*State
The overall (average) injury risk for involved drivers in tow-away crashes in NSW, SouthAustralia, Western Australia and Queensland was 16.84 injuries per 100 involved drivers.Appendix 2 gives the estimates of injury risk derived by logistic regression for the 427 individualcar models that were rated. Injury risk ranged from 8.33% for the 1996-2004 Peugeot 406 to42.58% for the 1982-1990 Daihatsu Hi Jet. An estimate of the variability in the injury riskestimates was calculated from the width of the corresponding 95% confidence intervals.Individual confidence interval widths ranged from 0.68% for both the 1989-1993 and 1993-1997Holden Commodore VN/VP, Toyota Lexcen to 16.45% for the 1982-1991 Porsche 944. Thesmall variability for the Holden Commodore and Toyota Lexcen series sedan is not surprisingdue to the large number of cars of this model in the data set and precision is known to improvewith increasing sample size.
The estimated injury risk for each market group is also given in Appendix 2. The large fourwheel drive vehicles had the lowest injury risk (12.54%) and the light car market group had thehighest (22.52%).

VEHICLE SAFETY RATINGS: 2009 UPDATE 27
5.1.2 Injury Severity
The data on "injured drivers" covered 744,742 drivers of 1982-2007 model vehicles who wereinjured in crashes in Victoria, New South Wales, South Australia, Western Australia,Queensland or New Zealand during 1987-2007. Because of missing values in one or more of thecovariates or invalid injury severity codes amongst the 744,742 injured drivers, the final file usedfor analysis consisted of the 348,618 drivers for which all the covariate data was complete. Ofthese drivers 72,391 were seriously injured. The following non-vehicle related factors and theirinteractions were significantly associated with injury severity and were included in the logisticmodel:
Base effectterms
First orderinteractions
Second orderinteractions
Third order interactions
Sex Sex*State Speedzone*Nveh*State Speedzone*State*Year*NvehSpeedzone Speedzone*Nveh Speedzone*State*YearAge Age*Sex Age*State*NvehNveh Nveh*State Age*State*YearState Speedzone*Age State*Year*NvehYear Age*State Speedzone*Year*Nveh
Age*Nveh Age*Speedzone*StateState*YearSpeedzone*YearAge*YearYear*NvehSpeedzone*StateSpeedzone*Sex
The average injury severity for injured drivers in the data analysed was 20.77 deaths or seriousinjuries per 100 injured drivers. Appendix 3 gives the estimates of injury severity derived bylogistic regression for 427 individual car models, or sets of combined models. Of the carsanalysed, injury severity ranged from 4.36% for the 2003-2006 Holden Adventra to 47.94% forthe 1982-1984 Alfa Romeo GTV. An estimate of the variability in the estimates of injuryseverity was calculated from the width of the corresponding 95% confidence intervals.Individual confidence interval widths ranged from 1.83% for the 1982-88 Ford Laser and Mazda323 / Familia to 42.62% for the 1982-1991 Porsche 944.
The estimated injury severity for each market group is also given in Appendix 3. Compact fourwheel drive vehicles performed best with respect to injury severity, having the lowest averageinjury severity of 19.48%. The light car market group had the highest average injury severity of22.23%.
5.1.3 Crashworthiness Ratings
The crashworthiness ratings for each car model and market group were obtained by multiplyingthe individual injury risk and injury severity estimates. Because each of the two components hadbeen adjusted for the confounding factors, the resultant crashworthiness rating was also adjustedfor the influence of these factors.
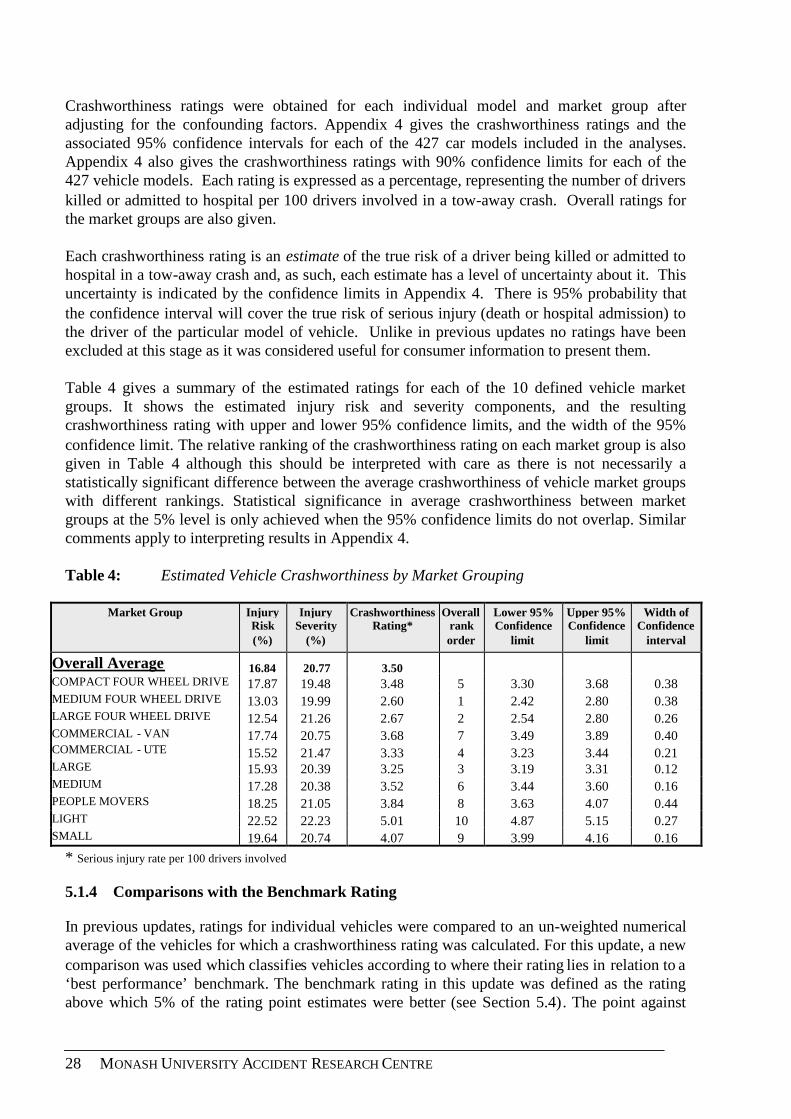
28 MONASH UNIVERSITY ACCIDENT RESEARCH CENTRE
Crashworthiness ratings were obtained for each individual model and market group afteradjusting for the confounding factors. Appendix 4 gives the crashworthiness ratings and theassociated 95% confidence intervals for each of the 427 car models included in the analyses.Appendix 4 also gives the crashworthiness ratings with 90% confidence limits for each of the427 vehicle models. Each rating is expressed as a percentage, representing the number of driverskilled or admitted to hospital per 100 drivers involved in a tow-away crash. Overall ratings forthe market groups are also given.
Each crashworthiness rating is an estimate of the true risk of a driver being killed or admitted tohospital in a tow-away crash and, as such, each estimate has a level of uncertainty about it. Thisuncertainty is indicated by the confidence limits in Appendix 4. There is 95% probability thatthe confidence interval will cover the true risk of serious injury (death or hospital admission) tothe driver of the particular model of vehicle. Unlike in previous updates no ratings have beenexcluded at this stage as it was considered useful for consumer information to present them.
Table 4 gives a summary of the estimated ratings for each of the 10 defined vehicle marketgroups. It shows the estimated injury risk and severity components, and the resultingcrashworthiness rating with upper and lower 95% confidence limits, and the width of the 95%confidence limit. The relative ranking of the crashworthiness rating on each market group is alsogiven in Table 4 although this should be interpreted with care as there is not necessarily astatistically significant difference between the average crashworthiness of vehicle market groupswith different rankings. Statistical significance in average crashworthiness between marketgroups at the 5% level is only achieved when the 95% confidence limits do not overlap. Similarcomments apply to interpreting results in Appendix 4.
Table 4: Estimated Vehicle Crashworthiness by Market Grouping
Market Group InjuryRisk(%)
InjurySeverity
(%)
CrashworthinessRating*
Overallrankorder
Lower 95%Confidence
limit
Upper 95%Confidence
limit
Width ofConfidence
interval
Overall Average 16.84 20.77 3.50COMPACT FOUR WHEEL DRIVE 17.87 19.48 3.48 5 3.30 3.68 0.38MEDIUM FOUR WHEEL DRIVE 13.03 19.99 2.60 1 2.42 2.80 0.38LARGE FOUR WHEEL DRIVE 12.54 21.26 2.67 2 2.54 2.80 0.26COMMERCIAL - VAN 17.74 20.75 3.68 7 3.49 3.89 0.40COMMERCIAL - UTE 15.52 21.47 3.33 4 3.23 3.44 0.21LARGE 15.93 20.39 3.25 3 3.19 3.31 0.12MEDIUM 17.28 20.38 3.52 6 3.44 3.60 0.16PEOPLE MOVERS 18.25 21.05 3.84 8 3.63 4.07 0.44LIGHT 22.52 22.23 5.01 10 4.87 5.15 0.27SMALL 19.64 20.74 4.07 9 3.99 4.16 0.16
* Serious injury rate per 100 drivers involved
5.1.4 Comparisons with the Benchmark Rating
In previous updates, ratings for individual vehicles were compared to an un-weighted numericalaverage of the vehicles for which a crashworthiness rating was calculated. For this update, a newcomparison was used which classifies vehicles according to where their rating lies in relation to a‘best performance’ benchmark. The benchmark rating in this update was defined as the ratingabove which 5% of the rating point estimates were better (see Section 5.4). The point against
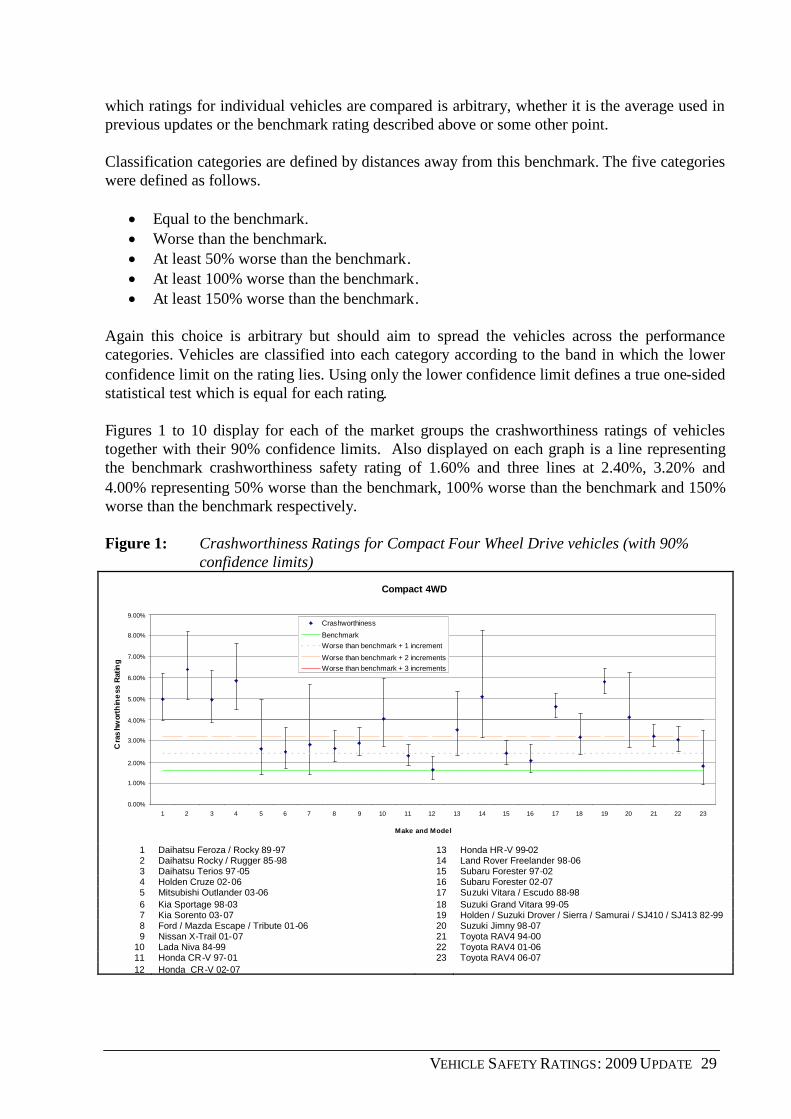
VEHICLE SAFETY RATINGS: 2009 UPDATE 29
which ratings for individual vehicles are compared is arbitrary, whether it is the average used inprevious updates or the benchmark rating described above or some other point.
Classification categories are defined by distances away from this benchmark. The five categorieswere defined as follows.
Equal to the benchmark. Worse than the benchmark. At least 50% worse than the benchmark. At least 100% worse than the benchmark. At least 150% worse than the benchmark.
Again this choice is arbitrary but should aim to spread the vehicles across the performancecategories. Vehicles are classified into each category according to the band in which the lowerconfidence limit on the rating lies. Using only the lower confidence limit defines a true one-sidedstatistical test which is equal for each rating.
Figures 1 to 10 display for each of the market groups the crashworthiness ratings of vehiclestogether with their 90% confidence limits. Also displayed on each graph is a line representingthe benchmark crashworthiness safety rating of 1.60% and three lines at 2.40%, 3.20% and4.00% representing 50% worse than the benchmark, 100% worse than the benchmark and 150%worse than the benchmark respectively.
Figure 1: Crashworthiness Ratings for Compact Four Wheel Drive vehicles (with 90%confidence limits)
Compact 4WD
0.00%
1.00%
2.00%
3.00%
4.00%
5.00%
6.00%
7.00%
8.00%
9.00%
1 2 3 4 5 6 7 8 9 10 11 12 13 14 15 16 17 18 19 20 21 22 23
Make and Model
Cra
shw
orth
ine
ssR
atin
g
Crashworthiness
BenchmarkWorse than benchmark + 1 increment
Worse than benchmark + 2 incrementsWorse than benchmark + 3 increments
1 Daihatsu Feroza / Rocky 89-97 13 Honda HR-V 99-022 Daihatsu Rocky / Rugger 85-98 14 Land Rover Freelander 98-063 Daihatsu Terios 97-05 15 Subaru Forester 97-024 Holden Cruze 02-06 16 Subaru Forester 02-075 Mitsubishi Outlander 03-06 17 Suzuki Vitara / Escudo 88-986 Kia Sportage 98-03 18 Suzuki Grand Vitara 99-057 Kia Sorento 03-07 19 Holden / Suzuki Drover / Sierra / Samurai / SJ410 / SJ413 82-998 Ford / Mazda Escape / Tribute 01-06 20 Suzuki Jimny 98-079 Nissan X-Trail 01-07 21 Toyota RAV4 94-00
10 Lada Niva 84-99 22 Toyota RAV4 01-0611 Honda CR-V 97-01 23 Toyota RAV4 06-0712 Honda CR-V 02-07
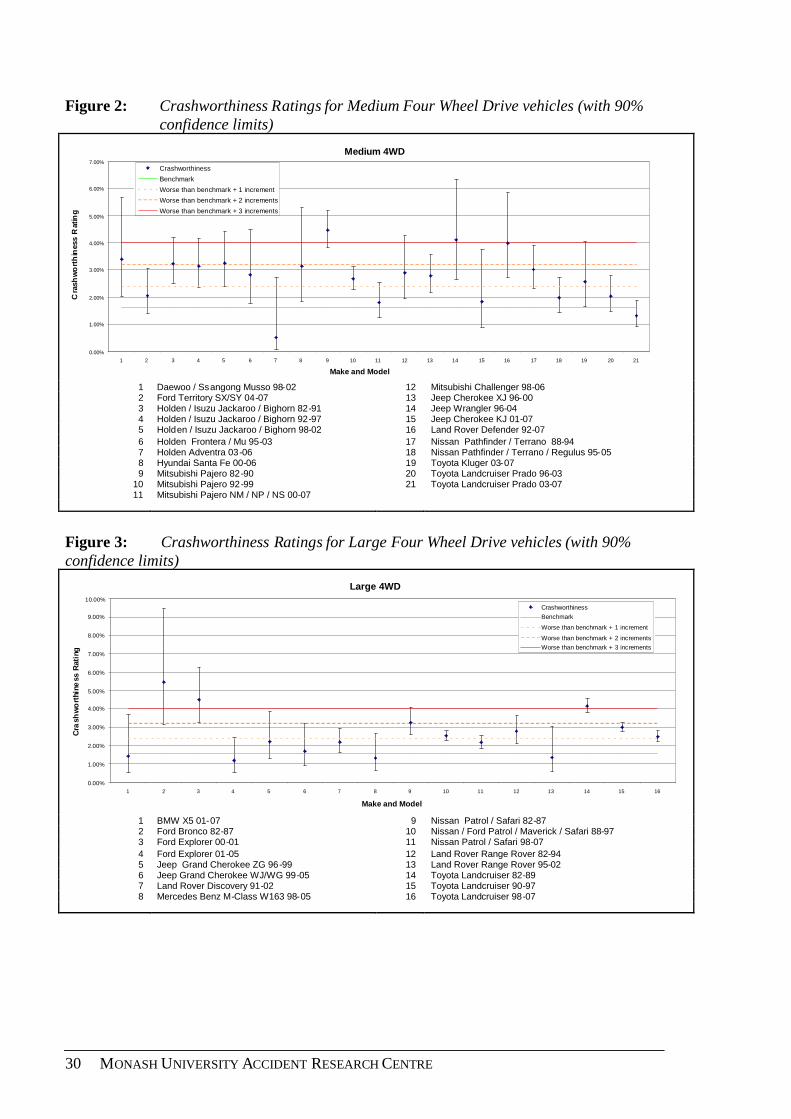
30 MONASH UNIVERSITY ACCIDENT RESEARCH CENTRE
Figure 2: Crashworthiness Ratings for Medium Four Wheel Drive vehicles (with 90%confidence limits)
Medium 4WD
0.00%
1.00%
2.00%
3.00%
4.00%
5.00%
6.00%
7.00%
1 2 3 4 5 6 7 8 9 10 11 12 13 14 15 16 17 18 19 20 21
Make and Model
Cra
shw
ort
hin
ess
Rat
ing
Crashworthiness
Benchmark
Worse than benchmark + 1 increment
Worse than benchmark + 2 increments
Worse than benchmark + 3 increments
1 Daewoo / Ssangong Musso 98-02 12 Mitsubishi Challenger 98-062 Ford Territory SX/SY 04-07 13 Jeep Cherokee XJ 96-003 Holden / Isuzu Jackaroo / Bighorn 82-91 14 Jeep Wrangler 96-044 Holden / Isuzu Jackaroo / Bighorn 92-97 15 Jeep Cherokee KJ 01-075 Holden / Isuzu Jackaroo / Bighorn 98-02 16 Land Rover Defender 92-076 Holden Frontera / Mu 95-03 17 Nissan Pathfinder / Terrano 88-947 Holden Adventra 03-06 18 Nissan Pathfinder / Terrano / Regulus 95-058 Hyundai Santa Fe 00-06 19 Toyota Kluger 03-079 Mitsubishi Pajero 82-90 20 Toyota Landcruiser Prado 96-03
10 Mitsubishi Pajero 92-99 21 Toyota Landcruiser Prado 03-0711 Mitsubishi Pajero NM / NP / NS 00-07
Figure 3: Crashworthiness Ratings for Large Four Wheel Drive vehicles (with 90%confidence limits)
Large 4WD
0.00%
1.00%
2.00%
3.00%
4.00%
5.00%
6.00%
7.00%
8.00%
9.00%
10.00%
1 2 3 4 5 6 7 8 9 10 11 12 13 14 15 16
Make and Model
Cra
shw
ort
hine
ssR
atin
g
CrashworthinessBenchmark
Worse than benchmark + 1 increment
Worse than benchmark + 2 incrementsWorse than benchmark + 3 increments
1 BMW X5 01-07 9 Nissan Patrol / Safari 82-872 Ford Bronco 82-87 10 Nissan / Ford Patrol / Maverick / Safari 88-973 Ford Explorer 00-01 11 Nissan Patrol / Safari 98-074 Ford Explorer 01-05 12 Land Rover Range Rover 82-945 Jeep Grand Cherokee ZG 96-99 13 Land Rover Range Rover 95-026 Jeep Grand Cherokee WJ/WG 99-05 14 Toyota Landcruiser 82-897 Land Rover Discovery 91-02 15 Toyota Landcruiser 90-978 Mercedes Benz M-Class W163 98-05 16 Toyota Landcruiser 98-07

VEHICLE SAFETY RATINGS: 2009 UPDATE 31
Figure 4: Crashworthiness Ratings for Commercial Vans (with 90% confidence limits)Commercial - Vans
0.00%
2.00%
4.00%
6.00%
8.00%
10.00%
12.00%
14.00%
16.00%
18.00%
20.00%
1 2 3 4 5 6 7 8 9 10 11 12 13 14 15 16 17 18 19 20 21 22
Make and Model
Cra
shw
ort
hine
ss
Rat
ing
CrashworthinessBenchmark
Worse than benchmark + 1 incrementWorse than benchmark + 2 increments
Worse than benchmark + 3 increments
1 Daihatsu Handivan 82-90 12 Mercedes Benz Sprinter 98-042 Daihatsu Hi-Jet 82-90 13 Honda Acty 83-863 Daihatsu Handivan / Cuore 99-03 14 Holden / Suzuki Scurry / Carry 82-004 Ford Falcon Panel Van 82-95 15 Suzuki Carry 99-055 Ford Falcon Panel Van 96-99 16 Toyota Hiace/Liteace 82-866 Ford Transit 95-00 17 Toyota Hiace/Liteace 87-897 Ford Transit 01-07 18 Toyota Hiace/Liteace 90-958 Holden Shuttle / WFR Van 82-87 19 Toyota Hiace/Liteace 96-049 Kia Pregio 02-06 20 Toyoa Hiace 05-07
10 Mercedes Benz MB100 / MB140 99-04 21 Volkswagen Caravelle / Transporter 88-9411 Mercedes Benz Vito / Viano 99-07 22 Volkswagen Caravelle / Transporter 95-04
Figure 5: Crashworthiness Ratings for Commercial Utes (with 90% confidence limits)Commercial - Utes
0.00%
2.00%
4.00%
6.00%
8.00%
10.00%
12.00%
14.00%
1 2 3 4 5 6 7 8 9 10 11 12 13 14 15 16 17 18 19 20 21 22 23 24 25 26 27 28 29 30 31 32 33
Make and Model
Cra
shw
orth
ines
sR
atin
g
CrashworthinessBenchmark
Worse than benchmark + 1 incrementWorse than benchmark + 2 increments
Worse than benchmark + 3 increments
1 Ford / Nissan Falcon Ute / XFN Ute 82-95 18 Kia Ceres 92-002 Ford Falcon Ute 96-99 19 Ford / Mazda Courier / B-Series / Bounty 98-023 Ford Falcon Ute AU 00-02 20 Ford / Mazda Courier / Bravo / Bounty 03-064 Ford Falcon Ute BA/BF 03-07 21 Nissan 720 Ute 82-855 Ford Ford F-Series 82-92 22 Nissan Navara 86-916 Holden Commodore Ute VG/VP 90-93 23 Nissan Navara 92-967 Holden / Isuzu Rodeo / Pickup 82-85 24 Nissan Navara 97-058 Holden / Isuzu Rodeo / Pickup 86-88 25 Nissan Navara 05-079 Holden / Isuzu Rodeo / Pickup 89-95 26 Subaru Brumby 82-92
10 Holden Rodeo 96-98 27 Suzuki Mighty Boy 85-8811 Holden Rodeo 99-02 28 Toyota 4Runner/Hilux 82-8512 Holden WB Series 82-85 29 Toyota 4Runner/Hilux 86-8813 Holden Commodore Ute VR/VS 94-00 30 Toyota 4Runner/Hilux 89-9714 Holden Commodore VU Ute 00-02 31 Toyota Hilux 98-0215 Holden Commodore VY/VZ Ute 02-07 32 Toyota Hilux 03-0416 Holden Rodeo 03-07 33 Toyota Hilux 05-0717 Mitsubishi Triton MK 96-06

32 MONASH UNIVERSITY ACCIDENT RESEARCH CENTRE
Figure 6: Crashworthiness Ratings for Large cars (with 90% confidence limits)Large
0.00%
2.00%
4.00%
6.00%
8.00%
10.00%
12.00%
1 2 3 4 5 6 7 8 9 10 11 12 13 14 15 16 17 18 19 20 21 22 23 24 25 26 27 28 29 30 31 32 33 34 35 36 37 38 39 40 41 42 43 44 45 46 47 48 49 50 51 52 53 54 55 56 57 58 59 60 61 62 63 64
Make and Model
Cra
sh
wo
rth
ine
ssR
ati
ng
Crashw orthiness
Benchmark
Worse than benchmark + 1 increment
Worse than benchmark + 2 increments
Worse than benchmark + 3 increments
1 BMW 7 Series E23 82-88 23 Holden Commodore VY/VZ 02-07 44 Nissan 300ZX / Fairlady Z 90-952 BMW 7 Series E32 89-94 24 Holden Monaro 01-05 45 Nissan Maxima 90-943 BMW 7 Series E38 95-01 25 Holden Statesman/Caprice WK/WL 03-06 46 Nissan Maxima / Cefiro 95-994 Ford Falcon XE/XF 82-88 26 Holden Commodore VB-VL 82-88 47 Nissan Maxima 00-025 Ford Fairlane Z & LTD F 82-87 27 Holden Commodore VE 06-07 48 Nissan Maxima 06-076 Ford Falcon EA / Falcon EB Series I 88-Mar 92 28 Hyundai Sonata 89-97 49 Honda Legend 86-957 Ford Falcon EB Series II / Falcon ED Apr 92-94 29 Hyundai Grandeaur / XG 99-00 50 Rover 3500 82-878 Ford Fairlane N & LTD D 88-94 30 Mitsubishi Magna TM/TN/TP / Sigma / V3000 85-90 51 Saab 9-5 98-059 Ford Fairlane N & LTD D 95-98 31 Mitsubishi Magna TE/TF/TH/TJ / Verada KE/KF/KH/KJ / Diamante 96-03 52 Toyota Camry 98-02
10 Ford Fairlane & LTD AU 99-02 32 Mitsubishi Magna TR/TS / Verada KR/KS / V3000 / Diamante 91-96 53 Toyota Crown / Cressida / Mark II 82-8511 Ford Fairlane & LTD BA/BF 03-07 33 Mitsubishi Magna TL/TW / Verada KL/KW 03-05 54 Toyota Crown / Cressida / Mark II 86-8812 Ford Falcon EF/EL 94-98 34 Mitsubishi 380 05-07 55 Toyota Cressida / Mark II 89-9313 Ford Falcon AU 98-02 35 Jaguar XJ6 82-86 56 Toyota Supra 82-9014 Ford Taurus 96-98 36 Jaguar XJ6 87-94 57 Lexus ES300 / Windom 92-0115 Ford Falcon BA/BF 02-07 37 Mazda 929 / Luce 82-90 58 Lexus LS400 / Celsior 90-0016 Holden / Toyota Commodore VN/VP / Lexcen 89-93 38 Mazda 929 / Sentia / Efini MS-9 92-96 59 Toyota Avalon 00-0517 Holden Statesman/Caprice WB 82-85 39 Mercedes Benz E-Class W123 82-85 60 Toyota Camry 02-0618 Holden Stateman/Caprice VQ 90-93 40 Mercedes Benz E-Class W124 86-94 61 Toyota Camry 06-0719 Holden Stateman/Caprice VR/VS 94-98 41 Mercedes Benz E-Class W210 96-02 62 Volvo 850/S70/V70/C70 92-0520 Holden / Toyota Commodore VR/VS / Lexcen 93-97 42 Mercedes Benz S-Class W126 82-92 63 Volvo 700/900 Series 84-9221 Holden Commodore VT/VX 97-02 43 Nissan Skyline 83-88 64 Volvo 960/S90/V90 90-9822 Holden Statesman/Caprice WH 99-03

VEHICLE SAFETY RATINGS: 2009 UPDATE 33
Figure 7: Crashworthiness Ratings for Medium cars (with 90% confidence limits)Medium
0.00%
2.00%
4.00%
6.00%
8.00%
10.00%
12.00%
14.00%
1 2 3 4 5 6 7 8 9 10 11 12 13 14 15 16 17 18 19 20 21 22 23 24 25 26 27 28 29 30 31 32 33 34 35 36 37 38 39 40 41 42 43 44 45 46 47 48 49 50 51 52 53 54 55 56 57 58 59 60 61 62 63 64 65 66 67 68 69 70 71 72 73 74 75 76 77 78 79 80 81 82 83
Make and Model
Cra
shw
orth
ines
sR
atin
g
Crashw orthiness
Benchmark
Worse than benchmark + 1 increment
Worse than benchmark + 2 increments
Worse than benchmark + 3 increments
1 Alfa Romeo 156 99-06 22 Hyundai Sonata 98-01 43 Nissan Bluebird 82-86 64 Saab 900 Series 82-922 Audi A4 95-01 23 Hyundai Sonata EF 02-05 44 Nissan 280ZX 82-84 65 Saab 900/9-3 94-023 Audi A4 01-07 24 Mitsubishi Sigma / Galant / Sapporo / Lambda 82-84 45 Nissan Bluebird 93-97 66 Saab 9000 86-974 BMW Z3 E36 97-03 25 Mitsubishi Starion 82-87 46 Nissan 200SX / Silvia 94-02 67 Subaru 1800 / Leone / Omega / 4WD Wagon 82-935 BMW 3 Series E90 05-07 26 Mitsubishi Galant 95-96 47 Nissan 350Z 03-07 68 Subaru Liberty / Legacy 89-936 BMW 3 Series E30 82-91 27 Ford / Mazda Telstar / 626 / MX6 / Capella 83-86 48 Honda Accord Euro 03-07 69 Subaru Liberty / Legacy / Outback 94-987 BMW 3 Series E36 92-98 28 Ford / Mazda Telstar / 626 / MX6 / Capella 88-91 49 Honda Accord 03-07 70 Subaru Liberty / Legacy / Outback 99-038 BMW 3 Series E46 99-06 29 Ford / Mazda Telstar / 626 / MX6 / Capella / Cronos 92-97 50 Honda Accord 82-85 71 Subaru Liberty / Legacy / Outback 03-079 BMW 5 Series E28 82-88 30 Mazda 626 98-02 51 Honda Accord 86-90 72 Toyota Corona 82-88
10 BMW 5 Series E34 89-95 31 Mazda RX7 82-85 52 Honda Accord 91-93 73 Toyota Camry 83-8611 BMW 5 Series E39 96-03 32 Mazda RX7 86-91 53 Honda Accord 94-98 74 Holden / Toyota Apollo JK/JL / Camry / Vista 88-9212 Chrysler PT Cruiser 00-07 33 Mazda Eunos 500 93-99 54 Honda Accord 99-02 75 Holden / Toyota Apollo JM/JP / Camry / Sceptor 93-9713 Daewoo Espero 95-97 34 Mazda Eunos 800 94-00 55 Honda Prelude 82-82 76 Toyota Celica 81-8514 Daewoo Leganza 97-02 35 Mazda 6 02-07 56 Honda Prelude 83-91 77 Toyota Celica 86-8915 Ford Mondeo 95-01 36 Mercedes Benz C-Class W201 87-93 57 Honda Prelude 92-96 78 Toyota Celica 90-9316 Ford Probe 94-98 37 Mercedes Benz C-Class W202 95-00 58 Honda Prelude 97-02 79 Toyota Celica 94-9917 Ford Cougar 99-03 38 Mercedes Benz CLK C208 97-03 59 Peugeot 405 89-97 80 Toyota Celica 00-0518 Holden Calibra 94-97 39 Mercedes Benz SLK R170 97-04 60 Peugeot 505 82-93 81 Lexus IS200 / IS300 99-0419 Holden Camira 82-89 40 Mercedes Benz C-Class W203 00-07 61 Peugeot 406 96-04 82 Volvo 200 Series 82-9320 Holden Vectra 97-03 41 Nissan Pintara 86-88 62 Porsche 944 82-91 83 Volkswagen Passat 98-0621 Holden Vectra ZC 03-05 42 Nissan / Ford Pintara / Corsair / Bluebird 89-92 63 Renault Feugo 82-87

34 MONASH UNIVERSITY ACCIDENT RESEARCH CENTRE
Figure 8: Crashworthiness Ratings for Small cars (with 90% confidence limits)Small
0.00%
2.00%
4.00%
6.00%
8.00%
10.00%
12.00%
14.00%
1 2 3 4 5 6 7 8 9 10 11 12 13 14 15 16 17 18 19 20 21 22 23 24 25 26 27 28 29 30 31 32 33 34 35 36 37 38 39 40 41 42 43 44 45 46 47 48 49 50 51 52 53 54 55 56 57 58 59 60 61 62 63 64 65 66 67 68 69 70 71 72 73 74 75 76 77 78 79 80 81 82 83 84 85 86 87 88 89 90 91 92 93 94 95 96 97 98 99 100
101
102
103
104
105
106
107
Make and Model
Cra
shw
orth
ines
sR
atin
g
Crashworthiness
Benchmark
Worse than benchmark + 1 increment
Worse than benchmark + 2 increments
Worse than benchmark + 3 increments
1 Alfa Romeo 33 83-92 28 Hyundai Excel 86-90 55 Mercedes Benz A-Class W168 98-04 82 Renault 19 91-962 Alfa Romeo 75 86-92 29 Hyundai Excel 90-94 56 Holden / Nissan Astra / Pulsar / Langley 84-86 83 Renault Scenic 01-043 Alfa Romeo GTV 82-84 30 Hyundai Excel / Accent 95-00 57 Holden / Nissan Astra / Pulsar / Vector / Sentra 88-90 84 Rover Quintet 82-864 Alfa Romeo Sprint 82-88 31 Hyundai Elantra 00-07 58 Nissan Pulsar / Vector / Sentra 92-95 85 MG MGF / MG TF 99-055 Alfa Romeo Alfasud 82-84 32 Hyundai S Coupe 90-96 59 Nissan Pulsar / Vector / Sentra 96-99 86 Subaru Impreza 93-006 Audi A3/S3 97-04 33 Hyundai Lantra 91-95 60 Nissan Stanza 82-83 87 Subaru Impreza 01-077 Mini Mini Cooper 02-07 34 Hyundai Lantra 96-00 61 Nissan Gazelle / Silvia 84-86 88 Suzuki Baleno / Cultus Crescent 95-028 Chrysler Neon 96-99 35 Hyundai Coupe 96-00 62 Nissan Exa 83-86 89 Suzuki Liana 01-079 Chrysler Neon 00-02 36 Hyundai Accent 00-06 63 Nissan Exa 87-91 90 Toyota Corolla 82-8410 Daihatsu Applause 89-99 37 Mitsubishi Lancer / Mirage CA 89-90 64 Nissan NX/NX-R 91-96 91 Toyota Corolla 86-8811 Daewoo 1.5i 94-95 38 Mitsubishi Lancer / Mirage CB 91-92 65 Nissan Pulsar 00-05 92 Toyota / Holden Corolla / Nova 89-9312 Daewoo Cielo 95-97 39 Mitsubishi Lancer / Mirage CC 93-95 66 Honda Civic 82-83 93 Toyota / Holden Corolla / Nova 94-9713 Daewoo Nubira 97-03 40 Mitsubishi Lancer / Mirage CE 96-03 67 Honda Civic / Ballade / Shuttle 84-87 94 Toyota Corolla / Allex 98-0114 Daewoo Lanos 97-03 41 Mitsubishi Cordia 83-87 68 Honda Civic / Shuttle 88-91 95 Toyota Corolla 02-0715 Daewoo Lacetti 03-04 42 Mitsubishi Lancer CH / CJ 03-07 69 Honda Civic 92-95 96 Toyota Tercel 83-8816 Ford Laser 91-94 43 Kia Rio 00-05 70 Honda Civic 96-00 97 Toyota MR2 87-9017 Ford Laser 95-97 44 Kia Spectra 01-04 71 Honda CRX 87-91 98 Toyota MR2 91-0018 Ford Capri 89-94 45 Kia Cerato 04-07 72 Honda CRX 92-98 99 Toyota Paseo / Cynos 91-9919 Ford Focus LR 02-05 46 Kia Rio JB 05-07 73 Honda Civic 01-05 100 Toyota Corolla 4WD Wagon 92-9620 Ford Focus LS / LT 05-07 47 Ford / Mazda Laser / 323 / Familia 82-88 74 Honda Integra 86-88 101 Volvo 300 Series 84-8821 Fiat Regata 84-88 48 Mazda 323 / Familia / Lantis 90-93 75 Honda Integra 90-92 102 Volvo S40/V40 97-0422 Holden Gemini 82-84 49 Mazda 323 / Familia / Lantis 95-98 76 Honda Integra 93-01 103 Volkswagen Golf 82-9423 Holden Gemini RB 86-87 50 Ford / Mazda Laser / 323 99-03 77 Honda Integra 02-06 104 Volkswagen Golf 95-9824 Holden Astra TR 96-98 51 Mazda MX5 / Eunos Roadster 89-97 78 Honda Concerto 89-93 105 Volkswagen Golf / Bora 99-0425 Holden Astra TS 98-06 52 Mazda MX5 / Eunos Roadster 98-05 79 Peugeot 306 94-01 106 Volkswagen New Beetle 00-0726 Holden Astra AH 04-07 53 Mazda Eunos 30X / Presso / MX-3 / Autozam AZ-3 90-97 80 Peugeot 307 01-07 107 Volkswagen Golf / Jetta 04-0727 Holden Viva JF 05-07 54 Mazda 3 / Axela 03-07 81 Proton Wira 95-96
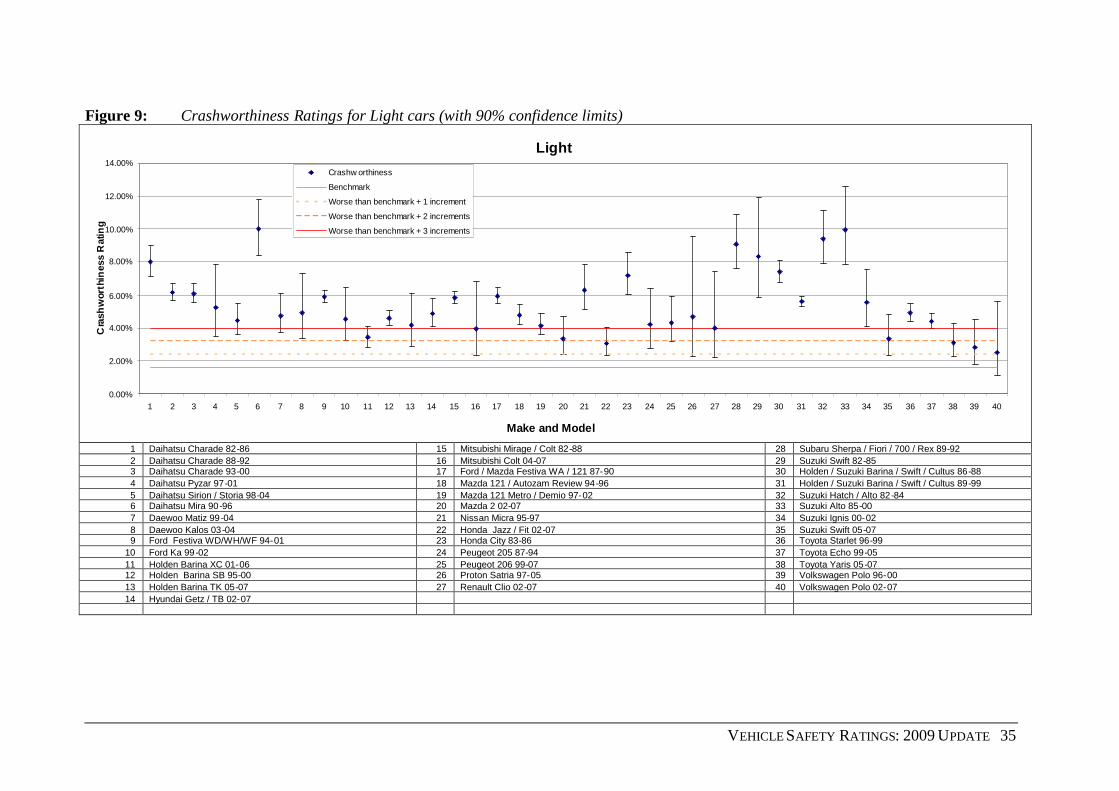
VEHICLE SAFETY RATINGS: 2009 UPDATE 35
Figure 9: Crashworthiness Ratings for Light cars (with 90% confidence limits)
Light
0.00%
2.00%
4.00%
6.00%
8.00%
10.00%
12.00%
14.00%
1 2 3 4 5 6 7 8 9 10 11 12 13 14 15 16 17 18 19 20 21 22 23 24 25 26 27 28 29 30 31 32 33 34 35 36 37 38 39 40
Make and Model
Cra
shw
orth
ines
sR
atin
g
Crashw orthiness
Benchmark
Worse than benchmark + 1 increment
Worse than benchmark + 2 increments
Worse than benchmark + 3 increments
1 Daihatsu Charade 82-86 15 Mitsubishi Mirage / Colt 82-88 28 Subaru Sherpa / Fiori / 700 / Rex 89-922 Daihatsu Charade 88-92 16 Mitsubishi Colt 04-07 29 Suzuki Swift 82-853 Daihatsu Charade 93-00 17 Ford / Mazda Festiva WA / 121 87-90 30 Holden / Suzuki Barina / Swift / Cultus 86-884 Daihatsu Pyzar 97-01 18 Mazda 121 / Autozam Review 94-96 31 Holden / Suzuki Barina / Swift / Cultus 89-995 Daihatsu Sirion / Storia 98-04 19 Mazda 121 Metro / Demio 97-02 32 Suzuki Hatch / Alto 82-846 Daihatsu Mira 90-96 20 Mazda 2 02-07 33 Suzuki Alto 85-007 Daewoo Matiz 99-04 21 Nissan Micra 95-97 34 Suzuki Ignis 00-028 Daewoo Kalos 03-04 22 Honda Jazz / Fit 02-07 35 Suzuki Swift 05-079 Ford Festiva WD/WH/WF 94-01 23 Honda City 83-86 36 Toyota Starlet 96-99
10 Ford Ka 99-02 24 Peugeot 205 87-94 37 Toyota Echo 99-0511 Holden Barina XC 01-06 25 Peugeot 206 99-07 38 Toyota Yaris 05-0712 Holden Barina SB 95-00 26 Proton Satria 97-05 39 Volkswagen Polo 96-0013 Holden Barina TK 05-07 27 Renault Clio 02-07 40 Volkswagen Polo 02-0714 Hyundai Getz / TB 02-07

36 MONASH UNIVERSITY ACCIDENT RESEARCH CENTRE
Figure 10: Crashworthiness Ratings for People Movers (with 90% confidence limits)People Mover
0.00%
1.00%
2.00%
3.00%
4.00%
5.00%
6.00%
7.00%
8.00%
9.00%
1 2 3 4 5 6 7 8 9 10 11 12 13 14 15 16 17 18
Make and Model
Cra
shw
orth
ines
sR
atin
g
Crashworthiness
BenchmarkWorse than benchmark + 1 increment
Worse than benchmark + 2 increments
Worse than benchmark + 3 increments
1 Chrysler Voyager 97-01 10 Kia Carnival 99-062 Holden Zafira TT 01-05 11 Mazda MPV 94-993 Mitsubishi Nimbus / Chariot / Spacewagon 85-91 12 Nissan Prairie 84-864 Mitsubishi Nimbus / Chariot 92-98 13 Nissan Serena 92-955 Mitsubishi Nimbus 99-03 14 Honda Odyssey 95-006 Mitsubishi Starwagon / L300 83-86 15 Toyota Tarago 83-897 Mitsubishi Starwagon / Delica Starwagon 87-93 16 Toyota Tarago / Previa / Estima 91-998 Mitsubishi Starwagon / Delica Spacegear 95-98 17 Toyota Tarago / Previa / Estima 00-069 Mitsubishi Starwagon / Delica Spacegear 98-03 18 Toyota Spacia 93-00
5.2 Aggressivity
5.2.1 Aggressivity towards Other Car Drivers and Unprotected Road Users
Using the methods described in Section 4.2, logistic regression models of the injury risk andinjury severity of the focus road user were built separately as functions of both vehicle model andmarket group of the focus vehicle colliding with the other road user whose injury outcome isbeing modelled. Variations in the other factors listed in Section 4.2, including other road usertype, were adjusted in the model by including them as predictors in the logistic regressionmodels along with the focus vehicle model or market group. The aggressivity injury risk measureis based only on the injury outcome to drivers of other vehicles.
The logistic regression models of aggressivity injury risk showed the following non-vehiclefactors and their interactions to be statistically significant predictors of injury risk (factors ageand sex refer to focus driver whose injury outcome is being modelled). The average aggressivityinjury risk in the data was 15.16%.

VEHICLE SAFETY RATINGS: 2009 UPDATE 37
Base effect terms First order interactions Second order interactionSex Sex*Year Sex*State*YearSpeedzone Age*Speedzone Age*Sex*StateAge Age*SexState Age*YearYear Speedzone*Year
Speedzone*StateAge*StateState*YearSex*StateSex*Speedzone
The logistic regression models of aggressivity injury severity users showed the following non-vehicle factors and their interactions to be statistically significant predictors of injury severity.These factors were included in the logistic model (factors age and sex refer to the age and sex ofthe other driver or unprotected road user). The average aggressivity injury severity in the datawas 22.48%.
Base effect terms First order interactions Second order interactionSex Sex*State Age*Sex*StateSpeedzone Sex*Crashtype Speedzone*State*CrashtypeAge Age*Sex Speedzone*State*YearState Age*Crashtype Age*State*CrashtypeYear Year*Crashtype Speedzone*Year*CrashtypeCrashtype Speedzone*State State*Year*Crashtype
Age*State Sex*State*CrashtypeState*CrashtypeState*YearSpeedzone*YearSpeedzone*CrashtypeSex*Year
Final estimates of vehicle aggressivity towards other road users were obtained by multiplying theestimated injury risk and injury severity components for each vehicle. Confidence limits on eachof the estimated aggressivity ratings were calculated. The average aggressivity rating in the data,used for comparisons against aggressivity of individual vehicle models was 3.56%.
Aggressivity ratings were obtained for 397 different vehicle models that satisfied the inclusioncriteria for analysis. The estimated aggressivity ratings and their injury risk and injury severitycomponents for individual vehicle models are given in Appendix 5 along with (95% confidencelimits on the estimated aggressivity ratings.
Table 5 summarises the estimated injury risk, injury severity and aggressivity ratings by the 10broad market groups along with the estimated 95% confidence limits on the aggressivity ratings.The estimated aggressivity rating is the expected number of road users killed or seriously injuredper 100 involved in two-car tow-away collisions where their vehicle impacts with one of thedesignated models or market groups. Table 5 shows large four wheel drive vehicles to be themost aggressive towards drivers of other vehicles, with an average of 5.01 unprotected road users
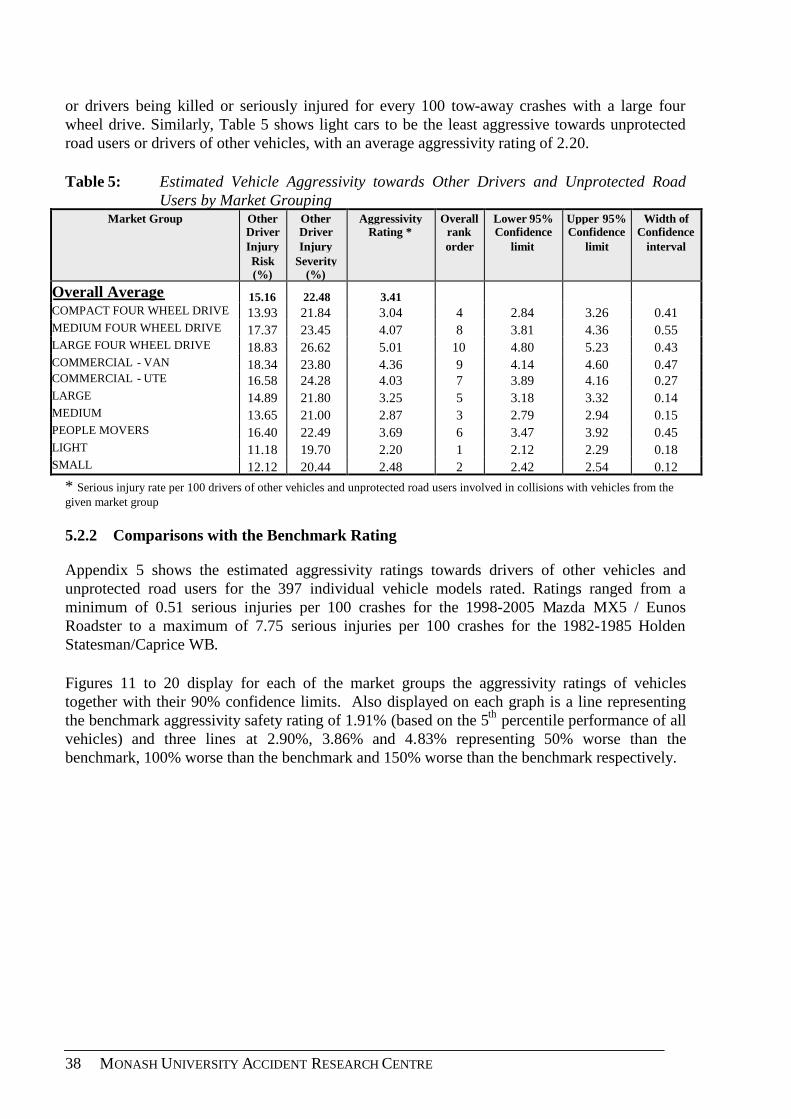
38 MONASH UNIVERSITY ACCIDENT RESEARCH CENTRE
or drivers being killed or seriously injured for every 100 tow-away crashes with a large fourwheel drive. Similarly, Table 5 shows light cars to be the least aggressive towards unprotectedroad users or drivers of other vehicles, with an average aggressivity rating of 2.20.
Table 5: Estimated Vehicle Aggressivity towards Other Drivers and Unprotected RoadUsers by Market Grouping
Market Group OtherDriverInjuryRisk(%)
OtherDriverInjury
Severity(%)
AggressivityRating *
Overallrankorder
Lower 95%Confidence
limit
Upper 95%Confidence
limit
Width ofConfidence
interval
Overall Average 15.16 22.48 3.41COMPACT FOUR WHEEL DRIVE 13.93 21.84 3.04 4 2.84 3.26 0.41MEDIUM FOUR WHEEL DRIVE 17.37 23.45 4.07 8 3.81 4.36 0.55LARGE FOUR WHEEL DRIVE 18.83 26.62 5.01 10 4.80 5.23 0.43COMMERCIAL - VAN 18.34 23.80 4.36 9 4.14 4.60 0.47COMMERCIAL - UTE 16.58 24.28 4.03 7 3.89 4.16 0.27LARGE 14.89 21.80 3.25 5 3.18 3.32 0.14MEDIUM 13.65 21.00 2.87 3 2.79 2.94 0.15PEOPLE MOVERS 16.40 22.49 3.69 6 3.47 3.92 0.45LIGHT 11.18 19.70 2.20 1 2.12 2.29 0.18SMALL 12.12 20.44 2.48 2 2.42 2.54 0.12
* Serious injury rate per 100 drivers of other vehicles and unprotected road users involved in collisions with vehicles from thegiven market group
5.2.2 Comparisons with the Benchmark Rating
Appendix 5 shows the estimated aggressivity ratings towards drivers of other vehicles andunprotected road users for the 397 individual vehicle models rated. Ratings ranged from aminimum of 0.51 serious injuries per 100 crashes for the 1998-2005 Mazda MX5 / EunosRoadster to a maximum of 7.75 serious injuries per 100 crashes for the 1982-1985 HoldenStatesman/Caprice WB.
Figures 11 to 20 display for each of the market groups the aggressivity ratings of vehiclestogether with their 90% confidence limits. Also displayed on each graph is a line representingthe benchmark aggressivity safety rating of 1.91% (based on the 5th percentile performance of allvehicles) and three lines at 2.90%, 3.86% and 4.83% representing 50% worse than thebenchmark, 100% worse than the benchmark and 150% worse than the benchmark respectively.

VEHICLE SAFETY RATINGS: 2009 UPDATE 39
Figure 11: Aggressivity Ratings for Compact Four Wheel Drive vehicles (with 90%confidence limits)
Compact 4WD
0.00%
1.00%
2.00%
3.00%
4.00%
5.00%
6.00%
7.00%
8.00%
9.00%
10.00%
1 2 3 4 5 6 7 8 9 10 11 12 13 14 15 16 17 18 19 20
Make and Model
Agg
ress
ivity
Rat
ing
AggressivityBenchmarkWorse than benchmark + 1 increment
Worse than benchmark + 2 incrementsWorse than benchmark + 3 increments
1 Daihatsu Feroza / Rocky 89-97 11 Honda CR-V 02-072 Daihatsu Rocky / Rugger 85-98 12 Honda HR-V 99-023 Daihatsu Terios 97-05 13 Subaru Forester 97-024 Holden Cruze 02-06 14 Subaru Forester 02-075 Mitsubishi Outlander 03-06 15 Suzuki Vitara / Escudo 88-986 Kia Sportage 98-03 16 Suzuki Grand Vitara 99-057 Ford / Mazda Escape / Tribute 01-06 17 Holden / Suzuki Drover / Sierra / Samurai / SJ410 / SJ413 82-998 Nissan X-Trail 01-07 18 Suzuki Jimny 98-079 Lada Niva 84-99 19 Toyota RAV4 94-00
10 Honda CR-V 97-01 20 Toyota RAV4 01-06

40 MONASH UNIVERSITY ACCIDENT RESEARCH CENTRE
Figure 12: Aggressivity Ratings for Medium Four Wheel Drive vehicles (with 90%confidence limits)
Medium 4WD
0.00%
1.00%
2.00%
3.00%
4.00%
5.00%
6.00%
7.00%
8.00%
9.00%
1 2 3 4 5 6 7 8 9 10 11 12 13 14 15 16 17 18 19 20
Make and Model
Ag
gres
sivi
tyR
atin
g
AggressivityBenchmarkWorse than benchmark + 1 incrementWorse than benchmark + 2 incrementsWorse than benchmark + 3 increments
1 Daewoo / Ssangong Musso 98-02 11 Mitsubishi Challenger 98-062 Ford Territory SX/SY 04-07 12 Jeep Cherokee XJ 96-003 Holden / Isuzu Jackaroo / Bighorn 82-91 13 Jeep Wrangler 96-044 Holden / Isuzu Jackaroo / Bighorn 92-97 14 Jeep Cherokee KJ 01-075 Holden / Isuzu Jackaroo / Bighorn 98-02 15 Land Rover Defender 92-076 Holden Frontera / Mu 95-03 16 Nissan Pathfinder / Terrano 88-947 Hyundai Santa Fe 00-06 17 Nissan Pathfinder / Terrano / Regulus 95-058 Mitsubishi Pajero 82-90 18 Toyota Kluger 03-079 Mitsubishi Pajero 92-99 19 Toyota Landcruiser Prado 96-03
10 Mitsubishi Pajero NM / NP / NS 00-07 20 Toyota Landcruiser Prado 03-07

VEHICLE SAFETY RATINGS: 2009 UPDATE 41
Figure 13: Aggressivity Ratings for Large Four Wheel Drive vehicles (with 90% confidencelimits)
Large 4WD
0.00%
2.00%
4.00%
6.00%
8.00%
10.00%
12.00%
1 2 3 4 5 6 7 8 9 10 11 12 13 14 15
Make and Model
Aggr
essi
vity
Rat
ing
Aggressivity
Benchmark
Worse than benchmark + 1 increment
Worse than benchmark + 2 increments
Worse than benchmark + 3 increments
1 BMW X5 01-07 9 Nissan / Ford Patrol / Maverick / Safari 88-972 Ford Bronco 82-87 10 Nissan Patrol / Safari 98-073 Ford Explorer 00-01 11 Land Rover Range Rover 82-944 Jeep Grand Cherokee ZG 96-99 12 Land Rover Range Rover 95-025 Jeep Grand Cherokee WJ/WG 99-05 13 Toyota Landcruiser 82-896 Land Rover Discovery 91-02 14 Toyota Landcruiser 90-977 Mercedes Benz M-Class W163 98-05 15 Toyota Landcruiser 98-078 Nissan Patrol / Safari 82-87

42 MONASH UNIVERSITY ACCIDENT RESEARCH CENTRE
Figure 14: Aggressivity Ratings for Commercial Vans (with 90% confidence limits)Commercial - Vans
0.00%
1.00%
2.00%
3.00%
4.00%
5.00%
6.00%
7.00%
8.00%
9.00%
1 2 3 4 5 6 7 8 9 10 11 12 13 14 15 16 17 18 19
Make and Model
Ag
gre
ssi
vity
Rat
ing
Aggressivity
Benchmark
Worse than benchmark + 1 increment
Worse than benchmark + 2 increments
Worse than benchmark + 3 increments
1 Daihatsu Handivan 82-90 11 Honda Acty 83-862 Ford Falcon Panel Van 82-95 12 Holden / Suzuki Scurry / Carry 82-003 Ford Falcon Panel Van 96-99 13 Toyota Hiace/Liteace 82-864 Ford Transit 95-00 14 Toyota Hiace/Liteace 87-895 Ford Transit 01-07 15 Toyota Hiace/Liteace 90-956 Holden Shuttle / WFR Van 82-87 16 Toyota Hiace/Liteace 96-047 Kia Pregio 02-06 17 Toyoa Hiace 05-078 Mercedes Benz MB100 / MB140 99-04 18 Volkswagen Caravelle / Transporter 88-949 Mercedes Benz Vito / Viano 99-07 19 Volkswagen Caravelle / Transporter 95-04
10 Mercedes Benz Sprinter 98-04

VEHICLE SAFETY RATINGS: 2009 UPDATE 43
Figure 15: Aggressivity Ratings for Commercial Utes (with 90% confidence limits)
Commercial - Utes
0.00%
2.00%
4.00%
6.00%
8.00%
10.00%
12.00%
1 2 3 4 5 6 7 8 9 10 11 12 13 14 15 16 17 18 19 20 21 22 23 24 25 26 27 28 29 30 31 32 33
Make and Model
Ag
gre
ssi
vit
yR
atin
g
Aggressivity
Benchmark
Worse than benchmark + 1 increment
Worse than benchmark + 2 increments
Worse than benchmark + 3 increments
1 Ford / Nissan Falcon Ute / XFN Ute 82-95 18 Mitsubishi Triton MK 96-062 Ford Falcon Ute 96-99 19 Kia Ceres 92-003 Ford Falcon Ute AU 00-02 20 Ford / Mazda Courier / B-Series / Bounty 98-024 Ford Falcon Ute BA/BF 03-07 21 Ford / Mazda Courier / Bravo / Bounty 03-065 Ford Ford F-Series 82-92 22 Nissan 720 Ute 82-856 Ford F-Series 01-06 23 Nissan Navara 86-917 Holden Commodore Ute VG/VP 90-93 24 Nissan Navara 92-968 Holden / Isuzu Rodeo / Pickup 82-85 25 Nissan Navara 97-059 Holden / Isuzu Rodeo / Pickup 86-88 26 Subaru Brumby 82-92
10 Holden / Isuzu Rodeo / Pickup 89-95 27 Suzuki Mighty Boy 85-8811 Holden Rodeo 96-98 28 Toyota 4Runner/Hilux 82-8512 Holden Rodeo 99-02 29 Toyota 4Runner/Hilux 86-8813 Holden WB Series 82-85 30 Toyota 4Runner/Hilux 89-9714 Holden Commodore Ute VR/VS 94-00 31 Toyota Hilux 98-0215 Holden Commodore VU Ute 00-02 32 Toyota Hilux 03-0416 Holden Commodore VY/VZ Ute 02-07 33 Toyota Hilux 05-0717 Holden Rodeo 03-07
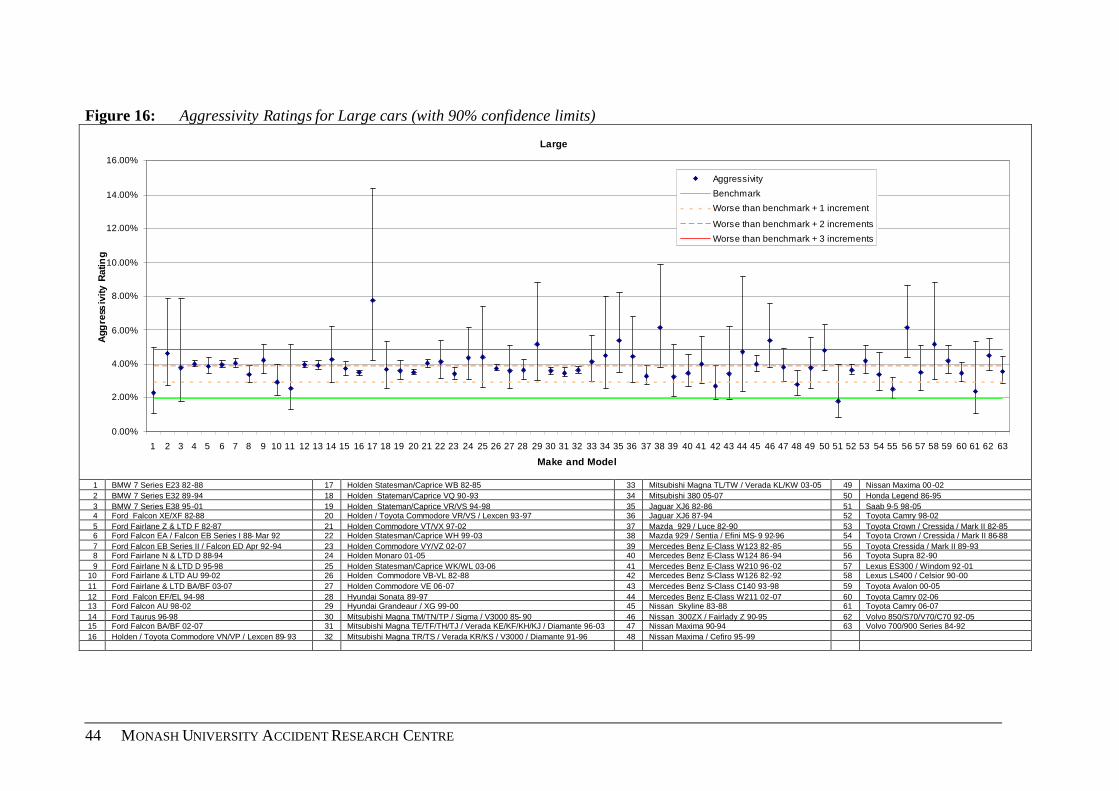
44 MONASH UNIVERSITY ACCIDENT RESEARCH CENTRE
Figure 16: Aggressivity Ratings for Large cars (with 90% confidence limits)
Large
0.00%
2.00%
4.00%
6.00%
8.00%
10.00%
12.00%
14.00%
16.00%
1 2 3 4 5 6 7 8 9 10 11 12 13 14 15 16 17 18 19 20 21 22 23 24 25 26 27 28 29 30 31 32 33 34 35 36 37 38 39 40 41 42 43 44 45 46 47 48 49 50 51 52 53 54 55 56 57 58 59 60 61 62 63
Make and Model
Agg
ress
ivity
Rat
ing
Aggressivity
Benchmark
Worse than benchmark + 1 increment
Worse than benchmark + 2 increments
Worse than benchmark + 3 increments
1 BMW 7 Series E23 82-88 17 Holden Statesman/Caprice WB 82-85 33 Mitsubishi Magna TL/TW / Verada KL/KW 03-05 49 Nissan Maxima 00-022 BMW 7 Series E32 89-94 18 Holden Stateman/Caprice VQ 90-93 34 Mitsubishi 380 05-07 50 Honda Legend 86-953 BMW 7 Series E38 95-01 19 Holden Stateman/Caprice VR/VS 94-98 35 Jaguar XJ6 82-86 51 Saab 9-5 98-054 Ford Falcon XE/XF 82-88 20 Holden / Toyota Commodore VR/VS / Lexcen 93-97 36 Jaguar XJ6 87-94 52 Toyota Camry 98-025 Ford Fairlane Z & LTD F 82-87 21 Holden Commodore VT/VX 97-02 37 Mazda 929 / Luce 82-90 53 Toyota Crown / Cressida / Mark II 82-856 Ford Falcon EA / Falcon EB Series I 88- Mar 92 22 Holden Statesman/Caprice WH 99-03 38 Mazda 929 / Sentia / Efini MS- 9 92-96 54 Toyota Crown / Cressida / Mark II 86-887 Ford Falcon EB Series II / Falcon ED Apr 92-94 23 Holden Commodore VY/VZ 02-07 39 Mercedes Benz E-Class W123 82-85 55 Toyota Cressida / Mark II 89-938 Ford Fairlane N & LTD D 88-94 24 Holden Monaro 01-05 40 Mercedes Benz E-Class W124 86-94 56 Toyota Supra 82-909 Ford Fairlane N & LTD D 95-98 25 Holden Statesman/Caprice WK/WL 03-06 41 Mercedes Benz E-Class W210 96-02 57 Lexus ES300 / Windom 92-01
10 Ford Fairlane & LTD AU 99-02 26 Holden Commodore VB-VL 82-88 42 Mercedes Benz S-Class W126 82-92 58 Lexus LS400 / Celsior 90-0011 Ford Fairlane & LTD BA/BF 03-07 27 Holden Commodore VE 06-07 43 Mercedes Benz S-Class C140 93-98 59 Toyota Avalon 00-0512 Ford Falcon EF/EL 94-98 28 Hyundai Sonata 89-97 44 Mercedes Benz E-Class W211 02-07 60 Toyota Camry 02-0613 Ford Falcon AU 98-02 29 Hyundai Grandeaur / XG 99-00 45 Nissan Skyline 83-88 61 Toyota Camry 06-0714 Ford Taurus 96-98 30 Mitsubishi Magna TM/TN/TP / Sigma / V3000 85- 90 46 Nissan 300ZX / Fairlady Z 90-95 62 Volvo 850/S70/V70/C70 92-0515 Ford Falcon BA/BF 02-07 31 Mitsubishi Magna TE/TF/TH/TJ / Verada KE/KF/KH/KJ / Diamante 96-03 47 Nissan Maxima 90-94 63 Volvo 700/900 Series 84-9216 Holden / Toyota Commodore VN/VP / Lexcen 89- 93 32 Mitsubishi Magna TR/TS / Verada KR/KS / V3000 / Diamante 91-96 48 Nissan Maxima / Cefiro 95-99
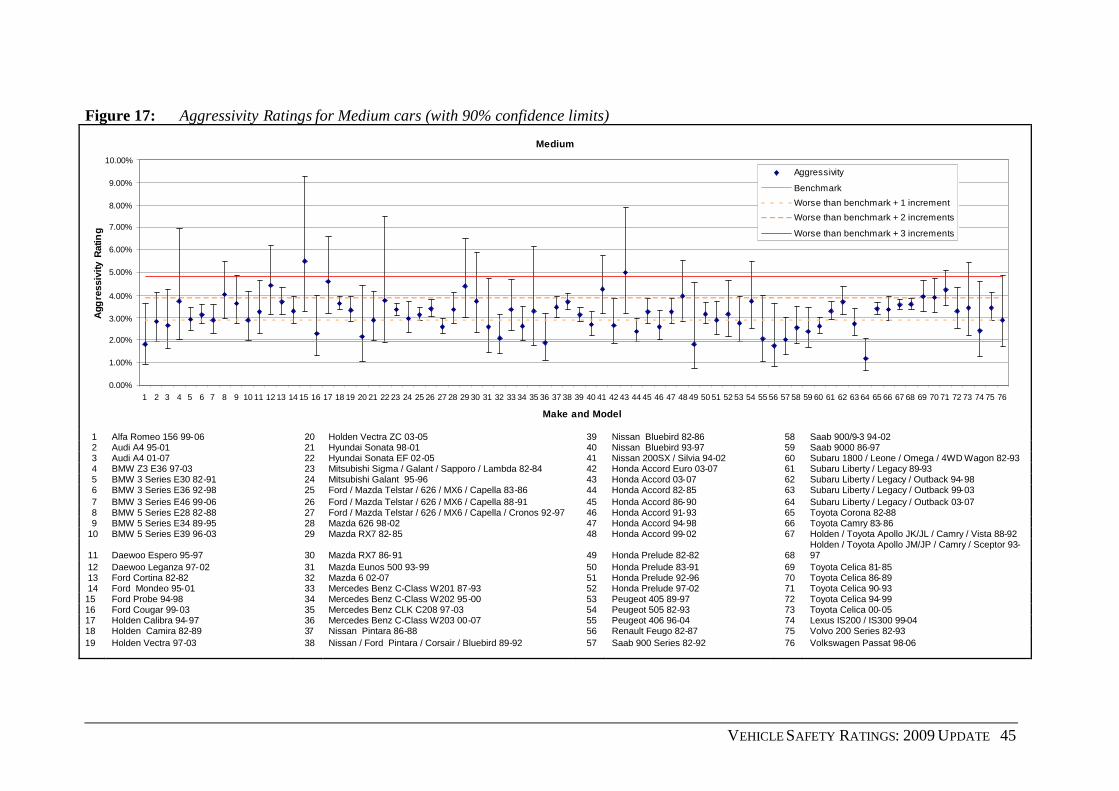
VEHICLE SAFETY RATINGS: 2009 UPDATE 45
Figure 17: Aggressivity Ratings for Medium cars (with 90% confidence limits)
Medium
0.00%
1.00%
2.00%
3.00%
4.00%
5.00%
6.00%
7.00%
8.00%
9.00%
10.00%
1 2 3 4 5 6 7 8 9 10 11 12 13 14 15 16 17 18 19 20 21 22 23 24 25 26 27 28 29 30 31 32 33 34 35 36 37 38 39 40 41 42 43 44 45 46 47 48 49 50 51 52 53 54 55 56 57 58 59 60 61 62 63 64 65 66 67 68 69 70 71 72 73 74 75 76
Make and Model
Agg
ress
ivity
Rat
ing
Aggressivity
Benchmark
Worse than benchmark + 1 increment
Worse than benchmark + 2 increments
Worse than benchmark + 3 increments
1 Alfa Romeo 156 99-06 20 Holden Vectra ZC 03-05 39 Nissan Bluebird 82-86 58 Saab 900/9-3 94-022 Audi A4 95-01 21 Hyundai Sonata 98-01 40 Nissan Bluebird 93-97 59 Saab 9000 86-973 Audi A4 01-07 22 Hyundai Sonata EF 02-05 41 Nissan 200SX / Silvia 94-02 60 Subaru 1800 / Leone / Omega / 4WD Wagon 82-934 BMW Z3 E36 97-03 23 Mitsubishi Sigma / Galant / Sapporo / Lambda 82-84 42 Honda Accord Euro 03-07 61 Subaru Liberty / Legacy 89-935 BMW 3 Series E30 82-91 24 Mitsubishi Galant 95-96 43 Honda Accord 03-07 62 Subaru Liberty / Legacy / Outback 94-986 BMW 3 Series E36 92-98 25 Ford / Mazda Telstar / 626 / MX6 / Capella 83-86 44 Honda Accord 82-85 63 Subaru Liberty / Legacy / Outback 99-037 BMW 3 Series E46 99-06 26 Ford / Mazda Telstar / 626 / MX6 / Capella 88-91 45 Honda Accord 86-90 64 Subaru Liberty / Legacy / Outback 03-078 BMW 5 Series E28 82-88 27 Ford / Mazda Telstar / 626 / MX6 / Capella / Cronos 92-97 46 Honda Accord 91-93 65 Toyota Corona 82-889 BMW 5 Series E34 89-95 28 Mazda 626 98-02 47 Honda Accord 94-98 66 Toyota Camry 83-86
10 BMW 5 Series E39 96-03 29 Mazda RX7 82-85 48 Honda Accord 99-02 67 Holden / Toyota Apollo JK/JL / Camry / Vista 88-92
11 Daewoo Espero 95-97 30 Mazda RX7 86-91 49 Honda Prelude 82-82 68Holden / Toyota Apollo JM/JP / Camry / Sceptor 93-97
12 Daewoo Leganza 97-02 31 Mazda Eunos 500 93-99 50 Honda Prelude 83-91 69 Toyota Celica 81-8513 Ford Cortina 82-82 32 Mazda 6 02-07 51 Honda Prelude 92-96 70 Toyota Celica 86-8914 Ford Mondeo 95-01 33 Mercedes Benz C-Class W201 87-93 52 Honda Prelude 97-02 71 Toyota Celica 90-93
15 Ford Probe 94-98 34 Mercedes Benz C-Class W202 95-00 53 Peugeot 405 89-97 72 Toyota Celica 94-9916 Ford Cougar 99-03 35 Mercedes Benz CLK C208 97-03 54 Peugeot 505 82-93 73 Toyota Celica 00-0517 Holden Calibra 94-97 36 Mercedes Benz C-Class W203 00-07 55 Peugeot 406 96-04 74 Lexus IS200 / IS300 99-0418 Holden Camira 82-89 37 Nissan Pintara 86-88 56 Renault Feugo 82-87 75 Volvo 200 Series 82-9319 Holden Vectra 97-03 38 Nissan / Ford Pintara / Corsair / Bluebird 89-92 57 Saab 900 Series 82-92 76 Volkswagen Passat 98-06
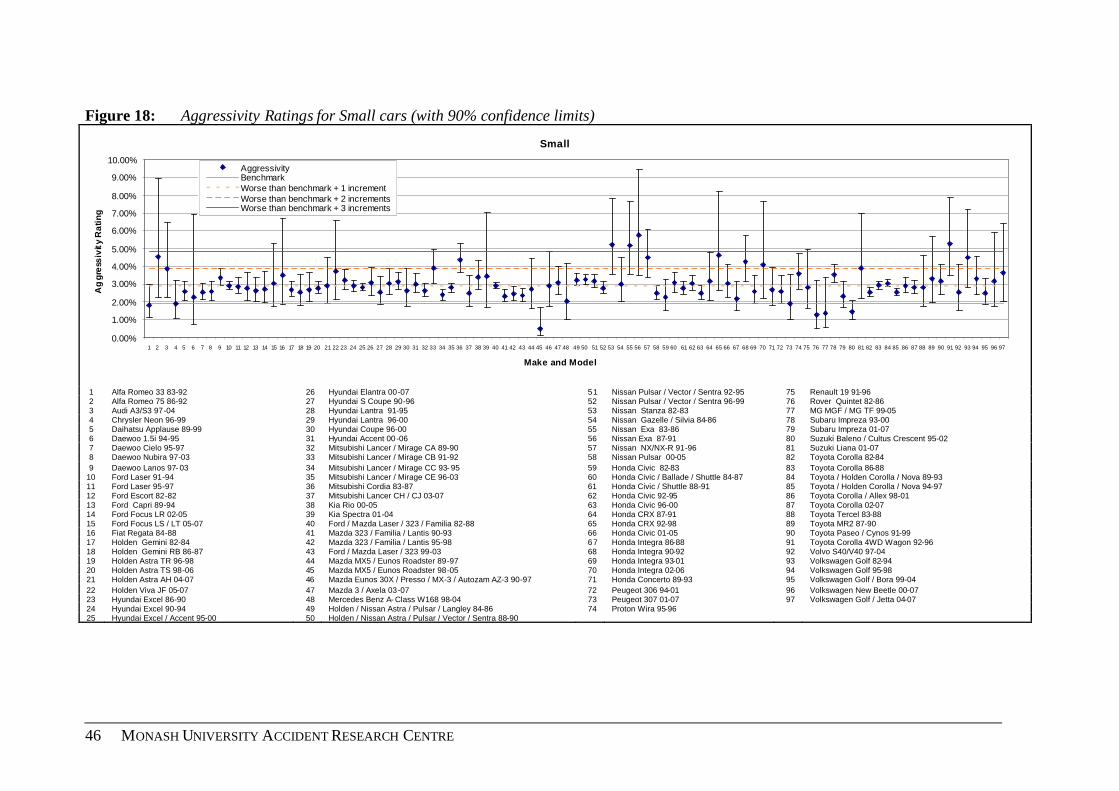
46 MONASH UNIVERSITY ACCIDENT RESEARCH CENTRE
Figure 18: Aggressivity Ratings for Small cars (with 90% confidence limits)
Small
0.00%
1.00%
2.00%
3.00%
4.00%
5.00%
6.00%
7.00%
8.00%
9.00%
10.00%
1 2 3 4 5 6 7 8 9 10 11 12 13 14 15 16 17 18 19 20 21 22 23 24 25 26 27 28 29 30 31 32 33 34 35 36 37 38 39 40 41 42 43 44 45 46 47 48 49 50 51 52 53 54 55 56 57 58 59 60 61 62 63 64 65 66 67 68 69 70 71 72 73 74 75 76 77 78 79 80 81 82 83 84 85 86 87 88 89 90 91 92 93 94 95 96 97
Make and Model
Ag
gres
sivi
tyR
atin
g
AggressivityBenchmarkWorse than benchmark + 1 incrementWorse than benchmark + 2 incrementsWorse than benchmark + 3 increments
1 Alfa Romeo 33 83-92 26 Hyundai Elantra 00-07 51 Nissan Pulsar / Vector / Sentra 92-95 75 Renault 19 91-962 Alfa Romeo 75 86-92 27 Hyundai S Coupe 90-96 52 Nissan Pulsar / Vector / Sentra 96-99 76 Rover Quintet 82-863 Audi A3/S3 97-04 28 Hyundai Lantra 91-95 53 Nissan Stanza 82-83 77 MG MGF / MG TF 99-054 Chrysler Neon 96-99 29 Hyundai Lantra 96-00 54 Nissan Gazelle / Silvia 84-86 78 Subaru Impreza 93-005 Daihatsu Applause 89-99 30 Hyundai Coupe 96-00 55 Nissan Exa 83-86 79 Subaru Impreza 01-076 Daewoo 1.5i 94-95 31 Hyundai Accent 00-06 56 Nissan Exa 87-91 80 Suzuki Baleno / Cultus Crescent 95-027 Daewoo Cielo 95-97 32 Mitsubishi Lancer / Mirage CA 89-90 57 Nissan NX/NX-R 91-96 81 Suzuki Liana 01-078 Daewoo Nubira 97-03 33 Mitsubishi Lancer / Mirage CB 91-92 58 Nissan Pulsar 00-05 82 Toyota Corolla 82-849 Daewoo Lanos 97- 03 34 Mitsubishi Lancer / Mirage CC 93- 95 59 Honda Civic 82-83 83 Toyota Corolla 86-88
10 Ford Laser 91-94 35 Mitsubishi Lancer / Mirage CE 96-03 60 Honda Civic / Ballade / Shuttle 84-87 84 Toyota / Holden Corolla / Nova 89-9311 Ford Laser 95-97 36 Mitsubishi Cordia 83-87 61 Honda Civic / Shuttle 88-91 85 Toyota / Holden Corolla / Nova 94-9712 Ford Escort 82-82 37 Mitsubishi Lancer CH / CJ 03-07 62 Honda Civic 92-95 86 Toyota Corolla / Allex 98-0113 Ford Capri 89-94 38 Kia Rio 00-05 63 Honda Civic 96-00 87 Toyota Corolla 02-0714 Ford Focus LR 02-05 39 Kia Spectra 01-04 64 Honda CRX 87-91 88 Toyota Tercel 83-8815 Ford Focus LS / LT 05-07 40 Ford / Mazda Laser / 323 / Familia 82-88 65 Honda CRX 92-98 89 Toyota MR2 87-9016 Fiat Regata 84-88 41 Mazda 323 / Familia / Lantis 90-93 66 Honda Civic 01-05 90 Toyota Paseo / Cynos 91-9917 Holden Gemini 82-84 42 Mazda 323 / Familia / Lantis 95-98 67 Honda Integra 86-88 91 Toyota Corolla 4WD Wagon 92-9618 Holden Gemini RB 86-87 43 Ford / Mazda Laser / 323 99-03 68 Honda Integra 90-92 92 Volvo S40/V40 97-0419 Holden Astra TR 96-98 44 Mazda MX5 / Eunos Roadster 89-97 69 Honda Integra 93-01 93 Volkswagen Golf 82-9420 Holden Astra TS 98-06 45 Mazda MX5 / Eunos Roadster 98-05 70 Honda Integra 02-06 94 Volkswagen Golf 95-9821 Holden Astra AH 04-07 46 Mazda Eunos 30X / Presso / MX-3 / Autozam AZ-3 90-97 71 Honda Concerto 89-93 95 Volkswagen Golf / Bora 99-0422 Holden Viva JF 05-07 47 Mazda 3 / Axela 03-07 72 Peugeot 306 94-01 96 Volkswagen New Beetle 00-0723 Hyundai Excel 86-90 48 Mercedes Benz A- Class W168 98-04 73 Peugeot 307 01-07 97 Volkswagen Golf / Jetta 04-0724 Hyundai Excel 90-94 49 Holden / Nissan Astra / Pulsar / Langley 84-86 74 Proton Wira 95-9625 Hyundai Excel / Accent 95-00 50 Holden / Nissan Astra / Pulsar / Vector / Sentra 88-90
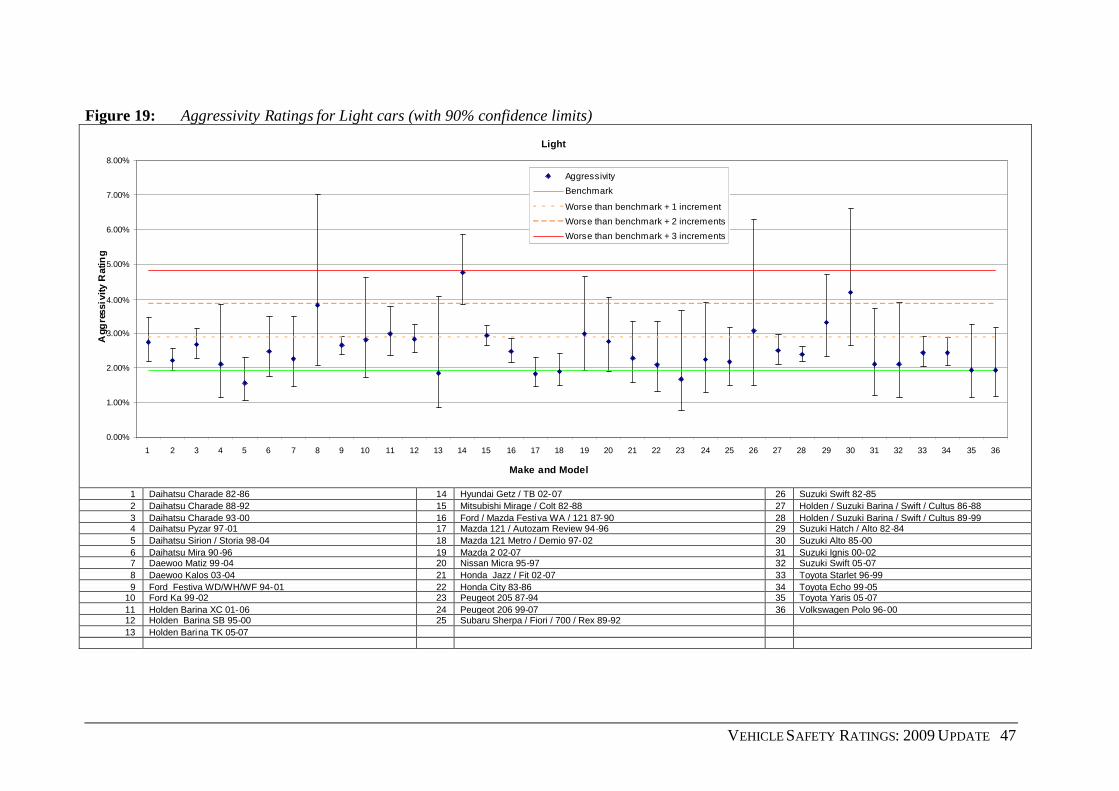
VEHICLE SAFETY RATINGS: 2009 UPDATE 47
Figure 19: Aggressivity Ratings for Light cars (with 90% confidence limits)
Light
0.00%
1.00%
2.00%
3.00%
4.00%
5.00%
6.00%
7.00%
8.00%
1 2 3 4 5 6 7 8 9 10 11 12 13 14 15 16 17 18 19 20 21 22 23 24 25 26 27 28 29 30 31 32 33 34 35 36
Make and Model
Agg
ress
ivity
Rat
ing
Aggressivity
Benchmark
Worse than benchmark + 1 increment
Worse than benchmark + 2 increments
Worse than benchmark + 3 increments
1 Daihatsu Charade 82-86 14 Hyundai Getz / TB 02-07 26 Suzuki Swift 82-852 Daihatsu Charade 88-92 15 Mitsubishi Mirage / Colt 82-88 27 Holden / Suzuki Barina / Swift / Cultus 86-883 Daihatsu Charade 93-00 16 Ford / Mazda Festiva WA / 121 87-90 28 Holden / Suzuki Barina / Swift / Cultus 89-994 Daihatsu Pyzar 97-01 17 Mazda 121 / Autozam Review 94-96 29 Suzuki Hatch / Alto 82-845 Daihatsu Sirion / Storia 98-04 18 Mazda 121 Metro / Demio 97-02 30 Suzuki Alto 85-006 Daihatsu Mira 90-96 19 Mazda 2 02-07 31 Suzuki Ignis 00-027 Daewoo Matiz 99-04 20 Nissan Micra 95-97 32 Suzuki Swift 05-078 Daewoo Kalos 03-04 21 Honda Jazz / Fit 02-07 33 Toyota Starlet 96-999 Ford Festiva WD/WH/WF 94-01 22 Honda City 83-86 34 Toyota Echo 99-05
10 Ford Ka 99-02 23 Peugeot 205 87-94 35 Toyota Yaris 05-0711 Holden Barina XC 01-06 24 Peugeot 206 99-07 36 Volkswagen Polo 96-0012 Holden Barina SB 95-00 25 Subaru Sherpa / Fiori / 700 / Rex 89-9213 Holden Barina TK 05-07
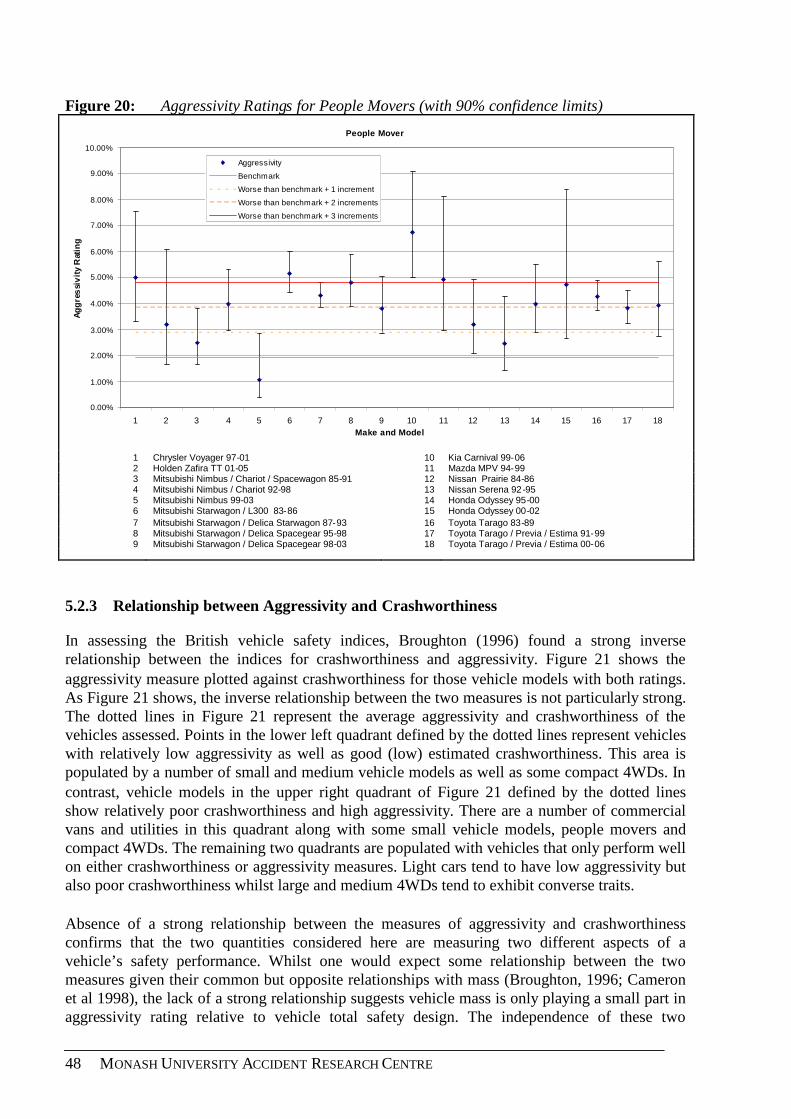
48 MONASH UNIVERSITY ACCIDENT RESEARCH CENTRE
Figure 20: Aggressivity Ratings for People Movers (with 90% confidence limits)
People Mover
0.00%
1.00%
2.00%
3.00%
4.00%
5.00%
6.00%
7.00%
8.00%
9.00%
10.00%
1 2 3 4 5 6 7 8 9 10 11 12 13 14 15 16 17 18Make and Model
Ag
gre
ssi
vit
yR
atin
g
Aggressivity
Benchmark
Worse than benchmark + 1 increment
Worse than benchmark + 2 increments
Worse than benchmark + 3 increments
1 Chrysler Voyager 97-01 10 Kia Carnival 99-062 Holden Zafira TT 01-05 11 Mazda MPV 94-993 Mitsubishi Nimbus / Chariot / Spacewagon 85-91 12 Nissan Prairie 84-864 Mitsubishi Nimbus / Chariot 92-98 13 Nissan Serena 92-955 Mitsubishi Nimbus 99-03 14 Honda Odyssey 95-006 Mitsubishi Starwagon / L300 83-86 15 Honda Odyssey 00-027 Mitsubishi Starwagon / Delica Starwagon 87-93 16 Toyota Tarago 83-898 Mitsubishi Starwagon / Delica Spacegear 95-98 17 Toyota Tarago / Previa / Estima 91-999 Mitsubishi Starwagon / Delica Spacegear 98-03 18 Toyota Tarago / Previa / Estima 00-06
5.2.3 Relationship between Aggressivity and Crashworthiness
In assessing the British vehicle safety indices, Broughton (1996) found a strong inverserelationship between the indices for crashworthiness and aggressivity. Figure 21 shows theaggressivity measure plotted against crashworthiness for those vehicle models with both ratings.As Figure 21 shows, the inverse relationship between the two measures is not particularly strong.The dotted lines in Figure 21 represent the average aggressivity and crashworthiness of thevehicles assessed. Points in the lower left quadrant defined by the dotted lines represent vehicleswith relatively low aggressivity as well as good (low) estimated crashworthiness. This area ispopulated by a number of small and medium vehicle models as well as some compact 4WDs. Incontrast, vehicle models in the upper right quadrant of Figure 21 defined by the dotted linesshow relatively poor crashworthiness and high aggressivity. There are a number of commercialvans and utilities in this quadrant along with some small vehicle models, people movers andcompact 4WDs. The remaining two quadrants are populated with vehicles that only perform wellon either crashworthiness or aggressivity measures. Light cars tend to have low aggressivity butalso poor crashworthiness whilst large and medium 4WDs tend to exhibit converse traits.
Absence of a strong relationship between the measures of aggressivity and crashworthinessconfirms that the two quantities considered here are measuring two different aspects of avehicle’s safety performance. Whilst one would expect some relationship between the twomeasures given their common but opposite relationships with mass (Broughton, 1996; Cameronet al 1998), the lack of a strong relationship suggests vehicle mass is only playing a small part inaggressivity rating relative to vehicle total safety design. The independence of these two

VEHICLE SAFETY RATINGS: 2009 UPDATE 49
measures does not seem to have been achieved to the same degree under other systems(Broughton, 1996).
Figure 21: Estimated Vehicle Aggressivity towards Other Drivers and Unprotected RoadUsers vs. Crashworthiness Rating
0.00%
1.00%
2.00%
3.00%
4.00%
5.00%
6.00%
7.00%
8.00%
9.00%
0.00% 2.00% 4.00% 6.00% 8.00% 10.00% 12.00%Crashworthiness Rating
Agg
ress
ivit
yR
atin
g
4WD - Compact 4WD - Medium 4WD - Large Commercial - Van Commercial - Ute
Large Medium People Mover Light Small
5.3 Vehicle Total Secondary Safety Rating
5.3.1 Injury Risk
Total secondary safety injury risk was estimated from the data on 4,726,829 road users involvedin tow-away crashes in New South Wales, Queensland and Western Australia during 1987-2007(as described in Section 2). This data set is referred to as the "involved road users". Because ofmissing values in one or more of the covariates road user sex and age, speed zone and number ofvehicles involved in the crash amongst the 4,726,829 involved road users and vehicle models ofinterest, the final file used for analysis consisted of the 2,736,290 road users for which all thecovariate data was complete. Of these road users 445,613 were injured. The "covariate" modelfor injury risk was determined from the variables described in Section 4.3.
The following terms were significantly associated with injury risk and were included in thelogistic model:
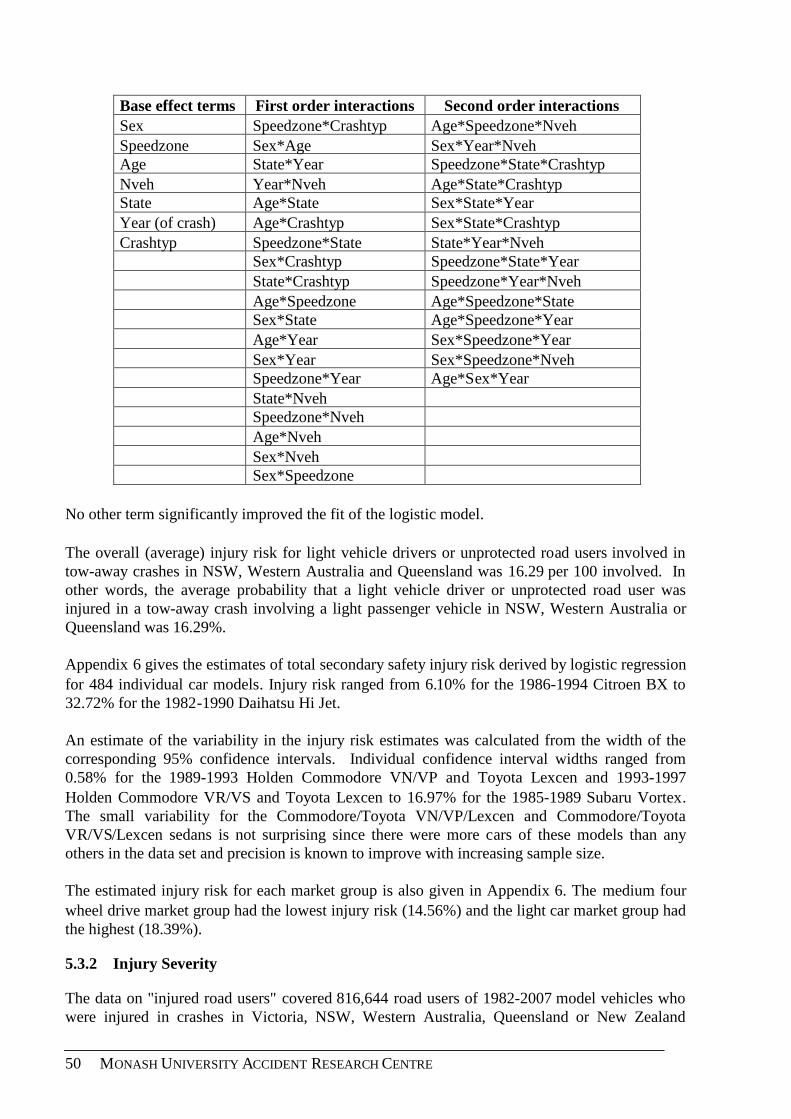
50 MONASH UNIVERSITY ACCIDENT RESEARCH CENTRE
Base effect terms First order interactions Second order interactionsSex Speedzone*Crashtyp Age*Speedzone*NvehSpeedzone Sex*Age Sex*Year*NvehAge State*Year Speedzone*State*CrashtypNveh Year*Nveh Age*State*CrashtypState Age*State Sex*State*YearYear (of crash) Age*Crashtyp Sex*State*CrashtypCrashtyp Speedzone*State State*Year*Nveh
Sex*Crashtyp Speedzone*State*YearState*Crashtyp Speedzone*Year*NvehAge*Speedzone Age*Speedzone*StateSex*State Age*Speedzone*YearAge*Year Sex*Speedzone*YearSex*Year Sex*Speedzone*NvehSpeedzone*Year Age*Sex*YearState*NvehSpeedzone*NvehAge*NvehSex*NvehSex*Speedzone
No other term significantly improved the fit of the logistic model.
The overall (average) injury risk for light vehicle drivers or unprotected road users involved intow-away crashes in NSW, Western Australia and Queensland was 16.29 per 100 involved. Inother words, the average probability that a light vehicle driver or unprotected road user wasinjured in a tow-away crash involving a light passenger vehicle in NSW, Western Australia orQueensland was 16.29%.
Appendix 6 gives the estimates of total secondary safety injury risk derived by logistic regressionfor 484 individual car models. Injury risk ranged from 6.10% for the 1986-1994 Citroen BX to32.72% for the 1982-1990 Daihatsu Hi Jet.
An estimate of the variability in the injury risk estimates was calculated from the width of thecorresponding 95% confidence intervals. Individual confidence interval widths ranged from0.58% for the 1989-1993 Holden Commodore VN/VP and Toyota Lexcen and 1993-1997Holden Commodore VR/VS and Toyota Lexcen to 16.97% for the 1985-1989 Subaru Vortex.The small variability for the Commodore/Toyota VN/VP/Lexcen and Commodore/ToyotaVR/VS/Lexcen sedans is not surprising since there were more cars of these models than anyothers in the data set and precision is known to improve with increasing sample size.
The estimated injury risk for each market group is also given in Appendix 6. The medium fourwheel drive market group had the lowest injury risk (14.56%) and the light car market group hadthe highest (18.39%).
5.3.2 Injury Severity
The data on "injured road users" covered 816,644 road users of 1982-2007 model vehicles whowere injured in crashes in Victoria, NSW, Western Australia, Queensland or New Zealand

VEHICLE SAFETY RATINGS: 2009 UPDATE 51
during 1987-2007 (as described in Section 2). Because of missing values in one or more of thecovariates amongst the 816,644 injured road users, the final file used for analysis consisted of the585,607 road users for which all the covariate data was complete. Of these road users 125,342were seriously injured. The "covariate" model for injury severity was determined from thevariables described in Section 4.3.
The following terms were significantly associated with injury severity and were included in thelogistic model:
Base effect terms First order interactions Second order interactionSex Age*Sex Speedzone*State*YearSpeedzone Age*Crashtype State*Year*CrashtypeAge State*Nveh Age*State*YearState Speedzone*State Age*State*NvehYear Age*State Speedzone*State*CrashtypeCrashtype Age*NvehNveh State*Year
Speedzone*YearSpeedzone*CrashtypeSex*StateSex*NvehAge*YearYear*CrashtypeState*CrashtypeSex*Crashtype
No other term significantly improved the fit of the logistic model.
The overall (average) injury severity for injured light vehicle drivers or unprotected road users inthe data analysed was 21.40 per 100 involved. In other words, the probability that a road userinjured in a crash was severely injured was 21.40%. Appendix 6 gives the estimates of injuryseverity derived by logistic regression for 484 individual car models, or sets of combinedmodels. Of the cars analysed, injury severity ranged from 2.92% for the 2005-2007 NissanPathfinder to 47.13% for the 1982-1984 Alfa Romeo GTV.
An estimate of the variability in the estimates of injury severity was calculated from the width ofthe corresponding 95% confidence intervals. Individual confidence interval widths ranged from1.44% for the 1982-88 Ford Laser and Mazda 323 / Familia to 43.70% for the 1985-1988 AlphaRomeo 90.
The estimated injury severity for each market group is also given in Appendix 6. Compact fourwheel drive vehicles performed best with respect to injury severity, having the lowest averageinjury severity of 20.27%. The large four wheel drive car market group had the highest averageinjury severity of 23.91%.
5.3.3 Total secondary safety index
The total secondary safety index for each car model and market group was obtained bymultiplying the individual injury risk and injury severity estimates. Because each of the two

52 MONASH UNIVERSITY ACCIDENT RESEARCH CENTRE
components had been adjusted for the confounding factors, the resultant total secondary safetyindex was also adjusted for the influence of these factors.
Total secondary safety indices were obtained for each individual model and market group afteradjusting for the confounding factors.
Appendix 6 gives the total secondary safety secondary index and the associated 90% confidenceintervals for each of the 484 car models included in the analyses. Each rating is expressed as apercentage, representing the number of road users killed or admitted to hospital per 100 lightvehicle drivers or unprotected road users involved in a tow-away focus crash. Overall ratings forthe market groups are also given.
Each total secondary safety rating is an estimate of the true risk of a light vehicle driver orunprotected road user being killed or admitted to hospital in a tow-away crash and, as such, eachestimate has a level of uncertainty about it. This uncertainty is indicated by the confidence limitsin Appendix 6. There is 95% probability that the confidence interval will cover the true risk ofserious injury (death or hospital admission) to the light vehicle driver or unprotected road userinvolved in a crash with the particular model of vehicle.
Table 6 gives a summary of the estimated ratings for each of the 10 defined vehicle marketgroups. It shows the estimated injury risk and severity components, and the resulting totalsecondary safety index with upper and lower 95% confidence limits, and the width of the 95%confidence limit. The relative ranking of the total secondary safety index on each market group isalso given in Table 6 although this should be interpreted with care as there is not necessarily astatistically significant difference between the average total secondary safety of vehicle marketgroups with different rankings. Statistical significance in average total secondary safety betweenmarket groups at the 5% level is only achieved when the 95% confidence limits do not overlap.Similar comments apply to interpreting results in Appendix 6.
Table 6: Estimated Vehicle Total Secondary Safety by Market GroupingMarket Group Injury
risk(%)
Injuryseverity
(%)
TotalSecondary
Safety Index*
Overallrankorder
Lower 95%Confidence
limit
Upper 95%Confidence
limit
Width ofConfidence
interval
Overall Average 16.29 21.40 3.49COMPACT FOUR WHEEL DRIVE 16.33 20.27 3.31 4 3.17 3.45 0.28MEDIUM FOUR WHEEL DRIVE 14.56 21.59 3.14 1 2.99 3.30 0.31LARGE FOUR WHEEL DRIVE 15.01 23.91 3.59 7 3.47 3.71 0.23COMMERCIAL - VAN 17.49 21.72 3.80 9 3.65 3.95 0.29COMMERCIAL - UTE 15.68 22.57 3.54 6 3.46 3.62 0.16LARGE 15.64 20.88 3.27 2 3.22 3.31 0.09MEDIUM 16.03 20.54 3.29 3 3.24 3.35 0.11PEOPLE MOVERS 17.15 21.12 3.62 8 3.47 3.78 0.30LIGHT 18.39 21.19 3.90 10 3.81 3.98 0.17SMALL 16.88 20.44 3.45 5 3.40 3.50 0.11
Serious injury rate per 100 road users involved
Table 6 shows medium four wheel drives to have the highest total secondary safety with anaverage of 3.14 light vehicle drivers or unprotected road users being killed or seriously injuredfor every 100 tow-away crashes. Similarly, light cars have the lowest total secondary safety withan average total secondary safety index of 3.90.

VEHICLE SAFETY RATINGS: 2009 UPDATE 53
5.3.4 Comparisons with the Benchmark Rating
As for the crashworthiness and aggressivity rating, the new rating presentation was used whichclassifies vehicles according to where their rating lies in relation to a best performancebenchmark was also used for the total secondary safety index. The benchmark rating in thisupdate was defined as the rating above which 5% of the rating point estimates were better (seeSection 5.4). The point against which ratings for individual vehicles are compared is arbitrary,whether it is the average used in previous updates or the benchmark rating described above orsome other point.
Figures 22 to 31 display for each of the market groups the total safety ratings of vehicles togetherwith their 90% confidence limits. Also displayed on each graph is a line representing thebenchmark total secondary safety rating of 1.91% and three lines at 2.87%, 3.82% and 4.78%representing at least 50% worse than the benchmark, at least 100% worse than the benchmarkand at least 150% worse than the benchmark respectively.
Figure 22: Total Secondary Safety for Compact Four Wheel Drive vehicles (with 90%confidence limits)
Compact 4WD
0.00%
2.00%
4.00%
6.00%
8.00%
10.00%
12.00%
1 2 3 4 5 6 7 8 9 10 11 12 13 14 15 16 17 18 19 20 21 22 23 24 25
Make and Model
Tota
lSec
onda
ryS
afet
y
Total Secondary Safety
Benchmark
Worse than benchmark + 1 increment
Worse than benchmark + 2 increments
Worse than benchmark + 3 increments
1 Daihatsu Feroza / Rocky 89-97 14 Honda CR-V 02-072 Daihatsu Rocky / Rugger 85-98 15 Honda HR-V 99-023 Daihatsu Terios 97-05 16 Land Rover Freelander 98-064 Holden Cruze 02-06 17 Subaru Forester 97-025 Hyundai Tucson 04-07 18 Subaru Forester 02-076 Mitsubishi Pajero iO 99-03 19 Suzuki Vitara / Escudo 88-987 Mitsubishi Outlander 03-06 20 Suzuki Grand Vitara 99-058 Kia Sportage 98-03 21 Holden / Suzuki Drover / Sierra / Samurai / SJ410 / SJ413 82-999 Kia Sorento 03-07 22 Suzuki Jimny 98-07
10 Ford / Mazda Escape / Tribute 01-06 23 Toyota RAV4 94-0011 Nissan X-Trail 01-07 24 Toyota RAV4 01-0612 Lada Niva 84-99 25 Toyota RAV4 06-0713 Honda CR-V 97-01
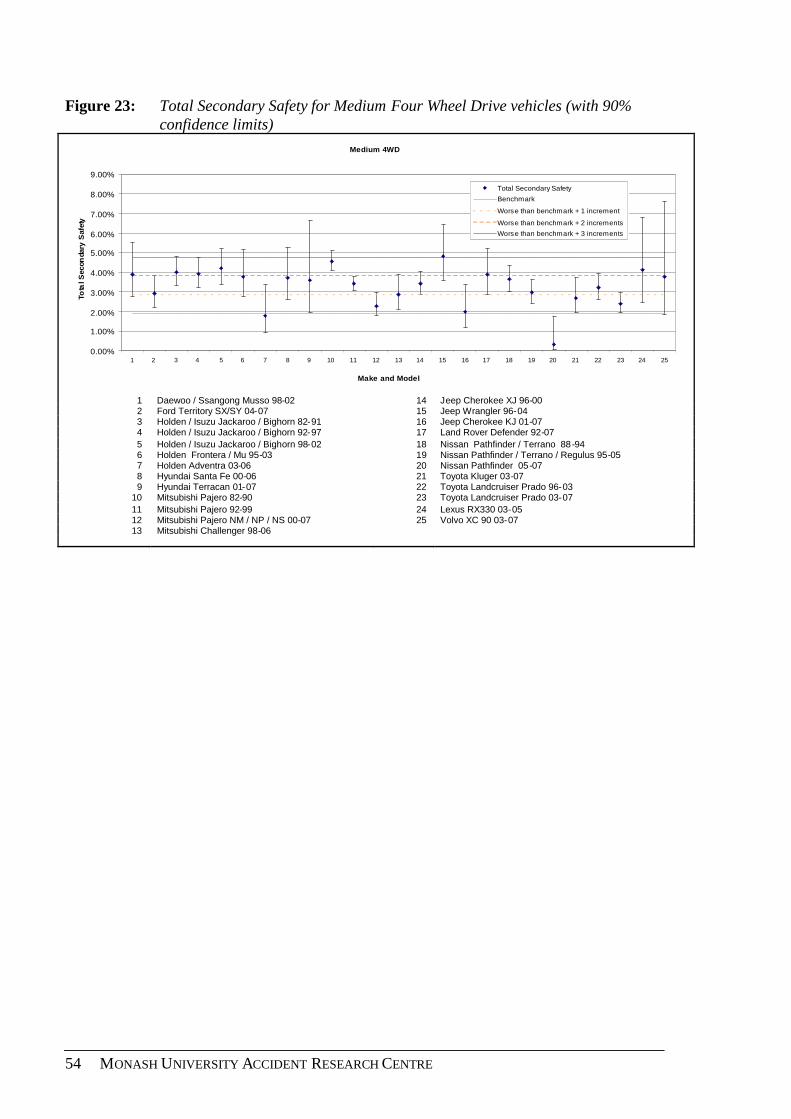
54 MONASH UNIVERSITY ACCIDENT RESEARCH CENTRE
Figure 23: Total Secondary Safety for Medium Four Wheel Drive vehicles (with 90%confidence limits)
Medium 4WD
0.00%
1.00%
2.00%
3.00%
4.00%
5.00%
6.00%
7.00%
8.00%
9.00%
1 2 3 4 5 6 7 8 9 10 11 12 13 14 15 16 17 18 19 20 21 22 23 24 25
Make and Model
Tota
lSec
onda
ryS
afet
y
Total Secondary Safety
Benchmark
Worse than benchmark + 1 increment
Worse than benchmark + 2 increments
Worse than benchmark + 3 increments
1 Daewoo / Ssangong Musso 98-02 14 Jeep Cherokee XJ 96-002 Ford Territory SX/SY 04-07 15 Jeep Wrangler 96-043 Holden / Isuzu Jackaroo / Bighorn 82-91 16 Jeep Cherokee KJ 01-074 Holden / Isuzu Jackaroo / Bighorn 92-97 17 Land Rover Defender 92-075 Holden / Isuzu Jackaroo / Bighorn 98-02 18 Nissan Pathfinder / Terrano 88-946 Holden Frontera / Mu 95-03 19 Nissan Pathfinder / Terrano / Regulus 95-057 Holden Adventra 03-06 20 Nissan Pathfinder 05-078 Hyundai Santa Fe 00-06 21 Toyota Kluger 03-079 Hyundai Terracan 01-07 22 Toyota Landcruiser Prado 96-03
10 Mitsubishi Pajero 82-90 23 Toyota Landcruiser Prado 03-0711 Mitsubishi Pajero 92-99 24 Lexus RX330 03-0512 Mitsubishi Pajero NM / NP / NS 00-07 25 Volvo XC 90 03-0713 Mitsubishi Challenger 98-06
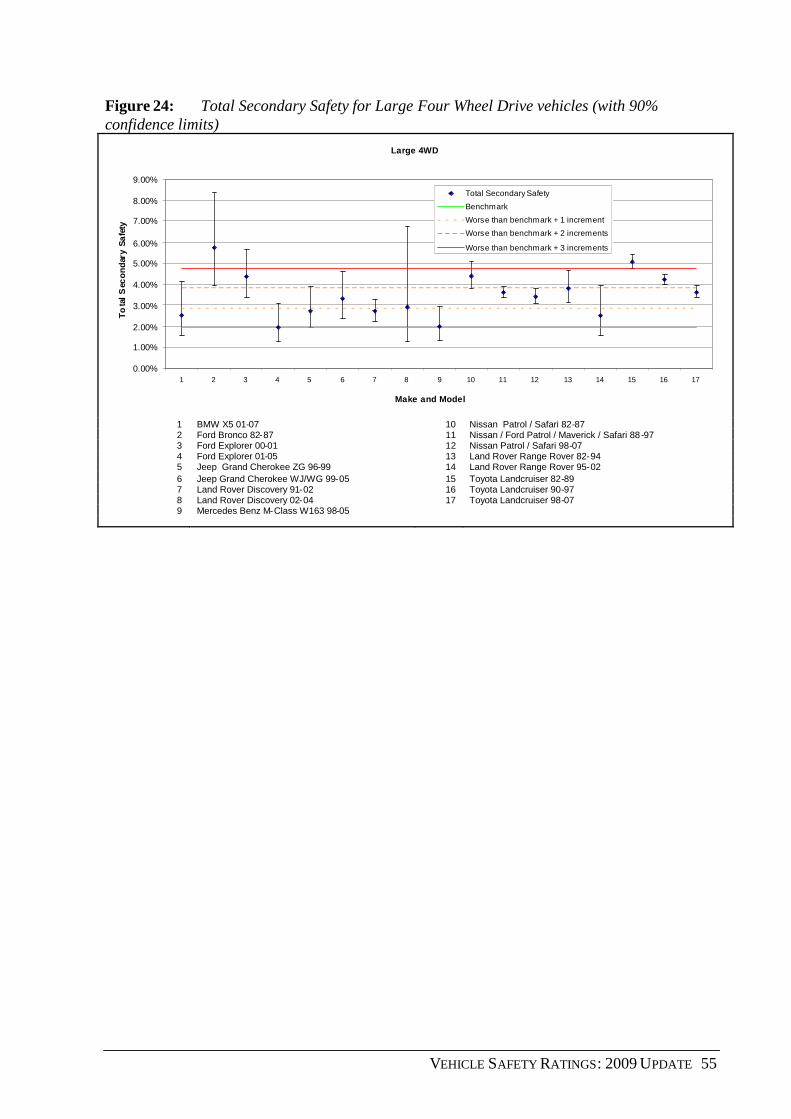
VEHICLE SAFETY RATINGS: 2009 UPDATE 55
Figure 24: Total Secondary Safety for Large Four Wheel Drive vehicles (with 90%confidence limits)
Large 4WD
0.00%
1.00%
2.00%
3.00%
4.00%
5.00%
6.00%
7.00%
8.00%
9.00%
1 2 3 4 5 6 7 8 9 10 11 12 13 14 15 16 17
Make and Model
To
tal
Sec
on
dar
yS
afe
ty
Total Secondary Safety
Benchmark
Worse than benchmark + 1 increment
Worse than benchmark + 2 increments
Worse than benchmark + 3 increments
1 BMW X5 01-07 10 Nissan Patrol / Safari 82-872 Ford Bronco 82-87 11 Nissan / Ford Patrol / Maverick / Safari 88-973 Ford Explorer 00-01 12 Nissan Patrol / Safari 98-074 Ford Explorer 01-05 13 Land Rover Range Rover 82-945 Jeep Grand Cherokee ZG 96-99 14 Land Rover Range Rover 95-026 Jeep Grand Cherokee WJ/WG 99-05 15 Toyota Landcruiser 82-897 Land Rover Discovery 91-02 16 Toyota Landcruiser 90-978 Land Rover Discovery 02-04 17 Toyota Landcruiser 98-079 Mercedes Benz M-Class W163 98-05

56 MONASH UNIVERSITY ACCIDENT RESEARCH CENTRE
Figure 25: Total Secondary Safety for Commercial Vans (with 90% confidence limits)Commercial- Vans
0.00%
2.00%
4.00%
6.00%
8.00%
10.00%
12.00%
14.00%
1 2 3 4 5 6 7 8 9 10 11 12 13 14 15 16 17 18 19 20 21 22
Make and Model
To
tal
Sec
on
dar
yS
afe
ty
Total Secondary Safety
Benchmark
Worse than benchmark + 1 increment
Worse than benchmark + 2 increments
Worse than benchmark + 3 increments
1 Daihatsu Handivan 82-90 12 Mercedes Benz Sprinter 98-042 Daihatsu Hi-Jet 82-90 13 Honda Acty 83-863 Daihatsu Handivan / Cuore 99-03 14 Holden / Suzuki Scurry / Carry 82-004 Ford Falcon Panel Van 82-95 15 Suzuki Carry 99-055 Ford Falcon Panel Van 96-99 16 Toyota Hiace/Liteace 82-866 Ford Transit 95-00 17 Toyota Hiace/Liteace 87-897 Ford Transit 01-07 18 Toyota Hiace/Liteace 90-958 Holden Shuttle / WFR Van 82-87 19 Toyota Hiace/Liteace 96-049 Kia Pregio 02-06 20 Toyoa Hiace 05-07
10 Mercedes Benz MB100 / MB140 99-04 21 Volkswagen Caravelle / Transporter 88-9411 Mercedes Benz Vito / Viano 99-07 22 Volkswagen Caravelle / Transporter 95-04

VEHICLE SAFETY RATINGS: 2009 UPDATE 57
Figure 26: Total Secondary Safety for Commercial Utes (with 90% confidence limits)Commercial- Utes
0.00%
1.00%
2.00%
3.00%
4.00%
5.00%
6.00%
7.00%
8.00%
9.00%
1 2 3 4 5 6 7 8 9 10 11 12 13 14 15 16 17 18 19 20 21 22 23 24 25 26 27 28 29 30 31 32 33 34 35 36
Make and Model
Tot
alS
econ
dary
Saf
ety
Total Secondary SafetyBenchmarkWorse than benchmark + 1 incrementWorse than benchmark + 2 incrementsWorse than benchmark + 3 increments
1 Ford / Nissan Falcon Ute / XFN Ute 82-95 19 Kia K2700 02-072 Ford Falcon Ute 96-99 20 Ford / Mazda Courier / B-Series / Bounty 98-023 Ford Falcon Ute AU 00-02 21 Ford / Mazda Courier / Bravo / Bounty 03-064 Ford Falcon Ute BA/BF 03-07 22 Nissan 720 Ute 82-855 Ford Ford F-Series 82-92 23 Nissan Navara 86-916 Ford F-Series 01-06 24 Nissan Navara 92-967 Holden Commodore Ute VG/VP 90-93 25 Nissan Navara 97-058 Holden / Isuzu Rodeo / Pickup 82-85 26 Nissan Navara 05-079 Holden / Isuzu Rodeo / Pickup 86-88 27 Proton Jumbuck 03-07
10 Holden / Isuzu Rodeo / Pickup 89-95 28 Subaru Brumby 82-9211 Holden Rodeo 96-98 29 Suzuki Mighty Boy 85-8812 Holden Rodeo 99-02 30 Toyota 4Runner/Hilux 82-8513 Holden WB Series 82-85 31 Toyota 4Runner/Hilux 86-8814 Holden Commodore Ute VR/VS 94-00 32 Toyota 4Runner/Hilux 89-9715 Holden Commodore VU Ute 00-02 33 Toyota Hilux 98-0216 Holden Commodore VY/VZ Ute 02-07 34 Toyota Hilux 03-0417 Holden Rodeo 03-07 35 Toyota Hilux 05-0718 Mitsubishi Triton MK 96-06 36 Kia K2700 02-07
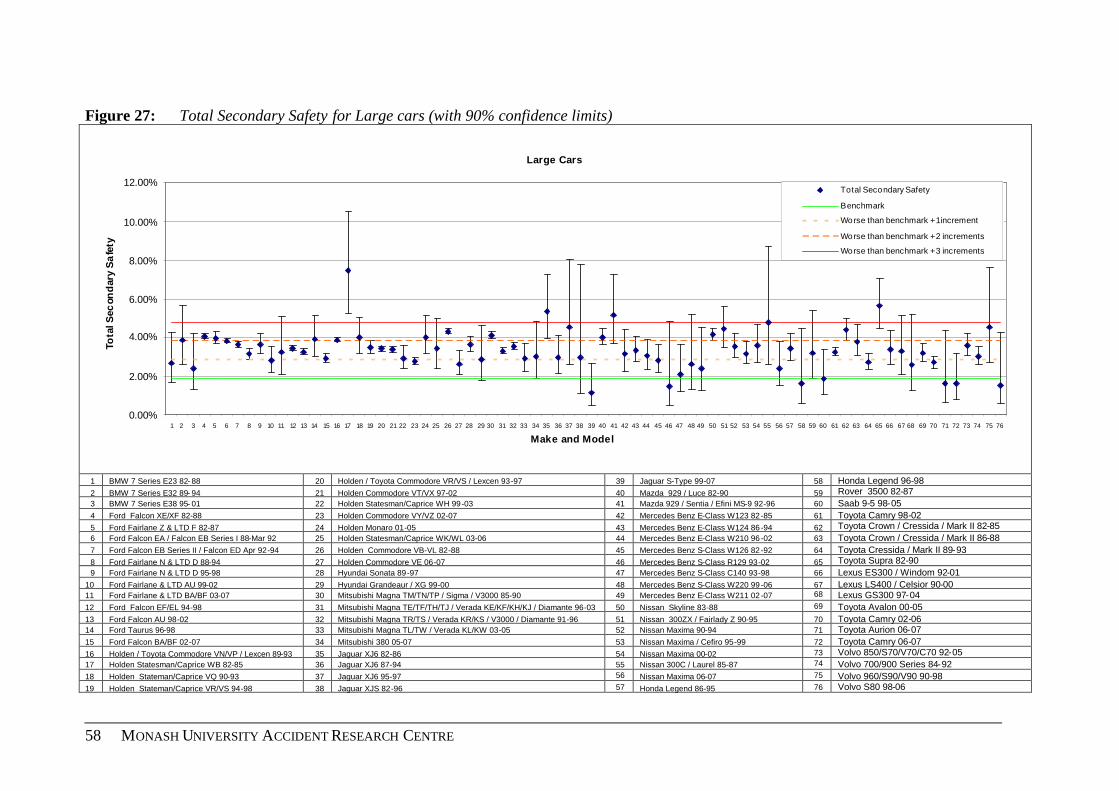
58 MONASH UNIVERSITY ACCIDENT RESEARCH CENTRE
Figure 27: Total Secondary Safety for Large cars (with 90% confidence limits)
Large Cars
0.00%
2.00%
4.00%
6.00%
8.00%
10.00%
12.00%
1 2 3 4 5 6 7 8 9 10 11 12 13 14 15 16 17 18 19 20 21 22 23 24 25 26 27 28 29 30 31 32 33 34 35 36 37 38 39 40 41 42 43 44 45 46 47 48 49 50 51 52 53 54 55 56 57 58 59 60 61 62 63 64 65 66 67 68 69 70 71 72 73 74 75 76
Make and Model
Tota
lSec
ond
ary
Sa
fety
Total Secondary Safety
Benchmark
Worse than benchmark +1increment
Worse than benchmark +2 increments
Worse than benchmark +3 increments
1 BMW 7 Series E23 82- 88 20 Holden / Toyota Commodore VR/VS / Lexcen 93-97 39 Jaguar S-Type 99-07 58 Honda Legend 96-982 BMW 7 Series E32 89- 94 21 Holden Commodore VT/VX 97-02 40 Mazda 929 / Luce 82-90 59 Rover 3500 82-873 BMW 7 Series E38 95- 01 22 Holden Statesman/Caprice WH 99-03 41 Mazda 929 / Sentia / Efini MS-9 92-96 60 Saab 9-5 98-054 Ford Falcon XE/XF 82-88 23 Holden Commodore VY/VZ 02-07 42 Mercedes Benz E-Class W123 82-85 61 Toyota Camry 98-025 Ford Fairlane Z & LTD F 82-87 24 Holden Monaro 01-05 43 Mercedes Benz E-Class W124 86-94 62 Toyota Crown / Cressida / Mark II 82-856 Ford Falcon EA / Falcon EB Series I 88-Mar 92 25 Holden Statesman/Caprice WK/WL 03-06 44 Mercedes Benz E-Class W210 96-02 63 Toyota Crown / Cressida / Mark II 86-887 Ford Falcon EB Series II / Falcon ED Apr 92-94 26 Holden Commodore VB-VL 82-88 45 Mercedes Benz S-Class W126 82-92 64 Toyota Cressida / Mark II 89-938 Ford Fairlane N & LTD D 88-94 27 Holden Commodore VE 06-07 46 Mercedes Benz S-Class R129 93-02 65 Toyota Supra 82-909 Ford Fairlane N & LTD D 95-98 28 Hyundai Sonata 89-97 47 Mercedes Benz S-Class C140 93-98 66 Lexus ES300 / Windom 92-01
10 Ford Fairlane & LTD AU 99-02 29 Hyundai Grandeaur / XG 99-00 48 Mercedes Benz S-Class W220 99-06 67 Lexus LS400 / Celsior 90-0011 Ford Fairlane & LTD BA/BF 03-07 30 Mitsubishi Magna TM/TN/TP / Sigma / V3000 85-90 49 Mercedes Benz E-Class W211 02-07 68 Lexus GS300 97-0412 Ford Falcon EF/EL 94-98 31 Mitsubishi Magna TE/TF/TH/TJ / Verada KE/KF/KH/KJ / Diamante 96-03 50 Nissan Skyline 83-88 69 Toyota Avalon 00-0513 Ford Falcon AU 98-02 32 Mitsubishi Magna TR/TS / Verada KR/KS / V3000 / Diamante 91-96 51 Nissan 300ZX / Fairlady Z 90-95 70 Toyota Camry 02-0614 Ford Taurus 96-98 33 Mitsubishi Magna TL/TW / Verada KL/KW 03-05 52 Nissan Maxima 90-94 71 Toyota Aurion 06-0715 Ford Falcon BA/BF 02-07 34 Mitsubishi 380 05-07 53 Nissan Maxima / Cefiro 95-99 72 Toyota Camry 06-0716 Holden / Toyota Commodore VN/VP / Lexcen 89-93 35 Jaguar XJ6 82-86 54 Nissan Maxima 00-02 73 Volvo 850/S70/V70/C70 92-0517 Holden Statesman/Caprice WB 82-85 36 Jaguar XJ6 87-94 55 Nissan 300C / Laurel 85-87 74 Volvo 700/900 Series 84-9218 Holden Stateman/Caprice VQ 90-93 37 Jaguar XJ6 95-97 56 Nissan Maxima 06-07 75 Volvo 960/S90/V90 90-9819 Holden Stateman/Caprice VR/VS 94-98 38 Jaguar XJS 82-96 57 Honda Legend 86-95 76 Volvo S80 98-06

VEHICLE SAFETY RATINGS: 2009 UPDATE 59
Figure 28: Total Secondary Safety for Medium cars (with 90% confidence limits)
Medium Cars
0.00%
2.00%
4.00%
6.00%
8.00%
10.00%
12.00%
1 2 3 4 5 6 7 8 9 10 11 12 13 14 15 16 17 18 19 20 21 22 23 24 25 26 27 28 29 30 31 32 33 34 35 36 37 38 39 40 41 42 43 44 45 46 47 48 49 50 51 52 53 54 55 56 57 58 59 60 61 62 63 64 65 66 67 68 69 70 71 72 73 74 75 76 77 78 79 80 81 82 83 84 85 86 87 88 89 90 91 92 93 94 95 96 97 98
Make and Model
Tot
alSe
con
dary
Safe
ty
Total Secondary SafetyBenchmark
Worse than benchmark +1incrementWorse than benchmark +2 incrementsWorse than benchmark +3 increments
1 Alfa Romeo 164 89-92 21 Ford Cortina 82-82 41 Mazda RX7 86-91 61 Honda Accord 03-07 81 Subaru 1800 / Leone / Omega / 4WD Wagon 82-932 Alfa Romeo 156 99-06 22 Ford Mondeo 95-01 42 Mazda RX7 92-98 62 Honda Accord 82-85 82 Subaru Liberty / Legacy 89-933 Alfa Romeo 147 01-07 23 Ford Probe 94- 98 43 Mazda Eunos 500 93-99 63 Honda Accord 86-90 83 Subaru Liberty / Legacy / Outback 94-984 Audi A4 95-01 24 Ford Cougar 99-03 44 Mazda Eunos 800 94-00 64 Honda Accord 91-93 84 Subaru Liberty / Legacy / Outback 99-035 Audi TT 99-06 25 Holden Calibra 94-97 45 Mazda 6 02-07 65 Honda Accord 94-98 85 Subaru Liberty / Legacy / Outback 03-076 Audi A4 01-07 26 Holden Camira 82-89 46 Mazda RX8 03-07 66 Honda Accord 99-02 86 Toyota Corona 82-887 BMW Z3 E36 97-03 27 Holden Vectra 97-03 47 Mercedes Benz C-Class W201 87-93 67 Honda Prelude 82-82 87 Toyota Camry 83-868 BMW 5 Series E60 03-07 28 Holden Vectra ZC 03-05 48 Mercedes Benz C-Class W202 95-00 68 Honda Prelude 83-91 88 Holden / Toyota Apollo JK/JL / Camry / Vista 88-929 BMW 3 Series E90 05-07 29 Hyundai Sonata 98-01 49 Mercedes Benz CLK C208 97-03 69 Honda Prelude 92-96 89 Holden / Toyota Apollo JM/JP / Camry / Sceptor 93-9710 BMW 3 Series E30 82-91 30 Hyundai Sonata EF 02-05 50 Mercedes Benz SLK R170 97-04 70 Honda Prelude 97-02 90 Toyota Celica 81-8511 BMW 3 Series E36 92-98 31 Mitsubishi Sigma / Galant / Sapporo / Lambda 82-84 51 Mercedes Benz C-Class W203 00-07 71 Peugeot 405 89-97 91 Toyota Celica 86-8912 BMW 3 Series E46 99-06 32 Mitsubishi Starion 82-87 52 Mercedes Benz CLK C209 03-07 72 Peugeot 505 82-93 92 Toyota Celica 90-9313 BMW 5 Series E28 82-88 33 Mitsubishi Galant 95- 96 53 Nissan Pintara 86-88 73 Peugeot 406 96-04 93 Toyota Celica 94-9914 BMW 5 Series E34 89-95 34 Jaguar X-Type 02-07 54 Nissan / Ford Pintara / Corsair / Bluebird
89-9274 Porsche 944 82-91 94 Toyota Celica 00-05
15 BMW 5 Series E39 96-03 35 Kia Credos 98-01 55 Nissan Bluebird 82-86 75 Renault Feugo 82-87 95 Lexus IS200 / IS300 99-0416 Chrysler PT Cruiser 00-07 36 Ford / Mazda Telstar / 626 / MX6 / Capella 83-86 56 Nissan 280ZX 82-84 76 Rover 75 01-05 96 Volvo 200 Series 82-9317 Citroen Xantia 94-00 37 Ford / Mazda Telstar / 626 / MX6 / Capella 88-91 57 Nissan Bluebird 93-97 77 Saab 900 Series 82-92 97 Volvo S60 01-0718 Daewoo Espero 95-97 38 Ford / Mazda Telstar / 626 / MX6 / Capella / Cronos
92-9758 Nissan 200SX / Silvia 94-02 78 Saab 900/9-3 94-02 98 Volkswagen Passat 98-06
19 Daewoo Leganza 97 -02 39 Mazda 626 98-02 59 Nissan 350Z 03-07 79 Saab 9000 86-9720 Daewoo Tacuma 00-04 40 Mazda RX7 82-85 60 Honda Accord Euro 03-07 80 Saab 9-3 03-07
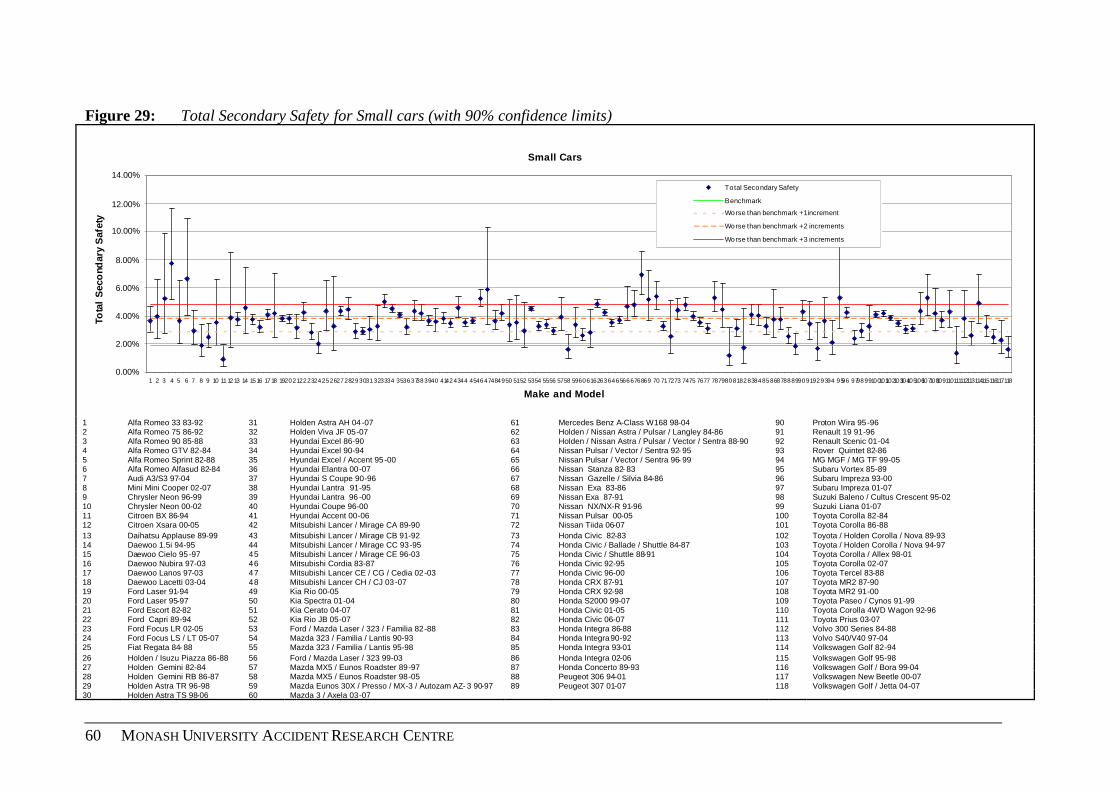
60 MONASH UNIVERSITY ACCIDENT RESEARCH CENTRE
Figure 29: Total Secondary Safety for Small cars (with 90% confidence limits)
Small Cars
0.00%
2.00%
4.00%
6.00%
8.00%
10.00%
12.00%
14.00%
1 2 3 4 5 6 7 8 9 10 1112 13 14 1516 1718 19202122232425262728293031323334 353637383940 41424344 454647484950 5152 5354 5556 5758 5960616263646566676869 70 717273 7475 7677 7879808182838485868788899091929394 9596 979899100101102103104105106107108109110111112113114115116117118
Make and Model
Tota
lS
eco
ndar
yS
afet
y
Total Secondary Safety
Benchmark
Worse than benchmark +1increment
Worse than benchmark +2 increments
Worse than benchmark +3 increments
1 Alfa Romeo 33 83-92 31 Holden Astra AH 04-07 61 Mercedes Benz A-Class W168 98-04 90 Proton Wira 95-962 Alfa Romeo 75 86-92 32 Holden Viva JF 05-07 62 Holden / Nissan Astra / Pulsar / Langley 84-86 91 Renault 19 91-963 Alfa Romeo 90 85-88 33 Hyundai Excel 86-90 63 Holden / Nissan Astra / Pulsar / Vector / Sentra 88-90 92 Renault Scenic 01-044 Alfa Romeo GTV 82-84 34 Hyundai Excel 90-94 64 Nissan Pulsar / Vector / Sentra 92- 95 93 Rover Quintet 82-865 Alfa Romeo Sprint 82-88 35 Hyundai Excel / Accent 95-00 65 Nissan Pulsar / Vector / Sentra 96- 99 94 MG MGF / MG TF 99-056 Alfa Romeo Alfasud 82-84 36 Hyundai Elantra 00-07 66 Nissan Stanza 82- 83 95 Subaru Vortex 85-897 Audi A3/S3 97-04 37 Hyundai S Coupe 90-96 67 Nissan Gazelle / Silvia 84-86 96 Subaru Impreza 93-008 Mini Mini Cooper 02-07 38 Hyundai Lantra 91-95 68 Nissan Exa 83-86 97 Subaru Impreza 01-079 Chrysler Neon 96-99 39 Hyundai Lantra 96 -00 69 Nissan Exa 87-91 98 Suzuki Baleno / Cultus Crescent 95-0210 Chrysler Neon 00-02 40 Hyundai Coupe 96-00 70 Nissan NX/NX-R 91-96 99 Suzuki Liana 01-0711 Citroen BX 86-94 41 Hyundai Accent 00-06 71 Nissan Pulsar 00-05 100 Toyota Corolla 82-8412 Citroen Xsara 00-05 42 Mitsubishi Lancer / Mirage CA 89-90 72 Nissan Tiida 06-07 101 Toyota Corolla 86-8813 Daihatsu Applause 89-99 43 Mitsubishi Lancer / Mirage CB 91-92 73 Honda Civic 82-83 102 Toyota / Holden Corolla / Nova 89-9314 Daewoo 1.5i 94-95 44 Mitsubishi Lancer / Mirage CC 93-95 74 Honda Civic / Ballade / Shuttle 84-87 103 Toyota / Holden Corolla / Nova 94-9715 Daewoo Cielo 95-97 45 Mitsubishi Lancer / Mirage CE 96-03 75 Honda Civic / Shuttle 88-91 104 Toyota Corolla / Allex 98-0116 Daewoo Nubira 97-03 46 Mitsubishi Cordia 83-87 76 Honda Civic 92-95 105 Toyota Corolla 02-0717 Daewoo Lanos 97-03 47 Mitsubishi Lancer CE / CG / Cedia 02-03 77 Honda Civic 96-00 106 Toyota Tercel 83-8818 Daewoo Lacetti 03-04 48 Mitsubishi Lancer CH / CJ 03-07 78 Honda CRX 87-91 107 Toyota MR2 87-9019 Ford Laser 91-94 49 Kia Rio 00-05 79 Honda CRX 92-98 108 Toyota MR2 91-0020 Ford Laser 95-97 50 Kia Spectra 01-04 80 Honda S2000 99-07 109 Toyota Paseo / Cynos 91-9921 Ford Escort 82-82 51 Kia Cerato 04-07 81 Honda Civic 01-05 110 Toyota Corolla 4WD Wagon 92-9622 Ford Capri 89-94 52 Kia Rio JB 05-07 82 Honda Civic 06-07 111 Toyota Prius 03-0723 Ford Focus LR 02-05 53 Ford / Mazda Laser / 323 / Familia 82-88 83 Honda Integra 86-88 112 Volvo 300 Series 84-8824 Ford Focus LS / LT 05-07 54 Mazda 323 / Familia / Lantis 90-93 84 Honda Integra90-92 113 Volvo S40/V40 97-0425 Fiat Regata 84- 88 55 Mazda 323 / Familia / Lantis 95-98 85 Honda Integra 93-01 114 Volkswagen Golf 82-9426 Holden / Isuzu Piazza 86-88 56 Ford / Mazda Laser / 323 99-03 86 Honda Integra 02-06 115 Volkswagen Golf 95-9827 Holden Gemini 82-84 57 Mazda MX5 / Eunos Roadster 89-97 87 Honda Concerto 89-93 116 Volkswagen Golf / Bora 99-0428 Holden Gemini RB 86-87 58 Mazda MX5 / Eunos Roadster 98-05 88 Peugeot 306 94-01 117 Volkswagen New Beetle 00-0729 Holden Astra TR 96-98 59 Mazda Eunos 30X / Presso / MX-3 / Autozam AZ- 3 90-97 89 Peugeot 307 01-07 118 Volkswagen Golf / Jetta 04-0730 Holden Astra TS 98-06 60 Mazda 3 / Axela 03-07
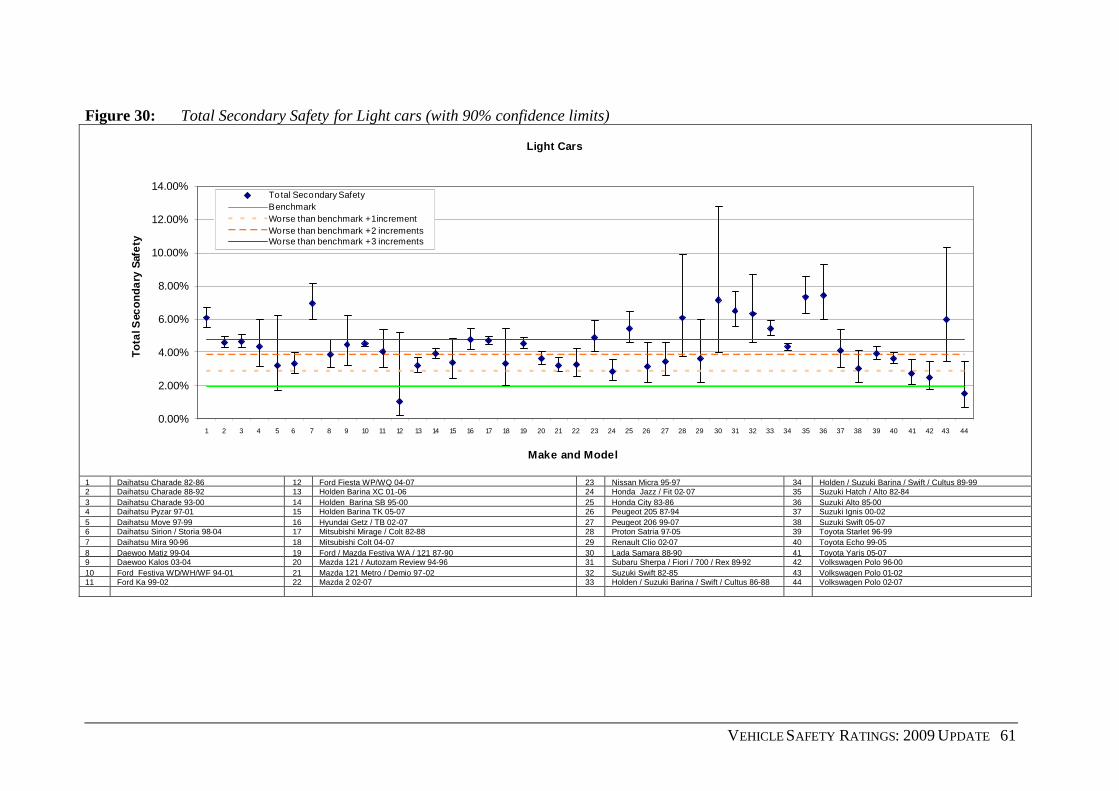
VEHICLE SAFETY RATINGS: 2009 UPDATE 61
Figure 30: Total Secondary Safety for Light cars (with 90% confidence limits)
Light Cars
0.00%
2.00%
4.00%
6.00%
8.00%
10.00%
12.00%
14.00%
1 2 3 4 5 6 7 8 9 10 11 12 13 14 15 16 17 18 19 20 21 22 23 24 25 26 27 28 29 30 31 32 33 34 35 36 37 38 39 40 41 42 43 44
Make and Model
To
talS
eco
nd
ary
Saf
ety
Total Secondary SafetyBenchmarkWorse than benchmark +1incrementWorse than benchmark +2 incrementsWorse than benchmark +3 increments
1 Daihatsu Charade 82-86 12 Ford Fiesta WP/WQ 04-07 23 Nissan Micra 95-97 34 Holden / Suzuki Barina / Swift / Cultus 89-992 Daihatsu Charade 88-92 13 Holden Barina XC 01-06 24 Honda Jazz / Fit 02- 07 35 Suzuki Hatch / Alto 82-843 Daihatsu Charade 93-00 14 Holden Barina SB 95-00 25 Honda City 83-86 36 Suzuki Alto 85-004 Daihatsu Pyzar 97-01 15 Holden Barina TK 05-07 26 Peugeot 205 87-94 37 Suzuki Ignis 00-025 Daihatsu Move 97-99 16 Hyundai Getz / TB 02-07 27 Peugeot 206 99-07 38 Suzuki Swift 05-076 Daihatsu Sirion / Storia 98-04 17 Mitsubishi Mirage / Colt 82-88 28 Proton Satria 97-05 39 Toyota Starlet 96-997 Daihatsu Mira 90-96 18 Mitsubishi Colt 04-07 29 Renault Clio 02-07 40 Toyota Echo 99-058 Daewoo Matiz 99-04 19 Ford / Mazda Festiva WA / 121 87-90 30 Lada Samara 88-90 41 Toyota Yaris 05-079 Daewoo Kalos 03-04 20 Mazda 121 / Autozam Review 94-96 31 Subaru Sherpa / Fiori / 700 / Rex 89-92 42 Volkswagen Polo 96-0010 Ford Festiva WD/WH/WF 94-01 21 Mazda 121 Metro / Demio 97-02 32 Suzuki Swift 82-85 43 Volkswagen Polo 01-0211 Ford Ka 99-02 22 Mazda 2 02-07 33 Holden / Suzuki Barina / Swift / Cultus 86-88 44 Volkswagen Polo 02-07

62 MONASH UNIVERSITY ACCIDENT RESEARCH CENTRE
Figure 31: Total Secondary Safety for People Movers (with 90% confidence limits)
People Movers
0.00%
1.00%
2.00%
3.00%
4.00%
5.00%
6.00%
7.00%
8.00%
9.00%
1 2 3 4 5 6 7 8 9 10 11 12 13 14 15 16 17 18 19 20 21 22 23
Make and Model
Tot
alS
eco
ndar
yS
afet
y
Total Secondary Safety
Benchmark
Worse than benchmark + 1 increment
Worse than benchmark + 2 increments
Worse than benchmark + 3 increments
1 Chrysler Voyager 97-01 13 Mazda MPV 00-062 Ford Spectron 86-90 14 Nissan Prairie 84-863 Holden Zafira TT 01-05 15 Nissan Serena 92-954 Mitsubishi Nimbus / Chariot / Spacewagon 85-91 16 Honda Odyssey 95-005 Mitsubishi Nimbus / Chariot 92-98 17 Honda Odyssey 00-026 Mitsubishi Nimbus 99-03 18 Honda Odyssey 04-077 Mitsubishi Starwagon / L300 83-86 19 Toyota Tarago 83-898 Mitsubishi Starwagon / Delica Starwagon 87-93 20 Toyota Tarago / Previa / Estima 91-999 Mitsubishi Starwagon / Delica Spacegear 95-98 21 Toyota Tarago / Previa / Estima 00-06
10 Mitsubishi Starwagon / Delica Spacegear 98-03 22 Toyota Spacia 93-0011 Kia Carnival 99-06 23 Toyota Avensis Verso 01-0712 Mazda MPV 94-99
5.3.5 Comparison of Crashworthiness, Aggressivity and the Total Secondary Safety index
Figure 32 plots vehicle models crashworthiness ratings against their total secondary safety index.The solid lines on the chart are the average value for each index. Figure 32 shows a strongrelationship exists between crashworthiness and total secondary safety reflecting thatcrashworthiness is relevant to injury outcome in all types of crashes involving light vehiclesexcluding those with unprotected road users.

VEHICLE SAFETY RATINGS: 2009 UPDATE 63
Figure 32: Crashworthiness vs. Total Secondary Safety
0.00%
2.00%
4.00%
6.00%
8.00%
10.00%
12.00%
14.00%
0.00% 1.00% 2.00% 3.00% 4.00% 5.00% 6.00% 7.00% 8.00% 9.00% 10.00% 11.00% 12.00% 13.00% 14.00% 15.00%
Total Safety
Cra
shw
ort
hin
ess
Ra
ting
4WD - Compact 4WD - Medium 4WD - Large Commercial - Van Commercial - Ute
Large Medium People Mover Light Small
In contrast, Figure 33 shows a much weaker relationship between aggressivity and total secondarysafety reflecting that aggressivity is only relevant to injury outcome in crashes between 2 lightvehicles and involving unprotected road users.
Figure 33: Aggressivity vs. Total Secondary Safety
0.00%
1.00%
2.00%
3.00%
4.00%
5.00%
6.00%
7.00%
8.00%
9.00%
0.00% 1.00% 2.00% 3.00% 4.00% 5.00% 6.00% 7.00% 8.00% 9.00% 10.00%
Total Safety
Agg
ress
ivit
yR
atin
g
4WD - Compact 4WD - Medium 4WD - Large Commercial - Van Commercial - Ute
Large Medium People Mover Light Small
Comparison by Market Groups
Tables 4, 5 and 6 show that essentially the rank order of the market groups within the totalsecondary safety index are consistent with the rankings within the crashworthiness measure but witha moderation effect on the total secondary safety index dependent on the aggressivity of the vehicle.In other words vehicles with high aggressivity display a shift in ranking for total secondary safetytowards higher or worse total secondary safety. For example, large four-wheel drives have shifted
64 MONASH UNIVERSITY ACCIDENT RESEARCH CENTRE
notably in their ranking from a 2 in the crashworthiness market group rankings to a ranking of 7across the market groups for total secondary safety.
5.4 Presentation of Total Secondary Safety Index, Crashworthiness andAggressivity Ratings for Consumer Information
Discussion in the previous work of Cameron et al (1998) noted the need for simplicity ofpresentation and interpretation in providing consumer safety advice through employing methodsthat summarised the complex statistical information contined in the ratings into an easily understoodsummary. Since the ratings of Newstead et al (2000), a method of presentation of the estimatedcrashworthiness ratings for Australian vehicles was devised that is similar in philosophy to thepresentation method devised by Folksam Insurance for presentation of Swedish ratings. The methodtook into account both the rating point estimate and confidence limits, but removed the emphasisfrom the point estimate. The same method of presentation was also used for the aggressivity andtotal secondary safety ratings.
As a first step in providing clear consumer information, the ratings presented have been filtered toensure a minimum level of statistical accuracy and hence a high degree of confidence in theinformation presented. In previous updates the total secondary safety, crashworthiness andaggressivity ratings presented for consumer information excluded those models where:
the vehicle was manufactured prior to 1986 (related to the introduction of unleaded petroland key regulatory changes in New Zealand), or
the width of the 90% two-sided confidence interval was greater than 3 and the comparisonaverage crashworthiness rating was within the 90% confidence interval (see section 5.1.4 forthe definition of the comparison average crashworthiness), or
the ratio of the confidence interval width to the rating score (coefficient of variation)exceeded 1.6 and the comparison average crashworthiness rating was within the 90%confidence interval.
The criteria above were used in the update of Newstead et al (2007a, b) and Newstead et al (2007c).For the most recent previous update of Newstead et al (2008a, b) the criteria were altered to avoidpublishing ratings for vehicles based on relatively limited quantities of data. Vehicles were alsoincluded that had a rating significantly different to the average crashworthiness rating although theconfidence interval width exceeded 3% or the coefficient of variation exceeded 1.6. These vehicleswhose confidence limit did not overlap the average could be classified statistically as either better orworse than average which was considered useful for consumer information. The criteria thenexcluded only those vehicles that were not statistically significantly different from average due toexcessive variation in the estimated rating or the vehicle was manufactured prior to 1986.
For this update the total secondary safety, crashworthiness and aggressivity ratings presented forconsumer information the presentation criteria have been tightened further to ensure even greateraccuracy. Ratings presented in the consumer information derived from this report exclude thosemodels where:
the vehicle was manufactured prior to 1992, or
the width of the 90% two-sided confidence interval was greater than 2.00%, or
VEHICLE SAFETY RATINGS: 2009 UPDATE 65
the ratio of the confidence interval width to the rating score (coefficient of variation)exceeded 1.6.
In previous updates, rated vehicles were classified into five categories based on the range in whichthe confidence limits on the estimated ratings lay relative to the average safety performance of thevehicle fleet. The five categories were defined as follows.
At least 15% safer than average: if the upper confidence limit on the estimated rating is lessthan 0.85 times the average crashworthiness rating for the vehicle fleet.
At least safer than average: if the upper confidence limit on the estimated rating is less thanthe average crashworthiness rating for the vehicle fleet.
Average: if the confidence interval on the estimated rating overlaps the averagecrashworthiness rating for the vehicle fleet.
At least less safe than average: if the lower confidence limit on the estimated rating isgreater than the average crashworthiness rating for the vehicle fleet.
At least 15% less safe than average: if the lower confidence limit on the estimated rating isgreater than 1.15 times the average crashworthiness rating for the vehicle fleet.
For this update, a new rating presentation classifies vehicles according to where their rating lies inrelation to a ‘best current performance’ benchmark. The benchmark is set by choosing a pecentileof the best (lowest) rating vehicles in the sample. The choice of percentle is arbitrary but shouldideally be less than 15% - i.e. 15% of vehicles have a rating better than that value. The benchmarkrating used in deriving the consumer presentation from this update was defined as the value belowwhich 5% of the rated vehicles’ rating point estimates lay (noting that a numerical lower ratingindicates better safety performance). Classification categories are then defined by distance bands inwhich the lower confidence limit on each individual vehicle rating lie away from this benchmark.The five categories were defined as follows.
Equal to the benchmark. Worse than the benchmark. At least 50% worse than the benchmark. At least 100% worse than the benchmark. At least 150% worse than the benchmark.
Again the separation gradients between categories are arbitrary but aimed to spread the vehiclesacross the performance categories. Vehicles are classified into each category according to the bandin which the lower confidence limit on the rating lies. Using only the lower confidence limit definesa true one-sided statistical test which is applied equally for each vehicle’s rating.
Presentation of the estimated crashworthiness ratings in this way is shown in Appendix 7. Thebenchmark crashworthiness rating above which 5% of the crashworthiness rating estimates werebetter is 1.60%. Colour coding of the categories has been used with green depicting that the rating isequivalent to the benchmark, blue depicting that the rating is worse than the benchmark throughorange and brown to red depicting at least 50%, 100% and 150% worse than the benchmarkrespectively.
A single column at the right of the table in Appendix 7 summarises the aggressivity ratings for eachvehicle. The benchmark aggressivity rating above which 5% of the aggressivity rating estimateswere better is 1.93%. In a manner similar to the classification of crashworthiness ratings, theestimated aggressivity ratings have been classified into five categories with each represented by asymbol in the final column of the table. These are:

66 MONASH UNIVERSITY ACCIDENT RESEARCH CENTRE
xx: At least 150% worse than the benchmark. x: At least 100% worse than the benchmark. o: At least 50% worse than the benchmark. +: Worse than the benchmark. ++: Equal to the benchmark.
Presentation of the estimated total secondary safety index in this way is also shown in Appendix 7.The benchmark total secondary safety rating above which 5% of the total secondary safety ratingestimates were better is 1.91%.
This presentation style has the advantage that it combines information about both the rating pointestimate and confidence limit to classify the safety performance of the vehicle. Like the previouspresentation format, this method of presentation takes the potential emphasis of the consumer offcomparison of only the point estimate ratings, an emphasis that can be potentially misleading fromthe point of view of statistical confidence. Rather, the presentation method categorises vehiclesaccording to the statistical significance of the difference of their estimated safety rating fromdefined points. Colour coding of the categories would typically be used with green depicting thesafest category through blue, orange and brown to red depicting the least safe category. 90% two-sided confidence limits have been used to categorise the crashworthiness ratings in Appendix 7.These are equivalent to a 95% one-sided confidence limit for the directional hypothesis testing howmuch greater than a defined point the ratings is, as employed in the new rating presentation.
Some vehicle models in Appendix 7 have no symbol in the aggressivity rating column. Thesevehicles have been involved in an insufficient number of crashes to have an aggressivity ratingestimated for them.
5.5 Crashworthiness by Year of Manufacture of the Australian Vehicle Fleet
5.5.1 Injury Risk
Injury risk was estimated from the data on 3,423,395 drivers involved in tow-away crashes in NewSouth Wales, South Australia, Western Australia and Queensland during 1987 to 2007. This data setis referred to as the "involved drivers". Because of missing values of some of the factors to beincluded in the logistic regression, and the exclusion of pre-1964 vehicles and unknown years,analysis was performed on data relating to 2,900,507 involved drivers, 492,722 of whom wereinjured. The following non-vehicle factors and their interactions were statistically significantlyassociated with injury risk and were included in the logistic regression model.
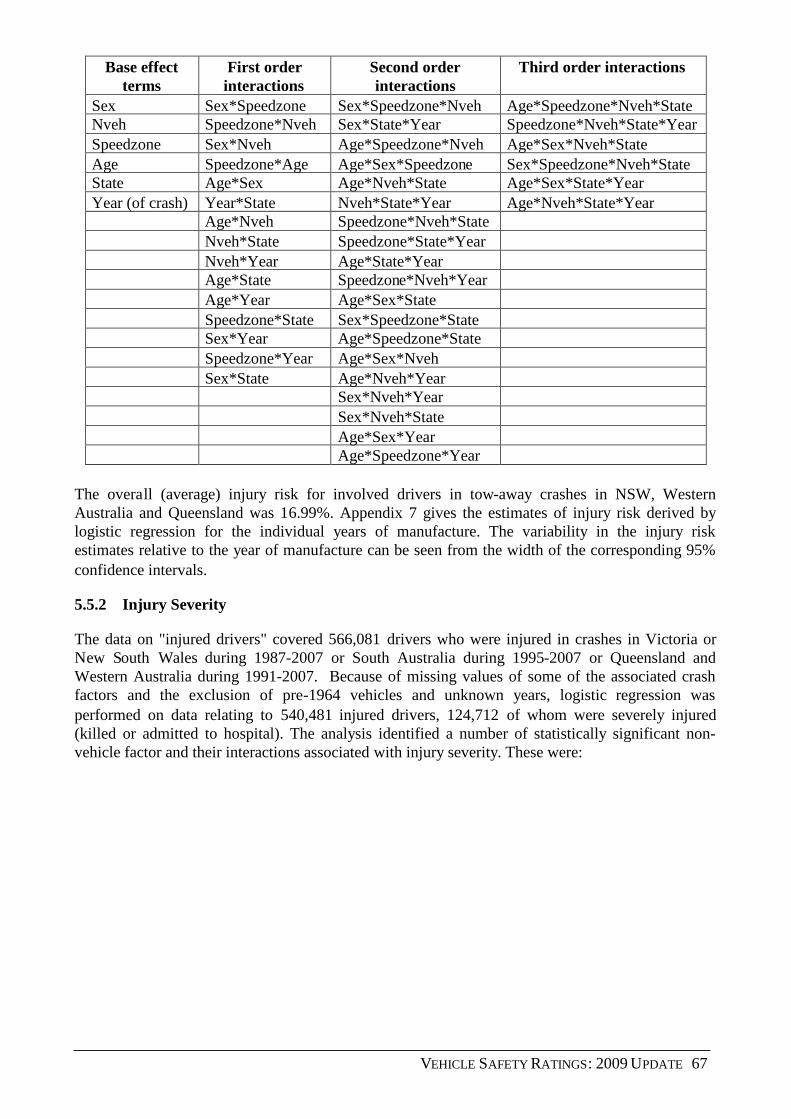
VEHICLE SAFETY RATINGS: 2009 UPDATE 67
Base effectterms
First orderinteractions
Second orderinteractions
Third order interactions
Sex Sex*Speedzone Sex*Speedzone*Nveh Age*Speedzone*Nveh*StateNveh Speedzone*Nveh Sex*State*Year Speedzone*Nveh*State*YearSpeedzone Sex*Nveh Age*Speedzone*Nveh Age*Sex*Nveh*StateAge Speedzone*Age Age*Sex*Speedzone Sex*Speedzone*Nveh*StateState Age*Sex Age*Nveh*State Age*Sex*State*YearYear (of crash) Year*State Nveh*State*Year Age*Nveh*State*Year
Age*Nveh Speedzone*Nveh*StateNveh*State Speedzone*State*YearNveh*Year Age*State*YearAge*State Speedzone*Nveh*YearAge*Year Age*Sex*StateSpeedzone*State Sex*Speedzone*StateSex*Year Age*Speedzone*StateSpeedzone*Year Age*Sex*NvehSex*State Age*Nveh*Year
Sex*Nveh*YearSex*Nveh*StateAge*Sex*YearAge*Speedzone*Year
The overall (average) injury risk for involved drivers in tow-away crashes in NSW, WesternAustralia and Queensland was 16.99%. Appendix 7 gives the estimates of injury risk derived bylogistic regression for the individual years of manufacture. The variability in the injury riskestimates relative to the year of manufacture can be seen from the width of the corresponding 95%confidence intervals.
5.5.2 Injury Severity
The data on "injured drivers" covered 566,081 drivers who were injured in crashes in Victoria orNew South Wales during 1987-2007 or South Australia during 1995-2007 or Queensland andWestern Australia during 1991-2007. Because of missing values of some of the associated crashfactors and the exclusion of pre-1964 vehicles and unknown years, logistic regression wasperformed on data relating to 540,481 injured drivers, 124,712 of whom were severely injured(killed or admitted to hospital). The analysis identified a number of statistically significant non-vehicle factor and their interactions associated with injury severity. These were:
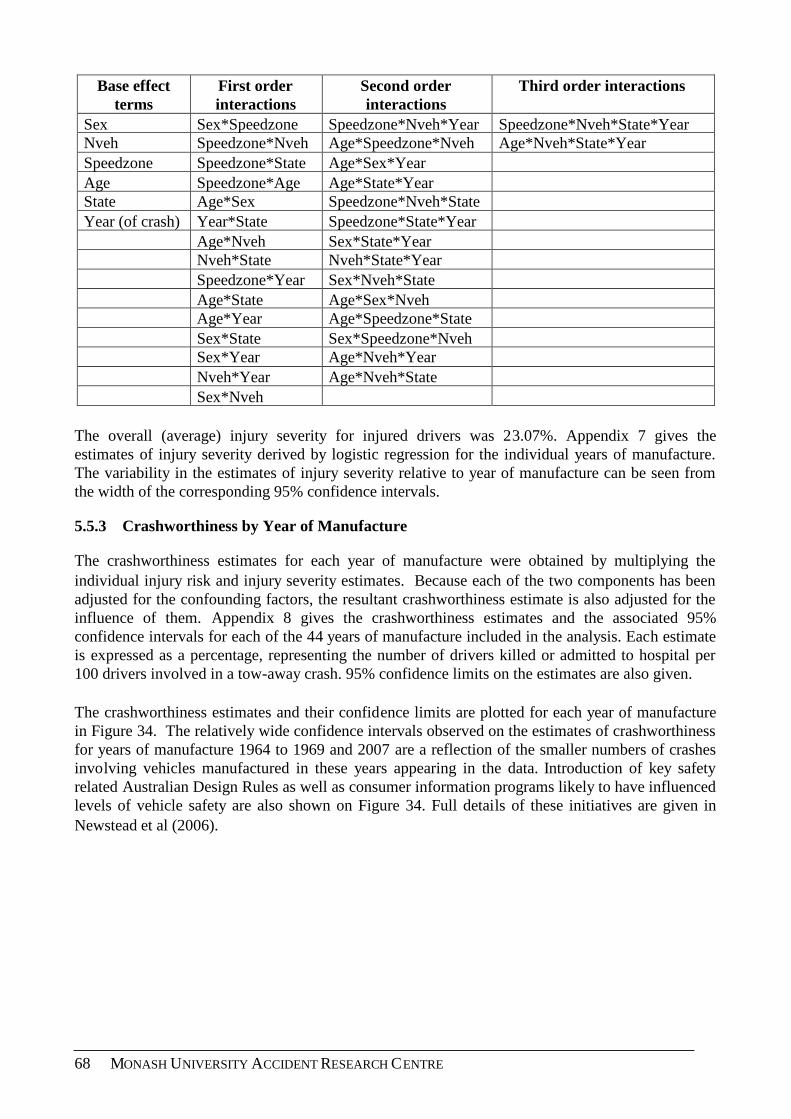
68 MONASH UNIVERSITY ACCIDENT RESEARCH CENTRE
Base effectterms
First orderinteractions
Second orderinteractions
Third order interactions
Sex Sex*Speedzone Speedzone*Nveh*Year Speedzone*Nveh*State*YearNveh Speedzone*Nveh Age*Speedzone*Nveh Age*Nveh*State*YearSpeedzone Speedzone*State Age*Sex*YearAge Speedzone*Age Age*State*YearState Age*Sex Speedzone*Nveh*StateYear (of crash) Year*State Speedzone*State*Year
Age*Nveh Sex*State*YearNveh*State Nveh*State*YearSpeedzone*Year Sex*Nveh*StateAge*State Age*Sex*NvehAge*Year Age*Speedzone*StateSex*State Sex*Speedzone*NvehSex*Year Age*Nveh*YearNveh*Year Age*Nveh*StateSex*Nveh
The overall (average) injury severity for injured drivers was 23.07%. Appendix 7 gives theestimates of injury severity derived by logistic regression for the individual years of manufacture.The variability in the estimates of injury severity relative to year of manufacture can be seen fromthe width of the corresponding 95% confidence intervals.
5.5.3 Crashworthiness by Year of Manufacture
The crashworthiness estimates for each year of manufacture were obtained by multiplying theindividual injury risk and injury severity estimates. Because each of the two components has beenadjusted for the confounding factors, the resultant crashworthiness estimate is also adjusted for theinfluence of them. Appendix 8 gives the crashworthiness estimates and the associated 95%confidence intervals for each of the 44 years of manufacture included in the analysis. Each estimateis expressed as a percentage, representing the number of drivers killed or admitted to hospital per100 drivers involved in a tow-away crash. 95% confidence limits on the estimates are also given.
The crashworthiness estimates and their confidence limits are plotted for each year of manufacturein Figure 34. The relatively wide confidence intervals observed on the estimates of crashworthinessfor years of manufacture 1964 to 1969 and 2007 are a reflection of the smaller numbers of crashesinvolving vehicles manufactured in these years appearing in the data. Introduction of key safetyrelated Australian Design Rules as well as consumer information programs likely to have influencedlevels of vehicle safety are also shown on Figure 34. Full details of these initiatives are given inNewstead et al (2006).
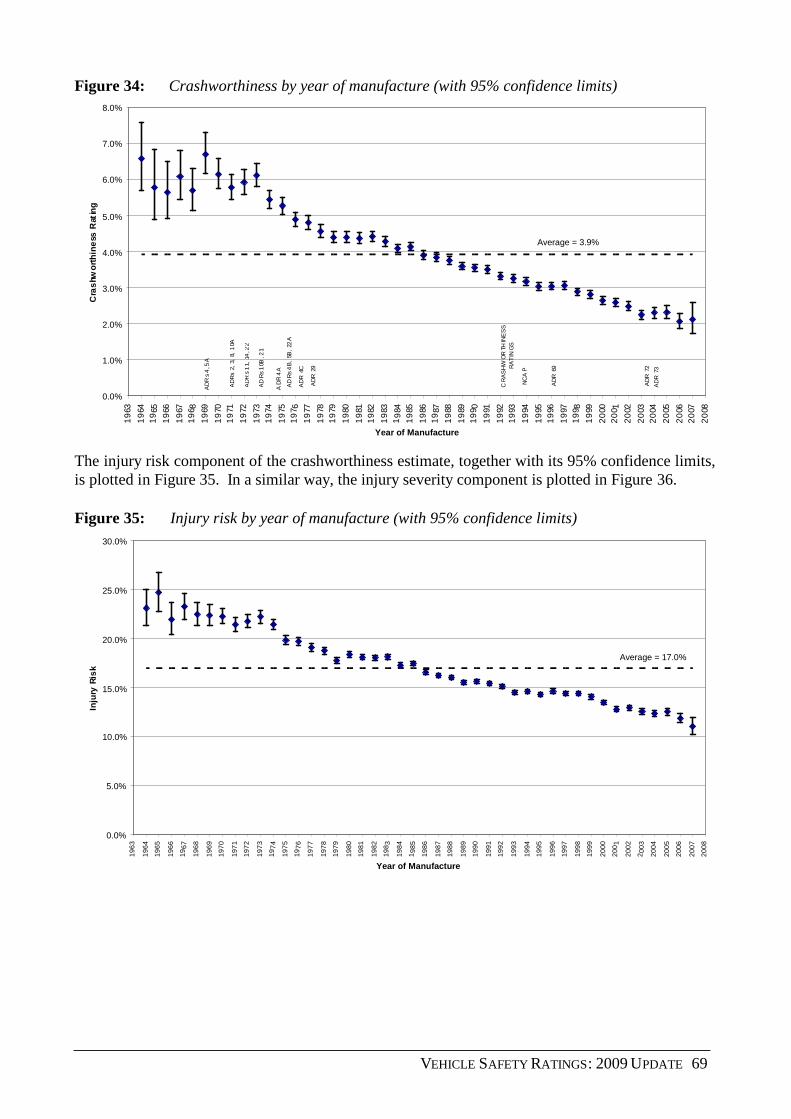
VEHICLE SAFETY RATINGS: 2009 UPDATE 69
Figure 34: Crashworthiness by year of manufacture (with 95% confidence limits)
0.0%
1.0%
2.0%
3.0%
4.0%
5.0%
6.0%
7.0%
8.0%
19
63
19
641
965
19
66
19
671
96 8
19
69
19
701
971
19
72
19
731
974
19
751
97 6
19
77
19
781
979
19
80
19
811
982
19
831
984
19
85
19
861
987
19
88
19
891
99 0
19
91
19
921
993
19
94
19
951
996
19
971
99 8
19
99
20
002
00 1
20
02
20
032
004
20
05
20
062
007
20
08
Year of Manufacture
Cra
shw
ort
hin
ess
Rat
ing
Average = 3.9%
AD
R69
NC
AP
CR
AS
HW
OR
THIN
ES
SR
AT
ING
S
AD
R29
AD
R4C
AD
Rs
4B
,5B
,22
A
AD
R4
A
AD
Rs
10B
,21
AD
Rs
11,
14,2
2
AD
Rs
2,3,
8,1
0A
AD
Rs
4,5
A
AD
R72
AD
R73
The injury risk component of the crashworthiness estimate, together with its 95% confidence limits,is plotted in Figure 35. In a similar way, the injury severity component is plotted in Figure 36.
Figure 35: Injury risk by year of manufacture (with 95% confidence limits)
0.0%
5.0%
10.0%
15.0%
20.0%
25.0%
30.0%
1963
1964
1965
1966
1967
1968
1969
1970
1971
1972
1973
1974
1975
1976
1977
1978
1979
1980
1981
1982
198 3
1984
1 985
1986
1987
1988
1989
1990
1991
1992
1993
1994
1995
1996
1997
1998
1999
2000
200 1
2002
2 003
2004
2005
2006
2007
2008
Year of Manufacture
Inju
ryR
isk
Average = 17.0%
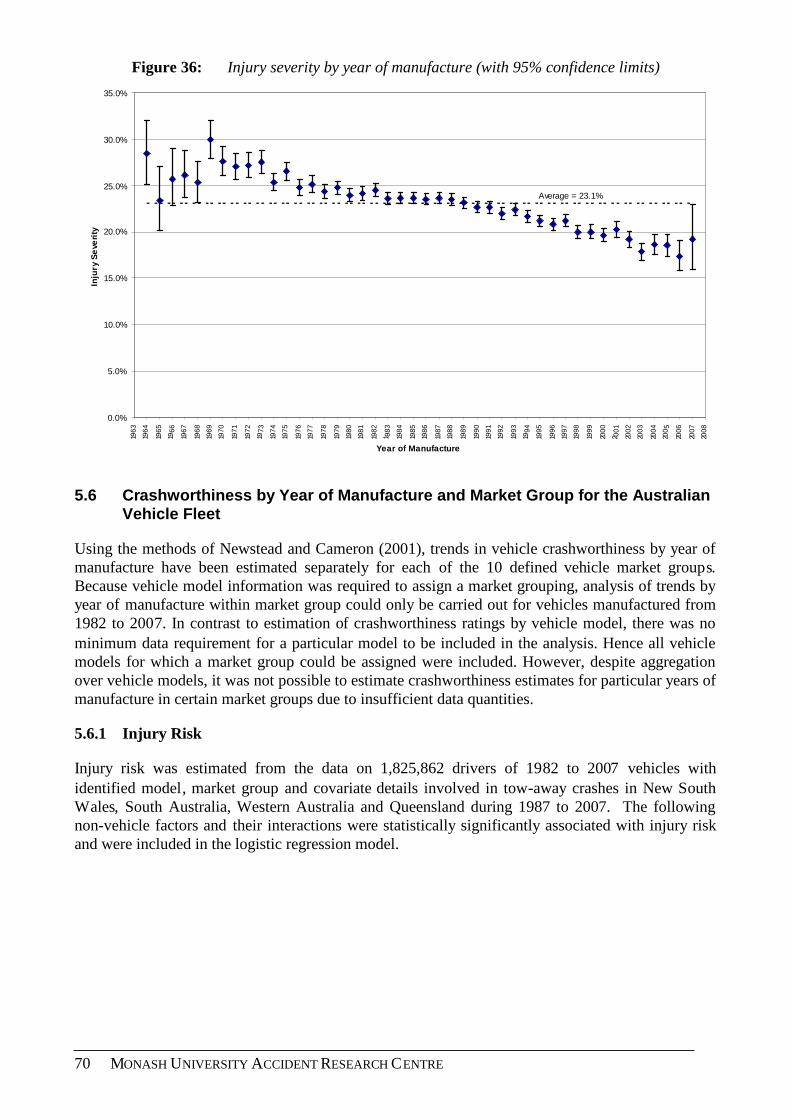
70 MONASH UNIVERSITY ACCIDENT RESEARCH CENTRE
Figure 36: Injury severity by year of manufacture (with 95% confidence limits)
0.0%
5.0%
10.0%
15.0%
20.0%
25.0%
30.0%
35.0%
1963
1964
1965
1966
1967
1968
1969
1970
1971
1972
1973
1974
1975
1976
1977
1978
1979
1980
1981
1982
1 983
1984
1985
1986
1987
1988
1989
1990
1991
1992
1993
1994
1995
1996
1997
1998
1999
2000
2 001
2002
2003
2004
200 5
2006
2007
2008
Year of Manufacture
Inju
ryS
eve
rity
Average = 23.1%
5.6 Crashworthiness by Year of Manufacture and Market Group for the AustralianVehicle Fleet
Using the methods of Newstead and Cameron (2001), trends in vehicle crashworthiness by year ofmanufacture have been estimated separately for each of the 10 defined vehicle market groups.Because vehicle model information was required to assign a market grouping, analysis of trends byyear of manufacture within market group could only be carried out for vehicles manufactured from1982 to 2007. In contrast to estimation of crashworthiness ratings by vehicle model, there was nominimum data requirement for a particular model to be included in the analysis. Hence all vehiclemodels for which a market group could be assigned were included. However, despite aggregationover vehicle models, it was not possible to estimate crashworthiness estimates for particular years ofmanufacture in certain market groups due to insufficient data quantities.
5.6.1 Injury Risk
Injury risk was estimated from the data on 1,825,862 drivers of 1982 to 2007 vehicles withidentified model, market group and covariate details involved in tow-away crashes in New SouthWales, South Australia, Western Australia and Queensland during 1987 to 2007. The followingnon-vehicle factors and their interactions were statistically significantly associated with injury riskand were included in the logistic regression model.
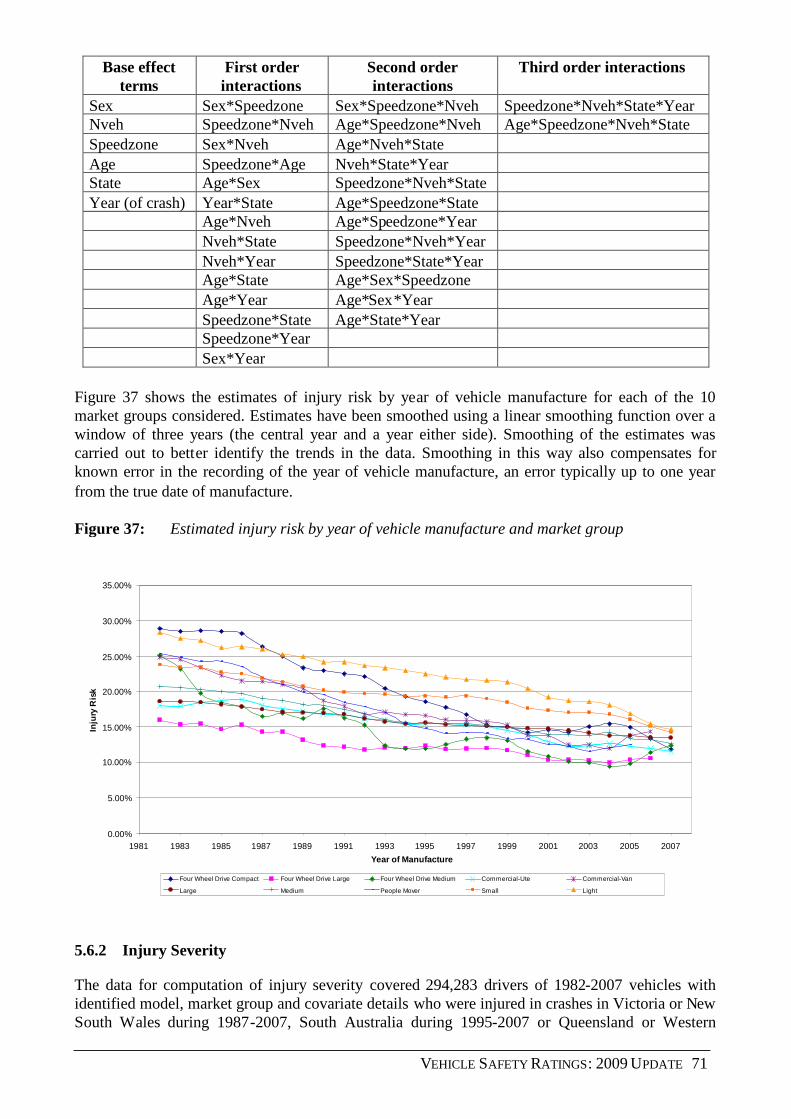
VEHICLE SAFETY RATINGS: 2009 UPDATE 71
Base effectterms
First orderinteractions
Second orderinteractions
Third order interactions
Sex Sex*Speedzone Sex*Speedzone*Nveh Speedzone*Nveh*State*YearNveh Speedzone*Nveh Age*Speedzone*Nveh Age*Speedzone*Nveh*StateSpeedzone Sex*Nveh Age*Nveh*StateAge Speedzone*Age Nveh*State*YearState Age*Sex Speedzone*Nveh*StateYear (of crash) Year*State Age*Speedzone*State
Age*Nveh Age*Speedzone*YearNveh*State Speedzone*Nveh*YearNveh*Year Speedzone*State*YearAge*State Age*Sex*SpeedzoneAge*Year Age*Sex*YearSpeedzone*State Age*State*YearSpeedzone*YearSex*Year
Figure 37 shows the estimates of injury risk by year of vehicle manufacture for each of the 10market groups considered. Estimates have been smoothed using a linear smoothing function over awindow of three years (the central year and a year either side). Smoothing of the estimates wascarried out to better identify the trends in the data. Smoothing in this way also compensates forknown error in the recording of the year of vehicle manufacture, an error typically up to one yearfrom the true date of manufacture.
Figure 37: Estimated injury risk by year of vehicle manufacture and market group
0.00%
5.00%
10.00%
15.00%
20.00%
25.00%
30.00%
35.00%
1981 1983 1985 1987 1989 1991 1993 1995 1997 1999 2001 2003 2005 2007
Year of Manufacture
Inju
ryR
isk
Four Wheel Drive Compact Four Wheel Drive Large Four Wheel Drive Medium Commercial-Ute Commercial-Van
Large Medium People Mover Small Light
5.6.2 Injury Severity
The data for computation of injury severity covered 294,283 drivers of 1982-2007 vehicles withidentified model, market group and covariate details who were injured in crashes in Victoria or NewSouth Wales during 1987-2007, South Australia during 1995-2007 or Queensland or Western
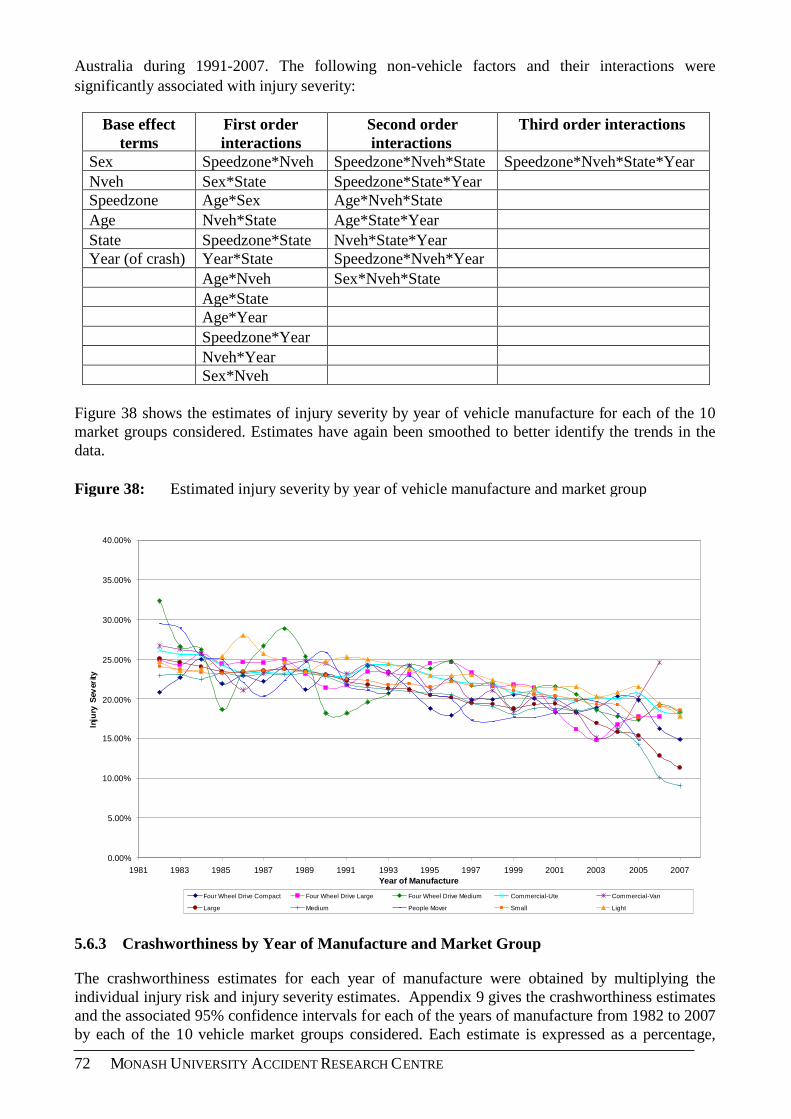
72 MONASH UNIVERSITY ACCIDENT RESEARCH CENTRE
Australia during 1991-2007. The following non-vehicle factors and their interactions weresignificantly associated with injury severity:
Base effectterms
First orderinteractions
Second orderinteractions
Third order interactions
Sex Speedzone*Nveh Speedzone*Nveh*State Speedzone*Nveh*State*YearNveh Sex*State Speedzone*State*YearSpeedzone Age*Sex Age*Nveh*StateAge Nveh*State Age*State*YearState Speedzone*State Nveh*State*YearYear (of crash) Year*State Speedzone*Nveh*Year
Age*Nveh Sex*Nveh*StateAge*StateAge*YearSpeedzone*YearNveh*YearSex*Nveh
Figure 38 shows the estimates of injury severity by year of vehicle manufacture for each of the 10market groups considered. Estimates have again been smoothed to better identify the trends in thedata.
Figure 38: Estimated injury severity by year of vehicle manufacture and market group
0.00%
5.00%
10.00%
15.00%
20.00%
25.00%
30.00%
35.00%
40.00%
1981 1983 1985 1987 1989 1991 1993 1995 1997 1999 2001 2003 2005 2007Year of Manufacture
Inju
ryS
ever
ity
Four Wheel Drive Compact Four Wheel Drive Large Four Wheel Drive Medium Commercial-Ute Commercial-Van
Large Medium People Mover Small Light
5.6.3 Crashworthiness by Year of Manufacture and Market Group
The crashworthiness estimates for each year of manufacture were obtained by multiplying theindividual injury risk and injury severity estimates. Appendix 9 gives the crashworthiness estimatesand the associated 95% confidence intervals for each of the years of manufacture from 1982 to 2007by each of the 10 vehicle market groups considered. Each estimate is expressed as a percentage,

VEHICLE SAFETY RATINGS: 2009 UPDATE 73
representing the number of drivers killed or admitted to hospital per 100 drivers involved in a tow-away crash. The crashworthiness estimates are plotted for each year of manufacture and vehiclemarket group in Figure 39. Again, the values in Figure 39 have been smoothed for reasons givenabove.
Figure 39: Estimated crashworthiness by year of vehicle manufacture and market group
0.00%
1.00%
2.00%
3.00%
4.00%
5.00%
6.00%
7.00%
8.00%
9.00%
1981 1983 1985 1987 1989 1991 1993 1995 1997 1999 2001 2003 2005 2007
Year of Manufacture
Cra
shw
ort
hine
ssR
atin
g
Four Wheel Drive Compact Four Wheel Drive Large Four Wheel Drive Medium Commercial-Ute Commercial-Van
Large Medium People Mover Small Light
Figure 39 clearly shows differential performance in crashworthiness between vehicle market groups,reflecting the same differences seen in average crashworthiness by market groups found in the makeand model specific ratings presented above (see Appendix 4). It is, however, difficult from Figure39 to gauge differential improvements in crashworthiness over time. This is due to the complexityof the figure with 10 market groups as well as the relatively high variance in some of the year toyear estimates despite smoothing. To try and better measure differential time based safetyimprovements by market group, Figure 40 presents average crashworthiness by five year timeblocks of manufacture for the periods 1982-1986, 1987-1991, 1992-1996 and 1997-2001 and a sixyear time block for 2002-2007. In addition, estimates have been scaled to be relative to the first timeblock (1982-1986) for each market groups. Whilst Figure 40 no longer reflects average differencesin crashworthiness between market groups, it more clearly demonstrates differential performancebetween market groups in improving crashworthiness over time.
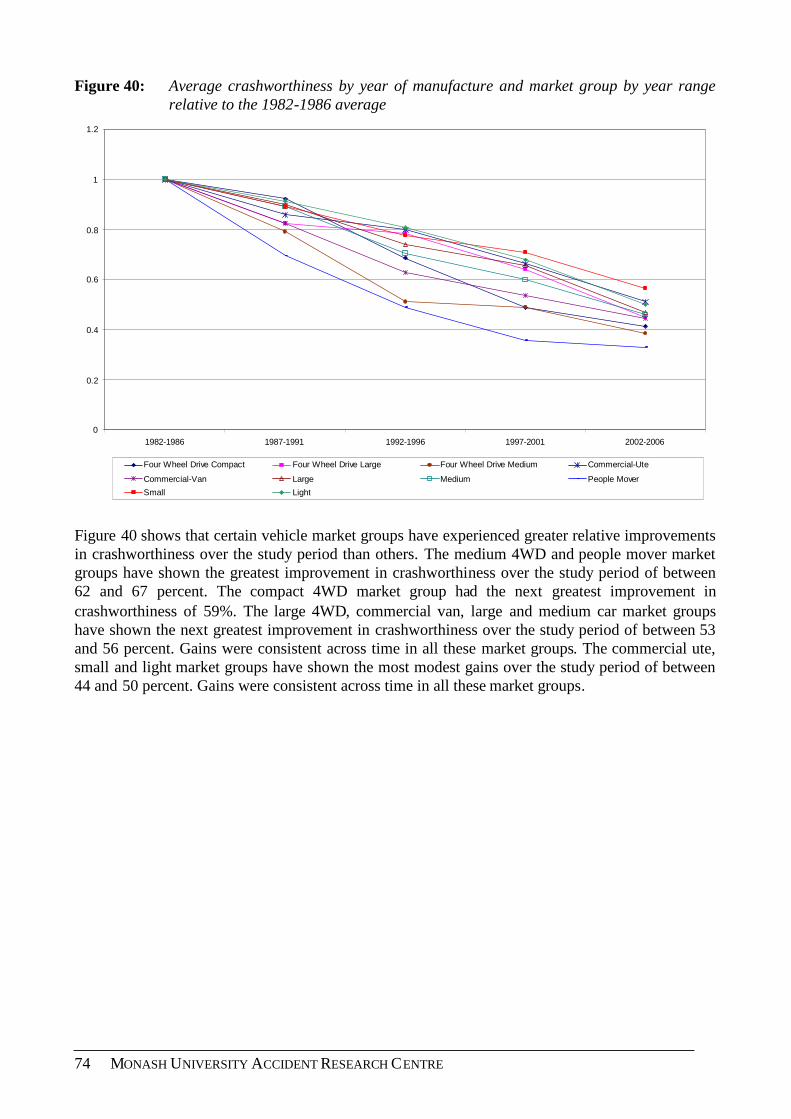
74 MONASH UNIVERSITY ACCIDENT RESEARCH CENTRE
Figure 40: Average crashworthiness by year of manufacture and market group by year rangerelative to the 1982-1986 average
0
0.2
0.4
0.6
0.8
1
1.2
1982-1986 1987-1991 1992-1996 1997-2001 2002-2006
Four Wheel Drive Compact Four Wheel Drive Large Four Wheel Drive Medium Commercial-Ute
Commercial-Van Large Medium People Mover
Small Light
Figure 40 shows that certain vehicle market groups have experienced greater relative improvementsin crashworthiness over the study period than others. The medium 4WD and people mover marketgroups have shown the greatest improvement in crashworthiness over the study period of between62 and 67 percent. The compact 4WD market group had the next greatest improvement incrashworthiness of 59%. The large 4WD, commercial van, large and medium car market groupshave shown the next greatest improvement in crashworthiness over the study period of between 53and 56 percent. Gains were consistent across time in all these market groups. The commercial ute,small and light market groups have shown the most modest gains over the study period of between44 and 50 percent. Gains were consistent across time in all these market groups.

VEHICLE SAFETY RATINGS: 2009 UPDATE 75
7. CONCLUSIONS
Additional crash data has enabled the crashworthiness ratings to be obtained for a larger range of carmodels than in previous studies with the ratings now covering 427 different vehicle modelsmanufactured from 1982-2007. The new data set has been able to produce more up-to-date andreliable estimates of the crashworthiness of individual car models than those published previously.
The rating scores estimate the risk of a driver being killed or seriously injured when involved in atow-away crash, to a degree of accuracy represented by the confidence limits of the rating in eachcase. The estimates and their associated confidence limits were sufficiently sensitive that they wereable to identify 203 models of passenger cars, four wheel drive vehicles, passenger vans and lightcommercial vehicles with ratings equal to or worse than the crashworthiness benchmark rating of1.60%. Ratings are presented for individual vehicle models in the Australian and New Zealandpassenger fleets classified into one of 10 market groups.
This update of the ratings also revised the vehicle aggressivity ratings. The aggressivity measureconsiders the injury outcome to both drivers of other vehicles and unprotected road users includingpedestrians, bicyclists and motorcyclists. The aggressivity rating measured the risk of death orserious injury a vehicle poses to drivers of other cars or unprotected road users with which itimpacts in a crash. The mix of other drivers and unprotected road users on which the rating for eachvehicle was based was standardised along with various other non-vehicle related factors usinglogistic regression techniques.
The aggressivity measure was calculated for 397 models of Australian and New Zealand passengervehicles (passenger cars, four wheel drive vehicles, passenger vans and light commercial vehicles)manufactured between the years 1982-2007. The degree of accuracy of the aggressivity ratings isrepresented by the confidence limits of the rating in each case. The estimates and their associatedconfidence limits were sufficiently sensitive that they were able to identify 154 models of passengercars, four wheel drive vehicles, passenger vans and light commercial vehicles with ratings equal toor worse than the crashworthiness benchmark rating of 1.93%. Estimated vehicle aggressivitytowards drivers of other vehicles or unprotected road users was found to have a proportionalrelationship with vehicle mass. It was also found to have little or no relationship with ratings ofvehicle crashworthiness, demonstrating the independence of the two complementary measures. Forthis update, 427 or 100% of the vehicle models rated for crashworthiness were also able to be ratedfor aggressivity.
The crashworthiness of passenger vehicles in the Australian vehicle fleet (cars, station wagons, fourwheel drives, vans and taxis), measured by the risk of the driver being killed or admitted to hospitalas the result of involvement in a tow-away crash, has been estimated for the years of manufacturefrom 1964 to 2007. This study further updates the original one by Cameron et al (1994a) for years ofmanufacture 1964 to 1992. It shows similar patterns of improvements in crashworthiness with thegreatest gains over the years 1970 to 1979 during which time a number of new Australian DesignRules aimed at occupant protection took effect. Further significant gains in crashworthiness havealso been observed over the years 1986 to 2007, with notable steady gains from 1985 to 1995 andsince 2000. Trends in crashworthiness by year of vehicle manufacture from 1982 to 2007 for each ofthe 10 vehicle market groups were also estimated showing differential improvement incrashworthiness by market group by year of manufacture.
The total secondary safety index developed in Newstead et al (2007c) was updated to includerecords of light vehicle crashes reported to the police in four Australian states and New Zealandfrom 1987 to 2007. The index was adjusted for the sex and age of the person whose injury outcomewas being measured, speed limit at the crash location, number of vehicles involved, the jurisdiction

76 MONASH UNIVERSITY ACCIDENT RESEARCH CENTRE
in which the crash occurred and the year in which the crash occurred. These factors were stronglyrelated to injury risk and/or severity. In addition to the above factors this rating was also adjusted forthe type of crash and road user combination as this factor was strongly related to injury risk and/orseverity. Total secondary safety index estimates and their associated confidence limits wereobtained for 484 vehicle models classified into 10 market groups. They were sufficiently sensitivethat they were able to identify 239 models of passenger cars, four wheel drive vehicles, passengervans and light commercial vehicles with ratings equal to or worse than the crashworthinessbenchmark rating of 1.91%.
The total secondary safety index summarises the combined crashworthiness and aggressivitymeasures in a way that best reflects the relative importance of each component in real world crashcircumstances. By constructing the total secondary safety index as a weighted average of injuryoutcome probabilities in a range of relevant major crash types involving light passenger vehiclesand weighting each component by the relative incidence of that crash type, the index developedrepresents the most objective and relevant summary possible.
By having a single index estimated in a single integrated analysis, it has allowed total secondarysafety to be considered on a vehicle by vehicle basis with statistical confidence limits placed in theestimates. One key advantage of the integrated total secondary safety measure is that it makesmaximum use of the available crash data to assess vehicle secondary safety performance. Applied tothe available police reported crash data it was possible to estimate statistically reliable ratings for484 distinct makes and models of vehicles. This compares to the separate crashworthiness andaggressivity measures calculated from the same data where only 427 and 397 vehicles respectivelywere rated.
Comparison of the total secondary safety index with the crashworthiness and aggressivity estimatesgives insight into the relative importance of the two separate measures in determining overallvehicle secondary safety performance. Comparison of Figures 32 with 33 shows the total vehiclesecondary safety index is much more strongly associated with the crashworthiness measure than theaggressivity measure. This is as expected given that a vehicle’s crashworthiness performance isrelevant in a wider range of crash types than is its aggressivity. Specifically, crashworthiness isrelevant in all crashes except crashes involving unprotected road users. In comparison, aggressivityis only relevant in crashes involving other light passenger vehicle or unprotected road users. Thiscomparison highlights how the total safety index weights the crashworthiness and aggressivityperformance in a way most appropriate to the crash types represented in the total crash population.However, this means the total secondary safety index will to a large degree be dependent on thedistribution of crash types in the jurisdiction where the rated vehicle set is exposed. Consequently,the total safety index most relevant to one country might not be the most relevant to another if theircrash type distributions are fundamentally different. For example, aggressivity might weight morehighly in the total secondary safety index in the UK where they have more multi-vehicle andunprotected road user crashes compared to Australia and New Zealand where single vehicle crashesand hence crashworthiness weight more highly.
When considering market group based results, Table 6 shows large cars and medium four wheeldrives to have the best (lowest) total safety index of the 10 market groups considered. In contrast,light vehicles and commercial vans have the poorest overall secondary safety performance (highestindex). It is interesting to note that the difference in between the best and worst market groups fortotal secondary safety differ by only a factor of 1.24. In contrast, the crashworthiness andaggressivity rating differ between best and worst market groups by a factor of 1.93 and 2.28respectively. Both the crashworthiness and aggressivity indexes are dependent on vehicle masswhich tends to heighten the spread of ratings between market groups. Since the mass relationship isopposite between the crashworthiness and aggressivity ratings, combining them in the total
VEHICLE SAFETY RATINGS: 2009 UPDATE 77
secondary safety index will to at least some degree cancel out the mass effect explaining the lowerrange of total secondary safety values estimated.
For vehicle regulators and safety advocates, the total secondary safety index possibly represents themost relevant measure of vehicle secondary safety performance as it encapsulates the totalperformance of the vehicle in preventing serious injury outcome. The total secondary safety index isthe most relevant to developing policy to optimise the safety of the light vehicle fleet. Advocatinguse of the total secondary safety index as the primary consumer focus is much more likely to lead tobetter vehicle safety choices for society as a whole. Optimising on crashworthiness or aggressivityalone will not necessarily produce the safest vehicle fleet. However, the crashworthiness andaggressivity components are still important separately to identify those characteristics of a vehicleleading to good performance in each dimension. Furthermore, the results of this study identify thatoptimising crashworthiness performance in the Australasian setting will lead to faster and widerspread gains than optimising aggressivity.

78 MONASH UNIVERSITY ACCIDENT RESEARCH CENTRE
8. ASSUMPTIONS AND QUALIFICATIONS
The results and conclusions presented in this report are based on a number of assumptions andwarrant a number of qualifications that the reader should note. These are listed in the followingsections.
8.1 Assumptions
It has been assumed that:
TAC claims records and, Victorian, New South Wales, South Australian, WesternAustralian, Queensland and New Zealand Police crash reports accurately recorded driverinjury, hospitalisation and death.
There was no bias in the merging of TAC claims and Victorian Police crash reports relatedto the model of car and factors affecting the severity of the crash.
Crashed vehicle registration numbers were recorded accurately on Police crash reports andthat they correctly identified the crashed vehicles in the Victorian, New South Wales, SouthAustralian, Queensland, Western Australian and New Zealand vehicle registers.
The adjustments for driver sex, age, speed zone, the number of vehicles involved and thestate and year in which the crash occurred removed the influences of the other main factorsavailable in the data that affected crash severity and injury susceptibility.
The form of the logistic models used to relate injury risk and injury severity with theavailable factors influencing these outcomes (including the car model, market group or yearof manufacture) was correct.
Information contained in the Police crash records allowed accurate matching of bothvehicles involved in crashes between two passenger cars and vehicles impacting unprotectedroad users for the purpose of calculating aggressivity ratings.
8.2 Qualifications
The results and conclusions warrant at least the following qualifications:
Only driver crash involvements and injuries have been considered. Passengers occupyingthe same model cars may have had different injury outcomes.
Some models with the same name through the 1982-2007 years of manufacture may havevaried substantially in their construction, specification and mass. Although there should befew such models in these updated results, the rating score calculated for these models maygive a misleading impression and should be interpreted with caution.
Other factors not collected in the data (e.g. crash impact severity) may differ between themodels and may affect the results. However, earlier analysis has suggested that the differentrating scores are predominantly due to vehicle factors alone (Cameron et al 1992).
VEHICLE SAFETY RATINGS: 2009 UPDATE 79
REFERENCES
Broughton, J. (1994) The theoretical basis for comparing the accident record of car models,Project Report 70, Safety and Environment Resource Centre, Transport Research Laboratory,Crowthorne, Berkshire, U.K.
Broughton, J. (1996) ‘The theoretical basis for comparing the accident record of car models’,Accident Analysis and Prevention, Vol. 28, No. 1, pp. 89-99.
Cameron, M. H. (1987) ‘The effectiveness of Australian Design Rules aimed at occupantprotection’, Proceedings, seminar on Structural Crashworthiness and Property Damage Accidents,Department of Civil Engineering, Monash University, Melbourne, Australia.
Cameron, M.H., Mach, T., Neiger, D., Graham, A., Ramsay, R., Pappas, M. & Haley, J. (1992a)‘Vehicle Crashworthiness Ratings in Australia’, Proceedings, International Conference on theBiomechanics of Impacts, Verona, Italy, pp. 105-119.
Cameron, M.H., Mach, T. & Neiger, D. (1992b) Vehicle Crashworthiness Ratings: Victoria 1983-90 and NSW 1989-90 Crashes - Summary Report, Report No. 28, Monash University AccidentResearch Centre, Melbourne, Australia.
Cameron, M.H., Finch, C.F. & Le, T. (1994a) Vehicle Crashworthiness Ratings: Victoria and NSWCrashes During 1987-92 - Summary Report, Report No. 55, Monash University Accident ResearchCentre, Melbourne, Australia.
Cameron, M.H., Finch, C.F. & Le, T. (1994b) Vehicle Crashworthiness Ratings: Victoria and NSWCrashes During 1987-92 - Technical Report, Report No. 58, Monash University Accident ResearchCentre, Melbourne, Australia.
Cameron, M.H., Newstead, S.V., Le, T. & Finch, C. (1994c) Relationship between vehiclecrashworthiness and year of manufacture, Report No. 94/6 Royal Automobile Club of Victoria Ltd,Melbourne, Australia.
Cameron, M.H., Finch, C., Newstead, S., Le, T., Graham, A., Griffiths, M., Pappas, M. & Haley, J.(1995) ‘Measuring Crashworthiness: Make/Model Ratings and the Influence of Australian DesignRules for Motor Vehicle Safety’, Proceedings, International Conference on the Biomechanics ofImpacts, Brunnen, Switzerland, pp. 297-310.
Cameron, M.H., Newstead, S.V. & Le, C.M. (1998) ‘Rating the aggressivity of Australian passengervehicles towards other vehicle occupants and unprotected road users’, Proceedings, InternationalIRCOBI Conference on the Biomechanics of Impact, Gothenborg, Sweden.
Green, P. (1990) Victorian Road Accident Database: Frequency Tables for Accident Data Fields:1988, Accident Studies Section, VicRoads, Melbourne, Australia.
Gustafsson, H., Hagg, A., Krafft, M., Kullgren, A., Malmstedt, B., Nygren, A. & Tingvall, C.(1989) Folksam Car Model Safety Rating 1989-90, Folksam, Stockholm, Sweden.
Hollowell, W.T. & Gabler, H.C. (1996) ‘NHTSA’s Vehicle Aggressivity and CompatibilityResearch Program’, Proceedings, Fifteenth International Technical Conference on the EnhancedSafety of Vehicles, Melbourne, Australia.

80 MONASH UNIVERSITY ACCIDENT RESEARCH CENTRE
Hosmer, D.W. & Lemeshow, S. (1989) Applied Logistic Regression, Wiley, New York.
LTSA (1998) Motor Accidents in New Zealand 1998, Land Transport Safety Authority, Wellington,New Zealand.
Newstead, S., Cameron, M. & Skalova, M. (1996) Vehicle Crashworthiness Ratings: Victoria andNSW Crashes During 1987-94, Report No. 92, Monash University Accident Research Centre,Melbourne, Australia.
Newstead, S., Cameron, M. & Le, C.M. (1997) Vehicle Crashworthiness Ratings andCrashworthiness by Year of Manufacture: Victoria and NSW crashes during 1987-95, Report No.107, Monash University Accident Research Centre, Melbourne, Australia.
Newstead, S., Cameron, M. & Le, C.M. (1998) Vehicle Crashworthiness Ratings andCrashworthiness by Year of Manufacture: Victoria and NSW crashes during 1987-96, Report No.128, Monash University Accident Research Centre, Melbourne, Australia.
Newstead, S., Cameron, M.H. & Le, C.M. (1999) Vehicle Crashworthiness Ratings andCrashworthiness by Year of Manufacture: Victoria and NSW Crashes During 1987-97, QueenslandCrashes During 1991-96, Report No. 150, Monash University Accident Research Centre,Melbourne, Australia.
Newstead, S., Cameron, M.H. & Le, C.M. (2000a) Vehicle Crashworthiness Ratings andCrashworthiness by Year of Manufacture: Victoria and NSW Crashes During 1987-98 QueenslandCrashes During 1991-98, Report No. 171, Monash University Accident Research Centre,Melbourne, Australia.
Newstead, S. (2000b). Review of the New Zealand Land Transport Safety Authority feasibility studyinto producing crashworthiness ratings for New Zealand vehicles. Report to the New Zealand LandTransport Safety Authority, Monash University Accident Research Centre, Melbourne, Australia.
Newstead, S. & Cameron, M. (2001), ‘Trends in Australian vehicle crashworthiness by year ofvehicle manufacture within vehicle market groups’, Proceedings of the 2001 IRCOBI Conference,Isle of Man, UK.
Newstead, S., Cameron, M., Watson, L. and Delaney, A. (2003a) Vehicle Crashworthiness Ratingsand Crashworthiness by Year of Manufacture: Victoria and NSW Crashes During 1987-2000Queensland and Western Australian Crashes During 1991-2000, Report No. 196, MonashUniversity Accident Research Centre, Melbourne, Australia.
Newstead, S., Delaney, A. and Watson, L. (2003b) Vehicle safety ratings estimated from combinedAustralian and New Zealand real crash data: Pilot Study, Report No. 203, Monash UniversityAccident Research Centre, Melbourne, Australia.
Newstead, S., Watson, L. and. Cameron, M. (2004a) Trends in aggressivity of the Australian lightvehicle fleet by year of manufacture and market group: 1964 to 2000, Report No. 214, MonashUniversity Accident Research Centre, Melbourne, Australia.
Newstead, S., Cameron, M., and Watson, L. (2004b) Vehicle Crashworthiness Ratings andCrashworthiness by Year of Manufacture: Victoria and NSW Crashes During 1987-2002

VEHICLE SAFETY RATINGS: 2009 UPDATE 81
Queensland, Western Australian and New Zealand Crashes During 1991-2002, Report No. 222,Monash University Accident Research Centre, Melbourne, Australia.
Newstead, S., Watson, L., Delaney, A. and. Cameron, M. (2004c) Crashworthiness and aggressivityof the Australian light vehicle fleet by major crash type, Report No. 227, Monash UniversityAccident Research Centre, Melbourne, Australia.
Newstead, S. and Watson, L. (2005a) Trends in crashworthiness of the New Zealand vehicle fleet byyear of manufacture: 1964 to 2002, Report No. 238, Monash University Accident Research Centre,Melbourne, Australia.
Newstead, S., Cameron, M., and Watson, L. (2005b) Vehicle safety ratings estimated from policereported crash data: 2005 update Australian and New Zealand crashes during 1987-2003, ReportNo. 241, Monash University Accident Research Centre, Melbourne, Australia.
Newstead, S., Cameron, M., and Watson, L. (2006) Vehicle safety ratings estimated from policereported crash data: 2006 update Australian and New Zealand crashes during 1987-2004, ReportNo. 248, Monash University Accident Research Centre, Melbourne, Australia.
Newstead, S., Watson, L., and Cameron, M. (2007a) Vehicle safety ratings estimated from policereported crash data: 2007 update Australian and New Zealand crashes during 1987-2005, ReportNo. 266, Monash University Accident Research Centre, Melbourne, Australia.
Newstead, S., Watson, L., and Cameron, M. (2007b) Trends in crashworthiness of the New Zealandvehicle fleet by year of manufacture: 1964 to 2005: Supplementary to report 266 vehicle safetyratings estimated from police reported crash data: 2007 update Australian and New Zealandcrashes during 1987-2005, Report No. 266 Supplement, Monash University Accident ResearchCentre, Melbourne, Australia.
Newstead, S., Watson, L., and Cameron, M. (2007c) An index for total secondary safety of lightpassenger vehicles estimated from police reported crash data, Report No. 273, Monash UniversityAccident Research Centre, Melbourne, Australia.
Newstead, S., Watson, L., and Cameron, M. (2008a) Vehicle safety ratings estimated from policereported crash data: 2008 update Australian and New Zealand crashes during 1987-2006, ReportNo. 280, Monash University Accident Research Centre, Melbourne, Australia.
Newstead, S., Watson, L., and Cameron, M. (2008b) Trends in crashworthiness of the New Zealandvehicle fleet by year of manufacture: 1964 to 2006: Supplementary to report 280 vehicle safetyratings estimated from police reported crash data: 2008 update Australian and New Zealandcrashes during 1987-2006, Report No. 280 Supplement, Monash University Accident ResearchCentre, Melbourne, Australia.
Pappas, M. (1993) NSW Vehicle Occupant Protection Ratings Documentation, Report to NRMALtd. and Road Safety Bureau, Roads and Traffic Authority, Sydney, NSW.
Road Safety Council of Western Australia (2001) Reported road crashes in Western Australia,2000, Road Safety Council of Western Australia, Office of Road Safety, Perth, Australia.
Robinson, T. (2000a) Vehicle crashworthiness feasibility study. Clustering guide and methodologyLand Transport Safety Authority, Wellington, New Zealand.
82 MONASH UNIVERSITY ACCIDENT RESEARCH CENTRE
Robinson, T. (2000b) Assessment of the fit between the New Zealand fleet and MUARC classesLand Transport Safety Authority, Wellington, New Zealand.
SAS Inc. (1989) SAS STAT Users Guide, Version 6, Fourth Edition, Volume 2. Carey, NC: SASInstitute.
Social Development Committee (1990) Inquiry into Vehicle Occupant Protection, Parliament ofVictoria, Melbourne, Australia.
Voyce, T. (2000) Crashworthiness study - data entry Land Transport Safety Authority, Wellington,New Zealand.

APPENDIX 1
MAKES AND MODELS OF CARS INVOLVED INVICTORIAN AND NSW CRASHES DURING 1987-2007,
SOUTH AUSTRALIA CRASHES DURING 1995-2007AND
WESTERN AUSTRALIA, QUEENSLANDAND NEW ZEALAND CRASHES DURING 1991-2007


FREQUENCY FOR EACH MODEL FOR ALL TYPES OF CRASHES (NSW/VIC/SA/QLD/WA/NZ)
Note: Only those models with a Market Group displayed were used in the crashworthiness analysis
MAKE/MODEL MODELCODE
No. ofuninjureddrivers in
NSW (87-2007)and
QLD, WA(91-2007)
andSA (95 -2007)
No. ofinjured
drivers inNSW (87-2007)
andQLD, WA(91-2007)
andSA (95-2007)
No. ofinvolveddrivers in
NSW (87-2007)and
QLD, WA(91-2007)
andSA (95-2007)
No. ofinjured(but notseverely)drivers inNSW andVictoria(87-2007)
andQLD, WA, NZ
(91-2007)and
SA (95-2007)
No. ofseverelyinjured
drivers inNSW andVictoria(87-2007)
andQLD, WA, NZ
(91-2007)and
SA (95-2007)
No. ofinjured
drivers inNSW,
Victoria(87-2007)
andQLD, WA, NZ
(91-2007)and
SA (95-2007)
ANALYSISINCLUSIONCRITERIAINV=100INJ=20
MARKETGROUP
Alfa Romeo 164 89-92 AL01Z 113 12 125 12 6 18 0Alfa Romeo 33 83-92 AL02Z 688 110 798 115 30 145 1 SmallAlfa Romeo 75 86-92 AL03Z 213 29 242 26 4 30 1 SmallAlfa Romeo 90 85-88 AL04Z 82 11 93 9 5 14 0Alfa Romeo GTV 82-84 AL05Z 161 18 179 13 10 23 1 SmallAlfa Romeo Sprint 82-88 AL06Z 131 24 155 30 6 36 1 SmallAlfa Romeo Alfasud 82-84 AL07Z 114 22 136 18 6 24 1 SmallAlfa Romeo Alfetta 82-88 AL08Z 57 12 69 4 6 10 0Alfa Romeo Guilietta 82-86 AL09Z 65 8 73 7 2 9 0ALFA Quattro AL10Z 1 0 1 1 0 1 0Alfa Romeo 156 99-06 AL13Z 344 60 404 37 6 43 1 MediumAlfa Romeo 166 99-07 AL14Z 30 3 33 1 1 2 0Alfa Romeo GTV / Spider 98-04 AL15Z 115 13 128 5 1 6 0Alfa Romeo 147 01-07 AL16Z 143 19 162 10 2 12 0Alfa Romeo 159 / Brera 06-07 AL17Z 4 0 4 1 0 1 0Alfa Others AL99Z 516 65 581 153 40 193 0Audi A4 / S4 Cabriolet 02-07 AU10Z 18 4 22 8 0 8 0Audi A3 04-07 AU11Z 17 3 20 1 1 2 0Audi Q7 06-07 AU12Z 2 1 3 1 0 1 0Audi TT 06-07 AU13Z 1 0 1 . . . 0Audi A6/S6/AllRoad 95-04 AUD1A 45 6 51 10 1 11 0Audi A6/S6/AllRoad 05-07 AUD1B 1 0 1 . . . 0
AUD1Z 2 0 2 1 0 1 0
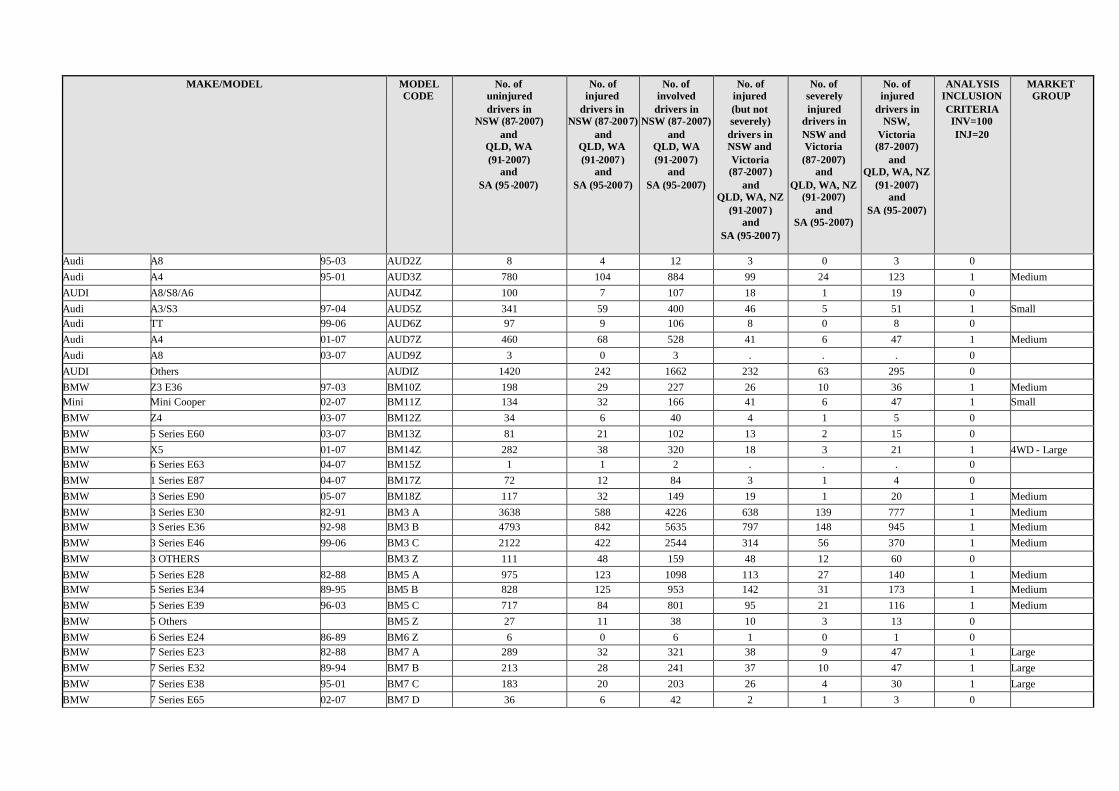
MAKE/MODEL MODELCODE
No. ofuninjureddrivers in
NSW (87-2007)and
QLD, WA(91-2007)
andSA (95 -2007)
No. ofinjured
drivers inNSW (87-2007)
andQLD, WA(91-2007)
andSA (95-2007)
No. ofinvolveddrivers in
NSW (87-2007)and
QLD, WA(91-2007)
andSA (95-2007)
No. ofinjured(but notseverely)drivers inNSW andVictoria(87-2007)
andQLD, WA, NZ
(91-2007)and
SA (95-2007)
No. ofseverelyinjured
drivers inNSW andVictoria(87-2007)
andQLD, WA, NZ
(91-2007)and
SA (95-2007)
No. ofinjured
drivers inNSW,
Victoria(87-2007)
andQLD, WA, NZ
(91-2007)and
SA (95-2007)
ANALYSISINCLUSIONCRITERIAINV=100INJ=20
MARKETGROUP
Audi A8 95-03 AUD2Z 8 4 12 3 0 3 0Audi A4 95-01 AUD3Z 780 104 884 99 24 123 1 MediumAUDI A8/S8/A6 AUD4Z 100 7 107 18 1 19 0Audi A3/S3 97-04 AUD5Z 341 59 400 46 5 51 1 SmallAudi TT 99-06 AUD6Z 97 9 106 8 0 8 0Audi A4 01-07 AUD7Z 460 68 528 41 6 47 1 MediumAudi A8 03-07 AUD9Z 3 0 3 . . . 0AUDI Others AUDIZ 1420 242 1662 232 63 295 0BMW Z3 E36 97-03 BM10Z 198 29 227 26 10 36 1 MediumMini Mini Cooper 02-07 BM11Z 134 32 166 41 6 47 1 SmallBMW Z4 03-07 BM12Z 34 6 40 4 1 5 0BMW 5 Series E60 03-07 BM13Z 81 21 102 13 2 15 0BMW X5 01-07 BM14Z 282 38 320 18 3 21 1 4WD - LargeBMW 6 Series E63 04-07 BM15Z 1 1 2 . . . 0BMW 1 Series E87 04-07 BM17Z 72 12 84 3 1 4 0BMW 3 Series E90 05-07 BM18Z 117 32 149 19 1 20 1 MediumBMW 3 Series E30 82-91 BM3 A 3638 588 4226 638 139 777 1 MediumBMW 3 Series E36 92-98 BM3 B 4793 842 5635 797 148 945 1 MediumBMW 3 Series E46 99-06 BM3 C 2122 422 2544 314 56 370 1 MediumBMW 3 OTHERS BM3 Z 111 48 159 48 12 60 0BMW 5 Series E28 82-88 BM5 A 975 123 1098 113 27 140 1 MediumBMW 5 Series E34 89-95 BM5 B 828 125 953 142 31 173 1 MediumBMW 5 Series E39 96-03 BM5 C 717 84 801 95 21 116 1 MediumBMW 5 Others BM5 Z 27 11 38 10 3 13 0BMW 6 Series E24 86-89 BM6 Z 6 0 6 1 0 1 0BMW 7 Series E23 82-88 BM7 A 289 32 321 38 9 47 1 LargeBMW 7 Series E32 89-94 BM7 B 213 28 241 37 10 47 1 LargeBMW 7 Series E38 95-01 BM7 C 183 20 203 26 4 30 1 LargeBMW 7 Series E65 02-07 BM7 D 36 6 42 2 1 3 0
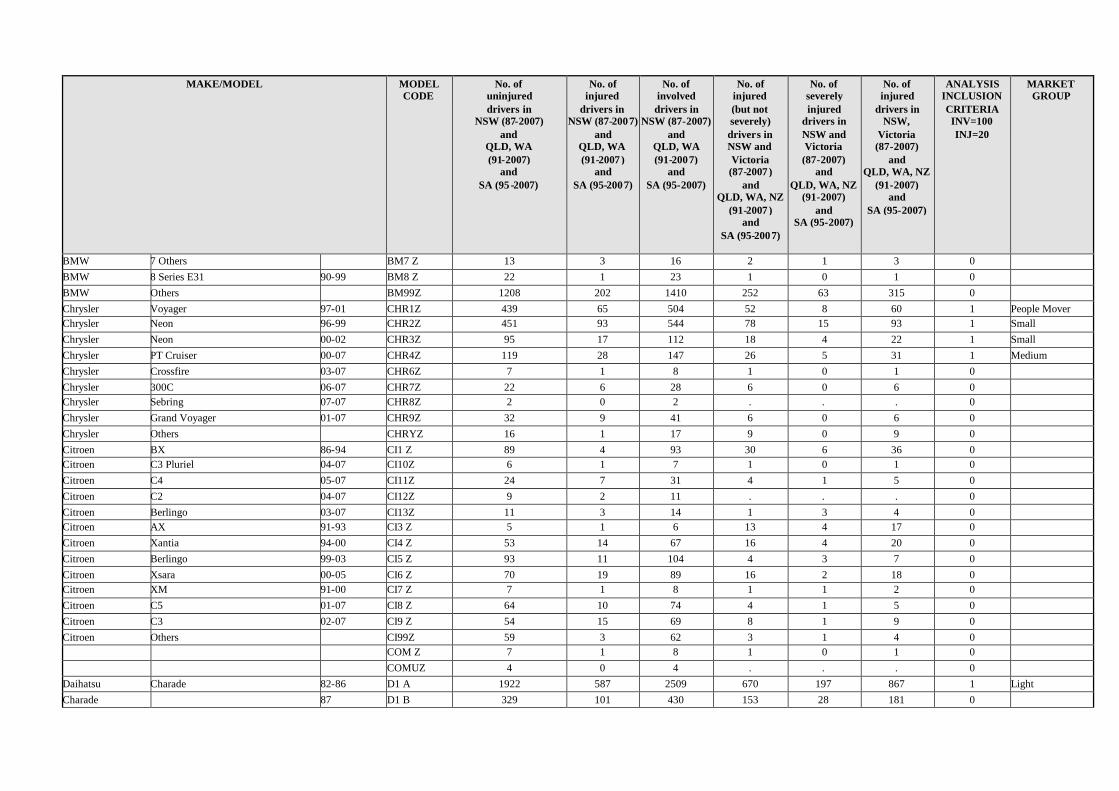
MAKE/MODEL MODELCODE
No. ofuninjureddrivers in
NSW (87-2007)and
QLD, WA(91-2007)
andSA (95 -2007)
No. ofinjured
drivers inNSW (87-2007)
andQLD, WA(91-2007)
andSA (95-2007)
No. ofinvolveddrivers in
NSW (87-2007)and
QLD, WA(91-2007)
andSA (95-2007)
No. ofinjured(but notseverely)drivers inNSW andVictoria(87-2007)
andQLD, WA, NZ
(91-2007)and
SA (95-2007)
No. ofseverelyinjured
drivers inNSW andVictoria(87-2007)
andQLD, WA, NZ
(91-2007)and
SA (95-2007)
No. ofinjured
drivers inNSW,
Victoria(87-2007)
andQLD, WA, NZ
(91-2007)and
SA (95-2007)
ANALYSISINCLUSIONCRITERIAINV=100INJ=20
MARKETGROUP
BMW 7 Others BM7 Z 13 3 16 2 1 3 0BMW 8 Series E31 90-99 BM8 Z 22 1 23 1 0 1 0BMW Others BM99Z 1208 202 1410 252 63 315 0Chrysler Voyager 97-01 CHR1Z 439 65 504 52 8 60 1 People MoverChrysler Neon 96-99 CHR2Z 451 93 544 78 15 93 1 SmallChrysler Neon 00-02 CHR3Z 95 17 112 18 4 22 1 SmallChrysler PT Cruiser 00-07 CHR4Z 119 28 147 26 5 31 1 MediumChrysler Crossfire 03-07 CHR6Z 7 1 8 1 0 1 0Chrysler 300C 06-07 CHR7Z 22 6 28 6 0 6 0Chrysler Sebring 07-07 CHR8Z 2 0 2 . . . 0Chrysler Grand Voyager 01-07 CHR9Z 32 9 41 6 0 6 0Chrysler Others CHRYZ 16 1 17 9 0 9 0Citroen BX 86-94 CI1 Z 89 4 93 30 6 36 0Citroen C3 Pluriel 04-07 CI10Z 6 1 7 1 0 1 0Citroen C4 05-07 CI11Z 24 7 31 4 1 5 0Citroen C2 04-07 CI12Z 9 2 11 . . . 0Citroen Berlingo 03-07 CI13Z 11 3 14 1 3 4 0Citroen AX 91-93 CI3 Z 5 1 6 13 4 17 0Citroen Xantia 94-00 CI4 Z 53 14 67 16 4 20 0Citroen Berlingo 99-03 CI5 Z 93 11 104 4 3 7 0Citroen Xsara 00-05 CI6 Z 70 19 89 16 2 18 0Citroen XM 91-00 CI7 Z 7 1 8 1 1 2 0Citroen C5 01-07 CI8 Z 64 10 74 4 1 5 0Citroen C3 02-07 CI9 Z 54 15 69 8 1 9 0Citroen Others CI99Z 59 3 62 3 1 4 0
COM Z 7 1 8 1 0 1 0COMUZ 4 0 4 . . . 0
Daihatsu Charade 82-86 D1 A 1922 587 2509 670 197 867 1 LightCharade 87 D1 B 329 101 430 153 28 181 0
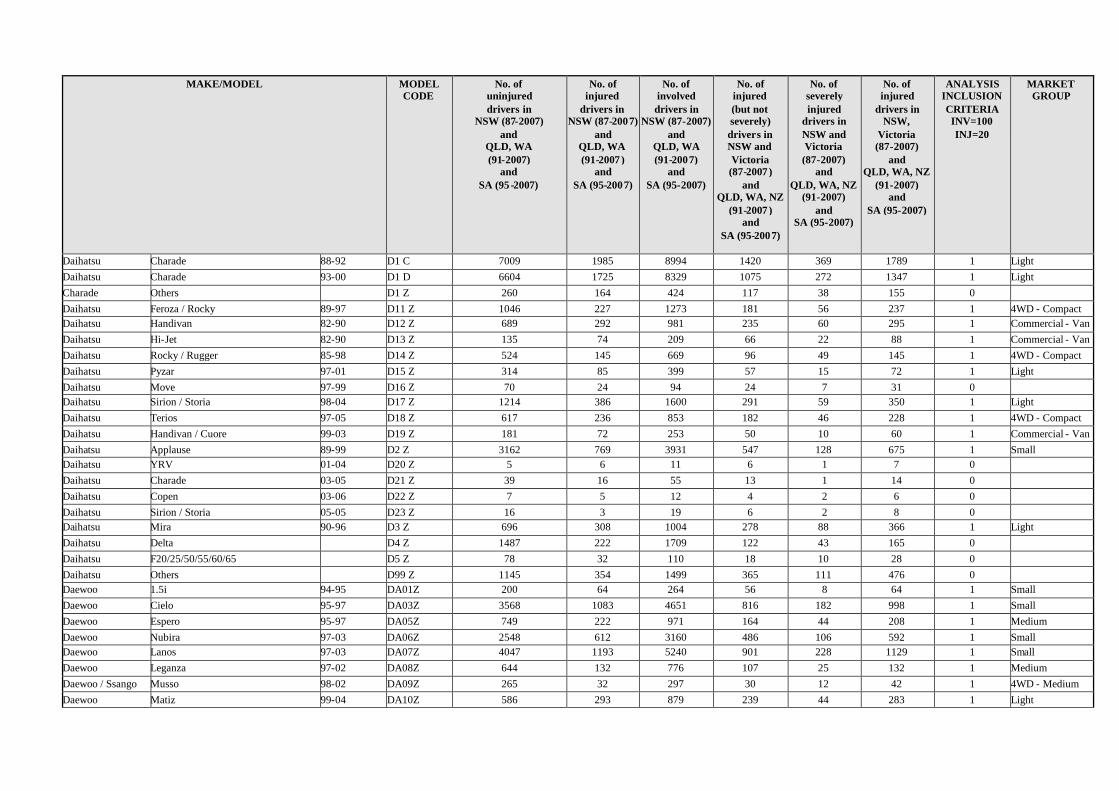
MAKE/MODEL MODELCODE
No. ofuninjureddrivers in
NSW (87-2007)and
QLD, WA(91-2007)
andSA (95 -2007)
No. ofinjured
drivers inNSW (87-2007)
andQLD, WA(91-2007)
andSA (95-2007)
No. ofinvolveddrivers in
NSW (87-2007)and
QLD, WA(91-2007)
andSA (95-2007)
No. ofinjured(but notseverely)drivers inNSW andVictoria(87-2007)
andQLD, WA, NZ
(91-2007)and
SA (95-2007)
No. ofseverelyinjured
drivers inNSW andVictoria(87-2007)
andQLD, WA, NZ
(91-2007)and
SA (95-2007)
No. ofinjured
drivers inNSW,
Victoria(87-2007)
andQLD, WA, NZ
(91-2007)and
SA (95-2007)
ANALYSISINCLUSIONCRITERIAINV=100INJ=20
MARKETGROUP
Daihatsu Charade 88-92 D1 C 7009 1985 8994 1420 369 1789 1 LightDaihatsu Charade 93-00 D1 D 6604 1725 8329 1075 272 1347 1 LightCharade Others D1 Z 260 164 424 117 38 155 0Daihatsu Feroza / Rocky 89-97 D11 Z 1046 227 1273 181 56 237 1 4WD - CompactDaihatsu Handivan 82-90 D12 Z 689 292 981 235 60 295 1 Commercial - VanDaihatsu Hi-Jet 82-90 D13 Z 135 74 209 66 22 88 1 Commercial - VanDaihatsu Rocky / Rugger 85-98 D14 Z 524 145 669 96 49 145 1 4WD - CompactDaihatsu Pyzar 97-01 D15 Z 314 85 399 57 15 72 1 LightDaihatsu Move 97-99 D16 Z 70 24 94 24 7 31 0Daihatsu Sirion / Storia 98-04 D17 Z 1214 386 1600 291 59 350 1 LightDaihatsu Terios 97-05 D18 Z 617 236 853 182 46 228 1 4WD - CompactDaihatsu Handivan / Cuore 99-03 D19 Z 181 72 253 50 10 60 1 Commercial - VanDaihatsu Applause 89-99 D2 Z 3162 769 3931 547 128 675 1 SmallDaihatsu YRV 01-04 D20 Z 5 6 11 6 1 7 0Daihatsu Charade 03-05 D21 Z 39 16 55 13 1 14 0Daihatsu Copen 03-06 D22 Z 7 5 12 4 2 6 0Daihatsu Sirion / Storia 05-05 D23 Z 16 3 19 6 2 8 0Daihatsu Mira 90-96 D3 Z 696 308 1004 278 88 366 1 LightDaihatsu Delta D4 Z 1487 222 1709 122 43 165 0Daihatsu F20/25/50/55/60/65 D5 Z 78 32 110 18 10 28 0Daihatsu Others D99 Z 1145 354 1499 365 111 476 0Daewoo 1.5i 94-95 DA01Z 200 64 264 56 8 64 1 SmallDaewoo Cielo 95-97 DA03Z 3568 1083 4651 816 182 998 1 SmallDaewoo Espero 95-97 DA05Z 749 222 971 164 44 208 1 MediumDaewoo Nubira 97-03 DA06Z 2548 612 3160 486 106 592 1 SmallDaewoo Lanos 97-03 DA07Z 4047 1193 5240 901 228 1129 1 SmallDaewoo Leganza 97-02 DA08Z 644 132 776 107 25 132 1 MediumDaewoo / Ssango Musso 98-02 DA09Z 265 32 297 30 12 42 1 4WD - MediumDaewoo Matiz 99-04 DA10Z 586 293 879 239 44 283 1 Light
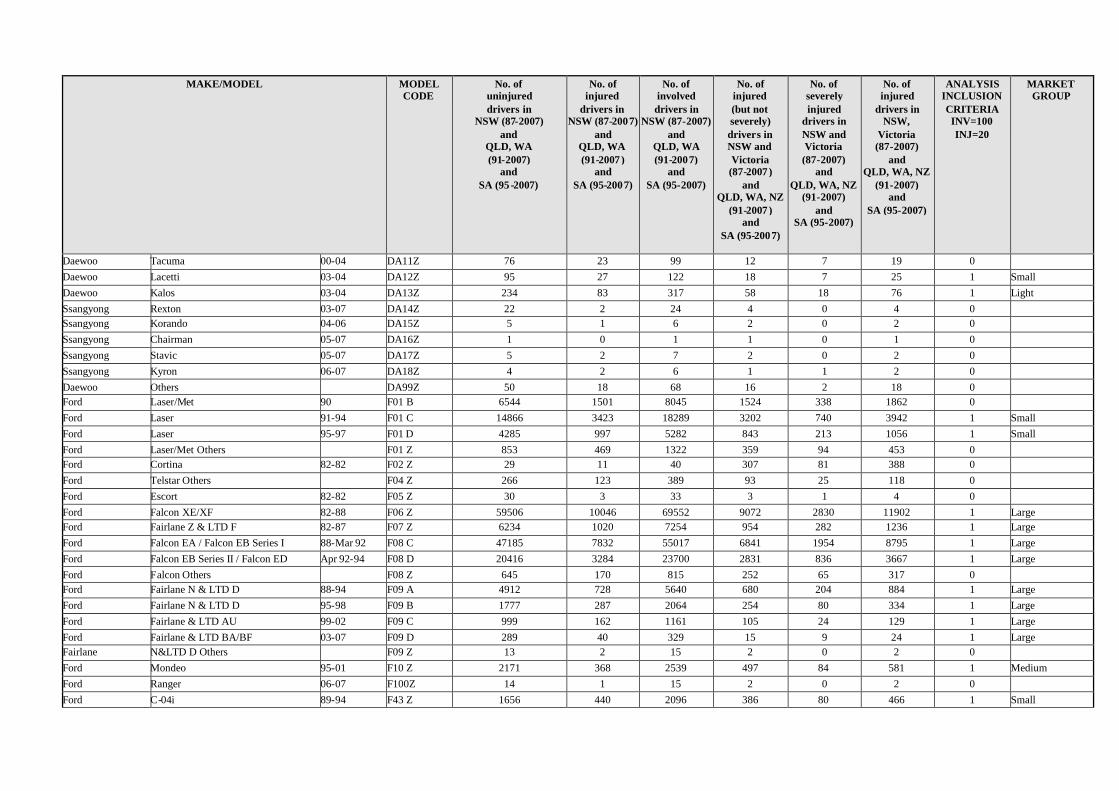
MAKE/MODEL MODELCODE
No. ofuninjureddrivers in
NSW (87-2007)and
QLD, WA(91-2007)
andSA (95 -2007)
No. ofinjured
drivers inNSW (87-2007)
andQLD, WA(91-2007)
andSA (95-2007)
No. ofinvolveddrivers in
NSW (87-2007)and
QLD, WA(91-2007)
andSA (95-2007)
No. ofinjured(but notseverely)drivers inNSW andVictoria(87-2007)
andQLD, WA, NZ
(91-2007)and
SA (95-2007)
No. ofseverelyinjured
drivers inNSW andVictoria(87-2007)
andQLD, WA, NZ
(91-2007)and
SA (95-2007)
No. ofinjured
drivers inNSW,
Victoria(87-2007)
andQLD, WA, NZ
(91-2007)and
SA (95-2007)
ANALYSISINCLUSIONCRITERIAINV=100INJ=20
MARKETGROUP
Daewoo Tacuma 00-04 DA11Z 76 23 99 12 7 19 0Daewoo Lacetti 03-04 DA12Z 95 27 122 18 7 25 1 SmallDaewoo Kalos 03-04 DA13Z 234 83 317 58 18 76 1 LightSsangyong Rexton 03-07 DA14Z 22 2 24 4 0 4 0Ssangyong Korando 04-06 DA15Z 5 1 6 2 0 2 0Ssangyong Chairman 05-07 DA16Z 1 0 1 1 0 1 0Ssangyong Stavic 05-07 DA17Z 5 2 7 2 0 2 0Ssangyong Kyron 06-07 DA18Z 4 2 6 1 1 2 0Daewoo Others DA99Z 50 18 68 16 2 18 0Ford Laser/Met 90 F01 B 6544 1501 8045 1524 338 1862 0Ford Laser 91-94 F01 C 14866 3423 18289 3202 740 3942 1 SmallFord Laser 95-97 F01 D 4285 997 5282 843 213 1056 1 SmallFord Laser/Met Others F01 Z 853 469 1322 359 94 453 0Ford Cortina 82-82 F02 Z 29 11 40 307 81 388 0Ford Telstar Others F04 Z 266 123 389 93 25 118 0Ford Escort 82-82 F05 Z 30 3 33 3 1 4 0Ford Falcon XE/XF 82-88 F06 Z 59506 10046 69552 9072 2830 11902 1 LargeFord Fairlane Z & LTD F 82-87 F07 Z 6234 1020 7254 954 282 1236 1 LargeFord Falcon EA / Falcon EB Series I 88-Mar 92 F08 C 47185 7832 55017 6841 1954 8795 1 LargeFord Falcon EB Series II / Falcon ED Apr 92-94 F08 D 20416 3284 23700 2831 836 3667 1 LargeFord Falcon Others F08 Z 645 170 815 252 65 317 0Ford Fairlane N & LTD D 88-94 F09 A 4912 728 5640 680 204 884 1 LargeFord Fairlane N & LTD D 95-98 F09 B 1777 287 2064 254 80 334 1 LargeFord Fairlane & LTD AU 99-02 F09 C 999 162 1161 105 24 129 1 LargeFord Fairlane & LTD BA/BF 03-07 F09 D 289 40 329 15 9 24 1 LargeFairlane N<D D Others F09 Z 13 2 15 2 0 2 0Ford Mondeo 95-01 F10 Z 2171 368 2539 497 84 581 1 MediumFord Ranger 06-07 F100Z 14 1 15 2 0 2 0Ford C-04i 89-94 F43 Z 1656 440 2096 386 80 466 1 Small
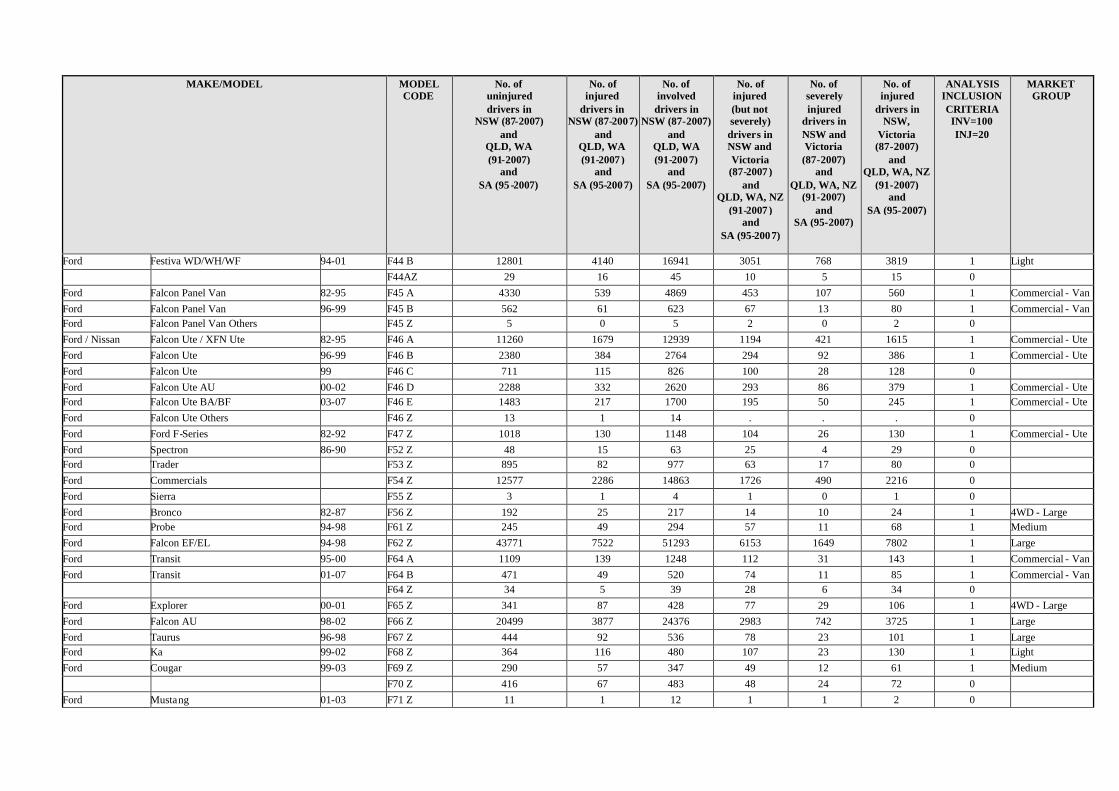
MAKE/MODEL MODELCODE
No. ofuninjureddrivers in
NSW (87-2007)and
QLD, WA(91-2007)
andSA (95 -2007)
No. ofinjured
drivers inNSW (87-2007)
andQLD, WA(91-2007)
andSA (95-2007)
No. ofinvolveddrivers in
NSW (87-2007)and
QLD, WA(91-2007)
andSA (95-2007)
No. ofinjured(but notseverely)drivers inNSW andVictoria(87-2007)
andQLD, WA, NZ
(91-2007)and
SA (95-2007)
No. ofseverelyinjured
drivers inNSW andVictoria(87-2007)
andQLD, WA, NZ
(91-2007)and
SA (95-2007)
No. ofinjured
drivers inNSW,
Victoria(87-2007)
andQLD, WA, NZ
(91-2007)and
SA (95-2007)
ANALYSISINCLUSIONCRITERIAINV=100INJ=20
MARKETGROUP
Ford Festiva WD/WH/WF 94-01 F44 B 12801 4140 16941 3051 768 3819 1 LightF44AZ 29 16 45 10 5 15 0
Ford Falcon Panel Van 82-95 F45 A 4330 539 4869 453 107 560 1 Commercial - VanFord Falcon Panel Van 96-99 F45 B 562 61 623 67 13 80 1 Commercial - VanFord Falcon Panel Van Others F45 Z 5 0 5 2 0 2 0Ford / Nissan Falcon Ute / XFN Ute 82-95 F46 A 11260 1679 12939 1194 421 1615 1 Commercial - UteFord Falcon Ute 96-99 F46 B 2380 384 2764 294 92 386 1 Commercial - UteFord Falcon Ute 99 F46 C 711 115 826 100 28 128 0Ford Falcon Ute AU 00-02 F46 D 2288 332 2620 293 86 379 1 Commercial - UteFord Falcon Ute BA/BF 03-07 F46 E 1483 217 1700 195 50 245 1 Commercial - UteFord Falcon Ute Others F46 Z 13 1 14 . . . 0Ford Ford F-Series 82-92 F47 Z 1018 130 1148 104 26 130 1 Commercial - UteFord Spectron 86-90 F52 Z 48 15 63 25 4 29 0Ford Trader F53 Z 895 82 977 63 17 80 0Ford Commercials F54 Z 12577 2286 14863 1726 490 2216 0Ford Sierra F55 Z 3 1 4 1 0 1 0Ford Bronco 82-87 F56 Z 192 25 217 14 10 24 1 4WD - LargeFord Probe 94-98 F61 Z 245 49 294 57 11 68 1 MediumFord Falcon EF/EL 94-98 F62 Z 43771 7522 51293 6153 1649 7802 1 LargeFord Transit 95-00 F64 A 1109 139 1248 112 31 143 1 Commercial - VanFord Transit 01-07 F64 B 471 49 520 74 11 85 1 Commercial - Van
F64 Z 34 5 39 28 6 34 0Ford Explorer 00-01 F65 Z 341 87 428 77 29 106 1 4WD - LargeFord Falcon AU 98-02 F66 Z 20499 3877 24376 2983 742 3725 1 LargeFord Taurus 96-98 F67 Z 444 92 536 78 23 101 1 LargeFord Ka 99-02 F68 Z 364 116 480 107 23 130 1 LightFord Cougar 99-03 F69 Z 290 57 347 49 12 61 1 Medium
F70 Z 416 67 483 48 24 72 0Ford Mustang 01-03 F71 Z 11 1 12 1 1 2 0

MAKE/MODEL MODELCODE
No. ofuninjureddrivers in
NSW (87-2007)and
QLD, WA(91-2007)
andSA (95 -2007)
No. ofinjured
drivers inNSW (87-2007)
andQLD, WA(91-2007)
andSA (95-2007)
No. ofinvolveddrivers in
NSW (87-2007)and
QLD, WA(91-2007)
andSA (95-2007)
No. ofinjured(but notseverely)drivers inNSW andVictoria(87-2007)
andQLD, WA, NZ
(91-2007)and
SA (95-2007)
No. ofseverelyinjured
drivers inNSW andVictoria(87-2007)
andQLD, WA, NZ
(91-2007)and
SA (95-2007)
No. ofinjured
drivers inNSW,
Victoria(87-2007)
andQLD, WA, NZ
(91-2007)and
SA (95-2007)
ANALYSISINCLUSIONCRITERIAINV=100INJ=20
MARKETGROUP
Ford Explorer 01-05 F72 Z 189 29 218 36 6 42 1 4WD - LargeFord Falcon BA/BF 02-07 F73 Z 8383 1545 9928 1163 291 1454 1 LargeFord Focus LR 02-05 F75 Z 889 241 1130 225 45 270 1 SmallFord F-Series 01-06 F76 Z 180 18 198 8 8 16 0Ford Territory SX/SY 04-07 F77 Z 520 66 586 56 21 77 1 4WD - MediumFord Fiesta WP/WQ 04-07 F78 Z 52 16 68 17 0 17 0Ford Focus LS / LT 05-07 F79 Z 395 84 479 75 11 86 1 SmallFord Others F99 Z 46129 7210 53339 11743 3791 15534 0
FAL Z 3 0 3 . . . 0Ferrari FERAZ 11 0 11 1 0 1 0Fiat Argenta 83-85 FI01Z 13 4 17 3 1 4 0Fiat Croma 88-89 FI02Z 22 5 27 9 1 10 0Fiat Regata 84-88 FI03Z 244 34 278 27 8 35 1 SmallFiat Superbrava 82-85 FI04Z 48 15 63 9 6 15 0Fiat X-1/9 FI05Z 6 3 9 2 1 3 0Fiat X-1/9 82-85 FI11Z 5 1 6 1 0 1 0Fiat Ducato 02-07 FI12Z 28 3 31 12 3 15 0Fiat Punto 06-07 FI13Z 7 2 9 1 0 1 0Fiat Others FI99Z 151 17 168 49 10 59 0FSM FSM Z 13 2 15 6 1 7 0Holden / Toyota Commodore VN/VP / Lexcen 89-93 H1 Z 60913 11188 72101 9288 3085 12373 1 LargeHolden Calibra 94-97 H12 Z 457 58 515 90 15 105 1 MediumHolden Statesman/C-04ice WB 82-85 H14 A 139 23 162 32 18 50 1 LargeHolden Stateman/C-04ice VQ 90-93 H14 B 714 106 820 98 42 140 1 LargeHolden Stateman/C-04ice VR/VS 94-98 H14 C 4113 665 4778 556 164 720 1 LargeStatesman/C-04i Others H14 Z 140 21 161 18 3 21 0Holden Nova Others H15 Z 121 33 154 33 7 40 0Holden Commodore Ute VG/VP 90-93 H18 Z 1934 332 2266 213 95 308 1 Commercial - UteHolden Camira 82-89 H2 Z 15798 3625 19423 3737 948 4685 1 Medium
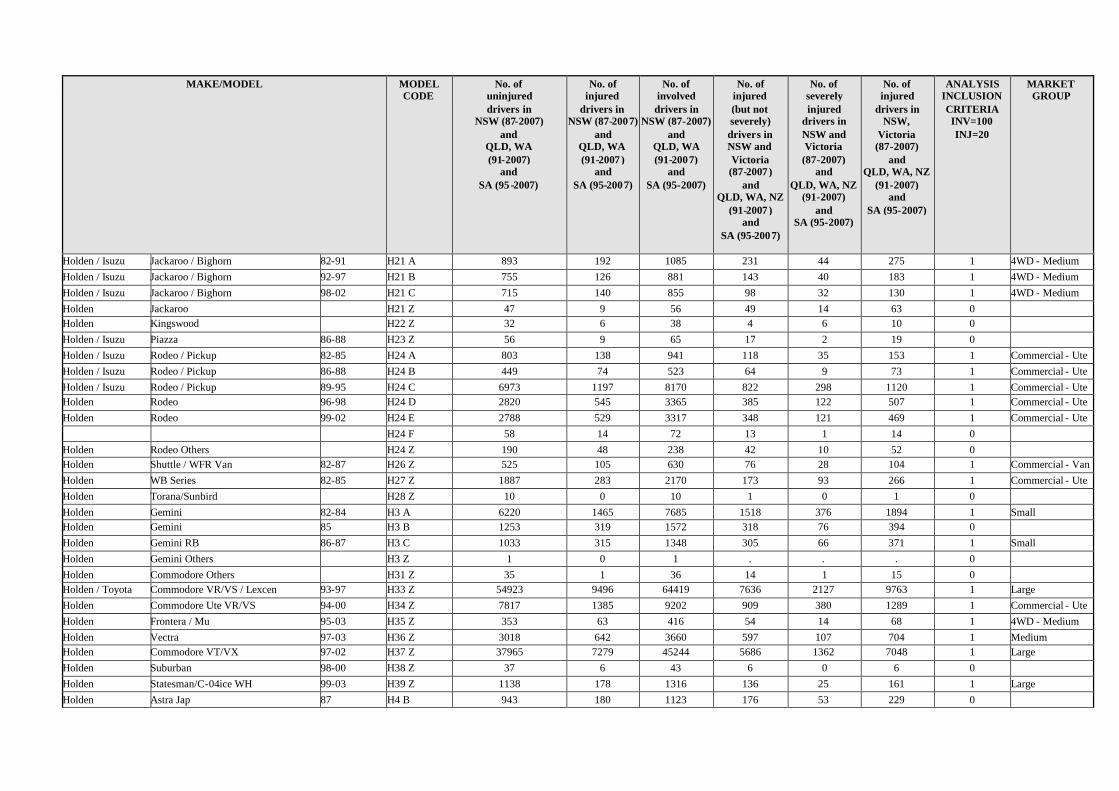
MAKE/MODEL MODELCODE
No. ofuninjureddrivers in
NSW (87-2007)and
QLD, WA(91-2007)
andSA (95 -2007)
No. ofinjured
drivers inNSW (87-2007)
andQLD, WA(91-2007)
andSA (95-2007)
No. ofinvolveddrivers in
NSW (87-2007)and
QLD, WA(91-2007)
andSA (95-2007)
No. ofinjured(but notseverely)drivers inNSW andVictoria(87-2007)
andQLD, WA, NZ
(91-2007)and
SA (95-2007)
No. ofseverelyinjured
drivers inNSW andVictoria(87-2007)
andQLD, WA, NZ
(91-2007)and
SA (95-2007)
No. ofinjured
drivers inNSW,
Victoria(87-2007)
andQLD, WA, NZ
(91-2007)and
SA (95-2007)
ANALYSISINCLUSIONCRITERIAINV=100INJ=20
MARKETGROUP
Holden / Isuzu Jackaroo / Bighorn 82-91 H21 A 893 192 1085 231 44 275 1 4WD - MediumHolden / Isuzu Jackaroo / Bighorn 92-97 H21 B 755 126 881 143 40 183 1 4WD - MediumHolden / Isuzu Jackaroo / Bighorn 98-02 H21 C 715 140 855 98 32 130 1 4WD - MediumHolden Jackaroo H21 Z 47 9 56 49 14 63 0Holden Kingswood H22 Z 32 6 38 4 6 10 0Holden / Isuzu Piazza 86-88 H23 Z 56 9 65 17 2 19 0Holden / Isuzu Rodeo / Pickup 82-85 H24 A 803 138 941 118 35 153 1 Commercial - UteHolden / Isuzu Rodeo / Pickup 86-88 H24 B 449 74 523 64 9 73 1 Commercial - UteHolden / Isuzu Rodeo / Pickup 89-95 H24 C 6973 1197 8170 822 298 1120 1 Commercial - UteHolden Rodeo 96-98 H24 D 2820 545 3365 385 122 507 1 Commercial - UteHolden Rodeo 99-02 H24 E 2788 529 3317 348 121 469 1 Commercial - Ute
H24 F 58 14 72 13 1 14 0Holden Rodeo Others H24 Z 190 48 238 42 10 52 0Holden Shuttle / WFR Van 82-87 H26 Z 525 105 630 76 28 104 1 Commercial - VanHolden WB Series 82-85 H27 Z 1887 283 2170 173 93 266 1 Commercial - UteHolden Torana/Sunbird H28 Z 10 0 10 1 0 1 0Holden Gemini 82-84 H3 A 6220 1465 7685 1518 376 1894 1 SmallHolden Gemini 85 H3 B 1253 319 1572 318 76 394 0Holden Gemini RB 86-87 H3 C 1033 315 1348 305 66 371 1 SmallHolden Gemini Others H3 Z 1 0 1 . . . 0Holden Commodore Others H31 Z 35 1 36 14 1 15 0Holden / Toyota Commodore VR/VS / Lexcen 93-97 H33 Z 54923 9496 64419 7636 2127 9763 1 LargeHolden Commodore Ute VR/VS 94-00 H34 Z 7817 1385 9202 909 380 1289 1 Commercial - UteHolden Frontera / Mu 95-03 H35 Z 353 63 416 54 14 68 1 4WD - MediumHolden Vectra 97-03 H36 Z 3018 642 3660 597 107 704 1 MediumHolden Commodore VT/VX 97-02 H37 Z 37965 7279 45244 5686 1362 7048 1 LargeHolden Suburban 98-00 H38 Z 37 6 43 6 0 6 0Holden Statesman/C-04ice WH 99-03 H39 Z 1138 178 1316 136 25 161 1 LargeHolden Astra Jap 87 H4 B 943 180 1123 176 53 229 0

MAKE/MODEL MODELCODE
No. ofuninjureddrivers in
NSW (87-2007)and
QLD, WA(91-2007)
andSA (95 -2007)
No. ofinjured
drivers inNSW (87-2007)
andQLD, WA(91-2007)
andSA (95-2007)
No. ofinvolveddrivers in
NSW (87-2007)and
QLD, WA(91-2007)
andSA (95-2007)
No. ofinjured(but notseverely)drivers inNSW andVictoria(87-2007)
andQLD, WA, NZ
(91-2007)and
SA (95-2007)
No. ofseverelyinjured
drivers inNSW andVictoria(87-2007)
andQLD, WA, NZ
(91-2007)and
SA (95-2007)
No. ofinjured
drivers inNSW,
Victoria(87-2007)
andQLD, WA, NZ
(91-2007)and
SA (95-2007)
ANALYSISINCLUSIONCRITERIAINV=100INJ=20
MARKETGROUP
Holden Astra TR 96-98 H4 D 1188 226 1414 249 44 293 1 SmallHolden Astra TS 98-06 H4 E 7220 1789 9009 1357 249 1606 1 SmallHolden Astra Others H4 Z 63 26 89 32 8 40 0Holden Commodore VU Ute 00-02 H41 Z 1824 296 2120 221 85 306 1 Commercial - UteHolden Commodore VY/VZ 02-07 H42 Z 9259 1817 11076 1473 300 1773 1 LargeHolden Commodore VY/VZ Ute 02-07 H43 Z 2751 483 3234 357 117 474 1 Commercial - UteHolden Monaro 01-05 H44 Z 526 102 628 78 26 104 1 LargeHolden Cruze 02-06 H45 Z 361 154 515 117 41 158 1 4WD - CompactHolden Barina XC 01-06 H46 Z 1790 496 2286 384 87 471 1 LightHolden Zafira TT 01-05 H47 Z 202 43 245 29 7 36 1 People MoverHolden Statesman/C-04ice WK/WL 03-06 H48 Z 374 71 445 43 12 55 1 LargeHolden Adventra 03-06 H49 Z 130 21 151 26 1 27 1 4WD - MediumHolden Barina SB 95-00 H5 D 6412 1902 8314 1344 279 1623 1 LightHolden Barina Others H5 Z 257 109 366 141 25 166 0Holden Rodeo 03-07 H50 Z 2096 367 2463 222 83 305 1 Commercial - UteHolden Vectra ZC 03-05 H51 Z 227 41 268 52 10 62 1 MediumHolden Astra AH 04-07 H55 Z 683 156 839 96 22 118 1 SmallHolden Barina TK 05-07 H56 Z 258 84 342 65 20 85 1 LightHolden Viva JF 05-07 H57 Z 191 58 249 56 12 68 1 SmallHolden Tigra 05-06 H58 Z 11 6 17 4 2 6 0Holden Captiva 06-07 H59 Z 48 8 56 3 2 5 0Holden Commodore VB-VL 82-88 H6 Z 53623 9789 63412 8874 2839 11713 1 LargeHolden Commodore VE 06-07 H60 Z 825 156 981 127 31 158 1 LargeHolden Statesman/C-04ice WM 06-07 H61 Z 18 1 19 3 0 3 0Holden Commodore VE Ute 07-07 H62 Z 1 0 1 . . . 0Holden Epica 07-07 H63 Z 6 3 9 3 1 4 0Holden Others H99 Z 34817 4892 39709 9824 3507 13331 0Hyundai Excel 86-90 HY1 A 2958 859 3817 934 238 1172 1 SmallHyundai Excel 90-94 HY1 B 9426 2683 12109 2175 534 2709 1 Small

MAKE/MODEL MODELCODE
No. ofuninjureddrivers in
NSW (87-2007)and
QLD, WA(91-2007)
andSA (95 -2007)
No. ofinjured
drivers inNSW (87-2007)
andQLD, WA(91-2007)
andSA (95-2007)
No. ofinvolveddrivers in
NSW (87-2007)and
QLD, WA(91-2007)
andSA (95-2007)
No. ofinjured(but notseverely)drivers inNSW andVictoria(87-2007)
andQLD, WA, NZ
(91-2007)and
SA (95-2007)
No. ofseverelyinjured
drivers inNSW andVictoria(87-2007)
andQLD, WA, NZ
(91-2007)and
SA (95-2007)
No. ofinjured
drivers inNSW,
Victoria(87-2007)
andQLD, WA, NZ
(91-2007)and
SA (95-2007)
ANALYSISINCLUSIONCRITERIAINV=100INJ=20
MARKETGROUP
Hyundai Excel / Accent 95-00 HY1 C 23810 7021 30831 5094 1089 6183 1 SmallHyundai Excel Others HY1 Z 344 149 493 123 35 158 0Hyundai Trajet 00-07 HY10Z 28 5 33 7 1 8 0Hyundai Elantra 00-07 HY11Z 1776 416 2192 273 54 327 1 SmallHyundai Santa Fe 00-06 HY12Z 300 65 365 48 10 58 1 4WD - MediumHyundai Getz / TB 02-07 HY13Z 1679 445 2124 305 84 389 1 LightHyundai Sonata 98-01 HY15A 846 179 1025 119 32 151 1 MediumHyundai Sonata EF 02-05 HY15B 168 41 209 22 2 24 1 Medium
HY15Z 3 2 5 3 1 4 0Hyundai Tiburon 02-07 HY16Z 51 13 64 8 2 10 0Hyundai Terracan 01-07 HY17Z 149 24 173 15 3 18 0Hyundai Elantra Lavita 01-03 HY18Z 49 5 54 21 1 22 0Hyundai Tucson 04-07 HY19Z 94 13 107 12 4 16 0Hyundai Sonata 89-97 HY2 Z 3524 730 4254 642 132 774 1 LargeHyundai Sonata NF 05-07 HY20Z 52 15 67 12 0 12 0Hyundai Grandeur TG 06-07 HY21Z 9 0 9 . . . 0Hyundai Accent 06-07 HY22Z 53 11 64 10 0 10 0Hyundai Santa Fe 06-07 HY23Z 1 0 1 1 0 1 0Hyundai Tucson 07-07 HY24Z 5 1 6 1 0 1 0Hyundai S Coupe 90-96 HY4 Z 1338 349 1687 284 61 345 1 SmallHyundai Lantra 91-95 HY5 A 2283 543 2826 394 105 499 1 SmallHyundai Lantra 96-00 HY5 B 4142 941 5083 752 157 909 1 SmallHyundai Lantra Others HY5 Z 49 13 62 17 2 19 0Hyundai Coupe 96-00 HY7 Z 854 186 1040 145 38 183 1 SmallHyundai Grandeaur / XG 99-00 HY8 Z 300 47 347 29 2 31 1 LargeHyundai Accent 00-06 HY9 Z 3883 1049 4932 720 173 893 1 SmallHyundai Others HY99Z 1140 299 1439 710 274 984 0Mitsubishi Mirage / Colt 82-88 I01 Z 12009 3242 15251 3240 780 4020 1 LightMitsubishi Sigma / Galant / Sapporo / Lambda 82-84 I02 Z 12698 2239 14937 2811 696 3507 1 Medium

MAKE/MODEL MODELCODE
No. ofuninjureddrivers in
NSW (87-2007)and
QLD, WA(91-2007)
andSA (95 -2007)
No. ofinjured
drivers inNSW (87-2007)
andQLD, WA(91-2007)
andSA (95-2007)
No. ofinvolveddrivers in
NSW (87-2007)and
QLD, WA(91-2007)
andSA (95-2007)
No. ofinjured(but notseverely)drivers inNSW andVictoria(87-2007)
andQLD, WA, NZ
(91-2007)and
SA (95-2007)
No. ofseverelyinjured
drivers inNSW andVictoria(87-2007)
andQLD, WA, NZ
(91-2007)and
SA (95-2007)
No. ofinjured
drivers inNSW,
Victoria(87-2007)
andQLD, WA, NZ
(91-2007)and
SA (95-2007)
ANALYSISINCLUSIONCRITERIAINV=100INJ=20
MARKETGROUP
Mitsubishi Magna TM/TN/TP / Sigma / V3000 85-90 I04 Z 29677 5123 34800 4807 1310 6117 1 LargeMitsubishi Charger/Valiant I05 Z 32 3 35 2 1 3 0Mitsubishi Magna TE/TF/TH/TJ / Verada
KE/KF/KH/KJ / Diamante96-03 I06 A 18071 3033 21104 2445 539 2984 1 Large
I06 Z 1 2 3 2 0 2 0Mitsubishi Starion 82-87 I07 Z 177 34 211 46 23 69 1 MediumMitsubishi Lancer / Mirage CA 89-90 I09 A 5481 1083 6564 1254 288 1542 1 SmallMitsubishi Lancer / Mirage CB 91-92 I09 B 917 216 1133 354 66 420 1 SmallMitsubishi Lancer / Mirage CC 93-95 I09 C 7471 1568 9039 1502 342 1844 1 SmallMitsubishi Lancer / Mirage CE 96-03 I09 D 17019 4227 21246 3169 626 3795 1 SmallMitsubishi Lancer Others I09 Z 3 0 3 458 100 558 0Mitsubishi Nimbus / Chariot / Spacewagon 85-91 I10 A 499 100 599 212 41 253 1 People MoverMitsubishi Nimbus / Chariot 92-98 I10 B 836 170 1006 207 36 243 1 People MoverMitsubishi Nimbus 99-03 I10 C 277 38 315 27 5 32 1 People MoverMitsubishi Cordia 83-87 I12 Z 1750 346 2096 564 148 712 1 SmallMitsubishi Magna TR/TS / Verada KR/KS /
V3000 / Diamante91-96 I15 Z 28017 4468 32485 4222 909 5131 1 Large
Mitsubishi Galant 89-93 I16 A 14 1 15 506 105 611 0Mitsubishi Galant 95-96 I16 B 1626 300 1926 410 88 498 1 MediumMitsubishi Galant Others I16 Z 9 11 20 364 81 445 0Mitsubishi Canter I21 Z 1374 142 1516 156 47 203 0Mitsubishi Starwagon / L300 83-86 I23 A 3181 718 3899 593 201 794 1 People MoverMitsubishi Starwagon / Delica Starwagon 87-93 I23 B 6285 1107 7392 928 263 1191 1 People MoverMitsubishi Starwagon / Delica Spacegear 95-98 I23 C 1842 276 2118 236 48 284 1 People MoverMitsubishi Starwagon / Delica Spacegear 98-03 I23 D 1098 183 1281 136 40 176 1 People MoverMitsubishi Starwagon Others I23 Z 152 67 219 173 45 218 0Mitsubishi Commercials I24 Z 5131 901 6032 666 202 868 0Mitsubishi Pajero 82-90 I25 A 2093 371 2464 399 128 527 1 4WD - MediumMitsubishi Pajero 91 I25 B 521 61 582 92 29 121 0Mitsubishi Pajero 92-99 I25 C 3912 498 4410 439 118 557 1 4WD - Medium

MAKE/MODEL MODELCODE
No. ofuninjureddrivers in
NSW (87-2007)and
QLD, WA(91-2007)
andSA (95 -2007)
No. ofinjured
drivers inNSW (87-2007)
andQLD, WA(91-2007)
andSA (95-2007)
No. ofinvolveddrivers in
NSW (87-2007)and
QLD, WA(91-2007)
andSA (95-2007)
No. ofinjured(but notseverely)drivers inNSW andVictoria(87-2007)
andQLD, WA, NZ
(91-2007)and
SA (95-2007)
No. ofseverelyinjured
drivers inNSW andVictoria(87-2007)
andQLD, WA, NZ
(91-2007)and
SA (95-2007)
No. ofinjured
drivers inNSW,
Victoria(87-2007)
andQLD, WA, NZ
(91-2007)and
SA (95-2007)
ANALYSISINCLUSIONCRITERIAINV=100INJ=20
MARKETGROUP
Mitsubishi Pajero NM / NP / NS 00-07 I25 D 1106 113 1219 91 23 114 1 4WD - MediumMitsubishi Pajero Others I25 Z 114 43 157 30 11 41 0Mitsubishi 3000GT 92-97 I26 Z 3 2 5 3 1 4 0Mitsubishi Challenger 98-06 I30 Z 474 69 543 66 19 85 1 4WD - MediumMitsubishi Pajero iO 99-03 I34 Z 76 13 89 9 4 13 0Mitsubishi Lancer CE / CG / Cedia 02-03 I37 Z 58 37 95 30 8 38 0Mitsubishi Magna TL/TW / Verada KL/KW 03-05 I38 Z 1039 187 1226 151 21 172 1 LargeMitsubishi Outlander 03-06 I39 Z 249 55 304 33 7 40 1 4WD - CompactMitsubishi Lancer CH / CJ 03-07 I40 Z 1227 318 1545 219 54 273 1 SmallMitsubishi Grandis 04-07 I42 Z 31 4 35 4 1 5 0Mitsubishi Colt 04-07 I43 Z 118 20 138 28 12 40 1 LightMitsubishi 380 05-07 I44 Z 221 40 261 34 4 38 1 LargeMitsubishi Triton MK 96-06 I45 Z 1313 144 1457 112 29 141 1 Commercial - UteMitsubishi Triton ML 06-07 I46 Z 52 6 58 4 3 7 0Mitsubishi Outlander 06-07 I47 Z 34 5 39 3 1 4 0Mitsubishi Others I99 Z 30914 5783 36697 7436 2237 9673 0Isuzu Nkr Series IS01Z 882 113 995 78 17 95 0Isuzu NPR Series IS02Z 1937 151 2088 95 27 122 0Isuzu Others IS99Z 2777 214 2991 225 99 324 0Jaguar XJ6 82-86 J01 A 351 53 404 41 13 54 1 LargeJaguar XJ6 87-94 J01 B 487 61 548 60 11 71 1 LargeJaguar XJ6 95-97 J01 C 109 13 122 7 5 12 0Jaguar XJ8 98-03 J01 D 11 1 12 1 0 1 0Jaguar XJ6 Others J01 Z 25 3 28 5 0 5 0Jaguar V12 Saloon J02 Z 11 2 13 2 0 2 0Jaguar XJS 82-96 J04 Z 68 11 79 10 1 11 0Jaguar XJR 95-03 J05 Z 4 0 4 1 0 1 0Jaguar XK8 / XKR 96-05 J07 Z 31 3 34 3 1 4 0Jaguar S-Type 99-07 J08 Z 138 15 153 15 1 16 0
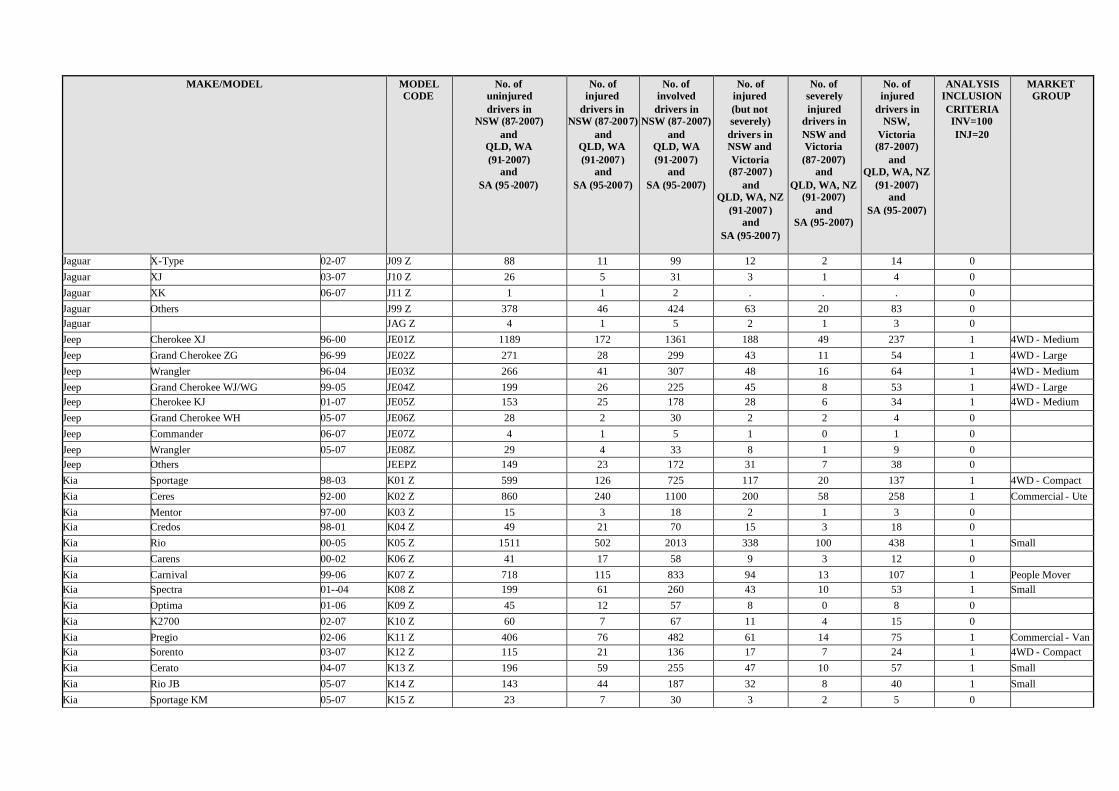
MAKE/MODEL MODELCODE
No. ofuninjureddrivers in
NSW (87-2007)and
QLD, WA(91-2007)
andSA (95 -2007)
No. ofinjured
drivers inNSW (87-2007)
andQLD, WA(91-2007)
andSA (95-2007)
No. ofinvolveddrivers in
NSW (87-2007)and
QLD, WA(91-2007)
andSA (95-2007)
No. ofinjured(but notseverely)drivers inNSW andVictoria(87-2007)
andQLD, WA, NZ
(91-2007)and
SA (95-2007)
No. ofseverelyinjured
drivers inNSW andVictoria(87-2007)
andQLD, WA, NZ
(91-2007)and
SA (95-2007)
No. ofinjured
drivers inNSW,
Victoria(87-2007)
andQLD, WA, NZ
(91-2007)and
SA (95-2007)
ANALYSISINCLUSIONCRITERIAINV=100INJ=20
MARKETGROUP
Jaguar X-Type 02-07 J09 Z 88 11 99 12 2 14 0Jaguar XJ 03-07 J10 Z 26 5 31 3 1 4 0Jaguar XK 06-07 J11 Z 1 1 2 . . . 0Jaguar Others J99 Z 378 46 424 63 20 83 0Jaguar JAG Z 4 1 5 2 1 3 0Jeep Cherokee XJ 96-00 JE01Z 1189 172 1361 188 49 237 1 4WD - MediumJeep Grand Cherokee ZG 96-99 JE02Z 271 28 299 43 11 54 1 4WD - LargeJeep Wrangler 96-04 JE03Z 266 41 307 48 16 64 1 4WD - MediumJeep Grand Cherokee WJ/WG 99-05 JE04Z 199 26 225 45 8 53 1 4WD - LargeJeep Cherokee KJ 01-07 JE05Z 153 25 178 28 6 34 1 4WD - MediumJeep Grand Cherokee WH 05-07 JE06Z 28 2 30 2 2 4 0Jeep Commander 06-07 JE07Z 4 1 5 1 0 1 0Jeep Wrangler 05-07 JE08Z 29 4 33 8 1 9 0Jeep Others JEEPZ 149 23 172 31 7 38 0Kia Sportage 98-03 K01 Z 599 126 725 117 20 137 1 4WD - CompactKia Ceres 92-00 K02 Z 860 240 1100 200 58 258 1 Commercial - UteKia Mentor 97-00 K03 Z 15 3 18 2 1 3 0Kia Credos 98-01 K04 Z 49 21 70 15 3 18 0Kia Rio 00-05 K05 Z 1511 502 2013 338 100 438 1 SmallKia Carens 00-02 K06 Z 41 17 58 9 3 12 0Kia Carnival 99-06 K07 Z 718 115 833 94 13 107 1 People MoverKia Spectra 01--04 K08 Z 199 61 260 43 10 53 1 SmallKia Optima 01-06 K09 Z 45 12 57 8 0 8 0Kia K2700 02-07 K10 Z 60 7 67 11 4 15 0Kia Pregio 02-06 K11 Z 406 76 482 61 14 75 1 Commercial - VanKia Sorento 03-07 K12 Z 115 21 136 17 7 24 1 4WD - CompactKia Cerato 04-07 K13 Z 196 59 255 47 10 57 1 SmallKia Rio JB 05-07 K14 Z 143 44 187 32 8 40 1 SmallKia Sportage KM 05-07 K15 Z 23 7 30 3 2 5 0

MAKE/MODEL MODELCODE
No. ofuninjureddrivers in
NSW (87-2007)and
QLD, WA(91-2007)
andSA (95 -2007)
No. ofinjured
drivers inNSW (87-2007)
andQLD, WA(91-2007)
andSA (95-2007)
No. ofinvolveddrivers in
NSW (87-2007)and
QLD, WA(91-2007)
andSA (95-2007)
No. ofinjured(but notseverely)drivers inNSW andVictoria(87-2007)
andQLD, WA, NZ
(91-2007)and
SA (95-2007)
No. ofseverelyinjured
drivers inNSW andVictoria(87-2007)
andQLD, WA, NZ
(91-2007)and
SA (95-2007)
No. ofinjured
drivers inNSW,
Victoria(87-2007)
andQLD, WA, NZ
(91-2007)and
SA (95-2007)
ANALYSISINCLUSIONCRITERIAINV=100INJ=20
MARKETGROUP
Kia Magentis 06-07 K16 Z 6 1 7 . . . 0Kia Carnival 06-07 K17 Z 52 4 56 5 0 5 0Lada LADAZ 222 88 310 114 32 146 0Lancia LANCZ 33 3 36 2 2 4 0Leyland LEY Z 101 11 112 10 5 15 0Land Rover Defender 92-07 LRO1Z 288 58 346 38 23 61 1 4WD - MediumLand Rover Discovery 91-02 LRO2A 958 160 1118 142 36 178 1 4WD - LargeLand Rover Discovery 02--04 LRO2B 64 13 77 9 3 12 0
LRO2Z 360 64 424 59 18 77 0Land Rover Others LROVZ 294 41 335 53 14 67 0Ford / Mazda Laser / 323 / Familia 82-88 M01 A 42672 11145 53817 12807 3095 15902 1 SmallMazda 323 89 M01 B 504 134 638 736 158 894 0Mazda 323 / Familia / Lantis 90-93 M01 C 3923 814 4737 1478 307 1785 1 SmallMazda 323 94 M01 D 1203 260 1463 203 46 249 0Mazda 323 / Familia / Lantis 95-98 M01 E 4591 1039 5630 919 190 1109 1 SmallFord / Mazda Laser / 323 99-03 M01 F 4967 1253 6220 941 190 1131 1 SmallMazda 323 Others M01 Z 349 178 527 216 56 272 0Mazda 626/MX6 / Telstar 82 M02 A 11844 2541 14385 2646 756 3402 0Ford / Mazda Telstar / 626 / MX6 / Capella 83-86 M02 B 9455 1923 11378 2631 650 3281 1 MediumMazda 626/MX6 / Telstar 87 M02 C 3025 441 3466 365 92 457 0Ford / Mazda Telstar / 626 / MX6 / Capella 88-91 M02 D 5546 1138 6684 1656 382 2038 1 MediumFord / Mazda Telstar / 626 / MX6 / Capella / Cronos 92-97 M02 E 5985 960 6945 1226 299 1525 1 MediumMazda 626 98-02 M02 F 1661 353 2014 334 68 402 1 MediumMazda 626/MX6 / Telstar Others M02 Z 267 111 378 72 34 106 0Mazda 929 / Luce 82-90 M03 A 3298 611 3909 651 178 829 1 LargeMazda 929 91 M03 B 209 32 241 40 9 49 0Mazda 929 / Sentia / Efini MS-9 92-96 M03 C 236 43 279 41 10 51 1 LargeMAZDA 929 OTHERS M03 Z 86 41 127 30 11 41 0Ford / Mazda Festiva WA / 121 87-90 M09 A 6557 1985 8542 1577 410 1987 1 Light

MAKE/MODEL MODELCODE
No. ofuninjureddrivers in
NSW (87-2007)and
QLD, WA(91-2007)
andSA (95 -2007)
No. ofinjured
drivers inNSW (87-2007)
andQLD, WA(91-2007)
andSA (95-2007)
No. ofinvolveddrivers in
NSW (87-2007)and
QLD, WA(91-2007)
andSA (95-2007)
No. ofinjured(but notseverely)drivers inNSW andVictoria(87-2007)
andQLD, WA, NZ
(91-2007)and
SA (95-2007)
No. ofseverelyinjured
drivers inNSW andVictoria(87-2007)
andQLD, WA, NZ
(91-2007)and
SA (95-2007)
No. ofinjured
drivers inNSW,
Victoria(87-2007)
andQLD, WA, NZ
(91-2007)and
SA (95-2007)
ANALYSISINCLUSIONCRITERIAINV=100INJ=20
MARKETGROUP
Mazda 121 / Autozam Review 94-96 M09 B 3307 1010 4317 721 160 881 1 LightMazda 121 Metro / Demio 97-02 M09 C 2321 632 2953 520 111 631 1 LightMazda 121 / Ford Festiva WA Others M09 Z 175 99 274 98 29 127 0Mazda RX7 82-85 M10 A 640 125 765 124 38 162 1 MediumMazda RX7 86-91 M10 B 372 56 428 93 27 120 1 MediumMazda RX7 92-98 M10 C 76 13 89 21 8 29 0Mazda RX7 Others M10 Z 10 0 10 7 5 12 0Mazda MX5 / Eunos Roadster 89-97 M11 A 449 102 551 91 19 110 1 SmallMazda MX5 / Eunos Roadster 98-05 M11 B 350 79 429 52 9 61 1 SmallMazda MX5 Others M11 Z 7 9 16 10 2 12 0Mazda Commercials M14 Z 7989 1343 9332 1074 337 1411 0Mazda MPV 94-99 M15 A 322 42 364 27 2 29 1 People MoverMazda MPV 00-06 M15 B 163 19 182 11 2 13 0Mazda MPV Others M15 Z 5 1 6 1 0 1 0Mazda Eunos 30X / Presso / MX-3 / Autozam
AZ-390-97 M16 Z 486 109 595 86 15 101 1 Small
Mazda Eunos 500 93-99 M17 Z 289 71 360 66 11 77 1 MediumMazda Eunos 800 94-00 M18 Z 111 15 126 17 3 20 1 MediumFord / Mazda Escape / Tribute 01-06 M21 Z 1005 189 1194 155 40 195 1 4WD - CompactFord / Mazda Courier / B-Series / Bounty 98-02 M22 A 1709 289 1998 245 85 330 1 Commercial - UteFord / Mazda Courier / Bravo / Bounty 03-06 M22 B 752 185 937 150 51 201 1 Commercial - UteMazda Bravo / Ford Courier Others M22 Z 188 24 212 67 16 83 0Mazda Premacy 01-03 M23 Z 2 0 2 2 1 3 0Mazda 2 02-07 M24 Z 462 127 589 94 27 121 1 LightMazda 6 02-07 M25 Z 731 162 893 171 27 198 1 MediumMazda RX8 03-07 M26 Z 133 14 147 13 3 16 0Mazda 3 / Axela 03-07 M27 Z 1754 436 2190 332 57 389 1 SmallMazda MX5 05-07 M28 Z 23 3 26 3 0 3 0Mazda CX-7 06-07 M29 Z 27 4 31 3 0 3 0

MAKE/MODEL MODELCODE
No. ofuninjureddrivers in
NSW (87-2007)and
QLD, WA(91-2007)
andSA (95 -2007)
No. ofinjured
drivers inNSW (87-2007)
andQLD, WA(91-2007)
andSA (95-2007)
No. ofinvolveddrivers in
NSW (87-2007)and
QLD, WA(91-2007)
andSA (95-2007)
No. ofinjured(but notseverely)drivers inNSW andVictoria(87-2007)
andQLD, WA, NZ
(91-2007)and
SA (95-2007)
No. ofseverelyinjured
drivers inNSW andVictoria(87-2007)
andQLD, WA, NZ
(91-2007)and
SA (95-2007)
No. ofinjured
drivers inNSW,
Victoria(87-2007)
andQLD, WA, NZ
(91-2007)and
SA (95-2007)
ANALYSISINCLUSIONCRITERIAINV=100INJ=20
MARKETGROUP
Mazda BT-50 06-07 M30 Z 1 0 1 . . . 0Ford / Mazda Escape / Tribute 06-07 M31 Z 28 2 30 1 0 1 0Mazda 2 07-07 M33 Z 6 1 7 . . . 0Mazda Others M99 Z 11627 1968 13595 3222 913 4135 0Maserati MASRZ 6 0 6 1 0 1 0Mercedes 100 Series ME1 Z 204 29 233 33 8 41 0Mercedes C180 ME10Z 48 11 59 10 2 12 0Mercedes Benz C-Class W201 87-93 ME11Z 776 136 912 136 30 166 1 MediumMercedes Benz C-Class W202 95-00 ME12Z 1342 193 1535 169 33 202 1 MediumMercedes Benz CLK C208 97-03 ME13Z 185 31 216 21 7 28 1 MediumMercedes Benz E-Class W123 82-85 ME14Z 428 65 493 44 11 55 1 LargeMercedes Benz E-Class W124 86-94 ME15Z 1213 187 1400 162 34 196 1 LargeMercedes Benz E-Class W210 96-02 ME16Z 718 90 808 75 21 96 1 LargeMercedes S-CLASS W107 ME17Z 37 7 44 8 0 8 0Mercedes Benz S-Class W126 82-92 ME18Z 961 121 1082 105 25 130 1 LargeMercedes Benz S-Class R129 93-02 ME19Z 80 8 88 9 1 10 0Mercedes 200 Series ME2 Z 349 27 376 40 17 57 0Mercedes Benz S-Class C140 93-98 ME20Z 208 12 220 10 1 11 0Mercedes Benz SLK R170 97-04 ME21Z 166 29 195 19 2 21 1 MediumMercedes Benz A-Class W168 98-04 ME22Z 289 63 352 38 6 44 1 SmallMercedes Benz MB100 / MB140 99-04 ME24Z 329 30 359 22 8 30 1 Commercial - VanMercedes Benz S-Class W220 99-06 ME25Z 118 10 128 5 3 8 0Mercedes Benz Vito / Viano 99-07 ME26Z 492 40 532 36 12 48 1 Commercial - VanMercedes Benz M-Class W163 98-05 ME27Z 391 42 433 36 6 42 1 4WD - LargeMercedes Benz CL500/600 C215 98-00 ME28Z 9 0 9 1 0 1 0Mercedes Benz C-Class W203 00-07 ME29Z 622 99 721 60 15 75 1 MediumMercedes 300 Series ME3 Z 452 37 489 41 11 52 0Mercedes Benz Sprinter 98-04 ME30Z 411 57 468 64 14 78 1 Commercial - VanMercedes Benz G-Class 83-88 ME31Z 3 0 3 1 0 1 0

MAKE/MODEL MODELCODE
No. ofuninjureddrivers in
NSW (87-2007)and
QLD, WA(91-2007)
andSA (95 -2007)
No. ofinjured
drivers inNSW (87-2007)
andQLD, WA(91-2007)
andSA (95-2007)
No. ofinvolveddrivers in
NSW (87-2007)and
QLD, WA(91-2007)
andSA (95-2007)
No. ofinjured(but notseverely)drivers inNSW andVictoria(87-2007)
andQLD, WA, NZ
(91-2007)and
SA (95-2007)
No. ofseverelyinjured
drivers inNSW andVictoria(87-2007)
andQLD, WA, NZ
(91-2007)and
SA (95-2007)
No. ofinjured
drivers inNSW,
Victoria(87-2007)
andQLD, WA, NZ
(91-2007)and
SA (95-2007)
ANALYSISINCLUSIONCRITERIAINV=100INJ=20
MARKETGROUP
Mercedes Benz CLK C209 03-07 ME32Z 128 17 145 9 1 10 0Mercedes Benz E-Class W211 02-07 ME33Z 186 22 208 12 0 12 0Mercedes Benz S-Class R230 02-07 ME34Z 19 3 22 3 0 3 0Mercedes Benz SLK R171 04-07 ME35Z 19 5 24 . . . 0Mercedes Benz M-Class W164 05-07 ME36Z 31 0 31 . . . 0Mercedes Benz A-Class W169 05-07 ME37Z 16 3 19 2 1 3 0Mercedes Benz CLS W219 05-07 ME38Z 8 2 10 1 0 1 0Mercedes Benz B-Class W245 05-07 ME39Z 12 1 13 . . . 0Mercedes 400 SERIES ME4 Z 175 31 206 24 7 31 0Mercedes Benz S-Class W221 06-07 ME40Z 6 2 8 . . . 0Mercedes Benz R-Class W251 06-07 ME41Z 1 0 1 . . . 0Mercedes Benz C-Class W204 07-07 ME42Z 3 0 3 . . . 0Mercedes 500 Series ME5 Z 38 5 43 4 1 5 0Mercedes Others ME99Z 2009 195 2204 322 100 422 0
MEE Z 1 0 1 . . . 0Holden / Nissan Astra / Pulsar / Langley 84-86 N01 A 9609 2406 12015 2647 675 3322 1 SmallNissan Pulsar/Vector 87 N01 B 1524 330 1854 670 118 788 0Holden / Nissan Astra / Pulsar / Vector / Sentra 88-90 N01 C 13645 3064 16709 2885 723 3608 1 SmallNissan Pulsar/Vector 91 N01 D 3544 770 4314 614 156 770 0Nissan Pulsar / Vector / Sentra 92-95 N01 E 7064 1392 8456 1566 340 1906 1 SmallNissan Pulsar / Vector / Sentra 96-99 N01 F 7909 2067 9976 1636 376 2012 1 SmallNissan Pulsar Others N01 Z 421 202 623 143 52 195 0Nissan Pintara 86-88 N02 A 5665 1064 6729 918 259 1177 1 MediumNissan / Ford Pintara / Corsair / Bluebird 89-92 N02 B 9209 1919 11128 1977 532 2509 1 MediumNissan Pintara Others N02 Z 1 0 1 96 24 120 0Nissan Bluebird 82-86 N03 Z 12177 2519 14696 2528 767 3295 1 MediumNissan Skyline 83-88 N04 Z 5286 954 6240 1274 366 1640 1 LargeNissan 180B/200B N05 Z 56 7 63 6 1 7 0Nissan 300ZX / Fairlady Z 90-95 N09 Z 576 93 669 116 30 146 1 Large

MAKE/MODEL MODELCODE
No. ofuninjureddrivers in
NSW (87-2007)and
QLD, WA(91-2007)
andSA (95 -2007)
No. ofinjured
drivers inNSW (87-2007)
andQLD, WA(91-2007)
andSA (95-2007)
No. ofinvolveddrivers in
NSW (87-2007)and
QLD, WA(91-2007)
andSA (95-2007)
No. ofinjured(but notseverely)drivers inNSW andVictoria(87-2007)
andQLD, WA, NZ
(91-2007)and
SA (95-2007)
No. ofseverelyinjured
drivers inNSW andVictoria(87-2007)
andQLD, WA, NZ
(91-2007)and
SA (95-2007)
No. ofinjured
drivers inNSW,
Victoria(87-2007)
andQLD, WA, NZ
(91-2007)and
SA (95-2007)
ANALYSISINCLUSIONCRITERIAINV=100INJ=20
MARKETGROUP
Nissan Stanza 82-83 N10 Z 510 105 615 92 21 113 1 SmallNissan 280C / Laurel 82-84 N11 Z 59 9 68 9 3 12 0Nissan Gazelle / Silvia 84-86 N12 Z 419 82 501 405 135 540 1 SmallNissan 280ZX 82-84 N13 Z 111 18 129 19 8 27 1 MediumNissan Prairie 84-86 N14 Z 381 85 466 138 27 165 1 People MoverNissan Maxima 90-94 N15 A 886 149 1035 282 63 345 1 LargeNissan Maxima / Cefiro 95-99 N15 B 1037 206 1243 268 57 325 1 LargeNissan Maxima 00-02 N15 C 343 70 413 78 20 98 1 LargeNissan Maxima Others N15 Z 44 15 59 242 63 305 0Nissan Exa 83-86 N16 A 475 126 601 122 35 157 1 SmallNissan Exa 87-91 N16 B 246 46 292 61 16 77 1 SmallNissan Exa Others N16 Z 9 2 11 8 2 10 0Nissan NX/NX-R 91-96 N17 Z 870 184 1054 152 48 200 1 SmallNissan 300C / Laurel 85-87 N20 Z 94 19 113 12 5 17 0Nissan 720 Ute 82-85 N21 Z 1638 311 1949 236 81 317 1 Commercial - UteNISSAN B120 N22 Z 122 28 150 19 9 28 0NISSAN H40 N23 Z 16 3 19 2 1 3 0Nissan Navara 86-91 N24 A 3911 618 4529 576 191 767 1 Commercial - UteNissan Navara 92-96 N24 B 1861 287 2148 267 79 346 1 Commercial - UteNissan Navara 97-05 N24 C 1844 253 2097 203 79 282 1 Commercial - UteNissan Navara Others N24 Z 304 80 384 105 23 128 0Nissan Vans(Nomad/Urvan/C22/E24/Vanette) N25 Z 3581 830 4411 650 205 855 0Nissan Patrol / Safari 82-87 N26 A 1506 200 1706 185 58 243 1 4WD - LargeNissan / Ford Patrol / Maverick / Safari 88-97 N26 B 7877 953 8830 854 263 1117 1 4WD - LargeNissan Patrol / Safari 98-07 N26 C 3120 416 3536 352 115 467 1 4WD - LargeNissan Patrol N26 Z 212 39 251 33 17 50 0Nissan Pathfinder / Terrano 88-94 N27 Z 615 82 697 236 63 299 1 4WD - MediumNissan Sunny /120Y N28 Z 24 7 31 14 2 16 0Nissan Serena 92-95 N30 Z 137 24 161 96 14 110 1 People Mover
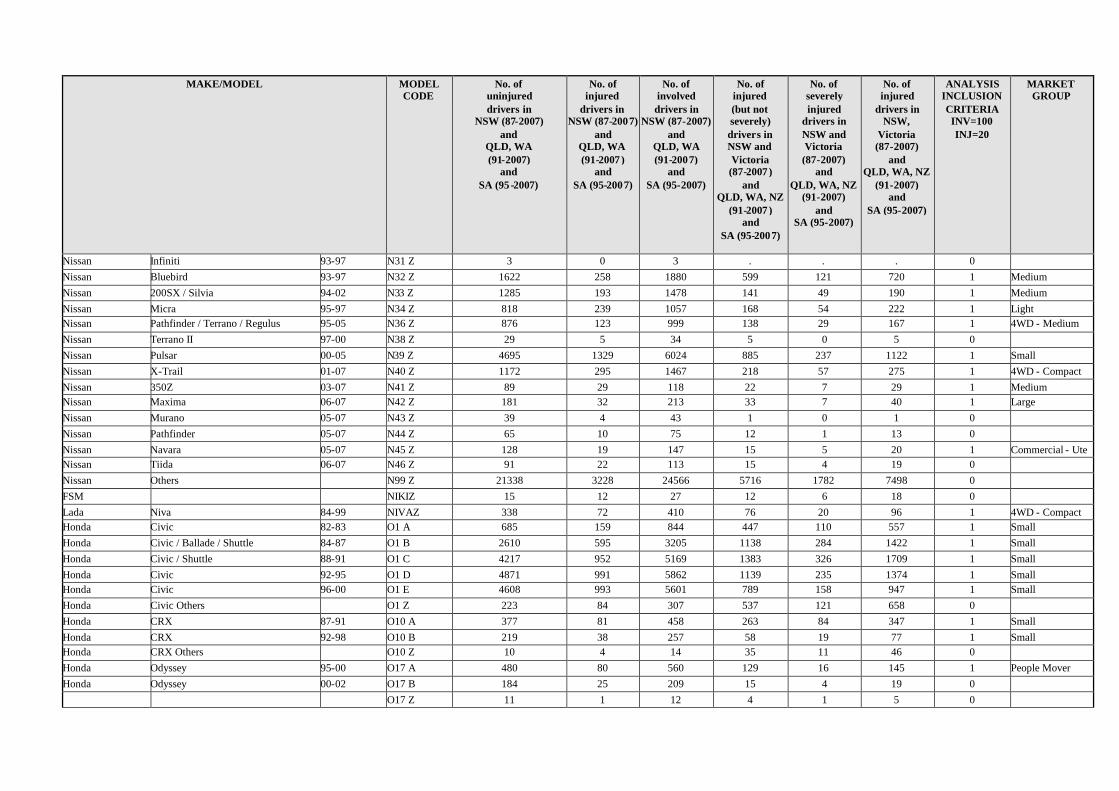
MAKE/MODEL MODELCODE
No. ofuninjureddrivers in
NSW (87-2007)and
QLD, WA(91-2007)
andSA (95 -2007)
No. ofinjured
drivers inNSW (87-2007)
andQLD, WA(91-2007)
andSA (95-2007)
No. ofinvolveddrivers in
NSW (87-2007)and
QLD, WA(91-2007)
andSA (95-2007)
No. ofinjured(but notseverely)drivers inNSW andVictoria(87-2007)
andQLD, WA, NZ
(91-2007)and
SA (95-2007)
No. ofseverelyinjured
drivers inNSW andVictoria(87-2007)
andQLD, WA, NZ
(91-2007)and
SA (95-2007)
No. ofinjured
drivers inNSW,
Victoria(87-2007)
andQLD, WA, NZ
(91-2007)and
SA (95-2007)
ANALYSISINCLUSIONCRITERIAINV=100INJ=20
MARKETGROUP
Nissan Infiniti 93-97 N31 Z 3 0 3 . . . 0Nissan Bluebird 93-97 N32 Z 1622 258 1880 599 121 720 1 MediumNissan 200SX / Silvia 94-02 N33 Z 1285 193 1478 141 49 190 1 MediumNissan Micra 95-97 N34 Z 818 239 1057 168 54 222 1 LightNissan Pathfinder / Terrano / Regulus 95-05 N36 Z 876 123 999 138 29 167 1 4WD - MediumNissan Terrano II 97-00 N38 Z 29 5 34 5 0 5 0Nissan Pulsar 00-05 N39 Z 4695 1329 6024 885 237 1122 1 SmallNissan X-Trail 01-07 N40 Z 1172 295 1467 218 57 275 1 4WD - CompactNissan 350Z 03-07 N41 Z 89 29 118 22 7 29 1 MediumNissan Maxima 06-07 N42 Z 181 32 213 33 7 40 1 LargeNissan Murano 05-07 N43 Z 39 4 43 1 0 1 0Nissan Pathfinder 05-07 N44 Z 65 10 75 12 1 13 0Nissan Navara 05-07 N45 Z 128 19 147 15 5 20 1 Commercial - UteNissan Tiida 06-07 N46 Z 91 22 113 15 4 19 0Nissan Others N99 Z 21338 3228 24566 5716 1782 7498 0FSM NIKIZ 15 12 27 12 6 18 0Lada Niva 84-99 NIVAZ 338 72 410 76 20 96 1 4WD - CompactHonda Civic 82-83 O1 A 685 159 844 447 110 557 1 SmallHonda Civic / Ballade / Shuttle 84-87 O1 B 2610 595 3205 1138 284 1422 1 SmallHonda Civic / Shuttle 88-91 O1 C 4217 952 5169 1383 326 1709 1 SmallHonda Civic 92-95 O1 D 4871 991 5862 1139 235 1374 1 SmallHonda Civic 96-00 O1 E 4608 993 5601 789 158 947 1 SmallHonda Civic Others O1 Z 223 84 307 537 121 658 0Honda CRX 87-91 O10 A 377 81 458 263 84 347 1 SmallHonda CRX 92-98 O10 B 219 38 257 58 19 77 1 SmallHonda CRX Others O10 Z 10 4 14 35 11 46 0Honda Odyssey 95-00 O17 A 480 80 560 129 16 145 1 People MoverHonda Odyssey 00-02 O17 B 184 25 209 15 4 19 0
O17 Z 11 1 12 4 1 5 0

MAKE/MODEL MODELCODE
No. ofuninjureddrivers in
NSW (87-2007)and
QLD, WA(91-2007)
andSA (95 -2007)
No. ofinjured
drivers inNSW (87-2007)
andQLD, WA(91-2007)
andSA (95-2007)
No. ofinvolveddrivers in
NSW (87-2007)and
QLD, WA(91-2007)
andSA (95-2007)
No. ofinjured(but notseverely)drivers inNSW andVictoria(87-2007)
andQLD, WA, NZ
(91-2007)and
SA (95-2007)
No. ofseverelyinjured
drivers inNSW andVictoria(87-2007)
andQLD, WA, NZ
(91-2007)and
SA (95-2007)
No. ofinjured
drivers inNSW,
Victoria(87-2007)
andQLD, WA, NZ
(91-2007)and
SA (95-2007)
ANALYSISINCLUSIONCRITERIAINV=100INJ=20
MARKETGROUP
Honda CR-V 97-01 O18 A 2085 374 2459 348 55 403 1 4WD - CompactHonda CR-V 02-07 O18 B 1263 239 1502 187 26 213 1 4WD - Compact
O18 Z 15 5 20 49 12 61 0Honda HR-V 99-02 O19 Z 387 81 468 60 16 76 1 4WD - CompactHonda Legend 86-95 O2 B 870 106 976 149 35 184 1 LargeHonda Legend 96-98 O2 C 80 8 88 6 0 6 0Honda Legend 99-04 O2 D 42 5 47 7 1 8 0Honda Legend Others O2 Z 12 8 20 52 12 64 0Honda S2000 99-07 O20 Z 180 19 199 14 2 16 0Honda Civic 01-05 O21 Z 1064 213 1277 189 47 236 1 SmallHonda Jazz / Fit 02-07 O22 Z 679 186 865 184 38 222 1 LightHonda Insight 01--04 O23 Z 1 0 1 . . . 0Honda MDX 03-06 O24 Z 58 2 60 2 1 3 0Honda Accord Euro 03-07 O25 Z 659 128 787 108 18 126 1 MediumHonda Accord 03-07 O26 Z 322 64 386 51 14 65 1 MediumHonda Odyssey 04-07 O27 Z 161 24 185 17 0 17 0Honda Civic 06-07 O28 Z 72 14 86 15 2 17 0Honda Legend 06-07 O29 Z 1 0 1 1 0 1 0Honda Accord 82-85 O3 A 1987 437 2424 1000 246 1246 1 MediumHonda Accord 86-90 O3 B 2220 367 2587 905 179 1084 1 MediumHonda Accord 91-93 O3 C 1543 208 1751 320 85 405 1 MediumHonda Accord 94-98 O3 D 3028 478 3506 538 130 668 1 MediumHonda Accord 99-02 O3 E 541 102 643 116 16 132 1 MediumHonda Accord Others O3 Z 127 47 174 321 73 394 0Honda CR-V 07-07 O30 Z 38 12 50 7 1 8 0Honda Prelude 82-82 O4 A 213 38 251 32 6 38 1 MediumHonda Prelude 83-91 O4 B 3470 573 4043 1248 308 1556 1 MediumHonda Prelude 92-96 O4 C 1562 244 1806 300 79 379 1 MediumHonda Prelude 97-02 O4 D 615 104 719 92 18 110 1 Medium

MAKE/MODEL MODELCODE
No. ofuninjureddrivers in
NSW (87-2007)and
QLD, WA(91-2007)
andSA (95 -2007)
No. ofinjured
drivers inNSW (87-2007)
andQLD, WA(91-2007)
andSA (95-2007)
No. ofinvolveddrivers in
NSW (87-2007)and
QLD, WA(91-2007)
andSA (95-2007)
No. ofinjured(but notseverely)drivers inNSW andVictoria(87-2007)
andQLD, WA, NZ
(91-2007)and
SA (95-2007)
No. ofseverelyinjured
drivers inNSW andVictoria(87-2007)
andQLD, WA, NZ
(91-2007)and
SA (95-2007)
No. ofinjured
drivers inNSW,
Victoria(87-2007)
andQLD, WA, NZ
(91-2007)and
SA (95-2007)
ANALYSISINCLUSIONCRITERIAINV=100INJ=20
MARKETGROUP
Honda Prelude Others O4 Z 58 25 83 158 32 190 0Honda Integra 86-88 O5 A 646 125 771 351 84 435 1 SmallHonda Integra 89 O5 B 420 85 505 280 70 350 0Honda Integra 90-92 O5 C 717 132 849 248 53 301 1 SmallHonda Integra 93 O5 D 214 34 248 30 7 37 0Honda Integra 93-01 O5 E 987 178 1165 246 49 295 1 SmallHonda Integra 02-06 O5 F 166 44 210 31 8 39 1 SmallHonda Integra Others O5 Z 39 20 59 62 14 76 0Honda Concerto 89-93 O6 Z 529 108 637 198 50 248 1 SmallHonda NSX 91-02 O7 Z 15 2 17 3 1 4 0Honda Acty 83-86 O8 Z 275 60 335 44 16 60 1 Commercial - VanHonda City 83-86 O9 Z 344 130 474 609 127 736 1 LightHonda Others O99 Z 4050 702 4752 1417 463 1880 0Peugeot 205 87-94 PE1 Z 293 44 337 58 18 76 1 LightPeugeot 607 01-07 PE10Z 8 0 8 1 0 1 0Peugeot 407 04-07 PE11Z 21 4 25 8 2 10 0Peugeot 207 07-07 PE12Z 8 1 9 . . . 0Peugeot 405 89-97 PE2 Z 585 94 679 138 35 173 1 MediumPeugeot 505 82-93 PE3 Z 698 84 782 93 29 122 1 MediumPeugeot 306 94-01 PE4 Z 1156 216 1372 235 39 274 1 SmallPeugeot 605 94-96 PE5 Z 35 4 39 7 2 9 0Peugeot 406 96-04 PE7 Z 245 21 266 37 7 44 1 MediumPeugeot 206 99-07 PE8 Z 541 107 648 73 26 99 1 LightPeugeot 307 01-07 PE9 Z 359 62 421 60 12 72 1 SmallPeugeot Others PE99Z 387 46 433 124 32 156 0Porsche 944 82-91 PO1 Z 99 11 110 14 6 20 1 MediumPorsche 911 82-07 PO2 Z 24 1 25 8 3 11 0Porsche 968 92-95 PO4 Z 1 0 1 . . . 0Porsche Boxter / Cayman 97-07 PO5 Z 2 0 2 2 1 3 0

MAKE/MODEL MODELCODE
No. ofuninjureddrivers in
NSW (87-2007)and
QLD, WA(91-2007)
andSA (95 -2007)
No. ofinjured
drivers inNSW (87-2007)
andQLD, WA(91-2007)
andSA (95-2007)
No. ofinvolveddrivers in
NSW (87-2007)and
QLD, WA(91-2007)
andSA (95-2007)
No. ofinjured(but notseverely)drivers inNSW andVictoria(87-2007)
andQLD, WA, NZ
(91-2007)and
SA (95-2007)
No. ofseverelyinjured
drivers inNSW andVictoria(87-2007)
andQLD, WA, NZ
(91-2007)and
SA (95-2007)
No. ofinjured
drivers inNSW,
Victoria(87-2007)
andQLD, WA, NZ
(91-2007)and
SA (95-2007)
ANALYSISINCLUSIONCRITERIAINV=100INJ=20
MARKETGROUP
Porsche Cayenne 03-07 PO6 Z 18 1 19 1 0 1 0Porsche Others PO99Z 769 77 846 73 35 108 0Proton Wira 95-96 PRO1Z 1064 330 1394 208 66 274 1 SmallProton Satria 97-05 PRO2Z 149 41 190 20 5 25 1 LightProton Waja 01-05 PRO3Z 13 6 19 2 2 4 0Proton Jumbuck 03-07 PRO4Z 66 12 78 8 5 13 0Proton Gen 2 04-07 PRO5Z 26 13 39 12 0 12 0Proton Satria 07-07 PRO6Z 1 0 1 . . . 0Proton Savvy 06-07 PRO7Z 11 2 13 2 1 3 0
PROTZ 41 11 52 9 4 13 0Renault 20 82-83 RE1 Z 17 4 21 7 4 11 0Renault Megane Cabriolet 01-03 RE10Z 44 6 50 9 1 10 0Renault Clio 02-07 RE11Z 150 36 186 32 7 39 1 LightRenault Megane II 03-07 RE12Z 45 16 61 13 3 16 0Renault Trafic 04-07 RE13Z 7 0 7 . . . 0Renault Master 04-07 RE14Z 4 0 4 . . . 0Renault Kangoo 04-07 RE15Z 15 3 18 1 0 1 0Renault Megane II Cabriolet 04-07 RE16Z 10 4 14 1 0 1 0Renault Scenic II 05-07 RE17Z 6 0 6 . . . 0Renault Grand Scenic 07-07 RE18Z 1 0 1 1 0 1 0Renault Feugo 82-87 RE2 Z 334 48 382 63 15 78 1 MediumRenault 21 87-91 RE3 Z 23 4 27 6 2 8 0Renault 25 85-91 RE4 Z 47 9 56 17 4 21 0Renault 19 91-96 RE5 Z 282 56 338 51 9 60 1 SmallRenault Laguna 95-96 RE7 Z 38 10 48 11 4 15 0Renault Laguna 02-07 RE8 Z 26 6 32 8 0 8 0Renault Scenic 01--04 RE9 Z 159 32 191 28 1 29 1 SmallRenault Others RE99Z 350 48 398 64 11 75 0Rover 3500 82-87 RO Z 176 29 205 36 4 40 1 Large
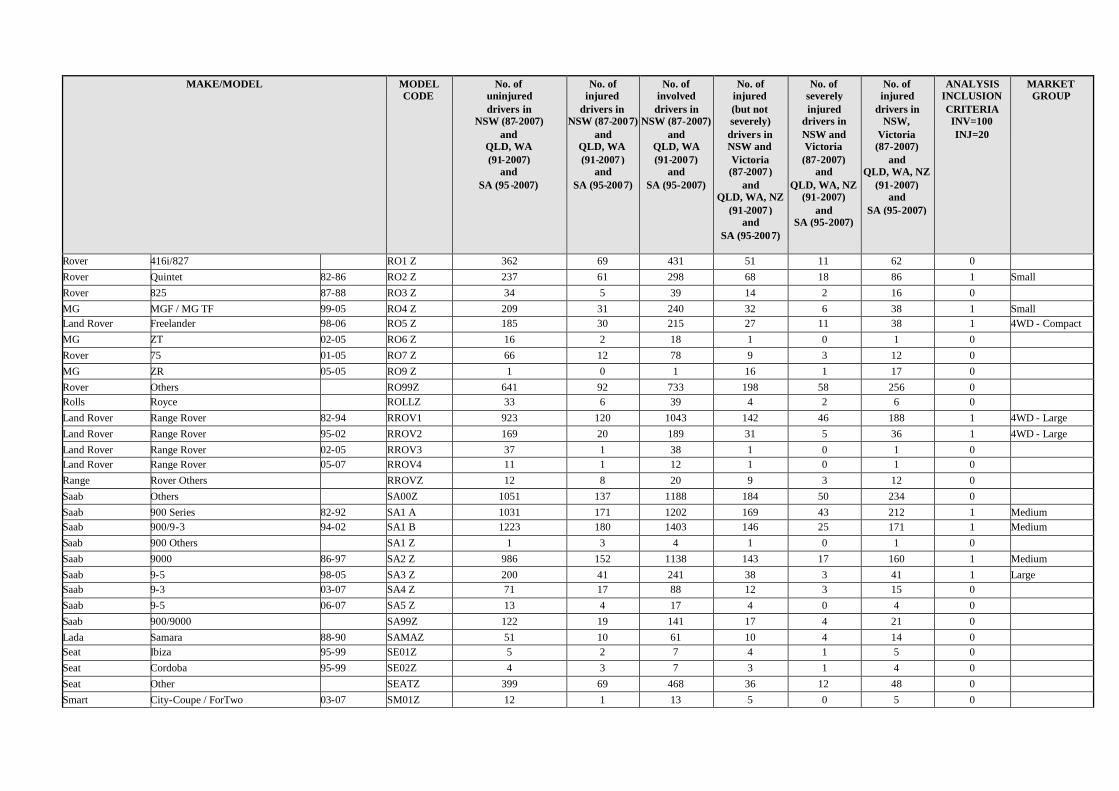
MAKE/MODEL MODELCODE
No. ofuninjureddrivers in
NSW (87-2007)and
QLD, WA(91-2007)
andSA (95 -2007)
No. ofinjured
drivers inNSW (87-2007)
andQLD, WA(91-2007)
andSA (95-2007)
No. ofinvolveddrivers in
NSW (87-2007)and
QLD, WA(91-2007)
andSA (95-2007)
No. ofinjured(but notseverely)drivers inNSW andVictoria(87-2007)
andQLD, WA, NZ
(91-2007)and
SA (95-2007)
No. ofseverelyinjured
drivers inNSW andVictoria(87-2007)
andQLD, WA, NZ
(91-2007)and
SA (95-2007)
No. ofinjured
drivers inNSW,
Victoria(87-2007)
andQLD, WA, NZ
(91-2007)and
SA (95-2007)
ANALYSISINCLUSIONCRITERIAINV=100INJ=20
MARKETGROUP
Rover 416i/827 RO1 Z 362 69 431 51 11 62 0Rover Quintet 82-86 RO2 Z 237 61 298 68 18 86 1 SmallRover 825 87-88 RO3 Z 34 5 39 14 2 16 0MG MGF / MG TF 99-05 RO4 Z 209 31 240 32 6 38 1 SmallLand Rover Freelander 98-06 RO5 Z 185 30 215 27 11 38 1 4WD - CompactMG ZT 02-05 RO6 Z 16 2 18 1 0 1 0Rover 75 01-05 RO7 Z 66 12 78 9 3 12 0MG ZR 05-05 RO9 Z 1 0 1 16 1 17 0Rover Others RO99Z 641 92 733 198 58 256 0Rolls Royce ROLLZ 33 6 39 4 2 6 0Land Rover Range Rover 82-94 RROV1 923 120 1043 142 46 188 1 4WD - LargeLand Rover Range Rover 95-02 RROV2 169 20 189 31 5 36 1 4WD - LargeLand Rover Range Rover 02-05 RROV3 37 1 38 1 0 1 0Land Rover Range Rover 05-07 RROV4 11 1 12 1 0 1 0Range Rover Others RROVZ 12 8 20 9 3 12 0Saab Others SA00Z 1051 137 1188 184 50 234 0Saab 900 Series 82-92 SA1 A 1031 171 1202 169 43 212 1 MediumSaab 900/9-3 94-02 SA1 B 1223 180 1403 146 25 171 1 MediumSaab 900 Others SA1 Z 1 3 4 1 0 1 0Saab 9000 86-97 SA2 Z 986 152 1138 143 17 160 1 MediumSaab 9-5 98-05 SA3 Z 200 41 241 38 3 41 1 LargeSaab 9-3 03-07 SA4 Z 71 17 88 12 3 15 0Saab 9-5 06-07 SA5 Z 13 4 17 4 0 4 0Saab 900/9000 SA99Z 122 19 141 17 4 21 0Lada Samara 88-90 SAMAZ 51 10 61 10 4 14 0Seat Ibiza 95-99 SE01Z 5 2 7 4 1 5 0Seat Cordoba 95-99 SE02Z 4 3 7 3 1 4 0Seat Other SEATZ 399 69 468 36 12 48 0Smart City-Coupe / ForTwo 03-07 SM01Z 12 1 13 5 0 5 0

MAKE/MODEL MODELCODE
No. ofuninjureddrivers in
NSW (87-2007)and
QLD, WA(91-2007)
andSA (95 -2007)
No. ofinjured
drivers inNSW (87-2007)
andQLD, WA(91-2007)
andSA (95-2007)
No. ofinvolveddrivers in
NSW (87-2007)and
QLD, WA(91-2007)
andSA (95-2007)
No. ofinjured(but notseverely)drivers inNSW andVictoria(87-2007)
andQLD, WA, NZ
(91-2007)and
SA (95-2007)
No. ofseverelyinjured
drivers inNSW andVictoria(87-2007)
andQLD, WA, NZ
(91-2007)and
SA (95-2007)
No. ofinjured
drivers inNSW,
Victoria(87-2007)
andQLD, WA, NZ
(91-2007)and
SA (95-2007)
ANALYSISINCLUSIONCRITERIAINV=100INJ=20
MARKETGROUP
Smart Roadster 03-06 SM02Z 7 0 7 . . . 0Subaru 1800 / Leone / Omega / 4WD Wagon 82-93 SU1 Z 6355 1535 7890 1312 420 1732 1 MediumSubaru Tribeca 06-07 SU10Z 6 1 7 1 0 1 0Subaru Liberty / Legacy 89-93 SU2 A 5191 952 6143 1279 318 1597 1 MediumSubaru Liberty / Legacy / Outback 94-98 SU2 B 2400 439 2839 610 143 753 1 MediumSubaru Liberty / Legacy / Outback 99-03 SU2 C 2497 437 2934 317 70 387 1 MediumSubaru Liberty / Legacy / Outback 03-07 SU2 D 614 90 704 66 22 88 1 MediumSubaru Liberty Others SU2 Z 104 36 140 358 95 453 0Subaru Vortex 85-89 SU3 Z 67 17 84 40 7 47 0Subaru Sherpa / Fiori / 700 / Rex 89-92 SU4 Z 654 317 971 303 78 381 1 LightSubaru SVX / Alcyone 92-95 SU5 Z 24 4 28 1 3 4 0Subaru Brumby 82-92 SU6 Z 1582 463 2045 285 153 438 1 Commercial - UteSubaru Impreza 93-00 SU7 A 4158 912 5070 848 236 1084 1 SmallSubaru Impreza 01-07 SU7 B 1634 296 1930 201 41 242 1 Small
SU7 Z 22 8 30 34 6 40 0Subaru Forester 97-02 SU8 Z 1500 286 1786 254 55 309 1 4WD - CompactSubaru Forester 02-07 SU9 Z 974 214 1188 141 29 170 1 4WD - CompactSubaru Others SU99Z 3445 720 4165 984 320 1304 0Suzuki Swift 82-85 SZ01A 202 68 270 52 20 72 1 LightHolden / Suzuki Barina / Swift / Cultus 86-88 SZ01B 3666 1225 4891 1228 323 1551 1 LightHolden / Suzuki Barina / Swift / Cultus 89-99 SZ01C 16991 4748 21739 3613 850 4463 1 LightSuzuki Swift Others SZ01Z 156 59 215 79 28 107 0Suzuki Vitara / Escudo 88-98 SZ02A 3604 836 4440 728 178 906 1 4WD - CompactSuzuki Grand Vitara 99-05 SZ02B 587 144 731 116 31 147 1 4WD - CompactSuzuki Vitara Others SZ02Z 59 25 84 59 20 79 0Suzuki Hatch / Alto 82-84 SZ03Z 795 372 1167 268 85 353 1 LightHolden / Suzuki Scurry / Carry 82-00 SZ04Z 412 172 584 142 49 191 1 Commercial - VanSuzuki Alto 85-00 SZ05Z 212 93 305 183 52 235 1 LightSuzuki Mighty Boy 85-88 SZ06Z 429 193 622 138 41 179 1 Commercial - Ute
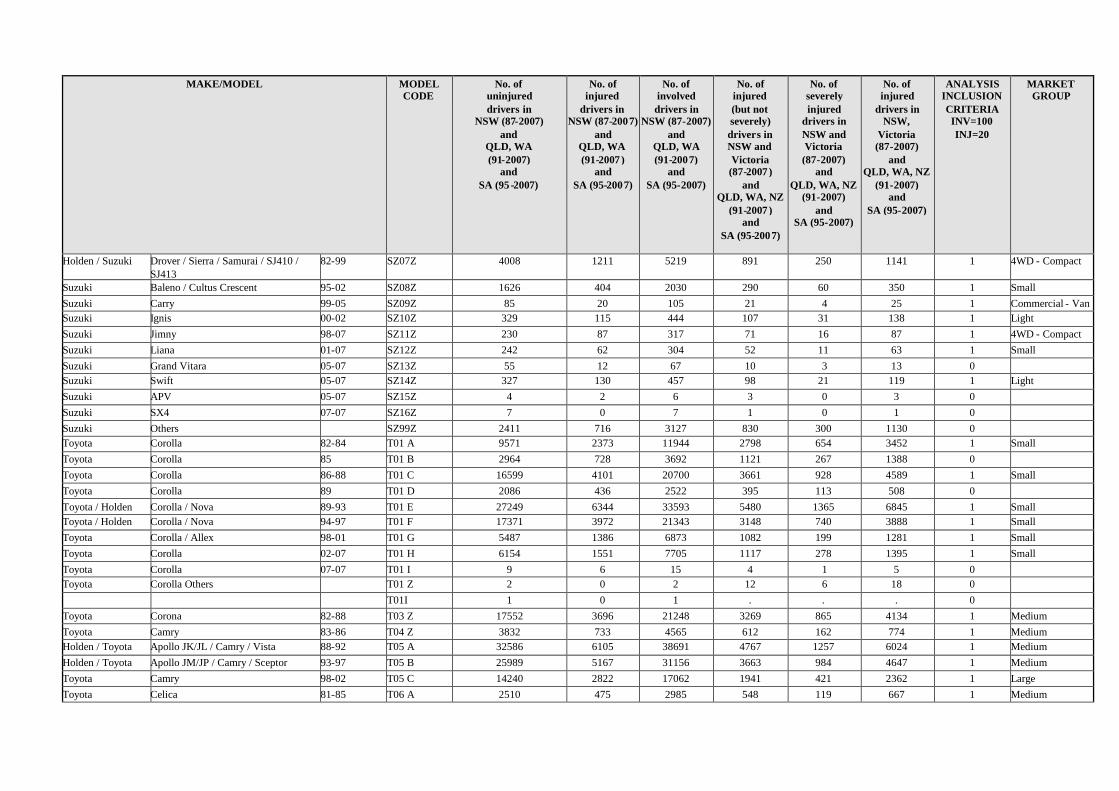
MAKE/MODEL MODELCODE
No. ofuninjureddrivers in
NSW (87-2007)and
QLD, WA(91-2007)
andSA (95 -2007)
No. ofinjured
drivers inNSW (87-2007)
andQLD, WA(91-2007)
andSA (95-2007)
No. ofinvolveddrivers in
NSW (87-2007)and
QLD, WA(91-2007)
andSA (95-2007)
No. ofinjured(but notseverely)drivers inNSW andVictoria(87-2007)
andQLD, WA, NZ
(91-2007)and
SA (95-2007)
No. ofseverelyinjured
drivers inNSW andVictoria(87-2007)
andQLD, WA, NZ
(91-2007)and
SA (95-2007)
No. ofinjured
drivers inNSW,
Victoria(87-2007)
andQLD, WA, NZ
(91-2007)and
SA (95-2007)
ANALYSISINCLUSIONCRITERIAINV=100INJ=20
MARKETGROUP
Holden / Suzuki Drover / Sierra / Samurai / SJ410 /SJ413
82-99 SZ07Z 4008 1211 5219 891 250 1141 1 4WD - Compact
Suzuki Baleno / Cultus Crescent 95-02 SZ08Z 1626 404 2030 290 60 350 1 SmallSuzuki Carry 99-05 SZ09Z 85 20 105 21 4 25 1 Commercial - VanSuzuki Ignis 00-02 SZ10Z 329 115 444 107 31 138 1 LightSuzuki Jimny 98-07 SZ11Z 230 87 317 71 16 87 1 4WD - CompactSuzuki Liana 01-07 SZ12Z 242 62 304 52 11 63 1 SmallSuzuki Grand Vitara 05-07 SZ13Z 55 12 67 10 3 13 0Suzuki Swift 05-07 SZ14Z 327 130 457 98 21 119 1 LightSuzuki APV 05-07 SZ15Z 4 2 6 3 0 3 0Suzuki SX4 07-07 SZ16Z 7 0 7 1 0 1 0Suzuki Others SZ99Z 2411 716 3127 830 300 1130 0Toyota Corolla 82-84 T01 A 9571 2373 11944 2798 654 3452 1 SmallToyota Corolla 85 T01 B 2964 728 3692 1121 267 1388 0Toyota Corolla 86-88 T01 C 16599 4101 20700 3661 928 4589 1 SmallToyota Corolla 89 T01 D 2086 436 2522 395 113 508 0Toyota / Holden Corolla / Nova 89-93 T01 E 27249 6344 33593 5480 1365 6845 1 SmallToyota / Holden Corolla / Nova 94-97 T01 F 17371 3972 21343 3148 740 3888 1 SmallToyota Corolla / Allex 98-01 T01 G 5487 1386 6873 1082 199 1281 1 SmallToyota Corolla 02-07 T01 H 6154 1551 7705 1117 278 1395 1 SmallToyota Corolla 07-07 T01 I 9 6 15 4 1 5 0Toyota Corolla Others T01 Z 2 0 2 12 6 18 0
T01I 1 0 1 . . . 0Toyota Corona 82-88 T03 Z 17552 3696 21248 3269 865 4134 1 MediumToyota Camry 83-86 T04 Z 3832 733 4565 612 162 774 1 MediumHolden / Toyota Apollo JK/JL / Camry / Vista 88-92 T05 A 32586 6105 38691 4767 1257 6024 1 MediumHolden / Toyota Apollo JM/JP / Camry / Sceptor 93-97 T05 B 25989 5167 31156 3663 984 4647 1 MediumToyota Camry 98-02 T05 C 14240 2822 17062 1941 421 2362 1 LargeToyota Celica 81-85 T06 A 2510 475 2985 548 119 667 1 Medium
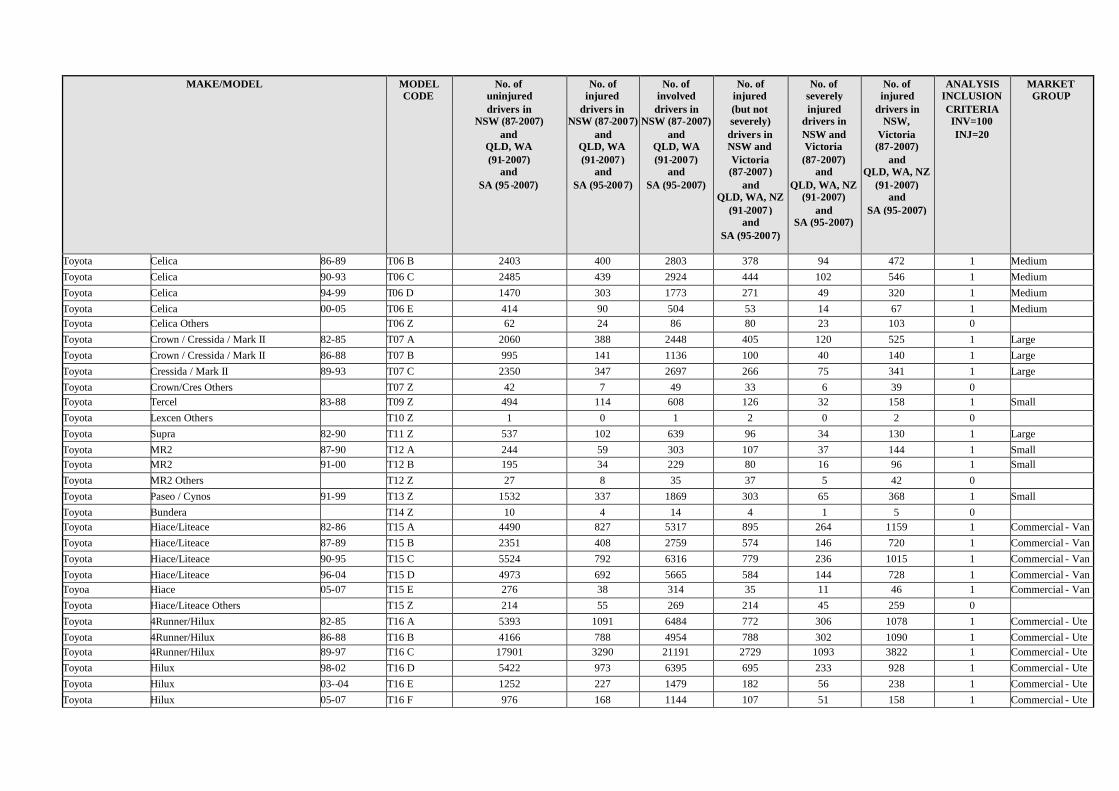
MAKE/MODEL MODELCODE
No. ofuninjureddrivers in
NSW (87-2007)and
QLD, WA(91-2007)
andSA (95 -2007)
No. ofinjured
drivers inNSW (87-2007)
andQLD, WA(91-2007)
andSA (95-2007)
No. ofinvolveddrivers in
NSW (87-2007)and
QLD, WA(91-2007)
andSA (95-2007)
No. ofinjured(but notseverely)drivers inNSW andVictoria(87-2007)
andQLD, WA, NZ
(91-2007)and
SA (95-2007)
No. ofseverelyinjured
drivers inNSW andVictoria(87-2007)
andQLD, WA, NZ
(91-2007)and
SA (95-2007)
No. ofinjured
drivers inNSW,
Victoria(87-2007)
andQLD, WA, NZ
(91-2007)and
SA (95-2007)
ANALYSISINCLUSIONCRITERIAINV=100INJ=20
MARKETGROUP
Toyota Celica 86-89 T06 B 2403 400 2803 378 94 472 1 MediumToyota Celica 90-93 T06 C 2485 439 2924 444 102 546 1 MediumToyota Celica 94-99 T06 D 1470 303 1773 271 49 320 1 MediumToyota Celica 00-05 T06 E 414 90 504 53 14 67 1 MediumToyota Celica Others T06 Z 62 24 86 80 23 103 0Toyota Crown / Cressida / Mark II 82-85 T07 A 2060 388 2448 405 120 525 1 LargeToyota Crown / Cressida / Mark II 86-88 T07 B 995 141 1136 100 40 140 1 LargeToyota Cressida / Mark II 89-93 T07 C 2350 347 2697 266 75 341 1 LargeToyota Crown/Cres Others T07 Z 42 7 49 33 6 39 0Toyota Tercel 83-88 T09 Z 494 114 608 126 32 158 1 SmallToyota Lexcen Others T10 Z 1 0 1 2 0 2 0Toyota Supra 82-90 T11 Z 537 102 639 96 34 130 1 LargeToyota MR2 87-90 T12 A 244 59 303 107 37 144 1 SmallToyota MR2 91-00 T12 B 195 34 229 80 16 96 1 SmallToyota MR2 Others T12 Z 27 8 35 37 5 42 0Toyota Paseo / Cynos 91-99 T13 Z 1532 337 1869 303 65 368 1 SmallToyota Bundera T14 Z 10 4 14 4 1 5 0Toyota Hiace/Liteace 82-86 T15 A 4490 827 5317 895 264 1159 1 Commercial - VanToyota Hiace/Liteace 87-89 T15 B 2351 408 2759 574 146 720 1 Commercial - VanToyota Hiace/Liteace 90-95 T15 C 5524 792 6316 779 236 1015 1 Commercial - VanToyota Hiace/Liteace 96-04 T15 D 4973 692 5665 584 144 728 1 Commercial - VanToyoa Hiace 05-07 T15 E 276 38 314 35 11 46 1 Commercial - VanToyota Hiace/Liteace Others T15 Z 214 55 269 214 45 259 0Toyota 4Runner/Hilux 82-85 T16 A 5393 1091 6484 772 306 1078 1 Commercial - UteToyota 4Runner/Hilux 86-88 T16 B 4166 788 4954 788 302 1090 1 Commercial - UteToyota 4Runner/Hilux 89-97 T16 C 17901 3290 21191 2729 1093 3822 1 Commercial - UteToyota Hilux 98-02 T16 D 5422 973 6395 695 233 928 1 Commercial - UteToyota Hilux 03--04 T16 E 1252 227 1479 182 56 238 1 Commercial - UteToyota Hilux 05-07 T16 F 976 168 1144 107 51 158 1 Commercial - Ute

MAKE/MODEL MODELCODE
No. ofuninjureddrivers in
NSW (87-2007)and
QLD, WA(91-2007)
andSA (95 -2007)
No. ofinjured
drivers inNSW (87-2007)
andQLD, WA(91-2007)
andSA (95-2007)
No. ofinvolveddrivers in
NSW (87-2007)and
QLD, WA(91-2007)
andSA (95-2007)
No. ofinjured(but notseverely)drivers inNSW andVictoria(87-2007)
andQLD, WA, NZ
(91-2007)and
SA (95-2007)
No. ofseverelyinjured
drivers inNSW andVictoria(87-2007)
andQLD, WA, NZ
(91-2007)and
SA (95-2007)
No. ofinjured
drivers inNSW,
Victoria(87-2007)
andQLD, WA, NZ
(91-2007)and
SA (95-2007)
ANALYSISINCLUSIONCRITERIAINV=100INJ=20
MARKETGROUP
Toyota 4Runner/Hilux Others T16 Z 901 300 1201 412 148 560 0Lexus ES300 / Windom 92-01 T17 Z 559 92 651 109 26 135 1 LargeToyota Tarago 83-89 T18 A 4772 1214 5986 803 243 1046 1 People MoverToyota Tarago 90 T18 B 189 29 218 130 15 145 0Toyota Tarago / Previa / Estima 91-99 T18 C 3202 493 3695 365 86 451 1 People MoverToyota Tarago / Previa / Estima 00-06 T18 D 678 111 789 79 19 98 1 People MoverToyota Tarago Others T18 Z 117 32 149 23 9 32 0Toyota Commercials T19 Z 5226 846 6072 549 143 692 0Toyota Landcruiser 82-89 T20 A 7792 1299 9091 943 419 1362 1 4WD - LargeToyota Landcruiser 90-97 T20 B 11533 1585 13118 1239 501 1740 1 4WD - Large
Toyota Landcruiser 98-07 T20 C 4842 833 5675 662 243 905 1 4WD - LargeToyota Lancruiser Others T20 Z 619 195 814 171 84 255 0
Toyota RAV4 94-00 T21 A 2608 527 3135 514 109 623 1 4WD - CompactToyota RAV4 01-06 T21 B 1902 435 2337 297 73 370 1 4WD - Compact
T21 Z 56 15 71 18 6 24 0Toyota Starlet 96-99 T22 Z 3966 1106 5072 849 214 1063 1 Light
Lexus LS400 / Celsior 90-00 T25 Z 186 30 216 26 3 29 1 LargeLexus IS200 / IS300 99-04 T26 Z 496 84 580 32 5 37 1 Medium
Toyota Echo 99-05 T27 Z 4103 1208 5311 864 249 1113 1 LightLexus GS300 97-04 T28 Z 129 16 145 9 1 10 0
Toyota Avalon 00-05 T29 Z 2033 398 2431 297 71 368 1 LargeToyota MR2 00-05 T30 Z 74 24 98 8 2 10 0
Lexus LS430 00-04 T31 Z 38 2 40 2 0 2 0Toyota Corolla 4WD Wagon 92-96 T32 Z 481 87 568 56 14 70 1 SmallToyota Spacia 93-00 T33 A 155 38 193 24 4 28 1 People Mover
Toyota Spacia 01-02 T33 B 13 5 18 4 0 4 0T33 Z 2 0 2 . . . 0
Lexus ES300 01-05 T34 Z 66 7 73 1 1 2 0

MAKE/MODEL MODELCODE
No. ofuninjureddrivers in
NSW (87-2007)and
QLD, WA(91-2007)
andSA (95 -2007)
No. ofinjured
drivers inNSW (87-2007)
andQLD, WA(91-2007)
andSA (95-2007)
No. ofinvolveddrivers in
NSW (87-2007)and
QLD, WA(91-2007)
andSA (95-2007)
No. ofinjured(but notseverely)drivers inNSW andVictoria(87-2007)
andQLD, WA, NZ
(91-2007)and
SA (95-2007)
No. ofseverelyinjured
drivers inNSW andVictoria(87-2007)
andQLD, WA, NZ
(91-2007)and
SA (95-2007)
No. ofinjured
drivers inNSW,
Victoria(87-2007)
andQLD, WA, NZ
(91-2007)and
SA (95-2007)
ANALYSISINCLUSIONCRITERIAINV=100INJ=20
MARKETGROUP
Lexus SC430 01-07 T35 Z 17 0 17 1 0 1 0
Toyota Camry 02-06 T36 Z 3789 837 4626 632 112 744 1 LargeToyota Prius 01-Feb T37 Z 26 1 27 1 0 1 0
Toyota Avensis Verso 01-07 T38 Z 118 23 141 10 7 17 0Toyota Prius 03-07 T39 Z 70 10 80 14 2 16 0
Toyota Kluger 03-07 T40 Z 449 74 523 49 14 63 1 4WD - MediumToyota Landcruiser Prado 96-03 T41 Z 984 142 1126 92 32 124 1 4WD - Medium
Toyota Landcruiser Prado 03-07 T42 Z 1063 139 1202 106 25 131 1 4WD - MediumLexus RX330 03-05 T43 Z 143 19 162 11 5 16 0
Lexus GS300/430/450h 05-07 T44 Z 16 2 18 3 0 3 0Toyota Yaris 05-07 T45 Z 546 137 683 103 30 133 1 Light
T46 Z 8 5 13 . . . 0Lexus IS250 05-07 T48 Z 63 7 70 4 0 4 0
Lexus ZZZZ 06-07 T49 Z 8 0 8 . . . 0Toyota Aurion 06-07 T50 Z 104 20 124 10 1 11 0
Toyota Camry 06-07 T51 Z 241 53 294 32 3 35 1 LargeToyota RAV4 06-07 T52 Z 200 37 237 26 7 33 1 4WD - Compact
Toyota Tarago 06-07 T54 Z 45 9 54 3 0 3 0Lexus LS460 07-07 T55 Z 1 0 1 . . . 0
Toyota Kluger 07-07 T57 Z 8 0 8 . . . 0Toyota Others T99 Z 27790 4429 32219 8711 2917 11628 0
Volvo 850/S70/V70/C70 92-05 V877Z 1710 277 1987 218 49 267 1 LargeVolvo 200 Series 82-93 VO02Z 3225 457 3682 336 95 431 1 MediumVolvo 300 Series 84-88 VO03Z 192 27 219 34 12 46 1 Small
Volvo 700/900 Series 84-92 VO07Z 2144 330 2474 280 50 330 1 LargeVolvo 960/S90/V90 90-98 VO10Z 113 24 137 19 5 24 1 Large
Volvo S80 98-06 VO11Z 71 8 79 6 1 7 0

MAKE/MODEL MODELCODE
No. ofuninjureddrivers in
NSW (87-2007)and
QLD, WA(91-2007)
andSA (95 -2007)
No. ofinjured
drivers inNSW (87-2007)
andQLD, WA(91-2007)
andSA (95-2007)
No. ofinvolveddrivers in
NSW (87-2007)and
QLD, WA(91-2007)
andSA (95-2007)
No. ofinjured(but notseverely)drivers inNSW andVictoria(87-2007)
andQLD, WA, NZ
(91-2007)and
SA (95-2007)
No. ofseverelyinjured
drivers inNSW andVictoria(87-2007)
andQLD, WA, NZ
(91-2007)and
SA (95-2007)
No. ofinjured
drivers inNSW,
Victoria(87-2007)
andQLD, WA, NZ
(91-2007)and
SA (95-2007)
ANALYSISINCLUSIONCRITERIAINV=100INJ=20
MARKETGROUP
Volvo S60 01-07 VO12Z 109 15 124 13 3 16 0
Volvo XC 90 03-07 VO13Z 73 14 87 7 3 10 0Volvo S40/V50 04-07 VO14Z 32 11 43 7 0 7 0
Volvo S40/V40 97-04 VO40Z 641 113 754 86 17 103 1 SmallVolvo Others VO99Z 3191 422 3613 513 141 654 0
Volkswagon VOLKZ 9 2 11 19 5 24 0Volkswagen Caravelle / Transporter 88-94 VS01A 340 44 384 27 7 34 1 Commercial - Van
Volkswagen Caravelle / Transporter 95-04 VS01B 916 141 1057 89 10 99 1 Commercial - VanVS01Z 121 18 139 10 3 13 0
Volkswagen Golf 82-94 VS02A 222 41 263 61 15 76 1 SmallVolkswagen Golf 95-98 VS02B 1067 183 1250 121 21 142 1 Small
Volkswagen Golf / Bora 99-04 VS02C 1433 290 1723 244 36 280 1 SmallVolkswagen Golf Others VS02Z 7 2 9 6 0 6 0
Volkswagen Kombi VS03Z 6 4 10 3 1 4 0Volkswagen Passat 95-97 VS04A 45 6 51 7 1 8 0
Volkswagen Passat 98-06 VS04B 298 43 341 48 7 55 1 MediumVolkswagon Passat Others VS04Z 4 1 5 2 0 2 0
Volkswagen 70E Pick Up VS07Z 24 1 25 5 1 6 0Volkswagen Polo 96-00 VS08A 451 121 572 90 11 101 1 Light
Volkswagen Polo 01-02 VS08B 53 16 69 12 6 18 0Volkswagon Polo Others VS08Z 6 1 7 2 0 2 0
Volkswagen New Beetle 00-07 VS10Z 187 38 225 43 4 47 1 SmallVolkswagen Polo 02-07 VS11Z 141 33 174 26 4 30 1 LightVolkswagen LT 03-06 VS12Z 20 1 21 3 1 4 0
Volkswagen Touareg 03-07 VS13Z 40 4 44 3 2 5 0Volkswagen Golf / Jetta 04-07 VS15Z 361 58 419 60 7 67 1 Small
Volkswagen Caddy 05-07 VS16Z 33 9 42 2 1 3 0

MAKE/MODEL MODELCODE
No. ofuninjureddrivers in
NSW (87-2007)and
QLD, WA(91-2007)
andSA (95 -2007)
No. ofinjured
drivers inNSW (87-2007)
andQLD, WA(91-2007)
andSA (95-2007)
No. ofinvolveddrivers in
NSW (87-2007)and
QLD, WA(91-2007)
andSA (95-2007)
No. ofinjured(but notseverely)drivers inNSW andVictoria(87-2007)
andQLD, WA, NZ
(91-2007)and
SA (95-2007)
No. ofseverelyinjured
drivers inNSW andVictoria(87-2007)
andQLD, WA, NZ
(91-2007)and
SA (95-2007)
No. ofinjured
drivers inNSW,
Victoria(87-2007)
andQLD, WA, NZ
(91-2007)and
SA (95-2007)
ANALYSISINCLUSIONCRITERIAINV=100INJ=20
MARKETGROUP
Volkswagen Multivan 04-07 VS17Z 7 3 10 3 0 3 0
Volkswagen Passat 06-07 VS18Z 23 1 24 3 0 3 0Volkswagen EOS 07-07 VS20Z 3 1 4 . . . 0
Volkswagon Others VS99Z 353 51 404 77 28 105 0Unknown 240991 79833 320824 61084 22106 83190 0
Total 2065882 441172 2507054 414840 118171 533011 427
APPENDIX 2
LOGISTIC REGRESSION ESTIMATES OFCRASHWORTHINESS INJURY RISK BY MODEL AND MARKET GROUP


CRASHWORTHINESS INJURY RISK RATINGS
New South Wales Data (1987-2007), South Australia (1995-2007),Queensland and Western Australia Data (1991-2007)
Make Model of Car Years ofManufacture
Pr(Risk)%
Lower 95%ConfidenceLimit
Upper 95%ConfidenceLimit
Width ofConfidenceInterval
ALL VEHICLE AVERAGE 16.84
Compact Four Wheel Drive Vehicles 17.87 17.47 18.27 0.80
Daihatsu Feroza / Rocky 89-97 19.74 17.48 22.21 4.73Daihatsu Rocky / Rugger 85-98 22.23 19.06 25.76 6.70Daihatsu Terios 97-05 23.21 20.54 26.12 5.57Holden Cruze 02-06 21.91 18.74 25.44 6.70Mitsubishi Outlander 03-06 15.58 12.05 19.90 7.84Kia Sportage 98-03 16.26 13.73 19.15 5.42Kia Sorento 03-07 11.45 7.41 17.28 9.88Ford / Mazda Escape / Tribute 01-06 13.22 11.49 15.16 3.67Nissan X-Trail 01-07 15.75 14.07 17.59 3.52Lada Niva 84-99 18.81 15.11 23.18 8.07Honda CR-V 97-01 13.83 12.54 15.24 2.70Honda CR-V 02-07 13.02 11.50 14.71 3.21Honda HR-V 99-02 15.46 12.51 18.95 6.45Land Rover Freelander 98-06 13.35 9.43 18.56 9.13Subaru Forester 97-02 13.36 11.92 14.95 3.03Subaru Forester 02-07 13.92 12.19 15.85 3.66Suzuki Vitara / Escudo 88-98 20.63 19.37 21.95 2.58Suzuki Grand Vitara 99-05 15.52 13.20 18.17 4.96
Holden / Suzuki Drover / Sierra / Samurai / SJ410 /SJ413 82-99 26.22 24.92 27.56 2.65
Suzuki Jimny 98-07 22.24 18.06 27.08 9.02Toyota RAV4 94-00 15.59 14.35 16.91 2.56Toyota RAV4 01-06 14.95 13.63 16.37 2.74Toyota RAV4 06-07 11.15 8.03 15.28 7.25
Medium Four Wheel Drive Vehicles 13.03 12.59 13.47 0.88
Daewoo /Ssangong
Musso 98-02 12.11 8.64 16.71 8.07
Ford Territory SX/SY 04-07 9.09 7.16 11.49 4.33Holden / Isuzu Jackaroo / Bighorn 82-91 20.23 17.74 22.98 5.24Holden / Isuzu Jackaroo / Bighorn 92-97 15.24 12.87 17.94 5.07Holden / Isuzu Jackaroo / Bighorn 98-02 14.76 12.54 17.30 4.76Holden Frontera / Mu 95-03 14.74 11.59 18.58 6.99Holden Adventra 03-06 11.86 7.76 17.70 9.93Hyundai Santa Fe 00-06 15.74 12.45 19.71 7.26Mitsubishi Pajero 82-90 17.63 16.03 19.35 3.32Mitsubishi Pajero 92-99 12.35 11.34 13.43 2.08Mitsubishi Pajero NM / NP / NS 00-07 8.63 7.20 10.31 3.10Mitsubishi Challenger 98-06 12.24 9.73 15.28 5.55Jeep Cherokee XJ 96-00 12.82 11.08 14.79 3.71Jeep Wrangler 96-04 14.75 10.99 19.52 8.53

Make Model of Car Years ofManufacture
Pr(Risk)%
Lower 95%ConfidenceLimit
Upper 95%ConfidenceLimit
Width ofConfidenceInterval
Jeep Cherokee KJ 01-07 10.94 7.36 15.97 8.61Land Rover Defender 92-07 13.40 10.33 17.19 6.86Nissan Pathfinder / Terrano 88-94 14.09 11.45 17.22 5.76Nissan Pathfinder / Terrano / Regulus 95-05 11.63 9.79 13.78 3.99Toyota Kluger 03-07 11.69 9.34 14.55 5.21Toyota Landcruiser Prado 96-03 9.82 8.32 11.56 3.24Toyota Landcruiser Prado 03-07 8.79 7.44 10.36 2.92
Large Four Wheel Drive Vehicles 12.54 12.25 12.84 0.58
BMW X5 01-07 10.94 8.01 14.77 6.75Ford Bronco 82-87 15.76 10.87 22.29 11.42Ford Explorer 00-01 18.43 15.03 22.39 7.37Ford Explorer 01-05 10.40 7.19 14.81 7.63Jeep Grand Cherokee ZG 96-99 10.35 7.19 14.69 7.50Jeep Grand Cherokee WJ/WG 99-05 10.48 7.16 15.09 7.93Land Rover Discovery 91-02 12.12 10.40 14.07 3.67Mercedes Benz M-Class W163 98-05 9.31 6.92 12.41 5.48Nissan Patrol / Safari 82-87 14.26 12.50 16.22 3.71Nissan / Ford Patrol / Maverick / Safari 88-97 11.74 11.03 12.49 1.45Nissan Patrol / Safari 98-07 10.23 9.30 11.25 1.95Land Rover Range Rover 82-94 13.73 11.57 16.23 4.66Land Rover Range Rover 95-02 11.13 7.22 16.76 9.54Toyota Landcruiser 82-89 15.84 15.03 16.69 1.65Toyota Landcruiser 90-97 12.42 11.83 13.04 1.21Toyota Landcruiser 98-07 12.18 11.38 13.03 1.65
Commercial Vehicles- Vans 17.74 17.31 18.17 0.86
Daihatsu Handivan 82-90 34.49 31.30 37.82 6.52Daihatsu Hi-Jet 82-90 42.58 35.46 50.03 14.56Daihatsu Handivan / Cuore 99-03 27.26 21.98 33.26 11.28Ford Falcon Panel Van 82-95 16.89 15.64 18.22 2.59Ford Falcon Panel Van 96-99 13.61 10.76 17.06 6.30Ford Transit 95-00 14.16 12.10 16.50 4.40Ford Transit 01-07 10.32 7.86 13.43 5.58Holden Shuttle / WFR Van 82-87 22.88 19.27 26.94 7.67Kia Pregio 02-06 16.74 13.53 20.53 7.01Mercedes Benz MB100 / MB140 99-04 10.39 7.35 14.48 7.12Mercedes Benz Vito / Viano 99-07 9.22 6.83 12.32 5.49Mercedes Benz Sprinter 98-04 13.50 10.53 17.14 6.61Honda Acty 83-86 16.43 12.85 20.77 7.93Holden / Suzuki Scurry / Carry 82-00 34.07 29.98 38.42 8.44Suzuki Carry 99-05 19.00 12.37 28.04 15.66Toyota Hiace/Liteace 82-86 22.32 21.00 23.70 2.70Toyota Hiace/Liteace 87-89 21.08 19.33 22.95 3.63Toyota Hiace/Liteace 90-95 17.81 16.71 18.97 2.26Toyota Hiace/Liteace 96-04 14.85 13.84 15.92 2.07Toyoa Hiace 05-07 12.72 9.34 17.08 7.73Volkswagen Caravelle / Transporter 88-94 13.83 10.43 18.12 7.68Volkswagen Caravelle / Transporter 95-04 15.24 13.04 17.73 4.69
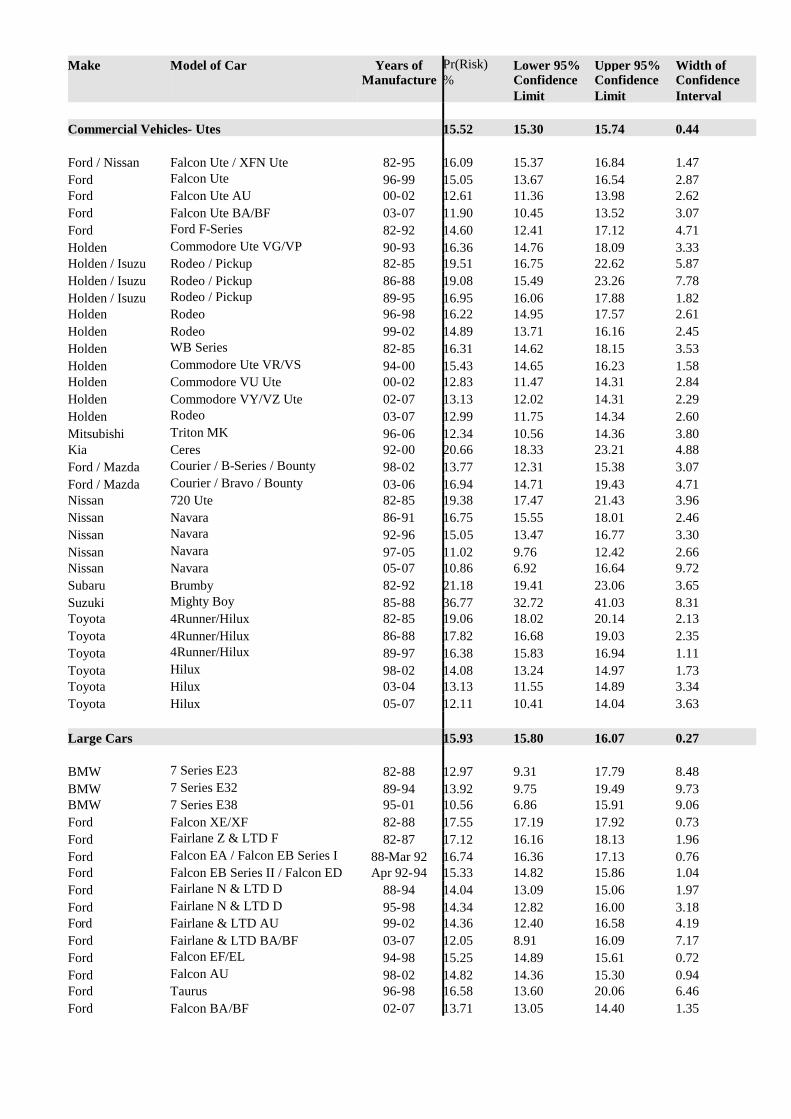
Make Model of Car Years ofManufacture
Pr(Risk)%
Lower 95%ConfidenceLimit
Upper 95%ConfidenceLimit
Width ofConfidenceInterval
Commercial Vehicles- Utes 15.52 15.30 15.74 0.44
Ford / Nissan Falcon Ute / XFN Ute 82-95 16.09 15.37 16.84 1.47Ford Falcon Ute 96-99 15.05 13.67 16.54 2.87Ford Falcon Ute AU 00-02 12.61 11.36 13.98 2.62Ford Falcon Ute BA/BF 03-07 11.90 10.45 13.52 3.07Ford Ford F-Series 82-92 14.60 12.41 17.12 4.71Holden Commodore Ute VG/VP 90-93 16.36 14.76 18.09 3.33Holden / Isuzu Rodeo / Pickup 82-85 19.51 16.75 22.62 5.87Holden / Isuzu Rodeo / Pickup 86-88 19.08 15.49 23.26 7.78Holden / Isuzu Rodeo / Pickup 89-95 16.95 16.06 17.88 1.82Holden Rodeo 96-98 16.22 14.95 17.57 2.61Holden Rodeo 99-02 14.89 13.71 16.16 2.45Holden WB Series 82-85 16.31 14.62 18.15 3.53Holden Commodore Ute VR/VS 94-00 15.43 14.65 16.23 1.58Holden Commodore VU Ute 00-02 12.83 11.47 14.31 2.84Holden Commodore VY/VZ Ute 02-07 13.13 12.02 14.31 2.29Holden Rodeo 03-07 12.99 11.75 14.34 2.60Mitsubishi Triton MK 96-06 12.34 10.56 14.36 3.80Kia Ceres 92-00 20.66 18.33 23.21 4.88Ford / Mazda Courier / B-Series / Bounty 98-02 13.77 12.31 15.38 3.07Ford / Mazda Courier / Bravo / Bounty 03-06 16.94 14.71 19.43 4.71Nissan 720 Ute 82-85 19.38 17.47 21.43 3.96Nissan Navara 86-91 16.75 15.55 18.01 2.46Nissan Navara 92-96 15.05 13.47 16.77 3.30Nissan Navara 97-05 11.02 9.76 12.42 2.66Nissan Navara 05-07 10.86 6.92 16.64 9.72Subaru Brumby 82-92 21.18 19.41 23.06 3.65Suzuki Mighty Boy 85-88 36.77 32.72 41.03 8.31Toyota 4Runner/Hilux 82-85 19.06 18.02 20.14 2.13Toyota 4Runner/Hilux 86-88 17.82 16.68 19.03 2.35Toyota 4Runner/Hilux 89-97 16.38 15.83 16.94 1.11Toyota Hilux 98-02 14.08 13.24 14.97 1.73Toyota Hilux 03-04 13.13 11.55 14.89 3.34Toyota Hilux 05-07 12.11 10.41 14.04 3.63
Large Cars 15.93 15.80 16.07 0.27
BMW 7 Series E23 82-88 12.97 9.31 17.79 8.48BMW 7 Series E32 89-94 13.92 9.75 19.49 9.73BMW 7 Series E38 95-01 10.56 6.86 15.91 9.06Ford Falcon XE/XF 82-88 17.55 17.19 17.92 0.73Ford Fairlane Z & LTD F 82-87 17.12 16.16 18.13 1.96Ford Falcon EA / Falcon EB Series I 88-Mar 92 16.74 16.36 17.13 0.76Ford Falcon EB Series II / Falcon ED Apr 92-94 15.33 14.82 15.86 1.04Ford Fairlane N & LTD D 88-94 14.04 13.09 15.06 1.97Ford Fairlane N & LTD D 95-98 14.34 12.82 16.00 3.18Ford Fairlane & LTD AU 99-02 14.36 12.40 16.58 4.19Ford Fairlane & LTD BA/BF 03-07 12.05 8.91 16.09 7.17Ford Falcon EF/EL 94-98 15.25 14.89 15.61 0.72Ford Falcon AU 98-02 14.82 14.36 15.30 0.94Ford Taurus 96-98 16.58 13.60 20.06 6.46Ford Falcon BA/BF 02-07 13.71 13.05 14.40 1.35

Make Model of Car Years ofManufacture
Pr(Risk)%
Lower 95%ConfidenceLimit
Upper 95%ConfidenceLimit
Width ofConfidenceInterval
Holden / Toyota Commodore VN/VP / Lexcen 89-93 17.31 16.97 17.65 0.68Holden Statesman/Caprice WB 82-85 16.66 11.34 23.81 12.47Holden Stateman/Caprice VQ 90-93 15.23 12.72 18.14 5.42Holden Stateman/Caprice VR/VS 94-98 15.28 14.21 16.42 2.21Holden / Toyota Commodore VR/VS / Lexcen 93-97 15.94 15.61 16.28 0.68Holden Commodore VT/VX 97-02 15.40 15.03 15.77 0.74Holden Statesman/Caprice WH 99-03 13.06 11.33 15.01 3.68Holden Commodore VY/VZ 02-07 14.35 13.71 15.02 1.31Holden Monaro 01-05 14.67 12.13 17.64 5.51Holden Statesman/Caprice WK/WL 03-06 15.92 12.75 19.70 6.95Holden Commodore VB-VL 82-88 18.76 18.37 19.16 0.78Holden Commodore VE 06-07 12.80 10.94 14.91 3.97Hyundai Sonata 89-97 17.81 16.63 19.05 2.42Hyundai Grandeaur / XG 99-00 13.88 10.55 18.05 7.50
Mitsubishi Magna TM/TN/TP / Sigma /V3000 85-90 18.60 18.11 19.10 0.99
Mitsubishi Magna TE/TF/TH/TJ / VeradaKE/KF/KH/KJ / Diamante 96-03 15.51 14.98 16.06 1.07
Mitsubishi Magna TR/TS / Verada KR/KS /V3000 / Diamante 91-96 16.57 16.09 17.05 0.95
Mitsubishi Magna TL/TW / Verada KL/KW 03-05 15.08 13.16 17.22 4.06Mitsubishi 380 05-07 15.21 11.30 20.18 8.88Jaguar XJ6 82-86 17.82 13.88 22.59 8.71Jaguar XJ6 87-94 12.89 10.12 16.28 6.17Mazda 929 / Luce 82-90 19.21 17.85 20.64 2.79Mazda 929 / Sentia / Efini MS-9 92-96 17.28 12.99 22.62 9.63Mercedes Benz E-Class W123 82-85 13.77 10.89 17.26 6.37Mercedes Benz E-Class W124 86-94 15.14 13.22 17.28 4.05Mercedes Benz E-Class W210 96-02 11.54 9.45 14.02 4.58Mercedes Benz S-Class W126 82-92 13.56 11.45 15.98 4.53Nissan Skyline 83-88 18.09 17.05 19.18 2.13Nissan 300ZX / Fairlady Z 90-95 17.80 14.73 21.34 6.61Nissan Maxima 90-94 16.74 14.39 19.39 5.00Nissan Maxima / Cefiro 95-99 16.70 14.66 18.97 4.31Nissan Maxima 00-02 15.87 12.66 19.72 7.06Nissan Maxima 06-07 13.15 9.36 18.19 8.83Honda Legend 86-95 12.82 10.69 15.32 4.63Rover 3500 82-87 19.48 13.86 26.68 12.82Saab 9-5 98-05 16.46 12.27 21.72 9.45Toyota Camry 98-02 15.39 14.84 15.95 1.12Toyota Crown / Cressida / Mark II 82-85 18.82 17.17 20.60 3.43Toyota Crown / Cressida / Mark II 86-88 14.80 12.66 17.24 4.58Toyota Cressida / Mark II 89-93 14.08 12.73 15.55 2.82Toyota Supra 82-90 20.04 16.77 23.77 7.00Lexus ES300 / Windom 92-01 15.32 12.62 18.47 5.85Lexus LS400 / Celsior 90-00 13.97 9.87 19.39 9.52Toyota Avalon 00-05 14.21 12.91 15.61 2.70Toyota Camry 02-06 15.16 14.19 16.19 2.00Toyota Camry 06-07 15.16 11.64 19.51 7.87Volvo 850/S70/V70/C70 92-05 14.23 12.71 15.89 3.18Volvo 700/900 Series 84-92 15.25 13.77 16.86 3.09Volvo 960/S90/V90 90-98 16.96 11.46 24.35 12.89

Make Model of Car Years ofManufacture
Pr(Risk)%
Lower 95%ConfidenceLimit
Upper 95%ConfidenceLimit
Width ofConfidenceInterval
Medium Cars 17.28 17.11 17.46 0.35
Alfa Romeo 156 99-06 15.25 11.98 19.21 7.23Audi A4 95-01 13.06 10.86 15.63 4.77Audi A4 01-07 12.20 9.69 15.25 5.56BMW Z3 E36 97-03 12.36 8.62 17.40 8.78BMW 3 Series E90 05-07 20.97 15.12 28.32 13.20BMW 3 Series E30 82-91 16.87 15.64 18.17 2.53BMW 3 Series E36 92-98 16.32 15.31 17.39 2.07BMW 3 Series E46 99-06 15.10 13.78 16.53 2.76BMW 5 Series E28 82-88 14.28 12.10 16.79 4.70BMW 5 Series E34 89-95 15.25 12.92 17.91 5.00BMW 5 Series E39 96-03 10.49 8.52 12.85 4.33Chrysler PT Cruiser 00-07 18.18 12.73 25.29 12.56Daewoo Espero 95-97 21.76 19.23 24.53 5.31Daewoo Leganza 97-02 15.63 13.24 18.35 5.11Ford Mondeo 95-01 14.92 13.53 16.42 2.90Ford Probe 94-98 21.27 16.47 27.02 10.55Ford Cougar 99-03 14.63 11.34 18.69 7.36Holden Calibra 94-97 15.12 11.86 19.09 7.23Holden Camira 82-89 23.14 22.44 23.85 1.41Holden Vectra 97-03 16.19 15.03 17.42 2.39Holden Vectra ZC 03-05 13.37 9.90 17.82 7.93Hyundai Sonata 98-01 16.27 14.14 18.65 4.51Hyundai Sonata EF 02-05 18.13 13.53 23.86 10.33
Mitsubishi Sigma / Galant / Sapporo /Lambda 82-84 20.46 19.69 21.25 1.56
Mitsubishi Starion 82-87 21.72 15.96 28.83 12.87Mitsubishi Galant 95-96 18.72 16.86 20.74 3.88Ford / Mazda Telstar / 626 / MX6 / Capella 83-86 19.87 19.05 20.71 1.65Ford / Mazda Telstar / 626 / MX6 / Capella 88-91 17.72 16.77 18.72 1.95
Ford / Mazda Telstar / 626 / MX6 / Capella /Cronos 92-97 15.16 14.27 16.10 1.83
Mazda 626 98-02 15.48 13.99 17.09 3.10Mazda RX7 82-85 21.81 18.61 25.40 6.79Mazda RX7 86-91 17.24 13.50 21.75 8.25Mazda Eunos 500 93-99 22.12 17.83 27.11 9.28Mazda Eunos 800 94-00 13.74 8.42 21.62 13.19Mazda 6 02-07 14.50 12.46 16.81 4.35Mercedes Benz C-Class W201 87-93 16.20 13.82 18.91 5.09Mercedes Benz C-Class W202 95-00 13.15 11.48 15.02 3.54Mercedes Benz CLK C208 97-03 14.95 10.67 20.55 9.87Mercedes Benz SLK R170 97-04 14.61 10.28 20.35 10.07Mercedes Benz C-Class W203 00-07 13.55 11.23 16.28 5.05Nissan Pintara 86-88 18.36 17.36 19.42 2.06Nissan / Ford Pintara / Corsair / Bluebird 89-92 19.66 18.85 20.50 1.65Nissan Bluebird 82-86 20.87 20.11 21.64 1.53Nissan 280ZX 82-84 16.90 10.86 25.34 14.48Nissan Bluebird 93-97 14.76 13.14 16.55 3.41Nissan 200SX / Silvia 94-02 13.57 11.83 15.51 3.68Nissan 350Z 03-07 21.87 15.33 30.21 14.88Honda Accord Euro 03-07 14.55 12.31 17.12 4.81Honda Accord 03-07 14.23 11.20 17.92 6.72
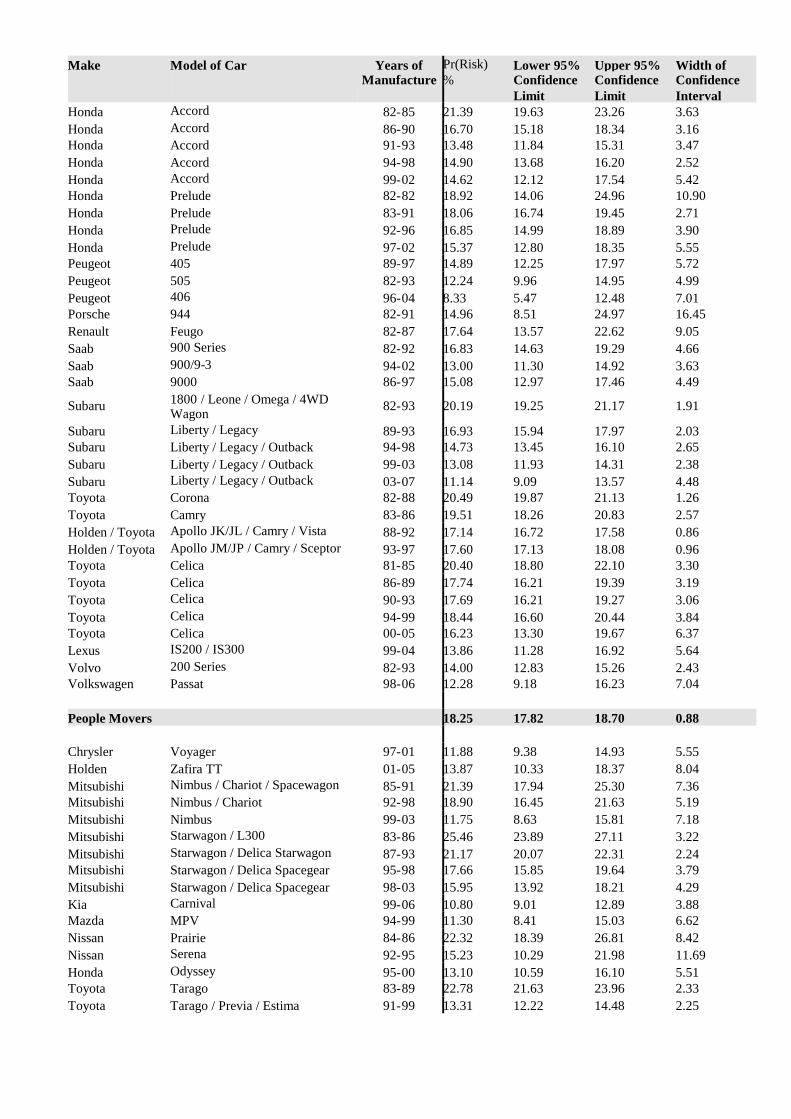
Make Model of Car Years ofManufacture
Pr(Risk)%
Lower 95%ConfidenceLimit
Upper 95%ConfidenceLimit
Width ofConfidenceInterval
Honda Accord 82-85 21.39 19.63 23.26 3.63Honda Accord 86-90 16.70 15.18 18.34 3.16Honda Accord 91-93 13.48 11.84 15.31 3.47Honda Accord 94-98 14.90 13.68 16.20 2.52Honda Accord 99-02 14.62 12.12 17.54 5.42Honda Prelude 82-82 18.92 14.06 24.96 10.90Honda Prelude 83-91 18.06 16.74 19.45 2.71Honda Prelude 92-96 16.85 14.99 18.89 3.90Honda Prelude 97-02 15.37 12.80 18.35 5.55Peugeot 405 89-97 14.89 12.25 17.97 5.72Peugeot 505 82-93 12.24 9.96 14.95 4.99Peugeot 406 96-04 8.33 5.47 12.48 7.01Porsche 944 82-91 14.96 8.51 24.97 16.45Renault Feugo 82-87 17.64 13.57 22.62 9.05Saab 900 Series 82-92 16.83 14.63 19.29 4.66Saab 900/9-3 94-02 13.00 11.30 14.92 3.63Saab 9000 86-97 15.08 12.97 17.46 4.49
Subaru 1800 / Leone / Omega / 4WDWagon 82-93 20.19 19.25 21.17 1.91
Subaru Liberty / Legacy 89-93 16.93 15.94 17.97 2.03Subaru Liberty / Legacy / Outback 94-98 14.73 13.45 16.10 2.65Subaru Liberty / Legacy / Outback 99-03 13.08 11.93 14.31 2.38Subaru Liberty / Legacy / Outback 03-07 11.14 9.09 13.57 4.48Toyota Corona 82-88 20.49 19.87 21.13 1.26Toyota Camry 83-86 19.51 18.26 20.83 2.57Holden / Toyota Apollo JK/JL / Camry / Vista 88-92 17.14 16.72 17.58 0.86Holden / Toyota Apollo JM/JP / Camry / Sceptor 93-97 17.60 17.13 18.08 0.96Toyota Celica 81-85 20.40 18.80 22.10 3.30Toyota Celica 86-89 17.74 16.21 19.39 3.19Toyota Celica 90-93 17.69 16.21 19.27 3.06Toyota Celica 94-99 18.44 16.60 20.44 3.84Toyota Celica 00-05 16.23 13.30 19.67 6.37Lexus IS200 / IS300 99-04 13.86 11.28 16.92 5.64Volvo 200 Series 82-93 14.00 12.83 15.26 2.43Volkswagen Passat 98-06 12.28 9.18 16.23 7.04
People Movers 18.25 17.82 18.70 0.88
Chrysler Voyager 97-01 11.88 9.38 14.93 5.55Holden Zafira TT 01-05 13.87 10.33 18.37 8.04Mitsubishi Nimbus / Chariot / Spacewagon 85-91 21.39 17.94 25.30 7.36Mitsubishi Nimbus / Chariot 92-98 18.90 16.45 21.63 5.19Mitsubishi Nimbus 99-03 11.75 8.63 15.81 7.18Mitsubishi Starwagon / L300 83-86 25.46 23.89 27.11 3.22Mitsubishi Starwagon / Delica Starwagon 87-93 21.17 20.07 22.31 2.24Mitsubishi Starwagon / Delica Spacegear 95-98 17.66 15.85 19.64 3.79Mitsubishi Starwagon / Delica Spacegear 98-03 15.95 13.92 18.21 4.29Kia Carnival 99-06 10.80 9.01 12.89 3.88Mazda MPV 94-99 11.30 8.41 15.03 6.62Nissan Prairie 84-86 22.32 18.39 26.81 8.42Nissan Serena 92-95 15.23 10.29 21.98 11.69Honda Odyssey 95-00 13.10 10.59 16.10 5.51Toyota Tarago 83-89 22.78 21.63 23.96 2.33Toyota Tarago / Previa / Estima 91-99 13.31 12.22 14.48 2.25

Make Model of Car Years ofManufacture
Pr(Risk)%
Lower 95%ConfidenceLimit
Upper 95%ConfidenceLimit
Width ofConfidenceInterval
Toyota Tarago / Previa / Estima 00-06 11.62 9.68 13.90 4.22Toyota Spacia 93-00 16.96 12.42 22.74 10.32
Light Cars 22.52 22.27 22.78 0.51
Daihatsu Charade 82-86 27.83 25.94 29.81 3.87Daihatsu Charade 88-92 24.43 23.47 25.41 1.95Daihatsu Charade 93-00 22.82 21.85 23.82 1.97Daihatsu Pyzar 97-01 20.27 16.58 24.55 7.97Daihatsu Sirion / Storia 98-04 21.64 19.70 23.72 4.02Daihatsu Mira 90-96 33.86 30.77 37.10 6.32Daewoo Matiz 99-04 27.69 24.85 30.72 5.87Daewoo Kalos 03-04 20.09 16.27 24.55 8.29Ford Festiva WD/WH/WF 94-01 23.76 23.08 24.46 1.38Ford Ka 99-02 20.81 17.46 24.60 7.14Holden Barina XC 01-06 18.13 16.65 19.71 3.07Holden Barina SB 95-00 22.18 21.26 23.13 1.87Holden Barina TK 05-07 18.19 14.70 22.29 7.59Hyundai Getz / TB 02-07 18.16 16.62 19.80 3.18Mitsubishi Mirage / Colt 82-88 24.26 23.50 25.04 1.54Mitsubishi Colt 04-07 12.94 8.42 19.37 10.94Ford / Mazda Festiva WA / 121 87-90 23.95 22.99 24.93 1.94Mazda 121 / Autozam Review 94-96 22.75 21.47 24.08 2.60Mazda 121 Metro / Demio 97-02 19.88 18.46 21.37 2.91Mazda 2 02-07 16.29 13.72 19.25 5.53Nissan Micra 95-97 22.34 19.82 25.07 5.25Honda Jazz / Fit 02-07 16.90 14.68 19.37 4.69Honda City 83-86 30.78 26.46 35.47 9.01Peugeot 205 87-94 17.45 13.24 22.65 9.41Peugeot 206 99-07 15.08 12.57 17.98 5.41Proton Satria 97-05 22.67 17.03 29.50 12.47Renault Clio 02-07 18.79 13.81 25.06 11.26Subaru Sherpa / Fiori / 700 / Rex 89-92 36.43 33.23 39.75 6.52Suzuki Swift 82-85 27.58 22.22 33.67 11.45Holden / Suzuki Barina / Swift / Cultus 86-88 28.20 26.85 29.60 2.75Holden / Suzuki Barina / Swift / Cultus 89-99 23.56 22.93 24.20 1.27Suzuki Hatch / Alto 82-84 35.89 32.96 38.92 5.96Suzuki Alto 85-00 33.73 28.29 39.64 11.35Suzuki Ignis 00-02 22.62 19.01 26.70 7.69Suzuki Swift 05-07 19.25 16.18 22.75 6.57Toyota Starlet 96-99 20.60 19.48 21.76 2.28Toyota Echo 99-05 18.45 17.46 19.48 2.02Toyota Yaris 05-07 15.22 12.90 17.87 4.97Volkswagen Polo 96-00 19.18 16.19 22.58 6.39Volkswagen Polo 02-07 14.98 10.70 20.57 9.87
Small Cars 19.64 19.47 19.80 0.33
Alfa Romeo 33 83-92 18.86 15.88 22.25 6.37Alfa Romeo 75 86-92 16.89 12.03 23.20 11.17Alfa Romeo GTV 82-84 15.69 10.15 23.48 13.33Alfa Romeo Sprint 82-88 22.29 15.47 31.00 15.52Alfa Romeo Alfasud 82-84 21.55 14.63 30.57 15.94Audi A3/S3 97-04 14.95 11.72 18.88 7.16

Make Model of Car Years ofManufacture
Pr(Risk)%
Lower 95%ConfidenceLimit
Upper 95%ConfidenceLimit
Width ofConfidenceInterval
Mini Mini Cooper 02-07 15.16 10.73 21.00 10.28Chrysler Neon 96-99 16.30 13.43 19.66 6.23Chrysler Neon 00-02 14.70 9.23 22.59 13.36Daihatsu Applause 89-99 20.96 19.63 22.35 2.72Daewoo 1.5i 94-95 26.29 21.14 32.19 11.05Daewoo Cielo 95-97 22.10 20.89 23.36 2.47Daewoo Nubira 97-03 17.17 15.90 18.51 2.61Daewoo Lanos 97-03 20.07 19.00 21.17 2.18Daewoo Lacetti 03-04 18.55 12.82 26.09 13.27Ford Laser 91-94 20.16 19.53 20.82 1.29Ford Laser 95-97 18.52 17.46 19.64 2.18Ford Capri 89-94 24.79 22.80 26.89 4.09Ford Focus LR 02-05 17.31 15.31 19.51 4.20Ford Focus LS / LT 05-07 13.07 10.55 16.09 5.55Fiat Regata 84-88 16.17 11.77 21.80 10.03Holden Gemini 82-84 23.09 22.04 24.18 2.14Holden Gemini RB 86-87 25.97 23.53 28.57 5.04Holden Astra TR 96-98 16.13 14.24 18.22 3.98Holden Astra TS 98-06 16.62 15.88 17.38 1.50Holden Astra AH 04-07 15.01 12.88 17.43 4.56Holden Viva JF 05-07 17.29 13.37 22.07 8.70Hyundai Excel 86-90 24.44 23.00 25.93 2.93Hyundai Excel 90-94 23.03 22.23 23.85 1.63Hyundai Excel / Accent 95-00 22.06 21.55 22.57 1.02Hyundai Elantra 00-07 16.76 15.29 18.34 3.05Hyundai S Coupe 90-96 23.05 20.95 25.29 4.34Hyundai Lantra 91-95 20.21 18.69 21.81 3.12Hyundai Lantra 96-00 17.81 16.76 18.91 2.15Hyundai Coupe 96-00 17.77 15.50 20.29 4.79Hyundai Accent 00-06 18.33 17.29 19.41 2.12Mitsubishi Lancer / Mirage CA 89-90 18.78 17.76 19.84 2.08Mitsubishi Lancer / Mirage CB 91-92 21.71 19.26 24.39 5.13Mitsubishi Lancer / Mirage CC 93-95 19.07 18.20 19.97 1.77Mitsubishi Lancer / Mirage CE 96-03 19.68 19.11 20.27 1.15Mitsubishi Cordia 83-87 23.10 21.05 25.29 4.25Mitsubishi Lancer CH / CJ 03-07 18.85 16.99 20.86 3.87Kia Rio 00-05 19.53 17.93 21.23 3.30Kia Spectra 01-04 18.78 14.67 23.72 9.05Kia Cerato 04-07 17.97 13.95 22.84 8.89Kia Rio JB 05-07 17.51 13.01 23.14 10.13Ford / Mazda Laser / 323 / Familia 82-88 23.65 23.21 24.11 0.90Mazda 323 / Familia / Lantis 90-93 18.72 17.56 19.95 2.39Mazda 323 / Familia / Lantis 95-98 18.99 17.93 20.09 2.16Ford / Mazda Laser / 323 99-03 17.25 16.35 18.20 1.85Mazda MX5 / Eunos Roadster 89-97 21.25 17.78 25.19 7.41Mazda MX5 / Eunos Roadster 98-05 16.81 13.59 20.62 7.03
Mazda Eunos 30X / Presso / MX-3 /Autozam AZ-3 90-97 18.79 15.73 22.30 6.57
Mazda 3 / Axela 03-07 15.60 14.23 17.08 2.85Mercedes Benz A-Class W168 98-04 17.61 13.94 22.00 8.06Holden / Nissan Astra / Pulsar / Langley 84-86 23.70 22.85 24.58 1.73Holden / Nissan Astra / Pulsar / Vector / Sentra 88-90 20.67 19.98 21.37 1.38Nissan Pulsar / Vector / Sentra 92-95 17.85 16.99 18.76 1.77Nissan Pulsar / Vector / Sentra 96-99 19.23 18.45 20.04 1.59

Make Model of Car Years ofManufacture
Pr(Risk)%
Lower 95%ConfidenceLimit
Upper 95%ConfidenceLimit
Width ofConfidenceInterval
Nissan Stanza 82-83 21.56 18.12 25.46 7.35Nissan Gazelle / Silvia 84-86 22.03 18.09 26.56 8.47Nissan Exa 83-86 28.21 24.24 32.56 8.32Nissan Exa 87-91 19.65 15.03 25.25 10.22Nissan NX/NX-R 91-96 21.14 18.53 24.02 5.49Nissan Pulsar 00-05 17.80 16.89 18.75 1.86Honda Civic 82-83 22.26 19.32 25.51 6.19Honda Civic / Ballade / Shuttle 84-87 22.81 21.23 24.48 3.25Honda Civic / Shuttle 88-91 20.57 19.40 21.79 2.40Honda Civic 92-95 18.98 17.91 20.10 2.19Honda Civic 96-00 17.86 16.84 18.93 2.09Honda CRX 87-91 23.43 19.25 28.19 8.94Honda CRX 92-98 17.56 13.01 23.28 10.27Honda Civic 01-05 14.33 12.57 16.28 3.70Honda Integra 86-88 20.64 17.59 24.07 6.47Honda Integra 90-92 18.59 15.86 21.66 5.80Honda Integra 93-01 16.82 14.64 19.24 4.59Honda Integra 02-06 19.00 14.25 24.87 10.62Honda Concerto 89-93 17.77 14.86 21.12 6.26Peugeot 306 94-01 16.56 14.60 18.73 4.14Peugeot 307 01-07 12.63 9.91 15.97 6.07Proton Wira 95-96 19.04 17.13 21.09 3.96Renault 19 91-96 20.13 15.79 25.31 9.52Renault Scenic 01-04 15.48 11.09 21.21 10.12Rover Quintet 82-86 22.54 17.84 28.05 10.20MG MGF / MG TF 99-05 12.59 8.92 17.48 8.56Subaru Impreza 93-00 18.41 17.31 19.56 2.25Subaru Impreza 01-07 13.79 12.34 15.37 3.03Suzuki Baleno / Cultus Crescent 95-02 19.35 17.65 21.17 3.52Suzuki Liana 01-07 15.52 12.12 19.66 7.54Toyota Corolla 82-84 22.97 22.13 23.83 1.70Toyota Corolla 86-88 21.33 20.71 21.96 1.25Toyota / Holden Corolla / Nova 89-93 19.62 19.14 20.11 0.96Toyota / Holden Corolla / Nova 94-97 18.45 17.90 19.02 1.12Toyota Corolla / Allex 98-01 16.96 16.11 17.84 1.73Toyota Corolla 02-07 16.34 15.55 17.15 1.60Toyota Tercel 83-88 21.53 18.18 25.29 7.11Toyota MR2 87-90 24.28 19.28 30.10 10.82Toyota MR2 91-00 19.82 14.55 26.41 11.87Toyota Paseo / Cynos 91-99 19.43 17.59 21.42 3.82Toyota Corolla 4WD Wagon 92-96 15.11 12.31 18.40 6.09Volvo 300 Series 84-88 15.56 10.88 21.76 10.87Volvo S40/V40 97-04 14.40 12.06 17.11 5.04Volkswagen Golf 82-94 20.11 15.15 26.17 11.02Volkswagen Golf 95-98 15.63 13.63 17.86 4.23Volkswagen Golf / Bora 99-04 15.26 13.66 17.00 3.34Volkswagen New Beetle 00-07 13.88 10.17 18.67 8.50Volkswagen Golf / Jetta 04-07 11.58 8.99 14.79 5.80

APPENDIX 3
LOGISTIC REGRESSION ESTIMATES OFCRASHWORTHINESS INJURY SEVERITY BY MODEL AND MARKET
GROUP

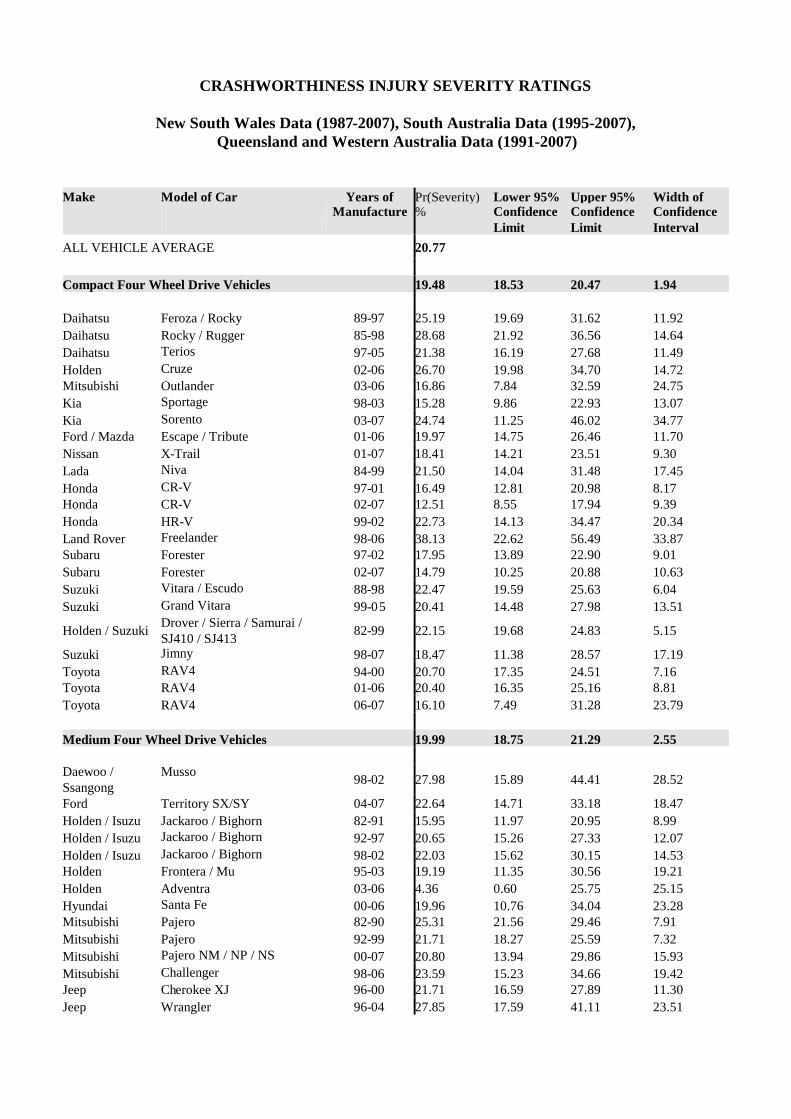
CRASHWORTHINESS INJURY SEVERITY RATINGS
New South Wales Data (1987-2007), South Australia Data (1995-2007),Queensland and Western Australia Data (1991-2007)
Make Model of Car Years ofManufacture
Pr(Severity)%
Lower 95%ConfidenceLimit
Upper 95%ConfidenceLimit
Width ofConfidenceInterval
ALL VEHICLE AVERAGE 20.77
Compact Four Wheel Drive Vehicles 19.48 18.53 20.47 1.94
Daihatsu Feroza / Rocky 89-97 25.19 19.69 31.62 11.92Daihatsu Rocky / Rugger 85-98 28.68 21.92 36.56 14.64Daihatsu Terios 97-05 21.38 16.19 27.68 11.49Holden Cruze 02-06 26.70 19.98 34.70 14.72Mitsubishi Outlander 03-06 16.86 7.84 32.59 24.75Kia Sportage 98-03 15.28 9.86 22.93 13.07Kia Sorento 03-07 24.74 11.25 46.02 34.77Ford / Mazda Escape / Tribute 01-06 19.97 14.75 26.46 11.70Nissan X-Trail 01-07 18.41 14.21 23.51 9.30Lada Niva 84-99 21.50 14.04 31.48 17.45Honda CR-V 97-01 16.49 12.81 20.98 8.17Honda CR-V 02-07 12.51 8.55 17.94 9.39Honda HR-V 99-02 22.73 14.13 34.47 20.34Land Rover Freelander 98-06 38.13 22.62 56.49 33.87Subaru Forester 97-02 17.95 13.89 22.90 9.01Subaru Forester 02-07 14.79 10.25 20.88 10.63Suzuki Vitara / Escudo 88-98 22.47 19.59 25.63 6.04Suzuki Grand Vitara 99-05 20.41 14.48 27.98 13.51
Holden / Suzuki Drover / Sierra / Samurai /SJ410 / SJ413 82-99 22.15 19.68 24.83 5.15
Suzuki Jimny 98-07 18.47 11.38 28.57 17.19Toyota RAV4 94-00 20.70 17.35 24.51 7.16Toyota RAV4 01-06 20.40 16.35 25.16 8.81Toyota RAV4 06-07 16.10 7.49 31.28 23.79
Medium Four Wheel Drive Vehicles 19.99 18.75 21.29 2.55
Daewoo /Ssangong
Musso 98-02 27.98 15.89 44.41 28.52
Ford Territory SX/SY 04-07 22.64 14.71 33.18 18.47Holden / Isuzu Jackaroo / Bighorn 82-91 15.95 11.97 20.95 8.99Holden / Isuzu Jackaroo / Bighorn 92-97 20.65 15.26 27.33 12.07Holden / Isuzu Jackaroo / Bighorn 98-02 22.03 15.62 30.15 14.53Holden Frontera / Mu 95-03 19.19 11.35 30.56 19.21Holden Adventra 03-06 4.36 0.60 25.75 25.15Hyundai Santa Fe 00-06 19.96 10.76 34.04 23.28Mitsubishi Pajero 82-90 25.31 21.56 29.46 7.91Mitsubishi Pajero 92-99 21.71 18.27 25.59 7.32Mitsubishi Pajero NM / NP / NS 00-07 20.80 13.94 29.86 15.93Mitsubishi Challenger 98-06 23.59 15.23 34.66 19.42Jeep Cherokee XJ 96-00 21.71 16.59 27.89 11.30Jeep Wrangler 96-04 27.85 17.59 41.11 23.51

Make Model of Car Years ofManufacture
Pr(Severity)%
Lower 95%ConfidenceLimit
Upper 95%ConfidenceLimit
Width ofConfidenceInterval
Jeep Cherokee KJ 01-07 16.82 7.48 33.58 26.11Land Rover Defender 92-07 29.74 19.67 42.25 22.58Nissan Pathfinder / Terrano 88-94 21.46 17.02 26.69 9.67Nissan Pathfinder / Terrano / Regulus 95-05 16.99 11.87 23.73 11.86Toyota Kluger 03-07 22.04 13.14 34.57 21.43Toyota Landcruiser Prado 96-03 20.69 14.59 28.49 13.90Toyota Landcruiser Prado 03-07 14.95 10.04 21.67 11.63
Large Four Wheel Drive Vehicles 21.26 20.36 22.18 1.82
BMW X5 01-07 13.04 4.04 34.80 30.76Ford Bronco 82-87 34.65 18.56 55.23 36.68Ford Explorer 00-01 24.42 17.08 33.64 16.56Ford Explorer 01-05 11.36 4.95 24.00 19.05Jeep Grand Cherokee ZG 96-99 21.59 12.00 35.75 23.75Jeep Grand Cherokee WJ/WG 99-05 16.32 8.23 29.79 21.57Land Rover Discovery 91-02 18.14 13.10 24.57 11.47Mercedes Benz M-Class W163 98-05 14.21 6.27 29.09 22.82Nissan Patrol / Safari 82-87 22.79 17.83 28.66 10.83Nissan / Ford Patrol / Maverick / Safari 88-97 21.73 19.33 24.35 5.02Nissan Patrol / Safari 98-07 21.17 17.69 25.14 7.45Land Rover Range Rover 82-94 20.34 15.26 26.57 11.30Land Rover Range Rover 95-02 12.13 4.91 26.96 22.04Toyota Landcruiser 82-89 26.30 23.96 28.77 4.81Toyota Landcruiser 90-97 24.16 22.15 26.29 4.14Toyota Landcruiser 98-07 20.57 18.12 23.26 5.14
Commercial Vehicles- Vans 20.75 19.76 21.78 2.02
Daihatsu Handivan 82-90 24.66 19.59 30.54 10.95Daihatsu Hi-Jet 82-90 29.02 19.85 40.30 20.46Daihatsu Handivan / Cuore 99-03 16.72 8.91 29.19 20.29Ford Falcon Panel Van 82-95 20.11 16.80 23.88 7.08Ford Falcon Panel Van 96-99 17.45 10.24 28.14 17.91Ford Transit 95-00 21.92 15.57 29.94 14.36Ford Transit 01-07 11.12 6.12 19.36 13.24Holden Shuttle / WFR Van 82-87 27.29 19.28 37.10 17.83Kia Pregio 02-06 16.94 9.99 27.25 17.26Mercedes Benz MB100 / MB140 99-04 24.77 12.20 43.83 31.63Mercedes Benz Vito / Viano 99-07 22.73 12.75 37.19 24.44Mercedes Benz Sprinter 98-04 15.24 8.95 24.75 15.80Honda Acty 83-86 23.14 14.28 35.24 20.95Holden / Suzuki Scurry / Carry 82-00 28.81 22.35 36.27 13.92Suzuki Carry 99-05 19.89 7.65 42.66 35.01Toyota Hiace/Liteace 82-86 25.24 22.60 28.08 5.48Toyota Hiace/Liteace 87-89 22.99 19.80 26.52 6.72Toyota Hiace/Liteace 90-95 24.90 22.13 27.89 5.77Toyota Hiace/Liteace 96-04 20.31 17.37 23.60 6.22Toyoa Hiace 05-07 26.48 15.00 42.38 27.38Volkswagen Caravelle / Transporter 88-94 20.27 9.58 37.89 28.31Volkswagen Caravelle / Transporter 95-04 9.71 5.23 17.34 12.10

Make Model of Car Years ofManufacture
Pr(Severity)%
Lower 95%ConfidenceLimit
Upper 95%ConfidenceLimit
Width ofConfidenceInterval
Commercial Vehicles- Utes 21.47 20.89 22.07 1.18
Ford / Nissan Falcon Ute / XFN Ute 82-95 23.87 21.77 26.11 4.34Ford Falcon Ute 96-99 20.15 16.47 24.41 7.94Ford Falcon Ute AU 00-02 20.29 16.49 24.70 8.21Ford Falcon Ute BA/BF 03-07 16.71 12.65 21.76 9.11Ford Ford F-Series 82-92 18.72 12.83 26.49 13.66Holden Commodore Ute VG/VP 90-93 26.25 21.62 31.46 9.84Holden / Isuzu Rodeo / Pickup 82-85 23.09 16.87 30.76 13.88Holden / Isuzu Rodeo / Pickup 86-88 12.87 6.73 23.19 16.46Holden / Isuzu Rodeo / Pickup 89-95 24.48 21.95 27.19 5.24Holden Rodeo 96-98 20.43 17.16 24.15 7.00Holden Rodeo 99-02 20.69 17.34 24.49 7.15Holden WB Series 82-85 32.18 26.70 38.20 11.50Holden Commodore Ute VR/VS 94-00 24.76 22.44 27.23 4.80Holden Commodore VU Ute 00-02 24.74 20.12 30.01 9.89Holden Commodore VY/VZ Ute 02-07 18.42 15.34 21.95 6.61Holden Rodeo 03-07 20.46 16.48 25.12 8.65Mitsubishi Triton MK 96-06 16.96 11.69 23.98 12.29Kia Ceres 92-00 27.91 22.08 34.61 12.53Ford / Mazda Courier / B-Series / Bounty 98-02 22.00 17.86 26.78 8.92Ford / Mazda Courier / Bravo / Bounty 03-06 21.72 16.59 27.91 11.33Nissan 720 Ute 82-85 23.01 18.69 28.00 9.31Nissan Navara 86-91 23.19 20.25 26.41 6.16Nissan Navara 92-96 20.77 16.80 25.41 8.61Nissan Navara 97-05 22.15 17.79 27.23 9.44Nissan Navara 05-07 22.96 9.39 46.14 36.75Subaru Brumby 82-92 29.26 25.18 33.70 8.52Suzuki Mighty Boy 85-88 25.98 19.66 33.50 13.84Toyota 4Runner/Hilux 82-85 23.83 21.38 26.46 5.09Toyota 4Runner/Hilux 86-88 24.63 22.12 27.33 5.21Toyota 4Runner/Hilux 89-97 24.21 22.80 25.68 2.88Toyota Hilux 98-02 19.98 17.58 22.62 5.04Toyota Hilux 03-04 18.44 14.17 23.63 9.46Toyota Hilux 05-07 23.39 17.69 30.27 12.58
Large Cars 20.39 20.04 20.74 0.70
BMW 7 Series E23 82-88 22.18 11.81 37.77 25.96BMW 7 Series E32 89-94 23.63 12.91 39.24 26.33BMW 7 Series E38 95-01 13.01 4.77 30.87 26.09Ford Falcon XE/XF 82-88 24.00 23.04 24.98 1.94Ford Fairlane Z & LTD F 82-87 23.47 21.02 26.11 5.09
Ford Falcon EA / Falcon EB SeriesI 88-Mar 92 22.63 21.61 23.70 2.09
Ford Falcon EB Series II / FalconED Apr 92-94 22.47 21.01 24.00 2.98
Ford Fairlane N & LTD D 88-94 21.30 18.66 24.20 5.54Ford Fairlane N & LTD D 95-98 23.07 18.69 28.13 9.45Ford Fairlane & LTD AU 99-02 17.64 11.87 25.39 13.52Ford Fairlane & LTD BA/BF 03-07 30.06 15.35 50.46 35.11Ford Falcon EF/EL 94-98 20.73 19.70 21.78 2.08Ford Falcon AU 98-02 19.07 17.74 20.48 2.74

Make Model of Car Years ofManufacture
Pr(Severity)%
Lower 95%ConfidenceLimit
Upper 95%ConfidenceLimit
Width ofConfidenceInterval
Ford Taurus 96-98 21.58 14.43 31.00 16.56Ford Falcon BA/BF 02-07 17.69 15.77 19.79 4.01Holden / Toyota Commodore VN/VP / Lexcen 89-93 24.04 23.12 24.98 1.86Holden Statesman/Caprice WB 82-85 40.12 26.59 55.34 28.75Holden Stateman/Caprice VQ 90-93 28.27 21.21 36.57 15.36Holden Stateman/Caprice VR/VS 94-98 21.64 18.65 24.96 6.31Holden / Toyota Commodore VR/VS / Lexcen 93-97 21.18 20.24 22.15 1.92Holden Commodore VT/VX 97-02 19.36 18.32 20.44 2.12Holden Statesman/Caprice WH 99-03 15.18 10.28 21.86 11.59Holden Commodore VY/VZ 02-07 16.17 14.45 18.05 3.60Holden Monaro 01-05 21.88 14.90 30.94 16.05Holden Statesman/Caprice WK/WL 03-06 18.19 10.19 30.36 20.17Holden Commodore VB-VL 82-88 25.13 24.14 26.14 2.00Holden Commodore VE 06-07 15.93 11.17 22.20 11.03Hyundai Sonata 89-97 20.21 17.22 23.57 6.35Hyundai Grandeaur / XG 99-00 7.11 1.73 24.95 23.22
Mitsubishi Magna TM/TN/TP / Sigma /V3000 85-90 24.11 22.86 25.42 2.56
Mitsubishi Magna TE/TF/TH/TJ / VeradaKE/KF/KH/KJ / Diamante 96-03 20.85 19.22 22.58 3.36
Mitsubishi Magna TR/TS / VeradaKR/KS / V3000 / Diamante 91-96 20.85 19.56 22.20 2.64
Mitsubishi Magna TL/TW / VeradaKL/KW 03-05 13.93 9.13 20.68 11.55
Mitsubishi 380 05-07 10.13 3.68 24.97 21.29Jaguar XJ6 82-86 28.05 16.86 42.84 25.98Jaguar XJ6 87-94 15.74 8.76 26.64 17.88Mazda 929 / Luce 82-90 23.66 20.66 26.96 6.30Mazda 929 / Sentia / Efini MS-9 92-96 21.71 11.89 36.28 24.39Mercedes Benz E-Class W123 82-85 22.46 12.71 36.56 23.85Mercedes Benz E-Class W124 86-94 18.41 13.27 24.97 11.71Mercedes Benz E-Class W210 96-02 23.46 15.51 33.85 18.34Mercedes Benz S-Class W126 82-92 21.67 14.88 30.46 15.59Nissan Skyline 83-88 24.65 22.41 27.04 4.64Nissan 300ZX / Fairlady Z 90-95 22.11 15.72 30.17 14.44Nissan Maxima 90-94 20.69 16.42 25.73 9.32Nissan Maxima / Cefiro 95-99 19.57 15.29 24.69 9.40Nissan Maxima 00-02 20.23 13.21 29.70 16.49Nissan Maxima 06-07 17.98 8.56 33.91 25.36Honda Legend 86-95 21.26 15.56 28.34 12.78Rover 3500 82-87 11.12 4.20 26.32 22.12Saab 9-5 98-05 9.64 3.12 26.10 22.97Toyota Camry 98-02 19.52 17.80 21.37 3.57Toyota Crown / Cressida / Mark II 82-85 23.97 20.28 28.09 7.80Toyota Crown / Cressida / Mark II 86-88 28.71 21.50 37.21 15.71Toyota Cressida / Mark II 89-93 20.12 16.13 24.80 8.67Toyota Supra 82-90 29.37 21.65 38.50 16.84Lexus ES300 / Windom 92-01 22.12 15.39 30.72 15.34Lexus LS400 / Celsior 90-00 9.95 3.13 27.40 24.27Toyota Avalon 00-05 18.88 15.06 23.41 8.35Toyota Camry 02-06 14.66 12.22 17.50 5.28Toyota Camry 06-07 8.84 2.81 24.52 21.71Volvo 850/S70/V70/C70 92-05 21.26 16.36 27.15 10.79Volvo 700/900 Series 84-92 16.98 13.04 21.82 8.78Volvo 960/S90/V90 90-98 18.84 7.68 39.29 31.60
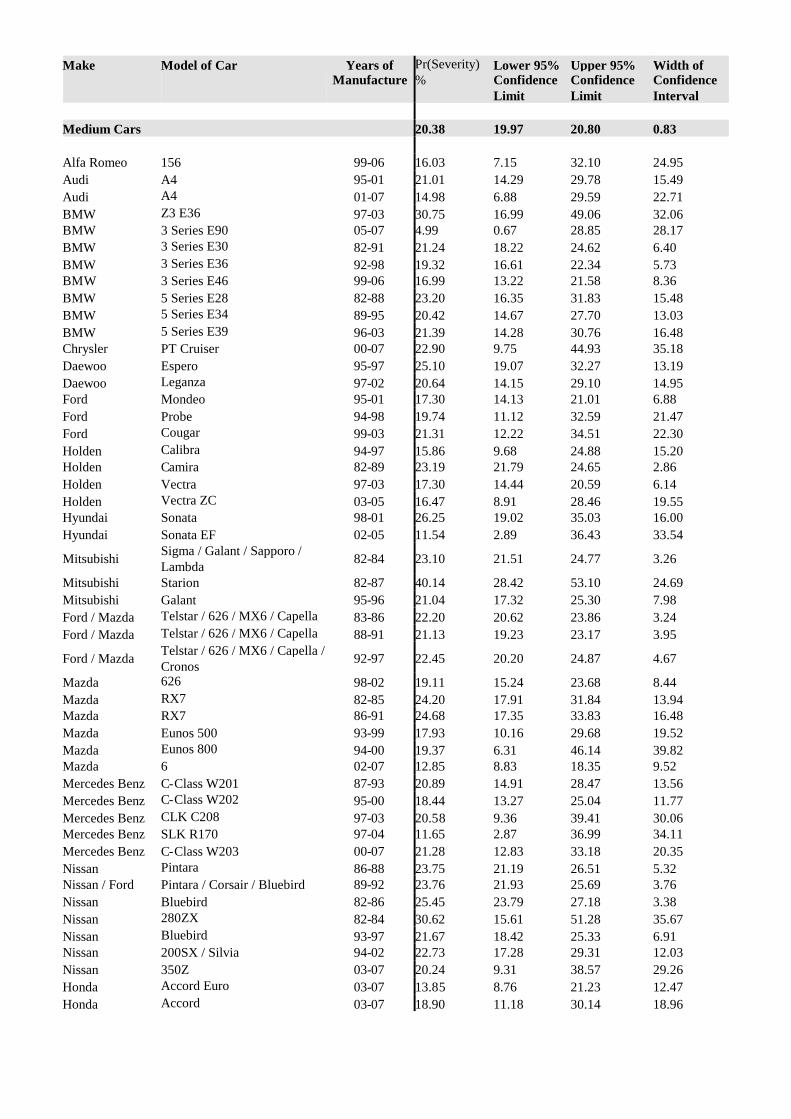
Make Model of Car Years ofManufacture
Pr(Severity)%
Lower 95%ConfidenceLimit
Upper 95%ConfidenceLimit
Width ofConfidenceInterval
Medium Cars 20.38 19.97 20.80 0.83
Alfa Romeo 156 99-06 16.03 7.15 32.10 24.95Audi A4 95-01 21.01 14.29 29.78 15.49Audi A4 01-07 14.98 6.88 29.59 22.71BMW Z3 E36 97-03 30.75 16.99 49.06 32.06BMW 3 Series E90 05-07 4.99 0.67 28.85 28.17BMW 3 Series E30 82-91 21.24 18.22 24.62 6.40BMW 3 Series E36 92-98 19.32 16.61 22.34 5.73BMW 3 Series E46 99-06 16.99 13.22 21.58 8.36BMW 5 Series E28 82-88 23.20 16.35 31.83 15.48BMW 5 Series E34 89-95 20.42 14.67 27.70 13.03BMW 5 Series E39 96-03 21.39 14.28 30.76 16.48Chrysler PT Cruiser 00-07 22.90 9.75 44.93 35.18Daewoo Espero 95-97 25.10 19.07 32.27 13.19Daewoo Leganza 97-02 20.64 14.15 29.10 14.95Ford Mondeo 95-01 17.30 14.13 21.01 6.88Ford Probe 94-98 19.74 11.12 32.59 21.47Ford Cougar 99-03 21.31 12.22 34.51 22.30Holden Calibra 94-97 15.86 9.68 24.88 15.20Holden Camira 82-89 23.19 21.79 24.65 2.86Holden Vectra 97-03 17.30 14.44 20.59 6.14Holden Vectra ZC 03-05 16.47 8.91 28.46 19.55Hyundai Sonata 98-01 26.25 19.02 35.03 16.00Hyundai Sonata EF 02-05 11.54 2.89 36.43 33.54
Mitsubishi Sigma / Galant / Sapporo /Lambda 82-84 23.10 21.51 24.77 3.26
Mitsubishi Starion 82-87 40.14 28.42 53.10 24.69Mitsubishi Galant 95-96 21.04 17.32 25.30 7.98Ford / Mazda Telstar / 626 / MX6 / Capella 83-86 22.20 20.62 23.86 3.24Ford / Mazda Telstar / 626 / MX6 / Capella 88-91 21.13 19.23 23.17 3.95
Ford / Mazda Telstar / 626 / MX6 / Capella /Cronos 92-97 22.45 20.20 24.87 4.67
Mazda 626 98-02 19.11 15.24 23.68 8.44Mazda RX7 82-85 24.20 17.91 31.84 13.94Mazda RX7 86-91 24.68 17.35 33.83 16.48Mazda Eunos 500 93-99 17.93 10.16 29.68 19.52Mazda Eunos 800 94-00 19.37 6.31 46.14 39.82Mazda 6 02-07 12.85 8.83 18.35 9.52Mercedes Benz C-Class W201 87-93 20.89 14.91 28.47 13.56Mercedes Benz C-Class W202 95-00 18.44 13.27 25.04 11.77Mercedes Benz CLK C208 97-03 20.58 9.36 39.41 30.06Mercedes Benz SLK R170 97-04 11.65 2.87 36.99 34.11Mercedes Benz C-Class W203 00-07 21.28 12.83 33.18 20.35Nissan Pintara 86-88 23.75 21.19 26.51 5.32Nissan / Ford Pintara / Corsair / Bluebird 89-92 23.76 21.93 25.69 3.76Nissan Bluebird 82-86 25.45 23.79 27.18 3.38Nissan 280ZX 82-84 30.62 15.61 51.28 35.67Nissan Bluebird 93-97 21.67 18.42 25.33 6.91Nissan 200SX / Silvia 94-02 22.73 17.28 29.31 12.03Nissan 350Z 03-07 20.24 9.31 38.57 29.26Honda Accord Euro 03-07 13.85 8.76 21.23 12.47Honda Accord 03-07 18.90 11.18 30.14 18.96

Make Model of Car Years ofManufacture
Pr(Severity)%
Lower 95%ConfidenceLimit
Upper 95%ConfidenceLimit
Width ofConfidenceInterval
Honda Accord 82-85 24.30 21.68 27.11 5.43Honda Accord 86-90 20.67 18.05 23.56 5.50Honda Accord 91-93 25.24 20.80 30.25 9.45Honda Accord 94-98 23.39 19.98 27.19 7.20Honda Accord 99-02 13.06 8.07 20.45 12.38Honda Prelude 82-82 18.55 8.56 35.64 27.07Honda Prelude 83-91 24.33 21.97 26.85 4.88Honda Prelude 92-96 24.77 20.24 29.94 9.70Honda Prelude 97-02 16.69 10.57 25.35 14.78Peugeot 405 89-97 20.48 14.88 27.50 12.62Peugeot 505 82-93 21.64 15.14 29.94 14.80Peugeot 406 96-04 16.11 7.70 30.64 22.94Porsche 944 82-91 34.83 16.50 59.12 42.62Renault Feugo 82-87 21.81 13.51 33.26 19.75Saab 900 Series 82-92 21.51 16.18 28.01 11.83Saab 900/9-3 94-02 17.37 11.94 24.58 12.64Saab 9000 86-97 11.64 7.30 18.07 10.77
Subaru 1800 / Leone / Omega / 4WDWagon 82-93 23.43 21.38 25.61 4.23
Subaru Liberty / Legacy 89-93 21.73 19.59 24.04 4.45Subaru Liberty / Legacy / Outback 94-98 21.19 18.16 24.58 6.42Subaru Liberty / Legacy / Outback 99-03 18.72 14.92 23.21 8.29Subaru Liberty / Legacy / Outback 03-07 22.42 14.78 32.50 17.72Toyota Corona 82-88 23.61 22.14 25.14 3.00Toyota Camry 83-86 24.02 20.85 27.50 6.65Holden / Toyota Apollo JK/JL / Camry / Vista 88-92 22.48 21.27 23.74 2.47
Holden / Toyota Apollo JM/JP / Camry /Sceptor 93-97 22.46 21.12 23.86 2.74
Toyota Celica 81-85 20.40 17.25 23.97 6.72Toyota Celica 86-89 24.07 20.01 28.65 8.64Toyota Celica 90-93 23.43 19.63 27.71 8.08Toyota Celica 94-99 18.84 14.46 24.17 9.71Toyota Celica 00-05 22.60 13.48 35.38 21.90Lexus IS200 / IS300 99-04 12.89 5.27 28.28 23.01Volvo 200 Series 82-93 23.66 19.61 28.26 8.65Volkswagen Passat 98-06 14.62 7.07 27.84 20.77
People Movers 21.05 19.99 22.15 2.16
Chrysler Voyager 97-01 18.39 9.43 32.78 23.35Holden Zafira TT 01-05 24.46 12.01 43.44 31.43
Mitsubishi Nimbus / Chariot /Spacewagon 85-91 20.91 15.76 27.20 11.44
Mitsubishi Nimbus / Chariot 92-98 20.59 15.25 27.20 11.95Mitsubishi Nimbus 99-03 19.40 8.26 39.14 30.87Mitsubishi Starwagon / L300 83-86 28.74 25.43 32.30 6.87Mitsubishi Starwagon / Delica Starwagon 87-93 23.30 20.81 25.99 5.18Mitsubishi Starwagon / Delica Spacegear 95-98 20.15 15.42 25.88 10.47Mitsubishi Starwagon / Delica Spacegear 98-03 25.81 19.39 33.46 14.07Kia Carnival 99-06 11.52 6.68 19.15 12.47Mazda MPV 94-99 6.97 1.70 24.50 22.80Nissan Prairie 84-86 20.78 14.67 28.59 13.92Nissan Serena 92-95 15.22 9.21 24.12 14.91Honda Odyssey 95-00 16.41 10.31 25.11 14.79

Make Model of Car Years ofManufacture
Pr(Severity)%
Lower 95%ConfidenceLimit
Upper 95%ConfidenceLimit
Width ofConfidenceInterval
Toyota Tarago 83-89 24.78 22.05 27.73 5.68Toyota Tarago / Previa / Estima 91-99 21.92 17.97 26.44 8.47Toyota Tarago / Previa / Estima 00-06 20.01 12.89 29.72 16.84Toyota Spacia 93-00 12.81 4.62 30.83 26.21
Light Cars 22.23 21.68 22.79 1.10
Daihatsu Charade 82-86 28.80 25.49 32.35 6.87Daihatsu Charade 88-92 25.27 23.02 27.66 4.65Daihatsu Charade 93-00 26.69 24.00 29.58 5.58Daihatsu Pyzar 97-01 25.80 16.10 38.65 22.55Daihatsu Sirion / Storia 98-04 20.49 16.08 25.72 9.64Daihatsu Mira 90-96 29.51 24.54 35.02 10.47Daewoo Matiz 99-04 17.09 12.85 22.36 9.52Daewoo Kalos 03-04 24.56 15.68 36.30 20.63Ford Festiva WD/WH/WF 94-01 24.82 23.22 26.50 3.28Ford Ka 99-02 21.94 14.88 31.13 16.25Holden Barina XC 01-06 18.84 15.37 22.89 7.52Holden Barina SB 95-00 20.63 18.46 22.97 4.51Holden Barina TK 05-07 23.04 15.04 33.62 18.58Hyundai Getz / TB 02-07 26.82 22.04 32.22 10.17Mitsubishi Mirage / Colt 82-88 24.16 22.61 25.78 3.17Mitsubishi Colt 04-07 30.52 17.70 47.29 29.59Ford / Mazda Festiva WA / 121 87-90 24.81 22.69 27.06 4.37Mazda 121 / Autozam Review 94-96 21.05 18.21 24.21 6.01Mazda 121 Metro / Demio 97-02 20.87 17.52 24.66 7.14Mazda 2 02-07 20.52 14.11 28.85 14.74Nissan Micra 95-97 28.26 22.18 35.26 13.07Honda Jazz / Fit 02-07 18.19 13.36 24.28 10.92Honda City 83-86 23.31 19.93 27.07 7.14Peugeot 205 87-94 24.23 15.52 35.75 20.23Peugeot 206 99-07 28.65 19.98 39.25 19.27Proton Satria 97-05 20.61 8.56 41.86 33.30Renault Clio 02-07 21.33 10.35 38.90 28.56Subaru Sherpa / Fiori / 700 / Rex 89-92 24.96 20.42 30.14 9.72Suzuki Swift 82-85 30.26 20.24 42.60 22.35Holden / Suzuki Barina / Swift / Cultus 86-88 26.25 23.80 28.86 5.06Holden / Suzuki Barina / Swift / Cultus 89-99 23.79 22.32 25.32 3.01Suzuki Hatch / Alto 82-84 26.27 21.66 31.48 9.82Suzuki Alto 85-00 29.49 23.24 36.61 13.37Suzuki Ignis 00-02 24.61 17.54 33.38 15.84Suzuki Swift 05-07 17.42 11.44 25.61 14.17Toyota Starlet 96-99 23.86 21.08 26.88 5.80Toyota Echo 99-05 23.79 21.17 26.63 5.46Toyota Yaris 05-07 20.44 14.36 28.25 13.89Volkswagen Polo 96-00 14.72 8.35 24.64 16.30Volkswagen Polo 02-07 16.84 6.42 37.40 30.98
Small Cars 20.74 20.37 21.12 0.75
Alfa Romeo 33 83-92 24.22 17.42 32.64 15.22Alfa Romeo 75 86-92 19.70 7.72 41.84 34.12Alfa Romeo GTV 82-84 47.94 27.98 68.58 40.60Alfa Romeo Sprint 82-88 20.75 9.63 39.15 29.51

Make Model of Car Years ofManufacture
Pr(Severity)%
Lower 95%ConfidenceLimit
Upper 95%ConfidenceLimit
Width ofConfidenceInterval
Alfa Romeo Alfasud 82-84 29.58 13.91 52.21 38.30Audi A3/S3 97-04 12.73 5.38 27.21 21.82Mini Mini Cooper 02-07 14.33 6.51 28.68 22.18Chrysler Neon 96-99 20.68 12.78 31.71 18.93Chrysler Neon 00-02 23.08 8.90 47.97 39.07Daihatsu Applause 89-99 21.91 18.65 25.57 6.92Daewoo 1.5i 94-95 23.06 12.13 39.43 27.30Daewoo Cielo 95-97 20.53 17.89 23.45 5.56Daewoo Nubira 97-03 21.33 17.85 25.29 7.44Daewoo Lanos 97-03 23.54 20.86 26.46 5.59Daewoo Lacetti 03-04 27.31 13.16 48.21 35.05Ford Laser 91-94 22.06 20.59 23.61 3.02Ford Laser 95-97 24.10 21.30 27.13 5.83Ford Capri 89-94 22.23 18.16 26.91 8.75Ford Focus LR 02-05 17.17 12.93 22.44 9.52Ford Focus LS / LT 05-07 11.67 6.45 20.19 13.74Fiat Regata 84-88 28.54 15.00 47.48 32.48Holden Gemini 82-84 23.32 21.21 25.56 4.35Holden Gemini RB 86-87 21.76 17.41 26.84 9.43Holden Astra TR 96-98 18.97 14.36 24.64 10.28Holden Astra TS 98-06 18.01 15.99 20.23 4.24Holden Astra AH 04-07 20.07 13.41 28.92 15.51Holden Viva JF 05-07 16.15 9.10 27.06 17.96Hyundai Excel 86-90 25.55 22.77 28.54 5.77Hyundai Excel 90-94 24.64 22.77 26.61 3.84Hyundai Excel / Accent 95-00 22.18 20.93 23.49 2.56Hyundai Elantra 00-07 19.78 15.36 25.09 9.73Hyundai S Coupe 90-96 23.16 18.40 28.71 10.31Hyundai Lantra 91-95 25.05 21.03 29.55 8.52Hyundai Lantra 96-00 22.56 19.55 25.89 6.33Hyundai Coupe 96-00 24.44 18.18 32.02 13.84Hyundai Accent 00-06 24.17 21.06 27.58 6.51Mitsubishi Lancer / Mirage CA 89-90 22.38 20.11 24.83 4.72Mitsubishi Lancer / Mirage CB 91-92 24.78 20.03 30.23 10.20Mitsubishi Lancer / Mirage CC 93-95 22.62 20.49 24.89 4.40Mitsubishi Lancer / Mirage CE 96-03 21.73 20.17 23.38 3.21Mitsubishi Cordia 83-87 25.47 22.04 29.23 7.20Mitsubishi Lancer CH / CJ 03-07 22.89 17.77 28.97 11.21Kia Rio 00-05 23.96 19.93 28.51 8.58Kia Spectra 01-04 17.72 9.49 30.68 21.19Kia Cerato 04-07 16.87 9.04 29.29 20.25Kia Rio JB 05-07 15.63 7.63 29.37 21.74Ford / Mazda Laser / 323 / Familia 82-88 23.78 22.88 24.71 1.83Mazda 323 / Familia / Lantis 90-93 21.56 19.43 23.84 4.41Mazda 323 / Familia / Lantis 95-98 21.80 19.12 24.74 5.62Ford / Mazda Laser / 323 99-03 18.85 16.46 21.51 5.05Mazda MX5 / Eunos Roadster 89-97 21.27 13.98 30.99 17.00Mazda MX5 / Eunos Roadster 98-05 14.25 7.34 25.86 18.52
Mazda Eunos 30X / Presso / MX-3 /Autozam AZ-3 90-97 17.44 10.70 27.14 16.43
Mazda 3 / Axela 03-07 15.22 11.81 19.38 7.57Mercedes Benz A-Class W168 98-04 19.30 8.88 36.99 28.11Holden / Nissan Astra / Pulsar / Langley 84-86 25.19 23.47 26.98 3.51Holden / Nissan Astra / Pulsar / Vector / Sentra 88-90 23.99 22.40 25.66 3.27

Make Model of Car Years ofManufacture
Pr(Severity)%
Lower 95%ConfidenceLimit
Upper 95%ConfidenceLimit
Width ofConfidenceInterval
Nissan Pulsar / Vector / Sentra 92-95 21.14 19.13 23.30 4.16Nissan Pulsar / Vector / Sentra 96-99 21.98 19.99 24.12 4.13Nissan Stanza 82-83 19.99 13.30 28.93 15.63Nissan Gazelle / Silvia 84-86 26.60 22.75 30.83 8.08Nissan Exa 83-86 27.23 20.20 35.62 15.42Nissan Exa 87-91 28.19 18.06 41.14 23.08Nissan NX/NX-R 91-96 28.83 22.37 36.29 13.92Nissan Pulsar 00-05 21.09 18.65 23.75 5.11Honda Civic 82-83 24.72 20.91 28.97 8.05Honda Civic / Ballade / Shuttle 84-87 25.80 23.25 28.54 5.29Honda Civic / Shuttle 88-91 22.98 20.80 25.33 4.53Honda Civic 92-95 20.98 18.64 23.54 4.91Honda Civic 96-00 20.17 17.43 23.22 5.79Honda CRX 87-91 28.65 23.70 34.18 10.48Honda CRX 92-98 26.09 17.10 37.67 20.57Honda Civic 01-05 21.49 16.39 27.65 11.27Honda Integra 86-88 24.24 19.98 29.07 9.08Honda Integra 90-92 21.64 16.87 27.30 10.42Honda Integra 93-01 21.01 16.22 26.75 10.53Honda Integra 02-06 18.46 8.96 34.25 25.30Honda Concerto 89-93 22.86 17.64 29.08 11.44Peugeot 306 94-01 14.61 10.72 19.59 8.87Peugeot 307 01-07 16.78 9.50 27.90 18.40Proton Wira 95-96 25.66 20.51 31.58 11.07Renault 19 91-96 18.19 9.72 31.48 21.76Renault Scenic 01-04 5.59 0.78 30.93 30.15Rover Quintet 82-86 22.50 14.48 33.24 18.76MG MGF / MG TF 99-05 18.35 8.35 35.65 27.30Subaru Impreza 93-00 24.75 22.00 27.73 5.73Subaru Impreza 01-07 17.52 13.02 23.17 10.16Suzuki Baleno / Cultus Crescent 95-02 20.85 16.46 26.04 9.59Suzuki Liana 01-07 17.06 9.47 28.80 19.33Toyota Corolla 82-84 23.42 21.79 25.14 3.35Toyota Corolla 86-88 23.48 22.07 24.95 2.88Toyota / Holden Corolla / Nova 89-93 22.52 21.35 23.73 2.37Toyota / Holden Corolla / Nova 94-97 22.11 20.63 23.65 3.02Toyota Corolla / Allex 98-01 17.65 15.45 20.09 4.64Toyota Corolla 02-07 19.84 17.70 22.17 4.46Toyota Tercel 83-88 24.09 17.48 32.23 14.76Toyota MR2 87-90 28.49 21.31 36.95 15.64Toyota MR2 91-00 17.79 11.10 27.28 16.18Toyota Paseo / Cynos 91-99 20.65 16.45 25.59 9.13Toyota Corolla 4WD Wagon 92-96 23.12 13.90 35.92 22.02Volvo 300 Series 84-88 31.64 18.91 47.89 28.98Volvo S40/V40 97-04 18.61 11.73 28.22 16.49Volkswagen Golf 82-94 31.68 20.57 45.36 24.79Volkswagen Golf 95-98 17.89 11.87 26.06 14.19Volkswagen Golf / Bora 99-04 14.80 10.78 19.98 9.20Volkswagen New Beetle 00-07 10.35 3.92 24.62 20.70Volkswagen Golf / Jetta 04-07 7.87 3.67 16.08 12.41


APPENDIX 4
CRASHWORTHINESS RATINGS OF1982-2007 MODELS OF CARS INVOLVED IN
CRASHES DURING 1987-2007with
(1) 95 % CONFIDENCE LIMITS(2) 90 % CONFIDENCE LIMITS

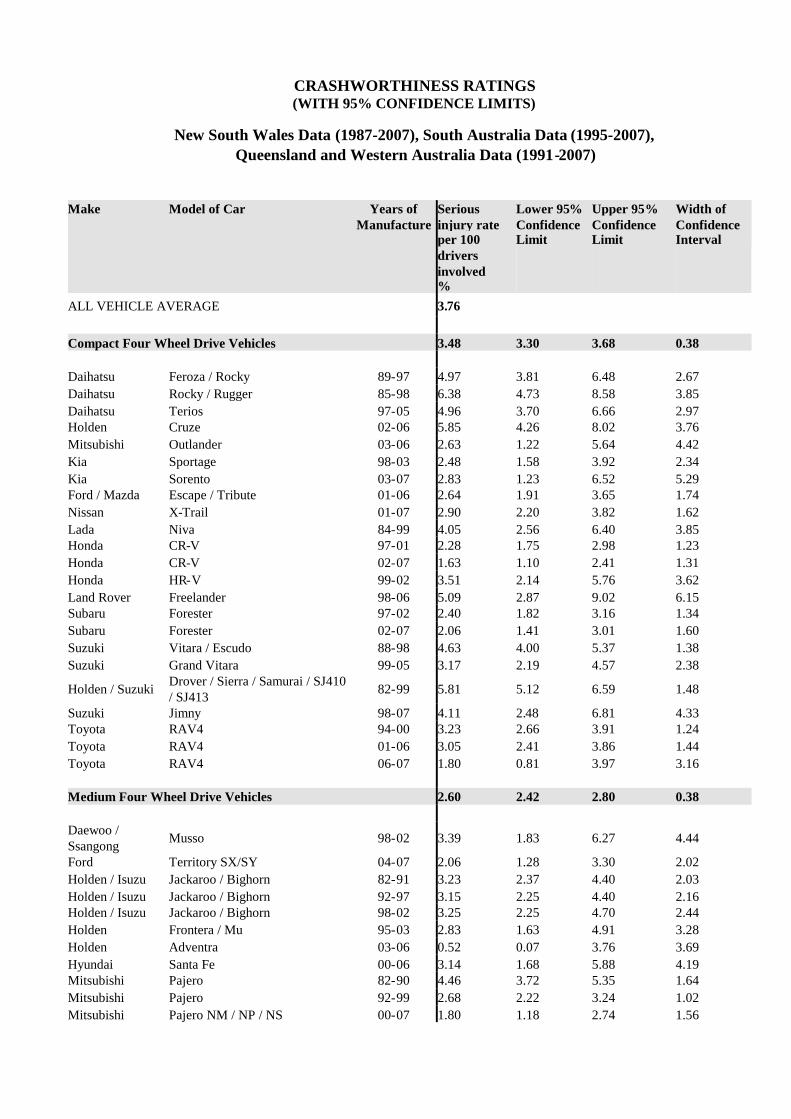
CRASHWORTHINESS RATINGS(WITH 95% CONFIDENCE LIMITS)
New South Wales Data (1987-2007), South Australia Data (1995-2007),Queensland and Western Australia Data (1991-2007)
Make Model of Car Years ofManufacture
Seriousinjury rateper 100driversinvolved%
Lower 95%ConfidenceLimit
Upper 95%ConfidenceLimit
Width ofConfidenceInterval
ALL VEHICLE AVERAGE 3.76
Compact Four Wheel Drive Vehicles 3.48 3.30 3.68 0.38
Daihatsu Feroza / Rocky 89-97 4.97 3.81 6.48 2.67Daihatsu Rocky / Rugger 85-98 6.38 4.73 8.58 3.85Daihatsu Terios 97-05 4.96 3.70 6.66 2.97Holden Cruze 02-06 5.85 4.26 8.02 3.76Mitsubishi Outlander 03-06 2.63 1.22 5.64 4.42Kia Sportage 98-03 2.48 1.58 3.92 2.34Kia Sorento 03-07 2.83 1.23 6.52 5.29Ford / Mazda Escape / Tribute 01-06 2.64 1.91 3.65 1.74Nissan X-Trail 01-07 2.90 2.20 3.82 1.62Lada Niva 84-99 4.05 2.56 6.40 3.85Honda CR-V 97-01 2.28 1.75 2.98 1.23Honda CR-V 02-07 1.63 1.10 2.41 1.31Honda HR-V 99-02 3.51 2.14 5.76 3.62Land Rover Freelander 98-06 5.09 2.87 9.02 6.15Subaru Forester 97-02 2.40 1.82 3.16 1.34Subaru Forester 02-07 2.06 1.41 3.01 1.60Suzuki Vitara / Escudo 88-98 4.63 4.00 5.37 1.38Suzuki Grand Vitara 99-05 3.17 2.19 4.57 2.38
Holden / Suzuki Drover / Sierra / Samurai / SJ410/ SJ413 82-99 5.81 5.12 6.59 1.48
Suzuki Jimny 98-07 4.11 2.48 6.81 4.33Toyota RAV4 94-00 3.23 2.66 3.91 1.24Toyota RAV4 01-06 3.05 2.41 3.86 1.44Toyota RAV4 06-07 1.80 0.81 3.97 3.16
Medium Four Wheel Drive Vehicles 2.60 2.42 2.80 0.38
Daewoo /Ssangong Musso 98-02 3.39 1.83 6.27 4.44
Ford Territory SX/SY 04-07 2.06 1.28 3.30 2.02Holden / Isuzu Jackaroo / Bighorn 82-91 3.23 2.37 4.40 2.03Holden / Isuzu Jackaroo / Bighorn 92-97 3.15 2.25 4.40 2.16Holden / Isuzu Jackaroo / Bighorn 98-02 3.25 2.25 4.70 2.44Holden Frontera / Mu 95-03 2.83 1.63 4.91 3.28Holden Adventra 03-06 0.52 0.07 3.76 3.69Hyundai Santa Fe 00-06 3.14 1.68 5.88 4.19Mitsubishi Pajero 82-90 4.46 3.72 5.35 1.64Mitsubishi Pajero 92-99 2.68 2.22 3.24 1.02Mitsubishi Pajero NM / NP / NS 00-07 1.80 1.18 2.74 1.56

Make Model of Car Years ofManufacture
Seriousinjury rateper 100driversinvolved%
Lower 95%ConfidenceLimit
Upper 95%ConfidenceLimit
Width ofConfidenceInterval
Mitsubishi Challenger 98-06 2.89 1.80 4.63 2.82Jeep Cherokee XJ 96-00 2.78 2.07 3.75 1.68Jeep Wrangler 96-04 4.11 2.45 6.88 4.42Jeep Cherokee KJ 01-07 1.84 0.78 4.33 3.55Land Rover Defender 92-07 3.98 2.51 6.32 3.81Nissan Pathfinder / Terrano 88-94 3.02 2.23 4.10 1.87Nissan Pathfinder / Terrano / Regulus 95-05 1.98 1.34 2.91 1.57Toyota Kluger 03-07 2.58 1.51 4.40 2.89Toyota Landcruiser Prado 96-03 2.03 1.40 2.95 1.56Toyota Landcruiser Prado 03-07 1.31 0.86 2.00 1.14
Large Four Wheel Drive Vehicles 2.67 2.54 2.80 0.26
BMW X5 01-07 1.43 0.45 4.49 4.03Ford Bronco 82-87 5.46 2.83 10.56 7.73Ford Explorer 00-01 4.50 3.03 6.68 3.65Ford Explorer 01-05 1.18 0.49 2.84 2.35Jeep Grand Cherokee ZG 96-99 2.24 1.16 4.31 3.16Jeep Grand Cherokee WJ/WG 99-05 1.71 0.81 3.62 2.81Land Rover Discovery 91-02 2.20 1.55 3.12 1.57Mercedes Benz M-Class W163 98-05 1.32 0.58 3.04 2.46Nissan Patrol / Safari 82-87 3.25 2.48 4.26 1.78Nissan / Ford Patrol / Maverick / Safari 88-97 2.55 2.24 2.91 0.67Nissan Patrol / Safari 98-07 2.17 1.77 2.65 0.87Land Rover Range Rover 82-94 2.79 2.02 3.87 1.85Land Rover Range Rover 95-02 1.35 0.52 3.53 3.01Toyota Landcruiser 82-89 4.17 3.75 4.63 0.88Toyota Landcruiser 90-97 3.00 2.72 3.31 0.59Toyota Landcruiser 98-07 2.51 2.17 2.89 0.71
Commercial Vehicles- Vans 3.68 3.49 3.89 0.40
Daihatsu Handivan 82-90 8.50 6.68 10.83 4.15Daihatsu Hi-Jet 82-90 12.36 8.32 18.35 10.03Daihatsu Handivan / Cuore 99-03 4.56 2.42 8.59 6.18Ford Falcon Panel Van 82-95 3.40 2.80 4.12 1.31Ford Falcon Panel Van 96-99 2.37 1.36 4.15 2.80Ford Transit 95-00 3.10 2.16 4.46 2.30Ford Transit 01-07 1.15 0.61 2.17 1.57Holden Shuttle / WFR Van 82-87 6.24 4.32 9.03 4.71Kia Pregio 02-06 2.84 1.64 4.90 3.26Mercedes Benz MB100 / MB140 99-04 2.57 1.24 5.35 4.12Mercedes Benz Vito / Viano 99-07 2.09 1.13 3.88 2.75Mercedes Benz Sprinter 98-04 2.06 1.17 3.63 2.46Honda Acty 83-86 3.80 2.27 6.36 4.09Holden / Suzuki Scurry / Carry 82-00 9.82 7.47 12.89 5.42Suzuki Carry 99-05 3.78 1.43 9.97 8.54Toyota Hiace/Liteace 82-86 5.63 4.98 6.38 1.40Toyota Hiace/Liteace 87-89 4.85 4.09 5.74 1.65Toyota Hiace/Liteace 90-95 4.43 3.89 5.06 1.17Toyota Hiace/Liteace 96-04 3.02 2.55 3.57 1.02

Make Model of Car Years ofManufacture
Seriousinjury rateper 100driversinvolved%
Lower 95%ConfidenceLimit
Upper 95%ConfidenceLimit
Width ofConfidenceInterval
Toyoa Hiace 05-07 3.37 1.84 6.17 4.33Volkswagen Caravelle / Transporter 88-94 2.80 1.32 5.94 4.62Volkswagen Caravelle / Transporter 95-04 1.48 0.79 2.76 1.96
Commercial Vehicles- Utes 3.33 3.23 3.44 0.21
Ford / Nissan Falcon Ute / XFN Ute 82-95 3.84 3.47 4.25 0.78Ford Falcon Ute 96-99 3.03 2.44 3.77 1.34Ford Falcon Ute AU 00-02 2.56 2.04 3.21 1.17Ford Falcon Ute BA/BF 03-07 1.99 1.47 2.69 1.21Ford Ford F-Series 82-92 2.73 1.84 4.07 2.23Holden Commodore Ute VG/VP 90-93 4.29 3.47 5.32 1.85Holden / Isuzu Rodeo / Pickup 82-85 4.51 3.22 6.31 3.09Holden / Isuzu Rodeo / Pickup 86-88 2.45 1.27 4.73 3.45Holden / Isuzu Rodeo / Pickup 89-95 4.15 3.68 4.68 1.00Holden Rodeo 96-98 3.31 2.74 4.00 1.26Holden Rodeo 99-02 3.08 2.54 3.73 1.19Holden WB Series 82-85 5.25 4.26 6.47 2.21Holden Commodore Ute VR/VS 94-00 3.82 3.42 4.26 0.84Holden Commodore VU Ute 00-02 3.17 2.52 3.99 1.46Holden Commodore VY/VZ Ute 02-07 2.42 1.98 2.95 0.97Holden Rodeo 03-07 2.66 2.10 3.36 1.25Mitsubishi Triton MK 96-06 2.09 1.41 3.10 1.68Kia Ceres 92-00 5.77 4.47 7.44 2.96Ford / Mazda Courier / B-Series / Bounty 98-02 3.03 2.40 3.82 1.41Ford / Mazda Courier / Bravo / Bounty 03-06 3.68 2.74 4.94 2.21Nissan 720 Ute 82-85 4.46 3.55 5.59 2.04Nissan Navara 86-91 3.88 3.34 4.52 1.18Nissan Navara 92-96 3.13 2.47 3.95 1.48Nissan Navara 97-05 2.44 1.91 3.12 1.21Nissan Navara 05-07 2.49 0.99 6.29 5.30Subaru Brumby 82-92 6.20 5.23 7.34 2.11Suzuki Mighty Boy 85-88 9.56 7.15 12.77 5.62Toyota 4Runner/Hilux 82-85 4.54 4.03 5.12 1.10Toyota 4Runner/Hilux 86-88 4.39 3.88 4.97 1.10Toyota 4Runner/Hilux 89-97 3.97 3.70 4.25 0.54Toyota Hilux 98-02 2.81 2.45 3.24 0.79Toyota Hilux 03-04 2.42 1.82 3.22 1.40Toyota Hilux 05-07 2.83 2.08 3.86 1.77
Large Cars 3.25 3.19 3.31 0.12
BMW 7 Series E23 82-88 2.88 1.47 5.63 4.16BMW 7 Series E32 89-94 3.29 1.70 6.37 4.67BMW 7 Series E38 95-01 1.37 0.49 3.89 3.40Ford Falcon XE/XF 82-88 4.21 4.02 4.41 0.38Ford Fairlane Z & LTD F 82-87 4.02 3.56 4.54 0.99Ford Falcon EA / Falcon EB Series I 88-Mar 92 3.79 3.60 3.99 0.39Ford Falcon EB Series II / Falcon ED Apr 92-94 3.45 3.20 3.71 0.51Ford Fairlane N & LTD D 88-94 2.99 2.58 3.47 0.89Ford Fairlane N & LTD D 95-98 3.31 2.62 4.18 1.56

Make Model of Car Years ofManufacture
Seriousinjury rateper 100driversinvolved%
Lower 95%ConfidenceLimit
Upper 95%ConfidenceLimit
Width ofConfidenceInterval
Ford Fairlane & LTD AU 99-02 2.53 1.68 3.81 2.13Ford Fairlane & LTD BA/BF 03-07 3.62 1.85 7.09 5.24Ford Falcon EF/EL 94-98 3.16 2.99 3.34 0.35Ford Falcon AU 98-02 2.83 2.61 3.06 0.44Ford Taurus 96-98 3.58 2.33 5.50 3.18Ford Falcon BA/BF 02-07 2.43 2.14 2.74 0.60Holden / Toyota Commodore VN/VP / Lexcen 89-93 4.16 3.98 4.34 0.36Holden Statesman/Caprice WB 82-85 6.69 3.96 11.29 7.33Holden Stateman/Caprice VQ 90-93 4.30 3.11 5.96 2.86Holden Stateman/Caprice VR/VS 94-98 3.31 2.81 3.89 1.08Holden / Toyota Commodore VR/VS / Lexcen 93-97 3.38 3.21 3.55 0.34Holden Commodore VT/VX 97-02 2.98 2.81 3.16 0.36Holden Statesman/Caprice WH 99-03 1.98 1.32 2.97 1.65Holden Commodore VY/VZ 02-07 2.32 2.06 2.62 0.56Holden Monaro 01-05 3.21 2.13 4.85 2.72Holden Statesman/Caprice WK/WL 03-06 2.90 1.60 5.24 3.63Holden Commodore VB-VL 82-88 4.71 4.51 4.93 0.42Holden Commodore VE 06-07 2.04 1.40 2.97 1.58Hyundai Sonata 89-97 3.60 3.03 4.27 1.24Hyundai Grandeaur / XG 99-00 0.99 0.25 3.97 3.72
Mitsubishi Magna TM/TN/TP / Sigma /V3000 85-90 4.48 4.23 4.76 0.53
Mitsubishi Magna TE/TF/TH/TJ / VeradaKE/KF/KH/KJ / Diamante 96-03 3.23 2.96 3.53 0.57
Mitsubishi Magna TR/TS / Verada KR/KS /V3000 / Diamante 91-96 3.45 3.22 3.70 0.48
Mitsubishi Magna TL/TW / Verada KL/KW 03-05 2.10 1.36 3.24 1.87Mitsubishi 380 05-07 1.54 0.56 4.26 3.70Jaguar XJ6 82-86 5.00 2.94 8.49 5.55Jaguar XJ6 87-94 2.03 1.10 3.73 2.63Mazda 929 / Luce 82-90 4.55 3.91 5.29 1.38Mazda 929 / Sentia / Efini MS-9 92-96 3.75 2.00 7.03 5.03Mercedes Benz E-Class W123 82-85 3.09 1.73 5.53 3.80Mercedes Benz E-Class W124 86-94 2.79 1.98 3.93 1.96Mercedes Benz E-Class W210 96-02 2.71 1.74 4.20 2.46Mercedes Benz S-Class W126 82-92 2.94 1.98 4.37 2.39Nissan Skyline 83-88 4.46 3.99 4.98 0.99Nissan 300ZX / Fairlady Z 90-95 3.93 2.70 5.73 3.03Nissan Maxima 90-94 3.46 2.64 4.54 1.89Nissan Maxima / Cefiro 95-99 3.27 2.49 4.29 1.80Nissan Maxima 00-02 3.21 2.02 5.10 3.09Nissan Maxima 06-07 2.36 1.09 5.12 4.03Honda Legend 86-95 2.73 1.92 3.87 1.95Rover 3500 82-87 2.17 0.81 5.82 5.02Saab 9-5 98-05 1.59 0.52 4.86 4.34Toyota Camry 98-02 3.00 2.72 3.31 0.59Toyota Crown / Cressida / Mark II 82-85 4.51 3.74 5.44 1.69Toyota Crown / Cressida / Mark II 86-88 4.25 3.10 5.83 2.73Toyota Cressida / Mark II 89-93 2.83 2.23 3.59 1.36Toyota Supra 82-90 5.89 4.20 8.25 4.05Lexus ES300 / Windom 92-01 3.39 2.28 5.04 2.75Lexus LS400 / Celsior 90-00 1.39 0.44 4.42 3.98
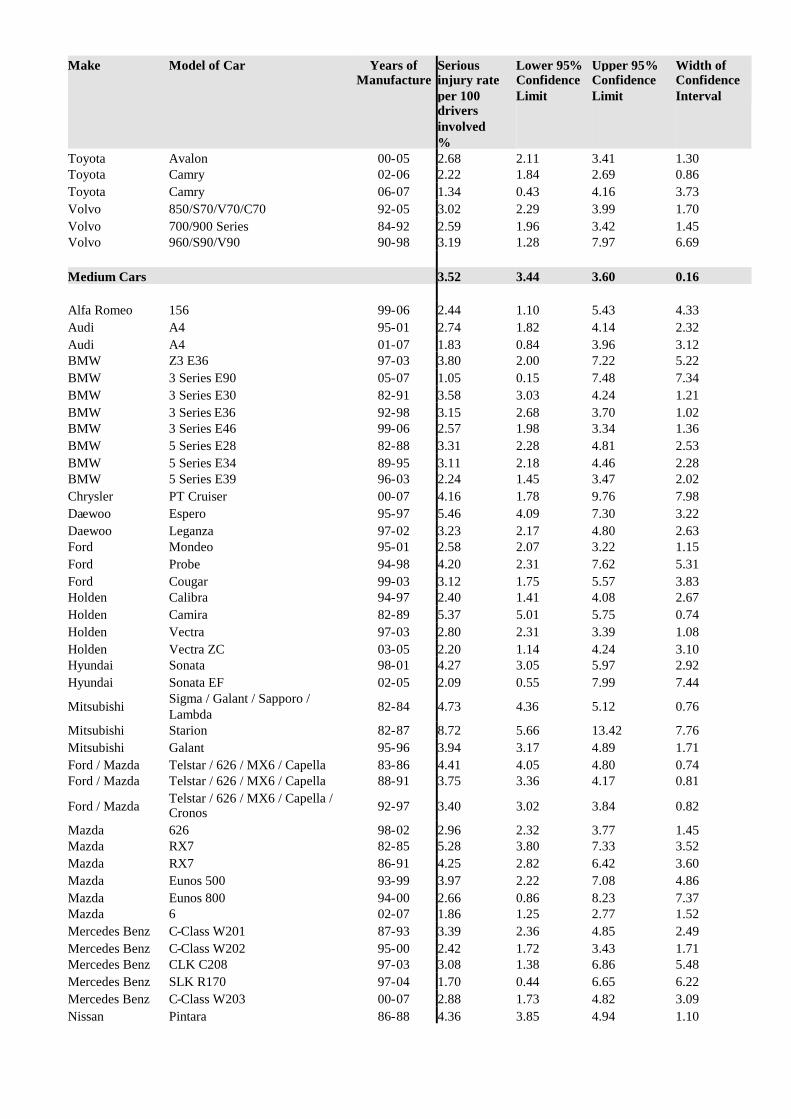
Make Model of Car Years ofManufacture
Seriousinjury rateper 100driversinvolved%
Lower 95%ConfidenceLimit
Upper 95%ConfidenceLimit
Width ofConfidenceInterval
Toyota Avalon 00-05 2.68 2.11 3.41 1.30Toyota Camry 02-06 2.22 1.84 2.69 0.86Toyota Camry 06-07 1.34 0.43 4.16 3.73Volvo 850/S70/V70/C70 92-05 3.02 2.29 3.99 1.70Volvo 700/900 Series 84-92 2.59 1.96 3.42 1.45Volvo 960/S90/V90 90-98 3.19 1.28 7.97 6.69
Medium Cars 3.52 3.44 3.60 0.16
Alfa Romeo 156 99-06 2.44 1.10 5.43 4.33Audi A4 95-01 2.74 1.82 4.14 2.32Audi A4 01-07 1.83 0.84 3.96 3.12BMW Z3 E36 97-03 3.80 2.00 7.22 5.22BMW 3 Series E90 05-07 1.05 0.15 7.48 7.34BMW 3 Series E30 82-91 3.58 3.03 4.24 1.21BMW 3 Series E36 92-98 3.15 2.68 3.70 1.02BMW 3 Series E46 99-06 2.57 1.98 3.34 1.36BMW 5 Series E28 82-88 3.31 2.28 4.81 2.53BMW 5 Series E34 89-95 3.11 2.18 4.46 2.28BMW 5 Series E39 96-03 2.24 1.45 3.47 2.02Chrysler PT Cruiser 00-07 4.16 1.78 9.76 7.98Daewoo Espero 95-97 5.46 4.09 7.30 3.22Daewoo Leganza 97-02 3.23 2.17 4.80 2.63Ford Mondeo 95-01 2.58 2.07 3.22 1.15Ford Probe 94-98 4.20 2.31 7.62 5.31Ford Cougar 99-03 3.12 1.75 5.57 3.83Holden Calibra 94-97 2.40 1.41 4.08 2.67Holden Camira 82-89 5.37 5.01 5.75 0.74Holden Vectra 97-03 2.80 2.31 3.39 1.08Holden Vectra ZC 03-05 2.20 1.14 4.24 3.10Hyundai Sonata 98-01 4.27 3.05 5.97 2.92Hyundai Sonata EF 02-05 2.09 0.55 7.99 7.44
Mitsubishi Sigma / Galant / Sapporo /Lambda 82-84 4.73 4.36 5.12 0.76
Mitsubishi Starion 82-87 8.72 5.66 13.42 7.76Mitsubishi Galant 95-96 3.94 3.17 4.89 1.71Ford / Mazda Telstar / 626 / MX6 / Capella 83-86 4.41 4.05 4.80 0.74Ford / Mazda Telstar / 626 / MX6 / Capella 88-91 3.75 3.36 4.17 0.81
Ford / Mazda Telstar / 626 / MX6 / Capella /Cronos 92-97 3.40 3.02 3.84 0.82
Mazda 626 98-02 2.96 2.32 3.77 1.45Mazda RX7 82-85 5.28 3.80 7.33 3.52Mazda RX7 86-91 4.25 2.82 6.42 3.60Mazda Eunos 500 93-99 3.97 2.22 7.08 4.86Mazda Eunos 800 94-00 2.66 0.86 8.23 7.37Mazda 6 02-07 1.86 1.25 2.77 1.52Mercedes Benz C-Class W201 87-93 3.39 2.36 4.85 2.49Mercedes Benz C-Class W202 95-00 2.42 1.72 3.43 1.71Mercedes Benz CLK C208 97-03 3.08 1.38 6.86 5.48Mercedes Benz SLK R170 97-04 1.70 0.44 6.65 6.22Mercedes Benz C-Class W203 00-07 2.88 1.73 4.82 3.09Nissan Pintara 86-88 4.36 3.85 4.94 1.10
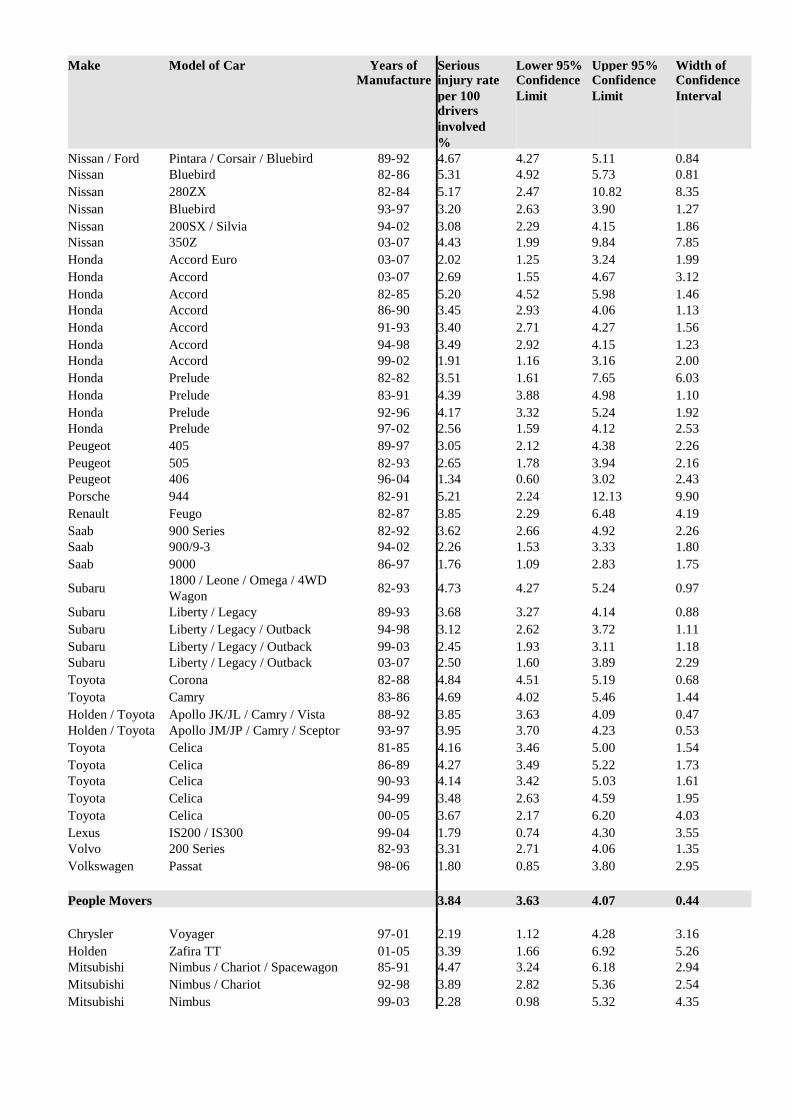
Make Model of Car Years ofManufacture
Seriousinjury rateper 100driversinvolved%
Lower 95%ConfidenceLimit
Upper 95%ConfidenceLimit
Width ofConfidenceInterval
Nissan / Ford Pintara / Corsair / Bluebird 89-92 4.67 4.27 5.11 0.84Nissan Bluebird 82-86 5.31 4.92 5.73 0.81Nissan 280ZX 82-84 5.17 2.47 10.82 8.35Nissan Bluebird 93-97 3.20 2.63 3.90 1.27Nissan 200SX / Silvia 94-02 3.08 2.29 4.15 1.86Nissan 350Z 03-07 4.43 1.99 9.84 7.85Honda Accord Euro 03-07 2.02 1.25 3.24 1.99Honda Accord 03-07 2.69 1.55 4.67 3.12Honda Accord 82-85 5.20 4.52 5.98 1.46Honda Accord 86-90 3.45 2.93 4.06 1.13Honda Accord 91-93 3.40 2.71 4.27 1.56Honda Accord 94-98 3.49 2.92 4.15 1.23Honda Accord 99-02 1.91 1.16 3.16 2.00Honda Prelude 82-82 3.51 1.61 7.65 6.03Honda Prelude 83-91 4.39 3.88 4.98 1.10Honda Prelude 92-96 4.17 3.32 5.24 1.92Honda Prelude 97-02 2.56 1.59 4.12 2.53Peugeot 405 89-97 3.05 2.12 4.38 2.26Peugeot 505 82-93 2.65 1.78 3.94 2.16Peugeot 406 96-04 1.34 0.60 3.02 2.43Porsche 944 82-91 5.21 2.24 12.13 9.90Renault Feugo 82-87 3.85 2.29 6.48 4.19Saab 900 Series 82-92 3.62 2.66 4.92 2.26Saab 900/9-3 94-02 2.26 1.53 3.33 1.80Saab 9000 86-97 1.76 1.09 2.83 1.75
Subaru 1800 / Leone / Omega / 4WDWagon 82-93 4.73 4.27 5.24 0.97
Subaru Liberty / Legacy 89-93 3.68 3.27 4.14 0.88Subaru Liberty / Legacy / Outback 94-98 3.12 2.62 3.72 1.11Subaru Liberty / Legacy / Outback 99-03 2.45 1.93 3.11 1.18Subaru Liberty / Legacy / Outback 03-07 2.50 1.60 3.89 2.29Toyota Corona 82-88 4.84 4.51 5.19 0.68Toyota Camry 83-86 4.69 4.02 5.46 1.44Holden / Toyota Apollo JK/JL / Camry / Vista 88-92 3.85 3.63 4.09 0.47Holden / Toyota Apollo JM/JP / Camry / Sceptor 93-97 3.95 3.70 4.23 0.53Toyota Celica 81-85 4.16 3.46 5.00 1.54Toyota Celica 86-89 4.27 3.49 5.22 1.73Toyota Celica 90-93 4.14 3.42 5.03 1.61Toyota Celica 94-99 3.48 2.63 4.59 1.95Toyota Celica 00-05 3.67 2.17 6.20 4.03Lexus IS200 / IS300 99-04 1.79 0.74 4.30 3.55Volvo 200 Series 82-93 3.31 2.71 4.06 1.35Volkswagen Passat 98-06 1.80 0.85 3.80 2.95
People Movers 3.84 3.63 4.07 0.44
Chrysler Voyager 97-01 2.19 1.12 4.28 3.16Holden Zafira TT 01-05 3.39 1.66 6.92 5.26Mitsubishi Nimbus / Chariot / Spacewagon 85-91 4.47 3.24 6.18 2.94Mitsubishi Nimbus / Chariot 92-98 3.89 2.82 5.36 2.54Mitsubishi Nimbus 99-03 2.28 0.98 5.32 4.35

Make Model of Car Years ofManufacture
Seriousinjury rateper 100driversinvolved%
Lower 95%ConfidenceLimit
Upper 95%ConfidenceLimit
Width ofConfidenceInterval
Mitsubishi Starwagon / L300 83-86 7.32 6.39 8.38 1.99Mitsubishi Starwagon / Delica Starwagon 87-93 4.93 4.36 5.58 1.22Mitsubishi Starwagon / Delica Spacegear 95-98 3.56 2.69 4.71 2.03Mitsubishi Starwagon / Delica Spacegear 98-03 4.12 3.04 5.58 2.55Kia Carnival 99-06 1.24 0.71 2.18 1.46Mazda MPV 94-99 0.79 0.20 3.18 2.98Nissan Prairie 84-86 4.64 3.16 6.81 3.65Nissan Serena 92-95 2.32 1.25 4.29 3.04Honda Odyssey 95-00 2.15 1.31 3.52 2.21Toyota Tarago 83-89 5.65 4.98 6.40 1.42Toyota Tarago / Previa / Estima 91-99 2.92 2.36 3.60 1.24Toyota Tarago / Previa / Estima 00-06 2.33 1.47 3.67 2.20Toyota Spacia 93-00 2.17 0.79 5.99 5.20
Light Cars 5.01 4.87 5.15 0.27
Daihatsu Charade 82-86 8.02 6.98 9.20 2.22Daihatsu Charade 88-92 6.17 5.58 6.82 1.24Daihatsu Charade 93-00 6.09 5.44 6.82 1.38Daihatsu Pyzar 97-01 5.23 3.23 8.48 5.25Daihatsu Sirion / Storia 98-04 4.43 3.44 5.71 2.27Daihatsu Mira 90-96 9.99 8.17 12.22 4.04Daewoo Matiz 99-04 4.73 3.51 6.37 2.85Daewoo Kalos 03-04 4.93 3.08 7.90 4.81Ford Festiva WD/WH/WF 94-01 5.90 5.49 6.34 0.85Ford Ka 99-02 4.57 3.03 6.87 3.84Holden Barina XC 01-06 3.42 2.75 4.24 1.49Holden Barina SB 95-00 4.58 4.07 5.14 1.07Holden Barina TK 05-07 4.19 2.66 6.60 3.95Hyundai Getz / TB 02-07 4.87 3.95 6.00 2.05Mitsubishi Mirage / Colt 82-88 5.86 5.45 6.31 0.86Mitsubishi Colt 04-07 3.95 2.06 7.55 5.49Ford / Mazda Festiva WA / 121 87-90 5.94 5.39 6.55 1.15Mazda 121 / Autozam Review 94-96 4.79 4.11 5.59 1.48Mazda 121 Metro / Demio 97-02 4.15 3.44 5.00 1.55Mazda 2 02-07 3.34 2.25 4.97 2.72Nissan Micra 95-97 6.31 4.87 8.19 3.32Honda Jazz / Fit 02-07 3.07 2.21 4.28 2.07Honda City 83-86 7.17 5.80 8.87 3.07Peugeot 205 87-94 4.23 2.57 6.96 4.39Peugeot 206 99-07 4.32 2.94 6.34 3.40Proton Satria 97-05 4.67 1.99 10.99 9.00Renault Clio 02-07 4.01 1.92 8.36 6.44Subaru Sherpa / Fiori / 700 / Rex 89-92 9.09 7.34 11.27 3.93Suzuki Swift 82-85 8.35 5.44 12.81 7.37Holden / Suzuki Barina / Swift / Cultus 86-88 7.40 6.65 8.25 1.60Holden / Suzuki Barina / Swift / Cultus 89-99 5.60 5.23 6.00 0.77Suzuki Hatch / Alto 82-84 9.43 7.68 11.57 3.89Suzuki Alto 85-00 9.95 7.49 13.21 5.71Suzuki Ignis 00-02 5.57 3.86 8.02 4.16Suzuki Swift 05-07 3.35 2.16 5.20 3.04
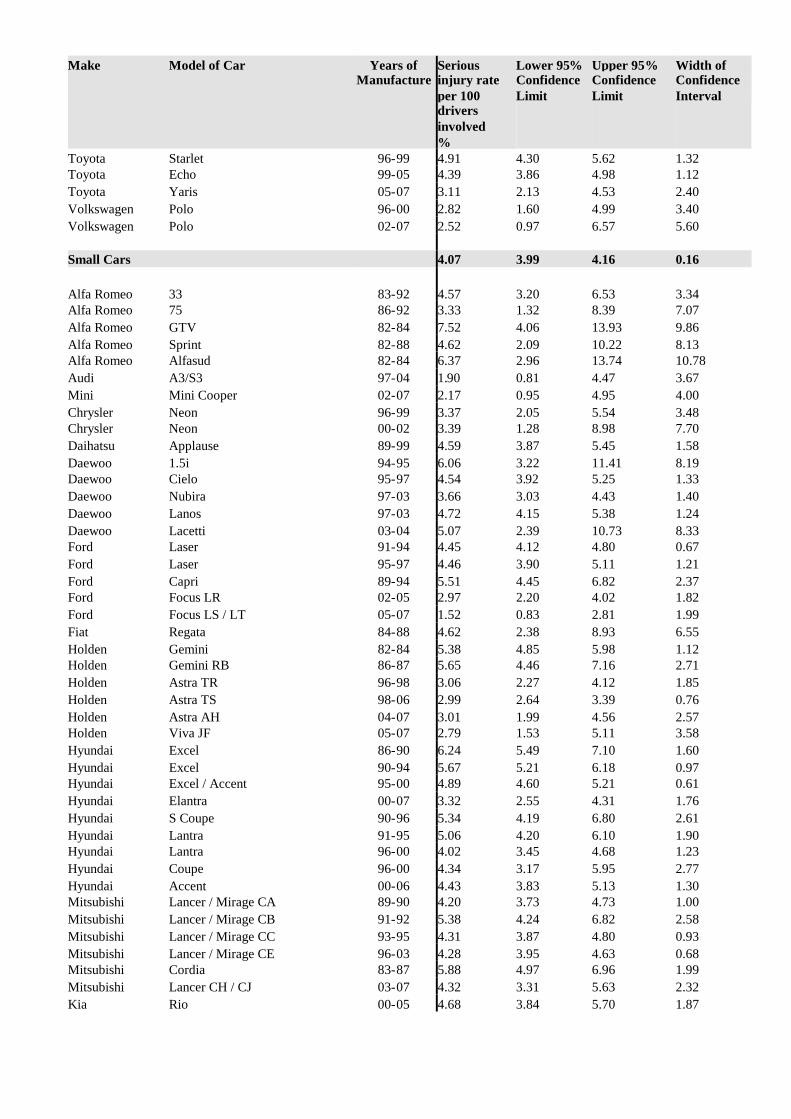
Make Model of Car Years ofManufacture
Seriousinjury rateper 100driversinvolved%
Lower 95%ConfidenceLimit
Upper 95%ConfidenceLimit
Width ofConfidenceInterval
Toyota Starlet 96-99 4.91 4.30 5.62 1.32Toyota Echo 99-05 4.39 3.86 4.98 1.12Toyota Yaris 05-07 3.11 2.13 4.53 2.40Volkswagen Polo 96-00 2.82 1.60 4.99 3.40Volkswagen Polo 02-07 2.52 0.97 6.57 5.60
Small Cars 4.07 3.99 4.16 0.16
Alfa Romeo 33 83-92 4.57 3.20 6.53 3.34Alfa Romeo 75 86-92 3.33 1.32 8.39 7.07Alfa Romeo GTV 82-84 7.52 4.06 13.93 9.86Alfa Romeo Sprint 82-88 4.62 2.09 10.22 8.13Alfa Romeo Alfasud 82-84 6.37 2.96 13.74 10.78Audi A3/S3 97-04 1.90 0.81 4.47 3.67Mini Mini Cooper 02-07 2.17 0.95 4.95 4.00Chrysler Neon 96-99 3.37 2.05 5.54 3.48Chrysler Neon 00-02 3.39 1.28 8.98 7.70Daihatsu Applause 89-99 4.59 3.87 5.45 1.58Daewoo 1.5i 94-95 6.06 3.22 11.41 8.19Daewoo Cielo 95-97 4.54 3.92 5.25 1.33Daewoo Nubira 97-03 3.66 3.03 4.43 1.40Daewoo Lanos 97-03 4.72 4.15 5.38 1.24Daewoo Lacetti 03-04 5.07 2.39 10.73 8.33Ford Laser 91-94 4.45 4.12 4.80 0.67Ford Laser 95-97 4.46 3.90 5.11 1.21Ford Capri 89-94 5.51 4.45 6.82 2.37Ford Focus LR 02-05 2.97 2.20 4.02 1.82Ford Focus LS / LT 05-07 1.52 0.83 2.81 1.99Fiat Regata 84-88 4.62 2.38 8.93 6.55Holden Gemini 82-84 5.38 4.85 5.98 1.12Holden Gemini RB 86-87 5.65 4.46 7.16 2.71Holden Astra TR 96-98 3.06 2.27 4.12 1.85Holden Astra TS 98-06 2.99 2.64 3.39 0.76Holden Astra AH 04-07 3.01 1.99 4.56 2.57Holden Viva JF 05-07 2.79 1.53 5.11 3.58Hyundai Excel 86-90 6.24 5.49 7.10 1.60Hyundai Excel 90-94 5.67 5.21 6.18 0.97Hyundai Excel / Accent 95-00 4.89 4.60 5.21 0.61Hyundai Elantra 00-07 3.32 2.55 4.31 1.76Hyundai S Coupe 90-96 5.34 4.19 6.80 2.61Hyundai Lantra 91-95 5.06 4.20 6.10 1.90Hyundai Lantra 96-00 4.02 3.45 4.68 1.23Hyundai Coupe 96-00 4.34 3.17 5.95 2.77Hyundai Accent 00-06 4.43 3.83 5.13 1.30Mitsubishi Lancer / Mirage CA 89-90 4.20 3.73 4.73 1.00Mitsubishi Lancer / Mirage CB 91-92 5.38 4.24 6.82 2.58Mitsubishi Lancer / Mirage CC 93-95 4.31 3.87 4.80 0.93Mitsubishi Lancer / Mirage CE 96-03 4.28 3.95 4.63 0.68Mitsubishi Cordia 83-87 5.88 4.97 6.96 1.99Mitsubishi Lancer CH / CJ 03-07 4.32 3.31 5.63 2.32Kia Rio 00-05 4.68 3.84 5.70 1.87

Make Model of Car Years ofManufacture
Seriousinjury rateper 100driversinvolved%
Lower 95%ConfidenceLimit
Upper 95%ConfidenceLimit
Width ofConfidenceInterval
Kia Spectra 01-04 3.33 1.76 6.31 4.55Kia Cerato 04-07 3.03 1.59 5.76 4.17Kia Rio JB 05-07 2.74 1.31 5.74 4.43Ford / Mazda Laser / 323 / Familia 82-88 5.63 5.39 5.87 0.48Mazda 323 / Familia / Lantis 90-93 4.04 3.58 4.55 0.98Mazda 323 / Familia / Lantis 95-98 4.14 3.59 4.76 1.17Ford / Mazda Laser / 323 99-03 3.25 2.82 3.76 0.94Mazda MX5 / Eunos Roadster 89-97 4.52 2.92 6.99 4.07Mazda MX5 / Eunos Roadster 98-05 2.40 1.23 4.68 3.45
Mazda Eunos 30X / Presso / MX-3 /Autozam AZ-3 90-97 3.28 1.99 5.40 3.41
Mazda 3 / Axela 03-07 2.37 1.82 3.09 1.27Mercedes Benz A-Class W168 98-04 3.40 1.59 7.27 5.68Holden / Nissan Astra / Pulsar / Langley 84-86 5.97 5.52 6.46 0.94Holden / Nissan Astra / Pulsar / Vector / Sentra 88-90 4.96 4.60 5.35 0.75Nissan Pulsar / Vector / Sentra 92-95 3.77 3.38 4.21 0.83Nissan Pulsar / Vector / Sentra 96-99 4.23 3.82 4.69 0.87Nissan Stanza 82-83 4.31 2.82 6.60 3.78Nissan Gazelle / Silvia 84-86 5.86 4.59 7.49 2.90Nissan Exa 83-86 7.68 5.58 10.59 5.01Nissan Exa 87-91 5.54 3.40 9.03 5.64Nissan NX/NX-R 91-96 6.10 4.63 8.02 3.39Nissan Pulsar 00-05 3.75 3.29 4.28 0.99Honda Civic 82-83 5.50 4.44 6.82 2.38Honda Civic / Ballade / Shuttle 84-87 5.89 5.20 6.67 1.47Honda Civic / Shuttle 88-91 4.73 4.22 5.30 1.08Honda Civic 92-95 3.98 3.50 4.54 1.04Honda Civic 96-00 3.60 3.09 4.21 1.12Honda CRX 87-91 6.71 5.15 8.75 3.60Honda CRX 92-98 4.58 2.80 7.50 4.70Honda Civic 01-05 3.08 2.30 4.12 1.83Honda Integra 86-88 5.00 3.92 6.39 2.47Honda Integra 90-92 4.02 3.02 5.36 2.34Honda Integra 93-01 3.53 2.66 4.70 2.04Honda Integra 02-06 3.51 1.68 7.31 5.63Honda Concerto 89-93 4.06 2.99 5.52 2.53Peugeot 306 94-01 2.42 1.74 3.35 1.61Peugeot 307 01-07 2.12 1.17 3.84 2.66Proton Wira 95-96 4.88 3.84 6.21 2.36Renault 19 91-96 3.66 1.93 6.94 5.00Renault Scenic 01-04 0.87 0.12 6.01 5.88Rover Quintet 82-86 5.07 3.15 8.16 5.00MG MGF / MG TF 99-05 2.31 1.03 5.19 4.17Subaru Impreza 93-00 4.56 4.00 5.20 1.20Subaru Impreza 01-07 2.42 1.77 3.29 1.52Suzuki Baleno / Cultus Crescent 95-02 4.03 3.15 5.16 2.01Suzuki Liana 01-07 2.65 1.44 4.88 3.44Toyota Corolla 82-84 5.38 4.97 5.83 0.87Toyota Corolla 86-88 5.01 4.68 5.36 0.68Toyota / Holden Corolla / Nova 89-93 4.42 4.17 4.68 0.51Toyota / Holden Corolla / Nova 94-97 4.08 3.78 4.40 0.61
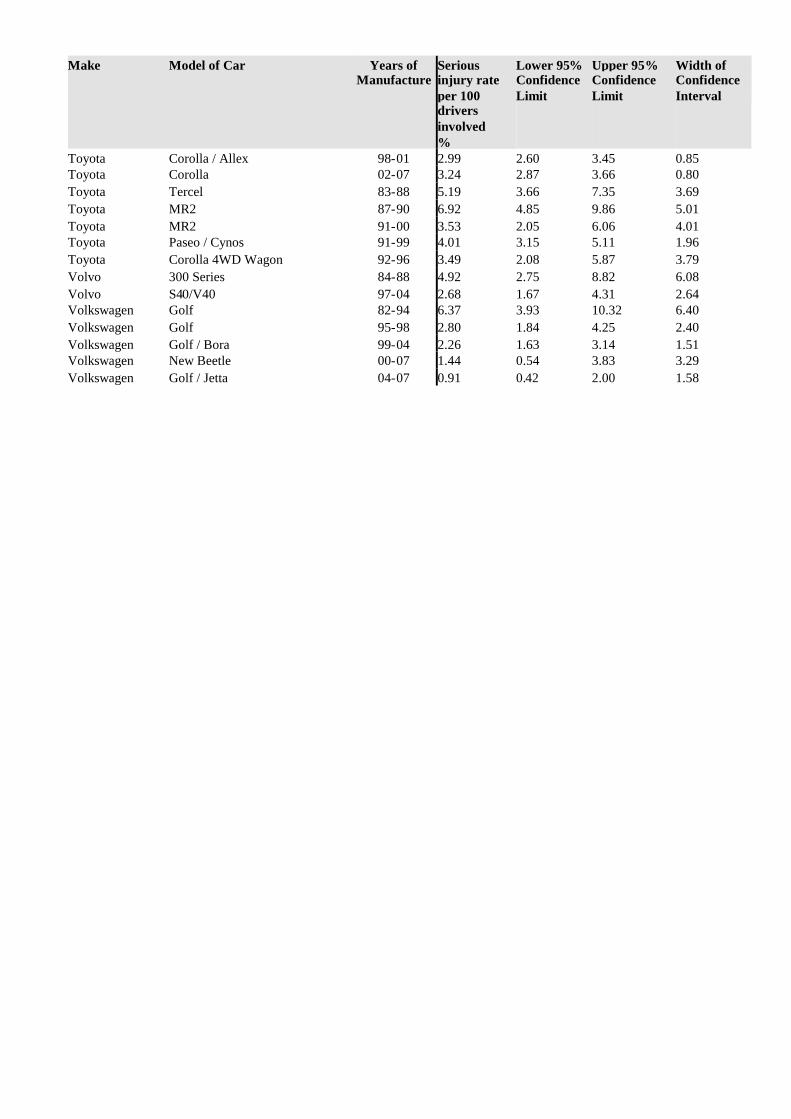
Make Model of Car Years ofManufacture
Seriousinjury rateper 100driversinvolved%
Lower 95%ConfidenceLimit
Upper 95%ConfidenceLimit
Width ofConfidenceInterval
Toyota Corolla / Allex 98-01 2.99 2.60 3.45 0.85Toyota Corolla 02-07 3.24 2.87 3.66 0.80Toyota Tercel 83-88 5.19 3.66 7.35 3.69Toyota MR2 87-90 6.92 4.85 9.86 5.01Toyota MR2 91-00 3.53 2.05 6.06 4.01Toyota Paseo / Cynos 91-99 4.01 3.15 5.11 1.96Toyota Corolla 4WD Wagon 92-96 3.49 2.08 5.87 3.79Volvo 300 Series 84-88 4.92 2.75 8.82 6.08Volvo S40/V40 97-04 2.68 1.67 4.31 2.64Volkswagen Golf 82-94 6.37 3.93 10.32 6.40Volkswagen Golf 95-98 2.80 1.84 4.25 2.40Volkswagen Golf / Bora 99-04 2.26 1.63 3.14 1.51Volkswagen New Beetle 00-07 1.44 0.54 3.83 3.29Volkswagen Golf / Jetta 04-07 0.91 0.42 2.00 1.58

CRASHWORTHINESS RATINGS(WITH 90% CONFIDENCE LIMITS)
New South Wales Data (1987-2007), South Australia Data (1995-2007),Queensland and Western Australia Data (1991-2007)
Make Model of Car Years ofManufacture
Seriousinjury rateper 100driversinvolved%
Lower 90%ConfidenceLimit
Upper 90%ConfidenceLimit
Width ofConfidenceInterval
ALL VEHICLE AVERAGE 3.76
Compact Four Wheel Drive Vehicles 3.48 3.33 3.64 0.32
Daihatsu Feroza / Rocky 89-97 4.97 3.98 6.21 2.23Daihatsu Rocky / Rugger 85-98 6.38 4.97 8.18 3.21Daihatsu Terios 97-05 4.96 3.88 6.35 2.47Holden Cruze 02-06 5.85 4.49 7.62 3.13Mitsubishi Outlander 03-06 2.63 1.38 4.98 3.60Kia Sportage 98-03 2.48 1.70 3.64 1.94Kia Sorento 03-07 2.83 1.41 5.69 4.28Ford / Mazda Escape / Tribute 01-06 2.64 2.01 3.46 1.45Nissan X-Trail 01-07 2.90 2.30 3.65 1.35Lada Niva 84-99 4.05 2.75 5.94 3.18Honda CR-V 97-01 2.28 1.83 2.85 1.02Honda CR-V 02-07 1.63 1.17 2.26 1.09Honda HR-V 99-02 3.51 2.32 5.32 2.99Land Rover Freelander 98-06 5.09 3.15 8.22 5.07Subaru Forester 97-02 2.40 1.91 3.02 1.11Subaru Forester 02-07 2.06 1.50 2.83 1.33Suzuki Vitara / Escudo 88-98 4.63 4.09 5.25 1.15Suzuki Grand Vitara 99-05 3.17 2.33 4.31 1.98
Holden / Suzuki Drover / Sierra / Samurai / SJ410/ SJ413 82-99 5.81 5.22 6.46 1.23
Suzuki Jimny 98-07 4.11 2.69 6.27 3.58Toyota RAV4 94-00 3.23 2.75 3.79 1.04Toyota RAV4 01-06 3.05 2.51 3.71 1.20Toyota RAV4 06-07 1.80 0.93 3.49 2.56
Medium Four Wheel Drive Vehicles 2.60 2.45 2.77 0.31
Daewoo /Ssangong Musso 98-02 3.39 2.02 5.67 3.65
Ford Territory SX/SY 04-07 2.06 1.39 3.06 1.67Holden / Isuzu Jackaroo / Bighorn 82-91 3.23 2.49 4.18 1.69Holden / Isuzu Jackaroo / Bighorn 92-97 3.15 2.37 4.17 1.79Holden / Isuzu Jackaroo / Bighorn 98-02 3.25 2.39 4.42 2.03Holden Frontera / Mu 95-03 2.83 1.78 4.49 2.71Holden Adventra 03-06 0.52 0.10 2.72 2.62Hyundai Santa Fe 00-06 3.14 1.86 5.30 3.44Mitsubishi Pajero 82-90 4.46 3.83 5.20 1.37Mitsubishi Pajero 92-99 2.68 2.29 3.14 0.85Mitsubishi Pajero NM / NP / NS 00-07 1.80 1.26 2.56 1.30
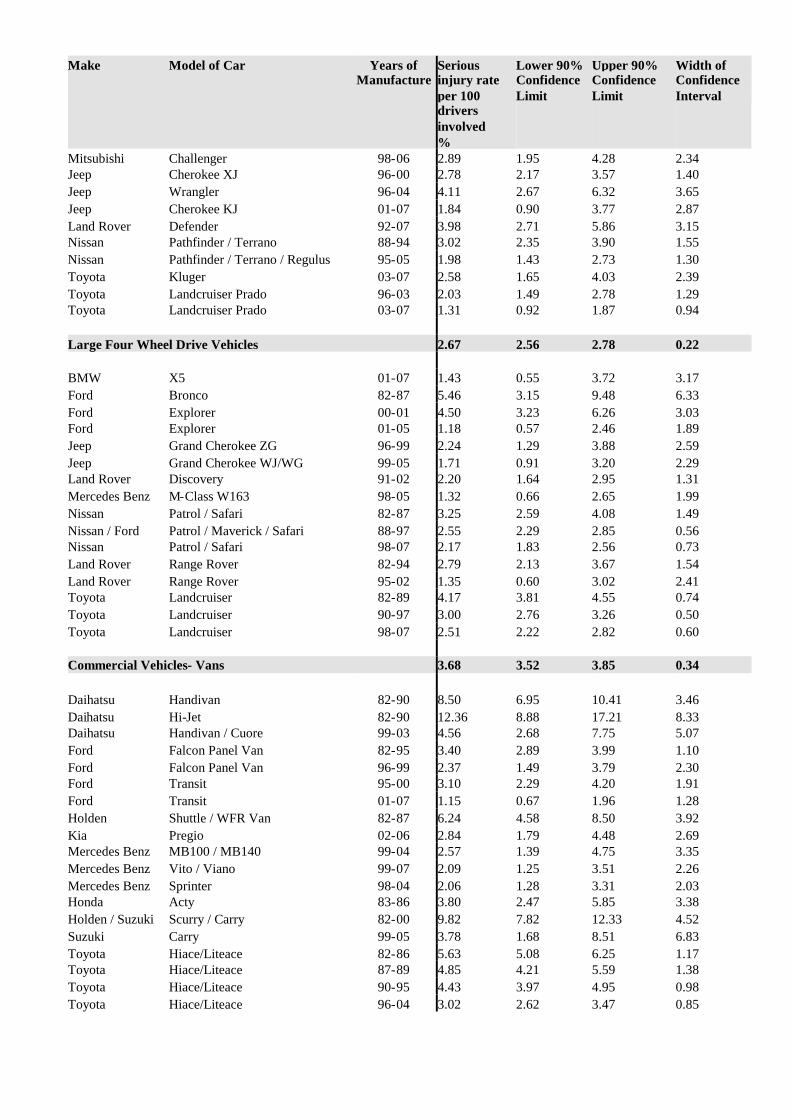
Make Model of Car Years ofManufacture
Seriousinjury rateper 100driversinvolved%
Lower 90%ConfidenceLimit
Upper 90%ConfidenceLimit
Width ofConfidenceInterval
Mitsubishi Challenger 98-06 2.89 1.95 4.28 2.34Jeep Cherokee XJ 96-00 2.78 2.17 3.57 1.40Jeep Wrangler 96-04 4.11 2.67 6.32 3.65Jeep Cherokee KJ 01-07 1.84 0.90 3.77 2.87Land Rover Defender 92-07 3.98 2.71 5.86 3.15Nissan Pathfinder / Terrano 88-94 3.02 2.35 3.90 1.55Nissan Pathfinder / Terrano / Regulus 95-05 1.98 1.43 2.73 1.30Toyota Kluger 03-07 2.58 1.65 4.03 2.39Toyota Landcruiser Prado 96-03 2.03 1.49 2.78 1.29Toyota Landcruiser Prado 03-07 1.31 0.92 1.87 0.94
Large Four Wheel Drive Vehicles 2.67 2.56 2.78 0.22
BMW X5 01-07 1.43 0.55 3.72 3.17Ford Bronco 82-87 5.46 3.15 9.48 6.33Ford Explorer 00-01 4.50 3.23 6.26 3.03Ford Explorer 01-05 1.18 0.57 2.46 1.89Jeep Grand Cherokee ZG 96-99 2.24 1.29 3.88 2.59Jeep Grand Cherokee WJ/WG 99-05 1.71 0.91 3.20 2.29Land Rover Discovery 91-02 2.20 1.64 2.95 1.31Mercedes Benz M-Class W163 98-05 1.32 0.66 2.65 1.99Nissan Patrol / Safari 82-87 3.25 2.59 4.08 1.49Nissan / Ford Patrol / Maverick / Safari 88-97 2.55 2.29 2.85 0.56Nissan Patrol / Safari 98-07 2.17 1.83 2.56 0.73Land Rover Range Rover 82-94 2.79 2.13 3.67 1.54Land Rover Range Rover 95-02 1.35 0.60 3.02 2.41Toyota Landcruiser 82-89 4.17 3.81 4.55 0.74Toyota Landcruiser 90-97 3.00 2.76 3.26 0.50Toyota Landcruiser 98-07 2.51 2.22 2.82 0.60
Commercial Vehicles- Vans 3.68 3.52 3.85 0.34
Daihatsu Handivan 82-90 8.50 6.95 10.41 3.46Daihatsu Hi-Jet 82-90 12.36 8.88 17.21 8.33Daihatsu Handivan / Cuore 99-03 4.56 2.68 7.75 5.07Ford Falcon Panel Van 82-95 3.40 2.89 3.99 1.10Ford Falcon Panel Van 96-99 2.37 1.49 3.79 2.30Ford Transit 95-00 3.10 2.29 4.20 1.91Ford Transit 01-07 1.15 0.67 1.96 1.28Holden Shuttle / WFR Van 82-87 6.24 4.58 8.50 3.92Kia Pregio 02-06 2.84 1.79 4.48 2.69Mercedes Benz MB100 / MB140 99-04 2.57 1.39 4.75 3.35Mercedes Benz Vito / Viano 99-07 2.09 1.25 3.51 2.26Mercedes Benz Sprinter 98-04 2.06 1.28 3.31 2.03Honda Acty 83-86 3.80 2.47 5.85 3.38Holden / Suzuki Scurry / Carry 82-00 9.82 7.82 12.33 4.52Suzuki Carry 99-05 3.78 1.68 8.51 6.83Toyota Hiace/Liteace 82-86 5.63 5.08 6.25 1.17Toyota Hiace/Liteace 87-89 4.85 4.21 5.59 1.38Toyota Hiace/Liteace 90-95 4.43 3.97 4.95 0.98Toyota Hiace/Liteace 96-04 3.02 2.62 3.47 0.85

Make Model of Car Years ofManufacture
Seriousinjury rateper 100driversinvolved%
Lower 90%ConfidenceLimit
Upper 90%ConfidenceLimit
Width ofConfidenceInterval
Toyoa Hiace 05-07 3.37 2.03 5.59 3.56Volkswagen Caravelle / Transporter 88-94 2.80 1.50 5.25 3.76Volkswagen Caravelle / Transporter 95-04 1.48 0.88 2.49 1.61
Commercial Vehicles- Utes 3.33 3.25 3.42 0.17
Ford / Nissan Falcon Ute / XFN Ute 82-95 3.84 3.53 4.18 0.66Ford Falcon Ute 96-99 3.03 2.52 3.64 1.12Ford Falcon Ute AU 00-02 2.56 2.12 3.09 0.98Ford Falcon Ute BA/BF 03-07 1.99 1.55 2.56 1.01Ford Ford F-Series 82-92 2.73 1.96 3.81 1.85Holden Commodore Ute VG/VP 90-93 4.29 3.59 5.13 1.54Holden / Isuzu Rodeo / Pickup 82-85 4.51 3.40 5.97 2.57Holden / Isuzu Rodeo / Pickup 86-88 2.45 1.42 4.25 2.83Holden / Isuzu Rodeo / Pickup 89-95 4.15 3.75 4.59 0.83Holden Rodeo 96-98 3.31 2.83 3.88 1.05Holden Rodeo 99-02 3.08 2.63 3.62 0.99Holden WB Series 82-85 5.25 4.40 6.25 1.85Holden Commodore Ute VR/VS 94-00 3.82 3.48 4.19 0.70Holden Commodore VU Ute 00-02 3.17 2.62 3.84 1.22Holden Commodore VY/VZ Ute 02-07 2.42 2.05 2.86 0.81Holden Rodeo 03-07 2.66 2.19 3.23 1.05Mitsubishi Triton MK 96-06 2.09 1.51 2.91 1.40Kia Ceres 92-00 5.77 4.66 7.13 2.47Ford / Mazda Courier / B-Series / Bounty 98-02 3.03 2.50 3.68 1.18Ford / Mazda Courier / Bravo / Bounty 03-06 3.68 2.87 4.71 1.84Nissan 720 Ute 82-85 4.46 3.69 5.39 1.70Nissan Navara 86-91 3.88 3.42 4.41 0.99Nissan Navara 92-96 3.13 2.57 3.80 1.23Nissan Navara 97-05 2.44 1.99 3.00 1.01Nissan Navara 05-07 2.49 1.15 5.40 4.26Subaru Brumby 82-92 6.20 5.38 7.14 1.76Suzuki Mighty Boy 85-88 9.56 7.49 12.18 4.69Toyota 4Runner/Hilux 82-85 4.54 4.11 5.02 0.92Toyota 4Runner/Hilux 86-88 4.39 3.96 4.87 0.92Toyota 4Runner/Hilux 89-97 3.97 3.74 4.20 0.45Toyota Hilux 98-02 2.81 2.50 3.16 0.66Toyota Hilux 03-04 2.42 1.91 3.07 1.17Toyota Hilux 05-07 2.83 2.19 3.67 1.48
Large Cars 3.25 3.20 3.30 0.10
BMW 7 Series E23 82-88 2.88 1.64 5.05 3.41BMW 7 Series E32 89-94 3.29 1.89 5.72 3.82BMW 7 Series E38 95-01 1.37 0.58 3.28 2.71Ford Falcon XE/XF 82-88 4.21 4.05 4.38 0.32Ford Fairlane Z & LTD F 82-87 4.02 3.63 4.45 0.83Ford Falcon EA / Falcon EB Series I 88-Mar 92 3.79 3.63 3.96 0.33Ford Falcon EB Series II / Falcon ED Apr 92-94 3.45 3.24 3.67 0.43Ford Fairlane N & LTD D 88-94 2.99 2.64 3.38 0.74Ford Fairlane N & LTD D 95-98 3.31 2.72 4.02 1.30
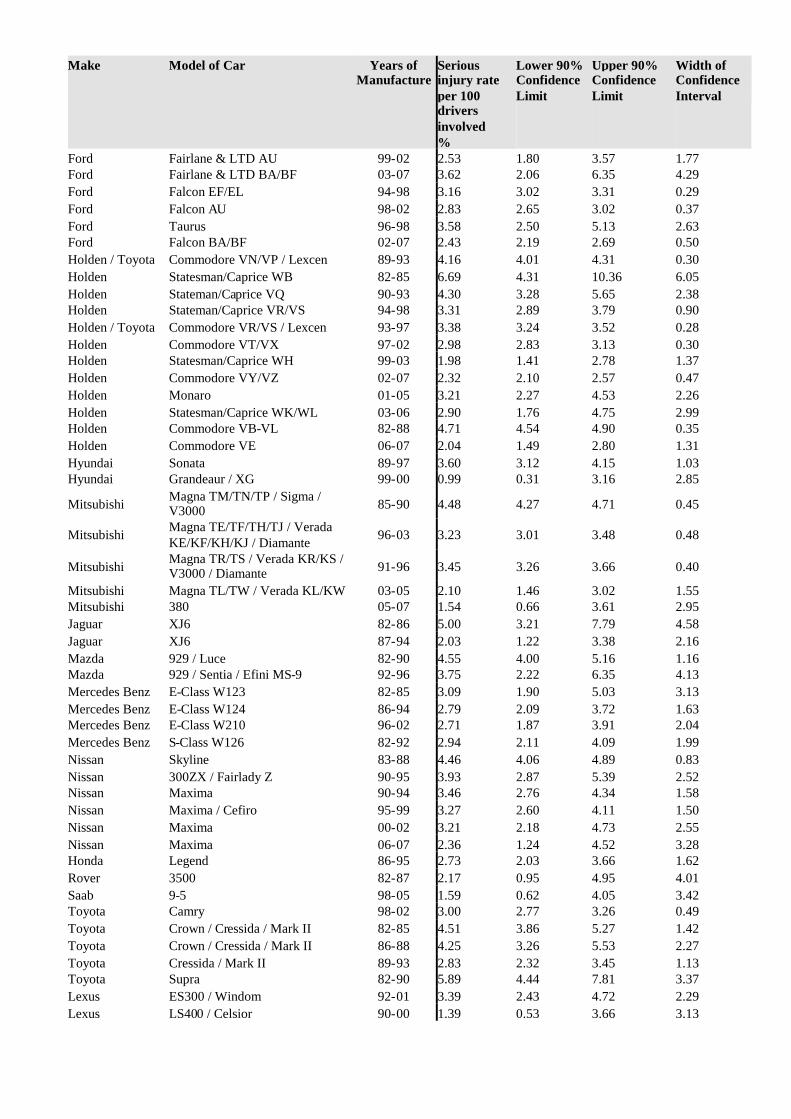
Make Model of Car Years ofManufacture
Seriousinjury rateper 100driversinvolved%
Lower 90%ConfidenceLimit
Upper 90%ConfidenceLimit
Width ofConfidenceInterval
Ford Fairlane & LTD AU 99-02 2.53 1.80 3.57 1.77Ford Fairlane & LTD BA/BF 03-07 3.62 2.06 6.35 4.29Ford Falcon EF/EL 94-98 3.16 3.02 3.31 0.29Ford Falcon AU 98-02 2.83 2.65 3.02 0.37Ford Taurus 96-98 3.58 2.50 5.13 2.63Ford Falcon BA/BF 02-07 2.43 2.19 2.69 0.50Holden / Toyota Commodore VN/VP / Lexcen 89-93 4.16 4.01 4.31 0.30Holden Statesman/Caprice WB 82-85 6.69 4.31 10.36 6.05Holden Stateman/Caprice VQ 90-93 4.30 3.28 5.65 2.38Holden Stateman/Caprice VR/VS 94-98 3.31 2.89 3.79 0.90Holden / Toyota Commodore VR/VS / Lexcen 93-97 3.38 3.24 3.52 0.28Holden Commodore VT/VX 97-02 2.98 2.83 3.13 0.30Holden Statesman/Caprice WH 99-03 1.98 1.41 2.78 1.37Holden Commodore VY/VZ 02-07 2.32 2.10 2.57 0.47Holden Monaro 01-05 3.21 2.27 4.53 2.26Holden Statesman/Caprice WK/WL 03-06 2.90 1.76 4.75 2.99Holden Commodore VB-VL 82-88 4.71 4.54 4.90 0.35Holden Commodore VE 06-07 2.04 1.49 2.80 1.31Hyundai Sonata 89-97 3.60 3.12 4.15 1.03Hyundai Grandeaur / XG 99-00 0.99 0.31 3.16 2.85
Mitsubishi Magna TM/TN/TP / Sigma /V3000 85-90 4.48 4.27 4.71 0.45
Mitsubishi Magna TE/TF/TH/TJ / VeradaKE/KF/KH/KJ / Diamante 96-03 3.23 3.01 3.48 0.48
Mitsubishi Magna TR/TS / Verada KR/KS /V3000 / Diamante 91-96 3.45 3.26 3.66 0.40
Mitsubishi Magna TL/TW / Verada KL/KW 03-05 2.10 1.46 3.02 1.55Mitsubishi 380 05-07 1.54 0.66 3.61 2.95Jaguar XJ6 82-86 5.00 3.21 7.79 4.58Jaguar XJ6 87-94 2.03 1.22 3.38 2.16Mazda 929 / Luce 82-90 4.55 4.00 5.16 1.16Mazda 929 / Sentia / Efini MS-9 92-96 3.75 2.22 6.35 4.13Mercedes Benz E-Class W123 82-85 3.09 1.90 5.03 3.13Mercedes Benz E-Class W124 86-94 2.79 2.09 3.72 1.63Mercedes Benz E-Class W210 96-02 2.71 1.87 3.91 2.04Mercedes Benz S-Class W126 82-92 2.94 2.11 4.09 1.99Nissan Skyline 83-88 4.46 4.06 4.89 0.83Nissan 300ZX / Fairlady Z 90-95 3.93 2.87 5.39 2.52Nissan Maxima 90-94 3.46 2.76 4.34 1.58Nissan Maxima / Cefiro 95-99 3.27 2.60 4.11 1.50Nissan Maxima 00-02 3.21 2.18 4.73 2.55Nissan Maxima 06-07 2.36 1.24 4.52 3.28Honda Legend 86-95 2.73 2.03 3.66 1.62Rover 3500 82-87 2.17 0.95 4.95 4.01Saab 9-5 98-05 1.59 0.62 4.05 3.42Toyota Camry 98-02 3.00 2.77 3.26 0.49Toyota Crown / Cressida / Mark II 82-85 4.51 3.86 5.27 1.42Toyota Crown / Cressida / Mark II 86-88 4.25 3.26 5.53 2.27Toyota Cressida / Mark II 89-93 2.83 2.32 3.45 1.13Toyota Supra 82-90 5.89 4.44 7.81 3.37Lexus ES300 / Windom 92-01 3.39 2.43 4.72 2.29Lexus LS400 / Celsior 90-00 1.39 0.53 3.66 3.13

Make Model of Car Years ofManufacture
Seriousinjury rateper 100driversinvolved%
Lower 90%ConfidenceLimit
Upper 90%ConfidenceLimit
Width ofConfidenceInterval
Toyota Avalon 00-05 2.68 2.19 3.28 1.09Toyota Camry 02-06 2.22 1.89 2.61 0.72Toyota Camry 06-07 1.34 0.52 3.46 2.94Volvo 850/S70/V70/C70 92-05 3.02 2.40 3.81 1.42Volvo 700/900 Series 84-92 2.59 2.05 3.26 1.21Volvo 960/S90/V90 90-98 3.19 1.49 6.86 5.38
Medium Cars 3.52 3.46 3.59 0.13
Alfa Romeo 156 99-06 2.44 1.25 4.76 3.51Audi A4 95-01 2.74 1.95 3.87 1.93Audi A4 01-07 1.83 0.96 3.49 2.53BMW Z3 E36 97-03 3.80 2.22 6.50 4.28BMW 3 Series E90 05-07 1.05 0.20 5.43 5.22BMW 3 Series E30 82-91 3.58 3.11 4.12 1.01BMW 3 Series E36 92-98 3.15 2.75 3.61 0.85BMW 3 Series E46 99-06 2.57 2.06 3.20 1.13BMW 5 Series E28 82-88 3.31 2.43 4.53 2.10BMW 5 Series E34 89-95 3.11 2.31 4.20 1.90BMW 5 Series E39 96-03 2.24 1.56 3.23 1.68Chrysler PT Cruiser 00-07 4.16 2.04 8.49 6.45Daewoo Espero 95-97 5.46 4.28 6.96 2.68Daewoo Leganza 97-02 3.23 2.31 4.50 2.18Ford Mondeo 95-01 2.58 2.14 3.10 0.96Ford Probe 94-98 4.20 2.55 6.92 4.37Ford Cougar 99-03 3.12 1.92 5.07 3.15Holden Calibra 94-97 2.40 1.54 3.74 2.20Holden Camira 82-89 5.37 5.07 5.68 0.62Holden Vectra 97-03 2.80 2.38 3.29 0.90Holden Vectra ZC 03-05 2.20 1.27 3.81 2.54Hyundai Sonata 98-01 4.27 3.22 5.66 2.43Hyundai Sonata EF 02-05 2.09 0.68 6.42 5.74
Mitsubishi Sigma / Galant / Sapporo /Lambda 82-84 4.73 4.42 5.05 0.63
Mitsubishi Starion 82-87 8.72 6.07 12.51 6.43Mitsubishi Galant 95-96 3.94 3.29 4.72 1.43Ford / Mazda Telstar / 626 / MX6 / Capella 83-86 4.41 4.11 4.73 0.62Ford / Mazda Telstar / 626 / MX6 / Capella 88-91 3.75 3.42 4.10 0.68
Ford / Mazda Telstar / 626 / MX6 / Capella /Cronos 92-97 3.40 3.08 3.76 0.69
Mazda 626 98-02 2.96 2.41 3.62 1.21Mazda RX7 82-85 5.28 4.01 6.95 2.93Mazda RX7 86-91 4.25 3.01 6.00 2.99Mazda Eunos 500 93-99 3.97 2.44 6.44 4.00Mazda Eunos 800 94-00 2.66 1.03 6.85 5.81Mazda 6 02-07 1.86 1.34 2.60 1.26Mercedes Benz C-Class W201 87-93 3.39 2.50 4.58 2.07Mercedes Benz C-Class W202 95-00 2.42 1.82 3.24 1.42Mercedes Benz CLK C208 97-03 3.08 1.57 6.02 4.44Mercedes Benz SLK R170 97-04 1.70 0.54 5.32 4.78Mercedes Benz C-Class W203 00-07 2.88 1.88 4.43 2.56Nissan Pintara 86-88 4.36 3.93 4.84 0.92

Make Model of Car Years ofManufacture
Seriousinjury rateper 100driversinvolved%
Lower 90%ConfidenceLimit
Upper 90%ConfidenceLimit
Width ofConfidenceInterval
Nissan / Ford Pintara / Corsair / Bluebird 89-92 4.67 4.33 5.03 0.70Nissan Bluebird 82-86 5.31 4.98 5.66 0.67Nissan 280ZX 82-84 5.17 2.79 9.59 6.81Nissan Bluebird 93-97 3.20 2.71 3.77 1.06Nissan 200SX / Silvia 94-02 3.08 2.40 3.96 1.55Nissan 350Z 03-07 4.43 2.27 8.64 6.37Honda Accord Euro 03-07 2.02 1.36 3.00 1.64Honda Accord 03-07 2.69 1.69 4.27 2.58Honda Accord 82-85 5.20 4.62 5.84 1.22Honda Accord 86-90 3.45 3.01 3.96 0.95Honda Accord 91-93 3.40 2.81 4.11 1.30Honda Accord 94-98 3.49 3.01 4.04 1.03Honda Accord 99-02 1.91 1.25 2.91 1.65Honda Prelude 82-82 3.51 1.83 6.73 4.90Honda Prelude 83-91 4.39 3.96 4.88 0.92Honda Prelude 92-96 4.17 3.45 5.05 1.60Honda Prelude 97-02 2.56 1.72 3.82 2.09Peugeot 405 89-97 3.05 2.25 4.13 1.88Peugeot 505 82-93 2.65 1.90 3.69 1.80Peugeot 406 96-04 1.34 0.68 2.65 1.97Porsche 944 82-91 5.21 2.57 10.57 8.00Renault Feugo 82-87 3.85 2.49 5.95 3.46Saab 900 Series 82-92 3.62 2.80 4.68 1.89Saab 900/9-3 94-02 2.26 1.63 3.13 1.49Saab 9000 86-97 1.76 1.18 2.62 1.44
Subaru 1800 / Leone / Omega / 4WDWagon 82-93 4.73 4.34 5.15 0.81
Subaru Liberty / Legacy 89-93 3.68 3.33 4.06 0.73Subaru Liberty / Legacy / Outback 94-98 3.12 2.69 3.62 0.92Subaru Liberty / Legacy / Outback 99-03 2.45 2.00 2.99 0.99Subaru Liberty / Legacy / Outback 03-07 2.50 1.72 3.62 1.90Toyota Corona 82-88 4.84 4.56 5.13 0.57Toyota Camry 83-86 4.69 4.12 5.33 1.21Holden / Toyota Apollo JK/JL / Camry / Vista 88-92 3.85 3.66 4.05 0.39Holden / Toyota Apollo JM/JP / Camry / Sceptor 93-97 3.95 3.74 4.18 0.44Toyota Celica 81-85 4.16 3.57 4.85 1.28Toyota Celica 86-89 4.27 3.61 5.05 1.44Toyota Celica 90-93 4.14 3.53 4.87 1.34Toyota Celica 94-99 3.48 2.76 4.38 1.63Toyota Celica 00-05 3.67 2.37 5.69 3.32Lexus IS200 / IS300 99-04 1.79 0.86 3.72 2.86Volvo 200 Series 82-93 3.31 2.80 3.92 1.13Volkswagen Passat 98-06 1.80 0.96 3.36 2.40
People Movers 3.84 3.67 4.03 0.36
Chrysler Voyager 97-01 2.19 1.25 3.83 2.59Holden Zafira TT 01-05 3.39 1.87 6.16 4.29Mitsubishi Nimbus / Chariot / Spacewagon 85-91 4.47 3.41 5.86 2.45Mitsubishi Nimbus / Chariot 92-98 3.89 2.98 5.09 2.12Mitsubishi Nimbus 99-03 2.28 1.12 4.63 3.51
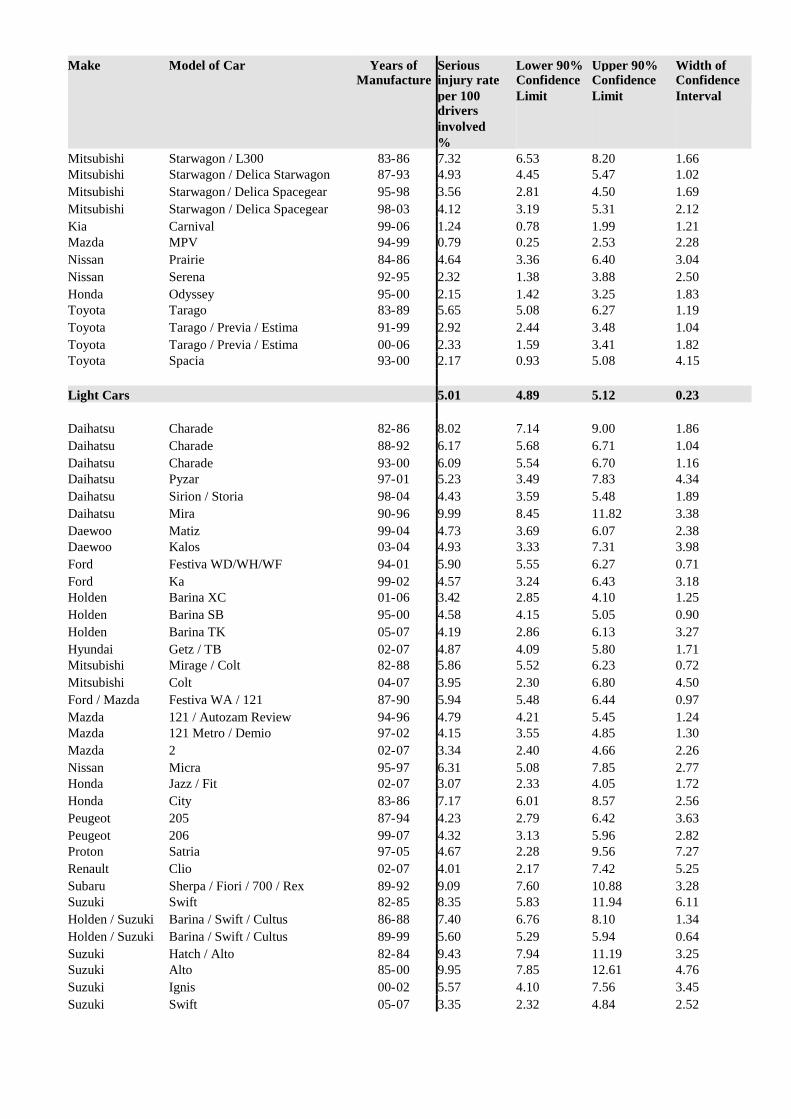
Make Model of Car Years ofManufacture
Seriousinjury rateper 100driversinvolved%
Lower 90%ConfidenceLimit
Upper 90%ConfidenceLimit
Width ofConfidenceInterval
Mitsubishi Starwagon / L300 83-86 7.32 6.53 8.20 1.66Mitsubishi Starwagon / Delica Starwagon 87-93 4.93 4.45 5.47 1.02Mitsubishi Starwagon / Delica Spacegear 95-98 3.56 2.81 4.50 1.69Mitsubishi Starwagon / Delica Spacegear 98-03 4.12 3.19 5.31 2.12Kia Carnival 99-06 1.24 0.78 1.99 1.21Mazda MPV 94-99 0.79 0.25 2.53 2.28Nissan Prairie 84-86 4.64 3.36 6.40 3.04Nissan Serena 92-95 2.32 1.38 3.88 2.50Honda Odyssey 95-00 2.15 1.42 3.25 1.83Toyota Tarago 83-89 5.65 5.08 6.27 1.19Toyota Tarago / Previa / Estima 91-99 2.92 2.44 3.48 1.04Toyota Tarago / Previa / Estima 00-06 2.33 1.59 3.41 1.82Toyota Spacia 93-00 2.17 0.93 5.08 4.15
Light Cars 5.01 4.89 5.12 0.23
Daihatsu Charade 82-86 8.02 7.14 9.00 1.86Daihatsu Charade 88-92 6.17 5.68 6.71 1.04Daihatsu Charade 93-00 6.09 5.54 6.70 1.16Daihatsu Pyzar 97-01 5.23 3.49 7.83 4.34Daihatsu Sirion / Storia 98-04 4.43 3.59 5.48 1.89Daihatsu Mira 90-96 9.99 8.45 11.82 3.38Daewoo Matiz 99-04 4.73 3.69 6.07 2.38Daewoo Kalos 03-04 4.93 3.33 7.31 3.98Ford Festiva WD/WH/WF 94-01 5.90 5.55 6.27 0.71Ford Ka 99-02 4.57 3.24 6.43 3.18Holden Barina XC 01-06 3.42 2.85 4.10 1.25Holden Barina SB 95-00 4.58 4.15 5.05 0.90Holden Barina TK 05-07 4.19 2.86 6.13 3.27Hyundai Getz / TB 02-07 4.87 4.09 5.80 1.71Mitsubishi Mirage / Colt 82-88 5.86 5.52 6.23 0.72Mitsubishi Colt 04-07 3.95 2.30 6.80 4.50Ford / Mazda Festiva WA / 121 87-90 5.94 5.48 6.44 0.97Mazda 121 / Autozam Review 94-96 4.79 4.21 5.45 1.24Mazda 121 Metro / Demio 97-02 4.15 3.55 4.85 1.30Mazda 2 02-07 3.34 2.40 4.66 2.26Nissan Micra 95-97 6.31 5.08 7.85 2.77Honda Jazz / Fit 02-07 3.07 2.33 4.05 1.72Honda City 83-86 7.17 6.01 8.57 2.56Peugeot 205 87-94 4.23 2.79 6.42 3.63Peugeot 206 99-07 4.32 3.13 5.96 2.82Proton Satria 97-05 4.67 2.28 9.56 7.27Renault Clio 02-07 4.01 2.17 7.42 5.25Subaru Sherpa / Fiori / 700 / Rex 89-92 9.09 7.60 10.88 3.28Suzuki Swift 82-85 8.35 5.83 11.94 6.11Holden / Suzuki Barina / Swift / Cultus 86-88 7.40 6.76 8.10 1.34Holden / Suzuki Barina / Swift / Cultus 89-99 5.60 5.29 5.94 0.64Suzuki Hatch / Alto 82-84 9.43 7.94 11.19 3.25Suzuki Alto 85-00 9.95 7.85 12.61 4.76Suzuki Ignis 00-02 5.57 4.10 7.56 3.45Suzuki Swift 05-07 3.35 2.32 4.84 2.52

Make Model of Car Years ofManufacture
Seriousinjury rateper 100driversinvolved%
Lower 90%ConfidenceLimit
Upper 90%ConfidenceLimit
Width ofConfidenceInterval
Toyota Starlet 96-99 4.91 4.39 5.50 1.10Toyota Echo 99-05 4.39 3.95 4.88 0.94Toyota Yaris 05-07 3.11 2.27 4.26 1.99Volkswagen Polo 96-00 2.82 1.75 4.55 2.80Volkswagen Polo 02-07 2.52 1.13 5.62 4.49
Small Cars 4.07 4.01 4.14 0.14
Alfa Romeo 33 83-92 4.57 3.39 6.16 2.77Alfa Romeo 75 86-92 3.33 1.54 7.21 5.68Alfa Romeo GTV 82-84 7.52 4.49 12.59 8.10Alfa Romeo Sprint 82-88 4.62 2.38 8.98 6.60Alfa Romeo Alfasud 82-84 6.37 3.35 12.12 8.77Audi A3/S3 97-04 1.90 0.93 3.89 2.96Mini Mini Cooper 02-07 2.17 1.09 4.33 3.24Chrysler Neon 96-99 3.37 2.23 5.11 2.88Chrysler Neon 00-02 3.39 1.50 7.66 6.16Daihatsu Applause 89-99 4.59 3.98 5.30 1.32Daewoo 1.5i 94-95 6.06 3.57 10.29 6.72Daewoo Cielo 95-97 4.54 4.02 5.13 1.11Daewoo Nubira 97-03 3.66 3.12 4.29 1.17Daewoo Lanos 97-03 4.72 4.24 5.27 1.03Daewoo Lacetti 03-04 5.07 2.70 9.49 6.78Ford Laser 91-94 4.45 4.18 4.74 0.56Ford Laser 95-97 4.46 3.99 5.00 1.01Ford Capri 89-94 5.51 4.61 6.59 1.98Ford Focus LR 02-05 2.97 2.31 3.83 1.52Ford Focus LS / LT 05-07 1.52 0.91 2.54 1.63Fiat Regata 84-88 4.62 2.66 8.02 5.36Holden Gemini 82-84 5.38 4.93 5.88 0.94Holden Gemini RB 86-87 5.65 4.63 6.89 2.26Holden Astra TR 96-98 3.06 2.39 3.93 1.54Holden Astra TS 98-06 2.99 2.69 3.33 0.63Holden Astra AH 04-07 3.01 2.13 4.26 2.13Holden Viva JF 05-07 2.79 1.69 4.63 2.94Hyundai Excel 86-90 6.24 5.61 6.95 1.34Hyundai Excel 90-94 5.67 5.28 6.09 0.81Hyundai Excel / Accent 95-00 4.89 4.64 5.15 0.51Hyundai Elantra 00-07 3.32 2.66 4.13 1.47Hyundai S Coupe 90-96 5.34 4.36 6.54 2.18Hyundai Lantra 91-95 5.06 4.33 5.92 1.59Hyundai Lantra 96-00 4.02 3.54 4.57 1.03Hyundai Coupe 96-00 4.34 3.34 5.65 2.31Hyundai Accent 00-06 4.43 3.92 5.01 1.09Mitsubishi Lancer / Mirage CA 89-90 4.20 3.80 4.64 0.84Mitsubishi Lancer / Mirage CB 91-92 5.38 4.41 6.56 2.15Mitsubishi Lancer / Mirage CC 93-95 4.31 3.94 4.72 0.78Mitsubishi Lancer / Mirage CE 96-03 4.28 4.00 4.57 0.57Mitsubishi Cordia 83-87 5.88 5.11 6.78 1.67Mitsubishi Lancer CH / CJ 03-07 4.32 3.46 5.39 1.93Kia Rio 00-05 4.68 3.96 5.52 1.56

Make Model of Car Years ofManufacture
Seriousinjury rateper 100driversinvolved%
Lower 90%ConfidenceLimit
Upper 90%ConfidenceLimit
Width ofConfidenceInterval
Kia Spectra 01-04 3.33 1.95 5.68 3.73Kia Cerato 04-07 3.03 1.77 5.19 3.42Kia Rio JB 05-07 2.74 1.47 5.09 3.61Ford / Mazda Laser / 323 / Familia 82-88 5.63 5.43 5.83 0.40Mazda 323 / Familia / Lantis 90-93 4.04 3.65 4.46 0.82Mazda 323 / Familia / Lantis 95-98 4.14 3.68 4.66 0.98Ford / Mazda Laser / 323 99-03 3.25 2.88 3.67 0.79Mazda MX5 / Eunos Roadster 89-97 4.52 3.14 6.51 3.37Mazda MX5 / Eunos Roadster 98-05 2.40 1.37 4.19 2.82
Mazda Eunos 30X / Presso / MX-3 /Autozam AZ-3 90-97 3.28 2.16 4.98 2.82
Mazda 3 / Axela 03-07 2.37 1.90 2.96 1.06Mercedes Benz A-Class W168 98-04 3.40 1.80 6.42 4.62Holden / Nissan Astra / Pulsar / Langley 84-86 5.97 5.59 6.38 0.79Holden / Nissan Astra / Pulsar / Vector / Sentra 88-90 4.96 4.65 5.28 0.63Nissan Pulsar / Vector / Sentra 92-95 3.77 3.44 4.14 0.70Nissan Pulsar / Vector / Sentra 96-99 4.23 3.88 4.61 0.73Nissan Stanza 82-83 4.31 3.02 6.16 3.14Nissan Gazelle / Silvia 84-86 5.86 4.77 7.19 2.42Nissan Exa 83-86 7.68 5.88 10.05 4.17Nissan Exa 87-91 5.54 3.68 8.34 4.66Nissan NX/NX-R 91-96 6.10 4.84 7.67 2.83Nissan Pulsar 00-05 3.75 3.36 4.19 0.83Honda Civic 82-83 5.50 4.60 6.58 1.98Honda Civic / Ballade / Shuttle 84-87 5.89 5.30 6.53 1.23Honda Civic / Shuttle 88-91 4.73 4.30 5.20 0.91Honda Civic 92-95 3.98 3.57 4.44 0.87Honda Civic 96-00 3.60 3.16 4.10 0.94Honda CRX 87-91 6.71 5.38 8.38 3.00Honda CRX 92-98 4.58 3.03 6.92 3.89Honda Civic 01-05 3.08 2.41 3.93 1.52Honda Integra 86-88 5.00 4.08 6.14 2.06Honda Integra 90-92 4.02 3.16 5.11 1.95Honda Integra 93-01 3.53 2.78 4.49 1.70Honda Integra 02-06 3.51 1.90 6.48 4.59Honda Concerto 89-93 4.06 3.15 5.25 2.10Peugeot 306 94-01 2.42 1.84 3.18 1.34Peugeot 307 01-07 2.12 1.29 3.48 2.19Proton Wira 95-96 4.88 4.00 5.97 1.97Renault 19 91-96 3.66 2.15 6.25 4.10Renault Scenic 01-04 0.87 0.17 4.38 4.21Rover Quintet 82-86 5.07 3.41 7.55 4.14MG MGF / MG TF 99-05 2.31 1.17 4.55 3.38Subaru Impreza 93-00 4.56 4.09 5.09 1.00Subaru Impreza 01-07 2.42 1.87 3.13 1.26Suzuki Baleno / Cultus Crescent 95-02 4.03 3.28 4.96 1.68Suzuki Liana 01-07 2.65 1.59 4.41 2.83Toyota Corolla 82-84 5.38 5.03 5.76 0.73Toyota Corolla 86-88 5.01 4.73 5.30 0.57Toyota / Holden Corolla / Nova 89-93 4.42 4.21 4.64 0.43Toyota / Holden Corolla / Nova 94-97 4.08 3.83 4.34 0.51

Make Model of Car Years ofManufacture
Seriousinjury rateper 100driversinvolved%
Lower 90%ConfidenceLimit
Upper 90%ConfidenceLimit
Width ofConfidenceInterval
Toyota Corolla / Allex 98-01 2.99 2.66 3.37 0.71Toyota Corolla 02-07 3.24 2.93 3.59 0.67Toyota Tercel 83-88 5.19 3.87 6.94 3.07Toyota MR2 87-90 6.92 5.14 9.31 4.17Toyota MR2 91-00 3.53 2.24 5.55 3.31Toyota Paseo / Cynos 91-99 4.01 3.28 4.91 1.64Toyota Corolla 4WD Wagon 92-96 3.49 2.26 5.39 3.13Volvo 300 Series 84-88 4.92 3.02 8.02 5.00Volvo S40/V40 97-04 2.68 1.80 3.99 2.19Volkswagen Golf 82-94 6.37 4.25 9.54 5.29Volkswagen Golf 95-98 2.80 1.97 3.97 1.99Volkswagen Golf / Bora 99-04 2.26 1.72 2.97 1.26Volkswagen New Beetle 00-07 1.44 0.63 3.27 2.63Volkswagen Golf / Jetta 04-07 0.91 0.47 1.76 1.28

APPENDIX 5
AGGRESSIVITY INJURY RISKAGGRESSIVITY INJURY SEVERITY ANDRATINGS OF VEHICLE AGGRESSIVITY
(with 95% and 90% CONFIDENCE LIMITS),TOWARDS OTHER VEHICLE DRIVERSAND UNPROTECTED ROAD USERS


AGGRESSIVITY INJURY RISK RATINGS
New South Wales Data (1987-2007), South Australia Data (1995-2007),Queensland and Western Australia Data (1991-2007)
Make Model of Car Years ofManufacture
Pr(Risk)%
Lower 95%ConfidenceLimit
Upper 95%ConfidenceLimit
Width ofConfidenceInterval
ALL VEHICLE AVERAGE 15.16
Compact Four Wheel Drive Vehicles 13.93 13.41 14.46 1.05
Daihatsu Feroza / Rocky 89-97 18.60 15.55 22.09 6.54Daihatsu Rocky / Rugger 85-98 16.68 12.44 22.00 9.55Daihatsu Terios 97-05 15.24 11.78 19.48 7.70Holden Cruze 02-06 12.87 9.29 17.56 8.27Mitsubishi Outlander 03-06 15.65 10.24 23.18 12.94Kia Sportage 98-03 18.30 14.69 22.57 7.88Ford / Mazda Escape / Tribute 01-06 15.52 12.52 19.08 6.56Nissan X-Trail 01-07 13.64 11.08 16.69 5.62Lada Niva 84-99 16.96 12.84 22.07 9.23Honda CR-V 97-01 14.60 12.64 16.80 4.16Honda CR-V 02-07 14.40 11.88 17.34 5.46Honda HR-V 99-02 15.26 11.34 20.22 8.89Subaru Forester 97-02 13.03 10.77 15.70 4.93Subaru Forester 02-07 14.53 11.49 18.19 6.70Suzuki Vitara / Escudo 88-98 15.80 14.22 17.52 3.30Suzuki Grand Vitara 99-05 13.53 10.04 17.99 7.95
Holden / Suzuki Drover / Sierra / Samurai / SJ410/ SJ413 82-99 15.12 13.64 16.74 3.10
Suzuki Jimny 98-07 17.35 11.89 24.62 12.73Toyota RAV4 94-00 15.86 14.09 17.81 3.73Toyota RAV4 01-06 16.17 13.91 18.71 4.80
Medium Wheel Drive Vehicles 17.37 16.71 18.06 1.35
Daewoo /Ssangong Musso 98-02 13.55 8.88 20.13 11.25
Ford Territory SX/SY 04-07 17.32 13.46 22.01 8.55Holden / Isuzu Jackaroo / Bighorn 82-91 20.65 17.37 24.36 6.99Holden / Isuzu Jackaroo / Bighorn 92-97 18.28 15.07 22.00 6.93Holden / Isuzu Jackaroo / Bighorn 98-02 21.14 17.41 25.42 8.02Holden Frontera / Mu 95-03 17.19 12.59 23.03 10.43Hyundai Santa Fe 00-06 19.94 14.47 26.84 12.37Mitsubishi Pajero 82-90 19.61 17.36 22.09 4.73Mitsubishi Pajero 92-99 18.95 17.34 20.68 3.34Mitsubishi Pajero NM / NP / NS 00-07 17.39 14.38 20.88 6.50Mitsubishi Challenger 98-06 19.42 14.94 24.86 9.92Jeep Cherokee XJ 96-00 19.14 16.59 21.99 5.40Jeep Wrangler 96-04 22.09 16.79 28.49 11.70Jeep Cherokee KJ 01-07 14.54 9.32 21.98 12.66Land Rover Defender 92-07 19.29 14.26 25.57 11.31Nissan Pathfinder / Terrano 88-94 22.43 18.28 27.21 8.93Nissan Pathfinder / Terrano / Regulus 95-05 16.53 13.27 20.40 7.13

Make Model of Car Years ofManufacture
Pr(Risk)%
Lower 95%ConfidenceLimit
Upper 95%ConfidenceLimit
Width ofConfidenceInterval
Toyota Kluger 03-07 18.71 13.88 24.73 10.85Toyota Landcruiser Prado 96-03 20.80 17.42 24.64 7.22Toyota Landcruiser Prado 03-07 19.07 16.00 22.57 6.57
Large Four Wheel Drive Vehicles 18.83 18.38 19.30 0.92
BMW X5 01-07 11.99 7.58 18.46 10.88Ford Bronco 82-87 25.33 17.75 34.77 17.02Ford Explorer 00-01 19.15 14.35 25.09 10.74Jeep Grand Cherokee ZG 96-99 18.00 13.06 24.27 11.21Jeep Grand Cherokee WJ/WG 99-05 16.27 11.45 22.59 11.13Land Rover Discovery 91-02 17.64 14.74 20.96 6.22Mercedes Benz M-Class W163 98-05 25.08 18.90 32.46 13.56Nissan Patrol / Safari 82-87 21.94 19.26 24.89 5.63Nissan / Ford Patrol / Maverick / Safari 88-97 19.81 18.68 21.00 2.32Nissan Patrol / Safari 98-07 20.65 18.90 22.52 3.63Land Rover Range Rover 82-94 22.04 18.48 26.07 7.59Land Rover Range Rover 95-02 14.42 8.70 22.97 14.28Toyota Landcruiser 82-89 21.78 20.57 23.05 2.48Toyota Landcruiser 90-97 21.54 20.55 22.56 2.01Toyota Landcruiser 98-07 19.31 17.87 20.83 2.96
Commercial Vehicles- Vans 18.34 17.77 18.92 1.14
Daihatsu Handivan 82-90 8.05 5.72 11.22 5.50Ford Falcon Panel Van 82-95 16.47 14.90 18.18 3.28Ford Falcon Panel Van 96-99 16.74 12.99 21.30 8.31Ford Transit 95-00 20.95 17.96 24.29 6.33Ford Transit 01-07 17.22 13.16 22.20 9.03Holden Shuttle / WFR Van 82-87 20.36 15.80 25.83 10.03Kia Pregio 02-06 21.27 16.89 26.42 9.53Mercedes Benz MB100 / MB140 99-04 20.02 15.06 26.10 11.05Mercedes Benz Vito / Viano 99-07 23.44 18.56 29.14 10.58Mercedes Benz Sprinter 98-04 23.29 18.50 28.88 10.38Honda Acty 83-86 12.33 7.66 19.26 11.60Holden / Suzuki Scurry / Carry 82-00 12.26 8.31 17.72 9.41Toyota Hiace/Liteace 82-86 20.65 18.81 22.62 3.81Toyota Hiace/Liteace 87-89 21.12 18.76 23.70 4.94Toyota Hiace/Liteace 90-95 23.12 21.55 24.76 3.22Toyota Hiace/Liteace 96-04 21.15 19.62 22.76 3.14Toyoa Hiace 05-07 17.66 12.72 23.98 11.27Volkswagen Caravelle / Transporter 88-94 20.66 15.12 27.57 12.44Volkswagen Caravelle / Transporter 95-04 23.48 19.86 27.53 7.68
Commercial Vehicles- Utes 16.58 16.28 16.89 0.61
Ford / Nissan Falcon Ute / XFN Ute 82-95 18.85 17.78 19.96 2.18Ford Falcon Ute 96-99 19.67 17.61 21.91 4.29Ford Falcon Ute AU 00-02 20.18 18.08 22.46 4.38Ford Falcon Ute BA/BF 03-07 18.47 15.96 21.29 5.33Ford Ford F-Series 82-92 22.47 19.40 25.86 6.46Ford F-Series 01-06 19.09 12.90 27.34 14.44Holden Commodore Ute VG/VP 90-93 15.54 13.24 18.15 4.90Holden / Isuzu Rodeo / Pickup 82-85 16.79 13.18 21.15 7.97

Make Model of Car Years ofManufacture
Pr(Risk)%
Lower 95%ConfidenceLimit
Upper 95%ConfidenceLimit
Width ofConfidenceInterval
Holden / Isuzu Rodeo / Pickup 86-88 18.29 13.98 23.55 9.56Holden / Isuzu Rodeo / Pickup 89-95 18.70 17.49 19.97 2.48Holden Rodeo 96-98 18.48 16.69 20.40 3.71Holden Rodeo 99-02 19.26 17.37 21.30 3.93Holden WB Series 82-85 18.42 16.11 20.99 4.89Holden Commodore Ute VR/VS 94-00 17.35 16.21 18.55 2.34Holden Commodore VU Ute 00-02 15.67 13.49 18.13 4.65Holden Commodore VY/VZ Ute 02-07 16.16 14.39 18.09 3.69Holden Rodeo 03-07 18.51 16.53 20.66 4.13Mitsubishi Triton MK 96-06 17.78 15.16 20.75 5.59Kia Ceres 92-00 13.38 10.89 16.32 5.43Ford / Mazda Courier / B-Series / Bounty 98-02 16.86 14.72 19.23 4.51Ford / Mazda Courier / Bravo / Bounty 03-06 16.53 13.65 19.88 6.23Nissan 720 Ute 82-85 18.10 15.50 21.03 5.53Nissan Navara 86-91 18.03 16.40 19.79 3.39Nissan Navara 92-96 20.48 18.19 22.98 4.79Nissan Navara 97-05 17.88 15.83 20.13 4.31Subaru Brumby 82-92 14.64 12.14 17.55 5.41Suzuki Mighty Boy 85-88 10.21 6.65 15.38 8.73Toyota 4Runner/Hilux 82-85 19.11 17.52 20.81 3.29Toyota 4Runner/Hilux 86-88 18.61 16.92 20.43 3.51Toyota 4Runner/Hilux 89-97 18.46 17.67 19.28 1.61Toyota Hilux 98-02 18.55 17.23 19.94 2.71Toyota Hilux 03-04 18.52 16.03 21.31 5.29Toyota Hilux 05-07 17.68 14.83 20.95 6.12
Large Cars 14.89 14.72 15.07 0.35
BMW 7 Series E23 82-88 17.15 11.30 25.17 13.87BMW 7 Series E32 89-94 17.68 11.61 25.99 14.38BMW 7 Series E38 95-01 23.25 16.06 32.42 16.36Ford Falcon XE/XF 82-88 17.06 16.55 17.59 1.04Ford Fairlane Z & LTD F 82-87 16.45 15.17 17.81 2.65Ford Falcon EA / Falcon EB Series I 88-Mar 92 16.75 16.24 17.28 1.04Ford Falcon EB Series II / Falcon ED Apr 92-94 17.26 16.53 18.02 1.49Ford Fairlane N & LTD D 88-94 15.12 13.74 16.62 2.88Ford Fairlane N & LTD D 95-98 17.64 15.38 20.15 4.77Ford Fairlane & LTD AU 99-02 14.22 11.62 17.29 5.67Ford Fairlane & LTD BA/BF 03-07 11.94 7.64 18.18 10.54Ford Falcon EF/EL 94-98 17.22 16.70 17.75 1.04Ford Falcon AU 98-02 17.32 16.63 18.03 1.40Ford Taurus 96-98 18.72 14.45 23.90 9.45Ford Falcon BA/BF 02-07 16.46 15.42 17.55 2.12Holden / Toyota Commodore VN/VP / Lexcen 89-93 15.37 14.93 15.83 0.90Holden Statesman/Caprice WB 82-85 20.05 13.25 29.17 15.93Holden Stateman/Caprice VQ 90-93 14.96 11.46 19.31 7.86Holden Stateman/Caprice VR/VS 94-98 14.93 13.47 16.52 3.05Holden / Toyota Commodore VR/VS / Lexcen 93-97 15.22 14.77 15.68 0.92Holden Commodore VT/VX 97-02 17.33 16.78 17.90 1.11Holden Statesman/Caprice WH 99-03 17.01 14.29 20.13 5.84Holden Commodore VY/VZ 02-07 16.66 15.67 17.71 2.04Holden Monaro 01-05 18.26 14.49 22.74 8.25Holden Statesman/Caprice WK/WL 03-06 16.27 11.96 21.76 9.80Holden Commodore VB-VL 82-88 16.36 15.85 16.89 1.04

Make Model of Car Years ofManufacture
Pr(Risk)%
Lower 95%ConfidenceLimit
Upper 95%ConfidenceLimit
Width ofConfidenceInterval
Holden Commodore VE 06-07 15.97 13.04 19.41 6.37Hyundai Sonata 89-97 15.11 13.63 16.71 3.07Hyundai Grandeaur / XG 99-00 21.58 15.95 28.52 12.58
Mitsubishi Magna TM/TN/TP / Sigma /V3000 85-90 15.72 15.10 16.36 1.27
Mitsubishi Magna TE/TF/TH/TJ / VeradaKE/KF/KH/KJ / Diamante 96-03 16.38 15.65 17.13 1.48
Mitsubishi Magna TR/TS / Verada KR/KS /V3000 / Diamante 91-96 16.74 16.12 17.37 1.26
Mitsubishi Magna TL/TW / Verada KL/KW 03-05 15.27 12.70 18.26 5.56Mitsubishi 380 05-07 15.40 10.26 22.49 12.23Jaguar XJ6 82-86 19.42 13.81 26.60 12.79Jaguar XJ6 87-94 21.66 16.84 27.40 10.56Mazda 929 / Luce 82-90 16.93 15.14 18.89 3.76Mazda 929 / Sentia / Efini MS-9 92-96 14.51 9.49 21.54 12.04Mercedes Benz E-Class W123 82-85 16.18 12.26 21.04 8.78Mercedes Benz E-Class W124 86-94 13.24 10.91 15.99 5.08Mercedes Benz E-Class W210 96-02 17.10 13.64 21.22 7.58Mercedes Benz S-Class W126 82-92 14.90 12.06 18.27 6.21Mercedes Benz S-Class C140 93-98 15.24 9.75 23.03 13.28Mercedes Benz E-Class W211 02-07 17.21 11.13 25.64 14.51Nissan Skyline 83-88 17.35 15.93 18.87 2.94Nissan 300ZX / Fairlady Z 90-95 19.45 14.93 24.93 9.99Nissan Maxima 90-94 15.33 12.32 18.90 6.58Nissan Maxima / Cefiro 95-99 16.13 13.50 19.16 5.66Nissan Maxima 00-02 16.23 11.73 22.01 10.28Honda Legend 86-95 19.58 16.10 23.60 7.50Saab 9-5 98-05 12.04 7.63 18.49 10.86Toyota Camry 98-02 16.43 15.66 17.23 1.57Toyota Crown / Cressida / Mark II 82-85 16.76 14.52 19.27 4.75Toyota Crown / Cressida / Mark II 86-88 13.52 10.62 17.05 6.43Toyota Cressida / Mark II 89-93 13.67 11.81 15.78 3.98Toyota Supra 82-90 23.89 18.85 29.79 10.93Lexus ES300 / Windom 92-01 19.52 15.33 24.53 9.20Lexus LS400 / Celsior 90-00 14.78 9.49 22.31 12.82Toyota Avalon 00-05 17.90 15.91 20.08 4.17Toyota Camry 02-06 15.24 13.89 16.70 2.81Toyota Camry 06-07 11.06 7.21 16.59 9.38Volvo 850/S70/V70/C70 92-05 17.86 15.56 20.41 4.86Volvo 700/900 Series 84-92 16.30 14.15 18.72 4.57
Medium Cars 13.65 13.45 13.86 0.41
Alfa Romeo 156 99-06 9.03 5.80 13.79 7.99Audi A4 95-01 14.37 11.17 18.30 7.13Audi A4 01-07 12.99 9.50 17.52 8.02BMW Z3 E36 97-03 15.56 9.66 24.11 14.45BMW 3 Series E30 82-91 13.51 11.93 15.27 3.34BMW 3 Series E36 92-98 12.57 11.34 13.92 2.58BMW 3 Series E46 99-06 13.51 11.71 15.53 3.81BMW 5 Series E28 82-88 16.94 13.61 20.87 7.26BMW 5 Series E34 89-95 14.27 11.20 18.02 6.82BMW 5 Series E39 96-03 15.28 12.13 19.07 6.93Daewoo Espero 95-97 15.73 12.81 19.18 6.37

Make Model of Car Years ofManufacture
Pr(Risk)%
Lower 95%ConfidenceLimit
Upper 95%ConfidenceLimit
Width ofConfidenceInterval
Daewoo Leganza 97-02 16.97 13.67 20.86 7.19Ford Cortina 82-82 16.18 14.52 17.99 3.46Ford Mondeo 95-01 14.92 13.07 16.99 3.92Ford Probe 94-98 15.14 10.03 22.21 12.18Ford Cougar 99-03 9.45 6.04 14.48 8.43Holden Calibra 94-97 17.37 13.02 22.80 9.77Holden Camira 82-89 16.44 15.58 17.35 1.77Holden Vectra 97-03 14.61 13.06 16.30 3.24Holden Vectra ZC 03-05 18.98 13.29 26.37 13.08Hyundai Sonata 98-01 15.33 12.59 18.55 5.96Hyundai Sonata EF 02-05 15.13 10.13 22.00 11.87
Mitsubishi Sigma / Galant / Sapporo /Lambda 82-84 14.95 14.12 15.81 1.68
Mitsubishi Galant 95-96 14.46 12.24 17.01 4.77Ford / Mazda Telstar / 626 / MX6 / Capella 83-86 14.74 13.73 15.82 2.08Ford / Mazda Telstar / 626 / MX6 / Capella 88-91 14.21 13.04 15.46 2.42
Ford / Mazda Telstar / 626 / MX6 / Capella /Cronos 92-97 12.96 11.86 14.16 2.30
Mazda 626 98-02 12.98 11.11 15.11 4.00Mazda RX7 82-85 12.88 9.02 18.04 9.02Mazda RX7 86-91 16.41 11.43 23.00 11.57Mazda Eunos 500 93-99 14.05 9.66 20.00 10.35Mazda 6 02-07 12.47 9.80 15.75 5.95Mercedes Benz C-Class W201 87-93 13.62 10.71 17.17 6.46Mercedes Benz C-Class W202 95-00 10.28 8.31 12.65 4.35Mercedes Benz CLK C208 97-03 14.25 8.82 22.22 13.41Mercedes Benz C-Class W203 00-07 13.06 10.02 16.85 6.83Nissan Pintara 86-88 15.22 13.95 16.58 2.63Nissan / Ford Pintara / Corsair / Bluebird 89-92 15.43 14.44 16.47 2.03Nissan Bluebird 82-86 14.37 13.43 15.36 1.93Nissan Bluebird 93-97 14.39 12.28 16.80 4.52Nissan 200SX / Silvia 94-02 14.88 12.06 18.22 6.17Honda Accord Euro 03-07 13.08 10.23 16.58 6.35Honda Accord 03-07 16.48 12.14 21.98 9.84Honda Accord 82-85 13.39 11.31 15.78 4.47Honda Accord 86-90 13.74 11.89 15.83 3.94Honda Accord 91-93 15.05 12.84 17.58 4.74Honda Accord 94-98 15.99 14.34 17.78 3.43Honda Accord 99-02 15.34 11.92 19.52 7.59Honda Prelude 82-82 10.87 5.74 19.61 13.87Honda Prelude 83-91 14.06 12.44 15.85 3.41Honda Prelude 92-96 14.37 12.05 17.06 5.01Honda Prelude 97-02 12.42 9.26 16.46 7.20Peugeot 405 89-97 12.10 8.87 16.31 7.44Peugeot 505 82-93 13.73 10.18 18.27 8.10Peugeot 406 96-04 6.41 3.21 12.39 9.18Renault Feugo 82-87 12.82 7.81 20.32 12.50Saab 900 Series 82-92 12.96 10.25 16.25 6.00Saab 900/9-3 94-02 14.58 12.12 17.44 5.32Saab 9000 86-97 14.08 11.42 17.25 5.83
Subaru 1800 / Leone / Omega / 4WDWagon 82-93 13.66 12.45 14.96 2.50
Subaru Liberty / Legacy 89-93 15.47 14.16 16.88 2.72Subaru Liberty / Legacy / Outback 94-98 14.09 12.33 16.06 3.72

Make Model of Car Years ofManufacture
Pr(Risk)%
Lower 95%ConfidenceLimit
Upper 95%ConfidenceLimit
Width ofConfidenceInterval
Subaru Liberty / Legacy / Outback 99-03 13.81 12.03 15.80 3.77Subaru Liberty / Legacy / Outback 03-07 9.45 6.66 13.24 6.58Toyota Corona 82-88 14.71 14.03 15.42 1.40Toyota Camry 83-86 16.33 14.69 18.10 3.41Holden / Toyota Apollo JK/JL / Camry / Vista 88-92 16.58 16.00 17.18 1.18Holden / Toyota Apollo JM/JP / Camry / Sceptor 93-97 15.89 15.29 16.50 1.21Toyota Celica 81-85 18.04 16.07 20.20 4.13Toyota Celica 86-89 16.96 14.92 19.22 4.30Toyota Celica 90-93 17.17 15.20 19.34 4.14Toyota Celica 94-99 16.20 13.79 18.93 5.14Toyota Celica 00-05 13.88 10.28 18.48 8.20Lexus IS200 / IS300 99-04 14.55 10.90 19.15 8.24Volvo 200 Series 82-93 14.69 12.95 16.61 3.66Volkswagen Passat 98-06 13.31 9.13 19.01 9.88
People Movers 16.40 15.84 16.99 1.15
Chrysler Voyager 97-01 21.77 17.22 27.12 9.90Holden Zafira TT 01-05 13.79 8.90 20.74 11.84Mitsubishi Nimbus / Chariot / Spacewagon 85-91 12.72 8.61 18.39 9.78Mitsubishi Nimbus / Chariot 92-98 14.44 11.58 17.86 6.28Mitsubishi Nimbus 99-03 9.44 5.89 14.80 8.91Mitsubishi Starwagon / L300 83-86 21.30 19.04 23.74 4.69Mitsubishi Starwagon / Delica Starwagon 87-93 18.43 17.06 19.89 2.83Mitsubishi Starwagon / Delica Spacegear 95-98 21.52 19.09 24.16 5.08Mitsubishi Starwagon / Delica Spacegear 98-03 17.96 15.26 21.01 5.76Kia Carnival 99-06 23.84 19.92 28.25 8.33Mazda MPV 94-99 20.37 15.37 26.48 11.12Nissan Prairie 84-86 13.37 8.98 19.43 10.45Nissan Serena 92-95 13.21 7.71 21.71 14.00Honda Odyssey 95-00 17.24 13.36 21.97 8.62Honda Odyssey 00-02 16.61 11.01 24.28 13.28Toyota Tarago 83-89 16.85 15.34 18.48 3.14Toyota Tarago / Previa / Estima 91-99 16.96 15.26 18.82 3.56Toyota Tarago / Previa / Estima 00-06 15.25 12.12 19.00 6.88
Light Cars 11.18 10.95 11.42 0.48
Daihatsu Charade 82-86 12.53 10.51 14.88 4.37Daihatsu Charade 88-92 11.13 10.18 12.15 1.98Daihatsu Charade 93-00 12.98 11.94 14.10 2.17Daihatsu Pyzar 97-01 8.80 5.49 13.81 8.31Daihatsu Sirion / Storia 98-04 9.46 7.68 11.61 3.94Daihatsu Mira 90-96 11.16 8.57 14.40 5.83Daewoo Matiz 99-04 11.65 9.20 14.65 5.45Daewoo Kalos 03-04 13.47 9.32 19.09 9.77Ford Festiva WD/WH/WF 94-01 13.81 13.08 14.58 1.50Ford Ka 99-02 11.62 8.29 16.06 7.76Holden Barina XC 01-06 14.10 12.24 16.19 3.94Holden Barina SB 95-00 12.81 11.82 13.87 2.05Holden Barina TK 05-07 11.85 8.00 17.22 9.22Hyundai Getz / TB 02-07 14.73 12.77 16.94 4.18Mitsubishi Mirage / Colt 82-88 13.87 13.00 14.77 1.77Ford / Mazda Festiva WA / 121 87-90 13.03 12.01 14.12 2.11

Make Model of Car Years ofManufacture
Pr(Risk)%
Lower 95%ConfidenceLimit
Upper 95%ConfidenceLimit
Width ofConfidenceInterval
Mazda 121 / Autozam Review 94-96 10.51 9.27 11.91 2.64Mazda 121 Metro / Demio 97-02 10.52 9.17 12.05 2.88Mazda 2 02-07 11.20 8.22 15.10 6.88Nissan Micra 95-97 12.35 9.87 15.34 5.47Honda Jazz / Fit 02-07 10.82 8.42 13.80 5.38Honda City 83-86 9.50 5.85 15.07 9.22Peugeot 205 87-94 9.82 5.52 16.87 11.34Peugeot 206 99-07 12.82 9.31 17.41 8.11Subaru Sherpa / Fiori / 700 / Rex 89-92 10.83 8.03 14.45 6.42Suzuki Swift 82-85 13.81 8.12 22.50 14.38Holden / Suzuki Barina / Swift / Cultus 86-88 12.74 11.35 14.28 2.93Holden / Suzuki Barina / Swift / Cultus 89-99 11.64 11.00 12.31 1.30Suzuki Hatch / Alto 82-84 12.55 9.59 16.25 6.66Suzuki Alto 85-00 14.41 9.25 21.76 12.51Suzuki Ignis 00-02 13.10 9.43 17.92 8.48Suzuki Swift 05-07 11.29 8.17 15.42 7.25Toyota Starlet 96-99 11.66 10.49 12.96 2.47Toyota Echo 99-05 10.81 9.73 11.99 2.26Toyota Yaris 05-07 10.33 7.59 13.91 6.32Volkswagen Polo 96-00 11.19 8.10 15.26 7.16
Small Cars 12.12 11.96 12.28 0.33
Alfa Romeo 33 83-92 7.36 4.74 11.26 6.52Alfa Romeo 75 86-92 18.95 12.44 27.80 15.36Audi A3/S3 97-04 14.16 9.59 20.43 10.84Chrysler Neon 96-99 12.62 9.33 16.85 7.53Daihatsu Applause 89-99 13.58 12.07 15.26 3.19Daewoo 1.5i 94-95 18.38 12.81 25.66 12.85Daewoo Cielo 95-97 12.76 11.50 14.12 2.62Daewoo Nubira 97-03 13.23 11.71 14.92 3.20Daewoo Lanos 97-03 15.45 14.14 16.85 2.70Ford Laser 91-94 13.59 12.85 14.36 1.51Ford Laser 95-97 12.14 10.95 13.44 2.49Ford Escort 82-82 15.63 13.63 17.85 4.22Ford Capri 89-94 15.59 13.43 18.03 4.60Ford Focus LR 02-05 14.61 12.05 17.61 5.57Ford Focus LS / LT 05-07 13.25 9.60 18.00 8.40Fiat Regata 84-88 11.91 6.67 20.37 13.70Holden Gemini 82-84 12.88 11.69 14.18 2.49Holden Gemini RB 86-87 12.63 10.24 15.49 5.25Holden Astra TR 96-98 12.42 10.22 15.02 4.80Holden Astra TS 98-06 12.85 11.92 13.83 1.91Holden Astra AH 04-07 14.37 11.23 18.20 6.97Holden Viva JF 05-07 12.04 7.78 18.18 10.40Hyundai Excel 86-90 15.75 14.12 17.53 3.40Hyundai Excel 90-94 13.58 12.73 14.48 1.75Hyundai Excel / Accent 95-00 13.20 12.65 13.77 1.12Hyundai Elantra 00-07 13.61 11.81 15.63 3.82Hyundai S Coupe 90-96 12.50 10.35 15.03 4.68Hyundai Lantra 91-95 14.94 13.11 16.97 3.85Hyundai Lantra 96-00 14.85 13.53 16.26 2.73Hyundai Coupe 96-00 15.69 12.73 19.18 6.44Hyundai Accent 00-06 15.12 13.80 16.53 2.73

Make Model of Car Years ofManufacture
Pr(Risk)%
Lower 95%ConfidenceLimit
Upper 95%ConfidenceLimit
Width ofConfidenceInterval
Mitsubishi Lancer / Mirage CA 89-90 12.67 11.51 13.94 2.43Mitsubishi Lancer / Mirage CB 91-92 15.13 12.68 17.95 5.27Mitsubishi Lancer / Mirage CC 93-95 11.95 10.99 12.98 1.99Mitsubishi Lancer / Mirage CE 96-03 13.01 12.38 13.68 1.30Mitsubishi Cordia 83-87 16.67 14.15 19.53 5.37Mitsubishi Lancer CH / CJ 03-07 12.19 10.11 14.62 4.50Kia Rio 00-05 13.22 11.39 15.29 3.91Kia Spectra 01-04 17.85 12.27 25.24 12.97Ford / Mazda Laser / 323 / Familia 82-88 13.76 13.27 14.27 0.99Mazda 323 / Familia / Lantis 90-93 12.72 11.34 14.24 2.89Mazda 323 / Familia / Lantis 95-98 12.39 11.22 13.67 2.45Ford / Mazda Laser / 323 99-03 12.37 11.31 13.50 2.19Mazda MX5 / Eunos Roadster 89-97 15.04 11.01 20.21 9.20Mazda MX5 / Eunos Roadster 98-05 8.09 5.05 12.71 7.66
Mazda Eunos 30X / Presso / MX-3 /Autozam AZ-3 90-97 11.77 8.50 16.08 7.58
Mazda 3 / Axela 03-07 14.06 12.21 16.13 3.92Mercedes Benz A-Class W168 98-04 11.95 8.01 17.44 9.42Holden / Nissan Astra / Pulsar / Langley 84-86 13.22 12.27 14.24 1.97Holden / Nissan Astra / Pulsar / Vector / Sentra 88-90 14.01 13.22 14.83 1.61Nissan Pulsar / Vector / Sentra 92-95 13.96 12.89 15.10 2.20Nissan Pulsar / Vector / Sentra 96-99 13.38 12.47 14.35 1.89Nissan Stanza 82-83 16.72 12.30 22.32 10.02Nissan Gazelle / Silvia 84-86 13.20 8.92 19.10 10.18Nissan Exa 83-86 20.44 15.48 26.50 11.02Nissan Exa 87-91 17.17 11.30 25.23 13.93Nissan NX/NX-R 91-96 18.69 15.37 22.55 7.18Nissan Pulsar 00-05 12.11 11.07 13.23 2.16Honda Civic 82-83 10.39 7.38 14.44 7.07Honda Civic / Ballade / Shuttle 84-87 14.29 12.41 16.40 3.98Honda Civic / Shuttle 88-91 13.70 12.35 15.17 2.82Honda Civic 92-95 13.35 12.13 14.68 2.56Honda Civic 96-00 15.21 13.94 16.58 2.64Honda CRX 87-91 15.09 10.13 21.88 11.74Honda CRX 92-98 15.67 9.76 24.19 14.42Honda Civic 01-05 14.09 11.66 16.93 5.26Honda Integra 86-88 13.61 10.25 17.86 7.62Honda Integra 90-92 18.09 14.39 22.51 8.12Honda Integra 93-01 13.82 11.10 17.08 5.98Honda Integra 02-06 15.46 10.04 23.06 13.03Honda Concerto 89-93 11.13 7.97 15.34 7.38Peugeot 306 94-01 11.64 9.27 14.51 5.24Peugeot 307 01-07 12.81 8.81 18.27 9.45Proton Wira 95-96 13.37 11.22 15.87 4.65Renault 19 91-96 13.78 9.26 20.02 10.76Rover Quintet 82-86 11.47 6.40 19.68 13.28MG MGF / MG TF 99-05 7.91 4.26 14.23 9.97Subaru Impreza 93-00 13.75 12.39 15.23 2.84Subaru Impreza 01-07 12.44 10.48 14.70 4.21Suzuki Baleno / Cultus Crescent 95-02 11.35 9.56 13.41 3.85Suzuki Liana 01-07 11.13 7.18 16.87 9.68Toyota Corolla 82-84 12.56 11.70 13.48 1.78Toyota Corolla 86-88 13.13 12.42 13.86 1.44Toyota / Holden Corolla / Nova 89-93 13.72 13.17 14.30 1.14
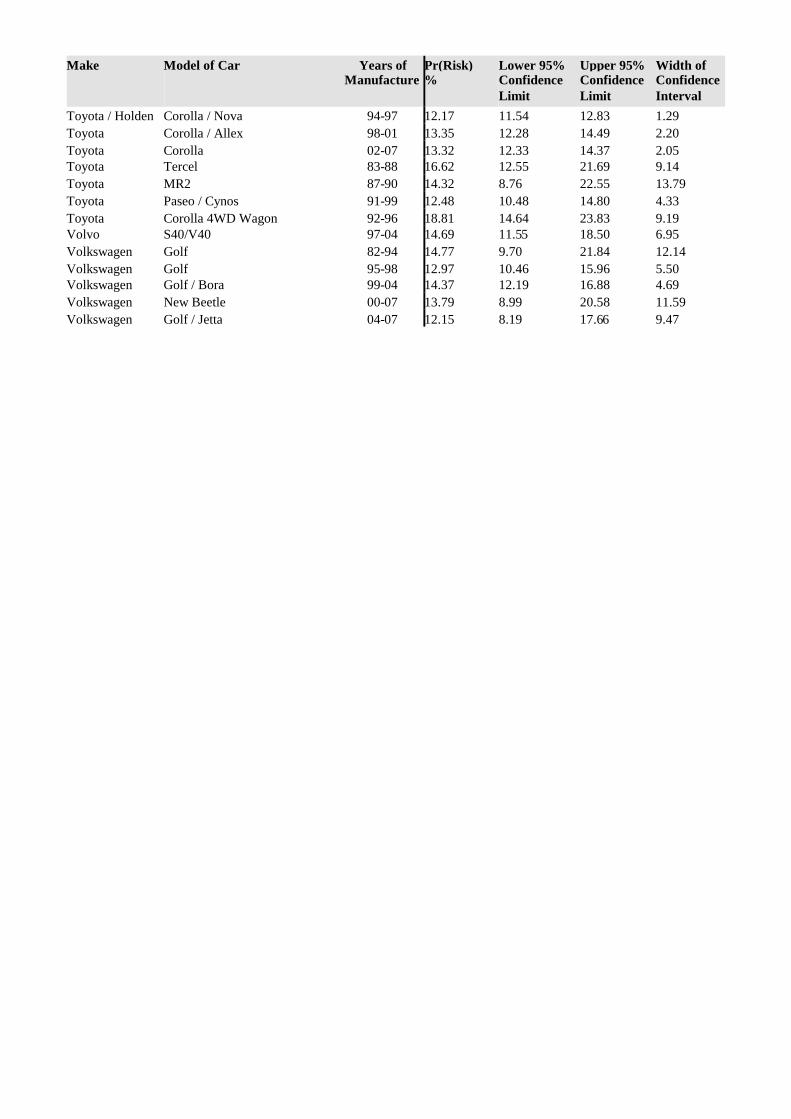
Make Model of Car Years ofManufacture
Pr(Risk)%
Lower 95%ConfidenceLimit
Upper 95%ConfidenceLimit
Width ofConfidenceInterval
Toyota / Holden Corolla / Nova 94-97 12.17 11.54 12.83 1.29Toyota Corolla / Allex 98-01 13.35 12.28 14.49 2.20Toyota Corolla 02-07 13.32 12.33 14.37 2.05Toyota Tercel 83-88 16.62 12.55 21.69 9.14Toyota MR2 87-90 14.32 8.76 22.55 13.79Toyota Paseo / Cynos 91-99 12.48 10.48 14.80 4.33Toyota Corolla 4WD Wagon 92-96 18.81 14.64 23.83 9.19Volvo S40/V40 97-04 14.69 11.55 18.50 6.95Volkswagen Golf 82-94 14.77 9.70 21.84 12.14Volkswagen Golf 95-98 12.97 10.46 15.96 5.50Volkswagen Golf / Bora 99-04 14.37 12.19 16.88 4.69Volkswagen New Beetle 00-07 13.79 8.99 20.58 11.59Volkswagen Golf / Jetta 04-07 12.15 8.19 17.66 9.47

AGGRESSIVITY INJURY SEVERITY RATINGS
New South Wales and Victoria Data (1987-2007), South Australia Data (1995-2007),Queensland, Western Australia and New Zealand Data (1991-2007)
Make Model of Car Years ofManufacture
Pr(Severity)%
Lower 95%ConfidenceLimit
Upper 95%ConfidenceLimit
Width ofConfidenceInterval
ALL VEHICLE AVERAGE 22.48
Compact Wheel Drive Vehicles 21.84 20.63 23.11 2.48
Daihatsu Feroza / Rocky 89-97 20.76 14.87 28.20 13.34Daihatsu Rocky / Rugger 85-98 29.85 20.62 41.08 20.46Daihatsu Terios 97-05 19.15 12.03 29.10 17.07Holden Cruze 02-06 26.91 15.76 42.02 26.26Mitsubishi Outlander 03-06 30.23 15.61 50.36 34.74Kia Sportage 98-03 19.69 13.29 28.18 14.88Ford / Mazda Escape / Tribute 01-06 20.91 15.12 28.19 13.08Nissan X-Trail 01-07 27.25 20.73 34.93 14.19Lada Niva 84-99 25.64 16.95 36.80 19.85Honda CR-V 97-01 21.40 17.26 26.21 8.95Honda CR-V 02-07 23.29 17.16 30.79 13.63Honda HR-V 99-02 29.04 19.40 41.04 21.64Subaru Forester 97-02 15.20 11.12 20.41 9.29Subaru Forester 02-07 22.71 15.74 31.60 15.86Suzuki Vitara / Escudo 88-98 23.70 20.09 27.72 7.63Suzuki Grand Vitara 99-05 19.19 12.52 28.26 15.74
Holden / Suzuki Drover / Sierra / Samurai / SJ410/ SJ413 82-99 21.88 18.45 25.75 7.30
Suzuki Jimny 98-07 22.90 11.75 39.87 28.12Toyota RAV4 94-00 26.33 22.50 30.56 8.06Toyota RAV4 01-06 22.90 17.97 28.70 10.72
Medium Wheel Drive Vehicles 23.45 22.17 24.78 2.61
Daewoo /Ssangong Musso 98-02 29.55 18.60 43.49 24.89
Ford Territory SX/SY 04-07 26.78 17.73 38.31 20.58Holden / Isuzu Jackaroo / Bighorn 82-91 26.57 21.12 32.84 11.72Holden / Isuzu Jackaroo / Bighorn 92-97 26.54 20.36 33.79 13.43Holden / Isuzu Jackaroo / Bighorn 98-02 26.75 19.40 35.65 16.25Holden Frontera / Mu 95-03 28.77 18.65 41.58 22.94Hyundai Santa Fe 00-06 23.57 14.46 36.01 21.55Mitsubishi Pajero 82-90 25.42 21.72 29.52 7.80Mitsubishi Pajero 92-99 24.22 20.94 27.83 6.89Mitsubishi Pajero NM / NP / NS 00-07 20.73 14.20 29.23 15.02Mitsubishi Challenger 98-06 15.83 9.62 24.96 15.34Jeep Cherokee XJ 96-00 22.42 17.59 28.13 10.53Jeep Wrangler 96-04 24.79 16.38 35.69 19.31Jeep Cherokee KJ 01-07 14.25 5.92 30.50 24.58Land Rover Defender 92-07 23.02 14.38 34.74 20.36Nissan Pathfinder / Terrano 88-94 22.42 18.42 27.00 8.58Nissan Pathfinder / Terrano / Regulus 95-05 27.98 21.99 34.87 12.88Toyota Kluger 03-07 18.45 10.74 29.83 19.09Toyota Landcruiser Prado 96-03 28.22 21.29 36.35 15.06

Make Model of Car Years ofManufacture
Pr(Severity)%
Lower 95%ConfidenceLimit
Upper 95%ConfidenceLimit
Width ofConfidenceInterval
Toyota Landcruiser Prado 03-07 25.86 19.34 33.66 14.33
Large Wheel Drive Vehicles 26.62 25.69 27.58 1.89
BMW X5 01-07 28.06 15.05 46.21 31.16Ford Bronco 82-87 26.91 16.01 41.56 25.55Ford Explorer 00-01 21.05 13.22 31.82 18.61Jeep Grand Cherokee ZG 96-99 21.24 13.39 32.01 18.63Jeep Grand Cherokee WJ/WG 99-05 32.92 23.39 44.10 20.70Land Rover Discovery 91-02 20.01 15.56 25.36 9.80Mercedes Benz M-Class W163 98-05 15.46 9.18 24.84 15.66Nissan Patrol / Safari 82-87 28.35 23.55 33.70 10.14Nissan / Ford Patrol / Maverick / Safari 88-97 26.30 24.02 28.72 4.70Nissan Patrol / Safari 98-07 26.84 23.59 30.36 6.77Land Rover Range Rover 82-94 27.81 21.19 35.56 14.37Land Rover Range Rover 95-02 26.37 15.47 41.21 25.73Toyota Landcruiser 82-89 30.08 27.66 32.63 4.97Toyota Landcruiser 90-97 28.52 26.55 30.58 4.03Toyota Landcruiser 98-07 29.74 26.76 32.91 6.15
Commercial Vehicles- Vans 23.80 22.79 24.84 2.05
Daihatsu Handivan 82-90 30.04 21.43 40.33 18.90Ford Falcon Panel Van 82-95 23.43 20.01 27.23 7.22Ford Falcon Panel Van 96-99 24.44 16.22 35.07 18.86Ford Transit 95-00 19.44 14.44 25.66 11.22Ford Transit 01-07 19.33 13.09 27.60 14.52Holden Shuttle / WFR Van 82-87 19.34 12.49 28.72 16.23Kia Pregio 02-06 19.37 12.00 29.74 17.75Mercedes Benz MB100 / MB140 99-04 24.44 15.10 37.05 21.96Mercedes Benz Vito / Viano 99-07 24.53 16.39 35.04 18.65Mercedes Benz Sprinter 98-04 24.41 16.32 34.82 18.50Honda Acty 83-86 13.28 6.26 26.00 19.74Holden / Suzuki Scurry / Carry 82-00 21.53 13.87 31.84 17.97Toyota Hiace/Liteace 82-86 27.61 24.94 30.44 5.50Toyota Hiace/Liteace 87-89 26.04 22.94 29.40 6.46Toyota Hiace/Liteace 90-95 24.52 22.19 27.01 4.82Toyota Hiace/Liteace 96-04 25.68 22.88 28.70 5.83Toyoa Hiace 05-07 24.66 14.90 37.97 23.08Volkswagen Caravelle / Transporter 88-94 21.55 10.51 39.10 28.59Volkswagen Caravelle / Transporter 95-04 27.38 20.13 36.07 15.93
Commercial Vehicles- Vans 24.28 23.62 24.95 1.33
Ford / Nissan Falcon Ute / XFN Ute 82-95 22.98 20.87 25.23 4.36Ford Falcon Ute 96-99 22.00 17.92 26.70 8.77Ford Falcon Ute AU 00-02 24.53 20.64 28.88 8.24Ford Falcon Ute BA/BF 03-07 20.67 15.65 26.80 11.16Ford Ford F-Series 82-92 27.66 21.80 34.39 12.59Ford F-Series 01-06 28.17 15.02 46.53 31.51Holden Commodore Ute VG/VP 90-93 19.46 15.00 24.85 9.85Holden / Isuzu Rodeo / Pickup 82-85 28.67 21.68 36.84 15.16Holden / Isuzu Rodeo / Pickup 86-88 23.24 14.44 35.18 20.74Holden / Isuzu Rodeo / Pickup 89-95 27.75 25.09 30.59 5.50

Make Model of Car Years ofManufacture
Pr(Severity)%
Lower 95%ConfidenceLimit
Upper 95%ConfidenceLimit
Width ofConfidenceInterval
Holden Rodeo 96-98 25.39 21.59 29.61 8.02Holden Rodeo 99-02 26.73 22.81 31.05 8.24Holden WB Series 82-85 25.85 21.03 31.34 10.31Holden Commodore Ute VR/VS 94-00 26.15 23.40 29.11 5.70Holden Commodore VU Ute 00-02 27.32 21.39 34.18 12.79Holden Commodore VY/VZ Ute 02-07 30.93 26.11 36.19 10.08Holden Rodeo 03-07 24.83 20.22 30.09 9.88Mitsubishi Triton MK 96-06 26.51 19.23 35.34 16.11Kia Ceres 92-00 23.88 16.61 33.06 16.45Ford / Mazda Courier / B-Series / Bounty 98-02 24.50 19.90 29.78 9.88Ford / Mazda Courier / Bravo / Bounty 03-06 21.12 15.25 28.48 13.23Nissan 720 Ute 82-85 20.12 15.80 25.27 9.47Nissan Navara 86-91 26.07 23.06 29.32 6.27Nissan Navara 92-96 23.68 19.82 28.04 8.22Nissan Navara 97-05 24.20 20.07 28.88 8.82Subaru Brumby 82-92 27.02 21.25 33.67 12.42Suzuki Mighty Boy 85-88 21.44 11.77 35.83 24.06Toyota 4Runner/Hilux 82-85 27.59 24.56 30.85 6.29Toyota 4Runner/Hilux 86-88 27.03 24.11 30.18 6.07Toyota 4Runner/Hilux 89-97 25.24 23.71 26.84 3.12Toyota Hilux 98-02 27.59 24.62 30.78 6.16Toyota Hilux 03-04 22.71 17.25 29.29 12.04Toyota Hilux 05-07 24.98 18.42 32.93 14.51
Large Cars 21.80 21.42 22.19 0.77
BMW 7 Series E23 82-88 13.43 5.60 28.85 23.24BMW 7 Series E32 89-94 26.19 15.46 40.78 25.32BMW 7 Series E38 95-01 16.25 6.90 33.69 26.80Ford Falcon XE/XF 82-88 23.50 22.49 24.54 2.05Ford Fairlane Z & LTD F 82-87 23.50 20.75 26.50 5.76Ford Falcon EA / Falcon EB Series I 88-Mar 92 23.60 22.51 24.74 2.23Ford Falcon EB Series II / Falcon ED Apr 92-94 23.31 21.76 24.93 3.17Ford Fairlane N & LTD D 88-94 22.33 19.38 25.58 6.20Ford Fairlane N & LTD D 95-98 23.81 19.33 28.94 9.61Ford Fairlane & LTD AU 99-02 20.38 14.63 27.65 13.03Ford Fairlane & LTD BA/BF 03-07 21.49 9.99 40.31 30.32Ford Falcon EF/EL 94-98 22.91 21.82 24.04 2.22Ford Falcon AU 98-02 22.65 21.25 24.11 2.86Ford Taurus 96-98 22.78 15.30 32.52 17.22Ford Falcon BA/BF 02-07 22.53 20.20 25.05 4.86Holden / Toyota Commodore VN/VP / Lexcen 89-93 22.62 21.60 23.67 2.06Holden Statesman/Caprice WB 82-85 38.64 18.63 63.40 44.78Holden Stateman/Caprice VQ 90-93 24.68 16.98 34.42 17.44Holden Stateman/Caprice VR/VS 94-98 23.89 20.32 27.87 7.55Holden / Toyota Commodore VR/VS / Lexcen 93-97 23.05 21.95 24.19 2.24Holden Commodore VT/VX 97-02 23.28 22.06 24.55 2.49Holden Statesman/Caprice WH 99-03 24.18 18.34 31.17 12.83Holden Commodore VY/VZ 02-07 20.48 18.33 22.82 4.49Holden Monaro 01-05 23.90 16.66 33.04 16.38Holden Statesman/Caprice WK/WL 03-06 26.89 14.71 43.96 29.24Holden Commodore VB-VL 82-88 22.86 21.77 23.99 2.22Holden Commodore VE 06-07 22.42 15.40 31.45 16.06Hyundai Sonata 89-97 24.10 20.51 28.09 7.58
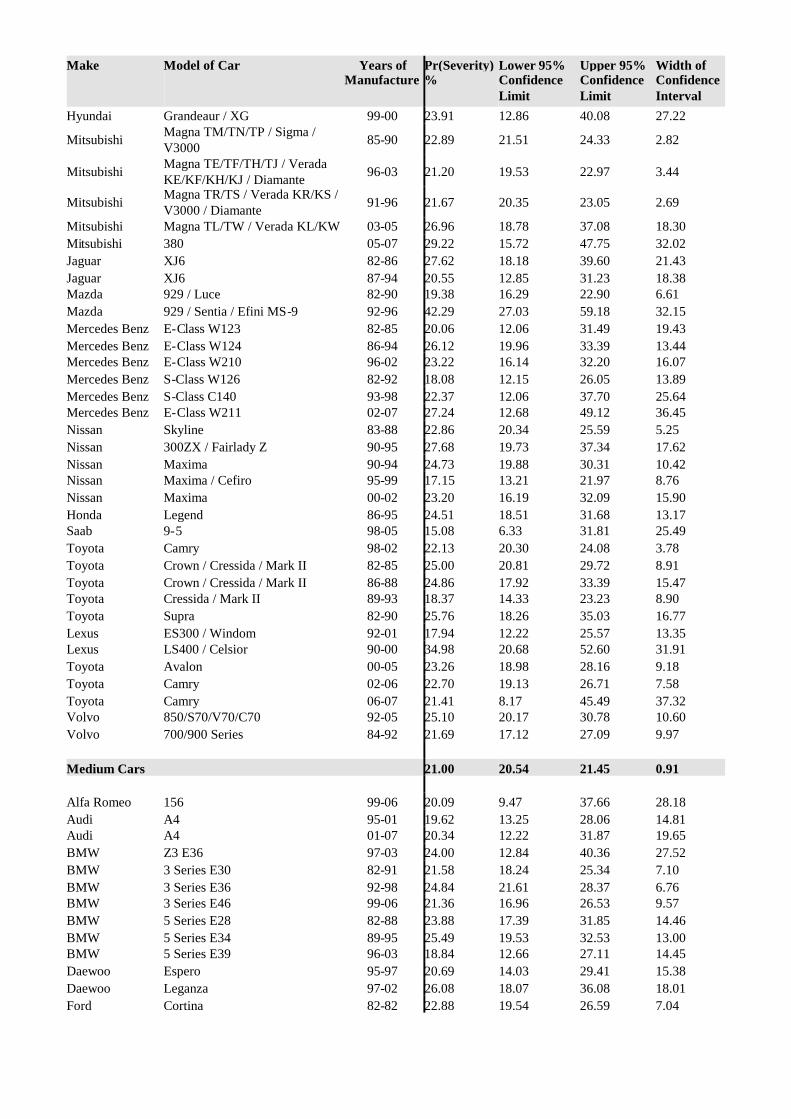
Make Model of Car Years ofManufacture
Pr(Severity)%
Lower 95%ConfidenceLimit
Upper 95%ConfidenceLimit
Width ofConfidenceInterval
Hyundai Grandeaur / XG 99-00 23.91 12.86 40.08 27.22
Mitsubishi Magna TM/TN/TP / Sigma /V3000 85-90 22.89 21.51 24.33 2.82
Mitsubishi Magna TE/TF/TH/TJ / VeradaKE/KF/KH/KJ / Diamante 96-03 21.20 19.53 22.97 3.44
Mitsubishi Magna TR/TS / Verada KR/KS /V3000 / Diamante 91-96 21.67 20.35 23.05 2.69
Mitsubishi Magna TL/TW / Verada KL/KW 03-05 26.96 18.78 37.08 18.30Mitsubishi 380 05-07 29.22 15.72 47.75 32.02Jaguar XJ6 82-86 27.62 18.18 39.60 21.43Jaguar XJ6 87-94 20.55 12.85 31.23 18.38Mazda 929 / Luce 82-90 19.38 16.29 22.90 6.61Mazda 929 / Sentia / Efini MS-9 92-96 42.29 27.03 59.18 32.15Mercedes Benz E-Class W123 82-85 20.06 12.06 31.49 19.43Mercedes Benz E-Class W124 86-94 26.12 19.96 33.39 13.44Mercedes Benz E-Class W210 96-02 23.22 16.14 32.20 16.07Mercedes Benz S-Class W126 82-92 18.08 12.15 26.05 13.89Mercedes Benz S-Class C140 93-98 22.37 12.06 37.70 25.64Mercedes Benz E-Class W211 02-07 27.24 12.68 49.12 36.45Nissan Skyline 83-88 22.86 20.34 25.59 5.25Nissan 300ZX / Fairlady Z 90-95 27.68 19.73 37.34 17.62Nissan Maxima 90-94 24.73 19.88 30.31 10.42Nissan Maxima / Cefiro 95-99 17.15 13.21 21.97 8.76Nissan Maxima 00-02 23.20 16.19 32.09 15.90Honda Legend 86-95 24.51 18.51 31.68 13.17Saab 9-5 98-05 15.08 6.33 31.81 25.49Toyota Camry 98-02 22.13 20.30 24.08 3.78Toyota Crown / Cressida / Mark II 82-85 25.00 20.81 29.72 8.91Toyota Crown / Cressida / Mark II 86-88 24.86 17.92 33.39 15.47Toyota Cressida / Mark II 89-93 18.37 14.33 23.23 8.90Toyota Supra 82-90 25.76 18.26 35.03 16.77Lexus ES300 / Windom 92-01 17.94 12.22 25.57 13.35Lexus LS400 / Celsior 90-00 34.98 20.68 52.60 31.91Toyota Avalon 00-05 23.26 18.98 28.16 9.18Toyota Camry 02-06 22.70 19.13 26.71 7.58Toyota Camry 06-07 21.41 8.17 45.49 37.32Volvo 850/S70/V70/C70 92-05 25.10 20.17 30.78 10.60Volvo 700/900 Series 84-92 21.69 17.12 27.09 9.97
Medium Cars 21.00 20.54 21.45 0.91
Alfa Romeo 156 99-06 20.09 9.47 37.66 28.18Audi A4 95-01 19.62 13.25 28.06 14.81Audi A4 01-07 20.34 12.22 31.87 19.65BMW Z3 E36 97-03 24.00 12.84 40.36 27.52BMW 3 Series E30 82-91 21.58 18.24 25.34 7.10BMW 3 Series E36 92-98 24.84 21.61 28.37 6.76BMW 3 Series E46 99-06 21.36 16.96 26.53 9.57BMW 5 Series E28 82-88 23.88 17.39 31.85 14.46BMW 5 Series E34 89-95 25.49 19.53 32.53 13.00BMW 5 Series E39 96-03 18.84 12.66 27.11 14.45Daewoo Espero 95-97 20.69 14.03 29.41 15.38Daewoo Leganza 97-02 26.08 18.07 36.08 18.01Ford Cortina 82-82 22.88 19.54 26.59 7.04
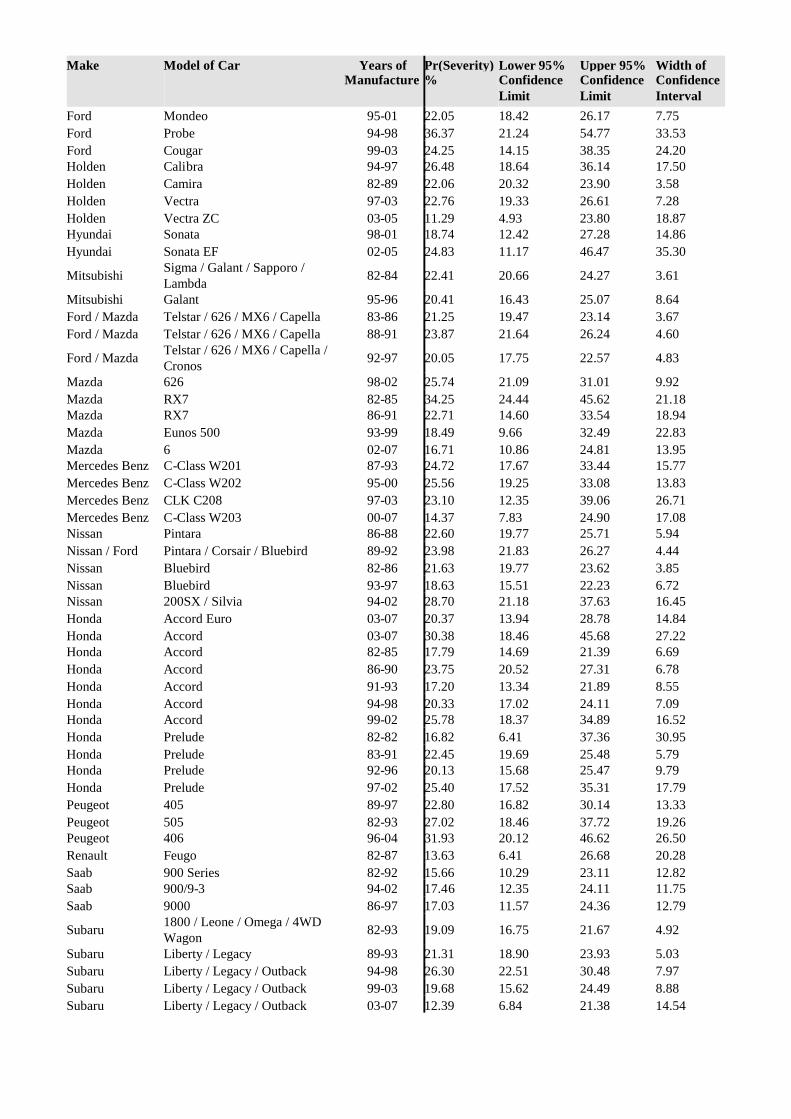
Make Model of Car Years ofManufacture
Pr(Severity)%
Lower 95%ConfidenceLimit
Upper 95%ConfidenceLimit
Width ofConfidenceInterval
Ford Mondeo 95-01 22.05 18.42 26.17 7.75Ford Probe 94-98 36.37 21.24 54.77 33.53Ford Cougar 99-03 24.25 14.15 38.35 24.20Holden Calibra 94-97 26.48 18.64 36.14 17.50Holden Camira 82-89 22.06 20.32 23.90 3.58Holden Vectra 97-03 22.76 19.33 26.61 7.28Holden Vectra ZC 03-05 11.29 4.93 23.80 18.87Hyundai Sonata 98-01 18.74 12.42 27.28 14.86Hyundai Sonata EF 02-05 24.83 11.17 46.47 35.30
Mitsubishi Sigma / Galant / Sapporo /Lambda 82-84 22.41 20.66 24.27 3.61
Mitsubishi Galant 95-96 20.41 16.43 25.07 8.64Ford / Mazda Telstar / 626 / MX6 / Capella 83-86 21.25 19.47 23.14 3.67Ford / Mazda Telstar / 626 / MX6 / Capella 88-91 23.87 21.64 26.24 4.60
Ford / Mazda Telstar / 626 / MX6 / Capella /Cronos 92-97 20.05 17.75 22.57 4.83
Mazda 626 98-02 25.74 21.09 31.01 9.92Mazda RX7 82-85 34.25 24.44 45.62 21.18Mazda RX7 86-91 22.71 14.60 33.54 18.94Mazda Eunos 500 93-99 18.49 9.66 32.49 22.83Mazda 6 02-07 16.71 10.86 24.81 13.95Mercedes Benz C-Class W201 87-93 24.72 17.67 33.44 15.77Mercedes Benz C-Class W202 95-00 25.56 19.25 33.08 13.83Mercedes Benz CLK C208 97-03 23.10 12.35 39.06 26.71Mercedes Benz C-Class W203 00-07 14.37 7.83 24.90 17.08Nissan Pintara 86-88 22.60 19.77 25.71 5.94Nissan / Ford Pintara / Corsair / Bluebird 89-92 23.98 21.83 26.27 4.44Nissan Bluebird 82-86 21.63 19.77 23.62 3.85Nissan Bluebird 93-97 18.63 15.51 22.23 6.72Nissan 200SX / Silvia 94-02 28.70 21.18 37.63 16.45Honda Accord Euro 03-07 20.37 13.94 28.78 14.84Honda Accord 03-07 30.38 18.46 45.68 27.22Honda Accord 82-85 17.79 14.69 21.39 6.69Honda Accord 86-90 23.75 20.52 27.31 6.78Honda Accord 91-93 17.20 13.34 21.89 8.55Honda Accord 94-98 20.33 17.02 24.11 7.09Honda Accord 99-02 25.78 18.37 34.89 16.52Honda Prelude 82-82 16.82 6.41 37.36 30.95Honda Prelude 83-91 22.45 19.69 25.48 5.79Honda Prelude 92-96 20.13 15.68 25.47 9.79Honda Prelude 97-02 25.40 17.52 35.31 17.79Peugeot 405 89-97 22.80 16.82 30.14 13.33Peugeot 505 82-93 27.02 18.46 37.72 19.26Peugeot 406 96-04 31.93 20.12 46.62 26.50Renault Feugo 82-87 13.63 6.41 26.68 20.28Saab 900 Series 82-92 15.66 10.29 23.11 12.82Saab 900/9-3 94-02 17.46 12.35 24.11 11.75Saab 9000 86-97 17.03 11.57 24.36 12.79
Subaru 1800 / Leone / Omega / 4WDWagon 82-93 19.09 16.75 21.67 4.92
Subaru Liberty / Legacy 89-93 21.31 18.90 23.93 5.03Subaru Liberty / Legacy / Outback 94-98 26.30 22.51 30.48 7.97Subaru Liberty / Legacy / Outback 99-03 19.68 15.62 24.49 8.88Subaru Liberty / Legacy / Outback 03-07 12.39 6.84 21.38 14.54

Make Model of Car Years ofManufacture
Pr(Severity)%
Lower 95%ConfidenceLimit
Upper 95%ConfidenceLimit
Width ofConfidenceInterval
Toyota Corona 82-88 23.15 21.52 24.86 3.34Toyota Camry 83-86 20.54 17.29 24.23 6.94Holden / Toyota Apollo JK/JL / Camry / Vista 88-92 21.54 20.28 22.85 2.57Holden / Toyota Apollo JM/JP / Camry / Sceptor 93-97 22.60 21.13 24.13 3.00Toyota Celica 81-85 21.70 18.11 25.78 7.67Toyota Celica 86-89 22.97 18.88 27.64 8.75Toyota Celica 90-93 24.63 20.53 29.25 8.72Toyota Celica 94-99 20.30 15.10 26.73 11.63Toyota Celica 00-05 24.79 15.16 37.81 22.66Lexus IS200 / IS300 99-04 16.71 7.92 31.86 23.94Volvo 200 Series 82-93 23.39 19.35 27.97 8.62Volkswagen Passat 98-06 21.62 12.58 34.60 22.02
People Movers 22.49 21.38 23.65 2.28
Chrysler Voyager 97-01 23.01 14.59 34.33 19.73Holden Zafira TT 01-05 23.20 11.58 41.07 29.49Mitsubishi Nimbus / Chariot / Spacewagon 85-91 19.64 13.95 26.92 12.97Mitsubishi Nimbus / Chariot 92-98 27.57 20.68 35.72 15.04Mitsubishi Nimbus 99-03 11.32 3.62 30.26 26.64Mitsubishi Starwagon / L300 83-86 24.21 20.95 27.80 6.85Mitsubishi Starwagon / Delica Starwagon 87-93 23.43 20.98 26.08 5.10Mitsubishi Starwagon / Delica Spacegear 95-98 22.24 17.82 27.39 9.57Mitsubishi Starwagon / Delica Spacegear 98-03 21.14 15.46 28.21 12.75Kia Carnival 99-06 28.32 20.50 37.71 17.22Mazda MPV 94-99 24.12 13.57 39.17 25.60Nissan Prairie 84-86 24.01 16.89 32.96 16.07Nissan Serena 92-95 18.72 12.28 27.49 15.21Honda Odyssey 95-00 23.15 17.06 30.60 13.54Honda Odyssey 00-02 28.40 15.36 46.44 31.08Toyota Tarago 83-89 25.32 22.13 28.82 6.69Toyota Tarago / Previa / Estima 91-99 22.58 18.99 26.63 7.65Toyota Tarago / Previa / Estima 00-06 25.80 17.59 36.17 18.58
Light Cars 19.70 19.02 20.39 1.37
Daihatsu Charade 82-86 21.96 17.63 27.00 9.37Daihatsu Charade 88-92 19.98 17.15 23.15 6.00Daihatsu Charade 93-00 20.64 17.42 24.28 6.86Daihatsu Pyzar 97-01 23.92 13.28 39.22 25.94Daihatsu Sirion / Storia 98-04 16.52 10.75 24.53 13.78Daihatsu Mira 90-96 22.19 16.01 29.90 13.89Daewoo Matiz 99-04 19.54 12.16 29.85 17.69Daewoo Kalos 03-04 28.26 13.99 48.83 34.84Ford Festiva WD/WH/WF 94-01 19.23 17.30 21.32 4.01Ford Ka 99-02 24.28 14.52 37.70 23.18Holden Barina XC 01-06 21.17 16.53 26.70 10.17Holden Barina SB 95-00 22.13 19.13 25.44 6.31Holden Barina TK 05-07 15.71 6.35 33.85 27.50Hyundai Getz / TB 02-07 32.21 25.86 39.28 13.42Mitsubishi Mirage / Colt 82-88 21.15 19.15 23.29 4.14Ford / Mazda Festiva WA / 121 87-90 19.07 16.42 22.03 5.61Mazda 121 / Autozam Review 94-96 17.39 13.54 22.05 8.51Mazda 121 Metro / Demio 97-02 18.11 14.07 22.99 8.93

Make Model of Car Years ofManufacture
Pr(Severity)%
Lower 95%ConfidenceLimit
Upper 95%ConfidenceLimit
Width ofConfidenceInterval
Mazda 2 02-07 26.57 16.68 39.54 22.86Nissan Micra 95-97 22.35 14.73 32.42 17.70Honda Jazz / Fit 02-07 21.24 14.47 30.06 15.59Honda City 83-86 22.13 16.64 28.80 12.16Peugeot 205 87-94 17.13 7.77 33.64 25.87Peugeot 206 99-07 17.48 9.47 30.03 20.56Subaru Sherpa / Fiori / 700 / Rex 89-92 20.22 14.18 27.99 13.80Suzuki Swift 82-85 22.28 10.66 40.78 30.13Holden / Suzuki Barina / Swift / Cultus 86-88 19.66 16.56 23.17 6.61Holden / Suzuki Barina / Swift / Cultus 89-99 20.53 18.61 22.60 3.99Suzuki Hatch / Alto 82-84 26.37 18.86 35.56 16.71Suzuki Alto 85-00 29.04 20.25 39.74 19.49Suzuki Ignis 00-02 16.14 8.69 28.03 19.34Suzuki Swift 05-07 18.77 9.42 33.94 24.52Toyota Starlet 96-99 20.97 17.45 24.98 7.54Toyota Echo 99-05 22.52 18.99 26.48 7.49Toyota Yaris 05-07 18.82 10.58 31.23 20.65Volkswagen Polo 96-00 17.25 10.26 27.55 17.29
Small Cars 20.44 20.03 20.86 0.83
Alfa Romeo 33 83-92 24.97 16.70 35.57 18.87Alfa Romeo 75 86-92 23.90 11.00 44.38 33.38Audi A3/S3 97-04 27.15 15.95 42.26 26.31Chrysler Neon 96-99 15.03 8.34 25.59 17.24Daihatsu Applause 89-99 18.93 15.13 23.43 8.30Daewoo 1.5i 94-95 12.39 3.16 37.97 34.80Daewoo Cielo 95-97 19.88 16.37 23.93 7.56Daewoo Nubira 97-03 19.46 15.48 24.16 8.68Daewoo Lanos 97-03 21.85 18.74 25.31 6.56Ford Laser 91-94 21.42 19.63 23.33 3.70Ford Laser 95-97 23.64 20.24 27.41 7.17Ford Escort 82-82 17.82 13.05 23.87 10.82Ford Capri 89-94 16.76 12.54 22.06 9.52Ford Focus LR 02-05 18.57 13.10 25.64 12.54Ford Focus LS / LT 05-07 23.07 12.44 38.77 26.33Fiat Regata 84-88 29.56 16.71 46.76 30.05Holden Gemini 82-84 20.97 18.12 24.14 6.02Holden Gemini RB 86-87 20.24 14.28 27.88 13.60Holden Astra TR 96-98 21.72 16.04 28.72 12.68Holden Astra TS 98-06 21.59 19.05 24.37 5.32Holden Astra AH 04-07 20.28 12.59 31.01 18.42Holden Viva JF 05-07 31.11 17.50 49.02 31.52Hyundai Excel 86-90 20.45 17.02 24.37 7.35Hyundai Excel 90-94 21.38 18.96 24.00 5.04Hyundai Excel / Accent 95-00 21.50 19.91 23.19 3.28Hyundai Elantra 00-07 22.59 17.01 29.36 12.35Hyundai S Coupe 90-96 20.30 14.49 27.69 13.19Hyundai Lantra 91-95 20.42 15.63 26.23 10.60Hyundai Lantra 96-00 21.00 17.81 24.59 6.79Hyundai Coupe 96-00 16.91 10.90 25.28 14.38Hyundai Accent 00-06 19.98 16.56 23.90 7.34Mitsubishi Lancer / Mirage CA 89-90 20.94 18.35 23.79 5.44Mitsubishi Lancer / Mirage CB 91-92 25.74 20.20 32.17 11.97

Make Model of Car Years ofManufacture
Pr(Severity)%
Lower 95%ConfidenceLimit
Upper 95%ConfidenceLimit
Width ofConfidenceInterval
Mitsubishi Lancer / Mirage CC 93-95 20.14 17.61 22.94 5.34Mitsubishi Lancer / Mirage CE 96-03 21.48 19.61 23.49 3.88Mitsubishi Cordia 83-87 26.20 22.31 30.51 8.20Mitsubishi Lancer CH / CJ 03-07 20.40 13.87 28.97 15.10Kia Rio 00-05 25.66 19.86 32.47 12.60Kia Spectra 01-04 19.23 8.35 38.37 30.03Ford / Mazda Laser / 323 / Familia 82-88 21.22 20.20 22.27 2.08Mazda 323 / Familia / Lantis 90-93 18.34 16.02 20.91 4.89Mazda 323 / Familia / Lantis 95-98 19.77 16.74 23.21 6.48Ford / Mazda Laser / 323 99-03 19.13 16.20 22.46 6.26Mazda MX5 / Eunos Roadster 89-97 18.05 10.63 28.97 18.35Mazda MX5 / Eunos Roadster 98-05 6.28 1.55 22.17 20.62
Mazda Eunos 30X / Presso / MX-3 /Autozam AZ-3 90-97 24.83 14.43 39.27 24.84
Mazda 3 / Axela 03-07 22.13 16.73 28.66 11.93Mercedes Benz A-Class W168 98-04 17.20 7.77 33.87 26.11Holden / Nissan Astra / Pulsar / Langley 84-86 24.49 22.18 26.95 4.78Holden / Nissan Astra / Pulsar / Vector / Sentra 88-90 23.29 21.37 25.32 3.95Nissan Pulsar / Vector / Sentra 92-95 22.66 20.26 25.26 5.00Nissan Pulsar / Vector / Sentra 96-99 20.72 18.30 23.37 5.07Nissan Stanza 82-83 31.38 21.05 43.96 22.91Nissan Gazelle / Silvia 84-86 22.78 16.72 30.23 13.51Nissan Exa 83-86 25.42 17.19 35.90 18.71Nissan Exa 87-91 33.59 20.93 49.15 28.22Nissan NX/NX-R 91-96 24.18 17.69 32.12 14.43Nissan Pulsar 00-05 20.52 17.29 24.17 6.87Honda Civic 82-83 21.74 16.25 28.44 12.19Honda Civic / Ballade / Shuttle 84-87 21.49 18.15 25.25 7.10Honda Civic / Shuttle 88-91 20.18 17.46 23.21 5.75Honda Civic 92-95 22.77 19.86 25.96 6.11Honda Civic 96-00 16.53 13.81 19.67 5.86Honda CRX 87-91 21.04 15.41 28.04 12.63Honda CRX 92-98 29.68 16.99 46.53 29.54Honda Civic 01-05 21.73 16.04 28.75 12.71Honda Integra 86-88 16.05 11.37 22.18 10.81Honda Integra 90-92 23.54 17.76 30.52 12.76Honda Integra 93-01 18.78 13.97 24.76 10.79Honda Integra 02-06 26.40 13.22 45.78 32.56Honda Concerto 89-93 24.14 17.31 32.59 15.27Peugeot 306 94-01 22.27 16.61 29.17 12.56Peugeot 307 01-07 14.94 7.61 27.23 19.62Proton Wira 95-96 26.71 19.87 34.89 15.02Renault 19 91-96 20.51 11.52 33.84 22.32Rover Quintet 82-86 10.95 3.95 26.87 22.91MG MGF / MG TF 99-05 17.41 6.63 38.46 31.82Subaru Impreza 93-00 25.92 22.58 29.57 6.99Subaru Impreza 01-07 18.71 13.20 25.85 12.65Suzuki Baleno / Cultus Crescent 95-02 12.93 8.57 19.03 10.46Suzuki Liana 01-07 34.95 18.87 55.38 36.51Toyota Corolla 82-84 20.32 18.44 22.34 3.89Toyota Corolla 86-88 22.44 20.73 24.24 3.51Toyota / Holden Corolla / Nova 89-93 22.25 20.86 23.70 2.83Toyota / Holden Corolla / Nova 94-97 21.04 19.27 22.92 3.65Toyota Corolla / Allex 98-01 21.80 18.79 25.15 6.36

Make Model of Car Years ofManufacture
Pr(Severity)%
Lower 95%ConfidenceLimit
Upper 95%ConfidenceLimit
Width ofConfidenceInterval
Toyota Corolla 02-07 21.10 18.34 24.14 5.80Toyota Tercel 83-88 16.92 9.88 27.46 17.58Toyota MR2 87-90 23.29 14.91 34.48 19.57Toyota Paseo / Cynos 91-99 25.39 19.18 32.80 13.62Toyota Corolla 4WD Wagon 92-96 28.01 17.95 40.89 22.93Volvo S40/V40 97-04 17.32 9.91 28.53 18.61Volkswagen Golf 82-94 30.59 20.25 43.35 23.10Volkswagen Golf 95-98 25.45 18.19 34.40 16.21Volkswagen Golf / Bora 99-04 17.28 12.63 23.20 10.57Volkswagen New Beetle 00-07 23.16 12.11 39.76 27.65Volkswagen Golf / Jetta 04-07 29.90 16.21 48.47 32.26
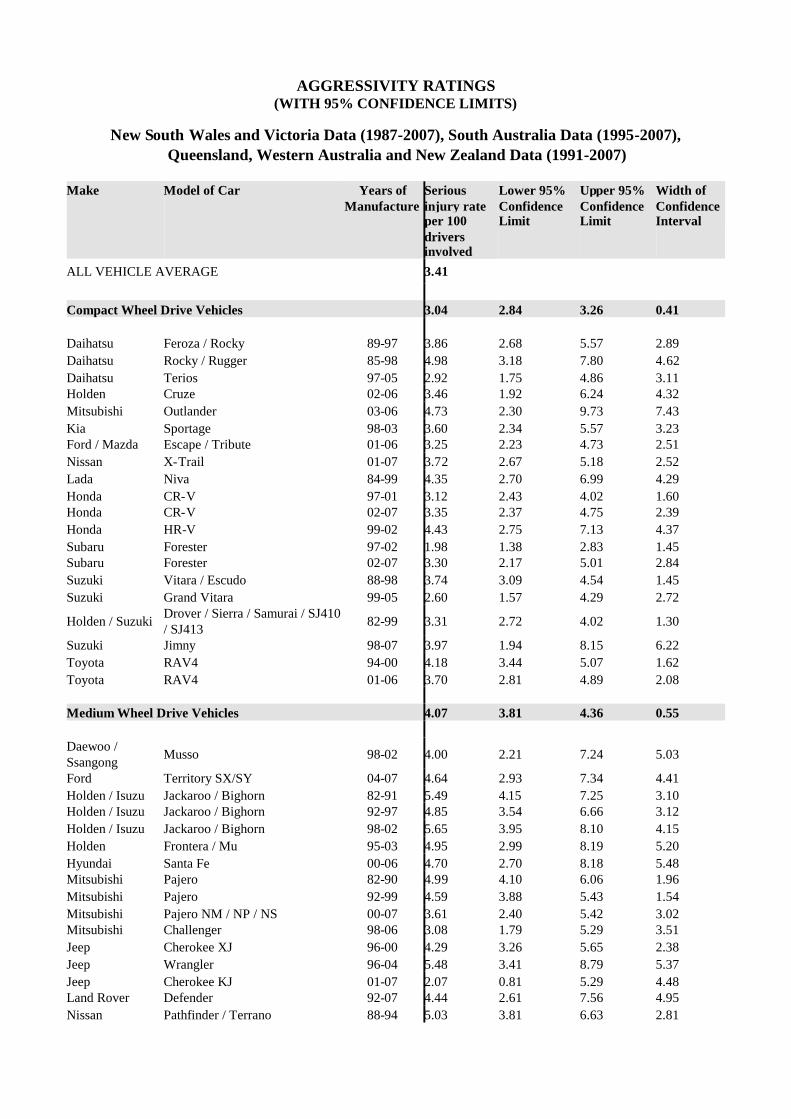
AGGRESSIVITY RATINGS(WITH 95% CONFIDENCE LIMITS)
New South Wales and Victoria Data (1987-2007), South Australia Data (1995-2007),Queensland, Western Australia and New Zealand Data (1991-2007)
Make Model of Car Years ofManufacture
Seriousinjury rateper 100driversinvolved
Lower 95%ConfidenceLimit
Upper 95%ConfidenceLimit
Width ofConfidenceInterval
ALL VEHICLE AVERAGE 3.41
Compact Wheel Drive Vehicles 3.04 2.84 3.26 0.41
Daihatsu Feroza / Rocky 89-97 3.86 2.68 5.57 2.89Daihatsu Rocky / Rugger 85-98 4.98 3.18 7.80 4.62Daihatsu Terios 97-05 2.92 1.75 4.86 3.11Holden Cruze 02-06 3.46 1.92 6.24 4.32Mitsubishi Outlander 03-06 4.73 2.30 9.73 7.43Kia Sportage 98-03 3.60 2.34 5.57 3.23Ford / Mazda Escape / Tribute 01-06 3.25 2.23 4.73 2.51Nissan X-Trail 01-07 3.72 2.67 5.18 2.52Lada Niva 84-99 4.35 2.70 6.99 4.29Honda CR-V 97-01 3.12 2.43 4.02 1.60Honda CR-V 02-07 3.35 2.37 4.75 2.39Honda HR-V 99-02 4.43 2.75 7.13 4.37Subaru Forester 97-02 1.98 1.38 2.83 1.45Subaru Forester 02-07 3.30 2.17 5.01 2.84Suzuki Vitara / Escudo 88-98 3.74 3.09 4.54 1.45Suzuki Grand Vitara 99-05 2.60 1.57 4.29 2.72
Holden / Suzuki Drover / Sierra / Samurai / SJ410/ SJ413 82-99 3.31 2.72 4.02 1.30
Suzuki Jimny 98-07 3.97 1.94 8.15 6.22Toyota RAV4 94-00 4.18 3.44 5.07 1.62Toyota RAV4 01-06 3.70 2.81 4.89 2.08
Medium Wheel Drive Vehicles 4.07 3.81 4.36 0.55
Daewoo /Ssangong Musso 98-02 4.00 2.21 7.24 5.03
Ford Territory SX/SY 04-07 4.64 2.93 7.34 4.41Holden / Isuzu Jackaroo / Bighorn 82-91 5.49 4.15 7.25 3.10Holden / Isuzu Jackaroo / Bighorn 92-97 4.85 3.54 6.66 3.12Holden / Isuzu Jackaroo / Bighorn 98-02 5.65 3.95 8.10 4.15Holden Frontera / Mu 95-03 4.95 2.99 8.19 5.20Hyundai Santa Fe 00-06 4.70 2.70 8.18 5.48Mitsubishi Pajero 82-90 4.99 4.10 6.06 1.96Mitsubishi Pajero 92-99 4.59 3.88 5.43 1.54Mitsubishi Pajero NM / NP / NS 00-07 3.61 2.40 5.42 3.02Mitsubishi Challenger 98-06 3.08 1.79 5.29 3.51Jeep Cherokee XJ 96-00 4.29 3.26 5.65 2.38Jeep Wrangler 96-04 5.48 3.41 8.79 5.37Jeep Cherokee KJ 01-07 2.07 0.81 5.29 4.48Land Rover Defender 92-07 4.44 2.61 7.56 4.95Nissan Pathfinder / Terrano 88-94 5.03 3.81 6.63 2.81
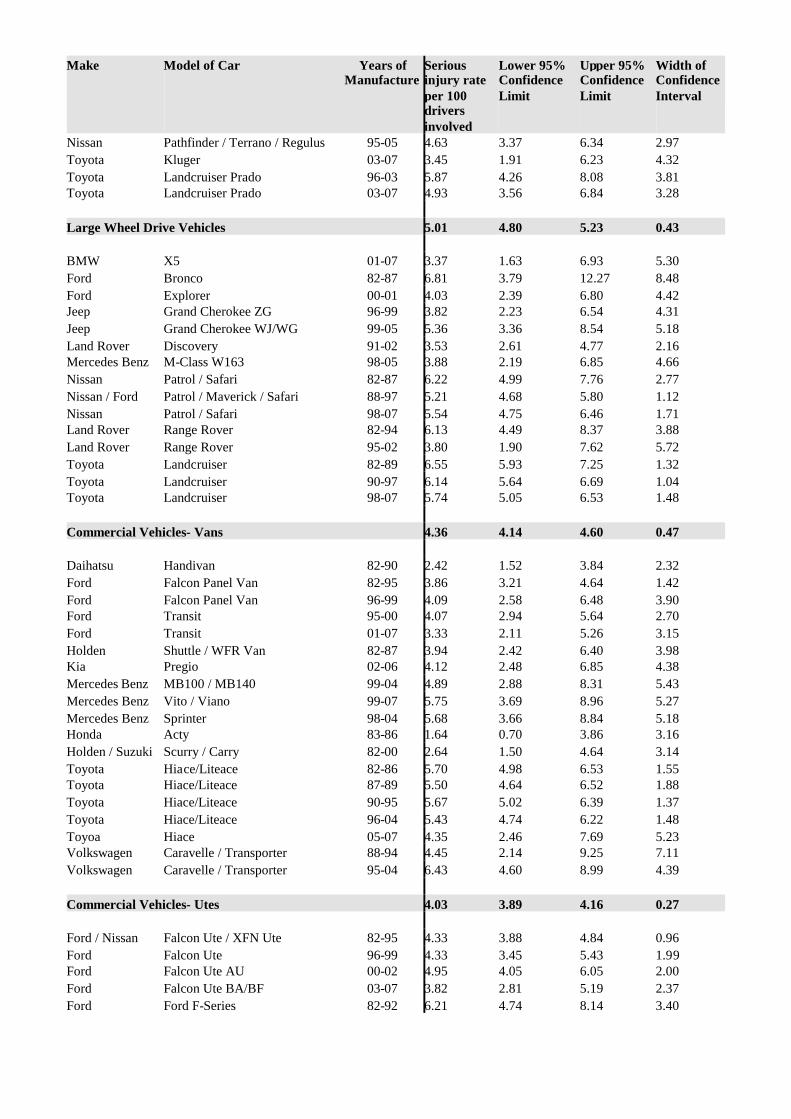
Make Model of Car Years ofManufacture
Seriousinjury rateper 100driversinvolved
Lower 95%ConfidenceLimit
Upper 95%ConfidenceLimit
Width ofConfidenceInterval
Nissan Pathfinder / Terrano / Regulus 95-05 4.63 3.37 6.34 2.97Toyota Kluger 03-07 3.45 1.91 6.23 4.32Toyota Landcruiser Prado 96-03 5.87 4.26 8.08 3.81Toyota Landcruiser Prado 03-07 4.93 3.56 6.84 3.28
Large Wheel Drive Vehicles 5.01 4.80 5.23 0.43
BMW X5 01-07 3.37 1.63 6.93 5.30Ford Bronco 82-87 6.81 3.79 12.27 8.48Ford Explorer 00-01 4.03 2.39 6.80 4.42Jeep Grand Cherokee ZG 96-99 3.82 2.23 6.54 4.31Jeep Grand Cherokee WJ/WG 99-05 5.36 3.36 8.54 5.18Land Rover Discovery 91-02 3.53 2.61 4.77 2.16Mercedes Benz M-Class W163 98-05 3.88 2.19 6.85 4.66Nissan Patrol / Safari 82-87 6.22 4.99 7.76 2.77Nissan / Ford Patrol / Maverick / Safari 88-97 5.21 4.68 5.80 1.12Nissan Patrol / Safari 98-07 5.54 4.75 6.46 1.71Land Rover Range Rover 82-94 6.13 4.49 8.37 3.88Land Rover Range Rover 95-02 3.80 1.90 7.62 5.72Toyota Landcruiser 82-89 6.55 5.93 7.25 1.32Toyota Landcruiser 90-97 6.14 5.64 6.69 1.04Toyota Landcruiser 98-07 5.74 5.05 6.53 1.48
Commercial Vehicles- Vans 4.36 4.14 4.60 0.47
Daihatsu Handivan 82-90 2.42 1.52 3.84 2.32Ford Falcon Panel Van 82-95 3.86 3.21 4.64 1.42Ford Falcon Panel Van 96-99 4.09 2.58 6.48 3.90Ford Transit 95-00 4.07 2.94 5.64 2.70Ford Transit 01-07 3.33 2.11 5.26 3.15Holden Shuttle / WFR Van 82-87 3.94 2.42 6.40 3.98Kia Pregio 02-06 4.12 2.48 6.85 4.38Mercedes Benz MB100 / MB140 99-04 4.89 2.88 8.31 5.43Mercedes Benz Vito / Viano 99-07 5.75 3.69 8.96 5.27Mercedes Benz Sprinter 98-04 5.68 3.66 8.84 5.18Honda Acty 83-86 1.64 0.70 3.86 3.16Holden / Suzuki Scurry / Carry 82-00 2.64 1.50 4.64 3.14Toyota Hiace/Liteace 82-86 5.70 4.98 6.53 1.55Toyota Hiace/Liteace 87-89 5.50 4.64 6.52 1.88Toyota Hiace/Liteace 90-95 5.67 5.02 6.39 1.37Toyota Hiace/Liteace 96-04 5.43 4.74 6.22 1.48Toyoa Hiace 05-07 4.35 2.46 7.69 5.23Volkswagen Caravelle / Transporter 88-94 4.45 2.14 9.25 7.11Volkswagen Caravelle / Transporter 95-04 6.43 4.60 8.99 4.39
Commercial Vehicles- Utes 4.03 3.89 4.16 0.27
Ford / Nissan Falcon Ute / XFN Ute 82-95 4.33 3.88 4.84 0.96Ford Falcon Ute 96-99 4.33 3.45 5.43 1.99Ford Falcon Ute AU 00-02 4.95 4.05 6.05 2.00Ford Falcon Ute BA/BF 03-07 3.82 2.81 5.19 2.37Ford Ford F-Series 82-92 6.21 4.74 8.14 3.40

Make Model of Car Years ofManufacture
Seriousinjury rateper 100driversinvolved
Lower 95%ConfidenceLimit
Upper 95%ConfidenceLimit
Width ofConfidenceInterval
Ford F-Series 01-06 5.38 2.71 10.68 7.97Holden Commodore Ute VG/VP 90-93 3.02 2.24 4.07 1.83Holden / Isuzu Rodeo / Pickup 82-85 4.81 3.37 6.87 3.50Holden / Isuzu Rodeo / Pickup 86-88 4.25 2.53 7.14 4.61Holden / Isuzu Rodeo / Pickup 89-95 5.19 4.61 5.85 1.24Holden Rodeo 96-98 4.69 3.89 5.66 1.77Holden Rodeo 99-02 5.15 4.28 6.19 1.92Holden WB Series 82-85 4.76 3.75 6.05 2.31Holden Commodore Ute VR/VS 94-00 4.54 3.99 5.16 1.17Holden Commodore VU Ute 00-02 4.28 3.24 5.65 2.41Holden Commodore VY/VZ Ute 02-07 5.00 4.09 6.10 2.01Holden Rodeo 03-07 4.59 3.66 5.77 2.12Mitsubishi Triton MK 96-06 4.71 3.34 6.64 3.30Kia Ceres 92-00 3.19 2.14 4.77 2.63Ford / Mazda Courier / B-Series / Bounty 98-02 4.13 3.24 5.26 2.02Ford / Mazda Courier / Bravo / Bounty 03-06 3.49 2.42 5.03 2.61Nissan 720 Ute 82-85 3.64 2.75 4.82 2.07Nissan Navara 86-91 4.70 4.03 5.48 1.44Nissan Navara 92-96 4.85 3.93 5.98 2.05Nissan Navara 97-05 4.33 3.48 5.38 1.91Subaru Brumby 82-92 3.96 2.94 5.31 2.37Suzuki Mighty Boy 85-88 2.19 1.08 4.42 3.34Toyota 4Runner/Hilux 82-85 5.27 4.57 6.08 1.51Toyota 4Runner/Hilux 86-88 5.03 4.35 5.83 1.48Toyota 4Runner/Hilux 89-97 4.66 4.32 5.03 0.71Toyota Hilux 98-02 5.12 4.48 5.85 1.37Toyota Hilux 03-04 4.21 3.11 5.69 2.57Toyota Hilux 05-07 4.42 3.15 6.20 3.05
Large Cars 3.25 3.18 3.32 0.14
BMW 7 Series E23 82-88 2.30 0.91 5.80 4.89BMW 7 Series E32 89-94 4.63 2.45 8.74 6.28BMW 7 Series E38 95-01 3.78 1.57 9.11 7.54Ford Falcon XE/XF 82-88 4.01 3.80 4.23 0.43Ford Fairlane Z & LTD F 82-87 3.87 3.34 4.48 1.14Ford Falcon EA / Falcon EB Series I 88-Mar 92 3.95 3.74 4.18 0.45Ford Falcon EB Series II / Falcon ED Apr 92-94 4.02 3.71 4.36 0.65Ford Fairlane N & LTD D 88-94 3.38 2.85 4.00 1.14Ford Fairlane N & LTD D 95-98 4.20 3.29 5.36 2.06Ford Fairlane & LTD AU 99-02 2.90 1.99 4.22 2.23Ford Fairlane & LTD BA/BF 03-07 2.56 1.12 5.89 4.78Ford Falcon EF/EL 94-98 3.95 3.73 4.18 0.45Ford Falcon AU 98-02 3.92 3.64 4.23 0.59Ford Taurus 96-98 4.27 2.71 6.72 4.02Ford Falcon BA/BF 02-07 3.71 3.27 4.20 0.93Holden / Toyota Commodore VN/VP / Lexcen 89-93 3.48 3.29 3.67 0.38Holden Statesman/Caprice WB 82-85 7.75 3.71 16.19 12.48Holden Stateman/Caprice VQ 90-93 3.69 2.38 5.74 3.36Holden Stateman/Caprice VR/VS 94-98 3.57 2.95 4.31 1.35Holden / Toyota Commodore VR/VS / Lexcen 93-97 3.51 3.31 3.71 0.40Holden Commodore VT/VX 97-02 4.04 3.79 4.30 0.50
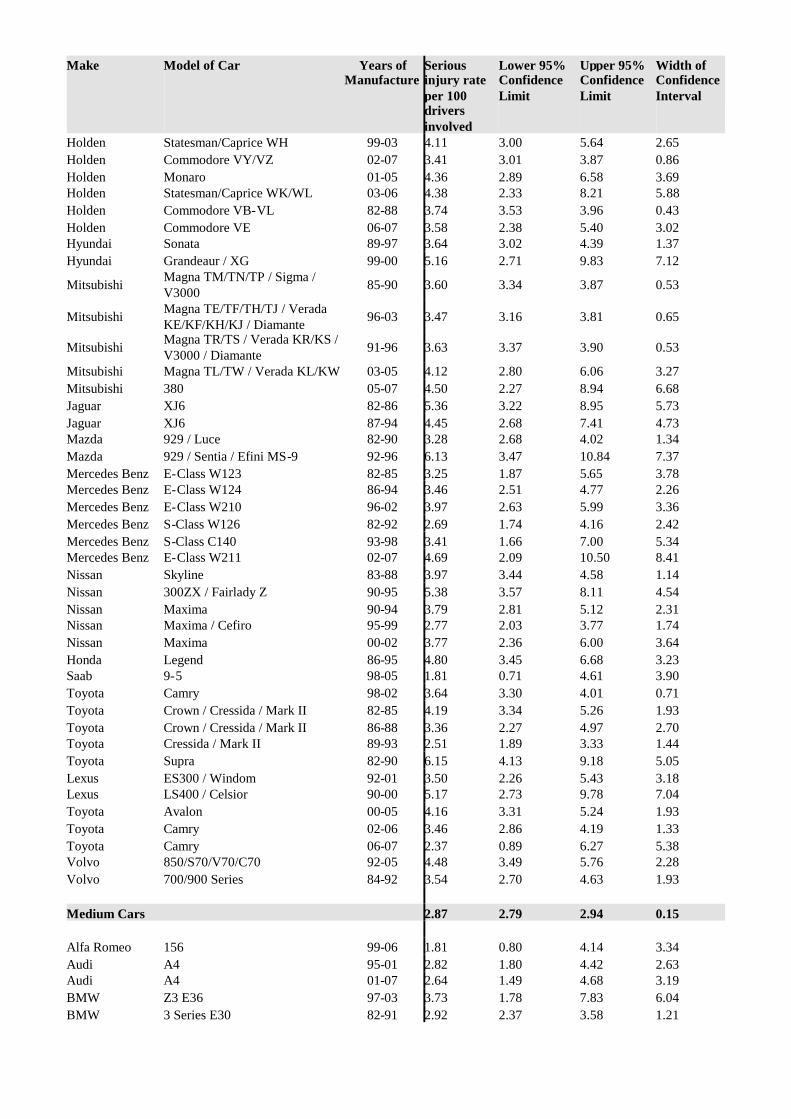
Make Model of Car Years ofManufacture
Seriousinjury rateper 100driversinvolved
Lower 95%ConfidenceLimit
Upper 95%ConfidenceLimit
Width ofConfidenceInterval
Holden Statesman/Caprice WH 99-03 4.11 3.00 5.64 2.65Holden Commodore VY/VZ 02-07 3.41 3.01 3.87 0.86Holden Monaro 01-05 4.36 2.89 6.58 3.69Holden Statesman/Caprice WK/WL 03-06 4.38 2.33 8.21 5.88Holden Commodore VB-VL 82-88 3.74 3.53 3.96 0.43Holden Commodore VE 06-07 3.58 2.38 5.40 3.02Hyundai Sonata 89-97 3.64 3.02 4.39 1.37Hyundai Grandeaur / XG 99-00 5.16 2.71 9.83 7.12
Mitsubishi Magna TM/TN/TP / Sigma /V3000 85-90 3.60 3.34 3.87 0.53
Mitsubishi Magna TE/TF/TH/TJ / VeradaKE/KF/KH/KJ / Diamante 96-03 3.47 3.16 3.81 0.65
Mitsubishi Magna TR/TS / Verada KR/KS /V3000 / Diamante 91-96 3.63 3.37 3.90 0.53
Mitsubishi Magna TL/TW / Verada KL/KW 03-05 4.12 2.80 6.06 3.27Mitsubishi 380 05-07 4.50 2.27 8.94 6.68Jaguar XJ6 82-86 5.36 3.22 8.95 5.73Jaguar XJ6 87-94 4.45 2.68 7.41 4.73Mazda 929 / Luce 82-90 3.28 2.68 4.02 1.34Mazda 929 / Sentia / Efini MS-9 92-96 6.13 3.47 10.84 7.37Mercedes Benz E-Class W123 82-85 3.25 1.87 5.65 3.78Mercedes Benz E-Class W124 86-94 3.46 2.51 4.77 2.26Mercedes Benz E-Class W210 96-02 3.97 2.63 5.99 3.36Mercedes Benz S-Class W126 82-92 2.69 1.74 4.16 2.42Mercedes Benz S-Class C140 93-98 3.41 1.66 7.00 5.34Mercedes Benz E-Class W211 02-07 4.69 2.09 10.50 8.41Nissan Skyline 83-88 3.97 3.44 4.58 1.14Nissan 300ZX / Fairlady Z 90-95 5.38 3.57 8.11 4.54Nissan Maxima 90-94 3.79 2.81 5.12 2.31Nissan Maxima / Cefiro 95-99 2.77 2.03 3.77 1.74Nissan Maxima 00-02 3.77 2.36 6.00 3.64Honda Legend 86-95 4.80 3.45 6.68 3.23Saab 9-5 98-05 1.81 0.71 4.61 3.90Toyota Camry 98-02 3.64 3.30 4.01 0.71Toyota Crown / Cressida / Mark II 82-85 4.19 3.34 5.26 1.93Toyota Crown / Cressida / Mark II 86-88 3.36 2.27 4.97 2.70Toyota Cressida / Mark II 89-93 2.51 1.89 3.33 1.44Toyota Supra 82-90 6.15 4.13 9.18 5.05Lexus ES300 / Windom 92-01 3.50 2.26 5.43 3.18Lexus LS400 / Celsior 90-00 5.17 2.73 9.78 7.04Toyota Avalon 00-05 4.16 3.31 5.24 1.93Toyota Camry 02-06 3.46 2.86 4.19 1.33Toyota Camry 06-07 2.37 0.89 6.27 5.38Volvo 850/S70/V70/C70 92-05 4.48 3.49 5.76 2.28Volvo 700/900 Series 84-92 3.54 2.70 4.63 1.93
Medium Cars 2.87 2.79 2.94 0.15
Alfa Romeo 156 99-06 1.81 0.80 4.14 3.34Audi A4 95-01 2.82 1.80 4.42 2.63Audi A4 01-07 2.64 1.49 4.68 3.19BMW Z3 E36 97-03 3.73 1.78 7.83 6.04BMW 3 Series E30 82-91 2.92 2.37 3.58 1.21
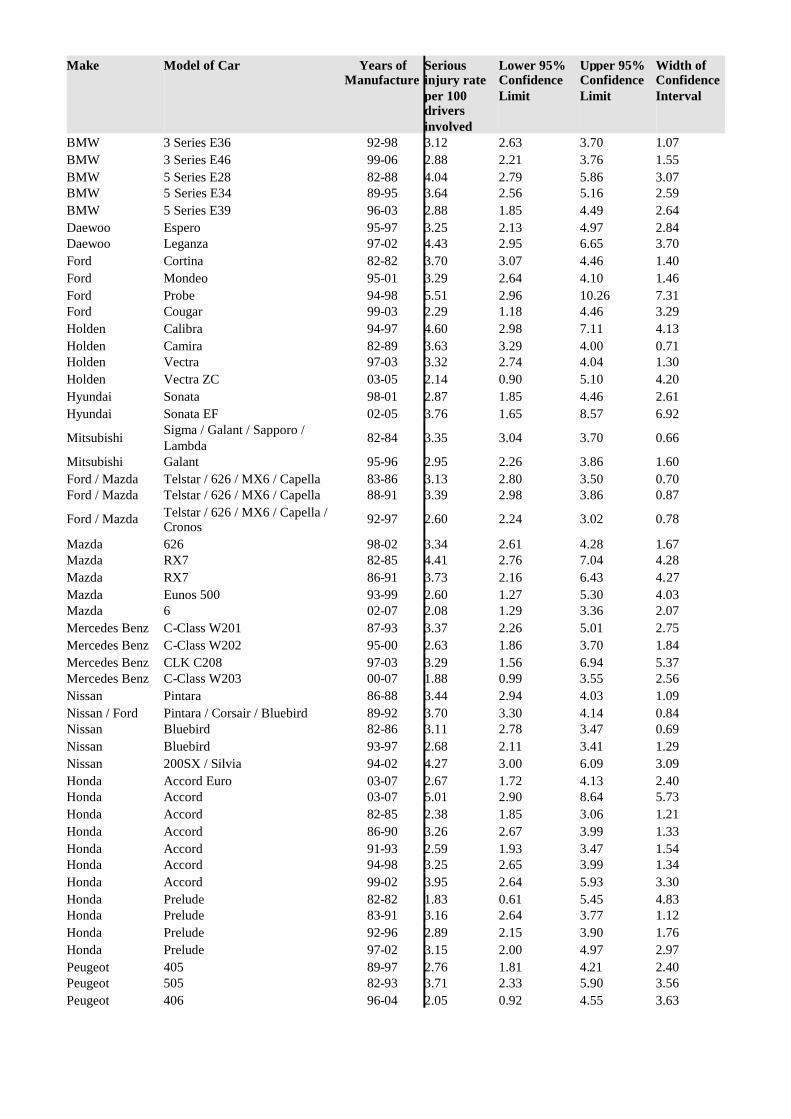
Make Model of Car Years ofManufacture
Seriousinjury rateper 100driversinvolved
Lower 95%ConfidenceLimit
Upper 95%ConfidenceLimit
Width ofConfidenceInterval
BMW 3 Series E36 92-98 3.12 2.63 3.70 1.07BMW 3 Series E46 99-06 2.88 2.21 3.76 1.55BMW 5 Series E28 82-88 4.04 2.79 5.86 3.07BMW 5 Series E34 89-95 3.64 2.56 5.16 2.59BMW 5 Series E39 96-03 2.88 1.85 4.49 2.64Daewoo Espero 95-97 3.25 2.13 4.97 2.84Daewoo Leganza 97-02 4.43 2.95 6.65 3.70Ford Cortina 82-82 3.70 3.07 4.46 1.40Ford Mondeo 95-01 3.29 2.64 4.10 1.46Ford Probe 94-98 5.51 2.96 10.26 7.31Ford Cougar 99-03 2.29 1.18 4.46 3.29Holden Calibra 94-97 4.60 2.98 7.11 4.13Holden Camira 82-89 3.63 3.29 4.00 0.71Holden Vectra 97-03 3.32 2.74 4.04 1.30Holden Vectra ZC 03-05 2.14 0.90 5.10 4.20Hyundai Sonata 98-01 2.87 1.85 4.46 2.61Hyundai Sonata EF 02-05 3.76 1.65 8.57 6.92
Mitsubishi Sigma / Galant / Sapporo /Lambda 82-84 3.35 3.04 3.70 0.66
Mitsubishi Galant 95-96 2.95 2.26 3.86 1.60Ford / Mazda Telstar / 626 / MX6 / Capella 83-86 3.13 2.80 3.50 0.70Ford / Mazda Telstar / 626 / MX6 / Capella 88-91 3.39 2.98 3.86 0.87
Ford / Mazda Telstar / 626 / MX6 / Capella /Cronos 92-97 2.60 2.24 3.02 0.78
Mazda 626 98-02 3.34 2.61 4.28 1.67Mazda RX7 82-85 4.41 2.76 7.04 4.28Mazda RX7 86-91 3.73 2.16 6.43 4.27Mazda Eunos 500 93-99 2.60 1.27 5.30 4.03Mazda 6 02-07 2.08 1.29 3.36 2.07Mercedes Benz C-Class W201 87-93 3.37 2.26 5.01 2.75Mercedes Benz C-Class W202 95-00 2.63 1.86 3.70 1.84Mercedes Benz CLK C208 97-03 3.29 1.56 6.94 5.37Mercedes Benz C-Class W203 00-07 1.88 0.99 3.55 2.56Nissan Pintara 86-88 3.44 2.94 4.03 1.09Nissan / Ford Pintara / Corsair / Bluebird 89-92 3.70 3.30 4.14 0.84Nissan Bluebird 82-86 3.11 2.78 3.47 0.69Nissan Bluebird 93-97 2.68 2.11 3.41 1.29Nissan 200SX / Silvia 94-02 4.27 3.00 6.09 3.09Honda Accord Euro 03-07 2.67 1.72 4.13 2.40Honda Accord 03-07 5.01 2.90 8.64 5.73Honda Accord 82-85 2.38 1.85 3.06 1.21Honda Accord 86-90 3.26 2.67 3.99 1.33Honda Accord 91-93 2.59 1.93 3.47 1.54Honda Accord 94-98 3.25 2.65 3.99 1.34Honda Accord 99-02 3.95 2.64 5.93 3.30Honda Prelude 82-82 1.83 0.61 5.45 4.83Honda Prelude 83-91 3.16 2.64 3.77 1.12Honda Prelude 92-96 2.89 2.15 3.90 1.76Honda Prelude 97-02 3.15 2.00 4.97 2.97Peugeot 405 89-97 2.76 1.81 4.21 2.40Peugeot 505 82-93 3.71 2.33 5.90 3.56Peugeot 406 96-04 2.05 0.92 4.55 3.63

Make Model of Car Years ofManufacture
Seriousinjury rateper 100driversinvolved
Lower 95%ConfidenceLimit
Upper 95%ConfidenceLimit
Width ofConfidenceInterval
Renault Feugo 82-87 1.75 0.73 4.16 3.42Saab 900 Series 82-92 2.03 1.27 3.24 1.97Saab 900/9-3 94-02 2.55 1.74 3.73 1.99Saab 9000 86-97 2.40 1.56 3.68 2.11
Subaru 1800 / Leone / Omega / 4WDWagon 82-93 2.61 2.23 3.05 0.83
Subaru Liberty / Legacy 89-93 3.30 2.85 3.82 0.97Subaru Liberty / Legacy / Outback 94-98 3.71 3.03 4.53 1.50Subaru Liberty / Legacy / Outback 99-03 2.72 2.09 3.54 1.45Subaru Liberty / Legacy / Outback 03-07 1.17 0.60 2.28 1.68Toyota Corona 82-88 3.41 3.12 3.71 0.59Toyota Camry 83-86 3.35 2.75 4.09 1.34Holden / Toyota Apollo JK/JL / Camry / Vista 88-92 3.57 3.33 3.83 0.50Holden / Toyota Apollo JM/JP / Camry / Sceptor 93-97 3.59 3.33 3.88 0.55Toyota Celica 81-85 3.92 3.17 4.83 1.66Toyota Celica 86-89 3.89 3.10 4.90 1.80Toyota Celica 90-93 4.23 3.41 5.24 1.83Toyota Celica 94-99 3.29 2.37 4.56 2.19Toyota Celica 00-05 3.44 1.99 5.94 3.95Lexus IS200 / IS300 99-04 2.43 1.14 5.19 4.06Volvo 200 Series 82-93 3.43 2.75 4.29 1.54Volkswagen Passat 98-06 2.88 1.53 5.40 3.86
People Movers 3.69 3.47 3.92 0.45
Chrysler Voyager 97-01 5.01 3.08 8.15 5.07Holden Zafira TT 01-05 3.20 1.48 6.91 5.42Mitsubishi Nimbus / Chariot / Spacewagon 85-91 2.50 1.51 4.13 2.62Mitsubishi Nimbus / Chariot 92-98 3.98 2.81 5.65 2.84Mitsubishi Nimbus 99-03 1.07 0.33 3.48 3.15Mitsubishi Starwagon / L300 83-86 5.16 4.31 6.17 1.86Mitsubishi Starwagon / Delica Starwagon 87-93 4.32 3.78 4.94 1.15Mitsubishi Starwagon / Delica Spacegear 95-98 4.79 3.74 6.12 2.37Mitsubishi Starwagon / Delica Spacegear 98-03 3.80 2.70 5.34 2.64Kia Carnival 99-06 6.75 4.75 9.60 4.86Mazda MPV 94-99 4.91 2.69 8.96 6.27Nissan Prairie 84-86 3.21 1.92 5.36 3.44Nissan Serena 92-95 2.47 1.28 4.78 3.50Honda Odyssey 95-00 3.99 2.72 5.86 3.15Honda Odyssey 00-02 4.72 2.37 9.37 7.00Toyota Tarago 83-89 4.27 3.63 5.02 1.39Toyota Tarago / Previa / Estima 91-99 3.83 3.14 4.68 1.54Toyota Tarago / Previa / Estima 00-06 3.93 2.57 6.03 3.46
Light Cars 2.20 2.12 2.29 0.18
Daihatsu Charade 82-86 2.75 2.09 3.62 1.53Daihatsu Charade 88-92 2.22 1.87 2.65 0.78Daihatsu Charade 93-00 2.68 2.22 3.23 1.00Daihatsu Pyzar 97-01 2.10 1.03 4.31 3.28Daihatsu Sirion / Storia 98-04 1.56 0.98 2.48 1.50Daihatsu Mira 90-96 2.48 1.65 3.72 2.07

Make Model of Car Years ofManufacture
Seriousinjury rateper 100driversinvolved
Lower 95%ConfidenceLimit
Upper 95%ConfidenceLimit
Width ofConfidenceInterval
Daewoo Matiz 99-04 2.28 1.37 3.78 2.41Daewoo Kalos 03-04 3.81 1.84 7.90 6.06Ford Festiva WD/WH/WF 94-01 2.66 2.36 2.99 0.63Ford Ka 99-02 2.82 1.57 5.06 3.49Holden Barina XC 01-06 2.98 2.26 3.94 1.68Holden Barina SB 95-00 2.84 2.41 3.34 0.93Holden Barina TK 05-07 1.86 0.73 4.74 4.01Hyundai Getz / TB 02-07 4.75 3.69 6.11 2.42Mitsubishi Mirage / Colt 82-88 2.93 2.61 3.30 0.69Ford / Mazda Festiva WA / 121 87-90 2.49 2.10 2.94 0.84Mazda 121 / Autozam Review 94-96 1.83 1.39 2.41 1.02Mazda 121 Metro / Demio 97-02 1.91 1.44 2.52 1.09Mazda 2 02-07 2.98 1.75 5.06 3.31Nissan Micra 95-97 2.76 1.75 4.35 2.59Honda Jazz / Fit 02-07 2.30 1.48 3.58 2.10Honda City 83-86 2.10 1.21 3.64 2.43Peugeot 205 87-94 1.68 0.66 4.27 3.61Peugeot 206 99-07 2.24 1.16 4.35 3.19Subaru Sherpa / Fiori / 700 / Rex 89-92 2.19 1.40 3.43 2.04Suzuki Swift 82-85 3.08 1.31 7.22 5.91Holden / Suzuki Barina / Swift / Cultus 86-88 2.51 2.04 3.07 1.03Holden / Suzuki Barina / Swift / Cultus 89-99 2.39 2.14 2.67 0.54Suzuki Hatch / Alto 82-84 3.31 2.19 5.00 2.82Suzuki Alto 85-00 4.18 2.42 7.23 4.81Suzuki Ignis 00-02 2.12 1.08 4.14 3.07Suzuki Swift 05-07 2.12 1.03 4.37 3.34Toyota Starlet 96-99 2.45 1.99 3.01 1.03Toyota Echo 99-05 2.43 2.00 2.96 0.96Toyota Yaris 05-07 1.94 1.04 3.63 2.59Volkswagen Polo 96-00 1.93 1.07 3.48 2.41
Small Cars 2.48 2.42 2.54 0.12
Alfa Romeo 33 83-92 1.84 1.03 3.27 2.24Alfa Romeo 75 86-92 4.53 2.00 10.25 8.25Audi A3/S3 97-04 3.85 2.07 7.16 5.09Chrysler Neon 96-99 1.90 1.00 3.59 2.59Daihatsu Applause 89-99 2.57 2.01 3.30 1.29Daewoo 1.5i 94-95 2.28 0.60 8.61 8.01Daewoo Cielo 95-97 2.54 2.04 3.15 1.10Daewoo Nubira 97-03 2.57 2.00 3.32 1.32Daewoo Lanos 97-03 3.37 2.84 4.02 1.18Ford Laser 91-94 2.91 2.63 3.23 0.60Ford Laser 95-97 2.87 2.39 3.45 1.06Ford Escort 82-82 2.79 2.00 3.88 1.88Ford Capri 89-94 2.61 1.90 3.60 1.70Ford Focus LR 02-05 2.71 1.84 3.99 2.15Ford Focus LS / LT 05-07 3.06 1.59 5.89 4.30Fiat Regata 84-88 3.52 1.64 7.57 5.93Holden Gemini 82-84 2.70 2.27 3.21 0.94Holden Gemini RB 86-87 2.56 1.72 3.79 2.07Holden Astra TR 96-98 2.70 1.90 3.83 1.93
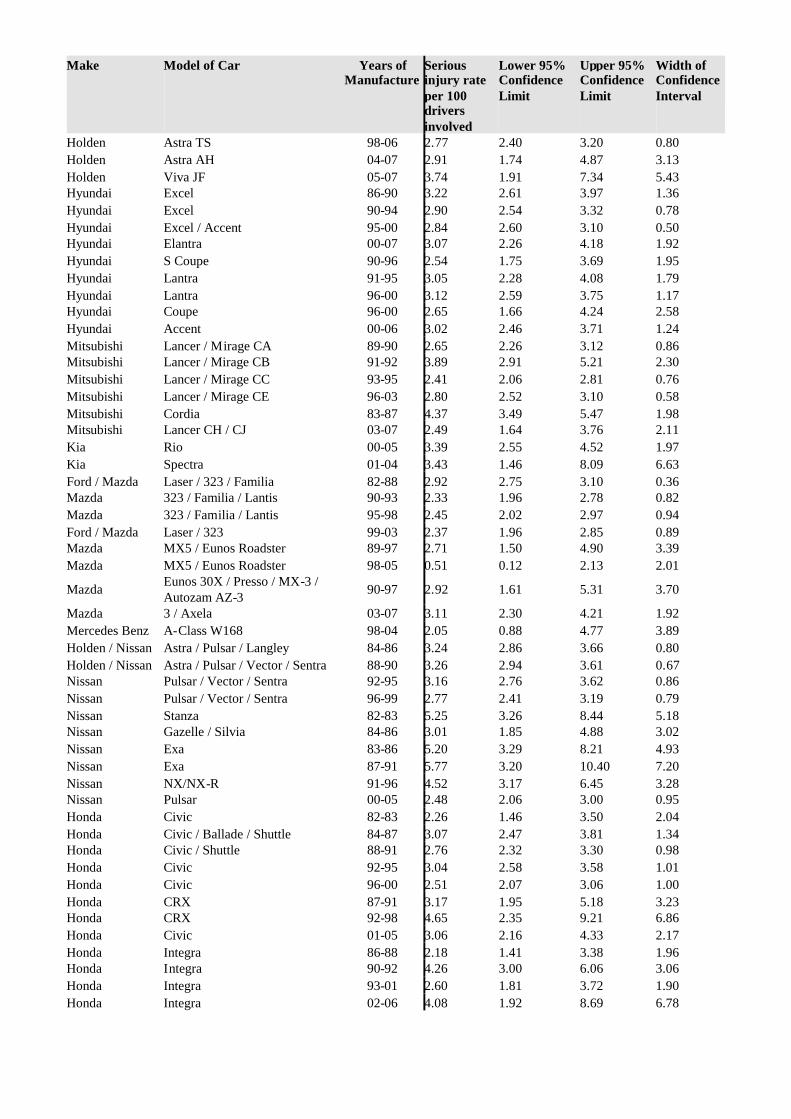
Make Model of Car Years ofManufacture
Seriousinjury rateper 100driversinvolved
Lower 95%ConfidenceLimit
Upper 95%ConfidenceLimit
Width ofConfidenceInterval
Holden Astra TS 98-06 2.77 2.40 3.20 0.80Holden Astra AH 04-07 2.91 1.74 4.87 3.13Holden Viva JF 05-07 3.74 1.91 7.34 5.43Hyundai Excel 86-90 3.22 2.61 3.97 1.36Hyundai Excel 90-94 2.90 2.54 3.32 0.78Hyundai Excel / Accent 95-00 2.84 2.60 3.10 0.50Hyundai Elantra 00-07 3.07 2.26 4.18 1.92Hyundai S Coupe 90-96 2.54 1.75 3.69 1.95Hyundai Lantra 91-95 3.05 2.28 4.08 1.79Hyundai Lantra 96-00 3.12 2.59 3.75 1.17Hyundai Coupe 96-00 2.65 1.66 4.24 2.58Hyundai Accent 00-06 3.02 2.46 3.71 1.24Mitsubishi Lancer / Mirage CA 89-90 2.65 2.26 3.12 0.86Mitsubishi Lancer / Mirage CB 91-92 3.89 2.91 5.21 2.30Mitsubishi Lancer / Mirage CC 93-95 2.41 2.06 2.81 0.76Mitsubishi Lancer / Mirage CE 96-03 2.80 2.52 3.10 0.58Mitsubishi Cordia 83-87 4.37 3.49 5.47 1.98Mitsubishi Lancer CH / CJ 03-07 2.49 1.64 3.76 2.11Kia Rio 00-05 3.39 2.55 4.52 1.97Kia Spectra 01-04 3.43 1.46 8.09 6.63Ford / Mazda Laser / 323 / Familia 82-88 2.92 2.75 3.10 0.36Mazda 323 / Familia / Lantis 90-93 2.33 1.96 2.78 0.82Mazda 323 / Familia / Lantis 95-98 2.45 2.02 2.97 0.94Ford / Mazda Laser / 323 99-03 2.37 1.96 2.85 0.89Mazda MX5 / Eunos Roadster 89-97 2.71 1.50 4.90 3.39Mazda MX5 / Eunos Roadster 98-05 0.51 0.12 2.13 2.01
Mazda Eunos 30X / Presso / MX-3 /Autozam AZ-3 90-97 2.92 1.61 5.31 3.70
Mazda 3 / Axela 03-07 3.11 2.30 4.21 1.92Mercedes Benz A-Class W168 98-04 2.05 0.88 4.77 3.89Holden / Nissan Astra / Pulsar / Langley 84-86 3.24 2.86 3.66 0.80Holden / Nissan Astra / Pulsar / Vector / Sentra 88-90 3.26 2.94 3.61 0.67Nissan Pulsar / Vector / Sentra 92-95 3.16 2.76 3.62 0.86Nissan Pulsar / Vector / Sentra 96-99 2.77 2.41 3.19 0.79Nissan Stanza 82-83 5.25 3.26 8.44 5.18Nissan Gazelle / Silvia 84-86 3.01 1.85 4.88 3.02Nissan Exa 83-86 5.20 3.29 8.21 4.93Nissan Exa 87-91 5.77 3.20 10.40 7.20Nissan NX/NX-R 91-96 4.52 3.17 6.45 3.28Nissan Pulsar 00-05 2.48 2.06 3.00 0.95Honda Civic 82-83 2.26 1.46 3.50 2.04Honda Civic / Ballade / Shuttle 84-87 3.07 2.47 3.81 1.34Honda Civic / Shuttle 88-91 2.76 2.32 3.30 0.98Honda Civic 92-95 3.04 2.58 3.58 1.01Honda Civic 96-00 2.51 2.07 3.06 1.00Honda CRX 87-91 3.17 1.95 5.18 3.23Honda CRX 92-98 4.65 2.35 9.21 6.86Honda Civic 01-05 3.06 2.16 4.33 2.17Honda Integra 86-88 2.18 1.41 3.38 1.96Honda Integra 90-92 4.26 3.00 6.06 3.06Honda Integra 93-01 2.60 1.81 3.72 1.90Honda Integra 02-06 4.08 1.92 8.69 6.78

Make Model of Car Years ofManufacture
Seriousinjury rateper 100driversinvolved
Lower 95%ConfidenceLimit
Upper 95%ConfidenceLimit
Width ofConfidenceInterval
Honda Concerto 89-93 2.69 1.70 4.24 2.54Peugeot 306 94-01 2.59 1.81 3.72 1.91Peugeot 307 01-07 1.91 0.91 4.01 3.10Proton Wira 95-96 3.57 2.56 4.98 2.41Renault 19 91-96 2.83 1.45 5.51 4.06Rover Quintet 82-86 1.26 0.41 3.87 3.47MG MGF / MG TF 99-05 1.38 0.47 4.07 3.60Subaru Impreza 93-00 3.56 3.01 4.22 1.22Subaru Impreza 01-07 2.33 1.60 3.39 1.80Suzuki Baleno / Cultus Crescent 95-02 1.47 0.95 2.26 1.31Suzuki Liana 01-07 3.89 1.95 7.78 5.83Toyota Corolla 82-84 2.55 2.27 2.88 0.61Toyota Corolla 86-88 2.94 2.68 3.24 0.56Toyota / Holden Corolla / Nova 89-93 3.05 2.83 3.29 0.46Toyota / Holden Corolla / Nova 94-97 2.56 2.31 2.83 0.52Toyota Corolla / Allex 98-01 2.91 2.46 3.44 0.98Toyota Corolla 02-07 2.81 2.40 3.29 0.89Toyota Tercel 83-88 2.81 1.57 5.04 3.47Toyota MR2 87-90 3.34 1.77 6.30 4.53Toyota Paseo / Cynos 91-99 3.17 2.30 4.36 2.06Toyota Corolla 4WD Wagon 92-96 5.27 3.26 8.52 5.26Volvo S40/V40 97-04 2.54 1.42 4.56 3.13Volkswagen Golf 82-94 4.52 2.58 7.90 5.32Volkswagen Golf 95-98 3.30 2.25 4.84 2.59Volkswagen Golf / Bora 99-04 2.48 1.76 3.51 1.75Volkswagen New Beetle 00-07 3.19 1.54 6.64 5.10Volkswagen Golf / Jetta 04-07 3.63 1.85 7.14 5.29
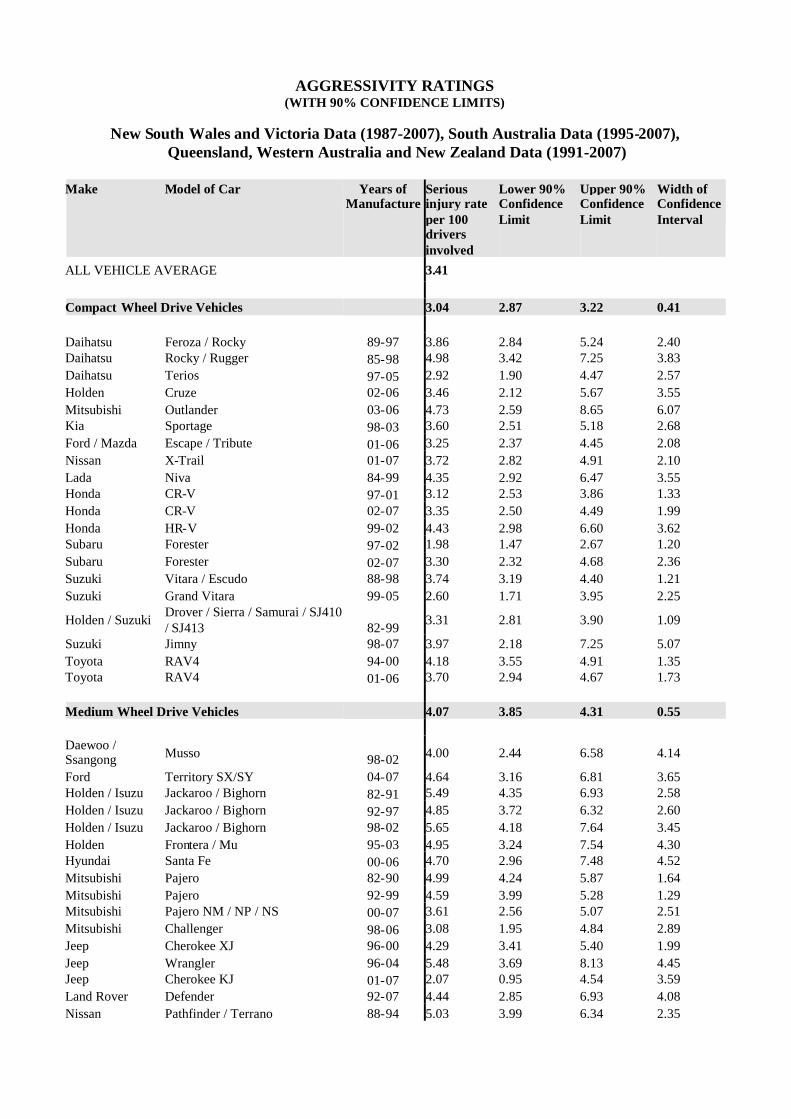
AGGRESSIVITY RATINGS(WITH 90% CONFIDENCE LIMITS)
New South Wales and Victoria Data (1987-2007), South Australia Data (1995-2007),Queensland, Western Australia and New Zealand Data (1991-2007)
Make Model of Car Years ofManufacture
Seriousinjury rateper 100driversinvolved
Lower 90%ConfidenceLimit
Upper 90%ConfidenceLimit
Width ofConfidenceInterval
ALL VEHICLE AVERAGE 3.41
Compact Wheel Drive Vehicles 3.04 2.87 3.22 0.41
Daihatsu Feroza / Rocky 89-97 3.86 2.84 5.24 2.40Daihatsu Rocky / Rugger 85-98 4.98 3.42 7.25 3.83Daihatsu Terios 97-05 2.92 1.90 4.47 2.57Holden Cruze 02-06 3.46 2.12 5.67 3.55Mitsubishi Outlander 03-06 4.73 2.59 8.65 6.07Kia Sportage 98-03 3.60 2.51 5.18 2.68Ford / Mazda Escape / Tribute 01-06 3.25 2.37 4.45 2.08Nissan X-Trail 01-07 3.72 2.82 4.91 2.10Lada Niva 84-99 4.35 2.92 6.47 3.55Honda CR-V 97-01 3.12 2.53 3.86 1.33Honda CR-V 02-07 3.35 2.50 4.49 1.99Honda HR-V 99-02 4.43 2.98 6.60 3.62Subaru Forester 97-02 1.98 1.47 2.67 1.20Subaru Forester 02-07 3.30 2.32 4.68 2.36Suzuki Vitara / Escudo 88-98 3.74 3.19 4.40 1.21Suzuki Grand Vitara 99-05 2.60 1.71 3.95 2.25
Holden / Suzuki Drover / Sierra / Samurai / SJ410/ SJ413 82-99 3.31 2.81 3.90 1.09
Suzuki Jimny 98-07 3.97 2.18 7.25 5.07Toyota RAV4 94-00 4.18 3.55 4.91 1.35Toyota RAV4 01-06 3.70 2.94 4.67 1.73
Medium Wheel Drive Vehicles 4.07 3.85 4.31 0.55
Daewoo /Ssangong Musso 98-02 4.00 2.44 6.58 4.14
Ford Territory SX/SY 04-07 4.64 3.16 6.81 3.65Holden / Isuzu Jackaroo / Bighorn 82-91 5.49 4.35 6.93 2.58Holden / Isuzu Jackaroo / Bighorn 92-97 4.85 3.72 6.32 2.60Holden / Isuzu Jackaroo / Bighorn 98-02 5.65 4.18 7.64 3.45Holden Frontera / Mu 95-03 4.95 3.24 7.54 4.30Hyundai Santa Fe 00-06 4.70 2.96 7.48 4.52Mitsubishi Pajero 82-90 4.99 4.24 5.87 1.64Mitsubishi Pajero 92-99 4.59 3.99 5.28 1.29Mitsubishi Pajero NM / NP / NS 00-07 3.61 2.56 5.07 2.51Mitsubishi Challenger 98-06 3.08 1.95 4.84 2.89Jeep Cherokee XJ 96-00 4.29 3.41 5.40 1.99Jeep Wrangler 96-04 5.48 3.69 8.13 4.45Jeep Cherokee KJ 01-07 2.07 0.95 4.54 3.59Land Rover Defender 92-07 4.44 2.85 6.93 4.08Nissan Pathfinder / Terrano 88-94 5.03 3.99 6.34 2.35
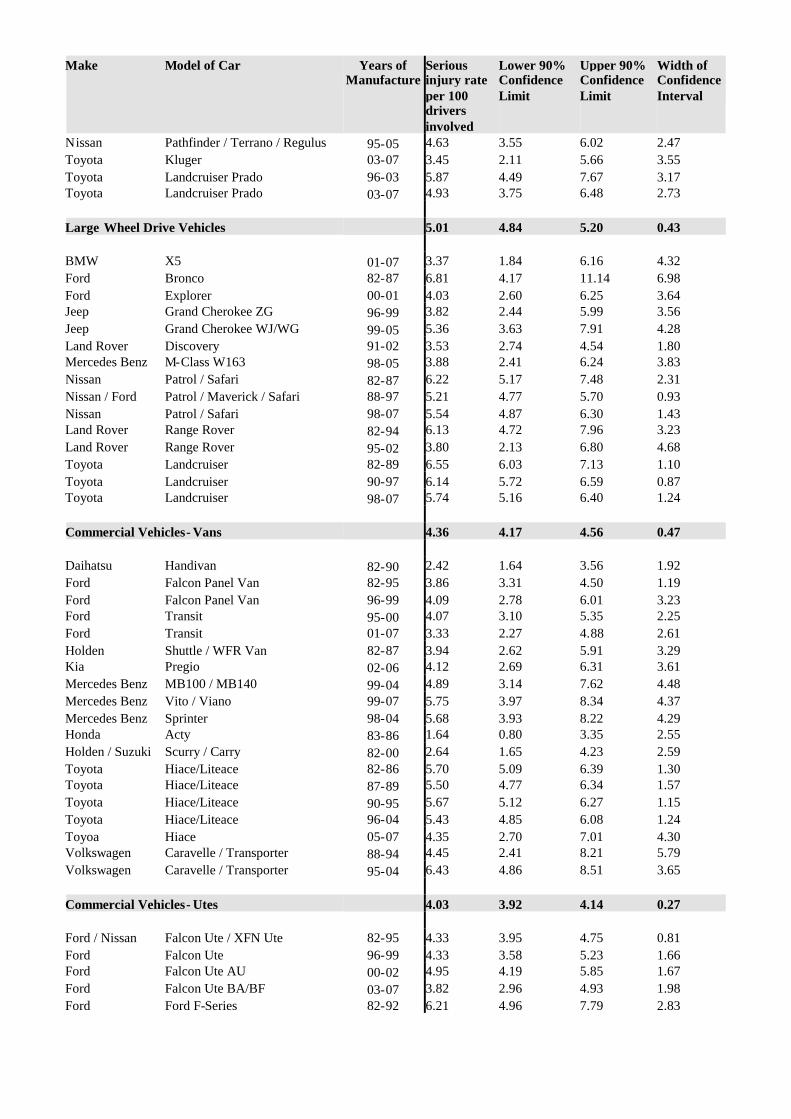
Make Model of Car Years ofManufacture
Seriousinjury rateper 100driversinvolved
Lower 90%ConfidenceLimit
Upper 90%ConfidenceLimit
Width ofConfidenceInterval
Nissan Pathfinder / Terrano / Regulus 95-05 4.63 3.55 6.02 2.47Toyota Kluger 03-07 3.45 2.11 5.66 3.55Toyota Landcruiser Prado 96-03 5.87 4.49 7.67 3.17Toyota Landcruiser Prado 03-07 4.93 3.75 6.48 2.73
Large Wheel Drive Vehicles 5.01 4.84 5.20 0.43
BMW X5 01-07 3.37 1.84 6.16 4.32Ford Bronco 82-87 6.81 4.17 11.14 6.98Ford Explorer 00-01 4.03 2.60 6.25 3.64Jeep Grand Cherokee ZG 96-99 3.82 2.44 5.99 3.56Jeep Grand Cherokee WJ/WG 99-05 5.36 3.63 7.91 4.28Land Rover Discovery 91-02 3.53 2.74 4.54 1.80Mercedes Benz M-Class W163 98-05 3.88 2.41 6.24 3.83Nissan Patrol / Safari 82-87 6.22 5.17 7.48 2.31Nissan / Ford Patrol / Maverick / Safari 88-97 5.21 4.77 5.70 0.93Nissan Patrol / Safari 98-07 5.54 4.87 6.30 1.43Land Rover Range Rover 82-94 6.13 4.72 7.96 3.23Land Rover Range Rover 95-02 3.80 2.13 6.80 4.68Toyota Landcruiser 82-89 6.55 6.03 7.13 1.10Toyota Landcruiser 90-97 6.14 5.72 6.59 0.87Toyota Landcruiser 98-07 5.74 5.16 6.40 1.24
Commercial Vehicles- Vans 4.36 4.17 4.56 0.47
Daihatsu Handivan 82-90 2.42 1.64 3.56 1.92Ford Falcon Panel Van 82-95 3.86 3.31 4.50 1.19Ford Falcon Panel Van 96-99 4.09 2.78 6.01 3.23Ford Transit 95-00 4.07 3.10 5.35 2.25Ford Transit 01-07 3.33 2.27 4.88 2.61Holden Shuttle / WFR Van 82-87 3.94 2.62 5.91 3.29Kia Pregio 02-06 4.12 2.69 6.31 3.61Mercedes Benz MB100 / MB140 99-04 4.89 3.14 7.62 4.48Mercedes Benz Vito / Viano 99-07 5.75 3.97 8.34 4.37Mercedes Benz Sprinter 98-04 5.68 3.93 8.22 4.29Honda Acty 83-86 1.64 0.80 3.35 2.55Holden / Suzuki Scurry / Carry 82-00 2.64 1.65 4.23 2.59Toyota Hiace/Liteace 82-86 5.70 5.09 6.39 1.30Toyota Hiace/Liteace 87-89 5.50 4.77 6.34 1.57Toyota Hiace/Liteace 90-95 5.67 5.12 6.27 1.15Toyota Hiace/Liteace 96-04 5.43 4.85 6.08 1.24Toyoa Hiace 05-07 4.35 2.70 7.01 4.30Volkswagen Caravelle / Transporter 88-94 4.45 2.41 8.21 5.79Volkswagen Caravelle / Transporter 95-04 6.43 4.86 8.51 3.65
Commercial Vehicles- Utes 4.03 3.92 4.14 0.27
Ford / Nissan Falcon Ute / XFN Ute 82-95 4.33 3.95 4.75 0.81Ford Falcon Ute 96-99 4.33 3.58 5.23 1.66Ford Falcon Ute AU 00-02 4.95 4.19 5.85 1.67Ford Falcon Ute BA/BF 03-07 3.82 2.96 4.93 1.98Ford Ford F-Series 82-92 6.21 4.96 7.79 2.83

Make Model of Car Years ofManufacture
Seriousinjury rateper 100driversinvolved
Lower 90%ConfidenceLimit
Upper 90%ConfidenceLimit
Width ofConfidenceInterval
Ford F-Series 01-06 5.38 3.03 9.55 6.52Holden Commodore Ute VG/VP 90-93 3.02 2.36 3.88 1.52Holden / Isuzu Rodeo / Pickup 82-85 4.81 3.57 6.48 2.91Holden / Isuzu Rodeo / Pickup 86-88 4.25 2.75 6.56 3.80Holden / Isuzu Rodeo / Pickup 89-95 5.19 4.70 5.73 1.04Holden Rodeo 96-98 4.69 4.01 5.49 1.48Holden Rodeo 99-02 5.15 4.41 6.01 1.60Holden WB Series 82-85 4.76 3.90 5.82 1.92Holden Commodore Ute VR/VS 94-00 4.54 4.07 5.05 0.98Holden Commodore VU Ute 00-02 4.28 3.39 5.40 2.01Holden Commodore VY/VZ Ute 02-07 5.00 4.23 5.90 1.67Holden Rodeo 03-07 4.59 3.80 5.56 1.77Mitsubishi Triton MK 96-06 4.71 3.54 6.28 2.75Kia Ceres 92-00 3.19 2.28 4.47 2.18Ford / Mazda Courier / B-Series / Bounty 98-02 4.13 3.37 5.06 1.69Ford / Mazda Courier / Bravo / Bounty 03-06 3.49 2.57 4.74 2.17Nissan 720 Ute 82-85 3.64 2.88 4.61 1.73Nissan Navara 86-91 4.70 4.14 5.34 1.20Nissan Navara 92-96 4.85 4.07 5.78 1.71Nissan Navara 97-05 4.33 3.60 5.20 1.59Subaru Brumby 82-92 3.96 3.09 5.06 1.97Suzuki Mighty Boy 85-88 2.19 1.22 3.94 2.72Toyota 4Runner/Hilux 82-85 5.27 4.68 5.94 1.26Toyota 4Runner/Hilux 86-88 5.03 4.45 5.69 1.24Toyota 4Runner/Hilux 89-97 4.66 4.37 4.96 0.59Toyota Hilux 98-02 5.12 4.58 5.72 1.15Toyota Hilux 03-04 4.21 3.27 5.41 2.14Toyota Hilux 05-07 4.42 3.33 5.87 2.54
Large Cars 3.25 3.19 3.31 0.14
BMW 7 Series E23 82-88 2.30 1.06 4.99 3.93BMW 7 Series E32 89-94 4.63 2.72 7.88 5.16BMW 7 Series E38 95-01 3.78 1.81 7.89 6.08Ford Falcon XE/XF 82-88 4.01 3.84 4.19 0.36Ford Fairlane Z & LTD F 82-87 3.87 3.42 4.37 0.95Ford Falcon EA / Falcon EB Series I 88-Mar 92 3.95 3.77 4.15 0.37Ford Falcon EB Series II / Falcon ED Apr 92-94 4.02 3.76 4.30 0.54Ford Fairlane N & LTD D 88-94 3.38 2.93 3.89 0.95Ford Fairlane N & LTD D 95-98 4.20 3.43 5.15 1.72Ford Fairlane & LTD AU 99-02 2.90 2.11 3.97 1.86Ford Fairlane & LTD BA/BF 03-07 2.56 1.28 5.15 3.87Ford Falcon EF/EL 94-98 3.95 3.76 4.14 0.38Ford Falcon AU 98-02 3.92 3.68 4.18 0.49Ford Taurus 96-98 4.27 2.91 6.24 3.33Ford Falcon BA/BF 02-07 3.71 3.34 4.12 0.78Holden / Toyota Commodore VN/VP / Lexcen 89-93 3.48 3.32 3.64 0.32Holden Statesman/Caprice WB 82-85 7.75 4.18 14.35 10.17Holden Stateman/Caprice VQ 90-93 3.69 2.55 5.34 2.79Holden Stateman/Caprice VR/VS 94-98 3.57 3.05 4.17 1.13Holden / Toyota Commodore VR/VS / Lexcen 93-97 3.51 3.34 3.68 0.34Holden Commodore VT/VX 97-02 4.04 3.83 4.25 0.42
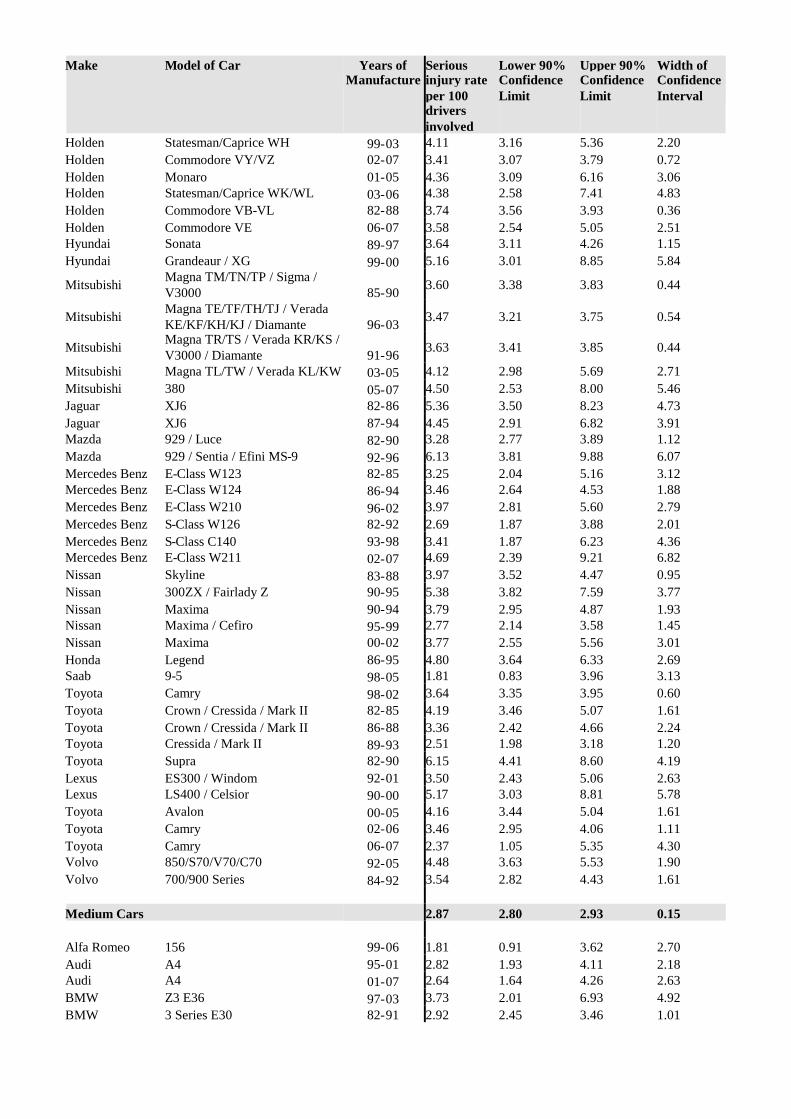
Make Model of Car Years ofManufacture
Seriousinjury rateper 100driversinvolved
Lower 90%ConfidenceLimit
Upper 90%ConfidenceLimit
Width ofConfidenceInterval
Holden Statesman/Caprice WH 99-03 4.11 3.16 5.36 2.20Holden Commodore VY/VZ 02-07 3.41 3.07 3.79 0.72Holden Monaro 01-05 4.36 3.09 6.16 3.06Holden Statesman/Caprice WK/WL 03-06 4.38 2.58 7.41 4.83Holden Commodore VB-VL 82-88 3.74 3.56 3.93 0.36Holden Commodore VE 06-07 3.58 2.54 5.05 2.51Hyundai Sonata 89-97 3.64 3.11 4.26 1.15Hyundai Grandeaur / XG 99-00 5.16 3.01 8.85 5.84
Mitsubishi Magna TM/TN/TP / Sigma /V3000 85-90 3.60 3.38 3.83 0.44
Mitsubishi Magna TE/TF/TH/TJ / VeradaKE/KF/KH/KJ / Diamante 96-03 3.47 3.21 3.75 0.54
Mitsubishi Magna TR/TS / Verada KR/KS /V3000 / Diamante 91-96 3.63 3.41 3.85 0.44
Mitsubishi Magna TL/TW / Verada KL/KW 03-05 4.12 2.98 5.69 2.71Mitsubishi 380 05-07 4.50 2.53 8.00 5.46Jaguar XJ6 82-86 5.36 3.50 8.23 4.73Jaguar XJ6 87-94 4.45 2.91 6.82 3.91Mazda 929 / Luce 82-90 3.28 2.77 3.89 1.12Mazda 929 / Sentia / Efini MS-9 92-96 6.13 3.81 9.88 6.07Mercedes Benz E-Class W123 82-85 3.25 2.04 5.16 3.12Mercedes Benz E-Class W124 86-94 3.46 2.64 4.53 1.88Mercedes Benz E-Class W210 96-02 3.97 2.81 5.60 2.79Mercedes Benz S-Class W126 82-92 2.69 1.87 3.88 2.01Mercedes Benz S-Class C140 93-98 3.41 1.87 6.23 4.36Mercedes Benz E-Class W211 02-07 4.69 2.39 9.21 6.82Nissan Skyline 83-88 3.97 3.52 4.47 0.95Nissan 300ZX / Fairlady Z 90-95 5.38 3.82 7.59 3.77Nissan Maxima 90-94 3.79 2.95 4.87 1.93Nissan Maxima / Cefiro 95-99 2.77 2.14 3.58 1.45Nissan Maxima 00-02 3.77 2.55 5.56 3.01Honda Legend 86-95 4.80 3.64 6.33 2.69Saab 9-5 98-05 1.81 0.83 3.96 3.13Toyota Camry 98-02 3.64 3.35 3.95 0.60Toyota Crown / Cressida / Mark II 82-85 4.19 3.46 5.07 1.61Toyota Crown / Cressida / Mark II 86-88 3.36 2.42 4.66 2.24Toyota Cressida / Mark II 89-93 2.51 1.98 3.18 1.20Toyota Supra 82-90 6.15 4.41 8.60 4.19Lexus ES300 / Windom 92-01 3.50 2.43 5.06 2.63Lexus LS400 / Celsior 90-00 5.17 3.03 8.81 5.78Toyota Avalon 00-05 4.16 3.44 5.04 1.61Toyota Camry 02-06 3.46 2.95 4.06 1.11Toyota Camry 06-07 2.37 1.05 5.35 4.30Volvo 850/S70/V70/C70 92-05 4.48 3.63 5.53 1.90Volvo 700/900 Series 84-92 3.54 2.82 4.43 1.61
Medium Cars 2.87 2.80 2.93 0.15
Alfa Romeo 156 99-06 1.81 0.91 3.62 2.70Audi A4 95-01 2.82 1.93 4.11 2.18Audi A4 01-07 2.64 1.64 4.26 2.63BMW Z3 E36 97-03 3.73 2.01 6.93 4.92BMW 3 Series E30 82-91 2.92 2.45 3.46 1.01
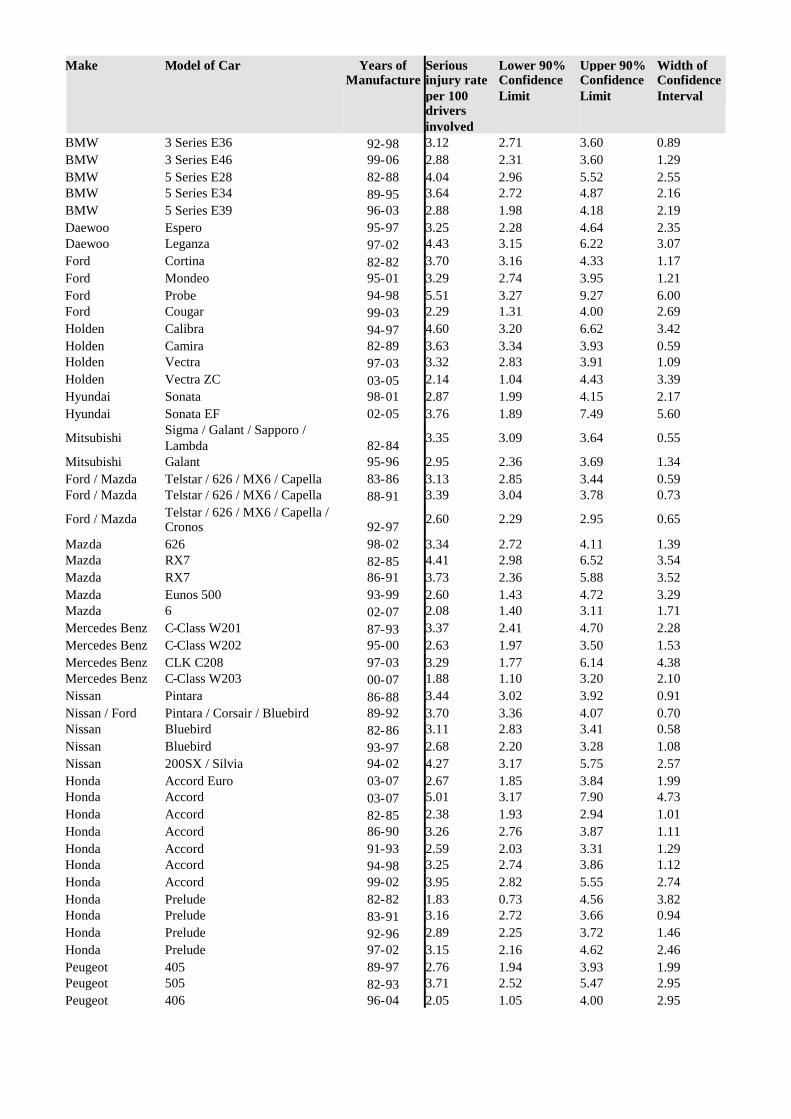
Make Model of Car Years ofManufacture
Seriousinjury rateper 100driversinvolved
Lower 90%ConfidenceLimit
Upper 90%ConfidenceLimit
Width ofConfidenceInterval
BMW 3 Series E36 92-98 3.12 2.71 3.60 0.89BMW 3 Series E46 99-06 2.88 2.31 3.60 1.29BMW 5 Series E28 82-88 4.04 2.96 5.52 2.55BMW 5 Series E34 89-95 3.64 2.72 4.87 2.16BMW 5 Series E39 96-03 2.88 1.98 4.18 2.19Daewoo Espero 95-97 3.25 2.28 4.64 2.35Daewoo Leganza 97-02 4.43 3.15 6.22 3.07Ford Cortina 82-82 3.70 3.16 4.33 1.17Ford Mondeo 95-01 3.29 2.74 3.95 1.21Ford Probe 94-98 5.51 3.27 9.27 6.00Ford Cougar 99-03 2.29 1.31 4.00 2.69Holden Calibra 94-97 4.60 3.20 6.62 3.42Holden Camira 82-89 3.63 3.34 3.93 0.59Holden Vectra 97-03 3.32 2.83 3.91 1.09Holden Vectra ZC 03-05 2.14 1.04 4.43 3.39Hyundai Sonata 98-01 2.87 1.99 4.15 2.17Hyundai Sonata EF 02-05 3.76 1.89 7.49 5.60
Mitsubishi Sigma / Galant / Sapporo /Lambda 82-84 3.35 3.09 3.64 0.55
Mitsubishi Galant 95-96 2.95 2.36 3.69 1.34Ford / Mazda Telstar / 626 / MX6 / Capella 83-86 3.13 2.85 3.44 0.59Ford / Mazda Telstar / 626 / MX6 / Capella 88-91 3.39 3.04 3.78 0.73
Ford / Mazda Telstar / 626 / MX6 / Capella /Cronos 92-97 2.60 2.29 2.95 0.65
Mazda 626 98-02 3.34 2.72 4.11 1.39Mazda RX7 82-85 4.41 2.98 6.52 3.54Mazda RX7 86-91 3.73 2.36 5.88 3.52Mazda Eunos 500 93-99 2.60 1.43 4.72 3.29Mazda 6 02-07 2.08 1.40 3.11 1.71Mercedes Benz C-Class W201 87-93 3.37 2.41 4.70 2.28Mercedes Benz C-Class W202 95-00 2.63 1.97 3.50 1.53Mercedes Benz CLK C208 97-03 3.29 1.77 6.14 4.38Mercedes Benz C-Class W203 00-07 1.88 1.10 3.20 2.10Nissan Pintara 86-88 3.44 3.02 3.92 0.91Nissan / Ford Pintara / Corsair / Bluebird 89-92 3.70 3.36 4.07 0.70Nissan Bluebird 82-86 3.11 2.83 3.41 0.58Nissan Bluebird 93-97 2.68 2.20 3.28 1.08Nissan 200SX / Silvia 94-02 4.27 3.17 5.75 2.57Honda Accord Euro 03-07 2.67 1.85 3.84 1.99Honda Accord 03-07 5.01 3.17 7.90 4.73Honda Accord 82-85 2.38 1.93 2.94 1.01Honda Accord 86-90 3.26 2.76 3.87 1.11Honda Accord 91-93 2.59 2.03 3.31 1.29Honda Accord 94-98 3.25 2.74 3.86 1.12Honda Accord 99-02 3.95 2.82 5.55 2.74Honda Prelude 82-82 1.83 0.73 4.56 3.82Honda Prelude 83-91 3.16 2.72 3.66 0.94Honda Prelude 92-96 2.89 2.25 3.72 1.46Honda Prelude 97-02 3.15 2.16 4.62 2.46Peugeot 405 89-97 2.76 1.94 3.93 1.99Peugeot 505 82-93 3.71 2.52 5.47 2.95Peugeot 406 96-04 2.05 1.05 4.00 2.95
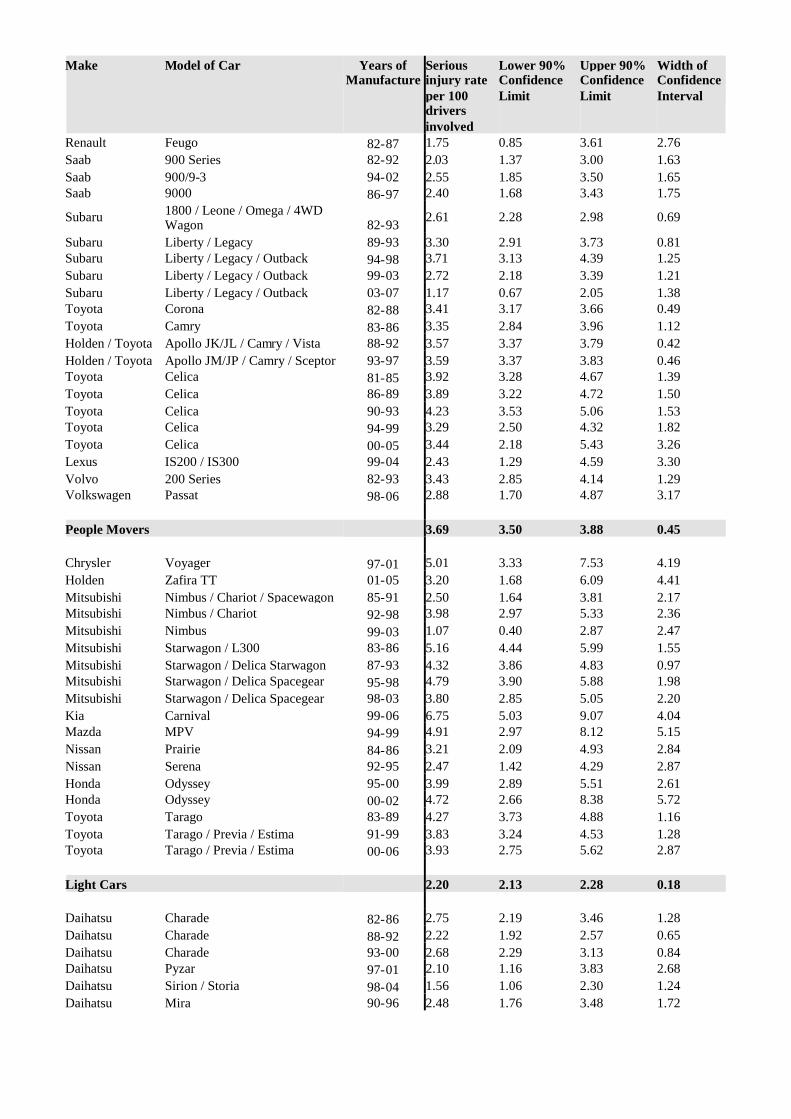
Make Model of Car Years ofManufacture
Seriousinjury rateper 100driversinvolved
Lower 90%ConfidenceLimit
Upper 90%ConfidenceLimit
Width ofConfidenceInterval
Renault Feugo 82-87 1.75 0.85 3.61 2.76Saab 900 Series 82-92 2.03 1.37 3.00 1.63Saab 900/9-3 94-02 2.55 1.85 3.50 1.65Saab 9000 86-97 2.40 1.68 3.43 1.75
Subaru 1800 / Leone / Omega / 4WDWagon 82-93 2.61 2.28 2.98 0.69
Subaru Liberty / Legacy 89-93 3.30 2.91 3.73 0.81Subaru Liberty / Legacy / Outback 94-98 3.71 3.13 4.39 1.25Subaru Liberty / Legacy / Outback 99-03 2.72 2.18 3.39 1.21Subaru Liberty / Legacy / Outback 03-07 1.17 0.67 2.05 1.38Toyota Corona 82-88 3.41 3.17 3.66 0.49Toyota Camry 83-86 3.35 2.84 3.96 1.12Holden / Toyota Apollo JK/JL / Camry / Vista 88-92 3.57 3.37 3.79 0.42Holden / Toyota Apollo JM/JP / Camry / Sceptor 93-97 3.59 3.37 3.83 0.46Toyota Celica 81-85 3.92 3.28 4.67 1.39Toyota Celica 86-89 3.89 3.22 4.72 1.50Toyota Celica 90-93 4.23 3.53 5.06 1.53Toyota Celica 94-99 3.29 2.50 4.32 1.82Toyota Celica 00-05 3.44 2.18 5.43 3.26Lexus IS200 / IS300 99-04 2.43 1.29 4.59 3.30Volvo 200 Series 82-93 3.43 2.85 4.14 1.29Volkswagen Passat 98-06 2.88 1.70 4.87 3.17
People Movers 3.69 3.50 3.88 0.45
Chrysler Voyager 97-01 5.01 3.33 7.53 4.19Holden Zafira TT 01-05 3.20 1.68 6.09 4.41Mitsubishi Nimbus / Chariot / Spacewagon 85-91 2.50 1.64 3.81 2.17Mitsubishi Nimbus / Chariot 92-98 3.98 2.97 5.33 2.36Mitsubishi Nimbus 99-03 1.07 0.40 2.87 2.47Mitsubishi Starwagon / L300 83-86 5.16 4.44 5.99 1.55Mitsubishi Starwagon / Delica Starwagon 87-93 4.32 3.86 4.83 0.97Mitsubishi Starwagon / Delica Spacegear 95-98 4.79 3.90 5.88 1.98Mitsubishi Starwagon / Delica Spacegear 98-03 3.80 2.85 5.05 2.20Kia Carnival 99-06 6.75 5.03 9.07 4.04Mazda MPV 94-99 4.91 2.97 8.12 5.15Nissan Prairie 84-86 3.21 2.09 4.93 2.84Nissan Serena 92-95 2.47 1.42 4.29 2.87Honda Odyssey 95-00 3.99 2.89 5.51 2.61Honda Odyssey 00-02 4.72 2.66 8.38 5.72Toyota Tarago 83-89 4.27 3.73 4.88 1.16Toyota Tarago / Previa / Estima 91-99 3.83 3.24 4.53 1.28Toyota Tarago / Previa / Estima 00-06 3.93 2.75 5.62 2.87
Light Cars 2.20 2.13 2.28 0.18
Daihatsu Charade 82-86 2.75 2.19 3.46 1.28Daihatsu Charade 88-92 2.22 1.92 2.57 0.65Daihatsu Charade 93-00 2.68 2.29 3.13 0.84Daihatsu Pyzar 97-01 2.10 1.16 3.83 2.68Daihatsu Sirion / Storia 98-04 1.56 1.06 2.30 1.24Daihatsu Mira 90-96 2.48 1.76 3.48 1.72

Make Model of Car Years ofManufacture
Seriousinjury rateper 100driversinvolved
Lower 90%ConfidenceLimit
Upper 90%ConfidenceLimit
Width ofConfidenceInterval
Daewoo Matiz 99-04 2.28 1.49 3.48 1.99Daewoo Kalos 03-04 3.81 2.07 7.01 4.94Ford Festiva WD/WH/WF 94-01 2.66 2.41 2.93 0.52Ford Ka 99-02 2.82 1.73 4.60 2.87Holden Barina XC 01-06 2.98 2.37 3.77 1.40Holden Barina SB 95-00 2.84 2.47 3.25 0.78Holden Barina TK 05-07 1.86 0.85 4.07 3.22Hyundai Getz / TB 02-07 4.75 3.84 5.86 2.02Mitsubishi Mirage / Colt 82-88 2.93 2.66 3.23 0.57Ford / Mazda Festiva WA / 121 87-90 2.49 2.16 2.86 0.70Mazda 121 / Autozam Review 94-96 1.83 1.45 2.30 0.85Mazda 121 Metro / Demio 97-02 1.91 1.51 2.41 0.91Mazda 2 02-07 2.98 1.91 4.64 2.73Nissan Micra 95-97 2.76 1.89 4.04 2.15Honda Jazz / Fit 02-07 2.30 1.59 3.33 1.74Honda City 83-86 2.10 1.33 3.33 2.00Peugeot 205 87-94 1.68 0.77 3.67 2.90Peugeot 206 99-07 2.24 1.29 3.90 2.61Subaru Sherpa / Fiori / 700 / Rex 89-92 2.19 1.50 3.19 1.69Suzuki Swift 82-85 3.08 1.51 6.28 4.77Holden / Suzuki Barina / Swift / Cultus 86-88 2.51 2.11 2.97 0.86Holden / Suzuki Barina / Swift / Cultus 89-99 2.39 2.18 2.62 0.45Suzuki Hatch / Alto 82-84 3.31 2.34 4.68 2.34Suzuki Alto 85-00 4.18 2.65 6.61 3.97Suzuki Ignis 00-02 2.12 1.20 3.71 2.51Suzuki Swift 05-07 2.12 1.16 3.88 2.72Toyota Starlet 96-99 2.45 2.05 2.91 0.86Toyota Echo 99-05 2.43 2.06 2.87 0.80Toyota Yaris 05-07 1.94 1.15 3.28 2.13Volkswagen Polo 96-00 1.93 1.18 3.16 1.98
Small Cars 2.48 2.43 2.53 0.12
Alfa Romeo 33 83-92 1.84 1.14 2.98 1.84Alfa Romeo 75 86-92 4.53 2.29 8.97 6.68Audi A3/S3 97-04 3.85 2.29 6.47 4.18Chrysler Neon 96-99 1.90 1.11 3.23 2.12Daihatsu Applause 89-99 2.57 2.09 3.17 1.08Daewoo 1.5i 94-95 2.28 0.75 6.93 6.18Daewoo Cielo 95-97 2.54 2.12 3.04 0.92Daewoo Nubira 97-03 2.57 2.08 3.18 1.10Daewoo Lanos 97-03 3.37 2.92 3.90 0.99Ford Laser 91-94 2.91 2.67 3.17 0.50Ford Laser 95-97 2.87 2.46 3.34 0.88Ford Escort 82-82 2.79 2.11 3.68 1.57Ford Capri 89-94 2.61 2.00 3.41 1.41Ford Focus LR 02-05 2.71 1.96 3.75 1.79Ford Focus LS / LT 05-07 3.06 1.77 5.29 3.52Fiat Regata 84-88 3.52 1.85 6.68 4.82Holden Gemini 82-84 2.70 2.34 3.12 0.78Holden Gemini RB 86-87 2.56 1.84 3.56 1.72Holden Astra TR 96-98 2.70 2.01 3.62 1.60
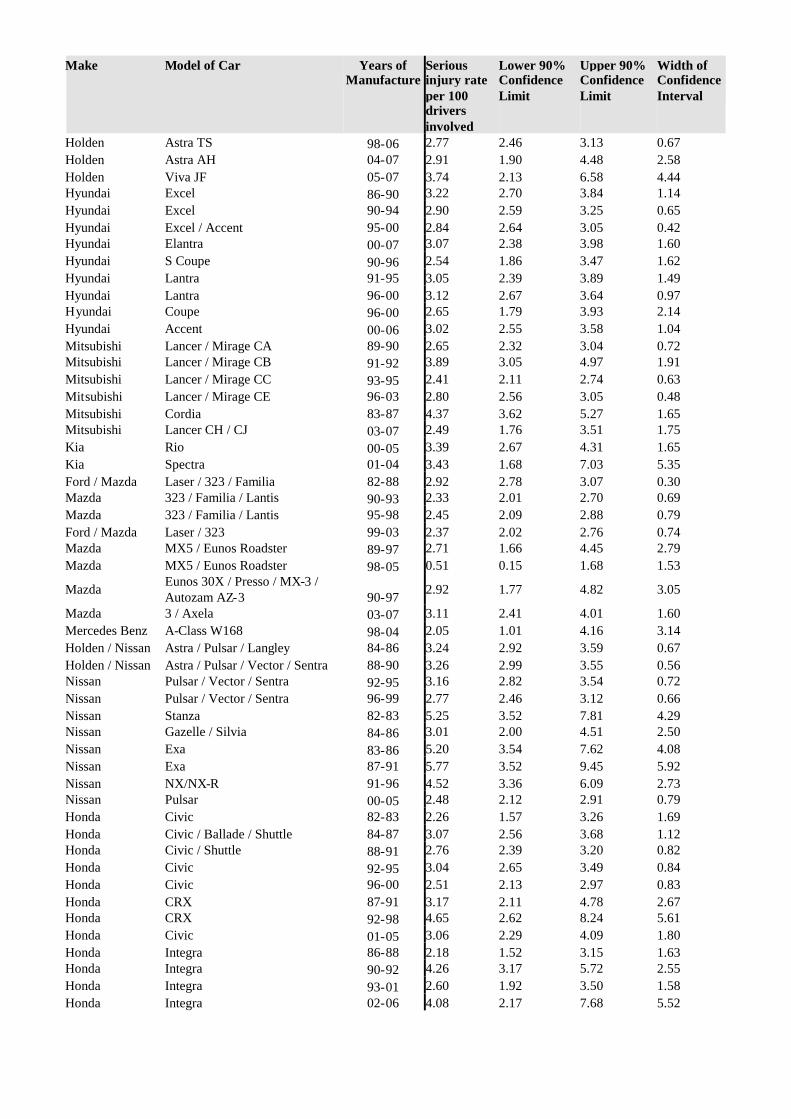
Make Model of Car Years ofManufacture
Seriousinjury rateper 100driversinvolved
Lower 90%ConfidenceLimit
Upper 90%ConfidenceLimit
Width ofConfidenceInterval
Holden Astra TS 98-06 2.77 2.46 3.13 0.67Holden Astra AH 04-07 2.91 1.90 4.48 2.58Holden Viva JF 05-07 3.74 2.13 6.58 4.44Hyundai Excel 86-90 3.22 2.70 3.84 1.14Hyundai Excel 90-94 2.90 2.59 3.25 0.65Hyundai Excel / Accent 95-00 2.84 2.64 3.05 0.42Hyundai Elantra 00-07 3.07 2.38 3.98 1.60Hyundai S Coupe 90-96 2.54 1.86 3.47 1.62Hyundai Lantra 91-95 3.05 2.39 3.89 1.49Hyundai Lantra 96-00 3.12 2.67 3.64 0.97Hyundai Coupe 96-00 2.65 1.79 3.93 2.14Hyundai Accent 00-06 3.02 2.55 3.58 1.04Mitsubishi Lancer / Mirage CA 89-90 2.65 2.32 3.04 0.72Mitsubishi Lancer / Mirage CB 91-92 3.89 3.05 4.97 1.91Mitsubishi Lancer / Mirage CC 93-95 2.41 2.11 2.74 0.63Mitsubishi Lancer / Mirage CE 96-03 2.80 2.56 3.05 0.48Mitsubishi Cordia 83-87 4.37 3.62 5.27 1.65Mitsubishi Lancer CH / CJ 03-07 2.49 1.76 3.51 1.75Kia Rio 00-05 3.39 2.67 4.31 1.65Kia Spectra 01-04 3.43 1.68 7.03 5.35Ford / Mazda Laser / 323 / Familia 82-88 2.92 2.78 3.07 0.30Mazda 323 / Familia / Lantis 90-93 2.33 2.01 2.70 0.69Mazda 323 / Familia / Lantis 95-98 2.45 2.09 2.88 0.79Ford / Mazda Laser / 323 99-03 2.37 2.02 2.76 0.74Mazda MX5 / Eunos Roadster 89-97 2.71 1.66 4.45 2.79Mazda MX5 / Eunos Roadster 98-05 0.51 0.15 1.68 1.53
Mazda Eunos 30X / Presso / MX-3 /Autozam AZ-3 90-97 2.92 1.77 4.82 3.05
Mazda 3 / Axela 03-07 3.11 2.41 4.01 1.60Mercedes Benz A-Class W168 98-04 2.05 1.01 4.16 3.14Holden / Nissan Astra / Pulsar / Langley 84-86 3.24 2.92 3.59 0.67Holden / Nissan Astra / Pulsar / Vector / Sentra 88-90 3.26 2.99 3.55 0.56Nissan Pulsar / Vector / Sentra 92-95 3.16 2.82 3.54 0.72Nissan Pulsar / Vector / Sentra 96-99 2.77 2.46 3.12 0.66Nissan Stanza 82-83 5.25 3.52 7.81 4.29Nissan Gazelle / Silvia 84-86 3.01 2.00 4.51 2.50Nissan Exa 83-86 5.20 3.54 7.62 4.08Nissan Exa 87-91 5.77 3.52 9.45 5.92Nissan NX/NX-R 91-96 4.52 3.36 6.09 2.73Nissan Pulsar 00-05 2.48 2.12 2.91 0.79Honda Civic 82-83 2.26 1.57 3.26 1.69Honda Civic / Ballade / Shuttle 84-87 3.07 2.56 3.68 1.12Honda Civic / Shuttle 88-91 2.76 2.39 3.20 0.82Honda Civic 92-95 3.04 2.65 3.49 0.84Honda Civic 96-00 2.51 2.13 2.97 0.83Honda CRX 87-91 3.17 2.11 4.78 2.67Honda CRX 92-98 4.65 2.62 8.24 5.61Honda Civic 01-05 3.06 2.29 4.09 1.80Honda Integra 86-88 2.18 1.52 3.15 1.63Honda Integra 90-92 4.26 3.17 5.72 2.55Honda Integra 93-01 2.60 1.92 3.50 1.58Honda Integra 02-06 4.08 2.17 7.68 5.52

Make Model of Car Years ofManufacture
Seriousinjury rateper 100driversinvolved
Lower 90%ConfidenceLimit
Upper 90%ConfidenceLimit
Width ofConfidenceInterval
Honda Concerto 89-93 2.69 1.83 3.94 2.10Peugeot 306 94-01 2.59 1.92 3.50 1.59Peugeot 307 01-07 1.91 1.03 3.56 2.52Proton Wira 95-96 3.57 2.71 4.71 2.01Renault 19 91-96 2.83 1.62 4.94 3.32Rover Quintet 82-86 1.26 0.49 3.22 2.73MG MGF / MG TF 99-05 1.38 0.56 3.41 2.85Subaru Impreza 93-00 3.56 3.09 4.11 1.02Subaru Impreza 01-07 2.33 1.70 3.19 1.49Suzuki Baleno / Cultus Crescent 95-02 1.47 1.02 2.11 1.09Suzuki Liana 01-07 3.89 2.18 6.95 4.77Toyota Corolla 82-84 2.55 2.31 2.82 0.51Toyota Corolla 86-88 2.94 2.72 3.19 0.47Toyota / Holden Corolla / Nova 89-93 3.05 2.87 3.25 0.39Toyota / Holden Corolla / Nova 94-97 2.56 2.35 2.79 0.44Toyota Corolla / Allex 98-01 2.91 2.53 3.35 0.82Toyota Corolla 02-07 2.81 2.46 3.21 0.74Toyota Tercel 83-88 2.81 1.73 4.58 2.86Toyota MR2 87-90 3.34 1.96 5.68 3.72Toyota Paseo / Cynos 91-99 3.17 2.42 4.14 1.72Toyota Corolla 4WD Wagon 92-96 5.27 3.52 7.88 4.35Volvo S40/V40 97-04 2.54 1.56 4.14 2.58Volkswagen Golf 82-94 4.52 2.83 7.21 4.38Volkswagen Golf 95-98 3.30 2.39 4.55 2.15Volkswagen Golf / Bora 99-04 2.48 1.86 3.32 1.46Volkswagen New Beetle 00-07 3.19 1.73 5.89 4.16Volkswagen Golf / Jetta 04-07 3.63 2.07 6.39 4.33

APPENDIX 6
TOTAL SECONDARY SAFETY INDEX OF1982-2007 MODELS OF CARS INVOLVED IN
CRASHES DURING 1987-2007with
90 % CONFIDENCE LIMITS


TOTAL SECONDARY SAFETY INDEX
(WITH 90% CONFIDENCE LIMITS)
Victoria and New South Wales Data (1987-2007), Queensland, Western Australiaand New Zealand Data (1991-2007)
Make Model of Car Years ofManufacture
Pr(Risk)%
Pr(Severity)%
Serious injuryrate per 100road usersinvolved%
Lower 90%ConfidenceLimit
Lower 90%ConfidenceLimit
Width ofConfidenceInterval
ALL VEHICLE AVERAGE 3.64Compact Four Wheel Drive Vehicles 16.33 20.27 3.31 3.19 3.43 0.23
Daihatsu Feroza / Rocky 89-97 19.42 22.87 4.44 3.70 5.33 1.64Daihatsu Rocky / Rugger 85-98 20.43 29.09 5.94 4.83 7.31 2.48Daihatsu Terios 97-05 20.93 19.86 4.16 3.34 5.18 1.84Holden Cruze 02-06 19.11 26.62 5.09 4.03 6.43 2.40Hyundai Tucson 04-07 10.20 25.72 2.62 1.36 5.05 3.69Mitsubishi Pajero iO 99-03 15.90 35.27 5.61 3.13 10.04 6.91Mitsubishi Outlander 03-06 15.74 21.71 3.42 2.21 5.30 3.09Kia Sportage 98-03 17.05 16.36 2.79 2.13 3.65 1.51Kia Sorento 03-07 12.57 18.13 2.28 1.21 4.28 3.07Ford / Mazda Escape / Tribute 01-06 13.88 20.42 2.83 2.31 3.48 1.17Nissan X-Trail 01-07 15.30 21.54 3.30 2.77 3.92 1.16Lada Niva 84-99 18.46 22.80 4.21 3.17 5.58 2.41Honda CR-V 97-01 14.14 18.37 2.60 2.23 3.03 0.80Honda CR-V 02-07 13.49 17.07 2.30 1.86 2.86 1.00Honda HR-V 99-02 15.60 26.56 4.14 3.14 5.47 2.34Land Rover Freelander 98-06 14.99 34.01 5.10 3.52 7.38 3.86Subaru Forester 97-02 13.29 16.24 2.16 1.80 2.60 0.80Subaru Forester 02-07 14.03 17.57 2.47 1.95 3.11 1.16Suzuki Vitara / Escudo 88-98 18.91 22.55 4.26 3.86 4.71 0.85Suzuki Grand Vitara 99-05 15.11 19.95 3.02 2.36 3.86 1.50

Make Model of Car Years ofManufacture
Pr(Risk)%
Pr(Severity)%
Serious injuryrate per 100road usersinvolved%
Lower 90%ConfidenceLimit
Lower 90%ConfidenceLimit
Width ofConfidenceInterval
Holden / Suzuki Drover / Sierra / Samurai / SJ410 / SJ413 82-99 22.41 21.17 4.74 4.33 5.19 0.86Suzuki Jimny 98-07 20.84 19.63 4.09 2.89 5.80 2.91Toyota RAV4 94-00 15.69 22.59 3.55 3.16 3.98 0.82Toyota RAV4 01-06 15.18 21.38 3.25 2.80 3.77 0.97Toyota RAV4 06-07 10.83 17.75 1.92 1.13 3.28 2.16
Medium Four Wheel Drive Vehicles 14.56 21.59 3.14 3.02 3.28 0.26
Daewoo / Ssangong Musso 98-02 12.90 30.19 3.89 2.75 5.51 2.76Ford Territory SX/SY 04-07 11.90 24.45 2.91 2.20 3.84 1.64Holden / Isuzu Jackaroo / Bighorn 82-91 20.70 19.34 4.00 3.34 4.79 1.45Holden / Isuzu Jackaroo / Bighorn 92-97 16.78 23.34 3.92 3.22 4.76 1.54Holden / Isuzu Jackaroo / Bighorn 98-02 17.18 24.43 4.20 3.38 5.21 1.82Holden Frontera / Mu 95-03 15.89 23.75 3.77 2.77 5.14 2.37Holden Adventra 03-06 12.01 14.80 1.78 0.94 3.35 2.41Hyundai Santa Fe 00-06 17.13 21.74 3.72 2.64 5.25 2.61Hyundai Terracan 01-07 14.98 23.97 3.59 1.95 6.63 4.68Mitsubishi Pajero 82-90 18.45 24.79 4.57 4.08 5.13 1.05Mitsubishi Pajero 92-99 15.01 22.80 3.42 3.08 3.80 0.73Mitsubishi Pajero NM / NP / NS 00-07 11.43 20.04 2.29 1.79 2.94 1.15Mitsubishi Challenger 98-06 14.78 19.32 2.86 2.10 3.88 1.78Jeep Cherokee XJ 96-00 15.69 21.83 3.42 2.89 4.06 1.17Jeep Wrangler 96-04 18.15 26.52 4.81 3.59 6.45 2.86Jeep Cherokee KJ 01-07 12.58 15.80 1.99 1.17 3.38 2.21Land Rover Defender 92-07 15.62 24.80 3.87 2.87 5.23 2.36Nissan Pathfinder / Terrano 88-94 17.46 20.89 3.65 3.05 4.36 1.31Nissan Pathfinder / Terrano / Regulus 95-05 13.20 22.59 2.98 2.44 3.65 1.22Nissan Pathfinder 05-07 10.90 2.92 0.32 0.06 1.72 1.66Toyota Kluger 03-07 13.58 19.76 2.68 1.92 3.74 1.82Toyota Landcruiser Prado 96-03 13.10 24.49 3.21 2.62 3.94 1.32
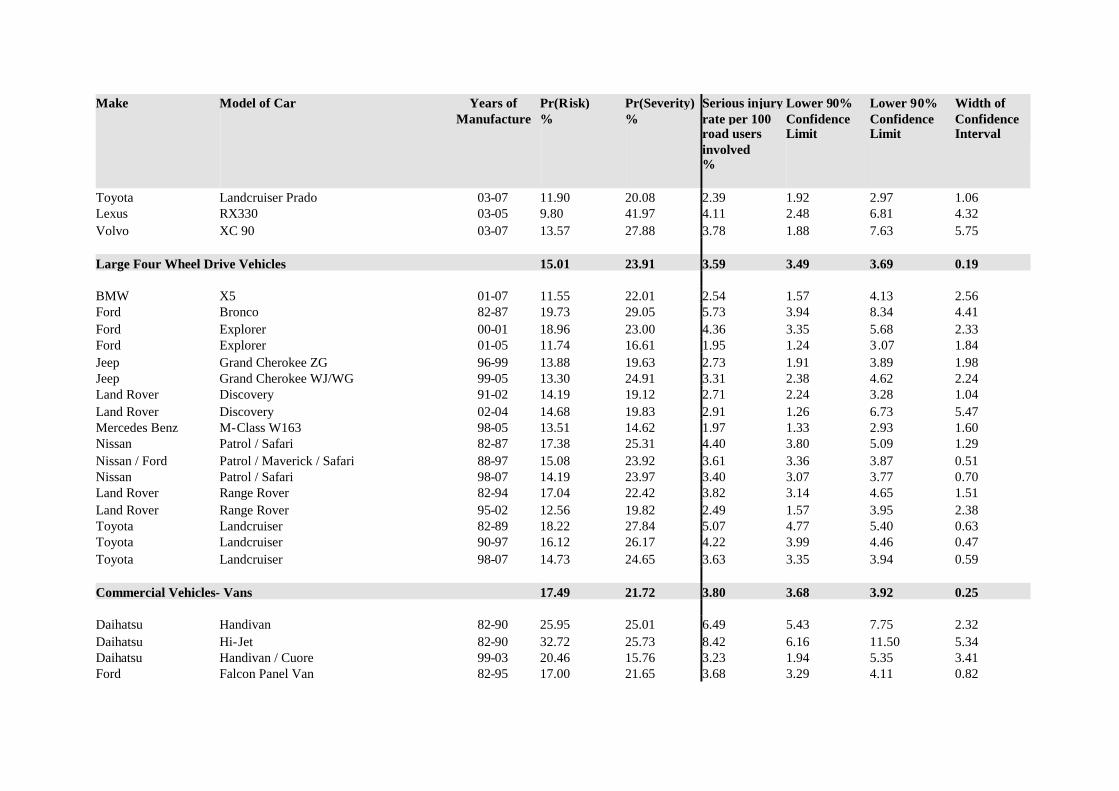
Make Model of Car Years ofManufacture
Pr(Risk)%
Pr(Severity)%
Serious injuryrate per 100road usersinvolved%
Lower 90%ConfidenceLimit
Lower 90%ConfidenceLimit
Width ofConfidenceInterval
Toyota Landcruiser Prado 03-07 11.90 20.08 2.39 1.92 2.97 1.06Lexus RX330 03-05 9.80 41.97 4.11 2.48 6.81 4.32Volvo XC 90 03-07 13.57 27.88 3.78 1.88 7.63 5.75
Large Four Wheel Drive Vehicles 15.01 23.91 3.59 3.49 3.69 0.19
BMW X5 01-07 11.55 22.01 2.54 1.57 4.13 2.56Ford Bronco 82-87 19.73 29.05 5.73 3.94 8.34 4.41Ford Explorer 00-01 18.96 23.00 4.36 3.35 5.68 2.33Ford Explorer 01-05 11.74 16.61 1.95 1.24 3.07 1.84Jeep Grand Cherokee ZG 96-99 13.88 19.63 2.73 1.91 3.89 1.98Jeep Grand Cherokee WJ/WG 99-05 13.30 24.91 3.31 2.38 4.62 2.24Land Rover Discovery 91-02 14.19 19.12 2.71 2.24 3.28 1.04Land Rover Discovery 02-04 14.68 19.83 2.91 1.26 6.73 5.47Mercedes Benz M-Class W163 98-05 13.51 14.62 1.97 1.33 2.93 1.60Nissan Patrol / Safari 82-87 17.38 25.31 4.40 3.80 5.09 1.29Nissan / Ford Patrol / Maverick / Safari 88-97 15.08 23.92 3.61 3.36 3.87 0.51Nissan Patrol / Safari 98-07 14.19 23.97 3.40 3.07 3.77 0.70Land Rover Range Rover 82-94 17.04 22.42 3.82 3.14 4.65 1.51Land Rover Range Rover 95-02 12.56 19.82 2.49 1.57 3.95 2.38Toyota Landcruiser 82-89 18.22 27.84 5.07 4.77 5.40 0.63Toyota Landcruiser 90-97 16.12 26.17 4.22 3.99 4.46 0.47Toyota Landcruiser 98-07 14.73 24.65 3.63 3.35 3.94 0.59
Commercial Vehicles- Vans 17.49 21.72 3.80 3.68 3.92 0.25
Daihatsu Handivan 82-90 25.95 25.01 6.49 5.43 7.75 2.32Daihatsu Hi-Jet 82-90 32.72 25.73 8.42 6.16 11.50 5.34Daihatsu Handivan / Cuore 99-03 20.46 15.76 3.23 1.94 5.35 3.41Ford Falcon Panel Van 82-95 17.00 21.65 3.68 3.29 4.11 0.82
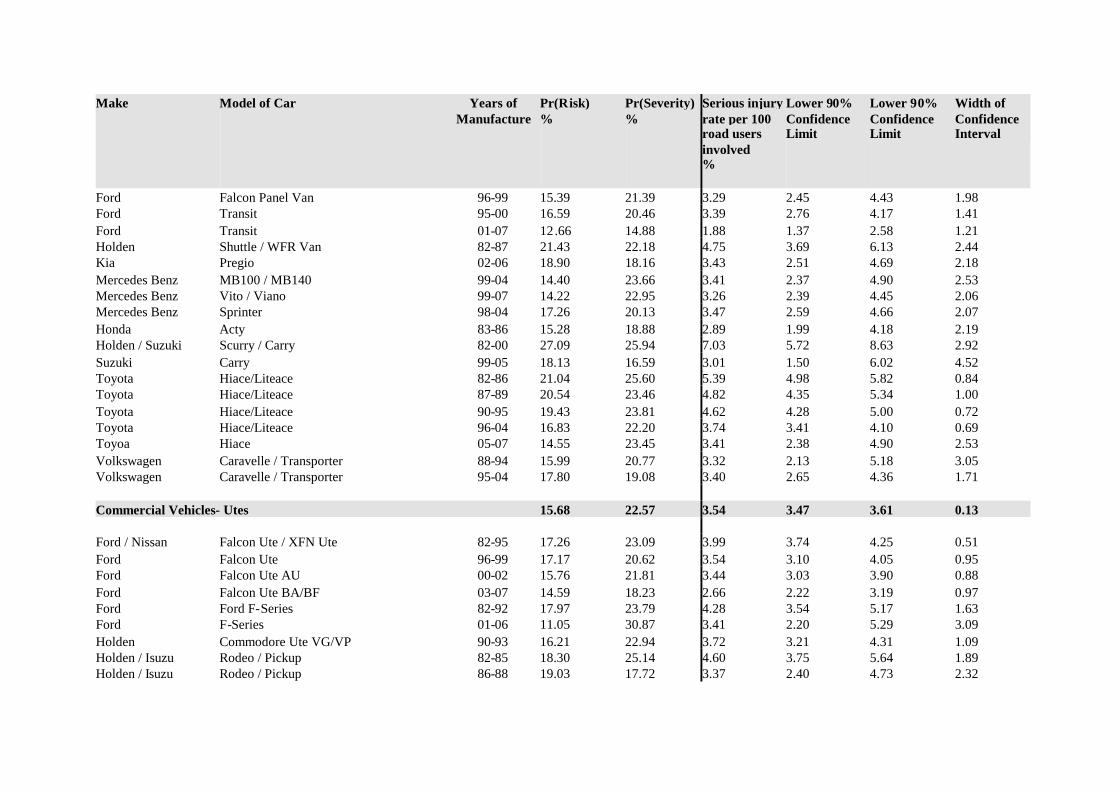
Make Model of Car Years ofManufacture
Pr(Risk)%
Pr(Severity)%
Serious injuryrate per 100road usersinvolved%
Lower 90%ConfidenceLimit
Lower 90%ConfidenceLimit
Width ofConfidenceInterval
Ford Falcon Panel Van 96-99 15.39 21.39 3.29 2.45 4.43 1.98Ford Transit 95-00 16.59 20.46 3.39 2.76 4.17 1.41Ford Transit 01-07 12.66 14.88 1.88 1.37 2.58 1.21Holden Shuttle / WFR Van 82-87 21.43 22.18 4.75 3.69 6.13 2.44Kia Pregio 02-06 18.90 18.16 3.43 2.51 4.69 2.18Mercedes Benz MB100 / MB140 99-04 14.40 23.66 3.41 2.37 4.90 2.53Mercedes Benz Vito / Viano 99-07 14.22 22.95 3.26 2.39 4.45 2.06Mercedes Benz Sprinter 98-04 17.26 20.13 3.47 2.59 4.66 2.07Honda Acty 83-86 15.28 18.88 2.89 1.99 4.18 2.19Holden / Suzuki Scurry / Carry 82-00 27.09 25.94 7.03 5.72 8.63 2.92Suzuki Carry 99-05 18.13 16.59 3.01 1.50 6.02 4.52Toyota Hiace/Liteace 82-86 21.04 25.60 5.39 4.98 5.82 0.84Toyota Hiace/Liteace 87-89 20.54 23.46 4.82 4.35 5.34 1.00Toyota Hiace/Liteace 90-95 19.43 23.81 4.62 4.28 5.00 0.72Toyota Hiace/Liteace 96-04 16.83 22.20 3.74 3.41 4.10 0.69Toyoa Hiace 05-07 14.55 23.45 3.41 2.38 4.90 2.53Volkswagen Caravelle / Transporter 88-94 15.99 20.77 3.32 2.13 5.18 3.05Volkswagen Caravelle / Transporter 95-04 17.80 19.08 3.40 2.65 4.36 1.71
Commercial Vehicles- Utes 15.68 22.57 3.54 3.47 3.61 0.13
Ford / Nissan Falcon Ute / XFN Ute 82-95 17.26 23.09 3.99 3.74 4.25 0.51Ford Falcon Ute 96-99 17.17 20.62 3.54 3.10 4.05 0.95Ford Falcon Ute AU 00-02 15.76 21.81 3.44 3.03 3.90 0.88Ford Falcon Ute BA/BF 03-07 14.59 18.23 2.66 2.22 3.19 0.97Ford Ford F-Series 82-92 17.97 23.79 4.28 3.54 5.17 1.63Ford F-Series 01-06 11.05 30.87 3.41 2.20 5.29 3.09Holden Commodore Ute VG/VP 90-93 16.21 22.94 3.72 3.21 4.31 1.09Holden / Isuzu Rodeo / Pickup 82-85 18.30 25.14 4.60 3.75 5.64 1.89Holden / Isuzu Rodeo / Pickup 86-88 19.03 17.72 3.37 2.40 4.73 2.32

Make Model of Car Years ofManufacture
Pr(Risk)%
Pr(Severity)%
Serious injuryrate per 100road usersinvolved%
Lower 90%ConfidenceLimit
Lower 90%ConfidenceLimit
Width ofConfidenceInterval
Holden / Isuzu Rodeo / Pickup 89-95 17.70 25.72 4.55 4.24 4.89 0.65Holden Rodeo 96-98 17.00 22.23 3.78 3.38 4.23 0.85Holden Rodeo 99-02 16.14 23.23 3.75 3.35 4.19 0.84Holden WB Series 82-85 17.11 28.69 4.91 4.30 5.61 1.31Holden Commodore Ute VR/VS 94-00 16.36 25.01 4.09 3.81 4.39 0.58Holden Commodore VU Ute 00-02 14.01 25.73 3.60 3.11 4.18 1.07Holden Commodore VY/VZ Ute 02-07 14.49 22.91 3.32 2.95 3.74 0.80Holden Rodeo 03-07 14.76 21.68 3.20 2.78 3.68 0.90Mitsubishi Triton MK 96-06 14.41 21.15 3.05 2.45 3.80 1.35Kia Ceres 92-00 18.01 26.53 4.78 3.99 5.72 1.73Kia K2700 02-07 13.41 22.36 3.00 1.51 5.95 4.44Ford / Mazda Courier / B-Series / Bounty 98-02 14.97 23.13 3.46 3.00 3.99 0.99Ford / Mazda Courier / Bravo / Bounty 03-06 16.90 21.33 3.61 2.97 4.38 1.41Nissan 720 Ute 82-85 18.03 20.75 3.74 3.22 4.35 1.13Nissan Navara 86-91 16.79 23.43 3.93 3.59 4.32 0.73Nissan Navara 92-96 16.99 22.04 3.75 3.28 4.28 1.00Nissan Navara 97-05 13.65 23.19 3.17 2.76 3.63 0.87Nissan Navara 05-07 14.49 26.31 3.81 2.28 6.37 4.09Proton Jumbuck 03-07 12.90 25.86 3.34 1.65 6.76 5.12Subaru Brumby 82-92 18.70 27.45 5.13 4.53 5.81 1.28Suzuki Mighty Boy 85-88 27.93 23.90 6.67 5.32 8.38 3.06Toyota 4Runner/Hilux 82-85 18.24 24.71 4.51 4.17 4.87 0.71Toyota 4Runner/Hilux 86-88 17.61 25.40 4.47 4.13 4.85 0.72Toyota 4Runner/Hilux 89-97 16.86 24.19 4.08 3.90 4.26 0.36Toyota Hilux 98-02 15.46 22.87 3.54 3.26 3.84 0.58Toyota Hilux 03-04 15.03 20.19 3.04 2.55 3.62 1.07Toyota Hilux 05-07 13.94 23.82 3.32 2.74 4.03 1.29

Make Model of Car Years ofManufacture
Pr(Risk)%
Pr(Severity)%
Serious injuryrate per 100road usersinvolved%
Lower 90%ConfidenceLimit
Lower 90%ConfidenceLimit
Width ofConfidenceInterval
Large Cars 15.64 20.88 3.27 3.23 3.30 0.08
BMW 7 Series E23 82-88 14.49 18.48 2.68 1.69 4.25 2.56BMW 7 Series E32 89-94 15.61 24.70 3.86 2.63 5.66 3.03BMW 7 Series E38 95-01 15.68 15.22 2.39 1.36 4.19 2.83Ford Falcon XE/XF 82-88 17.52 23.29 4.08 3.96 4.21 0.25Ford Fairlane Z & LTD F 82-87 17.11 23.19 3.97 3.66 4.30 0.63Ford Falcon EA / Falcon EB Series I 88-Mar 92 16.99 22.62 3.84 3.72 3.97 0.26Ford Falcon EB Series II / Falcon ED Apr 92-94 16.25 22.42 3.64 3.48 3.82 0.34Ford Fairlane N & LTD D 88-94 14.64 21.42 3.13 2.86 3.44 0.59Ford Fairlane N & LTD D 95-98 15.80 23.08 3.65 3.16 4.20 1.04Ford Fairlane & LTD AU 99-02 14.88 18.80 2.80 2.22 3.53 1.31Ford Fairlane & LTD BA/BF 03-07 12.49 26.19 3.27 2.11 5.08 2.98Ford Falcon EF/EL 94-98 16.22 21.27 3.45 3.33 3.57 0.24Ford Falcon AU 98-02 16.10 20.33 3.27 3.12 3.43 0.30Ford Taurus 96-98 17.60 22.23 3.91 3.01 5.09 2.09Ford Falcon BA/BF 02-07 15.06 19.46 2.93 2.72 3.16 0.44Holden / Toyota Commodore VN/VP / Lexcen 89-93 16.83 23.02 3.87 3.76 3.99 0.23Holden Statesman/Caprice WB 82-85 18.51 40.26 7.45 5.28 10.53 5.25Holden Stateman/Caprice VQ 90-93 15.28 26.30 4.02 3.22 5.01 1.79Holden Stateman/Caprice VR/VS 94-98 15.45 22.50 3.48 3.14 3.86 0.72Holden / Toyota Commodore VR/VS / Lexcen 93-97 15.92 21.53 3.43 3.32 3.54 0.23Holden Commodore VT/VX 97-02 16.32 20.76 3.39 3.26 3.52 0.25Holden Statesman/Caprice WH 99-03 14.77 19.77 2.92 2.38 3.59 1.21Holden Commodore VY/VZ 02-07 15.45 17.90 2.76 2.57 2.98 0.41Holden Monaro 01-05 16.61 24.24 4.03 3.14 5.16 2.01Holden Statesman/Caprice WK/WL 03-06 16.63 20.68 3.44 2.38 4.96 2.58Holden Commodore VB-VL 82-88 18.05 23.92 4.32 4.18 4.45 0.27Holden Commodore VE 06-07 14.19 18.63 2.64 2.09 3.33 1.24

Make Model of Car Years ofManufacture
Pr(Risk)%
Pr(Severity)%
Serious injuryrate per 100road usersinvolved%
Lower 90%ConfidenceLimit
Lower 90%ConfidenceLimit
Width ofConfidenceInterval
Hyundai Sonata 89-97 17.11 21.33 3.65 3.28 4.06 0.78Hyundai Grandeaur / XG 99-00 16.77 17.00 2.85 1.76 4.63 2.87Mitsubishi Magna TM/TN/TP / Sigma / V3000 85-90 17.77 23.17 4.12 3.96 4.29 0.33
Mitsubishi Magna TE/TF/TH/TJ / VeradaKE/KF/KH/KJ / Diamante 96-03 16.10 20.58 3.31 3.14 3.50 0.36
Mitsubishi Magna TR/TS / Verada KR/KS / V3000 /Diamante 91-96 16.88 21.02 3.55 3.40 3.71 0.31
Mitsubishi Magna TL/TW / Verada KL/KW 03-05 15.43 18.75 2.89 2.27 3.69 1.42Mitsubishi 380 05-07 15.70 19.14 3.00 1.87 4.83 2.96Jaguar XJ6 82-86 18.68 28.70 5.36 3.97 7.25 3.28Jaguar XJ6 87-94 16.34 18.14 2.96 2.13 4.12 1.99Jaguar XJ6 95-97 13.56 33.66 4.57 2.60 8.03 5.43Jaguar XJS 82-96 19.38 15.22 2.95 1.12 7.77 6.65Jaguar S-Type 99-07 13.05 8.66 1.13 0.48 2.68 2.20Mazda 929 / Luce 82-90 18.56 21.74 4.03 3.64 4.47 0.83Mazda 929 / Sentia / Efini MS-9 92-96 16.58 31.16 5.17 3.68 7.25 3.57Mercedes Benz E-Class W123 82-85 15.01 20.99 3.15 2.25 4.41 2.16Mercedes Benz E-Class W124 86-94 14.74 22.75 3.35 2.77 4.06 1.30Mercedes Benz E-Class W210 96-02 13.75 22.10 3.04 2.36 3.92 1.57Mercedes Benz S-Class W126 82-92 14.37 19.65 2.82 2.20 3.62 1.42Mercedes Benz S-Class R129 93-02 13.40 11.06 1.48 0.46 4.83 4.37Mercedes Benz S-Class C140 93-98 10.25 20.42 2.09 1.21 3.61 2.40Mercedes Benz S-Class W220 99-06 11.01 23.93 2.63 1.33 5.23 3.90Mercedes Benz E-Class W211 02-07 13.13 18.04 2.37 1.23 4.56 3.33Nissan Skyline 83-88 17.99 23.14 4.16 3.86 4.49 0.63Nissan 300ZX / Fairlady Z 90-95 18.59 23.85 4.43 3.51 5.60 2.09Nissan Maxima 90-94 16.56 21.36 3.54 2.97 4.21 1.24Nissan Maxima / Cefiro 95-99 16.84 18.81 3.17 2.66 3.76 1.10Nissan Maxima 00-02 16.27 21.92 3.57 2.71 4.69 1.98Nissan 300C / Laurel 85-87 18.48 25.82 4.77 2.62 8.70 6.08Nissan Maxima 06-07 13.80 17.32 2.39 1.51 3.79 2.28

Make Model of Car Years ofManufacture
Pr(Risk)%
Pr(Severity)%
Serious injuryrate per 100road usersinvolved%
Lower 90%ConfidenceLimit
Lower 90%ConfidenceLimit
Width ofConfidenceInterval
Honda Legend 86-95 15.47 22.28 3.45 2.81 4.23 1.42Honda Legend 96-98 10.89 14.86 1.62 0.59 4.48 3.89Rover 3500 82-87 19.68 16.20 3.19 1.87 5.42 3.55Saab 9-5 98-05 15.24 12.32 1.88 1.04 3.40 2.37Toyota Camry 98-02 16.04 20.38 3.27 3.08 3.47 0.39Toyota Crown / Cressida / Mark II 82-85 18.22 24.07 4.39 3.88 4.95 1.07Toyota Crown / Cressida / Mark II 86-88 14.53 26.01 3.78 3.06 4.66 1.60Toyota Cressida / Mark II 89-93 14.16 19.08 2.70 2.32 3.15 0.83Toyota Supra 82-90 21.32 26.35 5.62 4.49 7.03 2.54Lexus ES300 / Windom 92-01 16.98 19.91 3.38 2.62 4.36 1.74Lexus LS400 / Celsior 90-00 14.63 22.65 3.31 2.13 5.16 3.04Lexus GS300 97-04 12.90 20.02 2.58 1.28 5.23 3.96Toyota Avalon 00-05 15.78 20.17 3.18 2.76 3.67 0.90Toyota Camry 02-06 15.47 17.47 2.70 2.41 3.03 0.62Toyota Aurion 06-07 14.91 10.97 1.64 0.62 4.34 3.73Toyota Camry 06-07 13.97 11.57 1.62 0.83 3.16 2.33Volvo 850/S70/V70/C70 92-05 15.63 22.91 3.58 3.06 4.19 1.12Volvo 700/900 Series 84-92 15.66 19.27 3.02 2.57 3.54 0.97Volvo 960/S90/V90 90-98 17.46 26.09 4.56 2.73 7.60 4.87Volvo S80 98-06 13.56 11.45 1.55 0.56 4.27 3.71
Medium Cars 16.03 20.54 3.29 3.25 3.34 0.09
Alfa Romeo 164 89-92 17.42 31.68 5.52 3.28 9.29 6.01Alfa Romeo 156 99-06 13.35 18.34 2.45 1.53 3.92 2.38Alfa Romeo 147 01-07 11.24 18.63 2.09 0.96 4.56 3.60Audi A4 95-01 13.76 19.80 2.72 2.10 3.53 1.43Audi TT 99-06 11.36 17.02 1.93 0.86 4.36 3.50Audi A4 01-07 12.66 17.15 2.17 1.48 3.18 1.70BMW Z3 E36 97-03 13.47 27.60 3.72 2.48 5.57 3.09

Make Model of Car Years ofManufacture
Pr(Risk)%
Pr(Severity)%
Serious injuryrate per 100road usersinvolved%
Lower 90%ConfidenceLimit
Lower 90%ConfidenceLimit
Width ofConfidenceInterval
BMW 5 Series E60 03-07 19.07 31.85 6.07 3.51 10.50 6.98BMW 3 Series E90 05-07 16.48 15.72 2.59 1.23 5.45 4.22BMW 3 Series E30 82-91 15.88 21.34 3.39 3.04 3.78 0.74BMW 3 Series E36 92-98 15.25 21.44 3.27 2.96 3.60 0.64BMW 3 Series E46 99-06 14.81 18.68 2.77 2.37 3.23 0.87BMW 5 Series E28 82-88 15.36 22.78 3.50 2.80 4.38 1.58BMW 5 Series E34 89-95 15.13 22.92 3.47 2.83 4.25 1.43BMW 5 Series E39 96-03 12.51 20.00 2.50 1.92 3.26 1.35Chrysler PT Cruiser 00-07 16.28 26.09 4.25 2.51 7.19 4.68Citroen Xantia 94-00 15.65 22.64 3.54 1.83 6.85 5.01Daewoo Espero 95-97 19.73 22.78 4.49 3.67 5.51 1.84Daewoo Leganza 97-02 16.29 22.52 3.67 2.88 4.67 1.78Daewoo Tacuma 00-04 16.19 36.81 5.96 3.64 9.76 6.12Ford Cortina 82-82 19.03 23.45 4.46 3.89 5.11 1.22Ford Mondeo 95-01 15.06 19.16 2.89 2.53 3.29 0.77Ford Probe 94-98 19.19 25.20 4.84 3.39 6.90 3.51Ford Cougar 99-03 12.77 20.56 2.63 1.82 3.79 1.98Holden Calibra 94-97 16.24 20.21 3.28 2.46 4.37 1.91Holden Camira 82-89 21.03 22.37 4.70 4.48 4.93 0.45Holden Vectra 97-03 15.79 19.38 3.06 2.73 3.43 0.70Holden Vectra ZC 03-05 15.54 14.08 2.19 1.41 3.41 2.00Hyundai Sonata 98-01 16.18 22.71 3.67 2.93 4.60 1.67Hyundai Sonata EF 02-05 17.35 17.57 3.05 1.70 5.46 3.76Mitsubishi Sigma / Galant / Sapporo / Lambda 82-84 18.56 22.37 4.15 3.94 4.38 0.44Mitsubishi Starion 82-87 18.62 34.10 6.35 4.58 8.81 4.23Mitsubishi Galant 95-96 17.41 20.14 3.51 3.03 4.05 1.02Jaguar X-Type 02-07 10.58 17.38 1.84 0.79 4.30 3.52Kia Credos 98-01 24.95 25.69 6.41 3.64 11.30 7.66Ford / Mazda Telstar / 626 / MX6 / Capella 83-86 18.23 21.02 3.83 3.62 4.06 0.44Ford / Mazda Telstar / 626 / MX6 / Capella 88-91 16.65 21.71 3.61 3.37 3.88 0.51

Make Model of Car Years ofManufacture
Pr(Risk)%
Pr(Severity)%
Serious injuryrate per 100road usersinvolved%
Lower 90%ConfidenceLimit
Lower 90%ConfidenceLimit
Width ofConfidenceInterval
Ford / Mazda Telstar / 626 / MX6 / Capella / Cronos 92-97 14.55 21.41 3.12 2.88 3.38 0.50Mazda 626 98-02 14.79 21.77 3.22 2.79 3.72 0.93Mazda RX7 82-85 19.30 26.75 5.16 4.15 6.42 2.28Mazda RX7 86-91 17.14 20.87 3.58 2.67 4.80 2.13Mazda RX7 92-98 16.03 26.28 4.21 2.29 7.74 5.45Mazda Eunos 500 93-99 19.50 18.66 3.64 2.51 5.28 2.77Mazda Eunos 800 94-00 17.94 29.57 5.31 3.19 8.83 5.65Mazda 6 02-07 14.07 14.57 2.05 1.59 2.64 1.05Mazda RX8 03-07 11.96 21.45 2.56 1.28 5.14 3.86Mercedes Benz C-Class W201 87-93 15.44 22.19 3.43 2.74 4.28 1.54Mercedes Benz C-Class W202 95-00 12.34 21.34 2.63 2.16 3.21 1.06Mercedes Benz CLK C208 97-03 15.19 22.21 3.37 2.16 5.26 3.10Mercedes Benz SLK R170 97-04 15.01 13.81 2.07 0.98 4.38 3.40Mercedes Benz C-Class W203 00-07 13.63 17.98 2.45 1.75 3.43 1.68Mercedes Benz CLK C209 03-07 13.75 23.29 3.20 1.63 6.29 4.66Nissan Pintara 86-88 17.49 22.72 3.97 3.66 4.32 0.66Nissan / Ford Pintara / Corsair / Bluebird 89-92 18.35 23.37 4.29 4.04 4.56 0.52Nissan Bluebird 82-86 18.86 23.46 4.42 4.19 4.67 0.48Nissan 280ZX 82-84 16.85 29.42 4.96 2.99 8.21 5.22Nissan Bluebird 93-97 14.76 20.09 2.97 2.60 3.38 0.78Nissan 200SX / Silvia 94-02 13.98 24.37 3.41 2.81 4.13 1.32Nissan 350Z 03-07 23.35 21.73 5.07 2.94 8.76 5.83Honda Accord Euro 03-07 14.27 17.13 2.44 1.87 3.19 1.31Honda Accord 03-07 15.37 22.63 3.48 2.48 4.87 2.39Honda Accord 82-85 18.86 22.08 4.16 3.75 4.62 0.86Honda Accord 86-90 15.81 22.03 3.48 3.13 3.87 0.74Honda Accord 91-93 14.21 21.71 3.09 2.65 3.60 0.95Honda Accord 94-98 15.53 21.71 3.37 3.01 3.78 0.77Honda Accord 99-02 15.21 17.82 2.71 2.06 3.56 1.50Honda Prelude 82-82 16.49 17.38 2.87 1.69 4.85 3.16
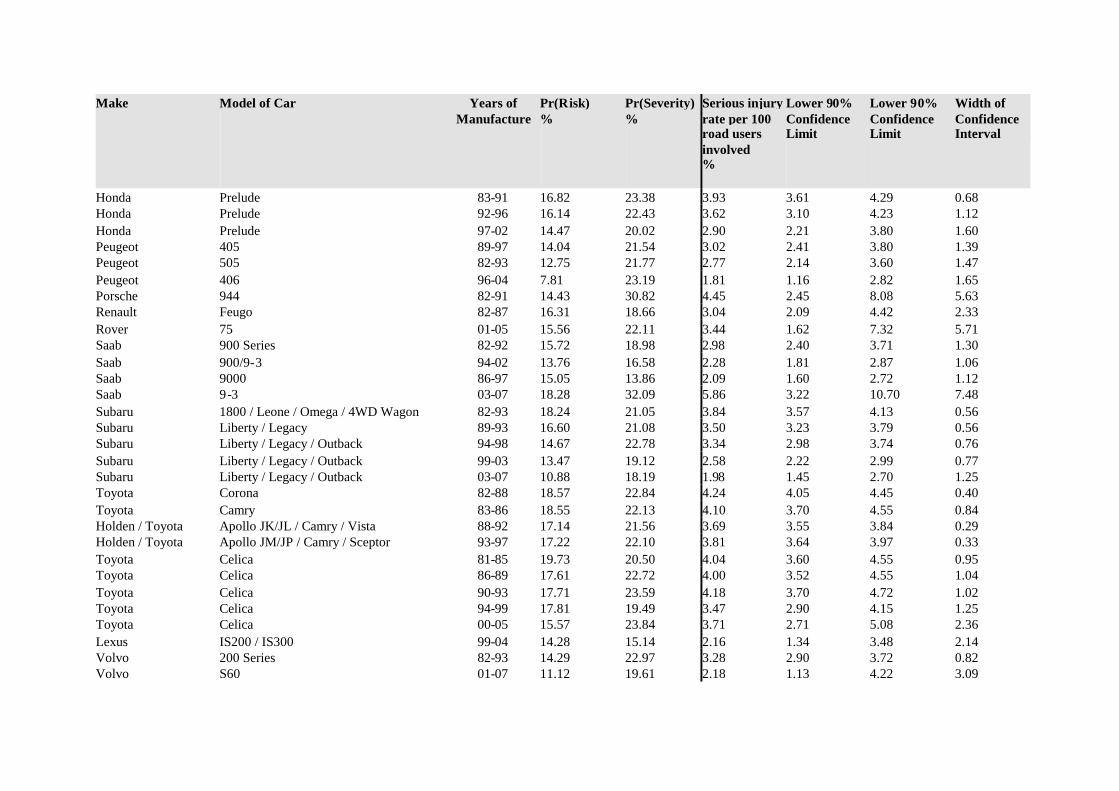
Make Model of Car Years ofManufacture
Pr(Risk)%
Pr(Severity)%
Serious injuryrate per 100road usersinvolved%
Lower 90%ConfidenceLimit
Lower 90%ConfidenceLimit
Width ofConfidenceInterval
Honda Prelude 83-91 16.82 23.38 3.93 3.61 4.29 0.68Honda Prelude 92-96 16.14 22.43 3.62 3.10 4.23 1.12Honda Prelude 97-02 14.47 20.02 2.90 2.21 3.80 1.60Peugeot 405 89-97 14.04 21.54 3.02 2.41 3.80 1.39Peugeot 505 82-93 12.75 21.77 2.77 2.14 3.60 1.47Peugeot 406 96-04 7.81 23.19 1.81 1.16 2.82 1.65Porsche 944 82-91 14.43 30.82 4.45 2.45 8.08 5.63Renault Feugo 82-87 16.31 18.66 3.04 2.09 4.42 2.33Rover 75 01-05 15.56 22.11 3.44 1.62 7.32 5.71Saab 900 Series 82-92 15.72 18.98 2.98 2.40 3.71 1.30Saab 900/9-3 94-02 13.76 16.58 2.28 1.81 2.87 1.06Saab 9000 86-97 15.05 13.86 2.09 1.60 2.72 1.12Saab 9-3 03-07 18.28 32.09 5.86 3.22 10.70 7.48Subaru 1800 / Leone / Omega / 4WD Wagon 82-93 18.24 21.05 3.84 3.57 4.13 0.56Subaru Liberty / Legacy 89-93 16.60 21.08 3.50 3.23 3.79 0.56Subaru Liberty / Legacy / Outback 94-98 14.67 22.78 3.34 2.98 3.74 0.76Subaru Liberty / Legacy / Outback 99-03 13.47 19.12 2.58 2.22 2.99 0.77Subaru Liberty / Legacy / Outback 03-07 10.88 18.19 1.98 1.45 2.70 1.25Toyota Corona 82-88 18.57 22.84 4.24 4.05 4.45 0.40Toyota Camry 83-86 18.55 22.13 4.10 3.70 4.55 0.84Holden / Toyota Apollo JK/JL / Camry / Vista 88-92 17.14 21.56 3.69 3.55 3.84 0.29Holden / Toyota Apollo JM/JP / Camry / Sceptor 93-97 17.22 22.10 3.81 3.64 3.97 0.33Toyota Celica 81-85 19.73 20.50 4.04 3.60 4.55 0.95Toyota Celica 86-89 17.61 22.72 4.00 3.52 4.55 1.04Toyota Celica 90-93 17.71 23.59 4.18 3.70 4.72 1.02Toyota Celica 94-99 17.81 19.49 3.47 2.90 4.15 1.25Toyota Celica 00-05 15.57 23.84 3.71 2.71 5.08 2.36Lexus IS200 / IS300 99-04 14.28 15.14 2.16 1.34 3.48 2.14Volvo 200 Series 82-93 14.29 22.97 3.28 2.90 3.72 0.82Volvo S60 01-07 11.12 19.61 2.18 1.13 4.22 3.09
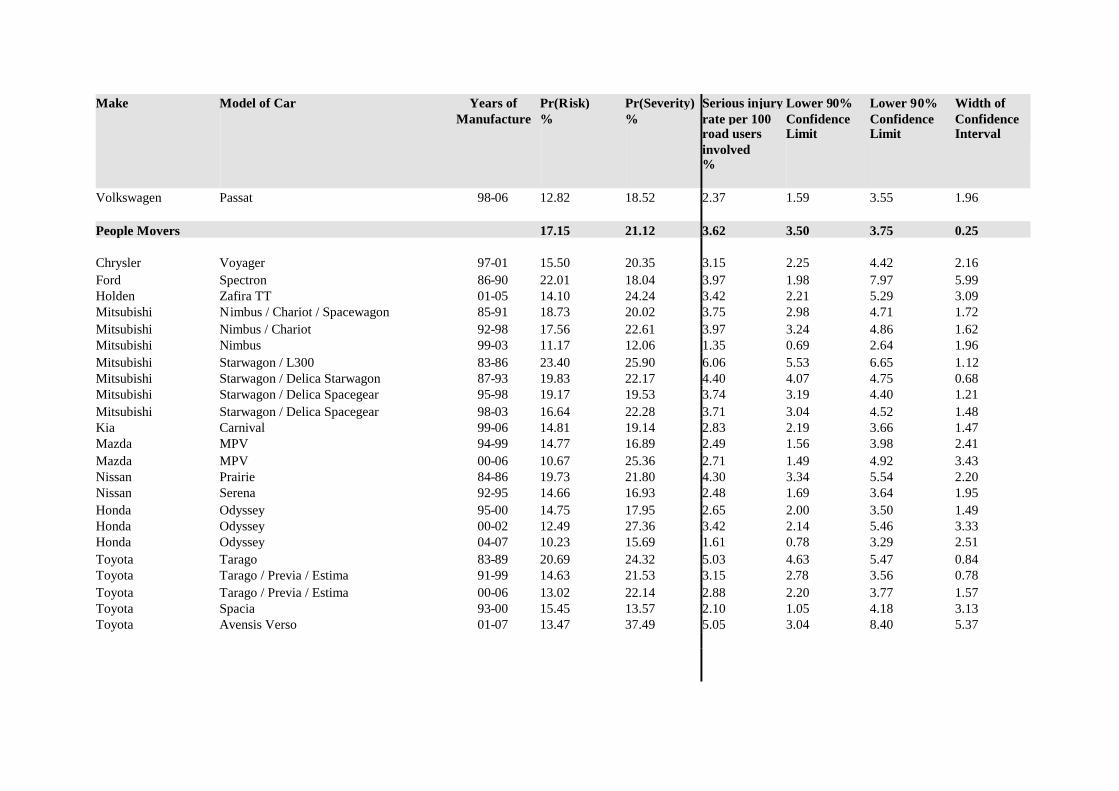
Make Model of Car Years ofManufacture
Pr(Risk)%
Pr(Severity)%
Serious injuryrate per 100road usersinvolved%
Lower 90%ConfidenceLimit
Lower 90%ConfidenceLimit
Width ofConfidenceInterval
Volkswagen Passat 98-06 12.82 18.52 2.37 1.59 3.55 1.96
People Movers 17.15 21.12 3.62 3.50 3.75 0.25
Chrysler Voyager 97-01 15.50 20.35 3.15 2.25 4.42 2.16Ford Spectron 86-90 22.01 18.04 3.97 1.98 7.97 5.99Holden Zafira TT 01-05 14.10 24.24 3.42 2.21 5.29 3.09Mitsubishi Nimbus / Chariot / Spacewagon 85-91 18.73 20.02 3.75 2.98 4.71 1.72Mitsubishi Nimbus / Chariot 92-98 17.56 22.61 3.97 3.24 4.86 1.62Mitsubishi Nimbus 99-03 11.17 12.06 1.35 0.69 2.64 1.96Mitsubishi Starwagon / L300 83-86 23.40 25.90 6.06 5.53 6.65 1.12Mitsubishi Starwagon / Delica Starwagon 87-93 19.83 22.17 4.40 4.07 4.75 0.68Mitsubishi Starwagon / Delica Spacegear 95-98 19.17 19.53 3.74 3.19 4.40 1.21Mitsubishi Starwagon / Delica Spacegear 98-03 16.64 22.28 3.71 3.04 4.52 1.48Kia Carnival 99-06 14.81 19.14 2.83 2.19 3.66 1.47Mazda MPV 94-99 14.77 16.89 2.49 1.56 3.98 2.41Mazda MPV 00-06 10.67 25.36 2.71 1.49 4.92 3.43Nissan Prairie 84-86 19.73 21.80 4.30 3.34 5.54 2.20Nissan Serena 92-95 14.66 16.93 2.48 1.69 3.64 1.95Honda Odyssey 95-00 14.75 17.95 2.65 2.00 3.50 1.49Honda Odyssey 00-02 12.49 27.36 3.42 2.14 5.46 3.33Honda Odyssey 04-07 10.23 15.69 1.61 0.78 3.29 2.51Toyota Tarago 83-89 20.69 24.32 5.03 4.63 5.47 0.84Toyota Tarago / Previa / Estima 91-99 14.63 21.53 3.15 2.78 3.56 0.78Toyota Tarago / Previa / Estima 00-06 13.02 22.14 2.88 2.20 3.77 1.57Toyota Spacia 93-00 15.45 13.57 2.10 1.05 4.18 3.13Toyota Avensis Verso 01-07 13.47 37.49 5.05 3.04 8.40 5.37

Make Model of Car Years ofManufacture
Pr(Risk)%
Pr(Severity)%
Serious injuryrate per 100road usersinvolved%
Lower 90%ConfidenceLimit
Lower 90%ConfidenceLimit
Width ofConfidenceInterval
Light Cars 18.39 21.19 3.90 3.82 3.97 0.15
Daihatsu Charade 82-86 23.11 26.25 6.07 5.46 6.74 1.28Daihatsu Charade 88-92 19.93 22.89 4.56 4.24 4.91 0.68Daihatsu Charade 93-00 19.43 23.96 4.66 4.29 5.06 0.77Daihatsu Pyzar 97-01 16.72 25.77 4.31 3.11 5.98 2.88Daihatsu Move 97-99 19.37 16.56 3.21 1.66 6.21 4.55Daihatsu Sirion / Storia 98-04 17.50 18.84 3.30 2.73 3.98 1.26Daihatsu Mira 90-96 26.27 26.57 6.98 5.99 8.14 2.16Daewoo Matiz 99-04 22.05 17.35 3.82 3.08 4.75 1.66Daewoo Kalos 03-04 17.97 24.84 4.46 3.19 6.24 3.04Ford Festiva WD/WH/WF 94-01 20.27 22.35 4.53 4.30 4.78 0.48Ford Ka 99-02 17.66 22.80 4.03 3.05 5.32 2.28Ford Fiesta WP/WQ 04-07 16.33 6.17 1.01 0.20 5.15 4.95Holden Barina XC 01-06 16.67 19.10 3.18 2.76 3.68 0.92Holden Barina SB 95-00 18.90 20.60 3.89 3.59 4.22 0.63Holden Barina TK 05-07 16.03 21.18 3.39 2.41 4.79 2.38Hyundai Getz / TB 02-07 17.12 27.62 4.73 4.12 5.42 1.30Mitsubishi Mirage / Colt 82-88 20.79 22.59 4.70 4.45 4.95 0.50Mitsubishi Colt 04-07 12.26 26.74 3.28 1.99 5.41 3.42Ford / Mazda Festiva WA / 121 87-90 20.18 22.48 4.54 4.22 4.87 0.65Mazda 121 / Autozam Review 94-96 18.58 19.38 3.60 3.21 4.03 0.82Mazda 121 Metro / Demio 97-02 16.48 19.39 3.20 2.80 3.65 0.84Mazda 2 02-07 14.61 22.24 3.25 2.49 4.23 1.74Nissan Micra 95-97 18.88 25.66 4.84 4.00 5.86 1.86Honda Jazz / Fit 02-07 14.84 19.23 2.85 2.28 3.56 1.28Honda City 83-86 24.58 22.12 5.44 4.59 6.43 1.84Peugeot 205 87-94 15.09 20.76 3.13 2.14 4.58 2.44Peugeot 206 99-07 14.39 23.91 3.44 2.59 4.58 2.00
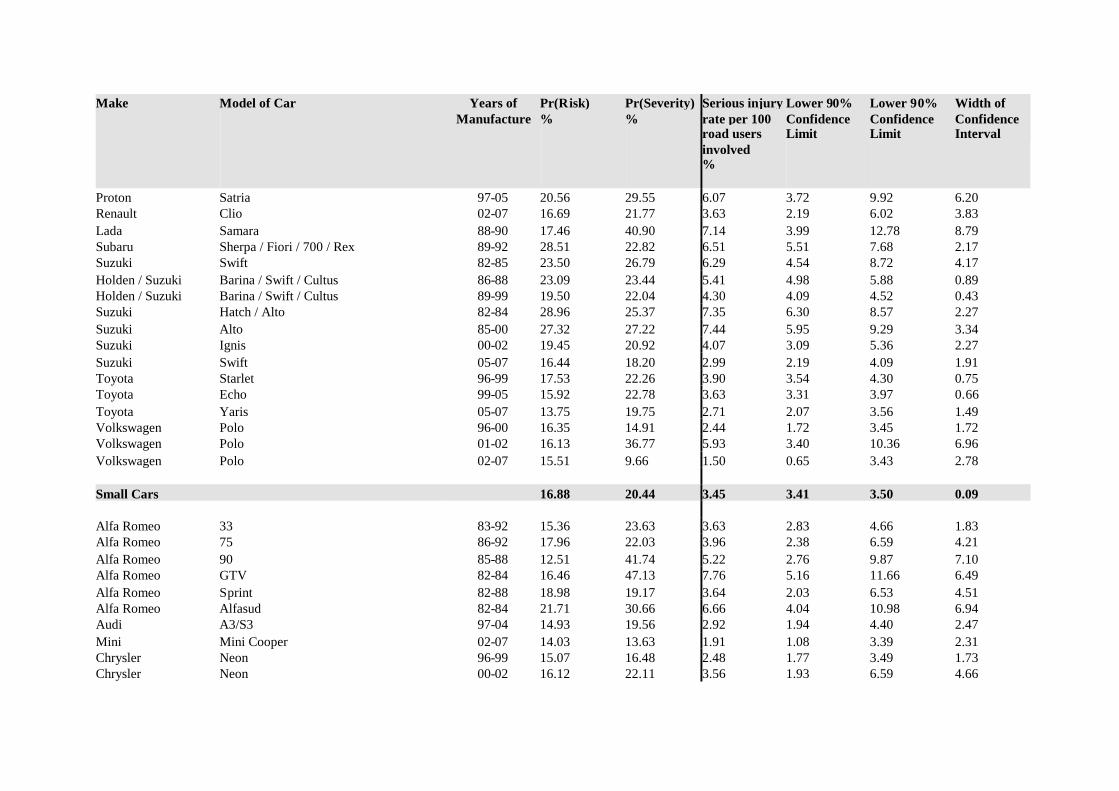
Make Model of Car Years ofManufacture
Pr(Risk)%
Pr(Severity)%
Serious injuryrate per 100road usersinvolved%
Lower 90%ConfidenceLimit
Lower 90%ConfidenceLimit
Width ofConfidenceInterval
Proton Satria 97-05 20.56 29.55 6.07 3.72 9.92 6.20Renault Clio 02-07 16.69 21.77 3.63 2.19 6.02 3.83Lada Samara 88-90 17.46 40.90 7.14 3.99 12.78 8.79Subaru Sherpa / Fiori / 700 / Rex 89-92 28.51 22.82 6.51 5.51 7.68 2.17Suzuki Swift 82-85 23.50 26.79 6.29 4.54 8.72 4.17Holden / Suzuki Barina / Swift / Cultus 86-88 23.09 23.44 5.41 4.98 5.88 0.89Holden / Suzuki Barina / Swift / Cultus 89-99 19.50 22.04 4.30 4.09 4.52 0.43Suzuki Hatch / Alto 82-84 28.96 25.37 7.35 6.30 8.57 2.27Suzuki Alto 85-00 27.32 27.22 7.44 5.95 9.29 3.34Suzuki Ignis 00-02 19.45 20.92 4.07 3.09 5.36 2.27Suzuki Swift 05-07 16.44 18.20 2.99 2.19 4.09 1.91Toyota Starlet 96-99 17.53 22.26 3.90 3.54 4.30 0.75Toyota Echo 99-05 15.92 22.78 3.63 3.31 3.97 0.66Toyota Yaris 05-07 13.75 19.75 2.71 2.07 3.56 1.49Volkswagen Polo 96-00 16.35 14.91 2.44 1.72 3.45 1.72Volkswagen Polo 01-02 16.13 36.77 5.93 3.40 10.36 6.96Volkswagen Polo 02-07 15.51 9.66 1.50 0.65 3.43 2.78
Small Cars 16.88 20.44 3.45 3.41 3.50 0.09
Alfa Romeo 33 83-92 15.36 23.63 3.63 2.83 4.66 1.83Alfa Romeo 75 86-92 17.96 22.03 3.96 2.38 6.59 4.21Alfa Romeo 90 85-88 12.51 41.74 5.22 2.76 9.87 7.10Alfa Romeo GTV 82-84 16.46 47.13 7.76 5.16 11.66 6.49Alfa Romeo Sprint 82-88 18.98 19.17 3.64 2.03 6.53 4.51Alfa Romeo Alfasud 82-84 21.71 30.66 6.66 4.04 10.98 6.94Audi A3/S3 97-04 14.93 19.56 2.92 1.94 4.40 2.47Mini Mini Cooper 02-07 14.03 13.63 1.91 1.08 3.39 2.31Chrysler Neon 96-99 15.07 16.48 2.48 1.77 3.49 1.73Chrysler Neon 00-02 16.12 22.11 3.56 1.93 6.59 4.66

Make Model of Car Years ofManufacture
Pr(Risk)%
Pr(Severity)%
Serious injuryrate per 100road usersinvolved%
Lower 90%ConfidenceLimit
Lower 90%ConfidenceLimit
Width ofConfidenceInterval
Citroen BX 86-94 6.10 15.41 0.94 0.45 1.97 1.53Citroen Xsara 00-05 20.35 18.94 3.86 1.75 8.50 6.75Daihatsu Applause 89-99 18.52 20.25 3.75 3.33 4.23 0.90Daewoo 1.5i 94-95 23.47 19.40 4.55 2.80 7.40 4.59Daewoo Cielo 95-97 18.83 19.88 3.74 3.38 4.15 0.77Daewoo Nubira 97-03 15.96 20.29 3.24 2.85 3.68 0.83Daewoo Lanos 97-03 18.42 22.22 4.09 3.75 4.47 0.73Daewoo Lacetti 03-04 19.54 21.50 4.20 2.51 7.03 4.53Ford Laser 91-94 17.94 21.18 3.80 3.61 4.00 0.40Ford Laser 95-97 16.37 23.20 3.80 3.46 4.17 0.70Ford Escort 82-82 17.96 17.45 3.13 2.38 4.13 1.76Ford Capri 89-94 21.68 19.62 4.25 3.66 4.94 1.28Ford Focus LR 02-05 16.52 17.30 2.86 2.34 3.50 1.16Ford Focus LS / LT 05-07 13.26 15.03 1.99 1.36 2.91 1.55Fiat Regata 84-88 14.91 29.38 4.38 2.94 6.52 3.58Holden / Isuzu Piazza 86-88 16.06 20.31 3.26 1.56 6.80 5.24Holden Gemini 82-84 19.68 22.06 4.34 4.03 4.68 0.66Holden Gemini RB 86-87 21.25 21.05 4.47 3.77 5.30 1.53Holden Astra TR 96-98 14.82 19.51 2.89 2.39 3.50 1.11Holden Astra TS 98-06 15.42 18.79 2.90 2.68 3.14 0.46Holden Astra AH 04-07 14.93 20.29 3.03 2.32 3.96 1.64Holden Viva JF 05-07 15.62 20.87 3.26 2.24 4.74 2.49Hyundai Excel 86-90 21.45 23.35 5.01 4.56 5.50 0.93Hyundai Excel 90-94 19.69 22.95 4.52 4.25 4.81 0.56Hyundai Excel / Accent 95-00 19.04 21.34 4.06 3.89 4.24 0.35Hyundai Elantra 00-07 15.87 20.38 3.23 2.73 3.82 1.09Hyundai S Coupe 90-96 19.41 22.38 4.34 3.67 5.14 1.47Hyundai Lantra 91-95 18.46 22.77 4.20 3.68 4.80 1.13Hyundai Lantra 96-00 16.96 21.52 3.65 3.30 4.04 0.74Hyundai Coupe 96-00 17.12 21.15 3.62 2.90 4.52 1.62
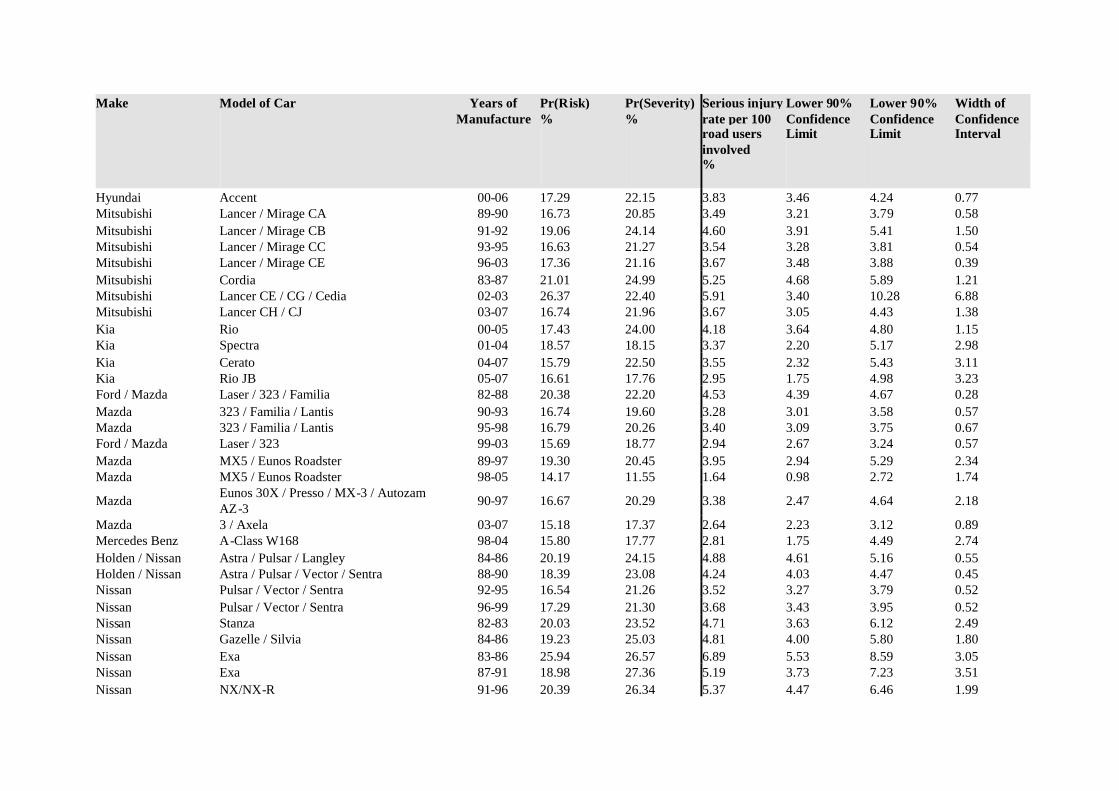
Make Model of Car Years ofManufacture
Pr(Risk)%
Pr(Severity)%
Serious injuryrate per 100road usersinvolved%
Lower 90%ConfidenceLimit
Lower 90%ConfidenceLimit
Width ofConfidenceInterval
Hyundai Accent 00-06 17.29 22.15 3.83 3.46 4.24 0.77Mitsubishi Lancer / Mirage CA 89-90 16.73 20.85 3.49 3.21 3.79 0.58Mitsubishi Lancer / Mirage CB 91-92 19.06 24.14 4.60 3.91 5.41 1.50Mitsubishi Lancer / Mirage CC 93-95 16.63 21.27 3.54 3.28 3.81 0.54Mitsubishi Lancer / Mirage CE 96-03 17.36 21.16 3.67 3.48 3.88 0.39Mitsubishi Cordia 83-87 21.01 24.99 5.25 4.68 5.89 1.21Mitsubishi Lancer CE / CG / Cedia 02-03 26.37 22.40 5.91 3.40 10.28 6.88Mitsubishi Lancer CH / CJ 03-07 16.74 21.96 3.67 3.05 4.43 1.38Kia Rio 00-05 17.43 24.00 4.18 3.64 4.80 1.15Kia Spectra 01-04 18.57 18.15 3.37 2.20 5.17 2.98Kia Cerato 04-07 15.79 22.50 3.55 2.32 5.43 3.11Kia Rio JB 05-07 16.61 17.76 2.95 1.75 4.98 3.23Ford / Mazda Laser / 323 / Familia 82-88 20.38 22.20 4.53 4.39 4.67 0.28Mazda 323 / Familia / Lantis 90-93 16.74 19.60 3.28 3.01 3.58 0.57Mazda 323 / Familia / Lantis 95-98 16.79 20.26 3.40 3.09 3.75 0.67Ford / Mazda Laser / 323 99-03 15.69 18.77 2.94 2.67 3.24 0.57Mazda MX5 / Eunos Roadster 89-97 19.30 20.45 3.95 2.94 5.29 2.34Mazda MX5 / Eunos Roadster 98-05 14.17 11.55 1.64 0.98 2.72 1.74
Mazda Eunos 30X / Presso / MX-3 / AutozamAZ-3 90-97 16.67 20.29 3.38 2.47 4.64 2.18
Mazda 3 / Axela 03-07 15.18 17.37 2.64 2.23 3.12 0.89Mercedes Benz A-Class W168 98-04 15.80 17.77 2.81 1.75 4.49 2.74Holden / Nissan Astra / Pulsar / Langley 84-86 20.19 24.15 4.88 4.61 5.16 0.55Holden / Nissan Astra / Pulsar / Vector / Sentra 88-90 18.39 23.08 4.24 4.03 4.47 0.45Nissan Pulsar / Vector / Sentra 92-95 16.54 21.26 3.52 3.27 3.79 0.52Nissan Pulsar / Vector / Sentra 96-99 17.29 21.30 3.68 3.43 3.95 0.52Nissan Stanza 82-83 20.03 23.52 4.71 3.63 6.12 2.49Nissan Gazelle / Silvia 84-86 19.23 25.03 4.81 4.00 5.80 1.80Nissan Exa 83-86 25.94 26.57 6.89 5.53 8.59 3.05Nissan Exa 87-91 18.98 27.36 5.19 3.73 7.23 3.51Nissan NX/NX-R 91-96 20.39 26.34 5.37 4.47 6.46 1.99

Make Model of Car Years ofManufacture
Pr(Risk)%
Pr(Severity)%
Serious injuryrate per 100road usersinvolved%
Lower 90%ConfidenceLimit
Lower 90%ConfidenceLimit
Width ofConfidenceInterval
Nissan Pulsar 00-05 15.92 20.61 3.28 2.99 3.59 0.60Nissan Tiida 06-07 13.96 18.49 2.58 1.30 5.14 3.84Honda Civic 82-83 18.59 23.82 4.43 3.77 5.21 1.44Honda Civic / Ballade / Shuttle 84-87 20.08 24.00 4.82 4.39 5.28 0.89Honda Civic / Shuttle 88-91 18.25 21.70 3.96 3.65 4.30 0.65Honda Civic 92-95 17.08 20.76 3.54 3.25 3.87 0.62Honda Civic 96-00 17.03 18.21 3.10 2.80 3.44 0.64Honda CRX 87-91 20.92 25.23 5.28 4.32 6.45 2.14Honda CRX 92-98 17.09 26.24 4.49 3.19 6.31 3.12Honda S2000 99-07 10.63 11.51 1.22 0.47 3.20 2.74Honda Civic 01-05 14.39 21.61 3.11 2.58 3.75 1.17Honda Civic 06-07 10.21 17.15 1.75 0.68 4.51 3.83Honda Integra 86-88 18.45 22.03 4.07 3.40 4.86 1.47Honda Integra 90-92 18.51 21.78 4.03 3.34 4.87 1.54Honda Integra 93-01 16.03 20.38 3.27 2.71 3.94 1.23Honda Integra 02-06 18.08 20.91 3.78 2.43 5.89 3.46Honda Concerto 89-93 15.72 23.99 3.77 3.06 4.65 1.60Peugeot 306 94-01 15.14 16.95 2.57 2.10 3.15 1.05Peugeot 307 01-07 12.77 14.45 1.85 1.24 2.75 1.52Proton Wira 95-96 17.07 25.17 4.30 3.65 5.06 1.42Renault 19 91-96 17.95 19.02 3.42 2.32 5.02 2.70Renault Scenic 01-04 15.02 11.14 1.67 0.79 3.53 2.74Rover Quintet 82-86 19.30 18.87 3.64 2.51 5.28 2.77MG MGF / MG TF 99-05 11.17 19.10 2.13 1.25 3.65 2.41Subaru Vortex 85-89 23.91 22.02 5.26 3.11 8.91 5.81Subaru Impreza 93-00 17.09 24.72 4.22 3.87 4.61 0.74Subaru Impreza 01-07 13.59 17.78 2.42 1.98 2.96 0.98Suzuki Baleno / Cultus Crescent 95-02 16.66 17.54 2.92 2.43 3.51 1.08Suzuki Liana 01-07 14.09 23.18 3.26 2.25 4.75 2.50Toyota Corolla 82-84 19.33 21.18 4.09 3.86 4.34 0.47

Make Model of Car Years ofManufacture
Pr(Risk)%
Pr(Severity)%
Serious injuryrate per 100road usersinvolved%
Lower 90%ConfidenceLimit
Lower 90%ConfidenceLimit
Width ofConfidenceInterval
Toyota Corolla 86-88 18.64 22.48 4.19 3.99 4.39 0.40Toyota / Holden Corolla / Nova 89-93 17.65 21.96 3.88 3.72 4.03 0.31Toyota / Holden Corolla / Nova 94-97 16.40 21.11 3.46 3.29 3.65 0.36Toyota Corolla / Allex 98-01 15.81 19.20 3.04 2.77 3.32 0.55Toyota Corolla 02-07 15.45 20.14 3.11 2.86 3.38 0.51Toyota Tercel 83-88 19.99 21.90 4.38 3.39 5.65 2.25Toyota MR2 87-90 21.40 24.67 5.28 4.03 6.92 2.89Toyota MR2 91-00 18.48 22.81 4.22 2.99 5.95 2.96Toyota Paseo / Cynos 91-99 16.99 21.95 3.73 3.17 4.38 1.21Toyota Corolla 4WD Wagon 92-96 16.57 25.93 4.30 3.20 5.77 2.56Toyota Prius 03-07 8.22 16.90 1.39 0.59 3.24 2.65Volvo 300 Series 84-88 13.99 27.28 3.82 2.52 5.79 3.27Volvo S40/V40 97-04 14.68 17.91 2.63 1.92 3.60 1.68Volkswagen Golf 82-94 18.32 26.88 4.92 3.49 6.94 3.45Volkswagen Golf 95-98 14.87 21.58 3.21 2.54 4.05 1.51Volkswagen Golf / Bora 99-04 15.16 16.42 2.49 2.04 3.03 0.98Volkswagen New Beetle 00-07 14.03 16.18 2.27 1.39 3.71 2.33Volkswagen Golf / Jetta 04-07 11.84 13.85 1.64 1.05 2.55 1.50
APPENDIX 7
PRESENTATION OF CRASHWORTHINESS, AGGRESSIVITY ANDTOTAL SECONDARY SAFETY RATINGS FOR CONSUMER INFORMATION
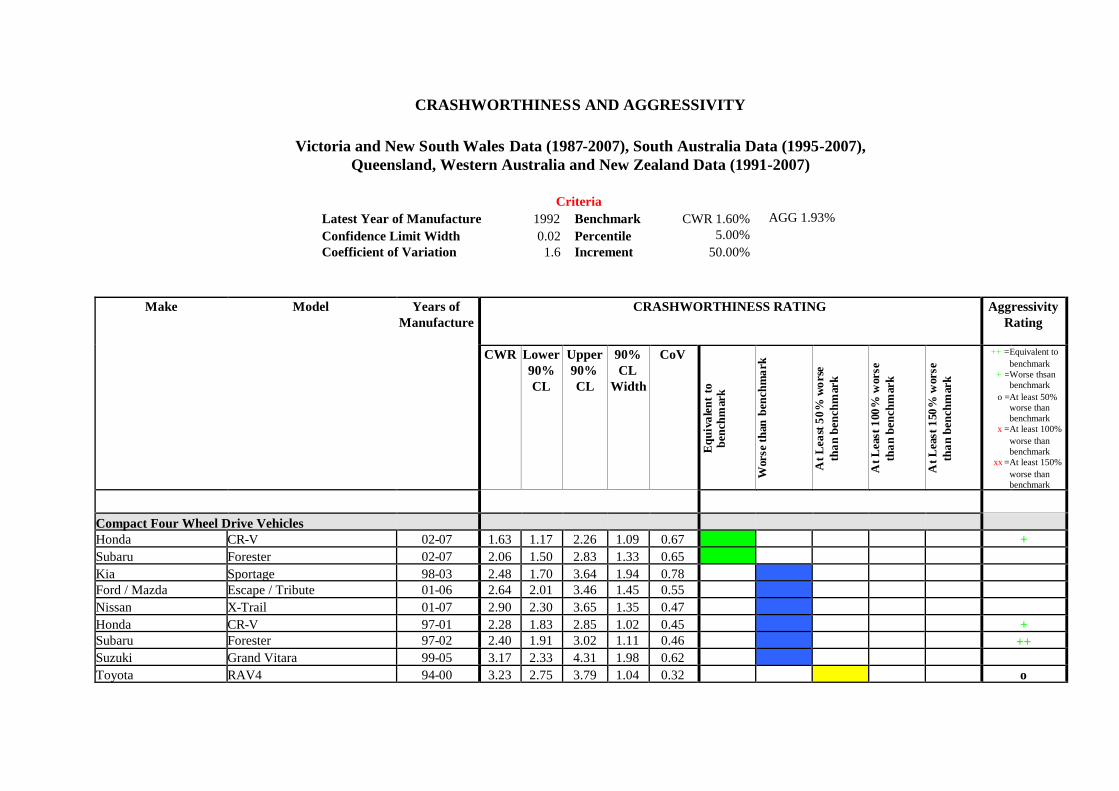
CRASHWORTHINESS AND AGGRESSIVITY
Victoria and New South Wales Data (1987-2007), South Australia Data (1995-2007),Queensland, Western Australia and New Zealand Data (1991-2007)
CriteriaLatest Year of Manufacture 1992 Benchmark CWR 1.60% AGG 1.93%Confidence Limit Width 0.02
1.6Percentile 5.00%
Coefficient of Variation Increment 50.00%
Make Model Years ofManufacture
CRASHWORTHINESS RATING00
AggressivityRating
CWR Lower90%CL
Upper90%CL
90%CL
Width
CoV
Equ
ival
ent
tobe
nchm
ark
Wor
seth
anbe
nchm
ark
AtL
east
50%
wor
seth
anbe
nchm
ark
AtL
east
100%
wor
seth
anbe
nchm
ark
AtL
east
150%
wor
seth
anbe
nchm
ark
++ =
+ =
o =
x =
xx =
Equivalent tobenchmarkWorse thsanbenchmarkAt least 50%worse thanbenchmarkAt least 100%worse thanbenchmarkAt least 150%worse thanbenchmark
Compact Four Wheel Drive VehiclesHonda CR-V 02-07 1.63 1.17 2.26 1.09 0.67 1 0 0 0 0 +Subaru Forester 02-07 2.06 1.50 2.83 1.33 0.65 1 0 0 0 0Kia Sportage 98-03 2.48 1.70 3.64 1.94 0.78 0 1 0 0 0Ford / Mazda Escape / Tribute 01-06 2.64 2.01 3.46 1.45 0.55 0 1 0 0 0Nissan X-Trail 01-07 2.90 2.30 3.65 1.35 0.47 0 1 0 0 0Honda CR-V 97-01 2.28 1.83 2.85 1.02 0.45 0 1 0 0 0 +Subaru Forester 97-02 2.40 1.91 3.02 1.11 0.46 0 1 0 0 0 ++Suzuki Grand Vitara 99-05 3.17 2.33 4.31 1.98 0.62 0 1 0 0 0Toyota RAV4 94-00 3.23 2.75 3.79 1.04 0.32 0 0 1 0 0 o
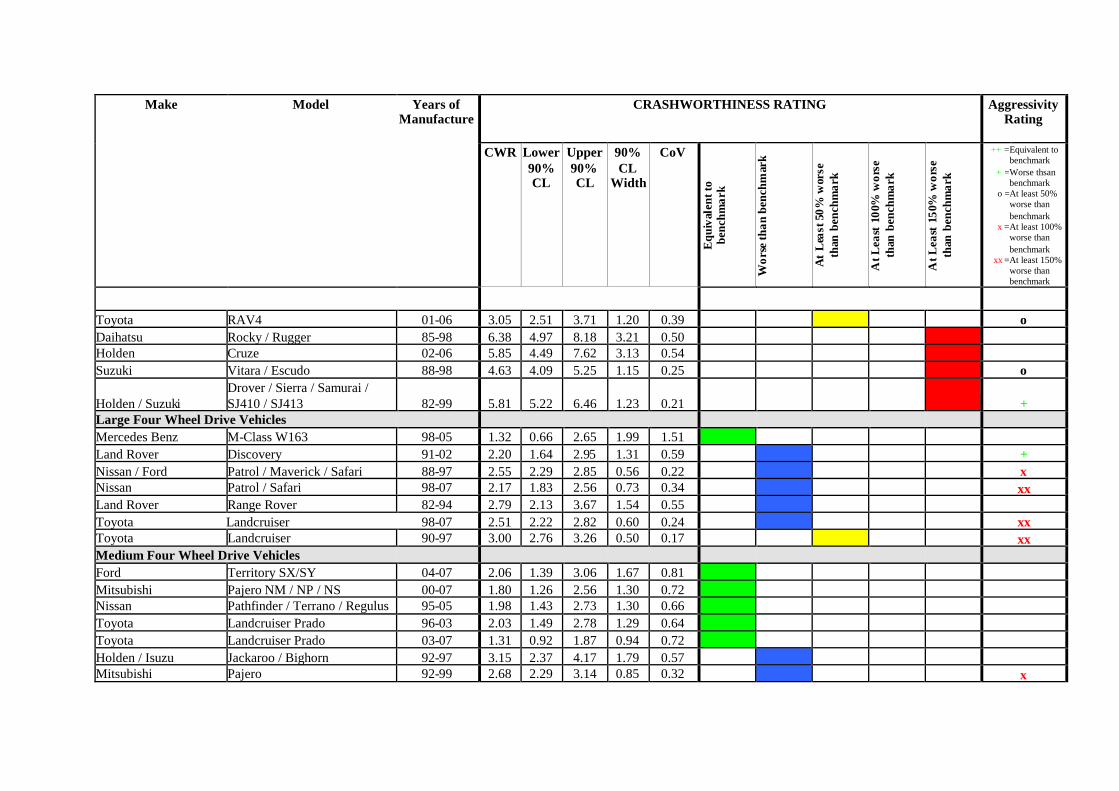
Make Model Years ofManufacture
CRASHWORTHINESS RATING00
AggressivityRating
CWR Lower90%CL
Upper90%CL
90%CL
Width
CoV
Equ
ival
entt
obe
nchm
ark
Wor
seth
anbe
nchm
ark
At
Lea
st50
%w
orse
than
benc
hmar
k
AtL
east
100%
wor
seth
anbe
nchm
ark
AtL
east
150%
wor
seth
anbe
nchm
ark
++ =
+ =
o =
x =
xx =
Equivalent tobenchmarkWorse thsanbenchmarkAt least 50%worse thanbenchmarkAt least 100%worse thanbenchmarkAt least 150%worse thanbenchmark
Toyota RAV4 01-06 3.05 2.51 3.71 1.20 0.39 0 0 1 0 0 oDaihatsu Rocky / Rugger 85-98 6.38 4.97 8.18 3.21 0.50 0 0 0 0 1Holden Cruze 02-06 5.85 4.49 7.62 3.13 0.54 0 0 0 0 1Suzuki Vitara / Escudo 88-98 4.63 4.09 5.25 1.15 0.25 0 0 0 0 1 o
Holden / SuzukiDrover / Sierra / Samurai /SJ410 / SJ413 82-99 5.81 5.22 6.46 1.23 0.21 0 0 0 0 1 +
Large Four Wheel Drive VehiclesMercedes Benz M-Class W163 98-05 1.32 0.66 2.65 1.99 1.51 1 0 0 0 0Land Rover Discovery 91-02 2.20 1.64 2.95 1.31 0.59 0 1 0 0 0 +Nissan / Ford Patrol / Maverick / Safari 88-97 2.55 2.29 2.85 0.56 0.22 0 1 0 0 0 xNissan Patrol / Safari 98-07 2.17 1.83 2.56 0.73 0.34 0 1 0 0 0 xxLand Rover Range Rover 82-94 2.79 2.13 3.67 1.54 0.55 0 1 0 0 0Toyota Landcruiser 98-07 2.51 2.22 2.82 0.60 0.24 0 1 0 0 0 xxToyota Landcruiser 90-97 3.00 2.76 3.26 0.50 0.17 0 0 1 0 0 xxMedium Four Wheel Drive VehiclesFord Territory SX/SY 04-07 2.06 1.39 3.06 1.67 0.81 1 0 0 0 0Mitsubishi Pajero NM / NP / NS 00-07 1.80 1.26 2.56 1.30 0.72 1 0 0 0 0Nissan Pathfinder / Terrano / Regulus 95-05 1.98 1.43 2.73 1.30 0.66 1 0 0 0 0Toyota Landcruiser Prado 96-03 2.03 1.49 2.78 1.29 0.64 1 0 0 0 0Toyota Landcruiser Prado 03-07 1.31 0.92 1.87 0.94 0.72 1 0 0 0 0Holden / Isuzu Jackaroo / Bighorn 92-97 3.15 2.37 4.17 1.79 0.57 0 1 0 0 0Mitsubishi Pajero 92-99 2.68 2.29 3.14 0.85 0.32 0 1 0 0 0 x
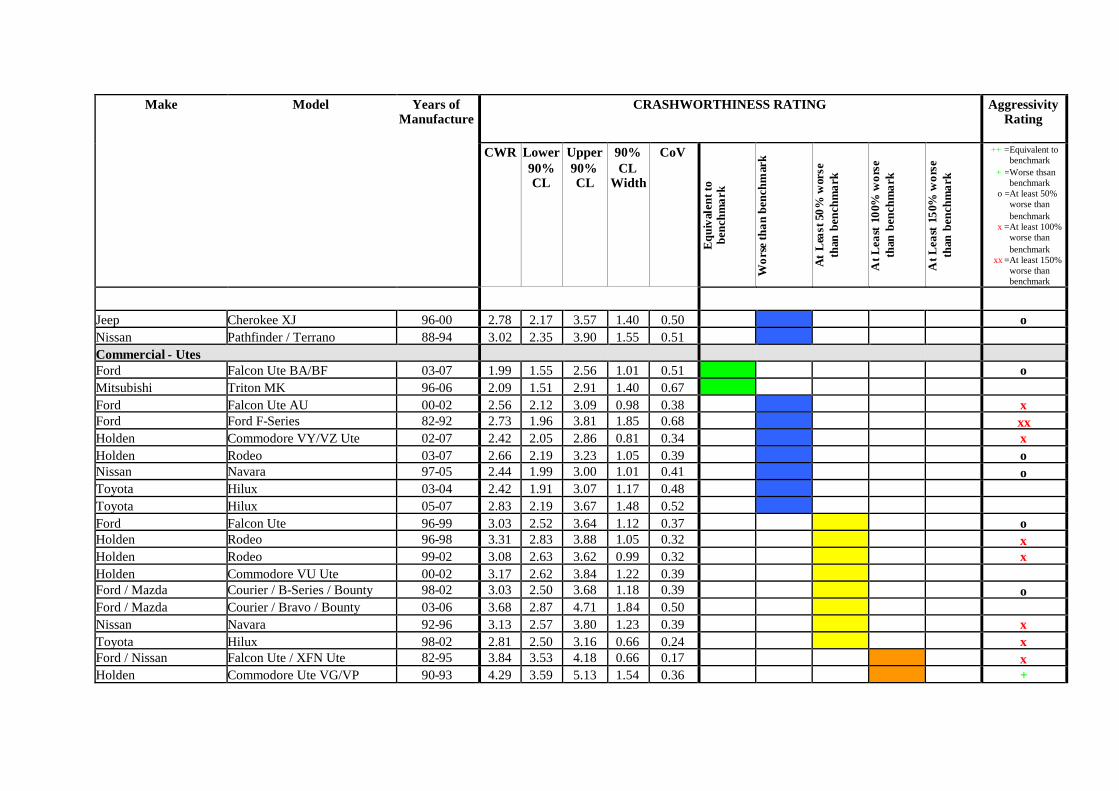
Make Model Years ofManufacture
CRASHWORTHINESS RATING00
AggressivityRating
CWR Lower90%CL
Upper90%CL
90%CL
Width
CoV
Equ
ival
entt
obe
nchm
ark
Wor
seth
anbe
nchm
ark
At
Lea
st50
%w
orse
than
benc
hmar
k
AtL
east
100%
wor
seth
anbe
nchm
ark
AtL
east
150%
wor
seth
anbe
nchm
ark
++ =
+ =
o =
x =
xx =
Equivalent tobenchmarkWorse thsanbenchmarkAt least 50%worse thanbenchmarkAt least 100%worse thanbenchmarkAt least 150%worse thanbenchmark
Jeep Cherokee XJ 96-00 2.78 2.17 3.57 1.40 0.50 0 1 0 0 0 oNissan Pathfinder / Terrano 88-94 3.02 2.35 3.90 1.55 0.51 0 1 0 0 0Commercial - UtesFord Falcon Ute BA/BF 03-07 1.99 1.55 2.56 1.01 0.51 1 0 0 0 0 oMitsubishi Triton MK 96-06 2.09 1.51 2.91 1.40 0.67 1 0 0 0 0Ford Falcon Ute AU 00-02 2.56 2.12 3.09 0.98 0.38 0 1 0 0 0 xFord Ford F-Series 82-92 2.73 1.96 3.81 1.85 0.68 0 1 0 0 0 xxHolden Commodore VY/VZ Ute 02-07 2.42 2.05 2.86 0.81 0.34 0 1 0 0 0 xHolden Rodeo 03-07 2.66 2.19 3.23 1.05 0.39 0 1 0 0 0 oNissan Navara 97-05 2.44 1.99 3.00 1.01 0.41 0 1 0 0 0 oToyota Hilux 03-04 2.42 1.91 3.07 1.17 0.48 0 1 0 0 0Toyota Hilux 05-07 2.83 2.19 3.67 1.48 0.52 0 1 0 0 0Ford Falcon Ute 96-99 3.03 2.52 3.64 1.12 0.37 0 0 1 0 0 oHolden Rodeo 96-98 3.31 2.83 3.88 1.05 0.32 0 0 1 0 0 xHolden Rodeo 99-02 3.08 2.63 3.62 0.99 0.32 0 0 1 0 0 xHolden Commodore VU Ute 00-02 3.17 2.62 3.84 1.22 0.39 0 0 1 0 0Ford / Mazda Courier / B-Series / Bounty 98-02 3.03 2.50 3.68 1.18 0.39 0 0 1 0 0 oFord / Mazda Courier / Bravo / Bounty 03-06 3.68 2.87 4.71 1.84 0.50 0 0 1 0 0Nissan Navara 92-96 3.13 2.57 3.80 1.23 0.39 0 0 1 0 0 xToyota Hilux 98-02 2.81 2.50 3.16 0.66 0.24 0 0 1 0 0 xFord / Nissan Falcon Ute / XFN Ute 82-95 3.84 3.53 4.18 0.66 0.17 0 0 0 1 0 xHolden Commodore Ute VG/VP 90-93 4.29 3.59 5.13 1.54 0.36 0 0 0 1 0 +
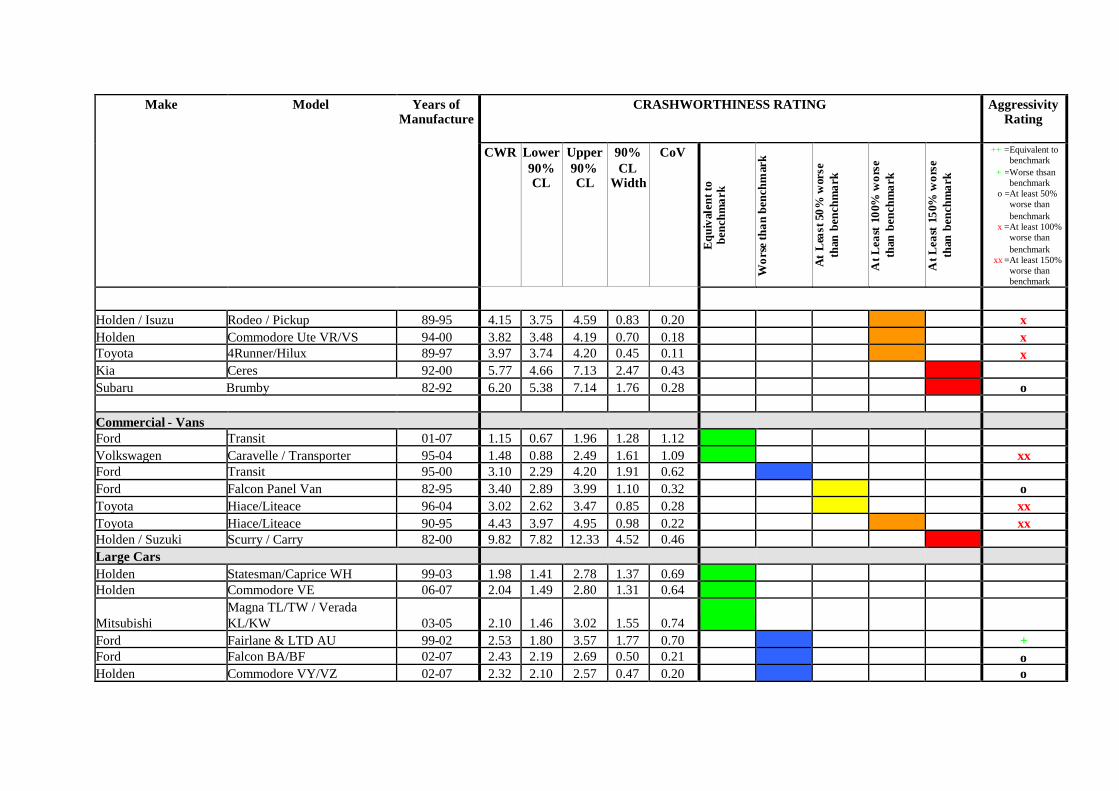
Make Model Years ofManufacture
CRASHWORTHINESS RATING00
AggressivityRating
CWR Lower90%CL
Upper90%CL
90%CL
Width
CoV
Equ
ival
entt
obe
nchm
ark
Wor
seth
anbe
nchm
ark
At
Lea
st50
%w
orse
than
benc
hmar
k
AtL
east
100%
wor
seth
anbe
nchm
ark
AtL
east
150%
wor
seth
anbe
nchm
ark
++ =
+ =
o =
x =
xx =
Equivalent tobenchmarkWorse thsanbenchmarkAt least 50%worse thanbenchmarkAt least 100%worse thanbenchmarkAt least 150%worse thanbenchmark
Holden / Isuzu Rodeo / Pickup 89-95 4.15 3.75 4.59 0.83 0.20 0 0 0 1 0 xHolden Commodore Ute VR/VS 94-00 3.82 3.48 4.19 0.70 0.18 0 0 0 1 0 xToyota 4Runner/Hilux 89-97 3.97 3.74 4.20 0.45 0.11 0 0 0 1 0 xKia Ceres 92-00 5.77 4.66 7.13 2.47 0.43 0 0 0 0 1Subaru Brumby 82-92 6.20 5.38 7.14 1.76 0.28 0 0 0 0 1 o
Commercial - VansFord Transit 01-07 1.15 0.67 1.96 1.28 1.12 1 0 0 0 0Volkswagen Caravelle / Transporter 95-04 1.48 0.88 2.49 1.61 1.09 1 0 0 0 0 xxFord Transit 95-00 3.10 2.29 4.20 1.91 0.62 0 1 0 0 0Ford Falcon Panel Van 82-95 3.40 2.89 3.99 1.10 0.32 0 0 1 0 0 oToyota Hiace/Liteace 96-04 3.02 2.62 3.47 0.85 0.28 0 0 1 0 0 xxToyota Hiace/Liteace 90-95 4.43 3.97 4.95 0.98 0.22 0 0 0 1 0 xxHolden / Suzuki Scurry / Carry 82-00 9.82 7.82 12.33 4.52 0.46 0 0 0 0 1Large CarsHolden Statesman/Caprice WH 99-03 1.98 1.41 2.78 1.37 0.69 1 0 0 0 0Holden Commodore VE 06-07 2.04 1.49 2.80 1.31 0.64 1 0 0 0 0
MitsubishiMagna TL/TW / VeradaKL/KW 03-05 2.10 1.46 3.02 1.55 0.74 1 0 0 0 0
Ford Fairlane & LTD AU 99-02 2.53 1.80 3.57 1.77 0.70 0 1 0 0 0 +Ford Falcon BA/BF 02-07 2.43 2.19 2.69 0.50 0.21 0 1 0 0 0 oHolden Commodore VY/VZ 02-07 2.32 2.10 2.57 0.47 0.20 0 1 0 0 0 o

Make Model Years ofManufacture
CRASHWORTHINESS RATING00
AggressivityRating
CWR Lower90%CL
Upper90%CL
90%CL
Width
CoV
Equ
ival
entt
obe
nchm
ark
Wor
seth
anbe
nchm
ark
At
Lea
st50
%w
orse
than
benc
hmar
k
AtL
east
100%
wor
seth
anbe
nchm
ark
AtL
east
150%
wor
seth
anbe
nchm
ark
++ =
+ =
o =
x =
xx =
Equivalent tobenchmarkWorse thsanbenchmarkAt least 50%worse thanbenchmarkAt least 100%worse thanbenchmarkAt least 150%worse thanbenchmark
Mercedes Benz E-Class W124 86-94 2.79 2.09 3.72 1.63 0.58 0 1 0 0 0 +Mercedes Benz S-Class W126 82-92 2.94 2.11 4.09 1.99 0.68 0 1 0 0 0Honda Legend 86-95 2.73 2.03 3.66 1.62 0.59 0 1 0 0 0Toyota Cressida / Mark II 89-93 2.83 2.32 3.45 1.13 0.40 0 1 0 0 0 +Toyota Avalon 00-05 2.68 2.19 3.28 1.09 0.41 0 1 0 0 0 oToyota Camry 02-06 2.22 1.89 2.61 0.72 0.32 0 1 0 0 0 oVolvo 850/S70/V70/C70 92-05 3.02 2.40 3.81 1.42 0.47 0 1 0 0 0 oVolvo 700/900 Series 84-92 2.59 2.05 3.26 1.21 0.47 0 1 0 0 0 +Ford Fairlane N & LTD D 88-94 2.99 2.64 3.38 0.74 0.25 0 0 1 0 0 oFord Fairlane N & LTD D 95-98 3.31 2.72 4.02 1.30 0.39 0 0 1 0 0 oFord Falcon EF/EL 94-98 3.16 3.02 3.31 0.29 0.09 0 0 1 0 0 oFord Falcon AU 98-02 2.83 2.65 3.02 0.37 0.13 0 0 1 0 0 oHolden Stateman/Caprice VR/VS 94-98 3.31 2.89 3.79 0.90 0.27 0 0 1 0 0 oHolden Commodore VT/VX 97-02 2.98 2.83 3.13 0.30 0.10 0 0 1 0 0 oHyundai Sonata 89-97 3.60 3.12 4.15 1.03 0.29 0 0 1 0 0 o
MitsubishiMagna TE/TF/TH/TJ / VeradaKE/KF/KH/KJ / Diamante 96-03 3.23 3.01 3.48 0.48 0.15 0 0 1 0 0 o
Nissan Maxima 90-94 3.46 2.76 4.34 1.58 0.46 0 0 1 0 0 oNissan Maxima / Cefiro 95-99 3.27 2.60 4.11 1.50 0.46 0 0 1 0 0 +Toyota Camry 98-02 3.00 2.77 3.26 0.49 0.16 0 0 1 0 0 oFord Falcon EA / Falcon EB Series I 88-92 3.79 3.63 3.96 0.33 0.09 0 0 0 1 0 oFord Falcon EB Series II / Falcon 92-94 3.45 3.24 3.67 0.43 0.12 0 0 0 1 0 o

Make Model Years ofManufacture
CRASHWORTHINESS RATING00
AggressivityRating
CWR Lower90%CL
Upper90%CL
90%CL
Width
CoV
Equ
ival
entt
obe
nchm
ark
Wor
seth
anbe
nchm
ark
At
Lea
st50
%w
orse
than
benc
hmar
k
AtL
east
100%
wor
seth
anbe
nchm
ark
AtL
east
150%
wor
seth
anbe
nchm
ark
++ =
+ =
o =
x =
xx =
Equivalent tobenchmarkWorse thsanbenchmarkAt least 50%worse thanbenchmarkAt least 100%worse thanbenchmarkAt least 150%worse thanbenchmark
EDHolden / Toyota Commodore VR/VS / Lexcen 93-97 3.38 3.24 3.52 0.28 0.08 0 0 0 1 0 o
MitsubishiMagna TR/TS / Verada KR/KS/ V3000 / Diamante 91-96 3.45 3.26 3.66 0.40 0.12 0 0 0 1 0 o
Holden / Toyota Commodore VN/VP / Lexcen 89-93 4.16 4.01 4.31 0.30 0.07 0 0 0 0 1 oLight CarsHonda Jazz / Fit 02-07 3.07 2.33 4.05 1.72 0.56 0 1 0 0 0 ++Toyota Yaris 05-07 3.11 2.27 4.26 1.99 0.64 0 1 0 0 0Holden Barina XC 01-06 3.42 2.85 4.10 1.25 0.36 0 0 1 0 0 +Daihatsu Sirion / Storia 98-04 4.43 3.59 5.48 1.89 0.43 0 0 0 1 0 ++Mazda 121 Metro / Demio 97-02 4.15 3.55 4.85 1.30 0.31 0 0 0 1 0 ++Toyota Echo 99-05 4.39 3.95 4.88 0.94 0.21 0 0 0 1 0 +Daihatsu Charade 88-92 6.17 5.68 6.71 1.04 0.17 0 0 0 0 1 ++Daihatsu Charade 93-00 6.09 5.54 6.70 1.16 0.19 0 0 0 0 1 +Daihatsu Mira 90-96 9.99 8.45 11.82 3.38 0.34 0 0 0 0 1 ++Ford Festiva WD/WH/WF 94-01 5.90 5.55 6.27 0.71 0.12 0 0 0 0 1 +Holden Barina SB 95-00 4.58 4.15 5.05 0.90 0.20 0 0 0 0 1 +Hyundai Getz / TB 02-07 4.87 4.09 5.80 1.71 0.35 0 0 0 0 1Mazda 121 / Autozam Review 94-96 4.79 4.21 5.45 1.24 0.26 0 0 0 0 1 ++Nissan Micra 95-97 6.31 5.08 7.85 2.77 0.44 0 0 0 0 1Subaru Sherpa / Fiori / 700 / Rex 89-92 9.09 7.60 10.88 3.28 0.36 0 0 0 0 1 ++Holden / Suzuki Barina / Swift / Cultus 89-99 5.60 5.29 5.94 0.64 0.12 0 0 0 0 1 +
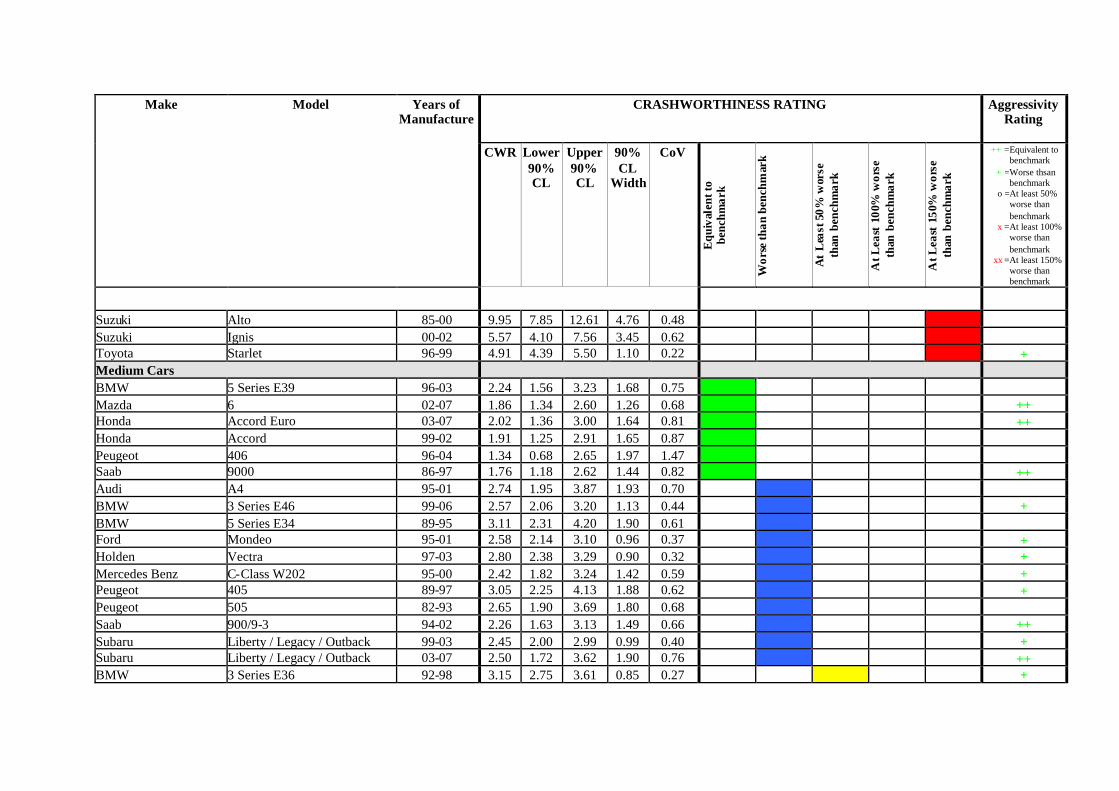
Make Model Years ofManufacture
CRASHWORTHINESS RATING00
AggressivityRating
CWR Lower90%CL
Upper90%CL
90%CL
Width
CoV
Equ
ival
entt
obe
nchm
ark
Wor
seth
anbe
nchm
ark
At
Lea
st50
%w
orse
than
benc
hmar
k
AtL
east
100%
wor
seth
anbe
nchm
ark
AtL
east
150%
wor
seth
anbe
nchm
ark
++ =
+ =
o =
x =
xx =
Equivalent tobenchmarkWorse thsanbenchmarkAt least 50%worse thanbenchmarkAt least 100%worse thanbenchmarkAt least 150%worse thanbenchmark
Suzuki Alto 85-00 9.95 7.85 12.61 4.76 0.48 0 0 0 0 1Suzuki Ignis 00-02 5.57 4.10 7.56 3.45 0.62 0 0 0 0 1Toyota Starlet 96-99 4.91 4.39 5.50 1.10 0.22 0 0 0 0 1 +Medium CarsBMW 5 Series E39 96-03 2.24 1.56 3.23 1.68 0.75 1 0 0 0 0Mazda 6 02-07 1.86 1.34 2.60 1.26 0.68 1 0 0 0 0 ++Honda Accord Euro 03-07 2.02 1.36 3.00 1.64 0.81 1 0 0 0 0 ++Honda Accord 99-02 1.91 1.25 2.91 1.65 0.87 1 0 0 0 0Peugeot 406 96-04 1.34 0.68 2.65 1.97 1.47 1 0 0 0 0Saab 9000 86-97 1.76 1.18 2.62 1.44 0.82 1 0 0 0 0 ++Audi A4 95-01 2.74 1.95 3.87 1.93 0.70 0 1 0 0 0BMW 3 Series E46 99-06 2.57 2.06 3.20 1.13 0.44 0 1 0 0 0 +BMW 5 Series E34 89-95 3.11 2.31 4.20 1.90 0.61 0 1 0 0 0Ford Mondeo 95-01 2.58 2.14 3.10 0.96 0.37 0 1 0 0 0 +Holden Vectra 97-03 2.80 2.38 3.29 0.90 0.32 0 1 0 0 0 +Mercedes Benz C-Class W202 95-00 2.42 1.82 3.24 1.42 0.59 0 1 0 0 0 +Peugeot 405 89-97 3.05 2.25 4.13 1.88 0.62 0 1 0 0 0 +Peugeot 505 82-93 2.65 1.90 3.69 1.80 0.68 0 1 0 0 0Saab 900/9-3 94-02 2.26 1.63 3.13 1.49 0.66 0 1 0 0 0 ++Subaru Liberty / Legacy / Outback 99-03 2.45 2.00 2.99 0.99 0.40 0 1 0 0 0 +Subaru Liberty / Legacy / Outback 03-07 2.50 1.72 3.62 1.90 0.76 0 1 0 0 0 ++BMW 3 Series E36 92-98 3.15 2.75 3.61 0.85 0.27 0 0 1 0 0 +

Make Model Years ofManufacture
CRASHWORTHINESS RATING00
AggressivityRating
CWR Lower90%CL
Upper90%CL
90%CL
Width
CoV
Equ
ival
entt
obe
nchm
ark
Wor
seth
anbe
nchm
ark
At
Lea
st50
%w
orse
than
benc
hmar
k
AtL
east
100%
wor
seth
anbe
nchm
ark
AtL
east
150%
wor
seth
anbe
nchm
ark
++ =
+ =
o =
x =
xx =
Equivalent tobenchmarkWorse thsanbenchmarkAt least 50%worse thanbenchmarkAt least 100%worse thanbenchmarkAt least 150%worse thanbenchmark
Ford / MazdaTelstar / 626 / MX6 / Capella /Cronos 92-97 3.40 3.08 3.76 0.69 0.20 0 0 1 0 0 +
Mazda 626 98-02 2.96 2.41 3.62 1.21 0.41 0 0 1 0 0 +Nissan Bluebird 93-97 3.20 2.71 3.77 1.06 0.33 0 0 1 0 0 +Nissan 200SX / Silvia 94-02 3.08 2.40 3.96 1.55 0.50 0 0 1 0 0Honda Accord 91-93 3.40 2.81 4.11 1.30 0.38 0 0 1 0 0 +Honda Accord 94-98 3.49 3.01 4.04 1.03 0.30 0 0 1 0 0 +Saab 900 Series 82-92 3.62 2.80 4.68 1.89 0.52 0 0 1 0 0 ++Subaru Liberty / Legacy / Outback 94-98 3.12 2.69 3.62 0.92 0.30 0 0 1 0 0 oToyota Celica 94-99 3.48 2.76 4.38 1.63 0.47 0 0 1 0 0 +Volvo 200 Series 82-93 3.31 2.80 3.92 1.13 0.34 0 0 1 0 0 +Mitsubishi Galant 95-96 3.94 3.29 4.72 1.43 0.36 0 0 0 1 0 +Honda Prelude 92-96 4.17 3.45 5.05 1.60 0.38 0 0 0 1 0 +Subaru Liberty / Legacy 89-93 3.68 3.33 4.06 0.73 0.20 0 0 0 1 0 oHolden / Toyota Apollo JK/JL / Camry / Vista 88-92 3.85 3.66 4.05 0.39 0.10 0 0 0 1 0 o
Holden / ToyotaApollo JM/JP / Camry /Sceptor 93-97 3.95 3.74 4.18 0.44 0.11 0 0 0 1 0 o
Toyota Celica 90-93 4.14 3.53 4.87 1.34 0.32 0 0 0 1 0 oDaewoo Espero 95-97 5.46 4.28 6.96 2.68 0.49 0 0 0 0 1Nissan / Ford Pintara / Corsair / Bluebird 89-92 4.67 4.33 5.03 0.70 0.15 0 0 0 0 1 o
Subaru1800 / Leone / Omega / 4WDWagon 82-93 4.73 4.34 5.15 0.81 0.17 0 0 0 0 1 +
People Movers

Make Model Years ofManufacture
CRASHWORTHINESS RATING00
AggressivityRating
CWR Lower90%CL
Upper90%CL
90%CL
Width
CoV
Equ
ival
entt
obe
nchm
ark
Wor
seth
anbe
nchm
ark
At
Lea
st50
%w
orse
than
benc
hmar
k
AtL
east
100%
wor
seth
anbe
nchm
ark
AtL
east
150%
wor
seth
anbe
nchm
ark
++ =
+ =
o =
x =
xx =
Equivalent tobenchmarkWorse thsanbenchmarkAt least 50%worse thanbenchmarkAt least 100%worse thanbenchmarkAt least 150%worse thanbenchmark
Kia Carnival 99-06 1.24 0.78 1.99 1.21 0.97 1 0 0 0 0 xxHonda Odyssey 95-00 2.15 1.42 3.25 1.83 0.85 1 0 0 0 0Toyota Tarago / Previa / Estima 00-06 2.33 1.59 3.41 1.82 0.78 1 0 0 0 0Mitsubishi Starwagon / Delica Spacegear 95-98 3.56 2.81 4.50 1.69 0.47 0 0 1 0 0 xToyota Tarago / Previa / Estima 91-99 2.92 2.44 3.48 1.04 0.35 0 0 1 0 0 oMitsubishi Starwagon / Delica Starwagon 87-93 4.93 4.45 5.47 1.02 0.21 0 0 0 0 1 xSmall CarsFord Focus LS / LT 05-07 1.52 0.91 2.54 1.63 1.07 1 0 0 0 0Volkswagen Golf / Jetta 04-07 0.91 0.47 1.76 1.28 1.41 1 0 0 0 0Ford Focus LR 02-05 2.97 2.31 3.83 1.52 0.51 0 1 0 0 0 +Holden Astra TR 96-98 3.06 2.39 3.93 1.54 0.50 0 1 0 0 0 +Mazda 3 / Axela 03-07 2.37 1.90 2.96 1.06 0.45 0 1 0 0 0 +Peugeot 306 94-01 2.42 1.84 3.18 1.34 0.55 0 1 0 0 0 ++Subaru Impreza 01-07 2.42 1.87 3.13 1.26 0.52 0 1 0 0 0 ++Volkswagen Golf 95-98 2.80 1.97 3.97 1.99 0.71 0 1 0 0 0Volkswagen Golf / Bora 99-04 2.26 1.72 2.97 1.26 0.56 0 1 0 0 0 ++Daewoo Nubira 97-03 3.66 3.12 4.29 1.17 0.32 0 0 1 0 0 +Holden Astra TS 98-06 2.99 2.69 3.33 0.63 0.21 0 0 1 0 0 +Hyundai Elantra 00-07 3.32 2.66 4.13 1.47 0.44 0 0 1 0 0 +Ford / Mazda Laser / 323 99-03 3.25 2.88 3.67 0.79 0.24 0 0 1 0 0 +Honda Civic 96-00 3.60 3.16 4.10 0.94 0.26 0 0 1 0 0 +Honda Civic 01-05 3.08 2.41 3.93 1.52 0.49 0 0 1 0 0 +
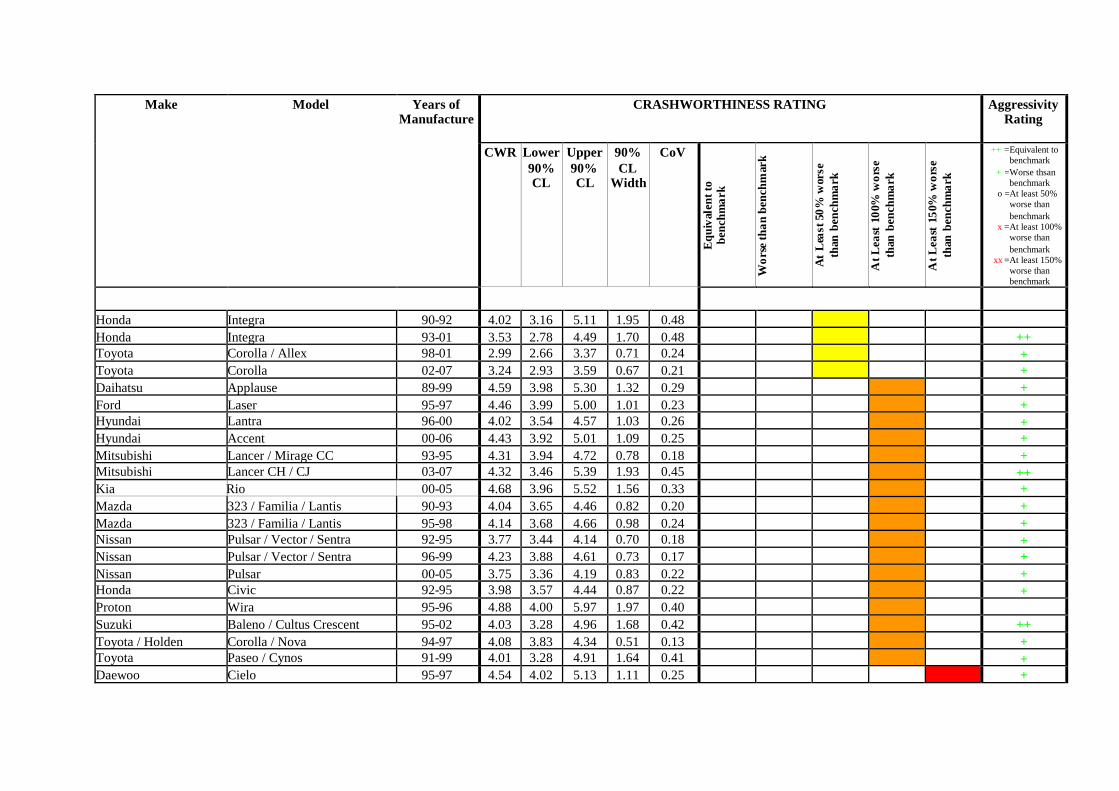
Make Model Years ofManufacture
CRASHWORTHINESS RATING00
AggressivityRating
CWR Lower90%CL
Upper90%CL
90%CL
Width
CoV
Equ
ival
entt
obe
nchm
ark
Wor
seth
anbe
nchm
ark
At
Lea
st50
%w
orse
than
benc
hmar
k
AtL
east
100%
wor
seth
anbe
nchm
ark
AtL
east
150%
wor
seth
anbe
nchm
ark
++ =
+ =
o =
x =
xx =
Equivalent tobenchmarkWorse thsanbenchmarkAt least 50%worse thanbenchmarkAt least 100%worse thanbenchmarkAt least 150%worse thanbenchmark
Honda Integra 90-92 4.02 3.16 5.11 1.95 0.48 0 0 1 0 0Honda Integra 93-01 3.53 2.78 4.49 1.70 0.48 0 0 1 0 0 ++Toyota Corolla / Allex 98-01 2.99 2.66 3.37 0.71 0.24 0 0 1 0 0 +Toyota Corolla 02-07 3.24 2.93 3.59 0.67 0.21 0 0 1 0 0 +Daihatsu Applause 89-99 4.59 3.98 5.30 1.32 0.29 0 0 0 1 0 +Ford Laser 95-97 4.46 3.99 5.00 1.01 0.23 0 0 0 1 0 +Hyundai Lantra 96-00 4.02 3.54 4.57 1.03 0.26 0 0 0 1 0 +Hyundai Accent 00-06 4.43 3.92 5.01 1.09 0.25 0 0 0 1 0 +Mitsubishi Lancer / Mirage CC 93-95 4.31 3.94 4.72 0.78 0.18 0 0 0 1 0 +Mitsubishi Lancer CH / CJ 03-07 4.32 3.46 5.39 1.93 0.45 0 0 0 1 0 ++Kia Rio 00-05 4.68 3.96 5.52 1.56 0.33 0 0 0 1 0 +Mazda 323 / Familia / Lantis 90-93 4.04 3.65 4.46 0.82 0.20 0 0 0 1 0 +Mazda 323 / Familia / Lantis 95-98 4.14 3.68 4.66 0.98 0.24 0 0 0 1 0 +Nissan Pulsar / Vector / Sentra 92-95 3.77 3.44 4.14 0.70 0.18 0 0 0 1 0 +Nissan Pulsar / Vector / Sentra 96-99 4.23 3.88 4.61 0.73 0.17 0 0 0 1 0 +Nissan Pulsar 00-05 3.75 3.36 4.19 0.83 0.22 0 0 0 1 0 +Honda Civic 92-95 3.98 3.57 4.44 0.87 0.22 0 0 0 1 0 +Proton Wira 95-96 4.88 4.00 5.97 1.97 0.40 0 0 0 1 0Suzuki Baleno / Cultus Crescent 95-02 4.03 3.28 4.96 1.68 0.42 0 0 0 1 0 ++Toyota / Holden Corolla / Nova 94-97 4.08 3.83 4.34 0.51 0.13 0 0 0 1 0 +Toyota Paseo / Cynos 91-99 4.01 3.28 4.91 1.64 0.41 0 0 0 1 0 +Daewoo Cielo 95-97 4.54 4.02 5.13 1.11 0.25 0 0 0 0 1 +

Make Model Years ofManufacture
CRASHWORTHINESS RATING00
AggressivityRating
CWR Lower90%CL
Upper90%CL
90%CL
Width
CoV
Equ
ival
entt
obe
nchm
ark
Wor
seth
anbe
nchm
ark
At
Lea
st50
%w
orse
than
benc
hmar
k
AtL
east
100%
wor
seth
anbe
nchm
ark
AtL
east
150%
wor
seth
anbe
nchm
ark
++ =
+ =
o =
x =
xx =
Equivalent tobenchmarkWorse thsanbenchmarkAt least 50%worse thanbenchmarkAt least 100%worse thanbenchmarkAt least 150%worse thanbenchmark
Daewoo Lanos 97-03 4.72 4.24 5.27 1.03 0.22 0 0 0 0 1 oFord Laser 91-94 4.45 4.18 4.74 0.56 0.13 0 0 0 0 1 +Ford Capri 89-94 5.51 4.61 6.59 1.98 0.36 0 0 0 0 1 +Hyundai Excel 90-94 5.67 5.28 6.09 0.81 0.14 0 0 0 0 1 +Hyundai Excel / Accent 95-00 4.89 4.64 5.15 0.51 0.10 0 0 0 0 1 +Hyundai S Coupe 90-96 5.34 4.36 6.54 2.18 0.41 0 0 0 0 1 ++Hyundai Lantra 91-95 5.06 4.33 5.92 1.59 0.31 0 0 0 0 1 +Mitsubishi Lancer / Mirage CB 91-92 5.38 4.41 6.56 2.15 0.40 0 0 0 0 1 oMitsubishi Lancer / Mirage CE 96-03 4.28 4.00 4.57 0.57 0.13 0 0 0 0 1 +Nissan NX/NX-R 91-96 6.10 4.84 7.67 2.83 0.46 0 0 0 0 1Subaru Impreza 93-00 4.56 4.09 5.09 1.00 0.22 0 0 0 0 1 oToyota / Holden Corolla / Nova 89-93 4.42 4.21 4.64 0.43 0.10 0 0 0 0 1 +Volkswagen Golf 82-94 6.37 4.25 9.54 5.29 0.83 0 0 0 0 1
Number of vehicles rated 26 54 48 36 39
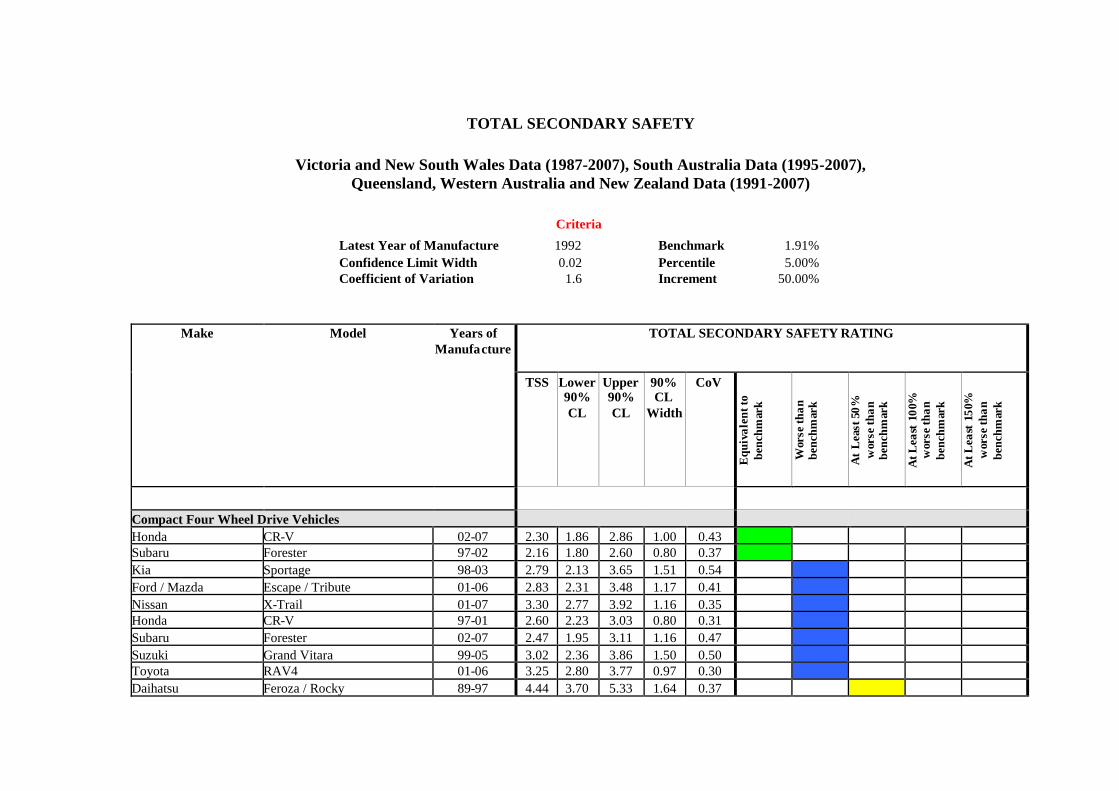
TOTAL SECONDARY SAFETY
Victoria and New South Wales Data (1987-2007), South Australia Data (1995-2007),Queensland, Western Australia and New Zealand Data (1991-2007)
Criteria
Latest Year of Manufacture 1992 Benchmark 1.91%Confidence Limit Width 0.02 Percentile 5.00%Coefficient of Variation 1.6 Increment 50.00%
Make Model Years ofManufacture
TOTAL SECONDARY SAFETY RATING00
TSS Lower90%CL
Upper90%CL
90%CL
Width
CoV
Equ
ival
entt
obe
nchm
ark
Wor
seth
anbe
nchm
ark
At
Lea
st50
%w
orse
than
benc
hmar
k
AtL
east
100%
wor
seth
anbe
nchm
ark
AtL
east
150%
wor
seth
anbe
nchm
ark
Compact Four Wheel Drive VehiclesHonda CR-V 02-07 2.30 1.86 2.86 1.00 0.43 1 0 0 0 0Subaru Forester 97-02 2.16 1.80 2.60 0.80 0.37 1 0 0 0 0Kia Sportage 98-03 2.79 2.13 3.65 1.51 0.54 0 1 0 0 0Ford / Mazda Escape / Tribute 01-06 2.83 2.31 3.48 1.17 0.41 0 1 0 0 0Nissan X-Trail 01-07 3.30 2.77 3.92 1.16 0.35 0 1 0 0 0Honda CR-V 97-01 2.60 2.23 3.03 0.80 0.31 0 1 0 0 0Subaru Forester 02-07 2.47 1.95 3.11 1.16 0.47 0 1 0 0 0Suzuki Grand Vitara 99-05 3.02 2.36 3.86 1.50 0.50 0 1 0 0 0Toyota RAV4 01-06 3.25 2.80 3.77 0.97 0.30 0 1 0 0 0Daihatsu Feroza / Rocky 89-97 4.44 3.70 5.33 1.64 0.37 0 0 1 0 0
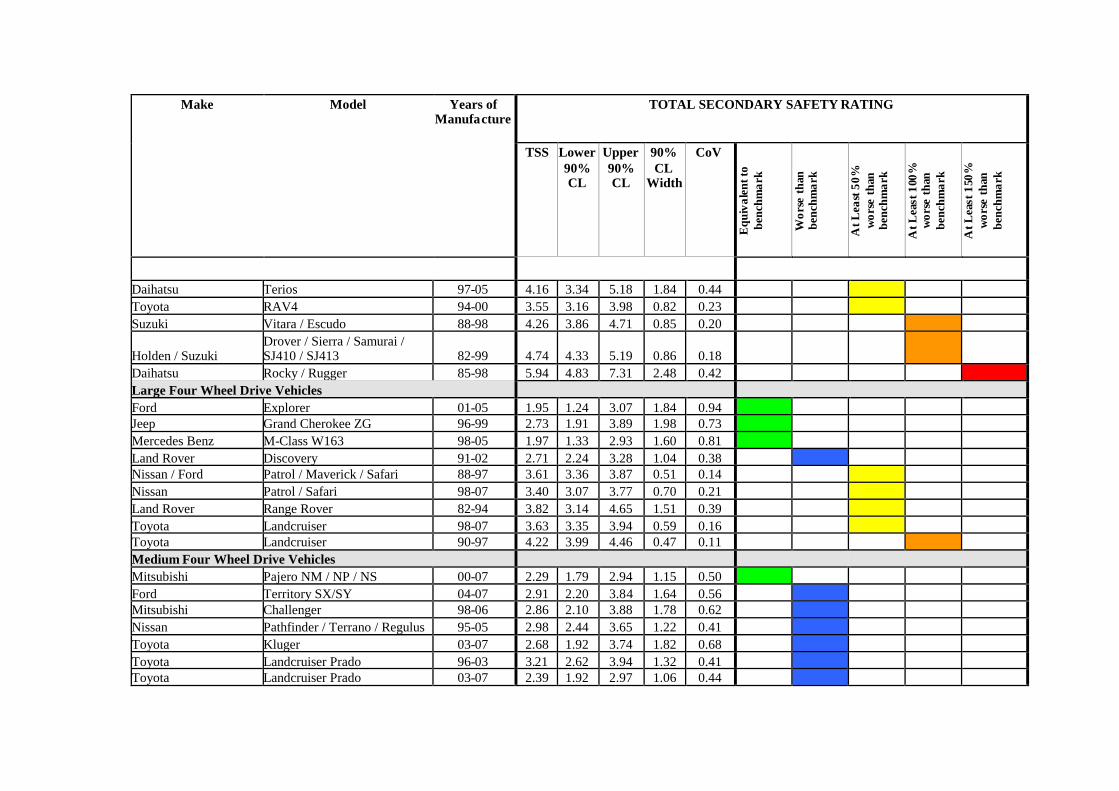
Make Model Years ofManufacture
TOTAL SECONDARY SAFETY RATING00
TSS Lower90%CL
Upper90%CL
90%CL
Width
CoV
Equ
ival
entt
obe
nchm
ark
Wor
seth
anbe
nchm
ark
AtL
east
50%
wor
seth
anbe
nchm
ark
AtL
east
100%
wor
seth
anbe
nchm
ark
AtL
east
150%
wor
seth
anbe
nchm
ark
Daihatsu Terios 97-05 4.16 3.34 5.18 1.84 0.44 0 0 1 0 0Toyota RAV4 94-00 3.55 3.16 3.98 0.82 0.23 0 0 1 0 0Suzuki Vitara / Escudo 88-98 4.26 3.86 4.71 0.85 0.20 0 0 0 1 0
Holden / SuzukiDrover / Sierra / Samurai /SJ410 / SJ413 82-99 4.74 4.33 5.19 0.86 0.18 0 0 0 1 0
Daihatsu Rocky / Rugger 85-98 5.94 4.83 7.31 2.48 0.42 0 0 0 0 1Large Four Wheel Drive VehiclesFord Explorer 01-05 1.95 1.24 3.07 1.84 0.94 1 0 0 0 0Jeep Grand Cherokee ZG 96-99 2.73 1.91 3.89 1.98 0.73 1 0 0 0 0Mercedes Benz M-Class W163 98-05 1.97 1.33 2.93 1.60 0.81 1 0 0 0 0Land Rover Discovery 91-02 2.71 2.24 3.28 1.04 0.38 0 1 0 0 0Nissan / Ford Patrol / Maverick / Safari 88-97 3.61 3.36 3.87 0.51 0.14 0 0 1 0 0Nissan Patrol / Safari 98-07 3.40 3.07 3.77 0.70 0.21 0 0 1 0 0Land Rover Range Rover 82-94 3.82 3.14 4.65 1.51 0.39 0 0 1 0 0Toyota Landcruiser 98-07 3.63 3.35 3.94 0.59 0.16 0 0 1 0 0Toyota Landcruiser 90-97 4.22 3.99 4.46 0.47 0.11 0 0 0 1 0Medium Four Wheel Drive VehiclesMitsubishi Pajero NM / NP / NS 00-07 2.29 1.79 2.94 1.15 0.50 1 0 0 0 0Ford Territory SX/SY 04-07 2.91 2.20 3.84 1.64 0.56 0 1 0 0 0Mitsubishi Challenger 98-06 2.86 2.10 3.88 1.78 0.62 0 1 0 0 0Nissan Pathfinder / Terrano / Regulus 95-05 2.98 2.44 3.65 1.22 0.41 0 1 0 0 0Toyota Kluger 03-07 2.68 1.92 3.74 1.82 0.68 0 1 0 0 0Toyota Landcruiser Prado 96-03 3.21 2.62 3.94 1.32 0.41 0 1 0 0 0Toyota Landcruiser Prado 03-07 2.39 1.92 2.97 1.06 0.44 0 1 0 0 0

Make Model Years ofManufacture
TOTAL SECONDARY SAFETY RATING00
TSS Lower90%CL
Upper90%CL
90%CL
Width
CoV
Equ
ival
entt
obe
nchm
ark
Wor
seth
anbe
nchm
ark
AtL
east
50%
wor
seth
anbe
nchm
ark
AtL
east
100%
wor
seth
anbe
nchm
ark
AtL
east
150%
wor
seth
anbe
nchm
ark
Holden / Isuzu Jackaroo / Bighorn 92-97 3.92 3.22 4.76 1.54 0.39 0 0 1 0 0Holden / Isuzu Jackaroo / Bighorn 98-02 4.20 3.38 5.21 1.82 0.43 0 0 1 0 0Mitsubishi Pajero 92-99 3.42 3.08 3.80 0.73 0.21 0 0 1 0 0Jeep Cherokee XJ 96-00 3.42 2.89 4.06 1.17 0.34 0 0 1 0 0Nissan Pathfinder / Terrano 88-94 3.65 3.05 4.36 1.31 0.36 0 0 1 0 0Commercial - UtesFord Falcon Ute BA/BF 03-07 2.66 2.22 3.19 0.97 0.37 0 1 0 0 0Holden Rodeo 03-07 3.20 2.78 3.68 0.90 0.28 0 1 0 0 0Mitsubishi Triton MK 96-06 3.05 2.45 3.80 1.35 0.44 0 1 0 0 0Nissan Navara 97-05 3.17 2.76 3.63 0.87 0.28 0 1 0 0 0Toyota Hilux 03-04 3.04 2.55 3.62 1.07 0.35 0 1 0 0 0Toyota Hilux 05-07 3.32 2.74 4.03 1.29 0.39 0 1 0 0 0Ford / Nissan Falcon Ute / XFN Ute 82-95 3.99 3.74 4.25 0.51 0.13 0 0 1 0 0Ford Falcon Ute 96-99 3.54 3.10 4.05 0.95 0.27 0 0 1 0 0Ford Falcon Ute AU 00-02 3.44 3.03 3.90 0.88 0.25 0 0 1 0 0Ford Ford F-Series 82-92 4.28 3.54 5.17 1.63 0.38 0 0 1 0 0Holden Commodore Ute VG/VP 90-93 3.72 3.21 4.31 1.09 0.29 0 0 1 0 0Holden Rodeo 96-98 3.78 3.38 4.23 0.85 0.23 0 0 1 0 0Holden Rodeo 99-02 3.75 3.35 4.19 0.84 0.22 0 0 1 0 0Holden Commodore Ute VR/VS 94-00 4.09 3.81 4.39 0.58 0.14 0 0 1 0 0Holden Commodore VU Ute 00-02 3.60 3.11 4.18 1.07 0.30 0 0 1 0 0Holden Commodore VY/VZ Ute 02-07 3.32 2.95 3.74 0.80 0.24 0 0 1 0 0Ford / Mazda Courier / B-Series / Bounty 98-02 3.46 3.00 3.99 0.99 0.29 0 0 1 0 0Ford / Mazda Courier / Bravo / Bounty 03-06 3.61 2.97 4.38 1.41 0.39 0 0 1 0 0
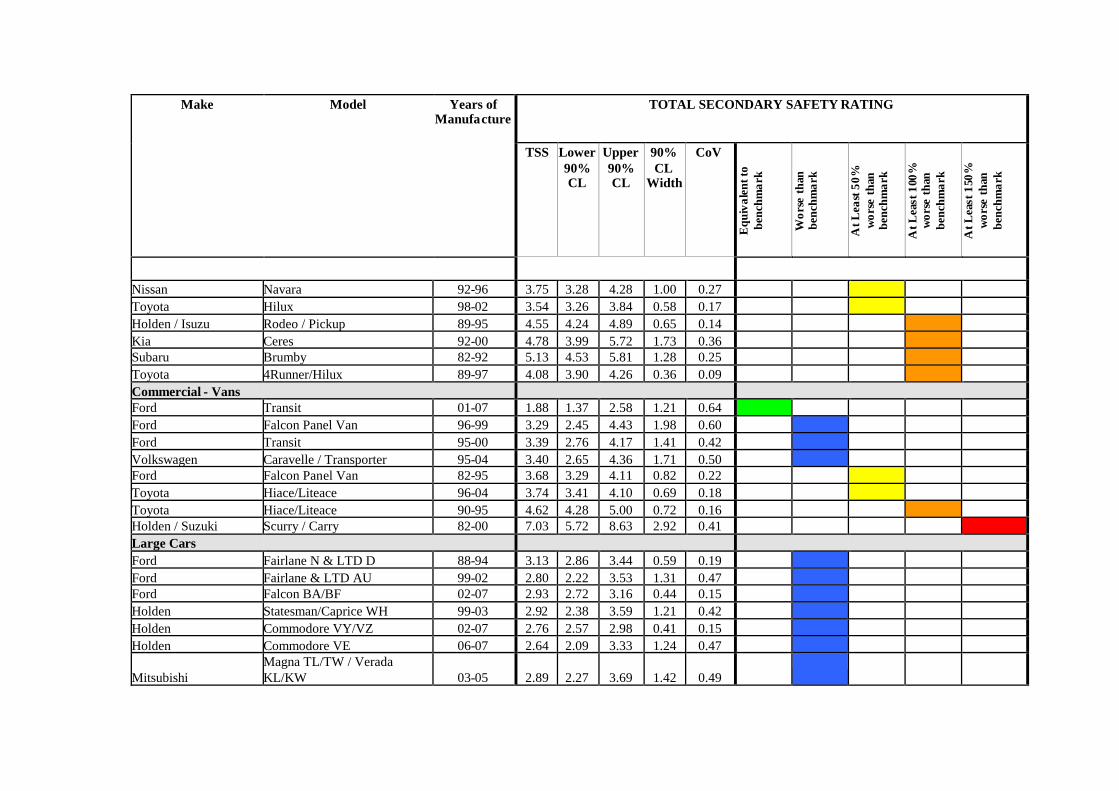
Make Model Years ofManufacture
TOTAL SECONDARY SAFETY RATING00
TSS Lower90%CL
Upper90%CL
90%CL
Width
CoV
Equ
ival
entt
obe
nchm
ark
Wor
seth
anbe
nchm
ark
AtL
east
50%
wor
seth
anbe
nchm
ark
AtL
east
100%
wor
seth
anbe
nchm
ark
AtL
east
150%
wor
seth
anbe
nchm
ark
Nissan Navara 92-96 3.75 3.28 4.28 1.00 0.27 0 0 1 0 0Toyota Hilux 98-02 3.54 3.26 3.84 0.58 0.17 0 0 1 0 0Holden / Isuzu Rodeo / Pickup 89-95 4.55 4.24 4.89 0.65 0.14 0 0 0 1 0Kia Ceres 92-00 4.78 3.99 5.72 1.73 0.36 0 0 0 1 0Subaru Brumby 82-92 5.13 4.53 5.81 1.28 0.25 0 0 0 1 0Toyota 4Runner/Hilux 89-97 4.08 3.90 4.26 0.36 0.09 0 0 0 1 0Commercial - VansFord Transit 01-07 1.88 1.37 2.58 1.21 0.64 1 0 0 0 0Ford Falcon Panel Van 96-99 3.29 2.45 4.43 1.98 0.60 0 1 0 0 0Ford Transit 95-00 3.39 2.76 4.17 1.41 0.42 0 1 0 0 0Volkswagen Caravelle / Transporter 95-04 3.40 2.65 4.36 1.71 0.50 0 1 0 0 0Ford Falcon Panel Van 82-95 3.68 3.29 4.11 0.82 0.22 0 0 1 0 0Toyota Hiace/Liteace 96-04 3.74 3.41 4.10 0.69 0.18 0 0 1 0 0Toyota Hiace/Liteace 90-95 4.62 4.28 5.00 0.72 0.16 0 0 0 1 0Holden / Suzuki Scurry / Carry 82-00 7.03 5.72 8.63 2.92 0.41 0 0 0 0 1Large CarsFord Fairlane N & LTD D 88-94 3.13 2.86 3.44 0.59 0.19 0 1 0 0 0Ford Fairlane & LTD AU 99-02 2.80 2.22 3.53 1.31 0.47 0 1 0 0 0Ford Falcon BA/BF 02-07 2.93 2.72 3.16 0.44 0.15 0 1 0 0 0Holden Statesman/Caprice WH 99-03 2.92 2.38 3.59 1.21 0.42 0 1 0 0 0Holden Commodore VY/VZ 02-07 2.76 2.57 2.98 0.41 0.15 0 1 0 0 0Holden Commodore VE 06-07 2.64 2.09 3.33 1.24 0.47 0 1 0 0 0
MitsubishiMagna TL/TW / VeradaKL/KW 03-05 2.89 2.27 3.69 1.42 0.49 0 1 0 0 0

Make Model Years ofManufacture
TOTAL SECONDARY SAFETY RATING00
TSS Lower90%CL
Upper90%CL
90%CL
Width
CoV
Equ
ival
entt
obe
nchm
ark
Wor
seth
anbe
nchm
ark
AtL
east
50%
wor
seth
anbe
nchm
ark
AtL
east
100%
wor
seth
anbe
nchm
ark
AtL
east
150%
wor
seth
anbe
nchm
ark
Jaguar XJ6 87-94 2.96 2.13 4.12 1.99 0.67 0 1 0 0 0Mercedes Benz E-Class W124 86-94 3.35 2.77 4.06 1.30 0.39 0 1 0 0 0Mercedes Benz E-Class W210 96-02 3.04 2.36 3.92 1.57 0.52 0 1 0 0 0Mercedes Benz S-Class W126 82-92 2.82 2.20 3.62 1.42 0.50 0 1 0 0 0Nissan Maxima / Cefiro 95-99 3.17 2.66 3.76 1.10 0.35 0 1 0 0 0Nissan Maxima 00-02 3.57 2.71 4.69 1.98 0.55 0 1 0 0 0Honda Legend 86-95 3.45 2.81 4.23 1.42 0.41 0 1 0 0 0Toyota Cressida / Mark II 89-93 2.70 2.32 3.15 0.83 0.31 0 1 0 0 0Lexus ES300 / Windom 92-01 3.38 2.62 4.36 1.74 0.51 0 1 0 0 0Toyota Avalon 00-05 3.18 2.76 3.67 0.90 0.28 0 1 0 0 0Toyota Camry 02-06 2.70 2.41 3.03 0.62 0.23 0 1 0 0 0Volvo 700/900 Series 84-92 3.02 2.57 3.54 0.97 0.32 0 1 0 0 0Ford Falcon EA / Falcon EB Series I 88-92 3.84 3.72 3.97 0.26 0.07 0 0 1 0 0
FordFalcon EB Series II / FalconED 92-94 3.64 3.48 3.82 0.34 0.09 0 0 1 0 0
Ford Fairlane N & LTD D 95-98 3.65 3.16 4.20 1.04 0.28 0 0 1 0 0Ford Falcon EF/EL 94-98 3.45 3.33 3.57 0.24 0.07 0 0 1 0 0Ford Falcon AU 98-02 3.27 3.12 3.43 0.30 0.09 0 0 1 0 0Holden / Toyota Commodore VN/VP / Lexcen 89-93 3.87 3.76 3.99 0.23 0.06 0 0 1 0 0Holden Stateman/Caprice VQ 90-93 4.02 3.22 5.01 1.79 0.44 0 0 1 0 0Holden Stateman/Caprice VR/VS 94-98 3.48 3.14 3.86 0.72 0.21 0 0 1 0 0Holden / Toyota Commodore VR/VS / Lexcen 93-97 3.43 3.32 3.54 0.23 0.07 0 0 1 0 0Holden Commodore VT/VX 97-02 3.39 3.26 3.52 0.25 0.08 0 0 1 0 0Hyundai Sonata 89-97 3.65 3.28 4.06 0.78 0.21 0 0 1 0 0
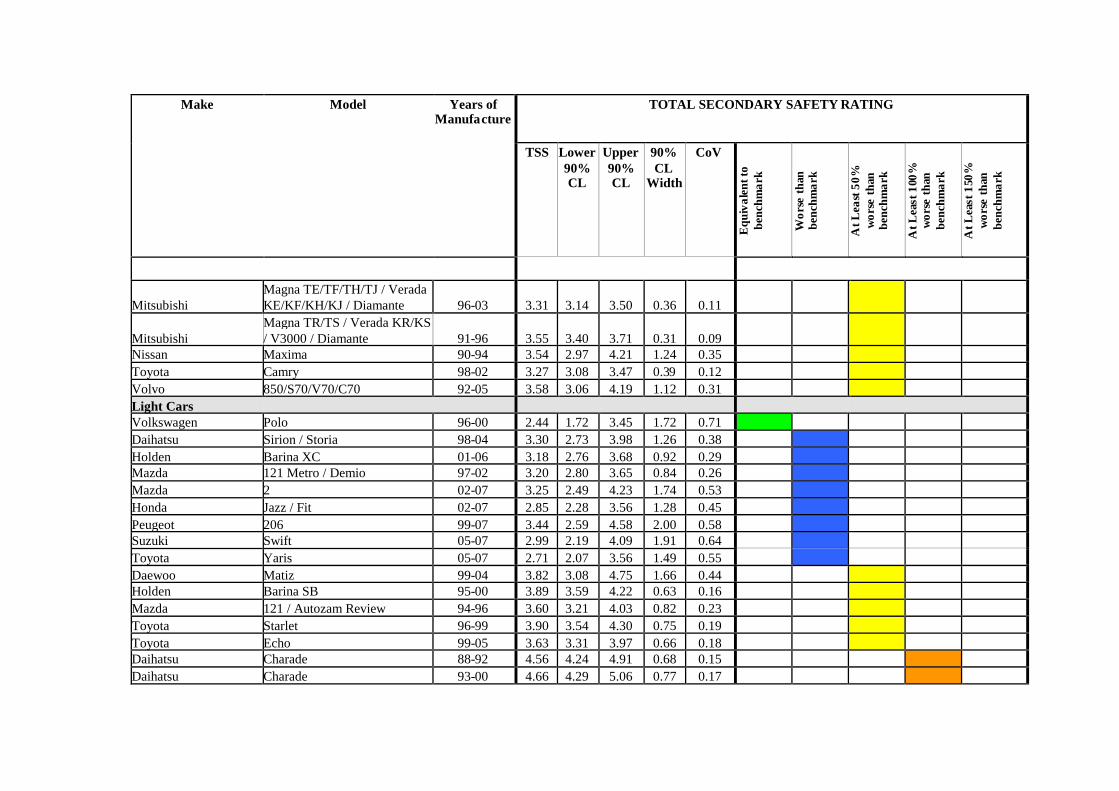
Make Model Years ofManufacture
TOTAL SECONDARY SAFETY RATING00
TSS Lower90%CL
Upper90%CL
90%CL
Width
CoV
Equ
ival
entt
obe
nchm
ark
Wor
seth
anbe
nchm
ark
AtL
east
50%
wor
seth
anbe
nchm
ark
AtL
east
100%
wor
seth
anbe
nchm
ark
AtL
east
150%
wor
seth
anbe
nchm
ark
MitsubishiMagna TE/TF/TH/TJ / VeradaKE/KF/KH/KJ / Diamante 96-03 3.31 3.14 3.50 0.36 0.11 0 0 1 0 0
MitsubishiMagna TR/TS / Verada KR/KS/ V3000 / Diamante 91-96 3.55 3.40 3.71 0.31 0.09 0 0 1 0 0
Nissan Maxima 90-94 3.54 2.97 4.21 1.24 0.35 0 0 1 0 0Toyota Camry 98-02 3.27 3.08 3.47 0.39 0.12 0 0 1 0 0Volvo 850/S70/V70/C70 92-05 3.58 3.06 4.19 1.12 0.31 0 0 1 0 0Light CarsVolkswagen Polo 96-00 2.44 1.72 3.45 1.72 0.71 1 0 0 0 0Daihatsu Sirion / Storia 98-04 3.30 2.73 3.98 1.26 0.38 0 1 0 0 0Holden Barina XC 01-06 3.18 2.76 3.68 0.92 0.29 0 1 0 0 0Mazda 121 Metro / Demio 97-02 3.20 2.80 3.65 0.84 0.26 0 1 0 0 0Mazda 2 02-07 3.25 2.49 4.23 1.74 0.53 0 1 0 0 0Honda Jazz / Fit 02-07 2.85 2.28 3.56 1.28 0.45 0 1 0 0 0Peugeot 206 99-07 3.44 2.59 4.58 2.00 0.58 0 1 0 0 0Suzuki Swift 05-07 2.99 2.19 4.09 1.91 0.64 0 1 0 0 0Toyota Yaris 05-07 2.71 2.07 3.56 1.49 0.55 0 1 0 0 0Daewoo Matiz 99-04 3.82 3.08 4.75 1.66 0.44 0 0 1 0 0Holden Barina SB 95-00 3.89 3.59 4.22 0.63 0.16 0 0 1 0 0Mazda 121 / Autozam Review 94-96 3.60 3.21 4.03 0.82 0.23 0 0 1 0 0Toyota Starlet 96-99 3.90 3.54 4.30 0.75 0.19 0 0 1 0 0Toyota Echo 99-05 3.63 3.31 3.97 0.66 0.18 0 0 1 0 0Daihatsu Charade 88-92 4.56 4.24 4.91 0.68 0.15 0 0 0 1 0Daihatsu Charade 93-00 4.66 4.29 5.06 0.77 0.17 0 0 0 1 0

Make Model Years ofManufacture
TOTAL SECONDARY SAFETY RATING00
TSS Lower90%CL
Upper90%CL
90%CL
Width
CoV
Equ
ival
entt
obe
nchm
ark
Wor
seth
anbe
nchm
ark
AtL
east
50%
wor
seth
anbe
nchm
ark
AtL
east
100%
wor
seth
anbe
nchm
ark
AtL
east
150%
wor
seth
anbe
nchm
ark
Ford Festiva WD/WH/WF 94-01 4.53 4.30 4.78 0.48 0.11 0 0 0 1 0Hyundai Getz / TB 02-07 4.73 4.12 5.42 1.30 0.27 0 0 0 1 0Nissan Micra 95-97 4.84 4.00 5.86 1.86 0.38 0 0 0 1 0Holden / Suzuki Barina / Swift / Cultus 89-99 4.30 4.09 4.52 0.43 0.10 0 0 0 1 0Daihatsu Mira 90-96 6.98 5.99 8.14 2.16 0.31 0 0 0 0 1Subaru Sherpa / Fiori / 700 / Rex 89-92 6.51 5.51 7.68 2.17 0.33 0 0 0 0 1Suzuki Alto 85-00 7.44 5.95 9.29 3.34 0.45 0 0 0 0 1Medium CarsAudi A4 01-07 2.17 1.48 3.18 1.70 0.78 1 0 0 0 0Ford Cougar 99-03 2.63 1.82 3.79 1.98 0.75 1 0 0 0 0Mazda 6 02-07 2.05 1.59 2.64 1.05 0.51 1 0 0 0 0Mercedes Benz C-Class W203 00-07 2.45 1.75 3.43 1.68 0.69 1 0 0 0 0Honda Accord Euro 03-07 2.44 1.87 3.19 1.31 0.54 1 0 0 0 0Peugeot 406 96-04 1.81 1.16 2.82 1.65 0.91 1 0 0 0 0Saab 900/9-3 94-02 2.28 1.81 2.87 1.06 0.47 1 0 0 0 0Saab 9000 86-97 2.09 1.60 2.72 1.12 0.54 1 0 0 0 0Subaru Liberty / Legacy / Outback 03-07 1.98 1.45 2.70 1.25 0.63 1 0 0 0 0Volkswagen Passat 98-06 2.37 1.59 3.55 1.96 0.83 1 0 0 0 0Audi A4 95-01 2.72 2.10 3.53 1.43 0.53 0 1 0 0 0BMW 3 Series E46 99-06 2.77 2.37 3.23 0.87 0.31 0 1 0 0 0BMW 5 Series E34 89-95 3.47 2.83 4.25 1.43 0.41 0 1 0 0 0BMW 5 Series E39 96-03 2.50 1.92 3.26 1.35 0.54 0 1 0 0 0Ford Mondeo 95-01 2.89 2.53 3.29 0.77 0.27 0 1 0 0 0Holden Calibra 94-97 3.28 2.46 4.37 1.91 0.58 0 1 0 0 0

Make Model Years ofManufacture
TOTAL SECONDARY SAFETY RATING00
TSS Lower90%CL
Upper90%CL
90%CL
Width
CoV
Equ
ival
entt
obe
nchm
ark
Wor
seth
anbe
nchm
ark
AtL
east
50%
wor
seth
anbe
nchm
ark
AtL
east
100%
wor
seth
anbe
nchm
ark
AtL
east
150%
wor
seth
anbe
nchm
ark
Holden Vectra 97-03 3.06 2.73 3.43 0.70 0.23 0 1 0 0 0Mazda 626 98-02 3.22 2.79 3.72 0.93 0.29 0 1 0 0 0Mercedes Benz C-Class W201 87-93 3.43 2.74 4.28 1.54 0.45 0 1 0 0 0Mercedes Benz C-Class W202 95-00 2.63 2.16 3.21 1.06 0.40 0 1 0 0 0Nissan Bluebird 93-97 2.97 2.60 3.38 0.78 0.26 0 1 0 0 0Nissan 200SX / Silvia 94-02 3.41 2.81 4.13 1.32 0.39 0 1 0 0 0Honda Accord 91-93 3.09 2.65 3.60 0.95 0.31 0 1 0 0 0Honda Accord 99-02 2.71 2.06 3.56 1.50 0.55 0 1 0 0 0Honda Prelude 97-02 2.90 2.21 3.80 1.60 0.55 0 1 0 0 0Peugeot 405 89-97 3.02 2.41 3.80 1.39 0.46 0 1 0 0 0Peugeot 505 82-93 2.77 2.14 3.60 1.47 0.53 0 1 0 0 0Saab 900 Series 82-92 2.98 2.40 3.71 1.30 0.44 0 1 0 0 0Subaru Liberty / Legacy / Outback 99-03 2.58 2.22 2.99 0.77 0.30 0 1 0 0 0BMW 3 Series E36 92-98 3.27 2.96 3.60 0.64 0.20 0 0 1 0 0Daewoo Espero 95-97 4.49 3.67 5.51 1.84 0.41 0 0 1 0 0Daewoo Leganza 97-02 3.67 2.88 4.67 1.78 0.49 0 0 1 0 0Hyundai Sonata 98-01 3.67 2.93 4.60 1.67 0.45 0 0 1 0 0Mitsubishi Galant 95-96 3.51 3.03 4.05 1.02 0.29 0 0 1 0 0
Ford / MazdaTelstar / 626 / MX6 / Capella /Cronos 92-97 3.12 2.88 3.38 0.50 0.16 0 0 1 0 0
Honda Accord 94-98 3.37 3.01 3.78 0.77 0.23 0 0 1 0 0Honda Prelude 92-96 3.62 3.10 4.23 1.12 0.31 0 0 1 0 0
Subaru1800 / Leone / Omega / 4WDWagon 82-93 3.84 3.57 4.13 0.56 0.15 0 0 1 0 0

Make Model Years ofManufacture
TOTAL SECONDARY SAFETY RATING00
TSS Lower90%CL
Upper90%CL
90%CL
Width
CoV
Equ
ival
entt
obe
nchm
ark
Wor
seth
anbe
nchm
ark
AtL
east
50%
wor
seth
anbe
nchm
ark
AtL
east
100%
wor
seth
anbe
nchm
ark
AtL
east
150%
wor
seth
anbe
nchm
ark
Subaru Liberty / Legacy 89-93 3.50 3.23 3.79 0.56 0.16 0 0 1 0 0Subaru Liberty / Legacy / Outback 94-98 3.34 2.98 3.74 0.76 0.23 0 0 1 0 0Holden / Toyota Apollo JK/JL / Camry / Vista 88-92 3.69 3.55 3.84 0.29 0.08 0 0 1 0 0
Holden / ToyotaApollo JM/JP / Camry /Sceptor 93-97 3.81 3.64 3.97 0.33 0.09 0 0 1 0 0
Toyota Celica 90-93 4.18 3.70 4.72 1.02 0.24 0 0 1 0 0Toyota Celica 94-99 3.47 2.90 4.15 1.25 0.36 0 0 1 0 0Volvo 200 Series 82-93 3.28 2.90 3.72 0.82 0.25 0 0 1 0 0Nissan / Ford Pintara / Corsair / Bluebird 89-92 4.29 4.04 4.56 0.52 0.12 0 0 0 1 0People MoverMitsubishi Nimbus 99-03 1.35 0.69 2.64 1.96 1.45 1 0 0 0 0Nissan Serena 92-95 2.48 1.69 3.64 1.95 0.79 1 0 0 0 0Kia Carnival 99-06 2.83 2.19 3.66 1.47 0.52 0 1 0 0 0Honda Odyssey 95-00 2.65 2.00 3.50 1.49 0.56 0 1 0 0 0Toyota Tarago / Previa / Estima 91-99 3.15 2.78 3.56 0.78 0.25 0 1 0 0 0Toyota Tarago / Previa / Estima 00-06 2.88 2.20 3.77 1.57 0.54 0 1 0 0 0Mitsubishi Nimbus / Chariot 92-98 3.97 3.24 4.86 1.62 0.41 0 0 1 0 0Mitsubishi Starwagon / Delica Spacegear 95-98 3.74 3.19 4.40 1.21 0.32 0 0 1 0 0Mitsubishi Starwagon / Delica Spacegear 98-03 3.71 3.04 4.52 1.48 0.40 0 0 1 0 0Mitsubishi Starwagon / Delica Starwagon 87-93 4.40 4.07 4.75 0.68 0.16 0 0 0 1 0Small CarsChrysler Neon 96-99 2.48 1.77 3.49 1.73 0.69 1 0 0 0 0Ford Focus LS / LT 05-07 1.99 1.36 2.91 1.55 0.78 1 0 0 0 0Mazda MX5 / Eunos Roadster 98-05 1.64 0.98 2.72 1.74 1.06 1 0 0 0 0

Make Model Years ofManufacture
TOTAL SECONDARY SAFETY RATING00
TSS Lower90%CL
Upper90%CL
90%CL
Width
CoV
Equ
ival
entt
obe
nchm
ark
Wor
seth
anbe
nchm
ark
AtL
east
50%
wor
seth
anbe
nchm
ark
AtL
east
100%
wor
seth
anbe
nchm
ark
AtL
east
150%
wor
seth
anbe
nchm
ark
Peugeot 307 01-07 1.85 1.24 2.75 1.52 0.82 1 0 0 0 0Volkswagen Golf / Jetta 04-07 1.64 1.05 2.55 1.50 0.91 1 0 0 0 0Alfa Romeo 33 83-92 3.63 2.83 4.66 1.83 0.51 0 1 0 0 0Daewoo Nubira 97-03 3.24 2.85 3.68 0.83 0.26 0 1 0 0 0Ford Focus LR 02-05 2.86 2.34 3.50 1.16 0.41 0 1 0 0 0Holden Astra TR 96-98 2.89 2.39 3.50 1.11 0.38 0 1 0 0 0Holden Astra TS 98-06 2.90 2.68 3.14 0.46 0.16 0 1 0 0 0Holden Astra AH 04-07 3.03 2.32 3.96 1.64 0.54 0 1 0 0 0Hyundai Elantra 00-07 3.23 2.73 3.82 1.09 0.34 0 1 0 0 0Ford / Mazda Laser / 323 99-03 2.94 2.67 3.24 0.57 0.19 0 1 0 0 0Mazda 3 / Axela 03-07 2.64 2.23 3.12 0.89 0.34 0 1 0 0 0Honda Civic 96-00 3.10 2.80 3.44 0.64 0.21 0 1 0 0 0Honda Civic 01-05 3.11 2.58 3.75 1.17 0.38 0 1 0 0 0Honda Integra 93-01 3.27 2.71 3.94 1.23 0.38 0 1 0 0 0Peugeot 306 94-01 2.57 2.10 3.15 1.05 0.41 0 1 0 0 0Subaru Impreza 01-07 2.42 1.98 2.96 0.98 0.41 0 1 0 0 0Suzuki Baleno / Cultus Crescent 95-02 2.92 2.43 3.51 1.08 0.37 0 1 0 0 0Toyota Corolla / Allex 98-01 3.04 2.77 3.32 0.55 0.18 0 1 0 0 0Toyota Corolla 02-07 3.11 2.86 3.38 0.51 0.16 0 1 0 0 0Volvo S40/V40 97-04 2.63 1.92 3.60 1.68 0.64 0 1 0 0 0Volkswagen Golf 95-98 3.21 2.54 4.05 1.51 0.47 0 1 0 0 0Volkswagen Golf / Bora 99-04 2.49 2.04 3.03 0.98 0.40 0 1 0 0 0Daihatsu Applause 89-99 3.75 3.33 4.23 0.90 0.24 0 0 1 0 0Daewoo Cielo 95-97 3.74 3.38 4.15 0.77 0.21 0 0 1 0 0
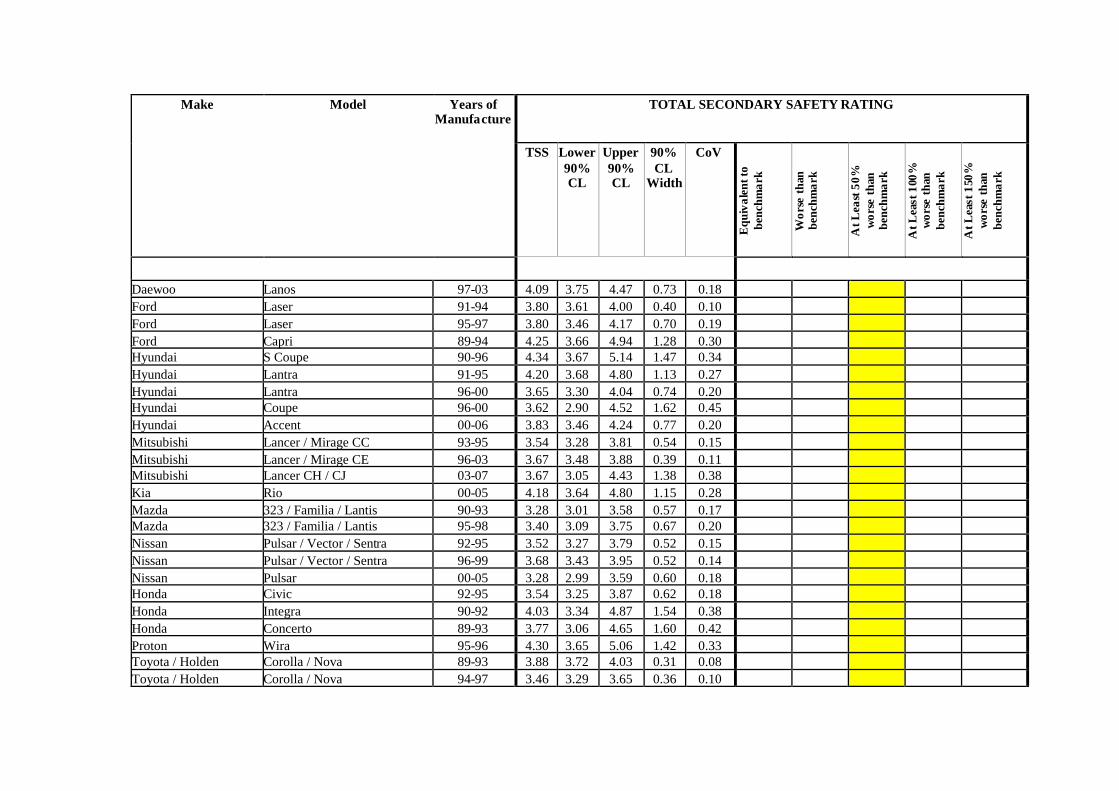
Make Model Years ofManufacture
TOTAL SECONDARY SAFETY RATING00
TSS Lower90%CL
Upper90%CL
90%CL
Width
CoV
Equ
ival
entt
obe
nchm
ark
Wor
seth
anbe
nchm
ark
AtL
east
50%
wor
seth
anbe
nchm
ark
AtL
east
100%
wor
seth
anbe
nchm
ark
AtL
east
150%
wor
seth
anbe
nchm
ark
Daewoo Lanos 97-03 4.09 3.75 4.47 0.73 0.18 0 0 1 0 0Ford Laser 91-94 3.80 3.61 4.00 0.40 0.10 0 0 1 0 0Ford Laser 95-97 3.80 3.46 4.17 0.70 0.19 0 0 1 0 0Ford Capri 89-94 4.25 3.66 4.94 1.28 0.30 0 0 1 0 0Hyundai S Coupe 90-96 4.34 3.67 5.14 1.47 0.34 0 0 1 0 0Hyundai Lantra 91-95 4.20 3.68 4.80 1.13 0.27 0 0 1 0 0Hyundai Lantra 96-00 3.65 3.30 4.04 0.74 0.20 0 0 1 0 0Hyundai Coupe 96-00 3.62 2.90 4.52 1.62 0.45 0 0 1 0 0Hyundai Accent 00-06 3.83 3.46 4.24 0.77 0.20 0 0 1 0 0Mitsubishi Lancer / Mirage CC 93-95 3.54 3.28 3.81 0.54 0.15 0 0 1 0 0Mitsubishi Lancer / Mirage CE 96-03 3.67 3.48 3.88 0.39 0.11 0 0 1 0 0Mitsubishi Lancer CH / CJ 03-07 3.67 3.05 4.43 1.38 0.38 0 0 1 0 0Kia Rio 00-05 4.18 3.64 4.80 1.15 0.28 0 0 1 0 0Mazda 323 / Familia / Lantis 90-93 3.28 3.01 3.58 0.57 0.17 0 0 1 0 0Mazda 323 / Familia / Lantis 95-98 3.40 3.09 3.75 0.67 0.20 0 0 1 0 0Nissan Pulsar / Vector / Sentra 92-95 3.52 3.27 3.79 0.52 0.15 0 0 1 0 0Nissan Pulsar / Vector / Sentra 96-99 3.68 3.43 3.95 0.52 0.14 0 0 1 0 0Nissan Pulsar 00-05 3.28 2.99 3.59 0.60 0.18 0 0 1 0 0Honda Civic 92-95 3.54 3.25 3.87 0.62 0.18 0 0 1 0 0Honda Integra 90-92 4.03 3.34 4.87 1.54 0.38 0 0 1 0 0Honda Concerto 89-93 3.77 3.06 4.65 1.60 0.42 0 0 1 0 0Proton Wira 95-96 4.30 3.65 5.06 1.42 0.33 0 0 1 0 0Toyota / Holden Corolla / Nova 89-93 3.88 3.72 4.03 0.31 0.08 0 0 1 0 0Toyota / Holden Corolla / Nova 94-97 3.46 3.29 3.65 0.36 0.10 0 0 1 0 0
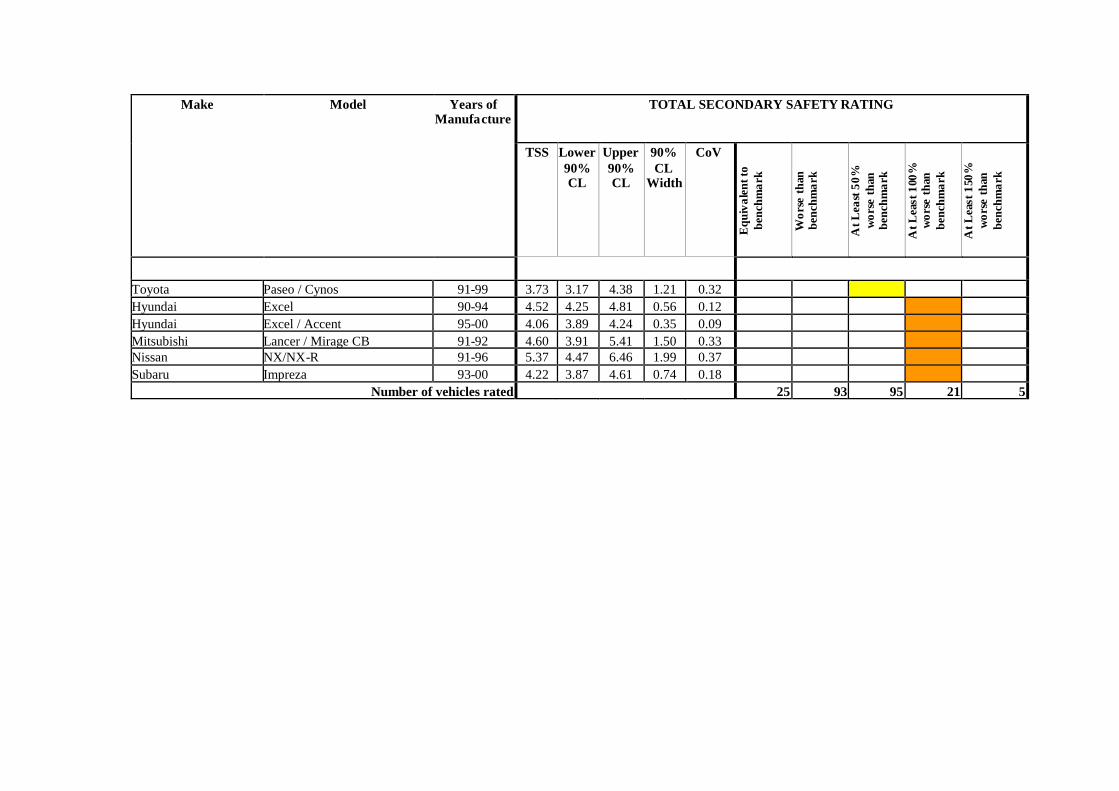
Make Model Years ofManufacture
TOTAL SECONDARY SAFETY RATING00
TSS Lower90%CL
Upper90%CL
90%CL
Width
CoV
Equ
ival
entt
obe
nchm
ark
Wor
seth
anbe
nchm
ark
AtL
east
50%
wor
seth
anbe
nchm
ark
AtL
east
100%
wor
seth
anbe
nchm
ark
AtL
east
150%
wor
seth
anbe
nchm
ark
Toyota Paseo / Cynos 91-99 3.73 3.17 4.38 1.21 0.32 0 0 1 0 0Hyundai Excel 90-94 4.52 4.25 4.81 0.56 0.12 0 0 0 1 0Hyundai Excel / Accent 95-00 4.06 3.89 4.24 0.35 0.09 0 0 0 1 0Mitsubishi Lancer / Mirage CB 91-92 4.60 3.91 5.41 1.50 0.33 0 0 0 1 0Nissan NX/NX-R 91-96 5.37 4.47 6.46 1.99 0.37 0 0 0 1 0Subaru Impreza 93-00 4.22 3.87 4.61 0.74 0.18 0 0 0 1 0
Number of vehicles rated 25 93 95 21 5
APPENDIX 8
CRASHWORTHINESS, INJURY RISK AND INJURY SEVERITY ESTIMATESBY YEAR OF VEHICLE MANUFACTURE FOR THE AUSTRALIAN VEHICLE
FLEET


INJURY RISK BY YEAR OF VEHICLE MANUFACTURE
Year ofManufacture
Coefficient ofCar Year
StandardError of
Coefficient
Pr(Risk)%
Lower 95%Confidence
Limit
Upper 95%Confidence
Limit
Width ofConfidence
Interval
AVERAGE -1.5865 16.99
1964 0.3852 0.0515 23.12 21.38 24.97 3.591965 0.4730 0.0545 24.72 22.79 26.76 3.971966 0.3193 0.0486 21.97 20.38 23.65 3.271967 0.3935 0.0385 23.27 21.95 24.65 2.691968 0.3495 0.0345 22.50 21.34 23.70 2.361969 0.3442 0.0309 22.40 21.37 23.47 2.111970 0.3373 0.0233 22.28 21.50 23.08 1.581971 0.2863 0.0210 21.41 20.73 22.11 1.391972 0.3083 0.0201 21.79 21.12 22.46 1.341973 0.3332 0.0183 22.21 21.60 22.84 1.241974 0.2883 0.0147 21.45 20.97 21.94 0.971975 0.1911 0.0147 19.85 19.40 20.32 0.921976 0.1840 0.0132 19.74 19.33 20.15 0.821977 0.1427 0.0135 19.10 18.69 19.51 0.821978 0.1210 0.0118 18.76 18.41 19.12 0.711979 0.0530 0.0110 17.75 17.44 18.06 0.631980 0.0954 0.0105 18.38 18.07 18.69 0.621981 0.0781 0.0099 18.12 17.83 18.41 0.581982 0.0727 0.0093 18.04 17.77 18.31 0.541983 0.0792 0.0095 18.13 17.86 18.41 0.551984 0.0218 0.0086 17.30 17.06 17.54 0.481985 0.0334 0.0081 17.46 17.24 17.69 0.461986 -0.0291 0.0090 16.58 16.34 16.83 0.491987 -0.0546 0.0094 16.23 15.98 16.48 0.501988 -0.0713 0.0086 16.01 15.78 16.23 0.451989 -0.1061 0.0081 15.54 15.34 15.75 0.421990 -0.0969 0.0081 15.66 15.45 15.88 0.421991 -0.1131 0.0088 15.45 15.23 15.68 0.451992 -0.1367 0.0087 15.15 14.93 15.37 0.441993 -0.1851 0.0088 14.53 14.32 14.75 0.431994 -0.1768 0.0085 14.64 14.43 14.85 0.421995 -0.2041 0.0086 14.30 14.09 14.51 0.411996 -0.1764 0.0090 14.64 14.42 14.86 0.441997 -0.1948 0.0089 14.41 14.20 14.63 0.431998 -0.1953 0.0088 14.41 14.20 14.62 0.431999 -0.2244 0.0096 14.05 13.83 14.28 0.462000 -0.2732 0.0103 13.47 13.24 13.71 0.472001 -0.3341 0.0115 12.78 12.53 13.03 0.502002 -0.3199 0.0122 12.94 12.67 13.21 0.542003 -0.3533 0.0132 12.57 12.29 12.85 0.572004 -0.3723 0.0151 12.36 12.04 12.68 0.642005 -0.3573 0.0174 12.52 12.15 12.90 0.752006 -0.4169 0.0233 11.88 11.41 12.37 0.962007 -0.4988 0.0456 11.05 10.20 11.96 1.76
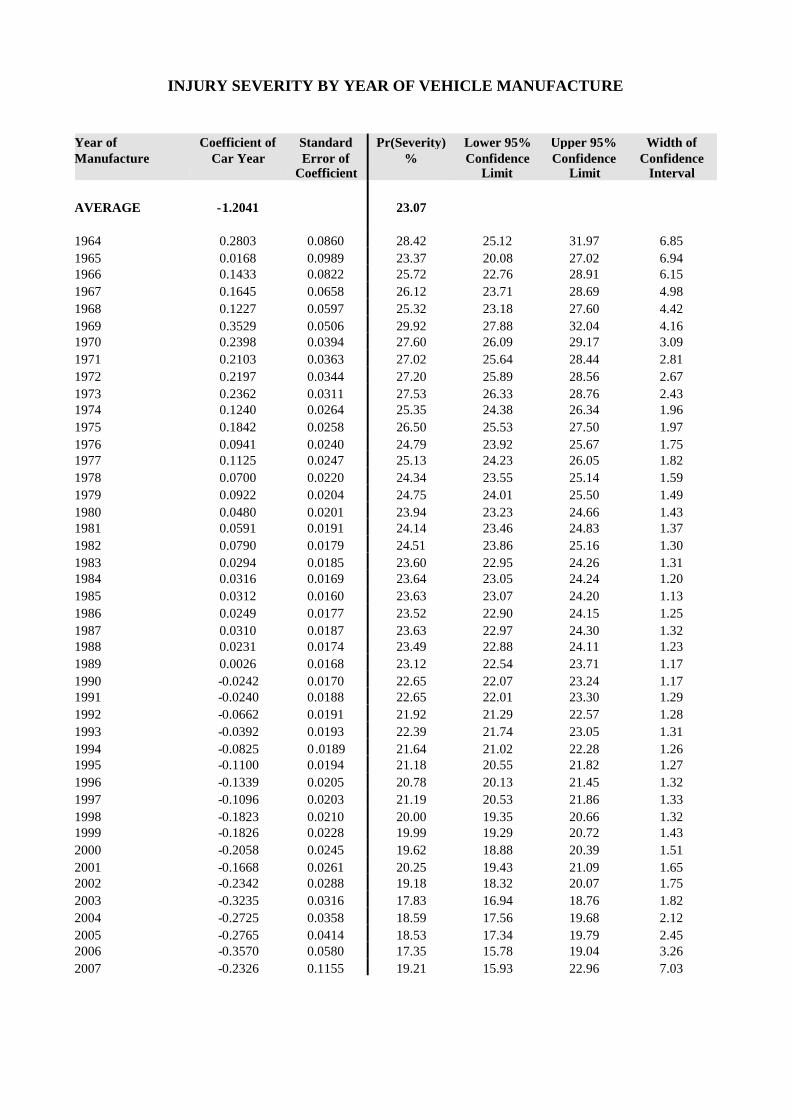
INJURY SEVERITY BY YEAR OF VEHICLE MANUFACTURE
Year ofManufacture
Coefficient ofCar Year
StandardError of
Coefficient
Pr(Severity)%
Lower 95%Confidence
Limit
Upper 95%Confidence
Limit
Width ofConfidence
Interval
AVERAGE -1.2041 23.07
1964 0.2803 0.0860 28.42 25.12 31.97 6.851965 0.0168 0.0989 23.37 20.08 27.02 6.941966 0.1433 0.0822 25.72 22.76 28.91 6.151967 0.1645 0.0658 26.12 23.71 28.69 4.981968 0.1227 0.0597 25.32 23.18 27.60 4.421969 0.3529 0.0506 29.92 27.88 32.04 4.161970 0.2398 0.0394 27.60 26.09 29.17 3.091971 0.2103 0.0363 27.02 25.64 28.44 2.811972 0.2197 0.0344 27.20 25.89 28.56 2.671973 0.2362 0.0311 27.53 26.33 28.76 2.431974 0.1240 0.0264 25.35 24.38 26.34 1.961975 0.1842 0.0258 26.50 25.53 27.50 1.971976 0.0941 0.0240 24.79 23.92 25.67 1.751977 0.1125 0.0247 25.13 24.23 26.05 1.821978 0.0700 0.0220 24.34 23.55 25.14 1.591979 0.0922 0.0204 24.75 24.01 25.50 1.491980 0.0480 0.0201 23.94 23.23 24.66 1.431981 0.0591 0.0191 24.14 23.46 24.83 1.371982 0.0790 0.0179 24.51 23.86 25.16 1.301983 0.0294 0.0185 23.60 22.95 24.26 1.311984 0.0316 0.0169 23.64 23.05 24.24 1.201985 0.0312 0.0160 23.63 23.07 24.20 1.131986 0.0249 0.0177 23.52 22.90 24.15 1.251987 0.0310 0.0187 23.63 22.97 24.30 1.321988 0.0231 0.0174 23.49 22.88 24.11 1.231989 0.0026 0.0168 23.12 22.54 23.71 1.171990 -0.0242 0.0170 22.65 22.07 23.24 1.171991 -0.0240 0.0188 22.65 22.01 23.30 1.291992 -0.0662 0.0191 21.92 21.29 22.57 1.281993 -0.0392 0.0193 22.39 21.74 23.05 1.311994 -0.0825 0.0189 21.64 21.02 22.28 1.261995 -0.1100 0.0194 21.18 20.55 21.82 1.271996 -0.1339 0.0205 20.78 20.13 21.45 1.321997 -0.1096 0.0203 21.19 20.53 21.86 1.331998 -0.1823 0.0210 20.00 19.35 20.66 1.321999 -0.1826 0.0228 19.99 19.29 20.72 1.432000 -0.2058 0.0245 19.62 18.88 20.39 1.512001 -0.1668 0.0261 20.25 19.43 21.09 1.652002 -0.2342 0.0288 19.18 18.32 20.07 1.752003 -0.3235 0.0316 17.83 16.94 18.76 1.822004 -0.2725 0.0358 18.59 17.56 19.68 2.122005 -0.2765 0.0414 18.53 17.34 19.79 2.452006 -0.3570 0.0580 17.35 15.78 19.04 3.262007 -0.2326 0.1155 19.21 15.93 22.96 7.03

CRASHWORTHINESS BY YEAR OF VEHICLE MANUFACTURE
Year ofManufacture
Pr(Risk)%
Pr(Severity)%
Serious injuryrate per 100
driversinvolved
Overallrankorder
Lower 95%Confidence
Limit
Upper 95%Confidence
Limit
Width ofConfidence
Interval
AVERAGE 16.99 23.07 3.92
1964 23.12 28.42 6.57 43 5.69 7.59 1.891965 24.72 23.37 5.78 37 4.88 6.84 1.961966 21.97 25.72 5.65 35 4.91 6.51 1.601967 23.27 26.12 6.08 40 5.44 6.80 1.361968 22.50 25.32 5.70 36 5.14 6.31 1.161969 22.40 29.92 6.70 44 6.16 7.29 1.131970 22.28 27.60 6.15 42 5.76 6.57 0.821971 21.41 27.02 5.78 38 5.44 6.15 0.711972 21.79 27.20 5.93 39 5.59 6.28 0.691973 22.21 27.53 6.12 41 5.80 6.44 0.641974 21.45 25.35 5.44 34 5.20 5.69 0.491975 19.85 26.50 5.26 33 5.04 5.50 0.461976 19.74 24.79 4.89 32 4.70 5.10 0.401977 19.10 25.13 4.80 31 4.60 5.01 0.401978 18.76 24.34 4.57 30 4.40 4.74 0.341979 17.75 24.75 4.39 27 4.24 4.55 0.311980 18.38 23.94 4.40 28 4.25 4.55 0.301981 18.12 24.14 4.37 26 4.23 4.52 0.281982 18.04 24.51 4.42 29 4.29 4.56 0.271983 18.13 23.60 4.28 25 4.15 4.42 0.271984 17.30 23.64 4.09 23 3.97 4.21 0.241985 17.46 23.63 4.13 24 4.02 4.24 0.231986 16.58 23.52 3.90 22 3.78 4.02 0.241987 16.23 23.63 3.84 21 3.71 3.96 0.251988 16.01 23.49 3.76 20 3.65 3.87 0.221989 15.54 23.12 3.59 19 3.49 3.70 0.211990 15.66 22.65 3.55 18 3.45 3.65 0.211991 15.45 22.65 3.50 17 3.39 3.61 0.221992 15.15 21.92 3.32 16 3.21 3.43 0.221993 14.53 22.39 3.25 15 3.15 3.36 0.211994 14.64 21.64 3.17 14 3.07 3.27 0.201995 14.30 21.18 3.03 11 2.93 3.13 0.201996 14.64 20.78 3.04 12 2.94 3.15 0.211997 14.41 21.19 3.05 13 2.95 3.16 0.211998 14.41 20.00 2.88 10 2.78 2.99 0.211999 14.05 19.99 2.81 9 2.70 2.92 0.222000 13.47 19.62 2.64 8 2.53 2.76 0.222001 12.78 20.25 2.59 7 2.47 2.71 0.232002 12.94 19.18 2.48 6 2.36 2.61 0.252003 12.57 17.83 2.24 3 2.12 2.37 0.252004 12.36 18.59 2.30 4 2.16 2.45 0.292005 12.52 18.53 2.32 5 2.16 2.50 0.342006 11.88 17.35 2.06 1 1.86 2.28 0.422007 11.05 19.21 2.12 2 1.74 2.59 0.85

APPENDIX 9
CRASHWORTHINESS, INJURY RISK AND INJURY SEVERITY ESTIMATESBY YEAR OF VEHICLE MANUFACTURE BY MARKET GROUP FOR THE
AUSTRALIAN VEHICLE FLEET


CRASHWORTHINESS BY YEAR OF VEHICLE MANUFACTURE BY MARKET GROUP
Year ofManufacture
Pr(Risk)%
Pr(Severity)%
Seriousinjury rate
per 100driversinvolved
Lower 95%Confidence
Limit
Upper 95%Confidence
Limit
Width ofConfidence
Interval
Compact Four Wheel Drives
1982 29.88 13.15 3.93 3.15 4.90 1.761983 27.75 28.47 7.90 7.05 8.85 1.791984 27.88 26.41 7.37 6.85 7.92 1.071985 29.99 20.03 6.01 5.72 6.32 0.601986 27.63 19.24 5.32 4.60 6.14 1.531987 26.88 29.61 7.96 7.21 8.79 1.581988 24.29 17.88 4.34 3.92 4.81 0.891989 23.83 23.86 5.69 5.47 5.91 0.441990 21.81 21.68 4.73 4.56 4.90 0.351991 23.14 23.44 5.42 5.21 5.65 0.451992 22.53 22.39 5.04 4.82 5.28 0.461993 20.71 26.50 5.49 5.24 5.75 0.521994 17.97 21.28 3.82 3.64 4.02 0.391995 19.13 15.67 3.00 2.74 3.28 0.541996 18.43 19.41 3.58 3.38 3.79 0.411997 15.71 18.60 2.92 2.80 3.05 0.251998 15.93 21.41 3.41 3.32 3.50 0.181999 14.15 19.72 2.79 2.71 2.87 0.162000 15.04 20.42 3.07 2.98 3.17 0.192001 13.46 19.95 2.69 2.60 2.78 0.182002 15.26 14.61 2.23 2.16 2.30 0.142003 14.19 20.22 2.87 2.79 2.95 0.162004 15.60 21.71 3.39 3.29 3.48 0.192005 16.37 18.87 3.09 2.96 3.22 0.262006 12.95 19.02 2.46 2.25 2.69 0.442007 10.73 10.72 1.15 0.58 2.30 1.73
Medium Four Wheel Drives
1982 30.16 31.90 9.62 7.36 12.57 5.201983 19.92 32.71 6.52 5.28 8.05 2.771984 19.43 15.08 2.93 2.29 3.75 1.461985 19.85 30.69 6.09 5.68 6.53 0.851986 15.73 10.25 1.61 1.07 2.43 1.361987 17.95 29.54 5.30 4.38 6.42 2.031988 15.81 40.12 6.34 5.77 6.97 1.201989 17.13 16.76 2.87 2.63 3.13 0.491990 15.55 19.12 2.97 2.71 3.27 0.561991 19.83 18.65 3.70 2.97 4.60 1.621992 13.32 16.74 2.23 2.06 2.41 0.341993 12.54 23.29 2.92 2.75 3.10 0.351994 11.37 22.06 2.51 2.33 2.70 0.381995 11.82 27.11 3.21 3.01 3.41 0.40

Year ofManufacture
Pr(Risk)%
Pr(Severity)%
Seriousinjury rate
per 100driversinvolved
Lower 95%Confidence
Limit
Upper 95%Confidence
Limit
Width ofConfidence
Interval
1996 12.50 22.30 2.79 2.60 2.99 0.391997 13.20 24.85 3.28 3.15 3.42 0.261998 14.16 17.89 2.53 2.36 2.72 0.361999 12.97 22.89 2.97 2.78 3.17 0.392000 12.01 15.19 1.83 1.64 2.04 0.402001 9.63 25.82 2.49 2.34 2.64 0.312002 10.88 23.65 2.57 2.42 2.74 0.322003 9.72 12.29 1.19 1.06 1.35 0.292004 9.22 19.86 1.83 1.73 1.94 0.212005 9.34 21.29 1.99 1.81 2.19 0.382006 10.83 10.74 1.16 0.98 1.39 0.412007 13.95 25.92 3.62 2.62 5.00 2.38
Large Four Wheel Drives
1982 16.35 23.74 3.88 3.71 4.06 0.341983 15.51 26.11 4.05 3.87 4.24 0.361984 14.17 23.01 3.26 3.15 3.38 0.231985 16.62 27.76 4.61 4.52 4.71 0.181986 13.16 22.43 2.95 2.80 3.11 0.321987 15.96 23.57 3.76 3.56 3.97 0.411988 13.76 27.55 3.79 3.69 3.89 0.201989 13.09 23.57 3.08 3.02 3.15 0.131990 12.60 18.30 2.31 2.24 2.37 0.131991 11.54 22.21 2.56 2.49 2.64 0.161992 12.23 24.62 3.01 2.94 3.08 0.141993 11.56 23.37 2.70 2.63 2.77 0.141994 12.35 21.79 2.69 2.62 2.76 0.141995 12.19 24.15 2.94 2.86 3.03 0.171996 12.26 27.43 3.36 3.28 3.44 0.161997 11.07 22.13 2.45 2.38 2.52 0.131998 12.47 20.20 2.52 2.46 2.58 0.121999 12.35 22.40 2.77 2.70 2.84 0.142000 10.26 22.74 2.33 2.25 2.42 0.182001 10.47 18.93 1.98 1.83 2.14 0.312002 10.26 13.61 1.40 1.27 1.54 0.262003 10.30 15.92 1.64 1.50 1.79 0.282004 9.68 16.58 1.60 1.43 1.80 0.382005 9.83 17.65 1.73 1.49 2.02 0.542006 11.31 17.77 2.01 1.67 2.41 0.74
Commercial Vehicles- Vans
1982 24.56 25.07 6.16 5.95 6.38 0.431983 25.12 28.21 7.09 6.87 7.30 0.431984 23.58 25.30 5.97 5.82 6.12 0.301985 21.52 23.38 5.03 4.89 5.18 0.291986 21.63 21.54 4.66 4.51 4.80 0.291987 21.42 18.44 3.95 3.76 4.15 0.391988 21.28 29.47 6.27 6.11 6.44 0.331989 20.34 24.40 4.96 4.76 5.18 0.42

Year ofManufacture
Pr(Risk)%
Pr(Severity)%
Seriousinjury rate
per 100driversinvolved
Lower 95%Confidence
Limit
Upper 95%Confidence
Limit
Width ofConfidence
Interval
1990 19.39 20.59 3.99 3.80 4.20 0.401991 16.33 28.17 4.60 4.35 4.86 0.521992 17.96 20.73 3.72 3.50 3.96 0.461993 15.95 24.03 3.83 3.58 4.10 0.521994 17.34 24.39 4.23 4.02 4.45 0.431995 16.97 24.14 4.10 3.93 4.27 0.341996 15.26 14.97 2.28 2.09 2.50 0.411997 15.79 28.46 4.50 4.28 4.72 0.441998 16.74 15.80 2.64 2.46 2.84 0.381999 14.68 18.81 2.76 2.57 2.96 0.392000 14.34 20.57 2.95 2.75 3.16 0.412001 12.47 21.13 2.64 2.41 2.88 0.472002 14.50 18.28 2.65 2.43 2.89 0.452003 10.49 15.53 1.63 1.42 1.87 0.452004 12.37 11.46 1.42 1.11 1.80 0.692005 13.03 21.17 2.76 2.28 3.34 1.072006 15.74 27.82 4.38 3.27 5.86 2.58
Commercial Vehicles- Utes
1982 18.87 25.55 4.82 4.74 4.90 0.171983 17.05 26.67 4.55 4.45 4.64 0.191984 17.94 24.36 4.37 4.32 4.42 0.101985 20.08 25.43 5.11 5.06 5.15 0.101986 18.33 23.00 4.22 4.16 4.27 0.111987 18.11 21.23 3.84 3.77 3.92 0.151988 17.46 25.98 4.54 4.49 4.59 0.101989 17.14 22.50 3.86 3.82 3.89 0.071990 16.82 22.50 3.78 3.75 3.82 0.071991 16.07 23.71 3.81 3.77 3.85 0.081992 16.89 22.69 3.83 3.80 3.87 0.071993 15.58 25.92 4.04 4.00 4.07 0.071994 15.45 24.28 3.75 3.72 3.78 0.071995 15.09 21.72 3.28 3.24 3.31 0.071996 15.59 22.62 3.53 3.49 3.56 0.071997 15.82 22.42 3.55 3.51 3.58 0.071998 14.64 20.62 3.02 2.99 3.05 0.071999 14.85 22.32 3.32 3.28 3.35 0.082000 14.08 19.34 2.72 2.68 2.76 0.082001 12.73 21.10 2.68 2.64 2.73 0.092002 11.88 19.71 2.34 2.30 2.38 0.082003 12.33 18.50 2.28 2.24 2.32 0.082004 12.97 22.02 2.86 2.81 2.90 0.092005 12.84 19.32 2.48 2.41 2.55 0.142006 11.17 20.68 2.31 2.20 2.43 0.232007 11.94 15.52 1.85 1.36 2.53 1.17
Large Cars
1982 18.32 25.23 4.62 4.61 4.64 0.031983 18.81 24.92 4.69 4.67 4.70 0.03
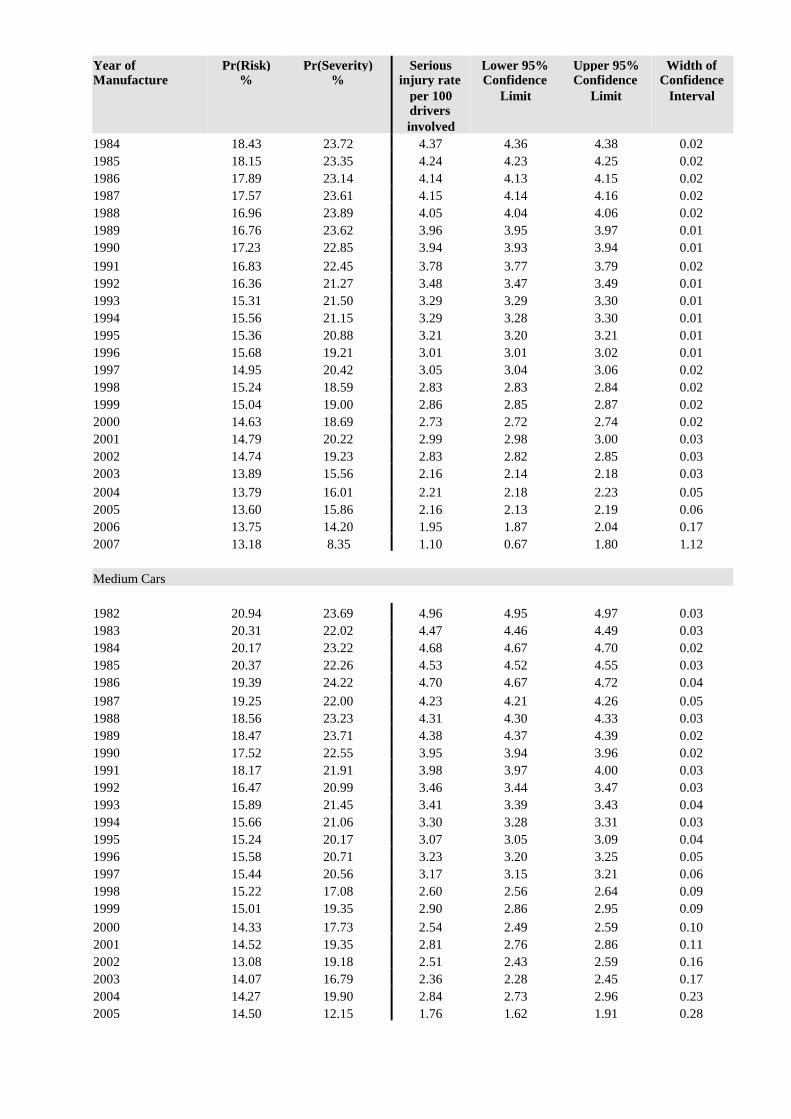
Year ofManufacture
Pr(Risk)%
Pr(Severity)%
Seriousinjury rate
per 100driversinvolved
Lower 95%Confidence
Limit
Upper 95%Confidence
Limit
Width ofConfidence
Interval
1984 18.43 23.72 4.37 4.36 4.38 0.021985 18.15 23.35 4.24 4.23 4.25 0.021986 17.89 23.14 4.14 4.13 4.15 0.021987 17.57 23.61 4.15 4.14 4.16 0.021988 16.96 23.89 4.05 4.04 4.06 0.021989 16.76 23.62 3.96 3.95 3.97 0.011990 17.23 22.85 3.94 3.93 3.94 0.011991 16.83 22.45 3.78 3.77 3.79 0.021992 16.36 21.27 3.48 3.47 3.49 0.011993 15.31 21.50 3.29 3.29 3.30 0.011994 15.56 21.15 3.29 3.28 3.30 0.011995 15.36 20.88 3.21 3.20 3.21 0.011996 15.68 19.21 3.01 3.01 3.02 0.011997 14.95 20.42 3.05 3.04 3.06 0.021998 15.24 18.59 2.83 2.83 2.84 0.021999 15.04 19.00 2.86 2.85 2.87 0.022000 14.63 18.69 2.73 2.72 2.74 0.022001 14.79 20.22 2.99 2.98 3.00 0.032002 14.74 19.23 2.83 2.82 2.85 0.032003 13.89 15.56 2.16 2.14 2.18 0.032004 13.79 16.01 2.21 2.18 2.23 0.052005 13.60 15.86 2.16 2.13 2.19 0.062006 13.75 14.20 1.95 1.87 2.04 0.172007 13.18 8.35 1.10 0.67 1.80 1.12
Medium Cars
1982 20.94 23.69 4.96 4.95 4.97 0.031983 20.31 22.02 4.47 4.46 4.49 0.031984 20.17 23.22 4.68 4.67 4.70 0.021985 20.37 22.26 4.53 4.52 4.55 0.031986 19.39 24.22 4.70 4.67 4.72 0.041987 19.25 22.00 4.23 4.21 4.26 0.051988 18.56 23.23 4.31 4.30 4.33 0.031989 18.47 23.71 4.38 4.37 4.39 0.021990 17.52 22.55 3.95 3.94 3.96 0.021991 18.17 21.91 3.98 3.97 4.00 0.031992 16.47 20.99 3.46 3.44 3.47 0.031993 15.89 21.45 3.41 3.39 3.43 0.041994 15.66 21.06 3.30 3.28 3.31 0.031995 15.24 20.17 3.07 3.05 3.09 0.041996 15.58 20.71 3.23 3.20 3.25 0.051997 15.44 20.56 3.17 3.15 3.21 0.061998 15.22 17.08 2.60 2.56 2.64 0.091999 15.01 19.35 2.90 2.86 2.95 0.092000 14.33 17.73 2.54 2.49 2.59 0.102001 14.52 19.35 2.81 2.76 2.86 0.112002 13.08 19.18 2.51 2.43 2.59 0.162003 14.07 16.79 2.36 2.28 2.45 0.172004 14.27 19.90 2.84 2.73 2.96 0.232005 14.50 12.15 1.76 1.62 1.91 0.28
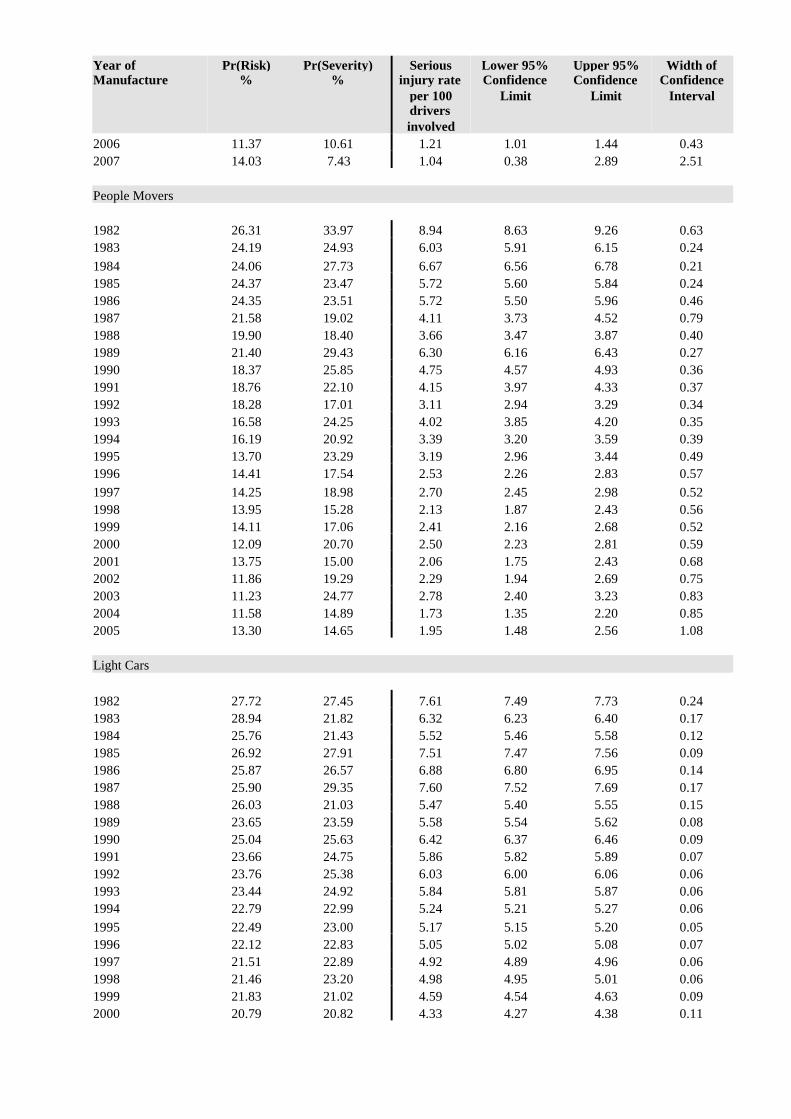
Year ofManufacture
Pr(Risk)%
Pr(Severity)%
Seriousinjury rate
per 100driversinvolved
Lower 95%Confidence
Limit
Upper 95%Confidence
Limit
Width ofConfidence
Interval
2006 11.37 10.61 1.21 1.01 1.44 0.432007 14.03 7.43 1.04 0.38 2.89 2.51
People Movers
1982 26.31 33.97 8.94 8.63 9.26 0.631983 24.19 24.93 6.03 5.91 6.15 0.241984 24.06 27.73 6.67 6.56 6.78 0.211985 24.37 23.47 5.72 5.60 5.84 0.241986 24.35 23.51 5.72 5.50 5.96 0.461987 21.58 19.02 4.11 3.73 4.52 0.791988 19.90 18.40 3.66 3.47 3.87 0.401989 21.40 29.43 6.30 6.16 6.43 0.271990 18.37 25.85 4.75 4.57 4.93 0.361991 18.76 22.10 4.15 3.97 4.33 0.371992 18.28 17.01 3.11 2.94 3.29 0.341993 16.58 24.25 4.02 3.85 4.20 0.351994 16.19 20.92 3.39 3.20 3.59 0.391995 13.70 23.29 3.19 2.96 3.44 0.491996 14.41 17.54 2.53 2.26 2.83 0.571997 14.25 18.98 2.70 2.45 2.98 0.521998 13.95 15.28 2.13 1.87 2.43 0.561999 14.11 17.06 2.41 2.16 2.68 0.522000 12.09 20.70 2.50 2.23 2.81 0.592001 13.75 15.00 2.06 1.75 2.43 0.682002 11.86 19.29 2.29 1.94 2.69 0.752003 11.23 24.77 2.78 2.40 3.23 0.832004 11.58 14.89 1.73 1.35 2.20 0.852005 13.30 14.65 1.95 1.48 2.56 1.08
Light Cars
1982 27.72 27.45 7.61 7.49 7.73 0.241983 28.94 21.82 6.32 6.23 6.40 0.171984 25.76 21.43 5.52 5.46 5.58 0.121985 26.92 27.91 7.51 7.47 7.56 0.091986 25.87 26.57 6.88 6.80 6.95 0.141987 25.90 29.35 7.60 7.52 7.69 0.171988 26.03 21.03 5.47 5.40 5.55 0.151989 23.65 23.59 5.58 5.54 5.62 0.081990 25.04 25.63 6.42 6.37 6.46 0.091991 23.66 24.75 5.86 5.82 5.89 0.071992 23.76 25.38 6.03 6.00 6.06 0.061993 23.44 24.92 5.84 5.81 5.87 0.061994 22.79 22.99 5.24 5.21 5.27 0.061995 22.49 23.00 5.17 5.15 5.20 0.051996 22.12 22.83 5.05 5.02 5.08 0.071997 21.51 22.89 4.92 4.89 4.96 0.061998 21.46 23.20 4.98 4.95 5.01 0.061999 21.83 21.02 4.59 4.54 4.63 0.092000 20.79 20.82 4.33 4.27 4.38 0.11

Year ofManufacture
Pr(Risk)%
Pr(Severity)%
Seriousinjury rate
per 100driversinvolved
Lower 95%Confidence
Limit
Upper 95%Confidence
Limit
Width ofConfidence
Interval
2001 18.70 22.33 4.17 4.09 4.26 0.172002 18.16 20.97 3.81 3.72 3.90 0.172003 19.09 21.12 4.03 3.97 4.10 0.142004 18.29 18.80 3.44 3.36 3.51 0.152005 16.94 22.49 3.81 3.73 3.89 0.162006 15.27 23.25 3.55 3.44 3.66 0.222007 14.03 12.28 1.72 1.24 2.40 1.16
Small Cars
1982 23.41 24.85 5.82 5.80 5.83 0.031983 24.09 23.29 5.61 5.59 5.63 0.031984 22.61 23.04 5.21 5.20 5.22 0.031985 23.41 23.70 5.55 5.53 5.57 0.031986 22.16 22.78 5.05 5.03 5.06 0.031987 21.92 24.01 5.26 5.24 5.28 0.041988 21.57 23.76 5.12 5.11 5.14 0.031989 20.56 23.49 4.83 4.82 4.84 0.021990 20.03 22.83 4.57 4.56 4.58 0.021991 19.93 22.52 4.49 4.48 4.50 0.021992 19.69 22.14 4.36 4.35 4.37 0.021993 19.48 22.24 4.33 4.32 4.34 0.021994 19.71 20.82 4.10 4.09 4.11 0.021995 18.68 22.50 4.20 4.19 4.21 0.021996 19.70 21.08 4.15 4.14 4.16 0.021997 19.32 22.80 4.40 4.39 4.42 0.021998 19.04 21.24 4.04 4.03 4.05 0.021999 18.49 20.64 3.82 3.80 3.83 0.032000 17.83 21.11 3.76 3.75 3.78 0.032001 16.62 19.84 3.30 3.28 3.31 0.032002 17.47 20.12 3.51 3.50 3.53 0.042003 16.96 19.58 3.32 3.30 3.34 0.042004 16.50 18.25 3.01 2.98 3.04 0.062005 16.86 19.99 3.37 3.34 3.41 0.072006 14.79 14.51 2.15 2.09 2.21 0.122007 13.75 22.54 3.10 2.77 3.46 0.69