Carbohydrate Structure Database: tools for statistical analysis of bacterial, plant and fungal...
22
Database tool Carbohydrate Structure Database: tools for statistical analysis of bacterial, plant and fungal glycomes K.S. Egorova † , A.N. Kondakova and Ph.V. Toukach †, * N.D. Zelinsky Institute of Organic Chemistry, Russian Academy of Sciences, Leninskiy prospect 47, 119991 Moscow, Russia *Corresponding author: Email: [email protected], Tel/Fax: þ7 499 137 6148 † These authors contributed equally to this work. Citation details: Egorova,K.S., Kondakova,A.N. and Toukach,Ph.V. Carbohydrate Structure Database: tools for statistical analysis of bacterial, plant and fungal glycomes. Database (2015) Vol. 2015: article ID bav073 doi:10.1093/database/bav073 Received 5 February 2015; Revised 26 May 2015; Accepted 1 July 2015 Abstract Carbohydrates are biological blocks participating in diverse and crucial processes both at cellular and organism levels. They protect individual cells, establish intracellular inter- actions, take part in the immune reaction and participate in many other processes. Glycosylation is considered as one of the most important modifications of proteins and other biologically active molecules. Still, the data on the enzymatic machinery involved in the carbohydrate synthesis and processing are scattered, and the advance on its study is hindered by the vast bulk of accumulated genetic information not supported by any ex- perimental evidences for functions of proteins that are encoded by these genes. In this article, we present novel instruments for statistical analysis of glycomes in taxa. These tools may be helpful for investigating carbohydrate-related enzymatic activities in vari- ous groups of organisms and for comparison of their carbohydrate content. The instru- ments are developed on the Carbohydrate Structure Database (CSDB) platform and are available freely on the CSDB web-site at http://csdb.glycoscience.ru. Database URL: http://csdb.glycoscience.ru Introduction In molecular biology, carbohydrates had long been shaded by other biological ‘building units’, such as proteins. It is established knowledge that cells of prokaryotic and eu- karyotic organisms possess the cell wall, which contains peptidoglycan, or murein (bacteria) (1, 2); branched beta- glucans linked to chitin (fungi) (3) or cellulose, hemicellu- loses and pectin (plants) (4). However, only when the importance of protein glycosylation began to emerge, the fundamental role of carbohydrates in numerous processes, such as development of immunological memory, was established. Glycosylation is one of major post-translational modifi- cations of proteins and is found in specimens from almost all domains of life, from bacteria to mammals. Glycan pat- terns can affect intra- and intermolecular interactions, as V C The Author(s) 2015. Published by Oxford University Press. Page 1 of 22 This is an Open Access article distributed under the terms of the Creative Commons Attribution License (http://creativecommons.org/licenses/by/4.0/), which permits unrestricted reuse, distribution, and reproduction in any medium, provided the original work is properly cited. (page number not for citation purposes) Database, 2015, 1–22 doi: 10.1093/database/bav073 Database tool at Institute of Organic Chemistry of the Russian Academy of Sciences on September 4, 2015 http://database.oxfordjournals.org/ Downloaded from
Transcript of Carbohydrate Structure Database: tools for statistical analysis of bacterial, plant and fungal...
Database tool
Carbohydrate Structure Database tools for
statistical analysis of bacterial plant and fungal
glycomes
KS Egorovadagger AN Kondakova and PhV Toukachdagger
ND Zelinsky Institute of Organic Chemistry Russian Academy of Sciences Leninskiy prospect 47
119991 Moscow Russia
Corresponding author Email netboxtoukachru TelFax thorn7 499 137 6148
daggerThese authors contributed equally to this work
Citation details EgorovaKS KondakovaAN and ToukachPhV Carbohydrate Structure Database tools for statistical
analysis of bacterial plant and fungal glycomes Database (2015) Vol 2015 article ID bav073 doi101093databasebav073
Received 5 February 2015 Revised 26 May 2015 Accepted 1 July 2015
Abstract
Carbohydrates are biological blocks participating in diverse and crucial processes both
at cellular and organism levels They protect individual cells establish intracellular inter-
actions take part in the immune reaction and participate in many other processes
Glycosylation is considered as one of the most important modifications of proteins and
other biologically active molecules Still the data on the enzymatic machinery involved
in the carbohydrate synthesis and processing are scattered and the advance on its study
is hindered by the vast bulk of accumulated genetic information not supported by any ex-
perimental evidences for functions of proteins that are encoded by these genes In this
article we present novel instruments for statistical analysis of glycomes in taxa These
tools may be helpful for investigating carbohydrate-related enzymatic activities in vari-
ous groups of organisms and for comparison of their carbohydrate content The instru-
ments are developed on the Carbohydrate Structure Database (CSDB) platform and are
available freely on the CSDB web-site at httpcsdbglycoscienceru
Database URL httpcsdbglycoscienceru
Introduction
In molecular biology carbohydrates had long been shaded
by other biological lsquobuilding unitsrsquo such as proteins It is
established knowledge that cells of prokaryotic and eu-
karyotic organisms possess the cell wall which contains
peptidoglycan or murein (bacteria) (1 2) branched beta-
glucans linked to chitin (fungi) (3) or cellulose hemicellu-
loses and pectin (plants) (4) However only when the
importance of protein glycosylation began to emerge the
fundamental role of carbohydrates in numerous processes
such as development of immunological memory was
established
Glycosylation is one of major post-translational modifi-
cations of proteins and is found in specimens from almost
all domains of life from bacteria to mammals Glycan pat-
terns can affect intra- and intermolecular interactions as
VC The Author(s) 2015 Published by Oxford University Press Page 1 of 22This is an Open Access article distributed under the terms of the Creative Commons Attribution License (httpcreativecommonsorglicensesby40) which permits
unrestricted reuse distribution and reproduction in any medium provided the original work is properly cited
(page number not for citation purposes)
Database 2015 1ndash22
doi 101093databasebav073
Database tool
at Institute of Organic C
hemistry of the R
ussian Academ
y of Sciences on September 4 2015
httpdatabaseoxfordjournalsorgD
ownloaded from
well as cell-cell contacts and adhesion (5) Now we know
that bacterial and fungal carbohydrates which are per se
weakly immunogenic as a part of glycoproteins or lipo-
polysaccharides (LPSs) can trigger a carbohydrate-specific
T cell immune reaction resulting in antibody production
and immunological memory development (6ndash8) Diverse
carbohydrates allow pathogenic microorganisms to find
ways to bypass the immune response of a host organism
Thus many infectious bacteria and viruses expose carbo-
hydrates on their surface and the structure of these carbo-
hydrates resembles closely that one of the molecules
which are present in surface glycoproteins and glycolipids
of host cells (6)
Carbohydrates of numerous pathogenic bacteria attract
attention as candidates for vaccines (9) Bacterial cell sur-
face capsular polysaccharides and LPSs can be utilized as
antigens for obtaining antibodies against the correspond-
ing infection and glycoconjugate vaccines seem to be ef-
fective in developing protective immune reactions When
N- and O-glycosylation of bacterial proteins was dis-
covered new perspectives in biotechnology have opened
(5) Therefore genetic and proteomic information on en-
zymatic apparatus involved in the synthesis of bacterial
carbohydrates and glycoconjugates is of particular
importance
Bacteria are not the only organisms whose carbohydrate
structures present interest for fundamental science and
medicine In fungi glycoproteins and glycolipids show di-
versity and complexity For example Cryptococcus neofor-
mans surrounds its cell wall with a polysaccharide capsule
that defines its virulence (10) Pathogenic fungi possess gly-
cosyltransferases (GTs) missing from humans and there-
fore presenting potential pharmaceutical targets that allow
avoiding host toxicity typical for many antifungal
substances
Cell walls of bacteria and fungi are known to be dy-
namic structures which provide both protection from and
interaction with the environment Cell walls of pathogenic
and commensal microorganisms are recognized by host re-
ceptors such as nucleotide oligomerization domain pro-
teins peptidoglycan recognition proteins Toll-like
receptors and C-type lectin receptors which in turn medi-
ate the organism reaction to the invasion (11) In order to
escape the host immune response microorganisms use sev-
eral tricks by modifying their cell walls (11) Thus the suc-
cess and survival of these bacteria and fungi depend on
their ability to synthesize particular carbohydrate-contain-
ing structures There is a whole complex of enzymes called
carbohydrate-active enzymes (CAZy) which mediate syn-
thesis assembly and processing of carbohydrate-containing
compounds The CAZy database combines numerous fami-
lies of glycoside hydrolases GTs polysaccharide lyases
and carbohydrate esterases as well as carbohydrate-bind-
ing modules (12 13) Outer carbohydrates are one of the
most variable characteristics of microbial cells (11 14)
and the glycome of such bacterial and fungal species
should reflect mechanisms of their interaction with the
host as well as their genetic constitution (in terms of
CAZy-encoding genes)
Plants constitute another group of organisms whose
carbohydrates are important for medicine Numerous
plant bioactive low-molecular weight products demon-
strate specific patterns of glycosylation (15) Sugar moi-
eties may modulate biological activity of these compounds
and where existing chemical technologies do not allow im-
plementing effective specific glycosylation of complex mol-
ecules enzymatic procedures can be used Therefore
information on activity and selectivity of plant carbohy-
drates and GTs is demanded
From 2005 we have been developing and maintaining
the Carbohydrate Structure Database (CSDB) intended for
provision of latest data on structures bibliography tax-
onomy nuclear magnetic resonance (NMR) spectroscopy
and other information regarding natural carbohydrates
CSDB includes Bacterial (BCSDB) and Plant and Fungal
(PFCSDB) parts which deposit glycans and glycoconju-
gates found in prokaryotes plants and fungi (16 17)
These databases are freely available at httpcsdbglyco-
scienceru
This article presents novel CSDB instruments for statis-
tical analysis of structural feature distribution in taxonomic
groups Completeness of the CSDB coverage on bacterial
carbohydrates suggests that such analysis of bacterial glyco-
mes would produce statistically significant results which
could be used for deciphering CAZy activities CSDB data
on plants and fungi though not complete at the moment
also present a possibility of correlating the information on
predicted CAZy genes and proteins with the existing carbo-
hydrates The article offers potential applications of the
statistical tools in the modern glycobiological research
Results and Discussion
A survey on database content especially in databases
claiming for complete coverage often provides valuable in-
formation for researches CSDB has several tools which
can be used in statistical studies Links to them are present
in the lsquoExtrasrsquo section of the main menu of the Bacterial
(BCSDB httpcsdbglycosciencerubacterialindexhtml)
and Plant and Fungal (PFCSDB httpcsdbglycoscienceru
plant_fungalindexhtml) CSDB The lsquoFragment abun-
dancersquo tool calculates the abundance of monomers and
dimers found in carbohydrates from specified taxonomic
groups whereas the lsquoCoverage statisticsrsquo tool gives statistics
Page 2 of 22 Database Vol 2015 Article ID bav073
at Institute of Organic C
hemistry of the R
ussian Academ
y of Sciences on September 4 2015
httpdatabaseoxfordjournalsorgD
ownloaded from
on the database coverage for specified groups The choice
of the database is of significant importance PFCSDB pro-
vides data on algae fungi and plants whereas BCSDBmdashon
bacteria archaea and protista Note that though the
groups lsquobacteriarsquo lsquoarchaearsquo and lsquoprotistarsquo are available
from PFCSDB (and vice versa) the correct database should
be used in each case
The lsquoTaxon clusteringrsquo tool can be launched from either
database with the same result This tool generates distance
matrices for mono- or dimeric fragment pools from taxa
populated in both databases Based on these matrices the
taxa are clustered into groups and corresponding dendro-
grams are displayed
When using CSDB please keep in mind that the term
lsquostructurersquo refers to an oligomeric molecule or a polymer
repeating unit built up of residues linked by ester ether or
amide linkages Every entity which is attached to the other
part of the molecule via these linkages is considered a dis-
tinct residue (including acetic acid methanol and other
monovalent residues) To be classified as a glycan the
structure should have at least one carbohydrate residue A
dimer is a structural fragment built of two residues of any
type More detailed explanation of terms has been pub-
lished recently (16)
The following sections describe possible applications of
the developed tools in scientific practice More detailed
user manual and examples for the fragment abundance
and coverage statistics tools will be published elsewhere
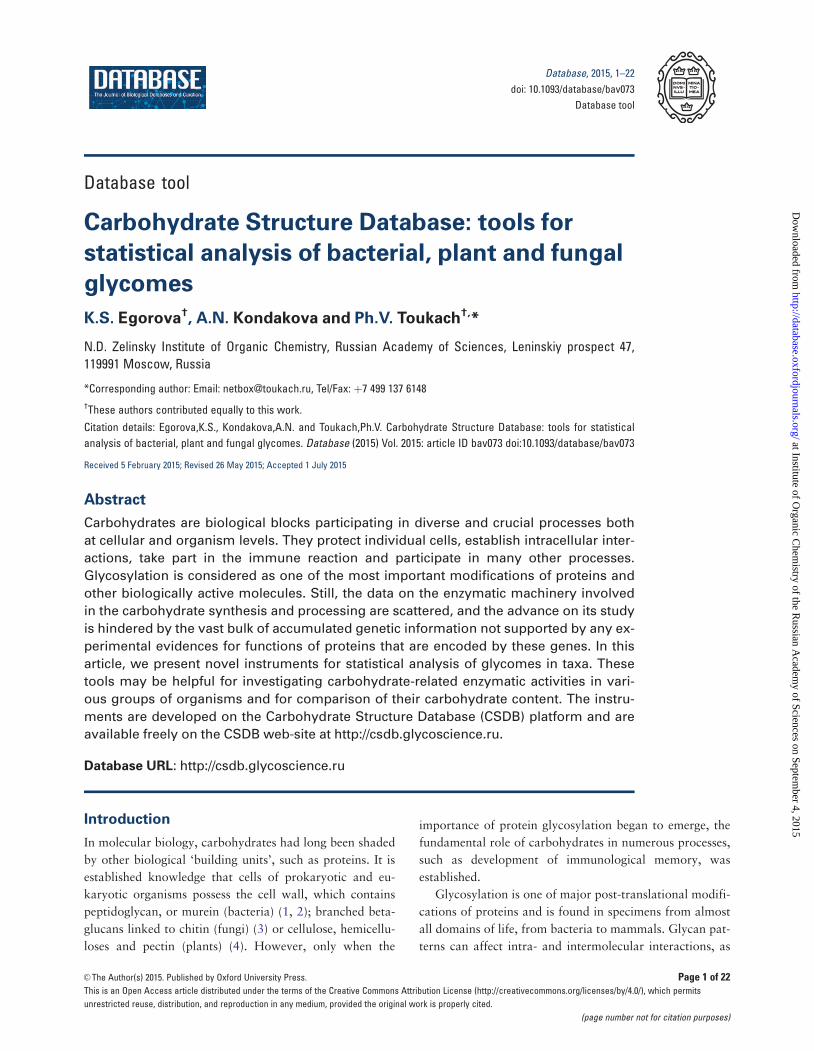
Interface
Fragment abundance
The tool estimates the abundance of monomers andor
dimers present in glycans from specified taxonomic groups
of different ranks The query form is shown in Figure 1
User can define the source from which the data are
gathered by selecting taxonomic rank A domain groups B
and specific taxa CD The available ranks are domain
phylum class genus species and strainsubspecies
Figure 1 shows an exemplary query on two species D of
Schizosaccharomyces C carbohydrates from which are
present in PFCSDB
The lsquoFragment abundancersquo tool provides the following
filters E
- Combine anomeric forms (treats different anomeric forms
of the same residue as a single entity) when checked the
resulting table will contain eg fragments with the DGlcp
residue combining a- and b-anomers otherwise frag-
ments containing a- and b-anomers of D-glucopyranose
(aDGlcp and bDGlcp) will occupy different rows
- Include undefined configs (underdetermined residues with
missing configurations are included into the query scope)
when checked the resulting table will include fragments
containing Kdop bFucp DGal etc
- Include ONLY saccharides (no monovalent residues
aglycons or aliases are shown) Please note that acetic
acid is treated as a separate monovalent residue thus
Figure 1 Fragment abundance form
Database Vol 2015 Article ID bav073 Page 3 of 22
at Institute of Organic C
hemistry of the R
ussian Academ
y of Sciences on September 4 2015
httpdatabaseoxfordjournalsorgD
ownloaded from
with this option checked Ac(1-2)GlcN will not be picked
up as a dimer from the structure Gal(1-3)GlcNAc while
Gal(1-3)GlcN will be
- Include monovalent residues (monovalent substituent
residues are included into the query scope) eg GlcNAc
or Glc-1OMe will be included as Ac(1-2)GlcN or
Glc(1-1)Me accordingly This and the previous filter are
interdependent
- Include aglycons in oligomers (aglycons are included into
the query scope as separate residues)
- Include aliases Aliases (explained entities missing from
the total residue list) and superclasses (LIP HEX etc)
are included into the query scope For example with this
option checked two dimersmdashSubst1(1-3)aDGlcp and
aDGlcp(1-1)LIP - and three monomers will be picked up
from the structure Subst1(1-3)aDGlcp(1-1)LIP
Subst1frac14 25-diaminopentanoic acid
- Explain lsquoSubstrsquo aliases (if unchecked substituents without
reserved residue names are displayed as lsquoSubstrsquo and
treated together otherwise they are differentiated) For
example with this option checked the above-mentioned
structure will produce the 25-diaminopentanoic
acid(1-3)aDGlcp dimer otherwise it will produce the
Subst1(1-3)aDGlcp dimer which will be combined with
dimers from other structures possessing Subst1 alias with
any explanation
Checkboxes F allow distinguishing the position of resi-
dues in bigger saccharides and the residue branching de-
gree The branching degree is a number of substituents
excluding the acceptor residue at the anomeric center (or
at another default center in non-sugars) By default it in-
cludes monovalent residues if they are not ignored by the
third checkbox in the group For example the branching
degree of GlcN in the structure Gal(1-3)GlcNAc(1-2)Man
is lsquodi-branchedrsquo with monovalent residues counted or lsquolin-
earrsquo without monovalent residues
Checkbox G allows showing only fragments that are
unique for a selected taxon among all biota or kingdom
phylum which it belongs to H Buttons I and J display
statistics on monomers and dimers correspondingly
In this example pressing button I displays the table of
monomers present in glycans and glycoconjugates from
Schizosaccharomyces japonicus and Schizosaccharomyces
pombe (Figure 2)
Figure 2 shows an overview of fragments structures
and organisms found A The table of results is composed of
the following columns position of a residue in the struc-
ture B (if it was checked to be distinguished terminal resi-
dues are shown in cyan and residues at the reducing end
are in pink the branching degree is also indicated) residue
names and configurations C abundance D (how many
times a particular residue occurs in the structures matching
the query) compound IDs E (links to the corresponding
compound pages) and abundance (absolute and relative) in
selected taxa F The columns can be sorted by position
residue name or abundance by clicking on column captions
B C or D The page contains accessory links eg export of
results as tab-separated values for copy-pasting into other
Figure 2 Monomeric composition for S japonicus and S pombe
Page 4 of 22 Database Vol 2015 Article ID bav073
at Institute of Organic C
hemistry of the R
ussian Academ
y of Sciences on September 4 2015
httpdatabaseoxfordjournalsorgD
ownloaded from
table-processing software and statistics on dimers for the
current query H
PFCSDB stores 14 saccharides from S japonicus and
S pombe and these saccharides are composed of 12
monomeric residues a-D-mannopyranose being the most
abundant a-D-mannopyranose a-D-galactopyranose and
a-D-glucopyranose are found at the terminal positions D-
mannitol and D-2-aminoglucitol found at the reducing
ends are probably analytical artifacts If a residue is
suspected to be an analytical artifact a corresponding
note is present in the full record which can be accessed
by clicking links in column E
Figure 3 exemplifies the usage of the dimer abundance
tool and shows the query form for statistics on dimers
found in glycans of the Eleutherococcus genus (ABC)
where only fragments unique for the genus in its phylum
are selected (FG) Monovalent residues (such as methyl or
acetyl groups) aglycons and other aliases are included (D)
positions of residues in the structure and residue branching
degree are left undistinguished (E) Pressing button H cal-
culates the statistics
The result table (Figure 4) lists dimeric fragments
unique for the Eleutherococcus genus in its phylum
(Streptophyta) together with statistical overview A It in-
cludes residues found in the structures from the organisms
belonging to the specified taxon (in this case eight dimeric
fragments from eight saccharides associated with three or-
ganisms from the Eleutherococcus genus) and their abso-
lute and relative (in per cent) abundance E There are
compound IDs F for structures that contain the corres-
ponding fragment (in this example unique fragments are
exotic and each fragment belongs to one structure only)
and fragment abundance among the genera G (in Figure 4
100 for all residues because only one genus was se-
lected) The result table for dimer abundance includes
lsquoDonorrsquo B lsquoLinkagersquo C and lsquoAcceptorrsquo D columns reflect-
ing two residues in a dimeric fragment and a linkage be-
tween them respectively The page also contains accessory
links H
Currently the lsquoall biotarsquo option (drop-down list G in
Figure 3) implies all biota present in the database that is
being queried Because BCSDB and PFCSDB are not
merged using this option especially at the domain level
produces many false positives (particularly there is al-
most no other biota than bacteria in BCSDB) When
analysing unique fragments you should keep in mind
that lsquoAll biotarsquo includes only those domains which are
populated in the current database This option is
reserved for the future using the option lsquoin its kingdomrsquo
is preferable
Figure 3 Fragment abundance form Only fragments unique for the genus Eleutherococcus in its phylum will be processed
Database Vol 2015 Article ID bav073 Page 5 of 22
at Institute of Organic C
hemistry of the R
ussian Academ
y of Sciences on September 4 2015
httpdatabaseoxfordjournalsorgD
ownloaded from
Coverage statistics
This tool produces statistics on coverage in various taxo-
nomic ranks (all biota domain phylum class or genus)
and allows comparison of structure distribution among
taxa Figure 5 shows the query form User can define taxo-
nomic rank A and then select groups B for which taxa C
of this rank are displayed (in this example two phyla
Actinobacteria and Firmicutes are selected) The data will
be distributed among the subtaxa having a lower rank than
that of the selected taxa Publication year D and structure
type E filters allow refining the search by date of publica-
tion or structure type (the available types are mono- and
oligomers all polymers mono- and homopolymers cyclic
polymers and biological repeats) The lsquoDisplay coveragersquo
button F processes the query
The resulting table together with short query overview
A is shown in Figure 6 The table includes selected taxa B
(in this case the phyla Actinobacteria and Firmicutes note
that the data are sorted by phyla not by default structure
abundance) subtaxa C of the selected taxa (in this case
Figure 4 Dimeric fragments unique for the Eleutherococcus genus in its phylum
Figure 5 Coverage statistics form
Page 6 of 22 Database Vol 2015 Article ID bav073
at Institute of Organic C
hemistry of the R
ussian Academ
y of Sciences on September 4 2015
httpdatabaseoxfordjournalsorgD
ownloaded from
classes comprising the Actinobacteria and Firmicutes
phyla) structures D (the number of structures found for a
corresponding subtaxon together with their part of the
total number of structures assigned to organisms from the
whole taxa selected) publications E (the number of papers
in which these structures were published) organisms F
(the number of taxonomically distinct organisms or groups
of organisms from which these structures were obtained)
and NMR spectra G (the number of NMR spectra for these
structures present in the database) Clicking on the num-
bers leads to the corresponding database entries Last row
H shows the cumulative values
Taxon clustering
This tool generates distance matrices for mono- or dimeric
fragment pools from taxa populated in both BCSDB and
PFCSDB databases Basing on these matrices selected taxa
can be clustered into groups with the corresponding den-
drograms displayed Such clustering of taxa according to
their glycans can be visualized as phenetic trees and can be
exported for external processing
Briefly the tool generates a list of taxa in accordance
with the specified constraints (Scope settings and
General settings) and a list of structural fragments
that will be included in the analysis in accordance with the
specified constraints (General settings and Fragment
pool settings) When these two lists are prepared the
program builds mono- or disaccharide profiles (binary oc-
currence codes) that reflect the occurrence of particular
fragments in the structures assigned to organisms belong-
ing to every taxon under analysis The occurrence codes
are compared to obtain Hamming distances (18) between
taxa these distances are normalized by the study degree
for each taxon (how many structures are assigned to it)
and produce a dissimilarity matrix used for cluster analysis
of taxa and for building phenetic trees
Figure 7 shows the input form of the tool The scope
settings define a particular taxonomic group for the ana-
lysis (by default it is all biota which means no limitations
on taxon selection) Available taxonomical scopes A are
lsquoall biotarsquo lsquodomainrsquo lsquophylumrsquo lsquoclassrsquo or lsquogenusrsquo If the
rank lsquophylumrsquo or lower is selected list C appears from
which individual phyla classes or genera can be selected
Multiple selection is allowed Checkboxes B allow filtering
these lists to the domains checked Both databases (BCSDB
and PFCSDB) are utilized
The general settings include options and thresholds for
generation of a taxon list a fragment list and occurrence
codes The lsquoRankrsquo selector D specifies the rank of taxa
being compared (kingdom phylum genus species or
strain) If lsquospeciesrsquo is selected the additional link lsquoSpecify
exact speciesrsquo appears on the right Clicking this link opens
the list of all species present in CSDB in a new window
where specific species can be selected If a species is missing
from the list currently there are no carbohydrate struc-
tures from this organism in CSDB This option resets scope
settings ABC to lsquoall biotarsquo
Two taxon population thresholds E define how popu-
lated a taxon should be to be included in the analysis The
population is a number of structures assigned to organisms
belonging to this taxon or its subtaxa The upper field
specifies the absolute minimum (the number of structures)
the lower field specifies the relative minimum (the number
of structures normalized by the total number of structures
in the database to which the taxon belongs) Checkboxes
define which threshold to use both can be used simultan-
eously Lower values produce analysis on greater variety of
taxa whereas higher values limit the taxonomical scope
only to the most studied taxa Low thresholds may lead to
Figure 6 Coverage statistics for the Actinobacteria and Firmicutes phyla
Database Vol 2015 Article ID bav073 Page 7 of 22
at Institute of Organic C
hemistry of the R
ussian Academ
y of Sciences on September 4 2015
httpdatabaseoxfordjournalsorgD
ownloaded from
Figure 7 Parameter input for clustering of taxa by glycan structural features
Page 8 of 22 Database Vol 2015 Article ID bav073
at Institute of Organic C
hemistry of the R
ussian Academ
y of Sciences on September 4 2015
httpdatabaseoxfordjournalsorgD
ownloaded from
the data biased by non-uniform distribution of deposited
structures in exotic taxa high thresholds decrease the num-
ber of taxa under analysis and the results even on wide-
spread genera may be lost Default values are pre-filled
depending on the selected rank to pick up from 5 to 20
most studied taxa
Two abundance thresholds F define how lsquopopularrsquo a
fragment should be to be qualified as present in biota and
therefore to be included in the analysis Higher abundance
thresholds shift the results to widespread saccharides
avoiding analytical artifacts and atypical rarely occurring
fragments The first threshold sets the minimal number of
structures in which a fragment should be present the se-
cond threshold sets the minimal number of instances of a
fragment in all structures present in CSDB As a structure
may contain several identical fragments the second thresh-
old should always be higher than the first one Default val-
ues are set to cover enough fragments specific to certain
taxa these values are sufficiently high not to cover statis-
tically unpopulated exotic fragments
Fragment presence threshold G defines how frequently
a fragment should appear in the structures belonging to a
taxon to be qualified as present in this taxon (by default it
is set to 2 to avoid unapproved occurrences)
Size of fragments H specifies which fragments (mono-
meric or dimeric) will be used for the analysis Monomeric
fragments focus the research on the glycan composition
whereas dimeric fragments (default) focus it on biosynthe-
sized linkages Type of structures I defines the scopes of
structures from which fragments are taken The allowed
types are lsquoanyrsquo (default) lsquoonly polymersrsquo lsquoonly oligomersrsquo
or lsquooptimizedrsquo The latter implies most biologically active
structures in each domain polymers from bacteria fungi
and archaea and oligomers from other kingdoms
Format J specifies how the dissimilarity matrix is ex-
ported (R-project Phylip or tab-separated values) If the
default format lsquoR-projectrsquo is selected the dendrographic
visualization of results is done automatically on the result
page Phylip matrices can be processed by various software
for clustering whereas the TSV format is most universal
Fragment pool settings define options for generation
of the fragment list lsquoCombine anomeric formsrsquo treats dif-
ferent anomers as a single residue without anomeric con-
figuration lsquoExclude underdetermined residuesrsquo omits
fragments containing residues with unknown anomeric (if
not combined) absolute or ring size configuration from
the analysis lsquoExclude monovalent residuesrsquo omits frag-
ments containing (or consisting of) monovalent residues
(including acetyl groups of amino sugars) from the ana-
lysis lsquoExclude superclassesrsquo omits fragments containing (or
consisting of) residues presented by superclasses (like HEX)
or aliases (like Subst) lsquoDifferentiate aliasesrsquo replaces all
Subst aliases with actual alias values prior to the analysis
In this case aliases are treated as different residues depend-
ing on their actual values otherwise all Subst aliases are
combined under a single residue name like Subst or
Subst1 lsquoSugars onlyrsquo omits fragments containing at least
one non-monosaccharide residue from the analysis
Acetylated amino sugars are interpreted as dimeric frag-
ments containing the non-sugar residue Ac and a sugar
residue lsquoExclude aglyconsrsquo omits fragments with residues
at the reducing end classified as aglycons If unchecked
aglycons from mono- and oligomeric structures are pro-
cessed together with other residues lsquoDifferentiate locationrsquo
(currently disabled) processes identical fragments at differ-
ent locations in the structure (inline terminal or reducing)
as different fragments lsquoStrict comparisonrsquo (currently al-
ways enabled) implies that similarity of two fragments is
evaluated by strict comparison of configurations (eg
DGalp is not equal to bDGalp) When unchecked resi-
dues with known configurations are considered a subset of
those with unknown
Pressing the lsquoClusterizersquo button runs the analysis The
specified restrictions affect the number of taxa and frag-
ments being processed and the calculation may take from
30 s to 10 min
Figure 8 shows the results of the cluster analysis the in-
put data for which are presented in Figure 7 Overview of
the taxonomic scope A is given at the window top Reports
on the number of generated fragments and taxa B indicate
that the taxon and fragment pools were prepared without
errors Occurrence bit-code generation report C is accom-
panied by the lsquoShowrsquo link which displays a table with taxa
and their binary glycoprofiles (occurrence codes) together
with a separate list of the fragments used Dissimilarity
matrix generation report D is also accompanied by the
lsquoShowrsquo link which displays the distance matrix in the se-
lected format
lsquoCalculation parametersrsquo E is a dump of all metadata
related to the analysis in accordance with the preferences
selected in the glycome-based taxon clustering form
(Figure 7) lsquoCoverage data on used taxarsquo F is a tab-
separated table containing processed taxon names with
database markers (in this case BA for bacterial) a number
of organisms within a taxon or its subtaxa and a number
of structures assigned to these organisms
As the lsquoR-projectrsquo dissimilarity matrix format was
chosen for the analysis dendrogram G reflecting the clus-
tering results is displayed together with additional options
Indash Regardless of the matrix format the analysis results
(excluding dendrograms) are stored on the CSDB server as
two files referenced by links H The first file (all job data)
contains a dump of the input parameters generated dis-
similarity matrix and coverage data on taxa The second
Database Vol 2015 Article ID bav073 Page 9 of 22
at Institute of Organic C
hemistry of the R
ussian Academ
y of Sciences on September 4 2015
httpdatabaseoxfordjournalsorgD
ownloaded from
Figure 8 Clustering result window
Page 10 of 22 Database Vol 2015 Article ID bav073
at Institute of Organic C
hemistry of the R
ussian Academ
y of Sciences on September 4 2015
httpdatabaseoxfordjournalsorgD
ownloaded from
file (in Figure 8 the distance matrix alone in the R format)
contains the dissimilarity matrix which can be later pro-
cessed in other software These files are stored for six
months
For R-formatted matrices additional options are avail-
able The clustering algorithm can be selected from drop-
down list I [in Figure 8 Wardrsquos minimum variance
method default is unweighted pair group method with
arithmetic mean (UPGMA) see the Experimental section
for details] Graph type selector J specifies the dendro-
gram type phylogram (rectangular stems) cladogram (tri-
angular stems) unrooted tree (as in Figure 8) or circular
tree The leaves (taxa) of the phenetic tree can be colored
according to the number of clusters specified by selector
(six in Figure 8) Depending on the selected clustering
method some types of dendrograms and the coloring fea-
ture may be disabled The lsquoRebuild dendrogramrsquo button
updates image G and exports the phenetic tree in the for-
mat specified by selector (allowed formats are lsquono ex-
portrsquo (default) Newick tree or Nexus tree) After the
export a link to the corresponding file appears below the
image
Estimation of CSDB content
The described statistical tools were employed to estimate
the CSDB coverage and content Figure 9 shows the CSDB
coverage in various domains phyla and most populated
classes At the moment CSDB contains 10 900 bacterial
structures from 5750 bacteria 4236 structures from 923
plants 636 structures from 327 fungi and 326 structures
from 118 archaeal algal or protista species published in
6100 papers (1941ndash2013) BCSDB currently provides con-
ditionally complete coverage on bacterial carbohydrate
structures The average time lag between the publication of
a structure and its deposition in CSDB is one year At the
moment PFCSDB provides complete coverage up to the
year 1997 and includes the plant and fungal data exported
from CarbBank (19) as well as data from selected publica-
tions up to 2009 (17)
Mono- and dimeric fragment distribution
The comparative analysis of mono- and disaccharide build-
ing blocks present in glycans from bacteria and mammals
was reported earlier (20) We conducted a similar analysis
of the bacterial carbohydrate content in comparison with
plant and fungal carbohydrates The lsquoFragment abun-
dancersquo tool was used for assessing the monomeric and di-
meric composition of all carbohydrate structures deposited
in CSDB according to taxonomic domains (bacteria ar-
chaea protista fungi and plantsthornalgae) The abundance
of monomers and dimers was normalized to the total num-
ber of structures from organisms belonging to the corres-
ponding domain thus giving the fragment frequency The
Figure 9 CSDB coverage by structures and organisms Absolute numbers of structuresorganisms are provided for every domainphylumclass The
inner diagram shows distribution of structures among domains split into lower ranks the outer ring shows distribution of organisms among do-
mains The following color code is used blue shades bacteria red shades fungi green shades plants orange archaea algae and protista
Database Vol 2015 Article ID bav073 Page 11 of 22
at Institute of Organic C
hemistry of the R
ussian Academ
y of Sciences on September 4 2015
httpdatabaseoxfordjournalsorgD
ownloaded from
monovalent residues such as methanol or acetic acid were
excluded from calculation due to their high frequency
non-carbohydrate nature and domain-unspecific
distribution
Figure 10 shows 30 most widespread monomeric resi-
dues typical for carbohydrate structures from organisms
belonging to the six domains present in BCSDB and
PFCSDB The distribution of monomers supports the
known fact that bacterial glycans are most diverse in their
monomeric composition (20) Such diversity allows bac-
teria to occupy numerous different niches and to survive
under the selection pressure induced by the host immune
system and competition (21 22) In bacterial glycans the
most widespread monomeric residues include the lipid A
alias L-glycero-D-manno-heptose and 3-deoxy-D-manno-
oct-2-ulosonic acid (Kdo) not found in other domains All
these monomers are present in the LPS of Gram-negative
bacteria (20 23) In Figure 10 Lipid A was removed from
consideration because it is an ambiguous compound and
includes both sugar and lipid parts
Figure 11 shows 30 most widespread dimers from
carbohydrate structures present in CSDB Dimeric frag-
ments unique for a taxonomic group can reflect peculiar-
ities of interactions of its organisms with the environment
realized by activities of group-specific GTs At the level of
domains top 10 dimers not present in glycans from any
other domain are given in Table 1 Although algae are in-
terpreted as a separate domain in CSDB currently there
are no disaccharides unique for this domain due to a lim-
ited number of algal structures deposited in the database
Dimers containing alditols at the reducing end were omit-
ted from the statistics because they mostly represent ana-
lytical artifacts
Plants are the known source of glycosides containing
various aglycons of triterpene steroid flavonoid or phen-
olic origin and possessing anti-cancer (24ndash26) and other
types of bioactivity Therefore we also analysed the
PFCSDB coverage on plant aglycons Figure 12 shows 17
most widespread dimeric fragments with non-sugar moi-
eties found in plant saccharides from PFCSDB Dimers
with amino acids at the reducing end were omitted from
the analysis because in most cases they present fragments
from protein glycosylation sites According to the statistics
three monosaccharide residues b-D-glucopyranosyluronic
acid b-D-glucopyranose and a-L-arabinopyranose form
linkages with non-sugar aglycons in plant glycosides most
often
More data rows for Figures 10ndash12 are available as
tables in the Supplementary Materials
Carbohydrate-based phylogenetics
Though as of 2014 the CAZy database contains the data on
almost 340 000 CAZy only 4 of them are characterized
biochemically and the gap between the number of putative
CAZy sequences and enzymes with established structure
and functions continues to grow (13) For example the
CAZy database includes almost 1800 GTs assigned to
Helicobacter pylori but only 17 of them are characterized
biochemically (see Supplementary Table S1) Supplementary
Table S2 contains disaccharide fragments from carbohy-
drates found in H pylori together with possible GTs syn-
thesizing these disaccharide fragments It is evident that
though the data on resolved carbohydrate structures and
predicted GTs mostly support each other there are disac-
charides for which no enzyme has yet been predicted (eg
mannosyl- rhamnosyl- or ribosyltransferases) as well as
Figure 10 Thirty most widespread monomeric residues in carbohydrate structures from major taxonomic groups Bubble area corresponds to aver-
aged monomer frequency in the domain (see text) varying from 97 (aDManp a-D-mannopyranose) to 012 (bDFruf b-D-fructofuranose) Amino
sugar residues include both acetylated and non-acetylated forms and are highlighted in lilac undetermined residues with unknown anomeric abso-
lute or ring size configuration are shaded
Page 12 of 22 Database Vol 2015 Article ID bav073
at Institute of Organic C
hemistry of the R
ussian Academ
y of Sciences on September 4 2015
httpdatabaseoxfordjournalsorgD
ownloaded from
predicted enzymes for which no product has yet been de-
tected (eg b-14-N-acetylgalactosaminyltransferases)
Therefore the decryption of the glycome code is far from
completion however bringing the enzymatic and carbohy-
drate ends together could promote the process Two organ-
isms possessing similar saccharides should possess enzymes
with similar activities and therefore studying the carbohy-
drate-based alliance between taxa may facilitate the investi-
gation of carbohydrate processing proteins with yet
unknown functions For instance Neisseria gonorrhoeae
and Neisseria meningitides two genetically close species
possess a similar set of disaccharides derived from their
carbohydrate structures and have GTs with similar pre-
dicted activities whereas Staphylococcus aureus differs
from the Neisseria species both in disaccharides and pre-
dicted activities of GTs (Supplementary Table S3) These
considerations urged us to develop the lsquoTaxon clusteringrsquo
tool on the CSDB platform In 93 of structures present in
Figure 11 Thirty most widespread dimers in carbohydrate structures from major taxonomic groups Bubble area corresponds to disaccharide fre-
quency in the domain (see text) varying from 315 (aDManp(1-2)aDManp) to 009 (aDGlcp(1-3)aDGlcp) Dimers containing amino sugars which in-
clude both acetylated and non-acetylated forms are highlighted in lilac dimers containing undetermined residues with unknown anomeric or ring
size configuration are shaded
Table 1 Top 10 unique dimeric fragments found in each domains of life present in CSDB in abundance descending order
Bacteria aLDmanHepp(1-3)aLDmanHepp bDGlcp(1-4)aLDmanHepp aLDmanHepp(1-5)aKdop aKdop(2-4)aKdop
aLDmanHepp(1-7)aLDmanHepp bDGlcpN(1-6)aDGlcpN P-6)aLDmanHepp bDGlcpN(1-3)bDGalp
aKdop(2-6)bDGlcpN P-4)bDGlcpN
Archaea S-6)aDManp S-2)aDManp bDManpNA(1-4)bDGlcpN3NA bDGlcpN3NA(1-3)bDGlcpN
bDGlcpN3NA(1-4)aDGlcpN3NA bDGlcpN3NA(1-3)bDGalpN P-1)dolichol C55-60
bDS6Fucp(1-4)bDGlcp aDDgalHepp(1-2)bDS6Fucp aDManp(1-3)bDS6Fucp
Protista aDGlcpN(1-6)phosphatidylinositol bDXylp(1-2)aDManp bDXylp(1-4)aDManp Aep(1-P aDArap(1-2)bDGalp
aDGlcpA(1-2)bDGalf P-1)Dce bDArap(1-2)bDGalp bDManp(1-2)DManp aDGalf(1-2)aDManp
Fungi bDXylp(1-2)aDManp bDXylp(1-4)aDManp aDGlcpA(1-2)bDGalf bDGalf(1-2)aDManp aDGalf(1-2)aDManp
bDXylp(1-6)aDManp bDXylp(1-3)aDManp aDGalf(1-6)aDManp aDManp(1-1)2-(4-trifluoroacetamido-phenyl)etha-
nol aDManp(1-2)bDXylp
Plants aDXylp(1-6)bDGlcp aLRhap(1-2)bDGlcp aLRhap(1-2)aLArap bDGalp(1-2)aDXylp bDXylp(1-2)bDManp
bDGlcp(1-3)diosgenin bDGlcp(1-3)aLArap aLRhap(1-2)bDFucp Me(1-3)bDDigp aLAraf(1-2)bDXylp
Database Vol 2015 Article ID bav073 Page 13 of 22
at Institute of Organic C
hemistry of the R
ussian Academ
y of Sciences on September 4 2015
httpdatabaseoxfordjournalsorgD
ownloaded from
CSDB all glycosidic linkages are fully determined (regard-
ing monosaccharides their three configurations and linkage
positions) with the exception of anomeric and ring size con-
figurations of mutarotating residues at reducing ends This
coverage allows statistically credible calculations based on
disaccharide fragments
We selected dimeric fragments for characterization of
glycome because the monomeric composition does not re-
flect the information on GTs whereas the composition of
fragments larger than dimers does not add valuable data to
that obtained from the dimeric composition Clustering of
most populated genera using the similarities in carbohy-
drate-containing dimers resulted in a phenetic tree com-
posed of three big clusters bacteria plants and mixed taxa
from plants fungi and protista (Figure 13)
When gathering this statistics we used the following fil-
ters to cover 37 most studied genera and 118 most wide-
spread fragments
- taxon rankfrac14 genus
- taxonomic scopefrac14 all biota (no restrictions applied)
- minimal number of carbohydrate structures assigned to
organisms belonging to a genusfrac14 12 of total struc-
tures in the corresponding database (130 structures for
the bacterial database and 65 structures for the plant
and fungal database)
- structure typefrac14 any (no restrictions on the molecule part
polymeric or oligomeric)
- population of a fragment in the database to consider it
statistically present in biotafrac14 at least 120 fragment in-
stances in at least 100 structures
- fragment sizefrac14 two residues (dimeric fragments)
- comprising residue filters anomeric forms were not com-
bined residues with missing configurations were
excluded monovalent residues were included super-
classes and aliases were excluded aglycons were
included
- minimal occurrence of a fragment in a taxon to be quali-
fied as presentfrac142 instances
The Wardrsquos minimum variance method (27) was used
for clustering Lengths of branches connected to leaves
were ignored for visual clarity The details on building the
dissimilarity matrix and phenetic tree are provided further
in the text (see discussion of bacterial species clustering)
Most of the clades roughly matched the taxonomic lin-
eages of organisms Particularly most enterobacteria ap-
peared in a single cluster and the genera most genetically or
antigenically close to each other (Escherichia Shigella and
Salmonella) (28ndash31) occupied a small clade with short branch
lengths Although Burkholderia and Pseudomonas belong to
different classes they tend to co-colonize hosts (32) and
many strains of the former were reclassified to the latter
based on genotyping (33ndash35) This may explain the resem-
blance of glycomes of these genera as deposited in the data-
base and their clustering in a small clade The co-clustered
Bacillus and Streptococcus are the only strictly Gram-positive
bacterial genera among those analysed (Mycobacteria do not
display the empirical Gram-reaction and are classified as
Gram-positive due to the absence of the outer membrane)
Phylogenetic relationship between Leishmania and fungal
genera may be explained by shared structural features in gly-
colipids from organisms of these taxonomic groups (36) It is
not possible to draw any reasonable conclusions from the
Figure 12 Seventeen most widespread dimeric fragments containing non-sugar moieties in plant saccharides Numbers are absolute abundance in
plant structures
Page 14 of 22 Database Vol 2015 Article ID bav073
at Institute of Organic C
hemistry of the R
ussian Academ
y of Sciences on September 4 2015
httpdatabaseoxfordjournalsorgD
ownloaded from
carbohydrate-based grouping of fungal and plant saccharide
structures because the CSDB coverage on the organisms from
these domains is incomplete Thus at the moment we can
only make preliminary observations eg that the fungal gen-
era Aspergillus Candida and Saccharomyces are clustered to-
gether with the plant genera Solanum Acer Nicotiana and
Glycine since according to the CSDB content their carbohy-
drate structures are rich in mannodisaccharides
Due to heterogeneity of species within genera and to
look more thoroughly into the possibilities of grouping
taxa by their carbohydrate content we applied clustering
at the level of species and then compared it to a canonical
small ribosomal subunit RNA-based phylogenetic tree fol-
lowing an example of Aguilar and colleagues who analysed
phenetic trees based on metabolic properties for several or-
ganisms from three domains (37)
For this purpose we used data from the bacterial
part of BCSDB due to its completeness to avoid an annota-
tion-induced bias Thirty-three bacterial species were se-
lected by their population in the database (at least 20
structures assigned to a taxon or its subtaxa) Some bacter-
ial species are studied significantly more thoroughly
than others therefore their structures in the database con-
tain more rarely occurring fragments This leads to longer
distances between these and other species in dissimilarity
matrices To avoid such population-induced bias we
normalized the distances by the number of structures
assigned to the organisms belonging to two species
being compared Another factor diminishing this bias is
the fragment presence threshold which determines
how populated a fragment should be within a taxon to be
included in its glycoprofile and to produce a positive mark in
the occurrence code Setting this threshold higher than 1 re-
duces the effect of analytical artifacts and atypical fragments
We prepared matrices which reflect the dissimilarity of
taxa by using the reported online tool on the content of
CSDB The underlying algorithm is summarized in
Figure 14 At first the fragment and taxon pools were pre-
pared according to the user input The filters and thresh-
olds that affect population of these pools are described in
the lsquoTaxon clusteringrsquo section
To select taxa we specified the explicit list of species
This list was obtained by manual curation of the available
ribosomal RNA (rRNA) data (see below) for the species
pre-selected with the following parameters
- taxon rankfrac14 species
- taxonomic scopefrac14 all biota (no restrictions applied)
- minimal number of carbohydrate structures assigned to
organisms belonging to a speciesfrac14 20
Figure 13 Glycome-based clustering of most studied genera Shades of blue represent various bacterial taxonomic groups shades of green repre-
sent plant groups red and orange represent fungi and protista domains respectively The outer arc for bacteria is colored according to the Gram-
reaction Size of the circles reflects the normalized popularity of a given genus in CSDB in terms of assigned organisms (green) and assigned struc-
tures (blue) When a blue circle is not visible it is the same size as a green one Color of labels denotes the database from which the data came
Database Vol 2015 Article ID bav073 Page 15 of 22
at Institute of Organic C
hemistry of the R
ussian Academ
y of Sciences on September 4 2015
httpdatabaseoxfordjournalsorgD
ownloaded from
To select fragments we used the following filters
- structure typefrac14 any (no limitation on the molecule part
polymeric or oligomeric)
- population of a fragment in the database to consider it
statistically present in biotafrac14 at least 120 fragment in-
stances in at least 100 structures lowering these thresh-
olds leads to inclusion of non-representative fragments
and analytical artifacts while making them higher leads
to loss of taxon-specific fragments which are the cluster-
ing basis
- fragment sizefrac14 two residues (dimeric fragments)
- comprising residue filters anomeric forms were not com-
bined residues with missing configurations were
excluded monovalent residues were included aglycons
and aliases were included and differentiated
118 fragments from the fragment pool were checked for
presence in the structures assigned to organisms belonging
to 33 taxa from the taxon pool The fragment was con-
sidered present in a taxon if its abundance in structures
from this taxon was equal to or exceeded 2 (filter
lsquoFragment presence thresholdrsquo) The fragment presence
was encoded as a binary string (occurrence code) specific
for every taxon These disaccharide composition phylogen-
etic profiles were obtained similarly to protein function
phylogenetic profiles reported by Pellegrini et al (38)
every fragment matched a certain bit position in the string
for present fragments the corresponding bits were set to 1
for absent fragmentsmdashcleared to 0
The occurrence codes were treated similarly to the work
by Aguilar and colleagues (37) The taxa were compared
pairwise using the Hamming distance between the frag-
ment occurrence codes to give a symmetrical distance ma-
trix The Hamming distance between two bit strings is a
number of bit inversions required to convert one string to
the other (18) it is a standard method to evaluate
dissimilarity
Every cell in the dissimilarity matrix was normalized
by the total number of structures assigned to both taxa
matching this cell to avoid the study-induced bias (see
above) and the whole matrix was normalized to a max-
imal distance 100 for compatibility with other clustering
software
The normalized dissimilarity matrix reflecting the disac-
charide composition of taxa was imported into the R envir-
onment (39) to be analysed by most common clustering
algorithms for distance data We built carbohydrate-based
phenetic trees from the distance matrix by seven clustering
algorithms hierarchical agglomerative complete linkage
clustering UPGMA (40) Wardrsquos minimum variance
method (27) classical (41) and improved [biological neigh-
bor joining (BIONJ)] (42) neighbor joining (NJ) ordinary
least-squares and balanced minimum evolution (43) Other
clustering algorithms were not applied due to their poor
applicability to biological phylogenetics (agglomerative
hierarchical clustering with other types of linkage inter-
pretation) or dedication to handling incomplete distance
matrices (minimum variance reduction) (44 45) Figure 15
represents circular phenetic trees obtained by three repre-
sentative clustering methods together with cumulative
data on the BCSDB coverage related to the examined spe-
cies (Figure15A)
Figure 14 Flow chart of data processing in the reported online tool
Page 16 of 22 Database Vol 2015 Article ID bav073
at Institute of Organic C
hemistry of the R
ussian Academ
y of Sciences on September 4 2015
httpdatabaseoxfordjournalsorgD
ownloaded from
The default method for the web interface is hierarchical
average linkage clustering (UPGMA) (40) This algorithm
analyses the structure of a pairwise dissimilarity matrix
and constructs a rooted ultrametric tree At each step
the two nearest clusters are combined into a higher-level
cluster based on the average distance between elements
of each cluster UPGMA was reported to produce ad-
equate results for genome-based clustering of bacteria
on the subspecies level (46) The main disadvantage
of UPGMA is the lsquomolecular clockrsquo assumption which pre-
supposes a constant rate of changes in all lineages This
assumption may be useful for genetic studies (47 48)
but not for phenetic trees based on differences in carbohy-
drate structures the occurrence rates of which are unlikely
to be constant
Alternative approach to hierarchical clustering is the
Wardrsquos method in which the choice of clusters to be
merged is based on the least possible increase in the overall
within-cluster variance This method is particularly effi-
cient if the data set includes no major outliers (49) In
2014 the Wardrsquos minimum variance method was reported
in regard to functional classification of phytoplankton spe-
cies (50)
The NJ algorithm is free from lsquomolecular clockrsquo restric-
tions and is widely accepted as a standard method for dis-
tance data clustering in biology (41) It is a bottom-up
clustering method which is usually used to construct trees
based on DNA sequence data Its improved version
BIONJ chooses the reduction which minimizes the vari-
ance of a new distance matrix at each step of matrix reduc-
tion allowing better estimations for selection of the pair
of taxa to be agglomerated during the next steps (42)
The ability of both UPGMA and NJ methods to
differentiate various taxa depends on the underlying struc-
ture of the data used to construct the dissimilarity matrix
(46 51)
The main disadvantage of the NJ methods is their abil-
ity to produce branches with negative lengths which leads
to occasional failure to find an optimal tree A more recent
minimum evolution method (43) was employed to over-
come these drawbacks This method is based on the as-
sumption that the correct tree is the one that exhibits the
minimal total amount of evolution However it has to be
mentioned that it still produced negative branch lengths in
some of our examples In the balanced weighting minimum
evolution scheme sibling subtrees have equal weights as
opposed to the standard lsquounweightedrsquo ordinary least
squares scheme where all taxa have the same weight so
that the weight of a subtree is equal to the number of its
taxa
Overall in our experience the methods produce
similar but not identical trees which differ in relative
positioning of more distant clusters while consistently
identify the same pairs of taxa as the most closely related
(Figure 15)
We compared the trees obtained by each method to a
canonical phylogenetic tree based on small ribosomal
subunit rRNA homology for the selected 33 bacterial spe-
cies (Figure 16 for SILVA numbers of the rRNA se-
quences and sequences themselves in the FASTA format
see the Supplementary materials) The mean topological
score between internal branches under the one-to-one
mapping of the trees was used as a similarity metrics It
was produced by pairwise mapping and topological scor-
ing of branches as described (52) We did not apply
sophisticated comparison methods because this article
presents tools for gathering and visualization of statistical
data while their interpretation requires special biochem-
ical and microbiological experience and is beyond its
scope The similarity between the RNA-based tree and
carbohydrate-based trees clustered by various methods
was 53 (complete linkage) 52 (UPGMA) 57
(Ward) 59 (NJ) 51 (BIONJ) 44 (balanced min-
imum evolution) and 46 [ordinary least squares (OLS)
minimum evolution] Filtering the fragment pool to
purely carbohydrate fragments (disaccharides) introduced
only minor changes to these values
It can be seen that the carbohydrate trees partially
agree with the rRNA one The phyla Firmicutes and
Actinobacteria are clustered together with the exception
of Streptococcus pneumonia whose carbohydrate con-
tent resembles that of Shigella Both rRNA and carbohy-
drate sequences converge Escherichia coli to Shigella
whereas species from Pseudomonas as well as from
Proteus are close to each other both by rRNA and gly-
cans The phylogeny of species constructed by using the
Wardrsquos criterion is most close to that of genera and to
existing knowledge on bacterial taxa localization in the
tree of life
The similarity between the two types of the tree of life is
expected as the repertoire of carbohydrate structures in an
organism is defined by its CAZy It was demonstrated that
genome-based and rRNA-based phylogenetic trees correl-
ate well with each other (37 53) and differences in CAZy
genes reflect the differences in the whole genomesmdashbut
only to some degree During evolution the selection pres-
sure differently affects different genes and therefore their
products and two organisms that differ significantly in the
genome content may possess similar phenotypic features
(54 55)
Thus the difference observed between the
carbohydrate-based and rRNA-based trees may reflect
the fact that carbohydrates are the main bacterial instru-
ment for interacting with the environment (11) and
Database Vol 2015 Article ID bav073 Page 17 of 22
at Institute of Organic C
hemistry of the R
ussian Academ
y of Sciences on September 4 2015
httpdatabaseoxfordjournalsorgD
ownloaded from
expression of certain carbohydrate structures may
correspond to certain habitatactivities For example
Neisseria gonorrheae and Haemophilus ducreyi which are
not very close in the rRNA-based tree of life but evidently
possess similar glycans both inhabit the urogenital track
of humans where they cause sexually transmitted diseases
(56 57) and therefore meet similar challenges Because
the exact mechanisms of bacterial pathogenesis in most
Figure 15 Circular phenetic trees based on dimers (containing monosaccharides aliases aglycons monovalent residues) present in compounds
from bacterial species most populated in BCSDB Firmicutes are shown in red Actinobacteria in green Enterobacteria in cyan and other
Proteobacteria in violet Three dendrograms correspond to different clustering methods NJ (A) Wardrsquos minimal variance (B) and balanced minimum
evolution (C) Blue and green circles in (A) depict the normalized number of structures and organisms assigned to each species correspondingly
When a blue circle is invisible it is the same size as a green one Gray color code in the outer rim (A) reflects the Gram-reaction The underlying num-
bers and trees are available in Supplementary materials
Page 18 of 22 Database Vol 2015 Article ID bav073
at Institute of Organic C
hemistry of the R
ussian Academ
y of Sciences on September 4 2015
httpdatabaseoxfordjournalsorgD
ownloaded from
cases are not understood at the molecular level such prox-
imity of species in the carbohydrate phenetic tree suggests
the similarity of the ways of their action and allows pro-
posing directions for future experimental study Thus the
carbohydrate-based phenetic trees may demonstrate simi-
larity and differences in both pathogenic and CAZy
activities
Conclusions
In this article we describe three new CSDB instruments
lsquoFragment abundancersquo lsquoCoverage statisticsrsquo and lsquoTaxon
clusteringrsquo These tools are dedicated to statistical analysis
of the carbohydrate content in different taxonomic groups
as well as to studying carbohydrate-based relationships be-
tween bacteria fungi and plants We suppose this
information may be useful for eliminating the gap between
the accumulated structural and biochemical data on carbo-
hydrate-processing enzymes We do not draw any far-reach-
ing conclusions from the obtained carbohydrate data
because it requires a thorough analysis by specialists in the
field of bacterial pathogenesis Still we have no doubts that
in the future these instruments would be fruitfully used by
glycoscientists and bacteriologists
Experimental
Programming
Presented tools were implemented as web-services on the
CSDB platform using the PHP 54 programming language
MySQL 55 database engine and DHTMLJavascript for
Figure 16 Phylogenetic tree based on small ribosomal subunit rRNA sequences Firmicutes are shown in red Actinobacteria in green Enterobacteria
in cyan and other Proteobacteria in violet The underlying data are available in the Supplementary materials
Database Vol 2015 Article ID bav073 Page 19 of 22
at Institute of Organic C
hemistry of the R
ussian Academ
y of Sciences on September 4 2015
httpdatabaseoxfordjournalsorgD
ownloaded from
web-pages The tools were tested in modern versions of
Mozilla Firefox Google Chrome and Microsoft Internet
Explorer The online help is available in the lsquoStatistical
toolsrsquo section of the CSDB help httpcsdbglycoscience
rubacterialcorehelpphptopicfrac14stat
Estimation of CSDB coverage
Data were exported as tab-separated values from the web-
interface of the presented tools were joined for BCSDB
and PFCSDB using a dedicated script in PHP 54 and were
processed and visualized in Microsoft Excel 2010
rRNA phylogenetic tree
Small subunit rRNA sequences were obtained from the
SILVA database (httpwwwarb-silvade release 119)
(58) The corresponding accession numbers are listed in
the Supplementary materials Phylogeny analysis was per-
formed at Phylogenyfr (httpphylogenylirmmfr) (59) in
the lsquoOne-Clickrsquo mode with default options implying
BIONJ clustering method the resulting tree was exported
in the Newick format and processed with the iTOL online
software (60)
Clustering and building dendrograms
Dissimilarity matrices were imported into the R environ-
ment (39) and analysed by multiple clustering algorithms
The hierarchical clustering was implemented via the built-
in hclust function in R [using UPGMA (40) complete link-
age (40) or wardD2 methods (27)] The NJ and minimum
evolution methods utilized the BIONJ (42) and balanced
fastME (43) functions correspondingly as implemented in
the Analyses of Phylogenetics and Evolution (ape) library
(61) for R The data were visualized online and were ex-
ported using built-in functionality provided in ape Tree
comparison was carried out using the approach of Nye and
coworkers (52) as implemented in the Compare2Trees tool
(httpwwwmasnclacukntmwncompare2treesindex
html) after conversion to the Newick format Complex
dendrograms were built using the iTOL service (60 62) on
distance matrices exported online in the Nexus format and
other supplementary data generated online The trees were
presented as rooted to avoid label overlap the terminal
branch lengths were ignored on plots for visual clarity
Unrooted trees and trees with variable terminal branch
lengths can be easily restored from the source data (see the
Supplementary Materials)
Abbreviations
Residue names
Aep 2-amino-ethylphosphonic acid
aDArap a-D-arabinopyranose
aDDgalHepp D-glycero-a-D-galacto-heptopyranose
aDGalf bDGalf D-galactofuranose (a- and b-anomers)
aDGalp bDGalp D-galactopyranose (a- and b-anomers)
aDGlcp bDGlcp D-glucopyranose (a- and b-anomers)
aDGlcpA bDGlcpA D-glucopyranosyluronic acid (a- and
b-anomers)
aDGlcpN bDGlcpN 2-deoxy-2-amino-D-glucopyranose
(a- and b-anomers alone or within N-acetylated
fragment)
aDGlcpN3NA bDGlcpN3NA 23-dideoxy-23-diamino-
D-glucopyranosuronic acid (a- and b-anomers)
aDManp bDManp D-mannopyranose (a- and b-
anomers)
aDXylp bDXylp D-xylopyranose (a- and b-anomers)
aKdop 3-deoxy-a-D-mannopyranosyl-oct-2-ulosonic acid
aLArap a-L-arabinopyranose
aLAraf a-L-arabinofuranose
aLDmanHepp L-glycero-a-D-manno-heptopyranose
aLFucp 6-deoxy-a-L-galactopyranose
aLRhap 6-deoxy-a-L-mannopyranose
bDDigp 26-dideoxy-b-D-ribo-hexopyranose
bDFruf b-D-fructofuranose
bDFucp 6-deoxy-b-D-galactopyranose
bDManpNA 2-deoxy-2-amino-b-D-mannopyranosuronic
acid
bDS6Fucp 6-deoxy-6-sulpho-b-D-galactopyranose
Dce cis-decenoic acid
DGlcN D-glucosamine with unknown anomeric and ring
size configurations
DMan D-mannose with unknown anomeric and ring size
configurations
DManp D-mannopyranose with unknown anomeric
configuration
EtN 2-aminoethanol
Gro glycerol with unknown absolute configuration
P phosphoric acid
S sulfuric acid
Funding
This work and open-access publication was supported by Russian
Science Foundation (RSF grant 14-50-00126)
Supplementary Data
Supplementary data are available at Database Online
Conflict of interest None declared
Page 20 of 22 Database Vol 2015 Article ID bav073
at Institute of Organic C
hemistry of the R
ussian Academ
y of Sciences on September 4 2015
httpdatabaseoxfordjournalsorgD
ownloaded from
References
1 van HeijenoortJ (2001) Formation of the glycan chains in the
synthesis of bacterial peptidoglycan Glycobiology 11 25Rndash
36R
2 KochAL (2003) Bacterial wall as target for attack past pre-
sent and future research Clin Microbiol Rev 16 673ndash687
3 LatgeJP (2007) The cell wall a carbohydrate armour for the
fungal cell Mol Microbiol 66 279ndash290
4 SelvendranRR and OrsquoNeillMA (1987) Isolation and
Analysis of Cell Walls from Plant Material John Wiley amp Sons
Inc Hoboken NJ
5 BakerJL CelikE and DeLisaMP (2013) Expanding the gly-
coengineering toolbox the rise of bacterial N-linked protein gly-
cosylation Trends Biotechnol 31 313ndash323
6 CobbBA and KasperDL (2005) Coming of age carbohy-
drates and immunity Eur J Immunol 35 352ndash356
7 FreireT and OsinagaE (2012) The sweet side of tumor im-
munotherapy Immunotherapy 4 719ndash734
8 SnapperCM (2012) Mechanisms underlying in vivo polysac-
charide-specific immunoglobulin responses to intact extracellu-
lar bacteria Ann N Y Acad Sci 1253 92ndash101
9 JonesC (2005) Vaccines based on the cell surface carbohydrates
of pathogenic bacteria An Acad Bras Cienc 77 293ndash324
10 KluttsJS YonedaA ReillyMC et al (2006)
Glycosyltransferases and their products cryptococcal variations
on fungal themes FEMS Yeast Res 6 499ndash512
11 SukhithasriV NishaN BiswasL et al (2013) Innate immune
recognition of microbial cell wall components and microbial strat-
egies to evade such recognitions Microbiol Res 168 396ndash406
12 CantarelBL CoutinhoPM RancurelC et al (2009) The
Carbohydrate-Active EnZymes database (CAZy) an expert re-
source for glycogenomics Nucleic Acids Res 37 D233ndashD238
13 LombardV Golaconda RamuluH DrulaE et al (2014) The
carbohydrate-active enzymes database (CAZy) in 2013 Nucleic
Acids Res 42 D490ndashD495
14 LiuB KnirelYA FengL et al (2008) Structure and genetics
of Shigella O antigens FEMS Microbiol Rev 32 627ndash653
15 OsmaniSA BakS and MollerBL (2009) Substrate specificity
of plant UDP-dependent glycosyltransferases predicted from
crystal structures and homology modeling Phytochemistry 70
325ndash347
16 ToukachPV and EgorovaKS (2015) Bacterial plant and fun-
gal Carbohydrate Structure Databases daily usage In Lutteke
T and Frank M (eds) Glycoinformatics Springer New York
pp 55ndash85
17 EgorovaKS and ToukachPV (2014) Expansion of coverage
of Carbohydrate Structure Database (CSDB) Carbohydr Res
389 112ndash114
18 HammingRW (1950) Error detecting and error correcting
codes Bell Syst Tech J 29 147ndash160
19 DoubetS BockK SmithD et al (1989) The complex
Carbohydrate Structure Database Trends Biochem Sci 14
475ndash477
20 HergetS ToukachPV RanzingerR et al (2008) Statistical
analysis of the Bacterial Carbohydrate Structure Data Base
(BCSDB) characteristics and diversity of bacterial carbohydrates
in comparison with mammalian glycans BMC Struct Biol 8
35ndash54
21 ReevesPR (1992) Variation in O-antigens niche-specific selec-
tion and bacterial populations FEMS Microbiol Lett 100
509ndash516
22 ReevesPP and WangL (2002) Genomic organization of LPS-
specific loci Curr Top Microbiol Immunol 264 109ndash135
23 RaetzCR ReynoldsCM TrentMS et al (2007) Lipid A
modification systems in gram-negative bacteria Annu Rev
Biochem 76 295ndash329
24 de CostaF YendoAC FleckJD et al (2011)
Immunoadjuvant and anti-inflammatory plant saponins charac-
teristics and biotechnological approaches towards sustainable
production Mini-Rev Med Chem 11 857ndash880
25 TianX TangH LinH et al (2013) Saponins the potential
chemotherapeutic agents in pursuing new anti-glioblastoma
drugs Mini-Rev Med Chem 13 1709ndash1724
26 ChenH GaoY WuJ et al (2014) Exploring therapeutic po-
tentials of baicalin and its aglycone baicalein for hematological
malignancies Cancer Lett 354 5ndash11
27 MurtaghF and LegendreP (2014) Wardrsquos hierarchical agglom-
erative clustering method which algorithms implement Wardrsquos
criterion J Classif 31 274ndash295
28 JohnstonJH JohnstonRJ and SimmonsDA (1967) The
immunochemistry of Shigella flexneri O-antigens The biochemical
basis of smooth to rough mutation Biochem J 105 79ndash87
29 JesudasonM SridharanG and JohnTJ (1991) Antigen shar-
ing of Salmonella typhi non-flagellar proteins with other
Salmonellae and some Shigellae and Escherichia coli Indian
J Exp Biol 29 338ndash341
30 PupoGM LanR and ReevesPR (2000) Multiple independ-
ent origins of Shigella clones of Escherichia coli and convergent
evolution of many of their characteristics Proc Natl Acad Sci
U S A 97 10567ndash10572
31 Muller-LoenniesS BradeL and BradeH (2007) Neutralizing
and cross-reactive antibodies against enterobacterial lipopoly-
saccharide Int J Med Microbiol 297 321ndash340
32 TomlinKL CollOP and CeriH (2001) Interspecies biofilms
of Pseudomonas aeruginosa and Burkholderia cepacia Can
J Microbiol 47 949ndash954
33 ViallardV PoirierI CournoyerB et al (1998) Burkholderia
graminis sp nov a rhizospheric Burkholderia species and re-
assessment of [Pseudomonas] phenazinium [Pseudomonas] pyr-
rocinia and [Pseudomonas] glathei as Burkholderia Int J Syst
Bacteriol 48 549ndash563
34 QuyenDT Schmidt-DannertC and SchmidRD (1999)
High-level formation of active Pseudomonas cepacia lipase after
heterologous expression of the encoding gene and its modified
chaperone in Escherichia coli and rapid in vitro refolding Appl
Environ Microbiol 65 787ndash794
35 MoissenetD BingenE ArletG et al (2005) [Use of 16S
rRNA gene sequencing for identification of ldquoPseudomonas-likerdquo
isolates from sputum of patients with cystic fibrosis] Pathol
Biol 53 500ndash502
36 TakahashiHK ToledoMS SuzukiE et al (2009) Current
relevance of fungal and trypanosomatid glycolipids and sphingo-
lipids studies defining structures conspicuously absent in mam-
mals An Acad Bras Cienc 81 477ndash488
37 AguilarD AvilesFX QuerolE et al (2004) Analysis of phe-
netic trees based on metabolic capabilites across the three do-
mains of life J Mol Biol 340 491ndash512
Database Vol 2015 Article ID bav073 Page 21 of 22
at Institute of Organic C
hemistry of the R
ussian Academ
y of Sciences on September 4 2015
httpdatabaseoxfordjournalsorgD
ownloaded from
38 PellegriniM MarcotteEM ThompsonMJ et al (1999)
Assigning protein functions by comparative genome analysis
protein phylogenetic profiles Proc Natl Acad Sci U S A 96
4285ndash4288
39 IhakaR and GentlemanR (1996) R a language for data ana-
lysis and graphics J Comput Graph Stat 5 299ndash314
40 MurtaghF (1984) Complexities of hierarchic clustering algo-
rithms the state of the art Comput Stat Quarter 1 101ndash113
41 SaitouN and NeiM (1987) The neighbor-joining method a
new method for reconstructing phylogenetic trees Mol Biol
Evol 4 406ndash425
42 GascuelO (1997) BIONJ an improved version of the NJ algo-
rithm based on a simple model of sequence data Mol Biol
Evol 14 685ndash695
43 DesperR and GascuelO (2002) Fast and accurate phylogeny
reconstruction algorithms based on the minimum-evolution
principle J Comput Biol 9 687ndash705
44 CriscuoloA and GascuelO (2008) Fast NJ-like algorithms to
deal with incomplete distance matrices BMC Bioinformatics 9
166ndash181
45 GascuelO (2000) Data model and classification by trees
the minimum variance reduction (MVR) method J Classif 17
67ndash99
46 HirayamaJ TazumiA HayashiK et al (2011) A phylogen-
etic comparison of urease-positive thermophilic Campylobacter
(UPTC) and urease-negative (UN) C lari J Basic Microbiol
51 269ndash278
47 DrummondA and RodrigoAG (2000) Reconstructing
genealogies of serial samples under the assumption of a mo-
lecular clock using serial-sample UPGMA Mol Biol Evol
17 1807ndash1815
48 Hong-WenD and Yun-XinF (2000) Counting mutations by
parsimony and estimation of mutation rate variation across nu-
cleotide sitesmdasha simulation study Math Comput Model 32
83ndash95
49 MooiE and SarstedtM (2010) Cluster Analysis A
Concise Guide to Market Research Springer Berlin Heidelberg
pp 237ndash284
50 SalmasoN Naselli-FloresL and PadisakJ (2015) Functional
classifications and their application in phytoplankton ecology
Freshwater Biol 60 603ndash619
51 Gonzalez-FernandezJ RoderoM DaschnerA et al (2014)
New insights into the allergenicity of tropomyosin a bioinfor-
matics approach Mol Biol Rep 41 6509ndash6517
52 NyeTM LioP and GilksWR (2006) A novel algorithm and
web-based tool for comparing two alternative phylogenetic trees
Bioinformatics 22 117ndash119
53 SnelB BorkP and HuynenMA (1999) Genome phylogeny
based on gene content Nat Genet 21 108ndash110
54 WittenbergJB (2007) On optima the case of myoglobin-facili-
tated oxygen diffusion Gene 398 156ndash161
55 ThakurS NormandP DaubinV et al (2013) Contrasted
evolutionary constraints on secreted and non-secreted proteomes of
selected Actinobacteria BMC Genomics 14 474ndash488
56 AndersonMT and SeifertHS (2011) Opportunity and means
horizontal gene transfer from the human host to a bacterial
pathogen mBio 2 e00005ndashe00011
57 LagergardT BolinI and LindholmL (2011) On the
evolution of the sexually transmitted bacteria Haemophilus
ducreyi and Klebsiella granulomatis Ann N Y Acad Sci
1230 E1ndashE10
58 QuastC PruesseE YilmazP et al (2013) The SILVA
ribosomal RNA gene database project improved data processing
and web-based tools Nucleic Acids Res 41 D590ndashD596
59 DereeperA GuignonV BlancG et al (2008) Phylogenyfr
robust phylogenetic analysis for the non-specialist Nucleic
Acids Res 36 W465ndashW469
60 LetunicI and BorkP (2011) Interactive Tree of Life v2 online
annotation and display of phylogenetic trees made easy Nucleic
Acids Res 39 W475ndashW478
61 ParadisE ClaudeJ and StrimmerK (2004) APE Analyses of
Phylogenetics and Evolution in R language Bioinformatics 20
289ndash290
62 LetunicI and BorkP (2007) Interactive Tree Of Life (iTOL) an
online tool for phylogenetic tree display and annotation
Bioinformatics 23 127ndash128
Page 22 of 22 Database Vol 2015 Article ID bav073
at Institute of Organic C
hemistry of the R
ussian Academ
y of Sciences on September 4 2015
httpdatabaseoxfordjournalsorgD
ownloaded from

well as cell-cell contacts and adhesion (5) Now we know
that bacterial and fungal carbohydrates which are per se
weakly immunogenic as a part of glycoproteins or lipo-
polysaccharides (LPSs) can trigger a carbohydrate-specific
T cell immune reaction resulting in antibody production
and immunological memory development (6ndash8) Diverse
carbohydrates allow pathogenic microorganisms to find
ways to bypass the immune response of a host organism
Thus many infectious bacteria and viruses expose carbo-
hydrates on their surface and the structure of these carbo-
hydrates resembles closely that one of the molecules
which are present in surface glycoproteins and glycolipids
of host cells (6)
Carbohydrates of numerous pathogenic bacteria attract
attention as candidates for vaccines (9) Bacterial cell sur-
face capsular polysaccharides and LPSs can be utilized as
antigens for obtaining antibodies against the correspond-
ing infection and glycoconjugate vaccines seem to be ef-
fective in developing protective immune reactions When
N- and O-glycosylation of bacterial proteins was dis-
covered new perspectives in biotechnology have opened
(5) Therefore genetic and proteomic information on en-
zymatic apparatus involved in the synthesis of bacterial
carbohydrates and glycoconjugates is of particular
importance
Bacteria are not the only organisms whose carbohydrate
structures present interest for fundamental science and
medicine In fungi glycoproteins and glycolipids show di-
versity and complexity For example Cryptococcus neofor-
mans surrounds its cell wall with a polysaccharide capsule
that defines its virulence (10) Pathogenic fungi possess gly-
cosyltransferases (GTs) missing from humans and there-
fore presenting potential pharmaceutical targets that allow
avoiding host toxicity typical for many antifungal
substances
Cell walls of bacteria and fungi are known to be dy-
namic structures which provide both protection from and
interaction with the environment Cell walls of pathogenic
and commensal microorganisms are recognized by host re-
ceptors such as nucleotide oligomerization domain pro-
teins peptidoglycan recognition proteins Toll-like
receptors and C-type lectin receptors which in turn medi-
ate the organism reaction to the invasion (11) In order to
escape the host immune response microorganisms use sev-
eral tricks by modifying their cell walls (11) Thus the suc-
cess and survival of these bacteria and fungi depend on
their ability to synthesize particular carbohydrate-contain-
ing structures There is a whole complex of enzymes called
carbohydrate-active enzymes (CAZy) which mediate syn-
thesis assembly and processing of carbohydrate-containing
compounds The CAZy database combines numerous fami-
lies of glycoside hydrolases GTs polysaccharide lyases
and carbohydrate esterases as well as carbohydrate-bind-
ing modules (12 13) Outer carbohydrates are one of the
most variable characteristics of microbial cells (11 14)
and the glycome of such bacterial and fungal species
should reflect mechanisms of their interaction with the
host as well as their genetic constitution (in terms of
CAZy-encoding genes)
Plants constitute another group of organisms whose
carbohydrates are important for medicine Numerous
plant bioactive low-molecular weight products demon-
strate specific patterns of glycosylation (15) Sugar moi-
eties may modulate biological activity of these compounds
and where existing chemical technologies do not allow im-
plementing effective specific glycosylation of complex mol-
ecules enzymatic procedures can be used Therefore
information on activity and selectivity of plant carbohy-
drates and GTs is demanded
From 2005 we have been developing and maintaining
the Carbohydrate Structure Database (CSDB) intended for
provision of latest data on structures bibliography tax-
onomy nuclear magnetic resonance (NMR) spectroscopy
and other information regarding natural carbohydrates
CSDB includes Bacterial (BCSDB) and Plant and Fungal
(PFCSDB) parts which deposit glycans and glycoconju-
gates found in prokaryotes plants and fungi (16 17)
These databases are freely available at httpcsdbglyco-
scienceru
This article presents novel CSDB instruments for statis-
tical analysis of structural feature distribution in taxonomic
groups Completeness of the CSDB coverage on bacterial
carbohydrates suggests that such analysis of bacterial glyco-
mes would produce statistically significant results which
could be used for deciphering CAZy activities CSDB data
on plants and fungi though not complete at the moment
also present a possibility of correlating the information on
predicted CAZy genes and proteins with the existing carbo-
hydrates The article offers potential applications of the
statistical tools in the modern glycobiological research
Results and Discussion
A survey on database content especially in databases
claiming for complete coverage often provides valuable in-
formation for researches CSDB has several tools which
can be used in statistical studies Links to them are present
in the lsquoExtrasrsquo section of the main menu of the Bacterial
(BCSDB httpcsdbglycosciencerubacterialindexhtml)
and Plant and Fungal (PFCSDB httpcsdbglycoscienceru
plant_fungalindexhtml) CSDB The lsquoFragment abun-
dancersquo tool calculates the abundance of monomers and
dimers found in carbohydrates from specified taxonomic
groups whereas the lsquoCoverage statisticsrsquo tool gives statistics
Page 2 of 22 Database Vol 2015 Article ID bav073
at Institute of Organic C
hemistry of the R
ussian Academ
y of Sciences on September 4 2015
httpdatabaseoxfordjournalsorgD
ownloaded from
on the database coverage for specified groups The choice
of the database is of significant importance PFCSDB pro-
vides data on algae fungi and plants whereas BCSDBmdashon
bacteria archaea and protista Note that though the
groups lsquobacteriarsquo lsquoarchaearsquo and lsquoprotistarsquo are available
from PFCSDB (and vice versa) the correct database should
be used in each case
The lsquoTaxon clusteringrsquo tool can be launched from either
database with the same result This tool generates distance
matrices for mono- or dimeric fragment pools from taxa
populated in both databases Based on these matrices the
taxa are clustered into groups and corresponding dendro-
grams are displayed
When using CSDB please keep in mind that the term
lsquostructurersquo refers to an oligomeric molecule or a polymer
repeating unit built up of residues linked by ester ether or
amide linkages Every entity which is attached to the other
part of the molecule via these linkages is considered a dis-
tinct residue (including acetic acid methanol and other
monovalent residues) To be classified as a glycan the
structure should have at least one carbohydrate residue A
dimer is a structural fragment built of two residues of any
type More detailed explanation of terms has been pub-
lished recently (16)
The following sections describe possible applications of
the developed tools in scientific practice More detailed
user manual and examples for the fragment abundance
and coverage statistics tools will be published elsewhere
Interface
Fragment abundance
The tool estimates the abundance of monomers andor
dimers present in glycans from specified taxonomic groups
of different ranks The query form is shown in Figure 1
User can define the source from which the data are
gathered by selecting taxonomic rank A domain groups B
and specific taxa CD The available ranks are domain
phylum class genus species and strainsubspecies
Figure 1 shows an exemplary query on two species D of
Schizosaccharomyces C carbohydrates from which are
present in PFCSDB
The lsquoFragment abundancersquo tool provides the following
filters E
- Combine anomeric forms (treats different anomeric forms
of the same residue as a single entity) when checked the
resulting table will contain eg fragments with the DGlcp
residue combining a- and b-anomers otherwise frag-
ments containing a- and b-anomers of D-glucopyranose
(aDGlcp and bDGlcp) will occupy different rows
- Include undefined configs (underdetermined residues with
missing configurations are included into the query scope)
when checked the resulting table will include fragments
containing Kdop bFucp DGal etc
- Include ONLY saccharides (no monovalent residues
aglycons or aliases are shown) Please note that acetic
acid is treated as a separate monovalent residue thus
Figure 1 Fragment abundance form
Database Vol 2015 Article ID bav073 Page 3 of 22
at Institute of Organic C
hemistry of the R
ussian Academ
y of Sciences on September 4 2015
httpdatabaseoxfordjournalsorgD
ownloaded from
with this option checked Ac(1-2)GlcN will not be picked
up as a dimer from the structure Gal(1-3)GlcNAc while
Gal(1-3)GlcN will be
- Include monovalent residues (monovalent substituent
residues are included into the query scope) eg GlcNAc
or Glc-1OMe will be included as Ac(1-2)GlcN or
Glc(1-1)Me accordingly This and the previous filter are
interdependent
- Include aglycons in oligomers (aglycons are included into
the query scope as separate residues)
- Include aliases Aliases (explained entities missing from
the total residue list) and superclasses (LIP HEX etc)
are included into the query scope For example with this
option checked two dimersmdashSubst1(1-3)aDGlcp and
aDGlcp(1-1)LIP - and three monomers will be picked up
from the structure Subst1(1-3)aDGlcp(1-1)LIP
Subst1frac14 25-diaminopentanoic acid
- Explain lsquoSubstrsquo aliases (if unchecked substituents without
reserved residue names are displayed as lsquoSubstrsquo and
treated together otherwise they are differentiated) For
example with this option checked the above-mentioned
structure will produce the 25-diaminopentanoic
acid(1-3)aDGlcp dimer otherwise it will produce the
Subst1(1-3)aDGlcp dimer which will be combined with
dimers from other structures possessing Subst1 alias with
any explanation
Checkboxes F allow distinguishing the position of resi-
dues in bigger saccharides and the residue branching de-
gree The branching degree is a number of substituents
excluding the acceptor residue at the anomeric center (or
at another default center in non-sugars) By default it in-
cludes monovalent residues if they are not ignored by the
third checkbox in the group For example the branching
degree of GlcN in the structure Gal(1-3)GlcNAc(1-2)Man
is lsquodi-branchedrsquo with monovalent residues counted or lsquolin-
earrsquo without monovalent residues
Checkbox G allows showing only fragments that are
unique for a selected taxon among all biota or kingdom
phylum which it belongs to H Buttons I and J display
statistics on monomers and dimers correspondingly
In this example pressing button I displays the table of
monomers present in glycans and glycoconjugates from
Schizosaccharomyces japonicus and Schizosaccharomyces
pombe (Figure 2)
Figure 2 shows an overview of fragments structures
and organisms found A The table of results is composed of
the following columns position of a residue in the struc-
ture B (if it was checked to be distinguished terminal resi-
dues are shown in cyan and residues at the reducing end
are in pink the branching degree is also indicated) residue
names and configurations C abundance D (how many
times a particular residue occurs in the structures matching
the query) compound IDs E (links to the corresponding
compound pages) and abundance (absolute and relative) in
selected taxa F The columns can be sorted by position
residue name or abundance by clicking on column captions
B C or D The page contains accessory links eg export of
results as tab-separated values for copy-pasting into other
Figure 2 Monomeric composition for S japonicus and S pombe
Page 4 of 22 Database Vol 2015 Article ID bav073
at Institute of Organic C
hemistry of the R
ussian Academ
y of Sciences on September 4 2015
httpdatabaseoxfordjournalsorgD
ownloaded from
table-processing software and statistics on dimers for the
current query H
PFCSDB stores 14 saccharides from S japonicus and
S pombe and these saccharides are composed of 12
monomeric residues a-D-mannopyranose being the most
abundant a-D-mannopyranose a-D-galactopyranose and
a-D-glucopyranose are found at the terminal positions D-
mannitol and D-2-aminoglucitol found at the reducing
ends are probably analytical artifacts If a residue is
suspected to be an analytical artifact a corresponding
note is present in the full record which can be accessed
by clicking links in column E
Figure 3 exemplifies the usage of the dimer abundance
tool and shows the query form for statistics on dimers
found in glycans of the Eleutherococcus genus (ABC)
where only fragments unique for the genus in its phylum
are selected (FG) Monovalent residues (such as methyl or
acetyl groups) aglycons and other aliases are included (D)
positions of residues in the structure and residue branching
degree are left undistinguished (E) Pressing button H cal-
culates the statistics
The result table (Figure 4) lists dimeric fragments
unique for the Eleutherococcus genus in its phylum
(Streptophyta) together with statistical overview A It in-
cludes residues found in the structures from the organisms
belonging to the specified taxon (in this case eight dimeric
fragments from eight saccharides associated with three or-
ganisms from the Eleutherococcus genus) and their abso-
lute and relative (in per cent) abundance E There are
compound IDs F for structures that contain the corres-
ponding fragment (in this example unique fragments are
exotic and each fragment belongs to one structure only)
and fragment abundance among the genera G (in Figure 4
100 for all residues because only one genus was se-
lected) The result table for dimer abundance includes
lsquoDonorrsquo B lsquoLinkagersquo C and lsquoAcceptorrsquo D columns reflect-
ing two residues in a dimeric fragment and a linkage be-
tween them respectively The page also contains accessory
links H
Currently the lsquoall biotarsquo option (drop-down list G in
Figure 3) implies all biota present in the database that is
being queried Because BCSDB and PFCSDB are not
merged using this option especially at the domain level
produces many false positives (particularly there is al-
most no other biota than bacteria in BCSDB) When
analysing unique fragments you should keep in mind
that lsquoAll biotarsquo includes only those domains which are
populated in the current database This option is
reserved for the future using the option lsquoin its kingdomrsquo
is preferable
Figure 3 Fragment abundance form Only fragments unique for the genus Eleutherococcus in its phylum will be processed
Database Vol 2015 Article ID bav073 Page 5 of 22
at Institute of Organic C
hemistry of the R
ussian Academ
y of Sciences on September 4 2015
httpdatabaseoxfordjournalsorgD
ownloaded from
Coverage statistics
This tool produces statistics on coverage in various taxo-
nomic ranks (all biota domain phylum class or genus)
and allows comparison of structure distribution among
taxa Figure 5 shows the query form User can define taxo-
nomic rank A and then select groups B for which taxa C
of this rank are displayed (in this example two phyla
Actinobacteria and Firmicutes are selected) The data will
be distributed among the subtaxa having a lower rank than
that of the selected taxa Publication year D and structure
type E filters allow refining the search by date of publica-
tion or structure type (the available types are mono- and
oligomers all polymers mono- and homopolymers cyclic
polymers and biological repeats) The lsquoDisplay coveragersquo
button F processes the query
The resulting table together with short query overview
A is shown in Figure 6 The table includes selected taxa B
(in this case the phyla Actinobacteria and Firmicutes note
that the data are sorted by phyla not by default structure
abundance) subtaxa C of the selected taxa (in this case
Figure 4 Dimeric fragments unique for the Eleutherococcus genus in its phylum
Figure 5 Coverage statistics form
Page 6 of 22 Database Vol 2015 Article ID bav073
at Institute of Organic C
hemistry of the R
ussian Academ
y of Sciences on September 4 2015
httpdatabaseoxfordjournalsorgD
ownloaded from
classes comprising the Actinobacteria and Firmicutes
phyla) structures D (the number of structures found for a
corresponding subtaxon together with their part of the
total number of structures assigned to organisms from the
whole taxa selected) publications E (the number of papers
in which these structures were published) organisms F
(the number of taxonomically distinct organisms or groups
of organisms from which these structures were obtained)
and NMR spectra G (the number of NMR spectra for these
structures present in the database) Clicking on the num-
bers leads to the corresponding database entries Last row
H shows the cumulative values
Taxon clustering
This tool generates distance matrices for mono- or dimeric
fragment pools from taxa populated in both BCSDB and
PFCSDB databases Basing on these matrices selected taxa
can be clustered into groups with the corresponding den-
drograms displayed Such clustering of taxa according to
their glycans can be visualized as phenetic trees and can be
exported for external processing
Briefly the tool generates a list of taxa in accordance
with the specified constraints (Scope settings and
General settings) and a list of structural fragments
that will be included in the analysis in accordance with the
specified constraints (General settings and Fragment
pool settings) When these two lists are prepared the
program builds mono- or disaccharide profiles (binary oc-
currence codes) that reflect the occurrence of particular
fragments in the structures assigned to organisms belong-
ing to every taxon under analysis The occurrence codes
are compared to obtain Hamming distances (18) between
taxa these distances are normalized by the study degree
for each taxon (how many structures are assigned to it)
and produce a dissimilarity matrix used for cluster analysis
of taxa and for building phenetic trees
Figure 7 shows the input form of the tool The scope
settings define a particular taxonomic group for the ana-
lysis (by default it is all biota which means no limitations
on taxon selection) Available taxonomical scopes A are
lsquoall biotarsquo lsquodomainrsquo lsquophylumrsquo lsquoclassrsquo or lsquogenusrsquo If the
rank lsquophylumrsquo or lower is selected list C appears from
which individual phyla classes or genera can be selected
Multiple selection is allowed Checkboxes B allow filtering
these lists to the domains checked Both databases (BCSDB
and PFCSDB) are utilized
The general settings include options and thresholds for
generation of a taxon list a fragment list and occurrence
codes The lsquoRankrsquo selector D specifies the rank of taxa
being compared (kingdom phylum genus species or
strain) If lsquospeciesrsquo is selected the additional link lsquoSpecify
exact speciesrsquo appears on the right Clicking this link opens
the list of all species present in CSDB in a new window
where specific species can be selected If a species is missing
from the list currently there are no carbohydrate struc-
tures from this organism in CSDB This option resets scope
settings ABC to lsquoall biotarsquo
Two taxon population thresholds E define how popu-
lated a taxon should be to be included in the analysis The
population is a number of structures assigned to organisms
belonging to this taxon or its subtaxa The upper field
specifies the absolute minimum (the number of structures)
the lower field specifies the relative minimum (the number
of structures normalized by the total number of structures
in the database to which the taxon belongs) Checkboxes
define which threshold to use both can be used simultan-
eously Lower values produce analysis on greater variety of
taxa whereas higher values limit the taxonomical scope
only to the most studied taxa Low thresholds may lead to
Figure 6 Coverage statistics for the Actinobacteria and Firmicutes phyla
Database Vol 2015 Article ID bav073 Page 7 of 22
at Institute of Organic C
hemistry of the R
ussian Academ
y of Sciences on September 4 2015
httpdatabaseoxfordjournalsorgD
ownloaded from
Figure 7 Parameter input for clustering of taxa by glycan structural features
Page 8 of 22 Database Vol 2015 Article ID bav073
at Institute of Organic C
hemistry of the R
ussian Academ
y of Sciences on September 4 2015
httpdatabaseoxfordjournalsorgD
ownloaded from
the data biased by non-uniform distribution of deposited
structures in exotic taxa high thresholds decrease the num-
ber of taxa under analysis and the results even on wide-
spread genera may be lost Default values are pre-filled
depending on the selected rank to pick up from 5 to 20
most studied taxa
Two abundance thresholds F define how lsquopopularrsquo a
fragment should be to be qualified as present in biota and
therefore to be included in the analysis Higher abundance
thresholds shift the results to widespread saccharides
avoiding analytical artifacts and atypical rarely occurring
fragments The first threshold sets the minimal number of
structures in which a fragment should be present the se-
cond threshold sets the minimal number of instances of a
fragment in all structures present in CSDB As a structure
may contain several identical fragments the second thresh-
old should always be higher than the first one Default val-
ues are set to cover enough fragments specific to certain
taxa these values are sufficiently high not to cover statis-
tically unpopulated exotic fragments
Fragment presence threshold G defines how frequently
a fragment should appear in the structures belonging to a
taxon to be qualified as present in this taxon (by default it
is set to 2 to avoid unapproved occurrences)
Size of fragments H specifies which fragments (mono-
meric or dimeric) will be used for the analysis Monomeric
fragments focus the research on the glycan composition
whereas dimeric fragments (default) focus it on biosynthe-
sized linkages Type of structures I defines the scopes of
structures from which fragments are taken The allowed
types are lsquoanyrsquo (default) lsquoonly polymersrsquo lsquoonly oligomersrsquo
or lsquooptimizedrsquo The latter implies most biologically active
structures in each domain polymers from bacteria fungi
and archaea and oligomers from other kingdoms
Format J specifies how the dissimilarity matrix is ex-
ported (R-project Phylip or tab-separated values) If the
default format lsquoR-projectrsquo is selected the dendrographic
visualization of results is done automatically on the result
page Phylip matrices can be processed by various software
for clustering whereas the TSV format is most universal
Fragment pool settings define options for generation
of the fragment list lsquoCombine anomeric formsrsquo treats dif-
ferent anomers as a single residue without anomeric con-
figuration lsquoExclude underdetermined residuesrsquo omits
fragments containing residues with unknown anomeric (if
not combined) absolute or ring size configuration from
the analysis lsquoExclude monovalent residuesrsquo omits frag-
ments containing (or consisting of) monovalent residues
(including acetyl groups of amino sugars) from the ana-
lysis lsquoExclude superclassesrsquo omits fragments containing (or
consisting of) residues presented by superclasses (like HEX)
or aliases (like Subst) lsquoDifferentiate aliasesrsquo replaces all
Subst aliases with actual alias values prior to the analysis
In this case aliases are treated as different residues depend-
ing on their actual values otherwise all Subst aliases are
combined under a single residue name like Subst or
Subst1 lsquoSugars onlyrsquo omits fragments containing at least
one non-monosaccharide residue from the analysis
Acetylated amino sugars are interpreted as dimeric frag-
ments containing the non-sugar residue Ac and a sugar
residue lsquoExclude aglyconsrsquo omits fragments with residues
at the reducing end classified as aglycons If unchecked
aglycons from mono- and oligomeric structures are pro-
cessed together with other residues lsquoDifferentiate locationrsquo
(currently disabled) processes identical fragments at differ-
ent locations in the structure (inline terminal or reducing)
as different fragments lsquoStrict comparisonrsquo (currently al-
ways enabled) implies that similarity of two fragments is
evaluated by strict comparison of configurations (eg
DGalp is not equal to bDGalp) When unchecked resi-
dues with known configurations are considered a subset of
those with unknown
Pressing the lsquoClusterizersquo button runs the analysis The
specified restrictions affect the number of taxa and frag-
ments being processed and the calculation may take from
30 s to 10 min
Figure 8 shows the results of the cluster analysis the in-
put data for which are presented in Figure 7 Overview of
the taxonomic scope A is given at the window top Reports
on the number of generated fragments and taxa B indicate
that the taxon and fragment pools were prepared without
errors Occurrence bit-code generation report C is accom-
panied by the lsquoShowrsquo link which displays a table with taxa
and their binary glycoprofiles (occurrence codes) together
with a separate list of the fragments used Dissimilarity
matrix generation report D is also accompanied by the
lsquoShowrsquo link which displays the distance matrix in the se-
lected format
lsquoCalculation parametersrsquo E is a dump of all metadata
related to the analysis in accordance with the preferences
selected in the glycome-based taxon clustering form
(Figure 7) lsquoCoverage data on used taxarsquo F is a tab-
separated table containing processed taxon names with
database markers (in this case BA for bacterial) a number
of organisms within a taxon or its subtaxa and a number
of structures assigned to these organisms
As the lsquoR-projectrsquo dissimilarity matrix format was
chosen for the analysis dendrogram G reflecting the clus-
tering results is displayed together with additional options
Indash Regardless of the matrix format the analysis results
(excluding dendrograms) are stored on the CSDB server as
two files referenced by links H The first file (all job data)
contains a dump of the input parameters generated dis-
similarity matrix and coverage data on taxa The second
Database Vol 2015 Article ID bav073 Page 9 of 22
at Institute of Organic C
hemistry of the R
ussian Academ
y of Sciences on September 4 2015
httpdatabaseoxfordjournalsorgD
ownloaded from
Figure 8 Clustering result window
Page 10 of 22 Database Vol 2015 Article ID bav073
at Institute of Organic C
hemistry of the R
ussian Academ
y of Sciences on September 4 2015
httpdatabaseoxfordjournalsorgD
ownloaded from
file (in Figure 8 the distance matrix alone in the R format)
contains the dissimilarity matrix which can be later pro-
cessed in other software These files are stored for six
months
For R-formatted matrices additional options are avail-
able The clustering algorithm can be selected from drop-
down list I [in Figure 8 Wardrsquos minimum variance
method default is unweighted pair group method with
arithmetic mean (UPGMA) see the Experimental section
for details] Graph type selector J specifies the dendro-
gram type phylogram (rectangular stems) cladogram (tri-
angular stems) unrooted tree (as in Figure 8) or circular
tree The leaves (taxa) of the phenetic tree can be colored
according to the number of clusters specified by selector
(six in Figure 8) Depending on the selected clustering
method some types of dendrograms and the coloring fea-
ture may be disabled The lsquoRebuild dendrogramrsquo button
updates image G and exports the phenetic tree in the for-
mat specified by selector (allowed formats are lsquono ex-
portrsquo (default) Newick tree or Nexus tree) After the
export a link to the corresponding file appears below the
image
Estimation of CSDB content
The described statistical tools were employed to estimate
the CSDB coverage and content Figure 9 shows the CSDB
coverage in various domains phyla and most populated
classes At the moment CSDB contains 10 900 bacterial
structures from 5750 bacteria 4236 structures from 923
plants 636 structures from 327 fungi and 326 structures
from 118 archaeal algal or protista species published in
6100 papers (1941ndash2013) BCSDB currently provides con-
ditionally complete coverage on bacterial carbohydrate
structures The average time lag between the publication of
a structure and its deposition in CSDB is one year At the
moment PFCSDB provides complete coverage up to the
year 1997 and includes the plant and fungal data exported
from CarbBank (19) as well as data from selected publica-
tions up to 2009 (17)
Mono- and dimeric fragment distribution
The comparative analysis of mono- and disaccharide build-
ing blocks present in glycans from bacteria and mammals
was reported earlier (20) We conducted a similar analysis
of the bacterial carbohydrate content in comparison with
plant and fungal carbohydrates The lsquoFragment abun-
dancersquo tool was used for assessing the monomeric and di-
meric composition of all carbohydrate structures deposited
in CSDB according to taxonomic domains (bacteria ar-
chaea protista fungi and plantsthornalgae) The abundance
of monomers and dimers was normalized to the total num-
ber of structures from organisms belonging to the corres-
ponding domain thus giving the fragment frequency The
Figure 9 CSDB coverage by structures and organisms Absolute numbers of structuresorganisms are provided for every domainphylumclass The
inner diagram shows distribution of structures among domains split into lower ranks the outer ring shows distribution of organisms among do-
mains The following color code is used blue shades bacteria red shades fungi green shades plants orange archaea algae and protista
Database Vol 2015 Article ID bav073 Page 11 of 22
at Institute of Organic C
hemistry of the R
ussian Academ
y of Sciences on September 4 2015
httpdatabaseoxfordjournalsorgD
ownloaded from
monovalent residues such as methanol or acetic acid were
excluded from calculation due to their high frequency
non-carbohydrate nature and domain-unspecific
distribution
Figure 10 shows 30 most widespread monomeric resi-
dues typical for carbohydrate structures from organisms
belonging to the six domains present in BCSDB and
PFCSDB The distribution of monomers supports the
known fact that bacterial glycans are most diverse in their
monomeric composition (20) Such diversity allows bac-
teria to occupy numerous different niches and to survive
under the selection pressure induced by the host immune
system and competition (21 22) In bacterial glycans the
most widespread monomeric residues include the lipid A
alias L-glycero-D-manno-heptose and 3-deoxy-D-manno-
oct-2-ulosonic acid (Kdo) not found in other domains All
these monomers are present in the LPS of Gram-negative
bacteria (20 23) In Figure 10 Lipid A was removed from
consideration because it is an ambiguous compound and
includes both sugar and lipid parts
Figure 11 shows 30 most widespread dimers from
carbohydrate structures present in CSDB Dimeric frag-
ments unique for a taxonomic group can reflect peculiar-
ities of interactions of its organisms with the environment
realized by activities of group-specific GTs At the level of
domains top 10 dimers not present in glycans from any
other domain are given in Table 1 Although algae are in-
terpreted as a separate domain in CSDB currently there
are no disaccharides unique for this domain due to a lim-
ited number of algal structures deposited in the database
Dimers containing alditols at the reducing end were omit-
ted from the statistics because they mostly represent ana-
lytical artifacts
Plants are the known source of glycosides containing
various aglycons of triterpene steroid flavonoid or phen-
olic origin and possessing anti-cancer (24ndash26) and other
types of bioactivity Therefore we also analysed the
PFCSDB coverage on plant aglycons Figure 12 shows 17
most widespread dimeric fragments with non-sugar moi-
eties found in plant saccharides from PFCSDB Dimers
with amino acids at the reducing end were omitted from
the analysis because in most cases they present fragments
from protein glycosylation sites According to the statistics
three monosaccharide residues b-D-glucopyranosyluronic
acid b-D-glucopyranose and a-L-arabinopyranose form
linkages with non-sugar aglycons in plant glycosides most
often
More data rows for Figures 10ndash12 are available as
tables in the Supplementary Materials
Carbohydrate-based phylogenetics
Though as of 2014 the CAZy database contains the data on
almost 340 000 CAZy only 4 of them are characterized
biochemically and the gap between the number of putative
CAZy sequences and enzymes with established structure
and functions continues to grow (13) For example the
CAZy database includes almost 1800 GTs assigned to
Helicobacter pylori but only 17 of them are characterized
biochemically (see Supplementary Table S1) Supplementary
Table S2 contains disaccharide fragments from carbohy-
drates found in H pylori together with possible GTs syn-
thesizing these disaccharide fragments It is evident that
though the data on resolved carbohydrate structures and
predicted GTs mostly support each other there are disac-
charides for which no enzyme has yet been predicted (eg
mannosyl- rhamnosyl- or ribosyltransferases) as well as
Figure 10 Thirty most widespread monomeric residues in carbohydrate structures from major taxonomic groups Bubble area corresponds to aver-
aged monomer frequency in the domain (see text) varying from 97 (aDManp a-D-mannopyranose) to 012 (bDFruf b-D-fructofuranose) Amino
sugar residues include both acetylated and non-acetylated forms and are highlighted in lilac undetermined residues with unknown anomeric abso-
lute or ring size configuration are shaded
Page 12 of 22 Database Vol 2015 Article ID bav073
at Institute of Organic C
hemistry of the R
ussian Academ
y of Sciences on September 4 2015
httpdatabaseoxfordjournalsorgD
ownloaded from
predicted enzymes for which no product has yet been de-
tected (eg b-14-N-acetylgalactosaminyltransferases)
Therefore the decryption of the glycome code is far from
completion however bringing the enzymatic and carbohy-
drate ends together could promote the process Two organ-
isms possessing similar saccharides should possess enzymes
with similar activities and therefore studying the carbohy-
drate-based alliance between taxa may facilitate the investi-
gation of carbohydrate processing proteins with yet
unknown functions For instance Neisseria gonorrhoeae
and Neisseria meningitides two genetically close species
possess a similar set of disaccharides derived from their
carbohydrate structures and have GTs with similar pre-
dicted activities whereas Staphylococcus aureus differs
from the Neisseria species both in disaccharides and pre-
dicted activities of GTs (Supplementary Table S3) These
considerations urged us to develop the lsquoTaxon clusteringrsquo
tool on the CSDB platform In 93 of structures present in
Figure 11 Thirty most widespread dimers in carbohydrate structures from major taxonomic groups Bubble area corresponds to disaccharide fre-
quency in the domain (see text) varying from 315 (aDManp(1-2)aDManp) to 009 (aDGlcp(1-3)aDGlcp) Dimers containing amino sugars which in-
clude both acetylated and non-acetylated forms are highlighted in lilac dimers containing undetermined residues with unknown anomeric or ring
size configuration are shaded
Table 1 Top 10 unique dimeric fragments found in each domains of life present in CSDB in abundance descending order
Bacteria aLDmanHepp(1-3)aLDmanHepp bDGlcp(1-4)aLDmanHepp aLDmanHepp(1-5)aKdop aKdop(2-4)aKdop
aLDmanHepp(1-7)aLDmanHepp bDGlcpN(1-6)aDGlcpN P-6)aLDmanHepp bDGlcpN(1-3)bDGalp
aKdop(2-6)bDGlcpN P-4)bDGlcpN
Archaea S-6)aDManp S-2)aDManp bDManpNA(1-4)bDGlcpN3NA bDGlcpN3NA(1-3)bDGlcpN
bDGlcpN3NA(1-4)aDGlcpN3NA bDGlcpN3NA(1-3)bDGalpN P-1)dolichol C55-60
bDS6Fucp(1-4)bDGlcp aDDgalHepp(1-2)bDS6Fucp aDManp(1-3)bDS6Fucp
Protista aDGlcpN(1-6)phosphatidylinositol bDXylp(1-2)aDManp bDXylp(1-4)aDManp Aep(1-P aDArap(1-2)bDGalp
aDGlcpA(1-2)bDGalf P-1)Dce bDArap(1-2)bDGalp bDManp(1-2)DManp aDGalf(1-2)aDManp
Fungi bDXylp(1-2)aDManp bDXylp(1-4)aDManp aDGlcpA(1-2)bDGalf bDGalf(1-2)aDManp aDGalf(1-2)aDManp
bDXylp(1-6)aDManp bDXylp(1-3)aDManp aDGalf(1-6)aDManp aDManp(1-1)2-(4-trifluoroacetamido-phenyl)etha-
nol aDManp(1-2)bDXylp
Plants aDXylp(1-6)bDGlcp aLRhap(1-2)bDGlcp aLRhap(1-2)aLArap bDGalp(1-2)aDXylp bDXylp(1-2)bDManp
bDGlcp(1-3)diosgenin bDGlcp(1-3)aLArap aLRhap(1-2)bDFucp Me(1-3)bDDigp aLAraf(1-2)bDXylp
Database Vol 2015 Article ID bav073 Page 13 of 22
at Institute of Organic C
hemistry of the R
ussian Academ
y of Sciences on September 4 2015
httpdatabaseoxfordjournalsorgD
ownloaded from
CSDB all glycosidic linkages are fully determined (regard-
ing monosaccharides their three configurations and linkage
positions) with the exception of anomeric and ring size con-
figurations of mutarotating residues at reducing ends This
coverage allows statistically credible calculations based on
disaccharide fragments
We selected dimeric fragments for characterization of
glycome because the monomeric composition does not re-
flect the information on GTs whereas the composition of
fragments larger than dimers does not add valuable data to
that obtained from the dimeric composition Clustering of
most populated genera using the similarities in carbohy-
drate-containing dimers resulted in a phenetic tree com-
posed of three big clusters bacteria plants and mixed taxa
from plants fungi and protista (Figure 13)
When gathering this statistics we used the following fil-
ters to cover 37 most studied genera and 118 most wide-
spread fragments
- taxon rankfrac14 genus
- taxonomic scopefrac14 all biota (no restrictions applied)
- minimal number of carbohydrate structures assigned to
organisms belonging to a genusfrac14 12 of total struc-
tures in the corresponding database (130 structures for
the bacterial database and 65 structures for the plant
and fungal database)
- structure typefrac14 any (no restrictions on the molecule part
polymeric or oligomeric)
- population of a fragment in the database to consider it
statistically present in biotafrac14 at least 120 fragment in-
stances in at least 100 structures
- fragment sizefrac14 two residues (dimeric fragments)
- comprising residue filters anomeric forms were not com-
bined residues with missing configurations were
excluded monovalent residues were included super-
classes and aliases were excluded aglycons were
included
- minimal occurrence of a fragment in a taxon to be quali-
fied as presentfrac142 instances
The Wardrsquos minimum variance method (27) was used
for clustering Lengths of branches connected to leaves
were ignored for visual clarity The details on building the
dissimilarity matrix and phenetic tree are provided further
in the text (see discussion of bacterial species clustering)
Most of the clades roughly matched the taxonomic lin-
eages of organisms Particularly most enterobacteria ap-
peared in a single cluster and the genera most genetically or
antigenically close to each other (Escherichia Shigella and
Salmonella) (28ndash31) occupied a small clade with short branch
lengths Although Burkholderia and Pseudomonas belong to
different classes they tend to co-colonize hosts (32) and
many strains of the former were reclassified to the latter
based on genotyping (33ndash35) This may explain the resem-
blance of glycomes of these genera as deposited in the data-
base and their clustering in a small clade The co-clustered
Bacillus and Streptococcus are the only strictly Gram-positive
bacterial genera among those analysed (Mycobacteria do not
display the empirical Gram-reaction and are classified as
Gram-positive due to the absence of the outer membrane)
Phylogenetic relationship between Leishmania and fungal
genera may be explained by shared structural features in gly-
colipids from organisms of these taxonomic groups (36) It is
not possible to draw any reasonable conclusions from the
Figure 12 Seventeen most widespread dimeric fragments containing non-sugar moieties in plant saccharides Numbers are absolute abundance in
plant structures
Page 14 of 22 Database Vol 2015 Article ID bav073
at Institute of Organic C
hemistry of the R
ussian Academ
y of Sciences on September 4 2015
httpdatabaseoxfordjournalsorgD
ownloaded from
carbohydrate-based grouping of fungal and plant saccharide
structures because the CSDB coverage on the organisms from
these domains is incomplete Thus at the moment we can
only make preliminary observations eg that the fungal gen-
era Aspergillus Candida and Saccharomyces are clustered to-
gether with the plant genera Solanum Acer Nicotiana and
Glycine since according to the CSDB content their carbohy-
drate structures are rich in mannodisaccharides
Due to heterogeneity of species within genera and to
look more thoroughly into the possibilities of grouping
taxa by their carbohydrate content we applied clustering
at the level of species and then compared it to a canonical
small ribosomal subunit RNA-based phylogenetic tree fol-
lowing an example of Aguilar and colleagues who analysed
phenetic trees based on metabolic properties for several or-
ganisms from three domains (37)
For this purpose we used data from the bacterial
part of BCSDB due to its completeness to avoid an annota-
tion-induced bias Thirty-three bacterial species were se-
lected by their population in the database (at least 20
structures assigned to a taxon or its subtaxa) Some bacter-
ial species are studied significantly more thoroughly
than others therefore their structures in the database con-
tain more rarely occurring fragments This leads to longer
distances between these and other species in dissimilarity
matrices To avoid such population-induced bias we
normalized the distances by the number of structures
assigned to the organisms belonging to two species
being compared Another factor diminishing this bias is
the fragment presence threshold which determines
how populated a fragment should be within a taxon to be
included in its glycoprofile and to produce a positive mark in
the occurrence code Setting this threshold higher than 1 re-
duces the effect of analytical artifacts and atypical fragments
We prepared matrices which reflect the dissimilarity of
taxa by using the reported online tool on the content of
CSDB The underlying algorithm is summarized in
Figure 14 At first the fragment and taxon pools were pre-
pared according to the user input The filters and thresh-
olds that affect population of these pools are described in
the lsquoTaxon clusteringrsquo section
To select taxa we specified the explicit list of species
This list was obtained by manual curation of the available
ribosomal RNA (rRNA) data (see below) for the species
pre-selected with the following parameters
- taxon rankfrac14 species
- taxonomic scopefrac14 all biota (no restrictions applied)
- minimal number of carbohydrate structures assigned to
organisms belonging to a speciesfrac14 20
Figure 13 Glycome-based clustering of most studied genera Shades of blue represent various bacterial taxonomic groups shades of green repre-
sent plant groups red and orange represent fungi and protista domains respectively The outer arc for bacteria is colored according to the Gram-
reaction Size of the circles reflects the normalized popularity of a given genus in CSDB in terms of assigned organisms (green) and assigned struc-
tures (blue) When a blue circle is not visible it is the same size as a green one Color of labels denotes the database from which the data came
Database Vol 2015 Article ID bav073 Page 15 of 22
at Institute of Organic C
hemistry of the R
ussian Academ
y of Sciences on September 4 2015
httpdatabaseoxfordjournalsorgD
ownloaded from
To select fragments we used the following filters
- structure typefrac14 any (no limitation on the molecule part
polymeric or oligomeric)
- population of a fragment in the database to consider it
statistically present in biotafrac14 at least 120 fragment in-
stances in at least 100 structures lowering these thresh-
olds leads to inclusion of non-representative fragments
and analytical artifacts while making them higher leads
to loss of taxon-specific fragments which are the cluster-
ing basis
- fragment sizefrac14 two residues (dimeric fragments)
- comprising residue filters anomeric forms were not com-
bined residues with missing configurations were
excluded monovalent residues were included aglycons
and aliases were included and differentiated
118 fragments from the fragment pool were checked for
presence in the structures assigned to organisms belonging
to 33 taxa from the taxon pool The fragment was con-
sidered present in a taxon if its abundance in structures
from this taxon was equal to or exceeded 2 (filter
lsquoFragment presence thresholdrsquo) The fragment presence
was encoded as a binary string (occurrence code) specific
for every taxon These disaccharide composition phylogen-
etic profiles were obtained similarly to protein function
phylogenetic profiles reported by Pellegrini et al (38)
every fragment matched a certain bit position in the string
for present fragments the corresponding bits were set to 1
for absent fragmentsmdashcleared to 0
The occurrence codes were treated similarly to the work
by Aguilar and colleagues (37) The taxa were compared
pairwise using the Hamming distance between the frag-
ment occurrence codes to give a symmetrical distance ma-
trix The Hamming distance between two bit strings is a
number of bit inversions required to convert one string to
the other (18) it is a standard method to evaluate
dissimilarity
Every cell in the dissimilarity matrix was normalized
by the total number of structures assigned to both taxa
matching this cell to avoid the study-induced bias (see
above) and the whole matrix was normalized to a max-
imal distance 100 for compatibility with other clustering
software
The normalized dissimilarity matrix reflecting the disac-
charide composition of taxa was imported into the R envir-
onment (39) to be analysed by most common clustering
algorithms for distance data We built carbohydrate-based
phenetic trees from the distance matrix by seven clustering
algorithms hierarchical agglomerative complete linkage
clustering UPGMA (40) Wardrsquos minimum variance
method (27) classical (41) and improved [biological neigh-
bor joining (BIONJ)] (42) neighbor joining (NJ) ordinary
least-squares and balanced minimum evolution (43) Other
clustering algorithms were not applied due to their poor
applicability to biological phylogenetics (agglomerative
hierarchical clustering with other types of linkage inter-
pretation) or dedication to handling incomplete distance
matrices (minimum variance reduction) (44 45) Figure 15
represents circular phenetic trees obtained by three repre-
sentative clustering methods together with cumulative
data on the BCSDB coverage related to the examined spe-
cies (Figure15A)
Figure 14 Flow chart of data processing in the reported online tool
Page 16 of 22 Database Vol 2015 Article ID bav073
at Institute of Organic C
hemistry of the R
ussian Academ
y of Sciences on September 4 2015
httpdatabaseoxfordjournalsorgD
ownloaded from
The default method for the web interface is hierarchical
average linkage clustering (UPGMA) (40) This algorithm
analyses the structure of a pairwise dissimilarity matrix
and constructs a rooted ultrametric tree At each step
the two nearest clusters are combined into a higher-level
cluster based on the average distance between elements
of each cluster UPGMA was reported to produce ad-
equate results for genome-based clustering of bacteria
on the subspecies level (46) The main disadvantage
of UPGMA is the lsquomolecular clockrsquo assumption which pre-
supposes a constant rate of changes in all lineages This
assumption may be useful for genetic studies (47 48)
but not for phenetic trees based on differences in carbohy-
drate structures the occurrence rates of which are unlikely
to be constant
Alternative approach to hierarchical clustering is the
Wardrsquos method in which the choice of clusters to be
merged is based on the least possible increase in the overall
within-cluster variance This method is particularly effi-
cient if the data set includes no major outliers (49) In
2014 the Wardrsquos minimum variance method was reported
in regard to functional classification of phytoplankton spe-
cies (50)
The NJ algorithm is free from lsquomolecular clockrsquo restric-
tions and is widely accepted as a standard method for dis-
tance data clustering in biology (41) It is a bottom-up
clustering method which is usually used to construct trees
based on DNA sequence data Its improved version
BIONJ chooses the reduction which minimizes the vari-
ance of a new distance matrix at each step of matrix reduc-
tion allowing better estimations for selection of the pair
of taxa to be agglomerated during the next steps (42)
The ability of both UPGMA and NJ methods to
differentiate various taxa depends on the underlying struc-
ture of the data used to construct the dissimilarity matrix
(46 51)
The main disadvantage of the NJ methods is their abil-
ity to produce branches with negative lengths which leads
to occasional failure to find an optimal tree A more recent
minimum evolution method (43) was employed to over-
come these drawbacks This method is based on the as-
sumption that the correct tree is the one that exhibits the
minimal total amount of evolution However it has to be
mentioned that it still produced negative branch lengths in
some of our examples In the balanced weighting minimum
evolution scheme sibling subtrees have equal weights as
opposed to the standard lsquounweightedrsquo ordinary least
squares scheme where all taxa have the same weight so
that the weight of a subtree is equal to the number of its
taxa
Overall in our experience the methods produce
similar but not identical trees which differ in relative
positioning of more distant clusters while consistently
identify the same pairs of taxa as the most closely related
(Figure 15)
We compared the trees obtained by each method to a
canonical phylogenetic tree based on small ribosomal
subunit rRNA homology for the selected 33 bacterial spe-
cies (Figure 16 for SILVA numbers of the rRNA se-
quences and sequences themselves in the FASTA format
see the Supplementary materials) The mean topological
score between internal branches under the one-to-one
mapping of the trees was used as a similarity metrics It
was produced by pairwise mapping and topological scor-
ing of branches as described (52) We did not apply
sophisticated comparison methods because this article
presents tools for gathering and visualization of statistical
data while their interpretation requires special biochem-
ical and microbiological experience and is beyond its
scope The similarity between the RNA-based tree and
carbohydrate-based trees clustered by various methods
was 53 (complete linkage) 52 (UPGMA) 57
(Ward) 59 (NJ) 51 (BIONJ) 44 (balanced min-
imum evolution) and 46 [ordinary least squares (OLS)
minimum evolution] Filtering the fragment pool to
purely carbohydrate fragments (disaccharides) introduced
only minor changes to these values
It can be seen that the carbohydrate trees partially
agree with the rRNA one The phyla Firmicutes and
Actinobacteria are clustered together with the exception
of Streptococcus pneumonia whose carbohydrate con-
tent resembles that of Shigella Both rRNA and carbohy-
drate sequences converge Escherichia coli to Shigella
whereas species from Pseudomonas as well as from
Proteus are close to each other both by rRNA and gly-
cans The phylogeny of species constructed by using the
Wardrsquos criterion is most close to that of genera and to
existing knowledge on bacterial taxa localization in the
tree of life
The similarity between the two types of the tree of life is
expected as the repertoire of carbohydrate structures in an
organism is defined by its CAZy It was demonstrated that
genome-based and rRNA-based phylogenetic trees correl-
ate well with each other (37 53) and differences in CAZy
genes reflect the differences in the whole genomesmdashbut
only to some degree During evolution the selection pres-
sure differently affects different genes and therefore their
products and two organisms that differ significantly in the
genome content may possess similar phenotypic features
(54 55)
Thus the difference observed between the
carbohydrate-based and rRNA-based trees may reflect
the fact that carbohydrates are the main bacterial instru-
ment for interacting with the environment (11) and
Database Vol 2015 Article ID bav073 Page 17 of 22
at Institute of Organic C
hemistry of the R
ussian Academ
y of Sciences on September 4 2015
httpdatabaseoxfordjournalsorgD
ownloaded from
expression of certain carbohydrate structures may
correspond to certain habitatactivities For example
Neisseria gonorrheae and Haemophilus ducreyi which are
not very close in the rRNA-based tree of life but evidently
possess similar glycans both inhabit the urogenital track
of humans where they cause sexually transmitted diseases
(56 57) and therefore meet similar challenges Because
the exact mechanisms of bacterial pathogenesis in most
Figure 15 Circular phenetic trees based on dimers (containing monosaccharides aliases aglycons monovalent residues) present in compounds
from bacterial species most populated in BCSDB Firmicutes are shown in red Actinobacteria in green Enterobacteria in cyan and other
Proteobacteria in violet Three dendrograms correspond to different clustering methods NJ (A) Wardrsquos minimal variance (B) and balanced minimum
evolution (C) Blue and green circles in (A) depict the normalized number of structures and organisms assigned to each species correspondingly
When a blue circle is invisible it is the same size as a green one Gray color code in the outer rim (A) reflects the Gram-reaction The underlying num-
bers and trees are available in Supplementary materials
Page 18 of 22 Database Vol 2015 Article ID bav073
at Institute of Organic C
hemistry of the R
ussian Academ
y of Sciences on September 4 2015
httpdatabaseoxfordjournalsorgD
ownloaded from
cases are not understood at the molecular level such prox-
imity of species in the carbohydrate phenetic tree suggests
the similarity of the ways of their action and allows pro-
posing directions for future experimental study Thus the
carbohydrate-based phenetic trees may demonstrate simi-
larity and differences in both pathogenic and CAZy
activities
Conclusions
In this article we describe three new CSDB instruments
lsquoFragment abundancersquo lsquoCoverage statisticsrsquo and lsquoTaxon
clusteringrsquo These tools are dedicated to statistical analysis
of the carbohydrate content in different taxonomic groups
as well as to studying carbohydrate-based relationships be-
tween bacteria fungi and plants We suppose this
information may be useful for eliminating the gap between
the accumulated structural and biochemical data on carbo-
hydrate-processing enzymes We do not draw any far-reach-
ing conclusions from the obtained carbohydrate data
because it requires a thorough analysis by specialists in the
field of bacterial pathogenesis Still we have no doubts that
in the future these instruments would be fruitfully used by
glycoscientists and bacteriologists
Experimental
Programming
Presented tools were implemented as web-services on the
CSDB platform using the PHP 54 programming language
MySQL 55 database engine and DHTMLJavascript for
Figure 16 Phylogenetic tree based on small ribosomal subunit rRNA sequences Firmicutes are shown in red Actinobacteria in green Enterobacteria
in cyan and other Proteobacteria in violet The underlying data are available in the Supplementary materials
Database Vol 2015 Article ID bav073 Page 19 of 22
at Institute of Organic C
hemistry of the R
ussian Academ
y of Sciences on September 4 2015
httpdatabaseoxfordjournalsorgD
ownloaded from
web-pages The tools were tested in modern versions of
Mozilla Firefox Google Chrome and Microsoft Internet
Explorer The online help is available in the lsquoStatistical
toolsrsquo section of the CSDB help httpcsdbglycoscience
rubacterialcorehelpphptopicfrac14stat
Estimation of CSDB coverage
Data were exported as tab-separated values from the web-
interface of the presented tools were joined for BCSDB
and PFCSDB using a dedicated script in PHP 54 and were
processed and visualized in Microsoft Excel 2010
rRNA phylogenetic tree
Small subunit rRNA sequences were obtained from the
SILVA database (httpwwwarb-silvade release 119)
(58) The corresponding accession numbers are listed in
the Supplementary materials Phylogeny analysis was per-
formed at Phylogenyfr (httpphylogenylirmmfr) (59) in
the lsquoOne-Clickrsquo mode with default options implying
BIONJ clustering method the resulting tree was exported
in the Newick format and processed with the iTOL online
software (60)
Clustering and building dendrograms
Dissimilarity matrices were imported into the R environ-
ment (39) and analysed by multiple clustering algorithms
The hierarchical clustering was implemented via the built-
in hclust function in R [using UPGMA (40) complete link-
age (40) or wardD2 methods (27)] The NJ and minimum
evolution methods utilized the BIONJ (42) and balanced
fastME (43) functions correspondingly as implemented in
the Analyses of Phylogenetics and Evolution (ape) library
(61) for R The data were visualized online and were ex-
ported using built-in functionality provided in ape Tree
comparison was carried out using the approach of Nye and
coworkers (52) as implemented in the Compare2Trees tool
(httpwwwmasnclacukntmwncompare2treesindex
html) after conversion to the Newick format Complex
dendrograms were built using the iTOL service (60 62) on
distance matrices exported online in the Nexus format and
other supplementary data generated online The trees were
presented as rooted to avoid label overlap the terminal
branch lengths were ignored on plots for visual clarity
Unrooted trees and trees with variable terminal branch
lengths can be easily restored from the source data (see the
Supplementary Materials)
Abbreviations
Residue names
Aep 2-amino-ethylphosphonic acid
aDArap a-D-arabinopyranose
aDDgalHepp D-glycero-a-D-galacto-heptopyranose
aDGalf bDGalf D-galactofuranose (a- and b-anomers)
aDGalp bDGalp D-galactopyranose (a- and b-anomers)
aDGlcp bDGlcp D-glucopyranose (a- and b-anomers)
aDGlcpA bDGlcpA D-glucopyranosyluronic acid (a- and
b-anomers)
aDGlcpN bDGlcpN 2-deoxy-2-amino-D-glucopyranose
(a- and b-anomers alone or within N-acetylated
fragment)
aDGlcpN3NA bDGlcpN3NA 23-dideoxy-23-diamino-
D-glucopyranosuronic acid (a- and b-anomers)
aDManp bDManp D-mannopyranose (a- and b-
anomers)
aDXylp bDXylp D-xylopyranose (a- and b-anomers)
aKdop 3-deoxy-a-D-mannopyranosyl-oct-2-ulosonic acid
aLArap a-L-arabinopyranose
aLAraf a-L-arabinofuranose
aLDmanHepp L-glycero-a-D-manno-heptopyranose
aLFucp 6-deoxy-a-L-galactopyranose
aLRhap 6-deoxy-a-L-mannopyranose
bDDigp 26-dideoxy-b-D-ribo-hexopyranose
bDFruf b-D-fructofuranose
bDFucp 6-deoxy-b-D-galactopyranose
bDManpNA 2-deoxy-2-amino-b-D-mannopyranosuronic
acid
bDS6Fucp 6-deoxy-6-sulpho-b-D-galactopyranose
Dce cis-decenoic acid
DGlcN D-glucosamine with unknown anomeric and ring
size configurations
DMan D-mannose with unknown anomeric and ring size
configurations
DManp D-mannopyranose with unknown anomeric
configuration
EtN 2-aminoethanol
Gro glycerol with unknown absolute configuration
P phosphoric acid
S sulfuric acid
Funding
This work and open-access publication was supported by Russian
Science Foundation (RSF grant 14-50-00126)
Supplementary Data
Supplementary data are available at Database Online
Conflict of interest None declared
Page 20 of 22 Database Vol 2015 Article ID bav073
at Institute of Organic C
hemistry of the R
ussian Academ
y of Sciences on September 4 2015
httpdatabaseoxfordjournalsorgD
ownloaded from
References
1 van HeijenoortJ (2001) Formation of the glycan chains in the
synthesis of bacterial peptidoglycan Glycobiology 11 25Rndash
36R
2 KochAL (2003) Bacterial wall as target for attack past pre-
sent and future research Clin Microbiol Rev 16 673ndash687
3 LatgeJP (2007) The cell wall a carbohydrate armour for the
fungal cell Mol Microbiol 66 279ndash290
4 SelvendranRR and OrsquoNeillMA (1987) Isolation and
Analysis of Cell Walls from Plant Material John Wiley amp Sons
Inc Hoboken NJ
5 BakerJL CelikE and DeLisaMP (2013) Expanding the gly-
coengineering toolbox the rise of bacterial N-linked protein gly-
cosylation Trends Biotechnol 31 313ndash323
6 CobbBA and KasperDL (2005) Coming of age carbohy-
drates and immunity Eur J Immunol 35 352ndash356
7 FreireT and OsinagaE (2012) The sweet side of tumor im-
munotherapy Immunotherapy 4 719ndash734
8 SnapperCM (2012) Mechanisms underlying in vivo polysac-
charide-specific immunoglobulin responses to intact extracellu-
lar bacteria Ann N Y Acad Sci 1253 92ndash101
9 JonesC (2005) Vaccines based on the cell surface carbohydrates
of pathogenic bacteria An Acad Bras Cienc 77 293ndash324
10 KluttsJS YonedaA ReillyMC et al (2006)
Glycosyltransferases and their products cryptococcal variations
on fungal themes FEMS Yeast Res 6 499ndash512
11 SukhithasriV NishaN BiswasL et al (2013) Innate immune
recognition of microbial cell wall components and microbial strat-
egies to evade such recognitions Microbiol Res 168 396ndash406
12 CantarelBL CoutinhoPM RancurelC et al (2009) The
Carbohydrate-Active EnZymes database (CAZy) an expert re-
source for glycogenomics Nucleic Acids Res 37 D233ndashD238
13 LombardV Golaconda RamuluH DrulaE et al (2014) The
carbohydrate-active enzymes database (CAZy) in 2013 Nucleic
Acids Res 42 D490ndashD495
14 LiuB KnirelYA FengL et al (2008) Structure and genetics
of Shigella O antigens FEMS Microbiol Rev 32 627ndash653
15 OsmaniSA BakS and MollerBL (2009) Substrate specificity
of plant UDP-dependent glycosyltransferases predicted from
crystal structures and homology modeling Phytochemistry 70
325ndash347
16 ToukachPV and EgorovaKS (2015) Bacterial plant and fun-
gal Carbohydrate Structure Databases daily usage In Lutteke
T and Frank M (eds) Glycoinformatics Springer New York
pp 55ndash85
17 EgorovaKS and ToukachPV (2014) Expansion of coverage
of Carbohydrate Structure Database (CSDB) Carbohydr Res
389 112ndash114
18 HammingRW (1950) Error detecting and error correcting
codes Bell Syst Tech J 29 147ndash160
19 DoubetS BockK SmithD et al (1989) The complex
Carbohydrate Structure Database Trends Biochem Sci 14
475ndash477
20 HergetS ToukachPV RanzingerR et al (2008) Statistical
analysis of the Bacterial Carbohydrate Structure Data Base
(BCSDB) characteristics and diversity of bacterial carbohydrates
in comparison with mammalian glycans BMC Struct Biol 8
35ndash54
21 ReevesPR (1992) Variation in O-antigens niche-specific selec-
tion and bacterial populations FEMS Microbiol Lett 100
509ndash516
22 ReevesPP and WangL (2002) Genomic organization of LPS-
specific loci Curr Top Microbiol Immunol 264 109ndash135
23 RaetzCR ReynoldsCM TrentMS et al (2007) Lipid A
modification systems in gram-negative bacteria Annu Rev
Biochem 76 295ndash329
24 de CostaF YendoAC FleckJD et al (2011)
Immunoadjuvant and anti-inflammatory plant saponins charac-
teristics and biotechnological approaches towards sustainable
production Mini-Rev Med Chem 11 857ndash880
25 TianX TangH LinH et al (2013) Saponins the potential
chemotherapeutic agents in pursuing new anti-glioblastoma
drugs Mini-Rev Med Chem 13 1709ndash1724
26 ChenH GaoY WuJ et al (2014) Exploring therapeutic po-
tentials of baicalin and its aglycone baicalein for hematological
malignancies Cancer Lett 354 5ndash11
27 MurtaghF and LegendreP (2014) Wardrsquos hierarchical agglom-
erative clustering method which algorithms implement Wardrsquos
criterion J Classif 31 274ndash295
28 JohnstonJH JohnstonRJ and SimmonsDA (1967) The
immunochemistry of Shigella flexneri O-antigens The biochemical
basis of smooth to rough mutation Biochem J 105 79ndash87
29 JesudasonM SridharanG and JohnTJ (1991) Antigen shar-
ing of Salmonella typhi non-flagellar proteins with other
Salmonellae and some Shigellae and Escherichia coli Indian
J Exp Biol 29 338ndash341
30 PupoGM LanR and ReevesPR (2000) Multiple independ-
ent origins of Shigella clones of Escherichia coli and convergent
evolution of many of their characteristics Proc Natl Acad Sci
U S A 97 10567ndash10572
31 Muller-LoenniesS BradeL and BradeH (2007) Neutralizing
and cross-reactive antibodies against enterobacterial lipopoly-
saccharide Int J Med Microbiol 297 321ndash340
32 TomlinKL CollOP and CeriH (2001) Interspecies biofilms
of Pseudomonas aeruginosa and Burkholderia cepacia Can
J Microbiol 47 949ndash954
33 ViallardV PoirierI CournoyerB et al (1998) Burkholderia
graminis sp nov a rhizospheric Burkholderia species and re-
assessment of [Pseudomonas] phenazinium [Pseudomonas] pyr-
rocinia and [Pseudomonas] glathei as Burkholderia Int J Syst
Bacteriol 48 549ndash563
34 QuyenDT Schmidt-DannertC and SchmidRD (1999)
High-level formation of active Pseudomonas cepacia lipase after
heterologous expression of the encoding gene and its modified
chaperone in Escherichia coli and rapid in vitro refolding Appl
Environ Microbiol 65 787ndash794
35 MoissenetD BingenE ArletG et al (2005) [Use of 16S
rRNA gene sequencing for identification of ldquoPseudomonas-likerdquo
isolates from sputum of patients with cystic fibrosis] Pathol
Biol 53 500ndash502
36 TakahashiHK ToledoMS SuzukiE et al (2009) Current
relevance of fungal and trypanosomatid glycolipids and sphingo-
lipids studies defining structures conspicuously absent in mam-
mals An Acad Bras Cienc 81 477ndash488
37 AguilarD AvilesFX QuerolE et al (2004) Analysis of phe-
netic trees based on metabolic capabilites across the three do-
mains of life J Mol Biol 340 491ndash512
Database Vol 2015 Article ID bav073 Page 21 of 22
at Institute of Organic C
hemistry of the R
ussian Academ
y of Sciences on September 4 2015
httpdatabaseoxfordjournalsorgD
ownloaded from
38 PellegriniM MarcotteEM ThompsonMJ et al (1999)
Assigning protein functions by comparative genome analysis
protein phylogenetic profiles Proc Natl Acad Sci U S A 96
4285ndash4288
39 IhakaR and GentlemanR (1996) R a language for data ana-
lysis and graphics J Comput Graph Stat 5 299ndash314
40 MurtaghF (1984) Complexities of hierarchic clustering algo-
rithms the state of the art Comput Stat Quarter 1 101ndash113
41 SaitouN and NeiM (1987) The neighbor-joining method a
new method for reconstructing phylogenetic trees Mol Biol
Evol 4 406ndash425
42 GascuelO (1997) BIONJ an improved version of the NJ algo-
rithm based on a simple model of sequence data Mol Biol
Evol 14 685ndash695
43 DesperR and GascuelO (2002) Fast and accurate phylogeny
reconstruction algorithms based on the minimum-evolution
principle J Comput Biol 9 687ndash705
44 CriscuoloA and GascuelO (2008) Fast NJ-like algorithms to
deal with incomplete distance matrices BMC Bioinformatics 9
166ndash181
45 GascuelO (2000) Data model and classification by trees
the minimum variance reduction (MVR) method J Classif 17
67ndash99
46 HirayamaJ TazumiA HayashiK et al (2011) A phylogen-
etic comparison of urease-positive thermophilic Campylobacter
(UPTC) and urease-negative (UN) C lari J Basic Microbiol
51 269ndash278
47 DrummondA and RodrigoAG (2000) Reconstructing
genealogies of serial samples under the assumption of a mo-
lecular clock using serial-sample UPGMA Mol Biol Evol
17 1807ndash1815
48 Hong-WenD and Yun-XinF (2000) Counting mutations by
parsimony and estimation of mutation rate variation across nu-
cleotide sitesmdasha simulation study Math Comput Model 32
83ndash95
49 MooiE and SarstedtM (2010) Cluster Analysis A
Concise Guide to Market Research Springer Berlin Heidelberg
pp 237ndash284
50 SalmasoN Naselli-FloresL and PadisakJ (2015) Functional
classifications and their application in phytoplankton ecology
Freshwater Biol 60 603ndash619
51 Gonzalez-FernandezJ RoderoM DaschnerA et al (2014)
New insights into the allergenicity of tropomyosin a bioinfor-
matics approach Mol Biol Rep 41 6509ndash6517
52 NyeTM LioP and GilksWR (2006) A novel algorithm and
web-based tool for comparing two alternative phylogenetic trees
Bioinformatics 22 117ndash119
53 SnelB BorkP and HuynenMA (1999) Genome phylogeny
based on gene content Nat Genet 21 108ndash110
54 WittenbergJB (2007) On optima the case of myoglobin-facili-
tated oxygen diffusion Gene 398 156ndash161
55 ThakurS NormandP DaubinV et al (2013) Contrasted
evolutionary constraints on secreted and non-secreted proteomes of
selected Actinobacteria BMC Genomics 14 474ndash488
56 AndersonMT and SeifertHS (2011) Opportunity and means
horizontal gene transfer from the human host to a bacterial
pathogen mBio 2 e00005ndashe00011
57 LagergardT BolinI and LindholmL (2011) On the
evolution of the sexually transmitted bacteria Haemophilus
ducreyi and Klebsiella granulomatis Ann N Y Acad Sci
1230 E1ndashE10
58 QuastC PruesseE YilmazP et al (2013) The SILVA
ribosomal RNA gene database project improved data processing
and web-based tools Nucleic Acids Res 41 D590ndashD596
59 DereeperA GuignonV BlancG et al (2008) Phylogenyfr
robust phylogenetic analysis for the non-specialist Nucleic
Acids Res 36 W465ndashW469
60 LetunicI and BorkP (2011) Interactive Tree of Life v2 online
annotation and display of phylogenetic trees made easy Nucleic
Acids Res 39 W475ndashW478
61 ParadisE ClaudeJ and StrimmerK (2004) APE Analyses of
Phylogenetics and Evolution in R language Bioinformatics 20
289ndash290
62 LetunicI and BorkP (2007) Interactive Tree Of Life (iTOL) an
online tool for phylogenetic tree display and annotation
Bioinformatics 23 127ndash128
Page 22 of 22 Database Vol 2015 Article ID bav073
at Institute of Organic C
hemistry of the R
ussian Academ
y of Sciences on September 4 2015
httpdatabaseoxfordjournalsorgD
ownloaded from
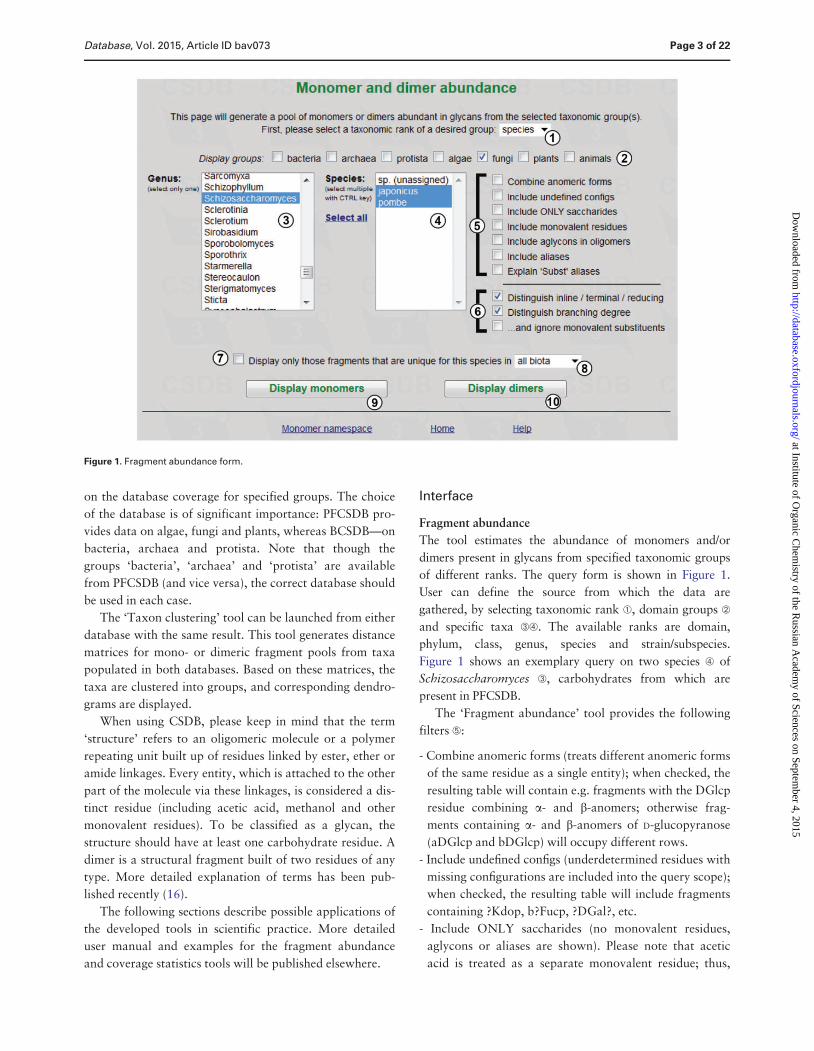
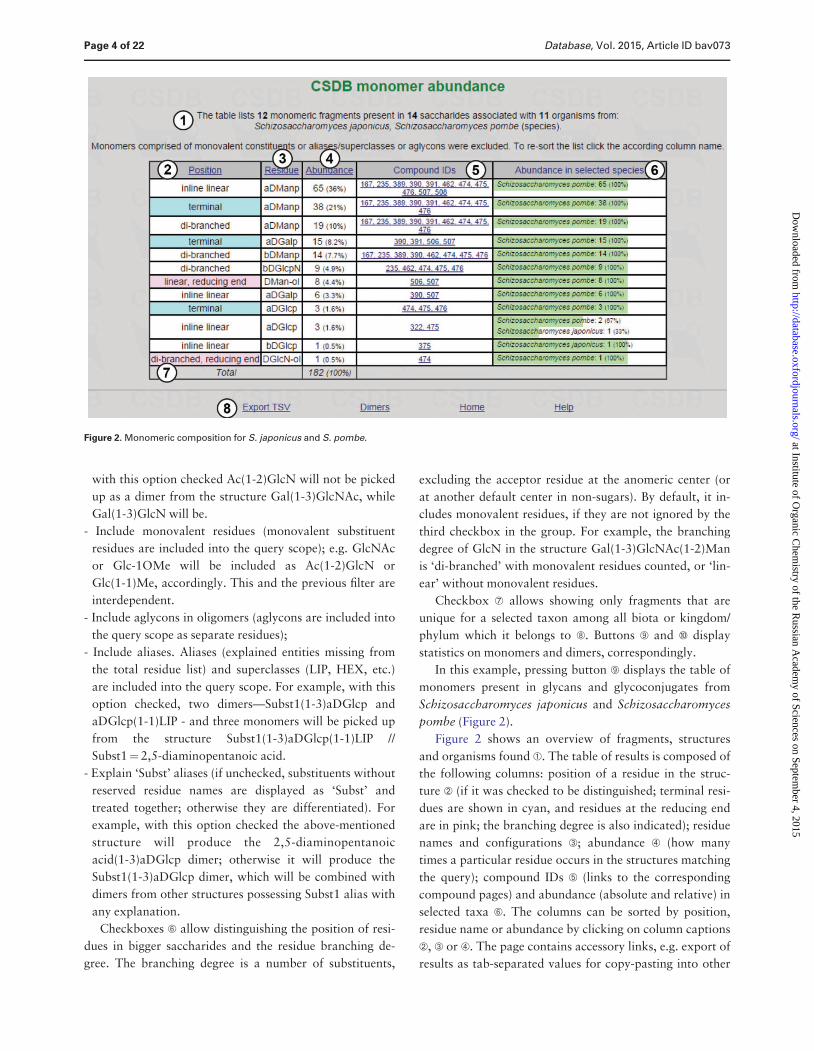
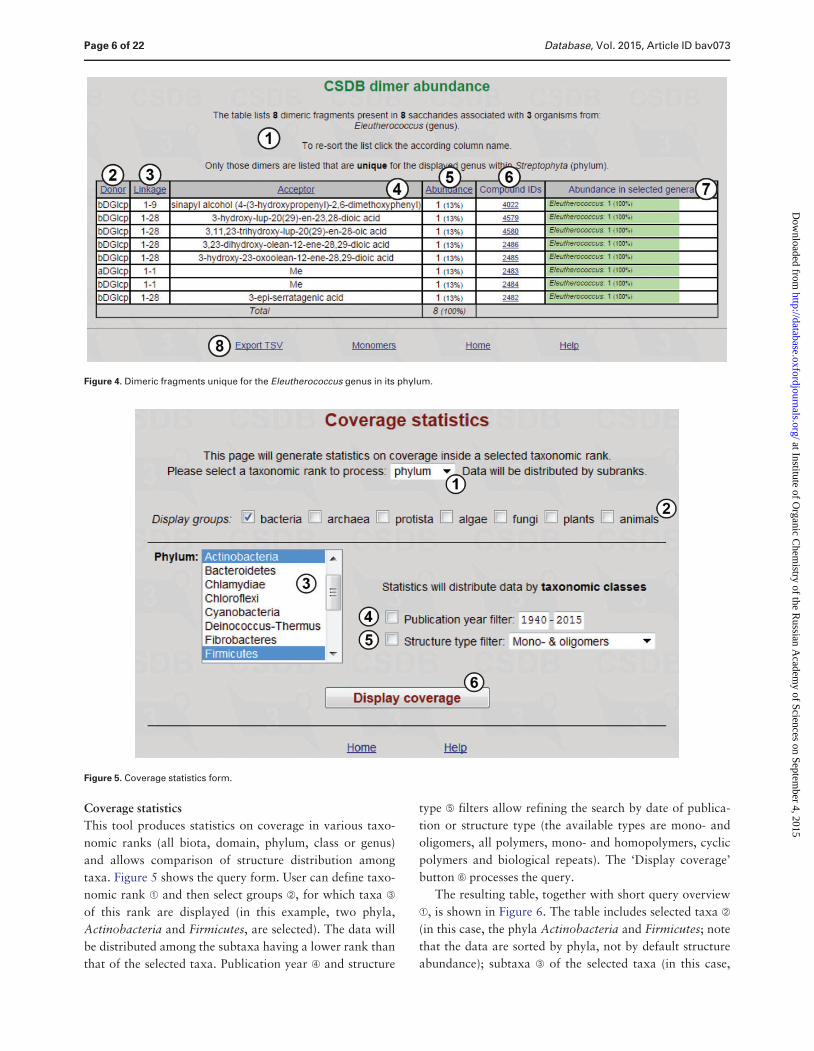
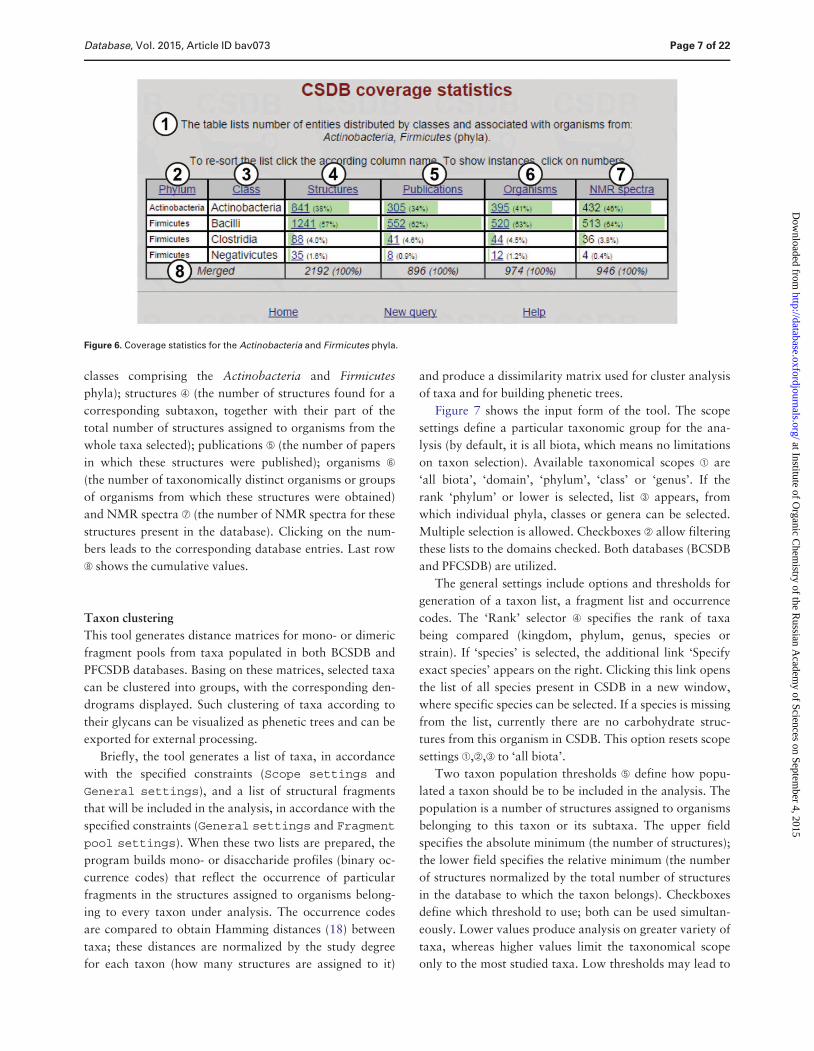
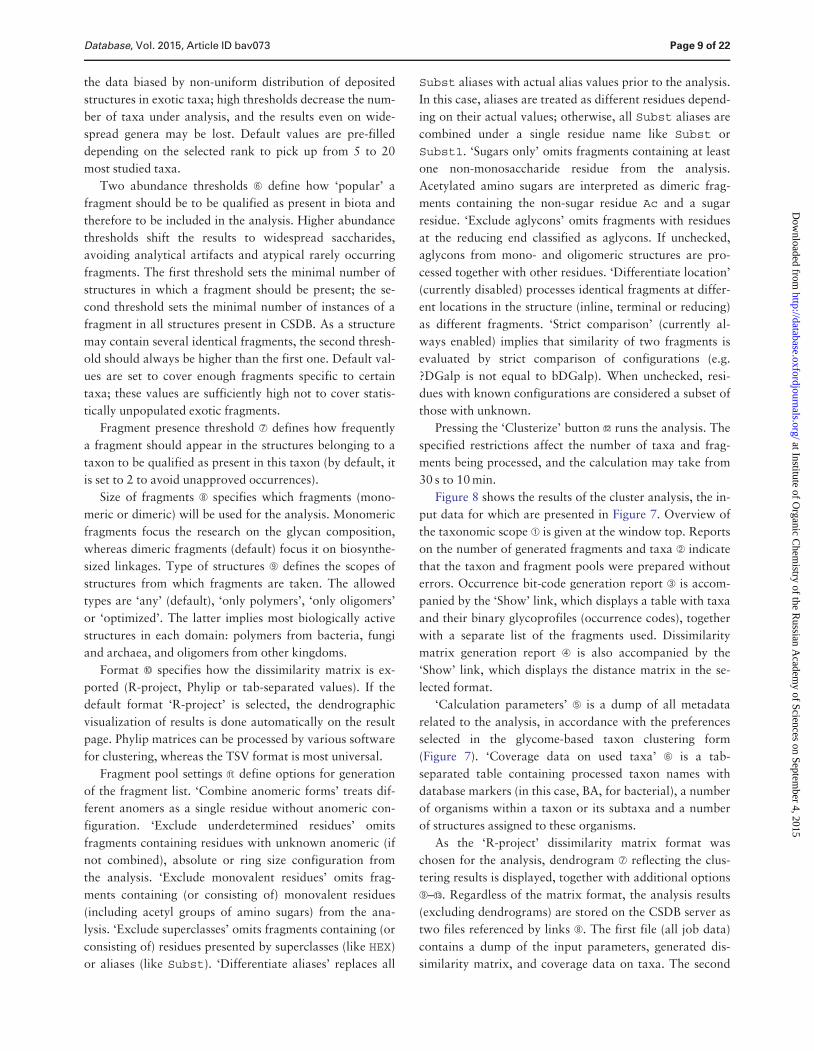
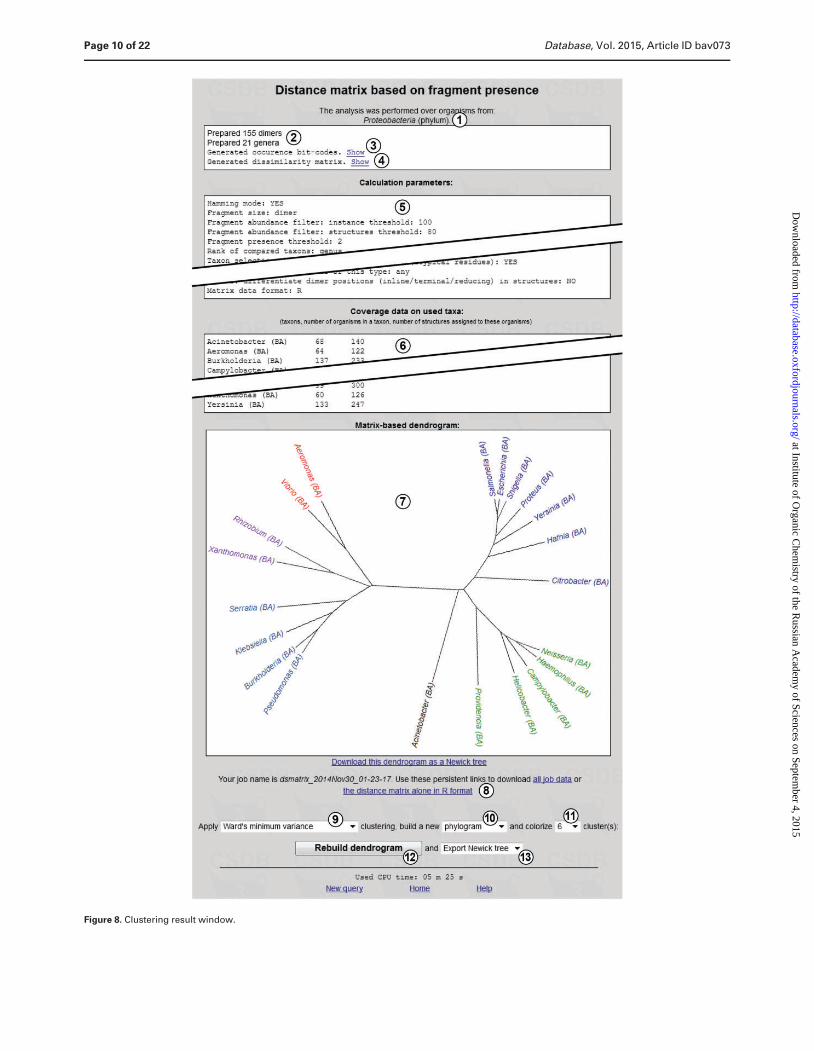
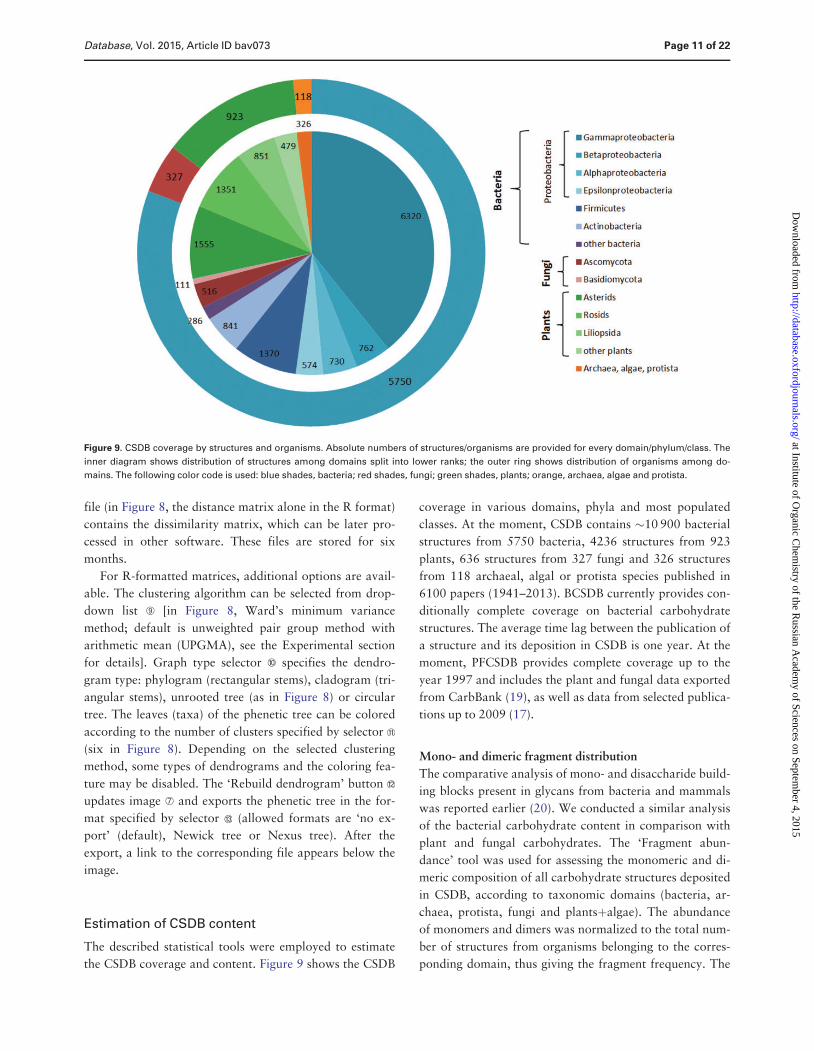
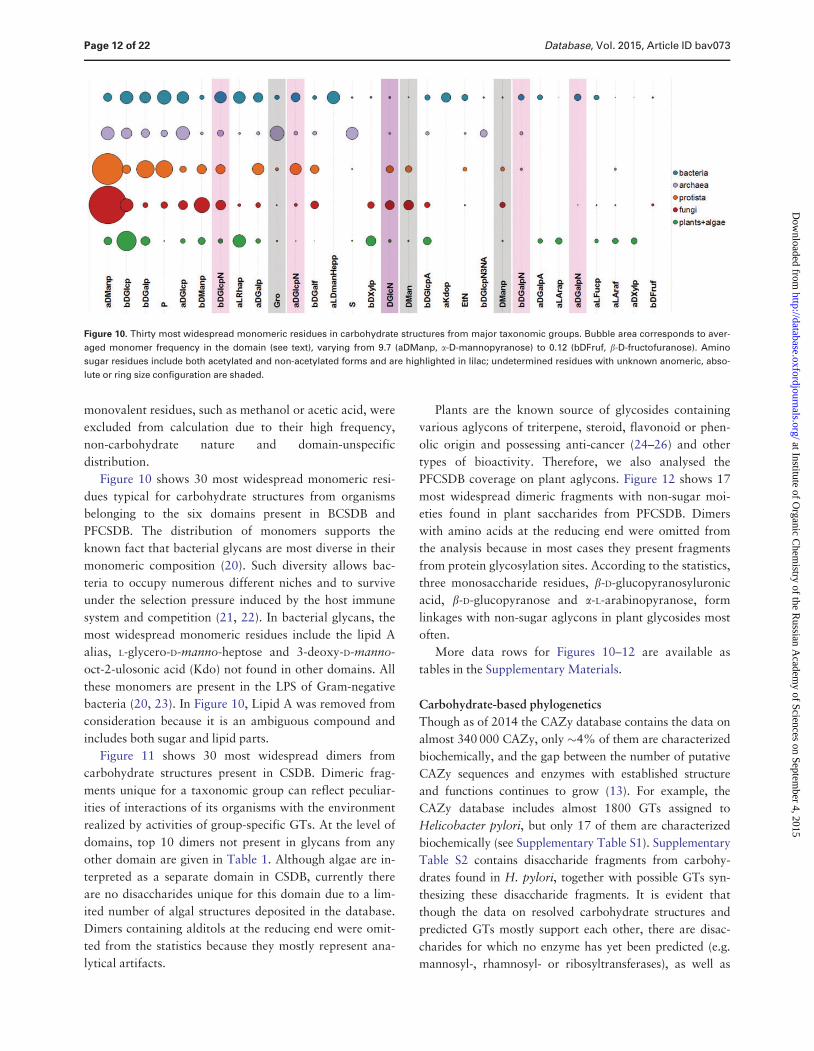
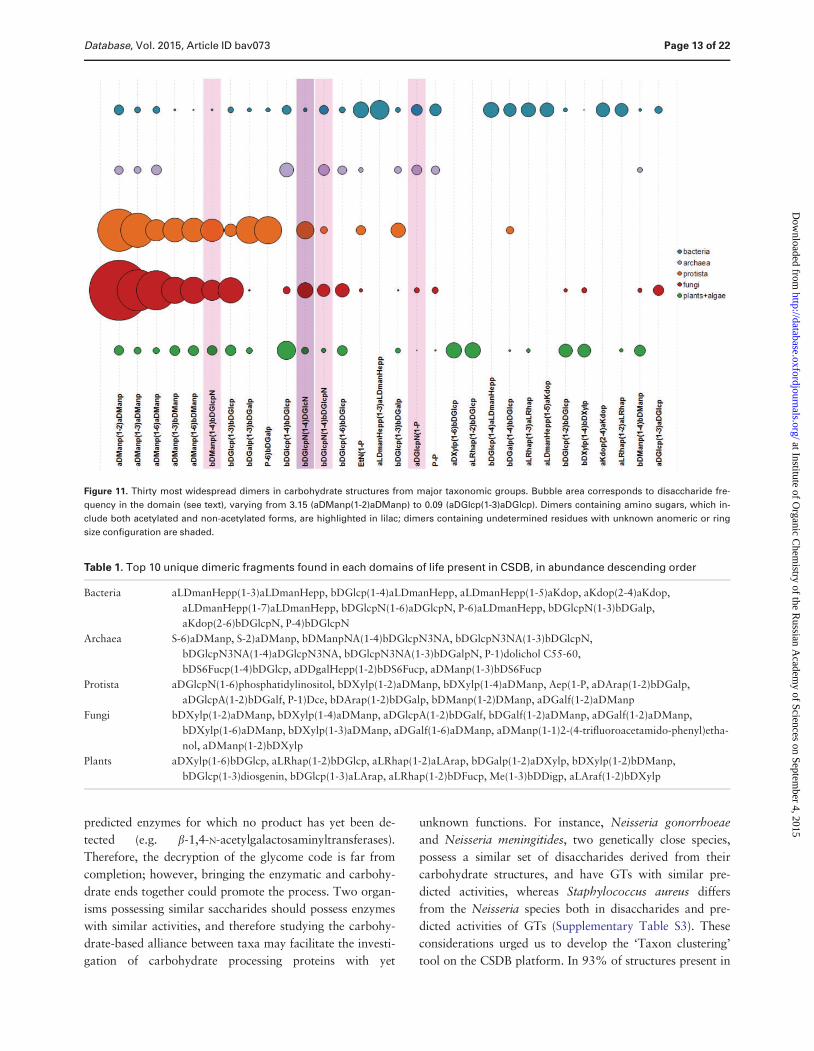
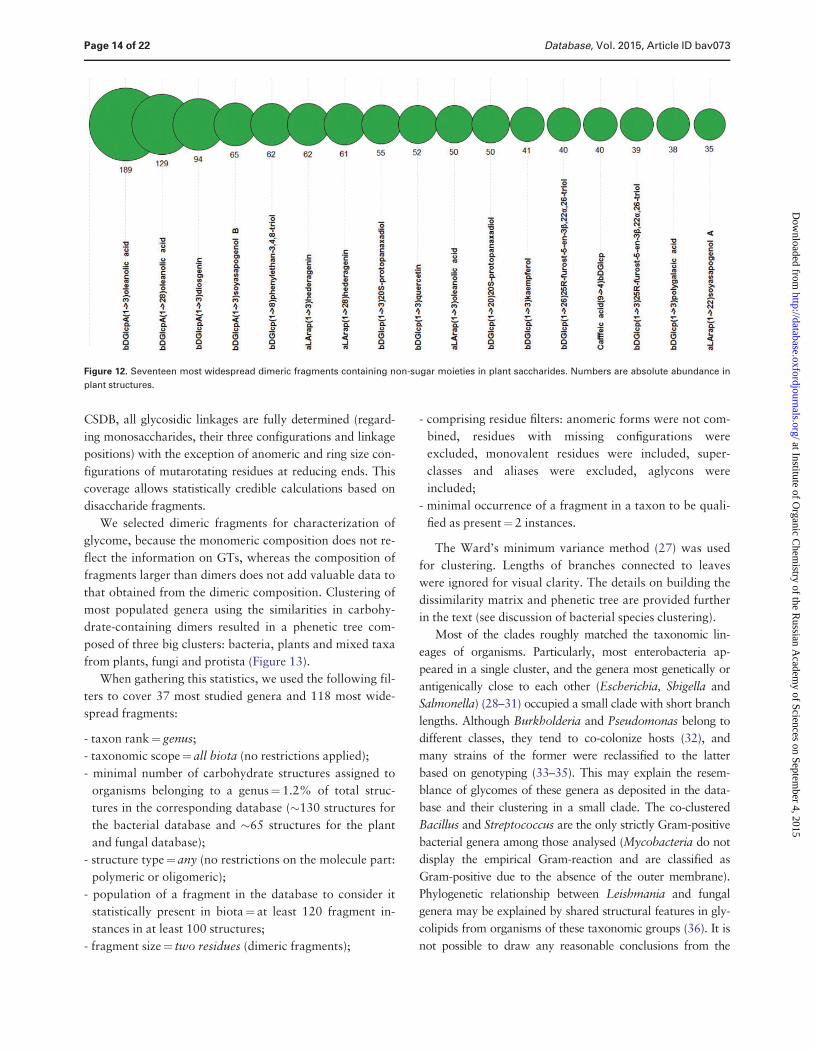
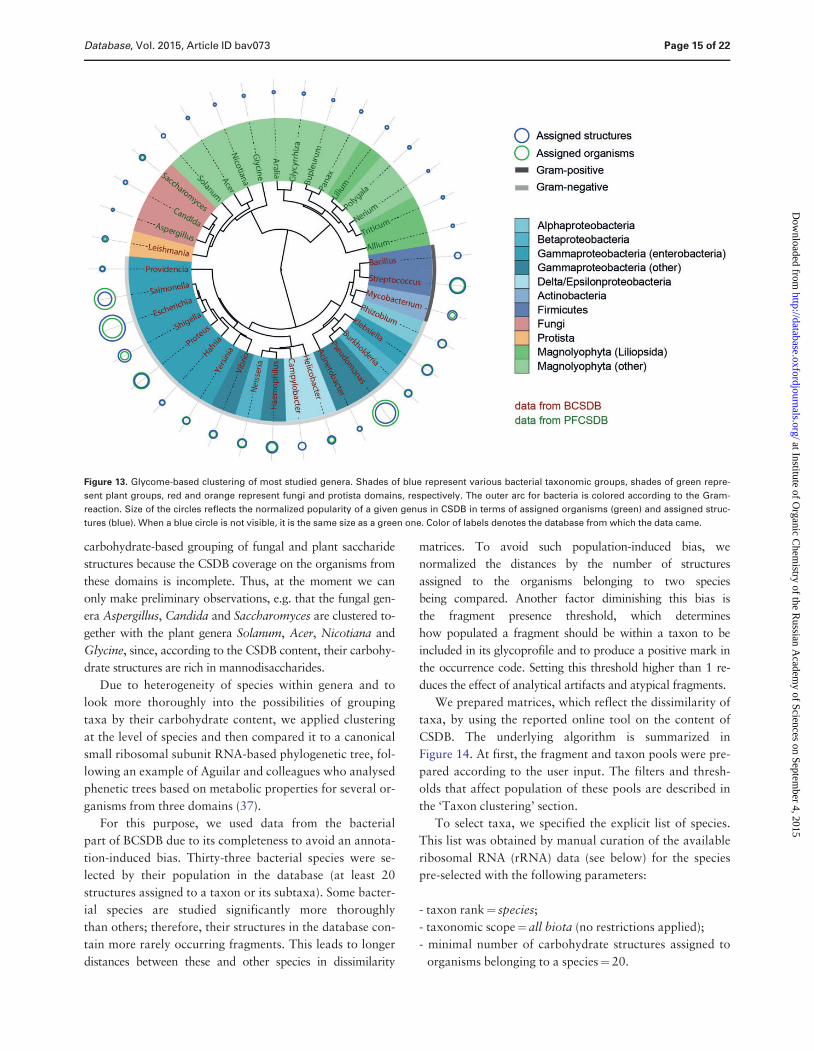
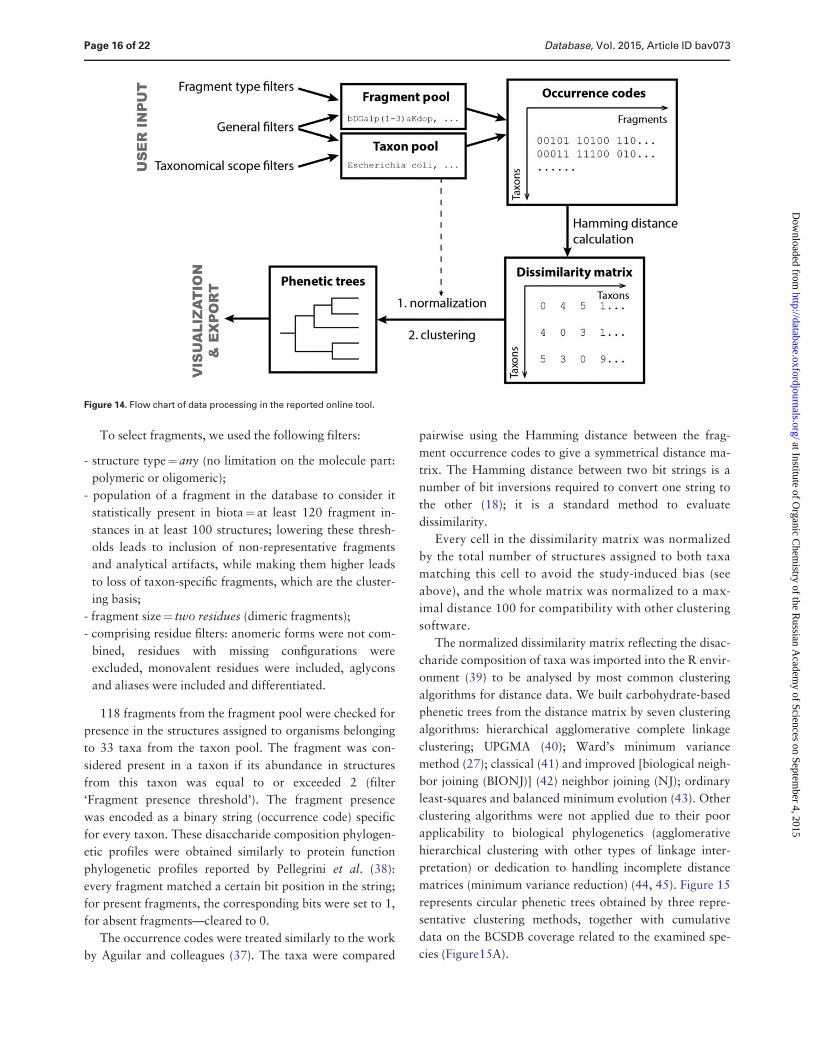