Management of gray mold of chickpea, Botrytis cinerea with bacterial and fungal biopesticides using...
12
QUERY NO. QUERY DETAILS Journal acronym GAPP Manuscript Information Volume/Issue AUTHOR: Please find attached a copy of the proofs of your article. These have been copy-edited and now require your attention. When reviewing your proofs you should: • Answer all queries raised during the editing of your manuscript (see below). • Check for any other factual corrections (NB – only minor changes can be made at this stage; major revisions cannot be accepted). All required corrections should be submitted using the CATS online corrections form. Once you have added ALL query answers and corrections, please press the SUBMIT button. PLEASE NOTE THAT ONCE YOUR CORRECTIONS HAVE BEEN ADDED TO THE ARTICLE, IT WILL BE CONSIDERED READY FOR PUBLICATION. Author name Article Proofs Cover Sheet Manuscript number General Query 1 General Query 2 Please confirm that affiliation details for all authors are present and correct. Please note that with the exception of typographical errors/missing information, we are unable to make changes to authors or affiliations. For clarification, please see http://journalauthors.tandf.co.uk/preparation/writing.asp As an author you are required to secure permission if you want to reproduce any copyrighted material in your article. For further details, please visit http://journalauthors.tandf.co.uk/preparation/permission.asp. Please confirm that: • permission has been sought and granted to reproduce the material in both print and online editions of the journal; and • any required acknowledgements have been included to reflect this. Mujeebur Rahman Khan _A_490403 1 Kindly check whether the article title is OK as edited. 2 Please note that the phrase ‘‘inoculated with P. aphanidermatum or not inoculated’’ seems unclear. Kindly rephrase for clarity. 3 Please check the sentence, ‘‘One millilitre of . . .’’ for sense. 4 The reference citation ‘‘Shane and kowblancky, 1968’’ has been amended to ‘‘Shane and Kowblansky, 1968’’ in accordance with that given in the list. Is this OK? 5 Please check the sentence, ‘‘Standard curve of SA . . .’’ for sense. 6 Please check whether the sentence, ‘‘Chlorophyll a, chlorophyll b . . .’’ is OK as edited. 7 Please check whether the sentence, ‘‘Significant reduction in . . .’’ is OK as edited. 8 Please check whether the sentence, ‘‘Within a few days of . . .’’ is OK as edited 9 Kindly note that the sentence ‘‘The water stress in . . .’’ seems unclear. Please rephrase for clarity.
Transcript of Management of gray mold of chickpea, Botrytis cinerea with bacterial and fungal biopesticides using...

QUERY NO. QUERY DETAILS
Journal acronym GAPP
Manuscript Information
Volume/Issue
AUTHOR: Please find attached a copy of the proofs of your article. These have been copy-edited and now require your attention. When reviewing your proofs you should: • Answer all queries raised during the editing of your manuscript (see below).• Check for any other factual corrections (NB – only minor changes can be made at this stage; major revisions cannot be accepted).
All required corrections should be submitted using the CATS online corrections form. Once you have added ALL query answers and corrections, please press the SUBMIT button.
PLEASE NOTE THAT ONCE YOUR CORRECTIONS HAVE BEEN ADDED TO THE ARTICLE, IT WILL BE CONSIDERED READY FOR PUBLICATION.
Author name
Article Proofs Cover Sheet
Manuscript number
GeneralQuery 1
GeneralQuery 2
Please confirm that affiliation details for all authors are present and correct.Please note that with the exception of typographical errors/missing information, we are unable to make changes to authors or affiliations. For clarification, please see http://journalauthors.tandf.co.uk/preparation/writing.asp
As an author you are required to secure permission if you want to reproduce any copyrighted material in your article. For further details, please visit http://journalauthors.tandf.co.uk/preparation/permission.asp. Please confirm that: • permission has been sought and granted to reproduce the material in both print and online editions of the journal; and• any required acknowledgements have been included to reflect this.
Mujeebur Rahman Khan
_A_490403
1 Kindly check whether the article title is OK as edited.
2 Please note that the phrase ‘‘inoculated with P. aphanidermatum or not
inoculated’’ seems unclear. Kindly rephrase for clarity.
3 Please check the sentence, ‘‘One millilitre of . . .’’ for sense.
4 The reference citation ‘‘Shane and kowblancky, 1968’’ has been amended to
‘‘Shane and Kowblansky, 1968’’ in accordance with that given in the list. Is
this OK?
5 Please check the sentence, ‘‘Standard curve of SA . . .’’ for sense.
6 Please check whether the sentence, ‘‘Chlorophyll a, chlorophyll b . . .’’ is OK as
edited.
7 Please check whether the sentence, ‘‘Significant reduction in . . .’’ is OK as
edited.
8 Please check whether the sentence, ‘‘Within a few days of . . .’’ is OK as edited
9 Kindly note that the sentence ‘‘The water stress in . . .’’ seems unclear. Please
rephrase for clarity.

Morphological and biochemical responses of selected germplasm of
tobacco to soil inoculation with Pythium aphanidermatum 1
Mujeebur Rahman Khan*, Ziaul Haque, M. Arshad Anwer and M. Mahmud Khan
Department of Plant Protection, Faculty of Agricultural Sciences, Aligarh Muslim University,Aligarh 202002, India
(Received 5 January 2010; final version received 10 April 2010)
The effect of inoculation with Pythium aphanidermatum was studied on totalphenol (TP), salicylic acid (SA), chlorophylls and carotenoid contents of leavesand plant growth characteristics of five tobacco cultivars, namely RK-10 P3,RK-12 P3, RK-13 P4, RK-18 P8 and RK-26 P3, to assess cultivar response atbiochemical and morphological levels. Root rot measured at 0–5 scale was 2.66on cv. RK-10 P3, followed by 2. 33 on cv. RK-18 P8, 1.33 on cv. RK-26 P3 and1.0 on cv. RK-13 P4. The cv. RK-12 P3 did not develop measurable root rot. Therhizosphere population of root rot fungus increased over time, being highest onthe cv. RK-10 P3 (P� 0.001), followed by cvs. RK-18 P8, RK-26 P3, RK-13 P4and RK-12 P3. Inoculation with the fungus resulted in 5% (cv. RK-10 P3), 10.3%(cv. RK-18 P8, P� 0.05), 10.9% (cv. RK-26 P3, P� 0.05), 16.4% (cv. RK-13 P4,P� 0.01) and 41.5% (cv. RK-12 P3, P� 0.001) increase in the TP content ofleaves. SA concentration in tobacco leaves increased marginally (0.8%–3%) incvs. RK-10 P3, RK-18 P8 and RK-26 P3, but considerably (16%–17%, P� 0.01)in cv. RK-13 and RK-12 P3 in comparison to uninoculated plants. Totalchlorophyll content of leaves in response to inoculation with P. aphanidermatumdecreased by 27% and 23% in tobacco cvs. RK-10 P3 and RK-18 P8 (P� 0.001)and 17.6 (P� 0.01) and 10.6% (P� 0.05) in cv. RK-26 P3 and RK-13 P4,respectively. Reduction in chlorophylls a and b was 20% and 15% in cv. RK-10P3 and 20% and 11% in cv. RK-18 P8. Total carotenoid contents of tobaccoleaves decreased significantly in cvs. RK-10 P3 and RK-18 P8 (P� 0.05).Significant and greater decrease in plant growth variables was recorded in thecultivars in which increase in TP and SA was lower and decrease in chlorophylland carotenoids was greater. This study has revealed that greater synthesis ofTP and SA may provide resistance in tobacco plants against P. aphanidermatum.The cv. RK-12 P3, in which greatest increase in the SA (17%) and TP (41.5%)was recorded, did not exhibit a significant decrease in plant growth variables andleaf pigments (P� 0.05).
Keywords: root rot; salicylic acid; total phenol; chlorophylls; carotenoids;tobacco; plant dry weight
Introduction
Tobacco is a high-value nonfood cash crop and is widely grown throughout theworld including India (Shepherd and Barker 1990). The crop is regularly attacked bypathogens from seed sowing until the time it is fashioned in to tobacco products.
5
10
15
20
25
30
35
40
45
*Corresponding author. Email: [email protected]
CE: DN PG: chinnapillaip 9/3/11 13:31 2008 – Style 1 (B5) GAPP_A_490403 (XML) RefSty-(C CSE name-year)
Archives of Phytopathology and Plant Protection
Vol. 00, No. 0, Month 2011, 1–11
ISSN 0323-5408 print/ISSN 1477-2906 online
� 2011 Taylor & Francis
DOI: 10.1080/03235408.2010.490403
http://www.informaworld.com

Pythium aphanidermatum is an important pathogen of tobacco throughout the worldand causes considerable damage to the crop (Martin and Loper 1999). The Pythiuminfection takes on many different forms in tobacco. The fungus causes dampingoff in nursery beds and root rot in the fields, especially during prolonged wetconditions and in poorly aerated soils (Chase 1999). The infected plants stopgrowing, and the leaves fade to a pale yellow (Lucos 1975; William 2003). Plantsreact to pathogen attack through a variety of active and passive defence mechanisms(Garcia et al. 2001). As soon as the plant detects the presence of the invading micro-organism, one or more defence mechanisms can be triggered to restrict the growthof the pathogen, and ultimately, it is destroyed (Dixon et al. 1994). Phenoliccompounds and salicylic acid (SA) are among the most influential and widelydistributed secondary products in the plant body and lay a completely differentaction in the defence of plants against pathogen attack (Nicholson andHammerschmidt 1992; Takahama and Oniki 1992). In general, these compounds,namely phenolic acids and SA, are present in a very low concentration in healthyplants. However, upon infection with pathogens, their concentration increasesconsiderably. In incompatible interactions, the accumulation of these compounds isrestricted to a few cells in the close vicinity of the invading pathogen, accompanyinghypersensitive response, which results in necrosis of both plant cell and pathogen,thus preventing further proliferation of the pathogens (Staskawicz et al. 1992).However, the severity of infection and the defence mechanism vary with the cultivar.In view of the essential roles of phenolic compounds and SA in the developmentof pathogen resistance in plants, the present study was undertaken to evaluate theresponse of some tobacco cultivars to P. aphanidermatum with regard tobiochemical parameters, namely total phenol (TP), SA, chlorophylls and carotenoidcontent, and morphological characteristics, namely root rot index, soil population,plant growth and biomass.
Materials and methods
Germplasm of tobacco
The germplasm of tobacco (Nicotianum tobaccum L.) consisting of five cultivars,namely RK-10 P3, RK-12 P3, RK-13 P4, RK-18 P8 and RK-26 P3, was procuredfrom the Central Tobacco Research Institute, Rajahmundry, Andhra Pradesh, India.
Preparation of fungal inoculum
Pure culture of P. aphanidermatum (Edson) Fitzp was procured from the Division ofMycology and Plant Pathology, Indian Agricultural Research Institute, New Delhi.Inoculum of the fungus was prepared on sorghum grains. For inoculation, a knownweight of fungus-colonised sorghum seeds were grinded with distilled water in anelectric grinder and standardised to 2 g seeds/10 ml.
Plant culture
Clay pots (15 cm in diameter) filled with 1 kg of soil and compost (in the ratio 3:1)were autoclaved at 15 kg/cm2 for 15–20 min. Before planting of tobacco seedling,10 ml of fungal suspension (containing 2 g of colonised seeds/pot) was added to thetop soil of the pot. A day later, three to four leaved seedlings (4-week old) of tobacco
50
55
60
65
70
75
80
85
90
95
2 M.R. Khan et al.
cultivars were transplanted in pots (1 seedling/pot). Ten replicates were maintainedfor each treatment; plants from five pots were used for biochemical analysis andremaining five for plant growth variables. Plants were arranged in a completelyrandomised design on a roof receiving uniform sunlight. Plants were grown for4 months. During this period, they were regularly observed for any visible symptomattributable to the pathogen. At harvest, four months after inoculation, plants wereflooded with water to facilitate root recovery, and root rot (0–5 scale), rhizospherepopulation of the fungus, length and fresh and dry weight of plants (excluding root)were determined. The dry weights were determined by drying the plants in a hot airoven at 608C for 2 days. Estimation of leaf pigments, TP contents and SA was doneafter 15 days of inoculation from another set of pots.
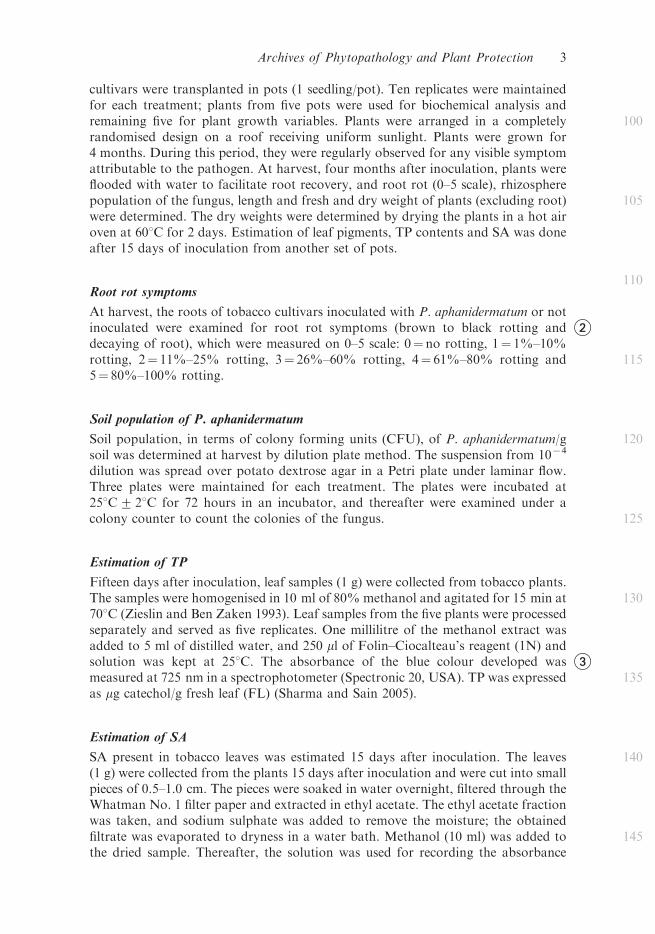
Root rot symptoms
At harvest, the roots of tobacco cultivars inoculated with P. aphanidermatum or notinoculated 2were examined for root rot symptoms (brown to black rotting anddecaying of root), which were measured on 0–5 scale: 0¼ no rotting, 1¼ 1%–10%rotting, 2¼ 11%–25% rotting, 3¼ 26%–60% rotting, 4¼ 61%–80% rotting and5¼ 80%–100% rotting.
Soil population of P. aphanidermatum
Soil population, in terms of colony forming units (CFU), of P. aphanidermatum/gsoil was determined at harvest by dilution plate method. The suspension from 1074
dilution was spread over potato dextrose agar in a Petri plate under laminar flow.Three plates were maintained for each treatment. The plates were incubated at258C+ 28C for 72 hours in an incubator, and thereafter were examined under acolony counter to count the colonies of the fungus.
Estimation of TP
Fifteen days after inoculation, leaf samples (1 g) were collected from tobacco plants.The samples were homogenised in 10 ml of 80% methanol and agitated for 15 min at708C (Zieslin and Ben Zaken 1993). Leaf samples from the five plants were processedseparately and served as five replicates. One millilitre of the methanol extract wasadded to 5 ml of distilled water, and 250 ml of Folin–Ciocalteau’s reagent (1N) andsolution was kept at 258C 3. The absorbance of the blue colour developed wasmeasured at 725 nm in a spectrophotometer (Spectronic 20, USA). TP was expressedas mg catechol/g fresh leaf (FL) (Sharma and Sain 2005).
Estimation of SA
SA present in tobacco leaves was estimated 15 days after inoculation. The leaves(1 g) were collected from the plants 15 days after inoculation and were cut into smallpieces of 0.5–1.0 cm. The pieces were soaked in water overnight, filtered through theWhatman No. 1 filter paper and extracted in ethyl acetate. The ethyl acetate fractionwas taken, and sodium sulphate was added to remove the moisture; the obtainedfiltrate was evaporated to dryness in a water bath. Methanol (10 ml) was added tothe dried sample. Thereafter, the solution was used for recording the absorbance
100
105
110
115
120
125
130
135
140
145
Archives of Phytopathology and Plant Protection 3

at 306 nm in a spectrophotometer (Shimadzu, 2450 PC; Japan) (Shane andKowblansky4 1968). Standard curve of SA was prepared by making SA solution ofdifferent concentrations in methanol (0, 10, 20, 30, 40, 50 and 100 ppm)5 . Absorbanceat 306 nm of different concentrations of SA (ppm) was read in the spectro-photometer. The standard curve was prepared by plotting the absorbance data,and the best-fit line passing through the origin was drawn. From the standard curve,the concentration of SA in the sample was calculated according to the formulay¼mx+ c (Lowery et al. 1951).
Estimation of leaf pigments
Chlorophyll a, chlorophyll b and total chlorophyll were estimated by grinding 1 gof fresh leaves from interveinal areas of 15-day old tobacco plants in 40 ml of 80%acetone with the help of mortar and pestle. The suspension was decanted in aBuchner funnel having two Whatman No.1 filter papers. The filtration was donewith the help of suction pump. The residue was ground thrice by adding acetone.The suspension was then decanted in the Buchner funnel and filtered by a vacuumpump. At last, mortar and pestle were rinsed with acetone, and the solution wastransferred in a Buchner funnel and filtered. The filtrate was transferred to a 100 mlvolumetric flask, and the volume was made up to the capacity by adding acetone.The optical density of the filtrate was read using a spectrophotometer (Spectronic20, USA) at 470 nm for carotenoid and 645 and 663 nm for chlorophylls.Chlorophyll a, chlorophyll b, total chlorophyll (Arnon 1949) and carotenoidcontents (Maclachlan and Zalik 1963) were calculated using the aforementionedformula.6
Statistical analysis
The experiment was conducted during two consecutive years. The data obtainedduring the two years were statistically identical; hence, the results are based on theexperiment conducted during the second year because during second year,experiments were performed with greater preciseness and perfection gained due tothe experience of the first year. All data were subjected to analysis of variance(ANOVA) using MINITAB 7.0 software for Windows XP. Means were thenseparated using the least significant difference (LSD) test at P� 0.05, 0.001 and0.001. The F-values were calculated and compared with the table value at P� 0.05,0.01 and 0.001. Root rot indices were regressed over selected morphological andbiochemical characteristics of tobacco cultivars, and correlation coefficients werecalculated.
Results
Symptoms of root rot
Tobacco plants inoculated with 2 g culture of P. aphanidermatum exhibited stuntedgrowth and mild yellowing of foliage. Characteristic root rots developed, and theaffected root or part turned dark brown to black. The root rot measured on 0–5 scalewas 2.66 on cv. RK-10 P3, followed by 2. 33 on cv. RK-18 P8, 1.33 on cv. RK-26 P3and 1.0 on cv. RK-13 P4. The cv. RK-12 P3 did not develop measurable root rot(Table 1). F-value for root rot index was significant at P� 0.01 (Table 1).
150
155
160
165
170
175
180
185
190
195
4 M.R. Khan et al.

200
205
210
215
220
225
230
235
240
Table
1.
Effects
ofinoculationwithP.aphanidermatum
onlength,freshweight,dry
weightofshootandrootoftobaccocultivars
andonroot-rotand
soilpopulationofthefungus.
Tobacco
cultivars
Inoculation
level
(g/pot)
Rootrot
index
(0–5scale)
Soilpopulation
(103CFU/kg)
Plantlength
(cm)
Fresh
weight(g)
Dry
weight(g)
Shoot
Root
Shoot
Root
Shoot
Root
RK-10P3
0.0
0.00
0.00
55.3
18.1
58.5
15.0
10.0
3.15
2.0
2.66
5600
50.6**
16.4***
49.0**
14.1**
8.9**
2.50***
RK-18P8
0.0
0.00
0.00
60.8
23.9
52.3
16.1
10.7
2.24
2.0
2.33
5400
56.5*
21.6**
44.7**
15.4*
9.9*
2.05*
RK-26P3
0.0
0.00
0.00
32.1
18.1
32.4
20.9
5.5
3.45
2.0
1.33
2264
29.5*
16.5*
27.8**
19.7
5.1
3.25
RK-13P4
0.0
0.00
0.00
41.4
20.0
43.9
15.3
8.2
2.60
2.0
1.00
2018
38.9
17.9*
39.4*
14.8
7.9
2.45
RK-12P3
0.0
0.00
0.00
46.8
16.2
49.4
13.0
10.3
2.80
2.0
0.33
63
46.3
16.1
49.0
13.0
10.2
2.75
LSD
P�0.05
0.876
0.595
6.700
2.829
4.599
1.282
0.505
0.348
P�0.01
1.278
0.868
9.189
3.879
6.307
1.758
0.693
0.477
P�0.001
1.916
1.302
12.508
5.281
5.585
2.394
0.943
0.649
F-value
cvs.(df¼4)
12.77b
181.31c
46.77c
18.62c
70.20c
82.07c
54.4
c27.69c
Fungus(df¼1)
––
NS
6.31a
NS
30.44b
4.74a
12.09b
cvs.6
fungus(df¼4)
––
NS
NS
NS
2.97a
NS
NS
Note:Each
valueisthemeanofthreereplicates.Values
followed
by*(P�0.05),**(P�0.01)and***(P�0.001)are
significantlydifferentfrom
thecontrol(uninoculated),
otherwisenotsignificant(N
S)atP�0.05.F-values
followed
by
a(P�0.05),
b(P�0.01)and
c(P�0.001)are
significant,otherwiseNSatP�0.05.
Archives of Phytopathology and Plant Protection 5

Rhizosphere population
Rhizosphere population of P. aphanidermatum was monitored at harvest, fourmonths after inoculation. The population of root rot fungus increased over time,highest population was recorded in the root zone of tobacco cv. RK-10 P3, followedby cvs. RK-18 P8, RK-26 P3, RK-13 P4 and RK-12 P3 (Table 1). F-values forrhizosphere population was highly significant at P� 0.001 (Table 1).
Plant growth and biomass
Inoculation with the root rot fungus P. aphanidermatum resulted in significantsuppression in the length, fresh weight and dry weight of root and shoot of tobaccocvs. RK-10 P3 (P� 0.01 and P� 0.001) and RK-18 P8 (P� 0.05 and P� 0.01) incomparison to controls (Table 1). The per cent decrease in the variables consideredwas 11%–20% and 7%–15% in cvs. RK-10 P3 and RK-18 P8, respectively.Significant reduction in shoot and root length and fresh weight of shoot in the cv.RK-26 P3 was recorded at P� 0.05 over the control7 . The root length and freshweight of shoot of the cv. RK-13 P4 also decreased (P� 0.05). The cv. RK-12 P3 didnot exhibit significant decrease in any plant growth and biomass variable at P� 0.05.ANOVA has revealed significant F-values of length, fresh and dry weight of shootand root for cultivars at P� 0.001, where F-value of fungus was significant for rootvariables (P� 0.05 or 0.01) and shoot dry weight (P� 0.05). F-value for interactiveeffects was significant only for fresh root weight (P� 0.05, Table 1).
TP and SA contents of leaf
TP content of leaves of P. aphanidermatum-inoculated plants increased by 5%(cv. RK-10 P3), 10.3% (cv. RK-18 P8, P� 0.05), 10.9% (cv. RK-26 P3, P� 0.05),16.4% (cv. RK-13 P4, P� 0.01) and 41.5% (cv. RK-12 P3, P� 0.001) in comparisonto controls (Table 2). Due to inoculation with P. aphanidermatum, SA content intobacco leaves increased marginally (0.8%–3%) in cvs. RK-10 P3, RK-18 P8 andRK-26 P3, but considerably (16%–17%, P� 0.01) in cvs. RK-13 and RK-12 P3 overuninoculated plants (controls) (P� 0.01, Table 2). F-values of all three sources forSA were significant at P� 0.001, but the value was highest for fungus, followed bycultivars, and lowest for the interaction (Table 2). Same trend was observed for TP,with significant F-value of interaction at P� 0.05.
Chlorophylls and carotenoid contents of leaves
Total chlorophyll content of leaves in response to inoculation with P. aphaniderma-tum decreased by 27% and 23% in tobacco cvs. RK-10 P3 and RK-18 P8 overuninoculated plants, respectively (P� 0.001). Reduction in chlorophylls a and b was20% and 15% for cv. RK-10 P3 and 20% and 11% for cv. RK-18 P8 (Table 2). Incvs. RK-26 P3 and RK-13 P4, the total chlorophyll reduced by 17.6% (P� 0.01) and10.6% (P� 0.05), respectively, whereas in cv. RK-12 P3, a significant reduction wasnot recorded at P� 0.05 (Table 2). The carotenoid contents of tobacco leaves of allfive cultivars decreased in a way similar to total chlorophyll (Table 2). Highestdecrease in carotenoids was observed in cv. RK-10 P3 (9.7%, P� 0.05), followed bycvs. RK-18 P8 (8.6%, P� 0.05), RK-26 P3 (6.2%), RK-13 P4 (4.5%) and RK-12 P3
250-
255
260
265
270
275
280
285
290
6 M.R. Khan et al.

295
300
305
310
315
320
325
330
335
340
Table
2.
Effects
ofinoculationwithP.aphanidermatum
ontheleafpigments,SA,TPper
gFL
oftobaccocultivars.
Tobacco
cultivars
Inoculation
level
(g/pot)
TP(mg
catecholg7
1FL)
SA
(ppm/g
FL)
Chlorophyll
a(m
g/g
FL)
Chlorophyll
b(m
g/g
FL)
Total
chlorophyll
(mg/g
FL)
Carotenoids
(mg/g
FL)
RK-10P3
0.0
76.5
13.46
1.002
0.989
1.991
0.134
2.0
81.5
13.57
0.798***
0.840***
1.461***
0.121*
RK-18P8
0.0
96.5
13.55
1.041
0.554
1.594
0.139
2.0
106.5*
13.74
0.834***
0.493*
1.227***
0.127*
RK-26P3
0.0
91.5
14.20
1.028
0.999
2.027
0.128
2.0
101.5*
14.94
0.869*
0.802**
1.669*
0.120
RK-13P4
0.0
91.5
13.79
0.799
0.731
1.530
0.131
2.0
106.5**
15.90**
0.717*
0.658*
1.376
0.125
RK-12P3
0.0
96.5
14.44
0.895
0.802
1.710
0.123
2.0
136.5***
16.93**
0.874
0.794
1.640
0.122
LSD
P�0.05
9.0869
1.0893
0.1067
0.1446
0.1549
0.0153
P�0.01
12.4620
1.6683
0.1464
0.1983
0.1225
0.0210
P�0.001
16.9622
2.3068
0.1993
0.2700
0.2892
0.0286
F-value
cvs.(df¼4)
22.18c
227.23c
5.27b
NS
28.09c
NS
Fungus(df¼1)
42.70c
419.56c
15.43b
NS
103.24c
6.00a
cvs.6
fungus(df¼4)
5.94b
79.58c
NS
NS
3.42a
NS
Note:Each
valueisthemeanofthreereplicates.Values
followed
by*(P�0.05),**(P�0.01)and***(P�0.001)are
significantlydifferentfrom
thecontrol(uninoculated),
otherwisenotsignificantatP�0.05.F-values
followed
by
a(P�0.05),
b(P�0.01)and
c(P�0.001)are
significant,otherwisenotsignificant(N
S)atP�0.05.
Archives of Phytopathology and Plant Protection 7
(0.8%). Overall effect of the fungus inoculation and cultivars was significant for totalchlorophyll (P� 0.001) and chlorophyll a (P� 0.01); effect of fungus was alsosignificant for carotenoids (P� 0.05). Interactive effect was significant for only totalchlorophyll (P� 0.05, Table 2).
Discussions
The tobacco cultivars inoculated with 2 g culture of P. aphanidermatum exhibitedstunted growth, mild yellowing of leaves and rotting of roots. The blackeneddiscolouration of roots observed in tobacco cvs. RK-10 P3, RK-18 P8, RK-26 P3and RK-13 P4, in particular, due to infection with P. aphanidermatum has also beenobserved on other tobacco cultivars (Ahmed et al. 2008). Roots of susceptiblecultivars turn dark brown (Oluma and Oladiran 1993; William 2003). Prominentroot rot developed on the cvs. RK-10 P3 and RK-18 P8 has indicated theirsusceptibility to the pathogen. Pythium species are soil inhabitants, where theysubsist as saprophyte or facultative parasite on roots or decaying organic matters(Lucos 1975). P. aphanidermatum multiplies rapidly in soil, especially in the rootzone of susceptible plants. Root exudates of actively growing susceptible plantsstimulate germination of oospores and sporangia (Stanghellini and Hancock 1971).Highest soil population of the fungus was recorded on the cv. RK-10 P3, whichexhibited that greatest root rot was apparently due to the stimulatory effects of theroot exudates of the cultivars.
The fungus infection resulted in significant suppression of the plant growth anddry matter production of tobacco cvs. RK-10 P3 and RK-18 P8. Within a few daysof inoculation, the affected roots, parts, tissues or all become water soaked, losecohesion and frequently develop a wet rot due to the action of pectolytic andcellulolytic enzymes secreted by the fungus (Chase 1999)8 . The rotting disintegratesthe internal tissues of the main root and impairs the ability of roots to absorb waterand minerals, as a result, progressive decline of the aerial growth occurs (Oluma andOladiran 1993), and ultimately the growth and biomass of the plants are reduced asobserved in the present investigation. Correlation analysis has also revealed positivelinear relationship between root rot index and per cent decrease, indicating that anincrease in the root rot directly impaired vital physiological functions such asabsorption of water, minerals, etc. and CO2 assimilation, which led to subsequentdecrease in the dry matter production as occurred in tobacco cultivars (Figure 1).
Chlorophylls are considered the basic unit for photosynthesis as these pigmentsabsorb light and transfer energy to cell organelles for CO2 fixation (Wallace 1987).On susceptible cultivars, mild yellowing of leaves was observed, which pronouncedgradually with the advancement of plants’ age. At 3–4 month of age, entire foliage ofsusceptible cultivars, as in RK-10 P3, became discernibly yellowish, whereas thefoliage of resistant cultivars, especially RK-13 P4, remained normal and healthy. Thechlorophyll pigments were found to be highly sensitive to alternation in hostphysiology induced by P. aphanidermatum. The water stress in plant body resultingdue to decay and loss root caused by the pathogen, chlorophyll and carotenoidsmolecules might have get denatured consequently their leaf contents were reduced,subsequently photosynthetic activity of plants decreased and reflected into a lowerbiomass production (Khan and Khan 1987)9 . Correlation analysis has shown a linearnegative relationship between leaf pigments and disease severity, where increase inthe root rot index resulted to a corresponding decrease in the chlorophyll and
345
350
355
360
365
370
375
380
385
390
8 M.R. Khan et al.

carotenoid contents of the leaves (Figure 1). Decrease in the chlorophylls andcarotenoids resulted in a lower assimilation of carbohydrates, leading to lesser drymatter production as evident in the correlation analysis done between leaf pigmentsand dry weight of shoots (Figure 2).
TP content of leaves of all five cultivars increased in the fungus-inoculated plants,but varied greatly. The cv. RK-10 P3, which was found highly susceptible to thefungus, showed lowest increase in the TP, whereas the greatest increase of TP was incv. RK-13 P4, which expressed resistant to P. aphanidermatum. This indicates thatthe phenolic compounds contribute in the defence of plants against pathogenattack (Nicholson and Hammerschmidt 1992; Hammond-Kosack and Jones 1996).In general, these compounds act as phytoalexins and are present in very lowconcentrations in healthy plants. However, upon infection with fungi, their
395
400
405
410
415
420
425
430
435
440
Figure 1. Correlation between disease (root rot index) and per cent change in TP, salicylicacid, total chlorophyll and carotenoid of tobacco cultivars subjected to inoculation of Pythiumaphanidermatum (2 g).
Figure 2. Correlation between % decrease in dry weight and per cent change in TP, salicylicacid, total chlorophyll and carotenoid of tobacco cultivars subjected to inoculation of Pythiumaphanidermatum (2 g).
Archives of Phytopathology and Plant Protection 9

concentrations increase considerably, particularly in resistant plants, tolerant plants,or cultivars. The correlation analysis has also shown that greater concentration ofphenols in the cultivars exhibited a lower root rot index, and the concentrationdecreased linearly with increase in root rot index as found in the present study(Figure 1). SA has also been implicated as one of the key components in the signaltransduction pathway leading to plant resistance to various pathogens, includingP. aphanidermatum (Ryals et al. 1996; Wobbe and Klessig 1996; Radhakrishnan andBalasubramanian 2009). Highest concentration of SA was recorded in the cv. RK-12P3, which did not exhibit root rot and plant growth reduction, whereas lowestincrease in SA occurred in cvs. RK-10 P3, RK-18 P8 and RK-26 P3, which showedsusceptibility to P. aphanidermatum. Increase in tolerance or resistance of the cv.RK-12 P3 against the fungus was apparently due to the synthesis of SA in a highconcentration in addition to other factors that were not determined. It has beenreported that greater accumulation of SA in tobacco leaves results in a significantreduction of disease symptoms caused by the fungi Phytophthora parasitica,Cercospora nicotianae and Peronospora tabacina (Ryals et al. 1996). This has alsobecome evident with the correlation analysis between increase in SA and decrease inroot rot index (Figure 1). Correlation analysis between TP or SA and dry matterproduction of infected plants has shown a positive linear relationship (Figure 2).Phenol or SA do not have any significant role in plant growth promotion. Thedecrease in the shoot dry weight with the decrease in TP and SA was apparentlydue to the strong negative linear relationship between TP or SA and disease severity(Figure 2). In the cultivars, where concentration of TP or SA was greater, root rotwas lower; as a result, decrease in dry matter production was also lower. F-valueswere much greater for SA than TP, indicating greater role of the former in thedisease tolerance.
The study has revealed that among the five cultivars of tobacco screened, thecv. RK-12 P3 showed considerable degree of tolerance against P. aphanidermatum,which can be exploited commercially. The expressed tolerance can be considered asa reliable characteristic as it was based on the biochemical parameters, i.e. greatersynthesis of TP and SA in response to the fungus infection.
References
Ahmed HI, Labuschagne N, Korsten L. 2008. Supression of Pythium ultimum root rotsorghum by rhizobacterial isolates from Ethiopia and South Africa. Biol Control.45(1):72–84.
Arnon D. 1949. Copper enzymes in isolated chloroplasts. Polyphenoloxidase in Beta vulgaris.Plant Physiol. 24:1–15.
Chase AR. 1999. Pythium root rot on ornamentals. Western Connection: Turf andOrnamentals. 8(1):1–4.
Dixon RA, Harrison MJ, Lambmb CJ. 1994. Early events in the activation of plant defenseresponses. Annu Rev Phytopathol. 32:479–501.
Garcia PC, Rivero RM, Lopez Lefebre LR, Sdnchez E, Ruiz JM, Romero L. 2001. Directaction of the biocide carbendazim on phenolic metabolism in tobacco plants. J Agric FoodChem. 49:131–137.
Hammond-Kosack KE, Jones JG. 1996. Resistance gene-dependent plant defense responses.Plant Cell. 8:1773–1791.
Khan MR, Khan MW. 1987. Histo-physiological alternations induced by Meloidogyneincognita in tomato. Int Nematol Network Newsl. 4:10–12.
Lowery OH, Roseenbrough NJ, Farr AL, Randall RH. 1951. Protein measurement with theFolin phenol reagent. J Biol Chem. 193:265–275.
445
450
455
460
465
470
475
480
485
10 M.R. Khan et al.

Lucos GB. 1975. Diseases of tobacco. North Carolina: Biological Consulting Associates.Maclachlan S, Zalik S. 1963. Plastid structure, chlorophyll concentration and free amino acid
composition of chlorophyll mutant of barley. Can J Botany. 41:1053–1062.Martin FN, Loper JE, 1999. Soilborne plant diseases caused by Pythium spp: ecology,
epidemiology, and prospects for biological control. Crit Rev Plant Sci. 18:111–181.Nicholson RL, Hammersehmid R. 1992. Phenolic compounds and their role in disease
resistance. Annu Rev Phytopathol. 30:369–389.Oluma HOA, Oladiran AO. 1993. Pythium aphanidermatum root rot of pawpaw (Carica
papaya L.) in Nigeria. Mycopathologia. 123:111–115.Radhakrishnan N, Balasubramanian R. 2009. Salicylic acid induced defence responses in
Curcuma longa (L.) against Pythium aphanidermatum infection. Crop Prot. 28:974–979.Ryals JK, Neuenschwander UH, Willits MG, Molina A, Steiner H, Hunt MD. 1996. Systemic
acquired resistance. Plant Cell. 8:1809–1819.Shane N, Kowblansky M. 1968. Determination of acetyl salicylic acid, salicyclamide,
acetominophone and caffeine in tablet or powder by independent methods. J Pharm Sci.57(7):1218–1223.
Sharma P, Sain SK. 2005. Use of biotic compounds against damping off of cauliflower byPythium aphanidermatum. Indian Phytopathol. 58(4):395–401.
Shepherd JA, Barker KR. 1990. Plantparasitic nematodes of tobacco. In: Luc M, Sikora RS,Bridge J, editors. Plant-parasitic nematodes in tropical and subtropical agriculture.St. Albans, UK: Commonwealth Agricultural Bureau International. p. 493–517.
Stanghellini ME, Hancock JG. 1971. The sporangium of. Pythium ultimum as a survivalstructure in soil. Phytopathology. 61:157–164.
Staskawicz PE, Su W, Howell SH. 1992. Methyl jasmonate inhibition of root growth andinduction of a leaf protein in an Arabidopsis thaliana mutant. Proc Natl Acad Sci USA.89:6837–6840.
Takahama U, Oniki T. 1992. Regulation of peroxidase-dependent oxidation of phenols in theapoplast of spinach leaves by ascorbate. Plant Cell Physiol. 33:379–387.
Wallace HR. 1987. Effect of nematode parasites on photosynthesis. In: Veech JA, DicksonDW, editors. Vistas on Nematology. Maryland (USA): SON Publication. p. 253–259.
William N. 2003. Pythium diseases in the tobacco float system understanding the problem.Kentucky Pest News. Issue no. 976.
Wobbe KK, Klessig DF. 1996. Salicylic acid: an important signal in plants. In: D.P.S. Verma,editor. Plant gene research series, signal transduction in plant growth and development.Vienna: Springer-Verlag. p. 167–196.
Zieslin N, Ben Zaken R. 1993. Peroxidase activity and presence of phenolic substances inpeduncles of rose flowers. Plant Physiol Biochem. 31:333–339.
495-
500
505
510
515
520
525
530
535
Archives of Phytopathology and Plant Protection 11