Synthesis and SmC* properties of chiral liquid crystalline terephthalates
Upload
independentCategory
view
1download
0
Available online at www.sciencedirect.com
www.elsevier.com/locate/actamat
Acta Materialia 59 (2011) 7776–7786
In situ formation of crystalline flakes in Mg-based metallicglass composites by controlled inoculation
Wanqiang Xu a, Rongkun Zheng b, Kevin J. Laws a, Simon P. Ringer b, Michael Ferry a,⇑
a Australian Research Council Centre of Excellence for Design in Light Metals, School of Materials Science and Engineering,
The University of New South Wales, Sydney, Australiab Australian Research Council Centre of Excellence for Design in Light Metals, Australian Centre for Microscopy and Microanalysis,
University of Sydney, Sydney, Australia
Received 2 August 2011; accepted 27 August 2011Available online 20 October 2011
Abstract
In situ bulk metallic glass (BMG) composites generally contain a crystalline phase(s) that forms throughout the amorphous matrixduring cooling from the melt. The presence of the crystalline phase in these materials is known to improve both ductility and toughness.In this study the nucleation and growth behaviour of crystalline a-Mg flakes during casting of a series of Mg–Cu–Y–Zn glass formingalloys were investigated. It was demonstrated that the a-Mg phase nucleates preferentially on the surface of micron-sized yttria (Y2O3)particles that form in the melt during casting and subsequently grow in preferential crystallographic directions to generate an intimatedistribution of interwoven flakes throughout the amorphous matrix. High resolution transmission electron microscopy revealed that athin (�5 nm) intermediate Cu layer forms at the particle–flake interface resulting in full coherency with both the particle and flake,thereby resulting in well-defined orientation relationships. The formation of this intermediate layer is argued to be the necessary precur-sor for nucleation of Mg flakes at the Y2O3 particles in a manner similar to that found for the preferential nucleation at TiB2 particles inconventional Al alloys. The overall effect of this intermediate layer is a reduction in the interfacial energy between the particle andnucleus, thereby lowering the thermodynamic barrier for nucleation. In general terms, inoculation controlled formation of a crystallinephase throughout an amorphous matrix in selected glass forming compositions may be a viable means of generating the desired twophase structure for generating high strength BMG composites exhibiting suitable ductility.� 2011 Acta Materialia Inc. Published by Elsevier Ltd. All rights reserved.
Keywords: Casting; Metallic glasses; Magnesium; Heterogeneous nucleation; Phase transformations
1. Introduction
A certain family of amorphous alloys, termed bulkmetallic glasses (BMGs) [1–4], are a relatively new classof highly processable engineering material that exhibit highglass forming ability (GFA) whereby as-cast componentswith large external dimensions (>1 mm diameter) are pos-sible. Most BMGs have high hardness and strength, butpoor ductility below their glass transition temperature(Tg) and fail in unconstrained loading geometries [5]. Forexample, some BMGs show significant plastic deformationin compression or bending, but have negligible plasticity
1359-6454/$36.00 � 2011 Acta Materialia Inc. Published by Elsevier Ltd. All
doi:10.1016/j.actamat.2011.08.044
⇑ Corresponding author. Tel.: +61 2 93854453.E-mail address: [email protected] (M. Ferry).
(0.5% strain) in uniaxial tension. The poor ductility canbe improved by the introduction of a second phase intothe BMG in several ways, for example: (i) in situ duringcasting where a primary crystalline phase is formed duringcooling [6,7]; (ii) ex situ by the addition of foreign phasesduring either casting or subsequent processing [8]; (iii) crys-tallization during reheating to above Tg [9].
The development of ductile BMG matrix compositesusing in situ crystallization methods has recently beenshown to be an effective method for overcoming the brittlenature of monolithic BMGs [10,11]. In a notable exampleHui et al. [6] developed a series of Mg–Cu–Y–Zn BMGcomposites by Cu mould casting whereby crystalline flakesof sizes 2–10 lm in length and 0.5–1.0 lm in thickness were
rights reserved.

W. Xu et al. / Acta Materialia 59 (2011) 7776–7786 7777
dispersed throughout an amorphous Mg-rich matrix. Themajor consequence of the dispersion of such flakesthroughout an amorphous matrix was the substantialenhancement in plasticity of the BMG. In compressionan ultimate strength of 1200 MPa was achieved in anMg81Cu9.3Y4.7Zn5 alloy. Most importantly, high strengthwas coupled with a total strain to failure of �18%, whichis the highest strain reported for Mg-based BMGs. In arelated work researchers made substantial progress in thedevelopment of ductile phase-reinforced BMG compositeswhereby careful design and microstructural control duringprocessing has resulted in the production of Zr- and Ti-based BMGs exhibiting combinations of high strength, ten-sile ductility and excellent fracture toughness [7,12]. It isargued that the creation of a ductile phase throughoutthe amorphous metal matrix effectively hinders the propa-gation of large-scale shear bands and promotes the forma-tion of multiple shear bands, thereby retarding the onset ofcatastrophic failure of the material and, hence, improvingcritical properties such as fracture toughness.
The formation of a crystalline phase in a cooling meltgenerally involves heterogeneous nucleation at either inoc-ulant particles or the wall of the mould, etc., and muchwork has been published for fully crystalline alloys, partic-ularly grain refined Al alloys [13]. The formation of a crys-talline phase within an amorphous matrix during castingalso requires an understanding of the nucleation andgrowth processes. However, the factors affecting the crea-tion of this crystalline phase exhibiting a particular size,shape and volume fraction whilst retaining an amorphousmatrix is not well understood. Here, nucleation and growthof the crystalline phase(s) occurs in a far-from-equilibriumenvironment involving high cooling rates, supercooling andrapidly increasing melt viscosities. The limited publishedwork on BMG composites describes crystalline dendritesprecipitating from the melt at high temperature, with theirshape and size controlled by cooling rate and melt compo-sition [14–17]. However, very little work has been pub-lished on the mechanisms of crystalline phase formation,although some workers have discussed nucleation in gen-eral terms [18]. In this paper, the nucleation and growthbehaviour of crystalline a-Mg flakes in a range of Mg–Cu–Y–Zn alloy compositions similar to those studied byHui et al. [6] were investigated, mainly by high resolutiontransmission electron microscopy (HRTEM). The paperdevotes particular attention to the origin of this crystallinephase and the development of the characteristic flake-likemorphology within the amorphous magnesium matrix.
2. Experimental procedure
2.1. Casting method
A range of Mg65+x(Cu0.667Y0.333)30�xZn5 alloys, wherex = 6, 12, 14 or 16, were produced using Mg (99.8 wt.%),Cu (99.99 wt.%), Y (99.9 wt.%) and Zn (99.9 wt.%) ascharge materials. These alloy compositions are comparable
with those studied by Hui et al. [6], who were the first toproduce a highly ductile Mg-based BMG composite con-taining a uniform distribution of crystalline Mg flakes.To produce the present as-cast alloys, a layer of Mg sheetwas first placed inside a BN-coated graphite crucible and Yadded to the layer. The melting chamber of the castingfacility was vacuum purged with argon and left for10 min under a circulating argon atmosphere. The chargewas induction heated to 750 �C, held for 5 min and stirredwith a tungsten rod to ensure thorough mixing. Theremaining alloying elements (Cu, Mg and Zn) were addedsequentially to the melt and stirred between additions togenerate the desired composition. Each alloy was remeltedthree times to generate a homogeneous distribution ofalloying elements. Between melting cycles the alloy wascooled to room temperature, removed from the crucibleand mechanically cleaned to remove any oxides. Each as-cast ingot was inverted (to ensure further homogenizationof each alloy) and placed in a new graphite crucible. Forcasting wedge-shaped samples of length 100 mm, width40 mm and maximum thickness 10 mm the alloys wereremelted, cooled to a temperature of 500 �C under circulat-ing argon gas, removed from the induction furnace, thenhand poured into a wedge-shaped mould consisting oftwo 25 mm thick Cu plates. This casting configuration gen-erates a range of cooling rates in a single sample duringcasting and produces microstructures ranging from fullyamorphous to crystalline [19]. For casting plate samplesof thickness 1 mm, width 12 mm and length 60 mm thealloys were cast in a naturally cooled Cu mould by invertedlow pressure injection die casting (described in Robin et al.[20]). The alloys were melted and cooled to the desiredinjection temperature (480 �C for the Mg71Cu16Y8Zn5 alloy(x = 6), and 500 �C for the other alloys (x = 12, 14 or 16)),held for 2 min and stirred immediately prior to injectioncasting to produce consistent composite microstructures.
2.2. Microstructural analysis
2.2.1. Sample preparation and two-dimensional analysis of
structure
Both the wedges and plates were sectioned through theirmid width and mounted in cold setting epoxy resin. Sam-ples were ground using successively finer grades of SiCpaper using water as the lubricant and coolant with polish-ing carried out using 3, 1 and 0.5 lm diamond pads con-taining an oil-based suspension. Microstructural analysisof lightly etched samples was carried out by optical micros-copy using a Nikon Epiphot 200 microscope attached to aNikon DXM 1200F digital camera and scanning electronmicroscopy (SEM) using an Hitachi S3400 fitted with abackscatter electron detector.
2.2.2. Three-dimensional (3-D) distribution of crystallinephases
Since the present study is aimed at understanding thenucleation and growth behaviour of crystalline flakes
7778 W. Xu et al. / Acta Materialia 59 (2011) 7776–7786
within an amorphous matrix, it was necessary to unambig-uously determine the flake morphology by generating 3-Dimages using a serial sectioning technique. This informa-tion was coupled with a detailed transmission electronmicroscopy (TEM) analysis to provide a more completeunderstanding of how this flake-shaped phase nucleatesand grows. A Nova NanoLab 200 DualBeame platformwas used to generate the 3-D structure of groups of Mgflakes in randomly selected volumes of material. Usingthe focused ion beam (FIB) of the DualBeam as a serialsectioning device and the accompanying SEM to imageeach milled surface, consecutive SEM images at 0.1 lmintervals were generated and the resultant images com-bined to generate the volume of interest. Amira imagingsoftware (v. 3.1, Visage Imaging, Carlsbad, CA) was usedto reconstruct the datasets whereby consecutive SEMimages were carefully aligned in order to generate an undis-torted and unrotated volume of microstructure. For agiven reconstructed volume, groups of flakes and theirnucleation sites were extracted and the surfaces renderedto generate an accurate spatial representation of thesefeatures.
2.2.3. Transmission electron microscopy
For TEM, samples were cut from the as-cast plates andmechanically polished to a thickness of 100 lm with the foiledge having a thickness of 5–20 lm. The edge of a givenfoil was further milled to �20–40 nm in thickness by Arion beam milling using a Fischione 3000 miller operatingat 4 kV voltage and 5 mA current. The milling system usesa liquid nitrogen cooled Mo stage with constant rotationand a 10� tilted angle. The as-milled samples werefurther cleaned using a Duo Ion Mill Gatan 600. The
Fig. 1. As-cast microstructures of the Mg77Cu12Y6Zn5 alloy (x = 12) (a) 0.7 mMg79Cu12Y6Zn5 alloy (x = 14): (c) 0.7 mm and (d) at 8 mm from the tip of the
crystallographic features of both the yttria (Y2O3) particlesand a-Mg flakes associated with these particles was studiedby selected area electron diffraction (SAED) using a JEOL3000F microscope operating at 300 kV. Using a PhilipsCM200 microscope, the compositional analysis of selectedfeatures in the TEM foils was carried out by point analysis,line scanning and area mapping using energy dispersive X-ray spectroscopy (EDS) at a spatial resolution of �10 nm.The distribution of Mg, Cu, Y and Zn in the vicinity of theY2O3 particles was determined using MgK, CuK, ZnK andYL lines using iDX data collection and analysis software.
3. Results
3.1. As-cast microstructures
A range of microstructures were generated in thewedge samples, depending on both composition (Mg65+x
(Cu0.667Y0.333)30�xZn5, where x = 6, 12, 14 or 16) and cool-ing rate within a given wedge [20]. At the tip of each wedge,where the cooling rate is highest, most of the alloys werefully amorphous (except x = 16) and there was a gradualtransition to a fully crystalline structure with distance awayfrom the tip. Fig. 1a shows a typical SEM micrograph ofthe Mg77Cu12Y6Zn5 alloy (x = 12) at z = 4 mm; the major(crystalline) phases observed within the amorphous matrixare a-Mg flakes (dark contrast) and square Y-rich particles(SAED confirmed them to be Y2O3, see Section 3.3). Atz = 8 mm the microstructure is fully crystalline (Fig. 1b).For the similar cast thickness of z = 3.5 mm, the lower sol-ute alloy (x = 14) shows a finer distribution of Mg flakesand a lower volume fraction of Y2O3 particles (Fig. 1c).Again, the microstructure is fully crystalline at the large
m and (b) 8 mm from the tip of the wedge; as-cast microstructures of thewedge. (Inset in a) The EDS spectrum of a typical Y2O3 particle (arrowed).
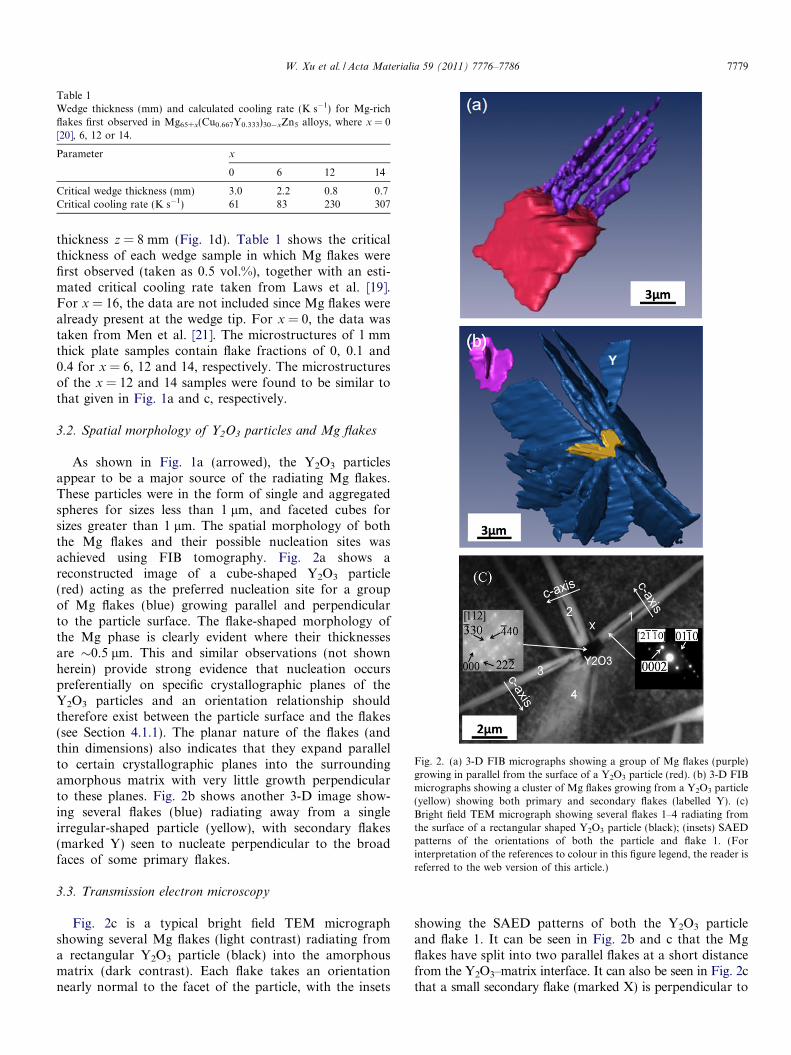
Table 1Wedge thickness (mm) and calculated cooling rate (K s�1) for Mg-richflakes first observed in Mg65+x(Cu0.667Y0.333)30�xZn5 alloys, where x = 0[20], 6, 12 or 14.
Parameter x
0 6 12 14
Critical wedge thickness (mm) 3.0 2.2 0.8 0.7Critical cooling rate (K s�1) 61 83 230 307
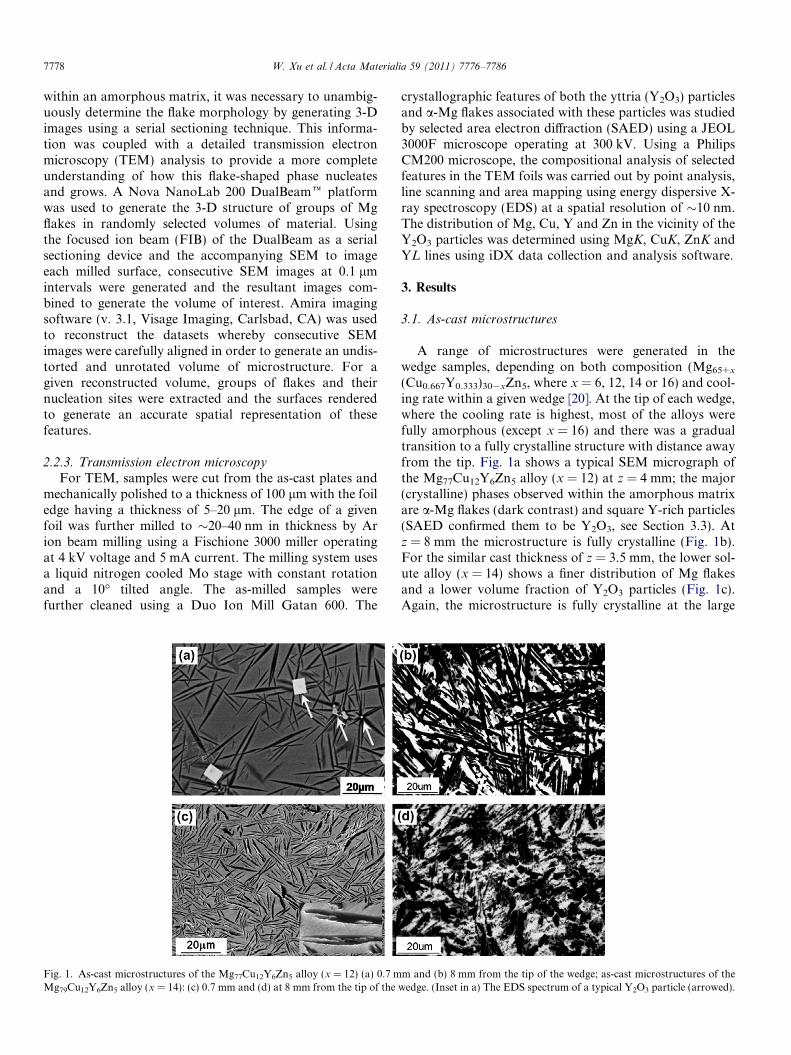
Fig. 2. (a) 3-D FIB micrographs showing a group of Mg flakes (purple)growing in parallel from the surface of a Y2O3 particle (red). (b) 3-D FIBmicrographs showing a cluster of Mg flakes growing from a Y2O3 particle(yellow) showing both primary and secondary flakes (labelled Y). (c)Bright field TEM micrograph showing several flakes 1–4 radiating fromthe surface of a rectangular shaped Y2O3 particle (black); (insets) SAEDpatterns of the orientations of both the particle and flake 1. (Forinterpretation of the references to colour in this figure legend, the reader isreferred to the web version of this article.)
W. Xu et al. / Acta Materialia 59 (2011) 7776–7786 7779
thickness z = 8 mm (Fig. 1d). Table 1 shows the criticalthickness of each wedge sample in which Mg flakes werefirst observed (taken as 0.5 vol.%), together with an esti-mated critical cooling rate taken from Laws et al. [19].For x = 16, the data are not included since Mg flakes werealready present at the wedge tip. For x = 0, the data wastaken from Men et al. [21]. The microstructures of 1 mmthick plate samples contain flake fractions of 0, 0.1 and0.4 for x = 6, 12 and 14, respectively. The microstructuresof the x = 12 and 14 samples were found to be similar tothat given in Fig. 1a and c, respectively.
3.2. Spatial morphology of Y2O3 particles and Mg flakes
As shown in Fig. 1a (arrowed), the Y2O3 particlesappear to be a major source of the radiating Mg flakes.These particles were in the form of single and aggregatedspheres for sizes less than 1 lm, and faceted cubes forsizes greater than 1 lm. The spatial morphology of boththe Mg flakes and their possible nucleation sites wasachieved using FIB tomography. Fig. 2a shows areconstructed image of a cube-shaped Y2O3 particle(red) acting as the preferred nucleation site for a groupof Mg flakes (blue) growing parallel and perpendicularto the particle surface. The flake-shaped morphology ofthe Mg phase is clearly evident where their thicknessesare �0.5 lm. This and similar observations (not shownherein) provide strong evidence that nucleation occurspreferentially on specific crystallographic planes of theY2O3 particles and an orientation relationship shouldtherefore exist between the particle surface and the flakes(see Section 4.1.1). The planar nature of the flakes (andthin dimensions) also indicates that they expand parallelto certain crystallographic planes into the surroundingamorphous matrix with very little growth perpendicularto these planes. Fig. 2b shows another 3-D image show-ing several flakes (blue) radiating away from a singleirregular-shaped particle (yellow), with secondary flakes(marked Y) seen to nucleate perpendicular to the broadfaces of some primary flakes.
3.3. Transmission electron microscopy
Fig. 2c is a typical bright field TEM micrographshowing several Mg flakes (light contrast) radiating froma rectangular Y2O3 particle (black) into the amorphousmatrix (dark contrast). Each flake takes an orientationnearly normal to the facet of the particle, with the insets
showing the SAED patterns of both the Y2O3 particleand flake 1. It can be seen in Fig. 2b and c that the Mgflakes have split into two parallel flakes at a short distancefrom the Y2O3–matrix interface. It can also be seen in Fig. 2cthat a small secondary flake (marked X) is perpendicular to

Fig. 3. (a) Bright field TEM micrograph showing several Mg flakes(labelled 1-5, etc.) radiating from the surface of a Y2O3 particle (black).(b–e) Qualitative EDS composition maps of the area denoted by the greenbox in (a) (the higher concentration of a given element is indicated by ahigher brightness). (g, h) EDS composition profiles along lines A–B andC–D in (a). (For interpretation of the references to colour in this figurelegend, the reader is referred to the web version of this article.)
Fig. 4. High resolution TEM micrograph taken from the boundary regionbetween the Y2O3 particle and flake 2 in Fig. 3a; (insets) the indexedSAED patterns from the particle and flake from which their crystal planesand directions were indexed and labelled.
7780 W. Xu et al. / Acta Materialia 59 (2011) 7776–7786
the bottom of flake 1, similar to the secondary flake(marked Y) shown in Fig. 2b.
Fig. 3a is a bright field TEM micrograph showing fiveflakes (1-5) of length �10–15 lm (lightly coloured) nucleat-ing preferentially at a Y2O3 particle (black). The broadfaces of flakes 1–4 are normal to the TEM foil, whereasflake 5 (bounded by the dashed line) is parallel. BothEDX and SAED analyses confirm that the particle isY2O3 containing a small amount of solute Cu (Fig. 3b–e). The composition profiles given in Fig. 5b–g were deter-mined by EDS in TEM and are discussed in Section 4.2.3.Y2O3 can be considered a distorted fluorite (CaF2) struc-ture with doubling of the CaF2 lattice parameter and witha quarter of the anions removed. The symmetry of thisstructure can be described in the space group Ia-3 with alattice parameter a = 1.06 nm [22]. SAED patterns confirmthat the a-Mg flakes are hexagonal with lattice parametersa = 0.321 nm and c = 0.521 nm.
Fig. 4 is a bright field HRTEM micrograph showingthe interfacial region (marked X) between the Y2O3 par-ticle and flake 2 in Fig. 3a. It contains indexed diffrac-tion patterns (insets) and the crystallographic planesand directions associated with the Y2O3 particle andthe flake. This flake exhibits a long-range ordered struc-ture, as demonstrated by the periodic contrast of sixclose-packed planes along a direction parallel to its c-axis, which is reported to have AB0CBCB stacking (6Htype) of close-packed planes of Mg atoms with the heavyelement Y and Zn atoms embedded in the A and B0 lay-ers [6]. It is pertinent to note that the left part of theflake in Fig. 4 does not exhibit this periodic contrast,thereby indicating that the flakes do not consist entirelyof a long-range ordered structure.
4. Discussion
It is well known that the nucleation of a crystallinephase in a cooling melt occurs mainly by heterogeneous
Fig. 5. High resolution TEM micrograph showing the lattice structure of the boundary between flake 5 and the Y2O3 particle (labelled Y) in Fig. 3a. It isdivided into four major zones; (insets) the FFT patterns, orientations represented by the lattice diagrams, and the orientation relationship between eachzone.
W. Xu et al. / Acta Materialia 59 (2011) 7776–7786 7781
nucleation at impurity particles, mould walls, inoculatingagents, etc. [23]. Inoculation is generally used to refinethe grain size during casting of many types of commercialalloys. It is clear from Figs. 1 and 2 that the Mg flakesnucleate preferentially from Y2O3 particles and grow inspecific directions into the cooling melt to below the glasstransition temperature to generate a multivariant, interwo-ven crystalline phase throughout the amorphous matrix.The following sections describe in detail both the nucle-ation and growth stages associated with the formation ofthis two-phase structure.
4.1. Nucleation of Mg flakes at Y2O3 particles
4.1.1. Orientation relationshipsThe orientation relationship between the Y2O3 parti-
cle and flake 2 in Fig. 3a was investigated usingnano-beam SAED. The resultant SAED patterns showthat both ½1 0 �1 0�Mg of flakes 1–3 and ½1 0 0�Y of theY2O3 particle are parallel to the electron beam, therebygenerating the orientation relationship (0002)Mg||(0 04)Y
(OR1 in Table 2). The interplanar spacing (d value)mismatch between the two matching planes and theinteratomic spacing misfit along these two close-packedor nearly close-packed directions of these two phasesis 2.6% and 3.9%, respectively; these are well belowthe critical values of 6% for interplanar spacing mis-match and 10% for the interatomic spacing misfit ofthe two matching phases in the edge–edge matchingmodel of Kelly and Zhang [24]. A careful measurementof the HRTEM micrographs in Fig. 6 shows a verysmall angle of 2.5� between the two matching planes.
OR1 is a perfect orientation relationship if it is not con-sidered that the atomic rows in ½1 0 1 0�Mg is a zigzagrow and ½1 0 0�Y a straight row, which does not meetthe criteria that the atomic rows in matching directionsrequire a straight atomic row to match another straightatomic row and a zigzag row to match another zigzagrow [24].
The nano-beam SAED pattern in Fig. 2c shows½2 �1 �1 0�Mg of flakes 1–3 and ½1 1 2�Y of the Y2O3 particleare parallel to the electron beam, thereby generating OR2in Table 2. This OR results in larger interplanar spacing (dvalue) mismatches between the two pairs of matching planes(9.4% and 15.5%) than the critical value of 6% in the edge–edge matching model. However, the interatomic spacing mis-fit along their matching directions is essentially zero. There isalso an angle of 4.5� between the two matching planes. Sim-ilarly to OR1, the zigzag atomic row in ½1 1 2�Y matches astraight row in ½2 �1 �1 0�Mg. OR2 is similar to the classic Craw-ley orientation relationship [25]: (1 0 �1 0)hcp||(1 10)bcc
(0001)hcp||(1 �1 1)bcc [1 �2 1 0]hcp||[�1 1 2]bcc.
4.1.2. Identification of an intermediate Cu layer at the
particle–flake interface
HRTEM of the interfacial region between the Y2O3 par-ticles and the flakes has revealed important informationconcerning nucleation of the Mg flakes on the Y2O3 parti-cles. Fig. 5 is a HRTEM micrograph of the interface of theparticle and flake 5 (Y in Fig. 3a), showing four principalzones. Each zone from left (particle) to right (flake) hasbeen characterized according to its lattice structure usingfast Fourier transformation (FFT) in conjunction withEDX (Fig. 3b–e). These transition zones include thefollowing:
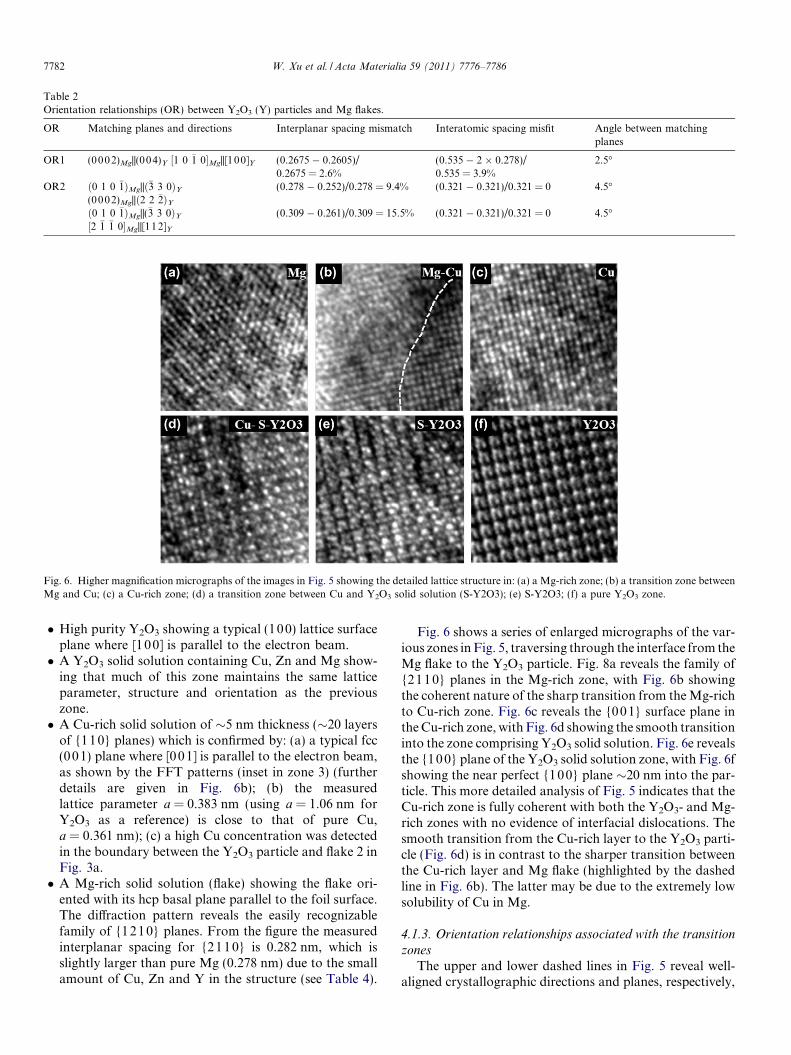
Table 2Orientation relationships (OR) between Y2O3 (Y) particles and Mg flakes.
OR Matching planes and directions Interplanar spacing mismatch Interatomic spacing misfit Angle between matchingplanes
OR1 (0002)Mg||(004)Y ½1 0 �1 0�Mg||[100]Y (0.2675 � 0.2605)/0.2675 = 2.6%
(0.535 � 2 � 0.278)/0.535 = 3.9%
2.5�
OR2 ð0 1 0 �1ÞMg||ð�3 3 0ÞY(0002)Mg||ð2 2 �2ÞY
(0.278 � 0.252)/0.278 = 9.4% (0.321 � 0.321)/0.321 = 0 4.5�
ð0 1 0 �1ÞMg||(�3 3 0ÞY½2 �1 �1 0�Mg||[112]Y
(0.309 � 0.261)/0.309 = 15.5% (0.321 � 0.321)/0.321 = 0 4.5�
Fig. 6. Higher magnification micrographs of the images in Fig. 5 showing the detailed lattice structure in: (a) a Mg-rich zone; (b) a transition zone betweenMg and Cu; (c) a Cu-rich zone; (d) a transition zone between Cu and Y2O3 solid solution (S-Y2O3); (e) S-Y2O3; (f) a pure Y2O3 zone.
7782 W. Xu et al. / Acta Materialia 59 (2011) 7776–7786
� High purity Y2O3 showing a typical (100) lattice surfaceplane where [100] is parallel to the electron beam.� A Y2O3 solid solution containing Cu, Zn and Mg show-
ing that much of this zone maintains the same latticeparameter, structure and orientation as the previouszone.� A Cu-rich solid solution of �5 nm thickness (�20 layers
of {110} planes) which is confirmed by: (a) a typical fcc(001) plane where [001] is parallel to the electron beam,as shown by the FFT patterns (inset in zone 3) (furtherdetails are given in Fig. 6b); (b) the measuredlattice parameter a = 0.383 nm (using a = 1.06 nm forY2O3 as a reference) is close to that of pure Cu,a = 0.361 nm); (c) a high Cu concentration was detectedin the boundary between the Y2O3 particle and flake 2 inFig. 3a.� A Mg-rich solid solution (flake) showing the flake ori-
ented with its hcp basal plane parallel to the foil surface.The diffraction pattern reveals the easily recognizablefamily of {1210} planes. From the figure the measuredinterplanar spacing for {2110} is 0.282 nm, which isslightly larger than pure Mg (0.278 nm) due to the smallamount of Cu, Zn and Y in the structure (see Table 4).
Fig. 6 shows a series of enlarged micrographs of the var-ious zones in Fig. 5, traversing through the interface from theMg flake to the Y2O3 particle. Fig. 8a reveals the family of{2110} planes in the Mg-rich zone, with Fig. 6b showingthe coherent nature of the sharp transition from the Mg-richto Cu-rich zone. Fig. 6c reveals the {001} surface plane inthe Cu-rich zone, with Fig. 6d showing the smooth transitioninto the zone comprising Y2O3 solid solution. Fig. 6e revealsthe {10 0} plane of the Y2O3 solid solution zone, with Fig. 6fshowing the near perfect {100} plane �20 nm into the par-ticle. This more detailed analysis of Fig. 5 indicates that theCu-rich zone is fully coherent with both the Y2O3- and Mg-rich zones with no evidence of interfacial dislocations. Thesmooth transition from the Cu-rich layer to the Y2O3 parti-cle (Fig. 6d) is in contrast to the sharper transition betweenthe Cu-rich layer and Mg flake (highlighted by the dashedline in Fig. 6b). The latter may be due to the extremely lowsolubility of Cu in Mg.
4.1.3. Orientation relationships associated with the transition
zones
The upper and lower dashed lines in Fig. 5 reveal well-aligned crystallographic directions and planes, respectively,
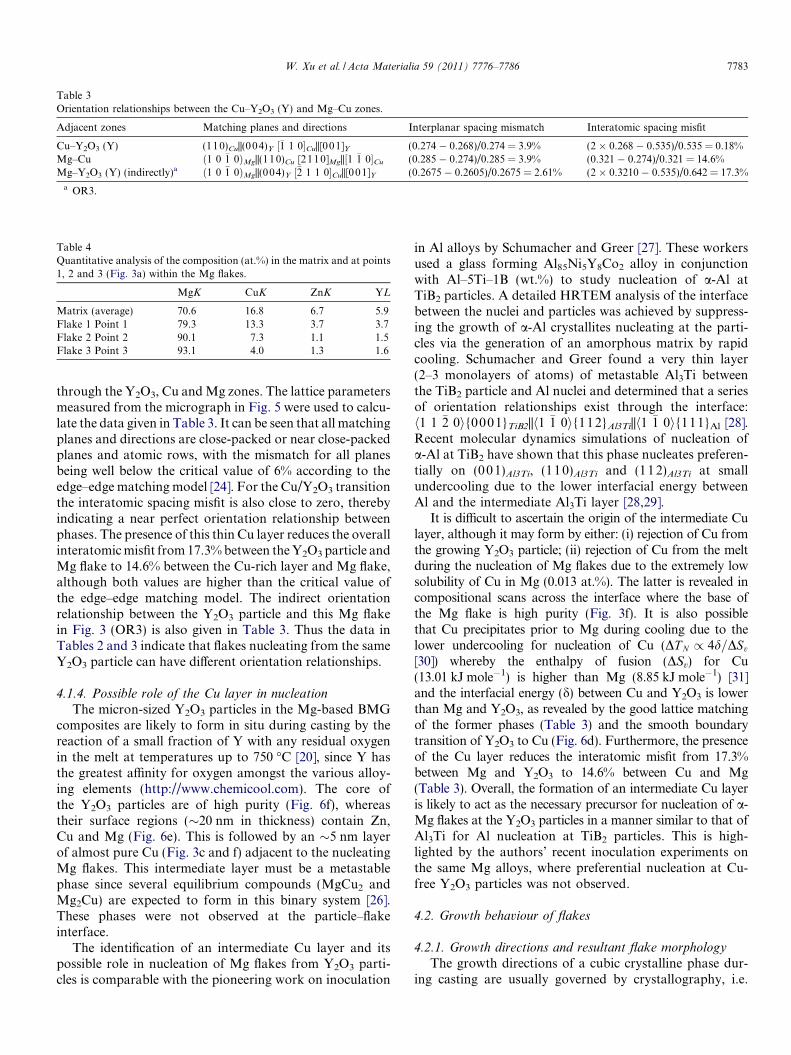
Table 4Quantitative analysis of the composition (at.%) in the matrix and at points1, 2 and 3 (Fig. 3a) within the Mg flakes.
MgK CuK ZnK YL
Matrix (average) 70.6 16.8 6.7 5.9Flake 1 Point 1 79.3 13.3 3.7 3.7Flake 2 Point 2 90.1 7.3 1.1 1.5Flake 3 Point 3 93.1 4.0 1.3 1.6
Table 3Orientation relationships between the Cu–Y2O3 (Y) and Mg–Cu zones.
Adjacent zones Matching planes and directions Interplanar spacing mismatch Interatomic spacing misfit
Cu–Y2O3 (Y) (110)Cu||(004)Y ½�1 1 0�Cu||[001]Y (0.274 � 0.268)/0.274 = 3.9% (2 � 0.268 � 0.535)/0.535 = 0.18%Mg–Cu ð1 0 �1 0ÞMg||(110)Cu [2110]Mg||½1 �1 0�Cu (0.285 � 0.274)/0.285 = 3.9% (0.321 � 0.274)/0.321 = 14.6%Mg–Y2O3 (Y) (indirectly)a ð1 0 �1 0ÞMg||(004)Y ½�2 1 1 0�Cu||[001]Y (0.2675 � 0.2605)/0.2675 = 2.61% (2 � 0.3210 � 0.535)/0.642 = 17.3%
a OR3.
W. Xu et al. / Acta Materialia 59 (2011) 7776–7786 7783
through the Y2O3, Cu and Mg zones. The lattice parametersmeasured from the micrograph in Fig. 5 were used to calcu-late the data given in Table 3. It can be seen that all matchingplanes and directions are close-packed or near close-packedplanes and atomic rows, with the mismatch for all planesbeing well below the critical value of 6% according to theedge–edge matching model [24]. For the Cu/Y2O3 transitionthe interatomic spacing misfit is also close to zero, therebyindicating a near perfect orientation relationship betweenphases. The presence of this thin Cu layer reduces the overallinteratomic misfit from 17.3% between the Y2O3 particle andMg flake to 14.6% between the Cu-rich layer and Mg flake,although both values are higher than the critical value ofthe edge–edge matching model. The indirect orientationrelationship between the Y2O3 particle and this Mg flakein Fig. 3 (OR3) is also given in Table 3. Thus the data inTables 2 and 3 indicate that flakes nucleating from the sameY2O3 particle can have different orientation relationships.
4.1.4. Possible role of the Cu layer in nucleationThe micron-sized Y2O3 particles in the Mg-based BMG
composites are likely to form in situ during casting by thereaction of a small fraction of Y with any residual oxygenin the melt at temperatures up to 750 �C [20], since Y hasthe greatest affinity for oxygen amongst the various alloy-ing elements (http://www.chemicool.com). The core ofthe Y2O3 particles are of high purity (Fig. 6f), whereastheir surface regions (�20 nm in thickness) contain Zn,Cu and Mg (Fig. 6e). This is followed by an �5 nm layerof almost pure Cu (Fig. 3c and f) adjacent to the nucleatingMg flakes. This intermediate layer must be a metastablephase since several equilibrium compounds (MgCu2 andMg2Cu) are expected to form in this binary system [26].These phases were not observed at the particle–flakeinterface.
The identification of an intermediate Cu layer and itspossible role in nucleation of Mg flakes from Y2O3 parti-cles is comparable with the pioneering work on inoculation
in Al alloys by Schumacher and Greer [27]. These workersused a glass forming Al85Ni5Y8Co2 alloy in conjunctionwith Al–5Ti–1B (wt.%) to study nucleation of a-Al atTiB2 particles. A detailed HRTEM analysis of the interfacebetween the nuclei and particles was achieved by suppress-ing the growth of a-Al crystallites nucleating at the parti-cles via the generation of an amorphous matrix by rapidcooling. Schumacher and Greer found a very thin layer(2–3 monolayers of atoms) of metastable Al3Ti betweenthe TiB2 particle and Al nuclei and determined that a seriesof orientation relationships exist through the interface:h1 1 �2 0i{0001}TiB2||h1 �1 0i{112}Al3Ti||h1 �1 0i{111}Al [28].Recent molecular dynamics simulations of nucleation ofa-Al at TiB2 have shown that this phase nucleates preferen-tially on (00 1)Al3Ti, (110)Al3Ti and (11 2)Al3Ti at smallundercooling due to the lower interfacial energy betweenAl and the intermediate Al3Ti layer [28,29].
It is difficult to ascertain the origin of the intermediate Culayer, although it may form by either: (i) rejection of Cu fromthe growing Y2O3 particle; (ii) rejection of Cu from the meltduring the nucleation of Mg flakes due to the extremely lowsolubility of Cu in Mg (0.013 at.%). The latter is revealed incompositional scans across the interface where the base ofthe Mg flake is high purity (Fig. 3f). It is also possiblethat Cu precipitates prior to Mg during cooling due to thelower undercooling for nucleation of Cu (DT N / 4d=DSv
[30]) whereby the enthalpy of fusion (DSv) for Cu(13.01 kJ mole�1) is higher than Mg (8.85 kJ mole�1) [31]and the interfacial energy (d) between Cu and Y2O3 is lowerthan Mg and Y2O3, as revealed by the good lattice matchingof the former phases (Table 3) and the smooth boundarytransition of Y2O3 to Cu (Fig. 6d). Furthermore, the presenceof the Cu layer reduces the interatomic misfit from 17.3%between Mg and Y2O3 to 14.6% between Cu and Mg(Table 3). Overall, the formation of an intermediate Cu layeris likely to act as the necessary precursor for nucleation of a-Mg flakes at the Y2O3 particles in a manner similar to that ofAl3Ti for Al nucleation at TiB2 particles. This is high-lighted by the authors’ recent inoculation experiments onthe same Mg alloys, where preferential nucleation at Cu-free Y2O3 particles was not observed.
4.2. Growth behaviour of flakes
4.2.1. Growth directions and resultant flake morphology
The growth directions of a cubic crystalline phase dur-ing casting are usually governed by crystallography, i.e.
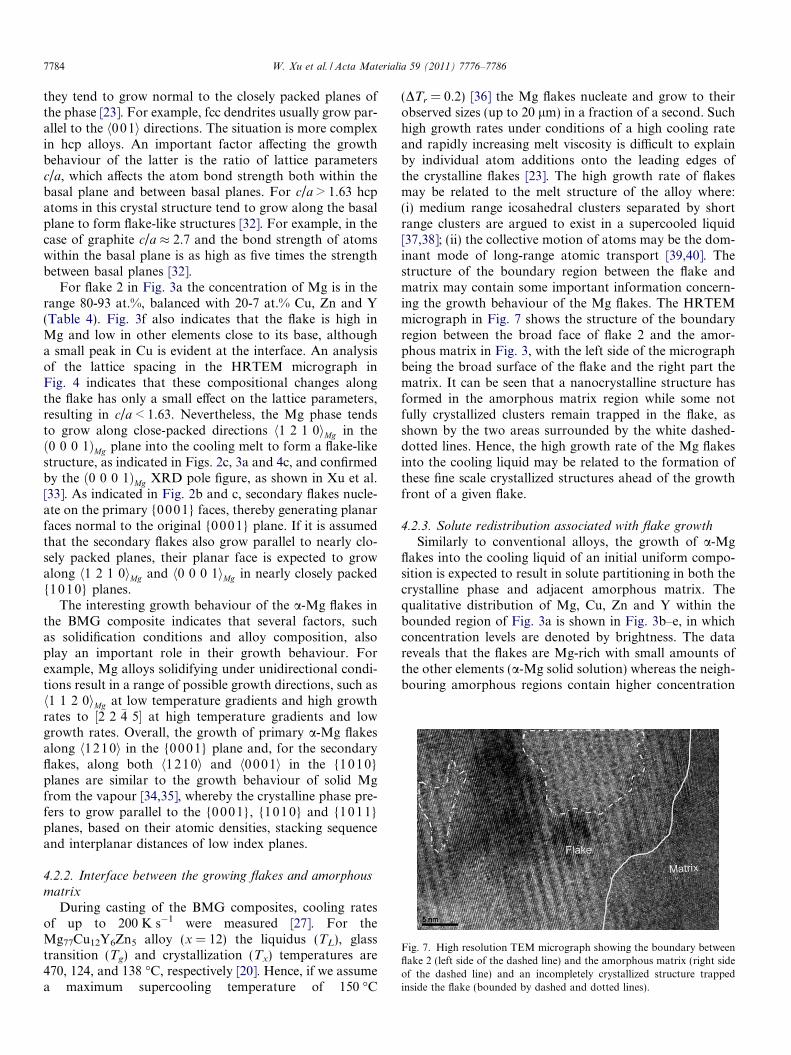
Fig. 7. High resolution TEM micrograph showing the boundary betweenflake 2 (left side of the dashed line) and the amorphous matrix (right sideof the dashed line) and an incompletely crystallized structure trappedinside the flake (bounded by dashed and dotted lines).
7784 W. Xu et al. / Acta Materialia 59 (2011) 7776–7786
they tend to grow normal to the closely packed planes ofthe phase [23]. For example, fcc dendrites usually grow par-allel to the h001i directions. The situation is more complexin hcp alloys. An important factor affecting the growthbehaviour of the latter is the ratio of lattice parametersc/a, which affects the atom bond strength both within thebasal plane and between basal planes. For c/a > 1.63 hcpatoms in this crystal structure tend to grow along the basalplane to form flake-like structures [32]. For example, in thecase of graphite c/a � 2.7 and the bond strength of atomswithin the basal plane is as high as five times the strengthbetween basal planes [32].
For flake 2 in Fig. 3a the concentration of Mg is in therange 80-93 at.%, balanced with 20-7 at.% Cu, Zn and Y(Table 4). Fig. 3f also indicates that the flake is high inMg and low in other elements close to its base, althougha small peak in Cu is evident at the interface. An analysisof the lattice spacing in the HRTEM micrograph inFig. 4 indicates that these compositional changes alongthe flake has only a small effect on the lattice parameters,resulting in c/a < 1.63. Nevertheless, the Mg phase tendsto grow along close-packed directions h1 2 1 0iMg in theð0 0 0 1ÞMg plane into the cooling melt to form a flake-likestructure, as indicated in Figs. 2c, 3a and 4c, and confirmedby the ð0 0 0 1ÞMg XRD pole figure, as shown in Xu et al.[33]. As indicated in Fig. 2b and c, secondary flakes nucle-ate on the primary {0001} faces, thereby generating planarfaces normal to the original {0001} plane. If it is assumedthat the secondary flakes also grow parallel to nearly clo-sely packed planes, their planar face is expected to growalong h1 2 1 0iMg and h0 0 0 1iMg in nearly closely packed{10 10} planes.
The interesting growth behaviour of the a-Mg flakes inthe BMG composite indicates that several factors, suchas solidification conditions and alloy composition, alsoplay an important role in their growth behaviour. Forexample, Mg alloys solidifying under unidirectional condi-tions result in a range of possible growth directions, such ash1 1 2 0iMg at low temperature gradients and high growthrates to ½2 2 �4 5� at high temperature gradients and lowgrowth rates. Overall, the growth of primary a-Mg flakesalong h1210i in the {0001} plane and, for the secondaryflakes, along both h1210i and h0001i in the {1010}planes are similar to the growth behaviour of solid Mgfrom the vapour [34,35], whereby the crystalline phase pre-fers to grow parallel to the {0001}, {1010} and {10 11}planes, based on their atomic densities, stacking sequenceand interplanar distances of low index planes.
4.2.2. Interface between the growing flakes and amorphous
matrix
During casting of the BMG composites, cooling ratesof up to 200 K s�1 were measured [27]. For theMg77Cu12Y6Zn5 alloy (x = 12) the liquidus (TL), glasstransition (Tg) and crystallization (Tx) temperatures are470, 124, and 138 �C, respectively [20]. Hence, if we assumea maximum supercooling temperature of 150 �C
(DTr = 0.2) [36] the Mg flakes nucleate and grow to theirobserved sizes (up to 20 lm) in a fraction of a second. Suchhigh growth rates under conditions of a high cooling rateand rapidly increasing melt viscosity is difficult to explainby individual atom additions onto the leading edges ofthe crystalline flakes [23]. The high growth rate of flakesmay be related to the melt structure of the alloy where:(i) medium range icosahedral clusters separated by shortrange clusters are argued to exist in a supercooled liquid[37,38]; (ii) the collective motion of atoms may be the dom-inant mode of long-range atomic transport [39,40]. Thestructure of the boundary region between the flake andmatrix may contain some important information concern-ing the growth behaviour of the Mg flakes. The HRTEMmicrograph in Fig. 7 shows the structure of the boundaryregion between the broad face of flake 2 and the amor-phous matrix in Fig. 3, with the left side of the micrographbeing the broad surface of the flake and the right part thematrix. It can be seen that a nanocrystalline structure hasformed in the amorphous matrix region while some notfully crystallized clusters remain trapped in the flake, asshown by the two areas surrounded by the white dashed-dotted lines. Hence, the high growth rate of the Mg flakesinto the cooling liquid may be related to the formation ofthese fine scale crystallized structures ahead of the growthfront of a given flake.
4.2.3. Solute redistribution associated with flake growth
Similarly to conventional alloys, the growth of a-Mgflakes into the cooling liquid of an initial uniform compo-sition is expected to result in solute partitioning in both thecrystalline phase and adjacent amorphous matrix. Thequalitative distribution of Mg, Cu, Zn and Y within thebounded region of Fig. 3a is shown in Fig. 3b–e, in whichconcentration levels are denoted by brightness. The datareveals that the flakes are Mg-rich with small amounts ofthe other elements (a-Mg solid solution) whereas the neigh-bouring amorphous regions contain higher concentration

W. Xu et al. / Acta Materialia 59 (2011) 7776–7786 7785
of Cu, Zn and Y. Table 4 provides a quantitative analysisof the composition at the mid thickness of three flakes(positions 1–3 in Fig. 3a) in close proximity to the Y2O3
particle. There is a significant difference in composition,with flake 1 containing considerably less Mg but enrichedin Cu, Zn and Y. This may indicate that flake 1 has nucle-ated at a later stage than flakes 2 and 3, with the limitedgrowth time not allowing considerable solute redistribu-tion. Typical semi-quantitative elemental concentrationprofiles (ROI counts) along the central axis of flake 2 (lineA–B) and across flakes 2 and 3 (line C–D) are given inFig. 3f and g, respectively. Along the flake, the Mg concen-tration decreases with distance from the particle, whereasthere is a slight increase in the other elements. Fig. 3greveals a reasonably smooth transition in Mg concentra-tion between the centre of a given flake to the mid-pointbetween flakes, and the build-up of rejected elements Cu,Y and Zn out of flake in front of the matrix, as shownby the small peaks of Cu, Y and Zn (Fig. 3g), which furtherstabilizes the amorphous matrix and promotes separationof the flake into a two piece structure in the early stageof growth (Fig. 2b and c). It is pertinent to note that theobserved concentration profiles in both the Mg flakes andadjacent amorphous matrix are in contrast to that reportedin a Zr56Ti14Nb5Cu7Ni6Be12 in situ BMG composite. Thelatter showed a relatively uniform elemental distributionin both the crystalline phase and amorphous matrix, anda much sharper transition at the particle–matrix interface[41]. The overall concentration profiles both along andacross the flakes (Fig. 3g) are consistent with microsegrega-tion of alloying elements during the growth of dendrites inconventional castings [23]. Here, the Cu, Zn and Y atomsare ejected from the growing flakes into the surroundingliquid, thereby causing (i) Mg-rich flakes and (ii) matrixenrichment in Cu, Zn and Y, which may also aid in stabil-ization of the remaining liquid by increasing the GFA[21,42,43].
5. Conclusions
The nucleation and growth behaviour of crystalline a-Mg flakes during the casting of a series of high glass form-ing Mg-based alloys was investigated. It was demonstratedthat the Mg phase nucleates preferentially on the surface ofmicron-sized yttria (Y2O3) particles that form in the meltduring casting. This phase subsequently grows in preferredcrystallographic directions as the alloy cools to below theTg to generate a multivariant, interwoven crystalline phasethroughout the amorphous matrix. The following majorobservations were made.
� Several possible orientation relationships were found toexist between the Y2O3 (denoted Y) particles and Mgflakes, for example:
[100]Y||½1 0 �1 0�Mg (004)Y||(0002)Mg
[001]Y||½�2 1 1 0�Mg (040)Y||ð1 0 �1 0ÞMg
[112]Y||½2 �1 �1 0�Mg ð2 2 �2ÞY||(0002)Mg
� HRTEM revealed the presence of a very thin (�5 nm)intermediate layer of almost pure Cu at the particle–flake interface, resulting in what seems to be a fullycoherent interface between the Y2O3 particles and theMg flakes, as described by the following orientationrelationships:
½�2 1 1 0�Mg||½�1 1 0�Cu||[00 1]Y,ð1 0 �1 0ÞMg||(1 10)Cu||(0 04)Y� The formation of this intermediate layer is likely to actas the necessary precursor for nucleation of a-Mg flakeson the Y2O3 particles in a manner similar to thatobserved for the preferred nucleation of solidifyinggrains at TiB2 particles in Al alloys via the formationof a metastable Al3Ti layer between the particle andAl nuclei. The overall effect is a reduction in the interfa-cial energy between the particle and nucleus, therebylowering the thermodynamic barrier for nucleation.� The subsequent growth of the Mg phase from the Y2O3
particles occurs most rapidly in certain crystallographicdirections, with growth markedly suppressed normal toboth {0001} of the primary flakes and {01 10} of anysecondary flakes that nucleate from the former. Thegrowth of flakes also results in substantial solute segre-gation both within the flakes and the surroundingmatrix, leading to solute enrichment of the matrix andan increase in the GFA, thereby leading to stabilizationof the amorphous structure.
The preferred nucleation of Mg flakes at Y2O3 particlesis significant because the control of the number density anddistribution of these inoculating particles may have a directinfluence on the same parameters for the flakes. Hence, tai-lor-made BMG composite structures may be generatedwith a favourable combination of mechanical properties.Furthermore, there is scope for incorporating certain typesof inoculating particles into other types of glass formingalloys to generate the desirable composite effect of highstrength and good ductility.
Acknowledgements
This work was funded by the Australian ResearchCouncil (ARC) under the Discovery Projects scheme (Pro-ject Id DP0986600). The authors are grateful for technicalsupport from the AMMRF (ammrf.org.au) nodes at theUniversity of New South Wales (Electron MicroscopeUnit) and The University of Sydney (Australian Centrefor Microscopy and Microanalysis). Mr Adam Sikorski,University of Sydney, is particularly thanked for his helpin producing the TEM specimens.
References
[1] Greer AL. Mater Today 2009;12:14.[2] Wang WH, Dong C, Shek CH. Mater Sci Eng R 2004;44:45.[3] Loffler JF. Intermetallics 2003;11:529.[4] Peker A, Johnson WL. Appl Phys Lett 1993;63:2342.

7786 W. Xu et al. / Acta Materialia 59 (2011) 7776–7786
[5] Rao X, Si PC, Wang JN, Xu Z, Xu S, Wang WM, et al. Mater Lett2001;50:279.
[6] Hui X, Dong W, Chen GL, Yao KF. Acta Mater 2007;55:907.[7] Hofmann DC, Suh JY, Wiest A, Duan G, Lind ML, Demetriou MD,
et al. Nature 2008;451:1085.[8] Xu YK, Xu J. Scr Mater 2003;49:843.[9] Greer AL. Science 1995;267:1947.
[10] Sun Y, Wang Y, Guo J, Wei B, Li W. Chin Sci Bull 2005;50:2804.[11] Fu H, Zhang H, Wang HB, Zhang Q, Hu Z. Scripta Mater
2005;52:669.[12] Hays CC, Kim CP, Johnson WL. Phys Rev Lett 2000;84:2901.[13] Porter DA, Easterling KE. Phase transformation in metals and
alloys. New York: Chapman & Hall; 1981.[14] Szuecs F, Kim CP, Johnson WL. Acta Mater 2001;49:1507.[15] Lee SB, Kim NJ. Mater Sci Eng A 2005;A404:153.[16] Clausen B, Lee SY, Ustundag E, et al. J Mater Res 2007;22:538.[17] Kong J, Ye ZT, Lu F. J Alloys Compd 2009;478:202.[18] Bian Z, Kato H, Qin CL, Zhang W, Inoue A. Acta Mater
2005;53:2037.[19] Laws KJ, Gun B, Ferry M. Metall Mater Trans A 2009;40A:2377.[20] Robin L, Laws KJ, Xu W, Privat K, Ferry M. Metall Mater Trans
2010;41A:1691.[21] Men H, Hu ZQ, Xu J. Scripta Mater 2002;46:699.[22] Ikeda S, Ogawa K. J Electron Microscopy 1992;41:330.[23] Flemings MC. Solidification process. New York: McGraw-Hill Book
Co.; 1974.[24] Zhang M-X et al. Acta Mater 2005;53:3261.[25] Zhang M-X, Kelly PM. Acta Mater 2005;53:1085.
[26] Nonaka K, Sakazawa T, Nakajima H. Mater Trans JIM1995;36:1463.
[27] Schumacher P, Greer AL. In: Hale W, editor. Light metals. Warren-dale, PA: TMS; 1996.
[28] Wang J, Horsfield A, Schwingenschlogl U, Lee PD. Phys Rev2010;82B:144203.
[29] Wang J, Horsfield A, Lee PD, Brommer P. Phys Rev2010;82B:184203.
[30] Greer AL. Phil Trans R Soc Lond A 2003;361:479.[31] Podesta M. Understanding the properties of matter, 2nd ed. Lon-
don: Taylor & Francis; 2002.[32] Double DD, Hellawell A. Acta Metall Mater 1995;43:2435.[33] Xu W, Robin L, Zheng R, Laws KJ, Ferry M. Scripta Mater
2010;63:556.[34] Straumanis M. Z Phys Chem 1935;30:132.[35] Van der Planken J, Deruyttere A. J Cryst Growth 1971;11:273.[36] Eckert J, Mattern N, Zinkevitch M, Seidel M. Mater Trans JIM
1998;39:623.[37] Wang WH, Wu E, Wang RJ, Kennedy SJ, Studer AJ. Phys Rev B
2002;66:104205.[38] Saida J, Matsushita M, Inoue A. Appl Phys Lett 2001;79:412.[39] Tang XP, Busch R, Johnson WL, Wu Y. Phys Rev Lett 1998;81:5358.[40] Tang XP, Geyer U, Busch R, Johnson WL, Wu Y. Nature
1999;402:160.[41] Nestler B, Danilov D, Bracchi A, Huang YL, Niermann T, Seibt M,
et al. Mater Sci Eng 2007;8:A452–453.[42] Gun B, Laws KJ, Ferry M. J Non-Crystal Solids 2006;352:3887.[43] Satta M, Palumbo M, Rizzi P, Baricco M. Adv Eng Mater 2007;9:475.
Copyright © 2022 FDOKUMEN