The impact of temperature on marine phytoplankton resource allocation and metabolism
Upload
independentCategory
view
2download
0
Freshwater Biology (1998) 39, 9–24
Can a community of small-bodied grazers controlphytoplankton in rivers?
V. G O S S E L A I N , L . V I R O U X A N D J . - P. D E S C Y *Unit of Freshwater Ecology, Facultes Universitaires Notre-Dame de la Paix, 61 rue de Bruxelles, 5000 Namur, Belgium
*Author to whom correspondence should be sent
S U M M A R Y
1. Phytoplankton, zooplankton and grazing were monitored throughout the growingseason for three years (1994–96) in the Belgian section of the River Meuse.2. A size structure analysis of the algal community shows that there was a summer shifttoward larger algal units, following a decline in phytoplankton biomass. These changesoccurred after an increase in zooplankton biomass and diversity.3. Daily filtration rates of grazers ranged from 1 to 113% day–1 and maxima wereobserved during the summer period. Higher rates tended to correspond with peaks ofrotifer biomass. A decline in total phytoplankton biomass within two weeks followedthe increase in zooplankton biomass and filtration rate. A rapid biomass recovery wasthen observed, along with a shift of the algal community toward larger units. Whengrazing activity was not sustained, due to zooplankton fluctuations, the change inphytoplankton size structure was less marked.4. We suggest that the composition of the phytoplankton community of large rivers mayat times be controlled by grazers. However, such biotic interactions can take place onlywhen physical constraints are reduced, i.e. when discharge is low, and when increasedtransfer time, high temperature and availability of grazeable algae allow highzooplankton biomass.
Introduction
Early studies of large rivers showed that they cansupport an abundant zooplankton that is usuallydominated by small, fast-reproducing organisms likerotifers (e.g. Hynes, 1970). As pointed out by Hynes,however, there has been no convincing, experimentalevidence of a strong trophic relationship betweenphytoplankton and zooplankton in rivers. Further, ineutrophic lakes, grazing on mostly edible algae oftenleads to a clear-water phase and to the subsequentdevelopment of larger, less-edible algae (Sommer et al.,1986; Lampert & Sommer, 1993). It is not knownwhether grazing by zooplankton on river phytoplank-ton has similar effects on algal community structure.
From comparisons amongst 10 lakes, Sterner (1989)observed that the highest grazing pressure occurredduring dominance by Daphnia, and that communities
© 1998 Blackwell Science Ltd 9
of smaller species (rotifers and Bosmina) achievedrelatively low grazing rates (scarcely . 50%day–1). He cited several other studies pointing to theimportance of large cladocerans in reducing phyto-plankton biomass. As large-bodied zooplankton arevirtually absent from large rivers because of the shortresidence times (see, e.g. de Ruyter van Stevenincket al., 1992; Pace et al., 1992; Thorp et al., 1994; Marneffeet al., 1996), one would not expect a significant influ-ence of grazing on phytoplankton structure andbiomass.
Nevertheless, some observations on the compositionof river phytoplankton, along with evidence frommodel simulations, indicate that changes attributableto grazer control may take place in large rivers.For instance, data from the River Moselle (France),

10 V. Gosselain, L. Viroux and J.-P. Descy
showing a sharp decline in phytoplankton density,strongly point to the selective elimination of smalldiatoms by zooplankton grazers (Descy, 1993). Follow-ing a steady increase in total algal abundance, a sharp10-fold decrease occurred within two weeks, affectingthe populations of Cyclotella meneghiniana Kutz.,Skeletonema potamos (Weber) Hasle, small Stephano-discus and small Thalassiosiraceae; among diatoms,only filamentous (Aulacoseira) and larger unicellularcentrics [Thalassiosira weissflogii (Grun.) Fryxell &Hasle] were left mostly unaffected. These changesmodified the ratio between diatoms and Chlorococ-cales, which also exhibited a compositional shifttoward large, colonial forms. Thus, size selection bysmall-bodied grazers may have been involved,although zooplankton numbers and grazing activitywere unfortunately not documented at that time. Inaddition, other phytoplankton loss processes couldnot provide a satisfactory explanation: indeed, a lowpercentage of algal cells were infected by chytrids,and sedimentation would have affected mostly largediatoms. Similar decreases of algal biomass in summerwere also observed, for instance in the rivers Meuse(Descy, 1987; Gosselain et al., 1994), Rhine (de Ruytervan Steveninck et al., 1992) and Seine (Garnier et al.,1995), even though a detailed account of the phyto-plankton community changes was not given inevery case.
A few attempts have been made to simulatezooplankton grazing in large rivers or to calculatecarbon budgets including the likely phytoplanktonloss processes (Descy et al., 1987; de Ruyter van Steven-inck et al., 1992; Admiraal et al., 1993; Billen et al., 1994;Gosselain et al., 1994; Garnier et al., 1995; Kohler, 1995).Most of those approaches suggest that zooplanktongrazing is a significant control mechanism of potamo-plankton biomass, especially during low-flow condi-tions when rotifers, along with some early copepodstages and small cladocerans, are abundant. However,these modelling studies usually did not take intoaccount the taxonomic composition of the algal andgrazer assemblages, and the models or calculationswere not based on actual measurements of grazing.
In a previous study (Gosselain et al., 1996), wecompared individual rotifer filtering rates measuredin situ in rivers and lakes, with those from laboratoryexperiments. The present study focuses on the phyto-plankton–zooplankton interaction in the river Meuseover three years, based on observations of community
© 1998 Blackwell Science Ltd, Freshwater Biology, 39, 9–24
Fig. 1 Map of the River Meuse and its catchment. The Belgianpart of the basin is shaded. Main tributaries are indicated.
changes and in situ measurements of grazing rates byzooplankton.
Materials and methods
Site description
The River Meuse (Fig. 1) rises in the east of Franceand flows through Belgium and the Netherlands,where it meets the lower Rhine, forming the DutchDelta, which opens to the North Sea. The total lengthof the river is 885 km and its catchment is about36 000 km2, 40% of it in Belgium. In all its Belgiancourse, the river has been regulated for navigation,with weirs and locks distributed along its length.
The study site, La Plante, is situated 537 km fromthe source. At this site, the mean depth is 3.95 m andthe mean width is 100 m. The River Meuse has alkaline,nutrient-rich waters. Some variations in the nutrientcontent occur over an annual cycle, due to inputs fromthe drainage area (N, Si), from sewage (mostly P) andto uptake by primary producers. However, nutrientsare not usually depleted to levels where they may be

Phytoplankton control by grazers in rivers 11
limiting for phytoplankton growth. More detail canbe found in Descy et al. (1987).
Sampling and data acquisition
Whenever possible, sampling was carried out weeklyfrom spring to autumn, from 1994 through 1996.Various environmental parameters were measuredthroughout the study: temperature, discharge, surfaceirradiance, vertical light attenuation in the watercolumn, dissolved nutrients (N, P, Si), particulatecarbon and nitrogen, chlorophyll a (Chla) and othergeneral measurements. The methods have beendescribed elsewhere (see, e.g. Descy & Gosselain,1994). In 1994, Chla was determined by HPLC analysisof phytoplankton extracts (Descy & Metens, 1996),and in 1995 and 1996, by the spectrophotometricmethod, according to Pechar (1987).
Phytoplankton was collected from the river surfacewith a 3-L opaque Van Dorn bottle and returned tothe laboratory within 1 h, where a 1-L aliquot waspreserved with Lugol’s solution. Subsamples wereobtained by sedimentation of the Lugol-preservedsamples in cylinders of decreasing volumes, allowing24 h settling in each cylinder. The subsamples weremounted in a Burker cell and examined with a stand-ard microscope (Leitz Laborlux D) equipped with agraduated eyepiece, most of the time under a 12.5 3 40optical combination. The dimensions of phytoplanktonunits were measured (6 1 µm) in every sample. Datawere computed using Hamilton’s software (Hamilton,1990), which enables the recording of number anddimensions of phytoplankton units in each sample.The program then calculates mean unit biovolume,using the closest simple geometric shape as reference.The level of identification varied from species to genus.Unicellular centric diatoms were counted in two steps:firstly, as a single group (1994) or in three size classes(1995–96); then, the relative proportions of differentcentric diatom taxa were determined by counting thevalves under phase contrast at 12.5 3 100 magnifica-tion. The absolute numbers of these taxa were calcu-lated from these proportions and total centricabundance. The number of specimens counted variedbetween 200 and about 500, depending on algal abund-ance and diversity. From biovolumes calculated byHamilton’s program, we converted to biomassexpressed as carbon using Eppley equations (inSmayda, 1978). In addition to biomass changes over
© 1998 Blackwell Science Ltd, Freshwater Biology, 39, 9–24
time, we examined changes in the size distribution,by plotting biomass vs size, assessed by the averageGALD (greatest axial linear dimension) of the cells orcolonies.
Zooplankton samples were collected from themiddle of the river, by repeated sampling with theVan Dorn bottle: 9–15 L of water were drawn fromthe river and sieved through a 63-µm-mesh Nitexplankton net fitted in a column topped by a funnel. Theplankton collected on the net was then resuspended inabout 200 mL of filtered river water and immediatelyfixed with acid Lugol’s solution (Leakey et al., 1994).In the laboratory, all samples were further concentratedby filtering through a 63-µm-mesh Nitex net fitted ina small plastic column; the seston was then resus-pended in a few ml of filtered river water and pre-served in 4% formalin solution, to obtain a finalconcentration factor ranging from 250 to 1000,depending on the sestonic load. For counting, sub-samples of 0.5–1 mL were drawn from the samples,after careful mixing, using a micropipette with a widebore tip. The subsample obtained was then dividedinto 10–12 drops laid down in a multidish microscopeslide. Four successive subsamples were examinedunder a dissecting microscope at 353 magnification.Rotifers were determined to the genus or species usingPontin (1978) and Ruttner-Kolisko (1974). Copepodnauplii were counted, regardless of their develop-mental stage, and Dreissena polymorpha Pallas veligers,regardless of their size. When counting of these cat-egories was complete, the entire sample was scannedand every crustacean counted as either cladoceran orcopepod, with no further level of identification.
Homogeneity of zooplankton distribution wasassumed, despite indications that during periods ofextremely low flow, the zooplankton may be unevenlydistributed with depth (Marneffe et al., 1996). Morespecific studies carried out recently under low flowconditions, when a maximum heterogeneity isexpected, confirmed this view. Rotifers were moreabundant near the surface, and variations amongsuccessive samples taken at a given point on the river(11–43% C.V.) were found to be in the same range asthose resulting from transversal position (26–31% C.V.)and slightly lower than those induced by depth (21–52% C.V.) (L. Viroux, unpublished results). Accord-ingly, we considered our successive samples as integ-rating the natural variability in zooplankton densitiesobserved longitudinally at short time intervals.

12 V. Gosselain, L. Viroux and J.-P. Descy
Grazing measurements
In 1994 and 1996, grazing measurements were carriedout every one or two weeks during the period ofzooplankton development. In 1995, owing to variousconstraints, they were performed less frequently. Weused Haney’s method (1971), with a 6.5-L grazingchamber designed following Gawler & Chapuis (1987).Dictyosphaerium ehrenbergianum Nag. produces, in ourculture conditions, Chlorella-like unicells of 4.4 µmmean diameter. They were labelled in exponentialgrowth over at least 24 h; 250 µCi NaH14CO3 wereadded to 250 mL of culture, reaching a final densityof about 10.106 cells per ml. Suspensions of labelledalgae were prepared so as not to exceed 10% ofthe phytoplankton biomass trapped in the grazingchamber: it can thus be assumed that zooplanktoningested the tracer algae with the phytoplankton pre-sent in the river. The suspensions were obtained fromthe labelled culture after three successive centrifuga-tions and resuspensions in fresh culture medium. Thecarbon content of the algae was assessed by severalmeasurements using a Carlo Erba nitrogen–carbonanalyser, NA 1500. Incubations in the river lastedbetween 6 and 14 min (time shorter than the knowngut passage time for most zooplankters; Downing &Rigler, 1984), from the closure of the grazing chamberto the end of the sieving of the chamber contentthrough a 37-µm mesh (or rarely a 63-µm mesh) Nitexscreen. The animals were narcotised for 2 min incarbonated water mixed with filtered river water.Before freezing in liquid nitrogen, they were eithersuspended in a small amount of water (samples forsubsequent sorting) or collected on 25 mm WhatmanGF/C filters (samples for measuring total communitygrazing); all samples were stored in 20 mL scintillationvials. Although this preservation by freezing has notbeen tested for radioactivity loss from rotifers, wehave assumed that the losses are not higher than 10%(Gulati, 1985; for marine copepods), and we did notapply any correction to the measurements to accountfor radioactivity losses.
A small volume of the water collected from thesieving through the Nitex screen was sampled andkept in a cooler for determining, on the same day, theradioactivity of the algal suspension; 2 3 2 mL werefiltered through Millipore 0.45 µm filters, and placedin 6 mL scintillation vials with 5 mL of scintillationcocktail (Beckman, Ready Safe). Background correc-
© 1998 Blackwell Science Ltd, Freshwater Biology, 39, 9–24
tions were applied by running control incubationswithout any labelled algae: the radioactivity measuredon the zooplankton and phytoplankton samples col-lected from these controls were subtracted from thecounts obtained for the zooplankton and for the algalsuspension, respectively.
Zooplankton samples collected on GF/C filters wereallowed to thaw and treated as follows: the animalswere dissolved by adding 1 mL Lumasolve (LumacLSC) and incubating for 2 h at 50 °C. Then, 300 µLglacial acetic acid and 15 mL scintillation cocktailwere added in the vials. The radioactivity (dpm) wasmeasured with a Beckman LS 600 scintillation counter.Community filtration rate was calculated according toHaney (1971) and expressed in percentage day–1, i.e.the percentage of water volume filtered per day.Phytoplankton loss rate or zooplankton ingestion ratecould then be calculated by multiplying the dailyfiltration rate by the algal biomass in the river water(Chla, converted to carbon), corrected for the propor-tion of edible units; this proportion was assessed fromthe phytoplankton counts, considering only algal unitsof GALD , 20 µm (Reynolds, 1986). Although arbit-rary, this size class limit was set despite the fact thatsome rotifers have a more specialized diet, includingsometimes larger algae (Dumont, 1977; Pourriot, 1977;Walz, 1995), and because the most abundant rotifers inthe river plankton (Brachionus angularis, B. calyciflorus,Keratella cochlearis) are considered as generalist species,which feed preferentially and more efficiently on smallparticles (Pourriot, 1977; Rothhaupt, 1990).
Results
Physical and chemical factors
In 1994, discharge and temperature patterns werequite typical for the river Meuse (Fig. 2a). After a highflow period from March until mid-April, dischargesteadily decreased toward a summer low-flow periodwhich lasted until the end of the study in September.In 1995 (Fig. 3a), the discharge and temperature patternwas similar, save that the low flow period was shorterthan in 1994: in particular, discharge remained above100 m3 s–1 until mid-June. By contrast, in 1996 (Fig. 4a),the river flow was very low from April until October.The temperature variations were similar over the threeyears, whereas the pattern of light in the water column(calculated as the ratio daily PAR : vertical extinction

Phytoplankton control by grazers in rivers 13
Fig. 2 (a) Water discharge (m3 s–1) andtemperature (°C), both variablesmeasured once daily in the RiverMeuse at Tailfer in 1994. Data from theCompagnie IntercommunaleBruxelloise des Eaux, Tailfer. (b) Lightavailable in the water column(µE m–2 s–1), calculated from meandaily irradiance (from integrated totalsolar radiation, measured at Saint-Hubert by the Institut RoyalMeteorologique) divided by meandepth and vertical attenuationcoefficient, measured weekly at LaPlante and averaged over one weekintervals.
Fig. 3 (a) Water discharge (m3 s–1) andtemperature (°C), in the River Meuse atTailfer in 1995. (b) Light available inthe water column (µE m–2 s–1) in 1995.All other details as for Fig. 2.
coefficient, averaged over 1 week intervals) variedfrom year to year. In 1994, it remained within therange 100–300 µE m–2 s–1 from spring to autumn(Fig. 2b). Note that this average PAR remained fairlyconstant from June to mid-August, which correspondsto the highest water temperatures. The light climate
© 1998 Blackwell Science Ltd, Freshwater Biology, 39, 9–24
was much more variable in 1995 and 1996, with severalalternate periods of low and high light availability(Fig. 3b, 4b).
The main nutrients (N, P, Si) exhibited some vari-ations, but were at all times well above limitingconcentrations for algal growth, with one notable

14 V. Gosselain, L. Viroux and J.-P. Descy
Fig. 4 (a) Water discharge (m3 s–1) andtemperature (°C) in the River Meuse atTailfer in 1996. (b) Light available inthe water column (µE m–2 s–1) in 1996.All other details as for Fig. 2.
Table 1 Summary of nutrient concentrations in the River Meuse at La Plante.
1994 1995 1996
Min Max Mean n Min Max Mean n Min Max Mean n
Total P (µg P L–1) 62.7 187 132.8 16 59 296 169.8 9 27 428 226 37Total N (mg N L–1) 2.3 16.3 4.3 (12)* 3.3 3.8 3.6 (9)* — — — —SRP (µg P L–1) 5 210 71 50* 2 297 55 52* 16 513 75 37DIN (mg N L–1) 1.4 3.6 2.4 15 1.7 4.1 2.6 27 0.6 4.2 2.0 37Si (mg Si L–1) 0.05 5.09 1.86 15 0.04 2.87 1.64 13 ,0.01 1.99 0.54 38
*Values from the RIWA (Association of the Companies of drinking water supply of Rhine and Meuse) at Tailfer, close to the studiedsite; (n) indicates statistics from monthly averages.
exception. Silica remained at low concentrations (0.01–0.04 mg Si L–1) for 6 weeks in spring 1996 (from theend of March to beginning of May). These low Siconcentrations resulted from uptake by diatoms (seebelow) forming the first spring bloom. A summary ofnutrient concentrations is given in Table 1.
Changes of phytoplankton and zooplankton over time
The phytoplankton composition in this section of theRiver Meuse is typically dominated by centric diatomsthroughout the growing season. Coccal green algaeare more important in summer, while other algalgroups remain less abundant. Composition and bio-mass fluctuate, depending mainly on discharge, tem-perature and light changes, although losses by grazing
© 1998 Blackwell Science Ltd, Freshwater Biology, 39, 9–24
and sedimentation may be significant in summer (see,e.g. Descy, 1987; Gosselain et al., 1994). Rotifers usuallydominate the zooplankton in terms of numbers andbiomass, while microcrustaceans develop significantlyonly in summer in this section of the Belgian Meuse.
Our collections of potamoplankton in 1994 con-formed to this overall pattern (Fig. 5a). As expectedfrom physical factors, the algal spring bloomdeveloped from mid-April through May and com-prised mainly centric diatoms (essentially Stephanod-iscus of the hantzschii-group). Fluctuations probablyresulted from weather changes, as shown by thetemperature and light diminutions in the middle ofMay. During this spring phase, the size of the phyto-plankton units (Fig. 6) was in a narrow range (meanGALD ™ 13 µm; mean biovolume ™ 1000 µm3). After

Phytoplankton control by grazers in rivers 15
Fig. 5 (a) Changes in phytoplankton biomass in the River Meuse at La Plante in 1994. Daily grazing rates (bars, meanpercentage day–1 1 1 SD) are overlaid. Missing dates indicate samples for which no assessment of edible/inedible ratio is available(missing sample). In these cases, data have been interpolated. (b) Changes in rotifer abundance in the River Meuse at La Plante in1994.
the first diatom peak, green algae and cryptomonadsappeared and increased slowly. Chlorococcales, inparticular, peaked in mid-June and participated in thebloom at the end of June; meanwhile, some changesin the diatom community occurred. From mid-May tothe end of June, the algal size/biomass distributionwidened and its maximum shifted to smaller units (5–10 µm GALD); on 24 June, units in the range 10–15 µmGALD dominated the phytoplankton.
In this first half of the year, there were distinctphases in the development of zooplankton (Fig. 5b): afirst peak of rotifers developed in May, whenBrachionus calyciflorus and Euchlanis spp. were domin-ant; rotifer numbers then declined (to little more than10 L–1) and an intense pulse of Dreissena veligers(582 6 64 larvae L–1) was observed. At the end of June,
© 1998 Blackwell Science Ltd, Freshwater Biology, 39, 9–24
rotifer numbers increased again, and B. calyciflorus andB. angularis were the most important components ofthe zooplankton community.
At the beginning of July, phytoplankton declined10-fold, with a minimum biomass recorded on 8 July:with the exception of Dinophyceae, all algal groupswere affected, particularly those within the 5–10 and10–15 µm classes, which had been the most abundantat the end of June. A recovery in the phytoplanktonwas observed as early as 20 July, along with a clearswitch in community composition and size range.First, the resumption started with the 10–15 µm classand unicellular centrics (Cyclotella meneghiniana) againdominated. Then filaments of Aulacoseira spp.developed and became dominant throughout August;as a result, the size distribution widened and was

16 V. Gosselain, L. Viroux and J.-P. Descy
Fig. 6 Changes in phytoplankton sizein the River Meuse at La Plante in1994; GALD is the greatest axial lineardimension (µm) of cells or colonies,measured in each sample.
dominated by much larger units than before (meanGALD, approx. 150 µm; mean biovolume, approx.7000–8000 µm3). The lower size range was still repres-ented by significant numbers, however, as some uni-cellular and filamentous diatoms developedthroughout the summer (Thalassiosira spp., Skeletonemapotamos).
Meanwhile, the zooplankton remained abundantuntil the end of August, although with some changein composition. From July through August, thecommunity was more diverse overall; for instance,there was a greater contribution by K. cochlearis andSynchaetidae (Synchaeta sp. and Polyarthra sp.). Alongwith those changes in the rotifer assemblage, a shortepisode of microscrustacean development (up to 32individuals L–1, mostly nauplii) took place. Brachionuscalyciflorus peaked in early September and algal bio-mass decreased, particularly the largest units. Thisevent was followed by a second Stephanodiscus bloom,resulting in the return to dominance of the algalassemblage by small units (mean GALD: 10–15 µm).This late summer bloom corresponded to the Chlamaximum over the growing season, recorded on 8thSeptember. After this bloom, there was a steady declineof both plankton communities until the end of thesampling on 25 September.
In 1995, the phases of phytoplankton development(Fig. 7a) were similar to those in 1994. A first algal
© 1998 Blackwell Science Ltd, Freshwater Biology, 39, 9–24
bloom comprising mainly small Stephanodiscus spp.followed a spring decline in river discharge. Algalbiomass then fluctuated and formed a second peak atthe end of June, with a Chla concentration close to160 µg L–1. As in 1994, a decrease in phytoplanktonwas observed at the beginning of July, and wasfollowed by a recovery. A peak in biomass wasrecorded at the end of September: it was probablyrelated to changes in flow rate and retention timesresulting from river regulation operations.
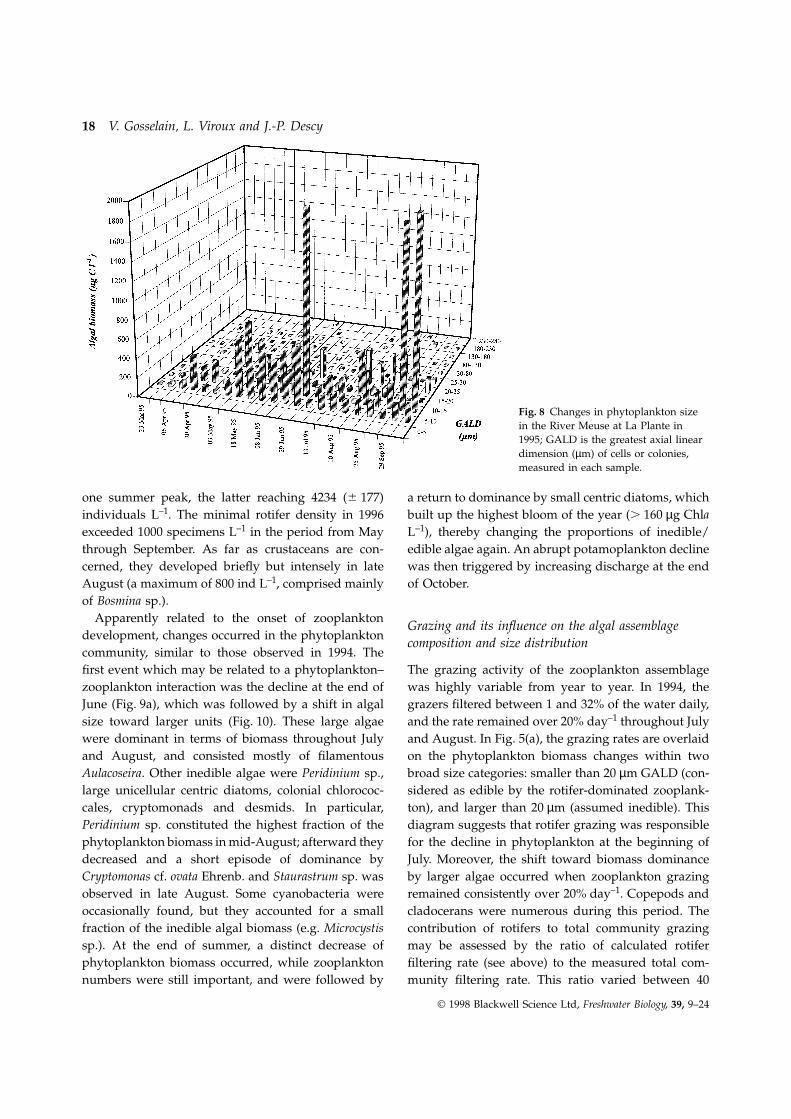
The changes in size distribution in 1995 were rathersmall (Fig. 8). From April to the end of June, phyto-plankton comprised only units in the 5–15 µm range,with a peak of 10–15 µm cells on 29 June; some algaeof the 20–25 µm class also developed a significantbiomass at this time. The July decline affected all sizes,and the recovery that followed comprised mainlyunits in the 5–15 µm range again. The phytoplanktonin August had a biomass almost evenly distributedover the 5–25 µm size range, and the largest unitswere unicellular centrics.
As far as the zooplankton was concerned, rotifersdeveloped in May and reached 677 (6 23)individuals L–1 on 8 June, with K. cochlearis andSynchaetidae dominant (Fig. 7b). Dreissena veligerswere observed only once, in May, with 91 (6 47)individuals L–1. Nevertheless, a peak may haveoccurred before sampling started. In mid-summer, the

Phytoplankton control by grazers in rivers 17
Fig. 7 (a) Changes in phytoplankton biomass in the River Meuse at La Plante in 1995. Daily grazing rates (bars, meanpercentage day–1 1 1 SD) are overlaid. Missing dates indicate samples for which no assessment of edible/inedible ratio is available(missing sample). In these cases, data have been interpolated. (b) Changes in rotifer abundance in the River Meuse at La Plante in1995.
maximum zooplankton numbers were close to 2000individuals L–1, usually with K. cochlearis dominantover other rotifers. Small cladocerans appeared insignificant numbers at the end of June 1995(12.2 individuals L–1), with Bosmina spp. representing98% of them. Copepodites reached maximum densities(2.1 individuals L–1) in August. Although the maximalrotifer densities were higher than in 1994, importantfluctuations of zooplankton biomass were observedduring the summer 1995.
The potamoplankton in 1996 exhibited several dis-tinct phases (Fig. 9a). The early decrease in dischargeallowed the spring diatom bloom to start at thebeginning of March: this bloom, developing throughApril, consisted of small centrics (10–15 µm GALD),along with some Chlorococcales. The shift in sizesobserved in the second part of April corresponded to
© 1998 Blackwell Science Ltd, Freshwater Biology, 39, 9–24
the presence of chain-forming Stephanodiscus. This firstbloom decreased from the end of April until mid-May,and was followed by a second phytoplankton peak,shared by centric diatoms and green algae; the domin-ant forms were again small centrics, whose size wasin the 10–15 µm GALD range (Fig. 10). This secondalgal bloom was probably favoured by a good lightavailability (Fig. 4b) from the end of May until mid-June.
Zooplankton development also started early in 1996(Fig. 9b). High densities, in excess of 1000 individualsL–1, were recorded already in late April, with Bra-chionus spp. dominant, although K. cochlearis wasalready well developed. Thereafter, the latter gaineddominance and dominated the rotifers over the wholegrowing season. Note the very high rotifer densitiesobserved several times, with two spring peaks and
18 V. Gosselain, L. Viroux and J.-P. Descy
Fig. 8 Changes in phytoplankton sizein the River Meuse at La Plante in1995; GALD is the greatest axial lineardimension (µm) of cells or colonies,measured in each sample.
one summer peak, the latter reaching 4234 (6 177)individuals L–1. The minimal rotifer density in 1996exceeded 1000 specimens L–1 in the period from Maythrough September. As far as crustaceans are con-cerned, they developed briefly but intensely in lateAugust (a maximum of 800 ind L–1, comprised mainlyof Bosmina sp.).
Apparently related to the onset of zooplanktondevelopment, changes occurred in the phytoplanktoncommunity, similar to those observed in 1994. Thefirst event which may be related to a phytoplankton–zooplankton interaction was the decline at the end ofJune (Fig. 9a), which was followed by a shift in algalsize toward larger units (Fig. 10). These large algaewere dominant in terms of biomass throughout Julyand August, and consisted mostly of filamentousAulacoseira. Other inedible algae were Peridinium sp.,large unicellular centric diatoms, colonial chlorococ-cales, cryptomonads and desmids. In particular,Peridinium sp. constituted the highest fraction of thephytoplankton biomass in mid-August; afterward theydecreased and a short episode of dominance byCryptomonas cf. ovata Ehrenb. and Staurastrum sp. wasobserved in late August. Some cyanobacteria wereoccasionally found, but they accounted for a smallfraction of the inedible algal biomass (e.g. Microcystissp.). At the end of summer, a distinct decrease ofphytoplankton biomass occurred, while zooplanktonnumbers were still important, and were followed by
© 1998 Blackwell Science Ltd, Freshwater Biology, 39, 9–24
a return to dominance by small centric diatoms, whichbuilt up the highest bloom of the year (. 160 µg ChlaL–1), thereby changing the proportions of inedible/edible algae again. An abrupt potamoplankton declinewas then triggered by increasing discharge at the endof October.
Grazing and its influence on the algal assemblagecomposition and size distribution
The grazing activity of the zooplankton assemblagewas highly variable from year to year. In 1994, thegrazers filtered between 1 and 32% of the water daily,and the rate remained over 20% day–1 throughout Julyand August. In Fig. 5(a), the grazing rates are overlaidon the phytoplankton biomass changes within twobroad size categories: smaller than 20 µm GALD (con-sidered as edible by the rotifer-dominated zooplank-ton), and larger than 20 µm (assumed inedible). Thisdiagram suggests that rotifer grazing was responsiblefor the decline in phytoplankton at the beginning ofJuly. Moreover, the shift toward biomass dominanceby larger algae occurred when zooplankton grazingremained consistently over 20% day–1. Copepods andcladocerans were numerous during this period. Thecontribution of rotifers to total community grazingmay be assessed by the ratio of calculated rotiferfiltering rate (see above) to the measured total com-munity filtering rate. This ratio varied between 40

Phytoplankton control by grazers in rivers 19
Fig. 9 (a) Changes in phytoplankton biomass in the River Meuse at La Plante in 1996. Daily grazing rates (bars, meanpercentage day–1 1 1 SD) are overlaid. Missing dates indicate samples for which no assessment of edible/inedible ratio is available(missing sample). In these cases, data have been interpolated. (b) Changes in rotifer abundance in the River Meuse at La Plante in1996; missing dates correspond to interpolated data (missing samples).
and 130% (Gosselain et al., 1996); the lowest valuecorresponding to the peak of microcrustacean num-bers. Assuming that zooplankters were feeding onlyon the ‘edible’ algae category, it is also worth noticingthat, in the mid-summer period, the grazing losseswere highest in terms of biomass removal per day(500–1188 mg C m–2 day–1). In contrast, the losses werelower in June and July (274–447 mg C m–2 day–1).
The six grazing measurements available for 1995yielded daily rates between 3.4 and 17.9% day–1
(Fig. 7a). The corresponding estimates of phytoplank-ton losses due to zooplankton feeding were 276–834 mg C m–2 day–1, with the highest value corres-
© 1998 Blackwell Science Ltd, Freshwater Biology, 39, 9–24
ponding to the algal bloom on 29 June, before thedecline of algae beginning in early July. Mid-summergrazing rates were lower than in summer 1994, butfield measurements are missing at the maximum ofzooplankton development. Estimates based on indi-vidual filtration rates of K. cochlearis (Gosselain et al.,1996) indicate that daily grazing may have amountedto about 50% day–1, with a contribution of microcrusta-ceans potentially higher than in 1994.
Zooplankton grazing rates measured in 1996 rangedbetween 1 and 113% day–1 (Fig. 9a). The grazingpressure exerted on algae by the dense rotifer com-munity reached high values several times, particularly

20 V. Gosselain, L. Viroux and J.-P. Descy
Fig. 10 Changes in phytoplankton sizein the River Meuse at La Plante in1996; GALD is the greatest axial lineardimension (µm) of cells or colonies,measured in each sample.
in May and July when K. cochlearis was the mostabundant zooplankter. In summer, rotifers were themost important grazers most of the time, except inAugust when rather abundant populations of Bosminasp. were twice recorded. At this time, the contributionof these microcrustaceans to community grazing mayhave been higher than that of rotifers. As was seen in1994, distinct shifts in the phytoplankton size towarddominance by large inedible forms followed theseepisodes of intense grazing. The estimated grazinglosses in 1996 ranged between 10 and 4040 mg Cm–2 day–1.
Discussion
Fluvial processes are complex and make it difficult tounderstand phytoplankton dynamics from measure-ments at one site, and variability among successiveyears does not make the interpretation easier. Despitethis complexity, the data presented above allow us todescribe the phytoplankton dynamics in the upperBelgian section of the river Meuse as influenced by theinterplay of physical processes and biotic interactions.Variations in algal biomass and composition observedin spring were probably influenced mainly by decreas-ing flow and improving light and temperature, whichare known to be important controlling factors ofphytoplankton in rivers (Descy et al., 1987; Reynolds,1988). These variations mostly consisted of changes in
© 1998 Blackwell Science Ltd, Freshwater Biology, 39, 9–24
abundance of a few dominant diatoms, and the springbiomass peaks coincided with periods of favourableweather, allowing a significant rise in both light andtemperature. Indeed, the small Stephanodiscus (S. hantz-schii Grun. and related taxa), that typically appearedabruptly in spring as discharge decreased, are ableto grow in low temperature and light conditions(Håkansson & Stoermer, 1984). The other algal groups,especially coccal green algae, usually respond toimproving temperature and light (Reynolds, 1994),and typically shared the spring biomass peaks withdiatoms.
The onset of zooplankton development seems alsorelated to the hydrology and weather conditions inspring. For instance, in 1994 and 1995, rotifers did notstart to develop significantly until June, while theyappeared as early as April in 1996. Although zooplank-ton dynamics in rivers are still poorly understood(Thorp et al., 1994), it is well known from the earlieststudies on river zooplankton that the primary con-straints on zooplankton development are downstreamtransport and temperature (Reinhard, 1931; Talling &Rzoska, 1967; Hynes, 1970) and that zooplankton withshort generation times, such as rotifers, are favoured.Of course, availability of algal food may also be anecessary condition for development of an abundantzooplankton, although rotifers can thrive on otherfood sources like bacteria and detritus (Pourriot, 1977).Nevertheless, most recent studies point to the over-

Phytoplankton control by grazers in rivers 21
whelming importance of control of river zooplanktonby hydrodynamics (Pace et al., 1992; de Ruyter vanSteveninck et al., 1992; Basu & Pick, 1996), including therole of river retentiveness and of spatial heterogeneity(Reynolds et al., 1991; Pace et al., 1992; Reynolds &Glaister, 1993), which is certainly even more significantthan for phytoplankton. It should be noted that max-imum zooplankton biomass observed in slow-flowing,eutrophic rivers like the Meuse (maxima from 500 to1600 µg dry weight L–1), reaches the levels reportedfor lakes; this contrasts with the common view thatadvective losses limit zooplankton biomass in flowingenvironments (Pace et al., 1992), which is consequentlymuch lower than in lakes (Basu & Pick, 1996).
As usually observed in the river Meuse (Marneffeet al., 1996), Brachionus calyciflorus and B. angularis werethe most abundant taxa in the spring zooplankton.The grazing measurements show that they were ableto feed on the large amount of small (5–15 µm GALD)edible diatoms of the spring biomass peak. Theserotifers are actually reported as generalists (Pourriot,1977; Rothhaupt, 1990) with high growth rates (Bennett& Boraas, 1989; Stemberger & Gilbert, 1985; Walz,1987, 1995; Walz & Rothbucher, 1987) and thus couldhave contributed to the clearance of small phytoplank-ton by non-selective feeding. However, Keratella coch-learis can also develop high numbers and, especiallyin 1996, was the dominant grazer in the upper BelgianMeuse. Not surprisingly, the highest daily filtrationrates (113% day–1) were achieved when these dominantrotifer taxa reached densities of several thousands ofindividuals L–1. Daily filtration rates in this range havebeen rarely reported from studies in rivers (de Ruytervan Steveninck et al., 1992; for the Rhine, based oncalculations from rotifer abundance).
Depending on the year, the removal rate of algalcells at the spring bloom, before the algal decline,ranged between 0.5 and 2.15 g C m–2 day–1. In mostcases, the grazing losses alone may have been sufficientto reduce the algal biomass by a factor of 10 withintwo weeks; indeed, they may approach or even exceedthe net production rate of algae at the maximum oftheir bloom (Descy et al., 1994). Briefly, the chlorophylla increase contributes to reduce further the euphoticdepth in the mixed, turbid water column, so thatcarbon losses may approach or exceed photosynthesis.Furthermore, the respiration–photosynthesis balanceis heavily dependent on day-to-day fluctuations inincident light. As a result, the algae are unable to
© 1998 Blackwell Science Ltd, Freshwater Biology, 39, 9–24
compensate for loss processes, including sedimenta-tion and parasitism in addition to grazing (Gosselainet al., 1994).
The reduction of a spring potamoplankton bloom,as observed here, is to some extent comparable to a‘clear water-phase’ in a eutrophic lake, save that thedecline of algal biomass does not necessarily increasewater clarity, which remains dependent on the amountof non-algal suspended matter. For instance, despitethe large changes in phytoplankton biomass in July1994, the mean daily PAR in the water column aver-aged 250 µE m–2 s–1, with little variation.
The highest grazing losses (0.5–4.0 g C m–2 day–1)were measured in summer and coincided with themost dense rotifer populations. Larger zooplankton(copepodites and small cladocerans) rarely reachedsignificant numbers and contributed significantly tocommunity grazing rate only in August 1994 and1996, during peaks of various crustaceans (1994) andBosmina sp. (1996). Worth noticing is that a muchhigher grazing pressure than actually measured wouldhave been expected, given the high densities (200–800ind L–1) of Bosmina and its published filtration rates(e.g. DeMott, 1982). This may result from poor captureof the cladocerans in the grazing chamber.
These highest daily grazing rates, usually measuredin summer, coincided with a change in the size struc-ture of the planktonic algal community, which wasmarked in 1994 and 1996, but barely detectable in1995. The shift toward dominance by larger phyto-plankton cells or colonies followed the decline of thespring bloom and probably resulted from size-selectivegrazing by the small-bodied zooplankton. Largephytoplankton, not subject to grazing losses, couldhave increase faster than edible phytoplankton, andconsequently were able to build summer algal blooms.As shown by the 1995 data, however, a large changein phytoplankton structure did not take place whenthe grazing pressure was not sustained over a sufficientperiod of time, due to zooplankton biomass fluctu-ations.
These observations are consistent with the hypo-thesis that the changes in phytoplankton biomass andcomposition in the upper Belgian section of the RiverMeuse were driven by physical factors in a firstphase, but that biotic interactions became increasinglyimportant in the summer low-flow period. Giventhe relative constancy of the physical and chemicalconditions during summer, the size-selective removal

22 V. Gosselain, L. Viroux and J.-P. Descy
of algae by small zooplankters shaped the algal assem-blage and led to dominance by large, inedible forms.However, even if zooplankton grazing played a signi-ficant role in determining phytoplankton composition,it was unable to exert effective, long-term control ontotal algal biomass. Control of biomass is typicallyachieved in eutrophic lakes by populations of large-bodied grazers, which have higher ingestion rates, awider food-size spectrum, and a greater range of foodtypes (Lampert & Sommer, 1993).
Zooplankton grazing in rivers appears to be highlysize-specific, depending on the composition of the twointeracting plankton communities. Therefore, everysituation cannot be satisfactorily simulated by simplemodels involving uni- or bispecific zooplankton andphytoplankton compartments (e.g. Descy et al., 1987;Garnier et al., 1995) without considering algae edibilityby small zooplankton. For instance, such modelswould fail to simulate the phytoplankton biomasschanges in the River Meuse in 1994, and should beimproved.
Nevertheless, persistent declines in phytoplanktonbiomass observed in some large rivers (e.g. in the R.Seine, by Billen et al., 1994 or in the R. Moselle, byGosselain et al., in press) cannot be explained onlyby grazing by small-bodied zooplankton, unless thedevelopment of large, less edible forms is preventedin some way. One may speculate that the algae likelyto be selected in deep, turbid rivers would be largediatoms (Reynolds, 1994), such as the Aulacoseiraobserved in the River Meuse in summer 1994 and1996. As those algae typically have high settling ratesand a tendency to meroplanktonic behaviour, onecould further speculate that they would be eliminatedby sedimentation in shallow rivers. This might explainwhy large diatom blooms in rivers are not always theoutcome of size-selective predation by small grazers.
Finally, other possible processes possibly involvedin phytoplankton declines in rivers should be investi-gated further, such as parasitism by chytrids or nutri-ent limitation. The latter can be ruled out in mostlarge rivers (Reynolds & Descy, 1996), even thoughprolonged episodes of Si depletion might affect diatomgrowth. Infection of river phytoplankton by chytridshas not been studied in detail, and virus infectionsmight increase algal mortality (Garnier et al., 1995).Another explanation to phytoplankton declines maylie in the activity of benthic filter-feeders, as reportedfrom several other rivers (see, e.g. Effler et al., 1996).
© 1998 Blackwell Science Ltd, Freshwater Biology, 39, 9–24
As shown by the veliger peak, the zebra mussel,Dreissena polymorpha, is present in the Belgian andDutch reaches of the River Meuse (Kraak et al., 1991).It does not build large and stable populations sufficientto affect the river plankton significantly, however, atleast at the study site. Indeed, the plankton in thestudied section do not seem to be affected by Dreissenafiltration; zebra mussels are known to feed on a wideparticle size range (Sprung & Rose, 1988; Mac Isaacet al., 1995), so they are able to dramatically depressalgal and rotifer populations. Typically, high grazingby benthic filter-feeders considerably increases phyto-plankton and zooplankton mortality over most of thegrowing season, and the effect is expected to increasewith decreasing discharge. This has not yet beenobserved in the Belgian sector of the River Meuse.
Acknowledgments
We are grateful for the technical assistance of G. Badaand to our colleagues, A. Metens, Y. Sadir (Laboratoryof Freshwater Ecology, FUNDP) and C. Joaquim-Justo(Laboratory of Animal Ecology and Ecotoxicology,University of Liege, Belgium), who assisted us in fieldexperiments. This paper also benefited from the reviewby two anonymous referees, as well as from A. Hild-rew. We are grateful for their critical comments.
References
Admiraal W., Mylius S.D., de Ruyter van Steveninck E.D.& Tubbing D.M.J. (1993) A model of phytoplanktonproduction in the lower River Rhine verified byobserved changes in silicate concentration. Journal ofPlankton Research, 15, 659–682.
Basu B.K. & Pick F.R. (1996) Factors regulatingphytoplankton and zooplankton biomass in temperaterivers. Limnology and Oceanography, 41, 1572–1577.
Bennett W.N. & Boraas M.E. (1989) A demographic profileof the fastest growing metazoan: the rotifer Brachionuscalyciflorus (Rotifera). Oikos, 55, 365–369.
Billen G., Garnier J. & Hanset Ph. (1994) Modellingphytoplankton development in whole drainagenetworks: the RIVERSTRAHLER model applied to theSeine river system. Hydrobiologia, 289, 119–137.
DeMott W.R. (1982) Feeding selectivities and relativeingestion rates of Daphnia and Bosmina. Limnology andOceanography, 27, 518–527.
Descy J.-P. (1987) Phytoplankton composition anddynamics in the river Meuse (Belgium). Archiv fur

Phytoplankton control by grazers in rivers 23
Hydrobiologie, Supplement, Algological Studies, 78, 225–245.
Descy J.-P. (1993) Ecology of the phytoplankton of theRiver Moselle: effects of disturbances on communitystructure and diversity. Hydrobiologia, 249, 111–116.
Descy J.-P. & Gosselain V. (1994) Ecological importanceand dynamics of phytoplankton in a large lowland river(River Meuse, Belgium). Hydrobiologia, 289, 139–155.
Descy J.-P., Gosselain V. & Evrard F. (1994) Respirationand photosynthesis of river phytoplankton.Verhandlungen der Internationale Vereinigung furtheoretische und angewandte Limnologie, 25, 1555–1560.
Descy J.-P. & Metens A. (1996) Biomass–pigmentrelationships in potamoplankton. Journal of PlanktonResearch, 18, 1557–1566.
Descy J.-P., Servais P., Smith J.S., Billen G. & Everbecq E.(1987) Phytoplankton biomass and production in theriver Meuse (Belgium). Water Research, 21, 1557–1566.
Downing J.A. & Rigler F.H. (eds) (1984) A Manual onMethods for the Assessment of Secondary Productivity inFresh Waters. IBP Handbook 17; Blackwell scientificpublications, Oxford.
Dumont H.J. (1977) Biotic factors in the populationdynamics of rotifers. Archiv fur Hydrobiologie, BeiheftErgebnisse Der Limnologie, 8, 98–122.
Effler S.W., Brooks C.M., Whitehead K., Wagner B., DoerrS.M., Perkins M., Siegfried C.A., Walrath L. & CanaleR.P. (1996) Impact of zebra mussel invasion in riverwater quality. Water Environment Research, 68, 205–214.
Garnier J., Billen G. & Coste M. (1995) Seasonal successionof diatoms and Chlorophyceae in the drainage networkof the River Seine: observations and modelling.Limnology and Oceanography, 40, 750–765.
Gawler M. & Chapuis R. (1987) An improved version ofthe Haney grazing chamber. Freshwater Biology, 18, 1–4.
Gosselain V., Descy J.-P. & Everbecq E. (1994) Thephytoplankton community of the River Meuse,Belgium: seasonal dynamics (year 1992) and thepossible incidence of zooplankton grazing.Hydrobiologia, 289, 179–191.
Gosselain V., Joaquim-Justo C., Viroux L., Hammer A.,Metens A. & Schweitzer S. (in press) Grazing by a largerivers zooplankton: a key to summer potamoplanktondecline ? The case of the Meuse and Moselle rivers in1994 and 1995. Hydrobiologia.
Gosselain V., Joaquim-Justo C., Viroux L., Mena M.,Metens A., Descy J.-P. & Thome J.-P. (1996) Laboratoryand in situ grazing rates of freshwater rotifers and theircontribution to community grazing rates. Archiv furHydrobiologie, Supplement, 113, Large Rivers, 10, 353–361.
Gulati R.D. (1985) Zooplankton grazing methods usingradioactive tracers: technical problems. HydrobiologicalBulletin, 19, 61–69.
© 1998 Blackwell Science Ltd, Freshwater Biology, 39, 9–24
Håkansson H. & Stoermer E.F. (1984) Observations onthe type material of Stephanodiscus hantzschii Grunowin Cleve et Grunow. Nova Hedwigia, 34, 477–495.
Hamilton P. (1990) The revised edition of a computerizedplankton counter for plankton, periphyton andsediment diatom analyses. Hydrobiologia, 194, 23–30.
Haney J.F. (1971) An in situ method for the measurementof zooplankton grazing rates. Limnology andOceanography, 16, 971–977.
Hynes H.B.N. (1970) The Ecology of Running Waters.Liverpool University press, Liverpool, 555 pp.
Kohler J. (1995) Growth, production and losses ofphytoplankton in the lowland River Spree: carbonbalance. Freshwater Biology, 34, 501–512.
Kraak M.H.S., Scholten M.C.T., Peeters W.H.M. & deKock W.C. (1991) Biomonitoring of heavy metals in theWestern European rivers Rhine and Meuse using thefreshwater mussel Dreissena polymorpha. EnvironmentalPollution, 74, 101–114.
Lampert W. & Sommer U. (1993) Limnookologie. Thieme,Stuttgart, 440 pp.
Leakey R.J.G., Burkill P.H. & Sleigh M.A. (1994) Acomparison of fixatives for the estimation of abundanceand biovolume of marine planktonic ciliatepopulations. Journal of Plankton Research, 16, 375–389.
Mac Isaac H.J., Lonnee C.J. & Leach J.H. (1995)Suppression of microzooplankton by zebra mussels:importance of mussel size. Freshwater Biology, 34, 379–387.
Marneffe Y., Descy J.-P. & Thome J.-P. (1996) Thezooplankton of the lower Meuse, Belgium: seasonalchanges and impact of industrial and municipaldischarges. Hydrobiologia, 319, 1–13.
Pace M.L., Findlay S.E.G. & Lints D. (1992) Zooplankton inadvective environments: the Hudson River communityand a comparative analysis. Canadian Journal of Fisheriesand Aquatic Sciences, 49, 1060–1069.
Pechar T.T. (1987) Use of acetone:methanol mixture forextraction and spectrophotometric determination ofchlorophyll a in phytoplankton. Archiv fur Hydrobiologie,(Suppl 78), Algological Studies, 46, 99–117.
Pontin R.M. (1978) A key to British Freshwater PlanktonicRotifera. Freshwater Biological Association, ScientificPublication 38, 178 pp.
Pourriot R. (1977) Food and feeding habits of rotifera.Archiv fur Hydrobiologie, Supplement, Ergebnisse derLimnologie, 8, 243–260.
Reinhard E.G. (1931) The plankton ecology of the upperMississipi, Minneapolis to Winona. EcologicalMonographs, 1, 395–464.
Reynolds C.S. (1986) Experimental manipulations of thephytoplankton periodicity in large limnetic enclosures

24 V. Gosselain, L. Viroux and J.-P. Descy
in Blelham Tarn, English Lake District. Hydrobiologia,138, 43–64.
Reynolds C.S. (1988) Potamoplankton: paradigms,paradoxes and prognoses. In F.E. Round (ed.) Algaeand the Aquatic Environment, Biopress Ltd., Bristol,285–311.
Reynolds C.S. (1994) The long, the short and the stalled:on the attributes of phytoplankton selected by physicalmixing in lakes and rivers. Hydrobiologia, 289, 9–21.
Reynolds C.S., Carling P.A. & Beven K.J. (1991) Flow inriver channels: new insights into hydraulic retention.Archiv fur Hydrobiologie, 121, 171–179.
Reynolds C.S. & Descy J.-P. (1996) The production,biomass and structure of phytoplankton in large rivers.Archiv fur Hydrobiologie, Supplement 113, Large Rivers,10, 198–187.
Reynolds C.S. & Glaister M.S. (1993) Spatial and temporalchanges in phytoplankton abundance in the upperand middle reaches of the River Severn. Archiv furHydrobiologie, Suppl 101, Large Rivers, 9, 1–22.
Rothhaupt K.O. (1990) Differences in particle size-dependent feeding efficiencies of closely related rotiferspecies. Limnology and Oceanography, 35, 16–23.
Ruttner-Kolisko A. (1974) Plankton Rotifers. Biology AndTaxonomy. Die Binnengewasser, Supplementary edn,english translation, 26(1), Stuttgart, 146 pp.
de Ruyter van Steveninck E.D., Admiraal W., BreebaartL., Tubbing G.M.J. & van Zanten B. (1992) Plankton inthe River Rhine: structural and functional changesobserved during downstream transport. Journal ofPlankton Research, 14, 1351–1368.
Smayda T.J. (1978) From phytoplankters to biomass. InSournia A. (ed.) Phytoplankton Manual. UNESCO, Paris,pp. 273–279.
© 1998 Blackwell Science Ltd, Freshwater Biology, 39, 9–24
Sommer U., Gliwicz Z.M., Lampert W. & Duncan A. (1986)The PEG-model of seasonal succession of planktonicevents in fresh waters. Archiv fur Hydrobiologie, 106,433–471.
Sprung M. & Rose U. (1988) Influence of food size andfood quantity on the feeding of the mussel Dreissenapolymorpha. Oecologia, 77, 526–532.
Stemberger R.S. & Gilbert J.J. (1985) Body size, foodconcentration, and population growth in planktonicrotifers. Ecology, 66, 1151–1159.
Sterner R.W. (1989) The role of grazers in phytoplanktonsuccession. In U. Sommer (ed.) Plankton Ecology:Succession in Plankton Communities. Springer-Verlag,Berlin, pp. 107–170.
Talling J.F. & Rzoska J. (1967) The development ofplankton in relation to hydrological regime in the BlueNile. Journal of Ecology, 55, 637–662.
Thorp J.H., Black A.R., Haag K.H. & Wehr J.D. (1994)Zooplankton assemblages in the Ohio River: seasonal,tributary and navigation dam effects. Canadian Journalof Fisheries and Aquatic Sciences, 51, 1634–1643.
Walz N. (1987) Comparative population dynamics of therotifers Brachionus angularis and Keratella cochlearis.Hydrobiologia, 147, 209–213.
Walz N. (1995) Rotifer populations in planktoncommunities: energetics and life history strategies.Experientia, 51, 437–453.
Walz N. & Rothbucher F. (1987) Effect of foodconcentration on body size, egg size, and populationdynamics of Brachionus angularis (Rotatoria).Verhandlungen der Internationale Vereinigung furtheoretische und angewandte Limnologie, 24, 2750–2753.
(Manuscript accepted 20 July 1997)
Copyright © 2022 FDOKUMEN