Exotic Collembola on subantarctic islands: pathways, origins and biology
Upload
independentCategory
view
0download
0
lable at ScienceDirect
Soil Biology & Biochemistry 41 (2009) 2308–2317
Contents lists avai
Soil Biology & Biochemistry
journal homepage: www.elsevier .com/locate/soi lb io
Low importance for a fungal based food web in arable soils under mineraland organic fertilization indicated by Collembola grazers
Christopher Ngosong a,*, Joachim Raupp b, Stefan Scheu c, Liliane Ruess a
a Institute of Biology, Ecology Group, Humboldt-Universitat zu Berlin, Phillipstr. 13, H 18, D-10115 Berlin, Germanyb Institute for Biodynamic Research Darmstadt, Brandschneise 5, 64295 Darmstadt, Germanyc J.F. Blumenbach Institute of Zoology and Anthropology, University of Gottingen, Berliner Str. 28, 37073 Gottingen, Germany
a r t i c l e i n f o
Article history:Received 27 April 2009Received in revised form18 August 2009Accepted 21 August 2009Available online 5 September 2009
Keywords:Fatty acidsBiomarkersMicrobial biomassLong-term field trialFertilizationCollembolaArbuscular mycorrhiza fungiDiet
* Corresponding author. Tel.: þ49 3020938372; faxE-mail address: [email protected] (C. Ngoson
0038-0717/$ – see front matter � 2009 Elsevier Ltd.doi:10.1016/j.soilbio.2009.08.015
a b s t r a c t
We investigated the Collembola community at an arable field where mineral and organic fertilizers havebeen applied at low and high rates for 27 years. As food resources for Collembola, the soil microbialcommunity was analyzed using phospholipid fatty acids (PLFAs). A special focus was put on AM fungi,which were estimated by the marker 16:1u5 in PLFA (viable hyphae) and neutral lipid fatty acid (NLFA –storage fat in spores) fractions. Additionally, whole cellular lipids in crop plant tissues and manure wereassessed. Greater Collembola species richness occurred in plots where mineral fertilizer was added. Incontrast, soil microbial biomass including AM fungal hyphae increased with addition of organic fertilizer,while the amount of AM fungal spores and biomass of saprotrophic fungi were not affected by fertilizertype. The lipid pattern in wheat roots was altered by fertilizer type, application rate and their interaction,indicating different rhizosphere communities. In sum, the availability and composition of food resourcesfor Collembola changed considerably due to farm management practice. The major diet of three domi-nant Collembola species, Isotoma viridis, Willemia anophthalma and Polyacanthella schaffer was deter-mined by lipid profiling. Multivariate analysis demonstrated species specific lipid patterns, suggestinggreater importance of species than management practice on the diet choice. Nevertheless, feedingstrategy was affected by fertilizer type and availability of resources, as trophic biomarker fatty acidsindicated feeding on wheat roots (and to some extent saprotrophic fungi) with mineral and a shift to soilorganic matter (litter, detritus) with organic fertilization. Although AM fungi dominated the soil fungalcommunity, the AMF marker 16:1u5 was not detected in Collembola lipids, indicating that these werenot consumed. The very low amount of saprotrophic fungi in the soil and the fact that Collembola asmajor fungal grazers did not feed on AM fungi indicates that the fungal energy channel in the investi-gated arable field is of little importance to the faunal food web.
� 2009 Elsevier Ltd. All rights reserved.
1. Introduction viridis and Isotoma notabilis (Alvarez et al., 2001). Leroy et al. (2007)
Sustainable agricultural practices, such as organic fertilization,enhance biological activity, resulting in greater turnover of organicmatter and the release of plant available nutrients (Bachinger, 1996;Carpenter-Boggs et al., 2000; Fließbach and Mader, 2000).Increased microbial growth leads to population growth of micro-bial-feeding arthropods such as Collembola (Petersen et al., 2003).However, the effects of fertilizer type on Collembola have notalways been consistent, the community composition and speciesdominance were influenced by farming regime, Entomobryamultifasciata and Isotomurus spp. were more common in conven-tional than organic fields, while the opposite was true for Isotoma
: þ49 3020938324.g).
All rights reserved.
demonstrated that application of complex organic fertilizers led toincreased density and diversity of Collembola populations. On theother hand, while some epedaphic species were favored underintegrated management (i.e. using organic manure and fertilizerwith reduced tillage), others were more abundant in convention-ally (i.e. using inorganic fertilizer with reduced use of pesticides)managed fields (Brussaard et al., 1990). Despite idiosyncraticresponses of individual species or groups to various agriculturaltreatments, current evidence indicates that overall managementpractice has a strong impact on soil Collembola communities.
Collembola as major fungal feeders play a vital role in regulatingthe fungal food chain in soil (Visser et al., 1987; Harris and Boerner,1990; Chen et al., 1995; Klironomos and Kendrick, 1995; Gange,2000; Partsch et al., 2006). AM fungi were frequently reported asdiet of Collembola in laboratory no choice experiments (Klironomosand Kendrick, 1996; Klironomos and Ursic, 1998). However, when
C. Ngosong et al. / Soil Biology & Biochemistry 41 (2009) 2308–2317 2309
given a choice they preferred saprotrophic to AM fungi (Klironomoset al., 1999). Meanwhile in plant-mesocosm soil systems, Collem-bola consumed both AM and saprotrophic fungi, with populationdensity increasing due to the availability of AM fungi (Jayne et al.,2007). Arbuscular mycorrhizal (AM) fungi are the dominantmycorrhizal fungi in agroecosystems and are believed to supportplant growth (Smith and Read, 1997; Gazey et al., 2003; Hijri et al.,2006). Besides farm management practices, such as type and rate offertilizer, crop rotation or tillage (Bethlenfalvay, 1992; Johnson andPfleger, 1992), the consumption of AM fungi by Collembola mayalter the AM symbiosis and subsequently plant performance (Harrisand Boerner, 1990; Boerner and Harris, 1991; Kaiser and Lussenhop,1991; Smith and Read, 2002). Although the potential of Collembolato affect mycorrhizal functioning was shown frequently undercontrolled laboratory conditions, few studies have investigated theoccurrence of these effects in the field (Gange, 2000).
PLFAs as essential structural components of living cellmembranes have been applied to assess microbial biomass,community composition and physiological status in environmentalsamples (White et al., 1996). Biomarker fatty acids (FAs) have beenascribed for major bacterial and fungal groups (Frostegard andBaath (1996); Zelles, 1999), with the FA 16:1u5 used as a marker forAM fungi (Graham et al., 1995; Olsson, 1999; Olsson and Johansen,2000). Furthermore, the trophic transfer of such biomarker FAsfrom microbial food resources to animal grazers have been appliedto assign feeding strategies of soil animals (Ruess et al., 2004,2005a, 2007; Chamberlain et al., 2004, 2005a). Recently, theassimilation of 16:1u5 from microbial diet into Collembola tissuewas reported by Haubert et al. (2006).
We investigated an arable field where mineral and organic (cattlemanure with biodynamic preparations) fertilizers have been appliedat low and high rates for 27 years. The effects on population densityand diversity of Collembola were assessed and lipid analysis wasperformed with biomarker FAs used to assess potential Collemboladiets i.e., microorganisms, AM fungi, wheat tissues and manure.Considering that AM fungi are the dominant fungal resource inarable fields and the preference of Collembola for fungal diets, ourhypothesis was that AM fungi form the basis of the fungal energychannel in the soil food web. Moreover, as fertilizer amendment isknown to affect the fungal-plant symbiosis, Collembola likelychange their feeding strategy due to management practice andavailability of resources. To the best of our knowledge this is the firststudy using biochemical markers to understand the trophic rela-tionship between Collembola and AM fungi under field conditions.
2. Materials and methods
2.1. Experimental site and design
The long-term field experiment was set up in 1980 at the Insti-tute for Biodynamic Research (IBDF) Darmstadt, Germany (latitude49� N; longitude 8� E; 100 m above sea level). The mean annual airtemperature at the site is 9.5 �C and the precipitation is 590 mm.The soil type is haplic cambisol with 87% sand, 8% silt and 5% clay inthe topsoil. The long-term trial established 27 years before thisstudy compares amendment with mineral (MIN) and organic(CMBD-composted cattle manure with biodynamic preparations,see below) fertilizers. The experiment is set up in a two factorialdesign with the fertilizer type (MIN, CMBD) and application rate(low, high) as factors. The treatments were implemented in fourreplicates according to a split block design with plots of 5 m � 5 meach. Management practice was homogenous in relation to croprotation, cultivation techniques and total nitrogen amendment tothe soil since the start of the experiment. There was no chemicalcontrol for pests or weeds in any treatment. In 2007, spring wheat
(Triticum aestivum cv. Passat) was cultivated. All plots were irrigatedtwice by droplet irrigation with 11 and 12 mm, six and eleven weeksafter sowing, respectively (Raupp and Oltmanns, 2006).
Mineral (MIN) plots were fertilized with lime ammoniumnitrate (N), super phosphate (P) and potassium magnesia (K) atrates of 60, 50, 75, and 140, 100, 125 of N, P, K (kg ha�1 y�1) for lowand high rates, respectively. The amount of mineral fertilizerapplied was the same every year. The organic plots received com-posted cattle manure with biodynamic preparations, applied assolid fertilizers, before ploughing and milling of the soil. Addi-tionally, biodynamic preparations were applied as spray two weeksbefore and one, eight, nine, eleven, sixteen weeks after sowing. Thebiodynamic preparations were made from natural and organicsubstances. Plant materials (e.g. chamomile) and cow manure wereplaced in selected animal parts (e.g. cow horn) and fermented inthe soil for half a year (Koepf et al., 1990). These biodynamicpreparations were incorporated into cattle manure once, at thebeginning of the composting period, to produce the cattle manurewith biodynamic preparations (CMBD). Manure amendment toCMBD plots was calculated to achieve similar N input as in the MINplots, resulting in varying amount of phosphorus and potassium,depending on the manure properties in a given year. On average,less P and more K was applied at CMBD compared to MIN plots.
2.2. Sampling
Samples were taken in July 2007, four months after sowing ofspring wheat and three weeks before crop harvest. Two fertilizeramendments were sampled (MIN and CMBD) at two applicationrates (low and high), at 0–5 and 5–10 cm soil depths. For PLFAanalysis of the soil microbial community, soil cores (5 cm diam.)were taken at 0–5 and 5–10 cm soil depths. One soil core wassampled per plot and stored at �20 �C prior to analysis. To assessthe community structure of Collembola, soil cores (20 cm diam.)were sampled at 0–5 and 5–10 cm depths. Whole wheat plantswere collected randomly from each plot, their roots and leaveswere frozen at �20 �C until analysis. Four replicates of the biody-namic manure portions were sampled randomly from the innersection of the compost heap and stored at �20 �C until analysis.
2.3. Collembola
Collembola were extracted from soil and manure using a highgradient extractor (Macfadyen, 1953; Kempson et al., 1963). Thetemperature was increased progressively from 22 �C on day one, to50 �C on day ten. Animals used to determine population structurewere collected in a solution of propylene glycol and water (1:1),preserved in ethanol and stored in the fridge prior to separationand identification under a dissecting microscope. Collembola werebrightened with lactic acid and identified to genus or species levelusing the keys of Gisin (1960) and Fjellberg (1998). Animals sub-jected to fatty acid analysis were extracted into water and hand-picked each day. Collembola were separated into taxa andpreserved in methanol at �20 �C prior to analysis.
The species richness of Collembola, SR ¼ (s – 1)/loge N(Yeates and Bird, 1994), and the Shannon–Wiener diversity index,H0 ¼ –
Ppi loge pi (Pielou, 1971) were calculated, where S is the
number of species, N the number of individuals identified persample and pi the relative density of the ith species.
2.4. Fatty acid analysis
Lipids from soil were divided into glycolipid, phospholipid (PLFA)and neutral lipid (NLFA) fractions according to Frostegard et al.(1993). Fatty acids (FAs) from 4 g of soil (wet weight) were extracted
C. Ngosong et al. / Soil Biology & Biochemistry 41 (2009) 2308–23172310
by adding 18.4 ml Bligh/Dyer solvent (chloroform: methanol: citratebuffer ratio of 1:2:0.8, pH 4), vortexed and rocked for 2 h. Sampleswere centrifuged at 2500 rev min�1 for 10 min and the solventtransferred to new tubes. Samples were re-extracted with 5 mlBligh/Dyer solvent and the extraction solvents of both steps werecombined. To the extract, 6.2 ml chloroform and 6.2 ml acid bufferwere added, vortexed for 1 min, centrifuged at 2500 rev min�1 for10 min and allowed to stand and separate. The chloroform fraction(3 ml) of each sample was transferred to a silica acid column (0.5 gsilicic acid, 3 ml; HF BOND ELUT – SI, Varian Inc.). Lipids were elutedwith 5 ml chloroform (NLFAs), 20 ml acetone (glycolipids) and 5 mlmethanol (PLFAs). Both PLFA and NLFA fractions were reduced byevaporation (40 �C, vacuum 200 hPa) in a vacuum rotator (RVC 2–25,CHRIST�, Buddeberg, Mannheim). Each sample was dissolved in1 ml methanol–toluene solvent (1:1) and 30 ml internal standard(5.77 mg methylnondecanoate in 25 ml isooctane) was added. Lipidmethanolysis was conducted in 1 ml 0.2 M methanolic KOH (2.8 gKOH in 250 ml methanol) and incubated for 15 min at 37 �C in a waterbath. The FA methyl esters (FAMEs) were extracted with 2 mlhexane–chloroform solvent (4:1), 0.3 ml 1 M acetic acid and 2 mldeionised water. Samples were vortexed and centrifuged at2500 rev min�1 for 10 min. The organic phase was transferred to newtubes and FAMEs were re-extracted with 2 ml hexane–chloroformsolvent. Extraction solvents of both steps were combined andreduced by evaporation. Samples were dissolved in 100 ml isooctaneand stored at �20 �C until analysis.
Whole cellular lipids from Collembola, wheat tissues (leaves/stems and roots) and manure samples were saponified and meth-ylated according to the Sherlock Microbial Identification System(MIDI Inc., Newark, Delaware, USA). Lipids were saponified ina solution of sodium hydroxide–methanol (45 g sodium hydroxide,150 ml methanol, and 150 ml distilled water) at 100 �C for 30 min,followed by acid methanolysis in HCl–methanol (325 ml 6.0 Nhydrochloric acid, 275 ml methyl alcohol) at 80 �C for 10 min.FAMEs were extracted into hexane/methyl tertiary butyl ether (1:1)and washed with aqueous NaOH (10.8 g sodium hydroxide, 900 mldistilled water). The lipid containing phase was then transferred tosample vials and stored at �20 �C prior to analysis.
FAMEs were identified by chromatographic retention timecomparison with a standard mixture composed of 37 different FAMEsranging from C11 to C24 (Sigma–Aldrich, St Louis, USA). Analysis wasperformed by gas chromatography using a GC-FID Clarus 500(PerkinElmer Corporation, Norwalk, USA) equipped with HP-5capillary column (30 m � 0.32 mm i.d., film thickness 0.25 mm). Thetemperature program started with 60 �C (held for 1 min) andincreased by 30 �C min�1–160 �C, followed by 3 �C min�1–260 �C. Theinjection temperature was 250 �C and helium was used as carrier gas.
To verify correct identification of FAMEs (chain length andsaturation), a range of soil samples were analyzed by mass spec-trometry using a 3400/Saturn4 Diontrap GC/MS system (Varian,Darmstadt, Germany), equipped with an HP-5 capillary column(50 m � 0.32 mm i.d., film thickness 0.17 mm) with helium 5.0 ascarrier gas at a constant pressure of 22.5 psi. The split/splitlessinjector was operated in splitless mode for 2 min and kept at300 �C. The GC oven temperature program started with 50 �C (holdtime 2 min) and increased by 5 �C min�1–300 �C, and held for8 min. The transfer line temperature was 300 �C and at a filamentemission current of 80 mA, a mass range of 50–500 m/z wasmonitored twice a second in Scan mode.
The microbial community was assigned using the PLFA 18:2u6for saprotrophic fungi, and i15:0, a15:0, i16:0, i17:0, cy17:0, cy19:0,16:1u7, 18:1u9t for bacteria according to Frostegard et al. (1993),Frostegard and Baath (1996) and Zelles (1999). The fatty acid16:1u5 was used as marker for AM fungi with the PLFA fractionrepresenting hyphal membranes and the NLFA fraction as storage
lipids (Graham et al., 1995; Olsson et al., 1995, 2003). The fluidity oflipids expressed as the FA Unsaturation Index (UI) was calculated asUI ¼(C:1 � 1) þ (C:2 � 2) þ (C:3 � 3) þ (C:4 � 4)/100, where C:1,C:2, C:3 and C:4 represent FAs proportion (%) with 1, 2, 3 and 4double bonds, respectively.
2.5. Statistical analysis
The effect of fertilizer type and application rate on PLFAs andCollembola abundance were tested using PLABSTAT (H.F. Utz,University of Hohenheim, Germany) split block model, developedfollowing example 7.3 in Federer (1975). The factors, type of fertilizer(two levels: MIN, CMBD) and application rate (two levels: low, high)were set as fixed. A third fixed factor, soil depth (two levels: 0–5 cm,5–10 cm) was analyzed for parameters that were determined atdifferent soil depths. The four levels of randomization were dividedinto the factor replication of type of fertilizer (2) and block withinreplication (2), taking into account the arrangement of the plots. Datasets were checked for outliers with the method of Anscombe andTukey (1963) and mean values of the treatments were compared witha simple t-test (P< 0.05) provided by PLABSTAT. Data sets were testedfor normal distribution based on Skewness and Kurtosis (Snedecorand Cochran, 1980), and those that did not follow a normal distri-bution were arcus sinus square-root (arcsin) transformed. Soil PLFAand NLFA data were arcsin transformed except for the PLFAs i17:0 and18:0. Collembola species abundance and diversity were analyzedwith the original values, while species richness and sum of taxa werearcsin transformed. In tables and figures, significant differences(p < 0.05) between mean values are shown by different letters.
Differences in the FA pattern of Collembola species, wheatleaves and roots were analyzed using STATISTICA 6.0 for Windows(StatSoft, 2001). Differences between Collembola FAs were testedby means of factorial ANOVA and compared by Tukey’s HSD test(P < 0.05). A multivariate fitting was performed by MANOVA withmeans of Collembola fatty acids as response design. Discriminantfunction analysis (DFA) was performed with dominant Collembolaspecies as groups (n ¼ 3) in the model and their fatty acidcomposition as variables (n ¼ 7). The canonical scores for the firstand second roots were correlated with the fatty acids and thePearson coefficients are given. FA pattern of wheat roots and leaveswere subjected to nonparametric statistics and a pairwisecomparison was performed by Kruskal–Wallis test. The type offertilizer and application rate were used as groups (n ¼ 4) in themodel and the FAs as variables (n ¼ 21). FA data of Collembola andwheat tissue were arcsin transformed prior to statistical analysis.
3. Results
3.1. Fatty acid patterns of Collembola food resources
3.1.1. MicroorganismsThe amount of PLFAs in soil at the different sites ranged between
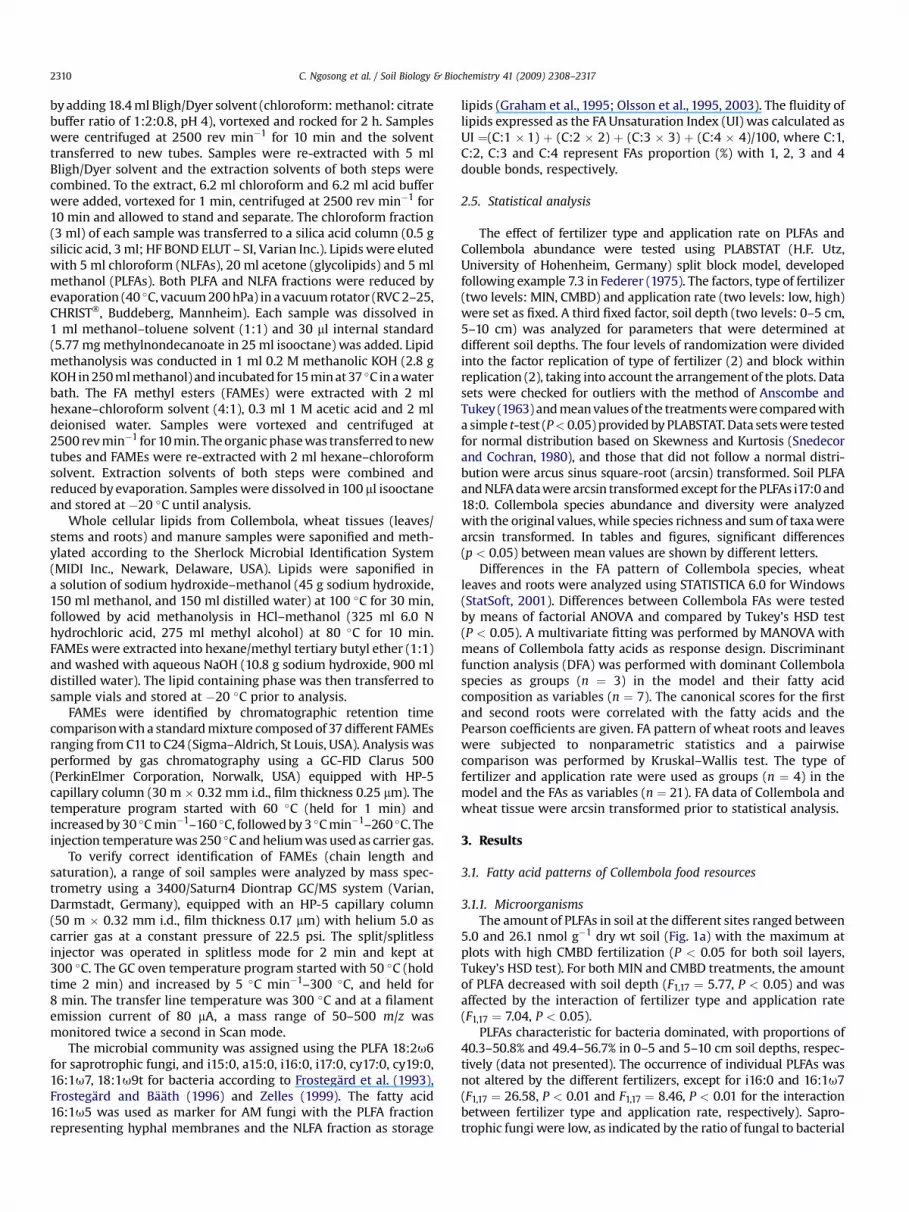
5.0 and 26.1 nmol g�1 dry wt soil (Fig. 1a) with the maximum atplots with high CMBD fertilization (P < 0.05 for both soil layers,Tukey’s HSD test). For both MIN and CMBD treatments, the amountof PLFA decreased with soil depth (F1,17 ¼ 5.77, P < 0.05) and wasaffected by the interaction of fertilizer type and application rate(F1,17 ¼ 7.04, P < 0.05).
PLFAs characteristic for bacteria dominated, with proportions of40.3–50.8% and 49.4–56.7% in 0–5 and 5–10 cm soil depths, respec-tively (data not presented). The occurrence of individual PLFAs wasnot altered by the different fertilizers, except for i16:0 and 16:1u7(F1,17 ¼ 26.58, P < 0.01 and F1,17 ¼ 8.46, P < 0.01 for the interactionbetween fertilizer type and application rate, respectively). Sapro-trophic fungi were low, as indicated by the ratio of fungal to bacterial
0
10
20
30
40
Low MIN High MIN Low CMBD High CMBD
Am
ou
nt o
f P
LF
A [n
mo
lg
-1
DW
+
/- S
D]
0-5 cm
5-10
F×A*, D*
bbb
a
0,00
0,20
0,40
0,60
0,80
1,00
Low MIN High MIN Low CMBD High CMBD
Fu
ng
al/b
ac
te
ria
l ra
tio
0-5 cm
5-10 cm
D*
a
b
Fig. 1. Microbial biomass assessed by phospholipid fatty acids (PLFAs) in soil amendedwith low or high amount of mineral (MIN) or organic (CMBD) fertilizer in 0–5 and5–10 cm soil depth (n ¼ 4). a – total amount of PLFAs (nmol g�1 DW � SD), b – ratio offungal to bacterial PLFAs (f/b). ANOVA with * for P < 0.05, D ¼ soil depth, F ¼ fertilizer,A ¼ amount of fertilizer. Bars sharing the same superscript letter are not significantlydifferent (Tukey Kramer HSD for 0–10 cm soil depth, P < 0.05).
0,0
0,3
0,6
0,9
1,2
1,5
1,8
Low MIN High MIN Low CMBD High CMBD
PL
FA
[n
mo
lg
-1
D
W +
/- S
D]
0-5 cm
5-10 cm
d
F×A**
ab
c
0
2
4
6
8
10
12
Low MIN High MIN Low CMBD High CMBD
NL
FA
[n
mo
lg
-1
DW
+
/- S
D]
D**
a
b
0-5 cm
5-10 cm
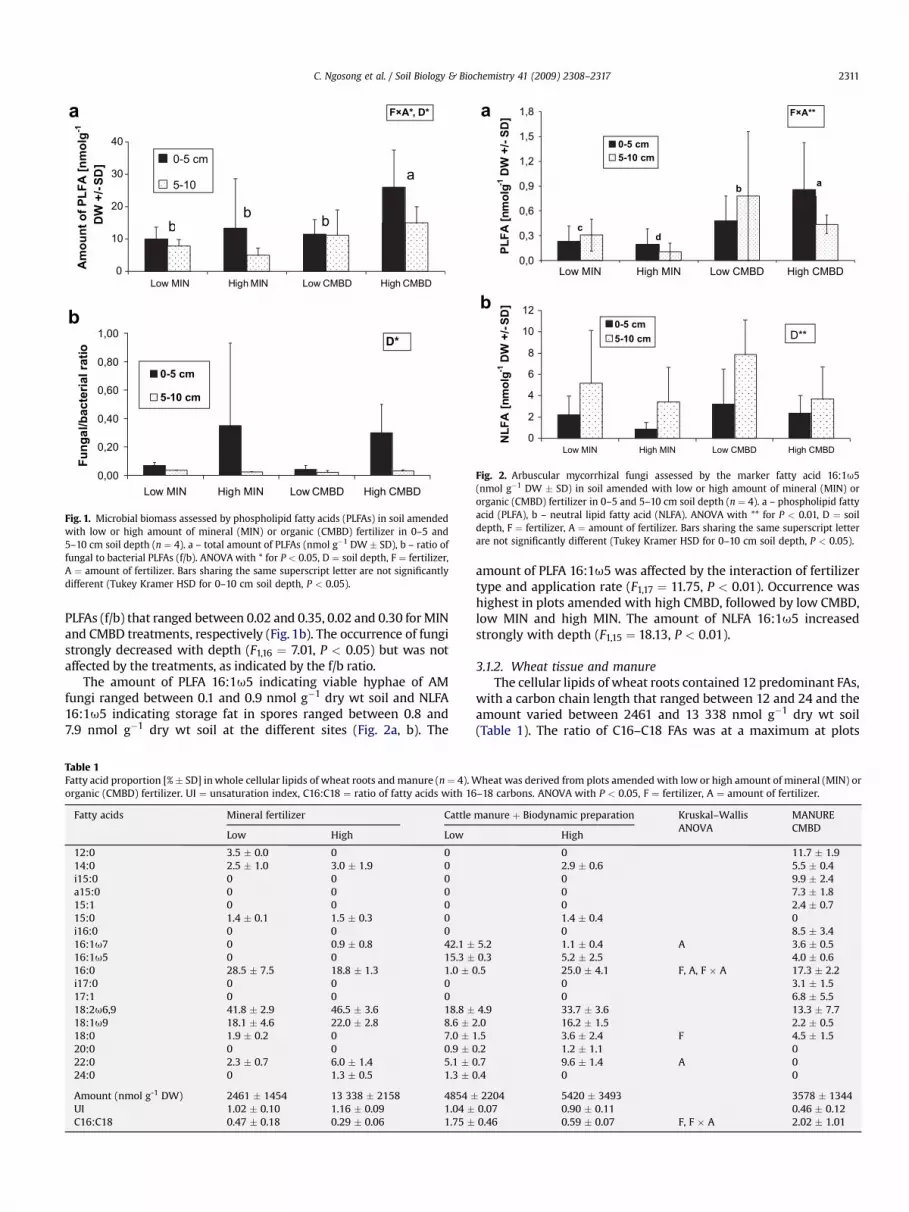
Fig. 2. Arbuscular mycorrhizal fungi assessed by the marker fatty acid 16:1u5(nmol g�1 DW � SD) in soil amended with low or high amount of mineral (MIN) ororganic (CMBD) fertilizer in 0–5 and 5–10 cm soil depth (n ¼ 4). a – phospholipid fattyacid (PLFA), b – neutral lipid fatty acid (NLFA). ANOVA with ** for P < 0.01, D ¼ soildepth, F ¼ fertilizer, A ¼ amount of fertilizer. Bars sharing the same superscript letterare not significantly different (Tukey Kramer HSD for 0–10 cm soil depth, P < 0.05).
C. Ngosong et al. / Soil Biology & Biochemistry 41 (2009) 2308–2317 2311
PLFAs (f/b) that ranged between 0.02 and 0.35, 0.02 and 0.30 for MINand CMBD treatments, respectively (Fig. 1b). The occurrence of fungistrongly decreased with depth (F1,16 ¼ 7.01, P < 0.05) but was notaffected by the treatments, as indicated by the f/b ratio.
The amount of PLFA 16:1u5 indicating viable hyphae of AMfungi ranged between 0.1 and 0.9 nmol g�1 dry wt soil and NLFA16:1u5 indicating storage fat in spores ranged between 0.8 and7.9 nmol g�1 dry wt soil at the different sites (Fig. 2a, b). The
Table 1Fatty acid proportion [%� SD] in whole cellular lipids of wheat roots and manure (n¼ 4). Worganic (CMBD) fertilizer. UI ¼ unsaturation index, C16:C18 ¼ ratio of fatty acids with 16
Fatty acids Mineral fertilizer Cattle
Low High Low
12:0 3.5 � 0.0 0 014:0 2.5 � 1.0 3.0 � 1.9 0i15:0 0 0 0a15:0 0 0 015:1 0 0 015:0 1.4 � 0.1 1.5 � 0.3 0i16:0 0 0 016:1u7 0 0.9 � 0.8 42.1 �16:1u5 0 0 15.3 �16:0 28.5 � 7.5 18.8 � 1.3 1.0 � 0i17:0 0 0 017:1 0 0 018:2u6,9 41.8 � 2.9 46.5 � 3.6 18.8 �18:1u9 18.1 � 4.6 22.0 � 2.8 8.6 � 218:0 1.9 � 0.2 0 7.0 � 120:0 0 0 0.9 � 022:0 2.3 � 0.7 6.0 � 1.4 5.1 � 024:0 0 1.3 � 0.5 1.3 � 0
Amount (nmol g-1 DW) 2461 � 1454 13 338 � 2158 4854 �UI 1.02 � 0.10 1.16 � 0.09 1.04 �C16:C18 0.47 � 0.18 0.29 � 0.06 1.75 �
amount of PLFA 16:1u5 was affected by the interaction of fertilizertype and application rate (F1,17 ¼ 11.75, P < 0.01). Occurrence washighest in plots amended with high CMBD, followed by low CMBD,low MIN and high MIN. The amount of NLFA 16:1u5 increasedstrongly with depth (F1,15 ¼ 18.13, P < 0.01).
3.1.2. Wheat tissue and manureThe cellular lipids of wheat roots contained 12 predominant FAs,
with a carbon chain length that ranged between 12 and 24 and theamount varied between 2461 and 13 338 nmol g�1 dry wt soil(Table 1). The ratio of C16–C18 FAs was at a maximum at plots
heat was derived from plots amended with low or high amount of mineral (MIN) or–18 carbons. ANOVA with P < 0.05, F ¼ fertilizer, A ¼ amount of fertilizer.
manure þ Biodynamic preparation Kruskal–WallisANOVA
MANURECMBD
High
0 11.7 � 1.92.9 � 0.6 5.5 � 0.40 9.9 � 2.40 7.3 � 1.80 2.4 � 0.71.4 � 0.4 00 8.5 � 3.4
5.2 1.1 � 0.4 A 3.6 � 0.50.3 5.2 � 2.5 4.0 � 0.6.5 25.0 � 4.1 F, A, F � A 17.3 � 2.2
0 3.1 � 1.50 6.8 � 5.5
4.9 33.7 � 3.6 13.3 � 7.7.0 16.2 � 1.5 2.2 � 0.5.5 3.6 � 2.4 F 4.5 � 1.5.2 1.2 � 1.1 0.7 9.6 � 1.4 A 0.4 0 0
2204 5420 � 3493 3578 � 13440.07 0.90 � 0.11 0.46 � 0.120.46 0.59 � 0.07 F, F � A 2.02 � 1.01
C. Ngosong et al. / Soil Biology & Biochemistry 41 (2009) 2308–23172312
amended with low amount of organic fertilizer (F3,11 ¼ 8.24,P < 0.05 for the interaction between fertilizer type and applicationrate). The occurrence of stearic acid increased with manure appli-cation (F1,8 ¼ 4.0, P < 0.05), while palmitic acid was at a maximumin the treatments with low amount of mineral fertilizer added(F3,11¼8.80, P < 0.05 for the interaction between fertilizer type andapplication rate). The amount of palmitoleic acid was ata maximum in the low input fertilizer regime (F1,9 ¼ 5.40, P < 0.05)and that of behenic acid in the high input fertilizer regime(F1,11 ¼ 5.63, P < 0.05). The FA profile of wheat leaves was domi-nated by palmitic (16:0), oleic (18:1u9) and linoleic acids(18:2u6,9), with 25–32%, 22–28% and 21–26%, respectively (datanot presented). The general pattern was not altered by fertilizertype or application rate.
Manure comprised 14 FAs with a carbon chain length thatranged between 12 and 18 atoms (Table 1). Palmitic acid was themost abundant FA with 17%, followed by linoleic acid with 13% andlauric acid (12:0) with 12%. This dominance of saturated FAs in theprofile is reflected in the low unsaturation index (UI) of 0.46.
3.2. Community structure of Collembola
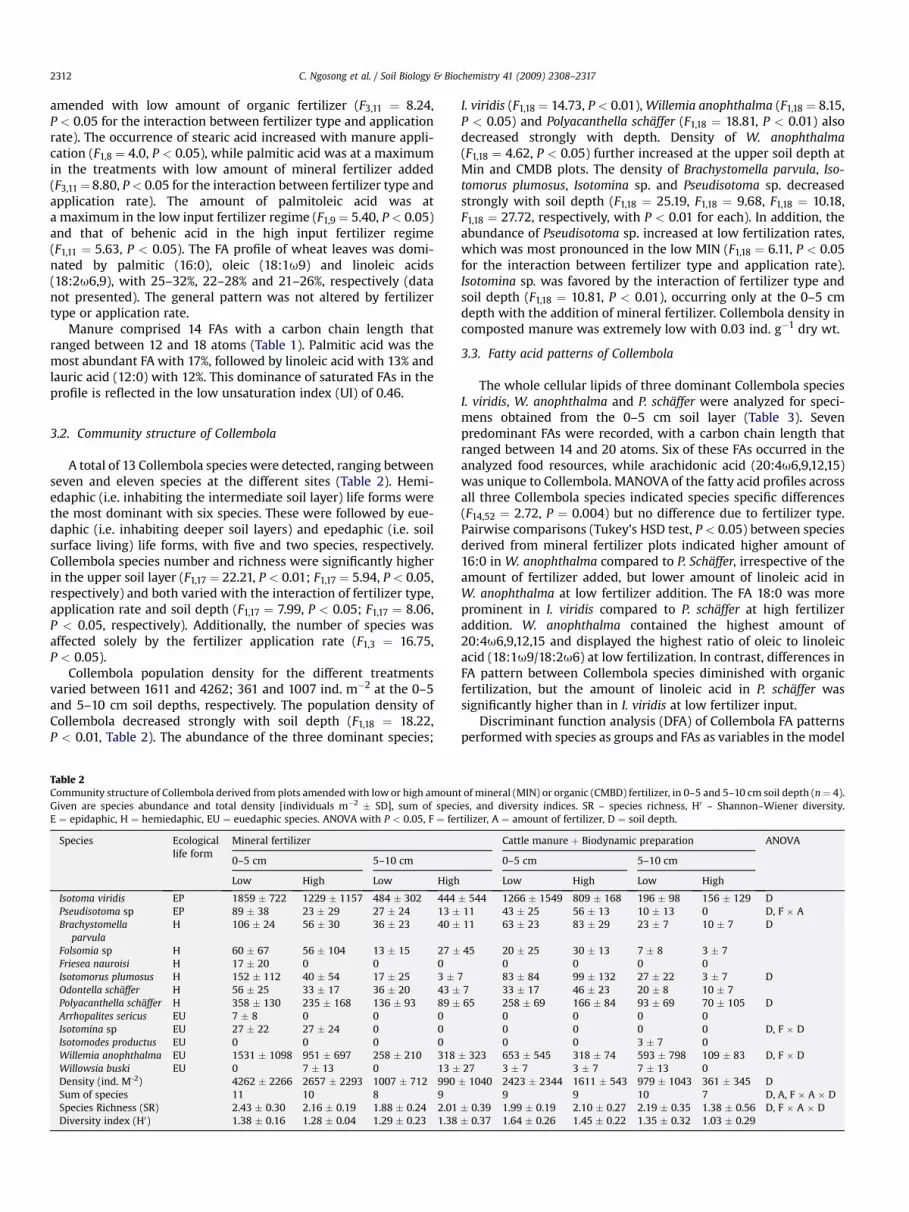
A total of 13 Collembola species were detected, ranging betweenseven and eleven species at the different sites (Table 2). Hemi-edaphic (i.e. inhabiting the intermediate soil layer) life forms werethe most dominant with six species. These were followed by eue-daphic (i.e. inhabiting deeper soil layers) and epedaphic (i.e. soilsurface living) life forms, with five and two species, respectively.Collembola species number and richness were significantly higherin the upper soil layer (F1,17 ¼ 22.21, P < 0.01; F1,17 ¼ 5.94, P < 0.05,respectively) and both varied with the interaction of fertilizer type,application rate and soil depth (F1,17 ¼ 7.99, P < 0.05; F1,17 ¼ 8.06,P < 0.05, respectively). Additionally, the number of species wasaffected solely by the fertilizer application rate (F1,3 ¼ 16.75,P < 0.05).
Collembola population density for the different treatmentsvaried between 1611 and 4262; 361 and 1007 ind. m�2 at the 0–5and 5–10 cm soil depths, respectively. The population density ofCollembola decreased strongly with soil depth (F1,18 ¼ 18.22,P < 0.01, Table 2). The abundance of the three dominant species;
Table 2Community structure of Collembola derived from plots amended with low or high amounGiven are species abundance and total density [individuals m�2 � SD], sum of speciE ¼ epidaphic, H ¼ hemiedaphic, EU ¼ euedaphic species. ANOVA with P < 0.05, F ¼ fer
Species Ecologicallife form
Mineral fertilizer
0–5 cm 5–10 cm
Low High Low High
Isotoma viridis EP 1859 � 722 1229 � 1157 484 � 302 444Pseudisotoma sp EP 89 � 38 23 � 29 27 � 24 13 �Brachystomella
parvulaH 106 � 24 56 � 30 36 � 23 40 �
Folsomia sp H 60 � 67 56 � 104 13 � 15 27 �Friesea nauroisi H 17 � 20 0 0 0Isotomorus plumosus H 152 � 112 40 � 54 17 � 25 3 �Odontella schaffer H 56 � 25 33 � 17 36 � 20 43 �Polyacanthella schaffer H 358 � 130 235 � 168 136 � 93 89 �Arrhopalites sericus EU 7 � 8 0 0 0Isotomina sp EU 27 � 22 27 � 24 0 0Isotomodes productus EU 0 0 0 0Willemia anophthalma EU 1531 � 1098 951 � 697 258 � 210 318Willowsia buski EU 0 7 � 13 0 13 �Density (ind. M-2) 4262 � 2266 2657 � 2293 1007 � 712 990Sum of species 11 10 8 9Species Richness (SR) 2.43 � 0.30 2.16 � 0.19 1.88 � 0.24 2.01Diversity index (H0) 1.38 � 0.16 1.28 � 0.04 1.29 � 0.23 1.38
I. viridis (F1,18 ¼ 14.73, P < 0.01), Willemia anophthalma (F1,18 ¼ 8.15,P < 0.05) and Polyacanthella schaffer (F1,18 ¼ 18.81, P < 0.01) alsodecreased strongly with depth. Density of W. anophthalma(F1,18 ¼ 4.62, P < 0.05) further increased at the upper soil depth atMin and CMDB plots. The density of Brachystomella parvula, Iso-tomorus plumosus, Isotomina sp. and Pseudisotoma sp. decreasedstrongly with soil depth (F1,18 ¼ 25.19, F1,18 ¼ 9.68, F1,18 ¼ 10.18,F1,18 ¼ 27.72, respectively, with P < 0.01 for each). In addition, theabundance of Pseudisotoma sp. increased at low fertilization rates,which was most pronounced in the low MIN (F1,18 ¼ 6.11, P < 0.05for the interaction between fertilizer type and application rate).Isotomina sp. was favored by the interaction of fertilizer type andsoil depth (F1,18 ¼ 10.81, P < 0.01), occurring only at the 0–5 cmdepth with the addition of mineral fertilizer. Collembola density incomposted manure was extremely low with 0.03 ind. g�1 dry wt.
3.3. Fatty acid patterns of Collembola
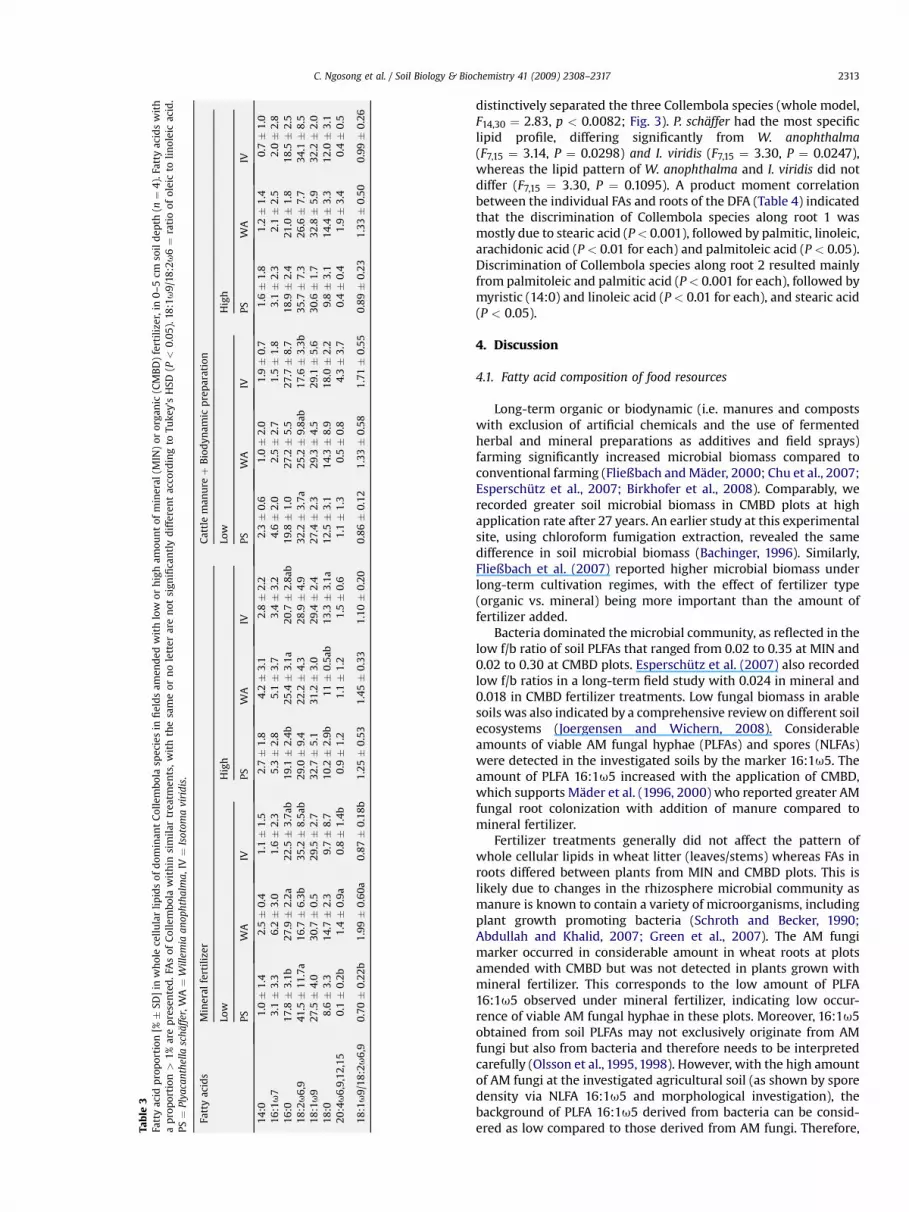
The whole cellular lipids of three dominant Collembola speciesI. viridis, W. anophthalma and P. schaffer were analyzed for speci-mens obtained from the 0–5 cm soil layer (Table 3). Sevenpredominant FAs were recorded, with a carbon chain length thatranged between 14 and 20 atoms. Six of these FAs occurred in theanalyzed food resources, while arachidonic acid (20:4u6,9,12,15)was unique to Collembola. MANOVA of the fatty acid profiles acrossall three Collembola species indicated species specific differences(F14,52 ¼ 2.72, P ¼ 0.004) but no difference due to fertilizer type.Pairwise comparisons (Tukey’s HSD test, P < 0.05) between speciesderived from mineral fertilizer plots indicated higher amount of16:0 in W. anophthalma compared to P. Schaffer, irrespective of theamount of fertilizer added, but lower amount of linoleic acid inW. anophthalma at low fertilizer addition. The FA 18:0 was moreprominent in I. viridis compared to P. schaffer at high fertilizeraddition. W. anophthalma contained the highest amount of20:4u6,9,12,15 and displayed the highest ratio of oleic to linoleicacid (18:1u9/18:2u6) at low fertilization. In contrast, differences inFA pattern between Collembola species diminished with organicfertilization, but the amount of linoleic acid in P. schaffer wassignificantly higher than in I. viridis at low fertilizer input.
Discriminant function analysis (DFA) of Collembola FA patternsperformed with species as groups and FAs as variables in the model
t of mineral (MIN) or organic (CMBD) fertilizer, in 0–5 and 5–10 cm soil depth (n¼ 4).es, and diversity indices. SR – species richness, H0 – Shannon–Wiener diversity.tilizer, A ¼ amount of fertilizer, D ¼ soil depth.
Cattle manure þ Biodynamic preparation ANOVA
0–5 cm 5–10 cm
Low High Low High
� 544 1266 � 1549 809 � 168 196 � 98 156 � 129 D11 43 � 25 56 � 13 10 � 13 0 D, F � A11 63 � 23 83 � 29 23 � 7 10 � 7 D
45 20 � 25 30 � 13 7 � 8 3 � 70 0 0 0
7 83 � 84 99 � 132 27 � 22 3 � 7 D7 33 � 17 46 � 23 20 � 8 10 � 765 258 � 69 166 � 84 93 � 69 70 � 105 D
0 0 0 00 0 0 0 D, F � D0 0 3 � 7 0
� 323 653 � 545 318 � 74 593 � 798 109 � 83 D, F � D27 3 � 7 3 � 7 7 � 13 0� 1040 2423 � 2344 1611 � 543 979 � 1043 361 � 345 D
9 9 10 7 D, A, F � A � D� 0.39 1.99 � 0.19 2.10 � 0.27 2.19 � 0.35 1.38 � 0.56 D, F � A � D� 0.37 1.64 � 0.26 1.45 � 0.22 1.35 � 0.32 1.03 � 0.29
Tab
le3
Fatt
yac
idp
rop
orti
on[%�
SD]
inw
hol
ece
llu
lar
lip
ids
ofd
omin
ant
Col
lem
bol
asp
ecie
sin
fiel
ds
amen
ded
wit
hlo
wor
hig
ham
oun
tof
min
eral
(MIN
)or
orga
nic
(CM
BD
)fe
rtil
izer
,in
0–
5cm
soil
dep
th(n¼
4).
Fatt
yac
ids
wit
ha
pro
por
tion
>1%
are
pre
sen
ted
.FA
sof
Col
lem
bol
aw
ith
insi
mil
artr
eatm
ents
,w
ith
the
sam
eor
no
lett
erar
en
otsi
gnifi
can
tly
dif
fere
nt
acco
rdin
gto
Tuke
y’s
HSD
(P<
0.0
5).
18:1
u9
/18
:2u
6¼
rati
oof
olei
cto
lin
olei
cac
id.
PS¼
Plya
can
thel
lasc
haf
fer,
WA¼
Will
emia
anop
hth
alm
a,IV¼
Isot
oma
viri
dis.
Fatt
yac
ids
Min
eral
fert
iliz
erC
attl
em
anu
reþ
Bio
dyn
amic
pre
par
atio
n
Low
Hig
hLo
wH
igh
PSW
AIV
PSW
AIV
PSW
AIV
PSW
AIV
14
:01
.0�
1.4
2.5�
0.4
1.1�
1.5
2.7�
1.8
4.2�
3.1
2.8�
2.2
2.3�
0.6
1.0�
2.0
1.9�
0.7
1.6�
1.8
1.2�
1.4
0.7�
1.0
16
:1u
73
.1�
3.3
6.2�
3.0
1.6�
2.3
5.3�
2.8
5.1�
3.7
3.4�
3.2
4.6�
2.0
2.5�
2.7
1.5�
1.8
3.1�
2.3
2.1�
2.5
2.0�
2.8
16
:01
7.8�
3.1
b2
7.9�
2.2
a2
2.5�
3.7
ab1
9.1�
2.4
b2
5.4�
3.1
a2
0.7�
2.8
ab19
.8�
1.0
27
.2�
5.5
27
.7�
8.7
18
.9�
2.4
21
.0�
1.8
18
.5�
2.5
18
:2u
6,9
41
.5�
11
.7a
16
.7�
6.3
b3
5.2�
8.5
ab2
9.0�
9.4
22
.2�
4.3
28
.9�
4.9
32.2�
3.7
a2
5.2�
9.8
ab1
7.6�
3.3
b3
5.7�
7.3
26
.6�
7.7
34
.1�
8.5
18
:1u
92
7.5�
4.0
30
.7�
0.5
29
.5�
2.7
32
.7�
5.1
31
.2�
3.0
29
.4�
2.4
27.4�
2.3
29
.3�
4.5
29
.1�
5.6
30
.6�
1.7
32
.8�
5.9
32
.2�
2.0
18
:08
.6�
3.3
14
.7�
2.3
9.7�
8.7
10
.2�
2.9
b1
1�
0.5
ab1
3.3�
3.1
a12
.5�
3.1
14
.3�
8.9
18
.0�
2.2
9.8�
3.1
14
.4�
3.3
12
.0�
3.1
20
:4u
6,9
,12
,15
0.1�
0.2
b1
.4�
0.9
a0
.8�
1.4
b0
.9�
1.2
1.1�
1.2
1.5�
0.6
1.1�
1.3
0.5�
0.8
4.3�
3.7
0.4�
0.4
1.9�
3.4
0.4�
0.5
18
:1u
9/1
8:2
u6
,90
.70�
0.2
2b
1.9
9�
0.6
0a
0.8
7�
0.1
8b
1.2
5�
0.5
31
.45�
0.3
31
.10�
0.2
00.
86�
0.1
21
.33�
0.5
81
.71�
0.5
50
.89�
0.2
31
.33�
0.5
00
.99�
0.2
6
C. Ngosong et al. / Soil Biology & Biochemistry 41 (2009) 2308–2317 2313
distinctively separated the three Collembola species (whole model,F14,30 ¼ 2.83, p < 0.0082; Fig. 3). P. schaffer had the most specificlipid profile, differing significantly from W. anophthalma(F7,15 ¼ 3.14, P ¼ 0.0298) and I. viridis (F7,15 ¼ 3.30, P ¼ 0.0247),whereas the lipid pattern of W. anophthalma and I. viridis did notdiffer (F7,15 ¼ 3.30, P ¼ 0.1095). A product moment correlationbetween the individual FAs and roots of the DFA (Table 4) indicatedthat the discrimination of Collembola species along root 1 wasmostly due to stearic acid (P< 0.001), followed by palmitic, linoleic,arachidonic acid (P < 0.01 for each) and palmitoleic acid (P < 0.05).Discrimination of Collembola species along root 2 resulted mainlyfrom palmitoleic and palmitic acid (P< 0.001 for each), followed bymyristic (14:0) and linoleic acid (P < 0.01 for each), and stearic acid(P < 0.05).
4. Discussion
4.1. Fatty acid composition of food resources
Long-term organic or biodynamic (i.e. manures and compostswith exclusion of artificial chemicals and the use of fermentedherbal and mineral preparations as additives and field sprays)farming significantly increased microbial biomass compared toconventional farming (Fließbach and Mader, 2000; Chu et al., 2007;Esperschutz et al., 2007; Birkhofer et al., 2008). Comparably, werecorded greater soil microbial biomass in CMBD plots at highapplication rate after 27 years. An earlier study at this experimentalsite, using chloroform fumigation extraction, revealed the samedifference in soil microbial biomass (Bachinger, 1996). Similarly,Fließbach et al. (2007) reported higher microbial biomass underlong-term cultivation regimes, with the effect of fertilizer type(organic vs. mineral) being more important than the amount offertilizer added.
Bacteria dominated the microbial community, as reflected in thelow f/b ratio of soil PLFAs that ranged from 0.02 to 0.35 at MIN and0.02 to 0.30 at CMBD plots. Esperschutz et al. (2007) also recordedlow f/b ratios in a long-term field study with 0.024 in mineral and0.018 in CMBD fertilizer treatments. Low fungal biomass in arablesoils was also indicated by a comprehensive review on different soilecosystems (Joergensen and Wichern, 2008). Considerableamounts of viable AM fungal hyphae (PLFAs) and spores (NLFAs)were detected in the investigated soils by the marker 16:1u5. Theamount of PLFA 16:1u5 increased with the application of CMBD,which supports Mader et al. (1996, 2000) who reported greater AMfungal root colonization with addition of manure compared tomineral fertilizer.
Fertilizer treatments generally did not affect the pattern ofwhole cellular lipids in wheat litter (leaves/stems) whereas FAs inroots differed between plants from MIN and CMBD plots. This islikely due to changes in the rhizosphere microbial community asmanure is known to contain a variety of microorganisms, includingplant growth promoting bacteria (Schroth and Becker, 1990;Abdullah and Khalid, 2007; Green et al., 2007). The AM fungimarker occurred in considerable amount in wheat roots at plotsamended with CMBD but was not detected in plants grown withmineral fertilizer. This corresponds to the low amount of PLFA16:1u5 observed under mineral fertilizer, indicating low occur-rence of viable AM fungal hyphae in these plots. Moreover, 16:1u5obtained from soil PLFAs may not exclusively originate from AMfungi but also from bacteria and therefore needs to be interpretedcarefully (Olsson et al., 1995, 1998). However, with the high amountof AM fungi at the investigated agricultural soil (as shown by sporedensity via NLFA 16:1u5 and morphological investigation), thebackground of PLFA 16:1u5 derived from bacteria can be consid-ered as low compared to those derived from AM fungi. Therefore,

Root 1 vs. Root 2
PSWAIV
-4 -3 -2 -1 0 1 2 3 4
Root 1
-4
-3
-2
-1
0
1
2
3
4
Roo
t 2
Fig. 3. Discriminant function analysis (DFA) with the three dominant Collembola species as groups (n ¼ 3) and their fatty acid composition as variables (n ¼ 7) in the model;PS ¼ Polyacanthella schaffer, WA ¼Willemia anolphthalma, IV ¼ Isotoma viridis; the scatter plot shows ellipses with a ¼ 0.05.
C. Ngosong et al. / Soil Biology & Biochemistry 41 (2009) 2308–23172314
the use of this fatty acid as marker in the present comparative studyis appropriate.
Manure applied to CMDB plots could be a potential diet forCollembola. The fatty acid pattern of the manure indicates that itcomprised bacteria (e.g. i15:0, a15:0), fungi (e.g. 18:2u6,9) andplant material (e.g. 18:1u9). Compared to other food resources, thecontent of saturated FAs was high, as reflected by the low unsatu-ration index (UI). This may be related to degradation processes ofplant tissue containing considerable amount of long-chain satu-rated FAs (Zelles, 1999).
4.2. Community structure of Collembola
Organic and biodynamic farming are known to support greaterpopulation density and diversity of Collembola than conventionalsystems (Petersen et al., 2003; Scholte and Lootsma, 1998;Miyazawa et al., 2002; Leroy et al., 2007). The community structureof Collembola at the investigated site does not corroborate thesereports, as an increase in species richness was recorded at plotsamended with mineral fertilizer. Correspondingly, Brussaard et al.(1990) observed increased abundance of epedaphic Collembolaspecies in wheat fields under conventional farming. Furthermore,
Table 4Correlation of fatty acid pattern of three dominant Collembola species with theextracted axes by discriminant functional analyses (DFA), with Collembola species asgroups (n ¼ 3) and fatty acids as variables (n ¼ 7) in the model. Canonical scores forthe first and second root were used for correlation and the Pearson coefficients aregiven (n ¼ 24). *P < 0.05; **P < 0.01; ***P < 0.001.
Fatty acid Root 1 Root 2
14:0 �0.2934 0.5520**16:1u7 �0.4078* 0.7784***16:0 0.5640** 0.7258***18:2u6 �0.6354** �0.5813**18:1u9 0.2912 �0.000618:0 0.6688*** �0.4101*20:4u6 0.6234* �0.0288
Alvarez et al., 2001 reported higher abundance of E. multifasciataand Isotomurus spp. in fields amended with mineral compared toorganic fertilizer, while I. viridis and I. notabilis were more abundantunder mineral fertilization. Overall, the community composition ofCollembola at the investigated field was influenced by MIN andCMBD fertilizer application, but no species was indicative of thedifferent management regimes, as they occurred ubiquitously in allplots.
Our study suggests favourable conditions for Collembola underlong-term mineral fertilization compared to organic manure. Thiscould be due to enhanced availability of saprotrophic fungi as foodsource in mineral fertilizer systems. In a companion study Heinzeet al. (in press) investigated the same field site six months earlierand observed a 40% increase in the fungal membrane componentergosterol with mineral fertilization. However, as revealed by themarker PLFA linoleic acid, the biomass of saprotrophic fungi waslow in all plots. This indicates that fungal resources are of minorimportance for Collembola and likely variations in environmentalconditions were more pronounced. Previous studies at the exper-imental site revealed higher crop density of wheat under mineralfertilization, i.e. reduced sunlight at the surface and hence lowersoil temperature and evaporation, resulting in higher soil moisture(Raupp, 1999; Heitkamp et al., 2009). Moreover, Heinze et al. (inpress) reported significantly lower pH values in MIN compared toCMBD plots and Collembola are known to increase under suchconditions (Salamon et al., 2008). In sum, higher population densityand diversity of Collembola observed with mineral fertilizationcompared to organic amendment is likely due to a combination ofbiotic and abiotic factors. Changes in food resources presumablywere less important than changes in soil properties.
4.3. Fatty acid pattern of Collembola
Lipid analysis has been used frequently to analyze the feedingstrategy of Collembola in the laboratory (Chamberlain et al., 2005a;Haubert et al., 2006; Ruess et al., 2004, 2005b). However, infor-mation on Collembola nutrition in the field is sparse, with some

C. Ngosong et al. / Soil Biology & Biochemistry 41 (2009) 2308–2317 2315
data from forests (Chamberlain and Black, 2005; Ruess et al., 2005a,2007) but few from arable land (Haubert et al., 2009). In this study,we investigated three ecological groups of Collembola (epedaphic,hemiedaphic and euedaphic) in an arable system. Discriminantfunction analysis (DFA) of their FA profiles demonstrated speciesspecific lipid patterns, suggesting specific feeding strategies, withvariations between species exceeding those between managementpractices.
Differences in Collembola FAs were more apparent in plotswhere mineral fertilizer was added compared to application ofmanure, resulting in discrepancies between species. Regardingspecific fatty acids, the separation of the hemiedaphic speciesP. schaffer was mainly related to the low occurrence of saturated FAs(16:0 and 18:0) and the high proportion of lineloic acid in cellularlipids. The euedaphic species W. anophthalma contained littlelinoleic acid, whereas the epedaphic species I. viridis displayed thelowest content of 16:1u7. These differences in FA composition werelikely due to the soil layer inhabited by the Collembola and asso-ciated differences in food resources. Epedaphic species are knownto feed unselectively on a wide range of food material includingfungi, bacteria, lichens, detritus and decomposing organic matter(Hopkins, 1997; Rusek, 1998), while the majority of euedaphic andhemiedaphic species are fungal feeders (Visser et al., 1987; Bardgettet al., 1993). Our results suggest distinct trophic niche diversifica-tion in Collembola, which is in line with the stable isotope basedfindings of Chahartaghi et al. (2005).
4.4. Feeding strategy of Collembola
Dietary routing of FA biomarkers has been used to infer foodresources of Collembola (Chamberlain et al., 2005a, 2005b; Ruesset al., 2004, 2005a, 2005b). According to these studies, palmitoleicacid (16:1u7) is derived from bacteria, linoleic acid from sapro-trophic fungi and oleic acid from plant resources. Furthermore,the ratio of oleic to linoleic acid has been used as a measure ofherbivory and fungivory in Collembola (Ruess et al., 2007).Chamberlain and Black (2005) ascribed oleic acid as an indicatorfor nematode feeding because they found the marker in Collem-bola reared on the bacterial-feeding nematode Panagrellusredividus. However, the nematodes may have assimilated FAsoriginating from the diet of nematodes and that may havecompromised the assignment of nematode marker FAs. Transportof FAs over two trophic levels has been shown by Ruess et al.(2004).
Collembolans can incorporate the FAs 16:1u7 and 16:1u5 fromtheir diet but they cannot synthesize these FAs. Thus, these FAs canbe used as absolute trophic markers (Ruess et al., 2005a; Haubertet al., 2006). The bacterial FA 16:1u7 was detected in all theinvestigated Collembola species, suggesting that they either feddirectly on bacteria or indirectly on animals with frequent bacterialdiet (e.g., nematodes). The marker FA 16:1u5 was not detected inCollembola, indicating that they do not feed on AM fungi in thefield. Evidence for the consumption of AM fungi by Collembola isbased on laboratory experiments (Klironomos and Ursic, 1998;Boerner and Harris, 1991; Kaiser and Lussenhop, 1991) where Col-lembola did not have access to alternative food resources of higherquality. When given a choice, Collembola prefer saprotrophic overAM fungi (Klironomos and Kendrick, 1996; Klironomos et al., 1999;Gange, 2000). This supports our results that AM fungi were not anappropriate diet for Collembola under field conditions, althoughthey were the dominant fungal group in the soil. Collembolamay have changed to more palatable resources, although theyare frequently reported as generalist feeders (Petersen andLuxton, 1982; Lartey et al., 1989; Bardgett et al., 1993; Hopkins,1997; Rusek, 1998).
Relative markers such as 18:1u9 and 18:2u6,9 can be synthe-sized by Collembola but their proportion is increased if abundant inthe diet (Ruess et al., 2005a). The fungal marker (18:2u6,9) waslowest in W. anophthalma followed by I. viridis and P. schaffer, whilethe marker for plant resources (18:1u9) was unaffected. Corre-spondingly, the ratio between 18:1u9 and 18:2u6,9 was high inW. anophthalma, indicating that they fed on plant tissue, but low inI. viridis and P. schaffer, indicating that they fed predominantly onfungi. Generally, the use of this ratio depends on the FA pattern ofthe plant resources available, i.e., that the proportion of 18:2u6,9 islow and that of 18:1u9 is high (Ruess et al., 2007). This was not thecase at the study site as wheat plants predominantly contained18:2u6,9, with 47% in roots and 27% in leave litter. Moreover,18:2u6,9 was scarce in soil PLFAs, suggesting that the biomass ofsaprotrophic fungi and their contribution to the diet of Collembolawas low.
Overall, the high content of 18:2u6,9 and 18:1u9 in roots andCollembola, and the low fungal biomass in soil suggest that rootsformed a major constituent of Collembola diet. Roots are potentialfood resource of Collembola and direct grazing has been reported(Brown, 1985; Filser, 2002; Endlweber et al., 2009). Feeding onroots is further supported by corresponding changes in the patternof saturated FAs in Collembola and the lipids of wheat roots, due tothe different fertilizer treatment. Therefore, the fungal basedenergy channel of the food web for the investigated arable fieldappears to be of little importance and only driven by saprotrophicbut not AM fungi. This is in line with the predominance of thebacterial energy channel indicated by microbial communityanalysis via soil PLFAs. Comparable findings are reported byVreeken-Buijs et al. (1994) who observed mainly ‘‘fungivorous’’microarthopods in a bacteria dominated food web of arable farmingsystems.
On the other hand, Chamberlain et al. (2005b) attributeddifferences in the ratio of 18:1u9 and 18:2u6,9 to taxonomic, ratherthan feeding relationships. They reported oleic acid as the major FAin species from Arthropleona while linoleic acid was most frequentin Symphypleona. The Collembola species investigated in this studyall belong to the Arthropleona and displayed different ratios of oleicto linoleic acid, which does not support group specific metabolismof these FAs. Overall, the use of the relative trophic markers oleicand linoleic acid has to take the lipid pattern of available resourcesinto consideration. To further improve the resolution of FA analysisof trophic links, it may be combined with other biochemicalmarkers such as stable isotopes. Using compound specific analysisof FAs, i.e., 13C in individual FAs, Haubert et al. (2009) were able todistinguish between the plant and fungal signals in the respectiveFAs assimilated by Collembola under field conditions.
In sum, FA differences between Collembola species in plotsamended with mineral fertilizer indicate that they fed on diverseresources. In contrast, the uniform lipid pattern of Collembola FAsin plots amended with organic fertilizer indicates common diets,which may be related to the higher SOM content with manureapplication (Bachinger, 1996). Contrary to laboratory information,Collembola adjusted their feeding strategy due to farm manage-ment practice and the availability of related resources, switchingdiet in plots where they had different food resources. Theypreferred the rich and easily accessible food i.e. wheat roots aspredominant diet with mineral fertilizer and a shift to SOM withorganic manure. Although AM fungi dominated the fungalcommunity in the investigated agroecosystem, they were not orrarely consumed by Collembola. Hence, previous findings on therole of AM fungi in Collembola nutrition were not supported by ourarable field study. Overall, the lipid pattern of Collembola gave noevidence of a dominant fungal based food web in the investigatedarable field. Knowledge on the feeding strategy of Collembola
C. Ngosong et al. / Soil Biology & Biochemistry 41 (2009) 2308–23172316
under natural and arable conditions is sparse and our resultshighlight the need for more in situ approaches to complementlaboratory information.
Acknowledgements
We extend gratitude to the counties Brandenburg and Thur-ingen, and the Leibniz Society Germany for funding the project. Weare also grateful to M. Jarosch and T. Volovei for their assistanceduring field sampling and laboratory analysis.
References
Abdullah, M.A., Khalid, M.H., 2007. Implementation of olive mill by products inagriculture. World Journal of Agricultural Sciences 3, 380–385.
Alvarez, T., Frampton, G.K., Goulson, D., 2001. Epigeic Collembola in winter wheatunder organic, integrated and conventional farm management regimes. Agri-culture, Ecosystems and Environment 83, 95–110.
Anscombe, F.J., Tukey, J.W., 1963. The examination and analysis of residuals. Tech-nometrics 5, 141–160.
Bachinger, J., 1996. Effects of different fertilisers on the C- and N-dynamics in soil.In: Kristensen, N.H., Høgh-Jensen, H. (Eds.), New Research in Organic Agricul-ture. Proc. vol. 2, 11th Intern. Sci. IFOAM Conf., August 11-15 1996, Copenhagen,pp. 11–16.
Bardgett, R.D., Whittaker, J.B., Frankland, J.C., 1993. The diet and food preferences ofOnyycchiurus procampatus (Collembola) from upland grassland soils. Biologyand Fertility of Soils 16, 296–298.
Bethlenfalvay, G.J., 1992. Mycorrhizae and crop productivity. In: Bethlenfalvay, G.J.,Linderman, R.G. (Eds.), Mycorrhizae in Sustainable Agriculture. Proceedings ofthe American Society of Agronomy, Madison, Wis, vol. 54, pp. 1–27.
Birkhofer, K., Bezemer, T.M., Bloem, J., Bonkowski, M., Søren, C., Dubois, D.,Ekelund, F., Fließbach, A., Gunst, L., Hedlund, K., Mader, P., Mikola, J., Robin, C.,Setala, H., Tatin-Froux, F., Van der Putten, W.H., Scheu, S., 2008. Long-termorganic farming fosters below and aboveground biota: implications for soilquality, biological control and productivity. Soil Biology & Biochemistry 40,2297–2308.
Boerner, R.E.J., Harris, K.K., 1991. Effects of Collembola (Arthropoda) and relativegermination date on competition between mycorrhizal Panicum-virgatum(Poaceae) and nonmycorrhizal Brassica-nigra (Brassiceae). Plant and Soil 136,121–129.
Brown, R.A., 1985. Effects of some root-grazing arthropods on the growth ofsugar-beet. British Ecological Society 4. In: Fitter, A.H., Atldnson, D.,Read, D.J., Usher, M.B. (Eds.), Ecological Interactions in Soil. Blackwell, Oxford,pp. 285–295.
Brussaard, L., Bouwman, L.A., Geurs, M., Hassink, J., Zwart, K.B., 1990. Biomass,composition and temporal dynamics of soil organisms of a silt loam underconventional and integrated management. Netherlands Journal of AgriculturalScience 38, 283–302.
Carpenter-Boggs, L., Kennedy, A.C., Reganold, J.P., 2000. Organic and biodynamicmanagement: effects on soil biology. Soil Science Society of America 64,1651–1659.
Chahartaghi, M., Langel, R., Scheu, S., Ruess, L., 2005. Feeding guilds in Collembolabased on nitrogen stable isotope ratios. Soil Biology & Biochemistry 37,1718–1725.
Chamberlain, P.M., Black, H.I.J., 2005. Fatty acid composition of Collembola:unusually high proportions of C20 polyunsaturated fatty acids in a terrestrialinvertebrate. Comparative Biochemistry and Physiology 140, 299–307.
Chamberlain, P.M., Bull, I.D., Black, H.I.J., Ineson, P., Evershed, R.P., 2004. Lipidcontent and carbon assimilation in Collembola: implications for the use ofcompound-specific carbon isotope analysis in animal dietary studies. Oecologia139, 325–335.
Chamberlain, P.M., Bull, I.D., Black, H.I.J., Ineson, P., Evershed, R.P., 2005a. Fatty acidcomposition and change in Collembola fed differing diets: identification oftrophic biomarkers. Soil Biology & Biochemistry 37, 1608–1624.
Chamberlain, P.M., Bull, I.D., Black, H.I.J., Ineson, P., Evershed, R.P., 2005b. Collem-bolan trophic preferences determined using fatty acid distributions andcompound-specific stable carbon isotope values. Soil Biology & Biochemistry38, 1275–1281.
Chen, B., Sneider, R.J., Sneider, R.M., 1995. Food preferences and effects of food typeon life history of some Collembola. Pedobiologia 39, 496–505.
Chu, H., Lin, X.G., Fujii, T., Morimoto, S., Yagi, K., Hu, J., Zhang, J., 2007. Soil microbialbiomass, dehydrogenase activity, bacterial community structure in response tolong-term fertilizer management. Soil Biology & Biochemistry 39, 2971–2976.
Endlweber, K., Ruess, L., Scheu, S., 2009. Collembola switch diet in the presence ofplant roots thereby functioning as herbivores. Soil Biology and Biochemistry 41,1151–1154.
Esperschutz, J., Gattinger, A., Mader, P., Schloter, M., Fließbach, A., 2007. Responseof soil microbial biomass and community structures to conventional and organicfarming systems under identical crop rotations. Microbial Ecology 61, 26–37.
Federer, W.T., 1975. The misunderstood split plot. In: Gupta, R.P. (Ed.), AppliedStatistics. North-Holland Publishers Company, pp. 9–39.
Filser, J., 2002. The role of Collembola in carbon and nitrogen cycling in soil.Pedobiologia 46, 234–245.
Fjellberg, A., 1998. The Collembola Fauna of Fennoscandia and Denmark. In: Part I,Families Poduridae, Hypogastruridae, Brachystomellidae, Neanuridae, Odon-tellidae and Onychiuridae, vol. 35. Brill, Leiden.
Fließbach, A., Mader, P., 2000. Microbial biomass and size-density fractions differbetween soils of organic and conventional agricultural systems. Soil Biology &Biochemistry 32, 757–768.
Fließbach, A., Oberholzer, H.-R., Gunst, L., Mader, P., 2007. Soil organic matter andbiological soil quality indicators after 21 years of organic and conventionalfarming. Agriculture, Ecosystems and Environment 118, 273–284.
Frostegard, A., Baath, E., 1996. The use of phospholipid fatty acid analysis to estimatebacterial and fungal biomass in soil. Biology and Fertility of Soils 22, 59–65.
Frostegard, A., Tunlid, A., Baath, E., 1993. Phospholipid fatty acid composition,Biomass and activity of microbial communities from two soil types experi-mentally exposed to different heavy metals. Applied Environmental Microbi-ology 59, 3605–3617.
Gange, A., 2000. Arbuscular mycorrhizal fungi, Collembola and plant growth.Trends in Ecology and Evolution 15, 369–372.
Gazey, C., Abbott, L.K., Robson, A.D., 2003. Indigenous and introduced arbuscularmycorrhizal fungi contribute to plant growth in two agricultural soils fromsouth-western Australia. Mycorrhiza 14, 355–362.
Gisin, H., 1960. Collembolefauna Europas. Museum d’histoire Naturelle, Geneve.Graham, J.H., Hodge, N.C., Morton, J.B., 1995. Fatty acid methyl ester profiles for
characterization of Glomalean fungi and their endomycorrhizae. Applied andEnvironmental Micriobiology 61, 58–64.
Green, S.J., Frederick, C.M.J., Yitzhak, H., Dror, M., 2007. Contrasting patterns of seedand root colonization by bacteria from the genus Chryseobacterium and fromthe family Oxalobacteraceae. Microbial Ecology 1, 291–299.
Harris, K.K., Boerner, R.E.J., 1990. Effects of belowground grazing by Collembola ongrowth, mycorrhizal infection and P uptake of Geranium robertianum. Plant andSoil 129, 203–210.
Haubert, D., Birkhofer, K., Fließbach, A., Gehre, M., Scheu, S., Ruess, L., 2009. Trophicstructure and major trophic links in conventional vs organic farming systems asindicated by carbon stable isotope ratios of fatty acids. Oikos, accepted.
Haubert, D., Haggbloom, M.M., Scheu, S., Ruess, L., 2006. Trophic shift of stableisotopes and fatty acids in bacterial based soil food chains. Soil Biology &Biochemistry 38, 2004–2007.
Heinze, S., Raupp, J., Joergensen, R.G. Effects of fertilizer and spatial heterogeneityin soil pH on microbial biomass indices in a long-term field trial of organicagriculture. Plant and Soil, in press, Doi: 10.1007/s11104-009-0102-2.
Heitkamp, F., Raupp, J., Ludwig, B., 2009. Impact of fertilizer type and rate on carbonand nitrogen pools in a sandy Cambisol. Plant and Soils. doi:10.1007/s11104-008-9868-x.
Hijri, I., S�ykorova, Z., Oehl, F., Ineichen, K., Mader, P., Wiemken, A., Redecker, D.,2006. Communities of arbuscular mycorrhizal fungi in arable soils are notnecessarily low in diversity. Molecular Ecology 15, 2277–2289.
Hopkins, J.P., 1997. Biology of the Springtails (Insecta: Collembola). Oxford UniverstyPress.
Jayne, L.J., Gail, W.T.W., White, P.M., Joern, A., 2007. Consumption of mycorrhizal andsaprophytic fungi by Collembola in grassland soils. Soil Biology and Biochem-istry 39, 2594–2602.
Joergensen, R.J., Wichern, F., 2008. Quantitative assessment of the fungal contri-bution to microbial tissue in soil. Soil Biology and Biochemistry 40, 2977–2991.
Johnson, N.C., Pfleger, F.L., 1992. Vesicular–arbuscular mycorrhizae and culturalstress. Mycorrhizae in sustainable agriculture. In: Bethlenfalvay, G.J.,Linderman, R.G. (Eds.), Proceedings of the American Society of Agronomy, vol.54, pp. 71–99. Madison, Wis.
Kaiser, P.A., Lussenhop, J., 1991. Collembolan effects on establishment of vesiculararbuscular mycorrhizae in soybean (Glycine max). Soil Biology and Biochemistry23, 307–308.
Kempson, D., Lloyd, M., Ghelardi, R., 1963. A new extractor for woodland litter.Pebiologia 3, 1–21.
Klironomos, J.N., Bednarczuk, E.M., Neville, J., 1999. Reproductive significance offeeding on saprobic and arbuscular mycorrhizal fungi by the collembolan,Folsomia candida. Functional Ecology 13, 756–761.
Klironomos, J.N., Ursic, M., 1998. Density-dependent grazing on the extraradicalhyphal network of the arbuscular mycorrhizal fungus, Glomus intraradices, bythe Collembolan, Folsomia candida. Biology and Fertility of Soils 26, 250–253.
Klironomos, J.N., Kendrick, W.B., 1996. Palatability of microfungi to soil arthropodsin relation to the functioning of arbuscular mycorrhizae. Biology and Fertility ofSoils 21, 43–52.
Klironomos, J.N., Kendrick, W.B., 1995. Relationship among microarthropods, fungiand their environment. Plant and Soil 170, 183–197.
Koepf, H.H., Pettersson, B.D., Schaumann, W., 1990. Bio-dynamic Agriculture: AnIntroduction. Anthroposophic Press, Hudson, N.Y.
Lartey, R.T., Curl, E.A., Peterson, C.M., Harper, J.D., 1989. Mycophagous grazingand food preference of Proisotoma minuta (Collembola: Isotomidae) and Onychiurusencarpatus (Collembola: Onychiuridae). Environmental Entomology 18, 334–337.
Leroy, Ben L.M.M., Bommele, L., Reheul, D., Moens, M., De Neve, S., 2007. Theapplication of vegetable, fruit and garden waste (VFG) compost in addition tocattle slurry in a silage maize monoculture: effects on soil fauna and yield.European Journal of Soil Biology 43, 91–100.
Macfadyen, 1953. Notes on methods for the extraction of small soil arthropods.Animal Ecology 22, 65–78.

C. Ngosong et al. / Soil Biology & Biochemistry 41 (2009) 2308–2317 2317
Mader, P., Pfiffner, L., Fließbach, A., von Lutzow, M., Munch, J.C., 1996. The impact oforganic and conventional agriculture on soil biota and its significance for soilfertility. Fundamentals of Organic Agriculture. In: Ostergaard, T.V. (Ed.), SoilEcology. Proceedings of the 11th IFOAM Scientific Conference, Copenhagen, vol.1, pp. 24–46.
Mader, P., Edenhofer, S., Boller, T., Wiemken, A., Niggli, U., 2000. Arbuscularmycorrhizae in a long-term field trial comparing low-input (organic, biological)and high input (conventional) farming systems in a crop rotation. Biology andFertility of Soils 31, 150–156.
Miyazawa, K., Tsuji, H., Yamagata, M., Nakano, H., Nakamoto, T., 2002. The effects ofcropping systems and fallow managements on microarthropod populations.Plant Production Science 5, 257–286.
Olsson, P.A., 1999. Signature fatty acids provide tools for determination of thedistribution and interactions of mycorrhizal fungi in soils. FEMS MicrobiologyEcology 29, 303–310.
Olsson, P.A., Johansen, A., 2000. Lipid and fatty acid composition of hyphae andspores of arbuscular mycorrhizal fungi at different growth stages. MycologicalResearch 104, 429–434.
Olsson, P.A., Larsson, L., Bago, B., Wallander, H., Arle, van, I.M., 2003. Ergosterol andfatty acids for biomass estimation of mycorrhizal fungi. New Phytologist 159,1–20.
Olsson, P.A., Francis, R., Read, D.J., Soderstrom, B., 1998. Growth of arbuscularmycorrhizal mycelium in calcareous dune sand and its interaction with othersoil microorganisms as estimated by measurement of specific fatty acids. Plantand Soil 201, 9–16.
Olsson, P.A., Bååth, E., Jakobsen, I., Soderstrom, B., 1995. The use of phospholipid andneutral lipid fatty acids to estimate biomass of arbuscular mycorrhizal fungi insoil. Mycological Research 99, 623–629.
Partsch, S., Milcu, A., Scheu, S., 2006. Decomposers (Lumbricidae, Collembola) affectplant performance in model grasslands of different diversity. Ecology 87,2548–2558.
Petersen, H., Luxton, M., 1982. A comparative analysis of soil faunal populations andtheir role in decomposition processes. Oikos 39, 287–388.
Petersen, S.O., Henrikson, K., Mortensen, G.K., Krogh, P.H., Brandt, K.K., Sorensen, J.,Madsen, T., Petersen, J., Gron, C., 2003. Recycling of sewage and householdcompost to arable land: fate and effects of organic contaminants, and impact onsoil fertility. Soil Tillage Research 72, 139–152.
Pielou, E.C., 1971. An Introduction to Mathematical Ecology. Wiley, New York.Raupp, J., 1999. Lichtangebot und Bodentemperatur in Winterrogen unterschied-
licher Bestandesdichte und Deren Konsequenzen fur die Stickstoffmineralisa-tion. In: Hoffman, H., Muller, S. (Eds.), Wissenschaftstagung Zum OkologischenLandbau, Beitr, vol. 5, pp. 117–120.
Raupp, J., Oltmanns, M., 2006. Soil properties, crop yield and quality with farmyardmanure with and without biodynamic preparations and with inorganic fertilizers.ISOFAR Scientific Series 1. In: Raupp, J., Pekrun, C., Oltmanns, M., Kopke, U. (Eds.),Long-term Field Experiments in Organic Farming. Koster, Berlin, pp. 135–155.
Ruess, L., Haggblom, M.M., Langel, J., Scheu, S., 2004. Nitrogen isotope ratios andfatty acid composition as indicators of animal diets in belowground systems.Oecologia 139, 336–346.
Ruess, L., Schutz, K., Haubert, D., Haggblom, M.M., Kandeler, E., Scheu, S., 2005a.Application of lipid analysis to understand trophic interactions in soil. Ecology86, 2075–2082.
Ruess, L., Tiunov, A., Haubert, D., Richnow, H.H., Haggblom, M.M., Scheu, S., 2005b.Carbon stable isotope fractionation and trophic transfer of fatty acids in fungalbased soil food chains. Soil Biology & Biochemistry 37, 945–953.
Ruess, L., Schutz, K., Migge-Kleian, S., Haggblom, M.M., Kandeler, E., Scheu, S., 2007.Lipid composition of Collembola and their food resources in deciduous foreststands – implications for feeding strategies. Soil Biology & Biochemistry 39,1990–2000.
Rusek, J., 1998. Biology of Collembola and their functional role in the ecosystem.Biodiversity and Conservation 7, 1207–1219.
Salamon, J.A., Scheu, S., Schaefer, M., 2008. The Collembola community of pure andmixed stands of beach (Fagus sylvatica) and spruce (Picea abies) of different age.Pedobiologia 51, 385–396.
Scholte, K., Lootsma, M., 1998. Effects of farmyard manure and green manure cropson populations of mycophagous soil fauna and Rhizoctonia stem canker ofpotato. Pedobiologia 42, 223–231.
Schroth, N.N., Becker, J.O., 1990. Concepts of ecological and physiological activitiesof rhizobacteria related to biological control and plant growth promotion. In:Hornby, D. (Ed.), Biological Control of Soil-borne Plant Pathogens. CAB Inter-national, Wallingford, pp. 389–414.
Smith, S.E., Read, D.J., 2002. Mycorrhizal Symbiosis. Academic Press, New York.Smith, S.E., Read, D.J., 1997. Mycorrhizal Symbiosis, second ed. Academic Press,
London.Snedecor, G.W., Cochran, W.G., 1980. Statistical Methods, seventh ed. Iowa State
Univ. Press, Ames.StatSoft, 2001. Statistica. Version 6.0 for Windows. StatSoft, Tulsa, USA.Visser, S., Parkinson, D., Hassall, M., 1987. Fungi asssociated with Protaphorura
subtenius (Collembola) in an aspen woodland. Canadian Journal of Botany 65,635–642.
Vreeken-Buijs, M.J., Geurs, M., De Ruiter, P.C., Brussaard, L., 1994. Microarthropodbiomass – C dynamics in the belowground food webs of two arable farmingsystems. Agriculture, Ecosystems and Environment 51, 161–170.
White, D.C., Stair, J.O., Ringelberg, D.B., 1996. Quantitative comparisons of in situmicrobial biodiversity by signature biomarker analysis. Journal of IndustrialMicrobiology 17, 185–196.
Yeates, G.W., Bird, A.F., 1994. Some observations on the influence of agriculturalpractice on nematode faunae of some south Australian soils. Fundamental andApplied Nematological Research 17, 185–196.
Zelles, L., 1999. Fatty acid patterns of phospholipids and lipopolysaccharides in thecharacterization of microbial communities in soil: a review. Biology andFertility of Soils 29, 111–129.
Copyright © 2022 FDOKUMEN