The dynamics of cultivation and floods in arable lands of central Argentina
27
HESSD 5, 2319–2345, 2008 The dynamics of cultivation and floods E. F. Viglizzo et al. Title Page Abstract Introduction Conclusions References Tables Figures Back Close Full Screen / Esc Printer-friendly Version Interactive Discussion Hydrol. Earth Syst. Sci. Discuss., 5, 2319–2345, 2008 www.hydrol-earth-syst-sci-discuss.net/5/2319/2008/ © Author(s) 2008. This work is distributed under the Creative Commons Attribution 3.0 License. Hydrology and Earth System Sciences Discussions Papers published in Hydrology and Earth System Sciences Discussions are under open-access review for the journal Hydrology and Earth System Sciences The dynamics of cultivation and floods in arable lands of central Argentina E. F. Viglizzo 1,2 , E. G. Jobbagy 3 , L. V. Carre˜ no 1 , F. C. Frank 1 , R. Arag ´ on 3 , L. De Oro 2 , and V. S. Salvador 1 1 INTA, Centro Regional La Pampa, Area of Environmental Management, Av. Spinetto 785, P.O.Box 302, 6300 Santa Rosa, La Pampa, Argentina 2 CONICET, Av. Spinetto 785, P.O.Box 302, 6300 Santa Rosa, La Pampa, Argentina 3 Grupo de Estudios Ambientales IMASL, Universidad Nacional de San Luis y CONICET, Ej´ ercito de los Andes 950, 5700 San Luis, Argentina Received: 25 June 2008 – Accepted: 27 June 2008 – Published: 21 August 2008 Correspondence to: E. F. Viglizzo ([email protected]) Published by Copernicus Publications on behalf of the European Geosciences Union. 2319
Transcript of The dynamics of cultivation and floods in arable lands of central Argentina
HESSD5, 2319–2345, 2008
The dynamics ofcultivation and floods
E. F. Viglizzo et al.
Title Page
Abstract Introduction
Conclusions References
Tables Figures
J I
J I
Back Close
Full Screen / Esc
Printer-friendly Version
Interactive Discussion
Hydrol. Earth Syst. Sci. Discuss., 5, 2319–2345, 2008www.hydrol-earth-syst-sci-discuss.net/5/2319/2008/© Author(s) 2008. This work is distributed underthe Creative Commons Attribution 3.0 License.
Hydrology andEarth System
SciencesDiscussions
Papers published in Hydrology and Earth System Sciences Discussions are underopen-access review for the journal Hydrology and Earth System Sciences
The dynamics of cultivation and floods inarable lands of central Argentina
E. F. Viglizzo1,2, E. G. Jobbagy3, L. V. Carreno1, F. C. Frank1, R. Aragon3,L. De Oro2, and V. S. Salvador1
1INTA, Centro Regional La Pampa, Area of Environmental Management, Av. Spinetto 785,P.O.Box 302, 6300 Santa Rosa, La Pampa, Argentina2CONICET, Av. Spinetto 785, P.O.Box 302, 6300 Santa Rosa, La Pampa, Argentina3Grupo de Estudios Ambientales IMASL, Universidad Nacional de San Luis y CONICET,Ejercito de los Andes 950, 5700 San Luis, Argentina
Received: 25 June 2008 – Accepted: 27 June 2008 – Published: 21 August 2008
Correspondence to: E. F. Viglizzo ([email protected])
Published by Copernicus Publications on behalf of the European Geosciences Union.
2319
HESSD5, 2319–2345, 2008
The dynamics ofcultivation and floods
E. F. Viglizzo et al.
Title Page
Abstract Introduction
Conclusions References
Tables Figures
J I
J I
Back Close
Full Screen / Esc
Printer-friendly Version
Interactive Discussion
Abstract
Although floods in watersheds have been associated with land-use change since an-cient times, the dynamics of flooding is still incompletely understood. In this paper weexplored the relations between rainfall, groundwater level, and cultivation to explain thedynamics of floods in the extremely flat and valuable arable lands of the Quinto river5
watershed, in central Argentina. The analysis involved an area of 12.4 million hectareduring a 26-y period (1978–2003), which comprised two extensive flooding episodesin 1983–1988 and 1996–2003. Supported by information from surveys as well as fieldand remote sensing measurements, we explored the correlation among precipitation,groundwater levels, flooded area and land use. Flood extension was associated to the10
dynamics of groundwater level, but these two variables displayed a poor associationwith rainfall, being particularly decoupled from it during the rainy periods. Correla-tions between groundwater level and flood extension were positive in all cases, butwhile highly significant relations (P <0.01) were found in highlands, non significant re-lations (P >0.05) predominate in lowlands. Our analysis supports the existence of a15
cyclic mechanism driven by the reciprocal influence between cultivation and ground-water levels in highlands. This cycle would involve the following stages: (a) cultivationboosts the elevation of groundwater levels through decreased evapotranspiration; (b)as groundwater level rises, floods spread causing a decline of land cultivation; (c) flood-ing propitiates higher evapotranspiration favouring its own retraction; (d) cultivation ex-20
pands following the retreat of floods. Thus, cultivation would trigger a destabilizingfeedback self affecting future cultivation in the highlands. It is unlikely that such se-quence can work in lowlands. The results suggest that rather than responding directlyand solely to the same mechanism, floods in lowlands may be the combined result ofvarious factors like local rainfall, groundwater level fluctuations, surface and subsur-25
face lateral flow, and water-body interlinking. Although the hypothetical mechanismsproposed here require additional understanding efforts, they suggest a promising av-enue of environmental management in which cultivation could be steered in the region
2320
HESSD5, 2319–2345, 2008
The dynamics ofcultivation and floods
E. F. Viglizzo et al.
Title Page
Abstract Introduction
Conclusions References
Tables Figures
J I
J I
Back Close
Full Screen / Esc
Printer-friendly Version
Interactive Discussion
to smooth the undesirable impacts of floods.
1 Introduction
Since ancient times, the hydrological dynamics of watersheds were associated to landuse/land cover change. Floods were frequently attributed to the conversion of wood-lands and grasslands into grazing, cropping and urban lands. Various studies (Elwell5
and Stocking, 1976; Lee and Skogerboe, 1985; Francis and Thornes, 1990) concludedthat water runoff decreases exponentially as plant cover increases, yet a review of137 paired experiments showed that the hydrological response of vegetated and de-vegetated watersheds is highly variable, rather unpredictable, and poorly understood(Andreassian, 2004). However, it is generally accepted that forests have greater water10
storage and retention capacity than grassland, and the latter have more than arablelands.
Beyond increased runoff, the effect of cultivation on groundwater levels and its re-lation to land flooding was less studied and is still poorly understood. Because of theexpansion of saline areas in agricultural lands of Australia, Ferdowsian and Bee (2006)15
reported an excessive groundwater recharge under traditional cultivation that led tothe rising of the water table. They recommended the use of deep-rooted perennialpastures (such as alfalfa) to reduce recharge and lower water level.
As it happens in complex biotic and non biotic systems (Jeong et al., 2000), thelarge scale dynamics of flooding processes are also essentially unknown. Holistic ap-20
proaches are necessary to improve our knowledge and forecasting ability (Clark etal., 1988). Data from long-term series have supported watershed studies, but theyare frequently criticised because most research was focused on certain spatial scales(Hornbeck et al., 1993). This is a relevant issue because agronomists, ecologists,environmentalists, land managers, policy makers and development agents who make25
decisions at different levels (plot, farm, ecosystem, landscape, eco-region) increasinglydemand scientific information about cross-scale relations and interactions in hierarchi-
2321
HESSD5, 2319–2345, 2008
The dynamics ofcultivation and floods
E. F. Viglizzo et al.
Title Page
Abstract Introduction
Conclusions References
Tables Figures
J I
J I
Back Close
Full Screen / Esc
Printer-friendly Version
Interactive Discussion
cal systems (Viglizzo et al., 2005).Some authors (Buringh and Dudal, 1987; Bailey, 1995; O’Neill et al., 1991; Wa-
genet, 1998) have stated that high-level environmental factors like landform, climateand land quality have strong top-down influence on lower levels. On the other hand,human-dependent factors at lower levels, such as land-use and management, may ex-5
ert bottom-up influences, that are smoothed at successively higher levels (King, 1993;Viglizzo et al., 2004).
In this paper we (1) describe the dynamics of flooding in the Pampas of Argentinaand (2) revise their triggering mechanisms, based on the analysis of ∼30 y-long tempo-ral series of precipitation, land cultivation, groundwater levels, and flooded area for the10
Quinto river watershed (124 000 km2). Lowlands in the watershed represent a typicalcase of flood-prone area in the Pampas, where regular floods undermine the regionaleconomy (Fuschini Mejıa, 1994). To guide our analysis we propose two extreme andsimple hypotheses that explain the onset of floods in the Quinto river watershed, ac-knowledging that a more complex combination of both is most likely taking place. Our15
climate-oriented hypothesis suggests that flooding is the result of increased precipita-tion inputs, which accumulated through a certain period, causes a widespread eleva-tion of groundwater levels that eventually reach the surface and limit cultivation. Ourecosystem-oriented hypothesis, on the other hand, proposes that flooding emergesas a result of increasing cultivation, which enhances recharge and raises groundwater20
level when high water-consuming pastures and grasslands are replaced by low water-consuming annual crops. In this paper we explore the temporal variation and correla-tion of rainfall, groundwater level, flooding and cultivation, and use our extreme guidinghypotheses to explain the development of flooding, and suggest possible non-linearinteractions and feedback mechanisms that might regulate the system.25
2322
HESSD5, 2319–2345, 2008
The dynamics ofcultivation and floods
E. F. Viglizzo et al.
Title Page
Abstract Introduction
Conclusions References
Tables Figures
J I
J I
Back Close
Full Screen / Esc
Printer-friendly Version
Interactive Discussion
2 Materials and methods
In order to understand the dynamics of floods in the study area, the associations amongrainfall, groundwater and cultivation were explored. We use the term cultivation toindicate the proportion of arable land that is allocated to extensive grain crops (mainlywheat, soybean, maize and sunflower) every year, based on the fact that the rest of the5
land is typically occupied by perennial pastures (Hall et al., 1992).
2.1 The study region
The Argentine Pampas (33–35◦ S, 62–64◦ W) is a wide plain of around 54 millionhectare of fertile lands suitable for cattle and crop production (Hall et al., 1992; Viglizzoet al., 2001). Soil quality varies (Satorre 2001) and rainfall declines from NE to SW.10
The climate of the western Pampas is temperate (mean annual temperature=16.2◦ C)with 70% of rainfalls, that average 750 mm y−1 (Dıaz Sorita et al., 1998), occurring be-tween October and April. Winds are more intense (around 16.8 km h−1) and frequent(only 14% of calmed days) during the hot season (Hall et al., 1992), triggering winderosion episodes. Cyclical drought and flood episodes that affect both crop and cattle15
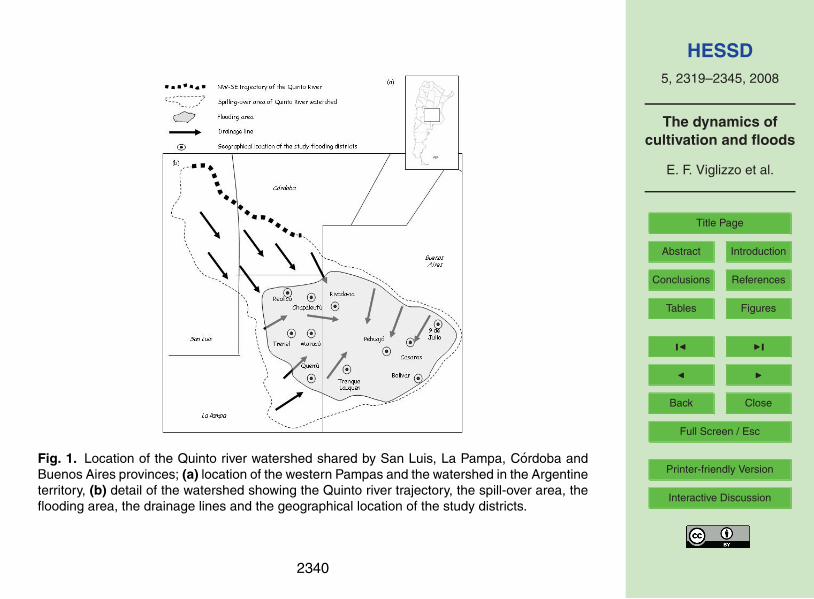
production have been described by Viglizzo et al. (1997) and Moncaut (2001).The western or “sandy” Pampas (Fig. 1) occupy approximately one third of the region
and consist of a large and complex system referred as the “Sand Sea” that comprise alarge regional configuration of longitudinal, mega-parabolic dunes (Iriondo, 1990). Theregion was shaped during the last Pleistocene glaciation and was partially reworked20
during later desertification episodes (Iriondo, 1999), particularly during the 1930–40’sdust bowl that affected the western Pampas (Zarrilli, 1999; Fig. 1b). The linear featuresnormally observed in satellite images correspond to a succession of elongated moundsand inter-dune depressions that constrain the natural evacuation of water (Malagnino,1991). The Late Pleistocene-Holocene deposits provide the parent material for the25
modern cultivated soils (Zarate, 2003).In hydrological terms, the region comprises an active groundwater system that is
2323
HESSD5, 2319–2345, 2008
The dynamics ofcultivation and floods
E. F. Viglizzo et al.
Title Page
Abstract Introduction
Conclusions References
Tables Figures
J I
J I
Back Close
Full Screen / Esc
Printer-friendly Version
Interactive Discussion
the result of the convergence of Araucana, Puelche and Pampeana formations, beingthe last one the top of the aquifer, which is relatively shallow (Aradas and Thorne,2001). Very often, rainfall adds to already water saturated soils and leads to multipleephemeral water bodies that, depending upon topographical configurations, can joinand produce extensive flooding episodes (Aradas and Thorne, 2001). Losses from the5
system occur by runoff and vertical water fluxes that involve infiltration, evaporation andevapotranspiration from a plethora of occasional lakes and wetlands (Scarpati et al.,2002). In order to relieve vulnerable lands from flooding and water-logging problemsin part of the region, and also to improve conditions for agricultural production, thepolitical authority of Buenos Aires province commissioned in 1987 the elaboration of10
an Integrated Master Plan (Saravia et al., 1987) that later was only partially carried out.
2.2 The Quinto river watershed
The Quinto river watershed, where floods occur, is in part located inside the westernPampas. It extends from NW to SE following a topographic gradient that ranges be-tween 900 m in the central hills of San Luis province (outside the Pampas), to less15
than 100 m a.s.l. on the flooding lowlands of NW Buenos Aires province. The Quintoriver mainstream flows into the Amarga lagoon (Carignano, 1999). A broad-scale NE-SW spill-over area (of around 12.3 million hectare) raises along the river, which favourswater drainage into a flooding area (Fig. 1) that comprise highly productive and valu-able lands in which cultivation has increased since the 1960s (Viglizzo et al., 2001).20
Drainage is robust in the higher part of the watershed (hereafter highlands) becauseof the steep topographic gradient that cuts across the Southern districts of San Luisand Cordoba provinces. The lower part of the watershed (hereafter lowlands) is, onthe other hand, a flat depression that extends over the NE districts of Buenos Airesprovince with elevations ranging from 130 and 50 m a.s.l. Despite flatness, episodes of25
weak drainage that are mediated by occasional interlinked water bodies and anthropicconstructions such as channels and roads occur inside the lowlands (Kruse, 1992;Kruse et al., 2001; Kruse and Zimmermann, 2002). Despite large differences, both
2324
HESSD5, 2319–2345, 2008
The dynamics ofcultivation and floods
E. F. Viglizzo et al.
Title Page
Abstract Introduction
Conclusions References
Tables Figures
J I
J I
Back Close
Full Screen / Esc
Printer-friendly Version
Interactive Discussion
highlands and lowlands are prone to flooding.We used different sources of information to place the limit between highlands and
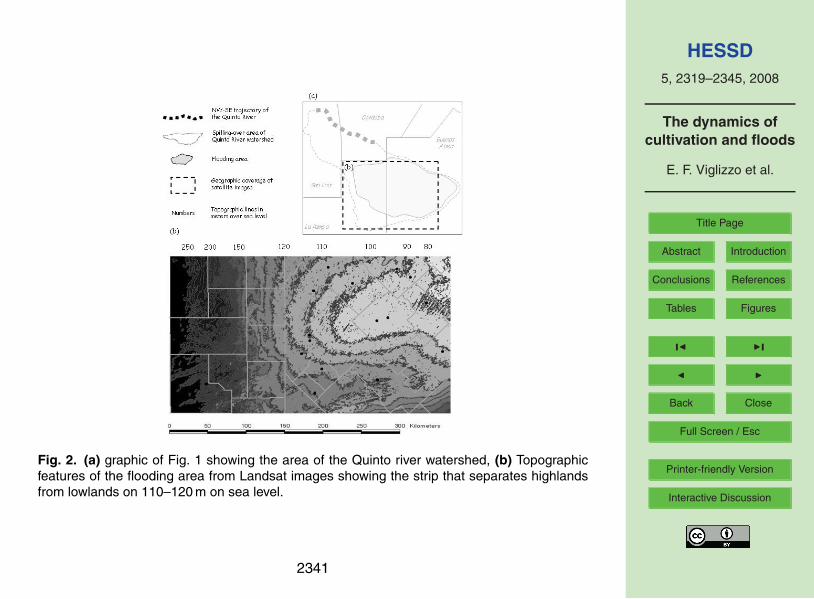
lowlands. In first place we used a digital elevation model (DEM) that included most ofthe Rio Quinto watershed to identify sharp shifts in slope and elevation. Independentlywe worked with a Landsat scene (227–85, 32 400 km2) that covers the transition zone5
within the watershed to characterize “baseline” flooding intensity based on the totalarea covered by ponds during the dry year of 1997. Elevation ranges between 300 and80 m, gradually decaying towards the SE. The topography is extremely flat with 90% ofthe area having <1% slope. A pronounced slope shift takes place across the range of110–120 m a.s.l. contour line. Using this contour as a limit for highlands and lowlands,10
the mean elevation and slope for the two regions were, respectively 183 m and 0.73%and 91 m and 0.45%. Based on the 1997 Landsat scene the area covered by waterbodies was 2% for highlands and 6% for lowlands (Fig. 2).
2.3 Data sources and analysis
Data on latitude, longitude and landform were obtained from field measurements, satel-15
lite images and topographic maps. Land-use datasets were provided by the AnnualAgricultural Surveys for the period 1978–2003 provided by the Secretary of Agricultureof Argentina. Public hydrological organizations (The Provincial Water Administration inLa Pampa and The Plains Hydrology Institute in Buenos Aires provinces) and the Na-tional Meteorological Services provided iii) long-term precipitation data and iv) ground-20
water level records from a large network involving 58 phreatimetric nodes scatteredamong 29 locations. A subset of 11 of these data points (see Fig. 1) had continuousand homogenous data for the whole study period.
We focused our work at two spatial and temporal scales: A broad-scale analysis forthe 1978–2003 period comprising highlands and lowlands as whole units in the flood-25
ing area, and a small-scale analysis for the 1996–2003 period in which informationwas disaggregated into eleven political districts (five located in highlands, and six inlowlands) (Fig. 1). Mean values and standard deviations were respectively used to
2325
HESSD5, 2319–2345, 2008
The dynamics ofcultivation and floods
E. F. Viglizzo et al.
Title Page
Abstract Introduction
Conclusions References
Tables Figures
J I
J I
Back Close
Full Screen / Esc
Printer-friendly Version
Interactive Discussion
characterize the patterns of precipitation, groundwater level and % of cultivation at thebroad highland and lowland scales during 1978–2003. Simple correlation analyses us-ing best-fitting linear models were used to evaluate relations at both scales. Correlationanalysis were used at the district level during the period of 1996–2003 to estimate thedegree of association between a) the groundwater level and the % of croplands affected5
by floods and b) the change of cultivation during the inter-flooding period of 1989–1995and the groundwater level during the 1996–2003 flooding period. It should be noticedthat cultivation increased in all districts during the inter-flooding period (Viglizzo et al.,2001).
Given that no numerical measurements of flood extension were available for the last10
30-y period we estimated it based on the values of reduction of cultivated area obtainedfrom survey data for the 1996–2003 flooding event. This estimate assumed that the cul-tivated area was exclusively reduced by flooding. To validate this procedure, we reliedon the support of satellite images in order to estimate the extension of flooded landsalong the flooded period of 1996–2003. Both, survey and satellite data sources were15
then correlated to check the consistency of the first approach. Considering that cor-relation coefficients were significant in nine out of eleven study districts, we assumedthat the reduction of the cultivated area is an appropriate estimator of flood extensionduring the flooding periods.
3 Results and discussion20
3.1 Precipitation, groundwater and land use at the broader, highland/lowland scale ofanalysis
Despite the similar behaviour of districts in the western Pampas regarding land-useuntil the middle of the 20th century, the flooded area tended to deviate from suchbehaviour during the rainy period that started in the 70‘s, suggesting a functional de-25
coupling of the flooding plain during the wetter periods (Viglizzo et al., 1997, 2001).
2326
HESSD5, 2319–2345, 2008
The dynamics ofcultivation and floods
E. F. Viglizzo et al.
Title Page
Abstract Introduction
Conclusions References
Tables Figures
J I
J I
Back Close
Full Screen / Esc
Printer-friendly Version
Interactive Discussion
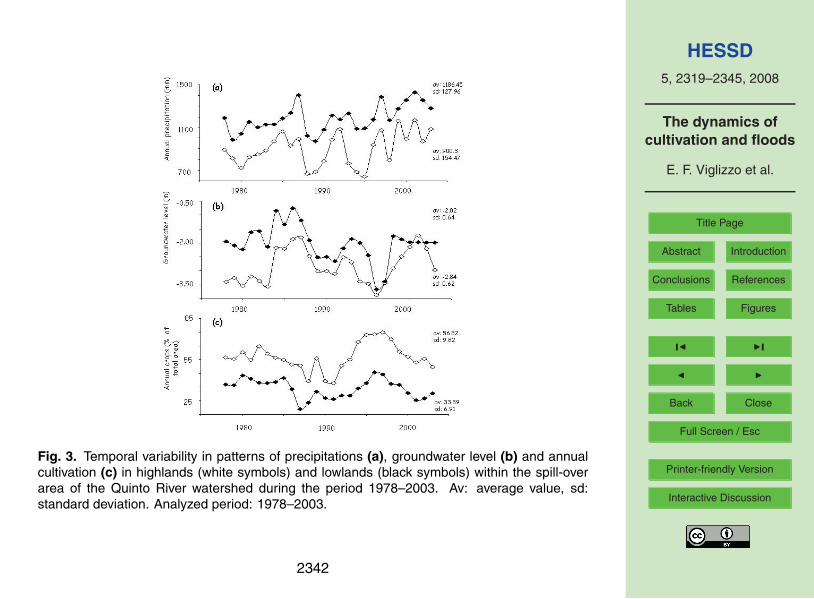
Throughout the 25 y-long study period (1978–2003) highlands and lowlands displayedsimilar trends in precipitation, groundwater level and cultivated area, with correlationcoefficients between regions of 0.75, 0.64 and 0.70 (P <0.01). Considering that bothareas tend to show parallel behaviour, it can be argued that they are connected infunctional terms. However, highlands were on average drier (lower precipitation and5
deeper groundwater) and more cultivated than lowlands, which in average show 20%more precipitation (Fig. 3a). In spite of having lower precipitation variability, lowlandsdisplayed similar groundwater level variability than highlands, with water tables beingon average 80 cm shallower throughout the study period (Fig. 3b). Highlands had onaverage 50% of their area cultivated with a peak of 70% of cultivation in 1995–199710
(Fig. 3c). In the lowlands, cultivation averaged and peaked 34% and 45% of the area,respectively. It should be noticed that in relation to highlands, the higher precipita-tion regime of lowlands agrees with a higher groundwater level and a lower cultivationpercentage.
Hypothetically, this could be explained not only by large recharge due to the higher15
rainfall regime of lowlands, but also by other factors like transfer of runoff water fromhighlands to lowlands. The cultivation pattern seems to show a cyclical behaviourwith increasing and decreasing phases that probably responds to flooding events. Thisflooding/cultivation cycle deserves particular attention in our hypothetical interpretation.
The relations between rainfall and groundwater on the one hand, and rainfall and20
cultivation on the other hand, are less clear (Table 1). While rainfall and groundwaterlevel are positively and significantly (P <0.05) correlated in highlands, such correlationis not significant (P >0.05) in the case of lowlands. The relation between rainfall andcultivation was non significant (P >0.05) in both areas, but the correlation coefficient Rin lowlands was substantially higher than in highlands. Therefore, in terms of flooding25
potential, the analysis would support the argument that while groundwater might have alarger effect in highlands than in lowlands, rainfall might be more influential in lowlands.This finding seems to weaken the local belief stating that groundwater levels, and con-sequently floods, are only strongly related to short-term precipitations. The negative
2327
HESSD5, 2319–2345, 2008
The dynamics ofcultivation and floods
E. F. Viglizzo et al.
Title Page
Abstract Introduction
Conclusions References
Tables Figures
J I
J I
Back Close
Full Screen / Esc
Printer-friendly Version
Interactive Discussion
relationship between groundwater and cultivation may have practical implications inhighlands: first, groundwater level can be useful to predict a cultivation reduction inresponse to flood expansion; second, considering the slow movement of groundwaterin soils, groundwater level can be monitored to anticipate flood risk, helping to cope inadvance with its potentially harmful consequences.5
Whenever we use rainfall or groundwater arguments to explain flooding, both tendto support our climate-oriented hypothesis, which suggests that floods are the resultof increased precipitation that directly expands water bodies, or indirectly cause awidespread elevation of groundwater that saturates land surface and limits cultivation.Nevertheless, in isolation this hypothesis seems to be unable to explain the potentially10
cyclical behaviour of floods and cultivation.
3.2 Groundwater and floods at the district scale
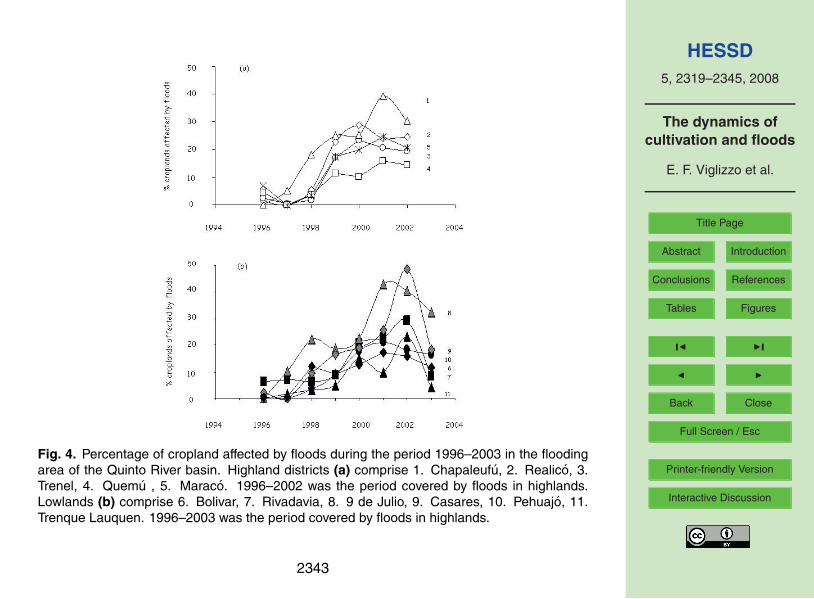
Considering the predominant and significant positive correlations between survey andsatellite data to estimate the extension of floods, we proceeded on our analysis by us-ing the first set of records from annual surveys. Figure 4 shows the temporal change15
of the flooded area at the district scale in highlands (Fig. 4a) and lowlands (Fig. 4b).Three aspects should be highlighted: i) Lowlands showed a more disperse and erraticbehaviour than highlands, where a relatively homogeneous flooding pattern predomi-nated ii) the flooding extension picked one year earlier in highlands than in lowlands,probably suggesting a slow transference of water from highlands to lowlands. In fact,20
when floods began to decrease in highlands (2002), they showed maximum expansionin lowlands (2003).
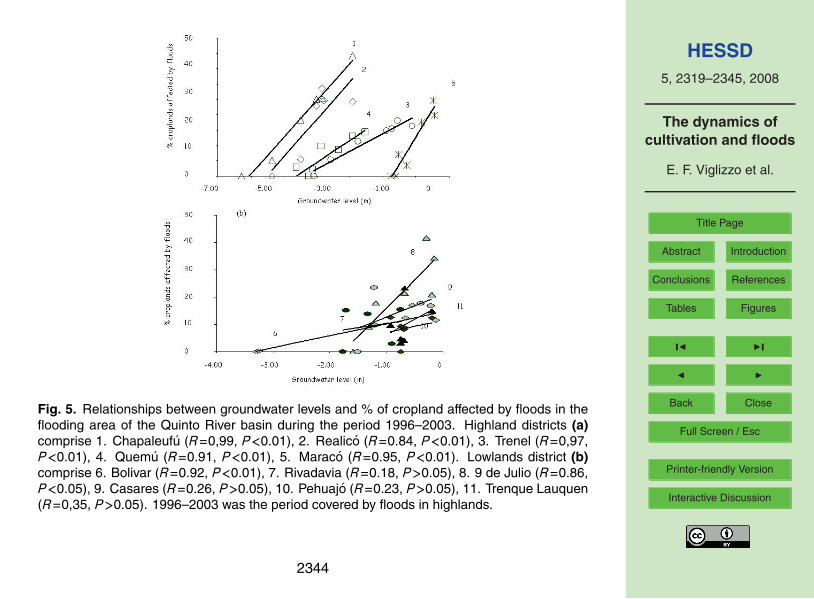
The association between groundwater and flooding is likely to be the most promisingrelation to explore (Table 1). Results show curious relations (Fig. 5) because highlands(Fig. 5a) and lowlands (Fig. 5b) behaved differently when groundwater level and the25
percentage of croplands affected by floods are related. Setting aside the fact thatcorrelations were positive in all study districts, relations were unambiguous and highlysignificant (P <0.01) in highlands, and rather anarchic and non-significant (P >0.05) in
2328
HESSD5, 2319–2345, 2008
The dynamics ofcultivation and floods
E. F. Viglizzo et al.
Title Page
Abstract Introduction
Conclusions References
Tables Figures
J I
J I
Back Close
Full Screen / Esc
Printer-friendly Version
Interactive Discussion
lowlands. While groundwater level seems to play a dominant role to trigger floods inhighlands, drivers other than groundwater seem to predominate in lowlands. Becauseof the flat landscape, it is likely that some other factors like local rainfall, outside andinside runoff, subsurface drainage, and even the coalescence of scattered water bodiescan be enhanced in wet periods. These factors probably merge with groundwater levels5
to trigger anarchic and unpredictable flooding episodes in lowlands.
3.3 The potential effect of cultivation on flooding
Our ecosystem-oriented hypothesis can provide an extra insight to the study problem.Two hydrological mechanisms have been suggested to explain the potential influenceof cultivation on flooding: increased runoff and decreased evapotranspiration (ET).10
Various authors (Fullen, 1985; Faulkner, 1990; Evans, 1993; McNeill and Winiwarter,2004; Withers et al., 2007) have reported that cultivation is likely to increase surfacerunoff and flooding. On the other hand, ET rates can decline in cultivated lands (New-man et al., 2006). Changes of ET in response to land use change proved to have apowerful effect on soil water balance (Wilcox et al., 2003; Nosetto et al., 2005; Wilcox15
and Thurow, 2006) in turn affecting groundwater level (Scanlon et al., 2005). Thetiming of groundwater raise in relation to land-use/land-cover change is not still wellunderstood, but different spatial and temporal plant-cover configurations can createdifferent ET patterns (Gilfedder et al., 2003). While perennial vegetation tends to showlong-term and rather continuous ET patterns, annual crops show short-term ET pulses20
that agree with periods of active growing (Doorenbos and Pruitt, 1977). Therefore, itis expected that the substitution of permanent or perennial plants by annual crops mayreduce ET rates, and eventually increase groundwater level because of a shortenedgrowing period. In Australia, Allison et al. (1990), Ward et al. (2006) and Ferdowsianand Bee (2006) reported that the broad-scale clearing of perennial vegetation and its25
replacement by annual crops and annual pastures has resulted in rising groundwaterlevels. An additional aspect that may restrain ET once the onset of floods has takenplace is the fact that land with the water table close to the surface (e.g. <0.8 m deep)
2329

HESSD5, 2319–2345, 2008
The dynamics ofcultivation and floods
E. F. Viglizzo et al.
Title Page
Abstract Introduction
Conclusions References
Tables Figures
J I
J I
Back Close
Full Screen / Esc
Printer-friendly Version
Interactive Discussion
often ceases to be sown and is deprived from plant transpiration. This process canproceed until groundwater reaches the surface and direct surface evaporation occurs.There is an incomplete understanding about the time lag between land-use changeand groundwater level change, but today this information is essential to design soundland use and land management strategies (Gilfedder et al., 2003).5
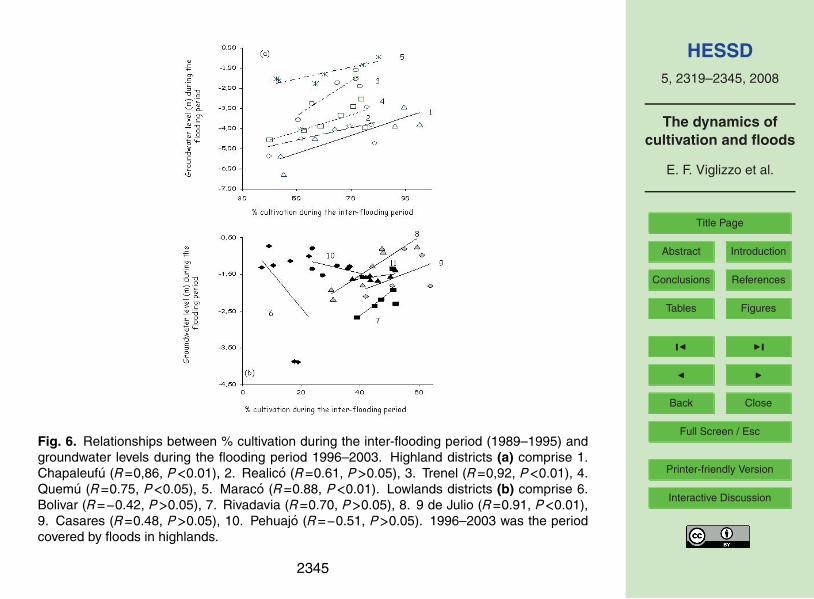
Given that both the percentage of annual crops and the flooded croplands were es-timations obtained from the same data source, any correlation between them wouldinevitably connote circular calculation and spurious results. To manipulate indepen-dent data periods, we alternatively explored the correlation between cultivation duringthe inter-flooding period (1989–1995) and groundwater level during the flooding period10
(1996–2003). Our hypothesis was that cultivation increase leads to groundwater ele-vation. Correlation results are presented in Fig. 6. Provided that positive correlationswere obtained for all highland districts (Fig. 6a), this response gives room to speculatethat the increase of cultivation during the inter-flooding period can trigger groundwaterelevation that later saturates the soil and expands floods. Thus, with a variable time15
lag, increased cultivation in one period would reduce the chance of cultivation in thefollowing period. This interpretation is consistent with our ecosystem-oriented hypoth-esis, which proposes that flooding possibly responds to increasing cultivation, whichenhances recharge and raises groundwater level when high water-consuming pasturesand grasslands are replaced by low water-consuming annual crops. However, in princi-20
ple this interpretation is not strictly applicable to lowland districts (Fig. 6b), which againshowed a random behaviour that deviates from that showed by highlands. Probably,the same multiple drivers of flood mentioned above generated noisy responses.
3.4 Cyclical behaviour and the ecosystem-oriented hypothesis
A complete and useful compilation of drought and flooding episodes that occurred25
in the Argentina Pampas between 1576 and 2001, reconstructed through historicalchronicles and numerical data by Moncaut (2001), indicates that flooding was a naturalepisode that repeated cyclically in the history of the study region. Given the qualitative
2330
HESSD5, 2319–2345, 2008
The dynamics ofcultivation and floods
E. F. Viglizzo et al.
Title Page
Abstract Introduction
Conclusions References
Tables Figures
J I
J I
Back Close
Full Screen / Esc
Printer-friendly Version
Interactive Discussion
nature of such information, quantification was not possible. Considering that coloniza-tion of lands in the study area started between the end of the 19th and the beginningof the 20th century, it is likely that cultivation affected the intensity and frequency offlooding episodes. The rapid cultivation wave that began at the end of 1970’s and stillpersists probably untied a force that destabilized the hydrology of the flooding lands.5
The abrupt transition from cultivation to flooding, and again to cultivation, especiallyin highlands, suggests that both hydrology and cultivation are probably subjected to acyclical behaviour.
One hypothetical interpretation to this cycle is that the competition between ampli-fying (positive) and controlling (negative) feedbacks is probably modulating the hydro-10
logical response of flooding lands. The inversion of phases within each cycle probablyoccurs when one feedback dominates over the opposite one. By triggering a positivefeedback, cultivation could destabilize the hydrological balance of the area. On theother hand, floods could trigger a negative feedback that forces the ecosystem to alower cultivation level that would stabilize the regional hydrology. While positive and15
negative feedbacks may be mutually neutralizing in a sequential order, we can pre-sume that the flooding process moves between two (upper and lower) critical thresh-olds that, in theory, were not still irreversibly surpassed (Scheffer et al., 2001; Rial etal., 2004). The consequences of positive feedbacks prevailing over the negative onesin the long term are pure speculative at this point, yet the possibility of irreversibly sur-20
passing threshold as stated by Peters et al. (2004) and Briske et al. (2006), should beconsidered.
Beyond the competing-feedback interpretation to explain cycles, one answeredquestion in our ecosystem-oriented hypothesis is what can explain water withdrawalonce flooding extension peaks. Flooding can favour vertical water-loss pathways25
through pan-evaporation from water bodies, hypothetically surpassing the ET rates ob-served under any herbaceous vegetation cover. Another vertical pathway can be theslow infiltration process that later causes lateral subsurface drainage to lower lands.Flooding water can also overflow beyond the watershed boundaries and connect large
2331
HESSD5, 2319–2345, 2008
The dynamics ofcultivation and floods
E. F. Viglizzo et al.
Title Page
Abstract Introduction
Conclusions References
Tables Figures
J I
J I
Back Close
Full Screen / Esc
Printer-friendly Version
Interactive Discussion
chains of water bodies, favouring surface flows towards the Atlantic Ocean. This situa-tion was observed under the extreme flooding conditions of 2001 when the Quinto riverwatershed get a surface connection with the Eastern Salado river watershed (Scarpatiet al., 2002). Certainly, a nested-scale configuration seems to be necessary to interpretthe agro-eco-hydrological dynamics of the study region.5
4 Conclusions
Our findings are useful to interpret the complex and dynamic relations between rain-fall, groundwater level and cultivation in flooding lands of the Quinto river watershed.Results indicate that a purely climate-oriented perspective that sets aside essential bio-logical aspects like those related to land-use and land-cover change may be insufficient10
to explain the potential cyclical behaviour of floods and cultivation, and a complemen-tary, ecosystem-oriented view, may be required. Cultivation may have a strong influ-ence on the dynamics of groundwater and floods in the highlands of the study region.In practice, cropping would cause a negative self-impact that could deplete cultivationin the near future. Besides, because of its location in an upper transitional drainage15
area, the hydrological effect of cultivation in highlands could indirectly contribute to al-ter the dynamics of floods in lowlands. So, on broad-scale basis both the climate- andthe ecosystem-oriented hypothesis should not be considered mutually excluding butcomplementary hypothesis.
Mediated by groundwater variability, the recurrent occurrence of cultivation-flooding20
cycles appears to be an outstanding feature of highlands that is not so evident in low-lands. Floods in lowlands appear to be the combined result of various factors that mayinclude not only groundwater variations, but also local rainfall inputs, runoff from up-per lands, subsurface drainage and interlinking of water bodies. Considering the flatconfiguration of lowlands, such factors can converge to mask a foreseeable relation25
between groundwater and flooding.Taking into account the relative importance of groundwater in highlands as a driver
2332

HESSD5, 2319–2345, 2008
The dynamics ofcultivation and floods
E. F. Viglizzo et al.
Title Page
Abstract Introduction
Conclusions References
Tables Figures
J I
J I
Back Close
Full Screen / Esc
Printer-friendly Version
Interactive Discussion
of flood, land planners and decision makers can take advantage of this condition toprevent catastrophic situations: the slow pace of groundwater processes is suitable toimplement an early-warning monitoring system to facilitate adaptation before the flood-ing outbreak. Likewise, a knowledge-based land-use policy for highland should notdiscard the potential effect of cultivation on flooding. To deal with this, we suggest the5
following hypothetical mechanism to explain the cultivation-flood relation: first, cultiva-tion boosts the elevation of groundwater level through decreased evapotranspiration;second, as groundwater level rises, floods spread causing a decrease of land cultiva-tion; third, flooding propitiates higher evaporation favouring its own retraction. Despitenowadays most drivers of the hydrological dynamics escape to human control, cultiva-10
tion emerges a promising human-controlling factor that could be managed to smooththe undesirable impact of floods. This view would become more relevant under a wetterclimate scenario like that the IPCC (2007) report predicts for the Argentine Pampas.
Given that drainage from highlands appears to be a strong factor affecting the low-lands hydrology, a sensible land-use policy should treat the flooding area a whole15
hydrological unit. In practical terms, the combination of an engineered channel-infrastructure plus a designed plant-cover structure in highlands seems to be neces-sary to smooth the impact of drainage water on lowlands.
Acknowledgements. We thank researchers and public agents of the Secretary of Agricultureand the Provincial Water Administration of La Pampa province, as well as the Instituto de20
Hidrologıa de Llanuras of Buenos Aires province for providing the statistical information toelaborate our data bases. We also acknowledge the financial support of INTA, SECyT in Ar-gentina and a grant from the Inter-American Institute for Global Change Research (IAI, CRN II2031), which is supported by the US National Science Foundation (Grant GEO-0452325).
References25
Allison, G. B., Cook, P. G., Barnett, S. R., Walker, G. R., Jolly, I. D., and Hughes, M. W.: Landclearance and river salinisation in the western Murray Basin, Australia, J. Hydrol., 119, 1–20,1990.
2333
HESSD5, 2319–2345, 2008
The dynamics ofcultivation and floods
E. F. Viglizzo et al.
Title Page
Abstract Introduction
Conclusions References
Tables Figures
J I
J I
Back Close
Full Screen / Esc
Printer-friendly Version
Interactive Discussion
Andreassian, V.: Waters and forests: from historical controversy to scientific debate, J. Hydrol.,291, 1–27, 2004.
Aradas, R. D. and Thorne, C. R.: Modelling Groundwater and Surface Water Interaction forWater Resources Management in Buenos Aires Province, Argentina. Proceedings of theSpecialty Symposium on Integrated Surface and Ground Water Management Symposium,5
edited by: Panigrahi, B. K., Singh, U. P., Pandit, A., Obeysekera, J., Krishnamurthy, M.,Orlando, Florida, USA, 120–129, 2001.
Bailey, R. G.: Description of the Ecoregions of the United States, Misc, Publ. No. 1391, USDAForest Service, Washington, DC, 1995.
Briske, D. D., Fuhlendorf, S. D., and Smeins, F. E.: A unified framework for assessment and10
application of ecological thresholds, Rangeland Ecol. Manag., 59, 225–236, 2006.Buringh, P. and Dudal, R.: Agricultural land use in space and time, in: Land Transformation in
Agriculture SCOPE, edited by: Wolman, M. G. and Fournier, F. G. A., John Wiley & Sons,1987.
Clark, J. S., Carpenter, S. R., Barber, M., Collins, S., and Dobson, A.: Ecological forecasts: an15
emerging imperative, Science, 293, 657–660, 1988.Carignano, C.: Late Pleistocene to recent climate change in Cordoba Province, Argentina:
Geomorphological evidence, Quatern. Int., 57/58, 117–134, 1999.Dıaz Sorita, M., Pepi, M., and Grosso, G.: Estudio de las precipitaciones en el oeste
bonaerense, Publicacion Tecnica no. 23, EEA INTA General Villegas, Buenos Aires, Ar-20
gentina, 15 pp., 1998.Doorenbos, J. and Pruitt, W. O.: Crop Water Requirements, FAO Irrigation and Drainage Paper
N0.24, Rome, 1977.Elwell, H. A. and Stocking, M. A.: Vegetal cover to estimate soil erosion hazard in Rhodesia,
Geoderma, 15, 61–70, 1976.25
Evans, R.: Extent, frequency and rates of rilling of arable land in localities in England andWales, in: Farm Land Erosion in Temperate Plains Environment and Hills, edited by:Wicherek, S., Elsevier, Amsterdam, 177–190, 1993.
Faulkner, H.: Vegetation cover density variations and infiltration patterns on piped alkali sodicsoils: Implications for the modelling of overland flow in semi-arid areas, in: Vegetation and30
Erosion, Processes and Environments, edited by: Thornes, J. B., Wiley, Chichester, 363–384, 1990.
Ferdowsian, R. and Bee, G.: The role of groundwater depth on the hydrological benefits of
2334
HESSD5, 2319–2345, 2008
The dynamics ofcultivation and floods
E. F. Viglizzo et al.
Title Page
Abstract Introduction
Conclusions References
Tables Figures
J I
J I
Back Close
Full Screen / Esc
Printer-friendly Version
Interactive Discussion
Lucerne and the subsequent recharge value. Proceedings of the 13th Agronomy Conference,The Australian Society of Agronomy, The Regional Institute Ltd., www.regional.org.au/au/asa/2006, 2006.
Francis, C. F. and Thornes, J. B.: Runoff hydrographs from three Mediterranean vegetationcover types, in: Vegetation and Erosion, Processes and Environments, edited by: Thornes,5
J. B., Wiley, Chichester, 363–384, 1990.Fullen, M. A.: Soil compaction, hydrological processes and soil erosion on loamy sands in East
Shropshire, England, Soil Till. Res., 29, 17–29, 1985.Fuschini Mejıa, M.C.: El Agua en las Llanuras (UNESCO, Oficina Regional de Ciencia y Tec-
nologıa para America Latina y el Caribe), Montevideo, 1994.10
Gilfedder, M., Smitt, Ch., Dawes, W., Petheram, C., Stauffacher, M., and Walker, G.: Impactof increased recharge on groundwater discharge: development and application of a simpli-fied function using catchment parameters, Landscape and Industries, CSIRO/CRC/MDBCPublications, Canberra (Australia), 28 pp., 2003.
Hall, A., Rebella, C., Ghersa, C., and Culot, P.: Field-crop systems of the Pampas, in: Field15
Crop Ecosystems, edited by: Pearson, C., Elsevier, Amsterdam, 413–450, 1992.Hornbeck, J. W., Adams, M. B., Corbett, E. S., Verry, E. S., and Lynch, J. A.: Long-term impacts
of forest treatments on water yield: a summary of northeastern USA, J. Hydrol., 150, 323–344, 1993.
IPCC, Climate Change 2007: The Physical Science Basis, Summary for Policy Makers, Work-20
ing Group 1 Report, Geneva, 18 pp., 2007.Iriondo, M.: Map of the South American plains – its present state, Quaternary of South America
and Antartic Peninsula, 6, 297–308, 1990.Iriondo, M.: Climatic changes in the South American plains: Records of a continent-scale
oscillation, Quatern. Int., 57/58, 93–112, 1999.25
Jeong, H., Tombor, B., Albert, R., Oltvai, Z. N., and Barabasi, A. L.: The large-scale organiza-tion of metabolic networks, Nature, 407, 651–654, 2000.
King, A. W.: Considerations of scale and hierarchy, in: Ecological Integrity and the Managementof Ecosystems, edited by: Woodley, S. J., Francis, K., and Francis, G., St. Lucie Press, DelrayBeach, Florida (USA), 19–45, 1993.30
Kruse, E.: El agua subterranea y los procesos fluviales en la region centro-oriental de la provin-cia de Buenos Aires, in: Situacion Ambiental de la Provincia de Buenos Aires, CIC II: 13–31,1992.
2335
HESSD5, 2319–2345, 2008
The dynamics ofcultivation and floods
E. F. Viglizzo et al.
Title Page
Abstract Introduction
Conclusions References
Tables Figures
J I
J I
Back Close
Full Screen / Esc
Printer-friendly Version
Interactive Discussion
Kruse, E., Forte Lay, J. A., Aiello, J. L., Basualdo, A., and Heinzenknecht, G.: Hydrologicalprocesses on large flatlands, Case study: Northwest region of Buenos Aires province (Ar-gentina), Remote Sensing and Hydrology 2000, IAHS Publication, 267, 531–536, 2001.
Kruse, E. and Zimmermann, E.: Hidrogeologıa de Grandes Llanuras. Particularidades en laLlanura Pampeana (Argentina), Workshop publication on Groundwater and Human Devel-5
opment 2025–2038, Mar del Plata, Argentina, 2002.Lee, C. R. and Skogerboe, J. G.: Quantification of erosion control by vegetation on problem
soils, in: edited by: El-Swaify, S.A., Moldenhauer, W.C., and Lo, A., Soil Erosion and Con-servation, Soil Conservation Soc. of America, 437–444, 1985.
Malagnino, E. C.: Late Pleistocen to late Holocene evolution of the paleodesert of the central10
region of Argentina and its paleoclimatic implications, International Conference on DesertLandscapes, International Geological Correlation Program, Project 252, Australia, 1991.
McNeill, J. R. and Winiwarter, V.: Breaking the sod: humankind, history and soil, Science, 304,1627–1629, 2004.
Moncaut, C. A.: Inundaciones y Sequıas en la Pampa Bonaerense 1576–2001, Editorial El15
Aljibe, City Bell (Argentina), 102 pp., 2001.Saravia, J. R., Benavidez, R. Canziani, O., Ferreiro, V., and Hernandez, M. A.: Lineamien-
tos Generales y Regionales para un Plan Maestro de Ordenamiento Hıdrico del TerritorioBonaerense, Convenio Ministerio de Obras y Servicios Publicos de la Nacion-Provincia deBuenos Aires, 323 pp., 1987.20
Nosetto, M. D., Jobbagy, E. G., and Paruelo, J. M.: Land use change and water losses: the caseof grassland afforestation across a soil textural gradient in central Argentina, Glob. ChangeBiol., 11, 1101–1117, 2005.
Newman, B. D., Wilcox, B. P., Archer, S. R., Breshears, D. D., Dahm, C. N., Duffy, C. J.,McDowell, N. G., Phillips, F. M., Scanlon, B. R., and Vivoni, E. R.: Ecohydrology of water-25
limited environments: A scientific vision, Water Resour. Res.h, 42, 1–15, 2006.O’Neill, R. V., Turner, S. J., Cullinan, V. I., Coffin, D. P., Cook, T., Conley, W., Brunt, J., Thomas,
J. M., Conley, M. R., and Gosz, J.: Multiple landscape scales: an inter-site comparison,Landscape Ecol., 5, 137–144, 1991.
Peters, D. P. C., Pielke, S. R., Bestelmeyer, B., Allen, C. D., Munson-McGee, S., Havstad, K. M.:30
Cross-scale interactions, nonlinearities, and forecasting catastrophic events, Proceedings ofthe National Academy of Sciences USA, 101(15), 130–135, 2004.
Rial, J. A., Pielke, R. A., Beniston, M., Claussen, M., Canadell, J., Cox, P., Held, H., de Noblet-
2336
HESSD5, 2319–2345, 2008
The dynamics ofcultivation and floods
E. F. Viglizzo et al.
Title Page
Abstract Introduction
Conclusions References
Tables Figures
J I
J I
Back Close
Full Screen / Esc
Printer-friendly Version
Interactive Discussion
Ducoudre, J., Prinn, R., Reynolds, J. F., and Salas, J. D.: Nonlinearities, feedbacks andcritical thresholds within the earth’s climate system, Climatic Change, 65, 11–38, 2004.
Scanlon, B. R., Reedy, R., Stonestrom, D. A., Prudic, D. E., and Dennehy, K. F.: Impact of landuse and land cover change on groundwater recharge and quality in the southwestern USA,Glob. Change Biol., 11, 1577–1593, 2005.5
Satorre, E.: Production systems in the Argentine Pampas and their ecological impact, in: Theimpact of Global Change and Information on the Rural Environment, edited by: Solbrig, O.,di Castri, F., and Paalberg, R., Harvard University Press, Cambridge, MA, 81–102, 2001.
Scarpati, O. E., Spescha, L., and Capriolo, A. D.: The impact of the heavy floods in the Sal-ado River basin, Buenos Aires province, Argentina, Mitigation and Adaptation Strategies for10
Global Change, 7, 285–301, 2002.Scheffer, M., Carpenter, S., Foley, J. A., Folkes, C., and Walker, B.: Catastrophic shifts in
ecosystems, Nature, 413, 591–596, 2001.Viglizzo, E. F., Lertora, F., Pordomingo, A. J., Bernardos, J., Roberto, Z. E., and Del Valle, H.:
Ecological lessons and applications from one century of low external-input farming in the15
pampas of Argentina, Agr. Ecosyst. Environ., 83, 65–81, 2001.Viglizzo, E. F., Pordomingo, A. J., Buschiazzo, D., and Castro, M. G.: A methodological ap-
proach to assess cross-scale relations and interactions in agricultural ecosystems of Ar-gentina, Ecosystems, 8, 546–558, 2005.
Viglizzo, E. F., Pordomingo, A. J., Castro, M. G., Lertora, F. A., Bernardos, J. N.: Scale-20
dependent controls on ecological functions in agroecosystems of Argentina, Agr. Ecosyst.Environ., 101, 39–51, 2004.
Viglizzo, E. F., Roberto, Z. E., Lertora, F. A., Lopez Gay, E., and Bernardos, J.: Climate andland-use change in field-crop ecosystems of Argentina, Agr. Ecosyst. Environ., 66, 61–70,1997.25
Wagenet, R. J.: Scale issues in agroecological research chains, Nutr. Cycl. Agroecosys., 50,23–34, 1998.
Ward, P., Dolling, P., and Duning, F.: The impact of Lucerne phase in a crop rotation on ground-water recharge in South-West Australia. Proceedings of the 13th Agronomy Conference,The Australian Society of Agronomy, The Regional Institute Ltd, www.regional.org.au/au/30
asa/2006, 2006.Wilcox, B. P., Seyfried, M. S., and Breshears, D. D.: The water balance on rangelands. in:
Encyclopedia of Water Science, edited by: Stewart, B. A. and Howell, T. A., Marcel Dekker,
2337
HESSD5, 2319–2345, 2008
The dynamics ofcultivation and floods
E. F. Viglizzo et al.
Title Page
Abstract Introduction
Conclusions References
Tables Figures
J I
J I
Back Close
Full Screen / Esc
Printer-friendly Version
Interactive Discussion
New York, 791–794, 2003.Wilcox, B. P. and Thurow, T. L.: Emerging issues in rangeland eco-hydrology: vegetation
change and the water cycle, Rangeland Ecol. Manag., 59, 220–224, 2006.Withers, P. J. A., Hodgkinson, R. A., Bates, A., and Withers, C. L.: Soil cultivation effects on
sediment and phosphorus mobilization in surface runoff from three contrasting soil types in5
England, Soil Till. Res., 93, 438–451, 2007.Zarate, M.: Loess of southern South America, Quaternary Sci. Rev., 22, 1987–2006, 2003.Zarrilli, A.: Produccion Agraria y Transformaciones Ecologicas en la Argentina, Los Lımites de
la Produccion Rural Pampeana, 1930–1950, X Congreso Nacional y Regional de la Historia,Santa Rosa (La Pampa), Argentina, 1999.10
2338
HESSD5, 2319–2345, 2008
The dynamics ofcultivation and floods
E. F. Viglizzo et al.
Title Page
Abstract Introduction
Conclusions References
Tables Figures
J I
J I
Back Close
Full Screen / Esc
Printer-friendly Version
Interactive Discussion
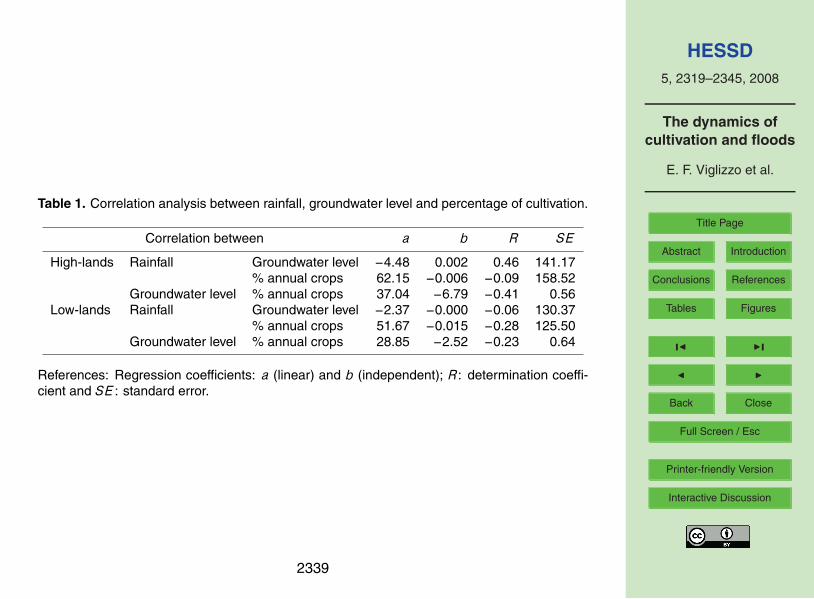
Table 1. Correlation analysis between rainfall, groundwater level and percentage of cultivation.
Correlation between a b R SE
High-lands Rainfall Groundwater level −4.48 0.002 0.46 141.17% annual crops 62.15 −0.006 −0.09 158.52
Groundwater level % annual crops 37.04 −6.79 −0.41 0.56Low-lands Rainfall Groundwater level −2.37 −0.000 −0.06 130.37
% annual crops 51.67 −0.015 −0.28 125.50Groundwater level % annual crops 28.85 −2.52 −0.23 0.64
References: Regression coefficients: a (linear) and b (independent); R: determination coeffi-cient and SE : standard error.
2339
HESSD5, 2319–2345, 2008
The dynamics ofcultivation and floods
E. F. Viglizzo et al.
Title Page
Abstract Introduction
Conclusions References
Tables Figures
J I
J I
Back Close
Full Screen / Esc
Printer-friendly Version
Interactive Discussion
Fig. 1. Location of the Quinto river watershed shared by San Luis, La Pampa, Cordoba andBuenos Aires provinces; (a) location of the western Pampas and the watershed in the Argentineterritory, (b) detail of the watershed showing the Quinto river trajectory, the spill-over area, theflooding area, the drainage lines and the geographical location of the study districts.
2340
HESSD5, 2319–2345, 2008
The dynamics ofcultivation and floods
E. F. Viglizzo et al.
Title Page
Abstract Introduction
Conclusions References
Tables Figures
J I
J I
Back Close
Full Screen / Esc
Printer-friendly Version
Interactive Discussion
Fig. 2. (a) graphic of Fig. 1 showing the area of the Quinto river watershed, (b) Topographicfeatures of the flooding area from Landsat images showing the strip that separates highlandsfrom lowlands on 110–120 m on sea level.
2341
HESSD5, 2319–2345, 2008
The dynamics ofcultivation and floods
E. F. Viglizzo et al.
Title Page
Abstract Introduction
Conclusions References
Tables Figures
J I
J I
Back Close
Full Screen / Esc
Printer-friendly Version
Interactive Discussion
Fig. 3. Temporal variability in patterns of precipitations (a), groundwater level (b) and annualcultivation (c) in highlands (white symbols) and lowlands (black symbols) within the spill-overarea of the Quinto River watershed during the period 1978–2003. Av: average value, sd:standard deviation. Analyzed period: 1978–2003.
2342
HESSD5, 2319–2345, 2008
The dynamics ofcultivation and floods
E. F. Viglizzo et al.
Title Page
Abstract Introduction
Conclusions References
Tables Figures
J I
J I
Back Close
Full Screen / Esc
Printer-friendly Version
Interactive Discussion
Fig. 4. Percentage of cropland affected by floods during the period 1996–2003 in the floodingarea of the Quinto River basin. Highland districts (a) comprise 1. Chapaleufu, 2. Realico, 3.Trenel, 4. Quemu , 5. Maraco. 1996–2002 was the period covered by floods in highlands.Lowlands (b) comprise 6. Bolivar, 7. Rivadavia, 8. 9 de Julio, 9. Casares, 10. Pehuajo, 11.Trenque Lauquen. 1996–2003 was the period covered by floods in highlands.
2343
HESSD5, 2319–2345, 2008
The dynamics ofcultivation and floods
E. F. Viglizzo et al.
Title Page
Abstract Introduction
Conclusions References
Tables Figures
J I
J I
Back Close
Full Screen / Esc
Printer-friendly Version
Interactive Discussion
Fig. 5. Relationships between groundwater levels and % of cropland affected by floods in theflooding area of the Quinto River basin during the period 1996–2003. Highland districts (a)comprise 1. Chapaleufu (R=0,99, P <0.01), 2. Realico (R=0.84, P <0.01), 3. Trenel (R=0,97,P <0.01), 4. Quemu (R=0.91, P <0.01), 5. Maraco (R=0.95, P <0.01). Lowlands district (b)comprise 6. Bolivar (R=0.92, P <0.01), 7. Rivadavia (R=0.18, P >0.05), 8. 9 de Julio (R=0.86,P <0.05), 9. Casares (R=0.26, P >0.05), 10. Pehuajo (R=0.23, P >0.05), 11. Trenque Lauquen(R=0,35, P >0.05). 1996–2003 was the period covered by floods in highlands.
2344
HESSD5, 2319–2345, 2008
The dynamics ofcultivation and floods
E. F. Viglizzo et al.
Title Page
Abstract Introduction
Conclusions References
Tables Figures
J I
J I
Back Close
Full Screen / Esc
Printer-friendly Version
Interactive Discussion
Fig. 6. Relationships between % cultivation during the inter-flooding period (1989–1995) andgroundwater levels during the flooding period 1996–2003. Highland districts (a) comprise 1.Chapaleufu (R=0,86, P <0.01), 2. Realico (R=0.61, P >0.05), 3. Trenel (R=0,92, P <0.01), 4.Quemu (R=0.75, P <0.05), 5. Maraco (R=0.88, P <0.01). Lowlands districts (b) comprise 6.Bolivar (R=−0.42, P >0.05), 7. Rivadavia (R=0.70, P >0.05), 8. 9 de Julio (R=0.91, P <0.01),9. Casares (R=0.48, P >0.05), 10. Pehuajo (R=−0.51, P >0.05). 1996–2003 was the periodcovered by floods in highlands.
2345