FEDERAL MINISTRY OF LANDS, HOUSING AND URBAN ...
137
DEPARTMENT OF URBAN AND REGIONAL DEVELOPMENT FEDERAL MINISTRY OF LANDS, HOUSING AND URBAN DEVELOPMENT SLUM IDENTIFICATION AND NEEDS ASSESSMENT STUDIES OF SELECTED SETTLEMENTS IN NIGERIA – ABA, KADUNA AND OSHOGBO CASE STUDY OF KADUNA, KADUNA STATE, NIGERIA FINAL REPORT POLAD TECHNOLOGIES LIMITED AUGUST 2014
-
Upload
khangminh22 -
Category
Documents
-
view
3 -
download
0
Transcript of FEDERAL MINISTRY OF LANDS, HOUSING AND URBAN ...

DEPARTMENT OF URBAN AND REGIONAL DEVELOPMENT
FEDERAL MINISTRY OF LANDS, HOUSING AND URBAN
DEVELOPMENT
SLUM IDENTIFICATION AND NEEDS ASSESSMENT STUDIES OF SELECTED SETTLEMENTS IN NIGERIA – ABA, KADUNA AND
OSHOGBO
CASE STUDY OF KADUNA, KADUNA STATE, NIGERIA
FINAL REPORT
POLAD TECHNOLOGIES LIMITED
AUGUST 2014

II
ACKNOWLEDGEMENTS
We acknowledge, with deep appreciation, the Department of Urban and
Regional Development (DURD) of the Federal Ministry of Lands, Housing and
Urban Development (FMLHUD) for giving Polad Technologies Ltd the
opportunity to carry out this Study.
In the process of carrying out this study, so many people, groups and
institutions assisted us but space would only permit us to mention just a few.
First, we would like to acknowledge the support of the Federal Controller
FMLHUD, Kaduna State, Mr. B.O.B. Isiki and the Director, Physical Planning
Unit- Mr. Ibrahim.
We would also like to thank the officials of the Ministry of Lands, Survey and
Urban Development who provided us with the necessary support; in
particular, Mr. Husaini.
We specially acknowledge the support and cooperation of community
leaders Alhaji Mohammed Innua Abubakar (The Seriki of Shagari Low Cost
Housing Estate, Barnawa) and Alhaji Amini Saidi (The Chairman of the
Abattoir Association, Sabo Gari, Kaduna South) as well as men, women,
youth and association leaders of the various communities covered in this
project.
In the same vein, our special thanks go to the experts who participated at
the Validation Workshop for their views and suggestions on the draft study
report. These experts include: TPL. Ayo Adejumo, TPL. Omotayo Awomosu,
TPL. Dr. Victor Ilechukwu, Prof. Iyiola Oni, Mrs. Gloria C. Agu-Nwofor, Mr.
Valentine Ofogba, Mrs. Joyce Omenai,Assoc. Prof. Alabi Soneye, Dr. Olatunji
Babatola, Arch. Osuade Oyediran, Mr. Chike Anikamadu and Mr. Lana
Olalekan.
Lastly, we wish to acknowledge the selfless service rendered by our
Consultants in various capacities in the execution of the project – Dr.
Mayowa Fasona, Dr. Peter Elias and Dr. Emmanuel Ege. We also appreciate
the technical support provided by Gbolahan Badru and Sam Udofia during
the various stages of this study.
Polad Technologies Ltd.
August, 2014

III
Table of Contents
Acknowledgement ...................................................................................................... VI
Table of Content .......................................................................................................... VI
Acronyms ...................................................................................................................... IX
Executive Summary .................................................................................................... 11
Chapter One – Project Scope ................................................................................... 16
1. 1 Introduction ....................................................................................................... 16
1.2 Terms Of Reference ........................................................................................... 18
1.3. Identified Scope Of Work ................................................................................ 19
Chapter Two – Project Methodology ....................................................................... 21
2.1 Research Framework ........................................................................................ 21
2.2 Desk Review And Literature.............................................................................. 22
2.3 Spatial Data ....................................................................................................... 23
2.4 Collation Of Social And Spatial Criteria For Slum Identification And
Delineation In Kaduna ............................................................................................ 23
2.4.1 Social Indicators Of Slum Conditions ........................................................ 23
2.4.2 Physical Indicators Of Slum Conditions ..................................................... 25
2.5 Fieldwork ............................................................................................................ 28
2.5.1 Preliminary Field Visits And Contacts ........................................................ 29
2.5.2 Fieldwork Protocol....................................................................................... 29
2.5.3 Field Equipment .......................................................................................... 30
2.5.4 Field Sampling ............................................................................................. 33
2.6 Expert Interactive Session ................................................................................. 34
2.7 Challenges And Constraints ............................................................................. 35
Chapter Three- Geography and Physical Characteristics of Slums in Kaduna .... 37
3.1 Geography ........................................................................................................ 37
3.1.1 Location ....................................................................................................... 37
3.1.2 History ........................................................................................................... 37
3.1.3 Physical Characteristics .............................................................................. 38
3.1.4 Human Characteristics ............................................................................... 39
3.2 Spatial Expansion Of Kaduna City ................................................................... 40

IV
3.3 Slum Delineation ................................................................................................ 43
3.3.1 Slum Areas Delineation .............................................................................. 43
3.4 Physical Conditions of the Slum Areas in Kaduna ......................................... 43
3.4.1 Physical Infrastructure and Road Conditions ........................................... 43
3.4.2 Waste Disposal, Water and Sanitation ..................................................... 43
3.4.3 Recreation Facilities .................................................................................... 43
3.4.4 School and Other Public Facilities ............................................................. 43
Chapter Four – Socio-Economic Characteristics of Slums in Kaduna .................. 56
4.1 Introduction ........................................................................................................ 56
4.2 Household Information ..................................................................................... 59
4.3 Housing Condition ............................................................................................. 62
4.4 Environmental Condition .................................................................................. 65
4.4.1 Perception Of Environmental Condition .................................................. 65
4.4.2 Perception Of Basic Infrastructure In The Community ............................ 66
4.4.3 Ratings Of Some Common Issues .............................................................. 70
4.4.4 Access To Sustainable Water And Sanitation ......................................... 72
4.5 Needs Assessment ............................................................................................. 75
4.5.1 Ranking Of The Needs By The Respondents............................................. 75
4.5.2 Ultimate Need ............................................................................................. 76
4.5.3expected Intervention From Government ................................................ 77
4.5.4 Willing Contribution From Communities .................................................... 78
4.6 Focus Group Discussion And Key Informant Interviews In Kaduna .............. 79
4.7 Status Of Infrastructure In Slum Areas Of Kaduna .......................................... 82
Chapter Five - Summary Of Outcomes, Slum Redevelopment Strategy,
Recommendations And Monitoring And Evaluation Plans .................................... 89
5.1 Introduction ........................................................................................................ 89
5.2 Summary Of Outcomes .................................................................................... 89
5.3 Sustainable Livelihood Assets And Threats In The Slums ................................ 91
5.4 Sustainable Slum Redevelopment Strategy ................................................... 93
5.5 Recommendations............................................................................................ 96
5.6 Monitoring And Evaluation ............................................................................. 101
5.6.1 Geoinformation Database ..................................................................... 101
5.6.2 Capacity Building ..................................................................................... 102

V
5.6.3 Periodic Image Acquisition For Updates ................................................ 102
5.6.4 The ToR ....................................................................................................... 102
References ................................................................................................................. 104
Appendix I – Questionnaire ..................................................................................... 107
Appendix II: Facility Forms ........................................................................................ 115
Appendix III: FGD/KII Report ................................................................................ 13208
Appendix IV: Summary Of Outcomes From The Slum Areas In Aba, Kaduna,
And Oshogbo ........................................................................................................ 11911
Appendix V: Report on Expert Interactive Session ................................................ 132
Appendix VI: Photo Album of Slum Areas .............................................................. 132

VI
LIST OF TABLES
Table 2.1: Social Indicators Of Slum Condition, Likely Metrics And Data
Sources ......................................................................................................................... 24
Table 2.2: Metric Relevant For Slum Delineation In Kaduna ................................... 27
Table 2.3: Sampling Frame For The City Of Kaduna ................................................ 33
Table 2.4: Number Of Questionnaire Administered Per Locality In Kaduna ......... 34
Table 3.1 : Slum Clusters Delineated In Kaduna City ............................................... 44
Table 4.1: Age Groups Represented In The Survey.................................................. 59
Table 4.2: Monthly Income Of Household Head ..................................................... 60
Table 4.3: Children Less Than 5 Years Of Age .......................................................... 61
Table 4.4: Elderly (Above 65 Years Of Age) ............................................................. 61
Table 4.5: Networks To Which Respondents Belong ................................................ 62
Table 4.6: Types Of Build Construction Materials ..................................................... 63
Table 4.7: Reason For Living In The Communities..................................................... 62
Table 4.8: Status Of Household Heads ...................................................................... 64
Table 4.9: Rating Of The Environment ....................................................................... 65
Table 4.10: Perception Of Environmental Condition Across Slum
Neighbourhoods In Kaduna ...................................................................................... 66
Table 4.11: Status Of Basic Infrastructures ................................................................. 66
Table 4.12: Perception Of The Condition Of Basic Infrastructure Across
Selected Clusters In Kaduna ...................................................................................... 69
Table 4.13: Ratings Of Some Common Issues .......................................................... 70
Table 4.14: Rating Of Community Issues ................................................................... 71
Table 4.15: Sources Of Household Drinking Water .................................................. 73
Table 4.16: Time Taken To Collect Water From Source ........................................... 73
Table 4.17: Adequacy Of Water For Daily Use In The Locations ............................ 73
Table 4.18: Toilet Facility ............................................................................................. 74
Table 4.19: Waste Disposal Methods Utilized ............................................................ 74
Table 4.20: Experience With Environment-Related Disaster Or Diseases ............... 75
Table 4.21: Ranking Of The Major Needs .................................................................. 69
Table 4.22: Ranking Of Community Needs .............................................................. 76
Table 4.23: One Necessary Facility Required To Function ...................................... 76
Table 4.24: One Necessary Facility Required To Function Across Selected
Solutions ....................................................................................................................... 77
Table 4.25: Expectations From The Government ..................................................... 77
Table 4.26: Expected Role Of Government In Slum Improvement From The
Selected Locations ..................................................................................................... 78
Table 4.27: Willing Contributions From Communities ............................................... 78
Table 4.28: Names And Types Of Facilities Present In The Communities ............... 83
Table 5.1: Identified Asset Base For The Slums In Kaduna ....................................... 92
Table 5.2: Identified Possible Threats For The Slums In Kaduna ............................... 92

VII
LIST OF FIGURES
figure 1.1: Nigeria Showing The Kaduna State Where Kaduna City Is Located ... 19
Figure 2.1: Methodological Framework .................................................................... 21
Fig 2.2: Elements Employed In Analysis Of Hr Image (Source: Jensen 2007)........ 26
Figure 2.4: Fieldwork Protocol .................................................................................... 28
Figure 3.1: The Regional Context Of Kaduna City ................................................... 37
Figure 3.2: Kaduna City In 1990 (Source: Www.Landcover.Org) ........................... 41
Figure 3.3: Kaduna City In 2014 (Source Www.Landcover.Org) ............................ 42
Figure 3.4: Location Context Of The Slum Areas In Kaduna ................................... 47
Figure 3.5: Identified Slum Areas On Hr Image......................................................... 48
Figure 3.6: Identified Slum Areas And Related Classes ........................................... 49
Figure 4.1: Locations Where The Social Survey Was Conducted In Kaduna ........ 58
Figure 4.2: Occupation Of Respondents .................................................................. 60
Figure 4.3: Respondents’ Duration Of Residency .................................................... 63
Figure 4.4: Tenure Document In Respect Of Property ............................................. 64
Figure 4.5: Approval Rating Of The Environment In Kaduna .................................. 65
Figure 4.6: Rating of Some Common Issues.............................................................. 65
Figure 4.7: Source Of Drinking Water In Sampled Slums In Kaduna ....................... 72
Figure 4.8: Major Problems Of The Communities ..................................................... 76
Figure 4.9: Spatial Pattern Of Mapped Facilities In Kaduna Slums......................... 82
Figure 5.1: The Flywheel Of Slum Improvement And Prosperity ............................. 94

VIII
LIST OF PLATES
Plate 2.1: Polad Officer At Field Planning Session With Field Officers In Kaduna . 31
Plate 2.2: Training Field Enumerators In Kaduna ...................................................... 31
Plate 2.3: Field Supervisors Been Conducted Around General Hospital In
Kaduna ........................................................................................................................ 31
Plate 3.1a: Street Layouts In Slum Areas ................................................................... 51
Plate 3.1b: Street Layouts In Slum Areas ................................................................... 51
Plate 3.2b: Majues Road In Ungwan Yelwa ............................................................. 51
Plate 3.2a: Sabon Birni Road In Kawo ....................................................................... 51
Plate 3.3: Road Without Drainage In Igabi ............................................................... 52
Plate 3.4: Open Waste Dump In Mando .................................................................. 52
Plate 3.5a: Public Water Supply In Tugwa Kaiji ........................................................ 53
Plate 3.5b: Solar Powered Borehole In Goni Gora .................................................. 53
Plate 3.6: Poorly Maintained Children Playground Along Zazzau Road In
Shagari Low Cost In Kaduna South ........................................................................... 53
Plate 3.7a: LGA Primary School, Maidugiri Road, Doka .......................................... 54
Plate 3.7b: Kawo Model Primary School, Kawo new extension ............................. 54
Plate 3.8a: Kawo General Hospital ........................................................................... 54
Plate 3.8b: Model Primary Health Care Ungwan Sanusi ......................................... 54
Plate 3.9a: Inside General Hospital Tundun Wada .................................................. 55
Plate 3.9b: Dilapidated Hospital Block In Tundun Wada General Hospital .......... 55
Plate 4.1: Inside Public Health Facility In Kaduna Slum Areas ................................ 67
Plate 4.2: Big Water Project Signboard, Yet Dry Tap Remains ................................ 68
Plate 4.3: Housing And Road Condition In The Inner Urban Villages ..................... 68
Plate 4.4: A Public Primary School ............................................................................. 69
Plate 4.5: A KII being conducted in Kaduna ............................................................ 75
Plate 4.6: After an FGD in Kaduna ............................................................................ 75

IX
ACRONYMS
C of O Certificate of Occupancy
DURD Department of Urban and Regional Development
ETM Enhanced Thematic Mapper
FGD Focus Group Discussion
FGN
FHA
Federal Government of Nigeria
Federal Housing Authority
FMLHUD Federal Ministry of Lands, Housing and Urban
Development
FMBN Federal Mortgage Bank of Nigeria
GIS Geographical Information System
GPS Global Positioning System
GRA Government Reserved Area
HR High Resolution
KASUPDA Kaduna State Urban Planning and Development
Agency
KII Key Informant Interview
LAT Latitude
LAUTECH Ladoke Akintola University of Technology
LGA Local Government Area
LONG Longitude
LULC Land Use Land Cover
MDG Millennium Development Goals
NBS National Bureau of Statistics
TM Thematic Mapper
TPL Town Planner
UN-Habitat United Nations Human Settlements Programme

X
VHR Very High Resolution
11
EXECUTIVE SUMMARY
Project Background
This project on slum identification and needs assessment study of Kaduna is
part of the effort by the Department of Urban and Regional Development
(DURD) of the Federal Ministry of Lands, Housing and Urban Development
(FMLHUD) to begin the study of Nigerian cities with the view to collecting,
collating, analyzing and synthesizing data on slums and blighted areas and
to propose inclusive renewal strategies and prioritize implementation action
plans and programmes. Two other cities involved in this initial effort of DURD
are Aba and Oshogbo.
The Specific Terms of Reference as Stated by the DURD are:
• Identification and delineation of the slum areas
• Provision of site photographs of the slum areas
• Preparation of an overview of the physical characteristics including
housing conditions, drainages, roads, schools, health centres, abattoirs,
sewage, solid and liquid waste collection and disposal points, places of
worship, markets, civic centres and playgrounds, etc
• Assessment and analysis of basic infrastructures and services required
by the inhabitants to uplift their living conditions
• Preparation of strategic proposal using phased development method
for improving slum conditions
• Provision of evaluation and monitoring strategies for successful
implementation of projects
Methodology
The study utilized both the remote sensing and social surveys approaches to
data collection and analysis. The activities carried out include desk review
and literature search; collation of physical and social criteria for slum
identification; collation, processing and analysis of maps and satellite
imageries; delineation of candidate slum clusters and preliminary slum area
maps; field work planning and field reconnaissance; field social surveys
including questionnaire administration and FDG and KII; GPS and
photographic campaign; data analysis and integration; in house
stakeholders validation workshop, and drafting of the reports.
The physical indicators of slum used were inferred from the spectral,
qualitative and locational information of high resolution satellite image data
were grouped into object, settlement and environment levels. The object
level which comprises of building characteristics include roof material,
footprint, shape, orientation, type, access network characteristics,

12
regular/irregular structure, type and width of roads, and other elements of
image interpretation including texture, object size and shape, and shadow.
The settlement level characteristics consists of development characteristics of
the settlement defining the overall shape and density including compactness
and complexity, haphazard, high density building pattern, unplanned
development, public infrastructure and services lag behind development,
proximity to public services (health, education, open space, public transport).
The environment level refers to the general characteristics of the environment
including the location of slums with respect to socio-economic status and
hazard-prone areas, poor management of solid waste, location of the
settlement/ proximity to natural and technological hazards, and degree of
greenness.
The social dimensions of the slum conditions were evaluated based on social
survey data collected on the field. The social factors of slums generated from
household surveys carried out across the slum clusters include household
information, housing conditions, and environmental conditions which
captures information on sustainable access to safe water, access to
improved sanitation, access to durable structure/housing, overcrowding,
access to tenure, access to social services. In addition a needs assessment
was conducted and what the communities are willing to offer in partnership
with other stakeholders to improve their living conditions were documented.
Summary of Findings
The followings are the summary of the findings for Kaduna.
• Kaduna city has been expanding at about 4.5% per annum
• About Forty Two (42) slum clusters (delineated based on major routes
and standalone basis) covering about 4,916ha or 49.16 km2 with a total
perimeter of about 205.6km were delineated in Kaduna.
• The slum area represents about 15.7% of the entire built up lands of
Kaduna City in 2014
• Every kinds and stages of slum formation - from infancy, consolidation
and maturity to gradual degradation of formal housing and social
filtering processes and a variety of informal housing development
processes either incremental and structured, incremental and
unstructured, sudden and structured, sudden and unstructured –are
found in Kaduna
• While some may have developed as a result of closeness to industrial
areas (especially south of the Kaduna river), some others developed as
a result of degradation of formal housing and re-densification of
originally planned areas. The most unique are those that developed as
individual towns (i.e. Kaduna urban villages).
• Trading or business dominates the major occupation or source of
livelihood
• Strong social network, 92% belongs to a group or association
• 71.3% of the houses are constructed of concrete

13
• On environmental indicators, planning of the area, building
appearance, number of people living in a building, and motorable
access to building were rated good. All other indicators receive either
poor or bad ratings
• On the condition of basic infrastructures, recreation facilities, children
playground, road side-walks, trees on the street, public toilets, street
lights, refuse collection points, civil centre, post office and abattoir are
rated as not available. Public water supply, electricity, public primary
and secondary schools, and markets were rated as been in very bad
shape.
• On common issues, food, being able to perform spiritual and cultural
rituals and communication are rated as good. Water, sanitation,
access to means of livelihood, housing, fuel for cooking, health care,
children school, and transportation were adjudged to be poor.
Sanitation and toilet facilities and security were considered to be in
bad condition
• Pipe borne water remains the major source of water relied on for
drinking. A significant population also relies on sachet water.
• 57% of the respondents feel they always have enough water for
household daily use, while 43% feel otherwise
• Majority of the population (56.5%) use the water closet toilet system
• Open waste dump remains the means for waste disposal for majority
(51.2%) of the population
• At least one in five respondents has ever experienced cholera and
typhoid outbreak and about 10.4% have experienced flooding
• Water, electricity, access to means of livelihood and road rehabilitation
are the most critical issue to living in the slum of Kaduna and remain
the key issues requiring urgent attention
• Access to the means of livelihood and infrastructure upgrade are the
key expectations from the government
• Enlighten other community members to support government efforts,
mobilise others to contribute to government efforts, and voluntary
personal labour are the assets the slum dwellers are willing to
contribute in partnership with other stakeholders.
Redevelopment Strategy
The identified slum areas in Kaduna face three key urban challenges. The
need to invest in: (A) upgrading the slums with the insertion of physical and
social infrastructure; (B) regeneration of the slum areas to bring infrastructure
and buildings that have suffered neglect and whose original functions have
been lost and (C) local economic development and empowerment by
activating the local assets to create jobs and improve livelihood, financial
independence and living conditions.
The figure below shows how these challenges can be addressed to turn
around the situation in the slums.

14
Recommendations
The suggested recommendations are divided into the short term (immediate
to 3 year), medium term (3-6 years), and long term (6-9 years) time-line. They
also include suggested agencies with implementation responsibility to actual
the recommendation.
Improving
condition of
basic
Infastructure
Road and drainage
rehabiltation
Provision of
water
Employment
and livelihood
Improving
general
environmental
conditionsInfrastructural
upgrade
Improving
water and
sanitation
conditions
Access to
water
Improved
Slum
Conditions
Access todurablehousing
Access to
social services
Improvedwaste
management
Improved
health facility
Recreation/relaxation facility
Public toilet
Improve school
conditions
Improved electric
power supply
Financial
empowerment
Activate
utlizations of
common
assets
Improved
living
conditions
Access to
health
Improved market and
public places
Initial triggers/pre-co
nditions
Desired
conditions
Improved
Slum
StageLiving Benefits
Sustained
Developm
ent Stage
Social-economic
benefits
Community
Activation
Stage

15
• Some of the recommendations on the short term include quick and
immediate rehabilitation of roads and clearing of drains in Kaduna.
• The medium term recommendations include investment in design and
provision of municipal infrastructure including water, public recreation
and relaxation areas and children’s playground, street light and waste
management, and the need to develop a digital GIS-based database
for managing the settlements, tracking progress made in slum
upgrading and human living conditions improvement plans.
• Recommendations for the long term include rehabilitation and
improvement of housing stock, removal of make shift structures
constructed of non-durable materials and leveraging on existing
economic and social assets and networks to institute cleavages to
improve local economic development.

16
CHAPTER ONE
PROJECT SCOPE
1. 1 INTRODUCTION
As with many cities in developing countries, urban development in Nigeria is
happening too rapidly, and at a large scale for the current system to cope.
This often results in urban degradation and deficiency in infrastructure and
related basic services including power supply, water, drainage and
sanitation, solid waste disposal, roads and public transport). The main
challenge is not to slow down urbanization but to cope with it and the
challenges it brings. The main challenges that rapid urbanization brings are
centered on how to provide adequate shelter, employment, and basic
urban services such as water and sanitation, and how to effectively respond
to the rising crime, urban poverty and environmental degradation.
The UN-Habitat described slums as the physical manifestation of urban
poverty and intra-city inequality. Slums occur partly because the prosperity of
cities is not well distributed. About 10% of the world population now live in
slums which are neighbourhoods that typically lack or denied access to basic
services. Slums can also result from the failure of public policy. Slums are
typically characterised by physical blight, insecure tenure, diseases, and
insecurity which resulted from absence of basic neighbourhood services such
as potable water, sanitation, vehicular access, and adequate housing. They
can be identified on the basis of the performance of a community against
some basic attributes such as access to land, potable water, sanitation and
generally good living conditions. They are also characterised by dense and
overcrowding conditions, where human rights are flagrantly denied.
Urban slums and blighted areas pose specific and peculiar physical and
environmental health planning challenges. They have population density that
is in most cases beyond the carrying capacity of both the environment and
infrastructure. Resource depletion is a natural result of a system that is fast
growing beyond its carrying capacity. Blighted areas are in themselves
evidence of development beyond the limit of acceptable change. Hence
environmental deterioration, waste management problem and inadequacy
and breakdown of infrastructure and facilities are the hall mark of blighted
areas. Epidemics of poor environment-induced and related diseases
including chorea, dysentery, malaria, etc are common occurrences. Waste
generation is high and waste collection and disposal is poor. Due to poor
planning and the lack or poor management of drains, flooding is also a
common challenge. People live in very unsanitary conditions which pose
serious challenges to the public health. Unfortunately, there are many of
these blighted areas in Nigerian cities, and they form the abode of over 50%
of cities’ population.

17
Location characteristics including socio-demographic and environmental
exposure offer a valuable source of data for urban slum research. Spatial
heterogeneity can develop for a variety of reasons including differences in
geography, history and ethnicity, social exclusion in access to markets,
employment, social services and infrastructure, and other aspects of public
policy. Providing information on the spatial heterogeneity of urban slums can
greatly assist in trying to identifying the proximate and underlying causes of
slum conditions and understanding the distribution of access to the assets
that are necessary to alleviate poverty and improve the performance of
human well-being. When spatial information is not available, the ability to
make informed intervention decisions and to monitor development activities
that are vital functions of governance would be basically difficult.
It is expected that urban development must meet current and anticipated
human needs, whilst making use of land, infrastructure and other natural and
human resources in the most efficient, cost effective and sustainable way.
Urban development plan often focuses on regeneration in terms of physical
transformation of disadvantaged places without explicitly considering the
poorest. The reality is that urban conditions become much worse when public
policy and programmes no longer secure and protect the set of needed
opportunities for sustainable development at the local level. Globally, urban
regeneration policy is now moving towards inclusive governance, tackling
poverty and deprivation in the context of disadvantaged places. This
inclusive and sustainable urban development approach as enshrined in the
doctrine of good urban governance aims to enable women and men to
access the benefits of urban citizenship. Good urban governance, based on
the principle of urban citizenship, as articulated by the UN-Habitat affirms
that no man, woman or child can be denied access to the necessities of
urban life, including adequate shelter, security of tenure, safe water,
sanitation, a clean environment, health, education and nutrition,
employment and public safety and mobility. Through good urban
governance, citizens are provided with the platform which will allow them to
use their talents to the full to improve their social and economic conditions.
Indeed, inclusive and sustainable urban development framework involves
urban situation analysis, sustainable urban development planning,
sustainable action planning, and implementation and management of
projects. The rights of citizens are also protected through access to
information, consultations and consensus building and inclusion in decision-
making, risk sharing, partnership and community-driven development
projects. These ensure that projects and programmes are relevant to
community’s needs and aspirations. Ultimately, while steps can be taken to
improve policy and the regulatory framework and strengthen the capacity
for administering it, the only way that a plan has any chance of working is if it
has buy-in from all those with a stake in it. Public and community
participation is essential particularly at the action planning stage. This will

18
ensure that the stakeholders ‘own’ the plan, and take their own steps to
ensure that it is followed.
The Federal Ministry of Lands Housing and Urban Development (FMLHUD), in
collaboration with the Federal Mortgage Bank of Nigeria (FMBN) and the
Federal Housing Authority (FHA) convened a national slum summit on
Monday 21st and Tuesday 22nd October, 2013 in Abuja. The theme of the
summit was ‘developing a national housing strategy for mass housing
delivery and slum upgrading’. The aim of the summit was to establish a
strategic platform that would guarantee sustainable mass housing delivery
and slum upgrading in Nigeria. The summit is a positive response to the
declaration made at the conference on ‘global efforts at making slums
history’ in 2012 at Rabat, Morocco. The summit was anticipated to produce
integrated approach and innovative strategies for sustainable housing
delivery and slum upgrading.
The current effort by the Department of Urban and Regional Development
(DURD) of the Ministry of Lands, Housing and Urban Development (FMLHUD)
to begin the study of Nigerian cities with the view to collecting, collating,
analysing and synthesising data on slums and blighted areas and to propose
inclusive renewal strategies and prioritise implementation action plans and
programmes is a welcome development. This will provide data on the extent
of urban slums in Nigerian cities and assist in mobilizing stakeholders to
participate in the quest to achieving sustainable cities where land,
infrastructure, and other natural and human resources are used in the most
efficient, cost effective and sustainable way. It is also in consonance with the
task of the FMLHUD to develop a National Programme of Action and
Strategic Plan to address slums in Nigeria.
1.2 TERMS OF REFERENCE
The aim of the study is to collect, collate, analyse required data and
subsequently propose alternative renewal strategies with prioritised
implementation programmes of actions for the slum areas.
The specific terms of reference as stated by the DURD are:
a. Identification and delineation of the slum areas
b. Provision of site photographs of the slum areas
c. Preparation of an overview of the physical characteristics including
housing conditions, drainages, roads, schools, health centres, abattoirs,
sewage, solid and liquid waste collection and disposal points, places of
worship, markets, civic centres and playgrounds, etc
d. Assessment and analysis of basic infrastructures and services required
by the inhabitants to uplift their living conditions

19
e. Preparation of strategic proposal using phased development method
for improving slum conditions
f. Provision of evaluation and monitoring strategies for successful
implementation of projects
1.3. IDENTIFIED SCOPE OF WORK
Based on the terms of reference listed above, the identified scope of work
includes the following:
i. Desk review and literature search and collation of preliminary
information – national and international criteria for slum definition and
delimitation, existing city reports and city/local development plans, etc
ii. Collation of existing spatial data on Kaduna – including base maps and
plans
Figure 1.1: Nigeria showing the Kaduna State where Kaduna City is located

20
iii. Field reconnaissance and identification of candidate slum areas and
clusters
iv. Sourcing of archived imageries imagery for the identification of the
slum clusters
v. Delineation of slum clusters and extraction of spatial information
(building footprints, roads, drainage, facilities, etc) from imageries
vi. Field Survey – GPS and Photographic campaign to capture point
facilities such as schools, medical facilities, places of worship, waste
disposal points, markets, civil centres, abattoir, etc. This also includes
inventory and documentation of status and conditions of all facilities
available. All photographic will be geolocated for import into GIS
database for each slum areas/clusters.
vii. Social Survey – questionnaire administration, focus group discussion
and key informant interviews to solicit information on proximate
conditions and personal experiences, communal lives, communal
aspiration and priorities. It will also elicit information on what individuals
and communities require to uplift their living standards.
viii. Information synthesises, integration and analysis
ix. Expert interactive session for Visioning, Scenario building and
preparation of phased, inclusive and strategic urban renewal
strategies to improving slum conditions and evaluation and monitoring
strategies for successful implementation of projects.

21
NEEDS ASSESSMENT STUDY OF SLUM
AREAS IN KADUNA
Desk review and
Bakground Literature
Search
Spatial data - maps and
Imagery acquisition
Pre-field contacts and
field reconnaissance
Collation of criteria for
Slum IdentifcationDelineation of candidate
slum clusters
Preliminary slum area
maps
Field survey - Social
Survey/FGD/KII
Data input, cleaning, integration
and analysis
GPS and Photographic
campaign
Final Slum area
maps
Interim Slum
Conditions Report
Final Slum Conditions Report
Image Processing
and Analysis
Developing field protocols,
Planning and Identification of
social survey sites
Expert
Interactive/Validation
Session
Two-timeLanduse/Landcover
Analysis
Figure 2.1: Methodological Framework
CHAPTER TWO
PROJECT METHODOLOGY
2.1 RESEARCH FRAMEWORK
Figure 2.1 shows the overall framework of the study based on the terms of
reference and identified scope of work.

22
The methodology for accomplishing the task is divided into the followings:
• Desk review and Literature search of the Kaduna
• Collation and acquisition of spatial data on Kaduna
• Collation of physical and social criteria for slum identification in Kaduna
• Delineation of candidate slum areas from imageries/preliminary slum
area maps for fieldwork
• Time series analysis of the city expansion
• Fieldwork planning(including preliminary field contacts and
reconnaissance)
• Actual fieldwork – social surveys and GPS/photographic campaign
• Data analysis and integration
• In-house expert interactive session for slum development strategy
• Final Reporting
As shown of Figure 2.1, the key components of the study include: desk review
and literature search on the state of Kaduna and to generate indicators for
slum conditions identification; acquisition of spatial data - very high and
medium resolution satellite imageries for time-series change analyses and
candidate slum areas delineation; field surveys consisting of social surveys
and GPS and photographic campaign in the slum areas, and in-house slum
redevelopment strategy workshop with experts to collate opinions on possible
strategies for upgrading the human living conditions in the identified slum
areas as well as possible monitoring and evaluation strategies.
2.2 DESK REVIEW AND LITERATURE
Several documents were collated with the view to establishing the study
background for Kaduna. They include the followings:
• The Draft final report of the Revised Master Plan for Kaduna City for
2010-2050, prepared by Max Lock Consultancy Nigeria Limited for the
Kaduna State Government, Ministry of Lands, Survey and Country
Planning, Published by MLC Press, University Of Westminster, London.

23
• Proceedings of housing & slum summit held by FMLHUD on 21st-22nd
October, 2013
• The UN-Habitat Kenya Slum Upgrading Programme Strategy
Document, 2008.
In addition, technical documents and academic articles were reviewed with
the view to gather information on the spatial and socio-economic criteria for
slum identification.
2.3 SPATIAL DATA
The following spatial data were accessed for this project:
• Landsat TM and ETM satellite image scenes for Kaduna for periods
ranging from 1980s to 2014. These image scenes were processed and
analysed to generate two-time period maps/image maps for Kaduna
with the view to estimating the changes in spatial extents of Kaduna
between the two time periods. This was also used to calculate the
spatial growth rate for the city.
• Very high resolution Quickbird imageries (62cm) – These were used for
delineating the slum areas using the physical/spatial indicators
retrieved from literature search.
• Existing base maps and data – Road data and place names were
retrieved from existing base maps and other digital spatial data
sources.
2.4 COLLATION OF SOCIAL AND SPATIAL CRITERIA FOR SLUM
IDENTIFICATION AND DELINEATION IN KADUNA
According to Sliuzas et al (2008), slum development is a process that can
take several different forms.
• Slums can develop through the gradual degradation of formal housing
and social filtering processes (examples of this are often found in the
developed cities but they are also found in the form of degraded
social or low income housing projects in developing countries).
• Slums can also develop through a variety of informal housing
development processes (e.g. incremental and structured, incremental
and unstructured, sudden and structured, sudden and unstructured).
Each form has its own distinctive characteristics.
2.4.1 SOCIAL INDICATORS OF SLUM CONDITIONS
Majority of human populations in the world lives in cities. This unprecedented
growth in human populations and settlements has created the type of
urbanization characterized by increased affluence and poverty. There is a
growing inequality among urban dwellers where the rich are found in
sections of the city served with basic social services and infrastructures while

24
the poor are confined to poorly served areas characterized by squalid
conditions (Elias, 1999). Demographically, the rich who enjoys the largest
share of city resources are fewer in number compared to the population of
the poor. This picture describes urbanization in the least development
countries where rapid urban populations is growing faster than available
resources. Consequently, majority of the urban dwellers do not have access
to basic life-support systems. The UN-Habitat (2003) describes slum areas as
“those communities characterized by: insecure residential status, poor
structural quality of housing, overcrowding and inadequate access to safe
water, sanitation and other infrastructure”.
Preliminary literature reviews revealed that five (5) main social indicators of
slum conditions (also referred to as the indices of deprivation) were identified
by the UN-Habitat expert group on slum identification and mapping. These
are:
• Sustainable access to safe water
• Access to improved sanitation
• Access to durable structure/housing
• Overcrowding • Access to tenure
• And to these we have added access to social services which is the one
of the most basic evidence of slum condition in cities of the developing
countries in general and Nigerian cities in particular. The identified metrics and the data sources from which they were generated
for Kaduna are shown in Table 2.1.
Table 2.1: Social indicators of slum condition, likely metrics and data sources Sn Indicator Likely metrics /measurement Data
sources
1 Sustainable
access to safe
water
Where major source of water for drinking and other
uses is not piped water, public tap, borehole or
pump, protected well, protected spring or rainwater
E.g. shallow well, pond, stream
Use and amount spent on vendor-provided waters,
bottled water, and tanker trucks. (water should take
less than 10% of household income)
Minimum water use per day
Maximum water access per day
Time spent on water collection
Amount paid per litre
Fieldwork
2 Access to
improved
sanitation
Lack of access to water system toilet or improved
latrine
E.g. – use of pit, open defecation, etc.
Fieldwork
3 Access to
durable
structure/housing
Lack of access to durable housing material
(e.g. where housing roof, wall, floor is made of non-
durable materials)
Building in hazardous areas such as floodplain, close
to canals, waste dumps, etc.
Fieldwork
4 Overcrowding Living in more than 3 people per room
Density of people per km2
Fieldwork

25
5 Access to tenure Approved building plans
Certificate of occupancy
Fieldwork
6 Access to social
services
Social services – health, education, police, etc. per
population
Fieldwork
While efforts were made to access census and demographic and health
surveys data, they did not contain these metrics at neighbourhood or
enumeration areas and household levels which are the spatial scale
desirable for high resolution mapping and analysis of slum conditions. All the
social metrics for slum condition analysis were, therefore, generated from
social surveys and field observations.
Access to tenure (criteria #5) is a strong indicator of possessory rights to
property. However, this is very difficult to operationalise in Nigeria where less
than 5% of all lands/properties are legally registered. But it is important in
terms of access and entitlement to compensation in cases where a private
dwelling has to give way for overriding public good especially in the process
of improving slum conditions. Question on the resident status (land lord or
tenant) was included in the questionnaire with a follow-up question on the
type of legal document for possessory right to the property.
2.4.2 Physical Indicators of Slum Conditions
Satellite imageries remain the best means of identifying slum clusters at the
city level. Satellite images are complemented and strengthened by results
derived from micro level survey. Very High Resolution (VHR) images are useful
for assessing and providing objective evidence on the physical conditions of
slum areas. They are also useful to assess the development stage - infancy,
consolidation, maturity -of a slum and to identify how slum characteristics
may change according to the development stage of the slum. Preliminary or
candidate slum area maps generated from satellite imageries are
indispensable tool for social vulnerability assessment of slums on the field.
According to Kohli et al (2012) and Sliuzas et al (2008), the physical indicators
which are inferable from spectral, qualitative and locational information
useful for identification of candidate slum areas on satellite imageries can be
grouped into object, settlement and environment levels.
Object Level comprises of building characteristics observable via VHR Images
such as:
• roof material,
• footprint,
• shape,
• orientation,
• type,
• height,

26
• access network characteristics such as connected/not connected with
surroundings
• regular/irregular structure
• type and width of roads.
• condition of drainage,
• durability of housing/material for roofing (corrugated tin, plastic
sheeting/tarps, cloth/grass);
• other elements of image interpretation including texture, lacunarity
(measure of the distribution of empty spaces within an image), object
size and shape, and shadow
Settlement level consists of development characteristics of the settlement
defining the overall shape and density including:
• Very compact and complex settlement patterns
• Extensive, high density, multi-storey unplanned development.
• Public infrastructure and services lag behind development
• haphazard, high density building pattern
• Proximity to public services (health, education, open space, public
transport).
The Environment level refers to the general characteristics of the environment
including:
• the location of slums with respect to socio-economic status and
hazard-prone areas
• Poor management of solid waste, air pollution
• Location of the settlement/ proximity to natural and technological
hazards - (in or near a steep slope, in or near a flood plain, in or near a
(toxic) waste area, in or near an industrial area, etc.)
• We also add to this class the degree of greenness – presence or
absence of trees that provide ecosystem services
The hybrid image analysis technique (combining elements of digital and
visual analysis) was employed for the interpretation and delineation of slum
areas from the Very High Resolution imageries. The elements of image
interpretation were employed in the visual analysis of the imageries. (See Fig
2.2)

27
Using the principle of convergence of evidence, all the three levels – object,
settlement and environment – were integrated. Table 2.2 shows the spatial
metric most relevant for delineating slum areas Kaduna.
Table 2.2: Metric Relevant for Slum Delineation in Kaduna
Spatial Metrics Kaduna
Settlement Level
· roof material, √
· footprint, √
· shape, √
· orientation,
· type, √
· height,
· access network characteristics such as connected/not
connected with surroundings √
· regular/irregular structure √
· type and width of roads. √
· condition of drainage,
· durability of housing/material for roofing (corrugated tin, plastic
sheeting/tarps, cloth/grass); √
· other elements of image interpretation including texture,
lacunarity (measure of the distribution of empty spaces within an
image), object size and shape, and shadow √
Object Level
· Very compact and complex settlement patterns √
· Extensive, high density, multi-storey unplanned development.
· Public infrastructure and services lag behind development √
· Redensification and Public infrastructure breakdown
· haphazard, high density building pattern √
· Proximity to public services (health, education, open space,
public transport). √

28
Environment Level
· the location of slums with respect to socio-economic status and
hazard-prone areas
· Poor management of solid waste, air pollution
· Location of the settlement/ proximity to natural and
technological hazards - (in or near a steep slope, in or near a flood
plain, in or near a (toxic) waste area, in or near an industrial area,
etc.)
√
· Degree of greenness – presence or absence of trees that
provide ecosystem services √
2.5 FIELDWORK
The fieldwork consists of pre-field contacts and visits, social surveys
(questionnaire administration and Focus Group Discussions (FGD)/Key
Informant Interviews (KII)) and GPS and Photographic Campaign. The field
protocol is as shown on Figure 2.3.
Federal Controler
FMLHUDState Commissioner for Physical Planning
Local Physical Planning/Urban Development Unit
Assemble Field Enumerators
Training of Enumerators
Allocation of Enumerators to
Slum clusters
FGD/KIIField SurveyGPS and Photographic Campaign
Students from Local
Higher Institutions
Traditional
Rulers/Institution
Community
Associations
Vetting/checking of completed field
instrumens

29
2.5.1 Preliminary Field Visits and Contacts
The pre-field visit to Kaduna was carried out between 9th and 12th April,
2014. The first point of call was at the Federal Secretariat in Kaduna where our
team was received by the Federal Controller for the Ministry of Lands,
Housing and Urban Development (Mr. Isiki). Mr. Isiki handed us over to Mr.
Ibrahim who is a Director in the Physical Planning Unit.Our team was taken to
the office of the State Commissioner for Physical Planning and Urban
Development where we were recieved by Mr. Husaini, a Director in the
Ministry. Efforts were thereafter made, without success, to meet with the
General Manager, Kaduna State Urban Planning and Development Agency
(KASUPDA). We were told KASUPDA has a list of priority areas for slum
upgrading and living conditions enhancement for the Kaduna Metropolis
which this study can key into. Both the Federal Controller and the State
Ministry of Physical Planning and Urban Development assured our team of
their cooperation in the course of the study. We also took a tour of some slum
areas including Sabon gari, Narayi and Television village.
2.5.2 Fieldwork Protocol
The actual fieldwork in Kaduna took place from Mid-April to Mid-May,
2014.The protocol for the actual fieldwork is shown on Figure 2.4. The Federal
Controller (FMLHUD) served as our primary contact and facilitator. The
Controller helped our team to link the State Ministry in charge of Urban
Development. The State Ministry gave us a briefing on and profile of the city.
It also either facilitated the recruitment of local enumerators, or as in the case
of Kaduna, linked us with the Local Urban Development office to do that
task. The enumerators came mainly from the State Ministry in charge of Urban
Development and local higher institutions. With this arrangement, the POLAD
team was able to recruit enumerators that are not only conversant with the

30
local city and community environments, but also conversant with issues
about slum conditions in those neighbourhoods.
Training of enumerator was conducted to get them familiarised with the
survey instrument. In addition, a pilot survey was conducted with them before
they proceeded to the field for the full survey. Each enumerator was
allocated to a slum cluster or sub-areas as the case may be. The total
number of enumerators employed for the questionnaire survey in Kaduna
was 15. The deployment of enumerators to the areas was based on the initial
slum area maps generated from satellite imageries. An enumerator was
expected to administer about 30 questionnaires in his/her allocated area
within a week.
In addition to the field enumerators, 2 other field assistants were specially
trained to handle the GPS/Photographic campaign. The focus group
discussion (FGD) and key informant interviews (KII) were handled by the
POLAD team and assisted by staff from the State Ministry in Charge of Urban
Development. The targets engaged in the FGD and KII include community
and traditional rulers/leaders, opinion leaders, neighbourhood groups and
community based organizations, and officials of the State Ministry in Charge
of Urban Development.
2.5.3 Field Equipment
2.5.3.1 Field Survey – Social Survey and FGD:
The questionnaire is the instrument used for the social survey. The household
head was the target of the survey. The questionnaire was designed to
capture all the social indicators of slum conditions including water, sanitation,
housing, overcrowding, access to tenure and access to social services (see
questionnaire in Appendix 1). The questionnaire consists of 35 questions and
about 116 variables. It captures issues such as location (LGA, Town, Locality
and Streets) where the survey was conducted. It also contains aspects
dealing with household information including income and means of
livelihood, among others. There is also a section on housing conditions and
residential status of household head, as well as environmental conditions
where respondents were asked to check from a catalogue of indicators
(facilities) and indicate the ones that are present in their locality and their
present conditions. It also captures aspects relating to water, and access to
water, toilet facilities, waste management, etc. The final aspect deals

31
Plate 2.1: Polad Officer at Field Planning Session with Field Officers in Kaduna
Plate 2.2: Training Field Enumerators In Kaduna

32
2.5.3.2 GPS and Photographic Campaign
A state-of-the-art Canon PowerShot SX280 HS GPS camerawith in-built GPS
capability was used for the GPS and photographic campaign. In this case we
were able to achieve photographic and coordinate collection with single
equipment. Prior to proceeding to the field, 4 types of forms were designed
to record information about the name and state/status of the facilities that
are available, as well as documenting the general environmental conditions
of the slum communities (see appendices).
Form A: captures the general facilities and environment including the locality
where they are, as well as their status and ownership or provider.
Form B: is for schools and health facilities. It captures the name, provider,
status and general conditions of the facility
Form C: specifically for some selected schools/education facilities. It captures
in-depth information about the schools, including estimated population,
number of teachers, number of classrooms, condition of buildings, water,
electricity, toilets, etc.
Form D: is for in-depth information on health facilities, including, estimated
number of patients, number of doctors and nurses, number of beds, etc. (See
Appendices II and VI)
2.5.3.3 FGD/KII
An interview guide was designed to elicit information from stakeholders
about the general conditions of the slum areas. In particular, aspects relating
to slum conditions including water, sanitation, housing, overcrowding, access
to tenure and access to social services were discussed with the stakeholders.
They were also requested to volunteer opinions on how the community as a
group can be involved in slum upgrading and improvement of lives in these
areas.

33
2.5.4 Field Sampling
The stratified sampling technique was used to select the candidate
respondents. First the LGAs that share the city were considered. Second, the
localities/neighbourhoods where the slum areas are concentrated were
considered. Lastly the streets were collated and questionnaires randomly
administered in selected streets. Due to the lack of population and
household size data scale lower than the LGA, the sampling efforts were
concentrated at ensuring adequate representations consisting of all the
identified slum types and stages (inner core, semi-urban, continuous,
standalone clusters, infant, consolidation, maturity, etc).
The sampling design in Kaduna was accomplished in conjunction with the
officials of Federal Ministry of Lands, Housing and Urban Development and
Kaduna State Ministry of Lands, Urban Development and Kaduna State Urban
Planning Development Agency. The representatives of these government
agencies played active roles with their extensive local and practical
knowledge to guide the selection of sampled communities. The State Ministry
also have special areas or neighbourhoods of interest where they have been
intervening. These were also factored into the selection of the final
communities to be sampled. The four LGAs that make up the Kaduna
metropolis - Kaduna North, Kaduna South, Igabi and Chikum – were first
selected. The sampled communities are shown in Table 2.3:
Table 2.3: Sampling frame for the City of Kaduna
LGA Sampled communities Sampling frame
Kaduna north Kawo new extension, Ungwan
Rimi, Low cost, Kabala costain,
Doka
117
Kaduna south Tudun wada, Sabongari, Ugwan
Sanusi, Tundun Nupawa, Shagari
low cost, Badikko, Ngwan Yawa,
Ngwan Boro,
116
Igabi Angwa Gwari, Trade fair layout,
KASDPC layout, Hayiabanmani,
Mando/light industrial layout, Igabi
110
Chikum Goni gora, Sabon tasha, Nayari
site, Ungwa Romi new extension
110
TOTAL 453
The recruitment of the field assistants and supervisors was facilitated by the
above named agencies.
Summary

34
In total 453 questionnaires were administered in Kaduna. Tables 2.4 shows the
locality where questionnaires were administered.
Table 2.4: Number of Questionnaire Administered Per Locality in Kaduna
Locality Frequency Percent Doka 71 15.7
Angwan Baro 10 2.2
CBD 15 3.3
OriapataCBD 4 0.9
Sadauna crescent 3 0.7
Kawo new extension 21 4.6
Sabo Tasha 50 11
Kabala Doki 9 2
Kabala Costain 10 2.2
Rigasa 27 6
Mando 20 4.4
Danmani 5 1.1
Hayin Danmani 12 2.6
Unguwan Gwari 32 7.1
Angwan Rimi Low-cost 10 2.2
Angwa Kudu/ Angwa
Rimi 10 2.2
Sabo Gari 15 3.3
Layin ado Gwaram 2 0.4
Television 9 2
Badiko 10 2.2
Narayi 10 2.2
Romi 20 4.4
Angwan Sanusi 10 2.2
Tudun Wada 17 3.8
Tundu Nupawa 10 2.2
Kurmin-Marshi 10 2.2
Goni –gora 10 2.2
Phase II 5 1.1
Phase I 5 1.1
Total 442 97.6
No location information 11 2.4
Total 453 100
2.6 EXPERT INTERACTIVE SESSION
The objective of the expert interactive session was to validate the fieldwork
and to offer further expert opinions and suggestions on the proposed slum
upgrading strategy and recommendations. The expert interactive session
took place on Tuesday 28th July 2014 after the initial comments on the draft

35
report have been received from the FMLHUD. The experts were drawn from
both the academic and industry. They include practicing Urban Planners and
Planners from the University, Expert Geographers with considerable
experience in Human Settlement Analysis, Remote Sensing, and Geographic
Information System (GIS). They also include experienced Estate Surveyor and
Valuers, and Lawyers with expertise in land management and policy. Two
representatives from the FMLHUD also attended the session. The experts also
acted as reviewers. They were given copies of the draft report to review in
advance and their observations, comments and suggestions were discussed
and collated during the session with the view to improving the report. During
the session each aspect of the report were thoroughly considered and
consensus reached on the strategies and recommendations for improving
human living conditions in the slum areas. The full report of the expert
interactive session including the names and domiciliation of the attendees is
shown in appendix V.
2.7 CHALLENGES AND CONSTRAINTS
The challenges and constraints encountered in the course of this project can
be divided into two major groups.
• The first are those that relates to sourcing and acquisition of spatial and
attribute data pertaining to the slum areas.
• The second are those experienced in the conduct of the fieldwork.
Spatial data
Ideally, this kind of study should have been done using the lowest official units
of spatial and /or population reporting zones e.g. census enumeration areas,
census supervisory areas, or electoral wards boundaries. Both government
records, administrative registers and spatial data or maps showing the
delimitation of these were not available. This makes it difficult to know either
the population or the actual extent of a slum neighborhood. Good street
network data (showing all the streets and their names in a town) is also
important for delineating the coverage of particular areas or neighborhoods.
The street data available for Kaduna is incomplete in attribute. The
unavailability of these spatial data makes the delineation of actual slum
neighborhoods very difficult except in those cases where the slum clusters are
standalone such as we have in the Kaduna Urban Villages. Hence, in the
inner city areas with extensive and continuous slum areas, these slum areas
were delineated as one polygon while the place or neighborhood names
are then placed as points to identify them. The implication is that it becomes
difficult to calculate the area of each separate inner city slum neighborhood.
On the Field
One of the major constraints encountered on the field is apathy. Some
households are unwilling to respond to the questionnaire because of the
feeling that the government has never implemented recommendations from

36
any study. In essence they feel it is sheer waste to devote any good time to
supporting or volunteer information for any study. This suggests
disenchantment with government disposition towards slum dwellers in not
being able to provide urban basic services to support improvement in their
living conditions. In few cases, there were demands for money as incentive
to participating in the survey.
Security was also a major concern during the fieldwork in Kaduna. The
security situation was explosive during the field visit. Although the field team
was not harassed, they were not very free to capture the photographs of
some infrastructures. Apart from wearing identification jackets, security
operatives were engaged thereby increasing the cost of data collection. In
one of the FGD in Sabon Gari, the participants, who kept anonymity, were at
loggerhead with a Staff from the Ministry on our field team. For example,
when some particular infrastructures (e.g. pipe borne water) were
mentioned, the FDG claimed they were not available but the Staff from the
Ministry says they were available. This created a heated argument which had
to be carefully managed. This also reflects the mistrust between the
government and the slum dwellers. There was also the lack of cooperation
from facility managers such as schools and health facility heads. In most
cases, they did not agree to complete the forms on attributes of facility,
citing orders from above and the need for us to obtain permission from the
school board or the health board before they can accede to our request.
This barrier exemplifies the divergence between data availability versus its
accessibility.

37
CHAPTER THREE
GEOGRAPHY AND PHYSICAL CHARACTERISTICS OF SLUMS IN
KADUNA
3.1 GEOGRAPHY
3.1.1 Location
Kaduna is a city, capital of Kaduna State and a trade centre whose name is
derived from the Hausa word for crocodiles, “Kada.”. Located in the north-
western geopolitical zone of Nigeria, along the Kaduna River, a major
tributary of the Niger River, the city is roughly defined by Latitudes 10o20’ to
10o 40’ North and Longitudes 7°20’ to 7o33’East (Fig 3.1). Spatially, Kaduna
city is about 25km long and 8–10km wide, and extends from Katabu in the
North to Kakau and the oil refinery in the South.
3.1.2 History
The original layout of Kaduna was conceived in 1913 by Lord Lugard and laid
out in 1917 as the administrative and military capital of what was then the
Figure 3.1: The Regional Context of Kaduna City

38
protectorate of northern Nigeria. Today it remains a capital city, albeit of one
of the largest states in Nigeria rather than the whole Northern region.
According to the Kaduna Revised Master Plan 2010, the city has recorded a
huge growth since the 1960s. South of the River Kaduna the expansion was
initially fuelled by industrial growth attracting large numbers of in-migrants.
Though much diminished since the closure of the majority of the textiles
factories and now supplemented by formal and informal opportunities north
of the river, the industrial concentrations south of the River continue to
underpin Kaduna’s role as Nigeria’s fifth city. Latterly, much of the growth has
been driven by endogenous demographic factors, with an urban
‘population explosion’ driving by high (but falling) birth rates of its young
population.
North of the River, subsequent to the growth of the new district of Sabon Gari
to the west of Tudun Wada, development of the western districts of Rigasa,
Afaka and Ungwan Mu’azu was stimulated by the building of the western
expressway by the Federal Government in the late 1970s as part of the new
North/South trunk road linking Kano, Kaduna, Abuja and a Niger River
crossing at Lokoja. Expanded development directly to the east has been
prevented by lack of access bridges over the River Kaduna. The potential for
dramatic change in this pattern of growth has increased with the recent
construction of the new Makarfi Bridge and plans for the new millennium city
that opens up the development potential east of the River Kaduna. The basic
pattern of grid-iron plot development in the original residential settlements of
Sabon Gari and Tudun Wada set the pattern for the majority of land
development in the city, both formal and informal, ever since.
3.1.3 Physical Characteristics
3.1.3.1 Climate and Vegetation
The city of Kaduna has a typical savannah climate with distinct wet and dry
seasons. The climate is strongly influenced by the equatorial maritime and
tropical continental air masses. While the wet season/rainfall regime is
derived from the moisture-laden equatorial maritime air mass with a long
history of movement over the Atlantic Ocean, the dry season/harmattan is
determined by the influence of the tropical continental air masses. The rainy
season extends from March/April to October while the dry season lasts from
November to March/April. The city's natural vegetation consists largely of
savanna woodlands characterised by grassland with scattered trees and
woody shrubs. The average temperature is between 26°C and 34°C while the
mean annual rainfall is around 1400mm (Kaduna Master Plan 2010). It has
been traditionally characterized by a mono-modal rainfall system and a
growing period of 150-180 days.
3.1.3.2 Soil and Geology
Most of the soils in the area are light in texture and free draining. Soils with
impeded drainage derived largely from aeolian loess and alluvium are found

39
in small areas along banks of watercourses and on valley bottoms and
terraces (Fadamas). The soils in the city of Kaduna are reddish-brown typical
of ferruginous soils. This is unconnected to the geology of the city which is
mainly underlain by the migmatite-gneiss complex consisting of migmatites,
biotites and granitic gneisses. The underlying complex is capped by laterites
which are highly consolidated especially at the surface and weathered into
lateritic nodules mixed with silty and sandy clays.
3.1.3.3 Drainage and Topography
The Kaduna City Region is drained by the Kaduna River and its tributaries, the
Tubo, Sarkin Pawa, Udawa, Karami and the Galma. The Kaduna River
provides most of the water requirements of the City. The source of the
Kaduna River lies on the Jos plateau. It flows for 210 km before reaching
Kaduna city. It crosses the city dividing it traditionally into north and south –
but now, with development to the east of the Kaduna metropolis being
undertaken, into east and west also. The drainage pattern is mostly dendritic
which indicates absence of structural control over drainage lines.
3.1.4 Human Characteristics
3.1.4.1 Population
According to the Kaduna Revised Master Plan 2010, Kaduna was a small city
of 150,000 people in 1967, with elegant tree-lined avenues and official
buildings befitting the capital of the whole northern region of Nigeria. Forty
years later it has grown to seven times this size and continues to be
overwhelmed by the rapid pace of urbanization. The combined population
of all four LGAs, which includes the rural population of Chikun and Igabi LGAs
living outside the Kaduna built-up area, is estimated in the provisional 2006
Census at 1,570,331. However, the UN estimates the population for the
Kaduna urban agglomeration (based on Federal Government estimates) in
2010 at 1,561,000. By this estimate Kaduna is Nigeria’s fifth largest city - behind
Lagos, Kano, Ibadan, and Abuja. The projected city population for Kaduna in
2025 by the UN is 2,362,000. The same source estimates the rate of growth of
population for the past five years at 2.55% per annum, similar to Kano but
considerably less than Abuja at 8.33% per annum.
3.1.4.2 Socio-Economic Activities
Kaduna is a cultural melting pot, with several distinct groups. The
Hausa/Fulani are the dominant groups in the city, and the Hausa language
serves as the lingua franca. Agriculture and animal husbandry are significant
commercial activities. The city's cotton-textile spinning and weaving mills
used to be Nigeria's largest and among the largest in Africa. Light
manufactures include leather goods, plastics, ceramics, pharmaceuticals,
furniture, and several printing and publishing firms. The town's heavy industries
make steel and aluminium rolling plants, automobiles, petro-chemical

40
refinery, cement, asbestos cement, concrete blocks, electrical motors,
ordnance, and explosives.
3.1.4.3 Settlement Pattern
Ribbon development has taken place along the major roads out of the city
to the North and the Southeast in particular. Large areas have been
demarcated in the outskirts of the urban area and the expansion of green
field urban development has continued, particularly in the south and
Southeast along with a consolidation and intensification of building within the
limits already reached. According to the Revised Master Plan 2010, long
established informal developments in such areas as Badarawa and west of
Makera (now Nassarawa) were just starting to develop in 1965 and were
observed to be progressing down this route in the 1967 Master Plan. Then they
were called ‘illegal’ as indeed they were, but they were not stopped. These
and many other places have now developed to the full extent of their
physical and topographical boundaries and as such have become
established urban areas even to the extent of individuals applying for and
being granted a Certificate of Occupancy and title deeds over developed
plots. What was once ‘illegal’ has over the years become accepted. This is a
basic tenet of land law in most parts of the world. Unchallenged occupancy
after a given number of years gives the occupier a legitimate right to occupy
and even ‘ownership.
As with many, if not most cities in developing countries, urban development is
happening on too rapid and large scale for the current system to cope.
Kaduna’s ‘urban villages’ are also a unique feature in Kaduna City. These are
the usually very high density informally laid out areas that have been
developed over time on the basis of traditional land holdings and their
subdivision. They are classified as areas with irregular street and plot layouts.
These layouts, and the fact that streets often take the form of narrow lanes in
these areas, means they create difficult and demanding requirements for
upgrading and improvements to basic services. Although these are often
very poor areas, they are characterised by a strong traditional community
identity and represent important concentrations of ‘social capital’ in the city.
Along with the wealthy, planned, tree-covered areas of the original GRA,
they represent part of Kaduna’s cultural heritage and, wherever possible,
their essential character should be preserved in any planned works that
affect them.
3.2 SPATIAL EXPANSION OF KADUNA CITY
The city of Kaduna has not only increased in terms of population, it has also
experienced rapid urban expansion between 1990 and 2014 as seen from
Landsat Imageries in Figures 3.2 and 3.3. In specific terms, the built-up area of
Kaduna increased from about 148.4km2 in 1990 to about 313.2km2 in 2014.
This represents increases of about 165km2 or about 111% which is about 4.5%
per annum.

41

42
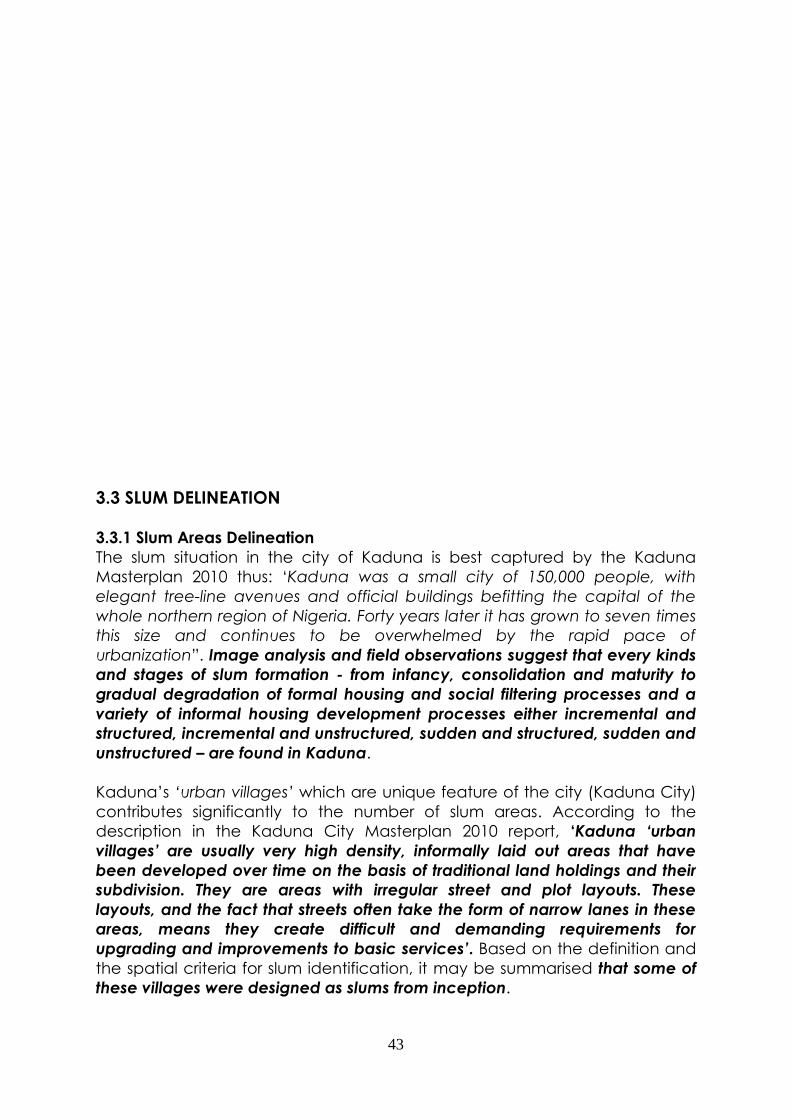
43
3.3 SLUM DELINEATION
3.3.1 Slum Areas Delineation
The slum situation in the city of Kaduna is best captured by the Kaduna
Masterplan 2010 thus: ‘Kaduna was a small city of 150,000 people, with
elegant tree-line avenues and official buildings befitting the capital of the
whole northern region of Nigeria. Forty years later it has grown to seven times
this size and continues to be overwhelmed by the rapid pace of
urbanization”. Image analysis and field observations suggest that every kinds
and stages of slum formation - from infancy, consolidation and maturity to
gradual degradation of formal housing and social filtering processes and a
variety of informal housing development processes either incremental and
structured, incremental and unstructured, sudden and structured, sudden and
unstructured – are found in Kaduna.
Kaduna’s ‘urban villages’ which are unique feature of the city (Kaduna City)
contributes significantly to the number of slum areas. According to the
description in the Kaduna City Masterplan 2010 report, ‘Kaduna ‘urban
villages’ are usually very high density, informally laid out areas that have
been developed over time on the basis of traditional land holdings and their
subdivision. They are areas with irregular street and plot layouts. These
layouts, and the fact that streets often take the form of narrow lanes in these
areas, means they create difficult and demanding requirements for
upgrading and improvements to basic services’. Based on the definition and
the spatial criteria for slum identification, it may be summarised that some of
these villages were designed as slums from inception.

44
A total of about 42 slum clusters according to neighbourhoods and
standalone basis (Urban Villages) covering about 4,916ha or 49.16 km2 with a
perimeter of about 205.6km were delineated in Kaduna. The slum area
represents about 15.7% of the entire built up lands of Kaduna City in 2014.
Table 3.1 shows the identified slums and their areal extent while Figures 3.4,
3.5 and 3.6 show the context and pattern of their locations in relation to non-
slum areas and other land-uses.
The largest cluster is the Tudun Wada-Tudun Nupawa-Ungwan Sanusi
complex which covers about 603ha.This is followed by Igabi and with 590 and
Badarawa with 590ha and 363ha respectively.
Table 3.1: Slum clusters delineated in Kaduna city
SN
Neighborhood
Name Class Acres
Area (in square
kilometer)
Area (in
hectares)
Perimeter
(km)
1 Ungwan Jatau
Slum
area 35.465 0.143526 14.3526 1.495561
2 Ungwan Kanji
Slum
area 50.385 0.203905 20.3905 1.995504
3 3 (In Map)
Slum
area 12.089 0.048925 4.8925 0.982438
4 Hayan Banki
Slum
area 167.125 0.676347 67.6347 4.227792
5 Ungwan Dosa
Slum
area 239.180 0.967947 96.7947 4.224884
6 Badarawa
Slum
area 896.081 3.626391 362.6391 10.713512
7 Ungwan Malali
Slum
area 47.472 0.192115 19.2115 1.76786
8 8
Slum
area 86.590 0.350423 35.0423 2.467824
9 Ungwan Shanu
Slum
area 319.334 1.292328 129.2328 8.606728
10 10
Slum
area 240.785 0.974442 97.4442 4.226236
11 11
Slum
area 5.809 0.023508 2.3508 0.579326
12 12
Slum
area 38.297 0.154987 15.4987 1.601645
13 Ungwan Muazu
Slum
area 488.995 1.978937 197.8937 8.239528
14
Tundun
Wada/Tudun
Nupawa/Ungwan
Sanusi
Slum
area 1490.548 6.032163 603.2163 16.477921
15 Sabon Gari
Slum
area 531.175 2.149638 214.9638 7.884639
16 16
Slum
area 12.411 0.050228 5.0228 1.030249
17 17
Slum
area 36.210 0.146539 14.6539 1.874026
18
Nassarawa
Village
Slum
area 690.331 2.79373 279.373 9.35739

45
19 19
Slum
area 23.380 0.094616 9.4616 1.358031
20 Television Village
Slum
area 436.936 1.768255 176.8255 7.212905
21 Ungwan Sunday
Slum
area 500.894 2.027092 202.7092 7.173077
22 22
Slum
area 258.997 1.048146 104.8146 5.650674
23 23
Slum
area 177.068 0.716586 71.6586 3.54732
24 Narayi
Slum
area 390.935 1.582094 158.2094 5.317244
25 Ungwan Barde
Slum
area 229.057 0.926981 92.6981 5.795305
26 Tsauni Kura
Slum
area 546.083 2.20997 220.997 7.050539
27 Igabi
Slum
area 1457.873 5.89993 589.993 15.834493
28 Igadi
Slum
area 159.716 0.646363 64.6363 3.464155
29 29
Slum
area 163.572 0.661969 66.1969 4.295969
30 Kabala Doki
Slum
area 181.867 0.736008 73.6008 4.796828
31 Mando
Slum
area 469.608 1.900478 190.0478 10.493284
32 Ungwan Rimi
Slum
area 370.059 1.497607 149.7607 5.549205
33 Goni Gora
Slum
area 94.822 0.383739 38.3739 2.941024
34 34
Slum
area 17.794 0.072011 7.2011 1.16343
35 35
Slum
area 196.768 0.79631 79.631 3.940377
36 Romi
Slum
area 432.064 1.748539 174.8539 6.864672
37 37
Slum
area 60.083 0.243152 24.3152 2.083089
38 Kawo
Slum
area 232.977 0.942845 94.2845 3.93614
39 39
Slum
area 150.032 0.60717 60.717 2.987519
40 40
Slum
area 14.298 0.057863 5.7863 1.061906
41 41
Slum
area 147.396 0.596505 59.6505 3.63727
42 42
Slum
area 46.868 0.189674 18.9674 1.655097
12147.429 49.160 4915.998 205.563
Source: GIS Analysis
As noted earlier, these clusters are very unique in their own. While some slum
areas may have developed as a result of closeness to industrial areas
(especially in areas south of the Kaduna River), some others developed as a

46
result of degradation of formal housing and re-densification of originally
planned areas. The most unique are those that developed as individual towns
(i.e. Kaduna urban villages).
Hanyan Banki, Ungwan Dosa, Badarawa, Ungwan Shanu, Ungwan Malali,
Ungwan Sanusi, Igabi, Ungwan Muazu, and Sabon Gari in Kaduna North are
independent towns (or urban villages) that have sprung up all at the vicinity
of the ‘elegant tree-line avenues and official buildings’ of the city metropolis.
Ungwan Rimi and Kabala Doki may have developed as slum settlements in
the delicate floodplain of the Kaduna River.
In the South, Nassarrawa Village, Makera, Barnawa, Ungwan Barde, and
Narayi, although they are independent urban villages, likely have strong
affiliations with the Kudenda and Makera industrial areas. Ungwan Sunday,
Tsauni Kura, Television village, Romi and Goni-Gora also emerged as
independent urban villages in Southern Kaduna.
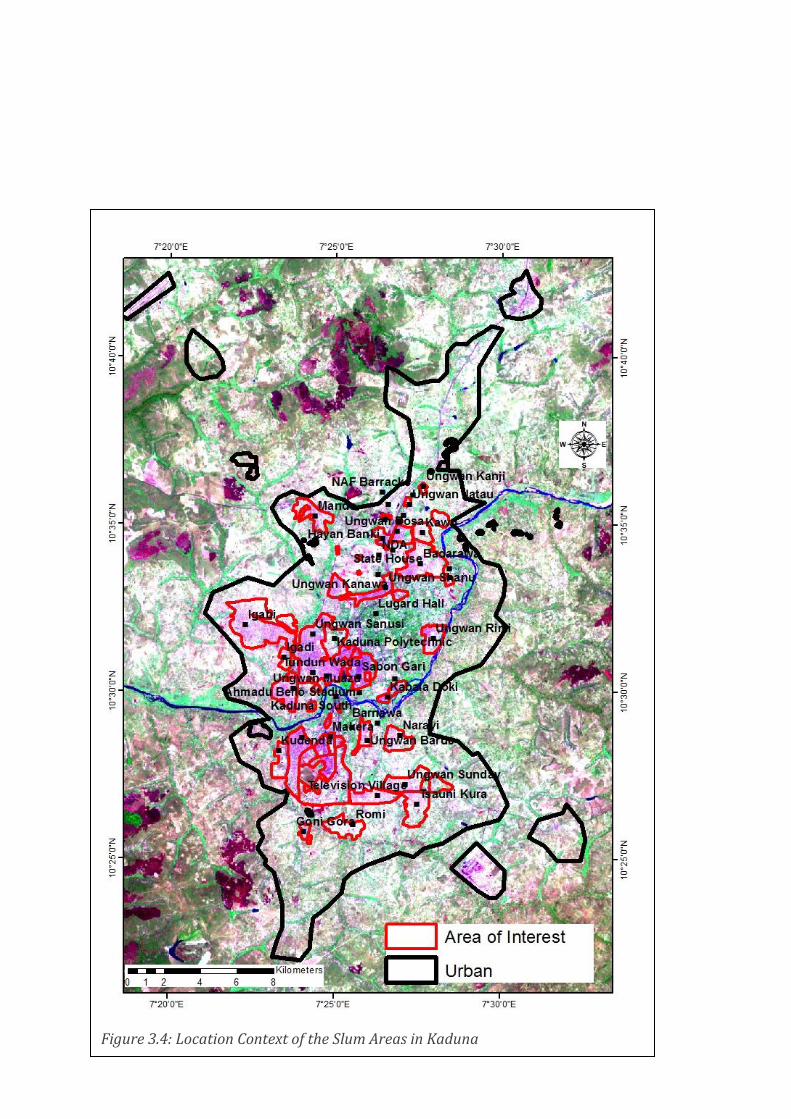
47
Figure 3.4: Location Context of the Slum Areas in Kaduna

48
Figure 3.5: Identified Slum Areas on HR Image

49
Figure 3.6: Identified Slum Areas and Related Classes

50
The development of informal settlements also contributes significantly to the
present level of slum areas in the city of Kaduna. This was succinctly
captured by the 2010 Master Plan Report thus: ”long established informal
developments in such areas as Badarawa (north of the Kaduna River) and
west of Makera (now Nassarawa) (south of the Kaduna River) were just
starting to develop in 1965 and were called ‘illegal’ as indeed they were, but
they were not stopped. These and many other places have now developed
to the full extent of their physical and topographical boundaries and as such
have become established urban areas even to the extent of individuals
applying for and being granted a C of O and title deeds over developed
plots. What was once ‘illegal’ has over the years become accepted. This is a
basic tenet of land law in most parts of the world. Unchallenged occupancy
after a given number of years gives the occupier a legitimate right to occupy
and even ownership”
The impacts of infrastructure deficiencies are generally more acute in these
low-income settlements, with a general lack of access to basic municipal
services. The experiences from these settlements are documented in the
following section on socio-economic profile of slum conditions in Kaduna.

51
3.4 PHYSICAL CONDITIONS OF THE SLUM AREAS IN KADUNA
3.4.1 Physical Infrastructure and Road Conditions
The influence of the planned and well laid out streets of the tree-line
neighbourhoods of the old ‘northern capital’ Kaduna City seems to have a
rubbing effect on all the other neighbourhoods including the Kaduna Urban
Villages. Every street seems to be straight and defined to imitate the grid iron
pattern, albeit narrow and hardly accessible to vehicles in some cases (Plates
3.1a and b).
Some roads are bad and others are in good condition. Roads in the greater
Kaduna areas such as Kawo, Hanyan Banki, Badarawa, Tundun Wada and
Ungwan Sanusi areas tend to suffer from traffic congestion (plate 3.2a) while
roads in the urban villages are very poorly maintained (Plate 3.2b).
Plate 3.1a: Street Layouts in Slum Areas
Plate 3.1b: Street Layouts in Slum Areas
Plate 3.2a: Sabon Birni Road in Kawo
Plate 3.2b: Majues Road in Ungwan Yelwa

52
Many roads do not have drainage channels. Areas such as Shagari low cost
housing estate in Barnawa and Igabi drainages are poorly laid out or
maintained where they exist where they exist.
3.4.2 Waste Disposal and Water and Sanitation
Waste disposal is poor in most parts of the identified slum areas. Open waste
dump is very common and used by significant percentage of the people.
Hence, refuse heaps in open areas are common sights in the urban villages.
Evidence of efforts to improve water supply in some of the slum
neighbourhoods abound. While some areas enjoy public water supply, others
Plate 3.3: Road without Drainage in Igabi
Plate 3.4: Open Waste Dump in Mando

53
depend on bore holes (both public and private). Plate 3.5a shows public
running tap in Tugwa Kaiji while plate 3.5b shows a solar powered bore hole
in Goni Gora in Chikun LGA. However, access to water still remains a key
challenge in the slum areas. A significant number of people still do not have
access to potable water and they depend on purchased sachet water and
water supplied by vendors.
3.4.3 Recreation Facilities
Some limited recreation facilities are available in schools and in estates (see
plate 3.6).
Plate 3.5a: Public Water Supply in Tugwa Kaiji
Plate 3.5b: Solar Powered Borehole in Goni Gora
Plate 3.6: Poorly Maintained Children Playground along Zazzau Road in Shagari Low Cost In Kaduna South

54
3.4.4 School and Other Public Facilities
Generally, the physical structures of the public primary schools are in fairly
good shape in some of the slum areas and villages as shown on plates 3.7a
and b.
Public health facilities in the areas appear to be very few and in dilapidated
state. In particular, the basic and primary health centres are in bad state
and this appears to be putting pressure on the general hospital. Dilapidated
structures were also sighted in some of the general hospitals (see plate 3.8a
to 3.9b)
Fig 3.7a: LGA Primary School, Maidugiri Road, Doka
Plate 3.7b: Kawo Model Primary School, Kawo new extension
Plate 3.8a: Kawo General Hospital
Plate 3.8b: Model Primary Health Care Ungwan Sanusi

55
Plate 3.9a: Inside General Hospital Tundun Wada
Plate 3.9b: Dilapidated Hospital Block In Tundun Wada General Hospital

56
CHAPTER FOUR
SOCIO-ECONOMIC CHARACTERISTICS OF SLUMS IN KADUNA*
4.1 INTRODUCTION
The social dimensions of slum conditions in the city of Kaduna was captured
by field surveys consisting of household questionnaire administration and key
informant interviews and focus group discussions in the slum communities. The
results are discussed below under the following headings:
• Household information
• Housing conditions
• Environmental conditions which captures information on
▪ Sustainable access to safe water
▪ Access to improved sanitation
▪ Access to durable structure/housing
▪ Overcrowding ▪ Access to tenure
▪ Access to social services
• Needs assessment of the communities
Figure 4.1 shows the neighbourhoods and urban villages where the social
survey took place. The delineation of these clusters was based on the major
roads in clustered and compact areas for the purpose of convenience.
Although the different neighbourhoods in the compact urban zone where
the survey was conducted exist as areas and place names, there were no
existing data to aid in accurate delineation of the neighbourhood
boundaries. But for those villages that are standalone, it was easier to
delineate their boundaries. Thus, figure 4.1 is a rough delineation showing the
major neighbourhoods and urban villages where the social survey was
conducted.

57
*See Appendix IV for the summary of the outcomes from, the slums in the three cities – Aba,
Kaduna and Oshogbo

58
Figure 4.1: Locations Where the Social Survey Was Conducted in Kaduna

59
4.2 HOUSEHOLD INFORMATION
A. Age, gender and ethnic composition of respondents
The survey of age composition of household heads (Table 3.1) was
dominated by the people in the middle age bracket 41-55 years (37.7%) and
the virile young group 26-40 years (33%). The older 56-70 years was strongly
represented with 21.2%.
Table 4.1: Age Groups Represented In the Survey
Age Frequency Percent
16 - 25 years 23 5.1
26 - 40 years 146 32.2
41 - 55 years 167 36.9
56 - 70 years 94 20.8
Above 70 years 13 2.9
Total 443 97.8
System 10 2.2
Total 453 100.0
In terms of gender, the male dominated overwhelmingly (88.3%) and only
11.7% of the respondents were female.
In terms of ethnic group of household heads, Kaduna city has always been a
melting pot of peoples and cultures not only across the northern region, but
the country as a whole. Hence, the ethnic profile of respondents that
participated in the survey is important. The Hausa-Fulani dominate with 32.7%.
The Yorubas accounted for 24.8%, and Igbos 12.2%. Other ethnic nationalities
including the Gbaggis and Bajjus and others accounted for 30.3%. This
presents a very broad base to visualize perceptions on slum conditions in the
city of Kaduna across ethnic spectra.
B. Occupation
Figure 4.2 shows the major occupation of household heads in the surveyed
area - the trading and business group dominate with 45.3%. Civil servant also
shows strongly with 22.7% and farmers were also sampled strongly here with
9.7%.

60
Figure 4.2: Occupation of Respondents
The information contained on Figure 4.2 is consistent with the volunteered
information on the major occupations of household heads around the sites
where 83.1% believes trading/business is the most prominent occupation.
C. Income Distribution
Table 4.2 summarises the average monthly income status of the respondents.
This is dominated by N25K – 50Kgroup with 32.7% and closely followed by
N50K-100K group and N10K-25K groups.
Table 4.2: Monthly Income of Household Head
Average monthly
income Frequency Percent
Less than 10,000 23 5.2
10,001 - 25,000 109 24.5
25,001 - 50,000 145 32.7
50,001 - 100,000 127 28.6
100,001 - 250,000 35 7.9
250,001 - 500,000 5 1.1
Total 444 100
D. Size of Household
Large number of people per household which breeds overcrowding is one of
the insignia of slum conditions around the world. This makes slum areas a
densely populated zone. Again the UN Habitat believes a situation of more
than three people living in a room results in overcrowding. About 40% of the
respondents in the slum areas of Kaduna have more than 7 people within
their households. 37% have between 5 and 7 people and 22.8% has between
1 and 4. As a matter of fact based on the records, there are households with
as many as over 30 people.

61
E. Proportion of Vulnerable Groups
The proportion of dependent populations including children less than 5 years
of age and elderly above 65 years of age are important indicators that could
help government policy and planning for slum areas. Table 4.3 indicates that
over fifty percent (50%) of households have one to two children below 5
years while majority of households (Table 4.4) do not have elderly persons.
Table 4.3: Children less than 5 years of age
Children less than 5
years
Number of
Households Percentage
one 119 26.3
two 123 27.2
three 48 10.6
four 13 2.9
five 5 1.1
six 2 0.4
seven 3 0.7
Eight 2 0.4
11 1 0.2
12 1 0.2
Total 317 70
System 136 30
Total 453 100
Table 4.4: Elderly (above 65 years of age)
Elderly over 65 years of
age Number of Households Percentage
one 13 2.9
two 4 0.9
three 1 0.2
Total 18 4
No Response 435 96
Total 453 100
F. Association of Household Heads
Community associations and networks provide veritable platform for
mobilizing communities to participate in developmental and slum
improvement projects to improve human wellbeing in the slum communities.
Again, religious institutions top the list with 30.3%. Town association is also very
significant at 19.8%. This is expected and it reflects the ethnic diversity of the
city. It is also worthy to note that at least one in every five of the respondents
belongs to more than two local network as shown on Table 4.5.

62
Table 4.5: Associations to Which Respondents Belong
Association
Frequenc
y %
None 35 7.8
Professional guide or association 18 4
Religious institutions 136 30.3
Landlord association 4 0.9
Vigilante association 6 1.3
Community development
association
24 5.3
Town association 89 19.8
Elders forum 15 3.3
Cooperative society 27 6
More than one 94 20.9
Trade union 1 0.2
Total 449 100
G. Reasons Why Respondents Live in Slum Area
On the reasons for residing in the community, most respondents indicate that
they decide to stay in the study area because it is close to their place of work
(31.1%). Another important reason given was the that the areas are generally
peaceful (17.3%) (Table 4.6).
Table 4.6: Reason for Living in the Communities
Reason Frequency Percentage
Financial constraint 4 0.9
Because my family and friends
live here
47 11
It is comfortable living here 73 17.1
It is cheaper living here 21 4.9
It is my home town 15 3.5
Good place before 3 0.7
Close to my work 133 31.1
Where I can afford to build my
house
42 9.8
Inherited the property 2 0.5
It is peaceful community 74 17.3
Due to nature of my work 10 2.3
Because of job opportunity 3 0.7
Total 428 100
4.3 HOUSING CONDITION
A. Age of Buildings
With regards to the age of the building where they live, 25% do not have an
idea of when it was constructed. However, 21.6% believes it is between 21

63
and 40 years while 21% think it is between 11 and 20 years. 9.5% believes the
house they live is more than 40 years old and about 21% think it is less than 10
years old.
B. Building Construction Materials
On construction materials for the building wall, 71.3% says their house is
constructed of concrete while a significant 25% says it is constructed of mud
as shown on figure 4.7.
Table 4.7: types of build construction materials
Type of materials Number of
households Percentage
Concrete 323 71.3
Zinc 11 2.4
Mud 113 24.9
Others 1 0.2
Total 448 98.9
No Response 5 1.1
Total 453 100
C. Length of Stay in Slum Area
With regards to the duration of stay in the community, 40% Of the sampled
population have lived in the area for over 10 years and in particular about
8.4% of the people were born in that community (Fig 4.3).
Figure 4.3: Respondents’ duration of residency
D. Status of Household Heads
On the residential status of the household head 52.8% of the sample
individuals are tenants while 46.5% are landlords. Lack of access to tenure is
always a big issue in slum communities (Table 4.8)

64
Table 4.8: Status of Household Heads
Status of household heads Number of
households Percentage
Landlord 208 45.5
Tenant 234 51.7
I inherited the house 1 0.2
Total 443 97.8
No response 10 2.2
Total 453 100
But in the surveyed sites in Kaduna, 85.3% of the landlords (which represents
174 of 204 respondents) claim to have access to tenure of their property
which means they possess a form of legal document or instrument of
ownership to their property. Only 14.7% has no access to tenure. This is
encouraging and it is consistent to earlier discussion and assertions from the
Kaduna 2010 Revised Master Plan that even property owners in some of the
Kaduna urban villages have applied for and were granted tenure
documents with respect to their property. Figure 4.4 shows the type of legal
instrument the landlords have in respect of their property. 55% have the
statutory certificate of occupancy (C of O), and 27% have the customary
freehold rights, 11% have survey plans while 7% have land certificate.
Figure 4.4: Tenure Document in Respect of Property

65
Figure 4.5: Approval Rating of the Environment in Kaduna
4.4 ENVIRONMENTAL CONDITION
4.4.1 PERCEPTION OF ENVIRONMENTAL CONDITION
Table 4.9 and Figure 4.5 show the rating or perception of the respondents
with regards to the environment of the place they live. The indicators that
have good approval with over a third of the respondents include planning of
the area, building appearance, number of people living in a building, and
motorable access to building. In all the other the indicators the approval
ratings is either poor or bad.
Table 4.9: Rating of the Environment Good Poor Bad Worse Worst
Percentage Percentage Percentage Percentage Percentage
Planning of the Area 33.6 51 15.2 0.2
Squatting 16.6 57.2 24.8 1.4
Building Appearance 39.2 41.9 18 0.7 0.2
Number of people
living in a building
40.3 42.8 15.9 0.5 0.5
Road Condition 14.9 45.7 34.8 3.6 0.9
Solid Waste disposal 5.2 42.3 47.7 4.3 0.5
Sewage/effluent
discharge
8.8 37.1 45.4 8.3 0.4
Motorable access to
the buildings
35.7 40.9 21.1 1.8 0.4
Pedestrian access to
the buildings
39 39.6 19.6 1.1 0.7
Traffic Congestion 26.3 45.8 25.2 2.2 0.4
Noise Pollution 16.1 42.7 36.6 1.1 0.2
Drainage/gutter/
Water channel
6 30.2 41.8 19.7 2.2
General cleanness of
the environment
4.6 41.8 48.3 3.4 1.9

66
Table 4.10 shows the ratings of the environmental indicators across selected
slum clusters in Kaduna based on the highest responses. Most of the
indicators are rated poor too bad in all locations.
Table 4.10: Perception of Environmental Condition Across Slum Neighbourhoods in
Kaduna
Indicator Doka
N=71
Sabo
Tasha
N=50
Rigasa
N=27
Mando
N=20
Ungwan
Gwari N=32
Romi N=20
Planning of the area Good Poor Poor Bad Bad Good
Squatting Poor Poor Poor Poor Bad Poor
Building appearance Good Poor Poor Poor Bad Good
Number of people living
in a building
Poor Poor Poor Poor Poor Good
Road condition Poor Poor Poor Bad Bad Bad
Solid waste disposal Poor Poor Bad Bad Bad Bad
Drainage/gutter/ water
channel Poor Poor Bad Worse Worse Bad
Rating Scale Good Poor Bad Worse Worst
4.4.2 PERCEPTION OF BASIC INFRASTRUCTURE IN THE COMMUNITY
Table 4.11 is a checklist and the status of facilities presented in the surveyed
slums in Kaduna. Over 50% of the sampled population are of the opinion that
recreation facilities, children playground, road side-walks, trees on the street,
public toilets, street lights, refuse collection points, tertiary institution, civil
centre, post office and abattoir are not available in their area. Over a third
believes public water supply, electricity supply, public primary and secondary
schools, and markets are in very bad shape. The only facilities believed to be
available and functioning by over 50% of the respondents are private primary
and secondary schools, church, mosque and private clinics.
Table 4.11: Status of Basic Infrastructures Present &
Good/Working
Present
but bad
Not
Available
Indicators Percentage Percenta
ge
Percentag
e
Public water supply 30 50.1 19.9

67
Plate 4.1: Inside Public Health Facility in Kaduna Slum Areas
Electricity Supply 36.8 62.1 1.1
Recreation/relaxation
facilities
9.2 24.1 66.7
Children Playground 10.3 17.2 72.3
Road side walks 3.3 20.2 76.4
Public Toilet Facility 4.7 13.7 81.4
Trees on the street 4.3 12.8 83
Street Lights 0 8 92
Refuse Collection point 1.1 38.9 60
Public primary schools 40.6 45.7 13.7
Public Secondary schools 34.3 35.4 30.3
Private primary schools 79.8 16.1 4
Private Secondary schools 74.1 12.8 13.1
Tertiary Institution 8.7 7.3 84
Market 31.1 47.3 21.6
Civic Center 9.3 17.8 72.9
Church 71.2 10.3 18.4
Mosque 65.5 19.2 15.2
Public Health Center 36.1 43 20.9
Private Clinic 67.5 20.2 12.3
Petro/ Gas station 35.1 17.8 47.1
Financial Institution 20.5 6.5 72.9
Post Office 9.2 10.3 80.6
Police Post/ Station 30.4 25.1 44.3
Abattoir 8.9 24.9 66.2

68
Plate 4.2: Big Water Project Signboard, Yet Dry Tap Remains
Plate 4.3: Housing and Road Condition in the Inner Urban Villages

69
Plate 4.4: A Public Primary School
Table 4.12 is a summary of the perceptions across selected slum locations in
Kaduna. Again, public water supply is rated as present and working in Doka
and Romi, but bad or absent in others. Children playground, side walk, public
toilet, and street lights and relaxation facilities are rated absent in all the
locations. Refuse collection points are also rated as absent in all except
Rigasa where it is rated as bad.
Table 4.12: Perception of the Condition of Basic Infrastructure Across Selected
Clusters in Kaduna Indicators Doka
N=71
Sabo
Tasha
N=50
Rigasa
N=27
Mando
N=20
Ungwan
Gwari
N=32
Romi
N=20
Public Water Supply Good Bad Bad Absent Bad Good
Electricity Supply Good Bad Bad Bad Bad Good

70
Recreation/Relaxation
Facilities
Absent Bad Absent Absent Absent Absent
Children’s Playground Absent Bad Absent Absent Absent Absent
Road Side Walks Absent Absent Absent Absent Absent Absent
Public Toilet Facility Absent Absent Absent Absent Absent Absent
Trees On The Street Absent Absent Absent Absent Absent Absent
Street Lights Absent Absent Absent Absent Absent Absent
Refuse Collection Point Bad Bad Absent Absent Bad Absent
Public Primary Schools Good Bad Absent Good Good Absent
Public Secondary
Schools
Good Bad Absent Good Absent Absent
Private Primary Schools Good Good Good Good Good Good
Private Secondary
Schools
Good Good Absent Good Good Good
Tertiary Institution Absent Good Absent Absent Absent Absent
Market Good Bad Bad Bad Absent Absent
Civic Center Absent Absent Absent Absent Absent Absent
Public Health Center Good Bad Bad Absent Good Absent
Private Clinic Good Good Good Good Absent Good
Petrol/ Gas Station Absent Good Absent Absent Good Bad
Financial Institution Absent Good Absent Absent Absent Absent
Police Post/ Station Good Good Absent Absent Absent Absent
Rating Scale
Good=present
and good
Bad=present
and bad
Absent= not
available
4.4.3 RATINGS OF SOME COMMON ISSUES
Table 4.13 and Figure 4.6 show the rating of some common issues required for
human wellbeing within the slum communities of Kaduna. The only ones that
received positive ratings by over 50% of the sampled population are food,
being able to perform spiritual and cultural rituals and communication. In
particular, water, sanitation, employment and livelihood, housing, fuel for
cooking, health care, children school, and transportation were adjudged to
be poor by over 45%. Sanitation and toilet facilities and security were
considered to be in bad situation by about 25% of the respondents.
Table 4.13: Ratings of Some Common Issues Indicator Good Poor Bad Worse Worst
Percentage Percentage Percentage Percentage Percentage
Water 29.8 49.7 13.4 4.5 2.4
Sanitation/ Toilet
Facilities
9.2 56 28.5 6.1 0.2
Food 60.9 32.6 3.6 2.5 0.4
Employment/livelihood 15.4 45 20.4 14.2 5
Housing/ Shelter 19.6 62.6 14.6 3 0.2
Fuel For Cooking 18.1 57.2 22.2 2 0.5

71
Figure 4.6: Ratings of Some Common Issues
Health care 28 51.4 15.7 4.6 0.2
Being able to perform
cultural &religious
rituals
63.3 27.7 7.2 1.6 0.2
Security 30.9 27.1 25.6 14.1 2
Children school 40.4 44 15 0.7
Transportation 36.1 47.1 14.1 2.7
Communication 54.6 30.3 13.5 1.6
Table 4.14 shows the rating of some community issues across the selected
locations. Everything from water to ability to perform cultural and religious
rituals is rated poor in Sabon Tasha and poor to severe in Mando. Others have
mixed bags from good to severe about these issues.
Table 4.14: Rating of Community Issues Indicator Doka
N=71
Sabo Tasha
N=50
Rigasa
N=27
Mando
N=20
Ungwan
Gwari
N=32
Romi
N=20
Water Good Poor Poor Severe Bad Good

72
Figure 4.7: Source of Drinking Water in Sampled Slums in Kaduna
Sanitation/ Toilet Facilities Poor Poor Bad Severe Bad Poor
Food Good Poor Good Poor Good Good
Employment/Livelihood Poor Poor Bad Severe Severe Severe
Housing/ Shelter Poor Poor Poor Poor Poor Poor
Fuel For Cooking Poor Poor Bad Poor Poor Poor
Health Care Good Poor Poor Bad Poor Severe
Being Able To Perform
Cultural &Religious Rituals Good Poor Good Poor Good Good
Rating Scale Good Poor Bad Severe Critical
4.4.4 ACCESS TO SUSTAINABLE WATER AND SANITATION
This indicator is designed to assess the proportion of the population with
sustainable access to an improved water source and to sanitation.
Sustainable water access means access to affordable and sufficient quantity
of water without excessive physical effort and time. For sanitation, access to
improved sanitation means access to facilities that hygienically separate
human excreta from human, animal and insect contact.
4.4.4.1 Main Source Of Drinking Water
Figure 4.7 depicts the main sources of drinking water for the households in the
sampled slum areas in Kaduna. Only about a third of the population (33.4%)
have access to pipe borne water, while about 20% depend on borehole.
However, a significant 16.4% depend on sachet water which is not
considered a safe and sustainable source of water.
Again, the source of water for drinking in across the selected slum locations is
diverse as shown on Table 4.15.

73
Table 4.15: Sources of Household Drinking Water
Source of Drinking
Water
Doka
N=71
Sabo
Tasha
N=50
Rigasa
N=27
Mando
N=20
Ungwan
Gwari
N=32
Romi
N=20
Pipe Borne Water X X
Borehole/ Sachet
Water
X X
Protected Dug Well X
Cart - Pushers X
Borehole &Well X
In terms of the time spent to access main water sources, about 73.4% of the
respondents take less than 30 minutes. 16.4% take between 30 minutes and
1hour, 4% take between 1-2 hours, another 4.5% take between 2-4hours while
1.7% take more than 4 hours to access drinking water as shown on Table 3.16.
Table 4.16: Time taken to collect water from source
How long Number of Households Percentage
<30minutes 295 65.1
30 minutes - 1hour 66 14.6
1 hour - 2 hours 16 3.5
2 hours - 4 hours 18 4
More than 4 hours 7 1.5
Total 402 88.7
System 51 11.3
Total 453 100
With respect to the adequacy of water for daily family use, 57% of the
respondents feel they always have enough water for household daily use,
while 43% feel otherwise. Across the slum neighbourhoods, respondents in
Doka, Rigasa and Romi always feel they have enough water for daily use; but
those at Sabo Tasha, Mando and Ungwan Gwari thinks otherwise as shown
on Table 4.17.
Table 4.17: Adequacy of water for daily use in the locations Community Yes No
Doka (N=71) X Sabo Tasha (N=50) X
Rigasa (N=27) X

74
Mando (N=20) X
Ungwan Gwari (N=32) X
Romi (N=20) X
4.4.4.2 Sanitation and Waste Disposal
Toilet facilities
Table 4.18 shows the toilet facilities used by the respondents. The water closet
toilet system according to the respondents is the most prominent in the study
area (56.5%). This is consistent with the fact that 57% believes they always
have enough water, which suggests that water for toilet may not be a big
problem. However, 32.8% still use the pit latrine system (32.8%), and 10.4%
share toilet with other households respectively.
Table 4.18: Toilet Facility Toilet facility Freq Percent
Water closet 255 56.5
Pit latrine 148 32.8
Toilet shared with other households 47 10.4
Bush/open area 1 0.2
Total 451 100
Waste disposal
Most of the respondents assert that they dispose their solid waste by taking
them to the open waste dump (51.2%), giving them to cart pushers (31%) and
giving them to government collectors (10%). Some people also dump in
drainages (2.3%) as shown on Table 4.19. This is consistent with the ratings of
waste management in the section of the general environment.
Table 4.19: Waste Disposal Methods Utilized
Waste disposal Frequency Percent
Take to open waste dump 230 51.2
Give to cart pushers 139 31
Give to government collectors 45 10
Store in the backyard 16 3.6
Throw into the gutters 13 2.9
Burn with fire 6 1.3
Total 449 100
4.4.4.3 Disease Outbreak and Disasters
Table 4.20 shows the experience of the respondents with regards to
environment-related diseases or disasters. At least one in five respondents has
ever experienced cholera and typhoid outbreak and about 10.4% have
experienced flooding.

75
Table 4.20: Experience with Environment-Related Disaster or Diseases Water and sanitation
issues Yes (%) No (%)
Flood 10.4 89.2
Fire 13.3 86.3
Building collapse 5.3 93.9
Typhoid outbreak 19.9 79.8
Cholera outbreak 21.8 77.9
Diarrhea outbreak 6.4 92.8
4.5 NEEDS ASSESSMENT
4.5.1 Ranking of the Needs by the Respondents
Table 4.21 show the ranking of the major challenges which the sampled
population want addressed to improve human living conditions in the study
area. From this table, despite the fact that about 57% feels they always have
enough water for daily use, water and electricity remains the most critical
issue to living in the slum of Kaduna. This is followed by employment
opportunities and need for roads improvement.
Table 4.21: Ranking of the Major needs Facility Percentage Rank
Water 40.7 1
Electricity 39.2 2
Employment opportunities 12.6 3
Tarred Road 10.9 4
Health Facility 4.4 5
Town Hall 4.3 6
Postal office/ postal
agency
3.3 7
GSM Facility 1.7 8
Cottage Industry 1.6 9
Tertiary Institution 1.5 10
Primary School 1.1 11
Market 1.1 11
Financial Institution 1 12
Housing Facility 0.6 13
Internet Facility 0.5 14
Secondary School 0.4 15
Samples across selected locations in the slum area show that water and
electricity are the primordial challenges recognised by the communities.
Road was also mentioned in Mando and primary school in Romi as shown on
Table 4.22

76
Figure 4.8: Major Problems of the Communities
Table 4.22: Ranking of Community Needs
Community Needs
Doka
N=71
Sabo
Tasha
N=50
Rigasa
N=27
Mando
N=20
Ungwan
Gwari
N=32
Romi
N=20
Water 2 1 2 1
Electricity 1 2 1 1
Tarred Road 2
Primary School 1
4.5.2 Ultimate Need
Table 4.23 and Figure 4.8 show the results of the follow up questions on one
major need that requires urgent attention and intervention to improve the
slum conditions in Kaduna. Again, the four items –electricity, road, water and
employment opportunities emerge as the key issues.
Table 4.23: One Necessary Facility Required to Function Need Frequency Valid Percent
Electricity 108 24.8
Road Construction 102 23.4
Water 97 22.2
Employment opportunities 82 18.8
Health Facility 20 4.6
Education/school
upgrading
8 1.8
Upgrade of infrastructures 7 1.6
Tertiary Institution 6 1.4
Security 5 1.1
Affordable Housing 1 0.2
Total 436 100

77
Again at the selected locations, water is the number one desire in Rigasa,
Mando and Ungwan Gwari. For Doka it is electricity, road rehabilitation in
Romi and access to employment in Sabo Tasha as shown on Table 3.24
Table 4.24: One Necessary Facility required to function across selected
solutions Needs Doka
N=71
Sabo
Tasha
N=50
Rigasa
N=27
Mando
N=20
Ungwan
Gwari
N=32
Romi
N=20
Water
X X X
Electricity X
Tarred Road
X
Employment
Opportunities
X
Tables 4.21 to 4.24 thus highlight the needs, priorities and aspirations of the
people who live in the identified slum areas to enable them improve their
human living conditions. Hence, intervention strategies from the governments
should aspire to go in this direction in order to secure the partnership of the
communities and give them the sense of inclusiveness in making decisions
that affect their own individual and communal lives.
4.5.3 Expected Intervention from Government
In terms of the expectation of the slum dwellers in their own words,
employment provision comes top as shown on Table 4.25. This is followed by
infrastructure upgrade (which includes road infrastructure, provision of power
(electricity) and then water. These are same set of issues that have come out
in consistently in this section on needs assessments of the communities.
Table 4.25: Expectations from the Government Expectations Frequency Percent
Employment provision 173 38.9
infrastructure upgrading 90 20.2
Water 38 8.5
Low cost Housing 5 1.1
Market 1 0.2
Provision of soft loan 13 2.9
Good Road 40 9
Drainage 9 2
Power 47 10.6
Hospital 17 3.8
Security 7 1.6

78
Education 5 1.1
Total 445 100
In the selected locations across the Kaduna slums, employment provision is
the most urgent thing required from government in Doka, Sabo Tasha, Rigasa,
Mando and Romi. Others include water in Mando, road in Rigasa and
electricity in Doka as shown on Table 4.26.
Table 4.26: Expected Role of Government in Slum Improvement from the
selected locations
Needs Doka
N=71
Sabo
Tasha
N=50
Rigasa
N=27
Mando
N=20
Ungwan
Gwari
N=32
Romi
N=20
Employment Provision X X X X X
Infrastructural Upgrade X
Water X
Good Road X
Electricity/Power X
4.5.4 Willing Contribution from Communities
Contribution from communities – On what the communities are willing to
contribute to partnership with the government in improving the human
conditions of slum dwellers in Kaduna, significant majority are willing to
enlighten other community members to support government efforts. 62.5%
will mobilise others to contribute to government efforts, while about 35% are
willing to contribute their personal labour free to the cause of improving lives
in their slums (Table 4.27)
Table 4.27: Willing Contributions from Communities Suggested Contributions Frequency Percentage
Volunteer Professional Service 46 10.2
Paid professional service 64 14.1
paid personal labour 77 17
Volunteer personal labour 157 34.7
Personal Financial contribution 99 21.9
Mobilizing other community members to
contribute
283 62.5
Enlighten other community members to
support government effort
328 72.4
The results from these social surveys from the identified slums strongly suggest
that the slum dwellers understand the challenges militating against their
human wellbeing. They also understand what needs to be done to improve
their living conditions. But obviously some of these issues such as provision of
water and electricity and improvement of the road conditions are well
beyond their capability. They are also willing to partner and support
government efforts. This willingness is an important goodwill and asset which

79
the government can use as the springboard to institute inclusive slum
improvement and upgrading strategies in these communities.
4.6 FOCUS GROUP DISCUSSION AND KEY INFORMANT INTERVIEWS IN
KADUNA
1. Structure
Key informants, community leaders and focus groups engaged in different
slum areas include:

80
• Alhaji Mohammed Innua Abubakar, The Seriki of Shagari Low Cost
Housing Estate, Barnawa)
• Alhaji Amini Saidi, The Chairman of the Abattoir Association, Sabo
Gari, Kaduna South.
• Men, women, youth and association leaders in Tudun Wada
• Men, women, youth and association leaders in Chikun
2. Highlights
A. KII
Mohammed Innua Abubakar, Seriki of Shagari Low Cost Housing Estate,
Barnawa, believes that water and electricity supply to the estate is good.
There are a number of private facilities such as schools, hospitals, church,
mosque, petro/gas station, financial institution. But the conditions of roads
and drainage are bad. In addition, the estate lacks public toilets, street lights,
public primary schools, public secondary schools, public health centre and
abattoir, among others. The sanitation and health care conditions in critical.
Alhaji, Amini Saidi, Chairman of the Abattoir Association In Sabo Gari,
Kaduna, said that none of the facilities in the abattoir is functional. He also
noted that the access road to the abattoir is very bad. He described water
as one the critical factors they contend with.
B. FGD
Tudun Wada
The FGD in Tudun Wada included men, women, and youth and association
leaders in Tudun Wada area.
• Major occupation: trading.
• Community associations and efforts: religious-based; they assist in
maintaining social amenities such as drainage channels and organizing
themselves into vigilante groups to provide security.
• Conditions of facilities: generally bad. These range from bad road
condition and poor motorable and pedestrian access to the buildings,
poor drainage channels etc. Solid waste disposal and traffic
congestion are in worse conditions.
• The following facilities are present, but in bad conditions: public water
supply, electricity supply, refuse collection point, public primary school,
public secondary schools, private primary schools, private secondary
schools, market, public health centre, police post and post office.
• The following facilities are not available: recreation or relaxation
facilities, children playground, road side walks, public toilet facility, and
trees on the street, street lights and civic centre. Only the private
facilities are good.

81
Plate 4.5: A KII being
conducted in Kaduna
• Expectations from the government: General improvement of the
infrastructural facilities; Widening of some drainage channels and
constructing new ones in some areas.
Angwa Yelwa and Television Village
• The FGD included men, women, youth and association leaders in
Angwa Yelwa and Television Village.
• The general opinion - no government impact in the communities.
• Individuals provide own water supply through borehole and the
community maintains the streets.
• Main expectation from the government - improving infrastructural
facilities especially waste collection and disposal, road construction
and maintenance, and provision of water and electricity.
3. Conclusions
The catalogue of complaints and expectations from the community leaders
and groups agrees with the results from household surveys. Water, sanitation
and health care are generally in poor situation. Public schools and waste
management and road condition are also in bad shape. The priorities listed
by the different groups align with the overriding priorities and needs of the
communities which are provision of water, electricity, road improvement,
employment opportunities and improvement of health facilities.
The full report of the FGD AND KII conducted in Kaduna is found in appendix
III.
Plate 4.6: After an FGD in Kaduna

82
4.7 STATUS OF INFRASTRUCTURE IN SLUM AREAS OF KADUNA
Figure 4.9 shows the spatial pattern of facilities in Kaduna city, while Table
4.28 shows the names and types of facilities present in the communities.
Figure 4.9: Spatial Pattern of Mapped Facilities in Kaduna Slums

83
Table 4.28: Names and types of facilities present in the communities
S_N State LGA Community Facility
Facility
Code Long Latitude Ownership
1
Kadun
a Igabi Mando
Divine Victory
Schools
Educatio
n 7.412765 10.587787 Private
2
Kadun
a Igabi Mando Unity Bank Finance 7.413095 10.588177 Private
3
Kadun
a Igabi Mando Road Road 7.413115 10.588572
State
Government
4
Kadun
a Igabi Mando Mosque Religion 7.413238 10.588573 Community
5
Kadun
a Igabi Mando
CAC Church,
Oke-Iyin Religion 7.418615 10.584793 Community
6
Kadun
a Igabi Mando
Communicatio
ns Shop/Mast
Social
Amenity 7.418367 10.583987 Private
7
Kadun
a Igabi Mando
Nazareth
Baptist School
Educatio
n 7.418195 10.583610 Private
8
Kadun
a Igabi Mando
Bajju
Community
Town Hall
Social
Amenity 7.417432 10.581433 Community
9
Kadun
a Igabi Mando
The Apostolic
Church Religion 7.417433 10.581422 Community
10
Kadun
a Igabi
Abdul Karim
Model School
Educatio
n 7.393387 10.525495 Private
11
Kadun
a Igabi Kachia Road Road 7.393398 10.525525 Public
12
Kadun
a Igabi Mosque Religion 7.392078 10.525912 Community
13
Kadun
a Igabi Ram Market Market 7.390548 10.526612 Public
14
Kadun
a Igabi
Community
Resource
Centre
Social
Amenity 7.390095 10.526805 Community
15
Kadun
a Igabi
Cambridge
International
College
Educatio
n 7.384882 10.529092 Private
16
Kadun
a Igabi Block Industry
Cottage
Industry 7.383878 10.529445 Private
17
Kadun
a Igabi Mando
Madrasatu
Hayatul
Primary School
Educatio
n 7.404335 10.591272 Private
18
Kadun
a Igabi Mando Refuse Dump Waste 7.404923 10.589312 Community
19
Kadun
a Igabi Mando Block Industry
Cottage
Industry 7.404615 10.589233 Private
20
Kadun
a Igabi Mando
Fine Wood
Seller
Cottage
Industry 7.404220 10.589025 Private
21
Kadun
a Igabi Mando Road Road 7.403880 10.589083 Public
22
Kadun
a Igabi Mando
Dami Clinic
and Maternity Health 7.400660 10.586268 Private
23
Kadun
a Igabi Mando Mosque Religion 7.406800 10.590382 Community
24
Kadun
a Igabi Mando Block Industry
Cottage
Industry 7.410617 10.589252 Private
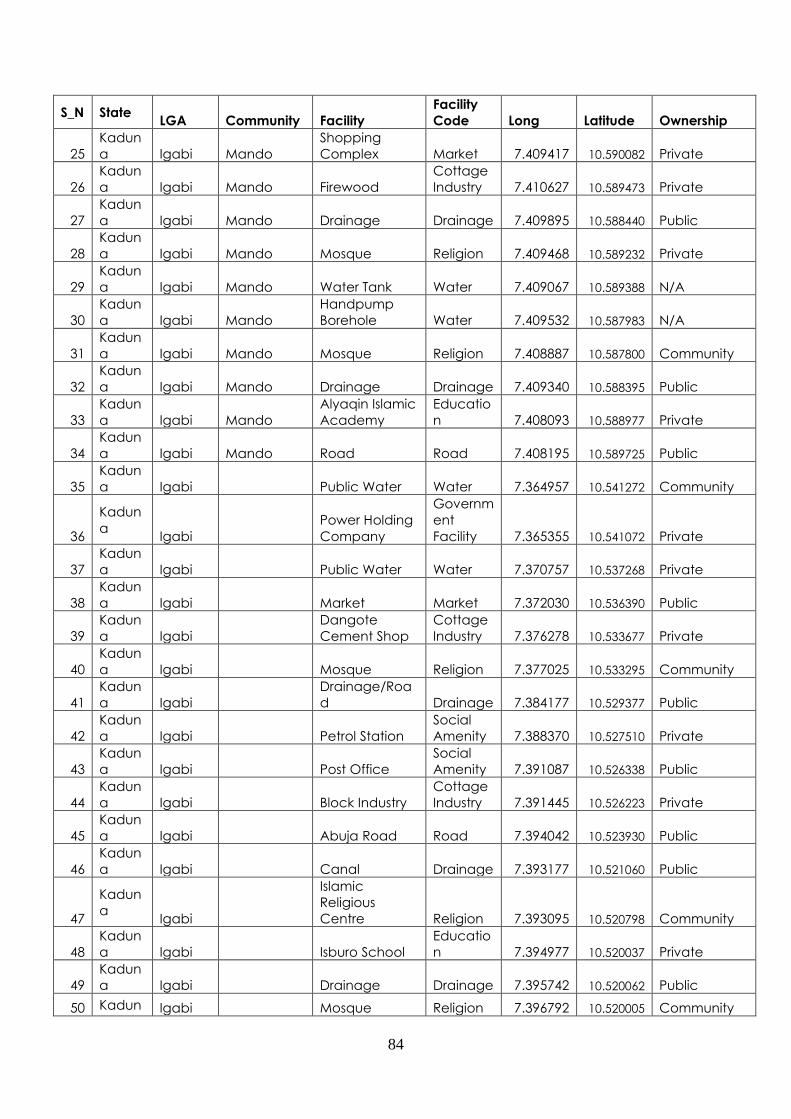
84
S_N State LGA Community Facility
Facility
Code Long Latitude Ownership
25
Kadun
a Igabi Mando
Shopping
Complex Market 7.409417 10.590082 Private
26
Kadun
a Igabi Mando Firewood
Cottage
Industry 7.410627 10.589473 Private
27
Kadun
a Igabi Mando Drainage Drainage 7.409895 10.588440 Public
28
Kadun
a Igabi Mando Mosque Religion 7.409468 10.589232 Private
29
Kadun
a Igabi Mando Water Tank Water 7.409067 10.589388 N/A
30
Kadun
a Igabi Mando
Handpump
Borehole Water 7.409532 10.587983 N/A
31
Kadun
a Igabi Mando Mosque Religion 7.408887 10.587800 Community
32
Kadun
a Igabi Mando Drainage Drainage 7.409340 10.588395 Public
33
Kadun
a Igabi Mando
Alyaqin Islamic
Academy
Educatio
n 7.408093 10.588977 Private
34
Kadun
a Igabi Mando Road Road 7.408195 10.589725 Public
35
Kadun
a Igabi Public Water Water 7.364957 10.541272 Community
36
Kadun
a Igabi
Power Holding
Company
Governm
ent
Facility 7.365355 10.541072 Private
37
Kadun
a Igabi Public Water Water 7.370757 10.537268 Private
38
Kadun
a Igabi Market Market 7.372030 10.536390 Public
39
Kadun
a Igabi
Dangote
Cement Shop
Cottage
Industry 7.376278 10.533677 Private
40
Kadun
a Igabi Mosque Religion 7.377025 10.533295 Community
41
Kadun
a Igabi
Drainage/Roa
d Drainage 7.384177 10.529377 Public
42
Kadun
a Igabi Petrol Station
Social
Amenity 7.388370 10.527510 Private
43
Kadun
a Igabi Post Office
Social
Amenity 7.391087 10.526338 Public
44
Kadun
a Igabi Block Industry
Cottage
Industry 7.391445 10.526223 Private
45
Kadun
a Igabi Abuja Road Road 7.394042 10.523930 Public
46
Kadun
a Igabi Canal Drainage 7.393177 10.521060 Public
47
Kadun
a Igabi
Islamic
Religious
Centre Religion 7.393095 10.520798 Community
48
Kadun
a Igabi Isburo School
Educatio
n 7.394977 10.520037 Private
49
Kadun
a Igabi Drainage Drainage 7.395742 10.520062 Public
50 Kadun Igabi Mosque Religion 7.396792 10.520005 Community

85
S_N State LGA Community Facility
Facility
Code Long Latitude Ownership
a
51
Kadun
a Igabi Waste Dump Waste 7.394220 10.520127 Public
52
Kadun
a Igabi
Mechanic
Workshop 7.393930 10.519993 Private
53
Kadun
a Igabi NP School
Educatio
n 7.393807 10.519937 Public
54
Kadun
a Igabi Mosque Religion 7.392625 10.519397 Private
55
Kadun
a Igabi
Molad bottle
H20
Cottage
Industry 7.392152 10.517455 Private
56
Kadun
a Igabi
Hayim Mallam
Bello Road 7.392765 10.517112 Public
57
Kadun
a Igabi
Merit
Academy
Educatio
n 7.391498 10.514787 Private
58
Kadun
a Igabi Wood Depot
Cottage
Industry 7.391237 10.513823 Private
59
Kadun
a Igabi
Maryyah
Model School
Educatio
n 7.392663 10.511863 Private
60
Kadun
a Igabi Bridge Road 7.393475 10.511640 Public
61
Kadun
a Igabi
LEA Primary
School
Educatio
n 7.451082 10.593403 Private
62
Kadun
a Kaduna
North
UNG Gwari
Primary Health
Clinic Health 7.450857 10.593277
Local
Government
63
Kadun
a Drainage Drainage 7.450903 10.593408 Public
64
Kadun
a Ugwa Kanji
HEA Primary
School
Educatio
n 7.459588 10.601802 Private
65
Kadun
a Ugwa Kanji Public Water Water 7.459265 10.603725 Public
66
Kadun
a Ugwa Kanji Waste Dump Waste 7.459193 10.603492 Public
67
Kadun
a Kaduna
South
Kagoro LEA
Primary School,
Sabon Garin
Tudun Wads
Educatio
n 7.402143 10.512070
Local
Government
68
Kadun
a
Kaduna
South
Salamatu
Hospital Health 7.404272 10.511575 Private
69
Kadun
a
Kaduna
South
Mosque at
Matazu
Educatio
n 7.404652 10.511192 Community
70
Kadun
a Kaduna
South Tudin Wada
Yusuf
Dantosho
Memorial
General
Hospital Health 7.417130 10.521160
State
Government
71
Kadun
a
Kaduna
South Tudin Wada
Kaduna
Polytechnic
Educatio
n 7.415927 10.521563
Federal
Government
72
Kadun
a Kaduna
South Tudin Wada
Polytechnic
Road Primary
School
Educatio
n 7.411487 10.521368
Local
Government
73 Kadun Kaduna Unguwan G. Girls Educatio 7.408913 10.524762 Public

86
S_N State LGA Community Facility
Facility
Code Long Latitude Ownership
a South Secondary T/W n
74
Kadun
a
Kaduna
South
Unguwan
Sanusi
Model Primary
Health Care Health 7.410043 10.525215
Local
Government
75
Kadun
a Kaduna
South
Unguwan
Sanusi
GLGA
Maimuna
Aguranzo
Primary School
Educatio
n 7.409403 10.524933
Local
Government
76
Kadun
a Kaduna
South
Unguwan
Sanusi,
Ibrahim
Taiwo Road
Kasuwan Barc
Market Market 7.408393 10.515857 Public
77
Kadun
a
Kaduna
North Kawo
General
Hospital Kawo Health 7.446735 10.582922
State
Government
78
Kadun
a
Kaduna
North Kawo
Sabin Birni
Road Road 7.447415 10.583868
State
Government
79
Kadun
a
Kaduna
North Kawo
Kawo Model
Primary School
Educatio
n 7.448758 10.583545
Local
Government
80
Kadun
a Kaduna
North Kawo
Moshacashi
(Kawo New
Expansion) Road 7.457295 10.581685
State
Government
81
Kadun
a Kaduna
North Kawo
Aileon
International
School
Educatio
n 7.452423 10.581878 Private
82
Kadun
a Kaduna
North Kawo
Kawo Market,
Sabo Maijaki
Road Market 7.449870 10.579147 Public
83
Kadun
a Igabi Igabi
Ummul Qura
Academy
Educatio
n 7.383740 10.530177 N/A
84
Kadun
a Igabi Igabi
Khalifa
Comprehensiv
e School
Educatio
n 7.381935 10.530312 N/A
85
Kadun
a Igabi Igabi Motor Park
Social
Amenity 7.382058 10.530310 Public
86
Kadun
a Igabi Igabi Mosque Religion 7.380305 10.531505 Community
87
Kadun
a Igabi Igabi Road Road 7.378323 10.531960 Public
88
Kadun
a Igabi Igabi Public water Water 7.378380 10.532202 Public
89
Kadun
a Igabi Igabi
Yalwa Nusrsing
and Maternity Health 7.377822 10.532967 Public
90
Kadun
a Igabi Igabi Drainage Drainage 7.377930 10.532890 Public
91
Kadun
a Igabi Igabi Road Road 7.375687 10.534055 Public
92
Kadun
a Igabi Igabi Shopping Mall Market 7.374915 10.534553 Private
93
Kadun
a Igabi Igabi Mosque Religion 7.374880 10.534578 Community
94
Kadun
a Igabi Igabi Shops Market 7.374817 10.534607 Private
95
Kadun
a Igabi Igabi Mosque Religion 7.374745 10.534660 Community

87
S_N State LGA Community Facility
Facility
Code Long Latitude Ownership
96
Kadun
a Igabi Igabi Road Road 7.374465 10.534812 Public
97
Kadun
a Igabi Igabi Ram Market Market 7.370620 10.537360 Public
98
Kadun
a Igabi Igabi
Kanoh Oil
Petrol Station
Social
Amenity 7.368473 10.538838 Private
99
Kadun
a Kaduna
South Barnawa
Kaduna
Polytechnic
College of
Environmental
Studies
Educatio
n 7.424193 10.491497
Federal
Government
100
Kadun
a
Kaduna
South Barnawa Filling Station
Social
Amenity 7.424287 10.491458 Private
101
Kadun
a Kaduna
South Barnawa
Drainage on
Aliyu Makama
Road Drainage 7.424287 10.491447 Public
102
Kadun
a Kaduna
North Doka
Drainage on
Oshogbo/Oyo
Road Drainage 7.432722 10.505712
Local
Government
103
Kadun
a Kaduna
North Doka
L.E.A Primary,
Maiduguri
Road
Educatio
n 7.434310 10.505895
Local
Government
104
Kadun
a
Kaduna
North Doka
Computer
House
Social
Amenity 7.433783 10.505957
Local
Government
105
Kadun
a Kaduna
North Doka
Kaduna North
Secretariat
Governm
ent
Facility 7.430543 10.510168
Local
Government
106
Kadun
a
Kaduna
North Doka
Central
Mosque Religion 7.433150 10.508968
Local
Government
107
Kadun
a Kaduna
North Doka
Maiduguri
Road
(Drainage) Drainage 7.433362 10.509167
Local
Government
108
Kadun
a
Kaduna
North Doka
Maiduguri/Day
va Road Road 7.433232 10.509678
Local
Government
109
Kadun
a
Kaduna
North Doka
Katsina Road
Primary School
Educatio
n 7.425525 10.511882
Local
Government
110
Kadun
a
Kaduna
North Doka Road Road 7.430047 10.521285
Local
Government
111
Kadun
a Chikun Gonin-Gora
Overcomers
Academy
Educatio
n 7.408335 10.421172 Private
112
Kadun
a Chikun Gonin-Gora
Living Faith
Foundation
Church Religion 7.403712 10.427110 Private
113
Kadun
a Chikun Gonin-Gora Petrol Station
Social
Amenity 7.401498 10.422087 Private
114
Kadun
a Chikun Gonin-Gora Gutter Drainage 7.407673 10.421660 Private
115
Kadun
a Chikun Gonin-Gora
Cedar
Academy
Educatio
n 7.403473 10.427142 Private
116
Kadun
a Chikun Gonin-Gora Market Market 7.402815 10.427260 Community
117
Kadun
a Chikun Gonin-Gora
Gonigore
Market Market 7.403040 10.427748 Community

88
S_N State LGA Community Facility
Facility
Code Long Latitude Ownership
118
Kadun
a Chikun Gonin-Gora
God Exalts
Petrol Station
Social
Amenity 7.403588 10.430538 Private
119
Kadun
a Chikun Gonin-Gora
Oando Petrol
Station
Social
Amenity 7.404422 10.434228 Private
120
Kadun
a Chikun Gonin-Gora
Sharon Petrol
Station
Social
Amenity 7.403957 10.432907 Private
121
Kadun
a Chikun Gonin-Gora
Metal
Company
Cottage
Industry 7.402712 10.429452 Private
122
Kadun
a Chikun Gonin-Gora
Cheribum and
Seraphim
Church Religion 7.401978 10.429262 Private
123
Kadun
a Chikun Gonin-Gora
Solar Powered
Borehole Water 7.401605 10.430938
124
Kadun
a Chikun Vng. Romi
Better Future
School
Educatio
n 7.416550 10.437778 Private
125
Kadun
a Chikun Vng. Romi
Faith Baptist
Church Religion 7.416717 10.437375 Private
126
Kadun
a
Unguwar
Yelwa,
Majelisa
Road
Road
(Dilapidated
Tarred Road) Road 7.435872 10.449210 Public
127
Kadun
a
Iyaka Street,
Unguwar
Yelwa
ECWA Church,
Nusery and
Primary School
Educatio
n 7.433842 10.449640 Private
128
Kadun
a
Iyaka Street
G18
United Church
of Christ Religion 7.434393 10.450590 Community
129
Kadun
a Kaduna
South Barnawa
Federal Neuro-
Psychiatric
Hospital Health 7.431380 10.463827
Federal
Government
130
Kadun
a
Kaduna
South Barnawa GT Bank Finance 7.431973 10.466933 Private
131
Kadun
a
Zazzau
Road
Community
Playground,
Shagari Low
cost
Social
Amenity 7.434252 10.464350
Federal
Government
132
Kadun
a
Kaduna
South Drainage Drainage 7.434245 10.464378
Federal
Government
133
Kadun
a Kaduna
South Barnawa FRCN Quarters
Governm
ent
Facility 7.435287 10.475892
Federal
Government
134
Kadun
a Kaduna
South Barnawa
Prison Staff
Quarters
Governm
ent
Facility 7.432227 10.487188
Federal
Government

89
CHAPTER FIVE
SUMMARY OF OUTCOMES, SLUM REDEVELOPMENT STRATEGY,
RECOMMENDATIONS AND MONITORING AND EVALUATION PLANS
5.1 INTRODUCTION
Deficiency in infrastructure and related basic services (power supply, water
and sanitation, roads and public transport, solid waste disposal) and lack of
ability to generate employment is a central challenge for the slum areas
across Kaduna. For the slums to achieve their full potentials as thriving centres
with improved human living conditions, well-targeted investment in improving
the environmental conditions and urban basic infrastructures is an essential
element. The impacts of infrastructure deficiencies are very acute in these
slum areas. There is a lack of access to basic municipal services which further
exacerbate individual and household family poverty levels and thus
aggravating other composite vulnerabilities. Experiences from these slum
areas in Kaduna suggest that the possibility of meeting the target of the
Millennium Development Goals (MDG), which winds down in 2015, especially
with regards to halving the proportion of people without adequate access to
water and sanitation services looks very unrealistic in these slums.
The thrust of this section of the report is to summarise the outcomes from the
identified slums of Kaduna, assess the assets and threats available to the slum
areas and suggest some slum upgrading and human lives improvement
strategies to improve the performance of human well-being in these slums.
5.2 SUMMARY OF OUTCOMES This project on slum identification and needs assessment study of Kaduna is
part of the effort by the Department of Urban and Regional Development
(DURD) of the Federal Ministry of Lands, Housing and Urban Development
(FMLHUD) to begin the study of Nigerian cities with the view to collecting,
collating, analyzing and synthesizing data on slums and blighted areas and
to propose inclusive renewal strategies and prioritize implementation action
plans and programmes.
The Specific Terms of Reference as Stated by the DURD are:
• Identification and delineation of the slum areas
• Provision of site photographs of the slum areas
• Preparation of an overview of the physical characteristics including
housing conditions, drainages, roads, schools, health centres, abattoirs,
sewage, solid and liquid waste collection and disposal points, places of
worship, markets, civic centres and playgrounds, etc.
• Assessment and analysis of basic infrastructures and services required
by the inhabitants to uplift their living conditions

90
• Preparation of strategic proposal using phased development method
for improving slum conditions
• Provision of evaluation and monitoring strategies for successful
implementation of projects
The study utilized both the remote sensing and social surveys approaches to
data collection and analysis. The activities carried out include desk review
and literature search; collation of physical and social criteria for slum
identification; collation, processing and analysis of maps and satellite
imageries; delineation of candidate slum clusters and preliminary slum area
maps; field work planning and field reconnaissance; field social surveys
including questionnaire administration and FGD and KII; GPS and
photographic campaign; data analysis and integration; in house
stakeholders validation workshop, and drafting of the final reports.
The followings are the summary of the findings:
• Kaduna city has been expanding at about 4.5% per annum
• About 42 slum clusters (delineated based on major routes and
standalone basis) covering about 4,916ha or 49.16 km2 with a perimeter
of about 205.6km were delineated in Kaduna.
• The slum area represents about 15.7% of the entire built up lands of
Kaduna City in 2014
• Every kinds and stages of slum formation - from infancy, consolidation
and maturity to gradual degradation of formal housing and social
filtering processes and a variety of informal housing development
processes either incremental and structured, incremental and
unstructured, sudden and structured, sudden and unstructured –are
found in Kaduna
• While some may have developed as a result of closeness to industrial
areas (especially south of the Kaduna river), some others developed as
a result of degradation of formal housing and re-densification of
originally planned areas. The most unique are those that developed as
individual towns (i.e. Kaduna urban villages).
• Trading or business dominates the major occupation or source of
livelihood
• Strong social network, 92% belongs to a group or association
• 71.3% of the houses are constructed of concrete
• On environmental indicators, planning of the area, building
appearance, number of people living in a building, and motorable
access to building were rated good. All other indicators receive either
poor or bad ratings
• On the condition of basic infrastructures, recreation facilities, children
playground, road side-walks, trees on the street, public toilets, street
lights, refuse collection points, civil centre, post office and abattoir are
rated as not available. Public water supply, electricity, public primary
and secondary schools, and markets were rated as been in very bad
shape.

91
• On common issues, food, being able to perform spiritual and cultural
rituals and communication are rated as good. Water, sanitation,
access to means of livelihood, housing, fuel for cooking, health care,
children school, and transportation were adjudged to be poor.
Sanitation and toilet facilities and security were considered to be in
bad condition
• Pipe borne water remains the major source of water relied on for
drinking. A significant population also relies on sachet water.
• 57% of the respondents feel they always have enough water for
household daily use, while 43% feel otherwise
• Majority of the population (56.5%) use the water closet toilet system
• Open waste dump remains the means for waste disposal for majority
(51.2%) of the population
• At least one in five respondents has ever experienced cholera and
typhoid outbreak and about 10.4% have experienced flooding
• Water, electricity, access to means of livelihood and road rehabilitation
are the most critical issue to living in the slum of Kaduna and remain
the key issues requiring urgent attention
• Access to the means of livelihood and infrastructure upgrade are the
key expectations from the government
• Enlighten other community members to support government efforts,
mobilise others to contribute to government efforts, and voluntary
personal labour are the assets the slum dwellers are willing to
contribute in partnership with other stakeholders.
5.3 SUSTAINABLE LIVELIHOOD ASSETS AND THREATS IN THE SLUMS
The need to make use of land, infrastructure, and other natural, social,
human, cultural and financial resources in the most efficient, cost effective
and sustainable way is important for sustainable slum upgrading and
improvement of human living conditions. All slum upgrading plans should
have strong physical, cultural and social connections. The inclusive or
sustainable livelihoods approach is important to this. This participatory
approach enables the slum dwellers to own the whole process of
redevelopment and human living conditions improvement from the onset
and to deploy their local assets to keep the system running once it is set in
motion.
The sustainable livelihoods approach focuses on the human livelihood as
capabilities, assets and activities required by people for a means of living. It
deals with the end-point and final resting place of policy, planning, projects,
interventions and investment which is improvement in human living
conditions. A sustainable slum improvement or re-development strategy must
create a context in which sustainable development and livelihoods can
flourish. This is where the assets possessed by the people as a community and
user of urban infrastructure become important. A livelihoods approach is
useful in recognising the needs of different income groups and inequality of

92
provision. It allows attention to be focussed on people’s own definitions of
deprivation – which in this case means a lack of, or little access to, basic
urban infrastructure and services.
Thus, in proposing inclusive slum re-development and human living conditions
improvement strategy, it is important to consider the peculiarities of Kaduna
with respect to the natural, physical, social, cultural and economic assets
that can be tapped into, as well as the threats that must be addressed. These
assets which can be harnessed by the community help to turn the wheel of
improvement once the process is instituted. It is also important to consider the
priorities and aspirations of the people – what do they consider the important
or pressing issues to improving their living conditions - in order to guarantee
cooperation and partnership.
Table 5.1 summarises the assets base and Table 5.2 summarises the threats for
the slums in Kaduna.
Table 5.1: Identified asset Base for the Slums in Kaduna Asset Kaduna
Economic ▪ Large informal sector economy
▪ Great resilience and capacity for diversification
▪ 70% earn above N25,000 monthly income
Physical ▪ 71% of houses constructed of concrete
Human
▪ Generally significant population
▪ Significant virile household heads – 26-45 years
▪ Large Literate population – only 1.3% had no formal
education
Natural
▪ Possibility of development in the western flank, and also in the
east with new bridges being constructed
▪ River Kaduna – presents enormous potentials for floodplain
agriculture and river park ecotourism
Social
▪ Good social network – 92% belongs to one association or
another
▪ Engaged in community self-help projects
▪ Long term commitment -46.5% are landlords
▪ 85.3% of the landlords have access to tenure
▪ Willingness to volunteer personal labour
▪ Willingness to engage in community mobilization and
enlightenment
▪ Willingness to make financial contributions
Cultural
▪ Historic city
▪ Renown administrative and military center
▪ Well mixed population with great diversity
▪ Strong traditional community identity
▪ Close to the Ahmadu Bello Stadium – potential for sports
tourism
Table 5.2: Identified Possible Threats for the Slums in Kaduna
Threat Kaduna
Economic ▪ 30% still earn less than N25,000/month

93
Physical ▪ Rapid spatial expansion – 4.5% pa
▪ 25% of houses constructed of mud
Human ▪ Relatively high density in Kaduna urban villages
▪ Large household size – about 75% has more than 4 persons
per household
Natural ▪ Slum clusters close to the Kaduna River floodplain (e.g.
Ungwan Rimi, Kabala Doki and Barnawa) risk flooding at high
flow
Social
▪ Explosive mix of population – frequent ethnic and religious
clashes
5.4 SUSTAINABLE SLUM REDEVELOPMENT STRATEGY
The task of redeveloping an existing slum is a complex challenge because it
presents a completely different scenario in comparison with developing a
virgin area that would ordinarily grant room for flexibility. The people who live
and work in slum areas have feelings and aspirations which must be
respected. The goal of slum redevelopment and upgrading should thus
address poverty alleviation, decentralization and governance and
propagate rights based approaches to providing basic urban services,
improve the livelihoods and impact maximally on the state of people living
and working in slums and not to increase their agony through drastic and
draconian measures.
The Federal Government of Nigeria's National urban development policy
aims to improve the living standards of the Nigerian people, by facilitating
adequate, efficient and functional service delivery. This is to be achieved by
providing infrastructure developed to design standards that make urban
facilities and amenities more affordable, through investments.
The identified slum areas in Kaduna face three key urban challenges. These
are:
• The need to invest in upgrading the slums with the insertion of physical
and social infrastructure (which are currently lacking or in serious
decrepit state) to bring them up to a basic living standard.
• The need to invest in regeneration of the slum areas to bring
infrastructure and buildings that have suffered neglect, including
renewal where original functions have been lost and/or decline or
progressed to the point of no return.
• The need to invest in local economic development and empowerment
by activating the local assets to create jobs and improve livelihood,
financial independence and living conditions. This will feed-back into
the system to contribute to maintenance of physical and social
infrastructure and restoration and maintenance of restoration of urban
functions.
The provision of basic infrastructure, such as water and sanitation, is an entry
point to slum upgrading. The main dimensions of improving the lives of slum

94
dwellers refer to access to water and sanitation, secure tenure, durability of
housing and ensuring sufficient living area. According to the UN-Habitat
(2008), these are to be achieved by guaranteeing accountable urban
governance, promoting a leading role for local authorities, supporting
decentralization and local democracy, building partnerships to deliver basic
services, empowering the urban poor, developing innovative financial
systems, motivating leadership at all levels, and funding large-scale slum
upgrading. This underscores that every tier of governments is important and
has a role to play in slum upgrading and redevelopment. In addition, the
roles of other stakeholders from the local community based organizations,
private sectors, to the international development partners are also critical to
the success of any slum upgrading strategy.
Figure 5.1 shows the strategy to address slum challenges and improve human
performance systems in the slums of Kaduna. This has been termed as the
flywheel of slum improvement and prosperity.
Improving
condition of
basic
Infastructure
Road and drainage
rehabiltation
Provision of
water
Employment
and livelihood
Improving
general
environmental
conditionsInfrastructural
upgrade
Improving
water and
sanitation
conditions
Access to
water
Improved
Slum
Conditions
Access todurablehousing
Access to
social services
Improvedwaste
management
Improved
health facility
Recreation/relaxation facility
Public toilet
Improve school
conditions
Improved electric
power supply
Financial
empowerment
Activate
utlizations of
common
assets
Improved
living
conditions
Access to
health
Improved market and
public places
Initial triggers/pre-co
nditions
Desired
conditions
Improved
Slum
StageLiving Benefits
Sustained
Developm
ent Stage
Social-economic
benefits
Community
Activation
Stage

95
From the systems analysis point of view, addressing the urban basic facilities
including road and drainage, water, electricity, health facility, public toilet,
waste management and recreation facility, among others, is the entry point
or preconditions into slum upgrading. As a first level platform, these have to
be provided by the government and its agencies, with support from other
stakeholders including the private sectors, volunteer organizations and
international development partners. At this stage, the slum dwellers will begin
to benefit in terms of employment and utilisation of community contracting
to implement small infrastructure works. Generally, community contracting
where community members are hired to do the construction work using
labour-based methods provide job opportunities for the community members
and it is cheaper for the government on the long run. This, in turn, enables the
slum community members to earn an income, and hence to improve their
livelihoods, or to invest in improved housing and infrastructure.
This first platform of providing these basic services is a trigger or preconditions
to addressing the key challenges and human aspirations within the slum
areas. These key aspirations or desired conditions are: improving the general
environmental conditions, improving the conditions of basic infrastructure
and improving water and sanitation conditions. These are interconnected
and take inputs from all the urban basic services. Slums represent composite
condition resulting from breakdown or degradation of many urban basic
infrastructure and services. The combination of the three desired conditions
will lead to general improvement in slum conditions which will translate into
improvement in human well-being. At the level of individuals and households,
it will generate living benefits which provide improved access to water and
sanitation, health, social services, housing and education, among others.
This improved slum conditions is expected to improve the social and
psychological well-being of the slum dwellers and enable the individuals and
community to activate the development and utilization of common assets
(physical, natural, economic, social and cultural). At this stage, the slum
communities would begin to organise themselves into groups and cleavages,
actively participate in decision making concerning them, and take charge of

96
their own needs related to housing, services and infrastructure. It is also
expected that they will begin to establish project management committees
that will monitor and coordinate the implementation of project activities at
the local level. It is also expected that the communities will organize
themselves to be involved in the construction, operation, and maintenance
of the facilities provided in order to gain maximum benefits. This activation
stage is expected to lead to socio-economic benefit stage with improved
access to employment and livelihoods opportunities and improved financial
independence and economic prosperity among the slum dwellers. In
essence, individuals and households living conditions are expected to
improve considerably.
This prosperity or socio-economic benefit stage is expected to lead to a
sustainable improved living condition stage where improved individuals and
households living conditions will feed back into the system and cause
individuals and households to contribute maximally to improvement in
environmental, basic infrastructure and water and sanitation conditions. The
cycle will then go on and thus spins the flywheel of slum improvement and
prosperity faster and faster.
5.5 RECOMMENDATIONS
This study has profiled the physical and social state of slum areas in the city of
Kaduna. The goal of slum redevelopment and upgrading is expected to
address poor urban basic facilities and services, the high incidence of
poverty, civic duty and responsibility, decentralization of governance to
include the communities and all those who live and work in the slum, as well
as the issue of rights based approaches to providing basic urban services
where the slum dwellers will own the process to improve their conditions and
livelihoods. Further recommendations should thus include strategy for
participatory planning at neighbourhood levels and participatory
implementation at community level.
These points are known to the Federal Government of Nigeria and in
particular, the FMLHUD as the driver of good urban development,
management and governance in Nigeria. Delivering the keynote address at
the National Housing and Slum Summit, the Vice President of the Federal
Republic of Nigeria, Arc. Namadi Sambo submits: for a more holistic
approach to slum reduction, there is the need for proper planning of urban
places, broad-based improvement efforts based on creating economic
opportunities for the residents and respect for the rule of law. People who live
in slums have emotional attachment to their poor homes and better choices
must be offered to goad them into relocating in instances when drastic slum
improvement measures are implemented.
Beyond the efforts of the Federal tier to confront the slum challenge, the Vice
President recognised the role of balanced inter-agency collaboration

97
amongst all stakeholders as well strengthening of institutions responsible for
implementing planned initiatives. He expressed strong preference for
continuous engagements and dialogue with affected slum residents as well
as inclusion of issues related to the allocation of financial and human
resources in the projects. That is inclusive governance in slum upgrading. The
physical approach of evicting slum dwellers under the guise of slum
redevelopment is contrary to the principle of human development, inclusive
governance and participatory slum upgrading. The hard approach of
eviction and relocation should be seen as the last option and should be
done only when alternatives that are in consonance with the emotional and
social aspirations of slum dwellers have been offered. Authorities concern
should be planning with the slum dwellers and not plan for them.
Based on the findings, the following recommendations are suggested for
implementation on the short term (immediate to 3 years), medium term (3-6
years), and long term (6-9 years) time-line.
Short-Term (Immediate To 3 Year) SN Recommendations Objectives Performance
Indicators
Implementation
Authority 1 Mobilization and
sensitization of
stakeholders – State
Government, Local
Government and the
communities about the
slum development Master
Plan.
To create the synergy
and establish
partnership` between
all the stake holders
(including
development
partners, NGOs, the
private sector and the
community)
Agreed blue print for
slum upgrading and
livelihood
improvement
FMLHUD
and other institutional
stakeholders

98
2 Immediate intervention in
water provision through
motorized or tanker-
supplied potable drinking
water.
To provide temporary
relief measures with
the view to reducing
the suffering on
access to drinking
water thereby
improving the water
and sanitation
conditions
Temporary
improvement in
access to drinking
water
Kaduna State
Government and the
LGAs – Kaduna North,
Kaduna South, Chikum
and Igabi
3 Immediate rehabilitation
and upgrading of roads
and streets through direct
labour.
Improve accessibility
to the slums.
To create livelihood
opportunities for slum
dwellers.
Improvement in road
and street conditions
FMLHUD and Kaduna
State Government (In
Partnership With LGA
and Communities)
4 Immediate clearance of
drainage and gutters
through direct labour.
To improve the
general
environmental
conditions.
To create livelihood
opportunities for slum
dwellers
Improved, clean and
free flowing drains
Kaduna State
Government (In
Partnership With LGA
and Communities)
5 Immediate clearance of
refuse in open and public
places including market areas
through direct labour
To improve the general
environmental
conditions.
To create livelihood
opportunities for slum
dwellers
Clean environment Kaduna State
Government (In
Partnership With LGA
and Communities)
6 Urgent provision of public
toilet facilities to improve
sanitation
To improve the water
and sanitation
conditions
Increase in number of
people with access to
improved toilet facility
Kaduna State
Government and the
LGAs concerned.
7 Repair and rehabilitation of
structures in primary and
secondary schools and
healthcare facilities
especially in the slum areas
of southern Kaduna.
To improve the health
and sanitation
conditions
To create livelihood
opportunities for local
artisans
Improvement in public
health facility Kaduna State
Government (In
Partnership With LGA
and development
partners)
8 Mobilization of the
community members for
street cleaning and
beautification.
To begin the process
of instituting civic duty
and responsibility and
decentralization of
urban governance
To utilise local assets
including paid and
voluntary professional
and technical
services
Clean and green
environment
Kaduna State
Government, the LGAs
and Local Associations
9 Rehabilitation of abattoirs To improve food
hygiene and
sanitation
To improve income
generation
Improved handling
and packaging of
meat products
LGAs and Public-
Private-Partnerships and
Local Associations

99
Medium Term (3-6 Years) SN Recommendations Objectives Performance
Indicators
Implementation
Authority
1 Investment in design and
provision of municipal
infrastructure including
public water supply,
public recreation and
relaxation areas and
children’s playground,
public toilet, street light
and waste management
(including recycling and
reuse) facilities.
To improve urban basic
infrastructure, general
environmental
conditions and water
and sanitation
conditions.
To create employment
and access to
livelihoods for skilled
professionals and
unskilled labourers
To improve the general
economy of the slums
through utilization of
community contracting
to implement small
infrastructure works
Improvement in
urban basic
infrastructure
and services
FMLHUD, Kaduna State
Government And the
LGAs (In Partnership
With Private Investors)
2 Improve supply and
distribution of electric
power.
To support other urban
basic services including
health and water and
sanitation
To boost local
production
Increase in
number of hours
of stable
electricity
Kaduna State
Government And
Private Investors
3 Creation of digital GIS-
based database for slum
management in Kaduna.
To track progress made
in slum upgrading and
living conditions
improvement plans
across space
To monitor degrading
areas and other areas
with possibility of slum
development.
To improve data
sharing and synergy
between the FMLHUD
and Kaduna State and
participating LGAS
A functional GIS
infrastructure
and database
FMLHUD And Kaduna
State Government
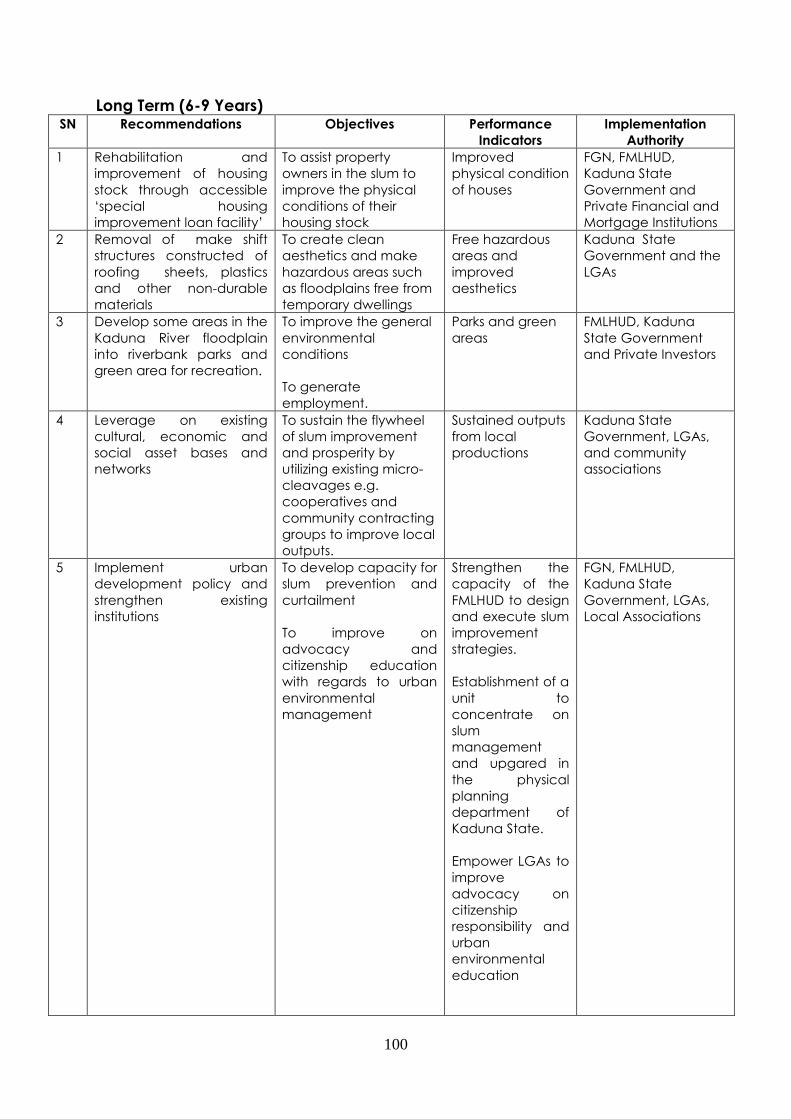
100
Long Term (6-9 Years) SN Recommendations Objectives Performance
Indicators
Implementation
Authority
1 Rehabilitation and
improvement of housing
stock through accessible
‘special housing
improvement loan facility’
To assist property
owners in the slum to
improve the physical
conditions of their
housing stock
Improved
physical condition
of houses
FGN, FMLHUD,
Kaduna State
Government and
Private Financial and
Mortgage Institutions
2 Removal of make shift
structures constructed of
roofing sheets, plastics
and other non-durable
materials
To create clean
aesthetics and make
hazardous areas such
as floodplains free from
temporary dwellings
Free hazardous
areas and
improved
aesthetics
Kaduna State
Government and the
LGAs
3 Develop some areas in the
Kaduna River floodplain
into riverbank parks and
green area for recreation.
To improve the general
environmental
conditions
To generate
employment.
Parks and green
areas
FMLHUD, Kaduna
State Government
and Private Investors
4 Leverage on existing
cultural, economic and
social asset bases and
networks
To sustain the flywheel
of slum improvement
and prosperity by
utilizing existing micro-
cleavages e.g.
cooperatives and
community contracting
groups to improve local
outputs.
Sustained outputs
from local
productions
Kaduna State
Government, LGAs,
and community
associations
5 Implement urban
development policy and
strengthen existing
institutions
To develop capacity for
slum prevention and
curtailment
To improve on
advocacy and
citizenship education
with regards to urban
environmental
management
Strengthen the
capacity of the
FMLHUD to design
and execute slum
improvement
strategies.
Establishment of a
unit to
concentrate on
slum
management
and upgared in
the physical
planning
department of
Kaduna State.
Empower LGAs to
improve
advocacy on
citizenship
responsibility and
urban
environmental
education
FGN, FMLHUD,
Kaduna State
Government, LGAs,
Local Associations

101
Funding is crucial to slum redevelopment and upgrading. It is clear that the
FGN alone will likely not be willing to put down the enormous funding
required for the slums upgrading and improvement of livelihoods in Kaduna.
This report is a good document to begin the process of negotiation for
assistance from, and partnership with, international development partners
including the UN-Habitat with regards to slum upgrading and livelihood
improvement in the slums of Kaduna. It is also a vital document to institute a
basis for partnership with local actors including the State Government and
LGAs, NGOs as well as private investors to mobilise the necessary support for
actualizing the strategy and recommendations.
5.6 MONITORING AND EVALUATION
There is the need to monitor and track progress recorded on slum upgrading
and human living condition improvement projects and plans. This will include
the ability to track progress in intervention strategies and projects and
monitor what it translates into in space and time across the target slum areas.
This also means ability to be able to compare environmental indicators and
performance of urban facilities across neighbourhoods in the slum areas. This
will enable the gauging of the progress on how much resources are
translating into actual improvement in human living conditions across space.
The recommended monitoring and evaluation tool in this case is GIS. The
current field data and slum areas maps generated in this project for the slum
areas in Kaduna could serve as the base. The required inputs into the M&E
from spatial perspective will include the following:
5.6.1 Geoinformation database
Every bit of data about the land base, urban basic infrastructure and
services, human livelihood activities, natural, available and potential
economic, social and cultural assets, etc is important. These data need to be
sourced, processed, integrated and stored within a GIS for easy interrogation
and updates. An Urban Geographic Information Systems (UGIS) tailored to
target areas in Kaduna (e.g. KADUNA-UGIS) can be developed for the
project. In this case, the identified slum area maps and facility location data
and photographs collated from the field can form the base. Mapping of the
target slums using high resolution satellite imagery is urgently required to
provide high resolution data for the recommended intervention strategies.
It is very likely that some States may have embarked on high resolution aerial
photographic mapping campaign or acquisition of high resolution satellite
imageries of their cities and other target areas in recent years. Some of these

102
data may also be lying in one office without the knowledge of sister
ministries/departments because of poor coordination and lack of data
sharing. Where this is predictably correct, there will be the urgent need to
engage all stakeholders and extend the search for spatial data to ministries
other than the ministries in charge of Urban Development. Some other
offices including Survey Offices/Departments, Ministry of Works (especially for
road and other infrastructure) and externally coordinated projects (e.g. past
World Bank Assisted Projects in the communities) may also have some urban
spatial data and information that could be accessed.
A way to integrate these agencies and offices from inception is to:
• Have an enlarged stakeholders’ workshop where data needs and
requirements for slum upgrading and urban basic services
improvement are discussed
• Design a well-structured questionnaire instrument to elicit information
from the ministries and agencies, first on their (spatial) data needs, and
secondly on the data that is available within their archives.
• Appoint one or two data focal person(s) in each agency
• Have a committee of data focal persons across the ministries and
across the state.
5.6.2 Capacity building
Technical and human capacity for GIS and spatial information gathering and
management needs to be developed at FMLHUD headquarters and at the
Federal Controllers’ offices in the State. The State Ministries in charge of Urban
Development should also be encouraged to participate in the capacity
building process.
5.6.3 Periodic image acquisition for updates
Periodic image acquisition (at least once a year) should form part of the M&E
strategies. This is to periodically monitor the extent of success and how much
the efforts are translating into improvement in basic services and
infrastructure across space. For example, from HR imageries one can quickly
know how many of the roads have been upgraded (say in the last one year)
and how much the face of the target areas has changed within the period.
5.6.4 The TOR
All the points discussed above can be fashioned into a term of reference for
the geoinformation component of the M&E to include:
• Access, acquisition, integration and harmonization of baseline data
• Access to possibly available large scale aerial photograph or
acquisition of new high resolution satellite data for target areas
• Acquisition, installation, and test run of GIS hardware and software at
the FMLHUD headquarters
• Training of trainers – training of key personnel who will be able to train
some other staff on the job

103
• Periodic acquisition of satellite imageries to monitor project success
across target areas
• Managing and updating the system

104
REFERENCES
Akinbamijo, O. B. (2012). Urbanization and Socio Economic Position Analysis –
An Approach to Housing and Health Relationships in Residential
Districts of Nigerian Cities, The Built & Human Environment Review, 5.
Aluko O. E. (2010). The Impact of Urbanization on Housing Development: The
Lagos Experience, Nigeria. Ethiopian Journal of Environmental
Studies and Management 3(3), pp 64–74.
Bobadoye, S.A. and Fakere, F.A (2013). Slum Prevalence in Nigeria: What Role
for Architects? World Environment 2013, 3(2): pp 45-51
Department of International Development (DFID) 2005. Nigeria by Numbers.
Development Magazine, 32: 8- 9.
Elias, P. O. (1999) “Mega-Cities and Informal Settlements: The Prospects Of
Community –Based Development Initiatives In The 21st Century
Lagos” MURP Thesis, University Of Ibadan, Nigeria.
Federal Government of Nigeria (2003). First National Communication on
Climate Change (Final Draft), Federal Ministry of Environment, Abuja.
Federal Ministry of Lands, Housing and Urban Development (2013). Report of
the National Housing and Slum Summit, Transcorp Hilton Hotel, Abuja,
21-22 October 2013.
FIG/UN-HABITAT (2008) Improving Slum Conditions through Innovative
Financing Summary Report. FIG Publication 44
Fourchard, L. (2003) The Case of Ibadan, Nigeria. Understanding Slums: Case
Studies for the Global Report on Human Settlements
Goicoechea, A. (2008). Preparing Surveys for Urban Upgrading Interventions:
Prototype Survey Instrument and User Guide. The World Bank Group:
Urban Papers.
Hebert, L. and Schwandt, H. (2011). In‐Depth Interviews with Family Planning
Providers in Ibadan and Kaduna, Nigeria
Imparato, I., Ruster, J. (2007). Slum Upgrading and Participation: Lessons from
Latin America, In: Directions in Development for The World Bank.

105
Jaitman, L. and Brakarz, J. (2013). Evaluation of Slum Upgrading Programs:
Literature Review and Methodological Approaches for Inter-
American Development Bank, No. IDB-TN-604
Kit, O., Lüdeke, M. and Reckien, D. (2013). Automated detection of slum area
change in Hyderabad, using multitemporal satellite imagery, ISPRS
Journal of Photogrammetry and Remote Sensing 83: pp 130-137
Kit, O., Lüdeke, M. and Reckien, D. (2014). Texture-based identification of
urban slums in Hyderabad, using remote sensing, Applied
Geography 32 (2): pp 660-667.
Kohli, D., Kerle, N., and Sliuzas, R. (2012): Local Ontologies for Object-Based
Slum Identification and Classification, Proceedings of the 4th
Geobia, May 7-9, 2012 - Rio De Janeiro - Brazil. P.201
Max Lock Consultancy Nigeria Limited (2010): The Draft final report of the
Revised Master Plan for Kaduna City for 2010-2050, prepared for the
Kaduna State Government, Ministry of Lands, Survey and Country
Planning, Published by MLC Press, University of Westminster, London.
National Bureau of Statistics (NBS), Federal Republic of Nigeria. Annual
Abstract of Statistics, 2011
Nwude, M.O., Igboro S.B., Ibrahim, Y. and Okuofu, C.A. (2009). Evaluation of
Solid Waste Management in Kaduna Metropolis, Nigeria.
Nnaji, A.O. (1998). Climate Forcing, Precipitation Variability and Rainfall
Forecasting Models for Northern Nigeria. Proceedings of the 94th
Annual Conference of Association of American Geographers. Boston
Massachusetts. March 26th- 29th
Nnaji, A.O. (1999). Climate Variation in the Sub – Saharan Region of West
Africa: A Study of Rainfall Variability in Northern Nigeria,” unpublished
PhD Dissertation, Department of Geography, University of Florida,
Gainesville.182pp.
Sliuzas, R., Mboup, G. and De Sherbinin, A. (2008): Report of the Expert Group
Meeting on Slum Identification and Mapping, International Institute
for Geoinformation Science and Earth Observation (ITC), The
Netherlands,v21-23.
UN-Habitat (2003) The Challenge Of The Slums: Global Report On Human
Settlements. Nairobi: United Nations.
UN-Habitat (2013) Time to Think Urban. 53 UN-Habitat Model Projects 2013/14

106
UN-Habitat (2008) UN-Habitat and the Kenya Slum Upgrading Programme:
Strategy Document. HS: 1010/08E

107
APPENDIX I – QUESTIONNAIRE
FEDERAL MINISTRY OF LANDS, HOUSING AND URBAN
DEVELOPMENT
NEEDS ASSESSMENT STUDY OF SLUMS IN KADUNA, NIGERIA
HOUSEHOLD QUESTIONNAIRE
General (to be filled before getting to respondent)
Household code
number
Survey details
Name of
interviewer……………
……………………..
Date of survey:………/………./………...
1 lga: start time:
2 town: finish time:
3 locality:
4 street name:
Household information
5 Age of
household head
6. Gender of household head
ð 16-25 years ð male ð female
ð 26-40 years
ð 41-55 years
ð 56-70 years
ð above 70 years
7 Age and gender
of informant(s)
for this
assessment (if
different from
household head)
informant 1: age:.................. ð male ð female
informant 2: age:.................. ð male ð female
informant 3: age: .................. ð male ð female
8 ethnic group of
household head
ð Hausa/Fulani
ð Yoruba
ð Igbo
ð Others....................................................................
9 marital status of
household head
ð Single
ð Married
ð Separated/divorced
ð Widow/widower
10 occupation of
household head
ð Artisan
ð Farmer

108
ð fishing
ð trading/business
ð civil servant
ð professional
ð unemployed
ð other (please specify)........................................
11 What is the
commonest
local occupation
in this community
12 monthly income
of household
head
ð less than ₦10,000
ð₦10,001 - ₦25,000
ð₦25,001 - ₦50,000
ð₦50,001 - ₦100,000
ð₦100,001 - ₦250,000
ð₦250,001 - ₦500,000
ð above ₦500,000
13 highest
educational
status of
household head
ð primary
ð secondary
ð post-secondary/technical
ð HND/B.Sc.
ð Postgraduate
ð Quranic education
ð No formal education
ð others (please specify)……………..........................
14 Total number in
household
Children (<5years)............ children (5-18years)………….
men.................
Women................
..
Elderly (above 65years).............
Children…………
………………..
Disabled............................
15 which of the
following
associations do
you or your
household
members belong
to (tick as many
as applicable)
Associations yes NO
ð professional guild or association
ð religious institutions
ð landlord association
ð vigilante association
ð community development association
ð town association
ð elders forum
ð cooperative society
ð others (specify).....

109
Housing condition
16 When was the
building you live
in constructed?
tick one only
ð less than 5years
ð 5-10years
ð 11-20years
ð 21-40years
ð more than 40years
ð i don’t know
17 construction
material of walls
of building
occupied
tick one only
ð wood
ð concrete
ð zinc
ð mud
ðothers (specify).............................
18 How long have
you been living
in this
community?
ð i was born here
ð less than 2 years
ð 2-5 years
ð 6-10 years
ð 11-20 years
ð more than 20 years
19 Why do you live
in this
community?
explain........................................................................................................................
.....................................................................................................................................
..............
20 What is the
residential status
of the household
head?
ð landlord
ð tenant
ð squatting
ð other (please specify)……………....................................
21 if you are a
landlord, do you
have any legal
document for
your house/land
yes No
22
if yes to #21,
which of this do
you have
customary freehold right c of o survey plan land certificate
Environmental conditions
23 how will you
rate/rank your
community with
indicators 1-good 2-poor 3-bad 2-bad 4-worse 5-WORST
planning of the area
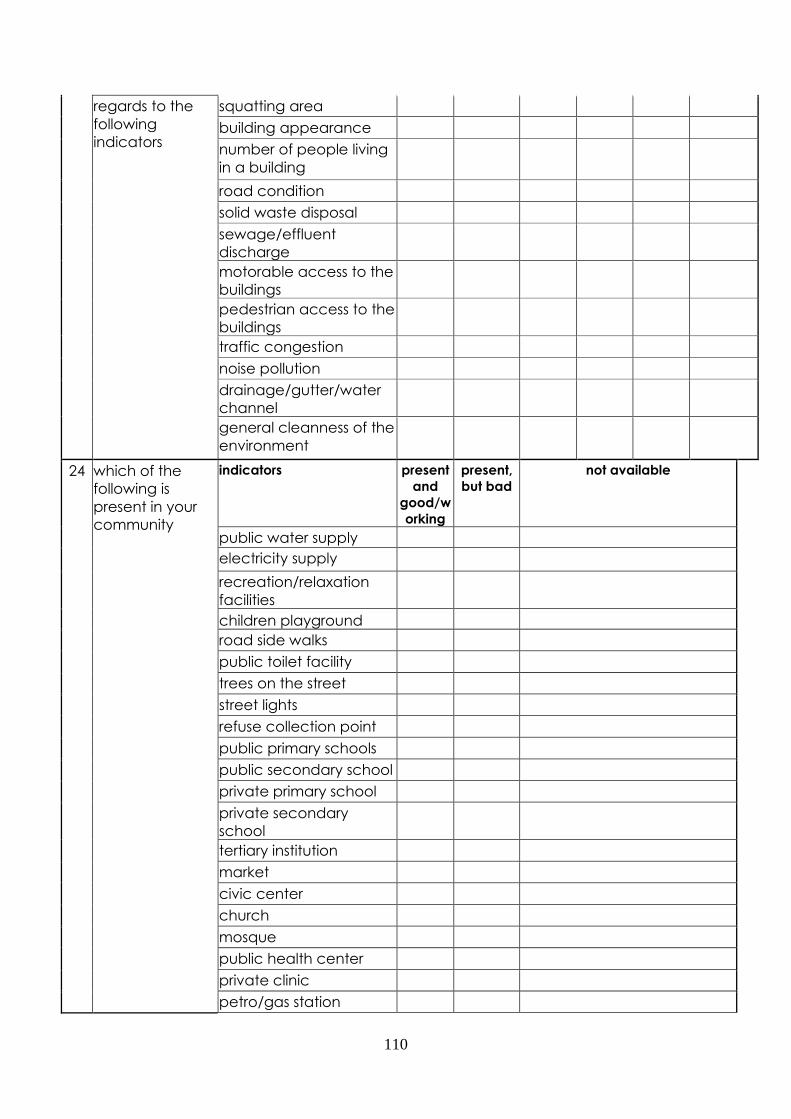
110
regards to the
following
indicators
squatting area
building appearance
number of people living
in a building
road condition
solid waste disposal
sewage/effluent
discharge
motorable access to the
buildings
pedestrian access to the
buildings
traffic congestion
noise pollution
drainage/gutter/water
channel
general cleanness of the
environment
24 which of the
following is
present in your
community
indicators present
and
good/w
orking
present,
but bad
not available
public water supply
electricity supply
recreation/relaxation
facilities
children playground
road side walks
public toilet facility
trees on the street
street lights
refuse collection point
public primary schools
public secondary school
private primary school
private secondary
school
tertiary institution
market
civic center
church
mosque
public health center
private clinic
petro/gas station

111
financial institution
post office
police post/station
abbatoir
25 how will you rate
the following
issues in your
community
indicators 1-good 2-poor 3-bad 4-severe 5-
critical
ð water
ð sanitation/toilet
facilities
ð food
ð employment/
livelihood
ð housing/ shelter
ð fuel for cooking
ð health care
ð being able to perform
cultural and religious
rituals
ð security
ð children school
ð transportation
ð communication
ð others
(specify)............................
...........................................
....
26 What is the main
source of
drinking water for
your household?
ð pipe borne water
ð public tap
ð borehole
ð protected dug well
ð unprotected dug well
ð shallow well
ð rain water collection
ð tanker truck
ð cart-pushers
ð surface water sources - river, stream, pond, etc
ð bottled water
ð sachet water
ð others (specify)
27 How long does it tick one only

112
take to go there,
collect water
and come back
(if not in the
dwelling)?
ð < 30 minutes
ð 30 minutes – 1 hour
ð 1 hour – 2 hours
ð 2 hours – 4 hours
ð more than 4 hours
28 do you feel your
family always
have enough
water for use
daily
tick one
yes
No
29 What toilet
facility does your
household use?
tick one
ð water closet
ð pit latrine
ð toilet shared with other households
ð public toilet shared with other members of the community
ð bush/open area
30 how do you
dispose your
waste
take to open waste dump
give to cat pushers
give to government collectors
store in the backyard
throw into the gutters
burn with fire
31 have you or your
household ever
experience any
of the following:
ð flood
ð fire
ð building collapse
ð typhoid outbreak
ð cholera outbreak
ð diarrhoea outbreak
Needs assessment
32 Needs: rank your first 10
needs in order of
priority. 1 for the most
important and 10 for
the least important.
Indicators SCORE
Electricity
Water
tarred road
primary school
secondary school
tertiary institution
health facility
postal office/postal agency

113
financial institution
cottage industry
Market
gsm facility
internet facility
housing facilities
town hall
employment opportunities
others (please specify)
33 if you are to mention
only one thing the
majority of people want
in this community, what
will you say
34 in your own view, what
do you think
government should do
to uplift the living
conditions of the
people in this area
35 what can you as an
individual contribute
towards the
improvement of the
slum condition in this
area
tick as many as appropriate
volunteer professional service
paid professional service
volunteer personal labour
paid personal labour
personal financial contribution
mobilizing other community members to contribute
enlighten other community members to support
government effort
any other (please list)-------
THANK YOU FOR YOUR TIME

114

115
APPENDIX II: FACILITY FORMS
INFRASTRUCTURAL FACILITIES / FEATURES FORM -
CATEGORY A
Sn State LGA Community/Cluster
Name of
Facility/Feature *Ownership **Condition
Picture
No
1
2
3
4
5
6

116
INFRASTRUCTURAL FACILITIES / FEATURES FORM - CATEGORY B
(SCHOOLS AND HEALTH FACILITIES)
Sn State LGA
Community/Cl
uster
Name of
School/Health
facility
*Owne
rship
Estim
ated
Capa
city
**Co
nditio
n-
inside
**Co
nditio
n-
outsid
e
1
2
3
4
5
'

117
FACILITY INDEPTH - SCHOOLS
1 2 3 4 5
School name
Location
Est student Population
No of Teachers
No of Class-rooms
Availability of playing
field
General condition of
surrounding
Condition of building
Condition of classes
Condition of Toilets
Water
Electricity
Any other observation

118
FACILITY INDEPTH - HEALTH
1 2 3 4 5
Health Facility name
Location
Type
Est Patients catered for
No of Doctors
No of Nurses
No of beds
General condition of
surrounding
Condition of building
Electricity
Water
Any Other observations
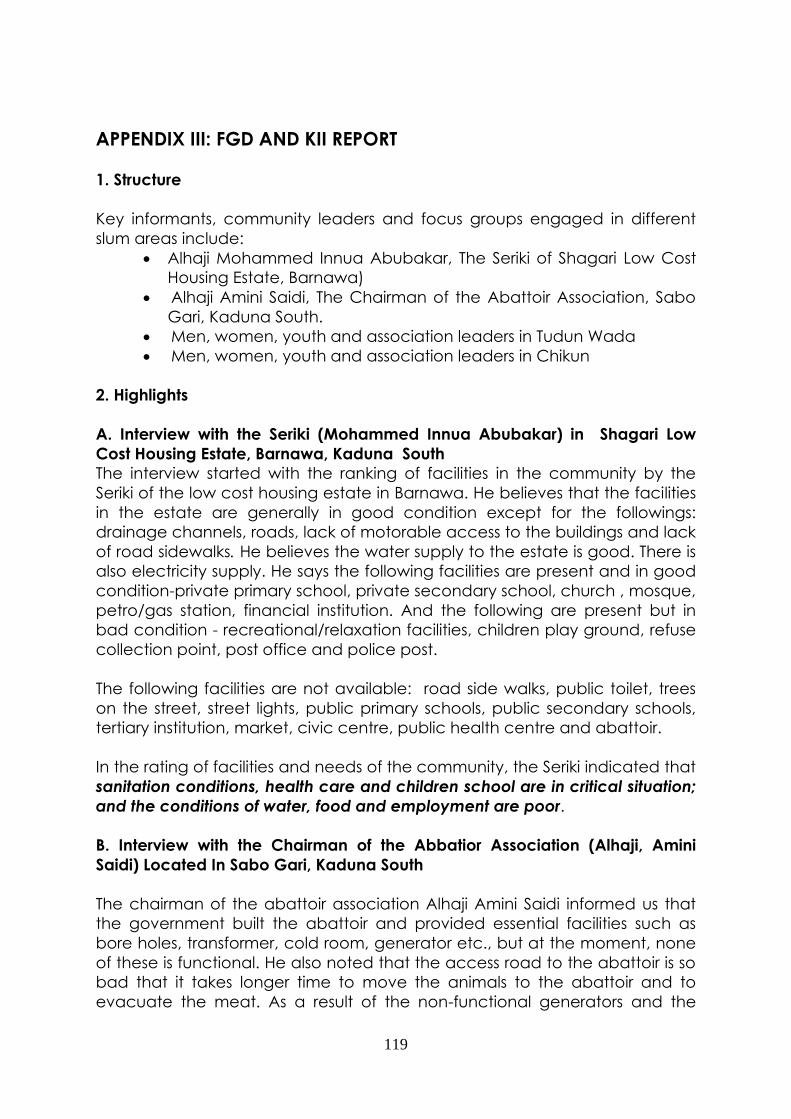
119
APPENDIX III: FGD AND KII REPORT
1. Structure
Key informants, community leaders and focus groups engaged in different
slum areas include:
• Alhaji Mohammed Innua Abubakar, The Seriki of Shagari Low Cost
Housing Estate, Barnawa)
• Alhaji Amini Saidi, The Chairman of the Abattoir Association, Sabo
Gari, Kaduna South.
• Men, women, youth and association leaders in Tudun Wada
• Men, women, youth and association leaders in Chikun
2. Highlights
A. Interview with the Seriki (Mohammed Innua Abubakar) in Shagari Low
Cost Housing Estate, Barnawa, Kaduna South
The interview started with the ranking of facilities in the community by the
Seriki of the low cost housing estate in Barnawa. He believes that the facilities
in the estate are generally in good condition except for the followings:
drainage channels, roads, lack of motorable access to the buildings and lack
of road sidewalks. He believes the water supply to the estate is good. There is
also electricity supply. He says the following facilities are present and in good
condition-private primary school, private secondary school, church , mosque,
petro/gas station, financial institution. And the following are present but in
bad condition - recreational/relaxation facilities, children play ground, refuse
collection point, post office and police post.
The following facilities are not available: road side walks, public toilet, trees
on the street, street lights, public primary schools, public secondary schools,
tertiary institution, market, civic centre, public health centre and abattoir.
In the rating of facilities and needs of the community, the Seriki indicated that
sanitation conditions, health care and children school are in critical situation;
and the conditions of water, food and employment are poor.
B. Interview with the Chairman of the Abbatior Association (Alhaji, Amini
Saidi) Located In Sabo Gari, Kaduna South
The chairman of the abattoir association Alhaji Amini Saidi informed us that
the government built the abattoir and provided essential facilities such as
bore holes, transformer, cold room, generator etc., but at the moment, none
of these is functional. He also noted that the access road to the abattoir is so
bad that it takes longer time to move the animals to the abattoir and to
evacuate the meat. As a result of the non-functional generators and the

120
public power supply, the following problems emerge: deterioration of the
meat and scarcity of water which forces them to be drawing water from the
wells.
The abattoir was designed to slaughter more than 200 animals daily but the
non-functionality of the facilities have made the unit to handle only less than
100 daily. This low productivity affects the income of the farmers in the area.
C. Focus Group Discussion in Tudun Wada
The FGD in Tudun Wada included men, women, and youth and association
leaders in Tudun Wada area.
Major occupation: the group is of the opinion that the commonest
occupation of the people is trading.
Community associations and efforts: the associations in the community are
mainly religious-based and they assist in maintaining social amenities such as
drainage channels, forming vigilante groups etc. To them the government
has been involved in constructing schools, roads, electricity and providing
security.
Conditions of facilities: the group was of the view that generally things are
bad. These range from bad road condition and poor motorable and
pedestrian access to the buildings, poor drainage channels etc.
The group agreed that solid waste disposal and traffic congestion are said to
be in worse conditions.
The group agreed that the following facilities are also present, but in bad
conditions in Tudun Wada: public water supply, electricity supply, refuse
collection point, public primary school, public secondary schools, private
primary schools, private secondary schools, market, public health centre,
police post and post office.
The group agreed that the following facilities are not available: recreation or
relaxation facilities, children playground, road side walks, public toilet facility,
and trees on the street, street lights and civic centre.
The group agreed that they following are present and in good condition:
tertiary institution, church, mosque, private clinic, petro/gas station, financial
institution and abattoir.
The following facilities are also in bad to critical shape: water, access to
food, transportation, employment, health care and security.
Public water supply is functional in some areas and non-functional in other
areas. There are no credit facilities from the government.

121
Expectations from the government
The group is of the opinion that the government should improve the
infrastructural facilities as a slum upgrading measures. In specific terms, this
should include widening of some drainage channels and constructing new
ones in some areas. In the government general hospital located almost
opposite Kaduna Polytechnic, the Director lamented that government
intervention is urgently needed to arrest an emerging ugly situation in front of
the hospital’s premises. This emerging situation has to do with parking along
the road by traders in the market.
Our team was also conducted round the general hospital and it was
observed that the facilities in the hospital are under serious pressure. We
noted sick women seating on bare floor waiting to be attended to by the
nurses and doctors. Many building in the premises were uncompleted and
abandoned.
D. Focus Group Discussion in Angwa Yelwa and Television Village in Chikun
Local Government Area, Kaduna South.
The FGD included men, women, youth and association leaders in Angwa
Yelwa and Television Village.
The general opinion of the group in the two communities is that there was no
government impact in the community. They say individuals sink their own
bore holes for water supply and the community maintains the streets. The
research team observed that the two intersecting roads in the community
were riddled with pot holes.
Their main expectation from the government is to come to their aid by
improving their infrastructural facilities especially in the area of waste
collection and disposal, road construction and maintenance, and provision
of pipe borne water and electricity.
3. Conclusions
Again, the catalogue of complaints and expectations from the community
leaders and groups from these various stakeholders tally with the results from
questionnaire analysis. Ratings of key infrastructure show water and sanitation
situation and health care to be in poor situation. Public schools and waste
management and road condition are also in bad shape. The priorities listed
by the different groups align with the overriding priorities and needs of the
communities as analyzed from the questionnaire, which are provision of
water, electricity, road improvement, employment opportunities and
improvement of health facilities.

122
APPENDIX IV: SUMMARY OF OUTCOMES FROM THE SLUM AREAS IN
ABA, KADUNA, AND OSHOGBO
The summary of the situation across the three cities is provided under the
followings:
• General environmental conditions
• Conditions of basic infrastructures
• Assessment of common issues
• Slum conditions which captures information on
▪ Sustainable access to safe water
▪ Access to improved sanitation
▪ Access to durable structure/housing
▪ Overcrowding ▪ Access to tenure
▪ Access to social services
• Needs assessment of the communities
The ratings represent the highest category of responses for each indicator
based on the simple majority rule. So it does not consider a situation of close
or very close tie between two indicators.
Environmental Conditions
Table 1 summarises the perception on the environmental conditions across
the slums in the three cities. The rating is from good to worst as shown on the
scale.
Table 1: Perception of Environmental Condition across the cities Indicator Aba Oshogbo Kaduna
Planning of the area Poor Poor Poor
Squatting Poor Poor Poor
Building appearance Poor Poor Poor
Number of people living in a
building Good Good Poor
Road condition Worst Poor Poor
Solid waste disposal Poor Good Bad
Sewage/effluent discharge Poor Poor Bad
Motorable access to the buildings Worst Poor Poor
Pedestrian access to the buildings Bad Good Poor
Traffic congestion Poor Good Poor
Noise pollution Poor Poor Poor
Drainage/gutter/ water channel Worst Poor Bad
Ratings
Scale Good Poor Bad Worse Worst

123
Oshogbo and Kaduna seem to have fared better than Aba on most of the
indicators. While Oshogbo has “good” in the number of people living in a
house, solid waste disposal, pedestrian access to building and traffic
congestion, and “poor” on the others; Kaduna oscillates between poor and
bad in these indicators. Aba on the other hand recorded “worst” in a road
condition, motorable access to buildings, and drainage/gutter, and poor in
other ones except number of people living in a building.
Conditions of Basic Infrastructure
Table 2 summarise the conditions of basic infrastructures across the slum
areas in the three cities. The scale is from present and good to absent or not
available. In all the cities, basic infrastructure including recreation area,
children playground, public toilet, road sidewalks, and street lights are not
available in the slums. Electricity is rated poor in all, public water supply is
acknowledge only in Kaduna, refuse collection and public primary and
secondary schools are rated as present and good only in Oshogbo,
financial institutions, police post/station, post office and abattoir are also
rated as not available. Markets are rated in the three cities as being in bad
condition.
Table 2: Conditions of basic Infrastructure across the cities
Indicators Aba Oshogbo Kaduna
Public water supply Absent Absent Bad
Electricity supply Bad Bad Bad
Recreation/relaxation
facilities
Absent Absent Absent
Children’s playground Absent Absent Absent
Road side walks Absent Absent Absent
Public toilet facility Absent Absent Absent
Trees on the street Absent Absent Absent
Street lights Absent Absent Absent
Refuse collection point Absent Good Absent
Public primary schools Bad Good Bad
Public secondary schools Absent Good Bad
Private primary schools Good Good Good
Private secondary schools Good Good Good
Tertiary institution Absent Absent Absent
Market Bad Bad Bad
Civic centre Bad Absent Absent
Church Good Good Good
Mosque Absent Good Good
Public health centre Absent Bad Bad
Private clinic Good Good Good

124
Petrol/ gas station Absent Absent Absent
Financial institution Absent Absent Absent
Post office Absent Absent Absent
Police post/ station Absent Absent Absent
Abattoir Absent Absent Absent
Ratings scale
Good=present and
good
Bad=present and
bad
Absent= not
available
Assessment of Common Issues
The assessment of common issues across the slums in the three cities is
summarised on Table 3. Issues regarding water and sanitation, healthcare,
access to employment or livelihoods, housing and shelter and children school
were rated poorly in all the cities. The only issues that received pass marks are
food, ability to perform cultural and religious rituals, and communication.
Table 3: Rating of Community Issues across the cities
Indicator Aba Oshogbo Kaduna
Water Poor Poor Poor
Sanitation/ toilet facilities Poor Poor Poor
Food Good Good Good
Employment/livelihood Worst Poor Poor
Housing/ shelter Poor Poor Poor
Fuel for cooking Poor Poor Poor
Health care Poor Poor Poor
Being able to perform cultural &religious
rituals Good Good Good
Security Poor Good Good
Children school Poor Poor Poor
Transportation Poor Good Poor
Communication Good Good Good
Rating
Scale Good Poor Bad Severe Critical
Slum Conditions
Access to Water
The most significant source of drinking water in each of the city is shown on
Table 4. Combination of water from borehole and purchased sachet water is
the major source of drinking water in the slum at Aba. For Oshogbo, it is
combination of public piped water and dug well, while Pipe borne water is
the dominant in Kaduna.
Table 4: Sources of Household Drinking Water across the cities

125
Source of drinking water ABA OSHOGBO KADUNA
Pipe borne water X
Public tap
Borehole/ sachet water X
Protected dug well
Unprotected dug well
Shallow well
Rain water collection
Tanker truck
Cart - pushers
Surface water source -
river, stream, pond
Bottled water
Pipe/well X
Borehole &well
Unprotected well & sachet
water
Protected well, rain
&sachet water
Public tap, rain & sachet
water
Total
The slum dwellers of Aba and Kaduna feel they do have enough water for
their household daily use, while those in Oshogbo feel otherwise (Table 5).
Table 5: Have Enough Water
Community Yes No
Aba X
Oshogbo X
Kaduna X
Sanitation
Water closet is the major type of toilet facility available in Aba and Kaduna,
while Pit latrine remains the commonest used by the slum population in
Oshogbo (Table 6). It has been shown earlier that public toilet facility is not
available.
Table 6: Toilet Facility
Major Toilet Facility Aba Oshogbo Kaduna
Water closet X X
Pit latrine X
Toilet shared with other households

126
Public toilet shared with other members
of the community
Bush/open area
Waste Disposal
Table 7 summarises the major means for disposing waste in the slum
communities in the three cities. Waste disposal seems to be more coordinate
and efficient in Oshogbo than Aba and Kaduna. This is also consistent with
the views on the environment and basic facilities where waste collection and
disposal is rated better in Oshogbo than the other two cities.
Table 7: Waste Disposal
Dispose of waste Aba Oshogbo Kaduna
Take to open waste
dump
X
Give to cat pushers X
Give to government
collectors
X
Needs Assessment
Community Needs
For all the basic facilities, the urgent needs of each community seem to be
different. Road/ street rehabilitation, electricity and access to employment or
livelihoods in that order dominate the need in Aba. Water, electricity, access
to employment and road/street rehabilitation in that order dominate the
needs in Oshogbo and Kaduna (Table 8).
Table 8: Ranking of the topmost Community Needs
Community needs Aba Oshogbo Kaduna
Water 1 1
Electricity 2 2 2
Employment
opportunities
3
3
3
Tarred road 1 4 4
Health facility 5
Primary school 6
Market 7
Secondary school
Housing facility
Town hall
Tertiary institution
Gsm facility
Internet facility

127
Financial institution
Cottage industry
Postal service
Public toilet
Ultimate Need
In mentioning just one thing that is ultimately desirable to improve human
living conditions, road/street rehabilitation mentioned in Aba. For Oshogbo, it
was access to water, while Kaduna was spilt roughly between electricity,
road/street rehabilitation and access to the means of livelihood (Table 9).
Table 9: Just One Need that is required Needs Aba Oshogbo Kaduna*
Water
X
Electricity
X
Tarred road X
X
Public toilet
Employment
opportunities
X
Security
Nothing
Health facility
Upgrade of
infrastructures
Tertiary institution
Affordable housing
Total
*None has up to 25%
Expectations from the Government
Table 10 summarises, according to priority, the main expectations from the
government on slum improvement. Infrastructural upgrade (which is a
complete package) tops the list in Aba and Oshogbo, while access to
employment is the ultimate in Kaduna (Table 10).
Table 10: Expected Role of Government in Slum Improvement
Needs Aba Oshogbo Kaduna
Employment provision 3 2 1
Infrastructural upgrade 1 1 2
Water 4 4
Low cost housing
Market
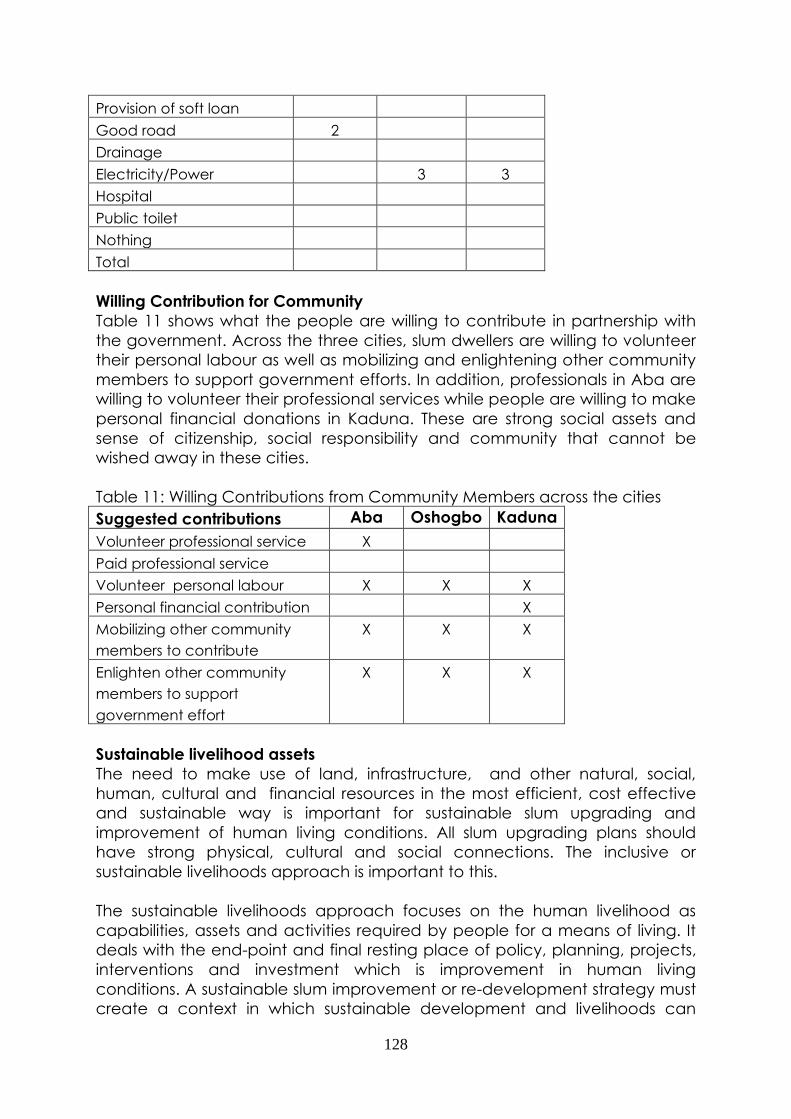
128
Provision of soft loan
Good road 2
Drainage
Electricity/Power 3 3
Hospital
Public toilet
Nothing
Total
Willing Contribution for Community
Table 11 shows what the people are willing to contribute in partnership with
the government. Across the three cities, slum dwellers are willing to volunteer
their personal labour as well as mobilizing and enlightening other community
members to support government efforts. In addition, professionals in Aba are
willing to volunteer their professional services while people are willing to make
personal financial donations in Kaduna. These are strong social assets and
sense of citizenship, social responsibility and community that cannot be
wished away in these cities.
Table 11: Willing Contributions from Community Members across the cities
Suggested contributions Aba Oshogbo Kaduna
Volunteer professional service X
Paid professional service
Volunteer personal labour X X X
Personal financial contribution X
Mobilizing other community
members to contribute
X X X
Enlighten other community
members to support
government effort
X X X
Sustainable livelihood assets
The need to make use of land, infrastructure, and other natural, social,
human, cultural and financial resources in the most efficient, cost effective
and sustainable way is important for sustainable slum upgrading and
improvement of human living conditions. All slum upgrading plans should
have strong physical, cultural and social connections. The inclusive or
sustainable livelihoods approach is important to this.
The sustainable livelihoods approach focuses on the human livelihood as
capabilities, assets and activities required by people for a means of living. It
deals with the end-point and final resting place of policy, planning, projects,
interventions and investment which is improvement in human living
conditions. A sustainable slum improvement or re-development strategy must
create a context in which sustainable development and livelihoods can

129
flourish. This where the assets possessed by the people as a community and
user of urban infrastructure becomes important. A livelihoods approach is
useful in recognising the needs of different income groups and inequality of
provision. It allows attention to be focussed on people’s own definitions of
deprivation – which in this case means a lack of, or little, access to basic
urban infrastructure and services.
Thus, in proposing inclusive slum re-development and human living conditions
improvement strategy, it is important to consider the peculiarities of each city
with respect to the natural, physical, social, cultural and economic assets
that can be tapped into, as well as the threats. It is also important to consider
the priorities and aspirations of the people – what do they consider the
important or pressing issues to improving their living conditions - in order to
guarantee cooperation and partnership.
Table 12 summarises the assets base and Table 13 summarise the threats for
the slums in Aba, Oshogbo and Kaduna.
Table 12: Identified asset Base for the Slums In The Three Cities Asset Aba Oshogbo Kaduna
Economic
▪ Large informal sector
economy
▪ Great resilience and
capacity for diversification
▪ Sewing and tailoring
substantial – presents
potential for specialization
and agglomeration and
expansion
▪ Big and renown local and
international markets –center
of commerce
▪ Large informal sector
economy
▪ Great resilience and
capacity for
diversification
▪ Large informal sector
economy
▪ Great resilience and
capacity for diversification
▪ 70% earn above N25,000
monthly income
Physical ▪ 84.7% of buildings
constructed of concrete
▪ 60% of houses
constructed of
concrete
▪ 71% of houses constructed
of concrete
Human
▪ Generally significant
population
▪ Significant virile household
heads – 26-45 years
▪ Creative and adaptive
population – mostly into
business/ trading
▪ Literate population – 96%
had formal education to at
least primary school level.
▪ Generally significant
population
▪ Significant virile
household heads – 26-
45 years
▪ Creative and
adaptive population –
mostly into trading
▪ Literate population –
about 55% had
above primary
education
▪ Generally significant
population Significant virile
household heads – 26-45
years
▪ Literate population – only
1.3% had no formal
education

130
Asset Aba Oshogbo Kaduna
Natural
▪ Possible development in
every front - city surrounded
by farmland and fallow land
▪ Aba River – presents
potential for riverbank parks
and urban green areas
▪ Possible development
in every front - city
surrounded by
farmland and fallow
land
▪ Osun River – presents
potential for riverbank
parks and urban
green areas
▪ Possibility of development in
the western flank, and also
in the east with new bridges
being constructed
▪ River Kaduna – presents
enormous potentials for
floodplain agriculture and
river park ecotourism
Social
▪ Religious Network – 79%
belongs to a religious group
▪ Engaged in community self-
help projects
▪ Willing to volunteer personal
labour
▪ Willing to Volunteer
professional service
▪ Willing to engage in
community mobilization and
enlightenment
▪ Good social network
– 75% belongs to one
association or another
▪ Long term
commitment – 45%
are landlords
▪ 74% of landlord have
access to tenure
▪ Engaged in some
form of self-help or
community efforts
▪ Willing to volunteer
personal labour
▪ Willing to engage in
community
mobilization and
enlightenment
▪ Good social network – 92%
belongs to one association
or another
▪ Engaged in community self-
help projects
▪ Long term commitment -
46.5% are landlords
▪ 85.3% of the landlords have
access to tenure
▪ Willing to volunteer personal
labour
▪ Willing to engage in
community mobilization
and enlightenment
▪ Willingness to make
financial contributions
Cultural
▪ Close to the Aba stadium –
potential for sports tourism
▪ Strong traditional
community identity
▪ Historic city
▪ Renown administrative and
military center
▪ Well mixed population with
great diversity
▪ Strong traditional
community identity
▪ Close to the Ahmadu Bello
Stadium – potential for
sports tourism
Table 13: Identified Possible Threats for the Slums in the Three Cities
Threat Aba Oshogbo Kaduna
Economic
▪ Weak financial base - 65%
earn less than N25,000/pm
▪ Financial institutions
absent
▪ Weak financial base -
45% earn less than
N25000/per month
▪ Financial institutions
absent
▪ 30% still earn less than
N25000/per month
Physical
▪ Rapid spatial expansion –
5.4%pa
▪ Very rapid spatial
expansion – 21%pa
▪ 38.3% of the houses
constructed of mud
▪ Rapid spatial expansion
– 4.5% pa
▪ 25% of houses
constructed of mud

131
Human
▪ Large household size –
70% has more than 4
persons per household
▪ Relatively high density
▪ Large household size,
over 90% has above
4person per household
▪ Relatively high density
in Kaduna urban
villages
▪ Large household size –
about 75% has more
than 4 persons per
household
Natural
▪ Aba River divides the city
into two unequal halves –
causes flooding of
surrounding areas
▪ Areas around the Osun
River risk flooding at high
flow
▪ Slum clusters close to
the Kaduna River
floodplain (e.g.
Ungwan Rimi, Kabala
Doki and Barnawa) risk
flooding at high flow
Social
▪ Long term commitment
may be lacking - 70% are
tenants
• Explosive mix of
population – frequent
ethnic and religious
clashes

132
APPENDIX V: EXPERT INTERACTIVE SESSION
Minutes of the Expert Interactive Session for the Slum Study Report on Three
Cities (3) held at the MGIS Room, Faculty of ARTS, University of Lagos, Akoka-
Yaba, Lagos Tuesday, July 29, 2014
Present
NAME ORGANISATION
1 Prof. Peter O. Adeniyi Polad Technologies ltd
2 Victor Ilechukwu
(Ph.D)
University of Lagos
3 Chike Anikamadu FMLHUD, Abuja
4 Badru Gbolahan University of Lagos
5 Lana Olalekan FMLHUD, Abuja
6 Mayowa Fasona University of Lagos/Polad Technologies ltd
Consultant
7 Ege Emmanuel University of Lagos/Polad Technologies ltd
Consultant
8 Prof. Iyiola Oni University of Lagos
9 Omotayo Awomosu Spatial Resource Consulting
10 Peter O. Elias University of Lagos/Polad Technologies ltd
Consultant
11 Ayo Adejumo Ayo Adejumo and Co
12 Banjo Kayinsola Ayo Adejumo and Co
13 Gloria C. Agu-Nwofor G.C. AguNwofor and Co
14 Ajayi Olalekan University of Lagos
15 Oni Adebukola F. University of Lagos
16 Val Ofogba Lensprings and Co
17 Olatunji Babatola University of Lagos
18 Alabi Soneye University of Lagos
19 Joyce Omenai University of Lagos
20 Osuade Oyediran
(Arc)
University of Lagos
21 Gbenga Obe Polad Technologies ltd
22 Sam Udofia University of Lagos
23 Muyiwa Adeniyi Polad Technologies ltd

133
Opening Remarks
The interactive session was called to order by the Managing Director/CEO of
Polad Technologies Ltd, Prof. Peter O. Adeniyi at 9.00am, with a welcome
and introductory remark where the purpose of the session and strategy to be
adopted was outlined.
This was followed by a brief remark by the Deputy Director, FMLHUD; Mr. L.C.
Anikamadu where the importance attached to the slum identification and
needs assessment study by the Ministry was accentuated. Specifically, he
noted that the study will among other things help reduce the embarrassing
lack of reliable data on the identification of slum phenomenon in the country
while also setting the stage for meaningful and well-coordinated interventions
and possibly charting the course for the development of a virile national slum
policy and strategic plan. He therefore challenged all present to make best
use of the opportunity to bring to birth a proactive report that would attract
due attention and set the stage for “cities without slums” in Nigeria.
Brief Presentation Of The Methodology And Major Findings Of The Slum Study
Dr. M.J Fasona, the lead consultant presented the adopted methodology
and major findings of the slum study. As presented, the methodology
adopted for the study entails the use of questionnaires, field observation, key
informant interviews, focus group discussions and photo campaigns while the
results were in the form of tables, charts and pictures depicting the conditions
of the selected slum indicators. Also presented are the findings of the needs
assessment of the residents of the three cities under study.
Presentation and Discussion Of Slum Upgrading Strategy
The peculiar slum upgrading strategy for each of the cities under study were
presented by members of the consulting team. Specifically, Dr. M.J. Fasona
presented the slum upgrading strategy for Kaduna, Dr. E.E Ege presented the
strategy for Aba while Dr. P.O. Elias presented the slum upgrading strategy for
Oshogbo.
Presentation, discussion/review and agreement/validation of
recommendations on slum upgrading action plans for the three (3) cities
The general observation/suggestions that cut across the three cities are:
• Dr. Victor Ilechukwu suggested that the rapid areal expansion of the
cities would have been better depicted if they were related to the
population growth estimates in the cities.

134
• Mr. Omotayo Awomosu opined that the designed rating scale for the
perception of the state of infrastructure is unconventional especially
the last two scales (i.e. Worse and worst).
• He also noted that the slums were not properly identified or
demarcated/singled out since no names were linked to specific slums.
He thus suggested that each identified slum should be named after the
major road in the area.
• Prof. Oni suggested that there is the need to assess the level/state of
ongoing intervention by other bodies so as to know the necessary point
of intervention.
• The need to introduce the assessment of gender, resettlement and
compensation issues into the study was also highlighted.
• Also noted is the need to develop a strategy to contain future growth
of slums.
• Mr Omotayo Awomosu also indicated that the slum upgrading strategy
recommendations are not encompassing enough as some germane
aspects are missing. He thus suggested a design which contains a
column for recommendation, objectives, activities, deliverables,
timelines and implementing agencies.
• The timelines for the slum upgrade plans was also amended, with the
short term increased to 1-3years, medium term increased to 3-5yrs while
the long term was increased to 5yrs and above.
• The need to separate the report into three with each city standing
alone and each having their own photo album was emphasised.
Specific validated recommendations for slum upgrading in Aba
Short term (1-3yrs)
• The specific names of the implementation agencies should be
mentioned
• The establishment of a slum upgrading unit in the planning
department of the FMLHUD which should be replicated in all state
ministries of lands and urban development. This is to ensure that the
recommended slum upgrade strategies are championed by a
specific agency in collaboration with others.
• Creation of a GIS database to monitor slum upgrade success or
failure.
• The search for donors or international development partners to fund
slum upgrading exercises.
Medium term (3-5yrs)

135
• Community based organisations (CBOs) and local government
areas should be involved in the implementation to ensure their
participation.
Long term (>5yrs)
• The need to create another pole in the state by moving a section of
the artisan in the market to another locality to ensure the
decongestion of the area.
Specific validated recommendations for slum upgrading in Kaduna
Short term (1-3yrs)
• Public places where the clearance are to be done should be noted
• The need to sensitize the citizens and especially the butchers on the
use of the abattoirs
• There is also the need to introduce private-public partnership system
to effectively run the abattoirs
• The establishment of a slum upgrading unit in the planning
department of the FMLHUD which should be replicated in all state
ministries of lands and urban development. This is to ensure that the
recommended slum upgrade strategies are championed by a
specific agency in collaboration with others.
• Creation of a GIS database to monitor slum upgrade success or
failure.
• The search for donors or international development partners to fund
slum upgrade exercises.
Medium term (3-5yrs)
• The need to improve the distribution of electricity through the
provision of transformers.
• The specific agencies that will implement the recommendations
should be mentioned.
Long term (>5yrs)
• The need for social instead of special housing
• Specific attention should be paid to the decongestion of slum
areas. This can be done by developing medium cost housing
estates where medium income households can move to thereby
decongesting the slum areas.
• The need to involve community based organisations (CBOS) in the
implementation of the slum upgrade strategies
Specific validated recommendations for slum upgrading in Oshogbo
Short term (1-3yrs)

136
• The specific public areas should be mentioned. Examples should
include; market, shopping malls, parks etc.
• The need for tenure improvement to ensure buy- in since most
inhabitants of the area are tenants and so do not have much at
stake.
• The establishment of a slum upgrading unit in the planning
department of the FMLHUD which should be replicated in all state
ministries of lands and urban development. This is to ensure that the
recommended slum upgrade strategies are championed by a
specific agency in collaboration with others.
• Creation of a GIS database to monitor slum upgrade success or
failure.
• The search for donors or international development partners to fund
slum upgrade exercises.
• The implementation agencies should be Osun State Government,
Local Government Area, trade associations and community based
organisations.
Medium term (3-5yrs)
• The need to improve the distribution of electricity through the
provision of transformers
• The specific agencies that will implement the recommendations
should be mentioned
• Responsible agencies should include the state government, LGAs
and the private sector.
Long term (>5yrs)
• Specific attention should be paid to the decongestion of slum
areas. This can be done by developing medium cost housing
estates where medium income households can move to thereby
decongesting the slum areas.
• Development plans for the Osun-Osogbo groove should be
conceptualised
• Provision of ancillary facilities should be improved
• Complimentary services like parks, shopping malls, hotels and golf
course should also be encouraged.
• The local stakeholders should be encouraged to take ownership of
the slum upgrade exercise
Closing remarks
The MD/CEO of Polad technologies thanked the participants for their
constructive contribution to the session which he noted would greatly

137
improve the final report of the slum study. He thereafter wished them journey
mercies.
APPENDIX VI: PHOTO ALBUM OF SLUM AREAS