Integrated pest management portfolios in UK arable farming: results of a farmer survey
Upload
khangminh22Category
view
1download
0


Using sludge on arable land – effect based levels and long-term accumulation for certain organic pollutants John Sternbeck, Line Diana Blytt, Kim Gustavson, Sofia Frankki and Morten Bjergström
TemaNord 2011:506

Using sludge on arable land - effect based levels and long-term accumulation for certain or-ganic pollutants TemaNord 2011:506 © Nordic Council of Ministers, Copenhagen 2011
ISBN 978-92-893-2194-5
This publication has been published with financial support by the Nordic Council of Ministers. But the contents of this publication do not necessarily reflect the views, policies or recommendations of the Nordic Council of Ministers.
Nordic Council of Ministers Nordic Council Ved Stranden 18 Ved Stranden 18 DK-1061 København K DK-1061 København K Phone (+45) 3396 0200 Phone (+45) 3396 0400 Fax (+45) 3396 0202 Fax (+45) 3311 1870 www.norden.org
Nordic co-operation
Nordic co-operation is one of the world’s most extensive forms of regional collaboration, involving Denmark, Finland, Iceland, Norway, Sweden, and three autonomous areas: the Faroe Islands, Green-land, and Åland.
Nordic co-operation has firm traditions in politics, the economy, and culture. It plays an important role in European and international collaboration, and aims at creating a strong Nordic community in astrong Europe.
Nordic co-operation seeks to safeguard Nordic and regional interests and principles in the global community. Common Nordic values help the region solidify its position as one of the world’s most innovative and competitive.
Content
Summary ............................................................................................................................ 7 1. Introduction .................................................................................................................. 11
1.1 Background .......................................................................................................... 11 1.2 Scope and goal of this project .............................................................................. 11 1.3 Production and use of sewage sludge ................................................................... 12 1.4 Pollutants in sludge – current legislation.............................................................. 13 1.5 History behind limit values .................................................................................. 15 1.6 Summary of the VKM model ............................................................................... 16
2. Methods and data.......................................................................................................... 19 2.1 Data on sludge quality.......................................................................................... 19 2.2 General principles for calculation of effect based levels ...................................... 19 2.3 Acceptable concentration in soil........................................................................... 21 2.4 Effect based levels in sludge ................................................................................ 27
3. Organic pollutants in sludge from the Nordic countries ............................................... 33 3.1 PAH...................................................................................................................... 33 3.2 PCB ...................................................................................................................... 35 3.3 Phthalates ............................................................................................................. 35 3.4 Alkylphenols ........................................................................................................ 35 3.5 LAS ...................................................................................................................... 35 3.6 PBDE ................................................................................................................... 35 3.7 Other organic compounds..................................................................................... 36
4. Chemicals use and near future prognosis...................................................................... 37 4.1. Sources of selected substances to the WWTPs.................................................... 37 4.2. Current legislation ............................................................................................... 43 4.3. Conclusions ......................................................................................................... 48
5. Accumulation in soil..................................................................................................... 49 5.1 Accumulation of organic pollutants – review of case studies............................... 49 5.2 Long-term accumulation in Nordic region ........................................................... 52
6. Effect based levels and risk assessment........................................................................ 59 6.1 Effect based levels................................................................................................ 59 6.2 Comparing effect based levels with levels in Nordic sludge ................................ 63
7. To control pollution from use of sludge ....................................................................... 67 7.1 Limit values or other ways to control? ................................................................. 67 7.2. Monitoring........................................................................................................... 71 References.................................................................................................................. 75
Appendice 1. Contaminants in sludge from the Nordic countries..................................... 79 Appendice 2. Substance-specific data used in the calculations......................................... 89
References.................................................................................................................. 91 Appendice 3. Critical sludge concentrations for soil organisms, human exposure and birds ................................................................................................ 93 Appendice 4. Management for soil protection.................................................................. 95 Appendice 5. Limit values and application rates for sludge – a comparison between the Nordic countries .................................................................. 97


Preface
In the waste water treatment process in sewage treatment plants, sewage sludge is produced as a by-product. The sludge contains nitrogen and phos-phorus that originate from the waste water. In addition to these nutrients, sludge also contains micronutrients and organic matter. Many of these sub-stances are required for the production of food and they can be recycled by using sludge as a fertiliser on farm lands.
Phosphorus is the nutrient that is of primary interest at present. This is due to the fact that phosphorus is a finite resource that is mined and has various levels of unwanted impurities. In the foreseeable future, there will be a shortage of phosphorus ore with low levels of impurities. Ores with higher levels of impurities may also be used in the production of mineral fertilisers in the future, but it may require that energy demanding cleaning techniques are used. Such a scenario will lead to higher market prices for phosphorus fertilisers, which may have social consequences on a global scale. It is therefore crucial that the available phosphorus is used efficiently, from an economic, environmental and social perspective.
However, sewage sludge also contains pollutants. The metal content in sludge that is to be used on farm land is regulated in the Nordic countries. Neither in the Nordic countries nor in the EU is there a corresponding regu-lation of organic pollutants in sludge that is to be used on arable land. The need for an updated legislation covering organic pollutants in sludge has been discussed within the EU for several years. To consider the need for limiting values for organic pollutants is of value for the Nordic legislation as well as for the EU.
The present report contributes to increasing the knowledge on the risks that organic pollutants in sewage sludge may pose. The report is thus an important contribution to the work of updating sludge legislation and to evaluating the possible need of limiting values.
Linda Gårdstam, Naturvårdsverket, Sweden

Summary
Sludge from municipal waste water treatment plants is rich in phosphorus. The use of sludge as a fertilizer on agricultural land may decrease the need for mineral fertilizers and may contribute to more efficient recycling of nu-trients. However, sewage sludge also contains numerous organic pollutants. There is a general concern that using sludge on agricultural land contributes to environmental pollution and may cause negative effects on human health and the environment. The major goals of this report was to assess this aspect by 1) reviewing current levels of organic pollutants in sludge form the Nor-dic countries; 2) assessing whether these levels may change as a conse-quence of recent chemicals legislation; 3) evaluate the potential for envi-ronmental pollution and risks, by suggesting effect based limit values (EBLs) for sludge on agricultural land; 4) discussing the suitability of apply-ing these EBLs as limit values.
Effect based values for sludge and long-term accumulation in soil were calculated using risk assessment and mass-balance models for three different application rates of sludge:
3,5 tonnes DW sludge/ha every 5th year 6 tonnes DW sludge/ha every 5th year 20 tonnes DW sludge/ha every 10th year. This work was based on modifications of a recent forward modelling of pollutant exposure from sludge use on agricultural land (VKM, 2009). The VKM report covered a number of exposure pathways, of which the two critical pathways were human exposure from root vegetables and effects on soil living organisms. A further exposure pathway, not considered by VKM, is the transfer from soil to earthworms that are eaten by birds. These three endpoints formed the basis for the effect based levels that were calculated. It was assumed that human intake of organic pollutants via root vegetables must not contribute with more than 10% of the tolerable daily intake.
The pollutants covered in this report are nonylphenol, octylphenol, LAS, DEHP, dibutylphthalate, PAHs, PCBs and PBDEs. LAS is by far the most abundant organic pollutant in sewage sludge, followed by DEHP and nonyl-phenol. Certain datasets from the Nordic countries shows evidence of de-creasing concentrations in sludge over the past 10–15 years. The legislation under REACH and WFD may further contribute to lower levels, in particu-lar for persistent substances.
The model estimated long-term accumulation of organic pollutants in soil, using current levels in sludge and atmospheric deposition as the pollut-ant sources. The modelling clearly shows that sludge application, even at the

Using sludge on arable land 10
low application rate of 3,5 ton/ha every 5th year, leads to significantly in-creased levels in soil as compared to the case of atmospheric deposition as the single pollutant source. The calculated concentrations for PBDEs and PCBs are in good agreement with measured levels in Swedish soils, both in the case on non-treated and sludge treated agricultural soils.
Soil concentrations of PCBs and BDE-209 are likely to increase over time due to repeated sludge application. This agrees well with case studies where this aspect has been investigated in long-term field studies. It is likely that other persistent sludge pollutants such as dioxins, PFOS and chlorinated paraffins also will increase in soil upon repeated application of sludge.
Due to the relatively large dilution in soil, the calculated effect based levels are generally higher or much higher than current limit values. The latter were, however, not derived from a risk assessment perspective. Except for octylphenol, the pollutants considered are not of concern when their current concentrations in sludge are compared to the effect based levels. For octylphenols, a smaller fraction of sludge may be of concern. The critical effect for octylphenol would be soil organisms but the underlying ecotoxi-cological data is highly uncertain and possibly too conservative. Applying those EBLs as limit values would thus neither impact the use of sludge on agricultural land, nor stimulate an improvement in sludge quality.
Alternative approaches for establishing limit values for organic pollutants in sludge are also discussed. Basic principles underlying alternative ap-proaches for limit values may be 1) the precautionary principle for minimis-ing the long-term accumulation of persistent pollutants; 2) a general objec-tive to reduce releases of organic pollutants, with sludge being an indicator of such releases; 3) to permit other uses of sludge where the application rates may be much higher than in agricultural land.
General recommendations are given below, and a monitoring strategy is briefly discussed in the report: There is no need for implementing effect based limits for organic
pollutants as limit values in sludge that is to be used on arable soils. The occurrence of persistent organic substances in sludge should be
monitored in some manner. Long term goals of decreasing temporal trends for persistent organics
in sludge may be implemented. Current use chemicals with particular hazardous properties (e.g.
endocrine disrupting) may be monitored at selected WWTPs. The purpose would be as indicators of diffuse release from society.

1. Introduction
1.1 Background
Large amounts of sludge are produced annually in municipal waste water treatment plants. The sludge is rich in nutrients and using sludge as a fertil-izer in e.g. agriculture may contribute to closing the societal nutrient fluxes and to diminishing the need for mineral fertilizers. However, municipal sludge also contains toxic pollutants. The occurrence of metals such as cop-per and lead in sludge is well known since decades. During the past decade or so, numerous organic pollutants have been detected ubiquitously in sludge. Widespread usage of sludge in agriculture and elsewhere may there-fore contribute to a contamination of large land areas and to toxics exposure in the ecosystem and to humans. It is therefore of general interest that nutri-ent recycling by sludge application is safe, i.e. that it does not pose risks for ecosystems, for human health or for pollutant accumulation in the soil envi-ronment.
1.2 Scope and goal of this project
This project aims at providing a basis for the Nordic countries in the nego-tiation and revision of the sludge directive within the EU. Specifically, the project aims at proposing effect based levels for organic pollutants and to evaluate possible consequenses of applying these levels as limit values. These are the primary goals of the project: To identify and summarise the concentration and occurrence of
organic pollutants in the Nordic countries and identify organic pollutants which may be critical now and in the future.
Suggest effect based values for sludge to be used on agricultural land, and discuss the need of limit values in legislation. This step is partly based on the risk assessment from the Norwegian Scientific Committee for Food Safety (VKM, 2009).
Evaluate the probability for changes in sludge pollutant levels in the near future with respect to on going and new management for chemicals (REACH).
Suggest a surveillance program for the critical chemicals (sampling methods and schemes) to be used by the stakeholders and the authorities, if limit values were to be implemented.
Using sludge on arable land 12
1.3 Production and use of sewage sludge
Municipal sewage water is a mix of wastewater from households and indus-try and urban runoff. The main purposes for wastewater treatment plants (WWTP) are to remove coarse debris, grit and organic material. Wastewater treatment plants may also remove phosphorus and/or nitrogen if they have discharges to vulnerable fresh water bodies and sea areas. Sludge slurry from the separation unit is thickened and dewatered from 0.5–3 % DM up to 20–40 % DM. The organic solid phase, without the grit and debris, is called sludge. Some sludge is also collected directly from septic tanks from dwell-ings or small communities. Septic sludge is dewatered in a WWTP or in other locations. When there is no WWTP in the district, dewatered septic sludge is usually composted or put in long term storage. Wet sludge (2–4% DM) are some times stored by spreading it on rush beds or other permeable sandy soil to dewater.
There is different practice on sludge application on land in the Nordic countries and this variation has different causes related to access to suitable agricultural land and practice and perception among farmers. There are also local variations within each country. When sludge is applied on agricultural soils, it is basically on perennial crops as grain fields. Farmers who have access to animal manure rarely uses sludge. Sludge is also applied on forests (energy forest and forest plantation) in Sweden and Denmark. The produc-tion and use of sludge in the Nordic countries are shown in Table 1.
There is some different legal requirements and practices for sludge treatment and the hygienic standards also differ between the Nordic coun-tries. In Norway there is legal requirements that sludge is stabile (odour control) and hygienic before application on agricultural land, green areas and cover for landfills. In general there is a legal requirement in Denmark, Sweden and Finland that sludge must have some additional treatment before it can be applied on agricultural land. On the whole, common treatment methods for sludge are anaerobic digestion in a biogas reactor, thermal dry-ing, lime treated (quick lime), windrow composting, wet composting in closed reactor and different types of long term storage which includes appli-cation of wet sludge on rush beds. Windrow composting and long term stor-age are methods that are more common for smaller WWTP in the country-side because the treatment may give unpleasant odour and the methods are area demanding.
Even though sludge is and has been used as soil amendments and fertil-iser for agricultural soil for numerous of years, an uncertainty whether sludge is safe for food production purposes has arisen in the last years. Questions concerning the scientific evidence behind the limit values for metals have been raised. The has also been concern whether sludge applica-tion may give harmful long and short term effects due to unknown sub-stances such as organic pollutants. Increased pressure from stakeholders on

Using sludge on arable land 13
the primary food producers in general on management on food safety issues, enforces these concerns.
Table 1. Statistics on produced amount of sludge, disposal routes and use of sludge in the Nordic countries. The amount is given in ton dry weight (DM)
Sludge in Denmark 2007 2) % Use of sludge, ton DM
Agricultural land /green areas 53 107 166 Incineration 3) 32 64 704 Export 8 16 176 Deposited 4) 3 6 066 Other /storage/ unknown 4 8 088 Total 100 202 200
Sludge in Finland (2001/2006) % Use of sludge, ton DM
Agricultural land /green areas 12 Green areas 82 Deposited 6 Total 100 150 000
Sludge in Norway (2006) % Use of sludge, ton DM
Agricultural land 49 50 818 Green areas 1) 24 24 708 Cover for landfills 5 5 064 Deposited 5 5 606 Other / storage/ unknown 17 17 600 Total 100 103 795
Sludge in Sweden (2006) Use of sludge, ton DM
Agricultural land 15 31 473 Green areas 36 81 153 Cover for landfills 22 45 867 Deposited 3 5 977 Other /storage/ unknown 21 42 668 Total 100 207 138
1) Include the amount of sludge for production of construction soil 2) Amount of sludge reported to the authorities in 2002 and use is based on a survey by DANVA in 2007 4) Incineration (including production of ash based products) 3) Amount of deposited sludge reported to the Danish authorities in 2002
1.4 Pollutants in sludge – current legislation
The current European regulation (sludge directive 86/278/ECC) regulates the concentration of metals and to some extent the hygienic standards for treatment for sludge from urban wastewater treatment plants The directive has set out minimum requirement for some metals and hygienic aspects and the individual member states in EU/EEA have implemented the directive and made stricter national legislation. Since the sludge directive is more than twenty years old some member states have enlarged the scope of their na-tional legislation and included maximum concentrations for selected organic pollutants in sludge.
Denmark has limit values for metals and organic pollutants. Phosphorus is usually the limiting factor for sludge application on agricultural soil, and the application quantity for sludge is also regulated by the need for phospho-

Using sludge on arable land 14
rus. Denmark has limit values for the organic pollutants LAS, PAH (9), NPE and DEHP, (see table 2).
Table 2. Limit values for organic pollutants that are proposed or implemented in Denmark Sweden and a proposed EU legislation on sludge.
Denmark Sweden* Proposed EU legislation
mg/ kg sludge DW
LAS 1,300 - 5,000 PAH9 3 - 6 PAH6 - 3 - NPE 10 50 450 DEHP 50 - - PCB7 - 0.4 0.8 PCDD /F - - 0.0001 ITEQ
* These values are based upon an voluntary agreement between the Swedish agricultural organisations and waste water treatment organisation and are “guidevalues (riktvärden)”.
Finland has limit values for metals in sludge. Focus on sludge and use of sludge has been scarce in Finland due to only few lager WWTP and many small ones. There are also challenges concerning strategic and planned utili-sation and quality control for septic sludge. The sludge production has in-creased the last years because more of the population are now connected to a public sewer system and WWTP. Finland has a strategy to make use of 90 % of the sludge within 2010. An investigation of sludge from four plants was carried out in 2005 and sludge was analysed for organic pollutants.
Norway has limit values for metals in sludge and depending on the con-centration of the metals; the sludge is categorized with a “quality class”. The classes are related to permitted application amounts per ha. There are no limit values for organic pollutants, but the WWTP must be aware of any hazards related to organic pollutants in sludge that may cause risk for the environment. It is a legal requirement to have a quality management system for WWTP who put sludge on the market. Different organic pollutants have been analysed in sludge in three larger national surveys since 1996.
Sweden has limit values for metals in sludge. It is proposed a new regula-tion that also considers concentration limits for the amount of phosphorus (Naturvårdsverket, 2010), similar to the regulation in Denmark. The author-ity has given “guide values”, which are advisory values, for organic pollut-ants in sludge (table 2). In Sweden WWTPs may be certified according to a national standard. This standard is a quality management system for sludge production. In this certificated system legal aspects and advices from the authorities and stakeholders (farmers) are taken into account (Naturvårds-verket, 1995).
Using sludge on arable land 15
1.5 History behind limit values
Restrictions and approval for chemicals substances are generally based on risk assessments, including scientific estimates of exposure and effects for the chemicals. However, pure scientific risk assessment has only partially been used to decide the current limits for pollutants in sludge. The current limit values have evolved over the last thirty years and can be regarded as target values. They are typically based on the 90-percentile for concentra-tions in sludge from different WWTPs. The upper 10 percent of the sludge was off the standard and WWTP had to take actions to get sludge within the limit values. History has shown that after some years, more and more WWTP satisfied the limit values. The expected concentration for metals declined. After a while the authorities reduced the limit values again.
There are different reasons why metal concentration in sludge has de-creased the last twenty-five years. Some WWTP found the source for the discharges and took action. Other explanations are the general environ-mental awareness by the society and industry, new legislation for chemicals, more extensive pollution control and environmental campaigns. Different strategies can be used to protect the environment and reduce the pollutant levels. However, limit values that are not based on scientific risk assess-ments are more difficult to communicate, and do not necessarily imply that sludge is safe when concentrations are below these values.
In the recent years, knowledge and focus on organic pollutants in the en-vironments have increased. Diffuse releases from various human activities are important for organic pollutants, why many organic pollutants occur in municipal wastewaters. Wastewater treatment plants use various treatments processes which reduce the discharges of organic pollutants differently. Common for all treatment plants is that some organic pollutants end up in the sludge, however the concentrations vary depending on the concentra-tions in wastewater, the wastewater treatment process and the sludge treat-ment process itself. Sludge treatment do not influence on the concentration on metals, however, various organic pollutants may be degraded through biological treatment both in the wastewater treatment process and in the sludge treatment process.
The most abundant organic pollutants in sludge are LAS, certain phtha-lates and nonylphenol. Other sludge pollutants that may be of concern due to their toxicity of persistence are PAHs, PCBs and PBDEs. New and better analytical techniques continuously put other chemicals on the board, e.g. PFAS and PFOS (Perfluoroalkylsulfonate, Perfluorooctanesulfonate), phar-maceuticals and musks. More details on organic pollutants are given in later chapters.
Using sludge on arable land 16
1.6 Summary of the VKM model
A recent risk assessment of organic pollutants in sludge were performed by VKM (2009), who modelled environmental concentrations and human ex-posure of pollutants following the application of sludge on agricultural soils. Several exposure scenarios were assessed and fairly high sludge application rates were used (40 and 60 tonnes/ha). Concentrations of organic pollutants in Norwegian sludge were used as input to model exposure at various com-partments. These exposures were related to toxicologically or ecotoxicologi-cally based levels in order to assess the possible risks from organic pollut-ants when using sludge on agricultural land.
Although their overall conclusion appears to be that organic pollutants poses no major risks, certain exposure pathways are more critical than oth-ers. In this report, those exposure routes with the highest risk quotients (RQs) were identified for each of the compounds evaluated in the VKM-report. These exposure routes were used as a basis for calculating critical soil concentrations, which are used in a mass-balance model for establishing critical concentrations in sewage sludge. Input data and exposure models were reevaluated for the critical exposure pathways. The following sections give a brief review of VKMs assessment of environmental and human risks.
1.6.1 Environmental effects
Plants and soil living organisms
The risks for effects on animals and plants living in soil were assessed based on direct comparison of modeled soil concentrations (PECsoil) and PNEC val-ues. For octylphenol and nonylphenol, PECsoil exceeds the PNEC values (RQ>1), indicating that nonyl- and octylphenol may pose a risk to plant living organisms. VKM point out, however, that PNEC value for octylphenol is based only on data for aquatic toxicity. The PNEC value for octylphenol may be too conservative, resulting in overestimated risks. The PECsoil of PAH16 is of the same order of magnitude as PNEC of individual PAH:s (acenaphthene, benzo(a)pyrene and benzo(a)anthracene), suggesting a certain margin of safety.
Surface water
Spreading sewage sludge on agricultural land or on green areas may results in increased levels of contaminants in both surface- and ground water. This may pose a risk of effect on biota in surface waters. Drainage and surface runoff were identified as the main transport routes for exposure to aquatic life in surface waters.
Transport of contaminants from the soil to surface water occurs through the drainage system or by runoff on the soil surface. In VKM report models developed for estimation of leakage of pesticides to surface waters (Pesti-cide Root Zone Model/PRZM3) have been used for the prediction of con-

Using sludge on arable land 17
centrations of sludge contaminants in surface water. The amount of con-taminants leaching into surface water depends on soil type, meteorological conditions and the physical/chemical properties of the contaminants.
In the VKM report model simulation was performed with sludge (40 and 60 tonnes/ha) applied on bare soil and incorporated in the soil down to 20 cm. The concentrations of the compound added correspond to the calculated amount of active ingredient according to the content of the different con-taminant in the sludge. Maximum concentrations in surface waters is esti-mated assumed that the drainage and run-off water is diluted a factor 10 in the primary recipient. For the organic compounds, decay rates are included in the model simulation.
The output of the simulation in the VKM report indicates low concentra-tion of the contaminants in surface water from spreading sewage sludge on agricultural land. Concentrations are in general far below Environmental Quality Standards and PNEC values for toxic effects on aquatic organism in freshwater.
Calculated RQ for surface waters were close to 1 for pyrene and in-deno(123cd)pyrene. No PEC in surface water was presented for PCB:s. In their assessment of impact on surface waters, surface runoff was the critical exposure pathway whereas drainage was insignificant. The model was very conservative because levels of most pollutants decline rapidly in soil follow-ing sludge application, and it is unlikely that a major surface runoff event occurs directly after sludge application. VKM also states that the results are very uncertain since the model has not been validated with field data from sludge amendments.
Animals eating food or feed
No RQs were calculated but the exposure to organic contaminants with chronic effects were supposed to be negligible as the lifetime of the animals is much shorter than for humans.
Human exposure
Human exposure was assessed via intake of food. Intake of root vegetables is the critical exposure pathway for all compounds. Exposure through intake of meat and milk was negligible when compared to the intake of vegetables.

2. Methods and data
2.1 Data on sludge quality
The evaluative step is critically dependent on pertinent data on current levels of organic pollutants in sludge in the nordic countries. Data on sewage sludge has been compiled by using open sources (databases and reports) and scientic papers. National experts were also contacted in all nordic countries in order to identify all available data. It is assumed that all studies from which data were compiled used sufficient QA/QS on the analytical methods used. Quality check in this study was constrained to identifying obvious outliers in datasets.
Following quality check, data were described by standard statistical pa-rameters. In cases where concentrations in sludge overlapped with the pro-posed effect based levels, data were fitted to suitable probability density functions. Cumulative distribution functions were used in order to estimate approximate fractions of sludge above or below certain proposed effect based levels.
2.2 General principles for calculation of effect based levels
The overall goal is to calculate pollutant levels in sludge that allows sludge to be used on agricultural soil without causing unacceptable risks to envi-ronment or human health. This is accomplished using risk assessment meth-ods for the critical exposure pathways as identified from the VKM (2009) report: terrestrial plants and soil organisms human exposure from root vegetables An additional exposure pathway is the soil-earthworm-bird chain. This pathway was not included in the VKM assessment but is included in this assessment in order to cover the risks of bioaccumulation and trophic trans-fer.
The impact on surface waters is also discussed but not treated quantita-tively. Calculations are performed in several steps: Calculate the highest acceptable level in soil for each pollutant and
exposure pathway

Using sludge on arable land 20
Select the lowest of these levels for each pollutant Use a mass-balance model to calculate the corresponding effect based
levels in sludge . In addition, the long-term accumulation of persistent organic pollutants in soils is assessed.
When establishing effect based levels for sludge it must also be specified for which conditions they are valid, and what they intend to protect. The overall purpose is to suggest effect based levels for certain organic pollut-ants that allow for using sludge at specified rates to agricultural soils with-out: posing unacceptable risks to humans posing unacceptable risks to the environment leading to significant long-term accumulation of organic pollutans in soil
The accumulation, degradation, transport and exposure of organic sub-stances in soils are influenced by many variables that vary with e.g. climate, crop type and soil. The intention with these effect based levels is that no further restrictions should be required. It is also assumed that humans can eat all their crops from soil that were treated with sludge during the entire life, based on data for high consumers (95-percentile intake rates). Because the toxicological endpoints, e.g. TDI, are based on a life-long intake, the fraction of diet deriving from sludge-treated soils should be specified. WHO (2002) discusses this subject and admittedly assumes a conservative value of 100%. For the Nordic countries, it was calculated how large areas of agricul-tural land that could be fertilised by sludge, based on the present annual sludge production. At the most about 20% of the agricultural land can fertil-ized by sludge (Table 3). It cannot, however, be assured that the vegetables consumed during a life-time are random samples from all available agricul-tural land. Therefore, the effect based levels are based on the principle that all vegetables consumed were grown on sludge-treated land.
Humans are exposed by the pollutants considered from various sources: e.g. fish (PCBs), indoor dust (phthalates), detergents (LAS and alkylphe-nols), urban air (PAHs). It is not considered possible, with a reasonable ef-fort, to provide accurate estimates of all these exposures. Rather than adjust-ing pollutant exposure from crops with this “background exposure”, the effect based levels were based on a principle that exposure from sludge through crops must not exceed 10% of TDI. This principle was selected in the work. As a comparison, the Swedish guidevalues for contaminated land are based on the general principle that exposure from vegetables grown on contaminated land may contribute to 50% of the TDI (10% for POPs).

Using sludge on arable land 21
Table 3. The current sludge production in the Nordic countries, in relation to area of arable land. The last columns show what fraction of the arable land that theoretically could be fertilised by sludge, based on current sludge production, at two rates of sludge application.
Fraction of areal that can be fertilized by sludge
Country Sludge production (tonnes dw/yr)
Areal (ha) of arable land for grain and root vegetables
3,5 ton/ha every 5th yr
20 ton/ha every 10th yr
Denmark 202 200 2 244 000 13% 4,5% Finland 150 000 1 386 500 15% 5,4%
Norway 103 800 664 200 22% 7,8%
Sweden 207 140 1 240 600 24% 8,3%
2.3 Acceptable concentration in soil
The first step in the derivation of effect based levels for sludge is to deter-mine the highest acceptable concentration in soil for the critical exposure pathways: soil living organims; human exposure via root vegetables; birds that feed on earthworms.
As summarized in chapter 1.5, VKM also modelled the impact on surface waters and stated that the results were uncertain but that the PECs of two PAHs were only slightly lower than the PNECs. The PECs were represent-ing short periods of time whereas the PNECs or EQSs for these PAHs actu-ally represent annual average concentrations. The actual risk is thus lower than VKMs risk ratios indicate. Neither EU (EC, 2003a) nor USEPA (1995) include the aquatic ecosystem in their assessments of sludge amendments of agricultural land. Schowanek et al. (2004) also points out that surface runoff will coincide with high dilution in the rivers, and that there is a lack of mod-els for this assessment. In the scenarios modelled in this report, sludge ap-plication rates are lower than those used by VKM (2009). In summary, im-pact of surface waters is not considered a critical endpoint and is therefore not included in the present assessment.
2.3.1 Effects in soil living animals and plants
These effects can be assessed directly by using PNECsoil (predicted no effect levels) values for soil living organisms. The derivation of PNECsoil is a re-quirement in REACH for substances manufactured/imported/used in quanti-ties from 10 t/y onwards. For derivation of PNECsoil all available hazard information needs to be evaluated.
The calculation of a PNECsoil uses the same assessment factors as used when calculating PNECs for the aquatic compartment (Table 4). The size of the assessment factor depends on the type of data that are available i.e. short-term or long-term toxicity test, the number of trophic levels tested and the general uncertainties in predicting ecosystem effects from laboratory data. A dataset comprising of toxicity data for primary producers, consumers

Using sludge on arable land 22
and decomposers is preferred. The assessment factors proposed in Table 4 must be regarded as indicative.
Table 4. Standard assessment factors for deriving PNEC values (EC, 2003).
Information available Assessment factor
L(E)C50 short-term toxicity test(s) (e.g. plants, earthworms, or microorganisms)
1000
NOEC for one long-term toxicity test (e.g. plants) 100 NOEC for additional long-term toxicity tests of two trophic levels 50 NOEC for additional long-term toxicity tests for three species of three trophic levels
10
Species sensitivity distribution (SSD method) 5–1, to be fully justified on a case-by-case basis
Field data/data of model ecosystems Case-bycase
A PNECsoil is calculated on the basis of the lowest determined effect concen-tration. If results from short-term tests with a producer, a consumer and/or a decomposer are available, the result is divided by a factor of 1000 to calcu-late the PNECsoil. If only one terrestrial test result is available (earthworms or plants), the risk assessment should be performed both of this test result and on the basis of the outcome of the aquatic toxicity data to provide an indication of the risk.
PNECsoil values were compiled by VKM and listed in table 5. These PNEC values protect for chronic toxicity and are used in our calculation of effect based limits for sludge. These PNECsoil values are lower than e.g. those used in Sweden for contaminated soils (NV, 2009), because they are more protective.
Table 5. PNECsoil values (mg/kg dw) for soil living organisms. Most PNECsoil values were taken from the compilation of VKM (2009).
Compound PNEC soil living plants and ani-
mals Reference
DEHP >13 VKM (2009) DBP 2 VKM (2009) 4-Octylphenol 0,0067 VKM (2009) 4-Nonylphenol 0,3 VKM (2009) LAS 35 VKM (2009) Naphftalene 1 VKM (2009) Acenaphtylene 0,29 VKM (2009) Acenaphtene 0,038 VKM (2009) Phenanthrene 1,8 VKM (2009) Anthracene 0,13 VKM (2009) Fluorene 1 VKM (2009) Fluoranthene 1,5 VKM (2009) Pyrene 1 VKM (2009) Benz(a)anthracene 0,079 VKM (2009) Chrysene 0,55 VKM (2009) Benzo(a)pyrene 0,053 VKM (2009) Benzo(b)fluoranthene 0,28 VKM (2009) Benzo(ghi)perylene 0,17 VKM (2009) BDE-99 0,38 EC (2000) BDE-209 > 98 EC (2002a)
Using sludge on arable land 23
3.2.2 Human exposure from root vegetables
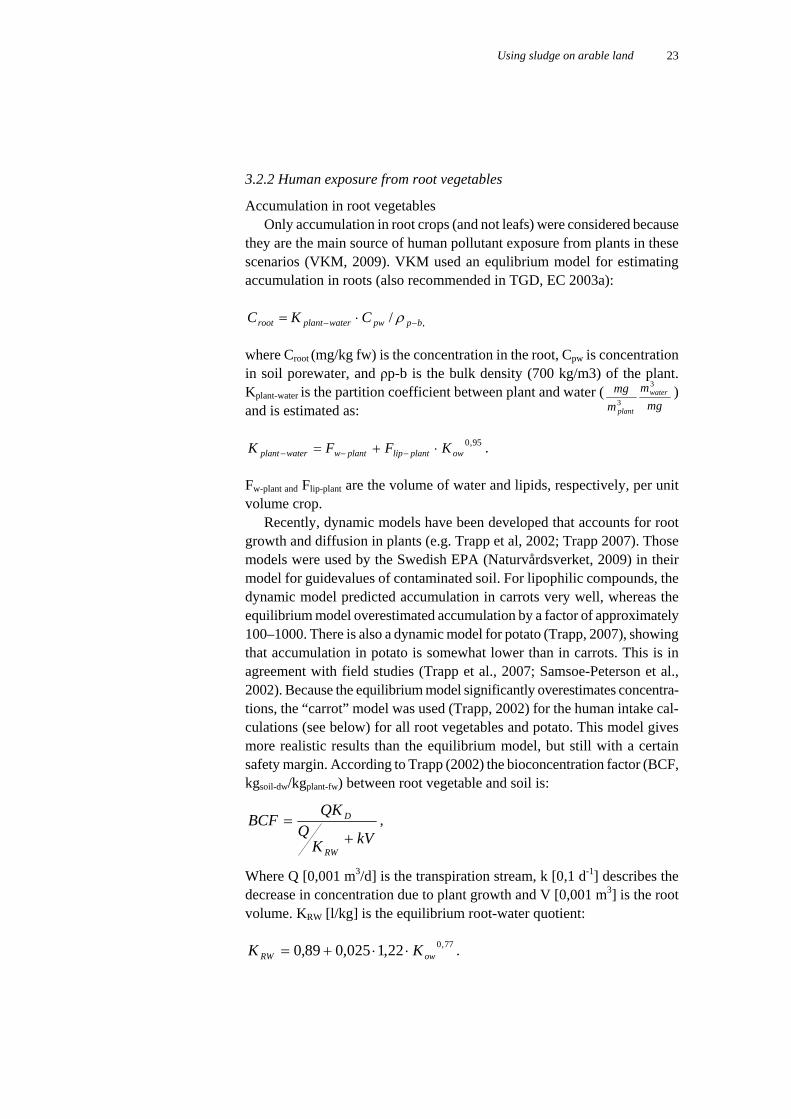
Accumulation in root vegetables Only accumulation in root crops (and not leafs) were considered because
they are the main source of human pollutant exposure from plants in these scenarios (VKM, 2009). VKM used an equlibrium model for estimating accumulation in roots (also recommended in TGD, EC 2003a):
,/ bppwwaterplantroot CKC where Croot (mg/kg fw) is the concentration in the root, Cpw is concentration in soil porewater, and ρp-b is the bulk density (700 kg/m3) of the plant. Kplant-water is the partition coefficient between plant and water (
mg
m
m
mg water
plant
3
3)
and is estimated as:
95,0owplantlipplantwwaterplant KFFK .
Fw-plant and Flip-plant are the volume of water and lipids, respectively, per unit volume crop.
Recently, dynamic models have been developed that accounts for root growth and diffusion in plants (e.g. Trapp et al, 2002; Trapp 2007). Those models were used by the Swedish EPA (Naturvårdsverket, 2009) in their model for guidevalues of contaminated soil. For lipophilic compounds, the dynamic model predicted accumulation in carrots very well, whereas the equilibrium model overestimated accumulation by a factor of approximately 100–1000. There is also a dynamic model for potato (Trapp, 2007), showing that accumulation in potato is somewhat lower than in carrots. This is in agreement with field studies (Trapp et al., 2007; Samsoe-Peterson et al., 2002). Because the equilibrium model significantly overestimates concentra-tions, the “carrot” model was used (Trapp, 2002) for the human intake cal-culations (see below) for all root vegetables and potato. This model gives more realistic results than the equilibrium model, but still with a certain safety margin. According to Trapp (2002) the bioconcentration factor (BCF, kgsoil-dw/kgplant-fw) between root vegetable and soil is:
kVKQ
QKBCF
RW
D
,
Where Q [0,001 m3/d] is the transpiration stream, k [0,1 d-1] describes the decrease in concentration due to plant growth and V [0,001 m3] is the root volume. KRW [l/kg] is the equilibrium root-water quotient:
77,022,1025,089,0 owRW KK .

Using sludge on arable land 24
KD [l/kg] is the sorption coefficient between pore water and soil and equals OC·KOC. OC is the organic carbon content of soils (2%). Substance specific data, including calculated BCF values, are listed in appendice 2.
Human exposure
Human exposure of organic pollutants from crops was estimated by com-bining food consumption data with estimated pollutants levels in crops derived from sludge treated soils. In the risk characterisation, this exposure is compared to TDI (or a similar toxicologically based threshold value). However, humans are exposed to these pollutants from additional sources such a fish and shellfish, air, indoor dust etc. VKM chose to handle this by adding Norwegian mean dietary intake for PAHs and PCBs to the esti-mated exposure via crops. This approach neglects other sources than diet and excludes some of the pollutants in this study. We chose to not estimate the contribution from other sources, but instead assume that allowing crop consumption to contribute with 10% of the TDI is conservative:
10/TDICI root ,
where I (5,7 g kgbw
-1 d-1) is the human intake rate of root crops per kg body weight. Data on intake rates from Norway and Sweden are compiled in Ta-ble 6. The 95th percentile was chosen in order to make the consumption safe also for high consumers. Intake rates for women and men are very similar when expressed per kg body weight.
Table 6. Human daily intake of root vegetables and potato.
Specification Body weight, kg Mean intake (g/d)
95%- intake (g/d)
Reference
Potato, Norway 70 123 261 VKM Root plants, Norway 70 165 409 VKM Root plants 70 181 347 Filipsson et al., 2008 Potato, Sweden 70 177 356 see Kemi, 2000 Carrot, Sweden 70 21 51 see Kemi, 2000
Combining the equations for intake and for Croot leads to an equation for the critical concentration in soil (mg/kg dw) regarding human consumption of root crops:
IBCF
TDIC
root
critplantshum
10.
3.2.3 Birds exposed from eating earthworms
Application of contaminated sludge on land may cause bioconcentration or biomagnification in worm-eating birds or mammals, also known as secon-dary poisoning via the terrestrial food chain:
Using sludge on arable land 25
soil → earthworm → worm-eating birds or mammals
Acceptable concentration in birds feed (PNECoral)
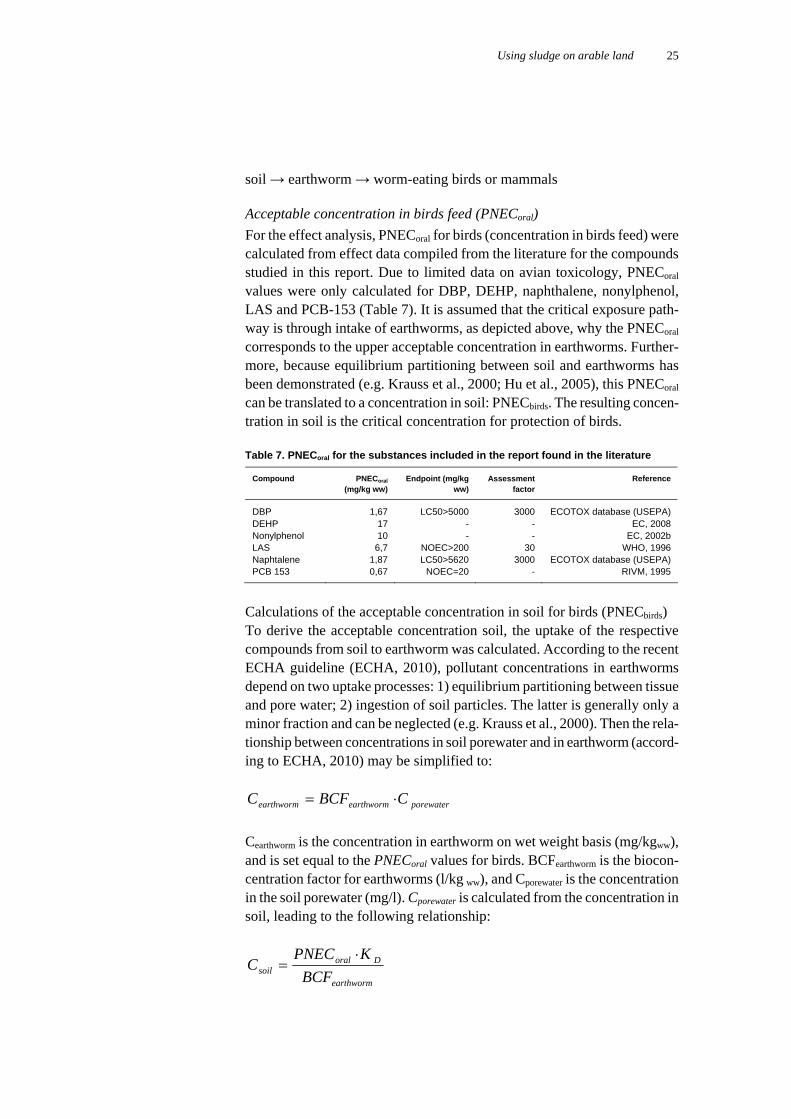
For the effect analysis, PNECoral for birds (concentration in birds feed) were calculated from effect data compiled from the literature for the compounds studied in this report. Due to limited data on avian toxicology, PNECoral values were only calculated for DBP, DEHP, naphthalene, nonylphenol, LAS and PCB-153 (Table 7). It is assumed that the critical exposure path-way is through intake of earthworms, as depicted above, why the PNECoral corresponds to the upper acceptable concentration in earthworms. Further-more, because equilibrium partitioning between soil and earthworms has been demonstrated (e.g. Krauss et al., 2000; Hu et al., 2005), this PNECoral can be translated to a concentration in soil: PNECbirds. The resulting concen-tration in soil is the critical concentration for protection of birds.
Table 7. PNECoral for the substances included in the report found in the literature
Compound PNECoral (mg/kg ww)
Endpoint (mg/kg ww)
Assessment factor
Reference
DBP 1,67 LC50>5000 3000 ECOTOX database (USEPA) DEHP 17 - - EC, 2008 Nonylphenol 10 - - EC, 2002b LAS 6,7 NOEC>200 30 WHO, 1996 Naphtalene 1,87 LC50>5620 3000 ECOTOX database (USEPA) PCB 153 0,67 NOEC=20 - RIVM, 1995
Calculations of the acceptable concentration in soil for birds (PNECbirds) To derive the acceptable concentration soil, the uptake of the respective compounds from soil to earthworm was calculated. According to the recent ECHA guideline (ECHA, 2010), pollutant concentrations in earthworms depend on two uptake processes: 1) equilibrium partitioning between tissue and pore water; 2) ingestion of soil particles. The latter is generally only a minor fraction and can be neglected (e.g. Krauss et al., 2000). Then the rela-tionship between concentrations in soil porewater and in earthworm (accord-ing to ECHA, 2010) may be simplified to:
porewaterearthwormearthworm CBCFC
Cearthworm is the concentration in earthworm on wet weight basis (mg/kgww), and is set equal to the PNECoral values for birds. BCFearthworm is the biocon-centration factor for earthworms (l/kg ww), and Cporewater is the concentration in the soil porewater (mg/l). Cporewater is calculated from the concentration in soil, leading to the following relationship:
earthworm
Doralsoil BCF
KPNECC

Using sludge on arable land 26
Csoil is the concentration in soil (mg/kgdw) and KD is the soil-pore water dis-tribution coefficient (l/kg dw). If measured data on BCF is not available, they can be calculated using the general equation (ECHA, 2010):
earthworm
OWearthworm RHO
KBCF
012,084,0
RHOearthworm is the bulk density of the worm (by default a value of 1 kgww/L can be assumed). With this model, the BCF only depends on the hydropho-bicity of the compound, not regarding for example metabolic degradation or the structural properties such as planarity of the compound. There is thus a need for comparing these estimates of BCF to empirical data.
Empirical studies on pollutant transfer from soil to earthworms generally express the bioaccumulation as the biota-to soil accumulation factor (BSAF; kg dw soil/kg ww worm). Because many studies report BSAF values nor-malized to soil organic matter (OM) and worm lipid weight, conversions between the two units were performed using soil OM=4% dw and worm lipid concentration of 1,5% ww (Matcheko et al., 2002b).
Concentrations in soil can then be calculated as:
BSAF
PNECC oral
soil
Theoretical BSAF values can be predicted from the theoretical BCF-values:
dK
BCFBSAF
The theoretically derived BSAF values neglects certain aspects that may lead to lower than predicted accumulation from soil to earthworms, e.g. 1) stronger sorption to soil; 2) metabolic degradation in worms; 3) steady-state non-equilibrium conditions. The theoretical BSAF values may thereby over-estimate the bioaccumulation in earthworms.
The theoretical and empirical BSAF values are listed in table 8. The val-ues for PCBs are of the same order of magnitude. For naphthalene, DEHP and DBP, the calculated BSAFs are about one order of magnitude greater than empirical literature values, indicating that the calculated values would overestimate the exposure of these specific compounds in birds that ingest earthworms. The data found for nonylphenol were approximately 2–6, re-ported in ng/g dw of the worm divided by ng/g dry soil (Kinney et al., 2008, 2010). With a typical dry weight of 20% in earthworms, BSAF of 0.4–1.2 g dw/g ww were estimated. No empirical data was found for LAS, why the theoretically predicted value was used for the calculations. By comparison with the other non-halogenated substances, it is highly likely that this value

Using sludge on arable land 27
represents an overestimate. With the exception of LAS, the values in the upper range of the empirical data were selected for assessing bird exposure to pollutants from ingestion of earthworms. Concentrations in soil were thereafter calculated for the compounds using a 180 day exposure period.
Table 8. BSAF (biota to soil accumulation factor) for earthworms. Theoretical values are compared to empirical values.
Compound BSAF (theoreti-cal)
BSAF (empirical) References empirical BSAF
Se-lected BSAF
g dw/g ww
g OM/g lw
g dw/g ww
g OM/g lw
g dw/g ww
DBP 7,1 19 0,24–0,37 Hu et al., 2005 0,4 DEHP 3,0 8,0 0,073–0,24 Hu et al., 2005 0,25 Nonylphenol 5,5 15 0,4–1,2 Based on Kinney et al.,
2008, 2010 1,2
LAS 0,61 1,6 0,6 Naphthalene 2,5 6,6 0,02–0,6 Matcheko et al., 2002a;
Ma et al., 1998; Krauss et al., 2000
0,23A
PCB 153 6,0 16 1–7 Belfroid et al., 1995; Matcheko et al., 2002b; Rattfeldt, 2010.
2,6A
A. These two values were recalculated from the lipid/organic matter normalised values, using lipid content of 1,5% w.w. and a soil organic matter content of 4% d.w.
2.4 Effect based levels in sludge
The accumulation rate of pollutants in soil following sludge amendment depends on several factors: Concentration in sludge Sludge amendment: rate and frequency Other pollutants sources Elimination processes Soil parameters
2.4.1 Concentration in sludge – mass balance
The concentration in sludge (Csl, mg/kg dw) is calculated so that the corre-sponding critical concentrations in soil for plant living organims, birds, or human exposure by root vegetables are not exceeded. The concentrations in sludge and in soil (Csoil, mg/kg dw) are related by a mass balance model, accounting for the sludge application rates and the elimination rates. The basic methodology is described in TGD (EC, 2003a). VKM also used these models but in a forward exposure modelling. The basic steps in this work are:

Using sludge on arable land 28
Calculate Csoil(0), i.e. the concentration in soil at the day when sludge is added
Calculate how Csoil(t) declines over time, due to elimination processes Calculate the time-integrated average concentration Clocal-soil, by
integrating Csoil(t) for a suitable period of time T Compare Clocal-soil to the PNECsoil, PNECbirds and crit
plantshumC Determine the effect based leves in sludge by iterating the
concentrations in sludge ,Csl, until - Clocal-soil=
critplantshumC or
- Clocal-soil=PNECsoil or - Clocal-soil=PNECbirds
Determine the lowest Csl from point 5, for the three endpoints specified in point 4 above. This is the highest acceptable concentration in sludge from a pure risk assessment perspective.
Figure 1 illustrates how concentration in soil may vary over time for an arbi-trary substance. Degradation causes concentrations to decrease following sludge application. For persistent substances, the average concentration will slowly increase over decades due repeated sludge application. When com-paring concentrations in soil to the critical values ( crit
plantshumC , PNECsoil or PNECbirds), it is thus necessary to specify the time period T for which Csoil(t) will be integrated to Clocal-soil. For persistent sub-stances we also need to determine after how many years of sludge applica-tion that concentrations are to be evaluated.
There is no standard for these aspects, but the recommendations in TGD (EC, 2003) and the choices made by VKM are listed in table 9. The recent guideline from ECHA (2010) is identical to TGD in this respect. Principles for risk assessment of sludge use on soil was also proposed by Schowanek et al (2004), who however did not address this question. For human exposure via root vegetables, the period for the growth season (180 days) was used by VKM and was also recommended in TGD. VKM approximated this value by the concentration at day 90. Because the concentrations decrease expo-nentially over time, this will lead to an underestimation especially for the more labile substances. Therefore, the integrated average concentration over day 0–180 was used. For soil living organisms, TGD recommends the aver-age concentration over the first 30 days following sludge application. VKM uses the concentration at the day of sludge application (Csoil(0)). Because the PNEC values consider chronic and not acute ecotoxicological effects, the average over day 0–30 was used in this report.

Using sludge on arable land 29
0,0E+00
4,0E-05
8,0E-05
1,2E-04
1,6E-04
2,0E-04
0 1 2 3 4 5 6 7 8 9 10 11 12 13 14 15 16
Years
Co
nc
en
tra
tio
n in
so
il
Figure 1. Variation of Csoil for an arbitrary substance over time in a case when sludge is applied every 5th year.
Table 9. Exposure periods that are considered for the two endpoints.
Exposure period Exposure pathway
VKM# TGD/ECHA This report
Soil animals and plants Day 0 Day 0–30 Average day 0–30, year 0 Birds via earthworms n.a. Day 0–180 Average day 0–180, year 0 Human exposure by plants Day 90 Day 0–180 Average day 0–180, year 0 and after
quarantine
# VKM evaluates persistent substances after 100 years of repeated sludge application and no-persistent substances at year zero.
The principles explained above (see also table 9) are applied for the first year of sludge application for non-accumulating substances. For persistent substances (PCBs and PBDEs in this report), the corresponding concentra-tions at year 100 are used.
For sanitary reasons, several countries apply a time of quarantine for cul-tivating certain crops. The new Swedish proposal for sludge use on agricul-tural land apply a time period of two years (Naturvårdsverket, 2010). The current quarantine period in Norway is three years for soils where e.g. fruits, carrots, potato and onions are grown. Critical concentrations in sludge are therefore calculated both for year 0 and for 2 and 3 years of quarantine. For the persistent substances, critical concentrations in sludge are calculated for the year 100, as explained above. Degradation during the quarantine period is very limited for the persistent substances and is thus not accounted for inte the calculations.
The value of risk assessment is always limited to the current toxicologi-cal knowledge of the substances to be evaluated. Once large areas of agri-cultural land have been contaminated by persistent organics, there is no way of changing this condition. An additional considered in this report is there-fore the long-term accumulation of persistent organic compounds in agricul-tural soils. The relative concentration increase after 10, 25 and 100 years are calculated and assessed. The long-term scenarios are hypothetic in the sense that current levels in sludge and atmospheric deposition are unlikely to re-main unchanged for such long periods of time. The results should be consid-ered as examples of what may happen in the status quo case. For metals, the

Using sludge on arable land 30
estimated long-term accumulation is frequently compared to the natural or to the current background levels in soil. This is not easily performed for or-ganic substances because there is very limited data on levels in agricultural soils. The calculated concentrations after 10, 25 or 100 years of sludge amendment are therefore compared to the reference case of only atmos-pheric deposition, and to the limited data available from agricultural refer-ence soils.
2.4.2 Sludge application – rates and frequency
Only the case of using sludge on agricultural soils are assessed. The applica-tion rates were selected by the Nordic Council of Ministers representative in this project. Application rates are thus chosen according to the Swedish regulation (SNFS, 1994:2). Application frequency was adjusted from every 7th year to every 5th year, according to a recent Swedish proposal (Naturvårdsverket, 2010).
It is assumed that the phosphorus concentration in soil is the limiting fac-tor for the application rate. For most areas in Sweden will an application rate of 110 kg P/ha be allowed. With an average phosphorus concentration of 3% in the sludge (SCB, 2010) this translates to 3,5 tonnes sludge/ha every 5th year. A higher application rate of 6 tonnes sludge/ha will be allowed in cer-tain areas with lower content of plant available P in soil. Slightly higher rates are common in e.g. Norway why a scenario with application of 20 ton/ha every 10th year also were modelled. In summary, three application rates were used in the derivation of effect based levels:
3,5 tonnes DW sludge/ha every 5th year 6 tonnes DW sludge/ha every 5th year 20 tonnes DW sludge/ha every 10th year
2.4.3 Additional sources
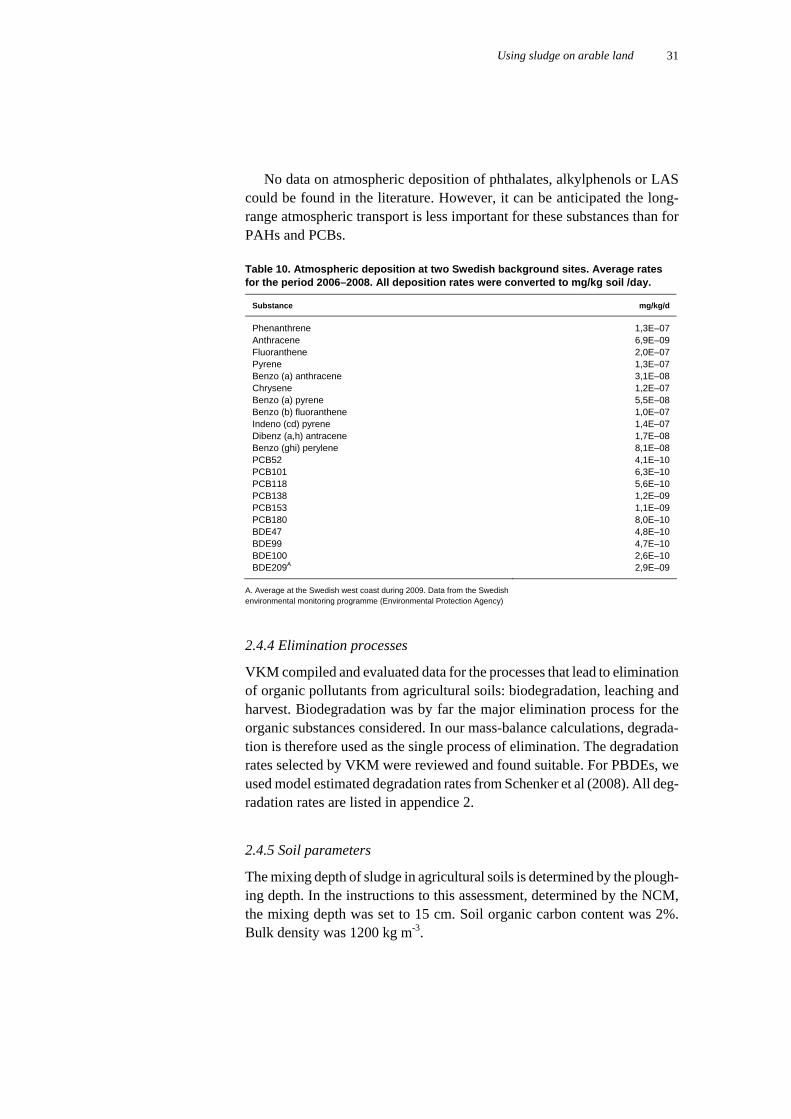
For the organic pollutants considered in this report, atmospheric deposition is a possible input source to the soils. VKM did not include atmospheric deposition, due to lack of data. PCBs and PAHs are subject to long-range atmospheric transport. Data on atmospheric deposition in background areas can therefore be used as a lower limit for this input. PAHs are also emitted by e.g. industrial point sources and by road traffic. Such sources vary re-gionally and are difficult to use in this context. The Swedish environmental monitoring programme (financed by the Swedish EPA) can provide data on the background deposition rates of PAHs, PCBs and certain PBDEs. Con-tinuous measurements are performed at the Swedish west and east coast (Råö and Aspvreten). The average deposition rates during the period 2006–2009 were calculated and included in the mass balance models. Data are shown in table 10.
Using sludge on arable land 31
No data on atmospheric deposition of phthalates, alkylphenols or LAS could be found in the literature. However, it can be anticipated the long-range atmospheric transport is less important for these substances than for PAHs and PCBs.
Table 10. Atmospheric deposition at two Swedish background sites. Average rates for the period 2006–2008. All deposition rates were converted to mg/kg soil /day.
Substance mg/kg/d
Phenanthrene 1,3E–07 Anthracene 6,9E–09 Fluoranthene 2,0E–07 Pyrene 1,3E–07 Benzo (a) anthracene 3,1E–08 Chrysene 1,2E–07 Benzo (a) pyrene 5,5E–08 Benzo (b) fluoranthene 1,0E–07 Indeno (cd) pyrene 1,4E–07 Dibenz (a,h) antracene 1,7E–08 Benzo (ghi) perylene 8,1E–08 PCB52 4,1E–10 PCB101 6,3E–10 PCB118 5,6E–10 PCB138 1,2E–09 PCB153 1,1E–09 PCB180 8,0E–10 BDE47 4,8E–10 BDE99 4,7E–10 BDE100 2,6E–10 BDE209A 2,9E–09
A. Average at the Swedish west coast during 2009. Data from the Swedish environmental monitoring programme (Environmental Protection Agency)
2.4.4 Elimination processes
VKM compiled and evaluated data for the processes that lead to elimination of organic pollutants from agricultural soils: biodegradation, leaching and harvest. Biodegradation was by far the major elimination process for the organic substances considered. In our mass-balance calculations, degrada-tion is therefore used as the single process of elimination. The degradation rates selected by VKM were reviewed and found suitable. For PBDEs, we used model estimated degradation rates from Schenker et al (2008). All deg-radation rates are listed in appendice 2.
2.4.5 Soil parameters
The mixing depth of sludge in agricultural soils is determined by the plough-ing depth. In the instructions to this assessment, determined by the NCM, the mixing depth was set to 15 cm. Soil organic carbon content was 2%. Bulk density was 1200 kg m-3.


3. Organic pollutants in sludge from the Nordic countries
An overview of available data for those substances that are prioritised in the report is shown in table 11. The full reference and a fuller description of data are given in appendice 1, that also includes a short summary of other organic compounds that have been detected in sludge during the last years. The concentrations of PAH, PCB, alkylphenols, phthalates and LAS are summarised below, with comments on: data coverage in the different countries any differences between the Nordic countries concentrations (range, average and statistical description) Data have mainly been obtained for Sweden, Norway and Denmark. There are only very few data from Finland and practically none for Iceland. Of the different substances studied, LAS is the most abundant organic pollutant in sludge. This also agrees with a larger review of data on Swedish sludge (WSP, 2010). Next to LAS comes, in falling order of abundance, DEHP > nonylphenol > ΣPAH16 > ΣPCB7.
3.1 PAH
There are large datasets of PAH from Sweden and Norway. Because PAH is a group of substances, comparing levels to riskbased criteria should only be done for equal groups of PAHs. At present several different groupings are present in the Nordic countries. Data on all the common 16 individual PAHs are only present in a few datasets.
Over the last few years, levels of ΣPAH16 are roughly comparable in Sweden, Denmark and Norway with average levels of 1,4–3,3 mg/kg dw. The few Finnish data available agree with these levels. The variation in con-centrations is moderate in Sweden and Norway, whereas ΣPAH16 vary widely in Danish sludge. The dominating PAHs are phenanthrene, pyrene and flouranthene.

Using sludge on arable land 34
Table 11. Overview of data (mg/kg dw) on organic pollutants in sludge from the Nor-dic countries. This table only describe those substances that are prioritised in the report. Data on other organic pollutants are briefly described in appendice 1. S: Swe-den: N: Norway; F: Finland: D: Denmark. N.d.: no data.
Country N median average 90-percentile min max
Nonylphenol S 278 6,5 12,1 20 0 437 D 1134 2,3 5,6 15 0,002 318 N 52 30 32 12 44 F N.d. Octylphenol S 28 0,46 1 0,9 0,076 8,7 D N.d. N 52 0,47 5,9 0,26 32 F N.d. LAS C10–C14 S 91 450 540 1100 9 2700 D 2558 64 285 820 0,35 11800 N 40 1400 1400 570 3200 F 4 360 1700 DEHP S 94 53 74 94 18 1000 D 1137 13 16 29 0,33 250 N 52 49 53 13 178 F 4 39 70 DBP S 80 0,15 0,39 0,74 0,016 5,2 D N.d. N 41 0,34 0,64 0,12 2,8 F N.d. ΣPAH6 S 520 0,3 0,5 0,9 0 23,7 D N.d. N N.d. F N.d. ΣPAH16 S 25 0,69 1,4 3,4 0,2 5 D 2610 1,1 3,3 2,8 0,02 1220 N 100 1,9 2,0 3,0 0,44 5 F 4 0,5 9,3 Fluoranthene S 25 0,13 0,32 0,77 <0,03 1,3 D N.d. N 100 0,22 0,22 0,35 0,024 0,48 F N.d. Benzo(a)pyrene S 25 <0,03 0,23 <0,03 0,27 D N.d. N 95 0,06 0,06 0,11 0,005 0,14 F N.d. ΣPCB7 S 260 0,031 0,040 0,061 0 0,48 D N.d. N 40# 0,030 0,032 0,005 0,096 F 4 0,03 0,08 PCB-153 S 9 0,012 0,013 0,004 0,022 D N.d. N 40# 0,0025 0,004 0,0025 0,023 F N.d. PBDE-99 S 70 0,037 0,046 0,097 0,004 0,16 D N.d. N 44 0,017 0,019 0,031 0,007 0,038 F N.d. PBDE-209 S 70 0,18 0,33 0,47 0,0005 3,9 D N.d, N 44 0,29 0,39 0,87 0,09 1,96 F N.d.
#: PCB7 >r.l. was found in 16 of 40 samples and PCB-153 in 10 of 40 samples.

Using sludge on arable land 35
3.2 PCB
Average levels of ΣPCB7 in Swedish sludge are about 0,04 mg/kg dw. Like for PAH, there is a pronounced variation between different WWTPs and the distribution of annual average levels appears to be lognormally distributed between the different plants.
In Norwegian sludge, ΣPCB7 was measured in eight WWTPs. Concentra-tion were above the analytical reporting limits in four of these WWTPs. The reported levels of ΣPCB7 are in the range 0,005–0,1 mg/kg dw, and thus in the same range as the Swedish levels. The few Finnish data are also in the normal range of Swedish levels.
3.3 Phthalates
In Sweden, there are several studies providing data on many different phtha-lates. Di(2-ethylhexyl)phthalate (DEHP) has for a decade or more been known as a major pollutant in municipal sludge, with levels ranging from 20 and occassionally exceeding 100 mg/kg. The levels are similar in Norway but slightly lower in Denmark.
Data on dibutylphthalate (DBP) was available for Sweden and Norway. Concentrations were approximately 100 times lower than those of DEHP.
3.4 Alkylphenols
Nonylphenol is found in almost every sample analysed, the average in the different countries ranging between 5,6 and 30 mg/kg DW. Concentrations were higher in Norway than in Sweden or Denmark.
The average concentrations of octylphenol in Sweden and Norway rang-ing between 0.46 and 5.9 mg/kg DW
3.5 LAS
Linear alkylbenzenesulphonates (LAS, measured as C10–C14) was the most abundant organic sludge pollutant in all countries. Levels are generally higher in Norway than in Sweden, and lowest in Denmark.
3.6 PBDE
There exists 209 different congeners of the polybrominated diphenylethers. The product deca-BDE is mainly composed of the fully brominated BDE-209, which is the major PBDE in sludge. Concentrations of BDE-209 is generally
Using sludge on arable land 36
slightly lower than 1 mg/kg dw. Other major PBDEs are the BDE-47 and BDE-99 that derive from the banned product penta-BDE. Concentrations of BDE-47 and BDE-99 are generally lower than approximately 0,05 mg/kg dw, but still more abundant than e.g. the PCBs.
3.7 Other organic compounds
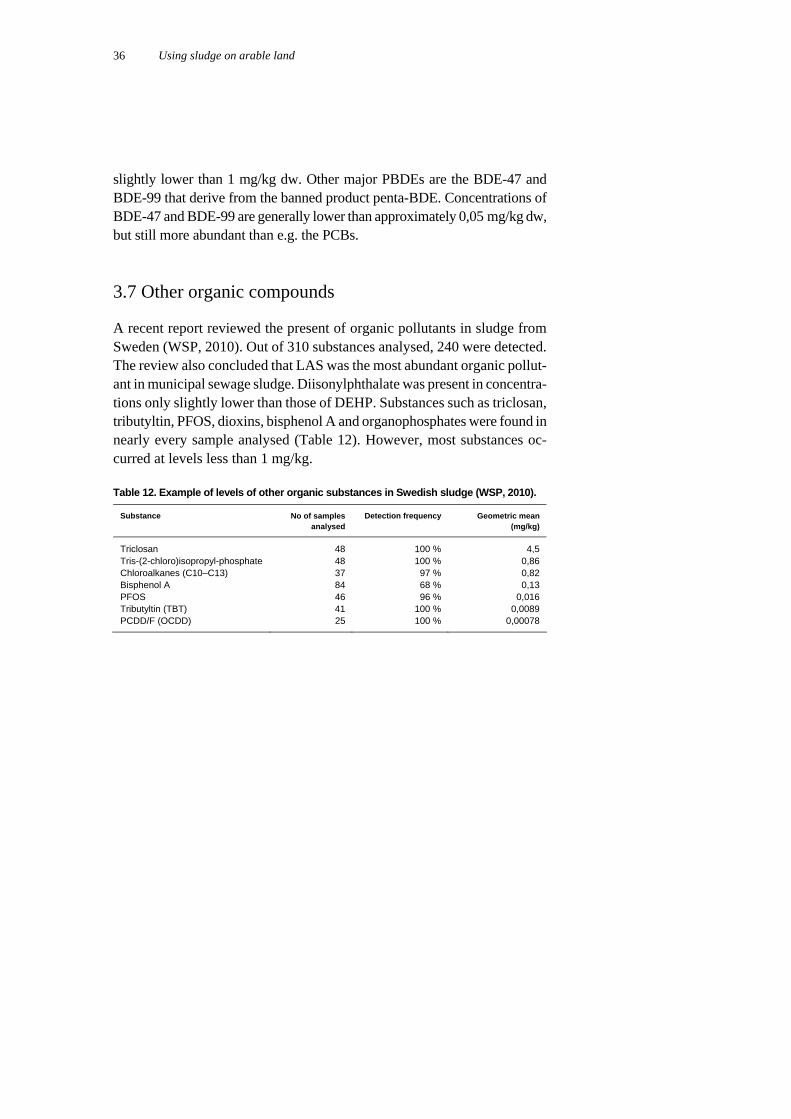
A recent report reviewed the present of organic pollutants in sludge from Sweden (WSP, 2010). Out of 310 substances analysed, 240 were detected. The review also concluded that LAS was the most abundant organic pollut-ant in municipal sewage sludge. Diisonylphthalate was present in concentra-tions only slightly lower than those of DEHP. Substances such as triclosan, tributyltin, PFOS, dioxins, bisphenol A and organophosphates were found in nearly every sample analysed (Table 12). However, most substances oc-curred at levels less than 1 mg/kg.
Table 12. Example of levels of other organic substances in Swedish sludge (WSP, 2010).
Substance No of samples analysed
Detection frequency Geometric mean (mg/kg)
Triclosan 48 100 % 4,5 Tris-(2-chloro)isopropyl-phosphate 48 100 % 0,86 Chloroalkanes (C10–C13) 37 97 % 0,82 Bisphenol A 84 68 % 0,13 PFOS 46 96 % 0,016 Tributyltin (TBT) 41 100 % 0,0089 PCDD/F (OCDD) 25 100 % 0,00078

4. Chemicals use and near future prognosis
4.1. Sources of selected substances to the WWTPs
The major sources of the selected chemicals to the WWTP are described based on information found in available publications. Information on pro-duction and use patterns of the selected chemicals are in combination with the physical and chemical properties of the chemical groups used for the identification of sources leading to emissions and contaminations of sludge in WWTP.
The selected chemicals comprises the prioritised substances and sub-stance groups: PAH, PCB, DEHP, DBP, LAS, nonylphenol and NP-ethoxylates, octylphenol and OP-ethoxylates and PBDE.
4.1.1 PAH
The PAHs (Polycyclic Aromatic Hydrocarbons) may contain three-, four-, five-, six- or seven-member rings. PAH toxicity is structurally dependent, varying from being nontoxic to being extremely toxic. One PAH compound, benzo[a]pyrene, is notable for being the first chemical carcinogen to be discov-ered. Seven PAH compounds has been classified as probable human carcino-gens: benzo[a]anthracene, benzo[a]pyrene, benzo[b]fluoranthene, benzo[k]fluoranthene, chrysene, dibenz(ah)anthra-cene, and indeno(1,2,3-cd)pyrene. PAHs are also known as mutagenic and teratogenic.
Most organisms can metabolize PAHs, though the degradation products can be even more toxic than the mother compounds. Invertebrates can bio-accumulate PAHs as the biodegradation in invertebrates is much lower than in vertebrates. The prevalent mechanism of PAH toxicity to invertebrates is narcosis, which results in the alteration of cell membrane function. This alteration can result in mild toxic effects or mortality depending upon the exposure.
PAHs occur in oil, coal and tar deposits, and are produced as byproducts of fuel burning (whether fossil fuel or biomass). In addition to industrial sources such as hard coal refineries, coking plants, aluminium industry, oil and coal power plants diffuse sources such as automobile traffic, residential heating, cigarette smoke, open burning, abrasion of asphalt are also sources to environmental release of PAHs. Urban stormwater is probably a source to certain WWTPs.
Anthracene, a three ring PAH is produced by destillation of high tem-perature coal tar. The use of anthracene in EU is limited to the use in small

Using sludge on arable land 38
amounts for the manufacture of pyrotechnics and for the use in scientific research laboratories (RAR). The release to the environment may arise dur-ing the production and the use of anthracene-containing coal-tar distillates and during combustion processes.
REF:
IUCLID Anthracene RAR, ECB, Anthracene vol 78. Annex XV Dossier. Proposal for Identification of a Substance as a CMR Cat 1 or 2, PBT, vPvB or a Substance of an Equivalent Level of Concern, Annex XV Re-port for Anthracene, Germany, June 2008
4.1.2 PCB
PCB (polychlorinated biphenyl) is a group of chlorinated organic chemicals and the group is represented by more than 50 different commercial congeners. PCBs are persistent compounds that are bioaccumulating and highly toxic. The toxicity of PCBs varies considerably among congeners. The coplanar PCBs, known as non-ortho-PCBs tend to have dioxin-like properties, and generally are among the most toxic congeners. PCB is toxic to aquatic organ-isms and may also biomagnify. PCBs have shown toxic and mutagenic effects by interfering with hormones in the body. PCBs, depending on the specific congener, have been shown to both inhibit and imitate estradiol, the main sex hormone in females. Imitation of the estrogen compound can feed estrogen-dependent breast cancer cells, and possibly cause other cancers, such as uterine or cervical. Inhibition of estradiol can lead to serious developmental problems for both males and females, including sexual, skeletal, and mental development issues.
PCB has been used for a number of technical purposes due to its high stability, good heat conducting properties, good electrical isolation (dielec-trics) and fire retardants properties. The PCBs have mainly been used as coolants and lubricating fluids and for transformers and capacitors. Addi-tionally PCB has been used as stabilizing additives in flexible PVC coatings of electrical wiring and electronic components, cutting oils, flame retardants, hydraulic fluids, sealants, adhesives, wood floor finishes, paints, de-dusting agents, and in carbonless copy paper.
The PCB production was restricted in the 1970s due to the high toxicity of most PCB congeners and mixtures. In 1976, the Directive 76/769/EEC on restrictions on the marketing and use of certain dangerous substances and preparations limited the open use of PCB in the EU. Further limitation of the use of PCB has since then been made by other directives. The first ban ap-plied to the so-called “open” applications of PCB such as uses in paints, sealant, carbonless paper etc. whereas uses in closed systems including ca-pacitors, transformers, vacuum pumps and hydraulic fluids were still al-lowed. The use of PCB in new closed systems were banned during the 1980s

Using sludge on arable land 39
and use in existing systems continued until 2000, where deadlines on the disposal or decontamination of existing equipments with PCB were posed.
A Danish inventory of PCB containing equipment was performed during 1998 and 1999. The investigation showed that only modest amount of PCB-containing equipment was in use at that time.
PCBs have been detected globally in the atmosphere, from the most urban-ized areas that are the centers for PCB pollution, to regions north of the Arctic Circle. The atmosphere serves as the primary route for global transport of PCBs. Volatilization of PCBs in soil was thought to be the primary source of PCBs in the atmosphere, but recent research suggests that ventilation of PCB-contaminated indoor air from buildings is the primary source of PCB con-tamination in the atmosphere. Environmental levels of PCBs have generally declined over the past approximately 20 years.
Atmospheric deposition and catchment runoff is probably a significant source of PCB to WWTPs. Diffuse sources of PCB to the WWTPs may include emissions from long-life goods such as sealants in buildings.
REF:
Danish EPA: Arbejdsrapport fra Miljøstyrelsen Nr. 15 2000. PCB i apparater i Dan-mark TemaNord 2004:556
4.1.3 DEHP
DEHP are classified as toxic, hormone disrupting, and can cause damage to the featus. They are also environmentally hazardous and very toxic to aquatic organisms.
DEHP is widely used as a plasticiser in polymer products, mainly PVC. The plasticizers have the function of improving the polymer material´s flexi-bility and workability. Content of DEHP in flexible polymer material varies but is often around 30 weight percent. 97% of the total DEHP consumption in Europe 1997 was used as plasticizer, mainly in PVC and the remaining 3% was used in non-polymer applications such as adhesives, sealants, paints, lac-quers, printing ink, capacitors and in advanced ceramic materials e.g. for elec-tronics. The use in flexible plastics includes building products (flooring, ca-bles, tubes and profiles, sealants and insulation), certain children products, clothing (footwear, rainwear), car products (car undercoating, imitation of leather) etc. The main part of DEHP consumption is for indoor applications of PVC such as flooring.
According to information from the European manufactures”trade organi-zation ECPI, the manufacturing of DEHP in Europe has decreased signifi-cantly since 1997 with a more than halving of the total production and con-sumption towards 2004 (Annex XV).
DEHP is release during the production and industrial use. Several studies also demonstrate the importance of diffuse societal emissions of DEHP from

Using sludge on arable land 40
the finished material or article during its use or disposal. The potential for diffuse release is high because DEHP is not chemically bound in the poly-mer material.
REF:
Annex XV Dossier. Proposal for Identification of a Substance as a CMR Cat 1 or 2, PBT, vPvB or a Substance of an Equivalent Level of Concern, Annex XV Report for Bis (2-ethyl(hexyl)phthalate (DEHP); Sweden, June 2008.
4.1.4 DBP
Dibutylphthalate has similar properties as DEHP (see above) but is more water soluble.
The main use of DBP is as a plasticizer in resins and polymers such as PVC. However DBP has a wide spread use in industrial and consumer prod-ucts. DBP is e.g. used in printing ink, adhesives, sealants, nitrocellulose paints, film coatings, glass fibres, cosmetics, perfume, and as suspension agent, lubricants and antifoamer. The production of DBP within the EU are decreasing. A significant decrease in volumes of DBP imported as part of products and goods has been seen in 2006 in Sweden.
DBP has a high volatility compared to other plasticizers and is only used in combination with other plasticizers. DBP was found in house dust in several studies. DBP is emitted during the production of DBP-containing products and during the use of consumer products containing DBP. Because of the very diverse uses of DBP a diffuse emission is taking place and DBP has been identified in air, water and soil. DBP concentrations in influents to wastewater plants indicated dependency on percentage of industry discharges, weather conditions or population equivalents.
REF:
Annex XV Dossier. Proposal for Identification of a Substance as a CMR Cat 1 or 2, PBT, vPvB or a Substance of an Equivalent Level of Concern, Annex XV Report for Dibutylphthalate; Austria, June 2008.
4.1.5 LAS
Linear Alkylbenzene Sulphonates (LAS) is a group of surfactants used as surface-active ingredients in detergents and cleaning products for private households as well as industries. Puret LAS is an irritant to skin and eyes, but the concentration in sludge is much lower. LAS can be harmful to aquatic organisms.
A survey study of the LAS consumption in Denmark was done in 2006 by contacting a series of major manufacturers and importers of detergents and cleaning agents. The survey found that 87% of the total consumption of LAS in Denmark in 2005 was used in consumer products and 13% was used

Using sludge on arable land 41
in products for industries and institutions. The use of LAS was distributed by 83% in laundry detergents and 17% in cleaning agents (Danish EPA,,2007).
REF:
Danish EPA, 2007 in Danish with English summary “Kortlægning af LAS” nr. 87
4.1.6 Nonylphenol and NP-ethoxylates
For alkylphenols, the longer the alkyl chain, the more toxic is the com-pound. Nonylphenol is bioaccumulating and very toxic to aquatic organ-isms. It has estrogenic disrupting properties in fish, birds, reptiles, and mammal cells. Less is known on its toxicity toward invertebrates.
Nonylphenol ethoxylates are effective washing chemicals. Due to the toxicity and the potential for hormonal effects from the degradation product nonylphenol, the use of nonylphenolethoxylates is in principle prohibited in the EU. Exempted from the ban are industrial uses in closed systems where all the nonylphenol is recycled, incinerated or eliminated by industrial treatment processes with no release into waste water. Use in personal care products is only allowed in spermicides.
There is no legislation controlling the import into EU of goods such as textiles and clothes which may contain nonylphenolethoxylates due to the high efficiency as a washing chemical in textile manufacturing stages.
A study performed by the Swedish Society for Nature Conservation (Natur-skyddsföreningen, 2008) analysed the content of nonylphenyl ethoxylates in a broad selection of t-shirts covering EU-produced and imported t-shirts. Nonyl-phenyl ethoxylates were found in all t-shirts (16) except one. The nonylphenol ethoxylates in t-shirts produced in the EU may arise from imported textiles or may be background levels from the allowed washing process in closed system. Another study on chemicals in bath towels found detectable (>1 mg/kg) to high levels (10600 mg/kg) of nonyphenol ethoxylates in 18 out of 20 products (Naturskyddsföreningen, 2007).
REF:
Naturskyddsföreningen, 2007. Handdukar med et smutsigt förflutet. Naturskyddsföreningen, 2008. T-shirts with a murky past.
4.1.7 Octylphenol and OP-ethoxylates
Octylphenol ethoxylates belongs to a group of man-made chemicals, primar-ily used in the production of cleaning products such as detergents, but also in lesser quantities in many other applications, such as pesticides, paints and varnishes. Octylphenol ethoxylates are chemically very similar to nonylphe-nol ethoxylates. Octylphenol most probably has the same toxic effects as
Using sludge on arable land 42
nonylphenol. Both substances belong to a class of chemicals called alkyl-phenol ethoxylates, which can biodegrade to form alkylphenols.
Most releases of Octylphenol ethoxylates to the environment arise from industrial wastewaters directly to ambient surface waters. Releases also oc-cur from vehicle washing, agricultural operations, and via sewage treatment plants (STPs). Releases can also occur resulting from manufacture and use in producing other products. Releases will be primarily to land and water. They are not known to occur naturally.
Octylphenol ethoxylates is very toxic to fish and other water dwelling organisms and is considered a hormone disrupting substance, mimicking oestrogen. It degrades relatively readily in the environment to form the even more harmful octylphenol. Octylphenol is not readily biodegradable and take months or even longer to degrade in surface waters or in soils and sediments, (where it tends to be immobilised). Non-biological degradation is negligible.
4.1.8 PBDE
Polybrominated diphenyl ethers (PBDEs) are a group of brominated flame retardants. PBDEs are persistent, bioaccumulating and toxic substances, the toxicity and bioaccumulation varies with number of bromines. PBDEs are hormone disrupting and may cause liver toxicity, thyroid toxicity, and neurodevelopmental toxicity. PBDEs are also highly toxic to aquatic organ-isms, bioaccumulate strongly and can cause long term effects in the envi-ronment.
Brominated flame retardants are synthetic additives, which are used above all in electrical and electronic appliances, furnitures and in construc-tion materials. The most common technical PBDE products are penta-, octa- and decaBDPE, and TBBPA (Tetrabromobisphenol A). Over recent dec-ades, global consumption of the four flame retardants has almost doubled as a result of the increasing use of plastics, and of stricter fire regulations. Pen-taBDPE is used in epoxy, polyester and flexible PUR foams. The typical uses of octaBDPE are plastics as ABS, HIPS, polyolefin and polyamide. DecaBDPE may be used in almost all plastics (PUR, unsaturated polyesters, epoxy resins, PE, PP, PS, PA, latex, textile HIPS, PBT/PET, polycarbonate, styrene butadiene rubber) representing building materials, electronics, furni-ture, carpets etc.
The brominated flame retardants may be present in the material in con-centrations from a few weight percent up to 25 weight percent. They can be chemically bound in the material or present as a separate unbound substance in the material. The unbound form is more likely to be released from the material during use or heating of the material.
A Danish survey on import of decaBDPE showed that decaBDPE is im-ported into Denmark as the substance as such and as part of semi-finished prod-ucts by the plastic industry. The study also showed that the main part is ex-

Using sludge on arable land 43
ported after processing. Also imported finished articles such as tents, cars and heat-shrink tubing contained decaBDPE (Danish EPA, 2007a).
The PBDE are emitted as part of the manufacturing and production of PBDE-containing products or articles as well as released during use or the disposal of the finished products or articles. Especially PBDE contained in electrical equipment is released when the equipments get warmed up during use. A Dutch study showed that PBDE can be found in dust from offices. An important source of PBDE to the environment is diffuse wet and dry deposi-tion from the atmosphere, to which the PBDE are emitted from the use of the PBDE-containing articles and from the incineration of PBDE-containing waste. Point sources are discharges of wastewater from consumers and in-dustries (Danish EPA, 2007b).
REF:
Danish EPA, 2007a. In Danish. Kortlægning af decabromodiphenylether (decaB-DPE) i andre produkter end elektriske og elektroniske produkter. Kortlægning af kemiske stoffer i forbrugerprodukter, 80, 2007. Danish EPA, 2007b. In Danish. Basisviden om EU-regulerede stoffer i vandmil-jøet. Regulering, anvendelser, forureningskilder og forekomst. Environmental project 1181, 2007
4.2. Current legislation
Current legislations on hazardous substances are applying either to the manufacturing, use or discharge of the selected substances. Many of the legislations are implemented in national legislations and may vary from country to country even within the Nordic countries. The EU regulations are applying to all Member states without implementation in national legislation before entering into force.
4.2.1 REACH
The main EU regulation applying the chemicals is REACH (Regulation (EC) No 1907/2006 of the European Parliament and of the Council of 18 December 2006). REACH entered into force 1. June 2007, with a stepwise application of requirements to registration, evaluation, authorization of chemicals.
With the REACH regulation substances of very high concern, SVHC, will be identified and listed first on the candidate list to Annex XIV which shall hold the substances subject for authorization. Important is that when substances are listed on the candidate list, importers and producers of arti-cles containing the substances in concentration above 0.1 weight percent are obliged to inform the receiver of the article of the substance and to give directions to safe use of the article. If a SVHC is listed in the Annex XIV, all uses of the substance shall be authorized by the EU Commission.
Using sludge on arable land 44
The criteria for identifying a substance as SVHC is:
Classification as carcinogenic category 1 or 2, or classification as mutagenic category 1 or 2, or classification as toxic to reproduction category 1 or 2, or identification as PBT/vPvB substance, or having endocrine disrupting properties or having similar levels of
concerns as the above mentioned substances.
Currently, three of the selected substances in this study: Anthracene, DBP and DEHP are identified as SVHC and listed on the candidate list. After being listed on the candidate list evaluations are done by the European Chemicals Agency in order to assess whether the substances should be sub-jects for authorization. It can be anticipated that the presence on the candi-date list of the substances and consequently the information on the SHVC in articles will make the articles unattractive on the market in favor to articles without SVHC. Also the industry may be indirectly forced to use alternative substances.
In case the substances are listed on Annex XIV, the required authoriza-tion may result in a decrease in the manufacturing and the uses of the sub-stances in advantage for the uses of alternatives. On a longer term the use of substances on Annex XIV may be restricted or totally banned.
As part of REACH is restrictions on the use of certain substances for-merly regulated by the Directive 76/769/EEC relating to restrictions on the marketing and use of certain dangerous substances and preparations. Sub-stances that are partly or entirely banned within the EU include penta-BDE, DEHP, DBP and nonylphenol (EC, 2009).
4.2.2 EMEA
According to Directive 2004/27/EC of the European Parliament and of the Council of 31 March 2004: An Environmental Risk Assessment (ERA) shall accompany an application for a marketing authorisation for a medicinal product for human use. In accordance with Article 8(3) of Directive 2001/83/EC, as amended, the evaluation of the potential environmental risks posed by medicinal products should be submitted, their environmental im-pact should be assessed and, on a case-by-case basis, specific arrangements to limit the impact should be considered. In any event this impact should not constitute a criterion for refusal of a marketing authorisation.
The directive requires that an environmental risk assessment is done as part of all new applications for a marketing authorisation for a medicinal product for human use. The environmental assessment includes the manu-facturing step and the use i.e. the medicine prescribed to a patient.
It is important to notice that the ERA part of the EMEA directive does not imply any restrictions on the marketing of new medicinal products,

Using sludge on arable land 45
hence it may be anticipated that the EMEA legislation will increase the knowledge of new substances discharged into the wastewater stream from medicinal products rather than decrease the use of environmental hazardous substances in medicinal products.
4.2.3 ROHS
RoHS stands for the “restriction on the use of certain hazardous substances in electrical and electronic equipment”. It is a European Directive aiming to control the use of certain hazardous substances in the production of new electrical and electronic equipment (EEE). It is a partner directive to the WEEE Directive (Waste in Electrical and Electronic Equipment) that con-trols the disposal and recycling of EEE.
In the Annex to Directive 2002/95/EC the following note is added: “For the purposes of Article 5(1)(a), a maximum concentration value of 0,1 % by weight in homogeneous materials for lead, mercury, hexavalent chromium, polybrominated biphenyls (PBB) and polybrominated diphenyl ethers (PBDE) and of 0,01 % by weight in homogeneous materials for cadmium shall be tolerated.”
The entering into force of the ROHS directive has put high demands on the industry to reduce the use of PBDE in electrical and electronic equip-ment and it may be foreseen that the emission of PBDE will decrease over a longer time span depending on the displacement of equipments that contain PBDE.
4.2.4 Water framework directive
The WFD classification scheme for water quality includes five status cate-gories: high, good, moderate, poor and bad. The general objective of the WFD is to achieve “good status”for all surface waters by 2015. “Good status”means both “good ecological status”and “good chemical status”. “High status”is defined as the biological, chemical and morphological con-ditions associated with no or very low human pressure. This is also called the “reference condition” as it is the best status achievable – the benchmark. These reference conditions are type-specific, so they are different for differ-ent types of rivers, lakes or coastal waters so as to take into account the broad diversity of ecological regions in Europe. Assessment of quality is based on the extent of deviation from these reference conditions, following the definitions in the Directive. “Good status” means “slight”deviation, “moderate status”means “moderate”deviation, and so on. These definitions are expanded in Annex V to the WFD.
The major part on Community strategy against pollution of surface waters control policy is set out in Article 16 of the Water Framework Directive, which defines new procedures for the identification of substances and devel-opment of control measures. The European Parliament and Council estab-
Using sludge on arable land 46
lished the list of priority substances in the field of water policy and amending Directive 2000/60/EC (Decision No 2455/2001/EC). This decision identifies a list of substances of concern (priority substances) that present a significant risk to the aquatic environment.
The Commission adopted in July 2006, a proposed Directive setting en-vironmental quality standards (EQS) for the priority substances which Member States must achieve by 2015, to ensure “good chemical surface water status”. The proposal also requires progressive reduction of emissions, losses and discharges of all priority substances, and phase-out or cessation of emissions, losses and discharges of priority hazardous substances within 20 years.
An Environmental Quality Standard (EQS) is not just a threshold level ensuring the protection of only a particular protection objective (like, for instance, a Predicted No Effect Concentration for the protection of the pe-lagic community), but is an overall stand alone value that encompasses the consideration of direct ecotoxicological effects in different habitats (water, sediment), indirect ecotoxicological effects occurring after bioaccumulation in biota (secondary poisoning of top predators) and effects on human health by oral uptake of water and food, including long term toxicity and CMR mechanisms.
Under the Water Framework Directive, Member States shall furthermore set quality standards for river basin specific pollutants, identified in accor-dance with that Directive and take action to meet those quality standards by 2015 as part of ecological status (Article 4, 11 and Annex V, WFD). For this purpose a programme of measures shall be in place by 2009, and become operational by 2012. This procedure will then replace Directive 76/464/EEC upon its repeal.
4.2.5 Priority substances under WFD
The preparation of the priority list included a procedure called COMMPS (see below) which was developed to identify the substances of highest con-cern at Community level. According to the Water Framework Directive, priority hazardous substances are defined as those among the priority sub-stances that are toxic, persistent and liable to bioaccumulate, and other sub-stances, which give rise to equivalent level of, concern (Definition, Article 2.29 and 2.30, WFD).
A proposal for a European Parliament and Council Decision establishing the list of priority substances in the field of water policy was first presented by the Commission on 7 February 2000 (COM (2000) 47 final). The priority list identifies 33 hazardous substances or group of substances (Table 13), which have been shown to be of major concern for European Waters. Within this list, 11 substances have been identified as priority hazardous substances, which are of particular concern for the inland, transitional, coastal and terri-torial waters. These substances will be subject to cessation or phasing out of
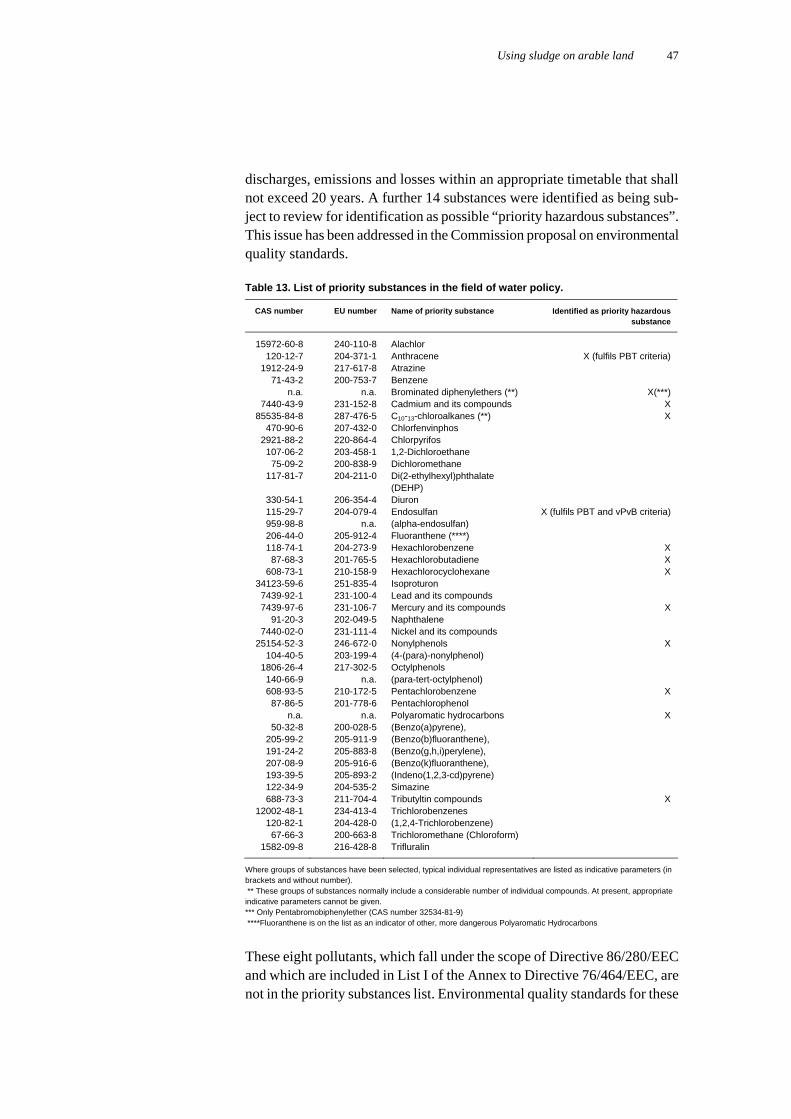
Using sludge on arable land 47
discharges, emissions and losses within an appropriate timetable that shall not exceed 20 years. A further 14 substances were identified as being sub-ject to review for identification as possible “priority hazardous substances”. This issue has been addressed in the Commission proposal on environmental quality standards.
Table 13. List of priority substances in the field of water policy.
CAS number EU number Name of priority substance Identified as priority hazardous substance
15972-60-8 240-110-8 Alachlor 120-12-7 204-371-1 Anthracene X (fulfils PBT criteria)
1912-24-9 217-617-8 Atrazine 71-43-2 200-753-7 Benzene
n.a. n.a. Brominated diphenylethers (**) X(***) 7440-43-9 231-152-8 Cadmium and its compounds X
85535-84-8 287-476-5 C10-13-chloroalkanes (**) X 470-90-6 207-432-0 Chlorfenvinphos
2921-88-2 220-864-4 Chlorpyrifos 107-06-2 203-458-1 1,2-Dichloroethane
75-09-2 200-838-9 Dichloromethane 117-81-7 204-211-0 Di(2-ethylhexyl)phthalate
(DEHP)
330-54-1 206-354-4 Diuron 115-29-7 204-079-4 Endosulfan X (fulfils PBT and vPvB criteria) 959-98-8 n.a. (alpha-endosulfan) 206-44-0 205-912-4 Fluoranthene (****) 118-74-1 204-273-9 Hexachlorobenzene X 87-68-3 201-765-5 Hexachlorobutadiene X
608-73-1 210-158-9 Hexachlorocyclohexane X 34123-59-6 251-835-4 Isoproturon 7439-92-1 231-100-4 Lead and its compounds 7439-97-6 231-106-7 Mercury and its compounds X
91-20-3 202-049-5 Naphthalene 7440-02-0 231-111-4 Nickel and its compounds
25154-52-3 246-672-0 Nonylphenols X 104-40-5 203-199-4 (4-(para)-nonylphenol)
1806-26-4 217-302-5 Octylphenols 140-66-9 n.a. (para-tert-octylphenol) 608-93-5 210-172-5 Pentachlorobenzene X
87-86-5 201-778-6 Pentachlorophenol n.a. n.a. Polyaromatic hydrocarbons X
50-32-8 200-028-5 (Benzo(a)pyrene), 205-99-2 205-911-9 (Benzo(b)fluoranthene), 191-24-2 205-883-8 (Benzo(g,h,i)perylene), 207-08-9 205-916-6 (Benzo(k)fluoranthene), 193-39-5 205-893-2 (Indeno(1,2,3-cd)pyrene) 122-34-9 204-535-2 Simazine 688-73-3 211-704-4 Tributyltin compounds X
12002-48-1 234-413-4 Trichlorobenzenes 120-82-1 204-428-0 (1,2,4-Trichlorobenzene) 67-66-3 200-663-8 Trichloromethane (Chloroform)
1582-09-8 216-428-8 Trifluralin
Where groups of substances have been selected, typical individual representatives are listed as indicative parameters (in brackets and without number). ** These groups of substances normally include a considerable number of individual compounds. At present, appropriate indicative parameters cannot be given. *** Only Pentabromobiphenylether (CAS number 32534-81-9) ****Fluoranthene is on the list as an indicator of other, more dangerous Polyaromatic Hydrocarbons
These eight pollutants, which fall under the scope of Directive 86/280/EEC and which are included in List I of the Annex to Directive 76/464/EEC, are not in the priority substances list. Environmental quality standards for these
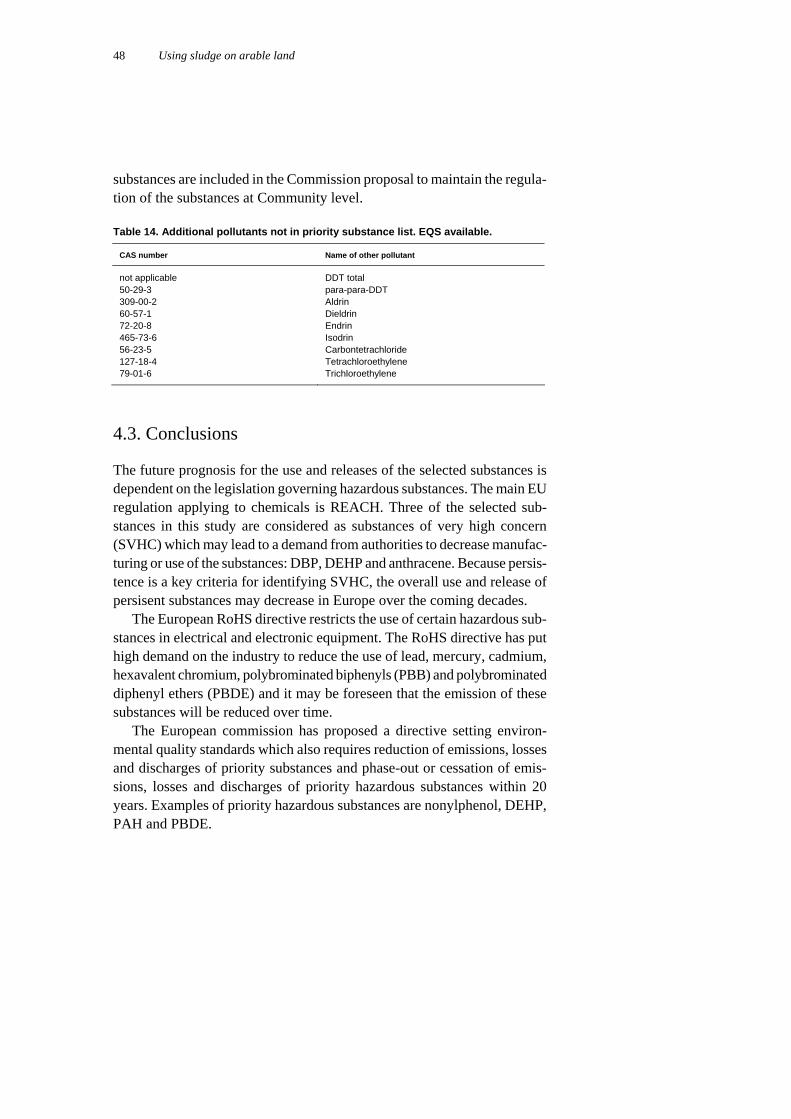
Using sludge on arable land 48
substances are included in the Commission proposal to maintain the regula-tion of the substances at Community level.
Table 14. Additional pollutants not in priority substance list. EQS available.
4.3. Conclusions
The future prognosis for the use and releases of the selected substances is dependent on the legislation governing hazardous substances. The main EU regulation applying to chemicals is REACH. Three of the selected sub-stances in this study are considered as substances of very high concern (SVHC) which may lead to a demand from authorities to decrease manufac-turing or use of the substances: DBP, DEHP and anthracene. Because persis-tence is a key criteria for identifying SVHC, the overall use and release of persisent substances may decrease in Europe over the coming decades.
The European RoHS directive restricts the use of certain hazardous sub-stances in electrical and electronic equipment. The RoHS directive has put high demand on the industry to reduce the use of lead, mercury, cadmium, hexavalent chromium, polybrominated biphenyls (PBB) and polybrominated diphenyl ethers (PBDE) and it may be foreseen that the emission of these substances will be reduced over time.
The European commission has proposed a directive setting environ-mental quality standards which also requires reduction of emissions, losses and discharges of priority substances and phase-out or cessation of emis-sions, losses and discharges of priority hazardous substances within 20 years. Examples of priority hazardous substances are nonylphenol, DEHP, PAH and PBDE.
CAS number Name of other pollutant
not applicable DDT total 50-29-3 para-para-DDT 309-00-2 Aldrin 60-57-1 Dieldrin 72-20-8 Endrin 465-73-6 Isodrin 56-23-5 Carbontetrachloride 127-18-4 Tetrachloroethylene 79-01-6 Trichloroethylene

5. Accumulation in soil
The long-term accumulation of organic pollutants in soil, following sludge amendment, is discussed in this chapter. The first section gives a brief re-view of case studies where sludge-treated soils have been monitored for organic pollutants. In the second section, the impact of sludge amendment on long-term accumulation of persistent organics in soils is discussed based on mass-balance modelling. The relative importance of atmospheric deposi-tion and sludge amendment is illustrated. Calculated levels in soil are com-pared to background soil concentrations.
5.1 Accumulation of organic pollutants – review of case studies
Contaminants in arable soil in Baden-Württemberg fertilized with sewage sludge.
In Germany a study to investigate if the application of sewage sludge to agricultural soil leads to increased levels of contaminants has been per-formed (Landesanstalt für Umweltschutz, Baden-Württemberg, 2003). The study was focused on metals, PAHs, PCBs, PCDD/PCDF and some other organic compounds such as organotin compounds, LAS, DEHP etc. The study was based on comparison of pairs of field with one field having had sewage sludge applied to it for many years and a reference field without sewage sludge application close to the sludge field. A total of 13 study loca-tions were included – 11 agricultural fields and 2 experimental locations. The quantities of applied sewage sludge to the agricultural fields were be-tween 3.2 t/ha and 31.5 t/ha in total. The experimental fields had 86 and 510 t/ha sewage sludge applied.
Significant differences between reference fields and sewage sludge fields were found for 3 out of 11 agricultural field locations for at least one organic parameter. Concentrations of dioxins and furans were elevated at 2 field locations and 1 experimental location. The concentrations of organotin com-pounds were elevated for both experimental locations and for 2 field loca-tions. The concentration of PCDD/PCDFs ranged from 2.7 to 5.2 ng TE/kg in the experimental locations and from 0.31 to 1.8 ng TE/kg at the field loca-tions. PCBs ranged from 0.050 mg/kg to 0.090 mg/kg. Organotin com-pounds ranged from 7.5 to 26.6 µg/kg at the experimental locations and from 1.1 to 8.3 µg/kg at the field locations. There was no signs of accumula-tion of DEHP, LAS or nonylphenol.
Using sludge on arable land 50
Based on extrapolations the authors conclude that continued fertilization with sewage sludge assuming a further 70 years of application is likely to cause that precautionary values will be reached and exceeded in the long term.
5.1.1 Oleszcuk, P. Chemosphere 65 (2006) 1616–1626
The persistence of PAH in sewage sludge-amended soil has been investi-gated by treating soils with different doses of sewage sludge (30, 75, 150, 300 and 600 Mg ha-1). The addition of sewage sludge to the soils resulted in increased levels of PAHs. The increase was proportional to the amount of sewage sludge applied. More than half of the individual PAHs introduced were degraded during the study period of 42/54 months.
The experiments were divided in two. The experiment with field plants took place on agriculturally utilized soils and was carried out for 54 months. Soil samples were analyzed after the introduction of sewage sludge and then after 6, 18, 30, and 42 respectively 54 months. The samples were taken from the surface soil (0–20 cm). The concentration of the 16 PAHs analyzed for decreased clearly during the first 6 months in the soils amended with sewage sludge. The decrease ranged from 80% to 33% depending on the applied sewage sludge dose.
5.1.2 Petersen, S.O. et al. Soil & Tillage Research 72 (2003) 139–152
The use of sewage sludge and household compost on Danish soils has been investigated using a 3-year field trial on two soil types and a 1-year plot experiment. Two types of sewage sludge from a municipal wastewater treatment plant (3–4 Mg DM ha-1), a household compost (17 Mg DM ha-1) and solid pig manure (10 Mg DM ha-1) were studied. The results showed no detectable accumulation of PAH, DEHP, NP+NPE or LAS after three re-peated waste applications. Plot experiments with banded sludge were con-ducted to examine sludge turnover and toxicity. Less than 5% NP and LAS applied in organic wastes were recovered after 6 months and less than 6% of DEHP applied was recovered after 12 months.
Soil samples were taken from the top 20cm of the soil. The measured concentrations of LAS and NP+NPE in the soil were below detection limit in all treatments by the end of the 3-year field trial. DEHP ranged from be-low the detection limit (0.05 mg kg-1) to 0.103 mg kg-1 and total PAH ranged from 0.125 to 0.209 mg kg-1. Degradation of DEHP in a band ex-periment with SShigh was slow during the first 6 weeks of the experiment and approximately 40% of the initial concentration was still present at the end of 6 months. Degradation of NP and LAS were much faster and around 70% of the initial amounts were degraded in the first 6 weeks and less than 5% of NP and LAS remained after 6 months.

Using sludge on arable land 51
The authors concluded that within a period of 6–12 months after time of application the levels of typical organic contaminants decreased considera-bly and monitoring carried out at the end of the 3-year field trial gave no indications of long-term accumulation.
5.1.3 Xia et al. Environ. Tox. Chem. vol 29 (2010) no.3 597–605
An American study has evaluated the levels of a range of organic contami-nants”(triclocarban, triclosan, 4-nonylphenol and polybrominated diphenyl ethers) in biosolids from 16 wastewater treatment plants and in soils from field plots having received biosolids for 33 years (16.8, 33.6 and 67.2 Mg biosolids/ha dry weight). The contaminants were detected in most of the biosolids in concentrations ranging from hundreds of µg/kg to over 1000 mg/kg (dry weight basis). In the biosolid amended soil the contaminants were detected in µg/kg levels with concentrations decreasing sharply with increasing soil depth for triclosan, 4-nonylphenol and triclocarban indicating limited soil leaching. The levels of all investigated compounds increased with increased biosolids application rate. Compared to the cumulative input over the 33 year period of biosolid application most of the polybrominated diphenyl ethers and a small percentage of triclosan, 4-nonylphenol and tri-clocarban remained in the top 120 cm soil layer suggesting a low degrada-tion of polybrominated diphenyl ethers and rapid transformation of the rest of the contaminants.
5.1.4 Gomez-Rico, M.F. Chemosphere 71 (2008) 2129–2138
In a study the degradation of LAS, nonylphenol and nonylphenolethoxylates over a period of nine months have been investigated in three different Medi-terranean forest soils amended with sewage sludge. After nine months the decomposition was 86–96% for LAS and nonylphenol and nonylphe-nolethoxylates was 61–84% though these numbers are averaged of very varying values ranging from worst case of 0–100% for LAS C-10 averaged at 55%. The total LAS in soil before sludge amendment was <1 mg kg-1, in sludge the concentration was 9660 mg kg-1 and in sludge amended soil the concentrations ranged from 2–640 mg kg-1. The total NP, NP1EO, NP2EO in soil before sludge amendment was <0.1 mg kg-1, in sludge the concentra-tion was 519 mg kg-1 and in sludge amended soil the concentrations ranged from 0.1–6.2 mg kg-1.
5.1.5 Summary of case studies
Based on the case studies briefly reviewed, some general conclusions can be drawn regarding repeated application of sludge to agricultural soil:
Using sludge on arable land 52
Persistent organics such as PCB, dioxins and PBDE accumulate in soil and the levels may increase over time
LAS and nonylphenol are quickly degraded in soil DEHP degrades more slowly than nonylphenol but shows no evidence
of long-term accumulation.
5.2 Long-term accumulation in Nordic region
5.2.1 Background concentrations and atmospheric deposition
As shown above, several field studies show that persistent organic pollutants may accumulate in agricultural soils following repeated long term sludge amendments. In order to investigate how large this accumulation can be, and how factors such as pollutant concentrations in sludge and degradation rates influence this accumulation, the accumulation of organic substances in soil was modelled as described in chapter 2.4.
History has shown that accumulation of persistent organic pollutants in the environment may cause severe harm that was not foreseen due to lack of e.g. toxicological knowledge. In this report we evaluate the relative concentration increase after 10, 25 and 100 years. The long-term scenarios are hypothetic in the sense that current levels in sludge and atmospheric deposition are unlikely to remain unchanged. The results should be considered as examples of what may happen in the status quo case.
Atmospheric deposition is treated in the model as a continuous process whereas sludge amendment occurs intermittently, i.e. every 5th or 10th years. These inputs are balanced by degradation and other elimination processes. Starting with atmospheric deposition as the single source of organic pollut-ants, concentrations in soil will increase until a steady-state between deposi-tion and degradation is reached. These results are shown in figure 2 for three chemicals with different persistence. The steady state is reached more slowly for the most persistent chemicals.
There is very limited data on organic pollutants in Nordic agricultural soils that have not been treated with sludge. Data from Vikelsöe et al., 2002; Samsöe-Petersen, 2002; VKM, 2009; Matscheko et al., 2002b and Sellström et al., 2005 are summarised in Table 15. Data for PAHs are so sparse that also data from Polish background soils were included (Olesczcuk, 2006). It is uncertain whether the higher PAH levels reported actually represent only large-scale atmospheric deposition, or if local emissions did influence the levels in soil.
The levels should be considered as examples of background agricultural soil concentrations, but not necessarily as typical concentrations. Table 15 also contains calculated levels in soil after 25 years of atmospheric deposi-tion at current rates. The agreement is good for PCBs and PBDEs, whereas the estimated levels for PAHs are lower than the reported data. Reasons for

Using sludge on arable land 53
this difference in PAHs may be that atmospheric deposition were much lar-ger in the few agricultural regions that were investigated than at the back-ground sites where deposition is measured. Higher deposition may be caused by e.g. local emissions from tractors etc or regional activities such as road traffic and industries. In Germany, concentrations of individual PAHs have been reported to be lower or much lower than 1 µg/kg dw in rural soils (Langenkamp and Hart, 2001), which would be in better agreement with the calculated levels.
Because the measured soil data are so sparse it is uncertain which the representative background soil concentrations are. Calculated levels from only atmospheric deposition will therefore be used as reference to the cases where sludge amendment is included in the model.
Figure 2. Buildup of pollutant concentrations in soil as a result of atmospheric deposition.

Using sludge on arable land 54
Table 15. Background levels (µg/kg dw) of organic pollutants in Nordic agricultural soils and calculated levels after 25 years of atmospheric deposition.
Substance Data from background soils Calculated at T=25 yrs
Phenanthrene 1–6 0,0091 Benzo(a)pyrene 1–170 0,029 Benzo(b)fluoranthene 1,5–130 Dibenz(ah)anthracene 1–2 0,014 PCB-52 0,004–0,015 0,0018 PCB-101 0,007–0,014 0,0027 PCB-118 0,004–0,010 0,0024 PCB-138 0,03–0,08 0,0073 PCB-153 0,005–0,02 0,0064 PCB-180 0,01–0,03 0,0056 BDE-47 0,007–0,03 0,00027 BDE-99 0,008–0,05 0,00048 BDE-100 0,002–0,02 0,00027 BDE-209 0,015–0,75 0,011
5.2.2 Calculated soil contamination from sludge
To illustrate the long-term accumulation of organic pollutants in soil follow-ing sludge application, approximate average levels in sludge from chapter 3 are used. Atmospheric deposition is also included as a pollutant source. How the predicted concentrations in soil vary over the first 15 years are shown in figure 3 for five chemicals with different degradation rates. More easily degradable pollutants level of within approximately 1–2 years after the sludge application. DEHP and benzo(a)pyrene degrade at roughly equal rates. Due to atmospheric deposition, concentrations of benzo(a)pyrene and BDE-99 never reaches zero. PCB-153 shows a behaviour that is typical for highly persistent substances: degradation is so slow that the concentrations in soil slowly increases with every sludge application. These patterns agree well with the general empirical evidence from the case studies (chapter 5.1) showing that persistent organics may accumulate in soil and that levels may increase over time.
Figure 4 shows the soil concentrations of benzo(a)pyrene and four halo-genated pollutants after 10, 25 and 100 years of sludge application at the low rate of 3,5 ton (ha 5yrs)-1. Concentrations would increase with increasing application rates. The figure also shows the concentrations that would be expected if atmospheric deposition was the only pollutant source. In relation to background levels, estimated by atmospheric deposition, concentration of benzo(a)pyrene increases about 5-fold (Figure 4). The relative increases of PCBs and PBDEs are much larger. BDE-209 is the substance predicted to occur at the highest concentrations.
The PCBs and BDE-209 increase over time upon repeated applications of sludge. This is not the case for the slightly less persistent B(a)P and the lighter PBDEs (#47, #99, #100). However, certain field studies indicate that also lighter PBDEs may accumulate over time in sludge treated soils (e.g. Sellström et al., 2005; Xia et al., 2010). The discrepancy between those em-pirical observations and the model results for lighter PBDEs may possibly be due to uncertainty in the degradation rates used in the modelling. To the

Using sludge on arable land 55
best of our knowledge, there are no experimentally determined rates and the values used were estimated by models (Schenker et al., 2008). However, a sensitivity analysis shows that if the degradation rate of BDE-99 were three times lower, the levels in soil would only be approximately 25% higher after 100 years.
The modelling clearly shows that sludge application, even at the low ap-plication rate of 3,5 ton/ha every 5th year, leads to significantly increased levels in soil as compared to the case of atmospheric deposition as the single pollutant source. With the exception of BDE-209 (2 µg/kg dw), the calcu-lated concentrations in soil (figure 4) are lower than 1 µg/kg dw after 100 years of sludge application. For BDE-99, BDE-209 and PCB-153, the calcu-lated concentrations are in good agreement with measured levels in Swedish sludge treated agricultural soils (Matcheko et al., 2002b; Sellström et al., 2005).
BDE-99 in Norwegian forest soils range from 0,063–1,4 µg/kg dw (me-dian 0,36; Hassanin et al., 2004). PCB-153 in a number of soils from south-ern Sweden were mainly in the range 0,3–1 µg/kg dw (Backe et al., 2004). These soils are not thought to be influenced by local point sources. The fol-lowing concentrations have been detected in sediments from remote sites in Sweden: BDE-99: 0,015–0,1 ng/g dw (Sternbeck et al., 2003); PCB-153: 0,2–4 (National Environmental Monitoring, unpubl.); BDE-209: 0,5–11 ng/g dw (Ricklund et al., 2010).
The estimated levels of PCB-153, BDE-99 and BDE-209 after 100 years of sludge application (figure 4) are thus in the range of levels currently en-countered in background soils and sediments. Finally, it is anticipated that the use and emissions of persistent organic pollutants will decrease over the coming decades, as a result of the REACH legislation and the UNEP Stock-holm convention.
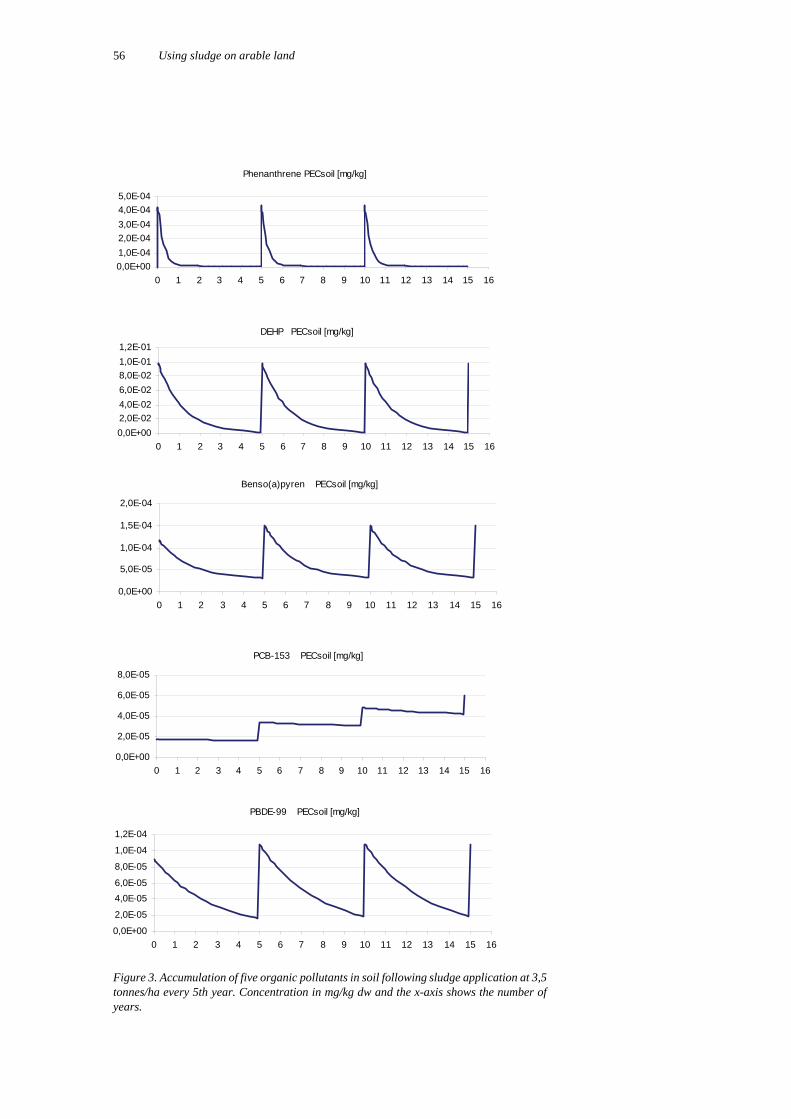
Using sludge on arable land 56
DEHP PECsoil [mg/kg]
0,0E+00
2,0E-02
4,0E-02
6,0E-02
8,0E-02
1,0E-01
1,2E-01
0 1 2 3 4 5 6 7 8 9 10 11 12 13 14 15 16
Phenanthrene PECsoil [mg/kg]
0,0E+00
1,0E-04
2,0E-04
3,0E-04
4,0E-04
5,0E-04
0 1 2 3 4 5 6 7 8 9 10 11 12 13 14 15 16
PCB-153 PECsoil [mg/kg]
0,0E+00
2,0E-05
4,0E-05
6,0E-05
8,0E-05
0 1 2 3 4 5 6 7 8 9 10 11 12 13 14 15 16
Benso(a)pyren PECsoil [mg/kg]
0,0E+00
5,0E-05
1,0E-04
1,5E-04
2,0E-04
0 1 2 3 4 5 6 7 8 9 10 11 12 13 14 15 16
PBDE-99 PECsoil [mg/kg]
0,0E+00
2,0E-05
4,0E-05
6,0E-05
8,0E-05
1,0E-04
1,2E-04
0 1 2 3 4 5 6 7 8 9 10 11 12 13 14 15 16
Figure 3. Accumulation of five organic pollutants in soil following sludge application at 3,5 tonnes/ha every 5th year. Concentration in mg/kg dw and the x-axis shows the number of years.
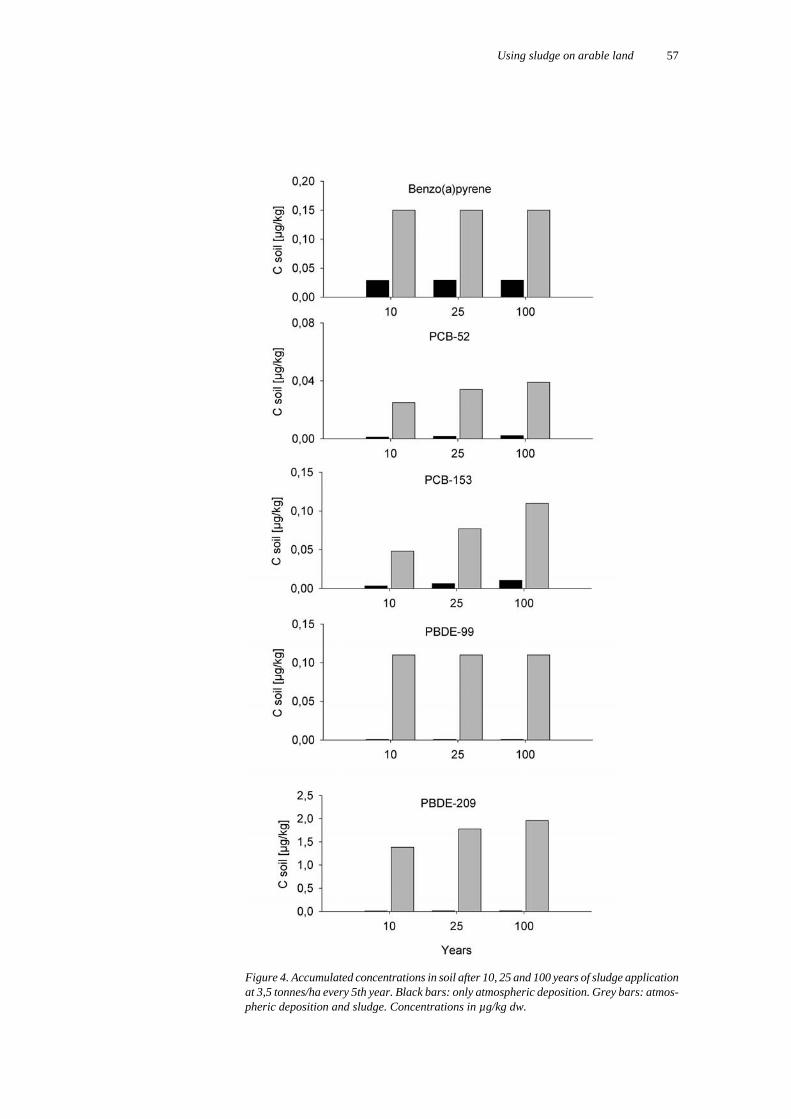
Using sludge on arable land 57
Figure 4. Accumulated concentrations in soil after 10, 25 and 100 years of sludge application at 3,5 tonnes/ha every 5th year. Black bars: only atmospheric deposition. Grey bars: atmos-pheric deposition and sludge. Concentrations in µg/kg dw.

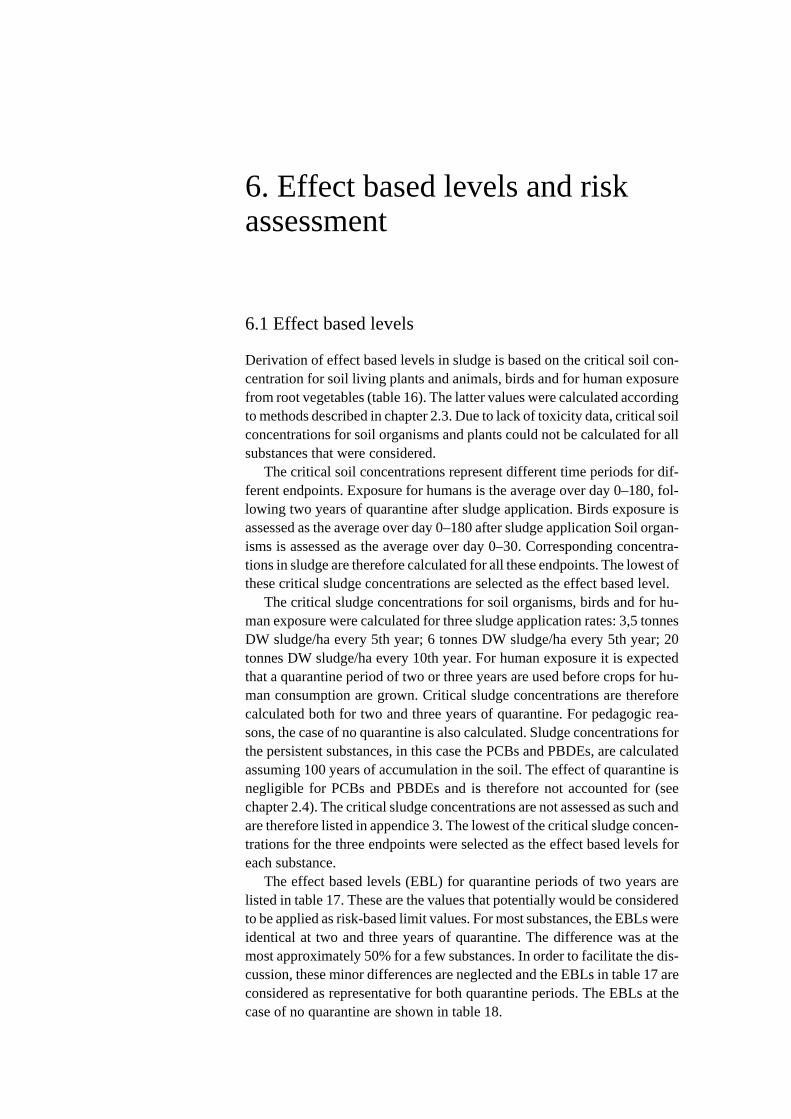
6. Effect based levels and risk assessment
6.1 Effect based levels
Derivation of effect based levels in sludge is based on the critical soil con-centration for soil living plants and animals, birds and for human exposure from root vegetables (table 16). The latter values were calculated according to methods described in chapter 2.3. Due to lack of toxicity data, critical soil concentrations for soil organisms and plants could not be calculated for all substances that were considered.
The critical soil concentrations represent different time periods for dif-ferent endpoints. Exposure for humans is the average over day 0–180, fol-lowing two years of quarantine after sludge application. Birds exposure is assessed as the average over day 0–180 after sludge application Soil organ-isms is assessed as the average over day 0–30. Corresponding concentra-tions in sludge are therefore calculated for all these endpoints. The lowest of these critical sludge concentrations are selected as the effect based level.
The critical sludge concentrations for soil organisms, birds and for hu-man exposure were calculated for three sludge application rates: 3,5 tonnes DW sludge/ha every 5th year; 6 tonnes DW sludge/ha every 5th year; 20 tonnes DW sludge/ha every 10th year. For human exposure it is expected that a quarantine period of two or three years are used before crops for hu-man consumption are grown. Critical sludge concentrations are therefore calculated both for two and three years of quarantine. For pedagogic rea-sons, the case of no quarantine is also calculated. Sludge concentrations for the persistent substances, in this case the PCBs and PBDEs, are calculated assuming 100 years of accumulation in the soil. The effect of quarantine is negligible for PCBs and PBDEs and is therefore not accounted for (see chapter 2.4). The critical sludge concentrations are not assessed as such and are therefore listed in appendice 3. The lowest of the critical sludge concen-trations for the three endpoints were selected as the effect based levels for each substance.
The effect based levels (EBL) for quarantine periods of two years are listed in table 17. These are the values that potentially would be considered to be applied as risk-based limit values. For most substances, the EBLs were identical at two and three years of quarantine. The difference was at the most approximately 50% for a few substances. In order to facilitate the dis-cussion, these minor differences are neglected and the EBLs in table 17 are considered as representative for both quarantine periods. The EBLs at the case of no quarantine are shown in table 18.
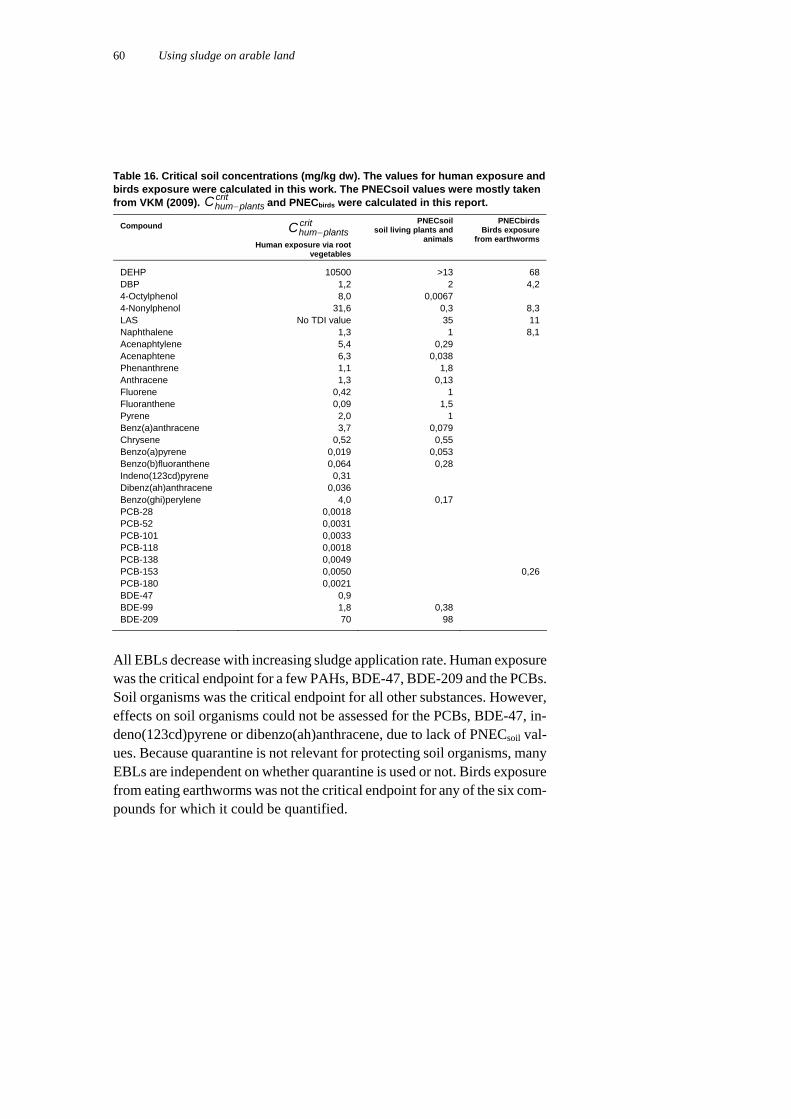
Using sludge on arable land 60
Table 16. Critical soil concentrations (mg/kg dw). The values for human exposure and birds exposure were calculated in this work. The PNECsoil values were mostly taken from VKM (2009).
critplantshumC and PNECbirds were calculated in this report.
Compound critplantshumC
Human exposure via root vegetables
PNECsoilsoil living plants and
animals
PNECbirdsBirds exposure
from earthworms
DEHP 10500 >13 68 DBP 1,2 2 4,2 4-Octylphenol 8,0 0,0067 4-Nonylphenol 31,6 0,3 8,3 LAS No TDI value 35 11 Naphthalene 1,3 1 8,1 Acenaphtylene 5,4 0,29 Acenaphtene 6,3 0,038 Phenanthrene 1,1 1,8 Anthracene 1,3 0,13 Fluorene 0,42 1 Fluoranthene 0,09 1,5 Pyrene 2,0 1 Benz(a)anthracene 3,7 0,079 Chrysene 0,52 0,55 Benzo(a)pyrene 0,019 0,053 Benzo(b)fluoranthene 0,064 0,28 Indeno(123cd)pyrene 0,31 Dibenz(ah)anthracene 0,036 Benzo(ghi)perylene 4,0 0,17 PCB-28 0,0018 PCB-52 0,0031 PCB-101 0,0033 PCB-118 0,0018 PCB-138 0,0049 PCB-153 0,0050 0,26 PCB-180 0,0021 BDE-47 0,9 BDE-99 1,8 0,38 BDE-209 70 98
All EBLs decrease with increasing sludge application rate. Human exposure was the critical endpoint for a few PAHs, BDE-47, BDE-209 and the PCBs. Soil organisms was the critical endpoint for all other substances. However, effects on soil organisms could not be assessed for the PCBs, BDE-47, in-deno(123cd)pyrene or dibenzo(ah)anthracene, due to lack of PNECsoil val-ues. Because quarantine is not relevant for protecting soil organisms, many EBLs are independent on whether quarantine is used or not. Birds exposure from eating earthworms was not the critical endpoint for any of the six com-pounds for which it could be quantified.

Using sludge on arable land 61
Table 17. Effect based levels in sludge (mg/kg dw) at three sludge application rates, and a quarantine period of two years. Values of max doses are also given.
Effect based levels (mg/kg dw) Effect based doses (g/ha/yr)
Substance
3,5 t/ha/5 yr
6 t/ha/5 yr
20 t/ha/10 yr
Critical endpoint
Applica-tion 5th yr
Applica-tion 10th yr
DEHP 6500 3800 1200 Soil organisms 4500 2400
DBP 1700 1000 280 Soil organisms 1200 550
4-Octylphenol 8 4,7 1,4 Soil organisms 5,6 2,8
4-Nonylphenol 350 200 60 Soil organisms 240 120
LAS 50000 30000 9000 soil organisms 35000 18000
Naphtalene 700 400 130 soil organisms 500 260
Acenaphtylene 180 100 30 soil organisms 120 60
Acenaphtene 24 14 4 soil organisms 17 8
Phenanthrene 1100 650 200 soil organisms 770 400
Anthracene 80 47 14 soil organisms 55 28
Fluorene 600 350 110 soil organisms 400 200
Fluoranthene 800 470 140 soil organisms 550 280
Pyrene 550 320 90 soil organisms 380 180
Benz(a)anthracene 40 23 7,5 soil organisms 28 15
Chrysene 300 175 50 soil organisms 200 100
Benzo(a)-pyrene 28 16 4,8 soil organisms 20 10 Benzo(b)-fluoranthene 110 68 20 human exp of root veg. 80 40 Indeno-(123cd)pyrene 400 235 70 human exp of root veg. 280 140 Dibenz(ah)-anthracene 48 28 8,4 human exp of root veg. 34 17 Benzo(ghi)-perylene 90 50 15 soil organisms 63 30
PCB-28 0,70 0,41 0,16 human exp root veg. 0,49 0,32
PCB-52 0,50 0,29 0,14 human exp of root veg. 0,35 0,28
PCB-101 0,50 0,29 0,15 human exp of root veg. 0,35 0,3
PCB-118 0,28 0,16 0,08 human exp of root veg. 0,20 0,16
PCB-138 0,43 0,25 0,14 human exp of root veg. 0,30 0,28
PCB-153 0,44 0,26 0,14 human exp of root veg. 0,31 0,28
PCB-180 0,11 0,064 0,04 human exp of root veg. 0,077 0,072 BDE-47 440 250 80 human exp of root veg. 310 160
BDE-99 100 95 33 Soil organisms 110 66
BDE-209 12000 7000 3400 human exp of root veg. 8400 6800
In general, the calculated effect based levels may be considered high. As a comparison, the current limitvalues/guidevalues in Denmark and Sweden are for LAS 1300 mg/kg, PAH 3 mg/kg dw, DEHP 50 mg/kg dw and PCB7 0,4 mg/kg dw. These values are not based on risk assessment principles (see chapter 1.5). One contributing factor for the high EBLs is that the amounts of sludge added are small (0,2–1%) compared to the amount of soil in which it is mixed. The sludge pollutants are effectively diluted. For the phthalates, alkylphenols, LAS and the lighter PAHs, degradation is rapid in soil. After a quarantine of two years, practically no dibutylphthalate, alkylphenols, LAS
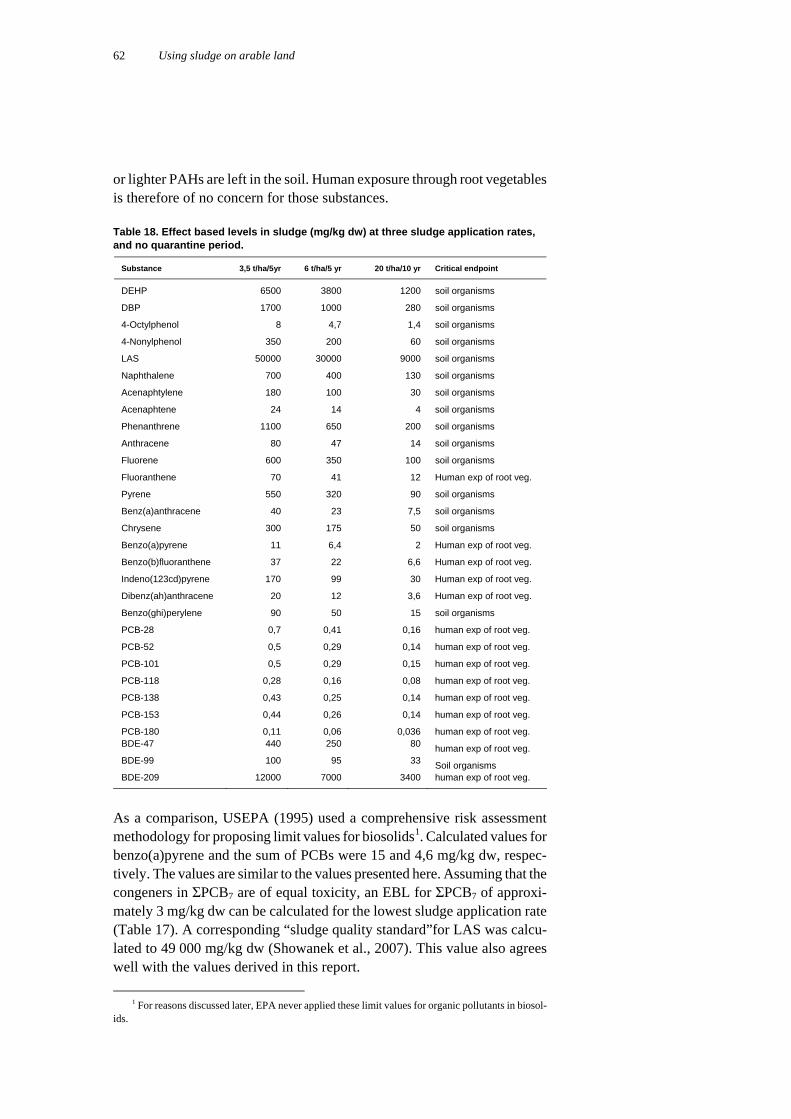
Using sludge on arable land 62
or lighter PAHs are left in the soil. Human exposure through root vegetables is therefore of no concern for those substances.
Table 18. Effect based levels in sludge (mg/kg dw) at three sludge application rates, and no quarantine period.
Substance 3,5 t/ha/5yr 6 t/ha/5 yr 20 t/ha/10 yr Critical endpoint
DEHP 6500 3800 1200 soil organisms
DBP 1700 1000 280 soil organisms
4-Octylphenol 8 4,7 1,4 soil organisms
4-Nonylphenol 350 200 60 soil organisms
LAS 50000 30000 9000 soil organisms
Naphthalene 700 400 130 soil organisms
Acenaphtylene 180 100 30 soil organisms
Acenaphtene 24 14 4 soil organisms
Phenanthrene 1100 650 200 soil organisms
Anthracene 80 47 14 soil organisms
Fluorene 600 350 100 soil organisms
Fluoranthene 70 41 12 Human exp of root veg.
Pyrene 550 320 90 soil organisms
Benz(a)anthracene 40 23 7,5 soil organisms
Chrysene 300 175 50 soil organisms
Benzo(a)pyrene 11 6,4 2 Human exp of root veg.
Benzo(b)fluoranthene 37 22 6,6 Human exp of root veg.
Indeno(123cd)pyrene 170 99 30 Human exp of root veg.
Dibenz(ah)anthracene 20 12 3,6 Human exp of root veg.
Benzo(ghi)perylene 90 50 15 soil organisms
PCB-28 0,7 0,41 0,16 human exp of root veg.
PCB-52 0,5 0,29 0,14 human exp of root veg.
PCB-101 0,5 0,29 0,15 human exp of root veg.
PCB-118 0,28 0,16 0,08 human exp of root veg.
PCB-138 0,43 0,25 0,14 human exp of root veg.
PCB-153 0,44 0,26 0,14 human exp of root veg.
PCB-180 0,11 0,06 0,036 human exp of root veg. BDE-47 440 250 80 human exp of root veg. BDE-99 100 95 33 Soil organisms BDE-209 12000 7000 3400 human exp of root veg.
As a comparison, USEPA (1995) used a comprehensive risk assessment methodology for proposing limit values for biosolids1. Calculated values for benzo(a)pyrene and the sum of PCBs were 15 and 4,6 mg/kg dw, respec-tively. The values are similar to the values presented here. Assuming that the congeners in ΣPCB7 are of equal toxicity, an EBL for ΣPCB7 of approxi-mately 3 mg/kg dw can be calculated for the lowest sludge application rate (Table 17). A corresponding “sludge quality standard”for LAS was calcu-lated to 49 000 mg/kg dw (Showanek et al., 2007). This value also agrees well with the values derived in this report.
1 For reasons discussed later, EPA never applied these limit values for organic pollutants in biosol-
ids.

Using sludge on arable land 63
6.2 Comparing effect based levels with levels in Nordic sludge
To assess whether the presence of organic pollutants in sludge is of concern for the health or the environment, when sludge is applied on agricultural soils, the effect based levels (Table 17) are compared to the current concen-trations in sludge.
A first screening is made by comparing the EBLs to the maximum re-ported levels in sludge from the Nordic countries (chapter 3 and appendice 1). This gives a worst-case indication of any risk substances. None of the PAHs were of concern, because risk ratios were less than 0,08 och mostly below 0,01. Neither were dibutylphthalate nor PBDEs of concern, with highest risk ratios of 0,02 and 0,005, respectively.
Risk ratios of the remaining substances are shown in figure 5. Using 90-percentiles of concentrations in sludge, risk ratios are well below 1 for DEHP, alkylphenols, LAS and PCBs, even at the highest sludge application rate (20 ton/ha every 10th year). At the maximum reported concentrations in sludge, one of the PCB-congeners exceeded a risk ratio of 1. However, hu-man exposure is the critical endpoint for PCBs and there are no established TDI-values for these single congeners. Since most PCB congeners and ΣPCB7 are below 1, it is not considered that PCBs are of concern in this context.
At the highest rate of sludge application, sludge with the highest concen-trations of LAS exceeds the effect based level. Such high levels were de-tected in Danish sludge only, and only in one out of 1630 samples. The con-clusion is therefore that LAS is not of concern in this context. This agrees with Schowanek et al. (2007), who used probabilistic methods and con-cluded that there was no reason for establishing a limit value for LAS in sludge based on the risk aspect.
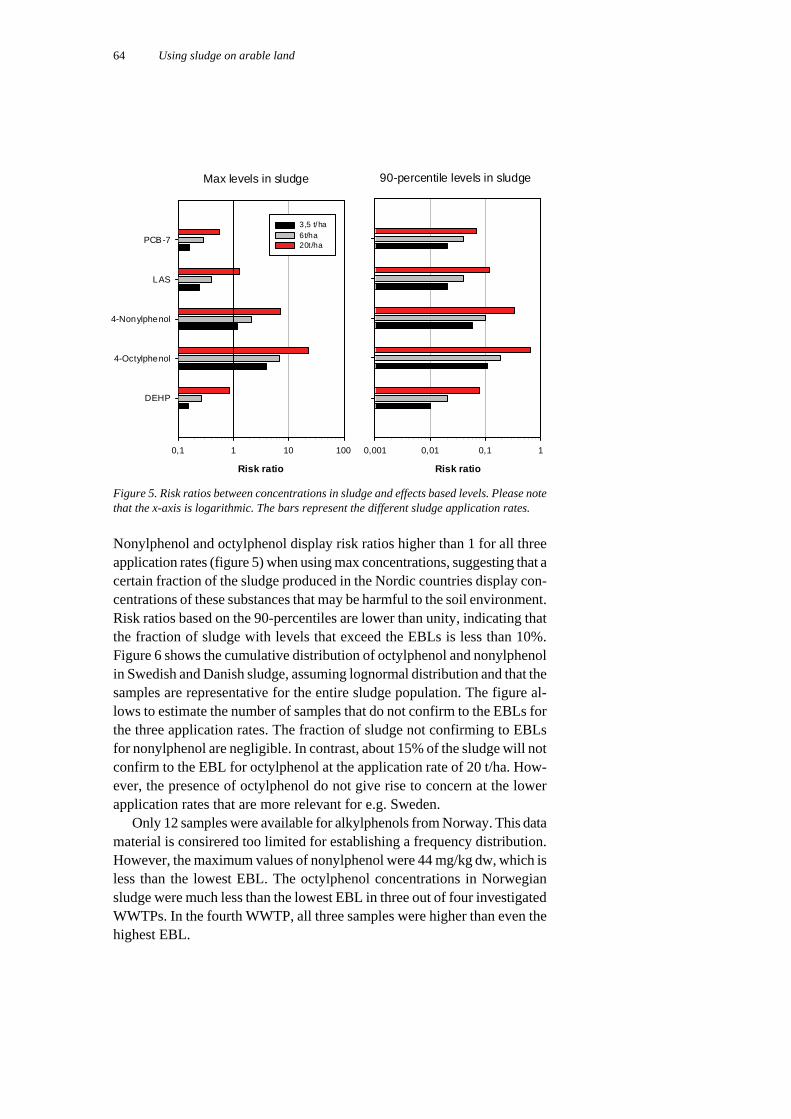
Using sludge on arable land 64
Max levels in sludge
Risk ratio
0,1 1 10 100
DEHP
4-Octylphenol
4-Nonylphenol
LAS
PCB-7
3,5 t/ha 6t/ha 20t /ha
90-percentile levels in sludge
Risk ratio
0,001 0,01 0,1 1
Figure 5. Risk ratios between concentrations in sludge and effects based levels. Please note that the x-axis is logarithmic. The bars represent the different sludge application rates.
Nonylphenol and octylphenol display risk ratios higher than 1 for all three application rates (figure 5) when using max concentrations, suggesting that a certain fraction of the sludge produced in the Nordic countries display con-centrations of these substances that may be harmful to the soil environment. Risk ratios based on the 90-percentiles are lower than unity, indicating that the fraction of sludge with levels that exceed the EBLs is less than 10%. Figure 6 shows the cumulative distribution of octylphenol and nonylphenol in Swedish and Danish sludge, assuming lognormal distribution and that the samples are representative for the entire sludge population. The figure al-lows to estimate the number of samples that do not confirm to the EBLs for the three application rates. The fraction of sludge not confirming to EBLs for nonylphenol are negligible. In contrast, about 15% of the sludge will not confirm to the EBL for octylphenol at the application rate of 20 t/ha. How-ever, the presence of octylphenol do not give rise to concern at the lower application rates that are more relevant for e.g. Sweden.
Only 12 samples were available for alkylphenols from Norway. This data material is consirered too limited for establishing a frequency distribution. However, the maximum values of nonylphenol were 44 mg/kg dw, which is less than the lowest EBL. The octylphenol concentrations in Norwegian sludge were much less than the lowest EBL in three out of four investigated WWTPs. In the fourth WWTP, all three samples were higher than even the highest EBL.

Using sludge on arable land 65
Octylphenol Swedish sludge
20%
30%
40%
50%
60%
70%
80%
90%
100%
0,00 2,00 4,00 6,00 8,00 10,00
Concentration (mg/kg dw)
cu
mu
lati
ve p
rob
ab
iliy
Figure 6. Cumulative distribution of octylphenol and nonylphenol in Swedish and Danish sludge and effect based levels for 3,5 (red), 6 (dark blue) and 20 ton/ha (light blue), respec-tively. Note that the probability scale for nonylphenol only represents the upper 10% of the distribution.

Using sludge on arable land 66
To summarise this chapter. Effect based levels for certain organic pollutants in sludge to be used on arable land were calculated. The major organic pollutants as well as certain low level persistent organics were included. The effect based levels were compared to current concentrations in sludge from the Nordic countries. It appeared that the occurrence of these pollutants in sludge were generally not of concern to either human health or the environment.

7. To control pollution from use of sludge
Limit values are used to protect human health and the environment, and are generally based on scientific principles. However, limit values may also be used as a driving force to obtain political or ethical principals. Limit values may well be an effective way to control soil contamination from sludge. However, limit values should be justified. Strict or liberal limitations can both cause criticism and give unexpected consequences regarding use of sludge as resource. Protection of soil and waters from contamination is im-portant. It is also important to look at different soil usage, i.e. whether it concerns food production or parks, green areas, city gardens, urban areas, forests or land reclamation. This chapter contains a discussion on the suit-ability and constraints of risk based limit values for organic pollutants. Fi-nally some aspects of monitoring programmes for organic pollutants in sludge are also discussed. An overview of the current Nordic regulations for use of sludge is given in appendice 5.
7.1 Limit values or other ways to control?
A limit value gives a signal that a substance is a hazard and is taken seri-ously by the authority and it signals a measure in order to control pollution. Is this approach necessary for organic pollutants in sludge? There may be several reasons for controlling organic pollutants in sludge: To ensure safe use on agricultural soils. To minimize long-term accumulation on agricultural soils. Sludge is an indicator for pollutant flows in the society and the
environment; controlling the levels in sludge may also lead to generally lower releases of organic pollutants.
Other uses of sludge.
7.1.1 Safe use
The safe use for human health and the terrestrial ecosystem was assessed using risk assessment methods that are similar but not identical to those applied in Sweden and Norway for contaminated soils (appendice 4). Effect based levels were presented in chapter 6 (Table 17). If one wishes to apply these levels as limit values for organic contaminants in sludge, the limit values should be specified for certain application rates. Three application

Using sludge on arable land 68
rates were used in the derivation of effect based levels in this report: 3.5 and 6 tonnes sludge/ha every 5th year; and 20 tonnes sludge/ha every 10th year.
The values may seem high compared to e.g. current guidevalues2 in Denmark and Sweden. For some of the substances, in particular the PAHs and LAS, the EBLs are so high that if they were applied in legislation it would give wrong signals to the public, the WWTPs and to the industry. The risk characterisation performed using these EBLs shows that concentrations in Nordic sludge are generally lower or much lower than these values (chap-ter 6.2.). Applying those EBLs as limit values would thus neither impact the use of sludge on agricultural land, nor stimulate an improvement in sludge quality.
The risk characterisation indicates that the use of sludge on arable soils is of no major concern when it comes to organic pollutants. This view has been expressed elsewhere, based on other assessments and in particular for the health assessment (e.g. USEPA, 1995; Langenkamp and Part, 2001; Latur-nus et al., 2007). However, the risk assessment methodology has inherent limitations:
This work as well as preceding assessments only cover a selection of
all the organic pollutants that are present in sludge. The present report do however cover the most abundant organic pollutants in sludge (LAS, DEHP, NP) as well as some highly persistent compounds (PCBs, PBDEs).
It has been demonstrated that chemical mixtures may display toxicity that is not predicted when assessing the chemicals one-by-one (e.g. Faust et al., 2001; Kortenkamp et al., 2007). This challenges the applicability of the NOEC and NOAEL concept for real mixtures. At present, these aspects are rarely treated in regulatory risk assessments. Neither was it treated in this report.
The risk assessment is limited to the current (eco-)toxicological knowledge of each substance. Because many persistent chemicals that are present in sludge may accumulate in soils over time (chapter 5), there is a risk of large-scale low-level contamination with chemicals that are not sufficiently characterised toxicologically.
All the above mentioned limitations may not be effectively solved, and must be weighed against the positive aspects of nutrient recycling when using sludge as a fertiliser. If there is a wish for establishing effective limit values for organic pollutants in sludge, this calls for other principles than risk as a basis.
2 Those guidevalues were not based on risk assessment.

Using sludge on arable land 69
7.1.2 Long-term accumulation
History has shown that accumulation of persistent organic pollutants in the environment may cause severe harm that was not foreseen due to limited knowledge on the toxicological properties of these substances. The value of risk assessment is always limited to the current toxicological knowledge of the substances to be evaluated. Once large areas of agricultural land have been contaminated by persistent organics, there is no way of changing this condition. The applicability of EBLs for persistent substances can thus be discussed, and the precautionary principle may be considered.
Accumulation over 10, 25 and 100 years of sludge application was mod-elled in this report (chapter 5.2) .The accumulation modelling shows that sludge may be a much more significant source than atmospheric deposition when it comes to persistent organic substances. Furthermore, it was shown that PCBs and BDE-209 will display increasing concentrations over time. Whether the lower brominated PBDEs also show this behaviour is uncertain, due to the uncertainty in degradation rates. Over a period of 100 years, the accumulated soil concentrations are predicted to be approximately 2 µg/kg dw for BDE-209 and approximately 0,1 µg/kg dw3 for PCB-153 and BDE-99. These concentrations are similar to those of Nordic background forest sites and sediments from remote sites.
It is known that several other persistent pollutants such as dioxins, PFOS and chlorinated paraffins also occur in sewage sludge. Such substances probably share the behaviour of PCBs and BDE-209, with concentrations in soil slowly increasing upon each addition of sludge. There are strong inter-national efforts directed at minimizing the use and release of persistent compounds. If it would be of interest to propose limit values for persistent substances in sludge based on long-term accumulation in soils, there is a need for a policy to base these limit values upon. It is also important to be aware of the fact that the relative increase in soils over time is mainly related to the degradation rates of each substance and to the frequency of sludge application. The concentration in sludge affects the absolute concentration in soils that are treated with sludge, but it does not influence the fact that soil concentrations of persistent substances increases over time.
7.1.3 General impact on pollutant releases
The chemicals occurring in sludge from municipal WWTPs do to a certain extent reflect the diffuse releases from society. A recent review of Swedish monitoring data (WSP, 2010) showed that many of those substances that occur at high levels in sludge, also occur at elevated levels in the urban aquatic environment. Temporal trends in pollutant concentrations in sludge may thus reflect the use and diffuse releases of many chemicals.
3 At the application rate of 3,5 tonnes/ha every 5th year. Higher application rates give proportionally
higher concentrations.
Using sludge on arable land 70
An alternative to effect based fixed limit values could thus be progres-sively decreasing pollutant concentrations in sludge. This can be formalised as a goal for individual WWTPs, with statistical support for how to identify a temporal trend and how to setup a monitoring programme that can provide data with necessary statistical confidence. However, before such goals are formalised it must be ascertained that pollutants are lower than effect based limits. If not, there may be a need to rapidly identify the sources responsible for the high concentrations.
Current Nordic guidevalues or limitvalues for e.g. metals in sludge have been based on the principle to obtain progressively lower concentrations in sludge. For instance, the 90-percentile concentration of a pollutant in sludge from all WWTPs may be used as a “target value”, forcing the WWTPs with highest levels to reduce the pollutant load (see chapter 1.5). Such a principle could possibly be effective also for this purpose of progressively decreasing concentrations.
7.1.4 Other uses of sludge
Although this report has the main focus on the influence of sludge on or-ganic pollutants in agricultural soils, sludge usage on green areas is another major enduse in the Nordic countries (table 1). Green areas can e.g. be parks, road construction, cover of landfill etc. Sludge with too high metal content for agricultural application can often be used on green areas, where application rates also may be higher.
The effect based levels presented in chapter 6.1 are not intended for sludge usage on green areas. First of all, there may be other protective goals and exposure pathways at green areas as compared to agricultural soils. Sec-ondly, the legal application rates are often higher on green areas than on agricultural soils. In Norway sludge can be applied in a 5 cm layer on green areas. This amount of sludge will represent 125 ton/ha (sludge density of 1 kg/L and DM content of 25%), which is much higher than the 3,5–20 ton/ha considered in this report. Conclusively, the EBLs proposed in this report are not protective for general use of sludge. It cannot be exluded that EBLs for other uses could be lower.
7.1.5 The need for regulating organic pollutants in sludge
Based on the discussions above it can be concluded: Sludge may be used on arable soils with no apparent risks to health or
the environment, with regard to the organic substances included in this report. However, there are uncertainties related to e.g. mixture effects.
The effects based levels proposed in this report are not intended for other enduses of sludge than as a fertiliser on arable soils.

Using sludge on arable land 71
Sludge contains a number of persistent organic pollutants that over time may accumulate in sludge treated soils, and thus in the terrestrial ecosystems. There is a general consensus that releases of persistent substances to the environment should decrease.
Sludge quality may also be used as a fingerprint for diffuse releases of organic pollutants in the society.
These recommendations are given: There is no need for implementing effect based limits for organic
pollutants as limit values in sludge that is to be used on arable soils. The occurrence of persistent organic substances in sludge should be
monitored. Example substances are given chapter 7.2. Long term goals of decreasing temporal trends for persistent organics
in sludge may be implemented, either on the national level or individually in WWTPs.
Current use chemicals with particular hazardous properties (e.g. endocrine disrupting) may be monitored at selected WWTPs. The purpose would be as indicators of diffuse release from society.
7.2. Monitoring
7.2.1 Current monitoring
It is common that larger WWTPs take regular samples of inlet and outlet waste water to control metals and some selected organic pollutants. This is a part of the plants own check and for the authority to have an overall over-view on the discharges. However, there are no limit values for the effluent regarding pollutants in waste waters for municipal WWTPs in the Nordic countries. The requirement for the treatment plant is to follow the trend and to evaluate measures to be taken.
Since 2006 the Norwegian legislation require WWTPs larger than 20,000 pe to analyse waste water for Pb, Cd, Cu, Cr, Hg, Ni, Zn and As and WWTPs larger than 50,000 pe to analyse in addition BDE-47, BDE-99, BDE-100, BDE-183 and BDE-209, TBBPA, HBCD, PAH16, ΣPCB7, DEHP and 4-nonylphenol (NP). It has not been conducted any authority based screening program for sludge in Norway, but authorities have supported three projects since 1996 initiated by the water industry.
In Sweden the WWTPs analyse waste water for Pb, Cd, Cu, Cr, Hg, Ni and Zn. Sludge is analysed for the same metals, PCB, PAHs, nonylphenol and toluene. There is also a long-term programme in the national environ-mental programme where a large number of organic pollutants are analysed in sludge from seven different WWTPs (e.g. Haglund and Olofsson, 2008).

Using sludge on arable land 72
7.2.2 Proposed programmes for sludge monitoring
As evident from the preceding discussions there are several purposes for monitoring organic pollutants in sludge. The stakeholders and the responsi-ble parts may differ between the different purposes. We suggest here two monitoring strategies to be used for different purposes. The suggestions are summarized in table 19.
7.2.3 Sludge with elevated concentrations
The number and concentrations of organic substances occurring in sludge vary between different WWTPs. Some WWTPs are influenced by wastewa-ter containing elevated concentrations of certain organic pollutants due to a certain industry or other point source. One approach could be to require that plants having identified higher concentrations of certain substances imple-ment surveillance schemes regarding specific organic substances.
This approach would mainly be relevant to WWTPs recieving industrial waste waters, and would be of limited value for national environmental goals. All WWTPs with significant supply of industrial waste waters could perform a broader screening of organic substances in sludge every third year. The need for limit values is assessed individually for each WWTP: 1) EBLs are calculated with the methodology used in this report; 2) A risk characterisation is performed by comparing the measured levels from the screening to the EBLs; 3) The need for establishing limit values for sludge at individual WWTPs depends on the outcome of the risk characterisation and the type of enduse for the sludge. If it is judged relevant to implement limit values, a site specific monitoring programme should be set up. Such a programme would aim at controlling that future efforts directed at decreas-ing the pollutants levels gives result.
This strategy allows for identifying WWTPs with anomalously high con-centrations of organic pollutants. The term screening is used to infer a broad coverage of substances. The need for application of high-quality analytical methods with low detection limits is as important as in any other serious work. Faulty analysis may have significant negative implications for all parts in the proposed strategy.
7.2.4 Occurrence of persistent and other prioritised substances
There are national and international goals to decrease the releases of sub-stances that are persistent or of “very high concern”. As has been explained in chapter 7.1., it would be more efficient to establish a goal of decreasing concentrations over time for such compounds, than to implement general effect based limit values. Such time trends would also be relevant to non-persistent chemicals with particular hazardous properties and that are abun-dant in sludge. Examples of persistent compounds that occurs in sludge would be: chlorinated paraffins, PBDE and other brominated compounds,
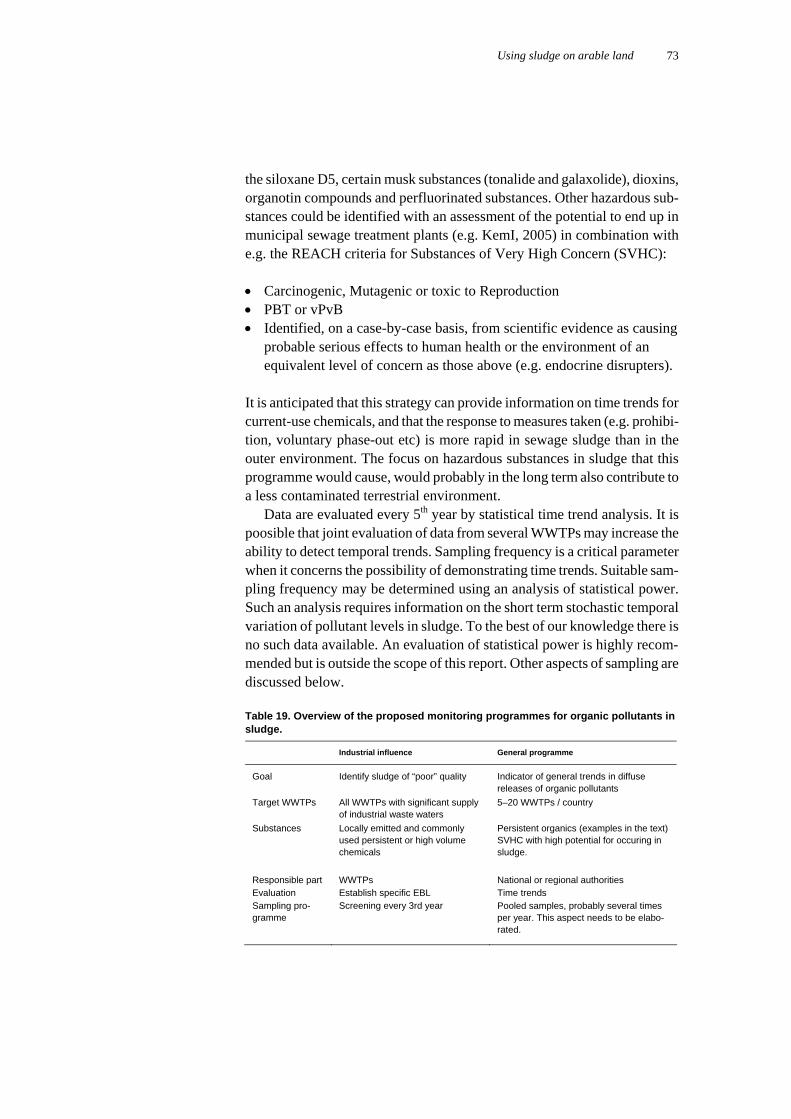
Using sludge on arable land 73
the siloxane D5, certain musk substances (tonalide and galaxolide), dioxins, organotin compounds and perfluorinated substances. Other hazardous sub-stances could be identified with an assessment of the potential to end up in municipal sewage treatment plants (e.g. KemI, 2005) in combination with e.g. the REACH criteria for Substances of Very High Concern (SVHC):
Carcinogenic, Mutagenic or toxic to Reproduction PBT or vPvB Identified, on a case-by-case basis, from scientific evidence as causing
probable serious effects to human health or the environment of an equivalent level of concern as those above (e.g. endocrine disrupters).
It is anticipated that this strategy can provide information on time trends for current-use chemicals, and that the response to measures taken (e.g. prohibi-tion, voluntary phase-out etc) is more rapid in sewage sludge than in the outer environment. The focus on hazardous substances in sludge that this programme would cause, would probably in the long term also contribute to a less contaminated terrestrial environment.
Data are evaluated every 5th year by statistical time trend analysis. It is poosible that joint evaluation of data from several WWTPs may increase the ability to detect temporal trends. Sampling frequency is a critical parameter when it concerns the possibility of demonstrating time trends. Suitable sam-pling frequency may be determined using an analysis of statistical power. Such an analysis requires information on the short term stochastic temporal variation of pollutant levels in sludge. To the best of our knowledge there is no such data available. An evaluation of statistical power is highly recom-mended but is outside the scope of this report. Other aspects of sampling are discussed below.
Table 19. Overview of the proposed monitoring programmes for organic pollutants in sludge.
Industrial influence General programme
Goal Identify sludge of “poor” quality Indicator of general trends in diffuse releases of organic pollutants
Target WWTPs All WWTPs with significant supply of industrial waste waters
5–20 WWTPs / country
Substances Locally emitted and commonly used persistent or high volume chemicals
Persistent organics (examples in the text) SVHC with high potential for occuring in sludge.
Responsible part WWTPs National or regional authorities Evaluation Establish specific EBL Time trends Sampling pro-gramme
Screening every 3rd year Pooled samples, probably several times per year. This aspect needs to be elabo-rated.

Using sludge on arable land 74
7.2.5 Sampling scheme
The major uncertainty for analysing the concentration of chemical sub-stances in sludge lies in the sampling. Organic pollutants have uneven dis-tribution in the waste water and this reflects the distribution in sludge. If achievable, samples should be taken from sludge in motion from ex. con-veyor belt as it is being transported from dewatering to storage or transport. Sampling from windrows piles (ex. compost) are in general more time con-suming and gives higher uncertainty than sampling from materials in mo-tion. There is undergoing work on sampling (Lambkin, et.al., 2003, Leo-nardo da Vinci Programmes) and under the European Commissions Leo-nardo da Vinci Programme it has been developed a project for education and training and also a handbook on wastewater and sludge sampling (2005) and there are European standards for sampling of sludge. Sampling methods are not given in detail here; however, in general a sample should be representa-tive for a given quantity of sludge and over a time period. This is achieved by taking numerous subsamples over production period or a certain pro-duced quantity. The subsamples can be pooled to an integrated sample. In order to reduce loss and contamination some organic chemicals requires special sampling methods and sampling containers and this have to be con-sidered specifically for the individual chemicals to be examined.
A sludge sample for organic pollutants should represent a production period of one month and the frequency according to the size of the WWTP. Analysis of organic pollutants in waste waters is performed three times per year on WWTP > 50,000 pe in Norway. If sludge should be ana-lysed regularly for organic pollutants, the frequency should be propor-tional with the requirements for analysis of waste waters discharges in other regulations. It is significant where in the sludge treatment process that the samples are taken (figure 7). The figure is based on the Norwegian guide for sampling of sludge and compost (Landbrukstilsynet, 2003).

Using sludge on arable land 75
Raw sludge (thickened)
Composting and screening
Compost Lime treated Dewatered sludge Liquid sludge Dried sludge Long term stored Long term stored
Stabile and hygienic sludge
Dewatering
Lime treatment
Wet composting
Hygienisation step
Anaerobictreatm ent
Dewatering
Wet composting
Hygeinsiation step
Anaerob ic treatment
Avvanning Dewatering
Long term storage
Dewatering
Thermal drying
S
S S
S S
SS*
S* S
Anaerobictreatment
S
Dewatering
Anaerob ic treatment
Raw sludge (thickened)
Composting and screening
Compost Lime treated Dewatered sludge Liquid sludge Dried sludge Long term stored Long term stored
Stabile and hygienic sludge
Dewatering
Lime treatment
Wet composting
Hygienisation step
Anaerobictreatm ent
Dewatering
Wet composting
Hygeinsiation step
Anaerob ic treatment
Avvanning Dewatering
Long term storage
Dewatering
Thermal drying
S
SS S
S S
SS*
S* S
Anaerobictreatment
S
Dewatering
Anaerob ic treatment
Figure 7. Recommended sampling points (S) for analysis of organic pollutants related to common sludge treatment processes. S* are alternative points for sampling (reference: Landbrukstilsynet, 2003).
References
Backe C., Cousins I.T. and Larsson P. (2004) PCB in soils and estimated soil-air exchange fluxes of selected PCB congeners in the south of Sweden. En-viron. Poll. 128, 59–72.
Belfroid A., Van Den Berg M., Seinen W., Hermens J., Van Gestel K. (1995) Uptake, bioavailability and elimination of hydrophobic compounds in earth-worms (eisenia andrei) in field-contaminated soil. Environ. Tox. Chem. 14, 605–612.
EC (2000) European Union Risk As-sessment Report: diphenyl ether, pen-tabromoderivative (Pentabromodi-phenylEther); CAS Number: 32534-81-9. European Commission.
EC (2002a) European Union Risk As-sessment Report: bis(pentabromo-phenyl) ether, CAS No: 1163-19-5. European Commission.
EC (2002b) European Union Risk As-sessment Report: 4-nonylphenol (branched) and nonylphenol. CAS Nos: 84852-15-3 and 25154-52-3 European Commission.
EC (2003a) Technical Guidance Docu-ment for risk assessment. European Commission.
EC (2003b) European Commission (2003) Proposal for a Directive of the
European Parliament and of the Council on spreading of sludge on land. 30 April 2003, EC, Brussels
EC (2008) European Union Risk Assess-ment Report: bis(2-ethylhexyl) phthalate (DEHP), CAS No: 117-81-7. European Commission.
EC (2009) COMMISSION REGULA-TION (EC) No 552/2009 of 22 June 2009 amending Regulation (EC) No 1907/2006 of the European Parliament and of the Council on the Registration, Evaluation, Authorisation and Restric-tion of Chemicals (REACH) as regards Annex XVII.
ECHA (2010) Guidance on information requirements and chemical safety as-sessment. Chapter R.16: Environmental Exposure. Version 2, May 2010.
Faust M. et al. (2001) Predicting the joint algal toxicity of multi-component s-triazine mixtures at low-effect concen-trations of individual toxicants. Aquat. Tox. 56, 13–32.
Gomez-Rico, M.F. Chemosphere 71 (2008) 2129–2138
Haglund P. and Olofsson U. (2008) Mil-jöövervakning av slam: Redovisning av resultat från 2008 års provtagning. Re-port from Umeå University.
Using sludge on arable land 76
Hassanin A., Breivik K., Meijer S.N., Steinnes E., Thomas G.O. and Jones K.C. (2004) PBDEs in european back-ground soils_ levels and factors con-trolling their distribution. Environ., Sci. Technol. 38, 738–745.
Hu X.-Y., Wen B., Zhang S. and Shan X.-q. (2005) Bioavailability of phtha-late congeners to earthworms (Eisenia fetida) in artificially contaminated soils. Ecotox. Environ. Saf. 62, 26–34.
KemI (2005) Framtagande av produk-tregisterbaserat ExponeringsIndex. Kemikalieinspektionen.
Kinney, C. A; Furlong, E. T.; Kolpin, D. W.; Burkhardt, M. R.; Zaugg, S. D.; Werner, S. L.; Bossio, J. P.; Benotti, M. J. (2008) Bioaccumula-tion of pharmaceuticals and other anthropo-genic waste indicators in earthworms from agricultural soil amended with biosolid or swine manure. Environ. Sci. Technol. 42, 1863 1870.
Kinney C.A., Furlong E.T. et al. (2010) Eartworms: diagnostic indicators of wastewater derived anthropogenic or-ganic contaminants in terrestrial envi-ronments. Ch. 14 in Contaminants of Emerging Concern in the Environ-ment: Ecological and Human Health Considerations; Halden, R.; ACS Symposium Series; American Chemi-cal Society: Washington, DC, 2010.
Kortenkamp A., Faust M. Scholze M. and Backhaus T. (2007) Low-level exposure to multiple chemicals: reason for human health concerns? Environ. Health Persp. 115, 106–114.
Krauss M, Wilcke W, Zech W. (2000) Availability of polycyclic aromatic hydrocarbons (PAHs) and polychlori-nated biphenyls (PCBs) to earthworms in urban soil. Environ Sci Technol 34, 4335–4340.
Landesanstalt für Umweltschutz, Baden-Württemberg (2003) Contaminants in arable soil in Baden-Württemberg fer-tilized with sewage sludge. Bo-denschutz 16.
Landbrukstitlsynet ( 2003) Veileder for prøvetaking av slam, kompost og and-re avfallsbaserte gjødselvarer.
Langenkamp H. and Part P. (2001) Organic contaminants in sludge for agricultural use. European Commis-sion, Joint Research Centre.
Laturnus F., Arnold K., Grön C. (2007) Organic contaminants from sewage
sludge applied to agriculturla soils. False alarm regarding possible problems for food safety? Env Sci Pollut Res 14, Spe-cial Issue 1, 53–60.
Ma W.C., Kleunen A., Immerzeel J. and De Maagd P.G.J. (1998) Bioaccumula-tion of polycyclic aromatic hydrocar-bons by earthworms: assessment of equilibrium partitioning theory in in situ studies and water experiments. Environ. Tox. Chem. 17, 1730–1737.
Matscheko.N. et al. (2002a) Accumulation and elimination of 16 polycyclic aro-matic compounds in the earthworm (Eisenia Fetida). Environ. Tox. Chem.. 21, 1724–1729.
Matscheko N, Tysklind M. et al. (2002b) Application of sewage sludge to arable land–soil concentrations of polybromi-nated diphenyl ethers and polychori-nated dibenzo-p-dioxins, dibenzofurans, and biphenyls, and their accumulation in earthworms. Environ. Tox. Chem. 12, 2515–2525.
Lambkin D.C., Evans T.D., Nortcliff S., and White, TC. (2003) Towards produc-ing harmonized methods, with quanti-fied precition for samling sludges, treated biowastes and soil in the land-scape, EU- prosject HORIZONTAL, WP2, August.
Naturvårdsverket (1995) Användning av slam i jordbruket. Rapport 4418.
Naturvårdsverket (2009) Riktvärden för förorenad mark – Modellbeskrivning och vägledning. Rapport 5976.
Naturvårdsverket (2010) Redovisning av regeringsuppdrag 21 Uppdatering av “Aktionsplan för återföring av fosfor ur avlopp”
Oleszczuk P. (2006) Persistence of poly-cyclic aromatic hydrocarbons (PAHs) in sewage sludge-amended soil. Chemos-phere 65, 1616–1626.
Petersen, S.O. et al. Soil & Tillage Re-search 72 (2003) 139–152
Rattfelt Nyholm J., Asamoah R.K., Van Der Wal L., Danielsson C. and Anders-son P.L. (2010) Accumulation of poly-brominated diphenyl ethers, hexabro-mobenzene, and 1,2-dibromo-4-(1,2-dibromoethyl)-cyclohexane in Earth-worm (Eisenia fetida). Environ. Sci. Technol. 44, 9189–9194.
Ricklund N., Kierkegaard A., McLachlan M. (2010). Levels and potential sources of decabromodiphenyl Ethane (DBDPE) and decabromodiphenyl ether (De-
Using sludge on arable land 77
caBDE) in lake and marine sediments in Sweden. Environ. Sci. Technol. 44, 1987–1991.
RIVM (1995) Risk assessment of bioac-cumulation in the food webs of two marine AMOEBE species: common tern and harbor seal. RIVM Report 719102040.
Samsöe-Petersen L. et al. , (2002) Up-take of Trace Elements and PAHs by Fruit and Vegetables from Contami-nated Soils. Environ. Sci. Technol. 36, 3057–3063.
SCB (2010) Utsläpp till vatten och slamproduktion 2006. Statistiska med-delanden MI 22 SM 0801.
SFT (2009) Helsebasert tilstandsklasser for forurenset grunn, TA2553/2009
Schenker U., Soltermann F., Scheringer M. and Hungerbhler K. (2008) Model-ing the Environmental Fate of Poly-brominated Diphenyl Ethers (PBDEs). Environ. Sci. Technol. 42, 9244–9249.
Schowanek, D., David, H., Francaviglia R. Hall, J., Kirchmann, H., et al. (2007) Probabilistic risk assessment for linear alkylbenzene sulfonate (LAS) in sewage sludge used on agri-cultural soil. Regul. Toxicol. Pharma-col. 49, 245–259.
Schowanek D. et al. (2004) A risk-based methodology for deriving quality stan-dards for organic contaminants in sew-age sludge for use in agriculture – con-ceptual framework. Regul. Toxicol. Pharmacol. 40 (3), 227–251.
Sellström U., De Wit C., Lundgren N and Tysklind M (2005) Effect of sew-age sludge application on concentra-tions of higher-brominated dipheyl ethers in soils and earthworms. Envi-ron. Sci. Technol. 39, 9064–9070.
SSB, 2005 Naturressurser og Miljø 2005. www.ssb.no.
Sternbeck J., Brorström-Lundén E., Rem-berger M et al. (2003) WFD priority substances in sediments from Stockholm and the Svealand coastal region. IVL report B1538.
Trapp S. (2002) Dynamic root uptake model for neutral lipophilic organics. Environ. Tox. Chem. 21, 203–206.
Trapp S. et al. (2007) Diffusion of PAH in Potato and Carrot Slices and Application for a Potato Model. Environ. Sci. Tech-nol. 41, 3103—3108.
USEPA (1995) A guide to the biosolids risk assessments for the EPA part 503 rule. EPA/832-B-93-005.
Vikelsøe J., Thomsen M., Carlsen L. and Johansen E. (2002) Persistent Organic Pollutants in Soil, Sludge and Sediment – A multianalytical Field Study of Se-lected Organic Chlorinated and Bromi-nated Compounds. NERI Technical Re-port No. 402.
VKM (2009) Risk assessment of contami-nants in sewage sludge applied on nor-wegian soils – Opinion of the Panel on Contaminants in the Norwegian Scien-tific Committee for Food Safety. 20 au-gust 2009.
WHO (1996) LAS and related com-pounds-AOS and AS. Environmental Health Criteria 169.
WHO (2002) Developing human health-related chemical guidelines for re-claimed waster and sewage sludge ap-plications in agriculture.
WSP (2010) Miljöövervakning av miljö-gifter i urbana områden – sammanställ-ning och analys. Rapport till Naturvårdsverket.
Xia K. et al. (2010) Triclocarban, tri-closan, polybrominated diphenyl ethers,and 4-nonylphenol in biosolids and in soil receiving 33-year biosolids application. Environ. Toxicol. Chem. 29, 597–605.

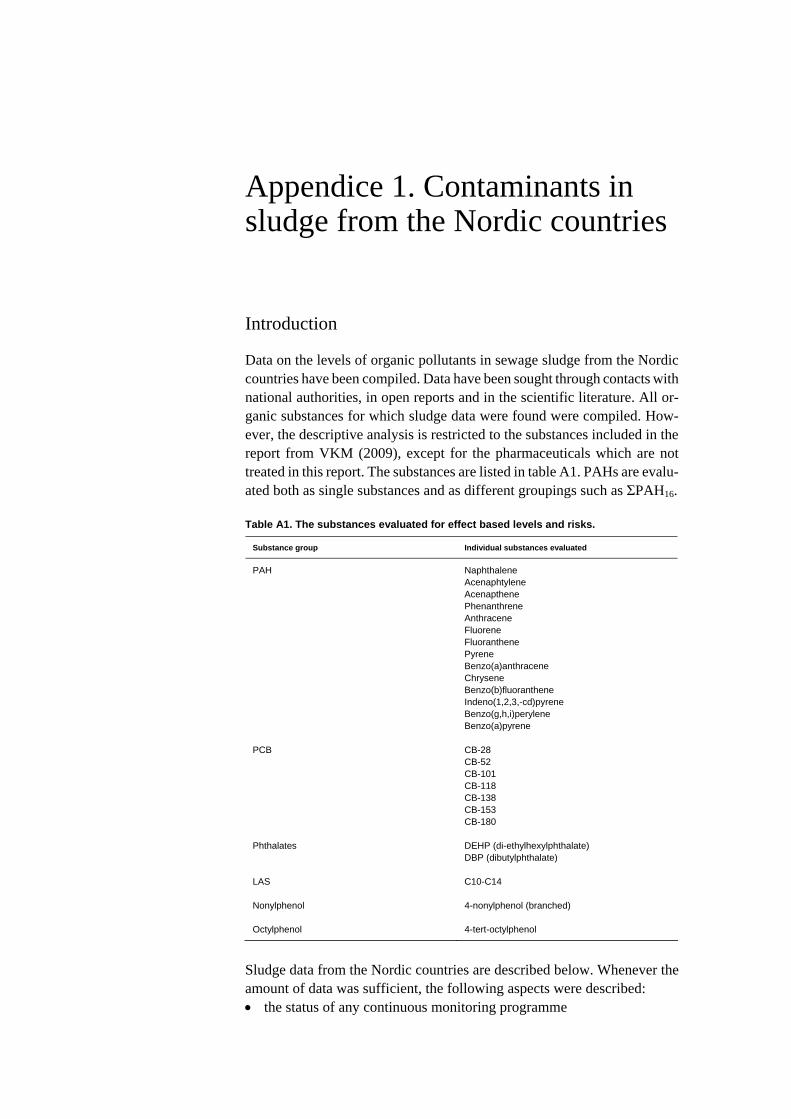
Appendice 1. Contaminants in sludge from the Nordic countries
Introduction
Data on the levels of organic pollutants in sewage sludge from the Nordic countries have been compiled. Data have been sought through contacts with national authorities, in open reports and in the scientific literature. All or-ganic substances for which sludge data were found were compiled. How-ever, the descriptive analysis is restricted to the substances included in the report from VKM (2009), except for the pharmaceuticals which are not treated in this report. The substances are listed in table A1. PAHs are evalu-ated both as single substances and as different groupings such as ΣPAH16.
Table A1. The substances evaluated for effect based levels and risks.
Substance group Individual substances evaluated
PAH Naphthalene Acenaphtylene Acenapthene Phenanthrene Anthracene Fluorene Fluoranthene Pyrene Benzo(a)anthracene Chrysene Benzo(b)fluoranthene Indeno(1,2,3,-cd)pyrene Benzo(g,h,i)perylene Benzo(a)pyrene
PCB CB-28 CB-52 CB-101 CB-118 CB-138 CB-153 CB-180
Phthalates DEHP (di-ethylhexylphthalate) DBP (dibutylphthalate)
LAS C10-C14
Nonylphenol 4-nonylphenol (branched)
Octylphenol 4-tert-octylphenol
Sludge data from the Nordic countries are described below. Whenever the amount of data was sufficient, the following aspects were described: the status of any continuous monitoring programme

80 Using sludge on arable land
amount of data on organic pollutants in sludge from the period 2000–2008
statistical description of levels (central tendency and variability) time trends The central tendency and the variability were estimated using the following parameters: median, arithmetic mean, 90-percentile, min and max. When the number of data was approximately 5 or less, only sample mean, min and max are presented. Data for each substance group are summarised in chapter 3. For Sweden, a brief presentation of certain additional organic pollutants are also made.
Sweden
An overview of Swedish data on organic pollutants in sewage sludge is shown in Table A2. There are three major sources of data on sludge pollut-ants in Sweden: Environmental reports from the WWTPs, Single research studies, National environmental monitoring programs. The Swedish mandatory program for environmental monitoring prescribes that metals and nutrients are measured in sewage sludge. The sampling and analysis frequency are related to the size of the WWTP, with pooled sam-ples to be analysed with a frequency from once a year to once a month (NV 1994, 1998). As a complement, a voluntary agreement was established in 1994, specifying nonylphenol, toluene, PAH and PCB to be measured (Naturvårdsverket, 1995a). As a result of this voluntary agreement, a large number of data exist on these organic pollutants (see SCB, 2008, in Table A2).
The national environmental monitoring programme (organized by the Swedish EPA) includes a programme on sludge. Within this programme, sludge from eight WWTPs are sampled anually and analysed for a large number of organics (see Haglund and Olofsson, 2008, in Table A2). The national environmental monitoring programme also includes other meas-urements on single substances in the so-called “screening programme”. Those data generally represents only a few WWTPs and at single occasions. There are also other projects where “newer” organic pollutants have been analysed, generally only once. Among these studies, there is one where 50 WWTPs were studied with regard to several brominated flame retardants. All these studies are summarised in table A2.

Using sludge on arable land 81
Table A2. Overview of Swedish data concering organic pollutants in municipal sludge.
Reference Haglund & Olofsson, 2008
SCB 2008 Svensson 2002
Wahlberg 2008 The screening programme (NV)
Naturvårds-verket 2002
Time period 2004–2006 1998–2008 2000 2004–2007 2000–2008 2001 No of WWTPs 8 260 19 4 50 Number of samples per WWTP and year 1 1 year average 1 2 1 PAH X X PCB X DEHP X X X X Other phtalates X X X X Nonylphenol X X X Nonyphenol-etoxilates X Octylphenol X X Octylphenol-etoxilates X LAS X X Triclosan X X X Antibiotics X X Other pharmaceuticals X Phosphate esters X X Dioxins (PCDD/F) X X X PFAS X X X X PBDE X X X X Other brominated flame retardants HBCD HBCD HBCD, TBBPA, PBBChlorobenzenes X X X Organotin compounds X X X
A summary of concentrations for the selected organic pollutants in Swedish sludge is given in Table A3. The average concentration span a range of more than 104 for the different substances. Linear alkylbenzenesulphonates, LAS, is by far the most abundant organic pollutant. A few samples contain LAS in levels above 1000 mg/kg DW. LAS has been reported from three studies over the last few years, with a total of 91 samples.
Nonylphenol is included in the voluntary monitoring that most WWTPs attend to (see also PAH and PCB), why data for approximately 260 WWTPs exist for the year 2006. There are some additional datasets that also include octylphenol (National screening and Stockholm Vatten 2010). A very few samples contain nonylphenol or octylphenol in levels that are an order of magnitude higher than the general levels.
A total of 11 phthalates have been analysed in five different studies. The high-volume phthalates DEHP, DINP and DIDP were detected in almost every sample investigated and with average concentrations of 25–60 mg/kg dw. Next comes di-n-butylphthalate, butylbensylphtalate and di-n-oktylphtalate in about 40 % of the samples and with average concentrations less than 1 mg/kg dw. The other 5 phthalates were detected in less than 20 % of the samples.

82 Using sludge on arable land
Table A3. Swedish data on selected chemicals in sludge (mg/kg dw).
median average 90-percentile
min max Reference
ΣPAH-6# 0,30 0,5 0,9 0 23,7 SCB, 2008 ΣPAH-16 0,69 1,4 3,4 0,20 5 Svensson, 2002; Sternbeck 2003 Nonylphenol 6,5 12,1 20,0 0 437 SCB, 2008; Sthlm Vatten 2010, National
screening Octylphenol 0,46 1,0 0,9 0,076 8,7 Sthlm Vatten 2010, National screening DEHP 53 74 94 18 1000 National Screening 2006, Wahlberg 2008,
Miljöövervakning av slam 2004–2007 DBP 0,15 0,39 0,74 0,016 5,2 See DEHP LAS C10-C14 450 540 1100 9 2700 Svensson, 2002; Wahlberg, 2008 ΣPCB-7 0,031 0,040 0,061 0 0,48 SCB, 2008
#: BAP, BBFA, BGP, BKFA, FA, ICP.
PAH
A large dataset describes ΣPAH6 in 260 WWTPs during 2006 (SCB, 2008). ΣPAH6, however, only represent a fraction of the PAHs commonly meas-ured (B(a)P, B(b)F, B(ghi)P, B(bk)F, Fluoranthene, and I(cd)P).
Data on ΣPAH16 are available from two single regional studies (Skåne and Västra Götaland) covering about 20 WWTPs each. Those studies describe the regional levels at two single years. Data are summarized in table A4.
In the county of Skåne, levels of PAH-16 in municipal sludge decreased during the period 1990–2001 in the largest WWTPs. No time trends could be detected in the smaller WWTPs (LST Skåne, 2002). Also the national average level of PAH in sludge have decreased during the period 1998–2006 (SCB, 2008).
Data on individual PAHs are available from 25 samples from three studies (Table A5; Svensson, 2002, Pettersson and Wahlberg, 2010; Sternbeck 2003). Most PAHs were below detection limits (0,03–0,05 mg/kg dw), why a typical PAH profile for sludge cannot be identified. It appears, however, that fluoran-thene, phenanthrene and pyrene are the major PAHs, roughly in agreement with data from the UK (Stevens et al., 2003).
Table A4. Data on PAH6 (SCB, 2008) and PAH16 (Svensson et al 2002 and Sternbeck, 2003) in Swedish sludge ( mg/kg dw).
n Median Average 90-percentile Min Max
PAH-6# 260 0,30 0,5 0,9 0 23,7 PAH-16 21 0,69 1,4 3,4 0,20 5
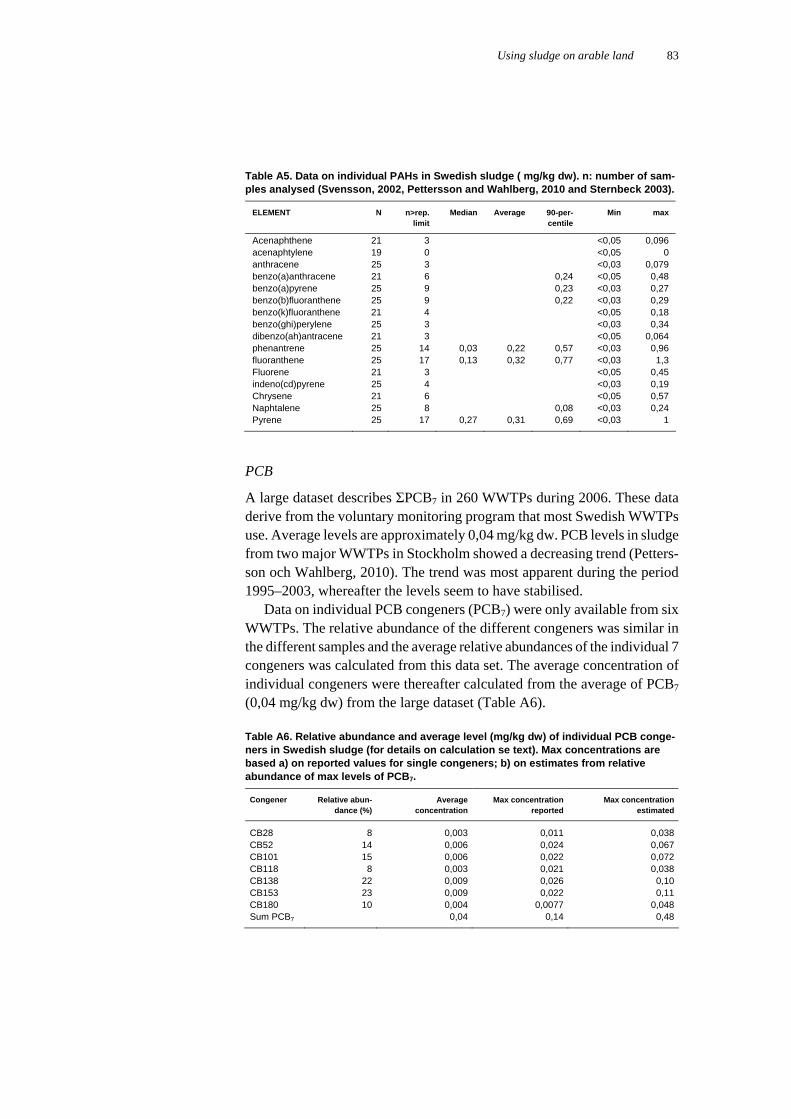
Using sludge on arable land 83
Table A5. Data on individual PAHs in Swedish sludge ( mg/kg dw). n: number of sam-ples analysed (Svensson, 2002, Pettersson and Wahlberg, 2010 and Sternbeck 2003).
ELEMENT N n>rep.limit
Median Average 90-per-centile
Min max
Acenaphthene 21 3 <0,05 0,096 acenaphtylene 19 0 <0,05 0 anthracene 25 3 <0,03 0,079 benzo(a)anthracene 21 6 0,24 <0,05 0,48 benzo(a)pyrene 25 9 0,23 <0,03 0,27 benzo(b)fluoranthene 25 9 0,22 <0,03 0,29 benzo(k)fluoranthene 21 4 <0,05 0,18 benzo(ghi)perylene 25 3 <0,03 0,34 dibenzo(ah)antracene 21 3 <0,05 0,064 phenantrene 25 14 0,03 0,22 0,57 <0,03 0,96 fluoranthene 25 17 0,13 0,32 0,77 <0,03 1,3 Fluorene 21 3 <0,05 0,45 indeno(cd)pyrene 25 4 <0,03 0,19 Chrysene 21 6 <0,05 0,57 Naphtalene 25 8 0,08 <0,03 0,24 Pyrene 25 17 0,27 0,31 0,69 <0,03 1
PCB
A large dataset describes ΣPCB7 in 260 WWTPs during 2006. These data derive from the voluntary monitoring program that most Swedish WWTPs use. Average levels are approximately 0,04 mg/kg dw. PCB levels in sludge from two major WWTPs in Stockholm showed a decreasing trend (Petters-son och Wahlberg, 2010). The trend was most apparent during the period 1995–2003, whereafter the levels seem to have stabilised.
Data on individual PCB congeners (PCB7) were only available from six WWTPs. The relative abundance of the different congeners was similar in the different samples and the average relative abundances of the individual 7 congeners was calculated from this data set. The average concentration of individual congeners were thereafter calculated from the average of PCB7 (0,04 mg/kg dw) from the large dataset (Table A6).
Table A6. Relative abundance and average level (mg/kg dw) of individual PCB conge-ners in Swedish sludge (for details on calculation se text). Max concentrations are based a) on reported values for single congeners; b) on estimates from relative abundance of max levels of PCB7.
Congener Relative abun-dance (%)
Averageconcentration
Max concentration reported
Max concentrationestimated
CB28 8 0,003 0,011 0,038CB52 14 0,006 0,024 0,067CB101 15 0,006 0,022 0,072CB118 8 0,003 0,021 0,038CB138 22 0,009 0,026 0,10CB153 23 0,009 0,022 0,11CB180 10 0,004 0,0077 0,048Sum PCB7 0,04 0,14 0,48
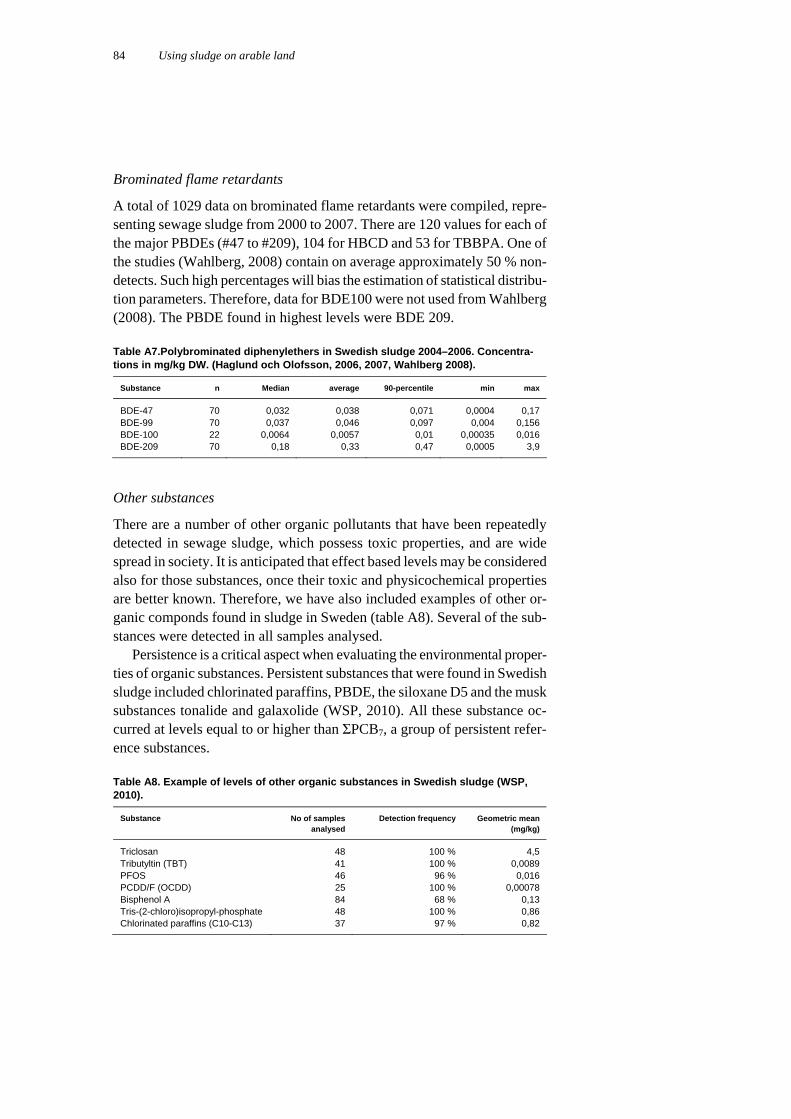
84 Using sludge on arable land
Brominated flame retardants
A total of 1029 data on brominated flame retardants were compiled, repre-senting sewage sludge from 2000 to 2007. There are 120 values for each of the major PBDEs (#47 to #209), 104 for HBCD and 53 for TBBPA. One of the studies (Wahlberg, 2008) contain on average approximately 50 % non-detects. Such high percentages will bias the estimation of statistical distribu-tion parameters. Therefore, data for BDE100 were not used from Wahlberg (2008). The PBDE found in highest levels were BDE 209.
Table A7.Polybrominated diphenylethers in Swedish sludge 2004–2006. Concentra-tions in mg/kg DW. (Haglund och Olofsson, 2006, 2007, Wahlberg 2008).
Substance n Median average 90-percentile min max
BDE-47 70 0,032 0,038 0,071 0,0004 0,17 BDE-99 70 0,037 0,046 0,097 0,004 0,156 BDE-100 22 0,0064 0,0057 0,01 0,00035 0,016 BDE-209 70 0,18 0,33 0,47 0,0005 3,9
Other substances
There are a number of other organic pollutants that have been repeatedly detected in sewage sludge, which possess toxic properties, and are wide spread in society. It is anticipated that effect based levels may be considered also for those substances, once their toxic and physicochemical properties are better known. Therefore, we have also included examples of other or-ganic componds found in sludge in Sweden (table A8). Several of the sub-stances were detected in all samples analysed.
Persistence is a critical aspect when evaluating the environmental proper-ties of organic substances. Persistent substances that were found in Swedish sludge included chlorinated paraffins, PBDE, the siloxane D5 and the musk substances tonalide and galaxolide (WSP, 2010). All these substance oc-curred at levels equal to or higher than ΣPCB7, a group of persistent refer-ence substances.
Table A8. Example of levels of other organic substances in Swedish sludge (WSP, 2010).
Substance No of samples analysed
Detection frequency Geometric mean (mg/kg)
Triclosan 48 100 % 4,5 Tributyltin (TBT) 41 100 % 0,0089 PFOS 46 96 % 0,016 PCDD/F (OCDD) 25 100 % 0,00078 Bisphenol A 84 68 % 0,13 Tris-(2-chloro)isopropyl-phosphate 48 100 % 0,86 Chlorinated paraffins (C10-C13) 37 97 % 0,82

Using sludge on arable land 85
Norway
Data on organic pollutants in Norwegan sludge has been collected from the VKM report and Norvar (2007) (table A9). The relative abundance of the different substances is similar to that in Sweden, with LAS as the major compound. Also nonylphenol and DEHP are found in relatively high con-centrations.
The concentrations of ΣPAH16 was higher during the 1990ies than at pre-sent (Table A10). The major PAHs (of PAH16) are phenanthrene, pyrene and flouranthene (Table A11), similar to the pattern found in Swedish sludge.
Data on individual PCB congeners was available from eight Norwegian WWTP:s, sampled five times during the years 2001 to 2002 (Table A12). PCB was found above the reporting limit in samples from four of the WWTP:s. The levels reported are of the same magnitude as the reporting limit. Because most results were reported as non-detects, it is not possible to derive a typical PCB composition profile.
Table A9. Norwegian data on selected chemicals in sludge (mg/kg dw).
median average 90-percentile min Max
ΣPAH-16 1,9 2,0 3,0 0,44 5 Nonylphenol 30 32 12 44 Octylphenol 0,47 5,9 0,26 32 DEHP 49 53 13 178 DBP 0,34 0,64 0,12 2,8 LAS C10–C14 1400 1400 570 3200 ΣPCB-7 0,030 0,032 0,005 0,096
Table A10. Norwegian data on PAH16 in sludge (mg/kg dw) (Norvar, 2007).
Substance Year Median average Std dev. 90-per-centile
ΣPAH16 96/97 4,1 6,1 7,3 14 ΣPAH16 01/02 1,8 2,1 0,9 3,4 ΣPAH16 06/07 1,9 2,0 1,0 3,0
Table A11. Data on individual PAHs in Norwegian sludge. mg/kg dw (Norvar, 2007).
Substance N det. freq. %
median average 90-per-centile
min max
Naphtalene 44 57 0,18 0,20 0,50 0,005 1,2 Acenaphtylene 44 14 0,02 0,01 0,086 Acenaphthene 44 55 0,03 0,10 0,29 0,005 0,47 Fluorene 44 80 0,15 0,19 0,40 0,005 0,96 Phenantrene 44 100 0,37 0,45 0,91 0,17 1,2 Anthracene 44 100 0,06 0,10 0,14 0,016 0,72 Fluoranthene 44 100 0,22 0,22 0,35 0,024 0,48 Pyrene 44 100 0,27 0,28 0,44 0,024 0,62 Benzo (a) antracene 44 95 0,07 0,08 0,14 0,005 0,22 Chrysene 44 100 0,12 0,12 0,20 0,012 0,3 Benzo(bjk)fluoranthene 44 100 0,12 0,12 0,22 0,018 0,24 Benzo (a) pyrene 44 95 0,06 0,06 0,11 0,005 0,14 Indeno (1,2,3-cd)pyrene 44 70 0,03 0,03 0,05 0,005 0,06 Dibenzo (a,h) antracene 44 45 0,01 0,05 0,005 0,08 Benzo (g,h,i) perylene 44 89 0,07 0,07 0,17 0,005 0,21 Sum PAH 44 100 1,91 2,03 3,03 0,438 5

86 Using sludge on arable land
Table A12. Levels of PCB (individual congeners) in Norwegian sludge 2001–2002 (mg/kg dw) from 8 WWTP:s, levels above the reporting limit (ranging from 0,005–0,4) was found in four WWTP:s.
Congener Number of samples
n>rep.limit
median average Max (>rep. limit)
PCB28 40 1 0,0065 PCB52 40 6 0,0025 0,005 0,025 PCB101 40 10 0,0025 0,007 0,063 PCB118 40 3 0,0038 0,005 0,020 PCB138 40 13 0,0025 0,006 0,031 PCB153 40 10 0,0025 0,004 0,023 PCB180 40 1 0,006
Denmark
Data on organic substances in Danish sludge were supplied from “By- og Landskabsstyrelsen”. Data from 1995–2006. The substances found in high-est levels is LAS followed by DEHP, consistent with results from Sweden and Norway. The max concentrations are very high PAH, PCB and nonyl-phenol. Since there is no information on quality assurance, these maximum levels are not considered as representative for present sludge from municipal sewage treatment plants.
Since 1995 the Danish EPA has perform screening investigation for met-als and organic pollutants in waste waters and sludge for selected WWTPs (Miljöstyrelsen, 2009). For heavy metals there is an overall decreasing ten-dency in the weighted average concentrations from 1995 to 2005. This is also the case for the organic pollutants nonylphenol, DEPH, LAS and PAH. For NPE the decrease in the weighted average concentration from 1997 to 2005 has been approximately 80 percent. This is in part due to the voluntary agreements made with industry in the late eighties aimed at reducing the use of NPE in products. Likewise, there has been a drastic decrease in the weighted average concentration of LAS, with the largest decrease taking place since 2000.
Table A13. Danish data on selected chemicals in sludge (mg/kg dw) from the period 1995–2006 (unpublished data recieved from By- og Landskabsstyrelsen).
median average 90-percentile min max
ΣPAH-16 1,1 3,33 2,8 0,02 1220 Nonylphenol 2,3 5,6 15 0,002 318 Octylphenol No data DEHP 13 16 29 0,33 250 DBP No data LAS C10–C14 64 285 820 0,35 11815 ΣPCB-7 1,1 3,33 2,8 0,02 1220

Using sludge on arable land 87
Finland
There is no continuous monitoring of organic pollutants in sewage sludge in Finland (pers. comm. Risto Saarinen, SYKE, 29/10-08). A brief report gives data for only a few samples (table A14). Concentrations are in the typical range for Sweden, Denmark and Norway.
Table A14. Data on organic pollutants in Finnish sludge (mg(kg DW). Data is based on only four samples.
Substance n min max
PAH-16 4 0,5 9,3 PCB-7 4 0,03 0,08 DEHP 4 39 70 nonylphenol 4 2 35 LAS 4 360 1700
Iceland
National experts in Iceland state that the data available is from the NCM screening studies. Up to 2007, no compounds of relevance to this study had been investigated.
Synthesis
Data on organic substances in sludge were mainly available from Sweden, Norway and Denmark. The abundance of the selected organic pollutants are similar in Sweden, Norway, Denmark and Finland. Concentrations generally decrease in the following order: LAS > DEHP > nonylphenol > ΣPAH16 > DBP> PBDE > ΣPCB7.
For certain substances, there appears to be national differences. For exam-ple. LAS and nonylphenol appear slightly higher in sludge from Norway than from Sweden or Denmark. However, care should be taken when com-paring different datasets of organic pollutants in sludge. There are analytical difficulties and analytical methods may also differ between different studies. A laboratory intercomparison shows that results for nonylphenol and DEHP may differ at least a factor 2 between different laboratories (Wahlberg and Wistrand, 2006).
88 Using sludge on arable land
References
Miljöstyrelsen (2009) Spildevandsslam fra kommunale og private renseanlæg i 2005. Orientering fra Miljöstyrelsen nr 3, 2009.
Naturvårdsverket (2002) Bromerade flamskyddsmedel i avloppsslam. Rap-port 5188.
NORVAR (2007) Organiske miljøgifter i norsk avløpsslam – Resultater fra un-dersøkelsen i 2006/07. Rapport 157-2007.
SCB (2008) Utsläpp till vatten och slam-produktion 2006. Statistiska medde-landen MI 22 SM 0801.
Sternbeck J., Brorström-Lundén E., Remberger M et al. (2003) WFD prior-
ity substances in sediments from Stock-holm and the Svealand coastal region. IVL report B1538.
Svensson (2002) Miljögifter i avloppsslam – en studie omfattande 19 reningsverk i Västra Götaland. Länsstyrelsen i Västra Götaland 2002:39.
Wahlberg C. and Wistrand B. (2006) Provningsjämförelse – DEHP, NF/NFE i dagvatten, dagvattensediment och av-loppsslam. Rapport från Stockholms Stad.
WSP (2010) Miljöövervakning av miljö-gifter i urbana områden – sammanställ-ning och analys. Rapport till Naturvårdsverket

Appendice 2. Substance-specific data used in the calculations
The calculations of guide values are based on the modelling performed by VKM (2009). The principles, equations and adjustments used are presented in chapter 2. Values of different substance specific parameters are listed in table A2. In some cases other values than those used by VKM were used. Arguments are given in the following.
In the VKM report, references to the KOC values were not given. We cho-se to generally use Koc from RIVM (2001).
For human toxicological effects, TDI values were selected for substances with a threshold level. Values and references are given in Table A2-2. For carcinogenic substances (many PAHs), RfD values were based on an excess cancer risk of 10-6, in accordance with the recent Swedish guideline for as-sessment of contaminated soils. This is a very low level, motivated by need for safe foods. No TDI could be found for LAS. For BDE-209 USEPA (2008c) critical doses both for carcinogenic effects and for other endpoints. In this assessment the lowest value were chosen, representing an excess cancer risk of 10-6.
There is no internationally established TDI for ΣPCB7. WHO (2003) pro-posed a value of 0,02 mg/kg bw/d for total-PCB. Naturvårdsverket (2009) used this value to derive a TDI of 0,004 mg/kgbw/d for ΣPCB7. This TDI represents the summed concentrations in the exposure (vegetables, in this case). The uptake from soil to vegetables fractionate between the congeners due to different BCF values. Therefore, this TDI cannot be used directly on sludge/soil. Using the average relative PCB composition in sludge (see ap-pendice 1), the concentration of ΣPCB7 was iteratively varied until the the calculated total exposure of the seven congeners from root vegetables was equal to 0,004 mg/kg bw/d. Provisional TDI values could then be calculated backwards.
All the BCF values (Table A2-2) for transfer from soil to root vegetable and potatoes were calculated according to the model presented in Trapp (2002). See also chapter 2.3.

90 Using sludge on arable land
Table A2-1. Kow, Koc and degradation rates.
Compound log Kow
Koc Ref Koc T 1/2 K d-1 Ref T 1/2
DEHP 7,5 6 000 000 VKM 2009 300 2,31E-03 EU (2008) DBP 4,57 3 150 VKM 2009 20 3,47E-02 EU (2008)
4-Octylphenol 4,12 1250 VKM 2009 10 6,93E-02 Mackay et al. 2006
Octylphenolethoxilate 4 5 1,39E-01
4-Nonylphenol 4,48 5360 EU 2002b 10 6,93E-02 Mackay et al. 2006
Nonylphenolethoxilate 4 5 1,39E-01
LAS 3,7 2500 HERA 2009 8 8,66E-02 Jensen, 1999
Naphftalene 3,3 955 RIVM 30 2,31E-02 Mackay et al. 2006
Acenaphtylene 3,9 2 950 RIVM 50 1,39E-02 Mackay et al. 2006
Acenaphthene 3,9 3 400 RIVM 50 1,39E-02 Mackay et al. 2006
Phenanthrene 4,47 17 000 RIVM 50 1,39E-02 Mackay et al. 2006
Anthracene 4,45 19 950 RIVM 50 1,39E-02 Mackay et al. 2006
Fluorene 4,2 5 900 RIVM 50 1,39E-02 Mackay et al. 2006
Fluoranthene 5,1 151 000 RIVM 150 4,62E-03 Mackay et al. 2006
Pyrene 5,1 67 600 RIVM 200 3,47E-03 Mackay et al. 2006
Benz(a)anthracene 5,54 617 000 RIVM 150 4,62E-03 Mackay et al. 2006
Chrysene 5,81 525 000 RIVM 300 2,31E-03 Mackay et al. 2006
Benzo(a)pyrene 6,1 661 000 RIVM 365 1,90E-03 Mackay et al. 2006
Benzo(b)fluoranthene 5,78 219 000 RIVM 450 1,54E-03 Mackay et al. 2006
Indeno(123cd)pyrene 6,87 1 050 000 RIVM 600 1,16E-03 Mackay et al. 2006
Dibenz(ah)anthracene 6,6 1 380 000 RIVM 600 1,16E-03 Mackay et al. 2006
Benzo(ghi)perylene 6,22 2 690 000 RIVM 600 1,16E-03 Mackay et al. 2006
PCB-28 5,6 41 000 RIVM 1000 6,93E-04 Mackay et al. 2006
PCB-52 5,8 50 200 RIVM 3600 1,93E-04 Mackay et al. 2006
PCB-101 6,2 340 000 RIVM 3600 1,93E-04 Mackay et al. 2006
PCB-118 6,5 400 000 Adjusted from RIVM
3600 1,93E-04 Mackay et al. 2006
PCB-138 7 513 000 RIVM 6900 1,00E-04 Mackay et al. 2006
PCB-153 7 741 000 RIVM 6900 1,00E-04 Mackay et al. 2006
PCB-180 7,2 1 000000 RIVM 13000 5,33E-05 Mackay et al. 2006
BDE-47 220 000 EC, 2000 385 1,8E-03 Schenker et al. 2008
BDE-99 500 000 EC, 2000 707 9,8E-04 Schenker et al. 2008
BDE-100 707 9,8E-04 Schenker et al. 2008
BDE-209 2000000 USEPA, 2008c
3200 2,2E-04 Schenker et al. 2008

Using sludge on arable land 91
Table A2-2. BCF for uptake in root crops and humantoxicological values. See the report for TDI of the PCBs. BCF values were calculated as described above.
Compound BCF soil-plantkgsoil-dw/kgplant-fw
TDI /RfDmg/kgbw/d
Ref TDI/RfD
DEHP 0,00008 0,05 VKM 2009; EFSA 2005a DBP 0,14 0,01 VKM 2009; EFSA 2005b 4-Octylphenol 0,33 0,15 EC 2005b Octylphenolethoxilate 4-Nonylphenol 0,0830 0,15 EC 2005a Nonylphenolethoxilate LAS 0,14 Naphthalene 0,28 0,02 Naturvårdsverket 2009 Acenaphtylene 0,13 0,04 Naturvårdsverket 2009 Acenaphthene 0,11 0,04 Naturvårdsverket 2009 Phenanthrene 0,026 1,70E-03 Naturvårdsverket 2009 Anthracene 0,022 1,70E-03 Naturvårdsverket 2009 Fluorene 0,071 1,70E-03 Naturvårdsverket 2009 Fluoranthene 0,0032 1,70E-05 Naturvårdsverket 2009 Pyrene 0,0071 8,30E-04 Naturvårdsverket 2009 Benz(a)anthracene 0,00080 1,70E-04 Naturvårdsverket 2009 Chrysene 0,00094 2,80E-05 Naturvårdsverket 2009 Benzo(a)pyrene 0,00075 8,30E-07 Naturvårdsverket 2009 Benzo(b)fluoranthene 0,0023 8,30E-06 Naturvårdsverket 2009 Indeno(123cd)pyrene 0,00048 8,30E-06 Naturvårdsverket 2009 Dibenz(ah)anthracene 0,00036 7,50E-07 Naturvårdsverket 2009 Benzo(ghi)perylene 0,00018 4,20E-05 Naturvårdsverket 2009 PCB-28 0,012 1,24E-06 Based on WHO 2003 PCB-52 0,0098 1,75E-06 Based on WHO 2003 PCB-101 0,0015 2,74E-07 Based on WHO 2003 PCB-118 0,0012 1,27E-07 Based on WHO 2003 PCB-138 0,0010 2,74E-07 Based on WHO 2003 PCB-153 0,0007 1,93E-07 Based on WHO 2003 PCB-180 0,0005 6,02E-08 Based on WHO 2003 BDE-47 0,0023 1,17E-04 USEPA 2008a BDE-99 0,001 1,0E-04 USEPA 2008b BDE-209 0,00025 1,0E-03 USEPA 2008c
References
EC (2005a) Environmental Quality Stan-dards (EQS) Substance Data Sheet. Pri-ority Substance No. 24–4-Nonylphenol (branched) and Nonylphenol CAS-No. 84852-15-3 and 25154-52-3.
EC (2005b) Environmental Quality Stan-dards (EQS) Substance Data Sheet. Pri-ority Substance No. 25–Octylphenols (para-tert-octylphenol) CAS-No. 1806-26-4 and 140-66-9.
EFSA (2005a) Opinion of the Scientific Panel on Food Additives, Flavourings, Processing Aids and Materials in Con-tact with Food (AFC) on a request from the Commission related to Bis(2-ethylhexyl)phthalate (DEHP) for use in food contact materials, The EFSA Journal (2005) 243, 1–20.
EFSA (2005b) Opinion of the Scientific Panel on Food Additives, Flavourings, Processing Aids and Material in Con-tact with Food (AFC) on a request from
the Commission related to Di-Butylphthalate (DBP) for use in food contact materials, The EFSA Journal (2005) 242, 1–17.
Naturvårsverket (2009) Riktvärden för förorenad mark – Modellbeskrivning och vägledning. Rapport 5976.
RIVM (2001) Evaluation and revision of the CSOIL parameter set. RIVM report 711701021.
USEPA (2008a) Toxicological review of 2,2’,4,4’-tetrabromodiphenyl ether (BDE-47).
USEPA (2008b) Toxicological review of 2,2’,4,4’,5-pentabromodiphenyl ether (BDE-99).
USEPA (2008c) Toxicological review of decabromodiphenyl ether (BDE-209).
WHO (2003) Polychlorinated biphenyls, consise international chemical assess-ment. Document 55, World Health Or-ganization, Geneve.


Appendice 3. Critical sludge concentrations for soil organisms, human exposure and birds
The tables show the critical concentrations in sludge (mg/kg dw) for the different endpoints considered.
Ccrit sludge soilorganisms, mg/kg Ccrit sludge human exposure no quarantine, mg/kg
Sludge application rate 3,5 t/ha/5y 6 t/ha/5yr 20 t/ha/10yr 3,5 t/ha/5y 6 t/ha/5yr 20 t/ha/10yr
DEHP 6500 3800 1200 unlimited. unlimited. unlimited. DBP 1700 1000 280 4000 2300 700 4-Octylphenol 8 5 1,4 50000 29 000 8750 4-Nonylphenol 350 200 60 200 000 117 000 35 000 LAS 50 000 30 000 9000 Naphthalene 700 400 130 2800 1650 480 Acenaphtylene 180 100 30 7500 4400 1300 Acenaphtene 24 14 4 8500 5000 1488 Phenanthrene 1100 650 200 1500 875 270 Anthracene 80 47 14 1800 1050 320 Fluorene 600 350 110 600 350 100 Fluoranthene 800 470 140 70 41 12 Pyrene 550 320 90 1300 760 240 Benz(a)anthracene 40 23 7,5 2700 1600 500 Chrysene 300 175 50 330 190 58 Benzo(a)pyrene 28 16 4,8 11 6 2,0 Benzo(b)fluoranthene 140 82 25 37 22 6,6 Indeno(123cd)pyrene 170 99 30 Dibenz(ah)anthracene 20 12 3,6 Benzo(ghi)perylene 90 50 15 2200 1300 400 PCB-28 no PNEC no PNEC no PNEC 0,70 0,41 0,16 PCB-52 no PNEC no PNEC no PNEC 0,50 0,29 0,14 PCB-101 no PNEC no PNEC no PNEC 0,50 0,29 0,15 PCB-118 no PNEC no PNEC no PNEC 0,28 0,16 0,08 PCB-138 no PNEC no PNEC no PNEC 0,43 0,25 0,14 PCB-153 no PNEC no PNEC no PNEC 0,44 0,26 0,14 PCB-180 no PNEC no PNEC no PNEC 0,11 0,06 0,04 BDE-47 no PNEC no PNEC no PNEC 440 250 80 BDE-99 160 95 33 750 440 150 BDE-209 16000 9600 4800 12 000 7 000 3 400

94 Using sludge on arable land
Ccrit sludge human exposure quarantine two years, mg/kg
Ccrit sludge human exposure quarantine three years, mg/kg
Sludge application rate 3,5 t/ha/5yr
6 t/ha/5yr
20 t/ha/10yr
3,5 t/ha/5yr
6 t/ha/5yr
20 t/ha/10yr
DEHP Unlimited unlimited. unlim-ited.
unlimited. unlimited. unlimited.
DBP Unlimited unlimited Unlimited unlimited Unlimited unlimited 4-Octylphenol Unlimited unlimited Unlimited unlimited Unlimited unlimited 4-Nonylphenol Unlimited unlimited Unlimited unlimited Unlimited unlimited LAS Naphthalene Unlimited unlimited Unlimited unlimited Unlimited unlimited Acenaphtylene Unlimited unlimited Unlimited unlimited Unlimited unlimited Acenaphtene Unlimited unlimited Unlimited unlimited Unlimited unlimited Phenanthrene Unlimited unlimited Unlimited unlimited Unlimited unlimited Anthracene Unlimited unlimited Unlimited unlimited Unlimited unlimited Fluorene Unlimited unlimited Unlimited unlimited Unlimited unlimited Fluoranthene 2000 1200 360 11000 6400 2000 Pyrene 18000 10400 3100 62000 36000 11000 Benz(a)anthracene 80000 47000 14000 unlimited unlimited. unlimited Chrysene 1700 1000 300 4100 2400 720 Benzo(a)pyrene 45 27 8,2 94 55 16 Benzo(b)fluoranthene 110 68 20 200 120 36 Indeno(123cd)pyrene 400 235 70 600 350 110 Dibenz(ah)anthracene 48 28 8,4 73 42 13 Benzo(ghi)perylene 5000 3000 900 8000 4700 1400 PCB-28 0,70 0,41 0,16 0,70 0,41 0,16 PCB-52 0,50 0,29 0,14 0,50 0,29 0,14 PCB-101 0,50 0,29 0,15 0,50 0,29 0,15 PCB-118 0,28 0,16 0,08 0,28 0,16 0,08 PCB-138 0,43 0,25 0,14 0,43 0,25 0,14 PCB-153 0,44 0,26 0,14 0,44 0,26 0,14 PCB-180 0,11 0,064 0,04 0,11 0,064 0,04 BDE-47 440 250 80 440 250 80 BDE-99 750 440 150 750 440 150 BDE-209 12 000 7 000 3 400 12 000 7 000 3 400
Ccrit sludge bird that feed on earthworms, mg/kg
Sludge application rate 3,5 t/ha/5yr 6 t/ha/5yr 20 t/ha/10yr
DEHP 42 000 24 000 6000 DBP 13 000 7500 2400 4-Nonylphenol 52 000 30 000 9000 LAS 90 000 50 000 15 000 Naphthalene 17 000 10 000 3000 PCB-153 22 13 7

Appendice 4. Management for soil protection
The main goal for making regulations as limit values and to restrict discharges is to protect human health and the environment. Contamination of agricultural soil is basically caused by different types of fertilisers, pesticides and by dif-fuse emissions from atmospheric deposition. Sludge is a fingerprint of the different substances we all are exposed to in our daily life, and the pollution by organic contaminants in the waste water system can be regarded as diffuse emissions. There are different management traditions and approaches to pro-tect soil and to identify contaminated soils and some of this management sys-tem should be considered before making a proposal for limit values for or-ganic contaminants in sludge.
Management for polluted soil
Contamination of soils is classified according to limit values for different substances. This classification system gives different management schemes whether the soil is suitable for kinder gardens or in road construction or should be treated as waste. In Norway a classification scheme based on health is given as five classes for risk acceptance criterion. In Sweden the risk acceptance criterion has two classes, sensitive and not sensitive land use (Table A4-1). Both these systems for soil classification are based on risk assessment principles, similar to the methods used in this report for calculat-ing effect based levels.
Table A4-1. Risk acceptance criterion for polluted soils for selected organic contami-nants in Norway (SFT, 2009) and Sweden (Naturvårdsverket, 2009) in mg/kg dw.
Risk acceptance criterion
Very good Good* Moderate* Poor Very poor
Norway PCB7 <0.01 0.01–0.5 0.5–1 1–5 5–50PAH16 <2 2–8 8–50 50–150 150–2500Benzo(a)-pyren <0.1 0.1–0,5 0.5–5 5–15 15–100DEHP <2.8 2,8–25 25–40 40–60 60–5000Dioxin <10-5 10-5-2·10-5 2·10-5-10-4 10-4-3.6·10-3 3.6·10-3-1.5·10-2
KM* MKM* Sweden PCB 8·10-3 0,2 Dioxin 10-5 10-4 PAHshort 3 15 PAHmedium 3 20 PAHlong 3 10
* Sensitive use (KM in Swedish) and medium sensitive use (MKM in Swedish). The KM values do not correspond to the Norwegian classification system.

96 Using sludge on arable land
Limit values in agricultural soil for using sludge
The agricultural soil has to be analysed for metals before sludge application (table A4-2). These limit values have been established to protect agricultural soil from further doses of metal. Sweden and Norway have some regions with relatively high natural content of e.g. nickel, zinc and cadmium. Excep-tions have been conducted for some areas where sludge application has been approved. Copper and zinc are both essential nutrients for plant growth. Both the Swedish and Norway legislations open for higher application rates for these metals when it is demonstrated shortage in the soils.
Table A4-2. Limit values for metals (mg7kg dw) in agricultural soil for sludge application.
Sweden new proposal Denmark Norway EU EU new proposal
soil pH 6-7 pH <6 pH 6-7
Pb 40 40 50 50–300 50 70 Cd 0.4 0.5 1 1–3 0.5 1 Cu 40 40 50 50–140 40 50 Cr 60 30 100 - 50 75 Hg 0.3 0.5 1 1–1,5 0.2 0,5 Ni 30 15 30 30–75 30 50 Zn 100 100 150 150–300 100 150
Appendice 5. Limit values and application rates for sludge – a comparison between the Nordic countries
The current Nordic regulations for sludge usage on agricultural land have two purposes: to allow efficient reuse of nutrients and to minimize the im-pact of metals on the agricultural ecosystems. This chapter aims at illustrat-ing these current regulations.
Limit values in sludge should be specified for certain application rates in view of the fact that the actual dose, rather than the concentration, is of concern. In the present European sludge directive (86/278/EEC) there is no application amount for sludge as such, only maximum limit values for metals (mg metal/kg sludge DW and kg metals/ha/year) to be added annu-ally based on a ten year average. The EU proposal for a new sludge direc-tive (DG environment, 2000) has strengthen the limit values for metals and included maximum limit values for organic pollutants and new limit values for metals related to phosphorus (P) by using 2,5 % P in sludge as a basis (Table A5-1). In addition, the proposal is strengthen regarding limit values for heavy metals content in agricultural soil. The present EU legislation has been implemented differently in the national sludge legislations in the Nordic countries (Table A5-2), and national legislations are undergoing revision in both Norway and Sweden in 2010. The application rates are specified as amounts per year for easier comparison.
Sweden has proposed a new regulation (Naturvårdsverket, 2010) for use of sludge to agricultural land. The new proposal has a similar approach as the Danish legislation and the proposed EU directive (EC, 2003b), with the application rates linked to the nutrient content. In the proposed regulation the application rates are limited by 1) the nutrient status for phosphorus in the soil; 2) the application rate for phosphorus; 3) limit values for metals in the sludge, 4) limit application rates for metals, and 5) limit values for metal concentrations in soil. The limit values for metal application per ha and year for metals (Table A5-2) are radically lower than both the present and the proposed EU directive (Table A5-1) and to some extent, lower than the ac-tual application rate in Denmark and Norway (Table A5-2). If sludge con-tains 3 % P (per DW), the total amount of sludge that can be applied accord-ing to the proposed regulation is 3.5 or 6 ton/ha per five years, dependent on the phosphorus concentration of the soil. The metal concentrations in Swed-ish sludge are in general lower than the limit values. During 2008, only 4%

98 Using sludge on arable land
of the sludge displayed levels of Cu higher than the limit value. For the other metals, this rate was lower. Metals will thus not effectively hinder the use of sludge on agricultural land in Sweden.
Table A5-1. Limit values in present and the proposed new EU directive (EU, 2003).
Present EU directive Proposed new directive
mg/kg DW g /ha/y mg/kg DW mg/ kg P g/ha/y
Pb 750–1200 15 000 750 30 000 1500 Cd 20–40 150 10 400 15 Cu 1000–1750 12 000 1000 40 000 3000 Cr - - 1000 40 000 3000 Cr(VI) 10 400 15 Hg 60–25 100 10 400 10 Ni 300–400 3000 300 12 000 750 Silver - - Zn 2500–4000 30 000 2500 100 000 7500 PAH 1) 6 PCB 2) 0.8 PCDD /F 0.0001 ITEQ LAS 5000 30 000 NPE 3) 450 2700
1) Sum of the following polycyclic aromatic hydrocarbons: acenapthene, phenanthrene, fluorene, flouranthene, pyrene, benzo (b+j+k) fluoranthene, benzo(a)pyrene, benzo(ghi)perylene, indeno(1, 2, 3-c, d)pyrene. 2) Sum of the polychlorinated byphenls components number 28, 52, 101, 118, 138, 153, 180. 3) It comprises the substances nonylphenol and nonylphenolethoxylates with 1 or 2 ethoxy group
Norway has three quality classes (0, I, II) pending on the metal content for sludge which correspond to different amounts to be legally spread on agri-cultural soils. Normal metal concentrations in sludge are between class I and II, and it is allowed with 2 tons DW/ha/year for class II. This is the common application rate for sludge in Norway. If sludge is in quality class I, it is allowed to spread 4 tons DW per ha and year , although this is seldom done in practice.
In Denmark the use of sludge on agricultural soil is closely linked to nu-trient requirement and the fertilisation plan for the farm. It is not allowed to spread more than 30 kg P per ha and year (including manure, sludge and other products derived from waste); however the phosphorus application can be calculated as an average per year over a three year period. Denmark has limit values for metals and some selected organic pollutants in sludge and limit values for metals linked to the total phosphorus concentration in the sludge. If the sludge fulfil the limit values for metals and phosphorus is not considered, sludge can be applied at a maximum rate of 7 tons DW ha and year over a period of ten years. In practise, if sludge contains 3 % P (DW) the application will not exceed more than 1 tons DW/ha/year. Thus, phos-phorus is generally limiting the use of sludge on agricultural land in Den-mark.
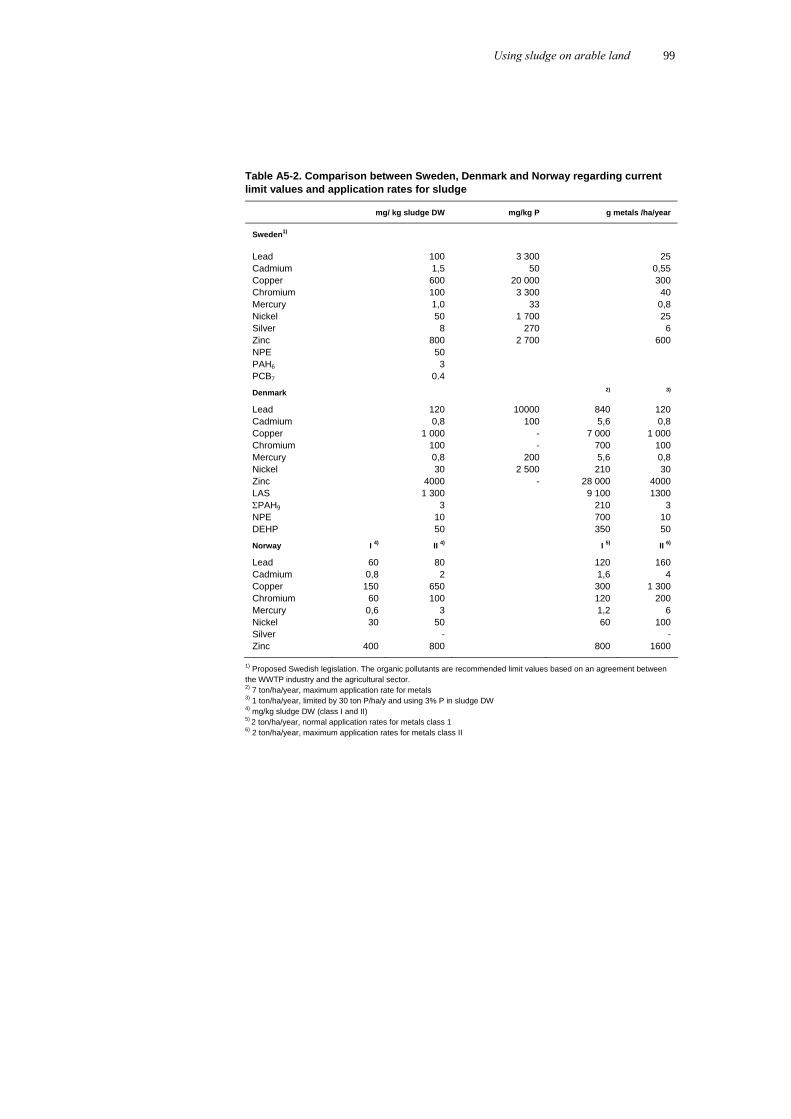
Using sludge on arable land 99
Table A5-2. Comparison between Sweden, Denmark and Norway regarding current limit values and application rates for sludge
mg/ kg sludge DW mg/kg P g metals /ha/year
Sweden1)
Lead 100 3 300 25 Cadmium 1,5 50 0,55 Copper 600 20 000 300 Chromium 100 3 300 40 Mercury 1,0 33 0,8 Nickel 50 1 700 25 Silver 8 270 6 Zinc 800 2 700 600 NPE 50 PAH6 3 PCB7 0.4
Denmark 2) 3)
Lead 120 10000 840 120 Cadmium 0,8 100 5,6 0,8 Copper 1 000 - 7 000 1 000 Chromium 100 - 700 100 Mercury 0,8 200 5,6 0,8 Nickel 30 2 500 210 30 Zinc 4000 - 28 000 4000 LAS 1 300 9 100 1300 PAH9 3 210 3 NPE 10 700 10 DEHP 50 350 50
Norway I 4) II 4) I 5) II 6)
Lead 60 80 120 160 Cadmium 0,8 2 1,6 4 Copper 150 650 300 1 300 Chromium 60 100 120 200 Mercury 0,6 3 1,2 6 Nickel 30 50 60 100 Silver - - Zinc 400 800 800 1600
1) Proposed Swedish legislation. The organic pollutants are recommended limit values based on an agreement between the WWTP industry and the agricultural sector. 2) 7 ton/ha/year, maximum application rate for metals 3) 1 ton/ha/year, limited by 30 ton P/ha/y and using 3% P in sludge DW 4) mg/kg sludge DW (class I and II) 5) 2 ton/ha/year, normal application rates for metals class 1 6) 2 ton/ha/year, maximum application rates for metals class II
Copyright © 2022 FDOKUMEN