Geotechnical Engineering Office Publications – Catalogue 土 ...
Upload
khangminh22Category
view
0download
0
sustainability
Article
Beneficial Use of Water Treatment Sludge in GeotechnicalApplications as a Sustainable Alternative to PreserveNatural Soils
Maria E. G. Boscov * , Juliana K. Tsugawa and Edy L. T. Montalvan
�����������������
Citation: Boscov, M.E.G.;
Tsugawa, J.K.; Montalvan, E.L.T.
Beneficial Use of Water Treatment
Sludge in Geotechnical Applications
as a Sustainable Alternative to
Preserve Natural Soils. Sustainability
2021, 13, 9848. https://doi.org/
10.3390/su13179848
Academic Editors: Gemmina Di
Emidio, Ecem Nur Barisoglu and
Muhammad Khizar Khan
Received: 12 July 2021
Accepted: 26 August 2021
Published: 2 September 2021
Publisher’s Note: MDPI stays neutral
with regard to jurisdictional claims in
published maps and institutional affil-
iations.
Copyright: © 2021 by the authors.
Licensee MDPI, Basel, Switzerland.
This article is an open access article
distributed under the terms and
conditions of the Creative Commons
Attribution (CC BY) license (https://
creativecommons.org/licenses/by/
4.0/).
Structural and Engineering Department, School of Engineering, University of Sao Paulo,Sao Paulo 05508-970, Brazil; [email protected] (J.K.T.); [email protected] (E.L.T.M.)* Correspondence: [email protected]; Tel.: +55-119-913-79203
Abstract: This paper explores the feasibility of employing drinking water treatment sludge (WTS)mixed with soils, lime, or rock powder in geotechnical applications, as well as discusses the sustain-ability of the approach based on experimental results, aiming at the beneficial reuse of waste andthe preservation of natural geomaterials. The selected materials were two soils largely used in earth-works, two WTSs, a high purity calcium hydrated lime, and rock powder from a granitic–gneissicquarry, all occurring in São Paulo State, Brazil. The mixtures were chemically, mineralogically, andgeotechnically characterized, and the geotechnical properties permeability, shear strength, and de-formability were investigated. Soil-WTS mixtures showed hydraulic conductivity (10−10–10−6 m/s,depending on soil and WTS), effective cohesion (10–30 kPa), friction angle (34◦–40◦), undrainedstrength (>50 kPa), and compression index (0.1–0.4) compatible with those of soils usually employedin earthworks. Lime:WTS and rock powder:WTS mixtures achieved 50 kPa undrained strength forWTS contents lower than 24% and 8%, respectively, and could be used as daily and intermediatecovers of waste landfills, as well as in other applications with low soliciting stresses. The possibilityof WTS being pumped instead of transported by trucks was analyzed in the light of results fromrheological tests.
Keywords: waste utilization; waste characterization; geotechnical; mechanical and hydraulic proper-ties; sustainability
1. Introduction
Water treatment sludge (WTS) is the residue generated at water treatment plants(WTPs) by the regular washing of decanters and filters. The main treatment processesto transform raw water into potable water in a conventional WTP are coagulation, floc-culation, decantation, filtration, pH correction, disinfection, and fluoridation. Duringthese processes, several chemicals are added to the water, e.g., chlorine, coagulants, lime,and fluorine. Coagulants (ferric, alum, polymeric) cause impurities to accumulate at thebottom of sedimentation basins and filters, which are periodically washed, producing WTS.Considering that WTS generation amounts to 0.2% to 5% of the volume of treated water [1]and the estimated increase in global demand for potable water is of 1% per year [2], WTSfigures as a major waste stream, presently and for the foreseeable future.
WTS is composed of more than 97% water, chemical compounds from the treat-ment process, and suspended solids, mainly soil particles—sand, silt, and clay, but mayalso present organic matter, algae, bacteria, and viruses. Dewatering usually raises thesolids content to 20–30%, which corresponds to 250–400% gravimetric water content, i.e.,a suspension.
In most developing countries, WTS is still released in water bodies—a practice nolonger allowed in countries with sound environmental regulations—causing silting anddeterioration of water quality. Environment-friendly alternatives, such as disposal in
Sustainability 2021, 13, 9848. https://doi.org/10.3390/su13179848 https://www.mdpi.com/journal/sustainability

Sustainability 2021, 13, 9848 2 of 26
sanitary or dedicated landfills or discharge in sewage treatment plants (STPs), still posesustainability concerns: WTS impairs the structural stability of sanitary landfills andoverloads STPs, by themselves insufficient in most developing countries, while dedicatedlandfills conflict with the global environmental goal of reducing land disposal of waste.On the other hand, reuse may introduce WTS in the circular economy and also substitutenatural resources in several production processes. The percentage of reused or recycledWTS is an indicator proposed by the standard ISO 24512:2007 for the evaluation of watersupply services management. Sustainable management of WTS is also encompassed byUN Sustainable Development Goal 6—Water and Sanitation [3].
Some techniques aiming at WTS reuse have been investigated: precast concreteelements, brick, ceramic, and cement production [4–8]; composting [9]; removal of phos-phorous from residual waters [10–12]; crop production [13] and forestry [14]; absorptionof heavy metals [15,16]; coagulant recovery [17,18]; landfill lining [19,20]; geotechnicalmaterial [21–24], among others. Reviews about the beneficial reuse/recycling alternativesfor WTS have been presented by some authors [25–27]. Despite the significant numberof studies, worldwide cases of WTS reuse are rare in the literature. Novel managementpractices, such as agriculture, forestry, land reclamation, incorporation into soils, soil im-provement, and incorporation into construction materials have been reported in the 2000sby governmental agencies in some countries (e.g., UK, Japan, France, Germany, USA),still representing low percentages of the total mass generated. However, information hasnot been updated in recent years on the respective websites or in regulations or technicalreports. Reuse of wastewater and sewage sludge, i.e., biosolids, which are much morevoluminous and with a wider range of applications, may have overshadowed the use ofWTS. This does not mean that WTS reuse is not taking place; for example, WTS is usedas an additive for sewage treatment in Portugal, and USEPA established directives forWTS reuse in 2011. Developing countries, however, still need sound research to enhanceWTS reuse under their specific conditions and need information on the performance ofpractical applications already under way. Though still scarce, research on the geotechnicalproperties and practical applications of WTS has increased in the last years. This paperinvestigates the feasibility of employing WTS at as-collected water content in geotechnicalapplications, such as covers and bottom liners of sanitary and industrial landfills, backfillfor trenches, bridge abutments and geosynthetic-reinforced earth walls, pavement andbuildings subbases, reinforcement for soft soils, and embankments. Additionally, it dis-cusses the sustainability of this approach based on experimental results, aiming at thebeneficial reuse of waste and the preservation of natural geomaterials.
Two approaches are envisaged: (1) the partial substitution of soils with adequategeotechnical properties by WTS in order to preserve natural resources; (2) the mixing ofWTS with additives to design a new geomaterial, aiming at beneficial reuse.
WTS addition may reduce the shear strength, increase the compressibility, or impairthe workability of soils; therefore, the maximum allowable content of WTS was sought inthe first approach. Two sludges and two soils were mixed in different proportions, andgeotechnical properties were determined for the mixtures.
The second approach investigated WTS-additive mixtures that could reach a minimumundrained strength for workability and spreading in the field. In this case, a sludge wasmixed separately with lime and rock powder to obtain a workable material for applicationsinvolving low soliciting stresses. Experimental adaptations to deal with materials withshear strength lower than that of soft clays are presented. The scientific background tointegrate rheology into geotechnical tests discussed in [28] is here first applied to WTS.Subsequent steps will be to produce materials with good geotechnical properties forgeneral earthworks.
The experimental results of both approaches are finally discussed in the light oftechnical feasibility, as well as environmental, economic, and social sustainability. Thediscussion perspective focuses on developing countries, where environmental regulationsand new business models for water and sanitation are still being implemented.

Sustainability 2021, 13, 9848 3 of 26
The new approaches and the scientific contribution of this research are (1) the geotech-nical utilization of as-collected WTS, without any previous treatment such as drying orchemical addition, which would drastically reduce the economic feasibility of reuse (airor oven-drying improves the geotechnical properties of WTS, but is time, space, andenergy consuming); (2) the determination of geotechnical properties for multipurposeapplications—while most investigations are directed toward a specific use and thereforemay discard suitable materials for geotechnical applications other than those previouslyenvisioned, the multipurpose approach can itself indicate the best alternative of reuse;and (3) the integration of geotechnical and rheological tests to understand the behavior ofgeomaterials and to discuss new possibilities of transport and manipulation in the light ofsustainability.
2. Materials and Methods2.1. Materials
Two WTSs were investigated, Cubatão-WTS and Taiaçupeba-WTS, both generatedat conventional-treatment WTPs located in São Paulo State, Brazil (Figure 1). Samplesof both WTSs were collected directly after centrifuge dewatering. The protocol to obtainrepresentative samples was designed according to the Theory of Sampling [29].
Sustainability 2021, 13, x FOR PEER REVIEW 3 of 27
The experimental results of both approaches are finally discussed in the light of tech-
nical feasibility, as well as environmental, economic, and social sustainability. The discus-
sion perspective focuses on developing countries, where environmental regulations and
new business models for water and sanitation are still being implemented.
The new approaches and the scientific contribution of this research are (1) the ge-
otechnical utilization of as-collected WTS, without any previous treatment such as drying
or chemical addition, which would drastically reduce the economic feasibility of reuse (air
or oven-drying improves the geotechnical properties of WTS, but is time, space, and en-
ergy consuming); (2) the determination of geotechnical properties for multipurpose ap-
plications—while most investigations are directed toward a specific use and therefore
may discard suitable materials for geotechnical applications other than those previously
envisioned, the multipurpose approach can itself indicate the best alternative of reuse;
and (3) the integration of geotechnical and rheological tests to understand the behavior of
geomaterials and to discuss new possibilities of transport and manipulation in the light of
sustainability.
2. Materials and Methods
2.1. Materials
Two WTSs were investigated, Cubatão-WTS and Taiaçupeba-WTS, both generated
at conventional-treatment WTPs located in São Paulo State, Brazil (Figure 1). Samples of
both WTSs were collected directly after centrifuge dewatering. The protocol to obtain rep-
resentative samples was designed according to the Theory of Sampling [29].
Figure 1. Location of Cubatão-WTP, Cubatão River, Taiaçupeba-WTP and Taiaçupeba Reservoir.
Cubatão-WTP collects raw water with turbidity of 800 NTU from the Cubatão River
and supplies 4.5 m3/s of potable water to a 1.5 million population. The water passes
through desanders before being submitted to the conventional treatment, which uses fer-
ric chloride as a coagulant. WTS produced by washing sedimentation basins and filters is
sent to a thickening tank (2% to 4% solids) and then dewatered by centrifuges, generating
circa 60 tons/day of WTS with 20% to 25% solids. Cubatão-WTS is presently sent to a pri-
vate waste disposal site.
Taiaçupeba-WTP collects raw water from the Taiaçupeba reservoir and produces 15
m3/s of potable water for the São Paulo Metropolitan Region (21 million inhabitants). The
Figure 1. Location of Cubatão-WTP, Cubatão River, Taiaçupeba-WTP and Taiaçupeba Reservoir.
Cubatão-WTP collects raw water with turbidity of 800 NTU from the Cubatão Riverand supplies 4.5 m3/s of potable water to a 1.5 million population. The water passesthrough desanders before being submitted to the conventional treatment, which uses ferricchloride as a coagulant. WTS produced by washing sedimentation basins and filters is sentto a thickening tank (2% to 4% solids) and then dewatered by centrifuges, generating circa60 tons/day of WTS with 20% to 25% solids. Cubatão-WTS is presently sent to a privatewaste disposal site.
Taiaçupeba-WTP collects raw water from the Taiaçupeba reservoir and produces15 m3/s of potable water for the São Paulo Metropolitan Region (21 million inhabitants).The coagulation process employs aluminum sulfate and a polymer (superfloc 8392).Residues collected from the sedimentation basins and filters backwashing are sent toan equalization tank (2% solids content), then to a thickening tank (4% solids content), and

Sustainability 2021, 13, 9848 4 of 26
finally to centrifuges (16% to 18% solids content). WTS is further air-dried and disposed ofin engineered cells inside the WTP or sent to an external landfill.
Two tropical lateritic soils widely used in geotechnical works were selected for theresearch: Botucatu clayey sand and Campinas clay, both largely occurring soils in SaoPaulo State, Brazil. Additives were a commercial high-purity calcium hydrated lime andgranite–gneiss rock powder collected in a quarry in Cubatão, São Paulo State.
All mixtures were prepared with WTS at as-collected water content (after centrifuge-dewatering), and soils, lime, and rock powder were prepared at hygroscopic water content.Soils were air-dried, a usual practice in soil mechanics laboratories, while lime and rockpowder were already obtained in a dry state. The proportions of WTS and mixed materialby wet mass were selected according to an arbitrary criterion of workability/compactabilityof the resulting mixture. For the analysis of test results, WTS content was expressed by drymass basis (mass of WTS solids divided by mass of soil, lime, or rock powder solids).
Three soil:WTS ratios by wet mass were selected between 1.5:1 and 5:1, resultingin 12 different mixtures. Four lime:WTS ratios by wet mass, varying between 1:1 and1.5:1, and four rock powder:WTS ratios, between 1:1 and 5:1, were also tested. Mixtureswere named with letters sequentially indicating soil or additive, WTS, and soil:WTS oradditive:WTS ratio, as presented in Table 1.
Table 1. Tested mixtures: composition and notation.
Notation. Soil or Additive WTS Proportion(by Wet Mass)
WTS Content (%)(by Dry Mass)
BC5:1 Botucatu sand Cubatão 5:1 4.5BC4:1 Botucatu sand Cubatão 4:1 5.6BC3:1 Botucatu sand Cubatão 3:1 7.5BT5:1 Botucatu sand Taiaçupeba 5:1 3.4BT4:1 Botucatu sand Taiaçupeba 4:1 4.2BT3:1 Botucatu sand Taiaçupeba 3:1 5.7CC4:1 Campinas clay Cubatão 4:1 7.0CC3:1 Campinas clay Cubatão 3:1 9.3CC2:1 Campinas clay Cubatão 2:1 13.9CT3:1 Campinas clay Taiaçupeba 3:1 5.7CT2:1 Campinas clay Taiaçupeba 2:1 8.5
CT1.5:5 Campinas clay Taiaçupeba 1.5:1 11.3LC1:1 Lime Cubatão 1:1 28.6
LC1.2:1 Lime Cubatão 1.2:1 25.0LC1.3:1 Lime Cubatão 1.3:1 22.2LC1.5:1 Lime Cubatão 1.5:1 20.0
RPC2.1:1 Rock Powder Cubatão 2.1:1 14.3RPC3:1 Rock Powder Cubatão 3:1 10.0RPC4:1 Rock Powder Cubatão 4:1 7.4RPC5:1 Rock Powder Cubatão 5:1 5.9
2.2. Chemical and Mineralogical Characterization of the Investigated Materials
Chemical composition was obtained by X-ray fluorescence using a spectrometer(Axios-Advanced PANalytical; standardless analysis from fluor to uranium) and loss-on-ignition (LOI) at 1020 ◦C for two hours. Analyses were carried out on powder of oven-driedsamples (35 ◦C). Concentrations of elements were semiquantitative and presented in theform of oxides normalized to the value of 100%. Chemical parameters, pH in water andKCl, P, K, Ca, Mg, Al, Al+H, exchangeable bases, cation exchange capacity, saturationby exchangeable bases, saturation by aluminum, organic carbon, and organic matter bytitrimetric method were determined using air-dried samples according to methods of theBrazilian Agricultural Research Corporation [30]. In order to determine organic mattercontent, 100 g samples were oven dried at 105 ◦C and then ignited using a muffle furnaceat 440 ◦C during 24 h, in accordance with ASTM D2974 standard.

Sustainability 2021, 13, 9848 5 of 26
Mineral composition was determined by X-ray diffraction using Phillips diffractome-ter MPD 1880 and scanning electron microscopy (SEM) using FEI Quanta m600 FEGmicroscope, equipped with a Bruker X-ray energy dispersion spectrometer (EDS) Quan-tax 400 (technology SDD—Silicon Drift Detector) and data analysis using Sprit software.The analyses were conducted on samples oven-dried at 35 ◦C. Crystalline phases wereidentified by comparing obtained diffractograms with those of the International Centre ofDiffraction Data and the PANalytical Inorganic Crystal Structure Database. Microscopicanalyses were carried out by collection of backscattered electron images and specific chem-ical analyses by EDS for the compositional characterization of particles. The SEM analyseswere conducted on pulverized samples (powder) glued to a double-sided carbon tape andcoated with platinum.
2.3. Geotechnical Characterization of the Materials
Geotechnical characterization comprised determination of water content (w), particle-size distribution (PSD), liquid limit (wL) and plastic limit (wP), specific gravity of solids(Gs), and organic matter content (OM), following ASTM standards: ASTM-D2974-14,ASTM-D422-07, ASTM-D4318-17, ASTM-D854-14, and ASTM-D2974-14, respectively.
For the sludges, solids content (SC) and dehydration over time were also determined:2 kg samples were air-dried and monitored over time until reaching the residual watercontent. Water content was determined at 105 ◦C following the recommendation of [31]for organic sludges. For the other characterization tests, WTS samples were tested atas-collected water content since several authors have reported significant alterations inWTS caused by previous air-drying [32–35]. Atterberg limits were determined by thewet method (from wet to dry) following ASTM D4318-17. PSD of the sludges was alsodetermined by laser analyses using wet and dry (powder) samples.
2.4. Geotechnical Properties of the Investigated Materials
Compaction tests at standard Proctor effort followed ASTM-D698-12e2 with air-driedsamples (Method A) and material reuse (necessary due to the great number of compactiontests since each test uses ~3 kg of material). Compaction of additive:WTS mixtures was car-ried out after previous drying to hygroscopic moisture. Compaction of soil:WTS mixtureswas carried out with and without previous drying. Refs. [35,36] showed that previousair-drying alters compaction parameters (maximum dry unit weight and optimum watercontent) of soil:WTS mixtures and that there is a linear correlation between compactionparameters and desiccation ratio, defined according to Equation (1). Compaction tests foreach soil:WTS mixture were conducted at three different desiccation ratios.
Desiccation ratio (%) =w0 − wi
w0× 100 (1)
where w0 = as-mixed water content, and wi = water content after air-drying.Soils and soil:WTS mixtures specimens were submitted to oedometric compression,
permeability, unconfined compression, and triaxial compression tests. Specimens werecompacted at optimum compaction parameters at Proctor standard effort. However, somemixtures (those with higher WTS content) were tested at as-mixed moisture, as they alreadywere slightly wet-of-optimum. Additive:WTS mixtures were submitted to unconfinedcompression tests on specimens compacted at as-mixed water content at Proctor standardeffort. When the stress–strain curve did not present a peak, i.e., the axial stress continuouslyincreased with strain, the adopted failure criterion was 15% (maximum) deformation.
Oedometric compression tests were carried out according to ASTM- D2435-11a, withthe specimen inside a stainless-steel ring of 71.3 mm diameter and 20.0 mm height, inunda-tion with distilled water at initial loading, incremental loading (load increment ratio of 1),subsequent unloading, and loading interval of 24 h. The applied vertical stresses were: 10,20, 40, 80, 160, 320, 640, 1280, and 2560 kPa.

Sustainability 2021, 13, 9848 6 of 26
The hydraulic conductivity of compacted soils and soil:WTS mixtures was determinedby constant head permeability tests in flexible-wall permeameter, following ASTM-D5084-16, with specimens of 70 mm height and 70 mm diameter. Saturation was achieved bybackpressure ranging from 500 to 700 kPa to reach B-value equal or higher than 0.96.
For each soil and soil:WTS mixture, isotropically consolidated undrained (CIU) triaxialcompression tests with measurement of pore pressure were carried out with confiningpressures of 50, 100, and 200 kPa on specimens of 38 mm diameter and 76 mm height,following ASTM-D4767-11. The undrained strength was defined as the maximum deviatorstress till axial strain of 17%.
Unconfined compression tests were carried out following ASDTM-D2166-16 at 1.0 %/minstrain rate with triplicate specimens of 50 mm diameter and 50 mm height (compacted bymini-MCV equipment) for each material. Since the L/D ratio of the specimens was 1, acorrection factor of 0.69 was applied to the maximum axial stress in order to obtain theequivalent axial stress for L/D = 2, based on the correction equation suggested by [37].
UCS( LD=2) =
UCS( LD )[
1.83− 0.39(
LD
)] (2)
where UCS(L/D = 2) = standard unconfined compression strength, and UCS(L/D) = measuredUCS for tested samples with L/D ratio.
2.5. Environmental Characterization of Cubatão-WTS and Taiaçupeba-WTS
The environmental characterization of Cubatão-WTS was based on the chemicalanalysis of four different samples submitted to X-ray fluorescence in two laboratories.The Brazilian standard for waste classification NBR 10,004 [38] uses specific properties(radioactivity, inflammability, pathogenicity, and corrosivity) or results of solubilizationand leaching tests to classify waste in three classes—hazardous, non-hazardous non-inert,and non-hazardous inert. NBR 10,004 implicitly considers WTS, municipal solid waste,and sewage treatment sludge as non-hazardous non-inert. Even so, since the quality of theraw water of Taiaçupeba Reservoir posed some concern, solubilization and leaching testswere carried out for Taiaçupeba-WTS following Brazilian standards NBR 10,006 [39] andNBR 10,005 [40], respectively. Ongoing research aims to analyze the chemical impact ofWTS reuse at each specific geotechnical application.
Biological characterization of WTS is not required yet, despite the probable presenceof microorganisms, hormones, and nano plastics that are not destroyed by the conventionaltreatment. Further research is necessary to address this topic.
2.6. Rheological Behavior of Cubatão-WTS
A sample of Cubatão-WTS at water content of 240% (solids content of 30%) wasmechanically mixed for 1 min at 10,000 rpm before the rotational rheometry tests. Steppedflow tests were performed using a Haake Mars 60 Rheometer with steel parallel plategeometry (diameter of 35 mm, gap of 1.0 mm) at a constant temperature of 23 ◦C. Shearstrain rate (usually named “shear rate” at rotational tests) was twice increased (acceleration)from 0 to 50 s−1 (3000 rpm) and subsequently decreased (deceleration)—i.e., two cycles ofshear rate acceleration–deceleration were performed, totalizing 400 s of test (Figure 2).

Sustainability 2021, 13, 9848 7 of 26
Sustainability 2021, 13, x FOR PEER REVIEW 7 of 27
tion) from 0 to 50 s−1 (3000 rpm) and subsequently decreased (deceleration)—i.e., two cy-cles of shear rate acceleration–deceleration were performed, totalizing 400 s of test (Figure 2).
Figure 2. Shear rate history applied during “stepped flow” or “stepwise flow” rheology tests [41].
2.7. Particular Aspects of WTS Characterization Characterization of WTS is challenging because quantities and characteristics vary
not only among different WTPs but also within the same WTP along any given year. Great variations in WTS composition (organic matter, clay, and sand particles) due to seasonal-ity of raw water quality have been reported [6]. The sampling procedure of both sludges was based on the Theory of Sampling to warrant a homogeneous sample representative of one month of WTS generation [42].
WTS characterization has been discussed in a recent technical event in Brazil, LETA 2021 (First Meeting on Water Treatment Sludge: Connections for Technology Innovation), which brought together professionals and researchers dealing with WTS to disclose the state-of-the-art in this subject and to propose new lines of action. Our position, which was in accordance with that of many colleagues who deal with WTS, is that WTS should be characterized according to the desired application. For instance, grain size distribution is fundamental for use in the ceramics industry since different ceramic elements demand suitable ranges of clay and sand fractions. On the other hand, mineralogical characteriza-tion is necessary for the cement industry since predominance of amorphous material dis-qualifies WTS for this application. Mineralogical classification is also important to identify active clay minerals for coagulant, phosphorous, or heavy metals recuperation. Micro and macro properties of WTS are intrinsically related [43] and should be selected for charac-terization according to each potential use.
Environmental characterization, on the other hand, should be related to WTS condi-tioning when reused. A WTS that presents heavy metals might release excessive concen-trations as a compacted layer is exposed to weather; however, leaching of these metals might not occur if the WTS is encapsulated in a concrete–bitumen matrix.
3. Results 3.1. Characterization of Cubatão-WTS and Taiaçupeba-WTS 3.1.1. Chemical and Mineralogical
The chemical composition of both WTSs obtained by X-ray fluorescence in terms of major elements is presented in Table 2, while chemical parameters are presented in Table 3. The mineralogical tests show that Cubatão-WTS is composed of quartz, goethite, mus-covite, and kaolinite, mineralogically compatible with the gneissic rocks and residual soils through which the Cubatão River flows. Taiaçupeba-WTS, collected in a reservoir, is
0
10
20
30
40
50
0 100 200 300 400
Shea
r ra
te (
s−1)
Time (s)
acceleration
deceleration
Figure 2. Shear rate history applied during “stepped flow” or “stepwise flow” rheology tests [41].
2.7. Particular Aspects of WTS Characterization
Characterization of WTS is challenging because quantities and characteristics varynot only among different WTPs but also within the same WTP along any given year. Greatvariations in WTS composition (organic matter, clay, and sand particles) due to seasonalityof raw water quality have been reported [6]. The sampling procedure of both sludges wasbased on the Theory of Sampling to warrant a homogeneous sample representative of onemonth of WTS generation [42].
WTS characterization has been discussed in a recent technical event in Brazil, LETA2021 (First Meeting on Water Treatment Sludge: Connections for Technology Innovation),which brought together professionals and researchers dealing with WTS to disclose thestate-of-the-art in this subject and to propose new lines of action. Our position, which wasin accordance with that of many colleagues who deal with WTS, is that WTS should becharacterized according to the desired application. For instance, grain size distribution isfundamental for use in the ceramics industry since different ceramic elements demand suit-able ranges of clay and sand fractions. On the other hand, mineralogical characterization isnecessary for the cement industry since predominance of amorphous material disqualifiesWTS for this application. Mineralogical classification is also important to identify activeclay minerals for coagulant, phosphorous, or heavy metals recuperation. Micro and macroproperties of WTS are intrinsically related [43] and should be selected for characterizationaccording to each potential use.
Environmental characterization, on the other hand, should be related to WTS condi-tioning when reused. A WTS that presents heavy metals might release excessive concen-trations if used in a compacted soil layer exposed to weather; however, leaching of thesemetals might not occur if the WTS is encapsulated in a concrete–bitumen matrix.
3. Results3.1. Characterization of Cubatão-WTS and Taiaçupeba-WTS3.1.1. Chemical and Mineralogical
The chemical composition of both WTSs obtained by X-ray fluorescence in termsof major elements is presented in Table 2, while chemical parameters are presented inTable 3. The mineralogical tests show that Cubatão-WTS is composed of quartz, goethite,muscovite, and kaolinite, mineralogically compatible with the gneissic rocks and residualsoils through which the Cubatão River flows. Taiaçupeba-WTS, collected in a reservoir,is mainly composed of amorphous phase, with traces of quartz, gibbsite, and kaolinite.There are three main likely sources of amorphous material in Taiaçupeba-WTS: organicmatter, expected because raw water comes from a reservoir; amorphous aluminum oriron (hydr)oxides from the coagulant; and the polymer of high molecular weight thatTaiaçupeba-WTP uses for coagulation and dewatering improvement.
Sustainability 2021, 13, 9848 8 of 26
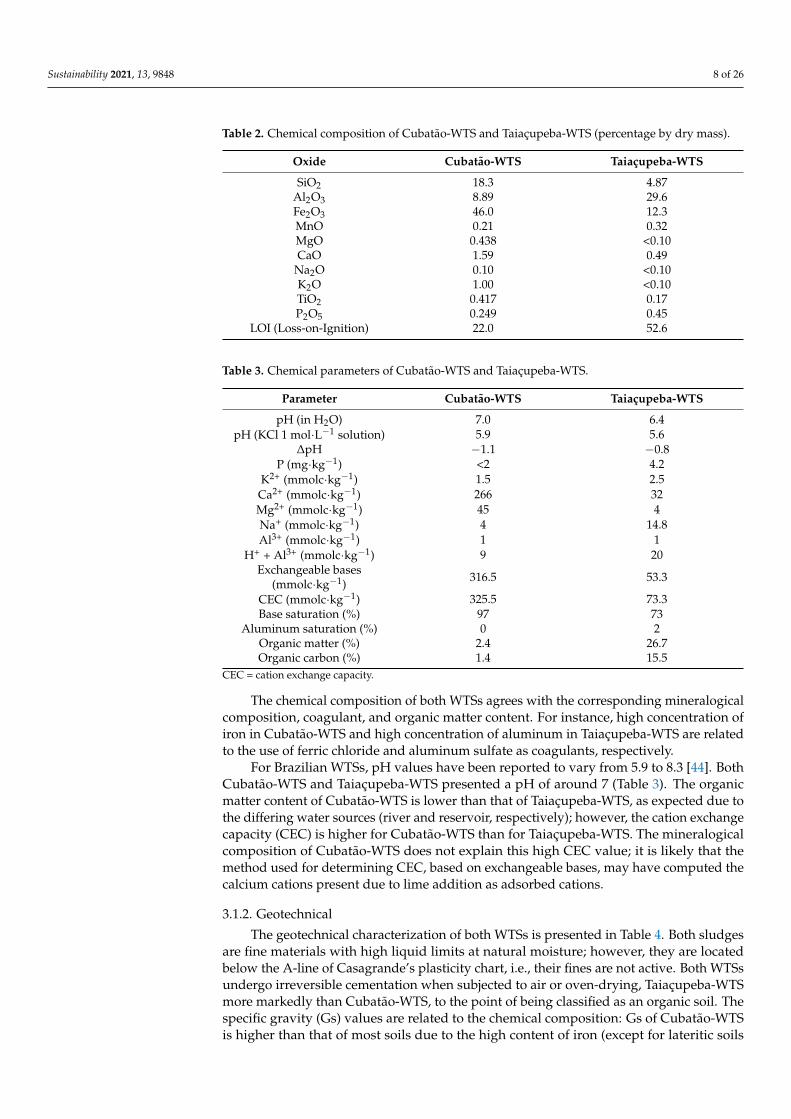
Table 2. Chemical composition of Cubatão-WTS and Taiaçupeba-WTS (percentage by dry mass).
Oxide Cubatão-WTS Taiaçupeba-WTS
SiO2 18.3 4.87Al2O3 8.89 29.6Fe2O3 46.0 12.3MnO 0.21 0.32MgO 0.438 <0.10CaO 1.59 0.49
Na2O 0.10 <0.10K2O 1.00 <0.10TiO2 0.417 0.17P2O5 0.249 0.45
LOI (Loss-on-Ignition) 22.0 52.6
Table 3. Chemical parameters of Cubatão-WTS and Taiaçupeba-WTS.
Parameter Cubatão-WTS Taiaçupeba-WTS
pH (in H2O) 7.0 6.4pH (KCl 1 mol·L−1 solution) 5.9 5.6
∆pH −1.1 −0.8P (mg·kg−1) <2 4.2
K2+ (mmolc·kg−1) 1.5 2.5Ca2+ (mmolc·kg−1) 266 32Mg2+ (mmolc·kg−1) 45 4Na+ (mmolc·kg−1) 4 14.8Al3+ (mmolc·kg−1) 1 1
H+ + Al3+ (mmolc·kg−1) 9 20Exchangeable bases
(mmolc·kg−1) 316.5 53.3
CEC (mmolc·kg−1) 325.5 73.3Base saturation (%) 97 73
Aluminum saturation (%) 0 2Organic matter (%) 2.4 26.7Organic carbon (%) 1.4 15.5
CEC = cation exchange capacity.
The chemical composition of both WTSs agrees with the corresponding mineralogicalcomposition, coagulant, and organic matter content. For instance, high concentration ofiron in Cubatão-WTS and high concentration of aluminum in Taiaçupeba-WTS are relatedto the use of ferric chloride and aluminum sulfate as coagulants, respectively.
For Brazilian WTSs, pH values have been reported to vary from 5.9 to 8.3 [44]. BothCubatão-WTS and Taiaçupeba-WTS presented a pH of around 7 (Table 3). The organicmatter content of Cubatão-WTS is lower than that of Taiaçupeba-WTS, as expected due tothe differing water sources (river and reservoir, respectively); however, the cation exchangecapacity (CEC) is higher for Cubatão-WTS than for Taiaçupeba-WTS. The mineralogicalcomposition of Cubatão-WTS does not explain this high CEC value; it is likely that themethod used for determining CEC, based on exchangeable bases, may have computed thecalcium cations present due to lime addition as adsorbed cations.
3.1.2. Geotechnical
The geotechnical characterization of both WTSs is presented in Table 4. Both sludgesare fine materials with high liquid limits at natural moisture; however, they are locatedbelow the A-line of Casagrande’s plasticity chart, i.e., their fines are not active. Both WTSsundergo irreversible cementation when subjected to air or oven-drying, Taiaçupeba-WTSmore markedly than Cubatão-WTS, to the point of being classified as an organic soil. Thespecific gravity (Gs) values are related to the chemical composition: Gs of Cubatão-WTSis higher than that of most soils due to the high content of iron (except for lateritic soils

Sustainability 2021, 13, 9848 9 of 26
which are also iron-rich), and Gs of Taiaçupeba-WTS is lower than that of most mineralsdue to the high organic matter content.
Table 4. Geotechnical characterization of Cubatão-WTS and Taiaçupeba-WTS.
Parameter Cubatão-WTS Taiaçupeba-WTS
Liquid limit, wL (%) 237 536Plastic index, PI (%) 138 30
Specific gravity of grains, Gs 2.95 2.42Clay fraction (%<2 µm) 78.1 52.5
Fines fraction (%<75 µm) 98.3 95.0Sand fraction (%) 1.7 5.0
Organic matter, OM (%) 19.2 49.0USCS 1 classification MH OH
1 USCS = Unified System of Soil Classification.
3.1.3. Environmental
Cubatão-WTS elemental concentrations by dry mass obtained for four samples at twodifferent laboratories are displayed in Table 5 and compared with intervention values foragricultural, residential, and industrial uses according to the environmental legislation ofSão Paulo State [45]. The tests scanned a wide range of elements, but just those detectedare shown in Table 5.
Table 5. Chemical composition of Cubatão-WTS compared with allowable values from legislation of São Paulo State [46].
Element Average (%) Coefficient of Variation (%)Intervention Value (mg × kg−1)
Agriculture Residential Industrial
Fe 45.2 21Si 6.18 30Al 3.37 34Ca 1.57 32K 0.66 31
Mg 0.25 23Ti 0.22 19Cl 0.14 15Na 0.07 31
Element Average (mg × kg−1) Coefficient of variation (%)
Mn 2092 37P 1265 20S 1166 15
Ni 525 111 190 480 3800Cu 414 85 760 2100 10,000Cr 243 49 150 300 400Sr 227 24Zn 163 37 1900 7000 10,000Zr 62 60Pb <QL - 150 240 4400V <QL -
Concentrations of the potentially toxic elements Cu, Cr, and Ni show a great variability.The slightly acidic pH value may favor the mobility of these elements. However, totalconcentrations in WTS do not represent concentration in leachates. Moreover, except forNi, concentrations of all controlled elements are below the intervention values for thethree uses.
Concentrations obtained by solubilization and leaching tests with Taiaçupeba-WTSare shown in Tables 6 and 7, compared with allowable values according to Brazilianstandards [38].

Sustainability 2021, 13, 9848 10 of 26
Table 6. Concentrations obtained by leaching test compared with allowable limits according to Brazilian standards [47].
Constituent Measured (mg/L) Quantification Limit (mg/L) Maximum Allowable (mg/L)
Ag Undetected 0.025 5.0As Undetected 0.025 1.0Ba 0.424 0.010 70.0Cd Undetected 0.003 0.5Cr Undetected 0.010 5.0Pb Undetected 0.010 1.0Se Undetected 0.025 1.0Hg Undetected 0.0008 0.1F− 0.55 0.600 150.0pH 5.3
Table 7. Concentrations obtained by solubilization test compared with allowable values according to Brazilian standards [47].
Constituent Measured (mg/L) Quantification Limit (mg/L) Maximum Allowable (mg/L)
Ag Undetected 0.025 0.05Al 0.025 0.010 0.20As Undetected 0.008 0.01Ba 0.247 0.010 0.70Cd Undetected 0.003 0.005Cr Undetected 0.010 0.05Cu Undetected 0.010 2.00Fe 0.012 0.010 0.3
Mn 3.948 0.005 0.10Pb Undetected 0.007 0.01Se Undetected 0.008 0.01Zn 0.008 0.003 5.0Hg Undetected 0.0008 0.001Na 39.445 0.060 200.00
SO42− 75.117 4.0 250.00
N 6.73 1.5 10.00Cl− 193.312 0.5 250.00F− Undetected 0.6 1.50
CN− Undetected 0.05 0.07Phenols 0.0189 0.005 0.01
pH 6.99
Leached concentrations of the analyzed constituents are lower than the allowablelimits, whereas solubilized concentrations of Mn and phenols exceed limit values, charac-terizing Taiaçupeba-WTS as non-hazardous non-inert. Mn concentration may be relatedto chemical waste discarded in one of the rivers feeding the reservoir, while phenols mayderive from chemical and industrial waste discharge as well as from decomposition ofvegetation [47].
Non-hazardous non-inert waste can be co-disposed of at sanitary landfills with mu-nicipal solid waste according to Brazilian standards. Therefore, the application in sanitarylandfills as daily cover is allowed; however, WTS at as-collected water content is a suspen-sion difficult to spread in the field and impairs the stability of the waste mass. Mixture withsoils and additives significantly improves the geotechnical behavior and opens a rangeof possibilities for reuse. For the most promising soil:WTS and additive:WTS mixtures,further environmental investigation will be carried out simulating field conditions.
3.2. Characterization of Soils and Soil:WTS Mixtures3.2.1. Chemical and Mineralogical
The chemical composition of both soils obtained by X-ray fluorescence is presented inTable 8, while chemical parameters are presented in Table 9. The mineralogical analysis

Sustainability 2021, 13, 9848 11 of 26
shows that Botucatu clayey sand, a lateritic residual soil derived from the alternating basaltand arenite layers of Parana Basin, is composed of quartz, kaolinite, gibbsite, hematite,and anatase. Campinas clay, a lateritic residual soil derived from diabase, presents quartz,kaolinite, gibbsite, hematite, magnetite, and ilmenite, with traces of smectite. Kaolinite isthe most common clay mineral found in the clay fraction of Brazilian lateritic soils [48],while crystalline aluminum and iron (hydr)oxides such as gibbsite, hematite, and goethiteare also of common occurrence in the fines fraction of lateritic soils. These oxides cover andcement clay (kaolinite) particles, forming the microaggregates that compose the peculiarmicrostructure of lateritic soils.
Table 8. Chemical composition of Botucatu clayey sand and Campinas clay (percentage by dry mass).
Oxide Botucatu Clayey Sand Campinas Clay
SiO2 68.1 31.1Al2O3 16.5 23.9Fe2O3 7.17 24.4MnO 0.03 0.141MgO 0.04 0.17CaO 0.02 0.09
Na2O - <0.02K2O 0.04 0.03TiO2 1.55 5.21P2O5 0.05 0.14
LOI (Loss-on-Ignition) 6.11 14.2
Table 9. Chemical parameters of Botucatu clayey sand and Campinas clay.
Parameter Botucatu Clayey Sand Campinas Clay
pH (in H2O) 4.7 5.0pH (KCl 1 mol·L−1 solution) 4.5 4.4
∆pH −0.2 −0.6P (mg·kg−1) <2 <2
K2+ (mmolc·kg−1) <0.5 2.2Ca+ (mmolc·kg−1) 2 21
Mg2+ (mmolc·kg−1) 0.4 4Na+ (mmolc·kg−1) <0.2 <0.2Al3+ (mmolc·kg−1) 3 1
H+ + Al3+ (mmolc·kg−1) 25 49Exchangeable bases
(mmolc·kg−1) 2.2 27.3
CEC (mmolc·kg−1) 27.2 76.3Base saturation (%) 8 36
Aluminum saturation (%) 58 4Organic matter (%) 0.9 2.5Organic carbon (%) 0.5 1.4
CEC = cation exchange capacity.
Both soils presented predominant percentages of silicon, aluminum, and iron, coherentwith their lateritic nature and mineralogical composition. CEC values for the clayey sandand the clay are low, indicating non-active soils (lower than 200 mmolc·kg−1), which iscommon for Brazilian lateritic soils [49] due to the covering of clay minerals by iron andaluminum oxides. Similarly, the pH values correspond to acid soils, which is typical oflateritic soils.
3.2.2. Geotechnical
The geotechnical characterization of soils and mixtures is presented in Table 10. Addi-tion of WTS to the soils did not significantly alter the particle size distribution (PSD), or elsecaused some of the mixtures to present only a slight increment in fines content compared

Sustainability 2021, 13, 9848 12 of 26
with that of the natural soil, which may be explained by the low solids content added tothe soils (varying from 3.4% to 13.9%).
All soil:WTS mixtures presented higher liquid limits and plasticity indexes withincreasing WTS content. WTS addition, however, dislocated the mixtures in Casagrande’splasticity chart parallel to or crossing downwards the A-line. Since both WTSs were notactive, they did not impart cohesive behavior to the soils.
Table 10. Geotechnical characterization of Botucatu clayey sand and Campinas clay.
Material wL (%) PI (%) Gs Clay Fraction (%) Fines (%) Sand (%) OM (%) USCS
Botucatu clayeysand—sample 1 31 14 2.69 24.4 34.2 65.8 - SC
BC5:1 32 14 2.71 26.8 36.1 63.9 - SCBC4:1 32 15 2.70 23.9 32.2 67.8 - SCBC3:1 33 16 2.69 27.1 36.6 63.4 - SC
Botucatu clayeysand—sample 2 25 8 2.80 28.9 35.3 64.7 3.5 SC
BT5:1 39 18 2.72 26.8 36.8 63.2 - SCBT4:1 44 19 2.70 26.1 38.8 61.2 - SCBT3:1 52 23 2.68 28.1 38.7 61.3 - SM
Campinas clay 45 18 2.98 52.0 78.1 21.9 11.7 CLCC4:1 46 18 2.98 44.7 80.1 19.9 - MLCC3:1 50 16 2.98 47.9 80.5 19.5 - ML-MHCC2:1 63 27 2.98 45.0 80.8 19.2 - MHCT3:1 61 23 2.95 49.6 79.1 20.9 - MHCT2:1 77 34 2.94 52.0 81.9 18.1 - MH
CT1.5:1 90 36 2.92 48.0 79.7 20.3 - MH
Note: wL = liquid limit, PI = plasticity index, GS = specific gravity of grains, OM = organic matter, USCS = Unified System ofSoil Classification.
3.3. Characterization of Additives and Additive:Soil Mixtures3.3.1. Chemical and Mineralogical
The chemical composition of both additives obtained by X-ray fluorescence is pre-sented in Table 11, while chemical parameters are presented in Table 12. The mineralogicalanalysis shows that lime is composed of calcite and portlandite. Portlandite derives fromthe calcination of carbonate rocks from Minas Gerais, Brazil, and calcite derives from non-calcinated rock or carbonatation of lime. Rock powder presents quartz, albite, microcline,phlogopite, amphibolite, and kaolinite, all of them minerals typical of granitic–gneissicrocks. The presence of kaolinite indicates that the rock was chemically weathered, eventhough the particles looked as if they came from sound rock.
Table 11. Chemical composition of lime and rock powder (percentage by dry mass).
Oxide Lime Rock Powder
SiO2 0.35 64.5Al2O3 0.08 14.0Fe2O3 0.98 4.83MnO 0.01 0.10MgO 0.35 1.45CaO 68.2 3.09
Na2O <0.001 3.88K2O 0.03 4.68TiO2 <0.001 0.76P2O5 0.08 0.28
LOI (Loss-on-Ignition) 30.3 1.8
The lime used in this investigation was composed mostly of calcium, with a lowpercentage of impurities. The high value of loss-on-ignition can be explained by the fact

Sustainability 2021, 13, 9848 13 of 26
that it is a hydrated lime. The pH value is inside the usual range for hydrated lime (12–13).The high value of CEC may be due to the experimental method based on exchangeablebases, which interpreted the high concentration of calcium as adsorbed cations.
Rock powder is mostly composed of silicon and aluminum, which are the mainelements of the rock-forming minerals. Loss-on-ignition is low as expected for a graniticrock. Rock powder is also alkaline due to the high content of alkaline metals (Na, K)and alkaline earth metals (Ca, Mg) in its composition. The low value of CEC for the rockpowder is coherent with the composing minerals, none of which are very active.
Table 12. Chemical parameters of lime and rock powder.
Parameter Lime Rock Powder
pH (in H2O) 12.2 9.5pH (KCl 1 mol·L−1 solution) 12.5 8.5
∆pH 0.3 −1.0K2+ (mmolc·kg−1) 4.1 24.9Ca+ (mmolc·kg−1) 745 22
Mg2+ (mmolc·kg−1) 2 5Na+ (mmolc·kg−1) - -Al3+ (mmolc·kg−1) 0 0
H+ + Al3+ (mmolc·kg−1) 0 3Exchangeable bases
(mmolc·kg−1) 751.1 51.9
CEC (mmolc·kg−1) 751.1 54.9Base saturation (%) 100 95
Aluminum saturation (%) 0 0Organic matter (%) 0.2 1.1Organic carbon (%) - -
CEC = cation exchange capacity.
3.3.2. Geotechnical
The geotechnical characterization of the additives and additive:WTS mixtures ispresented in Table 13.
Table 13. Geotechnical characterization of additives and additive:WTS mixtures.
Material WTS Content (%) wL (%) PI (%) Gs Clay Fraction (%) Fines (%) Sand (%) USCS
Lime (L) 61 17 2.44 33.5 (2) 98.9 (2) 1.1 (2) MHLC1:1 28.6 58 16.9 2.55 (1) - - - MH
LC1.2:1 25.0 - - 2.54 (1) - - - MHLC1.3:1 22.2 - - 2.53 (1) - - - MHLC1.5:1 20.0 56.1 17.9 2.53 (1) - - - MH
Rockpowder
(RP)NP NP NP 2.67 4 20 79 SM
RPC2.1:1 14.3 NP NP 2.71 (1) - - - SMRPC3:1 10.0 NP NP 2.70 (1) - - - SMRPC4:1 7.4 NP NP 2.69 (1) 7.1 14.8 65.5 SMRPC5:1 5.9 NP NP 2.69 (1) - - - SM
Note: wL = liquid limit, PI = plasticity index, GS = specific gravity of grains, OM = organic matter, USCS = Unified System of SoilClassification, NP = non-plastic. (1) Weighted average of the specific gravity of grains of WTS and additive. (2) Grain size distribution forlime obtained by laser diffraction granulometer from Helos Sympatec.
Lime PSD could not be determined by sedimentation (hydrometer) since lime floccu-lates in contact with water. A laser diffraction granulometer test showed that the lime isa fine sand with 48.3% fines. According to the consistency limits, lime and the lime:WTSmixtures were classified as MH (elastic silt). Rock powder has 20% non-plastic fines. Rockpowder and rock powder:WTS mixtures were classified as silty sands (SM).

Sustainability 2021, 13, 9848 14 of 26
3.4. Geotechnical Properties of Soils and Soil:WTS Mixtures3.4.1. Compaction
The results of the compaction tests show that the maximum dry unit weight decreasesand the optimum water content increases with WTS addition, i.e., at the optimum com-paction point, the void ratio and the water content of the mixture are higher than those ofthe soil. These alterations are more evident and proportional with increasing WTS content,so that correlations between maximum dry unit weight and WTS content, and betweenoptimum water content and WTS content, can be established. Compaction parameters ofBC and BT mixtures as a function of WTS content are presented in Figure 3, while Figure 4shows compaction parameters as a function of WTS content for CC and CT mixtures. Whilethe general rule of thumb requires a minimum of 10 points for an accurate estimate of alinear regression, a lower number may suffice when a high R2 is expected, and/or erroris small, and/or the aim is merely to obtain a general trend. The obtained determinationcoefficients R2 indicate that the variation of the dependent variables, maximum dry unitweight and optimum water content, can indeed be explained by the variation of the in-dependent variable sludge content. More experimental points would of course improvethe estimate. Nonetheless, we believe the presented correlations may in themselves beenough to determine the ideal mixture of soil and WTS to be used in the field. Therefore,the overall behavior of any new pairing of soil and WTS may be determined by a fewcompaction tests.
Sustainability 2021, 13, x FOR PEER REVIEW 15 of 27
course improve the estimate. Nonetheless, we believe the presented correlations may in themselves be enough to determine the ideal mixture of soil and WTS to be used in the field. Therefore, the overall behavior of any new pairing may be determined by a few compaction tests.
(a) (b)
Figure 3. Compaction parameters as a function of WTS content for BC and BT mixtures: (a) Maximum dry unit weight; (b) Optimum water content.
(a) (b)
Figure 4. Compaction parameters as a function of WTS content for CC and CT mixtures: (a) Maximum dry unit weight; (b) Optimum water content.
Some traces resulted in mixtures wet-of-optimum, and therefore were of limited workability. However, drying the mixture prior to compaction causes the maximum dry unit weight to increase and the optimum water content to decrease. These alterations are proportional to the desiccation ratio, so that a correlation between the compaction param-eters and the desiccation ratio can be established. Figure 5 shows the recovery of compac-tion parameters as a function of desiccation ratio for all the mixtures. Since air drying mixtures is much faster than air drying WTS, these correlations may indicate the use of mixtures with higher WTS content that, once air-dried to a certain desiccation ratio, may show a good performance in the field, comparable with that of soil.
R² = 0.99
R² = 0.8779
11.0
12.0
13.0
14.0
15.0
16.0
17.0
18.0
19.0
20.0
21.0
0 2 4 6 8 10 12 14
BT mixturesBC mixtures
Max
. dry
uni
t wei
ght (
kN/m
³)
Sludge content (%)
(a) R² = 0.9856
R² = 0.8623
5
10
15
20
25
30
35
0 2 4 6 8 10 12 14
BT mixturesBC mixtures
Opt
imum
wat
er c
onte
nt (%
)
Sludge content (%)
(b)
R² = 0.9938
R² = 0.9203
9.0
10.0
11.0
12.0
13.0
14.0
15.0
16.0
17.0
0 2 4 6 8 10 12 14 16 18 20
CT mixturesCC mixtures
Max
. dry
uni
t wei
ght (
kN/m
³)
Sludge content (%)
(a) R² = 0.9579
R² = 0.9165
15
20
25
30
35
40
45
50
55
60
0 2 4 6 8 10 12 14 16 18 20
CT mixturesCC mixtures
Opt
imum
wat
er c
onte
nt (%
)
Sludge content (%)
(b)
Figure 3. Compaction parameters as a function of WTS content for BC and BT mixtures: (a) Maximum dry unit weight;(b) Optimum water content.
Sustainability 2021, 13, x FOR PEER REVIEW 15 of 27
course improve the estimate. Nonetheless, we believe the presented correlations may in themselves be enough to determine the ideal mixture of soil and WTS to be used in the field. Therefore, the overall behavior of any new pairing may be determined by a few compaction tests.
(a) (b)
Figure 3. Compaction parameters as a function of WTS content for BC and BT mixtures: (a) Maximum dry unit weight; (b) Optimum water content.
(a) (b)
Figure 4. Compaction parameters as a function of WTS content for CC and CT mixtures: (a) Maximum dry unit weight; (b) Optimum water content.
Some traces resulted in mixtures wet-of-optimum, and therefore were of limited workability. However, drying the mixture prior to compaction causes the maximum dry unit weight to increase and the optimum water content to decrease. These alterations are proportional to the desiccation ratio, so that a correlation between the compaction param-eters and the desiccation ratio can be established. Figure 5 shows the recovery of compac-tion parameters as a function of desiccation ratio for all the mixtures. Since air drying mixtures is much faster than air drying WTS, these correlations may indicate the use of mixtures with higher WTS content that, once air-dried to a certain desiccation ratio, may show a good performance in the field, comparable with that of soil.
R² = 0.99
R² = 0.8779
11.0
12.0
13.0
14.0
15.0
16.0
17.0
18.0
19.0
20.0
21.0
0 2 4 6 8 10 12 14
BT mixturesBC mixtures
Max
. dry
uni
t wei
ght (
kN/m
³)
Sludge content (%)
(a) R² = 0.9856
R² = 0.8623
5
10
15
20
25
30
35
0 2 4 6 8 10 12 14
BT mixturesBC mixtures
Opt
imum
wat
er c
onte
nt (%
)
Sludge content (%)
(b)
R² = 0.9938
R² = 0.9203
9.0
10.0
11.0
12.0
13.0
14.0
15.0
16.0
17.0
0 2 4 6 8 10 12 14 16 18 20
CT mixturesCC mixtures
Max
. dry
uni
t wei
ght (
kN/m
³)
Sludge content (%)
(a) R² = 0.9579
R² = 0.9165
15
20
25
30
35
40
45
50
55
60
0 2 4 6 8 10 12 14 16 18 20
CT mixturesCC mixtures
Opt
imum
wat
er c
onte
nt (%
)
Sludge content (%)
(b)
Figure 4. Compaction parameters as a function of WTS content for CC and CT mixtures: (a) Maximum dry unit weight;(b) Optimum water content.

Sustainability 2021, 13, 9848 15 of 26
Some traces resulted in mixtures wet-of-optimum, and therefore were of limitedworkability. However, drying the mixture prior to compaction causes the maximum dryunit weight to increase and the optimum water content to decrease. These alterationsare proportional to the desiccation ratio, so that a correlation between the compactionparameters and the desiccation ratio can be established. Figure 5 shows the recovery ofcompaction parameters as a function of desiccation ratio for all the mixtures. Since airdrying mixtures is much faster than air drying WTS, these correlations may indicate theuse of mixtures with higher WTS content that, once air-dried to a certain desiccation ratio,may show a good performance in the field, comparable with that of soil.
Sustainability 2021, 13, x FOR PEER REVIEW 16 of 27
(a) (b)
Figure 5. Maximum dry unit weight and optimum water content as a function of desiccation ratio: (a) BC and BT mixtures; (b) CC and CT mixtures.
3.4.2. Shear Strength The long-term stability of embankments is usually analyzed for drained conditions,
i.e., effective stresses. The shear strength of the mixtures in terms of effective stresses ob-tained from triaxial tests was compared with shear strengths in a database of Brazilian soils used for the construction of large earth dams. These embankments have shown sat-isfactory stability and deformation behavior over decades. Figure 6 shows the strength envelopes of the mixtures compared with the soil envelopes from the database. Clearly, the mixtures presented higher shear strength than the soils from the database for confin-ing (normal) stresses higher than circa 80 kPa. Most mixtures presented a friction angle φ’ slightly higher than that of the natural soil. Addition of a clayey material with high plas-ticity limit was expected to reduce the friction angle; however, WTS fines were elastic (both WTSs were located below the A-line in Casagrande’s plasticity chart). Furthermore, values of friction angle higher than 40° have been reported for several WTSs [21,50]. Mix-tures of zeolite and WTS were also reported to exhibit an increase in φ’ with increasing WTS content [51]. The increase in the friction angle was accompanied by a decrease in the cohesion with increasing WTS content, resulting, for each soil, in a single envelope for the different mixtures with each WTS, as shown in Figure 6, with a determination coefficient R2 higher than 0.98.
11.0
12.0
13.0
14.0
15.0
16.0
17.0
18.0
19.0
20.0
21.0
0 20 40 60 80 100
BC5:1 BC4:1 BC3:1
BT5:1 BT4:1 BT3:1
Max
. dry
uni
wei
ght (
kN/m
³)
Desiccation ratio (%)
Maximum dry unitweight of the soil
5
10
15
20
25
30
35
0 20 40 60 80 100
BC5:1 BC4:1 BC3:1
BT5:1 BT4:1 BT3:1
Opt
imum
wat
er c
onte
nt (%
)
Desiccation ratio (%)
Optimum water content of the soil
9.0
10.0
11.0
12.0
13.0
14.0
15.0
16.0
17.0
0 20 40 60 80 100
CC-4:1 CC-3:1 CC-2:1
CT-3:1 CT-2:1 CT-1.5:1
Dry
uni
t wei
ght (
kN/m
³)
Desiccation ratio (%)
Maximum dry unitweight of the soil
15
20
25
30
35
40
45
50
55
60
0 20 40 60 80 100
CC-4:1 CC-3:1 CC-2:1
CT-3:1 CT-2:1 CT-1.5:1
Opt
imum
wat
erco
nten
t (%
)
Desiccation ratio (%)
Optimum water content of the soil
Figure 5. Maximum dry unit weight and optimum water content as a function of desiccation ratio: (a) BC and BT mixtures;(b) CC and CT mixtures.
3.4.2. Shear Strength
The long-term stability of embankments is usually analyzed for drained conditions, i.e.,effective stresses. The shear strength of the mixtures in terms of effective stresses obtainedfrom triaxial tests was compared with shear strengths in a database of Brazilian soils usedfor the construction of large earth dams. These embankments have shown satisfactorystability and deformation behavior over decades. Figure 6 shows the strength envelopes ofthe mixtures compared with the soil envelopes from the database. Clearly, the mixturespresented higher shear strength than the soils from the database for confining (normal)stresses higher than circa 80 kPa. Most mixtures presented a friction angle φ′ slightly

Sustainability 2021, 13, 9848 16 of 26
higher than that of the natural soil. Addition of a clayey material with high plasticitylimit was expected to reduce the friction angle; however, WTS fines were elastic (bothWTSs were located below the A-line in Casagrande’s plasticity chart). Furthermore, valuesof friction angle higher than 40◦ have been reported for several WTSs [21,50]. Mixturesof zeolite and WTS were also reported to exhibit an increase in φ′ with increasing WTScontent [51]. The increase in the friction angle was accompanied by a decrease in thecohesion with increasing WTS content, resulting, for each soil, in a single envelope for thedifferent mixtures with each WTS, as shown in Figure 6, with a determination coefficientR2 higher than 0.98.
Sustainability 2021, 13, x FOR PEER REVIEW 17 of 27
(a) (b)
Figure 6. Shear strength envelopes comparison: (a) CC and CT mixtures; (b) BC and BT mixtures.
For the analysis of end-of-construction stability of embankments, the undrained shear strength must be considered for design purposes. The specification of a minimum undrained shear strength is generally governed by stability or trafficability. According to [52], a range of 50 to 60 kPa is often considered to be an acceptable value for satisfactory equipment maneuvering without soil rutting, while [53] cites a minimum undrained strength of 40 to 50 kPa as typically required for earthworks. For daily cover in sanitary landfills, a minimum undrained shear strength of 10 to 20 kPa is required to assure easy spreading and workability of the material [20,52].
Figure 7 shows the as-compacted undrained shear strength su (unsaturated) from UC tests compared with the undrained shear strength su (saturated) from CU tests carried out with 50 kPa confining pressure. The mixtures were compacted at their mixing moisture, i.e., with no previous drying. WTS addition clearly decreases the undrained shearstrength. However, most mixtures answered to the criterion of su equal or higher than 50kPa.
(a) (b)
0
20
40
60
80
100
120
140
160
0 2 4 6 8 10 12 14 16
Und
rain
ed s
hear
stre
ngth
, Su
(kPa
)
WTS content (%)
BC mixtures (UC)
BC mixtures (CAU)
BT mixtures (UC)
BT mixtures (CIU)
Su = 50 kPa
0
20
40
60
80
100
120
140
160
0 2 4 6 8 10 12 14 16
Und
rain
ed s
hear
stre
ngth
, Su
(kPa
)
WTS content (%)
CC mixtures (UC)CC mixtures (CIU)CT mixtures (UC)CT mixtures (CIU)
Su = 50 kPa
0
100
200
300
0 100 200 300 400
She
ar s
tres
s (k
Pa)
Normal stress (kPa)
Promissão S-6 (SP)Prom. Macuco C (SP)Prom. P.Queixada (SP)3 Irmãos F.G. (SP0Prom. Macuco A (SP)Xavantes C (SP)Jupiá (SP-MT)Taquaruçu (SP-PR)Guaíra M.D. (SP)Ibitinga (SP)Ilha Solteira I (SP-MT)Xavantes C’ (SP)Anhembi (SP)Xavantes H1 (SP)Guaíra eixo 2-3 (SP)Promissão S-3 (SP)Ilha Solteira II (SP-MT)Dona Francisca B6 (RS)Dona Francisca B8 (RS)Dona Francisca B9 (RS)Ilha Solteira III (SP-MT)
BC mixturesBT mixtures
Database from Cruz (1967)
φ’ = 35°37°
0
100
200
300
0 100 200 300 400
She
ar s
tres
s (k
Pa)
Normal stress (kPa)
CC mixturesCT mixtures
Database from Cruz (1967)
φ’ = 34°40°
Figure 6. Shear strength envelopes comparison: (a) CC and CT mixtures; (b) BC and BT mixtures.
For the analysis of end-of-construction stability of embankments, the undrainedshear strength must be considered for design purposes. The specification of a minimumundrained shear strength is generally governed by stability or trafficability. Accordingto [52], a range of 50 to 60 kPa is often considered to be an acceptable value for satisfactoryequipment maneuvering without soil rutting, while [53] cites a minimum undrainedstrength of 40 to 50 kPa as typically required for earthworks. For daily cover in sanitarylandfills, a minimum undrained shear strength of 10 to 20 kPa is required to assure easyspreading and workability of the material [20,52].
Figure 7 shows the as-compacted undrained shear strength su (unsaturated) from UCtests compared with the undrained shear strength su (saturated) from CU tests carried outwith 50 kPa confining pressure. The mixtures were compacted at their mixing moisture,i.e., with no previous drying. WTS addition clearly decreases the undrained shear strength.However, most mixtures answered to the criterion of su equal or higher than 50 kPa.
3.4.3. Permeability and Deformability
Results of oedometric compression tests for soils and mixtures are presented inTable 14. In Table 15, permeability of soils and mixtures are presented as ranges sincetests were carried out with several different confining pressures (50 to 200 kPa) and hy-draulic gradients (10 to 50).

Sustainability 2021, 13, 9848 17 of 26
Table 14. Results of oedometric compression tests for soils and mixtures.
Material Cc/(1 + e0) Ce/(1 + e0)
Botucatu clayey sand 0.048 0.014BC mixtures 0.084–0.110 0.012–0.020BT mixtures 0.110–0.142 0.016–0.030
Campinas clay 0.103 0.022CC mixtures 0.113–0.167 0.014–0.023CT mixtures 0.138–0.189 0.014–0.025
Note: Cc = compression index, Ce = expansion index, e0 = initial void ratio.
Sustainability 2021, 13, x FOR PEER REVIEW 17 of 27
Figure 6. Shear strength envelopes comparison: (a) CC and CT mixtures; (b) BC and BT mixtures.
For the analysis of end-of-construction stability of embankments, the undrained shear strength must be considered for design purposes. The specification of a minimum undrained shear strength is generally governed by stability or trafficability. According to [52], a range of 50 to 60 kPa is often considered to be an acceptable value for satisfactory equipment maneuvering without soil rutting, while [53] cites a minimum undrained strength of 40 to 50 kPa as typically required for earthworks. For daily cover in sanitary landfills, a minimum undrained shear strength of 10 to 20 kPa is required to assure easy spreading and workability of the material [20,52].
Figure 7 shows the as-compacted undrained shear strength su (unsaturated) from UC tests compared with the undrained shear strength su (saturated) from CU tests carried out with 50 kPa confining pressure. The mixtures were compacted at their mixing moisture, i.e., with no previous drying. WTS addition clearly decreases the undrained shear strength. However, most mixtures answered to the criterion of su equal or higher than 50 kPa.
(a) (b)
Figure 7. Undrained shear strength as a function of WTS content obtained by triaxial compression tests (saturated) and unconfined compression tests (as-compacted, unsaturated): (a) BC and BT mixtures; (b) CC and CT mixtures.
0
20
40
60
80
100
120
140
160
0 2 4 6 8 10 12 14 16
Und
rain
ed s
hear
stre
ngth
, Su
(kPa
)
WTS content (%)
BC mixtures (UC)
BC mixtures (CAU)
BT mixtures (UC)
BT mixtures (CIU)
Su = 50 kPa
0
20
40
60
80
100
120
140
160
0 2 4 6 8 10 12 14 16
Und
rain
ed s
hear
stre
ngth
, Su
(kPa
)
WTS content (%)
CC mixtures (UC)CC mixtures (CIU)CT mixtures (UC)CT mixtures (CIU)
Su = 50 kPa
0
100
200
300
0 100 200 300 400
She
ar s
tres
s (k
Pa)
Normal stress (kPa)
Promissão S-6 (SP)Prom. Macuco C (SP)Prom. P.Queixada (SP)3 Irmãos F.G. (SP0Prom. Macuco A (SP)Xavantes C (SP)Jupiá (SP-MT)Taquaruçu (SP-PR)Guaíra M.D. (SP)Ibitinga (SP)Ilha Solteira I (SP-MT)Xavantes C’ (SP)Anhembi (SP)Xavantes H1 (SP)Guaíra eixo 2-3 (SP)Promissão S-3 (SP)Ilha Solteira II (SP-MT)Dona Francisca B6 (RS)Dona Francisca B8 (RS)Dona Francisca B9 (RS)Ilha Solteira III (SP-MT)
BC mixturesBT mixtures
Database from Cruz (1967)
φ’ = 35°37°
0
100
200
300
0 100 200 300 400
She
ar s
tres
s (k
Pa)
Normal stress (kPa)
CC mixturesCT mixtures
Database from Cruz (1967)
φ’ = 34°40°
Figure 7. Undrained shear strength as a function of WTS content obtained by triaxial compression tests (saturated) andunconfined compression tests (as-compacted, unsaturated): (a) BC and BT mixtures; (b) CC and CT mixtures.
Table 15. Hydraulic conductivity of soils and mixtures.
Material Hydraulic Conductivity K (m/s)
Botucatu clayey sand 10−8–10−6
BC mixtures 10−9–10−6
BT mixtures 10−10–10−8
Campinas clay 10−9–10−8
CC mixtures 10−10–10−9
CT mixtures 10−10–10−9
Most of the mixtures presented low to medium compressibility (compression indexvarying from 0.10 to 0.40). In comparison, some residual soils used for highway embank-ments in São Paulo State present compression index values ranging between 0.16 and 0.44with an average of 0.31 [54]. In general, the average compression index of compactedBrazilian residual soils is about 0.15. The compression coefficients (compression index Ccdivided by 1 + initial void ratio e0) of BC and BT mixtures were 1.8 to 3 times that of B soil,and of CC and CT mixtures, they were 1.1 to 1.8 times that of C soil; however, all valuesare inside an acceptable range for general earthworks. The same observation is valid forthe expansion coefficients of the mixtures as compared with those of the soils.
Table 15 shows that WTS addition to both soils caused a reduction in hydraulicconductivity, indicating the possibility of using the mixtures with permeability lower than

Sustainability 2021, 13, 9848 18 of 26
10−9 m/s as an adequate material for the construction of compacted clay liners (CCLs) orother impermeabilizing functions.
3.5. Geotechnical Properties of Additive:WTS Mixtures3.5.1. Compaction
Compaction parameters of lime:WTS and rock powder:WTS mixtures as a functionof WTS content are presented in Figure 8. The mixtures were air-dried to the hygroscopicwater content, and the compaction test was carried out with increasing water contents.Increase in WTS addition caused a decrease in maximum dry unit weight of rock pow-der:WTS mixtures and an increase in maximum dry unit weight of lime:WTS mixtures,whereas the opposite trends were observed for the optimum water content. Rock pow-der:WTS mixtures become more porous and more humid at the optimum compaction pointwith increasing WTS content, while lime:WTS become slightly denser and less humid.
Sustainability 2021, 13, x FOR PEER REVIEW 19 of 27
(a) (b)
Figure 8. Compaction parameters as a function of WTS content for lime:WTS and rock power-WTS mixtures: (a) Maximum dry unit weight; (b) Optimum water content.
3.5.2. Unconfined Compression The unconfined compression tests were carried out with mixtures compacted at as-
mixed water content. The undrained shear strength of additive:WTS mixtures as a func-tion of WTS are presented in Figure 9. During the unconfined compression tests with lime:WTS mixtures, the shear stress increased monotonically with the axial strain, and no peak was observed, except for the mixture with 20.0% WTS content. Accordingly, the stress correspondent to the axial strain of 15% (maximum) was adopted as a failure crite-rion. For the rock powder:WTS mixtures, the stress–strain curves presented a peak value, except for WTS content of 14.3%, in which case the stress for 15% axial strain was adopted as the failure threshold.
(a) (b)
Figure 9. Undrained shear strength as a function of WTS content: (a) WTS-lime mixtures; (b) WTS-rock powder mixtures.
For the lime:WTS mixtures, the higher the WTS content, the lower is the undrained shear strength (Figure 9a), because the mixtures become less dense and more humid. An exponential regression describes the su curve of lime:WTS mixtures with a determination coefficient R2 of 0.9307. As already observed, this indicates a general trend, whereas a
R² = 0.9832
R² = 0.993110111213141516171819202122232425
0 10 20 30 40 50 60 70 80 90 100
Max
, dry
uni
t wei
ght (
kN.m
−3)
WTS content (%)
RP mixtures L mixtures
R² = 0.9944
R² = 0.8195
0
5
10
15
20
25
30
35
40
0 10 20 30 40 50 60 70 80 90 100
Opt
imum
wat
er co
nten
t (%
)
WTS content (%)
RP mixtures L mixtures
slope = −0.02
y = 44391e−0.279x
R² = 0.9307
0
50
100
150
200
250
0 10 20 30 40 50
Su (k
Pa)
WTS content (%)
L mixtures
0
50
100
150
200
250
5 7 9 11 13 15
Su (k
Pa)
WTS content (%)
RP mixtures
Figure 8. Compaction parameters as a function of WTS content for lime:WTS and rock power-WTS mixtures: (a) Maximumdry unit weight; (b) Optimum water content.
3.5.2. Unconfined Compression
The unconfined compression tests were carried out with mixtures compacted at as-mixed water content. The undrained shear strength of additive:WTS mixtures as a functionof WTS is presented in Figure 9. During the unconfined compression tests with lime:WTSmixtures, the shear stress increased monotonically with the axial strain, and no peakwas observed, except for the mixture with 20.0% WTS content. Accordingly, the stresscorrespondent to the axial strain of 15% (maximum) was adopted as a failure criterion. Forthe rock powder:WTS mixtures, the stress–strain curves presented a peak value, exceptfor WTS content of 14.3%, in which case the stress for 15% axial strain was adopted as thefailure threshold.
For the lime:WTS mixtures, the higher the WTS content, the lower is the undrainedshear strength (Figure 9a), because the mixtures become less dense and more humid. Anexponential regression describes the su curve of lime:WTS mixtures with a determinationcoefficient R2 of 0.9307. As already observed, this indicates a general trend, whereas a moreprecise regression would require more experimental points. Rock powder:WTS mixturespresented much lower undrained strength values than lime:WTS mixtures, which may beexplained by both rock powder and WTS both being non-cohesive materials. The trendof the undrained shear strength curve (Figure 9b) of rock powder:WTS mixtures suggeststhat the optimum value of WTS content is 7.4%, where the maximum su is obtained.

Sustainability 2021, 13, 9848 19 of 26
Sustainability 2021, 13, x FOR PEER REVIEW 19 of 27
(a) (b)
Figure 8. Compaction parameters as a function of WTS content for lime:WTS and rock power-WTS mixtures: (a) Maximum
dry unit weight; (b) Optimum water content.
3.5.2. Unconfined Compression
The unconfined compression tests were carried out with mixtures compacted at as-
mixed water content. The undrained shear strength of additive:WTS mixtures as a func-
tion of WTS are presented in Figure 9. During the unconfined compression tests with
lime:WTS mixtures, the shear stress increased monotonically with the axial strain, and no
peak was observed, except for the mixture with 20.0% WTS content. Accordingly, the
stress correspondent to the axial strain of 15% (maximum) was adopted as a failure crite-
rion. For the rock powder:WTS mixtures, the stress–strain curves presented a peak value,
except for WTS content of 14.3%, in which case the stress for 15% axial strain was adopted
as the failure threshold.
(a) (b)
Figure 9. Undrained shear strength as a function of WTS content: (a) WTS-lime mixtures; (b) WTS-rock powder mixtures.
For the lime:WTS mixtures, the higher the WTS content, the lower is the undrained
shear strength (Figure 9a), because the mixtures become less dense and more humid. An
exponential regression describes the su curve of lime:WTS mixtures with a determination
coefficient R2 of 0.9307. As already observed, this indicates a general trend, whereas a
R² = 0.9832
R² = 0.993110111213141516171819202122232425
0 10 20 30 40 50 60 70 80 90 100
Ma
x, d
ry u
nit
wei
gh
t (k
N.m
−3)
WTS content (%)
RP mixtures L mixtures
R² = 0.9944
R² = 0.8195
0
5
10
15
20
25
30
35
40
0 10 20 30 40 50 60 70 80 90 100
Op
tim
um
wa
ter
con
ten
t (%
)
WTS content (%)
RP mixtures L mixtures
slope = −0.02
y = 44391e-0.279x
R² = 0.9307
0
50
100
150
200
250
0 10 20 30 40 50
Su
(k
Pa
)
WTS content (%)
L mixtures
0
50
100
150
200
250
5 7 9 11 13 15
Su
(k
Pa
)
WTS content (%)
RP mixtures
Figure 9. Undrained shear strength as a function of WTS content: (a) WTS-lime mixtures; (b) WTS-rock powder mixtures.
3.6. Rheological Behavior of Cubatão-WTS
Results of the rheometry flow tests are displayed in Figure 10. The complete shearhistory (two cycles of acceleration–deceleration) in Figure 10a shows that curves of acceler-ation and deceleration are different, i.e., a delay response of shear stress occurs, describinga hysteresis loop (area between acceleration and deceleration curves). Information aboutrheological behavior can be obtained by curve shape and/or hysteresis loop. Typically,only the second cycle is used to characterize the rheological behavior of materials becausethat is where the steady state of flow is assumed to have been reached. The second cycle isdetailed in Figure 10b,c.
Some authors [55–58] have associated a positive hysteresis loop with thixotropicbehavior (viscosity decreases with time) and a negative hysteresis loop with rheopecticbehavior (viscosity increases with time). However, the hysteresis loop alone is not a faithfulindicator of thixotropy or rheopexy since the effects of shear rate and time on viscosity maynot be completely separated [56] in stepwise flow tests. At this point, results from the firstcycle, related to a “very early age” behavior, are also important to characterize thixotropyand rheopexy. Figure 10d presents the results from the first cycle.
Figure 10b shows that shear stress for a certain value of shear rate is higher at deceler-ation than at acceleration, describing a negative hysteresis loop, i.e., rheopectic behavior(viscosity increases with time). The shape of the acceleration–deceleration curves describesshear thickening (or dilatant) behavior (viscosity increases with shear rate increase). Adetailed analysis (Figure 10c) at low shear rates shows the opposite behavior: up to shearrate of 3 s−1 (180 rpm), shear stress is lower at deceleration than at acceleration for thesame shear rate, describing a positive hysteresis loop, i.e., thixotropic (viscosity decreaseswith time) and shear thinning (viscosity decreases with shear rate increase) behavior.
Results of the first cycle of acceleration (Figure 10d) show that, despite the mixingprocedure applied to WTS before the tests, a fast increase in shear stress occurred (0 to340 Pa), followed by an abrupt decrease (340 to 84 Pa), while the shear rate increased (0 to7.5 s−1, i.e., 0 to 450 rpm). This trend suggests that WTS recovered its agglomerated statebetween the end of the mixing procedure and the beginning of the test, so that a highershear stress was needed to hold the shear rate. This interaction among particles beingovercome, WTS became softer and more fluid when further sheared. Viscosity decreaseddue to shear rate increase but also due to the microstructure rearrangement, indicating athixotropy behavior of WTS for early ages. The analysis of shear stress response duringthe first cycle of the flow test reinforced the interpretation based on the hysteresis loop:Cubatão-WTS probably presents shear thickening and rheopectic behavior for shear rateshigher than 3 s−1 (180 rpm) and shear thinning and thixotropic behavior for shear rates

Sustainability 2021, 13, 9848 20 of 26
lower than 3 s−1 (180 rpm). In other words, WTS viscosity decreases for low shear ratesand increases for high shear rates.
Sustainability 2021, 13, x FOR PEER REVIEW 20 of 27
more precise regression would require more experimental points. Rock powder:WTS mix-tures presented much lower undrained strength values than lime:WTS mixtures, which may be explained by both rock powder and WTS both being non-cohesive materials. The trend of the undrained shear strength curve (Figure 9b) of rock powder:WTS mixtures suggests that the optimum value of WTS content is 7.4%, where the maximum su is ob-tained.
3.6. Rheological Behavior of Cubatão-WTS Results of the rheometry flow tests are displayed in Figure 10. The complete shear
history (two cycles of acceleration–deceleration) in Figure 10a shows that curves of accel-eration and deceleration are different, i.e., a delay response of shear stress occurs, describ-ing a hysteresis loop (area between acceleration and deceleration curves). Information about rheological behavior can be obtained by curve shape and/or hysteresis loop. Typi-cally, only the second cycle is used to characterize the rheological behavior of materials because that is where the steady state of flow is assumed to have been reached. The second cycle is detailed in Figure 10b,c.
Some authors [55–58] have associated a positive hysteresis loop with thixotropic be-havior (viscosity decreases with time) and a negative hysteresis loop with rheopectic be-havior (viscosity increases with time). However, the hysteresis loop alone is not a faithful indicator of thixotropy or rheopexy since the effects of shear rate and time on viscosity may not be completely separated [56] in stepwise flow tests. At this point, results from the first cycle, related to a “very early age” behavior, are also important to characterize thix-otropy and rheopexy. Figure 10d presents the results from the first cycle.
(a) (b)
050
100150200250300350400
0 10 20 30 40 50
Shea
r str
ess (
Pa)
Shear rate (s−1)
2nd cycle-acceleration2nd cycle-deceleration1st cycle-acceleration1st cycle-deceleration
050
100150200250300350400
0 10 20 30 40 50
Shea
r str
ess (
Pa)
Shear rate (s−1)
2nd cycle-acceleration
2nd cycle-decelerationNegative hysteresis loop(shear thickening/rheopexy)
Sustainability 2021, 13, x FOR PEER REVIEW 21 of 27
(c) (d)
Figure 10. Results of flow tests for Cubatão-WTS: (a) Two cycles od acceleration–deceleration; (b) Second cycle; (c) Detail of second cycle at low shear rates; (d) First cycle. Source: Modified from Tsugawa et al. 2019.
Figure 10b shows that shear stress for a certain value of shear rate is higher at decel-eration than at acceleration, describing a negative hysteresis loop, i.e., rheopectic behavior (viscosity increases with time). The shape of the acceleration–deceleration curves de-scribes shear thickening (or dilatant) behavior (viscosity increases with shear rate in-crease). A detailed analysis (Figure 10c) at low shear rates shows the opposite behavior: up to shear rate of 3 s−1 (180 rpm), shear stress is lower at deceleration than at acceleration for the same shear rate, describing a positive hysteresis loop, i.e., thixotropic (viscosity decreases with time) and shear thinning (viscosity decreases with shear rate increase) be-havior.
Results of the first cycle of acceleration (Figure 10b) show that, despite the mixing procedure applied to WTS before the tests, a fast increase in shear stress occurred (0 to 340 Pa), followed by an abrupt decrease (340 to 84 Pa), while the shear rate increased (0 to 7.5 s−1, i.e., 0 to 450 rpm). This trend suggests that WTS recovered its agglomerated state be-tween the end of the mixing procedure and the beginning of the test, so that a higher shear stress was needed to hold the shear rate. This interaction among particles being overcome, WTS became softer and more fluid when further sheared. Viscosity decreased due to shear rate increase but also due to the microstructure rearrangement, indicating a thixotropy behavior of WTS for early ages. The analysis of shear stress response during the first cycle of the flow test reinforced the interpretation based on the hysteresis loop: Cubatão-WTS probably presents shear thickening and rheopectic behavior for shear rates higher than 3 s−1 (180 rpm) and shear thinning and thixotropic behavior for shear rates lower than 3 s−1 (180 rpm). In other words, WTS viscosity decreases for low shear rates and increases for high shear rates.
Rheological behavior of WTS has been less investigated than that of wastewater and sewage sludges [59–61]. In practice, flow test results can help to predict WTS behavior during pumping, mixing, spreading, and transportation, as follows: • According to the results of the second cycle (WTS already in flow), pumping at a
shear rate lower than 180 rpm is the best condition to avoid pipe clogging since vis-cosity tends to decrease. On the other hand, the first cycle indicates that a stress of 350 Pa is necessary to start WTS flow, i.e., pumping is more difficult to start than when WTS is already flowing. Therefore, mixing WTS is recommended before pump-ing.
• An interesting piece of equipment with which to mix WTS before pumping is the shallow soil mixer, whose arm is long enough to reach the bottom of a temporary
30
35
40
45
50
55
60
0 1 2 3 4 5
Shea
r str
ess (
Pa)
Shear rate (s−1)
2nd cycle-acceleration2nd cycle-deceleration
Negative hysteresis loop(shear thickening/rheopexy)
Positive hysteresis loop(shear thinning/thixotropy)
050
100150200250300350400
0 10 20 30 40 50
Shea
r str
ess (
Pa)
Shear rate (s−1)
1st cycle-acceleration1st cycle-deceleration
Negative hysteresis loop(shear thickening/theopexy)
Positive hysteresis loop(shear thinning/thixotropy)
Figure 10. Results of flow tests for Cubatão-WTS: (a) Two cycles od acceleration–deceleration; (b) Second cycle; (c) Detail ofsecond cycle at low shear rates; (d) First cycle. Source: Modified from Tsugawa et al. 2019.
Rheological behavior of WTS has been less investigated than that of wastewater andsewage sludges [59–61]. In practice, flow test results can help to predict WTS behaviorduring pumping, mixing, spreading, and transportation, as follows:
• According to the results of the second cycle (WTS already in flow), pumping at a shearrate lower than 180 rpm is the best condition to avoid pipe clogging since viscositytends to decrease. On the other hand, the first cycle indicates that a stress of 350 Pa isnecessary to start WTS flow, i.e., pumping is more difficult to start than when WTS isalready flowing. Therefore, mixing WTS is recommended before pumping.
• An interesting piece of equipment with which to mix WTS before pumping is theshallow soil mixer, whose arm is long enough to reach the bottom of a temporarystorage cell. This equipment could also be used to pump instead of washing materialat the bottom of the sedimentation basins.
• A concrete mixer may be an interesting alternative to produce additive:WTS mixtures,considering that it operates at 30 rpm (at shear rates lower than 180 rpm WTS viscositydecreases with shear rate, i.e., mixing is easier and demands less energy).

Sustainability 2021, 13, 9848 21 of 26
• The environmental and economic costs related to the transportation of WTS by truckscan make reuse impracticable, particularly where long distances must be transposedto reach the end user. Apart from the high costs of fuel and vehicle maintenance, trans-portation by trucks also poses a great environmental concern due to contaminationpotential and greenhouse emissions. Underground transportation by a “sludge-pipe”connecting WTP and WTS processing plants can be promising for big generators, suchas WTPs located in large cities where the lack of operational areas is an issue, and isalready under debate at the Basic Sanitation Company of Sao Paulo State (SABESP), aspresented at LETA 2021. Results from the rheological characterization of Cubatão-WTSstrongly support the feasibility of transportation by pipeline. Transportation of WTSby pipeline without previous dewatering is also a possibility.
Rheological characterization can be a powerful tool to analyze reuse of WTS in geotech-nical [28] and other applications, particularly focusing on WTS transportation.
4. General Discussion
Based on the results obtained by the experimental investigation, some aspects of WTSreuse in geotechnics should be further discussed in the light of economic, environmental,and social sustainability:
• This research used centrifuge dewatered WTS (at 20–25% solids) and showed theinfluence of water content on the geotechnical behavior of soil:WTS and additive:WTSmixtures. Important questions concern: (1) the validity of extending the results fordifferent dewatering methods, and (2) whether small municipalities in developingcountries have the technical and economic conditions to dewater WTS. In answer to thefirst question, the range of 20–25% solids content is feasible to be achieved by differentdewatering methods, albeit within different time spans. Electrodes associated withbelt presses and geo-bags, geotextile-lined buckets submitted to vibration, geo-tubesand geo-bags, and even drying beds produce similar final solids contents. Polymersand vibration accelerate the dewatering process; however, the final product is still~25% solids. Electrokinetic flow does not depend on the grain size of the mediumand was shown to be 10,000 times higher than hydraulic flow for bentonite; therefore,dewatering is much quicker, even though the final solids content of WTS will stillfall within the 20–30% range. The second question has a very promising answer: asimple and cheap drying bed may achieve the desired solids range, as shown in sixstudy cases of a modified drying bed design in use since 2004 in municipalities witha population lower or equal to 100,000 inhabitants (WTP production of 25–290 L/s),where the structuring gravel layer was substituted by non-woven geotextile; bedheight was 50–80 cm, WTS generation 2–32 L/month/inhabitant, dewatering cycle30–40 days, and geotextile substitution 3–8 years. The information in this paragraphcomes from unpublished state-of-the-art data conveyed during invited presentationsat LETA 2021. The references and website are shown in the acknowledgments.
• The first step in waste management is the reduction in waste generation. Despite thereduction in WTS generation not being the subject of this paper, some suggestionsarise from the experimental investigation: (1) improvement in the quality of rawwater, discussed in the next paragraph; (2) employment of other treatment processes,e.g., electrocoagulation and electro-flocculation, which generate less sludge than theconventional complete cycle treatment [62]; (3) employing adequate equipment to mixand pump the material deposited at the bottom of the sedimentation basins instead ofwashing (i.e., using more water) might also reduce the quantity of generated WTS; (4)as discussed in the previous paragraph, usual dewatering methods produce WTS withvery high residual water contents—to develop more efficient dewatering methodsinvestigation is needed into the different states of water (free, interstitial, vicinal, andhydration) in WTS and the kinetics of water desorption.
• Sustainable solutions for WTS reuse are directly related to the quality of raw water, apoint stressed in the presentations at LETA 2021. Discharge of domestic sewage and
Sustainability 2021, 13, 9848 22 of 26
industrial effluents in water courses where raw water is captured brings chemical andbiological risks (algae, cyanobacteria, protozoa, virus, pharmaceuticals, and hormones)that demand complementary processes and operations at the WTPs. A scanning oforganic compounds additional to those presently demanded by the environmentalregulations for WTS to assess the presence of pathogenic microorganisms, heavymetals, and halogenated compounds derived from chlorine and organic matter isrecommended. Waste treatment and disposal, quality of raw water, water treatment,residue generated at the WTP, and, finally, reuse alternatives for WTS form a cycle.Attention and action in all these stages are necessary for the sustainable, healthy, andenvironment-friendly supply of potable water.
• Fundamental steps for WTS reuse in geotechnics are characterization, determinationof geotechnical properties (sometimes adaptation of equipment and procedures arenecessary because of the water content being much higher than that of soft soils),and assessment of environmental impacts based on WTS characteristics and on theintended applications. Characterization, as previously discussed, should be relatedto the desired use, and also environmental assessment should be based on the realconditions of the applied product for the evaluation of toxicity in the short and longterms. Due to the complexity of the many geotechnical applications for WTS, wesuggest that WTS should be licensed as a byproduct for each different intendedgeotechnical application. Directives and protocols could then be made more directand clearer, furthering the WTS’s acceptance by environmental agencies, designers,constructors, and the population in general as a by-product.
• Directives for the approval of beneficial uses of waste are needed. Many developingcountries still do not have regulations to declassify a residue as waste and reclassifyit as a by-product. As an example, we mention the conditions that must be metaccording to the Portuguese regulation, article 44-A of the General Regime of WasteManagement [62]: certainty of posterior utilization; can be directly used, without anyprocess other than normal industrial practice; production must be an integrated partof a productive process; must meet the relevant requirements concerning environmentand health protection and do not cause adverse impacts on the environment andpublic health. According to this directive, WTS used in soil:WTS and additive:WTSmixtures for geotechnical applications is a promising by-product.
• In this research, the use of WTS as a geomaterial has been proven to be technicallyacceptable and environmentally safe. However, a protocol for characterization shouldbe followed for each WTS and each soil or additive to be mixed, i.e., each WTP mustbe treated individually. This is common practice in geotechnics, where soils and rocksare characterized for each project or work.
• Environmental sustainability of WTS reuse as here proposed is based on differentaspects: (1) the partial substitution of soil by WTS, which is a major advantage forthe preservation of natural resources in general, and particularly in countries whoseeconomy is based on agrobusiness and where land is an asset; (2) the intended reusedoes not require burning, incineration or any other activities that generate toxicreleases to the environment; (3) the application of WTS mixed with local soil forgeneral earthworks in municipalities avoids transportation over long distances; (4) theutilization of a sludge-pipe between large WTPs and WTS processing centers mayreduce the carbon footprint as compared with overland transportation.
• WTS dewatering, transportation, and reuse should take into account the reduction incarbon footprint. This evaluation must be carried out by further investigations.
• The economic sustainability of waste reuse depends on public policies since freshnatural materials are generally preferred due to custom, lower costs, and securitywherever communities do not feel environmentally pressed to reuse waste. On theother hand, the costs of an environmentally safe disposal of WTS, associated with fiscalincentives for the use of by-products, can make WTS reuse attractive, thus furthering

Sustainability 2021, 13, 9848 23 of 26
the necessary, if not urgent, change from the habitual and harmful discharge of WTSin bodies of water.
• Waste reuse can be troublesome for those municipalities that cannot rely on qualifiedstaff to attend to all the associated technical and legal issues. Private businesses shouldideally play a crucial part in the valorization of WTS, buying WTS from WTPs as wasteor by-product, processing it, and selling it to the end user. These businesses wouldobtain environmental licenses for the product and its intended uses, shouldering atleast part of the technical and legal burden for the municipalities.
• Developing countries would greatly benefit from creating a database of characteristicsof raw water and WTS characteristics to enhance WTS reuse.
• The social sustainability of the proposed WTS reuse alternatives relies on the opportu-nity to generate income by creating new jobs associated with the new products andWTS processing firms, the improvement of living standards and social equality sinceusually low-income communities are those most affected by water pollution, and theregaining of urban areas presently given to waste disposal.
5. Conclusions
The experimental investigation showed that soil:WTS mixtures are sound multipur-pose geomaterials from a geomechanical point of view, considering permeability, shearstrength, and deformability properties. Preliminary environmental tests indicate that theyare also environmentally viable, even if further research is needed to reach definitiveconclusions. Future work includes leaching tests, simulating practical conditions for eachspecific application and addressing other contaminants, such as microorganisms, phar-maceuticals, and hormones. Lime:WTS and rock powder:WTS mixtures can be used forapplications with low soliciting stresses. However, minimum shear strength for earthworkscould only be achieved at low sludge contents, requiring that the search continues foradditives capable of creating good all-purpose geomaterials. The paper also highlights theimportance of determining the properties of WTS and characterizing it in geological andrheological terms so that the possibilities of its sustainable reuse in developing countriescan be assessed at all stages, from mixing and transportation to environmental licensing.
Author Contributions: Conceptualization, methodology, resources, writing—original draft prepa-ration, writing—review and editing supervision, project administration, and funding acquisition,M.E.G.B.; methodology, first suggested by the M.E.G.B. and developed along the investigation bystraight collaboration with J.K.T. and E.L.T.M. (Ph.D. students); investigation, by J.K.T. and E.L.T.M.;validation, formal analysis, and data curation, by the three authors in straight collaboration. Allauthors have read and agreed to the published version of the manuscript.
Funding: This research was funded by a joint funding program of FAPESP and SABESP, grant number2013/50448-8, São Paulo Research Foundation (FAPESP); and scholarships: grant 2017/24056-6 and2019/17183-7, São Paulo Research Foundation (FAPESP), CNPq 141589/2016-7 and 310801/2017-6,and CAPES 88887.368004/2019-00.
Institutional Review Board Statement: Not applicable.
Informed Consent Statement: Not applicable.
Data Availability Statement: This study did not use data or datasets supporting results other thanthose produced by research from the authors.
Acknowledgments: The authors would like to acknowledge the technical support given by PauloScarano Hemsi, Delma Mattos Vidal, Iara Maria Carneiro de Camargo, and Marcelo Kenji Miki duringthis research. The authors would also like to acknowledge precious however yet unpublished informa-tion conveyed by the lecturers at LETA 2021: Albuquerque, A. Characteristics and applications of watertreatment sludge in Portugal; Urashima, D.; Vidal, D.; Lins, J. Dewatering in waste confinement system ingeotextiles; Morita, D. Water treatment sludge: lessons learned and perspectives; Zuffo, C.K. Actions and chal-lenges in research, development and innovation on the sanitation fiels: water treatment sludge; Tsugawa, J.K.;Fiore, F.A. Multiple characterizations of WTS for sutainable handling and destination; Müller, M. Dewater-ing of water treatment sludge in special draining container with geotextile refills; Castro, N. The use of geotube

Sustainability 2021, 13, 9848 24 of 26
technology in the restoration of Kings Bay, Florida. Case studies and innovative solutions; Fontana, A.O.;Cordeiro, J.S.; Achon, C.L.; Barroso, M.M.; Reis, R.F. dos Water treatment sludge dewatering: successfulexperiences with drying beds implantation; Jones, C. Electrokinetic dewatering of sludge; Di Bernardo, L. Theimportance of raw water characteristics in the efficiency of dewatering of water treatment sludge in geotextiles.These presentations are available at https://www.youtube.com/watch?v=Dd3UoXhDn7A&t=2778s(17 June 2021), https://www.youtube.com/watch?v=D2SBxoZRq-c&t=166s (18 June 2021) andhttps://www.youtube.com/watch?v=NiFiIAF8ejo&t=7186s (19 June 2021).
Conflicts of Interest: The authors declare no conflict of interest.
References1. Richter, C.A. Tratamento de Lodos de Estações de Tratamento de Águas, 1st ed.; Edgard Blücher: São Paulo, Brazil, 2001.2. Unesco. The United Nations World Water Development Report 2019: Leaving No One Behind; Unesco World Water Assessment
Programme: Paris, France, 2019; Volume 96, ISBN 9789231003097.3. United Nations. The 17 Goals. Available online: https://sdgs.un.org/goals (accessed on 8 July 2021).4. Garcia, S.S. Caracterização de Argamassas Auto-Compactáveis com Adição de Lamas Provenientes de uma ETA. Master’s Thesis,
Universidade de Beira Interior, Covilhã, Portugal, 2011.5. Chen, H.; Ma, X.; Dai, H. Reuse of water purification sludge as raw material in cement production. Cem. Concr. Compos. 2010, 32,
436–439. [CrossRef]6. Teixeira, S.R.; Santos, G.T.A.; Souza, A.E.; Alessio, P.; Souza, S.A.; Souza, N.R. The effect of incorporation of a Brazilian water
treatment plant sludge on the properties of ceramic materials. Appl. Clay Sci. 2011, 53, 561–565. [CrossRef]7. Benlalla, A.; Elmoussaouiti, M.; Dahhou, M.; Assafi, M. Utilization of water treatment plant sludge in structural ceramics bricks.
Appl. Clay Sci. 2015, 118, 171–177. [CrossRef]8. Godoy, L.G.G.; de Rohden, A.B.; Garcez, M.R.; Costa, E.B.; da Da Dalt, S.; Andrade, J.J. Valorization of water treatment sludge
waste by application as supplementary cementitious material. Constr. Build. Mater. 2019, 223, 939–950. [CrossRef]9. Uçaroglu, S.; Alkan, U. Composting of wastewater treatment sludge with different bulking agents. J. Air Waste Manag. Assoc.
2016, 66, 288–295. [CrossRef]10. Chaves, V.T.; Morita, D.M.; Chao, I.R.S.; Contrera, R.C. Phosphorus recovery from sewage with a sustainable and low-cost
treatment system. Water Sci. Technol. 2019, 80, 846–854. [CrossRef]11. Razali, M.; Zhao, Y.; Bruen, M. Effectiveness of a drinking-water treatment sludge in removing different phosphorus species form
aqueous solution. Sep. Purif. Technol. 2007, 55, 300–306. [CrossRef]12. Krishna, K.C.B.; Aryal, A.; Jansen, T. Comparative study of ground water treatment plants sludges to remove phosphorous from
wastewater. J. Environ. Manag. 2016, 180, 17–23. [CrossRef]13. Elliot, H.A.; Dempsey, B.A.; Hamilton, D.W.; DeWolfe, J.R. Land Application of Water Treatment Sludges: Impact and Management;
Foundation Report; American Water Works Association: Denver, CO, USA, 1990.14. Cruz, C.L.B.M.; Santos, A.S.; Ritter, E. Study on the viability of incorporation of the water treatment plant sludge in the substrate
for the production of native species to the Atlantic Forest (Brazil). In Proceedings of the 6th International Conference onSustainable Solid Waste Management: NAXOS2018, Naxos Island, Greece, 13–16 June 2018; Volume 1, pp. 1–8.
15. Abo-El-Enein, S.A.; Shebl, A.; Abo El-Dahab, S.A. Drinking water treatment sludge as an efficient adsorbent for heavy metalsremoval. Appl. Clay Sci. 2017, 146, 343–349. [CrossRef]
16. Siswoyo, E.; Mihara, Y.; Tanaka, S. Determination of key components and adsorption capacity of a low cost adsorbent based onsludge of drinking water treatment plant to adsorb cadmium ion in water. Appl. Clay Sci. 2014, 97–98, 146–152. [CrossRef]
17. Petruzzelli, D.; Volpe, A.; Limoni, N.; Passino, R. Coagulants removal and recovery from water clarifier sludge. Water Res. 2000,34, 2177–2182. [CrossRef]
18. Scalize, P.S.; Souza, L.M.D.; Albuquerque, A. Reuse of alum sludge for reducing flocculant addition in water treatment plants.Environ. Prot. Eng. 2019, 45, 57–70. [CrossRef]
19. Raghu, D.; Hsieh, H.-N.; Neilan, T.; Yih, C.-T. Water treatment plant sludge as landfill liner. In Proceedings of the GeotechnicalPractice for Waste Disposal’87. A Specialty Conference, Ann Arbor, MI, USA, 15–17 June 1987; ASCE-American Society of CivilEngineers: New York, NY, USA, 1987; pp. 744–758.
20. Dos Santos Silva, A.; Hemsi, P.S. Efeito do teor de sólidos na resistência ao cisalhamento de um lodo de ETA visando seu usoem cobertura diária de aterros sanitários. In Proceedings of the XIX Congresso Brasileiro de Mecânica dos Solos e EngenhariaGeotécnica—COBRAMSEG, Salvador, Brazil, 28 August–1 September 2018; ABMS, Ed.; ABMS: Salvador, Brazil, 2018.
21. Roque, A.J.; Carvalho, M. Possibility of using the drinking water sludge as geotechnical material. In Proceedings of the 5th ICEGEnvironmental Geotechnics: Opportunities, Challenges and Responsibilities for Environmental Geotechnics—Proceedings of theISSMGE 5th International Congress, Cardiff, UK, 26–30 June 2006; Volume II.
22. Fortes, R.M.; Merighi, J.V.; Pauli, D.R.; Barros, M.A.L.; de Carvalo, M.H.; Menetti, N.C.; Barbosa, A.S., Jr.; Ribeiro, F.V.; Bento, B.B.Study of dry sludge from water treatment plant (WTP) in Taiaçupeba to use as compacted soil in earthwork ditches. InProceedings of the 8th International Conference on the Bearing Capacity of Roads, Railways, and Airfields, Champain, IL, USA,29 June–2 July 2009.

Sustainability 2021, 13, 9848 25 of 26
23. Montalvan, E.L.T.; Boscov, M.E.G. Geotechnical parameters of mixtures of a tropical soil with water treatment sludge. InProceedings of the Environmental Science and Engineering, Kaohsiung, Taiwan, 28 October–1 November 2019.
24. Santos, E.F.; Scapin, J.; Pinheiro, R.J.B. Relação entre o teor de lodo de ETA e parâmetros de compactação em misturas comsolo siltoso da região de Santa Maria-RS. In Proceedings of the X Seminário de Engenharia Geotécnica do Rio Grande doSul—GEORS2019, Santa Maria, Rio Grande do Sul, Brazil, 13–14 June 2019; pp. 1–9.
25. Babatunde, A.O.; Zhao, Y.Q. Constructive approaches toward water treatment works sludge management: An internationalreview of beneficial reuses. Crit. Rev. Environ. Sci. Technol. 2007, 37, 129–164. [CrossRef]
26. Ahmad, T.; Ahmad, K.; Alam, M. Sustainable management of water treatment sludge through 3’R’ concept. J. Clean. Prod. 2016,124, 1–13. [CrossRef]
27. De Carvalho Gomes, S.; Zhou, J.L.; Li, W.; Long, G. Progress in manufacture and properties of construction materials incorporatingwater treatment sludge: A review. Resour. Conserv. Recycl. 2019, 145, 148–159. [CrossRef]
28. Tsugawa, J.K.; Romano, R.C.; Pileggi, R.G.; Boscov, M.E.G. Review: Rheology principles applied to geotechnical engineering.Appl. Rheol. 2019, 29, 202–221. [CrossRef]
29. Gy, P. Sampling for Analytical Purposes; Willey: Hoboken, NJ, USA, 1999.30. Donagema, G.; Campos, D.; Calderano, S.; Teixeira, W.; Viana, J. Handbook of Soil Analysis Method, 3rd ed.; Embrapa Soils: Rio de
Janeiro, Brazil, 2011.31. O’Kelly, B.C.; Sivakumar, V. Water content determinations for peat and other organic soils using the oven-drying method. Dry.
Technol. 2014, 32, 631–643. [CrossRef]32. Cornwell, D.A.; Vandermeyden, C.; Dillow, G.; Wang, M. Landfilling of Water Treatment Plant COAGULANT Sludges; AWWA
Research Foundation and American Water Works Association: Denver, CO, USA, 1992.33. Basim, S.C. Physical and Geotechnical Characterization of Water Treatment Plant Residuals; New Jersey Institute of Technology:
Newark, NJ, USA, 1999.34. Watanabe, Y.; Komine, H.; Yasuhara, K.; Murakami, S. Batch leaching test focusing on clod size of drinking water sludge
and applicability to long-term prediction using column leaching test. In Proceedings of the Geofrontiers 2011 Advances inGeotechnical Engineering, Dallas, TX, USA, 13 March 2011.
35. Montalvan, E.L.T.; Boscov, M.E.G. Geotechnical parameters of mixtures of a tropical soil with water treatment sludge. InProceedings of the Environmental Science and Engineering Book Serie: Proceedings of the 8th International Congress onEnvironmental Geotechnics, Hangzhou, China, 28 October–1 November 2018; Springer: Singapore, 2019; Volume 1, pp. 235–242,ISBN 9789811322204.
36. Montalvan, E.L.T. Investigação do Comportamento Geotécnico de Misturas de Solo Arenosos com Lodo da Estação de Tratamentode Água do Município de Cubatão, SP. Master’s Thesis, University of Sao Paulo, Sao Paulo, Brazil, 2016.
37. Güneyli, H.; Rüsen, T. Effect of length-to-diameter ratio on the unconfined compressive strength of cohesive soil specimens. Bull.Eng. Geol. Environ. 2016, 75, 793–806. [CrossRef]
38. Associação Brasileira de Normas Técnicas. ABNT-NBR 10004 Resíduos sólidos—Classificação; Associação Brasileira de NormasTécnicas: Rio de Janeiro, Brazil, 2004; p. 71.
39. Associação Brasileira de Normas Técnicas. ABNT-NBR 10006 Procedimento para Obtenção de Extrato Solubilizado de Resíduos Sólidos;Associação Brasileira de Normas Técnicas: Rio de Janeiro, Brazil, 2004; p. 3.
40. Associação Brasileira de Normas Técnicas. ABNT-NBR 10005 Procedimento para Obtenção de Extrato Lixiviado de Resíduos Sólidos;Associação Brasileira de Normas Técnicas: Rio de Janeiro, Brazil, 2004; p. 16.
41. Tsugawa, J.K.; Romano, R.C.; Pileggi, R.G.; Boscov, M.E.G. A rheological approach for the evaluation of geotechnical use of watertreatment sludge. In Environmental Science and Engineering Book Serie: Proceedings of the 8th International Congress on EnvironmentalGeotechnics; Springer: Singapore, 2019; Volume 1, pp. 264–272. ISBN 9789811322204.
42. Tsugawa, J.K.; Sabino, E.F.; Monte, R.; Boscov, M.E.G. Importance of composing representative samples according to the Theory ofSampling (TOS) for the reuse of water treatment sludge. In Proceedings of the XVI Pan-American Conference on Soil Mechanicsand Geotechnical Engineering (XVI PCSMGE), Geotechnical Engineering in the XXI Century: Lessons Learned and FutureChallenges, Cancun, Mexico, 17–20 November 2019; pp. 2450–2457.
43. Barroso, M.M. Influência das Micro e Macropropriedades dos Lodos de Estações de Tratamento de Águas no Desaguamento porLeito de Drenagem. Ph.D. Thesis, Universidade de São Paulo, Sao Paulo, Brazil, 2007.
44. Montalvan, E.L.T. Geotechnical Properties of Mixtures of Water Treatment Sludge and Residual Lateritic Soils from the State ofSão Paulo. Ph.D. Thesis, University of Sao Paulo, Sao Paulo, Brazil, 2021.
45. CETESB. Valores Orientadores Para Solo e Água Subterrânea. 2014. Available online: https://cetesb.sp.gov.br/aguas-subterraneas/valores-orientadores-para-solo-e-agua-subterranea/ (accessed on 25 August 2021).
46. Higashi, R.J.; Camargo, C.I.M.; Boscov, M.E.G. Chemical Charateristics os Cubatão water Treament Sludge. In Proceedings of theFirst Meeting of Water Treatment Sludge—Connections for Technology Innovation (LETA2021), Online Event, 17–19 June 2021;Available online: https://www.ggga.ita.br/Anais_LETA2021_comprimido.pdf (accessed on 25 August 2021).
47. Silva, A.R. Geotechnical Behavior of Mixtures of a Lateritic Clayey Sand and Sludge from the Water Treatment Plan Taiaçupeba,Suzano. Master’s Thesis, University of Sao Paulo, São Paulo, Brazil, 2021.
48. Nogami, J.S.; Villibor, D.F. Pavimentação de Baixo Custo com Solos Lateríticos; Villibor: São Paulo, Brazil, 1995.

Sustainability 2021, 13, 9848 26 of 26
49. Fadigas, F.D.S.; Amaral-Sobrinho, N.M.B.; Mazur, N.; Dos Anjos, L.H.C.; Freixo, A.A. Natural contents of heavy metals in someBrazilian soil classes. Bragantia 2002, 61, 151–159. [CrossRef]
50. O’Kelly, B.C.; Quille, M.E. Shear strength properties of water treatment residues. Proc. Inst. Civ. Eng. Geotech. Eng. 2010, 163,23–35. [CrossRef]
51. Balkaya, M. Evaluation of the geotechnical properties of alum sludge, zeolite, and their mixtures for beneficial usage. Environ.Prog. Sustain. Energy 2015, 34, 1028–1037. [CrossRef]
52. Trenter, N. Earthworks: A Guide, 1st ed.; Thomas Telford: London, UK, 2001.53. Murray, E.J.; Rix, D.W.; Humphrey, R.D. Clay linings to landfill sites. Q. J. Eng. Geol. 1992, 25, 371–376. [CrossRef]54. Pozzebon, B. Parameters of Compacted Residual Soils from the Sao Paulo’s Metropolitan Region: A Comparison with Data from
Other Brazilian Regions. Master’s Thesis, University of Sao Paulo, Sao Paulo, Brazil, 2017.55. Mewis, J.; Wagner, N.J. Thixotropy. Adv. Colloid Interface Sci. 2009, 147–148, 214–227. [CrossRef]56. Mewis, J. Thixotropy—A general review. J. Nonnewton. Fluid Mech. 1979, 6, 1–20. [CrossRef]57. Malkin, A.Y. Rheology Fundamentals; ChemTec Publishing: Scarborough, ON, Canada, 1994; ISBN 1-895198-09-7.58. Tadros, T.F. Rheology of Dispersions; Wiley: Hoboken, NJ, USA, 2010; Volume 44, ISBN 978-3-527-32003-5.59. Eshtiaghi, N.; Markis, F.; Yap, S.D.; Baudez, J.C.; Slatter, P. Rheological characterisation of municipal sludge: A review. Water Res.
2013, 47, 5493–5510. [CrossRef]60. Ratkovich, N.; Horn, W.; Helmus, F.P.; Rosenberger, S.; Naessens, W.; Nopens, I.; Bentzen, T.R. Activated sludge rheology: A
critical review on data collection and modelling. Water Res. 2013, 47, 463–482. [CrossRef]61. Seyssiecq, I.; Ferrasse, J.; Roche, N. State-of-the-art: Rheological characterisation of wastewater treatment sludge. Biochem. Eng. J.
2003, 16, 41–56. [CrossRef]62. Aguiar, T.D.; Scalize, P.S. Caracterização de lodo de tratamento de água para abastecimento através de sistema de eletroflotofil-
tração (SEFF). In Proceedings of the First Meeting of Water Treatment Sludge—Connections for Technology Innovation(LETA2021), Online Event, 17–19 June 2021; Available online: https://www.ggga.ita.br/Anais_LETA2021_comprimido.pdf(accessed on 25 August 2021).
Copyright © 2022 FDOKUMEN