Beneficial Use of Water Treatment Sludge in Geotechnical ...
Upload
khangminh22Category
view
3download
0
ECONOMICALLY BENEFICIAL DRUG
INTERACTIONS \ryITHCYCLOSPORIN AND TACROLIUMUS. CLINICAL
STUDIES IN RECIPIENTS OF KIDNEY ANI)LIVER TRANSPLANTS
By
T. E. JONES B.Pharm, Dip. Ed.
Department of Clinical and ExperimentalPharmacology
A thesis submitted to the University of Adelaide
for the degree ofDoctor of Philosophy
The work described herein was performed within the
departments of Clinical Pharmacology and Pharmacy,
The Queen Elizabeth Hospital
September 2000

Contents:
Abbreviations
Acknowledgments
Declaration
Publications and presentations
Abstract
Synopsis
Chapter 1 Introduction and literature review
1. 1. Chemical structure of cyclosporin
1.2. Mode of Action of cYclosPorin
1.3. Pharmacokinetics of cyclosporin
1.3.1. AbsorPtion
1.3.2. Distribution and Metabolism
1.3.3. Excretion
1.4. Drug Interactions with cyclosporin
1.4. 1. Cyclosporin-sparing agents
1.4.1.1. Grapefruit Juice
1.4.1.2. Ketoconazole and related azole antifungals
1.4.\.3. Calcium channel blocking drugs
I.4.I.3.1. Verapamil
1.4.1.3.2. Diltiazem
L4.1.3.3. Mibefradil
1. 5. Economic considerations
1.6. Effect of taking cyclosporin with food
1.7. Analytical problems
1.8 .Dose Response RelationshiPs
1.9. Other areas of uncertaintY
1.10. Secondary benefits versus adverse effects
1.11. Cytochrome P450 or P-gþoprotein
1.12. Tacrolimus
1rlz.l. Physical properties and mode of action
VI
vü
vüi
ix
1
4
11
t3
13
15
r6
18
23
24
25
26
28
31
32
JJ
35
35
36
31
38
4t
42
43
4l
41
Page ü
I.I2.2. Pharmacokinetics of tacrohmus
1.12.3. Adverse effects
1.I2.4. Cost of provision of TRM
1.13. Confounding biological factors affecting drug metabolism
1.14. Summary
1.15. Aims
1.16. Hypotheses
Chapter 2 Survey of Australasian transplant centres to ascertain current
practices regarding the use of cyclosporin-sparing agents, therapeutic ranges
and assay methodology
2.1 Introduction
2.2 Atrrß
2.3 Methods
2.4 Results
2.5 Discussion
2.5.1. To Use CsA-sparing agents or Not?
2.5.2. Who benefits from the use of CsA-sparing agents?
2.5.3. To Use DTZ ot KCZ
2.5.4. Dosage regimen of DTZ
2.5.5. Formulation effects
2.5.6. CsA theraPeutic range
2.5.1. CsA assay methodology and monitoring
2.5.8. Frequency of dosing for CsA
2.5.9. Numbers of transplants performed at each centre
2.6. Conclusions
49
51
52
52
53
55
56
57
58
59
59
60
10
7l
13
74
15
75
16
78
81
82
83
Chapter 3 Survey of outcomes of Australasian kidney transplant 84
recipients for the first 12 months post transplantation to ascertain the effect of
blood cyclosporin concentration and/or diltiazem use on measures of organ
rejection and/or cyclosporin toxicity.
Page üi
3.1 Introduction.
3.2 Aims
3.3 Methods
3.3. I Statistical Methods
3.4 Results
3.5 Discussion
3.6 Conclusions
Chapter 4 Diltiazem- cyclosporin pharmacokinetic interaction
dose response relationship
4.1 Introduction
4.2 Atrrß
4.3 Methods
4.4 Results
4.5 Discussion
4.6 Recommendations
Chapter 6 Diltiazem does not always increase blood cyclosporin
concentrations - a clinical study in a lung transplant recipient
6.1 Introduction
6.2 Methods
Chapter 5 A clinical study to compare the effect of changing diltiazem 142
formulation from conventional release tablet to extended delivery capsule
on the pharmacokinetic interaction between cyclosporin and diltiazem in kidney
transplant recipients
5.l lntroduction I43
5.2 Methods 145
5.3 Results 146
5.4 Discussion 153
5.5 Conclusions 159
85
90
90
9l
92
l12
119
122
123
124
124
t27
134
r40
T6I
t62
t63
Page iv

6.3 Results
6.4 Discussion
Chapter 7 Diltiazem disposition and metabolism in kidney transplant
recipients receiving cyclosporin
7.1 Introduction
7.2 Aims
7.3 Methods
7.3.1 Stock solutions
'7 .3.2 Plasma extractron
1.3.3 Cl'romatography
7 .3 .4 Analytical and Statistical Considerations
7.4 Results
7.5 Discussion
7.6 Summary
Chapter I Diltiazem-tacrolimus pharmacokinetic interaction - dose
response relationship in kidney and liver transplant recipients
8.1 Introduction
8.2 Aims
8.3 Patients and Methods
8.3.1 Statistics
8.4 Results
8.5 Discussion
8.6 Conclusions
Chapter 9 Discussion and future directions for research
Chapter L0 References
165
168
176
fl1t79
fl9180
181
181
r82
183
t92
198
200
20r
203
204
206
206
2t6
222
233
223
Appendices
Page v
259

List of Abbreviations:
AUC area under concentration-time curve
AXSYM Brand name of Abbott analyser
CsA cyclosporin
CD controlled diffrrsion
CV coeffrcient of variation
CYP3A4 isoenzyme 3,\4 of the cytochrome P450 enzyme superfamily
DTZ diltiazem
DADTZ deactyldiltiazem
DiMDTZ demethyldiltiazem
DMDADTZ demethyldeacetyldiltiazem
EMIT enzyme multiplied immunoassay
FPIA Fluorescence polarisation immunoassay
HPLC high performance liquid chromatography
ICZ itraconazole
KCZ ketoconazole
L litre
MEIA Microparticulate enzyme immunoassay
Tmax time to maximum concentration
TRM tacrolimus
llg nxcrogram
prmol micromole
mL millilitre
mo month
tds three times a day
bd twice a day
pa per annum
p p value
Page vi
Acknowledgements:
I am indebted to the following:
-Dr Colin Luke, Ms Heather McElroy and Dr Louis Pilotta, Epidemiology Dept, The
Queen Elizabeth Hospital
-Prof L Sansorn, Head of School of Pharmacy and Biomedical Sciences, University of
South Australia
-Dr R Morris and technicians Lucy, Ian and Chryss, Clinical Pharmacology Dept, The
Queen Elizabeth Hospital
-the thirteen organ transplant recipients who gave so generously of their time (and
blood)
-the nursing staff who drew so many of the blood samples in these studies.
Page vü

Declaration:
I hereby declare that this thesis contains no material which has been used for the award
of any other degree or diploma in any university and that, to the best of my knowledge
and belief, this thesis contains no material previously published or written by another
person except where due reference is made in the text. I also hereby conseRt to allow
this thesis to be available for photocopying and loan if applicable.
-l^1",Terence E Jones
Page vüi
The following publications have resulted from work contained within this thesis:
1) Jones TE. Survey of cyclosporin-sparing agent use in Australasian transplant centres.
Aust NZ J Med 1996:26:772-116
2) Jones TE, Morris RG. Diltiazem does not always increase blood cyclosporin
concentration. Br J Clin Pharmacol 1996;42: 642-644
3) Jones TE, Morris RG, Mathew TH. Diltiazem-cyclosporin pharmacokinetic
interaction - dose-response relationship. Br J Clin Pharmacol 1991;44: 499-504
4) Jones TE, Morris RG. Survey of cyclosporine therapeutic ranges, assay methodology
and use of sparing agents in Australasian transplant centres. Ther Drug Monit 1991:' I9i
650-656
5) Jones TE, Morris RG, Mathew T. Formulation of diltiazem affects cyclosporin-
sparing activity. Eur J Clin Pharmacol 1991;52: 55-58
6) Jones TE. The use of other drugs to allow a lower dosage of cyclosporin to be used
Clin Pharmacokinet 1991 32: 357 -361 (invited article)
7) Morris RG, Saccoia NC, Jones TE. Modified liquid chromatographic assay for
diltiazem and metabolites in human plasma. J Liq Chrom & Rel Technol 1996; 19(15):
2385-2394
8) Morris RG, Jones TE, Mathew TH. Diltiazem disposition and metabolism in renal
transplant recipients. Ther Drug Monit 1998; 20:365-3lO
Page ix

The following presentations at scientific meetings have also resulted from the work
contained in this thesis:
l)Jones TE, Morris RG, Saccoia NC. Diltiazem-Cyclosporin pharmacokinetic
interaction - dose response relationship. ASCEPT scientif,rc meeting, Adelaide
December 1995. Published tn Proceedlngs ASCEPT 1995; 2:ll0
2)Jones TE, Morris RG. Diltiazem affects CYP3A4 for longer than predicted.
Combined British and French Pharmacological Society meeting, Edinburgh, September
1997. Published in Br J Clin Pharmacol 1998; 45:208-209P
3)Jones TE, Morris RG, Westley IS. Tacrolimus-DiltiazemPharmacokinetic Interaction.
Dose-response relationship. International Association of Therapeutic Drug Monitoring
and Clinical Toxicology Meeting, Cairns, September 1999. Published in Ther Drug
Monit 1999;21(4):443
4)Jones TE, Morris RG, Westley IS. Diltiazem-tacrolimus pharmacokinetic interaction -dose response relationship. TQEH Research Day, 1999 (Winner of prize for best
presentation in section).
5)Morris RG, Jones TE, Saccoia NC. Comparison of two diltiazem formulations in
modiffing cyclosporin therapeutic management. AS CEPT scientific meeting, Adelaide,
December 1995. Published in Proceedings ASCEPT 1995:2:109
6)Morris RG, Jones TE, Diltiazem and metabolites - kinetics in renal transplant
recipients treated with cyclosporin. ASCEPT scientific meeting, Melbourne 1996.
Published in Proceedlngs ASCEPT 1996; 3:149
7)Morris RG, Jones TE. Cyclosporin-sparing effect of diltiazem - a predominantly gut
wall phenomenon? 'Oral absorption of drugs' meeting. Edinburgh Jtne 199'7 . Published
in Eur J Pharm Sci 1997; 5(Suppl 2) 569
Page x

8)Morris RG, Jones TE. Using metabolic interactions between drugs for an economic
advantage. . ISSX scientific meeting, Cairns October 1998. Published in ISSX Proc
1998; 13:48
9)Morris RG, Jones TE, Westley IS. Time course of the inhibition of cyclosporin or
tacrolimus metabolism by diltiazem. International Association of Therapeutic Drug
Montoiring and Clinical Toxicology meeting. Cairns, September 1999. Published in
Ther Drug Monit 1999:21(4):437
lO)Saccoia NC, Jones TE, Morris RG. Modified liquid chromatographic method for
diltiazem and its major metabolites in plasma - application to renal transplant recipients
ASCEPT scientihc meeting, Adelaide, December 1995. Published tn Proceedings
ASCEPT 1995;2:lO9
Page xi

ABSTRACT
Abstract
The studies contained in this thesis comprise three separate clinical studies in organ
transplant recipients, an extension clinical study and two suryeys of Australasian
transplant units. The overall aims of the studies presented are to examine fundamental
questions regarding the clinically and economically important pharmacokinetic
interaction between diltiazem and cyclosporin, an interaction widely utilised in organ
transplantation.
The first survey demonstrated, that diltiazem is widely employed as a cyclosporin-sparing
agent by some transplant physicians but not by others. It also showed that the reasons
for using cyclosporin-sparing agents was not based upon hard data but was more likely
to be influenced by familiarity with the agents and/or philosophical reasons. The
magnitude of the savings afforded by the coprescription of diltiazem approximated AUD
$7 million n 1995/6.
The second survey demonstrated that the use of diltiazem provided benefits in the early
post transplant period in the form of reduced need for dialysis and immunosuppressive
drugs and this data provides a strong argument in favour of the routine coprescription of
diltiazem in adult kidney transplant recipients. It also examined the effects of using
different blood cyclosporin concentrations on markers of effrcacy and adverse effects
which allowed recommendations for therapeutic ranges for cyclosporin in kidney
transplantation.
Page 1

ABSTRACT
The hrst clinical study demonstrated considerable interpatient variability in both
magnitude of cyclosporin-sparing effect and the dose of diltiazem needed to produce the
effect. Importantly, a signif,rcant effect was demonstrated with doses of diltiazem that
were lower than those currently employed. The potential for cyclosporin to interact with
diltiazem's metabolism was also investigated and three different patterns of diltiazem
kinetics were seen in kidney transplant recipients treated with cyclosporin. Although
interpatient plasma diltiazem concentrations varied considerably, these appeared to have
little bearing on the magnitude of the cyclosporin-sparing effect.
The extension clinical study demonstrated the folly of switching formulations without
proof of bioequivalence. The 'controlled diffusion' formulation of diltiazem was shown
to interact differently with cyclosporin than conventional release formulation diltiazem in
several transplant recipients.
The second clinical study failed to demonstrate an interaction between cyclosporin and
diltiazem in a patient who did have a considerable cyclosporin-sparing effect with
itraconazole, despite using a higher than usual dose of diltiazem.
The final clinical study examined the potential tacrolimus-sparing effect of diltiazem in
kidney and liver transplant recipients. Interestingly, there appeared to be a difference in
tacrolimus-sparing effect between these two transplant types where a clinically significant
sparing effect was noted in kidney transplant recipients but a less marked effect was
observed in liver transplant recipients.
Page 2

ABSTRACT
These data should assist the development of soundly based policies that will ensure a
benefit exists before a sparing agent is coprescribed and that the lowest effective dose of
sparing agent is used.
Page 3

ABSTRACT
Synopsis
The advent of cyclosporin (CsA) improved organ transplant success rates but increased
the costs of maintaining these transplants and introduced a new set of adverse effects
(including nephrotoxicity and hypertension). CsA-sparing agents were advocated by the
late 1980s primarily as a means of curbing costs, but how widely these were used and
what drugs were used, was not known. No formal dose response studies had been
performed with any sparing agent and the reliability of the interaction had also not been
studied.
A number of drugs had been shown to increase blood CsA concentrations via
interactions with the cytochrome P450 isoenzyme CYP3A4 (and/or the P-glycoprotein
drug efflux pump). Potentially useful CsA-sparing agents included DTZ, verapamil and
ketoconazole (KCZ) while grapefruit juice had also been shown to elevate blood CsA
concentrations. In addition to the economic benefits, therapeutic benefits (including
reduced nephrotoxicity) had also been demonstrated with some agents in some transplant
types.
Much of the literature on interactions with CsA and of the use of CsA-sparing agents
was derived from limited data and there was limited data on interpatient variability in
sparing effect. No dose-response relationship studies had been conducted and this was
presumably the reason for the doses of CsA-sparing agents being the same as those that
applied to the approved indications for these drugs. There was no data on the extent of
Page 4
ABSTRACT
use of CsA-sparing agents by different Australasian transplant centres, nor whether their
use affected therapeutic ranges that were utilised by these centres.
A survey of Australasian transplant physicians demonstrated that CsA-sparing agents
(especially DTZ) were widely used (Chapter 2). Considerable variability existed with
some centres using CsA-sparing agents routinely in all patients while in other centres,
they were not used at all. Different patterns of use were noted, where the majority of
heart, lung and kidney transplant recipients rwere prescribed CsA-sparing agents, but only
a minority of liver and pancreas transplant recipients were. The decision to use these
agents appeared to be based upon local factors since centres located in close proximity to
each other had widely different utilisation rates. Factors affecting the decision included
prescriber familiarity (surgeons appeared less likely to use them), consideration of drug
regimen complexity and philosophy rather than specific data relating to their use.
Several physicians observed that perceived benefits afforded by the use of DTZ needed
to be balanced against the potential for adverse outcomes, both direct and indirect e.g.
via increased complexity of drug regimen with resulting poor compliance.
The economic benefits resulting from the use of CsA-sparing agents accrued to the
funding body (the Commonwealth government when CsA was used for organ
transplantation). However, the Commonwealth government did not advocate this use
and had not granted approval for any specihc drug for a CsA-sparing indication while the
respective pharmaceutical manufacturers were either ambivalent or hostile to their use.
Hence, individual physicians and transplant units would be the most likely targets for
litigation in the event that an adverse outcome resulted from this (non-approved) use.
Page 5

ABSTRACT
Interestingly, there was no evidence that the use of CsA-sparing agents affected the
therapeutic range for blood CsA concentrations reported by clinicians and, despite
comments that assay methodology should affect the range used, this was not evident
from the data collected. There was great disparity in therapeutic ranges quoted which
was evident not only across organ transplant types (which may reflect the life-threatening
consequences of rejection of transplanted hearts and livers versus the less disastrous
effects of rejecting a kidney) but also within the same organ transplant type.
In Chapter 3, data from almost the entire Australasian cadaver kidney transplant
population was analysed to assess the clinical sequelae of using different therapeutic
ranges for CsA and also of using DTZ. Earlier findings thatDTZ use reduced the need
for dialysis in the first week and month post transplantation were confirmed. DTZ use
appeared not to reduce the frequency of rejection episodes post transplant, but this may
be because the marker used (methylprednisolone use) was insensitive. DTZ use was
associated with a reduced muromonab use, suggesting that the severity of rejection
episodes was reduced in this period. Importantly, these therapeutic benefits did not
occur as a consequence of higher blood CsA concentrations induced by DTZ.
No association was found between blood CsA concentration and either the need for
dialysis or the likelihood that serum creatinine concentrations would fall sooner in the
post transplant period. This may be a type II error, but it is consistent with earlier
findings in similar patient populations (Nankivell BJ, et al. 1994. Mahalati K, et al.
L999) and is one of the reasons for the current interest in sparse sampling AUC
monitoring.
Page 6
ABSTRACT
DTZ use was associated with a reduced need for additional antihypertensive agent use at
3, 6 and 12 months post transplantation. This accords with the approved indication for
DTZbut is contrary to earlier f,rndings from a prospective study in an Australian kidney
transplant population. The reduced need for additional antihypertensive therapy was
confirmed when drug doses were taken into account by way of a scaling system.
Serum creatinine concentration was used as a marker of nephrotoxicity, one of the more
ironic adverse effects of CsA. Creatinine concentration was also used as a marker of
eff,rcacy since rejection reduces functioning kidney mass. It was perhaps not surprising
therefore that no relationship was found between this marker (serum creatinine
concentration) and blood CsA concentration at 3, 6 and 12 months post transplantation
(Chapter 3).
'When data from virtually the entire adult Australasian kidney transplant population was
examined for evidence of benefit or harm resulting from either high or low blood CsA
concentrations, there was little to f,rnd that would assist the fine-tuning of current
therapeutic ranges. A range of IOO-225pglL for the early post transplant period and
100-200pg/1, for the later post transplant period reflects current practice and is
recommended for trough blood CsA concentration in the medium to long term.
The study reported in Chapter 4 provides the basic dose-response relationship on the
interaction between CsA and DTZ in adult kidney transplant recipients. There was
considerable interpatient variation in response to DTZ with respect to elevation of blood
CsA concentrations. Mean CsA AUC(0-24h) increased even after the lowest dose of
PageT
ABSTRACT
DTZ used (lOmg/day). The mean rate of increase slowed after 30-60mg/day but
continued up to the maximum dose tested (180mg/day). Interestingly, morning only
doses of DTZ (560mg/day) affected both morning (0-12h) and evening (12-24h) CsA
AUCs equally. This proves the interaction between DTZ and CYP3A4 (and/or P-gp)
persists aft"er DTZ is removed from plasma.
This data shows that a CsA-sparing effect occurs with lower DTZ doses than those
currently used for many patients (60mg thrice daily). Lower DTZ doses should reduce
the frequency of adverse effects and allow its use as a CsA-sparing agent where
conventional doses might be contraindicated. Because of the considerable interpatient
variability observed, a CsA-sparing effect must be demonstrated in each patient (via
blood CsA concentration monitoring both before and after the introduction of DTZ).
One caveat is that therapeutic benefits demonstrated for DTZ have occurred following
the use of 'conventional' doses (2l80mg/day) and these may not occur at lower doses.
It was shown in Chapter 2 that many centres switched from conventional release DTZ to
the 'controlled diffusion' (CD) formulation in the absence of evidence of bioequivalence
with respect to CsA-sparing effect. The folly of this switch was shown in Chapter 5
when patients were given 180mg CD formulation DTZ and the CsA-sparing effect
compared to 90mg (conventional release) given twice daily. Group data showed no
significant difference, but there were individual falls in CsA AUC(O-12) between 3O-607o
in 3 of the 8 patients while one experienced an increase of 36%. Interestingly, one
patient had unusually low plasma DTZ concentrations following the use of conventional
release DTZ followed by a surprising increase when the CD formulation was given.
Page 8
ABSTRACT
Notwithstanding this increase in plasma DTZ concentrations, the CsA-sparing effect was
largely unaffected and there was no evidence of increased therapeutic effect. The CD
formulation appeared not to perform according to the manufacturer's specifications since
mean DTZ AUC(O-L4) fell by >3OVo and the anticipated am:pm ratio of 0.67 was not
observed. This failure to perform may have affected the CsA-sparing activity and
conversely, may have been caused by the coprescription of CsA to the study participants.
Patients might be better served by changing the dosing regimen (to once or twice daily)
of conventional release DTZ (which simplifres the dosage regimen), rather than switching
to CD formulation DTZ.
In Chapter 6, the relative potencies of two CsA-sparing agents, DTZ and the antifungal
agent itraconazole (lCZ), was studied in a patient with a single lung transplant. CsA
AUC(0-24) increased signifrcantly when ICZ was co-prescribed (compared to when no
CsA-sparing agents were given) but no increase was apparent when DTZ was co-
prescribed with CsA. Despite widespread use as a CsA-sparing agent, this shows that
DTZ does not always increase CsA concentrations, despite the higher than usual dose
being used in this study (240m9/day). It is therefore reconìmended that, where DTZ is
prescribed for its economic benef,rt, the interaction should be proven and not assumed, in
every case.
In Chapter '7, DTZ kinetics were reported in adult kidney transplant recipients taking
routine CsA. Three different kinetic patterns were observed. One patient had a
'subnormal' AUC for DTZ and all its metabolites which was consistent with poor
bioavailability while the other patient had a 'normal' AUC for parent DTZ and primary
Page 9
ABSTRACT
metabolites (DMDTZ and DADTZ) but a higher AUC for the secondary metabolite
DMDADTZwbtch suggests a different metabolic pathway. Both patients demonstrated
a signilrcant CsA-sparing activity across the DTZ dose range studied however and,
combined with the strong statistical association with parent DTZ (compared to
metabolites), this suggests thatD'lZ is the interacting moiety. DTZ dose was as good a
predictor of CsA-sparing effect as either Cmax or AUC and hence there was no point in
monitoring DTZ kinetics.
In Chapter 8, the interaction between tacrolimus (TRM) and DTZ was studied in
recipients of kidney (n=2) and liver transplants (n=2). This study was undertaken
because the literature was equivocal regarding this interaction and it was considered
important to define the nature of the interaction before DTZ was advocated as a TRM-
sparing agent. DTZ exerted a clinically significant TRM-sparing effect in some organ
transplant recipients. The increase in AUC(O-24) for TRM was more marked n the 2
kidney transplant recipients than the liver transplant recipients. The magnitude of the
increase determined by trough (Cs) concentrations was similar to that demonstrated by
AUC(0-24). Whether the difference was due to functional differences in the liver (the
organ transplanted) or whether this is a manifestation of wider interpatient variability in
the transplant population remains to be determined.
These data will assist the formulation of rationally based policies for CsA (and TRM)
sparing agents which will reduce unnecessary exposure to potentially toxic drugs and
help simplifl'drug regimen design such that any effect on compliance is minimised.
Page 10
9'
INTRODUCTION
Chapter 1 INTRODUCTION and LITERATURE REVIEW
While it is possible to live for many years with the aid of one or more of the various
forms of dialysis, for most patients with end stage kidney failure, kidney transplantation
offers the best hope of leading a 'normal' lifestyle. Kidney transplantation involves the
surgical removal of a single kidney from a donor and its subsequent implantation into a
recipient. Kidneys are numerically the most commonly transplanted organ in Australia
where the hrst operations were conducted in the early 1960s. The source of the
transplanted kidney is usually a cadaver, although since most individuals have two
kidneys and a healthy life is possible with only one, it is relatively commonplace for the
donor to be a living relative of the recipient. This especially applies to kidney
transplantation in many overseas countries where religious beliefs prevent the use of
cadaver organs. In these situations, living (usually related) donors are the only source of
kidneys. One of the most important hurdles in kidney transplantation is the problem of
rejection of the transplanted kidney by the immune mechanisms of the recipient.
The immune mechanisms comprise a complex series of cellular and humoral processes
that are meant to protect the individual by recognising and destroying invading
'pathogens'. Because many of these invaders contain similar structures (ie enzymes,
proteins etc) to the host, it is vital that the immune mechanisms are able to detect 'self
from'non-self such that the attack can be directed against the invader. This recognition
of self is achieved by the expression of antigens that are present on the surface of most
cells. While antigens are made from the same (amino acid) base units, the arrangement
of these units is specihc for each individual and the potential number of different
arrangements is enormous. The consequence of this for practical purposes is each
individual will recognise every other individual's tissues are 'foreign'. Cyclosporin
impairs the ability of the immune system to destroy 'foreign tissue' (see section 1.2).
Page l1
INTRODUCTION
The immune system can be likened to armies where the antigens are the flags that are
used to distinguish between friend and foe and the different components of the immune
system can be likened to the various specialist units of the army.
Because they carry antigens that identi$r their origin, transplanted organs will be
recognised as foreign and rejected by the recipient unless the immune mechanisrns are
suppressed. While immunosuppression can be achieved with non-drug therapy
(including radiation and a variety of antibodies), the long term immunosuppression
currently required for the maintenance of organ transplantation is primarily achieved via
drugs. The drugs used in earlier decades (primarily prednisolone and azathioprine) were
relatively non-specific and hence the ability of the immune system to respond to foreign
bacteria and/or cancer cells was impaired along with the ability to reject the transplanted
organ. The most important advance in recent times has been the development of more
selective drugs including cyclosporin (CsA) (Morris PJ. 1996. Diasio RB, et al1996).
CsA is currently the major immunosuppressive drug used to prevent organ transplant
rejection. It is also used in a variety of autoimmune disorders including rheumatoid
arthritis, psoriasis and steroid resistant asthma (Keown PA. 1990).
CsA was obtained from the fungi Trichoderma polysporum and Cyclindrocarpon
lucidum Booth which were isolated from soil samples from Wisconsin, U.S.A. and the
Hardanger Vidda area of Norway in l9lo (Lindholm A. 1991, Borel JF 1981b). The
latter of these fungi was excluded as a commercial source of CsA because it would not
grow in submerged culture and the former fungus became the focus of attention. The
originai name was found to be taxonomically incorrect and the fungus was therefore
renamed Tolypocladium inflaturz Gams (Borel JF 1981b). More recently, this fungus
has been renamed Beauveria nivea (Personal communication, Rosalind Tindale, Novartis
Page 12
INTRODUCTION
Pharmaceuticals, North Ryde, NSW, Australia). During testing for potential
antimicrobial properties, CsA was shown to exert a more selective immunosuppressive
action than existing immunosuppressive agents (Borel JF. 198la, Borel JF. 198lb) and in
particular, bone marrow function was spared. CsA's mechanism of action was shown to
be selective, affecting primarily T helper cells. After success in a variety of animal organ
transplantation models, CsA was first used in the late 1970s in human transplantation
(kidney, pancreas and liver) (Calne RY, et al. I978a) either in addition to, or as an
alternative to, existing immunosuppressive agents (including prednisolone and
azathioprine) (Calne RY et al. 1978b, Calne RY, et al. 1919). While studies have proven
that CsA is an effective immunosuppressive drug when used alone (Hall BM, et al. 1988.
Wood AJ.1982), it is more often used in combination (often in lower doses) with other
immunosuppressive agents (Keown PA, 1990. Morris PJ. 1996. Kunz R, et al. 1997).
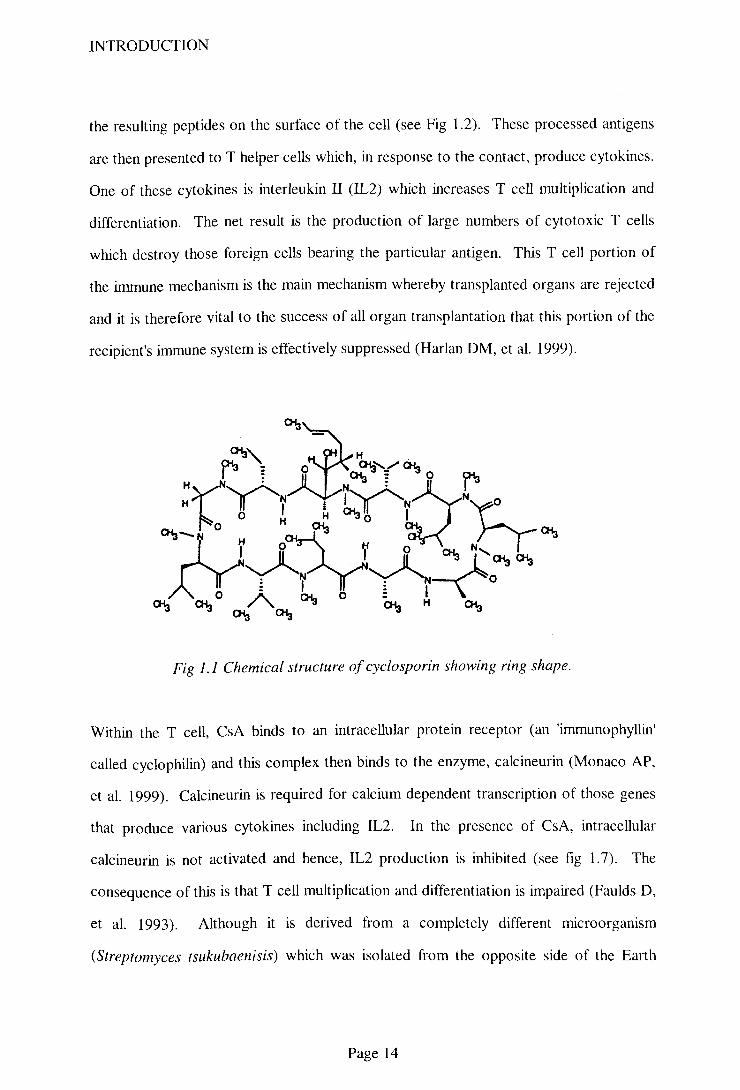
1. 1. Chemical structure:
CsA has a non polar, cyclic, undecapeptide structure (see Fig 1.1) with a molecular
weight of 12O2. CsA is only marginally water soluble (O.004Vow/w) although it is
soluble in fats and organic solvents (partition coeffrcient 120:1 octanol:water) (Shaw LM
et 1987). Other similar peptides are produced by the same fungus including cyclosporin
G which exhibits immunosuppressive activity and is thought to be less toxic (Shaw LM,
et al. 1987). Although trialed clinicaþ, cyclosporin G has to this time not become
commercially available.
1.2. Mode of Action:
Foreign antigens on transplanted organs are recognised by specialist cells (including
macrophages and B cells) which internalise the antigens, process them and then express
Page 13
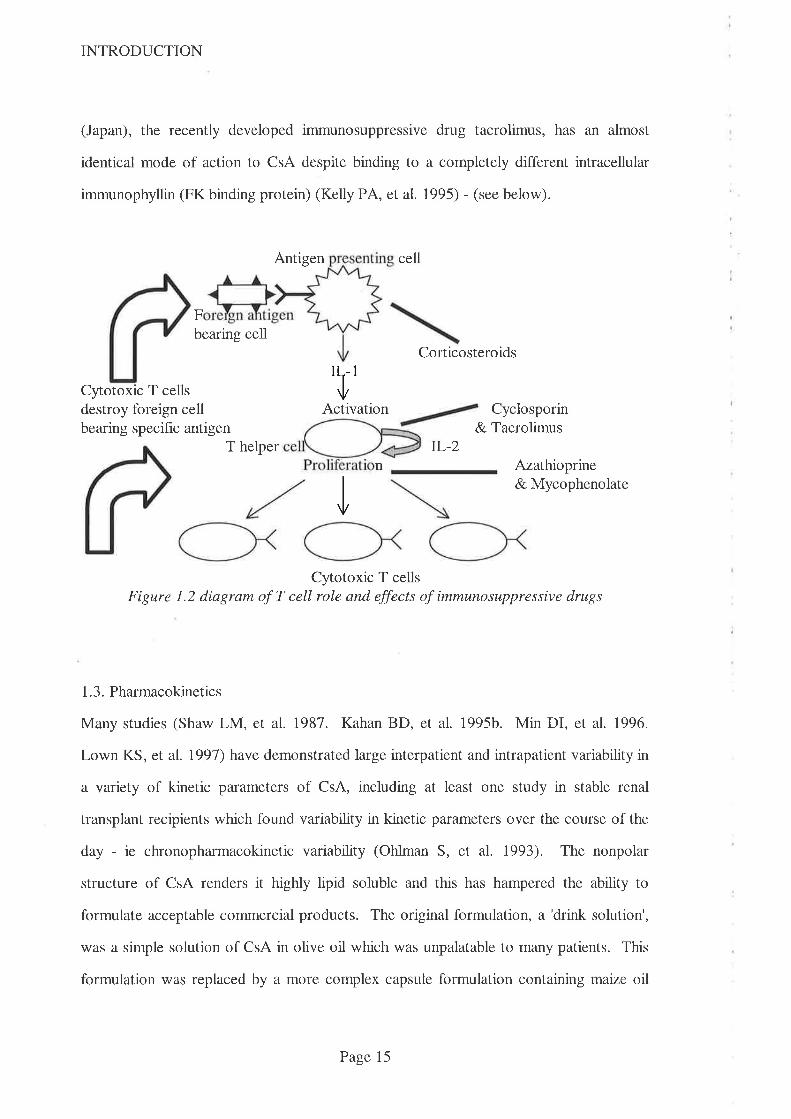
INTRODUCTION
(Japan), the recently developed immunosuppressive drug tacrolimus, has an almost
identical mode of action to CsA despite binding to a completely different intracellular
immunophyllin (FK binding protein) (Kelly PA, et al. 1995) - (see below).
Antigen cell
Fbearing cell
Corticosteroids
Cytotoxic T cellsdestroy foreign cellbearing specific antigen
'l'Activation Cyclosporin
& TacrolimusT helper TL-z
Azathioprine& Mycophenolate
Cyotoxic T cellsFigure 1.2 diagram of T cell role and effects of immunosuppressive drugs
1.3. Pharmacokinetics
Many studies (Shaw LM, et al. 1987. Kahan BD, et al. 1995b. Min DI, et al. 1996.
Lown KS, et al. 1991) have demonstrated large interpatient and intrapatient variability in
a variety of kinetic parameters of CsA, including at least one study in stable renal
transplant recipients which found variability in kinetic parameters over the course of the
day - ie chronopharmacokinetic variability (Ohlman S, et al. 1993). The nonpolar
structure of CsA renders it highly lipid soluble and this has hampered the ability to
formulate acceptable commercial products. The original formulation, a 'drink solution',
was a simple solution of CsA in olive oil which was unpalatable to many patients. This
formulation was replaced by a more complex capsule formulation containing maize oil
n
I
Page 15
INTRODUCTION
and alcohol (Sandimmun@, Sandoz Aust, later Novartis) which was more acceptable but
this formulation has been replaced by a technologically more advanced one - a
'microemulsion preconcentrate' (Neoral@, Novartis). This latest formulation contains
emulsifuing agents that are aimed at reducing the reliance on the presence of bile for
absorption thereby improving absorption from the gastrointestinal tract (Drewe J, et al.
1992a).
1.3.1Absorption
Drewe et al (1992) showed that absorption of CsA occurs predominantly from the
jejunum (Drewe J, et al. 1992b) when they instilled an emulsion of CsA at various
locations along the gastrointestinal tract in 10 volunteers. Absorption (expressed as
mean + sd) from the jejunum (AUC = 4344 + 2754¡tg.h/L), exceeded that from the
duodenum (AUC = 2837 + l39l¡t"g.h/L), which exceeded that from the ileum, (AUC =
1474 + 183¡tg.h/1,) while absorption from the descending colon (AUC = 13'71 +
2731¡tg.hlL) was least. Variability in absorption was greatest when CsA was
administered to the colon when 7 of the 10 subjects had absorption <3Vo of the same
dose given orally while the other 3 had 3'lVo, l9OVo and 299Vo of the same dose given
orally. It is unlikely that this variability resulted from problems with study design since
subjects were similar, meals were standardised, subjects served as their own controls, a
monoclonal assay method was used and hence metabolite cross reactivity should not
have been a major problem (especially with the single dose design). Since CsA is fat
soluble, it is more likely that variability in the ability to solubilise the drug (viz presence
of bile) was the cause of the variabaility.
That the small bowel is the major site for absorption of CsA is also supported by a study
in paediatric liver transplant recipients (Whitington PF, et al. 1990) which noted that the
Page 16
INTRODUCTION
dose of CsA required to maintain therapeutic blood CsA concentrations was almost ten
times that required for adults on a mglkg basis. These authors demonstrated that the
extent of absorption of CsA coruelated closely with the length of small bowel which
increases with growth during childhood.
Systemic absorption following oral administration of both liquid and capsule
formulations of CsA has been noted to be poor and highly variable, varying from as little
as 2Vo to as much as 927o (Venkataramanan R, et al. 1985. Jacqz-Agratn E, et al. 1994).
A number of physiological factors have been reported to affect both the rate and extent
of absorption of CsA including the presence of bile in the gastrointestinal tract (Grevel J.
1986. Lindholm A, et al. 1990). Bile flow may be reduced by disease (e.g. cholestasis)
or by surgical drainage and the poorest absorption is seen in liver transplant recipients
where external drainage of bile is required in the early postoperative period
(Venkataramanan R, et al. 1985. Burckart GJ, et al. 1986). CsA absorption is so
markedly impaired by these states that parenteral administration may be required for
prolonged periods until bile flow can be restored (Burckart GJ, et al. 1986. Trull AK, et
al. 1993. Levy G, et al. 1994. Friman S & BackmanL. 1996. Spencer CM, et al. 1997).
This poor absorption is perhaps not surprising, since CsA is a fat soluble drug which
requìres solubilisation before it can be absorbed and this is the reason behind the most
recent modification to the formulation which attempts to reduce the reliance on bile flow.
The administration of bile salts with CsA has been shown in one early study to increase
CsA's AUC (LindholmA, et al. 1990). In this study, 11 volunteers were given single
doses (6mglkg) of CsA on separate occasions, with and without food and bile salts.
Blood CsA concentrations were measured by HPLC and a significant 25Vo mean increase
in AUC was observed (9078 +2140 vs '7283+2I22¡tg.hn ). There was considerable
intersubject variability in response ranging from I2IVI increase to a 9Vo decrease in
AUC. In addition,2 of the 11 volunteers had a decrease in AUC (-l%o and -9Vo) that is
Page 17
INTRODUCTION
consistent ',vith the well described variability in CsA kinetics. The study was well
designed (standardised meals, random order of treatments, HPLC assay method etc) and
hence provides reasonable evidence of an effect of bile acid on CsA absorption in some
circumstances.
1.3.2 Distribution and Metabolism
CsA has alarge volume of distribution (approximately l3l-lkg) and is distributed widely
in the body. In whole blood, the majority of the CsA present is found in red blood cells
(approximately 50Vo) and leucocy|es (lÙ-207o). The remainder of the CsA in blood is
found bound to lipoproteins (Diasio RB & LoBuglio AF. 1996).
The cyclic ring structure of CsA is relatively resistant to metabolism in the body but the
side chains are extensively metabolised to more than 30 metabolites (Holt DW, et al.
1994. Diasio RB & LoBuglio AF. 1996). The cytochrome P450 isoenzyme, CYP3A4,
has been shown to be the major enzyme responsible for CsA metabolism (Combalbert J,
et al. 1989. Kronbach T, et al. 1988). The nomenclature used to describe cytochrome
P45O enzymes was originally based upon the substrate metabolised (e.g. nifedipine
oxidase) but has now changed to one based upon the amino acid sequence of the enzyme
Slaughter RL, et al. 1995). The 'cytochrome P450' part of the name is derived from the
ability of this enzyme family to absorb light at the 450 nanometre wavelength.
Subdivision into 'families' is denoted by an Arabic number and requires that all members
of the family have >40Vo amino acid homology. For enzymes that have >557o amino
acid homology, the next subdivision (into 'subfamilies') is denoted by a capital letter.
The final subdivision currently recognised is denoted by an Arabic number (Watkins PB.
1992) and at this level of discrimìnation, CYP isoenzymes have been shown to have
>857o amino acid homology (Kolars JC, et al. 1994). In a recent study comparing the
Page 18

INTRODUCTION
effects of chemical inhibitors of four CYP enzymes, it was noted that there are
differences in inhibitory specificity between rat derived enzymes and those derived from
humans (Eagling VA, et al. 1998). It is thus possible that structural differences exist
between CYP enzymes that are currently thought to be a single isoenzyme.
While the liver was thought to be the major source of drug metabolising enzymes (and
was the major target for research into cytochrome P45O enzymes), it has more recently
been recognised that CYP enzymes are also abundant in human enterocytes (Tjia JF, et
al. 1991). They are not uniformly distributed throughout the gastrointestinal tract but
rather, are concentrated in the small intestine (Kolars JC, et al. 1994. Krishna DR,
Klotz U. 1994) (see Fig 1.3). Cytochrome P45O3A4 is the predominant enterocyte
enzyme although there is significant intersubject variability in both intestinal and hepatic
activity (Henricsson S & Lindholm A. 1988. Kolars JC, et al. 1997a. Ketter TA, et al.
199s).
Fi gure l . 3 Immunoperoxidas e staining from human j ej unum showing CYP 3 A4
concentration in the tip of the villus -from Kolars et al 1994
Page 19
INTRODUCTION
V/hile it was initially thought that metabolism of CsA occurred primarily in the liver
(Faulds D, et al. 1993), the importance of intestinal metabolism was established in 1991
when researchers found metabo[tes of CsA in portal blood following instillation of CsA
into the small bowel of 2 patients during the anhepatic phase of liver transplantation
(Kolars JC, et al. 1991b). These authors were among the fust to suggest that intestinal
metabolism might contribute to CsA's poor bioavailability and that drug interactions
might also occur at this site. Other workers have also provided evidence that CsA is
metabolised in the gastrointestinal tract prior to absorption. In an early study (Hoppu K.
et al 1991), CsA was administered orally and intravenously to 2O children requiring
kidney transplantation. The study design included the administration of both oral and
intravenous CsA and blood sampling over a 24hperiod to allow the calculation of AUC.
Samples were assayed by two different assay methods - a 'specific' and non-specific
radioimmuno-assay that allowed an estimation of the degree of metabolism of CsA.
Non-specific assays give higher values because they cross-react to a greater extent with
CsA's metabolites than 'specific' assays and hence the ratio of non-specific to specihc
assays is an index of the degree of metabolism. The ratio of non-specihc to specific
AUC after oral administration was 1.96 (range 1.4-2.1) while afr.q intravenous
administration, it fell to 1.43 (range Ll-2.0) (p=0.0001), indicating greater metabolism
following oral administration. Because the ratio of non-specific to specific AUC after
oral administration decreased as clearance increased among the subjects, the authors
speculated that this implied pre-hepatic metabolism. This study had a number of
limitations including subject heterogeneity. In particular, there was a wide age range of
ages (1.1 - 16.8 years) and different diseases, including some children (n=12) with
nephrotic syndrome. This disease is commonly associated with hyperlipidaemia
(Witztum JL 1996) which thus has the potential to affect CsA's volume of distribution
(since CsA is highly bound to lipoproteins - see above). Also, a wide variety of kinetic
profiles including three distinct patterns of absorption has been described in this very
Page20
INTRODUCTION
population (Jacqz-Agrain E et al. 1994). A further limitation was the assumption that
the 'specihc' immunoassay method measured only parent CsA. The authors attempted
to verifl the specificity of this method by also analysing some samples via an HPLC
assay method. However, only 8 samples (from a total of 440 samples drawn for the
study) were compared by the 2 methods and hence the ratio of 1.16 (RIA:HPLC) value
quoted is suspect. Notwithstanding this limitation, because this study design involved
only a single dose, it would be unlikely that metabolite concentrations would exceed
those of parent CsA and hence the assumption may have been valid. The study design
could not however exclude the possibility that the difference in clearance was caused by
hepatic first pass metabolism.
In another study, 6 healthy volunteers were given fxed doses of CsA (lOmglkg orally
and 3mg/kg intravenously) with or without rifampicin (Hebert MF, et al. 1992).
Clearance of CsA was increased from 0.3 to 0.42L/hlkg by the coprescription of this
enzyme inducing drug, while bioavailability dropped ftom2l%o to lÙVo. These authors
concluded that this fall in bioavailability was best explained by induction of intestinal
cytochrome P450 enzymes which was markedly greater than the induction of hepatic
enzymes. Data from this study was used in a detailed pharmacokinetic analysis discussed
below (Wu CY, et al. 1995).
Interestingly, the ratio between more specific and less specihc assays has been used as a
guide to liver activity in liver transplant recipients (see Chapter 2). Given the importance
of presystemic metabolism and wide intersubject variability in intestinal CYP3A4
activity, it is possible that this might expiain much of the intersubject variability in
absorption following oral CsA administration.
Page2l
INTRODUCTION
A later report applied pharmacokinetic principles to determine the relative contributions
of gastrointestinal and hepatic extraction to overall bioavailability (Wu CY, et al. 1995).
Assuming that intestinal extraction of CsA was minimal after intravenous administration,
the authors compared results from 3 interaction studies they had previously reported.
These studies involved the administration of CsA, both orally and intravenously before
and after the administration of another drug that was known to affect CsA's metabolism.
The drugs in question were rifampicin (an enzyme inducer), or ketoconazole and
erythromycin (both enzyme inhibitors). By setting upper and lower estimates on the
extent of absorption of CsA, the authors were able to calculate gut extraction ratio,
fraction of oral dose absorbed through the gut and effect of interacting drug on gut
extraction. The results of these calculations were that gut extraction ratio exceeded
hepatic extraction ratio and that the effect of enzyme inhibitors is more marked in the gut
than in the liver. These authors further noted that the fraction of administered CsA that
is absorbed into the gut wall from the Sandimmun formulation was high (approximately
867o) and that metabolism in the gut wall was the major factor responsible for the poor
oral bioavailability of CsA. It was necessary for the authors to make some assumptions
including one that administration of each of the interacting drugs did not affect the extent
of absorption of CsA into the gut wall. This is reasonable since dosing of CsA and
interacting drugs were sepilated by lO-12 hours, but may be flawed since erythromycin
can affect gastric emptying (Janssens J, et al. 1990). A further assumption was that
rifampicin induced enzymes in the gastrointestinal wall to the same extent as in the liver.
Because the relative concentration of rifampicin in the intestinal lumen is higher, this
assumption may be flawed. These concerns are relatively minor and do not detract
significantly from this well presented and cogently argued work from highly respected
authors.
Page22
INTRODUCTION
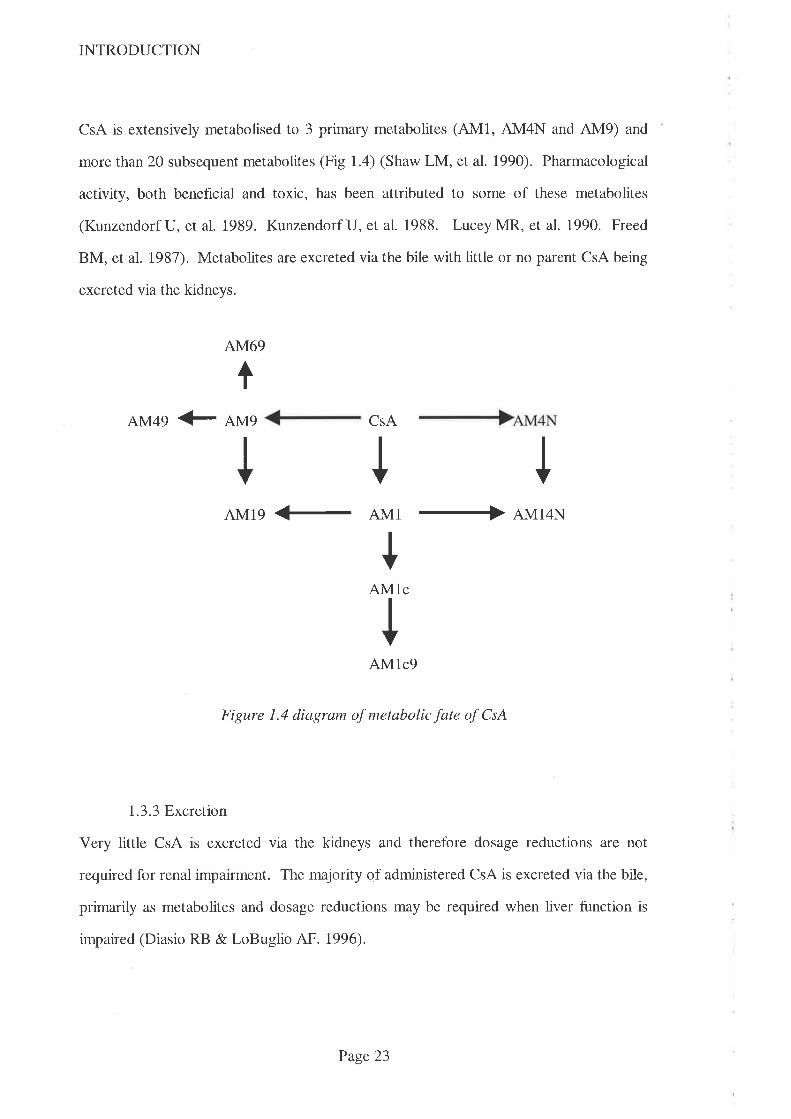
CsA is extensively metabolised to 3 primary metabolites (4M1, AM4N and AM9) and
more than 20 subsequent metabolites (Fig 1.4) (Shaw LM, et al. 1990). Pharmacological
activity, both beneficial and toxic, has been attributed to some of these metabolites
(Kunzendorf U, et al. 1989. Kunzendorf U, et al. 1988. LuceyMR, et al. 1990. Freed
BM, et al. 1987). Metabolites are excreted via the bile with little or no parent CsA being
excreted via the kidneys.
AM69
AM49 € AMq CSA
I
I I IAM19 <- AM1 + AM14N
+AMlc
IAM1c9
Figure 1.4 diagram of metabolic fate of CsA
1.3.3 Excretron
Very little CsA is excreted via the kidneys and therefore dosage reductions are not
required for renal impairment. The majority of administered CsA is excreted via the bile,
primarily as metabolites and dosage reductions may be required when liver function is
impaired (Diasio RB & LoBuglio AF. 1996).
Page23
INTRODUCTION
1.4. Drug Interactions
Many drugs have been reported to either elevate or lower blood CsA concentrations and
most of these interactions can be explained either via inhibition or induction of intestinal
and/or hepatic CYP3A4 (Wu CY, et al. 1995). Some authors however have proposed
alternative mechanisms including alterations to volume of distribution to account for
these interactions with CsA (Tjia JF, et al. 1989. Wagner K, et al. 1989. Shaw MA et
al. 1987). The uncertainty was caused primarily because concentrations of secondary
CsA metabolites were not reduced (as would be expected by inhibition of enzymes that
produce them). The currently accepted explanation for the increased (rather than
decreased) concentration of some secondary CsA metabolites is that the interaction
occurs at multiple levels, reducing both the metabolism of CsA and that of its primary
metabolites.
Established enzyme inducers including rifampicin, phenytoin and phenobarbitone have
been shown to decrease blood CsA concentrations, while drugs which have been
reported to increase blood CsA concentrations include erythromycin, verapamil,
diltiazem, nicardipine, ketoconazole and itraconazole (Holt D'W, et al. 1994).
Interestingly, interacting agents are not confined to prescription drugs - e.g. grapefruit
juice has been noted to interact with a number of drugs that are metabolised by CYP3A4,
including CsA (Min DI, et al. 1996. Edwards DJ, et al. 1999). Drugs that altered blood
CsA concentrations were initially seen as relatively contraindicated (Dieperink H &
Moller J. 1982) for patients receiving CsA because of the enhanced potential for toxicity
and/or rejection. Once the economic potential was realised however, deliberate
coprescription of drugs which allowed the dose of CsA to be reduced (while maintaining
blood concentrations within the therapeutic range) was soon advocated (Leibbrandt DM
&Day RO 1992. Wadhwa NK, et al. 1987 . Valentine H, et al. 1992). These drugs are
thus called'CsA-sparing agents'.
Page 24
INTRODUCTION
1.4. 1 Cyclosporin-sparing agents
CsA is substantially more expensive than earlier immunosuppressive drug regimens based
on prednisolone and azathioprine. In Australia, the annual acquisition costs for these
older drugs was approximately $400.00 per patient, which is approximately one
twentieth the acquisition cost for CsA (based on 4mglkg lday at $7/100mg Neoral@
capsules). The significance of these acquisition costs for CsA was recognised in the
design of a multicentre Australian study conducted in the mid 1980s (Hall BM, et al.
1988). The trial design included one arm where, partly for financial reasons, kidney
transplant recipients were switched (at three months post transplantation) from CsA only
immunosuppression to 'conventional' immunosuppression with azathioprine and
prednisolone. A detailed analysis of drug acquisition costs (including intravenous
methylprednisolone and antilymphocyte gammaglobulin therapy used for acute rejection)
of providing CsA, as part of triple immunosuppressive therapy to 84 kidney transplant
recipients, was undertaken at 'Westmead Hospital, Sydney in 1991 (Barclay PG, et al.
1992). These authors used actual patient data to determine the costs of providing
different immunosuppressive drugs regimens when patients were switched from triple
therapy using CsA to dual therapy (prednisolone and azathioprine alone) at 3 months
post transplant. The annual savings were shown to be $2350 per patient. This study did
not however include the costs associated with therapeutic drug monitoring and, since this
is only an issue with CsA based regimens, the financial impact of using CsA is larger than
this sum indicates.
Reports describing economically advantageous interactions with CsA vary from
serendipitous findings in individual patients (where drugs have been prescribed for
therapeutic purposes to patients already receiving CsA) (Dieperink H, et al. 1982.
Ferguson RM, et al. 1982) through single dose prospective studies in volunteers to long
term, prospective studies in transplant recipients (Macdonald P, et al. 1992.
Page 25

INTRODUCTION
Chrysostomou A, et aL. 1993. Keogh A, et al. 1995). These latter studies have usually
described the degree of CsA dosage reduction, at a set time post transplantation, realised
by coprescribing the CsA-sparing agent. In these studies, as in the clinical setting,
dosage requirements of CsA have been adjusted according to the results of a single
(morning) trough blood CsA concentration. Trough concentration monitoring to
determine drug-drug interactions is suboptimal, especially where the interaction occurs in
the intestinal wall. Because interactions at this site affect absorption more than
clearance, it is important that full AUC monitoring is performed rather than limited
(trough) sampling. These studies also provide limited data on the interaction between
CsA and the interacting drug by virtue of the limited doses of interacting drug used.
These studies have also used doses of CsA-sparing agents that are the recommended
doses for the traditional therapeutic indication and hence there is little data available on
the effects of different (especially lower) doses. Agents that have been studied in some
detail for their CsA-sparing activity are considered below:
1.4.1 J Grapefruit juice
Grapefruit juice was serendipitously shown to increase the bioavailability of some
dihydropyridine calcium channel blockers when it was used as a diluent for alcohol in a
drug interaction study (Bailey DG, et al. 1991). It has also been shown to interact with
other drugs including CsA (Ducharme MP, et a7. 1993), and caffeine (Fuhr U, et al.
1993). The active agent, although not identified, is probably naringin or its aglycone
metabolite, naringenin. Naringin is the flavonoid glycoside that is responsible for the
bitter taste of grapefruit which is not present in orange juice (Bailey DG, et al. 1991).
There is evidence in the literature that the site of interaction is within the intestine. In
one study of 6 hypertensive males, grapefruit juice increased bioavailability (expressed as
Page26
INTRODUCTION
AUC) of orally administered felodipine by 284Vo (range 164%o-4697o) when compared to
the same dose taken with water (Bailey DG, et al. 1991). The increase in AUC largely
resulted from an increase in Cmax (13 + 2nmoL increasing to 29 +3nmol/L) since
elimination half-life was not affected (3.0h vs 2.3h - not significant). This contrasted to
the effect of erythromycin, which increased both Cmax and half-life, which the authors
concluded indicated that grapefruit juice interacted only within the intestine but
erythromycin interacted at the intestinal and liver levels. A similar increase in
bioavailability of nifedipine (l34Vo - range 108-169) in 6 healthy males was reported in
the same paper. In this study, the same dose of nifedipine (10mg) was taken either with
grapefruit juice or water and, once again, the increase in AUC was primarily due to an
increase in Cmax (250t42 nmol/L vs 222+54nmol/L). Interestingly this study also
demonstrated a reduction in half-life of nifedipine caused by grapefruit juice (2.2 + O.\h
vs 1.8 + 0.2, p<0.05). In a study in 10 healthy volunteers, CsA was administered by both
oral and intravenous routes both with and without grapefruit juice (Ducharme MP, et al.
1995). The authors noted an increase in both Cmax and AUC for CsA when it was
administered with grapefruit juice via the oral route when compared to administration
without grapefruit juice and no alteration in pharmacokinetic parameters when CsA was
administered intravenously. The authors therefore concluded that the effect of grapefruit
juice was to inhibit intestinal metabolism of CsA. In another study in 12 kidney
transplant recipients, grapefruit juice was shown to increase Cmax of CsA which the
authors ascribed to a transient effect, probably upon gut enterocyte CYP3A rather than
hepatocyte CYP3A (Hollander AAMJ, et al. 1995).
The use of grapefruit juice as a cyclosporin-sparing agent has been both advocated
(Ducharme MP, et al. 1993) and cautioned against (Johnston A & Holt DW. 1995)
because of the increased variability in a number of pharmacokinetic parameters
(especially Cmax) and uncertainty about the nature of the interacting species. The long
Page 27

INTRODUCTION
term reliability of the interaction in transplant recipients has also not been verified and,
since the source of the interacting species is a seasonal food, there is likely to be
variability in content of active species (and hence in extent of interaction) with time.
This additional source of variability might therefore aggravate the already considerable
intrapatient variability in blood CsA concentrations which would increase the difficulty of
maintaining blood CsA concentrations within the therapeutic range and increase the
potential for toxicity or rejection.
1.4.1.2. Ketoconazole (and related azole antifungal agents)
KCZ was one of the first drugs shown to elevate blood CsA concentrations (Ferguson
RM, et al. 1982) when, in the early 1980s, it was prescribed for its antifungal activity to
a kidney transplant recipient. A dramatic increase in trough blood CsA concentrations
was noted (149 to 2828¡t"gil,) over a 4O day period despite modest CsA dose reductions
(from 900 to 800mg/day). Of particular concern was an associated significant increase in
serum creatinine concentration (1.1 to 3.6mg/dl) which was attributed to CsA toxicity.
The interaction was confirmed later that same year when a bone marrow transplant
recipient was prescrlbed KCZ in a similar dose (200mg/d) and both CsA trough
concentrations (<400 to I225nglrrtr ) and serum creatinine rose sharply (<140 to
450pmo1/L) (Dieperink H & Moller J. 1982). These authors reported that the
interaction was 'hazardous' and recommended caution if these two drugs must be
coprescribed.
Later in the 1980s, researchers from Cincinnati prospectively studied the interaction
between KCZ and CsA in a small group of kidney transplant recipients (First MR, et al.
1989. First MR, et al. 1991. First MR, et al. 1993). One of the aims of these
researchers was to demonstrate the magnitude of the cost savings that could be achieved
Page28
INTRODUCTION
by this coprescription. KCZ was shown to be a potent CsA-sparing ageît, allowing
doses of CsA to be reduced by more than 807o after 1 year which, the authors
speculated, if applied to the entire transplant population in the U.S.A., would translate
into savings in excess of US$100 million per year. Concerns over the safety over this
use of KCZ were partially addressed by this group who found that renal function and
both patient and graft survival were similar to those transplant recipients who were given
usual doses of CsA without KCZ. A similar decrease in CsA dose requirements was
observed in a study of 43 heart transplant recipients where 23 were randomised to
receive 2}}mg/day KCZ while the remainng 20 did not receive it (Keogh A, et al.
1995). These authors also noted annual savings in excess of $5,000 per patient and
therapeutic benefits in the form of reduced infection episodes and less rejection in the
KCZtreated patients.
Another report (Girardet RE, et al. 1989) attested to the apparent safety of the
combination, albeit in a single heart transplant recipient, who received both drugs for a
3.5 year period without apparent adverse effects. There is evidence in the literature that
the magnitude of the interaction between KCZ and CsA increases with time (First MR, et
aL. 1993). In this report of 43 kidney transplant recipients, the required CsA dose was
reduced from 92mglday lmonth after the introduction of KCZto 55mg/day at 36months.
This is greater than the usual fall in dosage of CsA required to maintain therapeutic
blood CsA concentrations in transplant recipients that has been attributed to an increase
in CsA bioavailability. These authors noted that the coprescription of KCZ with CsA
was of particular importance where the transplant recipient was underinsured and thus
required to pay for CsA. Another study in a small group of liver and kidney transplant
recipients demonstrated similar reductions in CsA dosage which averaged 227o (ller
transplant) and 4l.Vo (kidney transplant) at 1 week post transplant increasng to 707o
(liver transplant) and 6lVo (kidney transplant) at 3 months post transplant. The potential
Page29
INTRODUCTION
savings to the US health system was estimated at only US$4 million pa in this report
which is a much lower value than other estimates (First MR, et al. 1993. Sobh M, et al.
1995). The reason for this lower value is not entirely clear from this limited report but
the costs of providingKCZ were higher than expected ($1386 pa) and these offset some
of the savings from reduced CsA dosage (Odocha O, et al. 1996).
The strategy of deliberate coprescription of KCZ with CsA has been questioned on
several grounds (Frey FJ. 1990). These grounds can be broadly divided into
pharmacokinetic and economic. Pharmacokinetic concerns include the increase in
interpatient variability in CsA kinetics (variability in Cmax increasing from 5 to 11 fold
and dose range of CsA required to maintain therapeutic blood CsA concentrations
increasing from 3 to 4 fold) (First MR, et al. 1989). Economic concerns include
overstating the benefit derived from CsA-sparing agent use by virtue of the omission of
the costs associated with additional monitoring. There is also an increased potential for
adverse effects (especially hepatotoxicity) associated with the use of KCZ which would
have a negative impact on the overall saving. Another concern noted by several authors
(Frey FJ. 1990. Schweizer RT, et al. 1990. Didlake RH, et al. 1988. Kiley DJ, et al.
1993) is the impact on compliance when a complicated regimen (typically comprising >6
drugs) is further complicated by the addition of the CsA-sparing agent. The potential for
harm by the use of CsA-sparing agents has been dramatically demonstrated when one
transplant recipient inadvertently ran out of KCZ. The fall in blood CsA concentration
that occurred as a result of the withdrawal of KCZ resulted in rejection (First MR, et al.
1989).
Some kidney transplant recipients prescribed KCZ have also been prescribed calcium
channel blocking drugs including nifedipine, dütiazem or verapamil for the treatment of
hypertension. The CsA dosage required to maintain therapeutic blood CsA
Page 30
INTRODUCTION
concentrations in this group taking the two CsA-sparing agents was 5Vo lower on
average (First MR, et al. 1993) than that required for those patients taking only KCZ.
This suggests that KCZ may act at a different site to calcium channel blocking drugs or
that the effects of calcium channel blocking drugs are additive to those of KCZ.
In an in vitro study (Back DJ & Tjia JF. l99l), the relative potencies of the imidazole
antifungal drugs KCZ, itraconazole, fluconazole and the unrelated terbinafine as CsA-
sparing agents were studied. KCZ was found to be the most potent of these drugs. The
concentration of KCZ requtred to reduce 'cyclosporin hydroxylase' activity by 5OTo
(IC50) was 0.24¡tmoW, the IC50 for itraconazole was 2.2¡tmol/1. for fluconazole and
terbinafine, the IC50 was >100¡rmol/L. The clinical significance of the interaction
between CsA and itraconazole has been confirmed in a kidney transplant recipient given
itraconazole (200mg/d) for a cryptococcal infection in whom the mean blood CsA
concentration doubled (Kwan JTC, et al. 1987). A similar finding was observed in a
heart transplant recipient given 2}Omg/d itraconazole and whose trough blood CsA
concentrations trebled as a consequence (Trenk D, et al. 1987). While this interaction is
thus of considerable clinical significance for the CsA treated patient with a fungal
infection, itraconazole is an unlikely CsA-sparing agent because virtually all of the
savings achieved by the reduced CsA dosage would be spent on providing itraconazole.
1.4.1.3. Calcium channel blocking drugs
Diltiazem and verapamil were shown to inhibit hepatic enzymes tn an in vitro study on
aminopyrine metabolism (Renton KW. 1985). The enzyme responsible for CsA
metabolism was subsequently shown to also metabolise nifedipine in vitro (Combalbert J,
et al. 1989). Interestingly, this dihydropyridine calcium channel blocking drug does not
appear to affect blood CsA concentrations in vivo to any signihcant degree (Wagner K,
Page 3 1

INTRODUCTION
et al. 1989. Tortorice KL, et al. 1990. 'Wagner K, et al. 1988). The explanation for the
lack of interaction in the clinical setting may be related to the relatively low
concentrations of nifedipine that occur within the liver compared to other calcium
channel blocking drugs (Henricsson S & Lindholm A. 1988. Epstein M. 1992). The
structurally similar calcium channel blocking agent, nicardipine, has been shown to
elevate blood CsA concentrations (Bourbigot B, et al. 1986. Kessler M, et al. 1989), as
have the chemically unrelated calcium channel blockers verapamil and diltiazem.
1.4.1.3.1. Verapamil
The interaction between CsA and verapamil has been demonstrated in vitro (Henricsson
S & Lindholm A. 1988) and confirmed in a small number of organ transplant recipients.
In a retrospective review of 5 kidney transplant recipients (Lindholm A & Henricsson S.
1987) verapamil, in doses ranging. from l2}-32}mg/day, was associated with a
significant rise in trough, blood CsA concentrations. From the hgure published in this
letter to the editor, the mean value rose from approximately 500ng/ml to approximately
1100ng/ml, although specific concentrations and details of assay methodology were not
stated. In a South Australian report (Robson RA, et al. 1988), a kidney transplant
recipient prescribed verapamil 80mg twice daily for hypertension had an increase in
trough blood CsA concentration from 350 to 1054pg/L which fell back to 409p,gtL
when nifedipine was substituted. Another case report of a kidney transpiant recipient
demonstrated that the interaction may be dose dependent since no interaction was
observed with a dose of verapamil of 240mglday (for the treatment of hypertension) but,
when the dose was increased to 360mg/day, the trough blood CsA concentration rose
from 244¡tg[I- to 1009pg/L some 3 months later (Maggio TG & Bartels DW. 1988).
There have been no prospective controlled studies to this time which confrm the safety
and reproducibility of this interaction in organ transplant recipients.
Page 32

INTRODUCTION
1.4.1.3.2. Diltiazem
The pharmacokinetic interaction between CsA and diltiazem (DTZ) was first observed in
the mid 1980s when it was prescribed for prophylaxis of angina pectoris (Pochet JM &
Pirson Y. 1986) in a patient receiving CsA. Within 3 days of commencing DTZ, blood
CsA concentrations had risen approximately three fold while serum creatinine had risen
from 120 to l40pmolll. These values returned to baseline within 4 days of stopping
DTZbuq upon rechallenge some 2 months later, even greater increases were observed
(CsA concentration rose approximately five fold and creatinine rose from 130 to
170pmol/L). The effect was once again reversible upon stopping DTZ. DTZ was also
used in the mid 1980s in prospective trials in both dog and human kidney transplant
recipients.
In a series of studies, researchers aimed to demonstrate that, by calcium channel
blockade, DTZ rright prevent the increase in renal vascular resistance from CsA therapy
and thus reduce post transplant, ischaemic, acute renal failure (Wagner K & Neumayer
HH. 1985. Neumayer HH & Wagner K 1986. Oppenheimer F et al. 1992). In one
human kidney transplant study where results appear to have been published twice by the
authors (Wagner K & Neumayer HH. 1985. Neumayer HH & Wagner K. 1,986) DTZ
was added to the solution which perfused the kidney prior to transplantation as well as
being given orally to the recipient post transplant. It has also been noted that DTZ
administration oraþ post transplant (ie without adding it to the kidney perfusion
solution) also reduces the incidence of delayed graft function (Neumayer HH & Wagner
K. 1986. Oppenheimer F, et al. 1992). Compared to controls, (primary graft function
59Vo), DTZ treated kidney transplant recipients had better primary graft function (90Vo)
and a corresponding reduction in the need for haemodialysis in the post transplant
period. This benef,rt was seen despite higher blood CsA concentrations in the treatment
group which would have been expected to increase the incidence of nephrotoxicity. The
Page 33
INTRODUCTION
authors concluded therefore that DTZ exerted a protective effect against CsA induced
nephrotoxicity. A similar reduction in frequency of delayed kidney graft function has
been reported by other researchers, most notably in an Australian study in human kidney
transplant recipients (Chrysostomou A, et al. 1993). These authors prospectively studied
113 recipients of kidney transplants from both Adelaide and Melbourne in whom oral
DTZ was given post transplantation in a randomised fashion to 53 recipients while it was
withheld from the remaining 60. The control group suffered more primary non-function
(16 vs 5) and vascular rejection (14 vs 3) than theDTZ treated group while there were
no apparent differences in renal function (as measured by serum creatinine concentration)
or the incidence of graft failure (4 vs 3) at any interval up to 2 years post transplantation.
While these authors postulated that a reduction in CsA associated hypertension might
also be observed in the DTZ-treated patients, the trial did not demonstrate any such
difference. Interestingly, these authors concluded that, at a dose of 60mg administered
thrice datly,DTZ did not appear to exert an antihypertensive effect in this population.
Earlier observations on the interaction between DTZ and CsA focussed on the
nephrotoxic potential that resulted from elevated blood CsA concentrations. When CsA
dose reduction (guided by blood CsA concentration monitoring) was employed to
prevent excessive elevations in blood CsA concentrations, it was noted that the incidence
of CsA nephrotoxicity was reduced and that CsA dosage reductions of approximately
35Vo were achieved (Wagner K, et al. 1988. Neumayer HH & 'Wagner K. 1986.
Chrysostomou A, et al. 1993. Kohlaw K, et al. 1988. 'Wagner K, et al. 1987. Shennib
H & Auger J. 1994. Brockmoller J, et ai. 1990).
A recent paper (Mclachlan AJ &Tett SE. 1998) has confirmed the extent of the
interactions observed previously between CsA and DTZ, itraconazole, KCZ and the
combined use of DTZ and KCZ In cardiothoracic transplant recipients. These authors
Page 34
INTRODUCTION
used the results of routine trough blood samples used for therapeutic drug monitoring
(for which details of concurrent drug therapy were available) and compared the CsA
dose-rate to the trough CsA concentration at steady-state via a linear mixed effects
modelling approach. They concluded that DTZ reduced the CsA dose by 297o,
itraconazoleby 497o,KCZby'|lVo and combined DTZ andKCZby 847o.
1.4.1.3.3. Mibefradil
This recently developed calcium channel blocker was withdrawn by its manufacturers
shortly after its launch due (in part) to interactions with drugs via the CYP3A4
isoenzyme (personal communication, 5.6.98, Managing Director, Roche Products Pty
Ltd, Dee Why, Australia). Mibefradil was shown to increase the incidence of
rhabdomyolysis in patients taking 'statins' which are metabolised via this enzyme and in
an unpublished study (Peters J, et al. 1995), to signifrcantly elevate blood CsA
concentrations. In this single centre, open label study, 6 stable kidney transplant
recipients maintained on CsA were given 50mg mibefradil daily for 5-6 days. A mean
increase of lO3.'|Vo (range 43-1967o) in Cmax of CsA was observed along with a similar
increase in AUC(O-11) of I28.57o (range 83-232Vo). From this very limited data set, the
manufacturers recommended that the dose of CsA should be halved upon
coÍrmencement of mibefr adil.
1.5. Economic considerations relating to the prescription of CsA-sparing agents
Anecdotal evidence suggests that there is considerable variability in the use of CsA-
sparing agents around the world. In developing countries, the cost of CsA, combined
with meagre incomes, often precludes the use of CsA in transplantation. A similar
situation is seen in some western countries where transplant recipients are sometimes (viz
Page 35
INTRODUCTION
uninsured patients) required to pay for this expensive immunosuppressive drug (First
MR, et al. 1993. Curtis JJ, et al. 1986). In Australia, the Commonwealth government
meets the bulk of the costs of providing CsA for transplant recipients through the
'section 100' scheme which was set up in 1991 (primarily to cope with the costs of
providing CsA). State governments (via public hospitals) pay only for the CsA that is
consumed by inpatients and where CsA is used for non approved uses (as defined by the
'section 100' scheme). This represents only a small percentage of total CsA use and
hence State governments derive little economic benefit from the use of CsA-sparing
agents. Indeed, any benefit that is derived from the use of CsA-sparing agents is offset
by the costs of providing the sparing agent. Whether the practice of using CsA-sparing
agents changed with the introduction of the 'Section 100' scheme is not known.
1.6. Effect of taking CsA with food
Before the advent of CsA-sparing agents, other strategies were advocated to reduce the
required dose (and hence cost) of CsA. One of the most widely studied was the effect of
taking CsA with or without food. In a single dose study in volunteers (Gupta SK, et al.
1990), the effect of taking CsA with a high fat meal not only resulted in an increase in
bioavailability (79Vo compared to 2l%o when taken with a low fat meal) but also
increases in both clearance and volume of distribution. A similar increase in
bioavailability has been noted in renal transplant recipients in whom taking CsA with a
standard hospital breakfast increased bioavailability by 617o compared to taking CsA in
the fasting state (Ptachcinski RJ, et al. 1985). Unfortunately the literature is conflicting,
with other reports showing the opposite effect. In an Australian study (Keogh A, et al.
1988) involving 10 heart transplant recipients, researchers examined the effect of giving
CsA with a standard hospital breakfast versus taking the same dose in the fasting state.
Mean data for the group showed no significant alteration in CsA AUC although there
Page 36
INTRODUCTION
was considerable intersubject variability (range -2lVo to +55Vo). Because of this
confusion as to the effects of taking CsA with food, most authorities recommended that
patients be consistent in the way they take CsA in relation to meals (Honcharik N. 1991.
Morris RG. 1994).
1.7. Analytical problems
Much of the variability in results from early kinetic work on CsA was due to the
signihcant problems associated with analytical methodology (Shaw LM, et al. 1987).
High pressure liquid chromatography (HPLC) was one of the earliest assay
methodologies but it is laborious and expensive, and generaþ not suited to routine
therapeutic drug monitoring. Despite the availability of more easily performed assays
however, one laboratory in Australia has routinely used the HPLC assay method since
the mid 1980s (Morris RG. 1994). Early immunoassays utilised antibodies that were not
specific for parent CsA but cross-reacted to varying extents with many of CsA's
metabolites. Studies have been conducted in which results from non-specific assays were
compared to those from more specific assays and, by inference, any change in the ratio of
the results suggests an alteration in the metabolic fate of CsA (Sabate I, et al. 1989).
Non-specific assays have largely disappeared but one interesting use remains - as an
indicator of the metabolic capacity of the transplanted liver (see Chapter 2). While there
is still some variability in the degree of cross-reactivity between commercially available
immunoassays, the extent of this cross-reactivity with currently marketed immunoassays
is significantly less and inter-laboratory variability has been reduced by the creation (and
adoption) of consensus statements prepared by professional groups (Shaw LM, et al.
1990. Shaw LM, et al. 1987. Morris RG, et al. 1994. Oellerich M, et al. 1995).
Page 37
INTRODUCTION
A number of other factors have been shown to affect the result of CsA assays including
the sample matrix that is analysed, sample storage temperature and type of anticoagulant
used. Consensus recommendations have addressed these issues also and, although they
have not been universally adopted (Morris RG. 1994), more recent pharmacokinetic
studies are more reliable than those from a decade earlier. While it is tempting to believe
that analytical problems have been resolved, one recent development suggests that they
may continue to be a source of concern into the future. This development is the
AxSYI\4/FPIA assay which, the manufacturers claim, gives results that are closer to the
value reported by specific assays (e.g. HPLC) than the older TDx/FPIA assay. Since this
newly released assay method uses the same antibody as the older (monoclonal
TDxÆPIA) assay method but reports a different value (Morris RG. 2000), it appears that
a 'correction factor' has been used. Given the potential for variabiJity in metabolite
concentrations in the clinical setting, it is possible that this factor may on occasion reflect
more closely the specific parent CsA concentration but at other times be less accurate
than the older assay method. Because of the reality of commercial pressures, it is
important to remain vigilant about assay methods.
1.8. Dose Response Relationships
Before a drug is approved for use in human medicine, it is customary to perform dose-
response studies that define the dosage range over which the drug exerts the effect in
question. In the case of CsA-sparing agents, studies have been performed only for the
therapeutic indication(s) for which the drug is marketed (viz for DTZ, anti-anginal or
antihypertensive uses). To this time, pharmaceutical manufacturers have not sought a
CsA-sparing indication for any drug and the doses that are currently used are those
approved for the marketed indication(s). Pharmaceutical companies are unlikely to
perform the necessary dose-response studies for the CsA-sparing indication for two
Page 38
INTRODUCTION
reasons. Firstly, the market afforded by this indication is small and secondly, there are
both ethical and legal concerns over using a drug primarily for an economic purpose
(personal communication Dr H Smith, Medical Director, ICI Aust, manufacturer of
' Cardizem' brand of diltiazem, 1995).
While formal studies in humans are lacking, there are indications from the literature that
the interaction between CsA and the various sparing agents is dose dependent and hence
the doses used currently may not be appropriate. In one animal study (Myre SA, et al.
1991) on 7 adult mongrel dogs, the dose-response relationship for the interaction
between CsA and KCZ covering hve dosages (ranging from 1.25 - 20mg/kg/d) was
studied. The dogs were divided into two groups, the first (n=3) received 6mg/kg/d CsA
and the second (n=4) received reduced doses (3 or l.5mglkg/day) to allow for the
increased blood CsA concentrations that were anticipated as a result of the use of KCZ.
The first group received KCZ at doses of O, 1.25 and Z.5mglkg/d while the second group
received 5, 10 and 2}mg/kg/day. The authors used the ratio between HPLC and
FPIA/TDx assay methodologies to indicate the extent of metabolism of CsA and found
that this was highly correlated wtthKCZ dose (r=0.9980, p<0.0001 ). The effect was
not significant until at least I.25mg/kg/d and little additional effect was evident at KCZ
doses above lOmg/kg/d.
There is evidence that the interaction between verapamil and CsA is also dose dependent
(as noted earlier) where, in one kidney transplant recipient, no effect on blood CsA
concentrations was noted until the dose was increased ftom 240mgld to 360mg/d
(Maggio TG & Bartels DW 1988).
There is evidence that the interaction between CsA and grapefruit juice is not present in
all patients (Min DI, et al. 1996). In this study in 10 kidney transplant recipients, 240mL
Page 39

INTRODUCTION
of grapefruit juice was given in a randomised crossover fashion with the morning dose of
CsA. In 6 patients, CsA AUC(0-12h) was observed to increase (mean 5IVo, range 23-
93Vo) but in the remaining 4, no increase was observed. Interestingly, this study did not
demonstrate an increase in Cmax although a signif,rcant prolongation of Tmax was noted
(5.4h vs 2.8h).
There are suggestions in the literature that the interaction betweenDTZ and CsA occurs
at lower doses than those currently used (180mg/day in South Australia). One group
using 60mg bd (Wagner K & Neumayer HH. 1985. Brockmoller J, et al. 1990) noted a
407o tnqease in CsA AUC in kidney transplant recipients. In a retrospective study of
calcium channel blocker use in patients receiving CsA (Sketris IS, et al. 1994), CsA
dosage requirements were reduced by approximately 3O7o in a group of 13 patients given
DTZ even though 2 of these 13 were given a dose of <90mg/day. Unfortunately no
reason was given for the lower DTZ dose and the CsA dose reductions for these 2
patients were not given separately. In a study on 69 heart transplant recipients
(Valentine H, et al. 1992), D-12 was given to 32 patients starting at 30mg thrice daily
during the third or fourth week post transplantation. Trough CsA concentrations were
significantly higher (223 vs 175¡t"g/L) despite CsA doses being signihcantly lower
(4.3mg/kg/day vs 5.9m9/kg/day) at '1-2'months post transplantation. The dose of DTZ
was increased to 60mg three times a day and to the target dose of \20mg three times a
day as tolerated. While the data quoted for blood CsA concentration and DTZ dose are
imprecise (mean DTZ dose was 90mg at lmo and 195mg at 3mo), it suggests a
significant increase in blood CsA concentration occurred with the 30mg thrice daily dose.
Page 4O

INTRODUCTION
1.9. Other areas of uncertainty
Most of the studies concerning the interaction between CsA and drugs which reduce the
required dose of CsA have been performed using conventional release formulations.
There has been a tendency over recent years for pharmaceutical companies to produce
extended release formulations of those drugs which have short half lives and therefore
need to be prescribed more than twice a day if blood concentrations are to be maintained.
This has been particularly evident in the calcium channel blocking drug group (examples
include nifedipine, diltiazem and verapamil) and has been done to improve patient
compliance by simplifring the dosage regimen. While these formulations have been
shown to be as effective as the conventional release formulations in the control of
hypertension, there are reasons to suspect that their efficacy as CsA-sparing agents may
be different. As noted earlier, CsA is absorbed primarily from the upper gastrointestinal
tract and there is evidence that the gut is an important site for CsA's metabolism (Kolars
JC, et al. 1991b. Hoppu K, et al. 1991). DTZ was marketed in two extended release
formulations, 'Cardizem SR' and'Cardizem CD' (ICI Aust, Melbourne, Australia). The
latter 'controlled diffusion' formulation has replaced the former but, rather than
providing a slow, continuous release of drug, this formulation is designed to release DTZ
in two bursts, the hrst delivering 6O7o of the dose in the first 12h and the second burst
delivering the remaining 4O7o in the last 12h (personal communication, ICI Aust).
Because of the nature of gastrointestinal transit, the second burst will probably occur at a
site well below the principal site of absorption of CsA. If the interaction between CsA
andDTZ is a simple competitive inhibition of CYP3A4 occurring largely at the intestinal
wall site, this second burst of DTZ may not affect intestinal CYP3A4 to the same extent
and hence the effect on blood CsA concentrations may be less marked or absent.
If the second burst of DTZ has a lesser effect on the absorption of the evening dose of
CsA, there are implications for total exposure to CsA. Since CsA dosage adjustments
Page 4l

INTRODUCTION
are usually made following morning trough concentration monitoring (ie following the
evening AUC), the reduced effect of the evening DTZ burst will result in a relatively
higher CsA dose being prescribed. The consequence of this is that daytime CsA AUC
will be increased relative to the evening CsA AUC and hence total daily exposure to CsA
will be greater. Differences in CsA-sparing effect have been noted to occur when brands
of sustained release DTZ are changed (Cooke CE. 1994), although specif,rc details of
brand and magnitude of difference were not noted in this letter and the author was not
able to be contacted to provide these details.
1. 10. Secondary benefrts vetsus adverse effects
CsA-sparing agents have the potential to produce secondary therapeutic benefit as well
as adverse effects. The therapeutic benefits attributed directly to the use of DTZ include
reduced post operative acute tubular necrosis in kidney transplant recipients and reduced
atherosclerosis in heart transplant recipients (Schroeder JS, et al. 1993). DTZ is also
seen as having a 'modest' adverse effect prof,rle, in contrast to KCZ whose adverse effects
(especially hepatotoxicity) are of greater concern (Lewis JH, et al. 1984). In addition,
KCZ appears to have minimal secondary therapeutic benefits and this combination (of
limited benefit and potential for toxicity) is probably the reason for the limited
enthusiasm for using KCZ as a CsA-sparing agent in Australia. Indeed, despite the
evidence (albeit limited) regarding the safety of the combination from overseas groups,
the use of KCZ in Australia has, on occasion, been actively discouraged by ethics bodies
and pharmaceutical companies (personal communication-A.Keogh see Chapter 2).
Page 42

INTRODUCTION
1. 1 l.Cytochrome P450 or P-glycoprotein?
As noted earlier, explanations other than an effect on CYP3A enzymes have been
proposed to explain the interactions between CsA and other drugs. The principal
alternative explanation in the past has been an alteration to volume of distribution but
more recently, a totally different explanation has been proposed. This explanation is the
P-glycoprotein drug efflux pump.
In the late 1980s, a novel mechanism was discovered which was shown to be important
for the development of resistance to chemotherapeutic drugs by a variety of cancer cell
lines (Yahanda AM, et al. 1992).
The development of resistance in tumour cell lines that were previously sensitive is one
of the most disconcerting aspects of cancer chemotherapy. The nature of the acquired
resistance is particularly disturbing since it sometimes involves the development of
resistance to drugs the tumour line has not been exposed to. The gene responsible is
called the mdrl (multiple drug resistance) gene and the product of this gene is a 170 kd
membrane glycoproteìn called P-glycoprotein (P-gp). Using a monoclonal antibody, this
glycoprotein was found to be concentrated in a number of specific sites within the body
including liver, pancreas, kidney, colon and jejunum (Thiebaut F, et al. 1987). Cell types
which contained P-gp were noted to be those on epithelial surfaces which were in
contact with an excretory route. P-gp is also known to be expressed by a variety of
tumour lines that arise from these epithelial tissues and, following exposure to
chemotherapeutic drugs, the expression of P-gp has been shown to increase. In one
study of newly diagnosed lymphomas, only 2Vo of cells expressed P-gp but this figure
rose to 647o n previously treated, resistant tumour cells (Miller TP, et al. 1991).
Page 43
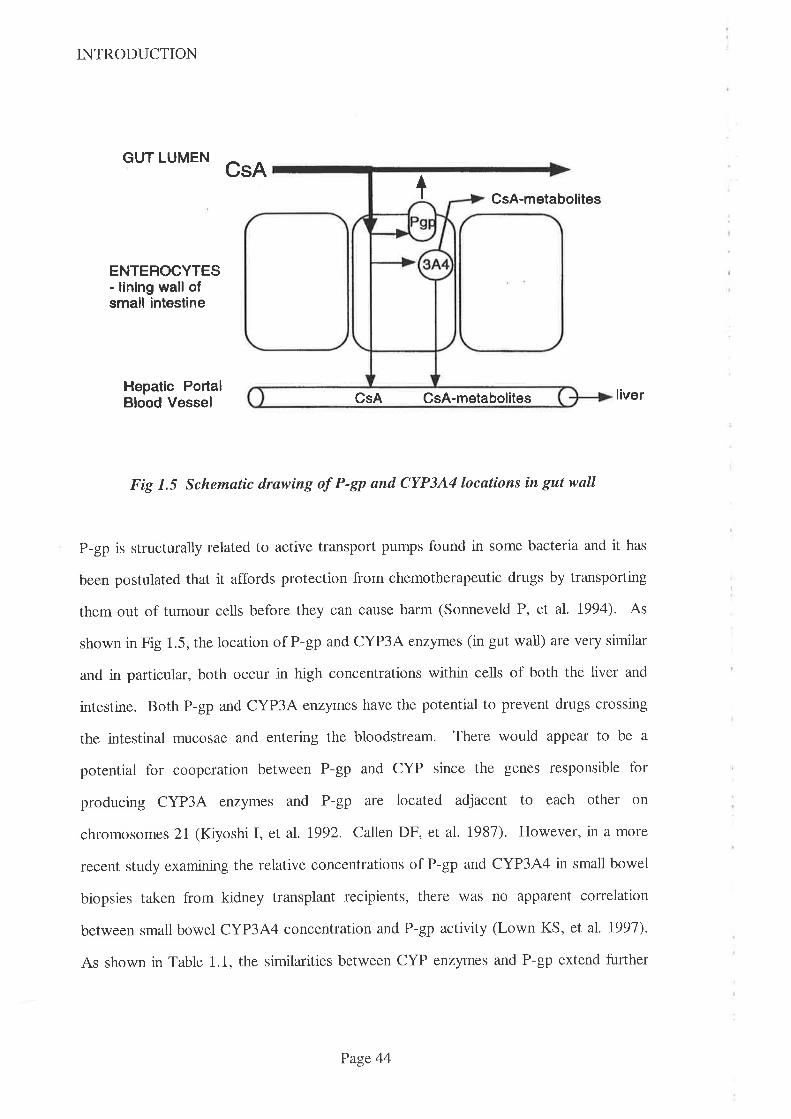
INTRODUCTION
GUT LUMENCsA
I CsA-metabolites
ENTEROCYTES- lining wall ofsmall intestine
Hepatic PortalBlood Vessel liver
Fig 1.5 Schematic drawing oÍ P-Sp and CYP3A4locations in gut wall
P-gp is structurally related to active transport pumps found in some bacteria and it has
been postulated that it affords protection from chemotherapeutic drugs by transporting
them out of tumour cells before they can cause harm (Sonneveld P, et al. 1994). As
shown in Fig 1.5, the location of P-gp and CYP3A enzymes (in gut wall) are very similar
and in particular, both occur in high concentrations within cells of both the liver and
intestine. Both P-gp and CYP3A enzymes have the potential to prevent drugs crossing
the intestinal mucosae and entering the bloodstream. There would appear to be a
potential for cooperation between P-gp and CYP since the genes responsible for
producing CYP3A enzymes and P-gp are located adjacent to each other on
chromosomes 21 (Kiyoshi I, et al. 1992. Callen DF, et al. 1987). Howevet, in a more
recent study examining the relative concentrations of P-gp and CYP3A4 in small bowel
biopsies taken from kidney transplant recipients, there was no apparent correlation
between small bowel CYP3A4 concentration and P-gp activity (Lown KS, et al. 1997).
As shown in Table 1.1, the similarities between CYP enzymes and P-gp extend further
CsA CsA-metabolites
Page 44
INTRODUCTION
than biological role since many of the drugs that act as substrates or inhibitors for a
variety of CYP enzymes also modulate P-gp activity (Wacher VJ, et al. 1995). These
drugs include the calcium channel blocking drugs DTZ and verapamil, and the
immunosuppressant drugs CsA and TRM. Both CsA and verapamil have been shown to
reduce P-gp activity and to thereby reverse the resistance that occurs to some
chemotherapy regimens (Sonneveld P, et al. 1994. Miller TP, et al. 1991. Yahanda AM,
et al. 1992. Lum BL, et al. 1992).
P-gp has also been recently identified in endothelial cells of the blood brain barrier
(Miyama T, et al. 1998. Rao VV, et al. 1999) where it is thought to regulate the influx
and efflux ofendogenous substances as well as a variety ofdrugs. It has been suggested
that coprescription of drugs which reduce P-gp activity might result in elevated
concentrations of drugs including CsA and tacrolimus in the brain (Hebert MF & Lam
AY. 1999)
Because of the close proximity of the P-gp and CYP3A systems within the
gastrointestinal tract and their similar potential for induction and/or inhibition by a
number of drugs, it is difhcult to apportion the effect of altered CsA absorption caused
by the coprescription of another drug to either system. Using the erythromycin breath
test as a marker of liver CYP3A4 activity and taking small bowel biopsies from kidney
transplant recipients, one group of researchers (Lown KS, et al. 1997) attempted to
apportion the relative contributions of each system to the overall interpatient variability
in clearance of orally administered CsA. The erythromycin breath test uses a radioactive
methyl group which is cleaved from the erythromycin molecule by CYP3A4 and after
absorption, radiolabelled carbon dioxide appears in expired air. The reseatchers assumed
that intestinal CYP3A4 does not contribute to demethylation of erythromycin and using
forward logistic regression, they were not able to attribute any of the interpatient
Page 45
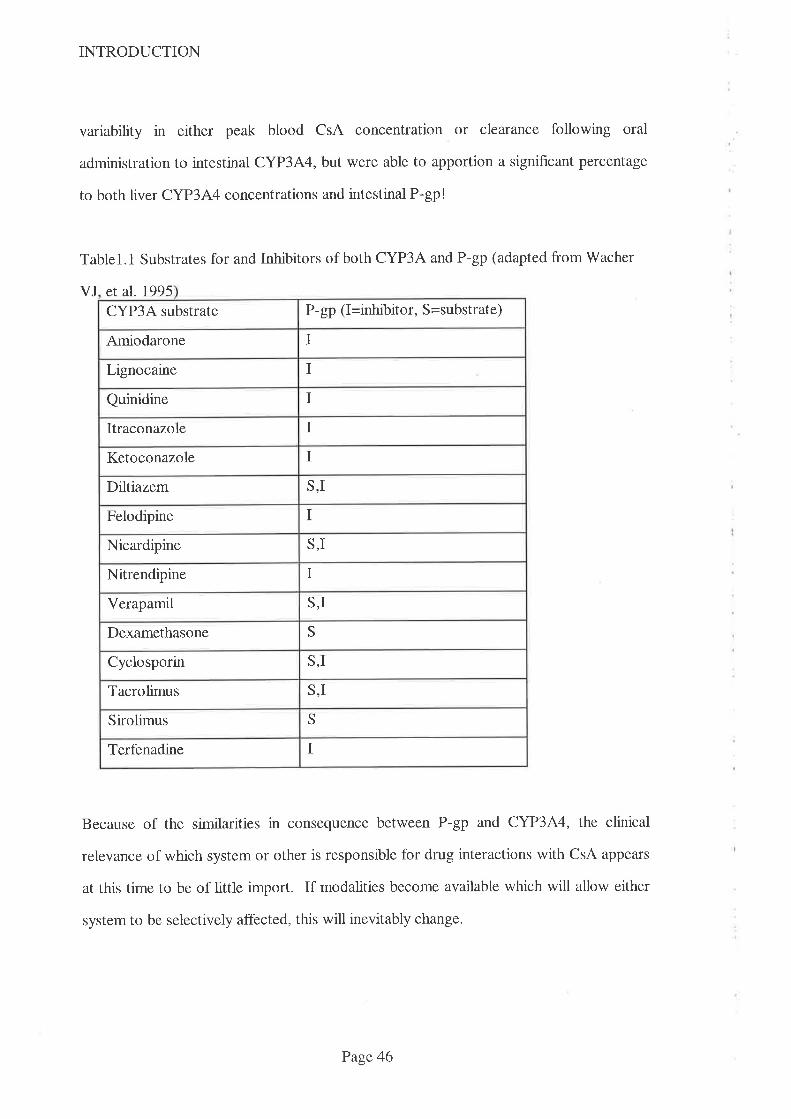
INTRODUCTION
variability in either peak blood CsA concentration or clearance following oral
administration to intestinal CYP3A4, but were able to apportion a significant percentage
to both liver CYP3A4 concentrations and intestinal P-gp!
Tablel.1 Substrates for and Inhibitors of both CYP3A and P-gp (adapted fromWacher
VJ et al. 1995
Because of the similarities in consequence between P-gp and CYP3A4, the clinical
relevance of which system or other is responsible for drug interactions with CsA appears
at this time to be of little import. If modalities become available which will allow either
system to be selectively affected, this will inevitably change.
P-gp (I=inhibitor, S=substrate)CYP3A substrate
Amiodarone I
Lignocaine I
IQuinidine
IItraconazole
IKetoconazole
S,IDiltiazem
IFelodipine
S,INicardipine
INitrendipine
Verapamil S,I
SDexamethasone
S,ICyclosporin
S,ITacrolimus
SSirolimus
ITerfenadine
Page 46

INTRODUCTION
1.12. Tacrolimus
Tacrolimus (TRM) was isolated in 1984 by workers from the Fujisawa Pharmaceutical
Co from the bacterium Streplomyces tsukubaenesis, so named because it was obtained
from the Japanese town, Tsukuba, some 30km north of Tokyo. Despite the geographical
and biological differences, there are many similarities between CsA and TRM, including
solubility, mode of action, pharmacokinetics, drug interactions, adverse effects and cost.
L.12.1 Physical Properties and Mode of Action
TRM is a large, macrolide, lactone antibiotic (Fig 1.6) with a 23 member ring structure
(Tanaka H, et al. 1987). Like CsA, it has a large molecular weight (804) and it is
practically insoluble in water and n-hexane but freely soluble in other organic solvents
including methanol, chloroform and acetone (Honbo T, et al. 1987).
ot Crl3o
Cltá
:
H
Þl3
otooll
to
ocHSoto
Figure 1.6 Structure of Tacrolimus
Page 47

INTRODUCTION
TRM binds to an intracellular binding protein (called 'FKBP' after the drug's
investigational 'name' 'FK506') which is different to the site that CsA binds to, but
following binding, the effect is almost identical (see Figure 1.7). After binding to their
respective intracellular binding proteins, the complex binds to calcineurin. After the
antigen presenting cell delivers the processed antigen to the T cell, a rise in intracellular
calcium occurs. This calcium is bound to calmodulin which then binds to calcineurin.
The next step in the process is the stimulation by calcineurin of the nucleus which
produces IL-2 (and other cytokines). \When calcineurin is blocked by the respective CsA
or TRM complex, IL-2 production is prevented. Since IL-2 is needed to upregulate T
cell production and differentiation, the abiìity of T cells to destroy the antigen bearing
cell is impaired (see Fig 1.2). As noted earlier, T cells are the most important part of the
immune system with respect to organ rejection and the effect of TRM is selective for this
system. Despite the similarities in mode of action between TRM and CsA, there are
important differences in clinical outcome, especially with respect to reversing acute
rejection where TRM has been shown to be effective whereas CsA is not (Kelly PA, et
aI.1995).
The first reports of the use of TRM in human medicine occurred in 1989 when
researchers from Pittsburgh reported on its use in liver, kidney and pancreas
transplantation (Starzl TE, et al. 1989). Until recently, TRM was approved for use in
liver transplantation only in Australia although it has been widely used overseas in kidney
transplantation. The enthusiasm for using TRM for kidney transplantation is very much
dependent upon its inclusion under the Section 100 scheme when the Commonwealth
government pay the acquisition costs. TRM had not been included in this scheme by late
1999 and hence the extent of use of TRM for kidney transplantation in Australia was
limited to this time. Success rates with TRM in liver transplantation are generally better
Page 48

INTRODUCTION
than comparable data using CsA, while success rates in kidney transplantation are similar
to those obtained using CsA (Kelly PA, et al. 1995).
Antigen presenting cell
T cell
IL-2
Figure 1.7 Diagram of intracellular sites of action of CsA and TRMFKBP = Tacrolimus binding protein, CsABP = Cyclosporin binding protein(cyclophilin). The CsAITRM-binding protein complex binds to calcineurin, preventingCa from binding. which then prevents IL-2 production in the nucleus.
IL-2 = Interleukin II is released from the T cell nucleus into the environment. IL-2attaches to receptors on the T cell surface (O ), resulting in multiplication anddifferentiation of cytototoxic T cells
1.I2.2 Pharmacokinetics of TRM
Like CsA, TRM's oral bioavailability is relatively poor (mean 29Vo) and it exhibits
considerable interpatient variability (range 5-67Vo), (Venkataramanan R, et al. 1995.
Kelly PA, et al. 1995). Despite possessing similar solubilities and molecular weight to
FKBP
CsABP
+lcu
@
4
Page 49

INTRODUCTION
CsA, TRM is not dependent upon the presence of bile in the gastrointestinal tract for
absorption. Hence TRM exhibits acceptable oral bioavailability even in the early
postoperative liver transplant period when bile is diverted externally (Jain AB, et al.
1990. Spencer CM, et al. 1997).
TRM is extensively metabolised, principally via CYP3A4 (Sattler M, et al. 1992) and,
while data is limited, there are indications that TRM interacts to a similar extent with
many drugs that also interact with CsA. In one volunteer (n=6) study (Floren LC, et al.
1991), oral and intravenous doses of TRM were given before and after 12 days of
treatment with oral KCZ. The authors demonstrated a doubling of bioavailability
(14¡5Vo increasing to 30+87o) following the use of KCZ. In a retrospective review of
drug charts and other medical records, it was concluded by one group of workers that
nifedipine reduced the daily TRM requirementby 3lVo (Seifeldin RA, et al. 1991) in liver
transplant recipients. This study showed a trend (not statistically significant) toward a
lower dose of TRM when 60mg daily, rather than 30mg daily, nifedipine was used.
Unfortunately the study design (retrospective review) and limited data set (22 nlfedipine
treated subjects and 28 untreated subjects only) limited the abiJity to define the
interaction which the authors concluded would require a controlled prospective study to
def,rne more fully.
In an in vitro stldy using human liver microsomes (Christians U, et al. 1996), 15 drugs
were shown to inhibit the metabolism of TRM including the calcium channel blocking
drugs verapamil and nifedipine. Interestingly, DTZ was not shown to affect TRM's
demethylation in this study although the authors noted that results from such in vitro
studies do not necessarily imply the same effect will be observed in vivo.
Page 50
INTRODUCTION
In another report (Regazzi MB, et al. 1996), the systemic interaction between DTZ and
TRM was def,rned in 4 piglets. Following 48h of constant intravenous infusion of TRM,
an intravenous infusion of DTZ was coÍrmenced and maintained for '72h. Blood
concentrations of TRM (pre and post DTZ infusion) were compared and clearance of
TRM was shown to be reduced from 5.}Llh/kg to l.ZLlhlkgby DTZ. While this study
provides useful information, extrapolation to human medicine would be premature, partly
because of the species difference and partly because the oral route of administration in
used in clinical practice involves another variable, viz the potential for the interaction
within the intestine.
I.I2.3 Adverse Effects of TRM
TRM shares a similar adverse effect profile to CsA, especially nephrotoxicity and
hypertension. Nephrotoxicity has been reported to occur in l8-42%o of liver transplant
recipients and 44Vo in kidney transplant recipients (Yamaguchi Y. 1991). In a
retrospective study of 128 consecutive renal transplant recipients, the incidence of
nephrotoxicity (defined as an increase in serum creatinine that responded to lowering the
dose of TRM and the absence of histopathological changes of acute rejection on biopsy)
was found to be l'77o (Katari SR, et al. 1997). It is likely that the frequency of adverse
effects (including nephrotoxicity) reported from these early studies will be higher than
the frequency that will be encountered after more experience is gained and optimal
therapeutic windows established. Nonetheless, nephrotoxicity and hypertension are two
adverse effects that may be ameliorated by the use of antihypertensive agents including
calcium channel blocking drugs. It is thus likely that, as with CsA, one or other members
of the calcium channel blocking group of drugs will be routinely coprescribed with TRM.
Page 51
INTRODUCTION
1.12.4 Cost of provision of TRM
TRM is similarly priced to CsA with each lmg capsule costing approximately
AUD$4.00. The dosage required to maintain blood TRM concentrations within the
currently accepted therapeutic range (5-2O¡t gil-) appears to vary markedly within a range
of 4mg to 20mg daily and hence the annual acquisition cost of providing TRM will often
exceed $8,000 per patient.
TRM was included in the 'Section 100' scheme for liver transplant immunosuppression
n 1997 but this approval was not extended to cover kidney transplantation until January
2000. The enthusiasm for using TRM in kidney transplantation has thus been tempered
because the individual transplant unit/hospital was responsible for the costs of provision
until it was included in the above scheme. It is reasonable to expect that the usage of
TRM will increase following the lifting of this financial burden from individual transplant
units.
1.13. Confounding biological factors affecting drug metabohsm
Hepatic CYP 450 enzyme activity is not constant and it has long been recognised that a
variety of diseases can affect drug metabolism via this enzyme system. Thus
theophylline's metabolism was shown to be affected by viral respiratory illness in the
1970s (Chang KC, et al. 1978) and more recently, nitrendipine's kinetics were shown to
be affected by acute febrile illness (Soons PA, et al. 1992). In this study, 10 patients
with febrile illnesses were given nitrendipine, a dihydropyridine analogue of nifedipine
during a febrile illness and again at least 6 weeks after their recovery. This data was
compared to that from a similar group of patients who were given the pl selective beta
blocker, bisoprolol. These two drugs were chosen because nitrendipine is completely
metabolised via the CYP3A eîzyme family while bisoprolol is partly excreted unchanged
Page 52
INTRODUCTION
in the urine. As expected, most patients showed an elevation of blood concentration of
both enantiomers of nitrendipine during the infectious period but, because renal function
was not affected, changes to clearance of bisoprolol were smaller and not detectable in
this study.
One group of researchers demonstrated that infusing recombinant interleukin 6 into rats
resulted in a reduction in hepatic microsomal CYP concentrations (Chen YL, et al.
1992). In an elegant study, these same researchers applied this knowledge to a study of
6 bone marrow recipients receiving constant intravenous infusions of CsA (Chen YL, et
al. 1994). In all patients there was a significant increase in blood concentration of parent
CsA (3.6 fold relative to day 2 of infusion) and the AMl metabolite (2.3 fold relative to
day 2 of infusion) while AM9 metabolite concentrations were low or undetectable (all
being measured by HPLC). The times at which blood concentrations of CsA and AMl
increased were coffelated with a prior peak in IL6 concentrations. The authors
concluded that IL6 directly affected metabolism of both CsA and its AMl metabolite
and, given the difficulty of the assay for IL6, that this could best be monitored by
measuring the more easily measured marker of inflammation, C-reactive protein (CRP).
1.14. Summary
CsA is currently the most important immunosuppressive drug used to prevent rejection
of transplanted organs. TRM has an established place in the maintenance of liver
transplants and will be more widely used in kidney transplantation now that the hnancial
burden to transplant units has been removed by inclusion in the 'Section 100' scheme in
Australia. Both drugs have narrow therapeutic margins and the dosage regimen of both
drugs is adjusted according to the results of blood concentration monitoring. Both drugs
are metabolised via the CYP 344 isoenzyme and a number of signihcant drug
Page 53
INTRODUCTION
interactions have been described which result in either an increase in blood CsA/TRM
concentrations (with potential for toxicity) or a decrease in these concentrations (with
potential for rejection). Because CsA is substantially more expensive than former
immunosuppressive drugs, deliberate coprescription of drugs which elevate blood CsA
concentrations (CsA-sparing agents) has been advocated so as to allow a reduction in
CsA dosage while maintaining blood CsA concentrations within the therapeutic range.
The deliberate use of drugs which reduce the dose of TRM has not been advocated in the
literature to this time, but given the similarity in adverse effect profrle between CsA and
TRM and the magnitude of the acquisition costs associated with the use of both these
drugs, it is likely that TRM-sparing agents will be advocated at some time soon.
Although CsA-sparing agents have been routinely used for years and their use appears
widespread, there is little data on how they are used, when they are used, when they are
not used and why they are not used. The nature of the interactions between CsA and
those drugs which are used as sparing agents is not well described, especially with
respect to the dose-response relationship, the reliability of the interaction, the time-
course of the interaction, the effect of changing formulations of sparing agent and the
effect on CsA metabolite profiles. It is unlikely that TRM-sparing agents are widely used
since less is known about the extent and reliability of interactions between TRM and any
of the drugs which might be considered as sparing agents. Given that CsA sparing
agents have been used for such a long time, this lack of knowledge is disturbing and it is
highly desirable that such data be made available before contemplating the use of drugs
as TRM-sparing agents.
Having identified these areas where knowledge is lacking, it is thus appropriate to
investigate these and other similar areas in order to optimise the use of CsA, TRM and
Page 54
INTRODUCTION
drugs which are used as sparing agents. In particular, it is important to conduct studies
that will:
-identiff the current usage of CsA-sparing agents by Australasian transplant
physicians,
-identiff why some centres may not use such agents
-examine the relationship betweenDTZ dose and increase in both blood CsA and
TRM concentration in organ transplant recipients,
-examine the clinical sequelae of using DTZ on parameters of effrcacy and
toxicity of CsA and TRM.
1.15. Aims
1. To ascertain the frequency of use of CsA-sparing agents, the doses and formulations
used, and savings achieved by their use in Australasian organ transplant recipients. This
will be achieved by surveying transplant centres identified from the ANZDATA registry
database that has details of all transplant centres performing organ transplantation in
Australia and New Zealand.
2. To ascertain the therapeutic ranges for CsA that are clinically relevant to transplant
physicians (as opposed to the ranges quoted by laboratories) in Australasia and to assess
the effect that the use of CsA-sparing agents has on these ranges. This data will be
obtained by surveying Australasian transplant centres in the same way as for Aim 1.
3. Where CsA-sparing agents are not routinely used, to ascertain the reasons for not
using them in the Australasian setting. This data will be obtained by surveying
Australasian transplant centres in the same way as for Aim 1.
Page 55

INTRODUCTION
4. To assess the therapeutic benefit of using DTZ n kidney transplant recipients with
respect to affecting early graft function and blood pressure control. This data will be
obtained by surveying Australasian transplant centres in the same way as for Aim l.
5. To dehne the dose-response relationship for DTZ with respect to its interaction with
CsA in a prospective trial in stable kidney transplant recipients.
6. To determine whether the controlled diffusion formulation of diltiazem affects the
extent of the interaction with CsA or TRM.
7. To define the dose-response relationship for DTZ with respect to its interaction with
TRM in a prospective trial in kidney and liver transplant recipients.
1.16. Hypotheses to be tested:
1. That the doses of DTZ currently used are greater than those required to produce a
significant CsA-sparing effect for a significant number of transplant recipients.
2. That coprescribingDTZ with TRM results in an increase in blood TRM
concentrations within the range of DTZ doses that are able to be used clinically and that
the use of DTZ as a TRM-sparing agent is clinically acceptable.
3. That the controlled diffusion formulation of DTZ given once daily interacts with CsA,
or TRM, differently and to a lesser extent than conventional release formulations.
Page 56
CHAPTER 2
CHAPTER 2:
Survey of Australasian transplant centres to ascertain current practices regarding
CsA-sparing agents, therapeutic ranges used and assay methodology.
2.1 Introduction
2.2 Alrns
2.3 Methods
2.4 Results
2.5 Discussion
2.5.1"1o Use CsA-sparing agents Or Not?
2.5.2Who benefits from the use of CsA-sparing agents?
2.5.3. To Use DTZ or KCZ
2.5.4. Dosage regimen of DTZ
2.5 .5 . Formulation Effects
2.5.6. CsA therapeutic range
2.5.1 . CsA assay methodology and monitoring
2.5.8. Frequency of dosing for CsA
2.5.9 Numbers of transplants performed at each centre
2.6. Conclusions
use of
58
59
59
60
10
1T
12
14
t5
15
t6
18
81
82
83
Page 57
CHAPTER 2
2.1 Introduction:
Since its introduction in the early 1980s, CsA has become the major immunosuppressive
drug used in organ transplantation and while it has improved graft survival, it has
significantly increased the cost of maintaining transplanted organs. CsA is approximately
twenty times more expensive than the immunosuppressive drugs it replaced
(prednisolone and azathioprine) - typical CsA costs for an adult transplant are
AUD$8,000 pa. (based on 4mglk glday Sandimmun@ capsules at $7/100mg).
CsA was initially difficult to manage because of poor and variable oral bioavailability, the
'drink solution' adhered to plastic surfaces, the injection leached plasticisers from
administration lines, there appeared to be limited correlation between blood
concentration, effrcacy and/or toxicity, little was known about drug interactions and
therapeutic drug monitoring was diff,rcult because most assay methodologies were not
specific for parent CsA, were expensive and laborious. Some of these issues have been
partially or completely resolved. Formulation refinements have reduced variability in
bioavailability while the advent of rapid and relatively selective CsA immunoassays have
facilitated therapeutic drug monitoring which now plays an important part in the
management of CsA therapy.
In the mid 1980s it was noted that some drugs reduce CsA metabolism resulting in
elevated blood CsA concentrations and consequent toxicity (Pochet JM & Pirson Y.
1986. Wagner K & Neumayer HH. 1985). Drugs which have been shown to elevate
blood CsA concentrations include DTZ, KCZ and erythromycin, while the enzyme
inducers rifampicin and phenytoin decrease blood CsA concentrations. In the late 1980s
it was suggested that this interaction could be exploited in part to contain the ever
growing cost of transplantation (Neumayer HH, Wagner K. 1986). The two drugs most
frequently cited as 'CsA-sparing' agents are DTZ and KCZ. DTZ is thought to be more
commonly used in Australia and New Zealand, but KCZ is thought to be more
Page 58
CHAPTER 2
commonly used in countries where the transplant recipient is requiied to pay for CsA
because without the large dose reductions afforded by the coprescription of KCZ, CsA
would not be affordable. V/hile many transplant patients maintained on CsA have a
therapeutic indication for DTZ (eg. hypertension and angina), and while there is some
evidence that DTZ improves transplant kidney function (Epstein M. 1992.
Chrysostomou A, et al. 1993. Vasquez EM & Pollak R. 1995) many are prescribed DTZ
purely for its economic benefit. This is the first time that drugs have been advocated
primarily for an economic purpose and thus it raises many ethical concerns. There is
little published data on the Australasian usage of CsA-sparing agents and so this survey
of Australian and New Zealand transplant centres was undertaken to ascertain current
practices.
2.2 Aims:
To determine the extent to which CsA-sparing agents are used by Australian and New
Zealand organ transplant centres, to determine which agents and what dosage regimens
are used and why these agents are used by some but not all centres. To ascertain the
assay methodologies and therapeutic ranges used by organ transplant centres and the
utility of therapeutic drug monitoring.
2.3 Methods:
Questionnaires (appendix 1) were mailed to the directors of 40 heart, kidney, liver, lung
and pancreas transplant centres identified from the Australia and New ZeaTand Dialysis
and Transplant - ANZDATA -registry in late 1995/early 1996. The questions asked
included the number and type of organ transplants performed, whether CsA-sparing
agents were routinely used, which agent/s were used and in what dosages, what savings
were associated with this use and reasons for not using CsA-sparing agents. Questions
Page 59
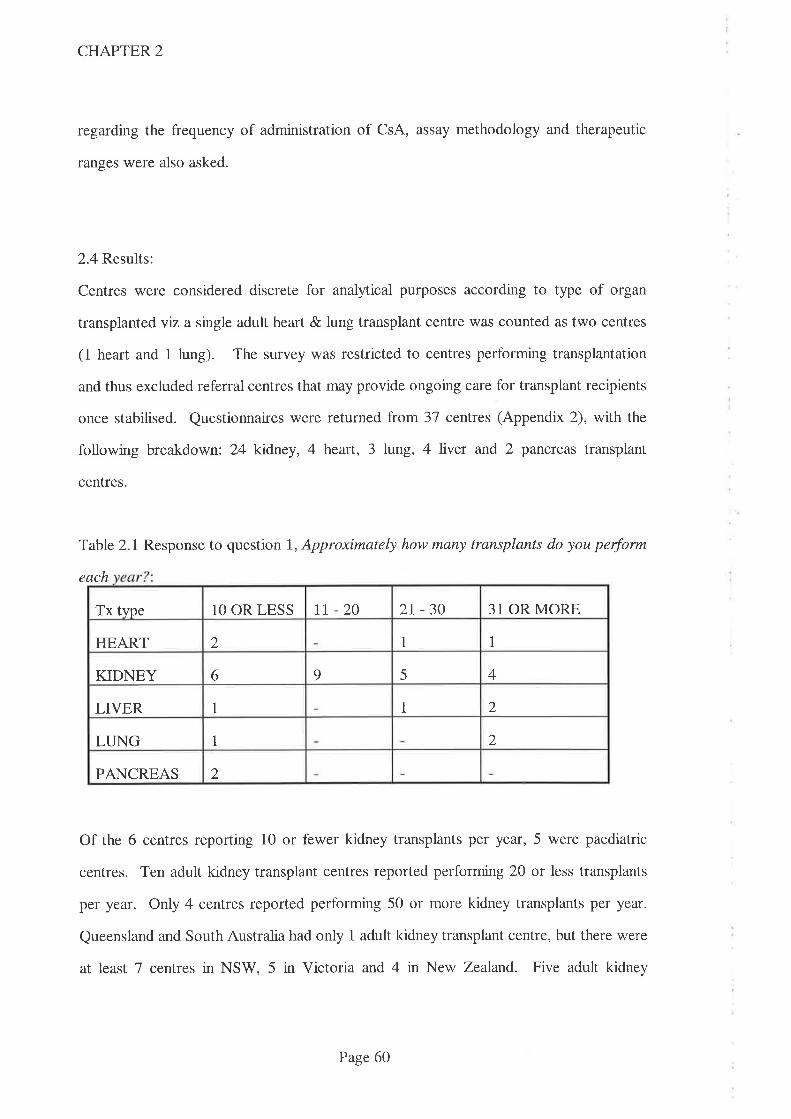
CHAPTER 2
regarding the frequency of administration of CsA, assay methodology and therapeutic
ranges were also asked.
2.4 Results:
Centres were considered discrete for analytical purposes according to type of organ
transplantedviza single adult heart & lung transplant centre was counted as two centres
(1 heart and 1 lung). The survey was restricted to centres performing transplantation
and thus excluded referral centres that may provide ongoing care for transplant recipients
once stabilised. Questionnaires rwere returned from 3'7 centres (Appendix 2), with the
following breakdown: 24 kidney, 4 heart, 3 lung, 4 liver and 2 pancreas transplant
centres.
Table 2.1 Response to question 1, Approximately how many transplants do you perform
each
Of the 6 centres reporting 10 or fewer kidney transplants per year, 5 were paediatric
centres. Ten adult kidney transplant centres reported performing 20 or less transplants
per year. Only 4 centres reported performing 50 or more kidney transplants per year.
Queensland and South Australia had only 1 adult kidney transplant centre, but there were
at least 7 centres in NSW, 5 in Victoria and 4 in New Zealand. Five adult kidney
Tx tvpe 10 OR LESS tt -20 2r-30 31 OR MORE
1 1HEART 2
6 9 5 4KIDNEY
1 2LIVER 1
2LUNG 1
2PANCREAS
Page 60

CHAPTER 2
transplant centres in NSW and 3 in Victoria reported performing 2O or less transplants
per year. All centres performing transplants were situated in the capital city of their
respective state with the exception of one centre performing adult kidney transplants
which was situated in Newcastle.
Table 2.2 Response to question 2, In what percentage of patients do you use CsA
2
Because the number of transplants performed varies considerably between units and the
numbers of transplant recipients receiving CsA-sparing agents was only grouped into one
of 4 categories (viz. 'all','most','some'or'none'), it was necessary to make the following
approximations. It was assumed that within the category 'most', 2/3 of transplant
recipients receive CsA-sparing agents and within the category 'some', l/3 of transplant
recipients receive them. Using this approximation, 857o of heart, '7I7o of kidney, 66Vo of
ltng,29Vo of pancreas and 6Vo of liver transplant recipients routinely receive DTZ.
The response to question 3, What CsA-sparing agent do you zs¿Z showed that DTZwas
the most frequently used CsA-sparing agent. 41128 centres which reported using CsA-
sparing agents (in all, most or some transplant recipients) used DTZ while four centres
routinely used KCZ and one centre (heart transplant) had used both agents concurrently.
Tx type ALL MOST SOME NONE
HEART 2 2
KIDNEY t3 1 5 5
LIVER 1aJ
LUNG 2 1
PANCREAS 1 1
Page 61
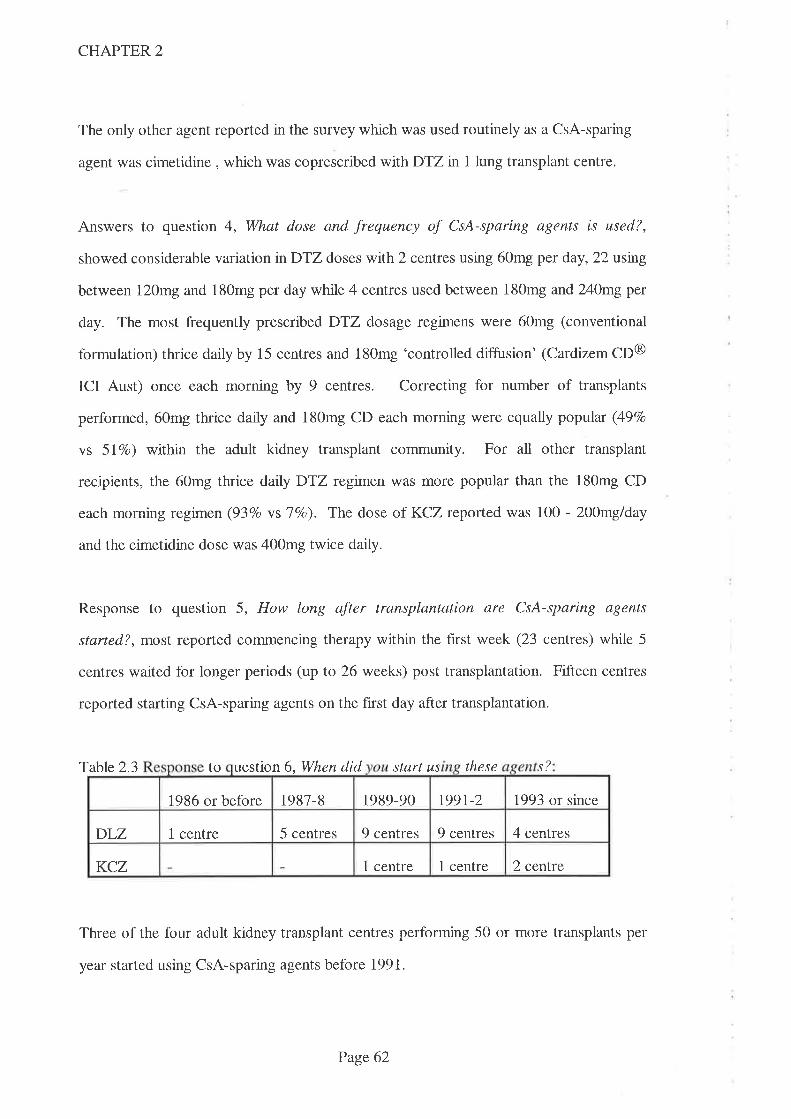
CHAPTER 2
The only other agent reported in the survey which was used routinely as a CsA-sparing
agent was cimetidine , which was coprescribed wifhDTZ in 1 lung transplant centre.
Answers to question 4, What dose and frequency of CsA-sparing agents is used?,
showed considerable variation nDTZ doses wtth2 centres using 60mg per day, 22 usng
between I20mg and 180mg per day while 4 centres used between 180mg and240mgper
day. The most frequently prescribed DTZ dosage regimens were 60mg (conventional
formulation) thrice daily by 15 centres and 180mg 'controlled diffusion' (Cardizem CD@
ICI Aust) once each morning by 9 centres. Correcting for number of transplants
performed, 60mg thrice daily and 180mg CD each morning were equally popúar (49Vo
vs 5l7o) within the adult kidney transplant community. For all other transplant
recipients, the 60mg thrice darlyDTZ regimen was more popular than the 180mg CD
each morning regimen (93Vo vslVo). The dose of KCZ reported was 100 - Z00mg/day
and the cimetidine dose was 400mg twice daily.
Response to question 5, How long after transplantation are CsA-sparing agents
started?, most reported commencing therapy within the first week (23 centres) while 5
centres waited for longer periods (up to 26 weeks) post transplantation. Fifteen centres
reported starting CsA-sparing agents on the f,rst day after transplantation.
Table 2.3 to uestion 6, When did start us these .ç?
Three of the four adult kidney transplant centres performing 50 or more transplants per
year started using CsA-sparing agents before 1991.
1987-8 1989-90 t99l-2 1993 or since1986 or before
1 centre 5 centres 9 centres 9 centres 4 centresDLZ
KCZ 1 centre 1 centre 2 cenfte
Page 62

CHAPTER 2
Answers to question 7 , How frequently is CsA administered each day?, showed that the
majority of centres used a twice daily CsA regimen although two centres (1 kidney, 1
pancreas) used a once daily regimen and three centres sometimes used a thrice daily
regimen. Two of the five paediatric transplant centres reported using thrice daily CsA
regimens in some patients.
Responses to question 8, What values do you use as a therapeutic range for CsA?, were
divided into three separate periods; the period soon after transplantation, an intermediate
period and in the long term. Twenty eight centres responded that they used different
ranges for all three periods, 6 centres reported using only two discrete ranges while 3
centres reported using only one range irrespective of time post transplantation. Data
from the adult kidney transplant population are presented in Table 2.4 and the
corresponding data for paediatric kidney transplantation are presented in Table 2.5. In
order to rank the ranges in tables 2.4 and 2.5, the mid-point of each range was taken for
comparison. Hence two ranges with the same mid-point value are quoted in the highest
range for the early and middle periods post transplantation.
Table 2.4 Highest and lowest CsA therapeutic ranges (ranked by mid-point value)
for adult
Where more than one range was identified, the values given for the early period after
transplantation were always higher than the middle which were higher than the late
period. The mean of the mid-point values quoted for CsA therapeutic ranges for early,
Period post transplant lowest range(lte[L) highest range(pgll-)
Earlv period 80-250 300-400 or 200-500
Middle period 130-170 200-400 or 250-350
Late period 50-150 225-300
Page 63
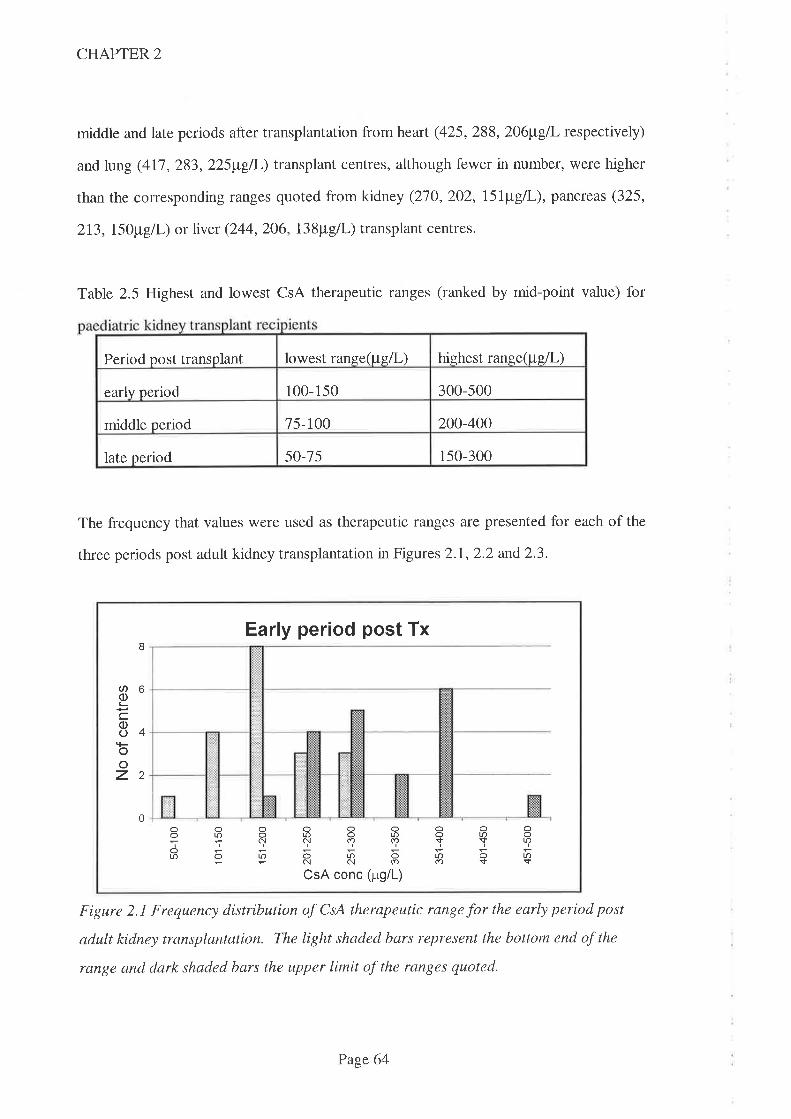
CHAPTER 2
middle and late periods after transplantation from heart (425,288,206¡t"gI respectively)
and lung (41'7,283,225¡tgfi-) transplant centres, although fewer in number, were higher
than the corresponding ranges quoted from kidney (270,202, l5l¡t"g/|,), pancteas (325,
213, I5O¡tg[I-) or ller (244,206, l3Spgll-) transplant centres.
Table 2.5 Highest and lowest CsA therapeutic ranges (ranked by mid-point value) for
The frequency that values were used as therapeutic ranges are presented for each of the
three periods post adult kidney transplantation in Figures 2.1,2.2 and2.3.
Figure 2.1 Frequency distribution of CsA therapeutic range for the early period post
adult kidney transplantation. The light shaded bars represent the bottom end of the
range and dark shaded bars the upper limit of the ranges quoted.
lowest range(pgll-) highest range1lg/l-)Period post transplant
300-500early period 100-150
75-100 200-400middle period
50-75 150-300late period
Early per¡od post Tx
Oo(\|f)
I
b
4
2
0
ØoL
cooooz
Oo
|f)
ro
o
olr)c!
o(\CsA
oo(f)
u.N
con
olr)(f)
ori(p,g/L)
o$rÍ)cr)
o|r)so$
oo|f)
U.sc
Page 64
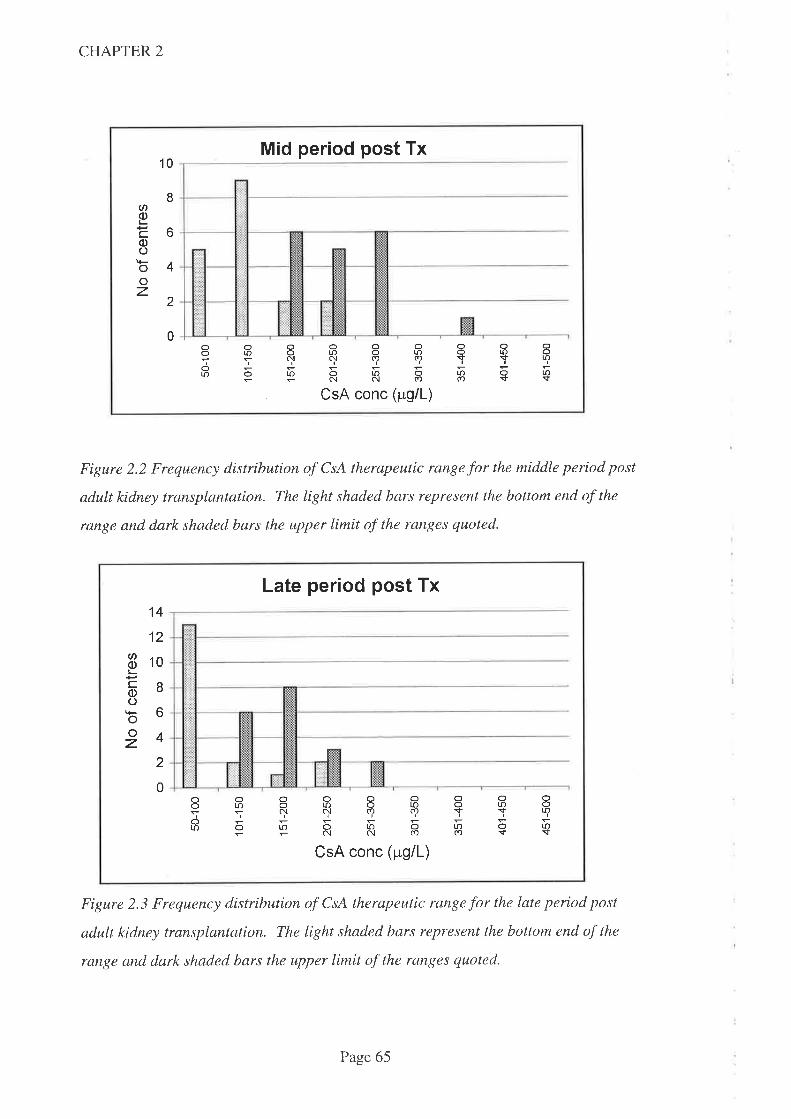
CHAPTER 2
Mid period post Tx10
ØoL
cc)oooz
8
6
4
2
0oooLr)
ooooooa'õÕú)olOA|f')ÌqS9çYTor.l)orno1r)a
CsA conc (¡rg/L)
oo|J-
Lr)s
Figure 2.2 Frequency distribution of CsA therapeutic range for the middle period post
adult kidney transplantation. The light shaded bars represent the bottom end of the
range and dark shaded bars the upper limit of the ranges quoted.
Late per¡od post Tx
CN
o¡-coo¡Þooz
14
12
10
I6
4
2
0ooolo
ooooooaõÕloolf)o|J.5qryqqYTor,ootooloa=Ëñc{(Ð(f)s
CsA conc (pg/L)
ooto
u.$
Figure 2.3 Frequency distribution of CsA therapeutic range for the late period post
adult kidney transplantation. The light shaded bars represent the bottom end of the
rangp and dark shaded bars the upper limit of the ranges quoted.
Page 65
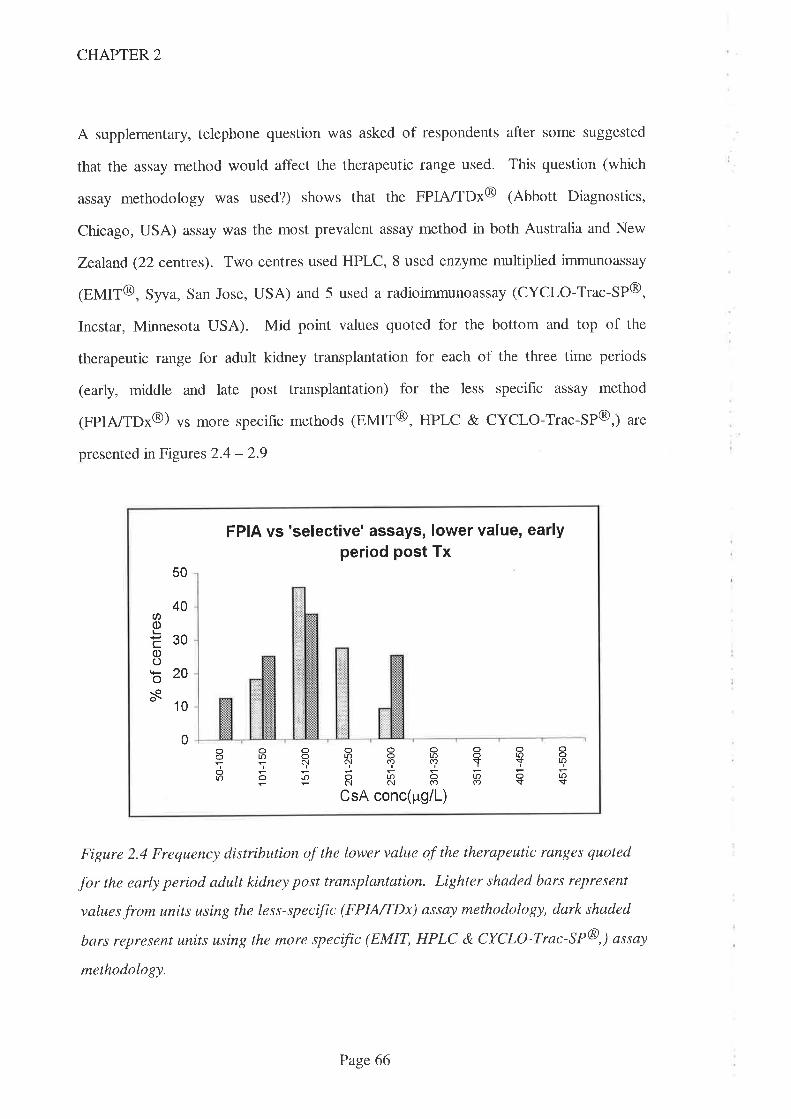
CHAPTER 2
A supplementary, telephone question was asked of respondents after some suggested
that the assay method would affect the therapeutic range used. This question (which
assay methodology was used?) shows that the FPIA/TDx@ (Abbott Diagnostics,
Chicago, USA) assay was the most prevalent assay method in both Australia and New
Zealand (22 cenTres). Two centres used HPLC, 8 used enzyme multiplied immunoassay
1EMIT@, Syva, San Jose, USA) and 5 used a radioimmunoassay (CYCLO-Trac-SP@,
Incstar, Minnesota USA). Mid point values quoted for the bottom and top of the
therapeutic range for adult kidney transplantation for each of the three time periods
(early, middle and late post transplantation) for the less specihc assay method
(FpIA/TDx@) vs more specific methods (EMIT@, HPLC & CYCLO-Trac-SP@,) are
presented in Figures 2.4 - 2.9
50
40U)q)L
E30oob20s- 10
FPIA vs 'selective' assays, lower value, earlyper¡od post Tx
oooooaañÕ|õotoa'¡?5+qqqYTE9RR8Eç
CsA conc(pg/L)
0ooon
ooLr)
r¡-)s
Figure 2.4 Frequency distribution of the lower value of the therapeutic ranges quoted
for the early period adult kidney post transplantation. Lighter shaded bars represent
values from units using the less-specific (FPIA/TDx) assay methodology, dark shaded
bars represent units using the more specific (EMIT, HPLC & CYCLO-Trac-SP@,) assay
methodology.
Page 66
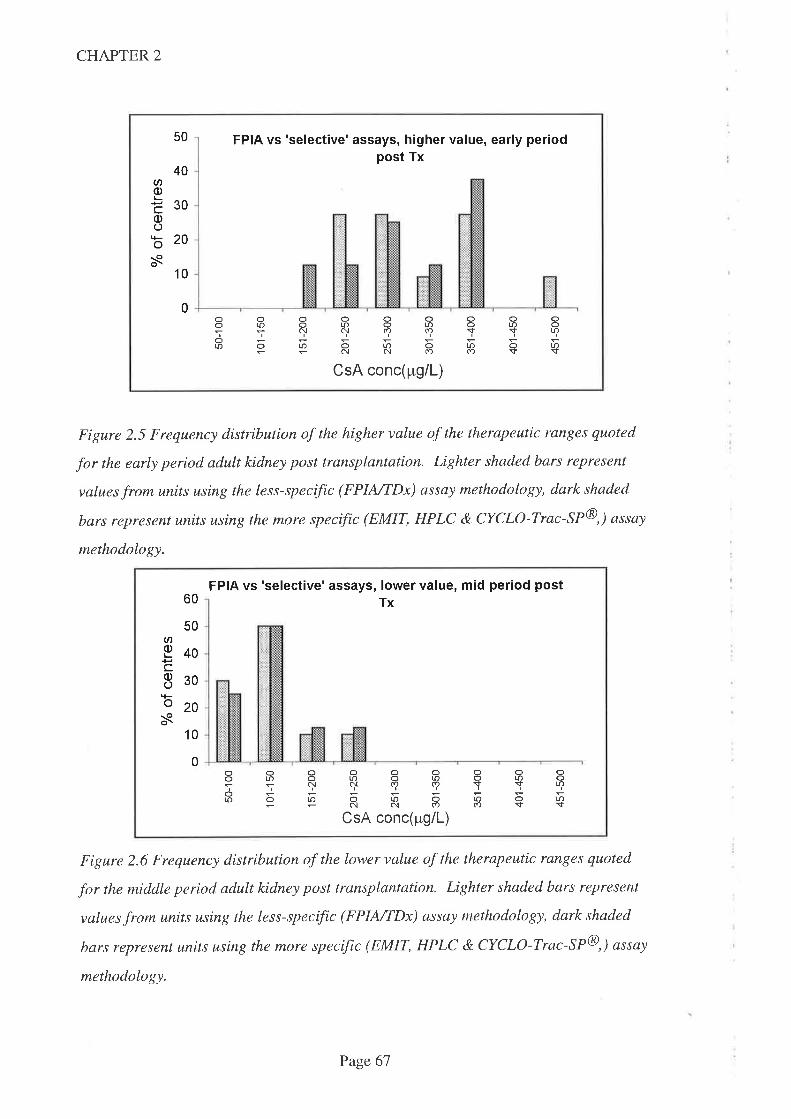
CHAPTER 2
50 FPIA vs 'selective'assays, higher value, early periodpost Tx
oooooooLr)otoorootr)
ol.r)orno|f)o-CsA conc(pg/L)
40ØoÈ300)ob20s
10
0oo
ú)
oo|f)
Lr)$
Figure 2.5 Frequency distribution of the higher value of the therapeutic ranges quoted
for the early period adult kidney post transplantation. Lighter shaded bars represent
values from units using the less-specific (FPINTDx) assay methodology, dark shaded
bars represent units using the more specific (EMIT, HPLC & CYCLO-Trac-SP@,) assay
methodology.
60
50an
g40cE30o20s
FPIA vs 'selective' assays, lower value, mid period postTx
ooooooorootr)oll)otl)NN(Ð(f)SS
orJorooloo=+NNÍ)(f)S
CsA conc(pg/L)
10
0ooo(.
oolf)
Lr){-
Figure 2.6 Frequency distribution of the lower value of the therapeutic ranges quoted
for the middle period adult kidney post transplantation. Lighter shaded bars represent
values from units using the less-specific (FPINTDx) assay methodology, dark shaded
bars represent units using the more specific (EMIT, HPLC & CYCLO-Trac-SP@,) assay
methodology.
Page 67
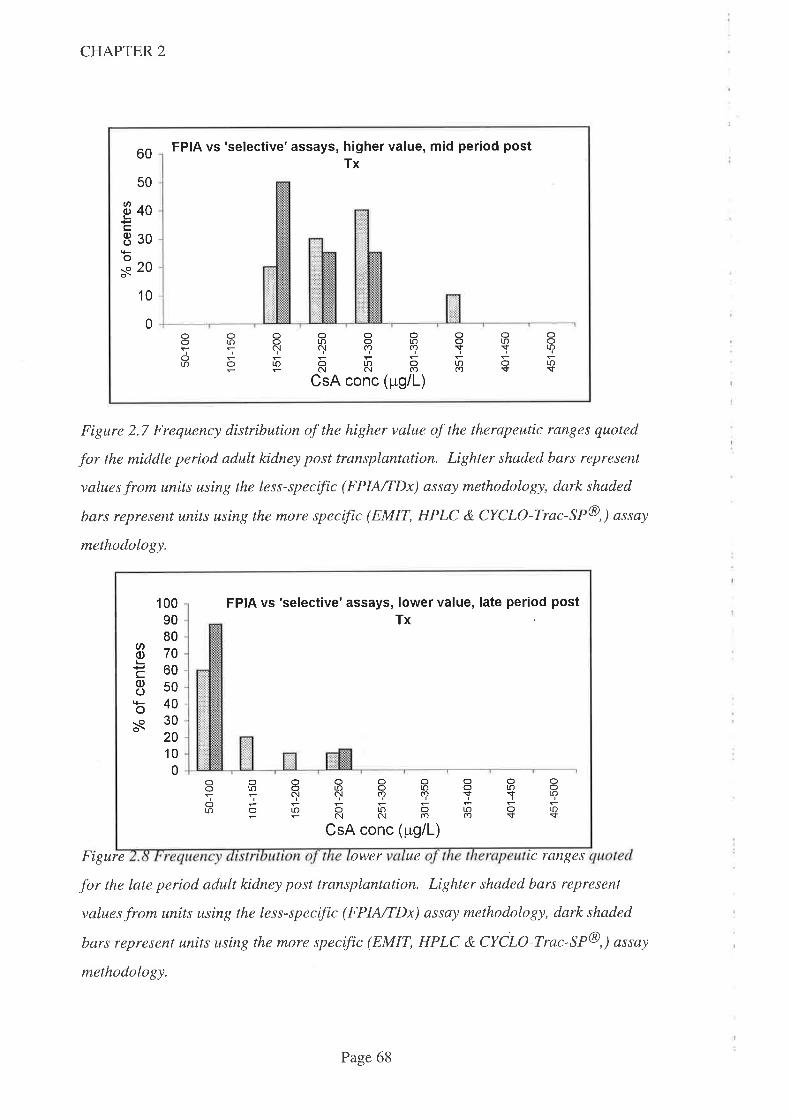
CHAPTER 2
60
50
ëooc830tso-o 20o\
10
FPIA vs 'selective'assays, higher value, mid period postTx
0ooorf)
oro
o
oooorDoe{c!(f)LOOtO
NNCsA conc (
olo(r)
oosto(f)
olosot
ooro
roso(9pg/L)
Figure 2.7 Frequency distribution of the higher value of the therapeutic ranges quoted
for the middle period adult kidney post transplantation. Lighter shaded bars represent
values from units using the less-specific (FPINTDx) assay methodology, dark shaded
bars represent units using the more specffic (EMIT, HPLC & CYCLO-Trac-SP@,) assay
methodology.
FrSure ower ue c ranqes
for the late period adult kidney post transplantation. Lighter shaded bars represent
values from units using the less-specffic (FPIA/TDx) assay methodology, dark shaded
bars represent units using the more specffic (EMIT, HPLC & CYCLO-Trac-SP@,) assay
methodology.
1009080
E70t-:c608sob40s30
2010
0
FPIA vs 'selective'assays, lower value, late period postTx
oooooaal'rJOl¡OtOOtOsqqqqTfo|r)o|f)oto0-;NC{CO(r)S
CsA conc (pg/L)
ooor.o
oorf)
r.Os
Page 68
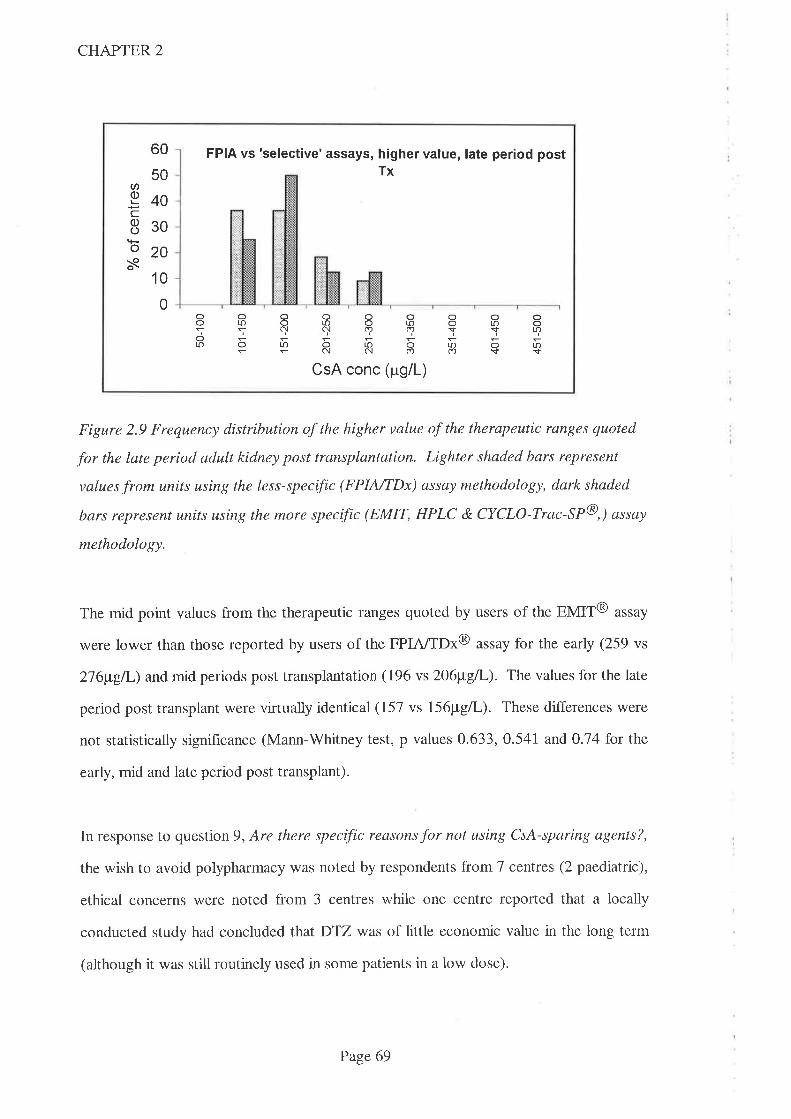
CHAPTER 2
60
50U)g40c830
tÈo20s
'10
0
FPIA vs 'selective' assays, higher value, late period postTx
ooo(-
oto
o
ooc{
LO
ooor.c) o toC.l(r)(r,
oo$
ro(f)
orosoï
o|l.
|r)s56õc!N(f)
CsA conc (rrg/L)
Figure 2.9 Frequency distribution of the higher value of the therapeutic ranges quoted
for the late period adult kidney post transplantation. Lighter shaded bars represent
values from units using the less-specific (FPINTDx) assay methodology, dark shaded
bars represent units using the more specific (EMIT, HPLC & CYCLO-Trac-SP@,) assay
methodology.
The mid point values from the therapeutic ranges quoted by users of the EMIT@ assay
were lower than those reported by users of the FPIA/TDx@ utruy for the early (259 vs
216¡t"gil-) and mid periods post transplantation (196 vs 206¡t"g/L). The values for the late
period post transplant were virtually identical (157 vs I56¡tgil,). These differences were
not statistically signihcance (Mann-V/hitney test, p values 0.633,0.541 and 0.14 for the
early, mid and late period post transplant).
In response to question 9, Are there specific reasons for not using CsA-sparing agents?,
the wish to avoid polypharmacy was noted by respondents from 7 centres (2 paediatric),
ethical concerns were noted from 3 centres while one centre reported that a locally
conducted study had concluded that DTZ was of little economic value in the long term
(although it was still routinely used in some patients in a low dose).
Page 69
CHAPTER 2
In answer to the final question, 'What reduction in dose of CsA do you feel you
achieve?', respondents estimated the savings in CsA dosage facilitated by the use of
sparing agents. These varied from2)Vo (6 centres) through 30-407o (20 centres) to 50-
6OVo (2 centres) withDTZ. Those centres quoting a lower value were more likely to use
a lower dose (120mg or less per day in 3 of these 6 centres) while those quoting the
highest value were more likely to use a higher DTZ dose (including one paediatric unit
using 180mg/day).
KCZwas reported to reduce CsA dose by more thanT}Vo in five centres and one centre
reported the combined use of DTZ and KCZ reduced CsA dose by 8O-907o. The
reduction in CsA dose afforded by the use of cimetidine was unknown.
2.5 Discussion:
This survey, like all surveys, has limitations. In particular, the views obtained were those
of the respondent rather than a consensus of all practitioners in the unit. Because the
respondent was usually the Director of the transplant unit, it is however likely that this is
the predominant view and the most authoritative available. The approximation used to
assess the number of transplant recipients taking CsA-sparing agents is another
limitation. The respondent was not asked for actual numbers because it was anticipated
that the extra work involved might have reduced the willingness to complete and return
the questionnaire. Hence f,rndings derived from these data (especially the estimated
annual cost savings) should be viewed with some caution. The times post transplantation
(early, middle and late) were also not specified but left to the respondent. This question
was deliberately formulated to gauge whether practitioners considered a gradual
reduction in blood CsA concentration was appropriate as concerns over chronic toxicity
exceeded the concern of rejection. The question did not ask if the ranges were officially
Page70
CHAPTER 2
quoted by the unit and hence the answer might have been different if another member of
staff (and especially a member of the analytical laboratory) was asked.
This survey has highlighted a number of differences between Australian and New
Zealand transplant centres with regard to the dosage and formulation of the most
frequently prescribed CsA-sparing agent (DTZ), the therapeutic ranges quoted and assay
methodologies employed. Perhaps the most important of these is whether CsA sparing
agents should be used at all.
2.5.1 To Use CsA-sparing agents Or Not?
Nine centres surveyed do not use CsA-sparing-agents at all and a further six centres only
use them for 'some' patients. Heart (4/4 use in all or most), lung (213 use in all and l/3 n
some) and kidney (14124 use in all or most) transplant centres are more likely to use CsA
sparing agents than liver or pancreas transplant centres. The data for CsA-sparing agent
use by liver transplantation centres (only 1 out of 4 centres surveyed used these agents in
only 'some' patients) and pancreas transplantation centres (one unit used CsA-sparing
agents in all patients while the other used DTZ only when it is indicated for a therapeutic
purpose) is interesting because the absorption of CsA has been reported to be decreased
following abdominal surgery and if bile flow or liver function is impaired (Lindholm A.
1991). The consequence of this is that to achieve comparable blood CsA concentrations,
CsA dosages must be higher in recipients of liver and pancreas transplants than those
used in renal transplant recipients and hence the need for agents which might allow a
lower dose to be administered is arguably greater.
Compliance has been shown to be affected by the number of drugs and/or doses taken
each day (Schweizer RT, et al. 1990. Kiley DJ, et al. 1993) and thus the prescription of
PageTI
CHAPTER 2
any additional drug may reduce compliance. This was the reason given by 7 respondents
for not using CsA-sparing agents.
Most of the data on DTZ's role as a CsA-sparing agent has come from studies of
recipients of kidney transplants but this suruey highlights the lack of consensus in this
population within Australia and New Zealand almost 10 years after this was hrst
advocated. The routine use of CsA-sparing agents early in the post transplant period
(23 ou't of 28 centres using CsA-sparing agents commence them in the first week post
transplantation) indicates that the primary reason is for economic rather than therapeutic
beneht. Hence the reason for this lack of uniformity might be related to the different
funding diffrculties that affect states or institutions. This survey has shown that
Australian kidney transplant centres who do not routinely use CsA-sparing agents are
sometimes situated close to centres who routinely use it in all patients, which suggests
that the decision to use CsA-sparing agents is not made at a state level but within
individual transplant units. Also one respondent noted that the decision to not use CsA-
sparing agents was based upon "local reasons for wishing to delay cost savings" which
operated at the time of the survey. Another possibility is that centres performing more
transplants have a greater financial incentive to use CsA-sparing agents. Results from
this survey support this hypothesis since 3 of the 4 kidney transplant centres performing
50 or more transplants per year use DTZ routinely (a11 or most patients) while only one
does not (used only in some patients).
2.5.2Who benehts fromthe use of CsA-sparing agents?
In I99I, the Commonwealth government assumed funding for CsA for organ
transplantation in Australia under the 'section 100' scheme. Since this time therefore,
neither individual transplant units, the hospitals of which they are a part, nor State
governments have gained financially by using CsA-sparing agents. Indeed, individual
Page72
CHAPTER 2
transplant units, hospitals and/or states are financially poorer because this practice
requires them to provide the CsA-sparing-agent (which is not covered by the section 100
scheme). Interestingly therefore, while three of the four kidney transplant units who
perform 50 or more transplants per year started using DTZ as a CsA-sparing agent
before 1991, the fourth centre (where DTZ is used in only some patients) started this
practice n 1993, ie after the 'section 100' scheme was in operation. In New Zealand, Ihe
costs are assumed by the individual transplant unit, hospital and health authority and thus
there is a direct economic benefit to the prescribers of CsA-sparing agents. Not
surprisingly perhaps, only one of the five New Zealand respondents (3 kidney, t heart, 1
lung) to this survey reported not routinely using CsA sparing agents.
It is interesting that in neither country does the transplant recipient benefit financially
from the reduced dose of CsA and indeed, is required to pay an additional fee for the
CsA-sparing agent. Transplant recipients are unlikely to be involved in the decision to
use CsA-sparing agents and may not even be aware of the reasons for their prescription.
This is the first time in Australia or New Zealand that a drug has been widely used for a
purely economic purpose and it is only because of the magnitude of the cost of CsA that
this is done. With the loss of patent protection (which has already expired in Australia),
it is possible that cheaper generic brands will become available and the economic
pressure to use CsA-sparing agents may lessen. Another factor which may affect the rate
of usage of CsA-sparing agents shown in this survey is the more recent availability of an
improved oral formulation (Neoral@ Sandoz) which has been shown to produce more
reliable and better absorption but at a similar price to the older formulation. If the action
of CsA sparing agents is (at least) in part due to improved bioavailability, the magnitude
of their effect may well be decreased with this formulation.
Since the Commonwealth government is the economic beneficiary of the use of CsA-
sparing agents in Australia and since this body has the responsibility for approving
Page73

CHAPTER 2
indications for use of drugs, it seems appropriate that the Commonwealth should actively
participate in (if not lead) the debate over their use. It is worth noting therefore that
neither DTZ nor KCZ are approved for use as CsA-sparing agents in Australia or New
Zealand and their respective manufacturers do not promote this use. The manufacturers
of CsA have long opposed the use of CsA-sparing agents, but awareness of their use is
widespread within the medical community and it is unlikely that regulatory authorities in
either Australia or New Zealand could be ignorant of this practice. Based upon the 357o
savings estimated in the Australian kidney transplant setting (Chrysostomou A, et al.
1993), this survey indicates that if the practice of using CsA-sparing agents were
abruptly stopped, the costs of providing CsA would increase by approximately AUD$7
million per year in Australia (the cost for providing CsA under the 'section 100'
arrangement was approximately AUD$28 million for the fiscal year 1995-1996).
2.5.3. To Use DTZ or KCZ
This survey shows that the decision as to whether DTZ or KCZ is used as the CsA-
sparing agent does not depend upon cost factors alone since KCZ is substantially more
potent in this regard but is only used by four transplant centres. The safety of using DTZ
as a CsA-sparing agent in transplant patients has been established by cünical trials
involving many patients (Chrysostomou A, et al. 1993. Wagner K, et al. 1988.
Neumayer HH, Wagner K. 1986), one of which was conducted in Australia. While there
is data on the safety of using KCZ as a CsA-sparing agent (Keogh A, et al. 1995),
experience with this latter agent is more limited. The limited use of KCZ reported in this
suruey is probably due to a combination of the reported adverse effects and the minimal
(if any) additional therapeutic benefit whieh, for the majority of transplant eentres,
outweigh the increased dollar saving. In particular, hepatotoxicity (including toxic
hepatitis) has been reported with KCZ and one authoritative review notes that the risks
are thought to increase with the duration of therapy (Tester-Dalderup CBM. 1992). The
Page74
CHAPTER 2
safety or otherwise of using KCZ as a CsA-sparing agent in transplant recipients will not
be established until more experience is obtained and thus it is of interest that one of the
respondents suggest that such trials may be diff,rcult to perform in Australia due to
pressures exerted by pharmaceutical companies, ethics committees and/or drug
committees (Personal communication, A Keogh, 1995).
2.5.4. Dosage regimen of DTZ
The threefold variation nDTZ dose (60 to 18Omg/day) across paediatric centres and the
fourfold variation across adult centres (60 to 240mg/day) is interesting since the
interaction between DTZ and CsA was initially noted in patients taking 'conventional'
doses of DTZ for therapeutic purposes. Because of the serendipitous nature of the
frnding that DTZ reduced the required dose of CsA and the lack of dose-response data in
the literature at the time of this survey, it is not surprising that usual anti-anginal or anti-
hypertensiveDTZ dosage regimens (60mg thrice daily or 180mg CD formulation taken
each morning) were the most frequently reported in this survey. The recommended dose
of DTZ in Australia is 180mg - 360mg/day but no centre reported using doses higher
than 240mg per day. This is interesting given the incidence of hypertension following
some types of organ transplantation which might sometimes warrant higher DTZ doses
and which might then afford a greater CsA-sparing effect.
2.5.5. Formulation Effects
There has been a trend in Australia to switch hypertensive patients from conventional
release (tablet) DTZ formulation to the modified release, CD capsule formulation,
principally for compliance reasons. Twelve Australian transplant centres reported using
the CD formulation routinely as a CsA-sparing agent whereas, despite its availability, no
New Zealand transplant centre used this formulation. This is of interest since, at the time
Page75
CHAPTER 2
of this survey, there was evidence that CsA was absorbed from the upper gastrointestinal
tract (Drewe, J, et al. 1992) and also some evidence that the interaction between DTZ
and CsA occurs in the enterocyte (Hebert MF, et al. 1992). Modified release
formulations will inevitably release some of thetr DTZ lower down the gastrointestinal
tract, perhaps beyond the site of the interaction. There is thus cause to suspect that
modified release formulations of DTZ might interact to a lesser extent than conventional
release formulations. At the time of this survey, there was no data in the literature on the
effect of changing DTZ formulation although it had been noted that altering the brand of
DTZ could result in variable effects on blood CsA concentrations (Cooke CE. 1994).
Also of interest is that two centres use conventional (ie non slow release) formulations of
DTZ given only once daily. Because of its short residence time in both gastrointestinal
tract and plasma (the manufacturer's product information states DTZ is completely
absorbed and has a half-life of 3.5 hours), it is likely that, unless DTZ acts as an 'enzyme
poison', the effect of such a regimen will be to elevate primarily the daytime blood CsA
concentration-time profile. Since CsA dosage modifications are usually based upon
morning trough concentrations, a single morning DTZ dose combined with twice daily
CsA dosing would produce higher overall CsA concentrations (and potential toxicity).
2.5.6. CsA therapeutic range
The questionnaire asked which concentrations are used as a therapeutic range for CsA
for the early period after transplantation, a middle and late period. These periods were
not defined and since they were usually the response of the director of the transplant
unit, they therefore do not necessarily reflect the 'official' ranges quoted by the assay
laboratory. Most respondents (28) identified three different ranges, 6 identified two
discrete ranges and the remaining 3 identified only one range. Where more than one
lange was identihed, the values given for the early period after transplantation were
Page76

CHAPTER 2
always higher than the middle or late period. This reflects the view that the
immunological challenge of a transplanted organ decreases with time, while the incidence
of adverse effects caused by CsA increases with time.
Higher CsA therapeutic ranges were reported from heart and lung transplant centres than
from kidney, pancreas or liver transplant centres. This may reflect either the
immunological nature of the heart or lung, the dire consequences of rejection for these
organs, or a lack of knowledge on the eff,rcacy of lower CsA concentrations in heart
and/or lung transplantation.
While therapeutic ranges reported from units performing heart, lung, liver and pancreas
transplants were similar for each organ type, there was considerable disparity in ranges
reported from kidney transplant centres. This was especially evident from paediatric
centres where therapeutic ranges quoted from two of the hve centres surveyed were
lower than corresponding ranges for adult kidney transplant centres, while the ranges
quoted from the other three centres were on the higher side of the adult ranges quoted.
Indeed, the lowest range quoted for the early period after transplantation from paediatric
centres (100-150pg/L) is lower than the highest range quoted for the period late after
transplantation (150-300pg/L) despite the same assay methodology being used (Table
2.s).
The highest and lowest values reported for the late-period range for adult kidney
transplantation are disparate and do not even overlap. The highest range reported is
225-300¡t"g/L while the lowest is 50 -150pg/L (Table 2.4). There was a similar
difference in the values used for the therapeutic range for the early period following
kidney transplantation where the highest range reported was 300-400pg/L and the
lowest was 80 -250¡tg/1,. The consequences of rejection of transplanted organs are such
that it is undoubtedly logical to err on the higher side of the blood concentration range
Page77
CHAPTER 2
initially (especially for heart and lung transplantation) and, to reduce the impact of drug
toxicity, to aim for a lower value in the long term. Data in the literature supports a
relationship between blood CsA concentration and efficacy and toxicity (Dunn J, et al.
1990. Lindholm A & Kahan BD. 1993) but this remains somewhat controversial
(Tsunoda SM & Aweeka FT. 1996) and relates primarily to adult kidney transplantation.
This survey shows a lack of consensus on this aspect of CsA therapy in Australia and
New Zealand, and more work is needed to define a therapeutic range for CsA if indeed
one can be defined.
Similar variability with respect to therapeutic ranges (and assay methodology) has been
noted by other authors (Morris RG. 1994, Morris RG. et al, 1994. Holt DW, et al.
1994. Oellerich M, et al. 1995) but, given the relative homogeneity within the
Australasian kidney transplant community, the magnitude of this variability is perhaps
surprising.
2.5.7 . CsA assay methodology and monitoring
Because clinicians (rather than laboratories) were surveyed, these results do not
necessarily reflect the popularity of any assay method. Thus one hospital performing
heart, lung and kidney transplantation that used the same laboratory for all CsA assays,
was recorded in this survey as three separate users of the same assay method. Similarly,
laboratories that might have provided CsA assay services solely to referral centres were
not included.
The type of CsA assay used and in particular, its specificity for parent CsA, should affect
the values used for the therapeutic range used since less specific assays cross-react to a
greater extent with CsA metabolites and thus have higher total values than assays which
measure only parent CsA. This was observed anecdotally by several respondents to the
Page78
CHAPTER 2
original questionnaire and was the reason for the additional (verbal) question regarding
assay method used. There is evidence that some metabolites of CsA may exert an
immunosuppressive action (Kunzendorf U, et al. 1989) but more recent reviews have
cast doubt on this (Oellerich M, et al. 1995). The degree of metabolite cross reactivity
with the most popular (FPIA/TDx@) assay noted in this survey is greater than other,
rapid assays (EMIT@, CYCLO-Trac-SP@) but much less than earlier, non-specific
assays. Hence it is unlikely that metabolite cross reactivity is the reason for the
popularity of this assay which is more likely to be related to logistical issues including
availability of this analyser and its ease of use.
High pressure liquid chromatography (HPLC) is considered to be the 'reference standard'
assay method because it measures only parent CsA, while the fluorescence polarisation
immunoassay (FPIA/TDx@, Abbott Laboratories) assay methodology has been shown to
be the least specific assay of those quoted in this survey (Dusci LJ, et al. 1992).
Different assay methodologies have been used at various times in Australia (Morris RG.
1994) and individual units have adopted and changed assay methods (and therapeutic
ranges) independently of each other. This has the potential to cause confusion, especially
where patients move from one centre to another for ongoing care. Guidelines have been
published for CsA therapeutic monitoring in Canada (Shaw LM, et al. 1990), in the USA
(Shaw LM, et al. 1987), in the UK (Holt DW, et al. 1994) and Australia (Morris RG, et
al. 1994) which would, if adopted, eliminate this problem.
Ranges quoted by users of more specific assay methods (HPLC, CYCLO-Trac-SP@ and
EMIT@) were generally lower than those quoted by users of the FPIA/TDx@ assay. The
EMIT@ assay was the most frequently used 'more specific' assay (6 adult kidney
transplant centres) while the FPIA/TDx@ assay was the most fi'equently used 'less
specific' assay (15 adult kidney transplant centres). Comparison of the mean values for
Page79
CHAPTER 2
CsA ranges from these two assay methodologies (FPIA/TDx@ vs EMIT@) from adult
kidney transplant centres are as follows:
-for the early period post transplantation, 276¡tgtL (FPINTO*@) vs 259¡tgll-
(EMIr@;
-for the intermediate period, 206¡tg/L (FPIA/TDx@; vs I96¡t"g/l- (EMIT@¡
-for the late period post kidney transplant, I56¡tg/L (FPIA/TDx@; vs I57¡t"g/I-
(EMII@;
As noted earlier, the differences between these mean values are not statistically different
(Mann Whitney test). Since several respondents noted assay method should affect the
range used, this finding is somewhat surprising.
Interestingly, one liver transplant centre used both monoclonal (relatively specihc)
FPIA/TDx@ and polyclonal (non-specific) FPIA/TD*@ urruy, where the difference was
used as a guide to the metabolic activity of the transplanted liver. Because of this cross
reactivity, this centre quoted the highest overall therapeutic range (200 - 800pg/L). This
was excluded from other analyses because it was used primarily as a guide to liver
metabolic activity.
The sole kidney transplant centre using the HPLC assay method reported therapeutic
ranges which were lower than the average (mean values for the early and middle periods
I75¡t"gll- and late period 125¡tgil,) but are not the lowest single range reported. The
highest individual value for a CsA therapeutic range (excluding the polyclonal
FPIA/TDx@ urruy mentioned earlier) was 400-6001tgfi, which is the range used for the
early period following heart or lung transplantation in one centre. Despite several
respondents reporting that therapeutic ranges should be modified to account for
differences in assay specificity, these results suggest that the lack of consensus over CsA
therapeutic range owes little to the assay method used. These data therefore suggests
Page 80

CHAPTER 2
that increasing the level of uniformity with respect to assay methodology will not
necessarily translate into less variability in values quoted for CsA therapeutic ranges.
2.5.8. Frequency of dosing for CsA
Only two adult transplant centres uses a once daily CsA dosing regimen, all others use
two or more times per day. Once daily administration results in higher peak blood CsA
concentrations and lower trough concentrations than equivalent twice daily regimens.
Since CsA therapeutic monitoring is based on trough concentrations, adoption of a lower
trough range would be appropriate for centres using a once daily CsA dosing regimen.
An alternative approach was adopted by the two centres using a once daily regimen,
namely the use of a 15 hour (rather than24 hour) post dose blood CsA concentrations.
The values quoted for CsA therapeutic ranges from these two centres (mean values for
the early, middle and late period being 30O, 225 and 150pg/L respectively) were
comparable with those from centres using a twice daily regimen.
Two of the five children's transplant centres surveyed prescribed CsA three times a day.
This regimen has presumably been adopted because of the higher clearance values seen
for CsA in children (Jacqz-Agrain et al. 1994) and the reduced surface area of bowel
which has been shown to correlate with CsA absorption and dosage requirements
(Whittington PF, et al. 1990). Thrice daily CsA regimens should result in higher trough
and lower peak values than for a comparable twice daily regimen and hence thrice daily
CsA ranges (which are based upon trough concentrations) should be higher. Data from
this survey shows the opposite effect. The mean of the values quoted for the three post
transplant periods (early, middle and late) for the two centres which sometimes use thrice
daily CsA regimens are 150, 88 and 81pg/L. The comparable mean values for the three
centres utilising twice daily CsA regimens are 358, 250 and 167¡tglI-. These mean
trough values are much higher (indeed, the ranges barely overlapped at any period post
Page 81
CHAPTER 2
transplantation) for the twice daily CsA regimen centres which magnifies the increased
exposure to CsA by those centres using twice daily CsA regimens.
2.5.9 Numbers of transplants performed at each centre
There was considerable disparity between Australian Sates with respect to the numbers
of transplant centres offering adult kidney transplants and hence the numbers of
transplants performed by each centre each year. In particular, New South Wales (seven
centres) and Victoria (hve centres) had the majority of centres and while these are the
most populous States, they are not geographically the largest. Only one centre in each
state performed 50 or more transplants per year with the exception of Vy'estern Australia,
where the two centres performing kidney transplantation performed 25 or less per year.
Ten adult kidney transplant centres reported performing 20 or less transplants per year,
four of these were in New South 'Wales and three in Victoria.
With the exception of one centre in Newcastle, all centres performing adult kidney
transplants are located in the capital city of their respective states and hence the number
of centres appears to be unrelated to ease of access for patients and/or relatives.
Queensland has only one centre which is located in Brisbane, a very long distance from
expanding population centres in northern Queensland.
Questions asked in this survey did not allow any conclusions to be drawn regarding the
issue of optimal numbers needed to maintain satisfactory levels of expertise. However,
while kidney transplantation is a relatively routine procedure nowadays, it is probable
that there is a minimum number of procedures that need to be performed each year both
to justify the expertise that is required and to maintain the standard of that expertise.
Page 82
CHAPTER 2
Precisely how individual centres came to provide adult kidney transplant servrces rs a
matter of historical fact but presumably, it was not planned by a central authority. Given
the concentration of centres in Sydney and Melbourne, and the distances some patients
must travel, there could be advantages in rationalising both the numbers and location of
these centres.
2.6. Conclusions
This survey has demonstrated considerable variability within Australia and New Zealand
in relation to dosage regimens of the CsA-sparing agent, DTZ. This variability probably
results from the paucity of data on the interaction. There is also considerable variability
in both assay methodologies and values quoted for therapeutic ranges for CsA which are
not explained by differences in assay specihcity. Some of the clinical ramifications of
these differences are discussed in Chapter 3.
Page 83
CHAPTER 3
Chapter 3
Survey of outcomes of Australasian kidney transplant recipients for the first 12 months
post transplantation to ascertain the effect of blood CsA concentration and/or DTZ use
on measures of organ rejection and/or CsA toxicity.
3.l lntroduction 85
3.2 Aims 90
3.3 Methods 90
3.3.1 Statistical Methods 9l
3.4 Results 92
3.5 Discussion ll2
3.6 Conclusions rrg
Page 84
CHAPTER 3
3.1 Introduction
The first experience with CsA in organ transplantation occurred in the late 1970s when it
was demonstrated to have powerful immunosuppressive action in a variety of animal
models involving a number of different transplant organ types (Green CJ & Allison AC.
1978. Calne RY, et al. 1978b). In these early studies, it was noted to be more potent
than existing agents and appeared to have a very modest adverse effect profile, especially
when compared to existing immunosuppressive drugs. Initial use in human transplant
medicine often included other immunosuppressive drugs (Calne RY, et al. 1919).
Unfortunately, the effect of this combination of CsA with existing immunosuppressive
drugs was to greatly increase mortality via serious infections and/or tumours (especially
lymphomas) in transplant recipients. Because of this experience and the desire to avoid
the long-term adverse effects of corticosteroids, the focus turned to using CsA as the
sole immunosuppressive agent.
Early experience was also hampered by lack of information on optimal dosage, primitive
formulations with unknown bioavailability and availability of a suitable assay
methodology. Doses of CsA were higher than those used today (initially 25mgkg/day
administered by intramuscular injection) with the consequence that adverse effects
including nephrotoxicity, hepatotoxicity and hirsutism, albeit relatively mild, were
frequently seen (Calne RY, et al. I978a).
Some years later, assays were developed but early methodologies were unsatisfactory
from a number of perspectives including complexity and cost of HPLC assays, and the
capacity of antibody based immunoassays to cross-react with metabolites of CsA. These
non-selective assays yielded results which were 3-5 fold greater than existing HPLC or
current immunoassay methods (Tredger JM, et al. 1988. Zylber-Katz E &. Granit L.
1989. Schran HF, et al. 1987). This delayed the construction of therapeutic ranges that
Page 85
CHAPTER 3
would eventually assist clinicians to prescribe CsA in a manner that maximised
therapeutic benefits while minimising toxicity (Shaw LM, et al. 1987). Assay
methodologies have improved substantially (especially with respect to immunoassay
cross-reactivity with CsA metabolites) and are sufficiently easy to perform such that daily
assay services are available to most clinicians using CsA. This improvement has allowed
therapeutic ranges for CsA to be refined and therapeutic monitoring has become an
integral part of CsA therapy for most indications. Notwithstanding these technical
advances, it has been observed that there is only limited agreement about the blood CsA
concentrations that should be used for the therapeutic range for any given indication
(Shaw LM, et al. 1981. Shaw LM, et al. 1990. Morris RG. 1994. Holt DW, et al.
re94).
Therapeutic ranges should not remain static but should evolve as drug therapies evolve.
With CsA therapy, evolution has seen the focus change from add-on therapy (noted
above) through monotherapy (because of concerns over corticosteroid adverse effects
and increased risk of malignancies) to the more recent dual, triple (or more) regimens.
The aims of combination therapy with two or more immunosuppressive drugs are to
minimise the frequency and severity of adverse effects by using lower doses of each
individual agent while reaping the benefits of additive (or synergistic)
immunosuppression. Typically, azathioprine or the newly introduced mycophenolate
mofetil aÍe coprescribed with CsA in combination regimens (sometimes with
prednisolone). Protocol changes which involve lower doses of CsA of this type should
be accompanied by a downward shift in desìred therapeutic ranges, but this is not evident
with CsA. The shift from monotherapy with CsA to dual or triple drug regimens
occurred at a time when therapeutic ranges were at an early stage of evolution and hence
Page 86

CHAPTER 3
it is not surprising that there are no comparative data on therapeutic ranges for CsA
when used as monotherapy or when used as a part of duaVtriple therapy.
Discord in the values used for CsA therapeutic ranges was evident in an Australasian
suruey conducted in 1995-6 as outlined in Chapter 2. Results from this survey revealed a
marked variability in therapeutic ranges quoted for CsA by the directors of individual
transplant units. Differences were evident not only across organ transplant types, as has
been reported previously (Holt DW, et al. 1994) and might be expected, but also within
the same transplant organ type. The magnitude of this variability in CsA therapeutic
ranges exceeded that which might be anticipated as a consequence of variability in
metabolite cross-reactivity of the different assay methodologies employed at this time.
This was surprising considering the relative uniformity of Australasian transplant funding
¿ilrangements, kidney availability, quality of care, etc. and the amount of research
conducted into CsA at the time this survey was conducted.
Within the same organ transplant type, the variability in CsA therapeutic ranges was
greatest for the paediatric kidney transplant population. There are however, only limited
number of these transplants performed each year and there is considerable variability
within this population with respect to ages of donors and recipients, etc. It is probable
therefore that any analysis of this population examining clinical sequelae resulting from
differences in therapeutic ranges would prove inconclusive due to a lack of statistical
power. There was also large variability in CsA therapeutic ranges quoted by directors of
adult kidney transplant centres. The adult kidney transplant population is larger in
number and hence any effect of using different therapeutic ranges for CsA might be
evident rn this group.
Therapeutic ranges usually comprise 2 numbers, the lower value being the mmtmum
concentration for effrcacy and the higher value being the point above which efficacy is
Page 87
CHAPTER 3
only marginally increased but toxicity increases significantly. Markers of efhcacy of CsA
include frequency and severity of transplant rejection which can be measured in a number
of ways including the need for dialysis and/or additional immunosuppression
(methylprednisolone, muromonab or other antibody preparations) in the early
postoperative period and/or graft survival. Since CsA causes hypertension and renal
impairment, markers of CsA toxicity which might be investigated include blood pressure
and/or the use of antihypertensive drugs, and plasma creatinine concentrations.
DTZ has been shown to interact with CsA such that the average dose of CsA for a
population of organ transplant recipients can be reduced by approximately 35Vo while
maintaining blood CsA concentrations within accepted therapeutic ranges. If this
interaction were purely pharmacokinetic (ie, to alter parent blood CsA concentrations
only), limited or no alteration to the CsA therapeutic range would be warranted. This
was a finding from the survey outlined in Chapter 2 where no transplant centres used a
different CsA therapeutic range for patients given DTZ. However, 1f DTZ exerts effects
other than elevating parent CsA blood concentrations (including altering active CsA
metabolite concentrations), or if immunological processes were affected, as has been
noted with both DTZ and verapamil (V/eir MR. 1991. Carozzt S, et al. 1995), an
entirely different therapeutic range might be warranted for patients coprescribedDTZ.
DTZ has been shown to confer therapeutic benefit to recipients of kidney transplants in
the form of reduced need for post transplant dialysis and immunosuppressive therapy
(Chrysostomou A, et al. 1993). The authors of this prospective, randomised study
involving two Australian adult kidney transplant centres also demonstrated that DTZ
coprescription reduced the required dose of CsA by 35Vo and that, despite its marketed
indication for hypertension, coprescription of DTZ had no apparent effect on lowering
blood pressure or reducing the need for antihypertensive medication at 3 months post
transplantation. These authors concluded that it was ineffective as an antihypertensive
Page 88
CHAPTER 3
agent at the dose used (180mg/day). There were several shortcomings with this trial,
including the failure to control for therapeutic practices at the two sites (other than the
use of DTZ) and the use of different assay methodologies and therapeutic ranges (one
centre used an FPIA/TDx polyclonal assay with a target therapeutic range of 400-
800pg/L, while the other centre used a more specihc assay methodology (EMIT) with a
therapeutic range quoted as 80-250pg/L). Blood CsA concentrations were also higher in
DTZ treated patients at most times post transplant and hence the benefit observed with
DTZ may have resulted merely from increased CsA exposure. It is thus diff,rcult to
determine if differences in outcome in this study were due to a pharmacological effect of
DTZ or other factors including blood CsA concentration. To address these
shortcomings, another prospective, double blind, placebo controlled, randomised trial
controlling for all factors other than DTZ use might be conducted.
In Chapter 2, it was demonstrated that the use of DTZ is widespread, but not universal
within the Australasian kidney transplant setting and that the decision to not use DTZ is
not made for medical reasons. Given the similarity in recipient and donor population,
standards of medical care, etc. within the Australasian transplant community, comparing
outcomes for transplant recipients receiving DTZ with those that do not receive it, might
shed some light on the potential for therapeutic benefit conferred by DTZ. Data analysis
from this population would need to control for any effect which was attributed to
individual centres or other practices and focus on the effects of using DTZ and/or the
effect of blood CsA concentrations on markers of effrcacy and toxicity.
Since outcomes of kidney transplantation are affected by source of kidney (viz cadaver
or living donor) and previous transplant history, these factors should also be controlled
for in a study which aims to identiff differences in outcome that are caused by different
blood CsA concentrations and/or use of DTZ.
Page 89
CHAPTER 3
3.2 Aims
-To determine whether blood CsA concentration in the early post transplant period is a
predictor of effrcacy (immune suppression) as indicated by the need for post transplant
dialysis, additional immunosuppression or early graft function, and of toxicity
(hypertension and nephrotoxicity) in first time recipients of cadaver kidney transplants.
-To determine whether blood CsA concentrations at 3, 6 and 12 months post
transplantation correlate with markers of efficacy (indicated by plasma creatinine
concentration) or toxicity (indicated by systolic and diastolic blood pressures and
numbers and doses of antihypertensive drugs)
-To determine the values of blood CsA concentration that correlate with these outcomes
and hence devise (or refine) a therapeutic range for CsA for adult recipients of cadaver
kidney transplants in Australasia.
-To confirm earlier observations that DTZ has a beneficial therapeutic effect on markers
of kidney function post transplantation including a reduced need for dialysis and use of
additional immunosuppressive drugs (methylprednisolone, muromonab, etc. )
-To confirm that DTZ does not exert an antihypertensive effect (determined by systolic
and diastolic blood pressures and use of antihypertensive drugs) in kidney transplant
recipients at the doses used when coprescribed for its CsA-sparing effect
3.3 Methods
All kidney transplant centres identified from the first survey (obtained from the
ANZDATA registry) were contacted and asked to complete a single A4 sheet
questionnaire (Appendix 1a) for each primary recipient of a cadaver kidney transplant.
To coincide with the previous survey, the same 12 month period was chosen (viz for
transplants performed between I.7.94 and 30.6.95). Data was collected for the first 12
month period post transplantation. Questions were designed to assess both efficacy and
toxicity of CsA. Questions aimed at determining efficacy included plasma creatinine
Page 90
CHAPTER 3
concentrations at various times in the first 12 months and need for dialysis and additional
anti-rejection drugs (methylprednisolone, muromonab or antithymocyte gammaglobulin)
in the early post transplantation period. Questions aimed at assessing CsA toxicity
included blood pressure, use of antihypertensive drugs and plasma creatinine
concentration at various times in the first 12 months post transplantation. These data
were compared to blood CsA concentration and use of DTZ.
3.3. 1 Statistical methods
Analysis of relationships between trough blood CsA concentrations and various
outcomes were performed using CsA concentrations as both continuous variables and
categorised into three groups (<125¡tglI-, I25-I99¡tg/l- and >2OO¡tg/L) and coded to
reflect risk relative to the lowest concentration group. These values were selected
because they represented high, medium and low values obtained from the earlier survey
discussed in Chapter 2. This analysis was undertaken to provide data to assist the
definition of an optimal therapeutic range. Logistic regression was used to examine the
relationship between blood CsA concentration and the need for diaþsis, allowing for
clustering by centre. Logistic regression, allowing for clustering by centre was also used
to examine the relationship between blood CsA concentration and plasma creatinine
concentrations at two levels, >15O¡rmol/L and >200pmoVl. Clustering by centre utilises
robust standard erroÍs to allow for differences between centres and similarities among
patients within a centre.
The relationship between taking DTZ and binary outcome variables such as the need for
dialysis, use of methylprednisolone (a marker of rejection), use of OKT3 (a marker of
more severe rejection) and use of antihypertensive drugs were also examined using
logistic regression, allowing for clustering by centre. The relationship between use of
Page 91
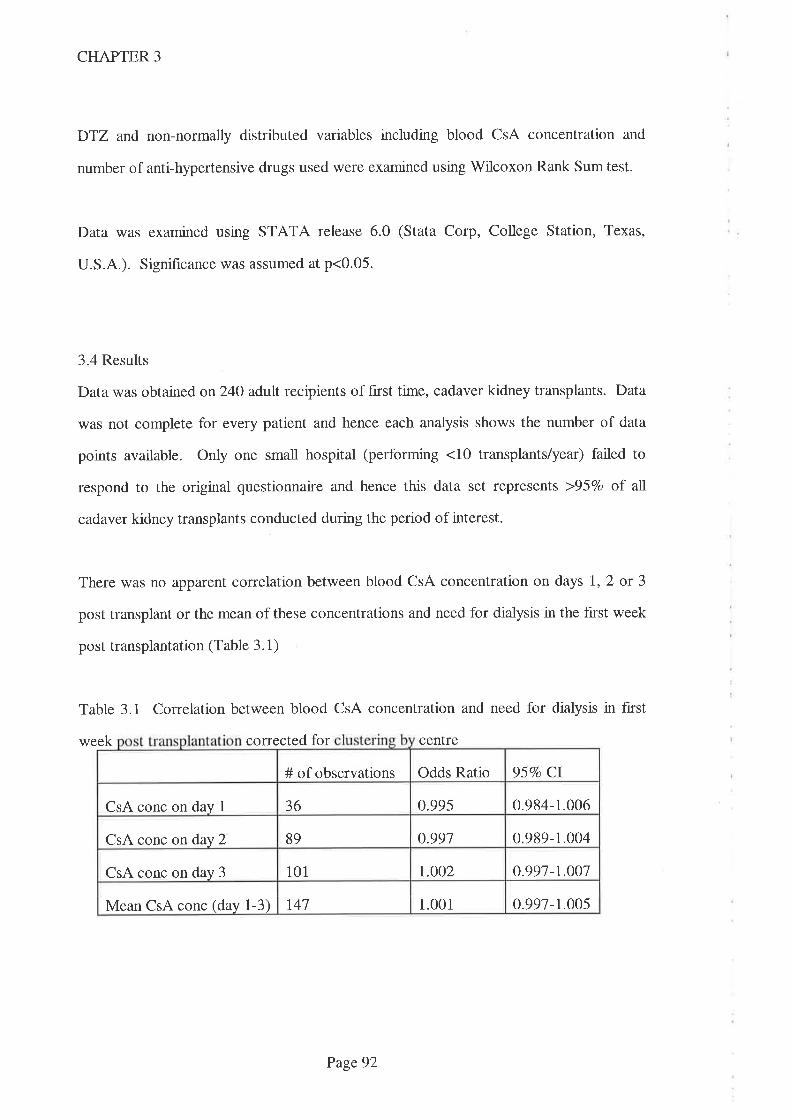
CHAPTER 3
DTZ and non-normally distributed variables including blood CsA concentration and
number of anti-hypertensive drugs used were examined using Wilcoxon Rank Sum test.
Data was examined using STATA release 6.0 (Stata Corp, College Station, Texas,
U.S.A.). Significance was assumed at p<0.05.
3.4 Results
Data was obtained on24O adult recipients of fnst time, cadaver kidney transplants. Data
was not complete for every patient and hence each analysis shows the number of data
points available. Only one small hospital (performing <10 transplants/year) failed to
respond to the original questionnaire and hence this data set represents >95Vo of all
cadaver kidney transplants conducted during the period of interest.
There was no apparent correlation between blood CsA concentration on days 1,2 or 3
post transplant or the mean of these concentrations and need for dialysis in the first week
post transplantation (Table 3.1)
Table 3.1 Correlation between blood CsA concentration and need for diaþsis in first
week corrected for centre
Odds Ratio 95Vo Cl# of observations
0.995 0.984-1.006CsA conc on day 1 36
89 0.991 0.989-1.004CsA conc on day 2
101 t.oo2 0.991-r.OO7CsA conc on day 3
t41 1.001 0.997-1.005Mean CsA conc (day 1-3)
Page92

CHAPTER 3
This apparent lack of correlation was also evident when blood CsA concentrations were
categorised into low (<I25¡tg/L= category 1), medium (125-199¡tg/L = category 2) and
high concentrations (>2OO¡tglI- = category 3) on days 1, 2 or 3 post transplant or mean
of these concentrations (also expressed as a category) and the need for diaþsis in the
f,nst week post transplantation (Tables 3.2.1 - 3.2.4).
Table 3.2.1 Correlation between blood CsA concentration (day 1) expressed as a
category and the need for dialysis in the first week post transplant corrected for
centre
Table 3.2.2 Correlation between blood CsA concentration (day 2) expressed as a
category and the need for dialysis in the first week post transplant corrected for
centre
Odds ratio 95Vo CICsA category # needing dialysis/total (Vo)
6/20 (3OVo) 1.00Category 1
0.39 o.ol-2.30Catezory 2 1/7 (I Vo)
0.29 0.03-2.92Category 3 1 1 Vo1 /9 ( )
# needing dialysis/total (Vo) Odds ratio 95Vo CICsA category
1.00Category 1 6/26 (23Vo)
0.56 0.09-3.53Category 2 3/2t (l47o)
4/42 (1,0Vo) 0.35 0.06-2.03Category 3
Page 93
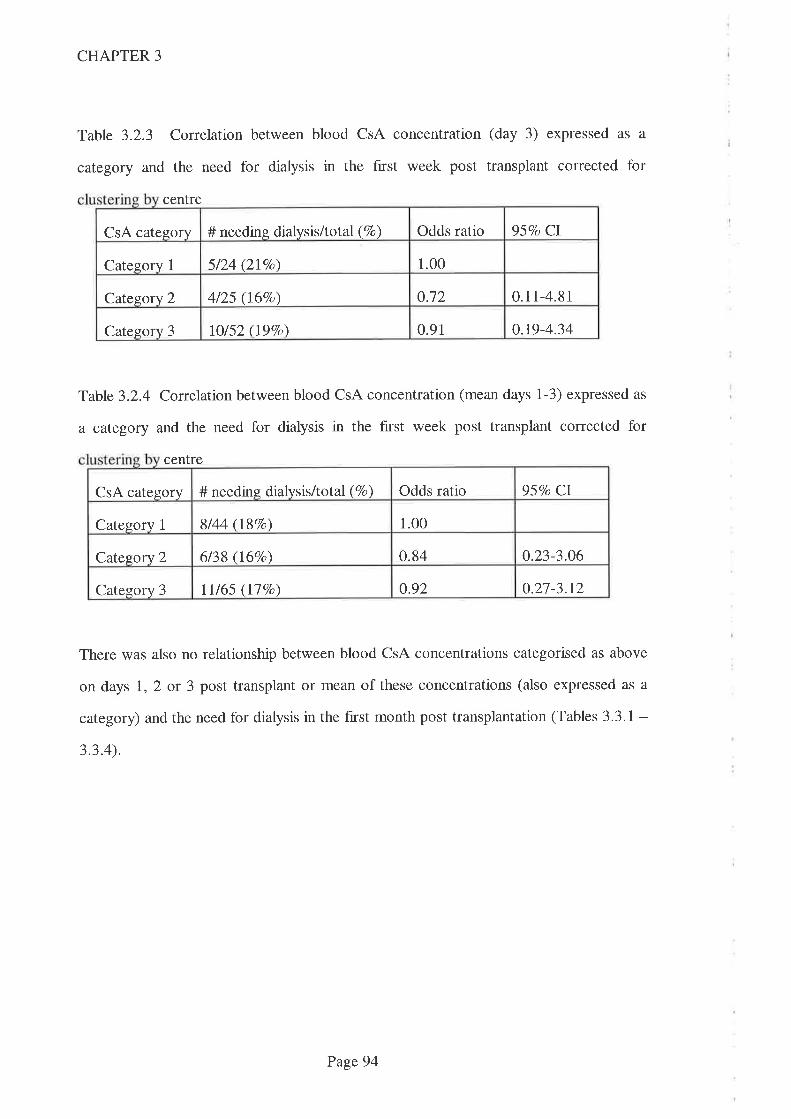
CHAPTER 3
Table 3.2.3 Correlation between blood CsA concentration (day 3) expressed as a
category and the need for dialysis in the f,trst week post transplant corrected for
centre
Table 3.2.4 Conelation between blood CsA concentration (mean days 1-3) expressed as
a category and the need for diaþsis in the first week post transplant corrected for
centre
There was also no relationship between blood CsA concentrations categorised as above
on days l, 2 or 3 post transplant or mean of these concentrations (also expressed as a
category) and the need for dialysis in the hrst month post transplantation (Tables 3.3.1 -3.3.4).
Odds ratio 95Vo CICsA category # needing dialysis/total (Vo)
1.00Category 1 5/24 (2lVo)
0.12 0.11-4.81Category 2 4/25 (167o)
o.t9-4.34lO/52 (197o\ 0.91Category 3
95Vo CI# needing dialysis/total (7o) Odds ratioCsA category
1.00Category 1 8/44 (187o)
0.84 0.23-3.06Category 2 6/38 (I6Vo)
0.92 0.27-3.t2lI/65 (llEo)Category 3
Page 94
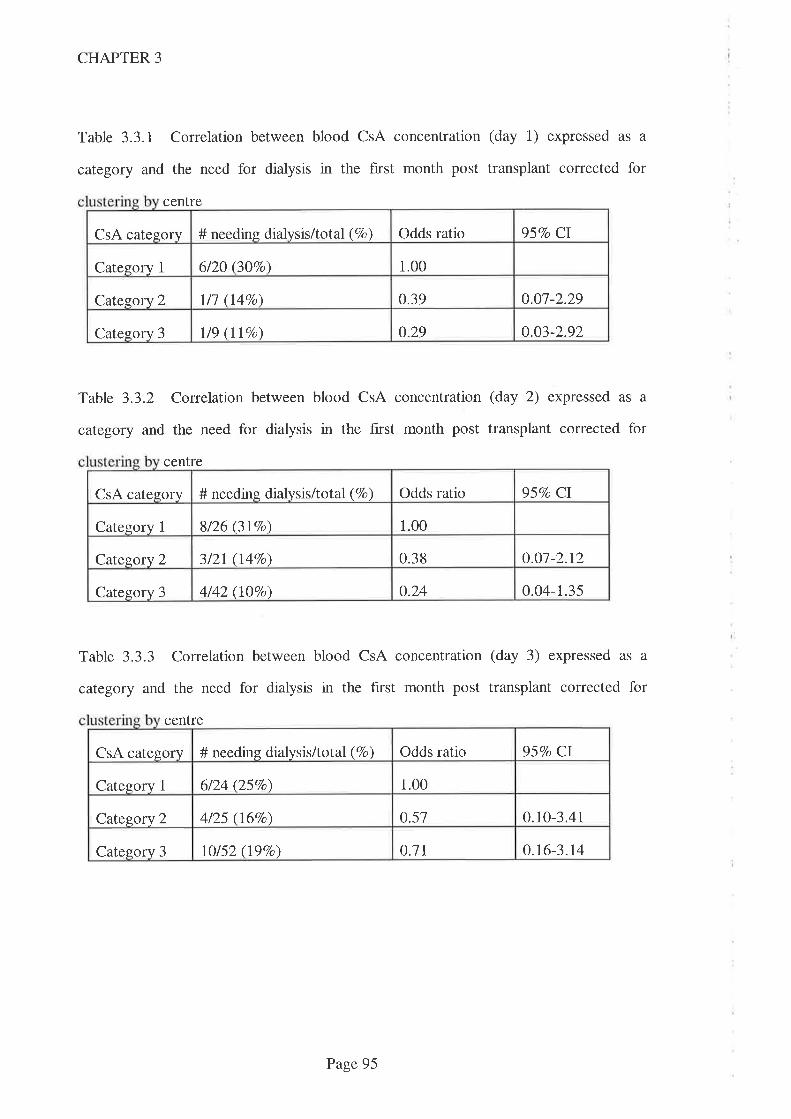
CHAPTER 3
Table 3.3.1 Correlation between blood CsA concentration (day 1) expressed as a
category and the need for dialysis in the first month post transplant corrected for
centre
Table 3.3.2 Correlation between blood CsA concentration (day 2) expressed as a
category and the need for dialysis in the first month post transplant corrected for
centre
Table 3.3.3 Correlation between blood CsA concentration (day 3) expressed as a
category and the need for dialysis in the first month post transplant corrected for
centre
Odds ratio 957o CICsA category # needing dialysis/total (Vo)
6/20 (307o) 1.00Category 1
o.o7-2.29l/1 (I4Vo) 0.39Category 2
0.29 0.03-2.92Categorv 3 1 t9 1 1 Vo( )
957o CICsA category # needing dialysis/total (Vo) Odds ratio
1.00Category 1 8/26 (3t7o)
o.o7-2.r23/2I (I Vo) 0.38Category 2
o.24 0.04-1.35Category 3 4/42 (lÙVo)
Odds ratio 95Vo CICsA category # needing dialysis/total (Vo)
6/24 (25Vo\ 1.00Category 1
0.10-3.414/25 (16%o\ 0.57Category 2
o.7t o.t6-3.r4Category 3 lO/52 (197o)
Page 95
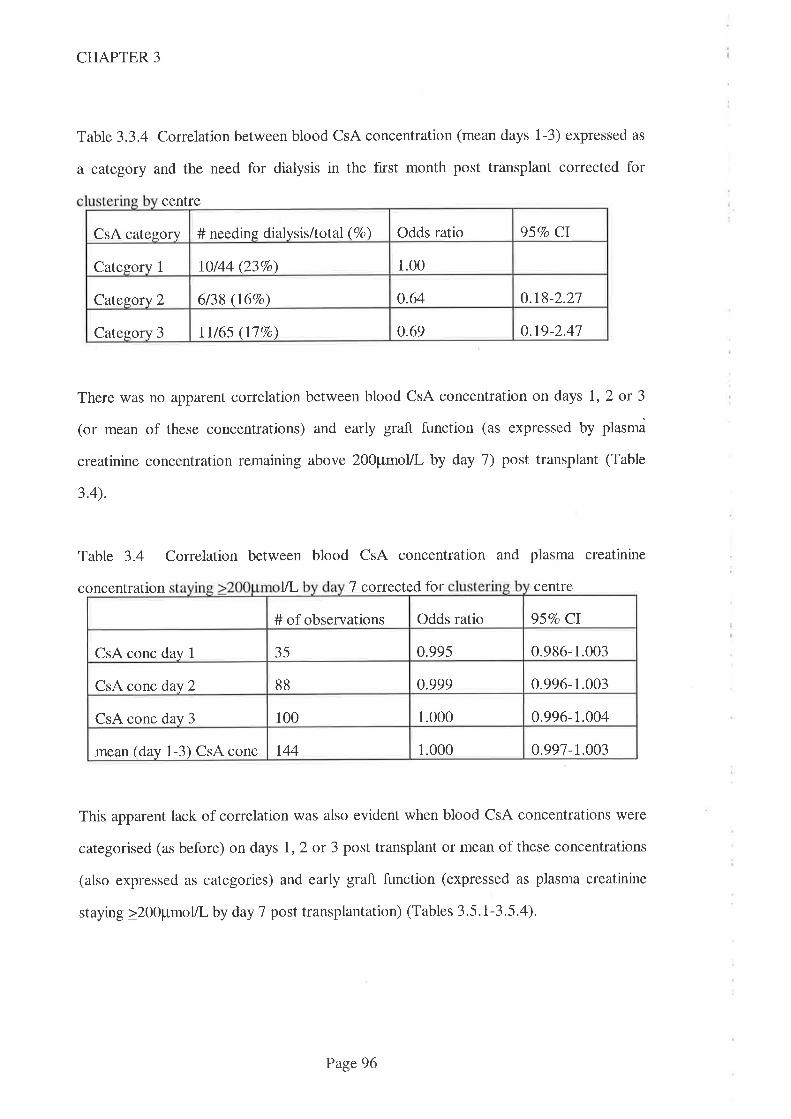
CHAPTER 3
Table 3.3.4 Correlation between blood CsA concentration (mean days 1-3) expressed as
a category and the need for dialysis in the fnst month post transplant corrected for
centre
There was no apparent correlation between blood CsA concentration on days 1,2 or 3
(or mean of these concentrations) and early graft function (as expressed by plasma
creatinine concentration remaining above 2}O¡tmolll- by day 7) post transplant (Table
3.4).
Table 3.4 Correlation between blood CsA concentration and plasma creatinine
concentratron til- 7 corrected for centre
This apparent lack of correlation was also evident when blood CsA concentrations were
categorised (as before) on days l, 2 or 3 post transplant or mean of these concentrations
(also expressed as categories) and early graft function (expressed as plasma creatinine
staying >200¡rmol/L by day 7 post transplantation) (Tables 3.5.l-3.5.4).
Odds ratio 95Vo CI# needing dialysis/total (Vo)CsA category
1.00Category 1 10144 (237o)
0.64 0.18-2.21Category 2 6/38 (l6Vo)
0.69 o.r9-2.41Category 3 11/65 (llVo)
Odds ratio 95Vo CI# of observations
35 0.995 0.986-1.003CsA conc day I
0.999 0.996-1.00388CsA conc day 2
1.000 0.996-1.004CsA conc day 3 100
0.991-r.003t44 1.000mean (day 1-3) CsA conc
Page96
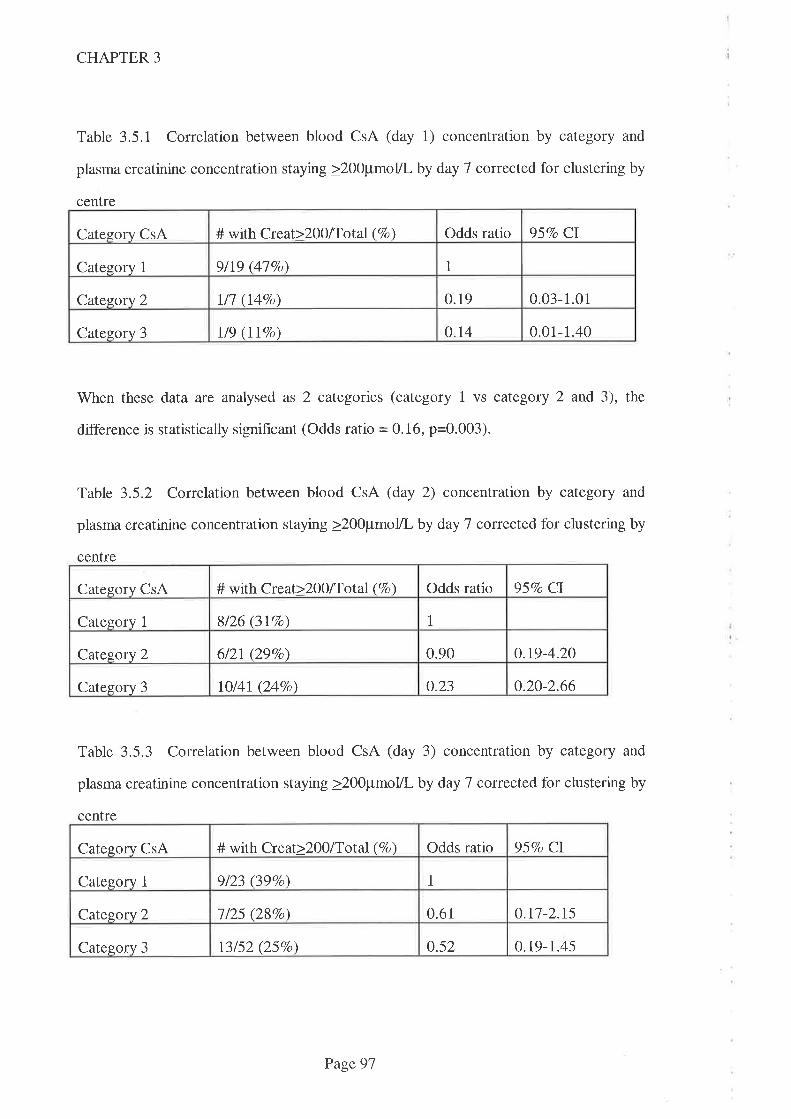
CHAPTER 3
Table 3.5.1 Correlation between blood CsA (day 1) concentration by category and
plasma creatinine concentration staying >200pmoVl by day 7 corrected for clustering by
centre
When these data are analysed as 2 categories (category 1 vs category 2 and 3), the
difference is statistically significant (Odds ratio = 0.16, p=Q.QQ3¡.
Table 3.5.2 Correlation between blood CsA (day 2) concentration by category and
plasma creatinine concentration staying >200pmolll by day 7 corrected for clustering by
centre
Category CsA # with Creat>200/Tor.al (7o) Odds ratio 95Vo CI
Category 1 8/26 (3I7o) 1
Category 2 6/2t (29Vo) 0.90 0.19-4.20
Category 3 IO/41(247o) 0.23 0.20-2.66
Table 3.5.3 Correlation between blood CsA (day 3) concentration by category and
plasma creatinine concentration staying >200pmol/L by day 7 corrected for clustering by
centre
Category CsA # with Creat>2OO/Total (Vo) Odds ratio 957o CI
Cal"egory 1 9/23 (39Vo\ 1
Category 2 1tzs (28%) 0.61 0.t7-2.t5
Category 3 13152 (25Vo) 0.52 0.19-1.45
Category CsA # with Creat>200lTotal (7o) Odds ratio 957o CI
Category 1 9ll9 Øl7o\ 1
Catesory 2 ll7 (I4Vo) 0.19 0.03-1.01
Category 3 t/9 (llVo) o.t4 0.01-1.40
Page 97
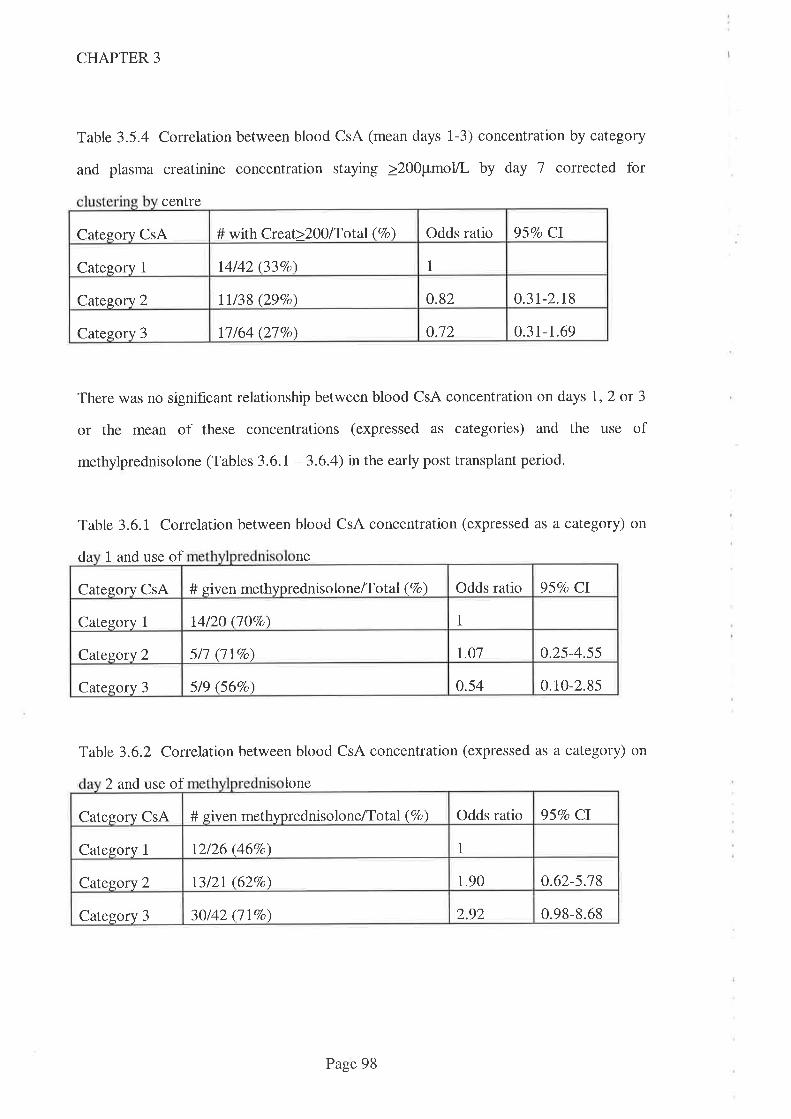
CHAPTER 3
Table 3.5.4 Correlation between blood CsA (mean days 1-3) concentration by category
and plasma creatinine concentration staying >200pmol/L by day 7 corrected for
centre
There was no significant relationship between blood CsA concentration on days 1,2 or 3
or the mean of these concentrations (expressed as categories) and the use of
methylprednisolone (Tables 3.6.I -3.6.4) in the early post transplant period.
Table 3.6.1 Correlation between blood CsA concentration (expressed as a category) on
da 1 and use of ne
Table 3.6.2 Correlation between blood CsA concentration (expressed as a category) on
2 and use of lone
Odds ratio 957o CICategory CsA # with Creat>Z}0lTotal (Vo)
14/42 (33Eo) 1Category 1
o.82 0.3t-2.r8I1138 (29Vo)Cate$ory 2
0.12 0.31-1.69Category 3 11/64 (27Vo)
957o CIOdds ratioCategory CsA # given methyprednisolone/Tot al (Vo)
114/20 (ljVo\Category 1
r.0l 0.25-4.55Category 2 5/l (lIVo)
o.54 0.10-2.855/9 66Vo)Category 3
Odds ratio 95Vo CICategory CsA # given methyprednisolone/Tot al (Vo)
1Category 1 t2/26 (467o)
0.62-5.1813/21(627o) 1.90Category 2
2.92 0.98-8.6830/42 (llEo)Category 3
Page 98
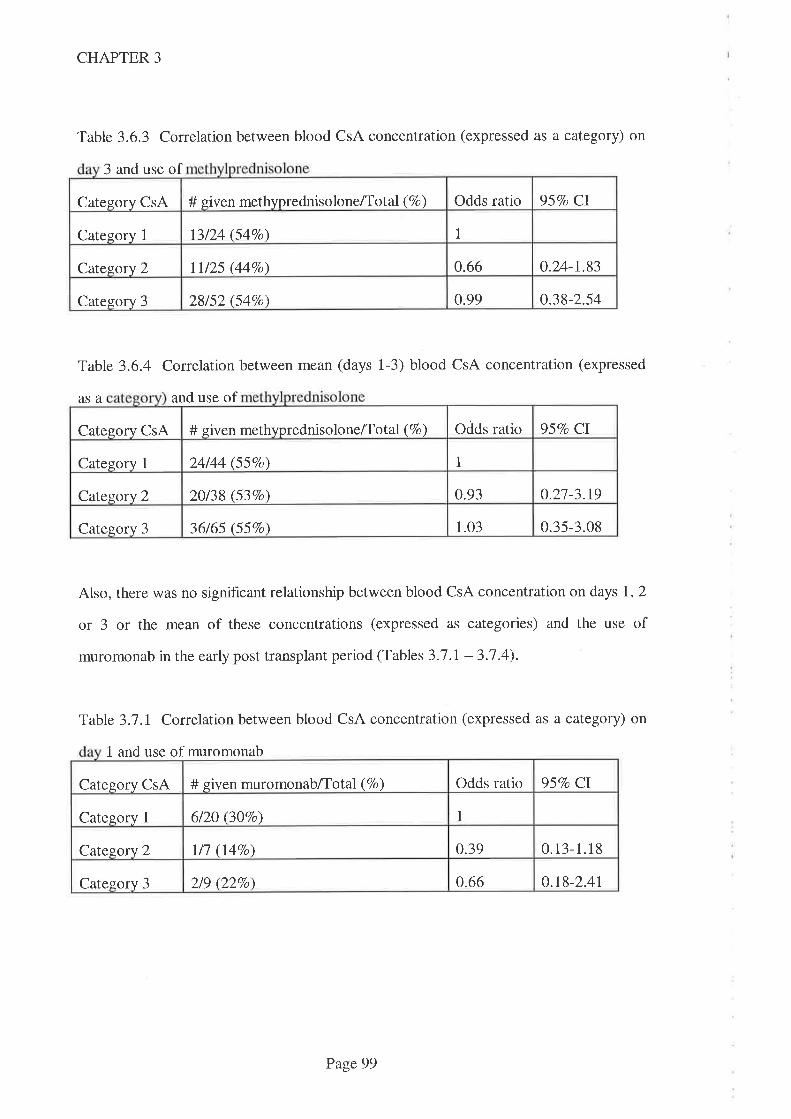
957o Cl# given methyprednisolone/Tot al (Vo) Odds ratioCategory CsA
It3/24 (547o)Category 1
0.66 0.24-1.83Catesory 2 lll25 (44Vo)
0.99 0.38-2.54Category 3 28152 (54Vo)
CHAPTER 3
Table 3.6.3 Corelation between blood CsA concentration (expressed as a category) on
3 and use of
Table 3.6.4 Correlation between mean (days 1-3) blood CsA concentration (expressed
asa and use of
Also, there was no significant relationship between blood CsA concentration on days 1, 2
or 3 or the mean of these concentrations (expressed as categories) and the use of
muromonab in the early post transplant period (Tables 3.7 .l - 3.1 .4).
Table 3.1 J Correlation between blood CsA concentration (expressed as a category) on
1 and use of muromonab
Odds ratio 95Vo CI# siven methyprednisolone/Tot al (Vo)Category CsA
1Cateqory 1 24/44 (55Vo)
0.27-3.1920138 (537o) 0.93Cateqory 2
1.03 0.35-3.08Category 3 36/65 (55Vo)
Odds ratio 957o CICategory CsA # given muromonab/Total (Vo)
6/20 (30Vo) 1Category I
0.39 0.13-1.18Catesory 2 I/1 (1.4Vo)
0.66 0.r8-2.4tCategory 3 219 (227o)
Page 99
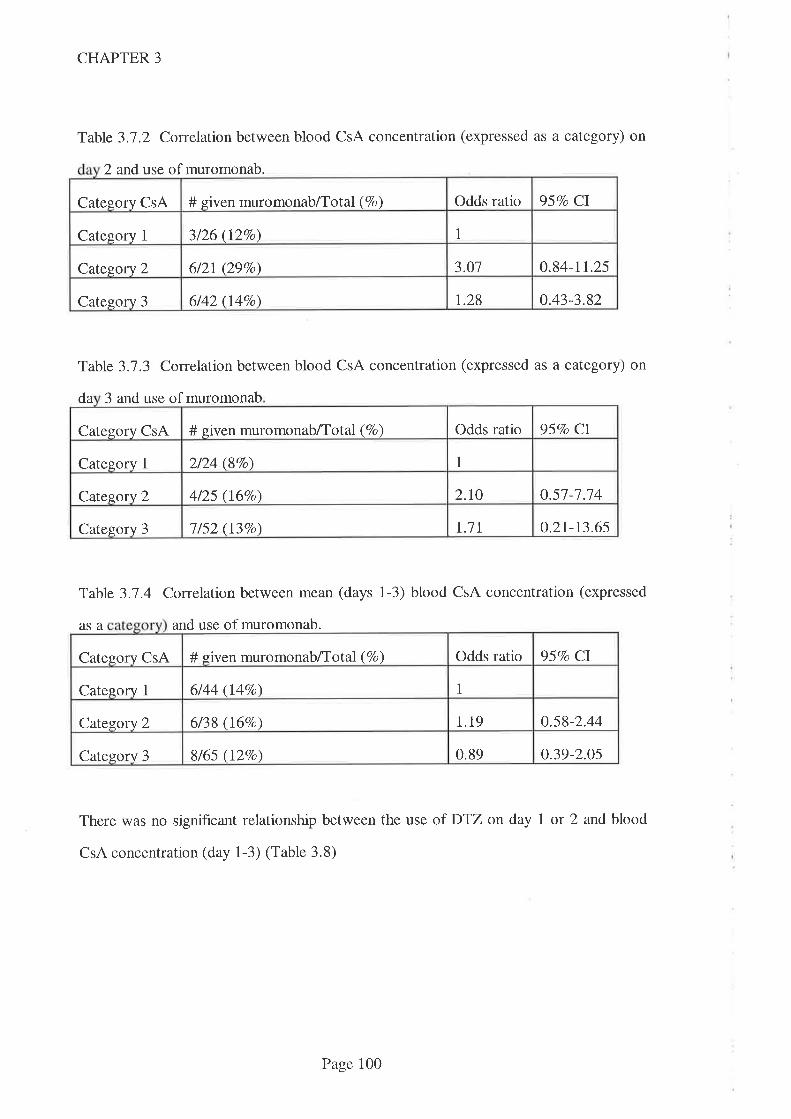
CHAPTER 3
Table 3.1.2 Correlation between blood CsA concentration (expressed as a category) on
2 and use of muromonab.
Table 3.1.3 Conelation between blood CsA concentration (expressed as a category) on
da 3 and use of muromonab
Category CsA # given muromonab/Total (Vo) Odds ratio 95Vo CI
Category 1 2/24 (8Vo) 1
Catezory 2 4/25 (167o) 2.10 0.57-1.14
Category 3 I /52 (I3Vo) r.1t o.2t-t3.65
Table 3.7.4 Correlation between mean (days 1-3) blood CsA concentration (expressed
asa and use of muromonab.
There was no significant relationship between the use of DTZ on day I or 2 and blood
CsA concentration (day 1-3) (Table 3.8)
Odds ratio 95Vo CICategory CsA # given muromonab/Total (Vo)
1Category 1 3/26 (12Vo)
o.84-11.25612I (297o) 3.O1Category 2
1.28 0.43-3.826/42 (l4%o)Category 3
Odds ratio 95Vo ClCatesorv CsA # given muromonab/Total (Vo)
1Category I 6/44 (r47o)
0.58-2.446/38 (16%o) 1.19Category 2
0.89 0.39-2.0sCategory 3 8/65 (l2Vo)
Page 100
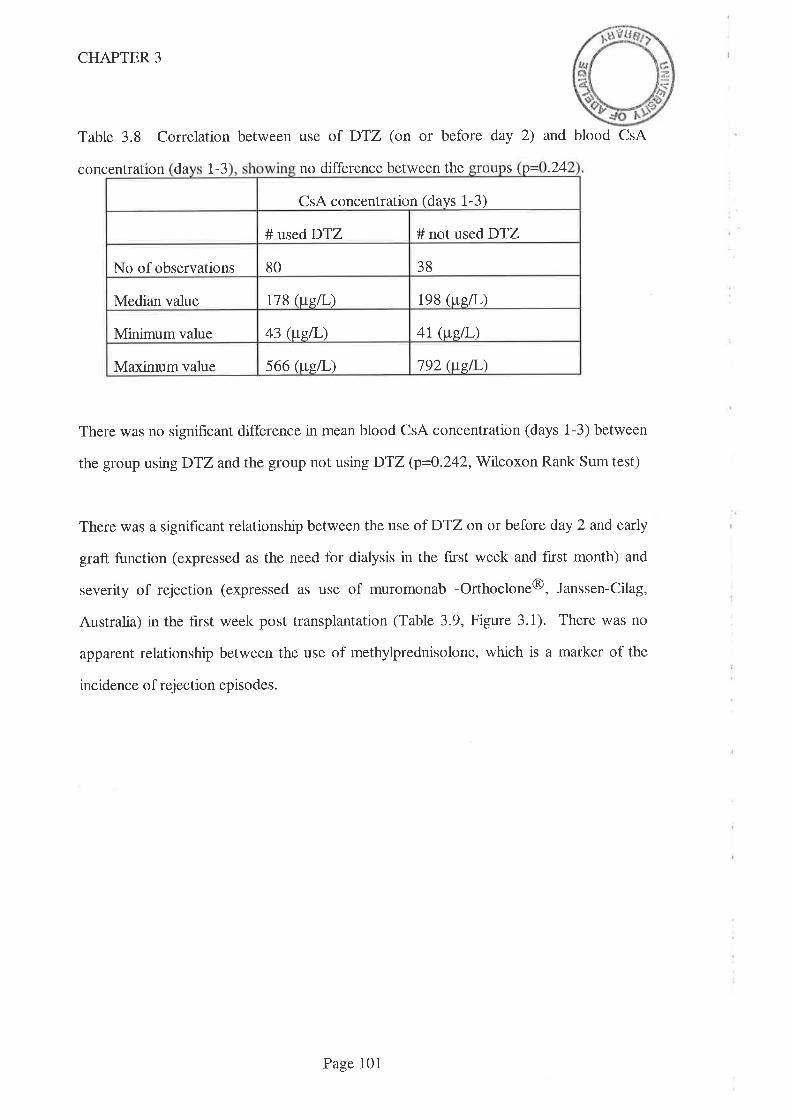
CHAPTER 3
Table 3.8 Correlation between use of DTZ (on or before day 2) and blood CsA
concentration da t-3 no difference between the S 24lruuuù \ lr-
CsA concentration (days 1-3)
# used DTZ # not used DTZ
No of observations 80 38
Median value tt8 (wgn ) 198 (uell-)
Minimum value 43 (us.L) 47 (weil-)
Maximumvalue 566 (tte[,) 192 (ttsil-)
There was no significant difference in mean blood CsA concentration (days 1-3) between
the group using DTZ and the group not using DTZ (p=Q.242,Wt7coxon Rank Sum test)
There was a significant relationship between the use ofDTZ on or before day 2 and early
graft function (expressed as the need for dialysis in the first week and first month) and
severity of rejection (expressed as use of muromonab -Orthoclone@, Janssen-Cilag,
Australia) in the first week post transplantation (Table 3.9, Figure 3.1). There was no
apparent relationship between the use of methylprednisolone, which is a marker of the
incidence of rejection episodes.
Page 101
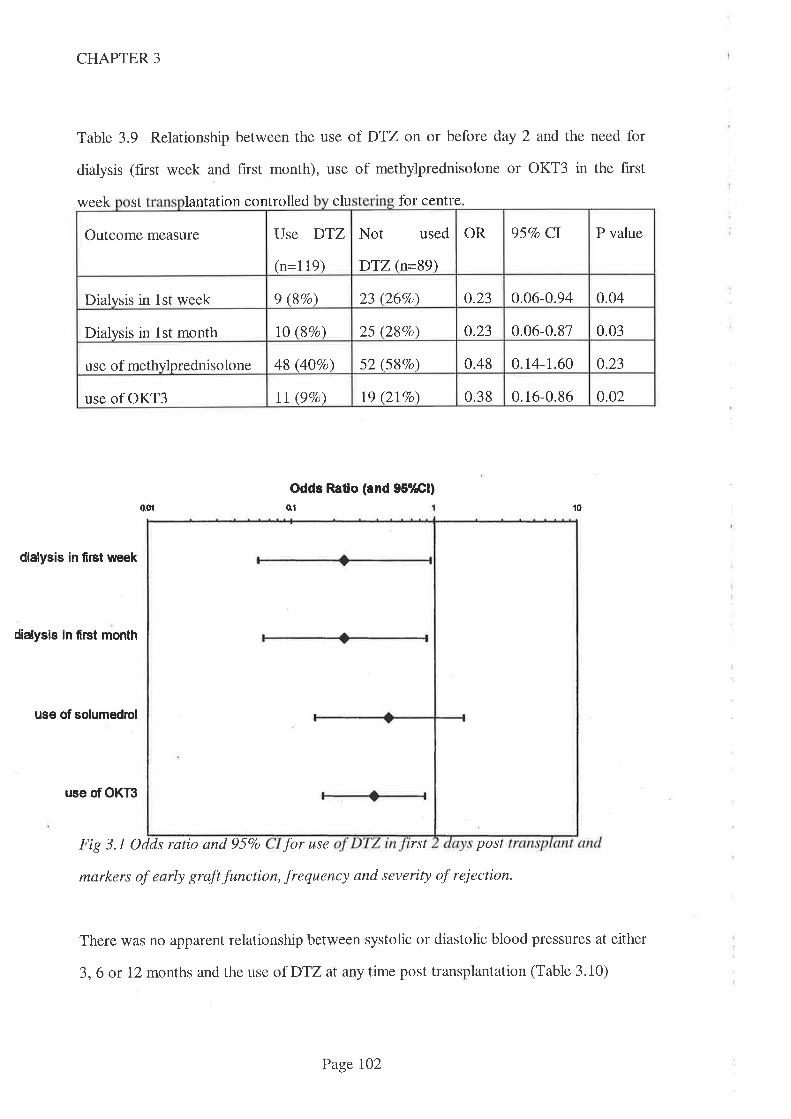
CHAPTER 3
Table 3.9 Relationship between the use of DTZ on or before day 2 and the need for
dialysis (f,rst week and hrst month), use of methylprednisolone or OKT3 in the first
week st lantation controlled clu for centre
Odds Ratlo (and 95o/Æl)
o01 o1 to
dialysis in first week
dialysis ln fi¡st month
use of solumedrol
use of OKT3
Fig 3.1 Odds ratio and 957o for use rst post
markers of early graft function, frequency and severity of reiection.
There was no apparent relationship between systolic or diastolic blood pressures at either
3,6 or 12 months and the use of DTZ at any time post transplantation (Table 3.10)
Not used
DTZ (n=89)
OR 95Vo CI P valueOutcome measure Use DTZ
(n=119)
23 (26Vo\ 0.23 0.06-0.94 0.04Dialysis in 1st week 9 (87o)
0.03lO (\Vo) 25 (28Vo) 0.23 0.06-0.87Dialysis in lst month
0.48 0.14-1.60 0.2348 (40Vo) 52 (58Vo)use of methylprednisolone
19 (2lVo) 0.38 0.16-0.86 0.02use of OKT3 ll (9Vo)
Page lO2
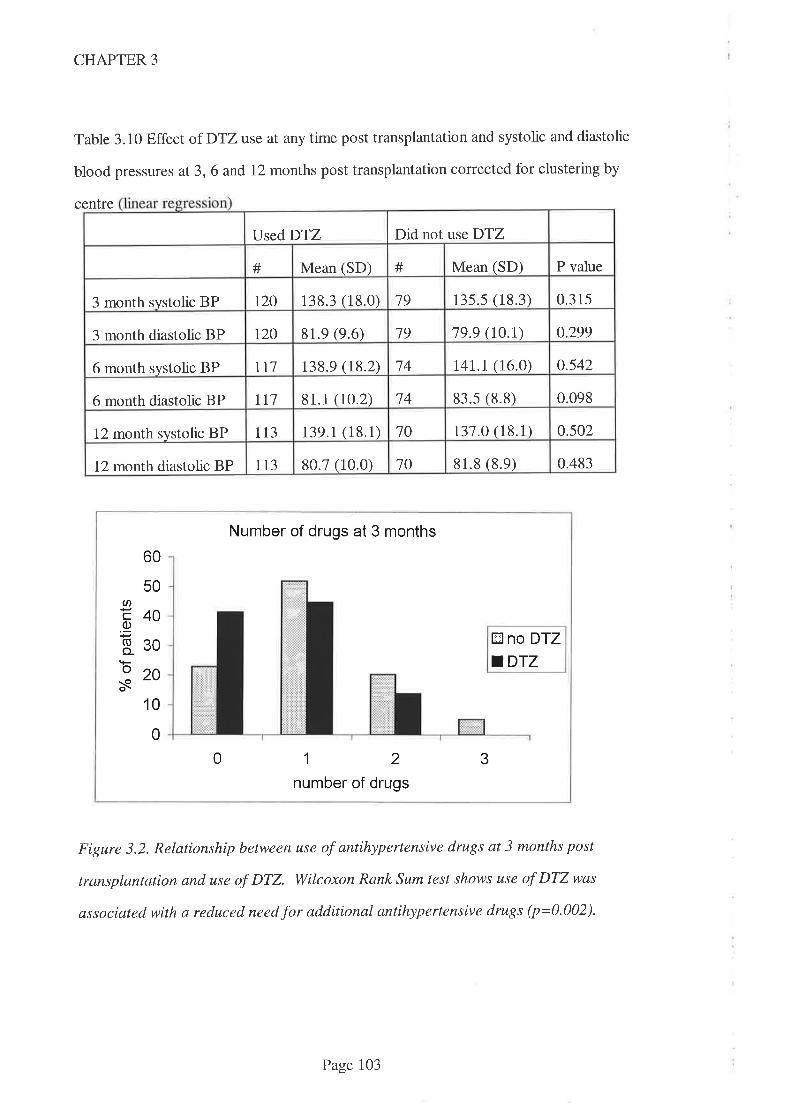
CHAPTER 3
Table 3.10 Effect of DTZuse at any time post transplantation and systolic and diastolic
blood pressures at 3, 6 and 12 months post transplantation corrected for clustering by
centre
Number of drugs at 3 months
60
50UI8400)'a830920N
E no DTZ
.DTZ
1 0
0
0 12number of drugs
3
Figure 3.2. Relationship between use of antihypertensive drugs at 3 months post
lrunsplantation and use of DTZ. Wilcoxon Rank Sum test shows use of DTZwas
associated with a reduced need for additional antihypertensive drugs (p=0.002).
Did not use DTZUsed DTZ
P valueMean (SD) # Mean (SD)#
135.5 (18.3) 0.315r20 138.3 (18.0) 193 month systolic BP
79 79.9 (t0.t) 0.299t20 81.9 (9.6)3 month diastolic BP
0.54214 141.1 (16.0)tl7 138.9 (18.2)6 month systolic BP
83.s (8.8) 0.09881.1 (10.2) 746 month diastolic BP 117
70 t37 .O (18.1) 0502tt3 139.1(18.1)12 month systolic BP
0.48310 81.8 (8.e)113 80.7 (10.0)12 month diastolic BP
Page 103
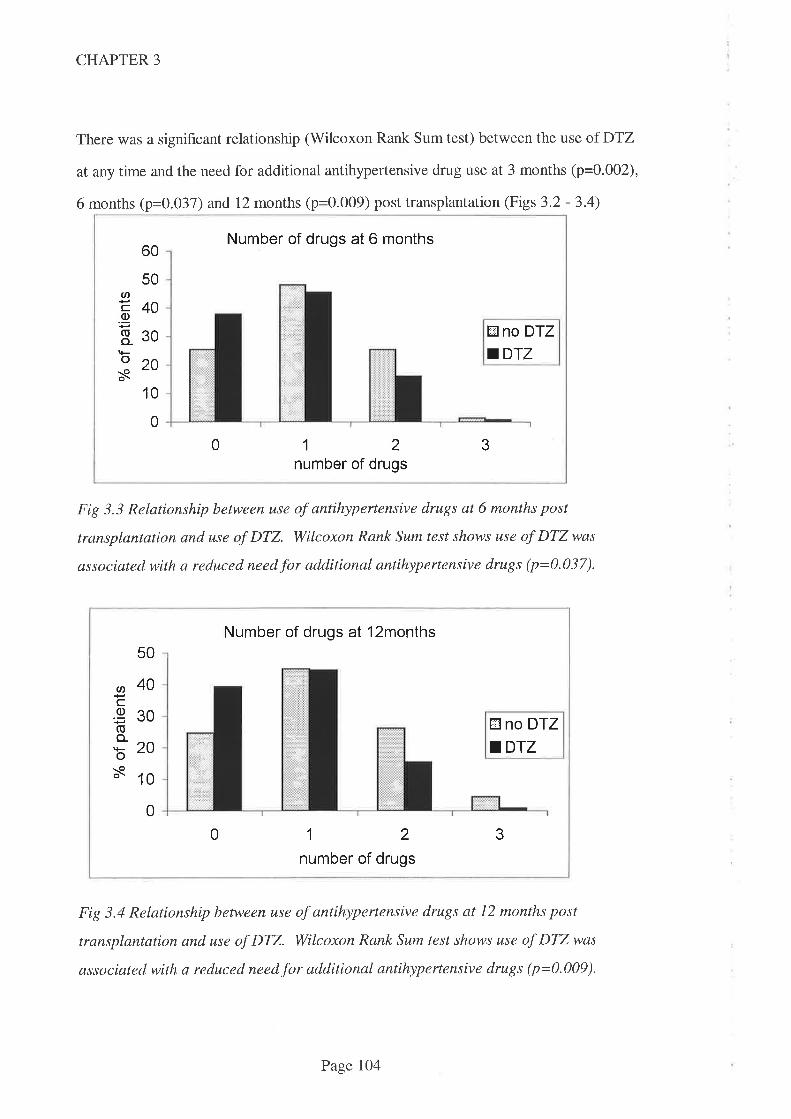
CHAPTER 3
There was a significant relationship (Wilcoxon Rank Sum test) between the use of DTZ
at any time and the need for additional antihypertensive drug use at 3 months (p=0.002),
6 months (p=0.037) and 12 months (p=0.009) post transplantation (Figs 3.2 - 3.4)
60
50
40
Number of drugs at 6 months
U'co(Ito-os
30 Øno DfZ.DTZ
20
1 0
0
0 12number of drugs
3
Fig 3.3 Relationship between use of antihypertensive drugs at 6 months post
transplantation and use of DTZ. Wilcoxon Rank Sum test shows use of DTZ was
associated with a reduced need for additional antihypertensive drugs (p=0.037).
Number of drugs at l2months50
g40cg30(Ito_
b20s 10
E no DTZ
.DTZ
0
0 12number of drugs
3
Fig 3.4 Relationship between use of antihypertensive drugs at 12 months post
transplantation and use of DTZ. Wilcoxon Rank Sum test shows use of DTZ was
associated with a reduced need for additional antihypertensive drugs (p=0.009).
Page lO4
CHAPTER 3
The above analysis does not taken into account the doses of antihypertensive drugs used.
In order to distinguish between the use of low doses of multiple antihypertensive drugs
and higher doses of fewer antihypertensive drugs, and to allow for the blood pressure
lowering effect of drugs which had an alternative indication, a rating system was devised
thus:
Where the dose of a drug indicated for use in hypertension was at the low to mid range
(see Table 3.1 1) a value of 1 was assigned. If the dose employed was above this range, a
value of 1.5 was assigned the therapy. Where a drug was used which had a different
indication, but was known to exert an blood pressure lowering effect (see list below), a
value of 0.5 was assigned this therapy. Where no information was available on dose of
antihypertensive drug used, a value of 1 was assigned. These calculations were made at
the 3, 6 and 12 month periods.
Other drugs which were not used primarily for an antihypertensive effect but which are
known to exert antihypertensive effects attracted a score of 0.5. These included
frusemide, sorbide nitrate, hydrochlor otbiazide I amiloride and verapamil.
There was also a statistically significant relationship (\üilcoxon Rank Sum test) between
the use of DTZ and the use of antihypertensive drugs according to the scaling system
outlined above at 3 months (p=0.002), 6months (p=0.026) and 12 months (p=0.020)
(Figures 3.5,3.6 and 3.7).
Page 105
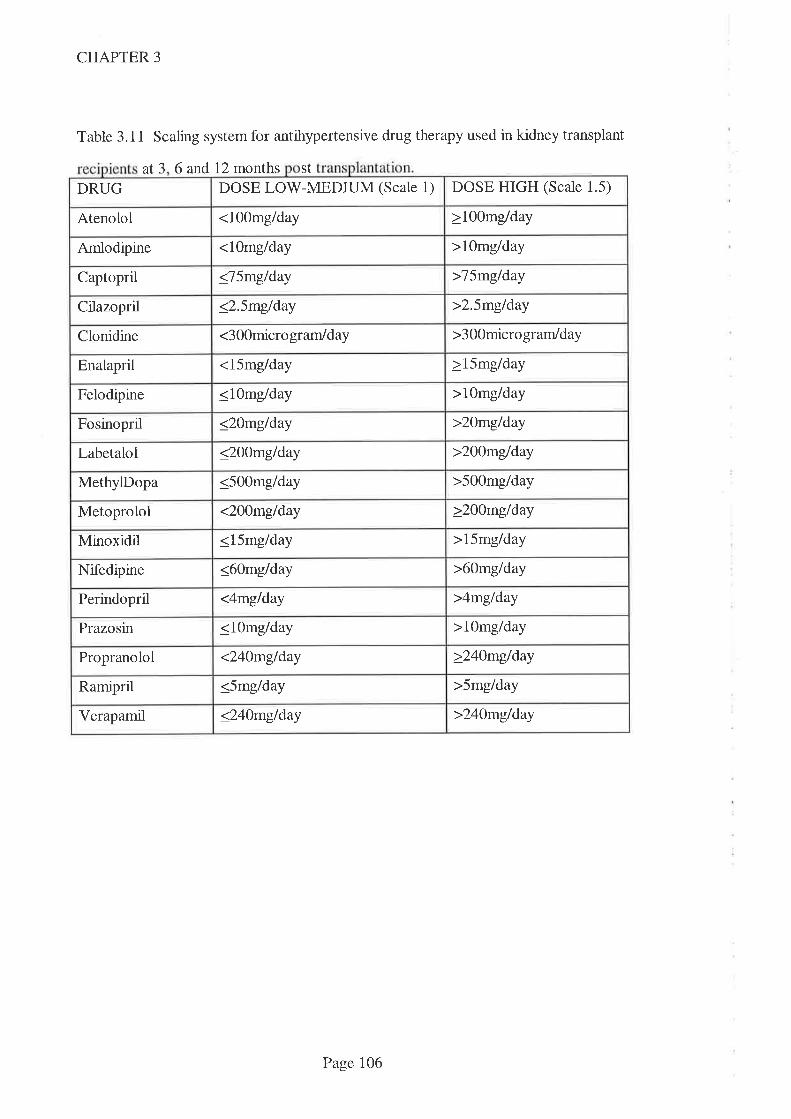
DOSE HIGH (Scale 1.5)DOSE LOV/-MEDIUM (Scale 1)DRUG
<1O0mg/day >1OOmg/dayAtenolol
<1Omg/day >10mg/dayArnlodipine
<75mglday >7SmgldayCaptopril
<2.5mg/day >2.5mg/dayCilazopril
<300micro gram/day >3OOmicro grarrldayClonidine
<15mg/day >15mg/dayEnalapril
<1Omg/day >1Omg/dayFelodipine
>20mg/day<20m9/dayFosinopril
>200mg/day<2OOmg/dayLabetalol
>5O0mg/dayMethylDopa <5OOmg/day
>2OOmg/dayMetoprolol <200mglday
>15mg/dayMinoxidil <15mg/day
<60mg/day >60mg/dayNifedipine
<4mg/day >4mg/dayPerindopril
>1Omg/day<1Omg/dayPrazosin
>24Ùmg/day<24Omg/dayPropranolol
>5mg/dayRamipril <5mg/day
>240mg/dayVerapamil <24omg/day
CHAPTER 3
Table 3.11 Scaling system for antihypertensive drug therapy used in kidney transplant
at3 6 and 12 months St
Page 106
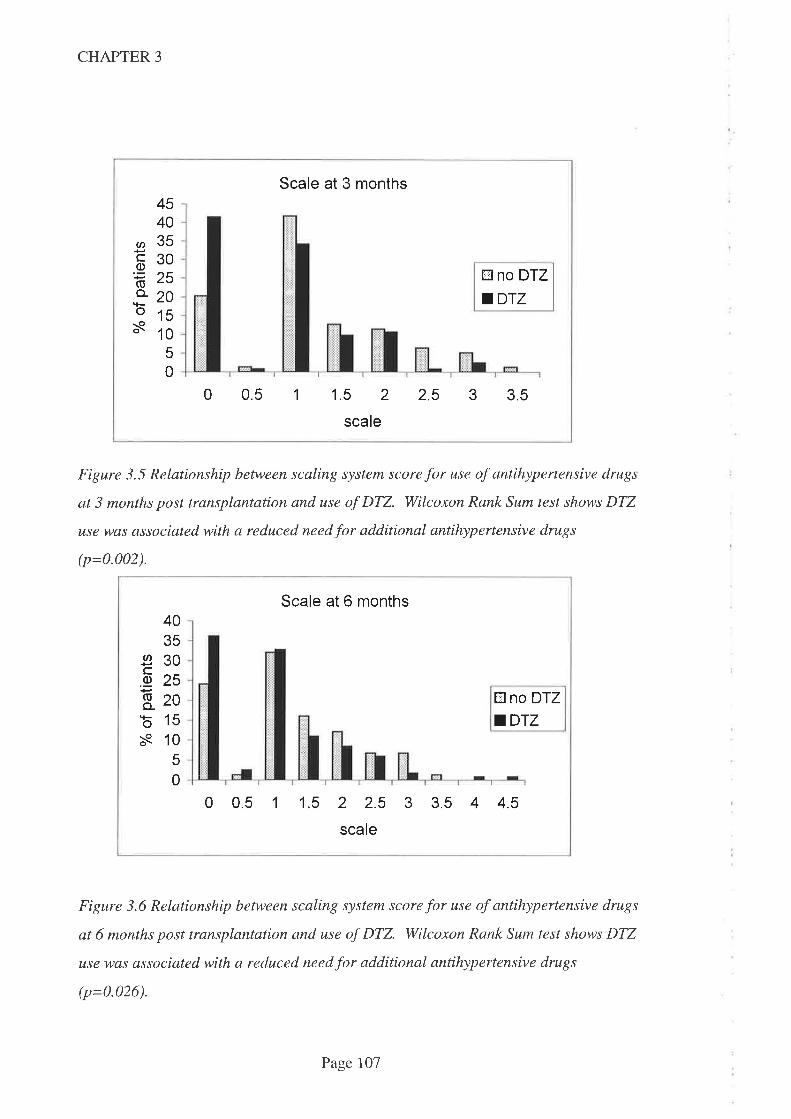
CHAPTER 3
Scale at 3 months4540eÃ(tt vu
Ë30.E 'R,ole
,*o 2oo1ss 10
50
tr no DTZ
aDrz
0 0.5 1 1.5 2 2.5 3 3.5
scale
Figure 3.5 Relationship between scaling system score for use of antihypertensive drugs
at 3 months post transplantation and use of DTZ. Wilcoxon Rank Sum test shows DTZ
use was associated with a reduced need for additional antihypertensive drugs
(p=0.002).
Scale at 6 months4035
930õ2sE- zob15s 10
5
0
EI no DTZ
aDrz
0 0.5 1 1.5 2 2.5 3 3.5 4 4.5
scale
Figure 3.6 Relationship between scaling system score for use of antihypertensive drugs
at 6 months post transplantation and use of DTZ. Wilcoxon Rank Sum test shows DTZ
use was associated with a reduced need for additional antihypertensive drugs
(p=0.026).
Page 107

CHAPTER 3
Scale at 12 months40
35
30I625'E
820o 15s
10
5
0
tr no DTZ
.DTZ
0 0.5 1 1.5 2 2.5 3 3.5 4 4.5
scale
Figure 3.7 Relationship between scaling system score for use of antihypertensive drugs
at 12 months post transplantation and use of DTZ. Wilcoxon Rank Sum test shows DTZ
use was associated with a reduced need for additional antihypertensive drugs
(p=0-020).
There was no apparent correlation between blood CsA concentration at 3, 6 or 12
months post transplantation and the likelihood that plasma creatinine concentration
would be >150pmoL atthe corresponding time (Tables 3.12.1-3.12.3).
Page 108
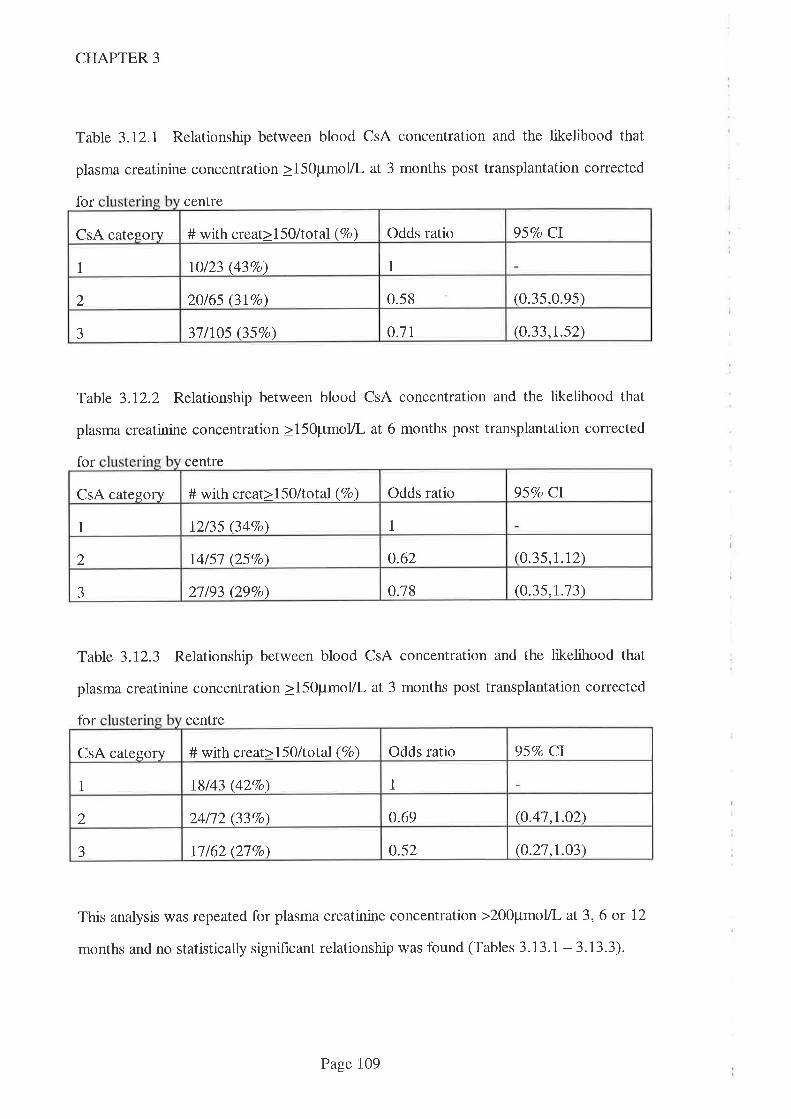
CHAPTER 3
Table 3.12.1 Relationship between blood CsA concentration and the likelihood that
plasma creatinine concentration >15OpmoL at 3 months post transplantation corrected
for centre
Table 3.12.2 Relationship between blood CsA concentration and the likelihood that
plasma creatinine concentration >15Opmol/L at 6 months post transplantation corrected
for centre
Table 3.72.3 Relationship between blood CsA concentration and the likelihood that
plasma creatinine concentration >150pmoL at 3 months post transplantation corrected
for centre
This analysis was repeated for plasma creatinine concentration >200pmoL at 3,6 or 12
months and no statistically significant relationship was found (Tables 3.13.1 -3.13.3).
Odds ratio 957o CICsA category # with creat>l50/total (7o)
11 \0123 (437o)
(0.35,0.9s)20/65 (3IVo) 0.582
o.7l (o.33,r.s2)3l/lO5 (357o)J
Odds ratio 95Vo CI# with creat>15O/total (Vo)CsA category
11 t2/35 (34Vo)
(0.35,1.12)14/51 QSVo\ 0.622
0.78 (0.35,t.13)aJ 21193 (29Vo)
Odds ratio 95Vo ClCsA category # with creat>l5O/total (Vo)
I1 18/43 (427o)
(0.41.r.02)24/12 (337o) o.692
o.52 (0.21,1.03)11162 (27Vo)J
Page 109
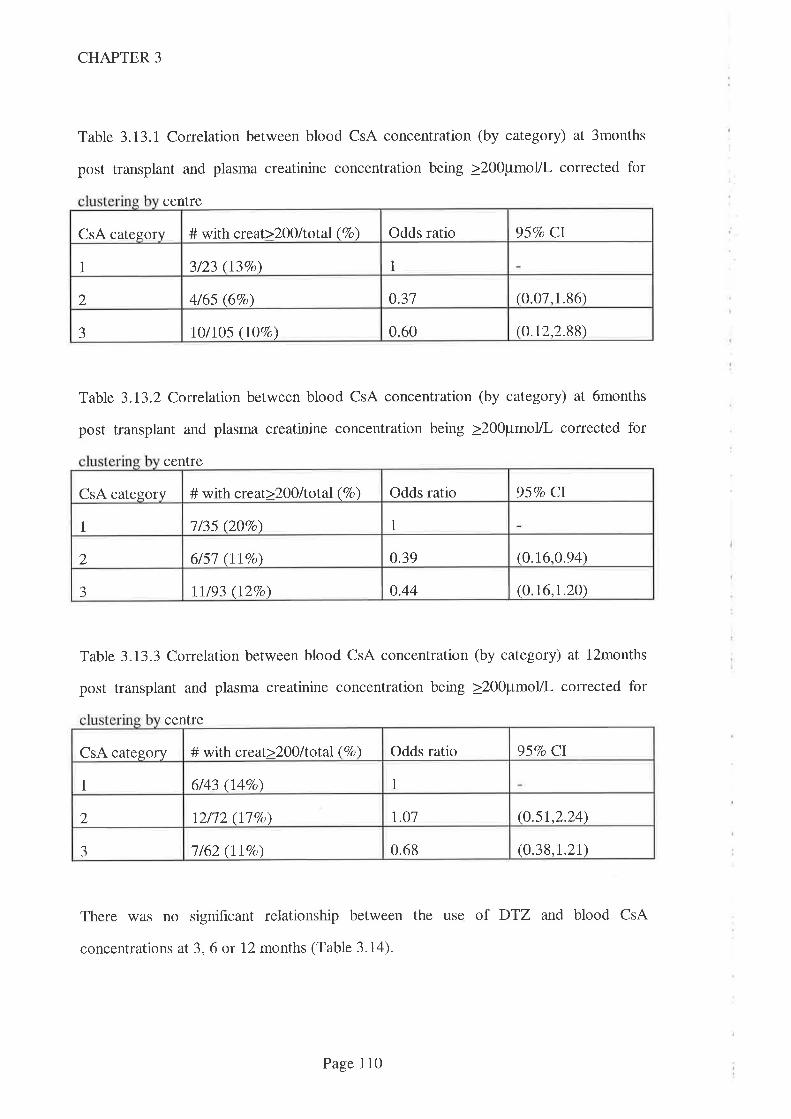
CHAPTER 3
Table 3.13.I Correlation between blood CsA concentration (by category) at 3months
post transplant and plasma creatinine concentration being >200pmol/L corrected for
centre
Table 3.13.2 Correlation between blood CsA concentration (by category) at 6months
post transplant and plasma creatinine concentration being >200pmol/L corrected for
centre
Table 3.13.3 Correlation between blood CsA concentration (by category) at l2months
post transplant and plasma creatinine concentration being >200pmol/L corrected for
centre
There was no significant relationship between the use of DTZ and blood CsA
concentrations at 3,6 or 12 months (Table 3.14).
957o CI# with qeat>2}0ltotal (7o) Odds ratioCsA category
3/23 (137o) 11
0.37 (0.07,1.86)2 4/65 (6Vo)
0.60 (o.t2,2.88)J 1 o/1 05 O7o )(1
Odds ratio 95Vo CICsA category # with creat>2O0/total (Vo)
1/35 QOTo) 11
0.39 (0.16,0.94)2 6/51 (IlVo)
0.44 (0.16,1.20)-J lt/93 (I2Vo)
957o Cl# with creat>200ltotal (Vo) Odds ratioCsA category
6/43 (l4%o) 11
l.o1 (0.s1,2.24)2 12/12 (177o)
0.68 (0.38,1.21)J 1162 (lt%o)
Page 110
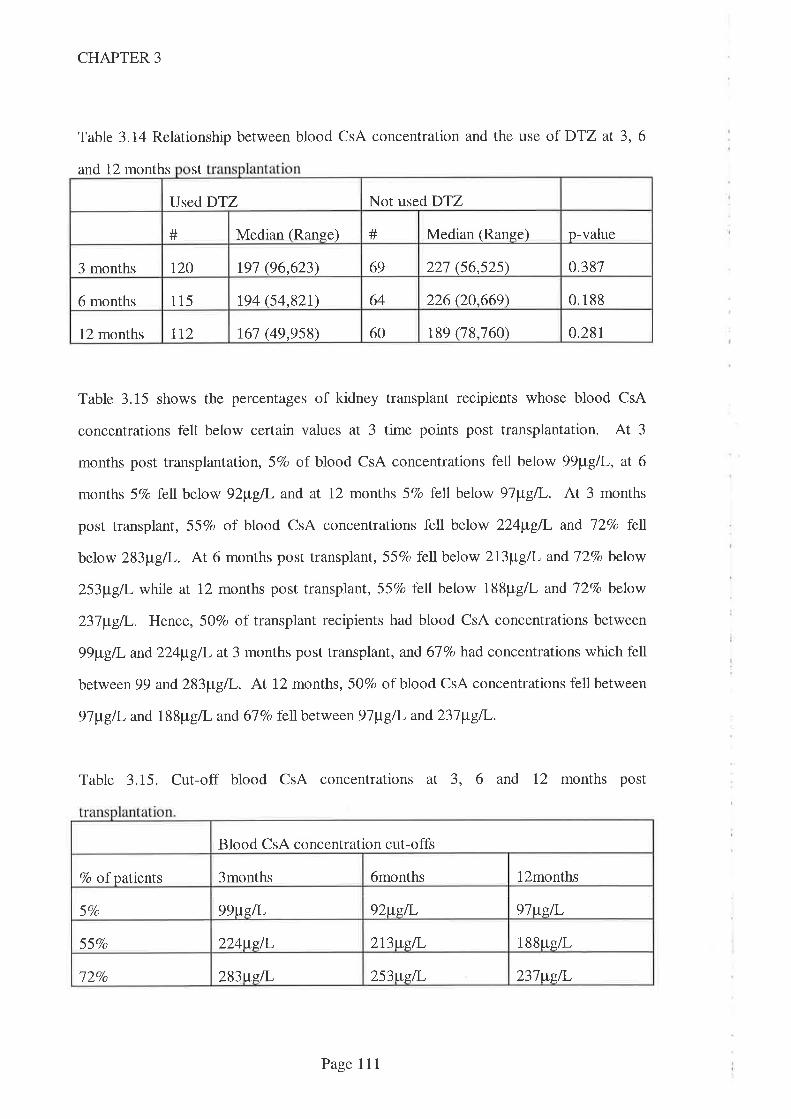
Not used DTZUsed DTZ
# Median (Ranee) # Median (Range) p-value
0.387t20 r9t (96,623) 69 221 (56,525)3 months
64 226 Q0.669) 0.1886 months 115 194 (54,82r)
60 189 (78,760) 0.28112 months tt2 161 (49,958)
CHAPTER 3
Table 3.14 Relationship between blood CsA concentration and the use of DTZ at 3,6
and 12 months St
Table 3.15 shows the percentages of kidney transplant recipients whose blood CsA
concentrations fell below certain values at 3 time points post transplantation. At 3
months post transplantation, 5Vo of blood CsA concentrations fell below 99¡tglI-, aT 6
months 5Vo fell. below 92¡t"gI and at 12 months 5Vo lell below 97¡tgil-. At 3 months
post transplant, 55Vo of blood CsA concentrations fell below 224¡t"g/I- and l2Vo fetl
below 283¡t"gT. At 6 months post transplant, 557o fell below 213¡t g/L and 72Vo below
253¡tg/I- while at 12 months post transplant, 55Vo fell below 188pg/L and J2Vo below
237¡tgil,. Hence, 50Vo of transplant recipients had blood CsA concentrations between
99¡t g/I- and 224¡tg/l- at 3 months post transplant, and 67 7o had concentrations which fell
between 99 and283¡tg/I-. At 12 months, 50Vo of blood CsA concentrations fell between
97¡tg/I- and 188¡rg/L and 677o fell between9T¡tgll' and237¡t"g/l-.
Table 3.15. Cut-off blood CsA concentrations at 3, 6 and 12 months post
Blood CsA concentration cut-offs
6months l2months7o of patients 3months
99ugil- 92ttsil, 9lweL57o
224ws,il, 2I3wgI 188ug/L55Vo
l2Vo 283tts,fi- 253wsÃ- 237wslL
Page 111
CHAPTER 3
3.5 Discussion:
The categories for blood CsA concentration (<I25¡t"gtL, I25-I99¡tg/l- and >2OO¡tg/I-)
selected for these analyses were chosen from the survey hndings (Chapter 2) as
representative of low, medium and high concentrations used for adult kidney
transplantation in Australasia. Additional analyses were performed using blood CsA
concentration expressed in tertiles (values were <140þLgil,,l40-222¡t"g/L and>223¡t"glL).
These analyses (for likelihood that plasma creatinine would be <20Opmolll and need for
dialysis in the first month post transplantation) provided similar results and did not alter
the conclusions.
The failure to reach statistical significance for analyses in this study does not necessarily
mean that correlations do not exist, since the same conclusion would result from too few
data (Type 2 error). Data was available fiom virtually the entire Australasian adult, first
cadaver, kidney transplant population for analysis but there were few blood CsA
concentrations in the first 3 days post transplantation. It was not surprising therefore
that the data did not support a relationship between the three categories of blood CsA
concentration (<125p9/L, 125-199¡tglI- and >200pg/L) and the need for dialysis in the
first week post transplantation. Assuming 3O7o of the lowest category and lOVo of either
category 2 or 3 would require dialysis in the hrst week, in order to detect a significant
difference (þ=0.2 and cr=0.05), there would need to be 60 patients in each category.
Data available for analysis included only 44 in the first category, 38 in the second and 65
in the third category. It was surprising that there were so few blood CsA concentration
data available (only 36 on day 1 post transplant and I4J over the first 3 post operative
days) given the availability of the assay and the importance of immunosuppression to
prevent rejection. Some transplant recipients were not commenced on CsA immediately
post transplant and hence blood CsA concentration monitoring in the hrst 3 days was not
performed. Not all transplant recipients received CsA on the day after transplant. One
limitation to these findings is that the time of commencement of CsA was not specifically
Page Il2
CHAPTER 3
asked in the questionnaire but where it was stated, it was assumed that the blood CsA
concentration was zero prior to this time and hence the data was available for analysis.
A similar limitation was seen when the relationship between blood CsA concentration
and the likelihood that serum creatinine concentration would be elevated (either
>l5Opmolll or >200pmo1ll) at 3, 6 or 12 months. The data available to detect a
difference between category 1 (blood CsA concentration <125¡tg/I-) and either category
2 025-f99þgil,) or category 3 (>ZOO¡tglL) allowed only 5O7o - lOVo po\¡/er (assuming
3OVo of those in category I and I)Vo in the other categories would have elevated serum
creatinine concentrations and cr=0.05).
The relationship between blood CsA concentration on day 1 (expressed as categories)
and likelihood that serum creatinine concentration would remain above 200pmol/L by
day 7 was interesting. When analysed as category 2 vs category 1 or category 3 vs
category 1, the relationship was not statistically signif,rcant (Table 3.5.1) but when
categories 2 and 3 were combined and then compared to category 1, the difference
became significant (p=0.003). This outcome implies that blood CsA concentrations
>125¡t"glL (ie. categories 2 and 3) on day 1 reduce the risk that creatinine concentrations
will remain elevated by day 7 (ie, a desirable outcome). It may however be just a
statistical artefact. Before interpreting this data, it is important to note that:
-the relationships between blood CsA concentration on days 2 or 3, as well as the
mean of blood CsA concentrations on days 1-3 and likelihood that serum
creatinine concentration would be less than 200pmol/L by day 7 were not
statistically significant (Tables 3.5.2 - 3.5.4.).
-the number of observations available for the day i anaiysis was smail (9 in
category 1 and 1 each in category 2 and category 3).
These suggest that the finding of signihcance in the relationship on day 1 is unlikely to be
real and should be ignored.
Page 113

CHAPTER 3
Further limitations of these analyses include the use of methylprednisolone as an
indicator of the occurrence of rejection and plasma creatinine concentration as a marker
of both nephrotoxicity and rejection. It was apparent from the distribution of the use of
methylprednisolone that, in some transplant recipients, there were additional reasons
(probably standard protocol) for use in the early post transplant period. Hence the use of
methylprednisolone is an imperfect marker of rejection. The use of plasma creatinine
concentration as a marker of kidney rejection is also suboptimal because high creatinine
concentrations might result from either rejection (presumed increased risk at lower blood
CsA concentration) or CsA induced nephrotoxicity (presumed increased risk at higher
blood CsA concentration). Similarly, using plasma creatinine concentration as a marker
of CsA induced nephrotoxicity is suboptimal. This may explain the lack of statistical
significance for the association between use of DTZ and need for methylprednisolone
post transplantation and also for the association between blood CsA and serum creatinine
concentrations at 3, 6 and 12 months post transplantation.
The finding that the blood CsA concentration in the immediate post transplant period is
not useful for predicting acute rejection has been reported previously in an Australian
kidney transplant population (Nankivell BJ, et al. 1994). These authors noted that "..the
majority of patients who reject do so at therapeutic CsA levels". They did however note
that blood CsA concentrations > }Ong/rnl- were 88Vo predictive and concentrations
>500ng/ml were 95Vo predictive for excluding acute rejection as a cause of worsening
creatinine concentrations. 'While the assay method used was relatively specific for parent
CsA, the CsA dosage and blood sampling schedule (once daily with blood concentration
determined at l2-l4h after the dose) restricts the ability to extrapolate to twice daily
CsA regimens used by most centres. Indeed, the authors recoÍrmended individual
transplant units construct their own therapeutic ranges to account for variability in
dosing regimen, sampling time and other differences. The use of DTZ was not noted as
a factor but, in the survey discussed in Chapter 2, this hospital was one where DTZ was
Page lI4
CHAPTER 3
used 'sometimes' (ie, neither in all nor none) post transplant and hence its use may have
further confounded these findings.
The inability of CsA trough concentration monitoring to predict outcomes has led some
authors to propose that AUC monitoring is a better tool to guide dosing (Kahan BD, et
al. 1995a. Grevel J, et al. 1989. Mahalati K, et al. 1999). Full AUC monitoring is time
consuming and expensive and hence a 'limited sampling' strategy has been advocated to
estimate AUC. One recent study (Mahalti K, et al. 1999) studied the relationship
between trough CsA concentrations or estimated CsA AUC and clinical outcomes (acute
rejection and CsA induced nephrotoxicity). Their findings from 156 kidney transplant
recipients included the observation that AUC was more closely associated with both
nephrotoxicity and rejection than trough concentration alone during the first 90 days post
transplant. Patients in that study used the microemulsion formulation of CsA which has
been shown to have improved absorption characteristics compared to the older
'sandimmun' formulation. This is significant since they monitored blood CsA
concentrations over the first four hours only which is the time that concentrations from
the older formulation rwere more likely to vary due to poorer and more variable
absorption. Unfortunately their findings were complicated by variability in the
immunosuppressive regimens (3 very different protocols), the use of DTZ in some but
not all patients and the high therapeutic range (trough concentrations 250-400pg/L days
1-3, reducing to 200-300¡tgl during the second and third months) which resulted in
greater exposure (AUC(O-12) 9500-11500pg.h/L) than that demonstrated in the study in
kidney transplant recipients reported in Chapters 4 & 5. In that study, the maximal CsA
AUC was seen at the 180mg/day DTZ dose (conventional release) when the mean
AUC(0-12) was 5301lLg.hlL (Table 5.2). Also worthy of note was the apparent lack of
benefit of DTZ use in the early post transplant period - a contrary finding to that of the
present study and of an earlier study in Australian kidney transplant recipients
(Chrysostomou A , et al. 1993). In the present study, the apparent lack of influence of
Page 115
CHAPTER 3
trough CsA concentration (which varied from <100¡t"g/I- to >500¡,tgll Table 3.14) on
clinical outcomes at 3, 6 and 12 months post transplant suggests that AUC monitoring in
the long term is unlikely to improve clinical outcomes significantly.
These data confirm that DTZ confers a therapeutic benefit in the early post transplant
period as indicated by the reduced need for diaþsis. There was no apparent relationship
between DTZ use and the need for methylprednisolone which suggests that the
frequency of rejection episodes are not reduced by the use of DTZ (1f the use of
methylprednisolone is an effrcient marker of rejection). However, there was a
relationship between the use of DTZ and a reduced need for muromonab which may
indicate that rejection episodes are milder when transplant recipients are prescribedDTZ.
Similar beneficial therapeutic effects have been noted before - in an Australian study
discussed earlier (Chrysostomou A, et al. 1993), DTZ was noted to exert a beneficial
therapeutic effect (reduced need for diaþsis and other immunosuppressive drugs post
transplantation). Unfortunately, in this study, kidney transplant recipients who received
DTZ had higher blood CsA concentrations at the first week and first month post
transplant and hence this therapeutic benefit might not be due to the prescription of DTZ
alone. In the present study DTZ use was not associated with higher blood CsA
concentrations in the early post operative period (Table 3.8) and hence the benehcial
therapeutic effects are likely to be as a direct consequence of DTZ use. Similar
therapeutic benef,rts in the form of a reduction of delayed graft function in the immediate
post transplantation period have been noted when verapamil was given to recipients of
cadaver kidney transplants (Dawidson I & Roth P. 1991).
It was not surprising that DTZ use was not associatecÍ with a higher blood CsA
concentration at 3, 6 or 12 months post transplant (Table 3.14) since doses are adjusted
to keep blood CsA concentration in the therapeutic range. This was also a finding in the
earlier Australian study (Chrysostomou A, et al. 1993) where the use oÏ DTZ allowed
Page 116
CHAPTER 3
the daily dose of CsA to be reduced by approxtrnately 35Vo. Respondents to the
questionnaire were not asked about the doses of CsA used and hence relative savings are
not quantifiable from the present study.
Blood pressure control (both systolic and diastolic blood pressure at any time post
transplantation) was similar in those kidney transplant recipients givenDTZ to those not
given it (Table 3.8). This is not surprising since this is one parameter that is regularly
monitored and kept within acceptable limits by the use of antihypertensive drugs. The
data does however demonstrate that the use of DTZ was associated with a reduced need
for additional antihypertensive drugs (Figure 3.2,3.3 and 3.4). This conflicts with the
earlier observations (Chrysostomou A, et al. 1993) made in a similar Australian
transplant population. The reason for this difference may be due to the larger population
in the present study since the Chrysostomou study suggested thatDTZ reduced the need
for additional antihypertensive drug use but the difference failed to reach statistical
significance.
In order to further explore the relationship between DTZ use and antihypertensive
effects, a scaling system was devised to overcome the bias associated with using numbers
of antihypertensive drugs used. Using crude numbers of antihypertensive drugs ignores
the effect of drug dose on blood pressure and also the blood pressure lowering effect of
other drugs which are prescribed for non-antihypertensive indications. The relationship
between DTZ use and each of these scales at 3, 6 and l2months were significant (Figures
3.5 - 3.7) and very similar to the relationship between DTZ use and actual number of
antihypertensive drugs used. These data therefore confirm r.hat DTZ exerts an
antihypertensive ef1êct in this patient population where the dose most commonly
employed in Australia during this time was 180mg per day given either as one
conventional release tablet (60mg) thrice daily or as one 180mg CD capsule each
morning. Both dosage regimens are approved for the treatment of hypertension in
Page II7
CHAPTER 3
Australia, albeit this is the lowest dose recommended (the maximum daily dose
recommended is 360mg per day).
Given the therapeutic benehts that have been conf,trmed in the present study, it would
seem wise to routinely prescribe DTZ n the immediate post transplant period for all
kidney transplant recipients (except where there is a clear contraindication). While lower
doses of DTZ have been shown to exert a significant CsA-sparing effect (see Chapter 4),
therapeutic benefits have only been demonstrated with 'conventional' doses of DTZ.
Therefore, until more data are available demonstrating therapeutic benefits at lower DTZ
doses, the recommended dose of DTZ should be 180mg/day.
In the event that blood pressure control warranted additional antihypertensive drugs, it
would seem reasonable to first increase the dose of DTZ (ie rather than starting another
drug) at least to 24omg per day. This could be administered either as 120mg
conventional release tablets given twice daily with the CsA, or as a single CD capsule
given once daily. The effect of this dosage increase on drug regimen complexity would
be minimal and there is at least some potential for further CsA dose reduction (see
Chapter 4) and hence potential for greater financial savings over the 18Omg/day dose.
Data from this study suggest that there is no therapeutic benefit to be gained from
increasing blood CsA concentration above a 'reasonable' value. Although there was no
demonstrable toxicity from higher blood CsA concentrations, using lower therapeutic
ranges would reduce the costs associated with CsA therapy. These costs are of such a
magnitude that it was one of the reasons for initially proposing that sparing drugs be
coprescribeci. Reciucing daily <iosage aiso has the potential to improve compiiance (by
reducing the number of capsules taken each day). Most respondents to the earlier
questionnaire (Chapter 2) used at least 2 tberapeutic ranges and hence the data were
analysed to determine where the majority of blood CsA concentrations lay at the 3 and
Page 118
CHAPTER 3
12 month periods post transplant. As noted in Table 3.I5, 5OVo of blood CsA
concentrations at 3 months post transplant fell between 99¡tgil- and 224¡t"g/1, wltiJe 617o
fell between 99¡tg/1, and 283¡tg/L. At 12 months post transplant, 507o of blood CsA
concentrations fell between 97¡tgil- and 188pg/L while 6lVo fell, between 97¡tg/L and
237¡t"gll-. From these data, it would seem reasonable to adopt an early post transplant
period CsA therapeutic range of 100pg/L - 225¡t"g/1, (or 100pg/L - 285¡tglL for higher
risk patients). Similarly, a reasonable late period post transplantation CsA therapeutic
range is 100pg/L - 200¡tg/1, (or 100pg/L - 240¡tgtL for higher risk patients). Because
these data are derived from the clinical setting, these proposed ranges are de facto what
happens in the Australasian, adult kidney transplant setting.
3.6 Conclusions
This study failed to show a signif,rcant relationship between blood CsA concentration at
any time post kidney transplantation and markers of efficacy (eg. reduced need for
dialysis or additional immunosuppression) or toxicity (eg. the likelihood that serum
creatinine concentration would remain above 150pmol/L). While data from almost the
entire Australasian kidney transplant population was available, this may be due to lack of
data or it may be as a consequence of the adequacy of the chosen variables to reflect
these outcomes. In particular, the use of methylprednisolone as a marker of rejection
episodes post transplantation was flawed by the apparent use by some centres of this
immunosuppressive drug routinely.
The finding that DTZ use was associated with a reduced need for dialysis and
muromonab use post transplantation supported earlier findings from the Australian
kidney transplant population and is a strong argument in favour of its routine
prescription. Contrary to earlier hndings, this study demonstrated that DTZ did exert an
antihypertensive effect in this population and since antihypertensive drug use was
Page 119
CHAPTER 3
widespread (>757o of patients not taking DTZ were prescribed one or more
antihypertensive drugs at 3mo post transplantation), the routine coprescription of DTZ is
logical.
Blood CsA concentration data provided at 3, 6 and l2mo post transplantation revealed
that 507o of kidney transplant recipients' concentrations fell between 100pg/L and
225¡tg/I- at 3 months and between 100pg/L and 190pg/L at 12 months. In addition,
6'7Vo of blood CsA concentrations fell between 100pg/L and 290¡t"gll- at 3 months and
between 100¡rg/L and 24O¡tg/L at 12 months post transplantation. The following
therapeutic ranges are thus recommended:
-100pg/L - 225¡tg\- (or 100pg/L - 285¡t"g/I- for patients deemed to need greater
immunosuppression) for the early period post transplantation.
-100pg/L - 2O}¡tg/I- (or 100pg/L - 24Ù¡tgll- for patients deemed to need greater
immunosuppression) for the late period post transplantation.
These values reflect the clinical situation that applied at the time of this study and are
lower than many in use at that time (see Chapter 2). The introduction of the
microemulsion formulation of CsA ('Neoral') and use of mycophenolate mofetil (instead
of azathioprine) have complicated the issue of therapeutic range construction. Given the
improvement in bioavailability associated with the former and enhanced
immunosuppression associated with the latter, it would seem reasonable to consider
using even lower values for CsA therapeutic range in the current environment.
Data provided in this and the previous Chapter provides valuable background data on the
practices associated with the use of CsA-sparing agents in Australasia. Because these
dala are derived from populations, they are limited by virtue of not being able to identrfy
individual patient responses. Clinical studies into the use of DTZ as a CsA-sparing agent
Page l2O

CHAPTER 3
in individual transplant recipients are needed to identifz variability in response - these are
the subject ofthe next 5 Chapters.
Page l2l

CHAPTER 4
Chapter 4
Diltiazem-Cyclosporin pharmacokinetic interaction - dose response relationship
4.1 Introduction
4.2 Aims
4.3 Methods
4.3 Results
4.4 Discussion
4.5 Recommendations
t23
t24
124
t2l
134
t40
Page 122
CHAPTER 4
4.1 Introduction
As noted in Chapter 1, CsA has become the most important immunosuppressive agent
used for the prevention of organ transplant rejection. The use of CsA has resulted in
better 12 month graft survival but this improvement has come at a signihcant financial
cost and with a new set of adverse effects. Partly for economic and partly for
therapeutic reasons, deliberate coprescription of other drugs with CsA has been
advocated (First MR, et al. 1993. Keogh A, et al. 7995. Wagner K, et al. 1988.
Leibbrandt DM & Day RO. 1992). CsA is metabolised by a cytochrome P450
isoenzyme (CYP3A4) in both liver (Kronbach T, et al. 1988. Combalbert J, et al. 1989)
and enterocyte (Kolars JC, et aL. 1991. 'Wu CY, et al. 1995) and many drug interactions
occur via this isoenzyme. In particular, KCZ and DTZ are inhibitors of CYP3A4
(Slaughter RL & Edwards DJ. 1995) and both have been shown to elevate blood CsA
concentrations.
Routine coprescription of DTZ with CsA was advocated in the mid 1980s (Neumayer
HH & 'Wagner K. 1986. Kohlaw K, et al. 1988) as a way of curbing the costs of
providing this expensive drug and coprescribing KCZ with CsA was advocated soon
after (First MR, et al. 1991. Keogh A, et al. 1995). Studies on transplant populations
have demonstrated that DTZ coprescription allows CsA blood concentrations to be
maintained within the 'therapeutic range' while reducing the mean dose of CsA by
approximately 30Vo (Neumayer HH & Wagner K. 1986. Chrysostomou A, et al. 1993.
Valentine H, et al. 1992. Sketris IS, et al. 1994. Wagner K, et al. 1988. Brockmoller J,
et al. 1990. Kohlaw K, et al. 1988. Shennib H & Auget J. 1994. Wagner K, et al.
1989). CoprescribngKCZ with CsA has been shown to facilitate a dose reduction of
JOTo or greater (First MR, et al. 1991. KeoghA, et al. 1995).
Page 123
CHAPTER 4
In vitro studies using human liver enzymes have shown large inter-individual variation in
CsA metabolic capacity (Kronbach T, et al. 1988. Combalbert J, et al. 1989.
Henricsson S & Lindholm A. 1988). It is therefore possible that the pharmacokinetic
interaction between CsA and drugs which affect its metabolism (including CsA-sparing
agents) will also show significant interpatient variability. The current study was
therefore designed to investigate the effect of DTZ on blood CsA concentrations in
individual transplant recipients. DTZ was chosen because, as demonstrated in Chapter 2,
it is the most widely prescribed CsA-sparing agent in Australia and New Zealand
As noted in Chapter 1, fluctuating concentrations of endogenous IL-6 are thought to
affect drug metabolising capacity. For this reason blood C-reactive protein
concentrations will be ascertained on each study day to monitor this variable.
4.2 Aims
The principal aim of this study was to dehne the dose-response curve for the interaction
between DTZ and CsA in renal transplant recipients maintained on this
immunosuppressive drug.. A secondary aim was to ascertain whether DTZ is the
interacting moiety or whether either of its metabolites interact by comparing the
correlation between blood concentrations of DTZ and/or those of its three major
metabolites with changes in blood CsA concentrations.
4.3 Methods
Eight stable renal transplant recipients maintained on CsA (Sandimmun@ caspules,
Novartis, formerly Sandoz Australia) (but not on DTZ) consented to take part in this
pharmacokinetic study which was approved by The Queen Elizabeth Hospital's Human
Ethics Committee (Appendix 3). Entry criteria included stable trough blood CsA
Page 124
CHAPTER 4
concentrations on routine monitoring for >3 months and plasma creatinine
concentrations which were stable for >3 months and <l8Opmolll. Patient details are
shown in Table 4.1. Exclusion criteria included: plasma creatinine concentration
>18Opmolll, known allergy to DTZ, sick sinus syndrome, hypotension, severe
congestive heart failure, acute myocardial infarction and/or pulmonary congestion.
On each 24h study day, serial blood samples were taken from an indwelling venous
catheter at times 0 (pre dose) and 1,2,3, 4, 6 and lZh after both morning and evening
CsA doses, making a total of 13 blood samples spanning 2 CsA dosing periods.
Incremental doses of DTZ were given between study days which were >2 weeks apart to
allow the interaction between CsA and DTZ to stabilise and steady-state blood CsA
concentrations to be achieved. The sequence of DTZ doses was 0, 10,20,30, 60mg in
the morning followed by 60mg and 90mg taken twice datly. DTZ doses less than 30mg
were taken in the form of a 10mg capsule manufactured from commercially available
tablets by the Hospital's Pharmacy Department, while doses of 30mg or more were taken
in the form of commercially available, conventional release 60mg tablets (Cardizem@,
ICI Australia). The DTZ content of the manufactured capsules was verified by HPLC
assay (see Chapter 7). EachDTZ dose was taken with the usual morning and/or evening
CsA dose (Sandimmun@ capsules, Novartis, formerly Sandoz, Australia) and food was
not consumed for at least th before or after CsA dosing. CsA dose reductions were
planned, if needed, to maintain blood CsA concentrations within the therapeutic range
used by this hospital (80-250pg/1,) and the resultant AUC was corrected by the same
factor (viz dose-normalised AUC) to allow for the dosage change. Apart from DTZ, no
drug which was known to interfere with CsA metabolism (including erythromycin and
KCZ), grapefruit juice, or any drug whose metabolism might be aftecteci by DTZ
(especially terfenadine and similar antihistamine drugs) were allowed during the course
of the study.
Page 125

CHAPTER 4
Patency of the venous catheter was maintained by instilling 1.5mL heparinised saline
(lOunits/ml) after each 7mL blood sample was withdrawn. To prevent contamination
from the heparinised saline, the first 2mJ, of blood withdrawn was discarded. Blood
samples were immediately stored at OoC (on ice) and transferred to a freezer (-20oC) as
soon as practicable and within 8h. 'Whole blood CsA concentrations were measured by
enzyme immunoassay (EMIT@ Behring/Syva, San Jose, California) which is relatively
specific for parent CsA (Dusci LJ, et al. 1992. Steimer 'W. 1999). AUCs were
calculated using the logarithmic trapezoidal method (Appendix 4).
Plasma DTZ, demethyldiltiazem (DMDTZ), desacetyldiltiazem (DADTZ) and
demethyldesacetyldiltiazem (DMD ADTZ) concentrations were determined using an
HPLC method developed as part of this study and described in Chapter 7. The assay had
an intra-assay CY(Vo) of <11 to <37o at concentrations of 2.5 to 100pg/L, respectively
(Morris RG, et al.1996).
The relationship between the daily dose of DTZ and both change in CsA AUC(0-24) and
change in CsA trough concentrations (l2h and 24h) were modelled using the sigmoid
E.rru* method. The curve was generated by entering the change from baseline AUCs
into the sigmoid Emax equation (Appendix 5) using GraphPad PRISM software (v 2.0,
Intuitive Software for Science, San Diego, USA), forcing the line through zero at time
zeïo
CsA AUC prior to DTZ admnistration was defined as E0 and the increase in effect at
datly DTZ doses of 30, 60 120 and 180mg were defined as E30, E60, E120 and E180.
Morning CsA AUCs were compared to evening AUCs by paired Student-t test and the
5Vo probability level was assigned to indicate significance. Relationships between change
in CsA AUC(O-24) and DTZ determinants were analysed by least squares ordinary
Page 126
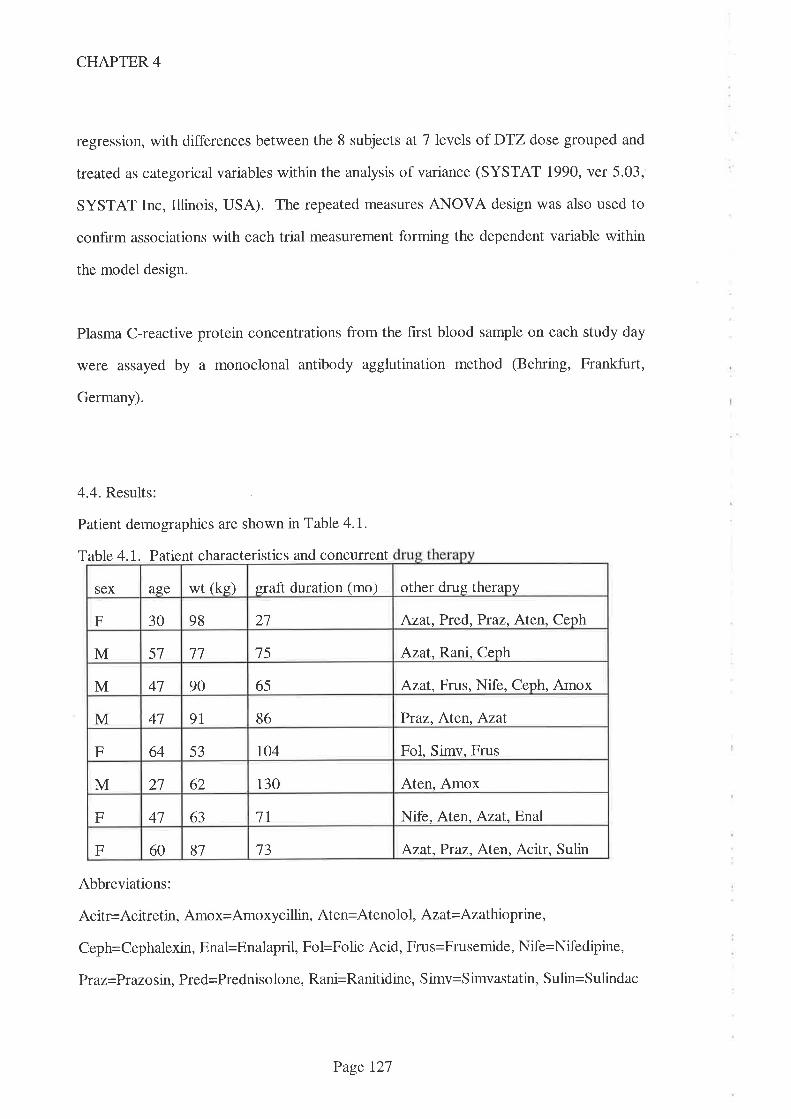
CHAPTER 4
regression, with differences between the 8 subjects at 7 levels of DTZ dose grouped and
treated as categorical variables within the anaiysis of variance (SYSTAT 1990, ver 5.03,
SYSTAT Inc, Illinois, USA). The repeated measures ANOVA design was also used to
confirm associations with each trial measurement forming the dependent variable within
the model design.
Plasma C-reactive protein concentrations from the first blood sample on each study day
were assayed by a monoclonal antibody agglutination method (Behring, Frankfurt,
Germany).
4.4. Results:
Patient demographics are shown in Table 4.1.
Table 4.1. Patient characteristics and concurrent
Abbreviations:
Acitr=Acitretin, Amox=Amoxycillin, Aten=Atenolol, Azat= Azathioprine,
Ceph=Cephalexin, Enal=Enalapril, Fol=Folic Acid, Frus=Frusemide, Nife=Nifedipine,
Praz=Prazosin, Pred=Prednisolone, Rani=Ranitidine, Simv=Simvastatin, Sulin=Sulindac
other drug therapysex age wt (ke) graft duration (mo)
27 Azat, Pr ed, Pr az, Aten, CephF 30 98
Azat. Rani, CephM 57 1l 15
65 Azat, Frus, Nife, Ceph, AmoxM 41 90
41 9l 86 Ptaz, Aten, AzatM
Fol, Simv, FrusF 64 53 ro4
130 Aten, AmoxM 2l 62
7l Nife, Aten, Azat,EnalF 41 63
81 73 Azat,Praz, Aten, Acitr, SulinF 60
Page 127
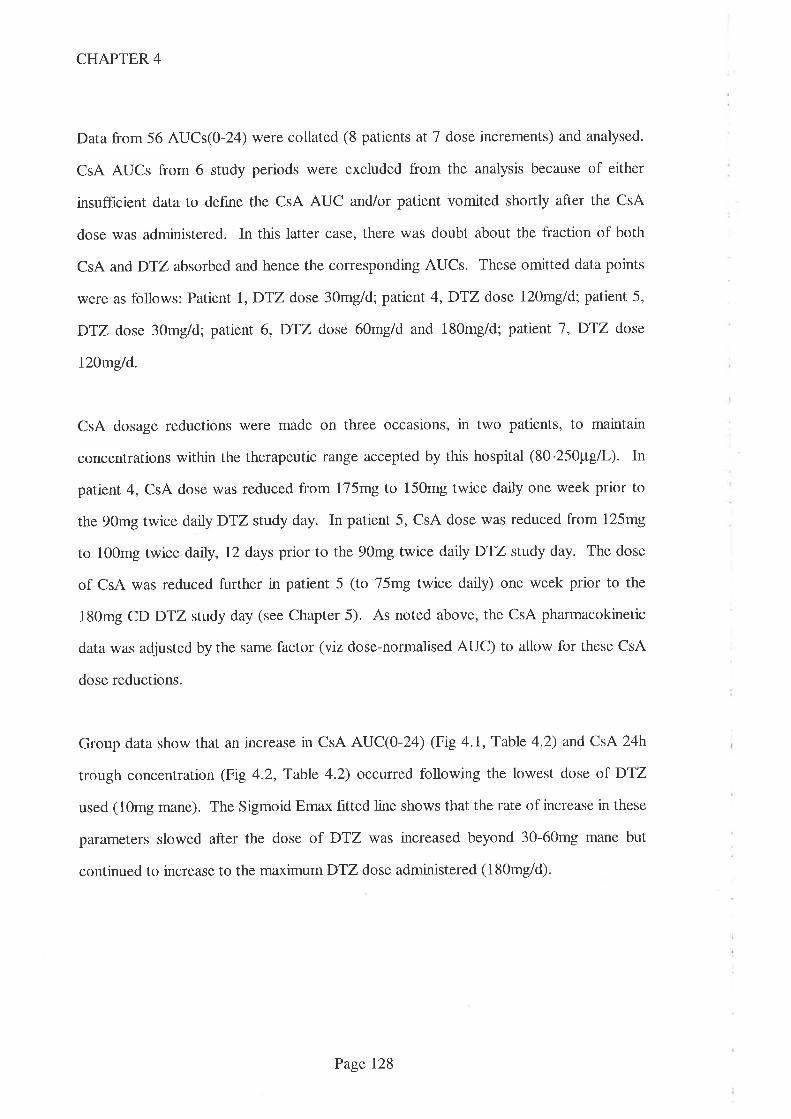
CHAPTER 4
Data from 56 AUCs(0-24) were collated (8 patients at 7 dose increments) and analysed.
CsA AUCs from 6 study periods were excluded from the analysis because of either
insuffrcient data to define the CsA AUC and/or patient vomited shortly after the CsA
dose was administered. In this latter case, there was doubt about the fraction of both
CsA and DTZ absorbed and hence the corresponding AUCs. These omitted data points
were as follows: Patient I,DTZ dose 30mg/d; patient 4,DTZ dose 120mg/d; patient 5,
DTZ dose 30mg/d; patient 6,DTZ dose 60mg/d and 180mg/d; patient J,DTZ dose
l20mg/d.
CsA dosage reductions were made on three occasions, in two patients, to maintain
concentrations within the therapeutic range accepted by this hospital (80-250pg/L). In
patient 4, CsA dose was reduced from 175mg to 150mg twice daily one week prior to
the 90mg twice daly DTZ study day. In patient 5, CsA dose was reduced from 125mg
to 100mg twice daúy, 12 days prior to the 90mg twice darly DTZ study day. The dose
of CsA was reduced further in patient 5 (to 75mg twice daily) one week prior to the
180mg CD DTZ study day (see Chapter 5). As noted above, the CsA pharmacokinetic
data was adjusted by the same factor (viz dose-normalised AUC) to allow for these CsA
dose reductions.
Group data show that an increase in CsA AUC(O-24) (Fig 4.1, Table 4.2) and CsA 24h
trough concentration (Fig 4.2, Table 4.2) occurred following the lowest dose of DTZ
used (10mg mane). The Sigmoid Emax frtted line shows that the rate of increase in these
parameters slowed after the dose of DTZ was increased beyond 30-60mg mane but
continued to increase to the maximum DTZ dose administered (180mg/d)'
Page 128
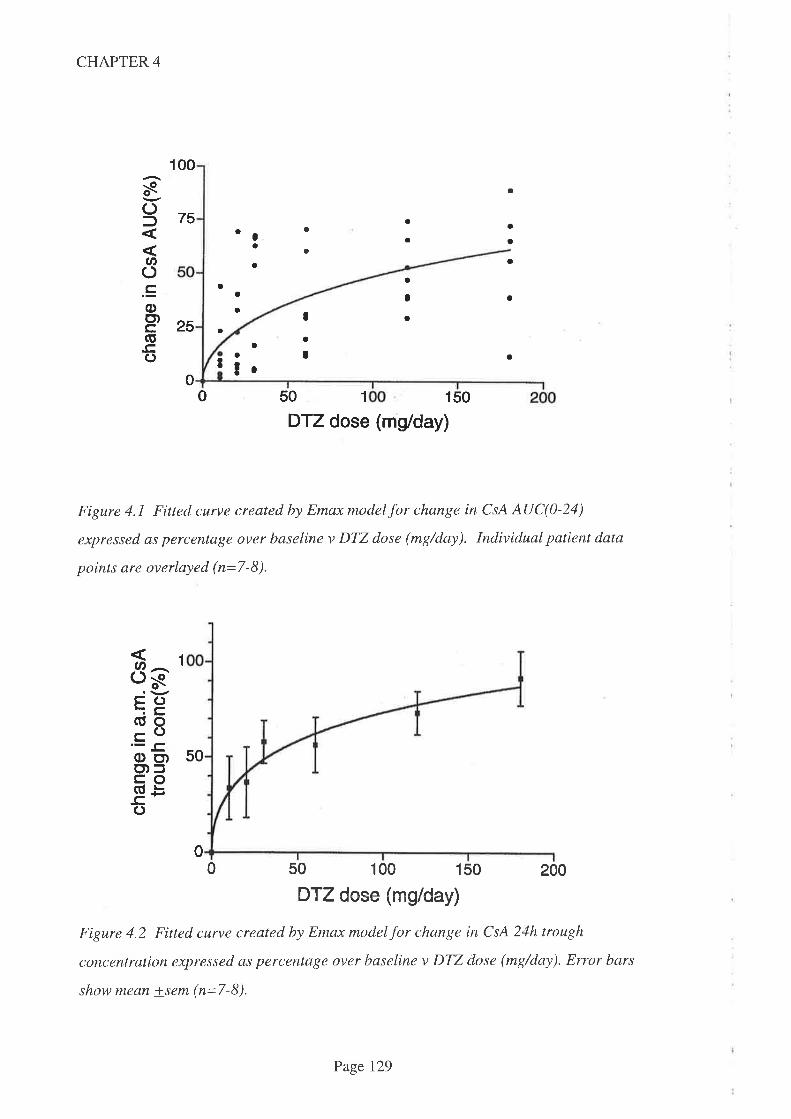
CHAPTER 4
a
50 1 150
Figure 4.1 Fitted curve created by Emax model for change in CsA AUC(0-24)
expressed as percentage over baseline v DTZ dose (mg/day). Individual patient data
points are overlayed (n=7-8).
00 50 100 150 200
ÐTZ dose (mg/day)
Figure 4.2 Fitted curve created by Emax model for change in CsA 24h trough
concentration expressed as percentage over baseline v DTZ dose (mg/day). Error bars
show mean +sem (n=7-8).
25
s()f
Ø().coo)cGC)
00
75
1
a
a
a
a
a
a
a
o
a
a
aIa
a
a
Ia
¡
a
a
aa
tr
a
a
o
I0
0
DTZ dose (mg/day)
8gFC)(Ú0coOo)o)fcoat -b-c'C)
1
50
Page 129
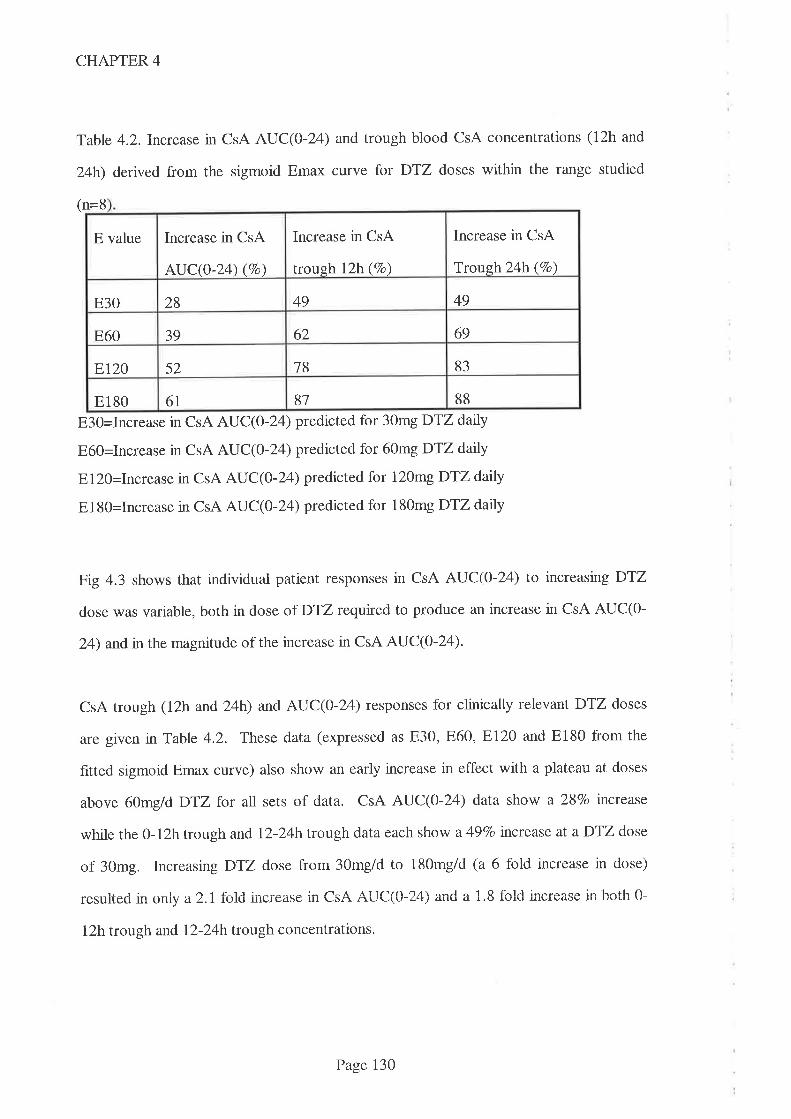
CHAPTER 4
Table 4.2.Increase in CsA AUC(O-T4) and trough blood CsA concentrations (12h and
24h) derived from the sigmoid Emax curve for DTZ doses within the range studied
n=8(
E3O=Increase in CsA AUC(O-I ) predicted for 30mg DTZ datly
E60=Increase in CsA AUC(O-L4) predicted for 60mg DTZ datly
El20=Increase in CsA AUC(O-24) predicted for 120mg DTZ darly
El80=Increase in CsA AUC(0-24) predicted for 180mg DTZ dalúy
Fig 4.3 shows that individual patient responses in CsA AUC(O-L4) to increasing DTZ
dose was variable, both in dose of D'12 requtred to produce an increase in CsA AUC(O-
24) andin the magnitude of the increase in CsA AUC(0-24)'
CsA trough (12h and 24b) and AUC(0-24) responses for clinically relevant DTZ doses
are given nTable 4.2. These data (expressed as 830,860, El20 and E180 from the
fitted sigmoid Emax curve) also show an early increase in effect with a plateau at doses
above 60mg/d DTZ for all sets of data. CsA AUC(O-T4) data show a 28Vo increase
while the 0-12h trough and l2-24h trough data each show a 497o tnctease at a DTZ dose
of 30mg. Increasing DTZ dose from 30mg/d to 180mgld (a 6 fold increase in dose)
| ^ I f r-r:,- :^ r1^^ ^ttr1/^
1,{\ -'.'{ ^ 1 O f^l.l ¡-^-^^.^i- h^thfìresulteo l]l only a z,l lolu,] lllu.lE:ilsg lll \-rfl' ¡al.J\-\u-2,'1,, 4llLr d r.o ruru urwrw4ùv rtr r,\rl¡¡ v
12h trough and l2-24h trough concentrations.
Increase in CsA
Trough 24h (Vo)
Increase in CsA
trough l2h(7o)
E value Increase in CsA
AUC(0-24) (%o)
4928 49E30
62 6939E60
8318ET2O 52
8887E180 6t
Page 130
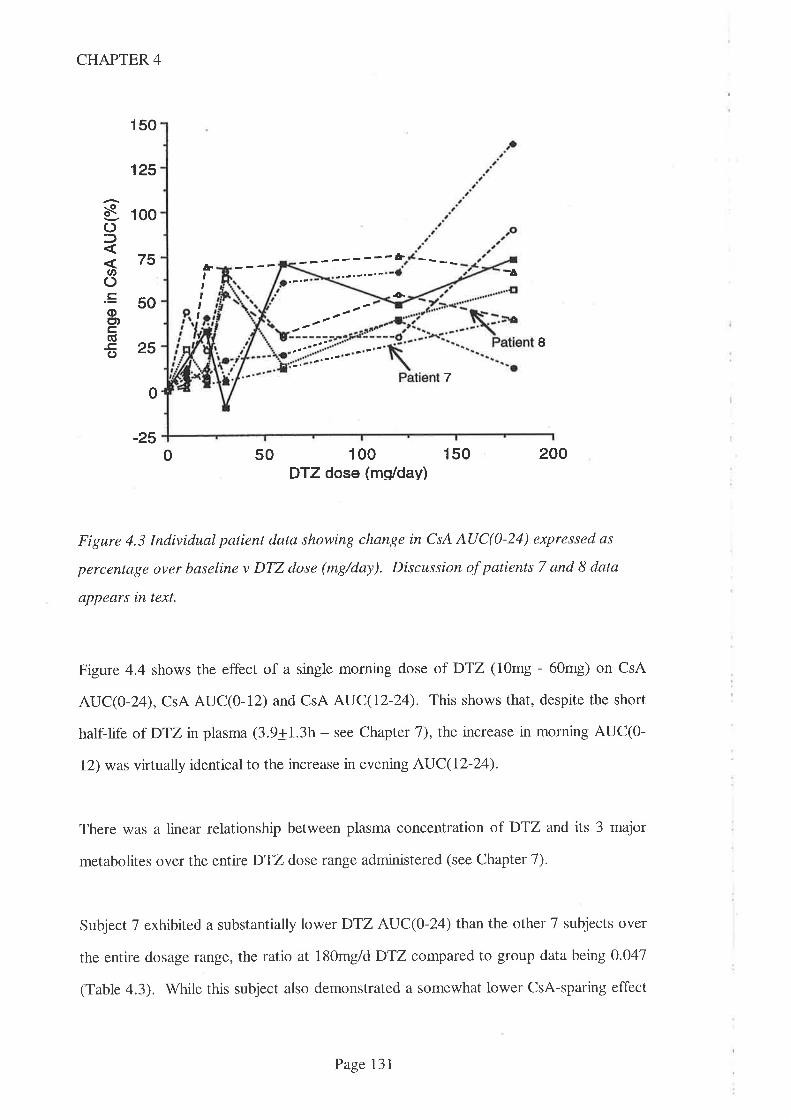
-¿'
CHAPTER 4
150
125
100
75
50
25
-oo\of,
U'C).=oct)c,(ú
o
¡Þ&,tt,t,
+
I
7
-2550 100
DTZ dose (ms/day)150 200
Figure 4.3 Individual patient data showing change in CsA AUC(0-24) expressed as
percentage over baseline v DTZ dose (mg/day). Discussion of patients 7 and 8 data
appears in text.
Figure 4.4 shows the effect of a single morning dose of DTZ (10mg - 60mg) on CsA
AUC(O-24), CsA AUC(O-12) and CsA AUC(12-24). This shows that, despite the short
half-life of DTZ in plasma (3.9+1.3h - see Chapter 1), the increase in morning AUC(O-
12) was virtually identical to the increase in evening AUC(12-24).
There was a linear relationship between plasma concentration of DTZ and its 3 major
metabolites over the entire DTZ dose range administered (see Chapter 7).
Subject 7 exhibited a substantially lower DTZ AUC(O-T4) than the other 7 subjects over
the entire dosage range, the ratio at l80mg/d DTZ compared to group data being 0.047
(Table 4.3). While this subject also demonstrated a somewhat lower CsA-sparing effect
0
0
Page 131
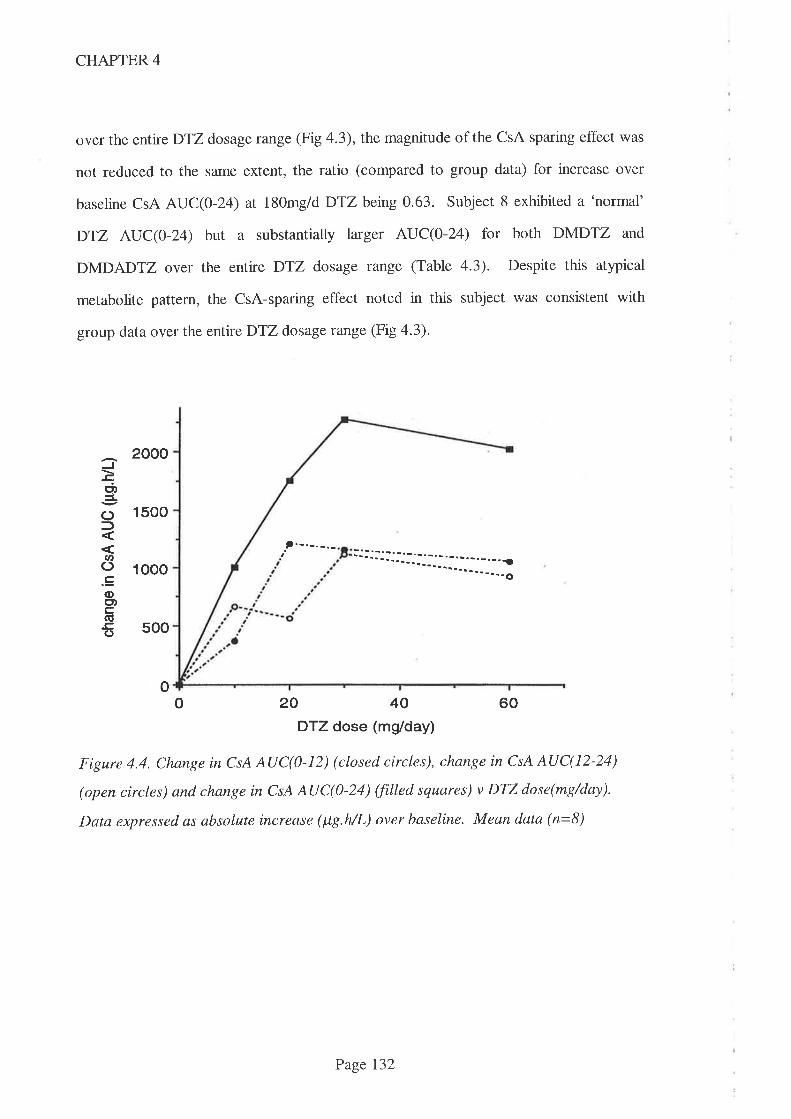
CHAPTER 4
over the entire DTZ dosage range (Fig 4.3), the magnitude of the CsA sparing effect was
not reduced to the same extent, the ratio (compared to group data) for increase over
baseline CsA AUC(0-24) at 180mg/d DTZ being 0.63. Subject 8 exhibited a 'normal'
DTZ AUC(0-24) but a substantially larger AUC(0-24) for both DMDTZ and
DMDADTZ over the entire DTZ dosage raîge (Table 4.3). Despite this atypical
metabolite pattem, the CsA-sparing effect noted in this subject was consistent with
group data over the entire DTZ dosage range (Fig 4.3).
2000
1500
.t.-.-.-.-
tri,
()
U'().E(l)o)c(ú-c()
1000
500
o204060DTZ dose (mg/day)
Figure 4.4. Change in CsA AUC(}-12) (closed circles), change in CsA AUC(12-24)
(open circles) and change in CsA AUC(0-24) ffilled squares) v DTZ dose(mg/day).
Data expressed as absolute increase (lt7.hlL) over baseline. Mean data (n=8)
: j :j r: l-..-: _--._: --j-1..1.-. - - - _. . -:
o
Page I32
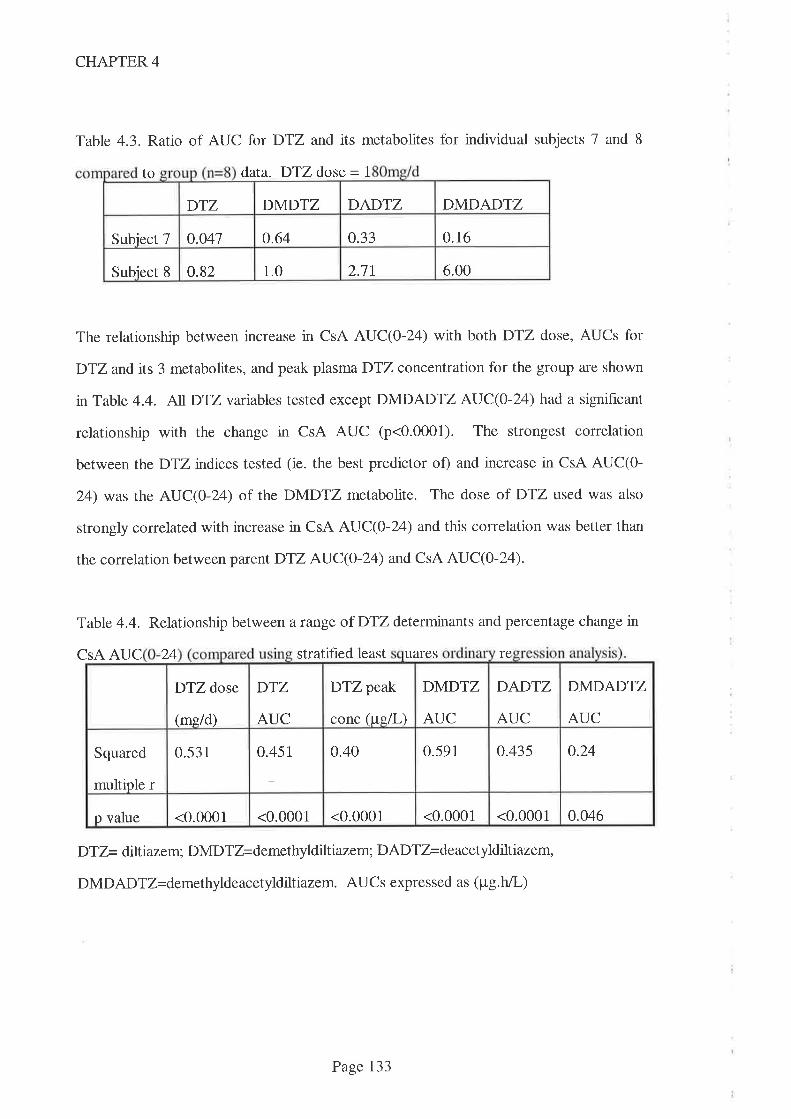
DTZ DMDTZ DADTZ DMDADTZ
0.16o.041 0.64 0.33Subiect 7
2.7t 6.00Subiect 8 0.82 1.0
CHAPTER 4
Table 4.3. Ratio of AUC for DTZ and its metabolites for individual subjects 7 and 8
to data. DTZ dose = 1
The relationship between increase in CsA AUC(O-L4) with both DTZ dose, AUCs for
DTZ and its 3 metabolites, and peak plasma DTZ concentration for the group are shown
in Table 4.4. ALIDTZvariables tested except DMDADTZ AUC(O-24) had a signihcant
relationship with the change in CsA AUC (p<0.0001). The strongest correlation
between theDTZ indices tested (ie. the best predictor of) and increase in CsA AUC(0-
24) was the AUC(0-24) of the DMDTZ metabohte. The dose of DTZ used was also
strongly correlated with increase in CsA AUC(O-24) and this correlation was better than
the correlation between parent DTZ AUC(O-24) and CsA AUC(0-24).
Table 4.4. Relationship between a range of DTZ determinants and percentage change in
CsA AUC 24 stratified least uares re
DTZ= diltiazem; DMDTZ=demethyldilt iazem; DADTZ=deacetyldilti azem,
DMDADT Z= demethylde ac etyldilt iazem. AUC s expres sed as ( p g. h/L)
DTZ peak
conc (uell-)
DMDTZ
AUC
DADTZ
AUC
DMDADTZ
AUC
DTZ dose
(me/d)
DTZ
AUC
o.240.451 0.40 0.591 0.435Squared
multiple r
0.531
<0.0001 <0.0001 0.046<0.0001 <0.0001 <0.0001p value
Page 133
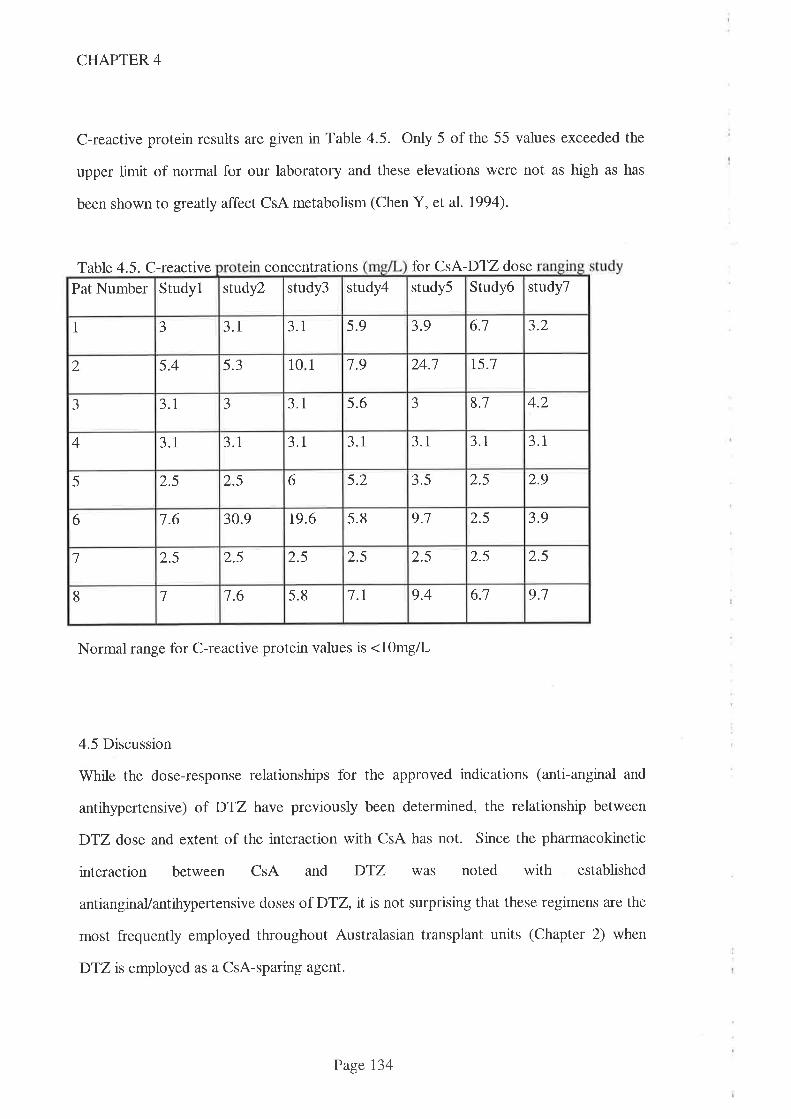
CHAPTER 4
C-reactive protein results are given in Table 4.5. Only 5 of the 55 values exceeded the
upper limit of normal for our laboratory and these elevations were not as high as has
been shown to greatly affect CsA metabolism (Chen Y, et al. 1994).
Table 4.5. C-reactive concentrations for CsA-DTZ dose
Pat Number Studyl study2 study3 study4 study5 Srudy6 study7
1 J 3.1 3.1 5.9 3.9 6.1 3.2
2 5.4 5.3 1 0 1 1.9 24.1 15.1
aJ 3.1 --t 3.1 5.6 J 8.1 4.2
4 3.1 3.1 3.1 3.1 3.1 3.1 3.1
5 2.5 2.5 6 5.2 3.5 2.5 2.9
6 7.6 30.9 t9.6 5.8 9.1 2.5 3.9
7 2.5 2.5 2.5 2.5 2.5 2.5 2.5
8 7 7.6 5.8 1.1 9.4 6.1 9.1
Normal range for C-reactive protein values is <lOmgll-
4.5 Discussion
While the dose-response relationships for the approved indications (anti-anginal and
antihypertensive) of DTZ have previously been determined, the relationship between
DTZ dose and extent of the interaction with CsA has not. Since the pharmacokinetic
interaction between CsA and DTZ was noted with established
antianginaVantihypertensive doses of D'IZ, it is not surprising that these regimens are the
most frequently employed throughout Australasian transplant units (Chapter 2) when
DTZis employed as a CsA-sparing agent.
Page 134
CHAPTER 4
The aim of this pharmacokinetic interaction study was to define the dose-response
relationship between CsA and DTZ. Surprisingly, even the lowest dose of DTZ used
(10mg/d) increased CsA AUC(0-24) significantly (meanlsem increase 14;7+74;17o,
p=0.039). The maximumDTZ dose used in this study was restricted to 180mg/d to
reduce the potential for unwanted pharmacological effects. In an extension study (see
Chapter 5), one subject who needed additional antihypertensive therapy was given a
higher dose (240mgld) of the CD formulation of DTZ.
Applying the sigmoid Emax model to our data, the predicted maximum effect (Emax)
occurred at a DTZ dose greatly in excess of that used in this study. It has been noted
that estimates of Emax and EC50 (dose required to achieve half the maximal effect) are
inaccurate when the greatest measured effect is less than 957o of the estimated Emax
(Dutta S, et al. 1996). These authors recommended that, instead of reporting unreliable
estimates, data descriptors be presented which are taken from within the range of doses
tested. Hence, values for both change in CsA trough concentrations and AUC(0-24), at
clinically relevant DTZ doses, are presented n Table 4.2. Importantly, these data
demonstrate that a clinically significant CsA-sparing effect is evident at doses of DTZ
much lower than those cumently used (180mg/d) for the majority of transplant recipients
(see Chapter 2). Although D'12 is considered to be relatively safe, the use of lower
doses should reduce the frequency and severity of adverse effects while also allowing its
use as a CsA-sparing agent in situations where a pharmacological effect might be
unwanted.
On three occasions, CsA dose was reduced because the blood CsA concentration rose
above the therapeutic range accepted by this hospital. This effect of DTZ on CsA's
kinetics was anticipated, and the respective CsA kinetic data used for calculations (AUCs
and trough concentrations) were increased proportionately to 'normalise' the data for
Page I35
CHAPTER 4
dose. This simple method of normalisation is widely applied but presumes drug kinetics
to be linear over the dose range in question. There is some evidence to suggest that this
may not apply for the Sandimmun@ formulation of CsA, especially when other drugs are
coprescribed. Sandimmun@ absorption kinetics over the dose range used are noted by
the manufacturer to be linear when plasma was the matrix studied but non-linear when
whole blood was the matrix (Sandimmun@ product information, Sandoz). Absorption
has been noted to be best described as first order and zero order by different authors
(Grevel J. 1986) and one report (where the oral solution formulation of CsA was used)
describes three different patterns of absorption in just 42 children (Jacqz-Agrain E, et al.
1994). DTZ is thought to affect CsA's intestinal CYP3A4 (and/or P-gp) and hence to
increase the extent of CsA's absorption. DTZ thus complicates the absorption process
and thus it may affect the relationship between CsA dose and blood CsA concentration.
There are no data on the linearity of CsA absorption when DTZ is coprescribed. Further
complications in the early Sandimmun@ data include the well described intrapatient
variability in absorption associated with this formulation and cross reactivity of CsA
metabolites with the assays used. The use of this method of normalisation is thus a
limitation to the study findings but, given that this was only required on three occasions,
it is unlikely that the data would be greatly affected.
While there is evidence that DTZ improves transplanted kidney function (Chrysostomou
A, et al. 1993. Epstein M. 1992. Yasquez EM, et al. 1995. 'Wagner K, et al. 1987) and
while hypertension is frequently observed in CsA-treated organ transplant recipients, as
noted in Chapter 3, not all transplant physicians are convinced that DTZ should be
routinely used. This is the first time that a drug has been widely prescribed primarily for
an economic purpose and as such there are significant ethical concetns that should be
addressed. Not the least of these concerns is that the optimal dosage of the 'sparing
agent' should be defined.
Page 136

CHAPTER 4
As reported with earlier in vitro studies, the results from this in vivo study also
demonstrate considerable interpatient variability in the dose of DTZ required to elevate
blood CsA concentrations and in the magnitude of the increase. One potential source of
variability is fluctuating levels of cytokines (including interleukin-6). Threefold increases
in blood CsA concentrations have been observed in bone marrow transplant recipients
(Chen YL, et al. 1994) following elevations in blood interleukin-6 concentrations. In the
present study, C-reactive protein (a marker of cytokine activity) concentrations were
only marginally elevated and in only a few patients (Table 4.5) and hence it is unlikely
that fluctuating interleukin-6 concentrations contributed to the interpatient variability
observed in this study.
CsA is metabolised by CYP3A4 within enterocytes (Kolars JC, et al. l99la. Wu CY, et
al. 1995) and the effect of DTZ on CsA metabolism might therefore largely occur as a
result of inhibition of this presystemic metabolism. In order to maximise any local effect
that might occur in the enterocyte, DTZ was administered at the same time as CsA in
this study. Because of the design employed in this study, data is available on the effect
of single, morning only doses of DTZ in the range 10mg - 60mg. Interestingly, the
results demonstrate that these, single, morning doses affected morning and evening
pharmacokinetic prof,rles to a similar extent (Fig 4.3). This was somewhat unexpected
since absorption of DTZ from the gut was rapid (Tmax = 2.8+L4h) and plasma half-life
of DTZ was short (3.9+1.3h) (data from Chapter 7). In the simplest model of drug
action, the effect wanes after 3 - 4 half-lives when the concentration of drug in plasma
(which is a reflection of the concentration at the receptor site) falls below lÙVo of the
peak concentration. If this model of action applies to the CsA-sparing effect of DTZ, its
effect would be expected to be less evident (or even absent) during the second CsA
dosing interval when compared to the first. Because this was not observed, it is likely
that the mechanism of action of DTZ is more complex than simple competitive inhibition
Page 137
CHAPTER 4
of CYP3A4. It is not known 1f DTZ remains within the enterocyte but this lack of effect
of timing of DTZ is of considerable clinical significance since, as noted in Chapter 2,
thrice datly DTZ regimens are widely employed in Australasia. It therefore follows that
not only can the dose of DTZ be significantly reduced for many patients, but the
frequency of administration could also be simplified to a morning only regimen without
reducing CsA-sparing effrcacy.
Many transplant centres have switched from conventional release DTZ to the modif,red
release 'controlled diffrrsion' (CD) formulation of DTZ administered once daily (see
Chapter 2). The principal attraction of this formulation is the reduced frequency of
administration and thus, improved compliance. However, the prolonged CsA-sparing
action of DTZ observed in the present study suggests that there is no need to change
DTZ formulations to achieve an improvement in compliance. The lowest dosage
available in the CD formulation (180mg DTZ n each capsule) is more than that required
to significantly elevate blood CsA concentrations for most patients. Because of this lack
of low-end dosage flexibility, the CD formulation is probably inferior to the conventional
DTZ formulation for CsA-sparing purposes. Additionally, there are reasons for
expecting that the CD formulation may result in an inferior CsA-sparing effect (discussed
in Chapter 5).
The low AUC of DTZ and correspondingly lower CsA-sparing effect exhibited by
subject 7 (Table 4.3 &.Fig4.2) suggests that parent DTZis the interacting moiety. This
hypothesis is also supported by the above average AUC for both DADTZ and
DMDADTZbtttypical CsA-sparing effect in subject 8.
If the primary target of DTZ is CYP3A4 within the enterocyte, then peak blood DTZ
concentration may more closely reflect the extent of the metabolic interaction than either
Page 138
CHAPTER 4
DTZ AUC or DTZ dose. The results (Table 4.4) from the DTZ time-concentration
profiles do not support this hypothesis. A highly significant relationship (p<0.0001) was
demonstrated between change in CsA AUC(0-24) and DTZ dose, DTZ peak
concentration,DTZ AUC(0-24), DMDTZ AUC(0-24) and DADTZ AUC(O-Z4). Since
peak concentration of DTZ and AUCs of DTZ metabolites are related to the dose of
DTZ, this is perhaps not surprising. Of theDTZ and/or metabolite parameters examined,
all showed strong relationships (p<0.0001) with increases in CsA AUC(O-24), with the
exception of the AUC of DMDADTZ (p=0'046). While the relationship between
DMDTZ AUC(O-L4) and CsA AUC(0-24) was marginally better than the relationship
between DTZ dose and CsA AUC(0-24) (Table 4.4), the insubstantial magnitude of the
difference combined with the diffrculty in determining DMDTZ AUC are strong
arguments in favour of simply using DTZ dose as the most practicable predictor of CsA-
sparing effect for clinical purposes.
Intensive blood CsA concentration monitoring required to define the 24h AUC is
inconvenient, laborious and expensive, and hence the relationship between increase in
trough blood CsA concentrations and CsA AUC(O-24) was examined. The relationship
showed a similar increase (Fig a.D commencing with the lowest dose of DTZ used and
plateauing out at doses above 60mg/d DTZ. The magnitude of the response was
different however, where the change in both I2h and 24h trough CsA concentrations
suggested the CsA-sparing effect was greater than that shown by the increase in CsA
AUC(0-24) (Table 4.2). Assuming CsA AUC(0-24) is a better guide to therapeutic
effrcacy, clinicians should not reduce the daily CsA dose to the same extent that the
increase in CsA trough concentration suggests. If the dose were reduced by the same
factor, the total exposure to CsA (ie. CsA AUC(O-T4)) would be reduceci. Tiris provicles
a sound argument to adopt a higher therapeutic (trough concentration) range for CsA
when DTZ is used as a CsA-sparing agent. However, as noted in Chapter 3, there is a
Page 139
CHAPTER 4
marked lack of concordance with respect to CsA therapeutic ranges within the
Australasian transplant community and this does not seem to have translated into any
discernible effect on either benefit or toxicity. It is thus unlikely that any modification to
existing CsA therapeutic ranges is warranted given the relatively modest difference
between the changes to CsA trough concentration and CsA AUC(O-24).
There are only limited data in the literature on the time course of the interaction between
DTZ and CsA but several authors have noted that it is non-competitive (Brockmoller J,
et al. 1990. Wagner K, et al. 1989. Tortorice KL, et al. 1990.). It has also been
observed that a signihcant effect on blood CsA concentrations are evident aTfer a 7 day
period (Brockmoller J, et al. 1990). In the present study, a minimum 2 week interval
between study days was selected partly because of concerns about restoration of blood
volume in the subjects and partly because this was thought to be sufficient for the
interaction to stabilise and blood CsA concentrations to reach their new steady state.
DTZhas a half-life of approximately 4h which is consistent with steady state blood DTZ
concentrations being attained by the end of the first day. There were thus an additional
13 day period for the interaction to develop but it is conceivable that the effect was not
maximal at this time, especially if factors other than mere blood concentration were
important. The incremental increase nDTZ dose design was adopted because the study
was undertaken in stable kidney transplant recipients and this study design reduced the
risk that dramatic alterations to CsA AUC would be effected. Since the order of doses
of DTZ were not randomised, a'period effect'cannot therefore be excluded.
4.Recommendations
The following recommendations are drawn from the study findings. In patients where
DTZ is indicated primarily for its economic beneht (viz to reduce the cost of providing
Page 140
CHAPTER 4
CsA), either CsA AUC(O-I4) or trough blood CsA concentration (12h and/or 24h)
should be determined prior to prescribngDTZ. Following a suitable stabilisation period
(eg. 2 weeks) on each dosage increment, blood CsA concentrations should be
remeasured. For practical reasons, the initial dose of DTZ should be 30mg (half a
conventional tablet) each morning followed by 60mg mane and then 60mg twice daily
depending upon the clinical situation and magnitude of response. DTZ doses should be
given at the same time as the CsA doses to lessen the impact of drug regimen complexity
on compliance. If there is no clinical indication for DTZ and no increase in blood CsA
concentrations are seen at this dose, it would seem prudent to discontinue DTZ. In
Chapter 5, dafa is presented which suggests higher doses of DTZ will produce a greater
CsA-sparing effect but in Chapter 6, data is presented which suggests that higher doses
of DTZ do not necessarily result in a CsA-sparing effect.
For transplant recipients currently receiving DTZ n a dose of >180mg/day for its CsA-
sparing effect, any dosage reduction should be undertaken with caution because the
potential for harm resulting from blood CsA concentrations falling below the therapeutic
range is significant. If the dosage regimen is thrice daily, it should fust be simptfied to a
twice daily regimen after which time the DTZ dosage should be reduced by 30-60mg
decrements every 2 weeks, aiming for a final dose of 60mg/day. In this situation it
would seem prudent to monitor blood CsA trough concentrations more frequently (eg.
weekly). Where there is a clinical indication forDTZ, it should be prescribed in the most
appropriate dose for the indication and the effects on blood CsA concentrations (either
trough concentrations or AUC estimations) monitored. 'Where patients are maintained
on 180mg/d DTZ as a CsA-sparing agent (as is commonplace in Australasia) and
additional therapeutic beneht is wanted, there would seem to be no reason not to
increase the dose of DTZ (to 240mg or higher) as warranted with the same blood CsA
concentration monitoring as outlined above.
Page I4l
CHAPTER 5
Chapter 5
A clinical study to compare the effect of changing DTZ formulation, from conventional
release tablet to extended delivery capsule, on the pharmacokinetic interaction between
CsA and D"fZ n kidney transplant recipients.
5.l lntroduction 143
5.2 Methods 145
5.3 Results 146
5.4 Discussion 153
5.5 Conclusions 159
Page 142
CHAPTER 5
5.1 Introduction
Diltiazem (DTZ) is an anti-hypertensive and anti-anginal agent which has been shown to
inhibit the metabolism of the expensive immunosuppressive drug, cyclosporin (CsA) via
the cytochrome P450 isoenzyme CYP3A4 (Kronbach T, et al. 1988. Pichard L, et al.
1990) and/or via the P-gp drug efflux system (Lown KS, et al. 1997).
As described in Chapter 2, this interaction is widely exploited by Australasian transplant
centres to allow a lower dose of CsA to be prescribed while maintaining whole blood
CsA concentrations within the therapeutic ranges accepted by the respective transplant
units. The pharmacokinetic interaction study described in Chapter 4 confirmed the
observations of several authors (Chrysostomou A, et al. 1993. Patton PR, et al. 1994.
Tortorice KL, et al. 1990. Mclachlan A & Tett S. 1998. Leibbrandt DM & Day RO.
1992) that significant savings are afforded by this deliberate coprescription. The dollar
savings to the Australian health care system were estimated to be approximately AUD$7
million per annum in Australia n 1995-6 (Chapter 2). Several authors have noted that,
in addition to this economic benef,rt, DTZ also affords therapeutic benefits (Epstein M.
1992. Chrysostomou A, et al. 1993. Morales JM, et al. 1994). These benefits were
confirmed in the early post kidney transplant period in the Australasian setting in the
study presented in Chapter 3. The therapeutic savings afforded by the use of DTZ (less
need for post transplant dialysis etc) have not been quantified and are outside the scope
of this thesis. In such a pharmacoeconomic analysis, the cost of provision of DTZ will
need to be discounted because >J5Vo transplant recipients require one or more
antihypertensive agents (Figs 3.5-3.7) for the treatment of hypertension.
One oi the factors wirich has <iirecteci tren<is in antihypertensive therapy in recent years
has been the issue of suboptimal patient compliance with antihypertensive medication.
The pharmaceutical industry has responded by producing newer agents with longer half-
lives and 'sustained release' formulations (designed to release the drug continuously over
Page 143
CHAPTER 5
an extended time period) of older agents, both of which allow less frequent
administration. This trend has been especially evident with the calcium channel blocker
group of drugs and sustained release formulations of verapamil, nifedipine and DTZ are
now coÍìmonly prescribed. At the time of this study, DTZ was marketed in two
different formulations with extended-release characteristics, one of which was a
'controlled diffusion' (CD) formulation. This is not a 'conventional' sustained release
formulation since the contents are not constantly released but rather, this formulation is
designed to deliver DTZ n two bursts, the first (4OVo) over the first 12h period and the
second (607o) over the next lZh period. While sustained release formulations have
proven efficacy in the control of angina and/or hypertension, their effect on another
widely used indication - that of CsA-sparing agent - has not been studied.
The site of absorption of CsA is the small intestine (Drewe J, et al. 1992), a site of
relatively high CYP3A4 metabolic activity (Krishna DR & Klotz U. 1994. Kolars JC, et
al. 1992. Hoppu K, et al. 1991. ïjia JF, et al. 1991. Peters WH & Kremer PG. 1989.
de Waziers I, et al. 1990). The CsA-sparing effect of conventional release DTZ
formulation was reported in Chapter 4 and has been widely reported elsewhere (Patton
PR, et al. 1994. Mclachlan A & Tett S. 1995. Leibbrandt DM & Day RO. 1992.
Pochet JM & Pirson Y. 1986. Chrysostomou A, et al. 1993. Brockmoller J, et al.
1990.). However, there have been no reports which compare the CsA-sparing activity of
extended release DTZ formulations to conventional DTZ formulations. Since the
'controlled delivery' DTZ formulation is designed to release a significant portion of its
contents in the second 12h period, the site where this portion of the dose is released is of
considerable signihcance. If this portion of the dose is released below the site of the
interaction in the gastrointestinai tract, it is possibie that extent oi the interaction with
CsA may be substantially less than that seen with conventional release formulations.
Page 144
CHAPTER 5
In Chapter 2 it was demonstrated that many Australasian transplant centres had made the
switch to the CD DTZ formulation and hence the present study was undertaken to
consider the effect of switching from conventional to CD formulation DTZ in a group of
stable renal transplant recipients.
5.2 Methods
This study was conducted as an extension of the dose-escalation study described in
Chapter 4. Briefly, Ethics of Human Research Committee (see Appendix 3) approval
was gained and 8 stable renal transplant recipients were enrolled in a dose-escalation
study using conventional formulation DTZ. Patient details are given in Table 4.1.
Inclusion criteria included stable trough blood CsA concentrations on routine monitoring
for >3 months, stable renal function for >3 months and plasma creatinine concentration
<18Opmol/L. Exclusion criteria (see Chapter 4) included consumption of any medication
which was known to interfere with the kinetics of CsA (especially erythromycin and
KCZ) or grapefruit juice, or the use of drugs whose metabolism might be adversely
affected by DTZ (especially terfenadine).
The first study day in this trial was the final study day in the dose escalation study
described in Chapter 4. The DTZ dose taken on this day (and for the previous 13 days)
was 90 mg twice daily of the conventional release DTZ formulation, Cardizem@, (ICI
Australia). As outlined in Chapter 4,DTZ was taken at l2h intervals, each dose being
taken with the respective CsA dose (Sandimmun@ capsules, Sandoz, Australia). After
this study day, subjects were switched to the CD formulation of DTZ at the same dose
(i80mg, Carciizem CDo, iCI Austraüa) given with the morning CsA dose. The seconci
study day occurred 2 weeks later and on both study days, no food was allowed within th
of taking either CsA (and hence DTZ) doses and subjects received the same meals.
Serial blood samples were drawn pre-dose, as well as I, 2, 3, 4, 6, and 12 hr following
Page 145
CHAPTER 5
both morning and evening CsA doses and the area under the blood CsA concentration
versus time curve (AUC) for each CsA dose was determined using the log trapezoidal
method (Appendix 4). Whole blood CsA concentrations were determined using a
specific (<IO7o cross-reactivity with CsA metabolites) monoclonal, whole-blood enzyme
immunoassay (EMIT@, Behring/Syva, San Jose, USA). The precision of the method in
this laboratory was +1L.97o at a concentration of 86pg/L and t7.IVo at a concentration
of 409¡tgtL (Sallustio BC, et al. 1997). Samples with concentrations exceeding the top
calibration standard (500¡tg/L) were diluted according to the manufacturer's protocol,
viz by diluting the supernatant following precipitation with methanoUwater and
reassayed. Plasma DTZ concentrations were determined using a reverse phase HPLC
with UV detection assay method as described in Chapter 7. Each blood sample was
divided into two aliquots, one for CsA assay (into an EDTA collection tube) and the
other for DTZ and its metabolites (into a lithium heparin collection tube) and hence the
timing of the samples for the DTZ assay was identical to those used for the CsA assay.
The results were compared by the Wilcoxon Signed-rank test and a 5Vo level assigned as
indicating significance.
5.3 Results
Data for 1 subject (Patient 6) were excluded because of vomiting shortly after CsA
administration which virtually eliminated the expected absorption phase of the CsA
concentration-time curve. The results for the remaining 7 subjects are shown in the
tables and figures.
There was consicierabie inierpatient variabiìity (in both magnitucie and <iirection oi CsA
AUC) when changing from conventional to the CD formulation of DTZ and this
difference was most marked following the morning CsA dose (Table 5.1). Three of the 7
subjects exhibited reductions in CsA AUC(O-12h) of 30-60Vo while one showed a 367o
Page 146
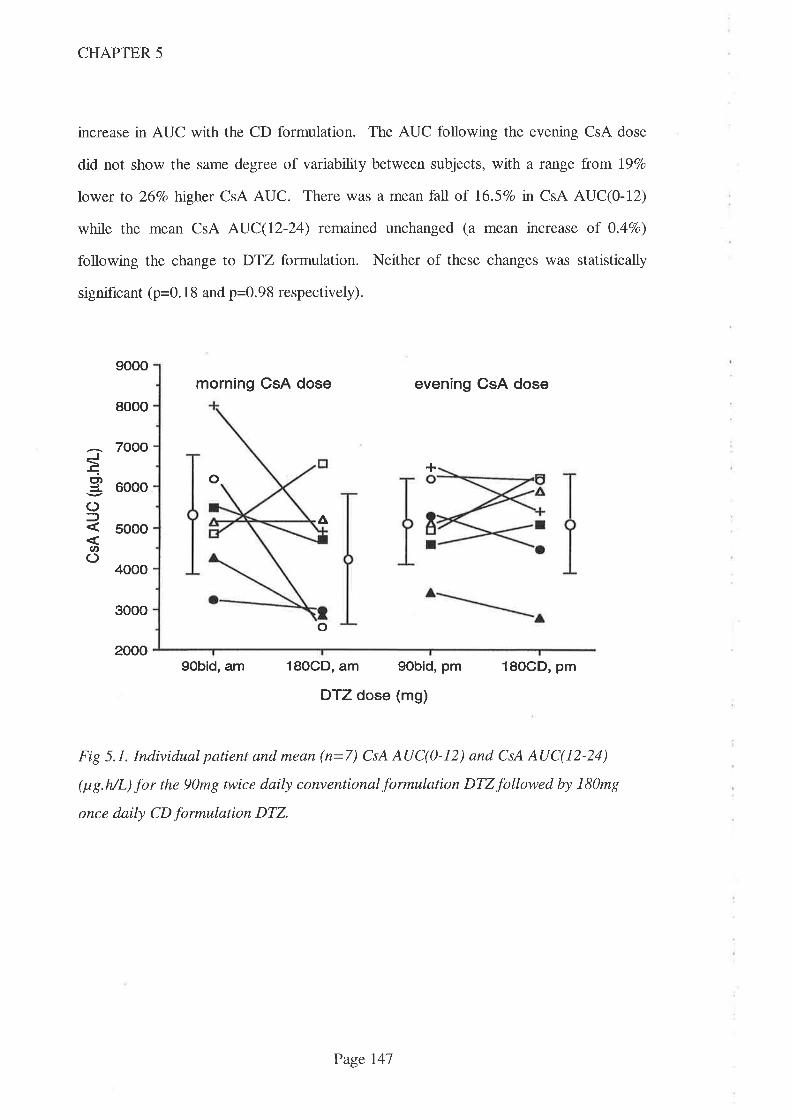
A
o
9000
8000
7000
6000
5000
4000
3000
2000
J!
ó()f
u,o
CHAPTER 5
increase in AUC with the CD formulation. The AUC following the evening CsA dose
did not show the same degree of variability between subjects, with a raîge from l97o
lower to 267o higher CsA AUC. There was a mean fall of 16.5%o in CsA AUC(0-12)
while the mean CsA AUC(I2-24) remained unchanged (a mean increase of 0.47o)
following the change to DTZ formulation. Neither of these changes was statistically
significant (p=0. 1 8 and p=0.98 respectively).
morning CsA dose even¡ng CsA dose
+
o
18OCD, am 9obid, pm
DTZ dose (mg)
18OCD, pm
Fig 5.1. Individual patient and mean (n=7) CsA AUC(0-12) and CsA AUC(12-24)
(¡tg.h/L) for the 90mg twice daily conventionalformulation DTZfollowed by l80mg
once daily CD formulation DTZ.
9Obid, am
Page 147
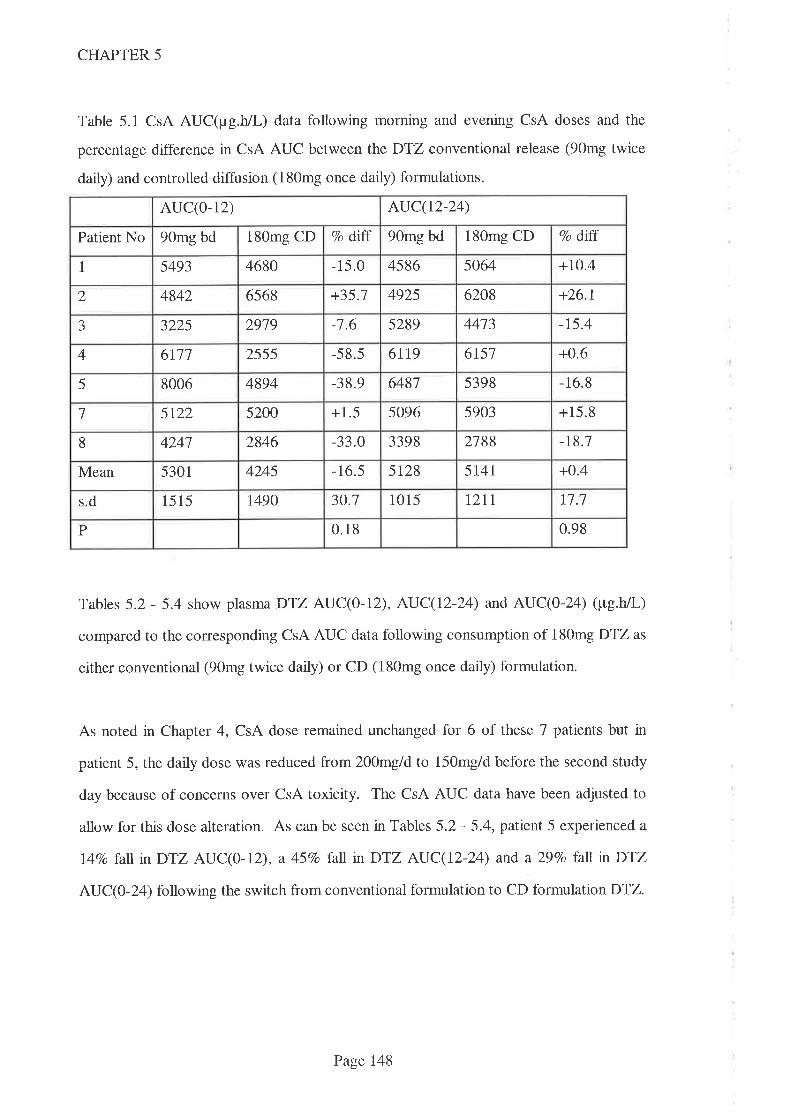
CHAPTER 5
Table 5.1 CsA AUC(¡rg.h/L) data following morning and evening CsA doses and the
percentage difference in CsA AUC between the DTZ conventional release (90mg twice
daily) and controlled diffusion (180mg once daily) formulations.
AUC(O- 12) AUC(t2-24)
Patient No 90mg bd 180mg CD clo dtff 90mg bd 180mg CD Vo ditr
1 5493 4680 -15.0 4586 5064 +10.4
2 4842 6568 +35.1 4925 6208 +26.1
J 3225 2919 -1.6 5289 4473 -15.4
4 6111 2555 -58.5 6l19 6r57 +0.6
5 8006 4894 -38.9 6487 5398 -16.8
l 5t22 5200 +1.5 5096 5903 +15.8
8 4241 2846 -33.0 3398 2788 -t8.1
Mean 5301 4245 -16.5 5t28 5T4I +0.4
s.d 15 15 t490 30.1 1015 tztl n.7
P 0.18 0.98
Tables 5.2 - 5.4 show plasmaDTZ AUC(0-12), AUC(12-24) and AUC(0-24) (pg.h/L)
compared to the corresponding CsA AUC data following consumption of 180mg DTZ as
either conventional (90mg twice daily) or CD (180mg once daily) formulation.
As noted in Chapter 4, CsA dose remaìned unchanged for 6 of these 7 patients but in
patient 5, the daily dose was reduced from 2}Omgld to 150mg/d before the second study
day because of concerns over CsA toxicity. The CsA AUC data have been adjusted to
allow for this dose alteration. As can be seen in Tables 5.2 - 5.4, patient 5 experienced a
l47o lall n DTZ AUC(0-12), a 457o fall in DTZ AUC(12-24) and a 29Vo fall n DTZ
AUC(0-24) following the switch from conventional formulation to CD formulation DTZ.
Page 148
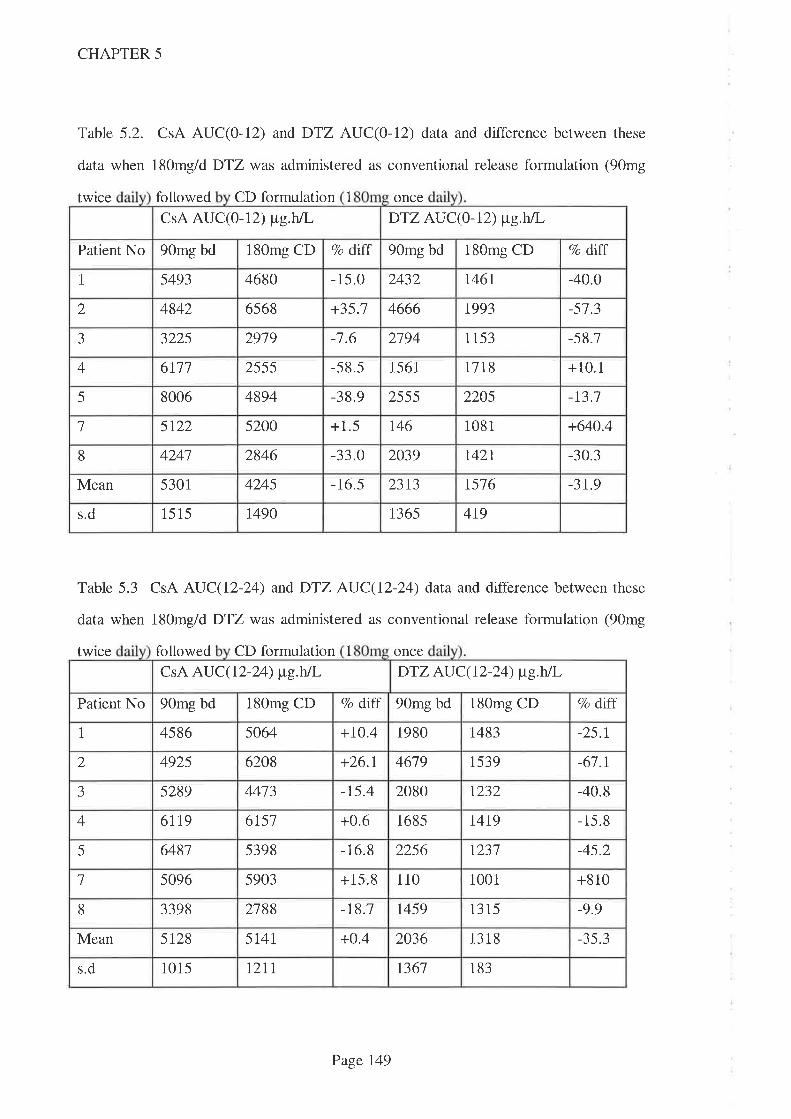
CHAPTER 5
Table 5.2. CsA AUC(O-LZ) and DTZ AUC(0-12) data and difference between these
data when 180mg/d DTZ was administered as conventional release formulation (90mg
twrce followed CD formulation 1 once
CsA AUC(}-IZ) ¡tg.hlL DTZ AU C(0 - 12) ¡t"g.h/l-
Patient No 90mg bd 180mg CD Vo dLff 90mg bd 180mg CD 7o dLff
I 5493 4680 -15.0 2432 1 46 1 -40.0
2 4842 6568 +35.1 4666 1993 -51.3
a--) 3225 2919 -7.6 2194 1 153 -58.7
4 6111 2555 -58.5 1561 1718 +10.1
-38.9 22055 8006 4894 2555 -r3.1
5200 +1.5 r46 1 08 11 5t22 +640.4
4241 2846 -33.0 2039 1 42 1 -30.38
Mean 5301 4245 -16.5 2313 t576 -31.9
s.d 15 15 1490 t365 419
Table 5.3 CsA AUC(12-24) andDTZ AUC(12-24) data and difference between these
data when 180mg/d DTZ was administered as conventional release formulation (90mg
twrce followed CD formulation 1 once
CsA AUC(12-24) ¡tg.hJL DTZ AU C(r2-24) ¡t"g.hÃ,
Patient No 90mg bd 180mg CD Vo diff 90mg bd 180mg CD 7o dlff
1 4586 5064 +70.4 1980 t483 -25.1
2 4925 6208 +26.1 4619 1539 -61.1
aJ 5289 4413 -r5.4 2080 1232 -40.8
4 6119 6751 +0.6 1685 l4t9 - 15.8
5 6481 5398 -16.8 2256 1231 -45.2
1 5096 5903 +15.8 110 1 00 1 +810
8 3398 2788 -18.7 1459 13 15 -9.9
Mean 5128 5T4I +o.4 2036 1318 -35.3
s.d 1015 1211 t361 183
Page 149
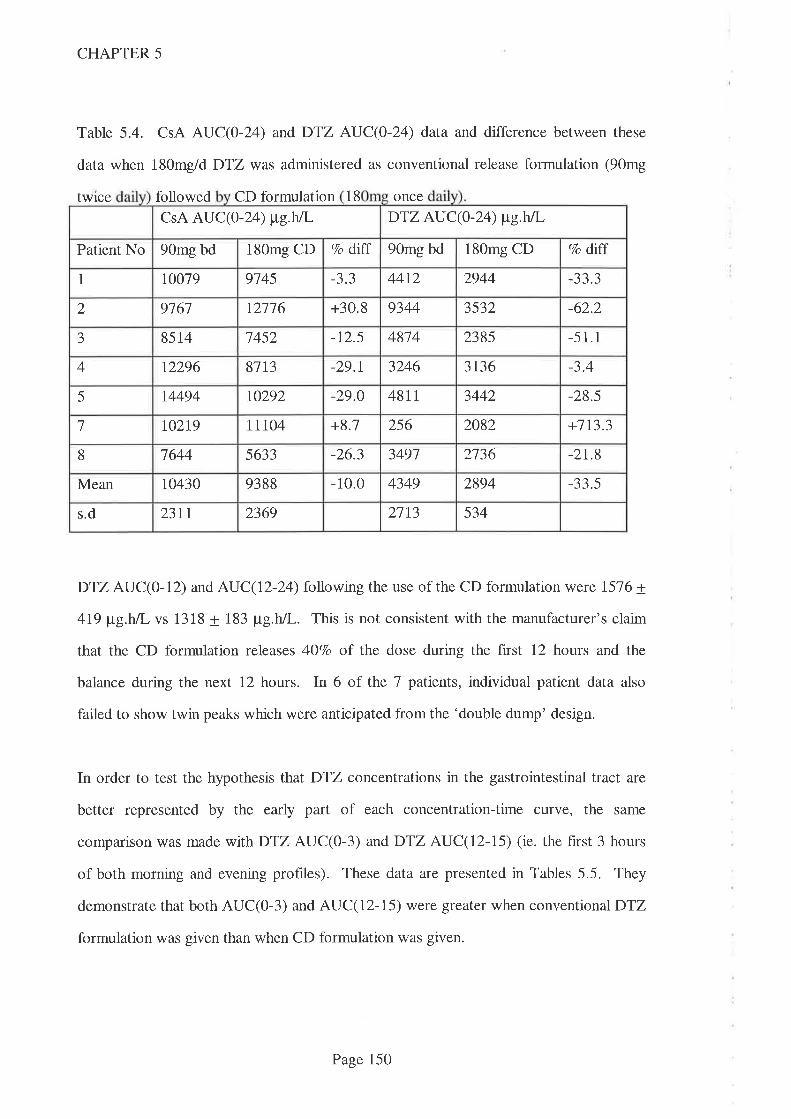
CHAPTER 5
Table 5.4. CsA AUC(O-24) and DTZ AUC(0-24) data and difference between these
data when 180mg/d DTZ was administered as conventional release formulation (90mg
twice followed CD formulation 18 once
DTZ AUC(0-12) and AUC(12-24) following the use of the CD formulation were 1576 +
4I9 ¡tg.h/l- vs 1318 + 183 ¡tg.h/L. This is not consistent with the manufacturer's claim
that the CD formulation releases 4O7o of the dose during the first 12 hours and the
balance during the next 12 hours. In 6 of the 7 patients, individual patient data also
failed to show twin peaks which were anticipated from the 'double dump' design.
In order to test the hypothesis that DTZ concentrations in the gastrointestinal tract are
better represented by the early part of each concentration-time curve, the same
comparison was made wtthDTZ AUC(0-3) andDTZ AUC(12-15) (ie. the first 3 hours
of both morning and evening profiles). These data are presented in Tables 5.5. They
demonstrate that both AUC(0-3) and AUC(12-15) were greater when conventional DTZ
formulation was given than when CD formulation was given.
CsA AUC(0-24) tt e.hn DTZ AUC(0-24) ¡t"g.h/L
Patient No 90mg bd 180mg CD 7o dtfî 90mg bd 180mg CD 7o diff
I 10019 9145 --1- -1 44t2 2944 aa a--) -1--'.)
2 9761 \2116 +30.8 9344 3532 -62.2
J 85 14 1452 -12.5 48'74 2385 -5 1.1
4 12296 81t3 -29.r 3246 3t36 -3.4
5 14494 r0292 -29.0 481 1 3442 -28.5
l t02t9 11104 +8.7 256 2082 +713.3
8 1644 5633 -26.3 3491 2136 -2t.8
4349 2894Mean 1o430 9388 -10.0 -33.5
2l13 534s.d 23II 2369
Page 150

DTZ AUC(0-3) (ttg.h/L) DTZ AU C(rz-ts) (tte.h/L)
180me CD 7o dlff 90me bd 180me CDPt No 90mg bd 7o diff
1 136 3t4 -51.3 382 448 +11.3
2 \444 399 -12.4 1438 381 -13.5
J 1116 223 -80.0 366 426 +16.4
+48.0 496 4294 3t9 412 -13.5
5 168 398 -48.2 669 533 -20.3
1 38 254 +568.4 18 239 +1221.8
235 -10.4 4tl 3388 194 - 17.8
Mean 145 328 -56.0 540 399 -26.r
sd 461 91 441 93
CHAPTER 5
Table 5.5. DTZ AUC(0-3) and DTZ AUC(I2-15) for DTZ doses of 180mg/day given
either as release twice orl CD formulation once
In one subject (patient 3), additional antihypertensive therapy was indicated after the
second study day and hence the dose of DTZ was increased to 240mg, taken as the CD
formulation, once daily. Two weeks later, the study was repeated with the same blood
sampling as had occurred in other study days. Figure 5.2 shows the change in CsA
AUC(0-24) which accompanied the administration of DTZ over the dosage range 0-
180mg for the group (n=8) taken from Chapter 4. Overlaying this curve is the change in
CsA AUC(O-24) (over the entire DTZ dose range) for patient 3 who was given 180mg
and240mgDTZ as the CD formulation. Table 5.6 shows the change from baseline CsA
AUC(O-L4) and trough CsA concentration over the DTZ dose range 0 - 240mg where
the last two doses were taken as the CD formulation.
Page 151

CHAPTER 5
0 50 100 150 200 250
DTZdose (mg/day)
Figure 5.2. Change from baseline (expressed as a percentage) in CsA AUC(0-24) with
increasing doses of DTZ (mg/day). Group data (n=8) taken from Chapter 4.
Overlaying this curve is the individual data for patient 3 over the DTZ dose range 0-
240mg. Closed circles represent DTZ given as conventional tablet formulation and
closed squares as the CD formulation.
Table 5.6. Change (expressed as percentage) over baseline in morning CsA trough
concentration c24 and CsA AU 24 with DTZ dose ln J
These data demonstrate that the magnitude of the change in trough CsA concentration
always exceeded the magnitude of change in CsA AUC(O-Z4).
00
75
Eof
ØO.coo)tr(!o
1
Vo change
20 30 60 120 180 180 (CD) 240 (CD)doseDTZ
(me/d)
0 10
0 123 62 80 58 108 ro4 15 t46c24
0 1 8 l1 20 38 12 n 53AUC(0-24)
Page 152

CHAPTER 5
The effect of the 3O7o tncrease in dose of DTZ (from 180mg/d to 240mg/d) in patient 3
was a jump in the percentage increase over baseline for both CsA morning trough (75Vo
to 146%o) and CsA AUC(O-24) (-2Vo to 53%) (Table 5.6). These data demonstrate that
the CsA-sparing effect of DTZ is not necessarily maximal at the 'conventional' dose of
18Omg/day used in Australasia (Chapter 2)
Table 5.7 shows the apparent Tmax lorDTZ for the 90mg (conventional release) given
twice daily (n=7). These data demonstrate a mean time to peak concentration of 2.1h
following the morningDTZ dose and 3.0h following the evening DTZ dose.
Table 5. 7. Apparent Tmax for DTZ following morning and evening doses of 90mg
(conventional release) DTZ.
Apparent Tmax
Pt No 1 2 a-) 4 5 1 8 Mean
Tmax (am) 2 J 2 4 J J 2 2.1
Tmax (pm) 3.15 2 4.25 a--) 2 4 2 3.0
5.4 Discussion
This study compared the CsA-sparing effect of the same daily dose of DTZ given as two
different DTZ formulations (conventional release and CD). As noted in Chapter 2, at the
time of this study, the CD formulation was used by approximately 5lVo of Australasian
organ transplantation recipients. 'While not asked of respondents to the questionnake,
the reason for the switch to this formulation is presumably because the once daily dosing
schedule simplifies the medication regimen and improves compliance. Poor patient
compliance has been noted to jeopardise transplant outcome and compliance deteriorates
as drug regimen complexity increases (Didlake RH, et al. 1988. Kiley DJ, et al. 1993.
Burke JF, et al. 1994. Schweizer RT, et al. 1990).
Page 153
CHAPTER 5
As noted above, this study was conducted in kidney transplant recipients who had
completed an escalating dose regimen of conventional formulation DTZ, where the final
dose was 90mg twice daily. While statistical variability was reduced by virtue of each
patient serving as his/her own control, it was not possible to effect a ïandomised
crossover design with appropriate washouts between doses and hence a period effect
cannot be excluded. These data need also be considered in the light of the well
established interpatient and intrapatient variability in CsA pharmacokinetics which was
observed in Chapter 4 and which has been described by others in the absence of
complications associated with the coprescription of metabolic inhibitors (Ohlman S, et al.
1993. Grevel J. 1986. Gupta SK, et al. 1990. Kahan BD, et al. 1995b).
The manufacturer of CsA (Novartis, formerly Sandoz, Australia) has replaced the older
Sandimmun@ formulation with a 'microemulsion preconcentrate' formulation of CsA
(Neoral@) which is designed to reduce the dependence on bile for CsA absorption and
hence reduce the variability in oral absorption. Interpatient variability has been shown to
be lessened by this formulation (Drewe J, et al. I992a) and hence it is possible that the
magnitude and/or reliability of the CsA-sparing effect might also be affected. Howevet,
it has been estimated by one group of researchers who have extensively studied
absorption of CsA from the gastrointestinal tract (Wu CY, et al. 1995), that the extent of
absorption of CsA from the older Sandimmun@ formulation was already very high (86Vo)
and that bioavailability was more likely to be affected by intestinal CYP3A4 activity than
CsA formulation. Therefore, the change to the newer CsA formulation may not result in
any marked change in CsA kinetics in the ptesence of CsA-sparing agents.
The precise site(s) and mechanism of this metabolic interaction between CsA and DTZ
remains to be completely elucidated but the upper intestine is one likely site. CYP3A4
enzyme activity is high in the upper intestine and is approximately half the CYP3A4
activity of the liver on a tissue weight basis (de 'Waziers I, et al. 1990. Watkins PB.
Page 154
CHAPTER 5
1992. Krishna DR & Klotz U. 1994). Several authors have postulated that large
percentages of orally administered CsA might be metabolised by CYP3A4 in enterocytes
(Watkins PB. 1992. Wu CY, et al. 1995). Further support for a significant role of the
intestine was provided by the pharmacokinetic interaction between CsA and
erythromycin (a substrate for and inhibitor of CYP3A4). In a study in six renal
transplant recipients, bioavailability of orally administered CsA increased from 36Vo to
6O7o following oral erythromycin (Gupta SK, et al. 1989). However, when CsA was
administered intravenously under the same circumstances, there was only a modest
(l3%o) decrease in clearance. Other researchers have suggested that intestinal P-gp is
more likely to be responsible for reduced CsA absorption than CYP3A4 (Lown KS, et al.
1997). However, since P-gp is also located in the proximal intestine, this reinforces the
importance of this site as the most likely site for the interaction.
The magnitude of the interaction between CsA and DTZ at this upper intestinal site
should be greatest if the concentration of DTZ at this site was maximal at the time that
CsA arrived. The concentration of DTZ at intestinal mucosal sites were not measured in
this study but the design required that conventional release DTZ formulation was to be
taken at the same time as CsA doses in order to maximise the interaction. The CD
formulation DTZ was also taken with the (morning) dose of CsA but, because it is
designed to release the second 'dump' 12 hours after the first, it was anticipated that this
might occur at more distal intestinal sites. If so, when the CD formulation was taken, the
concentration of DTZ at the upper intestinal site of absorption of CsA would be less for
the evening CsA dose than for the morning CsA dose. Individual time-concentration
profrles for the CD formulation of DTZ provtdes information on the blood concentration
throughout the day (Tables 5.2 - 5.4 and Chapter 7) but this does not necessarily reflect
upper intestinal concentrations since absorption of DTZ is unlikely to be confined to
upper intestinal sites.
Page 155

CHAPTER 5
While there was no consistent reduction in CsA AUC(12-24), the explanation may lie in
the performance of the CD formulation. The ratio of DTZ AUC(0-12) to AUC(12-24)
when the CD formulation was taken (Tables 5.2 and 5.3), was 1.20, not the 0.61 (40:60)
anticipated from the manufacturer's claims for the CD formulation. Also, with the
exception of one subject, plasma concentrations of DTZ did not exhibit the dual peaks
which were expected from the design of the CD formulation. In addition, the CD
formulation resulted in an AUC(0-24) which was 33.5Vo lower (Table 5.4) than the same
dose taken as conventional release formulation. The CD formulation thus failed to
perform as expected, although the data does confum that DTZ was being released from
the capsule and that absorption was still occurring during the second 12h period of the
study day. Given the nature of gastrointestinal tract transit times, it is likely that much of
the l2-24h absorption occurred below the primary site of CsA's absorption, namely the
upper intestine (Drewe J, et al. 1992b).
Mean CsA AUC(0-12) fel, 16.57o (Table 5.2) following the switch from conventional
release DTZto the CD formulation. The corresponding value for CsA AUC(12-24) was
a rise of 0.4Vo (Table 5.3). D"fZ AUC(0-12) fell by 31.97o following the switch while
the AUC(12-24) fell by a similar amount, namely 35.3Vo. The lesser CsA-sparing effect
following the morning dose of CsA might thus be explained by the fact that less DTZ
was present in the gastrointestinal tract (and hence was absorbed into the bloodstream)
during the first 12 hours. Despite the fall tnDTZ AUC(12-24) of 35.3Vo after switching
to the CD formulation, there was no similar fall in CsA AUC(12-24). This suggests that
the presence of DTZ n the gastrointestinal tract in the second 12 hour period after
taking the CD formulation had less impact on the absorption of CsA. This is consistent
with the proposition that during the l2-24h period, DTZ was absorbed from lower
gastrointestinal sites while CsA was in the upper intestine. That there was any CsA-
sparing effect at all can be explained with the persistence of the interaction following
conventional release DTZ formulation as described in Chapter 4.
Page 156

CHAPTER 5
Conventional release DTZ was rapidly absorbed from the gastrointestinal tract at the
90mg twice daily dose. Apparent Tmax values following the am dose was 2.lh and
following the evening dose apparent Tmax was 3h (Table 5.7). The early part of any
concentration-time curve is dominated by drug absorption while the latter part of the
same curve is dominated by excretion processes. Hence the early part of the curve
should more accurately reflect the amount of drug in the gastrointestinal tract than the
whole AUC. Since Tmax for conventional release DTZ was <3h, the same comparisons
between change in CsA AUC(0-12) and CsA AUC(12-24) were made with DTZ
AUC(0-3) andDTZ AUC(12-15) (ie the absorption part of both morning and evening
DTZ ctnves) for 180mg DTZ glen either as 90mg (conventional release) twice daily or
as 180mg (CD formulation) given in the morning. Five patients experienced falls nDTZ
AUC(0-3) and 4 experienced falls nDTZ AUC(12-15) (Table 5.5) when switched from
conventional (rapid release) to CD formulation. The mean fall for DTZ AUC(0-3) was
56Vo while the corresponding fall for DTZ AUC(I2-15) was 26Vo. Patient l
demonstrated an atypical response from the change to CD formulation with an increase
nDTZ AUC(0-3) of 5687o and in DTZ AUC(12-15) of l228Vo. The mean fall would
have thus have been greater had the data frompatient 7 been excluded.
Comparing data from tables 5.2, 5.3 and 5.5, it is apparent that neither DTZ AUC(0-3)
nor AUC(12-15) provide better explanations of the changes in CsA AUCs than do DTZ
AUC(0-12) or AUC(12-24). There are two potential explanations for this observation;
the fnst being that AUC(0-3) is a poor correlate of intestinal DTZ concentrations and the
second explanation is that intestinal DTZ concentrations are a poor predictor of changes
to CsA AUC. However, as demonstrated in Chapter 4, at a dose of 180mg DTZ dally,
the CsA-sparing effect was plateauing off and hence the magnitude of the fall ìn either set
of DTZ AUC data would be expected to be greater than the corresponding effect on
CsA AUC data.
Page 757
CHAPTER 5
Also of interest in this regard was the very low DTZ AUC(}-IZ), AUC(I2-24) and
hence AUC(0-24) demonstrated by patient 7 with the conventional release formulation
DTZ (Tables5.2 - 5.4). Similarly, DTZ AUC(0-3) and (12-15) were also much lower
than the mean values (Table 5.5) for the group. Lower than expected values for DTZ
AUC(0-12) and AUC(I2-24) were also observed with previous doses of DTZ used in
the dose escalation study (Chapter 4). Surprisingly, the switch to CD formulation of
DTZ resulted in a massive 64OVo increase tnDTZ AUC(O-12), a similar 8lo7o increase in
DTZ AUC(12-24) and hence a'7137o increase rr:'DTZ AUC(0-24). The corresponding
increases for CsA AUC(O-12) (l.5Vo), CsA AUC(12-24) (I5.8Vo) and CsA AUC(0-24)
(8.lTo) were much less, suggesting that the CsA-sparing effect was unrelated to plasma
DTZ concentrations in this patient. The 568Vo increase n DTZ AUC(0-3) and l228Vo
increase :r;rDTZ AUC(12-15) are similarly much largu than the modest increases in CsA
AUC. Once again, the failure of DTZ AUC(0-3) and AUC(12-15) to predict changes to
CsA AUC in this patient can be explained by the poor predictive value of AUC(0-3) to
reflect intestinal DTZ concentrations or that intestinal DTZ concentrations (at this dose
of DTZ) are poorly correlated with changes to CsA AUC.
Patient 5 experienced a fall rui'DTZ AUC(0-12) of l4Vo, inDTZ AUC(12-24) of 457o
which resulted in a fall n D'îZ AUC(0-24) of 297o when switched from conventional
release DTZ (9}mg taken twice daily) to CD formulation (180mg taken in the morning).
This patient also had a reduction in dose of CsA (from 100mg twice daily to 75mg twice
daily) between study days (CsA data were corrected for this reduction). CsA has been
proven to act as a felodipine-sparing agent (Madsen JK, et al. 7996) and since both these
calcium channel blockers are metabolised by CYP3A4, there is potential for CsA to also
act as a DTZ-sparing agent. Because of the design of the studies which comprise this
thesis, this hypothesis has not been tested. If this were the case, the reduced CsA dose
(25Vo lower) in patient 5 might explain the 297o fall in DTZ AUC(0-24). V/hile this is
one potential explanation, it is worth noting that 3 other patients (whose CsA dose was
Page 158
CHAPTER 5
unchanged) experienced greater falls in DTZ AUC(0-24) than patient 5 (Table 5.4) and
hence it is more likely that the explanation lies in poor performance of the CD DTZ
formulation.
The decision to switch from conventional formulation DTZ (administered thrice daily) to
CD formulation (administered once daily) by many Australasian transplant centres (see
Chapter 2) has presumably been made for compliance reasons. Given the variability
resulting from this switch to CD formulation and especially the falls of >3OVo in CsA
AUC(0-24) demonstrated by 3 patients observed in the present study, it would seem
more sensible to change to a 90mg conventional release DTZ formulation regimen which
required DTZ to be given twice daily, with each dose of CsA. Since CsA is dosed twice
daily in adult kidney transplant recipients (Chapter 2), this should improve compliance,
maximise proximal intestinal DTZ concentrations and hence optimise the CsA-sparing
effect.
The opportunity to increase DTZ dose from 180mg to 240mg in patient 3 provided
further insight to that gleaned in Chapter 4 into the effect of increasing DTZ dose on
CsA-sparing activity. The further increase in CsA AUC(O-L4) (-2Vo over baseline to
53Vo over baseline) and trough CsA concentration (75Vo over baseline to l46Vo over
baseline) shows that the CsA-sparing activity is not maximal at aDTZ dose of 180mg
daily in some subjects. Considerable interpatient variability in CsA kinetics, consistent
with the data on variability in intestinal CYP3A activity (Lown KS, et al. 1994), were
demonstrated in Chapfer 4 and this will be further explored in Chapter 6.
5.5 Conclusions
Changes in CsA AUC(0-12h), AUC(12-24î) and AUC(0-24) were observed when
changing from conventional release formulation DTZ to CD formulation DTZ. While
Page 159
CHAPTER 5
these changes were statistically insignificant across the group, individual changes were
clinically significant.
The CD formulation DTZ faled to perform as expected with a decrease nDTZ AUC(0-
24) of 33.57o relative to the same dose taken as conventional release formulation, more
being absorbed in the first 12 hour period and only one patient demonstrating a 'twin
peak' concentration-time profile anticipated from the manufacturer's description of the
formulation.
If compliance is the reason for considering a switch from conventional release to CD
formulation DTZ, the patient may be better served by changing from conventional
release formulation given thrice daily to the same formulation given twice daily, where
eachDTZ dose is given with the corresponding CsA dose.
Page 160
CHAPTER 6
Chapter 6
Diltiazem does not always increase blood cyclosporin concentration - a clinical study in a
lung transplant recipient
6.1 Introduction 162
6.2 Methods 163
6.3 Results 165
6.4 Discussion 168
Page 161
CHAPTER 6
6.1 Introduction
Since its introduction in the early/mid 1980s in Australia, CsA has become the major
immunosuppressive drug used for the prevention of transplant organ rejection. While it's
use has resulted in improved graft survival figures, it has been complicated by a new set
of adverse effects and interactions with other drugs. CsA is metabolised by CYP3A4
and several important drug interactions have been observed including interactions with
DTZ, KCZ, itraconazole (ICZ) and erythromycin which all impair metabolism and
elevate blood CsA concentrations, and rifampicin and phenytoin which induce
metabolism and significantly reduce blood CsA concentrations. In the mid 1980s,
deliberate coprescription of drugs which increased blood CsA concentrations were
advocated in an attempt to contain the costs of transplantation (Neumayer HH &'Wagner K. 1986. Kohlaw K, et al. 1988. Brockmoller J, et al. 1990). As noted in
Chapter 2, approxtrnately 7O7o of kidney transplant recipients and 66Vo of lung transplant
recipients are routinely prescribedDTZ in Australia and New Zealand.
The pharmacokinetic interaction study reported in Chapter 4 demonstrated that the
coprescription of DTZ tncreases blood CsA concentrations thereby allowing the dose of
CsA to be reduced while maintaining blood CsA concentrations within the therapeutic
range. Such an effect has been reported previously in population based studies and CsA
dosage reductions of approximately 35Vo have been reported (Chrysostomou A, et al.
1993. Patton PR, et aL 1994. Tortorice KL, et al. 1990. Mclacblan A & Tett S. 1998.
Leibbrandt DM & Day RO. 1992). This reduction in CsA dosage was estimated in
Chapter 2 to result in a saving to the Australian health care system of approximately
AUD$7 million per annum (199516 data). Some clinicians prefer to use KCZ because it
allows a reduction in CsA dose of >'707o (Keogh A, et al. 1995. Odocha O, et al. 1996.
Patton PR, et al. 1994. Sobh M, et al. 1995. First MR, et al. 1989. First MR, et al.
1991. First MR, et al.1993).
Page 162

CHAPTER 6
Many patients prescribed CsA will have a clinical indication for the use of DTZ (angna
and/or hypertension). Data presented in Chapter 3 demonstrated that DTZ improves
renal transplant outcomes in the early post operative period, a finding reported in an
earlier Australasian kidney transplant study (Chrysostomou A, et al. 1993). In Chapter 2
it was demonstrated that many transplant recipients were routinely prescribed DTZ prior
to the availability of this evidence and that the routine prescription was done primarily
for the economic benefits that accompany the CsA dose reduction. This is the first time
that a drug has been widely prescribed for an economic rather than a therapeutic purpose
but, despite the widespread use of DTZ as a CsA-sparing agent, there were only limited
pharmacokinetic data on the interaction prior to the study described in Chapter 4. In that
study, the dose-response curve for the interaction between CsA and DTZ was explored
in stable kidney transplant recipients and large interpatient differences in both the
magnitude of the interaction and the dose of DTZ required to produce a sparing effect
were demonstrated. While the mean increase in CsA AUC (or trough) observed in
Chapter 4 was consistent with the previously reported figure of 357o, there was
considerable interpatient variability in response with some patients experiencing greater
and some patients lesser increases.
There have been no systematic studies which compare the CsA-sparing effect of different
drugs in the same patients. Hence the opportunity to study the CsA-sparing effect of
both itraconazole and dlltiazem in a lung transplant recipient was welcomed when the
clinical situation allowed the study to be undertaken.
6.2 Methods
A 49 year old Caucasian female received a single lung transplant for cigarette smoking
related emphysema in July 1994. She was commenced on ICZ (200mg twice daily) 4
Page 163
CHAPTER 6
months later for its CsA sparing action but in August 1995 this antifungal agent was
withdrawn because it was thought to be contributing to adverse effects including ankle
oedema and hypokalaemia. After a period of 2 weeks without this known CsA sparing
agent, DTZ was coÍìmenced both for its antihypertensive activity and its potential for
minimising nephrotoxicity. Pharmacokinetic studies were conducted on 3 occasions, first
when the patient was taking ICZ, second when not taking any CYP3A4 modifting drug
and third when takingDTZ in a dose of 240mg given as the controlled (CD) diffusion
formulation.
On the day of the hrst study, 200mg ICZ (Sporuno*@, Janssen-Cilag, Australia) was
given in the morning with CsA (Sandimmun@, Nouurtis, formerly Sandoz Australia) and
13 serial blood samples were taken from an indwelling catheter. Sample times were 0
(pre dose) and at times 1, 2,3, 4,6 and 12 hours after both the morning and evening
CsA doses. This allowed the estimations of the area under CsA concentration vs time
curve for the 24 hotn period (AUC(0-24)) spanning two doses of CsA. AUCs were
calculated using the log-linear trapezoidal rule (Appendix 4). Patency of the catheter
(dead space 0.3mL) was maintained by instilling 1.5mL of heparinised saline (15 units
heparin) following collection of each 7mL blood sample. The hrst 2rnI- of blood was
discarded to prevent contamination by the heparinised saline. Samples were immediately
refrigerated (00C - 40C) before transporting to the laboratory where they were frozen
prior to assay. Because Dly'IDTZ has been shown to be unstable at -200C (Bonnefous
JL, et al. 1992), samples for DTZanalysis were stored at -800C.
Similar kinetic studies were performed 2 weeks later when the patient was receiving no
CsA sparing agents and finally 8 weeks later when stabilised on an extended release
formulation of DTZ (Cardizem CO@ ICI Australia). DTZ was commenced on the
morning after the second study day at a dose of 180mg (CD formulation) each morning
Page 164
CHAPTER 6
and increased to 240mg (because of inadequate control of hypertension) 11 days later
and 6 weeks before the final study day. EachDTZ dose was taken in the morning with
the corresponding CsA dose. As discussed in Chapter 5, this formulation is not a true
'sustained release' formulation of DTZ but one where the manufacturer claims that
approximately 407o of the drug is released inthe ftrst 12 hours and the rcmainng607o
over the second 12 hour period.
Whole blood CsA concentrations were measured by enzyme immunoassay (EMIT@,
Behring/Syva, San Jose, California) which is relatively specific for parent CsA (Steimer
W. 1999). Intra- and inter-assay CVs ranged from 6.6 to 13.37o at CsA concentrations
of 78¡tg/I- and 360pg/L (Morris RG, et al. 1992). DTZ concentrations were determined
by an HPLC assay described in Chapter 7. ICZ concentrations were measured by a
previously reported HPLC method (Badcock NR. 1990).
6.3 Results
Apart from CsA, other 'baseline' drugs consumed throughout the study (indication)
included prednisolone and azathioprine (to inhibit rejection), acyclovir and co-
trimoxazole (prophylaxis against herpes virus/pneumocystis carinü), prazosin and
captopril (hypertension), omeprazole (gastric reflux), calcium carbonate (prophylaxis for
osteoporosis), glipizide (hyperglycaemia), betaxolol eye drops (glaucoma), frusemide
(oedema), budesonide (airway inflammation) and salbutamol (bronchodilatation). During
study day 1 amoxycillin (500mg three times a day) was also taken, during study day 2,
paracetamol (1g four times a day) and spironolactone (50mg twice daily) were taken and
during study day 3, ceftriaxone (1g once a day) was taken in addition to the baseline
drugs.
Page 165
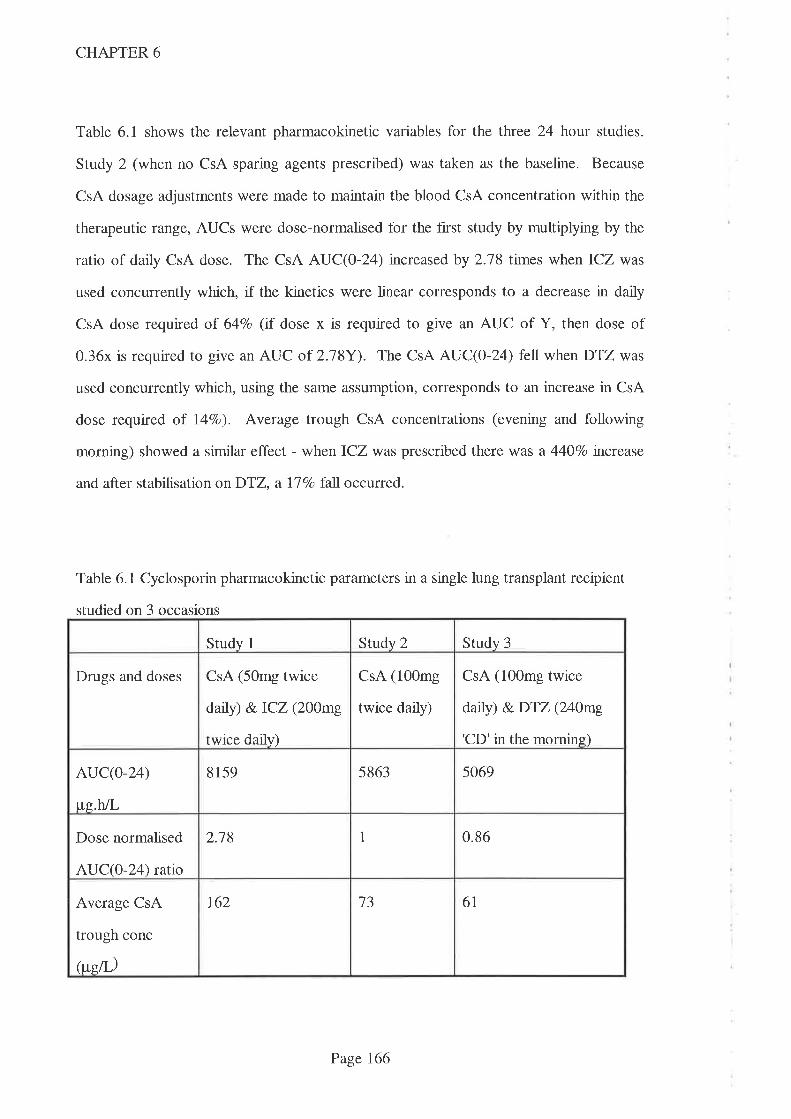
CHAPTER 6
Table 6.1 shows the relevant pharmacokinetic variables for the tfuee 24 hour studies.
Study 2 (when no CsA sparing agents prescribed) was taken as the baseline. Because
CsA dosage adjustments were made to maintain the blood CsA concentration within the
therapeutic range, AUCs were dose-normalised for the first study by multiplying by the
ratio of daily CsA dose. The CsA AUC(O-24) increased by 2.78 times when ICZ was
used concurrently which, if the kinetics were linear corresponds to a decrease in daily
CsA dose required of 64Vo (if dose x is required to give an AUC of Y, then dose of
0.36x is required to give an AUC of 2.18Y). The CsA AUC(O-Z ) fell when DTZ was
used concurrently which, using the same assumption, corresponds to an increase in CsA
dose required of l47o). Average trough CsA concentrations (evening and following
morning) showed a similar effect - when ICZ was prescribed there was a 440Vo increase
and after stabilisation onDTZ, a IlVo fall occurred.
Table 6.1 Cyclosporin pharmacokinetic parameters in a single lung transplant recipient
studied on 3 occasions
Study 1 Srudy 2 Srudy 3
Drugs and doses CsA (50mg twice
daily) &.ICZ (200mg
twice daily)
CsA (100mg
twice daily)
CsA (100mg twice
daily) &DTZ (240mg
'CD'in the morning)
AUC(o-24)
tte.hL
8159 5863 5069
Dose normalised
AUCQ-}4) ratio
2.18 1 0.86
Average CsA
trough conc
itu;eil')
r62 13 6t
Page 766
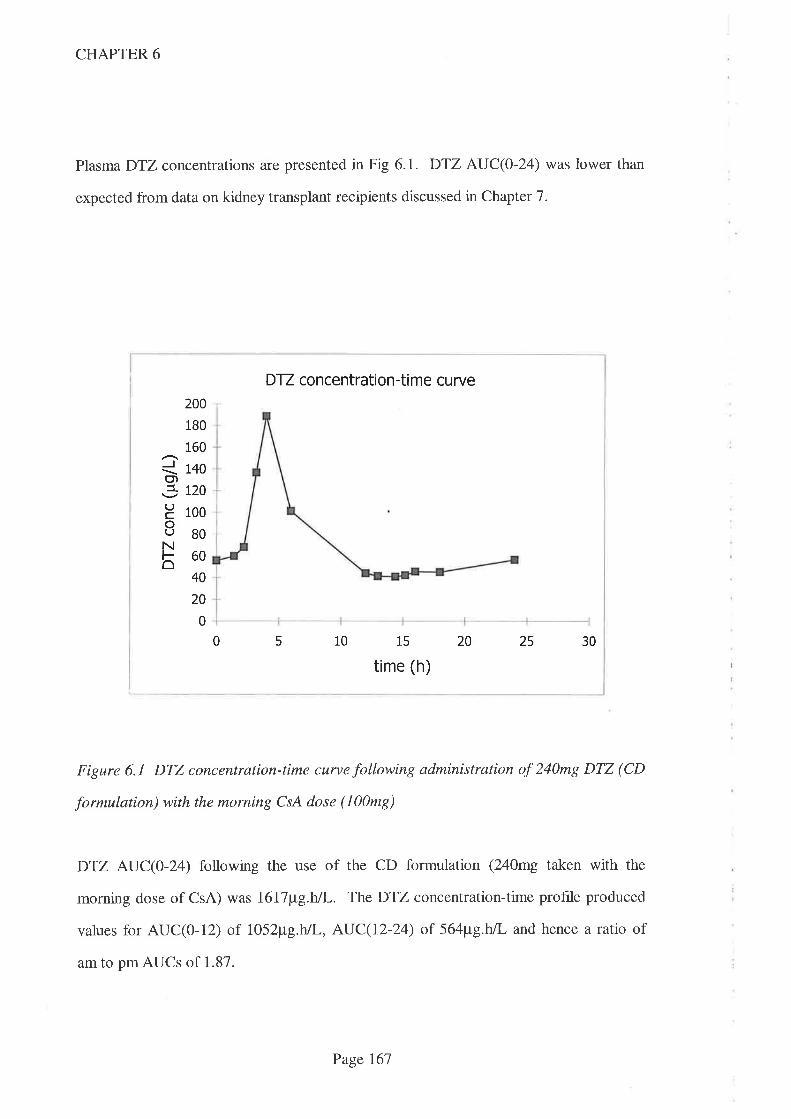
CHAPTER 6
Plasma DTZ concentrations are presented in Fig 6.1. DTZ AUC(0-24) was lower than
expected from data on kidney transplant recipients discussed in Chapter 7.
Figure 6.1 DTZ concentration-time curve following administration of 240mg DTZ (CD
formulation) with the morning CsA dose (100mg)
DTZ AUC(O-T ) following the use of the CD formulation (240mg taken with the
morning dose of CsA) was I6\7¡tg.h/L. The DTZ concentration-time profile produced
values for AUC(0-12) of 1052¡tg.h/l-, AUC(12-24) of 564¡tg.h/L and hence a ratio of
am to pm AUCs of 1.87.
DTZ concentration-ti me cu rve
5
200
180
160
Q r+ogl-jl tzo
H 1oooUBON860
40
20
0
0 10 15
time (h)
20 25 30
Page 167
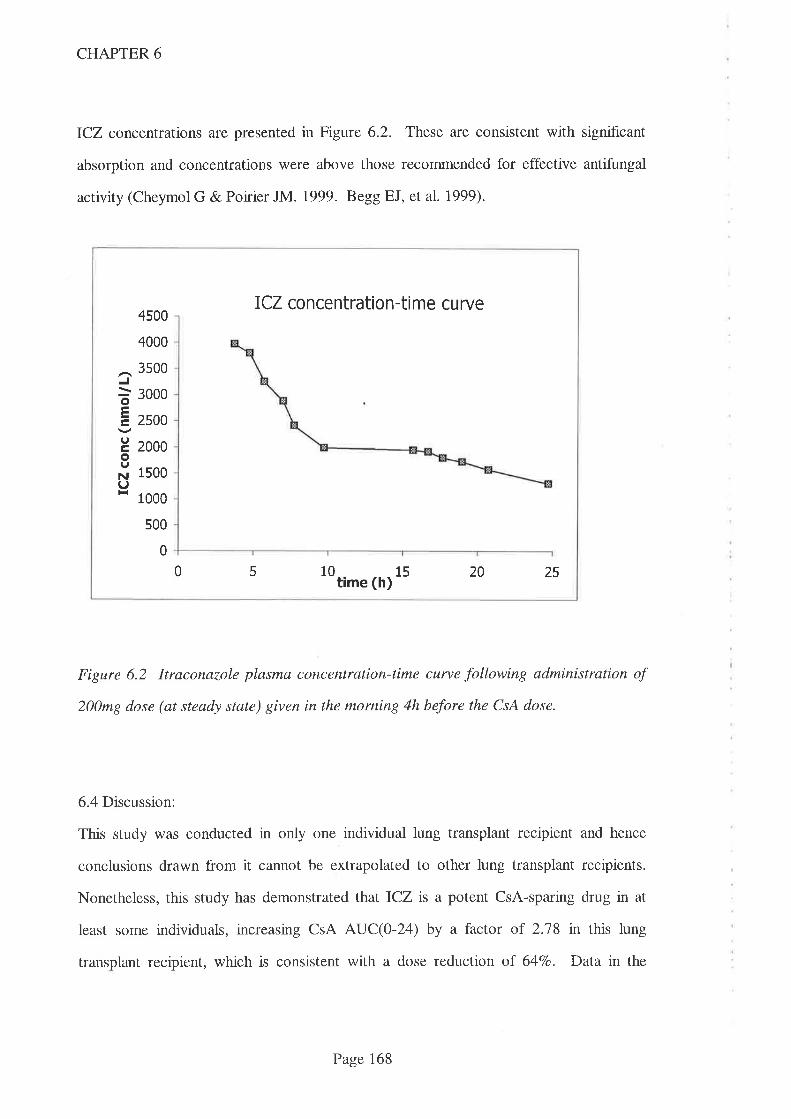
CHAPTER 6
ICZ concentrations are presented in Figure 6.2. These are consistent with significant
absorption and concentrations were above those recommended for effective antifungal
activity (Cheymol G & Poirier JM. 1999. Begg EJ, et al.1999).
ICZ concentration-time curve
J
oEtrIoINIl-{
4500
4000
3500
3000
2s00
2000
1500
1 000
s00
0
0 5 10 15 20 25time (h)
Figure 6.2 ltraconazole plasma concentration-time curve following administration of
200mg dose (at steady state) given in the morning 4h before the CsA dose.
6.4 Discussion:
This study was conducted in only one individual lung transplant recipient and hence
conclusions drawn from it cannot be extrapolated to other lung transplant recipients.
Nonetheless, this study has demonstrated that ICZ is a potent CsA-sparing drug in at
least some individuals, increasing CsA AUC(O-Z4) by a factor of 2.78 in this lung
transplant recipient, which is consistent with a dose reduction of 64Vo. Data in the
Page 168
CHAPTER 6
literature regarding interactions between ICZ and CYP enzymes is conflicting. Case
reports attesting to a sparing action of this magnitude have been published regarding a
heart transplant recipient (Trenk D, et al. 1987.) and a kidney transplant recipient (Kwan
JTC, et al. 1987) but there have also been clinical reports of no interaction occurring
between ICZ and CsA (Novakova I, et al. 1987). In this latter report, CsA blood
concentrations and daily doses (mg/kg/day) from 14 bone marrov/ transplant recipients
given[CZ for a therapeutic indication were compared to those same data from 20 similar
patients who were not given ICZ. The lack of difference between these two populations
in that report may be explained by the use of parenteral CsA (since the interaction
between CsA and ICZ may occur principally in the intestine) and/or the non-specific
radioimmunoassay used which cross reacts with metabolites of CsA. In another early
report (Shaw MA, et al. 1987) where interactions between ICZ and other drugs were
examined in rats, the authors concluded that the interaction between CsA and ICZ was
unlikely to be via the liver cytochrome P450 enzyme system but may be via an increase in
absorption or change in distribution. In another, in vitro study, using human liver
microsomes (Back DJ & Tjia JF. I99I),ICZ was noted to inhibit CsA's metabolism but
to a much lesser extent than the structurally related drag, KCZ. In a more recent report,
ICZ was shown to increase circulating concentrations of terfenadine, a pro-drug that is
normally completely converted to its active metabolite by intestinal CYP3A4 (Kvisto
KT, et al. 1994). One potential outcome of this inhibition of intestinal CYP3A4 is
cardiotoxicity (prolongation of QT interval) resulting from parent terfenadine.
The increase in CsA dose requirement when onDTZ (study 3) relative to baseline (study
2) suggest that DTZ reduced CsA AUC - the opposite effect of that anticipated and
widely reported. There are alternative explanations however. The first is that these data
merely reflect the considerable intrapatient variability in CsA kinetics observed in
Chapters 4 and 5 and widely reported previously (Ohlman S, et al. 1993. Grevel J. 1986.
Page 169
CHAPTER 6
Gupta SK, et al. 1990. Kahan BD, et al 1995b). Another explanation is that the apparent
decrease in dose normalised AUC(O-Z ) may have resulted from a 'carry-over' effect
from the first study day when the patient was receivng ICZ. If the time course of the
interaction between CsA and ICZ was such that blood CsA concentrations had not fallen
to their new steady state, they would be artificially elevated during study 2 and hence any
CsA-sparing effect afforded by the use of DTZ on the third study day would have been
masked. ICZhad a half-life of 15.7h in this study which is consistent with data reported
in the literature (21+6h - Goodman & Gilman, 1996) and hence the 2 week washout
period between study days 1 and 2 should have been suff,rcient to effectively clear the
drug from the bloodstream, allow regeneration of enzyme and a new steady state to be
achieved. There is little data in the literature on the time required for the
pharmacokinetic interaction between CsA and the various sparing agents to develop, but
observations in a single heart transplant recipient given ICZ suggested that the
interaction with this agent may not reach its peak for several weeks and may take > 4
weeks to return to baseline following cessation of ICZ (Trenk D, et al. 1987). This
finding must be interpreted with caution because a poþlonal assay method was used for
CsA monitoring and hence there is the potential for signihcant cross-reactivity with
metabolites of CsA and the single patient studied. In Chapter 4, it was demonstrated that
the duration of CsA-sparing effect of DTZ exceeded that which would be expected
merely from its half-life when a single morning dose of conventional rc7ease DTZ
affected CsA kinetics over a 24h period. Limited data are presented in Chapter 8 which
suggest that the interaction between DTZ and tacrolimus is stable by the end of 2 weeks.
If these data are accurate, the interaction between DTZ and both CsA and TRM should
follow a similar time course since they are both thought to occur via CYP3A4 (or P-gp).
The interaction with ICZ may take longer to develop and longer to abate (after
discontinuation of ICZ) however and hence the possibility remains that the 2 week
Page 770
CHAPTER 6
interval between studies 1 and 2 in the present study was not sufhcient for the effect of
ICZto be completely reversed.
On the first study day a lower CsA dose was used in order to maintain blood CsA
concentrations within the therapeutic range accepted by this hospital. This effect of ICZ
andDTZ on CsA's kinetics was anticipated, and the respective CsA kinetic data used for
calculations (AUCs and trough concentrations) were adjusted proportionately to
'normalise' the data for dose. As noted in Chapter 4, this simple method of
normalisation is widely applied but presumes drug kinetics to be linear over the dose
range in question. There is some evidence to suggest that this may not apply for the
Sandimmun@ formulation of CsA, especially when other drugs are coprescribed.
Sandimmun@ absorption kinetics over the dose range used are noted by the manufacturer
to be linear when plasma was the matrix studied but non-linear when whole blood was
the matrix (Sandimmun@ product information, Sandoz). Absorption has been noted to
be best described as first order and zero order by different authors (Grevel J. 1986) and
one report (where the oral solution formulation of CsA was used) describes three
different patterns of absorption in relatively small population of 42 children (Jacqz-
Agrain E, et al. 1994). CsA-sparing agents are thought to exert much of their sparing
activity via intestinal CYP3A4 (and/or P-gp) and hence to increase the extent of CsA's
absorption. DTZ thus complicates the absorption process and may thus affect the
linearity of the relationship between CsA dose and blood CsA concentration. There are
no data on the linearity of CsA absorption when DTZ ts coprescribed. Further
complications in the early Sandimmun@ data include the well described intrapatient
variability in absorption associated with this formulation and cross reactivity of CsA
metabolites with the assays used. The use of this method of normalisation of AUCs is
thus a limitation to the study findings but, in the absence of a greater understanding and
Page 17I
CHAPTER 6
given the clinical imperative of maintaining blood CsA concentrations within the
therapeutic range, it was unavoidable.
The lack of observed CsA-sparing effect in this patient even at the higher DTZ dose
(24}mg) than usually used in Australia (Chapter 2) could not be explained by other drug
interactions. Drugs taken on each study day (in addition to baseline drugs taken on all
study days) are noted in the Results section. None of these drugs are thought to interact
with CYP3 A4 and/or P-gp and hence to interact pharmacokinetically with CsA.
One potential explanation for the lack of effect by DTZ on CsA AUC(0-24) was the
lower than anticipatedDTZ AUC(O-24) following the 240mg dose (CD formulation) in
this lung transplant recipient. Despite using a 307o htgher dose (240mgld vs 180mg/d),
the DTZ AUC(O-L ) in the current study was lower than the mean value (289ap"g.hlL)
obtained from the 7 kidney transplant recipients given DTZ (180mg/d) in the study
described in Chapter 5. This value was also lower than any individual value obtained
from the kidney transplant group. At the same daily DTZ dose (180mg/d as CD
formulation), mean DTZ AUC(}-I2) observed in the 7 stable kidney transplant recipients
presented in Chapter 5 (1576pg.h,/L) was higher than the DTZ AUC(0-12) (1052¡t"g.h/L)
observed in the current patient. The difference in DTZ AUC(12-24) was larger. Mean
DTZ AIJC(12-24) observed in Chapter 5 (1318pg.h/L) was higher than the value
obtained from the current patient 66ap'g.hn'). DTZ AUC(O-I2), AUC(I2-24) and
hence AUC(0-24) from the current patient are also substantially lower than the values
obtained from the sole kidney transplant recipient (patient 3) given 240mg DTZ as the
CD formulation (Chapter 5). Respective values for DTZ AUC(0-12),DTZ AUC(12-24)
and DTZ AUC(0-24) arc 5396¡tg.hlI-, 6235¡tg.h/L and 11631¡tg.hlI- for that kidney
transplant recipient. Nonetheless,DTZ AUC values observed in the current patient are
higher than the AUC values obtained from one kidney transplant patient (number 7)
Page I72
CHAPTER 6
when taking 180mg/d DTZ as the conventional release tablet (Chapter 5). In this
patient, DTZ AUC(0-12), AUC(12-24) and hence AUC(O-24) were 146¡tg.h/L,
1l0pg.h/L and 256¡tg.h/I-. Despite these low DTZ AUC values, this kidney transplant
recipient experienced a modest 39Vo tncrease over baseline CsA AUC(0-24) (Chapter 4)
at the 180mg/day dose (conventional release formulation). Switching to the CD
formulation of DTZ (at 180mg/d) resulted in a further 9Vo tncrease in CsA AUC(0-24)
but a much larger increase nDTZ AUC(0-24) (1l3Eo) (Chapter 5). The lower DTZ
AUC data is probably not the reason behind the lack of a significant CsA-sparing effect
in the current patient.
The shape of the DTZ concentration-time profile (Fig 6.1) was unexpected from a
formulation that its manufacturer's claim releases DTZ n two phases, 4O7o betng
released in the ftrst 12 hours and the remaining 6OVo in the following 12 hours. While
not being a typical 'sustained release' formulation, the peak exhibited in the fìrst few
hours was unexpected and this resulted in a DTZ AUC(O-IZ) of 1052pg.h,/L while the
DTZ AUC(12-24) was 564pg.h/L and hence a ratio of 1.87 (not the 0.67 expected). A
similar ratio (1.20) of am to pm DTZ AUCs was also noted in the study presented in
Chapter 5.
As noted in Chapter 5 and further discussed in Chapter 7, CsA is an inhibitor of CYP3A4
and has been shown to be a felodipine-sparing agent. Since the site of the interaction is
thought to be in the upper intestine, the reason for this unexpected peak in DTZ during
the first 12 hours may result from CsA inhibiting intestinal CYP3A4 (or P-gp). Since the
CD formulation of DTZ would be expected to release its second portion at a lower
intestinal site, the evening dose of CsA would not be physically present at this intestinal
site when DTZ was being released and hence might not increase the absorption. Since
this is a single observation, this explanation is speculative and given the failure of the
Page 173

CHAPTER 6
180mg CD formulation of DTZto perform as expected in Chapter 5, it is probable that
this unexpected prof,rle in the current study is a similar failure to perform as expected.
The results of this study support the conclusion from Chapter 4 that it is important not
just to presume, but to demonstrate that a beneht exists when DTZ is prescribed solely
for its CsA-sparing effect. This can be achieved either by monitoring the full CsA
AUC(O-24) or more easily, by single (usually trough) monitoring both before and after
the introduction of the CsA-sparing agent. The change in CsA AUC(0-24) observed in
this study was numerically less than the change in trough blood CsA concentration
(278Vo vs 440Vo increase for ICZ - Table 6.1). This was also a finding of the DTZ dose-
escalation study described in Chapter 4. As noted there, it is assumed that CsA AUC(O-
24) is a better guide to overall exposure and hence to therapeutic efficacy. Clinicians
should thus be cautioned against reducing CsA dosage in line with CsA trough
concentration data since this would result in a decrease in overall CsA exposure (as
measured by CsA AUC(0-24)). One of the ways that this could be handled in the busy
clinic is to adopt a higher therapeutic (trough concentration) range for CsA when CsA-
sparing agents are used. However, as noted in Chapter 3, there is a marked lack of
concordance with respect to CsA therapeutic ranges within the Australasian transplant
community and this does not seem to have translated into any discernible effect on either
therapeutic benefit or toxicity. It would thus appear that modif,rcations to existing CsA
therapeutic ranges to account for the use of CsA-sparing agents are attempting to bring a
degree of f,rnesse to a situation which does not warrant it.
While a similar lack of effect has not been reported for any other CsA-sparing agent, it is
likely that not all patients will benefit from the use of all agents. It would therefore seem
prudent to stabilise all patients on CsA before introducing any sparing agent and to prove
that a sparing effect is occurring by monitoring the effect on blood CsA concentrations.
Page 174
CHAPTER 6
Similar caution should also be observed when changing brands or formulations of either
CsA or sparing agent. In Chapter 5, the effects of changing formulation of DTZ from
conventional to controlled delivery formulation were presented. Despite using the same
daily dose of DTZ, switching to the CD formulation of DTZ resulted in clinically
signihcant changes to CsA AUC for some transplant recipients. Another example of a
formulation change which might result in alterations to CsA-sparing effect is the newer,
microemulsion formulation of CsA (Neoral@, Novartis, formerly Sandoz Australia).
Since CsA is absorbed primarily from the upper gastrointestinal tract (Drewe J, et al.
1992) and there is evidence that the interaction between CsA and CsA-sparing agents
occurs at this site (Kolars JC, et al. 1991b. 'Watkins PB. 1992. Wu CY, et al. 1995),
altering the release characteristics of CsA or the sparing agent might affect the extent of
interaction. Indeed, there has been one report of an altered CsA-sparing effect resulting
from a change in brand of DTZ (Cooke CE. 1994). Data in this 'letter to the editor'
were limited and, despite attempts to contact the author, the brands used are not known,
adequacy of compliance and whether other drugs had been started or stopped are also
not known. Hence the veracity of this claim remains to be contrmed.
There are serious ethical concerns surrounding the use of a drug for a purely economic
purpose, but there can be no justification for the use of a drug il in addition to having no
clinical benefit, it also fails to provide an economic benefit.
Page 175

CHAPTER 7
Chapter 7
Diltiazem disposition and metabolism in kidney transplant recipients receiving
cyclosporin
7.1 Introduction
7.2 Atnß
7.3 Methods
7.4 Results
7.5 Discussion
7.6 Summary
7.3.1 Stock solutions
7 .3 .2 Plasma extraction
7.3.3 Chromatography
7 .3.4 Analytical and Statistical considerations
fl1
Il9
179
180
181
181
r82
183
192
198
Page 176
CHAPTER 7
7.1 Introduction
DTZ is a calcium-channel blocker with the approved indications for the treatment of
hypertension and angina pectoris in Australasia. In the mid/late 1980s, its use as a CsA-
sparing agent rwas advocated since it had potential to ameliorate CsA induced
nephrotoxicity and because its use allowed the dose (and hence cost) of this expensive
immunosuppressive drug to be reduced while maintaining blood CsA concentrations
(Pochet JM & Pirson Y. 1986. Neumayer HH & Wagner K. 1986. Wagner K, et al.
1987. Wagner K, et al. 1989. Oppenheimer F, et al. 1992. Brockmoller J, et al. 1990).
CsA is metabolised via the cytochrome P450 isoenzyme, CYP3A4 and DTZ has been
noted to reduce the extent of this metabolism with the consequence that blood CsA
concentrations rise (Kronbach T, et al. 1988. Pichard L, et al. 1990). The CYP3A4
isoenzyme occurs both in the liver and in enterocytes, where it is the predominant CYP
enzyme of the proximal intestine with activity approaching one-third that of hepatocytes
(Krishna DR & Klotz U. 1994. Kolars JC, et al. 1992. Hoppu K, et al. 1991. Tjia JF, et
al. 199I. Peters WH & Kremer PG. 1989. de Waziers I, et al. 1990. V/atkins PB.
1992). In addition, as noted in Chapter 1, P-gp has also been implicated as an alternative
interacting species. Interestingly, P-gp is also located in the upper intestine and DTZ has
been shown to reduce the activity of this 'drug efflux pump', reinforcing the importance
of the upper intestine as the site of the interaction betweenDTZ and CsA.
In Chapter 2 the widespread use of DTZ as CsA-sparing in Australasia was described.
Significant economic benefits have been shown to result from this coprescription since
the dosage of CsA can be reduced by approximately 35Vo (Chrysostomou A, et al. 1993.
Tortorice KL, et al. 1990. Patton PR, et al. 1994. Mclachlan A & Tett S. 1998.
Leibbrandt DM & Day RO. 1992). In the dose-response study described in Chapter 4,
these savings were confnmed (albeit with great interpatient variability) and in Cbapter 2,
Page 177
CHAPTER 7
they were estimated to be $7 million n 1995/6. In addition, several authors have noted
thatDTZ exerts beneficial therapeutic effects in kidney transplant recipients (Epstein M.
1992. Morales JM, et al. 1994. Chrysostomou A, et al. 1993. Neumayer HH &
Wagner K. 1986. Oppenheimer F, et al. 1992). These benefits were confirmed in
Australasian kidney transplant recipients in the study described in Chapter 3. In addition
to these benefits to kidney transplant recipients, other therapeutic benefits have been
attributed directly to the use of DTZ including reduced coronary artery atherosclerosis in
heart transplant recipients (Schroeder JS, et aI.7993).
The metabolism of DTZ is complex. It has been shown to be converted to 3 major
metabolites, N-demethyl-diltiazem (DMDTZ), deacetyl-diltiazem (DADTZ), and
demethyl-deacetyl-diltiazem (DMDADTZ) (Yetng PKF, et al. 1990. Yeung PKF, et al.
1993). Whilst most attention to date has focussed on the effect thatDTZ has on CsA's
metabolisrq there has been little attention on the effect that CsA might have on DTZ's
metabolism. It was speculated in Chapter 5 that the reduced DTZ AUC exhibited by one
patient after switching from conventional release to CD formulation DTZ might have
been as a consequence of a dose reduction in CsA that was necessitated by the study.
Both CsA and DTZ are metabolised by CYP3A4 and both drugs have been shown to
antagonise the action of this important drug metabolising enzyme. CsA has been shown
to inhibit the metabolism of midazolam in vitro although this effect could not be
demonstrated in vivo (Treiber GLG, et al. 1990). The design of this study did not allow
volunteers (kidney transplant recipients taking CsA to prevent rejection) to act as their
own controls but instead, data was compared to historic kinetic data from 'normal'
individuals. There were few subjects (n=9) in this study and large variability in
midazolam clearance (mean 4l4mLlmrrl range 218-556) was reported. It is thus
possible that CsA did affect midazolam's clearance but the trial did not have the
necessary power to identiff the fact. CsA has also been shown to elevate blood
Page 178
CHAPTER 7
concentrations of another calcium channel blocking drug, felodipine (Madsen JK, et al.
1996) (Cmax increased by l5l7o and AUC by 587o) in a single dose study involving 12
volunteers.
7.2 Aims:
The principal aim of this study is to examine the effect on DTZ' s kinetics by giving
increasing doses of DTZ to 8 stable kidney transplant recipients maintained on CsA. A
secondary aim is to compare the effect on DTZ's kinetics of changing the formulation of
DTZ from 'conventional release' (in a dose of 90mg twice daily) with the 'controlled
diffrrsion' formulation (in a dose of 180mg given in the morning).
7.3 Methods
This study was conducted in tandem with the dose-response study discussed in Chapter
4. Eight stable kidney transplant recipients (patient details are given in Table 4.1)
consented to take part in this study which was approved by the Hospital's Ethics of
Human Research Committee (Appendix 3). Inclusion criteria (detailed in Chapter 4)
included stable trough blood CsA concentrations on routine monitoring for >3 month,
stable renal function for >3 months with plasma creatinine <l80pmolll. Exclusion
criteria are also described in Chapter 4 and included use, throughout the study period, of
other medications known to interfere with either CsA's or DTZ's metabolism or the use
of drugs whose metabolism might be affected by D"fZ to the patient's detriment (eg.
terfenadine).
Patients were studied before the introduction of DTZ and aft.er a minimum interval of 2
weeks at each DTZ dosage level. DTZ doses employed wete 0, lO, 20,30, 60mg taken
Page 179

CHAPTER 7
with the morning CsA (Sandimmun@ capsules, Novartis - formerly Sandoz - Australia)
dose followed by 60 and 90mg taken twice daily (with respective CsA doses) and finally
180mg CD formulation of DTZ (Cardizem CD@, ICI, Australia) given with the morning
CsA dose. DTZ doses <3Omg/day were taken as 10mg capsules made by the Hospital's
Pharmacy Department and assayed by the HPLC assay outlined below. Doses >30mg
were taken as conventional release 60mg tablets (Cardizem@, ICI, Australia). CsA
doses were taken at 12 hourly intervals and at least th away from food. On each study
day, thìrteen blood samples were drawn from an indwelling venous catheter (kept patent
with heparinised saline, l5units/1.5ml) over a24h period. Sample times were 0 (pre-
dose) and at 1,2 ,3, 4, 6 and l2hr after both morning and evening doses of CsA which
allowed the calculation of both morning and evening AUCs for CsA and DTZ.
Heparinised samples for DTZ assays were collected and refrigerated (0-4oC) before
transfer to the laboratory where the plasma fraction was separated by centrifugation at
4oC and subsequently stored at -80oC until analysed, because DMDTZ has been shown
to deteriorate at -zOoC (Bonnefous JL, et al. 1992). Plasma DTZ and each of the
metabolite concentrations were determined using a specific reverse-phase HPLC-UV
method as follows:
7.3.1 Stock Solutions
Stock solutions (100mg base/L in glass distilled deionised water) were prepared for
DTZ, DADTZ, DMDTZ (fumarate salt) and DMDADTZ (HMR, formerly Marion
Merrell Dow Research Institute, Cincinnati, Ohio, USA). These solutions were serially
diluted to provide solutions of 10mg/L and lmgll-. A stock solution of desipramine
hydrochloride (Novartis, formerly Ciba Geigy Ltd, Sydney, Australia) was prepared in
the same way and used as the internal standard. Solutions were stored at -2OoC between
assays. Solvents for use in the HPLC analysis were of analytic reagent grade (BDH
Page 180
CHAPTER 7
Laboratory Supplies, Poole, England) and phosphate buffer was Univar grade (Ajax
Chemicals, Auburn, NSW, Australia).
1 .3 .2 Plasma Extraction
Calibration standards were prepared in 1.0mL human plasma which had been shown to
be free of interference in the chromatographic system. Concentrations of DTZ, DADTZ,
DMDTZ and DMDADTZ used for the preparation of standard curves were 10, 50, 100,
250, 500 and 750¡;,g/l-. Patient samples (1.0mL) and quality control samples were
aliquoted into 15mL screw capped extraction tubes in parallel with the calibration curve
samples. Each tube was spiked with 50pL internal standard, basified with 100pL
Na2HPO4 (50mM, pH=7.5) and briefly vortex mixed. Diethylether (5mL) was added
before capping and shaking horizontally for 20min at 100rpm. Phases were separated by
centrifugation (3000rpm for 10min) followed by snap freezing in a dry ice/ethanol bath.
The organic phase was decanted into a conical tube containing 100pL hydrochloric acid
(50mM) and vortex mixed for lmin. Phases were once again separated by snap freezing
in an ethanoVdry ice bath and the ether phase was discarded. The acidified extract was
transferred to autosampler tubes and 50pL injected into the HPLC system.
7.3.3 Chromatography
Reverse phase chromatography was performed isocratically using a mobile phase
comprising acetonitrile and Na2HPOa (40mM, pH=5.5) in a ratio of 1:3. This was
pumped at l.Oml-/min (Spectra Physics P4000) through a 5pm reverse phase column
(Lichrocart, RP-SelectB, 10cm x 4mm id, part #50829, E.Merck, Darmstadt, Germany).
The column was maintained at 400C and the eluted substances detected by UV
absorption at 275nm (Spectra Physics, model 452000). Aliquots of 50pL of extracted
Page 181
CHAPTER 7
samples were injected using an autosampler (Spectra Physics, model 453000) and
quantification provided by software data system (SpectraSystem ver I.2, Spectra
Physics).
7 .3 .4 Analytical and S tatistical considerations
Assay performance (precision and accuracy) was assessed by extracting replicates of
plasma containing DTZ and its three metabolites in concentrations of 2.5, 10 and
100pg/L within a single run (n=6) and at 75 and 350pg/L between runs (n=6). The
robustness of the assay was assessed by application to samples from 11 non-selected
kidney transplant recipients who were taking DTZ along with a variety of other drugs
(including aspirin, atenolol, azathioprine, cephalexin, CsA, frusemide, insulin, nifedipine,
prazosin, prednisolone, ranitidine and/or sorbide nitrate). These patient samples were
received by the laboratory for routine therapeutic drug monitoring of other drugs
(usually CsA) and where DTZ was noted as being taken as part of 'other drug therapy'
on the assay request form.
The area under the 24h plasma concentration versus time curves, AUC(0-24), for DTZ
and 3 metabolites for each of the 1 DTZ dosages were determined using the log
trapezoidal method (Appendix 4).
The protocol allowed for dosage reductions of CsA (to reduce the potential for toxicity)
and aimed at maintaining trough blood CsA concentrations within the therapeutic range
adopted by our laboratory (80-250pg/L). This was planned since increasing DTZ doses
were expected to increase blood CsA concentrations. In practice, only 2 patients
required reductions in CsA dosage because their blood CsA concentrations approached
or exceeded this therapeutic range. Patient 4 had the daily CsA dosage reduced from
175mg twice daily to 150mg twice daily following study 6 and patient 5 had two such
Page 182

CHAPTER 7
reductions from 125mg twice daily to 100mg twice daily after study 6 and to 75mg twice
daily after study 7.
7.4 Results
Inter and intra assay CVs for parent DTZ and its 3 metabolites were <Il.37o and <3.17o
at concentrations of 2.5 and 100pg/L respectively (Morris RG, et al. 1996).
In patients 1 to 6, parent DTZ and metabolite AUC(0-24) profiles were similar, the order
of magnitude being; DTZ > DMDTZ > DADTZ > DMDADTZ for all DTZ doses
studied. Individual data are shown in Tables 1.2 - 7.5 and mean data are presented in
Figure 7.1. Patients 7 and 8 displayed different profiles. In patient 7,DTZ AUC(0-24)
was substantially lower than the corresponding values obtained from patients 1-6
throughout the entire DTZ dosage used (Table 1.2 - 7.5, Figtre 7.2). This patient's
DTZ metabolite AUCs exceeded parent DTZ AUC and, despite being lower than the
grouped data (n=6), they were similarly ranked (i.e. DMDTZ>DADTZ>DMDADTZ).
Patient 8 displayed a different profile with a consistently high AUC(O-24) for the
DMDADTZ metabohte which was followed in order by DTZ, DADTZ and DMDTZ
(Table 7.2 - 1.5, Figure 7.3). The DTZ AUC(0-24) was similar in magnitude to that of
patients 1 to 6.
Page 183
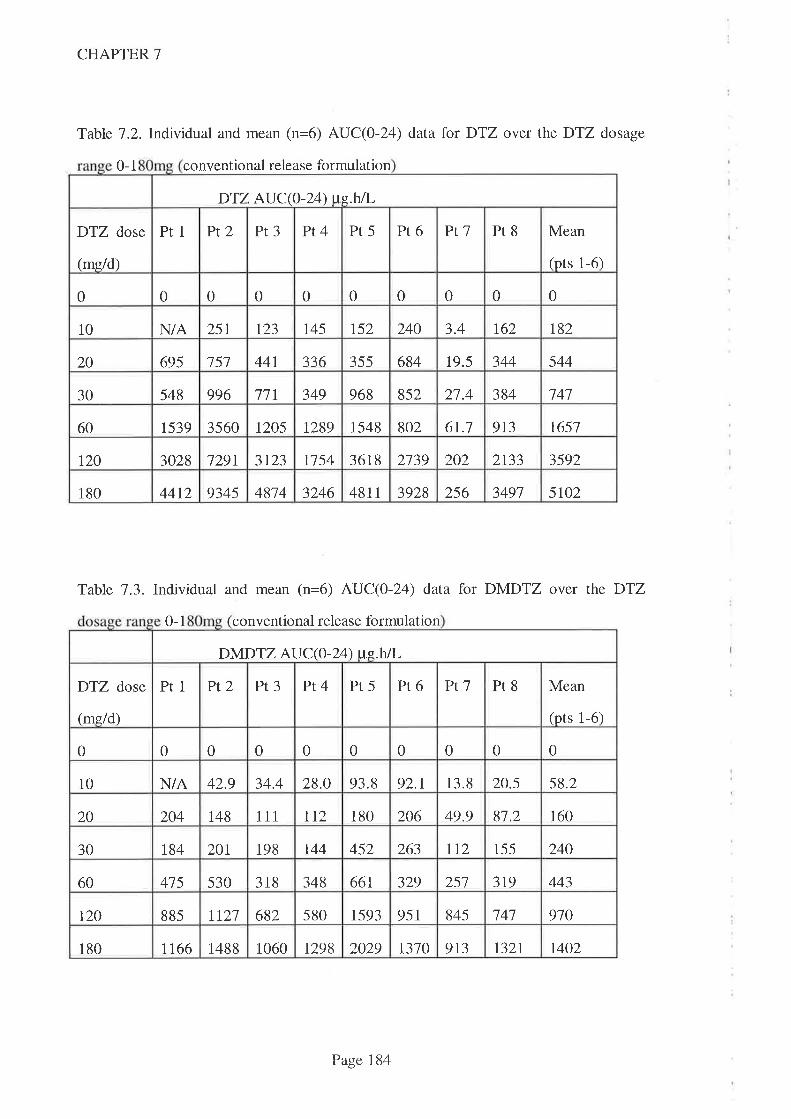
CHAPTER 7
Table 1.2.Indlidual and mean (n=6) AUC(0-24) data for DTZ over the DTZ dosage
0-1 conventional release formulation
Table 7.3. Individual and mean (n=6) AUC(0-24) data for DMDTZ over the DTZ
0-1 conventional release formulation
DTZ AUC(O-L4) we.hÃ,
Pr5 Pr6 Ptl Pr8 Mean
(pts 1-6)
DTZ dose
(me/d)
Pt1 Pt2 Pt3 Pt4
0 0 0 0 0 0 0 00 0
10 N/A 251 r23 t45 152 240 3.4 1,62 t82
20 695 151 44r 336 355 684 19.5 344 544
349 968 852 27.4 384 '74730 548 996 11r
1539 3560 1205 1289 1548 802 6t.l 913 165160
120 3028 1291 3r23 1154 361 8 2139 202 2133 3592
4814 3246 48II 3928 256 3497 5lo2180 44t2 9345
DÌMDTZ AUC(O-Z ) ue.h/L
Ptl Pr8 Mean
(pts 1-6)
DTZ dose
(mg/d)
Pr1 Pt2 Pt3 Pt4 Pr5 Pr6
0 0 0 0 0 0 0 00 0
10 N/A 42.9 34.4 28.0 93.8 92.r 13.8 20.5 58.2
20 204 148 I 1 1 112 180 206 49.9 81.2 160
1t2 155 24030 r84 201 198 144 452 263
348 66t 329 257 3t9 44360 415 530 318
682 580 r593 951 845 141 970t20 885 2111
1488 1060 r298 2029 r310 913 132t 1402180 1166
Page 184
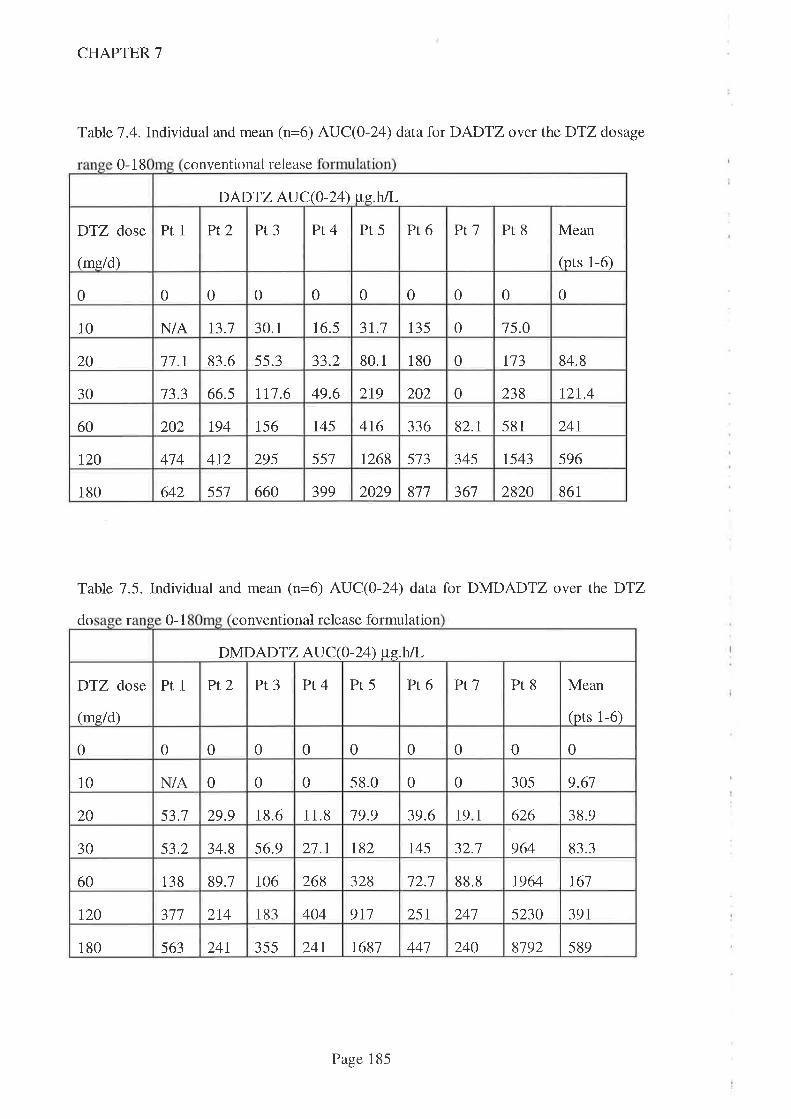
CHAPTER 7
Table 7.4. Individual and mean (n=6) AUC(0-24) data for DADTZ over the DTZ dosage
0-18 conventional release
Table 7.5. Individual and mean (n=6) AUC(0-24) data for DMDADTZ over the DTZ
do r 0-1 conventional release formulatio
DADTZ AUC(0-24) pe.h/L
DTZ dose
(mg/d)
Pr1 Pt2 Pr3 Pt4 Pt5 Pt6 Ptl Pt8 Mean
(pts 1-6)
0 0 0 0 0 00 0 0 0
13.7 30.1 16.5 31.7 135 0 15.010 N/A
20 77.r 83.6 55.3 33.2 80.1 180 0 173 84.8
30 13.3 66.s 111.6 49.6 2t9 202 0 238 12t.4
194 156 145 4t6 336 82.1 581 24t60 202
120 474 412 295 557 1268 513 345 t543 596
180 642 551 660 399 2029 817 367 2820 861
DMDADTZ AU C(O -24) tte.htL
DTZ dose
(me/d)
Prl Pt2 Pt3 Pt4 Pt5 Pr6 Ptl Pr8 Mean
(pts 1-6)
0 0 0 0 0 00 0 0 0
N/A 0 0 0 58.0 0 0 305 9.6110
20 53.1 29.9 18.6 11.8 19.9 39.6 1 9 1 626 38.9
30 53.2 34.8 56.9 21.7 t82 745 32.1 964 83.3
60 138 89.1 106 268 328 12.1 88.8 1964 r61
r20 311 2t4 183 404 911 251 247 5230 391
355 24t 7687 441 240 8192 589180 563 241
Page 185
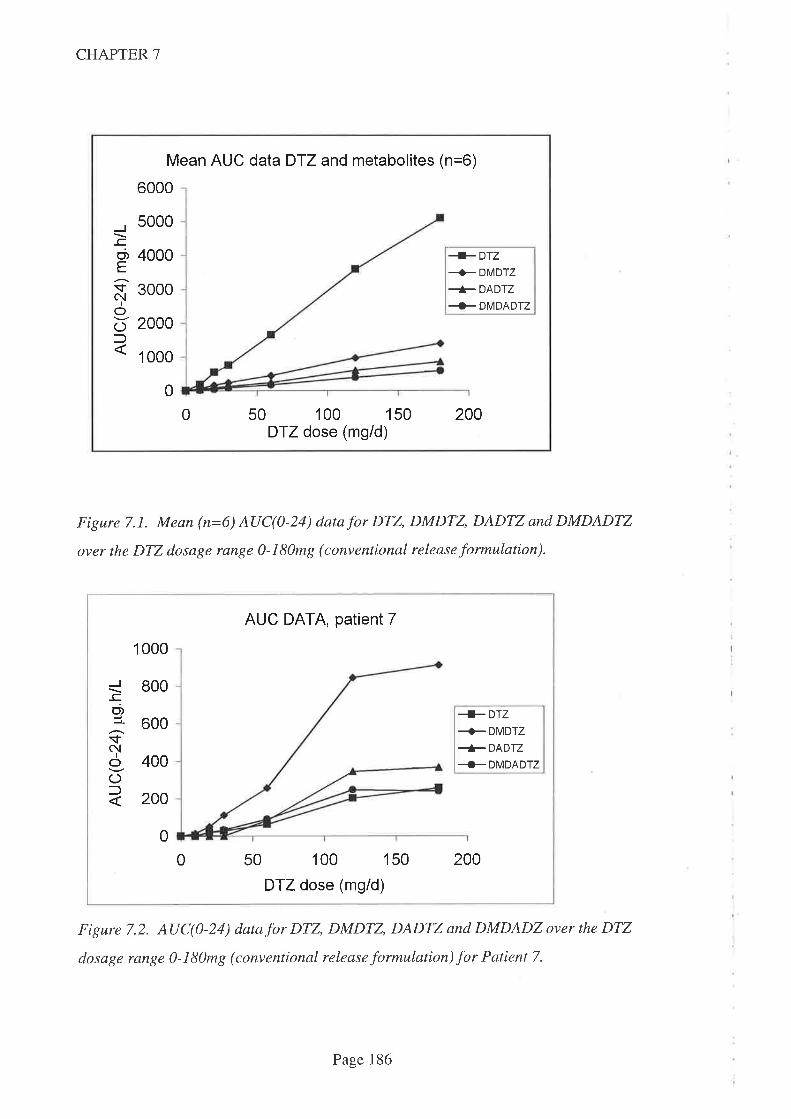
CHAPTER 7
Mean AUC data D-lZ and metabolites (n=6)
6000
J_ccT,
E
sC\,1
IoOf
5000
4000
3000
2000
1 000
+DTZ+ DMDTZ
+ DADTZ
+ DMDADTZ
0
0 50 100 150DTZ dose (mg/d)
200
Figure 7.1. Mean (n=6) AUC(0-24) datafor DTZ, DMDTZ, DADTZ and DMDADTZ
over the DTZ dosage range 0-180mg (conventional release formulation).
AUC DATA, patient 7
I 000
_cC',:l-
$NIo
(Jl
800
600+Drz+DMDTZ+DADTZ+ DMDADTZ400
200
0
0 50 100 150
DTZ dose (mg/d)
200
Figure 7.2. AUC(0-24) datafor DTZ, DMDTZ, DADTZ and DMDADZ over the DTZ
dosage range 0-180mg (conventional release formulation) for Patient 7.
Page 186
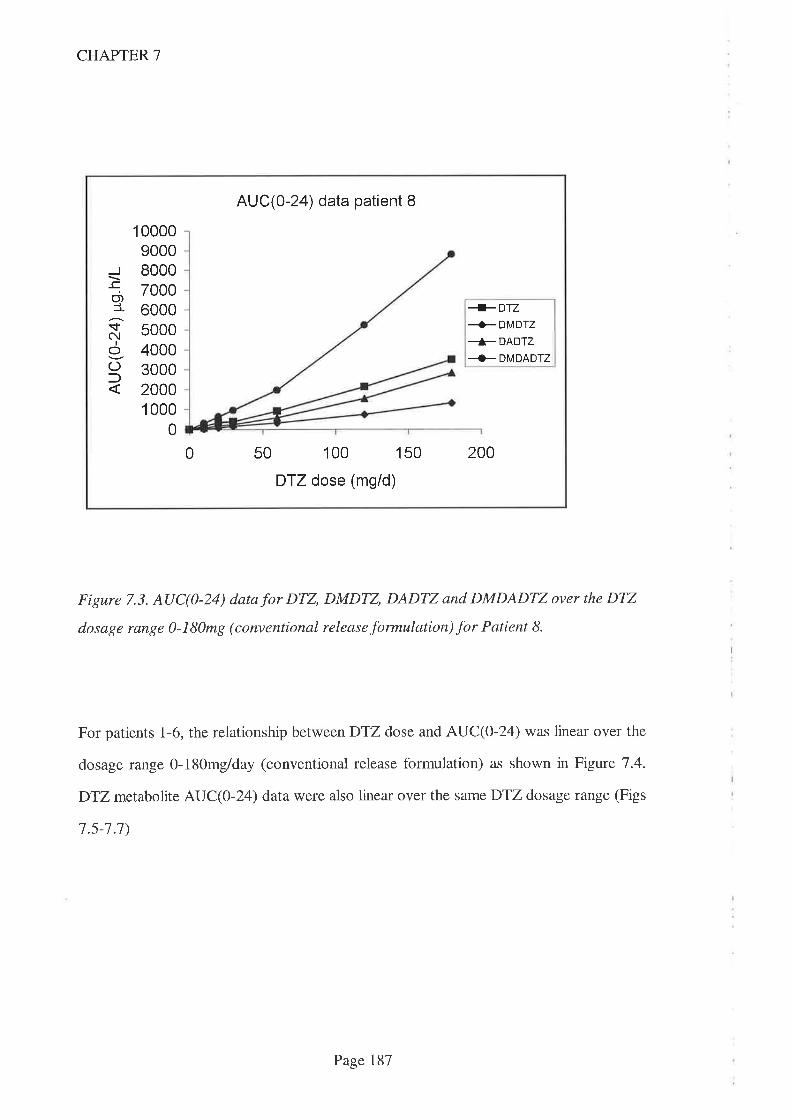
CHAPTER 7
Figure 7.3. AUC(0-24) datafor DTZ, DMDTZ, DADTZ and DMDADTZ over the DTZ
dosage range 0-180mg (conventional release formulation) for Patient 8.
For patients 1-6, the relationship betweenDTZ dose and AUC(O-24) was linear over the
dosage range 0-180mg/day (conventional release formulation) as shown in Figure 7.4.
DTZmetabolite AUC(O-Z4) data were also linear over the same DTZ dosage range (Figs
7.s-1.1)
AUC(0-24) data patient 8
_co,1.ifc{
IoOf
1 0000900080007000600050004000300020001 000
0
+DTZ-+ DMDTZ
+DADTZ+ DMDADTZ
0 50 100 150
DTZ dose (mg/d)
200
Page 187
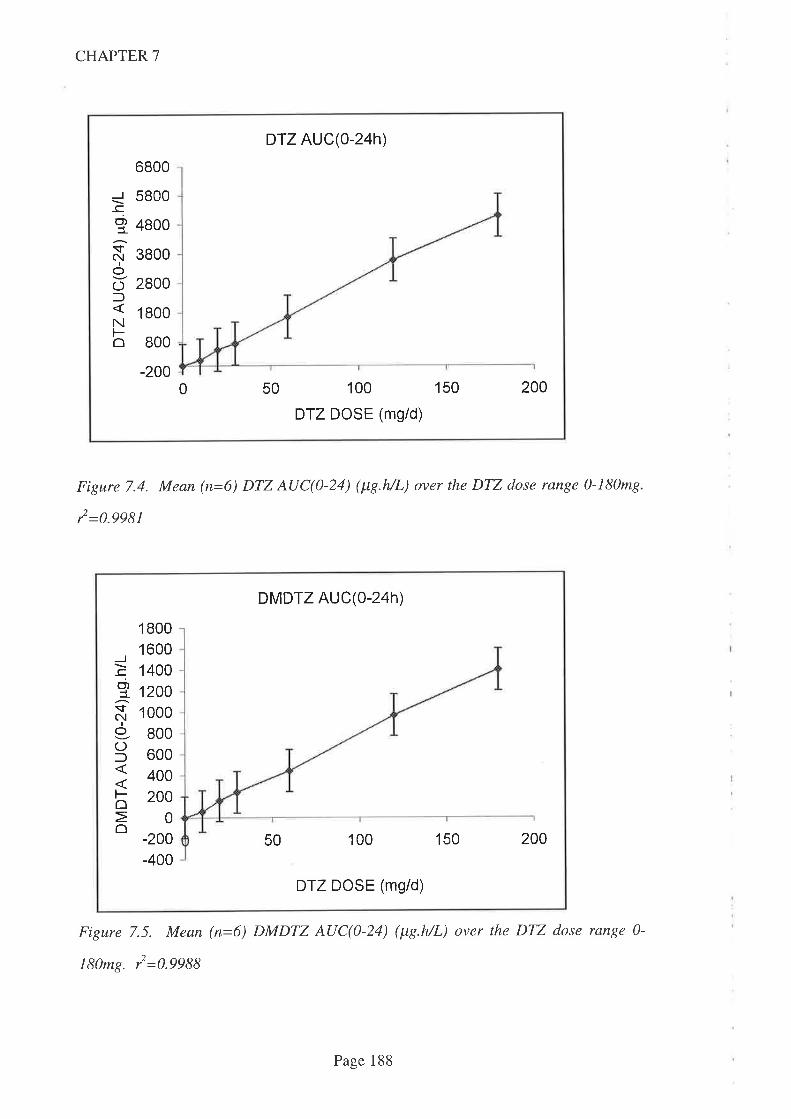
CHAPTER 7
DTZ AUC(o-24 )
_l_co,I
$NIo
OlNFo
6800
5800
4800
3800
2800
1 800
800
-2000 50 100 150
DTZ DOSE (mg/d)
200
Figure 7.4. Mean (n=6) DTZ AUC(0-24) (¡tg.h/L) over the DTZ dose range 0-180mg.
12 =0.9981
DMDTZ AUC(o-24h)
J
C',t
$N
IOOl
Foô
1 80016001400
12001 000800600400200
0
-200-400
100 150 20050
DTZ DOSE (mg/d)
Figure 7.5. Mean (n=6) DMDTZ AUC(0-24) (¡tg.h/L) over the DTZ dose range 0-
180mg. l=0.9988
Page 188
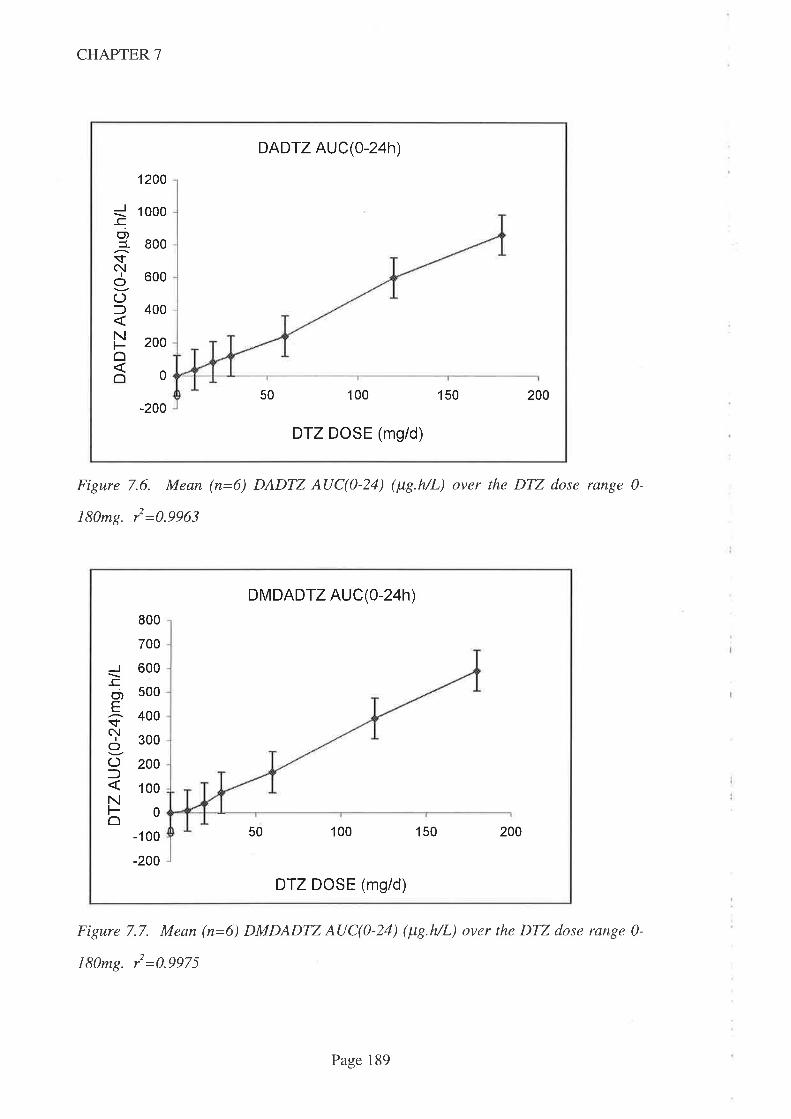
CHAPTER 7
DADTZ AUC(0-24h)
J_co)3-sN
Io(JfNFoô
1200
1 000
800
600
400
200
0
50 100 150 200-200
DTZ DOSE (mg/d)
Figure 7.6. Mean (n=6) DADTZ AUC(0-24) (¡tg.h/L) over the DTZ dose range 0-
t80mg. i=0.9963
DMDADTZ AUC(0-24h)
_co)Esc!
I
OO:)No
800
700
600
500
400
300
200
100
0
-1 00
-200
50 100 150 200
DTZ DOSE (mg/d)
Figure 7.7. Mean (n=6) DMDADTZ AUC(0-24) (¡tg.h/L) over the DTZ dose range 0-
180mg. y'=0.9975
Page 189
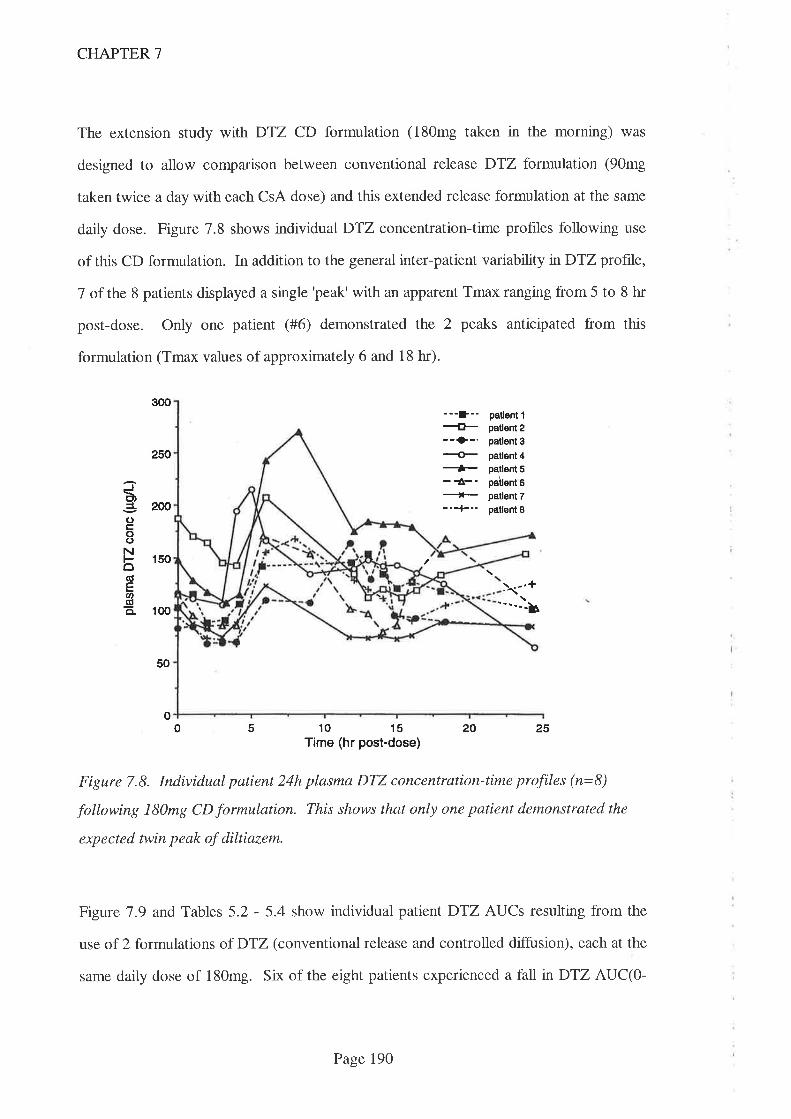
CHAPTER 7
The extension study with DTZ CD formulation (180mg taken in the morning) was
designed to allow comparison between conventional release DTZ formulation (90mg
taken twice a day with each CsA dose) and this extended release formulation at the same
daily dose. Figure 7.8 shows individual DTZ concentration-time profiles following use
of this CD formulation. In addition to the general inter-patient variability nDTZ profile,
7 of the 8 patients displayed a single 'peak' with an apparent Tmax ranging from 5 to 8 hr
post-dose. Only one patient (#6) demonstrated the 2 peaks anticipated from this
formulation (Tmax values of approximately 6 and 18 hr).
soo
250
200
150
1(x)
50
3È,aoco()NôC'EU'-ga.
---D--{t---r>-.-ù+-{-._'-
patlent fpatlent 2patlent 3patl€nt 4patl6nt 5pailent 6patlent 7pallent I
y.-.+""--b
0 20 25
Figure 7.8. Individual patient 24h plasma DTZ concentration-time profiles (n=8)
following 180mg CD formulation. This shows that only one patient demonstrated the
expected twin peak of diltiazem.
Figure'7.9 and Tables 5.2 - 5.4 show individual patientDTZ AUCs resulting from the
use of 2 formulations of DTZ (conventional release and controlled diffusion), each at the
same daily dose of 180mg. Six of the eight patients experienced a fall n DTZ AUC(O-
o5 10 15
Time (hr post-dose)
Page 190

CHAPTER 7
24),the mean drop (n=8) being of 33.5Vo. Similar falls in AUC were experienced across
the day - DTZ AUC(0-12) fell by 3I.9Vo andDTZ AUC(12-24) fell by 35.37o following
the change to CD formulation at the same daily dose of DTZ.
J_co,t
Ol
Nt-Ê
1 0000
9000
8000
7000
6000
5000
4000
3000
2000
1 000
0
DTZ AUC(0-24h)
45Pt No
E conventional tablet
I CD capsule
123 678
Figure 7.9. AUC(0-24) data comparing 180mg DTZ daily (n=8) given as conventional
release formulation (open bars) with CD formulation (closed bars). These data show
that 6 qf the I patients had afall in AUC with the CD formulation.
Interestingly, patient 7 who had a substantially lower DTZ AUC throughout the dose
escalation part of the study with conventional release DTZ, had a remarkable increase in
AUC when switched to the CD formulation. Fig7.9 and Tables 5.2 - 5.4 show an
increase nDTZ AUC(0-12) of 640Vo, AUC(12-24) of 8l0Vo and AUC(0-24) of 7137o.
Absolute values for the DTZ AUCs with the CD formulation from patient 7 are still
below the mean for the group as a whole, but the difference is much smaller than when
conventional release DTZ formulation was taken.
Page 191

CHAPTER 7
As comparative studies using intravenous DTZ were not performed, absolute oral
bioavailability could not be determined.
No adverse effects attributable to DTZ were noted throughout the study and one patient
was able to discontinue atenolol (prescribed for control of hypertension) when the DTZ
dose was l20mgld.
7.5 Discussion
As well as being used widely in the treatment of hypertension and angina, DTZ is widely
used as a CsA-sparing agent. As noted in Chapter 2, more than 70Vo of Australasian
kidney transplant recipients were routinely prescribed DTZ in 199516. The increase in
blood CsA concentrations resulting from DTZ administration (which allows a CsA dose
reduction of approximately 35Vo) has been described by others previously
(ChrysostomouA, etal.1993. TortoriceKL,etal. 1990. PattonPR, 1994. Mclachlan
A & Tett S. 1998. Leibbrandt DM & Day RO. 1992) and was explored in detail in an
Australian kidney transplant population presented in Chapter 4.
Data from the present study confirms the large interpatient variability previously reported
(Zehs RF & Kinney EL. f982. Smith MS, et al. 1983. Kinney EL, et al. 1981) in the
AUCs of parent DTZ and each of the 3 metabolites assayed over the 7 dosages studied
with conventional release DTZ. Many of the reports in the literature have resulted from
limited dose (or even single dose) studies in volunteers (Hung J, et al. 1988. Yeung
PKF, et al. 1983. Smith MS, et al. 1983. Kinney EL, et al. 1981. Du Souich P, et al.
1990) and most excluded the consumption of drugs with potential to interfere with
DTZ's kinetics. In the present study DTZ was taken for a minimum of 2 weeks prior to
Page 192
CHAPTER 7
each study day and the situation was complicated by the coprescription of CsA, a known
inhibitor of CYP3A4.
In the present study there appeared to be 3 different responses to DTZ. Patients 1-6 all
had similar kinetic outcomes from the DTZ dose escalation, while patients 7 and 8
exhibited very different responses. Since the dose of CsA remained unchanged (with the
exception of 2 dose reductions noted above) and at steady state (patients had been
receiving CsA for years - Table 4.1), any metabolic effect from CsA should have been
constant. Examination of the kinetic data for DTZ and its metabolites over the 0- 180mg
dose range (conventional formulation) do not reveal anything that would suggest CsA
was having a variable influence onD'lZ (or metabolite) kinetics. Indeed, the relationship
between DTZ dose and AUCs of DTZ and its metabolites were remarkably linear with 12
values >0.996 (Figs 7.5 - 1.8). Data in the literature of dose-linearity is mixed. One
group of workers report clinically insignificant non-linearity in volunteers but only two
dosage increments (60mg and 120mg) were used (Hoglund P & Nilsson LG. 1989).
Another study demonstrated non-linear disposition in a short study (24-48h) following
intravenous infusion (Dias VC, et al. 1992). One group of authors published two papers
apparently from the same group (n=13) of American male volunteers and in the first
publication, reported dose linearity (Kinney EL, et al. 1981) but in a subsequent
publication (Zehs RF, et al. 1982) reported non-linearity! In the fìrst publication, a
regression coeffrcient (r=0.99) value was quoted when the average of 3 doses (60mg,
90mg and 120mg) and an assumed zero were used. In the second paper, this relationship
was described as non-linear but a regression coeffrcient was not reported. It is also
worth noting that although12 volunteers took the first dose, only 4 agreed to take the
\2}mg dose, the remainder dropped out due to adverse effects and difhculty with
venipuncture. Both papers reported substantial interpatient variability in plasma DTZ
concentrations.
Page 193
CHAPTER 7
Patient 7 exhibited a yery different DTZ profile over the dosage range 10-180mg/d
(conventional release formulation). In particular, DTZ AUC(0-24) was considerably
lower than the mean of the 6 'normals' (ratio 0.049 at the 180mg/d dose) (Table 7.).
While metabolite AUCs were also lower than the 'normals', the degree of difference was
considerably less. At the same 180mg/dDTZ dose, the ratio of DMDTZ AUC(0-24)
compared to the 6 'normals' was 0.651, DADTZ AUC(0-24) ratio was 0.426 and
DMDADTZ AUC(O-T4) ratio was 0.407. This suggests that DTZ was metabolised to
primary (and perhaps secondary metabolites) before absorption into the bloodstream.
In patient 8, the magnitude of the secondary metabolite (DMDADTZ) AUC(0-24)
exceeded that of parenTDTZ and primary metabolites (DMDTZ and DADTZ) across the
whole DTZ dose range. AUC(O-Z ) for parent DTZ was marginally lower than the
mean of the 6 'normal' patients which suggests absorption of parent DTZ was 'normal'
but that subsequent metabolism differed, allowing the secondary metabolite to be the
dominant species. One explanation for this difference is an enhanced conversion of
parent to primary and thence to secondary (DMDADTZ) metabolite. This metabolite
has been noted to have a longer half life than either parent DTZ or its primary
metabolites (Yeung PKF, et al. 1990. Yeung PKF, et al. 1993. Hoglund P & Nilsson
LG 1989) and hence accumulation would occur. An alternative explanation is that this
patient had 'normal' metabolism of parent and primary metabolites but a delayed
clearance of secondary metabolite.
Apart from CsA therapy (common to all 8 patients), no other drugs were ingested which
might account for this discrepancy (Table 4.1). Diet is also unlikely to be the
explanation as the meals consumed were controlled throughout the study and it has been
shown that food does not influence the bioavailability of DTZ in either conventional or
slow release preparations (Du Souich P, et al. 1990), albeit in a single dose study where
Page 194

CHAPTER 7
the maximum daily dose was l2}mg/d. Another potential confounding factor might be
IL6 concentrations which, when elevated, have been shown to affect the metabolism of
theophylline (Chang KC et al. 1978) and CsA (Chen YL, et al. 1994). It is unlikely that
this could causs variation inDTZ metabolism in this trial since C-reactive protein (CRP -
a marker of IL6 concentrations) concentrations were monitored on each study day and
only two results were found to be marginally elevated (Table 4.5).
As noted in Chapter 5, the CD formulation of D'12 did not perform as anticipated from
the manufacturer's description of the formulation characteristics. The ratio of DTZ
AUC(0-12) to AUC(12-24) when the CD formulation was taken (Tables 5.2 and 5.3),
was 1.20, not the 0.61 (40:60) anticipated from the manufacturer's claims. Also, with
the exception of one subject, plasma concentrations of DTZ did not exhibit the dual
peaks which were expected from the design of the CD formulation. Switching to the CD
formulation of DTZ resulted in an AUC(0-24) which was 33.5Vo lower (Table 5.4) than
the same dose taken as conventional release formulation. These data suggest that the
CD formulation of DTZ was performing more like a 'typical' sustained release
formulation where drug was continually released (and absorption was occurring)
throughout both 12h study periods ofeach study day.
Because of the needs of the study population for immunosuppression, it was not possible
to study the absorption characteristics of the CD formulation in the absence of CsA. As
noted earlier, CsA has been shown to inhibit intestinal CYP3A4 (and/or P-gp) and
thereby acts as a felodipine-sparing agent (Madsen JK, et al. 1996). It is thus possible
that CsA also acts as a DTZ-sparing agent and affects the apparent performance of the
CD formulation. V/hile this was not evident with conventional formulation DTZ, this
may explain some of the anomalies experienced with the CD formulation. Given the
nature of gastrointestinal tract transit times, it is likely that the release of DTZ from the
Page 195
CHAPTER 7
CD formulation over the I2-24h period (following morning only CD dosing) would
occur well below the site where the evening dose of CsA was released. If CsA inhibited
intestinal CYP3A4 (and/or P-gp), DTZ AUC(0-12) should be increased more than
AUC(12-24). Since the ratio of DTZ AUC(}-I2) to AUC(12-24) exceeded the
anticipated figure of 0.6'/, this may be the explanation. For this explanation to be valid
however, there should be a greater fall in DTZ AUC(12-24) when switching from
conventional formulation to CD formulation (because any local DTZ-sparing effect of
CsA would be reduced or absent). Data from Tables 5.2 and 5.3 show that mean DTZ
AUC(0-12) fell by 31.97o while meanDTZ AUC(12-24) fell by a similar value (35.3Vo)
following the switch from conventional release DTZ given twice daily to CD formulation
given in the morning only. These data therefore suggest that the presence of CsA at any
particular site within the gastrointestinal tract was unimportant to DTZ's absorption and
that the 'abnormal' ratio of 1.2 was merely a failure of the CD formulation to perform as
expected.
In patient 7, both morning and eveningDTZ AUCs were similarly increased (Tables 5.2
and 5.3) following the switch to CD formulation. AUC(0-12) for DTZ ncreased from
146¡t"g.h/1, to 1081pg.h/L while the AUC(12-24) increased from 110¡tg.h/L to
1001pg.h/L. The reason for this massive increase is far from clear but one potential
explanation relies on the competing effects of metabolism and/or inactivation, and
absorption at specific sites within the gastrointestinal tract. The stomach provides a
model of such a site where inactivation is favoured over absorption since gastric acid is
highly reactive (thus favouring metabolism or inactivation) while the surface area is small
(and hence the capacity for absorption is reduced). If conventional release formulation
DTZ released most of the drug at this site, much would be destroyed before absorption
could occur and hence blood concentrations would be relatively low. Because the CD
formulation provides a slower release of D'lZ (as demonstrated in Fig 7.8), most of the
Page 196
CHAPTER 7
DTZ (and all of that released during the I2-24h period) would escape this destruction
and hence both am and pm DTZ AUCs would be increased. It should be noted that this
is purely speculative however, especially since DTZ is not acid labile. A variation on this
speculation is that this patient might have had an unusually high amount of intestinal
CYP3A4 which was confined to a short section of upper intestine. If this section of
intestine was situated such that conventional release formulation DTZ released all of its
DTZ at or above this site, then abnormally high levels of metabolism might occur and
systemic absorption of parent DTZ would be low. There is some support for this
hypothesis in the ratio of parent DTZ to metabolites. For patients I-6, DTZ is the
predominant species (Fig 7.1) while for patient 7,D'12 is the minor species in blood (Fig
1.2). This reversal of parent to metabolite ratio would be expected if intestinal
metabolism was unusually high and if these metabolites were subsequently absorbed into
the bloodstream.
As noted in Chapter 5, switching from conventional to CD formulation of DTZ in this
patient group had an unpredictable effect upon the CsA AUC. While mean data showed
no change, individual patients experienced both increases and decreases that could well
be clinically significant. The lack of correlation between change :r:,DTZ AUC and effect
on CsA AUC (mean data (n=7) showed a fall of 33.57o inDTZ AUC(O-L4) versus a fall
of only lOVo n CsA AUC(0-24)) (Table 5.4) was most notable in patient 7 where the
huge increase (7137o) :r;'DTZ AUC(0-24) was accompanied by a very modest increase
(8.4Vo) in CsA AUC(0-24). In Chapter 6 an absence of any CsA-sparing effect (despite
using a higher dose of the CD formulation) was observed in a lung transplant recipient.
There was also no obvious relationship between DTZ dose and/or blood DTZ
concentrations and anti-hypertensive response. As noted earlier, atenolol was stopped in
one patient due to a combined effect of low blood pressure and bradycardia. These
Page 197
CHAPTER 7
effects are to be expected from a combination of B-blocker and DTZ which both have
negative inotropic and chronotropic effects. Interestingly, patient 7 did not experience
any adverse effects following the switch from conventional to CD formulation DTZ
despite the huge (1137o) increase in DTZ AUC(0-24). This data supports earlier
observations of large interpatient variability in plasma DTZ concentrations which suggest
that antihypertensive effrcacy is not related to plasma concentrations. Hypertension is a
common finding in kidney transplant recipients (>70Vo were prescribed >1
antihypertensive drug at 3 months post transplant in the survey described in Chapter 3)
and is a focus of treatment with one or more of the vast array of drugs currently
approved to treat this problem. While earlier data (Chrysostomou A, et al. 1993)
suggested that DTZ does not exert an antihypertensive effect in kidney transplant
recipients, data presented in Chapter 3 demonstrates that, at DTZ doses of 180-
24Dmgld, DTZ does exert a clinically significant antihypertensive effect in this
population.
7.6 Summary
Only small numbers of patients were enrolled in this study (n=8) but this was sufficient to
describe three different patterns of DTZ handling by humans. The most common pattern
was that of DTZ being the predominant species in blood followed by DMDTZ,DADTZ
and DMDADTZ. One patient demonstrated very low AUCs for DTZ (and to a lesser
extent for its metabolites) when conventional release DTZ was administered but 'normal'
AUCs when CD formulation DTZ was given. The low AUCs following conventional
release DTZ is difhcult to explain but interestingly, did not appear to affect CsA sparing
activity however. Another patient demonstrated 'typical' parent DTZ concentrations but
markedly elevated DMDADTZ concentrations which might be as a result of a different
metabolic pathway for the secondary metabolite.
Page 198
CHAPTER 7
Over the dosage range studied (up to 180mg/d), kinetics were linear for DTZ and its
metabolites DMDTZ,DADTZ and DMDADTZ. Becatse all patients were taking CsA,
it was not possible to determine whether CsA affected DTZ kinetics as has been
demonstrated for felodipine.
The CD formulation of DTZ did not perform as expected from the manufacturer's
description of the release characteristics. There was evidence of a 'double-dump' profile
in only 1 patient and overall AUC(O-L ) fell by >3OVo. The explanation for this is
unknown but appears to be formulation related rather than due to concurrent CsA (or
other drug) administration.
Page 199
CHAPTER 8
Chapter 8
Preliminary pharmacokinetic study of the dose-response relationship for the interaction
between TRM andDTZ in kidney and liver transplant recipients.
S.l Introduction
8.2 Aims
8.3 Patients and Methods
8.3.1 Statistics
8.4 Results
8.5 Discussion
8.6 Conclusions
20r
203
204
206
206
2t6
222
Page2O0

CHAPTER 8
8.1 Introduction
Tacrolimus (TRM) is a powerful immunosuppressive drug that was granted marketing
approval in Australia for preventing organ transplant rejection n 1991. As noted earlier,
it is structurally unrelated to CsA, binds to a different intracellular receptor and was
isolated from a different micro-organism from the opposite side of the world.
Notwithstanding these differences, its mode of action, adverse effect profile and a
number of physical and pharmacokinetic parameters are remarkably similar.
In particular, TRM is insoluble in water, has a relatively poor oral bioavailability, is
metabolised by the cytochrome P450 isoenzyme CYP3A4 (Venkataramanan R, et al.
1995. Kelly PA, et al. 1995. Sattler M, et al. 1992), is nephrotoxic and it is also very
expensive.
While experience with this agent is more limited than with CsA, a number of interactions
have been reported with drugs that affect the CYP3A4 isoenzyme including drugs which
have been demonstrated to affect blood CsA concentrations. In particular, the
coprescription of KCZ has been shown to elevate blood TRM concentrations (Floren
LC, et al. 1991). Evidence in the literature supporting an interaction with DTZ is
conflicting. DTZ has been reported not to interact with TRM either in vitro (Christians
U, et al. 1996) or in limited report (abstract only), in human liver transplant recipients
(Teperman L, et al. 1996). Other reports however suggest there is an interaction. In a
retrospective review of 128 kidney transplant recipients, one group of researchers noted
that coprescription of DTZ with TRM in one patient required a 66Vo TRM dose
reduction in order to keep blood TRM concentrations within acceptable limits (Katari
SR, et al. 1997). DTZ and TRM have also been reported to interact in animals (Regazzi
MB, et al. t996). In this study, TRM was infused into 4 pigs and after 48h, DTZ was
also infused intravenously. Blood TRM concentrations during the DTZ infusion rose
Page20l

CHAPTER 8
significantly (from 10.0 + 3.9¡tgil- to 42.4 + rc.a¡tgil-) and mean clearance fell
(5.Ol/h/kg to I.2L/hlkg) when compared to the DTZ free period. This short report
failed to give details of the timing of samples and, although stating that TRM
concentrations were at steady-state, \t is possible that some of the increase in blood
TRM concentration may have been due to failure to reach steady-state. This report is
also of interest because it suggests that the interaction occurred in the liver since both
drugs were administered by intravenous infusion
Oral bioavailability of TRM is less affected than CsA by the presence of bile in the
gastrointestinal tract (Jain AB, et al. 1990. Spencer CM, et al. 7997) and it has therefore
found a special place in liver transplantation where bile is diverted externally in the
immediate postoperative period. As noted earlier, in these settings, CsA may need to be
given intravenously for extended periods because of poor absorption following oral
administration (Trull AK, 1993. Levy G, et a7. 1994. Friman S & Backman L. 1996.
Sokol RJ, et al. 1991. Grevel J. 1986).
The adverse effect profile of TRM is also similar to CsA. In particular, hypertension
(Seifeldin RA, et al. 1991. Spencer CM, et aL. 1997. Pirsch JD, et al. 1997) and
nephrotoxicity (Katari SR, et al. 1997) are well described. These were the principal
reasons for f,rst investigating the use of D'12 as a CsA-sparing agent and hence there is
potential for therapeutic benefit from coprescribing DTZ (a calcium channel blocking
drug with an approved indication in hypertension) with TRM. Coprescription of DTZ
with TRM has not yet been advocated, but in the absence of any contrary evidence,
given the economic and therapeutic benefits afforded the coprescription with CsA (as
discussed in Chapter 2) and the similarity in adverse effect profrle and cost, it seems
likely that it will.
Page 202

CHAPTER 8
Coprescription of DTZ with CsA was well established before evidence (Chapter 4)
became available on the dose-response relationship for the interaction. By this time,
protocols had become established and prescribers have been reluctant to alter the DTZ
regimens they had become familiar with (personal communication, AÆrof T Mathew,
The Queen Elizabeth Hospital, Woodville, South Australia). Therefore, it is highly
desirable to have evidence that an interaction occurs and to have data on its reliability,
and magnitude of the interaction, before routine coprescribing of DTZ with TRM starts.
8.2 Aims
The principal aim of this study is to determine the dose-relationship between DTZ and
TRM in kidney and liver transplant recipients maintained on this immunosuppressive
drug. Liver transplant recipients have been included for two reasons; fnstly because few
kidney transplant recipients are currently taking TRM and secondly to determine whether
there are differences between these two populations, given the importance of the liver as
a metabolic organ. The reason that TRM is not widely used in the kidney transplant area
is not because of pharmacological concerns, but rather an economic/political one. At the
time of this trial, TRM was not included in the 'Section 100' scheme when used for
kidney transplantation (liver transplantation was the only approved indication under this
scheme). Not being listed under this scheme means that individual hospitals and State
governments pay for TRM when used for kidney transplantation and hence the
alternative agent, CsA, is preferred since it is available free of charge to these bodies.
The second aim of the trial was to investigate the effect oÏ DTZ formulation changes -specifically, the controlled diffusion (CD) formulation - in organ transplant recipients
who demonstrated a TRM-sparing effect with conventional DTZ formulation.
Page 2O3
CHAPTER 8
8.3 Patients and Methods
Two stable kidney transplant recipients and two stable liver transplant recipients
maintained on TRM (but not on DTZ) consented to take part in this pharmacokinetic
study which was approved by the Ethics of Human Research Committee of The Queen
Elizabeth Hospital and the Committee on Clinical Investigation, and Clinical Drug Trials
Committee of the Flinders Medical Centre. Entry criteria included:
-stable blood TRM concentrations on routine monitoring for >3 months
-serum creatinine concentrations and liver function tests which were stable for >3
months and <I50Vo of the upper limit of normal.
Exclusion criteria included: unstable plasma creatinine concentration, elevated liver
function tests, known sensitivity to DTZ, sick sinus syndrome, hypotension, severe
congestive heart failure, history of acute myocardial infarction and/or pulmonary
congestion.
On each 24h study day, serial blood samples were taken from an indwelling venous
catheter at times 0 (pre dose) and I,2,3, 4, 6 and I2h after both morning and evening
TRM doses, making a total of 13 blood samples spanning 2 TRM dosing periods.
Incremental doses of DTZ were given between study days which were separaledby >2
weeks to allow the interaction between TRM and DTZ to stabilise and steady-state
blood TRM concentrations to be achieved. The sequence of DTZ doses were 0, lO,20,
30, 60mg in the morning followed by 60mg and 90mg taken twice daily and finally
180mg CD formulation. DTZ doses less than 30mg were taken in the form of a 10mg
capsule manufactured from commercially available, conventional telease, tablets
(Cardizem@, ICI Australia) by the Hospital's Pharmacy Department and assayed using
the HPLC assay outlined in Chapter 7. Doses of >30mg were taken in the same form of
commercially available, conventional release tablets except for the final study period
when CD formulation (Cardizem CD@, ICI, Melbourrie, Australia) was given. Each
Page 204
CHAPTER 8
DTZ dose was taken with the usual morning and/or evening TRM dose (PrograP
capsules, Janssen-Cilag Pty Ltd, Lane Cove, Australia) and food was not consumed for
>lh before or after TRM dosing. TRM dose reductions were planned, if needed, to
maintain blood TRM concentrations within the therapeutic range used by this hospital
(5-20¡tgil,) and in such an event, the resulting AUC was to be dose-normalised (ie
adjusted by the same factor as the dosage). Apart fromDTZ, no drug which was known
to interfere with TRM (or CsA) metabolism was permitted during the course of the
study, nor was any drug permitted whose metabolism might have been affected by DTZ
(especially terfenadine).
Patency of the venous catheter was maintained by instilling 1.5mL heparinised saline
(l5units heparin) into the venous catheter after each 8mL blood sample was withdrawn.
To prevent contamination of sample from the heparinised saline, the first 1.5mL of blood
withdrawn was discarded. Blood samples were immediately stored at 0-4oC and
transferred to a freezer (-20oC) as soon as practicable (<8 hours). Whole blood TRM
concentrations were measured by microparticulate enzyme immunoassay (Tacrolimus 2,
MEIA@) on the IMx analyser (Abbott Diagnostics, Chicago USA) which is relatively
specific for parent TRM (Cogill JL, et al 1998). AUCs were calculated using the log
trapezoidal method (Appendix 4).
TRM assays were performed after each study day to allow immediate dosage reductions
and guard against clinical sequelae resulting from prolonged high TRM concentrations.
Because these assays were therefore performed over a period of several months, the
possibility of inter-assay variability was a potential issue, especially for an assay where
the machinery does not allow manual adjustment of baseline. Consequently, three trough
samples (CO, Cl2 and C24h) from each patient on each study day were subsequently
assayed on the same day, at the completion of the study. Since this negated inter-assay
Page2O5
CHAPTER 8
variability, where there was >lOVo difference between the two results, all samples from
that patient's study day were repeated and the new values accepted.
Plasma DTZ, demethyldiltiazem (DMDTZ), deacetyldiltiazem (DADTZ) and
demethyldeacetyldiltiazem (DMDADTZ) concentrations \ryere determined using the
HPLC method described in Chapter 7.
Plasma C-reactive protein concentrations from the first blood sample on each study day
were assayed by an immunonephelometric method (ARRAY 360CE, Beckman
Instruments, Ca, USA).
8.3. 1 Statistics
Because of the limited numbers of study participants and the potential for differing
outcomes because of the nature of their transplanted organ, data are presented as
individual, rather than grouped data.
8.4 Results
Patient demographics and concurrent drug therapy for the four study participants are
shown in Table 8.1.
Page 206
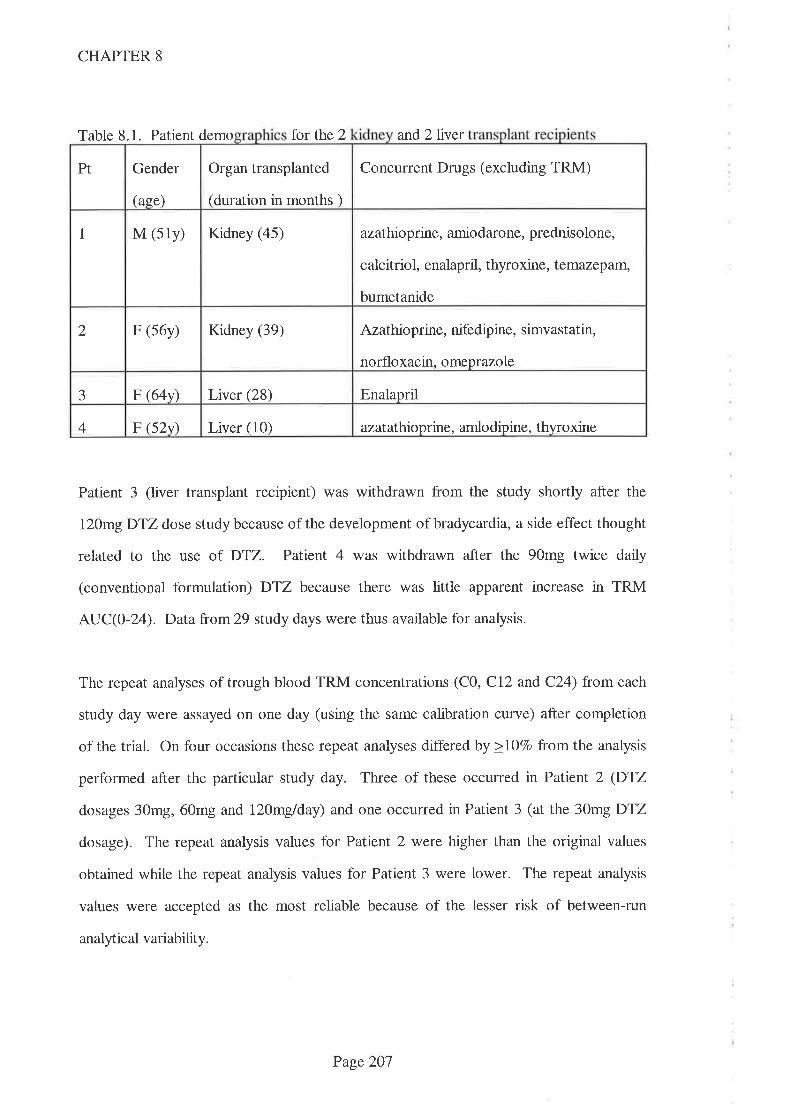
CHAPTER 8
Table 8.1. Patient demo for the 2 and 2liver
Patient 3 (liver transplant recipient) was withdrawn from the study shortly after the
l20mg DTZ dose study because of the development of bradycardia, a side effect thought
related to the use of DTZ. Patient 4 was withdrawn after the 90mg twice daily
(conventional formulation) DTZ because there was little apparent increase in TRM
AUC(0-24). Data from29 study days were thus available for analysis.
The repeat analyses of trough blood TRM concentrations (C0, Cl2 and C24) from each
study day were assayed on one day (using the same calibration curve) after completion
of the trial. On four occasions these repeat analyses differed by >lo7o from the analysis
performed after the particular study day. Three of these occurred in Patient 2 (DTZ
dosages 30mg, 60mg and 120mglday) and one occurred in Patient 3 (at the 30mg DTZ
dosage). The repeat analysis values for Patient 2 were higher than the original values
obtained while the repeat analysis values for Patient 3 were lower. The repeat analysis
values were accepted as the most reliable because of the lesser risk of between-run
analytic al variability.
Gender
(ase)
Organ transplanted
(duration in months )
Concurrent Drugs (excluding TRM)Pt
I M (s1y) Kidney (45) azathioprine, amiodarone, prednisolone,
calcitriol, enalapril, thyroxine, temazepam,
bumetanide
Azathioprine, nifedipine, simvastatin,
norfloxacin. omeprazole
2 F (s6y) Kidney (39)
EnalaprilaJ F (64v) Liver (28)
F (52v) Liver (10) azatatlioprine, amlo dipine, thyroxine4
Page 207
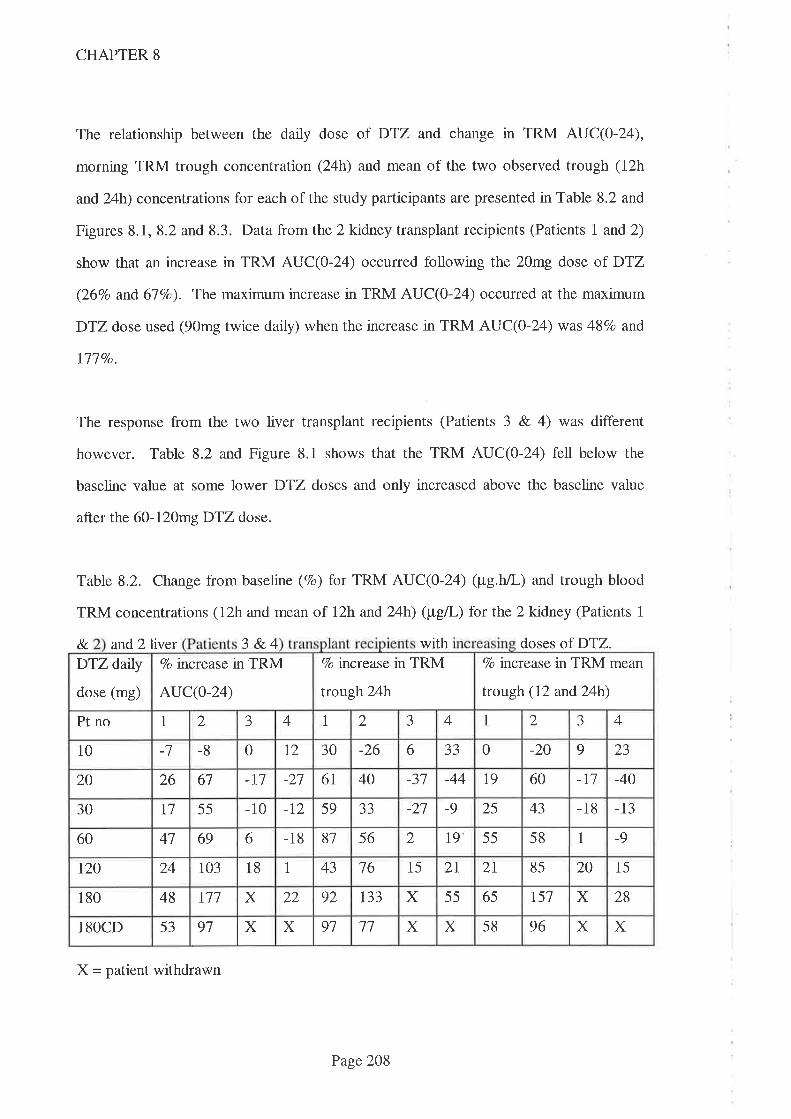
CHAPTER 8
The relationship between the daily dose of DTZ and change in TRM AUC(0-24),
morning TRM trough concentration (24h) and mean of the two observed trough (12h
and 24h) concentrations for each of the study participants are presented in Table 8.2 and
Figures 8.1, 8.2 and 8.3. Data from the 2 kidney transplant recipients (Patients I and2)
show that an increase in TRM AUC(O-Z ) occurred following the 20mg dose of DTZ
(26Vo and 67Vo). The maximum increase in TRM AUC(0-24) occurred at the maximum
DTZ dose used (90mg twice daily) when the increase in TRM AUC(0-24) was 48Vo and
Ill Vo.
The response from the two liver transplant recipients (Patients 3 & 4) was different
however. Table 8.2 and Figure 8.1 shows that the TRM AUC(O-24) fell below the
baseline value at some lower DTZ doses and only increased above the baseline value
after the 60-120mg DTZ dose.
Table 8.2. Change from baseline (7o) for TRM AUC(O-Z4) (pg.h/L) and trough blood
TRM concentrations (12h and mean of l2h and 24h) (ptgl) for the 2kidney (Patients 1
8. and 2liver 3 &.4 with doses of DTZ.7o increase in TRM
trotgh24h
Vo increase in TRM mean
trough (12 and24h)
DTZ datly
dose (mg)
Vo increase in TRM
AUC(O-24)
-J 4 1 2 J 4 1 2 3 4Pt no 1 2
0 t2 30 -26 6 aaJJ 0 -20 9 2310 -7 -8
-n -27 6l 40 -37 -44 19 60 -ll -4020 26 67
-10 -t2 59 aaJJ -27 -9 25 43 -18 -1330 T1 55
6 -18 81 56 2 l9 55 58 1 -960 47 69
43 16 15 2I 2I 85 20 15r20 24 103 18 1
r33 X 55 65 t51 X 28180 48 w X 22 92
X 58 96 X X18OCD 53 91 X X 91 ll X
X - patient withdrawn
Page 208
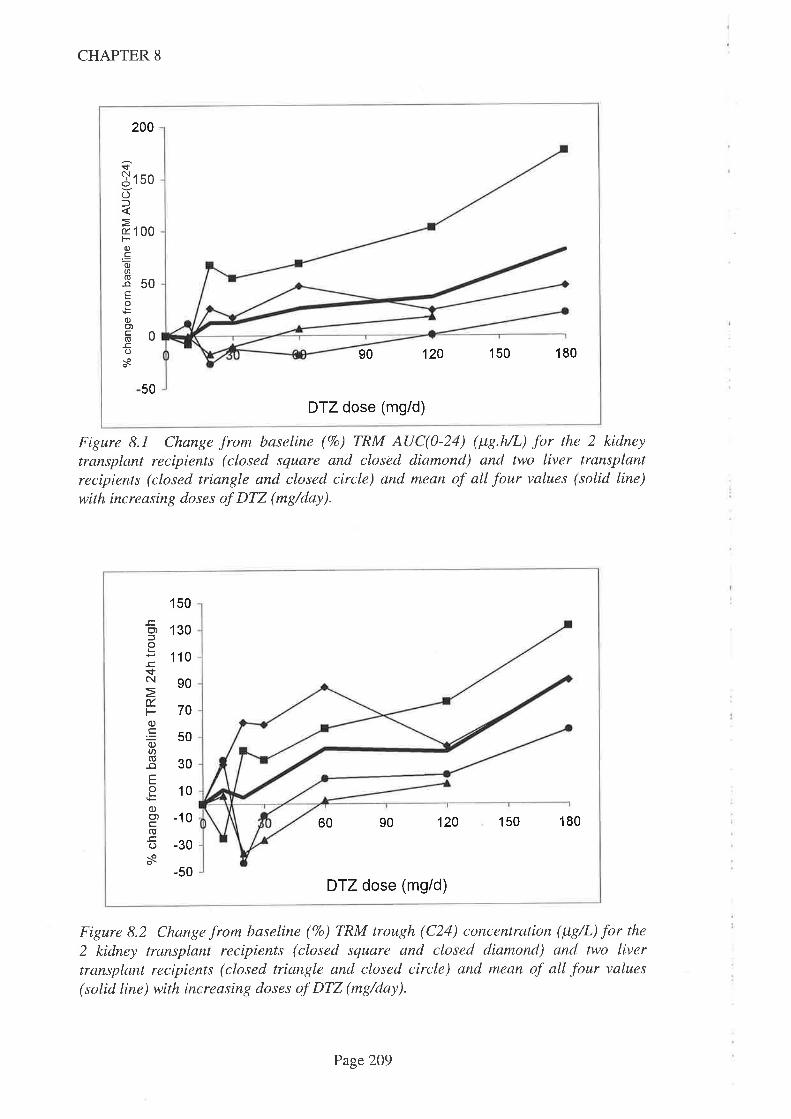
200
îjtso()f
ø 100F-0)co)a8soEo
0)o)FO-cos
50
1s0 18090
DTZ dose (mg/d)
120
CHAPTER 8
Figure 8.1 Change from baseline (7o) TRM AUC(0-24) (ltS.AL) for the 2 kidney
transplant recipients (closed square and closèd diamond) and two liver transplantrecipients (closed triangle and closed circle) and mean of all four values (solid line)with increasing doses of DTZ (mg/day).
150
.c,(')oL
!sN
É.Fo).Eo)U)o-oEoLo)Ç')
(õ
os
1 30
110
90
70
50
30
10
-10
-30
-50
60 90 120 150 180
DTZ dose (mg/d)
Figure 8.2 Change from baseline (7o) TRM trough (C24) concentration (¡tg/L) for the
2 kidney transplant recipients (closed square and closed diamond) and two livertransplant recipients (closed triangle and closed circle) and mean of all four values
(solid line) with increasing doses of DTZ (mg/day).
Page 209

(go)E
É.L^
ON.E o6
$oro5Q-tro)Yod)o,(g
!O
s
150
1
-50
00
50
0
90
DTZ dose (mgid)
120 150 180
CHAPTER 8
Figure 8.3 Change from baseline (7o) TRM mean trough (C12 & C2a) (¡tg/L) for the 2
kidney transplant recipients (closed square and closed diamond) and two livertransplant recipients (closed triangle and closed circle) and mean of all four values
(solid line) wíth increasing doses of DTZ (mg/day).
Figure 8.4 Relationship between daily DTZ dose (mg/daÐ for doses 0-60m9 and
change from baseline TRM AUC(0-12) (¡tg.h/L) (open diamonds), TRM AUC(12-24)(¡tg.h/L) (open squares) and TRM AUC(0-24) (¡tg.h/L) (open triangles). Datapresented are means for the four study subjects.
60
t+
isoc(E
ä40Eo(J130{ --.:._9)
þ-1 2ot-g10õoc0oo
-10
10 20 30
DTZ dose (mgid)
40 50 60
Page2lO

CHAPTER 8
The mean change in TRM AUC(0-12) , AUC (12-24) and AUC(0-24) for DTZ doses
<60mg/day are shown in Fig 8.4. Both AUC(O-L2) and AUC(12-24) contributed
approximately equally to the AUC(O-Z4).
The relationship between daiþ DTZ dose and plasma DTZ AUC(0-24) are shown in
Figure 8.5. The relationship between daily DTZ dose andDTZ metabolite AUC(0-24)
are shown in Figures 8.6 - 8.8. These data show an approximately linear relationship
between plasma concentration of DTZ and its three major metabolites over the DTZ
dose range administered. This is consistent with those DTZ data from the CsA-DTZ
interaction study data reported in Chapter 7.
J_co,l-
sC\,1
I
OOlNFo
6000
5000
4000
3000
2000
1 000
0
0 30 60 90 120 150 180
DTZ dose (mg/d)
Figure 8.5. DTZ AUC(0-24) (tt7.h/L) for increasing doses of DTZ (0-18)mg/day) fortwo recipients of kidney transplants (closed square and closed diamond) and two
recipients of liver transplants (closed triangle and closed circle) with mean of all fourshown as the solid line.
Page2lI
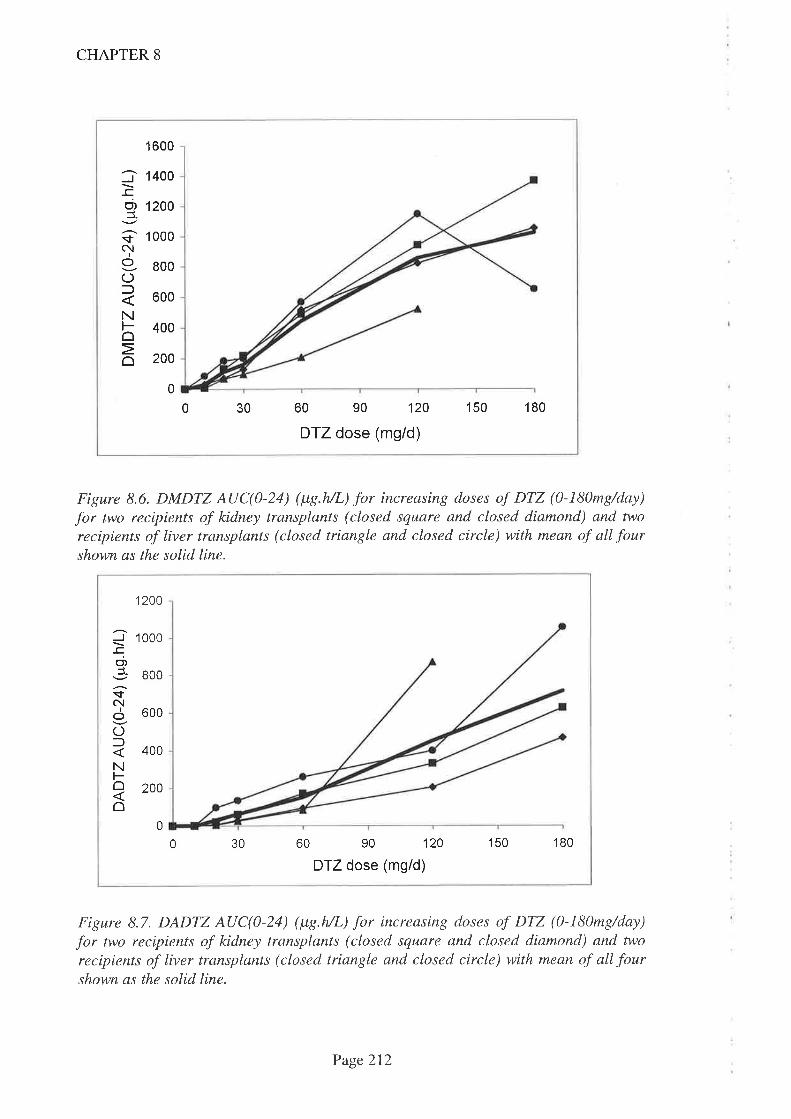
1 600
1400
1200
1 000
800
600
400
200
0
J
o,J
tc!I
OC)l
NFoo
0 30 60 90 120
DTZ dose (mg/d)
150 180
CHAPTER 8
Figure 8.6. DMDTZ AUC(0-24) (ltç.h/L) for increasing doses of DTZ (0-180mg/day)
for two recipients of kidney transplants (closed square and closed diamond) and two
recipients of liver transplants (closed triangle and closed circle) with mean of all fourshown as the solid line.
1200
J-cC',¿sN
IoOlNFoo
1000
00I
600
400
200
0
0 30 60 90 120
DTZ dose (mg/d)
150 '180
Figure 8.7. DADTZ AUC(0-24) (ltç.h/L) for increasing doses of DTZ (0-l\)mg/day)
for two recipients of kidney transplants (closed square and closed diamond) and two
recipients of liver transplants (closed triangle and closed circle) with mean of all fourshown as the solid line.
Page 212
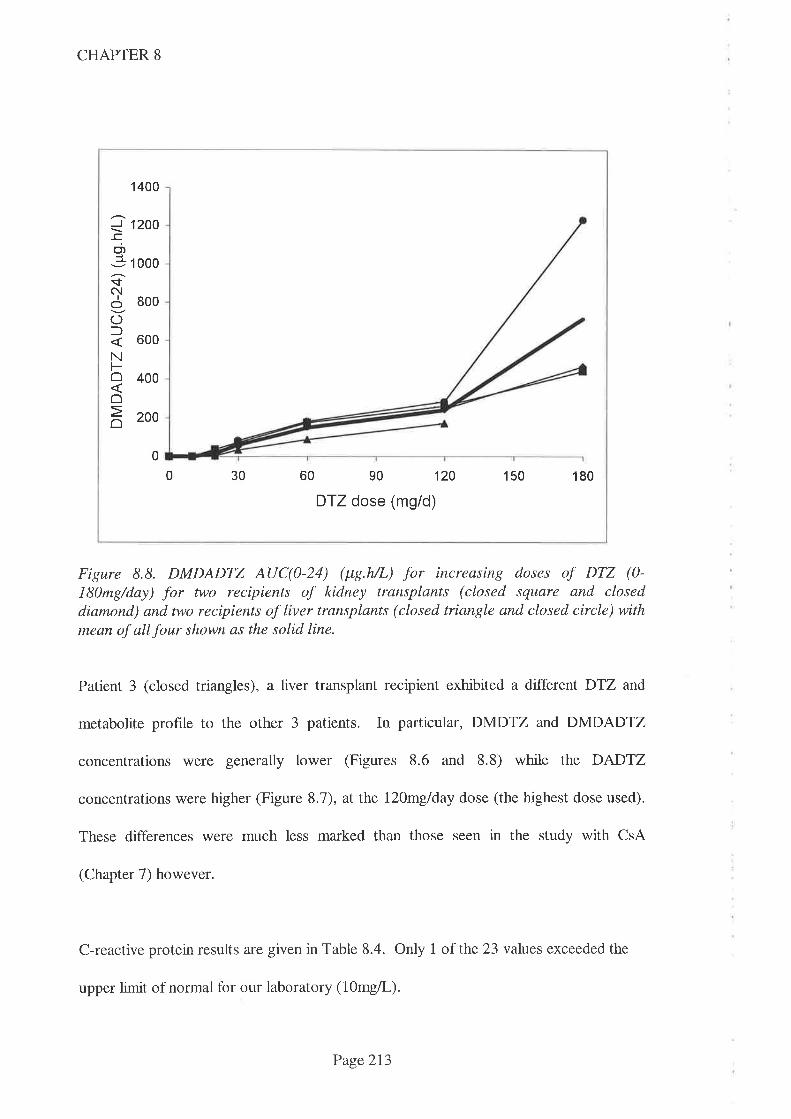
CHAPTER 8
_l_ccnl_
$N
Io(JlNFôôo
1 400
1200
1 000
800
600
400
200
0
0 30 60 90 120
DTZ dose (mg/d)
150 180
Figure 8.8. DMDADTZ AUC(0-24) (¡tg.h/L) for increasing doses of DTZ (0-
l8)mg/day) for two recipients of kidney transplants (closed square and closeddiamond) and two recipients of liver transplants (closed triangle and closed circle) withmean of all four shown as the solid line.
Patient 3 (closed triangles), a liver transplant recipient exhibited a different DTZ and
metabolite profile to the other 3 patients. In particular, DMDTZ and DMDADTZ
concentrations ìwere generally lower (Figures 8.6 and 8.8) while the DADTZ
concentrations were higher (Figure 8.7), at the l2Omglday dose (the highest dose used).
These differences were much less marked than those seen in the study with CsA
(Chapter 7) however.
C-reactive protein results are given in Table 8.4. Only 1 of the 23 values exceeded the
upper limit of normal for our laboratory (10mg/L).
Page2l3

CHAPTER 8
Table 8.4 C-reactive protein concentrations for the first blood sample of each study day
normal value<l
NA = not available. X= study not performed
On 2 occasions kidney transplant recipients inadvertently did not follow the correct DTZ
and TRM dosage protocol and hence the data from these study days were not included in
the primary analysis. The errors were:
-Patient 1 did not increase the DTZ dose as intended, in the interval between the
l2Omg and 180mg study days. Nevertheless, the study was performed on the set
day, 2 weeks after the previous l20mg study and after taking the hrst 180mg
(taken as 90mg twice daily) DTZ dose. The study was repeated 2 weeks later,
after taking 180mg/day as set out in the protocol. Data was thus available from
both study days (ie, day 1 and day 14 at aDTZ dose of 180mg/d).
-Patient 2 inadvertently omitted the evening TRM dose on study day 7 (DTZ
dose 90mg twice daily) and hence the study was repeated 2 weeks later. The
data (especially TRM AUC(O-12)) from the 2 days were available for comparison
(viz day 14 and 28 for DTZ at the 180mg/d dose).
This provided an opportunity to investigate the effect of length of time taken before the
TRM-sparing effect was maximal, albeit in a limited number of subjects. Comparative
data for Patients I and 2 where either DTZ or TRM doses were not taken correctly are
DAILY DTZ DOSE (me)
30 60 120 180 180'CD'Pt 0 10 20
NA <1 <1 <1 <1 <11 NA <1
<1NA <1 <1 <1 <1 22 NA
X X1 <1 4 NA <1 2J
6 26 8 X4 NA <l 5 4
Page 214
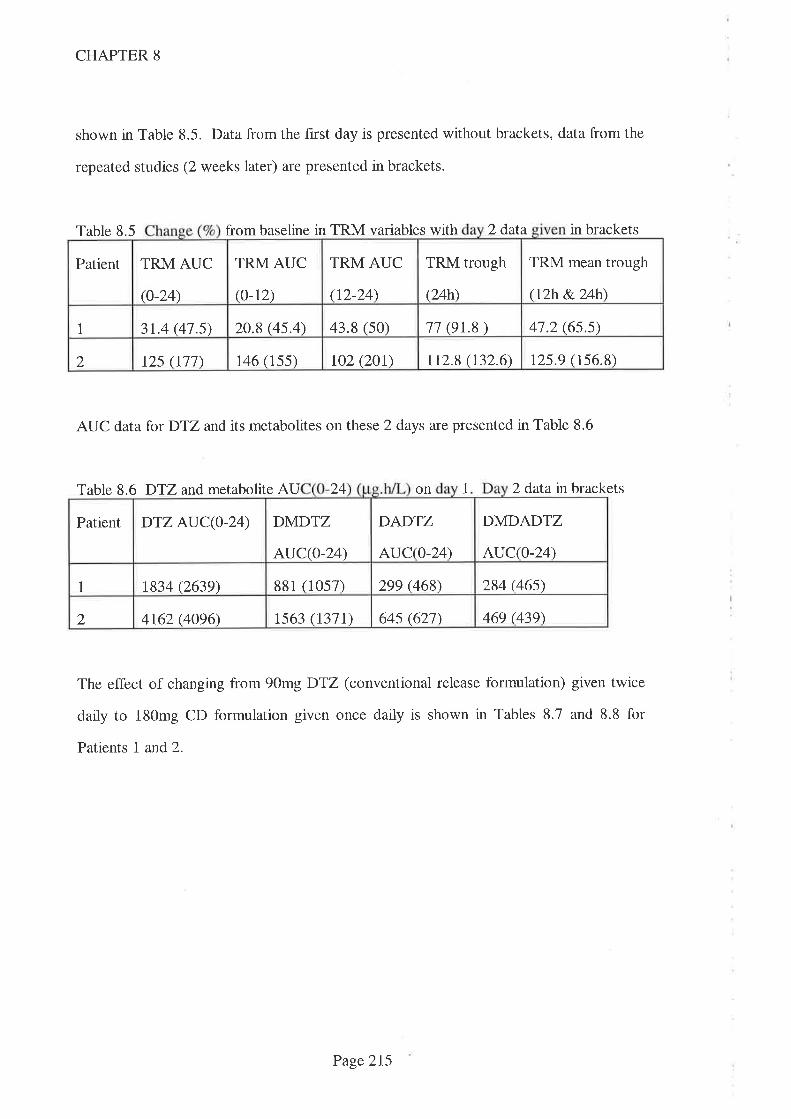
CHAPTER 8
shown in Table 8.5. Data from the first day is presented without brackets, data from the
repeated studies (2 weeks later) are presented in brackets.
Table 8.5 from baseline in TRM variables with 2 data in brackets
AUC data for DTZ and its metabolites on these 2 days are presented in Table 8.6
Table 8.6 DTZ and metabolite AU 24 on 1 2 dafa in brackets
The effect of changing from 90mg DTZ (conventional release formulation) given twice
daily to 180mg CD formulation given once daily is shown in Tables 8.7 and 8.8 for
Patients I and2.
TRM AUC
(t2-24)
TRM trough
(24h)
TRM mean trough
(rzh &.24h\
Patient TRM AUC
(o-24)
TRM AUC
(o-12)
20.8 (4s.4) 43.8 (s0) 11 (e1..8) 41.2 (6s.s)1 3t.4 (41.s)
r25.9 (156.8)rzs (r11) 146 (1ss) toz (zot) 112.8 (132.6)2
DADTZ
AUC(0-24)
DMDADTZ
AUC(O-24)
Patient DTZ AUC(0-24) DMDTZ
AUC(0-24)
881 (10s7) 299 (468\ 284 (46s)1 t834 (2639)
469 (439)4162 (4096\ ts63 (r371) 64s (621)2
Page2I5
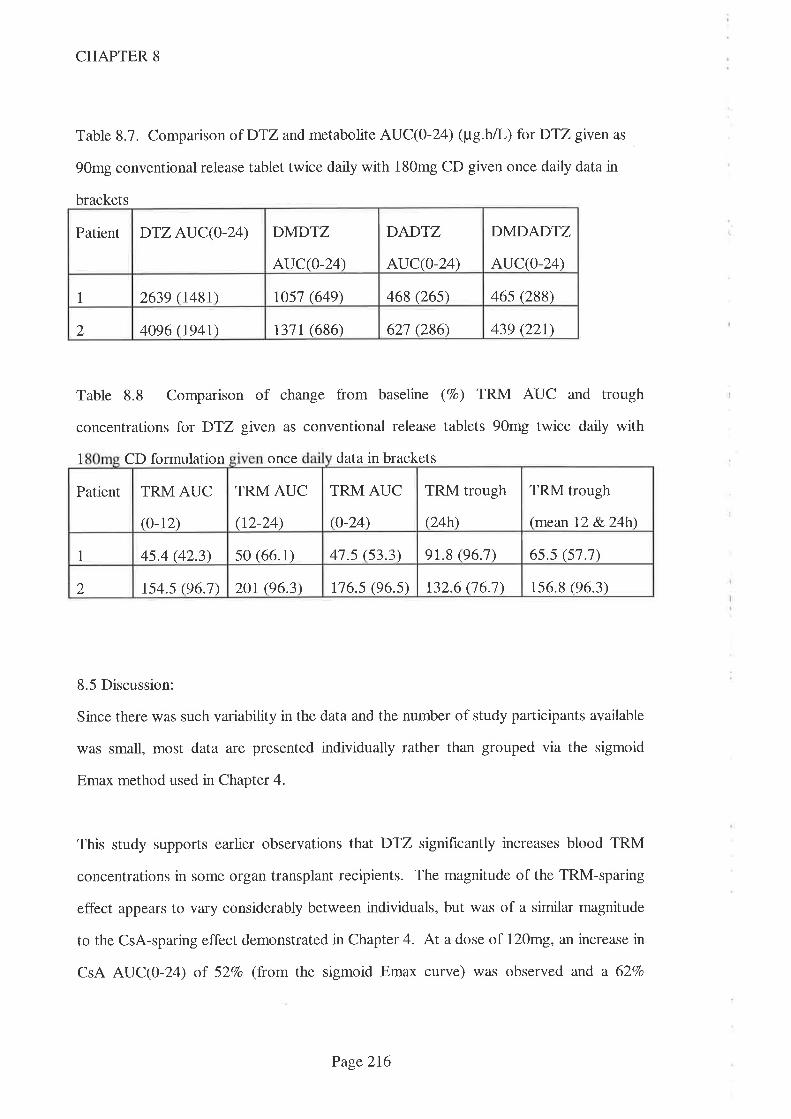
CHAPTER 8
Table 8.7. Comparison of DTZ and metabolite AUC(0-2Ð (¡t'g.hÃ-) for DTZ given as
90mg conventional release tablet twice daily with 180mg CD given once daily data in
brackets
Patient DTZ AUC(O-24) DMDTZ
AUC(O-24)
DADTZ
AUC(o-24)
DMDADTZ
AUC(0-24)
I 2639 048r) rosl (649) 468 (26s) 46s (288)
2 4096 (r94t) r31r (686) 621 (286) 439 Q21)
Table 8.8 Comparison of change from baseline (7o) TRM AUC and trough
concentrations for D'12 given as conventional release tablets 90mg twice daily with
1 CD formulation once data in brackets
8.5 Discussion:
Since there was such variabitty in the data and the number of study participants available
was small, most data are presented individually rather than grouped via the sigmoid
Emax method used in Chapter 4.
This study supports earlier observations that DTZ significantly increases blood TRM
concentrations in some organ transplant recipients. The magnitude of the TRM-sparing
efTect appears to vary considerably between individuals, but was of a similar magnitude
to the CsA-sparing effect demonstrated in Chapter 4. At a dose of 120mg, an increase in
CsA AUC(0-24) oT 527o (from the sigmoid Emax curve) was observed and a 627o
TRM AUC
(o-24)
TRM trough
(24h)
TRM trough
(mean 12 &.24h\
Patient TRM AUC
(0-12)
TRM AUC
(t2-24)
s0 (66.1) 41.s (53.3) 9r.8 (96.7) 6s.s (s].1)1 4s.4 (42.3)
132.6 06.1\ 156.8 (96.3\2 rs4.s (96.1) 2Or (96.3) r16.s (96.s)
Page 216

CHAPTER 8
increase at 180mg/day. By comparison, the mean increase in TRM AUC(0-24) at
l2}mgDTZ da:ily in the current study was 367o (n=4) and at 180mg, the mean increase
in TRM AUC(0-24) was 82Vo (n=3). The two recipients of kidney transplants had
clinically (and economically) significant increases in TRM AUC(0-24) but the two liver
transplant recipients had lesser increases which did not become evident until higher doses
of DTZ (>l2omg/d) were administered. The lesser TRM-sparing effect was not due to
lower plasma DTZ concentrations since one of the two liver transplant recipients had
higher DTZ concentrations than the two kidney transplant recipients while the other had
values that were similar to those values of the kidney transplant recipients (Figure 8.5).
Why the 2 ltver transplant recipients behaved differently to the 2 kidney transplant
recipients is not immediately apparent. The lack of effect of DTZ on TRM dosage
requirements in liver transplant recipients has been noted before (Teperman L. 1996) but
transplant recipients in that study were only given 90mg DTZ daúy. In addition, that
study used trough TRM concentrations only and compared data from only 7 patients
given DTZwith 7 not given DTZ. The failure to find an effect may thus have been due
to study design or simply a type II error. Given the similarity in kinetics of DTZ and its
metabolites in both kidney and liver transplant recipients (Figures 8.5-8.8), it is unlikely
that liver function is the differentiating factor since both drugs are metabolised by the
same enzyme and hence this would be expected to result in different DTZ kinetics.
Mean AUC(O-L ) for DTZ (at 90mg twice daily dosage) was similar for patients in this
study to those in the previous CsA-DTZ study (Chapter 4) (3934+I299¡t"g.hlL vs
4403+2708,pg.h/L). Mean AUC(0-24) for each of the three DTZ metabolites were also
similar at this DTZ dosage (DMDTZ: 860¡263¡tg.h/L vs 1322¡372¡t"g.h/I'; DADTZ:
717+305¡tg.h/L vs 787+576¡tg.h/L; DMDADTZ:712+450¡t"g.h/L vs 540¡495¡tg.hn-).
These data suggest that neither TRM nor CsA have an effect on DTZ metabolism or
alternatively, they both affect DTZmetabolism to a similar extent.
Page 2I7
CHAPTER 8
Patient 3 was withdrawn from the study after the l2}mglday DTZ dose because of the
development of bradycardia, a well described adverse effect with this calcium channel
blocking drug. At the time this patient had AUC(0-24) for DTZ, DMDTZ and
DMDADTZ wllch were below the mean of the other three patients, but a higher value
for DADTZ AUC(O-LÐ (812¡tg.h/L) than the mean for the other 3 study participants
(312¡tg.hfi-). The possibility that the DADTZ metabohte might be responsible for this
cardiac adverse effect was thus considered. Since patient 4 had a higher DADTZ
AUC(O-24) at the 180mg/day DTZ dose (1057¡t"g.hfl,) and, in the previous CsNDTZ
study in kidney transplant recipients (Chapter 4), 2 patrents also had higher values for
DADTZ AUC(O-L4) (2029 and 877¡tg.hlL) at the same DTZ dose and none of these
patients developed bradycardia, it seems unlikely that the DADTZ metabolite was
responsible.
Blood pressure was well controlled in all patients throughout the study and one (liver
transplant recipient) was able to discontinue one antihypertensive drug (40mg enalapril
daily) when theDTZ dose was l2}mg. No other adverse effects were noted.
As noted earlier, one of the reasons for interpatient (and intrapatient) variability in
metabolic capacity is fluctuating levels of cytokines (especially interleukin-6) (Chen YL,
et al. 1994). In the present study, C-reactive protein (a marker of IL6 activity)
concentrations were within the normal range for our laboratory (<10mg/L) with the
exception of 1 value (Table 8.4). This value (26mgil, seen in Patient 4 at the I20mg/day
DTZ dose) is nonetheless much lower than those concentrations proven to interfere with
drug metabolism (Chen YL, et al 1994) and hence it is unlikely that fluctuating
interleukin-6 concentrations contributed to the interpatient variability observed in this
study.
Page 218
CHAPTER 8
TRM is metabolised by CYP3A4 within enterocytes (Floren LC, et al. f991.
Venkataramanan R, et al. 1995. Spencer CM, et al. I99l) and hence much of the TRM-
sparing effect of DTZ could result from inhibition of this, presystemic metabolism. In
order to maximise this effect and to reduce the complexity of the drug regimen, DTZ
was administered at the same time as TRM. DTZ concentrations in the enterocyte
should therefore be near to maximal as TRM was passing this site. Interestingly, the
change in morning TRM AUC(0-12) was similar to the change in evening TRM
AUC(12-24) at DTZ doses given in the morning only (ie <60mg/day) (Figure 8.4).
Since these DTZ doses were given only with the morning dose of TRM, this confirms
the observation made with the earlier CsNDTZ study (Chapter 4), that DTZ affects
TRM concentrations for longer than would be predicted from the DTZ half-life in
plasma.
As noted in Chapter 4, this apparent lack of importance of the timing of DTZ is of
considerable clinical significance since thrice datly DTZ regimens have been commonly
employed in Australasia (Chapter 2) when DTZ is used as a CsA-sparing agent. It is
therefore likely that similar regimens would be employed 1f DTZ were advocated as a
TRM-sparing drug.
Intensive blood TRM concentration monitoring required to define AUC(0-24) is
inconvenient, laborious and expensive, and hence we examined the relationship between
increase in trough blood TRM concentrations (both C24 and the mean of Cl2 and C24)
and TRM AUC(O-T ) at different DTZ dosages. Data from Table 8.2 show that mean
changes in trough (Cl2 and C24) vafues were marginally better than mean change in C24
but both were a good approximation of mean change in TRM AUC(0-24). Data from
Patient t however showed that change in TRM C24 was greater than the change in TRM
AUC(O-Z ) at all dosages of DTZ. If TRM dosage adjustments were made on the basis
Page 219

CHAPTER 8
of the C24 vafue (as usually occurs when dosage adjustments are made in the clinic), this
patient would have had a reduction in TRM dosage which would have led to a decrease
in overall TRM exposure. The mean change in trough TRM (Cl2 and C24)
concentrations were much closer to the change in TRM AUC(O-Z4) and hence this
would appear to be a more reliable value on which to base dosage reductions.
For reasons of practicality, this study used a stepwise increase nDTZ dosage given for a
period of >2 weeks in kidney or liver transplant recipients who were stabilised on TRM.
Since the doses of DTZ were not randomised, a 'period effect' cannot be excluded.
Another potential source of error could be that the magnitude of the interaction was not
maximal at the 2 week interval set between study days. There is limited data from this
study which supports the hypothesis that 2 weeks was suffrcient. On the two occasions
when kidney transplant recipients failed to follow either the correct DTZ or TRM dosage
protocol, the studies were repeated 2 weeks later. While limited, data is thus available
for Patient 1 on both day 1 and day 14 of the 90mg DTZ taken twice daily and for
Patient 2, data is available (TRM AUC(0-12)) for day 14 and day 28 at the same DTZ
dosage. Data from the first of these two study days was not included in the primary
analysis.
Data from Table 8.5 shows that both TRM AUC(0-12) and AUC(I2-24) increased such
that AUC(0-24) increased from 3l7o to 487o over baseline in the 2 week interval for
Patient 1. A similar effect was noted on TRM trough concentrations where the mean of
lzh &. 24h concentrations increased from 4'77o to 667o over baseline in the 2 week
interval (Table 8.5). This suggests that the TRM-sparing effect of DTZ is not maximal
on day 7. DTZ AUC(O-24) also increased in the 2 week interval (1834 to 2639¡t"g.h/l-)
(Table 8.6) as did the threeDTZ metabolite AUCs. This is also consistent with DTZ not
reaching steady-state on the f,rst day after a 507o dose increase.
Page220
CHAPTER 8
Data for Patient 2, where day 14 and day 28 at the DTZ dose of 90mg taken twice daily
is available shows that TRM AUC(0-12) did not change in the 2 week interval (146 vs
155 pg.h/L) (Table 8.5). Because the evening TRM dose was omitted, neither AUC(I2-
24) nor AUC(0-24) can be used as the comparator. As expected, there was no increase
n DTZ AUC(O-24) nor AUC(O-I4) for the three DTZ metabolites (Table 8.6),
suggesting that the TRM-sparing effect of DTZ was indeed maximal by day 14.
The effect of switching from conventional release DTZ formulation to CD formulation
(at the same 180mg daily dose) was a fall in D'îZ AUC(O-24) and corresponding AUC
for the tltreeDTZ metabolites for both kidney transplant recipients (Table 8.7). DTZ
AUC(0-24) fell by 447o n Patient I (2639 to 148lpg.h/L) and 537o n Patient 2 (4096 to
ßal¡g.h/L). The magnitude of these falls values being greater than the mean fall
observed in the 8 kidney transplant recipients studied previously. In that study, the mean
GSD) AUC(O-L4) for 180mg DTZ conventional formulation was 4403 + 2708¡t"g.h/l-
while for the CD formulation, AUC(0-24) was 3112 + 907¡tg.hI (a fall of 28Vo)
(Chapter 7). This surprising result confirms the earlier observation in the CsA/DTZ
study that the CD formulation of DTZ has a poorer bioavailability than conventional
release tablet formulation of DTZ.
Changing the formulation of DTZ from conventional tablet to CD capsule had variable
effects on TRM-sparing activity. In Patient 1, there was an increase over baseline
AUC(0-24) from 487o to 537o but in Patient 2, there was a fall from lllTo to 97Vo
(Table 8.8). Similar variability was noted in the previous study with CsA/DTZ n kidney
transplant recipients (Chapter 4) and hence physicians should be cautious before
switching DTZ formulations merely for compliance reasons.
Page221
CHAPTER 8
8.6 Conclusions
Because TRM was not widely used in kidney transplantation at the time of study and
there are relatively few liver transplants performed, there were limited numbers of
transplants available for this study. Nonetheless, because considerable variability in
TRM-sparing activity was demonstrated in this study, it seems prudent to demonstrate
that a sparing effect exists in each and every transplant recipient before committing them
to a prolonged period of DTZ use. Changes in the mean of l2h and 24h trotgh blood
TRM concentration appears to be a good approximation of changes in TRM AUC(0-24)
and is easier to perform. For practical reasons, the initial dose of DTZ should be 60mg
(conventional release tablet) each morning followed by 60mg twice daily depending upon
the clinical situation and magnitude of TRM-sparing response. DTZ doses should be
given with TRM doses. If there is no clinical indication for DTZ and no increase in
blood TRM concentrations are seen at this dose, DTZ should be discontinued. There
would seem to little point in switching patients from conventional release DTZ
formulation to the CD formulation.
Page222
CHAPTER 9
Chapter 9
Summative discussion and directions for future research
Page223
CHAPTER 9
Summative discussion:
The work contained in this thesis was not intended to either provide support for or
discourage the use of CsA (or TRM) sparing agents. Rather, studies were undertaken to
explore the extent of their use, the reasons for this use and identiff issues that might
affect the decision to use them. Prior to publishing the studies contained in this thesis,
there was only limited data available to transplant physicians prescribing CsA-sparing
drugs that supported this practice. The lack of data (especially dose-response
relationship data) did not appear to be a deterrent to the use of these agents, given their
widespread use by Australasian transplant physicians identified in Chapter 2.
Physicians can usually assume that such data is available, even if they have not personally
sighted it, because it is normally provided by pharmaceutical companies as a routine part
of the new drug development process. However, pharmaceutical companies have not
been involved in the development of drugs which are intended for CsA (or TRM) sparing
indication and hence it is perhaps not surprising that this data has not been available to
prescribers. Also, since regulatory bodies have not been formally approached to approve
this new indication, it is perhaps not surprising that this data has not been demanded and
this situation appears unlikely to change. Indeed, if the withdrawal from sale of the
calcium channel blocking drug mibefradil (a more powerful CsA-sparing drug thanDTZ)
is any guide, pharmaceutical companies are not enthusiastic about promoting drugs
which have the potential for such significant drug interactions.
When first advocated in the mid 1980s, there was a sound basis (cost savings and
potential therapeutic benefit) for studying the role of potential sparing agents in the
transplant population, but early studies were limited in nature and provided relatively few
answers. There were also a number of quite new concerns associated with their use
(especially the ethics of using a drug for primarily an economic reason) and these
Page 224
CHAPTER 9
concerns, coupled with the lack of data, has caused many physicians to refrain from
using CsA (or TRM) sparing drugs.
The work contained in this thesis has added to the body of knowledge that underpins the
use of CsA (or TRM) sparing agents and will allow prescribing physicians to make a
more informed decision about whether to use them or not. 'While numbers are limited,
the dose-response relationship has been studied in kidney, liver and lung transplant
recipients and considerable variability in response has been noted (Chapters 4, 5, 6 and
S). Clinically significant reductions in CsA (and TRM) dosage have been demonstrated
in these studies but at doses that are much lower than those often used for this indication
in transplantation. The apparent lack of CsA-sparing effect observed with DTZ in one
transplant recipient who demonstrated a signihcant CsA-sparing effect withICZ reported
in Chapter 5 provides a strong argument for proving, rather than assuming, that a benefit
exists. Since a primary focus is cost saving, it is important to note that this need to
prove that a benef,rt exists demands additional effort and hence additional costs which
inevitably erodes the economic benefit achieved.
The acceptability of using changes in morning blood CsA or TRM trough concentrations
(the usual chnical practice) to prove a sparing effect has been raised as an issue in this
thesis because studies involving both CsA and TRM (Chapters 4 and 8) demonstrated a
greater effect on trough concentrations than the respective AUCs. Although there has
been some work in this area, the issue of the best sampling time/s which correlate with
effrcacy has not been resolved when CsA (or TRM) are used without sparing agents.
AUCs have traditionally been regarded as the best determinant of drug exposure and
hence of effrcacy but there are good examples elsewhere in medicine where this does not
apply. In particular, it does not apply to aminoglycoside antibiotics where peak plasma
concentration has been shown to correlate better than trough concentration with efficacy
and this awareness has lead to a fundamental change in practice from thrice daily
Page225
CHAPTER 9
regimens to less frequent administration of larger doses. If similar studies with CsA (and
TRM) demonstrate that AUCs correlate better with efhcacy than trough concentrations
when sparing agents are used, then more extensive monitoring will be mandatory. This
will affect the enthusiasm for using sparing agents since the costs of establishing that a
benefit exists (which is borne by the hospital system) will escalate accordingly.
It has been demonstrated in this thesis that the ratio between trough concentration and
AUC is altered by the use of sparing agents. Hence there is concern about relying on
trough concentration monitoring for adjusting CsA (or TRM) doses. Setting a higher
target trough concentration may resolve this concern but this would only be possible if
there was little inter and intrapatient variability between AUC and trough concentrations
- something that would need to be explored in larger populations. Because different
sparing agents might affect the ratio of trough concentration to AUC differently, it is
[kety that different therapeutic ranges might be needed for both CsA and TRM when
different sparing agents were used. This potential for different therapeutic ranges is
based solely upon different pharmacokinetic interaction factors and ignores the potential
for differing pharmacodynamic interactions between either CsA or TRM and the sparing
agent. If such pharmacodynamic interactions could be quantif,red, further adjustments
might be made to the target therapeutic (trough) blood concentration.
It was somewhat surprising that data collected for this thesis (Chapter 3), demonstrated
considerable differences between transplant units in such a fundamental area as the
therapeutic range for blood CsA concentrations used to maintain even the same type of
organ transplant. The use of CsA-sparing agents appeared not to affect the CsA
therapeutic range used by transplant physicians although there is potential for these to be
lowered due to an immunosuppressive action by some (DTZ) sparing agents (Carozzi S,
et al. 1995). While this might allow the development of different therapeutic ranges
where these drugs are coprescribed (noted above), the apparent inability to develop
Page 226
CHAPTER 9
uniform therapeutic ranges in the relatively uncomplicated environment that applied at
the time of the study does not auger well for this to happen given the complexity
involved.
A significant reduction in the rate of occlusion of coronary arteries has been
demonstrated when DTZ is coprescribed with CsA in heart transplant recipients
(Schroeder JS, et al. 1993. Keogh A, et al. 1995). This is a strong argument in favour
of its routine coprescription and is almost certainly the reason that these patients were
almost always prescribed DTZ n the survey (Chapter 2). This thesis has confirmed
earlier findings in the Australian adult kidney transplant population of therapeutic
benefits in the form of reduced need for dialysis or additional immunosuppressive drugs
associated with the coprescription of DTZ n the early days post kidney transplantation.
This is also a strong argument in favour of this coprescription at least in the first few
weeks post kidney transplantation. An argument in favour of long term coprescription of
DTZ is the frequent diagnosis of hypertension when CsA is used in organ
transplantation. Contrary to earlier hndings, data presented (Chapter 3) in this thesis
support the usefulness of DTZ as an antihypertensive drug and hence a therapeutic
benefit exists in most cases. It is important to note that these therapeutic benefits were
observed with higher doses of DTZ than those needed to spare the dose of CsA
(demonstrated in Chapter 4) and hence a therapeutic benefit cannot be assumed if lower
doses of DTZ are employed. If lower doses of DTZ were also shown to exert a
therapeutic benefit, most of the ethical concerns surrounding its coprescription would be
resolved.
While DTZ has a potentially significant role as a CsA-sparing agent, the magnitude of the
sparing effect afforded by KCZ is potentially of greater importance, especially in
countries where the costs of providing CsA preclude its use. In Australasia, KCZ has
not been widely used because it is perceived to be a more toxic (especially hepatotoxic)
Page 221

CHAPTER 9
drug and its use has been vigorously opposed by some regulatory bodies (personal
communication, A Keogh, St Vincent's Hospital, Sydney, 1995). It has however been
used in limited numbers of transplant recipients for extended periods without apparent ill
effects and in some countries, it is routinely coprescribed. Dose-response studies of the
type performed in this thesis are unlikely to be performed in these countries however
because of a lack of expertise and analytical equipment etc. If this data is to be provided
therefore, either a change in attitude will be required in Australia (to allow detailed study
of the interaction) or appropriate funding will need to be arranged to allow these studies
to be performed in developing countries. In addition to defining optimal KCZ doses that
afford a CsA-sparing effect, it would also be important to document the safety (or
otherwise) of the coprescription, especially since the risk of hepatotoxicity is potentially
greater in such countries due at least in part to Hepatitis B and C infection.
The magnitude of the savings afforded by the use of DTZ (as a CsA sparing drug) was
estimated at AUD$7 million in 1995. This saving is made by the authority which
provides the funding (the Commonwealth government in Australia) which is a powerful
argument for this body to play a central role in directing studies into the use of CsA (or
TRM) sparing agents. It is interesting to note that many centres started using these
agents after the introduction of the 'Section 100' scheme (1991) in Australia when this
saving, previously made by State governments, began to accrue to the Commonwealth
government. The cost of providing the CsA-sparing drugs remains a State government,
hospital and individual transplant recipient responsibility however. The Commonwealth
government is also charged with the responsibility for approving the marketed
indications for drugs within Australia, a reactive role that is normally activated when a
pharmaceutical company applies for marketing approval. Despite widespread knowledge
of the use of CsA (or TRM) sparing drugs, none have been granted marketing approval
and given the relatively small profit that might be generated, it is unlikely that
pharmaceutical companies will make such an application. Because no single organisation
Page228

CHAPTER 9
has assumed responsibility for studying the interaction between CsA (or TRM) and the
various sparing agents, it is likely that many issues surrounding the coprescription will
remain unanswered. Given these factors, it is logical that the Commonwealth
government should take the central role in this process, initiating studies which will
provide the required information, f,rnancing these studies and subsequently approving the
indications. It might be argued that Commonwealth government is currently shirking its
responsibilities because it is the sole beneficiary of the savings made. It is also worth
noting that the most likely targets for litigation in the event of an untoward effect
resulting from the use of CsA (or TRM) sparing agents will remain State governments,
and/or individual hospitals until sparing agents are ofFrcially approved.
One of the more interesting findings from this series of studies is that doses of DTZ up to
60mg/day (which were taken with the morning CsA dose only), affect both morning (0-
12h) and evening (12-24h) CsA AUCs equally. This finding demonstrates that the
interaction between DTZ and CYP3A4 (and/or P-gp) persists after the drug is removed
from plasma. Since patient compliance has been demonstrated to be an important cause
of graft failure (Didlake RH, et al. 1988) this information can be directly applied to drug
regimen simplification. Many transplant physicians switched patients from conventional
release DTZ tablets to the controlled diffusion capsules at the time of the survey
(Chapter 2) presumably for this reason.
This thesis has also highlighted the potential dangers of changing formulations without
first studying the effects of change. In Chapter 5, 3 patients experienced falls in CsA
AUC(0-12) between 30-60Vo and another experienced an increase of 367o when
switched from conventional tablet to CD formulation DTZ n the same dose. Changes in
formulation to both CsA and TRM have been made by the respective manufacturers over
recent years and while bioequivalence studies have been performed, these have not
focussed on the CsA (or TRM) sparing action. The interaction studies performed in this
Page 229

CHAPTER 9
thesis were performed with the older (Sandimmun@¡ formulation of CsA and Cardizem@
brand of DTZ hence the magnitude and reproducibility of the sparing effects might be
different with different formulations or brands. Interestingly, brand changes with DTZ
are almost inevitable in the current drug supply systems where contracts for drugs are
changed on a regular basis in hospitals and brand price premiurns encourage alternative
generic prescribing in the community. The potential for different CsA (or TRM) sparing
effects should be factored into any decision to change brands and those charged with the
responsibility for making these decisions should be cognisant of this potential problem.
The dose-response relationship study described in this thesis for the interaction between
CsA and DTZ was published n 1991, approximately a decade after the coprescription
was first used. Because the data became available only after policies had been
formulated, it is less likely that the data would affect prescribing practice. It is preferable
to have access to such basic information before policies are constructed and for this
reason, the interaction betweenDTZ and the newer immunosuppressive drug TRM was
investigated (Chapter 8) in a preliminary study in kidney and liver transplant recipients.
'While a number of questions have been addressed by these studies, many remain
unanswered or have arisen as a result of these studies. These include:
-Is CYP3A4 the major target for CsA-sparing agents or is P-gp more important.
Research into this aspect will require agents that are able to selectively affect one
system without affecting the other. This is of clinical importance since P-gp has
been found in the blood brain barrier and may serve a protective role at this site.
Drugs which impair P-gp may thus increase brain concentrations of a variety of
drugs with both beneficial and adverse effects.
-What is the relative contribution of gastrointestinal and hepatic CYP3A4 (and/or
P-gp) in metabolism of CsA and TRM
Page 230
CHAPTER 9
-How are CsA (and TRM) metabolite profiles altered by the use of sparing agents
and do these changes have any clinical sequelae?
-Is AUC monitoring the best predictor of immunosuppressive outcome or is
trough concentration a better predictor? As noted above, research into this area
is of great importance since AUC monitoring is both inconvenient and expensive.
Such studies should also investigate the potential for creating a new target
therapeutic ranges for trough concentrations where organ transplant recipients
are prescribed CsA (or TRM) sparing drugs.
-Other sparing agents need to be similarly studied. As noted earlier, the
magnitude of the costs associated with the use of CsA and TRM precludes their
use in many transplant recipients (especially in developing countries). Strategies
which reduce the dose (and hence cost) are thus more important in such countries
and, because it is a more powerful interactor, the dose-response relationship
between KCZ and both CsA and TRM should be established as soon as possible.
-Is the difference in TRM-sparing activity between kidney transplant and liver
transplant recipients (noted in Chapter 8) due to the nature of the transplanted
organ or is it another manifestation of the variability observed earlier?
-Is the observed performance failure of the CD formulation of DTZ dte to the
concomitant use of CsA? Is this confined to organ transplant recipients or is it
more widespread?
-How widespread is the poor absorption of DTZ seen in Patient 7 n Chapter 7?
While it did not appear to unduly affect CsA-sparing activity, does this poor
absorption result in poor antihypertensive and/or anti-anginal activity?
-Is there a relationship between blood CsA concentration and graft function in the
carly days post transplantation? Data available for analysis in Chapter 3 was too
limited to answer this question and given the potential for variable practices with
respect to other immunosuppressive drugs (especially immune system antibodies),
this would require a carefully designed, multicentre, clinical trial. This is a topical
Page 231.

CHAPTER 9
issue at present and some units have demonstrated less frequent rejection
episodes when sparse sampling AUCs for CsA are used (Mahalati K, et al. 1999)
in preference to trough blood concentration. The AUCs being advocated are
very high compared to those measured in Chapters 4 and 5 (which rwere many
months post transplant however) and hence the potential for adverse effects
(especially infection and cancer risk) must also be quantified for this approach.
Page232

CHAPTER 10
Chapter 10
References
Page 233
CHAPTER 10
- Back DJ, Tjia JF. Comparative effects of the antimycotic drugs ketoconazole,
fluconazole, itraconazole and terbinafine on the metabolism of cyclosporin by human
liver microsomes. Br J Clin Pharmacol l99l;32:624-626
- Badcock NR. Micro-scale method for itraconazole in plasma by reversed-phase
high performance liquid chromatography. J Chromatogr 1990; 525:.418-48
- Bailey DG, Spence JD, Munoz C, Arnold JMO. Interaction of citrus juices with
felodipine and nifedipine. Lancet l99l; l:268-269
- Barclay PG, Allen RDM, Stewart JH, Ng K, Chapman JR. Costs of
immunosuppressive therapies used in renal transplantation. Transplant Proc 1992;24
(1): 165-166
- Begg EJ, Barclay ML, Kirkpatrick CJM. The therapeutic monitoring of
antimicrobial agents. Br J Clin Pharmacol 1999;41:23-30.
- Bonnefous JL, Boulieu R, Lahet C. Stability of diltiazem and its metabohtes in
human blood samples. J Pharm Sci 1992;81: 34I-344
- Borel JF. Cyclosporin-A - Present experimental status. Transplant Proc 1981; 13:
344-348
- Borel JF. The history of Cyclosporin A and its significance. In Cyclosporin A,
'White DG editor, Elsevier Biomedical, 1981
- Bourbigot B, Guiserix J, Airiau J, Bressollette L, Morin JF, Cledes J. Nicardipine
increases cyclosporin blood levels. Lancet 1986; 1: 1441
- Brockmoller J, Neumayer HH, Wagner K, Weber W, Heinemeyer G, Kewitz H,
Roots I. Pharmacokinetic interaction between cyclosporin and diltiazem. Eur J Clin
Pharmacol l99O:' 38: 231 -242
Page 234

CHAPTER 10
- Burckart GJ, Venkataramanan R, Ptachcinski RJ, Starzl TE, Gartner C, ZitelllBJ,
Malatack JJ, Shaw B'W, Shunzaburo I, Van Thiel DH. Cyclosporine absorption
following orthoptic liver transplantation. J Clin Pharmacol 1986; 26:647-651
- Burke JF, Pirsch JD, Ramos EL, Salomon DR, Stablein DM, van Buren DH, West
JC. Long-term efficacy and safety of cyclosporine in renal transplant recipients. N
a
Engl J Med 1994; 331:358-363
- Callen DF, Baker E, Simmers RN, Seshadri R, Roninson IB. Localization of the
human multiple drug resistance gene, MDRI , to 7 qZl.I. Hum Genet 1981;11 : I42-
t44
- Calne RY, Thiru S, McMaster P, Craddock GN, White DJG, Evans DB, Dunn DC,
Pentlow BD, Rolles K. Cyclosporin A in patients receiving renal allografts from
cadaver donors. Lancet I978; 2: 1323-1321
- Calne RY,'White DJG, Rolles K, Smith DP, Herbertson BM. Prolonged survival of
pig orthotopic heart grafts treated with cyclosporin A. Lancet 1978;i:1183-1185
- Calne RY, Rolles K, Thiru S, McMaster P, Craddock GN, Aziz S, White DJG,
Evans DB, Dunn DC, Henderson RG, Lewis P. Cyclosporin initially as the only
immunosuppressant in 34 recipients of cadaveric organs: 32 kidneys, 2 pancreases
and 2 livers. Lancet 1919; 2: lO33-1036
- CarozziS, Nasini MG, Pietrucci A, Nocera A, Fontana I, Valente U.
Immunosuppressive effects of different calcium channel blockers in human kidney
allografts. Transplant Proc 1995; 27(l): 1054-1051
- Chang KC, Bell TD, Lauer BA, Chai H. Altered theophylline pharmacokinetics
during acute respiratory viral illness. Lancet 1918; I: 1132-1133
Page235
CHAPTER 10
- Chen YL, Florentin I, Batt AM, Ferrari L, Giroud JP, chauvelot-Moachon L.
Effects of interleukin-6 on cytochrome P45O-dependent mixed function oxidases in
the rat. Biochem Pharmacol 1992;44: 131-148
- Chen YL, Le Vraux V, Leneveu A, Dreyfus F, Stheneur A, Florentin I, De Soussa
M, Giroud JP, Flouvat B, Chauvelot-Moachon L. Acute-phase response, interleukin-
6, and alteration of cyclosporine pharmacokinetics. Clin Pharmacol Ther 1994;55:.
649-660
- Cheymol G, Poirier JM. Prevention of aspergillosis with itraconazole in
neutropenic patients: importance of drug monitoring. Bull Acad Natl Med 1999;
183: 380-381
- Christians U, Schmidt G, Bader A, Lampen A, Schottman R, Linck A, Sewing KF.
Identification of drugs inhibiting the in vitro metabolism of tacrolimus by human liver
microsomes. Br J Clin Pharmacol1996;41: I87-l9O
- Chrysostomou A,'Walker RG, Russ GR, D'Apice AJF, Kincaid-Smith P, Mathew
TH. Diltiazeminrenal allograft recipients receiving cyclosporine. Transplantation
1993; 55(2):300-4
- Cogill JL, Taylor PJ, Westley IS, Morris RG, Lynch SV, Johnson AG. Evaluation
of the tacrolimus microparticle enzyme immunoassay (MEIA II) in liver and renal
transplant recipients. Clin Chem 1998; 44 (9): 1942-1946
- Combalbert J, Fabre I, Fabre G, Dalet I, Dernancourt J, Cano JP, Maurel P.
Purihcation and identification of the rifampicin-inducible liver cytochrome P-450
(Cyclosporin A Oxidase) as a product of the P450IIIA gene subfamily. Drug Metab
Dispos 1989; l1(2): l9l-201
Page 236
CHAPTER 10
- Cooke CE. Nontherapeutic cyclosporin levels. Sustained-release diltiazem
products are not the same. Transplantation 1994;51(11): 1687
- Curtis JJ, Dubovsky E, Whelchel JD, Luke RG, Diethelm AG, Jones P.
Cyclosporin in therapeutic doses increases renal allograft resistance. Lancet 1986;2:
417-479
- Dawidson I, Roth P. Improvement of cadaver renal transplantation outcomes with
verapamil: a review. Am J Med I99l;90 (Supl5A): 37S-41S
- Du Souich P, Lery N, Lery L, Varin F, Boucher S, Vezina M, Pilon D, Spenard J,
Caille G. Influence of food on the bioavailability of diltiazem and two of its
metabolites following the administration of conventional tablets and slow-release
capsules. Biopharm Drug Dispos 1990;1 I:I31-147
- de Waziers I, Cugnenc PH, Yang CS, Leroux JP, Beaune PH. Cytochrome P450
isoenzymes, epoxide hydroxylase and glutathione transferase in rat and human
hepatic and extrahepatic tissues. J Pharmacol Exp Ther 1990; 253:381-394
- Dias VC, Weir SJ, Ellenbogen KA. Pharmacokinetics and pharmacodynamics of
intravenous diltiazem in patients with atrial fibrillation or atrial flutter. Circulation
1992;86: 1421-1428
- Diasio RB, LoBuglio AF. Immunomodulators: Immunosuppressive agents and
immunostimulants. In Goodman & Gilman's Pharmacological Basis of Therapeutics,
Hardman JG, Limberd LE, MolinoffPB, Ruddon RW, Gilman AG (Eds) 1996; l29l-
1308
- Didlake RH, Dreyfus K, Kerman RH, Van Buren CT, Kahan BD. Patient
noncompliance: a major cause of late graft failure in cyclosporine treated renal
transplants. Transplant Proc 1988;20 (3 Suppl3):63-69
Page 237

CHAPTER 10
- Dieperink H, Moller J. Ketoconazole and cyclosporin. Lancet 1982;2: I2Il
- Drewe J, Meier R, Vonderscher J, Kiss D, Posanski U, Kissel T, Gyr K.
Enhancement of the oral absorption of cyclosporin in man. Br J Clin Pharmacol
1992;34 60-64
- Drewe J, Beglinger C, Kissel T. The absorption site of cyclosporin in the human
gastrointestinal tract. Br J Clin Pharmacol 1992;33: 39-43
- Ducharme MP, Proveîzano R, Dehoorne-Smith M, Edwards DJ. Trough
concentrations of cyclosporine in blood following administration with grapefruit
juice. Br J Clin Pharmacol 1993;36:451-459
- Ducharme MP,'Warbasse LH, Edwards DJ. Disposition of intravenous and oral
cyclosporine after administration with grapefruit juice. Clin Pharmacol Ther 1995;
57:485-491
- Dunn J, Grevel J, Napoli K, Lewis RL, Van Buren CT, Kahan BD. The impact of
steady state cyclosporine concentrations on renal allograft outcome. Transplantation
1990; 49:30-34
- Dusci LJ, Hackett P, Chiswell GM, Illett KF. Comparison of cyclosporin in whole
blood by high performance liquid chromatography, monoclonal
fl uoresc entpolarization immuno assay and mono clo nal enzyme multiplied
immunoassay. Ther Drug Monit 1992; 14:321-332
- Dutta S, Matsumoto Y, Ebling WF. Is it possible to estimate the parameters of the
sigmoid Emax model with truncated data typical of clinical studies? J Pharm Sci
1996;85:232-239
Page238
CHAPTER 10
- Eagling VA, Tjia JF, Back DJ. Differential selectivity of cytochrome p450
inhibitors against probe substrates in human and rat liver michrosomes. Br J Clin
Pharmacol 1998; 45: 101 -I74
- Edwards DJ, Fitzsimmons ME, Schetz EG, Yasuda K, Ducharme MP, Warbasse
LH, Woster PM, Schuetz JD, Watkins P. 6',7'-Dihydroxybergamottin in grapefruit
juice and Seville ofange juice: Effects on cyclosporine disposition, enterocyte
CYP3A4, and P-glycoprotein. Clin Pharmacol Ther 19991,65:231-244
- Epstein M. Calcium antagonists and renal protection. Arch Intern Med 1992;152:
t5t3-1584
- Faulds D, Goa KL, Benf,reld P. Cyclosporin - a review of its pharmacodynamic and
pharmacokinetic properties and therapeutic use in immunoregulatory disorders.
Drugs 1993;45:953-1040
- Ferguson RM, Sutherland DR, Simmons RL, Najarian JS. Ketoconazole,
cyclosporin metabolism and renal transplantation. Lancet 1982;2: 882-883
- First MR, Schroeder TJ, Weiskittel P, Myre SA, Alexander J'W, Pesce AJ.
Concomitant administration of cyclosporin and ketoconazole in renal transplant
recipients. Lancet 1989; 2: ll98-l20l
- First MR, Schroeder TJ, Alexander JW, Stephens GW, V/eiskittel P, Myre SA,
Pesce AJ. Cyclosporine dose reduction by ketoconazole administration in renal
transplant recipients. Transplantation 1991; 5I 365-70
- First MR, Schroeder TJ, Michela A, Hariharan S, Weiskittel P, Alexander JW.
Cyclosporine-ketoconazole interaction. Long term follow up and preliminary results
of a randomizedtrial. Transplantation 1993; 55: 1000-1004
Page239
CHAPTER 10
- Floren LC, Bekersky I, Benet LZ, Mekki Q, Dressler D, Lee JW, Roberts JP,
Hebert MF. Tacrolimus oral bioavailability doubles with coadministration of
ketoconazole. Clin Pharmacol Ther I99l;62: 4I-49
- Freed BM, Rosano TG, Lempert N. In vitro immunosuppressive properties of
cyclosporine metabolites. Transplantation 1981 : 43 (l) : 123 - 121
- Frey FJ. Concomitant cyclosporin and ketoconazole. Lancet I99O; 1: 109-110
- Friman S, Backman L. A new microemulsion formulation of cyclosporin.
Pharmacokinetic and clinical features. Clin Pharmacokinet 1996; 3: 181-193
- Fuhr U, Klittich K, Staib AH. Inhibitory effect of grapefruit juice and its bitter
principal, naringenin, on CYP1A2 dependent metabolism of caffeine in man. Br J
Clin Pharmacol 1993; 35 431-436
- Girardet RE, Melo JC, Fox MS, Whaeln C, Lusk R, Masri ZH, Lansing AM.
Concomitant administration of cyclosporine and ketoconazole for three and a half
years in one heart transplant recipient. Transplantation 1989, 48: 887-890
- Goodman & Gilman's The Pharmacological basis of therapeutics 9th edn, 1996.
McGraw-Hill, New York, Editors Hardman JG, Limbird LE, Molinoff PB, Ruddon
RW, Goodman Gilman A.
- Grevel J. Absorption of cyclosporine A after oral dosing. Transplant Proc 1986;
18(6) Suppl 5: 9-15
- Grevel J, Welsh MS, Kahan B. Cyclosporine monitoring in renal transplantation:
area under the curve monitoring is superior to trough-level monitoring. Ther Drug
Monit 1989; lI:246
- Green CJ, Allison AC. Extensive prolongation of rabbit kidney allograft survival
after short term cyclosporin A treatment. Lancet 19181' i: 1182-1183
Page240
CHAPTER 10
- Gupta SK, Bakran A, Johnson RWG, Rowland M. Cyclosporin-erythromycin
interaction in renal transplant patients. Br J Clin Pharmacol 1989;21:415-48I
- Gupta SK, Manfro RC, Tomlanovich SJ, Gambertoglio JG, Garavoy MR, Benet
LZ. Effect of food on the pharmacokinetics of cyclosporine in healthy subjects
following oral and intravenous administration. J Clin Pharmacol 1990; 30:643-653
- Hall BM, Tiller DJ, Hardie I, Mahony J, Mathew T, Thatcher G, Miach P,
Thomson N, Shiell AGR. Comparison of three immunosuppressive regimens in
cadaver renal transplantation: long-term cyclosporine, short term cyclosporine
followed by azathioprine and prednisolone, and azathioprine and prednisolone
without cyclosporine. N Engl J Med 1988; 31'8: 1499-1501.
- Harlan DM, Kirk AD. The future of organ and tissue transplantation: Can T cell
costimulatory pathway modifiers revolutionize the prevention of graft rejection.
JAMA 1999; 282: lol 6-1082
- Hebert MF, Roberts JP, Prueksaritanont T, Benet LZ. Bioavailability of
cyclosporine with concomitant rifampicin administration is markedly less than
predicted by hepatic eîzyme induction. Clin Pharmacol Ther 1992;52:453-451
- Hebert MF, Lam AY. Diltiazemincreases tacrolimus concentrations. Ann
Pharmacother 1999; 33: 680-682
- Henricsson S, Lindholm A. Inhibition of cyclosporine metabolism by other drugs in
vitro, Transplant Proc 1988; XX(2) Suppl 2: 569-51 I
- Hoglund P, Nilsson LG. Pharmacokinetics of diltiazem and its metabolites after
repeated single dosing in healthy volunteers. Ther Drug Monit 1989; 11: 558-566
- Hollander AAMJ, van Rooij J, Lentjes EG'WM, Arbouw F, van Bree JB,
Schoemaker RC, van Es LA, van der Woude FJ, Cohen AF. The effect of grapefruit
Page 241
CHAPTER 10
juice on cyclosporin and prednisone metabolism in transplant patients. Clin
Pharmacol Ther 1995; 5l:318-324
- Holt D'W, Johnstone A, Roberts NB, Tredger JM, Trull AK. Methodological and
clinical aspects of cyclosporin monitoring: report of the Association of Clinical
Biochemists task force. Ann Clin Biochem 1994;31 420-446
- Honbo T, Koboyashi M, Hane K, Hata T, Ueda Y. The oral dosage form of FK-
506. Transplant Proc 1987; 19: 11-22
- Honcharik N. The effect of food on cyclosporine absorption. Clin Biochem 1991;
24(I):89-92
- Hoppu K. Koskimies O, Holrnberg C, Hirvisalo EL. Evidence for pre-hepatic
metabolism of oral cyclosporine in children. Br J Clin Pharmacol I99I;32: 411-481
- Hung J, Hackett PL, Gordon SPF, Ilett KF. Pharmacokinetics of diltiazem in
patients with unstable angina pectoris. Clin Pharmacol Ther 1988;43:466-1O
- Jacqz-Agrain E, Montes C, Brun P, Loirat C. Cyclosporin pharmacokinetics in
nephrotic and kidney transplanted children. Eur J Clin Pharmacol 1994; 41: 6I-65
- Jain AB, Venkataraman R, CadoffE, Fung JJ, Todo S, Krajack A, Starzl TE.
Effect of hepatic dysfunction and T tube clamping on FK 506 pharmacokinetics and
trough concentrations. Transplant Proc 1990; 22:57-59
- Janssens J, Peeters TL, Vantrappen G, Tack J, Urbain JL, De Roo M, Muls E,
Bouillon R. Improvement of gastric emptying in diabetic gastroparesis by
erythromycin. N Engl J Med 1990; 322: lO28-IO3l
- Johnston A, Holt DlM. Effect of grapefruit juice on blood cyclosporin
concentration. Lancet 1995; 346: 122-3
Page 242

CHAPTER 10
- Kahan BD,'Welsh M, Rutzky LP. Challenges in cyclosporine therapy: The role of
therapeutic monitoring by area under the curve monitoring. Ther Drug Monit 1995;
11:621-624
- Kahan BD, Dunn J, Fitts C, Van Buren D, Wombolt D, Pollak R, Carson R,
Alexander J'W, Choc M, Wong R, Hwang DS. Reduced inter and intrasubject
variability in cyclosporine pharmacokinetics in renal transplant recipients treated with
a microemulsion formulation in conjunction with fasting, low fat meals or high fat
meals. Transplantation 1995; 59: 505-511
- Katari SR, Magnone M, Shapiro R, Jordan M, Scantlebury V, Vivas C, Gritsch A,
McCauley J, Starzl T, Demetris AJ, Randhawa PS. Clinical features of acute
reversible tacrolimus (FK 506) nephrotoxicity in kidney transplant recipients. Clin
Transplantation 1997 : ll : 231 -242
- Kelly PA, Burckart GJ, Venkataramanan R. Tacrolimus: A new
immunosuppressive agent. Am J Health-Syst Pharm 1995;52:152I-1535
- Keogh A, Day R, Critchley L, Duggin G, Baron D. The effect of food and
cholestyramine on the absorption of cyclosporine in cardiac transplant recipients.
Transplant Proc 1988; 2O:21-30
- Keogh A, Spratt P, McCosker C, Macdonald P, Mundy J, Kaan A. Ketoconazole
to reduce the need for cyclosporin after cardiac transplantation. N Engl J Med 1995;
333:628-633
- Keown PA. Cyclosporin in organ transplantation and autoimmunity. Curr Therap
1990;Nov: 75-83
Page 243

CHAPTER IO
- Kessler M, Netter P, Renoult E, Jonon B, Mur JM, Trechot P, Dousset B.
Influence of nicardipine on renal function and plasma cyclosporin in renal transplant
patients. Eur J ClinPharmacol 1989; 36:631-638
- Ketter TA, Flockhart DA, Post RM, DenicoffK,Pazzaglia PJ, Marangell LB,
George MS, Callahan AM. The emerging role of cytochrome P450 3A in
psychopharmacology. J Clin Psychopharmacol 1995; 15: 387-398
- Kiley DJ, Lam CS, Pollak R. A study of treatment compliance following kidney
transplantation. Transplantation 1993. 55( 1 ) : 5 1 -56
- Kinney EL, Moskowitz RM, Zelis R. The pharmacokinetics and pharmacology of
oral diltiazem in normal volunteers. J Clin Pharmacol 1981; 2I:331-342
- Kivisto KT, Neuvonen PJ, Klotz U. Inhibition of terfenadine metabolism:
Pharmacokinetic and pharmacodynamic consequences. Clin Pharmacoknet 1994;21
1-5
- Kiyoshi I,Inazawal, Nakagawa H, Shimada T, YamazakiH, Guengerich FP, Abe
T. Assignment of the human cytochrome P-450 nifedipine oxidase gene (CYP3A4)
to chromosome 7 at band q22.1by fluorescence in situ hybridization. Jpn J Human
Genet 1992;37: I33-I38
- Kohlaw K,'Wonigeit K, Frei U, Oldhafer K, Neumann K, Pichlmayr R. Effect of
the calcium channel blocker diltiazem on cyclosporin A blood levels and dose
requirements. Transplant Proc 1988; 2O(2) Suppl 2: 512-514
- Kolars JC, Schmiedlin-Ren P, Scheutz J, Ghosh M, Dobbins WO, Watkins PB.
Expression of P450IIIA4 in duodenal mucosa: Interpatient variability and regulation
in cultured explants. Gastroenterology l99l; IOO: A22l
Page 244
CHAPTER 10
- Kolars JC, Awni'WM, Merion RM, Watkins PB. First pass metabolism of
cyclosporin by the gut. Lancet l99l;338: 1488-1490
- Kolars JC, Schmiedlin R, Schuetz JD, Fang C, Watkins PB. Identification of
rifampin-inducible P450IIIA4 (CYP3A4) in human small bowel enterocytes. J Clin
Invest 1992; 90: 1871-1878
- Kolars JC, Lown KS, Schmiedlin-Ren P, Ghosh M, Fang C, Wrighton SA, Merion
RM,'Watkins PB. CYP3A gene expression in human gut epithelium.
Pharmacogenetics 1994; 4: 241-259
- Krishna DR, Klotz U. Extrahepatic metabolism of drugs in humans. Clin
Pharmacoknet 199 4; 26: 144- 16O
- Kronbach T, Fischer V, Meyer UA. Cyclosporin metabolism in human liver:
identification of a cytochrome P-450I[ gene family as the major cyclosporin-
metabolizing enzyme explains interactions of cyclosporin with other drugs. Clin
Pharmacol Ther 1988; a36):630-635
- Kunz R, Neumayer HH. Maintenance therapy with triple versus double
immunosuppressive regimen in renal transplantation: a meta analysis.
Transplantation 1991 ; 63 : 386-392
- Kunzendorf U, Brockmoller J, Jochimsen F, Keller F, Walz G, Offermann G.
Cyclosporin metabolites and central nervous system toxicity. Lancet 1988; I: 1223.
- Kunzendorf U, Brockmoller J, Jochimsen F, Roots I, Offermann G.
Immunosuppressive properties of cyclosporin metabolites. Lancet 1989; I:134-135
- Kwan JTC, Foxall PJD, Davidson DGC, Bending MR, Eisinger AJ. Interaction of
cyclosporin and itraconazole. Lancet 1981 : II: 282
Page245
CHAPTER 10
- Leibbrandt DM, Day RO. Cyclosporin and calcium channel blockers: An
exploitable drug interaction?. Med J Aust 1992; 57: 296-291
- Levy G, Rochon J, Freeman D, W'ong P-Y, Banks L, Roach C, Engel K, Grant D.
Cyclosporine neoral in liver transplant recipients. Transplant Proc 1994;5:2949-
2952.
- Lewis JH,Zimtnerman HJ, Benson GD, Ishak KG. Hepatic injury associated with
ketoconazole therapy. Gastroenterology 1984; 86: 503-513
- Lindholm A, Henricsson S. Verapamil inhibits cyclosporin metabolism. Lancet
1981; I:1262-1263
- LindholmA, Henricsson S, Dahlqvist R. The effect of food and bile acid
administration on the relative bioavailabilty of cyclosporin. Br J Clin Pharmacol
l99O;29:541-548
- Lindholm A. Therapeutic monitoring of cyclosporin - An update. Eur J Clin
Pharmacol 199 I; 4I: 27 3-283
- Lindholm A, Kahan BD. Influence of cyclosporine pharmacokinetics, trough
concentrations and AUC monitoring on outcome after kidney transplantation Clin
Pharmacol Ther 1993 ; 54: 205-218
- Lown KS, Kolars JC, Thummel KE, Barnett JL, Kunze KL, Wrighton SA, Watkins
PB. Interpatient hetergeneity in expression of CYP3A4 and CYP3A5 in the small
bowel. Lack of prediction by the erythromycin breath test. Drug Metab Dispos
1994;22:941-55
- Lown KS, Mayo RR, Leichtman AIl, Hsaio HL, Turgeon K, Schmiedlin-Ren P,
Brown MB, Guo'W, Rossi SJ, Benet LZ,Watkins PB. Role of intestinal P-
Page 246
CHAPTER 10
glycoprotein (mdrl) in interpatient variation in the oral bioavailability of
cyclosporine. Clin Pharmacol Ther l99l ; 62: 248-260
- Lucey MR, Kolars JC, Merion RM, Campbell DA, Aldrich M, Watkins PB.
Cyclosporin toxicity at therapeutic blood levels and cytochrome P-450IIIA. Lancet
l99O;335:11-15
- Lum BL, Kaubisch, Yahanda AM, Adler KM, Jew L, Ehsan MN, Brophy NA,
Halsey J, Gosland MP, Sikic BI. Alteration of etoposide pharmacokinetics and
pharmacodynamics by cyclosporine in a Phase I trial to modulate multidrug
resistance. J Clin Oncol 1992;IO:1635-1642
- Madsen JK, Jensen JD, Jensen LW, Pedersen EB. Pharmacokinetic interaction
between cyclosporine and the dihydropyridine calcium antagonist felodipine. Eur J
Clin Pharmacol 1996; 50: 203-8
- Mahalati K, Belitsky P, Sketris I, West K, Panek R. Neoral monitoring by
simplif,red sparse sampling area under the concentration-time curve. Transplantation
1999;68: 55-62
- Maggio TG, Bartels DW. Increased cyclosporin blood concentrations due to
verapamil administration. DICP 1988; 22: 105-101
- Mclachlan AJ, Tett SE. Effect of metabolic inhibitors on cyclosporine
pharmacokinetics using a population approach. Ther Drug Monit 1998; 2O:390-395
- Miller TP, Grogan TM, Dalton WS, Spier CM, Scheper RJ, Salmon SE. P-
Glycoprotein expression in malignant lymphoma and reversal of clinical drug
resistance with chemotherapy plus high-dose verapamil. J Clin Oncol I99I;9: I1-24
Page247
CHAPTER 10
- Min DI, Ku YM, Perry PJ, Ukah FO, Ashton K, Martin MF, Hunsicker LG. Effect
of grapefruit juice on cyclosporine pharmacokinetics in renal transplant recipients.
Transplantation 1996; 62(l): 123-5
- Miyama T, Takanaga H, Matsuo H, Yamano K, Yamamoto K, Iga T, Naito M,
Tsuruo T, Ishizuka H, Kawahara Y, Sawada Y. P-glycoprotein mediated transport
of itraconazole across the blood brain barrier. Antimicrob Agents Chemother 1998;
42:1138-1744
- Monaco AP, Burke JF, Ferguson RM, Halloran PF, Kahan BD, Light JA, Matas
AJ, Solez K. Current thinking on chronic renal allograft rejection: Issues, concerns
and recommendations from a 1997 roundtable discussion. Am J Kidney Dis 1997;
33: 150-160
- Morales JM, Rodriguez-Paternina E, Araque A, HernandezB. Ruilpoe LM,
Rodicio JL. Long-term protective effect of a calcium antagonist on renal function in
hypertensive renal transplant patients on cyclosporine therapy: A 5-year prospective
randomized study. Transplant Proc 1994; 26: 2598-2599
- Morris PJ. A critical review of immunosuppressive regimens. Transplant Proc
1996;28:31-40
- Morris RG, Saccoia NC, Ryall RG, Peacock MK, Sallustio BC. Specific enzyme-
multiplied immunoassay and fluorescence polarization immunoassay for cyclosporin
compared with cyclotrac¡r25l1 radioimmunoassay. Ther Drug Monit 1992; 14:226-
233
- Morris RG, Tett S, Ray JE. Cyclosporin A monitoring in Australia: Consensus
recommendations. Ther Drug Monit 1994; 16:5lO-516
Page 248
CHAPTER 10
- Morris RG. Australian cyclosporin therapeutic monitoring method survey: 1993.
Ther Drug Monit 1994; 16:564-569
- Morris RG, Saccoia NC, Jones TE. Modifred liquid chromatographic assay for
diltiazem and metabolites in human plasma. J Liq Chrom & Rel Technol 1996;
19(15): 2385-2394
- Morris RG. Cyclosporine assays, metabolite cross reactivity and pharmacokinetic
monitoring. Ther Drug Monit 2000; 22: 1,60-162
- Myre SA, Schoeder TJ, Grund VR, Wandstrat TL, Nicely PG, Pesce AJ, First MR.
Critical ketoconazole dosage range for ciclosporin clearance inhibition in the dog.
Pharmacology 1991 ; 43: 233-24I
- Nankivell BJ, Hibbins M, Chapman JR. Diagnostic utility of whole blood
cyclosporine measurements in renal transplantation using triple therapy.
Transplantat ion 1994; 5 8 : 989-996
- Neumayer HH, Wagner K. Diltiazem and economic use of cyclosporin. Lancet
1986; lI:523
- Novakova I, Donnelly P, Witte T, de Pauw B, Boezeman J, Veltman G.
Itraconazole and cyclosporin nephrotoxicity. Lancet 1981 ; 2: 920-921
- Odocha O, Kelly B, Trimble S, Murigande C, Toussaint RM, Callender CO. Cost-
containment strategies in transplantation: The utility of cyclosporine-ketoconazole
combination therapy. Transplant Proc 1996;28(2): 907 -9
- Oellerich M, Armstrong VW, Kahan B, Shaw L, Holt D'W, YatscoffR, Lindholm
A, Halloran P, Gallicano K, Wonigeit K, Schutz E, Schran H, Annesley T. Lake
Louise consensus conference on cyclosporin monitoring: Report of the consensus
panel. Ther Drug Monit 1995; l1:642-654
Page 249
CHAPTER 10
- Ohlman S, Lindholm A, Hagglund H, Sawe J, Kahan BD. On the intraindividual
variability and chronobiology of cyclosporine pharmacokinetics in renal
transplantation. Eur J Clin Pharmacol 1993;44:265-2692.
- Oppenheimer F, Alcaraz A, Manalich M, Ricart MJ, Vilardell J, Campistol JM,
Andreu J, Talbot-'Wright R, Fernandez-CrlzL. Influence of the calciumblocker
diltiazem on the prevention of acute renal failure aft.er renal transplantation.
Transplant Proc 1992;24(l):50-5 1
- Patton PR, Brunson ME, Pfaff 'WW, Howard RJ, Peterson JC, Ramos EL, Karlix
JL. A preliminary report of diltiazem and ketoconazole. Their cyclosporin-sparing
effect and impact on transplant outcome. Transplantation 1994;57(6):889-892
- Peters J, Bock J, Kucera V, Patel M, SmallI, Welker HA. Final study report -
Protocol BD14401: Safety, tolerabiJity and pharmacokinetics of Ro 40-5961 in post
renal transplant patients with cyclosporin A treatment. Roche Research Report No.
B-I59443,September lz't, lg95
- Peters WH, Kremer PG. Cytochromes P-450 in the intestinal mucosa of man.
Biochem Pharmacol 1989; 38: 1535-1538
- Pichard L, Gillet G, Fabre I, Dalet-Beluche I, Bonfils C, Thenot J-P, Maurel P.
Identification of the rabbit and human cytochromes P-450IIIA as the major enzymes
involved in the N-demethylation of diltiazem. Drug Metab Dispos 1990; 18: 711-719
- Pirsch JD, Miller J, Deierhoi MH, Vincenti F, Filo RS. A comparison of tacrolimus
(FK506) and cyclosporine for immunosuppression after cadaveric renal transplant.
Transplantatton I99l; 63: 911-983
- Pochet JM, Pirson Y. Cyclosporin-diltiazem interaction. Lancet 1986; I:919
Page 250
CHAPTER 10
- Ptachcinski RJ, Venkataramanan R, Rosenthal JT, Burckart GJ, Taylor RJ, Hakala
TR. The effect of food on cyclosporine absorption. Transplantation 1985; 4O: 114-
r16
- Rao VV, Dahlheimer JL, Bardgett ME, Snyder AZ,Ftnch RA, Sartorelli AC,
Piwnica-Worms D. Choroid plexus epithelial expession of MDR1 P glycoprotein and
multidrug resistance-associated protein contribute to the blood-cerebrospinal-fluid
drug-permeability barrier. Proc Natl Acad Sci USA 1999; 96: 3900-3905
- RegazziMB, Iacona I, Alessiani M, Spada M, Vaccarisi S, Villani P, Molinaro M.
Interaction between FK 506 and diltiazem in an animal model. Transplant Proc 1996;
28: 1017-1018
- Renton KW. Inhibition of hepatic microsomal drug metabolism by the calcium
channel blockers diltiazem and verapamil. Biochem Pharmacol 1985; 34(14): 2549-
2553
- Robson RA, Fraenkel M, Barratt LJ, Birkett DJ. Cyclosporin-Verapamil
interaction. Br J Clin Pharmacol 1988; 25:402-403
- Sabate I, Grino JM, Castelao J, Huguet D, Seron D, Blanco A. Cyclosporin-
Diltiazem interaction: Comparison of cyclosporin levels measured with two
monoclonal antibodies. Transplant Proc 1989 ; 2l(1) : 146O- 146I
- Sallustio BC, Morris RG, Saccoia NC, Mangas S, Kassapidis C. Reducing the cost
of cyclosporin assays: Modification of the EMIT 2000 method. Ther Drug Monit
1997; 19:208-2II
- Sattler M, Guengerich FP, Yun CH, Christians U, Swing KF. Cytochrome P-450
3A enzymes are responsible for biotransformation of FK506 and rapamycin in man
and rat. Drug Metab Dispos 1992;20:753-161
Page25l

CHAPTER 10
- Schran HF, Rosano TG, Hassell AE, Pell MA. Determination of cyclosporine
concentrations with monoclonal antibodies. Clin Chem 1981', 33: 2225-2229
- Schroeder JS, Gao SZ, Alderman EL, Hunt SA, Johnstone I, Boothroyd DB,
Wiederhold V, Stinson EB. A preliminary study of diltiazem in the prevention of
coronary artery disease in heart transplant recipients. N Engl J Med 1993:'328: 164-
no
- Schweizer RT, Rovelli M, Palmeri D, Vossler E, Hull D, Bartus S. Noncompliance
in organ transplant recipients. Transplantation 1990; 49: 31 4-371 .
- Seifetdin RA, Marcos-Alvarez A, Gordon FD, Lewis'WD, Jenkins RL. Nifedipine
interaction with tacrolimus in liver transplant recipients. Ann Pharmacother 1991:
3l:571-515.
- Shaw LM, Bowers L, Demers L, Freeman D, Moyer T, Sanghvi A, Seltman H,
Venkataramanan R. Critical issues in cyclosporine monitoring: Report of the task
force on cyclosporine monitoring. Clin Chem 1981:.33(7): 1269-1288
- Shaw LM, YatscoffRW, Bowers LD, Freeman DJ, Jeffrey JR, Keown PA,
McGilveray IJ, Rosano TG, Wong PY. Canadian consensus meeting on cyclosporine
monitoring: Report of the consensus panel. Clin Chem 1990; 36(10): 1841-1846
- Shaw MA, Gumbleton M, Nicholls PJ. Interaction of cyclosporin and itraconazole.
Lancet 1987;2:637
- Shennib H, Auger J. Diltiazem improves cyclosporin dosage in cystic fibrosis lung
transplant recipients. J Heart Lung Transplant 1994 l3(2):292-296
- Sketris IS, Methot ME, Nicol D, Belitsky P, Knox MG. Effect of calcium-channel
blockers on cyclosporin clearance and use in renal transplant patients. Ann
Pharmacother t994: 28 : 1221 - 123 I
Page252

CHAPTER 10
- Slaughter RL, Edwards DJ. Recent advances: The cytochrome P450 enzymes.
Ann Pharmacother 1995:. 29: 619-24
- Smith MS, Verghese CP, Shand DG, Pritchett ELC. Pharmacokinetic and
pharmacodynamic effects of diltiazem. AmJ Cardiol 1983;51:1369-14
- Sobh M, El-Agroudy A, Moustafa F, Harras F, El-Bedewy M, Ghoneim M.
Coadministration of ketoconazole to cyclosporin treated kidney transplant recipients:
A prospective randomised study. Am J Nephrol 1995; 15: 493-499
- Sokol RJ, Johnson KE, Karrer FM, Narkewicz MR, Smith D, Kam I: Improvement
of cyclosporin absorption in children after liver transplantation by means of water
soluble vitamin E. Lancet 1991; 338: 272-215
- Sonneveld P, Schoester M, de Leeuw K. Clinical modulation of multidrug
resistance in multiple myeloma: Effect of cyclosporine on resistant tumour cells. J
Clin Oncol 1994; 12:1584-1591
- Soons PA, Grib C, Breimer DD, Kirch W. Effects of acute febrile infectious
disease on the pharmacokinetics and effects of nitrendipine enantiomers and of
bisolol. Clin Pharmacokinet 1992; 23: 238-248
- Spencer CM, Goa KL, Gillis JC. Tacrolimus: An update of its pharmacology and
clinical effrcacy in the management of organ transplantation. Drugs 1991:' 54: 925-
915
- Starzl TE, Todo S, Fung J, Demetris AJ, Venkataramanan R, Jain A. FK 506 for
liver, kidney and pancreas transplantation. Lancet 1989; 2: 1000-1004
- Steimer 'W. Performance and specif,rcity of monoclonal immunoassays for
cyclosporine monitoring: How specific is specif,rc?. Clin Chem 1999;45 (3): 371-381
Page 253
CHAPTER 10
- Tanaka H, Kuroda A, Marusawa H, Hashimoto M, Hatanaka H, Kino T, Goto T,
Okuhara M. Physichochemical properties of FK-506, a novel immunosuppressant
isolated from Streptomyces Tsukubaensis. Transplant Proc 1987; 19: 11-16
- Teperman L, Turgut S, Negron C, Diflo DJ, Morgan G, Tobias H. Diltiazem is a
safe drug in transplant patients on Prograf and does not affect Prograf levels.
Hepatology 1996 AASLD Abstracts: 1804
- Tester-Dalderup CBM. Antifungal drugs. In: Dukes MNG (Ed) Myeler's Side
Effects Of Drugs, 12 edition. Amsterdam: Elsevier Science Publishers BY,1992;
672-686
- Thiebaut F, Tsúruo F, Hamada H, Gottesman MM, Pastan I, \ù/illingham MC.
Cellular localization of the multidrug-resistance gene product in normal human
tissues. Proc Natl Acad Sci USA 1987; 84:1135-7138
- Tia JF, Back J, Breckenridge AM. Calcium channel antagonists and cyclosporine
metabolism in vitro studies with human liver microsomes. Br J Clin Pharmacol 1989;
28:362-365
- Tia JF, Webber R, Back DJ. Cyclosporin metabolism by the gastrointestinal
mucosa. Br J Clin Pharmacol l99l:31: 344-346
- Tortorice KL, Heim-Duthoy KL, Awni WM, Rao KV, Kasiske BL. The effects of
calcium channel blockers on cyclosporin and its metabolites in renal transplant
recipients. Ther Drug Monit 1,990; I2@):321-328
- Tredger JM, Steward CM, Williams R. Cyclosporine blood levels - an evaluation
of radioimmunoassay with selective monoclonal or polyclonal antibodies and high-
performance liquid chromatography in liver transplant recipients. Transplantation
1988;46: 681-686
Page 254
CHAPTER 10
- Treiber GLG, Meinshausen J, Wolf J, Werrinloer J, Klotz U. Is cyclosporin A an
inhibitor of drug metabolism? Br J Clin Pharmacol 1990;30:11-1
- Trenk D, Brett W, Jahnchen E, Birnbaum D. Time course of
cyclosporin/itraconazole interaction. Lancet 1981 ; 2: 1335 - 1336
- Trull AK, Tan KKC, Uttridge J, Bauer T, Alexander GJM, Jamieson NV.
Cyclosporin absorption from microemulsion formulation in liver transplant recipient.
Lancet 1993',341:433
- Tsunoda SM, Aweeka FT. The use of therapeutic drug monitoring to optimise
immunosuppressive therapy. Clin Pharmacokinet 1996; 3O(2): IO7 -140
- Valentine H, Keogh A, Mclntosh N, Hunt S, Oyer P, Schroeder J. Cost
containment: Coadministration of diltiazem with cyclosporine after heart
transplantation. J Heart Lung Transplant \992;11: 1-8
- Vasquez EM, Pollak R. Effect of calcium channel blockers on graft outcome in
cyclosporine-treated renal allo graft recipients. Transplantation 1995 ; 60 (8) : 8 85-
887
- Venkataramanan R, Ptachcinski RJ, Burckart GJ, Gray J, Van Thiel DH, Starzl TE
Cyclosporin bioavailability in liver disease. DICP 1985; 19: 451
- Venkataramanan R, Swaminathan A, Prasad T, Jain A, Zuckerman S, 'Warty V,
McMichael J, Lever J, Burckart G, Starzl T. Clinical Pharmacokinetics of
Tacrolimus. Clin Pharmacokinet 1995; 29: 404-430.
-'Wacher VJ, Wu CY, Benet LZ. Overlapping substrate specif,rcities and tissue
distribution of cytochrome P450 3A and P-Glycoprotein: Implications for drug
delivery and activity in cancer chemotherapy. Mol Carcinog 1995; 13: 129-134
Page 255

CHAPTER 10
- Wadhwa NK, Schroeder TJ, Pesce AJ, Myre SA, Clardy CW, First MR.
Cyclosporine drug interactions: A review. Ther Drug Monit 1981;9:399-406
- Wagner K, Neumayer HH. Prevention of delayed graft function in cadaver kidney
transplants by diltiazem. Lancet 1985; II: 1355-1356
- Wagner K, Albrecht S, Neumayer HH. Prevention of posttransplant acute tubular
necrosis by the calcium antagonist diltiazem: A prospective randomised study. Am J
Nephrol 1987 ; 1 : 281 -29I
- Wagner K, Henkel M, Heinemeyer G, Neumayer HH. Interaction of calcium
blockers and cyclosporine. Transplant Proc 1988; 2O(2) Suppl 2: 56I-568
- Wagner K, Philipp Th, Heinemeyer G, Brockmuller F, Roots I, Neumayer HH.
Interaction of cyclosporin and calcium antagonists. Transplant Proc 1989;2I(l):
1453-1456
- Watkins PB. Drug metabolismby cytochromes P450 in the liver and small bowel.
Gastroenterol Clin North Arn 1992,2I(3): 51I-526
- V/eir MR. Therapeutic benefits of calcium channel blockers in cyclosporine-treated
organ transplant recipients: blood pressure control and immunosuppression. Am J
Med 1991; 90 (Supl5A); 325-365
- Whitington PF, Edmond JC, Whitington SH, Broelsch CE, Baker AL. Small bowel
length and the dose of cyclosporine in children after liver transplantation. N Engl J
Med 1990; 322:733-138
-'Witztum JL. Drugs used in the treatment of hyperlipoproteinaemias. In Goodman
& Gilman's Pharmacological Basis of Therapeutics, Hardman JG, Limberd LE,
MolinoffPB, Ruddon RW, Gilman AG (Eds) 1,996;815-891
Page 256
CHAPTER 10
- Wood AJ, for the European Multicentre Trial group. Cyclosporin as a sole
immunosuppressive agent in recipients of kidney allografts from cadaver donors:
Preliminary results of a European multicentre trial. Lancet 1982:2: 57 -60
- \üy'u CY, Benet LZ,Hebert MF, Gupta SK, Rowland M, Gomez DY, Wacher VJ.
Diferentiation of absorption and hrst pass gut and hepatic metabolism in humans:
Studies with cyclosporine. Clin Pharmacol Ther 1995;58:492-491
- Yahanda AM, Adler KM, Fisher GA, Brophy NA, Halsey J, Hardy RI, Gosland
MP, Lum BL, Sikic BI. Phase 1 trial of etoposide with cyclosporine as a modulator
of multidrug resistance. J Clin Oncol 1992; I0 1624-1634
- Yamaguchi Y for the Japanese FK506 study group. Clinicopathological evaluation
of kidney transplants in patients given a lxed dose of FK506. Transplant Proc l99l1,
23:3lll
- Yeung PKF, Mosher SJ, Quilliam MA, Montague TJ. Species comparison of
pharmacokinetics and metabolism of diltiazem in humans, dogs, rabbits and rats.
Drug Metab Dispos 1990; 18: 1055-1059
- Yeung PKF, Precott C, Haddad C, Montague TJ, McGregor C, Quilliam MA, Xei
M, Farmer P, Klassen GA. Pharmacokinetics and metabolism of diltiazem in healthy
males and females following a single oral dose Eur J Drug Metab Pharmacokinet
1993; 18: 199-206
- Zehs RF, Kinney EL. The pharmacokinetics of diltiazem in healthy American men.
Am J Cardiol 1982; 49: 529-532
- Zylber-KatzB, Granit L. Cyclosporine blood concentrations determined by
different assay methods in heart transplant recipients. Ther Drug Monit 1989; I 1:
592-5975
Page 257

APPENDICES
APPENDICES
Appendix 1a:
Questionnaire to heads of kidney transplant units to ascertain 260
data on individual patients for the frst 12 months post transplantation
Appendix 1:
Questionnaire to heads of transplant units regarding
use of cyclosporin-sparing agent use
Appendix 2:
Transplantation centres and responders to questionnaires
Appendix 3:
Ethics of Human Research submission for
cyclosporin-diltiazem dose response study
Appendix 3a:
Ethics of Human Research submission for
tacrolimus-diltiazem dose response study
Appendix 4:
Log-trapezoid rule used to calculate AUC
259
26t
263
210
211
Appendix 5:
Sigmoid Emax equation used to derive population estimates from individual
renal transplant data (Chapter 4) 277
Page258
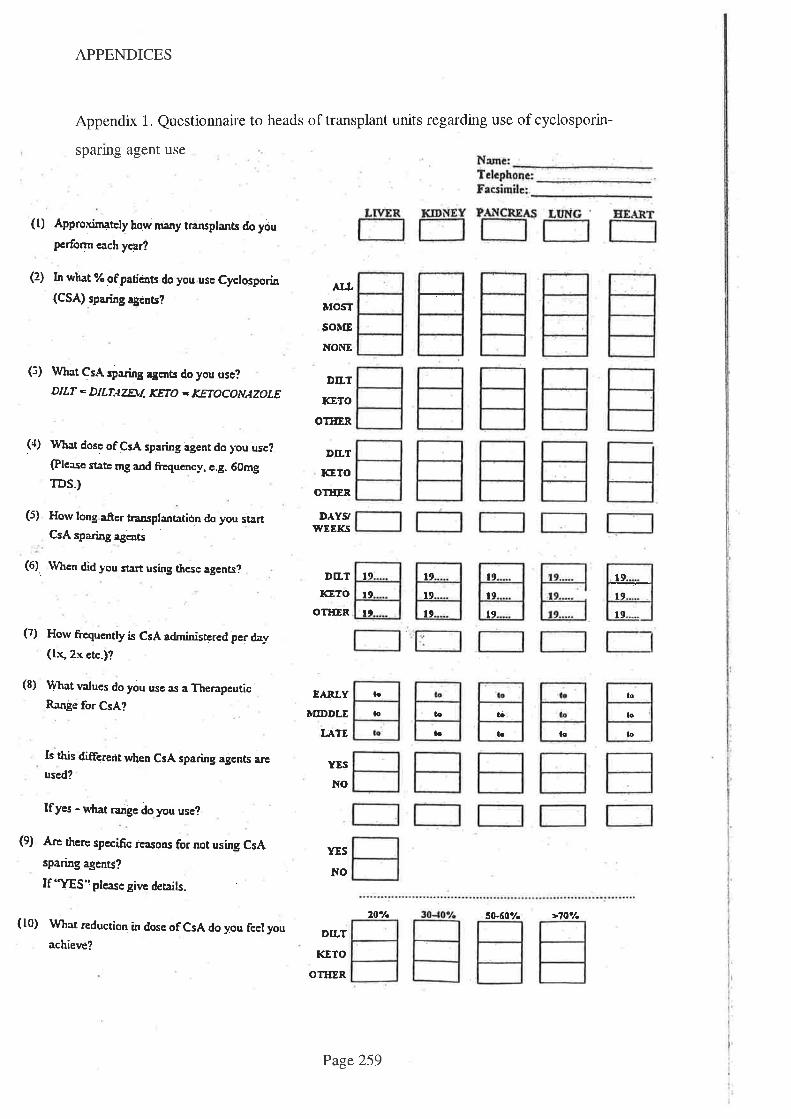
APPENDICES
Appendix 1. Questionnaire to heads of transplant units regarding use of cyclosporin-
sparing agent use
(t) Approximately how mary trarrsplants do you
pcrform each ycar?
(2) I¡ what % of paticnts do you use Cyctosporin
(CSA) sparing agcnts?
(3) What CsA sparing agmts do you use?
DILT - DILT¡L7EUI KETO - KETOCONAZOLE
(a) rrVhat dosc ofCsA sparing agent do you use?
(Plcase state mg and frrequency, c.g. 60mg
TDS.)
(5) Horv long after transplantatiön do you startCsA sparing agcnts
(6). Ilhcn did you start using these agents?
(7) How frcquently is CsA adminisærcd per da¡r
(lx, 2x ctc-)?
(8) \4/hat v¿ues do you use as a TherapeuticRange for CsA?
Is this different when CsA sparing agents a¡cused?
Ifyes - rr{rat ranle do you use?
(9) A¡c therc specific ieasons for not using CsA
sparing agents?
If 'Y¡S" please givc detaits.
(10) What reduction in dose oFCsA do you feel you
achieve?
^¡¡ÌrosT
soùE
NOIIE
DILT
KETO
OÎIIER
DTLT
KETO
o1Ë¡R
DÀYS'WEEI(.S
DfLT
trc81()
OTIIER
l9
l9l9
ao
la
l¡
lo
t!,
t9
t.t
tò
lo to
19
't9
l9
lo
lo
lo
EARLY
TÍIDDLE
IJTlE
YES
NO
DTLT
KETO
OTIIER
t9
t9
to
YES
NO
2O'/.
Page 259
sÈ60y. >70'/.
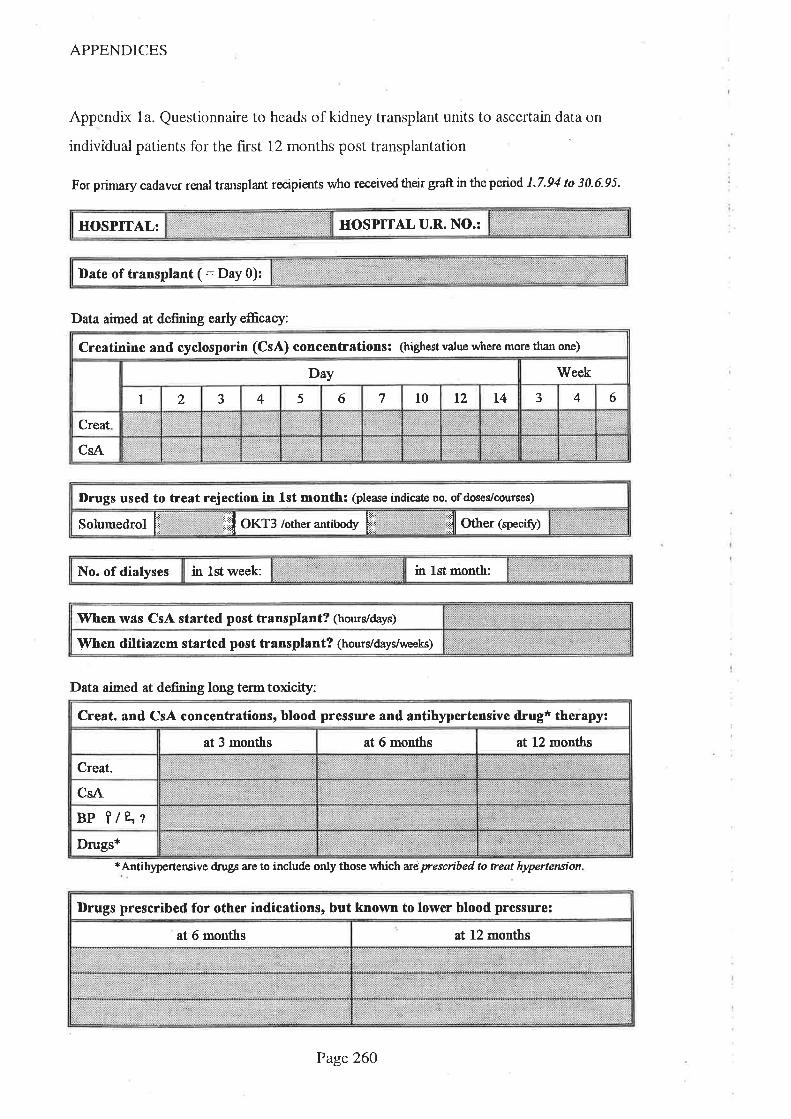
APPENDICES
Appendix 1a. Questionnaire to heads of kidney transplant units to ascertain data on
individual patients for the first 12 months post transplantation
For primary cadaver røral transplant recipients who received their graft in the period 1.7.94 to 30.6.95.
HOSPITAL U.R. NO.:HOSPITAL:
Date of transplant ( : Day 0):
Data aimed at defining earþ efEcacy:
Creatinine and cyclosporin (CsA) concentrations: (highest value u,here more than one)
Day Week
I 2 J 4 5 6 7 t0 t2 L4 .' 4 6
Creat
CsA
Drugs used to treat rejection in lst month: (please indicato no. of doseVcourses)
Solumedrol ft Êll orr: rottrer antiuoey [jÏ ill *- (speaty)
in lst month:No. of dialyses in lst week:
'When w¡s CsA started post transplant? (hours/days)
When diltiazem started post transplant? (hourldays/urceks)
Data aimed at defining long term toxicity:
*Antih)¡pertensive drugs a¡e to include only those tvhichariprescribed to treat hypertenaion
CreaL and CsA concentrations, blood pressure and antfüypertensive drug* therapy:
at 3 months at 6 months at 12 months
Creat-
CsA
Bp ?/e.'rDrugs*
Drugs prescribed for other indicstions, but known to lower blood pressure:
at 6 months at 12 months
Page26O
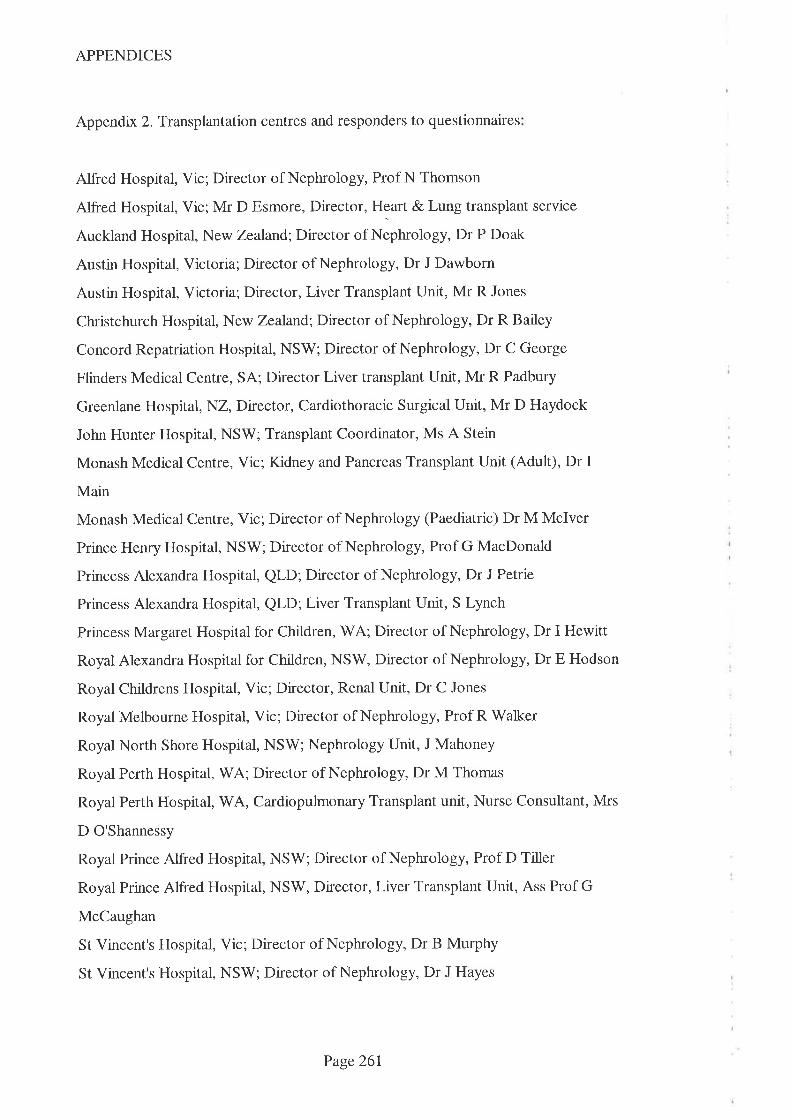
APPENDICES
Appendix 2. Transplantation centres and responders to questionnaires
Alfred Hospital, Vic; Director of Nephrology, Prof N Thomson
Alfred Hospital, Vic;Mr D Esmore, Director, Heart & Lung transplant service
Auckland Hospital, New Zealand;Director of Nephrology, Dr P Doak
Austin Hospital, Victoria; Director of Nephrology, Dr J Dawborn
Austin Hospital, Victoria; Director, Liver Transplant Unit, Mr R Jones
Christchurch Hospital, New Zealand; Director of Nephrology, Dr R Bailey
Concord Repatriation Hospital, NSW; Director of Nephrology, Dr C George
Flinders Medical Centre, SA; Director Liver transplant Unit, Mr R Padbury
Greenlane Hospital, NZ, Director, Cardiothoracic Surgical Unit, Mr D Haydock
John Hunter Hospital, NSW; Transplant Coordinator, Ms A Stein
Monash Medical Centre, Vic; Kidney and Pancreas Transplant Unit (Adult), Dr I
Main
Monash Medical Centre, Vic; Director of Nephrology (Paediatric) Dr M Mclver
Prince Henry Hospital, NSW; Director of Nephrology, Prof G MacDonald
Princess Alexandra Hospital, QLD; Director of Nephrology, Dr J Petrie
Princess Alexandra Hospital, QLD; Liver Transplant Unit, S Lynch
Princess Margaret Hospital for Children, WA; Director of Nephrology, Dr I Hewitt
Royal Alexandra Hospital for Children, NS'W, Director of Nephrology, Dr E Hodson
Royal Childrens Hospital, Vic; Director, Renal Unit, Dr C Jones
Royal Melbourne Hospital, Vic; Director of Nephrology, Prof R Walker
Royal North Shore Hospital, NSW; Nephrology Unit, J Mahoney
Royal Perth Hospital, WA;Director of Nephrology, Dr M Thomas
Royal Perth Hospital, WA, Cardiopulmonary Transplant unit, Nurse Consultant, Mrs
D O'Shannessy
Royal Prince Alfred Hospital, NSW; Director of Nephrology, Prof D Tiller
Royal Prince Alfred Hospital, NS'W, Director, Liver Transplant Unit, Ass Prof G
McCaughan
St Vincent's Hospital, Vic;Director of Nephrology, Dr B Murphy
St Vincent's Hospital, NSW; Director of Nephrology, Dr J Hayes
Page26l
APPENDICES
St Vincent's Hospital, NSW; Cardiopulmonary Transplant Unit, Dr A Keogh
Sir Charles Gairdner, WA; Director of Nephrology, Dr B Hutchinson
The Queen Elizabeth Hospital, SA; Director of Nephrology, Dr T Mathew
'Wellington Hospital, New Zealand; Director of Nephrology, Dr P Hatfield
'Women's and Childrens Hospital, Adelaide; Director, Dr K Jureidini
Westmead Hospital, NSW; Director of Nephrology, Dr J Chapman
St Georges Hospital, NSW, Head, Dept of Nephrology, Prof J Whitworth
Sir Charles Gairdner,'WA, Director, Liver Transplant Unit, Prof W Reid
Waikato Hospital, NZ, Director of Nephrology, Dr M Wallace
Page262

APPENDICES
Appendix 3. Ethics of Human Research submission for cyclosporin-diltiazem dose
response study
TitIE: THE INFLUENCE OF DILTIAZEM DOSE AND FREOUENCY ON
THE METABOLISM OF CYCLOSPORIN
lnvestigators: Mr T. Jones,.Pharmacy DePt
Mrs S. Goldsworthy, PharmacY DePt
Dr R. Morris, Dept of Clin Pharmacology
Dr W. James, Renal Unit
Dr T. Mathew, Renal Unit
Aim To study the effect of varying doses of diltiazem on themetabolism of cyclosporin A.
Background: Cyclosporin (CyA) is a complex molecule which is extensively
metabolized in the body. Several drugs have been shown to
reduce the extent of this metabolism and thus elevate CyA blood
levels. ln order to maintain blood levels within the accepted
'therapeutic range', the dose of CyA must be reduced in these
circumstances.Because CyA is particularly expensive (approximately $10,0O0per annum per patient), the concurrent use of metabol¡c
inhibitors can substantially reduce the net cost of this ímportant
immunosuppressive agent and this is widely practised throughoutthe world. Among the drugs which have been shown to reduce
the metabolism of cyclosporin, diltiazem has been exploited by
most transplant centres because of its limited adverse effectprofile and indications in hypertension and ischaemic heart
disease (disorders frequently encountered in renal transplantrecipients). Coprescribing diltiazem with CyA results inreduct¡ons of approximately 30% in CyA dosage and total drug
cost at T.O.E.H. (diltiazem ís relatively cheap).
The metabolic interaction was init¡ally noted anecdotally in CyA
treated patients who were prescribed diltiazem for hypertension
+/- ischaemic heart disease and subsequent trials have
confirmed this interaction using 'traditional' anti-
hypertensive/antianginal doses (viz 90mg per day to 360m9 per
day). Since the indication for diltiazem in many CyA patients is apurely metabolic one (viz. to reduce the dose of CyA ), and since
there is no dose ranging data available on this interaction, it ispertinent to examine the nature of the metabolic interaction in
Page 263

APPENDICES
Methodology
lnclusion Criteria
Exclusion Criteria
greater detail. This information should allow the selection of the
minimum diltiazem dosage and frequency consistent with
reducing CyA dose (and thus cost) while reducing the risk of
adverse effects from excessive doses of diltíazem'
The enzymatic nature of the cyA - diltiazem interaction is not
well understood but has been reported to be 'non competitive''
There is thus the potential that the effect on the enzyme persists
after diltiazem is removed from the bloodstream and its
antihypertensive and antianginal effect have dissappeared. Ïhismay allow once (or twice) daily diltiazem dosing instead of the
current thrice daily regimen which should improve patient
compliance.
Because cyclosporin's metabolism is complex and its metabolites
may possess activity (immunosuppressive and/or toxic), the
study will entail measurements of both parent cyclosporin AND
total metabolite levels (specific and non-specific immunoassay
methodology). These levels will also be related to any observed
changes in toxicity #/- immunosuppressive effect'
Subjects:8 renal transplant patients who are NOT currently
receiving diltiazem will be enrolled.
-males or females age between 18 years and 65 years
-stable renal function over 3 months
-plasma creatinine level less than l SOmicromol/L
-stable cyclosporin dose and plasma cyclosporin level within the
range 80 - 150 over at least 4 weeks.
-signed consent form
-patients with cyclosporin levels less than 80 or greater than 150
-known contraindication to diltiazem including:
-documented idiosyncrasy or hypersensitivity, sick sinus
syndrome, hypotension (systolic B.P. less than 90mm Hg),
severe congestive cardiac failure, acute myocardial infarction and
pulmonary congestion
-unwillingness or inability to understand/comply with
requirements as stated in informat¡on sheet
Page 264
APPENDICES
Withdrawal Criteria-development of any of the above exclusion criteria
-rise in plasma creatinine level of 3Omicromol/L (or greater) from
baseline value that cannot be explained by other factors (eg
dehydration)-patient request
-development of any adverse event thought to be caused by
diltiazem or due to interference with the metabolism of CyA
-use of any drug known to affect CyA metabolism (including
erythromycin, co-trimoxazole, ketoconazole)
Volunteer payment/accomodation :
Patients will be accomodated in ward 3A, Bay 1 for the duration
of each of the study days. This will be from approximately 7am
to 9am (a total of 26hours).
Four patients will be accomodated in this bay at each time at
intervals of 2 weeks. Beds and meals will be provided by the
hospital (paid for from study funds).
Payment ($50.OO) will be made for each day of study with a
completion bonus ($2OO.0O) being offered for the last study day.
Given the 26 hour stay, this amount is merely an honorarium and
we do not should not itself induce volunteers to participate.
Diltiazem dose escalation1)Commence diltiazem at dose of Smg mane - monitor CyA and
diltiazem levels
2)lncrease diltiazem dose to 1Omg mane and repeat monitoring
3)Continue diltiazem dose escalation as follows - 20mg mane
then 30mg mane, then 6Omg mane then 90mg mane.
Parent CyA tevels will be monítored routinely and will guide dosage increments such
that a balance can be struck between the need to define the dose-response curve
and undue imposition on the patient.
4)The temporal nature of the cyA metabolism (ie whether there
is a chronopharmacokinetic effect) and the CyA - diltiazem
interaction will be determined by blood sampling over twosequential CyA doses (ie over a 24 hour period) and if results
indicate a short term effect on cyclosporin levels, a twice da¡ly
diltiazem dosage regimen will be implemented.
Page 265
APPENDICES
Blood level monitoring:1)Trough blood CyA levels will be determined 5 - 7 days after
each diltiazem increment to ensure CyA levels do not r¡se
dramatically. Pr¡or to each diltiazem dosage incremenf., a 24
hour CyA dose-interval kinetic profile will be determined (blood
levels taken at 0 hour, t hour, 2hour,3 hour, 4 hour, I hour
and 1 2 hours post dose for 2 doses.
2)Whole blood CyA levels will be determined by specifíc EMIT
assay and metabolite levels calculated by subtracting this value
from the total (ie parent drug and metabolites) determ¡ned by a
non specific immunoassay.
3)Diltiazem levels will be measured prior to the next dose
increment at times O hour, t hour, 2 hours, 3 hours, 4 hours, 8
hours and 24 hours. These levels will be determined from the
same blood sample as the CyA blood levels.
4)Diltiazem assay will be performed by HPLC.
5)Blood samples will be taken by tra¡ned R.N.s who will be on
duty on 3C. The proximity of ward 3A will facilitate th¡s
sampling and staffing levels on 3C will be increased to cover the
anticipated needs of the group (funds will be provided from
study funds).
6)Blood samples will be taken from an indwelling catheter
inserted by an experienced mediacl officer and patency
maintained by flushing with heparinized saline (as per agreed
protocol). Samples will be stored in an EDTA tube and split ¡nto
a whole blood sample (for CyA assay) and plasma sample (for
diltiazem assay) after centrifuging. Clinical Chemistry staff willspin and freeze the blood.
Cyclosporin dosage alterations:
1)Cyclosporin level increases will be closely monitored and if
they exceed the upper limit of the therapeut¡c range (250), the
CyA dose will be reduced by an appropriate decrement.
2)Plasma creatinine levels that rise more than 30micromole/L
above baseline and that are thought to be consistent with CyA
toxicity will be treated by reducing CyA dosage in a similar
fashion.
Page 266
APPENDICES
Ethical lssues
Drugs
The combined use of diltiazem and CyA is widepsread and has
not been shown to increase the risk of adverse eventsexperienced by the patient. lndeed, it has been suggested thatdiltiazem might reduce some of the nephrotoxic adverse effectsof CyA . Patients will be recruited from the renal transplantpopulation who are not receiving diltiazem, primarily becausethey received the¡r transplant before the combined use of CyAand diltiazem became popular.
Close monitoring of CyA levels will allow dosage reductÍons tobe made where necessary which will ensure that the levels donot exceed those considered safe. (An alterative approach is
reduce the diltiazem dose in patients already receiving thecombination and increase the dose of cyclosporin in order tomaintain the levels in the normal range. This approach is
considered more dangerous in that it exposes the patient to thepossibility that cyclosporin levels may fall to a point whereimmunosuppression fails and rejection may ensue).lnvolvement in this trial will require more blood samples beingperformed than would otherw¡se occur but such sampling is wellestablished and is not considered to be a major ethical issue.The requirement to be available for regular blood sampling over a
24 hour period for each diltiazem dosing increment (initially on 6
occasions over a 3 month period) will be clearly explained to thepatients and a payment as outlined above will be made.
Diltiazem is marketed in Australia for the treatment of ischaemicheart disease and hypertension. Since it is being used in thistrial to reduce the metabolísm of CyA, this will require a CTNapplication. The pharmacy dept. will manufacture capsulescontain¡ng 5mg and 10mg diltiazem either from tablets or fromraw material supplied by the drug company. These will be
manufactured and assayed according to the Code Of GoodManufacturing Practice.
Drug company (l.C.l.) support has been sought for purchase ofdrug, assay kits, payment to volunteers, boarding & meal costsetc as outlined above.
Page 267

APPENDICES
Analysis:The object of the trial ¡s to relate the dose and/or plasma level of
diltiazem to the dose and blood level of CyA and metabolites'
Patientswillbetheirowncontrolsandindividualandaveragedata will be analysed to determine the magnitude of any
observed effect. Results will be reported in an appropriate
refereed iournal.
Page268
APPENDICES
THE OUEEN ELIZABETH HOSPITAL
PATIENT CONSENT FORM
THE INFLUENCE OF DILTIAZEM DOSE AND FREOUENCY ON THE METABOLISM OF
CYCLOSPORIN
l, the undersigned . hereby consent to part¡cipate in the
above research project.
I acknowledge that the nature, purpose and effects of the trial so far as they affect
me have been fully explained to my satisfaction and my consent is given voluntarily
The detail of the procedures proposed including the length of time, frequency of
blood monitoríng and indication of discomfort have been explained.
I acknowledge that the trial may not be of direct benef¡t to me
I have been given the opportunity to have a family member/friend present while the
project was explained to me and have received a copy of the'Patient lnformation'
sheet.
I am informed that although the results of the trial will be published, no information
will be divulged which could in any way identify me.
I understand that I am free to withdraw from the trial at any time and that my future
treatment at this hospital will not be prejudiced in any way by this action. lf I decide
to withdraw from the trial, I understand that my cyclosporin levels will need to be
monitored and the dosage adjusted to prevent rejection of my kidney.
SIGNED:...
ADDRESS:
DATE:...........--
WITNESS SIGNATURE:.......
WITNESS NAME (print).......
DATE:
Page 269
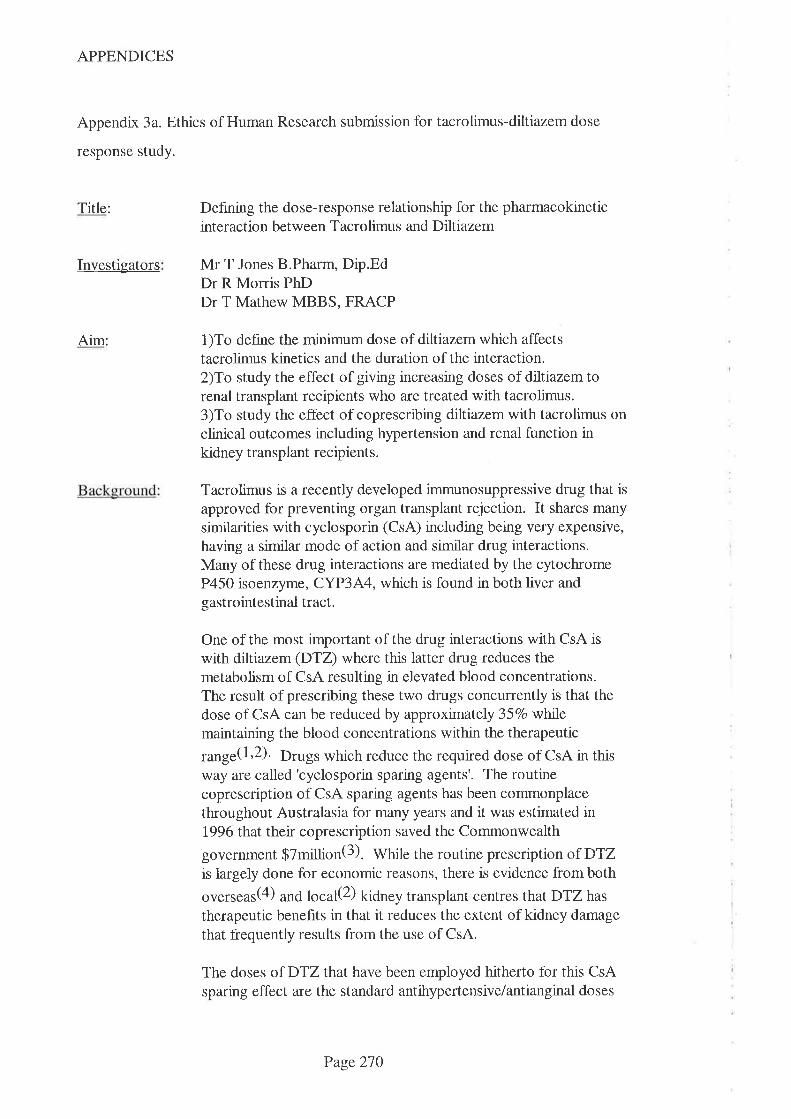
APPENDICES
Appendix 3a. Ethics of Human Research submission for tacrolimus-diltiazem dose
response study.
Title: Defining the dose-response relationship for the pharmacokineticinteraction between Tacrolimus and Diltiazem
Investigators Mr T Jones B.Pharm, Dip.EdDr R Morris PhDDr T Mathew MBBS, FRACP
Aim: 1)To define the minimum dose of diltiazem which affects
tacrolimus kinetics and the duration of the interaction.2)To study the effect of giving increasing doses of diltiazem torenal transplant recipients who are treated with tacrolimus.3)To study the effect of coprescribing diltiazem with tacrolimus on
clinical outcomes including hypertension and renal function inkidney transplant recipients.
Tacrolimus is a recently developed immunosuppressive drug that isapproved for preventing organ transplant rejection. It shares many
similarities with cyclosporin (CsA) including being very expensive,
having a similar mode of action and similar drug interactions.Many of these drug interactions are mediated by the cytochromeP450 isoenzyme, CYP3A4, which is found in both liver andgastrointestinal tract.
One of the most important of the drug interactions with CsA iswith diltiazem (DTZ) where this latter drug reduces the
metabolism of CsA resulting in elevated blood concentrations.The result of prescribing these two drugs concurrently is that thedose of CsA can be reduced by approximately 35Vo whilemaintaining the blood concentrations within the therapeutic
range(7,2). Drugs which reduce the required dose of CsA in this
way are called 'cyclosporin sparing agents'. The routinecoprescription of CsA sparing agents has been commonplacethroughout Australasia for many years and it was estimated in1996 that their coprescription saved the Commonwealth
government $Tmillion(3). Wme the routine prescription of DTZis largely done for economic reasons, there is evidence from both
ouers"ur(4) and local(2) kidney transplant centres that DTZ has
therapeutic benefits in that it reduces the extent of kidney damage
that frequently results from the use of CsA.
The doses of DTZ that have been employed hitherto for this CsAsparing effect are the standard antihypertensive/antianginal doses
Page 270
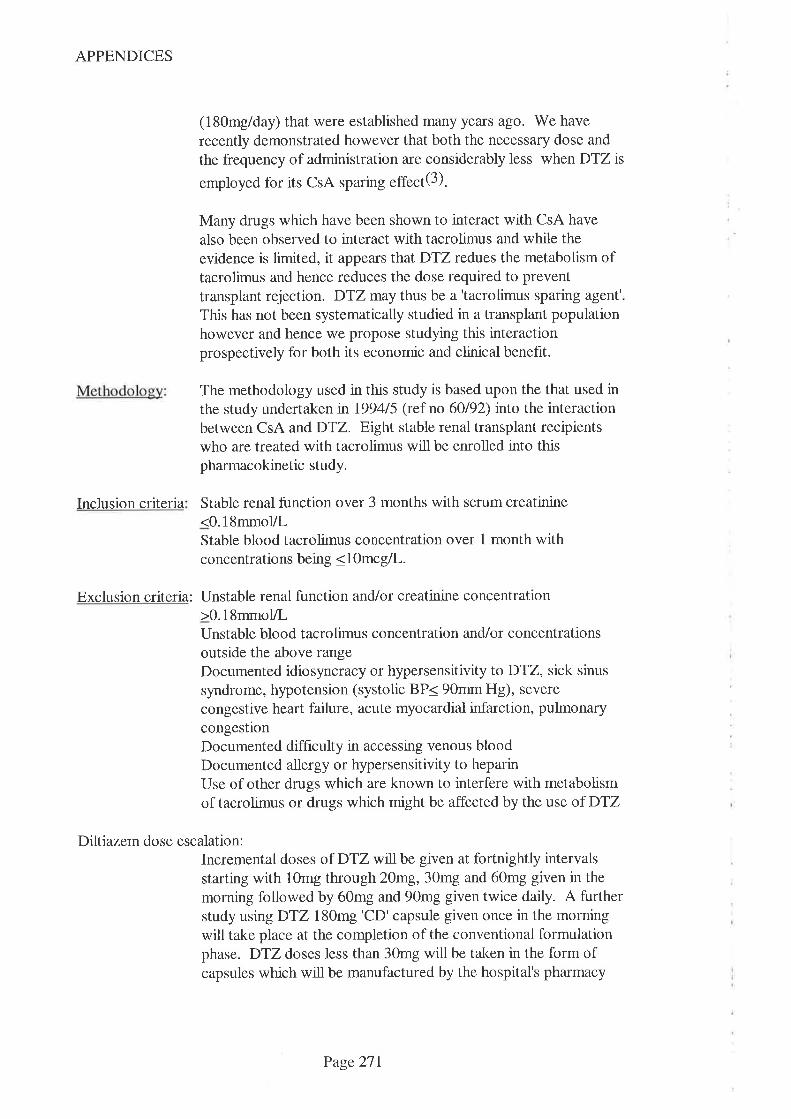
APPENDICES
(180mg/day) that were established many years ago. 'We have
recently demonstrated however that both the necessary dose and
the frequency of administration are considerably less when DTZ is
employed for its CsA sparing effect(3).
Many drugs which have been shown to interact with CsA have
also been observed to interact with tacrolimus and while the
evidence is limited, it appears thatDTZ redues the metabolism oftacrolimus and hence reduces the dose required to prevent
transplant rejection. DTZ may thus be a 'tacrolimus sparing agent'
This has not been systematically studied in a transplant populationhowever and hence we propose studying this interactionprospectively for both its economic and clinical benefit.
The methodology used in this study is based upon the that used inthe study undertaken n 1994/5 (ref no 60/92) into the interactionbetween CsA and DTZ. Eight stable renal transplant recipientswho are treated with tacrolimus will be enrolled into thispharmacokinetic study.
Inclusion criteria Stable renal function over 3 months with serum creatinine<0.18mmol/LStable blood tacrolimus concentration over 1 month withconcentrations being < lOmcg/L.
Exclusion criteria: Unstable renal function and/or creatinine concentration>0.18mmol,/LUnstable blood tacrolimus concentration and/or concentrationsoutside the above range
Documented idiosyncracy or hypersensitivity to DTZ, sick sinus
syndrome, hypotension (systolic BP< 90mm Hg), severe
congestive heart failure, acute myocardial infarction, pulmonary
congestionDocumented diffrculty in accessing venous bloodDocumented allergy or hypersensitivity to heparinUse of other drugs which are known to interfere with metabolismof tacrolimus or drugs which might be affected by the use of DTZ
Diltiazem dose escalation:Incremental doses of DTZ willbe given at fortnightly intervals
starting with 10mg through 20mg,30mg and 60mg given in the
morning followed by 60mg and 90mg given twice daily. A furtherstudy using DTZ 180mg 'CD'capsule given once in the morning
will take place at the completion of the conventional formulationphase. DTZ doses less than 30mg will be taken in the form ofcapsules which will be manufactured by the hospital's pharmacy
Page 271
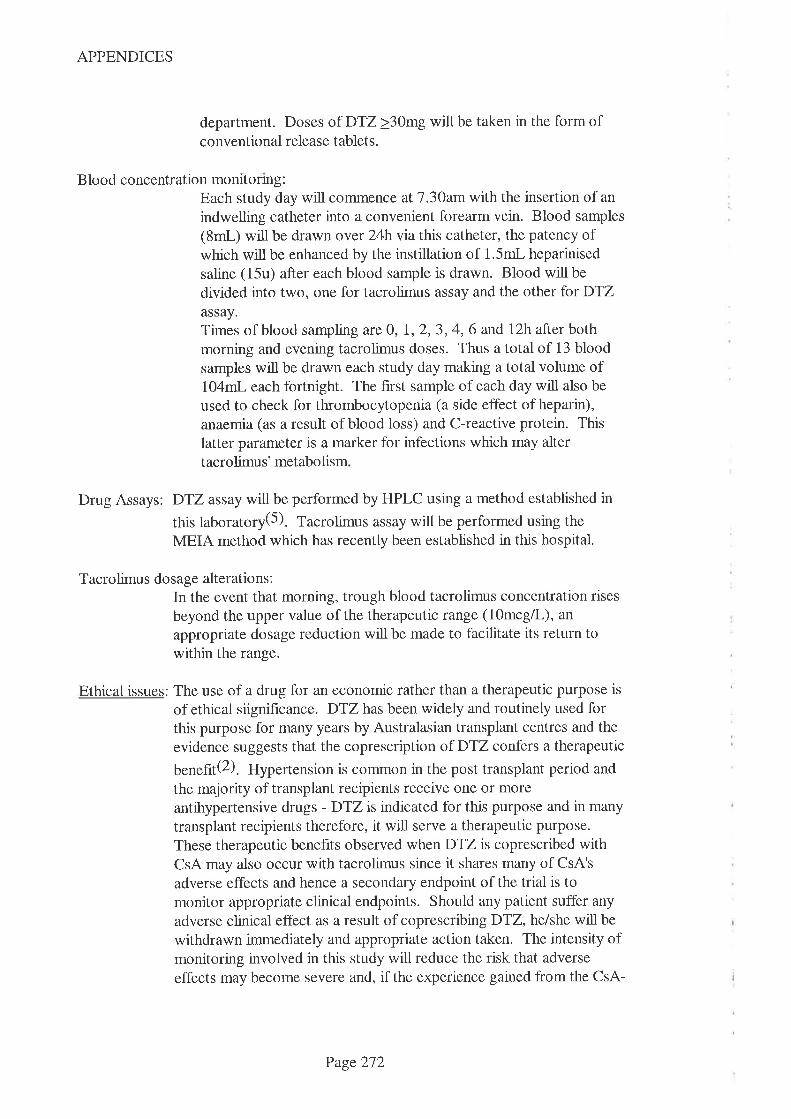
APPENDICES
department. Doses of DTZ >30mg will be taken in the form ofconventional release tablets.
Blood concentration monitoring:Each study day will cornmence at7 .3}amwith the insertion of an
indwelling catheter into a convenient forearm vein. Blood samples
(8mL) will be drawn over 24h via this catheter, the patency ofwhich will be enhanced by the instillation of 1.5mL heparinised
saline (15u) after each blood sample is drawn. Blood will be
divided into two, one for tacrolimus assay and the other for DTZassay'
Times of blood sampling ate 0, I,2,3, 4, 6 and 12h after bothmorning and evening tacrolimus doses. Thus a total of 13 blood
samples will be drawn each study day making a total volume of104mL each fortnight. The first sample of each day will also be
used to check for thrombocytopenia (a side effect of heparin),
anaemia (as a result of blood loss) and C-reactive protein. This
latter parameter is a marker for infections which may altertacrolimus' metabolism
Drug Assays: DTZ assay will be performed by HPLC using a method established in
this laboratory(5). Tacrolimus assay will be performed using the
MEIA method which has recently been established in this hospital.
Tacrolimus dosage alterations:In the event that morning, trough blood tacrolimus concentration rises
beyond the upper value of the therapeutic range (lOmcgll-), an
appropriate dosage reduction will be made to facilitate its return towithin the range.
Ethical issues: The use of a drug for an economic rather than a therapeutic purpose is
of ethical siignificance. DTZ has been widely and routinely used forthis purpose for many years by Australasian transplant centres and the
evidence suggests that the coprescription of DTZ confers a therapeutic
6ens¡¡(2). Hypertension is common in the post transplant period and
the majority of transplant recipients receive one or more
antihypertensive drugs - DTZ is indicated for this purpose and in many
transplant recipients therefore, it will serve a therapeutic purpose.
These therapeutic benehts observed when DTZ is coprescribed withCsA may also occur with tacrolimus since it shares many of CsA's
adverse effects and hence a secondary endpoint ofthe trial is to
monitor appropriate clinical endpoints. Should any patient suffer any
adverse cänical effect as a result of coprescrlbngDTZ, he/she will be
withdrawn immediately and appropriate action taken. The intensity ofmonitoring involved in this study will reduce the risk that adverse
effects may become severe and, if the experience gained from the CsA-
Page 272
APPENDICES
Drugs
DTZ interaction study are a guide, patients may benefit from the
intensity of monitoring (eg optimising blood pressure control).
While CsA has improved graft survival, it has increased the cost ofimmunosuppression - CsA is approximately 10 times more expensive
than previous immunosuppressive drugs. The use of CsA sparing
agents has allowed organ transplant recipients in developing countries
and the underinsured patient in the USA to receive CsA when they
would not have been able to afford it if prescribed alone. It is unlikelythat organ transplant recipients in these countries will be able to benefit
from tacrolimus unless a similar cost reduction strategy is employed
since this new immunosuppressive drug is more expensive than CsA.
When used for kidney transplantation, tacrolimus is NOT currently
funded via the 'section 100' scheme in Australia with the result that this
hospital pays for the costs (approximately $13,000 per patient per
annum). Assuming thatDTZ spares tacrolimus to the same extent that
it spares cyclosporin, anticipated savings that might result from the
coprescription of DTZ will be approximately $4000 per annum per
patient.
Study participants will be offered $100 per study day to recompense
them for inconvenience, taxi fares etc. This sum is not considered to
be large enough to induce people to enrol in the study and is in keeping
with similar remuneration offered to participants in similar trials inAdelaide. Some participants may be bored by the need to stay inhospital but because participants will serve as their own controls, we
are keen that participants should not withdraw for non medical reason.
To reduce the likelihood that participants will withdraw, we will offer a
$200 completion bonus. Participants will be withdrawn from the trial ifit is considered by their doctor to be injurious to their health.
Tacrolimus is a powerful immunosuppressive drug that has been used
both to prevent and to treat rejection for a variety oforgan transplant
recipients. It is currently approved for liver transplantation only in
Australia but indications for kidney transplantation have been granted
in USA, UK and have been applied for in Australia. Patients invited toenrol in the study will already be receiving tacrolimus forimmunosuppression to prevent kidney transplant rejection.
DTZ is a calcium channel blocking agent that has been widely used
throughout Australia for the treatment of hypertension and angina
pectoris. It is considered by most authorities to have a safe adverse
reaction proftle, especially in the doses that are being used in this trial.
Adverse effects that have been reported include:-Headache, dizziness, bradycardia, first degree heart block, oedema,
asthenia, rash and dyspepsia.
Page 273
APPENDICES
Because DTZ is known to interact with the CYP3A4 enzyme system
and because tacrolimus' metabolism is known to be affected by the use
of drugs which interact with this system, no other drug which is knownto affect tacrolimus (or cyclosporin) metabolism will be permitted, nor
will any drug whose metabolism is affected byDTZ be permitted
during the course of the trial. These drugs include erythromycin,
cisapride, terfenadine, ketoconazole, itraco n azole, verap amil and
grapefruit juice. In addition, the use of beta blockers will be restricted
since the combined use of 'normal doses' (viz >180mg per day) of DTZcan result in additive cardiac effects.
Funding Funding sources have yet to be finalised but we anticipate that these
might include TQEH since the savings that will result from thecoprescription of DTZ may well exceed the costs of performing the
trial.
Housing Patients will be housed in a suitable anea (perhaps a vacant ward) forthe 24h period. Meals will be provided by the hospital's catering dept
and a television will be provided.
CTN/CTX A CTN application will be made because the capsule oÏDTZ that are
made by the hospital pharmacy are not a marketed formulation. Thesame processes that were used n 1994/5 will be used in this trial. TheCTN application is also required because tacrolimus is not yet
approved for kidney transplantation in Australia.
Refs:1)Jones TE, Morris RG, Mathew TH. Diltiazem-cyclosporin pharmacokinetic
interaction - dose-response relationship. Br J Clin Pharmacol1991:-44: 499-504
2)Chrysostomou A, Walker RG, Russ GR, D'Apice AJF, Kincaid-Smith P, MathewTH. Diltiazem in renal allograft recipients receiving cyclosporine. Transplantation1993; 55(2): 300-43)Jones TE. Survey of cyclosporin-sparing agent use in Australasian transplant
centres. Aust NZ J Med 1996;26:112-1764)Wagner K, Philipp Th, Heinemeyer G, Brockmuller F, Roots I, Neumayer HH:Interaction of cyclosporin and calcium antagonists, Transplant Proc, 1989,2I, (l)1453-14565)Morris RG, Saccoia NC, Jones TE. Modified liquid chromatographic assay fordiltiazem and metabolites in human plasma. J Liq Chrom & Rel Technol 1996;
19(15): 2385-2394
Page 274
APPENDICES
Patient Information SheetTacrolimus-Diltiazem Interaction Study
You are invited to participate in this study which aims to define the size and frequencyof the dose of Diltiazemwhich will affect the blood concentration of Tacrolimus. The
study will also address the safety of prescribing these two drugs together.
Tacrolimus is an immunosuppressive drug (suppresses the immune system) whichprevents your transplanted kidney from being rejected. Diltiazem is used for the
treatment of high blood pressure and angina (chest pain) and the recommended doses
in Australia are between 180-360mg per day. In this trial, you will be given increasing
doses of Diltiazem each fortnight, starting at nil and increasing up to a maximum dose
of 180mg per day.
Diltiazem is considered to have a safe side effect profrle but you may suffer one ormore of the following side effects:
low blood pressure, headache, nausea, rash, water retention and abnormalheart conduction.Most of these side effects are related to the dose used and since most of the doses
used in this trial are very low, it is untkely that you will suffer any side effects. Yourblood pressure will be carefully monitored during the course of the study and if youexperience this or any other side effect, you may be withdrawn from the study. Youmay also withdraw from the study at anytime if you wish and your treatment at this
hospital will not be affected by this decision. If you do decide to withdraw fiom thestudy, we may need to take a few additional blood samples to ensure the tacrolimusconcentration in your blood is at the correct level to prevent your kidney fromrejecting.
Diltiazem has been prescribed routinely with the other major immunosuppressive drugused in Australia (cyclosporin) for many years because there is evidence that diltiazemprotects the kidney from some of the side effects of cyclosporin. Since tacrolimus and
cyclosporin cause the same type of kidney damage, we anticipate that diltiazem may
reduce the kidney damage that can sometimes be seen in patients treated withtacrolimus. Dtltiazem also reduces the rate of metabolism of cyclosporin and therebyallows the dose of cyclosporin to be reduced by approximately 35To without impairingits efficacy. The savings to the taxpayer from this lower dose of cyclosporin are
significant (approximately $7mi11ion per annum). Tacrolimus is more expensive than
cyclosporin and if diltiazem reduces tacrolimus' metabolism by a similar amount, weanticipate that approximately $4,000 will be saved for every patient each year.
You will be required to come into hospital for a full day (a little over 24 hours) each
fortnight for a total of 8 visits spanning 4 months. In the morning of each study day,
an indwelling catheter will be placed in a convenient vein in the forearm and bloodsamples will be drawn from this tube over the next 24 houl. period. Sample times willbe 0, 1, 2, 3, 4,6 and 12 hours after both morning and evening doses of tacrolimus.The tube will be removed the next morning when you will be free to return home.
Each blood sample will be 8mL (approximately 2 teaspoonsful) so that a total volume
Page 275
APPENDICES
of 104mL (approximately half a cupful) of blood will be taken each fortnight. The
tube will be injected with a low dose of heparin to help keep it working - this drug has
been used for decades to prevent blood clotting. One of the side effects which may be
caused by heparin is reduced numbers of platelets and we will monitor yow blood forthis problem as well as for anaemia which may occur due to the blood we take. You
may suffer some pain and bruising as a result of the indwelling catheter.
While in hospital, you will be free to move around and a television will be provided
for your entertainment. Meals will be provided by the hospital. To compensate you
for out of pocket expenses and taxi fares, you will be given $100 each study day and
upon completion of the study, you will be given an additional bonus of $200.
Because diltiazem and tacrolimus are affected by (and can affect) other drugs, you
will not be allowed to take any other drug which can interfere with the metabolism oftacrolimus or whose metabolism could be affected by diltiazem. These drugs include
terfenadine ('Teldane'), erythromycin ('Eryc'), cisapride ('Prepulsid'), ketoconazole('Nizoral'), verapamil ('Isoptin', 'Anpec', 'Cordilox'). You will not be allowed to take
grapefruit juice either and, as a matter of principle, before any new drug is taken, one
ofthe researchers should be contacted so that the prescriber can be advised ofthepotential for interaction and alternatives sought.
If diltiazem proves to reduce the side effects of tacrolimus (especially any damage toyour kidney), then this may prolong the life of your kidney. You may also be able toreduce the number of blood pressure medications that you take. We cannot guarantee
that you will derive any beneht from participation in this trial however. If you wouldlike to speak to either ofthe researchers about the project, they can be contacted thus:
Terry Jones 82226000 (ask switchboard to page)
Ray Morris 82226153Dr Matthew 82226665If you wish to speak to someone who is not involved with the trial, please contact
Paul Miller, Executive Officer, The Ethics Of Human Research Committee on
82226000 (ask switchboard to page)
Page 276
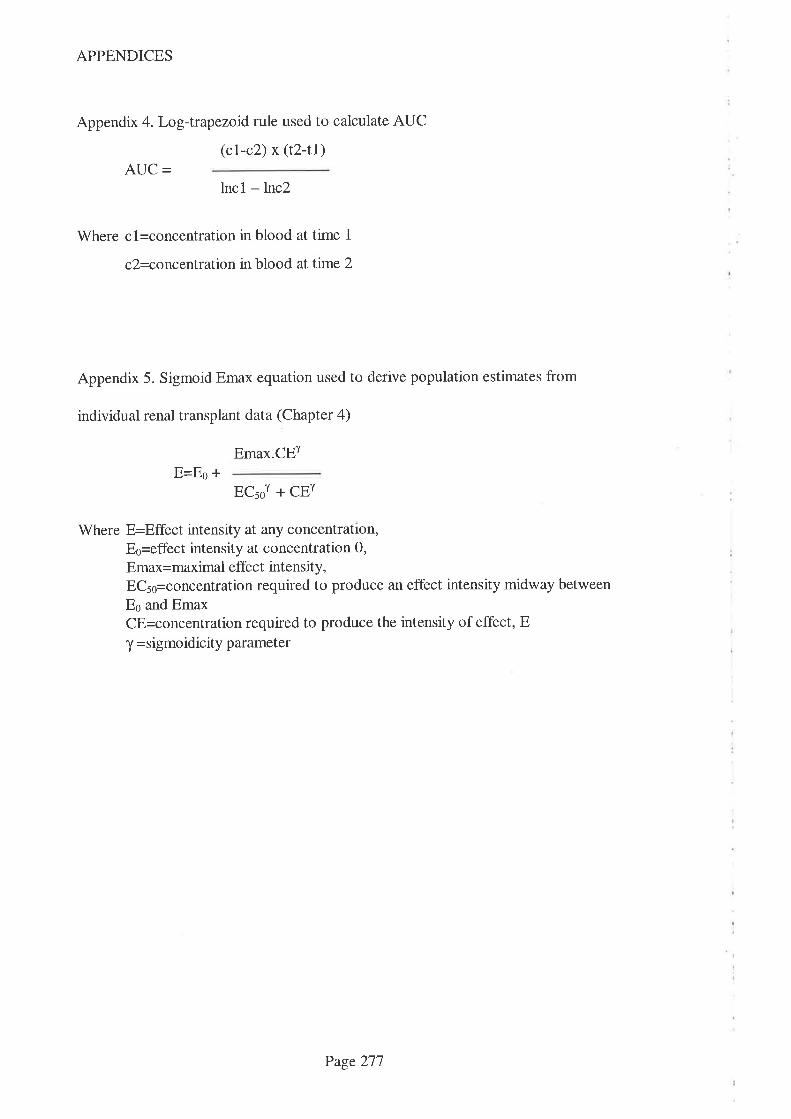
APPENDICES
Appendix .Log-trapezoidrule used to calculate AUC
(cl-c2) x (t2-tI)AUC =
lncl - lnc2
Where cl=concentration in blood at time 1
c2=coírceÍrtration in blood at time 2
Appendix 5. Sigmoid Emax equation used to derive population estimates from
individual renal transplant data (Chapter 4)
Emax.CEÏE=Eo *
ECsoT + CEY
Where E=Effect intensity at any concentration,Eo=effect intensity at concentration 0,
Emax=maximal effect intensity,EC5'=s¡nsentration required to produce an effect intensity midway between
Es and EmaxCE=concentration required to produce the intensity of effect, E
T =sigmoidicity parameter
Page277
Copyright © 2022 FDOKUMEN