The Powdery Mildew Effector CSEP0027 Interacts With Barley ...

African Journal of Biotechnology Vol. 5 (3), pp. 235-248, 2 February 2006 Available online at http://www.academicjournals.org/AJB ISSN 1684–5315 © 2006 Academic Journals
Full Length Research Paper
Construction of barley consensus map showing chromosomal regions associated with economically
important traits
Ayman A. Diab Agricultural Genetic Engineering Research Institute, Agricultural Research Center, 9 Gamaa St., Giza, Egypt. E-mail
[email protected]. Tel: (+2010) 129-0009.
Accepted 8 December, 2005
In the past, it has been difficult to accurately determine the location of many types of barley molecular markers due to the lack of commonality between international barley linkage maps. In this study, a consensus map of barley was constructed from five different maps (OWB, VxHs, KxM, barley consensus 2 and barley consensus 2003) to produce the consensus AD-2005 map with 1536 markers. The QTL that have been identified in previous barley studies were then incorporated into the integrated consensus map to provide a quick method of aligning and comparing barley linkage maps and to identify markers closely linked to barley traits. The markers placed on this map are consistent with respect to order on the chromosomes with the individual maps and other barley maps with a few minor differences. The consensus AD-2005 was compared with rice Cornell RFLP map to examine the reliability of the constructed map in comparative genomic studies. Unlike previous consensus maps, the purpose of this consensus map (containing QTL) is to provide a tool for scientists to accurately locate molecular markers to chromosome regions responsible for economically important traits. It is estimated that markers placed on the consensus map are located very close to their true positions as determined by the five maps used in this study. It is envisaged that the consensus map will benefit small-grain researchers by providing an efficient means of choosing markers of interest and identifying QTL regions for future genetic or plant breeding studies on a worldwide basis. Key words: Barley, QTL, genetic linkage mapping, consensus map, comparative genome mapping.
INTRODUCTION Several different types of DNA markers are currently available for genetic analysis and new marker types are being developed continuously. Markers differ from each other in many respects such as the initial workload and costs for building up the marker system, running costs and ease of use, level of polymorphism, dominance, number of loci analyzed per assay, reproducibility and distribution on the linkage groups of the genetic linkage maps. A genetic linkage map is a fundamental organizational tool for genomic research. The most important applications of genetic maps are towards: (1) A basic knowledge of genome organization and
evolution;
(2) The localization of monogenic and oligogenic traits; and
(3) Studies of genetic diversity. Therefore, for any given species, individual genetic maps are often constructed with a specific goal in mind, thereby generating multiple maps for a single species that feature novel markers and genetic information. The information contained within these individual maps can be further enhanced when these maps are incorporated into a single consensus map to represent a given species. Consensus maps have been constructed for a number
of plant species such as Arabidopsis thaliana (Hauge et al., 1993), Brassica oleracea (Kianian and Quiros, 1992), Helianthus annus (Gentzbittel et al., 1995), Hordeum

236 Afr. J. Biotechnol. vulgare (Qi et al., 1996) and Zea mays (Beavis and Grant, 1991). Mapping with multiple populations provides several advantages over mapping based on a single population. In particular, a larger number of loci can be placed onto a single map. This is especially important when attempting to map specific genes of interest (e.g., morphological markers or candidate genes for economically important traits) that are unlikely to segregate within a single mapping population. These multi population mapping studies provided evidence for chromosomal rearrangements and gene duplication and have assisted in the assignment of linkage groups to chromosomes. The consensus maps provide the basis for comparative genomic studies among related species and sub species. Barley (Hordeum vulgare L.) is a model species for
genetic and physiological studies and shows a wide range of adaptations to various habitats. It is an annual, diploid self-pollinating species with a relatively short life cycle. Primitive landraces and the wild progenitor of barley (H. spontaneum) exhibit large variations in physiology, morphology and genetics, which might be used to improve cultivated barley (Nevo, 1992; Forster et al., 2000). QTL mapping has been employed in several areas of
biological sciences. In plant breeding; one of the major lines of research is the detection of useful traits in relatives of cultivated species (Fulton et al., 1997; Xiao et al., 1998; Bernacchi et al., 1998). There has been much interest in studying quantitative traits of agronomic importance, disease resistance (Young, 1996), drought tolerance (Teutat et al., 2001; Diab et al., 2004), and many other traits for biotic and abiotic stress tolerance in barley. QTL mapping has led to a vast body of genetic information in public database and provided the scientific community with powerful tools for comparative genomics (Gai et al., 2000; Mekhdov et al., 2000). In the present study, an integrated consensus map of
barley was constructed based on a common set of markers mapped onto the respective linkage groups and the QTL, identified in previous barley studies, were transferred to the integrated consensus map. The main objective of this work is to facilitate comparative mapping studies of cereals and gathering many mapping information to allow scientist to compare genetic information from diploid species such as barley to species with more complex genomic structure that could lead to the identification of highly conserved sequences and regulatory mechanisms by which it is possible to predict function and location of genes in different maps that have been traditionally studied separately.
MATERIALS AND METHODS Genetic maps Three Linkage maps and two consensus maps of barley were used in this study to construct the consensus AD-2005 barley map. Rice
Cornell RFLP map was used as a test drive comparative model. The major feature of the five barley maps and the rice map are described below. Hordeum-OWB linkage map This map was built with a range of markers. These include 11 morphological markers (NEPs), 79 restriction fragment length polymorphisms (RFLPs), 19 intron fragment length polymorphisms (IFLPs) and 50 simple sequence repeats (SSRs). Additional information on the markers in the linkage map is available at http://barleyworld.org. Hordeum-Graner1VxHs This map was constructed using 135 individuals of an interspecific F2/F3 progeny (VADA x H. spontaneum). The map consisted of 160 markers with colinear arrangement covers a distance of 1,453 cM and identifies regions of varying map distances. Hordeum KxM This map is an RFLP linkage map that was constructed using 120 F2 plants from a cross between Ko A (a Japanese two-rowed malting barley) and Mokusekko 3 (a Chinese six-rowed barley landrace). 188 loci were mapped with an average distance of 6.5 cm between markers for a total of 1389 cM, and included 117 genomic DNA RFLPs, 69 cDNA RFLPs, one isozyme (Est1) and one morphological (vrs1) marker. This map showed three gap regions exceeding 25 cM.
Barley Consensus 2 This consensus map was constructed using four segregation data sets, Proctor x Nudinka, Igri x Franka, Steptoe x Morex, and Harrington x TR306. 22% of the markers were common to at least two of the independent data sets. The integrated map contains 882 markers. Barley Consensus 2003 This consensus map, combining SSR, RFLP, and AFLP markers has been developed by combining five Australian barley linkage maps, Galleon x Haruna Nijo, Chebec x Harrington, Clipper x Sahara, Alexis x Sloop and Amaji Nijo x W12585. This consensus map consists of 705 markers, with 138 being SSRs. Rice map This map is an updated version of the Cornell RFLP 1994 map reported by Causse et al. (1994) and revised by Wilson et al. (1999). The mapping population was derived from a backcross between cultivated rice (Oryza sativa) and its wild African relative (Oryza longistaminata). Construction of the consensus AD-2005 map Five mapping data sets were downloaded from the publicly available Grain Genes database (http://www.graingenes.org). The consensus map was constructed in three stages with each stage adding a new layer of information. In the first stage, the initial map

Diab. 237
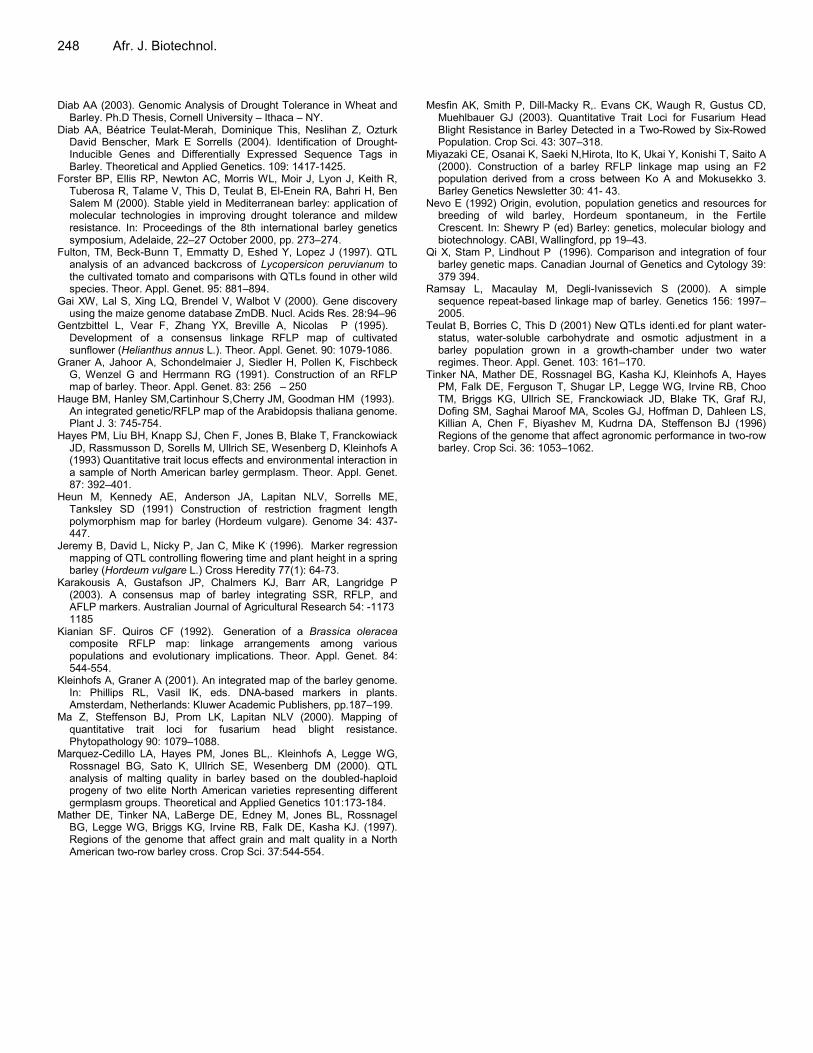
Table 1. Quantitative trait loci for traits gathered from different barley studies and placed on barley consensus-AD 2005 map.
Trait Map Reference
Relative water content under stress treatment Tad X ER Diab et al., 2003
Relative water content under irrigated condition Tad X ER Diab et al., 2003
Osmotic potential under irrigated condition Tad X ER Diab et al., 2003
Osmotic potential at full turgor Tad X ER Diab et al., 2003
Water soluble carbohydrates Tad X ER Diab et al., 2003
Fusarium head blight resistance F x S Mesfin et al., 2003
Ma et al., 2000
Zhu et al., 1999
Flowering time I x T Jeremy et al., 1996
Malting quality H x M Marquez et al., 2000
was constructed based on common markers (anchor loci) present in the five barley maps. In the second stage, the markers on the five maps were matched according to sequence similarity using the sequence similarity program (http://www.ncbi.nlm.nih.gov/blast/bl2 seq/bl2.html) and this information was used to identify additional links between the maps. Finally, the consensus AD-2005 map was constructed as described by Diab (2003). To construct the consensus AD-2005 map, the consensus map 2
(Qi X et al., 1996) and consensus 2003 (Karakousis et al., 2003) were first integrated to produce the first framework map (AD1). The AD1 framework was then merged with OWB map (Wolfe et al., 1996) to produce a second framework map (AD2), then KXM map (Miyazaki et al., 2000) was incorporated into the AD2 map to produce a third framework map (AD3). Finally, the AD3 framework map was integrated with the VxHs map (Graner et al., 1991) to produce the consensus AD-2005 map with 1536 markers distributed on the seven chromosomes. Comparative study for rice and barley maps To examine the reliability of the consensus AD-2005 in comparative studies, the Cornell rice RFLP 2001 map (http://www.gramene.org) was downloaded and compared with the constructed barley consensus AD-2005 map, OWB, KXM and VXHs maps based on common markers (anchor loci). Incorporation of QTL The QTL that were previously identified in different barley studies were incorporated into the integrated barley consensus AD-2005 map for QTL comparison purpose. Quantitative trait loci for relative water content under stress condition (RWCs), relative water content under irrigated condition (RWCi), osmotic potential under irrigated condition (OPi), osmotic potential at full turgor (OP100), water soluble carbohydrates (WSC), Fusarium head blight resistance (FHB), flowering time (FT) and malting quality (MQ) were gathered from previous studies and placed on the constructed consensus AD-2005 (Table 1, Figure 1).
RESULTS AND DISCUSSION Well developed barley genetic maps exist as a result of
the efforts of numerous groups worldwide. These maps
include RFLPs, amplified fragment length polymorphisms
(AFLPs), single sequence repeat or microsatellites
(SSRs), isozyme protein markers; and morphological
markers (Becker and Heun, 1995; Graner et al., 1991;
Heun et al., 1991; Kleinhofs and Graner, 2001). These
genetics maps were based on various markers, the most useful being those that are transferable from one mapping population to another. These markers have been incorporated
into bin maps (Karakousis et al., 2003;
Qi et al., 1996). In the present study, five different barley maps were integrated to produce a consensus map with 1536 markers distributed on the seven linkage groups with 240 common markers between the five maps. The 882 markers of the consensus 2 map were merged with the 705 markers of the consensus 2003 to produce the first framework integrated barley consensus map (AD1) with 1255 markers. The 1255 marker of the AD1 map were then merged with OWB map to produce the second framework integrated barley consensus map (AD2) with 1371 markers. Then the AD2 was incorporated with KxM map to produce the third framework map integrated barley consensus map (AD3) with 1461 marker. Finally, the AD3 map was merged with VXHs map to generate the barley AD-2005 consensus map with 1536 markers.
Description of the barley consensus AD-2005 map
The primary goal for the construction of this consensus map was to place, relative to one another, as many genetic markers as possible onto a single map. Therefore, the concern is raised more towards obtaining a general order and distance among these markers rather than the fine resolution of order and distance. The markers placed on this map are consistent with respect to order on the chromosomes with the barley consensus 2 (Qi et al., 1996), barley consensus 2003 (Karakousis et al., 2003) and with other published or consensus barley maps (Kleinhofs and Graner, 2001; Qi et al., 1996;

238 Afr. J. Biotechnol.
Table 2. Comparison between the five individual maps and barley consensus AD-2005 map in respect of number of markers on each chromosome.
Miyazaki et al., 2000; Graner et al., 1991; Wolfe et al., 1996; Ramsay et al., 2000) with a few minor differences. This conservative property of the barley genome makes the integrated maps reliable and successful. Based on this integrated map, geneticists and breeders can choose their favorite markers in any region of interest of the barley genome. For comparable areas, the size of the consensus map
constructed in this study (consensus AD-2005) is consistently larger than the consensus map constructed by Qi et al. (1996) and the consensus map constructed by Karakousis et al. (2003) despite the fact that each of those two maps has been constructed using five different maps (Table 2). Obvious explanation is that those two maps were integrated together with another three maps (OWB, VXHs and KXM) beside the step-wise procedure used to integrate the individual maps. The utility of the constructed consensus map is
enhanced with the availability of the SSR, RFLP, and AFLP markers integrated from the barley consensus map 2003 (Karakousis et al. 2003). The integrated map removes many large gaps present in the individual maps and in other consensus maps except a gap on chromosome 4H. The poor coverage in this region might be due to a lack of polymorphism for the markers screened in this region. Incorporation of QTL QTL analysis can be done in relation to mapped genetic markers and provide data on genome location and the relative effects both positive and negative of loci and alleles. The next step is the identification of the genes, alleles and physiological processes that are biologically important. Numerous studies identifying QTL
for relative
water content (RWC), osmotic potential (OP), water soluble carbohydrates (WSC), Fusarium head blight resistance (FHB), flowering time (FT) and malting quality
(MQ) have been conducted in barley (Teulat et al., 2001; Diab et al., 2004; Mesfin et al., 2003; Ma et al., 2000; Zhu et al., 1999; Jeremy et al., 1996; Marquez et al., 2000; Hayes et al., 1993; Tinker et al., 1996). Presently, 143 QTL were gathered from previous barley studies and placed on the consensus AD-2005 map. Seventy seven QTL for Fusarium head blight resistance, 32 for malting quality, 24 for flowering time, 1 for relative water content under stress condition, 1 for relative water content under irrigated condition, 2 for osmotic potential at full turgor, 1 for osmotic potential under irrigated condition and 5 for water soluble carbohydrates (Figure 1). For Fusarium head blight resistance trait, 7 QTL were
located on chromosome 1H, 12 on chromosome 2H, 9 on 3H, 8 on 4H, 13 on 5H, 12 on 6H and 16 on chromosome 7H (Figure 1). Mesfin et al. (2003) reported the presence of QTL for FHB on all chromosomes except chromosome 6H, and Zhu et al. (1999) found QTL for FHB resistance on all barley chromosomes except chromosome 5H, while Ma et al. (2000) reported QTL for FHB resistance located on chromosomes 2H, 3H, 5H, 6H and 7H. Taken together, these studies indicate that resistance is conditioned by many loci and that the low resolution of the mapping populations has resulted in a limited assessment of the FHB. Integrating these QTL from different studies on a single consensus map gives the opportunity for scientist to compare between QTL and might solve the problem of low resolution maps hence detecting false negative QTL during trait analysis. Two markers (ABG317 and ABC153) on chromosome 2H were found to be associated with QTL for Fusarium head blight resistance. Those two markers were located on the same chromosomal region on the consensus barley AD-2005 (Figure 1). This indicates the reliability of placing QTL on consensus maps. For flowering time trait, 6 QTL were placed on
chromosome 1H, 4 on 2H, 1 on 4H, 7 on 5H, 3 on 6H and 7H each, while no QTL were found on chromosome 3H (Figure 1). This result agrees with the finding of Jeremy
Chromosome
Barley consensus
2
Barley consensus 2003
Hordeum-OWB
Hordeum-KxM
Hordeum-Graner VxHs
Barley Consensus - AD 2005
1H 92 87 24 27 19 189
2H 163 160 30 28 28 306
3H 133 54 20 28 28 150
4H 81 59 24 24 18 136
5H 139 137 19 28 28 270
6H 98 81 22 25 20 175
7H 176 127 20 28 19 310
Total 882 705 159 188 160 1536

Diab. 239
Figure (1). Integrated barley Consensus AD-2005 map with QTL for some biotic and abiotic traits.
MWG20 0.425 Centromere-1H 0.434 P12/M50-78 0.444 ABC164(SM) 0.447 Bmag0211 0.452 JBG54 0.455 ksuF2A RisBPP161C ABG452 MWG789B RisBPP7 ABC152B ABG494 BCD351C
0.462
MWG506 Pcr2 0.468
MWG36A ABG59 MWG837 ZenG11b 0.000 ksue18a 0.006 Hor5 MWG938 0.007 Hor1 Chs3 0.013 Hor2 0.017 P14/M49-70 0.023 P14/M61-92 0.025 ABC310A 0.030 JBG158 BCD1434 MWG2083 dMla6 0.034 P13/M47-221 0.035 P12/M52-181 P13/M55-308 P14/M48-363 0.036 MWG2148 0.037 MWG837A 0.040 RWTHAT13 0.041 MWG68 0.046 Bmac0399 0.049 ABG316f MWG2021a MWG2048 MWG645 0.051 RisIC10b 0.054 ABA4 0.057 X5.1 0.064 pBSC5 0.066 ksuD14 0.079 JBG180 0.093 P12/M50-95 0.098 P12/M50-94a P13/M61-164 ABG53 0.105 MWG896 0.107 BCD372 0.117 BCD454 CDO473 0.135 AWWM3 0.146 BCD098 0.149 ksuE19a 0.155 CDO99 BCD980.156 P13/M50-114 P14/M47-111 Bmac32 0.176 HvALAAT 0.177 AWBMA5 0.190 BCD453A Bmac90 0.212 P12/M50-242 CDO580a 0.220 HVM20 0.233 P11/M48-132 CDO98 0.249 P11/M48-333 BCD207 PSR544 EBmac501 0.262 P12/M50-111 AWRM1 PSR929a AWBMS80 0.274 Ica1 0.283 MWG75 0.289 MWG62 0.312 X5.2 0.319 ABG74 0.323 BCD22 0.341 ksuD14B MWG913 ABG500A 0.359 MWG184 0.371 MWG2056 0.379 MWG758 0.397
1H(a)
ksuA1A 0.977 P13/M47-163 P14/M61-94 ABG373 BCD351A Bmac31a
0.983 Pgd2 BCD508a 0.984 ABG702a 0.985 XBA1 0.990 PSR305 bcd808a ABC322B 0.991 JBG159 0.992 ABC257 MWG706A ABC261 AWBMA24 BCD340
1.000
Bmac213 0.475 MWG55 0.478 AWBMA27a 0.482 MWG45 0.494 MWG12 0.529 MWG800 CDO105B 0.534 CDO1396 0.535 MWG56 0.545 JBC773D 0.591 X5.3 0.598 ABC151E 0.604 MWG943 P12/M50-94b 0.623 ABC151D 0.640 MWG78 0.642 PSR162a CDO419A 0.643 ABC160 0.655 MWG2077 0.663 EI 0.700 ABC706B 0.717 HVM2 0.721 JBG77C 0.732 JBG77A 0.748 P14/M49-139a AWBMA35 0.759 JBG61 0.778 His4A 0.818 Bmac0144a 0.820 ABG464 0.835 JBG231 0.861 Bmag0113a 0.866 MWG649b 0.882 MWG518 0.887 MWG947 His3B 0.895 Bmac154 0.904 P13/M47-305 0.905 Atpb 0.911 ABC307A 0.912 JBG132 0.914 MWG504 0.921 AtpbA 0.932 ABA2 MWG635C 0.936 MWG733 0.938 MWG984b 0.942 MWG632b 0.944 Dor3 Kas1.2(0.3) 0.945 TubA2 0.950 ABG702 0.953 Cab2 0.954 MWG954 Blp 0.955 Aga7 pTAG558 0.956 BCD304 MWG92 0.959 BCD310 X7GLOB 0.963 MWG733A 0.964 dTls 0.965 CDO400a MWG676 0.966 P13/M49-161 AWBMA4 0.969 P12/M50-82 P14/M61-148 ABG55 MWG701b MWG2028
0.975
1H(b)
Osmotic potential under irrigated condition
Fusarium head blight resistance
Malting quality
Flowering t ime
Relative water content under stress treatment
Osmotic potential at fu ll turgor
Relative water content under irrigated condition
Water soluble carbohydrates

240 Afr. J. Biotechnol.
ABR338 ABG356 0.129
Centromere-2H 0.115 ksuD22 Bmac93 Bmag518 EBmac684 0.116 PSR126 0.118 CDO675A ABC306ABG316C ABC4680.119 BCD221B 0.121 JBG299 0.123 ABG459 0.128 DGE12 MWG658
MWG64 ABG358 MWG516 Pox 0.000 P13/M47-275 0.006 P12/M50-240 0.013 P12/M51-265 PBI21aCDO57 0.014 MWG996 ABC162 0.020 MWG950 0.021 DGD18 BG140B ABG8 0.023 BCD221A MWG222A0.024 P13/M48-123 P13/M54-107 P13/M55-306 P14/M48-279 P14/M59-287 P14/M62-238
0.025
cdo506a 0.026 BCD1750.027 HVM36 P14/M47-275 0.030 AWBMA14 0.031 CDO370 0.035 ABC167B 0.040 Hot1 MWG763 0.041 P14/M48-94 BCD355 MWG223 bBE54D 0.045 ABG453 PSR131a 0.054 MWG858 ABG2 0.055 MWG222B MWG789A 0.056 P13/M47-399 0.057 PSR666a MWG647 MWG646a MWG887a MWG2133 MWG874 MWG663
0.063
RbcS 0.067 EBmac0684 ABG714a ksuA1B WG405A 0.071 BCD402B Bmac132 HVM23 0.077 BCD351B MWG636(HT) MWG2054 ABG602 ABC256
0.079
ABG397 0.083 MWG65 0.084 BCD351F 0.088 CDO667 0.089 AWBMA27b EBmac607 0.091 B15C 0.092 MBmag341a 0.094 ABG318 0.096 PSR108a 0.097 ABG19 ABG716 CDO537 MWG557 P14/M48-332
0.100
P12/M50-199 P14/M59-176 0.103 MWG889(IF) MWG578 MWG553b BCD339B 0.105 BCD334 MWG2058 Bmy2 CDO770 0.107 CDO64 PSR933b ABC156A 0.108 MWG949B 0.110 BCD1110.112
2H(a)
0.687
ABG072 0.676 P11/M51-170 0.679 P12/M51-157 0.684 P13/M59-288 BCD386 Bmag378 EBmac623 EBmac640
0.685
MWG581
P12/M51-270 P13/M54-224 0.132 P13/M61-58 ABC309 Bmy2 CDO474a ksuI32 MWG996a EBmac715 HVHOTRI
0.163
ABG14 ABC451 CDO588 0.207 X2.2 0.235 GMS30.240 MWG520a 0.252 Bmag692 0.267 MWG737 MWG9 0.342 CDO537 0.344 MWG81 0.374 ABG464B CDO665 ABG5 0.401 MWG71 0.406 JBC495 JBG282 0.429 MWG84a 0.432 JBC582 0.455 PSR901 0.468 MWG657 0.477 P13/M49-59 AWBMA33 Bmag381 0.485 BCD3340.491 JBG255 0.494 MWG2067 0.501 MWG656 0.510 csRCH4(5) 0.511 MWG844E 0.512 X2.3 0.519 BCD453B 0.520 CDO474C 0.522 KFP203 0.527 ABG619 CDO474C AdhIntC 0.530 MWG702 0.535 ABG72 0.543 EBmatc39 0.545 P14/M60-94 0.550 MWG882A 0.554 DGF15 BCD266 0.555 ABC152D MWG865 0.557 AAW605 EBmac571a0.558 Crg3A 0.563 JBC253B 0.576 P13/M59-275 CDO665B CDO1335a 0.578 EXO2F PSR117a 0.607 CDO680 0.608 MWG726 0.619 Bmag140 0.629 P13/M59-256 0.630 Bmag0113E 0.635 P14/M59-226 EBmac793 0.644 ksuF15A 0.647 MWG50.648 cdo665a 0.651 JBG63B MWG2081 MWG801 MWG699 hex-v
0.656
P13/M59-266 0.668
2H(b)
MWG738 MWG655B 0.690 ABC157 0.702 ABC252 0.720 MWG520B F3hA CDO373 0.728 PSR540 EBmac415 MWG2123 MWG882 0.730 Gln2 0.740 P13/M47-256 CDO373 0.744 GS1 0.745 HVM54 0.768 EBmac0415 0.782 MWG180 0.792 MWG1 0.794 cnx1 0.796 vrs1 0.797 JBG303 0.814 ABC620 0.816 P13/M50-203 0.817 ABG72 0.826 P13/M50-127 HvCSG 0.837 P14/M60-299 CDO474B 0.844 ksuF41 0.845 Bmag114 Bmag125 0.846 Rrn5S1 0.850 ABC165 ABG3170.853 P12/M54-94 P14/M47-378 0.855 ABG317B ABC153 DGF41 0.863 Zeo 0.873 P14/M61-348 BCD512 Bmag749 0.879 ABG316E ABG317A 0.891 AWBMS56 P14/M61-111 DGG43 0.910 Bmac0144F 0.913 ABC171A PSR934 0.914 ABG609A 0.928 Bmag0125 0.937 ABG316D 0.939 Pcr1 0.945 MWG503 0.948 BCD292 0.950 MWG636(IF) 0.955 PSR609 0.957 PSR370a MWG90 MWG866 Prx2 0.962 MWG892 MWG876 0.964 ABG613 0.965 BCD339C MWG989 0.968 X2.4 0.973 MWG338A MWG829 MWG949 0.974 MWG80 MWG2076 RWTHBE54c BG123a 0.975 P14/M55-156 CDO36 Rlch4Bama Rlch4NcoC P13/M47-192 CDO366
0.976
2H(c)
Figure 1. contd.
Osmotic potential under irrigated condition
Fusarium head blight resistance
Malting quality
Flowering t ime
Relative water content under stress treatment
Osmotic potential at fu ll turgor
Relative water content under irrigated condition
Water soluble carbohydrates

Diab. 241
Figure 1. contd.
MWG584 MWG2021b ABG471 MWG848 ABC171b PSR1196 PSR1316
0.000
MWG577 MWG974 0.027 HVM6a 0.037 X3.1 0.051 JBG112 0.058 WM1.F 0.066 ksuA1d 0.077 MWG14 0.086 CDO395 0.087 alm 0.091 JBG194B 0.110 MWG798B 0.117 pTAG683 0.129 JBG20 0.134 ABG460 0.150 MWG22 0.156 MWG497 ABG57 ABG10 0.176 GMS27A 0.250 MWG178 BCD339A Centromere-3H 0.313 ABG398 ABR334 0.321 ksuF2B Adh5 Dor4A ABC323 ksuA3C ABG462 ABC156C
0.331
bcd1145 0.346 AtpbB BCD828 0.352 MWG582 MWG985 PBI21c MWG802 MWG844b MWG852 MWG952 MWG2064
0.371
MWG687 0.375 JBG305 0.379 PBI5 MWG595 MWG561a 0.388 CDO1174 0.403 Bmag6 Bmag603 0.407 ABG703A 0.417 JBG18 0.420 MWG2105 MWG2065(IF) MWG2138 Myb HvPEPD1PR
0.428
MWG8 0.445 Bmac0067 0.453 MWG571B 0.457 JBG287 0.460 MWG844c RisP114 0.491 MWG61 0.492 JBG297A 0.500 BCD809 0.507 JBG53A 0.539 MWG812 MWG904 PSR156 0.543 ABC176 0.566
3H(a)
Bmac67 0.586 MWG986 0.589 Bmag112 HVM33 0.612 MWG631 0.641 MWG405B ABG377 0.646 Rrn5S20.656 Bmac0209 0.660 JBG113 0.661 Bmag0225 0.668 MWG940 0.696 CDO718 0.699 ABG396 0.701 JBG298 0.715 MWG555b MWG975 MWG2026 0.730 PSR312a 0.732 HVM60 0.750 JBC751 JBG304 0.751 Bmag225 0.762 MWG784 MWG961 MWG973 Crg3B 0.767 CDO113B 0.775 psr598 0.784 ABG453 0.794 ABG315 0.807 MWG2013 FG71 0.822 MWG847 His4B 0.825 Bmag122 0.829 MWG823 0.852 JBC302 0.859 GMS116 0.860 P14/M61-154 MWG405A 0.861 CDO113 GVI 0.875 EBmac871 0.879 MWG571a 0.887 Telo17& 0.894 ABG399 0.896 ABC154D 0.901 MWG884 0.905 ABG4 0.920 ABR320 CDO419B 0.923 ABC325 0.940 MWG803 MWG2025 ksuA1c 0.948 ABG703A 0.961 BCD298a pTAG645 0.962 P13/M50-331 P14/M48-216 ABG4 BCD451 0.965 MWG2036B 0.972 ABC307B 0.979 X3.2 0.985 Bmac29 0.991 CDO684 MWG680 ABG499 MWG110 1.000
3H(b)
Osmotic potential under irrigated condition
Fusarium head blight resistance
Malting quality
Flowering t ime
Relative water content under stress treatment
Osmotic potential at fu ll turgor
Relative water content under irrigated condition
Water soluble carbohydrates

242 Afr. J. Biotechnol.
Figure 1. contd.
ksuE2 0.450 BG125 iAco2 iHxk2 0.458 CDO1312 HVMLOHIA 0.463 JBG130C 0.472 ABG500b U19 0.485
MWG58 MWG622a BCD351B Dhn6 0.000 CDO541 MWG181 bBE54A 0.002 ABG3 0.006 MWG1026B 0.009 P13/M50-110 AWBMS62 Pm 0.010 HVM3 0.011 MWG180B 0.012 CDO650 CDO795 Mne1a MWG232 AWBMS90
0.013
MWG2135 MWG57 0.021 ABC303 0.025 MWG2036 ABA3 Adh4 ABG484 0.028 Pgk2A MWG2110 MWG939 bAl57 MWG793 Ris2A2 dMlg
0.035
Mne1b 0.036 ABG461C MWG635a 0.038 MWG2097 MWG948 MWG2134 PBI25 0.044 MWG880 0.064 CDO586 0.070 ABG472 0.079 EBmac635 EBmac701 0.093 Bmag375 0.096 TubA1 BCD265B0.100 P13/M50-371 0.102 ABG715 Bmac181 EBmac906 0.106 MWG35C 0.112 MWG677 0.125 P13/M51-252 P13/M51-90 PSR141 0.127 BCD453B(69.8) 0.129 MWG464 0.135 P14/M47-328 0.138 Centromere-4H 0.141 BCD453c 0.144 WG719 0.166 X4.1 0.173 Bmag0353 0.188 X4.2 0.203 ABG394 0.204 P12/M50-292 P13/M61-318 0.221 Bmac0186 0.253 ABG319A 0.254 JBC970 0.259 BCD15a 0.265 CDO1406 0.274 ABG618 0.352 HvBTAI3 TaCMD 0.356 MWG655C 0.376 MWG114 EBmac788 0.388 ABG4B 0.397 P13/M47-454 0.404 ABG498 PSR164 0.411
4H(a)
JBG47B 0.487 CDO63 0.503 JBC773B JBG47A 0.504 BCD1130 0.513 AL88/2 bAP91 0.514 CDO677 0.521 X4.3 0.525 MWG2159 cMWG652B 0.538 ABG397 0.570 P11/M48-119 0.572 ABG366 0.580 MWG464B 0.593 MWG464A 0.602
KFP221 0.661
Bmag419 0.736 EBmac0701 0.738 EBmac679 0.740 ABG319C 0.753 ABC151C 0.757 ABG3a GMS89 0.774 ABG54 0.795 ABR315 ABC321 0.816 X4.4 0.834
ABG601 0.880 BCD402 MWG199 0.909 ABA306C MWG2047b 0.945 P14/M51-122 0.949 CDO465 MWG2112 0.962 ABC305B 0.972 ASE1C 0.983 Hsh0.985 EXO2a 0.993 MWG542 HVM67 Bmy1 1.000
4H(b)
Osmotic potential under irrigated condition
Fusarium head blight resistance
Malting quality
Flowering t ime
Relative water content under stress treatment
Osmotic potential at fu ll turgor
Relative water content under irrigated condition
Water soluble carbohydrates

Diab. 243
Figure 1. contd.
B12DB0.213 ABC302 0.215 Centromere-5H 0.222 MWG7 0.225 Ltp1 ksuA3A 0.236 MWG514 AWBMS31 HvACLIa HVM3 0.253
MWG596 ABG705A ABC483 0.000 P13/M50-437 0.004 ABG610 0.006 AWPCB7b pTAG354a 0.017 AWWM1a HVTL 0.019 Bmac0273B ABG610 0.032 MWG618 MWG920A 0.039 MWG609 0.043 CDO669B 0.048 MWG717 MWG526 MWG561b MWG889 0.050 JBC96 JBC134 JBC485 0.063 ABC156A ksuA1f PSR162b PSR360 AWBMS53
0.065 ksuD16 PSR123 PSR156 0.076 MWG16 0.085 Dor5 0.087 JBC467 0.094 MWG835 MWG920 ABG708 P11/M48-223 P13/M48-180 P13/M49-211 P13/M54-356 P14/M55-370 ABG3b BCD147a BCD276 BCD1072 ksuA3 PSR117b PSR1204 psr161 MWG405B Bmac113 Bmac286 Bmag387
0.097
Adh6 ABR336 0.099 Al e MWG40 0.105 ABG497 0.112 MWG998 0.115 ABG395 0.126 JBC253A P13/M50-79 CDO989 0.131 Bmac0096 0.137 P12/M50-370 cdo665c CDO1335b 0.138 BCD508B0.140 CDO348B 0.146 ksuH7 0.151 BG140C 0.152 MWG37 0.155 Bmag337 0.156 P13/M50-167 0.158 CDO749 MWG635A(HT) 0.165 JBG127 P11/M48-181 P13/M51-127 P14/M51-239 ABC164 ABG705
0.169 Rrn2 0.178 ABC314 0.179 P12/M50-71 ABG702B PSR128 AWBMS70 AWBMS75 AWBMS88
0.183 Ubi2 MWG2040B 0.190 P14/M61-98 CDO504 0.199 BCD21a Bmag105 KFP002 0.204 MWG13 0.205
5H(a)
0.730 cdo57b 0.737 iEst9 MWG900 0.739 P14/M48-123 0.741 MWG908 MWG922 MWG908A CDO583 0.748 MWG923 MWG999 0.754 MWG908B 0.756
JBG250 0.254 JBG876 0.261 XrDNA 0.266 CDO460 BCD410B MWG541 0.284 MWG592 0.285 ABC321B 0.295 JBC288 0.302 Telo18& 0.321 MWG530 ABC706 ABA1 BG123b 0.325 MWG604 0.328 P14/M47-220 AWBMA3 X-I 0.334 AWBMA12 AWBMS54 0.335 P14/M51-294 0.338 MWG770 0.341 P13/M61-386 0.344 DGA3 0.354 GMS27B 0.367 EXO1 EXO2b Bmac96 0.371 MWG50 0.383 Ebmatc3 MWG564 0.386 JBG173 0.393 BCD339f 0.404 P13/M50-305 0.417 MWG805 0.430 MWG1026 CDO771A 0.434 MWG914 MWG549b 0.460 MWG553a 0.473 ABG003b 0.484 BCD351C 0.485 MWG894 0.496 psr326 PSR426 0.499 MWG550 0.508 MWG364 Bmag222 0.532 MWG72 0.540 Bmag223 0.551 P11/M48-235 P13/M47-384 P14/M61-294 0.563 MWG533 0.575 MWG781 0.602 MWG646b 0.610 P13/M59-224 0.613 P12/M54-118 psr131 0.627 ABG712 0.633 MWG514B 0.637 MWG877 0.676 srh 0.678 JBG273 0.691 X7.1 ABG391 CDO419B PSR370b 0.694 P13/M61-198 BCD265B bcd808c 0.697 TubA3 0.699 MWG516 MWG644 MWG716a MWG862 MWG933
0.708 ABG496 BCD298BPSR911 0.720 MWG76
5H(b)
MWG2121 0.787 MWG181 EBmac85 0.821 ABG495A MWG956 MWG583 MWG624 0.823
MWG79a 0.835 MWG1026 0.836 CDO675B MWG522 ksuA1B 0.850
MWG740 0.853 PSR637a 0.863 CDO400b CDO678b PSR394 0.870
ABC168 MWG768 PBI39 0.872
MWG654 MWG2020 0.875 AWBMA32 0.880 ABG390 ABG707 ABC310A MWG701a 0.883
ABC155 Cab1 0.891 MWG827 MWG850 0.897 MWG34 0.905 MWG650 0.909 BCD351e 0.914 BCD298 0.918 ABG707b BCD339e psr115 0.923
ABC310b ABG390 0.940 CDO484 0.941 HVM6b 0.949 DGE2A 0.952 CDO113 CDO213 0.956 csRCH4(1) P14/M51-134 P14/M55-135 0.962
CDO457 ABC482 0.965 ABG463 0.967 ABG69 0.974 MWG2 0.983 MWG2037a ABC309 ABG314B 0.987
MWG364 0.991 ABG57B 0.992 P12/M50-372 0.993 Bmag0113D 0.994 MWG891 0.995 P14/M55-146 GS2 0.996 ABG473 ABC717 ABG314A MWG813a ABC622 CDO506
1.000
5H(c)
Osmotic potential under irrigated condition
Fusarium head blight resistance
Malting quality
Flowering t ime
Relative water content under stress treatment
Osmotic potential at fu ll turgor
Relative water content under irrigated condition
Water soluble carbohydrates

244 Afr. J. Biotechnol.
Figure 1. contd.
MWG620 ABG466 Bmac316 LthPSR167 PSR312b
0.000
HVM14 P11/M48-141 TAM10 0.015 MWG663-2A Nar1 0.016 BCD102 0.020 ABG378 0.030 BCD21B 0.032 HVM74 0.035 MWG966 0.038 NAR7a 0.039 PSR611 0.044 MWG573(IF) 0.049 MWG59 0.056 MWG10A 0.061 JBC1212 0.079 ABG654 P14/M61-376 0.083 JBG130B 0.098 Bmag9 MWG405C 0.110 MWG652 0.115 Cxp3 0.164 ABC152A 0.172 His3D 0.179 ksuA1g 0.184 P13/M61-331 MWG690 0.197 MWG652A 0.205 MWG602B 0.249 AWBMA23 0.314 MWG887b MWG988 0.392 JBG259A 0.414 X6.1 0.419 P14/M61-171 0.427 EBmac874 0.429 ABG387b PSR106 0.435 JBG274 0.454 MWG653 MWG664a 0.469 ABG458 0.472 JBG297B 0.474 MWG26 0.502 MWG2065(HT) 0.504 MWG79b 0.516 MWG916 0.534 MWG664b 0.540 JBG77B 0.548 X6.2 0.550 MWG666 0.573 EBmac806 P14/M49-139b 0.596 PSR167B 0.600 MWG996b 0.605 ABR331 Ubi4 MWG820 0.612 HVM31 0.620 ABC163 0.629 ABC169B Ubi5 0.633 rob 0.639 ABC175 0.644 Rrn1 0.647 Bmag0009 0.650 ABA6 B12DA 0.654 MWG286 0.657 ABR335 CDO497 ksuA3B 0.663 ABC156b 0.668 MWG223b 0.670 MWG679 0.679 ABG474 0.717 ABG20 BCD340E 0.726 ABG705B 0.737 MWG984a 0.746 X6.3 0.749
6H(a)
1.000
CDO580B 0.762 ABC164(IF) ksuD17 MWG2043 MWG2061 0.765 Centromere-6H 0.769 JBG130A 0.774 Amy1 PSR149 0.776 MWG872 0.783 ABG379 ABG388 MWG2029 PBI9 Ris2E7 RisP31
0.792
Bmac0218C 0.822 Bmac251 0.832 P14/M51-166 0.841 ABC170B ABG1A MWG2100 MWG684B MWG951 MWG967b JBG123
0.842
NAR7b 0.848 DGF2 ksuA3D 0.854 EBmac571b HvACLIb 0.866 ABG1C 0.878 P13/M49-101 0.881 BCD269 EBmac602 0.887 P13/M50-367 0.896 MWG19 BCD221A 0.897 P12/M51-191 PSR666b 0.902 BCD1 P13/M61-205 0.904 BCD453d 0.911 BG140A 0.912 P14/M49-91 0.916 MWG282 0.920 MWG2137 MWG2141 0.924 P22/M58-151 0.935 ABC154F Nir 0.942 PSR627 0.952 ABC264 BCD339BDhn3 dhn5 0.956 BCD453A 0.962 MWG684c MWG716b 0.963 P13/M61-272 0.966 Nar7 0.967 P13/M48-254 0.968 BCD221B PSR154 0.969 X6.4 0.975 ABG711 0.978 ABC170A P14/M47-197 0.980 P13/M51-205 0.981 CDO419A MWG549a 0.982 ABG614 0.984 P14/M51-308 BCD15b CDO836 0.986 MWG222B MWG684A 0.987 ABG461B 0.989 P13/M61-357 0.994 ABC154 MWG897 MWG934 P11/M62-390 P13/M61-216 P13/M61-328 BCD339g MWG669
6H(b)
Osmotic potential under irrigated condition
Fusarium head blight resistance
Malting quality
Flowering t ime
Relative water content under stress treatment Osmotic potential at fu ll turgor Relative water content under irrigated condition
Water soluble carbohydrates

Diab. 245
Figure 1. contd.
MWG530 MWG807 MWG905 ABG399B ABG312d Plc ABG704 RisBPP161a
0.000
ABG65B dRpg1 0.006 ABG1B 0.008 BCD130 CDO545 ABG320 0.018 MWG36B MWG851a ABG77 0.019 AWWM1b 0.033 Bmag0007 0.034 MWG555a 0.038 PBI35 MWG799 0.040 ABG75 RisIC10a 0.047 ABC255 0.051 Pgd1A 0.060 ABR303 0.069 iEst5 MWG2080 0.070 P12/M51-73 P14/M47-278 P14/M47-357 PSR160 0.075 Glx(Wx) 0.079 JBC401 0.081 P11/M51-341 P13/M50-237 BCD15c CDO1400 Bmag206
0.083 MWG2074 0.088 P11/M62-141 PSR637b 0.096 JBG235 0.099 P13/M50-272 0.101 P11/M62-353 P13/M48-208 P13/M48-85 ABC465 CDO420A
0.102
P14/M47-315 0.107 Prx1A MWG733B 0.108 BCD129 0.109 BCD351D0.114 P13/M61-73 psr119b 0.117 MWG703 His3A ABG320 0.132 MWG4a 0.141 BCD339h0.162 BCD135 0.170 HvWaxy4a HvWaxyG 0.203 MWG789A MWG564 ABC151A 0.211 MWG834 0.235 ABC152 0.241 ABC169A CDO475 0.249 MWG18 0.275 MWG89 0.282 JBG209 0.291 MWG773 0.300 ABC167a 0.311 MWG789B 0.321 ABG380 dSbl 0.334 ABG497b MWG721 RisBPP161b MWG832 MWG622 MWG980 MWG527
0.349
ABG616 0.378 P14/M47-164 0.394 ABG497a 0.443 ABC158 0.448 MWG606 0.460 MWG39 0.469 HVCMA 0.492 ksuA1A 0.526 MWG66 0.548 MWG2040D 0.562
7H(a)
ABC154A 0.569 Bmac0187 0.573 MWG710a 0.588 MWG2040C 0.593 MWG836 0.616 MWG622a 0.678 LD 0.688 P11/M48-367 P14/M48-150 0.721 ABG603 0.726 lks2 0.737 PSR933a YAtp57A 0.749 Brz 0.753 P12/M54-56 0.754 AWBMA15 0.763 MWG2031 RisBPP144 MWG967a MWG2030 0.768 CDO36 0.771 Amy2 0.781 AWBMA16 0.782 DO348 0.816 Bmac047B 0.821 MWG53 0.826 MWG940 MWG728 MWG599 0.828 Bmag0120 AWBMA11 0.831 PSR929b 0.836 CDO420B 0.839 CDO771B 0.840 MWG686 0.845 MWG996c Bmag120 P14/M47-354 Bmac167 Bmag359a Bmag359b EBmac827
0.846
JBG149 JBG26 0.849 ABG11 ABG701 AWBMA26 CDO665d PSR108b MWG2072 MWG729 ICIG11a
0.850
RisP103 0.851 ABC156d P13/M50-102 EBmac755 0.853 DAK642 P14/M55-102 EBmac764 0.856 B12D 0.858 MWG380B 0.861 ABC305 0.863 Bmag217 0.865 MWG573(HT) BCD351A 0.866 bBE54E Pgk2B 0.869 nud 0.870 MWG36C 0.871 Bmag183 HvSS1 0.874 PSR129 0.875 P14/M59-215 Bmac31b 0.876 MWG911(SM) MWG3 0.878 MWG696 MWG825 0.880 MWG808 0.885 P12/M51-200 ABC308a Bmag369 0.886 P13/M47-300 0.888 MWG704 MWG815 0.890 ABG652a cdo57b AWBMS37 0.891 ABC306 CDO583 EBmac757 P11/M48-364 HvA22S
0.894 ksuF37 psr547 0.898 ksuE19b 0.899 P14/M55-130 ABG652b ABG714b ABG476 0.900 ABC253 0.902 CDO595 0.904
7H(b)
Osmotic potential under irrigated condition
Fusarium head blight resistance
Malting quality
Flowering t ime
Relative water content under stress treatment
Osmotic potential at fu ll turgor
Relative water content under irrigated condition
Water soluble carbohydrates
P11/M48-317 BCD263 Bmag341b 0.906 MWG571D 0.910 CDO358 ksuA1h MWG789c 0.913 HVM11b 0.918 MWG889(HT) 0.923 MWG539 BCD147b0.925 MWG2046 CDO687 MWG669 BCD421 CDO689
0.926
Bmag321 0.927 Centromere-7H 0.929 JBG13 0.930 P13/M59-277 P13/M59-309 0.931 Ubi1 0.934 MWG2041 ABC308 CDO464 MWG813B BCD340D MWG511 MWG741 MWG10B MWG977 BCD205
0.936
AaWBI Bmac156 0.940 CDO676 MWG878B MWG635b 0.942 P14/M51-228 0.947 Adh7 0.948 P12/M50-286 HVM49 0.949 Cat3 BCD298B Tha Chi1 MWG2062
0.950 P11/M48-292 0.954 ABC321 P14/M61-275 0.956 PSR106B Dor4B 0.957 Ris44 0.958 mn BG143 MWG719 ABC322A ABC254
0.959 ksue18b 0.961 AWBMS22 0.962 ABR329 BCD340C ABC719 0.965 pTAG732 ABG608 ABG461 0.968 JBG256 0.970 ABG461A 0.971 PSR637c 0.974 P12/M51-360 ksuE18c 0.975 PSR680 0.980 MWG903 ABC455 0.982 PSR117c ABC310b RisP60 0.983 ABC308b M501 0.984 BCD512 0.987 P13/M59-118 0.988 ksuD14C MWG420 0.989 PSR150a MWG739 MWG705 PBI21b ABC151B MWG987 MWG681 PBI19 MWG957 MWG714 ABC621 Rip Acl3 MWG626 CDO673 MWG725 MWG649a P13/M50-76 Bmag507
0.992
JBG194A BG141 0.994 ABG652 0.996 ABG497b 0.998 MWG380A MWG528 ABC154B MWG633 CDO347b
1.000
7H(c)

246 Afr. J. Biotechnol. et al. (1996) as they identified QTL for flowering time on all chromosomes except the chromosome 3H. This indicates that the constructed consensus map is consistent with other barley maps used in QTL studies. In some genomic regions of the consensus map, markers associated with flowering time and Fusarium head blight resistance were co-located on the same place. Jeremy et al. (1996) reported a correlation between heading date and plant height but there is no reports for a correlation between heading date and Fusarium head blight resistance. This might reflect a possible correlation between the two traits. However, more studies and investigations are needed to be done in this area to verify this possibility. Malting quality traits such as percentage of plump
kernels, test weight, grain protein percentage, soluble/total protein ratio, L-amylase activity, diastatic power and malt-extract percentage are highly correlated and controlled by almost the same loci (Marquez et al., 2000). In the present study 32 QTL for malting quality were placed on the integrated map. Six of them were on chromosome 1H, 8 on 2H, 2 on 4H, 5 on 5H, 4 on 6H and 7 on 7H (Figure 1). In the progeny of Steptoe (feed) x More (malt), malting quality QTL were mapped to all seven chromosomes (Hayes et al., 1993). In the progeny of Harrington (malt) x TR306 (feed), malting quality QTL mapped to all chromosomes except 2H (Mather et al., 1997). Ten QTL related to drought tolerance were
incorporated into the consensus AD-2005 map. One for osmotic potential under irrigated condition on chromosome 2H, 1 for relative water content under stress condition on chromosome 7H, and one QTL for relative water content under irrigated condition on chromosome 5H. Two QTL for osmotic potential at full turgor were placed, one on chromosome 4H and one on 3H. While 5 QTL for water soluble carbohydrates were placed, two of them on chromo-some 7H and 5H each and one on chromosome 2H. This result agrees with Diab et al. (2004) and Teulat et al. (2001). QTL for water soluble carbohydrates and relative water content were found to be associated with the marker MWG626 and the marker Acl3 respectively on chromosome 7H. These traits are components of drought tolerance; therefore, the co-localization of these QTL is most likely due to pleiotropic effects of the same gene(s). The correlation between the 2 traits has been reported by Teulat et al. (2001) and Diab et al. (2004).
Markers associated with more than one trait Markers on the consensus AD-2005 that was found to be associated with more than one trait should receive more attention, as it could be of a great use to correlate traits that were not reported to be correlated or to support a correlation between traits that was suspected or need
more investigation. For example, the marker HVM36 on chromosome 2H was found to be associated with a QTL for Fusarium head blight resistance (Mesfin et al., 2003) and a QTL for osmotic potential (Diab et al., 2004). Also the marker (Bmag0125) on the same chromosome was found to be associated with a QTL for Fusarium head blight resistance (Mesfin et al., 2003) and a QTL for water soluble carbohydrates (Diab et al., 2004). Another case of one marker associated with 2 different traits is the locus MWG503 on the same chromosome (2H) that was reported to be associated with a QTL for Fusarium head blight resistance (Mesfin et al., 2003) and a QTL for malting quality (Marquez et al., 2000). There are no reports supporting the correlation between these traits, however, the association of these traits with the same marker suggests a sort of correlation between these traits. The marker CDO484 on chromosome 5 was found to
be associated with QTL for relative water content and water soluble carbohydrates (Diab et al., 2004). The co-location of water soluble carbohydrates and relative water content in this region suggests that the accumulation of water soluble carbohydrates may be important for plants to maintain their relative water content. Teulate et al. (2001) reported a correlation between these two traits as a part of the drought tolerance mechanism in barley. This study reports the first barley consensus map
gathering QTL for Fusarium head blight resistance, malting quality, flowering date and QTL related to drought stress. Gathering QTL for agronomic traits and biotic and abiotic stress on the same map provides new tools to align QTL traits between gramenea species and determine the most important regions for saturated mapping. The comparative genome mapping of such QTL may provide new information on shared genetic variation for those traits among cereals, which in turn might be useful for identifying potential candidate genes. Proof of reliability of the consensus AD-2005 map Comparative genomic studies of maps between cereal species have shown conservation of genome structure ( Devos and Gale,1993 and 1997; Van Deynze et al., 1995a,b,c). More extensive analysis of genome organization has revealed that the genome of rice can be subdivided into 19 linkage segments, which can be aligned with the genomes of wheat and barley (Moore et al., 1995). Based on previous comparative linkage mapping studies, the rice linkage groups 5 and 10 are known to be syntenic with at least parts of the linkage group 1(1H), while the rice chromosome 1 is syntenic with chromosome 3(3H). Similarly, rice non homologous chromosomes (4 and 7), (3 and 10) and (6 and 8) are syntenic with chromosomes 2H, 4H, and 7H, respectively. Accordingly, the Cornell rice RFLP 2001 map (http://www. gramene. org) was downloaded and

Diab. 247
Table 3. Comparison of the common markers (anchor loci) found in comparative study between rice and consensus AD-2005, OWB, KXM, and VXHs barley maps.
compared with the constructed barley consensus AD-2005, OWB, KXM and VXHs maps based on common markers (anchor loci). The results obtained from this comparative study are showed in Table 3. The total number of shared markers between rice and barley maps increased from two with OWB map, three with KXM and one with VXHs to 14 when the consensus AD-2005 map was used. These results meet the main objective of constructing an integrated barley consensus map to increase the chance of finding anchor loci between durum wheat, barley and rice. The construction of consensus map allows scientists to
easily compare genetic information from diploid species such as barley to species with more complex genomic structure, such as wheat, and increases the efficiency of molecular marker and gene isolation technologies applied to crop improvement. The objective of this work was to construct a consensus map for barley to be used in molecular breeding, QTL analysis and comparative genome mapping, which in turn will help plant breeders to combine QTL traits with other traits desired by farmers. Although more data are desperately needed, we can now conclude that this consensus map will serve as a useful tool for
more precise mapping of cereals, molecular
breeding studies in barley and related species, gene isolation based on map-based cloning and a
basis for
studies of genome organization and evolution.
ACKNOWLEDGMENTS
The author is grateful to Prof Dr. Hanayia El-Itriby, Prof Dr. Osama Momtaz and Prof. Dr. Gharib Abdelraouf for their technical support and helpful discussion. Special thanks for Prof. Dr. Ahmed Bahyeldin, for his effort in reviewing and editing the manuscript before submission. The author is also appreciative to Ms. Lamia Salah for her assistance in this work. REFERENCES Beavis WD,Grant D (1991). A linkage map based on information from
four F2 populations of maize (Zea mays L.). Theor. Appl. Genet. 82:636-644.
Becker J, Heun M (1995). Barley microsatellite – allele variation and mapping. Plant Molecular Biology 27: 835-845.
Bernacchi D, Beck-Bunn T, Eshed Y, Lopez J, Petiard V, Uhlig J, Zamir D, Tanksley SD (1998). Advanced backcross QTL analysis in tomato. I. Identification of QTLs for traits of agronomic importance from Lycopersicon hirsutum. Theor. Appl. Geneti. 97: 381–397.
Causse MA, Fulton TM, Cho YG, Ahn SN, Chunwongse J, Wu K, Xiao J, Yu Z, Ronald PC, Harrington SE, Second G, McCouch SR, Tanksley SD (1994). Saturated molecular map of the rice genome based on an interspecific backcross population. Genetics 138: 1251-1274
Devos KM, Gale MD (1997). Comparative genetics in the grasses. Pl. Mol. Biol. 35: 3–15.
Devos KM, Gale MD (1993). Extended genetic map of the homoeologous group 3 chromosomes of wheat, rye and barely. Theor Appl Genet 85: 649-652.
Position Marker Position Marker Position Marker Position Marker
Consensus AD-2005 -1H VXHs - 1H KXM - 1H OWB - 1H
Map
0.16
0.244
0.519
BCD454
CDO580a
CDO105B
46.5 MWG68 102.8 CDO105B - 0 Rice 5
0.26
0.28
CDO98
BCD207
- 0 - 0 - 0 Rice 10
Consensus AD-2005 - 2H VXHs - 2H KXM - 2H OWB - 2H
0.608
0.97
CDO680
CDO36
- 0 113.7 JBG282 - 0
Rice 4
Consensus AD-2005 - 3H VXHs - 3H KXM - 3H OWB - 3H
0.087
0.35
1.0
CDO395
BCD828
MWG110
- 0 113.3 MWG110 - 0
Rice 1
Consensus AD-2005 - 4H VXHs - 4H KXM - 4H OWB - 4H
0.013 CDO795 - 0 - 0 31.2
32.3
CDO542
CDO122
Rice 3
Consensus AD-2005 - 7H VXHs - 7H KXM - 7H OWB - 7H
0.175
0.295
0.67
Glx(Wx)
CDO475
Amy2
- 0 - 0 - 0
Rice 6
14 1 3 2 Total
248 Afr. J. Biotechnol. Diab AA (2003). Genomic Analysis of Drought Tolerance in Wheat and
Barley. Ph.D Thesis, Cornell University – Ithaca – NY. Diab AA, Béatrice Teulat-Merah, Dominique This, Neslihan Z, Ozturk
David Benscher, Mark E Sorrells (2004). Identification of Drought- Inducible Genes and Differentially Expressed Sequence Tags in Barley. Theoretical and Applied Genetics. 109: 1417-1425.
Forster BP, Ellis RP, Newton AC, Morris WL, Moir J, Lyon J, Keith R, Tuberosa R, Talame V, This D, Teulat B, El-Enein RA, Bahri H, Ben Salem M (2000). Stable yield in Mediterranean barley: application of molecular technologies in improving drought tolerance and mildew resistance. In: Proceedings of the 8th international barley genetics symposium, Adelaide, 22–27 October 2000, pp. 273–274.
Fulton, TM, Beck-Bunn T, Emmatty D, Eshed Y, Lopez J (1997). QTL analysis of an advanced backcross of Lycopersicon peruvianum to the cultivated tomato and comparisons with QTLs found in other wild species. Theor. Appl. Genet. 95: 881–894.
Gai XW, Lal S, Xing LQ, Brendel V, Walbot V (2000). Gene discovery using the maize genome database ZmDB. Nucl. Acids Res. 28:94–96
Gentzbittel L, Vear F, Zhang YX, Breville A, Nicolas P (1995). Development of a consensus linkage RFLP map of cultivated sunflower (Helianthus annus L.). Theor. Appl. Genet. 90: 1079-1086.
Graner A, Jahoor A, Schondelmaier J, Siedler H, Pollen K, Fischbeck G, Wenzel G and Herrmann RG (1991). Construction of an RFLP map of barley. Theor. Appl. Genet. 83: 250 – 256
Hauge BM, Hanley SM,Cartinhour S,Cherry JM, Goodman HM (1993). An integrated genetic/RFLP map of the Arabidopsis thaliana genome. Plant J. 3: 745-754.
Hayes PM, Liu BH, Knapp SJ, Chen F, Jones B, Blake T, Franckowiack JD, Rassmusson D, Sorells M, Ullrich SE, Wesenberg D, Kleinhofs A (1993) Quantitative trait locus effects and environmental interaction in a sample of North American barley germplasm. Theor. Appl. Genet. 87: 392–401.
Heun M, Kennedy AE, Anderson JA, Lapitan NLV, Sorrells ME, Tanksley SD (1991) Construction of restriction fragment length polymorphism map for barley (Hordeum vulgare). Genome 34: 437-447.
Jeremy B, David L, Nicky P, Jan C, Mike K. (1996). Marker regression
mapping of QTL controlling flowering time and plant height in a spring barley (Hordeum vulgare L.) Cross Heredity 77(1): 64-73.
Karakousis A, Gustafson JP, Chalmers KJ, Barr AR, Langridge P (2003). A consensus map of barley integrating SSR, RFLP, and AFLP markers. Australian Journal of Agricultural Research 54: 1173- 1185
Kianian SF. Quiros CF (1992). Generation of a Brassica oleracea composite RFLP map: linkage arrangements among various populations and evolutionary implications. Theor. Appl. Genet. 84: 544-554.
Kleinhofs A, Graner A (2001). An integrated map of the barley genome. In: Phillips RL, Vasil IK, eds. DNA-based markers in plants. Amsterdam, Netherlands: Kluwer Academic Publishers, pp.187–199.
Ma Z, Steffenson BJ, Prom LK, Lapitan NLV (2000). Mapping of quantitative trait loci for fusarium head blight resistance. Phytopathology 90: 1079–1088.
Marquez-Cedillo LA, Hayes PM, Jones BL,. Kleinhofs A, Legge WG, Rossnagel BG, Sato K, Ullrich SE, Wesenberg DM (2000). QTL analysis of malting quality in barley based on the doubled-haploid progeny of two elite North American varieties representing different germplasm groups. Theoretical and Applied Genetics 101:173-184.
Mather DE, Tinker NA, LaBerge DE, Edney M, Jones BL, Rossnagel BG, Legge WG, Briggs KG, Irvine RB, Falk DE, Kasha KJ. (1997). Regions of the genome that affect grain and malt quality in a North American two-row barley cross. Crop Sci. 37:544-554.
Mesfin AK, Smith P, Dill-Macky R,. Evans CK, Waugh R, Gustus CD,
Muehlbauer GJ (2003). Quantitative Trait Loci for Fusarium Head Blight Resistance in Barley Detected in a Two-Rowed by Six-Rowed Population. Crop Sci. 43: 307–318.
Miyazaki CE, Osanai K, Saeki N,Hirota, Ito K, Ukai Y, Konishi T, Saito A (2000). Construction of a barley RFLP linkage map using an F2 population derived from a cross between Ko A and Mokusekko 3. Barley Genetics Newsletter 30: 41- 43.
Nevo E (1992) Origin, evolution, population genetics and resources for breeding of wild barley, Hordeum spontaneum, in the Fertile Crescent. In: Shewry P (ed) Barley: genetics, molecular biology and biotechnology. CABI, Wallingford, pp 19–43.
Qi X, Stam P, Lindhout P (1996). Comparison and integration of four barley genetic maps. Canadian Journal of Genetics and Cytology 39: 379 394.
Ramsay L, Macaulay M, Degli-Ivanissevich S (2000). A simple sequence repeat-based linkage map of barley. Genetics 156: 1997–2005.
Teulat B, Borries C, This D (2001) New QTLs identi.ed for plant water-status, water-soluble carbohydrate and osmotic adjustment in a barley population grown in a growth-chamber under two water regimes. Theor. Appl. Genet. 103: 161–170.
Tinker NA, Mather DE, Rossnagel BG, Kasha KJ, Kleinhofs A, Hayes PM, Falk DE, Ferguson T, Shugar LP, Legge WG, Irvine RB, Choo TM, Briggs KG, Ullrich SE, Franckowiack JD, Blake TK, Graf RJ, Dofing SM, Saghai Maroof MA, Scoles GJ, Hoffman D, Dahleen LS, Killian A, Chen F, Biyashev M, Kudrna DA, Steffenson BJ (1996) Regions of the genome that affect agronomic performance in two-row barley. Crop Sci. 36: 1053–1062.
Copyright © 2022 FDOKUMEN