Marketing of malting and feed barley in ... - ScholarWorks
175
Marketing of malting and feed barley in Montana and in the United States by Edward Dean Vaughan A thesis submitted to the Graduate Faculty in partial fulfillment of the requirements for the degree of DOCTOR OF PHILOSOPHY in Agricultural Economics Montana State University © Copyright by Edward Dean Vaughan (1966) Abstract: The apparent need for this study arose in about 1957 when the barley variety Betzes was released in Montana as a potential malting barley. Following designation by the Malting. Barley Improvement Association of Betzes as an approved malting variety, there immediately arose many problems of marketing. Purpose of this study was to examine the market for barley and malting barley in the context of the. opportunities and problems in the marketing of malting barley produced in Montana. Objectives were to attempt to determine whether, and if so, what form of marketing improvements might be made and to examine the market in terms of needed research aimed toward the solution of marketing problems. The study was conducted largely as a library type analysis utilizing secondary sources of data. The purpose, objectives, methods' and progress of the study were discussed and approved in a meeting of the thesis committee at Montana State College on December 11, 1962. At that time the study was visualized as a panoramic view of the market structure and as a basic reference piece on malting barley marketing. A companion study of the nature of the market for malting barley specifically in Montana was initiated by the Montana Experiment Station in 1960 and, at this writing, was in progress. This study included a description of United States and Montana production, distribution, and marketing of barley and malting barley. The malting and brewing processes were reviewed in terms of the market requirements for malting barley. The brewing industry was examined from the point of view of consumption of beer, the major end product of malting barley. Pricing and price relationships were analyzed and related to governmental price and production policy. As an important market outlet, the export market was considered in terms of future prospects for the maintenance and possible expansion of overseas sales' of barley. The writing of this dissertation was considered by the author as an anti-climax in that the chief contribution of the study and its related efforts has been to the development of Extension Service educational programs concerned with the marketing! and production of malting barley. It is hoped that this writing will further contribute to those programs and to future research studies dealing with more limited and specific marketing problems.
-
Upload
khangminh22 -
Category
Documents
-
view
2 -
download
0
Transcript of Marketing of malting and feed barley in ... - ScholarWorks

Marketing of malting and feed barley in Montana and in the United Statesby Edward Dean Vaughan
A thesis submitted to the Graduate Faculty in partial fulfillment of the requirements for the degree ofDOCTOR OF PHILOSOPHY in Agricultural EconomicsMontana State University© Copyright by Edward Dean Vaughan (1966)
Abstract:The apparent need for this study arose in about 1957 when the barley variety Betzes was released inMontana as a potential malting barley. Following designation by the Malting. Barley ImprovementAssociation of Betzes as an approved malting variety, there immediately arose many problems ofmarketing.
Purpose of this study was to examine the market for barley and malting barley in the context of the.opportunities and problems in the marketing of malting barley produced in Montana. Objectives wereto attempt to determine whether, and if so, what form of marketing improvements might be made andto examine the market in terms of needed research aimed toward the solution of marketing problems.The study was conducted largely as a library type analysis utilizing secondary sources of data. Thepurpose, objectives, methods' and progress of the study were discussed and approved in a meeting ofthe thesis committee at Montana State College on December 11, 1962. At that time the study wasvisualized as a panoramic view of the market structure and as a basic reference piece on malting barleymarketing. A companion study of the nature of the market for malting barley specifically in Montanawas initiated by the Montana Experiment Station in 1960 and, at this writing, was in progress.
This study included a description of United States and Montana production, distribution, and marketingof barley and malting barley. The malting and brewing processes were reviewed in terms of the marketrequirements for malting barley. The brewing industry was examined from the point of view ofconsumption of beer, the major end product of malting barley. Pricing and price relationships wereanalyzed and related to governmental price and production policy. As an important market outlet, theexport market was considered in terms of future prospects for the maintenance and possible expansionof overseas sales' of barley.
The writing of this dissertation was considered by the author as an anti-climax in that the chiefcontribution of the study and its related efforts has been to the development of Extension Serviceeducational programs concerned with the marketing! and production of malting barley. It is hoped thatthis writing will further contribute to those programs and to future research studies dealing with morelimited and specific marketing problems.

THE MARKETING OF MALTING AND FEED BARLEY IN MONTANA AND IN THE UNITED STATES
BY
A thesis submitted to the Graduate Faculty in partial fulfillment of the requirements for the degree
ofDOCTOR OF PHILOSOPHY
inAgricultural Economics
Approved:
Montana State University Bozeman, Montana
June, 1966

iii
ACKNOWLEDGEMENTSFor guidance and assistance I am especially indebted to Professors
John Lo Fischer, Clive R. Harston, William Ewasiuk, Layton Thompson, Edward Ward, and Clarence Jensen of the Department of Agricultural Economics at Montana State University. To Mesdames Jeanne Gillie in Montana and Joyce East in Washington, D. C., grateful appreciation for their secretarial contribution. Most of all thanks to my wife Jane and to my sons and daughters for accepting neglect during the process.

iv
TABLE OF CONTENTS
VITA. . . . . . . .ACKNOWLEDGEMENTS. TABLE OF CONTENTS LIST OF TABLES. . LIST OF FIGURES . ABSTRACT. . . . .CHAPTER I. BARLEY MARKETING IN MONTANA . . . . . . .
The P Iems. . . . . . . . . . . . . . . . . . .Proposed Producer Marketing Associations. . . . .
CHAPTER II. BARLEY IN THE GRAIN MARKETING SYSTEM . .
Grain Marketing Channels. . . . . . . . . . . . .Changes in Grain Marketing. . . . . . . . . . . .
c Comgiarison of Barley and Wheat Marketing Channels Influence of Change on Barley Marketing . . . . . '
CHAPTER III. BARLEY PRODUCTION AND DISTRIBUTION. . .
United States Barley Production and Distribution. Principal Barley Producing States . . . . . . . .The Value of Betzes to Montana. . . . . . . . . .Montana Barley Production . . . . . . . . . . . .Malting Barley Production . . . . . . . . . . . .
. New Areas, New Varieties, and Competition . = . . Approved Malting Barley . . . . . . . . . . . . .Cultural Practices Problems . . . . . . . . . . . . .
CHAPTER IV. MALTING AND BREWING. . . . . . . . . . .
The Malting ProcessMaltsters' Requirements . . . . . . . . . . . . .The Brewing Process . . . . . . . . . . . . . . .The Geography of Barley, Malt, and Beer . , . . .
CHAPTER V. STRUCTURAL CHANGES IN THE BEER INDUSTRY .Beer Consumption Characteristics. . . . . . . . .Mergers and Integration . . . . . . . . . . . . .Beer Industry Trends. . . . . . . . . . . . . . .Taxes, Incomes, and Sales of Beer . . . . . . . .

V
TABLE OF CONTENTSPage
CHAPTER VI0 DETERMINING THE PRICE OF MALTING BARLEY. . . . . . . . 79Country Elevator Pricing . . . . . . . . . . . . . . . . . . . . 79Terminal Market Pricing. . . . . . . . . . . . . . . . . . . . 81Barley Support Prices . . . . . . . . . . . . . . . . . . . . . 93
CHAPTER VII. AGRICULTURAL POLICY PROGRAMS AND MALTING BARLEY . . . 96)
The Policy Setting. . . . . . . . . . . . . . . . . . . . . . . 96The 1962 Barley Program . . . . . . . I . . . . . . . . . . . . 97"Compana and Exempt Barley . . . . . . . . . . . . . . . . . . . 100Predicted Program Effects . . . . . . . . . . . . . . . . . . . . 104Program Evaluation. . . . . . . . . . . . . . . . . . . . . . . 109
CHAPTER VIII. FOREIGN TRADE IN BARLEY AND FEED GRAINS. . . . . . . . IllUnited States Feed Grains’in World Trade. . . . . . . . . . . . IllWorld Barley Production Patterns. . . . . . . . . . . . . . . . . 116
• World Trade in Barley and Grains. . . . . . . . . . . . . . . . . 118Prospects for Exports of United States' Barley . . . . . . . . . 122International Grain Trade Barriers. . . . . . . . . . . . . . . 123European Economic Community Feed Grain Production andTrade Policies. . . . . . . . . . . . . . . . . . . . . . . . 125
Grain Prices under the Common Agricultural.Policy . . . . . . . 130
CHAPTER IX. SUMMARY AND CONCLUSIONS. . . . . . . . . . . . . . . . 133..J .,T
Summary. . . . . . . . . . . . . 133Conclusions . . . . . . . . . . . . . . . . . . . . . . . . . . 137
LITERATURES CITED . . . . . . . . . . . a . . . . . . . . . . . . . 143

vi
LIST OF TABLESNumber
I UNITED STATES BARLEY: ACRESGRAIN, YIELD PER HARVESTED 1950-61o o o o 6 m o 9 e e
PLANTED, ACRES HARVESTED FOR ACRE, AND TOTAL PRODUCTION,
II ESTIMATED PLANTED ACREAGES OF BARLEY IN FOURTEEN STATES INTHE UNITED STATES, 1959-60 . o . . . . . . . . . . . . . . o .
Ill UNITED STATES BARLEY DISTRIBUTION, 1950-60 . . . . . . . . . .IV ESTIMATED PRODUCTION. OF TWO-ROW MALTING BARLEY, WESTERN
' STATES, 1959—60, AVERAGE . . . . . . . . . . . o . . . . . .V THE CONTRIBUTION OF BETZES BARLEY TO MONTANA FARMERS' INCOME .VI CASH RECEIPTS FROM FARM MARKETINGS IN MONTANA COMPARING
BARLEY WITH ALL CROPS AND LIVESTOCK, 1950-61 . . . . . . . .VII ACRES HARVESTED, YIELD, PRODUCTION, PRICE, AND VALUE OF ALL
MONTANA BARLEY, 1950-61 .VIII PERCENTAGES OF STATE TOTAL ACRES OF ALL BARLEY, DRY LAND
BARLEY, IRRIGATED BARLEY, AND BETZES BARLEY BY MONTANA CROP REPORTING DISTRICTS, 1959-60 AVERAGE. . . . . . . . . .
IX YIELD PER ACRE AND TOTAL PRODUCTION OF ALL BARLEY Iti THEMIDWESTERN STATES, MONTANA, AND THE. UNITED STATES, 1959-60 .
X PERCENTAGES OF TOTAL ACRES OF ALL VARIETIES OF BARLEY PLANTED TO MBIA APPROVED MALTING BARLEY VARIETIES,SELECTED STATES, 1959 and 1960 . . . . . . . . . b . . . . . .
XI CERTIFIED SEED PRODUCTION OF MALTING BARLEY VARIETIES INTHE WESTERN STATES, 1957-61 „ . . . . . . . . . . . . . . .
XII UNITED STATES BREWERIES. CAPACITY, 1960 . . . .
LEADING STATES IN NUMBER ANDo o o e o o e o o o o o o o o e o o o
XIII NUMBERS OF FIRMS, BREWERIES, TOTAL SALES, AND SALES OF DRAUGHT’ BEER IN THE UNITED STATES, SELECTED YEARS,19 34-60 0 0 0 0 0 0 0 0 0 0 0 . 0 0 0 . 0 0 . 0 0 0 0
Page
22
2426
28
29
31
33
34
35
37
38
61
68

LIST O F TABLES (Cont „)
Number • PageXIV UNITED STATES BREWERIES'NUMBER AND PERCENTAGES OF
TOTAL NUMBERS' BY PLANT SIZE GROUPS, I960........ . . . 70XV SALES AND CAPACITIES OF THE TOP TEN UNITED STATES BREWERS,
19 61 o o oo o o o o o o o o o oo o e * e o 0 9 0 9 0 0 0 71XVI MINNEAPOLIS CASH GRAIN AVERAGE CLOSING PRICES PER BUSHEL
NO. 3 FEED BARLEY, SEASONS 1954-61. . . . . . . . . . . . 82XVII MINNEAPOLIS CASH GRAIN AVERAGE CLOSING PRICES PER BUSHEL
NO. 2 MALTING BARLEY, SEASONS 1954-61 ....... . . . . . 84XVIII PREDICTED AND ACTUAL BARLEY ACRES PLANTED, AND COMPARISON
OF ACRES PLANTED IN.1962 t o 1959-60 AVERAGES RESULTING FROM THE 1962 FEED GRAIN PROGRAM . . . . . . . . . . . . 1°5
XIX PRINCIPAL BARLEY ..PRODUCING COUNTRIES'OF THE WORLD, ANNUAL PRODUCTION IN BUSHELS 1950-54, AVERAGE AND ANNUAL FROM 1957 THROUGH 1961 . ........................ . 117
XX BARLEY: WORLD PRODUCTION BY GEOGRAPHIC DIVISIONS, AVERAGE1955-59, ANNUAL 1960 AND 1961 . . . . . . . . . . . . . . 118
XXI PRINCIPAL BARLEY.PRODUCING COUNTRIES OF THE WORLD. AVERAGEYIELDS PER HARVESTED ACRE 1950-54, ANNUAL 1957-61 . . . . 119
XXII WORLD IMPORTS AND EXPORTS OF BARLEY AND GRAINS, 1958-62 , . 120XXIII LEADING COUNTRIES OF THE WORLD IN THE EXPORT OF BARLEY,
1958-62o o o o o o e o e e o e o e o e o o o o o o e e oXXIV LEADING COUNTRIES OF THE WORLD IN THE IMPORT OF BARLEY9
1958-62 o o o o o e e e o o o e o e o o o o o e o o o o oXXV U0 So BARLEY EXPORTS BY WORLD REGIONS OF DESTINATION9I QSft-6? 123X Z/ —J O V ® o oo o o ® 0 oo o o- a oo » a o e o o o o ooXXVI U. So BARLEY EXPORTS BY COUNTRIES OF DESTINATION, ^
1958~62 o e o o o o o e e e e e o e e o o o o o o o e o o

Viii
LIST.OF TABLES (Cont.)
Number PageXXVII NONTARIFF RESTRICTIONS OF FOREIGN COUNTRIES' AGAINST
GRAIN IMPORTS FROM THE UNITED STATES. . . . . . . . . . . . 125a
XXViII EUROPEAN ECONOMIC COMMUNITY•MEMBER COUNTRY GRAIN TARGETPRICES, 1962-63 AND 1963-64 . . . . . . . . . . . . . . . . 131
XXIX EUROPEAN ECONOMIC COMMUNITY UPPER AND LOWER LIMIT TARGETPRICES, 1962-63 AND 1963-64 . . . . . . . . . . . . . . . . 132132

ix
LIST OF FIGURES
Number12
3
45678
9
10
11
12
1314
15
16
17
Marketing Channels for Barley— 1959. . . . . . . . . .
Marketing Channels for Wheat— 1959 . . . . . . . . . .Estimated 1959-60 Average Barley Acreage Planted b y Regions in the U . S . . . . . 6 . . . . . . . . . . .
State of Montana Crop Reporting Districts. . . . . . .A Typical Brewing Process . . . . . . . . . . . . . .Location of U. S. Breweries. . . . . . . . . . . . . . .Location of U. S. Malt Companies . . . . . . . . . . .
Per Capita Consumption of Beer and State Excise Taxes, by States U. S. 1960 . . . . . . . . . . . . . . .
Per Capita Income and State Excise Taxes on Beer, by States, U. So, 1960 . . . . . . . . * . . . . . . .
Per Capita Consumption Beer and Per Capita Incomes,by States, U. S., 1960 . . . . . . . . . . . . . . . . . .
Monthly Average Prices and Trends for No. 2 MaltingBarley and No. 3 Feed Barley, Minneapolis, 1953-61.. . . .
Rates of Change in U. S. Barley Production Plus Imports, Total Disappearance, and Stocks at Year's End, 1950-60 . .
U. S. Barley Uses and Total Disappearance, 1950-60 . . . .Correlation of Feed and Malting Barley Market Prices at Minneapolis, 1953—60. . . . . . . . . . o . . . . . . . .
Receipts of Barley by Months at Principal Markets,1953-61. 9 0 0 9 0 0 0 0 0 0 9 0 0
Monthly Indices of Barley Receipts and Prices for Feed and Malting Barley, 1953-61. . . . . . . . . . . . .
Page17a
18a
21a32a555960
75
76
77
83
86
88
89
91
92
Correlation between National Average Barley Support Pricesand Minneapolis Market Prices ■, 1944-60 . . . . . . . . . . 94

X
LIST OF FIGURES (Cont.)
Number18 U, So Exports as a Percentage of Sales. .19 U. So Agricultural Exports by Country, 1962 . ........20 Coarse Grains: U. S. Exports by Area of Destination. „ »
Page
. o 112o o 113 O O 114
21 Coarse Grains: Ui S. Exports by Commodities. . 115

xi
ABSTRACTThe apparent need for this study arose in about 1957 when the barley
variety Betzes was released in. Montana as a potential malting barley. Following designation by the.Malting.Barley Improvement Association of Betzes as an approved malting variety, there immediately arose many problems of marketing.
Purpose of this study.was.to examine the market for barley and malting barley in the context of the. opportunities and problems in the marketing of malting barley produced in. Montana. Objectives were to attempt to determine whether, and.if.so, what form of marketing improvements might be made and to examine the market, in. terms of needed research aimed toward the solution of marketing problems. The study was conducted largely as a library type analysis utilizing secondary sources of data. The purpose, objectives, methods' and progress of the study were discussed and approved in a meeting of the thesis committee at Montana State College on December 11, 1962. At that time the study was visualized as a panoramic view of the market structure and as a basic reference piece on malting barley marketing. A companion study of the nature of the market for malting barley specifically in Montana was initiated by the Montana Experiment Station in 1960 and, at this writing, was in progress.
This study included a description of United States and Montana production, distribution, and marketing of barley and malting barley. The malting and brewing processes were reviewed in terms of the market requirements for malting barley. The brewing.industry was examined from the point of view of consumption of beer, the major end product of malting barley. Pricing and price relationships were analyzed and related to governmental price and production policy. As an important market outlet, the export market was considered in terms of future prospects for the maintenance and possible expansion of overseas sales' of barley.
The writing of this dissertation was considered by the author as an anti-climax in that the chief contribution of the study and its related efforts has been to the development, of Extension Service educational programs concerned with the marketing! and production of malting barley. It is hoped, that this writing will further, contribute to those programs and to future research studies dealing with more limited and specific marketing problems.

CHAPTER I
BARLEY MARKETING IN MONTANA 'Until 195^s when wheat acreage restriction went into effect, barley was
a relatively minor crop in Montana. Since then, production has increased to the point where Montana ranks among the leading states in barley production„ For all practical purposes, barley.is the only significant alternative on much of the diverted wheat acres. During the late 1950'ss annual production of barley in Montana varied from Ul to over 52 million bushels„
Historically; grain trade channels in Montana have been geared to the
handling of wheat. The trade found it difficult to segregate barley from other grains. during the processes of marketing. With increasing production
of barleys there.arose problems of harvest, storage, transportation, pricing, quality, variability of supply, interregional competition and market outlets. Foreign markets became an important, but unstable, market factor.
Barley producers, also discovered that Montana's livestock .feeding industry
was not keeping pace with increasing feed grain production.The release.of Betzes barley by the Montana Experiment .Station (in
1957) and its.approval by the trade as a malting variety (in 1958) provided
an opportunitytfor. Montana producers to take advantage, of price premiums associated with the sale of malting barley.
The malting industry annually uses approximately 100 million bushels
of barley. ..About 10 percent of the total usage or 10 million bushels is
two-row malting, barley. Until 1957 this market, largely in the Midwest and East, was satisfied by Idaho, Oregon, and northern California. With

— 2 —the approval of Betzes as a malting variety by the Malting Barley Improvement Association, Montana began to compete with other two-row barley producers in the Pacific Northwest„
In the meantime, freight rates on Washington and Oregon malting barley were reduced, offsetting Montana's advantage in shipping barley to midwest malting centers, Colorado, Idaho and Alberta, Canada, began
producing Betzes. barley. Agronomic research for improved malting varieties
continued in all barley producing areas, Within a period of two or three years the question changed from "Can Montana produce an acceptable malting
barley?" to "Can Montana successfully compete in the marketing of malting barley?"
Malting..barley is produced in Montana in the Gallatin Valley and in
Teton, Pondera, and Glacier Counties, The principal markets are the malt ' houses located,in Minnesota and Wisconsin, The problems associated with its
marketing are found at all levels.Little .previous work dealing with the economics of marketing malting
barley has been done. In Montana research and extension..work has been con
cerned primarily with problems of production and the technological problems of harvesting and handling by farmers,
Some time, after this dissertation was started, a research.project was
initiated by.the Agricultural Economics Department of Montana State College, entitled Marketing Two-Row Malting Barley in Montana, I/ The objectives of
I/ Ewasiuk, W, J,, Project Statement, Montana AES, September 27, I960,

- 3 -the project were to:
(1) Examine the market potential and specific outlets'for Montana-malting barley=
(2) Determine the,buying and selling practices of elevators ■ and maltsters»
(3) Recommend changes in marketing procedures»
The project was designed as a study of the specific nature of the marketing of two-row malting barley in Montana-and" as a complementary study
to this dissertation which was designed as a "panoramic view of the market structure and problems of the United States malting barley marketing=" 2/
The ProblemsBy the mid-1950’s9 Montana’s barley marketing problem had become
serious= In a..1957 Master’s degree thesis, Fedje 3/ hypothesized that even though the Montana market for barley was undeveloped, the market could be expanded through ,.increased livestock feeding, increased production of
malting barley ,..and through new and expanded market outlets, such as the
export market.for pearled barley= At the time of Fedje’,s study, Montana had no approved.malting variety of barley= Hence his analysis and conclusions were ..directed mainly toward expanded livestock feeding as a market for barley= . * *
2/ From notes taken during a meeting of the dissertation-committee atMontana-State College, December 11, 1962, attended„:by.,.Clive R= Harston, Chairman; John L 6 Fischer; William J= Ewasiuk; and the author=
3/ Fedje, D= L 0= An Analysis of the Market Structure for Montana Barleyand Potential:Outlets= Montana AES Agricultural Economics Research Report, No= I, Bozeman, Montana, May, 1957=
* n

- U -During the period 195U-1958, plant breeders at Montsma State College
were being pressed to develop an acceptable malting barley <> Compana9 the variety in greatest production9 was not recognized either by the United States Department of Agriculture or by the malting industry as a malting variety. U/ The variety Betzes9 which was brought to the United States from
Poland9 was first tested in Montana as a possible malting variety in 1953.It was released in 1957 for commercial production and recommended for irrigated land or for areas of above normal rainfall east of the Continental Divide in Montana. 5/ Betzes yields satisfactorily on.dry.land but cannot be expected to.consistently produce a malting quality barley. It compares
favorably with other varieties as a feed barley. It is also recommended as
a pearling.barley,Agronomically9 Betzes is a two-row, medium-early variety of moderate
yield. It is white seeded, midtail, moderately stiff strawed, rough awned,
has medium to small seeds, and has a tendency to shatter when mature. 6/
Montana's climate is favorable for the production of bright, disease-free• barleyo But the climate also results in high protein barley which is
U/ Small quantities of Compana were being used for malting by the Great Falls Brewing Company.
5/ Montana Cooperative. Extension Service mimeo folder, Betzes Barley in Montana., Bozeman, Montana, March, 1958°
6/ Montana AES Cereal Quality Control Laboratory Second Annual Report,. released as The Malting Quality of Montana Barleys in Agron. and Soils Department, Mimeo Leaflet No. 30, Bozeman, Montana, October, 1959°
\
- 5 -undesirable in malting. 7./ Thus the future for malting barley in Montana appears to be.on irrigated land or in areas of high rainfall - conditions favoring the production of a lower protein content barley.
Just as all barley is not necessarily acceptable for malting, neither is Betses necessarily acceptable for malting even though an approved variety. 8/ Thus, ideally, barley must be segregated from other grains; Betses must be segregated from other barley until tested; portions of Betses meeting malting requirements must be segregated from that which does not
meet the requirements; and malting quality portions of the Betzes crop may need to be further segregated into lots which are relatively uniform in such
malting quality,factors as protein content; test weight; color, size, and plumpness of kernel; rate of germination; and kernel damage. < Few, if any.
7/ Protein.is a nitrogenous compound. If there is too much protein— -hence too much nitrogen— in barley, chemical reactions result in a malt which may cause:instability in the finished brew. Some nitrogen is necessary in the malt to furnish nutrient,for the yeast during fermentation.Nitrogen also acts as a carbonic gas carrier, in the .finished brew. Thus too much nitrogen causes a "hazy" beer, but too little slows fermentation. See: Banasik, 0. J 0, "Evaluation of Barley Quality,"■North DakotaAgricultural College, Bimonthly Bulletin, Fargo, North Dakota, July- August , 1957 o
8/ In a paper presented to the Western Barley Conference at Spokane, Washington, in 19559 John H. Parker of the MBIA said:, "Malt for brewing may be made from nearly any kind of barley. However,.it is only reasonable that brewers and maltsters prefer the higher quality barleys for their particular purposes. Thus total barley production is not a necessary indicator of the quality of.the malting.barley available. Frost, diseases, etc., may not significantly reduce total barley production but may seriously reduce the supply of high quality barley for malting."

- 6 -
to handle the relatively small quantities produced or received according to .the above described ideal quality segregation.
Pricing problems have also been evident. Even, though a particular lot
of Betzes may meet malting standards, it does not necessarily follow thata malting price, will be paid. In some cases producers have felt thatpremiums should be paid for all Betzes. In other instances grain handlershave purchased Betzes from farmers at malting prices and later found that
they had to resell it at feed prices— or vice versa.The handling, storing, and pricing problems in the marketing of Betzes
were additionally complicated by a lack of understanding of the malting and
brewing industries by both producers and local grain handlers.These and. other problems were recognized by producers .and the grain
trade. The Director of the Malting Barley Improvement Association said:
"If Montana is eventually in the position of marketing large, quantities of malting barley, it must be.recognized that this barley will very likely.have to.be. . marketed through the recognized grain.marketing v channels and be sold on the Minneapolis market as is other malting barley produced in the Midwest." 9/
Proposed Producer Marketing Associations.■
Betzes barley producers, generally, were sympathetic with the storage
and handling problems of the grain trade but were not content with an inadequate marketing system for a new crop which, though small relative to
wheat, held the potential of significant additional annual..farm income. In
9/ Letter by A. J. Lejeune, Director, MBIA, Addressed to E. D. Vaughan, Montana Extension Service, March J, 1958.
individual producers or grain handlers have had sufficient storage facilities
- 7 -the summer of. 1958, there occurred an incident illustrative of Montana's malting barley marketing problems. That incident is summarized in the following paragraphs„
Members of the Gallatin County Grain Growers Association., who were producers of Betzes barley, were dissatisfied with the marketing of their crops, Their reasons were that local grain marketing facilities apparently could not adequately handle the problems of testing, segregation, and pricing of Betzes as a malting barley. Their proposed alternative, was to form a producers marketing and/or bargaining association to sell their
barley direct to maltsters. The Montana Cooperative Extension Service Marketing Economist, E. D. Vaughan, 10/ and the Gallatin County Agent,
Owen Wirak, 11/ were requested to assist in determining the feasibility of the proposal. It was decided that the Extension Marketing. Economist would visit the Minneapolis Grain Exchange and interview commission■firms, maltsters, and others interested in the malting barley^market concerning
the proposed, bargaining association. Grain trade, representatives inter
viewed were .cordial, interested, alarmed, and unanimous,in. their;reactions
10/ Now Assistant Director, Marketing Division, Federal Extension Service, USDA, Washington, D. C.
11/ Now Marketing Specialist, Cooperative Extension Service, Washington State University, Pullman, Washington.

- 8 -
to the proposalo Their opinions were summarized as follows: 12/(1) The malting industry is actively interested in seeking out
new areas of malting barley production,(2) Local elevator problems in the handling of. Betzes as a
malting barley are recognized and efforts are being made. to overcome those problems«
(3) It is recommended that producers store their.barley on the farm at harvest time, have samples tested, submit test results to local elevators, who may then act as agent for producers in seeking malt house buyers directly or through grain exchange commission firms, Barley shipped to.Minneapolis may be sold either "on track" or "to arrive",
. depending on market conditions at the time,(U) It is considered unethical for maltsters to send buyers
into the producing area for direct purchase from producers.
(5) If and when Betzes is produced in commercial quantities, local grain handlers will be active in the market,
(6) Any attempt by a producer's marketing organization to sell direct to maltsters or to otherwise bypass regular grain trade channels will be opposed.
With a crop of barley ready for harvest, the producers, feeling more
helpless than..mollified, accepted the general recommendation in No, (3)
above, Local elevators then made an apparently sincere effort to cooperate with producers in handling and marketing their malting barley. This
compromise solution was generally adopted in all major Betzes-produeing
12/ From a letter by E, D, Vaughan in the form of a Malting Barley Marketing Report, addressed to the Gallatin County Grain. Growers Association, e/o Owen Wirak, County Agent, July 21, 1958.
- 9 -areas in the state- It did alleviate— "but it did not necessarily solve—
problems of segregated storage, sample testing, handling and pricing.
Some time later (in i960) there was an attempt on the part of a group of farmers to combine the original proposal for a malting barley marketing bargaining association in the Gallatin Valley with the recommendations of the grain trade as given above. The following outline summarizes the pro-
pos al;
Proposed
.Gallatin Valley Malting Barley Marketing- Association
I. Background1. Gallatin Valley wheat acreage allotments have been severely
reduced. Malting barley appears as a profitable alternative crop.
2. Production conditions indicate the Gallatin Valley as a potentially reliable source of supply, of high quality
■ ■ malting barley in relatively large total quantities.
II. Existing Marketing SystemI. Same as traditional farmer to local elevator grain
marketing methods with one exceptions Barley.stored on the farm until purchaser calls for delivery. Eeason;Local elevatorsgeared to handling wheat, cannot. properly bin and store relatively small quantities of malting barley.
III. NeedI. Producers market malting barley individually at
different times, and in varying quantities and qualities.

- 102» . Feel they aren't receiving full value for barley of
malting quality and are not utilizing their potential bargaining power»
IV„ PurposesIo Educational— -advice and assistance to farmers in
methods of planting, harvesting, sampling, storing, testing, handling, marketing,
2o Profit— through emphasis on quality and concentration of volume under the marketing control of a bargaining association, producers may realize greater returns,
3» Reduced costs— buying costs to the grain trade should be reduced by having.the output of many producers available through a single marketing agency,
Vo Methods , - . ■ ■
I= Full utilization of established grain trade channels. Barley to be sold in the same manner as individual producers normally market their crops. Difference- selling.the combined output of/members by a sales committee of the association,
2, Producers to sign long-term, enforceable contracts naming the association as sales agent,
3, Association to specify malting quality standards and accept for sale only barley meeting those standards,
it. Producers required to have adequate farm storagefacilities for maintenance of quality of grain stored,
5, Producers sample each load as binned. Association's representative samples each bin. Bin sealed. Producer's and association’s representatives samples tested for quality simultaneously in State Grain Laboratory, 13/
13/ See quality report form on page 12,
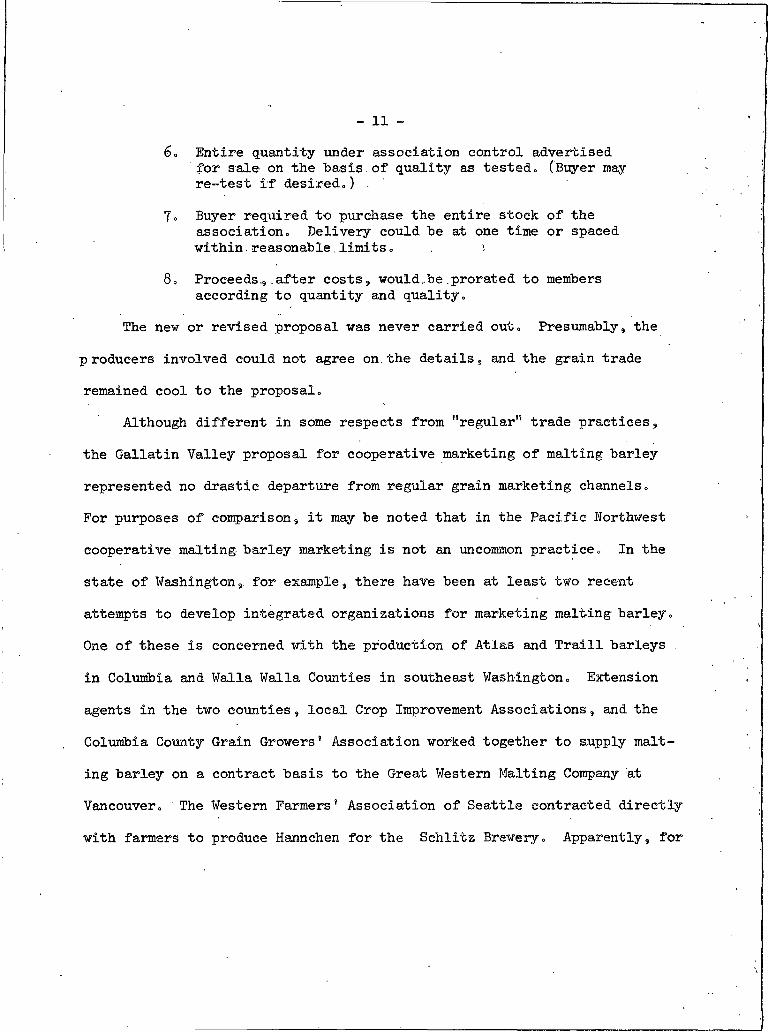
- 11 -6» Entire quantity under association control advertised
for sale on the basis.of quality as tested. (Buyer may re-test if desired.) .
7. Buyer required to purchase the entire stock of the association. Delivery could be at one time or spaced within.reasonable.limitsc
8. Proceeds,g after costs, would,.be.prorated to members according to quantity and quality.
The new or revised proposal was never carried out. Presumably, the p reducers involved could not agree on.the details, and the grain trade remained cool to the proposal.
Although different in some respects from "regular" trade practices, the Gallatin Valley proposal for cooperative marketing of malting barley represented no drastic departure from regular grain marketing channels.For purposes of comparison, it may be noted that in the Pacific Northwest
cooperative malting barley marketing is not an uncommon practice. In the state of Washingtonfor example, there have been at least two recent attempts to develop integrated organizations for marketing malting barley. One of these is concerned with the production of Atlas and Traill barleys ,
in Columbia and Walla Walla Counties in southeast Washington. Extension agents in the two counties, local Crop Improvement Associations, and the Columbia County Grain Growers9 Association worked together to supply malting barley on a contract basis to the Great Western Malting Company at Vancouver. The Western Farmers’ Association of Seattle contracted directly
with farmers to produce Hannchen for the Schlitz Brewery. Apparently, for

- 12 -
Betzes Barley Quality Report
Grower ____________ _Addre s s ______________________________Lab0 ffOo______________ Other identification____________________________Weight per bushel Ibs0 per bu«
Dockage _________________ %
Sound barley _________________%Moisture _ ________________ %
Skinned and broken kernels ________________ %
Other grains ______________ __ %
Foreign material __________%
Other barley ________ ______ %
Damaged kernels _________________ %
Type of damage %
Protein (over-dry basis) _________________ %
Kernel size assortmenton top T/6k sieve . ______ %on top 6/6k sieve _____________ %on top 5/6k sieve ________________ %thru 5/6k sieve ' ________________ %
Remarks;
Montana Grain Inspection Laboratory Montana State College Bozeman9 Montana

- 13 -reasons unknown to the author, these two attempts have not been entirely satisfactory even though cooperatives dominate the Pacific Northwest grain
trade

CHAPTER II
BARLEY IN THE GRAIN MARKETING SYSTEM Basically the need for studies of grain markets stems from the fact
that the flow of grain through marketing channels is affected by ever changing kinds and amounts of production, technological advances, adjust
ments in farming operations, population and consumption patterns, domestic and international markets and competitive advantages = This is a study of the market for malting barley. The physical channels of marketing and the institutions involved are essentially the same for all grains, including barley and malting barley. Thus it would seem desirable to examine the grain marketing system to determine what changes have taken place in grain marketing and to determine how barley, as compared to wheat, is marketed. The changes and differences are important in possible recommendations for
future changes in barley marketing procedures.
Grain Marketing ChannelsThe so-called "regular grain marketing channels" include the organic
zations and agencies which handle grain and perform the services ofstorage, delivery, processing, etc. , from farmer to consumer. Typically,
/the channel includes:Country elevators, handlers, and truckers constituting the farmers’ primary market;Brokers, agents, and dealers;Secondary outlets including terminals, sub-terminals, and port elevators;

- 15 -Food9 feed, and industrial products processors;
Wholesalers, exporters, and the Commodity Credit Corporation;RetailersoFor purposes of this study„ the following definitions I/ are assumed:County elevators are those located in grain-producing areas and en
gaged primarily in receiving grain.from farmers for future sale and delivery to secondary elevators» Country elevator size is up to about 10,000 bushel capacityo
Terminal markets consist of a grain exchange, several large secondary elevators, and a network of marketing agencies 'and facilities„
Terminal elevators are the large elevators located in terminal markets and whose primary function is that of receiving grain from country elevators and other sources for later sale or delivery to processors and exporters.
Sub-terminal elevators generally are larger than country elevators and
are often, but not necessarily, smaller thaft terminal elevators. Size of sub-terminals may range up to 100,000 bushel capacity. Chief distinction between sub-terminals and terminals is that they are located in areas where there is no grain exchange.
I/ The definitions are those found in: Market Channels, Washington, D= C., ERS, 39» November, 1961.
Heid USDA,
W. GoERS, Marketing Econ. Div.,

- i6Port elevators may be of varying capacity and are distinguished by
location at water transportation facilities for the handling of export
grain„
Changes in Grain MarketingDuring the past 20 years some of the important changes which have
occurred in grain marketing channels include the following: 2/Both the production and off-farm sales of all grains have increased,,
Large (but now decreasing) amounts, of grain have been channeled into Commodity Credit Corporation storage„
' i'Country elevators have decreased in number and increased in size.More grain is handled by the remaining country elevators, but more grain also bypasses them going from farmers to subterminals or terminals„Volume of grain from country elevators going directly to processors has declined. Brokers9 commission firms, and other agencies are now more likely to be an intermediate step in the channel.
■ Grain exports have increased.The nature of the total barley marketing problem may be illustrated by
use of United States Department of Agriculture statistics for 1959» For all
2/ Ibid.

- IY —feed grains» country elevators received 85 percent of the total off-farm sales 0 Approximately 70 percent of the total barley produced entered marketing channels, but 17 percent of the amount marketed bypassed the country elevators„ Therefore, because a relatively small volume of barley
flows through country elevators, there is a chronic handling problem?Barley must be segregated from other types of grain and the small volume of barley finds it difficult to compete', with other grains for bin space.For the year 19599 processors received about:,:half of off-farm barley sales. Malt liquors accounted for 1.8 million tons of barley, 0.2 million tons ■ Tfent into distilled spirits and alcohol--, 2 = 0-million tons went into animal
feeds, 2.8 million tons were exported, and-the remainder flowed into feed channels or carryover. Figure I shows the 1959 barley marketing channels.
Comparison of Barley and Wheat Marketing ChannelsIn the past there has been a common statement to the effect that most
>'-of the barley produced is used on the farms where produced and that most ofthe balance goes through regular channels into the malting trade. Figure I
demonstrates that this particular "rulerof-thumb" has become inaccurate.
In 1959 a high percentage of the barley produced entered marketing channels(See previous paragraph.) From Figure 'I it may be calculated that:
Eight-three percent of off-farm sales of barley went to country elevators. Seventeen percent bypassed the elevators going directly to agencies (primarily commission firms) and a smaller amount to Commodity Credit Corporation owned or con- controlled storage;

1.8 ) Malt Liquors
R * Receipts S = Shipments
A= less than 0 .0 5 million tons
Local Sales to Farmers
04O
Distilled Spirits and Alcohol
Prepared Animal Feeds
Exports
All channels and flow bars ore shown on the basis of their relationship to o ff-farm sales.
CCC owned or , controlled storage
R0.3 S= 0.2
—/Flow o f other CCC-owned grain is included in the country and subterminal, terminal, and port elevator receipts and shipments.
^ Shaded area indicates that 1959 receipts based on the 1939 definition of terminal elevators would have been approximately 88.4 percent o f the subterminol, terminal, and port elevator receipts based on the 1959 definition.
U S. DEPARTMENT OF AGRICULTURE NEG. ERS 5 5 5 -6 1 (9 ) ECONOMIC RESEARCH SERVICE
Figure I e Marketing Channels for Barley - 195Qe* * Source: USDA photo.
17a

- 18 -Forty percent of country elevator sales were to terminal elevators; U8 percent to agencies; and 12 percent to prepared animal feeds, direct to processors, and local sales to farmers;Terminal elevators received 51 percent - of their supplies of barley from country elevators and-39 percent from agencies;Sales from the terminal markets (terminal elevators and agencies) were 56 percent to processors and hk percent to export;Fifty-three percent of processors’ sales were to malt liquor and distilled spirits and alcohol, U5 percent to prepared animal feed products, and 2 percent to export;
Only 25 percent of off-farm sales went into malt liquors or about IT»5 percent of the barley produced=From the farm to the terminal markets, the channels through which
barley flows are nearly identical to those for wheat = In many cases the
same firms within the channels handle barley, wheat, and other grains =For comparative purposes, Figure 2 presents the market channels for wheat
It may be calculated from Figure 2 that; ■
The volume of off-farm barley sales was only about 21 percent ■ of off-farm wheat sales;
Seventy-nine percent of the off-farm wheat sales went to country elevators and 21 percent bypassed the elevators;Fifty-five percent of country elevators sales of wheat were to terminal elevators, 36 percent to agencies, and 9 percent direct to processors and to local sales to farmers;Sixty-four percent of terminal elevator receipts of wheat were from country elevators, 26 percent from agencies, and 10 percent direct from farms;Sales from terminal markets were 55 percent to processors and k5 percent to export =

4.6 I Bakery0.2 0—
ImportsBiscuits, Crackers and Pretzels
Prepared Flour and Flour Mixes
R = Receipts S = Shipments Elevators Sf
Macaroni and Spaghetti
Cereals
Country Elevators
R:26.7 S: 22.8
Subterminol , terminal 8 port Markets
2.1 I FlourOff-Farm Sales
Prepared Animal FeedsAgencies
R: 10.9 S= 10.9 Mill Feeds
ExportsLocal Sales to Formers
0 . 3 0 - -----------All channels and flow bars are shown on the basis of their relationship to off-farm sales.
Whole Grain 10.8 Flour
V 2.5 y
Military Procurement and Territorial Shipments
CCC owned or controlled storage
-j r Flow of other CCC owned grain is included in the country and subterminal, terminal, and port elevator receipts and shipments. CCC acquisitions into commercial storage totaled 14.3 million tons during 1959. CCC dispositions from commercial storage totaled 3.9 million tons during 1959.
& Shaded area indicates that 1959 receipts based on the 1939 definition of terminal elevators would have been approximately 71.6 percent of the subterminaJ, terminal, and port elevator receipts based on the 1959 definition.
U.S. DEPARTMENT OF AGRICULTURE NEC. ERS 552-61(9 ) ECONOMIC RESEARCH SERVICE
Figure 2* Marketing Channels for Wheat - 1959.** Source: USDA photo.
18
a

- 19 -From the above, it may be noted that even though barley and wheat
Imarket channels are essentially the same, there are these differences;Volume of off-farm wheat sales was nearly five times that of barley;A larger portion of off-farm barley sales goes to country elevators or a larger percentage of wheat bypasses country elevators;Agencies handle a larger portion of the barley crop than they do of wheat (presumably to "spot" barley suitable for malting before it becomes commingled with feed barley);Proportionately, sales to processors and to export of both wheat and barley from terminal markets were nearly identical.
Influence of Change on Barley MarketingIt may be hypothesized that the differences and changes noted in this
chapter may separately or in combination influence the future course of
malting barley marketing in one or more of the following ways:Comparison of data on barley production', barley malt used for alcoholic beverages, and beer sales (See Tables I , IV, and XIII) lead to the assumption that consumption' of the final product - beer - has been and probably will remain more stable and less subject to increase than the production of barley for malt. This, plus the fact that, if necessary, any barley may be malted, results in downward pressures on the price of malting barley;
Malting barley rarely if ever falls into government storage, but Commodity Credit Corporation holdings of other grains indirectly influence malting barley prices;Fewer but larger elevators and the fact that barley marketings are small relative to wheat will result in increasing difficulties in handling malting barley on a segregated basis in areas where wheat or other grains predominate. An offsetting force may result from declining storage of Commodity Credit Corporation grains in commercial facilities;

- 20 -
Fewer, larger9 and probably more specialized grain handling and processing facilities will give further impetus to the role of commission firms or other types of brokers and dealers.

CHAPTER III
BARLEY PRODUCTION AND DISTRIBUTION United States Barley Production and Distribution
During the years immediately prior to 19549 United States barley production was declining= In 195*+5 when wheat acreage restrictions became effectives acreage and production of barley increased sharply = From then through 1961s planted acres varied from about 15 million acres to nearly 17 million acres = These changes are shown in Table I= Simple average data for the years 1959-60 are used hereafter in this chapter= I/ United States averages for.1959-60 were:
A c r e s planted Acres harvested for grain
Yield (bu=) per harvested acre Total production (bu=)
Where those *>26 = 8 million bushels of barley were produced is indicated by Figure 3.» showing estimated planted acres by regions in the United States« Regional data on acres of barley harvested for grain was increased
by 12=5 percent (see footnote l) to estimate planted acres=. Shaded areas on the map in Figure 3 are the 1*> malting barley producing States referred
to in the 1962 feed grain program=
16,216,000 1*1 ,*>29,000
29.61>26,8*>6,000
I/ Reason: The U= S= Feed Grain Program for 1962 legally defined 1*> Statesas malting barley producing areas = The program used 1959-60 averages in computing acreage restrictions= Note that U= S= harvested acreage for 1959-60 was 12 = 5 percent less than planted acres =

Figure 3. Estimated 1959-60 Average Barley Acreage Planted by Regions in the U. S. *
* Source: Grain and Feed Statistics through 1961, USDA, ERS, Stat. Bul. 159, Rev. June,1962. Shaded areas indicate Barley Producing States included in the 1962 Feed Grain Program.
21a

- 22 -
TABLE Io UNITED STATES BARLEY: ACRES PLANTED, ACRES HARVESTED .FOR GRAIN,YIELD PER HARVESTED ACRE, AND TOTAL PRODUCTION, 1950-61. *
YearPlanted
All PurposesHarvested FOr Grain Yield Total Production
OOO Acres 000 Acres Bu/acres, 000 Bu.
1950 13,010 11,155 27.2 303,7721951 10,790 9 ,k2k 27.3 257,2131952 9,190 8,236 27.7 228,1681953 9,615 8,680 2&ok 2k6,7231954 1U,7*»0 13,370 28,k 379,25k1955 16,293 Ik,523 27.8 k03,0651956 Ik,732 12,852 29.3 376,6611957 16,398 Ik , 872 29 .8 kk2a76i1958 16,150 Ik,791 32.3 k77,3681959 16,817 lk,918 28.3 k22,383i960 1 5,61k 13,939 30.9 k31,3091961 15,800 12,969 30.3 393,38k
* Source: USDA9 Grain and Feed Statistics, Washington, D„ Co, ERS, Stat„Bui, 1599 ReVo9 June9 1962c.
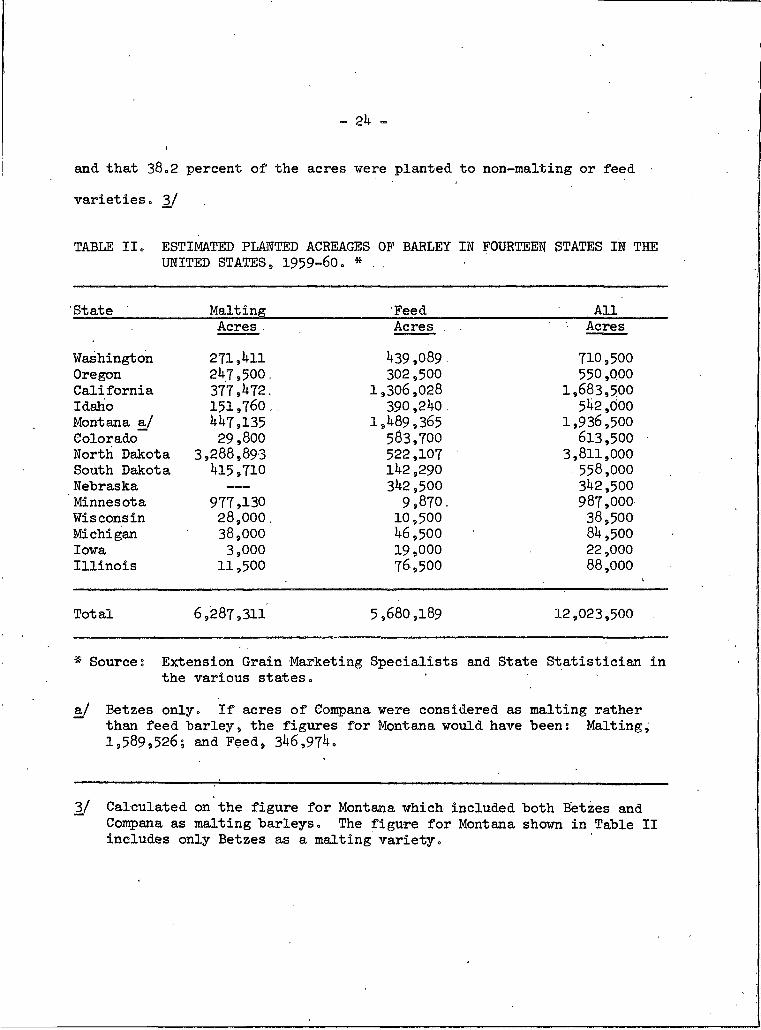
Table II provides a more detailed^picture of barley-producing states 0 . Total acres of barley planted (1959-60 average) in the IU malting barley states are shown according to malting and feed varieties planted. From this data (Table II), it was calculated that 7^=2 percent of the total United
States planted barley acreage was in those states» Within the lit states, 6lo8 percent of the acres were planted to approved 2/ malting varieties
2/ Approved according to varieties exempt from acreage limitations of the 1962 Feed Grain Program,

Filmed as received without page(s)____23
UNIVERSITY MICROFILMS, H G
-21*»
and that 38.2 percent of the acres were planted to non-malting or feed • varieties. 3/
TABLE II. ESTIMATED PLANTED ACREAGES OF BARLEY IN FOURTEEN STATES IN THE UNITED STATES, 1959-60. * . .
State Malting Feed . AllAcres . Acres . . Acres
Washington 271,411 439,089 . 710,500Oregon 247,500. 302,500 550,000California 377,472. 1,306,028 1,683,500Idaho 151,760 .. 390,240 . 542,000Montana a/ 447,135 1,489,365 1,936,500Colorado 29,800 583,700 613,500North Dakota 3,288,893 522,107 3,811,000South Dakota 415,710 142,290 . 558,000Nebraska — — — 342,500 342,500Minnesota 977,130 9,870. 987,000Wisconsin 28,000. 10,500 38,500Michigan 38,000. 46,500 84,500Iowa 3,000 19,000 22,000Illinois 11,500 76,500 88,000
I
Total 6,287,311 5,680,189 12,023,500
* Source: Extension Grain Marketing Specialists and State Statistician inthe various states.
a/ Betzes only. If acres of Compana were considered as malting ratherthan feed "barley9 the figures for Montana would have been: Malting,1,589,526; and Feed, 346,974.
3/ Calculated on the figure for Montana which included both Betzes and Compana as malting barleys. The figure for Montana shown in Table II includes only Betzes as a malting variety.

- 25 -
Principal Barley Producing StatesAssuming United States average figures to "be applicable to the malting
barley producing region, it was calculated that the IU states annually produced 192 million bushels of barley of malting varieties during the 1959-60 period; k j However, barley of malting varieties is not necessarily used for malting. From Table III it may be calculated that the United States average barley utilization for 1959-60 was 91»680,000 bushels malted
for alcohol, alcoholic beverages, and for other malt food uses. Conse-, quently, 100,7 9,27 bushels of barley of malting varieties were channeled into other uses.
According to Lejeune and Parker 5/ about 90 percent of the barley used for malting is of the six-row varieties and the remaining 10 percent of the two-row barleys. For 1959-60, this indicates a usage of approximately 82.5 million bushels of six-row barley and 9»2 million bushels of two-row barley.
The two-row malting: barleys are produced primarily in the western states. Even though Compana barley in Montana was declared as a malting
barley by the 1962 Feed Grain Program, Betzes was the only Malting Barley Improvement Association (MBIA) approved malting barley for the state. (See footnote in Table II.) Thus Montana was competing with Betzes only for its
share of the two-row malting barley market.
hj 7,^29,702 acres planted - 12.5% = 6,500,989 harvested acres x 29.6 bu/A = 192,1+29,271+. ■
5/ Lejeune, A.J., and Parker, J.H., "The Story of Malting Barley", What's New in Crops and Soils, February, 1955»

• TABLE'. III. UNITED STATES .BARLEY DISTRIBUTION,' 1950-60„ *
Year Beginning Domestic Use Livestock Domestic
Disappearance000 Buo
Exports000.Buo
TotalDisappearance
000.BuoStocks
End of.Year 000 Buo
July as Malt' Seed Feed000 BuO - 7- ' 000 Bu0 000 Eu.
1950 101,Wo^ 17,804 144,5121951 92,738 15,164 151*3681952 83, ViO 15,672 134,0311953 91,^8 ■ 23,731 130,909195k 88,025 26,232. 186,2371955 90,136 . 23,719 228,0971956 GA, 036 26,401 215,5121957 87,li90 26,002 220,913■ 1958 ' 89,676 26,403 . 232,0051959 ■ 92,536 24,514 - 232,611i960 a/ 1 90,824 24,806 259,853
263,716. 40,000 303,716 93,569259,270. 31,041 290,311 73,349238,143. . 37,053. 275,196 51,231
T 246,088. . 19,044 265,132 71,144300,494 43,463 343,957 130,550341,952 102,890. 444,842 117,048330,949 61,842 392,791 127,460334,406 91,582. 425 ,988 168,620348,084 . 116,685 464,769 195,530349,661 118,409 468,070 167,389.375,483 . 85,702 461,185 152,762
* S o u r c e USDAy Grain and Feed: StatisticsWashington, D. C., ERS Stat0 Bui. 159, Rev0 June,1962 O
■a/; Preliminary

- 27 -
Table IV, showing the estimated annual average production of western
two-row malting barley, indicates production of about 22.5 million bushels or nearly 2 1/2 times the annual average utilization for malting purposes. Table IV was computed according to United States average yield per harvested acre and on the assumption that harvested acres were 12.5 percent less than planted acres. Thus the production data in Table IV are to be considered only as estimates derived to indicate conditions of supply of
two-row malting barley. Data on actual acres harvested and yields per harvested acre of two-row barley were not available for individual states.
The Value of Betzes to MontanaEslick and Shaw 6/ estimated the annual average production of Betzes
barley in Montana at about 10.4 million bushels for 1959-60, or about 10 percent less than the estimates in Table IV. Assuming the possibility
of a 10 percent - error in the calculation for, each of the states in Table IV, the annual average production of two-row western malting barley (1959- 60) was somewhere between 20 and 25 million bushels. In the same paper, Eslick and Shaw estimated that Montana marketed an average of 20.5 percent of the Betzes crop or 2.1 million bushels as malting barley for the 1959-60 period. Their conclusions on the contribution of Betzes to Montana farm
incomes are reproduced as Table V.
6/ Eslick, R. F„ and Shaw, A. F., The Contribution of Betzes Barley to Montana Farmers * Income, unpublished paper, Montana State College, Bozeman, Montana, 19627

TABLE IV„ ESTIMATED; PRODUCTION- OF TVJO-ROW MALTIHG BARLEY, WESTERN STATES, 1959-60 AVERAGE„ *Mont o Wash= ' Ofe = Calif= Idaho Colo =
Esto total plantings ofall varieties’ (acres) 1,936,500 710,500 550 ,000 . .1,739,500 542,000 613,500
Less esto 12 = 5%' of plantingsnot' harvested for-grain (acres) 242,063 88,813 68,750 217,438
1 I/ 67,750 76,688Est'o harvest,all varieties (acres) 1,694,437 621,687 481,250 1,522,062 474,250 536,812
Esto- plantings-,- two-row maltingvarieties MBIA approved for1961 (%-of total) 23 = 2 8 = 7 35 = 5 3 = 2 i 4 „o
Est = - harvest,- two-row■ varieties’" (acres) 393,109 54,088 170,844 48,706 66,395
1ro29,800 031
Est= yield (bu/harvested acre) 29=6 29.6 29 = 6 29 = 6 29=6 29.6Esto- annual- aver= -production of two-row barley (bu=) 11,636,603 1,601,005 5,056,982 1,441,698 1,965,292 882,080Est = - total production6 states (bu) = 22,583,660
* Sourcet- Malting Barley Improvement- Association, Varietal Survey/s, Milwaukee, Wisconsin, 1959 • andr i960-; and Table XVIIIo

TABLE V„ THE-CONTRIBUTION, OF BETZES= BARLEY- TO MONTANA FARMERS’ INCOME. *
Item. (See explanations 'below "t ABle.' ) 1955 1956' 1957 '■ 1958.....1959 - i960 . 1961
Total or Average'
Acreage planted to Betzes {%) aj ' ' — - 8 .7 19.2 27.1 20.8
Betzes produced (bu). b/ 150 11,1+00 185,500 I+,51+1+,800 9,9^7,500 10,851,900 5,485,000 31,026,250
Marketed asmalting barley (bu.) c/0 6,000 1+0,000 3,575,000 2,134,000 2,145,000 1,800,000 9,700,000Portion of crop going as malting barley {%) d/ 0 53 22 79 21 20 33 31ASC: barley loan' ($/bu.) e/ I OD ON = 77 »75 »59 »59 »79 »73Estimated- price for Betzes- used for malting ($/bu.) f/ — I. 05 1.06 .91 1.20 1.20 1.25 1.11Malting- barley premium" over ASC loan.- ($/bu.) g/ 0 20 .29 .26 061 .61 .46Season-average . price, all- barley ($/bu .) ir/ ——■ 0 83 .72 .75 .67 .66 ,84 »75Estimated; total premiums" paid- ($ I ■ xj ■ ——- - 1,200- ■ -U,600 929,500 1,301,740 1,308,450 •828,000 4,380,490
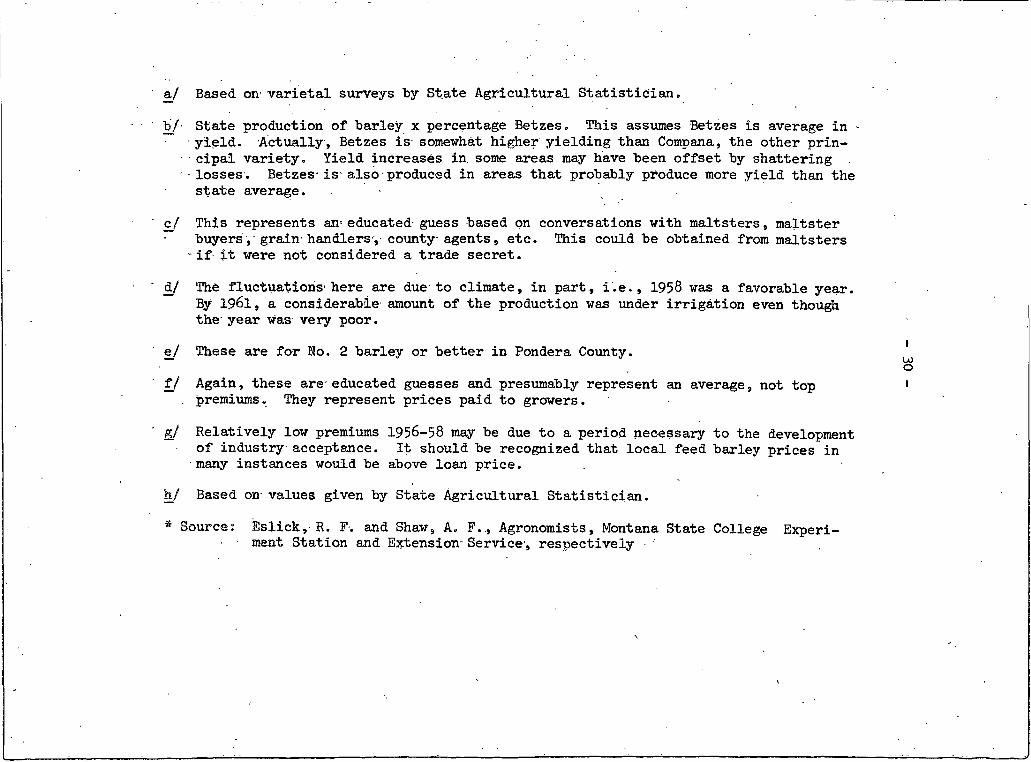
a/ Based on varietal surveys by State Agricultural Statistician,
b/' State production of barley x percentage Betzes. This assumes Betzes is average in - ■ yield- Actually , Betzes is- somewhat higher yielding than Compana, the other prin- ■ - cipal variety. Yield increases in, some areas may have been offset by shattering - losses . Betzes- is-also produced in areas that probably produce more yield than the
state average.
c/ This represents an-educated guess based on conversations with maltsters, maltster buyers, grain handlers, county agents, etc. This could be obtained from maltsters - if it were not considered a trade secret.
d/ The fluctuations1 here are due to climate, in part, i.e., 1958 was a favorable year. By 1961, a considerable amount of the production was under irrigation even though the year was very poor.
e/ These are for No. 2 barley or better in Pondera County.
f/ Again, these are- educated guesses and presumably represent an average, not top . premiums. They represent prices paid to growers.
g/ Relatively low premiums 1956-58 may be due to a period necessary to the development of industry acceptance. It should be recognized that local feed barley prices in many instances would be above loan price.
h/ Based on values given by State Agricultural Statistician.
* Source: Eslick, R. F-. and Shaw5 A. F., Agronomists, Montana State College Experiment Station and Extension- Service , respectively
— 31 —
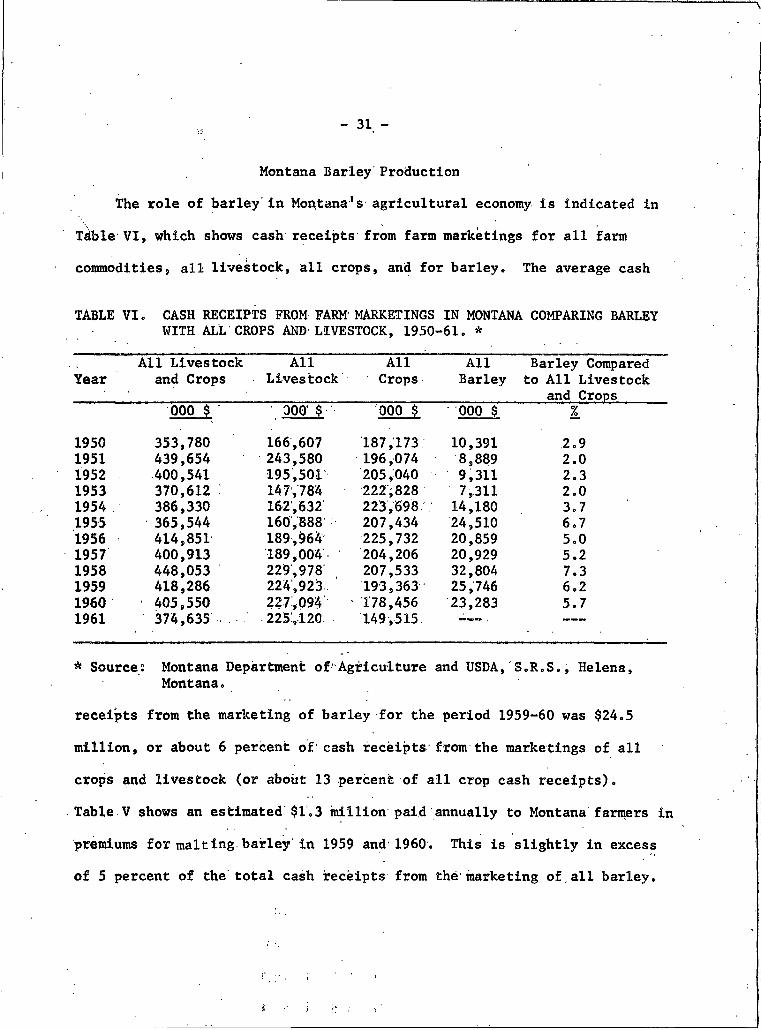
Montana Barley ProductionThe role of barley in Montana's agricultural economy is indicated in
Table VI, which shows cash receipts from farm marketings for all farm commodities» all livestock, all crops, and for barley. The average cash
TABLE VI. CASH RECEIPTS FROM FARM' MARKETINGS IN MONTANA COMPARING BARLEY WITH ALL CROPS AND LIVESTOCK, 1950-61. *
YearAll Livestock
and CropsAll
LivestockAllCrops
AllBarley
Barley Compared to All Livestock
and Crops000 $ 300 $ 000 $ 000 $ %
1950 353,780 166,607 187,173 10,391 2.91951 439,654 243,580 196,074 8,889 2.01952 400,541 195,501 205,040 9,311 2.31953 370,612 147,784 222;828 7,311 2.01954 386,330 162,632 223,698 14,180 3.71955 365,544 160,888 207,434 24,510 6.71956 414,851 189,964 225,732 20,859 5,01957 400,913 189,004 204,206 20,929 5.21958 448,053 229,978 207,533 32,804 7.31959 418,286 224,923. 193,363 25,746 6.21960 405,550 227,094 • 178,456 23,283 5.71961 374,635 225,120 149,515
* Sources Montana Department of Agriculture and USDA, S.R.S., Helena, Montana.
receipts from the marketing of barley for the period 1959-60 was $24.5
million, or about 6 percent of cash receipts from the marketings of all crops and livestock (or about 13 percent of all crop cash receipts).
Table V shows an estimated $1,3 million paid annually to Montana farmers in premiums for malting.barley in 1959 and 1960. This is slightly in excess of 5 percent of the total cash receipts from the marketing of all barley.

- 32 -Table VII shows the acres harvested, yield, production, price, and value Tj
of all Montana barley for the years 1950-62.The boundaries of Montana's seven crop reporting districts are shown
in Figure 4. The percentages of the state's total acres of all barley,
dry-land barley, irrigated barley, and Betzes barley grown in each district
are shown in Table VIII.Barley production in Montana is greatest in the North Central and
Northeast Crop Reporting Districts’. Those two districts, in 1959-60,
accounted for 73 percent of Montana's total harvested acres of all barley,76 percent of the dry-land barley, 31 percent of the irrigated barley, and
89 percent (I960 only) of the planted acres of Betzes barley.
The Southwest and South Central Crop Reporting Districts were import
ant areas for irrigated barley, accounting for 43 percent of the state's total harvested acres in 1959-60. In those two districts, most of the irrigated barley was produced in the Gallatin and Yellowstone Valleys and in irrigated portions of Big Horn and Carbon Counties.
The production of Betzes barley in Montana is concentrated in the North Central Crop Reporting District.with the greatest concentration in
planted acres in 1960 in Choteau (92,100), Pondera (67,800), Hill (47,900),
Teton (46,400), Glacier (39,800), and Toole (39,600) Counties.Betzes is a Malting Barley Improvement Association approved two-row
malting barley for Montana east of the Continental Divide. It was originally released by the Agronomy Department of Montana State College as
U Not cash receipts from marketings.

NORTH
NORTHWEST
,CENTRAL
SOUTHEAST >
SOUTHWE: OUTH /CENTRAL
Figure 4. State of Montana Crop Reporting Districts. *
* Source: Montana Department of Agriculture.
32a

TABLE VII, ACRES HARVESTED:, YIELDis' PRODUCTION, PRICE, AND VALUE OF ALL MONTANA BARLEY, 1950-61. *
Irrigated' - Noii-Irrigated TotalTotalProd.
AveragePrice
Value of Total Prod.Year
HarvestedAcres Yield
Harvested ' Acres Yield .
HarvestedAcres Yield
000 • Bii/acre 000 Bii / acre 000 Bu/acre 000 Bu $/Bu. Mil. $
1950 128 35.8 724 . 26.0 852 27.5 23,430 0.95 22.31951 102 38.6 . 358 24.3 460 27.5 12,650 1.07 13.51952 106 41,9 368 24.6 474 28.5 13,509 1.22 16 a 51953 108 35.3 442 25.0 550 27.0 14,850 1.02 15.11954 112 35.7 1,153 24.0 1,265 25.0 31,625 0.97 30.71955 83 38.5 1,271 29.4 1,354 30.0 40,620 0.77 31.31956 77 40.3 966 27.6 1,043 28.5 29,726 0.83 24.71957 95 41,6 1,626 25.6 1,721 26.5 45,606 0.72 32.81958 94 43.7 1,489 33.4 1,583 34.0 53,822 0.75 40.41959 102 40.6 1,750 26.7 1,852 27.5 50,930 0.67 34.11960 92 36.5 1,612 22.8 1,704 23.5 40,044 0.66 26.41961 94 40.1 1,371 16.5 . 1,455 18.0 26,370 0.84 22.2
* Sources Montana Department, of Agriculture and USDA9 S.R.S., Helena, Montana

— 34 —
TABLE VIIIo PERCENTAGES OF STATE TOTAL ACRES OF ALL BARLEY, DRYLANDBARLEY, IRRIGATED BARLEY, AND BETZES BARLEY BY MONTANA CROP REPORTING DISTRICTS, 1959^60 AVERAGE. *
Crop Reporting District
AllBarley
DrylandBarley
IrrigatedBarley
BetzesBarley
Pet. Pet. Pet. Pet.Northwest 3.0 ' 2.0 15.0 1.0Southwest 3.0 1.0 20.0 2.0North Central 53.0 55.0 24.0 68.0Central 11.0 12.0 9.0 4.0South Central 7.0 6.0 23.0 1.0Northeast 20.0 21.0 7.0 21.0Southeast 3.0 3.0 2.0 3.0Total 100.0 100.0 100.0 100.0
* Source; Based on Montana Department of Agriculture and USDA, SeR.S., data*
an irrigated land malting barley. Consequently, according to the Montana Grain Inspection Laboratory at Montana State College, most of the Betzes barley which has been sold for malting has been produced in Gallatin, Teton,
Pondera, and Glacier counties. Its production on dry land (which, in acreage, far exceeds the irrigated acreage) elsewhere in Montana, is, however, explain
able. Betzes yields well on dry land - compared to other dry land varieties —
and it is a good feed and pearling barley. Ordinarily Betzes produced on dry land is too high in protein to be suitable for malting, but in
occasional years its protein level is low enough for malting. Therefore,Betzes may be a two-way dry land barley. It is a good feed barley and may bring the producer a malting premium.
The production of Compana barley, which was classified as a malting barley by the 1962 Feed Grain Program but not by the Malting Barley
35Improvement Association, approximately parallels the pattern of dry land barley production in Montana as shown in Table VIII.
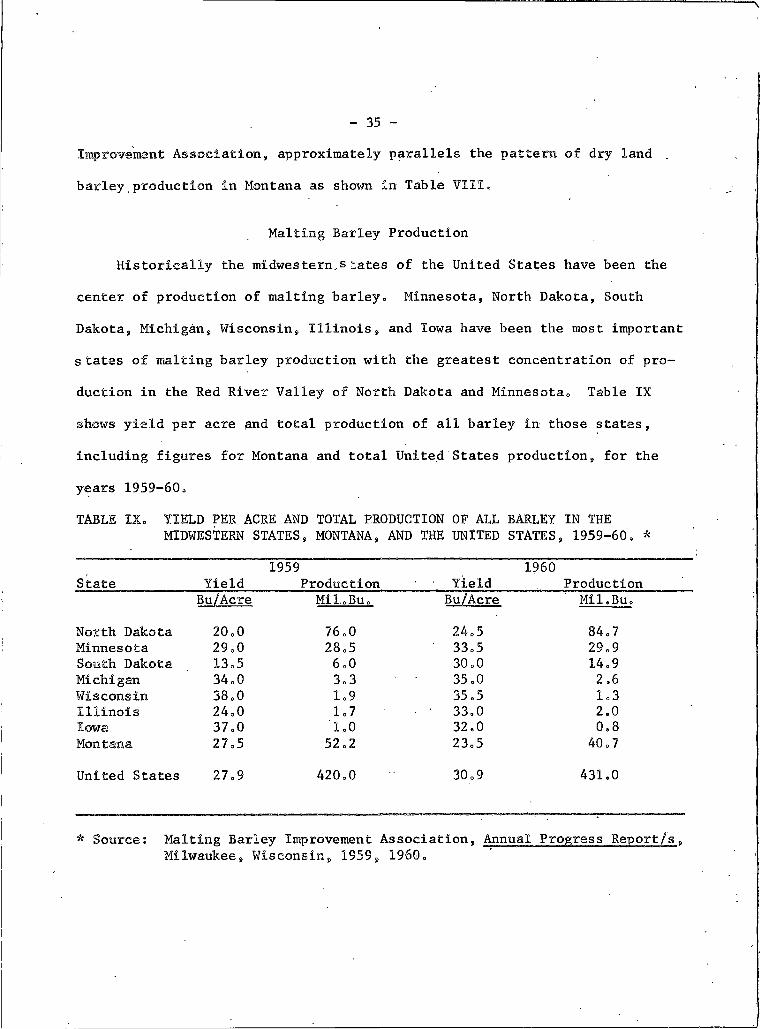
Malting Barley ProductionHistorically the midwestern,s tates of the United States have been the
center of production of malting barley. Minnesota, North Dakota, South Dakota, Michigan, Wisconsin, Illinois, and Iowa have been the most important s bates of malting barley production with the greatest concentration of production in the Red River Valley of North Dakota and Minnesota. Table IX shows yield per acre and total production of all barley in those states,
including figures for Montana and total United States production, for the years 1959-60.TABLE IX. YIELD PER ACRE AND TOTAL PRODUCTION OF ALL BARLEY IN THE
MIDWESTERN STATES, MONTANA, AND THE UNITED STATES, 1959-60. *
State Yield1959
Production YieldI960
Production
North Dakota
Bu/Acre
20.0Mil.Eu. 76.0
Bu/Acre
24.5
Mil.Eu.
84.7Minnesota 29.0 28.5 33.5 29.9South Dakota 13.5 6.0 30.0 14.9Michigan 34.0 3.3 35.0 2.6Wisconsin 38.0 1.9 35.5 1.3Illinois 24.0 1.7 33.0 2.0Iowa 37.0 1.0 32.0 0.8Montana 27.5 52.2 23.5 40.7United States 27.9 420.0 30.9 431.0
* Source: Malting Barley Improvement Association, Annual Progress Report/s,Milwaukee, Wisconsin, 1959, 1960.

36According to Pederson, 8/ about one-third of the total barley produced
in the United States is used annually for malting purposes. The balance is utilized as feed and for pearling. The amount used for malting varies from year to year according to barley production and beer consumption. From 1936 to 1940, the United States malting industry produced an average of about 65 million bushels of malt. During the period 1949-1953, the annual average number of bushels of malt produced increased to approximately 94 million bushels. Of those amounts, about 90 percent was produced from barley of the six-row varieties and only about 10 percent was of the western two-row varieties. 9/ Most of the six-row varieties are produced in the Midwest, and two-row varieties are produced in the West— principally in Oregon, Wash
ington, California, Colorado, Idaho, and more recently in Montana. Table X
shows the malting varieties, of six-row and two-row barley produced in eight principal malting barley producing states during 1959 and 1960. Until the
introduction of Betzes, Hannchen and Hanna produced in Oregon, Washington, and California were the principal two-row malting barleys.
New Areas, New Varieties, and Competition During the early 1950's, the malting industry, through the Malting
Barley Improvement Association and State Experiment Stations, began a search
8/ Pederson, Harold C„, More Profits from Malting Barley, Minnesota Agricultural Extension Service Folder 68, University.of Minnesota, December, 1954.
9/ Lejeune, A. J. and Parker, J. H., "The Story of Malting Barley", What's New In Crops and Soils, February, 1955.

TABLE X. 'PERCENTAGES OF TOTAL ACRES OF ALL VARIETIES OF -BARLEY PLANTED TO MBIA APPROVED MALTING BARLEY VARIETIES, SELECTED STATES, 1959 and 1960. *
Minn. N. Dak. S. Dak= Calif. Wash. Ore„ Idaho Mont,mil. acres mil. acres mil. acres mil. acres mil. acres mil. acres mil. acres mil. acres
Variety 1959 1960 ■ 1959 1960 1959 1960 1959 1960 1959 1960 1959 1960 1959 1960 1959 1960____________1.04 0.94 4.19 3.43 0.61 0.51 1.76 1.72 0.73 0.70 0.60 0.50 0.56 0.53 1.97 1.91
% % % % % % % % % % % % ^ % % % %(6-row)
Traill 48.0 50.0 52.0 57.0 27.0 32.0 — — — 1.3 — — — — — —Kindred 31.0 36.0 29.5 24.5 41.0 36.0 — — — — — — — — — . —Parkland 4.0 4.0 2.5 3.0 (1.0) (1.0)a/— — — — — ■ ■— — — —Atlas — — — — -— — 12.9 13.5 4.6 — ■— — '— — — —Tenn.Winter — — — -- — -- - 4.8 5.8 — — — — — — —
(2-row) I •Hannchen — — — — — — 3.4 3.0 4.3 2.4 41.0 30.0 — — — TjHanna — - — — — —— — — — 3.4 3.8 ■— (1.0) a_/12.0 16. Ob/ — —Heines-Hanna — = 1— — — -- — ■ — — 1*4 2.1 ‘— *— — — — "
Betzes (0.1) (1.0)a/— — — — — — — — — — (8.0)a/19.2 27.1
Total acres in malting varieties-Percentage 83.0 90.0 84.0 84.5 68.0 68.0 21.1 22.3 13.7 9.6 41.0 30.0 12.0 20.0 19.2 27.1
* Source: Malting Barley Improvement Association, Annual Progress Report/s, Milwaukee, Wisconsin,1959 and 1960.
a/ Figures in parentheses are varieties not approved by MBIA for that particular State.
bj Includes Hanna and Heines Hann.
38 -for new areas of malting barley production and for new varieties. Effortshave been concentrated in the northwestern states, including Montana.Reasons for the shift were that barley diseases and competition from othercash crops had reduced the production of high quality malting barley in
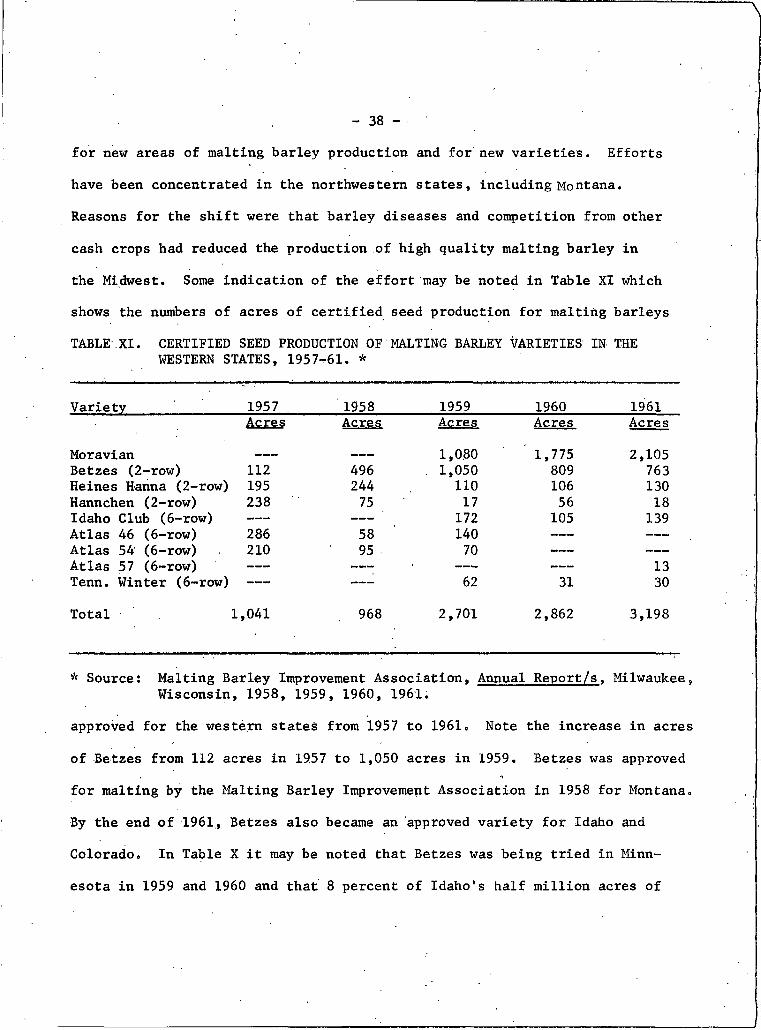
the Midwest. Some indication of the effort may be noted in Table XI whichshows the numbers of acres of certified seed production for malting barleysTABLE.XI. CERTIFIED SEED PRODUCTION OF MALTING BARLEY VARIETIES IN THE
WESTERN STATES, 1957-61. *
Variety 1957 1958 1959 1960 1961
Moravian
Acres Acres Acres
1,080
Acres
' 1,775
Acres
2,105Betzes (2-row) 112 496 1,050 809 763Heines Hanna (2-row) 195 244 n o 106 130Hannchen (2-row) 238 75 17 56 18Idaho Club (6-row) —- — 172 105 139Atlas 46 (6-row) 286 58 140 — — ———Atlas 54 (6-row) 210 95 • 70 — — ——Atlas 57 (6-row) — -— -- 13Tenn. Winter (6-row) — — — 62 31 30Total . I,041 968 2,701 2,862 3,198
* Source: Malting Barley Improvement Association, Annual Report/s. Milwaukee,Wisconsin, 1958, 1959, 1960, 1961.
approved for the western states from 1957 to 1961. Note the increase in acres
of Betzes from 112 acres in 19.57 to 1,050 acres in 1959. Betzes was approved for malting by the Malting Barley Improvement Association in 1958 for Montana. By the end of 1961, Betzes also became an approved variety for Idaho and Colorado, In Table X it may be noted that Betzes was being tried in Minnesota in 1959 and 1960 and that 8 percent of Idaho's half million acres of

- 39 -barley was planted to,Betzes in 1960.
The position of Montana in the malting barley market is indicated by
the following quotation from the Malting Barley Improvement Association1960 Annual Progress Report:
"Present indications are that the release of superior new malting barley varieties is on the immediate horizon in the Midwest and impending in western areas o „ . In Colorado, for the first time, a limited acreage of Betzes two-row was grown under irrigation in the area north of Denver, east of the Rocky Mountains, and in the San Luis Valley of south central Colorado.Preliminary examination of the crop indicates that there is a potential for the production of Betzes in Colorado."
Winn 10/ estimated that there were 1500 acres of Betzes planted in Colorado in 1960 and a production of 15,000 to 30,000 bushels of foundation
seed. In 1961 there were 17,000 acres of Betzes grown under irrigation in Colorado and 22,000 acres in 1962. 11/
The Malting Barley Improvement Association worked with the Montana
Experiment Station and Cooperative Extension Service for a number of years and provided funds to aid in the development of Betzes as an approved two-
row malting barley in Montana. This, of course, does not mean that Montana has any monopoly on Betzes. The malting industry has been interested in expanding and improving malting barley production wherever.feasible.
10/ Winn, J. H., Colorado Extension Service; letter to Owen Wirak, Montana Extension Service, March 17, 1961.
11/ MBIA, 17th and 18th Annual Reports, Milwaukee, Wisconsin, November 16, 1961, and November 14, 1962.

' — 40 —
In summary, the following points may be pertinent to a study of the Montana malting barley marketing problem:
(1) Barley diseases and competing crops threatened the production of high quality malting barley in the Midwest.
(2) To insure supply, the malting industry encouraged development of new varieties and new production areas.
(3) Betzes was approved for Montana by the Malting Barley Improvement Association for malting in 1958.
(4) Quality and quantity of Betzes production in Montana have been erratic.
(5) A change in freight rates eliminated Montana's transportation advantage over Oregon and Washington two-row malting
barley.(6) Betzes was tested in other areas and has been approved
for Idaho and Colorado,
(7) Testing and development of malting barley in other areas . indicate increased production in other western states
and a "comeback" in production in the Midwest.Whether Montana may develop its potential as a malting barley state
depends on how Betzes is produced, threshed, handled, stored, and sold. It
depends on whether the malting and brewing industries accept and use two- row barleys, including Betzes, in increasing, amounts. And it depends on competition from other production areas.
Approved Malting BarleyThe Malting Barley Improvement Association lists the varieties of
malting barley which have been approved by the Association for production in several states and for use by the malting industry. Those varieties approved by the Malting Barley Improvement Association " . . . when grown in the states and areas recommended and when delivered to market in pure
carlots of sound, bright, plump, low moisture barley, will command premium prices over feed barley. These varieties are considered acceptable for malting and brewing by the members of the Malting Barley Improvement Association and are also approved for production by the Agricultural Experiment Stations in the states listed." 12/ Approved varieties for the
various states are published annually in advance of planting seasons.A barley variety approved for malting by the Malting Barley Improvement
Association may or may not be classified as malting barley according to
United States Department of Agriculture Official Grain Standards. At present, Federal malting barley grades are divided into two sections— six-row malting
varieties and two-row western malting varieties. Barley which may be Federally graded as malting barley may or may not be approved by the Malting Barley Improvement Association.
In an attempt to clear up the confusion, the Malting Barley Improve
ment Association made the following statements in its 1960 Annual Progress Report: ......
12/ Malting Barley Improvement Association, Annual Progress Report.Milwaukee, Wisconsin, .1958.
- 41 -
7

— 42 —
"On August I, 1959, varietal grading in the six-row Federal malting barley grades was initiated. Only varieties classed as.acceptable by the malting and brewing industries were eligible for Federal malting barley grades = . . At the present time» the two-row malting variety Betzes, when grown in Montana and other areas east of the Continental Divide, is not eligible for the western two-row Federal malting grades. 13/ Certain changes in these grades will be recommended by the Malting Barley Improvement Association to officials of the United States Department of Agriculture so that Betzes (and other two-row varieties which may be classified as acceptable for malting in future years) will be eligible to grade under the two-row Federal malting barley grades."
On March 13, 1962, the United.States Official Grain Standards for barley were amended to permit Betzes barley produced east of the Rocky Mountains as being eligible for Federal grading as a malting barley. 14/
Before any variety may be listed as approved by the Malting Barley
Improvement Association, it is subjected to an exhaustive series of tests. Agronomic data are based on field observations and on Agricultural
Experiment Station and United States Department of Agriculture tests. Information on malting and brewing is being developed by the Malt Research Institute at Madison, Wisconsin. Bases for the Institute’s tests are that:
"Conclusions obtained by Malt Research Institute, relative to the industrial suitability of barley varieties and selections, are based on the results of numerous evaluations by many collaborators over a period of years. Evaluation procedures consist, first, of
13/ Federal grades for western two-row malting barley specified production west of the Continental Divide only,.
14/ Federal Register, March 17, 1962.

- 43 -pilot scale malting and brewing tests, followed by commercial scale tests, when this becomes possible or feasible = Among the collaborators are representative industry laboratories, both malting and brewing, as . well as malting and brewing companies who collaborate in commercial scale tests." 15/
Like all other Malting Barley Improvement Association approved varieties,Betzes was subjected to the above procedure..
"Results of malting and brewing tests over a four- year period have been generally satisfactory and Betzes has been classed as acceptable for malting and brewing when grown in suitable areas of Montana east of the Continental Divide. The future status of Betzes depends on its general use and acceptance, by the malting and brewing industries." 16/
Cultural Practices ProblemsEven though Betzes has become an approved variety and despite extensive
educational efforts by the Montana Cooperative Extension Service and Experiment Station, problems of cultural practice, threshing, storing, etc., continue to plague producers. Many of those problems may be attributed to a
lack of understanding by producers of the malting and brewing processes and their requirements. For example, the Malting Barley Improvement Association
15/ Malt Research Institute, Publication XV, Madison, Wisconsin, October, 1958.
16/ Malting Barley Improvement Association, Annual. Progress. Report. Milwaukee, Wisconsin, 1958.

— 44 —recommends that barley offered for malting meet the following .conditions: 17/
(1) Not over 5 percent other barley.■
(2) Test weight 45-48 pounds„'(3) No more than 3 percent to 5 percent through a 5/64 sieve.(4) Less than 5 percent skinned and broken.(5) ^permination 95 percent or higher.(6) Not over 13.5 percent moisture.(7) Not over 12.5 percent protein.Those requirements are difficult to meet, but all are for good reasons. 18/
Many Montana wheat producers, accustomed to seeking high protein content and to blending of lots of grain, have been disappointed when their Betzes barley (often produced under dry land conditions) has not met malting requirements. In 1960, the Malting Barley Improvement Association reported on a project designed to help overcome some of the production problems.Excerpts from that report are as follows: 19/
"A special project was developed in Montana in 1960 to stimulate the production of high quality Betzes barley on irrigated land in the Triangle region. The program was sponsored cooperatively by this Association and the Montana State Agricultural Extension Service. Organizational meetings were held at Fairfield, Conrad, and Cut Bank, January 20, 21 and 22, respectively. A nucleus of 20 growers was selected to cooperate in the . first year of the project. These growers were advised on the proper use of recommended cultural and irrigation practices in producing Betzes barley. An educational program on quality factors of malting barley was a part of this project. On July 14-16, 1960, a special tour of Betzes fields in the project was sponsored for farmers in the Triangle area.
17/ See Davis, D. J„, Report on the Quality of Commercial Samples of Betzes Bariev. Montana Grain Inspection Lab, Mimeo Leaflet #35, Montana AES, Bozeman, Montana, 1960»
18/ See Chapter IV on Malting and Brewing,19/ Malting Barley Improvement Association, Annual Progress Report, Milwaukee,
Wisconsin, 1960.

— 45 —"The cooperating growers harvested a total of 709 acres with an average yield of 57.4 bushels per acre which produced a total of 40,675 bushels'. The average kernel assortment was 86.7 percent plump kernels and 3.8 percent thin kernels. The average protein content dry basis was 12.4 percent. The skinned and broken content averaged less than 2 percent. It is expected that other growers of Betzes on irrigated land will adopt the recommended cultural practices followed by the successful cooperating growers."
Even though beer may, if necessary, be made from malt of almost any variety and quality of barley, it should also be recognized that maltsters purchase only the best barley available which meets their malt production and barley price specifications. The specifications may be variable according to supplies available as well as to other factors The malting industry's encouragement in developing new areas of production and new , varieties is not without purpose. The greater the total production of barley and the more areas of production, the more likely there will be larger
quantities of top quality malting barley available. This means that Montana has become involved in a highly competitive business and can expect to receive malting premiums only for the best quality barley for malting
purposes.Montana Grain Inspection Laboratory annual reports and Malting Barley
Improvement Association Annual Reports refer to cultural practices and
harvesting problems and indicate a concern for quality production of Betzes barley in Montana. 20/
20/ See: Davis, D. J., Report(s) on the Quality of Commercial Samples ofBetzes Barley, Montana Grain Inspection Lab Mimeo leaflets #32 and #35, Montana AES, Bozeman, Montana; and.Malting Barley Improvement Association, Annual Progress Reports, Milwaukee, Wisconsin, 1958, 1959, and I960.

— 46 —In an undated issue, the Malting Barley Improvement Association's
"Grains of Truth" newsletter listed 10 steps for success in the production of high quality malting barley. These steps, which are assumed to be applicable to all malting barley producing areas, including Montana, are:
(1) Plant certified or other clean, pure seed of recommended variety.
(2) Treat seed for disease control..(3) Sow in early spring on fertile soil.(4) Fertilize as recommended locally.(5) Control weeds.(6) Harvest only when fully ripe.
(7) Thresh carefully to avoid skinned and broken kernels,
(8) Ship and store at 13.5 percent moisture or less.(9) Inspect stored barley regularly to detect heat.damage
or insect infestation.(10) Market pure, one-variety lots. x

CHAPTER IV
MALTING AND BREWING
The Malting Process I/Malt is a food product which results from specific treatment of barley
or other grains„ 2/ Most malt produced is used by beer makers with lesser quantities used in distilling, baking, and in other foods and .drugs.
During the malting process, certain chemical changes take place in the
grain. Insoluble starch changes into a sugar called maltose (the chemical term for malt sugar). Malting releases the enzymes diastase (alpha-amylase
and beta-amylase) and peptase. Diastase converts starch into sugar and peptase changes certain proteins. The enzyme diastase and the enzymes produced by growing yeast cells result in fermentation which converts the maltose
iinto alcohol.
A brief description of the malting process may provide a better understanding of the reasons for the quality requirements of barley for the malting process.
I/ This section based on: (I) Lejeune, A. J. and Parker, John H., Guide toPremiums for High Quality Malting Barley. MBIA, Milwaukee, Wisconsin, January, 1953: (2) Watson, C. A.: Bequette, R. K.: and Ellis G.H., Malting Barley. Increased Income to Montana Producers, Montana AES, Cereal Quality Lab. Mimeo leaflet #28, Bozeman, Montana, July 1959; and (3) Vogel, S. L., Thresh Barley for Malting Carefully, MBIA, Milwaukee, Wisconsin,June, 1950.
2/ Conversion factor: One 48-lb. bu. barley = one 34-lb. bu. malt.

— 48 —The first step in malting is the removal of all thin or cracked
kernels and all foreign material„ The barley is then steeped, or soaked, in water until the moisture of the barley is approximately 42 percent. The barley is then germinated, or allowed to sprout, which activates and synthe- .
sizes certain enzymes. These enzymes are the materials in the germinated barley which break down the starch and proteins in the grain for subsequent conversion to simple sugars and simple proteins which are important to malt users. The sprouting must be uniform and complete so that the conversion of grain products to malt is complete.
When undamaged barley kernels are germinated, the sprout grows from the
germ ep.d underneath the husk of the kernel and emerges from the beard end.The husk protects the sprout so that its growth is normal and modification
of the barley starch is complete, thus producing high grade malt. Skinned kernels sprout faster because they take up water faster, and the sprouts grow out of the breaks in the kernel, unprotected by the husk. When the
maltster stirs the sprouting barley to aerate it and to keep the roots growing, these unprotected sprouts are broken off; consequently, sprouting stops and malt quality suffers. -
When the barley has been properly modified, germination is stopped by
drying in a kiln, or drying oven. This material is then known as malt. Different malts are aged for a proper period of time and are then blended to meet the exacting requirements of the malt users.
There are several different types: of malts, and the type of malt produced is determined by the use for which it is intended. A considerable

- 49 -portion of the malt produced in the United States is used in the brewing industry. Brewers prefer malt made from approved varieties of malting barley grown in adapted areas, These varieties should have high extract yield and high diastase content. The diastase content of the malt should be high enough to convert its own modified starch and the raw starches of other grains, such as corn, into simple sugars. Distillers' malts are usually higher in diastase than brewers' malts because a small amount of malt is used to convert the starch of other grains into fermentable sugars
in the distilling process. "Malt extract is the amount of soluble material that can be extracted
from ground malt when mashed with water. The percent of malt extract is important in brewers' malt because it determines to a large exteht the amountof product which can be produced from a given amount of malt. The amount of
/malt extract is influenced by the variety of barley, protein content, and kernel plumpness. Plump, low protein kernels give large amounts of malt extract. Thin, high protein barley often produces extracts which are
unstable during the brewing process.
Maltsters' Requirements
Consumers seem to have definite preferences in their beer. Conse
quently, brewers specify to maltsters the kinds of malt required. In turn, maltsters pass their specifications on to handlers and finally to the farm

- 50 -
producers of malting barleyo Generally the requirements of maltsters for barley are:,3/
(1) Acceptable varieties in carload lots unmixed with other varieties»
(2) Uniform, vigorous germination.(3) Low percent of skinned and broken kernels.(4) Bright, clean, sound barley, free from blight, weathering,
and damage.(5) Free from other grains, foreign matter.(6) Ripe, plump, uniform kernels,(7) Uniform moisture content.Barley which may meet United State's Department of Agriculture official
grain standards for malting may not be acceptable for malting by the trade,
either or both because of more exacting standards or because of conditionsIof supply and demand, At times high quality malting barley may go for feed.
At other times that which would ordinarily be sold as feed barley may be used for malting because of short supplied or unusually heavy demand for malting barley.
Any price received for barley above feed prices may be considered as a
malting premium. Premium prices are usually paid only for the preferred or
_3/ ' Lejeune, A. J. and Parker, John H., "The Story of Malting Barley," What's New in Crops and Soils, February,, 1955.
- 51 -
"‘approved" varieties« A study by Pederson 4/ showed that in an 8-year period (beginning in 1946) malting barley prices at Minneapolis averaged about 45 cents per bushel above feed prices, with a variation of from 25 cents to 60 cents per bushel premium;, His study also indicated that, at least in Minnesota, local elevators priced malting barley according to the elevator manager's belief as to what terminal market price less freight and other costs will be at the time of delivery. It was concluded that the demand for malt had less influence on malting barley prices than the supply of barley offered for sale and that the reputation of the producing area was an important factor in determining,whether local elevators may command a malting price premium=
Lejeune and Parker made the following additional conclusions concerning barley requirements of maltsters: _5/
"Io To obtain maximum premium, segregation and separatebinning on farms and in elevators should be practiced=
"2= Test weight is not adequate as a measure of value ofbarley for mAltfng= Kernel plumpness is more important=
"3= Otherwise acceptable malting barley having in excess of three to five percent skinned"or broken kernels is discounted in price=
"4= Without a high (95 percent or better) rate of germination and without a uniform rate of gemination, barley is almost useless for malting. (One of the chief
4/ Pederson, H= C=, More Profits from Malting Barley, University of Minnesota, Ag Ext= Service Folder 68, December, 1954.
5/ Lejeune, A= J= and Parker, John H=, Guide to Premiums for High Quality Malting Barley, MBIA, Milwaukee, Wisconsin, January, 1953»

- 52 -reasons for loss of germination has been due to storage of barley having in excess of 13o5 percent mois ture content„)
"5. Other discounts for malting barley may result from: heat damage, ground damage, blight or scale, smut,
, ergot, garlic or other odors; unsound or sick, musty, weathered, frosted, immature, bleached, weevily, treated, or sprouted barley; from barley containing other kinds of barley, foreign matter or other grains; and from uneven or plugged methods of car loading,"
The Brewing Process 6/Beer and ale, both fermented malt beverages, are classed as alcoholic
drinks, which are any beverages containing ethyl alcohol in intoxicating quantities„ Amounts of alcohol in beer may be as little as 2 percent.
The alcohol in alcoholic drinks is obtained by the fermentation of sugar or of starchy products such as corn, barley, wheat, rice, and potatoes to change their starch into sugar. Beverage alcohol may also be obtained by distillation of fermented, mashed fruit,
\ There are many different formulas for brewing ale and beer. Most beersIhave an alcoholic strength of from 2 percent., to 6 percent. Ale
usually contains greater quantities of alcohol than beer, and its more tart
flavor results from, the use of larger quantifies of hops'. Beer is orinarily made from malted barley, but corn or. rice may also be used.
Brewing is the making of fermented alcoholic beverages such as beer
and ale from cereal grains, yeast, hops', and water. Brewing refers to the
6/ This section based on: (I) Various volumes of The World Book EncyclopediaField Enterprises, Merchandise Mart Plaza, Chicago, Illinois, 1962 ed,;(2) How Olympia Beer Is Made, Olympia Brewing Company, Olympia, Washington,

53 -entire process which consists of malting, mashing, boiling, hopping, fermenting, and finishing. These terms, except malting, which has been discussed in the previous section of this chapter, are briefly defined in the following outline of the brewing process;
(1) Malted barley and other cereals, such as rice or corn,
are binned separately by the brewer for combination
according to the brewer's particular formula or recipe.(2) The barley malt is ground and sent to the mashing tub.(3) As the barley malt is ground, a certain portion is
diverted to the cereal cooker where it is mixed with the rice or corn and boiled. This mixing and boiling process
prepared starches for conversion to other carbohydrates.(4) The boiling cereal is pumped into the main mashing tub
with the ground barley malt. The temperature rises converting starches into dextrin. When the stirring stops, the solids settle and are removed for processing into dry feed grains for livestock, ^he remaining liquid is called wort.
(5) The wort is pumped to a brew kettle where it is again
boiled with hops. Brewers use differing amounts of hops to give the beer a distinctive flavor.
(6) From the brew kettle, the wort goes through a hop strainer and then to coolers where it is chilled.
(7) After chilling, the wort goes to a starting tank where a
yeast culture is added to start the process of fermentation.

- 54 -The yeast converts sugars into alcohol and carbon dioxide gaso After it is well started, the wort goes into a fermenting tank where the process continues. During the fermenting, the yeast multiplies and settles. It is removed and the most active portions are reused in the starting tanks.
(8) The young beer is then sent to aging tanks, then through a
final filtering, arid finally to the canning and bottling lines.
Figure 5 is a schematic diagram showing the general processes of' I
brewing which are followed, with variatioris, by most brewers.
~The Geography of Barley, Malt, and Beer 77The origin of barley is lost in antiquity, but there is evidence of its
use as early as 3500 B.C. Until about the sixteenth century, barley was used primarily for food— porridge, flour,'and beer. Some writers believe that brewing outdates even baking: The"first known book on brewing wasby George Watkins, published in London in 1773. After the 1500's, barley also became important as a livestock feed.
Presently about one of every ten bushels of barley produced in the
world is used for malt. In the United State's,. this figure is about one for
Tj This section based on: (I) Blaich,' 0. P. , Barley: Its Production andUses, University of California ditto, August 31, 1961; (2) Combs, W. B., The Production and Grading of Malting Bariev. USDA, October 6, 1953;(3) Weaver, J. C., Barley Geography. University of Minnesota mimeo, January 28, 1948; and (4) Brewers Digest Annual Buyers Guide, 1962.

RICE CEREAL MALTED BARLEY B IN BIN
Figure 5. A Typical Brewing Process
PACKAGING

- 56 -every three bushels, Over one-half of the world’s barley supply is used for livestock feed„ Barley rates fourth place as a feed in the United States following com, oats, and sorghum. Pound for pound, barley is as good a feed, especially for hogs, as any other feed grain. Its use is limited, however, because other feed grains, often produce greater yields per acre. Barley is still used for flour in some parts of the world, producing a dark heavy brepdp
Barley was brought to America by the earliest settlers. It was first planted in Massachusetts in 1602, in Virginia in 1611, and on Manhattan Island in 1626. At one time, the principal crop of Rhode Island was barley. The Colonists used barley primarily for brewing. The Spaniards introduced
barley to Mexico and southwestern United States.The Atlantic Coast States were not particularly suited for barley
production. So, as the frontier was moved back, barley production also
moved westward. By 1820, two-thirds of the United States barley crop was produced in New York State. Thirty years later, in the 1850's, barley production had spread into the Midwest.' Its production was concentrated around the urban centers because, even though there was a growing use as livestock feed, the main use of barley was for malt. Costly transportation
resulted in barley production near to cities where the beer drinkers lived. The malting and brewing centers of the period 1850-1880 included Wheeling,
Detroit, Cincinnati, Chicago, Milwaukee, Davenport, Canton, and St. Louis. Following the Gold Rush of 1848, California became an important barley producing area and has remained so to the present.

\
- 57 -In the latter part of the 1880' s transportation had become sufficiently
efficient that barley production became diffused into ecologically suitable areas. By 1900 barley production was concentrated in the Upper Midwest of the United States.
Today all of the 11 leading barley producing states are located west of the Mississippi River. (North Dakota, California, Montana, Minnesota, Washington, Kansas, Oregon* Idaho, Colorado, Oklahoma, and South Dakota).The Red River Valley of North Dakota arid Minnesota has become the principal United States source of six-row malting barley.
The history of barley production in America has been that of concentrations of population, transportation costs and efficiency, soil and climate, disease 8/, and agricultural policy. 9/ While these and possibly other
factors cannot be quantified, their effect op location of malt and brewing facilities should not be passed over without'comment.
It is evident that malting and brewing plant locations have been influenced by location of beer consuming centers, transportation, and barleyproduction— but with a lag in time. Once the investment in plant,
.
8/ This is a very significant factor outside the scope of this study.Particularly since World War II, there has been an increased, search for new disease resistant varieties, chemical and mechanical controls, and for new areas of production.
9/ Policy is treated in more detail iri Chapter VII. Two examples here will suffice: Until wheat acreage limitations were effected in 1954,Montana produced little barley. By 1950, Montana was a leading barley producing state. Canada's grain policies also encouraged barley production in the 1950's. Canadian producers were permitted to ship one carload of malting barley in addition to their wheat quotas.

— 58 —equipment, and trained workers has been made, it is not a simple task to move malting and brewing facilities„ Barley production has long since moved West $ but population density remains high in the North Atlantic region. Thus, malting and brewing firms continue to operate in that region.
Figures 6 and 7 show the location of brewers and maltsters as of 1961. Figure 6 locates brewing plants (not companies). These were first developed
in the North Atlantic region, then in the Midwest, and northward into the
Lake States at the-eastern edge of the great malting barley producing regions of the Upper Midwest and Northern Plains. There is a much lighter concentration of breweries on the Pacific Coast, the Gulf Coast, and a scattering elsewhere. Table XII shows numbers and capacity of breweries in leading states in the United States. Figure 7 locates malt companies (not plants). Figure 7 is an incomplete picture in that some malt companies have plants
elsewhere and some brewing companies also have their own malt plants.It is said that beer may now be profitably shipped up to 500 miles. If
so, then it may be verified from Figure 6 that no one, wherever he may be in the United States, need be without a beer!
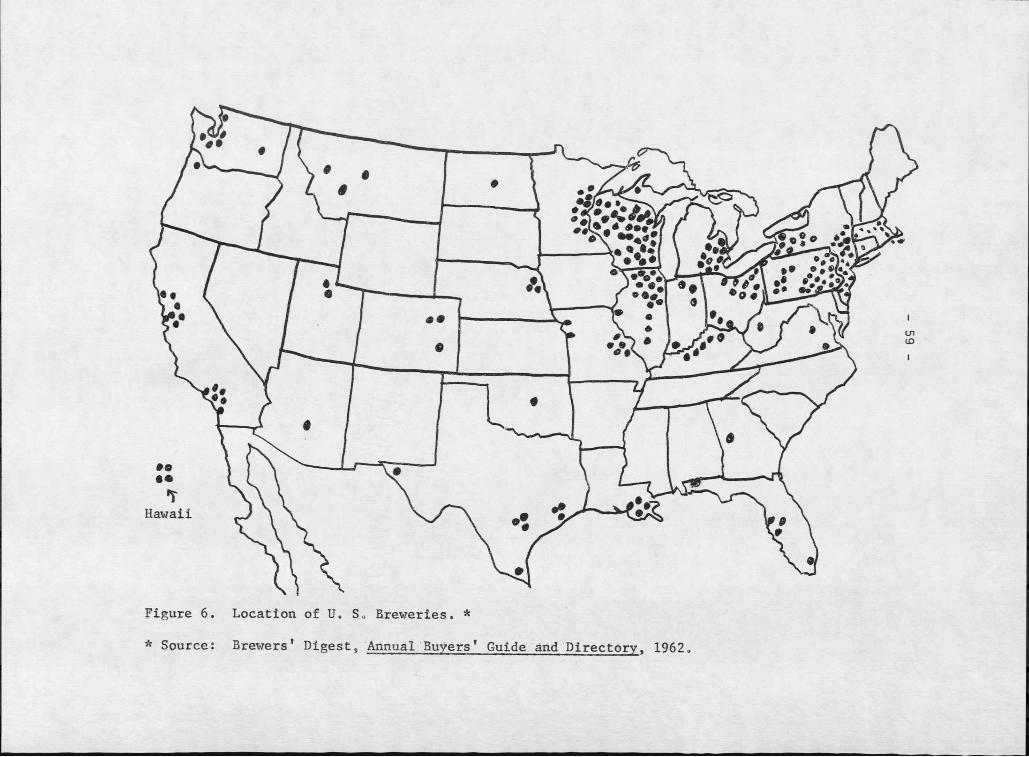
Hawaii
Figure 6. Location of U. S0 Breweries* Source: Brewers' Digest, Annual Buyers' Guide and Directory, 1962
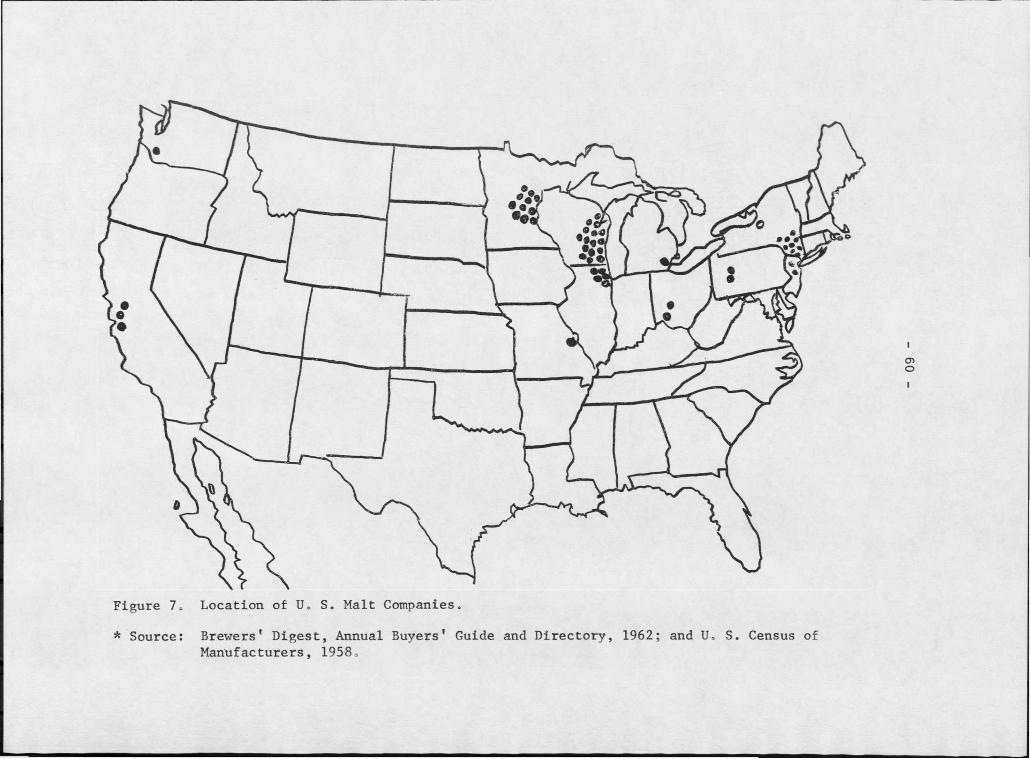
•••
cno
Figure 7. Location of U 0 S. Malt Companies.
* Source: Brewers' Digest, Annual Buyers' Guide and Directory, 1962; and U0 S. Census ofManufacturers, 1958,
•a

— 61 —
TABLE XIIo UNITED STATES BREWERIES. LEADING STATES IN NUMBER AND CAPACITY,I960. *
State BreweriesPortion of
Uo So TotalTotal
CapacityPortion of U. S. Total
No. Pht_. 000 bbls. Pct.California 13 5.7 12,930 9.3Illinois 17 7.5 6,375 '4.6Michigan 11 4.9 . 9,770 7.1Minnesota 12 5.3 5,187 3.8(Montana) (3) (1.3) (400) (0.3)
New Jersey 8 3.5 10,857 7.8New York 17 7.5 16,415 11.9
Ohio 12 5.3 7,445 5.4Pennsylvania 25 11.0 11,130 8.0Wisconsin 33 14.5 16,752 12.0All Other (23 states) 76 33.5 41,205 29.8
Total 227 100.0 138,466 100.0
* Source; The Brewers Digest , Annual Buyers Guide and Directory, MountMorris, Illinois, 1962.

CHAPTER V
STRUCTURAL CHANGES IN THE BEER INDUSTRY
Beer Consumption Characteristics !_/ xBeer, by 1961, had become a $2.2 billion industry in the United States.
Sales in that year were at a record high of 89.2 million barrels, up 1.5 percent or 1.3 million barrels over 1960 sales, The brewers, however, were not particularly happy. Total sales were up, but population increases were outstripping total beer consumption. The net result was a per capita beer consumption of 15.1 gallons, which was the same in both 1961 and 1960 and below the peak per capita consumption 18.6 gallons in 1946.
Apparently the beer industry as a whole doesn’t know enough about the consumer of its product. An Ernest Dichter study suggested that beer, which is a beverage somewhere between hard liquor and soft drinks, has lost contact with the young potential beer drinker and that the type of beer produced in . the United States is really not the type preferred by consumers..2/ The study
JL/ This section based on information contained in several articles in theJanuary 19, 1962, Annual Beer Sales Report issue of Printers Ink Magazine All data, except as otherwise noted, were taken from this reference.
2/ A possible indicator of this may be construed from the fact that even though imported beer amounts to only 0.6% of the total U. S. Market, imports increased by 500% from 1949 to I960. A. F. Shaw (Barley Possibilities Important; Income Now Second to Wheat, MSC Div. of Ag. Challenges, Jano-Feb. 1960) stated that "chances are that the total malt production will shift to 2-row varieties if suitable sources are developed. As in Europe, at the present time, a shift to 2-row varieties may be gradual."

— 63 —concluded that it is time for the brewing industry to seek answers to some fundamental questions about their products and its consumers„
The historically tradition-bounds mainly family-owned brewers» have been too busy researching their own particular brand market to give much consideration to industry-wide market research. Furthermore, profits have been declining so that individual brewers have been reluctant to finance
coordinated industry research. Market wide research development has also been hampered because privately owned brewers have been reluctant to release brand sales data, because varying state laws; result in major differences in types of market outlets, and because of the difficulty of interpretation of motivation research (the appeal of beer apparently rests in intangible consumer needs rather than strictly in product utility.)
In the meantime, beer's share of. the overall market continued to decline Why? What are beer consumers like? How do they live? Information of this type, as pertains specifically to the beer market, is rare but interesting and is apparently having some pronounced effects on the brewing industry.The following items suggest the profile of the beer consumer:
(1) Since the advent of television, people stay at home more
often and drink less beer at home than when they go out.(2) Too few babies were born in the 1930's and 1940’s, resulting
in relatively few people in beer drinking age brackets now.

— 64
This problem is expected to be overcome'in the 1960’s when
the post-World War II baby crop comes of beer drinking age. 3/(3) An Elmo Roper study found that one-fourth of the total
population accounts for one-half of all beer drinkers and that one-half of the beer drinkers consume four-fifths of the beer sold.. Thus it was concluded that the average consumer either drinks little or no beer or drinks considerable quantities of it.
(4) Beer ranks third in popularity of all beverages, following
coffee and soft drinks. *(5) There are, according to Social Research Incorporated of
Chicago, two basic but not mutually exclusive beer drinking motives: (a) for enjoyment in a social setting where beeris served, and (b) for the pleasurable effects of drinking
beer o(6) The Roper study, Referred to above, also, discovered that
level of income has little effect on beer consumption.In fact, low income people are less likely to drink beer I
(7) A Sah Francisco firm, the Institute for Design Analysis, describes the beer consumer as being notoriously fickle.Beer does not enjoy a consistent nor stable consumer image.
3/ More recent beer consumption data indicate that in the 1960’s, theWorld War II baby crop is disappointing the brewers by failing to drink as much beer as anticipated!

- 65Apparently there are some rigid status connotations concerning beer. Some persons feel that beer may properly be served.only at particular types'of sdcial occasions.Some identify beer with particular age of income groups. Others view beer strictly as a drink of. moderation. In other words, there is emotional commitment involved with beer drinking,
(8) Occasional beer drinkers most often buy.on whimsy and frequently don't drink beer simply because they forget to
buy it,(9) Regular beer drinkers tend to stay with two or threei., favorite brands. The particular brand and quantity pur
chased is most likely to b6 decided upon at the time of purchase (which accounts fdf the concentration [21 percent
, • of the total] of advertising at the point of purchase).(10) Currently, about 60 percent to 70 percent of total beer
sales are in retail supermarkets, (Elaborate merchandising methods have boosted beer sales in some, retail stores by as much as 650 percent!)
(11) Brewers have become sensitive to ethnic markets. For example, it has been noted that the Negro market in at.least 29 metropolitan areas has become sufficiently large and
prosperous to make or break the beer, or any other, market, .
Beer consumption studies among Negroes indicate that Negroes

- 66 —drink more beer and are more likely to drink it regularly than whites » Consequently, many public relations conscious brewers are now publicizing such items as their Negro employment policies.
The effects of all this— whimsical consumers, declining per capita consumption, and falling profits— on the brewing industry are significant to maltsters and barley producers as well as to beer makers,
Mergers and IntegrationFrom 1946 to 1961, one-half the number of brewers went out of business
at a rate of 16 per year. Many of the breweries were swallowed up in mergers,
of which there were 18 between June i960 and December 1961, Result: Fewerbut larger breweries. Brewers selling over one million barrels accounted for
71 percent of total 1961 beer sales. Further evidence of the continuing trend for bigness in brewing, was that the top 26 brewers increased their
volume by 2.24 percent in 1961 as compared to a total industry volume increase of 1.5 percent.
, Despite excess capacity in the brewing industry (139 million barrel capacity with an 89 million barrel output in 1961), expansion and integration of facilities, particularly among the big breweries, continues. Presumably
the trend of expansion is indicative of outmoded plants and equipment and of decreasing costs with increasing size. Economies of scale are most apparent in utilization of by-products and more particularly in the use of adver
tising. The trend in facilities integration has been both horizontal andvertical, i„e, , brewers merging with other brewers and with brewers buying or building their own malting plants.

- 67 ■ —
Thei expansion and integration trends have made it difficult for the small brewers whose total costs may be relatively high and who cannot afford to operate their own malting plants„
Another possible problem, particularly for small breweries is that of beer concentrates. Perfection and adoption of the process could convert the big breweries into mere bottling plants and could result in the complete demise of small brewers. This could also significantly alter the location
of malting and brewing facilities, (See Chapter IV,)All these developments point to a continuing strong marketing com
petition among brewers with emphasis oh sales to women in supermarkets, packaging innovations, and new and expanding advertising and merchandising methods. In 1961, the industry spent $.168 million on advertising ($36 million on television and $18,5 million for outdoor ads). The top 20
brewers spent a total of $87 million in advertising or about $1.93 per barrel sold. Advertising expenditures are expected to increase in the 1960's.
On the horizon the beer industry has projected increasing sales up to 1 95 million barrels by 1965 and to H O million barrels in 1970. The projection is based on the assumption that by 1970 there will have been an
increase in the percentage of the total population in the 21-39 year age group, which is (or at least has been) the beer drinking age. Other assumed
favorable factors include more women beer drinkers and an increase in beer consumption resulting from leisure and outdoor living patterns.
• X
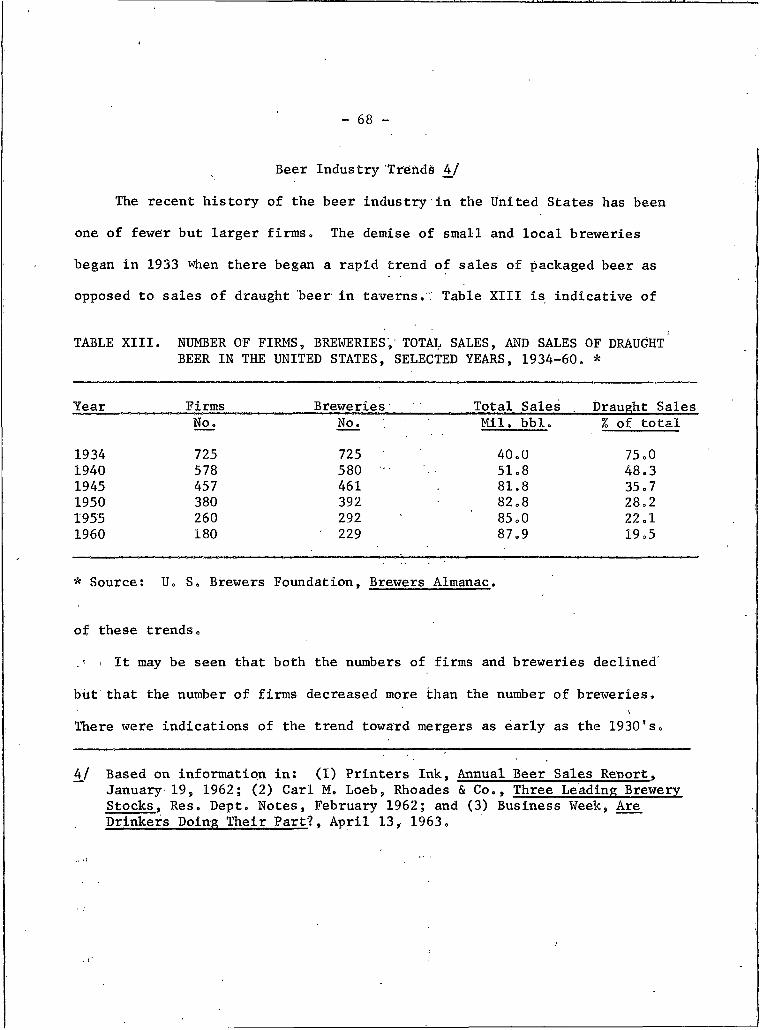
- 68
Beer Industry Trends 4/
The recent history of the beer industry in the United States has been one of fewer but larger firms. The demise of small and local breweries began in 1933 when there began a rapid trend of sales of packaged beer as opposed to sales of draught beer in taverns.. Table XIII is indicative of
TABLE XIII. NUMBER OF FIRMS, BREWERIES, TOTAL SALES, AND SALES OF DRAUGHT BEER IN THE UNITED STATES, SELECTED YEARS, 1934-60. *
Year Firms Breweries Total Sales Draught SalesNo. No. Mil. bbl. % of total
1934 725 725 40.0 75.01940 578 580 ' 51.8 48.31945 457 461 81.8 35.71950 380 392 82.8 28.21955 260 292 85.0 22.11960 180 ' 229 87.9 19.5
* Source: Uo S. Brewers Foundation, Brewers Almanac.
of these trends„
. ’ I It may be seen that both the numbers of firms and breweries declined
but that the number of firms decreased more than the number of breweries.There were indications of the trend toward mergers as early as the 1930's.
4/ Based on information in: (I) Printers Ink, Annual Beer Sales Report,January 19, 1962; (2) Carl M. Loeb, Rhoades & Co., Three Leading Brewery Stocks, Res. Dept. Notes, February 1962; and (3) Business Week, Are Drinkers Doing Their Part?, April 13, 1963,

— 69 —Local breweries continued to go out of business during the 1940's and 1950’ They could not compete with the regional and"national brewers who had advantages of size, wider markets, greater financial strength, etc. Rising costs of operation and declining profits in the 1950's hastened the process Table XIV shows the number and percent of total breweries in the United States by size groupings. Profit margins for all brewers during the 1950's dropped from 6 percent to 3 percent. It was said that price cutting was an ineffective method of attempting to increase sales, indicating a relatively
inelastic demand for beer. Profits per barrel dropped from about $1.75 in the late 1940's to 75 cents in the mid-1950's. However, the larger brewers managed to maintain a profit of about $1.00 to $1.50 per barrel.
During the 20-year period 1940 to 1960, the five largest brewers increased their share of the beer market from one-sixth to one-fourth. The top 10 increased from one-fourth to one-half, of the. total market and the leading 25 brewers increased from one-third to three-fourths of total beer sales. Table XV presents sales data for the top 10 brewers of 1961.
Some conclusions may be drawn from Tables XIII, XIV, and XV:
(1) The top 10 brewers— about 5.5 percent of the total number—
accounted for more than one-half of the total beer sold in
1961.(2) Sales per brewing firm among the top 10 wejre generally, but
not necessarily, related positively to capacity.
(3) The beer industry operated at 64 percent of capacity in 1961. The top 10 (at 79 percent of capacity) were consid
erably above "all others" (54 percent of capacity). Sales

70I
TABLE XIVo UNITED STATES BREWERIES, NUMBERS AND PERCENTAGES OF TOTAL NUMBERS BY PLANT SIZE GROUPS, 1960* *
Brewing Capacity Total Breweries Portion of Total BreweriesBbls. No. Pet.
Under 50,000 20 1050,000 - 249,000 70 36250,000 - 449,000 32 19450,000 - 649,000 16 8650,000 - 849,000 19 10850,000 - 1,049,000 10 5
1,050,000 and over 27 14
Total 194 100
* Source: The Brewers Digest, Annual Buyers Guide and Directory, Mount Morris,Illionois, 1962.
as a percent of capacity may be considered as indicative of relative efficiency. No quantitative conclusions may be drawn here because capacity of breweries must exceed annual sales to allow for seasonality of consumption and because about 5 per
cent of production is lost thorough spillage and other wastes.
,However, in the case of Falstaff, for example, sales of 96 percent of capacity suggests one or more of several possibilities, namely: (a) enviable efficiency, (b) erroneous data, (c) littlewaste and spillage, (d) stable seasonal sales, and

- 71TABLE XV. SALES AND CAPACITIES OF THE TOP TEN UNITED STATES BREWERS, 1961. *
Brewer SalesPortion of Total U.S.
SalesBrewingCapacity
Sales to Capacity Ratio
Portion of Total U.S. Capacity
Annheuser-Mil. bbl. Pet. Mil. bbl. Pet. Pet.
Busch 8.5 9.5 10.5 81 7.6Schlitz 5.8 6.5 9.0 64 6.5
Pabst 5.2 5,8 6.0 87 4.3Falstaff 5.1 5.7 5.3 96 3.8Carling 5.0 5.6 6.8 74 4.9Ballantine 4.5 5.0 5.0 90 3.6
Hamm 3.7 4.1 5.0 74 3.6
Schaefer 3.2 3.6 4.0 80 2.9
Liebmann 2.8 3.1 3.5 80 2.5Miller 2.6 2.9 4.0 65 2.9
Sub-total 46.4 51.8 59.1 79 . 42.6
All others 42.8 48.2 79.4 54 57.4
Total 89.2 100.0 138.5 64 100.0
*. Sources: The Brewers Digest, Annual Buyers Guide and Directory, MountMorris, Illinois, 1962; and Printers Ink, Annual Beer Sales Report, January 19, 1962.
(e) remarkable control of inventory as related to production and sales.

72’-
Sales leadership among the brewers' has changed rapidly as integration, mergers, and acquisitions have occurred and as multiple plant operations and broader geographic distribution and advertising have become recognized as sales boosters„ For example, during" the past 25 years the four national brewers (Annheuser-Busch, Schlitz, Pabst, and. Miller) more than doubled their share of the total market up to nearly 25 percent of total beer sales in 1961= In the same period, the semi-national brewers (Falstaff, Carling,
and Hamm) increased their share of the market by five-fold up to about 15 1/2.percent of the total=
Despite the fact of several anti-trust suits, it is expected that the small breweries will continue to fade out of the picture= Sales of draught beer in taverns will probably continue to decrease while canned beer of national brands continues to increase in sales, primarily through supermarket selling= In assessing beer market trends, several characteristics, including costs, prices, taxes, and consumption,are of.importance. Data for detailed
analyses were not available=, The brewing industry has not escaped the general problem of rising
industrial costs. An average of brewing industry costs as a percentage ofsales for 1961 was as follows:
>:L. i I, ab or, , = ,, = , , , , = , i Containers . = . , o , Other packaging materials. « , M a l t 0 0 8 0 8 0 . 0 0 = 0 , 1
Other raw materials, . . , . , Advertising and promotion. , , Distribution and other costs , Pre-tax profits. . . . , , . ,
o 20 - 25% . 15 - 20% o 3 - 5%o 8-10%, 10 - 14% . 6 - 10% . 18 - 22% . 3 - 6 %
I

73 -
If items 6 and 7 may be lumped together, it is evident that "marketing" costs were the greatest part of the total (24 percent - 32 percent). Selling or marketing costs were high presumably as a result of concerted effort to improve the brewing industry's sales and profit position.
Even though still relatively low priced, wholesale beer prices rose by about I percent per year during the five years preceding 1961. An analysis of retail pricing was not undertaken because it is so highly variable depending upon draught vs, packaged, retail store vs. tavern, local vs. premium beers, local preferences, income levels, degree of competition, taxes, etc.
Taxes, Incomes, and Sales of BeerTaxation is apparently a sensitive subject among the alcoholic beverage
industries and is assumed to have an important bearing on beer sales. Since
1940, state taxes (average) have doubled— to about $2.93 per barrel. Federal taxes per barrel were increased by $1.Q0 each of three times during World War IT and once during the Korean conflict. Levels of income also are generally assumed to have an influence on beer consumption. 5/ Data on the beer industry are not easily obtained. However, the accompanying Figures 8, 9, and 10 may be indicative of the influence of taxes and income on beer consumption. Each of the three are scatter diagrams for 1960 data for the 48
continental states and the District of Columbia.Figure 8 relates per capita consumption of beer with state excise taxes
per barrel of beer. In all of the states having above average excise taxes,
5/ This is a questionable assumption. See the previous section of this chapter.

74 -beer consumption was below average. Conversely, in all states where con-' sumption was above average, excise taxtis were below average.
Figure 9 compares per capita income with state excise taxes. In this case, it may be seen that in all states where excise taxes were above average, the per capita income was below average. Conversely, in all states of above average per capita income, the state excise taxes on beer were below average.
Figure 10 compared per capita consumption of beer with per capita in
comes. Here it was found that of the states with below average consumption,84 percent were also states of below average per capita income. Of the states with above average per capita consumption, 60 percent were also of above average per capita income.
From a visual analysis and preliminary computations of data in Figures 8, 9', and 10, it was tentatively concluded that:
(I) Contrary to popular notion, beer is not necessarily a poor , man's drink. There appeared to be a positive relation
ship between per capita income and per capita consumption
vx
of beer.(2) States with low per capita incomes (presumably in search
for sources of revenue) tend to levy higher excise taxeson beer.
(3) As a result of (2), the high taxes on beer raise beer prices and discourage consumption by the already low
V • I ■
average income populace. A further possibility which was
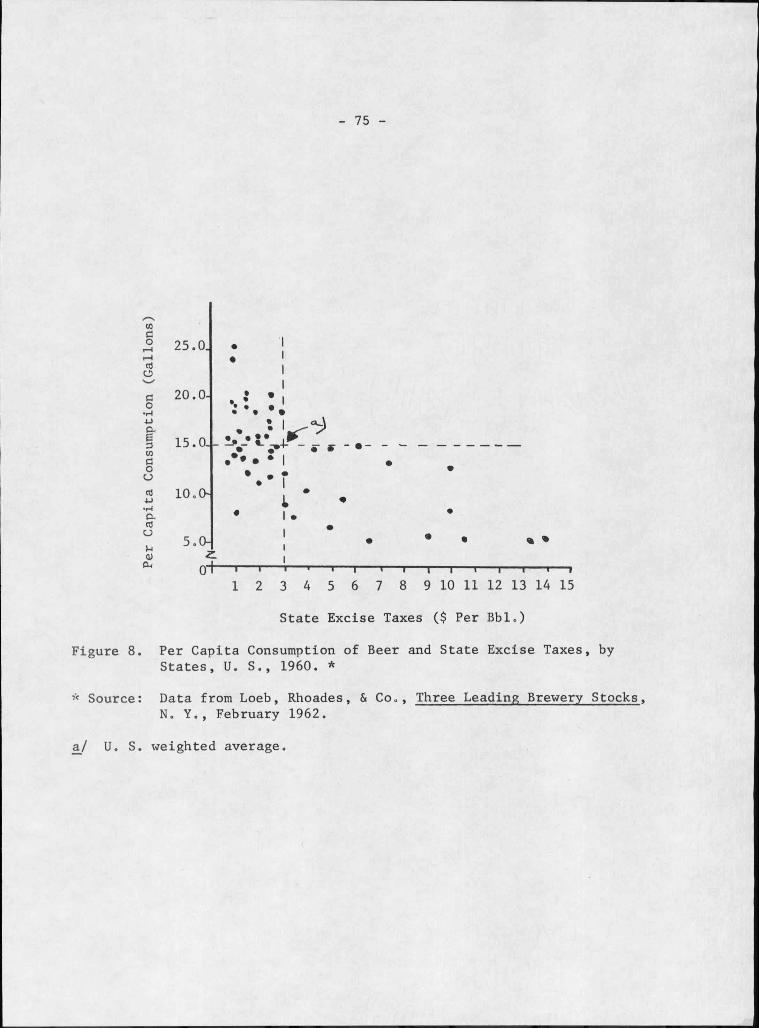
75
Figure 8
* Source
a/ U. S
CO§ r—I
r—I CtiO§•H4J
ICOguCfl4-1•HCLCfl
U
H<DP-i
25.0.
20. 0-
15.0,
IO-O-
5.0-Zoi
• *
•l
<k »I I I
I 2 3 4 5 6 7 8 9 10 11 12 13 14 15State Excise Taxes ($ Per Bbl.)
Per Capita Consumption of Beer and State Excise Taxes, by States, U. S., 1960. *Data from Loeb, Rhoades, & Co., Three Leading Brewery Stocks, N . Y., February 1962.
weighted average.
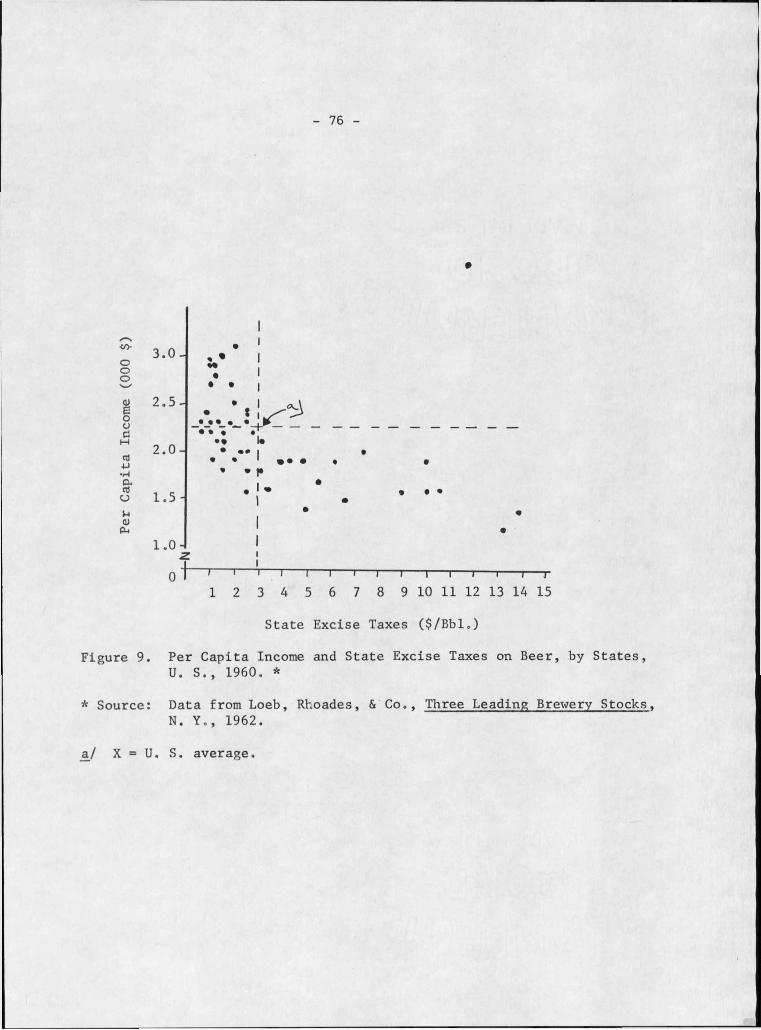
Per
Capita I
ncome
(000 $)
76
Figure 9.
* Source:
5.0 -
5.5 -
5.0
L .5 -
L .0
## #
• X* # * * e• • •
• * # # »« # • • • S
9 • •
q I I > I I i I I I I r
e
I I T
I 2 3 4 5 6 7 8 9 10 11 12 13 14 15State Excise Taxes ($/Bbl.)
Per Capita Income and State Excise Taxes on Beer, by States, U. S., 1960. *Data from Loeb, Rhoades, & Co., Three Leading Brewery Stocks, N . Y., 1962.
a./ X = U. S. average

Per
Capita C
onsumption (
Gallons)
77
25.0-
20. 0-
15.0.
10.0.
5.Oj0-f T------T -
1.0 1.5— I--- '-----1---------1 "2.0 2.5 3.0 3.5
Income: $ Thousands Per Capita
Figure 10. Per Capita Consumption of Beer and Per Capita Incomes, by States, U. S., 1960. *
* Source: Data from Loeb, Rhoades, & Co., Three Leading BreweryStocks, N. Y., 1962.
a/ X = U . S. average

- 78 -not studied-could be that of lesser total state revenue from .high taxes than would result from increased beer consumption with"a IdBser tax and a presumably lower price.)
Multiple correlation analyses of per capita consumption, per capita income, and state excise taxes resulted in conclusions that the only statistically significant relationship was between consumption and income.
There is some doubt as to whether one year's data divided into two parts may have been sufficient to obtain statistically conclusive results.
Thug, with the available data, conclusion (I) seems to be verified, but conclusions (2) and (3) remain tentative. ,
.____________________________________________ _________ ;_____________________________ ______________ ____ - r-
6/
ft .-V
6/ . This was in the southern states where incomes were low, taxes high, and consumption low. The data were divided into two parts—^the South and the remainder of the U.S. The data were turned over to a statistical laboratory in the USDA for machine analysis of: %1 = f(X2, X3) forthe two areas. Xl - per capita consumption (dependent); X2 = state excise taxes (independent); and X3 = per capita income (independent). Results were as follows:
South "Other" U. S.
Rl.23 = .726761 R1.23 = 460003R2I.23 = .528181 R2I.23 = .211603r212 = .227502 . r212 = .044789r213 = .486030 r213 = .211069r223 = ,173404 r223 = .172149/12.3 = .082013 r212.3 = .000676r213.2 = .389224 r213.2 = .174636

CHAPTER VI
DETERMINING THE PRICE OF MALTING BARLEY
Country Elevator PricingDuluth, Milwaukee, Chicago, and Minneapolis all are important barley
markets in the United States, Minneapolis is the largest barley market in th$ United States and probably in the world. I/ Barley is sold in carload lots at terminal market grain exchanges on the -basis of samples taken directly from cars by official grain inspectors. Prices are determined by bids on the cash trading floor. Principal barley buyers are terminal ele
vators, grain dealers, maltsters, and;:mAl-tihg brewers. Each purchaser hascertain requirements for particular uses of the grain.
,How is the price of barley:, or other grains, determined? The typical
answer is that it depends upon many fHTngs which boil down to a common or average judgment among buyers and sellers of basic supply and demand con
ditions at thg time. That kind of an answer is correct but too general to be of much help. For example: Are country elevator barley prices basedon terminal prices? Or vice versa? Or both? How does a country elevator
operator know what price to pay farmers for barley?
I/ Sleik, John, What Happens to Barley on the Trading Floor and in the Malthouse Because of-Skinned and Broken Kernels?, G. Heileman Brewing Co., La Crosse, Wisconsin (undated).

80A study by the North Dakota Agricultural Experiment Station released in
1954 2/ is indicative of malting barley price procedures. The study pointed out that there was an undercurrent of uncertainty among country elevator operators concerning the pricing of malting barley and a general lack of understanding of terminal market operations; Some operators felt they were ■ purposely being "kept in the dark" on malting barley prices. Others felt that the problem was more one of "organized confusion." Still others thought that at least a part of the problem was due to a lack- of a common
marketing language for malting barley. Some question was also raised as to whether the rigidity of maltsters’ requirements was realistic or even observed by malt barley buyers. i
The North Dakota country elevator operators were asked the following
questions:(1) How do you arrive at your posted or basic price for malting
barley each day?(2) How do you evaluate the degree of importance of the
possible price determining factors listed?(3) What sources of price information are used?(4) After establishing a basic malting barley price, what
factors are used in price determination for particular lots of barley?
2/ Hemphill, Perry V., How Does the Local Elevator Determine A Price forMalting Barley?, N. D. AES Rep. No. 387, from Bi-monthly Bulletin,Sept. - Oct., 1954, Fargo, North Dakota.

81 -
A summary of the replies to those questions indicated that country elevator operators generally rely on terminal markets plus their own experience to determine the basic price for malting barley. This price information is obtained from radio reports and market letters of various kind's originating at the terminal markets -, Particular lots of barley are then priced according to generally accepted physical quality measurements.
Terminal Market PricingObservation and experience support the general conclusion of the
North Dakota study that local or country elevator prices are based on
terminal market prices. The question then becomes one of how terminal
prices are determined.Analysis of annual average United States barley production and prices
received by farmers showed no statistical correlation for the period 1920-,
I960. Neither was there any significailt:relationship between annual average terminal market prices (Minneapolis) and annual average United States pro
duction, nor between annual average terminal market prices and annual
average receipts at terminal markets.From Tables XVI and XVII there was made an analysis of the prices of
feed barley and malting barley. The graphic relationship between the twb is shown in Figure 11. In the figure, it may be seen that malting barley prices were always above feed barley prices and that the two prices tended to rise and fall together. 3/ During.the period covered, the price trend
3/ This is a typical relationship. For a comparison of earlier years, seeLejeune, A. J. and Parker, J, H., Guide to Premiums for High QualityMalting Barley, MBIA, Milwaukee, Wisconsin, January, 1953.

TABLE XVI. MINNEAPOLIS CASH GRAIN AVERAGE CLOSING PRICES PER BUSHEL NO. 3 FEED BARLEY, SEASONS 1954-61. *
Season July Aug. Sept. Oct. Nov. Dec. Jan. Feb. Mar.. Apr. May • June X$/bu $/bu $/bu $/bu $/bu $/bu $/bu $/bu $/bu $/bu $/bu $/bu $/bu
1953-54 1.02 .99 .95 .95 .96 .97 1.04 1.05 1.01 .98 .99 .92 .991954-55 .88 .94 1.06 1.10 1.09 1.03 1.03 1.04 1.05 1.02 1.04 .96 1.021955-56 .89 .81 .81 .83 «79 .81 .84 .84 .87 .95 1.01 ,97 .871956-57 .94 .96 .92 .93 1.01 1.02 1.04 1.03 1.01 1.01 1.01 .89 .981957-58 .81 .85 .91 - * 96 .92 .89 .89 ;93 .90 .95 .98 .95 .911958-59 .98 .92 .94 . 98 1.00 1.00 1.01 .98 .97 .96 .94 .90 .97'1959-60 .91 .91 .90 . 92 .90 .89 .90 .90 .88 .88 ;9U .88 .901960-61 .84 .85 .83 .82 .79 .78 .81 .83 .81 .84 .85. .. .82 .82X .91 O .92 .94 .92 .92 .95 .95 .94 .95 .97 ,91 .93Index a/96.8 95.7 97.9. 100.0 98.9 98.9 102.1 102,1. 101.1 102.1 104.3 97.9
* Source: USDA, Grain Market News,. Weekly Summary and Statistics, AMS Grain Division, Washington, D. C.
a/ Trend adjusted

Price
Per
Bushel
83
Malting1.40-
.053x1.30-
1.20-
1.10-Feed
1.0 - .017x
July July July July July July July July July1953 1954 1955 1956 1957 1958 1959 1960 1961
Years
Figure 11. Monthly Average Prices and Trends for No. 2 Malting Barley and No. 3 Feed Barley, Minneapolis, 1953-61. *
Source: USDA, Grain Market News, AMS, Washington, D. C . (Weekly issues,1953-61).
*

TABLE XVII. MINNEAPOLIS CASH GRAIN AVERAGE CLOSING PRICES' PER BUSHEL NO. 2 MALTING BARLEY, SEASONS 1954-61. *
Season July Aug. Sept. Oct. Nov. Dec. Jan. Feb. Mar. Apr. May June X$/bu $/bu $/bu $/bu $/bu $/bu $/bu $/bu $/bu $/bu $/bu $/bu $/bu1953-54 1.48 1.54 1.51 1.54 1.54 1.55 1.56 1.56 1.56 1.56 1.56 1.55 1.541954-55 1.54 1.44 1.45 1.47 1.48 1.46 1.49- 1.50 1.49 1.48 1.46 1.44 1.481955-56 1.36 1.29 1.29 1.29 1.30 1.27 1.27 1.27 1.30 1.32 1.33 1.29 1.301956- 571957- 58
1.271.13
1.31 1.15 '
1.261.20
1.271.25
1.321.24
1.341.23..
1.321.23
1.301.22
1.271.24
1.261.28
1.241.30
1.171.31
1.281.231958-59 1.30 1.20 1.17 1.18 1.16 .1.19 1.17 1.19 1.17 1.22 1.23 1.21. 1.201959-60 1.23 1.17 1.17 1.16 1.18 1.16 1.18 1.15 1-.14 1.16 1.18 1.17 1.171960-61 1.11 1.12 1.11 1.14 1.11 1.12 1.12 1.13 1.14 1.18 1.20 1.22 1.14
X • 1.30 1.28 1.27 1.29 1.29 1.29 1.29 1.29 1.29 1.31 1.31 1.30 1.29Index a/ 99.2 97.7 97.7 99.2 100.0 100.0 100.0 100.8 100.8 103.1 103.1 102.2 —
* Source: USDA, Grain Market News, Weekly Summary and Statistics, AMS Grain Division, Washington,25, D. Co
a/ Trend adjusted.
- 85was downward for both feed and malting barley with a more rapid decline in malting barley prices. 4/
Total supplies of barley available increased, as shown in Figure 12„ Total use or disappearance also increased so declining consumption or use per se cannot be blamed for price declines. There appeared to be insufficient difference in the relative rates of change between supply and disappearance to conclude that stocks on hand were necessarily the sole or primary cause of declining prices. It is deduced that the general increase in production and supplies of all types of feed grain was also responsible for the relatively moderate down trend in feed barley prices. This does
not explain the greater rate of decline in malting barley prices.It is technically possible to make malt from nearly any variety and
quality of barley. However, as indicated in Chapter IV, maltsters and brewers prefer barley of specific qualifications. Consequently, it isassumed that the premiums paid for malting barley depend in large part on
<
the supply of barley which meets the preferred specifications relative to
4/ Price data for 1961-62 (which became available after Figure 11 was constructed) showed an increase of 24 percent.for feed prices and 22 percent for, malting prices over the previous year. From the low price points in 19(50.-61 to the hlehs in 1961-62 and dtiwh again to the lows in 1961-62, feed barley prices rose by a greater percentage than malting prices and fell by a lesser percentage. Whether or not this indicates a continuing trend in the "closing" of the spread between feed and malting prices is unknown.
Vj

Percent
86
StocksEnd of Year
Production Plus Imports
Disappearance
1950 1951 1952 1953Years
"Figure 12. Rates of Change in U. S. Barley Production Plus Imports, Total Disappearance, and Stocks at Year's End, 1950-60. *
* Source: Based on data in Table II, U. S. Barley Distribution.

87 -the total supply of all barley. During the post-war years, the malting industry made a concerted effort to improve t;he quality of acceptable malting varieties produced, to develop new varieties, and to encourage production in new (as well as in old) geographic areas. Evidently, the efforts have been successful= The relative supply of barley suitable for malting has increased, and malting prices have declined more than feed prices. 5j
Further evidence of this supposition is provided in Figure 13, showing the various uses and total disappearance of barley for the years 1950-60. Increased use of barley for livestock feeding and to a lesser extent increased exports have accounted for most of the increase in total disappearance. Amounts of barley used for malting and other uses (primarily for food) have been very stable.
Analyses of malting and feed barley prices at Minneapolis for theperiod included in Tables XVI and XVII resulted in an expected high degree
2of correlation (r = .99+) and in the regression equation Y = .08 + I=299X„
That curve, shown in Figure 14, is consistent with Figure 11 which shows that falling feed barley prices are accompanied by more rapidly falling malting barley prices.
5/ This cannot be substantiated statistically because barley does notbecome malting barley until someone buys it for malting purposes. Out of any given year's supply of barley, a substantial amount which could have been malted is used for other purposes. There are no data available dividing barley supplies into feed barley and malting barley.

Million
Bushels
88
Total Disappearance
Exports
Malt - Alcoholic Bev.
Livestock Feed
1950 1951 1952 1953 1954 1955 1956 1957 1958 1959 1960Years
Figure 13. U. S. Barley Uses and Total Disappearance, 1950-60. *
* Source: Based on Table II, U. S. Barley Distribution.

Ialting Barley
89
Feed BarleyFigure 14„ Correlation of Feed and Malting Barley Market Prices at
Minneapolis, 1953-61. ** Source: Based on data in Tables XVI and XVII,
Figure 11, showing monthly prices of barley from 1953-61, gives a visual impression of marked seasonality of barley prices, Figure 15 indi
cates pronounced seasonality of receipts of barley at various markets, Statistical analyses of the data from which Figures 11 and 15 were developed
revealed that the trend line of receipts in Figure 15 is insignificantly/
upward despite increasing barley production. Apparently, the increased production did not go to the markets but was absorbed in livestock feeding1 on the. farm and to some unknown extent into channels bypassing the terminal markets. 6/ Price and receipts data were adjusted for trend and converted into monthly indices. The results are shown in Figure 16. During the month of August, receipts were more than twice the average, dropping to about 70 percent of average in April. Despite this wide swing in monthly receipts, the indices of prices were relatively stable throughout the year. Obviously monthly receipts have little to do with monthly prices. Apparently, the grain trade is geared to seasonal use of barley, to pricing
which accounts for highly seasonal receipts, or both.
- 90-
6/ About one third of the barley produced in the U.S. is used on the farm where grown. See USDA, ERS, Stat. Bul. No. 159, revised June 1962.

OOO
Bushels
91
12.766 + . 1097x
July July July July July1957 1958 1959 1960 1961
Years
Figure 15. Receipts of Barley by Months at Principal Markets, 1953-61. * a/
* Source: Based on USDA, ERS data,
a/ Minneapolis, Milwaukee, Duluth.

92
200
180
160
140xQ)H3C 120
100
80
hi\ --- - — Receipts1 1I I Malting PricesI i
I II 1
60 .
® I I I I i I I I I I I IJuly Sept. Nov. Jan. Mar. May
Aug. Oct. Dec. Feb. Apr. June Months
Figure 16. Monthly Indices of Barley Receipts and Prices for Feed and Malting Barley, 1953-61. * a/
* Source: Based on USDA, ERS data.
a/ Indices trend adjusted.

93
Barley Support PricesThe foregoing analysis is largely an indication of that which does not
determine market prices of barley. The factor which does determine barley prices in the market is the support price. Figure 17 is a graphic presentation of linear correlation analysis of national average barley support
prices and Minneapolis market prices for all, barley for the years 1944-60.7/As might be expected, there was a high degree of correlation and significance of correlation. 81/' From Y = .468 + .8x and from Sy = .07, market prices may be predicted from support prices announced prior to the marketing of a particular year's crop. For example, the national average support price for barley (X) in both 1959 and 1960 was 77 cents per bushel. The
predicted market price (Yc) would have.been $1.08. As it turned out, actual market prices (Y) were $1.10 and $1.05 respectively. 9/ The degree of accuracy in predicting market prices in any particular year may vary depending for example, on the degree to which there may be significant changes in market supply and demand conditions after the support price has been decided upon.
7/ Excluding 1946 and 1947 as non-representative post-war adjustment periods.These were average prices for all than malting prices.
8/ Standard deviation of Y values Standard error of estimate Coefficient of correlation Coefficient of determination Standard deviation of r Regression equation
barley--higher than feed prices, lower
Oy ™ 4.76 Sy= .0747 rg = .999754 r = .999508 Or =..000129 Y = .468 + .8x
9/ Sy = 50% chance of prices between $1.01 and $1.15 2Sy = 95% chance of prices between $0.94 and $1.22 3Sy = 99.7% chance of prices between $0,87 and $1.29

94
wCUU•HU(ZD•Hr-40
1
National Average Support Prices
Figure 17. Correlation between National Average Barley Support Prices and Minneapolis Market Prices, 1944-60, *
* Source: Based on USDA1 ERS data.

95Nor should it be -assumed that having predicted an all barley market price that malting barley prices may necessarily be accurately predicted. As we progress from a known (in advance) support price to a predicted all barley market price to feed barley prices to malting barley prices, errors are compounded, and the predictions become rapidly less reliable. Prediction of malting prices from predicted all barley market price becomes in practice largely a matter of subjective analysis.
This is not to imply that a precise analysis of the demand and price structure for all barley, feed barley, and malting barley could not be made. Techniques such as those used by K . W. Meinken to determine the demand for wheat (United States Department of Agriculture, Agricultural Marketing Service, Technical Bulletin 1136, November 1955) and by R. J,Foote and associates to determine the demand for corn and feed concentrates (United States Department of Agriculture, Bureau of Agricultural Economics, Technical Bulletin 1061, October 1952) could be applied to an
analysis for barley. To do so would involve a research project of sizable proportions including analysis of a dozen or more endogenous and exogenous
variables for mathematical treatment.
CHAPTER VII
AGRICULTURAL POLICY PROGRAMS AND MALTING BARLEY
The Policy SettingSince it has been found that United States support prices are the
principal determining factor in barley pricing, it may be well to examinethe agricultural policies, and particularly feed grain programs, which
rdetermine support prices.In 1959 the United States Department of Agriculture published its
projected estimates of production of wheat, feeds, and livestock during the period 1960-65. I/ Presumably those were the estimates which provided the
basis for policies and programs for feed grains during the 1960 ’ s. In brief, the prospects were for continued excess stocks in the 1960’s. Under such circumstances, it was inevitable that feed grains receive considerable political attention. . '
Under the direction of Secretary Orville Freeman, the United States Department of Agriculture, in 1962, published a bulletin called Food and Agriculture, A Program for the 1960's. T j In the bulletin's opening
\j Christenson, R. P.; Johnson, S. E.; and Baumann, R.V., Production Prospects for Wheat, Feed, and Livestock, 1960-65, USDA, ARS 43-115, Washington, D. C=, December 1959.
TJ USDA, Washington, D. C., March 1962.

97statement, Mr, Freeman said that, with reference to overall agricultural policy, "a fresh start has been made in 1961, , .
The "fresh start" had been an emergency feed grain program for 1961,
which--according to Secretary Frpeman— had„b;een successful in holding,, , total farm production below potential output. . . . " Another
similar feed grain program was enacted for the. crop year 1962. "Without new legislation in 1962", said Freeman, "the program in effect in the late 1950’s would be in effect for 1963 crops,. That program has failed— and would fail again." A new program for 1963 was enacted. In the meantime, the feed grain program proposed for the 1960’s by Mr. Freeman was. expected to reduce stocks, acreage, and government expenditures and to retain support
prices and farm income levels— no mean taskI
The 1962 Barley ProgramBarley was not included in the 1961 United States feed grain program
because most of the crop had already been planted before feed grain legislation for that year was enacted. A special, but temporary, barley feed grain program was designed for the 1962 crop year only.
Purposes of the 1962 barley program were to reduce barley acreage and production, reduce stocks and costs of Commodity Credit Corporation barley holdings, to support farm prices of barley;,, and to pay farmers for diverting
barley acres to conservation uses.
V.--; . ■
98 -Need for a barley program was found in the facts 3/ that United States
barley acreage had increased from 10 million to 17 million between 1952 and
1960o The record supply of 659 million bushels of barley in 1958 was nearly double the 1952 supply. The 1960-61 barley supply was 610 million bushels, while utilization for that year was estimated at 458 million bushels.
The 1962 barley program was, for the most part, composed of what had ^become fairly typical of requirements for calculation of base acres, minimum and maximum diversion of acres, payment for diversion, price support eligibility, and crops eligible as substitutes for diversion. However, the final provision of the program stated that malting barley producers were not required to participate in the 1962 program if:
(1) they had previously produced a malting barley variety,
(2) they planted only barley of acceptable malting varietiesfor harvest in 1962. r
(3) they did not grow in 1962 an acreage in excess ofH O percent of their 1959 and 1960 average barley acres, and •
(4) they did not grow in 1962 an acreage of corn and sorghum grain in excess of the average acres of those crops in .1959 and I960,
In an October 10, 1961, news release, the United States Department of .
Agriculture listed 21 varieties of barley for 'exemption from the provisions
3/ ASCS Fact Sheet, 1962 Barley Feed Grain Program, USDA, Washington, D.C., .August, 1961.

99 -of the 1962 feed grain program. 4/ Fourteen states were listed ,Sn -whichproducers were eligible for exemption if they planted the designatedvarieties for 1962 harvest. 5/ Provisions of the program prior to the newsrelease did not elaborate on what was meant by "acceptable" varieties ofmalting barley which were to be exempt from the law. When the United StatesDepartment of Agriculture released the list of exempt varieties and states,it became clear that "acceptable" referred to a combination of MaltingBarley Improvement Association approved varieties arid states where thosevarieties were approved for production, of official United States graingrading standards for malting barley, and of other factors. The MaltingBarley Improvement Association had this to say:
"In comparing the Malting Barley Improvement Association list with the United States Department of Agriculture list, it will be noted that the USDA includes six other varieties (Barbless, Forrest,Maisa II, Manchuria, OAC 21, arid Odessa) and one state (Nebraska) not included in the(Association list.These are included in the USDA list for historical reasons or because these varieties, are used for malting by some members of the industry (underlining added). While the U.S. Department of Agriculture list did not list the designated varieties by states, the Malting Barley Improvement Association classifies only certain barley varieties,"which have general
kj Including Atlas, Barbless, Betzes, Forrest, Hanna, Haisa It, Hannchen, Heines Hanna, Idaho Club, Kindred, Manchuria, Montcalm, Moravian,OAC 21, Oderbrucker, Odessa, Parkland, Traill, White Winter, Winter Club, and Winter Tennessee.
5/ Including California, Colorado, Idaho, Illinois, Iowa, Michigan, Minnesota, Montana, Nebraska, North Dakoth, Oregon, South Dakota, Washington, and Wisconsin.
/

100 -
industry acceptance, as acceptable when grown in specific states„" 6/ ^
And the fight was on— over^a seemingly innocent point: What ismalting barley?
Compana and Exempt BarleyWhile some farmers and farm groups were protesting that the entire.
1962 feed grain program should be eliminated-(over the question of what is
a reasonable county average yield), the Montana Grain Growers Association pursued the issues involved in defining malting barley»
Montana Grain Growers Association President Larry Erpelding was',quoted as follows:
"We realize MGGA was the subject of criticism in some circles for not leading a statewide campaign against the entire Feed Grain Program, but our decision has been borne out that a change in the status of Compana was more logical and had better evidence in its support than propositions based on'yields or payments."It is glaringly evident that all farm programs are involved in politics, and long ago ’politics’ was defined as the art of the possible. In this barley matter, MGGA has accomplished what was ’possible’".
Erpelding thanked those who had assisted in the barley campaign, including various members of the grain trade, newspapers, and other publications, and the numerous barley "protest" groups that formed in Montana when the issues were at their peak:
"Although the barley protest groups chose a different approach to the problem, their efforts and subsequent publicity undoubtedly aided in pointing up the importance
6/ MBIA, Grains of Truth, newsletter, Milwaukee, Wiscbnsin.

- 101 -
of MGGA's drive to have Compana added to the malting barley list," Tj
The Montana Grain Growers Association (primarily a wheat producers organization) may have viewed the barley protest groups’ fight to have the feed grain program thrown out as a possible precedent for elimination of wheat programs— which would not necessarily be viewed by all Montana Grain Growers Association members as a desirable consequence, At any rate, the Montana Grain Growers Association ptirsued the question; What is malting barley?
It appeared that the malting barley.provision of the 1962 barley feed
grain program— assuming a favorable growing season in 1962— would result in little reduction of the total United States barley production. The 14 states exempted by the law were all malting barley producing states and as a group could be depended on to produce about 95 percent of the nation’s
total supply of barley of all types. Within*those states, most barley producers had a history of production of malting varieties and thus could
increase their acreages by 10 percent over their 1959-60 average acreage,Among the 14 exempt states there washowever, considerable difference
in the numbers of "acceptable'1 maltingxvarieties which could be ,produced and in relative amounts of malting and feed barleys produced. It was on
these differences that the Montana Grain Growers Association fought the battle of Compana,
Tj MGGA, The Wheat Scoop. Great Falls, Montana, March 1962,
102
At the time (October 1961) , there was but one exempt barley variety (Betzes) adaptable to Montana growing conditions and approved as a malting variety by the Malting Barley Improvement Association, By way of comparison, North Dakota' had five varieties acceptable to the Malting Barley !Improvement Association, In Montana about one-fifth of the total
barley acreage was Betzes0 In North Dakota Over 86 percent was of various malting varieties, Minnesota's malting barley acreage was 99 percent. Thus it was theoretically possible that 80 percent of Montana's base barley acreage would be reduced by 20 percent and the remaining 20 percent of the acreage increased by 10 percent. In North Dakota the situation was nearly
the reverse with a possible 10 percent increase in 86 percent of the acreage and a reduction of 20 percent in 14 percent of the base acres, This appeared to Montana producers as an inequitable division of the barley
acreage exemption.On that basis, the Montana Grain Growers Association (then) President
George Skarda protested to Montana's Governor’, Commissioner ^f Agriculture, United States Congressional delegation, and the Chairman of the United States
Senate and House Agricultural Committees; 8/Culmination of the Montana Grain Growers Association's campaign was
another United States Department of Agriculture news release on February 2,; •
1962, in which Darker, Trophy, and Compana barleys were added to the exempt
I/ Ibid,

103 -
list. Larker and Trophy are North Dakota developed varieties which, at that
time, had been recently approved by the Malting Barley Improvement Association for malting. "Compana", said the news release, "is a variety limited to Montana for purposes of the 1962 feed grain program," (Underlining added.)
Compana had for several years been used in small quantities by a brewing company in Montana for malting and brewing. The United States Department of Agriculture had previously exempted six non-approved (by the Malting Barley Improvement Association) varieties "for historical reasons or because these varieties are used for malting by some members of the industry." 9/ Gn that basis Compana became a Montana malting barley variety for purposes of the,1962 feed grain program even though not approved by the Malting Barley Improvement Association and not a malting variety by official United States grain grading standards. 'This declaration of Compana as a malting barley was of considerable potential impact in Montana. In 1959 and 1960 (from which barley base acres were calculated), Betzes accounted for 19.2 percent and 27.1 percent respectively of Montana's total barley acreage. For the same years, Compana accounted for 59.3 percent and"59.2 percent. 10/ With the addition of Compana to the exempt list, Montana's malting barley acreage
jumped from a little over 20 percent to over 80 percent.
9/ MBIA, IocO cit.'10/ Estimated by Robert Eslick, Agronomist, Mont= AES, Bozeman, Montana.

104 -
Predicted Program EffectsFrom the above discussion and from Table XVIII, the following pre
dictions were made on United States production of malting barley:(NOTE: Data in Table XVIII for predicted acres planted wereavailable at the time of initial writing. Information onactual acreages planted was not known until 1963.)(1) Acreage of malting barley varieties would increase.(2) - Acreage of feed barley varieties would decrease.
' '(3) Total United States acreage of all barley would
decrease slightly— if at all.
(4) Total barley production would,be about the same and possibly less than in 1961.
(5) Malting barley supply would increase relative to feed barley supply, and premiums for malting would decrease.
(6) The program would^accomplish little of its stated goals.
Only 8 of the 14 exempt states made malting vs. feed varietal surveys for their 1962 barley crops = In comparing the actual plantings of the 8
with their 1959-60 averages, it turned out that there was a 15 percent - decrease in malting acres planted, a 4 percent decrease in feed acres, and an 11 percent decrease in total acres.
The above result was, of course, annoying to the author because it had been predicted that malting acreage would increase. In Montana the predica
tions were reasonably accurate. In Table XVIIT, there appear two sets of
figures for Montana. 'In the one (with parentheses) is shown the situation
" ' - 1. .V i''
S ■ - ■" ■; - . h i

TABLE XVIII. PREDICTED AND ACTUAL BARLEY ACRES PLANTED, AND COMPARISON OF ACRES PLANTED IN 1962 TO 1959-60 AVERAGES RESULTING FROM THE 1962 FEED GRAIN PROGRAM. *
StatePlanting Predictions
for 1962 a/Malt. Feed All .+10% -20% '
Actual Plantings 1962 b/
Malt. Feed All
Comparison of Acres Planted in 1962 to
1959-60 Average Malt. Feed All
OOO Acres 000 Acres 000 Acres 000 Acres 000 Acres 000 Acres % .% %Calif. 415 1,090 1,505 258 1,353 1,611 -32 -I -7Colo. 33 • 467 500 — 715 --- —— +16Idaho 167 312 479 190 503 693 +25 +29 +28111. 13 61 74 65 — —— -26Iowa 3 15 18 — 16 — — -27Mich. 42 37 79 — — 69 —— — -19Minn. 1,075 8 1,083 832 26 858 -15 +163 -13(Monto} c/ (492) (1,191) (1,683) (382) (1,527) (1,909) (-15) +3 -IMont o 1,748 278 2,026 1,718 191 1,909 +8 ■ -45 -INebr. 308 308 —— 291 — —— -15Oregon 272 242 514 149 303 452 -40 0 -18S. Dakota 457 114 571 297 146 443 -29 +3 -21Wash. 299 351 650 323 323 646 +19 -26 -9Wise. 31 13 44 —— ——— 31 —— — — -20No Dakota 3,618 418 4,036 2,481 544 3,025 -25 +4 -218 states 8,051 2,813 10,864 • 6,248 3,389 9,637 -15 -4 -1114 states 8,173 3,714 11,887 10,824 —— — — -10U.S. 14,701 *- -10
(See next page for reference and footnotes)
105

* Source: USDA, Agricultural Estimates Division, SRS, Washington, D, C.
a_/ Predictions assume maximum increase in malting acreage and minimum decreases in feed acreage under 1962 Feed Grain Program.
bj Malting and feed acreages' derived from individual state varietal surveys. Data on all varieties planted from USDA, SRS, Agricultural Estimates Division.
c/ Figures for Montana in parentheses are for Betzes only as a malting variety. Montana figures not in parentheses are for Betzes and Compana. (See pages 116 and 119 of text).
i106

107 -if only Betzes had been listed as a malting variety. In the other is the actual situation with both Betzes and Compana as malting varieties. With Compana as a malting barley, the 1962 Feed Grain Program permitted an increase in total barley acres from a maximum of 1,683,000 to 2,026,000.Actual total acres were reported at 1*909,000, including an 8 percent increase in malting varieties, a 45 percent decrease in feed varieties, and an overall decrease of but I percent in all varieties,. Obviously, Montana took advantage of its possibilities I
What happened elsewhere? Why didn’t the states of normally large malting barley production take advantage of the program? In some cases, such as in Idaho and Washington, they did. In others, such as North Dakota, California, and Minnesota, they did not.
The explanation for North Dakota— which is the largest United. States barley-producing state— was that". . . much of our malting barley acreage is Red. River Valley oriented" and, in 1962, " . . . much of the crop land
normally earmarked for malting barley had mallards swimming on it at planting time. . o'." 11/ Heavy rains resulted in a 15 percent decrease in North Dakota’s 3,289,000 average acreage of malting barley. Much of Minnesota’s barley is also produced in Red River Valley counties and was subject to the same conditions as prevailed in eastern North Dakota. 12/
11/ From a letter by H. W. Herbison, North Dakota State University, addressed to E. Dean Vaughan, April 8, 1963.
12/ From a letter by H. C. Pederson, University of Minnesota, addressed to E. Dean Vaughan, April 23, 1963.

108 -
California's total barley acreage decreased by 7 percent in 1962 as compared with its 1959-60 base, and its malting acreage was down 32 percent. Several factors account for the declined High yielding varieties of milo are tending to replace barley as a" feed crop; the malting varieties produced do not seem to be favored by West Coast.brewers, and malting price premiums have narrowed. 13/ The demand for livestock feed is increasing faster than malting needs, and there are greater returns from other crops in California's malting barley area. 14/
In Washington— which has in the past been an important source of supply for two-row malting barley— there was a 15 percent increase in malting barley production but not in two-row varieties. Some beer market changes explain the situation. While UnTtad States beer production rose
from 85 million barrels in 1956 to 91 million.barrels in 1962, sales in the
West increased from 7.5 million barrels in 1946 to 13.5 million barrels in 1962--nearly 100 percent increase. As a result, the beer industry in the Pacific Northwest has changed. About two-thirds of the major brewers in the far West are now established as branches of midwestern brewers process
ing eastern type beer. Consequently, there has been a shift away from the . two-row varieties and an increase in Pacific Northwest production of six-row varieties, which produce beer of the eastern flavor. Barley of the six-row
13/ From a letter by Kenneth R. Farrell, University of California, addressed to E. Dean Vaughan, May 8, 1963.
14/ Blaich, 0. P., Barley; Its Production and Use, University of California Davis, August 31, 1961. V

109varieties is being imported into the Pacific Northwest while local production is shifting from two-row to six-row barldys, Another factor in the shift has been the increasing ability of areas in Montana, Idaho, and Colorado to compete in the limited market for two-row malting barley in the midwest brewing centers„ 15/
Similarly, in Oregon, which has also been an important two-row malting barley producing area, malting barley production declined sharply in 1962 as compared with the 1959-60 average. Disease in the Williamette Valley reduced plantings; and in the Klamath Basin, Hannchen barley malting
premiums have not been sufficiently high to offset the increasing yields from six-row barley varieties. In 1962, much of the acreage formerly in malting
varieties was planted to feed varieties.16/
Program EvaluationWas the program a success? Previously it was stated that purposes of
the program were to reduce barley acreage, production, and stocks. Acreage was reduced (by 10 percent) but not because of the program. Production : increased by 33 million bushels primarily because yields per acre increased
by 4,1 bushels, Stocks on hand in all positions rose from 335.5 million bushels on June I, 1962, to 341.1 million bushels on June I, 1963. Prices received by farmers declined by about five cents per bushel.
.Early in 1963, the author asked a United States Department of Agriculture official in a telephone conversation why the special malting barley provision
15/ From a letter by Owen S. Wirak, WSU, to E. Dean Vaughan, May 7, 1963.16/ From a letter by Ray H. Teal, OSU, to E. Dean Vaughan, June 13, 1963.

H Ohad been put into the 1962 program and why it was taken out 17/ of the 1963 program= The reply was that in 1961, production and stocks of barley had decreased (true) and that it was felt that production increases for 1962 were desirable! That reply was in direct contradiction to the objectives as stated above. In any event, the special malting exemption was quietly eliminated from the Feed Grain program for the 1963 crop.
17/ "Taken out" refers to the fact that the; same malting barley exemption was also in the Feed Grain Program for 1963. The difference was that for 1963 the exemption was at the discretion of the Secretary of Agriculture, who did not grant the Exemption for 1963. because of the large 1962 barley crop.
4

CHAPTER VIII
FOREIGN TRADE IN BARLEY AND FEED GRAINS
United States Feed Grains in World Trade In recent years it has become a well publicized fact that world trade
is of increasing importance to the United States and that exports provide a significant market for many United States agricultural products. The following series of illustrations quantitatively substantiate this statement: Figure 18 shows for various crops the percentage portion exported in1962» Figure 19 lists the volume of United States agricultural exports to
selected countries« Figure 20 shows the relative volume of United States exports of course grains (com, oats, barley, sorghum, rye, millets) to
various regions of the world. Barley is shown in Figure 21 as holding the number 3 position in United States coarse grain exports.
World trade in barley is a somewhat confusing subject. Barley is more important in the United States grain trade than the size of the crop would
indicate because a large part of off-farm sales of barley moves into commercial market channels and, as shown in Chapter II, more than half of all
United, States barley which moves in commercial channels goes either to domestic malt production or into the export trade. The United States is a leading country in both barley production and exports. The largest customer for United States barley is Western.Europe, where, it is used primarily for livestock feed. While the United States exports feed barley, it also

WHEAT10 Major Export Agricultural Products, 1962 *
63RICE-- --------
OSOYBEANS — —TALLOW — -- —BARLEY-------SORGHUM GRAINS
-
3735
55
CORN . COTTON
2625
TOBACCO ■ 24LARD* Exports compared with farm sales for crops and with production for
lard and tallow.Including oil.
i
i
Figure 18. U. S. Exports as a Percentage of Sales. * * Source: USDA photo.
112

Figure 19.
* Source:
$ Mil.0 100 200 300 400 500 600
Japan --------United Kingdom Canada--- ---West Germany ^e^hfrlands-Italy------Uar-Egypt —Belgium —Spam-------Brazil------Korea, RepublicPakistan ------France------- -Yugoslavia----
of
— 482 (I) -445 (37) 425 (-87) -395 (3)
176 (0.4- 171 (0) -135 (3)- 99 (0.4- 94 (0)— 92 (0)— 91 (0)— 90 (4)— 88 (2$
Amounts in parentheses represent $87 million subtracted from Canada and added to other countries to allocate to proper countries. Shipments to Canada used to finish loading ships leaving the St. Lawrence Seaway.
Ue S. Agricultural Exports by Country, 1962. *
USDA photo.
i113

1955 1957 1959 1961 1963Year Ending June 30. 1963 Preliminary
Figure 20. Coarse Grains: U. S. Exports by Area of Destination. *
* Source: USDA Photo.
114

MIL. SHORT TONS
1955 1957 1959 1961 1963Figure 21. Coarse Grains: U. S. Exports by Commodities. ** Source: USDA photo.
115

116
imports malting barley— primarily from Canada. I/ An examination of data on international trade and production of barley may provide clues to the future of foreign markets for United States barley.
World Barley Production PatternsTable XIX shows barley production for several countries and world
totals for the period 1950-54 and annually from 1957 through 1961. Total estimated world production, which appears to be slowly rising, is relatively stable at from 3.2 to 3.6 billion bushels ,annually. Production within any particular country may vary from year to year, due to weather conditions,
trade policies, and probably other factors. Calculated oh a continental or world regions basis, it is shown in Table XX that western Europe is usually the leading barley producing area, followed by Asia in second place and with North America and the USSR 2/ alternating in third and fourth positions.
Production is, of course, a function of acres and yield per acre. The extremes in yield shown in Table XXI vary from 6.6 bushels per harvested acre in Morocco in 1961 to 68.8 bushels per harvested acre in Denmark in 1960. It will be noted that yields in western European countries are often
more than double the estimated world averages.
JL/ For a more detailed discussion of these points, see: Blaich, 0. P.,Barley: Its Production and Uses. University of California, Davis,
. August 31, 1961; and Schonberg, James S.;'The Grain Trade: How It Works,New York, Exposition Press, 1956.
2/ The !USSR is in both Asia and Europe. Its barley production figures are not included in those for either Asia or Europe.
;

TABLE XIX. PRINCIPAL a/ BARLEY PRODUCING COUNTRIES OF THE WORLD. ANNUAL PRODUCTION IN BUSHELS 19,50-54, AVERAGE AND ANNUAL FROM 1957 THROUGH 1961. *
CountryAverage1950-54 1957 1958 1959 1960
Est.1961
' Mil .'Eu. Mil.Eu. Mil.Eu. Mil.Bu Mil-. Bu. Mil.Bu.Canada 228 216 245 226 207 123United States 283 437 475 422 431 393Denmark 89 118. .114 107 129 125France 89 167 179 226 263 247Germany, West .82 115 111 131 I 48 125Spain 89 83 82 94 72 70United Kingdom 100 138 148 187 198 226Cze chosIovakia -52 63 55 67 80 — —
Germany, East . 27 . 35 40 45 55 — —
Hungary 30 44 34 50 45 45Poland 50 56 55 48 58USSR 350 400 440 380 525 500Iraq ; 35 60 44 33 37 41Turkey 128 160 130 140 142 142• China 3.25
118. —r — — — —
India. 132 104 125 125 128J apan 90 90 86 96 96 83Morocco n>i> ■ 22 58 50 52 25Argentina 39 46 49 51 36 ■ 45Australia 31 32 65 36 71 50Total:. Above- countries 2,312 2,414 2,514 2,514 2,768 2,368AlL other countries 3§8’ 761 796 771 787 1,042
Est. World Total • 2,700 3,175 3,310 3,285 3,555 3,410
* Source: USDA. Foreien Agriculture Circular, Washington, D. C., FAS (FG2-62, Feb. 1962)(FG7-61, May 1961) CFG2-60, Feb. 12 , I960) (FG6-59 , May 21, 1959).
a/ .. Principal countries arbitrarily limited to those producing 50 mil. bu. or more in any year.
117

118 -
TABLE XXo BARLEY: WORLD PRODUCTION BY GEOGRAPHIC DIVISIONS, AVERAGE 1955-59,ANNUAL 1960 AND 1961„ *
)Area
Average1955-59 v _-I960 1961Mil.Eu, Mil.Eu. Mil.Eu.
North America 675 647 515Western Europe a/ , 800 993 1,000Eastern Europe a/ 250 307 ■ 285USSR 440 525 590Asia 845 820 835Africa ■ 125 130 75South America 76 65 65Oceania 49 74 44
World Total 3,260 3,560 3,410
* Source: USDA„ Prospects for Foreign Trade in Wheat, Rice, Feed Grain,Dry Peas, Dry Beans, Seeds , Hops: Washington, D. C., FAS, May1963.
aj Excluding USSR production.
World Trade in Barley and- GrainsWheat is by far the most important '(quantitatively) grain in world
trade, usually, amounting to roughly half"of all world trade in grains. The
"coarse" grains— rye, barley, oats, sorghums and millets, and maize or corn— - account for most of the balance. World trade in all grains in the past five years has been approximately double the average of the late 1930’s. Trade in barley, all coarse grains, and in all grains is shown in Table XXII.
Barley accounts for about one-fourth to one-third of the total trade in coarse grains, and coarse grains are between one-third and one-half of the
trade in all grains.

TABLE XXIo PRINCIPAL a/ BARLEY PRODUCING COUNTRIES OF THE WORLD, AVERAGE YIELDS PER HARVESTED ACRE 1950-54, ANNUAL 1957-61, *
CountryAver.
1950-54 1957 1958' 1959 1960Est.1961
Bu./acre Bu.. /acre Bu./acre Bu-. /acre Bu./acre Bu./acre
Canada 28.9 23.0 25.6 27.1 28.1 20.2United States 27.8 29.2 £1.8 28.3 30.9 30.3Denmark 64.4 68.7 64.1 57.8 68.8 63.1France 32.9 41.0 40.6 46.1 50.9 44.2Germany, West 47.5 53.4 51.1 55.6 61.1 45.2Spain 2 2.8 22.0 21.8 25.4 20.9 20.5United Kingdom 48.9 52.6 53.7 61.3 58.7 59.0Czechoslovakia 3 3.5 37.9 ,33.3
48.540.7 45.7 —
Germany, East 38.2 44.0 51.8 57.3 —Hungary 27.3 ■ 37.0 25.3 37.6 36.1 35.1Poland 24.3 29.3 30.2 30.1 32.3 ——USSR 15.6 16.5 18.7 16.0 17.5 17.5Iraq / 14.9 19.6 15.3 12.4 14.4 16.3Turkey 2 3,2 24.6 23.6 21.5 22.2 —China —— — ■ — — — ——India 14.7 15.1 13.8 15.1 15.0 16.1Japan 37.7 38.9 37.8 43.6 46.2 48.5Morocco 14.6 7.3 13.7 11.8 12.0 6.6Argentina 24.8 22.5 ■21.9 22.9 20.0Australia 22.2 15.0 27.1 14.8 25.0 18.8Est. World Average 22.2 23.3 24.4 24.1 25.0 24.3
* Source: USDA , Foreign Agriculture Circulars, Washington, D. C., FAS (FG2-62 , Feb. 1962)(FG7--61", May 1961) (FG2-60, Feb. 12, 1960) (FG6-59, May 21, 1959).
a/ Principal countries arbitrarily limited to those countries producing 50 mil. bu. or more in any year.
119

120 -
TABLE XXIIo WORLD IMPORTS AND EXPORTS OF BARLEY AND GRAINS, 1958-62. * a/
Grain 1957-58 1958-59 1959-60 1960-61 1961-62000 000 000 000 000
met. tons met, tons met. tons metc tons met. tons
ImportsBarley All coarse
6,580 6,340 6,020 5,750 7,000grains 18,420 20,410 22,600 22,850 28,280
All grains 47,140 51,010 53,750 60,550 70,190Exports
Barley All coarse
6,680 6,400 6,090 6,820 7,220
grains 18,960 ' 20,840 22,380 23,000 29,590All grains 48,270 52,090 54,320 61,870 72,830
* Source: FA0 of the United Nations, World Grain Trade Statistics 1961-62.Rome, Italy, 1962.
a/ Conversion factors: I bushel of barley = 48 poundsI metric ton = 2,204.622 pounds 45.9 bushels of barley = I metric ton
Some of the leading nations in the export and import of barley are shown in Tables XXIlI and XXIV. During the 1950's, the United States over
came Canada’s lead and has been the largest' exporter of barley during the
period shown. Countries not shown in Table XXIII which have been, from time to time, important in the barley export trade include the Benelux countries, USSR, Iraq, Morocco, Turkey, China, and others. Some of the leading barley exporters are also leading importers, as shown in Tables XXIII and XXIV.
Included in both tables are the United States, Denmark, and United Kingdom.If the list were expanded to include all importers and exporters, there would

121 -
TABLE XXIII. LEADING COUNTRIES OF THE WORLD IN THE EXPORT OF BARLEY,1958-62. *
Country 1957-58 1958-59 1959-60 1960-61 1961-62000 000 000 000 000
met» tons met. tons met. tons met. tons met. toilsUnited States 1998.5 2540.6 2316.5 1808.7 1779.7Canada 1653.1 1561.1 1306.7 838.0 897.9Australia 437.0 683.3 567.3 755.2 712.9Argentina 500.5 250.0 299.7 131.4 201.0Denmark 408.3 293.4 98.7 59.8 114.7France 664.7 82.2 408.1 1080.1 . 1661.2United Kingdom 92.3 186.0 . 360.6 124.1 .340.6
* Source: USDA, The World Grain Trade, Washington, D. C., FAS-M-53, April1959; FAS-M-53 Revised, July 1960s '
TABLE XXIV. LEADING COUNTRIES OF THE WORLD IN THE IMPORT OF BARLEY, 1958-62. *
Country 1957-58' -I .
1958-59 1959-60 1960-61 1961-62000 000 000 000 000
met. tons met. tons met. tons met. tons met. toi
United States. Belgium- ’
. 583.0 239.4 302.2 247.4 326.0
Luxembourg , . .T 614.2 355.2 302.6 356.5 328.6Denmark 274.2 334.8 637.8 377.5 121.1W„ Germany - 1358.8 1453.8 1500.6 766.9 2103.3Italy , 290.9 186.5 242.7 460.3 473.4Netherlands 678.4 511.2 ' 454.4 321.2 334.4United Kingdom 1305.4 1141.3 828.8 965.0 539.8
* Source: USDA, The World Grain Trade. Washington, D. C. ,. FAS-M-53, April.1959.

122
be many such duplications„ Reasons are that a country (such as the United States) may export feed barley and import malting barley— or vice versa.Other countries (such as Benelux) are trading nations and export to third
countries their imports from first countries. It is apparent that the United States9 greatest competitors in barley exports are Canada, Australia, Argentina, and France.
As previously indicated, Europe— and particularly western Europe,—
is the best customer for United States barley. Asia has been a large customer but in recent, years its purchases 'declined drastically. Japan
formally had imported United States bailey as a rice substitute, and Korea received large quantities of barley, largely under Public Law 480. Other regions of the world have been sporadic in the use of United States barley. Table XXV shows United States barley exports by world regions for the years 1957-62. Specific countries which have been among the larger users of United States barley are shown in Table XXVI. It may be noted from Tables XXIV and XXVI that the world's largest importing countries are among the list of countries which are major importers of United States barley.
This does not mean that the large importers necessarily import all or even most of their barley from the United States. For example, the United Kingdomreceives most of its barley imports from Canada and Australia.
, -
Prospects for Exports of United States BarleyBecause such a large portion of the market for United States barley is
made up of exports, both feed and malting barley interests are concerned
with the possibilities of maintenance and expansion of foreign markets.

123 -
TABLE XXVo U. S„ BARLEY EXPORTS BY WORLD REGIONS OF DESTINATION9 1958-62. *
Destination 1957-58 1958-59 1959-60 1960-61 1961-6200,0 000 . 000 000 000
met. tons met. tons met. tons met„ tons met.tonsEuropeNorth & Central
1293.0 1860.5, 1955.3 1263.5 1334.5America 31.1 40.0 36.2 69.6 108.1
South America 8.7 . 7.1 65.1 —— 0.2Asia 559.4 535.0 224.6 398.1 29.9Africa — — — — - : 18.8 41.0 287.2Other 1.0 0.1 16.5 36.5 19.8
Total 1893.2 2442.7 2316.5 1808.7 1779.7
* Source: FAO of the United Nations, World Grain Trade Statistics, Rome,■ Italy, 1958-62.
The remainder of this chapter is concerned primarily with prospects for
sales in Europe.The potential for international trade, in feed grains, including United
States barley exports, is a mixture of assumed favorable and unfavorable factors o Judging from upward trends in United States exports of feed and food grains over the past ten years, it might be concluded that the United
States export picture is favorable. Unfortunately, for purposes of predictions, the past is no necessary indicator of the future.
International Grain Trhde Barriers
International trade in agricultural products may take place when sellers
and buyers are able to surmount trade obstacles consisting of a combination of domestic agricultural policies and of import and export regulations in the

124 -
TABLE XXVIo U„ S, BARLEY EXPORTS BY COUNTRIES OF-DESTINATION, 1958-62. *
Destination a/ 1957-58 1958-59 1959-60 1960-61 1961-62Ouu " 000 000 000 tioo
Belguim-met. tons met. tons met. tons met. tons met. tons
Luxembourg 301.0 288.8 148.2 93.7 55.6Denmark 35.7 107.7 204.4 74.3 50.0W. Germany ir 145.8 476.8 492.9 207.6 , 639.7Greece 20.4 10.0 26.9 51.7 46.0Italy 13.3 41.1 31.2 58.0 8.1Netherlands 256.9 583.2 409.9 232.8 224.3Spain 15 = 5 112.5 76.7 202.2 92.7United Kingdom 364 = 8 46.4 67.2 6.3 15.7Poland 90.4 119.2 347.5 246 = 1 96.5Japan 315 = 1 333.2 58.3 —~— — —Korea 21,5.3 154.9 181.4 10.2
Total (World) 1893.2 2442.7 2316=5 1808.7 1779.7
* Sources FAO of the United Nations, World Grain Trade Statistics, Rome, Italy, 1958-62.
Si/ Arbitrarily limited to receivers of 50 metric tons or over in any year =
countries involved0 Most, if not all, countries prefer to be internally self sufficient in the production of agricultural products for such purposes as security and national pride. In many countries, farmers still are numerous and in most instances, are politically important,; Consequently, countries which are exporters of particular agricultural commodities wish to maintain high levels of production, high levels of income to producers, and to main
tain or increase their export market. Countries which import the particular commodity may wish to develop their own productive capacity and to protect
domestic producers of the product from undue foreign competition. The

125
resultant myriads of internal and external controls over production and marketing lead to the conclusion that price for the product may be of lesser importance than other types of international trade barriers. 3/Those barriers include tariffs, quotas, embargoes, licensing of imports.
State trading, and internal price supports and production controls. Table XXVII, showing nontariff restrictions of foreign countries against United States grain imports, gives an indication of the obstacles to trade. Other more general devices such as customs unions and bilateral trade agreements also affect trading of specific products. Nearly every country of the world has some sort of government grain program, no two of which are exactly alike.
European Economic Community Feed Grain Production and Trade PoliciesThe Common Market in Europe has posed problems to United States grain
exporters. Since the European Economic Community has the stated objective of relative self-sufficiency in grains, the United States faces these
questions: (I) What will be the future levels of European Economic Community price supports for home-grown grains? (2) What will be the levels of tariff and other protective devices levied against non-member countries?(3) What will be the levels Of production in European Economic Community
countries? (4) What will be the effects on other non-European Economic Community countries and their markets?
These and other questions about the European Common Market cannot be answered until the European Economic Community itself has reached agreement
_3/ Price, however, is still the final factor which determines whether or not a sale will be made.

TABLE XXVII NONTARIFF RESTRICTIONS OF FOREIGN COUNTRIES AGAINST GRAIN IMPORTS FROM THE UNITED STATES.
NONTJkRIFF RESTRICTIONS OF FOREIGN COUNTRIES AGAINST GRAIN IMPORTS FROM THE UNITED STATESf ill VllRS
IIEA 111 CIIItIT UI m il lI1IHIl'Fill IlEAI Fll FEEI IAllET Fll FElI HAIR SllIRIHS
C o m m o n M a r k e t ® n sO tk I I E i r o p i
A i s t r i i ONlEl H B B B B B BD en m a rk Kl H K H B B B B B aF in la n d OD H HI re la n d 13 HI l l i r i p TS p i l l TS w e d e n BHKl B H B B K B B aS w itz e r la n d BKI B H B H B H B H B HI t l i l l d K in g d o m □
Th e A m e r ic a s
B r a z i l T H ®B K C BKTC IBKC Bidfc ®B K C BI^Pc b e PoC anada KlC o lo m b ia
M e x ic o m f W K C ■ K C K C K C ■ K CP e ru □V e n e zu e la K B B B B K B
O th e r C o u n t r ie s
In d ia D T m K K K K Ki i p i i UDBB T B B TBBl K B B BPB K B B K B BLeban on KlN ew Z e a la n d T B K B K T B K B K B K B BP a k is ta n
S o u th A f r ic a mDCH KBI K B K B K B K B K B K B
I I I l II nriiHmH Ciilnl Il Iiiiiii IlCtlW
ES IkwhlB m ini IlliIiUtISB linn
0 IMiitli IeiIIl lulu II UiiIIntiIi Ins H SHU Infill
1 Wniti Wwsll iHilneiils. wins Inis H Ietmi
B Hi ll Wictini il WeislIt inlis tj Iewiliis IiHiitW Il Iewils IiWiilIn sill il Weisllt Iilil Il HiIIWIi Filtisl
(T) IiIliiB linetint, Iittiilills, list Wieiw In iti n! Hill
® III Iltiiiii in sill Ii Iewiliis H FWIIt iiellii.
CD WniiBiiI iewililiii Is ill Miliiins (f)lBW'ti»l Ff tilt WHiMHl iW Friuli Inins is iln sWjitl
Ii eiBFHiiliiF IItHHi iiimmims, Li.. Hi ll HW'IHlii•I ClBBlIiliis il IISII FllFlltlM il Fill'll IBIIIlI
CD Pul il tin iepiils Wii t| Fiiiili lulus ill Sltlicl Il Iicillill 111 Wills

126 -
on agricultural policy. It seems reasonable, however, to project that within the European Economic Community area the common agricultural policy to be pursued will contain provisions for (I) protection for domestic farmers,(2) increasing production of grains, including barley, as better production
techniques are adopted, and (3) decreasing imports of food and feed grains from non-European Economic Community countries. However, it is possible that as population and income levels continue to rise within the European Economic Community there will be increasing consumption of meats. A consequent question arises as to whether'the European Economic Community
countries may be able to become self-sufficient in feed grain production.The latter point above relates to feed grain and barley production and
trade in other parts of the world. It may be noted that as -economic develop
ment takes place one of the first changes is an improvement in dietary levels including increased protein consumption. This means increased livestock
production and increased use of livestock feeds. Japan, for example, appears to be consciously pursuing a policy of increased livestock production with the realization that it will need to continue the importation of feed grains. Whether the United States may be able to take advantage of such market potentials remains to be seen.
Less encouraging is the fact that relatively few areas and countries of
the world are sufficiently developed, economically speaking, to make any rapid increases in livestock production ancl in the consumption of feed grains. Furthermore, countries which are Short of United States dollar exchange are most likely to buy their feed-grains from the soft currency countries, and to use their United States dollar supply for other types of
purchases.

f
In addition to the above examples of trade barriers, there are many
other production and marketing factors which complicate international trade in grains. Not all areas of the world have soils and climate suited to the production of grain, and variable weather results in marked variation in production from one year to another. Particular kinds of grains for specific uses are even more limited. For example, most of the world's supply of
malting barley is produced in certain parts of the United States, Denmark, Germany, Poland, the United Kingdom, the Soviet Union, the Danube Basin
countries, and in Chile. 4/ The highly variable production in the major producing areas results in an unstable international trade. A country having sizable exports of barley in one year may find itself short for even domestic consumption in the next.
The general conclusion is that there is an increased worldwide need
for feed grains. However, factors of trade barriers, and problems of
effective demand or purchasing power do not indicate any rapid increase in
market potentials for United States barley and feed grains. Those factors
do indicate a need for continued effort in market research and in market
development.There is considerable question as concerns the future feed grain
market within theEuropean Economic Community or Common Market. Agricultural
fundamentalism is basic to the political structure of western Europe and is reflected in official European Economic Community policy and regulations.
4/ It may be noted in passing that consumption of beer has been increasing in Europe; thus, there is an increasing demand for malting barley there.
- 127 -

128 -
Apparently there is a feeling in most European Economic Community areas that no party can gain and keep power without farmer support which tends
toward protectionism— or limited imports of agricultural products, Other
groups, such as importers and to some extent consumers, tend to favor
liberalized trade. In balance, the position of governments within the European Economic Community seems to be: "Don't pay too much attention tofarmers, but enough."
A brief background on some of the European Economic Community countries
may help to explain recent European Economic Community action on grain prices:
Germany. West Germany has a relatively intensive agricultural production plant and is second only to France (among European
Economic Community nations) in grain production. There is little
room for production expansion except through increased yields from application of advancing technology. Grain support prices
are high internally, and there is considerable resistance to change from a politically powerful farm organization.France. As concerns European Economic Community policy, France
is the key member nation. All European Economic Community nations
except France are expected to continue as.feed grain importers..
Theoretically, France could expand grain production to the point of
being a major source of feed grain supply to the other European Economics Community members. French price policy preference for the
European Economic Community is not clear. Presumably, she prefers
prices, internally, high enough to be profitable to French farmers

129
but not high enough to discourage imports" from France into other
European Economic Community countries„ It is further assumed
that France prefers relatively high duties on imports into the European Economic Community.Netherlands. The Netherlands is characterized by a highly intensive but flexible agriculture. Livestock products are exported, and feed grains are imported in large quantities„ The Netherlands is
committed to low internal feed prices and also to low import duties on feed grains.
Italy. The preference of Italy also seems to-be for low internal feed grain prices and low import duties. This is due principally to the fact of increasing livestock production and feed grain
production but an even greater increase in meat consumption. Feed production has not been increasing as rapidly as livestock pro
duction.
Failure of the European Economic Community to come to early agreement on common agricultural policy resulted -from internal pressures from farming
and grain trade interests within the respective European Economic Community countries. As of July 30, 1962, the European Economic Community put into
operation a Common Agricultural Policy designed to support grain prices in member countries and to control trade. A seven and one-half year transition
period is scheduled to end in 1970 with uniform grain prices in all member
countries— or with a single market area.

130 -
Grain Prices Under the Common Agricultural Policy
The method of operations under the Common. Agricultural Policy (CAP) includes the establishment of:
(1) target,prices which are the internal wholesale priceobjectives, "
(2) intervention prices which are the prices at which governments buy grain (usually at a figure of 5 percent to 10 percent below the target price),
(3) market prices which normally fluctuate somewhere between (I) and (2), and
(4) variable tariff levies set according to a level necessary to maintain internal price supports. (This becomes the threshold price.)
Target prices, within some of the European Economic Community countries, are shown in Table XXVIII, comparing 1962-63 with 1963-64.
Increases in Belgian and Dutch prices are offset somewhat by those
countries moving from lower quality standards to the higher European Economic Community grain standards. In effect, the no change in German prices resulted in a decrease in prices by reason of increasing quality standards.
Outside suppliers were disturbed by the French price increase which presumably may lead to increased production in France.
The target prices within individual countries are established within
an agreed-to upper and lower target price limit schedule. That schedule for 1962-63 and 1963-64 is shown in Table XXIX.

TABLE XXVIII. EUROPEAN ECONOMIC COMMUNITY MEMBER COUNTRY GRAIN TARGET PRICES 1962-63 AND 1963-64. * a/
ItemWestGermany France Italy Belgium Netherlands
Soft Wheat:$/M.T. $/M.T. $/M.T. $/M.T.. $/M.T.
1962-63 118.88 90.40 104.40 102.60 91.991963-64 118.88 92.20 102.40 104.60 98.34Change , — +2.20 -2.00 +2.00 +6.35
Barley:1962-63 103.00 72.19 66.40 84.80 79.141963-64 103.00 74.38 69.65 86.80 80.66Change ---- — +2.19 +3.25 +2.00 +1.52
Rye:1962-63 108.13 72.31 98.59 80.00 69.471963-64 ' 108.13 73.77 98.69 80.80 72.51Change +1.46 +0.10 +0.80 +3.04
* Source: USDA, Foreign Agriculture, Washington, D. C„, FAS, August 1962.a/ These target prices are applicable in the deficit producing areas of
each country, except for the French prices and the Italian soft wheat price, which apply in the surplus producing areas of those countries.Eventually (in 1970 at the end of the transition period), target (and
other) prices are to be uniform throughout the European Economic Community.In the meantime, the big issues are unification of grain prices internallyand the eventual support level to be decided upon during the transition
period.Only time will tell whether the levels will be low or high and whether
the United States may be successful in maintaining and increasing its export
market to Europe.

132 -
TABLE XXIXo EUROPEAN ECONOMIC COMMUNITY UPPER AND LOWER LIMIT TARGET' PRICES, 1962-63 and 1963—64 . * a/
Item 1962-63 1963-64 Change$/M.T. $/M.T. $/M.T.
Soft wheat:■ Upper limit 118,92 118.92 , 0Lower limit 89.43 89.43 0
Barley:Upper limit 103.07 103.07 0Lower limit 71.42 72.17 +0.75
Rye:Upper limit 108.17 108.17 0Lower limit 65.71 67.71 +2.00
Corn:Lower limit 62.40 65.60 +3.20
* Source: USDA, Foreign Agriculture, Washington, D. Co, FAS, August 1963 =
a/ The upper limits apply in the EEC deficit producing areas; the lower limits, in the^surplus producing areas.

■ CHAPTER IX
SUMMARY AND CONCLUSIONS Summary
During the period 1956-61, which may be termed as the commercial trial period of Betzes barley in Montana, there was received an estimated $4.5 million additional return to the state in the form of malting premiums. This amounted to an annual average (1959-60) of about 5 percent of total receipts from the marketings of all barley.
The malting industry uses about 100 million bushels of barley for malt ' each year. About 10 million bushels of that is of the two-row varieties, including Betzes. Calculations of this study indicated that production of
all approved malting barley (both six-row and tWo-row varieties) is about double the actual use of barley for malt. For' the two-row varieties alone, production is about two and one-half times the annual malt use. Approximately
one-fourth of all off-farm barley sales are for malt use, or about 17,5 percent of all barley produced. Through 1961, about one-third of the Betzes barley produced in Montana had been sold at malting prices. Relative to
wheat, Montana markets little barley and an even smaller amount of barley suitable for malting.
The malting industry, through the Malting Barley Improvement Association (composed of malting and brewing companies), has encouraged and financially supported research and development of new and improved malting barley
varieties, better cultural practices, and better harvesting and handling methods. Betzes was developed by Montana State College as a malting variety

- 134 -for Montana with the assistance of the Malting Barley Improvement Association= It is recommended as a malting variety for Montana on irrigated land because dry-land barley is usually too high in protein for brewing=
The quality and quantity of Betzes produced in Montana has been erratic. In addition, there have been Other production and marketing problems because producers and local market personnel were not familiar with
maltster requirements as relates to the harvesting, handling, storing, binning, protein content, etc=, of malting barley.
It was noted that the trend in the grain marketing system is toward fewer but larger firms handling greater volumes of grain. There is an
apparent parallel trend in the number and size of operations of grain brokers, commission firms, etc.$ with these types of agents increasing in importance, especially in the marketing of barley.
Barley which may meet United States Department' of Agriculture official malting barley grades does not necessarily meet Malting Barley Improvement Association standards. Barley may meet both standards and still may not be
purchased for use in malting.In any attempt to alter the regular market channels, the most likely
departure would be direct marketing from producers or producer organizations to.maltsters. Frequently this type of marketing becomes involved with con
tractual arrangements between buyer and seller in advance of harvest or production. An attempt of this nature was made to develop a producer marketing or bargaining association of malting barley producers in the Gallatin
Valley.

135
The reason for malting barley premium prices is that premiums insure diversion of malting quality barley from feed uses„ In this study the ' data examined showed a closing of the price gap between feed and malting barley prices„
The limited research results available confirmed the observation that local elevator pricing of malting barley is based primarily on terminal market prices plus trading experience and evaluation of the physical character of grain received. The relatively simple statistical methods
applied to the data examined indicated no significant causal relationship between United States annual average farm prices and annual average production of barley, between annual average terminal market prices and production, nor between monthly average terminal market prices and receipts. There was found to be a high degree of correlation between feed and malt prices and terminal market prices and support prices for barley. Further
statistical analysis indicated stable monthly average terminal market prices for both feed and malting barley relative to market receipts.
It is commonly accepted that United States grain growers have the ability to produce more feed and food grains than the market will absorb at prices acceptable to farmers. Hence the assumed need for some sort of governmental control program for the I9608 s, For barley, the program adopted for the 1962 crop included an exemption of malting varieties from
acreage restrictions. Requests to permit the exemptions came from farm groups as well as from the malting industry. On the basis of the provisions for malting barley program for the 1962 crop, it was predicted by this study that there would be no reduction and probably an increase in United

136 -
States barley acres and production, As if turned out, there was a decrease in acreage but an increase in total production because of increasing yields per harvested acre.
An increasingly important market for United States barley has been in exports— principally to Europe, About one-third of the United States annual production has been exported as feed grain. There is an increasing worldwide need for feed grains, World production of barley is, in total, relatively stable from year to year. However, within particular countries
there is a highly variable production.Vertical integration in brewing has taken the form of brewers' purchase
of existing malt companies and building of their own malting facilities. Horizontal integration and expansion in size of the progressively fewer
number of brewers has been hastened by obsolescence of the smaller, often outdated facilities of brewing firms which cannot successfully compete with
the economies of scale of the larger firms,Domestically, the principal means of expanding malting barley sales is
through increased beer sales. Competition among brewers has revealed that price cutting is a relatively ineffective means of sales expansion. Beer
sales may be unresponsive to price changes, but they do seem to respond to
changes in levels of consumer income. Hence promotion-and advertising expenses are generally high in the beer industry. The brewing industry has long assumed high taxes to be a major deterrent to expanded sales.
Little is known of the drinking habits of beer consumers. This study indicated stable retail prices, a relatively inelastic demand for beer, and a positive relationship between consumer income and,consumption of beer.

137 -
Other studies suggest that beer drinkers tend to drink either considerable quantities or not at all., and who often don',t drink beer because they forget to buy it. They buy most of their beer in supermarkets but drink less beer at home than when .they go out. - ■
ConclusionsEven though Betzes barley has brought to Montana about an additional one
million dollars per year, there remains doubt that the annual malting barley premium amount to Montana may be significantly increased. This conclusion was reached as a result of production and use comparisons. United States farmers have the ability, and apparently the willingness, to produce more barley and more malting barley than is needed by the malting industry„ One need not be an economist to predict the direction of free market price movement under such conditions of over supply „
The over supply of malting variety barley production is encouraged by
the actions of both the malting industry and the producers of barley„Montanans presumably are grateful to the Malting Barley Improvement Association for its financial and other assistance in developing and promoting Betzes as a malting variety for Montana. It would be naive, however, to
assume that the Malting Barley Improvement Association is a philanthropic organization. Its concern is assumed to be with the production of large quantities of malting barley wherever feasible— and that includes most of the
upper Midwest and Plains States and the Pacific Northwest. Most states in the barley-producing regions are in search of new or improved malting varieties.
Many have the advantage over Montana of being closer to malting and brewing

138
plants o Malt may be made from nearly any barley, but maltsters prefer the best and have a better chance of obtaining the best when there are large acreages of barley« These factors suggest the need for an in-depth, study of the nature of inter and intra regional competition in the markets for barley, malt, and beer.
Assuming feed value and other considerations to be approximately equal, it is understandable that a farmer who intends to plant any barley
is likely to select an approved malting variety in preference to a feed variety, He may gain a malting premium and, if not, he has lost little—
if anything. Malting varieties are thus popular in areas approved for their production. This has been repeatedly demonstrated in Montana, SinceBetzes is a good feed barley, dry-land farmers raise it because sometimes
/(such as in an unusually rainy year) it may be suitable for malting and sell at a premium. It may also be true- that much of the irrigated farm land in Montana which is suitable for the production of high quality malting barley is.equally suited to the production of more profitable alternative crops „
These factors tend to result in erratic production in both quality and quantity and do not encourage efficient, reliable marketing.
Assuming the trend of fewer and larger firms and dealers in grain
marketing as affecting Montana Betzes barley, it becomes doubtful that the
regular grain marketing facilities (which are,geared to the handling of wheat) will ever be able to satisfactorily and economically handle barley of malting quality. It is difficult for a small, volume of malting barley to
compete with other grains for time and. facilities in marketing channels.This conclusion appears somewhat paradoxical to the grain trade's insistence

139
that barley and malting barley should be marketed through regular channels = However, resistance by the trade to any drastic departure from regular channels of marketing goes deeper than vested interest in handling as much as possible of all grains marketed. Maltsters resist direct marketing and possible production contractual arrangements because the quantity, quality, and location of,the better malting barley are nearly impossible to predict from year to year. Thus they prefer to remain free to secure supplies from . a wide variety of original sources. So long as barley supplies are plentiful,
it is likely that maltsters will generally observe the ethics of dealing through regular grain trade channels.
One achievement related to this thesis effort (which covered a span of
several years and many types of activities) had to do with the attempt by Gallatin Valley barley producers to organize a malting barley marketing or
bargaining association. Some view the attempt as a failure— which it was in that no such organization was developed. It was nonetheless successful in
other respects. It resulted in an educational program directed to producers and local elevator management in the production and marketing of barley which would meet malting requirements. It demonstrated to the trade at
terminal markets that producer dissatisfaction with marketing methods and facilities is not to be ignored or taken, lightly. It indicated to producers
that marketing involves more than merely agreeing to price. It resulted In
a compromise marketing method which, although less than hoped for by
producers, was considered by them to be an improvement.There is a question as to why. a price difference, may be required to
divert barley from feed to malt uses. The answer is probably a combination of

- 140 -factors, In part, it may be because of maltsters competing for particular lots of malting barleyc It may also be that at a particular time and place malting barley could be purchased at lesser prices,, but over a period of time a relatively high premium over feed prices is necessary to encourage
farmers to gamble on the' production of ,varieties- which may bring malting price premiums. A third possibility is that of some direct relationship
between the prices of malting barley, malt, and of spent malt converted to livestock feed„
It was concluded that the narrowing of the feed-malt price differential was due to greater production of all barley of both feed and malting varieties. The analysis indicated that malting barley prices are determined
primarily by feed barley-prices; which are determined primarily by support prices, and in turn by the very ,complex interrelationships among supplies and prices of all grains.
It could not be determined from this study whether"local elevator pricing or even, terminal market pricing accurately-reflect basic conditions of
demand for the free market- supply^' The stable monthly average terminal
market prices led to the-conclusion-that the-barley market is geared to seasonal use and/or storage and- tc pricing'which takes variable seasonal receipts into account. ...
In terms of its stated' purpose- of- reducing production, it was fortunate for the barley provisions portion-of the 1962 feed grain program that adverse weather and other unforeseeable-circumstances prevented some of the
larger barley-producing states from taking full advantage of the malting

141 -)
variety exemption. In- Montana • the-exemption was particularly advantageous because of the inclusion of Compana which previously had been primarily a
dryland feed variety used’in -small quantities for malting by a brewer in the state.
Whether the large European outlet for United States feed grains may continue, increase, or decrease is unknown-. Circumstances of direction of European economic growth and the degree of protectionism within the European Economic Community-will be the key determinants’. The growing
world need for increased amounts of feed grains is .encouraging but, excepting the more economically advanced countries such as in the European Economic
:■ . . :
Community, there remains limited ability to buy. World trading patternschange rapidly according to variable production. One year’s exporting
\
country may be a heavy importer the following year. This variability in
production and innumerable types o& national non-price trade restrictions
appear to be more important barriers to international trade than is price.It may be conjectured that whatever degree of economic power brewers
have is brought to bear on raw materials suppliers (malt, hops, etc.) If
true, such pressure presumably is reflected through maltsters to producers not necessarily or totally in the form of lower prices but also in the form
of insistence on higher quality barley and malt. As brewers become larger through expansion and horizontal integration, they can— presumably--
afford to operate their own malt plants. Also, it seems reasonable to assume that as a brewery becomes larger, it prefers not to be dependent upon a non-affiliated malting plant/s for its supplies of raw materials., The
142 -entire competitive structure of the beer industry is changing and may be deserving of greater economic research efforts.
With relative price inelasticity and income elasticity of demand for beer, there is indicated'a need for thorough study;of the beer drinking habits of various income bracket consumers and' a:'detailed1 analysis of the
nature of price and income elasticities of demand."These tentative conclusions about price and income elasticities of demand have raised questions as to the validity of the assumption- that- tax- levels directly
influence sales of beer. The same; conclusions may also be applied to the fact of large advertising-expenses in the brewing industry which may in
part account for the recent"and"rapid: trend, to- integration— both horizontal and vertical. As in other industries, it; appears-that large promotion and advertising campaigns' are-most" effective for brewing firms having- large
output and a national market.

- 143 -
....LITERATURE CITEDAnderson, ,R. N., "The United Kingdom as a Market for U. S. Farm Products",,
Foreign Agriculture:,' Washington, D . C., U. S. Department of Agriculture, Foreign Agricultural' Service, February, 1960.
Anderson, R. N. and Hollowell, E. W., "Our New Trade Center in London," Foreign Agriculture, Washington, D. C., U. S. Department of Agriculture, Foreign Agricultural Service, April, 1961.
Banasik, 0. J., "Evaluation of Barley Quality," Bimonthly Bulletin,. Fargo. North Dakota, North Dakota Agricultural College, July-August,.1957.
Banasik, 0. Jt,, "Malting Qualities of North Dakota Barley Varieties,"Bimonthly Bulletin, Fargo, North Dakota, North Dakota Agricultural College, November-December, 1957. ■
Benedict, M. R. and Associates, Destinations of U. S. Farm Exports and Sources of U. S. Agricultural'Imports. Berkeley, California, University of California, Giannini Foundation,- 1962.
' i
Bequette, Robert and Shaw, Arthur, Malting Barley in Montana, Mimeograph, Montana State College, Bozeman, Montana, July, 1958.
Blaich, 0. P., Barley Promotion and Market Development under P. L. 480,San Luis Obispo Barley Growers Association, San Luis Obispo, California, June 15, 1961.
Blaich, 0. P., Barley; Its Production and Uses. 4-H Leadership Conference, University of California, Davis, California, August 31, 1961.
Blaich, 0. P., Some Considerations in Regulating the Marketing of Hops, Mimeograph, University of California, Berkeley, California, March, 1962.
Bower, J. C., "What Proposed.Wheat Program Might Mean in Montana," Montana Farmer Stockman, Great Falls, Montana, April I, 1962.
Brookins, W. W., Quality Production of Barley, Mimeograph, University of Minnesota, Extension Service, St. Paul, Minnesota (undated).
Brooks, Bruce, "An Evaluation of the Market Outlets for Pacific Northwest Wheat," Wheat Marketing Short Course, Washington State University,Pullman, Washington, February 7, 1962.
Brooks, Bruce, "A Description of the Washington Wheat Market," WheatMarketing Short Course, Washington State University, Pullman, Washington, February 7, 1962.

- 144 -Bross, H. E., "The U. S. Wheat Grower and the Common Market," ForeignAgriculture, Washington, D. Co, U, S. Department of Agriculture, Foreign Agricultural Service, July I, 1960.
Brown, W. G.; Jackson, T. L.; and Foote., W. H.; Economics of GrowingMalting Barley, Corvallis, Oregon, Oregon Agricultural Extension Service, August 31, 1959 (Reprinted from Plant Food Review).
Bryan, Francis, "The Common Market," Better Farming Methods, May, 1952.Canadian Grain Journal, Show Interest in New Barley, Press release, Winnipeg, Manitoba, Canada, April, 1960. ,
Cereal Quality Laboratory, The Malting Quality of Montana Barleys, Second and Fourth Annual Reports, Montana State College, Agronomy and Soils Department, Mimeograph leaflets Nos. 30 and 40, Bozeman, Montana,October, 1959 and December, 1961.
Chohlis, John and Nielson, Don, "World Trade and the Common Market,"Western Livestock Journal, Denver, Colorado, August, 1962.
Christenson', Raymond P.; Johnson, Sherman-E.; and Baumann, Ross V.; Production Prospects for Wheat, Feed, and. Livestock, 1960-65, Washington, D. C., U. S. Department of Agriculture, Agricultural Research Service 43-115, December, 1959.
Clough, Malcolm, "Feed Situation and Outlook for 1962-63," Midwest Regional Outlook Conference, Peoria, Illinois, August 14, 1962.
Coleman, D . A., Brewing and Malting on the Pacific Coast, New York, New York, August, 1937, Reprint from Modern Brewer.
Commonwealth Economic Committee, Grain Crops— A Review, London, England, 1962.
Cook, Audrey; "Supporting the World's Largest Agricultural Export Business," Extension Service Review, Washington, D. C, ,, U, S. Department of Agriculture, May, 1962.
Combs, W. Bo, "The Production and Grading of Malting Barley," Paper for Siebel Institute of Technology, October 6, 1953, U. S. •
Committee for Economic DevelopmentThe European Common Market and Its Meaning to the United States, New York, 1959.
Committee for Economic Development, Cooperation for Progress in Latin America, New York, April, 1961.

- 145 -Davis, D 0 Jo, Report on the Quality of Commercial Samples of Betzes Barley*
Bozeman, Montana, Montana Agricultural Extension Service, Grain Inspection Laboratory, Mimeograph Leaflets Nos. 32 and 35.
Davis, Do J„, Grain Inspection.and Grading, Mimeograph publication, Bozeman Montana, Montana Agricultural Extension Service, Grain Inspection Laboratory, (undated)o
Davis, H. P.; "Sharing Our Surplus," Foreign Agriculture. Washington, D„ C., USDA, Foreign Agricultural Service, February, 1960.
DeFelice, A. R. and Zaglits, Oscar, "The Common Market and American Agriculture," Foreign Agriculture, Washington, D„ C., USDA, Foreign Agricultural Service, April, 1958.
DeWitt, Donn, Malting Barley Program. Seattle, Washington, Western Farmers Association, (undated).
Distillers Feed Research Council, Inc., Distillers Feeds: Their Importanceto the Uo So Economy, Cincinnati, Ohio, 1951.
Dunbar, John 0., "The 1963 Feed Grain Program," Tarheel Farm Economist,Raleigh, North Carolina, North Carolina State College, January, 1963.
Elrod, W . E.," Jr., Importance of .U. S. Farm Exports to Balance of Payments, Washington 25, D. C., USDA, Economic Research Sfervice and Foreign Agri- , cultural Service, Foreign Agricultural Economic Report No. 7, (undated).
Erpelding, Larry, "Feed Grain Plan to Hurt State," The Wheat Scoop, Great Falls, Montana, MGGA, January, 1962.
Eslick, R. Foi Davis, D. J.; and Hockett, E. A.; Report on the Quality of Commercial Samples of Betzes Barley Raised in Montana, Bozeman, Montana Montana Agricultural Extension Service, Agronomist and Soils Mimeo Leaflets 20 and 22, November 5, 1957, and October 15, 1958.
Ewasiuk, William J., Marketing Two-rRow Malting Barley in Montana, Montana A.E.S., Res Proj. Statement, Bozeman, Montana, September, 1960.
Fedje, Duane L., Analysis of the Market Structure for Montana Barley and Potential Outlets, Bozeman, Montana, M.A.E.S., Agricultural Economics Research Report No. I, May, 1957.
Fitzgerald, D. A., "The International Age in Agriculture," Foreign Agriculture; Washington, D. C., USDA, Foreign Agricultural Service, February, 1960.

146
Foote, R. Jo and Associates, The Demand and Price Structure for Corn and Total Feed Concentrates, Washington. D. C., USDA, BAE, Technical Bulletin 1061, October, 1952»
Fraser, Go 0„, "U„ S. Feed Grain's Have Bright Future," Foreign Agriculture, Washington, D. C., USDA, FAS, July, 1958»
Frazier, Charles L„, ASCS Handbook, 1962 Feed Grain County Handbook. Washington, D. Co, USDA, ASCS, August 9, 1961.
Freeman, 0„ L., "Let's Look at the Record," ASCS Regional Meeting. Atlanta, Georgia, February 8, 1962.
Freeman 0. L., "Food for Peace— Promise and Problems," Foreign Agriculture, Washington, D. C., USDA, FAS, May, 1962. ^
Gastineau, R. L., "What are Trade Barriers?", Foreign Agriculture, Washington, D. Co, USDA, FAS, September, 1957.
Great Falls Tribune, Company's Switch to Malting Barley Could Mean $2,250,000 to Montana, Great Falls, Montana, March 7, 1962.
Hadley, N 0 S. and Associates; 1962 Barley Program Fact Sheet. Lafayette, Indiana, Purdue University Mimeo EC-234, September, 1961.
Haldeman, R. C,, Potential Effects of St. Lawrence Seaway on Costs ofTransporting Grain, Washington, D. C.,,USDA, AMS, Marketing Research Report No. 319, April, 1959.
Haldeman, R. C., "Research Findings on the Transportation of Grain," National Marketing Service WorkshopBiloxi, Mississippi, November 16, 1960.
Haldeman, R. C. and Associates, Grain Transportation in the North Central Region, Washington, D. C,; USDA, AMS, Marketing Research Report No. 490, July, 1961.
Hallett and Carey, Ltd., An Analysis of USA Imports of Canadian Barley, Winnipeg, Canada, July 10, 1953.
Hardin, L. S. and Hesser, L. F., "Market Development in Japan," Foreign Agriculture, Washington, D. C., USDA, FAS, April, 1961.
Harlan, H„ V., Growing Barley for Malt and Feed, Washington, D. C., USDA, Farmers Bulletin No. 1732, November 1943 (revised).
Harrington, A. H., "Wheat Price Relationships," Wheat Marketing Short Course, Washington State University, Pullman, Washington, February 7, 1962.

- 147 -
Harrington, A. H., "Wheat Supply and Distribution," Wheat Marketing Short Course, Washington State University, Pullman, Washington, February 7, 1962.
Earston, C. R., "Proposed Regional Research in Wheat Marketing," WAERC, Marketing Research Committee Meeting, Bozeman, Montana, November, 1961»
Ears ton, C. R., "Research Work Related to Wheat," WAERC, Marketing Research Committee Meeting. Bozeman, Montana, November, 1961.
Heffer, W. and Sons, Ltd., Journal of the Institute of Brewing. Cambridge, England, 1961.
Heid, W . G., Jr., Changing Grain Market Channels, Washington, D. C., USDA,ERS 39, November, 1961.
Hemphill, P . V., "How Does the Local Elevator Determine a Price for Malting Barley?", Bimonthly Bulletin. Fargo, North Dakota, NDAES, September- October, 1954.
Herbison, H. W., North Dakota's Changing Barley Marketing Situation. Fargo, North Dakota, NDAES Mimeo, March 12, 1953.
Hiram Walker and Sons, Inc., All This from Grain, Peoria, Illinois, 1960.
Hobson, Karl, "Wheat Price Relationships," Wheat Marketing Short Course, Washington State University, Pullman, Washington, February 7, 1962.
Hoos, Sidney and Bales, J. N., Hops: Statistical-Economic Analysis ofMarketing, Berkeley, California, University of California, College of Agriculture, Giannini Foundation Mimeo Report 139, September, 1952.
Ioahes, R. A., "A New-Old Foreign Market," Agricultural Marketing. Washington, Do C., USDA, June, 1962.
Ioanes, R. A., "The St. Lawrence Seaway— Effect on Grain Marketing," Foreign Agriculture, Washington, D. C., USDA, FAS, January, 1958.
Ioanes, R. A., Our Special Export Programs," Foreign Agriculture. Washington, D. C., USDA, FAS, January, 1961.
Ioanes, R. A., "What's New in Agricultural Exports?", Foreign Agriculture, Washington, D. C., USDA, FAS, December, 1961.
Jones, E. W. and Associates, Feed Grain Program's Impact on North Carolina Agriculture, North Carolina State College, Raleigh, North Carolina, Department of Agricultural Economics, Miscellaneous Publication 4, January, 1963»

148 -•Kellett, M„ G. and Associates, Growing Barley for Malting, Vancouver, Washington, Great Western Malting Company, Inc., (undated).
Kennedy, John F. , Message from the President of the United StatesRelative 'to an Agricultural Program, Washington, D* C., House of Rep-' resentatives Document 323,, 87th Congress, 2nd Session, January 31, 1962.
Keaton, Clyde R., Competition in the Grain Market of Western Europe. Washington, D* C., USDA, FAS-M-138, May 1962.
Kutish, Francis A., "An Analysis of the 1961 Feed Grain Program," Better Farming Methods, April 1962.
Learn, Elmer W., "The European Common Market," World Trade; What Are the the Issues? No. 4., Farm Foundation, North Carolina State College, Iowa State University, March, 1962.
Learn, Elmer W. and Houck, James P., Jr., "Market Development— The Concept and the Program," Foreign Agriculture, Washington, D . C., USDA, FAS,July, 1961.
Lejeune, A. J., "Malting Barley is Important Crop," Grain Age Magazine. October, 1960.
Lejeune, A. J., "Barley Variety Surveys and Acceptable Varieties of Malting Barley for 1963," Proceedings, Barley Improvement Conference. MBIA, Milwaukee, Wisconsin, June 17, 1963.
Lejeune, A. J., "Malting Barley Outlook, 1963," Grains of Truth, Milwaukee, Wisconsin, MBIA, February 12, 1963.
Lejeune, A. J., and Parker, J„.H., Guide to Premiums for High Quality Malting Barley, Milwaukee, Wisconsin, MBIA, January, 1953.
Lejeune, A. J. and Parket, J.H., "Gold Discovered in the Red River Valley," Great Northern Agriculture, St. Paul, Minnesota, 1954.
Lejeune, A. J . and Parker, J.H., "The Story of Malting Barley," What's New in Crops and Soils?, February, 1955.
Loeb, Carl M., Rhoades and Co.. Three Leading Brewery Stocks, New York 5,New York, February, 1962.
Long, Mary E., "Australia and New Zealand Watch the Common Market,"Foreign Agriculture, Washington, D. C., FAS, September, 1959.

- 149Ludlarns F„ S„ and Associates„ Identification of Barley Varieties, Winnipeg, Manitoba, Board of Grain Commissioners foi Canada, 1945»
Malaher, W» G„, Malting-Barley.in Western Canada, Winnipeg, Manitoba,Canada, Searle Grain Co», Ltd,, March, 1961.
Malt Research.Institute, Grow and Market Good Quality Barley. Madison, Wisconsin, July I, 1937.
Malt Research Institute, Proper Threshing and Handling of Barley. Madison, Wisconsin, June, 1941.
Malting Barley Improvement Association, Price Support Rate Map/s for Barley, Milwaukee, Wisconsin, 1948, 1959, 1960»
Malting Barley Improvement Association, Barley Variety Survey Map/s, Milwaukee Wisconsin, 1958, 1959, 1960»
Malting Barley Improvement Association, Annual Progress Report/s, Milwaukee Wisconsin, 1958, 1959, 1960, 1961.
Malting Barley Improvement Association, "Betzes Barley FoundsAcceptable for Malting and Brewing," Grains of Truth, Milwaukee, Wisconsin, November, 1958.
Malting Barley Improvement Association, "Betzes Barley Not Recommended for Midwest," Grains of Truth, Milwaukee, Wisconsin, January 9, 1959.
Malting Barley Improvement Association, Report on Barley ImprovementConference/s, Milwaukee, Wisconsin, January 20, 1959, and January 26, 1961.
Malting Barley Improvement Association,, Thresh Malting Barley Carefully, Milwaukee, Wisconsin, May, 1959»
Malting Barley Improvement Association, Report on Irrigated Betzes Project in Montana, 1960, Milwaukee, Wisconsin, March 29, 1960.
Master Brewers Association of America, Malting Barley Contest Rules and Regulations, Cincinnati, Ohio, 1935»
Mauch, Arthur, "World Trade:, A Time for Decision," Better Farming Methods, July, 1962.
Mauch, Arthur, "Why Trade with Other Nations?", World Trade: What Are theIssues? No. I, Farm Foundation, North Carolina State College, Iowa State University, March, 1962.
,'i

150 -McCraken, Willard, "Grain Allotment Fight Flares: Local ASC, Man Fired by
Freeman Appointees," Western Livestock Journal, Denver, Colorado, March 22, 1962.
McCraken, Willard, "Montana Feeders, Barleymen Face Threat in Cut BankDispute over Federal Action," Western Livestock Journal. Denver, Colorado, March 29, 1962. 1
Meinken, K. W., The Demand and Price Structure for Wheat, Washington, D. C ., USDA, AMS, Technical Bulletin 1136, November, 1955.
Menze, R0 E., "Exporters' Position in the Pacific Northwest Wheat Market," Wheat Marketing Short Course, Washington State University, Pullman, Washington, February 7, 1962.
MikkeIsen, Walter C., "The Miller in the Marketing of Pacific NorthwestWheat," Wheat Marketing Short Course. Washington State University, Pullman, Washington, February 7, 1962.
Miller, Clarence L=, "Our Farm Export Problems," Foreign Agriculture, Washington, D. C., USDA, FAS, December., 1959 .
Milwaukee Journal, "Barley Center Seen for City,". Milwaukee, Wisconsin,January 24, 1955.
Milwaukee Sentinel, "More Barley Growing in State Urged," Milwaukee,Wisconsin, January 25, 1955.
Minneapolis Grain Exchange, How to Market Grain. Minneapolis, Minnesota, January, 1958.
Montana Department of Agriculture, Montana Agricultural Statistics, Helena, Montana, Volumes III to VIII, 1950 to 1960.
Montana Farmer Stockman, "Wheat, Feed Grain Programs," Great Falls, Montana, February 15, 1962.
Montana Farmer Stockman,. "State ASC Committee Suspends Glacier County Committee," Great Falls, Montana, April I, 1962.
Montana State Department of Agriculture, Montana Directory of Licensed Grain Dealers, Helena, Montana, 1961.
Morrison, K. J., Wheat, Oats, and Barley Varieties Recommended for Washington, Pullman, Washington, WAES, Miscellaneous Publication 14, March, 1958.
Morrison, K. J.; Nilon, Robert; and Roche, Ben; Growing Barley in Washington,- Pullman, Washington, WAES, Miscellaneous Publication 30, September, 1959.

151Newell, Cameron B., Know Your Barley Varieties, Milwaukee, Wisconsin,Midwest Barley Improvement. Association, June, 1950.
Northwest Crop Improvement Association and MBIA, High Quality Malting Barley, Milwaukee, Wisconsin, March, 1954.
O'Donnell, P. E., "Britain and ..the. Common Market," Foreign Agriculture. Washington, D. C., USDA, FAS, September, 1961.
Olson, W0 Jo, "Protein Content..in.Malting Barley— Effect on Quality," Proceedings, Barley Improvement Conference, MBIA, Milwaukee, Wisconsin January 17, 1963,
Olympia Brewing Company, How Olympia Beer Is Made. Olympia, Washington, (undated)»
Oregon State College, Barley: What to Do with It, Corvallis, Oregon,Extension Circular 560, January, 1954.
Pacific Northwest Grain Dealers.Association, 1962 Official Directory of Pacific Northwest Grain Dealers Association, Spokane, Washington, 1962.
Paarlberg, Don, "U. S. Agriculture Venture intp the International Age,"Foreign Agriculture, .rWashington, D. C., USDA, FAS, November, 1959.
Paarlberg, Don, "Balance of Payments," World Trade: What Are the Issues?No. 2, Farm Foundation, North Carolina State College, Iowa State University, March, 1962. \
Parker, John H., The Annual Barley Usage of the Malting and Brewing Industries, American Brewer, May, 1955.
Parker, J. H., The Story of Malting Barley in Wisconsin, MBIA, Milwaukee, Wisconsin, (undated)=
Pederson, H. C., More Profits from Malting Barley, St. Paul, Minnesota,MAES Folder 68, December, 1959.
Pederson, H. C. and Crewdson, B. G., Cereal Grains, Oilseeds, and Other, Field Crops, St, Paul, Minnesota, MAES Handbook, November, 1958.Peterson, E. E., "The European Economic Community," Nebraska Farm and
Ranch Economics, No. 175, University of Nebraska, Lincoln, Nebraska, September, 1962.
Penn, Raymond J,, "Reciprocal Trade Agreements," World Trades What Are the Issues? No, 3, Farm Foundation, North Carolina State College, Ioway State University, March, 1962.

152Porter, Sylvia, F., "Time for a Giant Step," Life Magazine, April 20, 1962„Printer's Ink, Annual Beer Sales Report Issue, January 19, 1962,Pugh, Charles, "An Analysis of Policy Alternatives for Feed Grains," Farm Policy Alternatives, Washington, D= C=, USDA, FES, March, 1963=
Putnam, Henry 0=, Malting Barley, Minneapolis, Minnesota, Northwest Crop Improvement Association, October 23, 1957.
Quenemoen, M= E=, "1962 Wheat-Feed: Grain Program-,"-Montana Farmer Stockman, Great Falls, Montana, November I, 1961=
Quenemoen, M= E=, "1962 Wheat-Feed Program Income Potentials of Production Alternatives," Montana Farmer Stockman, Great Falls, Montana, November I,1961 =
Rasmussen, Wayne D=, "History of America’s Farm Exports (I)," Foreign Agriculture, Washington, D. C=, USDA, FAS, July, 1960.
Rasmussen, Wayne D0, "History of America's Farm Exports (II)," Foreign Agriculture, Washington, D= C=, USDA, FAS, July', 1960.
Richter, Jay, "Blueprint for Agriculture," Better Farming Methods, March, 1962= ,
, Root, Floyd, "P= L= 480 and Its Importance to the U= S= Wheat Industry," Wheat Marketing Short Course, Washington State University, Pullman, Washington, February 7, 1962=
Root, Floyd, "Summary of the International Wheat Agreement," Wheat Marketing Short Course, Washington State University, Pullman, Washington, February 7,1962 =
Rossiter, Fred J=, "Canada and the Common Market," Foreign Agriculture, Washington, D= C=, USDA, FAS, August, 1960=
Rudd, Robert W=, "Can Exports Solve the Farm Problem?", World Trade: WhatAre the Issues? No= 6, Farm Foundation, North Carolina State College,Iowa State University, March, 1962=
Schaffner, L= W=, Barley Marketing in North Dakota, Fargo, North Dakota,NDAES Bulletin 352, June, 1948.
Schonberg, James S., The Grain Trade; How It Works, New York Exposition Press, 1956=

153 -Seeborg, Ed, "The Japanese Wheat Market," Wheat Marketing Short Course« Washington State University, Pullman, Washington, February 7, 1962„
Shaw, A 0 Fo, Betzes Barley in Montana. Bozeman, Montana, MAES Folder, March, 1958,
Shaw, A, F,, "The Barley Problem.in Montana," Regional Extension Grain Marketing Conference, Great Falls, Montana, May 6-8, 1958,
Shaw, A, F,, "Barley Possibilities Important; Income Now Second to Wheat," Challenges, Bozeman, Montana, MSC, January-February, I960.'
Shaw, A. Fo and Eslick, Robert, "Alternative Uses for Land Diverted from Wheat and Barley," Montana Farmer Stockman. Great Falls, Montana,November I, 1961.
Sheppard, Daniel S,, "How We Are Developing Markets in Latin America,"Foreign Agriculture, Washington, D, C., USDA, FAS, April, 1962.
Siebel Publishing Company, "Buyers Guide and Directory, 1962,” The Brewers Digest, Chicago, Illinois, 1962.
Sisler, W. W,, "Quality Factors in Malting Barley," Extension Grain Marketing Conference, Minneapolis, Minnesota, May'll, 1961.
Sleik, John, What Happens to Barley on the Trading Floor and in the Malthouse ■ because of Skinned arid Broken Kernels. G. Heileman Brewing Company, LaCrosse, Wisconsin, (undated),
Snowden, Obed L. and Donahoo, Alvin W 0, Profitable Farm Marketing, Englewood Cliffs, New Jersey, Prentice-Hall, Inc., 1960.
Sorenson, L 0 Orlo, "Grain Transportation," The Kansas Agricultural Situation. Kansas State University, Manhattan, Kansas, January, 1962.
Swindlehurst, E0 B., "Palliser and Betzes Barley," Science and the Land, Edmonton, Alberta, Canada, September 16, 1960.
Sykes, W. J., The Principles and Practice of Brewing. London, England, Charles Griffin and Company, Ltd., 1897.
Taylor, F. R., and Nelson, D. C., Factors Affecting the Transportation of North Dakota Grain, Fargo, North Dakota, NDAES Bulletin No. 430,December, I960.
Taylor, Maurice C0, "Food and Agriculture Act of 1962," Montana Farmer Stockman, Great Falls, Montana, April I, 1962.

154 -Teal, Ro H„, Report on Betzes~Malting Barley in Montana, Corvallis, Oregon, OAES mimeo, August, 1959.
Thomas, Marion D=, Grain Price Relationships, Corvallis, Oregon, OAES mimeo, November, 1962„
Thompson, W 0 H., "Cross Current in Transportation," Feed and Grain Conference, Manhattan, Kansas, November 28, 1962„
Thuroczy, N, M,, Impact of the St. Lawrence Seaway on the Location ofGrain Export Facilities, Washington, D. C„, USDA, AMS, Marketing Research Report No, 442, December, I960.
The United Nations, National Grain Policites (Supplement No. 4), Rome Italy, FAO, Commodities Division, 1962.
United States Law 87-128,
Congress, Agricultural Act of 1961. Washington, D. C., 87th Congress, S. 1643, August 8, '1961.
Public
United States H.R. 10010,
Congress, 1962 Food and Agricultural Act, Washington, D. C., 87th Congress, 2nd Session,. June 4, 1962.
United States H.R. 11970,
Congress, Trade Expansion Act of 1962, Washington, D. C., 87th Congress, 2nd Session, June 4, 1962.
United States Department of Agriculture, Grading Barley at Country Points. Washington, D. C., AIS 54, September, 1946.
United States Department of Agriculture, Handbook of Official Grain Standards of the U 0S0, Washington, D. C., AMS, Miscellaneous Publication 722, 1956.
United States Department of Agriculture, Fact Sheet, 1962 Barley Feed Grain Program, Washington, D 0 C. ASCS, August, 1961.
United States Department of Agriculture, If You Produce Barley, Washington, D. C., ASCS Folder, PA 470, August, 1961.
United States Department of Agriculture, Summary and Highlights— The Agricultural Act of 1961, Washington, D. C., ASCS, August, 1961.
United States Department of ..Agriculture, The Wheat Stabilization and Feed Grain Programs, Bozeman, Montana, ASCS, March, 1962.
United States Department of Agriculture, Revised Estimates of Barley Acreage, Yield, and Production, 1886-1929, Washington, D. C.,BAE Mimeo, February, 1935.
- 155
United States Department of Agriculture, Farm Production, Disposition, and Value of Barley, 1909-41, Washington, D„ C„, BAE mimeo, October, 1944„
United States Department of Agriculture, Field Crops by States, 1954-59, Washington, D„ C«, CRB, Stat= Bul= 290, June, 1961=
United States Department of Agriculture', Fact Sheet, U= S= Agricultural Exports, Washington, D= C=, ERS, December, 1961=
United States Department of Agricultural, Foreign Agricultural Trade of the U= S0, Fiscal Year 1960-61= Washington, D= C=, ERS, December, 1961=
United States Department of Agriculture, Foreign Agricultural Trade of the U= S=, Washington, D= C=, ERS, August, 1961, February, 1962=
United States Department of Agriculture, Fact Sheet, U= S= Agricultural Imports, Washington, D= C=, ERS, March, 1962=
United States Department of Agriculture, World Food Needs, Washington, D= C=,ERS, Ag. Inf= Bui. 261, May, 1962=
United States Department of Agriculture, Grain and Feed Statistics,Washington, D= C=, ERS, Stat= Bul= 159 (revised), June, 1962=
United States Department of Agriculture, The World Food Budget, 1962 and1966, Washington, D= C=, ERS and FAS, For= Ag= Econ= Rep= No= 4, October, 1961
United States Department of Agriculture, 1962 Agricultural Outlook Chartbook, Washington, D= C=, ERS, FAS, ARS, November, 1961=
United States Department of ..Agriculture, U= S= Agricultural Exports in Historical Perspective, Washington, D= C=, FAS, February, 1956=
United States Department of,Agriculture, Developing Foreign Markets for U= S= Farm Products, Washington, D= C=, FAS, February, 1958
■: ■ ' .United 1 States Department of Agriculture, Free Trade Area for Europe— How It Is Developing, Foreign Agriculture, Washington, D= C=, FAS, May, 1958=
United States Department of Agriculture, Prospects for Foreign Trade inFeed Grains, etc=, Washington, D= C=, FAS, January, 1959, January, 1960, ,May, 1961, April, 1962=
United States Department of Agriculture, "Tariffs and the Common M a r k e t ' Foreign Agriculture, Washington, D= C=, FAS, February, 1959«
156United States Department of' Agriculture, "Thirty-Six Countries Are Now
Involved in Common Markets, Free Trade Area," Foreign Agriculture,Washington, D0 C0, FAS, February, 19600
United States Department of Agriculture, "Developing Markets in Italy,"Foreign Agriculture, Washington, D. C0, FAS, June, 19600
United States Department of Agriculture, The World Grain Trade, Washington,D0 Co, FAS-M-53 (revised), July, 1960„
United States Department of Agriculture, Foreign Agricultural Trade Outlook Charts, 1961, Washington, D. C., FAS, November, 1960„
United States Department of Agriculture, U, S0 Agricultural Exports, Past and Present, 1925-1960, Washington, D 0 C0 FAS-M-109, February, 1961
United States Department of Agriculture, "Shifts in World Agricultural Trade,” Foreign Agriculture, Washington, D 0 C,, FAS, March, 1961,
United States Department of Agriculture, "Common Market Commission Forecasts Smaller Food Import Needs by 1965," Foreign Agriculture, Washington,D 0 C, , FAS, April, 1961,
United States Department of Agriculture, "How U. S0 Wheat Growers Have Boosted Overseas Sales," Foreign Agriculture, Washington, D 0 C,, FAS,April, 1961,
United States Department of Agriculture, Foreign Agricultural Market Development, Washington, D 0 C0, FAS, June, 1961,
United States Department of Agriculture, "Free Ports of the World," Foreign Agriculture, Washington, D0 C,, FAS, September, 1961,
United. States Department of Agriculture, The Barter Export Program,Washington, D„ C0, FAS, October, 1961.
United States Department of Agriculture, U, S0 Grain Exports under Government Programs, 1960-61, Washington, D 0 C,, FAS-M-127, February, 1962,
United States Department of.Agriculture, "New U, S, Trade Pact with Common Market," Foreign Agriculture, Washington, D, C0, FAS, April, 1962,
United States Department of Agriculture, Foreign Crops and Markets, Washington, D, C,, FAS, August 27, 1962,

- 157 -United States Department of Agriculture, "Common Market Adopts New GrainTrade Rules," Foreign Agriculture Circular, Washington, D„ Co, FAS,August, 1962,
■
United States Department of Agriculture, "European Common Market Grain Regulation," Foreign Agriculture Circular; Washington, D„ C., FAS,November, 1962„
United States Department of.Agriculture, France's Key Role in the Grain Sector of the European Common Market. Washington, D= Co, FAS, FAR-122, April, 1963o
United States Department of Agriculture, New Markets for U» S, Agricultural Commodities, Washington, D„ C., Miscellaneous Publication 756, February, 1958.
United States Department of Agriculture, Analysis of Grain Export Programs Washington, D. C., Miscellaneous Publication 905, May, 1962»
United States Department.of Agriculture, Conversion Factors and Weights and Measures for Agricultural Commodities and Their Products.. Washington,Do Co, Po & Mo Ao, May, 1952.
United States Department of.Agriculture, Three. Additional Barley Varieties Excepted under 1962 Feed Program. Washington, D0 C., February 2, 1962.
United States Department of Agriculture, Details of Feed Grain Price- Support Programs, Washington, D. Co, February 2, 1962.
United States Department of .Agriculture, Food and Agriculture, A Program for the 1960's, Washington, D. C., March, 1962.
Vaughan, E0 D., Marketing Betzes as Malting Barley, Bozemau, Montana, MAES Mkto Newsletter, July 15, 1958.
Vaughan, E. D,, Malting Barley Marketing Report. Bozeman, Montana, MAES Report, July 21, 1958.
Vickery, R. E., Canadian Wheat Marketing, Washington, D0 C., FAS-M-140,July, 1962.
Vogel, Eo Ho, Jr., and Associates, The Practical Brewer, St. Louis, Missouri, Van Hoffman Press, 1946.
Vogel, So Lo, Thresh Barley for Malting Carefully, Milwaukee, Wisconsin, Midwest Barley Improvement Association, June, 1950.

158 -
Watson, C. A„; Bequette, R. K„; and Ellis, G« H0; Malting Barley, Increased Income to Montana Growers. Bozeman, Montana, Montana State College,Cereal Quality Laboratory, Agronomy and Soils Department Mimeo, Leaflet No, 28, July, 1959.
Watson, Co A„; Es lick, R0 F0; Bequette., R. K,; and Ellis, G. H.; Malting Data Obtained on Montana Barley, by the USDA Malt Laboratory,- Bozeman, Montana, MAES, Agronomy Circ„ 29, July, 1959.
Weaver, J. C., "Barley Geography," American Society of Brewing Chemists Conference, Milwaukee, Wisconsin, January 28, 1948.
Western Agricultural Economics Research Council, The Philosophy, Methodology, Basic Tools of Marketing Research, Berkeley, California, November
• 14-16, 1960.The Wheat Scoop, "MGGA Wins Compatta Campaign," Great Falls, Montana,March, 1962.
Winter, J. S., "The Effect.of,Changing Transportation Rates on GrainPricing and Movement," Extension Marketing Workshop. Purdue University, November I, 1960.
Witt, Lawrence, "Food for. Peace," World.Trades What Are the Issues? No. 5. Farm Foundation, North Carolina State College, Iowa State University,March, 1962.
World Book Encyclopedia. (Articles on beer, brewing, malting), Chicago, Illinois, Field Enterprise Educational Corporation, 1962 ed.
Wylie, Kathryn H., "Latin America Plans Another Common Market," Foreign Agriculture, Washington, D 0 C. FAS, July, 1960.
Zaglits, Oscar, "The Common Market’s Proposed Farm Policies," Foreign Agriculture, Washington, D. C., FAS, February, 1960.