W&M ScholarWorks
16
W&M ScholarWorks W&M ScholarWorks VIMS Articles Virginia Institute of Marine Science 9-2015 Decadal re-evaluation of contaminant exposure and productivity Decadal re-evaluation of contaminant exposure and productivity of ospreys (Pandion haliaetus) nesting in Chesapeake Bay of ospreys (Pandion haliaetus) nesting in Chesapeake Bay Regions of Concern Regions of Concern RS Lazarus BA Rattner PC McGowan Robert Hale Virginia Institute of Marine Science et al Follow this and additional works at: https://scholarworks.wm.edu/vimsarticles Part of the Environmental Sciences Commons Recommended Citation Recommended Citation Lazarus, RS; Rattner, BA; McGowan, PC; Hale, Robert; and al, et, "Decadal re-evaluation of contaminant exposure and productivity of ospreys (Pandion haliaetus) nesting in Chesapeake Bay Regions of Concern" (2015). VIMS Articles. 1661. https://scholarworks.wm.edu/vimsarticles/1661 This Article is brought to you for free and open access by the Virginia Institute of Marine Science at W&M ScholarWorks. It has been accepted for inclusion in VIMS Articles by an authorized administrator of W&M ScholarWorks. For more information, please contact [email protected].
-
Upload
khangminh22 -
Category
Documents
-
view
0 -
download
0
Transcript of W&M ScholarWorks
W&M ScholarWorks W&M ScholarWorks
VIMS Articles Virginia Institute of Marine Science
9-2015
Decadal re-evaluation of contaminant exposure and productivity Decadal re-evaluation of contaminant exposure and productivity
of ospreys (Pandion haliaetus) nesting in Chesapeake Bay of ospreys (Pandion haliaetus) nesting in Chesapeake Bay
Regions of Concern Regions of Concern
RS Lazarus
BA Rattner
PC McGowan
Robert Hale Virginia Institute of Marine Science
et al
Follow this and additional works at: https://scholarworks.wm.edu/vimsarticles
Part of the Environmental Sciences Commons
Recommended Citation Recommended Citation Lazarus, RS; Rattner, BA; McGowan, PC; Hale, Robert; and al, et, "Decadal re-evaluation of contaminant exposure and productivity of ospreys (Pandion haliaetus) nesting in Chesapeake Bay Regions of Concern" (2015). VIMS Articles. 1661. https://scholarworks.wm.edu/vimsarticles/1661
This Article is brought to you for free and open access by the Virginia Institute of Marine Science at W&M ScholarWorks. It has been accepted for inclusion in VIMS Articles by an authorized administrator of W&M ScholarWorks. For more information, please contact [email protected].
Decadal re-evaluation of contaminant exposure and productivityof ospreys (Pandion haliaetus) nesting in Chesapeake Bay Regionsof Concern
Rebecca S. Lazarus a, b, Barnett A. Rattner a, *, Peter C. McGowan c, Robert C. Hale d,Sandra L. Schultz a, Natalie K. Karouna-Renier a, Mary Ann Ottinger b, 1
a U.S. Geological Survey, Patuxent Wildlife Research Center, Beltsville, MD 20705, USAb Marine-Estuarine Environmental Sciences Program and Department of Animal and Avian Sciences, University of Maryland, College Park, MD 20742, USAc U.S. Fish and Wildlife Service, Chesapeake Bay Field Office, Annapolis, MD 21401, USAd Virginia Institute of Marine Science, College of William and Mary, Gloucester Point, VA 23062, USA
a r t i c l e i n f o
Article history:Received 30 March 2015Received in revised form19 May 2015Accepted 28 May 2015Available online 24 June 2015
Keywords:Chesapeake BayGenotoxicityOspreyPersistent pollutantsProductivity
a b s t r a c t
The last large-scale ecotoxicological study of ospreys (Pandion haliaetus) in Chesapeake Bay was con-ducted in 2000e2001 and focused on U.S. EPA-designated Regions of Concern (ROCs; Baltimore Harbor/Patapsco, Anacostia/middle Potomac, and Elizabeth Rivers). In 2011e2012, ROCs were re-evaluated todetermine spatial and temporal trends in productivity and contaminants. Concentrations of p,p0-DDEwere low in eggs and below the threshold associated with eggshell thinning. Eggs from the Anacostia/middle Potomac Rivers had lower total PCB concentrations in 2011 than in 2000; however, concentra-tions remained unchanged in Baltimore Harbor. Polybrominated diphenyl ether flame retardantsdeclined by 40%, and five alternative brominated flame retardants were detected at low levels. Ospreyproductivity was adequate to sustain local populations, and there was no relation between productivityand halogenated contaminants. Our findings document continued recovery of the osprey population,declining levels of many persistent halogenated compounds, and modest evidence of genetic damage innestlings from industrialized regions.
Published by Elsevier Ltd.
1. Introduction
The Chesapeake Bay is the largest estuary in the United Statesand supports a diversity of avian species. Degradation of habitatquality by a mixture of agricultural, industrial and urban pollutioncontinues to threaten the most vulnerable portions of the estuary,and jeopardize fish and wildlife health. Globally, the largest nestingosprey (Pandion haliaetus) population is found in the ChesapeakeBay, which has been nicknamed the “osprey garden of the world”(Poole, 1989). Ospreys are used as ecological sentinels of environ-mental health due to their high trophic level, widespread
distribution and nest-site fidelity (Grove et al., 2009; Henny et al.,2010).
The Chesapeake Bay osprey population has been extensivelystudied since the 1970s. In 1973, the osprey population was esti-mated to be only 1450 nesting pairs, and only seven pairs wereobserved north of the Chesapeake Bay Bridge (near Annapolis, MD)to the Susquehanna River (Henny et al., 1974). With the banning ofthe pesticide DDT in 1972, the osprey population rebounded bothnumerically and spatially. A bay-wide survey in 1995e1996 esti-mated 3500 nesting pairs, and population growth was rapid in thetidal freshwater tributaries and areas north of the Chesapeake BayBridge (Watts et al., 2004).
For decades, impaired water quality and toxic chemicals in sedi-ment, water and biota have been found in highly industrialized andurbanized areas of Chesapeake Bay including Baltimore Harbor andthe Anacostia and Elizabeth Rivers. These three sites have beendesignated by the U.S. Environmental Protection Agency (US EPA) asRegions of Concern (ROCs) (US EPA, 1994). Rattner et al. (2004)
* Corresponding author. Patuxent Wildlife Research Center, U.S. Geological Sur-vey, c/o BARC-East, Building 308, 10300 Baltimore Avenue, Beltsville, MD 20705,USA.
E-mail address: [email protected] (B.A. Rattner).1 Present address: Department of Biology and Biochemistry, University of
Houston, Houston, TX 77004, USA.
Contents lists available at ScienceDirect
Environmental Pollution
journal homepage: www.elsevier .com/locate/envpol
http://dx.doi.org/10.1016/j.envpol.2015.05.0260269-7491/Published by Elsevier Ltd.
Environmental Pollution 205 (2015) 278e290
proyster2
Text Box
This document is a U.S. government work and is not subject to copyright in the United States.
reported that osprey productivity in these regions was marginallyadequate to sustain local populations. Although concentrations ofp,p’-DDE and other organochlorine pesticides declined in eggs, PCBlevels remained elevated especially inBaltimoreHarbor compared toreference sites. Polybrominated diphenyl ethers (PBDEs) weredetected in osprey eggs from all sites, with values being some ofthe greatest found in North America. All ROCs continue to have hu-man health advisories on the consumption of several fish andshellfish species due to contamination with PCBs and other pesti-cides (VDH, 2009; MDE, 2014).
In May 2009, the Chesapeake Bay Executive Order 13508 wassigned, which placed emphasis on continued monitoring of ROCsand the restoration and protection of the Bay (Chesapeake BayExecutive Order, 2009). Just over a decade has elapsed sincethe last large-scale ecotoxicological monitoring study of Ches-apeake Bay wildlife, during which time there were limitedexposure data for Bay avifauna (Rattner and McGowan, 2007;Chen et al., 2010; US EPA, 2012). As part of a larger studyexamining contaminant exposure, food web transfer, and po-tential effects on ospreys in Chesapeake Bay, the three historicalROCs were re-visited to examine temporal and spatial changes inosprey productivity and concentrations of legacy and morecontemporary pollutants.
2. Materials and methods
2.1. Study sites
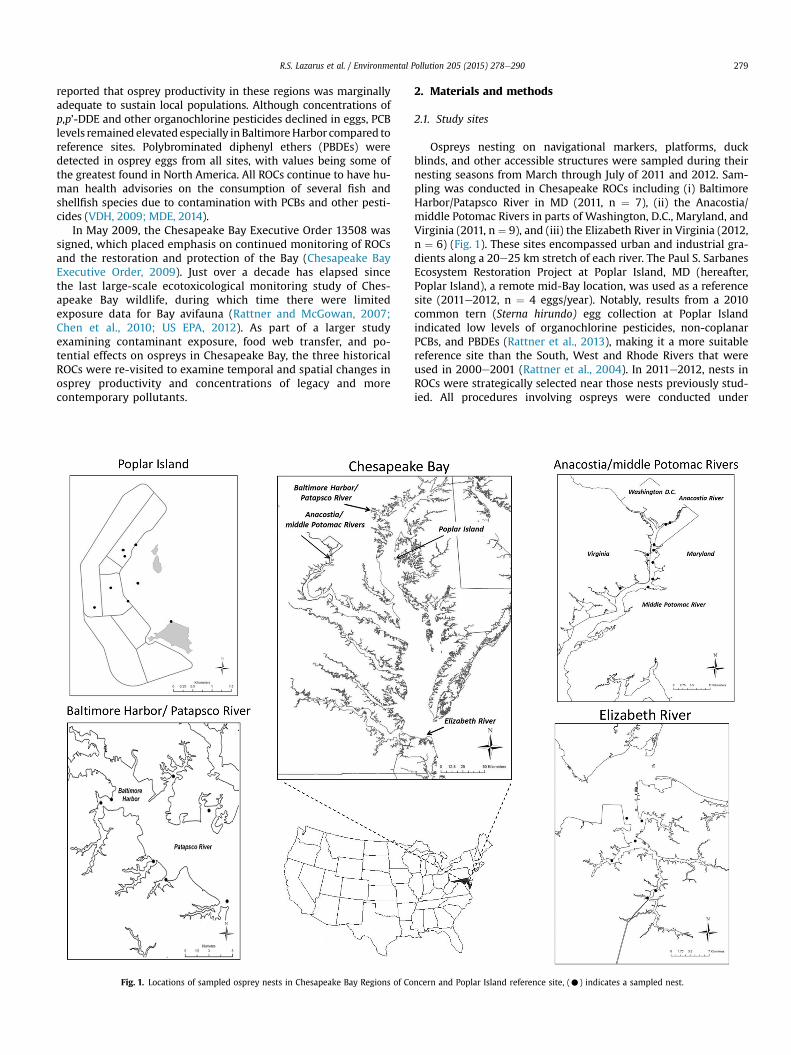
Ospreys nesting on navigational markers, platforms, duckblinds, and other accessible structures were sampled during theirnesting seasons from March through July of 2011 and 2012. Sam-pling was conducted in Chesapeake ROCs including (i) BaltimoreHarbor/Patapsco River in MD (2011, n ¼ 7), (ii) the Anacostia/middle Potomac Rivers in parts of Washington, D.C., Maryland, andVirginia (2011, n ¼ 9), and (iii) the Elizabeth River in Virginia (2012,n ¼ 6) (Fig. 1). These sites encompassed urban and industrial gra-dients along a 20e25 km stretch of each river. The Paul S. SarbanesEcosystem Restoration Project at Poplar Island, MD (hereafter,Poplar Island), a remote mid-Bay location, was used as a referencesite (2011e2012, n ¼ 4 eggs/year). Notably, results from a 2010common tern (Sterna hirundo) egg collection at Poplar Islandindicated low levels of organochlorine pesticides, non-coplanarPCBs, and PBDEs (Rattner et al., 2013), making it a more suitablereference site than the South, West and Rhode Rivers that wereused in 2000e2001 (Rattner et al., 2004). In 2011e2012, nests inROCs were strategically selected near those nests previously stud-ied. All procedures involving ospreys were conducted under
Fig. 1. Locations of sampled osprey nests in Chesapeake Bay Regions of Concern and Poplar Island reference site, (C) indicates a sampled nest.
R.S. Lazarus et al. / Environmental Pollution 205 (2015) 278e290 279
approval of the Institutional Animal Care and Use Committees ofthe USGS-Patuxent Wildlife Research Center (USGS-PWRC) and theUniversity of Maryland, and with appropriate Federal and Statescientific collection permits.
2.2. Egg sample collection
Using the sample egg technique described in Blus (1984), ospreyeggs were collected for residue analysis (n ¼ 30 total). After eachclutch was complete (three or more eggs), a random egg wassampled within a week for subsequent contaminant analysis. Eggswere transported to the USGS-PWRC, cleaned with distilled water,weighed and their length and breadthweremeasured to the nearest0.01 mm. A 2.4-mm hole was drilled into the blunt end of the egg(Dremel®MultiPro®7.2V,Model770,Mt. Prospect, IL,USA).Moistureloss during incubation concentrates contaminants in the egg.Distilled water was injected into the air cell to return moisturecontent and contaminant concentrations to those in the egg when itwas freshly laid (Heinz et al., 2009). Eggs were weighed, opened todetermine fertility and developmental stage, and contents trans-ferred into a chemically clean jar (I-CHEM, VWR Scientific, Radnor,PA, USA), stored at�80 �C, and eventually transported to theVirginiaInstitute of Marine Science (VIMS), Gloucester, VA, USA. Eggshellswere dried for 3e4 months at room temperature and measured forthickness at three sites on the equator using a micrometer (Model1010M; L.S. Starrett Co., Athol, MA, USA) and averaged.
2.3. Osprey reproductive success
Osprey productivity was monitored following the definitionsand traditional methods described by Postupalsky (1977) and morerecently Steenhof and Newton (2007). Initial nest visits were madein March to locate study nests and determine breeding status.Additional nests were monitored to have back-up locations forsampled nests if the targeted nests failed. Nests were visited at7e10 day intervals to determine the fate of the nest including thenumbers of eggs laid, eggs hatched, and young present at advancedage (>45 days) to fledging. Other observations including evidenceof predation or disturbance were noted.
2.4. Osprey nestling blood samples and morphological endpoints
A blood sample was collected from a 40e45-day-old nestling ateach nest from which a sample egg was collected. In the event thetarget nest failed (8/30 instances), the sample was drawn from anestling residing in a nearby nest (within 2.5 km). Specifically,before fledging, one nestling per nest (n ¼ 30) was removed fromthe nest for about 10 min. Following physical examination, culmenlength and body weight were measured and the crop was palpatedto determine level of crop filling. A 5e7-mL brachial blood samplewas drawn using a 23-gauge 1-inch needle into a heparinized sy-ringe (Sarstedt International, Newton, NC, USA). About 100 mL offresh osprey nestling blood was transferred to a microcentrifugetube, frozen on dry ice, and stored at �80 �C for the DNA damageassay. The remainder of the blood sample was saved for a concur-rent study (Lazarus et al., 2015).
2.5. Analysis of contaminant residues in osprey eggs
Osprey egg analyses for 11 PBDE congeners, 5 alternativebrominated flame retardants [(alt-BFRs: a, b, g hex-abromocyclododecane (HBCD), 1,2-bis (2,4,6-tribromophenoxy)ethane (BTBPE), di(2-ethylhexyl)-2,3,4,5-tetrabromophthalate(TBPH), 2-ethylhexyl 2,3,4,5-tetrabromobenzoate (TBB), and deca-bromodiphenyl ether (DBDPE)], 129 PCB congeners, 44
organochlorine pesticides and methoxytriclosan were conductedbased on the methods of Chen et al. (2008) and La Guardia et al.(2007, 2010). Egg contents were homogenized, lyophilized andthen spiked with surrogate standards of PCB 30, 65 and 204 (UltraScientific, North Kingstown, RI, USA), 13C-methoxytriclosan, 13C-PCB-126 and 2,3,4,40,5,6 e hexabromodiphenyl ether (BDE 166;Cambridge Isotope Laboratories, Inc., Andover, MA, USA). Blanks,consisting of sodium sulfate (baked at 450 �C overnight), wereanalyzed to evaluate possible laboratory contamination. Driedsamples underwent accelerated solvent extraction (Dionex ASE200, Sunnyvale, CA, USA) usingmethylene chloride (DCM) at 100 �Cand 68 atm.
Extracts were purified by size exclusion chromatography (SEC,Envirosep-ABC®, 350 � 21.1 mm column; Phenomenex, Torrance,CA, USA). Each post-SEC extract was reduced in volume, added to asolid-phase 2-g silica glass extraction column (Isolute, Interna-tional Sorbent Technology, Ltd., Hengoed Mid Glamorgan, UK) andeluted with 3.5 mL hexane (to waste), followed by 6.5 mL of 60:40hexane/DCM and 8 mL DCM. The latter two fractions were com-bined, pooled and then split, with half going for coplanar PCBanalysis. Coplanar PCBs were separated from nonplanar PCBs byelution through a Supleclean ENVI-Carb SPE column (Sigma-eAldrich Co., St. Louis, MO, USA). The column was first eluted with15 mL hexane (to waste). The coplanar congeners were obtained byelution with 20 mL hexane/toluene (99:1) and 20 mL toluene. Thepooled eluent was reduced in volume, spiked with p-terphenyl(Ultra Scientific, North Kingstown, RI, USA) as an internal standard,and analyzed by gas chromatography/mass spectrometry (GC/MS)on an Agilent 5975C instrument (Agilent Technologies, Santa Clara,CA, USA), in electron impact mode and selected ion monitoring. A60 m DB-5 MS GC column (Agilent, 0.32 mm ID � 0.1 mm thick-ness) was used.
The second half of the silica SPE fraction retained was spikedwith decachlorodiphenyl ether (Ultra Scientific) as the internalquantitation standard. Identification and quantitation of non-coplanar PCBs was conducted by GC/MS in the electron ionizationmode on a Varian 2200 GC/MS (Agilent Technologies). Organo-chlorine pesticides and methoxytriclosan were analyzed similarlyby GC/MS on a Varian 4D MS. Both analyses used 60-m DB-5 col-umns (0.32 mm ID � 0.25 mm thickness).
The PBDEs and alt-BFRs were analyzed using this same fraction.PBDEs and alt-BFRs were separated by ultra-performance liquidchromatography (UPLC, Waters Corp., Milford, MA, USA) andanalyzed by atmospheric pressure photoionization tandem massspectrometry (APPI/MS/MS, Q-Trap3200 MS, AB Sciex, Framing-ham,MA, USA). Further details of the UPLC-APPI/MS analysis can befound in La Guardia et al. (2013).
2.6. Quality control and assurance
Instrumental analysis and laboratory QA/QC for methoddevelopment are described in Chen et al. (2008). The methoddetection limit (MDL) for organochlorine pesticides and non-coplanar PCB congeners was 0.4 mg/kg ww, coplanar PCBs was0.04 mg/kg ww, and PBDEs and alt-BFRs was 0.4 mg/kg ww. Datawere corrected based on the recovery of surrogate standards ineach sample. For quantification of organochlorine pesticides andmethoxytriclosan, average recovery of the surrogate standard PCB-204 (similar physiochemical properties to the organochlorinepesticides) and 13C-methoxytriclosan from the eggs were(mean ± SD) 85.9 ± 11.0%. Recoveries of the surrogates for the non-coplanar PCBs (PCB-204) averaged 94.9 ± 13.7%, coplanar PCBs97.9 ± 0.13%, and brominated flame retardants (BDE 166)98.6 ± 24.1%. Overall, moisture content (adjusted to fresh weight)in eggs averaged 83.7 ± 1.37%.
R.S. Lazarus et al. / Environmental Pollution 205 (2015) 278e290280
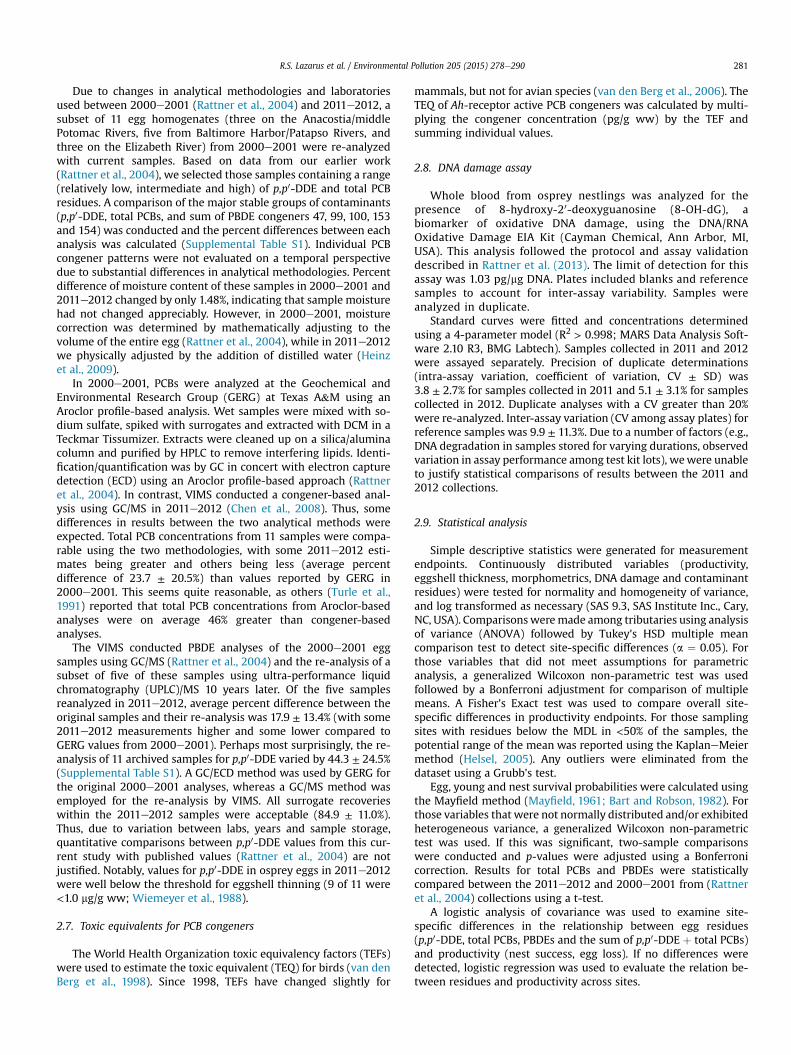
Due to changes in analytical methodologies and laboratoriesused between 2000e2001 (Rattner et al., 2004) and 2011e2012, asubset of 11 egg homogenates (three on the Anacostia/middlePotomac Rivers, five from Baltimore Harbor/Patapso Rivers, andthree on the Elizabeth River) from 2000e2001 were re-analyzedwith current samples. Based on data from our earlier work(Rattner et al., 2004), we selected those samples containing a range(relatively low, intermediate and high) of p,p0-DDE and total PCBresidues. A comparison of the major stable groups of contaminants(p,p0-DDE, total PCBs, and sum of PBDE congeners 47, 99, 100, 153and 154) was conducted and the percent differences between eachanalysis was calculated (Supplemental Table S1). Individual PCBcongener patterns were not evaluated on a temporal perspectivedue to substantial differences in analytical methodologies. Percentdifference of moisture content of these samples in 2000e2001 and2011e2012 changed by only 1.48%, indicating that sample moisturehad not changed appreciably. However, in 2000e2001, moisturecorrection was determined by mathematically adjusting to thevolume of the entire egg (Rattner et al., 2004), while in 2011e2012we physically adjusted by the addition of distilled water (Heinzet al., 2009).
In 2000e2001, PCBs were analyzed at the Geochemical andEnvironmental Research Group (GERG) at Texas A&M using anAroclor profile-based analysis. Wet samples were mixed with so-dium sulfate, spiked with surrogates and extracted with DCM in aTeckmar Tissumizer. Extracts were cleaned up on a silica/aluminacolumn and purified by HPLC to remove interfering lipids. Identi-fication/quantification was by GC in concert with electron capturedetection (ECD) using an Aroclor profile-based approach (Rattneret al., 2004). In contrast, VIMS conducted a congener-based anal-ysis using GC/MS in 2011e2012 (Chen et al., 2008). Thus, somedifferences in results between the two analytical methods wereexpected. Total PCB concentrations from 11 samples were compa-rable using the two methodologies, with some 2011e2012 esti-mates being greater and others being less (average percentdifference of 23.7 ± 20.5%) than values reported by GERG in2000e2001. This seems quite reasonable, as others (Turle et al.,1991) reported that total PCB concentrations from Aroclor-basedanalyses were on average 46% greater than congener-basedanalyses.
The VIMS conducted PBDE analyses of the 2000e2001 eggsamples using GC/MS (Rattner et al., 2004) and the re-analysis of asubset of five of these samples using ultra-performance liquidchromatography (UPLC)/MS 10 years later. Of the five samplesreanalyzed in 2011e2012, average percent difference between theoriginal samples and their re-analysis was 17.9 ± 13.4% (with some2011e2012 measurements higher and some lower compared toGERG values from 2000e2001). Perhaps most surprisingly, the re-analysis of 11 archived samples for p,p0-DDE varied by 44.3 ± 24.5%(Supplemental Table S1). A GC/ECD method was used by GERG forthe original 2000e2001 analyses, whereas a GC/MS method wasemployed for the re-analysis by VIMS. All surrogate recoverieswithin the 2011e2012 samples were acceptable (84.9 ± 11.0%).Thus, due to variation between labs, years and sample storage,quantitative comparisons between p,p0-DDE values from this cur-rent study with published values (Rattner et al., 2004) are notjustified. Notably, values for p,p0-DDE in osprey eggs in 2011e2012were well below the threshold for eggshell thinning (9 of 11 were<1.0 mg/g ww; Wiemeyer et al., 1988).
2.7. Toxic equivalents for PCB congeners
The World Health Organization toxic equivalency factors (TEFs)were used to estimate the toxic equivalent (TEQ) for birds (van denBerg et al., 1998). Since 1998, TEFs have changed slightly for
mammals, but not for avian species (van den Berg et al., 2006). TheTEQ of Ah-receptor active PCB congeners was calculated by multi-plying the congener concentration (pg/g ww) by the TEF andsumming individual values.
2.8. DNA damage assay
Whole blood from osprey nestlings was analyzed for thepresence of 8-hydroxy-20-deoxyguanosine (8-OH-dG), abiomarker of oxidative DNA damage, using the DNA/RNAOxidative Damage EIA Kit (Cayman Chemical, Ann Arbor, MI,USA). This analysis followed the protocol and assay validationdescribed in Rattner et al. (2013). The limit of detection for thisassay was 1.03 pg/mg DNA. Plates included blanks and referencesamples to account for inter-assay variability. Samples wereanalyzed in duplicate.
Standard curves were fitted and concentrations determinedusing a 4-parameter model (R2 > 0.998; MARS Data Analysis Soft-ware 2.10 R3, BMG Labtech). Samples collected in 2011 and 2012were assayed separately. Precision of duplicate determinations(intra-assay variation, coefficient of variation, CV ± SD) was3.8 ± 2.7% for samples collected in 2011 and 5.1 ± 3.1% for samplescollected in 2012. Duplicate analyses with a CV greater than 20%were re-analyzed. Inter-assay variation (CV among assay plates) forreference samples was 9.9 ± 11.3%. Due to a number of factors (e.g.,DNA degradation in samples stored for varying durations, observedvariation in assay performance among test kit lots), wewere unableto justify statistical comparisons of results between the 2011 and2012 collections.
2.9. Statistical analysis
Simple descriptive statistics were generated for measurementendpoints. Continuously distributed variables (productivity,eggshell thickness, morphometrics, DNA damage and contaminantresidues) were tested for normality and homogeneity of variance,and log transformed as necessary (SAS 9.3, SAS Institute Inc., Cary,NC, USA). Comparisonsweremade among tributaries using analysisof variance (ANOVA) followed by Tukey's HSD multiple meancomparison test to detect site-specific differences (a ¼ 0.05). Forthose variables that did not meet assumptions for parametricanalysis, a generalized Wilcoxon non-parametric test was usedfollowed by a Bonferroni adjustment for comparison of multiplemeans. A Fisher's Exact test was used to compare overall site-specific differences in productivity endpoints. For those samplingsites with residues below the MDL in <50% of the samples, thepotential range of the mean was reported using the KaplaneMeiermethod (Helsel, 2005). Any outliers were eliminated from thedataset using a Grubb's test.
Egg, young and nest survival probabilities were calculated usingthe Mayfield method (Mayfield, 1961; Bart and Robson, 1982). Forthose variables that were not normally distributed and/or exhibitedheterogeneous variance, a generalized Wilcoxon non-parametrictest was used. If this was significant, two-sample comparisonswere conducted and p-values were adjusted using a Bonferronicorrection. Results for total PCBs and PBDEs were statisticallycompared between the 2011e2012 and 2000e2001 from (Rattneret al., 2004) collections using a t-test.
A logistic analysis of covariance was used to examine site-specific differences in the relationship between egg residues(p,p0-DDE, total PCBs, PBDEs and the sum of p,p0-DDE þ total PCBs)and productivity (nest success, egg loss). If no differences weredetected, logistic regression was used to evaluate the relation be-tween residues and productivity across sites.
R.S. Lazarus et al. / Environmental Pollution 205 (2015) 278e290 281
3. Results
3.1. Reproduction of ospreys
In 2011, 36 nests were identified along a 25-km segment on theAnacostia River, from the Frederick Douglass Bridge to DogueCreek, a tributary of the middle Potomac River. Thirty nests werefound along a 20-km stretch from Baltimore Harbor (Curtis Creek)east to themouth of Patapsco River (Bodkin Point). In 2012, 29 nestswere found along a 20-km stretch of the Elizabeth River (includingthe Lafayette River, West and South branches). No nests were foundon the East branch of the River. At Poplar Island (reference site),there were 12 active nests in 2011 and 24 in 2012. Osprey nestdensity based on total water surface area surveyed was 1 nest/1.60 km2 on the Anacostia/middle Potomac Rivers,1 nest/3.9 km2 inBaltimore Harbor/Patapsco River, and 1 nest/3.57 km2 on ElizabethRiver. Poplar Island had the highest density of osprey nests in 2012,at 1 nest/0.19 km2.
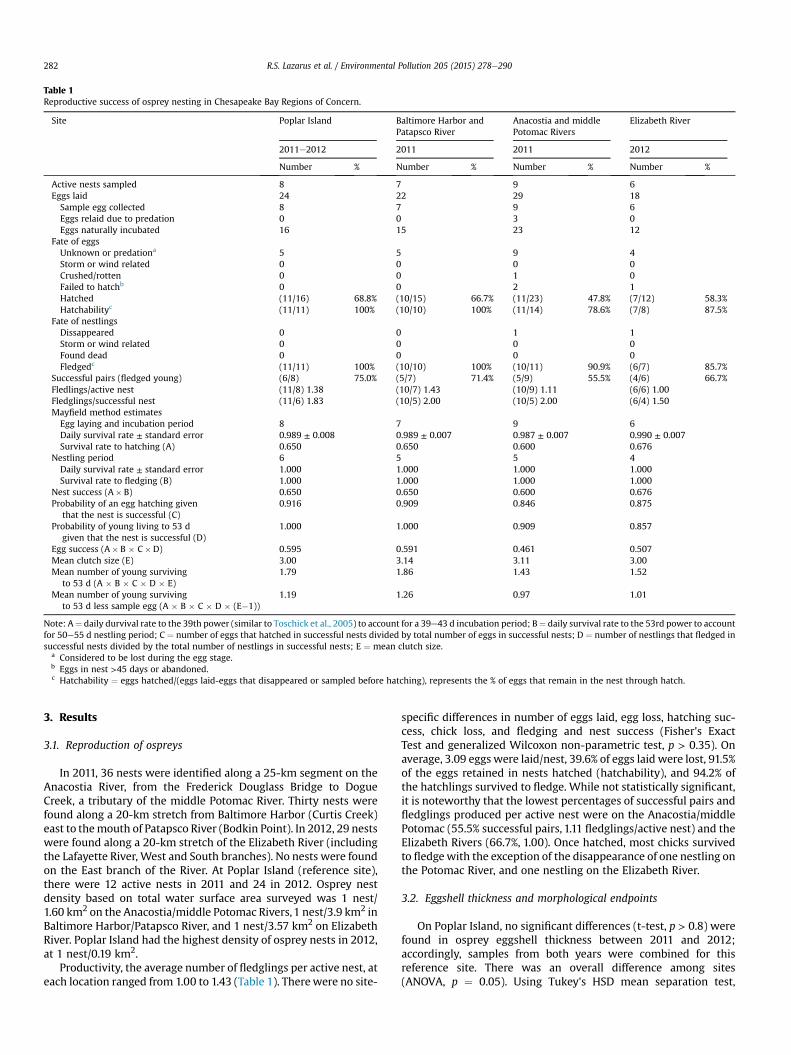
Productivity, the average number of fledglings per active nest, ateach location ranged from 1.00 to 1.43 (Table 1). Therewere no site-
specific differences in number of eggs laid, egg loss, hatching suc-cess, chick loss, and fledging and nest success (Fisher's ExactTest and generalized Wilcoxon non-parametric test, p > 0.35). Onaverage, 3.09 eggs were laid/nest, 39.6% of eggs laid were lost, 91.5%of the eggs retained in nests hatched (hatchability), and 94.2% ofthe hatchlings survived to fledge. While not statistically significant,it is noteworthy that the lowest percentages of successful pairs andfledglings produced per active nest were on the Anacostia/middlePotomac (55.5% successful pairs, 1.11 fledglings/active nest) and theElizabeth Rivers (66.7%, 1.00). Once hatched, most chicks survivedto fledgewith the exception of the disappearance of one nestling onthe Potomac River, and one nestling on the Elizabeth River.
3.2. Eggshell thickness and morphological endpoints
On Poplar Island, no significant differences (t-test, p > 0.8) werefound in osprey eggshell thickness between 2011 and 2012;accordingly, samples from both years were combined for thisreference site. There was an overall difference among sites(ANOVA, p ¼ 0.05). Using Tukey's HSD mean separation test,
Table 1Reproductive success of osprey nesting in Chesapeake Bay Regions of Concern.
Site Poplar Island Baltimore Harbor andPatapsco River
Anacostia and middlePotomac Rivers
Elizabeth River
2011e2012 2011 2011 2012
Number % Number % Number % Number %
Active nests sampled 8 7 9 6Eggs laid 24 22 29 18Sample egg collected 8 7 9 6Eggs relaid due to predation 0 0 3 0Eggs naturally incubated 16 15 23 12
Fate of eggsUnknown or predationa 5 5 9 4Storm or wind related 0 0 0 0Crushed/rotten 0 0 1 0Failed to hatchb 0 0 2 1Hatched (11/16) 68.8% (10/15) 66.7% (11/23) 47.8% (7/12) 58.3%Hatchabilityc (11/11) 100% (10/10) 100% (11/14) 78.6% (7/8) 87.5%
Fate of nestlingsDissappeared 0 0 1 1Storm or wind related 0 0 0 0Found dead 0 0 0 0Fledgedc (11/11) 100% (10/10) 100% (10/11) 90.9% (6/7) 85.7%
Successful pairs (fledged young) (6/8) 75.0% (5/7) 71.4% (5/9) 55.5% (4/6) 66.7%Fledlings/active nest (11/8) 1.38 (10/7) 1.43 (10/9) 1.11 (6/6) 1.00Fledglings/successful nest (11/6) 1.83 (10/5) 2.00 (10/5) 2.00 (6/4) 1.50Mayfield method estimatesEgg laying and incubation period 8 7 9 6Daily survival rate ± standard error 0.989 ± 0.008 0.989 ± 0.007 0.987 ± 0.007 0.990 ± 0.007Survival rate to hatching (A) 0.650 0.650 0.600 0.676
Nestling period 6 5 5 4Daily survival rate ± standard error 1.000 1.000 1.000 1.000Survival rate to fledging (B) 1.000 1.000 1.000 1.000
Nest success (A� B) 0.650 0.650 0.600 0.676Probability of an egg hatching given
that the nest is successful (C)0.916 0.909 0.846 0.875
Probability of young living to 53 dgiven that the nest is successful (D)
1.000 1.000 0.909 0.857
Egg success (A� B � C�D) 0.595 0.591 0.461 0.507Mean clutch size (E) 3.00 3.14 3.11 3.00Mean number of young surviving
to 53 d (A � B � C � D � E)1.79 1.86 1.43 1.52
Mean number of young survivingto 53 d less sample egg (A � B � C � D � (E�1))
1.19 1.26 0.97 1.01
Note: A¼ daily durvival rate to the 39th power (similar to Toschick et al., 2005) to account for a 39e43 d incubation period; B¼ daily survival rate to the 53rd power to accountfor 50e55 d nestling period; C ¼ number of eggs that hatched in successful nests divided by total number of eggs in successful nests; D ¼ number of nestlings that fledged insuccessful nests divided by the total number of nestlings in successful nests; E ¼ mean clutch size.
a Considered to be lost during the egg stage.b Eggs in nest >45 days or abandoned.c Hatchability ¼ eggs hatched/(eggs laid-eggs that disappeared or sampled before hatching), represents the % of eggs that remain in the nest through hatch.
R.S. Lazarus et al. / Environmental Pollution 205 (2015) 278e290282
eggshell thickness on the Anacostia/middle Potomac Rivers(0.481 ± 0.049 mm) was significantly lower than for Poplar Island(0.549 ± 0.057 mm) (p ¼ 0.04). While eggshell thickness wasnumerically lowest on the Anacostia/middle Potomac Riverscompared to the other sites (Baltimore Harbor 0.504 ± 0.040 mmand Elizabeth River 0.529 ± 0.044 mm), this trend was not signif-icant (p > 0.48). Of the egg that failed to hatch on the Potomac,there was no evidence of eggshell thinning (0.503 mm).
All nestlings examined were in good body condition. One chickon the Elizabeth River had a plastic bag around its neck, but other-wise appeared to be fine. Osprey nestling bodyweight (bodyweightminus estimatedweight of food in crop; Schaadt andBird,1993)wascompared among sites. Several of the nestlings on the ElizabethRiver had mites and there were instances of feather pluckingindicative of sibling competition for food. Therewere no differencesin body weight between sampling years on Poplar Island (t-test,p > 0.6); therefore, measurements were combined. There were nodifferences in osprey nestling body weight among the four sites(p¼ 0.11, ANOVA; Poplar Island2011e2012,1603±159 g; Anacostia/middle Potomac Rivers 1480 ± 144 g; Baltimore Harbor/PatapscoRivers 1551 ± 140 g; Elizabeth River 1365 ± 138 g). There were nodifferences in culmen length among sites (p ¼ 0.3, ANOVA) andvalues ranged by 5.2 mm (26.9e32.1 mm).
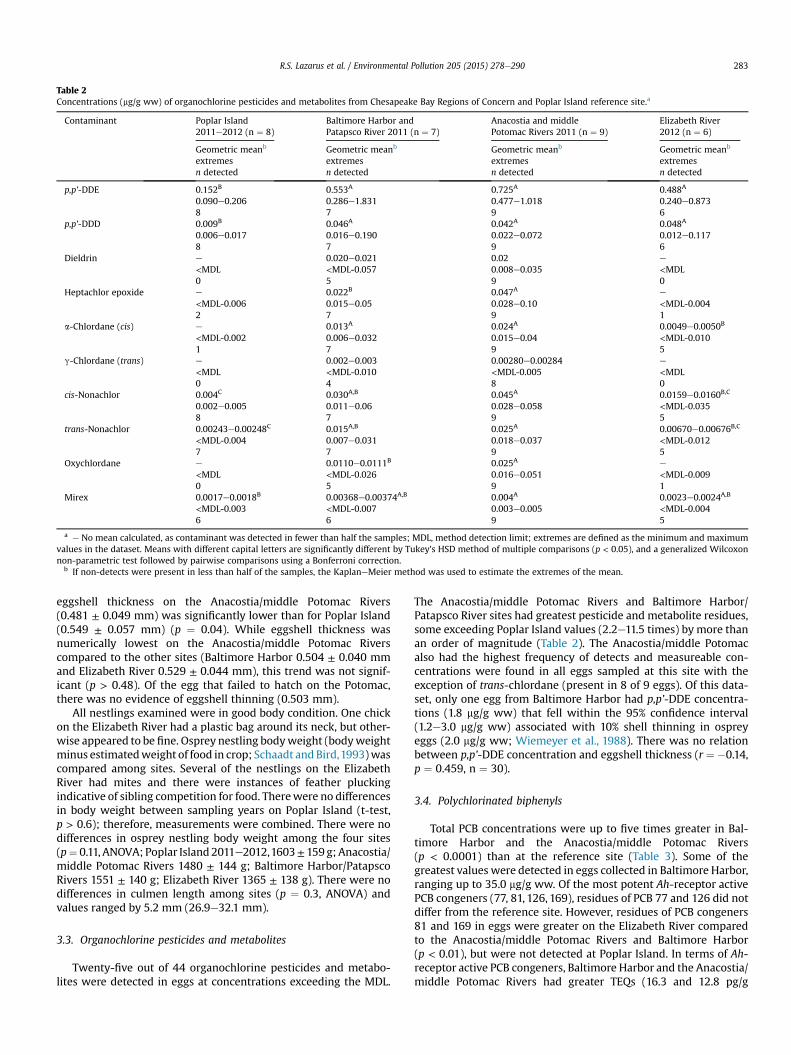
3.3. Organochlorine pesticides and metabolites
Twenty-five out of 44 organochlorine pesticides and metabo-lites were detected in eggs at concentrations exceeding the MDL.
The Anacostia/middle Potomac Rivers and Baltimore Harbor/Patapsco River sites had greatest pesticide and metabolite residues,some exceeding Poplar Island values (2.2e11.5 times) by more thanan order of magnitude (Table 2). The Anacostia/middle Potomacalso had the highest frequency of detects and measureable con-centrations were found in all eggs sampled at this site with theexception of trans-chlordane (present in 8 of 9 eggs). Of this data-set, only one egg from Baltimore Harbor had p,p’-DDE concentra-tions (1.8 mg/g ww) that fell within the 95% confidence interval(1.2e3.0 mg/g ww) associated with 10% shell thinning in ospreyeggs (2.0 mg/g ww; Wiemeyer et al., 1988). There was no relationbetween p,p’-DDE concentration and eggshell thickness (r ¼ �0.14,p ¼ 0.459, n ¼ 30).
3.4. Polychlorinated biphenyls
Total PCB concentrations were up to five times greater in Bal-timore Harbor and the Anacostia/middle Potomac Rivers(p < 0.0001) than at the reference site (Table 3). Some of thegreatest values were detected in eggs collected in Baltimore Harbor,ranging up to 35.0 mg/g ww. Of the most potent Ah-receptor activePCB congeners (77, 81, 126, 169), residues of PCB 77 and 126 did notdiffer from the reference site. However, residues of PCB congeners81 and 169 in eggs were greater on the Elizabeth River comparedto the Anacostia/middle Potomac Rivers and Baltimore Harbor(p < 0.01), but were not detected at Poplar Island. In terms of Ah-receptor active PCB congeners, Baltimore Harbor and the Anacostia/middle Potomac Rivers had greater TEQs (16.3 and 12.8 pg/g
Table 2Concentrations (mg/g ww) of organochlorine pesticides and metabolites from Chesapeake Bay Regions of Concern and Poplar Island reference site.a
Contaminant Poplar Island2011e2012 (n ¼ 8)
Baltimore Harbor andPatapsco River 2011 (n ¼ 7)
Anacostia and middlePotomac Rivers 2011 (n ¼ 9)
Elizabeth River2012 (n ¼ 6)
Geometric meanb
extremesn detected
Geometric meanb
extremesn detected
Geometric meanb
extremesn detected
Geometric meanb
extremesn detected
p,p'-DDE 0.152B 0.553A 0.725A 0.488A
0.090e0.206 0.286e1.831 0.477e1.018 0.240e0.8738 7 9 6
p,p'-DDD 0.009B 0.046A 0.042A 0.048A
0.006e0.017 0.016e0.190 0.022e0.072 0.012e0.1178 7 9 6
Dieldrin e 0.020e0.021 0.02 e
<MDL <MDL-0.057 0.008e0.035 <MDL0 5 9 0
Heptachlor epoxide e 0.022B 0.047A e
<MDL-0.006 0.015e0.05 0.028e0.10 <MDL-0.0042 7 9 1
a-Chlordane (cis) e 0.013A 0.024A 0.0049e0.0050B
<MDL-0.002 0.006e0.032 0.015e0.04 <MDL-0.0101 7 9 5
g-Chlordane (trans) e 0.002e0.003 0.00280e0.00284 e
<MDL <MDL-0.010 <MDL-0.005 <MDL0 4 8 0
cis-Nonachlor 0.004C 0.030A,B 0.045A 0.0159e0.0160B,C
0.002e0.005 0.011e0.06 0.028e0.058 <MDL-0.0358 7 9 5
trans-Nonachlor 0.00243e0.00248C 0.015A,B 0.025A 0.00670e0.00676B,C
<MDL-0.004 0.007e0.031 0.018e0.037 <MDL-0.0127 7 9 5
Oxychlordane e 0.0110e0.0111B 0.025A e
<MDL <MDL-0.026 0.016e0.051 <MDL-0.0090 5 9 1
Mirex 0.0017e0.0018B 0.00368e0.00374A,B 0.004A 0.0023e0.0024A,B
<MDL-0.003 <MDL-0.007 0.003e0.005 <MDL-0.0046 6 9 5
a e No mean calculated, as contaminant was detected in fewer than half the samples; MDL, method detection limit; extremes are defined as the minimum and maximumvalues in the dataset. Means with different capital letters are significantly different by Tukey's HSD method of multiple comparisons (p < 0.05), and a generalized Wilcoxonnon-parametric test followed by pairwise comparisons using a Bonferroni correction.
b If non-detects were present in less than half of the samples, the KaplaneMeier method was used to estimate the extremes of the mean.
R.S. Lazarus et al. / Environmental Pollution 205 (2015) 278e290 283
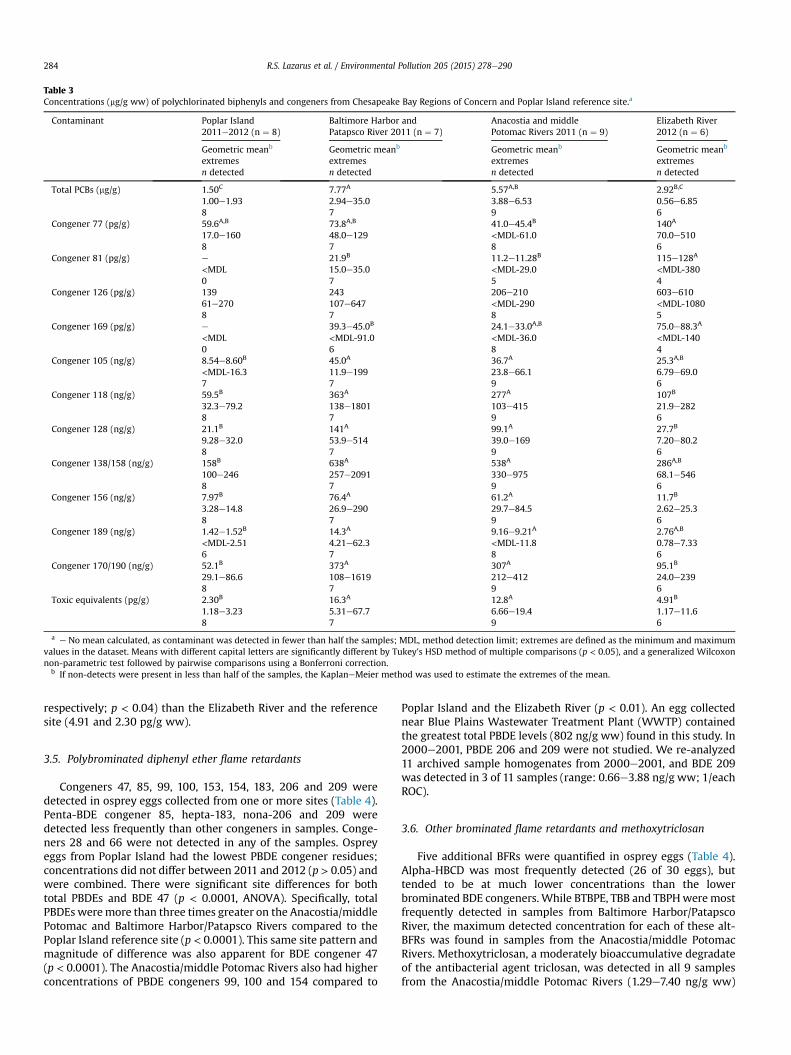
respectively; p < 0.04) than the Elizabeth River and the referencesite (4.91 and 2.30 pg/g ww).
3.5. Polybrominated diphenyl ether flame retardants
Congeners 47, 85, 99, 100, 153, 154, 183, 206 and 209 weredetected in osprey eggs collected from one or more sites (Table 4).Penta-BDE congener 85, hepta-183, nona-206 and 209 weredetected less frequently than other congeners in samples. Conge-ners 28 and 66 were not detected in any of the samples. Ospreyeggs from Poplar Island had the lowest PBDE congener residues;concentrations did not differ between 2011 and 2012 (p > 0.05) andwere combined. There were significant site differences for bothtotal PBDEs and BDE 47 (p < 0.0001, ANOVA). Specifically, totalPBDEs weremore than three times greater on the Anacostia/middlePotomac and Baltimore Harbor/Patapsco Rivers compared to thePoplar Island reference site (p < 0.0001). This same site pattern andmagnitude of difference was also apparent for BDE congener 47(p < 0.0001). The Anacostia/middle Potomac Rivers also had higherconcentrations of PBDE congeners 99, 100 and 154 compared to
Poplar Island and the Elizabeth River (p < 0.01). An egg collectednear Blue Plains Wastewater Treatment Plant (WWTP) containedthe greatest total PBDE levels (802 ng/g ww) found in this study. In2000e2001, PBDE 206 and 209 were not studied. We re-analyzed11 archived sample homogenates from 2000e2001, and BDE 209was detected in 3 of 11 samples (range: 0.66e3.88 ng/g ww; 1/eachROC).
3.6. Other brominated flame retardants and methoxytriclosan
Five additional BFRs were quantified in osprey eggs (Table 4).Alpha-HBCD was most frequently detected (26 of 30 eggs), buttended to be at much lower concentrations than the lowerbrominated BDE congeners. While BTBPE, TBB and TBPHweremostfrequently detected in samples from Baltimore Harbor/PatapscoRiver, the maximum detected concentration for each of these alt-BFRs was found in samples from the Anacostia/middle PotomacRivers. Methoxytriclosan, a moderately bioaccumulative degradateof the antibacterial agent triclosan, was detected in all 9 samplesfrom the Anacostia/middle Potomac Rivers (1.29e7.40 ng/g ww)
Table 3Concentrations (mg/g ww) of polychlorinated biphenyls and congeners from Chesapeake Bay Regions of Concern and Poplar Island reference site.a
Contaminant Poplar Island2011e2012 (n ¼ 8)
Baltimore Harbor andPatapsco River 2011 (n ¼ 7)
Anacostia and middlePotomac Rivers 2011 (n ¼ 9)
Elizabeth River2012 (n ¼ 6)
Geometric meanb
extremesn detected
Geometric meanb
extremesn detected
Geometric meanb
extremesn detected
Geometric meanb
extremesn detected
Total PCBs (mg/g) 1.50C 7.77A 5.57A,B 2.92B,C
1.00e1.93 2.94e35.0 3.88e6.53 0.56e6.858 7 9 6
Congener 77 (pg/g) 59.6A,B 73.8A,B 41.0e45.4B 140A
17.0e160 48.0e129 <MDL-61.0 70.0e5108 7 8 6
Congener 81 (pg/g) e 21.9B 11.2e11.28B 115e128A
<MDL 15.0e35.0 <MDL-29.0 <MDL-3800 7 5 4
Congener 126 (pg/g) 139 243 206e210 603e61061e270 107e647 <MDL-290 <MDL-10808 7 8 5
Congener 169 (pg/g) e 39.3e45.0B 24.1e33.0A,B 75.0e88.3A
<MDL <MDL-91.0 <MDL-36.0 <MDL-1400 6 8 4
Congener 105 (ng/g) 8.54e8.60B 45.0A 36.7A 25.3A,B
<MDL-16.3 11.9e199 23.8e66.1 6.79e69.07 7 9 6
Congener 118 (ng/g) 59.5B 363A 277A 107B
32.3e79.2 138e1801 103e415 21.9e2828 7 9 6
Congener 128 (ng/g) 21.1B 141A 99.1A 27.7B
9.28e32.0 53.9e514 39.0e169 7.20e80.28 7 9 6
Congener 138/158 (ng/g) 158B 638A 538A 286A,B
100e246 257e2091 330e975 68.1e5468 7 9 6
Congener 156 (ng/g) 7.97B 76.4A 61.2A 11.7B
3.28e14.8 26.9e290 29.7e84.5 2.62e25.38 7 9 6
Congener 189 (ng/g) 1.42e1.52B 14.3A 9.16e9.21A 2.76A,B
<MDL-2.51 4.21e62.3 <MDL-11.8 0.78e7.336 7 8 6
Congener 170/190 (ng/g) 52.1B 373A 307A 95.1B
29.1e86.6 108e1619 212e412 24.0e2398 7 9 6
Toxic equivalents (pg/g) 2.30B 16.3A 12.8A 4.91B
1.18e3.23 5.31e67.7 6.66e19.4 1.17e11.68 7 9 6
a e No mean calculated, as contaminant was detected in fewer than half the samples; MDL, method detection limit; extremes are defined as the minimum and maximumvalues in the dataset. Means with different capital letters are significantly different by Tukey's HSD method of multiple comparisons (p < 0.05), and a generalized Wilcoxonnon-parametric test followed by pairwise comparisons using a Bonferroni correction.
b If non-detects were present in less than half of the samples, the KaplaneMeier method was used to estimate the extremes of the mean.
R.S. Lazarus et al. / Environmental Pollution 205 (2015) 278e290284
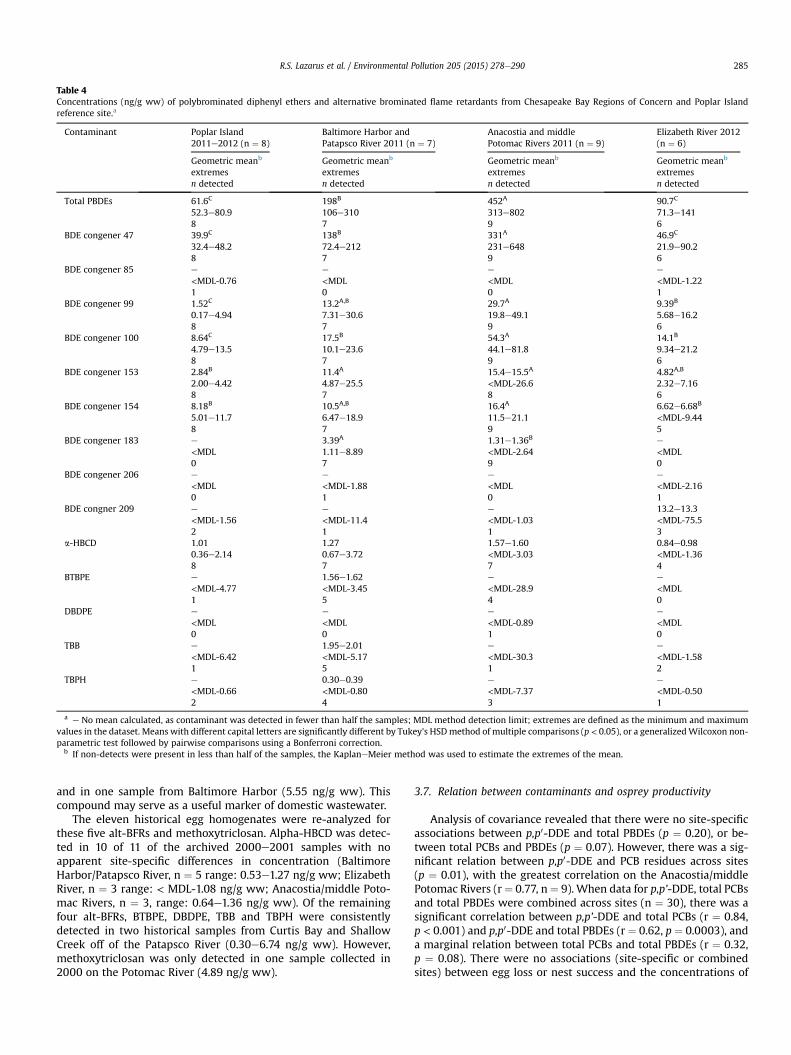
and in one sample from Baltimore Harbor (5.55 ng/g ww). Thiscompound may serve as a useful marker of domestic wastewater.
The eleven historical egg homogenates were re-analyzed forthese five alt-BFRs and methoxytriclosan. Alpha-HBCD was detec-ted in 10 of 11 of the archived 2000e2001 samples with noapparent site-specific differences in concentration (BaltimoreHarbor/Patapsco River, n ¼ 5 range: 0.53e1.27 ng/g ww; ElizabethRiver, n ¼ 3 range: < MDL-1.08 ng/g ww; Anacostia/middle Poto-mac Rivers, n ¼ 3, range: 0.64e1.36 ng/g ww). Of the remainingfour alt-BFRs, BTBPE, DBDPE, TBB and TBPH were consistentlydetected in two historical samples from Curtis Bay and ShallowCreek off of the Patapsco River (0.30e6.74 ng/g ww). However,methoxytriclosan was only detected in one sample collected in2000 on the Potomac River (4.89 ng/g ww).
3.7. Relation between contaminants and osprey productivity
Analysis of covariance revealed that there were no site-specificassociations between p,p0-DDE and total PBDEs (p ¼ 0.20), or be-tween total PCBs and PBDEs (p ¼ 0.07). However, there was a sig-nificant relation between p,p0-DDE and PCB residues across sites(p ¼ 0.01), with the greatest correlation on the Anacostia/middlePotomac Rivers (r¼ 0.77, n¼ 9). When data for p,p’-DDE, total PCBsand total PBDEs were combined across sites (n ¼ 30), there was asignificant correlation between p,p’-DDE and total PCBs (r ¼ 0.84,p < 0.001) and p,p0-DDE and total PBDEs (r ¼ 0.62, p ¼ 0.0003), anda marginal relation between total PCBs and total PBDEs (r ¼ 0.32,p ¼ 0.08). There were no associations (site-specific or combinedsites) between egg loss or nest success and the concentrations of
Table 4Concentrations (ng/g ww) of polybrominated diphenyl ethers and alternative brominated flame retardants from Chesapeake Bay Regions of Concern and Poplar Islandreference site.a
Contaminant Poplar Island2011e2012 (n ¼ 8)
Baltimore Harbor andPatapsco River 2011 (n ¼ 7)
Anacostia and middlePotomac Rivers 2011 (n ¼ 9)
Elizabeth River 2012(n ¼ 6)
Geometric meanb
extremesn detected
Geometric meanb
extremesn detected
Geometric meanb
extremesn detected
Geometric meanb
extremesn detected
Total PBDEs 61.6C 198B 452A 90.7C
52.3e80.9 106e310 313e802 71.3e1418 7 9 6
BDE congener 47 39.9C 138B 331A 46.9C
32.4e48.2 72.4e212 231e648 21.9e90.28 7 9 6
BDE congener 85 e e e e
<MDL-0.76 <MDL <MDL <MDL-1.221 0 0 1
BDE congener 99 1.52C 13.2A,B 29.7A 9.39B
0.17e4.94 7.31e30.6 19.8e49.1 5.68e16.28 7 9 6
BDE congener 100 8.64C 17.5B 54.3A 14.1B
4.79e13.5 10.1e23.6 44.1e81.8 9.34e21.28 7 9 6
BDE congener 153 2.84B 11.4A 15.4e15.5A 4.82A,B
2.00e4.42 4.87e25.5 <MDL-26.6 2.32e7.168 7 8 6
BDE congener 154 8.18B 10.5A,B 16.4A 6.62e6.68B
5.01e11.7 6.47e18.9 11.5e21.1 <MDL-9.448 7 9 5
BDE congener 183 e 3.39A 1.31e1.36B e
<MDL 1.11e8.89 <MDL-2.64 <MDL0 7 9 0
BDE congener 206 e e e e
<MDL <MDL-1.88 <MDL <MDL-2.160 1 0 1
BDE congner 209 e e e 13.2e13.3<MDL-1.56 <MDL-11.4 <MDL-1.03 <MDL-75.52 1 1 3
a-HBCD 1.01 1.27 1.57e1.60 0.84e0.980.36e2.14 0.67e3.72 <MDL-3.03 <MDL-1.368 7 7 4
BTBPE e 1.56e1.62 e e
<MDL-4.77 <MDL-3.45 <MDL-28.9 <MDL1 5 4 0
DBDPE e e e e
<MDL <MDL <MDL-0.89 <MDL0 0 1 0
TBB e 1.95e2.01 e e
<MDL-6.42 <MDL-5.17 <MDL-30.3 <MDL-1.581 5 1 2
TBPH e 0.30e0.39 e e
<MDL-0.66 <MDL-0.80 <MDL-7.37 <MDL-0.502 4 3 1
a e No mean calculated, as contaminant was detected in fewer than half the samples; MDL method detection limit; extremes are defined as the minimum and maximumvalues in the dataset. Means with different capital letters are significantly different by Tukey's HSDmethod of multiple comparisons (p < 0.05), or a generalizedWilcoxon non-parametric test followed by pairwise comparisons using a Bonferroni correction.
b If non-detects were present in less than half of the samples, the KaplaneMeier method was used to estimate the extremes of the mean.
R.S. Lazarus et al. / Environmental Pollution 205 (2015) 278e290 285
p,p0-DDE, PCBs, PBDEs or the sum of p,p0-DDE þ PCBs (p > 0.09).
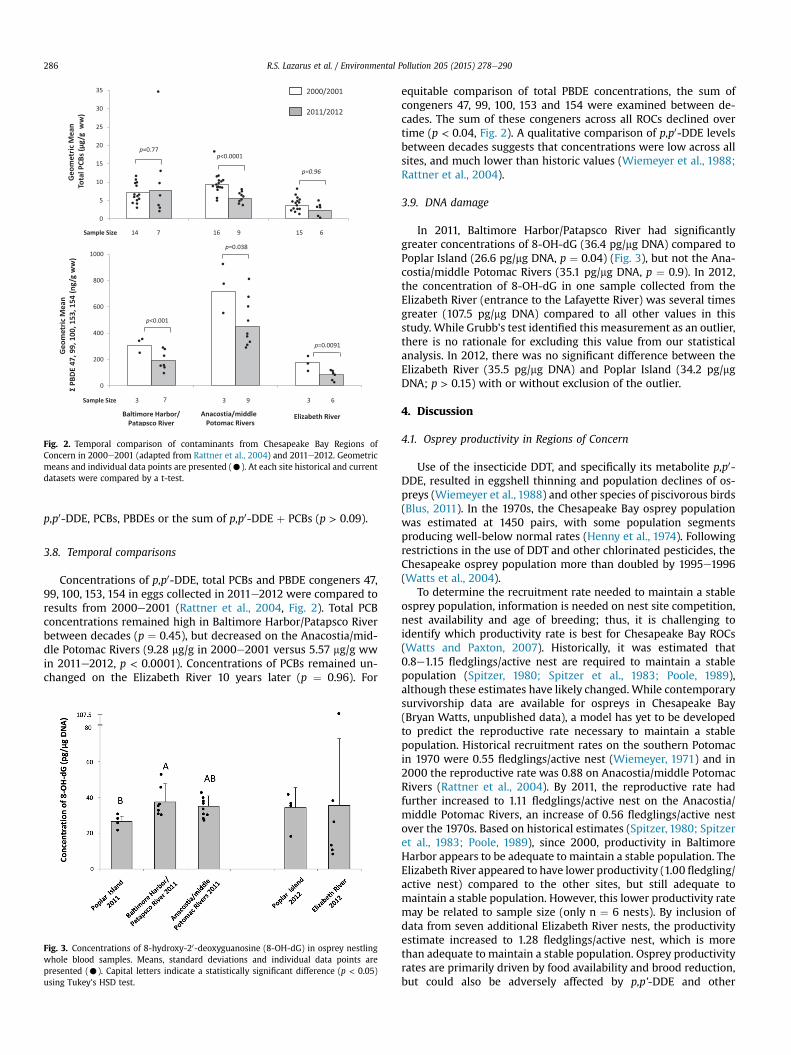
3.8. Temporal comparisons
Concentrations of p,p0-DDE, total PCBs and PBDE congeners 47,99, 100, 153, 154 in eggs collected in 2011e2012 were compared toresults from 2000e2001 (Rattner et al., 2004, Fig. 2). Total PCBconcentrations remained high in Baltimore Harbor/Patapsco Riverbetween decades (p ¼ 0.45), but decreased on the Anacostia/mid-dle Potomac Rivers (9.28 mg/g in 2000e2001 versus 5.57 mg/g wwin 2011e2012, p < 0.0001). Concentrations of PCBs remained un-changed on the Elizabeth River 10 years later (p ¼ 0.96). For
equitable comparison of total PBDE concentrations, the sum ofcongeners 47, 99, 100, 153 and 154 were examined between de-cades. The sum of these congeners across all ROCs declined overtime (p < 0.04, Fig. 2). A qualitative comparison of p,p0-DDE levelsbetween decades suggests that concentrations were low across allsites, and much lower than historic values (Wiemeyer et al., 1988;Rattner et al., 2004).
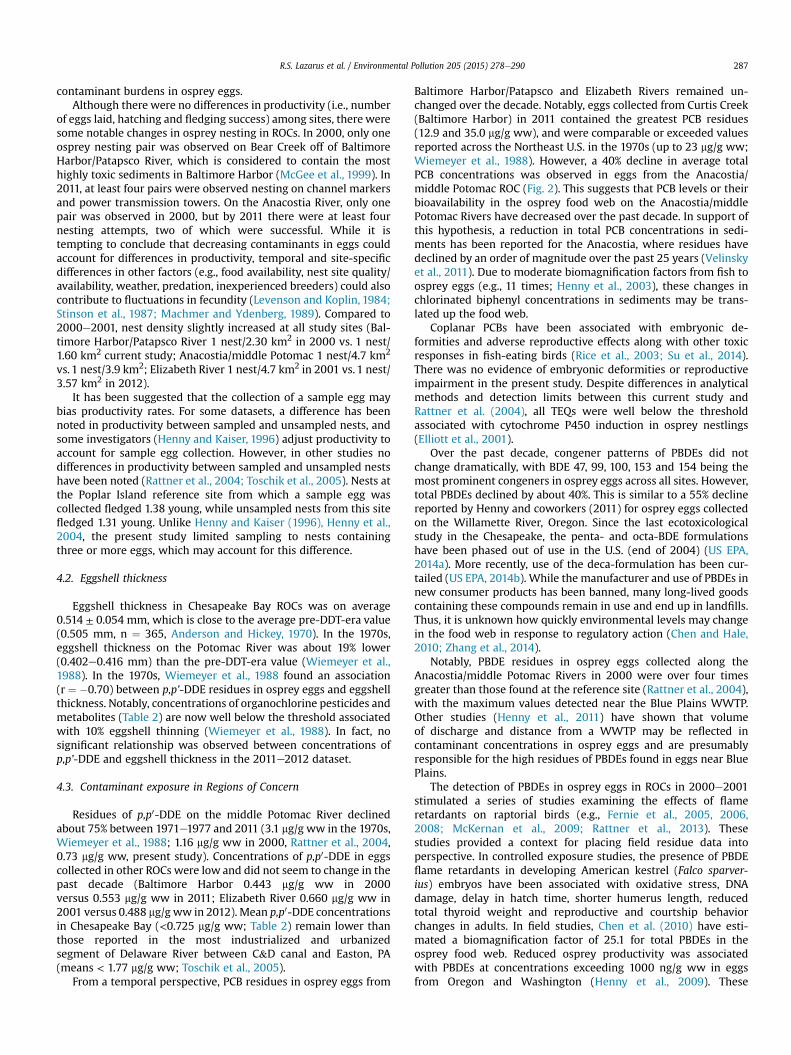
3.9. DNA damage
In 2011, Baltimore Harbor/Patapsco River had significantlygreater concentrations of 8-OH-dG (36.4 pg/mg DNA) compared toPoplar Island (26.6 pg/mg DNA, p ¼ 0.04) (Fig. 3), but not the Ana-costia/middle Potomac Rivers (35.1 pg/mg DNA, p ¼ 0.9). In 2012,the concentration of 8-OH-dG in one sample collected from theElizabeth River (entrance to the Lafayette River) was several timesgreater (107.5 pg/mg DNA) compared to all other values in thisstudy. While Grubb's test identified this measurement as an outlier,there is no rationale for excluding this value from our statisticalanalysis. In 2012, there was no significant difference between theElizabeth River (35.5 pg/mg DNA) and Poplar Island (34.2 pg/mgDNA; p > 0.15) with or without exclusion of the outlier.
4. Discussion
4.1. Osprey productivity in Regions of Concern
Use of the insecticide DDT, and specifically its metabolite p,p0-DDE, resulted in eggshell thinning and population declines of os-preys (Wiemeyer et al., 1988) and other species of piscivorous birds(Blus, 2011). In the 1970s, the Chesapeake Bay osprey populationwas estimated at 1450 pairs, with some population segmentsproducing well-below normal rates (Henny et al., 1974). Followingrestrictions in the use of DDT and other chlorinated pesticides, theChesapeake osprey population more than doubled by 1995e1996(Watts et al., 2004).
To determine the recruitment rate needed to maintain a stableosprey population, information is needed on nest site competition,nest availability and age of breeding; thus, it is challenging toidentify which productivity rate is best for Chesapeake Bay ROCs(Watts and Paxton, 2007). Historically, it was estimated that0.8e1.15 fledglings/active nest are required to maintain a stablepopulation (Spitzer, 1980; Spitzer et al., 1983; Poole, 1989),although these estimates have likely changed. While contemporarysurvivorship data are available for ospreys in Chesapeake Bay(Bryan Watts, unpublished data), a model has yet to be developedto predict the reproductive rate necessary to maintain a stablepopulation. Historical recruitment rates on the southern Potomacin 1970 were 0.55 fledglings/active nest (Wiemeyer, 1971) and in2000 the reproductive rate was 0.88 on Anacostia/middle PotomacRivers (Rattner et al., 2004). By 2011, the reproductive rate hadfurther increased to 1.11 fledglings/active nest on the Anacostia/middle Potomac Rivers, an increase of 0.56 fledglings/active nestover the 1970s. Based on historical estimates (Spitzer, 1980; Spitzeret al., 1983; Poole, 1989), since 2000, productivity in BaltimoreHarbor appears to be adequate to maintain a stable population. TheElizabeth River appeared to have lower productivity (1.00 fledgling/active nest) compared to the other sites, but still adequate tomaintain a stable population. However, this lower productivity ratemay be related to sample size (only n ¼ 6 nests). By inclusion ofdata from seven additional Elizabeth River nests, the productivityestimate increased to 1.28 fledglings/active nest, which is morethan adequate to maintain a stable population. Osprey productivityrates are primarily driven by food availability and brood reduction,but could also be adversely affected by p,p’-DDE and other
Fig. 2. Temporal comparison of contaminants from Chesapeake Bay Regions ofConcern in 2000e2001 (adapted from Rattner et al., 2004) and 2011e2012. Geometricmeans and individual data points are presented (C). At each site historical and currentdatasets were compared by a t-test.
Fig. 3. Concentrations of 8-hydroxy-20-deoxyguanosine (8-OH-dG) in osprey nestlingwhole blood samples. Means, standard deviations and individual data points arepresented (C). Capital letters indicate a statistically significant difference (p < 0.05)using Tukey's HSD test.
R.S. Lazarus et al. / Environmental Pollution 205 (2015) 278e290286
contaminant burdens in osprey eggs.Although there were no differences in productivity (i.e., number
of eggs laid, hatching and fledging success) among sites, there weresome notable changes in osprey nesting in ROCs. In 2000, only oneosprey nesting pair was observed on Bear Creek off of BaltimoreHarbor/Patapsco River, which is considered to contain the mosthighly toxic sediments in Baltimore Harbor (McGee et al., 1999). In2011, at least four pairs were observed nesting on channel markersand power transmission towers. On the Anacostia River, only onepair was observed in 2000, but by 2011 there were at least fournesting attempts, two of which were successful. While it istempting to conclude that decreasing contaminants in eggs couldaccount for differences in productivity, temporal and site-specificdifferences in other factors (e.g., food availability, nest site quality/availability, weather, predation, inexperienced breeders) could alsocontribute to fluctuations in fecundity (Levenson and Koplin, 1984;Stinson et al., 1987; Machmer and Ydenberg, 1989). Compared to2000e2001, nest density slightly increased at all study sites (Bal-timore Harbor/Patapsco River 1 nest/2.30 km2 in 2000 vs. 1 nest/1.60 km2 current study; Anacostia/middle Potomac 1 nest/4.7 km2
vs. 1 nest/3.9 km2; Elizabeth River 1 nest/4.7 km2 in 2001 vs. 1 nest/3.57 km2 in 2012).
It has been suggested that the collection of a sample egg maybias productivity rates. For some datasets, a difference has beennoted in productivity between sampled and unsampled nests, andsome investigators (Henny and Kaiser, 1996) adjust productivity toaccount for sample egg collection. However, in other studies nodifferences in productivity between sampled and unsampled nestshave been noted (Rattner et al., 2004; Toschik et al., 2005). Nests atthe Poplar Island reference site from which a sample egg wascollected fledged 1.38 young, while unsampled nests from this sitefledged 1.31 young. Unlike Henny and Kaiser (1996), Henny et al.,2004, the present study limited sampling to nests containingthree or more eggs, which may account for this difference.
4.2. Eggshell thickness
Eggshell thickness in Chesapeake Bay ROCs was on average0.514 ± 0.054 mm, which is close to the average pre-DDT-era value(0.505 mm, n ¼ 365, Anderson and Hickey, 1970). In the 1970s,eggshell thickness on the Potomac River was about 19% lower(0.402e0.416 mm) than the pre-DDT-era value (Wiemeyer et al.,1988). In the 1970s, Wiemeyer et al., 1988 found an association(r ¼ �0.70) between p,p’-DDE residues in osprey eggs and eggshellthickness. Notably, concentrations of organochlorine pesticides andmetabolites (Table 2) are now well below the threshold associatedwith 10% eggshell thinning (Wiemeyer et al., 1988). In fact, nosignificant relationship was observed between concentrations ofp,p’-DDE and eggshell thickness in the 2011e2012 dataset.
4.3. Contaminant exposure in Regions of Concern
Residues of p,p0-DDE on the middle Potomac River declinedabout 75% between 1971e1977 and 2011 (3.1 mg/g ww in the 1970s,Wiemeyer et al., 1988; 1.16 mg/g ww in 2000, Rattner et al., 2004,0.73 mg/g ww, present study). Concentrations of p,p0-DDE in eggscollected in other ROCs were low and did not seem to change in thepast decade (Baltimore Harbor 0.443 mg/g ww in 2000versus 0.553 mg/g ww in 2011; Elizabeth River 0.660 mg/g ww in2001 versus 0.488 mg/g ww in 2012). Mean p,p0-DDE concentrationsin Chesapeake Bay (<0.725 mg/g ww; Table 2) remain lower thanthose reported in the most industrialized and urbanizedsegment of Delaware River between C&D canal and Easton, PA(means < 1.77 mg/g ww; Toschik et al., 2005).
From a temporal perspective, PCB residues in osprey eggs from
Baltimore Harbor/Patapsco and Elizabeth Rivers remained un-changed over the decade. Notably, eggs collected from Curtis Creek(Baltimore Harbor) in 2011 contained the greatest PCB residues(12.9 and 35.0 mg/g ww), and were comparable or exceeded valuesreported across the Northeast U.S. in the 1970s (up to 23 mg/g ww;Wiemeyer et al., 1988). However, a 40% decline in average totalPCB concentrations was observed in eggs from the Anacostia/middle Potomac ROC (Fig. 2). This suggests that PCB levels or theirbioavailability in the osprey food web on the Anacostia/middlePotomac Rivers have decreased over the past decade. In support ofthis hypothesis, a reduction in total PCB concentrations in sedi-ments has been reported for the Anacostia, where residues havedeclined by an order of magnitude over the past 25 years (Velinskyet al., 2011). Due to moderate biomagnification factors from fish toosprey eggs (e.g., 11 times; Henny et al., 2003), these changes inchlorinated biphenyl concentrations in sediments may be trans-lated up the food web.
Coplanar PCBs have been associated with embryonic de-formities and adverse reproductive effects along with other toxicresponses in fish-eating birds (Rice et al., 2003; Su et al., 2014).There was no evidence of embryonic deformities or reproductiveimpairment in the present study. Despite differences in analyticalmethods and detection limits between this current study andRattner et al. (2004), all TEQs were well below the thresholdassociated with cytochrome P450 induction in osprey nestlings(Elliott et al., 2001).
Over the past decade, congener patterns of PBDEs did notchange dramatically, with BDE 47, 99, 100, 153 and 154 being themost prominent congeners in osprey eggs across all sites. However,total PBDEs declined by about 40%. This is similar to a 55% declinereported by Henny and coworkers (2011) for osprey eggs collectedon the Willamette River, Oregon. Since the last ecotoxicologicalstudy in the Chesapeake, the penta- and octa-BDE formulationshave been phased out of use in the U.S. (end of 2004) (US EPA,2014a). More recently, use of the deca-formulation has been cur-tailed (US EPA, 2014b). While the manufacturer and use of PBDEs innew consumer products has been banned, many long-lived goodscontaining these compounds remain in use and end up in landfills.Thus, it is unknown how quickly environmental levels may changein the food web in response to regulatory action (Chen and Hale,2010; Zhang et al., 2014).
Notably, PBDE residues in osprey eggs collected along theAnacostia/middle Potomac Rivers in 2000 were over four timesgreater than those found at the reference site (Rattner et al., 2004),with the maximum values detected near the Blue Plains WWTP.Other studies (Henny et al., 2011) have shown that volumeof discharge and distance from a WWTP may be reflected incontaminant concentrations in osprey eggs and are presumablyresponsible for the high residues of PBDEs found in eggs near BluePlains.
The detection of PBDEs in osprey eggs in ROCs in 2000e2001stimulated a series of studies examining the effects of flameretardants on raptorial birds (e.g., Fernie et al., 2005, 2006,2008; McKernan et al., 2009; Rattner et al., 2013). Thesestudies provided a context for placing field residue data intoperspective. In controlled exposure studies, the presence of PBDEflame retardants in developing American kestrel (Falco sparver-ius) embryos have been associated with oxidative stress, DNAdamage, delay in hatch time, shorter humerus length, reducedtotal thyroid weight and reproductive and courtship behaviorchanges in adults. In field studies, Chen et al. (2010) have esti-mated a biomagnification factor of 25.1 for total PBDEs in theosprey food web. Reduced osprey productivity was associatedwith PBDEs at concentrations exceeding 1000 ng/g ww in eggsfrom Oregon and Washington (Henny et al., 2009). These
R.S. Lazarus et al. / Environmental Pollution 205 (2015) 278e290 287
findings were suggested to be equivocal in a subsequent study(Henny et al., 2011). In the Chesapeake, the greatest residues oftotal PBDEs in osprey eggs (0.928 mg/g in 2000 and 0.802 mg/gww in 2011) approached the lowest-observed-adverse-effect-level (LOAEL) of 1.8 mg/g ww for pipping and hatching success(McKernan et al., 2009), but there was no evidence of impairedhatching success or overall productivity in Chesapeake Bay os-preys. Many uncertainty factors (differences in species sensitivityand metabolism, exposure to mixtures of toxicants) andknowledge gaps for toxicity thresholds make extrapolations fromthe lab to the field difficult.
In place of PBDE formulations, alt-BFRs are now being manu-factured and there are concerns regarding their potential persis-tence and bioaccumulation (de Wit et al., 2011; Stieger et al., 2014).Like PBDEs, these BFRs can leach into the environment and havebeen detected in piscivorous birds (Glaucous gulls Larus hyper-boreus, Verreault et al., 2007; herring gulls Larus argentatus,Gauthier et al., 2007; white-tailed sea eagles Haliaeetus albicilla,Eulaers et al., 2014). Among the alt-BFRs, HBCD has been shown tocause endocrine and behavioral effects in captive American kestrels(Marteinson et al., 2011, 2012). Concentrations of HBCD in Ches-apeake Bay osprey eggs were much lower than the HBCD toxicitythresholds determined to date. In this current study, a-HBCD wasdetected most frequently in osprey egg samples, but at much lowerconcentrations than other locations, including the NorwegianArctic (7.23e63.9 ng/g ww, Verreault et al., 2007 versus < MDL-3.72 ng/g ww in the present study). Our results reveal that mixturesof flame retardants are present in egg samples from the ChesapeakeBay, but the biological significance of these levels is unclear.
4.4. DNA damage
This study documents evidence of mild DNA damage in Balti-more Harbor/Patapsco and Anacostia/middle Potomac Riverscompared to the reference site, and also variations of 8-OH-dGconcentrations between individuals. Xenobiotics including PCBs,PBDEs and even PAHs are known to increase reactive oxygen spe-cies in cells and can damage lipids, proteins and DNA. Mild oxida-tive stress has been detected in American kestrels (and to a lesserdegree in common terns) in response to embryonic exposure tothe penta-BDE commercial mixture DE-71 (Fernie et al., 2005;McKernan et al., 2009; Rattner et al., 2013). Osprey nestlings areexposed to a multitude of stressors, and may have adapted anti-oxidant defense mechanisms. Life history traits including trophiclevel and life span may influence their capability to tolerateoxidative stress leading to large variations in responses even be-tween individuals (Costantini, 2008). Current evidence suggeststhat oxidative stress may impair immune function, longevity andreproduction (Costantini, 2008). Ultimately, damage to DNA maymake the individual susceptible to disease progression and epige-netic effects that may be reflected in later generations (Cooke et al.,2003).
5. Conclusions
The present findings indicate that organochlorine pesticidesand PBDE flame retardants continue to decline in osprey eggs inChesapeake Bay, consistent with discontinuation of their use. Lowlevels of organochlorine pesticides were detected at all sites, wellbelow the threshold associated with 10% eggshell thinning.Interestingly, PBDE residues in eggs were greatest near the BluePlains WWTP on the Potomac River, which suggests that waste-water discharge and sewage sludge are a source of continuedinput of PBDEs to the environment (LaGuardia et al., 2010). Whiletotal PCB concentrations declined at some sites, they remain high
in Baltimore Harbor/Patapsco River and continue to drive fishconsumption advisories in Chesapeake Bay (MDE, 2014; VDH,2009). Overall, there were no apparent large-scale effects of thecontaminants examined here on osprey productivity. The Bayosprey population continues to increase and productivity rates areat or have exceeded the threshold to maintain a stable population.Since reaching their nadir in the 1970s the Chesapeake Bay ospreypopulation has demonstrated its resilience in the face of anthro-pogenic threats. Although osprey productivity appears stable atthe population level, DNA damage assays suggest more subtlebiochemical and cellular effects that could have consequences onthe fitness of some individuals.
Acknowledgments
The authors thank C.P. Guy and C.R. Callahan of the U.S. Fish andWildlife Service, D.D. Day and J.S. Hatfield of the USGS-PWRC forassistance with various phases of this study. We thank Drs. CharlesJ. Henny and Bryan D. Watts for providing valuable comments on adraft of this manuscript. This work was primarily supported by theUSGS-Chesapeake Bay Program. Any use of trade, product, or firmnames is for descriptive purposes only and does not implyendorsement by the U.S. government.
Appendix A. Supplementary data
Supplementary data related to this article can be found at http://dx.doi.org/10.1016/j.envpol.2015.05.026.
References
Anderson, D.W., Hickey, J.J., 1970. Eggshell changes in certain North American birds.Proc. Int. Ornithol. Cong. 15, 514e540.
Bart, J., Robson, D.S., 1982. Estimating survivorship when the subjects are visitedperiodically. Ecology 63, 1078e1090.
Blus, L.J., 1984. DDE in birds' eggs: comparison of two methods for estimatingcritical levels. Wilson Bull. 96, 268e276.
Blus, L.J., 2011. DDT, DDD, and DDE in birds. In: Beyer, W.N., Meador, J.P. (Eds.),Environmental Contaminants in Biota: Interpreting Tissue Concentrations, 2nded. CRC Press, Taylor & Francis Group, Boca Raton, FL, USA, pp. 425e444.
Chen, D., LaGuardia, M.J., Harvey, E., Amaral, M., Wohlfort, K., Hale, R.C., 2008.Polybrominated diphenyl ethers in peregrine falcon (Falco peregrinus) eggsfrom the Northeastern U.S. Environ. Sci. Technol. 42, 7594e7600.
Chen, D., Hale, R.C., 2010. A global review of polybrominated diphenyl ether flameretardant contamination in birds. Environ. Int. 36, 800e811.
Chen, D., Hale, R.C., Watts, B.D., LaGuardia, M.J., Harvey, E., Mojica, E.K., 2010.Species-specific accumulation of polybrominated diphenyl ether flame re-tardants in birds of prey from the Chesapeake Bay region, USA. Environ. Pollut.158, 1883e1889.
Chesapeake Bay Executive Order, 2009. Chesapeake Bay Protection and Restoration.Office of the Press Secretary. Available. http://executiveorder.chesapeakebay.net/EO/file.axd?file¼2009%2f8%2fChesapeakeþExecutiveþOrder.pdf (accessed27.03.15).
Cooke, M.S., Evans, M.D., Dizdaroglu, M., Lunec, J., 2003. Oxidative DNA damage:mechanisms, mutation and disease. FASEB J. 17, 1195e1214.
Costantini, D., 2008. Oxidative stress in ecology and evolution: lessons from avianstudies. Ecol. Lett. 11, 1238e1251.
de Wit, C.A., Kierkegaard, A., Ricklund, N., Sellstr€om, U., 2011. Emerging brominatedflame retardants in the environment. In: Eljarrat, E., Barcel�o, D. (Eds.), Bromi-nated Flame Retardants, The Handbook of Environmental Chemistry, vol. 16.Heidelberg, Germany, 241e286.
Elliott, J.E., Wilson, L.K., Henny, C.J., Trudeau, S.F., Leighton, F.A., Kennedy, S.W.,Cheng, K.M., 2001. Assessment of biological effects of chlorinated hydrocarbonsin osprey chicks. Environ. Toxicol. Chem. 20, 866e879.
Eulaers, I., Jaspers, V.L.B., Halley, D.J., Lepoint, G., Nygård, T., Pinxten, R., Covaci, A.,Eens, M., 2014. Brominated and phosphorous flame retardants in white-tailedeagle Haliaeetus albicilla nestlings: bioaccumulation and associations with di-etary proxies (d13C, d15N and d34S). Sci. Tot. Environ. 478, 48e57.
Fernie, K.J., Shutt, J.L., Mayne, G., Hoffman, D., Letcher, R.J., Drouillard, K.G.,Ritchie, I.J., 2005. Exposure to polybrominated diphenyl ethers (PBDEs):changes in thyroid, vitamin A, glutathione homeostasis, and oxidative stress inAmerican kestrels (Falco sparverius). Toxicol. Sci. 88, 375e383.
Fernie, K.J., Shutt, J.L., Ritchie, I.J., Letcher, R.J., Drouillard, K., Bird, D.M., 2006.Change in the growth, but not the survival, of American kestrels (Falco spar-verius) exposed to environmentally relevant polybrominated diphenyl ethers.
R.S. Lazarus et al. / Environmental Pollution 205 (2015) 278e290288
J. Toxicol. Environ. Health A 69, 1541e1554.Fernie, K.J., Shutt, J.L., Letcher, R.J., Ritchie, I.J., Sullivan, K., Bird, D.M., 2008. Changes
in reproductive courtship behaviors of adult American kestrels (Falco sparver-ius) exposed to environmentally relevant levels of the polybrominated diphenylether mixture, DE-71. Toxicol. Sci. 102, 171e178.
Gauthier, L.T., Hebert, C.E., Weseloh, D.V.C., Letcher, R.J., 2007. Current-use flameretardants in the eggs of herring gulls (Larus argentatus) from the LaurentianGreat Lakes. Environ. Sci. Technol. 41, 4561e4567.
Grove, R.A., Henny, C.J., Kaiser, J.L., 2009. Osprey: worldwide sentinel species forassessing and monitoring environmental contamination in rivers, lakes, reser-voirs and estuaries. J. Toxicol. Environ. Health B Crit. Rev. 12, 25e44.
Heinz, G.H., Stebbins, K.R., Klimstra, J.D., Hoffman, D.J., 2009. A simplified methodfor correcting contaminant concentrations in eggs for moisture loss. Environ.Toxicol. Chem. 28, 1425e1428.
Helsel, D.R., 2005. Nondetects and Data Analysis Statistics for Censored Environ-mental Data. John Wiley & Sons, Inc., Hoboken. NJ, USA.
Henny, C.J., Smith, M.M., Stotts, V.D., 1974. The 1973 distribution and abundance ofbreeding ospreys in the Chesapeake Bay. Chesap. Sci. 15, 125e133.
Henny, C.J., Kaiser, J.L., 1996. Osprey population increase along the Willamette River,Oregon and the role of utility structures, 1976e1993. In: Bird, D.M.,Varland, D.E., Negro, J.J. (Eds.), Raptors in Human Landscapes. Academic PressLtd., London, pp. 97e108.
Henny, C.J., Kaiser, J.L., Grove, R.A., Bently, V.R., Elliott, J.E., 2003. Biomagnificationfactors (fish to osprey eggs from Willamette River, Oregon, U.S.A.) for PCDDs,PCDFS, PCBS and OC pesticides. Environ. Monit. Assess. 84, 275e315.
Henny, C.J., Grove, R.A., Kaiser, J.L., Bentley, V.R., 2004. An evaluation of osprey eggsto determine spatial residue patterns and effects of contaminants along thelower Columbia River, U.S.A. In: Chancellor, R.D., Meyburg, B.U. (Eds.), RaptorsWorldwide. WWGBP/MME, Budapest, Hungary, pp. 369e388.
Henny, C.J., Kaiser, J.L., Grove, R.A., Johnson, B.L., Letcher, R.J., 2009. Polybrominateddiphenyl ether flame retardants in eggs may reduce reproductive success ofospreys in Oregon and Washington, USA. Ecotoxicology 18, 802e813.
Henny, C.J., Grove, R.A., Kaiser, J.L., Johnson, B.L., 2010. North American ospreypopulations and contaminants: historic and contemporary perspectives.J. Toxicol. Environ. Health B Crit. Rev. 13, 579e603.
Henny, C.J., Grove, R.A., Kaiser, J.L., Johnson, B.L., Furl, C.V., Letcher, R.J., 2011.Wastewater dilution index partially explains observed polybrominated flameretardant concentrations in osprey eggs from Columbia River Basin,2008e2009. Ecotoxicology 20, 682e697.
La Guardia, M.J., Hale, R.C., Harvey, E., 2007. Evidence of debromination of deca-bromodiphenyl ether (BDE-209) in biota from a wastewater receiving stream.Environ. Sci. Technol. 41, 6663e6670.
La Guardia, M.J., Hale, R.C., Harvey, E., Chen, D., 2010. Flame-retardants and otherorganohalogens detected in sewage sludge by electron capture negative ionmass spectrometry. Environ. Sci. Technol. 44, 4658e4664.
La Guardia, M.J., Hale, R.C., Newman, B., 2013. Brominated flame-retardants in sub-Saharan Africa: burdens in inland and coastal sediments of the eThekwinimetropolitan municipality, South Africa. Environ. Sci. Technol. 47, 9643e9650.
Lazarus, R.S., Rattner, B.A., Brooks, B.W., Du, B., McGowan, P.C., Blazer, V.S.,Ottinger, M.A., 2015. Exposure and food web transfer of pharmaceuticals inospreys (Pandion haliaetus): predictive model and empirical data. Integ. Envi-ron. Assess. Manag. 11, 118e129.
Levenson, H., Koplin, J.R., 1984. Effects of human activity on productivity of nestingospreys. J. Wild. Manage 48, 1374e1377.
Machmer, M.M., Ydenberg, R.C., 1989. Weather and osprey foraging energetics. Can.J. Zool. 68, 40e43.
Marteinson, S.C., Kimmins, S., Letcher, R.J., Palace, V.P., Bird, D.M., Ritchie, I.J.,Fernie, K.J., 2011. Diet exposure to technical hexabromocyclododecane (HBCD)affects testes and circulating testosterone and thyroxine levels in AmericanKestrels (Falco sparverius). Environ. Res. 111, 1116e1123.
Marteinson, S.C., Bird, D.M., Letcher, R.J., Sullivan, K.M., Ritchie, I.J., Fernie, K.J., 2012.Dietary exposure to technical hexabromocyclododecane (HBCD) alters court-ship, incubation and parental behaviors in American Kestrels (Falco sparverius).Chemosphere 89, 1077e1083.
Mayfield, H., 1961. Nesting success calculated from exposure. Wilson Bull. 73,255e261.
McGee, B.L., Fisher, D.J., Yonkos, L.T., Ziegler, G.P., Turley, S., 1999. Assessment ofsediment contamination, acute toxicity, and population viability of the estua-rine amphipod Leptocheirus plumulosus in Baltimore Harbor, Maryland, USA.Enivron. Toxicol. Chem. 18, 2151e2160.
McKernan, M.A., Rattner, B.A., Hale, R.C., Ottinger, M.A., 2009. Toxicity of poly-brominated diphenyl ethers (DE-71) in chicken (Gallus gallus), mallard (Anasplatyrhynchos), and American kestrel (Falco sparverius) embryos and hatchlings.Environ. Toxicol. Chem. 28, 1007e1017.
(MDE) Maryland Department of the Environment, 2014. Guidelines for Recrea-tionally Caught Fish Species in Maryland. Available. http://www.mde.state.md.us/assets/document/fish/advisory_summary.pdf (accessed 03.02.15.).
Poole, A.F., 1989. Ospreys: a Natural and Unnatural History. Cambridge UniversityPress, New York.
Postupalsky, S., 1977. A critical review of problems in calculating osprey repro-ductive success. In: Ogden, J.C. (Ed.), Transactions North American OspreyResearch Conference, U.S. Department of the Interior National Park ServiceTransactions and Proceedings Series No. 2. College of William and Mary,
Williamsburg, VA, pp. 1e11, 1972.Rattner, B.A., McGowan, P.C., Golden, N.H., Hatfield, J.S., Toschik, P.C., Lukei, R.F.,
Hale, R.C., Schmitz-Afonso, I., Rice, C.P., 2004. Contaminant exposure andreproductive success of ospreys (Pandion haliaetus) nesting in Chesapeake Bayregions of concern. Arch. Environ. Contam. Toxicol. 47, 126e140.
Rattner, B.A., McGowan, P.C., 2007. Potential hazards of environmental contami-nants to avifauna residing in the Chesapeake Bay estuary. Waterbirds 30 (Sp 1),63e81.
Rattner, B.A., Lazarus, R.S., Heinz, G.H., Karouna-Renier, N.K., Schultz, S.L., Hale, R.C.,2013. Comparative embryotoxicity of a pentabrominated diphenyl ethermixture to common terns (Sterna hirundo) and American kestrels (Falco spar-verius). Chemosphere 92, 441e447.
Rice, C.P., O'Keefe, P.W., Kubiak, T.J., 2003. Sources, pathways and effects of PCBsdioxins and dibenzofurans. In: Hoffman, D.J., Rattner, B.A., Bruton Jr., G.A.,Cairns Jr., J. (Eds.), Handbook of Ecotoxicology. Lewis Publishers, Boca Raton, FL,pp. 501e573.
Schaadt, C.P., Bird, D.M., 1993. Sex-specific growth in ospreys: the role of sexual sizedimorphism. Auk 110, 900e910.
Spitzer, P.R., 1980. Dynamics of a Discrete Coastal Breeding Population of Ospreys inthe Northeastern United States during the Period of Decline and Recovery,1969e1978 (Ph.D. thesis). Cornell Univ., Ithaca, NY.
Spitzer, P.R., Poole, A.F., Scheibel, M., 1983. Initial recovery of breeding ospreys in theregion between New York City and Boston. In: Bird, D.M. (Ed.), Biology andManagement of Bald Eagles and Ospreys. Harpell Press, Ste, Anne de Bellevue,Quebec, pp. 231e241.
Steenhof, K., Newton, I., 2007. Assessing nesting success and productivity. In:Bird, D.M., Bildstein, K.L. (Eds.), Raptor Research and Management Techniques.Hancock House, Surrey, British Columbia, Canada, pp. 181e192.
Stieger, G., Scheringer, M., Ng, C.A., Hungerbühler, K., 2014. Assessing the persis-tence, bioaccumulation potential and toxicity of brominated flame retardants:data availability and quality for 36 alternative brominated flame retardants.Chemosphere 116, 118e123.
Stinson, C.H., Lauthner, J., Ray, R.T., 1987. The effect of weather conditions onbehavior of ospreys in northwestern Washington. Can. J. Zool. 65, 2116e2118.
Su, H., Wu, F., Zhang, R., Zhao, X., Mu, Y., Feng, C., Giesy, J.P., 2014. Toxicity referencevalues for protecting aquatic birds in China from the effects of polychlorinatedbiphenyls. Rev. Environ. Contam. Toxicol. 230, 59e82.
Toschik, P.C., Rattner, B.A., McGowan, P.C., Christman, M.C., Carter, D.B., Hale, R.C.,Matson, C.W., Ottinger, M.A., 2005. Effects of contaminant exposure on repro-ductive success of ospreys (Pandion haliaetus) nesting in Delaware River andBay, USA. Environ. Toxicol. Chem. 24, 617e628.
Turle, R., Norstrom, R.J., Collins, B., 1991. Comparison of PCB quantification methods:re-analysis of archived specimens of herring gull eggs from the Great Lakes.Chemosphere 22, 201e213.
(US EPA) U.S. Environmental Protection Agency, 1994. Chesapeake Bay BasinwideToxics Reduction Strategy Reevaluation Report, p. 192. U.S. EPA CBP/TRS 117/94,Annapolis, MD.
(US EPA) United States Environmental Protection Agency, U.S. Geological Survey,U.S. Fish and Wildlife Service, 2012. Toxic Contaminants in the Chesapeake Bayand its Watershed: Extent and Severity of Occurrence and Potential BiologicalEffects. U.S. EPA Chesapeake Bay Program Office, Annapolis, MD, p. 175.
(US EPA) United States Environmental Protection Agency, 2014a. PolybrominatedDiphenylethers (PBDEs) Significant New Use Rules. Available. http://www.epa.gov/oppt/existingchemicals/pubs/qanda.html (accessed 03.02.15.).
(US EPA) United States Environmental Protection Agency, 2014b. DecaBDE Phase-out Initiative. Available. http://www.epa.gov/oppt/existingchemicals/pubs/actionplans/deccadbe.html (accessed 03.02.15.).
van den Berg, M., Birnbaum, L., Bosveld, A.T.C., Brunstr€om, B., Cook, P., Feeley, M.,Giesy, J.P., Hanberg, A., Hasegawa, R., Kennedy, S.W., Kubiak, T., Larsen, J.C., Rolafvan Leeuwen, F.X., Djien Liem, A.K., Nolt, C., Peterson, R.E., Poellinger, L., Safe, S.,Schrenk, D., Tillitt, D., Tysklind, M., Younes, M., Waern, F., Zacharewski, T., 1998.Toxic equivalency factors (TEFs) for PCBs, PCDDs, PCDFs for humans andwildlife. Environ. Health Perspect. 106, 775e792.
van den Berg, M., Birnbaum, L.S., Denison, M., De Vito, M., Farland, W., Feeley, M.,Fiedler, H., Hakansson, H., Hanberg, A., Haws, L., Rose, M., Safe, S., Schrenk, D.,Tohyama, C., Tritscher, A., Tuomisto, J., Tysklind, M., Walker, N., Peterson, R.E.,2006. The 2005 world health organization reevaluation of human andmammalian toxic equivalency factors for dioxins and dioxin-like compounds.Toxicol. Sci. 93, 223e241.
Velinsky, D.J., Riedel, G.F., Ashley, J.T.F., Cornwell, J.C., 2011. Historical contaminationof the Anacostia river, Washington, D.C. Environ. Monit. Assess. 183, 307e328.
Verreault, J., Gebbink, W.A., Gauthier, L.T., Gabrielsen, G.W., Letcher, R.J., 2007.Brominated flame retardants in glaucous gulls from the Norwegian Artic: morethan just an issue of polybrominated diphenyl ethers. Environ. Sci. Technol. 41,4925e4931.
(VDH) Virginia Department of Health, 2009. Consumption Advisories and Re-strictions in Effect of Virginia Waterways. Available. http://www.vdh.state.va.us/epidemiology/DEE/PublichealthToxicology/Advisories (accessed 03.02.15.).
Watts, B.D., Byrd, M.A., Watts, M.U., 2004. Status and distribution of breeding os-preys in Chesapeake Bay: 1995e1996. J. Raptor Res. 38, 47e54.
Watts, B.D., Paxton, B.J., 2007. Ospreys of the Chesapeake Bay: population recovery,ecological requirements, and current threats. Waterbirds 30 (Sp 1), 39e49.
Wiemeyer, S.N., 1971. Reproductive success of Potomac River ospreys, 1970. Chesap.
R.S. Lazarus et al. / Environmental Pollution 205 (2015) 278e290 289

Sci. 12, 278e280.Wiemeyer, S.N., Bunk, C.M., Krynitsky, A.J., 1988. Organochlorine pesticides, poly-
chlorinated biphenyls, and mercury in osprey eggs e1970-79eand their re-lationships to shell thinning and productivity. Arch. Environ. Contam. Toxicol.17, 767e787.
Zhang, R., Guo, J., Wu, F., Mu, Y., Giesy, J.P., Chang, H., Zhao, X., Feng, C., 2014. Toxicityreference values for polybrominated diphenyl ethers: risk assessment forpredatory birds and mammals from two Chinese lakes. Rev. Environ. Contam.Toxicol. 229, 111e137.
R.S. Lazarus et al. / Environmental Pollution 205 (2015) 278e290290
Supporting Information
Title: Decadal re-evaluation of contaminant exposure and productivity in ospreys (Pandion
haliaetus) nesting in Chesapeake Bay Regions of Concern
Authors: Rebecca S. Lazarus a,b, Barnett A. Rattner a *, Peter C. McGowan c, Robert C. Hale d,
Sandra L. Schultz a, Natalie K. Karouna-Renier a, Mary Ann Ottinger b,1
a U.S. Geological Survey, Patuxent Wildlife Research Center, Beltsville, Maryland 20705, USA
b Marine-Estuarine Environmental Sciences Program and Department of Animal and Avian
Sciences, University of Maryland, College Park, MD 20742, USA
c U.S. Fish and Wildlife Service, Chesapeake Bay Field Office, Annapolis, Maryland 21401,
USA
d Virginia Institute of Marine Science, College of William and Mary, Gloucester Point, VA 23062
USA
*To whom correspondence may be addressed:
Barnett A. Rattner, Ph.D.
Patuxent Wildlife Research Center, U.S. Geological Survey
c/o BARC-East, Building 308
10300 Baltimore Avenue
Beltsville, Maryland 20705, USA
Telephone: 1-301-497-5671; FAX: 1-301-497-5624
Email: [email protected]
1 Present Address: Department of Biology and Biochemistry, University of Houston, Houston,
TX 77004, USA
Number of pages: 1 (this cover page excluded)
Number of tables: 1
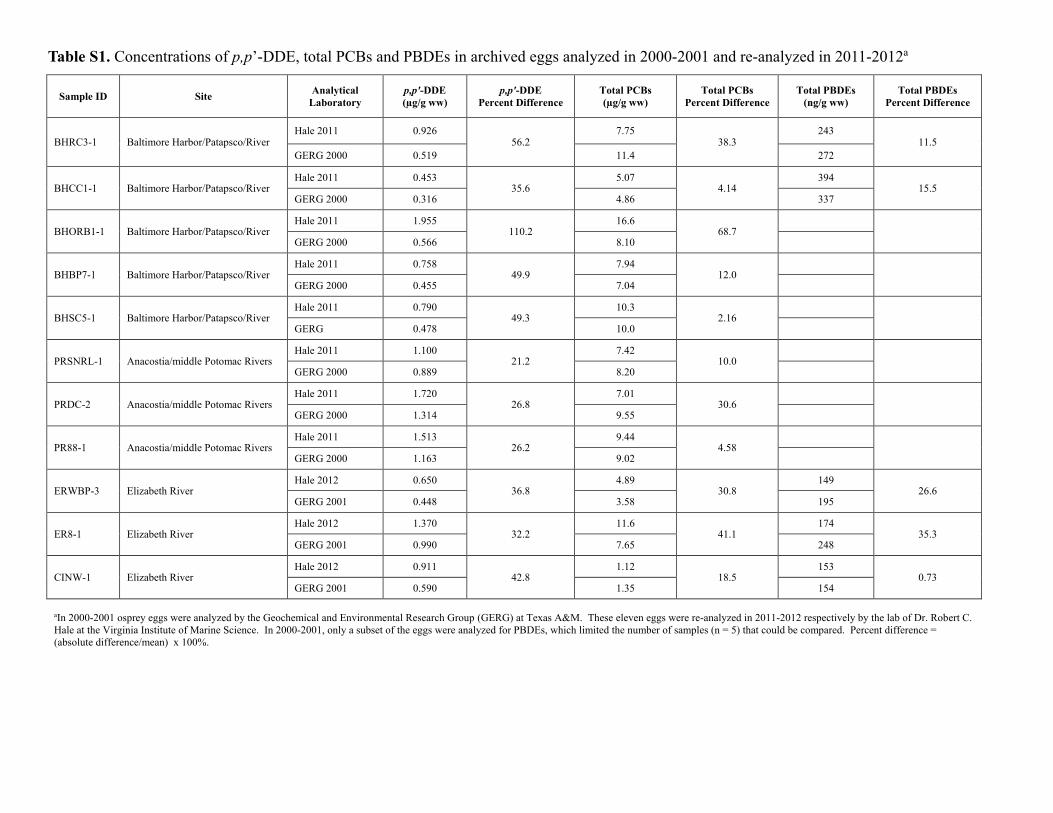
Table S1. Concentrations of p,p’-DDE, total PCBs and PBDEs in archived eggs analyzed in 2000-2001 and re-analyzed in 2011-2012a
Sample ID Site Analytical
Laboratory
p,p'-DDE
(µg/g ww)
p,p'-DDE
Percent Difference
Total PCBs
(µg/g ww)
Total PCBs
Percent Difference
Total PBDEs
(ng/g ww)
Total PBDEs
Percent Difference
BHRC3-1 Baltimore Harbor/Patapsco/River Hale 2011 0.926
56.2 7.75
38.3 243
11.5
GERG 2000 0.519 11.4 272
BHCC1-1 Baltimore Harbor/Patapsco/River Hale 2011 0.453
35.6 5.07
4.14 394
15.5 GERG 2000 0.316 4.86 337
BHORB1-1 Baltimore Harbor/Patapsco/River Hale 2011 1.955
110.2 16.6
68.7 GERG 2000 0.566 8.10
BHBP7-1 Baltimore Harbor/Patapsco/River Hale 2011 0.758
49.9 7.94
12.0 GERG 2000 0.455 7.04
BHSC5-1 Baltimore Harbor/Patapsco/River Hale 2011 0.790
49.3 10.3
2.16 GERG 0.478 10.0
PRSNRL-1 Anacostia/middle Potomac Rivers Hale 2011 1.100
21.2 7.42
10.0 GERG 2000 0.889 8.20
PRDC-2 Anacostia/middle Potomac Rivers Hale 2011 1.720
26.8 7.01
30.6 GERG 2000 1.314 9.55
PR88-1 Anacostia/middle Potomac Rivers Hale 2011 1.513
26.2 9.44
4.58 GERG 2000 1.163 9.02
ERWBP-3 Elizabeth River Hale 2012 0.650
36.8 4.89
30.8 149
26.6 GERG 2001 0.448 3.58 195
ER8-1 Elizabeth River Hale 2012 1.370
32.2 11.6
41.1 174
35.3 GERG 2001 0.990 7.65 248
CINW-1 Elizabeth River Hale 2012 0.911
42.8 1.12
18.5 153
0.73 GERG 2001 0.590 1.35 154
aIn 2000-2001 osprey eggs were analyzed by the Geochemical and Environmental Research Group (GERG) at Texas A&M. These eleven eggs were re-analyzed in 2011-2012 respectively by the lab of Dr. Robert C.
Hale at the Virginia Institute of Marine Science. In 2000-2001, only a subset of the eggs were analyzed for PBDEs, which limited the number of samples (n = 5) that could be compared. Percent difference =
(absolute difference/mean) x 100%.