ScholarWorks@UMass Amherst
163
University of Massachusetts Amherst University of Massachusetts Amherst ScholarWorks@UMass Amherst ScholarWorks@UMass Amherst Doctoral Dissertations Dissertations and Theses October 2018 COMPRESSIBILITY AND NORMALIZED UNDRAINED SHEAR COMPRESSIBILITY AND NORMALIZED UNDRAINED SHEAR BEHAVIOR OF SOFT COASTAL FINE-GRAINED SOILS BEHAVIOR OF SOFT COASTAL FINE-GRAINED SOILS Arash Pirouzi University of Massachusetts Amherst Follow this and additional works at: https://scholarworks.umass.edu/dissertations_2 Part of the Geotechnical Engineering Commons Recommended Citation Recommended Citation Pirouzi, Arash, "COMPRESSIBILITY AND NORMALIZED UNDRAINED SHEAR BEHAVIOR OF SOFT COASTAL FINE-GRAINED SOILS" (2018). Doctoral Dissertations. 1377. https://doi.org/10.7275/12670151 https://scholarworks.umass.edu/dissertations_2/1377 This Open Access Dissertation is brought to you for free and open access by the Dissertations and Theses at ScholarWorks@UMass Amherst. It has been accepted for inclusion in Doctoral Dissertations by an authorized administrator of ScholarWorks@UMass Amherst. For more information, please contact [email protected].
-
Upload
khangminh22 -
Category
Documents
-
view
0 -
download
0
Transcript of ScholarWorks@UMass Amherst

University of Massachusetts Amherst University of Massachusetts Amherst
ScholarWorks@UMass Amherst ScholarWorks@UMass Amherst
Doctoral Dissertations Dissertations and Theses
October 2018
COMPRESSIBILITY AND NORMALIZED UNDRAINED SHEAR COMPRESSIBILITY AND NORMALIZED UNDRAINED SHEAR
BEHAVIOR OF SOFT COASTAL FINE-GRAINED SOILS BEHAVIOR OF SOFT COASTAL FINE-GRAINED SOILS
Arash Pirouzi University of Massachusetts Amherst
Follow this and additional works at: https://scholarworks.umass.edu/dissertations_2
Part of the Geotechnical Engineering Commons
Recommended Citation Recommended Citation Pirouzi, Arash, "COMPRESSIBILITY AND NORMALIZED UNDRAINED SHEAR BEHAVIOR OF SOFT COASTAL FINE-GRAINED SOILS" (2018). Doctoral Dissertations. 1377. https://doi.org/10.7275/12670151 https://scholarworks.umass.edu/dissertations_2/1377
This Open Access Dissertation is brought to you for free and open access by the Dissertations and Theses at ScholarWorks@UMass Amherst. It has been accepted for inclusion in Doctoral Dissertations by an authorized administrator of ScholarWorks@UMass Amherst. For more information, please contact [email protected].

COMPRESSIBILITY AND NORMALIZED UNDRAINED SHEAR BEHAVIOR OF SOFT COASTAL FINE-GRAINED SOILS
A Dissertation Presented
by
ARASH PIROUZI
Submitted to the Graduate School of the University of Massachusetts Amherst in partial fulfillment
of the requirements for the degree of
DOCTOR OF PHILOSOPHY
September 2018
Civil and Environmental Engineering

© Copyright by Arash Pirouzi 2018
All Rights Reserved

COMPRESSIBILITY AND NORMALIZED UNDRAINED SHEAR BEHAVIOR OF SOFT COASTAL FINE-GRAINED SOILS
A Dissertation Presented
by
ARASH PIROUZI
Approved as to style and content by: Don J. DeGroot, Chair Guoping Zhang, Member Jon Woodruff, Member Jason T. DeJong, Member
________________________________ Richard N. Palmer, Department Head Department of Civil and Environmental Engineering

DEDICATION
To my selfless parents Lotfollah and Farkhondeh
my supportive siblings Shirin and Kourosh
and
my loving wife Talaye

v
ACKNOWLEDGMENTS
I would like to express my sincere gratitude to my advisor and mentor Dr. Don
DeGroot for his dedication supervision and guidance throughout this journey. The greatest
admiration is given to his knowledge of laboratory testing and soil behavior as well as his
teaching skills. With no doubt he has taught me more about geotechnical engineering than
any other person and I am truly indebted to him for that. I would like to thank Dr. Guoping
Zhang, Dr. Jon Woodruff, and Dr. Jason DeJong for serving as my committee members
and for their guidance throughout this project.
I would also like to acknowledge and thank the following people for helping make
this research possible: Dr. Eric Hinlein and Dr. Camelia Rotaru for providing funding for
me through Salt project and teaching me about groundwater sampling; my friends Andrew
Rohrman, Shreeya Pandey, Hossein Ganji, and other students who selflessly assisted me
with laboratory work through different stages of this research; all the faculty and staff of
the CEE department for their assistance and friendship during my time at UMass Amherst.
I also am sincerely grateful to my parents and siblings for their encouragement and
unconditional support, and to my wife Talaye who has been by side and has given me
purpose and happiness throughout all these challenging years.
Finally, I would like to acknowledge GeoEngineers, Inc. for providing data, some
of the tested soils, and partial funding for this research.

vi
ABSTRACT
COMPRESSIBILITY AND NORMALIZED UNDRAINED SHEAR BEHAVIOR OF SOFT COASTAL FINE-GRAINED SOILS
SEPTEMBER 2018
ARASH PIROUZI, B.S., AZAD UNIVERSITY, AHVAZ, IRAN
M.S., AZAD UNIVERSITY, TEHRAN, IRAN
Ph.D., UNIVERSITY OF MASSACHUSETTS AMHERST
Directed by: Professor Don J. DeGroot
This thesis investigates empirical correlations between consolidation design
parameters and index properties of soft fine-grained soils from coastal Louisiana region,
normalized undrained shear behavior of high liquid limit organic fine-grained coastal soils,
and consolidation behavior of fine-grained soils.
The first phase of this research consisted of studying a database of site investigation
data from 15 marsh creation projects across the coastal Louisiana region. The database
includes a wide variety of fine-grained soils ranging from low-plasticity inorganic clays
and silts to high-plasticity organic clays and silts with a large range of water content and
liquid limit. Most of the empirical correlations in the literature do not cover the soils in this
data set. Correlations between consolidation parameters (compressibility, preconsolidation
stress, and coefficient of consolidation) determined from 1-D incremental loading
consolidation tests and index properties (water content, void ratio, Atterberg Limits, and
dry unit weight) were developed. The degree of correlation between the index parameters
and different consolidation design parameters varied significantly. In many cases,
considering inorganic and organic soil separately improved the correlations.
vii
The second phase of this research investigated the undrained shear behavior of high
liquid limit, organic soils from coastal Louisiana region over the consolidation effective
stress range of 50 to 1600 kPa. Undrained direct simple shear (DSS) behavior of 6
resedimented natural organic soils with liquid limit ranging from 81 to 215% and two
natural inorganic soils with liquid limit equal to 45% and 46% was studied. CK0UDSS tests
were performed on normally consolidated samples. Normalized undrained shear strength
and normalized undrained Young’s modulus decreased with increasing consolidation stress
level. The organic soils had significantly higher normalized undrained shear strengths than
the inorganic soils especially at lower stresses with the difference became smaller at higher
stresses. The rate of decrease in normalized undrained shear strength was found to correlate
well with liquid limit or organic matter and new correlations were developed to relate
undrained shear strength and consolidation stress level as a function of liquid limit. Such
correlations were not observed for normalized undrained modulus and liquid limit or
organic matter. Thus, a collection of plots of undrained modulus normalized by undrained
shear strength versus applied stress ratio for the organic soils tested are provided.
The third phase of this research involved a suite of CRS consolidation tests to
investigate different methods of determining the recompression ratio (RR). Tests were
performed on a variety of natural clays and silts from different quality samples (intact,
highly disturbed, and resedimented) by conducting unload-reload loops at different stress
levels and different unloading ratios. Seven different methods were used to determine
recompression ratio from each loop resulting, on average, in over 240% difference in RR
estimates from the different methods on a loop. The results showed that RR from all the
methods increased with increasing stress level and unloading ratio with higher influence

viii
for higher OCR soils and sensitive clays. Recommendations for practice are provided for
conduct of CRS tests and how to interpret the test results to best estimate RR.

ix
TABLE OF CONTENTS Page ACKNOWLEDGMENTS ...................................................................................................v
ABSTRACT ....................................................................................................................... vi
LIST OF TABLES ............................................................................................................ xii
LIST OF FIGURES ......................................................................................................... xiii
LIST OF SYMBOLS ..................................................................................................... xviii
CHAPTER
1. INTRODUCTION ...........................................................................................................1
2. EMPIRICAL CORRELATIONS FOR ESTIMATING FOUNDATION SOIL
CONSOLIDATION PARAMETERS FROM INDEX PROPERTIES FOR
LOUISIANA MARSH CREATION ...................................................................................4
2.1.Introduction ........................................................................................................4 2.2.Background ........................................................................................................8
2.2.1 Settlement Calculations ...................................................................8 2.2.2 Influence of Sample Disturbance .....................................................9
2.3.Database Development ....................................................................................11 2.4.Correlations Investigated .................................................................................13
2.4.1 Preconsolidation Stress ..................................................................14 2.4.2 In Situ Vertical Effective Stress .....................................................15 2.4.3 Compression Index ........................................................................16 2.4.4 Recompression Index .....................................................................18 2.4.5 Coefficient of Consolidation ..........................................................19 2.4.6 Coefficient of Secondary Compression .........................................21
2.5.Recommendation for use of Correlations in Practice ......................................21 2.6.Summary and Conclusions ..............................................................................23 2.7.Acknowledgments............................................................................................25

x
3. NORMALIZED UNDRAINED DIRECT SIMPLE SHEAR BEHAVIOR OF
SOFT COASTAL ORGANIC SOILS ...............................................................................54
3.1.Introduction ......................................................................................................54 3.2.Background ......................................................................................................57
3.2.1 Undrained Shear Strength ..............................................................57 3.2.2 Undrained Young’s Modulus .........................................................59
3.3.Test Results and Procedures ............................................................................60
3.3.1 Test Soils ........................................................................................60 3.3.2 Sample Preparation ........................................................................61 3.3.3 Direct Simple Shear .......................................................................62
3.4.Test Results ......................................................................................................64
3.4.1 Consolidation Behavior .................................................................64 3.4.2 DSS Shear Stress-Strain Behavior .................................................64 3.4.3 Summary Undrained Shear Behavior ............................................66 3.4.4 Undrained Young’s Modulus .........................................................67 3.4.5 Summary Undrained Young’s Modulus ........................................67
3.5.Interpretation and Discussion of Results .........................................................69
3.5.1 Undrained Shear Strength ..............................................................69 3.5.2 Correlation with Organic Matter ....................................................71 3.5.3 Undrained Young’s Modulus .........................................................72 3.5.4 Implications for Practice ................................................................73
3.6.Summary and Conclusion ................................................................................74 3.7.Acknowledgment .............................................................................................75
4. RECOMPRESSION RATIO OF FINE-GRAINED SOILS ..........................................97
4.1.Introduction ......................................................................................................97 4.2.Materials and Methods ...................................................................................101
4.2.1 Test Soils ......................................................................................101 4.2.2 Sample Preparation ......................................................................101 4.2.3 Consolidation tests .......................................................................102
4.3.Test Results ....................................................................................................104
4.3.1 Compression Behavior .................................................................104

xi
4.3.2 Recompression Ratio ...................................................................105
4.4.Discussion of Results .....................................................................................110 4.5.Conclusion .....................................................................................................114
5. SUMMARY AND CONCLUSIONS ..........................................................................131
6. REFERENCES ............................................................................................................133

xii
LIST OF TABLES
Page
Table 2.1: List of projects/locations included in creation of database and number oedometer tests for each by soil type ........................................................................26
Table 2.2: Summary of empirical correlations investigated and efficacy rating .....................27
Table 3.1: Summary of the index properties for the eight test soils ........................................76
Table 3.2: Summary of undrained shear results from the CK0DSS tests.................................77
Table 4.1: Summary of the sampler type and index and classification properties of the soil samples .............................................................................................................116
Table 4.2: Summary of the consolidation test results ............................................................117
Table 4.3: Summary of the consolidation test results ............................................................118
Table 4.4: Variation of recompression ratio values for BBC samples with respect to RR4,1 from constant ’u/’r tests .............................................................................119
Table 4.5: Variation of recompression ratio values for BBC and Presumpscot clay samples with respect to RR4,1 from constant ’r tests ............................................119

xiii
LIST OF FIGURES
Page
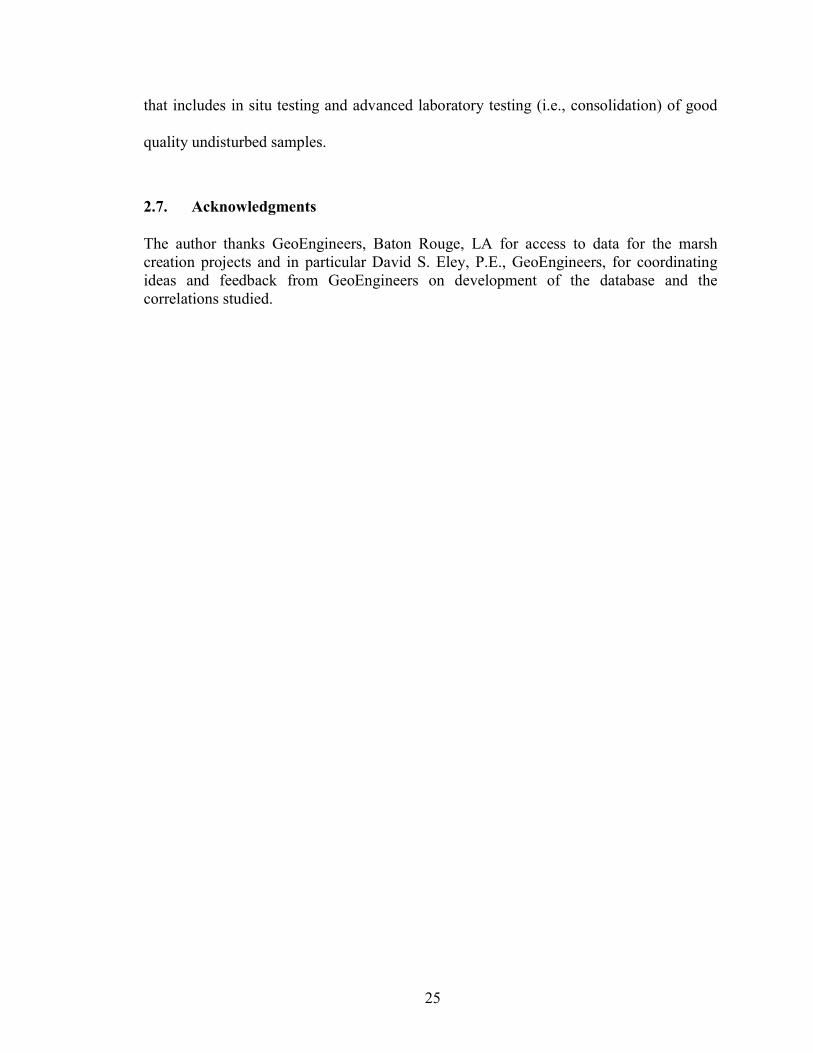
Figure 2.1: Fundamentals of 1-D consolidation behavior and influence of sample disturbance: compression curve, coefficient of consolidation and secondary compression versus vertical effective stress (modified from Ladd and DeGroot, 2003) .........................................................................................................28
Figure 2.2: Estimation of recompression index (Cr) using average slope of unload-reload loop and use of Simplified Schmertmann (1955) method for estimating compression index (Cc) (after Holtz et al. 2011): 'p is estimated using Casagrande (1936) construction; Pt.1 is defined at ('v0, e0), Line 1-2 is drawn at slope Cr from 'v0 to 'p to define Pt. 2; Pt. 3 is defined as intersection of 0.42e0 and extension of normally consolidated slope of measured compression line (Line L), Cc is defined as slope of Line 2-3 (figure from Holtz et al., 2011)......................................................................................................29
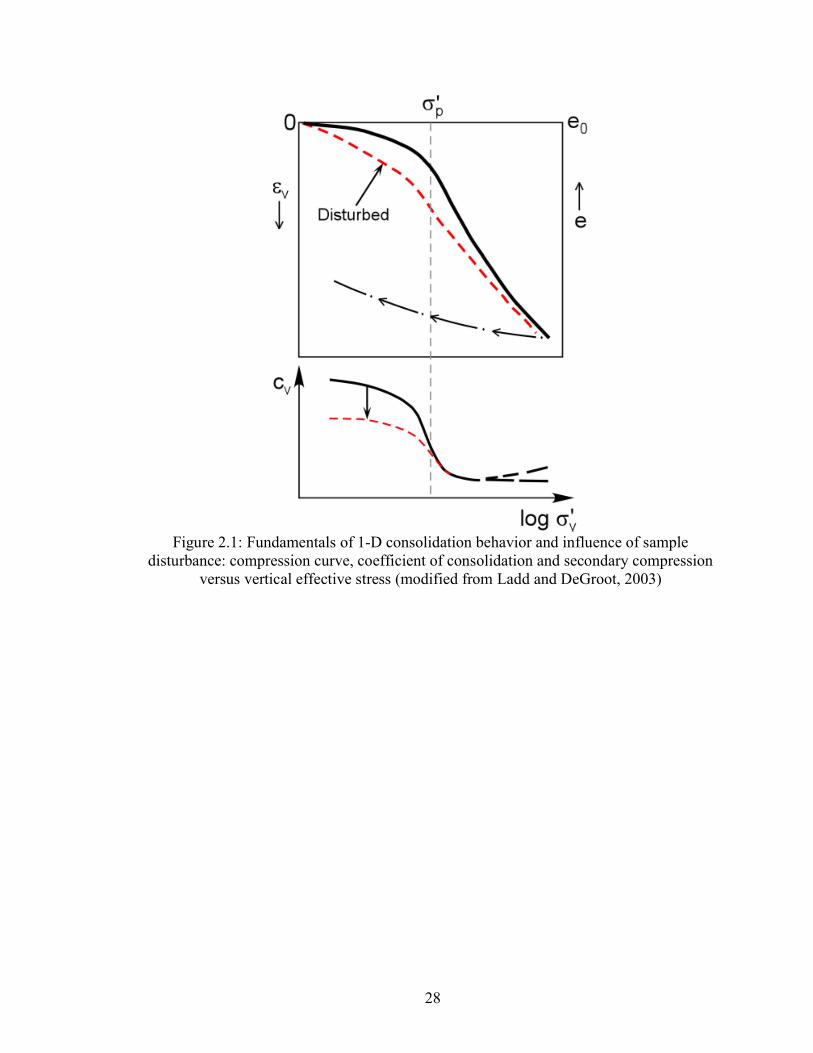
Figure 2.3: Atterberg limits for soils included in the database ................................................30
Figure 2.4: NAVFAC DM7 (1982) correlation among Liquidity Index, preconsolidation stress, and sensitivity .....................................................................31
Figure 2.5: Liquidity Index versus preconsolidation stress. Plotted lines are recommended correlations by USACE NAVFAC DM-7 (1982) shown in Figure 2.4 ..................................................................................................................32
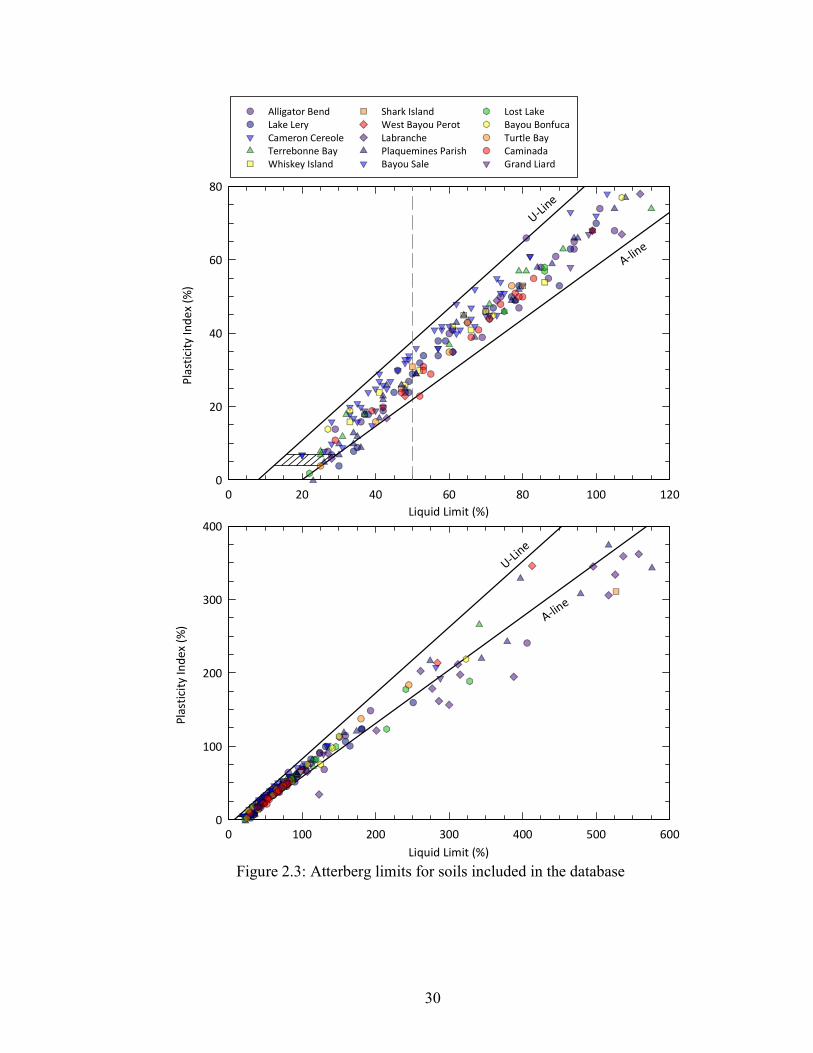
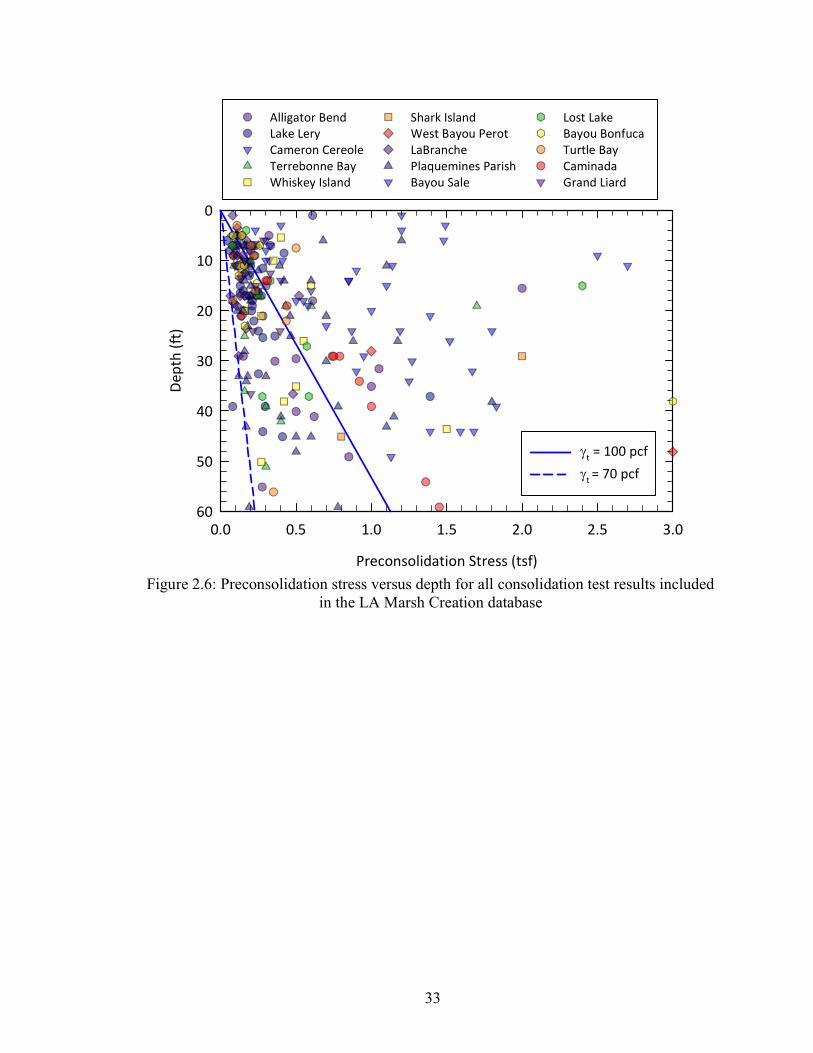
Figure 2.6: Preconsolidation stress versus depth for all consolidation test results included in the LA Marsh Creation database ............................................................33
Figure 2.7: Preconsolidation ratio versus depth for all consolidation test results included in the LA Marsh Creation database ............................................................34
Figure 2.8: Specific gravity versus liquid limit and recommended correlation (Eqs. 2.6 and 2.7) .....................................................................................................................35
Figure 2.9: Specific gravity versus water content ....................................................................36
Figure 2.10: Total unit weight versus water content and recommended correlation (Eq. 2.8) ............................................................................................................................37
Figure 2.11: Compression index versus water content with some common published correlations ................................................................................................................38

xiv
Figure 2.12: Compression index versus water content with recommended correlation for inorganic CL, CH, ML and MH soils (Eq. 2.9). .................................................39
Figure 2.13: Compression Index versus water content with recommended correlation for organic OL, OH, and Pt soils (Eq. 2.10) .............................................................40
Figure 2.14: Compression Index versus initial void ratio with some common published correlations ................................................................................................................41
Figure 2.15: Compression Index versus initial void ratio with recommended correlation for inorganic CL, CH, ML and MH soils (Eq. 2.11) ................................................42
Figure 2.16: Compression Index versus initial void ratio with recommended correlation for organic OL, OH, and Pt soils (Eq. 2.12) .............................................................43
Figure 2.17: Compression Index versus initial void ratio with recommended correlation for organic OL, OH, and Pt soils (Eq. 2.14) .............................................................44
Figure 2.18: Recompression Index versus Compression Index with recommended correlation for all soils ..............................................................................................45
Figure 2.19: Recompression Index versus Compression Index with recommended correlation for inorganic CL, CH, ML and MH soils (Eq. 2.15) ..............................46
Figure 2.20: Recompression Index versus Compression Index with recommended correlation for organic OL, OH, and Pt soils (Eq. 2.16) ...........................................47
Figure 2.21: Coefficient of Consolidation at 'v ≈ 'v0 versus Liquid Limit from all oedometer tests with overconsolidation ratio greater than approximately 1.5 .........48
Figure 2.22: Coefficient of Consolidation at 'v ≈ 'p versus Liquid Limit for all soils .........49
Figure 2.23: Coefficient of Consolidation at 'v ≈ 5'p versus Liquid Limit for all soils 50
Figure 2.24: Coefficient of Consolidation at 'v ≈ 5'p versus Liquid Limit for inorganic CL, CH, ML and MH soils .......................................................................................51
Figure 2.25: Coefficient of Consolidation at 'v ≈ 5'p versus Liquid Limit for organic OL, OH, and Pt soils .................................................................................................52
Figure 2.26: Field vane undrained strength ratio at OCR = 1 vs. Plasticity Index for homogeneous clays without shells or sand (from Ladd and DeGroot, 2003) ...........53
Figure 3.1: Undrained strength anisotropy from CK0UC tests on normally consolidated clays and silts (from Ladd and DeGroot, 2003) ........................................................79
xv
Figure 3.2: Correlation between S1 (Eq. 2) and liquid limit for inorganic soils with liquid limit between 26 and 74% (Casey and Germaine, 2013) ...............................79
Figure 3.3: Plasticity chart for the eight test soils ....................................................................80
Figure 3.4: Compression curves in terms of vertical strain for consolidation phase of DSS tests performed on soil #6 .................................................................................80
Figure 3.5: Compression curves in terms of void ratio for consolidation phase of DSS tests performed on soil #6 .........................................................................................81
Figure 3.6: Composite compression curves in terms of void ratio for normally consolidated stress state for soil #6 ...........................................................................81
Figure 3.7: Shear stress-strain behavior for soil #6 during shear ............................................82
Figure 3.8: Normalized shear stress-strain behavior for soil #6 during shear .........................82
Figure 3.9: Pore pressure versus shear strain for soil #6 .........................................................83
Figure 3.10: Normalized pore Pressure versus shear strain for soil #6 ...................................83
Figure 3.11: Stress plots for soil #6 during shear ....................................................................84
Figure 3.12 Normalized stress plot for soil #6 during shear ....................................................84
Figure 3.13: Variation in the measured undrained strength ratios for all the soils (regression lines are for 'vc ≥ 100 kPa) ...................................................................85
Figure 3.14: Undrained Young’s modulus versus shear strain for soil #6...............................85
Figure 3.15:Normalized undrained Young’s modulus versus shear strain for soil #6.............86
Figure 3.16: Variation is secant undrained modulus (normalized by su) for soil #6 as a function of shear stress ratio .....................................................................................86
Figure 3.17: Secant undrained modulus against vertical consolidation stress for a shear stress ratio of 0.25 .....................................................................................................87
Figure 3.18: Secant undrained modulus against vertical consolidation stress for a shear stress ratio of 0.50 .....................................................................................................87
Figure 3.19: Secant undrained modulus against vertical consolidation stress for a shear stress ratio of 0.75 .....................................................................................................88

xvi
Figure 3.20: Variation of normalized undrained modulus with vertical consolidation stress for a shear stress ratio of 0.25 .........................................................................88
Figure 3.21: Variation of normalized undrained modulus with vertical consolidation stress for a shear stress ratio of 0.50 .........................................................................89
Figure 3.22: Variation of normalized undrained modulus with vertical consolidation stress for a shear stress ratio of 0.75 .........................................................................89
Figure 3.23: Correlation between the Eq. 3.2 parameter S1 and liquid limit for organic soils. * symbols in gray show the data from Casey and Germaine (2013) ...............90
Figure 3.24: Correlation between the Eq. 3.2 parameter T and liquid limit for organic soils. * symbols in gray show the data from Casey and Germaine (2013) ...............91
Figure 3.25: Predictions of variation in NC su/'vc vs. 'vc for a) CK0UC behavior of inorganic soils with LL = 25, 40, 50 and 75% (Eqs. 3.2, 3.3 and 3.4) and b) DSS behavior of organic soils with LL = 75, 100, 150, 200 and 250% (Eqs. 3.2, 3.16, and 3.17) ...................................................................................................92
Figure 3.26: Correlation between liquid limit and organic matter ...........................................93
Figure 3.27: Correlation between parameter S1 and organic matter ........................................93
Figure 3.28: Correlation between parameter T and organic matter .........................................94
Figure 3.29: Eu/’vc versus LL at shear stress ratios (/su) of 0.25, 0.50 and 0.75 for the organic soils at 'vc = a) 100 kPa, b) 200 kPa, c) 400 kPa and d) 1600 kPa .............95
Figure 3.30: Eu/su versus /su for the organic soils at 'vc = a) 100 kPa, b) 200 kPa, c) 400 kPa and d) 1600 kPa ..........................................................................................96
Figure 4.1: Common procedures for estimating the recompression ratio RR (after Leonards 1976, Holtz et al. 2011) ...........................................................................120
Figure 4.2: One-dimensional compression behavior of N2SBS3 block in - log’v space ........................................................................................................................121
Figure 4.3: One-dimensional compression behavior of N2SBS3 block in e - log’v space ........................................................................................................................122
Figure 4.4: Different methods used to determine RR in this study .......................................123
Figure 4.5: Variation in recompression ratio with ’u/’r .....................................................124
Figure 4.6: Variation in the recompression ratio with ’u/’p ...............................................124

xvii
Figure 4.7: Variation in the recompression ratio with v at ’u .............................................125
Figure 4.8: Variation in the recompression ratio with v at ’u for all the tested soils ..........126
Figure 4.9: Range of RR values from all the methods. The line in the box presents the median, the top and bottom boarders of the box show 25th and 75th percentile, the two upper and lower whiskers represent 10th and 90th percentile, and the outliers are presented with dots...............................................................................127
Figure 4.10: Variation in recompression ratio with ’u/’r for BB-6 sample .......................127
Figure 4.11: Variation in the recompression ratio with ’u/’p for BB-6 sample .................128
Figure 4.12: Variation in the recompression ratio with v at ’u for BB-6 sample................128
Figure 4.13: Variation in recompression ratio with ’u/’r for N2SBS3 sample ..................129
Figure 4.14: Variation in the recompression ratio with ’u/’p for N2SBS3 sample ............129
Figure 4.15: Variation in the recompression ratio with v at ’u for N2SBS3 sample ..........130
xviii
LIST OF SYMBOLS
C Coefficient of secondary compression
Cc Compression index
Cr Recompression index
cv Vertical coefficient of consolidation
e Void ratio
e0 Initial void ratio
Eu Secant Young's Modulus
G Shear modulus
Gs Specific gravity of solids
H0 Thickness of soil layer
Ic Soil behavior type
k CPTU correlation coefficient for 'p
K Stress ratio
Kc Consolidation stress ratio = 'h/'v
K0 Coefficient of lateral earth pressure at rest
LL Liquid limit
LI Liquidity index = (w – PL)/PI
M Constrained (oedometer) modulus = 'vv
mv Coefficient of volume change
Nkt Cone factor
PI Plasticity index
PL Plastic limit
xix
q Shear stress = (v – h)/2
qt Corrected tip resistance
Qtn Normalized tip resistance
Rf Friction ratio = fs/qt
sci Consolidation settlement
SFV Field vane undrained strength ratio
St Sensitivity
su Undrained shear strength
t Time
u Shear induced pore pressure (psf or tsf)
w Water content (%)
wL Liquid limit
wn Natural water content (%)
wp Plastic limit
Change
L Horizontal displacement
H Vertical displacement (change in specimen height)
u Equivalent DSS shear induced pore pressure
v Vertical strain
vc Vertical consolidation strain
vf Final vertical consolidation strain
vol Volumetric strain

xx
vmax Maximum vertical strain during consolidation phase of DSS test
Bjerrum's field vane test correction factor
Shear strain for DSS test
d Dry unit weight
t Total unit weight
w Unit weight of water
% Percentage
'v0 In situ vertical effective stress
'hc Horizontal effective stress at end of consolidation
'h0 In situ horizontal effective stress
'p Preconsolidation stress
'v Vertical effective stress
v0 In situ total vertical stress
'vc Vertical effective stress at end of consolidation
'vf Final vertical effective stress (at mid height soil layer)
'vmax Maximum vertical stress during consolidation phase of DSS test
h Horizontal shear stress
1
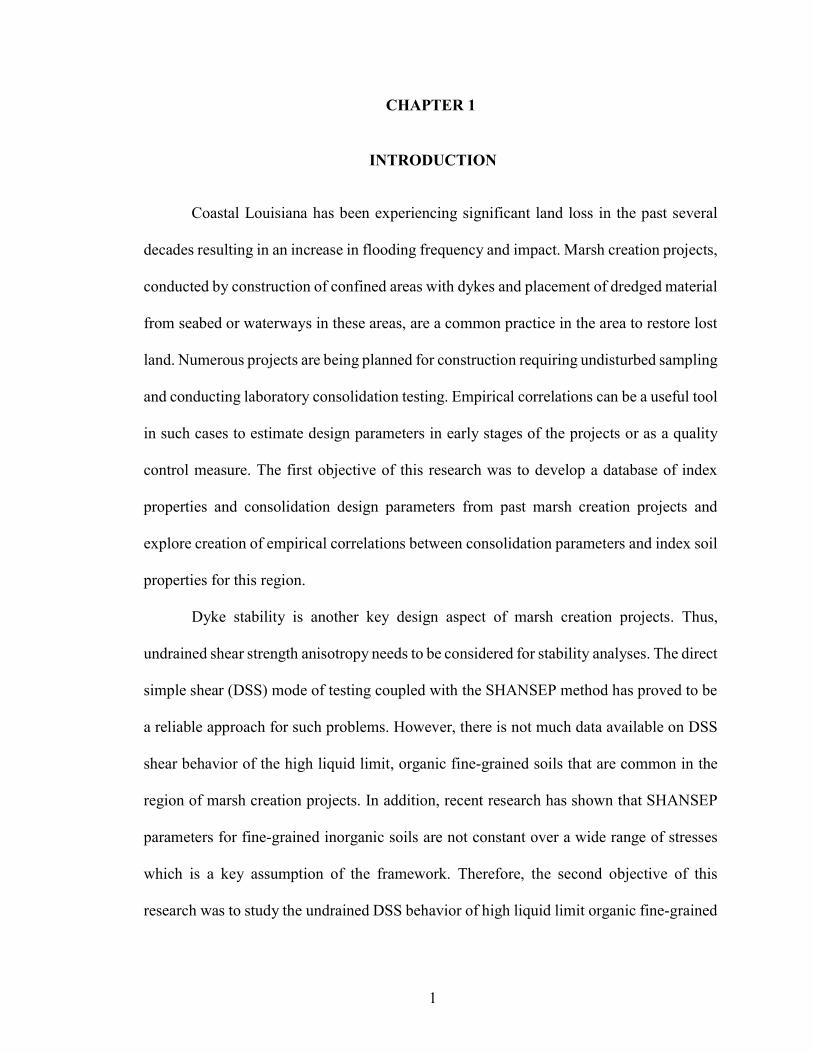
CHAPTER 1
INTRODUCTION
Coastal Louisiana has been experiencing significant land loss in the past several
decades resulting in an increase in flooding frequency and impact. Marsh creation projects,
conducted by construction of confined areas with dykes and placement of dredged material
from seabed or waterways in these areas, are a common practice in the area to restore lost
land. Numerous projects are being planned for construction requiring undisturbed sampling
and conducting laboratory consolidation testing. Empirical correlations can be a useful tool
in such cases to estimate design parameters in early stages of the projects or as a quality
control measure. The first objective of this research was to develop a database of index
properties and consolidation design parameters from past marsh creation projects and
explore creation of empirical correlations between consolidation parameters and index soil
properties for this region.
Dyke stability is another key design aspect of marsh creation projects. Thus,
undrained shear strength anisotropy needs to be considered for stability analyses. The direct
simple shear (DSS) mode of testing coupled with the SHANSEP method has proved to be
a reliable approach for such problems. However, there is not much data available on DSS
shear behavior of the high liquid limit, organic fine-grained soils that are common in the
region of marsh creation projects. In addition, recent research has shown that SHANSEP
parameters for fine-grained inorganic soils are not constant over a wide range of stresses
which is a key assumption of the framework. Therefore, the second objective of this
research was to study the undrained DSS behavior of high liquid limit organic fine-grained

2
soils from the coastal LA region and investigate the stress dependency of the SHANSEP
undrained shear strength parameters.
Compressibility parameters as determined from consolidation tests are key soil
properties for estimating the magnitude of the consolidation settlement. There has been
extensive research conducted on measurement and evaluation of the preconsolidation stress
and compression ratio for normally consolidation loading. The recompression ratio for
recompression loading from in situ stresses up to the preconsolidation stress has received
much less attention generally due to the lower strains, and hence lower consolidation
settlement in this stress range. However, for some design problems, such as for example
heavy loading of thick high overconsolidation ratio clays obtaining reliable estimates of
the recompression ratio can be important. Yet, there is no consensus on the best practice to
conduct consolidation tests for determining the recompression ratio. The third objective of
this research was to develop a better understanding of the effects of stress level and
unloading ratio as well as the different methods of estimating the recompression ratio.
Chapters 2, 3 and 4 present the products from this research for the three topics listed
above. All three chapters have been prepared for submission as a journal article. Chapter 2
presents the results of an investigation into the correlations between index soil properties
and consolidation design parameters for soft soil of coastal Louisiana region. The author
is the lead author, responsible for writing and organizing the paper, processing the data,
and developing the correlations. Coauthors on this paper are expected to be DeGroot, D.J.
and Zhang, G.
Chapter 3 presents the results of an investigation into the effects of consolidation
effective stress level on DSS undrained shear behavior of organic soils from coastal

3
Louisiana area. The author is the lead author, responsible for writing and organizing the
paper, testing, and evaluating experimental results. Coauthor on this paper is expected to
be DeGroot, D.J.
Chapter 4 presents the results of an investigation into the best practice for
determination of recompression ratio from consolidation tests. The author is the lead
author, responsible for writing and organizing the paper, testing, and evaluating
experimental results. Coauthors on this paper are expected to be DeGroot, D.J. and DeJong,
J.T.

4
CHAPTER 2
EMPIRICAL CORRELATIONS FOR ESTIMATING FOUNDATION SOIL
CONSOLIDATION PARAMETERS FROM INDEX PROPERTIES FOR
LOUISIANA MARSH CREATION
This paper presents a collection of empirical correlations for estimating
consolidation parameters of fine-grained soils for settlement calculations using basic index
and classification measurements. The database was generated using site investigation data
from 15 marsh creation projects in the coastal Louisiana region. These projects typically
involved low to near normally consolidated soft, high liquid limit organic silts and clays,
for which a majority of published empirical correlations do not exist. Index and
classification properties included in the database were water content, void ratio, Atterberg
Limits, and dry unit weight. Consolidation design parameters (compressibility,
preconsolidation stress and coefficient of consolidation) were determined from 1-D
incremental loading consolidation test results. The degree of correlation between the index
parameters and design parameters varied significantly with the strongest one being for the
compression ratio as a function of water content considering inorganic and organic soil
separately. No useful correlation was found for the preconsolidation stress which is the
most important parameter for settlement calculations. Recommendations for use of the
correlations in practice are provided.
2.1. Introduction
The geotechnical engineering literature contains numerous examples of empirical
correlations between basic index properties and soil design parameters (e.g., NAVFAC,
5
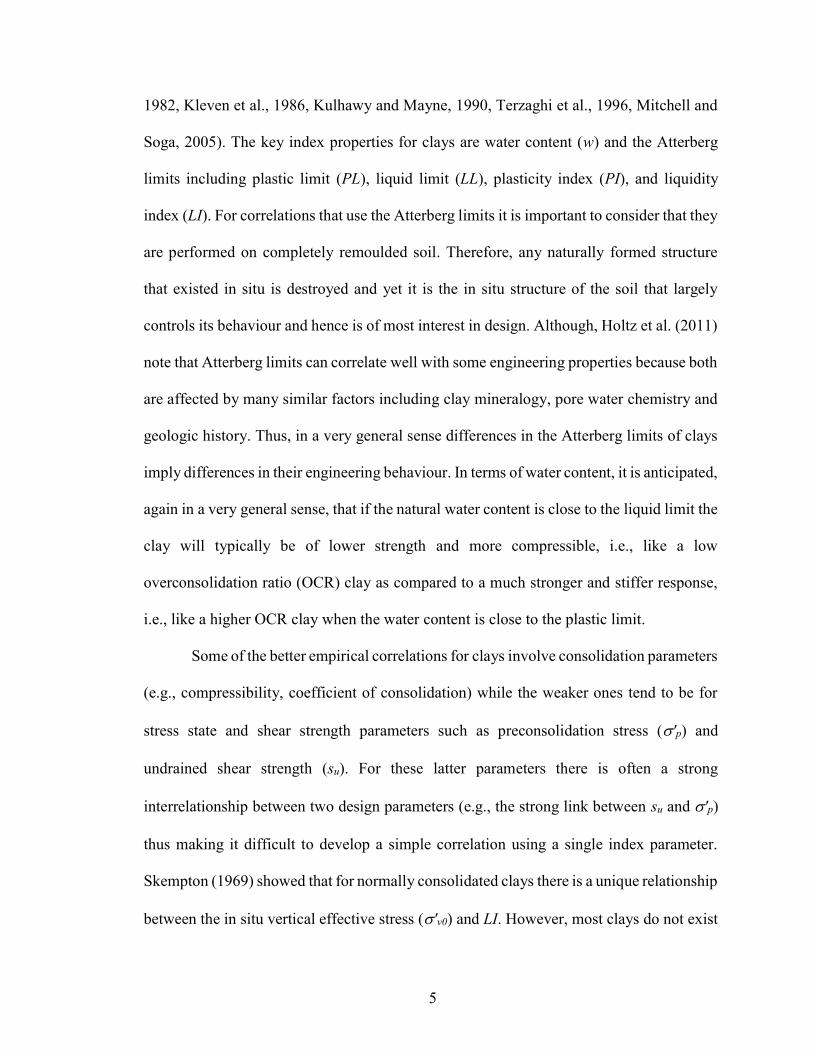
1982, Kleven et al., 1986, Kulhawy and Mayne, 1990, Terzaghi et al., 1996, Mitchell and
Soga, 2005). The key index properties for clays are water content (w) and the Atterberg
limits including plastic limit (PL), liquid limit (LL), plasticity index (PI), and liquidity
index (LI). For correlations that use the Atterberg limits it is important to consider that they
are performed on completely remoulded soil. Therefore, any naturally formed structure
that existed in situ is destroyed and yet it is the in situ structure of the soil that largely
controls its behaviour and hence is of most interest in design. Although, Holtz et al. (2011)
note that Atterberg limits can correlate well with some engineering properties because both
are affected by many similar factors including clay mineralogy, pore water chemistry and
geologic history. Thus, in a very general sense differences in the Atterberg limits of clays
imply differences in their engineering behaviour. In terms of water content, it is anticipated,
again in a very general sense, that if the natural water content is close to the liquid limit the
clay will typically be of lower strength and more compressible, i.e., like a low
overconsolidation ratio (OCR) clay as compared to a much stronger and stiffer response,
i.e., like a higher OCR clay when the water content is close to the plastic limit.
Some of the better empirical correlations for clays involve consolidation parameters
(e.g., compressibility, coefficient of consolidation) while the weaker ones tend to be for
stress state and shear strength parameters such as preconsolidation stress ('p) and
undrained shear strength (su). For these latter parameters there is often a strong
interrelationship between two design parameters (e.g., the strong link between su and 'p)
thus making it difficult to develop a simple correlation using a single index parameter.
Skempton (1969) showed that for normally consolidated clays there is a unique relationship
between the in situ vertical effective stress ('v0) and LI. However, most clays do not exist
6
in a truly normally consolidated state and the potential existence of such a relationship for
overconsolidated clays is often observed empirically. That is, lightly overconsolidated
clays often have a water content around the liquid limit (LI = 1) while heavily
overconsolidated clays often have a water content around the plastic limit (LI = 0). In terms
of 'p, it is only for the case of removal of overburden would it be expected that
overconsolidated clays might also exhibit a unique relationship between 'p and LI. Other
factors such as weathering, aging, diagenetic bonding and other physico-chemical
processes also change the in situ stress state of a clay (Stas and Kulhawy 1984, Ladd and
DeGroot 2003) and the relationship between 'p and LI becomes weaker and more
scattered. Yet in spite of these complicating factors, most empirical correlations for 'p use
LI (e.g., NAVFAC, 1982, Wroth, 1979, Stas and Kulhawy, 1984). NAVFAC (1982)
presents a relationship between 'p and LI that makes use of the sensitivity (St) to refine the
correlation. Stas and Kulhawy (1984) reviewed data for clays with sensitivities ranging
from 1 to 10 and suggest a direct correlation between 'p and LI and contrary to NAVFAC,
found no influence of St on the correlation.
Many correlations have been presented between the 1-D compressibility of clays,
as for example expressed by compression index Cc, and either the natural water content or
the plasticity index. Terzaghi et al. (1996) present a correlation between Cc and w for a
large variety of clays and suggest that such a direct relationship should exist because both
properties are controlled by composition and structure unlike PI and LI. Leroueil et al.
(1983) found that St strongly influences the value of Cc and present a correlation that links
Cc with the in situ void ratio (e0) and St for sensitive clays. The coefficient of consolidation
(cv) for the normally consolidated state has been found to correlate well with wn (e.g., Janbu

7
1985) while NAVFAC (1982) presents a correlation between cv and LL for normally
consolidated, overconsolidated and remoulded states.
The most reliable way to determine soil parameters is by conducting an integrated
site characterization program that combines in situ testing and laboratory consolidation
testing on good quality undisturbed samples as described for example in Hight and Leroueil
(2003) and Ladd and DeGroot (2003), and DeJong et al. (1998). However, there are
practical circumstances for which it may be necessary to rely on empirical correlations
such as for example (NGI, 2002): 1) to derive soil design parameters at an early stage (e.g.,
feasibility study) before advanced laboratory testing is planned or conducted; 2) in projects
where budgets for performing advanced laboratory tests are limited or not available, and
3) as a quality control to check whether new testing results for a new site are consistent
with previous experience. However, the usefulness and applicability of any correlation are
strongly dependent on the reliability of datasets that are used to develop the correlation.
Mixing data from a variety of sources can result in increasing scatter and a decrease in the
reliability of the correlations because of the differences in measurement techniques and the
quality of the data used. Furthermore, there can be significant differences in soil
composition and behavior among soils worldwide due to differences in geologic origin,
depositional environmental and geologic stress history.
This paper presents the results of a study that analysed an extensive past project
database and developed empirical correlations between basic soil index test data and
consolidation design parameters for soft fine-grained coastal soils commonly encountered
as underlying foundations in Louisiana (LA) marsh creation projects. While the literature
presents numerous examples of empirical correlations the majority are not for high liquid

8
limit and organic soft fine-grained soils that are commonly involved in LA marsh creation
projects. The database created in this work includes soil properties from fifteen (15) LA
marsh creation projects that cover a wide variety of fine-grained soils ranging from low-
plasticity inorganic clays and silts (CL, ML) to high-plasticity organic clays and silts (OH,
MH). The paper presents an overview of the created database, presents the developed
correlations and provides recommendations for use of the correlations in practice. The
work presented herein follows the framework developed by the Norwegian Geotechnical
Institute (NGI 2002) for the study of empirical correlations for offshore soils.
2.2. Background
2.2.1 Settlement Calculations
For settlement analyses, the magnitude of the final consolidation settlement for an
individual soil layer can be estimated using the generic Eq.
sci = Cr[H0/(1 + e0)]log ('p/'v0) + Cc[H0/(1 + e0)]log ('vf/'p) Eq. 2.1
where for a given soil layer i
sci = consolidation settlement
Cr = recompression index = e/log'v for recompression stresses, 'v ≤ 'p
Cc = compression index = e/log'v for normally consolidated stresses, 'v ≥ 'p
H0 = thickness of soil layer
e0 = initial void ratio
'v0 = vertical effective stress (at mid height soil layer)
'p = preconsolidation stress (at mid height soil layer)
'vf = final vertical effective stress (at mid height soil layer)

9
The overall consolidation settlement sc is the sum of the individual soil layer sci
values. This does not consider any other potential sources of settlement such as initial
undrained shear induced, elastic, or drained creep (i.e., secondary compression).
For a soil layer that exists in a normally consolidated (NC) state prior to
construction with an overconsolidation ratio (OCR):
OCR = 'p/'v0 Eq. 2.2
equal to 1.0, then Eq. 2.1 reduces to
sci = Cc[H0/(1 + e0)]log ('vf/'v0) for 'p = 'v0 Eq. 2.3
For a soil layer that exists in an overconsolidated (OC) state and remains OC at the
end of construction (i.e., OCR > 1 prior to and after construction), Eq. 2.1 reduces to
sci = Cr[H0/(1 + e0)]log ('vf/'v0) for 'vf ≤ 'p Eq. 2.4
Calculating the rate of primary consolidation settlement requires an estimate of the
coefficient of consolidation (cv) and calculating secondary consolidation settlement
requires an estimate of the secondary compression index C (= e/logt). Thus, the
required soil parameters for conducting settlement predictions are: 1) state parameters: e0,
'v0 and 'p and 2) consolidation parameters: Cr, Cc, cv, C
2.2.2 Influence of Sample Disturbance
Figure 2.1 illustrates the significant changes in one-dimensional compressibility
and flow properties when a soft clay is loaded beyond the preconsolidation stress. This
transition stress separates small, mostly elastic strains as defined by Cr from large mostly
plastic strains as defined by Cc. Furthermore, as the loading changes from recompression
(OC) to virgin compression (NC), cv and C also undergo marked changes. For undisturbed

10
clay, cv(OC) is typically 5 to 10 times the value of cv(NC), which is mostly due to a lower
coefficient of volume change (mv = v/'v) in the OC region. The rate of secondary
compression increases as 'v approaches 'p and often reaches a peak just beyond 'p. Most
of these one-dimensional consolidation properties are adversely influenced by sample
disturbance, as also illustrated in Figure 2.1. Sample disturbance results in a more rounded
compression curve with greater v (or lower e) at all stress levels. The increased
compressibility in the OC range (higher Cr) and decreased compressibility in the NC range
(lower Cc) tends to obscure and usually lower 'p. During recompression, cv(OC) is usually
much lower and C(OC) is higher. The only parameter not significantly affected by sample
disturbance is cv(NC) well beyond 'p and the e–logkv relationship, unless there is severe
disturbance.
No definitive method exists for evaluating the quality of samples and it is especially
difficult to distinguish disturbance caused by constrained swelling (due to sampling stress
relief) versus that caused by shear distortions. The former should have minimal effect on
consolidation properties whereas the latter can produce irreversible destructuring that alters
basic behavior depending on the degree of damage to the soil structure (Ladd and DeGroot
2003). Nevertheless, some useful methods for assessing sample quality have been
developed. X-rays of tube samples can provide useful visual information on variations in
soil type, layering, presence of inclusions, and signs of disturbance including bending of
soil layers near the tube perimeter, cracks due to stress relief, and voids due to gross
disturbance. The most widely recognized quantitative method of evaluating sample quality
for clays is the measurement of volume change (vol = v in 1-D consolidation) during
laboratory 1-D reconsolidation to the estimated in situ effectives stress state (e.g., from IL

11
or CRS oedometer testing or from consolidation phase of anisotropically consolidated
triaxial tests). Andresen and Kolstad (1979) proposed that increasing sample disturbance
should result in increasing values of vol or v. Terzaghi et al. (1996) adopted this approach,
coined the term Specimen Quality Designation (SQD) with sample quality ranging from A
(best) to E (worst), and suggested that reliable laboratory data required samples with SQD
of B or better for clays with OCR < 3 – 5. Lunne et al. (2006) modified the method of
Andresen and Kolstad (1979) with the use of the normalized change in void ratio e/e0
during laboratory reconsolidation to the estimated in situ effective stress state and
distinguished between clays of OCR = 1 to 2 versus 2 to 4. The sample quality criterion of
Lunne et al. (2006) was developed for clay soils with a plasticity index in the range of 6%
to 43%. More recently, Karlsrud and Hernandez-Martinez (2013) and DeJong et al. (2018)
proposed methods that use the recompression and virgin compression behavior during 1-
D consolidation testing to evaluate sample quality. It is not known if any of the sample
quality evaluation methods listed above are applicable to high liquid limit, organic silts and
clays.
2.3. Database Development
The database was created using data from laboratory soil classification and 1-D
incremental loading (IL) consolidation tests performed on samples collected for selected
past LA marsh creation projects. All projects were performed by GeoEngineers, Inc. (Baton
Rouge, LA). Table 2.1 lists by project name/location these projects included in the
database. All samples were distinguished as being either organic or inorganic based on the
reported Unified Soil Classification System (USCS; ASTM D2487) with the designations
as CL, CH, ML and MH or inorganic soils and OL, OH and Pt for organic soils. The focus

12
of this work was on soil properties and design parameters needed to estimate the
consolidation settlement of LA marsh creation project foundation soils. These included:
total unit weight (t), specific gravity (Gs), preconsolidation stress ('p), recompression
index (Cr), compression index (Cc), coefficient of consolidation (cv), and coefficient of
secondary compression (C). The basic index and classification properties that were
studied in developing the recommended correlations included: water content (w), initial
void ratio (e0), Atterberg Limits (liquid limit, plastic limit, plasticity index), liquidity index,
and dry unit weight (d).
Ideally the database should have been filtered to separate out test results from the
better-quality samples and remove those from the poor to very poor-quality samples.
However, as noted in the background section, no quantitative method has been developed
for evaluating sample quality for high liquid limit organic soils. An effort was made to
mitigate, albeit to an unknown degree, the influence of sample disturbance by using: 1) an
unload-reload loop to estimate Cr, 2) the simplified Schmertmann procedure to estimate
Cc, and 3) considering cv not just at 'v0 but also at 'p and well into the normally
consolidated stress state at 5'p. In sum, the following procedures were used to estimate
the desired parameters for each IL consolidation test:
‐ 'v0 was estimated using information from the boring logs and a
combination of measured or appropriately estimated total unit weight values
for each of the soil units identified in the boring logs
‐ 'p was estimated using Casagrande (1936) construction from the 1-D
consolidation stress-strain plots
‐ OCR was computed as the ratio of the above estimated 'p and 'v0 values

13
‐ Cr was estimated using the simplified Schmertmann (1955) construction
procedure as shown schematically in Figure 2.2 with the unload-reload loop
serving as a guide for selection of Cr.
‐ Cc was estimated using a simplified Schmertmann (1955) construction
using the above noted Casagrande estimate of 'p as shown schematically
in Figure 2.2. In all cases this method resulted in a value of Cc that was
either equal to or greater than the slope of the measured compression curve
for stress levels beyond 'p.
‐ cv values were determined using the Taylor (1948) square root of time
method for interpreting individual load increment displacement-time
curves.
The construction shown in Figure 2.2 is termed the "simplified" Schmertmann
(1955) method as it does not involve the full graphical construction procedure suggested
by Schmertmann (1955) for adjusting laboratory compression curves to estimate the in situ
consolidation behavior. As such, 'p values were not adjusted for any possible influence of
sample disturbance.
2.4. Correlations Investigated
Table 2.1 lists the number of oedometer tests used to create the database by USCS
soil type as inorganic (CL, CH, ML and MH) and organic (OL, OH, and Pt). Figure 2.3
plots the Atterberg limits in a Casagrande plasticity chart. As is evident in Table 2.1 and
Figure 2.3 the database contains results from tests conducted on a wide variety of soil types
that span a large range in water content and liquid limit. In general, the degree of correlation

14
between the index parameters and design parameters investigated varied significantly;
while in many cases there are distinct trends there is also often a large degree of scatter.
For the strongest correlations, best fit regression equations are presented whereas for
weaker correlations with significant scatter fitting regression equations to the data was not
justified.
2.4.1 Preconsolidation Stress
The most important soil parameter for estimating consolidation settlement is the
preconsolidation stress 'p as it separates small (i.e., recompression) versus large (i.e.,
normally consolidated) deformation (Figure 2.1 and Eq. 2.1). However, as noted in the
Introduction there are numerous factors that can influence how a soil deposit develops 'p
and generally no reliable universal correlations between 'p and an index parameter exist.
One common correlation presented in the literature is between 'p and LI as shown for
example in Figure 2.4 from the USACE NAVFAC DM-7 (1982). But as shown in Figure
2.5, which plots the LA Marsh Creation database values, no useful correlation can be
recommended from this dataset. Sensitivity values were not available for the LA Marsh
Creation projects included in the database and it is unknown if the availability of such
would reduce the scatter in Figure 2.5. Furthermore, many of the 'p values are less than
'v0 as shown in Figure 2.6 which corresponds to a computed OCR of less than one (Figure
2.7). Generally, OCR values of less than one is not possible and one of the main reasons
such values are obtained from laboratory test results is due to the detrimental effects of
sample disturbance. In the absence of a reliable correlation for 'p, recommendations are
given at the end of the paper on an hierarchy of procedures to consider for estimating 'p.

15
2.4.2 In Situ Vertical Effective Stress
Computation of the in situ vertical effective stress ('v0) requires estimates of the in
situ equilibrium pore water pressure (u0) and the total unit weight to compute the in situ
vertical total stress (v0). In the absence of direct measurement of total unit weight from
reasonable quality samples, it can be estimated using the specific gravity and assuming
100% saturation as
t = (1 + w/100)d = (1 + w/100)(Gsw)/(1 + wGs/100) Eq. 2.5
where
t = total unit weight [pcf]
d = dry unit weight [pcf]
Gs = specific gravity [ - ]
w = natural water content [percent]
w = unit weight of water [pcf]
Measurement of the specific gravity Gs is recommended although in the absence of
such measurement normally a reasonable estimate of Gs can be made knowing the basic
soil type. However, for high liquid limit and organic clays Gs values can be much lower
than the range of conventional estimates. Figure 2.8 presents Gs as a function of liquid limit
and for which the trend lines suggest;
Gs = 2.6 to 2.7 for LL ≤ 100% Eq. 2.6
Gs = 2.86 – 0.002LL for LL > 100% Eq. 2.7
Figure 2.9 presents the correlation between Gs and water content for use if Atterberg
Limits data are not available. The correlation is similar to that for LL but with somewhat
more scatter.
16
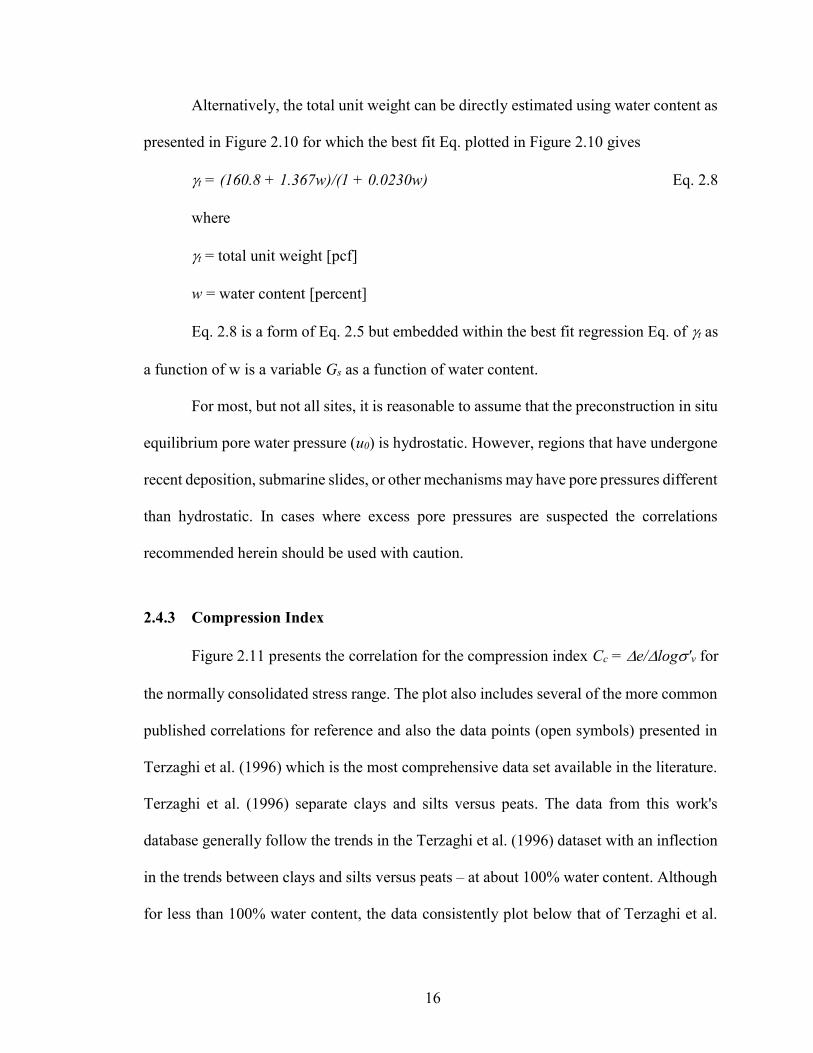
Alternatively, the total unit weight can be directly estimated using water content as
presented in Figure 2.10 for which the best fit Eq. plotted in Figure 2.10 gives
t = (160.8 + 1.367w)/(1 + 0.0230w) Eq. 2.8
where
t = total unit weight [pcf]
w = water content [percent]
Eq. 2.8 is a form of Eq. 2.5 but embedded within the best fit regression Eq. of t as
a function of w is a variable Gs as a function of water content.
For most, but not all sites, it is reasonable to assume that the preconstruction in situ
equilibrium pore water pressure (u0) is hydrostatic. However, regions that have undergone
recent deposition, submarine slides, or other mechanisms may have pore pressures different
than hydrostatic. In cases where excess pore pressures are suspected the correlations
recommended herein should be used with caution.
2.4.3 Compression Index
Figure 2.11 presents the correlation for the compression index Cc = e/log'v for
the normally consolidated stress range. The plot also includes several of the more common
published correlations for reference and also the data points (open symbols) presented in
Terzaghi et al. (1996) which is the most comprehensive data set available in the literature.
Terzaghi et al. (1996) separate clays and silts versus peats. The data from this work's
database generally follow the trends in the Terzaghi et al. (1996) dataset with an inflection
in the trends between clays and silts versus peats – at about 100% water content. Although
for less than 100% water content, the data consistently plot below that of Terzaghi et al.

17
(1996), which could be in some cases lower sample quality resulting in lower Cc values
and also that a number of the data points in the 50 to 100% water content range in the
Terzaghi et al. (1996) database are for highly structured sensitive clays which have very
large Cc values.
Overall a best fit Eq. for the full data set presented in Figure 2.11 does not reflect
the data well at lower water contents. Therefore, separate correlations for Cc as a function
of water content are recommended and presented in Figure 2.12 and Figure 2.13 for
inorganic and organic soils such that
Cc = 0.015w – 0.16 for inorganic CL, CH, ML and MH soils Eq. 2.9
and
Cc = 0.010w for organic OL, OH, and Pt soils Eq. 2.10
For reference Mesri and Ajlouni (2007) recommend Cc = 0.010w for fibrous peats
which is the same as Eq. 2.10.
Figure 2.14 presents the correlation for Cc as a function of the initial void ratio e0
along with a number of correlations presented in the literature. The best fit regression to
the full dataset gives a relationship nearly identical to that of Park and Lee (2011).
However, this Eq. overpredicts Cc for low void ratio soils and therefore separate
correlations are recommended for inorganic (Figure 2.15) and inorganic soils (Figure 2.16)
resulting in
Cc = 0.57e0 – 0.20 for inorganic CL, CH, ML and MH soils Eq. 2.11
and
Cc = 0.50e0 for organic OL, OH, and Pt soils Eq. 2.12

18
Use of Eqs. 2.11 and 2.12 requires measurements to compute e0 or in the absence
of such measurements it can be estimated w and Gs for an assumed condition of 100%
saturation as
e0 = Gsw Eq. 2.13
and if Gs is not measured it can be estimated using Eqs. 2.6 and 2.7.
Plots of Cc versus liquid limit and Cc versus plasticity index show positive trends
but the scatter is somewhat greater than that of the water content correlations (Figure 2.12
and Figure 2.13) and are not recommended.
If a reliable measure of the dry unit weight is available there is a strong correlation
between Cc and d that includes both inorganic and organic soils as shown in Figure 2.17
Best-fit regression fit to the data gives
Cc = 7.15e-0.037d for inorganic and organic soils Eq. 2.14
2.4.4 Recompression Index
The recompression index Cr = e/log'v is for recompression loading from the in
situ vertical effective stress ('v0) to a stress equal to or less than the preconsolidation stress
('p). Correlations between Cr and w, e0, LL or PL show positive trends, but all have
significant scatter and are not recommended. Rather it is common in practice to correlate
Cc with Cr as plotted in Figure 2.18 for which Cr = 0.10Cc is within the range of 0.02 to
0.20 reported for most soils (Terzaghi et al., 1996). Figure 2.19 and Figure 2.20 present
separate plots for inorganic and organic soils and provide some refinement resulting in
Cr = 0.13Cc for inorganic CL, CH, ML and MH soils Eq. 2.15
and

19
Cr = 0.10Cc for organic OL, OH, and Pt soils Eq. 2.16
2.4.5 Coefficient of Consolidation
The coefficient of consolidation is highly dependent on the stress state relative to
the preconsolidation stress as shown schematically in Figure 2.1, Figure 2.21, Figure 2.22,
and Figure 2.23 plots versus cv at 'v ≈ 'v0, 'v ≈ 'p, and 'v ≈ 5'p. The cv at 'v ≈ 'v0
values in Figure 2.21 are from oedometer test for which the test specimen OCR was greater
than approximately 1.5. Terzaghi et al. (1996) note the recompression values of cv (i.e.,
loading from 'v0 towards 'p) can be from one to as much as one hundred times the
normally consolidated value although for most soft clays the ratio typically ranges from
around 5 to 10. Furthermore, for soft clays and silts cv is more or less constant in the
compression range from 'p to 5'p but can decrease by a factor of 10 to 20 for fibrous
peats. The Figure 2.21, Figure 2.22, and Figure 2.23 data have significant scatter but depict
several trends: 1) cv values for 'v ≈ 'v0 are somewhat more scattered than that for cv at 'v
≈ 5'p which is expected as there is generally more uncertainly in interpretation of cv data
for recompression loading due to sample disturbance; 2) cv values for 'v ≈ 5'p at a given
liquid limit are lower than for cv at 'v ≈ 'v0 which is expected for NC vs OC behavior;
and 3) cv initially decreases with an increase in liquid limit and then transitions to increasing
with an increase in liquid limit – this is especially evident in Figure 2.23 for cv at 'v ≈ 5'p.
Figure 2.24 and Figure 2.25 present cv at 'v ≈ 5'p for inorganic and organic soils. Also
included in Figure 2.24 is the NAVFAC DM7 (1982) correlation for normally consolidated
cv and data points from Terzaghi et al. (1996) for normally consolidated cv.

20
Overall, the scatter in the various cv versus liquid limit plots is large and a pragmatic
approach is proposed here on recommendation for use of the correlations in practice. Given
the generally greater reliability of estimates of cv at 'v ≈ 5'p it is recommended that values
of cv be first estimated based on liquid limit values for this stress state using the
recommended ranges plotted in Figure 2.24 and Figure 2.25 as a guide
cv('v≈5'p) = (50 to 250)(LL)-1.9 for inorganic soils Eq. 2.17
cv('v≈5'p) = (0.002 to 0.009)e0.007LL for organic soils Eq. 2.18
where
e = exponential function
Values of cv for states of stress around 'v0 and 'p can be estimated using
approximate ratios based upon the data plotted in Figure 2.21, Figure 2.22, and Figure 2.23
Inorganic:
cv('v≈'v0)/cv('v≈5'p) ≈ 5 for inorganic soils Eq. 2.19
cv('v≈'p)/cv('v≈5'p) ≈ 3 for inorganic soils Eq. 2.20
Organic:
cv('v≈'v0)/cv('v≈5'p) ≈ 6 for organic soils Eq. 2.21
cv('v≈'p)/cv('v≈5'p) ≈ 5 for organic soils Eq. 2.22
The Eqs. 2.17 to 2.22 are an approximate guideline as there is overall a significant
degree of scatter in the dataset that they are based upon.
21
2.4.6 Coefficient of Secondary Compression
The coefficient of secondary compression C = e/logt is best evaluated from
incremental loading (IL) consolidation tests. In the absence of such measurements the
Terzaghi et al. (1996) correlations between C and Cc are recommended
C = (0.04 ± 0.01)Cc for inorganic clays and silts Eq. 2.23
C = (0.05 ± 0.01)Cc for organic clays and silts Eq. 2.24
C = (0.06 ± 0.01)Cc for peat and muskeg Eq. 2.25
These correlations are independent of stress level and hold for both recompression
and normally consolidated stress states.
2.5. Recommendation for use of Correlations in Practice
Table 2.2 presents a summary of the correlations investigated and includes an
assessment of the efficacy of each correlation. Use of the correlations should only be used
for feasibility studies, preliminary analyses and for comparative purposes as data are being
collected on new projects. Final design should always involve an integrated site
characterization program that includes in situ testing and advanced laboratory testing (i.e.,
consolidation) of undisturbed samples. It is also important to note that while most of the
correlations have clear trends there is also often significant scatter adding a further
cautionary note to their use. Users of the correlations are encouraged to always inspect the
scatter associated with any estimate as opposed to just using the best-fit equations. Given
project considerations, appropriate decisions can be made as to whether to select values
along the best-fit equations for the correlations or to use a range of values.

22
The most important parameter for estimating consolidation settlement is 'p but
unfortunately no useful empirical correlations exist between 'p and any index parameter.
As such the options, in the absence of collection of any additional site investigation data,
are limited. One approach is to assume an OCR of one (or other appropriate values) based
on knowledge of the site geology and past experience. For feasibility studies and
preliminary design assuming normally consolidated (OCR = 1) conditions in practice is
generally considered a conservative approach. However, this may not necessarily be the
case for marsh creation projects where settlement predictions typically need to be within a
particular range (i.e., not too large or too small) to make the marsh creation successful.
Beyond using only empirical correlations, conducting in situ tests such as the
piezocone (CPTU) and field vane test (FVT) can provide much valuable additional
information. The CPTU is more versatile than the FVT and well conducted CPTU tests
with reliable pore pressure measurements (typically in the u2 position, which is located on
the shoulder behind the cone tip) can provide detailed information for determination of soil
units and for estimating (e.g., Lunne et al. 1997, Mayne 2007, Robertson 2009), soil
behavior type, t, 'p and cv (if dissipation tests are conducted). The CPTU is generally not
reliable for estimating the consolidation compressibility parameters Cc and Cr. CPTU data
can be used to estimate 'p for which the commonly used universal Eq. is (Lunne et al.
1997, Mayne 2007)
'p = k(qt - v0) = 0.33(qt - v0) Eq. 2.26
where
qt = corrected tip resistance
v0 = in situ total vertical stress
23
k = CPTU correlation coefficient for 'p
Alternatively, Mesri (2001) proposed different k values for inorganic versus
organic clays and silts to estimate the end of primary consolidation value of 'p
'p = 0.28(qt - v0) for inorganic clays and silts Eq. 2.27
'p = 0.24(qt - v0) for organic clays and silts Eq. 2.28
The primary purpose of conducting FV tests is to measure the in situ undrained
shear strength. However, FVT data can also be used to estimate 'p for inorganic clays as
(Chandler 1988, Ladd and DeGroot 2003)
'p = 'v0[(su(FV)/'v0)/SFV]1.05 Eq. 2.29
where
su(FV) = measured field vane undrained shear strength (not corrected)
'v0 = in situ vertical effective stress at depth of su(FV)
SFV = coefficient estimated using Figure 2.26
The Eqs. 2.26 to 2.29 correlation coefficients are considered universal values and
ideally specific regional or specific soil type correlations should be developed from past
projects that involved CPTU testing and parallel laboratory 1-D consolidation tests
performed on good quality undisturbed samples. Certainly, any estimates of 'p from that
result in computed OCRs of less than one should be considered unreliable (presuming a
reliable estimate of the in situ equilibrium pore pressure u0 is made).
2.6. Summary and Conclusions
This paper presents a collection of empirical correlations for estimating
consolidation parameters of fine-grained soils for settlement calculations using basic index

24
and classification measurements. The database was generated using site investigation data
from 15 marsh creation projects in the coastal Louisiana region. These projects often
involve low to near normally consolidated soft, high liquid limit organic silts and clays, for
which a majority of published empirical correlations do not cover. The collective data set
included a wide variety of soil types that span a large range in water content and liquid
limit. Index and classification properties included in the database were water content, void
ratio, Atterberg Limits, and dry unit weight. Consolidation design parameters for the 15
projects were determined from 1-D incremental loading (IL) consolidation test results and
included recompression ratio (Cr), compression ratio (Cc), preconsolidation stress ('p),
and coefficient of consolidation (cv). Sample quality was a concern and the IL test results
were interpreted using an unload-reload loop for Cr and simplified Schmertmann's
construction for Cc. Cv values were evaluated relative to the normally consolidated stress
state. For all the correlations investigated, the degree of correlation between the index
parameters and design parameters varied significantly (Table 2.2); while in many cases
there are distinct trends there is also often a large degree of scatter. The strongest
correlation was for Cc as function of w considering inorganic and organic soil separately.
No useful correlation was found for 'p, which is the most important parameter for
settlement calculations. This requires estimating the in situ stress history based on geology
and local experience or conducting additional site investigation testing such as in situ
testing. Use of the correlations presented herein should only be used for feasibility studies,
preliminary analyses and for comparative purposes as data are being collected on new
projects. Final design should always involve an integrated site characterization program
25
that includes in situ testing and advanced laboratory testing (i.e., consolidation) of good
quality undisturbed samples.
2.7. Acknowledgments
The author thanks GeoEngineers, Baton Rouge, LA for access to data for the marsh creation projects and in particular David S. Eley, P.E., GeoEngineers, for coordinating ideas and feedback from GeoEngineers on development of the database and the correlations studied.

26
Table 2.1: List of projects/locations included in creation of database and number oedometer tests for each by soil type
Project Name/Location
Number of Oedometer Tests Inorganic CL, CH, ML, MH
Organic OL, OH,
Pt Total
Alligator Bend 15 9 24 Lake Lery 24 10 34
Cameron Cereole 28 1 29 Terrebonne Bay 8 6 14 Whiskey Island 10 0 10
Shark Island 2 2 4 West Bayou Perot 1 2 3
LaBranche 7 17 24 Plaquemines Parish 38 11 49
Bayou Sale 29 1 30 Lost Lake 5 4 9
Bayou Bonfuca 3 6 9 Turtle Bay 4 3 7 Caminada 8 0 8
Grand Liard 4 6 10 Totals 186 78 264

27
Table 2.2: Summary of empirical correlations investigated and efficacy rating
Soil Property
Index parameter
Comments w e0 LL PI LI
Gs VG VG
t E correlation includes Gs
'p VP no reliable correlation exists for 'p
Cc VG VG G G separate correlations for inorganic vs
organic soils; universal correlation with d
Cr P P P P best option is to correlate with Cr and
separate inorganic vs organic soils
cv P P P P
significant scatter; separate correlations for inorganic vs organic and by stress
level; 'v ≈ 'p for recompression; 'v ≈ 5'p for normally consolidated
compression
C best option is to directly correlate with
Cc Notes: E = excellent, VG = very good, G = good, P = poor, VP = very poor
28
Figure 2.1: Fundamentals of 1-D consolidation behavior and influence of sample
disturbance: compression curve, coefficient of consolidation and secondary compression versus vertical effective stress (modified from Ladd and DeGroot, 2003)

29
Figure 2.2: Estimation of recompression index (Cr) using average slope of unload-reload
loop and use of Simplified Schmertmann (1955) method for estimating compression index (Cc) (after Holtz et al. 2011): 'p is estimated using Casagrande (1936)
construction; Pt.1 is defined at ('v0, e0), Line 1-2 is drawn at slope Cr from 'v0 to 'p to define Pt. 2; Pt. 3 is defined as intersection of 0.42e0 and extension of normally
consolidated slope of measured compression line (Line L), Cc is defined as slope of Line 2-3 (figure from Holtz et al., 2011)
30
Figure 2.3: Atterberg limits for soils included in the database
Liquid Limit (%)0 20 40 60 80 100 120
Plas
ticity
Inde
x (%
)
0
20
40
60
80
Liquid Limit (%)0 100 200 300 400 500 600
Plas
ticity
Inde
x (%
)
0
100
200
300
400
A‐line
U‐Line
U‐Line
A‐line
Alligator BendLake LeryCameron CereoleTerrebonne BayWhiskey Island
Shark IslandWest Bayou PerotLabranchePlaquemines ParishBayou Sale
Lost LakeBayou BonfucaTurtle BayCaminadaGrand Liard

31
Figure 2.4: NAVFAC DM7 (1982) correlation among Liquidity Index, preconsolidation
stress, and sensitivity
Preconsolidation Stress (tsf)0.01 0.1 1 10 100
Liqu
idity
Inde
x
‐0.5
0.0
0.5
1.0
1.5
DM7 SensitivityContours
2010
86421

32
Figure 2.5: Liquidity Index versus preconsolidation stress. Plotted lines are recommended
correlations by USACE NAVFAC DM-7 (1982) shown in Figure 2.4
Preconsolidation Stress (tsf)0.1 1 10
Liqu
idity
Inde
x
0.0
0.5
1.0
1.5
2.0
Alligator BendLake LeryCameron CereoleTerrebonne Bay Whiskey Island
Shark IslandWest Bayou Perot LaBranchePlaquemines ParishBayou Sale
Lost LakeBayou Bonfuca Turtle BayCaminadaGrand Liard
DM7 SensitivityContours
20
10
86
42
1
33
Figure 2.6: Preconsolidation stress versus depth for all consolidation test results included
in the LA Marsh Creation database
Preconsolidation Stress (tsf)
0.0 0.5 1.0 1.5 2.0 2.5 3.0
Dep
th (f
t)
0
10
20
30
40
50
60
Alligator BendLake LeryCameron CereoleTerrebonne Bay Whiskey Island
Shark IslandWest Bayou Perot LaBranchePlaquemines ParishBayou Sale
Lost LakeBayou Bonfuca Turtle BayCaminadaGrand Liard
t = 100 pcf
t = 70 pcf

34
Figure 2.7: Preconsolidation ratio versus depth for all consolidation test results included
in the LA Marsh Creation database
OCR
0 1 2 3 4 5 6 7 8 9 10
Dep
th (f
t)
0
10
20
30
40
50
60
Alligator BendLake LeryCameron CereoleTerrebonne Bay Whiskey Island
Shark IslandWest Bayou Perot LaBranchePlaquemines ParishBayou Sale
Lost LakeBayou Bonfuca Turtle BayCaminadaGrand Liard

35
Figure 2.8: Specific gravity versus liquid limit and recommended correlation (Eqs. 2.6
and 2.7)
Liquid Limit (%)
0 200 400 600 800
Spec
ific
Gra
vity
1.0
1.5
2.0
2.5
3.0
G = 2.6 to 2.7 for LL < 100%G = 2.86 ‐ 0.002LL for LL > 100%
Alligator BendLake LeryCameron CereoleTerrebonne BayWhiskey Island
Shark IslandWest Bayou PerotLabranchePlaquemines ParishBayou Sale
Lost LakeBayou BonfucaTurtle BayCaminadaGrand Liard

36
Figure 2.9: Specific gravity versus water content
Water Content (%)
0 200 400 600 800 1000
Spec
ific
Gra
vity
1.0
1.5
2.0
2.5
3.0
Alligator BendLake LeryCameron CereoleTerrebonne BayWhiskey Island
Shark IslandWest Bayou PerotLabranchePlaquemines ParishBayou Sale
Lost LakeBayou BonfucaTurtle BayCaminadaGrand Liard

37
Figure 2.10: Total unit weight versus water content and recommended correlation (Eq. 2.8)
Water Content (%)
0 200 400 600 800 1000
Tota
l Uni
t Wei
ght (
pcf)
60
80
100
120
140
t = (160.8 + 1.367w)/(1 + 0.0230w)
Alligator BendLake LeryCameron CereoleTerrebonne BayWhiskey Island
Shark IslandWest Bayou PerotLabranchePlaquemines ParishBayou Sale
Lost LakeBayou BonfucaTurtle BayCaminadaGrand Liard

38
Figure 2.11: Compression index versus water content with some common published
correlations
Water Content, w (%)
10 100 1000
Com
pres
sion
Inde
x C c
0.01
0.1
1
10
Alligator BendLake LeryCameron CereoleTerrebonne Bay Whiskey IslandShark Island
West Bayou Perot LaBranchePlaquemines ParishBayou Sale Lost LakeBayou Bonfuca
Turtle BayCaminadaGrand LiardTPM (1996) ‐ clay&siltTPM (1996) ‐ peatsTPM (1996) ‐ shales

39
Figure 2.12: Compression index versus water content with recommended correlation for
inorganic CL, CH, ML and MH soils (Eq. 2.9).
Water Content, w (%)
0 20 40 60 80 100 120
Com
pres
sion
Inde
x C c
0.0
0.5
1.0
1.5
2.0
Alligator BendLake LeryCameron CereoleTerrebonne Bay Whiskey Island
Shark IslandWest Bayou Perot LaBranchePlaquemines ParishBayou Sale
Lost LakeBayou Bonfuca Turtle BayCaminadaGrand Liard
Cc = 0.015w ‐ 0.16

40
Figure 2.13: Compression Index versus water content with recommended correlation for
organic OL, OH, and Pt soils (Eq. 2.10)
Water Content, w (%)
0 200 400 600 800 1000
Com
pres
sion
Inde
x C c
0
1
2
3
4
5
6
7
8
Alligator BendLake LeryCameron CereoleTerrebonne Bay Whiskey Island
Shark Island West Bayou PerotLaBranchePlaquemines ParishBayou Sale
Lost LakeBayou BonfucaTurtle BayCaminada Grand Liard
Cc = 0.010w

41
Figure 2.14: Compression Index versus initial void ratio with some common published
correlations
Void Ratio, e0
0 2 4 6 8 10 12 14 16
Com
pres
sion
Inde
x C c
0
1
2
3
4
5
6
7
8
Hough (1957)Nishida (1955)Nishida (1956)Sowers (1979)Cozzolino (196)Bowles (1984)Park and Lee (2011)Ahadiyan et al. (2008)
Alligator BendLake LeryCameron CereoleTerrebonne Bay Whiskey Island
Shark IslandWest Bayou Perot LaBranchePlaquemines ParishBayou Sale
Lost LakeBayou Bonfuca Turtle BayCaminadaGrand Liard

42
Figure 2.15: Compression Index versus initial void ratio with recommended correlation
for inorganic CL, CH, ML and MH soils (Eq. 2.11)
Void Ratio, e0
0.0 0.5 1.0 1.5 2.0 2.5 3.0 3.5
Com
pres
sion
Inde
x C c
0.0
0.5
1.0
1.5
2.0
Alligator BendLake LeryCameron CereoleTerrebonne Bay Whiskey Island
Shark IslandWest Bayou Perot LaBranchePlaquemines ParishBayou Sale
Lost LakeBayou Bonfuca Turtle BayCaminadaGrand Liard
Cc = 0.57e0 ‐ 0.20

43
Figure 2.16: Compression Index versus initial void ratio with recommended correlation
for organic OL, OH, and Pt soils (Eq. 2.12)
Void Ratio, e0
0 2 4 6 8 10 12 14
Com
pres
sion
Inde
x C c
0
1
2
3
4
5
6
7
Alligator BendLake LeryCameron CereoleTerrebonne Bay Whiskey Island
Shark Island West Bayou PerotLaBranchePlaquemines ParishBayou Sale
Lost LakeBayou BonfucaTurtle BayCaminada Grand Liard
Cc = 0.5e0

44
Figure 2.17: Compression Index versus initial void ratio with recommended correlation
for organic OL, OH, and Pt soils (Eq. 2.14)
Dry Unit Weight d (pcf)
0 20 40 60 80 100 120
Com
pres
sion
Inde
x C c
0.1
1
10
Alligator BendLake LeryCameron CereoleTerrebonne bayWhiskey Island
Shark IslandWest Bayou PerotLaBranchePlaquemines ParishBayou Sale
Lost LakeBayou BonfucaTurtle BayCaminadaGrand Liard
Cc = 7.15e(‐0.037d)
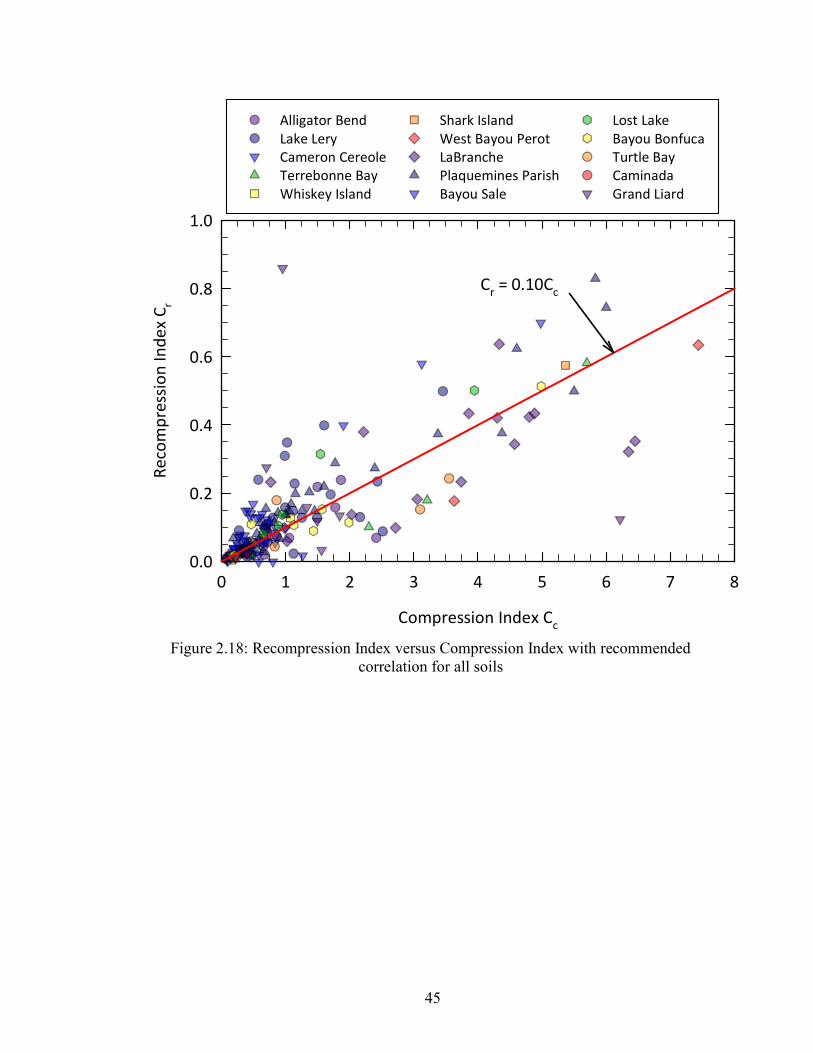
45
Figure 2.18: Recompression Index versus Compression Index with recommended
correlation for all soils
Compression Index Cc
0 1 2 3 4 5 6 7 8
Reco
mpr
essi
on In
dex
C r
0.0
0.2
0.4
0.6
0.8
1.0
Alligator BendLake LeryCameron CereoleTerrebonne Bay Whiskey Island
Shark IslandWest Bayou Perot LaBranchePlaquemines ParishBayou Sale
Lost LakeBayou Bonfuca Turtle BayCaminadaGrand Liard
Cr = 0.10Cc
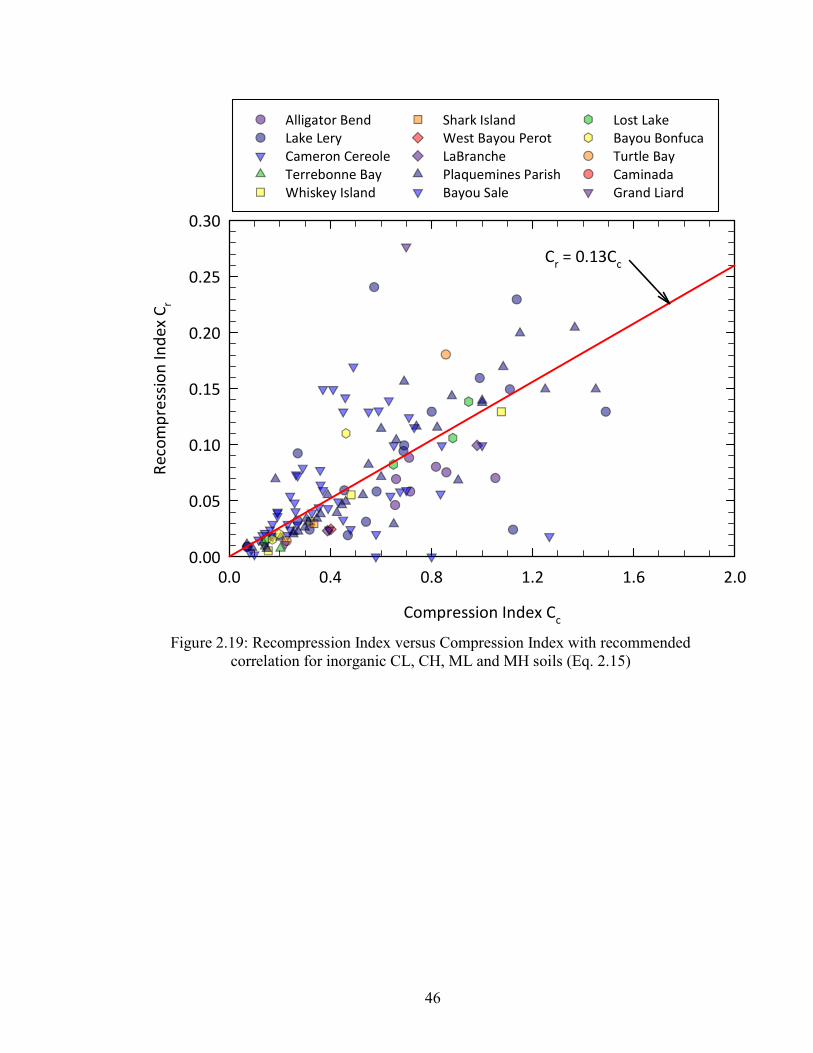
46
Figure 2.19: Recompression Index versus Compression Index with recommended
correlation for inorganic CL, CH, ML and MH soils (Eq. 2.15)
Compression Index Cc
0.0 0.4 0.8 1.2 1.6 2.0
Reco
mpr
essi
on In
dex
C r
0.00
0.05
0.10
0.15
0.20
0.25
0.30
Alligator BendLake LeryCameron CereoleTerrebonne Bay Whiskey Island
Shark IslandWest Bayou Perot LaBranchePlaquemines ParishBayou Sale
Lost LakeBayou Bonfuca Turtle BayCaminadaGrand Liard
Cr = 0.13Cc

47
Figure 2.20: Recompression Index versus Compression Index with recommended
correlation for organic OL, OH, and Pt soils (Eq. 2.16)
Compression Index Cc
0 1 2 3 4 5 6 7 8
Reco
mpr
essi
on In
dex
C r
0.0
0.2
0.4
0.6
0.8
1.0
Alligator BendLake LeryCameron CereoleTerrebonne Bay Whiskey Island
Shark Island West Bayou PerotLaBranchePlaquemines ParishBayou Sale
Lost LakeBayou BonfucaTurtle BayCaminada Grand Liard
Cr = 0.10Cc

48
Figure 2.21: Coefficient of Consolidation at 'v ≈ 'v0 versus Liquid Limit from all
oedometer tests with overconsolidation ratio greater than approximately 1.5
Liquid Limit (%)
0 200 400 600 800
Coef
ficie
nt o
f Con
solid
atio
n at
' v0
(ft2 /d
ay)
0.001
0.01
0.1
1
10
NAVFAC DM7 lower limitfor recompression loading
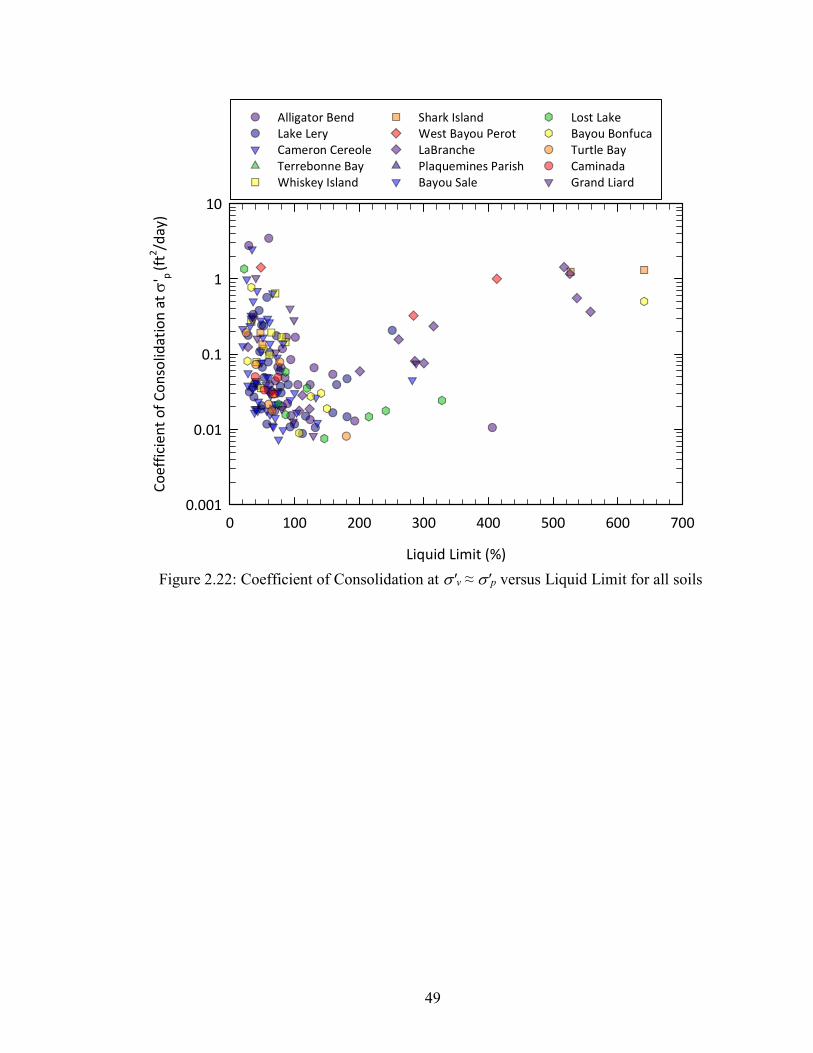
49
Figure 2.22: Coefficient of Consolidation at 'v ≈ 'p versus Liquid Limit for all soils
Liquid Limit (%)
0 100 200 300 400 500 600 700
Coef
ficie
nt o
f Con
solid
atio
n at
' p
(ft2 /d
ay)
0.001
0.01
0.1
1
10
Alligator BendLake LeryCameron CereoleTerrebonne BayWhiskey Island
Shark IslandWest Bayou PerotLaBranchePlaquemines ParishBayou Sale
Lost LakeBayou BonfucaTurtle BayCaminadaGrand Liard

50
Figure 2.23: Coefficient of Consolidation at 'v ≈ 5'p versus Liquid Limit for all soils
Liquid Limit (%)
0 100 200 300 400 500 600 700
Coef
ficie
nt o
f Con
solid
atio
n at
5'
p (ft2 /d
ay)
0.001
0.01
0.1
1
10
Alligator BendLake LeryCameron CereoleTerrebonne BayWhiskey Island
Shark IslandWest Bayou PerotLaBranchePlaquemines ParishBayou Sale
Lost LakeBayou BonfucaTurtle BayCaminadaGrand Liard

51
Figure 2.24: Coefficient of Consolidation at 'v ≈ 5'p versus Liquid Limit for inorganic
CL, CH, ML and MH soils
Liquid Limit (%)
0 20 40 60 80 100 120 140
Coef
ficie
nt o
f Con
solid
atio
n at
5'
p (ft2 /d
ay)
0.001
0.01
0.1
1
10
Terzaghiet al. (1996)
RecommendedRange
DM7.01 for NC soils
Alligator BendLake LeryCameron CereoleTerrebonne BayWhiskey Island
Shark IslandWest Bayou PerotLaBranchePlaquemines ParishBayou Sale
Lost LakeBayou BonfucaTurtle BayCaminadaGrand Liard

52
Figure 2.25: Coefficient of Consolidation at 'v ≈ 5'p versus Liquid Limit for organic
OL, OH, and Pt soils
Liquid Limit (%)
0 100 200 300 400 500 600 700
Coef
ficie
nt o
f Con
solid
atio
n at
5'
p (ft2 /d
ay)
0.001
0.01
0.1
1
10
RecommendedRange
Alligator BendLake LeryCameron CereoleTerrebonne BayWhiskey Island
Shark IslandWest Bayou PerotLaBranchePlaquemines ParishBayou Sale
Lost LakeBayou BonfucaTurtle BayCaminadaGrand Liard

53
Figure 2.26: Field vane undrained strength ratio at OCR = 1 vs. Plasticity Index for
homogeneous clays without shells or sand (from Ladd and DeGroot, 2003)
Plasticity Index, PI (%)
0 20 40 60 80 100
SFV
0.10
0.15
0.20
0.25
0.30
0.35
Canadian CementedOther CL & CH Clays
Chandler (1988)m = 0.95
0.77 0.90
0.800.97
0.93
1.51
0.96
0.87
1.35
1.18m
m

54
CHAPTER 3
NORMALIZED UNDRAINED DIRECT SIMPLE SHEAR BEHAVIOR OF SOFT
COASTAL ORGANIC SOILS
The SHANSEP procedure for estimating the in situ undrained shear behavior of
fine-grained soils assumes perfectly normalized undrained shear behavior. However,
recent findings indicate that such is not the case for the triaxial compression behavior of
resedimented inorganic soils with liquid limits (LL) less than 100%. This paper presents
results from a laboratory investigation of the influence of vertical consolidation stress ('vc)
on the undrained direct simple shear (DSS) behavior of six resedimented natural organic
soils with LL ranging from 81 to 215% and two inorganic soils with LL equal to 45 and
46%. DSS tests were conducted on normally consolidated specimens with 'vc ranging
from 50 to 1600 kPa. The results show that the organic soils have much higher su/'vc and
lower normalized undrained Young's modulus (Eu/'vc) than the inorganic soils.
Furthermore, the decrease in su/'vc with an increase in 'vc is much greater than that of the
lower LL inorganic soils. Correlations are presented for the organic soils that relate
normally consolidated su/'vc and 'vc for DSS mode of shear as a function of LL or organic
matter. These equations can be used to estimated su at 'vc values not included in a
laboratory test program.
3.1. Introduction
Various factors, including subsidence caused by oil extraction and sea-level rise
due to climate change, have resulted in significant land loss in coastal Louisiana (Walker
55
et al., 1987) and other regions in the Gulf of Mexico. Marsh creation projects, conducted
by construction of confined areas with dykes and placement of dredged material from
seabed or waterways in these areas, are being used to restore lost land. The soft, organic
and often near normally consolidated nature of soils in the area are of concern for stability
and undrained shear deformation of the levees with the key design parameters being
undrained shear strength (su) and undrained Young's modulus (Eu). For such stability
problems undrained shear strength anisotropy needs to be considered as it varies with the
orientation of the major principal stress at failure as shown for example in Figure 3.1. More
advanced design approaches consider the various modes of shear shown in Figure 3.1,
which include triaxial compression (TC), direct simple shear (DSS) and triaxial extension
(TE), in anisotropic undrained stability analyses. Although such an approach requires a
relatively extensive laboratory test program and a pragmatic alternative is to focus only on
DSS testing in stability analyses as the peak shear stress measured in the DSS has proved
to provide a reliable estimate of the average or mobilized undrained shear strength (su(ave)
or su(mob)) for isotropic stability analyses (e.g., Ladd 1991, Ladd and DeGroot 1991).
Likewise, Eu determined from DSS tests has also proved useful for estimating the
undrained shear deformation of embankments or dikes constructed on soft soils (Ladd et
al. 1977).
Organic fine-grained soils are often very soft and compressible although they
typically have a higher normalized undrained shear strength (su/'v0), where 'v0 = in situ
vertical effective stress, than inorganic soils (e.g., Mesri 1993, Terzaghi et al. 1996).
However, collecting undisturbed samples of soft, organic coastal soils can be a challenge
and laboratory test programs need to consider the potential effects of testing disturbed

56
samples. The Stress History and Normalized Soil Engineering Properties (SHANSEP)
method was developed by Ladd and Foott (1974) as a practical framework for dealing with
the influence of sample disturbance for fine-grained soils that have low to moderate
structure. The foundation of the method is the assumption of perfectly normalized
behavior, i.e., su/'vc is a constant independent of 'vc, where 'vc = vertical consolidation
stress. However, the recent work by Casey and Germaine (2013) showed that such was not
the case for a collection of inorganic fine-grained soils with a liquid limit ranging from
around 40 to 75% for which su/'vc decreased with an increase in 'vc over the stress range
100 kPa to 10 MPa. These findings have practical implications for use of the SHANSEP
method for design applications. It is unknown if such behavior is also the case for higher
liquid limit (i.e., LL > 100%), organic fine-grained soils.
This paper presents the results from a suite of DSS tests conducted on resedimented
samples of six organic soils collected from coastal areas of Louisiana and two inorganic
marine soils collected from Massachusetts and Maine. The tests were conducted over a
range of stresses varying from 100 to 1600 kPa. The objective of the research was to
determine how su and Eu of high liquid limit, organic soils vary as a function of vertical
consolidation stress level. The laboratory test program focused on testing the soil at a
normally consolidated state of stress as that is a key component of the SHANSEP method
and furthermore many soils in coastal regions such as Louisiana are normally or near
normally consolidated.

57
3.2. Background
3.2.1 Undrained Shear Strength
It is common in practice to analyze undrained shear strength data obtained from
triaxial or DSS tests on clays normalized by the in situ vertical effective stress. The
SHANSEP procedure is based on the experimental observation that clays at different
consolidation stresses but at the same overconsolidation ratio (OCR) exhibit comparable
normalized undrained shear behavior for both normally consolidated (NC) and
overconsolidated (OC) conditions. The variation of the normalized undrained shear
strength with OCR is expressed as the SHANSEP equation:
= 𝑆(𝑂𝐶𝑅) Eq. 3.1
where S is undrained strength ratio su/'vc for NC state and m is a power coefficient
that expresses the increase in su/'vc with an increase in OCR. As described in Ladd (1991)
and Ladd and DeGroot (2003), application of the SHANSEP method requires specimens
to be K0-consolidated to a 'vc greater than the preconsolidation stress ('p) into the
normally consolidated stress range to measure the value of S. Specimens consolidated in a
similar manner but rebounded to various OCRs as needed are used to estimate the m
parameter. Of the two coefficients in Eq. 3.1 the S parameter is the most important.
Alternatively, the Recompression method (Bjerrum 1973, Ladd and DeGroot 2003)
advocates dealing with sample disturbance by anisotropically consolidating specimens to
the in situ effective stress state 'v0 and 'h0 where 'h0 is the estimated in situ horizontal
effective stress. While the Recompression method is philosophically very different than
the SHANSEP procedure in dealing with sample disturbance, both methods otherwise
advocate the same approach to laboratory testing in terms of evaluating anisotropy and rate

58
effects. Results from Recompression tests can also be interpreted using Eq. 3.1 provided
an estimate of the in situ OCR profile is available.
Some recent work indicates that the SHANSEP S parameter is not constant with
varying 'vc and that perfectly normalized behavior may only be relevant over a relatively
narrow range of stresses. Jones (2010) performed a suite of CK0UC tests on resedimented
NC Ugnu Clay and reported that S decreases as stress level increases. Abdulhadi et al.
(2012) conducted CK0UC tests on NC and OC resedimented Boston Blue Clay (RBBC)
and reported that S decreased from 0.32 to 0.28 as consolidation stress increased from 0.15
MPa to 10 MPa. However, the authors also reported that m remained essentially constant
over the range of stresses investigated. Casey and Germaine (2013) investigated results of
CK0UC tests on eight resedimented soils (liquid limit from 26% to 74%) and confirmed
Abdulhadi et al. (2012)’s conclusion that S decreases with increased consolidation stress
level while variations in m were insignificant. The one exception to this was the low liquid
limit, non-plastic Skibbereen silt for which su/'vc increased with an increase in 'vc
(Gennan 2010). Based on a limited set of results from DSS tests on RBBC and Skibbereen
silt, they also reported that S did not change with consolidation stress level for RBBC but
followed the same trend as TC for Skibbereen silt. To account for the influence of 'vc,
Casey and Germaine (2013) introduced a modified SHANSEP equation as:
= 𝑆 (1000𝜎′ ) (𝑂𝐶𝑅) Eq. 3.2
where 'p is in MPa and coefficients S1 can be estimated from Figure 3.2 or Eq. 3.3,
and T from Eq. 3.4.
𝑆 = 0.0091 𝐿𝐿 − 0.05 Eq. 3.3
𝑇 = −0.48𝑙𝑜𝑔 (𝐿𝐿) + 0.77 Eq. 3.4

59
3.2.2 Undrained Young’s Modulus
Eu is commonly estimated from empirical data in the form of Eu/su as it is
challenging to obtain reliable measurement from routine lab tests, especially at small
deformations. Ladd et al. (1977) conducted CK0UDSS tests on seven NC organic and
inorganic soils with liquid limit above 35%. They reported that Eu/su decreased as plasticity
and organic matter increased. Santagata et al. (2005) and Abdulhadi et al. (2012) studied
the effects of stress level on Eu by performing a series of CK0UC tests on RBBC samples
and concluded that Eu increases with increased consolidation stress at different OCRs.
Abdulhadi et al. (2012) also reported that Eu/’vc is stress dependent and decreases with
increasing stress level. Casey et al. (2015) investigated the results from CK0UC tests on
eight fine-grained soils (liquid limit ranging from 26% to 79%) for stresses in the range of
0.1 to 100 MPa. They confirmed the abovementioned findings and indicated that OC soils
have higher Eu, but the value of OCR does not have any tangible effects on Eu
measurements. They introduced Eqs. 3.5, 3.6, and 3.7 to estimate Eu from ’vc at applied
shear stress ratios of 0.25, 0.50 and 0.75, where the shear stress ratio is defined as ( –
0)/(su – 0) where is the current maximum shear stress in the specimen and 0 is the
maximum shear stress in the specimen prior to undrained shear.
, . = 465( ) . Eq. 3.5
, . = 364( ) . Eq. 3.6
, . = 260( ) . Eq. 3.7
where 'vref is taken as 100 kpa.

60
The variations in su and Eu with consolidation stress level described above were
primarily based on TC tests conducted on inorganic clays and silts with liquid limits
ranging from around 25 to 80%. No such similar results are available for the undrained
DSS behavior of organic, high liquid limit (LL > 100%) fine-grained soils.
3.3. Test Results and Procedures
3.3.1 Test Soils
Table 3.1 provides a summary of the index properties and classification according
to the United Soil Classification System (USCS, ASTM D2487, 2016) of the eight soils
tested in this study. The first six are very soft marine organic soil samples collected from
Plaquemines Parish, LA and Jefferson Parish, LA. All the soils are natural, except for soil
#5 where 10% Pure Gold Gel, an inorganic commercial bentonite that is mostly Na-
montmorillonite was added to the natural soil to increase its liquid limit. The other two
soils are inorganic Boston Blue Clay (BBC) and Presumpscot Clay collected from
Massachusetts and Maine, respectively. These two inorganic soils were included in the test
program to evaluate the test procedures and findings of this work relative to that of Casey
and Germaine (2013) as they also tested these two soils. Overall, the data set includes soils
with a wide range of liquid limit and organic matter.
Liquid limit tests were conducted using both Casagrande cup (ASTM D4318) and
Fall cone (ISO/TS 17892-12) methods. As expected based on the literature (e.g., Sridharan
and Prakash 1998) the values are similar for the low liquid limit soils (BBC, Presumpscot)
whereas the Casagrande cup results in higher to much higher values for the higher liquid

61
limit, organic soils. Soil classification was conducted based on the liquid limit from
Casagrande cup and the classification as an organic soil was performed in accordance with
the USCS through measurement of the liquid limit for both natural and oven-dried samples.
Figure 3.3 presents the plasticity chart for the soils in the data set. In addition, organic
matter tests were conducted on all soils in accordance with ASTM D6528 by burning the
oven-dried specimen in a muffle furnace at 440°C.
3.3.2 Sample Preparation
It was not feasible to obtain high quality, undisturbed samples for this test program
even though that would be the ideal situation. In addition, for this research, it was necessary
to eliminate from the test samples potential variations in soil structure due to soil layering,
sample disturbance, different storage conditions, etc. Thus, reconstituting batches of the
test soils was considered necessary to test soil specimens in as near as possible identical
conditions, so only the effects of different consolidation stresses could be studied. Large
diameter block samples could possibly be used for testing of several samples at the same
depth, however, block sampling is more complicated and expensive, and there is always
the possibility of layering within a block (especially in organic soils). As a result,
resedimented soil samples of various LL, permeability, and compressibility were used for
this research.
For all the organic soils, bag samples and extruded Shelby tube samples obtained
from several LA marsh creation projects were thoroughly mixed into soil batches of various
liquid limits. In some cases, short fibers were visible in the samples and were removed.
The samples were resedimented using the general procedure described by Lukas et al.
(2018) to form a soil cake from which test specimens were trimmed. This was initially

62
done by mixing the soils with distilled water at 1.25-2 times the liquid limit and allowing
the slurry to hydrate overnight. The slurry was then thoroughly mixed under vacuum after
being placed in a 102 mm ID acrylic consolidometer to remove trapped air. Later, the soil
was incrementally 1-D consolidated to the desired stress level using a computer controlled
GeoJac system. Each load increment was applied until the End of Primary (EOP) was
achieved. Given the limitation of maximum vertical consolidation strain obtainable in the
DSS device, soil cakes for the DSS tests planned for higher consolidation stresses (i.e., 400
to 1600 kPa) were consolidated to higher stresses in the consolidometer. At the end of
consolidation, the soil cake was extruded and either trimmed immediately for testing or
coated by a layer of a 50-50 mixture of petroleum jelly and paraffin wax and at least 2
layers of plastic film dipped in the same mixture (La Rochelle et al. 1981) before being
stored in a humid room with a controlled temperature of 11°C and >85% relative humidity
for future testing.
3.3.3 Direct Simple Shear
The Direct Simple Shear (DSS) tests were conducted using a Geonor DSS device
in general accordance to the procedures described by Bjerrum and Landva (1966), DeGroot
et al. (1992) and ASTM D6528 Standard Test Method for Consolidated Undrained Direct
Simple Shear Testing of Cohesive Soils. The Geonor DSS device consists of a specimen
chamber, lever arm for application of consolidation weights and a gear driven thrust shaft
for applying the horizontal shear stress to the specimen. Load cells and linear variable
differential transformers were connected to a dedicated data acquisition system and used
for measurement of load and displacement. Specimens were prepared for testing by
trimming the 35 cm2 soil into a set of thin stainless-steel stacked rings with a 0.3 mm thick

63
internal membrane to a nominal target height of 19 mm. The stacked ring-membrane
system allowed for one-dimensional consolidation during the consolidation phase of a test
and direct simple shear strain mode of deformation during the shear phase of a test. Top
and bottom drainage stones with a waffle pattern were used to increase the contact surface
between the specimen and the stones to minimize the possibility of slippage at the soil-
stone interface. The final vertical effective consolidation stresses ('vc) ranged from 50 kPa
to 1600 kPa. To mitigate possible effects of disturbance during extraction of soil cakes
from the consolidometer and ensure that the specimens reached the true normally
consolidated virgin compression line, the specimens were loaded beyond a minimum of
twice the cake sedimentation stress or until > 10% vertical strain occurred, as suggested by
Ladd and DeGroot (2003). Once 'vc was reached, the specimens were held at that stress
for up to 24 h of secondary compression. Constant volume shear was conducted at a shear
strain rate of 5%/hr up until 20% horizontal strain was reached. The constant volume
procedure consisted of maintaining specimen height constant by changing the vertical load
using a computer-controlled servo system. It was assumed that the required changes in the
vertical stress to keep the height constant during shear were equal to the pore pressure that
would have generated during a truly undrained shear (Dyvik et al. 1987). All the measured
deformations and forces were corrected for apparatus deflection and stacked ring-
membrane resistance as applicable. The undrained shear strength was assumed to be equal
to the maximum measured horizontal shear stress (DeGroot et al. 1992). The shear modulus
G was computed as / and the undrained Young's modulus Eu was computed assuming
Poisson's ratio v = 0.5 for undrained shear and Eu = 2(1 + v)G = 3G.

64
3.4. Test Results
3.4.1 Consolidation Behavior
Detailed results from Soil #6, the highest plasticity soil in the data set (LL = 215%
and OM = 20.1%), are presented here as being representative of the organic soils. All the
other test soils followed the same general behavior during consolidation and undrained
shear.
Figure 3.4 and Figure 3.5 present the stress-strain and stress-void ratio behavior of
soil #6 during the K0-consolidation phase of the DSS tests. Figure 3.6 shows the virgin
compression behavior of this soil created by synthesizing the results from all the test
specimens. The higher plasticity soils had significantly higher void ratios at low stresses
and experienced much larger compression during consolidation. At larger stresses (i.e. over
1 MPa), the void ratios approach that of the low plasticity BBC and Presumpscot clay. As
a result, higher plasticity soils undergo larger strains, specifically in the virgin compression
range (i.e. much larger compression ratio), under a similar load. For instance, soil #6
experienced deformations more than two times that of BBC and Presumpscot clay under
the final load increment. Expectedly, it was observed that the EOP is significantly larger
in organic soils, and also tend to increase among organic soils with increasing liquid limit.
3.4.2 DSS Shear Stress-Strain Behavior
Shear stress and normalized shear stress (h/'vc) for soil #6 are presented as a
function of shear strain at consolidation stresses from 60 kPa to 1600 kPa in Figure 3.7 and
Figure 3.8. In all tests, horizontal shear stress increased quickly towards to the peak shear
stress at which the rate of increase decreased up to the peak followed by a gradual strain

65
softening response. As a general trend, with increasing consolidation stress level, the stress-
strain behavior became more ductile, the strain to failure increased, and strain softening
was less. This is consistent with that obtained by Abdulhadi et al. (2012) and Casey and
Germaine (2013). In addition, failure in the inorganic soils occurred at smaller horizontal
strains around 4 to 6% compared to greater than 9% and most often around 14%-16% for
the organic soils. There is no clear trend between this increase in strain at failure (ductile
behavior) and liquid limit. Figure 3.8 illustrates that there is a distinct reduction in h/’vc
with an increase in consolidation stress level except for the 60 kPa test. It was found that
for most of the low stress tests (i.e., <100 kPa) performed on all the soils, slippage was
often observed to occur during shear despite use of the waffle stones. This may have in
some cases resulted in premature failure of the test at the stone-soil interface instead of
developing failure within the soil specimen and a consequent underestimation of su.
Accordingly, interpretation and synthesis to follow of the full set of results for all the test
soils is based on the results for tests with consolidation stresses above 100 kPa, and the
data related to the tests conducted at stresses below 100 kPa are for illustration purposes.
Figure 3.9 and Figure 3.10 present pore pressure and normalized pore pressure in
the specimen during shear for soil #6. As expected for a NC soil, all the specimens have
contractive behavior, i.e., positive shear induced pore pressures, throughout shear.
Normalized pore pressure increases more slowly with increasing stress level, but it reaches
a very similar value for all tests at higher strains towards end of the test.
Figure 3.11 and Figure 3.12 present the effective stress plots and normalized
effective stress plots for soil #6. Given that all the specimens were consolidated to a
normally consolidated stress state, all specimen showed contractive behavior or the

66
equivalent of developing positive shear induced pore pressures. For all the tests, in the
beginning, the vertical effective stress decreased slightly while shear stress increased
quickly followed by a more rapid reduction in vertical stress as shear stress slowly
increased towards the peak. For soil #6, peak shear stress occurred when the normalized
vertical stress (’v/’vc) reached 0.64 to 0.68.
3.4.3 Summary Undrained Shear Behavior
Table 3.2 presents a summary of all the DSS test results and Figure 3.13 presents
the undrained strength ratio versus consolidation stress for all tests. The su/'vc values are
significantly greater than that reported for inorganic soils while the inorganic BBC and
Presumpscot clay are within the typical range reported for inorganic clays (e.g., Figure
3.1). Furthermore, su/'vc at a given 'vc value tends to increase with an increase in liquid
limit. It is also clear that all the soils show a general trend of a decrease in su/'vc with
increasing 'vc which is consistent with the findings of Quirós et al. (2000) for a large
collection of NC DSS tests performed on inorganic soils with the majority having a liquid
limit between 50 and 100% and some limited organic soils. It is also consistent with Casey
and Germaine (2013) results for CK0UC tests on inorganic soils. Although the decrease in
su/'vc with increasing 'vc for this work is much greater for the organic soils. Furthermore,
the inorganic soils tested by Casey and Germaine (2013) exhibited most of the decrease in
su/'vc up to 'vc equal to around 1000 kPa; whereas the results presented in Figure 3.13
show that there is still a significant decrease in su/'vc from 800 to 1600 kPa. Figure 3.13
shows that the su/'vc values for tests with 'vc below 100 kPa are often inconsistent with
the results from the tests at higher stresses which is believed to be due to slippage at the

67
soil-porous stone interface as noted above. Best fit regression lines for 'vc ≥ 100 kPa and
grouping all the organic soil together and the two inorganic soils together results in
su/'vc = 0.697('vc)-0.141 six organic soils Eq. 3.8
su/'vc = 0.327('vc)-0.067 two inorganic soils Eq. 3.9
3.4.4 Undrained Young’s Modulus
Figure 3.14 and Figure 3.15 illustrate the variation of secant undrained modulus
and normalized undrained modulus with shear strain for soil #6. Modulus values at strains
lower than 0.02% are not included as the data is not considered reliable at such low strain
levels. As expected, Eu decreases with an increase in while it increases with increase in
'vc. Figure 3.15 shows that Eu/'vc decreases with increasing 'vc similar to that found for
su/'vc. At smaller strains, the difference between Eu/'vc from tests at high and low stresses
is larger and this gap decreases at higher stresses and all the measurements tend to merge
together. Figure 3.16 presents Eu/su versus shear stress ratio which is defined as the ratio
of the measured shear stress and the undrained shear stress (h/su), which is essentially
1/FS, where FS = factor of safety. The modulus values are plotted for h/su from 0.2 to 0.8;
values less than 0.2 are generally not reliable because of the very small strains at those low
stress ratios. Aside from the test with 'vc = 60 kPa, all the results plot relatively close
together throughout shear.
3.4.5 Summary Undrained Young’s Modulus
Figure 3.17, Figure 3.18, and Figure 3.19 present secant undrained modulus for all
soils tested at shear stress ratios 0.25, 0.50, and 0.75. In all cases Eu goes up with an increase

68
in 'vc and the high plasticity organic soils have lower Eu than the low plasticity inorganic
BBC and Presumpscot clay. There is more scatter in the results at lower shear stress ratio
of 0.25 which can be due to the sensitivity of the results to accurate measurement of the
shear strain and apparatus compressibility at small strains. This scatter reduces as the shear
stress ratio increases. There is also greater variation in the results for tests below 100 kPa.
Regression fits for the 6 organic soils for the shear stress ratios of 0.25, 0.50 and 0.75 give:
, . = 184( ) . Eq. 3.10
, . = 82( ) . Eq. 3.11
, . = 33( ) . Eq. 3.12
Figure 3.17, Figure 3.18, and Figure 3.19 also present, for reference, the Casey et
al. (2015) equations (Eqs. 3.5, 3.6, and 3.7) which were derived from CK0UC tests. The
BBC and Presumpscot results from this work plot near the Casey et al. (2015) equations
for /su = 0.25, below for /su = 0.50 and well below for /su = 0.75. This is expected as
generally the strain to failure in DSS mode of shear is greater than that for CK0UC shear
and as such there is greater degradation in Eu for the same /su ratio as the soil strains
towards su in the DSS. The value of the exponents in Eqs. 3.10 to 3.12 increase with
increasing shear stress ratio which is opposite of that found by Casey et al. (2015) but
consistent with that reported by others (e.g., Wroth et al. 1979; Viggiani and Atkinson
1995).
Figure 3.20, Figure 3.21, and Figure 3.22 plot Eu/’vc versus consolidation stress
level for all soils at shear stress ratios of 0.25, 0.50, and 0.75. For the organic soils, Eu’vc

69
decreases with increasing 'vc and the rate of decrease also decreases with an increase in
h/su. Regression fits for the organic soils with 'vc ≥ 100 kPa are
Eu,0.25/'vc = 622('vc)-0.264 Eq. 3.13
Eu,0.50/'vc = 199('vc)-0.193 Eq. 3.14
Eu,0.75/'vc = 55.8('vc)-0.113 Eq. 3.15
3.5. Interpretation and Discussion of Results
3.5.1 Undrained Shear Strength
The su/'vc data plotted in Figure 3.13 were fitted using Eq. 3.2 for NC conditions
(i.e., 'p = 'vc and (OCR)m = 1) for each soil to determine the S1 and T parameters. Figure
3.23 and Figure 3.24 present S1 and T versus Casagrande cup LL and show strong
correlations, for which best fit regressions give:
𝑆 = 0.0016 𝐿𝐿 + 0.47 Eq. 3.16
𝑇 = −0.0002 𝐿𝐿 − 0.1127 Eq. 3.17
The LL from the Casagrande Cup was used for Eqs. 3.16 and 3.17 as it showed
somewhat less scatter than using the Fall cone LL data. It is unclear why this is the case
although the Casagrande cup does have a greater range of LL values compared to the Fall
cone. Also plotted for reference in Figure 3.23 and Figure 3.24 are the equations
recommend by Casey and Germaine (2013) for CK0UC behavior of inorganic soils
between with maximum liquid limit = 80% and 'vc values ranging up to 10 MPa (Eqs. 3.3
and 3.4). Figure 3.23 shows that S1 linearly increases with an increase in LL for the organic
clays which is in agreement with findings of Casey and Germaine (2013) although with a
significantly lower slope. As for the inorganic soils tested in this work, the BBC result plots

70
directly on the Casey and Germaine (2013) correlation while the Presumpscot clay result
also plots on the line if the 1600 kPa test is not considered or below the line if it is. The
Presumpscot clay tested by Casey and Germaine had a lower liquid limit of 33% compared
to the 47% for this work and the 1600 kPa test in this study had a high su value relative to
the overall trend based on the other Presumpscot clay tests and influenced the correlations
for that soil as shown in Figure 3.23.
Figure 3.24 illustrates that parameter T decreases with an increase in LL. Once again
this is similar to that found by Casey and Germaine (2013), but the slope of the organic
soils tested in this work is significantly lower; in fact, a simple linear regression fits the
data as well as a log regression used by Casey and Germaine (2013). It is also significant
to note that the T values for the BBC and Presumpscot clay tested in this work plot well
below the Casey and Germaine (2013) equation, unlike that found for the S1 parameter.
Given that this work involved DSS mode of shear it is expected that su/'vc values should
be lower than that of the CK0UC tests performed by Casey and Germaine (2013). As such,
the results presented in Figure 3.23 and Figure 3.25 suggest that the T parameter reflects
undrained shear strength anisotropy and the S1 parameter is apparently independent of
mode of shear. For example, BBC with LL = 47% (for which whether determined from
Casagrande Cup or Fall cone makes no difference; Table 3.1) the Casey and Germaine
(2013) S1 and T values are 0.38 and -0.032 (Eqs. 3.2 and 3.3) whereas the DSS S1 and T
values for BBC from this work are 0.36 and -0.079 (Table 3.2).
It appears that one line fits all the data from this study and Casey and Germaine
(2013) in Figs. 23 and 24 (the gray short dotted line). However, these universal correlations
are not recommended in the absence of more data from DSS tests on low-plasticity organic
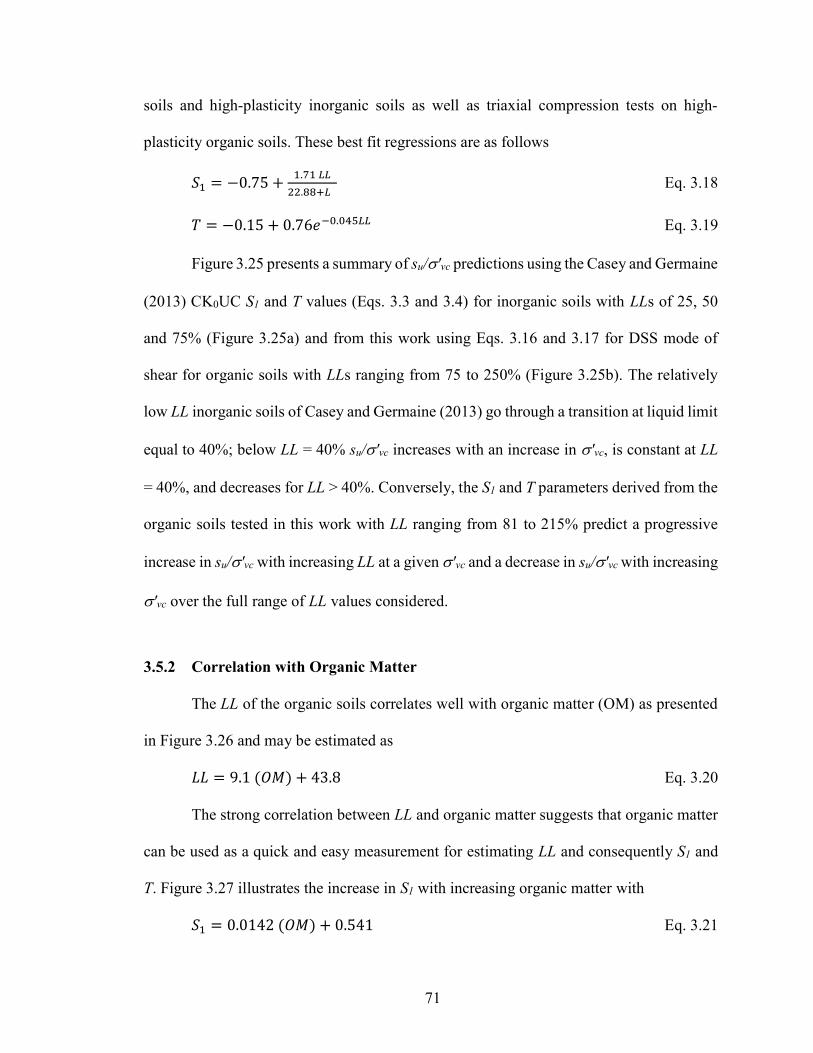
71
soils and high-plasticity inorganic soils as well as triaxial compression tests on high-
plasticity organic soils. These best fit regressions are as follows
𝑆 = −0.75 +.
. Eq. 3.18
𝑇 = −0.15 + 0.76𝑒 . Eq. 3.19
Figure 3.25 presents a summary of su/'vc predictions using the Casey and Germaine
(2013) CK0UC S1 and T values (Eqs. 3.3 and 3.4) for inorganic soils with LLs of 25, 50
and 75% (Figure 3.25a) and from this work using Eqs. 3.16 and 3.17 for DSS mode of
shear for organic soils with LLs ranging from 75 to 250% (Figure 3.25b). The relatively
low LL inorganic soils of Casey and Germaine (2013) go through a transition at liquid limit
equal to 40%; below LL = 40% su/'vc increases with an increase in 'vc, is constant at LL
= 40%, and decreases for LL > 40%. Conversely, the S1 and T parameters derived from the
organic soils tested in this work with LL ranging from 81 to 215% predict a progressive
increase in su/'vc with increasing LL at a given 'vc and a decrease in su/'vc with increasing
'vc over the full range of LL values considered.
3.5.2 Correlation with Organic Matter
The LL of the organic soils correlates well with organic matter (OM) as presented
in Figure 3.26 and may be estimated as
𝐿𝐿 = 9.1 (𝑂𝑀) + 43.8 Eq. 3.20
The strong correlation between LL and organic matter suggests that organic matter
can be used as a quick and easy measurement for estimating LL and consequently S1 and
T. Figure 3.27 illustrates the increase in S1 with increasing organic matter with
𝑆 = 0.0142 (𝑂𝑀) + 0.541 Eq. 3.21

72
Figure 3.28 presents the change in T with organic matter with
𝑇 = −0.0017 𝐿𝐿 − 0.1225 Eq. 3.22
While there is somewhat more scatter in both these plots compared to the S1 and T
correlations with liquid limit the trends are still strong.
3.5.3 Undrained Young’s Modulus
Figure 3.29 presents Eu/'vc versus LL for the six organic soils at /su values of 0.25,
0.50 and 0.75 and 'vc = 100, 200, 400 and 1600 kPa. The normalized undrained modulus
generally decreases as the LL increases for shear stress ratio equal to 0.25 and either slightly
decreases with LL or is essentially independent of LL for shear stress ratios of 0.50 and
0.75. Likewise, plots of the Eqs. 3.13 to 3.15 coefficients versus LL for the organic soils
show little to no trend for all cases other than the 'a' coefficient for Eq. 3.13 for Eu,0.25/'vc
which somewhat decreases with an increase in LL. Overall consideration of LL does not
result in improved correlations unlike that found for the su/'vc relationships (i.e., Eqs. 3.16
and 3.17).
It has historically been common to present Eu data as Eu/su versus /su (e.g., Ladd
et al. 1977, Duncan and Buchignani 1976) but without consolidation stress level. Figure
3.30 presents the data from this work for 'vc values equal to 100, 200, 400 and 1600 kPa.
The results from all the tests fall within the lower range of Eu/su proposed by Ladd et al.
(1977). In most cases, the slope of the decrease in Eu/su is very similar to Ladd et al.
(1977)’s results for Atchafalaya clay (LL = 95% and PI = 75%), i.e. decreasing from around
400 at h/su = 0.2 to around 55 at h/su = 0.8.

73
3.5.4 Implications for Practice
The results from this work clearly show that the normally consolidated DSS
normalized undrained shear strength for the six high LL organic soils tested decreases with
an increase in consolidation stress level. This is the same as that found by Casey and
Germaine (2013) for the CK0UC behavior of the lower LL inorganic clays that they tested.
However, the rate of decrease in su/'vc with an increase in 'vc is much greater for the
organic clays. The S1 and T parameters from Eqs. 3.16 and 3.17 correlate well with LL and
provide a means for predicting DSS su/'vc for 'vc values not included in a laboratory test
program. The direct implication of these findings is that the S parameter in the SHANSEP
equation is not a constant (i.e., the soils do not exhibit perfectly normalized behavior) as is
typically assumed in practice. On average for the six organic soils tested in this work su/'vc
decreases from 0.36 to 0.24 for an order of magnitude increase in 'vc from 100 to 1000
kPa. The practical implications of this depends on project specifics such as the depth of
interest for design (and hence values of 'v0) and stress levels at which laboratory tests are
conducted. Tests performed at low consolidation stress levels for designs involving higher
in situ stresses would result in unsafe su values. Although the SHANSEP procedure
requires that specimens be loaded well past the 'p into the normally consolidated stress
range and hence well beyond 'v0. Furthermore, rarely are truly normally consolidated soils
encountered in nature (with exceptions being relatively recent deposits still undergoing
self-weight consolidation or the foundation soil of a stage constructed embankment if the
first stage or stages load the soil into the NC range). Thus, in many cases the SHANSEP
tests will be conducted at 'vc values too much greater than 'v0 and the resulting su values
will often be on the conservative side. Conversely it does mean that in some cases the

74
laboratory determined su values could be too conservative and uneconomical. The
important point being that the laboratory testing scope should carefully consider the
specified consolidation stresses for test specimens relative to the design in situ vertical
effective stress states. This should avoid unsafe designs or provide an opportunity for more
cost-effective designs through adjustment of laboratory measured strengths using the
correlations presented herein.
3.6. Summary and Conclusion
This study investigated the results of K0 consolidated undrained direct simple shear
(DSS) tests performed on six resedimented natural organic soils and two natural inorganic
soils at preshear vertical consolidation stress ('vc) levels ranging from 50 kPa to 1600 kPa.
All tests were conducted on at a normally consolidated state of stress. The six organic soils
consisted of three organic clays and three organic silts with liquid limits ranging from 80
to 215%. The two inorganic clays had a liquid limit of 45 and 46%. The organic soils had
much lower unit weights, higher void ratios and underwent significantly greater
consolidation strains compared to the inorganic soils. They also exhibited, during DSS
shear, more ductile behavior, especially with an increase in 'vc, a larger strain at failure
and less strain softening behavior. However, the normalized undrained shear strengths were
much higher at low 'vc values than the inorganic soils with this difference becoming
smaller at higher stresses (i.e., above 1 MPa).
The organic soils su/'vc values were found to be a function of 'vc extending the
findings of Abdulhadi et al. (2012) and Casey and Germaine (2013) for low LL inorganic
soils to high LL organic soils. Furthermore, the rate of decrease in su/'vc with an increase

75
in 'vc is much greater for the organic soils. These findings have implications for use of the
SHANSEP procedure which inherently assumes perfectly normalized behavior and hence
constant su/'vc regardless of 'vc. The decrease in su/'vc with 'vc was found to correlate
well with liquid limit or organic matter and new equations were developed from this work
for estimating su/'vc at 'vc values not included in a laboratory test program.
The undrained Young's modulus (Eu) of the organic soils was also found to be
dependent on 'vc but unlike for su/'vc the rate of change in Eu/'vc with 'vc did not
correlate well with liquid limit. Alternatively, correlations are presented for estimating Eu
and Eu/'vc as a function of 'vc for shear stress ratios (/su) of 0.25, 0.50 and 0.75.
Furthermore, plots of Eu/su versus /su are also presented and supplement those presented
by Ladd et al (1977).
3.7. Acknowledgment
The authors thank David S. Eley, P.E. and his colleagues at GeoEngineers, Inc.
(Baton Rouge, LA) for providing the organic soil samples used in this work.

76
Table 3.1: Summary of the index properties for the eight test soils
Soil LL* (%)
LL** (%)
PL (%)
PI (%)
LLoven
dried/LLnot
dried
USCS Organic Matter
(%)
Soil 1 81 80 20 61 0.66 OH
Organic Clay 5.5
Soil 2 154 142 60 94 0.51 OH
Organic Silt 11.7
Soil 3 187 144 80 107 0.45 OH
Organic Silt 14.5
Soil 4 167 136 60 108 0.48 OH
Organic Clay 12.8
Soil 5 108 93 43 65 0.70 OH
Organic Clay 6.7
Soil 6 215 163 95 120 0.41 OH
Organic Silt 20.1
BBC 46 48 24 22 N/A CL 1.8
Presumpscot Clay
45 47 24 20 N/A CL 1.4
Note: * Fall cone, ** Casagrande cup

77
Table 3.2: Summary of undrained shear results from the CK0DSS tests
Soil 'vc (kPa)
Shear Data at su = h,max S1 T
Eu,0.25
(MPa) Eu,0.50
(MPa) Eu,0.75
(MPa) (%)
su (kPa) su/'vc 'v/'vc
°
Soil 1
101 18.8 35 0.342 0.548 18.9
0.624 -0.125
25.704 8.535 2.841
101 12.0 38 0.374 0.634 20.5 36.741 10.233 3.999
200 17.4 61 0.305 0.554 17.0 32.727 14.820 7.638
400 14.7 118 0.294 0.587 16.4 75.228 33.060 13.935
810 13.0 216 0.266 0.604 14.9 132.855 49.791 23.217
1615 11.7 409 0.253 0.610 14.2 149.028 88.059 46.704
Soil 2
101 9.9 36 0.356 0.704 19.6
0.690 -0.142
14.172 5.610 2.625
200 13.4 65 0.326 0.673 18.1 28.323 15.036 6.876
403 17.6 121 0.300 0.662 16.7 46.182 20.652 9.159
807 13.6 218 0.270 0.698 15.1 97.560 48.333 20.619
1615 14.1 387 0.239 0.674 13.5 146.988 71.286 35.673
Soil 3
100 11.8 38 0.382 0.696 20.9
0.801 -0.158
15.744 9.894 3.960
201 12.9 71 0.353 0.693 19.5 25.629 14.130 6.453
402 14.3 125 0.312 0.681 17.3 42.405 21.657 10.281
807 14.5 219 0.271 0.679 15.2 63.579 35.463 18.261
1609 16.1 405 0.252 0.675 14.1 123.852 65.943 33.792
Soil 4
121 13.7 45 0.373 0.643 20.4
0.734 -0.138
19.512 10.008 3.657
202 11.0 71 0.350 0.663 19.3 33.480 16.599 7.677
403 14.1 130 0.321 0.667 17.8 65.325 33.426 14.724
807 13.3 237 0.294 0.679 16.4 103.707 59.892 27.060
1614 11.6 426 0.264 0.703 14.8 157.950 93.954 46.941
Soil 5
121 15.0 37 0.308 0.623 17.1
0.611 -0.139
22.146 8.787 3.753
252 14.4 70 0.279 0.629 15.6 33.315 14.661 5.862
404 13.2 106 0.262 0.645 14.7 47.544 20.760 8.934
805 13.9 191 0.237 0.647 13.4 87.336 41.673 18.543
1611 13.8 361 0.224 0.650 12.6 147.240 72.816 35.568
Soil 6
121 13.5 46 0.384 0.676 21.0
0.795 -0.151
16.224 8.802 3.825
251 16.6 86 0.343 0.683 18.9 30.219 18.252 9.012
403 15.1 131 0.325 0.677 18.0 44.343 23.658 11.229
806 16.6 231 0.287 0.667 16.0 69.363 40.086 20.214
1613 15.6 419 0.260 0.677 14.6 127.638 72.006 38.340
BBC
127 4.6 32 0.254 0.565 14.3
0.358 -0.079
35.070 19.479 6.819
143 4.3 33 0.233 0.580 13.1 64.203 42.126 20.610
302 4.8 69 0.227 0.592 12.8 79.263 45.633 21.147

78
503 7.2 110 0.218 0.533 12.3 202.836 91.932 36.207
806 6.8 168 0.208 0.553 11.8 197.067 107.856 46.458
1604 7.8 324 0.202 0.547 11.4 241.212 137.352 67.632
Presumpscot Clay
126 7.0 30 0.236 0.481 13.3
0.337† 0.291
-0.078† -0.051
43.968 26.433 12.666
201 5.1 43 0.215 0.526 12.1 88.257 44.943 19.680
403 3.7 84 0.210 0.640 11.8 95.634 65.028 33.081
809 5.6 162 0.201 0.574 11.4 204.747 98.448 45.081
1630 5.6 334 0.205 0.593 11.6 271.680 158.016 79.815
Notes: = tan-1(su/'v) †values are range for analysis with and without the 'vc = 1600 kPa test

79
Figure 3.1: Undrained strength anisotropy from CK0UC tests on normally consolidated
clays and silts (from Ladd and DeGroot, 2003)
Figure 3.2: Correlation between S1 (Eq. 2) and liquid limit for inorganic soils with liquid
limit between 26 and 74% (Casey and Germaine, 2013)
PI (%)
0 10 20 30 40 50 60 70 80 90 100
s u/ '
vc
0.10
0.15
0.20
0.25
0.30
0.35
0.40
Triaxial Compression (TC): qf
Direct Simple Shear (DSS): h
Triaxial Extension (TE): qf
TC
DSS
TE

80
Figure 3.3: Plasticity chart for the eight test soils
Figure 3.4: Compression curves in terms of vertical strain for consolidation phase of DSS
tests performed on soil #6
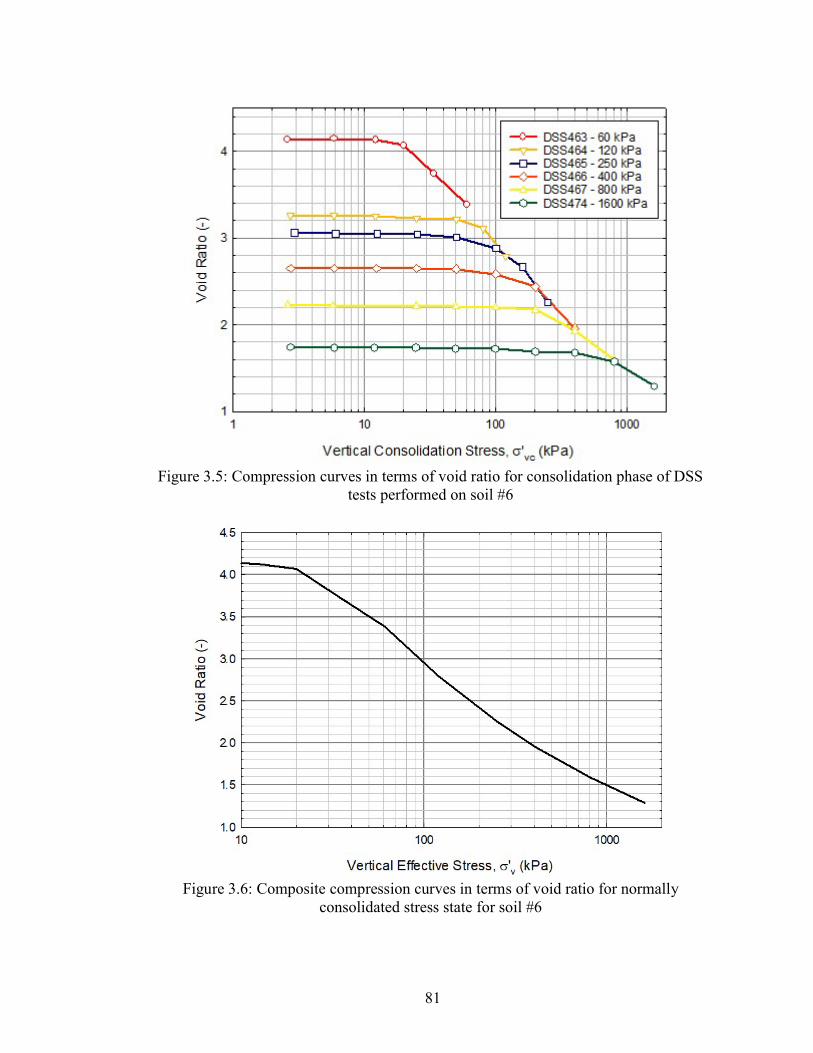
81
Figure 3.5: Compression curves in terms of void ratio for consolidation phase of DSS
tests performed on soil #6
Figure 3.6: Composite compression curves in terms of void ratio for normally
consolidated stress state for soil #6

82
Figure 3.7: Shear stress-strain behavior for soil #6 during shear
Figure 3.8: Normalized shear stress-strain behavior for soil #6 during shear

83
Figure 3.9: Pore pressure versus shear strain for soil #6
Figure 3.10: Normalized pore Pressure versus shear strain for soil #6

84
Figure 3.11: Stress plots for soil #6 during shear
Figure 3.12 Normalized stress plot for soil #6 during shear
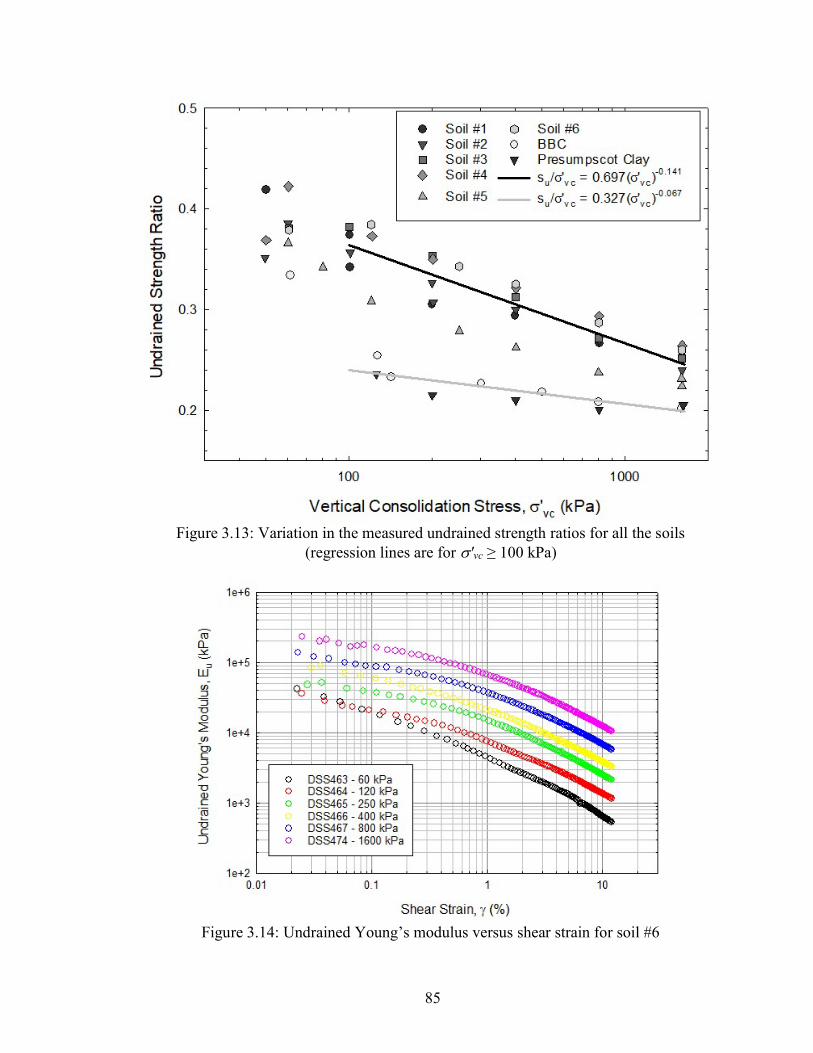
85
Figure 3.13: Variation in the measured undrained strength ratios for all the soils
(regression lines are for 'vc ≥ 100 kPa)
Figure 3.14: Undrained Young’s modulus versus shear strain for soil #6
86
Figure 3.15:Normalized undrained Young’s modulus versus shear strain for soil #6
Figure 3.16: Variation is secant undrained modulus (normalized by su) for soil #6 as a
function of shear stress ratio

87
Figure 3.17: Secant undrained modulus against vertical consolidation stress for a shear
stress ratio of 0.25
Figure 3.18: Secant undrained modulus against vertical consolidation stress for a shear
stress ratio of 0.50

88
Figure 3.19: Secant undrained modulus against vertical consolidation stress for a shear
stress ratio of 0.75
Figure 3.20: Variation of normalized undrained modulus with vertical consolidation
stress for a shear stress ratio of 0.25

89
Figure 3.21: Variation of normalized undrained modulus with vertical consolidation
stress for a shear stress ratio of 0.50
Figure 3.22: Variation of normalized undrained modulus with vertical consolidation
stress for a shear stress ratio of 0.75

90
Figure 3.23: Correlation between the Eq. 3.2 parameter S1 and liquid limit for organic
soils. * symbols in gray show the data from Casey and Germaine (2013)

91
Figure 3.24: Correlation between the Eq. 3.2 parameter T and liquid limit for organic
soils. * symbols in gray show the data from Casey and Germaine (2013)

92
Figure 3.25: Predictions of variation in NC su/'vc vs. 'vc for a) CK0UC behavior of
inorganic soils with LL = 25, 40, 50 and 75% (Eqs. 3.2, 3.3 and 3.4) and b) DSS behavior of organic soils with LL = 75, 100, 150, 200 and 250% (Eqs. 3.2, 3.16, and 3.17)

93
Figure 3.26: Correlation between liquid limit and organic matter
Figure 3.27: Correlation between parameter S1 and organic matter

94
Figure 3.28: Correlation between parameter T and organic matter

95
Figure 3.29: Eu/’vc versus LL at shear stress ratios (/su) of 0.25, 0.50 and 0.75 for the
organic soils at 'vc = a) 100 kPa, b) 200 kPa, c) 400 kPa and d) 1600 kPa

96
Figure 3.30: Eu/su versus /su for the organic soils at 'vc = a) 100 kPa, b) 200 kPa, c) 400
kPa and d) 1600 kPa

97
CHAPTER 4
RECOMPRESSION RATIO OF FINE-GRAINED SOILS
There are well-established procedures available for performing consolidation tests
and obtaining preconsolidation stress (’p) and compression ratio (CR) from these tests as
well as adjusting measured values for the effects of sample disturbance. However,
determination of the recompression ratio (RR) has not gained nearly similar attention and
no clear consensus has been provided in the literature on to the best approach to perform
consolidation tests and how to determine RR from the measured data. A suite of CRS tests
on a variety of high-quality, highly disturbed, and resedimented samples of natural fine-
grained soils with unload-reload (U-R) loops at different stress and strain levels were
conducted to investigate the effects of stress level and unloading ratio on estimates of RR.
Seven different methods were used to estimate RR from the results of each U-R loop. The
results show a consistent increase in RR from almost all the methods with increasing stress
level and unloading ratio. Different methods resulted in significantly different RR values
specifically for higher OCR soils as well as sensitive clays. Based on the findings from this
study recommendations for practice are provided for conduct of CRS tests and how to
interpret the test results to best estimate RR.
4.1. Introduction
Recompression ratio (RR), preconsolidation stress (’p), and compression ratio
(CR), as determined from 1-D incremental loading (IL) or constant rate of strain (CRS) test
results are the key soil properties for estimating primary consolidation settlement of fine-
grained soils. RR is the slope of the 1-D strain versus log effective stress curve (-log'v)

98
for recompression loading up to 'p while CR is the slope for virgin compression (i.e.,
normally consolidated) loading beyond 'p. The 1-D -log'v compression curve can be
adversely influenced by sample disturbance and hence estimating of primary consolidation
parameters can be unreliable. Methods to determine CR and ’p, and effects of sample
disturbance on these parameters have been extensively studied (e.g. Schmertmann, 1955;
Crawford, 1986, Sandbaekken et al., 1986; Gregory et al., 2006; Lunne et al. 2006, Park
and Lee, 2011). On the other hand, limited research has been conducted on the
determination of RR and effects of sample disturbance on this parameter. This is due to the
much greater impact CR and ’p have estimating the magnitude of settlement for soils
loaded beyond 'p. However, RR can be a more critical element in some cases, including
loading of thick layers of highly overconsolidated clay deposits and especially if the in situ
soil remains in the recompression zone after loading. In addition, the Schmertmann (1955)
method of reconstructing the equivalent in situ compression curve from a laboratory curve
measured on disturbed samples relies on an accurate measure of RR.
RR is strongly dependent on sample quality and increasing disturbance results in
overestimating its value. Empirically RR can be estimated as a function of CR, but the
typical range of reported RR/CR values spans an order of magnitude from 0.02 to 0.20
(Terzaghi et al., 1996). Determining RR from IL or CRS consolidation tests can be
unreliable due to small movements, seating and apparatus errors, swelling, recompression
of gas bubbles, and sample disturbance (Leonards, 1976; Crawford, 1996; Holtz et al.,
2011). Furthermore, a decision needs to be made at which stage of the test to evaluate RR.
Leonards (1976) recommended measuring RR from an unload-reload (U-R) loop with
unloading effective stress (’u) at ’p (or ’v0+’v if < 'p where 'v is the design

99
increase in vertical stress) and reloading effective stress (’r) at ’v0 (Figure 4.1). However,
it is not clear how loading the specimen to ’p and unloading to ’v0 would affect
recompression slope as the void ratio would be lower (significantly lower in case of highly
disturbed samples) than the in-situ condition. In addition, conducting an U-R loop around
’p could make estimating 'p more difficult using common graphic construction
procedures (e.g., Casagrande procedure). Sandbaekken et al. (1986) recommended
determining RR from an U-R loop starting from ’p or 2’p and going back to ’v0. Lunne
et al. (1998) proposed the U-R loop to be performed at 2’p or higher (until reaching the
virgin compression) and unloading with unloading ratio (’u/’r) equal to the in-situ
overconsolidation ratio (OCR = 'p/'v0). DeJong et al. (2018) performed CRS tests on
resedimented intermediate soil samples with varying degrees of disturbance and
recommended conducting the U-R loop at 2.5’p and unloading to the estimated K0=1
condition.
If an U-R loop is performed several different methods have been presented in the
literature to determine RR from the loop which can results in different RR estimates. In
some publications, it is not explicitly described how RR values were calculated, although
the most common approach appears to take the average slope of the hysteresis loop by
connecting ’r to the intersection of the unloading and rebound curves (Figure 4.1) as
suggested by Leonards (1976). Another practice is to measure RR as the slope of the line
connecting ’u to’r (Sandbaekken et al., 1986). DeJong et al. (2018) suggested that RR
is overestimated for intermediate soils such as silts if evaluated from the ’u to ’r slope
and recommended the slope of ’r to the larger of ’u/OCR or ’u/2 as a more accurate
100
measurement. Das (2004) suggested RR should be determined as the slope of the unloading
section of the U-R loop.
Different values of 'u at which to perform the U-R loop have been suggested by
various publications. However, the slope of the U-R loop tends to vary with ’u and the
unloading ’u/’r. Gunduz and Arman (2007) investigated the effect of OCR and e0 on RR
and CR for resedimented low-plasticity overconsolidated clayey samples. It was concluded
that as e0 increases RR and CR decrease and as OCR increases RR and CR also increase.
Oedometer tests were conducted by performing U-R loops at 400, 800, and 3200 kPa
stresses and RR/CR ratios ranged from 0.05 to 0.14 with the higher values being from the
U-R loops started at higher ’u. Vipulanandan et al. (2008) conducted IL tests on nine
different soft clay samples from Houston, TX and investigated three different methods to
determine RR: Leonards (1976), Das (2004), and connecting ’v0 to ’p on an U-R loop.
Three unload U-R loops were performed at different ’u for each test and as up to 760%
difference in RR values were reported for the different methods within a single U-R loop.
It was also reported that RR increases (significantly in case of CH soils) with increasing
’u.
This paper presents the results of a series of CRS tests conducted on high-quality,
disturbed, and resedimented samples of natural clays and silts. Tests were performed using
U-R loops with constant ’u/’r or constant ’r and with several such U-R loops performed
during each test at different ’u values to systematically investigate the effect of such test
procedure variations on RR. Various methods of estimating RR were examined and
compared to develop a better understanding of potential best practice methods for
conducting CRS tests and data interpretation for estimating RR.

101
4.2. Materials and Methods
4.2.1 Test Soils
Table 4.1 lists the index properties and classification according to the United Soil
Classification System (USCS, ASTM D2487, 2016) of the soils tested in this study. The
samples were collected using Shelby tube, NGI 76 mm fixed piston thin walled tube, and
Sherbrooke block sampler. The database comprises 15 samples of low to high-plasticity
soils, although the majority are low plasticity, with liquid limit values determined using
the Casagrande cup (ASTM D4318, 2016). The Boston Blue Clay (BBC) Shelby tube
samples were collected from Boston, MA and the BBC Sherbrooke Block samples were
collected from Newbury, MA (Landon et al. 2007); the Halden Silt samples were collected
in Halden, Norway (2016); the Presumpscot clay from, Falmouth, ME, the Onsøy sample
from Onsøy, Norway (Lunne et al. 2003); the Connecticut Valley Varved Clay (CVVC)
from Amherst, MA (DeGroot and Lutenegger 2003), and the Leda clay from Gloucester,
Canada. All the soils are marine clays except for CVVC, which is a lacustrine clay.
4.2.2 Sample Preparation
Samples of three broadly defined quality levels were tested to study the effects of
sample disturbance on RR. They included intact or “undisturbed” (block samples and
Shelby tube samples), laboratory disturbed, and resedimented. Laboratory disturbed
samples were prepared using an undisturbed sample and following the general procedures
described in DeJong et al. (2018). This was done by extruding an intact specimen, covering
it in plastic wrap, freezing it for a minimum of 24 hrs, and thereafter allowing it to thaw
for a minimum of 24 hrs. in a humid room with a controlled temperature of 11°C and
102
relative humidity of >85%. Cracks typically developed in the samples when following this
process. Resedimented samples were prepared according to the general described by Lukas
et al. (2018) to form a soil cake from which test specimens were trimmed. This was initially
done by mixing the soils with distilled water at 1.25-2 times the liquid limit and allowing
the slurry to hydrate overnight. The slurry was then thoroughly mixed under vacuum after
being placed in a 102 mm ID acrylic consolidometer to remove any trapped air. Later, the
soil was incrementally 1-D consolidated to a target 'vc = 220 kPa using a computer
controlled GeoJac system followed by unloading to an estimated K0 = 1 condition and
allowed to fully swell at that final unloading effective stress prior to removal. Each load
increment was applied until at least the End of Primary (EOP) was achieved. Once the
sample was extruded it was immediately trimmed into the oedometer ring for CRS testing.
4.2.3 Consolidation tests
The constant rate of strain (CRS) consolidation tests were performed in general
accordance with ASTM D4186 Standard Test Method for One-Dimensional Consolidation
Properties of Soils Using Controlled-Strain Loading and Sandbeakken et al. (1986). The
tests were conducted using a GeoTac personal computer based test control and data
acquisition system, which includes a load frame, flow pump, CRS consolidometer cell and
Sigma-1TM CRS control and data acquisition software. Specimens were hand trimmed
using a soil lathe together with a sharp trimming ring and sharp trimming tools. The top
and bottom surfaces of the specimens were trimmed flat with a wire saw and a long sharp
edged knife with the final trimmed right cylinder dimensions equaling a diameter of 63.5
mm and a height of 19.0 mm. Specimens were placed in the CRS cell with moist top and
bottom filter stones. Specimens were initially incrementally loaded up to 0.25’vo to

103
0.50’vo (or 10 kPa for highly disturbed samples) before back-pressure saturation to 400
kPa at constant height to ensure no swelling. Constant rate of strain loading was performed
at a rate that resulted in a normalized base excess pore pressure ratio of less than 10% in
the normally consolidated range; for the clay samples this rate was typically 1%/hr (2.8x10-
6 s-1). In all the tests, specimens were allowed to creep for 300 min after every load or
unload step to allow the base excess pore water pressure to dissipate before reversing the
loading direction. All measurements during testing were made using load, displacement
and pressure transducers. The measured data were processed using the methods of Wissa
et al. (1971) and also described in ASTM D4186 and Sandbækken et al. (1986). All vertical
strains were computed taking into account the apparatus compliance that was determined
using a steel disk.
Tests were conducted on each soil in the following general sequence, although not
all of these tests were performed on each sample (Table 2):
1. Constant 'r = 'v0: The first test on each soil was conducted on an intact block
or tube sample by consolidating the specimen to around 10% strain (i.e., into
the normally consolidated stress range) before performing the first U-R loop.
The specimen was then unloaded to ’v0 followed by reloading with two
additional U-R loops at strains of about 15% and 20% prior to unloading to ’v0
for each loop. The 'p value from this specimen was used to estimate the sample
OCR.
2. Constant ’u’r: The second test on each soil was also performed on an intact
sample but now the first U-R loop was performed at (0.8-1.0)’v0 and unloading
back to ’u/’r equal to the estimated sample OCR from Test 1. Three other U-

104
R loops at strains similar to the first test were then conducted, each followed by
an unloading step with ’u/’r = OCR unless OCR < 2 for which a ’u/’r = 3-
4 was used.
3. The third test was conducted on the laboratory disturbed samples and with U-R
loops similar to the first test.
4. The fourth test was conducted on a resedimented sample of the same soil used
for tests 1, 2 and 3 and tested with U-R loops similar to the first test.
4.3. Test Results
4.3.1 Compression Behavior
Table 4.2 and Table 4.3 summarize the consolidation results from the CRS tests
performed for this study. Preconsolidation stresses were calculated using Casagrande
method and sample quality was determined using NGI method of e/e0 at 'v0 (Lunne et
al., 2006) and SQD method of v at 'v0 (Terzaghi et al., 1996). Figure 4.2 and Figure 4.3
present an example set of results for Sherbrooke block sample N2SBS3 in - log’v and
e-log'v spaces. The results from the pair of tests on the intact sample and the pair on the
resedimented sample were very consistent and follow the same recompression curve up to
'p. The laboratory disturbed sample categorized as poor quality by NGI method and acted
similar to a remolded sample with ’p over 85% smaller than that of the intact specimens.
Beyond 'p, the intact specimens showed the behavior of a structured clay with a distinct
break in the compression curve just beyond 'p and a steep CR that progressives decreases
with increasing stress. The resedimented specimens started with a lower void ratio, had a
much more rounded curve beyond 'p and much smaller CR values which is attributed to
105
the loss of structure from the resedimentation process. In void ratio space (Figure 4.2) all
of the test specimens indicate a convergence at higher stresses and by extrapolation all
appear to merge at around 0.4e0 which is in accordance with the findings of Schmertmann
(1955).
The abovementioned general observations were consistently perceived for all sets
of tests. Disturbed samples had initial void ratios 0.8-0.9 times smaller than those of the
undisturbed samples. In addition, compression curves for all soils tested tended to merge
at around 0.4e0, excluding for CVVC sample where the curves seemed to merge at around
0.25e0. This difference can be due to the fact that because of the layering in CVVC samples
it was not possible to obtain the same layering of clay and silt in all the specimens.
Table 4.3 presents the maximum CR slope (CRmax) measured for the different tests.
CRmax, as expected, is higher for undisturbed samples and decreases significantly for
disturbed and resedimented samples. CRmax is also higher in case of the more structured
sensitive soils as corroborated by the higher LI values listed in Table 4.1 for those samples.
4.3.2 Recompression Ratio
From Figure 4.2 and Figure 4.3 it can be seen that the general slope of the U-R
loops increased with increasing ’u and ’u/’r. To study these changes, nine different
methods of estimating RR were used for each U-R loop, when applicable, as follows
(Figure 4.4):
- RRCasa is the traditional RR value calculated by Casagrande method from the
line joining ’v0 to ’p.
- RR1 is the slope of the line from ’u to ’r (Sandbaekken et al., 1986).

106
- RR2 is the slope of the line connecting’r to the intersection of unload and
rebound curves (Leonards, 1976).
- RR3 is determined by calculating a Casagrande preconsolidation stress value
for the intended U-R loop (’p,U-L) and measuring the slope of the line joining
this point to the point where the recompression loops starts curving (after the
first flat portion of the loop). This method is chosen as representative of the
average slope of recompression portion of the loop curve.
- RR4 is similar to RR3 with the difference being that the slope of the line
connecting ’p,U-L to ’p,U-L/OCR is measured. This method is a facsimile of the
Casagrande method on every loop.
- RR5 is the slope of the line connecting ’v0 to ’p on the U-R loop.
- RR6 is the slope of the line joining ’u to ’u/OCR.
- RR7 is the average slope of the U-L loop just before ’p,U-L.
- RR8 is the slope of initial recompression slope right after ’v0.
All the methods were calculated using the reloading portion of the curves and not
the rebound part. Table 4.3 presents the RRcasa and RR2 results for all the tests as well as
’u at which each loop was conducted. It can be seen that there are considerable variations
in the results for all soils. The measured RR2 values from different loops for a single test
in many instances differ between two to nine times.
Figure 4.5, Figure 4.6, and Figure 4.7 present RR values from all the different
methods for all the soils with respect to ’u/’r, ’u/’p, and v at ’u, respectively. A
general trend of increase in RR with increasing ’u/’r and ’u/’p values can be observed
in Figure 4.5 and Figure 4.6. This trend is stronger with v at ’u as shown in Figure 4.7.

107
RRCasa and RR8 values are not shown in this plot as the v at ’u is only considered the U-
R loops, but ’u/’r and ’u/’p are assumed to be equal to OCR and 1, respectively. These
trends confirm that RR, in general, increases with increase in ’u and/or ’u/’r. In addition,
the more systematic increasing trend between RR and v at ’u suggests that RR is more
influenced by stress or strain level than the unloading ratio.
Figure 4.8 illustrates RR1 to RR7 values versus v at ’u in separate plots which
shows that RR values determined from all the methods, excluding RR5, increased with
increasing v at ’u. RR5 values did not show any meaningful trend with strain level and
their values were generally smaller that RR from other methods. Figure 4.9 also presents
the range of RR values from each method. The following conclusions are drawn from the
trends shown in Figure 4.8 and Figure 4.9:
- RR1 and RR2 values were very close as the intersection of rebound and
recompression curves and ’u are close to each other.
- RR5 as explained above had the lowest mean value followed by RR1 and RR2
with values <0.016. These lower values of RR5 are due to the fact that this
method determines RR from the slope of the first portion of the U-R loop and
this slope is mostly shallow if the reload starts at ’v0 as the recompression loops
start with a flat line in the beginning and the slope increases with increasing
load.
- RR8 had the highest average and range of results which suggests it is most
influenced by sample disturbance and overestimates RR since it was larger than
RRCasa, while RRCasa values tend to be higher due to the disturbance effects.
108
- Mean value of RR7 was slightly higher than RRCasa which suggests this
approach also overestimates RR. RR7, in most cases, was somewhat larger than
RR4.
- RR3 and RR4 values were mostly very close to RR4 values being slightly higher
in the constant ’r tests.
Figure 4.10, Figure 4.11, and Figure 4.12 plot the RR values from all the tests on
BB-6 sample; for which the undisturbed samples had excellent quality ratings (Table 4.2).
RR values range over one order of magnitude from 0.004 (RR1) to 0.035 (RR8) which could
potentially result in that large of a difference in settlement estimates. There is a distinct
trend of increase in RR with stress and strain level. RR values from different methods on
different loops, excluding RR5 and RR7, increased with a similar slope. However, the rate
of gain was higher in the constant ’u tests since both unloading ratio and stress level
increased during these tests. RRCasa values were in the higher end of the measured RR
values. Similar trends were observed for CVVC and Leda clay.
Figure 4.13, Figure 4.14, and Figure 4.15 show the results of the two tests on
undisturbed and the two tests on resedimented samples of N2SBS3, for which the
undisturbed samples were also of excellent quality (Table 4.2). The general increase in RR
with stress level and ’u/’r can be seen here as well, but the rates at which RR from each
method increased is not as distinct as BB-6. This increase for most methods still occurred
at a comparable rate. RR values varied from 0.01 to 0.04. RRCasa, RR3, RR4, and RR6 values
from the two constant ’u/’r and the two constant ’r tests were similar, respectively. For
the constant ’u/’r tests, RR3, RR4, and RR7 values were nearly constant with less than
10% variation for the different loops. RR1, RR2, and RR6, on the other hand, increased up

109
to 61% in these tests which was due to the higher rebound values at higher ’u/’p. For the
constant ’r tests, RR values were generally higher than constant ’u/’r tests. In addition,
RR values increased for all the methods, excluding RR5, with increasing stress level. Other
BBC samples as well as Onsøy sample followed the same patterns.
For ’u/’r values of around 2, U-R loops were very flat (specifically at low strains)
and RR1 and RR2 values became very small. For constant ’r test on ST3 sample, RR1 and
RR2 from the first loop (v at ’u = 2.5%) were respectively 24 and 19 times smaller than
the same values from the final loop (v at ’u = 11.6%) while RR3, RR4, and RR7 values
remained nearly constant for all the loops.
For the tests on disturbed samples, RR slopes from all the methods, excluding RR7,
constantly increased with increasing ’u and ’u/’r regardless of the type of the tests (i.e.,
constant ’u/’r versus constant ’r). Similar to the other tests, this increase in RR3, RR4,
and RR7 values was smaller than the change in RR1, RR2, and RR6 values.
RR values from the first loop on the highly disturbed N1SBS10A sample (’u/’r
= 3.45 and v at ’u = 10.7%) were considerably smaller than the ones obtained from first
loop of the constant ’r tests on the undisturbed sample (’u/’r = 12.2 and v at ’u =
3.1%) which suggests that ’u/’r has more influence on RR values than sample
disturbance as the slope RR for the highly disturbed specimen, which is expected to be the
highest RR measurement, is lower than the slope from the undisturbed specimen, but with
larger ’u/’r. A similar pattern was observed for the other soils.

110
RR3, RR4, and RR7 values from the constant ’r tests on the low PI Halden silt were
constant for all the loops, except from the one loop where ’u/’r = 92. RR5 did not change
for any of the tests and RR1, RR2, and RR6 increased with stress level.
It is certainly clear that RR4 values tend to be in a narrow range, specifically for the
constant ’u/’r tests, where for many cases, RR values were the same for all the loops.
RR4 values for ’u/’r < OCR loops were noticeably smaller than those calculated from
the loops on the same soils with ’u/’r > OCR. RR4 for clays also increased significantly
when ’u/’r > 10 which might be due to the very high curvature of the recompression part
of the loops when ’u/’r is large. This increased curvature also makes obtaining accurate
estimates of ’p,U-L challenging. The curves also become more rounded as the stress/strain
level increases. Maximum curvature points for all soils occurred in the close proximity of
the intersection of unloading and reloading curves.
Limited number of IL tests were also performed on some of the soils for comparison
purposes. The slope of the U-R loops from those tests were consistent with CRS results.
However, the curves were not as well-defined as the continuous CRS curves, specifically
for ’u/’r < 2.0 loops where rebound and recompression curves mostly plot on top of each
other. In general, tested soils do not rebound much up to ’u/’r < 2 where the rebound rate
starts to increase with increasing ’u/’r values.
4.4. Discussion of Results
The results presented in the previous section show that RR can vary significantly
depending on the method used to estimate it. On average, RR may vary more than 240%
from a single loop and more than 340% from a single test with higher numbers being for

111
more sensitive or higher OCR soils. For an ideal sample with no disturbance, RRCasa should
most closely reflect the in-situ value, however, due to the unavoidable, and potentially
highly variable, sample disturbance, RRCasa is expected to overestimate the in situ RR
value, with the possible exception of high-quality block samples collected from relatively
shallow depth. Theoretically, RR4 measured from a loop performed at near or at ’p and
unloaded back to ’v0 (RR4,1) on a high-quality sample could mitigate to some degree
effects of sample disturbance and provide a practical estimate of RR.
RRCasa was larger than RR4,1 for all the soils, apart from ST3 sample with OCR =
1.25. Casagrande estimation of the 'p for samples with a relatively steep recompression
slope up to ’p is often considerably above the measured compression curve (i.e., lower
vertical strain). In other words, Casagrande method in such cases might compensate for the
influence of disturbance to some unknown degree (i.e., the line connecting ’v0 to ’p plots
noticeably above the recompression curve). For example, it resulted in a very flat slope of
RRCasa for samples with OCR<1.5. Although the in situ recompression slope is not
necessarily linear (in e-log'v space) and could naturally be rounded.
Table 4.4 shows the range of variation of RR with respect to RR4,1 from the constant
’u/’r tests on the high-quality BBC samples. Obviously, RR5 values are not applicable
to constant ’u/’r tests as the soils are not unloaded back to ’v0. RR1 and RR2 values were
significantly smaller than RR4,1 values for the initial loops. RR1 and RR2 slopes were closer
to RR4,1 for the loops performed at large strains (i.e., >15%). RR6 followed similar trends
with slightly higher values compared to RR1 and RR2. For CVVC and Presumpscot clay,
RR1, RR2, and RR6 from the loops with ’u/’p ≈ 2 were in the 20% range of RR4,1. RR3
and RR4 values for ’u/’p < 3 loops on BBC samples tended to be in the 20% and 15%

112
range of RR4,1, respectively. It can be seen from Table 4.4 that these two methods are in
the closest range of RR4,1. However, RR3 and RR4 for CVVC and Presumpscot clay
samples were somehow larger than RR4,1. For both these two soils only one constant ’u/’r
test was performed and ’u/’r on the first loop was smaller than in-situ OCR which
probably resulted in smaller RR4,1 values. RR7/RR4,1 variation for all the soils was similar
to that of RR3 and RR4 but with larger magnitude. Overall, RR8 values were similar to
RRCasa values but there was more scatter in the data which is shown by higher standard
deviation in Table 4.4.
The first loop for the constant ’r tests was not conducted at ’p to obtain accurate
estimates of ’p and RRCasa. Therefore, the first U-R loop for these tests occurred at ’u/’p
≈ 2 where RR4 is potentially higher than that of a loop performed at around ’p. Therefore,
RR4,1 values from the constant ’u/’p tests on the same soils are used as the reference
point and compared to the values from the loops conducted around 2’p or 10% strain in
the constant ’r tests. Table 4.5 summarizes the results. RRCasa and RR8 for all the tests
were higher than RR4 values. RR1 and RR2 values for BBC and Presumpscot clay were in
good agreement with RR4,1 values with RR1 values being closer to RR4,1 mostly for the
loops where ’u/’p = 1.5-2.0 and RR2 for the ’u/’p = 2.0-2.5 loops. It is concluded from
results presented in Table 5 that RR1 and RR2 provided the closest estimate of RR4,1 for
these soils. This finding has practical significance as it is common practice to use RR1 or
RR2 values from U-R loops performed at around 2’p with ’r = ’v0 as design
recompression ratio. For the CVVC sample RR1 and RR2 overestimated RR4,1 by 27% and
38%, respectively. This difference can be because of the explained underestimation of
RR4,1 for these soils as well as the fact that the constant ’u/’p and constant ’r tests had
113
different soil layering (i.e., different e0) and RR4,1 values might not be relevant to constant
’r tests. RR3, RR4, RR6 and RR7 values for all the soils were higher than RR4,1. RR5 can
be lower or higher than RR4,1 with no trend.
The previous conclusions apply to all the resedimented samples as well. However,
for constant ’r tests on highly disturbed samples of BBC and Presumpscot Clay, RR1,
RR2, and RR6 values tended to be noticeably larger or smaller than RR4,1 from the
undisturbed samples. RR3, RR4, and RR7 values from U-R loops conducted at 9% < strain
<15% and ’u/’p > 1 (’p measured from undisturbed tests) seem to vary less than 25%
from RR4,1. On the other hand, for the CVVC sample, RR1 and RR2 from such loops were
very similar to RR4,1.
Based on the observations in this study and assuming that RR4,1 for good-quality
samples is a reliable representative of the recompression ratio, the most appropriate
practice to conduct CRS tests with respect to determining RR is as follows:
In the case of access to high-quality samples and a reasonable estimate of ’p, the
best approach seems to be loading the specimen up to ’p before unloading it back to the
smaller of ’v0/1.2 or ’u/3 (to avoid a flat recompression curve). The specimen should then
be loaded to any desired effective stress. RR4 may be calculated as the recommended RR
for these tests.
In the case of lower quality samples, it is best to conduct the U-R loop at around
10% strain, or 2’p and unload the specimen to the smaller of ’u/(1.2OCR) and ’u/3.
Again, recompression ratio can be determined as RR4.

114
Initial estimates of ’p are not always available in practice. In such conditions, CRS
tests can be conducted by loading the specimen to 10% strain or 2’p and unloading to ’v0.
Recompression ratio in this case may be estimated from RR2 method.
4.5. Conclusion
There appears to be no consensus in the literature on best practice methods for
conduct of 1-D consolidation test for determining the recompression ratio of soils. CRS
test results from a variety of different quality samples (i.e., high-quality, highly disturbed,
and resedimented) prepared from block and Shelby tube samples were investigated in this
study. Each test was performed with several U-R loops at different stress levels and with
different ’u/’r ratios to examine how they effect on estimation of RR. The results show
that the slope of the U-R loops becomes steeper with increasing ’u/’p, ’u/’r, or v at
’u.
Seven different methods for interpreting an U-R loop (i.e., Fig. 4 RR1 to RR7) and
two slopes from the initial recompression part of the compression curve (i.e., RRCasa and
RR8) were examined. RRCasa and RR8, as anticipated, produced the highest values, followed
by RR7, RR4, and RR3. RR1, RR2, and RR5 gave the lowest estimates of the recompression
ratio. RR for all the methods seemed to increase as stress level increased, excluding RR5
and RR4 which were the least stress-dependent methods producing nearly constant results
in most constant ’u/’r tests. In addition, RR values from all the methods, apart from RR5,
increased with increasing unloading ratio. The results showed that RR estimates can vary
more than 240% from a loop and over 340% through one test depending on where and how
the U-R loop is performed during the test. This variation can lead to significant uncertainty

115
in settlement estimations especially in the case of heavy loading of a thick highly
overconsolidated clay that does not reach ’p.
RR4 from a U-R loop performed at ’u’p with ’u/’r = 1.2OCR (RR4,1) is
recommended as the most reliable estimate of RR. For constant ’u/’r tests, RR4 provided
acceptable estimates of RR4,1 where ’u/’r > 1.2OCR. RR4 was significantly smaller in
the tests with ’u/’r < OCR. In case of constant ’r tests on BBC and Presumpscot clay
samples, RR1 and RR2 slope on a U-R loop performed at ’u/’p = 1.5-2.5 seemed to be a
reliable representative of RR4,1. RR4 was higher than RR4,1 in these tests due to the very
large ’u/’r values. For highly disturbed samples, RR4 calculated from a U-R loop at a
strain larger than 9% and smaller than 15%, where ’u/’p > 1, was consistent with RR4,1
values from undisturbed samples.
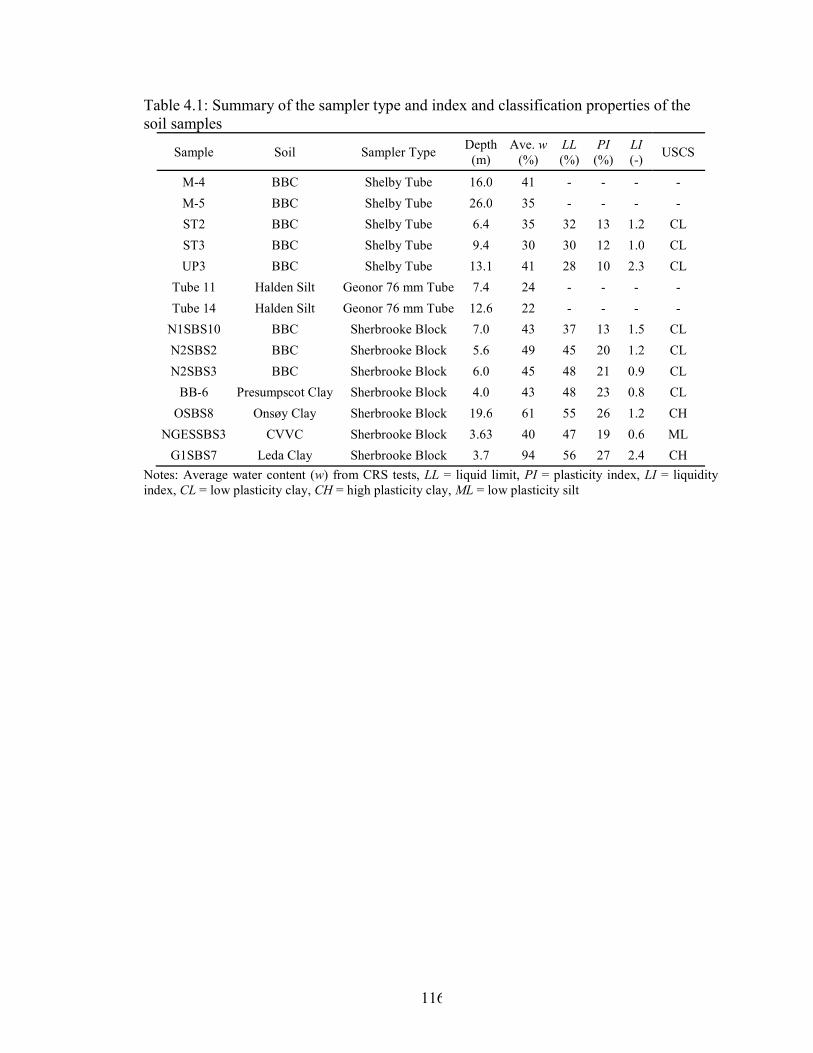
116
Table 4.1: Summary of the sampler type and index and classification properties of the soil samples
Sample Soil Sampler Type Depth
(m) Ave. w
(%) LL (%)
PI (%)
LI (-)
USCS
M-4 BBC Shelby Tube 16.0 41 - - - -
M-5 BBC Shelby Tube 26.0 35 - - - -
ST2 BBC Shelby Tube 6.4 35 32 13 1.2 CL
ST3 BBC Shelby Tube 9.4 30 30 12 1.0 CL
UP3 BBC Shelby Tube 13.1 41 28 10 2.3 CL
Tube 11 Halden Silt Geonor 76 mm Tube 7.4 24 - - - -
Tube 14 Halden Silt Geonor 76 mm Tube 12.6 22 - - - -
N1SBS10 BBC Sherbrooke Block 7.0 43 37 13 1.5 CL
N2SBS2 BBC Sherbrooke Block 5.6 49 45 20 1.2 CL
N2SBS3 BBC Sherbrooke Block 6.0 45 48 21 0.9 CL
BB-6 Presumpscot Clay Sherbrooke Block 4.0 43 48 23 0.8 CL
OSBS8 Onsøy Clay Sherbrooke Block 19.6 61 55 26 1.2 CH
NGESSBS3 CVVC Sherbrooke Block 3.63 40 47 19 0.6 ML
G1SBS7 Leda Clay Sherbrooke Block 3.7 94 56 27 2.4 CH
Notes: Average water content (w) from CRS tests, LL = liquid limit, PI = plasticity index, LI = liquidity index, CL = low plasticity clay, CH = high plasticity clay, ML = low plasticity silt

117
Table 4.2: Summary of the consolidation test results
Sample Test No.
Condi-tion
w (%)
e0 (-) t
(kN/m3) ’v0
(kPa)’p
(kPa) OCR
(-)
At ’v0 Sample Quality e/e0
(-) v
(%) NGI SQD
M-4 CRS273 U 41 1.08 17.80 182 280 1.54 0.047 2.46 2 C M-5 CRS275 U 35 0.99 18.26 266 230 0.87 0.057 2.83 3 C
ST2 CRS278 CRS279
U U
36 34
1.00 0.98
18.19 18.42
82 82
159 182
1.96 2.23
0.029 0.020
1.47 0.97
1 1
B A
ST3 CRS280 CRS281
U U
32 28
0.93 0.83
18.42 18.83
107 107
132 134
1.23 1.25
0.041 0.015
1.97 0.68
2 1
B A
UP3
CRS293 CRS296 CRS297 CRS298
U U U D
42 37 42 43
1.14 1.16 1.08 1.08
17.53 16.73 18.08 18.10
147 147 147 147
245 208 208 73
1.68 1.42 1.42 0.50
0.047 0.057 0.046 0.150
2.48 3.13 2.38 7.81
2 2 2 2
C C C C
Tube 11 CRS284 U 24 0.78 18.43 88 828 9.46 0.028 1.22 1 B Tube 14 CRS285 U 22 0.64 19.70 137 788 5.77 0.006 0.21 1 A
N1SBS10A
CRS274 CRS309 CRS317
U U D
41 41 46
1.22 1.29 1.21
16.81 16.93 17.48
81 81 81
190 210 21
2.35 2.59 0.26
0.022 0.013 0.162
1.23 0.72 8.86
1 1 4
B A E
N2SBS2
CRS288 CRS289 CRS303 CRS311
U U D R
53 53 49 39
1.44 1.44 1.41 1.12
16.63 16.64 16.42 17.5
67 67 67 55
244 244 71 55
3.65 3.65 1.07 3.40
0.023 0.026 0.092 0.002
1.34 1.52 5.37 0.12
1 1 3 1
B B D A
N2SBS3
CRS282 CRS283 CRS304 CRS306 CRS307
U U D R R
50 52 47 39 39
1.39 1.39 1.25 1.10 1.10
16.59 16.76 17.22 17.48 17.47
70 70 70 55 55
212 212 42
220 220
3.03 3.03 0.60 4.00 4.00
0.016 0.013 0.101 0.013 0.010
0.92 0.76 5.60 0.65 0.53
1 1 3 1 1
A A D A A
BB-6
CRS310 CRS312 CRS314 CRS313 CRS315
U U D R R
50 49 44 37 35
1.41 1.40 1.20 1.04 0.99
16.44 16.45 17.30 17.70 17.89
46 46 46 55 55
152 152 49
182 208
3.35 3.35 1.08 3.31 3.79
0.006 0.004 0.066 0.021 0.013
0.34 0.24 3.59 1.05 0.64
1 1 3 1 1
A A C B A
OSBS8 CRS286 CRS287
U U
61 61
1.68 1.69
16.08 15.98
117 117
132 117
1.13 1.00
0.026 0.040
1.64 2.54
1 2
B C
NGESSBS3
CRS290 CRS295 CRS305
U U D
43 37 39
1.19 0.99 1.10
17.31 18.33 17.65
43 43 43
315 326 131
7.33 7.59 3.06
0.009 0.004 0.046
0.47 0.22 2.41
1 1 2
A A C
G1SBS7
CRS276 CRS277
U U
91 96
2.70 2.84
14.26 14.11
33 33
81 81
2.45 2.45
0.007 0.007
0.55 0.55
1 1
A A
Note: U = undisturbed, D = Disturbed, R = Resedimented

118
Table 4.3: Summary of the consolidation test results
Sample Test No. Condi-
tion CRmax RRCasa
’u (kPa)
RR2 ’u
(kPa) RR2
’u (kPa) RR2
’u (kPa)
RR2
M-4 CRS273 U 0.156 0.030 168 0.011 776 0.021 2383 0.019 - - M-5 CRS275 U 0.176 - - - - - - - - -
ST2 CRS278 CRS279
U U
0.167 0.168
0.018 0.024
390 230
0.011 0.001
536 864
0.015 0.005
1455 1192
0.020 -
- 3229
- 0.009
ST3 CRS280 CRS281
U U
0.130 0.103
- 0.009
204 251
0.002 0.001
391 488
0.011 0.005
508 585
0.010 0.007
1413 1763
0.016 0.007
UP3
CRS293 CRS296 CRS297 CRS298
U U U D
0.186 0.195 0.185 0.127
0.022 0.014 0.021
-
736 191 227 187
0.025 0.008 0.016 0.014
- 422 424 439
- 0.015 0.020 0.019
- 747 748 760
- 0.019 0.024 0.024
- 1527 1527 1535
- 0.017 0.031 0.029
Tube 11 CRS284 U 0.099 0.014 910 0.005 1249 0.008 2482 0.014 - - Tube 14 CRS285 U 0.022 0.008 1898 0.007 6009 0.009 7955 0.010 - -
N1SBS10A
CRS274 CRS309 CRS317
U U D
0.156 0.310 0.101
0.030 0.043
-
114 170 122
0.011 0.012 0.010
526 317 323
0.021 0.025 0.014
1617 813 953
0.019 0.025 0.022
- - -
- - -
N2SBS2
CRS288 CRS289 CRS303 CRS311
U U D R
0.290 0.280 0.126 0.140
0.032 0.032
- 0.026
422 229 63
544
0.028 0.016 0.019 0.026
741 426 249
1158
0.036 0.023 0.018 0.030
1489 753 746
-
0.037 0.023 0.028
-
- 1509 1543
-
- 0.025 0.032
-
N2SBS3
CRS282 CRS283 CRS304 CRS306 CRS307
U U D R R
0.340 0.370 0.124 0.150 0.152
0.035 0.035
- 0.034 0.039
352 233 53
522 216
0.024 0.013 0.026 0.021 0.012
617 321 153 925 522
0.027 0.017 0.016 0.024 0.016
1561 636 624
1797 925
0.032 0.020 0.025 0.028 0.019
- 1580 1536
- 1797
- 0.021 0.032
- 0.019
BB-6
CRS310 CRS312 CRS314 CRS313 CRS315
U U D R R
0.370 0.390 0.113 0.132 0.124
0.026 0.026
- 0.029 0.032
230 145 180 233 428
0.010 0.005 0.008 0.011 0.015
418 232 390 431
1184
0.016 0.010 0.015 0.012 0.023
876 420 724
1185 -
0.018 0.014 0.019 0.016
-
- 876
1478 - -
- 0.015 0.021
- -
OSBS8 CRS286 CRS287
U U
0.390 0.186
0.021 -
205 -
- -
351 -
0.015 -
645 -
0.022 -
- -
- -
NGESSBS3
CRS290 CRS295 CRS305
U U D
0.160 0.152 0.134
0.021 0.022
-
613 286 114
0.018 0.008 0.012
1321 615 231
0.026 0.015 0.012
2372 1318 768
0.030 0.023 0.022
- 2370 1406
- 0.024 0.024
G1SBS7
CRS276 CRS277
U U
1.14 2.26
0.027 0.027
53 85
0.007 0.013
92 91
- 0.013
117 122
0.020 0.015
- -
- -
Note: U = undisturbed, D = Disturbed, R = Resedimented

119
Table 4.4: Variation of recompression ratio values for BBC samples with respect to RR4,1 from constant ’u/’r tests
RRCasa/RR4,1 RR1/RR4,1 RR2/RR4,1 RR3/RR4,1 RR4/RR4
,1 RR6/RR4,
1 RR7/RR4,1
RR8/RR4,
1 Number 6 22 22 22 19 22 19 5 Mean 1.55 0.57 0.66 1.05 0.99 0.74 1.10 1.48
Minimum 0.61 0.02 0.03 0.81 0.86 0.41 0.56 0.56 Maximum 2.00 0.95 1.11 1.27 1.25 1.02 1.33 2.42
S.D. 0.500 0.245 0.289 0.140 0.093 0.176 0.248 0.662
Note: S.D. = Standard deviation
Table 4.5: Variation of recompression ratio values for BBC and Presumpscot clay
samples with respect to RR4,1 from constant ’r tests RRCasa/RR4,
1
RR1/RR4,
1 RR2/RR4,
1 RR3/RR4,
1 RR4/RR4,
1 RR5/RR4,
1 RR6/RR4,
1 RR7/RR4,
1 RR8/RR4,
1 Number 7 8 8 8 7 7 8 8 7
Mean 1.74 0.92 1.00 1.38 1.54 0.79 1.32 1.74 1.73 Minimum 1.43 0.72 0.80 1.13 1.29 0.50 0.84 1.33 1.00 Maximum 2.04 1.14 1.25 1.52 1.83 1.12 1.83 2.08 3.17
S.D. 0.262 0.156 0.184 0.163 0.198 0.249 0.289 0.289 0.254
Note: S.D. = Standard deviation

120
Figure 4.1: Common procedures for estimating the recompression ratio RR (after Leonards 1976, Holtz et al. 2011)

121
Figure 4.2: One-dimensional compression behavior of N2SBS3 block in - log’v space

122
Figure 4.3: One-dimensional compression behavior of N2SBS3 block in e - log’v space

123
Figure 4.4: Different methods used to determine RR in this study

124
Figure 4.5: Variation in recompression ratio with ’u/’r
Figure 4.6: Variation in the recompression ratio with ’u/’p

125
Figure 4.7: Variation in the recompression ratio with v at ’u

126
Figure 4.8: Variation in the recompression ratio with v at ’u for all the tested soils

127
Figure 4.9: Range of RR values from all the methods. The line in the box presents the median, the top and bottom boarders of the box show 25th and 75th percentile, the two
upper and lower whiskers represent 10th and 90th percentile, and the outliers are presented with dots.
Figure 4.10: Variation in recompression ratio with ’u/’r for BB-6 sample

128
Figure 4.11: Variation in the recompression ratio with ’u/’p for BB-6 sample
Figure 4.12: Variation in the recompression ratio with v at ’u for BB-6 sample

129
Figure 4.13: Variation in recompression ratio with ’u/’r for N2SBS3 sample
Figure 4.14: Variation in the recompression ratio with ’u/’p for N2SBS3 sample
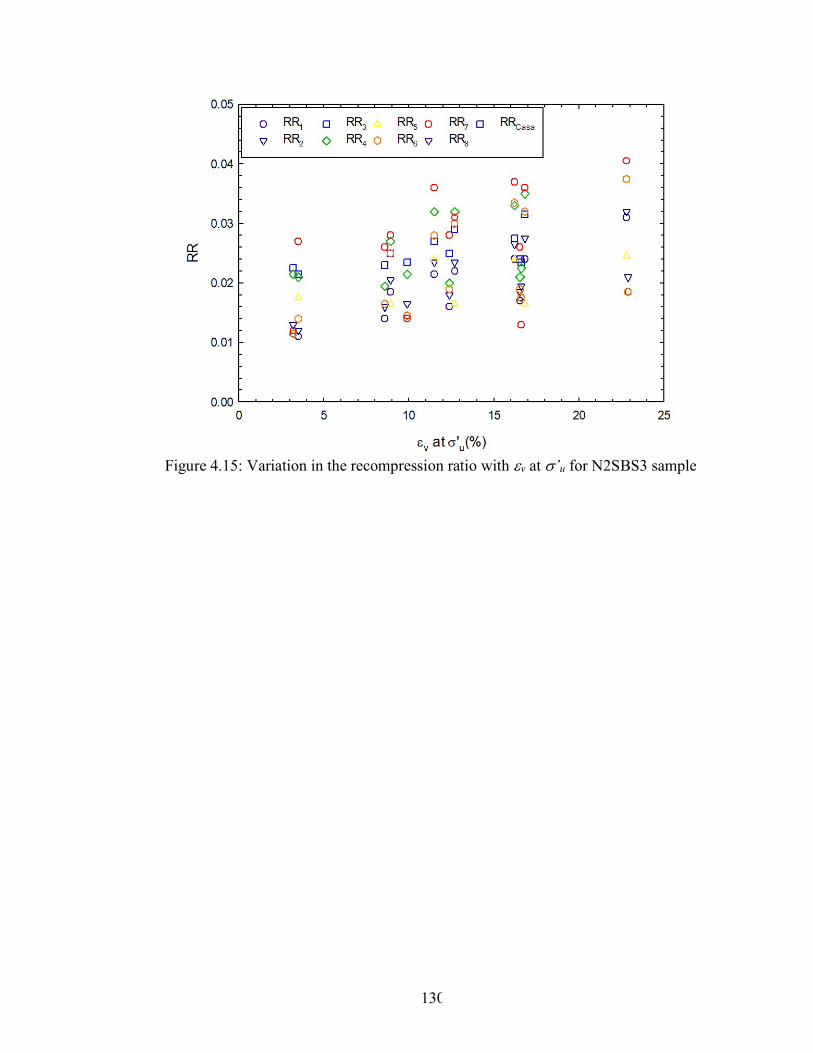
130
Figure 4.15: Variation in the recompression ratio with v at ’u for N2SBS3 sample

131
CHAPTER 5
SUMMARY AND CONCLUSIONS
The main objectives of this dissertation were to develop correlations between
consolidation parameters and soil index properties for soft fine grained soils from the
coastal Louisiana region, gain a better understanding of the normalized undrained shear
behavior of high liquid limit organic soils, and investigate different methods for estimating
the recompression ratio from consolidation tests. The objectives were met through the
research presented in three chapters that detail the results and analysis of the site
investigation data and laboratory test program. A brief overview of the most important
results of these chapters is presented below.
Chapter 2 presented a collection of empirical correlations for estimating
consolidation design parameters of fine-grained soils from the coastal Louisiana region.
The correlations were developed through investigation of the relationship between
different consolidation parameters (i.e., compressibility, preconsolidation stress and
coefficient of consolidation) and basic index measurements (i.e., water content, void ratio,
Atterberg Limits, and dry unit weight) using data from 15 marsh creation projects.
Different correlations were suggested with the strongest being for estimating compression
index from natural water content considering inorganic and organic soils separately.
Chapter 3 presented the results of a suite of DSS tests performed on six
resedimented natural high liquid limit organic soils and two lower liquid limit inorganic
soils. Tests were performed on normally consolidated specimens at consolidation vertical
effectives stresses ranging from 50 to 1600 kPa. The organic soils exhibited more ductile
behavior and had higher su/’vc and lower Eu/'vc than the inorganic soils. su/’vc for all the

132
soils decreased with increasing 'vc. Empirical correlations were developed to estimate
su/’vc from 'vc as a function of liquid limit or organic matter for the organic soils. Eu/'vc
was found to decrease as ’vc increased with no trend with liquid limit. Alternatively,
correlations are presented for estimating Eu and Eu/'vc as a function of 'vc for applied
shear stress ratios (/su) of 0.25, 0.50 and 0.75.
Chapter 4 presented the results of an investigation into the different practices for
determining the recompression ratio from consolidation tests. CRS tests were conducted
on fourteen different block and Shelby tube samples of clay and silt in intact, disturbed,
and resedimented conditions. Unload-reload loops were performed at different stresses and
with different unloading ratios (constant ’u/’r and constant ’r). RR was estimated for
each U-R loop using seven different methods. The results showed a consistent increase in
RR values from almost all interpretation methods with increasing stress level and
unloading ratio. In addition, RR values on average varied more than 240% from an U-R
loop and over 340% through one test depending on where and how the U-R loop was
performed. RR4 determined from a U-R loop performed at ’u’p with ’u/’r = 1.2OCR
(RR4,1) was recommended as the best estimate of RR.

133
REFERENCES
Abdulhadi, N. O., Germaine, J. T., and Whittle, A. J. (2012). “Stress- dependent
behavior of saturated clay.” Can. Geotech. J., 49(8), 907–916.
Ahadiyan, J., Ebne, J. R., and Bajestan, M. S. (2008). “Prediction Determination of
Soil Compression Index, Cc.” Ahwaz Region (In Persian). J. Faculty Eng, 35(3), 75-80.
ASTM (2016). Volume 04.08 ‐ Soil and Rock (I): D420 to D5876 and Volume 04.09
‐ Soil and Rock (II): D5877 to latest. ASTM International, West Conshohocken, PA, USA.
Andresen, A., and Kolstad, P. (1979). "The NGI 54-mm sampler for undisturbed
sampling of clays and representative sampling of coarser materials." Proc. of the Int. Conf.
on Soil Sampling, Singapore, 1-9.
Been, K., Quinonez, A. and Sancio, R.B. (2010). "Interpretation of the CPT in
engineering practice." Proc. 2nd Int. Symp. on Cone Penetration Testing, Los Angeles. 9
– 11 May 2010.
Bjerrum, L., and Landva, A. (1966). "Direct simple shear tests on Norwegian quick
clay." Geotechnique, 16(1), 1-20.
Bjerrum, L. (1972). "Embankments on soft ground: SOA Report." Proc. Specialty
Conf. on Performance of Earth and Earth-Supported Structures, ASCE, 2: 1-54.
Bjerrum, L. (1973). "Problems of soil mechanics and construction on soft clays."
Proc., 8th Int. Conf. Soil Mech. and Found. Eng., Moscow, 3, 111-159.
Blaker, Ø., Carroll, R., L’Heureux, J.S. and Klug, M. (2016). “Characterisation of
Halden silt.” Proc. of the 5th Int. Conf. on Geotechnical and Geophysical Site
Characterization ISC-5’, Gold Coast, Australia.
134
Bowles, J. E. (1984). Physical and Geotechnical Properties of Soils, 2nd ed.,
McGraw Hill Book Co., New York.
Casagrande, A., (1936). "The determination of the preconsolidation load and its
practical significance." Proc., 1st Int. Conf. Soil Mech. Found. Eng., Cambridge, 3, 60‐64.
Casey, B., and Germaine, J. T. (2013). “The stress dependence of shear strength in
fine-grained soils and correlations with liquid limit.” J. Geo- tech. Geoenviron. Eng.,
10.1061/(ASCE)GT.1943-5606.0000896, 1709–1717.
Casey, B., Germaine, J., Abdulhadi, N., Kontopoulos, N., and Jones, C. (2015).
“Undrained Young’s modulus of fine-grained soils.” J. Geotech. Geoenviron. Eng.,
10.1061/(ASCE)GT.1943-5606.0001382, 04015070.
CEN (European Committee for Standardization) (2004). “Geotechnical
investigation and testing—Laboratory testing of soil—Part 12: Determination of Atterberg
limits.” ISO/TS 17892-12, Brussels, Belgium.
Chandler, R. J. (1988). “The in situ measurement of the undrained shear strength
of clays using the field vane: State of the art paper.” ASTM STP1014, Vane shear strength
testing in soils: Field and laboratory studies, ASTM, Conshohocken, Pa., 13-44.
Cozzolino, V. M. (1961). “Statistical forecasting of compression index.” Proc., 5th
Int. Conf. Soil Mech. And Found Eng., Paris (Vol. 1, pp. 51-53).
Crawford, C. B. (1986). “State of the art: evaluation and interpretation of soil
consolidation tests.” Consolidation of soils: Testing and evaluation. ASTM International.
DeGroot, D.J., Ladd, C.C., and Germaine, J.T. (1992). "Direct simple shear testing
of cohesive soils." Research Report R92-18, Center for Scientific Excellence in Offshore
Engineering, MIT, 153pp

135
DeGroot, D.J. and Lutenegger, A.J. (2003). "Geology and engineering properties
of Connecticut Valley varved clay." Characterisation and Engineering Properties of
Natural Soils, Tan et al. (eds.), Balkema, 1: 695-724.
DeGroot, D.J. (2014). "Evaluation of soft clay properties from interpretation of
CPTU data within a SHANSEP framework." Proc. 5th International Workshop: CPTU and
DMT in Soft Clays and Organic Soils. Poznan, Poland, Sept 2014, pp. 79-94.
DeJong, J.T., Krage, C.P, Albin, B.A., & DeGroot, D.J. (2018). “A Work Based
Framework for Sample Quality Evaluation of Low Plasticity Soils.” J. Geotech.
Geoenviron. Eng., in press.
Dyvik, R., Berre, T., Lacasse, S., and Raadim, B, (1987). “Comparistion of truly
undrained and constant volume direct simple shear tests,” Geotechnique, Vol. 37, No. 1,
3-10.
Gregory, A. S., Whalley, W. R., Watts, C. W., Bird, N. R. A., Hallett, P. D., and
Whitmore, A. P. (2006). “Calculation of the compression index and precompression stress
from soil compression test data.” Soil and Tillage Research, 89(1), 45-57.
Grennan, J. T. (2010). “Characterization of a low plasticity silt.” S.M. thesis,
Massachusetts Institute of Technology, Cambridge, MA.
Gunduz, Z., and Arman, H. (2007). “Possible relationships between compression
and recompression indices of a low-plasticity clayey soil.” Arabian Journal for Science
and Engineering, 32(2), 179.
Herrero, O. R. (1983). “Universal compression index Eq.; closure.” J. Geotech.
Eng., ASCE, 109(5), 755-761.

136
Hight, D.W. and Leroueil, S. (2003). "Characterisation of soils for engineering
purposes." Characterisation and Engineering Properties of Natural Soils, Tan et al. (eds.),
Balkema, 1: 255-360.
Holtz, R.D., Kovacs, W.D., and Sheahan, T.C. (2011) An Introduction to
Geotechnical Engineering, 2nd Edition, Upper Saddle River, NJ: Pearson Prentice‐Hall,
853 pp.
Hough, B.K. (1957). Basic soils engineering. The Ronald Press Company, New
York.
Janbu, N. (1985). “Soil Models in Offshore Engineering.” Geotechnique, 35(3):
241-281
Jones, C. A. (2010). “Engineering properties of resedimented Ugnu clay from the
Alaskan north slope.” S.M. thesis, Massachusetts Institute of Technology, Cambridge,
MA.
Karlsrud, K., Lunne, T., Kort, D.A., and Strandvik, S. (2005) “CPTU correlations
for clays”, 16th International Conference on Soil Mechanics and Foundation Engineering,
Osaka, Vol. 1, pp. 1‐8.
Kleven, A., Lacasse, S. and Andresen, K.H. (1986). “Soil parameters for offshore
foundation design.” NGI Report 40013-34, Oslo, Norway.
Krage, C.P., DeJong, J.T., DeGroot, D.J, Dyer, A.M., and Lukas, W.G., (2015).
“Applicability of Clay-Based Sample Disturbance Criteria to Intermediate Soils,” Proc.
6th Int. Conf. on Earthquake Geotechnical Engineering, Christchurch, New Zealand.

137
Kulhawy, F.H. and Mayne, P.W. (1990). “Manual on Estimating Soil Properties for
Foundation Design.” Report No. EL‐6800, Electric Power Research Institute, Palo Alto,
CA, August 1990, 306 pp.
Ladd, C. C., and Foott, R. (1974). “New design procedure for stability of soft clay.”
J. Geotech. Eng. Div., 100(7), 763–786.
Ladd, C. C., Foott, R., Ishihara, K., Schlosser, F., and Poulos, H. (1977). “Stress-
deformation and strength characteristics.” Proc., 9th Int. Conf. Soil Mech. and Found. Eng.,
Vol. 2, Japanese Society of Soil Mechanics and Foundation Engineering, Tokyo, 421–494.
Ladd, C. C. (1991). “Stability evaluation during staged construction.” J. Geotech.
Eng., 10.1061/(ASCE)0733-9410(1991)117:4(540), 540–615.
Ladd, C.C., and DeGroot, D.J. (2003). "Recommended practice for soft ground site
characterization: Arthur Casagrande Lecture." Proc., 12th Panamerican Conf. on Soil
Mechanics and Geotechnical Engineering, Boston, MA, pp. 3-57.
Landon, M.M., DeGroot, D.J., and Sheahan, T.C. (2007). "Sample Quality
Assessment using Shear Wave Velocity for a Marine Clay," J. Geotech. and Geoenviron.
Eng., ASCE, 133(4), 424-432.
La Rochelle, P., Sarrailh, J., Tavenas, F., Roy, M. and Leroueil, S. (1981). "Causes
of Sampling Disturbance and Design of a New Sampler for Sensitive Soils." Can. Geotech.
J., 18(1), 52-66.
Leonards, G. A. (1976). “Estimating consolidation settlements of shallow
foundations on overconsolidated clay.” Special Report 163, Transportation Research
Board.

138
Leroueil, S., Samson, L., & Bozozuk, M. (1983). Laboratory and field
determination of preconsolidation pressures at Gloucester. Can. Geotech. J., 20(3), 477-
490.
Leroueil, S., and Hight, D. W. (2003). “Behaviour and properties of natural soils
and soft rocks.” Proc., Int, Conf. on Characterization and engineering properties of natural
soils, Swets and Zeitliner, Singapore, 29-254.
Low, H.E., Lunne, T., Andersen, K.H., Sjursen, M.A., Li, X. and Randolph, M.F.
(2010). "Estimation of intact and remoulded undrained shear strengths from penetration
tests in soft clays." Geotéchnique, 60(11): 843-859.
Lukas, W.G., DeGroot, D.J., DeJong, J.T., Krage, C.P. and Zhang, G. (2018).
"Undrained shear behavior of low-plasticity intermediate soils under simulated tube
sampling disturbance." J. Geotech. Geoenviron. Eng. (accepted).
Lunne, T. Robertson, P.K., and Powell, J.J.M. (1997). Cone Penetration Testing in
Geotechnical Practice. Chapman & Hall, London.
Lunne, T., Berre, T., and Strandvik, S. (1998). “Deep water sampling and the
influence of gas.” Report No. 521676-7, Olso: Norwegian Geotechnical Institute.
Lunne, T., Long, M., and Forsberg, C.F. (2003). "Characterisation and engineering
properties of Onsøy clay." Characterisation and Engineering Properties of Natural Soils,
Tan et al. (eds.), Balkema, 1: 395-427.
Lunne, T., Berre, T., Andersen, K.H., Strandvik, S. and Sjursen, M. (2006). "Effects
of sample disturbance and consolidation procedures on measured shear strength of soft
marine Norwegian clays." Can. Geotech. J., 43(7), 726-750.

139
Mayne, P.W. (2007). “Cone Penetration Testing: A Synthesis of Highway
Practice.” NCHRP Synthesis 368. Transportation Research Board, Washington, D.C.
Mesri, G. (1975). “Discussion on new design procedure for stability analysis of soft
clays.” J. Geotech. Eng., 101(GT4): 409‐412.
Mesri, G. (1993). “Initial investigation of the soft clay test site at Bothkennar.”
Discussion. Geotechnique, 43, No. 3, 503-504.
Mesri, G. (2001). "geotech.Undrained shear strength of soft clays from push cone
penetration test.” Geotéchnique, 51(2): 167-168.
Mesri, G., and Ajlouni, M. (2007). “Engineering Properties of Fibrous Peats.” J.
Geotech. Geoenviron. Eng., 10.1061/(ASCE)1090-0241(2007)133:7(850)
Mitchell, J.K. and Soga, K. (2005). Fundamentals of Soil Behavior, 3rd Edition,
Wiley and Sons, NY.
Moran, P. (1958). “Mueser and Rutledge, Study of deep soil stabilization by
vertical sand drains.” Report to the US Navy Bureau of Yards and Docks, Washington DC,
156-177.
Nishida, Y. (1956). “A brief note on compression index of soil.” Journal of the Soil
Mechanics and Foundations Division, 82(3), 1-14.
NAVFAC DM-7.1 (1982). Soil Mechanics. Facilities Engineering Command, U.S.
Dept. of the Navy, Alexandria, VA, 364p.
Norwegian Geotechnical Institute NGI (2002); DeGroot, D.J., Lunne, T. and
Knudsen, S. (Authors). “Assessment of Soil Design Parameters from Index Measurements
in Clays Summary Report / Manual.” Report Number, 521553-3, Oslo, Norway.

140
Park, H.I. and Lee, S.R. (2011). “Evaluation of the compression index of soils using
an artificial neural network.” Computers and Geotechnics, 38(4), 472-481.
Peck, R. B., & Reed, W. C. (1954). Engineering properties of Chicago subsoils.
University of Illinois at Urbana Champaign, College of Engineering. Engineering
Experiment Station.
Quirós G. W., Little, R. L., and Garmon, S. (2000). “A normalized soil parameter
procedure for evaluating in-situ undrained shear strength.” Offshore Technology Conf.,
Houston, TX.
Robertson, P.K. (1990). "Soil classification using the cone penetration test." Can.
Geotech. J., 27(1), 151-158.
Robertson, P.K. (2009) “Interpretation of Cone Penetration Tests – a unified
approach.” Can. Geotech. J., Vol. 46, pp. 1337‐1355.
Robertson, P.K. (2012) “The James K. Mitchell Lecture: Interpretation of in‐situ
tests – some insights.” Geotechnical and Geophysical Site Characterization 4, pp. 3 – 24.
Sandbaekken, G., Berre, T., & Lacasse, S. (1986). “Oedometer testing at the
Norwegian Geotechnical Institute. Consolidation of soils: Testing and evaluation.” ASTM
STP 892, 329-353.
Santagata, M. C., Germaine, J. T., and Ladd, C. C. (2005). “Factors affecting the
initial stiffness of cohesive soils.” J. Geotech. Geoenviron. Eng., 10.1061/(ASCE)1090-
0241(2005)131:4(430), 430–441.
Schmertmann, J. H. (1955). "The undisturbed consolidation behavior of clay."
ASCE Transactions, 120, 1201‐1227.

141
Skempton, A.W. (1969). "The Consolidation of clays by gravitational compaction."
Q. Journal of Geologic Society, Vol. 125, pp. 373-411.
Sowers, G. F. (1979). Introductory soil mechanics and foundations. Macmillan
Publication.
Sridharan, A. and Prakash, K. (1998). "Discussion of 'Liquid limit and fall cones.'"
by Leroueil and Le Bihan (1996), Can. Geotech. J., Vol. 35, No. 2, pp. 407-408.
Stas, C.V. and Kulhawy, F.H. (1984). “Critical Evaluation of Design Methods for
Foundations Under Axial Uplift and Compression Loading.” Report EL- 3771, Electric
Power Research Institute, Palo Alto, 198p.
Taylor, D.W. (1948). Fundamentals of soil mechanics. Soil Science, 66(2), p.161.
Teh, C.I. and Houlsby, G.T. (1991) "An Analytical Study of the Cone Penetration
Test in Clay." Geotechnique, Vol. 41, No. 1, pp. 17‐34.
Terzaghi, K., Peck, R.B., and Mesri, G. (1996). Soil Mechanics in Engineering
Practice. Third Edition, John Wiley & Sons, Inc., New York.
Vipulanandan, C., Ahossin Guezo, Y. J., Bilgin, Ö., Yin, S., and Khan, M. (2008).
“Recompression index (Cr) for overconsolidated soft clay soils.” GeoCongress 2008:
Characterization, Monitoring, and Modeling of GeoSystems, GSP 179, ASCE, Reston,
VA, 68-75.
Walker, H.J., Coleman, J.M., Roberts, H.H. and Tye, R.S. (1987). “Wetland loss in
Louisiana.” Geografiska Annaler. Series A. Physical Geography, 189-200.
Wroth, C. P. (1979) Correlations of some engineering properties of soils.
Proceedings, 2nd International Conference on Behaviour of Offshore Structures, Vol. 1,
pp. 121–132.
142
Yassir, N.A. 1989. Mud volcanoes and the behaviour of over-pressured clays and
silts. Ph.D. thesis, University College London, University of London, London, UK.