WU_iupui_0104D_10460.pdf - IUPUI ScholarWorks
386
THE EXPLORATION OF AN EFFECTIVE MEDICAL COUNTERMEASURE ENHANCING SURVIVAL AND HEMATOPOIETIC RECOVERY AND PREVENTING IMMUNE INSUFFICIENCY IN LETHALLY-IRRADIATED MICE Tong Wu Submitted to the faculty of the University Graduate School in partial fulfillment of the requirements for the degree Doctor of Philosophy in the Department of Cellular and Integrative Physiology, Indiana University August 2020
-
Upload
khangminh22 -
Category
Documents
-
view
1 -
download
0
Transcript of WU_iupui_0104D_10460.pdf - IUPUI ScholarWorks

THE EXPLORATION OF AN EFFECTIVE MEDICAL COUNTERMEASURE
ENHANCING SURVIVAL AND HEMATOPOIETIC RECOVERY AND
PREVENTING IMMUNE INSUFFICIENCY IN LETHALLY-IRRADIATED MICE
Tong Wu
Submitted to the faculty of the University Graduate School in partial fulfillment of the requirements
for the degree Doctor of Philosophy
in the Department of Cellular and Integrative Physiology, Indiana University
August 2020

ii
Accepted by the Graduate Faculty of Indiana University, in partial fulfillment of the requirements for the degree of Doctor of Philosophy.
Doctoral Committee
______________________________________ Christie M. Orschell, Ph.D., Chair
______________________________________ David P. Basile, Ph.D.
June 24, 2020
______________________________________
Joseph L. Unthank, Ph.D.
______________________________________
Laura S. Haneline, M.D.
______________________________________ Louis M. Pelus, Ph.D.
______________________________________
Thomas J. MacVittie, Ph.D.

iii
© 2020
Tong Wu

iv
DEDICATION
To my family, and in memory of my beloved family members that I have lost
over these years, thank you for all your support and encouragement.

v
ACKNOWLEDGEMENT
First and foremost, I would like to thank my mentor Dr. Christie M. Orschell for
accepting me in her lab. She has been a preeminent teacher and has provided me with
insights and instructions during my academic training. Through the discussion and
exchange of views with Christie, I not only received construction feedbacks but also
learned the core of scientific attitude, which are of great importance to my future career.
I would like to thank my lab members, Dr. Artur Plett, Dr. Hui Lin Chua, Dr.
Sasidhar Vemula, Dr. Rajendran Sellamuthu, Carol Sampson, Hailin Feng, Helen Chin
Sinex, and Alexa Fisher; and Pelus lab members, Dr. Andrea Patterson, Dr. Pratibha
Singh, Dr. Liqiong Liu and Dr. Hongge Li; and Max Jacobsen in Dr. George E.
Sandusky’s pathology lab, for their generous helping hands in organizing studies,
reviewing manuscript, image processing, sharing immense knowledge and patiently
answering my questions, providing technical training and technical assistance.
I would like to thank my committee members, Dr. Louis M. Pelus, Dr. Thomas J.
MacVittie, Dr. David P. Basile, Dr. Joseph L. Unthank, and Dr. Laura S. Haneline, for
their valuable inputs throughout these studies.
I also want to extend thanks to Dr. Louise Pay for her help in grammatical
checking and corrections to the draft of my thesis; Jennifer Stashevsky for her help in
Picrosirius red staining; Dr. Laura Wright for her help in measurement of bone marrow
volume through micro CT in the bone marrow cytokine analysis.
Thanks Dr. Medhora at Medical College of Wisconsin for supplying lisinopril;
Dr. George Cox at Bolder Biotech for supplying all the pegylated hematopoietic growth

vi
factors; and Dr. Zuniga-Pflucker at University of Toronto for providing OP9 and OP9-
DL4 cell lines.
Finally, I thank the members of the Flow Cytometry Resource Facility (FCRF) of the
IU Simon Cancer Center and the Laboratory Animal Resource Center (LARC) of IU School
of Medicine for their helps during completing these studies; and funding institutes and
agencies which supported these studies, including the National Institute of Allergy and
Infectious Diseases (NIAID) under contracts HHSN266200500043C and
HHSN272201000046C and grants 1U01AI107340-01 and 2R44 AI088288-03A1, and
National Institute on Aging (NIA) under grant R01AG046246-01, National Institutes of
Health, Department of Health and Human Services, and the Department of Defense under
grants PR140896, PR141527, and PR140433P1.

vii
Tong Wu
THE EXPLORATION OF AN EFFECTIVE MEDICAL COUNTERMEASURE
ENHANCING SURVIVAL AND HEMATOPOIETIC RECOVERY AND
PREVENTING IMMUNE INSUFFICIENCY IN LETHALLY-IRRADIATED MICE
There is an urgent demand for effective medical countermeasures (MCM) in the
event of high-dose radiation exposure ranging from nuclear plant disasters to potential
nuclear warfare. Victims of lethal-dose radiation exposure face multi-organ injuries
including the hematopoietic acute radiation syndrome (H-ARS) and the delayed effects of
acute radiation exposure (DEARE) years after irradiation. Defective lymphocyte
reconstitution and its subsequent immune insufficiency are some of the most serious
consequences of H-ARS and DEARE. In order to investigate potential MCMs to protect
or mitigate these radiation injuries, the prolonged tissue-specific immunosuppression at
all levels of lymphocyte development in established murine H-ARS and DEARE models
was defined, along with unique sex-related and age-related changes present in some
tissues but not others. The “double hits” of irradiation and age-related stress on
lymphopoiesis led to significant myeloid skew and long-term immune involution.
Different kinds and different combinations of hematopoietic growth factors, some in
combination with angiotensin converting enzyme inhibitor, were administered to lethally
irradiated mice. These radiomitigators were found to significantly increase survival and
enhance hematopoiesis in H-ARS, but they did little to alleviate the severity of DEARE
including immune insufficiency. 16,16 dimethyl-prostaglandin E2 (dmPGE2), a long-
acting formulation of PGE2 with similar biological effects as PGE2, was found to
enhance survival and hematopoiesis in lethal-irradiated mice when used as radiomitigator

viii
or radioprotectant. The optimum time window for administration of radioprotectant and
radiomitigator dmPGE2 was defined, which is -3hr to -15min prior to irradiation and
+6hr to +30hr post irradiation. Significant survival efficacy of radioprotectant dmPGE2
was also demonstrated in pediatric and geriatric mice. Using specific PGE2 receptor (EP)
agonists, the EP4 receptor was defined as the PGE2 receptor potentially responsible for
dmPGE2 radioprotection. Radioprotectant dmPGE2 was also found to prevent radiation-
induced thymic involution and to ameliorate the long-term immune suppression in
radiation survivors in the DEARE phase via promoting hematopoietic stem cell
differentiation towards to the lymphoid lineage. This is the first report of an effective
MCM for H-ARS which also targets long-term thymic involution and lymphoid lineage
reconstitution.
Christie M. Orschell Ph.D., Chair

ix
TABLE OF CONTENTS
List of Tables .................................................................................................................. ixiii List of Figures ................................................................................................................. xiv List of Abbreviations ...................................................................................................... xvii Chapter 1. Introduction .......................................................................................................1
1.1. Rationale and Overview ..........................................................................................1 1.2. Types of Ionizing Radiation ....................................................................................3 1.3. Radiation Quantities................................................................................................7 1.4. Biological Effects of Ionizing Radiation ................................................................7 1.5. Illnesses and Treatments Related to Radiation Exposure .....................................11
1.5.1. Acute radiation syndrome ............................................................................11 1.5.1.1. Gastrointestinal acute radiation syndrome ..........................................19 1.5.1.2. Cerebrovascular acute radiation syndrome .........................................19 1.5.1.3. Hematopoietic acute radiation syndrome ............................................20 1.5.1.4. Other ARS sub-syndromes .................................................................23 1.5.2. Deterministic and stochastic effects of ionizing radiation ...........................24 1.5.3. Delayed effects of acute radiation exposure ................................................24 1.5.3.1. Non-cancer diseases ............................................................................27 1.5.3.2. Solid tumors and hematopoietic malignancies ...................................28 1.5.3.3. Residual bone marrow damage ...........................................................28 1.5.4. Medical management of radiation injury .....................................................32 1.5.4.1. Standard management of H-ARS ........................................................33 1.5.4.1.1. Transfusion and supportive care ................................................33 1.5.4.1.2. Hematopoietic stem cell transplantation ....................................33 1.5.4.1.3. Growth factor therapy ................................................................34 1.5.4.2. Potential new therapeutics of H-ARS and DEARE ............................35 1.5.4.2.1. IL-7 ............................................................................................36 1.5.4.2.2. KGF............................................................................................36 1.5.4.2.3. Flt3 ligand ..................................................................................36 1.5.4.2.4. Angiotensin converting enzyme inhibitor (ACEI) .....................37 1.5.4.2.5. Prostaglandin E2 (PGE2) ...........................................................42
1.6. Hematopoiesis .......................................................................................................52 1.6.1. Colony assays and competitive transplantation assays ................................52 1.6.2. HSPC phenotype ..........................................................................................57 1.6.3. Hematopoietic differentiation tree ...............................................................59 1.6.4. T cell hematopoiesis ....................................................................................65
Chapter 2. Reconstitution and Involution of Lymphoid Lineage in Hematopoietic Acute Radiation Syndrome and Delayed Effects of Acute Radiation Exposure ...........................................................................................................71
2.1. Introduction ...........................................................................................................71 2.2. Materials and Methods ..........................................................................................73 2.2.1. Mice and husbandry .....................................................................................73 2.2.2. Irradiation, dosimetry and monitoring .........................................................73 2.2.3. Complete blood cell count (CBC) ................................................................74
2.2.4. Tissue harvest and single cell suspension ....................................................74

x
2.2.5. Tissue fixation, histological staining, and imaging .....................................75 2.2.6. Antibody staining and flow cytometric analyses .........................................75 2.2.7. Statistical analysis ........................................................................................76
2.3. Results ...................................................................................................................77 2.3.1. Reconstitution and involution of peripheral blood cells ..............................77 2.3.2. Reconstitution and involution of thymus and spleen ...................................78 2.3.3. Histological analyses of thymus and spleen ................................................79
2.3.4. Phenotypic analyses of lymphoid compartments .........................................82 2.4. Discussion .............................................................................................................88
Chapter 3. Optimizing and Profiling Prostaglandin E2 as a Medical Countermeasure for the Hematopoietic Acute Radiation Syndrome ...............93
3.1. Introduction ...........................................................................................................93 3.2. Materials and Methods ..........................................................................................97
3.2.1. Mice, husbandry, monitoring and irradiation ..............................................97 3.2.2. Compounds ..................................................................................................98 3.2.3. CBC..............................................................................................................98 3.2.4. Antibody staining and flow cytometry analysis ...........................................98 3.2.5. Colony assay ................................................................................................99 3.2.6. BM cellularity and BM cytokine quantification ........................................100 3.2.7. Statistical analysis ......................................................................................101
3.3. Results .................................................................................................................101 3.3.1. DmPGE2 increases day 30 survival post-IR ..............................................101 3.3.2. DmPGE2 effects are different in pediatric and geriatric mice ...................105 3.3.3. EP4 Receptor is target receptor in dmPGE2 radioprotection ....................105 3.3.4. DmPGE2 accelerates hematopoietic recovery post-IR ..............................108 3.3.5. DmPGE2 affects BM cytokines and BM cellularity post-IR .....................112
3.4. Discussion ...........................................................................................................117 Chapter 4. Prostaglandin E2 and Lymphoid Lineage Reconstitution ..............................125
4.1. Introduction .........................................................................................................125 4.2. Materials and Methods ........................................................................................126
4.2.1. Mice, radiation, dosimetry, husbandry, and tissue harvest ........................126 4.2.2. Compounds ................................................................................................126 4.2.3. CBC............................................................................................................127 4.2.4. Antibody staining, flow cytometry analysis and flow cytometric cell sorting ..................................................................................................127 4.2.5. T and B cell development in vitro and PMA stimulation assay ................128 4.2.6. Long-term competitive transplantation and short-term thymus homing study ..............................................................................................129 4.2.7. Thymus epithelial cells identification ........................................................130 4.2.8. RNA sequencing and IPA analysis of HSC ...............................................130 4.2.9. Bone marrow cytokine analysis .................................................................131
4.2.10. Statistical analysis ....................................................................................131 4.3. Results .................................................................................................................132
4.3.1. DmPGE2 extends lifespan and prevents the myeloid skew of DEARE mice .............................................................................................132 4.3.2. DmPGE2 transiently decreases lymphocyte level in normal mice ............135

xi
4.3.3. Both B and T cells are increased in the spleen of dmPGE2-treated mice .140 4.3.4. DmPGE2 protects thymus from irradiation-induced involution ................140 4.3.5. DmPGE2 protects thymocytes from delay in DN to DP transition induced by irradiation ................................................................................143 4.3.6. Lymphoid progenitors increased in bone marrow of dmPGE2-treated mice ............................................................................................................147 4.3.7. Bone marrow cells from dmPGE2-treated mice have higher engraftment and lineage reconstitution potential than Veh mice ...............148 4.3.8. Bone marrow progenitor cells from dmPGE2-treated mice have better lymphoid differentiation in vitro than Veh mice .............................154 4.3.9. Mature T cells generated from OP9-DL4 co-culture system are functional ...................................................................................................155 4.3.10. DmPGE2 increases chemokine receptors expression on lymphoid progenitors but does not increase homing to thymus...............................155 4.3.11. DmPGE2 does not increase incidence of thymic mass ............................160 4.3.12. DmPGE2 thymic protection effect is time-sensitive and intensive treatment is not necessary .......................................................................165 4.3.13. DmPGE2 receptors partially involve in the thymic protection ................168 4.3.14. DmPGE2 does not change the number of thymic stromal cells in DEARE mice .......................................................................................171 4.3.15. Lymphopoiesis related genes are impacted by radioprotectant dmPGE2 ....................................................................................................171 4.3.16. Cytokines that support lymphopoiesis were prevented from decreasing by dmPGE2 ............................................................................174
4.4. Discussion ...........................................................................................................179 Chapter 5. Other stories: Pegylated Hematopoietic Growth Factors and Lisinopril as Radiomitigators .........................................................................................189
5.1. Introduction .........................................................................................................189 5.2. Materials and Methods ........................................................................................191
5.2.1. Mouse husbandry and irradiation...............................................................191 5.2.2. Compounds ................................................................................................192 5.2.3. CBC and tissue harvest ..............................................................................194 5.2.4. Antibody staining and flow cytometry analysis .........................................194 5.2.5. CFC assays and competitive transplantation .............................................195 5.2.6. Plasma and bone marrow cytokine analysis ..............................................196 5.2.7. Statistical analysis ......................................................................................197
5.3. Results .................................................................................................................197 5.3.1. Peg-HGFs increase post-TBI day 30 survival rate ....................................197
5.3.2. Peg-HGFs accelerate recovery of peripheral blood cells ...........................199 5.3.3. Peg-HGFs does not reduce peripheral blood cell apoptosis ......................226 5.3.4. Peg-HGFs increase HSPC count early post-TBI .......................................229 5.3.5. Peg-HGFs do not extend lifespan of DEARE mice ...................................230 5.3.6. Peg-HGFs do not alleviate body weight loss in DEARE mice ..................239 5.3.7. Peg-HGFs do not reverse myeloid skewing in DEARE mice ...................245 5.3.8. Peg-HGFs do not increase HSC number and function in DEARE mice ...245 5.3.9. Peg-HGFs enhance early thymic recovery post-TBI but do not

xii
alleviate thymic involution in DEARE mice .............................................254 5.3.10. Adding lisinopril to the TC regimen further alleviates irradiation damage .....................................................................................................256
5.4. Discussion ...........................................................................................................266 Chapter 6. Future Directions ............................................................................................301
6.1. Time-window and dosage-window of dmPGE2 efficacy ...................................301 6.2. Mechanism of dmPGE2 protection .....................................................................303 6.3. Polypharmacy of peg-HGFs and dmPGE2 .........................................................306 6.4. DmPGE2 used in the scenarios of chemotherapy or radiotherapy .....................307
References ........................................................................................................................310 Curriculum Vitae

xiii
LIST OF TABLES
Table 1. Selectivity and sensitivity of EP receptor agonists ............................................109 Table 2. Comparisons of thymocyte subpopulations at 12 months post-TBI of lethal-irradiated mice treated with radioprotectant dmPGE2 ............................146 Table 3. Comparisons of thymocyte subpopulation reconstitution in competitive transplantation assay of lethal-irradiated mice treated with radioprotectant dmPGE2 .............................................................................................................153 Table 4. Dose and combination regimens of pegylated HGFs ........................................193 Table 5. Comparisons of day 30 survival rates of lethal-irradiated mice treated with pegylated HGFs .........................................................................................202 Table 6. Comparisons of WBC at different time-points in H-ARS phase of lethal-irradiated mice treated with pegylated HGFs ..........................................206 Table 7. Comparisons of NE at different time-points in H-ARS phase of lethal-irradiated mice treated with pegylated HGFs ..........................................208 Table 8. Comparisons of LY at different time-points in H-ARS phase of lethal-irradiated mice treated with pegylated HGFs ..........................................210 Table 9. Comparisons of RBC at different time-points in H-ARS phase of lethal-irradiated mice treated with pegylated HGFs ..........................................212 Table 10. Comparisons of PLT at different time-points in H-ARS phase of lethal-irradiated mice treated with pegylated HGFs ..........................................214 Table 11. Comparisons of long-term survival of lethal-irradiated mice treated with pegylated HGFs ...........................................................................242

xiv
LIST OF FIGURES
Figure 1. Types of ionizing radiation ...................................................................................4 Figure 2. Direct and indirect effects of ionizing radiation ...................................................9 Figure 3. Biological effects of ionizing radiation ..............................................................12 Figure 4. Stages of acute radiation syndrome ....................................................................15 Figure 5. Acute radiation syndrome in different organs ....................................................17 Figure 6. Classical Andrews lymphocyte depletion kinetics and accompanying clinical severity ranges .......................................................................................22 Figure 7. Deterministic effects and stochastic effect of radiation .....................................25 Figure 8. Life Span Study (LSS) radiation-associated deaths per year .............................29 Figure 9. The renin-angiotensin system .............................................................................39 Figure 10. Eicosanoid biosynthesis from arachidonic acid ...............................................44 Figure 11. Prostaglandin E2 receptors ...............................................................................46 Figure 12. Prostaglandin E2 signaling ...............................................................................48 Figure 13. Hierarchy of hematopoietic tree .......................................................................54 Figure 14. Classic hematopoietic differentiation tree ........................................................61 Figure 15. Revised hematopoietic differentiation tree .......................................................63 Figure 16. T cell development from bone marrow to thymus ...........................................68 Figure 17. Reconstitution and involution in peripheral blood, thymus and spleen post-IR ...................................................................................................80 Figure 18. Images and histology of thymi and spleens in NI and IR mice ........................83 Figure 19. Lymphocyte subsets in young and aged NI mice and aged H-ARS survivors ...........................................................................................................85 Figure 20. Effect of dmPGE2 as radiomitigator given at +6 hr or +24 hr post-TBI on day 30 survival and hematopoietic recovery of lethal-irradiated mice ........95 Figure 21. Thirty-day survival of lethal-irradiated mice treated with radioprotectant or radiomitigator dmPGE2 ...................................................103 Figure 22. Thirty-day survival of lethal-irradiated pediatric or geriatric mice treated with radioprotectant or radiomitigator dmPGE2. ..............................106 Figure 23. Thirty-day survival of lethal-irradiated mice treated with dmPGE2 or PGE2 receptor agonists at -30 min prior to TBI ........................................110 Figure 24. Hematopoietic recovery of lethal-irradiated mice treated with radioprotectant dmPGE2 ................................................................................113 Figure 25. BM cytokines and BM cellularity at 6 and 24 hr post-TBI treated with radioprotectant dmPGE2........................................................................115 Figure 26. Long-term survival of lethal-irradiated mice treated with radioprotectant dmPGE2 ................................................................................133 Figure 27. CBC profiles in DEARE phase of lethal-irradiated mice treated with radioprotectant dmPGE2 ................................................................................136 Figure 28. CBC profiles in NI mice injected with dmPGE2 ...........................................138 Figure 29. Spleen T and B cells in DEARE phase of lethal-irradiated mice treated with radioprotectant dmPGE2........................................................................141 Figure 30. Thymus weight and cellularity in H-ARS and DEARE phases of lethal-irradiated mice treated with radioprotectant dmPGE2 ........................144 Figure 31. BM cellularity and HSPC phenotypes in H-ARS and DEARE phases

xv
of lethal-irradiated mice treated with radioprotectant dmPGE2 ....................149 Figure 32. Thymic engraftment and thymocyte subpopulation reconstitution of BM cells from mice treated with radioprotectant dmPGE2 in competitive transplantation assays .................................................................151 Figure 33. In vitro T and B cell lineage differentiation in lethal-irradiated mice treated with radioprotectant dmPGE2 ............................................................156 Figure 34. IFN-γ production in CD4 and CD8 T cells from OP9-DL4 co-culture ..........158 Figure 35. CXCR4 and CCR5 expression on DEARE lymphoid progenitors and homing of DEARE BM cells to thymus .................................................161 Figure 36. Thymic mass incidence in aged irradiation survivors ....................................163 Figure 37. Impact of different times and dosing schedule of dmPGE2 injections on thymic recovery .........................................................................................166 Figure 38. Impact of different dmPGE2 receptors activation on thymic recovery ..........169 Figure 39. Thymic stromal cells in DEARE phase of lethal-irradiated mice ..................172 Figure 40. Heat map of genes associated with enriched GOTERM_BP: lymphopoiesis .......................................................................175 Figure 41. BM cytokines in NI mice and irradiated mice at day 9 post-TBI ..................177 Figure 42. Thirty-day survival of lethal-irradiated mice treated with pegylated HGFs ..200 Figure 43. CBC profiles in H-ARS phase of lethal-irradiated mice treated with pegylated HGFs .............................................................................................204 Figure 44. CBC profiles in H-ARS phase of lethal-irradiated mice treated with “with IL-11” or “no IL-11” regimen ...............................................................216 Figure 45. CBC profiles in H-ARS phase of lethal-irradiated mice treated with “with G” or “no G” regimen ...........................................................................218 Figure 46. CBC profiles in H-ARS phase of lethal-irradiated mice treated with “with GM” or “no GM” regimen ....................................................................220 Figure 47. CBC profiles in H-ARS phase of lethal-irradiated mice treated with “single” or “combined” regimen ....................................................................222 Figure 48. CBC profiles in H-ARS phase of lethal-irradiated mice treated with “HGFs” or “Veh” regimen .............................................................................224 Figure 49. Apoptosis of peripheral white blood cells at day 2 post-TBI .........................227 Figure 50. Total BM cell count in H-ARS phase of lethal-irradiated mice treated with pegylated HGFs .........................................................................231 Figure 51. Recovery kinetics of HPCs in H-ARS phase of lethal-irradiated mice treated with pegylated HGFs .........................................................................233 Figure 52. Recovery kinetics of hematopoietic stem cells in H-ARS phase of lethal-irradiated mice treated with pegylated HGFs ......................................235 Figure 53. BM competitive transplantation for donor cells at H-ARS phase from lethal-irradiated mice treated with pegylated HGFs ......................................237 Figure 54. Long-term survival of day 30 survived mice treated with pegylated HGFs ..240 Figure 55. Body weight in DEARE phase of lethal-irradiated mice treated with pegylated HGFs ..............................................................................................243 Figure 56. CBC profiles in DEARE phase of lethal-irradiated mice treated with pegylated HGFs .............................................................................................247 Figure 57. BM cellularity and HSPC in DEARE phase of lethal-irradiated mice treated with pegylated HGFs .........................................................................250

xvi
Figure 58. BM competitive transplantation for donor cells at DEARE phase from lethal-irradiated mice treated with pegylated HGFs ......................................252 Figure 59. WBC phenotype at day 21 post-TBI of mice treated with G-CSF or TC ......257 Figure 60. Thymus weight and cellularity of lethal-irradiated mice treated with pegylated HGFs .............................................................................................259 Figure 61. Thymus subpopulation of lethal-irradiated mice treated with pegylated HGFs .............................................................................................261 Figure 62. Thirty-day survival of lethal-irradiated mice treated with TC, Lisinopril or TC+L ..........................................................................................................267 Figure 63. CBC profiles in H-ARS phase of lethal-irradiated mice treated with TC or TC+L ....................................................................................................269 Figure 64. HSC number and HSC cell cycle in H-ARS phase of lethal-irradiated mice treated with TC or TC+L ......................................................................271 Figure 65. HPC in H-ARS phase of lethal-irradiated mice treated with TC or TC+L ....273 Figure 66. BM and plasma cytokine in H-ARS phase of lethal-irradiated mice treated with TC or TC+L ...............................................................................275 Figure 67. Brain hemorrhages in H-ARS phase of lethal-irradiated mice treated with TC or TC+L ............................................................................................277 Figure 68. Thymus weight, cellularity and thymocyte subpopulations in H-ARS phase of lethal-irradiated mice treated with TC or TC+L .............................279 Figure 69. Long-term survival of day 30 survived mice treated with Liso, TC or TC+L ....................................................................................................281 Figure 70. CBC profiles in DEARE phase of lethal-irradiated mice treated with TC or TC+L ....................................................................................................283 Figure 71. HSC number and HSC cell cycle in DEARE phase of lethal-irradiated mice treated with TC or TC+L .......................................................................285 Figure 72. Long-term engraftment potential of BM cells in DEARE phase from lethal-irradiated mice treated with TC or TC+L .............................................287

xvii
LIST OF ABBREVIATIONS
13-PGR 15- ketoprostaglandin D13-reductase
15-PGDH 15-hydroxyprostaglandin dehydrogenase
AA Arachidonic acid
ACE Angiotensin converting enzyme
ACEI Angiotensin converting enzyme inhibitors
AcSDKP N-acetyl-seryl-aspartyl-lysyl-proline
ADH Antidiuretic hormone
AHS Adult Health Study
Aire Autoimmune regulator
AR Animal Rule
ARB Angiotensin II receptor blockers
ARS Acute radiation syndromes
Ang I Angiotensin I
Ang II Angiotensin II
ATM Ataxia-telangiectasia mutated kinase
BCS Bovine calf serum
BFU-E Burst-forming unit-erythroid
BM Bone marrow
Bq Becquerel
BSA Bovine serum albumin
Cadm1 Cell Adhesion Molecule 1
cAMP Cyclic adenosine monophosphate
xviii
CBC Complete blood count
CCR5 C-C chemokine receptor type 5
CD62L CD62 ligand
Cdk2 Cyclin-dependent kinase 2
Cdkn1c Cyclin dependent kinase inhibitor 1C
CFC Colony forming cell
CFU Colony-forming unit
CFU-E CFU-erythroid
CFU-GEMM CFU-granulocyte/erythroid/macrophage/megakaryocyte
CFU-GM CFU-granulocyte/macrophage
CFU-S CFU-spleen
CFU-pre-B Colony-forming unit-pre-B
Ci Curie
c-kit Stem cell factor receptor
CLP Common lymphoid progenitor
CMJ Cortico-medullary junction
CMP Common myeloid progenitors
CNS Central nerve system
COX Cyclooxygenases
cTEC Cortical thymic epithelial cell
CTZ Chemoreceptor trigger zone
CXCR4 C-X-C chemokine receptor type 4
D Day

xix
DAG Diglyceride
DAPI 4’,6-diamidino-2-phenylindole
DDR Dose response relationship
DEARE Delayed effects of acute radiation exposure
DL Delta-like
DmPGE2 16,16 dimethyl-prostaglandin E2
DN Double negative
DNA Deoxyribonucleic acid
Dntt DNA nucleotidylexotransferase
DP Double positive
DRR Dose response relationship
DSB Double strand break
EDTA Ethylenediaminetetraacetic acid
Efnb2 Ephrin B2
EMH Extramedullary hematopoiesis
EoBP Eosinophil/basophil progenitor
EP PGE2 receptor
EPO Erythropoietin
EpoR EPO receptor
ETC Electron transport chain
EtOH Ethanol
ETP Early thymic progenitor
Ets2 ETS proto-oncogene 2, transcription factor

xx
F Female
FACS Fluorescence-activated cell sorting
FBS Fetal bovine serum
FDA Food and Drug Administration
FDR False discovery rate
Flt3 FMS-like tyrosine kinase 3
FLT3L FMS-like tyrosine kinase 3 ligand
Furin FES upstream region
G-CSF Granulocyte colony-stimulating factor
GI Gastrointestinal
GI-ARS Gastrointestinal acute radiation syndrome
GM-CSF Granulocyte macrophage colony-stimulating factor
GMP granulocyte monocyte progenitor
GPCR G-protein-coupled receptor
GSK-3 Glycogen synthase kinase-3
Gy Gray
H-ARS Hematopoietic-acute radiation syndromes
HBSS Hank's balanced salt solution
H&E Hematoxylin/eosin stain
HGF Hematopoietic growth factor
HLA Human leukocyte antigen
HPC Hematopoietic progenitor cell
HPE Homeostatic peripheral expansion

xxi
HSC Hematopoietic stem cell
HSCT Hematopoietic stem cell transplantation
HSPC Hematopoietic stem and progenitor cell
Ifngr1 Interferon gamma receptor 1
IFN-γ Interferon gamma
IHC Immunohistochemistry
IL Interleukin
Il6ra Interleukin-6 receptor subunit alpha
IL-3 Interleukin-3
IL-7 Interleukin-7
IL7R IL7 receptor
IP3 Inositol trisphosphate
IP-10 Interferon gamma-induced protein
IPA Ingenuity pathway analysis
IR Irradiated
IT-HSC Intermediate-term HSC
K5/K14 Cytokeratin 5/14
K8/K18 Cytokeratin 8/18
KC Keratinocyte chemoattractant
KGF Keratinocyte growth factor
KM Kaplan-Meier
LD Lethal dose
LDR Lymphocyte depletion rate
xxii
Lepr Leptin receptor
LIF Leukemia inhibitory factor
Lin Lineage
Liso Lisinopril
LIX Lipopolysaccharide-induced CXC chemokine
Lmo1 LIM domain only 1
LMPP Lymphoid-primed multipotent progenitors
LS Lin- Sca-1+
LS CD150+ Lin- Sca-1+ CD150+
LSK Lin - Sca-1hi c-Kithi
LSS Life Span Study
LT-HSC Long term-HSC
LY Lymphocyte
M Male
MCM Medical countermeasure
MCSF Macrophage colony-stimulating factor
MCSFR MCSF receptor
MCP-1 Monocyte chemoattractant protein-1
MEP Megakaryocyte erythrocyte progenitor
MFI Median fluorescence intensity
MHC Major histocompatibility complex
MIG Monokine induced by gamma interferon
MIP-1α Macrophage inflammatory protein 1 α

xxiii
MIP-1β Macrophage inflammatory protein 1 β
MIP-2 Macrophage inflammatory protein 2
m/o Month-old
mo. Months
MODS Multiple organ dysfunction syndromes
MPP Multipotent progenitor
MSC Mesenchymal stromal cell
mTEC Medullary thymic epithelial cell
mtDNA Mitochondrial DNA
Myb MYB proto-oncogene, transcription factor
NBF Neutral buffered formalin
NE Neutrophil
NI Non-irradiated
NK Natural killer
NOX Nicotinamide adenine dinucleotide phosphate oxidase
NRC Nuclear Regulatory Commission
NS Not significant
NSAID Nonsteroidal anti-inflammatory drug
PB Peripheral blood
PBS Phosphate buffered saline
Peg Pegylated
PG Prostaglandins
PGE2 Prostaglandin E2

xxiv
PGI2 Prostaglandin I2
PI3K Phosphoinositide 3-kinase
PIP2 Phosphatidylinositol 4,5-bisphosphate
PKA Protein kinase A
PKC Protein kinase C
PLA2 Phospholipase A2
PLC Phospholipase C
PLT Platelet
PMA Phorbol 12-myristate 13-acetate
Post-IR Post-irradiation
Prkca Protein kinase C alpha
R Roentgen
Rad Radiation absorbed dose
RANTES Regulated upon activation normal T cell expressed and secreted
RAS Renin-angiotensin system
RBC Red blood cell
RBMD Residual bone marrow damage
REM Roentgen equivalent man
RGB Red, green, and blue
rhSCF Recombinant human stem cell factor
RNA Ribonucleic acid
RNS Reactive nitrogen species
Rora RAR related orphan receptor A

xxv
ROS Reactive oxygen species
RPKM Reads Per Kilobase per Million
RTE Recent thymic emigrant
Sca-1 Stem cell antigen-1
SCZ Subcapsular zone
SDF1 Stromal cell-derived factor 1
SEM Standard error of the mean
SLAM Signaling lymphocyte activation molecule
Smad7 Mothers against decapentaplegic homolog 7
SP Single positive
SQ Subcutaneous
Stat3 Signal transducer and activator of transcription 3
ST-HSC Short-term HSC
Sv Sievert
TBI Total body irradiation
TC Triple combination
TC+L TC + lisinopril
TCM Central memory T
TCR T cell receptor
TEC Thymic epithelial cell
TEM Effector memory T cell
Tgfbr1 Transforming growth factor beta receptor 1
Tk1 Thymidine kinase 1

xxvi
TNF-α Tumor necrosis factor alpha
TSP Thymus-seeding progenitor
TXA2 Thromboxane A2
UD Undetectable
UEA1 Ulex europaeus agglutinin 1
VEGF Vascular endothelial growth factor
Veh Vehicle
vWF von Willebrand factor
WBC White blood cell
w/o Week-old
Zmiz1 Zinc finger MIZ-type containing 1

1
Chapter 1. Introduction
1.1. Rationale and Overview
There is an urgent demand for effective medical countermeasures (MCM) in the
event of high-dose radiation exposure ranging from nuclear plant disasters to potential
nuclear warfare. The first and only use of nuclear weapons to date occurred in Japan in
1945, when US forces dropped the atomic bombs “Little Boy” and “Fat Man” over
Hiroshima and Nagasaki, respectively. While this act ended the Second World War, it
resulted the deaths of over 200,000 people, over 80% of whom were civilians. This
culminated in a loss of 28% of the population of Hiroshima, and 39% of the population of
Nagasaki. Approximately 35,000 people in Nagasaki and 70,000 people in Hiroshima
were killed instantly. The remaining victims died as a result of high-dose radiation
exposure, typically within 20-30 days. At the time, the symptoms of high-dose radiation
exposure were unknown, and were referred to as “atomic bomb disease” or “radiation
poisoning”. Infection, hemorrhage, and multiple-organ failure were the main causes of
death. Antibiotics and repeated blood transfusions were given, with limited success [1, 2].
Survivors suffered long-term effects of radiation exposure, including malignancies, birth
defects in their offspring, cataracts, and cognitive decline [3, 4].
Nuclear reactors are another source of radiation threat. Explosions followed by
core meltdown at Chernobyl (1986) and Fukushima (2011) nuclear power plants exposed
employees and firefighters to high-dose radiation at the reactor site, and civilians to
radiation from contaminated air, water, and soil. The Chernobyl accident released over
four hundred times the amount of radioactive material in comparison with the atomic

2
bombs in Japan; however, due to the relative underpopulation of the surrounding area,
mortality was significantly lower [5].Two hundred people in Chernobyl suffered acute
complications similar to the atomic bombing victims, with 31 deaths within the first three
months. Over 200,000 emergency workers, police, soldiers, firefighters, and volunteers
responsible for clean-up after the Chernobyl accident experienced negative effects from
radiation exposure at varying doses. The nearby city of Pripyat was evacuated the day
after the accident, and an exclusion zone of 30 km radius around the site was instituted in
the following years. The accident displaced over 300,000 people. However, people
residing nearby were exposed to repeated low-dose radiation, and according to
epidemiological studies, 4,000 cancer deaths occurred in the next 30 years among this
population. This cancer rate is significantly higher than the global average [6, 7]. In the
Fukushima accident, less radioactive material was released as the plant’s radioactive
cores remained largely intact. No immediate deaths occurred; however, it was confirmed
that a worker died from radiation-related cancer in 2018. The impact of the release of
radioactive material into the sea is still unknown, as are long-lasting health implications
for people in the area surrounding the plant [4, 8].
During the Cold War years that followed World War II, the United States and the
then Soviet Union stockpiled around 125,000 nuclear warheads between them. Most
sovereign states participated in the 1970 Treaty on the Non-Proliferation of Nuclear
Weapons, and the Soviet Union dissolved in 1991, resulting in a dramatic decrease of
global nuclear warheads to under 15,000 among nine nations [9]. However, the threat
from nuclear war to mankind is still a possibility. The use of nuclear energy presents the

3
most credible risk of radiation exposure through nuclear plant accidents. Over 100
serious nuclear accidents have been recorded since the first use of nuclear power. Two-
thirds of these occurred in the USA [10]. Technological and safety advances have
minimized risk; however, unpredictable factors such as the earthquake and tsunami
responsible for the Fukushima accident pose a threat to these nuclear facilities. The
development of interventions for people exposed to high-dose radiation is required to
reduce mortality after nuclear accidents and warfare globally. This motivated me in Dr.
Orschell's laboratory to study MCMs in response to high-dose radiation exposure.
1.2. Types of Ionizing Radiation
There are five types ionizing radiation: alpha, beta, gamma, x-ray, and neutron
(Figure 1). Alpha, beta, and neutron radiation consists of small particles; gamma
radiation and x-rays are high-energy photon waves. Alpha particles are ejected from
unstable nuclei during alpha decay and are identical to the nucleus of helium, with the
absence of surrounding electrons. These particles can travel only a few centimeters in air,
thus their penetrating capacity is weak and can be blocked by clothing. Beta particles are
high-energy electrons released during radioactive decay, with a smaller mass than alpha
particles. They can travel approximately one meter in air, and have a higher penetrating
capacity than alpha particles, though can be blocked by a thin aluminum plate. Beta
particles are capable of penetrating the skin to the germinal layer, potentially resulting in
injury. Alpha and beta radiation generally do not pose a serious risk to human health
unless inhaled or ingested.

4
Figure 1
α
β
γ, x ray
neutrons
paper
Plastic/aluminum
lead
water

5
Figure 1. Types of ionizing radiation.
In the five types of ionizing radiation, alpha, beta and neutron radiation are small
particles; gamma and x radiation are photon waves. Alpha radiation travels only a short
distance with weak penetrating ability. Beta radiation travels longer and has higher
penetrating ability than alpha radiation but still easily be blocked by a thin aluminum
plate. Gamma and x radiation travels far in air and easily penetrate body tissue, which
could be blocked by dense material such as lead. Neutron, which has excellent
penetration ability, its effect is dependent on ionizing other atoms. Only hydrogen-rich
material such as water can effectively block neutron radiation. The main radiation source
in this thesis is gamma radiation. Figure adapted from Wikipedia contributors. (2020,
June 21). Ionizing radiation. In Wikipedia, The Free Encyclopedia. Retrieved July 14,
2020, from https://en.wikipedia.org/wiki/Ionizing_radiation.

6
The fission of radioactive atoms results in the emission of numerous neutrons,
which are uncharged. Neutron radiation is indirectly ionizing as a result of subsequent
ionization of other atoms when the free neutrons react with other nuclei. Neutrons can
travel hundreds or even thousands of meters in air and have high penetration ability --
only hydrogen-rich material can effectively block neutron radiation. Nuclear reactors are
surrounded by meter-thick concrete or water outer layers for this reason [11, 12]. Alpha,
beta, and neutron particles are either low-penetrating or hard to control, and thus are
unlikely to be used in warfare, unlike gamma and x-rays, which pose a more significant
threat (Figure 1).
Gamma and x-rays are electromagnetic radiation, with waves similar to visible
light in form, but higher in energy. Both travel far in air and are high-penetrating, capable
of reaching bodily tissue. This results in electron displacement and energy release
sufficient to burn surrounding tissues. Gamma and x-rays are blocked only by extremely
dense material such as lead. Common gamma radiation sources are 137Cs, 131I, 60Co,
226Ra, and 99mTc. The 137Cs source was used in following studies. The difference between
gamma and x-ray is controversial, though it is generally accepted that gamma radiation is
emitted from the atom’s nucleus, whereas x-rays are emitted from the electron cloud.
Gamma radiation has a shorter wavelength and higher photon energy than x-rays [13,
14].

7
1.3. Radiation Quantities
The U.S. Nuclear Regulatory Commission (NRC) defines four radiation dose
units: radioactivity, exposure, absorbed dose, and dose equivalent. The dose unit for
radioactivity is the curie (Ci, British) or becquerel (Bq, international) and represents the
number of decayed atoms in a material over a specific time. The does unit for exposure is
roentgen (R), representing the amount of ionization in the air. The absorbed dose is the
amount of energy absorbed by a defined mass of tissue, and its dose unit is gray (Gy) or
radiation absorbed dose (Rad). The dose equivalent measures the clinical effect of
radiation on the body as a product of the absorbed dose and tissue weighting factor,
which varies depending on tissue sensitivity to radiation. It is expressed as roentgen
equivalent man (REM) or Sievert (Sv) [11, 15]. The Gy or cGy (1 Gy = 100 cGy = 100
Rad) are used as the radiation unit in following studies.
The dose rate in the following studies refers to the rate of radiation dose exposure,
measured in cGy per minute. Higher dose rates are associated with a more severe
response to the radiation and increased carcinogenic risk [15]. Dose rate allows us to
calculate the time necessary for whole-body irradiation. E.g. if the target dose for a
mouse is 8.72 Gy, and the dose rate is 89.14 cGy/minute, the exposure time is 9 minutes
and 47 seconds (8.72 Gy/89.14 cGy/minute = 9.78 minutes).
1.4. Biological Effects of Ionizing Radiation
The biological effects of ionizing radiation lead to the symptoms of radiation
sickness. Absorbed radiation affects multiple cellular organelles. It disrupts atomic bonds

8
directly or indirectly via water radiolysis, which produces reactive oxygen species (ROS)
and reactive nitrogen species (RNS). 137Cs gamma radiation causes 60 nmol/L ROS per
nanogram of tissue within one microsecond post- irradiation (post-IR) [16]. ROS
metabolites produced via water radiolysis are predominantly O2•−, •OH, and H2O2, causing
deoxyribonucleic acid (DNA) damage via the induction of abasic sites and base
oxidation, contributing to carcinogenic mutagenesis [17, 18]. These free radicals also
oxidize accessory structures such as histone, which is critical for gene regulation and
DNA packaging (Figure 2), and cause protein carbonylation and lipid peroxidation in
non-nuclear organelles. The mitochondria are particularly affected as they produce most
of the intracellular ROS. The mitochondria are responsible for energy production and
oxidation-reduction balance [19-21], and persistent increased mitochondrial oxidative
stress and heritable mitochondrial DNA (mtDNA) damage post-IR contributes to
accelerated aging [17, 22].
Radiation-induced mitochondrial DNA damage occurs through several
mechanisms. Firstly, radiation-induced lipid peroxidation disrupts the mitochondrial
membrane, which is the location of the electron transport chain (ETC) [23]. Subsequent
electron leakage from the ETC reduces O2, producing more superoxide, leading to
mitochondrial dysfunction, mitochondrial DNA mutation, and apoptosis [24]. Secondly,
radiation damages protein translocation machinery, impairing the import of cytosolic
proteins required for mitochondrial biogenesis into the mitochondria [25, 26]. Thirdly,
radiation damages mtDNA in the same way as it does nuclear DNA, inducing abasic sites
and base oxidation. This damage is heritable and transmitted to new mitochondria

9
Figure 2
•OH H2O
e-
p+
γ-ray
Indirect effect
Direct effect
e-
p+
γ-ray
10Å
20Å

10
Figure 2. Direct and indirect effects of ionizing radiation.
There are two types of biological effects of ionizing radiation: the direct effect and the
indirect effect. The disruption of DNA structure by indirect effect is mainly mediated by
the production of ROS and RNS. The indirect damage is generally more severe than the
direct damage since indirect effect also brings damage to other organelles as shown in
Figure 3. Figure adapted from Hall, E. J. and Giaccia, A. J., Radiobiology for the
Radiologist. 2012 [27].

11
generated post-IR [17, 28]. Finally, fragments of damaged mtDNA can migrate into the
nucleus and insert into the nuclear genome during DNA double strand break (DSB)
repair, which is induced by radiation. These insertions further increase radiation-induced
genomic instability, heightening the potential for carcinogenesis [17] (Figure 3).
Another characteristic of radiation is the bystander effect, in which non-irradiated
(NI) cells are affected by radiation through communication with irradiated cells. Several
possible mechanisms have been proposed. Free radicals and cytokines produced by
irradiated cells may impact non-irradiated cells via paracrine signaling [29]. Epigenetic
alteration may also occur as a result of non-coding ribonucleic acid (RNA, such as
miRNA or siRNA, which silence gene expression) detaching from irradiated cells and
altering gene expression in non-irradiated cells [30]. mtDNA fragments also contribute to
the bystander effect by migrating to non-irradiated cells [17]. Understanding of the
biological effects of ionizing radiation helps delineate the short- and long-term effects of
radiation, and the pharmacological mechanism of treatments.
1.5. Illnesses and Treatments Related to Radiation Exposure
1.5.1. Acute radiation syndrome
Less than 24 hours after exposure to high doses of ionizing radiation, victims
develop a continuum of multi-system symptoms referred to as acute radiation syndrome
(ARS). Different tissues have different radio-sensitivity; less-differentiated and actively-
proliferating cells are the most sensitive (Law of Bergonié and Tribondeau) [11, 31].

12
Figure 3
H2O
•OH+H+
•OH
ONOO-
H2O2
O2.-.NO-
(RNS)
(ROS)
SOD
Fe2+
Fe3+
Radiation
O2
Mitochondrion
Nucleus
DNAdamage
Cellmembrane
e-
O2.-
O2
e-
• Oxidative damage to mtDNA and nuclear DNA• Protein and lipid oxidation• Enzymes deactivation
Direct
Indirect

13
Figure 3. Biological effects of ionizing radiation.
Ionizing radiation causes direct damage to DNA structure, or indirect damage to DNA
and mitochondrion by the free radicals produced from water radiolysis. The free radicals,
mainly ROS and RNS, oxidize and permanently change the structure of lipids, proteins,
nuclear DNA and mtDNA. Figure adapted from Azzam, E.I., Jay-Gerin, J.P. and Pain,
D., Ionizing radiation-induced metabolic oxidative stress and prolonged cell injury.
Cancer Lett, 2012 [17].

14
There are four stages of ARS: the prodromal phase, latent phase, manifestation
phase and recovery/death phase (Figure 4). When the radiation dose is extremely high
(>50 Gy), victims quickly progress into unconsciousness and hypotension, and death will
occur within 48 hours as a result of neurologic and cardiovascular collapse (Figure 5)
[32]. When the radiation does is less than 1 Gy, although there is sub-clinical damage to
hematological system, the victim is generally asymptomatic. At a dose higher than 1 Gy
but not at a level considered extremely high (e.g. 2-10 Gy), digestive tract symptoms
appear first, including nausea, vomiting, and anorexia. This results from radiation-
induced damage to the vomiting center of the chemoreceptor trigger zone (CTZ) in the
medulla oblongata, as opposed to direct digestive tract damage. Typically, these
symptoms persist no longer than 48 hours [15], and are followed by a short latent phase
in which the victim appears to recover before live cell numbers decrease below the
clinical threshold. The latent phase period varies and is inversely proportional to radiation
dose. The subsequent manifestation phase results from cell depletion and dysfunction of
the hematopoietic, gastrointestinal, and central nervous systems. This phase can last from
days to months. If victims receive sub-lethal irradiation dose, the recovery phase will
follow; without treatment, death is highly probably in victims exposed to a lethal dose
(LD). LD××/×× days is used to define a lethal dose, representing number of deaths over
time, i.e. LD70/30 means at this dose, 70% of the irradiated population will die within 30
days [11, 33].

15
Figure 4
Prodromal syndrome
Radi
atio
n do
se
Latentperiod
Symptoms of illness
Death or recovery
Time

16
Figure 4. Stages of acute radiation syndrome.
The prodromal syndrome develops first, followed by a latent period and then symptoms
of illness shows up. The severity of symptoms at prodromal syndrome stage and
symptoms of illness stage is directly proportional to radiation dose. The time of the latent
period is inversely proportional to radiation dose. Figure adapted from Hall, E. J. and
Giaccia, A. J., Radiobiology for the Radiologist. 2012 [27].

17
Figure 5
12-3
0
Days post-irradiationd2-3 d7-15 d30
40-5
01-
10Ra
diat
ion
does
(Gy) Neurovascular
syndrome
Gastrointestinalsyndrome
Hematopoieticsyndrome

18
Figure 5. Acute radiation syndrome in different organs.
Neurovascular system is one of the most radio-resistant system and victims will quickly
progress death once the neurovascular symptoms develop. Hematological system is one
of the most radio-sensitive system where the low radiation dose even as 1 Gy could
induce sub-clinical damages and the recovery phase is late at around days 20-30 post-
irradiation. If victims received lethal dose of radiation, there will be no recovery phase
and will progress to death earlier. The radio-sensitivity of the gastrointestinal system is in
the middle of neurovascular system and hematological system. Figure adapted from
Seedhouse, E., Space Radiation and Astronaut Safety. 2018 [34].

19
1.5.1.1. Gastrointestinal acute radiation syndrome
The epithelial cells lining the gastrointestinal (GI) tract are highly sensitive to
radiation as they slough and replenish on a regular basis. In humans, Gastrointestinal
acute radiation syndrome (GI-ARS) occurs following exposure to radiation >5 Gy. In
addition to the nausea, vomiting, and anorexia observed in the prodromal phase, victims
experience abdominal cramps, watery diarrhea, hematemesis, and melena. This results
from compromise of the GI barrier, impairing the balance of absorption, secretion, and
excretion. Associated dehydration and electrolyte imbalance can be lethal. The
breakdown of GI integrity also increases the movement of normal or pathogenic bacteria
from the GI into blood, leading to bacteremia and sepsis. Because the hematopoietic
system is also inhibited, severe infection can lead to septic shock, multiple organ
dysfunction syndromes (MODS), and death [32, 33, 35].
1.5.1.2. Cerebrovascular acute radiation syndrome
Compared to the digestive and hematopoietic systems, the central nerve system
(CNS) is relatively radioresistant. Although low-dose irradiation can disturb the vomiting
center in the prodromal phase and induce some functional disorders, these effects are
transient and no measurable damage occurs in the brain until the radiation dose reaches
10 Gy. The typical symptoms at total-body irradiation (TBI) doses >20 Gy include
nausea, vomiting, dizziness, headache, disorientation, hypo- or hyper-reflexia, ataxia,
seizure, delirium and dementia. The mechanism is believed to be due to direct nerve cell
damage and indirect capillary circulation damage. The latter compromises blood-brain
barrier integrity and leads to interstitial edema and intracerebral hemorrhage, contributing

20
to intracranial hypertension, brain herniation, and circulatory collapse. Most
cerebrovascular damages are irreversible and severe symptoms generally represent poor
prognosis [11, 15, 32].
1.5.1.3. Hematopoietic acute radiation syndrome
Hematopoietic cells are the most proliferative cell type and the majority of bone
marrow (BM) cells are immature progenitors. Thus, the hematopoietic system is one of
the most radiosensitive, and a dose as low as 0.2 Gy can induce cell cycle arrest.
Transient, mild cytopenia occurs at 0.2 - 2 Gy without significant clinical manifestations.
Victims may experience prodromal symptoms such as nausea and fatigue. Clinical
hematopoietic acute radiation syndrome (H-ARS) occurs when the absorbed dose is
above 2 Gy [11, 33], and symptoms will not be apparent until circulating cell numbers
have dropped significantly. The symptoms of H-ARS are due to leukopenia, which leads
to susceptibility to infection and poor wound healing; erythropenia, leading to anemia,
fatigue, and heart failure; and thrombocytopenia, leading to petechiae, purpura, and
hemorrhage [15]. The radiosensitivity of blood cells varies by type. Lymphocytes (LY)
are the most sensitive, despite being terminally-differentiated, and are the first population
to be depleted in H-ARS [11]. LY depletion is positively proportional to the absorbed
dose. The lymphocyte depletion rate (LDR) is used as a biodosimetry method.
Biodosimetry is the measure of biological parameters to estimate the radiation dose a
person has received (Figure 6). LDR is more accurate than observing clinical symptoms
and less complicated than other biodosimetry, such as dicentric chromosome analysis or
fluorescence in situ hybridization [11, 36]. LY depletion begins in the first 6-24 h after

21
Figure 6
Normal range
Moderate injury
Mild injury
Severe injury
Very severe injury
Lethal injury 0 1 2
Days post-irradiation
Lym
phoc
yte
num
ber (
K/µl
)
3
2
1
0.5
0.10
(1)
(2)
(3)
(4)

22
Figure 6. Classical Andrews lymphocyte depletion kinetics and accompanying
clinical severity ranges.
Lymphocyte decreasing rate and degree of the decline is positively proportional to the
absorbed radiation dose. The lymphocyte depletion rate is used as a biodosimetry
method. Curves 1 to 4 roughly represent the following does of TBI: (1): 3.1 Gy; (2): 4.4
Gy; (3): 5.6 Gy; (4): 7.1 Gy. Figure adapted from Christensen, D.M., Iddins, C.J. and
Sugarman, S.L., Ionizing radiation injuries and illnesses. Emerg Med Clin North Am,
2014 [11].

23
exposure and reaches nadir at 3-6 days, depending on the radiation dose. Neutrophils
(NE) deplete to their lowest level 1- 2 weeks after TBI dosage greater than 2 Gy in
human, which is later than LY [37, 38]. Neutropenia and lymphocytopenia render victims
immunocompromised and highly susceptible to infection in the nadir phase. Red blood
cells (RBC) and platelets (PLT) are considerably less radiosensitive than white blood
cells (WBC). RBC typically renew every 120 days; PLT every 8-9 days; and they are
non-nucleated end-product cells with terminal differentiation. Thus, RBC depletion is
slow and nadir is not remarkable [11]. The decline pattern of PLT is similar to NE,
reaching nadir 1- 2 weeks after exposure to a lethal dose. The time to nadir and the nadir
level is inversely proportional to radiation dose, whereas nadir duration is positively
proportional to the absorbed dose. The lower the nadir level and the longer its duration is,
the risk of infection and hemorrhage risk increases, thus increasing the mortality risk
[32].
1.5.1.4. Other ARS sub-syndromes
Due to the limitations of this study, further ARS sub-syndromes are not discussed
in detail. However, radiation also damages the eyes, skin, endocrine system, urogenital
system, etc., some of which show specific ARS symptoms [11]. Additionally, inhalation
or digestion of alpha and beta particles causes internal exposure and subsequent ARS in
exposed organs, which may be more severe than ARS resulting from external exposure
[15].

24
1.5.2. Deterministic and stochastic effects of ionizing radiation
Most of the discussed ARS are deterministic effects of ionizing radiation,
meaning that the dose of radiation determines the severity of the effect. There are two
characteristics of deterministic effect. Firstly, the severity of the effect is proportional to
the absorbed dose. Secondly, there is a dose threshold and symptoms occur only when the
dose is at or above this threshold. It is due to the damage of many cells by radiation. The
shape of the curve is sigmoid (Figure 7). The effects on testis and bone marrow are the
examples of the deterministic effect, which have the lowest thresholds of body tissue
(0.15 Gy for testis and 0.5 Gy for bone marrow) [33].
In contrast, stochastic effects occur by chance. The probability of occurrence is
proportional to the dose of radiation, but there is no obvious threshold, and the effect can
occur even if only one cell is damaged. The shape of the curve is linear. Malignancy
induced by irradiation an example of stochastic effect [15, 39] (Figure 7).
1.5.3. Delayed effects of acute radiation exposure
Delayed effects of acute radiation exposure (DEARE) is a spectrum of chronic
illnesses involving multiple systems after years post-IR, which is the result of oxidative
stress, inflammation, fibrosis, and loss of stem cell self-renewal in the ARS survivors [40,
41]. Little is known about DEARE in comparison with ARS, and most knowledge are
gleaned from observing atomic bomb survivors and post-radiotherapy cancer survivors.
There are three types of DEARE: somatic, genetic (hereditable), fetal (in utero). In
following studies, somatic effect is the focus.

25
Figure 7
threshold
Radiation dose
Seve
rity
prob
abili
ty
Radiation dose
Deterministic effect(threshold-sigmoid)
Stochastic effect(no threshold-linear)

26
Figure 7. Deterministic effects and stochastic effect of radiation.
Deterministic effect occurs when victim exposes to radiation exceeding a certain level
(threshold). The higher the radiation dose, the more severe deterministic effect will be.
The reason for deterministic effect is the cell killing/death. Stochastic effect does not
have a threshold and does not happen at everyone exposed to radiation. The higher the
radiation dose, the higher probability of certain stochastic effect (such as cancer) will be.
It is due to accumulated damage to DNA and malignant proliferation. Figure adapted
from Chouker, A., Stress Challenges and Immunity in Space. 2020 [42].
27
1.5.3.1. Non-cancer diseases
According to the Life Span Study (LSS) and Adult Health Study (AHS) of the
Hiroshima and Nagasaki atomic bomb survivors, cataract, thyroid disease,
hyperparathyroidism, chronic liver disease and cirrhosis, uterine myoma, hypertension,
myocardial infarction, stroke, chronic kidney diseases, pneumonia/influenza [3, 43] are
significantly associated with radiation. Cancer survivors who received radiotherapy of the
abdomen or pelvis have been reported to develop delayed radiation enteropathy,
presenting as featured as malabsorption or dysmotility [44]. The risk for late-onset
chronic kidney disease is increased significantly in patients receiving >16 Gy TBI before
hematopoietic stem cell transplantation [45]. In patients receiving thoracic radiotherapy,
around 5-15% develop symptomatic pneumonitis and 43% experience radiation-induced
pneumonitis or pulmonary fibrosis 6-24 months after treatment [46, 47]. Neurocognitive
deficits occur several months to years after treatment in 30-50% of patients who received
radiotherapy for brain tumors [48, 49]. Some of the effects seen after radiotherapy were
not reported in atomic bomb survivors as the TBI they received was much lower than
targeted dose administered to specific organs during radiotherapy. According to the
stochastic effect rule, the higher the dose, the higher possibility of a late effect occurs.
The LD50 for humans is 4 Gy in TBI, but the dose required to eradicate an epithelial
tumor is 60-80 Gy. This dose is achieved by providing multiple fractionated irradiations
directed at the target organ.

28
1.5.3.2. Solid tumors and hematopoietic malignancies
Unlike in radiotherapy, atomic bomb survivors received penetrating TBI, and
their risk for developing malignancies increased in multiple organs and systems as a
consequence. Over the years following radiation exposure, the risk for solid tumor
development gradually increases at a greater extent than the age-related risk of tumors in
non-irradiated humans (Figure 8). There is a significant linear dose-response relationship
to tumor development in cancers of the oral cavity, esophagus, stomach, colon, liver,
lung, etc. Other factors also increase risk, such as gender, age at exposure, time after
exposure, and lifestyle. The relative risk for total solid tumors is 50% higher in females
than males, and two-fold higher in survivors irradiated at a younger age than at an older
age [3, 50, 51].
The latent period for hematopoietic malignancies is much shorter than for solid
tumors. Leukemia is the predominant radiation-related cause of death in the early years
post-exposure. The first instance of radiation-induced leukemia was reported 7 years after
the atomic bombing of Japan[52]. In atomic bomb survivors, the risk for developing
leukemia peaked 8-10 years after exposure and then rapidly decreased [53]. Risk for
myelodysplastic syndromes (MDS) is also associated with radiation; unlike leukemias,
these develop later in life [54]. There is little evidence to indicate that radiation exposure
increases risk for lymphomas or multiple myeloma [55].
1.5.3.3. Residual bone marrow damage
DEARE effects on the hematopoietic system are known as residual bone marrow

29
Figure 8
Deat
hs/y
ear
1945 1955 1965 1975 1985 1995 2005 2015 20250
5
10
15
20
Year
All solid tumor
All solid tumor, projected
Non-cancer disease
Non-cancer disease, projected
Leukemia
Leukemia, prior to data (?)

30
Figure 8. Life Span Study (LSS) radiation-associated deaths per year.
Around 120,000 Hiroshima and Nagasaki atomic bomb survivors and control subjects
were included in the LSS. Mortality data for solid tumor, leukemia and benign diseases
were followed up through the year of 2002. Leukemia is the first radiation-associated
long-term health effect observed in the LSS. Risk assessment of leukemia for the period
1945-1950 is not possible since victims had to be alive in 1950 to be in the cohort, the
estimated leukemia deaths during this period are shown as green dotted line. Figure
adapted from Douple, E.B., et al., Long-term radiation-related health effects in a unique
human population: lessons learned from the atomic bomb survivors of Hiroshima and
Nagasaki. Disaster medicine and public health preparedness, 2011 [50].

31
damage (RBMD), a latent condition characterized prolonged inhibition of hematopoiesis
leading to immunosuppression and increased infection risk [4, 40, 56]. As previously
described, radiation-induced apoptosis of hematopoietic stem cell (HSC) causes H-ARS.
This damage to the hematopoietic system can persist long-term [40], though this
phenomenon has been largely ignored due to seemingly-complete recovery of peripheral
blood (PB) cell counts, BM cellularity, and number of colony-forming unit (CFU) early
after exposure [57, 58].
There are three proposed mechanisms of RBMD: 1) exhaustion of the HSC pool;
2) HSC senescence; 3) HSC niche damage. First, radiation increases ROS level, which in
turn induces DNA DSBs. Ataxia-telangiectasia mutated kinase (ATM) recognizes, and is
activated by, DSBs and phosphorylates downstream p53 and PUMA, which inhibits the
anti-apoptotic Bcl-2 and activates pro-apoptotic Bax and Bak [59, 60]. Bax and Bak open
the voltage-dependent anion channel in mitochondria, leading to the release of
cytochrome C, which activates caspase-9 and induces apoptosis. This is one possible
mechanism of HSC pool depletion; however, quiescent, metabolically inactive HSC have
few mitochondria and rely on glycolysis vs. aerobic metabolism [61], and the role of
apoptosis in RBMD is still controversial.
The second proposed mechanism, HSC senescence, is based on ROS or p53-
mediated activation of p38 and downstream p16. Activation of p16 results in irreversible
cell cycle arrest and senescence [62, 63]. Increased ROS in HSC may occur through

32
endogenous oxygen consumption mediated by nicotinamide adenine dinucleotide
phosphate oxidase (NOX) [64]. There are five isoforms of NOX (1-5), and NOX4 has
been implicated in radiation-induced chronic oxidative stress in HSC [56, 65].
The third proposed mechanism is based on the role of the HSC niche in HSC self-
renewal and differentiation. Radiation can induce senescence in bone marrow stromal
cells via the p38/p16 pathway and this is at least partially responsible for RBMD [66].
Sinusoidal endothelial cells have also been known to be affected by radiation-induced
senescence [67]. It is not clear if osteoblasts contribute to HSC senescence. Other niche
cells may impact HSC self-renewal and differentiation via altered secretion of cytokines
or cell-cell contact post-IR.
1.5.4. Medical management of radiation injury
In the event of unexpected atomic activity and radiation accidents, triage should
be applied. Physicians must identify victims exposed to life-threatening doses and
provide treatment prior to decontamination, such as removal of clothing. The priorities in
triage of victims are based on their injuries, estimated radiation dose, and clinical
symptoms [15, 68]. The following studies focused solely on the management of radiation
injury to the hematopoietic system.

33
1.5.4.1. Standard management of H-ARS
1.5.4.1.1. Transfusion and supportive care
Blood transfusions are typically administered 10-30 days post-IR. These include
blood component transfusion or irradiated whole blood transfusion. Antibiotics should be
given to mitigate the effect of bacterial translocation from the GI system to the blood as
GI tract barrier impairment and myelosuppression greatly increase infection risk in H-
ARS patients. In the H-ARS mouse model, treatment with antibiotics and acidified water
from day 4 to 30 post-TBI increases the survival rate and decreases infection risk [69]. In
leukopenic patients, broad-spectrum antibiotics plus antiviral and antifungal agents
should be provided prophylactically until the granulocyte number has recovered.
1.5.4.1.2. Hematopoietic stem cell transplantation
Hematopoietic stem cell transplantation (HSCT) is an effective treatment for
hematopoietic malignancies such as multiple myeloma or leukemia, and for benign
hematopoietic diseases such as aplastic anemia. Aplastic anemia shares similarities with
H-ARS, such as bone marrow failure. HSCT appears to be a promising option for H-ARS
treatment; however, many obstacles prevent HSCT following a radiation event.
In the event of an atomic bomb detonation or large-scale radiation accident, the
number of victims is likely to be disproportionately higher than the number of available
HSC for transplantation. Human leukocyte antigen (HLA)-matched donors are required,
and finding these in sufficient numbers is a significant complication. Additionally, the
process of HLA typing takes 1-2 weeks, which is too long to wait for treatment [15]. It is

34
also difficult to determine radiation dose and whether the radiation dose a victim received
was partial or whole-body. In mice, partial irradiation is associated with increased
survival in comparison with mice receiving total-body irradiation (TBI) at the same dose
[11]. Partially-irradiated victims and TBI victims exposed to a dose <3 Gy generally do
not experience fatal hematological effects, so HSCT in these patients is unnecessary. The
lethal TBI dose is 7-8 Gy, and victims exposed to >10 Gy die of CNS complications
before H-ARS appears. The therapeutic window for HSCT, 7-10 Gy, is difficult to
estimate immediately after exposure [15]. Finally, though available data are limited,
HSCT has not produced favorable results. After the Chernobyl disaster, of 29 victims
receiving HSCT, only three survived, and despite transient donor engraftment,
autologous reconstitution eventually took over the bone marrow. The remaining 26
victims died with a median survival of 33 days [15, 68]. This evidence collectively
indicates that HSCT is a suboptimal intervention following adverse radiation events.
1.5.4.1.3. Growth factor therapy
Growth factor treatment is a more practical and economic therapy than HSCT.
Currently, the Food and Drug Administration (FDA) has approved recombinant
granulocyte colony-stimulating factor (G-CSF), recombinant granulocyte macrophage
colony-stimulating factor (GM-CSF), and pegylated G-CSF to address neutropenia after
radiation exposure. G-CSF binds to its receptors and subsequently activates the
downstream signal pathways, Jak/Stat, Ras/MAPK, and phosphoinositide 3-kinase
(PI3K) /Akt. This mediates the proliferation of myeloid progenitors and increases the
number of circulating mature neutrophils [70, 71]. The mechanism of GM-CSF is similar,

35
but with a broader target, including monocyte-macrophages and eosinophils [72, 73]. LY,
RBC, and PLT recovery is accelerated following growth factor treatment due to induction
of HSC differentiation. However, this stimulating effect is short-lived and may expedite
HSC pool exhaustion and exacerbate RBMD [65]. No MCM approved for treatment post-
IR is effective in RBMD, highlighting a critical need to develop new strategies for
RBMD/DEARE intervention.
1.5.4.2. Potential new therapeutics of H-ARS and DEARE
Although current FDA-approved MCMs increase survival and complete blood
count in H-ARS victims, survivors are plagued with long-term hematopoietic
insufficiency; in particular, defective lymphocyte reconstitution [74]. These MCMs are
myeloid lineage stimulators leading to early- and long-term myeloid reconstitution, but
not long-term lymphoid reconstitution. No complete reconstitution of T-cells has been
observed [75]. Long-term T-cell deficiencies include decreased T-cell number,
imbalanced CD4/CD8 ratio, and compromised T-cell receptor diversity due to thymic
involution [15]. Victims of radiation exposure often experience frequent infections and
cancer in later life, which may be related to deficient T-cell surveillance [76, 77].
The application of growth factors and cytokines capable of enhancing T-cell
reconstitution and thymic recovery are a promising new direction in therapeutic strategies
for H-ARS. These include interleukin-7 (IL-7), keratinocyte growth factor (KGF), and
fetal liver tyrosine kinase 3 (Flt3) ligand, which aid lymphocyte reconstitution in both H-
36
ARS and DEARE. Drugs such as lisinopril, which enhance the radio-mitigating effect of
colony-stimulating factors, are another interesting therapeutic avenue.
1.5.4.2.1. IL-7
While IL-7 efficacy in H-ARS has yet to be investigated, it has been reported that
IL-7 accelerates thymopoiesis and increases CD4 and CD8 T-cell number following
chemotherapy and bone marrow transplantation [78]. IL-7 induces cyclin-dependent
kinase 2 (Cdk2) or Cdk4 activity, thus increasing cyclin E levels in lymphoid progenitors
and promoting the proliferation of both T and B lymphocytes [79]. IL-7 administration
also promotes homeostatic T-cell expansion in normal NI mice [15].
1.5.4.2.2. KGF
KGF is known to protect epithelial cells from radiation damage [15, 80]. Its
receptors are expressed on the surface of thymic epithelial cell (TEC), which produce IL-
7 and promote thymopoiesis. KGF may protect TEC from radiation damage. Min et al.
[81] demonstrated that administration of KGF for three consecutive days prior to
allogeneic bone marrow transplant enhanced thymic cellularity for at least three months,
and increased the number of donor-derived T-cells in recipient spleens.
1.5.4.2.3. Flt3 ligand
Flt3 is an important surface marker for identifying lymphoid-primed multipotent
progenitor (LMPP) and common lymphoid progenitor (CLP), which are the common
progenitors of LY. Binding of FMS-like tyrosine kinase 3 ligand (FLT3L) to Flt3

37
dimerizes Flt3 and subsequently activates downstream PI3K and Ras pathways. This
promotes the survival and growth of hematopoietic progenitors [82]. FLT3L has minimal
biological effect when used alone; however, it exhibits synergy with other hematopoietic
growth factors (HGF) including G-CSF, GM-CSF, interleukin-3 (IL-3), stem cell factor,
or as an engineered protein containing both FLT3L and another colony-stimulating factor
[83, 84]. Combination therapies and the engineered protein both accelerate granulocyte
and immune recovery in mice whether administrated before or after irradiation [85, 86].
1.5.4.2.4. Angiotensin converting enzyme inhibitor (ACEI)
The renin-angiotensin system (RAS) is known for its role in regulating blood
pressure and hydro-electrolyte homeostasis [87]. Renin from the kidney cleaves and
activates the angiotensinogen from the liver to form angiotensin I (Ang I). Angiotensin
converting enzyme (ACE), abundant in the lung and blood vessel endothelium, converts
Ang I into angiotensin II (Ang II). Ang II binds angiotensin receptors on arterial smooth
muscle, inducing vasoconstriction and increasing blood pressure. Ang II also increases
hypothalamic production of antidiuretic hormone (ADH) and aldosterone production in
the zona glomerulosa of the adrenal cortex. Together, these hormones increase sodium
and water retention in arteries and veins, further elevating blood pressure [88]. ACEI
inhibits ACE activity and decreases the conversion of Ang I to Ang II, thus down-
regulating blood pressure. Angiotensin II receptor blockers (ARB) is a competitive
inhibitor of Ang II receptor, directly binding angiotensin receptors [87, 89]. ACEI and
ARB are widely used for controlling hypertension and coronary artery disease.
Angiotensin (1-7) is the metabolite of Ang I, catalyzed by neprilysin; or the metabolite of

38
Ang II, catalyzed by ACE2 [90]. Angiotensin (1-7) mediates vasodilation, and is also
degraded by ACE. Therefore ACEI, as an inhibitor of ACE, increases angiotensin (1-7).
This contributes to blood pressure control via mediation of vasodilation (Figure 9).
The RAS system may play a role in the regulation of hematopoiesis. Ang II
receptors present on bone marrow CD34+CD38- cells, stromal cells, erythroid
progenitors, and mature lymphocytes [91, 92]. Mas is the receptor of angiotensin (1-7),
which presents on BM hematopoietic stem and progenitor cells and its expression is
enhanced during hematopoietic stress [93]. Ang II and angiotensin (1-7) may have direct
effects on hematopoiesis. The Ang II receptor and Mas receptor also present on bone
marrow endothelial cells, an important component of the bone marrow niche, indicating
that Ang II and angiotensin (1-7) may regulate hematopoiesis indirectly through altering
the bone marrow microenvironment [94]. Ang II and angiotensin (1-7) may also
stimulate hematopoietic progenitors indirectly by modulating HGF such as erythropoietin
(EPO) in kidney cells [95]. Both in vitro and in vivo experiments show that Ang II or
angiotensin (1-7) enhances hematopoiesis only under hematopoietic stress, such as in
myelosuppression following chemo- or radiotherapy. Ang II or angiotensin (1-7) are
generally given along with other stimulating factors such as G-CSF or erythropoietin to
facilitate the stimulating effect [93, 94, 96].
ACEI induces anemia and leukopenia when given at high dose [97, 98].
Paradoxically, however, ACE inhibition has been found to enhance hematopoiesis and
mitigate hematopoietic injury after radiation in a time-dependent manner [95, 99-101].

39
Figure 9
Angiotensinogen
Renin Kidney
Liver
Angiotensin I (Ang I)
Angiotensin II (Ang II)
AT2R AT1R
ACE Lung and kidneyendotheliumACE2
neprilysin
Angiotensin (1-7)
Aldosterone
VasodilationADH secretion
VasoconstrictionFluid retention
Sympathetic activation
ACEI
ARB
Sodium reabsorption
Vasodilation

40
Figure 9. The renin-angiotensin system.
Renin from kidney cleaves and activates the angiotensinogen from liver which turns into
Ang I. ACE, which abounds in endothelium of lung and blood vessels, then converts Ang
I into Ang II. Ang II regulates blood pressure by binding to angiotensin receptors and by
regulating ADH production. ACEI inhibits ACE activity and ARB blocks the angiotensin
receptors, which down-regulate blood pressure. The metabolite of Ang I and Ang II,
angiotensin (1-7), has opposite effect on blood pressure, which down-regulates blood
pressure by causing vasodilation. Figure adapted from Conti, S., Cassis, P. and Benigni,
A., Aging and the renin-angiotensin system. Hypertension, 2012 [102].

41
When given for 7 consecutive days before irradiation, ACEI sensitizes the hematopoietic
system to radiation damage by increasing the number of short-term HSC (ST-HSC) and
hematopoietic progenitor cell (HPC) in the G2/M phase at the time of irradiation. This
leads to severe pancytopenia and 100% lethality. When ACEI is given 1-48 hr after
irradiation, and for 14 to 30 consecutive days, hematopoietic recovery is significantly
increased, along with survival rate. There is no significant difference in survival between
early (1 hr) and late (48 hr), short regimens (14 days) and longer regimens (30 days) of
ACEI. This radiomitigating effect likely results from transient quiescence of ST-HSC and
HPC, allowing for DNA damage repair and, thus, increased cellular survival [101, 103].
In NI mice, ACEI treatment induces quiescence after 2 days and proliferation after 7 days
of administration. In NI humans, patients may experience one or multiple-lineage
cytopenia. The tetrapeptide N-acetyl-seryl-aspartyl-lysyl-proline (AcSDKP) is the
natural substrate of ACE and a negative regulator of hematopoiesis. ACE inhibition
would decrease AcSDKP degradation and thus increase its plasma level [104]. Inhibition
of Ang II formation and increase of AcSDKP explains the transient anemia and
leukopenia resulting from ACE inhibition in non-irradiated scenario [99]. Administration
of AcSDKP at peri-irradiation (both before and after TBI) does not decrease mortality,
while Ang II-receptor antagonists does. Therefore, blocking the Ang II pathway, rather
than increasing AcSDKP, and thus stopping the HSC from entering the cell cycle [105],
is thought to be the mechanism of protection effect of ACEI and ARB, in which
angiotensin (1-7)-Mas signal pathway might also involve [99].

42
Drugs targeting the Ang II receptor or Mas receptor also attenuate lung, cardiac
and renal fibrosis in DEARE mice. Many reports of this phenomenon exist, but the
mechanism remains unknown [103, 106, 107].
1.5.4.2.5. Prostaglandin E2 (PGE2)
Arachidonic acid (AA) is a component of the inner cell lipid membrane. It is
released by phospholipase A2 (PLA2) and converted to prostaglandins (PG) by
cyclooxygenases (COX) and tissue-specific synthases. PGs have a short half-life and act
as autocrine or paracrine factors on different systems with overlapping functions [108].
The rate of PG synthesis depends on local expression and activity of COX, which has two
isozymes, COX-1 and COX-2. COX-1 is constitutively expressed in most tissues under
physiological conditions. COX-2 expression is induced by inflammation, injury, or
cytokines, and is the dominant source of PGs in pathological conditions. The products of
COX-1 and COX-2 are different, but overlapping, as they are capable of interacting with
different tissue-specific synthases, yet not mutually exclusive preferences. COX-1
primarily interacts with thromboxane synthase, prostaglandin F synthase, and the
cytosolic prostaglandin E synthase. COX-2 prefers prostaglandin I synthase and
microsomal prostaglandin E synthase [109, 110]. The main products of COX-1 are
prostaglandin I2 (PGI2), thromboxane A2 (TXA2), and PGE2. PGI2 protects the gastric
mucosa. TXA2 is a coagulant and a vasoconstrictor. PGE2 regulates renal blood flow and
natriuresis [111, 112]. The main product of COX-2 is PGE2, which mediates many
pathological processes, including pain, fever, and inflammation [113] (Figure 10). PGE2
is unstable with a half-life of 30 seconds and is rapidly catabolized by 15-

43
hydroxyprostaglandin dehydrogenase (15-PGDH) and 15- ketoprostaglandin D13-
reductase (13-PGR) [114, 115].
The physiological and pathological effects of PGE2 are heterogeneous, including
labor induction, bone resorption, vasodilation, anti-inflammation, and fever onset [108].
PGE2 interacts with four specific G-protein coupled receptor (GPCR) isoforms (EP1,
EP2, EP3 and EP4) [115]. EP1 and EP2 are low-affinity receptors requiring high PGE2
levels for activation, whereas EP3 and EP4 are high-affinity receptors. EP2 and EP4
couple with Gαs, EP3 couples with Gαi, and EP1 couples with Gαq [116] (Figure 11).
PGE2 binding to EP1 activates Gαq and phospholipase C (PLC), which hydrolyzes
phosphatidylinositol 4,5-bisphosphate (PIP2) into diglyceride (DAG) and inositol
trisphosphate (IP3). IP3 releases Ca2+ from endoplasmic reticulum and increases
intracellular Ca2+ concentrations. DAG activates protein kinase C (PKC). PGE2 binding
to EP2 or EP4 activates Gαs and adenylate cyclase, which stimulates cyclic adenosine
monophosphate (cAMP) dependent protein kinase A (PKA), or directly stimulates the
cAMP-independent PI3K signal pathway. Both PKA and PI3K activate Akt kinase,
which inhibits glycogen synthase kinase-3 (GSK-3). GSK-3 inhibits the activation of β-
catenin. The stimulation of EP2 or EP4 pathways therefore activates and translocates β-
catenin into the nucleus [115, 117]. The nuclear translocation of β-catenin triggers
transcription and translation of downstream proteins, including Survivin and Cyclin D,
promoting cellular survival and proliferation. EP3 has multiple splice variants. Most
couple with Gαi, and a few with Gαs. The Gαi subunit inhibits adenylate cyclase and
decreases cAMP [118] (Figure 12). Susceptibility to desensitization also regulates PGE2
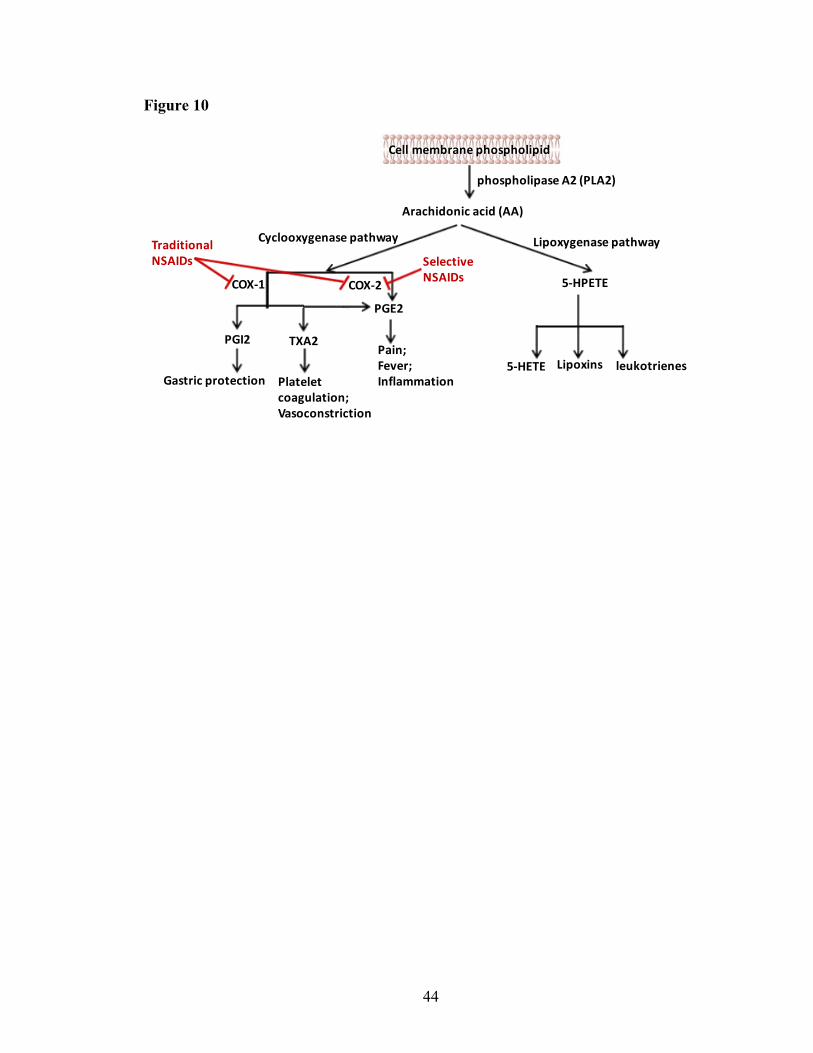
44
Figure 10
Cell membrane phospholipid
phospholipase A2 (PLA2)
Arachidonic acid (AA)
Cyclooxygenase pathway
COX-1 COX-2
Lipoxygenase pathway
5-HPETE
5-HETE Lipoxins leukotrienes
PGI2 TXA2
PGE2
Gastric protection Plateletcoagulation;Vasoconstriction
Pain;Fever;Inflammation
TraditionalNSAIDs Selective
NSAIDs

45
Figure 10. Eicosanoid biosynthesis from arachidonic acid.
Arachidonic acid is released from cell membrane by PLA2 and is converted to
prostaglandins by COX, or to leukotrienes and lipoxins by lipoxygenase. COX-1
constitutively express in most tissues under physiological condition, and COX-2 is
induced by pathological conditions such as inflammation and injury. The main products
of COX-1 are PGI2, TXA2 and PGE2. The main product of COX-2 is PGE2, which
mediates many pathological processes such as pain, fever and inflammation. Figure
adapted from Harizi, H., Corcuff, J.B. and Gualde, N., Arachidonic-acid-derived
eicosanoids: roles in biology and immunopathology. Trends Mol Med, 2008 [108].

46
Figure 11
Gαi GαsGαs
PGE2
EP1 EP2 EP3 EP4
Gαq
↑Intracellular Ca2+, IP3 ↑ cAMP ↓cAMP ↑cAMP

47
Figure 11. Prostaglandin E2 receptors.
PGE2 receptors are G-protein-coupled receptors, which have four isoforms (EP1, EP2,
EP3 and EP4). EP1 couples to Gαq in which the activation results in the increase of
intracellular Ca2+. EP2 and EP4 couple to Gαs in which the activation results in the
increase of intracellular cAMP. EP3 couples to Gαi in which the activation results in the
decrease of intracellular cAMP. Figure adapted from Dey, I., Lejeune, M., and Chadee,
K., Prostaglandin E2 receptor distribution and function in the gastrointestinal tract. Br J
Pharmacol, 2006 [117].

48
Figure 12
EP1 EP2 EP3EP4
PIP2
DAG IP3
PKC Ca2+
Adenylate cyclase
ATPcAMP
PKA PI3K
Akt
GSK-3
β-catenininto nucleus
Survivin↑ Cyclin D ↑
Adenylate cyclase
cAMP↓
CREB ERK, JNK
Pro-survival and proliferation
VEGFEGFR
Angiogenesis
Bcl-2Egr-1
Anti-apoptosis
PGE2
GαsGαs GαiGαq

49
Figure 12. Prostaglandin E2 signaling.
Binding of PGE2 with EP2 or EP4 activates Gαs and adenylate cyclase, which stimulates
cAMP dependent PKA through the increase of cAMP; or directly stimulates cAMP
independent PI3K pathway. Both PKA and PI3K activate Akt kinase which inhibits
GSK-3. GSK-3 inhibits the activation of β-catenin. So, the stimulation of EP2 or EP4
pathways eventually activates and translocates β-catenin into nucleus. The nuclear
translocation β-catenin triggers the transcription and translation of downstream proteins
such as Survivin and Cyclin D, which correspond to the final results of EP2/EP4
activation, such as pro-survival and proliferation. Most of EP3 variants couple to Gαi
which decrease the intracellular cAMP and thus have opposite effects to EP2/EP4.
Activation of EP1 increases intracellular Ca2+ concentrations and activates PKC. The
effects of PGE2 are pleiotropic. Figure adapted from Dey, I., Lejeune, M. and Chadee,
K., Prostaglandin E2 receptor distribution and function in the gastrointestinal tract. Br J
Pharmacol, 2006 [117].

50
responsiveness. After agonist stimulation, GPCRs can become desensitized and
internalized, and signal intensity decreases. EP4 is more rapidly desensitized after PGE2
binding compared with EP2, which is resistant to PGE2-induced desensitization [115,
117, 119]. EP4 and EP3 isoform-I are more rapidly internalized than EP2, EP3 isoform-
III, and EP3 isoform-IV [117, 120]. To summarize, the different EP receptor pathways
are both alternative and overlapping; therefore, PGE2 effects are diverse and depend on
tissue-specific receptor expression and G protein coupling [118].
The effects of PGE2 on hematopoiesis are pleiotropic. Different timing,
concentration, and formulation of PGE2 may lead to different results. Nanomolar levels
of PGE2 exposure in vitro inhibits granulocyte-macrophage progenitor cell (colony-
forming unit - granulocyte/macrophage, CFU-GM) growth, indicating myeloid progenitor
inhibition [121, 122]. In vivo, injected PGE2 inhibited CFU-GM growth [123]. PGE2
also enhanced erythroid progenitor cell (burst-forming unit-erythroid, BFU-E) and
multipotential progenitor cell (colony-forming unit granulocyte/erythrocyte/macrophage/
megakaryocyte, CFU-GEMM) growth. This may result from direct stimulation or indirect
mediation via increased renal EPO production [124-126].
PGE2 synthesis is indispensable for HSC formation and hematopoietic
development in zebra fish embryogenesis [127]. For adult human HSC, two-hour ex vivo
exposure to 16,16 dimethyl-prostaglandin E2 (dmPGE2) (1 µM) increases Survivin and
decreases caspase-3, inhibiting HSC apoptosis. Short-term exposure to dmPGE2 also
initiates cell cycle activation in long term-HSC (LT-HSC) but not in progenitor cells

51
[128]. In a competitive transplantation study, short-term dmPGE2 exposure increased
chimerism in the peripheral blood 20 weeks post-transplantation and increased homing to
bone marrow within 16 hr due to increased self-renewal and proliferation of LT-HSC
[128]. Conversely, in another study, bone marrow cells from mice treated with 6 mg/kg
dmPGE2 twice daily for 16 days were used for competitive transplantation and
demonstrated superior lymphomyeloid reconstitution that was lost at 16 weeks post-
transplantation, indicating that ST-HSCs were predominantly stimulated [129]. These
discrepancies may be due to different concentration of dmPGE2 treatment, different
treatment duration, and different stimulatory effect on HSC between ex vivo and in vivo
dmPGE2 exposure. The effects of dmPGE2 on both HSC and HSC niche in vivo vs. the
effect of dmPGE2 on HSC alone ex vivo may also contribute to the discrepancies.
Short term ex vivo exposure to dmPGE2 increases HSC homing to the bone
marrow via increased expression of C-X-C chemokine receptor type 4 (CXCR4), which
promotes chemotactic migration to stromal cell-derived factor 1 α (SDF1α) in the stem
cell niche. This effect is blocked by the CXCR4 antagonist AMD3100 [128]. This
supports the finding that HSC engraftment is enhanced following short-term ex vivo
dmPGE2 exposure [130]. In contrast, endogenous PGE2 enforces HSC marrow retention
through the activation of EP4 receptor and independent of the SDF-1-CXCR4 axis,
highlighting the difference in mechanisms on HSC between in vivo and ex vivo
experiment [131]. Recently, another CXCR4/SDF1-independent, osteopontin-dependent
axis was found to mediate nonsteroidal anti-inflammatory drug (NSAID)-induced HSC
trafficking through inhibiting PGE2-EP4 signaling pathway [131].

52
As dmPGE2 appears to promote HSC survival and self-renewal, it was considered
to be a potential MCM, either as a radioprotectant or radiomitigator. Since nuclear attacks
and accidents cannot be predicted in advance, first responders and military personnel
facing radiation threats need radioprotectant MCM, whereas civilian victims need
radiomitigator MCM. Hanson et al. [132, 133] demonstrated that dmPGE2 protected
intestinal clonogenic cells from radiation damage in B6D2F1 mice when used as a
radioprotectant one hour prior to radiation exposure. Walden TL et al. [134] found that
dmPGE2 increased the LD50/30 survival rate of CD2F1 mice when administrated 30 min
prior to radiation. Recently, Hoggatt J et al. [135] demonstrated that dmPGE2
significantly increases the day 30 survival rate of C57Bl/6 mice in a radiomitigating
manner when administered 6 or 24 hr post-IR, potentially by enhancing HSC survival and
self-renewal. These studies were performed in adult mice with different genetic
backgrounds, encouraging researchers to evaluate the efficacy and optimal time window
of dmPGE2, either as radioprotectant or radiomitigator, in a well-defined animal model
[69]. Since there is no effective MCM against DEARE, the potential for dmPGE2 to
alleviate DEARE in H-ARS survivors was investigated.
1.6. Hematopoiesis
1.6.1. Colony assays and competitive transplantation assays
The adverse impacts on hematopoietic stem and progenitor cell (HSPC) and
hematopoiesis from radiation exposure are the main causes of H-ARS and RBMD.
Investigation into the extent of damage and which cell compartment is targeted by a

53
specific treatment are crucial to develop and evaluate MCM. Thus, in this section, the
concept of hematopoiesis and methods to evaluate hematopoiesis will be introduced.
HSC is at the top of the hematopoietic hierarchy and continuously gives rise to all mature
blood cells, including neutrophils, eosinophils, basophils, monocytes, macrophages,
lymphocytes, red blood cells, and platelets. The two key characteristics of HSC are self-
renewal, either symmetric or asymmetric; and differentiation, which gives rise to mature
progenies (Figure 13). The idea of HSC originated in the 1950s when it was
discovered that shielding the spleen or injecting bone marrow cells prevented the death in
mice with radiation-induced bone marrow failure mice [136]. In the 1960s, Till &
McCulloch further hypothesized that there existed common progenitors in the bone
marrow, and that a single cell may be capable of reconstituting hematopoiesis after
radiation - the colony forming unit-spleen (CFU-S) [137]. They later confirmed that
CFU-S is clonal after identifying the same unique chromosomal aberrations between the
irradiated donor cells and CFU-S cells [138]. With the advent of in vitro hematopoietic
cell culture system, the colony forming cell (CFC) assay was developed as a method for
quantifying multi-potent or committed HPC. HPC is lineage-restricted, meaning that it
can only differentiate into certain types of mature blood cells [139]. CFC assays in solid
methylcellulose-based medium can be used to quantify HPC of myeloid, erythroid and
megakaryoid lineages. Terminology for colony forming units are: BFU-E, colony-
forming unit-erythroid (CFU-E), CFU-GM and CFU-GEMM [139-142]. Lymphoid
lineage progenitor culture methodology was developed much later. B-lymphoid
progenitor cells (colony-forming unit-pre-B, CFU-pre-B) can be detected by adding IL-7
into the medium or on special medium such as Whitlock-Witte culture [143].

54
Figure 13
Long-term HSC
Short-term HSC
Multipotentprogenitor
CLP
CMP
GMP
Pro-B
Pro-T
Pro-NK
MEP
Megakaryocyte
Reticulocyte
Red blood cells
Platelets
Macrophages
Neutrophils
Dendritic cells
B cells
T cells
NK cells
Monocytes
Basophiles
Eosinophils
SCF
GM-CSF
G-CSFGM-CSF
SCF
SCF SCFIL-11
GM-CSF
GM-CSFEPO TPO
IL-11
EPO

55
Figure 13. Hierarchy of hematopoietic tree.
The classic view of hematopoietic tree uses phenotypical markers to identify multipotent
HSC and bi-/oligopotent and unipotent progenitors where HSC is at the top of the
hematopoietic tree with self-renewal ability. The HSCs give rise to CLP and CMP, which
then give rise to all lymphoid and myeloid cells. The hematopoietic growth factors which
are used as MCMs to radiation damage mimic the endogenous cytokine pathways. Figure
adapted from Reya, T., et al., Stem cells, cancer, and cancer stem cells. Nature, 2001
[144].

56
The aforementioned CFC assay was initially thought to measure HSC; however, it
actually measures multi-potent progenitors with limited self-renewal. The true
measurement of HSC is the ability to recapitulate hematopoiesis in a transplant recipient
where endogenous hematopoiesis has be ablated. Competitive bone marrow
transplantations is a commonly used variant [145, 146], in which a mixture of donor and
competitor bone marrow cells are transplanted into lethally irradiated mice. Cell surface
markers for donor cells, competitor cells and host cells are all different, which allows
these markers to be used to determine the source of mature blood cells. Donor cell ability
to produce multi-lineage reconstitution relative to the standard competitor is evaluated. In
following studies, donor mice are C57Bl/6 (CD45.2+), and the recipient and competitor
mice are B6.SJL-PtrcAPep3B/BoyJ mice (B6.BoyJ; CD45.1+) or the F1 hybrid mice of
C57Bl/6 and BoyJ mice (CD45.1+CD45.2+) [147]. CD45 expression on the white blood
cells of these congenic mice differs and can be distinguished by flow cytometry.
Chimerism is estimated from the percentage of CD45.2+CD45.1- cells in recipient mice
and is evaluated monthly post-transplantation.
HSC is a heterogeneous group of cells with various levels of “stemness”. There
are 3 subgroups of HSC with different self-renewal capacities and multipotent
differentiation: ST-HSC, intermediate-term HSC (IT-HSC) and LT-HSC with capability
to reconstitute <16 weeks, 16-32 weeks, and >32 weeks, respectively [148, 149]. To
demonstrate LT-HSC potential, serial transplantations are required in which primary
donor cells are transplanted from the primary recipient into secondary recipients. This

57
may be repeated in tertiary and quaternary recipients and beyond. Secondary
transplantation is typically carried out 4-6 months after the primary transplantation [150].
1.6.2. HSPC phenotype
Fluorescence-activated cell sorting (FACS) is used to quantify, separate, or sort
subpopulations of blood cells, including HSPCs and mature peripheral blood cells. The
immunophenotypic assay determines the percentage or frequency of a specific
subpopulation of blood cells by using the fluorophore-conjugated antibodies to probe
antigens expressed on the cell surface or inside the cell. Lineage-specific antigens present
on the surface of mature cells. Different mouse blood cells express different lineage
markers, for example, Ter119 for erythroid cells, Gr1 for myeloid cells, CD3 for T
lymphocytes, B220 for B lymphocytes, and CD11b for monocytes/macrophages and
natural killer (NK) cells. Using a combination of these antibodies allows for negative
selection of cells that do not express these lineage markers. The lineage negative (Lin-,
Ter119- CD3- Gr1-B220- CD11b-) population is enriched for immature hematopoietic
cells. The stem cell antigen-1 (Sca-1) and stem cell factor receptor (c-kit, CD117) further
define the HSPC population in the Lin- population. Lin- c-kit hi Sca-1hi (LSK) cells are
enriched for HSC, whereas the Lin- c-kit hi Sca-1lo cells are enriched for myeloid-
erythroid HPC and Lin- c-kit intermediate Sca-1intermediate cells (Lin- c-kit int Sca-1int) are
enriched with lymphoid HPC. CD16/32 and CD34 further divide the myeloid-erythroid
HPCs in Lin- c-kit hi Sca-1lo population into common myeloid progenitor (CMP,
CD34+CD16/32-), granulocyte monocyte progenitor (GMP, CD34+CD16/32+) and
megakaryocyte erythrocyte progenitor (MEP, CD34-CD16/32-) [151, 152]. Flt3 and IL-7

58
receptor (IL7R, CD127) further define lymphoid HPC (CLP) in the Lin- c-kit int Sca-1int
population as Lin- c-kit int Sca-1int Flt3 hi IL7R+ [153, 154].
LSK cells are heterogeneous, including both HSC and HPC. There are two gating
strategies to sub-divide LSK cells, one is based on the introduction of two signaling
lymphocyte activation molecule (SLAM) family markers (CD150 and CD48) with or
without CD34; and another one is based on the introduction of CD34 and Flt3. The first
method subdivides the LSK cells into HSC (SLAM LSK, CD150+CD48-), multipotent
progenitor (MPP, CD150-CD48-), HPC-1 (CD150-CD48+) and HPC-2 (CD150+CD48+)
[155, 156]. By adding the CD34, the HSC can be further subdivided into LT-HSC
(CD34-) and ST-HSC (CD34+) [149]. The second method subdivides the LSK cells into
LMPP (Flt3hiCD34+), MPP (Flt3intCD34+), LT-HSC (Flt3-CD34-) and ST-HSC (Flt3-
CD34+) [82, 157, 158]. There is no standard criterion on the phenotype of HSPC and
there are many overlaps between these two methods.
Flt3 is a type III receptor tyrosine. Binding of FLT3L with Flt3 plays an important
role in B and T cell lymphopoiesis. Flt3 expression on different HSPC compartments is
variable. LT-HSC and ST-HSC express low levels of Flt3 (5%-8%), whereas 60% of
MPP are Flt3 positive. Thirty percent of CMP express Flt3 on their surface and have the
potential to differentiate into granulocytes/erythrocytes/megakaryocytes but with limited
potential to lymphocytes. HPC-1 and LMPP express the highest level of Flt3 (60%-
100%) and preferentially differentiate to lymphocytes/granulocytes. LMPP/HPC-1 give
rise to the lymphoid lineage-restricted CLP and the myeloid lineage-restricted GMP.
59
More than 80% of CLP and only 15% of GMP express Flt3 on their surface. Rare HPC-2
(<10%) and MEP (<1%) express Flt3 and HPC-2 and almost exclusively differentiate
into erythrocytes and megakaryocytes [159-162]. Other growth factor receptors such as
receptors for MCSF (MCSFR) and EPO (EpoR) are involved in myeloid lineage
differentiation, but are not widely accepted as markers [82]. In summary, Flt3 expression
is confined to myeloid-lymphoid progenitors as opposed to megakaryoid-erythroid
progenitors.
Hematopoiesis is not deficient in Flt3-/- mice [159]; however, Flt3L-/- mice
demonstrate a severe deficiency in myeloid and B-lymphoid progenitors [161]. MPP,
LMPP, CLP, and early thymic progenitor (ETP) are affected in this knockout model,
either due to decrease in number or decrease in differentiation potential [163]. This
suggests that the Flt3 signal promotes lymphoid development, possibly at the expense of
myelopoiesis [164]. There are controversies regarding whether Flt3 is the sole deciding
factor in the fate choice between myeloid and lymphoid lineages, but there is no doubt
that lymphoid development is dependent on Flt3 expression [82, 163, 164]. Myelopoiesis
may depend on the combined action of Flt3 and MCSFR or EpoR [82, 158].
1.6.3. Hematopoietic differentiation tree
HSC are at the top of the hematopoietic differentiation tree and have the capacity
to divide into all mature peripheral blood cells. The microscope-dependent and
morphology-based classification of HSPC is limited in its ability to differentiate between
HSC and early HPC, which lack of distinguishable morphological characteristics.

60
Initially, the more advanced colony-forming assay and single cell bone marrow
transplantation assays identified the first branch point at MPP, followed by the separation
of myeloid and lymphoid potential identified by CMP and CLP [144]. MPP do not have
self-renewal ability and their differentiation ability is increased in comparison with HSC.
CLP give rise to B-, T- and NK cells. CMP give rise to MEP and GMP, which give rise
to red blood cells and platelets, and neutrophils, monocytes/macrophages, and
eosinophils respectively (Figure 14 A). This model of hematopoiesis was later revised
with the identification of LMPP which expresses high level of Flt3 and preferentially
generates lymphoid lineages, while retains myeloid potential [158, 165]. This challenged
the classic model as the separation between the myeloid and lymphoid potential is not
defined as previously thought. Later, it was proposed that GMP are heterogeneous,
containing eosinophil/basophil progenitors (EoBP) associated with erythrocyte and
megakaryocyte fate (erythro-myeloid progenitor) but not with granulocytes precursors
[166-169]. It has also been reported that HSC is functionally and molecularly
heterogeneous, containing myeloid-biased (MPP2), balanced (MPP3) and lymphoid-
biased (MPP4) HSC [170-172]. These progenitors are downstream of “true” HSC and
have self-renewal ability and are referred to collectively as the “HSC pool” (Figure 14
B).
Recently, a group of von Willebrand factor (vWF)-positive, platelet-primed HSCs
was identified, which differentiates into megakaryocytes independently from any other
lineages. This suggests that the separation of megakaryoid-erythroid potential may be the
earliest lineage commitment [171, 173] (Figure 15). Additionally, recent single-cell

61
Figure 14
CLPCMP
GMPMEP B cells T cells
LT-HSC
ST-HSC
MPP
MonocyteNeutrophilEosinophilBasophil
ErythrocyteMegakaryocyte
CLP
CMP
MEP EoBP/GMP
LT-HSC
ST-HSC
MPPMPP MPP
LMPP
ErythrocyteMegakaryocyte
MonocyteNeutrophilEosinophilBasophil
B/T cells
HSCpool
A B

62
Figure 14. Classic hematopoietic differentiation tree.
At earlier era, it is generally accepted that the first branch point separating the myeloid
and lymphoid lineages in differentiation tree is via the separation of CMP and CLP
populations. The primitive cells differentiate from multipotent to bipotent and then to
unipotent progenitor cells. HSCs are homogeneous, which consist of LT-HSC and ST-
HSC (panel A). But later on, HSCs were found functionally and molecularly
heterogeneous which contain at least myeloid-biased (MPP2), balanced (MPP3) and
lymphoid-biased (MPP4) groups. Myeloid and lymphoid separation is not as strict as
researchers previously thought and the myeloid and lymphoid potentials remain coupled
in the LMPP. GMPs are phenotypically homogenous but are functionally heterogeneous
which contain the eosinophil/basophil progenitor (panel B). Figure adapted from
Laurenti, E. and Gottgens B., From haematopoietic stem cells to complex differentiation
landscapes. Nature, 2018 [165].

63
Figure 15
B/T cellsErythrocyteMegakaryocyte MonocyteNeutrophilEosinophilBasophil
HSC pool: multipotent
unipotent

64
Figure 15. Revised hematopoietic differentiation tree.
Platelet-biased stem cells were found at the apex of the hematopoietic stem-cell hierarchy
which suggest that the first branch point in the differentiation tree is much more
complicated than a simple segregation of myeloid and lymphoid lineages. Lineage choice
occurs earlier than previously thought. Multipotent and unipotent progenitors dominate
adult BM, whereas the oligopotent progenitors are rare or absent, or transient exist.
Lineage fate choice is a continuous process where the low-primed undifferentiated
hematopoietic stem and progenitor cells gradually differentiate to unilineage-restricted
cells. A consensus on the revised model of hematopoiesis has not been reached. Figure
adapted from Laurenti, E. and Gottgens B., From haematopoietic stem cells to complex
differentiation landscapes. Nature, 2018 [165].

65
transcriptome analysis revealed that lineage fate choice may be a continuous process,
where low-primed undifferentiated HSPC gradually differentiates to unilineage-restricted
cell without a multipotent or bipotent progenitor (Figure 15) [174-176]. The
hematopoietic differentiation model is therefore not yet fully understood, and is
continuously evolving as new findings reveal that hematopoietic differentiation is more
sophisticated than previously thought.
1.6.4. T cell hematopoiesis
T cell hematopoiesis is relatively unique compared with other lineages as T cells
mature in the thymus, a specialized primary lymphoid organ critical to the adaptive
immune system. Other hematopoietic cells mature in the bone marrow. In the bone
marrow, after MPP differentiates into LMPP and CLP, a portion of LMPP and CLP cells
termed thymus-seeding progenitors (TSP) enter the thymus via postcapillary venules at
the cortico-medullary junction (CMJ) [177]. In the thymus, BM TSP differentiate into
ETP, then differentiate into double negative (DN) cells, which gives rise to double
positive (DP) cells and further differentiate into either CD4 or CD8 single positive (SP) T
cells. DN thymocytes can be further divided into DN1, DN2, DN3 and DN4 cells based
on the expression of CD44 and CD25 (DN1: CD44+CD25-; DN2: CD44+CD25+; DN3:
CD44-CD25+; DN4: CD44-CD25-). As thymocytes differentiate from DN1 to DN4, they
progressively migrate from the CMJ toward the subcapsular zone (SCZ) [178, 179].
The T cell receptor (TCR) consists of an alpha (α) and a beta (β) chain [180]. The
major histocompatibility complex (MHC) is a group of cell surface molecules that

66
present foreign epitopes to TCR and thus trigger T-cell activation [181, 182]. In order to
recognize the foreign epitope presented by MHC, TCR must go through α and β
rearrangement. The TCRβ chain is rearranged at the DN3 stage and then paired with the
pre-Tα to form the pre-TCR. This step is called β-selection [183]. Cells that do not
produce functional pre-TCR are eliminated by apoptosis. Cells that successfully traverse
through β-selection undergo TCRα rearrangement, resulting in complete TCR and
transition into the DP stage [184]. DP thymocytes undergo positive selection, which
means that they will be eliminated if their complete TCRs are unable to bind MHCs
[179]. CD8 is a coreceptor that binds MHC class I molecule and CD4 is a coreceptor for
MHC class II molecule. Cell receiving signal from TCR/MHC I binding develops into SP
CD8+ T cell and likewise, cell receiving signal from TCR/MHC II binding develops into
SP CD4+ T cell. SP thymocytes then migrate from thymic cortex to medulla [185]. In the
medulla, SP thymocytes go through negative selection in order to eliminate autoreactive
thymocytes. The SP thymocytes which have high affinity for self-peptides presented on
MHC molecules are driven to apoptosis through upregulating the pro-apoptotic molecules
[186]. Non-autoreactive thymocytes that have appropriate affinity for MHC molecules
enter into the peripheral blood and become mature T cells. These recent thymic emigrants
(RTEs) are naïve cells expressing CD62 ligand (CD62L) [187]. After encountering novel
foreign antigens, naïve T cells proliferate and produce inflammation to eliminate the
pathogens [188, 189]. A protective memory effect mediated by memory T cells will
forms during the latter phase of inflammation. There are two types of memory T cells
circulating in the peripheral blood and lymphoid organs: effector memory T cell (TEM)
which can be identified as CD44+CD62L-, and central memory T (TCM) cell as

67
CD44+CD62L+ [190, 191]. The T cell developmental pathway from bone marrow to
peripheral blood is summarized in Figure 16.
TEC cells are the main component of thymic niche, which support T-cell
development and maturation as “nursing cells”. TECs reside in specialized anatomical
regions, and are defined as cortical TEC (cTEC) or medullary TEC (mTEC) [192].
Markers commonly associated with cTEC include cytokeratin 8/18 (K8/K18), Ly51,
CD205, and the proteasomal subunit β5t and delta‐like (DL) 4. Markers commonly
associated with mTEC include cytokeratin 5/14 (K5/K14), the lectin ulex europaeus
agglutinin 1 (UEA1), CD80, autoimmune regulator (Aire), MTS10, ERTR5, and the tight
junction components claudin-3/claudin-4 [192, 193]. The ratio of cTEC/mTEC quantified
by K8/K5 by fluorescent immunohistochemistry (IHC) is 1.78 in the neonatal mouse
thymus and 0.56 in adults [12]. LMPP and CLP express CCR7 and CCR9, and interact
with their ligands, CCL21/CCL19 and CCL25, which mainly express on endothelial cell
and TEC in thymus [194-196]. Progenitors settling in the thymus are exposed to the
cytokines IL-7 and Notch ligand DL4, which are highly expressed by cTEC [197]. mTEC
is indispensable in establishing central tolerance with the expression of Aire gene and in
promoting the development of CD4+CD25+Foxp3+ T regulatory and NK cells [192, 198].
The T cell development from bone marrow to thymus then to peripheral blood is
summarized in Figure 16 [178].
In this chapter, I introduce the concept and biological effects of ionizing radiation;
describe the clinical syndromes of radiation damages and potential treatments

68
Figure 16
LT-HSC
ST-HSC
MMP
LMPP&CLP
Pro-B
Bone marrow
CD4+ SP CD8+ SP
TCR+DP
DP
DN4
γδ T cell
Pre-TCR
Blood vessel
DN3
DN2
DN1
Medulla
Cortico-medullary
Junction(CMJ)
Cortex
Sub-capsular
Zone (SCZ)
Peripheral bloodNaïve T cell (RTE)
Antigen stimulation
Memory T cellEffector T cell
Thymus

69
Figure 16. T cell development from bone marrow to thymus.
A portion of LMPPs and CLPs enters the thymus via postcapillary venules at CMJ and
differentiates into DN cells and then to DP cells and follow with CD4 and CD8 SP cells.
DN cells can be further divided into DN1, DN2, DN3 and DN4 cells based on their
expression of CD44 and CD25. As thymocytes differentiate from DN1 to DN4, they
progressively migrate from the CMJ toward SCZ. Mature thymocytes, which have
appropriate affinity for MHC molecules, enter into the peripheral blood and become
naïve T cells (RTE, recent thymic emigrant). After encountering novel foreign antigens,
naïve T cells proliferate and produce effector T cells to eliminate the pathogens. A
protective memory effect mediated by memory T cells forms during the latter phase of
inflammation. Figure adapted from Aifantis, I., Raetz, E. and Buonamici, S., Molecular
pathogenesis of T-cell leukaemia and lymphoma. Nat Rev Immunol, 2008 [199].

70
currently available for these damages, especially focusing on the damage of
hematopoietic system; and characterize the hematopoietic development and research
methods in hematopoiesis. In chapter two to chapter five, the hematopoietic irradiation
damages by a well-established mouse model, both in short-term and long-term, will be
defined; and the radioprotective and radiomitigative effects of several promising MCMs
will be presented. The hypothesis will be proposed as the hematopoietic recovery,
including the immune recovery, would be severely impaired in survivors of H-ARS
through interference on HSPC differentiation; and this defect can be corrected or
prevented by the optimized administration of MCM. The following specific aims were
planned in order to test the hypothesis: Aim 1. Characterize the hematopoietic and
immune suppression during the H-ARS phase and the recovery of different lymphoid
compartments in H-ARS survivors. Aim 2. Evaluate the impact of different MCMs on
the hematopoietic and immune systems during H-ARS and DEARE phases; and
investigate the potential intrinsic and extrinsic mechanisms responsible for the
effectiveness of these MCMs. The research is expected to pave the road for more
extensive and efficient MCM screening to combat the threat of radiation damage in the
future.

71
Chapter 2. Immune Reconstitution and Thymic Involution in the Acute and Delayed
Hematopoietic Radiation Syndromes
2.1. Introduction
H-ARS and DEARE are serious and potentially lethal outcomes of exposure to
high-dose radiation. Treatments for H-ARS include the recently approved MCM
including Neupogen (G-CSF), Neulasta (pegylated G-CSF) and Leukine (GM-CSF)
[200], which stimulate primitive hematopoietic progenitor cells to produce life-saving
blood elements, primarily of the myeloid lineage [69, 201-204]. Although these MCM
significantly increase survival from H-ARS, they do little to alleviate the morbidity of
DEARE and its devastating multi-organ dysfunction, including long-term hematopoietic
insufficiency.
One of the most serious consequences of hematopoietic DEARE is defective
lymphocyte reconstitution and its subsequent immune insufficiency. Survivors of H-ARS
often suffer from long-term T-cell deficiencies that dampen robust protective immune
responses, including decreased T cell number, imbalanced CD4/CD8 ratio, and
compromised naive T cell receptor diversity [15]. Long-term survivors, as well victims of
the atomic bombings of Hiroshima and Nagasaki [4, 205] and cancer patients that have
received radiotherapy [206], also experience increased incidence of infections and cancer,
likely due to deficient T cell surveillance [76]. Many of these immune perturbances also
occur to a lesser degree during normal aging in association with thymic involution.
Thymic involution, the age-related loss of thymic mass and reduction of naïve T cell
output, correlates with reduced immune surveillance and onset of cancers, autoimmunity,

72
and infectious diseases in aging [186]. Age-related thymic involution and its associated
immune dysfunction are exacerbated by previous radiation exposure, further
compounding the immune deficiencies in hematopoietic DEARE.
While immune dysfunction has been well characterized in normal aging [207], as
well as in the acute phase of radiation exposures, little is known regarding the immune
suppression that occurs during DEARE. Generation of functional immunity is a complex
process. Briefly, BM LT-HSC differentiate into MPP, followed by LMPP, and then CLP.
LMPP and CLP emigrate from the BM to the thymus where they differentiate into CD4-
CD8- DN cells, followed by CD4+CD8+ DP cells, and finally single positive CD4+ or
CD8+ T cells, remaining CLP in the BM develop into mature B cells [178, 179], as
described in Chapter 1. Mature CD4+ and CD8+ T cells migrate from the thymus into
peripheral blood and secondary lymphoid organs, where they initiate
immunosurveillance. Due to the rapid proliferation and turnover of thymocytes, the
thymus is highly radiosensitive.
Dr. Orschell’s laboratory has previously developed a well characterized murine
model of H-ARS and DEARE in young adult C57BL/6 mice, and have used this model to
study mechanisms and efficacy of MCM against radiation for licensure and treatment
strategies [41, 69, 107, 135, 147, 201, 208-215]. Herein, the prolonged
immunosuppression is characterized, at all levels of lymphocyte development in these
acute and chronic radiation models. Data presented here aims to increase understanding
of the severe immune dysfunction that occurs in radiation survivors, with the ultimate
goal of generating a mouse model suitable for assessing the efficacy of potential MCM
and therapeutic strategies.
73
2.2. Materials and Methods
2.2.1. Mice and husbandry
Specific pathogen-free C57BL/6 mice (50:50 male:female; Jackson Laboratory,
Bar Harbor, ME) were received at 10-week-old (w/o) and acclimatized for 2-week prior
to irradiation. Husbandry and health status monitoring were carried out as previously
described [147, 210]. All studies were approved by the Indiana University School of
Medicine Institutional Animal Care and Use Committee.
2.2.2. Irradiation, dosimetry and monitoring
Irradiation and dosimetry were performed as previously described [147, 210]. In
sum, mice were placed in single chambers of a Plexiglas irradiation apparatus and rotated
horizontally (thus irradiated posterior-anteriorly) with a single uniform TBI doses of 8.72
(estimated LD70/30) or 9.04 Gy (estimated LD90/30) gamma radiation from a 137Cs
radiation source (Mark 1 Irradiator, JL Shepherd, San Fernando, CA) at an exposure rate
of 0.93-1.03 Gy/min. Inflight OSL nanodosimeters (Landauer Inc, Glenwood, IL) were
used to verify homogeneity of exposure. Between day (d) 1-30 post-TBI, mice were
provided with autoclaved acidified water and wet feed ad libitum. In H-ARS phase,
irradiated mice were observed twice daily and scored for signs meeting the criteria for
early euthanasia as Dr. Orschell’s laboratory described [69]. Surviving mice at day 30
post-TBI were allowed to age for the study of DEARE and fed with regular extruded
chow. Since there were no differences in the experimental outcomes assessed in these

74
studies between the LD70/30 and LD90/30, data from mice exposed to either dose were
combined.
2.2.3. Complete blood cell count (CBC)
Around 2-3 mm was snipped from the tail of randomly selected male and female
mice and 40 µl of peripheral blood was collected into an ethylenediaminetetraacetic acid
(EDTA)-coated capillary tube. Stiptic stick containing silver nitrate was applied to the
tail to stop the bleeding. Complete blood cell counts with differentials were performed at
baseline and on various days after irradiation, using a validated HEMAVET® 950FS
Hematology System (Drew Scientific, Waterbury, CT), as previously described [69, 147,
211]. To minimize stress effects, mice were bled no less than 14 days apart during H-
ARS phase.
2.2.4. Tissue harvest and single cell suspension
All tissues were harvested following euthanasia by CO2 inhalation. Thymi were
carefully cleared of fat and connective tissue under a dissecting microscope to eliminate
contamination with non-thymic tissue. Thymus and spleen weights were obtained using a
Mettler Toledo Balance XS204 (Mettler-Toledo LLC, Columbus, OH). Single cell
suspensions of thymocytes and splenocytes were generated by macerating tissues
between the frosted ends of two microscope slides or with the blunt end of a syringe
plunger, respectively. PB was collected from tail snips and BM cells were flushed from
femurs, tibias, pelvis, and humeri. Single cells were suspended in Hank's balanced salt
solution (HBSS, Lonza, Walkersville, MD) with 20U/ml heparin (Hospira Inc., Lake

75
Forest, IL). Erythrocytes were removed from samples by ammonium chloride lysis
(0.16M NH4Cl, 0.01M KHCO3) [40].
2.2.5. Tissue fixation, histological staining, and imaging
Thymi and spleens were fixed in neutral buffered formalin (NBF) overnight.
Formalin-fixed tissues were paraffin embedded and sectioned, then stained with
hematoxylin/eosin (H&E) and Picrosirius red. For H&E sections, digital images were
acquired using an Aperio Scan Scope CS system (Aperio, Inc., Vista, CA). For
Picrosirius red sections, digital images were acquired using a Leica DM 5000B
microscope (Leica Microsystems, Inc., Buffalo Grove, IL) with a Diagnostic Instruments
Spot RTKE camera (SPOT Imaging Solutions, Sterling Heights, MI) [41, 216]. For
quantifying the Picrosirius red stained thymus tissue, 4-6 images were obtained randomly
per slide at 5× magnification. All images were analyzed using ImageJ (version 1.50v;
National Institutes of Health). Red, green, and blue (RGB) images were converted to
grayscale then percentage of red-stained collagen in the background of pale-stained
medullar area was measured. The measurement follows the guidance at
https://imagej.nih.gov/ij/docs/examples/stained-sections/index.html.
2.2.6. Antibody staining and flow cytometric analyses
B220+ B cells were identified using B220-PE-Texas Red or APC, CD4+ T cells by
CD4-APC or PECY5, and CD8+ T cells by CD8a-PE or Pacific Blue. Naïve CD4+ and
CD8+ T cells (CD44lo CD62Lhi) were detected using the additional antibodies CD44-
APCCY7 and CD62L- PerCPCY5-5. DN thymocytes were defined as CD4- CD8- cells
76
and subdivided into DN1, DN2, DN3, and DN4 cells based on expression of CD44 and
CD25 as follows: DN1: CD44+ CD25-; DN2: CD44+ CD25+; DN3: CD44-CD25+; DN4:
CD44-CD25- using CD4-PerCPCY5-5, CD8-PE or Pacific Blue, CD44-APC or APCCY7
and CD25-PECY7 antibodies. BM LMPP (Lin- c-Kithi Sca-1hi Flt3hi CD34+) and CLP
(Lin- c-Kitint Sca-1int IL7R+ Flt3hi) were identified using CD11b-FITC, Ter119-FITC,
CD3-FITC, Gr1-FITC, B220-FITC, Sca-1-PECY7 or BV650, c-Kit-APC, CD34-Pacific
Blue or BV421, IL7R-APCCY7 and FLT3-PE or PECY5 antibodies. All antibodies were
purchased from BD Biosciences (San Jose, CA), Biolegend (San Diego, CA),
eBiosciences (San Diego, CA) or R&D Systems (Minneapolis, MN). The staining
processes were carried out for 20 min at 4°C in the dark, followed by washing with 1%
bovine calf serum (BCS)/phosphate buffered saline (PBS). Samplers were acquired using
BD LSRII system (Becton Dickinson Immunocytometry Systems, San Jose, CA) and
analyzed using FlowJo Software (FlowJo LLC, Ashland, OR).
2.2.7. Statistical analysis
Unpaired Student’s t-tests were performed to compare the following parameters:
CBC, thymus and spleen weight and cellularity, thymic collagen deposition, and
lymphoid cell types. If no sex differences were observed, data from males and females
were combined. While many parameters measured over time were also significantly
different at individual time-points, a single asterisk denoting significance comparing all
mice over a specific time range was used rather than multiple asterisks at individual time-
points, for the ease of the reader. Data are expressed as mean ± standard error of the
mean (SEM). P<0.05 was considered significant.

77
2.3. Results
2.3.1. Reconstitution and involution of peripheral blood cells
Dr. Orschell’s laboratory has previously documented significantly decreased
numbers of all blood elements in the PB of aged H-ARS survivors compared to NI age-
matched controls [147]. To investigate male / female differences in the decreased blood
production in H-ARS survivors, as well as in normal aging in NI age-matched controls,
PB CBC from males and females were examined separately. The fluctuation in animal
number during the course of the study is due to the fact that these are retrospective
analyses that combined data from several studies, and also because mortality increases
with age, especially in radiation survivors, leaving fewer aged mice available for analyses
at later time-points. When CBC from NI male or NI female mice of multiple ages
between 3- and 24-month-old (m/o) were compared, WBC, NE, LY, and PLT were all
found to be significantly higher in NI males compared to females. In IR mice, all blood
parameters were significantly reduced during the H-ARS phase, as Dr. Orschell's
laboratory and others have reported [69, 211, 217], and did not differ between males and
females. However, sex differences in CBC became again apparent as H-ARS survivors
aged. When data from IR males or IR females between 6 and 21 months post-TBI were
compared, all blood elements were found to be significantly decreased in IR females
compared to IR males (Figure 17 A-E). NE gradually increased in the DEARE phase in
both IR males and IR females (Figure 17 B), whereas LY declined over time, most
dramatically in IR females (Figure 17 C). A similar trend was observed in NI mice during
aging, in which NE increased and LY decreased, indicative of myeloid skew. The

78
enhanced radiosensitivity of LY compared to other blood elements is evidenced by the
sustained lymphopenia at the end of the H-ARS phase (day 30 post-TBI) compared to the
nearly complete recovery of most other blood elements (Figure 17 A-E).
2.3.2. Reconstitution and involution of thymus and spleen
Lymphocytes originate in the BM from the LT-HSC and migrate as LMPP and
CLP to the thymus, where they continue maturation to become mature CD4+ and CD8+ T
lymphocytes. Given the high degree of radiosensitivity of the thymus [218, 219], and
potential impact of radiation-induced thymic damage on long-term T cell maturation,
thymus weight and cellularity in IR mice were examined during the H-ARS and DEARE
phases in comparison to NI age-matched controls.
Thymus weight and cellularity were found to be significantly greater in young 12
w/o NI female mice compared to young males (Figure 17 F & G), in agreement with
others [220, 221]. However, as NI mice aged, thymus weight and cellularity gradually
decreased in both sexes, and sex differences in geriatric mice lessened with age, similar
to other reports [220, 222].
During the H-ARS phase, thymic weight and cellularity changed in a biphasic
pattern, with nadirs at day 3 and day 20 post-IR and a transient peak at day 10 which
reached 60% and ~32% of the NI baseline value, respectively (Figure 17 F & G). Due to
the higher baseline values in NI females, radiation-induced thymic suppression was
proportionally greater in females than males. Similar to CBC shown in Figure 17 A-E,

79
there were no sex differences in thymic weight or cellularity during H-ARS. By day 30,
thymus weight in IR males and females combined was 40% of that in NI mice (p<0.01,
Figure 17 F). Thymus weights in both NI and IR mice continued to decrease as mice
aged, with values from IR mice remaining significantly less than those in NI mice
throughout the DEARE phase (p<0.01). Parallel trends were observed for thymic
cellularity (Figure 17 G).
Naïve T cells migrate from the thymus to the spleen where they encounter foreign
antigens and undergo activation. Spleen weight and cellularity reached their nadirs by
day 3 post-IR, followed by a partial recovery by day 20 (Figure 17 H & I). Similar to
peripheral blood, the reconstitution of spleen in the H-ARS phase was monophasic.
Spleen weight and cellularity from both NI and IR survivors did not change drastically as
mice aged, unlike the age-related involution observed in thymus (Figure 17 F-I).
2.3.3. Histological analyses of thymus and spleen
Thymi and spleens from NI and IR mice at different ages were stained by H&E to
evaluate histological changes throughout the H-ARS and DEARE phases. Young (3 m/o)
NI thymi were characterized by a large cortex:medulla ratio of 3:1-4:1 with a distinct
cortico-medullary junction (CMJ) (Figure 18 A). The cortex thinned significantly after
irradiation, such that by day 20 post-IR (second nadir) the cortex:medulla ratio dropped
to 1:1-2:1 and the CMJ became blurry. Thymi from aged NI mice (15 m/o) also displayed
a thin cortex but with a clear CMJ, as well as focal fibrous proliferation. Aged thymi

80
from H-ARS survivors [12 months (mo.) post-IR] demonstrated a large mass of adipose
tissue and reticular connective tissue surrounding a small, hypocellular thymus with
Figure 17
B
C
E
NE
PLT
∆
* *
* *LY
∆
* *
∆
0
3
6
9
12
15
0
1
2
3
4
5
0
500
1000
1500
2000
D RBC
∆
0
3
6
9
12
15
A * WBC
∆
*
0
5
10
20
15
0 10 20 25 30 3 6 9 12 15 18 2112 13.4 15 15.5 16 6 9 12 15 18 21 2487 10 20 12 24 24 26 28 25 6 8 4189 10 18 6 10 37 38 41 22 18 5 3187 14 9 12 13 9 31 15 11 15 13 189 14 12 11 14 12 25 17 19 17 7 3
time-post-IR (day or mo.)age (wk. or mo.)
NI male,nNI female,n
IR male,nIR female, n
x-axis and n for each group in Figs. 1a-1e:
*G
F
x gr
amx
106
Thymocyte number
*Thymus weight
0
0.02
0.03
0.05
0.04
0.01
0
40
80
120
160
200
0 3 7 10 20 30 6 9 12 1512 12.4 13 13.4 15 16 9 12 15 1814 Not done 7 5 7 11 218 Not done 6 8 5 12 314 16 4 9 6 2 8 3 4 118 11 4 10 8 2 11 7 8 3
time-post-IR (day or mo.)age (wk. or mo.)
NI male,nNI female,n
IR male,nIR female, n
x-axis and n for each group in Figs. 2a-2b:
*
H
I
x gr
amx
106
Spleen weight
Splenocyte number
50
0
100
150
0.05
0.10
0.15
0.20
0
0 3 10 20 6 1212 12.4 13.4 15 9 1518 Not done 8 917 Not done 10 1018 10 8 3 1 217 8 8 5 2 4
time-post-IR (day or mo.)age (wk. or mo.)
NI male,nNI female,n
IR male,nIR female, n
x-axis and n for each group in Figs. 3a-3b:
NI FNI MIR FIR M
H-ARS phase
DEARE phase
K/µl
M/µ
lK/
µlK/
µlK/
µl

81
Figure 17. Reconstitution and involution in peripheral blood, thymus and spleen
post-IR.
Peripheral blood, thymi, and spleens were harvested from C57Bl/6 mice that had received
a single TBI dose of 8.72 or 9.04 Gy gamma radiation at 12 w/o (IR) and from age-
matched NI controls at various time-points. NI and IR mice were evaluated for WBC
(panel A), NE (panel B), LY (panel C), RBC (panel D), PLT (panel E), thymus weight
(panel F), thymus cellularity (panel G), spleen weight (panel H) and spleen cellularity
(panel I) and analyzed separately by gender. Data are mean ± SEM. Asterisk (*) indicates
p<0.05 comparing female (F) with male (M) in NI group. Triangle (∆) indicates p<0.05
comparing F with M in IR group. All data are significantly different between NI and IR
mice and thus not indicated on each graph. Time post-IR, age, and number of mice
analyzed for CBC, thymus and spleen at each time-point are given below panels E, G and
I, respectively.

82
undistinguishable CMJ. The cortex:medulla ratio of aged thymus ranged between 1.1-2.1.
Photographs of thymi from NI and IR mice at different ages in Figure 18 A illustrate the
vast differences in size.
To further confirm that radiation induces fibrous proliferation in the thymus early
post-IR, thymi at 30 days post-IR were stained with Picrosirius red to identify collagen
deposition, which was found to be localized to the medulla (Figure 18 B). Quantification
with ImageJ revealed 20-30% more collagen deposition in the medulla of IR mice in
comparison with NI mice as early as day 30 post-IR (Figure 18 B).
2.3.4. Phenotypic analyses of lymphoid compartments
Dr. Orschell’s laboratory has previously documented significantly decreased PB
lymphocytes in H-ARS survivors, which correlated with significant myeloid skew [147]
and decreased number of functional BM-derived lymphoid progenitors [40]. To better
understand the effects of lethal radiation exposure on specific lymphoid subpopulations,
lymphocyte populations were phenotypically defined and enumerated in PB, thymus,
spleen, and BM of aged H-ARS survivors in comparison to age-matched NI controls and
young NI mice. Aged H-ARS survivors exhibited significantly decreased numbers of PB
B220+ B cells, CD4+ T cells, CD4+ naïve cells, and CD8+ naïve T cells compared to age-
matched NI controls (Figure 19 A, B, D & E). PB CD8+ cells of aged H-ARS survivors
also had similar trend but not significantly different comparing to aged NI controls
(Figure 19 C), as were CD4+ memory and CD8+ memory cells (non-significantly; data
not shown). Normal aging in NI mice resulted in non-significant reductions in all PB T

83
Figure 18

84
Figure 18. Images and histology of thymi and spleens in NI and IR mice.
Panel A shows representative photographs of thymi from NI and IR mice at various time-
points, and thymi that were fixed in formalin, embedded in paraffin and stained for
hematoxylin and eosin. Panel B shows representative micrographs of thymic sections
from 4 m/o NI mice and IR mice 30 days post-IR stained with Picrosirius red. Collagen
deposition is presented as the percentage of Picrosirius red positive area in the medullary
area using ImageJ software. Data are mean ± SEM. n=6 mice per group (2 females and 4
males per group), with one tissue section stained per mouse. *p<0.05 comparing IR and
NI mice. Panel C shows spleens from 3 and 15 m/o NI mice and IR mice 20 days and 12
mo. post-IR. Tissues were fixed in formalin, embedded in paraffin and stained for
hematoxylin and eosin. Dr. George E. Sandusky and Jennifer Stashevsky provided the
histological staining.

85
Figure 19
* * ∆* * ∆
A B C D E
∆
∆∆
∆ ∆
∆∆
F HG I
∆
* *
∆
R S T U
* **
∆
∆
* **
∆
* **
∆
**
* **
∆
* **
* **
* **
JK L M
N O QP
∆
∆
*
NI3 m/o
NI IR15 m/o
NI3 m/o
NI IR15 m/o
NI3 m/o
NI IR15 m/o
NI3 m/o
NI IR15 m/o
NI3 m/o
NI IR15 m/o
NI3 m/o
NI IR15 m/o
NI3 m/o
NI IR15 m/o
NI3 m/o
NI IR15 m/o
NI3 m/o
NI IR15 m/o
NI3 m/o
NI IR15 m/o
NI3 m/o
NI IR15 m/o
NI3 m/o
NI IR15 m/o
NI3 m/o
NI IR15 m/o
NI3 m/o
NI IR15 m/o
NI3 m/o
NI IR15 m/o
NI3 m/o
NI IR15 m/o
NI3 m/o
NI IR15 m/o
NI3 m/o
NI IR15 m/o
NI3 m/o
NI IR15 m/o
NI3 m/o
NI IR15 m/o
NI3 m/o
NI IR15 m/o
∆
∆
*
B220+ CD4+ CD8+ CD4 naïve CD8 naïve
CD4+ CD8+ CD4 naïve CD8 naïve
LMPP CLP LMPP CLP
% F
lt3hi
CD34
+of
LSK
x 10
5
%IL
7R+
Flt3
hiof
L- Sin
tkin
t
DN DP CD4+ CD8+
DN1 DN2 DN3 DN4
†
†
††
†
PB
Spleen
Thymus
BM
x 10
6
x 10
6x
106
x 10
6
x 10
6
x 10
6
x 10
6
x 10
6
x 10
6
x 10
6
x 10
6
x 10
6
x 10
3 / μL
x 10
3 / μL
x 10
3 /μL
x 10
3 /μL
x 10
3 /μL
x 10
4
6543210 0 0 0
0 0 0 0
0 0
0.1
0.2
0.3
0.4
50
100
150
200
5
10
15
20
2554
32
1
0.5
1.0
1.5 2.0
1.5
1.0
0.5
2.5
2.0
1.5
1.0
0.5
1
2
3
4
8
12
10%
20%
30%
0%
10%
20%
30%
0%
40%

86
Figure 19. Lymphocyte subsets in young and aged NI mice and aged H-ARS
survivors.
C57Bl/6 mice were exposed to a single TBI dose of 8.72 or 9.04Gy gamma radiation at
12 w/o and euthanized at 15 m/o, along with 3 m/o and 15 m/o NI mice. Peripheral blood,
splenocytes, thymocytes and bone marrow cells were processed and stained with
antibodies as described in Materials and Methods. Flow cytometric analyses identifies
peripheral blood B220+ cells (panel A), CD4+ T cells (panel B), CD8+ T cells (panel C),
CD4 naïve T cells (panel D) and CD8 naïve T cells (panel E); splenic CD4+ T cells
(panel F), CD8+ T cells (panel G), CD4 naïve T cells (panel H), and CD8 naïve T cells
(panel I); thymic DN (panel J), DP (panel K), CD4+ (panel L), CD8+ (panel M), DN1
(panel N), DN2 (panel O), DN3 (panel P) and DN4 (panel Q) cells; and percentages of
BM LMPP (panel R) and CLP cells (panel S), and absolute number of LMPP (panel T)
and CLP cells (panel U). Data from male and female PB, spleen, and BM were not
significantly different and thus combined. Data are mean ± SEM. n=4-6 mice per group.
* p<0.05 compared to 15-month-old NI; ∆ p<0.05 compared to 3-month-old NI group in
panels A-I and R-U. Brackets (⊓) in panels J-Q indicate p<0.05 comparing F and M
combined data to other groups, and dagger (†) indicates p<0.05 comparing F to M within
each NI or IR group.

87
lymphocyte populations examined in comparison to 3 m/o NI mice (Figure 19 B-E), with
an apparent increase in B cells (Figure 19 A). There were no sex differences in numbers
of PB lymphocyte subpopulations in any group, so male and female data were combined.
In the spleen, a similar pattern of decreased numbers of CD4+, CD4+ naïve, and
CD8+ naïve cells was observed in H-ARS survivors versus NI age-matched controls as in
PB, but differences did not reach significance (Figure 19 F, H & J). More prominent was
a significant age-related decrease in CD8+, CD4+ naïve, and CD8+ naïve splenocytes in
aged NI mice compared to young NI mice (Figure 19 G-I). There was no difference in the
number of CD8+ lymphocytes between aged NI and IR mice, similar to PB (Figure 19 G),
and there were no sex differences in splenocyte T cell subgroups.
The age-related and radiation-related decrease in total thymocytes presented in
Figure 19 G was also found to exist when thymic subpopulations were examined: DN,
DP, CD4+, CD8+, DN1, DN2, DN3, and DN4 were all significantly decreased in H-ARS
survivors compared to NI age-matched controls. Likewise, all these populations were
significantly decreased in aged NI mice compared to young NI mice, illustrating the
normal age-related thymic involution (Figure 19 J-Q, male and female data combined).
Of interest, sex differences in thymic subpopulations were found to exist. In agreement
with others [223], 3 m/o females had more DP cells than males (Figure 19 K). In
addition, all thymic subpopulations trended higher in male H-ARS survivors compared to
females, similar to the increased PB CBC in males versus females, and these differences
reached significance for DN, DP, CD4+, and DN3 cells (Figure 19 J-L & P).

88
Peripheral lymphocytes originate from primitive BM progenitors termed LMPP
and CLP, which originate from multi-potent HSC. To better understand BM involvement
in immune deficiencies, BM LMPP and CLP were enumerated in H-ARS survivors in
comparison to age-matched NI mice and young NI controls. Both frequency (as a
percentage of LSK cells or Lin- Sca-1int c-Kitint cells) and absolute number of LMPP and
CLP were significantly decreased in H-ARS survivors compared to age-matched controls
(Figure 19 R-U). In NI mice, LMPP and CLP frequencies were also found to decrease
significantly with age (Figure 19 R & S), as previously reported [224, 225]. However,
when calculated as a percentage of whole BM, the percentages of both LMPP and CLP
were found to be two-fold higher in aged NI mice compared to young NI (LMPP of old
vs. young: 0.04 ± 0.009% vs. 0.02 ± 0.005%, p=0.02; CLP of old vs. young: 0.013 ±
0.0029 vs. 0.007 ± 0.0015%, p=0.06). Similarly, absolute numbers of LMPP and CLP
were 5-fold and 6-fold increase in old vs. young NI mice, respectively (Figure 19 T & U).
This apparent dichotomy between decreased frequency and increased number can be
explained by the significant phenotypic expansion of LT-HSC with age, as Dr. Orschell’s
laboratory [147] and others [226] have reported, despite declining functional potential
[40, 147, 227-234]. No sex differences were observed in the frequency or number of BM
lymphoid progenitors.
2.4. Discussion
Lymphoid organs and lymphocytes are highly radiosensitive [235] due in part to
their propensity toward rapid apoptosis when exposed to radiation. The acute effects of

89
radiation exposure on the lymphoid system are well known, but the late effects and long-
term immune suppression in survivors of H-ARS are less well characterized [147, 236,
237]. In this report, radiation damage was investigated at all levels of lymphopoiesis in
both male and female long-term H-ARS survivors, and was found to be characterized by
significant tissue-specific reconstitution and involution patterns, age-related differences,
and noteworthy male/female differences, especially in the thymus.
Dr. Orschell’s laboratory previously reported persistent long-term dysfunction in
competitive transplantation assays of phenotypically defined BM LT-HSC isolated from
H-ARS survivors. Of note, lymphoid reconstitution in recipients of these BM LT-HSC
transplants was severely diminished [40, 147], illustrating the loss of multi-lineage
reconstitution potential of LT-HSC from DEARE mice. Herein, the primitive BM
progenitors LMPP and CLP, progenies of LT-HSC, were enumerated and found to be
significantly decreased in frequency and absolute number in DEARE mice, strongly
implicating LT-HSC dysfunction as a significant contributor to the diminished lymphoid
reconstitution in DEARE mice.
Peripheral blood reconstitution in long-term H-ARS survivors was marked by
significant myeloid skew, as previously reported [147, 237], and found herein to be
present in both males and females. Of interest, myeloid skew was found to be more
severe in IR females compared to males, and was characterized by a steady decline in
lymphocyte number beginning around 9 months of age. Declining PB LY numbers in IR
females paralleled observations in the thymus, which also showed worse recovery of

90
most classes of thymocytes (DN, DP, CD4+, CD8+ cells) in females, illustrating curious
sex differences in immune reconstitution in the DEARE phase. Phenotypic analyses of
PB LY subpopulations of DEARE mice revealed that the loss of LY was primarily due to
significant loss of B cells, CD4+ T cells, and both CD4+ and CD8+ naïve T cells
compared to NI age-matched controls. The LY subpopulation least affected by radiation
exposure was CD8+ T cells, which are known to undergo homeostatic peripheral
expansion (HPE) in lymphopenic environments [238, 239]. Similar trends in these LY
subpopulations were also present in spleen.
A biphasic recovery pattern of thymocytes was documented during the H-ARS
phase with recovery to only ~40% of baseline values, similar to other reports [218, 219].
The first spike of cellularity in the biphasic recovery pattern is thought to be due to
proliferation of remaining thymocytes [240, 241], which eventually deplete [242, 243].
This depletion, along with lack of BM support [244], leads to the second nadir. Thymic
precursors migrating from the bone marrow to the thymus are responsible for eventual
reconstitution [241, 245]. However, in H-ARS mouse model with high dose radiation,
BM insufficiency is evident [40, 147], leading to long-term thymic insufficiency. The
observed increase in medullary fibrosis in the thymus also likely contributes to thymic
dysfunction in long-term H-ARS survivors. Thymic fibrosis early post-IR has also been
reported in non-human primate radiation models [246].
Interesting male/female differences were also documented in normal NI C57BL/6
mice. First, males possessed significantly increased numbers of most PB CBC parameters

91
compared to females (WBC, NE, LY, and PLT), and these sex differences persisted into
old age. For LY, these differences intensified as mice aged, leading to more severe
myeloid skew in NI geriatric females than in males. The presence of myeloid skew in
both NI aged mice and H-ARS survivors illustrates similarities between normal aging and
radiation damage on hematopoiesis [147, 247]. The decrease in LY in aged NI mice was
primarily due to a decline in all classes of T cells, while B cells increased, as previously
shown [248, 249]. Evidence of homeostatic peripheral expansion of PB CD8+ T cells was
also present in aged NI mice. While most thymus parameters (mass, cellularity and T cell
subpopulations) were increased in young NI females compared to males (in agreement
with others [223, 250] and consistent with human data [251]), these differences
diminished as mice aged. Spleen also showed decreased numbers of T cell
subpopulations with age in both genders, but significantly increased spleen mass in NI
aged females. Sex differences in PB and thymus parameters were both abolished after
radiation exposure.
Sex differences in lymphoid organs [250] and age-related thymic involution [252]
have been postulated to be due to sex hormones, which may be further exacerbated by
radiation damage to sex organs. Other factors independent of sex hormones, such as sex
chromosomes, may also contribute to the observed sex differences. Many genes
implicated in immune function are located on the X chromosome, including
theinterleukin-2 receptor gamma chain gene [253] which participates in signal
transduction of a number of cytokines, and FOXP3 gene which is involved in regulatory
T cell development [254]. The X chromosome in general imparts an immunological

92
advantage to females in the face of various immune challenges, but can also lead to
increased autoimmune diseases [255]. In addition, radiation-induced epigenetic changes
in the murine thymus have been shown to differ between males and females [256], which
may also contribute to sex-related differences in the radiation response and immune
reconstitution.
Taken together, this study has defined the prolonged immunosuppression at all
levels of lymphocyte development in established murine H-ARS and DEARE models.
These data build upon previous work by others and add to the understanding of the severe
immune dysfunction that occurs in radiation survivors, with the hope that they will be
useful for development of potential MCM and therapeutic strategies for radiation-induced
long-term immune deficiency.
In conclusion, immune suppression is a serious health risk in individuals exposed
to myelosuppressive or ablative radiation, and has not been well-defined in long term
survivors of H-ARS. Herein radiation-induced changes in primitive and mature lymphoid
cells at all levels of lymphopoiesis were delineated in mice exposed to potentially lethal
doses of radiation. Tissue-specific reconstitution and involution patterns were
documented in PB, thymus, spleen, and BM tissues, along with unique sex-related and
age-related changes present in some tissues but not others. The “double hits” of
irradiation and age-related stress on lymphopoiesis lead to significant myeloid skew and
long-term immune involution. These H-ARS and DEARE mouse model provide useful

93
tools for developing and evaluating medical countermeasures against the immune-
suppressing effects of irradiation.
Chapter 3. Optimizing and Profiling Prostaglandin E2 as a Medical
Countermeasure for the Hematopoietic Acute Radiation Syndrome
3.1. Introduction
Terrorist activities, nuclear warfare, and radiation accidents have the potential to
expose humans to dangerous levels of radiation. Victims of exposure to a lethal dose of
radiation face acute and chronic organ injuries, including H-ARS and DEARE. H-ARS
and DEARE have been characterized by Dr. Orschell's laboratory in Chapter 2.
MCM can be radioprotectant, when used pre-exposure for protection, or
radiomitigator, when used post-exposure for mitigation [257]. Current FDA-approved
radiomitigators including Neupogen (G-CSF), Leukine (GM-CSF), and Neulasta
(pegylated G-CSF) are effective in increasing the survival rate and ameliorating H-ARS
in victims of civilian radiation accident [200]. However, for first responders and military
personnel who work in the radioactive-material contaminated environment, no
radioprotectant has been approved [258]. Amifostine is approved for tissue protection in
patients undergoing with chemotherapy and/or radiotherapy, but has not been approved
as radioprotectant for H-ARS [259]. An effective radioprotectant for H-ARS is a
significant, unmet medical need.
PGE2 is one of the most abundant eicosanoids and mediates diverse physiological
and pathological processes, including hematopoiesis [130, 260], bone metabolism [261],

94
blood pressure regulation [262], and pain and inflammation [263, 264]. The
radioprotective and radiomitigating properties of dmPGE2, a long-acting analogue of
PGE2 with similar biological effects as PGE2 but with a longer half-life, have been
investigated. Hanson et al. [132, 265] indicated that dmPGE2 protected intestinal
clonogenic cells from radiation damage in B6D2F1 mice when used as radioprotectant 1
hr prior to radiation exposure. Walden et al. [134] demonstrated that dmPGE2 increased
the LD50/30 survival rate of CD2F1 mice when administrated -30 min prior to radiation.
Hoggatt J et al. [135] investigated dmPGE2 as a radiomitigator at +6 and +24 post-IR,
demonstrating significantly enhanced day 30 survival rate and accelerated hematopoietic
recovery in C57Bl/6 mice, possibly due to enhanced HSC survival and self-renewal
(Figure 20). These early studies were performed on adult mice with different genetic
backgrounds.
The FDA Animal Rule (AR) is a set of FDA guidance about drug development
when human studies are unethical, such as studies on lethal radiation exposure. Besides
expecting the drug response in animal model could predict the response in human, FDA
AR also encourages researchers to investigate the efficacy of MCMs in special
populations, including pediatric and geriatric populations. In order to develop dmPGE2
as an effective MCM, the efficacy of dmPGE2 was evaluated in the well-defined animal
model [69] to investigate the optimal time window of dmPGE2 treatment and age-related
effects on its radioprotective and radiomitigative properties. Additionally, the potential
PGE2 receptor that might play a role in mediating dmPGE2 protection was identified,
and the hematopoietic recovery and bone marrow environment changes post-IR were

95
evaluated. These findings may contribute to the possibility of stockpiling and widely
distributing dmPGE2 as an MCM for H-ARS in the future.
Figure 20
0
3
6
9
12
5 10 15 20 25 300
1
2
3
4
5 10 15 20 25 30
0
4
8
12
16
5 10 15 20 25 30
C
WBC
(K/µ
l)
NE
(K/µ
l)
Days post-TBI
LY (K
/µl)
ED
VehdmPGE2
NI
*
120
100
80
60
40
20
00 5 10 15 20 25 30
120
100
80
60
40
20
0 0 5 10 15 20 25 30
VehdmPGE2
A B
% S
urvi
val
Days post-TBI Days post-TBI%
Sur
viva
l
+6hr +24hr
**

96
Figure 20. Effect of dmPGE2 as radiomitigator given at +6 hr or +24 hr post-TBI on
day 30 survival and hematopoietic recovery of lethal-irradiated mice.
Mice were exposed to 7.96 Gy (LD70/30) TBI at 12 w/o. DmPGE2 was injected
subcutaneously single dose of 40 µg per mouse at +6 hr (panel A) or +24 hr (panel B)
post-TBI. The survival in each group was monitored daily for consecutive 30 days after
TBI. Thirty-day survival rates between the dmPGE2 and Veh group were compared using
the Kaplan-Meier method and log-rank test. n=20-40 per group. * p<0.05 comparing to
Veh group. For the +6 hr group, WBC, NE and LY were analyzed at various days post-
TBI (panel C-E). n=3 per group per time-point. Reproduced from Hoggatt J, Singh P,
Stilger KN, et al. Recovery from hematopoietic injury by modulating prostaglandin E (2)
signaling post-irradiation. Blood Cells Mol Dis. 2013 Mar;50(3):147-53.

97
3.2. Materials and Methods
3.2.1. Mice, husbandry, monitoring and irradiation
Male and female young adult C57BL/6 mice were purchased from Jackson
laboratory (Bar Harbor, ME) at 10 w/o and acclimated with acidified water for 2-week
prior to irradiation. In accordance with pilot studies, the adult mice were irradiated at 12
w/o, an age analogous to a “young adult” human at 20 years old [266], with an
unfractionated TBI dosage of 8.53 Gy (LD50/30), 8.72 Gy (LD70/30), or 9.04 Gy
(LD90/30). Geriatric mice were aged in-house to 23.5 months and then provided acidified
water for 2-week prior to irradiation. The geriatric mice were irradiated at 24 m/o
(analogous to human at 70 years old [266]) with 10.08 Gy for male mice and 9.47 Gy for
female mice. The pediatric mice were received from in-house breeding colony at the
Indiana University Melvin and Bren Simon Cancer Center In Vivo Therapeutics Core
(Indianapolis, IN), and were not provided acidified water until after TBI. The pediatric
mice were irradiated at 6 w/o (analogous to human at 11.5 years old [266]) with 7.41 Gy
for male mice and 8.01 Gy for female mice. Husbandry, health status monitoring,
irradiation, and dosimetry were carried out as previously described in Chapter 2 and in
earlier paper [69, 267]. The irradiation dosages for pediatric and geriatric mice were
chosen based on previous dose response relationship (DRR) probit plots to reach lethality
around LD70/30 in Veh group (data not shown). Males and females were exposed
separately since the sex-specific LD70/30 at this pediatric or geriatric age differs by 0.6
Gy, much greater than the difference in young adult (12 w/o) mice which is only 0.1 Gy
(unpublished data). All studies were approved by the Indiana University School of
Medicine Institutional Animal Care and Use Committee.

98
3.2.2. Compounds
DmPGE2 in methyl acetate was purchased from Cayman Chemicals (Cayman
Chemicals, Ann Arbor, MI), and evaporated on ice under N2 then reconstituted in 100%
ethanol (EtOH) at a final concentration of 0.1 M. DmPGE2 was injected subcutaneously
at one dose of 35 µg or two doses of 20 µg as indicated in Figures and Legends. Vehicle
(Veh; 1.75% EtOH/PBS solution) was injected at the same time as dmPGE2,
respectively. In PGE2 receptor activation study, the EP agonists are EP1+3 dual agonist
(17-phenyl trinor PGE2, Cayman Chemical, Ann Arbor, MI), EP2 selective agonist
(butaprost free-acid, Cayman Chemical, Ann Arbor, MI) and EP4 selective agonist
(L902-688, Cayman Chemical, Ann Arbor, MI). EP receptor agonists (10 µg or 35 µg per
mouse) were injected subcutaneously -30 min prior to TBI [131, 268]. The volume of all
compounds to deliver per mouse per injection was 200 µl.
3.2.3. CBC
Complete blood count was performed on peripheral blood of mouse on a validated
HEMAVET 950FS Hematology System (Drew Scientific, Waterbury, CT). The
procedures of blood collection and HEMAVET validation were carried out as previously
described [69].
3.2.4. Antibody staining and flow cytometry analysis
For HSC analysis, whole BM cells were acquired from femurs crushed with a
mortar and pestle in PBS with 2% fetal bovine serum (FBS) and 2 mM EDTA. Filtered

99
cells then were stained with FcR blocking antibody followed by anti-Lin, anti-c-Kit, anti-
Sca-1, anti-CD48, and anti-CD150 antibodies (Biolegend, San Diego, CA) in PBS
containing 0.5% bovine serum albumin (BSA) and 2 mM EDTA. HSC was identified by
the LSK and SLAM markers (CD48- CD150+) as previously described [128].
For mesenchymal stromal cells (MSC) analysis, crushed femurs were digested
with 0.25% collagenase IV (Invitrogen, Waltham, MA) in PBS and 10% FBS, 30 min at
37°C. Cells were stained with FcR blocking antibody followed by anti-CD45, anti-
ter119, anti-CD31, anti-CD51 and anti-PDGFR antibodies (Biolegend, San Diego, CA).
MSCs were identified as CD45- Ter119- CD31- CD51+ PDGFR+ as previously described
[131, 269]. Flow cytometry analyses were performed on LSR-II flow cytometer (Becton
Dickinson Immunocytometry Systems, San Jose, CA) (Andrea Patterson and Pratibha
Singh in Dr. Pelus’ laboratory provided the bone marrow phenotype analyses).
3.2.5. Colony assay
The surviving mice of the “young adult” group at day 35 post-TBI were sacrificed
and 5×10⁴ BM cells acquired from femurs were plated in ColonyGEL Mouse Complete
Medium (Reach Bio, Seattle, WA) as previously described [131, 135]. After 7 days of
incubation in a 37°C 5% CO2 incubator, CFC, CFU-GM, BFU-E and CFU-GEMM were
counted by microscopy. CFC was the total number of all colonies. Colony assay for each
mouse were done in triplicate.
100
3.2.6. BM cellularity and BM cytokine quantification
BM supernatants were collected by flushing 2 femurs and 2 tibiae twice with a
single volume of 500 µl cold PBS, stored at -80°C and thawed on ice before analysis.
Samples were centrifuged at 16,300 g for 10 min to remove debris and measured in
duplicate for 32 cytokines/chemokines by Milliplex Map Kit (EMD Millipore, Billerica,
MA) using a Bio-Plex 200 system with High Throughput Fluidics Multiplex Array
System (Bio-Rad Laboratories, Hercules, CA) according to the manufacturer’s
instructions. Data were analyzed with Bio-PlexTM 6.0 Manager software (Bio-Rad
Laboratories, Hercules, CA). The 32-plex cytokine panel contained the following
cytokines: MCSF, GM-CSF, G-CSF, IL-3, IL-7, leukemia inhibitory factor (LIF), IL-15,
vascular endothelial growth factor (VEGF), IL-1α, IL-1β, tumor necrosis factor alpha
(TNF-α), IL-2, IL-12 (p40), IL-12 (p70), interferon gamma (IFN-γ), IL-6, IL-17, IL-4,
IL-5, IL-9, IL-10, IL-13, keratinocyte chemoattractant (KC, CXCL1), macrophage
inflammatory protein 2 (MIP-2, CXCL2), lipopolysaccharide-induced CXC chemokine
(LIX, CXCL5) , monokine induced by gamma interferon (MIG, CXCL9), interferon
gamma-induced protein 10 (IP-10, CXCL10), monocyte chemoattractant protein-1
(MCP-1, CCL2), macrophage inflammatory protein 1 α (MIP-1α, CCL3), macrophage
inflammatory protein 1 β (MIP-1β,CCL4), regulated upon activation normal T cell
expressed and secreted (RANTES, CCL5) and Eotaxin (CCL11). Since the results of
Bio-Plex analysis represent the concentration of BM cytokines diluted in 500 µl PBS, and
the mean BM cavity volume of 2 femurs + 2 tibiae for each mice are 53.1178 µl for
males and 39.1072 µl for females (personal communication with Dr. Laura Wright who
did the microcomputed tomography on the BM cavity of young adult mice), the
101
following dilution factor was applied to values from the BioPlex to obtain the actual
concentration of cytokines as they exist in the BM space: for males, 500 µl /53.1178 µl =
9.413; for females, 500 µl /39.1072 µl = 12.7854. For example, the concentration of
cytokine A in Bio-Plex analysis of female mice is 1 pg/ml, so the weight of cytokine A in
500 µl BM flush is 0.5 pg, and the concentration of cytokine A in BM milieu is 0.5 pg/
39.1072 µl = 12.7854 pg/ml. Total BM cells concentration in BM flush was performed on
HEMAVET 950FS Hematology System (Drew Scientific, Waterbury, CT) as previously
described in CBC analysis. Similar dilution factor was applied to the BM cellularity.
3.2.7. Statistical analysis
All data are expressed as mean ± SEM. Binary comparisons between dmPGE2-
treated group and Veh-treated group, or Veh-treated group and NI group were subjected
to a two-sample unpaired t test using Microsoft Excel 2010 (Microsoft Corp, Redmond,
WA). The day 30 survival Kaplan-Meier (KM) analyses and log-rank tests were
performed with SPSS Statistics Version 24 (IBM, Armonk, NY). A p value less than 0.05
was considered significant. All data shown with error bars represent mean ± SEM.
3.3. Results
3.3.1. DmPGE2 increases day 30 survival post-IR
Hoggatt J et al. [135] previously found that a single dose of dmPGE2 acts as a
radiomitigator when administered +6 hr post-TBI, increasing the day 30 survival rate
from 5% to 55%. When administered +24 hr post-TBI, the day 30 survival rate was
increased from 35% to 70% (Figure 20). To test the hypothesis that dmPGE2 may be as

102
effective as a radioprotectant as it is as a radiomitigator and explore the optimal time
window of dmPGE2 administration, the previously described well-established H-ARS
mouse model was used [69]. Day 30 survival efficacies of 1 dose of 35 µg dmPGE2
when given at -24 hr, -3 hr, -1 hr, -30 min, -15 min, +3 hr, +24 hr, or +30 hr relative to
time of irradiation; or 2 doses of 20 µg at -15 min and -45 min prior to TBI, were tested.
Survival efficacies were verified by two different irradiation doses, i.e., LD70/30 and
LD90/30. The results demonstrated that dmPGE2 administration in the -3 hr to -15 min
time window prior to TBI has the best survival efficacy, which reaches 100% survival in
LD70/30 and 90-100% in LD90/30. No statistically significant difference was observed
between the survival rate of one dose of 35 µg dmPGE2 injected at -30 min and two
doses of 20 µg injected at -15 and -45 min prior to TBI, respectively. Administration of
dmPGE2 at +24 hr post 8.72 Gy TBI significantly increased day 30 survival, supporting
previous observation [135]. Now the time frame of radiomitigating dmPGE2 was
extended to +30 hr. Interestingly, when dmPGE2 was used as radioprotectant at -24 hr
prior to TBI or as radiomitigator at +3 hr post TBI, the day 30 survival rates in dmPGE2
group were the same as Veh group (Figure 21). These results indicated that there exists a
specific time window pre- and post-TBI at which dmPGE2 is effective.

103
Figure 21
LD70
-24hr
LD90
+3hr
-15, -45min
-1hr
-3hr
-15min
-30min
+24hr
Veh
dmPGE2
N.D.
N.D.
N.D.
Days post-TBI
0
20
40
60
80
100
0 5 10 15 20 25 30
*
% S
urvi
val
0
20
40
60
80
100
0 5 10 15 20 25 30
*
% S
urvi
val
0
20
40
60
80
100
0 5 10 15 20 25 30
*
% S
urvi
val
Days post-TBI
+30hr N.D.
% S
urvi
val
0
20
40
60
80
100
0 5 10 15 20 25 30
*
% S
urvi
val
0
20
40
60
80
100
0 5 10 15 20 25 30
% S
urvi
val
0
20
40
60
80
100
0 5 10 15 20 25 30
*
% S
urvi
val
0
20
40
60
80
100
0 5 10 15 20 25 30
*
% S
urvi
val
0
20
40
60
80
100
0 5 10 15 20 25 30
*
0
20
40
60
80
100
0 5 10 15 20 25 30
*
0
20
40
60
80
100
0 5 10 15 20 25 30
*
0
20
40
60
80
100
0 5 10 15 20 25 30
*
0
20
40
60
80
100
0 5 10 15 20 25 30
*
0
20
40
60
80
100
0 5 10 15 20 25 30
0
20
40
60
80
100
0 5 10 15 20 25 30

104
Figure 21. Thirty-day survival of lethal-irradiated mice treated with radioprotectant
or radiomitigator dmPGE2.
Mice were exposed to 8.72 Gy (LD70/30) or 9.04 Gy (LD90/30) TBI at 12 w/o. Single
dose of 35 µg dmPGE2 per mouse was injected subcutaneously at -24 hr, -3 hr, -1 hr, -30
min, -15 min, +3 hr, +24 hr, or +30 hr relative to time of irradiation; or 2 doses of 20 µg
at -15 min and -45 min prior to TBI. Veh control of same dose was given at same time-
points as dmPGE2. Male and female mice were equally distributed in each group. The
survival in each group was monitored twice daily for consecutive 30 days after TBI.
Thirty-day survival rates between the dmPGE2 and Veh group were compared using the
Kaplan-Meier method and log-rank test. n=19-20 mice per group except LD70/30 +24hr
where n=60 per group. *p<0.05 comparing to Veh group.

105
3.3.2. DmPGE2 effects are different in pediatric and geriatric mice
Radiation victims represent a heterogenous population; therefore, age effects of
treatments need to be taken into consideration to ensure MCMs are suitable and/or
optimized to use in children and the elderly. Pre-clinical animal studies in young and
aging mice can be used to determine the impact of age on efficacy when human
irradiation studies are not ethical. To date, there has been no research on the efficacy of
dmPGE2 as a radioprotectant or radiomitigator in pediatric or geriatric animals.
Therefore the efficacy of dmPGE2 was investigated in 6 w/o and 2-year-old mice which
represent the juvenile and senior human populations, respectively. The 35 µg dose of
dmPGE2 was tested previously and tolerated well by pediatric and geriatric mice with no
mortality 24 hr after administration (data not shown). The -30 min and +24 hr Veh-
injected mice were combined into one Veh group in the pediatric or geriatric analysis,
respectively. In pediatric mice, dmPGE2 given -30 min before TBI (7.41-8.01 Gy)
protected 95% (p<0.001) of mice compared to 33% survival in vehicle treated mice.
However, dosing at +24 hr was not radiomitigative in pediatric mice (Figure 22 A). In
geriatric mice, dmPGE2 given -30 min before TBI (9.47-10.08 Gy) protected 80%
(p=0.005) of mice compared to 36% survival in vehicle treated mice, and it is an effective
radiomitigator given at +24 hr, which increased the survival rate to 67% (p=0.008) in
comparison with 36% survival in vehicle treated mice (Figure 22 B).
3.3.3. EP4 Receptor is the potential target receptor in dmPGE2 radioprotection
PGE2 interacts with four conserved G-protein receptors: EP1, EP2, EP3 and EP4.
In order to identify the responsible receptor involved in the survival efficacy of dmPGE2

106
Figure 22
0
20
40
60
80
100
0 5 10 15 20 25 30
0
20
40
60
80
100
0 5 10 15 20 25 30
A.
Days post-TBI
B.
*
Veh
dmPGE2 -30min
dmPGE2 +24hr
Days post-TBI
% S
urvi
val
% S
urvi
val
6 weeks old
24 months old
**
Veh
dmPGE2 -30mindmPGE2 +24hr
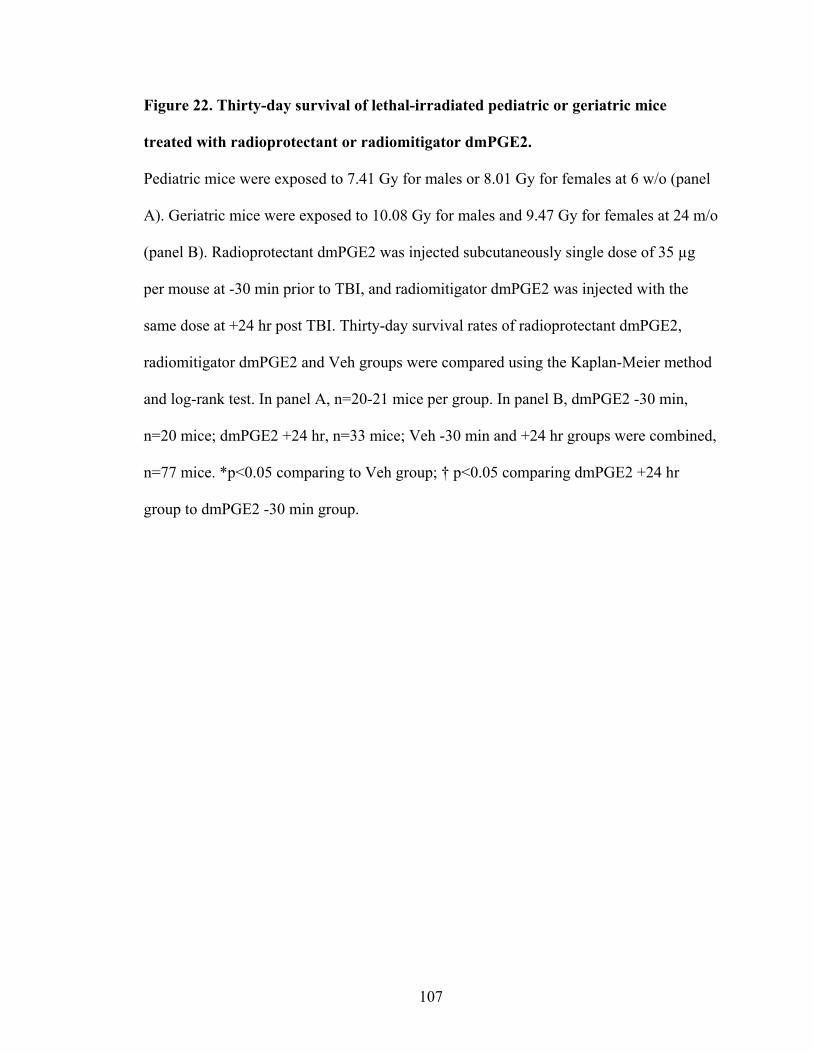
107
Figure 22. Thirty-day survival of lethal-irradiated pediatric or geriatric mice
treated with radioprotectant or radiomitigator dmPGE2.
Pediatric mice were exposed to 7.41 Gy for males or 8.01 Gy for females at 6 w/o (panel
A). Geriatric mice were exposed to 10.08 Gy for males and 9.47 Gy for females at 24 m/o
(panel B). Radioprotectant dmPGE2 was injected subcutaneously single dose of 35 µg
per mouse at -30 min prior to TBI, and radiomitigator dmPGE2 was injected with the
same dose at +24 hr post TBI. Thirty-day survival rates of radioprotectant dmPGE2,
radiomitigator dmPGE2 and Veh groups were compared using the Kaplan-Meier method
and log-rank test. In panel A, n=20-21 mice per group. In panel B, dmPGE2 -30 min,
n=20 mice; dmPGE2 +24 hr, n=33 mice; Veh -30 min and +24 hr groups were combined,
n=77 mice. *p<0.05 comparing to Veh group; † p<0.05 comparing dmPGE2 +24 hr
group to dmPGE2 -30 min group.

108
administered as a radioprotectant, agonists highly specific for EP1&3 (17-phenyl trinor
PGE2; Ki=14/3.7 nM), EP2 (Butaprost-free acid; Ki=11 nM), or EP4 (L-902,688;
Ki=0.38 nM) were tested for survival efficacies in comparison with dmPGE2 (Table 1).
Only the EP4 agonist, used as radioprotectant, significantly increased the day 30 survival
compared with the Veh control (45% in EP4 group vs. 13% in Veh group), although this
rate was still significantly lower than the day 30 survival with radioprotectant dmPGE2,
which provided nearly 100% protection. Neither EP1&3 nor EP2 agonist increased the
day 30 survival rate (Figure 23). Radioprotection appears to be the result of activating the
signal pathway via the EP4 receptor.
3.3.4. DmPGE2 accelerates hematopoietic recovery post-IR
Hoggatt, J et al. [135] previously found that dmPGE2 administered +24 hr post-
TBI effectively enhanced the recovery of peripheral blood cells and HPC potential. Here,
the effects of radioprotectant dmPGE2 (-30 min) on the hematopoietic recovery were
investigated. The nadir of hematopoietic inhibition post-TBI is around day 7-10, and
under the protection of dmPGE2, WBC, NE, RBC and PLT started to recover as early as
day 10 post-TBI, and continuously accelerated the hematopoietic recovery to 38 days
post-TBI. DmPGE2 treatment had little effect on LY nadir where LY started to recover
after day 20 post-TBI (Figure 24 A). Analyses of SLAM LSK and MSC phenotypes in
BM at day 50 post-TBI showed a significant increase in HSCs and niche cells (mainly
MSC) in dmPGE2-radioprotectant-treated mice compared with mice treated with the Veh
control (Figure 24 B & C, Andrea Patterson and Pratibha Singh in Dr. Pelus’ laboratory

109
Table 1. Selectivity and sensitivity of EP receptor agonists.
All compounds are commercially available from Cayman Chemical, Ann Arbor, MI and
data are from Cayman Chemical product sheets.
Compound Receptor Utilization
Selectivity (Ki) at Receptor (nM)
EP1 EP2 EP3 EP4
PGE2 EP1,2,3,4 20 12 0.85 1.9
dmPGE2 EP2,3,4 x 17 1.9 43
17-phenyl trinor PGE2 EP1,3 14 x 3.7 x
Butaprost-free acid EP2 x 11 x x
L-902,688 EP4 x x x 0.38

110
Figure 23
0
20
40
60
80
100
0 5 10 15 20 25 30
*†
*
Days post-TBI
Veh
dmPGE2
EP1&3EP2
EP4
% S
urvi
val

111
Figure 23. Thirty-day survival of lethal-irradiated mice treated with dmPGE2 or
PGE2 receptor agonists at -30 min prior to TBI.
Mice were exposed to 8.72 Gy TBI at 12 w/o. 17-phenyl trinor PGE2 (EP1+3 agonist),
Butaprost free-acid (EP2 agonist), L-902,688 (EP4 agonist) or dmPGE2, were injected at
35 µg per mouse subcutaneously -30 min prior to TBI, respectively. Thirty-day survival
rates of each group were compared using the Kaplan-Meier method and log-rank test.
n=20-40 mice per agonist group and n=79-80 mice per dmPGE2 and Veh group. *p<0.05
comparing to Veh group; † p<0.05 comparing to dmPGE2 group.

112
provided the bone marrow phenotype analyses). The HPC potential analysis (presented as
CFU-GM, BFU-E, CFU-GEMM, and CFC frequency per femur) at day 35 post-TBI
demonstrated that dmPGE2 enhanced expansion of myeloid, erythroid, and megakaryoid
progenitors in the bone marrow when used as a radioprotectant (Figure 24 D, Liqiong Liu
in Dr. Pelus’ laboratory provided the CFC analysis).
3.3.5. DmPGE2 affects BM cytokines and BM cellularity post-IR
Irradiation induces cytokine storm where cytokines could play positive or
negative roles in hematopoiesis post-TBI. Some of them have been proved to be as
radioprotectant when given before radiation [270]. Considering the key role of BM
cytokine in hematopoietic regulation [271, 272], cytokine levels in BM milieu post-TBI
with radioprotectant dmPGE2 treatment were investigated. In order to accurately evaluate
the cytokine concentration in BM, Dr. Laura Wright used micro computed tomography to
calculate the volume of femur and tibia marrow cavity in male and female mice
respectively, in which male had significantly 1.4 times more BM volume than female,
emphasizing the importance of cytokine analyses in BM milieu in a gender-specific
manner. The values in the Y-axes of Figure 25 represent the cytokine levels in the BM
milieu after conversion of the Bio-Plex reads by dilution factor as described in the
Materials and Methods section. The cytokine levels in mice sacrificed 30 min after 35 µg
dmPGE2 or Veh injection without sham-irradiation represent the cytokine levels at the
time of irradiation, in which the hematopoiesis-supporting cytokine KC was significantly
increased by dmPGE2. KC was equally increased in both dmPGE2 and Veh groups at 6
hr post-TBI and equally reduced in the two groups at 24 hr post-TBI (Figure 25 A).

113
Figure 24
0
10
20
30
40
50
VehdmPGE2
CFU-GM BFU-E GEMM CFC
Colo
nies
per
fem
ur (×
103 )
(mea
n±SE
M)
05
10152025
Veh dmPGE2
SLA
M L
SK/f
emur
(×10
2 )(m
ean±
SEM
)
*
05
10152025
Veh dmPGE2
MSC
/fem
ur (×
103 )
(mea
n±SE
M) *
B C
DDay 35 post-TBI
Day 50 post-TBI Day 50 post-TBI
NI
*** **
*
**
**
Days post-TBI
0
1
2
3
4
0 2 7 10 20 38
*
*
0
3
6
9
12
0 2 7 10 20 38
*
0
300
600
900
0 2 7 10 20 38
*
*
0
3
6
9
12
0 2 7 10 20 38
**
0
4
8
12
16
0 2 7 10 20 38
*
*A
WBC
(K/µ
l)(m
ean±
SEM
)
NE
(K/µ
l)(m
ean±
SEM
)
VehdmPGE2
RBC
(M/µ
l)(m
ean±
SEM
)
PLT
(K/µ
l)(m
ean±
SEM
)
LY (K
/µl)
(mea
n±SE
M)
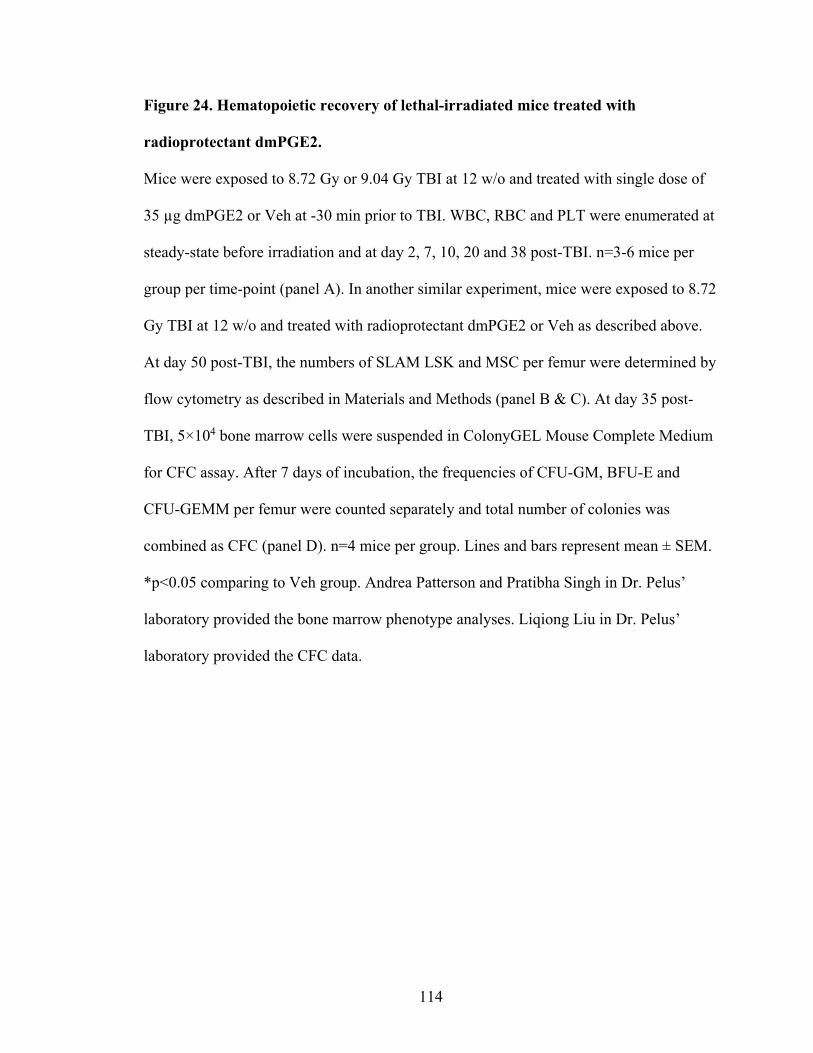
114
Figure 24. Hematopoietic recovery of lethal-irradiated mice treated with
radioprotectant dmPGE2.
Mice were exposed to 8.72 Gy or 9.04 Gy TBI at 12 w/o and treated with single dose of
35 µg dmPGE2 or Veh at -30 min prior to TBI. WBC, RBC and PLT were enumerated at
steady-state before irradiation and at day 2, 7, 10, 20 and 38 post-TBI. n=3-6 mice per
group per time-point (panel A). In another similar experiment, mice were exposed to 8.72
Gy TBI at 12 w/o and treated with radioprotectant dmPGE2 or Veh as described above.
At day 50 post-TBI, the numbers of SLAM LSK and MSC per femur were determined by
flow cytometry as described in Materials and Methods (panel B & C). At day 35 post-
TBI, 5×10⁴ bone marrow cells were suspended in ColonyGEL Mouse Complete Medium
for CFC assay. After 7 days of incubation, the frequencies of CFU-GM, BFU-E and
CFU-GEMM per femur were counted separately and total number of colonies was
combined as CFC (panel D). n=4 mice per group. Lines and bars represent mean ± SEM.
*p<0.05 comparing to Veh group. Andrea Patterson and Pratibha Singh in Dr. Pelus’
laboratory provided the bone marrow phenotype analyses. Liqiong Liu in Dr. Pelus’
laboratory provided the CFC data.
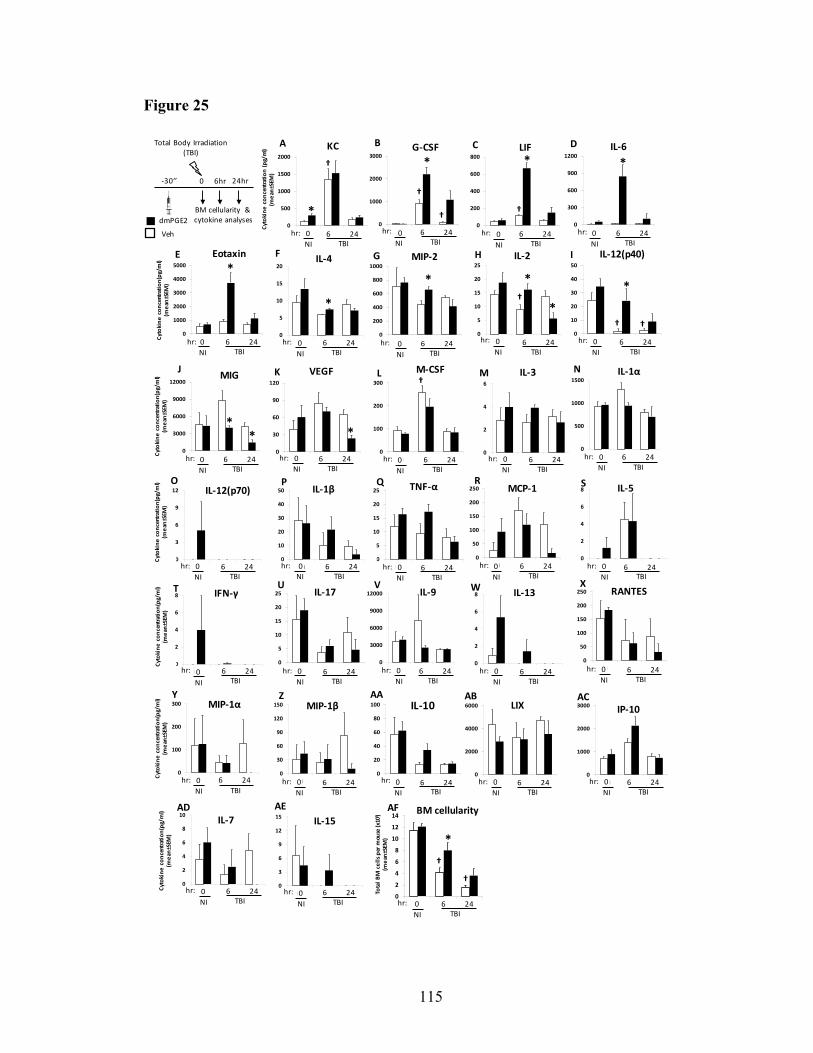
115
Figure 25
0
100
200
300
NI 6 24
M-CSF
0NI
6 24TBI
hr:
†
Cyto
kine
con
cent
ratio
n (p
g/m
l)(m
ean±
SEM
)
Cyto
kine
con
cent
ratio
n(pg
/ml)
(mea
n±SE
M)
Cyto
kine
con
cent
ratio
n(pg
/ml)
(mea
n±SE
M)
-30’’ 0 6hr 24hr
dmPGE2
Total Body Irradiation(TBI)
BM cellularity &cytokine analyses
Veh
0
3000
6000
9000
12000
MIG
**
6 24TBI
0NI
hr:
0
300
600
900
1200
IL-6
*
6 24TBI
0NI
hr:
0
1000
2000
3000
4000
5000
Eotaxin*
6 24TBI
0NI
hr:
0
30
60
90
120
VEGF
*
6 24TBI
0NI
hr:
0
5
10
15
20
IL-4
0NI
6 24TBI
hr:
*
0
200
400
600
800
1000
MIP-2
0NI
6 24TBI
hr:
*
0
1000
2000
3000
G-CSF*
6 24TBI
0NI
hr:
†
†0
200
400
600
800
LIF*
6 24TBI
0NI
hr:
†
0
5
10
15
20
25
IL-2
*
*
6 24TBI
0NI
hr:
†
0
10
20
30
40
50
IL-12(p40)
*
6 24TBI
0NI
hr:
† †
0
500
1000
1500
2000
KC
0NI
6 24TBI
hr:
*
†
A B C D
E F G H I
J K L
0
2
4
6
8
10
12
14
Tota
l BM
cel
ls p
er m
ouse
(x10
7 ) (m
ean±
SEM
)
BM cellularity
0NI
6 24TBI
hr:
*†
†
AF
0
2
4
6
8
NI 6 24
0
5
10
15
20
25
NI 6 24
0
3000
6000
9000
12000
NI 6 24
0
2
4
6
8
NI 6 24
0
1000
2000
3000
NI 6 24
0
2000
4000
6000
NI 6 24
0
30
60
90
120
150
NI 6 24
0
100
200
300
NI 6 24
0
2
4
6
8
NI 6 24
0
5
10
15
20
25
NI 6 24
0
10
20
30
40
50
NI 6 24
0
3
6
9
12
NI 6 24
0
3
6
9
12
15
NI 6 24
0
2
4
6
8
10
NI 6 24
IL-1β
IL-15
IL-17
IL-5
IL-13IL-9
LIX IP-10MIP-1α MIP-1β
IL-7
IL-12(p70) TNF-α
IFN-γ
0
2
4
6
NI 6 24
IL-3
0NI
6 24TBI
hr:
0NI
6 24TBI
hr: 0NI
6 24TBI
hr:
0
500
1000
1500
NI 6 24
IL-1α
0NI
6 24TBI
hr:
0NI
6 24TBI
hr: 0NI
6 24TBI
hr: 0NI
6 24TBI
hr: 0NI
6 24TBI
hr:
0NI
6 24TBI
hr: 0NI
6 24TBI
hr: 0NI
6 24TBI
hr: 0NI
6 24TBI
hr:
0NI
6 24TBI
hr: 0NI
6 24TBI
hr: 0NI
6 24TBI
hr: 0NI
6 24TBI
hr:
0
50
100
150
200
250
NI 6 24
RANTES
0NI
6 24TBI
hr:Cyto
kine
con
cent
ratio
n(pg
/ml)
(mea
n±SE
M)
Cyto
kine
con
cent
ratio
n(pg
/ml)
(mea
n±SE
M)
Cyto
kine
con
cent
ratio
n(pg
/ml)
(mea
n±SE
M)
Cyto
kine
con
cent
ratio
n(pg
/ml)
(mea
n±SE
M)
0
50
100
150
200
250
NI 6 24
MCP-1
0NI
6 24TBI
hr:
0
20
40
60
80
100
NI 6 24
IL-10
6 24TBI
0NI
hr:
M N
O P Q R S
T U V W X
Y Z AA AB AC
AD AE

116
Figure 25. BM cytokines and BM cellularity at 6 and 24 hr post-TBI treated with
radioprotectant dmPGE2.
Twelve w/o NI mice were treated with single dose of 35 µg dmPGE2 or Veh
subcutaneously at -30 min prior to sacrifice. Irradiated mice (8.53 Gy TBI) were treated
with single dose of 35 µg dmPGE2 or Veh per mouse subcutaneously at -30 min prior to
TBI and sacrificed at 6 and 24 hr post-TBI. Femurs and tibias were flushed by cold PBS,
BM cellularity was enumerated and cytokine levels in BM supernatant were measured by
bead-based multiplex technology as described in Materials and Methods. Bars represent
mean ± SEM. n=4-5 mice per group per time-point. *p<0.05 comparing dmPGE2 group
to Veh group at each indicated time-point; † p<0.05 comparing TBI Veh group to NI Veh
group (0 hr time-point). Huilin Chua and Hailin Feng did the Bio-Plex study; Tong Wu
did the analyses.

117
By 6 hr post-TBI, irradiation exposure increased G-CSF and LIF in BM and
dmPGE2 further increased their concentrations (Figure 25 B & C). IL-6, Eotaxin, IL-4
and MIP-2 were not influenced by irradiation but increased in dmPGE2 group at 6 hr
post-TBI (Figure 25 D-G). Radioprotectant dmPGE2 attenuated the irradiation-induced
decreases of IL-2 and IL-12(p40) (Figure 25 H & I); or attenuated the irradiation-induced
increase of MIG (Figure 25 H & I). There were also cytokines which only impacted by
irradiation but not by dmPGE2, such as M-CSF (Figure 25 L); or neither impacted by
irradiation nor by dmPGE2 (Figure 25). The BM cell loss induced by irradiation was
attenuated by dmPGE2 prior to TBI (Figure 25 AF).
By 24 hr post-TBI, most irradiation-induced or dmPGE2-induced cytokine
production subsided. IL-2 was decreased at 24 hr in dmPGE2 group although it was
increased at 6 hr (Figure 25 H). MIG and VGEF were lower in dmPGE2 group
comparing to Veh group at 6 hr and further suppressed at 24 hr (Figure 25 J & K).
3.4. Discussion
PGE2 could be an inhibitor and a stimulator of hematopoiesis depending on
regimen and dose [123, 127, 260, 273]. Early studies demonstrated that short-term in
vitro culture of BM cells with PGE2 stimulated quiescent cells to enter the cell cycle and
increased colony-forming unit-spleen (CFU-S) following transplantation [273]. However,
in vivo treatment with PGE2 had little or no impact on hematopoiesis [130, 274].
Recently, ex vivo embryonic exposure to dmPGE2 was shown to increase HSC numbers
in a Zebrafish embryo model, while blocking PGE2 production by indomethacin

118
decreased the HSC number [127]. On the contrary, Gentile P et al. and Hoggatt J et al.
[123, 260] showed that in vivo repeated treatments (3 or 7 consecutive days) with native
PGE2 or dmPGE2 decreased bone marrow and splenic cellularity, and CFU-GM
frequency. Considering that these different studies used different timing and duration of
exposure, it is reasonable to hypothesize that the administration schedule of dmPGE2 (or
PGE2) plays a critical role in deciding its stimulatory or inhibitory effect on
hematopoiesis under the radiation scenario, and certain schedules might be ineffective or
even deleterious to survival, which makes the optimization of dmPGE2 dosing windows
important.
Survival analysis indicates that administration of dmPGE2 as radioprotectant
during -3 hr to -15 min prior to TBI confers almost complete survival but -24 hr schedule
was not radioprotective (Figure 21). Data from Dr. Pelus’ laboratory show that the
PGE2’s inhibition on proliferation of HSPC lasts longer than 24 hr after injection [123,
275]. The potential mechanism that dmPGE2 inhibits cell cycling and thus decrease DNA
damage brought by irradiation, cannot explain the phenomenon that -24hr schedule is not
radioprotective. The attenuation of irradiation-induced increase in HSPC cycling by
dmPGE2 administration at -30 min or earlier prior to TBI is more likely a direct dmPGE2
signaling response at the time of irradiation.
The dmPGE2 +3 hr administration schedule fails to increase day 30 survival rate.
Hoggatt J et al. [135] showed that radiomitigator dmPGE2 administrated at +6 hr and +24
hr post-TBI increases survival, and now the efficacy of +24 hr time-point in another

119
cohort of mice is confirmed and the time window is extended to +30 hr post-TBI. So, the
time-window for dmPGE2 radiomitigator is +6 to +30 hr post-TBI. This information is
important for maximizing survival in civilian victims of unexpected lethal radiation when
radioprotection is impossible. Although Porter RL et al. [276] reported that dmPGE2
given immediately after sub-lethal irradiation decreased the loss of functional HSPC,
another survival study reported by Walden TL et al. [134] demonstrated that dmPGE2
given at either +5, +15, +30, or +60 min after lethal irradiation was not radiomitigative.
This discrepancy might relate to different mouse stain, different irradiation dose and
different dmPGE2 dose. These studies indicate that irradiation transient induces unknown
mechanisms to prevent dmPGE2 to take effect in at least 3 hr post-TBI.
The obtained dmPGE2 survival data in pediatric and geriatric populations are
important considerations for real-life radiation scenarios. Although there were detailed
studies about using prostaglandin analogues, most focused on the use of PGE1 in
maintaining the patency of the ductus arteriosus in neonates [277]. The information from
these studies could not apply to the radiation scenario because of the different disease
status and differences between neonates and juveniles. This study, for the first time,
indicates that radioprotectant dmPGE2 is effective both in pediatric and geriatric
population, although the survival in geriatric population (80%) is slightly lower than in
pediatric and adult population (95-100%), which might relate to the underlying
impairment in aging mice. Radiomitigator PGE2 injected at +24 hr post-irradiation is
effective in geriatric population but not in pediatric population (Figure 22). Sex
difference in adolescence where male and female have significantly different sex

120
hormones profile might interfere the dmPGE2 radiomitigation. These results provide
evidence that the stockpiling of dmPGE2 for use as a radioprotectant for H-ARS might
benefit more widely diverse populations.
By using specific EP agonists, the potential EP receptor responsible for dmPGE2
radioprotection was investigated. Survival efficacy was only observed in mice receiving
an EP4 agonist. However, while strongly suggestive of an EP4 binding effect, the level of
protection provided by EP4 agonist was less than that by dmPGE2 (Figure 23). Binding
of PGE2 to EP4 activates the cAMP dependent PKA/GSK3β/β-catenin pathway or cAMP
independent GPCR kinase/PI3K/GSK3β/β-catenin pathway and then enhances the Wnt
signaling pathway by stabilizing β-catenin. The nuclear translocation β-catenin activates
the transcription and translation of CXCR4, Survivin and Cyclin D, thus promotes the
homing, survival, and proliferation of HSCs [278-280]. When EP agonists given as
radiomitigators, none of them show survival efficacy (unpublished data from Dr. Pelus’
laboratory), which indicates that the mechanisms of radioprotection and as a
radiomitigation is different. The possible reasons for EP4 agonist not achieving the same
level of protection as dmPGE2 might be the low agonist potency or dosing regimen, or
more than one EP receptors activation needed for full survival efficacy. Experiments on
combination of EP receptor agonists, intensive agonist regimens, EP receptor antagonists
and genetic knockouts of EP receptors are ongoing to further confirm the responsible EP
receptors.

121
Enhanced day 30 survival of dmPGE2-treated mice coincided with more robust
recovery of all CBC parameters (Figure 24 A), indicative of enhanced hematopoietic
recovery. Enhanced recovery of CBC correlated with increased HPC potential (Figure 24
D). The result of the colony assay seems be contradictory to an early study that in vivo
PGE2 administration inhibits the production of CFU-GM [123]. One probable reason is
that inhibition might not last as late as the time-point of colony assay was taken; another
reason is that the increased HPC potential came from HSC protection, where SLAM-LSK
levels were increased in dmPGE2-treated mice (Figure 24 B). The increased number of
MSCs in dmPGE2 treated mice (Figure 24 C), a critical component of the HSC-
supportive BM microenvironment, indicates the possibility that dmPGE2 influences HSC
indirectly by protecting the BM microenvironment. It was previously demonstrated that
PGE2 regulates dendritic cell generation through EP1 and EP3 receptors and the
downstream STAT3/Survivin pathway [268]. Ikushima et al. found that PGE2 indirectly
induced hematopoiesis through the activation of mesenchymal progenitor cells, which is
consistent with finding of increased MSC in dmPGE2-treated mice [281].
BM supernatant is the extracellular fluid component of the BM
microenvironment, which is rich in cytokines and growth factors. As the BM supernatant
“bathes” HSCs and HPCs in their specialized niches, the BM cytokine milieu is more
informative than the peripheral blood cytokine level in determining the effect of
treatment on hematopoiesis [282]. Cytokines induced by dmPGE2 at the time of
irradiation may enhance survival and hematopoietic recovery post-TBI. Since straining
mouse in a limited space during irradiation is a huge pressure on mouse and this

122
procedure itself will impact the cytokine level, the NI mice in this study were not sham-
irradiated, which the levels of BM cytokines at 30 min post-injection represent the
cytokine levels at the time of irradiation. In NI group, although most cytokines between
dmPGE2-injected and Veh-injected NI mice were not statistically different, KC
significantly increased in dmPGE2 group (Figure 25), which play roles in neutrophil
recruitment [283] and has potent hematopoietic activities in truncated form [284]. Future
study would need to verify the radioprotective effect of KC. Some other cytokines,
which have been proven to be effective radioprotectants in vivo or in vitro, such as TNF-
α [285], LIF [286], VEGF [287], IL-12 [288, 289] and IL-6 [290, 291], had trends of
increasing in the dmPGE2 group at the time-point of 0 hr although not statistically
different from the Veh-injected NI group (Figure 25). All these results indicate that
radioprotectant dmPGE2 enhances survival through up-regulating BM cytokines or
activating a network of cytokines interaction.
In mice sacrificed at 6 hr and 24 hr post-TBI, the BM cytokine levels reflect how
dmPGE2 injected before irradiation impacts cytokines post-TBI and hence promotes
hematopoietic recovery. In cytokines that up-regulated in the dmPGE2 group, some have
potent effect in stimulating the proliferation of hematopoietic progenitor cells, such as G-
CSF and IL-12(p40) [272]; some others need synergistic actions from other cytokines to
promote hematopoiesis, such as LIF, IL-6 and IL-4 [292, 293]; and some chemokines
which do not have directly stimulating effect but can help with the transmigration and
diapedesis of HSCs or attract inflammatory cells to bone marrow niche to regulate the
HSCs, such as Eotaxin [294] and MIP-2 [295] (Figure 25). In cytokine down-regulated in

123
the dmPGE2 group, MIG has pleotropic effects, which acts as mediators of chemotaxis
and as myelosuppressor [296]. The attenuation of HPC inhibition from the down-
regulation of suppressive factors, together with the up-regulation of stimulatory factors,
might be one of the mechanisms for quick recovery of CBC parameters (Figure 24 A)
and enhances survival (Figure 21) in dmPGE2 group. DmPGE2 also promotes
hematopoiesis through regulating the pro-inflammatory vs. anti-inflammatory status of
BM microenvironment by cytokine such as IL-2. The transient increase and rapid
decrease of IL-2 in dmPGE2-treated mice indicated that in less than 24 hr post-TBI, the
stresses and free-radical attacks on HSC from the inflammatory microenvironment were
attenuated by dmPGE2, which might relate to the immunosuppressive effect of dmPGE2
[297]. In addition to angiogenesis, VEGF inhibits the maturation of dendritic cells and
differentiation of lymphocytes through inhibiting the activation of NF-κB in HPC. The
lower expression of VEGF at 24 hr post-TBI in dmPGE2-treated group indicates that NF-
κB signal pathway was activated by inhibiting VEGF, thus indirectly enhancing
hematopoiesis [298, 299]. The study on RNA-sequencing and Ingenuity pathway analysis
(IPA) of these cytokines related gene expression changes in HSC are ongoing and will
provide more insight on how these cytokines regulate hematopoiesis post-TBI (data
unpublished).
In summary, these studies characterized the optimum time window for
administering dmPGE2 as radioprotectant and radiomitigator, showed the survival
efficacy in pediatric and geriatric populations, investigated the potential receptor for
dmPGE2’s radioprotective effect, revealed hematopoietic recovery in peripheral blood

124
and bone marrow, and further demonstrated the bone marrow cytokine milieu changes in
mice received dmPGE2 as a radioprotectant. These studies provide supports for
developing dmPGE2 as a MCM for H-ARS with FDA approval.

125
Chapter 4. Prostaglandin E2 and Lymphoid Lineage Reconstitution
4.1. Introduction
Exposure to a lethal dose of irradiation results in H-ARS and DEARE, as
previously discussed. Immune involution is an important component of DEARE, mainly
resulting from defective de novo lymphopoiesis and partially compensated by
lymphocyte HPE. Thymic and peripheral lymphocytes are highly radiosensitive. The
“double hit” from radiation and aging accelerates long-term thymic involution and
immune deficiency. Immune deficiency is linked to the increased incidence of infection,
cancer, and defective immune surveillance functions in H-ARS survivors [4, 205, 206].
Thymic involution in H-ARS survivors can result from: 1) decreased number and/or
function of bone marrow-derived thymic precursors, 2) inability of these precursors to
settle in the thymic niches, or 3) disruption of the thymic nurturing niches [4, 40, 56].
Currently, there are no effective treatments or preventions for radiation-induced thymic
involution.
DmPGE2 has demonstrated remarkable radioprotection effect in the H-ARS
model (discussed in Chapter 3). DmPGE2 is a long-acting analog of PGE2, which has
similar biological effects to PGE2. PGE2 inhibits T cell activation and proliferation by
up-regulating cAMP and down-regulating IL-2 [300-302], and thus is considered
detrimental to T cells. The potential for dmPGE2 to play a positive role in lymphoid
lineage reconstitution post-IR had not been previously investigated.

126
Dr. Orschell’s laboratory has developed robust murine models of H-ARS in adult
mice [69], which were used to evaluate thymic involution and immune reconstitution in
survivors of lethal irradiation and to elucidate potential protective effects of dmPGE2. In
this chapter, the radioprotection effect of dmPGE2 on radiation-induced thymic
involution and long-term immune suppression in irradiation survivors is investigated.
This is the first report of an effective radioprotectant MCM targeting thymic involution
and lymphoid lineage reconstitution post-IR.
4.2. Materials and Methods
4.2.1. Mice, radiation, dosimetry, husbandry, and tissue harvest
Specific pathogen-free C57BL/6 mice (CD45.2+), B6.SJL-PtrcaPep3b/BoyJ mice
(B6.BoyJ, CD45.1+) and Fgd5-ZsGreen mice were purchased from Jackson laboratory
(Bar Harbor, ME). F1 hybrids of C57Bl/6 and B6.BoyJ mice (CD45.2+/CD45.1+) were
bred in-house. Mice were received at 10 w/o and allowed to acclimate for 2-week prior to
irradiation. Husbandry, irradiation, dosimetry, tissue harvest and process are described as
in Chapter 2. The TBI dose is either 8.53 (LD50/30), 8.72 (LD70/30) or 9.04 Gy
(LD90/30) as specified. All studies were approved by the Indiana University School of
Medicine Institutional Animal Care and Use Committee.
4.2.2. Compounds
DmPGE2 and EP1-EP4 were purchased from Cayman Chemicals (Ann Arbor,
MI). The reconstitution, dosage, administration of dmPGE2 and EP agonists were the
same as in Chapter 3 and were indicated in Figures and Legends.

127
4.2.3. CBC
Peripheral blood CBC was performed as previously described in Chapter 2. For
CBC from cardiac puncture, mice were euthanized by CO2 inhalation and laid in dorsal
position. A 25-G 5/8inch needle was inserted toward the mouse’s left ventricle, under the
sternum, and into the heart. The plunger of the syringe was slowly pulled and 100-150 μl
blood was collected. Complete blood count was analyzed by HEMAVET 950FS
Hematology System (Drew Scientific, Waterbury, CT).
4.2.4. Antibody staining, flow cytometry analysis and flow cytometric cell sorting
Antibodies used for identifying HSC, HPC, thymocyte subsets, and peripheral
lymphocyte subsets were described in Chapter 2. In the in vitro lymphoid lineage
differentiation assay, lysed bone marrow cells were stained with CD11b-FITC, Ter119-
FITC, CD3-FITC, Gr1-FITC, B220-FITC, Sca-1-PECY7 or BV650, c-Kit-APC
antibodies and sorted for LSK cells to seed on the monolayer stromal cells. The live cells
harvested from the culture system at different time-points were stained with CD11b-
APCCY7, B220-PE-TEXAS RED, CD4-PECY5, CD8α-PE, CD44-APC, CD25-PECY7,
CD62L-PerCPCY5-5 antibodies. In bone marrow competitive transplantation study,
thymi of recipients were processed into single cell suspension and stained with CD45.1-
PE, CD45.2-FITC, CD4-PerCPCy5.5, CD8α-PECy5, CD44-APC and CD25-PECy7
antibodies to evaluate thymic donor chimerism and thymocyte subgroups reconstitution.
In short-term thymus homing study, recipient thymocytes were stained with CD45.1-PE
and CD45.2-FITC antibodies to evaluate the homing efficiency. In TEC analysis study,

128
the single thymocyte suspensions after enzyme digestion were stained with CD45-PE,
EpCAM-APCCy7, UEA-1-FITC and Ly51-APC antibodies. All antibodies were
purchased from BD Biosciences (San Jose, CA), Biolegend (San Diego, CA),
eBiosciences (San Diego, CA) and Vector Laboratories (Burlingame, CA). Analytical
data were collected on an LSR-II flow cytometer (Becton Dickinson Immunocytometry
Systems, San Jose, CA).
4.2.5. T and B cell development in vitro and PMA stimulation assay
To test the ability of progenitor cells to differentiate into B and T lymphoid
lineages in vitro, I used the OP9 or OP9-DL4 co-culture system, respectively. The co-
culture system and the staining protocol are described by Zuniga-Pflucker et al. [303-
305]. OP9 and OP9-DL4 cell lines were obtained from Zúñiga-Pflücker JC (University of
Toronto, Canada). The culture medium for OP9 and OP9-DL4 was minimal essential
medium (HyClone Laboratories Inc., Logan, UT) with 20% FBS and 1% penicillin
streptomycin (Lonza, Walkersville, MD). OP9 and OP9-DL4 cells were thawed and
passaged 2-3 times and grown to 80% confluence in a T25 flask, and 4×10⁴ OP9 or OP9-
DL4 cells were plated per well in a 24-well plate 24 hours prior to co-culture at 80-90%
confluence. Co-culture was carried out with OP9 medium plus 1 ng/ml IL-7 and 5 ng/ml
FLT3L (both from PeproTech, Rocky Hill, NJ). One thousand sorted LSK cells were
resuspended with 1 ml co-culture medium and were applied to the stromal monolayer at
the first day of co-culture. Half of the medium was changed every 3-4 days. The cultured
cells were demi-depopulated and transferred to new monolayers every 5-7 days after the
appearance of the first colony (~day 9). Half of the acquired cells were transferred to new

129
monolayer stromal cells and the rest of the cells were used for phenotyping until the end
of the co-culture [304].
At day 16 or day 32 of co-culture, 5×10⁵ cultured cells from OP9-DL4 co-culture
system were stimulated with 20 ng/ml phorbol 12-myristate 13-acetate (PMA) (Santa
Cruz Biotechnology Inc., Santa Cruz, CA) plus 500 ng/ml Ionomycin (Santa Cruz
Biotechnology Inc., Santa Cruz, CA) for 5 hr at 37°C with 5% atmospheric CO2.
Brefeldin A (1 μg/ml; GolgiPlug, BD Biosciences, NJ) was added to inhibit intracellular
protein transport. After 5 hr of activation, cells were fixed and permeabilized with
Cytofix and Cytopermb buffers (BD Biosciences, NJ), and stained with intracellular IFN-
γ APC.
4.2.6. Long-term competitive transplantation and short-term thymus homing study
Donor whole bone marrow cells were flushed from long bones of NI or IR mice
(C57BL/6, CD45.2+), and 3×10⁵ of these cells were transplanted intravenously along with
2× 10⁵ congenic competitor bone marrow cells into congenic recipients. The competitors
and recipients were B6.BoyJ (CD45.1+) or the F1 hybrid of C57Bl/6 and B6.BoyJ mice
(CD45.1+ and CD45.2+). Recipients had been irradiated with 11 Gy which consisted with
a split-dose of 5.5 Gy followed by 5.5 Gy four hours later. The use of congenic mice in
competitive bone marrow transplantation has been previously described [40, 306, 307].
Recipient mice were sacrificed at 6 months post-transplantation and thymi were used for
chimerism analysis. For short-term thymus homing study, 2×10⁷ whole BM cells from
donor mice (C57Bl/6, CD45.2+) were transplanted intravenously into lethally-irradiated

130
recipient mice (B6.BoyJ, CD45.1+). After 16 hr, recipient thymocytes were analyzed by
flow cytometry for homing efficiency.
4.2.7. Thymus epithelial cells identification
Thymi were cut into small pieces with fine scissors and incubated with 0.5 ml
thymic enzyme solution [RPMI1640 medium with 0.05% (w/v) Liberase TH (Roche
Diagnostics, Indianapolis, IN) and 100 U/ml DNase I (New England Biolabs, Ipswich,
MA)] at 37 °C for 20 min. Supernatant was discarded and fresh enzyme solution was
added to remaining debris until digestion was complete [308]. The cTEC was defined as
CD45-EpCAM+UEA-1-Ly51+ and mTEC was defined as CD45-EpCAM+UEA-1+Ly51-
by flow cytometry analysis.
4.2.8. RNA sequencing and IPA analysis of HSC
Fgd5 mice received one 35 µg dose of dmPGE2 or equivalent Veh injection -30
min prior to TBI (8.53 Gy, LD50/30) and were sacrificed 24 hr post-TBI. Fgd5 ZsGreen
was used to enhance the purity of HSCs due to the loss of c-kit expression after radiation
[309]. HSCs were identified as CD45+SLAM-LSKwideZsGreen+ and sorted by FACSAria.
RNA was extracted with a RNeasy Plus Micro kit (Qiagen, Hilden, Germany). To obtain
adequate amounts of high-quality cDNA, due to the low cell number (1,000-6,000 HSCs
per sample), SMART-Seq v4 Ultra Low Input RNA Kit (Takara Bio, Mountain View,
CA) was used for cDNA synthesis. RNA sequencing was performed by the Genomics
Core at Indiana University School of Medicine. To compare gene expression between
different groups, results were converted to Reads Per Kilobase per Million (RPKM).

131
Significant differences were defined as false discovery rate (FDR) <0.05 and fold change
>2. IPA analysis was used to evaluate differentially expressed genes. Lymphopoiesis and
its related genes were identified by IPA cellular function predictions. The RPKM values
were transformed to Z-scores for visualization purposes. The Z-score was defined as the
difference of individual and average RPKM value divided by standard deviation. Blue
represented lower scores and red for higher scores (Andrea Patterson in Dr. Pelus’
laboratory provided the RNA sequencing and IPA analysis).
4.2.9. Bone marrow cytokine analysis
C57BL/6 mice were treated with one dose of 35 µg dmPGE2 at -30 min or
equivalent Veh prior to 8.53 (LD50/30) and were sacrificed 9 days post-TBI. The BM
cytokine detection and analyses were the same as described in Chapter 3. The Z-score of
each cytokine was calculated as the difference of individual and average cytokine level
divided by standard deviation. The Z-scores were transferred to color scale with blue for
low and red for the high expression levels.
4.2.10. Statistical analysis
Lifespan in DEARE mice were analyzed by Kaplan-Meier analyses and log-rank
tests using SPSS Statistics Version 24 (IBM, Armonk, NY). Blood parameters
comparisons between dmPGE2-injected NI and baseline were subjected to unpaired two-
tailed t-tests using Microsoft Excel 2010 (Microsoft Corp, Redmond, WA). Comparisons
of more than two groups were performed by one-way analysis of variance (ANOVA)
with post-hoc Tukey-Kramer HSD or Welch ANOVA for unequal variances using JMP

132
14 (SAS Institute, Cary, NC). Fisher’s exact test was used to assess the incidence of
thymic mass post-TBI and was performed using online Fisher exact test calculator from
www.socscistatistics.com/tests. The day 30 survival difference between vehicle-treated
and dmPGE2-treated groups were compared with the Kaplan-Meier (log-rank) test using
SPSS Statistics Version 24 (IBM, Armonk, NY). P<0.05 was considered significant. All
data are expressed as mean ± SEM.
4.3. Results
4.3.1. DmPGE2 extends lifespan and prevents the myeloid skew of DEARE mice
When used as a radioprotectant, dmPGE2 greatly increased the day 30 survival
rate of lethally irradiated mice. There was no statistical difference in day 30 survival rates
between mice received one dose of 35 µg or two doses of 20 µg dmPGE2 at -15 min to -3
hr time-window prior to TBI (Chapter 3, Figure 21). And there was no statistical
difference in long-term survival rates between mice exposed to LD50/30, LD70/30 or
LD90/30 (unpublished data). Data from theses dmPGE2 schedules with different lethal-
irradiation exposure were therefore combined and referred to as radioprotectant dmPGE2
group in all the following studies unless specifically stated otherwise. Consistent with
earlier reports [310, 311], lifespan was significantly shortened in Veh mice comparing
with age-matched NI controls. Radioprotectant dmPGE2 greatly extended the long-term
survival rate comparing with Veh but still lower than the NI control (Figure 26).
Complete blood counts in Veh and dmPGE2-treated survivors and NI controls were
followed up to 12 months post-TBI. At 6 months post-TBI, NE count in the Veh and
dmPGE2 group were lower than the NI group. No statistical difference among these

133
Figure 26
**∆
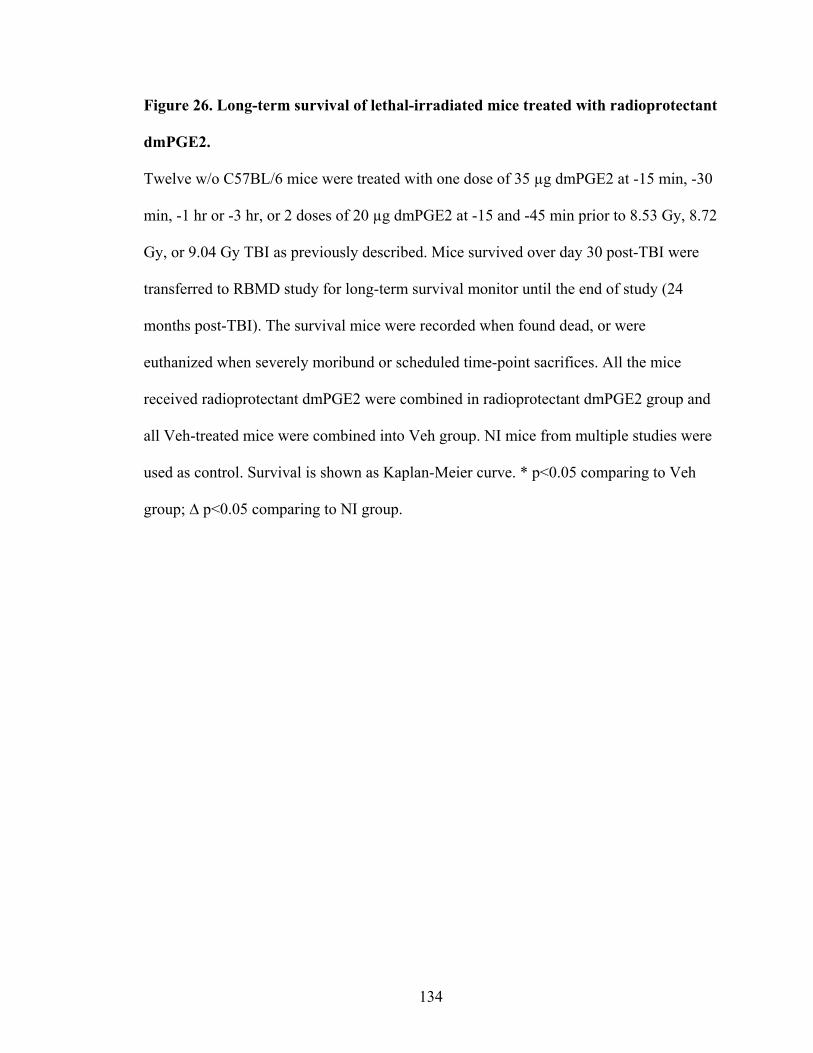
134
Figure 26. Long-term survival of lethal-irradiated mice treated with radioprotectant
dmPGE2.
Twelve w/o C57BL/6 mice were treated with one dose of 35 µg dmPGE2 at -15 min, -30
min, -1 hr or -3 hr, or 2 doses of 20 µg dmPGE2 at -15 and -45 min prior to 8.53 Gy, 8.72
Gy, or 9.04 Gy TBI as previously described. Mice survived over day 30 post-TBI were
transferred to RBMD study for long-term survival monitor until the end of study (24
months post-TBI). The survival mice were recorded when found dead, or were
euthanized when severely moribund or scheduled time-point sacrifices. All the mice
received radioprotectant dmPGE2 were combined in radioprotectant dmPGE2 group and
all Veh-treated mice were combined into Veh group. NI mice from multiple studies were
used as control. Survival is shown as Kaplan-Meier curve. * p<0.05 comparing to Veh
group; ∆ p<0.05 comparing to NI group.

135
groups remained at 12 months post-TBI. At 6 and 12 months post-TBI, LY count in the
Veh group was significantly lower than in the NI and dmPGE2 groups, with no
difference between the NI and dmPGE2 groups (Figure 27 A-C). Myeloid skewing was
also obvious when expressed as percentages (Figure 27, D & E), where the percentage of
NE was significantly higher in the Veh group than the NI group, and the percentage of
LY was significantly lower in the Veh group than the NI group. These differences
increased as mice aged. DmPGE2 effectively prevented myeloid skew in DEARE mice,
where the dmPGE2 group had higher LY percentage and lower NE percentage than Veh
group. NI mice had higher RBC and PLT counts than Veh, and dmPGE2 group had
higher RBC and PLT than Veh group (Figure 27 F & G).
4.3.2. DmPGE2 transiently decreases lymphocyte level in normal mice
Lymphocyte recovery post-TBI is relatively later than neutrophil recovery in
dmPGE2 group, which has been discussed in previous Chapter and in Figure 24),
whether dmPGE2 itself, in NI scenario, could regulate lymphocyte number, has not been
tested. Complete blood count was evaluated in non-irradiated mice receiving one shot of
dmPGE2 or Veh and followed up to 10 days post injection (Figure 28 A-C). The basal
levels of WBC, NE, LY, RBC and PLT from cardiac puncture were lower than the
corresponding values from the tail-bled CBC, corresponding with earlier study from
Hoggatt J et al. [312]. Compared with untreated controls (day 0, Figure 28 A-G),
dmPGE2-treated mice had rapidly decreasing LY numbers and a relatively higher
percentage of NE day 1 post-injection, demonstrating the early toxicity of dmPGE2 in

136
Figure 27
0
4
8
12
16
6 12
0
1
2
3
4
6 12
0
2
4
6
8
10
12
6 12
0
10
20
30
40
50
6 12
0
20
40
60
80
100
6 12
0
2
4
6
8
10
12
6 12
0
200
400
600
800
1000
1200
6 12
Months post-TBI
WBC
(K/µ
l)(m
ean
±SE
M)
NE
(K/µ
l)(m
ean
±SE
M)
RBC
(M/µ
l)(m
ean
±SE
M)
PLT
(K/µ
l)(m
ean±
SEM
)LY
(K/µ
l)(m
ean
±SE
M)
% o
f NE
(mea
n ±
SEM
)
% o
f LY
(mea
n ±
SEM
)
** *
**
* ***
* * ** * *
**
*
*
†
NI
Veh
dmPGE2
A
D
B
C
E F
G

137
Figure 27. CBC profiles in DEARE phase of lethal-irradiated mice treated with
radioprotectant dmPGE2.
C57BL/6 mice were treated with radioprotectant dmPGE2 or Veh prior to lethal TBI.
Complete blood count analyses of WBC (panel A), NE (panel B), LY (panel C), %NE
(panel D), %LY (panel E), RBC (panel F) and PLT (panel G) were followed up at 6 and
12 months post-TBI. Lines represent mean ± SEM. n=6-12 mice per group (panel A-G).
*p<0.05 comparing to Veh; † p<0.05 comparing to NI.

138
Figure 28

139
Figure 28. CBC profiles in NI mice injected with dmPGE2.
NI C57BL/6 mice were injected with one dose of 35 µg dmPGE2 and CBC analyses of
WBC (panel A), NE (panel B), LY (panel C), %NE (panel D), %LY (panel E), RBC
(panel F) and PLT (panel G) were followed up to 10 days post-injection. Lines represent
mean ± SEM. n=3 mice per group per time-point. *p<0.05 comparing to baseline
parameters before the injection (day 0 points). Andrea Patterson provided the data; Tong
Wu did the analyses.

140
lymphocytes. The LY number started to recover at day 2 and had returned to normal at
day 4 (Figure 28 C and E). There was no significant difference in the absolute values of
other types of blood cell (NE, RBC and PLT) between dmPGE2-treated and Veh-treated
mice (Figure 28 B, F & G). The CBC data indicate that the negative effect of dmPGE2
on peripheral lymphocytes is transient.
4.3.3. Both B and T cells are increased in the spleen of dmPGE2-treated mice
Since splenic lymphocytes are representative of circulating lymphocytes [248,
313] and naïve T cell in secondary lymphoid organ is an estimation of RTE [314, 315],
the lymphocyte subsets in the spleen were analyzed. At 12 months post-TBI, spleens
were processed into a single cell suspension and phenotyped by flow cytometry. Veh
group had less CD4+ T cells and naïve CD4+ T cells and B220+ B cells than NI group,
and radioprotectant dmPGE2 prevented the loss. The differences in CD8+ T and CD8+
naïve T cells between NI and Veh group, Veh and dmPGE2 group followed the similar
trend as CD4+ T cell but were not significant (Figure 29 A-E). Treatment with
radioprotectant dmPGE2 not only alleviates T lymphocyte involution by increasing
thymic output, but also increases B lymphocytes, which indicates that dmPGE2 may
protect the common lymphoid progenitor cells.
4.3.4. DmPGE2 protects thymus from irradiation-induced involution
Hoggatt J et al. [128] have previously shown that PGE2 protects stem cells from
apoptosis in vitro and dmPGE2, when used as radioprotectant, accelerates hematopoiesis,
including lymphopoiesis in H-ARS phase (Figure 24). In DEARE mice model,
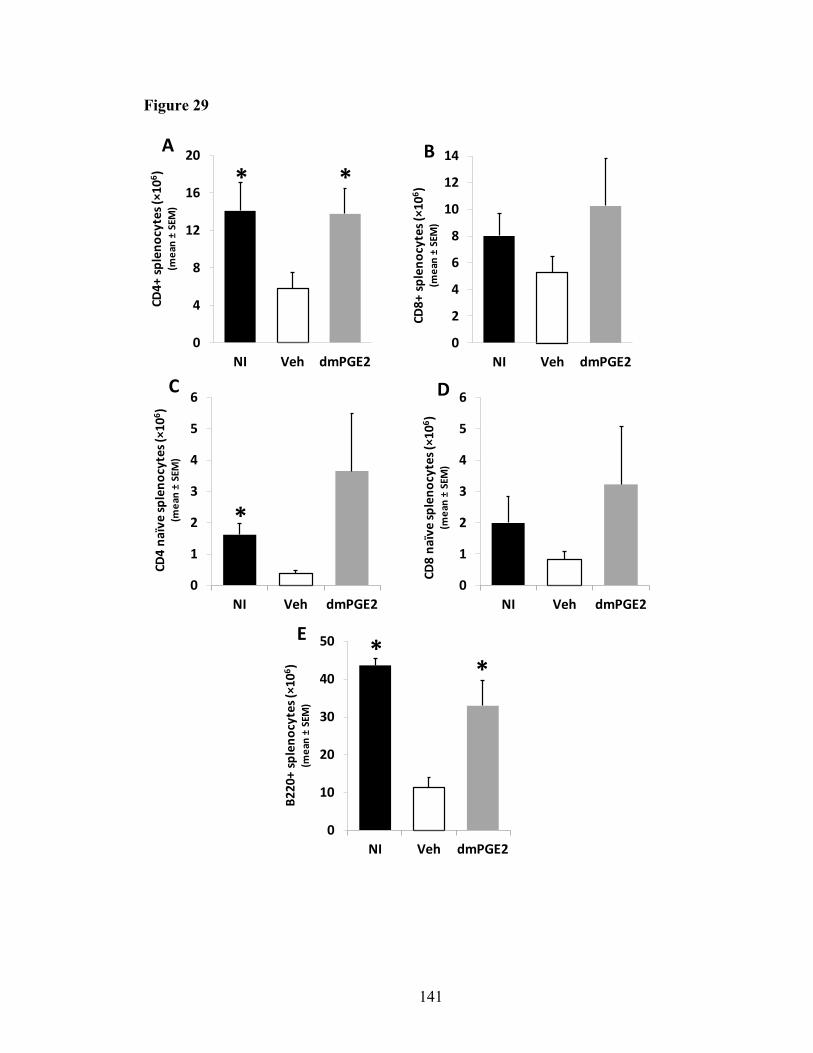
141
Figure 29
0
2
4
6
8
10
12
14
NI Veh dmPGE2
B
CD8+
sple
nocy
tes (
×106 )
(m
ean
±SE
M)
0
1
2
3
4
5
6
NI Veh dmPGE2
*
C
CD4
naïv
e sp
leno
cyte
s (×1
06 )
(mea
n ±
SEM
)
0
1
2
3
4
5
6
NI Veh dmPGE2
D
CD8
naïv
e sp
leno
cyte
s (×1
06 )
(mea
n ±
SEM
)
0
10
20
30
40
50
NI Veh dmPGE2
**
E
B220
+ sp
leno
cyte
s (×1
06 )
(mea
n ±
SEM
)
0
4
8
12
16
20
NI Veh dmPGE2
*
ACD
4+ sp
leno
cyte
s (×1
06 )
(mea
n ±
SEM
)*

142
Figure 29. Spleen T and B cells in DEARE phase of lethal-irradiated mice treated
with radioprotectant dmPGE2.
C57BL/6 mice were treated with radioprotectant dmPGE2 or Veh prior to lethal TBI and
were sacrificed at 12 months post-TBI. Splenocytes from age-matched NI, Veh and
dmPGE2 group were stained with CD4, CD8, CD44, CD62L and B220 antibodies and
analyzed by flow cytometry for the absolute number of CD4+ splenocytes (panel A),
CD8+ splenocytes (panel B), CD4 naïve (CD44-CD62L+) spleen T cells (panel C), CD8
naïve (CD44-CD62L+) spleen T cells (panel D), B220+ splenocytes (panel E) as described
in Materials and Methods. Bars represent mean ± SEM. n=3 mice per group. *p<0.05
comparing to Veh group.

143
radioprotectant dmPGE2 also prevents the decline of lymphocytes and myeloid skew
(Figure 27). Since the thymus is where T cells are educated and the site of de novo T
lymphopoiesis, I tracked thymic weight and cellularity post-TBI in NI, Veh-treated, and
dmPGE2-treated group, from H-ARS to DEARE phase. No difference in thymic weight
or cellularity was observed between the dmPGE2 and Veh groups at the early time-point
of H-ARS (day 3 and day 10 post-TBI). The protective effect became apparent at day 20
post-TBI and extended to the 6 and 12 months post-TBI (Figure 30 A & B). As dmPGE2
has a minimal effect on body weight change post-TBI, the difference in thymic weight
between groups was not related to body weight change (the trend of thymic index, which
is represented by thymus weight/body weight is similar to Figure 30 A & B, data not
shown).
4.3.5. DmPGE2 protects thymocytes from delay in DN to DP transition induced by
irradiation
Differences in thymocyte subpopulation distribution between dmPGE2- and Veh-
treated mice at DEARE phase were analyzed. Thymocytes were measured at 12 months
post-TBI from the earliest thymic settling cells [CD4-CD8-CD44+CD25- DN1 cells, and
CD44+CD25+ DN2 cells, CD44-CD25+ DN3 cells, and CD44-CD25- DN4 cells]; to the
intermediate CD4+CD8+ DP cells and then to the mature CD4 or CD8 single positive
cells, which are ready to immigrate into peripheral blood. At 12 months post-TBI, the
percentages of DN2, DN3 and DP in the dmPGE2-treated mice were 5.2, 4.4 and 1.1
times more than the Veh-treated mice, respectively (p<0.05) (Table 2). Fewer thymocytes
in the dmPGE2-treated mice were trapped in DN1 stage than Veh-treated mice. The

144
Figure 30
Thym
us w
eigh
t (gr
am)
(mea
n ±
SEM
)
Months post-IRDays post-IR
Months post-IRDays post-IR
NIVehdmPGE2
A
0
30
60
90
120
150
0 3 10 20 30 6 12
0
0.01
0.02
0.03
0.04
0.05
0 3 10 20 30 6 12
Thym
ocyt
e nu
mbe
r (x 1
06 )(m
ean
±SE
M)
*
*
*
*
*
*
**
*
*
**
†
†
†
B

145
Figure 30. Thymus weight and cellularity in H-ARS and DEARE phases of lethal-
irradiated mice treated with radioprotectant dmPGE2.
C57BL/6 mice were treated with radioprotectant dmPGE2 prior to lethal TBI. The
thymus weight (panel A) and cellularity (panel B) were calculated and analyzed up to 1-
year post-TBI. Lines represent mean ± SEM. n=3-10 mice per group per time-point.
*p<0.05 comparing to Veh; † p<0.05 comparing to NI.

146
Table 2. Comparisons of thymocyte subpopulations at 12 months post-TBI of lethal-
irradiated mice treated with radioprotectant dmPGE2.
%CD4 %CD8 %DP %DN %DN1 %DN2 %DN3 %DN4
NI vs. Veh 0.96 3.25* 1.10* 1.53 0.64* 7.97* 5.21* 1.05
dmPGE2 vs. Veh 1.08 1.38 1.11* 1.25 0.79 5.24* 4.39* 0.95
#CD4 #CD8 #DP #DN #DN1 #DN2 #DN3 #DN4
NI vs. Veh 3.51* 12.81* 5.04* 7.35* 4.04* 24.86* 28.67* 9.09*
dmPGE2 vs. Veh 2.74* 3.69* 3.36* 3.75* 2.97* 9.39* 13.20* 3.64*
Numbers in the table are the ratio of NI/Veh or dmPGE2/Veh. *p<0.05 comparing to Veh
group.

147
absolute values of most subpopulations were higher in the NI and dmPGE2-treated mice
than in the Veh-treated mice due to the increase in the total thymocyte number. The
distribution of thymocyte subpopulations in dmPGE2-treated mice was similar to NI
mice. These results suggest that more thymocytes accumulate in the earlier
undifferentiated stage with fewer differentiating into mature cells in the Veh-treated mice
than in the dmPGE2-treated mice and dmPGE2 prior to TBI prevents the delay in DN to
DP transition observed in Veh mice as a consequence of irradiation.
4.3.6. Lymphoid progenitors increase in bone marrow of dmPGE2-treated mice
T cells in thymus, and B cells in the secondary lymphoid organs, are the progenies
of committed bone marrow progenitors. The LMPP and CLP are the committed
progenitors of lymphoid lineage; whereas the CMP, GMP and MEP are the committed
progenitors of myeloid and erythroid lineages [316]. In order to back-track the influence
of dmPGE2 on HSPC, HSPC compartments in BM at day 20 post-TBI in H-ARS phase
and 12 months post-TBI in DEARE phase were analyzed. LT-HSC were identified as
Lin- c-Kithi Sca-1hi Flt3lo CD34-, ST-HSC were identified as Lin- c-Kithi Sca-
1hi Flt3lo CD34+, LMPP were identified as Lin- c-Kithi Sca-1hi Flt3hi CD34+, CLP were
identified as Lin- c-Kitint Sca-1int IL7R+ Flt3hi, CMP were identified as Lin- c-kithi Sca-1lo
CD34+CD16/32-, GMP were identified as Lin- c-kithi Sca-1lo CD34+CD16/32+, and MEP
were identified as Lin- c-kithi Sca-1lo CD34-CD16/32-. At day 20 post-TBI, dmPGE2
prevented the decrease of total BM cells and all types of HSPC (Figure 31 A-H). At 12
months post-TBI, the total BM cells, HSC, CMP, GMP and MEP were completely or
partially recovered in the Veh mice whereas the lymphoid progenitors, LMPP and CLP,

148
were still severely inhibited (Figure 31 I-P). But the number of LMPP and CLP in the
dmPGE2-treated group was 5.8 times and 7.9 times higher than Veh group, respectively.
DmPGE2 effectively prevented the decrease of LMPP and CLP for at least 12 months
post-TBI (Figure 31 J & K).
4.3.7. Bone marrow cells from dmPGE2-treated mice have higher engraftment and
lineage reconstitution potential than Veh mice
Post-TBI HSPCs do not regain full multi-lineage repopulating potential during the
lifetime of the irradiated survivors [40]. Since T cell development in thymus is dependent
on the proliferation and differentiation of HSPCs entering into thymus, the ability of BM
HSPCs to repopulate the thymus was investigated. Whole BM cells isolated from Veh-
treated mice at 6 months post-TBI were found to have <1% of the repopulating potential
in recipient thymus in comparison with NI mice. BM cells from mice treated with
radioprotectant dmPGE2 had significantly higher chimerism rate than Veh-treated mice,
although still significantly lower than in NI mice, indicates that dmPGE2 treatment
partially protected the thymic repopulating potential of BM HSPCs (Figure 32 A). Donor
cells from Veh-treated mice showed lower level of DP reconstitution, and higher level of
DN reconstitution than the NI mice (Figure 32 B). Within the donor-derived DN cells, the
Veh group showed a significantly higher percentage of DN cells arrested in the DN1
stage than the NI group (Figure 32 C). Interestingly, the donor cells from mice that
received radioprotectant dmPGE2 partially corrected the deficiencies, which with more
cells developed into DP stage and fewer cells stuck in the DN and DN1 stages than Veh-
treated mice (Figure 32 B-D and Table 3).

149
Figure 31
0
1
2
3
4
5
0
5
10
15
20
25
0
5
10
15
20
25
0
5
10
15
20
0
5
10
15
20
25
0
50
100
150
200
0
30
60
90
120
150
0
50
100
150
200
250
0.0
0.5
1.0
1.5
2.0
h d
0
2
4
6
8
10
0
1
2
3
4
0
1
2
3
4
5
0
2
4
6
0
10
20
30
0
10
20
30
40
0
10
20
30
40
BM cellularity
LMPP
CLP
CMP
GMP
MEP
* *†
I
J
K
N
O
P
*
*†
*
*†
ST-HSC
LT-HSC
L
M
A
B
C
F
G
H
D
E
NI Veh dmPGE2NI Veh dmPGE2
x 10
4x
104
x 10
4x
104
x 10
4x
104
x 10
4x
108
**
**
*
*
*†
*
*†
*
**
*
*†
**
x 10
4x
104
x 10
4x
104
x 10
4x
104
x 10
4x
108
Day 20 post-TBI 12 months post-TBI

150
Figure 31. BM cellularity and HSPC phenotypes in H-ARS and DEARE phases of
lethal-irradiated mice treated with radioprotectant dmPGE2.
C57BL/6 mice were treated with radioprotectant dmPGE2 prior to lethal TBI and were
sacrificed at 20 days and 12 months post-TBI. BM cells were enumerated and stained
with antibodies as described in Materials and Methods. Flow cytometric analyses
identifies LMPP (panel B & I), CLP (panel C & J), LT-HSC (panel D & K), ST-HSC
(panel E & L), CMP (panel F & M), GMP (panel G & N) and MEP (panel H & O). Bars
represent mean ± SEM. n=3-6 mice per group. *p<0.05 comparing to Veh group; †
p<0.05 comparing to NI group.

151
Figure 32
D
105
104
103
-103
0
-103 0 103 104 105
14±3.1
30±1.731±4.3
105
104
103
-103
0
-103 0 103 104 105
6±4.3
3±2.07±3.1
105
104
103
-103
0
-103 0 103 104 105
0.5±0.2
4±3.021±4.8
NI dmPGE2CD25
CD44
Veh
84±9.426±2.8 75±7.2
105
104
103
-103
0
-103 0 103 104 105
10±1.6
2±0.3
105
104
103
-103
0
-103 0 103 104 105
28±0.4
18±7.6
105
104
103
-103
0
-103 0 103 104 105
17±3.2
7±2.5
CD8
CD4
85±14.0 8±0.1
3±0.5 47±6.5
57±9.5
20±6.1
B C
0%
20%
40%
60%
80%
100%
NI Veh dmPGE2
% CD8+ of donor
% CD4+ of donor
% DP of donor
% DN of donor
0%
20%
40%
60%
80%
100%
NI Veh dmPGE2
% DN4 of donor
% DN3 of donor
% DN2 of donor
% DN1 of donor%
of d
onor
DN
thym
ocyt
es(m
ean
±SE
M)
% o
f don
or th
ymoc
ytes
(mea
n ±
SEM
)
0%
20%
40%
60%
80%
100%
NI Veh dmPGE2
*
*†
% c
him
erism
in t
hym
us(m
ean
±SE
M)
A

152
Figure 32. Thymic engraftment and thymocyte subpopulation reconstitution of BM
cells from mice treated with radioprotectant dmPGE2 in competitive
transplantation assays.
C57BL/6 mice were treated with radioprotectant dmPGE2 prior to lethal TBI. Survivors
were sacrificed at 6 months post-TBI, and 3×10⁵ whole bone marrow cells isolated from
age-matched NI, Veh or dmPGE2 mice, along with 2×10⁵ competitor cells of congenic
origin were transplanted into congenic recipients conditioned with lethal radiation as
described in Materials and Methods. Thymocytes from recipients at 6 months post-
transplantation were stained by CD45.1, CD45.2, CD4, CD8, CD44 and CD25 antibodies
and analyzed by flow cytometry to determine donor chimerism (panel A) and thymocyte
subgroups reconstitution (panel B and C). Panel D is representing flow plots of
recipient’s thymocytes in each group. Bars represent mean ± SEM. n=3-13 per group.
*p<0.05 comparing to Veh group; † p<0.05 comparing to NI group.

153
Donor treatments
% of donor
Table 3. Comparisons of thymocyte subpopulation reconstitution in competitive
transplantation assay of lethal-irradiated mice treated with radioprotectant
dmPGE2.
DN DP CD4 CD8 DN1 DN2 DN3 DN4
NI vs. Veh 0.0002 <.0001 0.0023 0.0102 0.0001 NS <.0001 0.0192
NI vs. dmPGE2 0.0423 0.0172 NS NS <.0001 0.0031 <.0001 NS
dmPGE2 vs. Veh 0.0105 0.0019 NS NS NS NS NS NS
Numbers in the table are p values of comparisons. Donor bone marrow cells were from
NI, Veh and dmPGE2 treated mice at 6 months post-TBI and recipient mice were
sacrificed at 6 months post-transplantation. NS: Not significant.

154
4.3.8. BM progenitor cells from dmPGE2-treated mice have better lymphoid
differentiation in vitro than Veh mice
The HSPC count and competitive transplantation suggest dmPGE2 protects
against TBI-related defects in primitive cell proliferation and/or differentiation. To test
this hypothesis, LSK cells were co-cultured with OP9 or OP9-DL4 cells to mimic B cells
and thymic T cells development in vitro, respectively. The function of the delta-like (DL)
signal (Notch ligand) and the features of this co-culture system were described by
Zuniga-Pflucker et al. [303-305].
Cell proliferation in the Veh group was much slower than in the NI and dmPGE2-
treated groups in both OP9 or OP9-DL4 co-culture systems (Figure 33 A & B). In the
OP9-DL4 co-culture system, the phenotype analysis showed that at early days of co-
culture, the Veh-treated group had higher percentage of T cells arrested at the DN1 stage
and fewer cells developed to the DN2 and DN3 stage compared with NI and dmPGE2-
treated groups (Figure 33 C-F). As co-culture progressed, the Veh-treated group had a
lower percentage of T cells in the DP, CD4+ and CD8+ mature stages, and a higher
percentage in DN the stage than NI and dmPGE2-treated groups (Figure 33 G- J). Mature
CD8 naïve T cells group grew more slowly in the Veh group than the NI and dmPGE2-
treated groups (Figure 33 K). T cell development in mice treated with dmPGE2 prior to
TBI was almost indistinguishable from NI mice but apparently better than Veh mice.
In the OP9 co-culture system, B cell progenitors showed a mature phenotype
(B220) much earlier than T cell progenitors. At day 8, NI and dmPGE2-treated groups

155
had higher B220 expression level than the Veh-treated group, and B220 expression
quickly increased in all groups and there was no difference between groups in the
following days (Figure 33 L). These results indicate that HSPCs from DEARE mice are
deficient in both T and B lineage differentiation, and that treating with dmPGE2 prior to
TBI partially prevents this deficiency.
4.3.9. Mature T cells generated from OP9-DL4 co-culture system are functional
In order to further prove that the T cells under dmPGE2 protection are
functionally intact, IFN-γ production stimulated by PMA and Ionomycin in mature CD4
and CD8 from OP9-DL4 co-culture system was used to evaluate T cell function. Since
the difference of IFN-γ positive percentages between day 16 and day 32 was minimal,
data of these two time-points were combined for analysis. Mature CD4 and CD8 T cells
in the OP9-DL4 co-culture system from NI and dmPGE2-treated group produced 1.5 to 2
times more IFN-γ than cells from Veh group (Figure 34). This result indicates that mature
cells developed from primitive cells that protected by dmPGE2 are functional, rather than
only increased in number.
4.3.10. DmPGE2 increases chemokine receptors expression on lymphoid progenitors
but does not increase homing to thymus
DmPGE2 enhances HSC homing by increasing CXCR4 expression [128, 317].
Both CXCR4 and C-C chemokine receptor type 5 (CCR5) mediate the homing of
primitive BM cells to thymus [318]. Radioprotectant dmPGE2 treated mice were
sacrificed at 12 months post-TBI and CXCR4 and CCR5 expressions were evaluated

156
Figure 33
0
20
40
60
80
100
120
cell
no. i
n O
P9 c
o-cu
ture
(×
106 )
(mea
n±SE
M)
0%
10%
20%
30%
40%
% D
N4
of C
D4-
CD8-
cells
(mea
n±SE
M)
0%
20%
40%
60%
80%
100%
% D
N3
of C
D4-
CD8-
cells
(mea
n±SE
M)
0%
10%
20%
30%
40%
50%
60%
% D
N2
of C
D4-
CD8-
cells
(mea
n±SE
M)
0%
20%
40%
60%
80%
100%
% D
N1
of C
D4-
CD8-
cells
(mea
n±SE
M)
0
50
100
150
200
250ce
ll no
. in
OP9
-DL4
co-
cutu
re(×
106 )
(mea
n±SE
M)
B
D
FE
C
A
*
*
*
*
*
*
*†**
**
**
**
*
**
**
*
*
†
0%
20%
40%
60%
80%
100%
8 15 22 29
% B
220+
cel
ls(m
ean
±SEM
)
70%
80%
90%
100%
% D
N o
f B22
0-G
r1-
cells
(mea
n±SE
M)
0%
5%
10%
15%
20%
% D
P of
B22
0-G
r1-
cells
(mea
n±SE
M)
0%
1%
2%
3%
4%
5%
% C
D4+
CD8-
of B
220-
Gr1
-cel
ls(m
ean±
SEM
)
0%
2%
4%
6%
8%
% C
D4-
CD8+
of B
220-
Gr1
-ce
lls (m
ean±
SEM
)
0%
20%
40%
60%
80%
100%
8 15 22 29
% n
aïve
T o
f CD
8+ c
ells
(mea
n±SE
M)
H
LK
I
G
*
*
*
*
**
NIVehdmPGE2
Days in culture
J
157
Figure 33. In vitro T and B cell lineage differentiation in lethal-irradiated mice
treated with radioprotectant dmPGE2.
C57BL/6 mice were treated with radioprotectant dmPGE2 prior to lethal TBI and were
sacrificed at 12 months post-TBI. BM cells from age-matched NI, Veh and dmPGE2
group were flushed and 1×10³ flow cytometry sorted LSK cells per mouse were co-
cultured with 80-90% confluent OP9 or OP9-DL4 monolayer. Cultured cells were demi-
depopulated and transferred to new monolayers every 5-7 days. Half of the depopulated
cells were used for phenotyping at the time-points indicated in the plots till to the end of
the co-culture. Cells were stained with CD11b, B220, CD4, CD8, CD44, CD25 and
CD62L antibodies and analyzed by flow cytometry. Panel A and B depict the total
number of T cell progenies in OP9-DL4 (panel A) and B cell progenies in OP9 (panel B)
co-culture at different time-points. Panel C-F show the percentages of DN1-4 cells in the
OP9-DL4 co-culture. Panel G-J show the percentages of DN, DP, CD4+ and CD8+ cells
in the OP9-DL4 co-culture. Panel K shows the percentages of naïve T cells in the CD8+ T
cells of OP9-DL4 co-culture system. Panel L shows the percentages of B220+ cells in the
OP9 co-culture. Lines represent mean ± SEM. n=3-7 per group per time-point. *p<0.05
comparing to Veh group; † p<0.05 comparing to NI group at different time-points.

158
Figure 34
0
1
2
3
NI Veh dmPGE2
0
2
4
6
8
NI Veh dmPGE2
A
* *
B *
Fold
incr
ease
of I
FN-γ
in C
D4+
cells
(mea
n ±
SEM
)Fo
ld in
crea
se o
f IFN
-γin
CD8
+ ce
lls(m
ean
±SE
M)

159
Figure 34. IFN-γ production in CD4 and CD8 T cells from OP9-DL4 co-culture.
5×10⁵ cultured cells from OP9-DL4 co-culture system were stimulated by PMA and
Ionomycin for 5 hr and then stained with intracellular IFN-γ antibodies as described in
Materials and Methods. Percentage of IFN-γ positive cells after PMA/Ionomycin
stimulation divided by the percentage before stimulation is the fold increase of IFN-γ in
Y-axis. Bars represent mean ± SEM. n=4-13 per group. *p<0.05 comparing to Veh
group.

160
based on the staining of LMPP and CLP. Results showed that CXCR4 and CCR5
expressions were lower in the Veh-treated group than NI group and radioprotectant
dmPGE2 increased their expression, albeit still lower than NI group (Figure 35 A & B).
As the input of KSL or LMPP/CLP cells provided too few homed cells to analyze,
unfractionated BM cells (CD45.2+) were transplanted into lethally-irradiated congenic
recipient mice (CD45.1+) in another similar study in which donor mice were sacrificed at
6 months post-TBI. There was no significant difference in the percentage of homed cells
at 16 hr post-transplantation among NI, Veh, and dmPGE2-treated groups (Figure 35 C).
The result indicates that the long-term protective effect of dmPGE2 probably is not
mediated by increasing the thymic homing in the early stages post-TBI.
4.3.11. DmPGE2 does not increase incidence of thymic mass
The protective effect of dmPGE2 on HSC raises concerns that it may increase the
prevalence of malignancies in DEARE. Thymic lymphoma is the most common
radiation-induced malignancy in C57/BL6 mice, presenting as increased thymic mass,
variable splenomegaly, and lymphadenopathy [319, 320]. Thymic mass was evaluated in
mice from previous radioprotectant and radiomitigator dmPGE2 studies at 6 and 12
months post-TBI with an irradiation dose range of 8.53-9.04 Gy at 12 w/o. There was no
thymic mass in the NI group. The incidences of thymic mass in both dmPGE2 and Veh-
treated mice increased as aging, consistent with previous reports on thymic mass post-
TBI [321, 322]. The dmPGE2 group had lower thymic mass incidence than Veh group at
6 months post-TBI (1.8% vs. 14.8%) and 12 months post-TBI (6.6% vs. 20%) (Figure
36),

161
Figure 35
NI
VehdmPGE2
B
0
1000
2000
3000
CCR5 CXCR4
M
FI o
f CCR
5/CX
CR4
in C
LP
(mea
n±SE
M)
**
A
0
500
1000
1500
2000
CCR5 CXCR4
MFI
of C
CR5/
CXCR
4 in
LMPP
(m
ean±
SEM
)
†
*
*†*
0.000%
0.002%
0.004%
0.006%
0.008%
0.010%
0.012%
NI Veh dmPGE2
C
% h
omed
cells
in th
ymus
(mea
n±SE
M)

162
Figure 35. CXCR4 and CCR5 expression on DEARE lymphoid progenitors and
homing of DEARE BM cells to thymus.
C57BL/6 mice were treated with radioprotectant dmPGE2 prior to lethal TBI and were
sacrificed at 12 months post-TBI. BM cells from age-matched NI, Veh and dmPGE2
group were stained with LMPP/CLP markers and CXCR4/CCR5 antibodies as described
in Materials and Methods, and analyzed by flow cytometry for MFI of CXCR4 and
CCR5 in the LMPP (panel A) and CLP population (panel B). For short-term thymus
homing study (panel C), donor mice were treated with radioprotectant dmPGE2 prior to
lethal TBI and were sacrificed at 12 months post-TBI, 2×10⁷ whole bone marrow cells
from donor mice (C57Bl/6, CD45.2+) were transplanted intravenously into lethally
irradiated recipient mice (B6.BoyJ, CD45.1+). After 16 hr, recipient thymocytes were
stained with CD45.1 and CD45.2 antibodies and analyzed by flow cytometry. The
thymus homing efficiency was calculated as percentage of CD45.2+ donor cells within
recipient’s thymocytes. Bars represent mean ± SEM. n=2-7 per group. *p<0.05
comparing to Veh; † p<0.05 comparing to NI group.

163
Figure 36
0%
5%
10%
15%
20%
25%
0 6 12
thym
ic ly
mph
oma
inci
denc
e
Months post-TBI
NIVehdmPGE2*

164
Figure 36. Thymic mass incidence in aged irradiation survivors.
C57BL/6 mice were exposed to 8.53-9.04 Gy irradiation at 12 weeks old and treated with
radioprotectant or radiomitigative dmPGE2 as described in Chapter 3. Any mice that
received dmPGE2 treatment were pooled in dmPGE2 group, no matter it is as
radioprotectant or radiomitigator. The Veh group was the pooled mice received
equivalent volume of Veh at the same study at the same time. The thymic masses were
identified at necropsy of 6 and 12 months post-TBI. Thymic mass (lymphoma) incidence
was calculated as a percentage of thymic mass positive mice over all evaluable mice.
n=34-89 per group. *p<0.05 comparing to Veh in total number of thymic masses at 6 and
12 months post-TBI.

165
and there was statistical difference in total thymic mass incidence rate between dmPGE2
and Veh group (3.7% vs. 17.3%, p<0.05).
4.3.12. DmPGE2 thymic protection effect is time-sensitive and intensive treatment is
not necessary
Because the time-point of dmPGE2 injection impacts the day 30 survival rate of
H-ARS mice (Chapter 3, Figure 21), the impact of different treatment time-points on day
30 thymic recovery were investigated. Mice received 8.72 Gy TBI (LD70/30) with 1 dose
of 35 µg dmPGE2 injection at different time [24 hr prior to TBI (-24 hr), 30 min prior to
TBI (-30 min), 3 hr post-TBI (+3 hr) and 24 hr post-TBI (+d1)]. The result shows that the
-30 min and +d1 groups had better thymic recovery compared to the Veh group, and there
was no difference among -24 hr, +3 hr and Veh groups (Figure 37 A), which is consistent
with the survival efficacies for -30 min and +d1 schedule. Whether intensive treatment
could further increase the protection effect of dmPGE2 in DEARE mice was also
investigated. The multiple injection schedule included: dmPGE2 injected at both prior to
and after TBI (one dose of 35 µg dmPGE2 injected at -30 min, +d1, d2 and d3) ,
dmPGE2 injected at prior to TBI and consolidated by monthly injection post-TBI (one
dose of 35 µg dmPGE2 injected at -30 min and one dose of 35 µg dmPGE2 injected
every 28 days beginning on days 92-93 post-TBI), and one dose of 35 µg dmPGE2
injected at days 1, 2 and 3 post-TBI (Figure 37 B). Thymi were collected at 6 months
post-TBI. The results showed that one dose of 35 µg dmPGE2, -30 min prior to TBI, is
sufficient to achieve the thymic protection. Injection of dmPGE2 +d1 post-TBI is not as
effective as injection at -30 min prior to TBI in maintaining thymus in DEARE phase,

166
Figure 37
0
0.01
0.02
0.03
0.04
0.05
Veh -24hr -30min +3hr +d1
0
0.01
0.02
0.03
A
**
†
Veh -30min -30min,+d1,2,3
-30min,+monthly
+d1 +d1,2,3
B
†
* **
∆∆†
Thym
us w
eigh
t (g)
(mea
n±SE
M)
Thym
us w
eigh
t (g)
(mea
n±SE
M)

167
Figure 37. Impact of different times and dosing schedule of dmPGE2 injections on
thymic recovery.
All mice received one-time TBI dose of 8.72 Gy. Panel A: Mice received 1 dose of 35 µg
dmPGE2 injection at 24 hr prior to TBI (-24 hr), 30 min prior to TBI (-30 min), 3 hr post-
TBI (+3 hr) or 24 hr post-TBI (+d1). Veh mice in each group were pooled into Veh group
since no difference in thymus weight between different time-points of Veh injection.
Thymi were collected at day 30 post-TBI. *p<0.05 comparing to Veh group; † p<0.05
comparing to -30 min group. In -24 hr group, there was only one mouse survived at day
30 post-TBI; n=4 mice in other groups. Panel B: Mice received 1 dose of 35 µg dmPGE2
injection at -30 min prior to TBI (-30 min), 1 dose 30 min prior to TBI and 1 dose on
days 1, 2 or 3 post TBI (-30 min, +d1,2,3), 1 dose 30 min prior to TBI and monthly 35 µg
injections beginning on day 92-93 post-TBI(-30 min, +monthly), 1 dose on 24 hr post-
TBI (+d1) or 1 dose on days 1, 2 and 3 post-TBI (+d1,2,3). Thymi were collected at 6
months post-TBI. Bars represent mean ± SEM. n=6-10 mice per group. *p<0.05
comparing to Veh group; † p<0.05 comparing to -30 min; ∆ p<0.05 comparing to -30
min, +d1,2,3 group.

168
and multiple injections after the -30 min or +24 hr injection neither enhance thymic
recovery nor further increase the protective effect.
4.3.13. DmPGE2 receptors partially involve in the thymic protection
DmPGE2 has four receptor subtypes, designated EP1, EP2, EP3, and EP4 [323].
Hoggatt J et al. demonstrated that regulatory effects of NSAID on HSPC retention
through the reduction of EP4 receptor signaling [131]. The role of the EP receptors in the
thymic protection effect of dmPGE2 has not been investigated. Mice were injected with
one dose of 35 µg dmPGE2 or same dose of EP1+3 agonist (17-phenyl trinor dmPGE2),
EP2 agonist (butaprost free-acid), or EP4 agonist (L902-688) -30 min prior to 8.72 Gy
TBI. The thymi analysis at day 30 post-TBI showed that none of the EP agonists were as
effective as dmPGE2 in protecting the thymus, and that thymocyte subpopulation
distributions were aberrant in agonist groups compared with the dmPGE2 group (Figure
38 A & B). Because only one mouse survived to day 30 in the EP1+3 and EP2 groups,
statistical comparison was not available for these two groups. This result indicates that
activation of EP1-4 receptors may only be partially responsible for dmPGE2’s thymic
protection effect; or that simultaneous activation of all or some combination of EP
receptors is required for the full protection effect; or the currently used agonists are not
potent enough.

169
Figure 38
0
0.01
0.02
0.03
0.04
0.05
Veh dmPGE2 EP1+3 EP2 EP4
*
†
ATh
ymus
wei
ght (
g)(m
ean±
SEM
)
0%
20%
40%
60%
80%
100%
Veh dmPGE2 EP1+3 EP2 EP4
CD8CD4DPDN%
of t
hym
ocyt
es(m
ean±
SEM
)
B

170
Figure 38. Impact of different dmPGE2 receptors activation on thymic recovery.
C57BL/6 mice received one dose of 35 µg dmPGE2 or same dose of EP1+3 agonist (17-
phenyl trinor dmPGE2) or EP2 agonist (butaprost free-acid) or EP4 agonist (L902-688) -
30 min prior to 8.72 Gy TBI. Thymi were weighed (panel A) and thymocytes were
phenotyped for CD4, CD8 single positive, DP and DN subpopulations by flow cytometry
at day 30 post-TBI (panel B) as previously described. Bars represent mean ± SEM. In
EP1+3 and EP2 group, there was only one mouse survived at day 30 post-TBI in each
group; n=4 mice in other groups. *p<0.05 comparing to Veh group; † p<0.05 comparing
to dmPGE2 group.

171
4.3.14. DmPGE2 does not change the number of thymic stromal cells in DEARE
mice
Thymic stromal cells, mainly TECs, support the development of T cell
progenitors and direct positive and negative selection [324, 325]. DmPGE2 might
provide thymic protection by indirectly influencing thymic stromal cells. The number of
cTECs and mTECs at 12 months post-TBI were investigated. The flow cytometry
analysis showed that there was no significant difference in the numbers of cTECs and
mTECs between the dmPGE2 and Veh groups (Figure 39 A & B).
4.3.15. Lymphopoiesis related genes are impacted by radioprotectant dmPGE2
To investigate whether the benefit of radioprotectant dmPGE2 treatment on long-
term immune reconstitution results from its early impact on HSC differentiation, RNA
sequencing was carried out on highly-purified HSCs from mice that received one dose of
35 μg dmPGE2 -30 min prior to TBI. Mice were sacrificed 24 hr post-TBI. IPA predicted
that lymphopoiesis was increased at 24 hr post-TBI in dmPGE2 group with a high
activation z-score of 4.34 when compared with Veh group, and 115 associated genes
were identified. Meanwhile, IPA also predicted that lymphopoiesis was decreased in Veh
group at 24 hr post-TBI with a z-score of 2.01 when comparing with NI group, with 186
associated genes were identified. Nineteen genes either decreased in Veh but increased in
dmPGE2 group; or increased in Veh but decreased in dmPGE2 group. The following
lymphopoiesis-associated genes were up-regulated by radioprotectant dmPGE2: Lepr
(Leptin receptor), Dntt (DNA nucleotidylexotransferase), Flt3, Smad7 (Mothers against
decapentaplegic homolog 7), Il6ra (Interleukin-6 receptor Subunit Alpha), Efnb2 (Ephrin

172
Figure 39
0
0.5
1
1.5
NI Veh dmPGE2
0
0.1
0.2
0.3
NI Veh dmPGE2
mTE
Cnu
mbe
r per
thym
us (
×103 )
(mea
n±SE
M)
cTEC
num
ber p
er th
ymus
(×1
03 )(m
ean±
SEM
)BA

173
Figure 39. Thymic stromal cells in DEARE phase of lethal-irradiated mice.
C57BL/6 mice were treated with radioprotectant dmPGE2 and were sacrificed at 12
months post-TBI. Thymi were enzyme-digested and stained with CD45, EpCAM, UEA-1
and Ly51 antibodies and analyzed by flow cytometry as described in Materials and
Methods. The absolute cell numbers of cTEC (Panel A) and mTEC (Panel B) were the
total thymocyte numbers multiplied by the percentage of cTEC and mTEC. Bars
represent mean ± SEM. n=3-6 mice per group.

174
B2), Cadm1(Cell adhesion molecule 1), Ifngr1 (Interferon gamma receptor 1), Rora
(RAR related orphan receptor A), Furin (FES upstream region), Stat3 (Signal transducer
and activator of transcription 3), Cdkn1c (Cyclin dependent kinase inhibitor 1C), Tgfbr1
(Transforming growth factor beta receptor 1), Myb (MYB proto-oncogene, transcription
factor), Ets2 (ETS proto-oncogene 2, transcription factor) and Zmiz1(Zinc finger MIZ-
type containing 1). And the following genes which inhibit the lymphopoiesis were down-
regulated by radioprotectant dmPGE2: Prkca (Protein kinase C alpha), Lmo1 (LIM
domain only 1) and Tk1 (Thymidine kinase 1) (Figure 40). Radioprotectant dmPGE2
may impact HSC differentiation through these genes as early as 24 hr post-TBI. (Andrea
Patterson in Dr. Pelus’ laboratory provided the RNA sequencing and IPA analysis).
4.3.16. Cytokines that support lymphopoiesis were prevented from decreasing by
dmPGE2
To investigate whether the bone marrow environment helps immune
reconstitution at early time-points, BM supernatant was collected from NI, Veh, and
dmPGE2-treated mice at day 9 post-TBI, and 32 cytokines were detected by Millipore
mouse cytokine/chemokine panel. DmPGE2-treated mice had increase in the average
levels of growth factor, both anti- and pro-inflammatory cytokines than Veh-treated mice,
although most differences were not statistically significant. In the growth factor category,
growth factors that support lymphopoiesis (IL-2 and IL-7) were increased in dmPGE2-
treaed mice compared with the Veh at day 9 (green box labeled at Figure 41). On the
contrary, growth factors that support myelopoiesis (MGSF, G-CSF, IL-3) were increased

175
Figure 40
LeprDnttFlt3Smad7Il6raEfnb2Cadm1Ifngr1RoraFurinStat3Cdkn1cTgfbr1MybEts2Zmiz1PrkcaLmo1Tk1
NI Veh dmPGE2
* *

176
Figure 40. Heat map of genes associated with enriched GOTERM_BP:
lymphopoiesis.
Fgd5 mice were treated with one dose of 35 µg dmPGE2 or equivalent Veh at -30 min
prior to 8.53 Gy TBI and were sacrificed at 24 hr post-TBI. 1,000-6,000 HSCs
(CD45+SLAM-LSKwideZsGreen+) per mouse were sorted from BM by FACSAria and
were subjected to RNA sequencing. Genes were identified by IPA with FDR <0.05 and
fold change >2. Lymphopoiesis and its related genes were identified by IPA cellular
function predictions. Genes up-regulated in HSC are presented in red and genes down-
regulated are in blue. n=7-8 mice per group. *FDR <0.05 in all genes between indicated
groups. Andrea Patterson provided the RNA sequencing and IPA analysis.

177
Figure 41
UD UD UD
NI Veh dmPGE2MCSF G-CSF IL-3 IL-2 IL-7 LIF IL-5 VEGFIL-9 IL-4
IL-10 IL-13 IL-6
IL-1 a IL-1 BETA
IL-17 IFN-g TNF-a
IL-12(p40) IL-12(p70)
IL-15 KC
MCP-1 MIP-1a MIP-1b RANTES
LIX Eotaxin MIP-2 MIG IP-10
support myelo
support lymph *
*
**

178
Figure 41. BM cytokines in NI mice and irradiated mice at day 9 post-TBI.
C57BL/6 mice were treated with one dose of 35 µg dmPGE2 or equivalent Veh at -30
min prior to 8.53 Gy and mice were sacrificed at day 9 post-TBI. Cytokines in BM
supernatant were analyzed by Bio-Plex multiplex system. Expression level of individual
cytokine is represented by shades of blue (low value) to red (high value) as described in
Materials and Methods. n=4 mice per group. *p<0.05 comparing dmPGE2 to Veh group.
UD: undetectable, values out of range. Huilin Chua and Hailin Feng did the Bio-Plex
study; Tong Wu did the analyses.

179
in Veh-treated mice at day 9 post-TBI but attenuated by radioprotectant dmPGE2 (black
box labeled at Figure 41).
4.4. Discussion
The thymus is the central lymphoid organ for T cell maturation and education.
Although there are controversies regarding the extent of thymic recovery post-TBI, it is
generally accepted that an irradiated thymus would be inevitably more involuted than the
non-irradiated one, and that there is no effective method to prevent or delay this
involution [186, 218, 219]. Ventevogel MS et al.[75] and Majumdar S et al. [326]
reported that leuprolide, IL-7, IL-22, keratinocyte growth factor, growth hormone, and
Ghrelin have thymic-regeneration potential in aged mice. However, none of these has
been shown to prevent the effect of irradiation. Developing a treatment to protect against
radiation-induced thymic involution is of significant importance to victims of radiation
disasters, and to radiotherapy patients.
PGE2, a lipid arachidonic acid derivative, induces lymphocyte apoptosis through
DNA fragmentation by up-regulating c-Myc expression [327], and suppresses T cell
activation by down-regulating IL-2 production [300-302]. Since PGE2 has been
considered a “foe” to lymphoid cells, previous studies about MCMs targeting immune
recovery post-IR had not considered PGE2 or dmPGE2 as candidate. However, many
recent studies indicate that PGE2 has both pro- and anti-inflammatory effects [301, 328]
and its derivative dmPGE2 plays a positive role in hematopoiesis post-TBI [130, 135,

180
276]. To date, no study has evaluated the effect of PGE2/dmPGE2 on the lymphoid
lineage in the context of irradiation.
Drs. Orschell and Pelus have recently discovered that one dose of dmPGE2 -30
min prior to TBI greatly increased the day 30 survival rate (Figure 21). Here, I observed
that radioprotectant dmPGE2 also prevents irradiation-induced thymic involution as early
as 20 days post-TBI, and that this effect is maintained for at least one-year post-TBI. The
thymic protection effect is time-sensitive and works best when dmPGE2 is administered
as a radioprotectant, -30 min prior to TBI. The exact reason for this time sensitivity is
unclear.
Treatment with radioprotectant dmPGE2 does not demonstrate the thymic
protection effect until day 20. At day 3 and day 10, there is no difference in thymic
weight between dmPGE2- and Veh-treated groups. Takada et al. [218] reported that the
first recovery peak of the thymus, at day 10 post-IR, is due to the proliferation of
surviving residual thymocytes, and the second recovery peak at day 30 is due to the enter
and proliferation of progenitor cells from the bone marrow. Here, the hypothesis is that
the thymic protection from dmPGE2 occurs as a result of protection of early bone
marrow progenitors as opposed to directly protecting mature T cells. Under protection
from dmPGE2, lymphoid progenitors with less irradiation damage enter thymus and
proliferate post-IR. Increases in CXCR4 and CCR5 expression were observed in LMPP
and CLP of dmPGE2-treated mice group compared with the Veh control, although an
increase in thymic homing was not observed (Figure 35). This is inconsistent with other

181
studies on chemokine receptors and HSC homing to the bone marrow [22] and may relate
to a difference in the time at which the “gate” opens post-IR between the bone marrow
niche and thymic niche. Post-IR and until the second recovery peak, the thymic “gate” is
not open which does not allow bone marrow progenitors anchor in the thymus.
In in vivo competitive transplantation studies, a better thymic reconstitution is
achieved by donor cells from dmPGE2 group than Veh group (Figure 32). The Veh mice
were deficient in thymus repopulation, supporting result from previous report of reduced
T cell lineage reconstitution in peripheral blood by donor cells from Veh mice [40].
These results also supported previous data (Table 2) showing an increased percentage of
DP thymocytes and decreased percentage of DN1 thymocytes in dmPGE2-treated mice.
These data indicate that dmPGE2 as a radioprotectant likely protects the thymus through
the protection of bone marrow HSPCs.
In further support of the hypothesis that dmPGE2 protects the thymus via the
“intrinsic mechanism” (HSPC protection) rather than the “extrinsic mechanism” (thymic
stromal cell protection), I demonstrated that the lymphoid progenitors, LMPP and CLP,
were decreased in Veh group and attenuated by radioprotectant dmPGE2 at 12 months
post-TBI, whereas myeloid progenitors were not (Figure 31). Additionally, co-culture
studies revealed that HSPCs from dmPGE2-treaetd mice had increased proliferation and
differentiation capabilities compared with cells from Veh-treated mice (Figure 33), and
the dmPGE2-treated mice did not have significantly higher cTEC and mTEC numbers
compared with Veh group (Figure 39). These data indicate that HSPCs are protected by

182
radioprotectant dmPGE2, and that these cells have better lymphoid lineage development
than HSPCs in the Veh-treated mice, although the impact of radioprotectant dmPGE2 on
bone marrow niche prior to LMPP/CLP entering the thymus cannot be ruled out.
In mice treated with radioprotectant dmPGE2, lymphoid progenies (T and B cells)
in thymus (Table 2) and spleen (Figure 29) were increased in comparison with the Veh
control group. In the mature peripheral T cell subsets, naïve T cells were trended higher
in dmPGE2 group than Veh group although not significant, which is probably because of
the limited number of mice in each group. There are two mechanisms for T cell
regeneration: one is thymus-dependent de novo regeneration originated from the
proliferation of BM-derived progenitors; another is thymus-independent HPE. In normal
mice, naïve T cells in the spleen are predominantly RTE, which represents the thymus-
dependent de novo regeneration, as opposed to homeostatic proliferation of naïve T cells
[314, 315]; in lymphopenic situation, such as post-TBI or post-transplantation, how
thymic output involves in T cell reconstitution and whether peripheral naïve T cells still
represent RTE are not clear, but from the consistency of increased thymocytes and
peripheral naïve T cells in dmPGE2 group, it is highly possible that the increased thymic
output by dmPGE2 protection comprises, at least involve in, the peripheral T cell
reconstitution. Further measurement of the ratio of thymic output and HPE in Veh and
dmPGE2 group would further verify the effect of dmPGE2 on T cell reconstitution post-
TBI.

183
B cells were increased in the spleens of DEARE mice treated with radioprotectant
dmPGE2 (Figure 29), and HSPCs from dmPGE2-treated mice have enhanced mature B
cell development in comparison with the Veh mice in OP9 co-culture (Figure 33 L). The
protective effect of dmPGE2 treatment prior to TBI on B and T lymphocytes ameliorates
myeloid skewing, which is a sign of immune suppression (Figure 27). Myeloid skewing
is also seen in geriatric mice with HSPCs that have accumulated DNA damage [329]. The
prevention of myeloid skewing by radioprotectant dmPGE2 indicates that dmPGE2 may
successfully prevent radiation-induced DNA damage and that its target stage of
hematopoietic differentiation is likely before the LMPP and CMP stage, whether it is the
earlier HSC or the latter MPP stage is not clear.
Although all current evidence indicates that dmPGE2 plays a positive role in
lymphocyte recovery post-IR. Interestingly, dmPGE2 is also a “foe” to lymphocytes in an
unirradiated scenario (Figure 28 C). The CBC analysis in unirradiated mice received
dmPGE2 injection demonstrates that dmPGE2 has quick, transient, toxicity to peripheral
lymphocytes, which is similar to the reports from Mastino et al. [327, 330] showing that
PGE2 induces apoptosis of lymphocytes both in vivo and in vitro; and the report from
Chouaib et al. [331] showing that PGE2 inhibits T lymphocyte proliferation. This effect
is probably mediated through the activation of EP2 and EP4 since murine mature T cells
do not express EP1 and EP3 [301, 328]. Other components of the peripheral blood are not
significantly affected by dmPGE2. The “double hit” from irradiation and dmPGE2
exposure delays lymphocyte recovery in comparison with neutrophil recovery until the
cells are replenished by RTEs; however, during the lymphocyte-low period (until day 20

184
post-TBI), the death rate of the dmPGE2-treated group does not increase (Figure 21).
Considering that infection is the main cause of death during this period [15, 69], the main
anti-infection effect arises from neutrophils, which are higher in the dmPGE2-treated
group than Veh-treated group (Figure 24 A).
DmPGE2 represents a simple and effective radioprotectant with the potential to
provide immense benefits to emergency personnel responding to radiation emergency
and/or patient receiving radiotherapy. It is known that radiation increases the risk of
secondary cancers [4, 205], and whether dmPGE2 would exacerbate this situation is
unknown. In C57BL/6 mice, the most common secondary cancer post-TBI is thymic
lymphoma [319], which correlates with radiation dosage. In thymic mass study, the
thymic mass incidence in the dmPGE2-treated group was only 1/5 of that observed in the
Veh-treated group (Figure 36), indicating that pmPGE2 may protect against secondary
tumors. The prevention of DNA damage and enhanced immune surveillance in dmPGE2-
treaetd group are potential mechanisms for this finding. This result, however, should be
interpreted with caution as this study is not designed for estimating thymic mass
incidence post-TBI, and the total mouse number was relatively low to make a definitive
conclusion.
Lineage commitment occurs early in the HSC differentiation pathway. As
myeloid skewing was prevented by dmPGE2 treatment prior to TBI, in order to elucidate
whether lymphopoietic potential is protected by dmPGE2, RNA sequencing was carried
out on HSCs +24 hr post-TBI. The IPA analysis indicates that a group of genes that

185
support lymphopoiesis were up-regulated in dmPGE2-treated group and another group of
genes inhibiting lymphopoiesis were up-regulated in Veh group and attenuated by
radioprotectant dmPGE2 (Figure 40). Those genes promote lymphopoiesis through
different mechanisms. Flt3 is a cytokine tyrosine kinase receptor and is one of surface
markers of LMPP. Flt3-/- and Flt3L-/- mice are deficient in B cell development and earliest
thymic progenitors [332]. By synergizing with other cytokine defects, such as in Flt3L-/-
Il-7r-/- mice, the thymopoiesis and subsequent T lymphopoiesis are more exacerbated
[333]. The RNA sequencing shows that Flt3 was significantly up-regulated in dmPGE2
group comparing to Veh group. IL-7R is the receptor for IL-7 and is an important surface
mark for CLP. IL-7R gene follows a similar trend as Flt3 with eight times higher
expression level in dmPGE2 group than Veh group, although this difference was not
statistically significant (p<0.05 but FDR>0.05), which might be attributed to the limited
number in this study. The changes in Flt3 and IL-7R gene expression in dmPGE2 group
accelerate T cell reconstitution post-TBI. Other cytokine receptors in which the ligand-
receptor signal pathways are important for either B cell or T cell development (Lepr,
Il6ra, Ifngr1 and Tgfbr1) display elevated gene expression in the HSCs from dmPGE2-
treated mice. Additionally, several downstream genes regulating the cell cycle (Stat3,
Cdkn1c), and genes involving in V(D)J recombination (Dntt) and Notch ligand cleavage
(Furin) were higher in HSCs from dmPGE2-treated mice than Veh-treated mice. Some
genes reportedly take action in later lymphopoiesis, such as Zmiz1 coordinates with
Notch1 to promote thymocyte proliferation [334] and Ets2 promotes thymocyte
proliferation via inhibition of dexamethasone-induced apoptosis [335].

186
The following BM cytokine analysis represents the bone marrow
microenvironment difference between dmPGE2 and Veh mice. At day 9 post-TBI, the
dmPGE2-treated group had a higher average cytokine level than the Veh-treated group in
growth factor and anti- and pro-inflammatory categories, in which IL-2, IL-4, IL-9 and
Eotaxin levels were significantly elevated (Figure 41). IL-4 and IL-9 are both produced
by activated mature T cells, mast cells, and basophils. These cytokines regulate the
mature T cell response, B cell class switching, and promote B and T cell proliferation. A
group of growth factors (MCSF, G-CSF and IL-3) that support myelopoiesis (black box
labeled in Figure 41) were decreased in the dmPGE2-treated group, although not
significantly. In contrast, the cytokines IL-2 and IL-7, supporting lymphopoiesis (green
box labeled in Figure 41), increased in dmPGE2-treated group in comparison with Veh
control group. IL-7-/- or IL-2-/- mice have severe reduction in T and B cells, an involuted
thymus, and a high incidence of autoimmune disease [336, 337]. Compared with IL-7,
IL-2 has a broader biological function since the γ chain of the IL-2R is the common
gamma chain for multiple cytokines such as IL-4, IL-7, IL-9, IL-15 and IL-21 [338]. IL-
2-/- mice, therefore, have several additional hematopoietic defects in addition to
dysfunctional lymphopoiesis. It has been reported that PGE2 inhibits mature T cell
function and proliferation by decreasing IL-2 production [10-12]. The cytokine analysis
indicates that radioprotectant dmPGE2 increases IL-2 shortly after the injection (Figure
25) and still increases as late as day 9 post-TBI (Figure 41), which further supports the
“friend or foe” nature of dmPGE2. The change in IL-7 expression also indicates that, as
early as day 9 post-TBI, the mice under dmPGE2 protection have pro-lymphopoietic
environment despite peripheral lymphocyte recovery starts to show in CBC analysis

187
around day 20 (Figure 24). This can be explained by the slow process of development
from LMPP to mature peripheral T cells. The decrease in IL-7 in BM microenvironment
post-IR and the prevention of this decrease by dmPGE2 corresponds to the RNA
sequencing findings in which the decrease of IL-7R gene expression in HSC post-IR is
also prevented by dmPGE2. Determining whether BM cytokines act either in permissive
(only promote the proliferation and survival of HSC) or instructive (activate a lineage
differentiation direction) pattern will be helpful to illustrate the mechanism of dmPGE2
protection [332]. Other cytokine levels, such as FLT3L and CXCL12 which are not
included in the Millipore mouse 32 cytokines panel, also need to be evaluated in H-ARS
mouse model in order to investigate other important signal pathways in lymphopoiesis
under the protection of dmPGE2.
In conclusion, these studies, for the first time, show that radioprotectant dmPGE2
results in long-lasting protection to the immune system including increased thymic-
settling progenitors in BM, prevention of irradiation-induced thymic involution,
enhanced differentiation of T and B cells, increased peripheral lymphocyte number, and
blunted myeloid skewing. DmPGE2 is detrimental to peripheral lymphocytes
immediately on administration; however, this toxicity is transient, and its pro-
development and pro-differentiation effects rapidly counteract the toxicity, leading to
lymphoid lineage reconstitution in the long-term post-IR. Further safety test to evaluate
the effect of dmPGE2 on primary tumor in patients undergoing radiotherapy scenario and
studies to determine the mechanism of dmPGE2 including the targeted cells and receptors
and downstream signal pathways are necessary before applying dmPGE2 as a

188
radioprotectant to first responders and military personnel facing radiation disasters and/or
patients undergoing radiotherapy.

189
Chapter 5. Other stories: Pegylated Hematopoietic Growth Factors and Lisinopril
as Radiomitigators
5.1. Introduction
The majority of clinical symptoms and radiation-related deaths occur early post-
IR in the ARS phase. Treatment development has therefore largely focused on early
intervention. Irradiation doses higher than two Gy and five Gy induce clinical H-ARS
and GI-ARS, respectively [2, 35, 339]. H-ARS and GI-ARS are the most common causes
of radiation-related death. Blood transfusions, supportive care, and administration of
HGF-based regimens are used to rescue pancytopenia in H-ARS.
G-CSF and GM-CSF have similar signaling pathway and mechanism in
hematopoiesis, as discussed in Chapter 1. IL-11 belongs to the IL-6 family and has a
heterodimer receptor composed of IL-11Rα and gp130. IL-11 activates the downstream
Jak/Stat, RAS/MAPK and PI3K/AKT signaling pathways to promote thrombopoiesis and
erythropoiesis. It is also an anti-inflammatory cytokine and is cytoprotective for intestinal
crypt cells [340, 341]. Recombinant human IL-11 (Oprelvekin, Neumega®) is FDA-
approved for the treatment of chemotherapy-induced thrombocytopenia. The most
common adverse effects of IL-11 are tolerable, including edema and fluid retention. More
severe adverse effects such as atrial fibrillation occur less frequently [342]. Recombinant
IL-11 has a longer half-life than natural IL-11, but still requires daily injection [343,
344]. Dr. Orschell's laboratory and others have shown that long-acting pegylated (peg)
IL-11 analogs with a 10-fold higher half-life result in a sustained platelet increase for 7-
10 days [74, 345]. Dr. Orschell's laboratory has shown that multiple injections or higher

190
doses of peg-IL-11 did not further increase survival compared to single, lower dose
schedule (1.0 mg/kg vs. 0.3 mg/kg; three doses at day 1, 3, 5 vs. 1 dose at day 1 post-
TBI) [74]. Similar trends were observed with peg-G-CSF and peg-GM-CSF in the same
study. This efficacy of a single-dose treatment is of particular significance in treatment of
victims of nuclear accidents, where daily dosing is complicated by the chaotic aftermath.
Since G-CSF, GM-CSF, and IL-11 interact with different receptors, work through
different mechanisms, and target different HPCs (as discussed in Chapter 1), the
combined treatment (double and triple combination of different peg-HGFs) were
hypothesized to be able to further enhance survival rate and hematopoietic recovery.
Many other potential interventions have been investigated for H-ARS, as
discussed in Chapter 1. In this study, the efficacy and mechanism of action of lisinopril,
an ACE inhibitor, were investigated in the well-established H-ARS mouse model.
Lisinopril decreases Ang II plasma levels by inhibiting ACE and has been approved for
the treatment of hypertension, congestive heart failure, coronary artery disease, and
diabetic nephropathy. Ang II receptors express on HSCs, BM stromal cells, erythroid
progenitors, and mature LY [91, 92]. It has minimal positive effect on hematopoiesis
when administered alone in the non-irradiated scenario [93, 94, 96], with adverse effects
including anemia and leukopenia at high dose or when used long-term. This adverse
effect results from an increase in plasma AcSDKP, an ACE substrate which negatively
regulates hematopoiesis [99, 104]. The negative regulation of hematopoiesis does not,
however, rule out the potential of ACEI used as a MCM to radiation. There are many

191
evidences showing that ACE inhibition post-IR is radiomitigating and the increased DNA
damage repair in HSC due to ACEI-induced quiescence is thought to be a possible
mechanism [101, 103]. Lisinopril is safe with tolerable adverse effects, and it is
economical and easily accessible. It neither needs to be injected, nor to be refrigerated
during the logistics chain. All these advantages make lisinopril an ideal MCM to
stockpile in case of significant radiation event. Because only using lisinopril alone has
minimal effect on hematopoiesis, and previous study indicates that there is a synergistic
response on the hematopoietic recovery when angiotensin (1-7) and G-CSF combined
[93], the effect of triple HGFs combination therapy in conjunction with lisinopril was
evaluated in the H-ARS mouse model.
5.2. Materials and Methods
5.2.1. Mouse husbandry and irradiation
C57BL/6 mice were purchased from Jackson Laboratory (Bar Harbor, ME) at 10
w/o and housed in microisolators with up to five mice per cage. Extruded chow (Harlan
2018SXC) and acidified water were provided ad libitum. Mice were irradiated at 12 w/o
after 2 weeks of acclimatization. At day 0, mice were exposed to single uniform TBI
doses of gamma radiation a 137Cs radiation source (Mark 1 Irradiator, JL Shepherd, San
Fernando, CA) at 8.72 Gy (LD70/30), 9.04 Gy (LD90/30) or 9.27 Gy (LD95/30).
Autoclaved acidified water and wet feed were provided from day 4 to day 30 post-TBI. In
the competitive transplantation study, recipients and competitors were congenic
PtrcaPep3b/BoyJ (B6.BoyJ; CD45.1+) or the F1 hybrid of C57Bl/6 and B6.BoyJ mice
(CD45.2+/CD45.1+). B6.BoyJ and F1 hybrid mice were bred in-house and used between

192
8-12 w/o. Morbidity and mortality of irradiated mice was monitored twice daily for the
duration of the H-ARS study (day 30). Mice were evaluated daily using a scale system
incorporating body posture, activity level, and eye appearance to determine when
euthanasia was required as previously described [69]. Day 30 post-TBI, surviving mice
were transferred to the RBMD study. All studies were approved by the Indiana
University School of Medicine Institutional Animal Care and Use Committee (IACUC
protocol 10689).
5.2.2. Compounds
The manufacturing process of pegylated-HGFs have been described [74]. All
pegylated-HGFs (subsequently referred to as “peg-HGFs” or “HGFs”) were administered
by subcutaneous injection (SQ) 24±4 hr post-TBI at the following doses: peg-huG-CSF
(BBT-015, subsequently referred to as “G”), 1.0 mg/kg; peg-muGM-CSF (BBT-007,
subsequently referred to as “GM”), 1.0 mg/kg; peg-huIL-11 (BBT-059, subsequently
referred to as “IL-11”), 0.3 mg/kg) were obtained from Bolder Biotech and formulated in
10 mM sodium phosphate, 4% mannitol, 1% sucrose pH 6.2 before use. The final volume
of HGFs (~100 µl) was adjusted by mouse weight resulting in a dose of 6 µg of peg-IL-
11, 20 µg of peg-G-CSF or 20 µg of peg-GM-CSF per mouse. An equivalent volume of
vehicle (10 mM sodium phosphate, 4% mannitol, 1% sucrose, subsequently referred to as
Veh) was delivered to the control group. The doses were chosen based on the previous
efficacy study [74]. The different regimens of HGFs are summarized in Table 4.
Lisinopril was supplied by Dr. Medhora at Medical College of Wisconsin and

193
Table 4. Dose and combination regimens of pegylated HGFs.
Group ID Treatment
1 Vehicle (Veh)
2 peg-G-CSF (1.0 mg/kg) (G)
3 peg-GM-CSF (1.0 mg/kg) (GM)
4 peg-IL-11 (0.3 mg/kg) (IL-11)
5 peg-G + peg-IL-11 (G+IL-11)
6 peg-GM + peg-IL-11 (GM+IL-11)
7 peg-G + peg-GM (G+GM)
8 peg-G + peg-GM + peg-IL-11 (triple combo, TC)
9 Non-irradiated controls (NI)

194
dissolved into 60 mg/L in autoclaved acidified water for dosing on days 7-30 post-TBI.
Lisinopril was delivered at a dose of 9 mg/kg (180 µg/20 g mouse) based on a previous
finding that mice consume ~3 ml water per day in the absence of wet chow [69].
5.2.3. CBC and tissue harvest
Mice were tail-bled for CBC, which was performed at baseline and repeated
throughout the study. NI, Veh-treated, and MCM-treated mice were assessed at various
time-points at H-ARS and DEARE stage for CBC, bone marrow cellularity, and thymus
weight/cellularity as previously described in Chapter 2. For the brain hemorrhage study,
mice were sacrificed immediately at day 10 post-TBI. The scalp was cut in a sagittal
direction with a scalpel from the forehead to the neck and the skull was broken between
the eyes with scissors. A scoop was used to extract the cerebrum and cerebellum from the
brain stem for counting macroscopic petechiae on the brain surface.
5.2.4. Antibody staining and flow cytometry analysis
Twelve w/o C57BL/6 mice were injected with different HGF regimens 24 hr post-
TBI as described above. At day 2 post-TBI, peripheral blood cells were harvested by tail
snip. Erythrocytes were lysed, and leukocytes (“total cells” in figures) were stained with
antibodies for T cells (CD3-PE), B cells (B220-FITC), and myeloid cells (Gr-1-
PerCPCy5.5). Annexin-V-APC was used as an apoptosis marker and 7-AAD as a
viability stain. Apoptotic rate in each white blood cell subpopulation was evaluated by
flow cytometry. Expression of c-Kit was rapidly down-regulated post-IR at cell numbers
were very low at myelosuppressive nadir. Therefore, for bone marrow stem cell

195
population analysis, lineage-, Sca-1+ and CD150+ (SLCD150+ cells) markers were used
to identify the enriched population in HSCs at day 2, 7, 10 post-TBI in the H-ARS study
to gain sufficient cells for flow cytometry analysis. The gating strategy used in DEARE
stage was different from in the H-ARS stage since hematopoiesis had almost or partially
recovered at the DEARE time-points. Therefore, in the DEARE study, lineage-, c-Kit+,
Sca-1+, CD150+ and CD48- (KSLCD150+CD48-) markers were used to identify the
enriched population in HSCs at 6 and 12 months post-TBI. Thymocyte subgroup staining
and analysis was as described in Chapter 2. For cell cycle analysis in the lisinopril study,
bone marrow cells were stained at day 10 post-TBI for the SLCD150+ marker, or 6
months post-TBI for KSL CD150+CD48-, as described above. Cells were fixed overnight
in 1% (v/v) formaldehyde and stained with 4’,6-diamidino-2-phenylindole (DAPI,
Invitrogen, Eugene, OR). All antibodies were purchased from BD Biosciences (San Jose,
CA), Biolegend (San Diego, CA), eBiosciences (San Diego, CA), or R&D Systems
(Minneapolis, MN). Staining procedures and flow cytometric analyses were as previously
described [40].
5.2.5. CFC assays and competitive transplantation
Twelve w/o C57BL/6 mice were exposed to 9.27 Gy (LD95/30) and treated with
different HGF regimens at 24 hr post-TBI as previously described. In H-ARS phase, four
mice per treatment group were euthanized at day 5, 7, 14, and 30. BM cells were flushed
from eight bones (humeri, pelvis, femurs, and tibias) and pooled together because cell
number was very low at days 5, 7, and 14. Three quarters of the total cells were
transplanted into three recipient mice (one aliquot number of cells per recipient, total of

196
three recipients per group); remaining cells were used for the colony assay. In H-ARS
CFC assays, one aliquot of BM cells was suspended in 1 ml semi-solid methylcellulose
media supplemented with murine SCF, murine IL-3, recombinant human IL-6, and
recombinant human EPO (Methocult M3434, Stem Cell Technologies, Vancouver, BC,
Canada) and incubated for 7 days (37°C, 5% CO2) prior to quantification of CFU-GM,
BFU-E and CFU-GEMM. In H-ARS transplantation studies, one aliquot of BM cells was
transplanted into one recipient along with 2×10⁵ competitor cells. Peripheral blood was
analyzed monthly for donor-derived chimerism for 1-5 months post-transplantation. In
DEARE CFC assays, 2.5×10⁴ whole BM cells were cultured in duplicate in similar
procedures as in H-ARS CFC studies. In DEARE transplantation studies, donor mice
were sacrificed at 12 months post-TBI, and BM cells were flushed from pelvis, femurs,
and tibias, and 3×10⁵ whole BM donor cells were transplanted intravenously with 2×10⁵
competitor cells into congenic recipient. Peripheral white blood cells were stained with
CD45.1, CD45.2, Gr-1, B220, CD4 and CD8 antibodies for chimerism and lineage
reconstitution at 6 months post-transplantation. Similar studies were also carried out on
TC ± lisinopril study.
5.2.6. Plasma and bone marrow cytokine analysis
Plasma samples were obtained by cardiac puncture. BM supernatants were
obtained from 2 femurs and 2 tibiae flushed twice with 500 µl cold PBS. Plasma samples
were acquired after centrifuging EDTA-anticoagulant whole blood from cardiac puncture
at 956 g for 4 min. BM supernatants and plasma samples were stored at -80°C and

197
thawed on ice before analysis. The cytokine detection and analysis were described in
Chapter 3.
5.2.7. Statistical analysis
Thirty-day survival in H-ARS studies and lifespan in DEARE studies were
analyzed by KM analyses and log-rank tests using SPSS Statistics Version 24 (IBM,
Armonk, NY). Unpaired two-tailed t-tests were performed on Microsoft Excel 2010
(Microsoft Corp, Redmond, WA) to compare the parameters between “with xx” and “no
xx” as the combined analysis strategy, or between female and male in lisinopril studies,
where at least three mice of either gender were analyzed. In rest studies, when comparing
more than two groups, one-way ANOVA with post-hoc Tukey-Kramer HSD or Welch
ANOVA for unequal variances were performed by JMP 14 (SAS Institute, Cary, NC).
Data were expressed as mean ± SEM. P<0.05 was considered significant.
5.3. Results
5.3.1. Peg-HGFs increase post-TBI day 30 survival rate
Dr. Orschell’s laboratory recently reported a significantly increased day 30
survival rate in mice treated with SQ injections of single-dose individual peg-HGFs +24
hr post-TBI [74]. In the current study, the efficacy of combined HGFs strategy on day 30
survival was investigated. The difference between LD90/30 and LD95/30 is minimal so
mice were combined. The day 30 survival rate in mice receiving the Veh injection was
7.5%, consistent with the expected LD. The day 30 survival rate significantly increased in
mice receiving a single individual dose of G, GM, or IL-11 (50%, 32.5%, and 62.5%,

198
respectively), consistent with previous report [74] (Figure 42 A and Table 5). Mice
receiving combinations of two or three HGFs had higher day 30 survival rates than mice
treated with individual HGFs. Treating with G+IL-11, GM+ IL-11, G+GM, and
G+GM+IL-11 (triple combination, TC) increases day 30 survival to levels of 65%,
72.5%, 55%, and 80%, respectively. TC-treated mice had a significantly higher survival
than G, GM, and G+GM groups; however, no statistical difference was found in
comparison with IL-11-containing regimens (IL-11, G+IL-11, GM+IL-11) (Figure 42 A
and Table 5). Comparable results were obtained in a subsequent study with a lower dose
of irradiation (8.72 Gy, LD70/30; data not shown).
To further understand how combining HGFs contributes to increased survival,
different HGF-treated mice were pooled together for analysis. Mice treated with G, G +
GM, G + IL-11, or TC were pooled as G-CSF regimens (“with G” in figures) and
compared with a pooled group of mice treated with GM, IL-11, or GM + IL-11 (“no G”
in figures). The pooling criteria were applied to mice treated with GM-CSF regimens and
IL-11 regimens. To compare the use of multiple HGFs vs. a single HGF, the G+IL-11,
GM+IL-11, G+GM, and TC groups were combined into one group (“combined” in
Figures and Legends) and the G, GM and IL-11 groups into one group (“single” in
Figures and Legends). To compare HGFs vs. Veh, all HGF-treated groups were
combined (“HGFs” in figures) and compared with the Veh group. The analyses showed
that the “with IL-11” and “combined” groups had a higher day 30 survival rate than the
“no IL-11” and “single” groups, respectively (Figure 42 D & E). However, there were no
differences in the day 30 survival rates between “with G” and “with GM” groups in

199
comparison with the “no G” and “no GM” groups, respectively (Figure 42 B & C). All
HGF-treated groups had significant higher day 30 survival rates than the Veh group
(Figure 42 A & F).
5.3.2. Peg-HGFs accelerate recovery of peripheral blood cells
To examine the relationship of hematopoietic recovery to survival, CBC with
differential counts were performed at baseline as well as at day 2, 4, 7, 10, 21, and 30
post-TBI. The fluctuation in animal number during the course of the study is due to the
fact that these are retrospective analyses that combined data from several MCM screening
studies. At day 2 post-TBI, LY level was at a low level approaching their nadir at day 7-
10, whereas NE level only decreased to 33-50% of normal (Figure 43 B & C, Table 7 &
8, for comparisons of other CBC parameters, please see Table 6-10). As expected, the
declines of RBC and PLT were delayed in comparison with NE and LY. RBC and PLT
decreased at day 10 and at day 7 post-TBI, respectively, in comparison with NI mice. The
nadirs of WBC, LY and NE occurred at day 7-10, whereas RBC and PLT reached nadir
around day 21. At the time-points around the nadirs (day 4, 7, and 10), almost all HGF-
treated groups had no significant differences in WBC, NE, and LY compared with Veh-
treated mice. All irradiated mice (both HGF-treated and Veh-treated mice) had significant
differences in these parameters in comparison with NI mice. At day 30, NE levels had
recovered to normal in all irradiated mice with no difference to NI mice; in contrast,
WBC and LY numbers remained significantly lower in IRR mice than in NI mice. No
HGF treatment rescued this low LY count at day 30. At day 21, the nadir time-point of
RBC and PLT, mice receiving HGF treatments had higher numbers of these cells than

200
Figure 42
Veh
G
GM
IL-11
G+IL-11
GM+IL-11
G+GM
TCVeh
G
GM
G+GMIL-11
G+IL-11GM+IL-11
TC
100
80
60
40
20
0
A
Veh
with G
no G
no Gwith G
Veh
100
80
60
40
20
0
Veh
with GM
no GM
no GM
with GM
Veh
100
80
60
40
20
0
**
**
B
C
Veh
with IL-11
with IL-11
Veh
100
80
60
40
20
0
no IL-11
no IL-11
*
*
∆
Veh
Combined
Single
Single
Combined
Veh
100
80
60
40
20
0
*
*
∆
D
E
Veh
HGFs
HGFs
Veh
100
80
60
40
20
0
*
F
% S
urvi
val

201
Figure 42. Thirty-day survival of lethal-irradiated mice treated with pegylated
HGFs.
Mice were exposed to 9.04 Gy or 9.27 Gy TBI and treated with pegylated HGFs in
single, double, or triple combination (TC) 24 hr later. Survival on day 30 is shown as
Kaplan-Meier survival curve. n=39-41 mice in each group (panel A). P values of
comparisons in panel A were summarized in Table 5. The day 30 survival data were also
analyzed in the method of combining different HGF groups into “with G” vs. “no G”
(panel B), “with GM” vs. “no GM” (panel C), “with IL-11” vs. “no IL-11” (panel D),
“single” vs. “combined” (panel E), or combining all HGF groups into one “HGFs” group
and compared with Veh group (panel F). *p<0.05 comparing to Veh group. ∆ p<0.05
comparing to “no IL-11” group (panel D) or comparing to “single” group (panel E).
Sasidhar Vemula acquired the data; Tong Wu did the analyses.
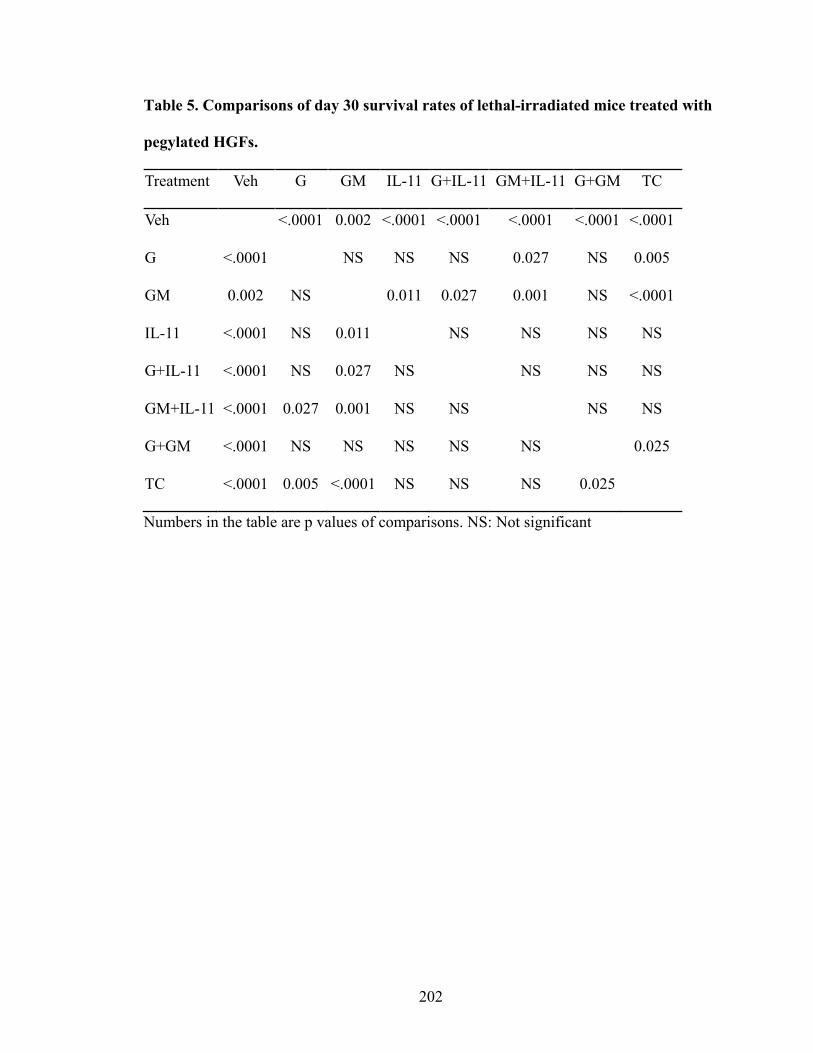
202
Table 5. Comparisons of day 30 survival rates of lethal-irradiated mice treated with
pegylated HGFs.
Treatment Veh G GM IL-11 G+IL-11 GM+IL-11 G+GM TC
Veh <.0001 0.002 <.0001 <.0001 <.0001 <.0001 <.0001
G <.0001 NS NS NS 0.027 NS 0.005
GM 0.002 NS 0.011 0.027 0.001 NS <.0001
IL-11 <.0001 NS 0.011 NS NS NS NS
G+IL-11 <.0001 NS 0.027 NS NS NS NS
GM+IL-11 <.0001 0.027 0.001 NS NS NS NS
G+GM <.0001 NS NS NS NS NS 0.025
TC <.0001 0.005 <.0001 NS NS NS 0.025
Numbers in the table are p values of comparisons. NS: Not significant
203
Veh-treated mice. This difference no longer existed by day 30, though RBC and PLT in
mice treated with most HGF regimens were lower than NI control mice (Figure 43 D &
E, Table 9 & 10).
To reduce the number of comparisons and identify which HGF or which
combination regimen promoted hematopoietic recovery, data were analyzed as “with IL-
11” vs. “no IL-11”, “with G” vs. “no G”, “with GM” vs. “no GM”, “single” vs.
“combined”, and “HGFs” vs. “Veh”(Figure 44-48). The “with IL-11” group had higher
NE numbers than “no IL-11” group at day 2 post-TBI (Figure 44). The “with G” group
had higher NE, RBC and PLT numbers, but not LY number, than “no G” group at day 21
post-TBI (Figure 45). The “with GM” group had lower WBC and LY numbers at day 21
post-TBI than “no GM” group (Figure 46). These analyses indicate that the three
different HGFs took effect at different time-points and affect different cell types.
Regimens containing G-CSF increase NE, RBC and PLT levels at day 21 post-TBI,
which is when most Veh-treated mice die from infection and hemorrhage. This was not
observed in mice treated with GM-CSF or IL-11-containing regimens. The “single” vs.
“combined” analysis indicated that combining HGFs increased WBC and NE at day 2
post-TBI; RBC and PLT at day 21 post-TBI. However, LY at day 21 post-TBI was lower
with combined treatment than treatment with single HGF (Figure 47). Analyzing all
HGF-treated groups together in comparison with the Veh group (Figure 48) revealed that
the most significant increases in CBC parameters were at day 21, where WBC, NE, LY,
RBC, and PLT counts were higher in HGF-treated mice than in Veh-treated mice.

204
Figure 43
0
1
10
0 5 10 15 20 25 30
WBC
(K/u
l)(M
ean
±SE
M)
Days post Irradiation
NI
Veh
G
GM
IL-11
G+IL-11
GM+IL-11
G+GM
TC
A
0
0
1
10
0 5 10 15 20 25 30
NE
(K/u
l)(M
ean
±SE
M)
Days post Irradiation
0.1
B
0
1
10
0 5 10 15 20 25 30
LY (K
/ul)
(Mea
n ±
SEM
)
Days post Irradiation
C
0
3
6
9
12
0 5 10 15 20 25 30
RBC
(M/u
l)(M
ean
±SE
M)
Days post Irradiation
D
0
300
600
900
1200
0 5 10 15 20 25 30
PLT
(K/u
l)(M
ean
±SE
M)
Days post Irradiation
E
A WBC NE
LY
PLT
RBC

205
Figure 43. CBC profiles in H-ARS phase of lethal-irradiated mice treated with
pegylated HGFs.
Mice were exposed to 9.04 Gy or 9.27 Gy TBI and treated with pegylated HGFs in
single, double, or TC 24 hr later. Peripheral blood CBCs were performed at different
time-points as indicated in panels. n=3-21 mice in each group (panel A). P values of
comparisons were summarized in Table 6-10. Sasidhar Vemula acquired the data; Tong
Wu did the analyses.

206
Table 6. Comparisons of WBC at different time-points of lethal-irradiated mice
treated with pegylated HGFs.
WBC
Treatments Day2 Day4 Day7 Day10 Day21 Day30
NI vs. Veh <.0001 <.0001 <.0001 <.0001 <.0001 0.0072
NI vs. G <.0001 <.0001 <.0001 <.0001 0.0002 0.0001
NI vs. GM <.0001 <.0001 <.0001 <.0001 <.0001 0.0001
NI vs. IL-11 <.0001 <.0001 <.0001 <.0001 <.0001 0.0001
NI vs. G+IL-11 <.0001 <.0001 <.0001 <.0001 <.0001 0.0112
NI vs. GM+IL-11 <.0001 <.0001 <.0001 <.0001 <.0001 <.0001
NI vs. G+ GM <.0001 <.0001 <.0001 <.0001 <.0001 <.0001
NI vs. TC <.0001 <.0001 <.0001 <.0001 <.0001 <.0001
Veh vs. G NS NS NS NS 0.0047 NS
Veh vs. IL-11 NS NS NS NS 0.0102 NS
Veh vs. G+IL-11 NS NS NS NS 0.0062 NS
Veh vs. GM+IL-11 NS NS NS NS 0.0208 NS
Veh vs. G+GM NS NS NS NS 0.008 NS
Veh vs. TC NS NS NS NS 0.0052 NS
G vs. GM+IL-11 NS 0.0441 NS NS NS NS
G vs. TC NS NS NS NS 0.0181 NS
GM vs. GM+IL-11 NS 0.0441 NS NS NS NS

207
Numbers in the table are p values of comparisons. If a comparison has no significant
difference at any time-points, it will not be shown in the table. NS: Not significant

208
Table 7. Comparisons of NE at different time-points in H-ARS phase of lethal-
irradiated mice treated with pegylated HGFs.
NE
Treatments Day2 Day4 Day7 Day10 Day21 Day30
NI vs. Veh 0.0386 <.0001 <.0001 <.0001 <.0001 NS
NI vs. G NS <.0001 <.0001 <.0001 0.0295 NS
NI vs. GM 0.0109 <.0001 <.0001 <.0001 <.0001 NS
NI vs. IL-11 NS <.0001 <.0001 <.0001 <.0001 NS
NI vs. G+IL-11 NS <.0001 <.0001 <.0001 0.0004 NS
NI vs. GM+IL-11 NS <.0001 <.0001 <.0001 <.0001 NS
NI vs. G+ GM NS <.0001 <.0001 <.0001 0.0005 NS
NI vs. TC NS <.0001 <.0001 <.0001 <.0001 NS
Veh vs. G NS NS NS NS 0.0059 NS
Veh vs. IL-11 NS NS NS NS 0.0361 NS
Veh vs. G+IL-11 NS NS NS NS 0.0078 NS
Veh vs. GM+IL-11 NS NS NS NS 0.0203 NS
Veh vs. G+GM NS NS NS NS 0.0101 NS
Veh vs. TC NS NS NS NS 0.0063 NS
G vs. GM NS NS NS NS 0.0114 NS
G vs. IL-11 NS NS NS NS 0.0555 NS
G vs. GM+IL-11 NS 0.0441 NS NS NS NS
GM vs. IL-11 0.0211 NS NS NS NS NS
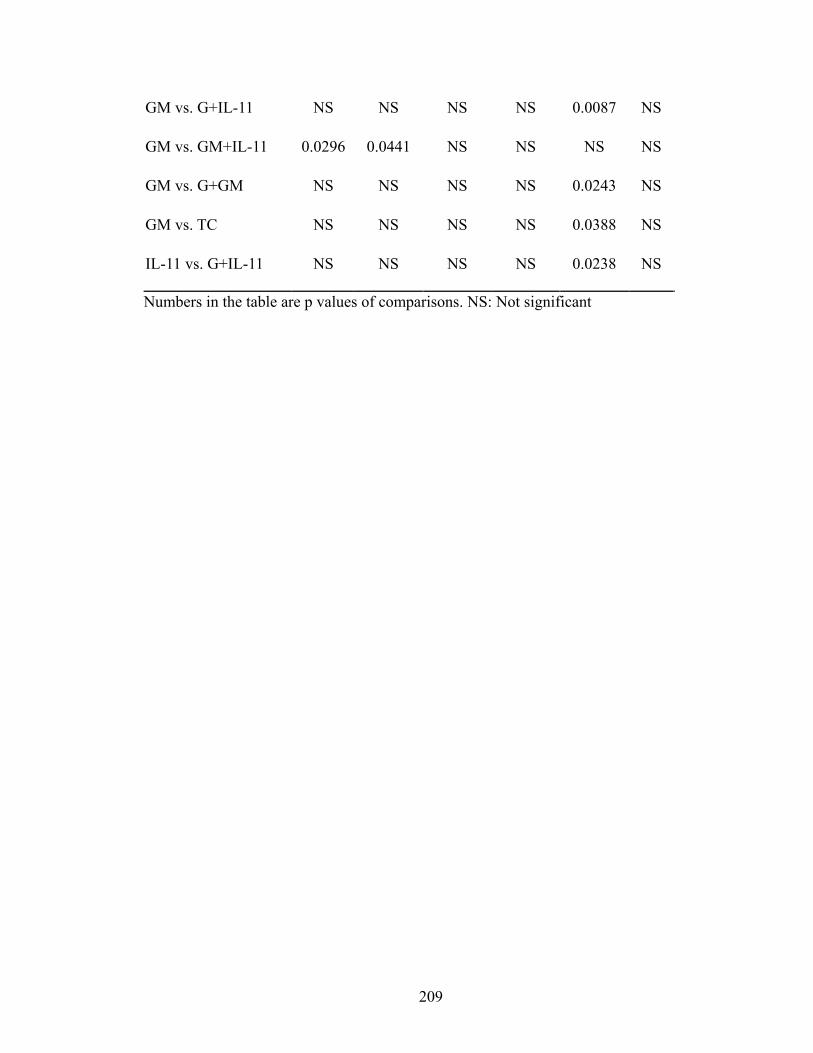
209
GM vs. G+IL-11 NS NS NS NS 0.0087 NS
GM vs. GM+IL-11 0.0296 0.0441 NS NS NS NS
GM vs. G+GM NS NS NS NS 0.0243 NS
GM vs. TC NS NS NS NS 0.0388 NS
IL-11 vs. G+IL-11 NS NS NS NS 0.0238 NS
Numbers in the table are p values of comparisons. NS: Not significant
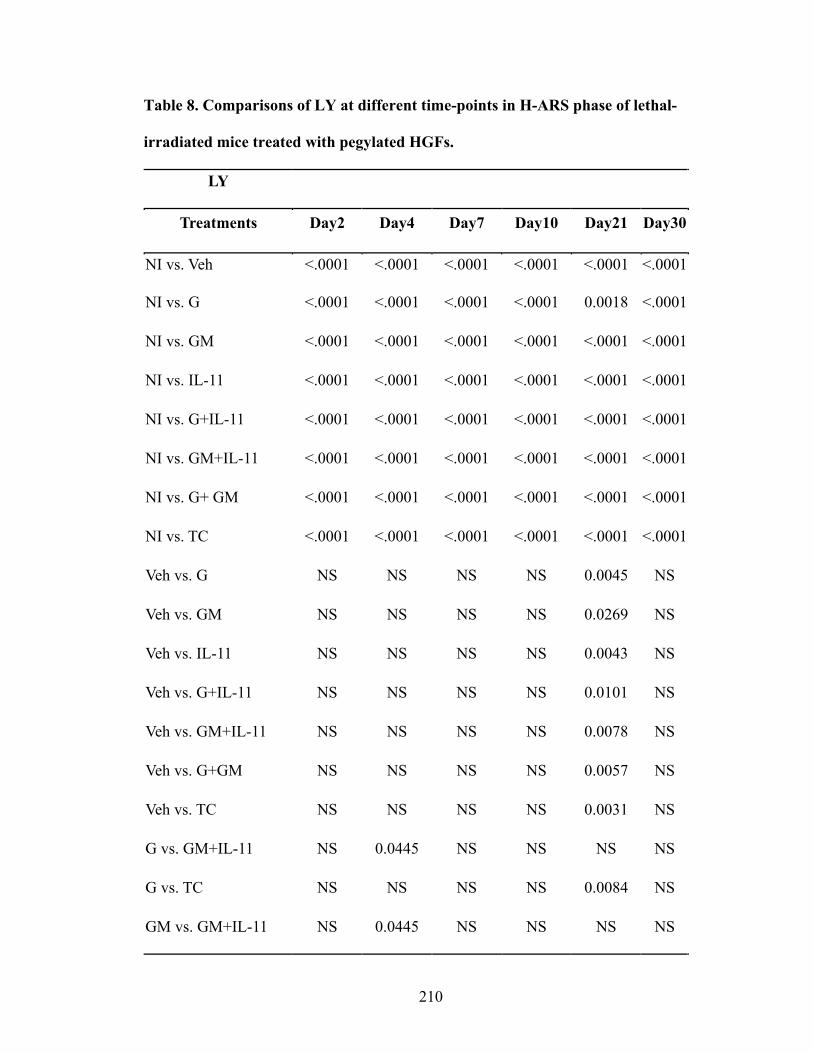
210
Table 8. Comparisons of LY at different time-points in H-ARS phase of lethal-
irradiated mice treated with pegylated HGFs.
LY
Treatments Day2 Day4 Day7 Day10 Day21 Day30
NI vs. Veh <.0001 <.0001 <.0001 <.0001 <.0001 <.0001
NI vs. G <.0001 <.0001 <.0001 <.0001 0.0018 <.0001
NI vs. GM <.0001 <.0001 <.0001 <.0001 <.0001 <.0001
NI vs. IL-11 <.0001 <.0001 <.0001 <.0001 <.0001 <.0001
NI vs. G+IL-11 <.0001 <.0001 <.0001 <.0001 <.0001 <.0001
NI vs. GM+IL-11 <.0001 <.0001 <.0001 <.0001 <.0001 <.0001
NI vs. G+ GM <.0001 <.0001 <.0001 <.0001 <.0001 <.0001
NI vs. TC <.0001 <.0001 <.0001 <.0001 <.0001 <.0001
Veh vs. G NS NS NS NS 0.0045 NS
Veh vs. GM NS NS NS NS 0.0269 NS
Veh vs. IL-11 NS NS NS NS 0.0043 NS
Veh vs. G+IL-11 NS NS NS NS 0.0101 NS
Veh vs. GM+IL-11 NS NS NS NS 0.0078 NS
Veh vs. G+GM NS NS NS NS 0.0057 NS
Veh vs. TC NS NS NS NS 0.0031 NS
G vs. GM+IL-11 NS 0.0445 NS NS NS NS
G vs. TC NS NS NS NS 0.0084 NS
GM vs. GM+IL-11 NS 0.0445 NS NS NS NS

211
Numbers in the table are p values of comparisons. NS: Not significant

212
Table 9. Comparisons of RBC at different time-points in H-ARS phase of lethal-
irradiated mice treated with pegylated HGFs.
RBC
Treatments Day2 Day4 Day7 Day10 Day21 Day30
NI vs. Veh NS NS 0.0312 <.0001 <.0001 NS
NI vs. G NS NS NS <.0001 <.0001 0.0303
NI vs. GM NS NS NS <.0001 <.0001 0.0093
NI vs. IL-11 NS NS NS <.0001 <.0001 NS
NI vs. G+IL-11 0.0131 NS NS <.0001 0.0003 NS
NI vs. GM+IL-11 NS NS NS <.0001 <.0001 0.0009
NI vs. G+ GM 0.0174 NS NS <.0001 0.001 0.0072
NI vs. TC NS NS NS <.0001 <.0001 0.0009
Veh vs. G NS NS NS NS 0.0047 NS
Veh vs. IL-11 NS NS NS NS 0.0115 NS
Veh vs. G+IL-11 NS NS NS NS 0.0047 NS
Veh vs. GM+IL-11 NS NS NS NS 0.0038 NS
Veh vs. G+GM NS NS NS NS 0.006 NS
Veh vs. TC NS NS NS NS 0.0025 NS
G vs. GM NS NS NS NS 0.023 NS
GM vs. G+IL-11 NS NS NS NS 0.0045 NS
GM vs. G+GM NS NS NS NS 0.0155 NS
GM vs. TC NS NS NS NS 0.0072 NS

213
IL-11 vs. G+IL-11 NS NS NS NS 0.0486 NS
IL-11 vs. G+GM NS NS NS NS 0.0473 NS
Numbers in the table are p values of comparisons. NS: Not significant

214
Table 10. Comparisons of PLT at different time-points in H-ARS phase of lethal-
irradiated mice treated with pegylated HGFs.
PLT
Treatments Day2 Day4 Day7 Day10 Day21 Day30
NI vs. Veh NS NS <.0001 <.0001 <.0001 NS
NI vs. G NS NS <.0001 <.0001 <.0001 0.0009
NI vs. GM NS 0.0172 <.0001 <.0001 <.0001 0.0059
NI vs. IL-11 NS NS <.0001 <.0001 <.0001 0.001
NI vs. G+IL-11 NS 0.0481 <.0001 <.0001 <.0001 NS
NI vs. GM+IL-11 NS 0.0459 <.0001 <.0001 <.0001 0.0356
NI vs. G+ GM NS 0.0413 <.0001 <.0001 <.0001 0.004
NI vs. TC NS 0.0204 <.0001 <.0001 <.0001 0.0104
Veh vs. G NS NS NS NS 0.0047 NS
Veh vs. GM NS NS NS NS 0.0135 NS
Veh vs. IL-11 NS NS NS NS 0.004 NS
Veh vs. G+IL-11 NS NS NS NS 0.0047 NS
Veh vs. GM+IL-11 NS NS NS NS 0.0262 NS
Veh vs. G+GM NS NS NS NS 0.006 NS
Veh vs. TC NS NS 0.0464 NS 0.0026 NS
G vs. GM NS NS NS NS 0.0016 NS
G vs. IL-11 NS NS NS NS 0.0072 NS
GM vs. G+IL-11 NS NS NS NS 0.003 NS

215
GM vs. G+GM NS NS NS NS 0.0129 NS
GM vs. TC NS NS NS NS 0.0015 NS
IL-11 vs. G+IL-11 NS NS NS NS 0.0039 NS
IL-11 vs. TC NS NS NS NS 0.0034 NS
Numbers in the table are p values of comparisons. NS: Not significant
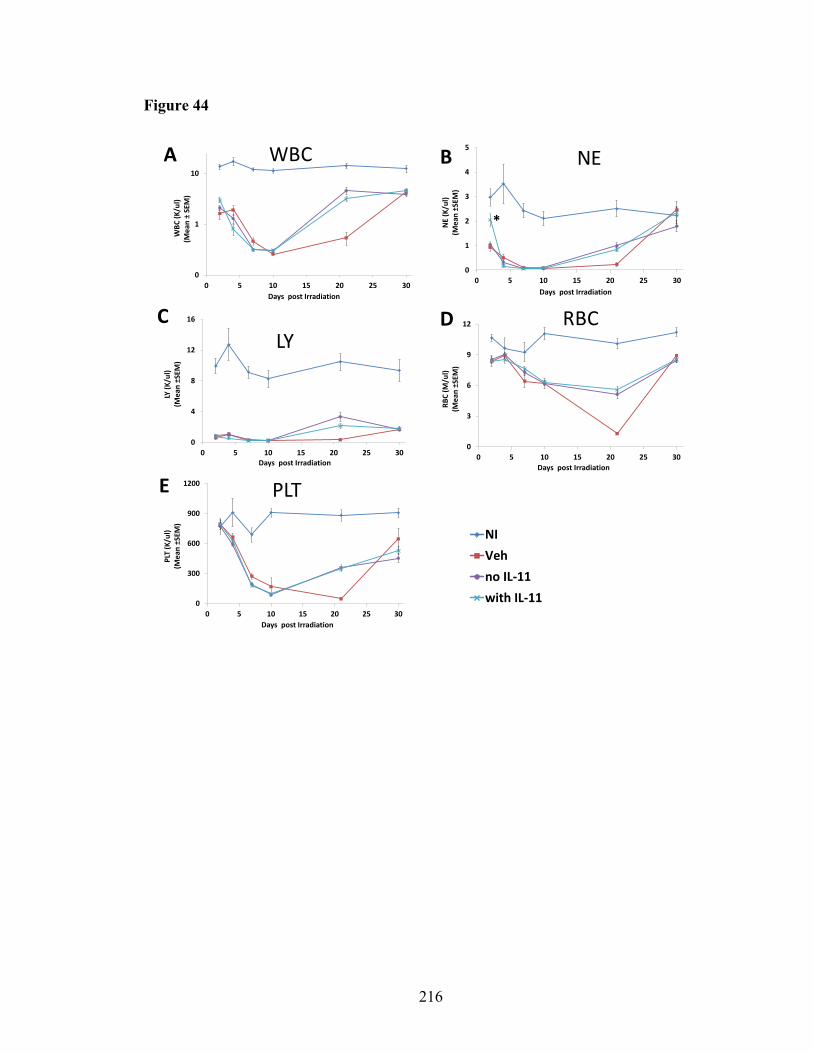
216
Figure 44
0
1
2
3
4
5
0 5 10 15 20 25 30
NE
(K/u
l)(M
ean
±SEM
)
Days post Irradiation
*
0
1
10
0 5 10 15 20 25 30
WBC
(K/u
l)(M
ean
±SE
M)
Days post Irradiation
0
300
600
900
1200
0 5 10 15 20 25 30
PLT
(K/u
l)(M
ean
±SEM
)
Days post Irradiation
0
3
6
9
12
0 5 10 15 20 25 30RB
C (M
/ul)
(Mea
n ±S
EM)
Days post Irradiation
0
4
8
12
16
0 5 10 15 20 25 30
LY (K
/ul)
(Mea
n ±S
EM)
Days post Irradiation
WBC NE
LYRBC
PLT
NIVehno IL-11with IL-11
B
C
A
D
E

217
Figure 44. CBC profiles in H-ARS phase of lethal-irradiated mice treated with
“with IL-11” or “no IL-11” regimen.
Mice in Figure 43 were re-grouped as mice received any regimens containing IL-11 were
combined into “with IL-11” group and mice received regimens containing other HGFs
were combined into “no IL-11” group. n=21-71 mice per time-point per group. * p<0.05
comparing “with IL-11” group (light blue) to “no IL-11” group (purple) at time-points as
marked. Sasidhar Vemula acquired the data; Tong Wu did the analyses.
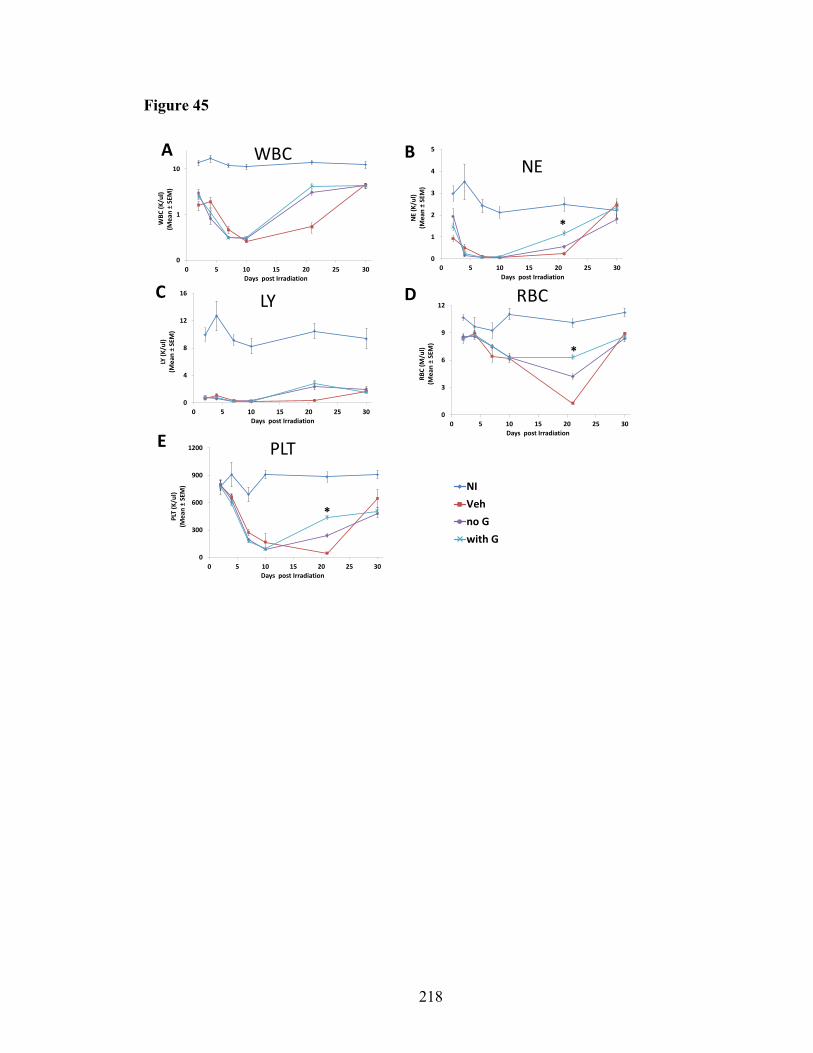
218
Figure 45
0
3
6
9
12
0 5 10 15 20 25 30RB
C (M
/ul)
(Mea
n ±
SEM
) Days post Irradiation
*
0
4
8
12
16
0 5 10 15 20 25 30
LY (K
/ul)
(Mea
n ±
SEM
)
Days post Irradiation
0
1
2
3
4
5
0 5 10 15 20 25 30
NE
(K/u
l)(M
ean
±SE
M)
Days post Irradiation
0
1
10
0 5 10 15 20 25 30
WBC
(K/u
l)(M
ean
±SE
M)
Days post Irradiation
WBCNE
LY RBC
0
300
600
900
1200
0 5 10 15 20 25 30
PLT
(K/u
l)(M
ean
±SE
M)
Days post Irradiation
*
NIVehno Gwith G
*
B
C
A
D
E PLT

219
Figure 45. CBC profiles in H-ARS phase of lethal-irradiated mice treated with
“with G” or “no G” regimen.
Mice in Figure 43 were re-grouped as the method of “with G” vs. “no G” as previously
described. n=21-72 mice per time-point per group. *p<0.05 comparing “with G” group
(light blue) to “no G” group (purple) at time-points as marked. Sasidhar Vemula acquired
the data; Tong Wu did the analyses.

220
Figure 46
0
300
600
900
1200
0 5 10 15 20 25 30
PLT
(K/u
l)(M
ean
±SE
M)
Days post Irradiation
0
3
6
9
12
0 5 10 15 20 25 30RB
C (M
/ul)
(Mea
n ±
SEM
) Days post Irradiation
0
4
8
12
16
0 5 10 15 20 25 30
LY (K
/ul)
(Mea
n ±
SEM
)
Days post Irradiation
*
0
1
2
3
4
5
0 5 10 15 20 25 30
NE
(K/u
l)(M
ean
±SE
M)
Days post Irradiation
0
1
10
0 5 10 15 20 25 30
WBC
(K/u
l)(M
ean
±SE
M)
Days post Irradiation
*
WBC NE
LY RBC
PLT
NIVehno GMwith GM
*
B
C
A
D
E

221
Figure 46. CBC profiles in H-ARS phase of lethal-irradiated mice treated with
“with GM” or “no GM” regimen.
Mice in Figure 43 were re-grouped as the method of “with GM” vs. “no GM” as
previously described. n=21-71 mice per time-point per group. * p<0.05 comparing “with
GM” group (light blue) to “no GM” group (purple) at time-points as marked. Sasidhar
Vemula acquired the data; Tong Wu did the analyses.

222
Figure 47
0
1
2
3
4
5
0 5 10 15 20 25 30
NE
(K/u
l)(M
ean
±SE
M)
Days post Irradiation
*
NE
0
300
600
900
1200
0 5 10 15 20 25 30
PLT
(K/u
l)(M
ean
±SE
M)
Days post Irradiation
*
PLT
0
4
8
12
16
0 5 10 15 20 25 30
LY (K
/ul)
(Mea
n ±
SEM
)
Days post Irradiation
*
LY
NIVehSingleCombined
0
3
6
9
12
0 5 10 15 20 25 30RB
C (M
/ul)
(Mea
n ±
SEM
) Days post Irradiation
*
RBC
0
1
10
0 5 10 15 20 25 30
WBC
(K/u
l)(M
ean
±SE
M)
Days post Irradiation
WBC B
C
A
D
E
*

223
Figure 47. CBC profiles in H-ARS phase of lethal-irradiated mice treated with
“single” or “combined” regimen.
Mice in Figure 43 were re-grouped as the method of “single” vs. “combined” as
previously described. n=21-72 mice per time-point per group. *: p<0.05 comparing
“combined” group (light blue) to “single” group (purple) at time-points as marked.
Sasidhar Vemula acquired the data; Tong Wu did the analyses.

224
Figure 48
NI
Veh
HGFs
0
1
10
0 5 10 15 20 25 30
WBC
(K/u
l)(M
ean
±SE
M)
Days post Irradiation
WBC*
0
1
2
3
4
5
0 5 10 15 20 25 30
NE
(K/u
l)(M
ean
±SE
M)
Days post Irradiation
NE
*
0
300
600
900
1200
0 5 10 15 20 25 30
PLT
(K/u
l)(M
ean
±SE
M)
Days post Irradiation
PLT
*
0
3
6
9
12
0 5 10 15 20 25 30RB
C (M
/ul)
(Mea
n ±
SEM
) Days post Irradiation
RBC
*
0
4
8
12
16
0 5 10 15 20 25 30
LY (K
/ul)
(Mea
n ±
SEM
)
Days post Irradiation
LY
*
B
C
A
D
E

225
Figure 48. CBC profiles in H-ARS phase of lethal-irradiated mice treated with
“HGFs” or “Veh” regimen.
Mice in Figure 43 were re-grouped as the method of “HGFs” vs. “Veh” as previously
described. n=52-121 mice per time-point per group. *p<0.05 comparing “HGFs” group
(purple) to “Veh” group(red) at time-points as marked. Sasidhar Vemula acquired the
data; Tong Wu did the analyses.
226
To summarize, HGF treatments do not increase WBC, NE, and LY counts at their
nadirs. Instead, significant recovery of the hematopoietic system occurs around day 21
post-TBI, where HGFs increase all CBC parameters. G-CSF-containing regimens
increase NE, RBC, and PLT counts at day 21; polypharmacy regimens increase WBC
and NE at day 2, and increase RBC and PLT at day 21. These results support the use of
HGFs in a lethal irradiation scenario, and are consistent with the increased survival of
HGF-treated mice.
5.3.3. Peg-HGFs does not reduce peripheral blood cell apoptosis
Previous findings show that “combined” HGFs regimens treated mice had higher
WBC and NE count at day 2 post-TBI and lower WBC count at day 4 than mice treated
with individual HGFs, indicating that WBC and NE decrease more rapidly in mice
receiving “combined” HGFs regimens (Figure 47). Comparable results were observed in
the “with IL-11” vs. “no IL-11” analysis. The effect of HGF treatment on radiation-
induced apoptosis was evaluated, as a potential mechanism for the observed CBC
parameter changes. Peripheral blood was collected at day 2 post-TBI (24 hr post-HGFs
injection). WBCs were stained with CD3 (T cells), Gr-1 (myeloid cells), Annexin-V
(apoptosis marker), and 7-AAD (viability stain), and analyzed by flow cytometry. There
was no statistical difference between HGFs treatment and Veh treatment; as expected,
apoptosis in NI mice was lower than in IR mice, although not statistically different, in all
cell types (Figure 49 A-F).

227
Figure 49
0
10
20
30
40
50
60
Total cells B220+ cells CD3+ cells Gr-1+ cells
% A
popt
otic
cells
(Mea
n ±
SEM
)
0
10
20
30
40
50
Total cells B220+ cells CD3+ cells Gr-1+ cells
% A
popt
otic
cells
(Mea
n ±
SEM
)
0
10
20
30
40
50
Total cells B220+ cells CD3+ cells Gr-1+ cells
% A
popt
otic
cells
(Mea
n ±
SEM
)
0
10
20
30
40
50
Total cells B220+ cells CD3+ cells Gr-1+ cells
% A
popt
otic
cells
(Mea
n ±
SEM
)
0
10
20
30
40
50
Total cells B220+ cells CD3+ cells Gr-1+ cells
% A
popt
otic
cells
(Mea
n ±
SEM
)
B C
A
D E
NIVehGGMIL-11G+IL-11GM+IL-11G+GMTC
NIVehno Gwith G
NIVehno GMwith GM
NIVehno IL-11with IL-11
0
10
20
30
40
50
Total cells B220+ cells CD3+ cells Gr-1+ cells
% A
popt
otic
cells
(Mea
n ±
SEM
)
F
NIVehHGFs
NIVehSingleCombined

228
Figure 49. Apoptosis of peripheral white blood cells at day 2 post-TBI.
Mice were exposed to 9.04 Gy TBI and injected with pegylated HGFs in single, double,
or TC 24 hr later. Mice were euthanized on day 2 post-TBI and PB collected via cardiac
puncture. PB cells were stained with CD3, B220, Gr-1, Annexin (apoptosis marker), and
7AAD (viability stain). Expression of Annexin-V+7AAD- (apoptotic cells) was assessed
on total white blood cells, B220+ cells (B cells), CD3+ cells (T cells) and Gr-1+
(neutrophils) (panel A). Data were combined and analyzed in the methods as “with G” vs.
“no G” (panel B), “with GM” vs. “no GM” (panel C), “with IL-11” vs. “no IL-11” (panel
D), “single” vs. “combined” (panel E), “HGFs” vs. “Veh” (panel F). Bars represent mean
± SEM. n = 3-4 mice per group. P values of percentage of apoptotic cells between
different groups were summarized in Table 8 (all p values > 0.05, only show the
comparisons with p values <0.1). Artur Plett acquired the data; Tong Wu did the
analyses.
229
5.3.4. Peg-HGFs increase HSPC count early post-TBI
To determine whether the enhanced survival and hematopoietic recovery of
combined HGF regimens results from altered HSPC numbers in the bone marrow, bone
marrow cellularity and HSPC numbers were analyzed up to 30 days post-TBI. Bone
marrow inhibition persisted until day 21 post-TBI and recovered at day 30. At day 30,
only G-CSF-treated mice had higher total bone marrow cell counts than IL-11 treated
mice, there was no statistical difference between any irradiated groups and the NI control,
and there was no statistical difference between any HGF-treated group and the Veh
control. Up to day 21, all irradiated groups had significantly lower bone cell counts than
the NI group and there was no significant difference between different irradiated groups
(Figure 50 A). When analyzed in a manner similar to “with xx” vs. “no xx” in the CBC
analysis, there was no statistical difference in total bone marrow cell numbers between
any “with xx” and “no xx” groups at any time-points. (Figure 50 B-F). HPC numbers
were slightly higher in mice receiving combined HGF regimens than in mice receiving a
single HGF at day 5 and 7 post-TBI, although difference was not statistically significant
(Figure 51).
In a similar study, HSC counts were phenotyped by flow cytometry post-TBI. No
statistical significance in HSC (Lin-Sca+CD150+) numbers was observed comparing
HGF-treated groups with Veh group, or comparing different HGF-treated groups, at day
2, 7, 10 and 21 post-TBI (Figure 52). Combining all HGF-treated groups together, HSC
counts were significantly increased in comparison with the Veh control at day 10 post-
TBI (Figure 52 E). The differences between “single” and “combined”, “with G” and “no

230
G”, “with GM” and “no GM”, “with IL-11” and “no IL-11” were minimal (Figure 52 F-
I).
Competitive transplantation studies at day 5, 7, and 14 post-TBI with donor bone
marrow cells from mice treated with different HGF regimens or the Veh control did not
show statistical differences in chimerism rate up to 5 months post-transplantation (Figure
53 A-C). When analyzed as “HGFs” vs. “Veh”, at four months post-transplantation in
day-14 post-TBI transplant recipients, chimerism was significantly lower in the “HGFs”
group than in the Veh control. There was no statistical difference between Veh control
and “HGFs” group at any other time-points (Figure 53 D-F). When analyzed as “single”
vs. “combined”, the chimerism rate of “combined” group was only transiently higher than
the “single” group at 1 month post-transplantation (Figure 53 I). There was no statistical
difference among the “single”, “combined” or Veh groups at day 5 or day 7 post-TBI
(Figure 53 G & H). When analyzed in the pattern of “with G” vs. “no G” (Figure 53 J-L),
“with GM” vs. “no GM” (Figure 53 M-O), and “with IL-11” vs. “no IL-11” (Figure 53 P-
R), there was no significant difference between “with xx” and “no xx”. In mice
transplanted at day 14, both “with xx” and “no xx” groups had lower chimerism rates
than Veh group.
5.3.5. Peg-HGFs do not extend lifespan of DEARE mice
Radiomitigator peg-HGFs successfully increased the survival rate of lethally-
irradiated mice in H-ARS phase, whether the early administration can extend lifespan or
alleviate DEARE symptoms in survivors is unknown. In the current study, mice surviving

231
Figure 50
0
1
2
3
4
5
21
Tota
l BM
cel
ls p
er m
ouse
(×10
7 ) (M
ean±
SEM
)
Days post Irradiation
Veh
G
GM
IL-11
G+IL-11
GM+IL-11
G+GM
TC
0
5
10
15
20
25
0 5 10 15 20 25 30
Tota
l BM
cel
ls p
er m
ouse
(×10
7 ) (M
ean±
SEM
)
Days post Irradiation
NI
Veh
no IL-11
with IL-11
0
5
10
15
20
25
0 5 10 15 20 25 30
Tota
l BM
cel
ls p
er m
ouse
(×10
7 ) (M
ean±
SEM
)
Days post Irradiation
NI
Veh
no GM
with GM
0
5
10
15
20
25
0 5 10 15 20 25 30
Tota
l BM
cel
ls p
er m
ouse
(×10
7 ) (M
ean±
SEM
)
Days post Irradiation
NI
Veh
no G
with G
B C
D
Total BM cell # per mouseTotal BM cell # per mouse
Total BM cell # per mouse
0
5
10
15
20
25
0 5 10 15 20 25 30
Tota
l BM
cel
ls p
er m
ouse
(×10
7 ) (M
ean±
SEM
)
Days post Irradiation
NI
Veh
Single
Combined
E Total BM cell # per mouse
0
5
10
15
20
25
0 5 10 15 20 25 30
Tota
l BM
cel
ls p
er m
ouse
(×10
7 ) (M
ean±
SEM
)
Days post Irradiation
NI
Veh
HGFs
F Total BM cell # per mouse
*
0
5
10
15
20
25
0 5 10 15 20 25 30
Tota
l BM
cel
ls p
er m
ouse
(×10
7 ) (M
ean±
SEM
)
Days post Irradiation
VehGGMIL-11G+IL-11GM+IL-11G+GMTCNI
A Total BM cell # per mouse
∆

232
Figure 50. Total BM cell count in H-ARS phase of lethal-irradiated mice treated
with pegylated HGFs.
Mice were exposed to 9.04 Gy or 9.27 Gy TBI and treated with pegylated HGFs. Mice
were sacrificed on day 2, 4, 7, 10, 21 and 30 post-TBI, and BM cells were flushed from
femurs, tibias, pelvis, and humeri (8 bones), and counted for total BM cells per mouse
(panel A, insert is the bar graph of day 21 data, no statistical difference among different
irradiated groups). Data were combined and analyzed in the methods as “with IL-11” vs.
“no IL-11” (panel B), “with G” vs. “no G” (panel C), “with GM” vs. “no GM” (panel D),
“single” vs. “combined” (panel E), “HGFs” vs. “Veh” (panel F). Lines represent mean ±
SEM. n=3-12 per group per time-point in panel A. ∆ p<0.05 comparing IL-11 to G group
in panel A. * p<0.05 comparing “HGFs” to “Veh” group in panel F. Artur Plett and
Sasidhar Vemula acquired the data; Tong Wu did the analyses.

233
Figure 51
0
20
40
60
80Day 5 post-TBI
Colo
ny fo
rmin
gun
its/m
ouse
0
50
100
150
200
Colo
ny fo
rmin
gun
its/m
ouse Day 7 post-TBI
0
1000
2000
3000 Day 14 post-TBI
Colo
ny fo
rmin
g un
its/m
ouse
048
121620 Day 30 post-TBI
CFUs
(×10
4 ) /m
ouse
A B
C D
0
20
40
60 Day 5 post-TBI
Colo
ny fo
rmin
g un
its/m
ouse
0
40
80
120
160 Day 7 post-TBI
Colo
ny fo
rmin
g un
its/m
ouse
0
500
1000
1500
2000
2500 Day 14 post-TBI
Colo
ny fo
rmin
g un
its/m
ouse
0
5
10
15
Day 30 post-TBI
CFUs
(×10
4 ) /m
ouse
CFU-GMBFU-ECFU-GEMM
F
G
E
H
Veh Single Combined Veh Single Combined
Veh Single Combined Veh Single Combined NI

234
Figure 51. Recovery kinetics of HPCs in H-ARS phase of lethal-irradiated mice
treated with pegylated HGFs.
Mice were exposed to 9.27 Gy TBI and treated with pegylated HGFs as previously
described. Four mice in each HGF treated group were euthanized on days 5, 7, 14 and 30
post-TBI separately and BM cells were flushed from femurs, tibias, pelvis, and humeri (8
bones). BM cells from the 4 mice were pooled and ¼ were used into colony assay. In
panel A-D, n=1 in each group. Data were analyzed in method as “single” vs. “combined”
(panel E-H). n=3-4 in “single” and “combined” group. Sasidhar Vemula acquired the
data; Tong Wu did the analyses.

235
Figure 52
0
5
10
15
20
Tota
l Lin
-Sca
+150
+ ce
lls (×
103 )
(Mea
n ±
SEM
)
Day 10 post-TBI
0
5
10
15
20
25To
tal L
in-S
ca+1
50+
cells
(×
103 )
(Mea
n ±
SEM
) Day 2 post-TBI
0
5
10
15
20
Tota
l Lin
-Sca
+150
+ ce
lls (×
103 )
(Mea
n ±
SEM
)
Day 7 post-TBINI=43.7A B
C
0
20
40
60
80
100
120
140
160
Tota
l Lin
-Sca
+1
50
+ c
ell
s (×
10
3)
(Me
an
±S
EM
)
Day 21 post-TBID
0
20
40
60
80
2 7 10 21 NI
Tota
l Lin
-Sca
+150
+ ce
lls
(×10
3 )(M
ean
±SE
M)
Days post-TBI
Veh
HGFs
*0
20
40
60
80
100
2 7 10 21 NI
Tota
l Li
n-Sc
a+15
0+ c
ells
(×
103 )
(Mea
n ±
SEM
)
Days post-TBI
Veh
Single
Combined*
E F
0
20
40
60
80
100
2 7 10 21
Tota
l Li
n-S
ca+1
50
+ ce
lls
(×1
03)(
Me
an ±
SEM
)
Days post-TBI
Veh
with IL-11
no IL-11
*
0
20
40
60
80
100
2 7 10 21 NI
Tota
l Lin
-Sca
+150
+ ce
lls
(×10
3 )(M
ean
±SE
M)
Days post-TBI
Veh
with GM
no GM
*0
20
40
60
80
2 7 10 21 NI
Tota
l Li
n-Sc
a+15
0+ c
ells
(×
103 )
(Mea
n ±
SEM
)
Days post-TBI
Veh
with G
no G
*
G
I
H

236
Figure 52. Recovery kinetics of hematopoietic stem cells in H-ARS phase of lethal-
irradiated mice treated with pegylated HGFs.
Mice were exposed to 9.04 Gy TBI and treated with pegylated HGFs as previously
described. Mice were sacrificed on days 2, 7, 10 and 21 post-TBI. Flushed BM cells were
stained with Lin markers, Sca-1 and CD150 antibodies, and then assessed by flow
cytometry. The number of Lin-Sca-1+CD150+ (LS CD150+) cells per mouse were
analyzed in each HGF treated group (panel A-D). Data were analyzed in methods as
“HGFs” vs. “Veh” (panel E), “single” vs. “combined” (panel F), “with G” vs. “no G”
(panel G), “with GM” vs. “no GM” (panel H) and “with IL-11” vs. “no IL-11” (panel I).
Bars represent mean ± SEM. n=4 per group per time-point in panel A-D. *p<0.05
comparing to Veh group. Artur Plett acquired the data; Tong Wu did the analyses.

237
Figure 53
63
VehGGMIL-11G+IL-11GM+IL-11G+GMTC0
1
2
3A
0
3
6
9
12
15B
0
4
8
12
16Cday 5 Post-TBI day 7 Post-TBI day 14 Post-TBI
0.0
0.2
0.4
0.6day 5 Post-TBI
0
1
2
3day 7 Post-TBI
0
4
8
12
16
day 14 Post-TBI
VehHGFs
D E F
∆
0.0
0.2
0.4
0.6
0.8
1.0day 5 Post-TBI
VehSingleCombined
0
1
2
3
4
5
day 7 Post-TBI
0
4
8
12
16
day 14 Post-TBI
∆
*
∆ ∆
G H I
0
4
8
12
16
0
1
2
3
4
5
0.0
0.2
0.4
0.6
0.8
day 5 Post-TBI day 7 Post-TBI day 14 Post-TBI
∆ ∆
J K L
Vehwith Gno G
0
4
8
12
16
0
1
2
3
4
5
6
0.0
0.2
0.4
0.6
0.8
1.0
day 5 Post-TBI day 7 Post-TBI day 14 Post-TBI
∆ ∆
M N O
Vehwith GMno GM
0
4
8
12
16
0
1
2
3
4
0.0
0.2
0.4
0.6
0.8
1.0
1.2
day 5 Post-TBI day 7 Post-TBI day 14 Post-TBI
∆ ∆
P Q R
Vehwith IL-11no IL-11
1 2 3 4 5 1 2 3 4 5 1 2 3 4 5
Months post-transplantation
Perc
ent o
f chi
mer
ism
(%)
(mea
n ±
SEM
)

238
Figure 53. BM competitive transplantation for donor cells at H-ARS phase from
lethal-irradiated mice treated with pegylated HGFs.
Mice were exposed to 9.27 Gy TBI and treated with pegylated HGFs as previously
described. Four mice in each HGF treated group were euthanized on day 5, 7 and 14 post-
TBI and BM cells were flushed from femurs, tibias, pelvis, and humeri (8 bones). BM
cells from the 4 mice were pooled and pooled sample then was split into 4 equal aliquots.
Three aliquots were used for transplantation into 3 recipient mice (one aliquot per
recipient, the rest one aliquot was used in colony assay as describe in Figure 51). For
transplantation, the whole bone marrow fraction, regardless of the number of cells, was
transplanted via the retro orbital sinus into one irradiated (5.5 + 5.5 Gy) recipient BoyJ
mouse, along with 2 × 10⁵ whole bone marrow competitor cells. Donor chimerism rates
of peripheral white blood cells were tracked monthly till to 5 months post-transplantation.
Data were presented as line graphs in each HGF treated group (panel A-C) and bar
graphs in “HGFs” vs. “Veh” (panel D-F), “single” vs. “combined” (panel G-I), “with G”
vs. “no G” (panel J-L), “with GM” vs. “no GM”(panel M-O) and “with IL-11” vs. “no
IL-11” (panel P-R). Lines and bars represent mean ± SEM. n=3 per group per time-point
in panel A-C. ∆ p<0.05 comparing to Veh group. *p<0.05 comparing to “single” group in
panel I. Artur Plett acquired the data; Tong Wu did the analyses.

239
the H-ARS stage (day 30 post-TBI; 4 months of age) were transferred to the RBMD
study and observed until 24 months post-TBI. Mice were euthanized when severely
moribund or were sacrificed at scheduled time-points for DEARE studies. Kaplan-Meier
lifespan analyses were performed in SPSS. Consistent with earlier reports [310, 311], a
significantly shortened lifespan was observed in Veh-treated irradiated mice in
comparison with NI mice. No significant difference was observed between HGF-treated
and Veh-treated groups, with the exception of the G+GM group (significantly lower than
Veh group), and the differences between different HGF-treated groups were minimal
(Figure 54 A and Table 11). When analyzed as “HGFs” vs. “Veh”, “with IL-11” vs. “no
IL-11”, and “single” vs. “combined”, there was no difference between “HGFs” vs.
“Veh”, “with IL-11” vs. “no IL-11”, and “single” vs. “combined” groups (Figure 54 B-
D); “no IL-11” group had significantly lower survival rate than Veh group, whereas
“with IL-11”group had not (Figure 54 C).
5.3.6. Peg-HGFs do not alleviate body weight loss in DEARE mice
Pegylated HGFs do not increase survival rate of DEARE mice, whether HGFs at
24 hr post-TBI impact DEARE markers is still unknown. Weight loss is one of the
significant markers of DEARE [40]. The body weights at 6 and 12 months post-TBI were
measured. There was no statistical difference between different irradiated groups either at
6 or at 12 months post-TBI, no matter what treatments mice received (Figure 55 A).
When analyzed as “HGFs” vs. “Veh”, “single” vs. “combined”, or “with IL-11” vs. “no
IL-11”, the “HGFs” and Veh mice had lower body weights than NI mice at 12 months
post-TBI (Figure 55 B), but there was no difference in “single” vs. “combined” and “with

240
Figure 54
100
80
60
40
20
0
Months of age3 mon
VehG
GM
G+GM
IL-11
G+IL-11
GM+IL-11
TC
100
80
60
40
20
0
NI
% S
urvi
val
Months of age3 mon
A B
**
NI
VehHGFs
100
80
60
40
20
0
Months of age3 mon
100
80
60
40
20
0
Months of age3 mon
DC
**
*
**
*
NI
VehVeh
NI
with IL-11
no IL-11
combined
single∆

241
Figure 54. Long-term survival of day 30 survived mice treated with pegylated
HGFs.
Mice were exposed to 9.27 Gy TBI and treated with pegylated HGFs as previously
described. Mice survived over day 30 post-TBI were transferred to RBMD study for
long-term survival monitor until the end of study (24 months post-TBI). The survival
mice were recorded when found dead, or were euthanized when severely moribund, or
scheduled time-point sacrifices. Survival is shown as Kaplan-Meier curve. n=60-109
mice in each group (panel A). P value of comparisons for panel A were summarized in
Table 11. Survival data were analyzed in the manner of “HGFs” vs. “Veh” (panel B),
“with IL-11” vs. “no IL-11” (panel C), “single” vs. “combined” (panel D). “with G” vs.
“no G” and “with GM” vs. “no GM” comparisons were not shown since no statistical
difference between the two types of comparison. *p<0.05 comparing to NI group in panel
B-D. ∆p<0.05 comparing to Veh group in panel C. Artur Plett and Sasidhar Vemula
acquired the data; Tong Wu did the analyses.

242
Table 11. Comparisons of long-term survival of lethal-irradiated mice treated with
pegylated HGFs.
Treatment G G+GM G+IL-11 GM GM+IL-11 IL-11 NI TC Veh
G NS NS NS NS NS <.0001 NS NS
G+GM NS NS 0.029 0.023 NS <.0001 0.033 0.01
G+IL-11 NS NS NS NS NS <.0001 NS NS
GM NS 0.029 NS NS NS <.0001 NS NS
GM+IL-11 NS 0.023 NS NS NS <.0001 NS NS
IL-11 NS NS NS NS NS <.0001 NS NS
NI <.0001 <.0001 <.0001 <.0001 <.0001 <.0001 <.0001 <.0001
TC NS 0.033 NS NS NS NS <.0001 NS
Veh NS 0.01 NS NS NS NS <.0001 NS
Numbers in the table are p values of comparisons. NS: Not significant

243
Figure 55
0
10
20
30
40
50
VehGGMIL-11G+IL-11GM+IL-11G+GMTCNI
A
0
10
20
30
40
50
Vehicle
HGFs
NI
B
**
0
10
20
30
40
50
Vehicleno IL-11with IL-11NI
D
**
0
10
20
30
40
50
VehicleSingleCombinedNI
C
**Body
wei
ght (
x gr
am)
(Mea
n ±
SEM
)
6 12 6 12
Months post-TBI
244
Figure 55. Body weight in DEARE phase of lethal-irradiated mice treated with
pegylated HGFs.
Mice were exposed to 9.04 Gy TBI and treated with pegylated HGFs as previously
described. Body weights were assessed at 6 and 12 months post-TBI (panel A). Data
were analyzed by “HGFs” vs. “Veh” (panel B), “single” vs. “combined” (panel C), “with
IL-11” vs. “no IL-11” (panel D) as previously described. Bars represent mean ± SEM. n=
5-8 mice for each group in panel A. *p<0.05 comparing to NI group. Artur Plett acquired
the data; Tong Wu did the analyses.

245
IL-11” vs. “no IL-11” comparisons. (Figure 55 C & D). This indicates that HGF
administration 24 hr post-TBI does not alleviate weight loss in DEARE mice.
5.3.7. Peg-HGFs do not reverse myeloid skewing in DEARE mice
Hematopoiesis is severely defective in DEARE mice following exposure to lethal
radiation at young age [40, 147]. Dr. Orschell's laboratory has already proved that HGFs
treatment at 24 hr post-TBI accelerates hematopoietic recovery at the H-ARS phase,
whether it would alleviate defective long-term hematopoiesis is not clear. The CBC
changes at 6 and 12 months post-TBI in the survivor mice of lethal radiation were
investigated. At 12 months post-TBI, WBC, LY, and RBC were significantly decreased
in most irradiated mice in comparison with age-matched NI controls. No significant
difference in NE number was observed between irradiated and NI control mice at 6 or 12
months post-TBI. Myeloid skewing was apparent 12 months post-TBI in most irradiated
groups, but no significant difference between HGF-treated and Veh-treated mice was
observed. (Figure 56 A-G). When analyzed as “HGFs” vs. “Veh”, “single” vs.
“combined”, or “with xx” vs. “no xx”, all the significant differences were from the
comparisons to NI group, there was no statistical difference between “HGFs” and “Veh”,
“single” and “combined”, or “with xx” and “no xx” (Figure 56 H-AI).
5.3.8. Peg-HGFs do not increase HSC number and function in DEARE mice
While HGF treatment does not alleviate peripheral blood defects in DEARE mice,
the possibility of beneficial effects in HSPC cannot be excluded. Mice were irradiated at
12 weeks LD90/30 and received HGFs treatments 24 hr post-TBI as previously

246
described. Survivors were sacrificed 6 and 12 months post-TBI and bone marrow
cellularity, LSK cell number, and LSK CD150+CD48- cell number were assessed by flow
cytometry. There was no statistical difference between different HGF groups and Veh
control (Figure 57 A-C). Consistent with the previous report, LSK and LSK
CD150+CD48- cell numbers were generally higher at 12 months post-TBI than at 6
months [40]. When analyzed as “HGFs” vs. “Veh”, “single” vs. “combined”, or “with
xx” vs. “no xx”, there was no statistical difference in these comparisons (Figure 57 D-O).
To test HSC function, transplantation studies were done at 12 months post-TBI.
One hundred and fifty KSL CD150+ cells were transplanted into the congenic recipients
and recipients were sacrificed 6 months post-transplantation. The donor chimerism rates
and donor-derived lineage reconstitution of peripheral blood Gr-1+ NE, CD8+ T cells,
CD4+ T cells, and B220+ B cells were measured by flow cytometry. KSL CD150+ cells
from irradiated mice had significantly lower repopulation capacity than the cells from
age-matched NI controls. There was no significant difference between the Veh control
and HGF-treated mice (Figure 58 A) or “HGFs” vs. Veh (Figure 58 C), or “with IL-11”
vs. “no IL-11” (Figure 58 E), or “single” vs. “combined” (Figure 58 G). As previously
observed [147], recipients of KSL CD150+ cells from irradiated donors exhibited
imbalanced lymphoid-myeloid reconstitution. Myeloid (Gr-1+) percentages were higher
in all irradiated groups than in the NI control, explaining the myeloid skewing observed
in the peripheral blood. No HGF treatment improved this HSC defect (Figure 58 B, D, F
& H). HGF treatment 24 hr after TBI, therefore does not alleviate HSC deficiencies
despite improving survival in the H-ARS stage.

247
Figure 56
0
20
40
60
80
100
% LY
**** **
0
2
4
6
8
10
12
14
LY
*****
**
**0
4
8
12
16
20
(
)
WBC
** ***** **
0
2
4
6
0
300
600
900
1200
(
)
Veh
G
GM
IL-11
G+IL-11
A EB CNE
PLT0
20
40
60
% NE*** * **
0
4
8
12
(
)
* ****
RBC
D
FE
WBC
(K/µ
l)(m
ean±
SEM
)
NE
(K/µ
l)(m
ean±
SEM
)RB
C (M
/µl)
(mea
n±SE
M)
PLT
(K/µ
l)(m
ean±
SEM
)LY
(K/µ
l)(m
ean±
SEM
)
% N
E(m
ean±
SEM
)
% L
Y(m
ean±
SEM
)
6
12 12
0
300
600
900
1200
VehicleSingleCombinedNI
0
4
8
12
16
20
**** * *
0
2
4
6
*
0
2
4
6
8
10
12
14
*** **
0
20
40
60
** * *
0
20
40
60
80
* **
0
4
8
12
(
)
* ** *
H
L
KI J
NM
WBC NE LY
RBC PLT
%NE
%LY
WBC
(K/µ
l)(m
ean±
SEM
)
NE
(K/µ
l)(m
ean±
SEM
)RB
C (M
/µl)
(mea
n±SE
M)
PLT
(K/µ
l)(m
ean±
SEM
)LY
(K/µ
l)(m
ean±
SEM
)
% N
E(m
ean±
SEM
)
% L
Y(m
ean±
SEM
)
0
4
8
12
(
)
****
0
20
40
60
80
* * *
0
2
4
6
8
10
12
14
(
)
* * ** *
0
20
40
60
** **
0
4
8
12
16
20
(
)
* * ** * *
0
2
4
6
(
)
0
300
600
900
1200
(
)
Vehicleno IL-11with IL-11NI
O
S
RP Q
UT
WBC NE LY
RBC PLT
%NE
%LY
WBC
(K/µ
l)(m
ean±
SEM
)
NE
(K/µ
l)(m
ean±
SEM
)RB
C (M
/µl)
(mea
n±SE
M)
PLT
(K/µ
l)(m
ean±
SEM
)LY
(K/µ
l)(m
ean±
SEM
)
% N
E(m
ean±
SEM
)
% L
Y(m
ean±
SEM
)
G
GM+IL-11
G+GM
TC
NI
Months post-TBI
6 12 6 12 6 12
6 12

248
Figure 56 continue
0
2
4
6
0
4
8
12
16
20
* ** * * *
0
2
4
6
8
10
12
14
* * **
0
20
40
60
* * **
0
300
600
900
1200
*
0
4
8
12
(M
ean
SM
)
** *
0
20
40
60
80
* * *
V
Z
YW X
ABAA
WBC NE LY
RBC PLT
%NE
%LY
Vehicleno Gwith GNI
0
2
4
6
0
4
8
12
16
20
(
)
* ** *
0
2
4
6
8
10
12
14
(
)
* ** *
0
20
40
60
* *
0
20
40
60
80
* *
0
4
8
12
(
)
**
0
300
600
900
1200
(
)
*
AC
AG
AFAD AE
AIAH
WBC NE LY
RBC PLT
%NE
%LY
VehicleHGFsNI
WBC
(K/µ
l)(m
ean±
SEM
)
NE
(K/µ
l)(m
ean±
SEM
)RB
C (M
/µl)
(mea
n±SE
M)
PLT
(K/µ
l)(m
ean±
SEM
)
LY (K
/µl)
(mea
n±SE
M)
% N
E(m
ean±
SEM
)
% L
Y(m
ean±
SEM
)W
BC (K
/µl)
(mea
n±SE
M)
NE
(K/µ
l)(m
ean±
SEM
)RB
C (M
/µl)
(mea
n±SE
M)
PLT
(K/µ
l)(m
ean±
SEM
)LY
(K/µ
l)(m
ean±
SEM
)
% N
E(m
ean±
SEM
)
% L
Y(m
ean±
SEM
)
6 12
6 12 6 12 6 12
Months post-TBI

249
Figure 56. CBC profiles in DEARE phase of lethal-irradiated mice treated with
pegylated HGFs.
Mice were exposed to 9.04 Gy TBI and treated with pegylated HGFs as previously
described. Survived mice were tail-bled at 6 and 12 months post-TBI and assessed for
CBC parameters including WBC (panel A), NE (panel B), LY (panel C), %NE (panel D),
%LY (panel E), RBC (panel F), and PLT (panel G). Data were analyzed in the method as
“single” vs. “combined” (panel H-N), “with IL-11” vs. “no IL-11” (panel O-U), “with G”
vs. “no G” (panel V-AB), “HGFs” vs. “Veh” (panel AC-AI). Bars represent mean ±
SEM. n=5-8 mice per group in panel A-G. *p<0.05 comparing to NI group. Artur Plett
acquired the data; Tong Wu did the analyses.

250
Figure 57
0
2
4
6
() (
)
0
2
4
6
8
10
12
VehGGMIL-11G+IL-11GM+IL-11G+GMTCNI0
5
10
15
20
25
30
A B C
79
*
**
*
* * *** *
*
0
2
4
6
8
10
12
**
***
0
1
2
3
4
5
0
5
10
15
20
25
30
*
VehicleSingleCombinedNI
D E F
*
0
5
10
15
20
25
30
*
0
1
2
3
4
5
Vehicleno IL-11with IL-11NI
0
2
4
6
8
10
12
**
***
G H I
*
0
1
2
3
4
5
0
5
10
15
20
25
30
0
2
4
6
8
10
12
Vehicleno Gwith GNI
*****
*
J K L
0
5
10
15
20
25
30
0
2
4
6
8
10
12
***
*
0
1
2
3
4
5
*
M N O
Vehicle
HGFs
NI
Tota
l BM
cells
per
mou
se (×
107 )
(mea
n±SE
M)
BM LS
K ce
lls p
er m
ouse
(×10
5 )(m
ean±
SEM
)
BM LS
K CD
150+
CD48
-cel
ls pe
r mou
se (×
105 )
(mea
n±SE
M)
Months post-TBI6 12 6 12 6 12

251
Figure 57. BM cellularity and HSPC in DEARE phase of lethal-irradiated mice
treated with pegylated HGFs.
Mice were exposed to 9.04 Gy TBI and treated with pegylated HGFs as previously
described. Mice were sacrificed at 6 and 12 months post-TBI. BM cells were flushed
from pelvis, femur and tibia; red blood cells were lysed and nucleated cells were
enumerated. BM cells were stained with Lin markers, c-Kit, Sca-1, CD48 and CD150
antibodies, and then assessed by flow cytometry. Cellularity and HSPC numbers were
analyzed in each HGF treated group (panel A-C). Data were analyzed in the method as
“single” vs. “combined” (panel D-F), “with IL-11” vs. “no IL-11” (panel G-I), “with G”
vs. “no G” (panel J-L), “HGFs” vs. “Veh” (panel M-O). “with GM” vs. “no GM” plots
were not shown since there was no difference between groups and the plot was similar to
others. Bars represent mean ± SEM. n=5-8 per group per time-point in panel A-C.
*p<0.05 comparing to NI group. Artur Plett acquired the data; Tong Wu did the analyses.

252
Figure 58
0
20
40
60
0%
20%
40%
60%
80%
100%
% Gr-1+ of donor% CD8+ of donor% CD4+ of donor% B220+ of donor
AB
0
20
40
60
C
NI Veh HGFs0%
20%
40%
60%
80%
100%
NI Veh HGFs
% o
f don
or c
ells
(Mea
n ±
SEM
)
D
NI Veh HGFs
0
20
40
60
E F
NI Veh no IL-11 with IL-11
0
20
40
60
G
NI Veh Single Combined0%
20%
40%
60%
80%
100%
NI Veh Single Combined
H
NI Veh Single Combined
0%
20%
40%
60%
80%
100%
NI Veh no IL-11 with IL-11
NI Veh no IL-11 with IL-11
* ** * *
**
*
**
*
***
* *
* * * * * * * *
* *
* * *
* **
*
**
* **
* **
Perc
ent o
f Chi
mer
ism (
%)
(Mea
n ±
SEM
)

253
Figure 58. BM competitive transplantation for donor cells at DEARE phase from
lethal-irradiated mice treated with pegylated HGFs.
Mice were exposed to 9.27 Gy TBI and treated with pegylated HGFs as previously
described. Survivors were euthanized at 12 months post-TBI and 3×10⁵ of donor whole
bone marrow cells were transplanted intravenously along with 2×10⁵ congenic competitor
cells into lethal-irradiated (5.5 + 5.5 Gy) congenic recipients. Recipient mice were
sacrificed at 6 months post-transplantation. The donor chimerism and lineage
reconstitution were evaluated by flow cytometry as described in the Materials and
Methods. Data were analyzed in each HGF treated group separately (panel A & B) and in
the method as “HGFs” vs. “Veh” (panel C & D), “with IL-11” vs. “no IL-11” (panel E &
F), and “single” vs. “combined” (panel G & H). Bars present as mean ± SEM. n=6-9 per
group in panel A & B. *p<0.05 comparing to NI group. Artur Plett acquired the data;
Tong Wu did the analyses.

254
5.3.9. Peg-HGFs enhance early thymic recovery post-TBI but do not alleviate thymic
involution in DEARE mice
Peg-HGFs treatment 24 hr post-TBI increases LY count at day 21 (Figure 48). LY
HPE is a physiological reaction to radiation-induced lymphopenia, consisting of G-CSF-
driven immune reconstitution [346]. HPE is the predominant source of T cells after
thymic involution [347]. The potential of HGFs treatment to promote thymic regeneration
and hence boost de novo T cell generation were investigated. First, the main components
of peripheral blood cells at day 21 post-TBI in selected HGFs-treated groups were
assessed by flow cytometry. Consistent with previous reports, the stimulating effect of
peg-G-CSF was most prominent in Gr-1+ neutrophils [74, 203, 348]. Additionally, peg-
G-CSF treated mice had higher B220+ B cell count, CD4+ and CD8+ T cell counts
compared with Veh-treated mice at day 21 post-TBI. Combining peg-HGFs did not
further increase cell numbers (Figure 59).
Twelve w/o mice were irradiated LD90/30 and treated with peg-HGFs 24 hr post-
TBI as previously described. Thymic weight and cellularity were measured at different
time-points up to 12 months post-TBI. At all time-points (day 2, 7, 10, and 12 months
post-TBI), thymus weight and cellularity were lower in irradiated mice in comparison
with NI mice, no matter what treatments received. At day 21, peg-HGFs-treated mice had
higher thymic weight and cellularity than Veh mice, although ANOVA analysis of all
irradiated groups revealed no statistical difference (Figure 60 A & B). This trend was
significant when combined all HGFs-treated groups together as a “HGFs” group and
compared it to Veh group. The HGFs-treated mice had significantly higher thymus

255
weight and cellularity than the Veh-treated mice at day 21 (Figure 60 C & D). At 12
months post-TBI, the peg-HGFs-treated mice had slightly lower thymic weight and
cellularity than Veh-treated mice, though the difference was not significant. When
analyzed as “single” vs. “combined”, “with G” vs. “no G”, “with GM” vs. “no GM”, and
“with IL-11” vs. “no IL-11” as previously described, there was no statistical difference
between any of these two groups at any time-point (Figure 60 E-L).
When analyzed the phenotype of thymocyte subpopulations, since there was no
significant difference between different HGF groups at each time-point and the trends
were similar to the thymus cellularity plot, for the easy of readers, the plots of each HGF
comparison were not presented but only the combined analysis plots were presented as in
the method of “HGFs” vs. “Veh” (Figure 61 A-H) and “single” vs. “combined” (Figure
61 I-P). The rest comparisons including “with G” vs. “no G”, “with GM” vs. “no GM”,
and “with IL-11” vs. “no IL-11” were not presented because the similarity to the plots of
“single” vs. “combined”. In the plots of “HGFs” vs. “Veh” (Figure 61 A-H), DP and
DN3 percentages in irradiated mice were decreased at day 2 compared to NI mice, and
the percentages of CD4+, CD8+, DN, and DN1, DN2, and DN4 groups were relatively
increased or not change. Thymi of irradiated mice began to recover with DN3 level
restored to normal by day 7 and DP by day 10 respectively. No significant difference of
subpopulation distribution between HGFs-treated mice and Veh-treated mice was
observed at day 2, 7 or 10, consistent with the thymocyte number changes at these time-
points (Figure 60 C & D). At day 21, the HGFs-treated mice had a higher percentage of
DP cells than Veh-treated mice, which was significant when all HGFs-treated mice were

256
combined together for analysis (Figure 61 B). DN2 and DN3 followed similar trends,
with no statistical difference (Figure 61 F & G). Again, at 12 months post-IR, the
percentages of DP, DN2, and DN3 were lower in HGFs-treated mice than Veh mice,
though the difference was not statistically significant (Figure 61 A-H). When analyzed
“single” vs. “combined” as previously described, there was no statistical difference at any
time-point (Figure 61 I-P). HGFs treatment therefore promotes early thymic recovery
post-TBI but does not alleviate thymic involution in DEARE mice. Polypharmacy
strategy does not further enhance the effect on thymic recovery.
5.3.10. Adding lisinopril to the TC regimen further alleviates irradiation damage
Combining all three peg-HGFs (peg-G-CSF + peg-GM-CSF + peg-IL-11, TC)
results in the highest day 30 survival rate (Figure 42), and evidence suggests that ACEI is
an effective radiomitigator when used alone or in combination with HGFs [93, 101, 103].
Here, radiomitigating potential of lisinopril (Liso) was evaluated on the TC-treated H-
ARS mouse model. TC was administrated as previously described 24 hr post-TBI and
Liso was added to drinking water (60 mg/L) from day 7-30 post-TBI. Some mice were
euthanized on day 10 to evaluate bone marrow HSC content, HPC number, HSC
function, and BM cytokines. Brains were examined on day 10 for petechiae as ACE
inhibition is a known mitigator of brain hemorrhage post-TBI [103]. CBC parameters
were analyzed at day 10 and 20. Surviving mice over day 30 were transferred to the
RBMD study and monitored for long-term survival.

257
Figure 59
0
1
2
3
4
5
NI Veh G TC
Gr-
1+ c
ells
(K/μ
L)(m
ean±
SEM
)
0
3
6
9
12
NI Veh G TC
B220
+ ce
lls(K
/μL)
(mea
n±SE
M)
0
1
2
3
4
5
NI Veh G TC
CD4+
cel
ls(K
/μL)
(mea
n±SE
M)
0
1
2
3
NI Veh G TC
CD8+
cel
ls(K
/μL)
(mea
n±SE
M)
A
C
B
D
*
*
*
*
*
*
*∆ ∆
Gr-1+ B220+
CD4+ CD8+

258
Figure 59. WBC phenotype at day 21 post-TBI of mice treated with G-CSF or TC.
Mice were exposed to 8.72 Gy TBI and treated with pegylated G-CSF or TC at 24 hr
post-TBI. Mice were tail-bled at day 21 post-TBI and the expression levels of Gr-1,
B220, CD4 and CD8 on peripheral nucleated cells were assessed by flow cytometry. Cell
number was the product of WBC number in CBC analysis at day 21 and the percentage
of each population acquired by flow cytometry. Bars present mean ± SEM. n=2-4 per
group. *p<0.05 comparing to Veh group; ∆p<0.05 comparing to NI group.

259
Figure 60
0
30
60
90
120
150
0
0.01
0.02
0.03
0.04
A
**
*
********
*****
*** *
*
*
**
*
* **
*** *
*
*
*****
*
2 7 10 21 12 2 7 10 21 12
TH cellularity
******** *******
*
***
*
** ** * *** ** **
***
*
**
TH weight
0
0.01
0.02
0.03
0.04
()
C
2 7 10 21 12 2 7 10 21 12
∆
∆
TH cellularityTH weight
****
**
** *
*
** **
**
** *
*
0
20
40
60
80
SingleCombined
0
0.01
0.02
0.03
E
2 7 10 21 12 2 7 10 21 12
0
0.01
0.02
0.03
G
0
20
40
60
80
no Gwith G
2 7 10 21 12 2 7 10 21 12
0
0.01
0.02
0.03
I
0
20
40
60
80
no GMwith GM
2 7 10 21 12 2 7 10 21 12
0
0.01
0.02
0.03
K
0
20
40
60
80
no IL-11with IL-11
Days Months
2 7 10 21 12
Days Months
2 7 10 21 12
NIVehHGFs
NIVehGGMIL-11G+IL-11GM+IL-11G+GMTC
B
D
F
H
J
L
Thym
us w
eigh
t (×g
ram
)(m
ean
±SE
M)
Thym
ocyt
e nu
mbe
r (x
106 )
(mea
n ±
SEM
)TH cellularityTH weight
TH cellularityTH weight
TH cellularityTH weight
TH cellularityTH weight
Post-TBI

260
Figure 60. Thymus weight and cellularity of lethal-irradiated mice treated with
pegylated HGFs.
Mice were exposed to 8.72, 9.04 or 9.27 Gy TBI and treated with pegylated HGFs as
previously described. Thymus weight and cellularity were analyzed at day 2, 7, 10, 21
and 12 months post-TBI (panel A & B). Data were analyzed in the method as “HGFs” vs.
“Veh” (panel C & D), “single” vs. “combined” (panel E & F), “with G” vs. “no G” (panel
G & H), “with GM” vs. “no GM” (panel I & J) and “with IL-11” vs. “no IL-11” (panel K
& L). Bars present mean ± SEM. n=3-21 per group per time-point in panel A & B.
*p<0.05 comparing to NI group; ∆p<0.05 comparing to Veh group.

261
Figure 61
0%
5%
10%
15%
20%
25%
% DN
0%
20%
40%
60%
80%
100%
% DP
0%
20%
40%
60%
80%
% CD4+
0%
10%
20%
30%
% CD8+
A B
C D
* ∆
*
**
*
**
**
*
*∆ *
**
∆
**
**
*
**
*∆***
2 7 10 21 12 2 7 10 21 12
2 7 10 21 12 2 7 10 21 12
0%
20%
40%
60%
80%
% DN1
0%
2%
4%
6%
% DN2
0%
20%
40%
60%
% DN3
0%
20%
40%
60%
80%
100%
% DN4
E F
G H
**
**
*
** *
**
**
** ** *
*
** **
2 7 10 21 122 7 10 21 12
2 7 10 21 122 7 10 21 12
NIVehHGFs
Days Months Days Months
% o
f tot
al th
ymoc
ytes
(mea
n±SE
M)
% o
f DN
cells
(mea
n ±SE
M)
Post-TBI

262
Figure 61 continue
0%
10%
20%
30%
% DN
0%
20%
40%
60%
80%
100%
% DP
0%
20%
40%
60%
80%
% CD4+
0%
10%
20%
30%
% CD8+
I J
K L
2 7 10 21 122 7 10 21 12
2 7 10 21 122 7 10 21 12
0%
20%
40%
60%
80%
% DN1
0%
2%
4%
6%
% DN2
0%
20%
40%
60%
% DN3
0%
20%
40%
60%
80%
100%
% DN4
M N
O P2 7 10 21 12
Post-TBI
2 7 10 21 12
2 7 10 21 12
2 7 10 21 12
SingleCombined
Days Months Days Months
% o
f tot
al th
ymoc
ytes
(mea
n±SE
M)
% o
f DN
cells
(mea
n±SE
M)

263
Figure 61. Thymus subpopulation of lethal-irradiated mice treated with pegylated
HGFs.
Mice were exposed to 8.72, 9.04 or 9.27 Gy TBI and treated with pegylated HGFs as
previously described. At day 2, 7, 10, 21 and 12 months post-TBI, thymocytes were
stained with CD4, CD8, CD44 and CD25 antibodies and percentages of different
thymocyte subpopulations were assessed by flow cytometry as described in Materials and
Methods. Plots of each HGF comparison and the comparisons of “with G” vs. “no G”,
“with GM” vs. “no GM”, and “with IL-11” vs. “no IL-11” were not presented because no
significant difference was observed; and for the easy of readers, only “HGFs” vs. “Veh”
(panel A-H) and “single” vs. “combined” (panel I-P) plots were presented. Bars present
mean ± SEM. n=16-28 in NI group, 3-8 in Veh group, and 14-45 in HGFs group, per
time-point, respectively. *p<0.05 comparing to NI group. ∆p<0.05 comparing to Veh
group.

264
All treatment groups [Liso, TC, and TC + lisinopril (TC+L)] significantly
increased the day 30 survival rate compared with the Veh control, and this effect was
most pronounced TC+L group. There was no significant difference between TC and Liso
treatments alone (Figure 62 A). Interestingly, TC+L significantly increased survival rate
in female mice but not in male mice (Figure 62 B & C).
Complete blood count analysis at day 20 revealed that TC+L group had higher
NE numbers than TC group and Veh group only in females. Female TC+L-treated and
TC-treated mice had higher RBC counts than Veh-treated mice, though the difference
between TC+L and TC treatment was not significant. Male mice followed the similar
trends but did not reach statistical significance (Figure 63). At day 10, there was no
significant difference in total bone marrow cell number or HSC number when comparing
irradiated mice to Veh mice, regardless of treatments received or gender of mice.
However, cell cycle analysis revealed that female TC+L-treated mice had significantly
more quiescent HSCs than males (Figure 64). The colony-forming ability of cells from
TC+L-treated mice was slightly increased in comparison with cells from TC or Veh-
treated mice, but this difference was not statistically significant and there were no sex
differences in colony-forming ability between TC+L and TC-treated mice (Figure 65).
TC+L-treated mice had lower levels of the pro-inflammatory cytokines RANTES
(in bone marrow supernatant) and IL-3 (in plasma) than Veh-treated mice. No significant
difference between TC- and TC+L-treated mice, or between females and males, was
observed (Figure 66). No difference in other cytokines was observed. TC+L-treated mice

265
had fewer petechiae in the brain than Veh-treated mice, whereas TC-treated mice were
similar to Veh controls (Figure 67). Reduced brain hemorrhage in TC+L-treated mice
correlates with the enhanced day 30 survival rate and is also consistent with its higher
PLT level than TC-treated and Veh controls at day 10, although the difference is not
statistically significant (Figure 63). The impact of TC+L on thymic recovery was also
evaluated at day 10 (Figure 68). No statistically-significant differences were observed
between TC, TC+L, and Veh treatment indicating that Liso is not involved in thymic
recovery at day 10. The only sex difference observed was the higher percentage of DN1
in males in the Veh and TC+L groups (Figure 68).
H-ARS survivors were transferred to the RBMD study. The KM estimation of
long-term survival showed no statistical difference among groups regardless of treatment,
and the sex difference observed in the H-ARS study was not maintained long-term.
(Figure 69). Complete blood count analysis at 6 months post-TBI showed lower WBC
and LY numbers in irradiated mice but no statistical difference between Veh, TC and
TC+L treated mice. No sex differences were found in CBC parameters at 6 months post-
TBI (Figure 70). Cells were flushed from the bone marrow and stained for SLAM-LSK
including cell cycle analysis at 6 months post-TBI. Since there was no male mouse in
Veh group and only 1 female mouse in Veh group at 6 months post-TBI time-point,
ANOVA test was not available; and t-test comparisons between TC and TC+L group and
between male and female in the two groups was used instead. There was no significant
difference in bone marrow cell number, HSC number and HSC cell cycle status between
TC and TC+L groups. Male mice had higher total bone marrow cell count than female

266
mice in TC-treated group, and female mice had higher Lin- cells than male mice in the
TC+L-treated group. There were no sex differences in HPC (LSK) and HSC (SLAM-
LSK) cells (Figure 71). To assess HSC function, 0.3×10⁶ donor cells from TC- or TC+L-
treated mice were injected into each recipient with 0.2×10⁶ competitor cells, and
recipients were monitored for donor chimerism monthly up to 4 months post-
transplantation. Although the average chimerism rates were higher in TC+L group than
TC group, no statistically significant difference was observed when males and females
were combined (Figure 72 A). Separately, however, the TC+L male mice had
significantly higher donor chimerism rates than TC+L female mice, and also higher than
male and female TC-treated mice. There were no sex differences in TC-treated mice
(Figure 72 B).
In summary, TC+L further slightly increased day 30 survival rate than TC (not
significant, Figure 62) mice and this was consistent with no significant difference
between TC and TC+L groups in hematopoietic recovery markers (CBC parameters, BM
cell numbers, HSC/HPC numbers, etc.). Dr. Orschell's laboratory also found a sex
difference where TC+L regimen was especially effective in female population which
might relate to the higher CBC parameters and less HSC in proliferation status than male
mice, although the causal relationship has not been verified. Same as peg-HGFs, adding
lisinopril to the mitigator regimens did not help to alleviate the DEARE effect.

267
5.4. Discussion
Impacts of different peg-HGFs regimens on survival and hematopoiesis were
investigated from the H-ARS to the DEARE stage. The increased day 30
Figure 62
TC+LiTCLisoVeh
0
20
40
60
80
100
0 5 10 15 20 25 30
0
20
40
60
80
100
0 5 10 15 20 25 30
B C
0
20
40
60
80
100
0 5 10 15 20 25 30
AF+M
Female only Male only
**
*
∆
*
*
*
∆ †
**
Days post-TBI
% S
urvi
val
268
Figure 62. Thirty-day survival of lethal-irradiated mice treated with TC, Lisinopril
or TC+L.
Mice were exposed to 9.04 Gy TBI and treated with TC or Veh 24 hr later. Lisinopril was
dissolved into water for ad libitum at days 7-30 post-TBI. Thirty-day survival is shown as
Kaplan-Meier curves. Total n=50-123 mice in each group (panel A). Female n=29-101
mice in each group (panel B). Male n=10-22 mice in each group (panel C). *p<0.05
comparing to Veh; ∆p<0.05 comparing to Liso; †p<0.05 comparing to TC. Sasidhar
Vemula and Tong Wu acquired the data; Tong Wu did the analyses.

269
Figure 63
0
5
10
15
20
25 # WBC
0
5
10
15
20
25 # WBC
0
1
2
3
4
5
# NE
0
4
8
12
16
20
# LY
0
2
4
6
8
10
12
RBC
0
200
400
600
800
1000
()
PLT
V
T
T
Female
A
B
C
D
E
FWBC
NE
LY
RBC
PLT
WBC
0
1
2
3
4
5
# NE
G NE
0
4
8
12
16
20
# LY
H LY
0
2
4
6
8
10
12
RBC
I RBC
0
200
400
600
800
1000
()
PLT
J PLT
**
**
*∆
MaleW
BC (K
/µl)
(mea
n±SE
M)
NE
(K/µ
l)(m
ean±
SEM
)RB
C (M
/µl)
(mea
n±SE
M)
PLT
(K/µ
l)(m
ean±
SEM
)LY
(K/µ
l)(m
ean±
SEM
)
0 10 20 0 10 20
NI
Veh
TC
TC+L
Days post-TBI

270
Figure 63. CBC profiles in H-ARS phase of lethal-irradiated mice treated with TC
or TC+L.
Mice were exposed to 9.04 Gy TBI and treated with TC or TC+L as previously
described. Mice were tail-bled on and assessed for CBC parameters were evaluated at
baseline, day 10 and day 20 post-TBI. WBC (panel A & F), NE (panel B & G), LY
(panel C & H), RBC (panel D & I), PLT (panel E & J) were analyzed in male (panel A-
E) and female (panel F-J) separately. Lines present mean ± SEM. n=2-10 per group per
gender per time-point. *p<0.05 comparing to Veh; ∆p<0.05 comparing to TC. Sasidhar
Vemula and Tong Wu acquired the data; Tong Wu did the analyses.
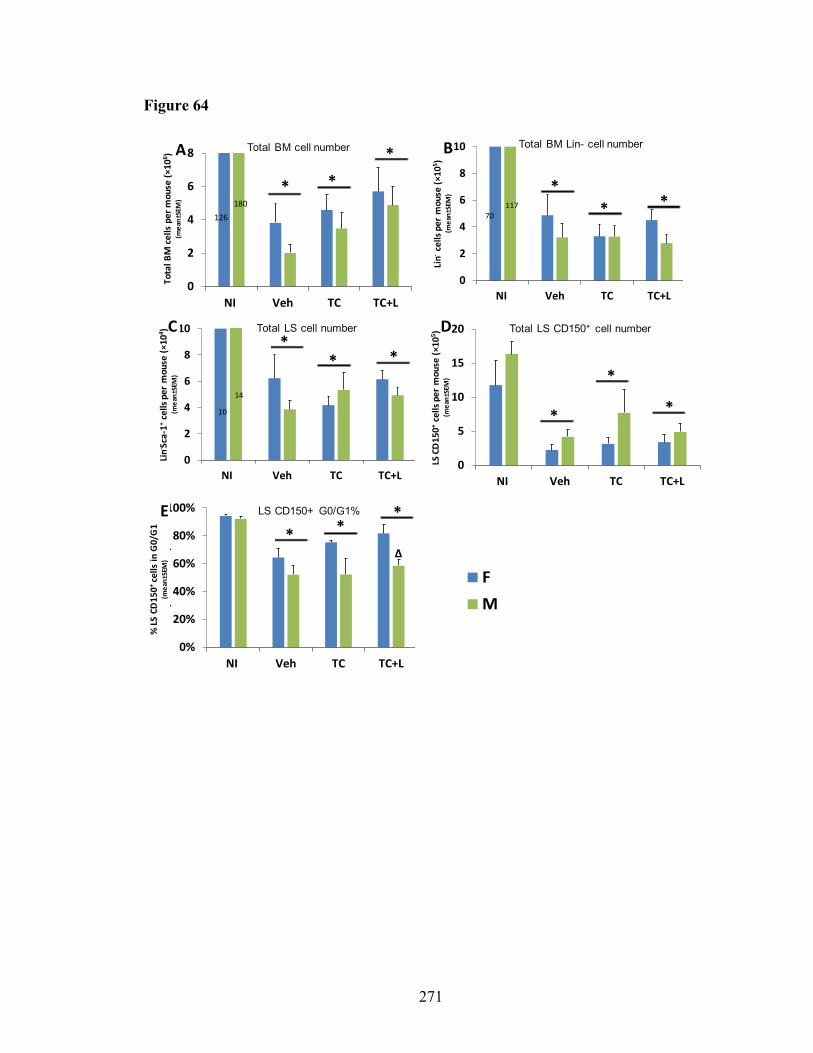
271
Figure 64
0
2
4
6
8
10
NI Veh TC TC+L
70117
126180
0
2
4
6
8
NI Veh TC TC+L
0
5
10
15
20
NI Veh TC TC+L
0
2
4
6
8
10
NI Veh TC TC+L
10
14
FM
Total BM cell number Total BM Lin- cell number
Total LS cell number Total LS CD150+ cell number
0%
20%
40%
60%
80%
100%
NI Veh TC TC+L
(
)
LS CD150+ G0/G1%
A B
C D
E
* *** *
*
*
**
* **
**
*∆
Tota
l BM
cel
ls p
er m
ouse
(×10
6 )(m
ean±
SEM
)
Lin-
cells
per
mou
se ( ×
105 )
(mea
n±SE
M)
Lin- Sc
a-1+
cells
per
mou
se (×
104 )
(mea
n±SE
M)
LS C
D15
0+ce
lls p
er m
ouse
(×10
5 )(m
ean±
SEM
)
% LS
CD
150+
cells
inG
0/G
1(m
ean±
SEM
)
272
Figure 64. HSC number and HSC cell cycle in H-ARS phase of lethal-irradiated
mice treated with TC or TC+L.
Mice were irradiated and treated as previously described. Mice were sacrificed at day 10
post-TBI. Flushed BM cells were stained with Lin markers, Sca-1 and CD150 antibodies
(panel A-D); and after fixed overnight in 1% formaldehyde, 0.042% DAPI was added for
cell cycle analysis (panel E). Bars present mean ± SEM. n=5-7 per gender per group.
*p<0.05 comparing to NI; ∆p<0.05 comparing male to female.

273
Figure 65
FM
A
B
C
0
2
4
6
8
CFU-G
400
549
0
0.1
0.2
0.3
BFU-E
9
4.6
0
0.01
0.02
0.03
0.04
0.05
CFU-GEMM
0.5
2.6
NI Veh TC TC+L
CFU
(x10
3 ) /
mou
se(m
ean
±SE
M)
*
*
*
∆
∆
**
*
*
*
*
∆

274
Figure 65. HPC in H-ARS phase of lethal-irradiated mice treated with TC or TC+L.
Mice were irradiated and treated as previously described. Mice were sacrificed at day 10
post-TBI and CFC assay was done as described in Materials and Methods. Bars present
mean ± SEM. n=5-7 per gender per group. *p<0.05 comparing to NI; ∆p<0.05 comparing
male to female.

275
Figure 66
BM sup: Pro-inflammatory Plasma: Pro-inflammatory
0
1
2
3
4
5
NI Veh TC TC+L
IL-3B
0
50
100
150
200
NI Veh TC TC+L
RANTES
**
* †
*
††
FM
Cyto
kine
con
cent
ratio
n(pg
/ml)
(mea
n±SE
M)
A

276
Figure 66. BM and plasma cytokine in H-ARS phase of lethal-irradiated mice
treated with TC or TC+L.
Mice were irradiated and treated as previously described. Mice were sacrificed at day 10
post-TBI and plasma was obtained by cardiac puncture. BM supernatants were obtained
by flushing 2 femurs and 2 tibias twice with 500 ul PBS. Cytokine detection and analysis
were followed as in Materials and Methods of Chapter 3. Bars present mean ± SEM. n=4-
6 per gender per group. *p<0.05 comparing to NI; †p<0.05 comparing to Veh.

277
Figure 67
00
3
6
9
12
15
NI Veh TC TC+LN
umbe
r of s
urfa
ce
pete
chia
e/br
ain(
mea
n±SE
M)
FM
NI Veh TC TC + LCerebral cortex
and superior view
Base of brain
A
B
*

278
Figure 67. Brain hemorrhages in H-ARS phase of lethal-irradiated mice treated
with TC or TC+L.
Mice were irradiated and treated as previously described. Mice were sacrificed at day 10
post-TBI and cerebrum and cerebellum were scooped out of brain and petechiae were
counted macroscopically on the surface on brain. Bars present mean ± SEM. Figures in
panel B were the representative brain images taken from superior and base views. The
representative petechiae were circled out in black colors. n=5-7 per gender per group.
*p<0.05 comparing to Veh.

279
Figure 68
0
0.01
0.02
0.03
0.04
0.05
0
20
40
60
80
0
3
6
9
12
15
0
1
2
3
4
5
0
1
2
3
4
0
20
40
60
80
100
26 210
3
6
9
12
0.6 0.4
0
0.02
0.04
0.06
0.08
17 100
1
2
3
4
5
0
20
40
60
80
100
FM
A B
C D
E F
G H
I J
* * *
* * *
* * *
* * *
* * *
**
*
*
*
*
* * **
**
∆∆
Thym
us w
eigh
t (×g
ram
)(m
ean
±SE
M)
Thym
ocyt
e nu
mbe
r (x
106 )
(mea
n ±
SEM
)
% o
f DN
cells
(mea
n ±
SEM
)%
of t
otal
thym
ocyt
es(m
ean
±SE
M)
CD4+ CD8+
DN DP
DN1 DN2
DN3 DN4
Thymus weight Thymocyte number
NI Veh TC TC+L NI Veh TC TC+L

280
Figure 68. Thymus weight, cellularity and thymocyte subpopulations in H-ARS
phase of lethal-irradiated mice treated with TC or TC+L.
Mice were irradiated and treated as previously described. Mice were sacrificed at day 10
post-TBI and the thymus weight, cellularity and thymocyte subpopulation analyses were
followed as in Materials and Methods of Chapter 2. Bars present mean ± SEM. n=4-6 per
gender per group. *p<0.05 comparing to NI; ∆p<0.05 comparing male to female.

281
Figure 69
VehTCTC+LLiso
10080
60
40
20
0
% S
urvi
val
Months of age3 mon
C Male only
100
80
60
40
20
0
% S
urvi
val
B Female only
100
80
60
40
20
0
% S
urvi
val
A Female + Male

282
Figure 69. Long-term survival of day 30 survived mice treated with Liso, TC or
TC+L.
Mice were exposed to 9.27 Gy TBI and treated with Liso, TC or TC+L as previously
described. Mice survived over day 30 post-TBI were transferred to RBMD study for
long-term survival monitor until the end of study (15 months post-TBI). The survival
mice were recorded when found dead, or were euthanized when severely moribund or
scheduled time-point sacrifices. Survival is shown as Kaplan-Meier curves. Total n=8-41
mice in each group (panel A). Female n=7-29 mice in each group (panel B). Male n=1-14
mice in each group (panel C). Sasidhar Vemula and Tong Wu acquired the data; Tong
Wu did the analyses.

283
Figure 70
FM
0
5
10
15
20
25
NI Veh TC TC+L
WBCA WBC
0
1
2
3
4
5
NI Veh TC TC+L
NEB NE
0
4
8
12
16
20
NI Veh TC TC+L
LYC LY
0
2
4
6
8
10
12
NI Veh TC TC+L
RBCD RBC
0
200
400
600
800
1000
NI Veh TC TC+L
PLTE PLT
** *
** *
WBC
(K/µ
l)(m
ean±
SEM
)
NE
(K/µ
l)(m
ean±
SEM
)RB
C (M
/µl)
(mea
n±SE
M)
PLT
(K/µ
l)(m
ean±
SEM
)LY
(K/µ
l)(m
ean±
SEM
)

284
Figure 70. CBC profiles in DEARE phase of lethal-irradiated mice treated with TC
or TC+L.
Mice were exposed to 9.27 Gy TBI and treated with TC or TC+L as previously
described. Survivors were tail-bled at 6 months post-TBI and assessed for the WBC
(panel A), NE (panel B), LY (panel C), RBC (panel D), and PLT (panel E). Bars present
mean ± SEM. n= 6-10 mice per group. *p<0.05 comparing to NI. Sasidhar Vemula and
Tong Wu acquired the data; Tong Wu did the analyses.

285
Figure 71
0
1
2
3
4
5
6
7
8
NI TC TC+L Veh
Abs. LSK
0.0
0.5
1.0
1.5
NI TC TC+L Veh
Abs. SLAM-LSK
FM
0
1
2
3
4
NI TC TC+L Veh
Abs. Lin-
*
0
1
2
3
4
5
NI TC TC+L Veh
Total BM cells per mouse
*
0
20
40
60
80
100
TC TC+L
LSK SLAM G0/G1%
A B
C D
E
Abs. SLAM LSK
Tota
l BM
cel
ls p
er m
ouse
(×10
8 )(m
ean±
SEM
)
Lin-
cells
per
mou
se (×
105 )
(mea
n±SE
M)
LSK
cells
per
mou
se (×
105 )
(mea
n±SE
M)
LSK
SLAM
cel
ls p
er m
ouse
(×10
5 )(m
ean±
SEM
)
% LS
K SL
AM c
ells
inG
0/G
1(m
ean±
SEM
)
Total BM cell number Total BM Lin- cell number
Total LSK cell number Total LSK SLAM cell number

286
Figure 71. HSC number and HSC cell cycle in DEARE phase of lethal-irradiated
mice treated with TC or TC+L.
Mice were exposed to 9.27 Gy TBI and treated with TC or TC+L as previously
described. Survivors were sacrificed at 6 months post-TBI. Flushed BM cells were
stained with Lin markers, c-Kit, Sca-1, CD48 and CD150 antibodies for SLAM LSK
analysis (panel D); and after fixed overnight in 1% formaldehyde, 0.042% DAPI was
added for cell cycle analysis (panel E). Bars present mean ± SEM. n=2 per gender in NI
group, only one female in Veh group, n=4-7 per gender in TC and TC+L groups. *p<0.05
comparing to female to male.

287
Figure 72
0
5
10
15
20
25
0 1 2 3 4 5
TCTC+L
0
10
20
30
40
0 1 2 3 4 5
Month post-transplantation
TC FTC MTC+L FTC+L M
A
B * ∆
†
** *
Ơ
Perc
ent o
f chi
mer
ism
(%)
(mea
n ±
SEM
)

288
Figure 72. Long-term engraftment potential of BM cells in DEARE phase from
lethal-irradiated mice treated with TC or TC+L.
Mice were exposed to 9.27 Gy TBI and treated with TC or TC+L as previously
described. Survivors were euthanized at 6 months post-TBI and 3×10⁵ of donor whole
BM cells were transplanted intravenously along with 2×10⁵ competitor cells into
congenic recipient. Peripheral blood was monitored for donor chimerism monthly till to 4
months post-transplantation. Data were analyzed as male + female (gender of donors)
combined in each treatment group (panel A) or male and female separately (panel B).
Lines present mean ± SEM. n= 9-15 recipients per group per gender. *p<0.05 comparing
to female TC+L group; ∆p<0.05 comparing to male TC group; †p<0.05 comparing to
female TC group. Sasidhar Vemula and Tong Wu acquired the data; Tong Wu did the
analyses.

289
survival rates with single or combined peg-HGFs regimens are similar to multiple daily
injections of nonpegylated HGFs [69, 349]. One injection of peg-HGFs has logistical
advantage over multiple daily administrations in the chaos scenario of nuclear plant
disasters and nuclear warfare and has less possibility to develop neutralizing antibodies
comparing to multiple injections. Besides, the risk of spleen rupture reported in
chemotherapy patient who received multiple injections of G-CSF for treatment of
neutropenia [350] is less likely to happen in single dose of peg-HGF scenario; especially
considering there is a portion of patients receiving HGF treatment after nuclear accident
whose radiation exposure might be very low but cannot be identified because of the
limitation of dosimetry methods, the risk of spleen rupture might be even higher in those
immune-intact population if they receive multiple injections of HGFs.
The increased day 30 survival rate of mice treated with peg-HGFs correlates with
the increased CBC parameters, including WBC, NE, RBC, and PLT, mainly at day 21
post-TBI (Figure 42 & 50). The most pronounced differences observed were between
peg-HGFs-treated and Veh-treated, with few differences observed between groups treated
with different combinations of peg-HGFs (Figure 44-48). The CBC analyses indicate that
some peg-HGFs regimens, such as “with IL-11” and “combined” regimens increase NE
level at day 2 post-TBI. The lifespan of NE is short, generally fewer than 24 hours; and
the cells are constitutively committed to apoptosis after leaving the bone marrow. G-CSF
and GM-CSF have been reported to delay NE apoptosis in an unirradiated scenario in
vivo and in vitro by regulating the activity of caspase family proteases [351-353] and IL-
11 is known to prevent intestinal crypt cell apoptosis after radiotherapy and

290
chemotherapy [354]. Pegylated HGFs might increase the CBC parameters at day 2 post-
TBI through the protection from apoptosis. The in vivo experiment shows that irradiation
increases NE and LY apoptosis at day 2 post-TBI as expected; however, peg-HGFs did
not protect NE and LY from apoptosis 24h after injection, where there is no difference in
the apoptotic rate between peg-HGFs-treated and Veh groups (Figure 49). There are
several possible reasons for the inconsistencies between the CBC data and apoptosis
study. First, RBC lysis and staining during the apoptosis study might impact WBC
integrity, obscuring any anti-apoptotic effects of peg-HGFs treatment. Secondly, a
protective effect may occur earlier than 24 hr, making the 24 hr post-injection (day 2
post-TBI) time-point too late to observe differences. Third, the higher NE numbers in
“combined” and “with IL-11” groups may result from stronger progenitor stimulation in
these groups compared with the “single” and “no IL-11” groups. However, this
explanation is not supported by the lack of sustained high NE numbers at day 4 and 7.
Since mature peripheral blood cells differentiate from immature HPCs and HSCs
in the BM, the HPC function was evaluated by CFU assay at different days post-TBI.
Because of the scarcity of BM cells post-TBI, BM cells from four mice were pooled.
Three quarters of the cells were used for the transplantation study, and the remainder for
the CFU assay (Figure 51 A-D). Although statistical comparison to Veh is not available
(Veh was pooled form four mice), the peg-HGFs treated groups had higher average CFU
number than Veh-treated group as early as day 5 post-TBI and prominent at day 14 post-
TBI (Figure 51). In another similar study to evaluate the HSC number in BM, peg-HGFs
treated group had significantly higher HSC number (LSCD150+) than Veh-treated group
291
at day 10 post-TBI (Figure 52 E). These results indicate that peg-HGFs stimulate the
proliferation of the remaining committed hematopoietic progenitor cells after radiation
exposure, whether peg-HGFs also have indirect effect on the bone marrow niche cells
remains to be determined in future study.
Mice received “combined” regimens had slightly higher, but not significantly
different, CFU number and HSC number than “single” regimens at early days post-TBI
(Figure 51 E-H & Figure 52 F), and this hematopoietic recovery in bone marrow is
consistent with the hematopoietic recovery in peripheral blood at later day (day 21) post-
TBI (Figure 47), which indicates that the extra benefit in hematopoietic recovery brought
from polypharmacy strategy is limited. Similar results were observed for “with IL-11”
and “no IL-11” analysis. These results indicate that there is possibility that “combined” or
“with IL-11” regimens have positive effects on non-hematopoietic systems, such as in
gastrointestinal system [341, 355], and thus enhance the day 30 survivals in mice
received these regimens (Figure 42). Future studies will investigate the broad
systems/organs effects other than hematopoietic system of the peg-HGFs.
Next, transplantation study was used to evaluate the repopulation capacity of
HSCs, monitoring peripheral blood chimerism for five months post-transplantation. In
general, recipients had higher chimerism when transplanted at day 7 post-TBI than at 5,
and higher at day 14 than days 7 and 5, meeting the expectation that HSC dysfunction
gradually recovers over time following irradiation. Overall, the donor chimerism of
irradiated mice was transient, no matter which treatments the donor mice received, which

292
indicates the loss of HSC long-term repopulating potential in irradiated mice. There were
no statistically significant differences in chimerism rate between different peg-HGFs
regimens (Figure 53 A-C). In order to increase the number of N in each group, all peg-
HGFs-treated groups were combined into the “HGF” group and compared with Veh
group. No statistical difference between these groups at any time-point in mice
transplanted at day 5 or day 7 post-TBI. The average chimerism in the “HGF” group was
generally lower than in the Veh group in mice transplanted 14 days post-TBI. This
difference was statistically significant at four months post-transplantation (Figure 53 D-
F). When “single” vs. “combined” were compared, at 1-month post day 14
transplantation study, donor cells from mice receiving “combined” regimens had
significantly higher chimerism than those from mice that received “single” regimens.
This trend was sustained over the subsequent months but without statistical difference
(Figure 53 G-I). When analyzed in the pattern of “with G” vs. “no G” (Figure 53 J-L),
“with GM” vs. “no GM” (Figure 53 M-O) and “with IL-11” vs. “no IL-11” (Figure 53 P-
R), there was no significant difference comparing “with xx” to “no xx”. These results
indicate that peg-HGFs did not rescue the loss of HSC repopulating potential brought by
radiation exposure and even exacerbate the loss at certain time-point post-TBI. Peg-HGFs
likely enhance hematopoietic recovery by promoting proliferation and differentiation of
short-term repopulating progenitors at early time post-TBI but at the expense of self-
renewal and long-term repopulating potential of HSC, which may aggravate RBMD. This
is consistent with the previous report from Li et al.[356] in which the donor receiving G-
CSF treatment had lower chimerism than the donor receiving Veh treatment 1-month
post-TBI. The “combined” regimen transiently increase the chimerism rate indicates that

293
“combined” regimen preserves the HSC short-term repopulating potential better than
“single” regimen. The effect of irradiation and peg-HGFs on self-renewal capacity of
stem cells need to be tested by secondary transplantation which is beyond the scope of
this study.
Many studies have reported similar survival benefit of early administration of
HGFs or peg-HGFs [74, 267], but long-term survival studies are rare due to prohibitive
costs in long-term animal husbandry and monitoring. Most RBMD studies used sublethal
radiation exposure or only monitored mice a few months post-TBI and did not use peg-
HGFs as MCM [40, 357, 358]. In this study, survivors of H-ARS were transferred to
RBMD study with time-point sacrifices to observe delayed effects and evaluate long-term
survival. Survival analyses showed that the survival benefit of peg-HGFs treatments in
H-ARS phase did not sustain in DEARE. All irradiated mice had significantly lower 2-
year survival rates than NI mice, and no any peg-HGFs-treated group had significant
higher survival rate than Veh-treated mice (Figure 54 A and Table 11). Combining
different groups into “HGF” vs. “Veh” (Figure 54 B), “with IL-11” vs. “no IL-11”
(Figure 54 C) and “single” vs. “combined” (Figure 54 D) as previously described, there
was no significant difference between any of these comparisons. This result contradicts to
the survival superiority of peg-HGFs in H-ARS phase, but it is consistent with the
transplantation chimerism study at day 14 post-TBI (Figure 53 F) which highlighted the
detrimental effect of peg-HGFs on HSC function post-TBI.

294
In DEARE markers studies including the body weight, CBC parameters, bone
marrow HSC number and function at 6 and/or 12 months post-TBI, the results followed
the similar trend in DEARE survival study, where the differences between peg-HGFs-
and Veh-treated mice were minimal and there was no significant difference between
“with xx” and “no xx” comparisons, or between “combined” and “single” comparison
(Figure 55-58). The difference between irradiated mice and NI mice are generally more
apparent in 12 months post-TBI than in 6 months post-TBI, such as body weight and
myeloid skewing in peripheral blood, which reflects the “double hits” of aging and
irradiation on the DEARE mice. The bone marrow LSKCD150+ cells followed the
opposite trend where the number per mouse was higher in the 12 months NI and DEARE
mice than the 6 months NI and DEARE mice, respectively (Figure 57). Dr. Orschell's
laboratory has previously confirmed that the LSKCD150+ cells from irradiated survivor
represent the long-term repopulating HSCs, the same as LSKCD150+ cells from NI mice
[147]. The increased CD150 on KSL population of the irradiated mice has been reported
by Simonnet AJ et al. [359] and by Chua HL et al. [40, 147]. Whether the increased
CD150 expression represents the enhanced long-term repopulating ability is unknown,
the lack of 6 months post-TBI transplantation data makes the comparison to 12 months
post-TBI transplantation impossible. There is a possibility that more LSKCD150+ cells in
DEARE mice represent a compensatory mechanism to try to maintain the increased
hematopoietic demand, which is through the enhanced proliferation of HSCs, but the
repopulating function of these HSCs is still defective [360-362]. From the result of 12
months post -TBI HSC phenotyping study and the result of transplantation study at the
same time, peg-HGFs have limited effect on either increasing the HSC number or

295
enhancing long-term repopulating progenitors, comparing to the Veh-treated control. The
lower levels of donor-derived lymphoid differentiation in both peg-HGFs- and Veh-
treated mice than in NI mice (Figure 58) were consistent with the lower lymphocyte
percentages in peripheral blood in these two groups than the NI group (Figure 56). This
result indicates that the long-term immune deficiency roots in the HSCs whose
multilineage differentiation ability is defective, rather than the direct effects of radiation
exposure on mature lymphocytes.
DNA damage and epigenetic changes are induced by irradiation and aging,
leading to downregulation of lymphoid genes and upregulation of myeloid genes, which
shifts the differentiation potential of the HSC pool to the myeloid lineage. Wang et al.
found that irradiation-induced G-CSF/STAT3/BATF upregulation bypasses the lymphoid
differentiation checkpoint, impairs the self-renewal potential of HSCs, and depletes
lymphoid-biased HSCs [363]. Potentially, BATF activation is G-CSF dependent and
needs continuous stimulation with G-CSF sustain activated status and maintain HSC self-
renewal inhibition [363]. Irradiation-induced apoptosis or cell cycle arrest [364] in HSCs
cannot explain the myeloid skewing observed in normal aging mice and DEARE mice
[363]. This model perfectly explains that LY number partially recovers at day 21 post-
TBI, especially apparent in the peg-G-CSF group (Figure 45). It also raises the concern
that administration of HGFs would impair HSC self-renewal and exacerbate the myeloid
skewing. The transplantation study shows that a decreased chimerism rate at 4 months
post-transplantation in the peg-HGFs group comparing with Veh group (Figure 53 F).
This result indicates the possibility that administration of peg-HGFs as MCM rescues the

296
irradiated mice by inducing the differentiation of short-term repopulating progenitors and
impairs the HSC long-term repopulating potential at an early time-point post-TBI,
whether this impairment relates to the G-CSF/STAT3/BATF pathway needs further
investigation.
The day 21 peripheral blood analysis indicated that T and B cells increase in the
peg-G-CSF treated group compared to Veh group, albeit to a less extent than the
increased Gr1+ neutrophils (Figure 59). Adding more peg-HGFs into the regimen does
not increase lymphocytes and neutrophils. The differentiation of T lymphocytes is
different from B lymphocytes and neutrophils since T cells require thymic education and
maturation. The atrophy of thymus is a hallmark of aging and contributes to the loss of
immune function in senior mammals, including humans and mice. The involution of
thymus post-TBI has been reported [186, 218, 219], but rarely discussed in an MCM
scenario. In this section, the thymic involution and recovery post-TBI in H-ARS and
DEARE phases, and the impact of peg-HGFs on the thymus, were investigated. Thymus
is extremely sensitive to radiation, reaching the first nadir at day 2 post-TBI, followed by
the first recovery peak at day 10, and then second nadir at around day 21 and second peak
at around day 30-40. Subsequently, the thymus gradually involutes under the double hits
of aging and irradiation (Figure 60 A & B). The first recovery results from the
proliferation and expansion of radioresistant thymocytes and the second recovery is from
the proliferation and expansion of ETPs which are generated de novo from HSC in bone
marrow [218, 365].
297
Administration of peg-HGFs at 24 hr post-TBI did not change the thymic weight
and cellularity at the first nadir and peak. When combining all peg-HGFs-treated groups
together, the “HGFs” group had statistically higher thymus weight and cellularity than
Veh group at day 21 post-TBI (Figure 60 C & D). Analysis of thymic subpopulations at
day 21 reveals that the “HGF” group had a statistically higher percentage of DP cells
which indicates peg-HGFs enhance the de novo thymus regeneration. Previous studies
have shown that G-CSF, GM-CSF or IL-11 enhance hematopoiesis mainly by promoting
the proliferation and differentiation of myeloid-megakaryoid progenitor cells [366, 367].
Current studies indicate that peg-HGFs treatment 24 hr post-TBI enhances immune
recovery in both the myeloid and lymphoid lineage. Thymus-dependent de novo
regeneration originated from BM-derived progenitors and thymus-independent HPE are
the two ways of T cell reconstitution. The effect of peg-HGFs on HPE has not been
evaluated; however, the G-CSF receptor has expression on some mature B and T
lymphocytes [368, 369] and G-CSF enhances the proliferation of these cells [346, 369].
Although the expression of GM-CSF and IL-11 receptors have not been reported on the
surface of peripheral lymphocytes, it is possible that GM-CSF or IL-11-taregeted cells
such as monocytes have an indirect influence on lymphocyte proliferation [370, 371].
Lymphocyte recovery at day 21 following peg-HGF administration post-TBI involves
both the thymus-dependent and thymus-independent T cell recovery pathways.
Lymphocyte with thymus education provide a more comprehensive immune protection
than lymphocyte generated from HPE. Interestingly, at 12 months post-TBI, the peg-
HGFs-treated mice had lower thymic weight and cellularity than Veh group (Figure 61 J,
N & O). It is consistent with the lower chimerism rate in bone marrow of peg-HGFs

298
group comparing with Veh control in the transplantation study (Figure 53 F). The lower
thymus repopulating potential of the ETPs might be similar to the lower bone marrow
repopulating potential HSCs in the irradiated mice. Further study is needed to identify
whether peg-HGFs impair the homing of ETPs to thymus or impair the proliferation and
differentiation of ETPs.
Except peg-HGFs, other MCMs are also investigated to see if there is space to
further increase survival in H-ARS and alleviate DEARE effects. ACE is part of the
classic RAS system, which converts angiotensin I to angiotensin II. ACEI is widely used
in the treatment of hypertension. Recent research found that HSCs express ACE
throughout the hematopoietic ontogeny from embryo to adulthood [372]. HPCs exhibit
transient cell cycle arrest after two days of captopril (a classic ACEI) administration in
vivo. When used as a radiomitigator instead of a radioprotectant, captopril significantly
decreases radiation-induced lethality by accelerating hematopoietic recovery. The cell
cycle pause leads to side effects in hypertension patients including agranulocytosis,
anemia, or pancytopenia [373-375]. Based on previous findings, Liso was added to TC
regimen to determine whether this new combination (TC+L) more effectively alleviates
H-ARS and DEARE than TC alone. The results show that the day 30 survival rate
slightly increased in the TC+L group in comparison with the TC group, and there was a
sex difference in this effect. TC+L was more effective in female than in male mice
(Figure 62 A-C). In the HSC cell cycle analysis at day 10 post-TBI (3 days after Liso
treatment), more quiescent HSCs were present in female TC+L-treated mice than in male
TC+L-treated mice; and in female mice, the percentage of HSCs in quiescent status was

299
slightly higher in the TC+L group than the TC and Veh group, although not statistically
different (Figure 64 E). This result indicates that sex difference in cell cycle pause is a
possible mechanism for the higher survival rate in female TC+L group. This is consistent
with a report from Davis et al., showing an increased percentage of HSCs in quiescent
status in captopril-treated female mice [103]. The transient cell cycle pause allowing
more time for repair of radiation-induced DNA damage in HSCs. Cautions are needed for
the interpretation of these results because there was no statistical difference in cell cycle
between TC+L and TC group; and in TC group, there was similar trend of sex difference
although not statistically different, which was not seen in other TC studies. The possible
reasons could relate to the small size of N (5-7 mice per group) or relate to the time of
sacrifice, day 10 post-TBI (3 days after Liso treatment) might be too short to observe the
full effect of Liso, which also explains that why there was no significant difference
between TC+L and TC groups in BM cellularity, HSC and HPC number, BM cytokines
and brain petechiae studies at this time-point. Because the cell cycle arrest is transient
and followed with more cells entering the G1 to G2 transition [103], it is possible that the
higher neutrophil number at day 20 in the female TC+L group than TC group correlates
with the earlier cell cycle pause on progenitors. In summary, there are several possible
mechanisms to explain the survival benefit and the sex difference for TC+L regimen,
further studies are needed to investigate other time-points after Liso treatment and
increase the sample size.
In the DEARE study, TC+L group did not improve long-term survival, myeloid
skewing, or HSC number (Figure 69-71). However, analysis of HSC function at DEARE

300
mice (6 months post-TBI) with competitive transplantation revealed that TC+L-treated
male mice had significantly higher donor chimerism rate than TC+L-treated female mice
and significantly higher than TC-treated mice in both genders (Figure 72). Although the
long-term survival rate in TC+L-treated male mice was higher than the TC-treated male
mice and was higher than TC- and TC+L-treated female mice, which is consistent with
the transplantation results, the differences were not statistically significant and this might
relate to the limited number of mice survived to the DEARE phase. The reason for why
female TC+L-treated mice had higher day 30 survival rate than male mice in H-ARS
phase, but lower long-term survival rate and HSC repopulation ability in the DEARE
phase, is not clear. Further evaluation of sex hormone status at these time-points may
provide insights into the observed sex difference.
To summarize, one shot of single or multiple combined peg-HGFs at 24 hr post-
TBI enhances the day 30 survival rate and alleviates H-ARS, including thymus recovery,
which promotes the de novo regeneration of T cells. The effects of peg-HGFs on DEARE
are minimal when compared to Veh-treated mice in terms of long-term survival, body
weight, myeloid skewing, HSPC number, and HSC function. Adding lisinopril from day
7 post-TBI further increases the day 30 survival rate and shows a sex difference in TC+L
group. Future studies with large sample size and more mechanism studies such as sex
hormone status in H-ARS and DEARE phases are needed.
301
Chapter 6. Future Directions
6.1. Time-window and dosage-window of dmPGE2 efficacy
As described in Chapter 3, dmPGE2 administrated at -24 hr prior to irradiation
does not enhance survival; whereas dmPGE2 schedules administrated within 3 hr time
window prior to irradiation are all effective and -1 hr prior to irradiation conferred a little
better survival than -3 hr prior to irradiation, though not statistically significantly (day 30
survival rate of 90% vs.100% respectively; Figure 21). Previous studies reported that the
closer to irradiation, the more effective the dmPGE2 protection and suggested that -1 hr
prior to irradiation is the time limit [134]. Current studies show the similar trend and
extend the time-window to -3 hr prior to irradiation. There is a specific time-window in
which dmPGE2 must be administered for a protective effect to be achieved. Since the -24
hr time-point is the only earlier time-point tested than -3 hr, whether other time-points
early than -3 hr will still be effective and where is the upper limit of the time window for
radioprotection are unknown. Further studies at time-points between -3 hr and -24 hr
prior to irradiation would help to reveal when PGE2 signaling pathway to start and end
its effects in hematopoietic system.
One dose of 35 µg or two doses of 20 µg dmPGE2 were tested in the survival
studies. According to previous reports, the closer of the time-point of dmPGE2
administration to the time-point of irradiation, the lesser dmPGE2 dose is needed for
providing an adequate protection. Walden TL et al. reported that 1 µg of dmPGE2
injected -5 min prior to TBI (10 Gy) results in ~90% survival [134]. The side effects of
dmPGE2 injection include diarrhea and decreased ambulation, which are dose-dependent

302
[134], and these side effects are one of the main obstacles that prevent its wide usage.
The severity and duration of these side effects with a 1 µg dmPGE2 treatment would be
significantly lower than the 35 µg schedule. Investigating the potential to use this smaller
dose is of importance if dmPGE2 is to be used as a radioprotectant for first responders
and military personnel as they will be required to work in a radioactive material-
contaminated environment and thus require treatment which is not associated with side
effects that will affect their ability to work.
Another limitation of current studies is that the highest irradiation dose tested is
9.04 Gy (LD90/30) and therefore it is not known whether the dmPGE2 schedule tested
render the mice capable of tolerating a higher radiation dose. In previous studies, a
similar dmPGE2 regimen (40 µg at -30 min prior to TBI) increased the LD50/30 from
9.39 Gy to 16.14 Gy, with the survival curve beginning to decline after 10 Gy [134]. A
probit analysis in well-defined mouse model would provide information on to how to
adjust the dmPGE2 regimen according to the predicted level of radiation exposure.
As for the dmPGE2 radiomitigation, although +3 hr schedule fails to increase the
survival rate and +6 hr schedule is effective and the time-window is extended to +30 hr
post-TBI, whether earlier time-points than the +3 hr, especially the time-points very close
to irradiation, will be effective or not, is still unknown. Although a previous study [276]
indicated that dmPGE2 given immediately after irradiation could decrease the loss of
functional HSPC, another survival study [134] demonstrated that mice received dmPGE2
at either 5, 15, 30, or 60 post-irradiation were all dead. This discrepancy might relate to

303
different mouse stain (C57BL/6 vs. CD2F1), different irradiation dose (6.5 Gy from 137Cs
vs. 10 Gy from 60Co) and different dmPGE2 dose (2 µg/g, around 40 µg per mouse vs. 10
µg per mouse). Since Walden TL et al. [134] in the survival study only used 10 µg
dmPGE2, whether the result will be different if higher dosage applied, such as 35 µg, is
unknown. And since in radioprotection studies, the protective effect is dmPGE2 dosage-
dependent, it is reasonable to assume that radiomitigation effect might also be dosage-
dependent.
In summary, further investigations into the limits of the use of dmPGE2 as a
radioprotectant are required for optimizing the timing of injection, the dose of dmPGE2,
and the effect of the dose of irradiation on efficacy. These studies will be beneficial
curating an optimal regimen according to predicted radiation exposure, and will be
meaningful to the potential recipients of dmPGE2 protection, especially to first
responders and military personnel facing a radiation threat.
6.2. Mechanism of dmPGE2 protection
It is not known whether the protection effect of dmPGE2 is dependent on the
presence of dmPGE2 at the time of irradiation, or whether non-dmPGE2 components
mediate the protection effect. The metabolism of endogenous PGE2 occurs rapidly via
pulmonary circulation and has a half-life of ~30 s [376]. DmPGE2 has two methyl groups
at position 16, rendering it resistant to 15-hydroxy PGDH degradation [377] and
extending its half-life to 20-25 min (unpublished data). Although dmPGE2 has a longer
half-life than regular PGE2, the half-life of dmPGE2 is still much shorter than the

304
dmPGE2 radioprotectant time-window (3 hr prior to TBI). It is possible that dmPGE2
protection is not dependent on a specific lowest presence level or a threshold of dmPGE2
in bone marrow or peripheral blood. Another early study also indicate this possibility by
detecting the dmPGE2 concentration in plasma, spleen and BM after injection, where
they found that dmPGE2 concentrations in BM and spleen are higher in 1 hr post-
injection than 5 min post-injection, whereas the -5 min dmPGE2 protection effect is
better than -1 hr administration [134]. The lack of correlation between drug concentration
and protection effect indicates that dmPGE2-induced activities are receptor mediated.
There are several potential mechanisms for dmPGE2 radioprotection. First, free
radical scavenger is supposed to be the mechanism for protectants with sulfhydryl (thiol)
group such as amifostine or glutathione [378]. However, dmPGE2 does not have
sulfhydryl (thiol) group and at 30 min after injection most dmPGE2 in tissue are still in
unmetabolized status, so at least it seems not a direct scavenger effect. Future study
would focus on the detection of intracellular sulfhydryl containing compounds, such as
glutathione, induced by the radioprotectant in a relative short time (considering the time-
window for radioprotectant dmPGE2 could be as short as -5 min to -15 min prior to
irradiation). Second, inhibiting cell cycling or redistributing cell cycle to late S phase
could decrease the DNA damages brought by irradiation and thus increase survival.
However, as described in previous chapter, the dmPGE2 suppression on HSPC
proliferation is longer than 24 hr after injection but the -24 hr dmPGE2 schedule is not
radioprotectant, which challenge the cell cycle inhibition theory; what’s more,
considering as short as -5 min prior irradiation could provide radioprotection [134], it is

305
almost impossible to redistribute cell cycle to late S phase in such short time. Last,
changing microenvironment, such as hypoxia environment, is also a potential mechanism
for radioprotectant and this is also a mechanism for radioresistant cancer cells. Although
lack of direct evidence that dmPGE2 could induce hypoxia, considering one of its
physiological effect is vasodilation, which means bring more oxygen to tissues,
challenges this hypothesis [132]. Among all these mechanisms, the future studies
focusing on accumulated intracellular sulfhydryl compounds [132] and/or elevated cAMP
[379] induced by PGE2 receptor activation are promising.
Here, results suggest that EP4 agonist increases day 30 survival compared to Veh
and other EP agonists (Figure 23), but the survival rate with was considerably lower than
observed with dmPGE2 treatment. Although EP1, 2, and 3 agonists fail to show similar
protection, it cannot be ruled out that the protective effect is mediated through a
combination of all three or four agonists. In order to further verify the responsible EP
receptor, future experiments need to include an EP 2+3+4 agonist combination group, or
use EP agonist which hits all EP receptors (such as misoprostol), or seek a more potent
EP4 agonist, or test an intensive EP4 agonist regimen.
In bone marrow, non-dmPGE2 components such as KC (Figure 25), may be
regulated by dmPGE2 shortly after dmPGE2 injection. The contribution of these
cytokines to the radioprotective activity of dmPGE2 will be assessed in future
experiments by injecting the cytokines prior to TBI. The potential for dmPGE2 to
regulate non-protein components, such as the sulfhydryl compounds as observed with

306
PGE2 gastric cytoprotection, cannot be ruled out [380, 381]. Considering the complexity
of the role of PGE2 in normal physiological processes, it is highly possible that dmPGE2
radioprotection involves multiple molecules or pathways. The RNA sequencing and IPA
analysis on the LMPP and CLP population, which under the protection of dmPGE2,
would be helpful in identifying more lymphoid-related genes and reveal which
differentiation stage dmPGE2 protection targets on.
6.3. Polypharmacy of peg-HGFs and dmPGE2
Peg-HGFs are effective radiomitigators, treatment with multiple peg-HGFs
increases the survival rate following TBI (Figure 42). Although mice receiving peg-HGFs
had accelerated CBC recovery at around day 20 post-TBI (Figure 48), the treatment did
not ameliorate low WBC, NE, and LY counts at their nadir (day 10 post-TBI). DmPGE2
similarly increased the day 30 survival rate when used as a radioprotectant, and increased
WBC and NE levels at day 10 post-TBI. DmPGE2 did not increase LY levels at day 10
post-TBI, and prolonged LY recovery until day 30 (Figure 24). DEARE mice receiving
peg-HGF treatment at young age showed a trend of a more involuted thymus than Veh-
treated mice (Figure 60), whereas mice receiving dmPGE2 treatment had better thymic
reconstitution than Veh-treated mice (Figure 27). The lower WBC, NE, or LY post-TBI
in H-ARS mice and involuted thymus in DEARE mice contribute to the higher
opportunistic infection rate and death rate. A polypharmacy strategy combining dmPGE2
as radioprotectant and peg-HGFs as radiomitigator will be investigated in the future,
which may further enhance hematopoiesis post-TBI. Additionally, this combined therapy
may reduce the required dose of dmPGE2, alleviating the side effects associated with a

307
higher dose. Combining the dmPGE2 radioprotective protection of HSCs from radiation
damage and peg-HGF radiomitigating promotion of HPC proliferation and differentiation
may result in a beneficial synergistic effect.
6.4. DmPGE2 used in the scenarios of chemotherapy or radiotherapy
Patients undergoing chemotherapy or radiotherapy for malignancy or bone
marrow transplantation have been successfully treated with HGFs and peg-HGFs. There
are a limited number of FDA-approved radioprotectants. The only FDA-approved
cytoprotectant for chemotherapy and radiotherapy is Amifostine. Although dmPGE2 as a
radioprotectant greatly enhances day 30 survival, accelerates hematopoiesis recovery, and
prevents myeloid skewing in DEARE mice, there is a concern that dmPGE2 may protect
cancer cells and thus increase recurrence rate.
Recently, endogenous PGE2 has been shown to play an important role in
tumorigenesis. COX-2, a key enzyme in the prostaglandin synthesis pathway, is
overexpressed in 80-85% of adenocarcinomas [382]. Prostaglandin E synthase 2
(PTGES2), the enzyme catalyzing the final step of PGE2 synthesis, has a higher
expression level in endometrial cancer tissue than in normal tissue [383]. The
concentration of PGE2 is increased five-fold in breast cancer tissue compared with
normal tissue [384]. The expression level of 15-hydroxyprostaglandin dehydrogenase
(15-PGDH), an important enzyme responsible to the degradation of PGE2, is lower in
colorectal cancer than in normal tissue [385]. Administration of a COX-2 inhibitor or
EP4 antagonist inhibits cancer growth and metastasis through inhibiting

308
lymphangiogenesis and angiogenesis in a breast cancer mouse model [386]. Clinically,
celecoxib, a selective COX-2 inhibitor, has been approved by the FDA for the treatment
of familial adenomatous polyposis (FAP) [387]. Clinical trials on celecoxib or aspirin for
cancer primary prevention are ongoing [388].
In addition to studies suggesting that PGE2 is a driver of cancer, a few studies
indicate that it may also play an anti-cancer role. Wilson et al. reported that weekly
injections of dmPGE2 for 12 weeks in APCMin/+ mice reduced the size and number of
GI adenomas in comparison with control-treated mice. Although this study’s result is the
opposite to other findings, it indicates that the effects on cancer cells from PGE2 are
more complicated than initially thought, and the effect of exogenous vs. endogenous
PGE2 might be different [389, 390].
In most PGE2 studies indicating a pro-cancer effect, the focus was on
endogenous, long-lasting exposure to PGE2. A one-time injection of dmPGE2 would be
metabolized quickly and thus may not drive tumorigenesis. Considering the
hypovascularity and low PH in the cancer microenvironment, which is different from
normal tissue, the amount of PGE2 exposure in cancer compared with in normal tissue
following dmPGE2 treatment is likely to be considerably different. Since the
concentration of endogenous PGE2 in the cancer microenvironment is elevated in
compared with normal tissue [384], the increase brought about by a one-time dmPGE2
injection might be negligible in cancer tissue, but sufficient to provide radioprotection in
normal tissue.
309
Future studies will therefore investigate the impact of dmPGE2 on tumorigenesis
and using dmPGE2 before radiotherapy in a tumor-bearing mouse model. If dmPGE2
increases survival and boosts immune reconstitution, but does not impact the effect of
radiotherapy and increase the cancer relapse rate in the long-term, it will be a strong
candidate for preventing radiation effects in cancer patients.
However, the double-hit to lymphoid cells from dmPGE2 and radiotherapy may
prolong the lymphoid cell inhibition period. Whether the risk for infection will increase,
especially opportunistic viral infection, needs further evaluation. Additionally, the
lymphocyte percentage in humans (20-30%) and mice (60-90%) is different, and the
observation of initial inhibition and later recovery of lymphopoiesis in dmPGE2 injected
mice might not appear in humans. A non-human primate study is necessary before
progressing to human clinical trial.

310
REFERENCES
1. Putnam, F.W., The Atomic Bomb Casualty Commission in retrospect. Proc Natl
Acad Sci U S A, 1998. 95(10): p. 5426-31.
2. Cerezo, L., Radiation accidents and incidents. What do we know about the
medical management of acute radiation syndrome? Rep Pract Oncol Radiother,
2011. 16(4): p. 119-22.
3. Ozasa, K., et al., Studies of the mortality of atomic bomb survivors, Report 14,
1950-2003: an overview of cancer and noncancer diseases. Radiat Res, 2012.
177(3): p. 229-43.
4. Kamiya, K., et al., Long-term effects of radiation exposure on health. Lancet,
2015. 386(9992): p. 469-78.
5. Petryna, A., Nuclear Payouts: Knowledge and Compensation in the Chernobyl
Aftermath. Anthropology Now, 2009. 1(2): p. 30-39.
6. McCall, C., Chernobyl disaster 30 years on: lessons not learned. Lancet, 2016.
387(10029): p. 1707-8.
7. Hatch, M. and E. Cardis, Somatic health effects of Chernobyl: 30 years on. Eur J
Epidemiol, 2017. 32(12): p. 1047-1054.
8. Yamashita, S., et al., Lessons from Fukushima: Latest Findings of Thyroid Cancer
After the Fukushima Nuclear Power Plant Accident. Thyroid, 2018. 28(1): p. 11-
22.
9. Kristensen, H.M. and R.S. Norris, Global nuclear weapons inventories, 1945–
2013. Bulletin of the Atomic Scientists, 2013. 69(5): p. 75-81.

311
10. Sovacool, B.K., A Critical Evaluation of Nuclear Power and Renewable
Electricity in Asia. Journal of Contemporary Asia, 2010. 40(3): p. 369-400.
11. Christensen, D.M., C.J. Iddins, and S.L. Sugarman, Ionizing radiation injuries and
illnesses. Emerg Med Clin North Am, 2014. 32(1): p. 245-65.
12. Gofman, J.W., Radiation and Human Health. 1981, San Francisco, CA, USA:
Random House, Inc.
13. Christensen, D.M., et al., Management of ionizing radiation injuries and illnesses,
part 1: physics, radiation protection, and radiation instrumentation. J Am
Osteopath Assoc, 2014. 114(3): p. 189-99.
14. Glarum, J., D. Birou, and E. Cetaruk, 2 - Assessment of Likely Mass Casualty
Events and Potential Hospital Impact, in Hospital Emergency Response Teams, J.
Glarum, D. Birou, and E. Cetaruk, Editors. 2010, Butterworth-Heinemann:
Boston. p. 19-83.
15. Dainiak, N., et al., The hematologist and radiation casualties. Hematology Am
Soc Hematol Educ Program, 2003: p. 473-96.
16. Baljinnyam, E., et al., Effect of densely ionizing radiation on cardiomyocyte
differentiation from human-induced pluripotent stem cells. Physiol Rep, 2017.
5(15).
17. Azzam, E.I., J.P. Jay-Gerin, and D. Pain, Ionizing radiation-induced metabolic
oxidative stress and prolonged cell injury. Cancer Lett, 2012. 327(1-2): p. 48-60.
18. Reisz, J.A., et al., Effects of ionizing radiation on biological molecules--
mechanisms of damage and emerging methods of detection. Antioxid Redox
Signal, 2014. 21(2): p. 260-92.

312
19. Cadenas, E. and K.J. Davies, Mitochondrial free radical generation, oxidative
stress, and aging. Free Radic Biol Med, 2000. 29(3-4): p. 222-30.
20. Boveris, A. and B. Chance, The mitochondrial generation of hydrogen peroxide.
General properties and effect of hyperbaric oxygen. Biochem J, 1973. 134(3): p.
707-16.
21. Phaniendra, A., D.B. Jestadi, and L. Periyasamy, Free radicals: properties,
sources, targets, and their implication in various diseases. Indian J Clin Biochem,
2015. 30(1): p. 11-26.
22. Cheng, X. and A.S. Ivessa, The migration of mitochondrial DNA fragments to the
nucleus affects the chronological aging process of Saccharomyces cerevisiae.
Aging Cell, 2010. 9(5): p. 919-23.
23. Brand, R.M., et al., Targeting Mitochondrial Oxidative Stress to Mitigate UV-
Induced Skin Damage. Front Pharmacol, 2018. 9: p. 920.
24. Kalyanaraman, B., et al., Teaching the basics of reactive oxygen species and their
relevance to cancer biology: Mitochondrial reactive oxygen species detection,
redox signaling, and targeted therapies. Redox Biol, 2018. 15: p. 347-362.
25. Davey, K.M., et al., Mutation of DNAJC19, a human homologue of yeast inner
mitochondrial membrane co-chaperones, causes DCMA syndrome, a novel
autosomal recessive Barth syndrome-like condition. J Med Genet, 2006. 43(5): p.
385-93.
26. MacKenzie, J.A. and R.M. Payne, Mitochondrial protein import and human health
and disease. Biochim Biophys Acta, 2007. 1772(5): p. 509-23.

313
27. Hall, E.J. and A.J. Giaccia, Radiobiology for the Radiologist. 7th edition ed.
2012, Philadelphia, PA, USA: Lippincott Williams & Wilkins.
28. Gaziev, A.I. and G.O. Shaikhaev, [Ionizing radiation can activate the insertion of
mitochondrial DNA fragments in the nuclear genome]. Radiats Biol Radioecol,
2007. 47(6): p. 673-83.
29. Calveley, V.L., et al., Partial volume rat lung irradiation: temporal fluctuations of
in-field and out-of-field DNA damage and inflammatory cytokines following
irradiation. Int J Radiat Biol, 2005. 81(12): p. 887-99.
30. Najafi, M., et al., The mechanisms of radiation-induced bystander effect. J
Biomed Phys Eng, 2014. 4(4): p. 163-72.
31. Bergonie, J. and L. Tribondeau, Interpretation of some results of radiotherapy and
an attempt at determining a logical technique of treatment. Radiat Res, 1959. 11:
p. 587-8.
32. Donnelly, E.H., et al., Acute radiation syndrome: assessment and management.
South Med J, 2010. 103(6): p. 541-6.
33. López, M. and M. Martín, Medical management of the acute radiation syndrome.
Reports of practical oncology and radiotherapy : journal of Greatpoland Cancer
Center in Poznan and Polish Society of Radiation Oncology, 2011. 16(4): p. 138-
146.
34. Seedhouse, E., Space Radiation and Astronaut Safety. 2018, Cham, Switzerland:
Springer.
35. Elliott, T.B., et al., Gastrointestinal acute radiation syndrome in Gottingen
minipigs (Sus scrofa domestica). Comp Med, 2014. 64(6): p. 456-63.

314
36. Swartz, H.M., B.B. Williams, and A.B. Flood, Overview of the principles and
practice of biodosimetry. Radiation and environmental biophysics, 2014. 53(2): p.
221-232.
37. Goans, R.E., et al., Early dose assessment in criticality accidents. Health Phys,
2001. 81(4): p. 446-9.
38. Christensen, D.M., et al., Management of ionizing radiation injuries and illnesses,
part 4: acute radiation syndrome. J Am Osteopath Assoc, 2014. 114(9): p. 702-11.
39. Blakely, E.A., Biological effects of cosmic radiation: deterministic and stochastic.
Health Phys, 2000. 79(5): p. 495-506.
40. Chua, H.L., et al., Long-term hematopoietic stem cell damage in a murine model
of the hematopoietic syndrome of the acute radiation syndrome. Health Phys,
2012. 103(4): p. 356-66.
41. Unthank, J.L., et al., Delayed Effects of Acute Radiation Exposure in a Murine
Model of the H-ARS: Multiple-Organ Injury Consequent to <10 Gy Total Body
Irradiation. Health Phys, 2015. 109(5): p. 511-21.
42. Chouker, A., Stress Challenges and Immunity in Space. 2020, Cham, Switzerland:
Springer.
43. Yamada, M., et al., Noncancer disease incidence in atomic bomb survivors, 1958-
1998. Radiat Res, 2004. 161(6): p. 622-32.
44. Hauer-Jensen, M., J.W. Denham, and H.J.N. Andreyev, Radiation enteropathy--
pathogenesis, treatment and prevention. Nature reviews. Gastroenterology &
hepatology, 2014. 11(8): p. 470-479.

315
45. Kal, H.B. and M.L. van Kempen-Harteveld, Renal dysfunction after total body
irradiation: dose-effect relationship. Int J Radiat Oncol Biol Phys, 2006. 65(4): p.
1228-32.
46. Williams, J.P., C.J. Johnston, and J.N. Finkelstein, Treatment for radiation-
induced pulmonary late effects: spoiled for choice or looking in the wrong
direction? Current drug targets, 2010. 11(11): p. 1386-1394.
47. Movsas, B., et al., Pulmonary radiation injury. Chest, 1997. 111(4): p. 1061-76.
48. Durand, T., et al., Cognitive outcome after radiotherapy in brain tumor. Curr Opin
Oncol, 2015. 27(6): p. 510-5.
49. Yamada, M.K., A link between vascular damage and cognitive deficits after
whole-brain radiation therapy for cancer: A clue to other types of dementia? Drug
Discov Ther, 2016. 10(2): p. 79-81.
50. Douple, E.B., et al., Long-term radiation-related health effects in a unique human
population: lessons learned from the atomic bomb survivors of Hiroshima and
Nagasaki. Disaster medicine and public health preparedness, 2011. 5 Suppl 1(0
1): p. S122-S133.
51. Furukawa, K., et al., Predicting future excess events in risk assessment. Risk
Anal, 2009. 29(6): p. 885-99.
52. Finch, S.C., et al., Detection of Leukemia and Related Disorders, Hiroshima and
Nagasaki: Research Plan. 1965, Hiroshima, Japan: Atomic Bomb Casualty
Commission.
53. Preston, D.L., et al., Effect of recent changes in atomic bomb survivor dosimetry
on cancer mortality risk estimates. Radiat Res, 2004. 162(4): p. 377-89.

316
54. Iwanaga, M., et al., Risk of myelodysplastic syndromes in people exposed to
ionizing radiation: a retrospective cohort study of Nagasaki atomic bomb
survivors. J Clin Oncol, 2011. 29(4): p. 428-34.
55. Preston, D.L., et al., Cancer incidence in atomic bomb survivors. Part III.
Leukemia, lymphoma and multiple myeloma, 1950-1987. Radiat Res, 1994.
137(2 Suppl): p. S68-97.
56. Wang, Y., et al., Total body irradiation causes residual bone marrow injury by
induction of persistent oxidative stress in murine hematopoietic stem cells. Free
Radic Biol Med, 2010. 48(2): p. 348-56.
57. Wang, Y., et al., Total body irradiation selectively induces murine hematopoietic
stem cell senescence. Blood, 2006. 107(1): p. 358-66.
58. Shinjo, K., et al., Granulocyte colony-stimulating factor receptor at various
differentiation stages of normal and leukemic hematopoietic cells. Leuk
Lymphoma, 1997. 25(1-2): p. 37-46.
59. Yu, H., et al., Deletion of Puma protects hematopoietic stem cells and confers
long-term survival in response to high-dose gamma-irradiation. Blood, 2010.
115(17): p. 3472-80.
60. Tichy, A., et al., Ataxia-telangiectasia mutated kinase (ATM) as a central
regulator of radiation-induced DNA damage response. Acta Medica (Hradec
Kralove), 2010. 53(1): p. 13-7.
61. Ito, K. and T. Suda, Metabolic requirements for the maintenance of self-renewing
stem cells. Nat Rev Mol Cell Biol, 2014. 15(4): p. 243-56.
317
62. Beausejour, C.M., et al., Reversal of human cellular senescence: roles of the p53
and p16 pathways. Embo j, 2003. 22(16): p. 4212-22.
63. Herranz, N. and J. Gil, Mechanisms and functions of cellular senescence. J Clin
Invest, 2018. 128(4): p. 1238-1246.
64. Piccoli, C., et al., Characterization of mitochondrial and extra-mitochondrial
oxygen consuming reactions in human hematopoietic stem cells. Novel evidence
of the occurrence of NAD(P)H oxidase activity. J Biol Chem, 2005. 280(28): p.
26467-76.
65. Shao, L., Y. Luo, and D. Zhou, Hematopoietic stem cell injury induced by
ionizing radiation. Antioxid Redox Signal, 2014. 20(9): p. 1447-62.
66. Carbonneau, C.L., et al., Ionizing radiation-induced expression of INK4a/ARF in
murine bone marrow-derived stromal cell populations interferes with bone
marrow homeostasis. Blood, 2012. 119(3): p. 717-26.
67. Hooper, A.T., et al., Engraftment and reconstitution of hematopoiesis is
dependent on VEGFR2-mediated regeneration of sinusoidal endothelial cells. Cell
Stem Cell, 2009. 4(3): p. 263-74.
68. Waselenko, J.K., et al., Medical management of the acute radiation syndrome:
recommendations of the Strategic National Stockpile Radiation Working Group.
Ann Intern Med, 2004. 140(12): p. 1037-51.
69. Plett, P.A., et al., Establishing a murine model of the hematopoietic syndrome of
the acute radiation syndrome. Health Phys, 2012. 103(4): p. 343-55.
70. Liongue, C., et al., Granulocyte colony-stimulating factor receptor: stimulating
granulopoiesis and much more. Int J Biochem Cell Biol, 2009. 41(12): p. 2372-5.

318
71. Panopoulos, A.D. and S.S. Watowich, Granulocyte colony-stimulating factor:
molecular mechanisms of action during steady state and 'emergency'
hematopoiesis. Cytokine, 2008. 42(3): p. 277-88.
72. Ruef, C. and D.L. Coleman, Granulocyte-macrophage colony-stimulating factor:
pleiotropic cytokine with potential clinical usefulness. Rev Infect Dis, 1990.
12(1): p. 41-62.
73. Mehta, H.M., M. Malandra, and S.J. Corey, G-CSF and GM-CSF in Neutropenia.
J Immunol, 2015. 195(4): p. 1341-9.
74. Plett, P.A., et al., PEGylated G-CSF (BBT-015), GM-CSF (BBT-007), and IL-11
(BBT-059) analogs enhance survival and hematopoietic cell recovery in a mouse
model of the hematopoietic syndrome of the acute radiation syndrome. Health
Phys, 2014. 106(1): p. 7-20.
75. Ventevogel, M.S. and G.D. Sempowski, Thymic rejuvenation and aging. Curr
Opin Immunol, 2013. 25(4): p. 516-22.
76. van Heijst, J.W., et al., Quantitative assessment of T cell repertoire recovery after
hematopoietic stem cell transplantation. Nat Med, 2013. 19(3): p. 372-7.
77. Frasca, D., et al., Hematopoietic reconstitution after lethal irradiation and bone
marrow transplantation: effects of different hematopoietic cytokines on the
recovery of thymus, spleen and blood cells. Bone Marrow Transplant, 2000.
25(4): p. 427-33.
78. Morrissey, P.J., et al., Administration of IL-7 to mice with cyclophosphamide-
induced lymphopenia accelerates lymphocyte repopulation. J Immunol, 1991.
146(5): p. 1547-52.

319
79. Barata, J.T., et al., Interleukin-7 promotes survival and cell cycle progression of
T-cell acute lymphoblastic leukemia cells by down-regulating the cyclin-
dependent kinase inhibitor p27(kip1). Blood, 2001. 98(5): p. 1524-31.
80. Farrell, C.L., et al., Keratinocyte growth factor protects mice from chemotherapy
and radiation-induced gastrointestinal injury and mortality. Cancer Res, 1998.
58(5): p. 933-9.
81. Min, D., et al., Protection from thymic epithelial cell injury by keratinocyte
growth factor: a new approach to improve thymic and peripheral T-cell
reconstitution after bone marrow transplantation. Blood, 2002. 99(12): p. 4592-
600.
82. Mooney, C.J., et al., Selective Expression of Flt3 within the Mouse
Hematopoietic Stem Cell Compartment. Int J Mol Sci, 2017. 18(5).
83. Neipp, M., et al., Effect of FLT3 ligand and granulocyte colony-stimulating factor
on expansion and mobilization of facilitating cells and hematopoietic stem cells in
mice: kinetics and repopulating potential. Blood, 1998. 92(9): p. 3177-88.
84. Streeter, P.R., et al., Progenipoietins: biological characterization of a family of
dual agonists of fetal liver tyrosine kinase-3 and the granulocyte colony-
stimulating factor receptor. Exp Hematol, 2001. 29(1): p. 41-50.
85. Streeter, P.R., L.Z. Dudley, and W.H. Fleming, Activation of the G-CSF and Flt-3
receptors protects hematopoietic stem cells from lethal irradiation. Exp Hematol,
2003. 31(11): p. 1119-25.

320
86. Herodin, F., et al., Short-term injection of antiapoptotic cytokine combinations
soon after lethal gamma -irradiation promotes survival. Blood, 2003. 101(7): p.
2609-16.
87. Schmieder, R.E., et al., Renin-angiotensin system and cardiovascular risk. Lancet,
2007. 369(9568): p. 1208-19.
88. Paul, M., A. Poyan Mehr, and R. Kreutz, Physiology of local renin-angiotensin
systems. Physiol Rev, 2006. 86(3): p. 747-803.
89. Yusuf, S., et al., Effects of an angiotensin-converting-enzyme inhibitor, ramipril,
on cardiovascular events in high-risk patients. N Engl J Med, 2000. 342(3): p.
145-53.
90. Chappell, M.C., Biochemical evaluation of the renin-angiotensin system: the
good, bad, and absolute? Am J Physiol Heart Circ Physiol, 2016. 310(2): p. H137-
52.
91. Rodgers, K.E., et al., Effect of angiotensin II on hematopoietic progenitor cell
proliferation. Stem Cells, 2000. 18(4): p. 287-94.
92. Mrug, M., et al., Angiotensin II stimulates proliferation of normal early erythroid
progenitors. J Clin Invest, 1997. 100(9): p. 2310-4.
93. Ellefson, D.D., et al., Synergistic effects of co-administration of angiotensin 1-7
and Neupogen on hematopoietic recovery in mice. Cancer Chemother Pharmacol,
2004. 53(1): p. 15-24.
94. Durik, M., B. Seva Pessoa, and A.J. Roks, The renin-angiotensin system, bone
marrow and progenitor cells. Clin Sci (Lond), 2012. 123(4): p. 205-23.

321
95. Barshishat-Kupper, M., et al., Captopril modulates hypoxia-inducible factors and
erythropoietin responses in a murine model of total body irradiation. Exp
Hematol, 2011. 39(3): p. 293-304.
96. Rodgers, K.E. and G.S. Dizerega, Contribution of the Local RAS to
Hematopoietic Function: A Novel Therapeutic Target. Front Endocrinol
(Lausanne), 2013. 4: p. 157.
97. Griffing, G.T. and J.C. Melby, Enalapril (MK-421) and the white cell count and
haematocrit. Lancet, 1982. 1(8285): p. 1361.
98. Marathias, K.P., et al., Hematocrit-lowering effect following inactivation of renin-
angiotensin system with angiotensin converting enzyme inhibitors and
angiotensin receptor blockers. Curr Top Med Chem, 2004. 4(4): p. 483-6.
99. Charrier, S., et al., Inhibition of angiotensin I-converting enzyme induces
radioprotection by preserving murine hematopoietic short-term reconstituting
cells. Blood, 2004. 104(4): p. 978-85.
100. Day, R.M., et al., Enhanced hematopoietic protection from radiation by the
combination of genistein and captopril. Int Immunopharmacol, 2013. 15(2): p.
348-56.
101. McCart, E.A., et al., Delayed Captopril Administration Mitigates Hematopoietic
Injury in a Murine Model of Total Body Irradiation. Sci Rep, 2019. 9(1): p. 2198.
102. Conti, S., P. Cassis, and A. Benigni, Aging and the renin-angiotensin system.
Hypertension, 2012. 60(4): p. 878-83.

322
103. Davis, T.A., et al., Timing of captopril administration determines radiation
protection or radiation sensitization in a murine model of total body irradiation.
Exp Hematol, 2010. 38(4): p. 270-81.
104. Azizi, M., et al., Acute angiotensin-converting enzyme inhibition increases the
plasma level of the natural stem cell regulator N-acetyl-seryl-aspartyl-lysyl-
proline. J Clin Invest, 1996. 97(3): p. 839-44.
105. Rousseau-Plasse, A., et al., Lisinopril, an angiotensin I-converting enzyme
inhibitor, prevents entry of murine hematopoietic stem cells into the cell cycle
after irradiation in vivo. Exp Hematol, 1998. 26(11): p. 1074-9.
106. Moulder, J.E. and E.P. Cohen, Future strategies for mitigation and treatment of
chronic radiation-induced normal tissue injury. Semin Radiat Oncol, 2007. 17(2):
p. 141-8.
107. Fish, B.L., et al., Combined Hydration and Antibiotics with Lisinopril to Mitigate
Acute and Delayed High-dose Radiation Injuries to Multiple Organs. Health Phys,
2016. 111(5): p. 410-9.
108. Harizi, H., J.B. Corcuff, and N. Gualde, Arachidonic-acid-derived eicosanoids:
roles in biology and immunopathology. Trends Mol Med, 2008. 14(10): p. 461-9.
109. Ricciotti, E. and G.A. FitzGerald, Prostaglandins and inflammation. Arterioscler
Thromb Vasc Biol, 2011. 31(5): p. 986-1000.
110. Smyth, E.M., et al., Prostanoids in health and disease. J Lipid Res, 2009. 50
Suppl: p. S423-8.

323
111. Nasrallah, R., R. Hassouneh, and R.L. Hebert, PGE2, Kidney Disease, and
Cardiovascular Risk: Beyond Hypertension and Diabetes. J Am Soc Nephrol,
2016. 27(3): p. 666-76.
112. Norregaard, R., T.H. Kwon, and J. Frokiaer, Physiology and pathophysiology of
cyclooxygenase-2 and prostaglandin E2 in the kidney. Kidney Res Clin Pract,
2015. 34(4): p. 194-200.
113. Claria, J., Cyclooxygenase-2 biology. Curr Pharm Des, 2003. 9(27): p. 2177-90.
114. Gomez, I., et al., The role of prostaglandin E2 in human vascular inflammation.
Prostaglandins Leukot Essent Fatty Acids, 2013. 89(2-3): p. 55-63.
115. Kalinski, P., Regulation of immune responses by prostaglandin E2. J Immunol,
2012. 188(1): p. 21-8.
116. Markovič, T., et al., Structural features of subtype-selective EP receptor
modulators. Drug Discov Today, 2017. 22(1): p. 57-71.
117. Dey, I., M. Lejeune, and K. Chadee, Prostaglandin E2 receptor distribution and
function in the gastrointestinal tract. Br J Pharmacol, 2006. 149(6): p. 611-23.
118. Markovic, T., et al., Structural features of subtype-selective EP receptor
modulators. Drug Discov Today, 2017. 22(1): p. 57-71.
119. Nishigaki, N., M. Negishi, and A. Ichikawa, Two Gs-coupled prostaglandin E
receptor subtypes, EP2 and EP4, differ in desensitization and sensitivity to the
metabolic inactivation of the agonist. Mol Pharmacol, 1996. 50(4): p. 1031-7.
120. Bilson, H.A., D.L. Mitchell, and B. Ashby, Human prostaglandin EP3 receptor
isoforms show different agonist-induced internalization patterns. FEBS Lett,
2004. 572(1-3): p. 271-5.

324
121. Pelus, L.M., H.E. Broxmeyer, and M.A. Moore, Regulation of human
myelopoiesis by prostaglandin E and lactoferrin. Cell Tissue Kinet, 1981. 14(5):
p. 515-26.
122. Pelus, L.M., et al., Regulation of macrophage and granulocyte proliferation.
Specificities of prostaglandin E and lactoferrin. J Exp Med, 1979. 150(2): p. 277-
92.
123. Gentile, P., D. Byer, and L.M. Pelus, In vivo modulation of murine myelopoiesis
following intravenous administration of prostaglandin E2. Blood, 1983. 62(5): p.
1100-7.
124. Lu, L., et al., Prostaglandin E acts at two levels to enhance colony formation in
vitro by erythroid (BFU-E) progenitor cells. Exp Hematol, 1987. 15(7): p. 765-71.
125. Lu, L., L.M. Pelus, and H.E. Broxmeyer, Modulation of the expression of HLA-
DR (Ia) antigens and the proliferation of human erythroid (BFU-E) and
multipotential (CFU-GEMM) progenitor cells by prostaglandin E. Exp Hematol,
1984. 12(9): p. 741-8.
126. Lu, L., et al., Enhancement of the proliferation of human marrow erythroid (BFU-
E) progenitor cells by prostaglandin E requires the participation of OKT8-positive
T lymphocytes and is associated with the density expression of major
histocompatibility complex class II antigens on BFU-E. Blood, 1986. 68(1): p.
126-33.
127. North, T.E., et al., Prostaglandin E2 regulates vertebrate haematopoietic stem cell
homeostasis. Nature, 2007. 447(7147): p. 1007-11.

325
128. Hoggatt, J., et al., Prostaglandin E2 enhances hematopoietic stem cell homing,
survival, and proliferation. Blood, 2009. 113(22): p. 5444-55.
129. Frisch, B.J., et al., In vivo prostaglandin E2 treatment alters the bone marrow
microenvironment and preferentially expands short-term hematopoietic stem
cells. Blood, 2009. 114(19): p. 4054-63.
130. Pelus, L.M. and J. Hoggatt, Pleiotropic effects of prostaglandin E2 in
hematopoiesis; prostaglandin E2 and other eicosanoids regulate hematopoietic
stem and progenitor cell function. Prostaglandins Other Lipid Mediat, 2011. 96(1-
4): p. 3-9.
131. Hoggatt, J., et al., Differential stem- and progenitor-cell trafficking by
prostaglandin E2. Nature, 2013. 495(7441): p. 365-9.
132. Hanson, W.R. and C. Thomas, 16, 16-dimethyl prostaglandin E2 increases
survival of murine intestinal stem cells when given before photon radiation.
Radiat Res, 1983. 96(2): p. 393-8.
133. Hanson, W.R. and D.J. Grdina, Radiation-induced DNA single-strand breaks in
the intestinal mucosal cells of mice treated with the radioprotectors WR-2721 or
16-16 dimethyl prostaglandin E2. Int J Radiat Biol Relat Stud Phys Chem Med,
1987. 52(1): p. 67-76.
134. Walden, T.L., Jr., M. Patchen, and S.L. Snyder, 16,16-Dimethyl prostaglandin E2
increases survival in mice following irradiation. Radiat Res, 1987. 109(3): p. 440-
8.

326
135. Hoggatt, J., et al., Recovery from hematopoietic injury by modulating
prostaglandin E(2) signaling post-irradiation. Blood Cells Mol Dis, 2013. 50(3):
p. 147-53.
136. Jacobson, L.O., et al., The role of the spleen in radiation injury and recovery. J
Lab Clin Med, 1950. 35(5): p. 746-70.
137. Till, J.E. and C.E. Mc, A direct measurement of the radiation sensitivity of normal
mouse bone marrow cells. Radiat Res, 1961. 14: p. 213-22.
138. Becker, A.J., C.E. Mc, and J.E. Till, Cytological demonstration of the clonal
nature of spleen colonies derived from transplanted mouse marrow cells. Nature,
1963. 197: p. 452-4.
139. Bradley, T.R. and D. Metcalf, The growth of mouse bone marrow cells in vitro.
Aust J Exp Biol Med Sci, 1966. 44(3): p. 287-99.
140. Stephenson, J.R., et al., Induction of colonies of hemoglobin-synthesizing cells by
erythropoietin in vitro. Proc Natl Acad Sci U S A, 1971. 68(7): p. 1542-6.
141. Iscove, N.N. and F. Sieber, Erythroid progenitors in mouse bone marrow detected
by macroscopic colony formation in culture. Exp Hematol, 1975. 3(1): p. 32-43.
142. Johnson, G.R. and D. Metcalf, Pure and mixed erythroid colony formation in vitro
stimulated by spleen conditioned medium with no detectable erythropoietin. Proc
Natl Acad Sci U S A, 1977. 74(9): p. 3879-82.
143. Whitlock, C.A., D. Robertson, and O.N. Witte, Murine B cell lymphopoiesis in
long term culture. J Immunol Methods, 1984. 67(2): p. 353-69.
144. Reya, T., et al., Stem cells, cancer, and cancer stem cells. Nature, 2001.
414(6859): p. 105-11.

327
145. Harrison, D.E., Competitive repopulation: a new assay for long-term stem cell
functional capacity. Blood, 1980. 55(1): p. 77-81.
146. Harrison, D.E., et al., Primitive hemopoietic stem cells: direct assay of most
productive populations by competitive repopulation with simple binomial,
correlation and covariance calculations. Exp Hematol, 1993. 21(2): p. 206-19.
147. Chua, H.L., et al., Lifelong Residual bone Marrow Damage in Murine Survivors
of the Hematopoietic Acute Radiation Syndrome (H-ARS): A Compilation of
Studies Comprising the Indiana University Experience. Health Phys, 2019.
116(4): p. 546-557.
148. Benveniste, P., et al., Intermediate-term hematopoietic stem cells with extended
but time-limited reconstitution potential. Cell Stem Cell, 2010. 6(1): p. 48-58.
149. Osawa, M., et al., Long-term lymphohematopoietic reconstitution by a single
CD34-low/negative hematopoietic stem cell. Science, 1996. 273(5272): p. 242-5.
150. Morita, Y., H. Ema, and H. Nakauchi, Heterogeneity and hierarchy within the
most primitive hematopoietic stem cell compartment. J Exp Med, 2010. 207(6): p.
1173-82.
151. Challen, G.A., et al., Mouse hematopoietic stem cell identification and analysis.
Cytometry A, 2009. 75(1): p. 14-24.
152. Akashi, K., et al., A clonogenic common myeloid progenitor that gives rise to all
myeloid lineages. Nature, 2000. 404(6774): p. 193-7.
153. Kondo, M., I.L. Weissman, and K. Akashi, Identification of clonogenic common
lymphoid progenitors in mouse bone marrow. Cell, 1997. 91(5): p. 661-72.

328
154. Karsunky, H., et al., Flk2+ common lymphoid progenitors possess equivalent
differentiation potential for the B and T lineages. Blood, 2008. 111(12): p. 5562-
70.
155. Kiel, M.J., et al., SLAM family receptors distinguish hematopoietic stem and
progenitor cells and reveal endothelial niches for stem cells. Cell, 2005. 121(7): p.
1109-21.
156. Oguro, H., L. Ding, and S.J. Morrison, SLAM family markers resolve
functionally distinct subpopulations of hematopoietic stem cells and multipotent
progenitors. Cell Stem Cell, 2013. 13(1): p. 102-16.
157. Adolfsson, J., et al., Upregulation of Flt3 expression within the bone marrow
Lin(-)Sca1(+)c-kit(+) stem cell compartment is accompanied by loss of self-
renewal capacity. Immunity, 2001. 15(4): p. 659-69.
158. Adolfsson, J., et al., Identification of Flt3+ lympho-myeloid stem cells lacking
erythro-megakaryocytic potential a revised road map for adult blood lineage
commitment. Cell, 2005. 121(2): p. 295-306.
159. Mackarehtschian, K., et al., Targeted disruption of the flk2/flt3 gene leads to
deficiencies in primitive hematopoietic progenitors. Immunity, 1995. 3(1): p. 147-
61.
160. Lyman, S.D. and S.E. Jacobsen, c-kit ligand and Flt3 ligand: stem/progenitor cell
factors with overlapping yet distinct activities. Blood, 1998. 91(4): p. 1101-34.
161. McKenna, H.J., et al., Mice lacking flt3 ligand have deficient hematopoiesis
affecting hematopoietic progenitor cells, dendritic cells, and natural killer cells.
Blood, 2000. 95(11): p. 3489-97.
329
162. Sitnicka, E., et al., Key role of flt3 ligand in regulation of the common lymphoid
progenitor but not in maintenance of the hematopoietic stem cell pool. Immunity,
2002. 17(4): p. 463-72.
163. Zriwil, A., et al., Direct role of FLT3 in regulation of early lymphoid progenitors.
Br J Haematol, 2018. 183(4): p. 588-600.
164. Beaudin, A.E., S.W. Boyer, and E.C. Forsberg, Flk2/Flt3 promotes both myeloid
and lymphoid development by expanding non-self-renewing multipotent
hematopoietic progenitor cells. Exp Hematol, 2014. 42(3): p. 218-229.e4.
165. Laurenti, E. and B. Gottgens, From haematopoietic stem cells to complex
differentiation landscapes. Nature, 2018. 553(7689): p. 418-426.
166. Gorgens, A., et al., Revision of the human hematopoietic tree: granulocyte
subtypes derive from distinct hematopoietic lineages. Cell Rep, 2013. 3(5): p.
1539-52.
167. Drissen, R., et al., Distinct myeloid progenitor-differentiation pathways identified
through single-cell RNA sequencing. Nat Immunol, 2016. 17(6): p. 666-676.
168. Zheng, S., et al., Molecular transitions in early progenitors during human cord
blood hematopoiesis. Mol Syst Biol, 2018. 14(3): p. e8041.
169. Pellin, D., et al., A comprehensive single cell transcriptional landscape of human
hematopoietic progenitors. Nat Commun, 2019. 10(1): p. 2395.
170. Pietras, E.M., et al., Functionally Distinct Subsets of Lineage-Biased Multipotent
Progenitors Control Blood Production in Normal and Regenerative Conditions.
Cell Stem Cell, 2015. 17(1): p. 35-46.

330
171. Sanjuan-Pla, A., et al., Platelet-biased stem cells reside at the apex of the
haematopoietic stem-cell hierarchy. Nature, 2013. 502(7470): p. 232-6.
172. Muller-Sieburg, C.E., et al., Myeloid-biased hematopoietic stem cells have
extensive self-renewal capacity but generate diminished lymphoid progeny with
impaired IL-7 responsiveness. Blood, 2004. 103(11): p. 4111-8.
173. Yamamoto, R., et al., Clonal analysis unveils self-renewing lineage-restricted
progenitors generated directly from hematopoietic stem cells. Cell, 2013. 154(5):
p. 1112-1126.
174. Velten, L., et al., Human haematopoietic stem cell lineage commitment is a
continuous process. Nat Cell Biol, 2017. 19(4): p. 271-281.
175. Buenrostro, J.D., et al., Integrated Single-Cell Analysis Maps the Continuous
Regulatory Landscape of Human Hematopoietic Differentiation. Cell, 2018.
173(6): p. 1535-1548.e16.
176. Karamitros, D., et al., Single-cell analysis reveals the continuum of human
lympho-myeloid progenitor cells. Nat Immunol, 2018. 19(1): p. 85-97.
177. Dzhagalov, I. and H. Phee, How to find your way through the thymus: a practical
guide for aspiring T cells. Cell Mol Life Sci, 2012. 69(5): p. 663-82.
178. Zlotoff, D.A. and A. Bhandoola, Hematopoietic progenitor migration to the adult
thymus. Ann N Y Acad Sci, 2011. 1217: p. 122-38.
179. Germain, R.N., T-cell development and the CD4-CD8 lineage decision. Nat Rev
Immunol, 2002. 2(5): p. 309-22.

331
180. Dembic, Z., H. von Boehmer, and M. Steinmetz, The role of T-cell receptor alpha
and beta genes in MHC-restricted antigen recognition. Immunol Today, 1986.
7(10): p. 308-11.
181. Davis, M.M. and P.J. Bjorkman, T-cell antigen receptor genes and T-cell
recognition. Nature, 1988. 334(6181): p. 395-402.
182. Krogsgaard, M. and M.M. Davis, How T cells 'see' antigen. Nat Immunol, 2005.
6(3): p. 239-45.
183. Radtke, F., H.R. MacDonald, and F. Tacchini-Cottier, Regulation of innate and
adaptive immunity by Notch. Nat Rev Immunol, 2013. 13(6): p. 427-37.
184. Baldwin, T.A., et al., The timing of TCR alpha expression critically influences T
cell development and selection. J Exp Med, 2005. 202(1): p. 111-21.
185. Singer, A., S. Adoro, and J.H. Park, Lineage fate and intense debate: myths,
models and mechanisms of CD4- versus CD8-lineage choice. Nat Rev Immunol,
2008. 8(10): p. 788-801.
186. Rezzani, R., et al., Thymus and aging: morphological, radiological, and functional
overview. Age (Dordr), 2014. 36(1): p. 313-51.
187. Fink, P.J., The biology of recent thymic emigrants. Annu Rev Immunol, 2013. 31:
p. 31-50.
188. Tanchot, C., et al., Conversion of naive T cells to a memory-like phenotype in
lymphopenic hosts is not related to a homeostatic mechanism that fills the
peripheral naive T cell pool. J Immunol, 2002. 168(10): p. 5042-6.

332
189. Bosco, N., et al., Auto-reconstitution of the T-cell compartment by radioresistant
hematopoietic cells following lethal irradiation and bone marrow transplantation.
Exp Hematol, 2010. 38(3): p. 222-232.e2.
190. Mueller, S.N., et al., Memory T cell subsets, migration patterns, and tissue
residence. Annu Rev Immunol, 2013. 31: p. 137-61.
191. Kaech, S.M., Celebrating diversity in memory T cells. J Immunol, 2014. 192(3):
p. 837-9.
192. Gray, D.H., et al., Developmental kinetics, turnover, and stimulatory capacity of
thymic epithelial cells. Blood, 2006. 108(12): p. 3777-85.
193. Seach, N., M. Hammett, and A. Chidgey, Isolation, characterization, and
reaggregate culture of thymic epithelial cells. Methods Mol Biol, 2013. 945: p.
251-72.
194. Zlotoff, D.A., et al., Delivery of progenitors to the thymus limits T-lineage
reconstitution after bone marrow transplantation. Blood, 2011. 118(7): p. 1962-
70.
195. Lai, A.Y. and M. Kondo, Identification of a bone marrow precursor of the earliest
thymocytes in adult mouse. Proc Natl Acad Sci U S A, 2007. 104(15): p. 6311-6.
196. Saran, N., et al., Multiple extrathymic precursors contribute to T-cell development
with different kinetics. Blood, 2010. 115(6): p. 1137-44.
197. Schwarz, B.A., et al., Selective thymus settling regulated by cytokine and
chemokine receptors. J Immunol, 2007. 178(4): p. 2008-17.
198. Shi, Y. and M. Zhu, Medullary thymic epithelial cells, the indispensable player in
central tolerance. Sci China Life Sci, 2013. 56(5): p. 392-8.

333
199. Aifantis, I., E. Raetz, and S. Buonamici, Molecular pathogenesis of T-cell
leukaemia and lymphoma. Nat Rev Immunol, 2008. 8(5): p. 380-90.
200. Singh, V.K. and T.M. Seed, Pharmacological management of ionizing radiation
injuries: current and prospective agents and targeted organ systems. Expert Opin
Pharmacother, 2020. 21(3): p. 317-337.
201. Chua, H.L., et al., Survival efficacy of the pegylated G-CSF Maxy-G34 and
Neulasta in a mouse model of lethal H-ARS, and residual bone marrow damage in
treated survivors. Health Physics, 2014. 106(1): p. 21-38.
202. Hankey, K.G., et al., Pegfilgrastim Improves Survival of Lethally Irradiated
Nonhuman Primates. Radiat Res, 2015. 183(6): p. 643-55.
203. Farese, A.M., et al., Filgrastim improves survival in lethally irradiated nonhuman
primates. Radiat Res, 2013. 179(1): p. 89-100.
204. Satyamitra, M., et al., Impact of Abbreviated Filgrastim Schedule on Survival and
Hematopoietic Recovery after Irradiation in Four Mouse Strains with Different
Radiosensitivity. Radiat Res, 2017. 187(6): p. 659-671.
205. Sasaki, H., K. Kodama, and M. Yamada, A review of forty-five years study of
Hiroshima and Nagasaki atomic bomb survivors. Aging. J Radiat Res, 1991. 32
Suppl: p. 310-26.
206. Bhatia, S., et al., Breast cancer and other second neoplasms after childhood
Hodgkin's disease. N Engl J Med, 1996. 334(12): p. 745-51.
207. Denkinger, M.D., et al., HSC Aging and Senescent Immune Remodeling. Trends
Immunol, 2015. 36(12): p. 815-824.

334
208. Unthank, J.L., et al., Cardiac and Renal Delayed Effects of Acute Radiation
Exposure: Organ Differences in Vasculopathy, Inflammation, Senescence and
Oxidative Balance. Radiat Res, 2019. 191(5): p. 383-397.
209. Shakhov, A.N., et al., Prevention and mitigation of acute radiation syndrome in
mice by synthetic lipopeptide agonists of Toll-like receptor 2 (TLR2). PLoS One,
2012. 7(3): p. e33044.
210. Plett, P.A., et al., The H-ARS Dose Response Relationship (DRR): Validation and
Variables. Health Phys, 2015. 109(5): p. 391-8.
211. Plett, P.A., et al., PEGylated G-CSF (BBT-015), GM-CSF (BBT-007), and IL-11
(BBT-059) analogs enhance survival and hematopoietic cell recovery in a mouse
model of the Hematopoietic Syndrome of the Acute Radiation Syndrome. Health
Physics, 2014. 106(1): p. 7-20.
212. Jones, J.W., et al., Effect of gender on biomarker response in a mouse model of
the hematopoietic acute radiation syndrome. Health Physics, 2019. 116(4): p. 484-
502.
213. Garrett, J., et al., Characterization and Etiology of Swollen Muzzles in Irradiated
Mice. Radiation Research, 2019. 191(1): p. 31-42.
214. Garrett, J., et al., Subcutaneous wounding postirradiation reduces radiation
lethality in mice. Radiat Res, 2014. 181(6): p. 578-83.
215. Dynlacht, J.R., et al., Further Characterization of the Mitigation of Radiation
Lethality by Protective Wounding. Radiation Research, 2017. 187(6): p. 732-742.

335
216. Vogel, B., et al., Determination of collagen content within picrosirius red stained
paraffin-embedded tissue sections using fluorescence microscopy. MethodsX,
2015. 2: p. 124-34.
217. Patchen, M.L., Amifostine plus granulocyte colony-stimulating factor therapy
enhances recovery from supralethal radiation exposures: preclinical experience in
animals models. Eur J Cancer, 1995. 31A Suppl 1: p. S17-21.
218. Takada, A., et al., Biphasic pattern of thymus regeneration after whole-body
irradiation. J Exp Med, 1969. 129(3): p. 445-57.
219. Huiskamp, R., J.A.G. Davids, and O. Vos, Short- and Long-Term Effects of
Whole-Body Irradiation with Fission Neutrons or X Rays on the Thymus in CBA
Mice. Radiation Research, 1983. 95(2): p. 370-381.
220. Guo, D., et al., Age and sex differences in microRNAs expression during the
process of thymus aging. Acta Biochimica et Biophysica Sinica, 2017. 49(5): p.
409-419.
221. Gui, J., et al., MCL1 increases primitive thymocyte viability in female mice and
promotes thymic expansion into adulthood. International Immunology, 2011.
23(10): p. 647-659.
222. Sempowski, G.D., et al., T cell receptor excision circle assessment of
thymopoiesis in aging mice. Mol Immunol, 2002. 38(11): p. 841-8.
223. Aspinall, R. and D. Andrew, Gender-related differences in the rates of age
associated thymic atrophy. Dev Immunol, 2001. 8(2): p. 95-106.

336
224. Xiao, J., et al., The non-canonical Wnt pathway negatively regulates dendritic cell
differentiation by inhibiting the expansion of Flt3(+) lymphocyte-primed
multipotent precursors. Cell Mol Immunol, 2016. 13(5): p. 593-604.
225. Grover, A., et al., Single-cell RNA sequencing reveals molecular and functional
platelet bias of aged haematopoietic stem cells. Nat Commun, 2016. 7: p. 11075.
226. Rossi, D.J., et al., Cell intrinsic alterations underlie hematopoietic stem cell aging.
Proceedings of the National Academy of Sciences of the United States of
America, 2005. 102(26): p. 9194-9199.
227. Rube, C.E., et al., Accumulation of DNA damage in hematopoietic stem and
progenitor cells during human aging. PLoS One, 2011. 6(3): p. e17487.
228. Kim, M., H.-B. Moon, and G.J. Spangrude, Major Age-Related Changes Of
Mouse Hematopoietic Stem/Progenitor Cells. Annals of the New York Academy
of Sciences, 2003. 996(1): p. 195-208.
229. Kamminga, L.M., et al., Impaired hematopoietic stem cell functioning after serial
transplantation and during normal aging. Stem Cells, 2005. 23(1): p. 82-92.
230. Behrens, A., et al., Impact of genomic damage and ageing on stem cell function.
Nat Cell Biol, 2014. 16(3): p. 201-7.
231. Rossi, D.J., et al., Deficiencies in DNA damage repair limit the function of
haematopoietic stem cells with age. Nature, 2007. 447(7145): p. 725-729.
232. Morrison, S.J., et al., The aging of hematopoietic stem cells. Nature Medicine,
1996. 2(9): p. 1011-1016.
233. Nijnik, A., et al., DNA repair is limiting for haematopoietic stem cells during
ageing. Nature, 2007. 447(7145): p. 686-90.

337
234. Snoeck, H.W., Aging of the hematopoietic system. Curr Opin Hematol, 2013.
20(4): p. 355-61.
235. Trowell, O.A., The sensitivity of lymphocytes to ionising radiation. J Pathol
Bacteriol, 1952. 64(4): p. 687-704.
236. Kusunoki, Y. and T. Hayashi, Long-lasting alterations of the immune system by
ionizing radiation exposure: implications for disease development among atomic
bomb survivors. Int J Radiat Biol, 2008. 84(1): p. 1-14.
237. Farese, A.M., et al., Lymphoid and Myeloid Recovery in Rhesus Macaques
Following Total Body X-Irradiation. Health Phys, 2015. 109(5): p. 414-26.
238. Li, C.R., S. Santoso, and D.D. Lo, Quantitative analysis of T cell homeostatic
proliferation. Cell Immunol, 2007. 250(1-2): p. 40-54.
239. Min, B.H., Spontaneous T Cell Proliferation: A Physiologic Process to Create and
Maintain Homeostatic Balance and Diversity of the Immune System. Front.
Immunol., 2018. 19: p. 547.
240. Kadish, J.L. and R.S. Basch, Hematopoietic thymocyte precursors. I. Assay and
kinetics of the appearance of progeny. J Exp Med, 1976. 143(5): p. 1082-99.
241. Hiesche, K.D. and L. Revesz, Effect of cortisone and X-irradiation on cellular
depletion and regeneration in the thymus of mice: experimental discrimination
between thymus lymphocyte precursors in the bone marrow and in the thymus.
Pathol Res Pract, 1979. 164(2): p. 157-66.
242. Harris, J.E. and C.E. Ford, CELLULAR TRAFFIC OF THE THYMUS:
EXPERIMENTS WITH CHROMOSOME MARKERS. EVIDENCE THAT THE
THYMUS PLAYS AN INSTRUCTIONAL PART. Nature, 1964. 201: p. 884-5.

338
243. Dukor, P., et al., Regeneration of thymus grafts. I. Histological and cytological
aspects. Transplantation, 1965. 3(5): p. 639-68.
244. Blomgren, H. and L. Revesz, Cellular composition of mouse thymus after x-ray
exposure. Exp Cell Res, 1968. 51(1): p. 92-104.
245. Coggle, J.E., The absence of late effects of radiation on the cellularity of the
mouse thymus. Int J Radiat Biol Relat Stud Phys Chem Med, 1981. 40(2): p. 229-
32.
246. Zhang, P., et al., Increased Expression of Connective Tissue Growth Factor
(CTGF) in Multiple Organs After Exposure of Non-Human Primates (NHP) to
Lethal Doses of Radiation. Health Phys, 2015. 109(5): p. 374-90.
247. Hernández, L., et al., Aging and radiation: bad companions. Aging Cell, 2015.
14(2): p. 153-161.
248. Pinchuk, L.M. and N.M. Filipov, Differential effects of age on circulating and
splenic leukocyte populations in C57BL/6 and BALB/c male mice. Immun
Ageing, 2008. 5: p. 1.
249. Youm, Y.H., et al., Prolongevity hormone FGF21 protects against immune
senescence by delaying age-related thymic involution. Proc Natl Acad Sci U S A,
2016. 113(4): p. 1026-31.
250. Kajioka, E.H., et al., Immunologic variables in male and female C57BL/6 mice
from two sources. Comp Med, 2000. 50(3): p. 288-91.
251. Pido-Lopez, J., N. Imami, and R. Aspinall, Both age and gender affect thymic
output: more recent thymic migrants in females than males as they age. Clin Exp
Immunol, 2001. 125(3): p. 409-13.

339
252. Dooley, J. and A. Liston, Molecular control over thymic involution: from
cytokines and microRNA to aging and adipose tissue. Eur J Immunol, 2012.
42(5): p. 1073-9.
253. Noguchi, M., et al., Interleukin-2 receptor gamma chain mutation results in X-
linked severe combined immunodeficiency in humans. Cell, 1993. 73(1): p. 147-
57.
254. Gui, J., et al., Thymus Size and Age-related Thymic Involution: Early
Programming, Sexual Dimorphism, Progenitors and Stroma. Aging Dis, 2012.
3(3): p. 280-90.
255. Libert, C., L. Dejager, and I. Pinheiro, The X chromosome in immune functions:
when a chromosome makes the difference. Nat Rev Immunol, 2010. 10(8): p.
594-604.
256. Pogribny, I., et al., Fractionated low-dose radiation exposure leads to
accumulation of DNA damage and profound alterations in DNA and histone
methylation in the murine thymus. Mol Cancer Res, 2005. 3(10): p. 553-61.
257. Prasanna, P.G., et al., Radioprotectors and Radiomitigators for Improving
Radiation Therapy: The Small Business Innovation Research (SBIR) Gateway for
Accelerating Clinical Translation. Radiat Res, 2015. 184(3): p. 235-48.
258. Singh, V.K., et al., Medical countermeasures for unwanted CBRN exposures: part
II radiological and nuclear threats with review of recent countermeasure patents.
Expert Opin Ther Pat, 2016. 26(12): p. 1399-1408.
259. Glover, D., et al., Clinical trials of WR-2721 prior to alkylating agent
chemotherapy and radiotherapy. Pharmacol Ther, 1988. 39(1-3): p. 3-7.

340
260. Hoggatt, J. and L.M. Pelus, Eicosanoid regulation of hematopoiesis and
hematopoietic stem and progenitor trafficking. Leukemia, 2010. 24(12): p. 1993-
2002.
261. Lisowska, B., D. Kosson, and K. Domaracka, Lights and shadows of NSAIDs in
bone healing: the role of prostaglandins in bone metabolism. Drug Des Devel
Ther, 2018. 12: p. 1753-1758.
262. Yang, T. and Y. Du, Distinct roles of central and peripheral prostaglandin E2 and
EP subtypes in blood pressure regulation. Am J Hypertens, 2012. 25(10): p. 1042-
9.
263. Martinez-Colon, G.J. and B.B. Moore, Prostaglandin E2 as a Regulator of
Immunity to Pathogens. Pharmacol Ther, 2018. 185: p. 135-146.
264. Kawahara, K., et al., Prostaglandin E2-induced inflammation: Relevance of
prostaglandin E receptors. Biochim Biophys Acta, 2015. 1851(4): p. 414-21.
265. Hanson, W.R., Radiation protection of murine intestine by WR-2721, 16,16-
dimethyl prostaglandin E2, and the combination of both agents. Radiat Res, 1987.
111(2): p. 361-73.
266. Dutta, S. and P. Sengupta, Men and mice: Relating their ages. Life Sci, 2016. 152:
p. 244-8.
267. Chua, H.L., et al., Survival efficacy of the PEGylated G-CSFs Maxy-G34 and
neulasta in a mouse model of lethal H-ARS, and residual bone marrow damage in
treated survivors. Health Phys, 2014. 106(1): p. 21-38.

341
268. Singh, P., et al., Blockade of prostaglandin E2 signaling through EP1 and EP3
receptors attenuates Flt3L-dependent dendritic cell development from
hematopoietic progenitor cells. Blood, 2012. 119(7): p. 1671-82.
269. Singh, P., et al., Survivin Is Required for Mouse and Human Bone Marrow
Mesenchymal Stromal Cell Function. Stem Cells, 2018. 36(1): p. 123-129.
270. Singh, V.K. and V.S. Yadav, Role of cytokines and growth factors in
radioprotection. Exp Mol Pathol, 2005. 78(2): p. 156-69.
271. Mirantes, C., E. Passegué, and E.M. Pietras, Pro-inflammatory cytokines:
emerging players regulating HSC function in normal and diseased hematopoiesis.
Exp Cell Res, 2014. 329(2): p. 248-54.
272. Metcalf, D., Hematopoietic cytokines. Blood, 2008. 111(2): p. 485-91.
273. Feher, I. and J. Gidali, Prostaglandin E2 as stimulator of haemopoietic stem cell
proliferation. Nature, 1974. 247(5442): p. 550-1.
274. Gidali, J. and I. Feher, The effect of E type prostaglandins on the proliferation of
haemopoietic stem cells in vivo. Cell Tissue Kinet, 1977. 10(4): p. 365-73.
275. Pelus, L.M., Modulation of myelopoiesis by prostaglandin E2: Demonstration of a
novel mechanism of action in vivo. Immunologic Research, 1989. 8(3): p. 176-
184.
276. Porter, R.L., et al., Prostaglandin E2 increases hematopoietic stem cell survival
and accelerates hematopoietic recovery after radiation injury. Stem Cells, 2013.
31(2): p. 372-83.

342
277. Akkinapally, S., et al., Prostaglandin E1 for maintaining ductal patency in
neonates with ductal-dependent cardiac lesions. Cochrane Database Syst Rev,
2018. 2: p. Cd011417.
278. Hagedorn, E.J., et al., Getting more for your marrow: boosting hematopoietic
stem cell numbers with PGE2. Exp Cell Res, 2014. 329(2): p. 220-6.
279. Yokoyama, U., et al., The prostanoid EP4 receptor and its signaling pathway.
Pharmacol Rev, 2013. 65(3): p. 1010-52.
280. O'Callaghan, G. and A. Houston, Prostaglandin E2 and the EP receptors in
malignancy: possible therapeutic targets? Br J Pharmacol, 2015. 172(22): p. 5239-
50.
281. Ikushima, Y.M., et al., Prostaglandin E(2) regulates murine hematopoietic
stem/progenitor cells directly via EP4 receptor and indirectly through
mesenchymal progenitor cells. Blood, 2013. 121(11): p. 1995-2007.
282. Smith, J.N. and L.M. Calvi, Regulatory Interactions in the Bone Marrow
Microenvironment. IBMS Bonekey, 2011. 8(2): p. 96-111.
283. Sawant, K.V., et al., Chemokine CXCL1 mediated neutrophil recruitment: Role of
glycosaminoglycan interactions. Sci Rep, 2016. 6: p. 33123.
284. King, A.G., et al., Identification of unique truncated KC/GRO beta chemokines
with potent hematopoietic and anti-infective activities. J Immunol, 2000. 164(7):
p. 3774-82.
285. Slordal, L., et al., Radioprotection by murine and human tumor-necrosis factor:
dose-dependent effects on hematopoiesis in the mouse. Eur J Haematol, 1989.
43(5): p. 428-34.

343
286. Pruijt, J.F., et al., Leukemia inhibitory factor induces in vivo expansion of bone
marrow progenitor cells that accelerate hematopoietic reconstitution but do not
enhance radioprotection in lethally irradiated mice. Stem Cells, 1997. 15(1): p.
50-5.
287. Gomez-Roman, N., RBIO-01. RADIATION RESPONSES OF 2D AND 3D
GLIOBLASTOMA CELLS: A NOVEL, 3D-SPECIFIC RADIOPROTECTIVE
ROLE OF VEGF/Akt SIGNALING THROUGH FUNCTIONAL ACTIVATION
OF NHEJ. Neuro-Oncology, 2016. 18(suppl_6): p. vi172-vi172.
288. Basile, L.A., et al., Multilineage hematopoietic recovery with concomitant
antitumor effects using low dose Interleukin-12 in myelosuppressed tumor-
bearing mice. J Transl Med, 2008. 6: p. 26.
289. Chen, T., et al., IL-12 facilitates both the recovery of endogenous hematopoiesis
and the engraftment of stem cells after ionizing radiation. Exp Hematol, 2007.
35(2): p. 203-13.
290. Legue, F., et al., IL-6 a key cytokine in in vitro and in vivo response of Sertoli
cells to external gamma irradiation. Cytokine, 2001. 16(6): p. 232-8.
291. Neta, R., et al., Role of interleukin 6 (IL-6) in protection from lethal irradiation
and in endocrine responses to IL-1 and tumor necrosis factor. J Exp Med, 1992.
175(3): p. 689-94.
292. Keller, J.R., J.M. Gooya, and F.W. Ruscetti, Direct synergistic effects of leukemia
inhibitory factor on hematopoietic progenitor cell growth: comparison with other
hematopoietins that use the gp130 receptor subunit. Blood, 1996. 88(3): p. 863-9.

344
293. Sonoda, Y., Interleukin-4--a dual regulatory factor in hematopoiesis. Leuk
Lymphoma, 1994. 14(3-4): p. 231-40.
294. Fischer, K.D. and D.K. Agrawal, Hematopoietic stem and progenitor cells in
inflammation and allergy. Front Immunol, 2013. 4: p. 428.
295. Wang, J., et al., Enhanced mobilization of hematopoietic progenitor cells by
mouse MIP-2 and granulocyte colony-stimulating factor in mice. J Leukoc Biol,
1997. 62(4): p. 503-9.
296. Broxmeyer, H.E., et al., Synergistic inhibition in vivo of bone marrow myeloid
progenitors by myelosuppressive chemokines and chemokine-accelerated
recovery of progenitors after treatment of mice with Ara-C. Exp Hematol, 2006.
34(8): p. 1069-77.
297. Chung, S.W., et al., The comparative effects of cyclosporin A and 16,16 dimethyl
prostaglandin E2 on the allogeneic induction of monocyte/macrophage
procoagulant activity and the cytokines macrophage procoagulant inducing factor
and interleukin-2. Immunology, 1991. 74(4): p. 670-6.
298. Bottero, V., S. Withoff, and I.M. Verma, NF-kappaB and the regulation of
hematopoiesis. Cell Death Differ, 2006. 13(5): p. 785-97.
299. Dikov, M.M., et al., Vascular endothelial growth factor effects on nuclear factor-
kappaB activation in hematopoietic progenitor cells. Cancer Res, 2001. 61(5): p.
2015-21.
300. Maca, R.D., The effects of prostaglandins on the proliferation of cultured human
T lymphocytes. Immunopharmacology, 1983. 6(4): p. 267-77.

345
301. Sreeramkumar, V., M. Fresno, and N. Cuesta, Prostaglandin E2 and T cells:
friends or foes? Immunol Cell Biol, 2012. 90(6): p. 579-86.
302. Mary, D., et al., Regulation of interleukin 2 synthesis by cAMP in human T cells.
J Immunol, 1987. 139(4): p. 1179-84.
303. Mohtashami, M., et al., Induction of T-cell development by Delta-like 4-
expressing fibroblasts. Int Immunol, 2013. 25(10): p. 601-11.
304. Schmitt, T.M. and J.C. Zuniga-Pflucker, Induction of T cell development from
hematopoietic progenitor cells by delta-like-1 in vitro. Immunity, 2002. 17(6): p.
749-56.
305. Zuniga-Pflucker, J.C., T-cell development made simple. Nat Rev Immunol, 2004.
4(1): p. 67-72.
306. Plett, P.A., S.M. Frankovitz, and C.M. Orschell-Traycoff, In vivo trafficking, cell
cycle activity, and engraftment potential of phenotypically defined primitive
hematopoietic cells after transplantation into irradiated or nonirradiated recipients.
Blood, 2002. 100(10): p. 3545-52.
307. Plett, P.A., S.M. Frankovitz, and C.M. Orschell, Distribution of marrow
repopulating cells between bone marrow and spleen early after transplantation.
Blood, 2003. 102(6): p. 2285-91.
308. Xing, Y. and K.A. Hogquist, Isolation, identification, and purification of murine
thymic epithelial cells. J Vis Exp, 2014(90): p. e51780.
309. Gazit, R., et al., Fgd5 identifies hematopoietic stem cells in the murine bone
marrow. J Exp Med, 2014. 211(7): p. 1315-31.

346
310. Thomson, J.F., et al., Life shortening in mice exposed to fission neutrons and
gamma rays I. Single and short-term fractionated exposures. Radiat Res, 1981.
86(3): p. 559-72.
311. Upton, A.C., M.L. Randolph, and J.W. Conklin, Late effects of fast neutrons and
gamma rays in mice as influenced by the dose rate of irradiation: life shortening.
Radiat Res, 1967. 32(3): p. 493-509.
312. Hoggatt, J., et al., Bleeding the laboratory mouse: Not all methods are equal. Exp
Hematol, 2016. 44(2): p. 132-137.e1.
313. Sckisel, G.D., et al., Differential phenotypes of memory CD4 and CD8 T cells in
the spleen and peripheral tissues following immunostimulatory therapy. J
Immunother Cancer, 2017. 5: p. 33.
314. den Braber, I., et al., Maintenance of peripheral naive T cells is sustained by
thymus output in mice but not humans. Immunity, 2012. 36(2): p. 288-97.
315. Yanes, R.E., et al., Lymphocyte generation and population homeostasis
throughout life. Semin Hematol, 2017. 54(1): p. 33-38.
316. Doulatov, S., et al., Hematopoiesis: a human perspective. Cell Stem Cell, 2012.
10(2): p. 120-36.
317. Hoggatt, J., et al., Prostaglandin E2 enhances long-term repopulation but does not
permanently alter inherent stem cell competitiveness. Blood, 2013. 122(17): p.
2997-3000.
318. Robertson, P., et al., CXCR4 and CCR5 mediate homing of primitive bone
marrow-derived hematopoietic cells to the postnatal thymus. Exp Hematol, 2006.
34(3): p. 308-19.
347
319. Rivina, L., M.J. Davoren, and R.H. Schiestl, Mouse models for radiation-induced
cancers. Mutagenesis, 2016. 31(5): p. 491-509.
320. Morse, H.C., 3rd, et al., Bethesda proposals for classification of lymphoid
neoplasms in mice. Blood, 2002. 100(1): p. 246-58.
321. Utsuyama, M. and K. Hirokawa, Radiation-induced-thymic lymphoma occurs in
young, but not in old mice. Exp Mol Pathol, 2003. 74(3): p. 319-25.
322. Ward, J.M., Lymphomas and leukemias in mice. Exp Toxicol Pathol, 2006. 57(5-
6): p. 377-81.
323. Breyer, R.M., et al., Prostanoid receptors: subtypes and signaling. Annu Rev
Pharmacol Toxicol, 2001. 41: p. 661-90.
324. Anderson, G. and Y. Takahama, Thymic epithelial cells: working class heroes for
T cell development and repertoire selection. Trends Immunol, 2012. 33(6): p.
256-63.
325. Nitta, T. and H. Suzuki, Thymic stromal cell subsets for T cell development. Cell
Mol Life Sci, 2016. 73(5): p. 1021-37.
326. Majumdar, S. and D. Nandi, Thymic Atrophy: Experimental Studies and
Therapeutic Interventions. Scand J Immunol, 2018. 87(1): p. 4-14.
327. Pica, F., et al., Prostaglandin E2 induces apoptosis in resting immature and mature
human lymphocytes: a c-Myc-dependent and Bcl-2-independent associated
pathway. J Pharmacol Exp Ther, 1996. 277(3): p. 1793-800.
328. Konya, V., et al., E-type prostanoid receptor 4 (EP4) in disease and therapy.
Pharmacol Ther, 2013. 138(3): p. 485-502.

348
329. Rossi, D.J., D. Bryder, and I.L. Weissman, Hematopoietic stem cell aging:
mechanism and consequence. Exp Gerontol, 2007. 42(5): p. 385-90.
330. Mastino, A., et al., Correlation between induction of lymphocyte apoptosis and
prostaglandin E2 production by macrophages infected with HIV. Cell Immunol,
1993. 152(1): p. 120-30.
331. Chouaib, S., et al., Prostaglandin E2 acts at two distinct pathways of T
lymphocyte activation: inhibition of interleukin 2 production and down-regulation
of transferrin receptor expression. J Immunol, 1985. 135(2): p. 1172-9.
332. Tsapogas, P., et al., The Cytokine Flt3-Ligand in Normal and Malignant
Hematopoiesis. Int J Mol Sci, 2017. 18(6).
333. Sitnicka, E., et al., Critical role of FLT3 ligand in IL-7 receptor independent T
lymphopoiesis and regulation of lymphoid-primed multipotent progenitors.
Blood, 2007. 110(8): p. 2955-64.
334. Wang, Q., et al., Stage-specific roles for Zmiz1 in Notch-dependent steps of early
T-cell development. Blood, 2018. 132(12): p. 1279-1292.
335. Zaldumbide, A., et al., The role of the Ets2 transcription factor in the
proliferation, maturation, and survival of mouse thymocytes. J Immunol, 2002.
169(9): p. 4873-81.
336. Ceredig, R. and A.G. Rolink, The key role of IL-7 in lymphopoiesis. Semin
Immunol, 2012. 24(3): p. 159-64.
337. Ma, A., R. Koka, and P. Burkett, Diverse functions of IL-2, IL-15, and IL-7 in
lymphoid homeostasis. Annu Rev Immunol, 2006. 24: p. 657-79.

349
338. Kohn, L.A., et al., Human lymphoid development in the absence of common
gamma-chain receptor signaling. J Immunol, 2014. 192(11): p. 5050-8.
339. Moroni, M., et al., Accelerated hematopoietic syndrome after radiation doses
bridging hematopoietic (H-ARS) and gastrointestinal (GI-ARS) acute radiation
syndrome: early hematological changes and systemic inflammatory response
syndrome in minipig. Int J Radiat Biol, 2014. 90(5): p. 363-72.
340. Hauer-Jensen, M., Toward development of interleukin-11 as a medical
countermeasure for use in radiological/nuclear emergencies. Dig Dis Sci, 2014.
59(7): p. 1349-51.
341. Yang, L., et al., The protective role of interleukin-11 against neutron radiation
injury in mouse intestines via MEK/ERK and PI3K/Akt dependent pathways. Dig
Dis Sci, 2014. 59(7): p. 1406-14.
342. Demetri, G.D., Targeted approaches for the treatment of thrombocytopenia.
Oncologist, 2001. 6 Suppl 5: p. 15-23.
343. Maier, R., V. Ganu, and M. Lotz, Interleukin-11, an inducible cytokine in human
articular chondrocytes and synoviocytes, stimulates the production of the tissue
inhibitor of metalloproteinases. J Biol Chem, 1993. 268(29): p. 21527-32.
344. Kaye, J.A., The clinical development of recombinant human interleukin 11
(NEUMEGA rhIL-11 growth factor). Stem Cells, 1996. 14 Suppl 1: p. 256-60.
345. Lee, H.T., et al., Interleukin-11 protects against renal ischemia and reperfusion
injury. Am J Physiol Renal Physiol, 2012. 303(8): p. F1216-24.

350
346. Zhao, H., et al., Effects of recombinant human granulocyte colony-stimulating
factor on central and peripheral T lymphocyte reconstitution after sublethal
irradiation in mice. J Radiat Res, 2013. 54(1): p. 83-91.
347. Moxham, V.F., et al., Homeostatic proliferation of lymphocytes results in
augmented memory-like function and accelerated allograft rejection. J Immunol,
2008. 180(6): p. 3910-8.
348. Singh, V.K., V.L. Newman, and T.M. Seed, Colony-stimulating factors for the
treatment of the hematopoietic component of the acute radiation syndrome (H-
ARS): a review. Cytokine, 2015. 71(1): p. 22-37.
349. MacVittie, T.J., et al., Therapeutic use of recombinant human G-CSF (rhG-CSF)
in a canine model of sublethal and lethal whole-body irradiation. Int J Radiat Biol,
1990. 57(4): p. 723-36.
350. Masood, N., et al., Splenic rupture, secondary to G-CSF use for chemotherapy
induced neutropenia: a case report and review of literature. Cases J, 2008. 1(1): p.
418.
351. van Raam, B.J., et al., Granulocyte colony-stimulating factor delays neutrophil
apoptosis by inhibition of calpains upstream of caspase-3. Blood, 2008. 112(5): p.
2046-54.
352. Klein, J.B., et al., Granulocyte-macrophage colony-stimulating factor delays
neutrophil constitutive apoptosis through phosphoinositide 3-kinase and
extracellular signal-regulated kinase pathways. J Immunol, 2000. 164(8): p. 4286-
91.

351
353. Kobayashi, S.D., et al., Spontaneous neutrophil apoptosis and regulation of cell
survival by granulocyte macrophage-colony stimulating factor. J Leukoc Biol,
2005. 78(6): p. 1408-18.
354. Orazi, A., et al., Interleukin-11 prevents apoptosis and accelerates recovery of
small intestinal mucosa in mice treated with combined chemotherapy and
radiation. Lab Invest, 1996. 75(1): p. 33-42.
355. Booth, C. and C.S. Potten, Effects of IL-11 on the growth of intestinal epithelial
cells in vitro. Cell Prolif, 1995. 28(11): p. 581-94.
356. Li, C., et al., Granulocyte colony-stimulating factor exacerbates hematopoietic
stem cell injury after irradiation. Cell Biosci, 2015. 5: p. 65.
357. Botnick, L.E., E.C. Hannon, and S. Hellman, A long lasting proliferative defect in
the hematopoietic stem cell compartment following cytotoxic agents. Int J Radiat
Oncol Biol Phys, 1979. 5(9): p. 1621-5.
358. Hellman, S. and L.E. Botnick, Stem cell depletion: an explanation of the late
effects of cytotoxins. Int J Radiat Oncol Biol Phys, 1977. 2(1-2): p. 181-4.
359. Simonnet, A.J., et al., Phenotypic and functional changes induced in
hematopoietic stem/progenitor cells after gamma-ray radiation exposure. Stem
Cells, 2009. 27(6): p. 1400-9.
360. Testa, N.G., J.H. Hendry, and G. Molineux, Long-term bone marrow damage in
experimental systems and in patients after radiation or chemotherapy. Anticancer
Res, 1985. 5(1): p. 101-10.

352
361. Mauch, P., et al., Hematopoietic stem cell compartment: acute and late effects of
radiation therapy and chemotherapy. Int J Radiat Oncol Biol Phys, 1995. 31(5): p.
1319-39.
362. Mauch, P., M. Rosenblatt, and S. Hellman, Permanent loss in stem cell self
renewal capacity following stress to the marrow. Blood, 1988. 72(4): p. 1193-6.
363. Wang, J., et al., A differentiation checkpoint limits hematopoietic stem cell self-
renewal in response to DNA damage. Cell, 2012. 148(5): p. 1001-14.
364. d'Adda di Fagagna, F., et al., A DNA damage checkpoint response in telomere-
initiated senescence. Nature, 2003. 426(6963): p. 194-8.
365. Kadish, J.L. and R.S. Basch, Thymic regeneration after lethal irradiation evidence
for an intra-thymic radioresistant T cell precursor. J Immunol, 1975. 114(1 Pt 2):
p. 452-8.
366. Tanikawa, S., et al., Effects of recombinant human granulocyte colony-
stimulating factor on the hematologic recovery and survival of irradiated mice.
Blood, 1990. 76(3): p. 445-9.
367. Goldman, S.J., Preclinical biology of interleukin 11: a multifunctional
hematopoietic cytokine with potent thrombopoietic activity. Stem Cells, 1995.
13(5): p. 462-71.
368. Franzke, A., et al., G-CSF as immune regulator in T cells expressing the G-CSF
receptor: implications for transplantation and autoimmune diseases. Blood, 2003.
102(2): p. 734-9.

353
369. Morikawa, K., et al., Characterization of granulocyte colony-stimulating factor
receptor expressed on human lymphocytes. Br J Haematol, 2002. 118(1): p. 296-
304.
370. Prevost, J.M., et al., Granulocyte-macrophage colony-stimulating factor (GM-
CSF) and inflammatory stimuli up-regulate secretion of the soluble GM-CSF
receptor in human monocytes: evidence for ectodomain shedding of the cell
surface GM-CSF receptor alpha subunit. J Immunol, 2002. 169(10): p. 5679-88.
371. Akdis, M., et al., Interleukins (from IL-1 to IL-38), interferons, transforming
growth factor beta, and TNF-alpha: Receptors, functions, and roles in diseases. J
Allergy Clin Immunol, 2016. 138(4): p. 984-1010.
372. Bernstein, K.E., et al., A modern understanding of the traditional and
nontraditional biological functions of angiotensin-converting enzyme. Pharmacol
Rev, 2013. 65(1): p. 1-46.
373. van Brummelen, P., et al., Captopril-associated agranulocytosis. Lancet, 1980.
1(8160): p. 150.
374. Strair, R.K., et al., Reversible captopril-associated bone marrow aplasia. Can Med
Assoc J, 1985. 132(4): p. 320-2.
375. Safar, M.E., Fatal bone-marrow suppression associated with captopril. Br Med J
(Clin Res Ed), 1981. 283(6294): p. 791-2.
376. Kozak, K.R., et al., Metabolism of prostaglandin glycerol esters and prostaglandin
ethanolamides in vitro and in vivo. J Biol Chem, 2001. 276(40): p. 36993-8.

354
377. Stone, C.D., et al., Prostaglandin E2 inhibits in vitro and in vivo lymphocyte
responses in allogeneic transplantation. Ann Thorac Surg, 1990. 49(6): p. 927-30;
discussion 931.
378. Hospers, G.A., E.A. Eisenhauer, and E.G. de Vries, The sulfhydryl containing
compounds WR-2721 and glutathione as radio- and chemoprotective agents. A
review, indications for use and prospects. Br J Cancer, 1999. 80(5-6): p. 629-38.
379. Hanson, W.R. and E.J. Ainsworth, 16,16-Dimethyl prostaglandin E2 induces
radioprotection in murine intestinal and hematopoietic stem cells. Radiat Res,
1985. 103(2): p. 196-203.
380. Miller, T.A., et al., Nonprotein sulfhydryl compounds in canine gastric mucosa:
effects of PGE2 and ethanol. Am J Physiol, 1985. 249(1 Pt 1): p. G137-44.
381. Szabo, S., J.S. Trier, and P.W. Frankel, Sulfhydryl compounds may mediate
gastric cytoprotection. Science, 1981. 214(4517): p. 200-2.
382. Williams, C.S., M. Mann, and R.N. DuBois, The role of cyclooxygenases in
inflammation, cancer, and development. Oncogene, 1999. 18(55): p. 7908-16.
383. Ke, J., et al., Prostaglandin E2 (PGE2) promotes proliferation and invasion by
enhancing SUMO-1 activity via EP4 receptor in endometrial cancer. Tumour
Biol, 2016. 37(9): p. 12203-12211.
384. O'Flaherty, J.T., et al., Fatty acid metabolites in rapidly proliferating breast
cancer. PLoS One, 2013. 8(5): p. e63076.
385. Yan, M., et al., 15-Hydroxyprostaglandin dehydrogenase, a COX-2 oncogene
antagonist, is a TGF-beta-induced suppressor of human gastrointestinal cancers.
Proc Natl Acad Sci U S A, 2004. 101(50): p. 17468-73.

355
386. Xin, X., et al., Targeting COX-2 and EP4 to control tumor growth, angiogenesis,
lymphangiogenesis and metastasis to the lungs and lymph nodes in a breast cancer
model. Lab Invest, 2012. 92(8): p. 1115-28.
387. Steinbach, G., et al., The effect of celecoxib, a cyclooxygenase-2 inhibitor, in
familial adenomatous polyposis. N Engl J Med, 2000. 342(26): p. 1946-52.
388. Wu, Q., et al., Long-term aspirin use for cancer primary prevention: A protocol
for updated systematic review and subgroup meta-analysis of randomized clinical
trials. Medicine (Baltimore), 2019. 98(39): p. e17382.
389. Wilson, J.W. and C.S. Potten, The effect of exogenous prostaglandin
administration on tumor size and yield in Min/+ mice. Cancer Res, 2000. 60(16):
p. 4645-53.
390. Nakanishi, M. and D.W. Rosenberg, Multifaceted roles of PGE2 in inflammation
and cancer. Semin Immunopathol, 2013. 35(2): p. 123-37.

CURRICULUM VITAE
Tong Wu
Education
2005 B.S. Clinical Medicine
Tianjin Medical University
Tianjin, China
2008 M.S. Hematology/Oncology
Peking Union Medical College
Tianjin, China
2020 Ph.D. Anatomy, Cell Biology & Physiology
Indiana University
Indianapolis, IN
Professional Experience
2008-2010 Residency/Staff; Jiangxi Provincial Cancer Institute & Cancer Hospital
• Performed primary patient care under the supervision of
attending physicians, attended clinical rounds and provided
patient education.
2010-2013 Attending Physician; Jiangxi Provincial Cancer Institute & Cancer
Hospital
• Appropriately diagnosed and treated hematologic diseases and
other solid tumors.
• Involved in clinical trials in new therapeutics to complications of
chemotherapy/radiotherapy with patients suffered from
hematological or solid malignancies.

2014-
present
Research Assistant; Indiana University School of Medicine
• Participated in projects involving in developing and evaluating
new medical countermeasures against lethal radiation in a well-
defined mouse model.
Honors and Certificates
2001-2004 Tianjin Medical University Scholarship; Tianjin Medical University
2014 IBMG Program Fellowship; Indiana University School of Medicine
2015 Achievement Multiparameter Flow; Flocyte Associates Training
Program
2015 Scholars In Training; Radiation Research Society
2017 Abstract Achievement Award; American Society of Hematology
2017 Graduate Student Travel Grants; Indiana University School of Medicine
2017-2019 Excellence in Reviewing; Spandidos Publications
2019 Jumpstart to Teaching; IUPUI
Publications
[1] Wu T, Plett PA, Chua HL, Jacobsen M, Sandusky GE, MacVittie TJ, Orschell CM.
Immune reconstitution and thymic involution in the acute and delayed hematopoietic
radiation syndromes. Health Phys. Submitted.
[2] Wu T, Plett PA, Chua HL, Pelus LM, and Orschell CM. Prostaglandin E2 promotes
recovery of thymus in survivors of the hematopoietic acute radiation syndrome (H-ARS).
Blood.2017; 130:1008 (poster).

[3] Koh B, Hufford MM, Pham D, Olson MR, Wu T, Jabeen R, Sun X, Kaplan MH. The
ETS family transcription factors Etv5 and PU.1 function in parallel to promote Th9 cell
development. J Immunol. 2016;197:2465-72. PMID: 27496971.
[4] Plett PA, Sampson CH, Chua HL, Jackson W, Vemula S, Sellamuthu R, Fisher A,
Feng H, Wu T, MacVittie TJ, Orschell CM. The H-ARS Dose Response Relationship
(DRR): validation and variables. Health Phys. 2015;109:391-8. PMID: 26425900.
[5] Wu T, Vemula S, Plett PA, Chua HL, Sampson CH, Fisher A, Feng H, Sellamuthu R,
Cox GN, and Orschell CM. Pegylated hematopoietic growth factors and effects on long-
term immune reconstitution in a murine model of residual bone marrow damage
(RBMD). 61st Annual Meeting of the Radiation Research Society, September 19-22,
2015 (poster).
[6] Shuang YR, Li YP, Wu T, Peng ZQ, Yang GM, Huang Y, Yi K, Chen JX, Wu YH.
(2013). Clinical manual of lymphoma. Nanchang: Jiangxi Science and Technology
Publishing House.
[7] Wu T, Li ZJ, Qiu LG. Complications of chronic lymphocytic leukemia: analysis of
203 cases in China. Leuk Res. 2010; 34: e64-5. PMID: 19699521.
[8] Wu T, Li ZJ, Wang YF, Qiu LG. Applicability of different clinical staging systems in
chronic lymphocytic leukemia for Chinese patients. Journal of Leukemia & Lymphoma.
2010; 3:136-9.
[9] Wu T, Li ZJ, Qiu LG. Advancement about hematological autoimmune complications
in chronic lymphocytic leukemia (Review). Journal of Leukemia & Lymphoma. 2010;
19: 246-9.

[10] Wu T, Shuang YR. Recent advances in prognosis and treatment of peripheral T-Cell
lymphoma, not otherwise specified (Review). The Practical Journal of Cancer. 2010; 25:
100-3.
[11] Wu T, Li ZJ, Wang YF, Zhao YZ, Qi JY, Qian LS, Qiu LG. Prognostic factor
analysis in 203 patients with chronic lymphocytic leukemia. Zhonghua Xue Ye Xue Za
Zhi. 2009; 30:435-9. PMID: 19954591.
[12] Wu T, Li ZJ, Wang YF, Zhao YZ, Qian LS, Qiu LG. Autoimmune cytopenia as a
complication in patients with chronic lymphocytic leukemia: report of 7 cases and
literature review. Journal of Clinical Hematology. 2009; 5: 491-2.
[13] Li ZJ, Wu T, Qiu LG, Li YN. Clinical analysis and diagnosis of mantle cell
lymphoma presented as lympho-proliferative disease. Journal of Clinical Hematology.
2009; 5: 225-8.
[14] Wu T, Li ZJ, Qiu LG. Research progress in chronic lymphocytic leukemia and its
secondary cancers (Review). Journal of Clinical Hematology. 2009; 22:629-31.
[15] Wu T, Wang YF, Qiu LG. Pathophysiological research advances in immunologic
lung injury after allogeneic stem cell transplantation (Review). International Journal of
Blood Transfusion and Hematology. 2008; 31: 343-6.
[16] Wu T, Wang YF, Qiu LG. Research progress in diagnosis and treatment of
immunologic lung injury after allogeneic stem cell transplantation (Review). Chinese
Journal of Organ Transplantation. 2008; 5:317-9.
[17] Li ZJ, Qiu LG, Wu T, Wang YF, Zou DH, Zhao YZ, Qi JY, Yang RC, Qian LS. The
clinical and laboratory features of 263 cases of chronic lymphocytic leukemia. Zhonghua
Xue Ye Xue Za Zhi. 2008; 29:300-3. PMID: 18844065.

[18] Wang YF, Deng SH, Wu T, Xu Y, Zou DH, Wang Y, Zhao YZ, Qiu LG. Outcome
of bortezomib plus chemotherapy with or without stem cell transplantation for treatment
of multiple myeloma. Zhonghua Xue Ye Xue Za Zhi. 2008; 29:397-400. PMID:
19031743.
[19] Hao M, Li SD, Wu T, Meng HX, Li CH, Xu Y, Qiu LG. Influence of mesenchymal
stem cells on UCB CD34+ cell expansion and characteristics. Zhongguo Shi Yan Xue Ye
Xue Za Zhi. 2008; 16:1403-7. PMID: 19099653.