NIH Public Access - IUPUI ScholarWorks
32
Gene Expression within the Extended Amygdala of 5 Pairs of Rat Lines Selectively Bred for High or Low Ethanol Consumption William J. McBride a,* , Mark W. Kimpel a , Jeanette N. McClintick b , Zheng-Ming Ding a , Petri Hyytia c , Giancarlo Colombo d , Tiebing Liang e , Howard J. Edenberg b , Lawrence Lumeng e , and Richard L. Bell a a Institute of Psychiatric Research, Department of Psychiatry, Indiana University School of Medicine, Indianapolis, IN 46202-4887 b Department of Biochemistry & Molecular Biology and Center for Medical Genomics, Indiana University School of Medicine, Indianapolis, IN 46202-4887 c Institute of Biomedicine/Pharmacology, POB 63, 00014 University of Helsinki, Finland d Institute for Neuroscience, National Research Council of Italy, Section of Cagliari, S.S. 554, km. 4,500, I-09042, Monserrato (CA), Italy e Department of Medicine, Indiana University School of Medicine, Indianapolis, IN 46202 Abstract The objectives of this study were to determine innate differences in gene expression in 2 regions of the extended amygdala between 5 different pairs of lines of male rats selectively bred for high or low ethanol consumption: a) alcohol-preferring (P) vs. alcohol-non-preferring (NP) rats, b) high-alcohol-drinking (HAD) vs. low-alcohol-drinking (LAD) rats (replicate line-pairs 1 and 2), c) ALKO alcohol (AA) vs. nonalcohol (ANA) rats, and d) Sardinian alcohol-preferring (sP) vs. Sardinian alcohol-nonpreferring (sNP) rats, and then to determine if these differences are common across the line-pairs. Microarray analysis revealed up to 1,772 unique named genes in the nucleus accumbens shell (AcbSh) and 494 unique named genes in the central nucleus of the amygdala (CeA) that significantly differed [False Discovery Rate (FDR) = 0.10; fold-change at least 1.2] in expression between the individual line-pairs. Analysis using Gene Ontology (GO) and Ingenuity Pathways information indicated significant categories and networks in common for up to 3 or 4 line-pairs, but not for all 5 line-pairs. However, there were almost no individual genes in common within these categories and networks. ANOVAs of the combined data for the 5 line-pairs indicated 1,014 and 731 significant (p < 0.01) differences in expression of named genes in the AcbSh and CeA, respectively. There were 4–6 individual named genes that significantly differed across up to 3 line-pairs in both regions; only 1 gene (Gsta4 in the CeA) differed in as many as 4 line-pairs. Overall, the findings suggest that a) some biological categories or networks (e.g., cell-to-cell signaling, cellular stress response, cellular organization, etc.) may be in common for subsets of line-pairs within either the AcbSh or CeA, and b) regulation of different genes and/or combinations of multiple biological systems may be contributing to the disparate alcohol drinking behaviors of these line-pairs. © 2013 Elsevier Inc. All rights reserved Address correspondence to: William J. McBride, Department of Psychiatry, Institute of Psychological Research, Indiana University Medical Center, 791 Union Drive, Indianapolis, IN 46202-4887, Telephone: + 1 317 274 3820, Fax: + 1 317 274 1365, [email protected]. Publisher's Disclaimer: This is a PDF file of an unedited manuscript that has been accepted for publication. As a service to our customers we are providing this early version of the manuscript. The manuscript will undergo copyediting, typesetting, and review of the resulting proof before it is published in its final citable form. Please note that during the production process errors may be discovered which could affect the content, and all legal disclaimers that apply to the journal pertain. NIH Public Access Author Manuscript Alcohol. Author manuscript; available in PMC 2014 November 01. Published in final edited form as: Alcohol. 2013 November ; 47(7): . doi:10.1016/j.alcohol.2013.08.004. NIH-PA Author Manuscript NIH-PA Author Manuscript NIH-PA Author Manuscript
-
Upload
khangminh22 -
Category
Documents
-
view
0 -
download
0
Transcript of NIH Public Access - IUPUI ScholarWorks

Gene Expression within the Extended Amygdala of 5 Pairs of RatLines Selectively Bred for High or Low Ethanol Consumption
William J. McBridea,*, Mark W. Kimpela, Jeanette N. McClintickb, Zheng-Ming Dinga, PetriHyytiac, Giancarlo Colombod, Tiebing Liange, Howard J. Edenbergb, Lawrence Lumenge,and Richard L. Bella
aInstitute of Psychiatric Research, Department of Psychiatry, Indiana University School ofMedicine, Indianapolis, IN 46202-4887 bDepartment of Biochemistry & Molecular Biology andCenter for Medical Genomics, Indiana University School of Medicine, Indianapolis, IN46202-4887 cInstitute of Biomedicine/Pharmacology, POB 63, 00014 University of Helsinki,Finland dInstitute for Neuroscience, National Research Council of Italy, Section of Cagliari, S.S.554, km. 4,500, I-09042, Monserrato (CA), Italy eDepartment of Medicine, Indiana UniversitySchool of Medicine, Indianapolis, IN 46202
AbstractThe objectives of this study were to determine innate differences in gene expression in 2 regionsof the extended amygdala between 5 different pairs of lines of male rats selectively bred for highor low ethanol consumption: a) alcohol-preferring (P) vs. alcohol-non-preferring (NP) rats, b)high-alcohol-drinking (HAD) vs. low-alcohol-drinking (LAD) rats (replicate line-pairs 1 and 2), c)ALKO alcohol (AA) vs. nonalcohol (ANA) rats, and d) Sardinian alcohol-preferring (sP) vs.Sardinian alcohol-nonpreferring (sNP) rats, and then to determine if these differences are commonacross the line-pairs. Microarray analysis revealed up to 1,772 unique named genes in the nucleusaccumbens shell (AcbSh) and 494 unique named genes in the central nucleus of the amygdala(CeA) that significantly differed [False Discovery Rate (FDR) = 0.10; fold-change at least 1.2] inexpression between the individual line-pairs. Analysis using Gene Ontology (GO) and IngenuityPathways information indicated significant categories and networks in common for up to 3 or 4line-pairs, but not for all 5 line-pairs. However, there were almost no individual genes in commonwithin these categories and networks. ANOVAs of the combined data for the 5 line-pairs indicated1,014 and 731 significant (p < 0.01) differences in expression of named genes in the AcbSh andCeA, respectively. There were 4–6 individual named genes that significantly differed across up to3 line-pairs in both regions; only 1 gene (Gsta4 in the CeA) differed in as many as 4 line-pairs.Overall, the findings suggest that a) some biological categories or networks (e.g., cell-to-cellsignaling, cellular stress response, cellular organization, etc.) may be in common for subsets ofline-pairs within either the AcbSh or CeA, and b) regulation of different genes and/orcombinations of multiple biological systems may be contributing to the disparate alcohol drinkingbehaviors of these line-pairs.
© 2013 Elsevier Inc. All rights reserved
Address correspondence to: William J. McBride, Department of Psychiatry, Institute of Psychological Research, Indiana UniversityMedical Center, 791 Union Drive, Indianapolis, IN 46202-4887, Telephone: + 1 317 274 3820, Fax: + 1 317 274 1365,[email protected].
Publisher's Disclaimer: This is a PDF file of an unedited manuscript that has been accepted for publication. As a service to ourcustomers we are providing this early version of the manuscript. The manuscript will undergo copyediting, typesetting, and review ofthe resulting proof before it is published in its final citable form. Please note that during the production process errors may bediscovered which could affect the content, and all legal disclaimers that apply to the journal pertain.
NIH Public AccessAuthor ManuscriptAlcohol. Author manuscript; available in PMC 2014 November 01.
Published in final edited form as:Alcohol. 2013 November ; 47(7): . doi:10.1016/j.alcohol.2013.08.004.
NIH
-PA Author Manuscript
NIH
-PA Author Manuscript
NIH
-PA Author Manuscript

Keywordsgene expression; nucleus accumbens; central nucleus of the amygdala; selectively bred rat lines;alcohol-preferring; Alko alcohol; high-alcohol-drinking; Sardinian alcohol-preferring
IntroductionGene expression studies can potentially contribute to the identification of genes associatedwith the risk for excessive alcohol drinking and help elucidate mechanisms underlying thisbehavior. Gene expression studies with human tissue used autopsy samples from individualswith a previous history of alcohol abuse versus controls without this history (Flatscher-Bader et al., 2005; 2008; Lewohl et al., 2000; Mayfield et al., 2002). To differentiate geneticdifferences related to susceptibility from those resulting from long-term alcohol abuse, it isimportant to conduct studies on subjects who are genetically susceptible to high alcoholdrinking but have not had any previous exposure to ethanol. Since this is not feasible inhumans, animal studies offer an alternative. To that end, multiple rat and mouse lines,selected on the basis of various criteria for high (HEC) or low (LEC) ethanol consumptionor displaying these phenotypes innately, have been studied.
Kimpel et al. (2007) reported several differences in gene expression between inbred alcohol-preferring (iP) and inbred alcohol non-preferring (iNP) rats in the nucleus accumbens (Acb)and amygdala. Arlinde et al. (2004) reported gene expression differences between ALKOalcohol (AA), ALKO non-alcohol (ANA), and Wistar rats in the Acb and amygdala.However, these studies did not distinguish between the Acb shell (Sh) and core, or attemptto delineate any of the amygdala nuclei. It is important to distinguish subregions of the Acbbecause the shell (Sh), but not the core, is involved in processing dopamine-mediatedrewards (Ikemoto et al., 1997) and the reinforcing actions of ethanol (Engleman et al.,2009). It is also important to distinguish nuclei within the amygdala, because each has adifferent function, especially the central nucleus of the amygdala (CeA), which may beinvolved in regulating dependence-induced alcohol drinking (Roberts et al., 1996).
Tabakoff et al. (2009) reported results of gene expression levels in HXB/BXH recombinantinbred rats that linked candidate genes involved in GABA release, activation of dopamineneurons, and postsynaptic GABA receptor trafficking in the hypothalamus, ventraltegmentum, and amygdala to alcohol consumption. In another study, Kerns et al. (2005)reported the effects of acute ethanol administration on gene expression in the Acb, prefrontalcortex, and ventral tegmental area (VTA) of DBA/2J and C57BL/6J mice, and reportedregion-specific changes in ethanol-responsive genes.
Tabakoff et al. (2008) performed a meta-analysis across 3 types of mouse populations (high-alcohol-preference [HAP], low-alcohol-preference [LAP], and BXD recombinant inbred)and 22 inbred strains, to correlate innate whole brain gene expression with previouslyreported levels of alcohol intake to identify candidate genes associated with the variance inalcohol consumption across the mouse lines and strains. These authors reported that the 8candidate genes identified play important roles in neuronal migration and differentiation, aswell as synaptic remodeling. However, this study was conducted using whole brains, and notall of the mice were selected for high alcohol consumption or low alcohol consumption.
A recent study (McBride et al., 2012) examined gene expression in the VTA of 5 pairs of ratlines selectively bred for HEC or LEC. The results of this study indicated that there were nocommon gene differences across all 5 line-pairs, but rather there were biological processes
McBride et al. Page 2
Alcohol. Author manuscript; available in PMC 2014 November 01.
NIH
-PA Author Manuscript
NIH
-PA Author Manuscript
NIH
-PA Author Manuscript

(e.g., transcription, synaptic function, intracellular signaling, and protection againstoxidative stress) or gene networks that were in common for subsets of the line-pairs.
The AcbSh is a region mediating the rewarding effects of ethanol (Engleman et al., 2009)and alcohol drinking behavior (reviewed in Koob et al., 1998; McBride & Li, 1998). TheCeA appears to be involved in regulating dependence-induced alcohol drinking (Roberts etal., 1996). Changes in gene expression in the AcbSh and CeA have been reported followingbinge-drinking by P rats (McBride et al., 2010). Therefore, comparing innate geneexpression differences in these 2 regions of the extended amygdala across 5 line-pairs of ratsselectively bred for high or low ethanol intake may yield important information on commondifferences that could contribute to their disparate alcohol drinking characteristics.
The present study was undertaken to better delineate innate differences in gene expression inthe AcbSh and CeA between 5 pairs of independent, divergently selected HEC and LEC ratline-pairs: a) the alcohol-preferring (P) and alcohol-non-preferring (NP) rats (Murphy et al.,2002), b) two replicate lines of high-alcohol-drinking (HAD) and low-alcohol-drinking(LAD) rats (Murphy et al., 2002), c) ALKO alcohol (AA) and nonalcohol (ANA) rats(Eriksson, 1968), and d) Sardinian alcohol-preferring (sP) and Sardinian non-preferring(sNP) rats (Colombo, 1997). Characteristics of these 5 selectively bred line-pairs haverecently been reviewed (Bell et al., 2012). Undoubtedly, genes unrelated to alcoholpreference were fixed during the selection process of these lines. By analyzing differentialgene expression both within and across line-pairs, it is hoped that any gene expressiondifferences present by chance would be minimized and gene expression differences presentbecause of the high alcohol drinking phenotype would be maximized. It is also possible thatdifferent genes may contribute to alcohol drinking via the same underlying mechanism ifthey are in the same biologic pathway. For this reason, it is important to also analyzepathways that may be affected within line-pairs.
Because of the involvement of the AcbSh and CeA in regulating alcohol drinking, it isimportant to examine gene expression in these regions of alcohol-naïve subjects with agenetic predisposition for HEC or LEC. The hypothesis to be tested is that there will becommon differences across the 5 pairs of selectively bred lines of male rats in geneexpression or within biological systems in the AcbSh and/or CeA that could influenceneuronal function, contribute to the reinforcing actions of ethanol, and promote high alcoholconsumption.
Materials and methodsAnimals
Animals used for this study were ethanol-naïve, male adult selectively bred rats (n = 9–10/line). The alcohol-preferring (P), alcohol-non-preferring (NP), high-alcohol-drinking lines 1& 2 (HAD1, HAD2), and low-alcohol-drinking lines 1 & 2 (LAD1, LAD2) were bred at theIndiana University School of Medicine. Animals were pair-housed in normal 12-h light/darkcycle rooms (lights on at 8:00 A.M.). The ALKO alcohol (AA) and ALKO nonalcohol(ANA) were housed in a similar manner in animal facilities in Helsinki, Finland. TheSardinian alcohol-preferring (sP) and Sardinian alcohol-nonpreferring (sNP) rats were alsosimilarly housed in animal facilities in Cagliari, Italy.
The P and NP lines of rats were derived by selective breeding from an outbred stock ofWistar rats maintained at Walter Reed Army Institute of Research (Lumeng et al., 1977).The HAD and LAD replicate lines were derived from the N/Nih heterogeneous stock rats(Hansen & Spuhler, 1984; Li et al., 1993). The sP and sNP rats were selectively bred from abase population of Wistar rats obtained from a vendor in Italy (Fadda et al., 1989). The AA
McBride et al. Page 3
Alcohol. Author manuscript; available in PMC 2014 November 01.
NIH
-PA Author Manuscript
NIH
-PA Author Manuscript
NIH
-PA Author Manuscript

and ANA lines were originally derived from a foundation stock that included Wistar andSprague-Dawley strains; these lines were subsequently crossed with F1 hybrids from Lewisand Brown Norway rats (Erikson, 1981; Kiianmaa et al., 1992; Sinclair et al., 1989; Sommeret al., 2006). The selection criteria were similar for all the lines. The selection criteria for theHEC lines were ethanol intakes of > 5 g/kg/day and a preference ratio of 10% ethanol towater ≥ 2:1, using a 24-h free-choice drinking procedure. The LEC lines were selected forethanol intakes less than 1 g/kg/day.
The P, NP, HAD1,2 and LAD1,2 animals used in these experiments were maintained infacilities fully accredited by the Association for the Assessment and Accreditation ofLaboratory Animal Care (AAALAC). All research protocols were approved by theinstitutional animal care and use committee and are in accordance with the guidelines of a)the Institutional Care and Use Committee of the National Institute on Drug Abuse, NationalInstitutes of Health, and the Guide for the Care and Use of Laboratory Animals (Institute ofLaboratory Animal Resources, Commission on Life Sciences, National Research Council1996), and b) the European Communities Council Directive (86/609/EEC) on the“Protection of animals used for experimental and other scientific reasons”.
Sample preparationRats were killed by decapitation, and the brains were quickly removed and frozen inisopentane in frozen carbon dioxide (dry ice). Brains were stored at −80 °C until sectioned.Whole brains from AA, ANA, sP, and sNP rats were shipped overnight to Indianapolis indry ice. On the day of preparation of micro-punch samples, brains were transferred, at least2 h prior to sectioning, to a cryostat set at −6 to −10 °C. Sections (300 µm) were obtainedand transferred to glass slides that had been pre-cooled in the cryostat. Micro-punchsampling was done on a frozen stage (−25 to −35 °C) with an anatomic microscopeequipped with a cool microscope lamp. The stereotaxic atlas of Paxinos & Watson (1998)was used to identify the AcbSh and CeA. Micro-dissection needles (Fisher Scientific) withan inner diameter of 0.77 mm were used to obtain samples. This inner diameter fits withinthe entire region and minimizes contamination from adjacent tissue. Punches were takenbilaterally from 2–3 sections. A different fresh sterile micro-punch needle was used for eachanimal. After withdrawing the micro-punch sample, a distinct demarcated hole remained;this hole was used to validate the micro-dissection method. All equipment used to obtaintissue was treated with RNAse Zap (Ambion, Inc., Austin, TX) to prevent RNA degradation.To minimize batch and order effects within each line-pair, micro-punch samples wereobtained from each line-pair of HEC and LEC rats in a counterbalanced design over a 2–3day period, such that equal numbers within each line-pair were obtained on the same day.However, micro-punch samples from the 5 line-pairs were processed at different times, withintervals up to several months between line-pairs.
The micro-punched samples were immediately homogenized in Trizol reagent (Invitrogen,Carlsbad, CA) and processed according to the manufacturer’s protocol, but with twice thesuggested ratio of Trizol to tissue (Edenberg et al., 2005). Ethanol-precipitated RNA wasfurther purified through RNeasy® columns (Qiagen, Valencia, CA) according to themanufacturer’s protocol. The yield, concentration, and purity of the RNA were determinedby running a spectrum from 210 to 350 nm, and analyzing the ratio of large and smallribosomal RNA bands using an Agilent Bioanalyzer. Yields, purity, and quality of the RNAwere excellent; RNA integrity numbers (RIN) averaged 8.5 for the samples, showing little orno degradation.
McBride et al. Page 4
Alcohol. Author manuscript; available in PMC 2014 November 01.
NIH
-PA Author Manuscript
NIH
-PA Author Manuscript
NIH
-PA Author Manuscript

Microarray proceduresSeparate preparations of total RNA were made for each animal. Samples from differentanimals were not pooled at any stage Thus, 9–10 microarrays were analyzed for each lineper region. RNA extraction, sample processing, and array hybridization/scanning werecompleted at different times for each line-pair. Within each line-pair, all of the samples fromeach brain region were processed in a single batch, to eliminate batch effects within eachbrain region. This approach was used to keep the technical variability for each brain regionas low as possible, because between-region comparisons within a line-pair were not thefocus of this study. Because the primary comparisons are between the 2 lines within eachpair, samples from each line-pair were processed in 1 batch for labeling. Samples from the 2HAD/LAD line-pairs were labeled using the Affymetrix 2-cycle protocol. Due to thediscontinuation of that kit, the remaining line-pairs were labeled using the 3′ IVT ExpressProtocol, which uses only 1 round of IVT amplification. Although amplification biases havebeen reported between PCR and IVT protocols (Degrelle et al., 2008), this is not likely to bea factor in the present study since the PCR protocol was not used. Moreover, the primarycomparisons are within line-pairs and were done using identical protocols at the same time.Hybridization and scanning of samples from each line-pair were in 2 evenly distributedbatches across the HEC and LEC animals. The fragmented, biotinylated cRNA from eachindependent sample was mixed into 300 µL of hybridization cocktail, of which 200 µL wereused for hybridization to Affymetrix Rat Genome 230 2.0 GeneChips. Hybridization wascarried out for 17 h at 42 °C. Washing and scanning of the GeneChips were carried outaccording to standard protocols, as previously described (Edenberg et al., 2005; McClinticket al., 2003). Each GeneChip® was scanned using an Affymetrix Model 3000 scanner andunderwent image analysis using Affymetrix GCOS software. Microarray data are availablefrom the National Center for Biotechnology Information's Gene Expression Omnibus http://www.ncbi.nlm.nih.gov/geo/ under accession SuperSeries GSE31709 (AcbSh subseriesGSE31705, CeA subseries GSE31708).
Statistical and neuroinformatics analysis of microarray dataRaw CEL files were imported into the statistical programming environment R (R: Alanguage and environment for statistical computing Ver 2.13.0; R Foundation for StatisticalComputing, 2011) for further analysis with tools available from the Bioconductor Project(Gentleman et al., 2004). Expression data from the arrays of each experiment werenormalized and converted to log(2) values using the Robust Multi-chip Average (RMA)method (Irizarry et al., 2003). As a standardization step to facilitate later comparisons withother experiments, expression levels were scaled such that the mean expression of all arrayswas the raw RMA signal scaled to 1000. After the initial statistical analysis (Table 1), allprobe sets currently annotated by Affymetrix as “expressed sequence tags” or whose genenames contain the words “riken”, “predicted”, or “similar to” were not included in anyfurther analyses; only the remaining probe sets deemed “named genes” were furtheranalyzed. Probe sets that were not detectable above background were filtered out to reducenoise (McClintick & Edenberg, 2006). Probe sets that did not have a median expressionacross experiments of at least log2 (100) were therefore excluded. To obtain lists ofsignificant genes within each line-pair, a simple t test was performed and the resultant pvalues were used to calculate the FDR q value for each gene according to the method ofStorey et al. (2004). Genes with a q value ≤ 0.10 were deemed significant. Because thisapproach resulted in a very high number of statistically significant genes between P vs. NPrats in the AcbSh, an additional filter was applied to eliminate genes with a fold-change lessthan 1.2. This filter was applied to data for all other line-pairs in the AcbSh, as well as to allline-pairs in the CeA. To test for significance of genes across line-pairs, 2-factor linearmodeling including the interaction term using ANOVA (p < 0.01) was conducted. Onefactor was line-pair (5 levels) and the other factor was ethanol consumption phenotype (2
McBride et al. Page 5
Alcohol. Author manuscript; available in PMC 2014 November 01.
NIH
-PA Author Manuscript
NIH
-PA Author Manuscript
NIH
-PA Author Manuscript

levels). FDR was calculated using the same method as for the within-line t tests andsignificance was again set at FDR ≤ 0.10.
Testing for over-representation of GO (Ashburner et al., 2000; Harris et al., 2004) biologicalprocesses (BP) and KEGG categories was performed using the Bioconductor packageGOstats (Gentleman, 2004). Briefly, for each set of significant genes tested, a list of uniqueEntrez-Gene identifiers was constructed. This list was then compared to the list of allEntrez-Gene identifiers for the named genes that were called “present” using the filteringmethods described above. Identification of over-represented categories was thenaccomplished using the hypergeometric distribution. Categories were called significant at p< 0.05.
Genes differentially expressed at FDR 10% and 1.2 fold-change cutoff for each individualline-pair and for those significant at FDR 10% in the ANOVA analyses were uploadedseparately into Ingenuity Pathway Analysis® (Ingenuity® Systems, www.ingenuity.com).Genes were identified by their Affymetrix probe set ID and then mapped to theircorresponding objects in the Ingenuity® Knowledge Base. These molecules, called NetworkEligible molecules, were overlaid onto a global molecular network developed frominformation contained in the Ingenuity Knowledge Base. Networks of Network EligibleMolecules were then algorithmically generated based on their connectivity. CanonicalPathway Analysis results are reported. Pathways were deemed significant if the genes in thepathway were over-represented in the list of genes used for the analysis.
Weighted gene co-expression network analysis (WGCNA) was conducted (Zhang &Horvath, 2005) using the Bioconductor (Gentleman et al., 2004) package WGCNA(Langfelder & Horvath, 2008, 2012) within R (R: A language and environment for statisticalcomputing Ver 3.0.0; R Foundation for Statistical Computing, 2013). Analyses wereconducted separately within each brain region but across all line-pairs, using the consensusmodule approach to build modules with consensus across line-pairs. For WGCNA, defaultvalues, including the use of the power function with power β, were used for all functionswith the exception that signed correlation coefficients were used. All “present” probe setswere included to achieve the best scale-free topology. A power β equal to 8 met the criteriafor scale-free topology in each brain region and was used in the construction of modules.Resultant modules were tested for enrichment with differentially expressed genes by line-pair using Gene Set Enrichment Analysis (GSEA, Subramanian et al., 2005) withsignificance set at p < 0.05. For modules found significant with GSEA in at least 3 line-pairs, further testing for enrichment was performed using the hyper-geometric distributionusing sets of genes by GO biologic process (Ashburner et al., 2000; Harris et al., 2004) andlocation by cell type (Cahoy et al., 2008).
Present probe sets were analyzed for enrichment in regions of established rat QTLs foralcohol consumption in P × NP (Bice et al., 1998; Carr et al., 1998, 2007; Foroud et al.,2002) and HAD × LAD replicates (Bice et al., 2010; Carr et al., 2003; Foroud et al., 2003)using the methodology of Gene Set Enrichment Analysis (GSEA) (Subramanian et al.,2005) accompanied by linear modeling (Oron et al., 2008) with the Bioconductor packagesGSEABase (R package version 1.17.1) and GSEAlm (R package version 1.15.0). For theacross line-pairs analysis, the same linear model was used, as described above for theANOVA analysis, and GSEA was conducted using the statistic for the ethanol consumptionphenotype factor. For the within line-pair analyses, ethanol consumption phenotype was theonly factor in the model. The aggregate gene set statistic used was the J-G statistic describedin Jiang & Gentleman (2007).
McBride et al. Page 6
Alcohol. Author manuscript; available in PMC 2014 November 01.
NIH
-PA Author Manuscript
NIH
-PA Author Manuscript
NIH
-PA Author Manuscript

ResultsIndividual line-pair analysis
In the AcbSh (Table 1), there is a 14-fold difference in the number of significant namedgenes across the line-pairs, with the highest number in the P-NP line-pair (1,772) and thelowest number in the AA-ANA line-pair (127; see Table 1). Supplemental Tables A–E listall named genes that significantly differed for each line-pair. Supplemental Tables G–K listunnamed probe sets that significantly differed for each line-pair.
In the CeA (Table 1), there was a 3-fold difference in significant unique named genes across4 of the line-pairs with the highest number in the HAD2-LAD2 line-pair (518) and a lowernumber in the HAD1-LAD1 line-pair (158); the AA and ANA lines showed only 1difference (Mosc2: MOCO sulphurase C-terminal domain containing 2). SupplementalTables AA–DD list unique named genes that significantly differed for each line-pair.Supplemental Tables FF–II list unnamed probe sets that significantly differed for each line-pair.
Principal Components Analysis (PCA) by line-pair for the AcbSh and CeA (Fig. 1)indicated that, in both regions, the HAD-LAD replicate lines clustered separately from theother 3 lines. However, replicate line 1 clustered separately from replicate line 2. Becausethe HAD-LAD replicates clustered separately from the other 3 line-pairs in the 1st PCA (Fig.1, left panels), separate PCA plots were made for the HEC and LEC lines (Fig. 1, middleand right panels). The second PCA indicated that genes for the HEC lines did not clusterseparately from genes for the LEC lines for both regions (Fig. 1). Heat maps (clustergrams;not shown) of genes that were significant between individual line-pairs did not reveal anyclear pattern of genes associated with high or low ethanol consumption in either region.
Intersections of lists of unique named genes indicated that there were no overlappingcommon genes across 4 or 5 line-pairs in the AcbSh (see Supplemental Tables A–E) oracross 4 line-pairs in the CeA (see Supplemental Tables AA–DD). However, in the AcbSh,there were 23 genes that were in common across 3 of the 5 line-pairs (e.g., Acaa2, Cbr4,Nek1, Pls1, Sp110, Tmem14a and Zcchc9). In the CeA, there were 6 genes in commonacross 3 of the 5 line-pairs (Acaa2, Exosc7, Mcee, Ncaph, Snx10, and Svep1). No singlegene was differentially expressed across the 5 line-pairs of selectively bred rats.
GSEA was used to determine enrichment of probe sets in established rat QTLs for ethanolconsumption. No enrichment was found for any of the QTLs within a line-pair or acrossline-pairs for either region.
Gene Ontology (GO) analysis of individual line-pairsWithin the AcbSh, there were 8 significant biological categories that were in common across3 line-pairs, but there were none in common across 4 or 5 line-pairs (Table 2). The P-NP andsP-sNP line-pairs were most similar, with all 8 categories being found in both. In the AcbSh,the HAD1-LAD1 and HAD2-LAD2 line-pairs were not similar to each other. There were 4GO categories (regulation of neurotransmitter levels, and responses to glucocorticoid,retinoic acid, and steroid hormone stimuli) that were common across the P-NP, HAD2-LAD2, and sP-sNP line-pairs in the AcbSh. However, among these, there was only 1 gene incommon (Mef2c; myocyte enhancer factor 2c).
Within the CeA, there were 7 significant GO categories that were common across 3 or 4line-pairs, with only the AA-ANA line-pair having no significant GO categories (Table 2).The ‘circadian rhythm’ category (along with ‘leukocyte chemotaxis’ and ‘wound healing’categories) was observed in 4 line-pairs; there was only 1 gene (Pf4; platelet factor 4) in
McBride et al. Page 7
Alcohol. Author manuscript; available in PMC 2014 November 01.
NIH
-PA Author Manuscript
NIH
-PA Author Manuscript
NIH
-PA Author Manuscript

common across the 4 line-pairs. An intracellular signaling cascade category was observedfor the P-NP, HAD1-LAD1 and HAD2-LAD2 line-pairs, but there were no genes incommon within this category.
Ingenuity Pathway Analyses for individual line-pairsWithin the AcbSh, there were 22 significant canonical pathways that contained 15 or moregenes (Table 3). Twenty-one of the pathways were observed for the P-NP line-pair, whichreflects the high number of significant unique named genes found in this line-pair comparedto the others (Table 1). The HAD2-LAD2 line-pair was the only other line-pair thatexhibited a significant canonical pathway with at least 15 genes, the ILK (integrin-linkedkinase) signaling pathway. This pathway was also significant for the P-NP line-pair;however, there were no genes in common in this pathway between the P-NP and HAD2-LAD2 line-pairs.
In the AcbSh, several pathways had a noticeable imbalance in the number of genes withsignificantly lower expression, compared to the number with higher expression in the P vs.NP line. The cAMP-mediated signaling, synaptic long-term potentiation, glutamate receptorsignaling, CREB signaling in neurons, synaptic long-term depression, alpha-adrenergicsignaling, and gap junction signaling pathways all had differences of 6 to 17 genes, and a1.7- to 2.7-fold higher number with lower expression than with higher expression.
In the CeA, there were 5 significant pathways with 10 or more genes observed for theHAD2-LAD2 line-pair (Table 3). In addition, there was 1 canonical pathway observed forthe HAD1-LAD1 line-pair in the CeA. Both replicate line-pairs of HAD-LAD rats had asignificant IL-8 signaling pathway; however, there were no genes in common in thispathway between the 2 line-pairs. There were no significant canonical pathways in the CeAof the P-NP and sP-sNP line-pairs, even though both line-pairs had large numbers of uniquenamed genes that significantly differed (Table 1).
Overall ANOVA for all line-pairs combinedANOVAs, using ethanol consumption phenotype (HEC and LEC) and line-pair (5categories) as factors, were conducted for each probe set. In the AcbSh, there were 1,014individual named genes that were significantly (p < 0.01) different between the HEC andLEC lines; in the CeA, there were 731 individual named genes that differed (seeSupplemental Tables F and EE for named genes in the AcbSh and CeA, respectively, andSupplemental Tables L and JJ for un-named probe sets that significantly differed in these 2regions).
Ingenuity Pathway Analysis (IPA) identified 5 major networks each in the AcbSh and CeA(Table 4). For the AcbSh, 1 network involved general development and function and had1.7-fold more genes with higher than lower expression in the HEC vs. LEC lines. Incontrast, 2 other networks (general category of Cellular Growth and Proliferation, andNervous System Development and Function) had 1.7-fold more genes with lower thanhigher expression in the HEC vs. LEC lines. The remaining 2 categories (Cell-to-CellSignaling and Interaction, and Cellular Assembly and Organization) had approximatelyequal numbers of genes with higher and lower expression levels in the HEC vs. LEC lines.
In the CeA, networks 3, 4, and 5 had 1.4-fold more genes with lower than higher expressionin the HEC vs. LEC lines (Table 4). Although both regions had networks involved inCellular Assembly and Cell-to-Cell Signaling, there was only 1 gene in common betweenthe 2 regions (i.e., Dhx36).
McBride et al. Page 8
Alcohol. Author manuscript; available in PMC 2014 November 01.
NIH
-PA Author Manuscript
NIH
-PA Author Manuscript
NIH
-PA Author Manuscript

Several KEGG categories emerged from the overall ANOVA that were evident in at least 3line-pairs in the CeA (Table 5). All of the categories were significant in the P-NP and sP-sNP line-pairs, and 1 category was significant across 4 line-pairs. However, none of the 3categories had any clear role in neuronal function. There were no significant KEGGcategories observed for the AcbSh that were evident in more than 2 line-pairs.
The WGCNA identified several GO biological categories that were significant in at least 3line-pairs (Table 6). In the AcbSh, these categories were relatively general. In the CeA, therewere 2 categories, involving protein kinase activity and Wnt receptor signaling, that wereslightly less general. Overall, the WGNCA did not provide much information towarddefining any common biological systems among all 5 line-pairs.
There were 6 genes differentially expressed (in the same direction) in at least 3 of the line-pairs in the overall ANOVAs for the AcbSh (Table 7). The HAD2-LAD2 line-pair exhibitedsignificant differences in all 6 genes; the P-NP line-pair exhibited significant differences in 5of the 6 genes. AA-ANA differences were observed for only 1 gene, i.e., Avil.
In the CeA, there were 5 genes differentially expressed in at least 3 line-pairs from theoverall ANOVAs (Table 7). All 5 genes were differentially expressed in both replicate line-pairs of HAD-LAD rats. Gsta4 was the only gene differentially expressed in 4 line-pairs inthe CeA. None of the genes differentially expressed in the CeA were differentially expressedin the AcbSh.
Sufficient material was available from several of the micro-punched samples of the AcbShto conduct a qRT-PCR validation on some of the genes in Table 7. Three genes (Avil, Mef2c,and Zcchc9) were selected that had a fold-change of at least 1.4 in the AcbSh of the P vs. NPrats. The results with the qRT-PCR were in excellent agreement with the microarray data(Table 8).
DiscussionSeveral significant findings emerged from this study using male rats from the 5 line-pairsselectively bred for disparate alcohol drinking. However, the overall hypothesis that thereare common biological pathways within the AcbSh and/or CeA across the 5 line-pairs thatcontribute to their disparate alcohol drinking characteristics was not supported. The PCAplots by line-pair for both regions (Fig. 1, left panels) indicated a separation of the HAD-LAD replicates from the other 3 line-pairs. This separation is likely due to a combination offactors, such as differences in microarray protocols, batch effects, and genetic background.However, there was also separate clustering of each replicate line-pair, suggesting somedifferences between the replicates. Examining the data with ethanol consumption as a factor(Fig. 1, middle and right panels) does not indicate any clear separation between the HEC vs.LEC groups, suggesting that there may be few genes in common across the 5 line-pairs thatcould influence alcohol drinking, and/or other factors (i.e., technical) may predominate overany possible clusters of genes associated with high or low ethanol consumption. Otherfactors may also play a role in not finding more genes in common across the 5 line-pairs.For example, the origins of the line-pairs are different, the environment in which the line-pairs were raised is different, and other factors not adequately studied across line-pairs mayinfluence the gene expression data. Only the HAD-LAD replicate lines were derived fromthe same foundation stock (Hansen & Spuhler, 1984; Li et al., 1993), which was not the casewith the other 3 line-pairs. The foundation stocks of these 3 line-pairs were also differentfrom each other (Eriksson, 1981; Fadda et al., 1989; Kiianmaa et al., 1992; Lumeng et al.,1977; Sinclair et al., 1989). Although the selection criteria were similar for each of the line-pairs, there were differences in the environments in which the line-pairs were raised that
McBride et al. Page 9
Alcohol. Author manuscript; available in PMC 2014 November 01.
NIH
-PA Author Manuscript
NIH
-PA Author Manuscript
NIH
-PA Author Manuscript

could influence gene expression. Finally, even though the selection criteria were similar,other traits (e.g., anxiety, metabolism, etc.) may have been differentially carried through inthe selection process depending upon the line-pair. Furthermore, essentially no overlap ofsignificant categories was obtained across line-pairs using a general FDR enrichment cut-offset at either 0.1 or 0.2.
The AcbSh and CeA are 2 regions that are key parts of the extended amygdala. Both regionsare important in regulating alcohol drinking behavior and both regions respond to ethanoladministration (reviewed in Koob et al., 1998; McBride, 2002; McBride & Li, 1998).Because of the importance of these two distinct regions in the effects of ethanol and alcoholdrinking behavior, the expectation was that some innate common gene expressiondifferences would be found within a region across 5 line-pairs of rats selectively bred forhigh or low alcohol consumption. However, because these 2 regions receive different inputsand have different intrinsic neuronal circuitries (Cassell et al., 1999; Meredith, 1999), it ispossible that any common differences in gene expression found across the line-pairs in oneregion may not necessarily be the same common differences found in another region. On theother hand, some similarities exist between the 2 regions, e.g., both contain GABAergicmedium spiny neurons (Cassell et al., 1999; Meredith, 1999), and some common differencesmight be expected. Apparently, the unique features of the CeA vs. the AcbSh outweigh thesimilarities since there were so few common differences in gene expression between these 2regions.
Individual line-pair analysisIn neither the AcbSh nor the CeA were there any common genes that significantly differedacross all 5 individual line-pairs, suggesting that differential expression of variouscombinations of genes may contribute to the disparate alcohol drinking characteristics ofeach line-pair. This could be due to the way selection works. Selection acts on the existinggenetic variations in the founder stock, which differ among the starting lines and increasesthe frequency of alleles that contribute to the phenotype (high or low preference) as well asnearby alleles. Thus, differences in the selectable alleles in each line will lead to differencesin the genes and pathways that emerge. And, if there are multiple pathways that can lead tothe selected phenotype, an early divergence in one pathway is likely to be reinforced bycontinued selection. The lack of common genes across all 5 line-pairs also implies that thereare multiple mechanisms that can contribute to innate differences in responses to alcoholthat, in turn, contribute to high ethanol intake. It could also be that other brain regionsinvolved in regulating alcohol drinking are more important sites of innate differences ingene expression. The lack of common genes could also be due to technical reasons:accumulated effects of several small differences may not be detected with the microarrayprocedure, and/or common differences in as yet unnamed genes are important. It is alsopossible that common differences in gene expression across the 5 line-pairs within a givenregion may not be detected unless the rats are first exposed to ethanol.
The lack of differentially expressed genes in the CeA between the AA and ANA linessuggests that this region may not play a major role in determining alcohol drinking behaviorin these lines. However, innate differences between the AA and ANA line could still exist(e.g., post-translational modifications) but are not detected with the current technique.
Within the AcbSh, there were no GO biological categories that differed across more than 3line-pairs. Furthermore, there was only 1 gene in common within any of these categoriesacross the line-pairs. These results support the idea that various combinations of biologicalpathways in this region may contribute to the alcohol drinking characteristics of each line-pair.
McBride et al. Page 10
Alcohol. Author manuscript; available in PMC 2014 November 01.
NIH
-PA Author Manuscript
NIH
-PA Author Manuscript
NIH
-PA Author Manuscript

In the CeA, there were 3 GO biological categories (Circadian Rhythm, LeukocyteChemotaxis, and Wound Healing) that were significant across all the line-pairs, except theAA-ANA line-pair, suggesting that, in this region, there may be some common biologicalpathways that could influence alcohol drinking in most of the line-pairs. However, sincethere was only 1 gene in common across the 4 line-pairs in these categories, the mechanismsunderlying these biological categories may all be different.
The high number of significant biological canonical pathways identified by IPA (Table 3)suggests that the AcbSh may strongly influence a predisposition for high alcohol drinking inthe P rats, whereas the CeA may strongly influence a predisposition for high alcoholdrinking in the HAD2 rats. In the AcbSh of the P-NP line-pair, there were several significantnotable canonical pathways that could influence intracellular signaling pathways, as well asdopamine and glutamate receptor signaling, all of which could influence synaptic plasticity.However, similar pathways were not evident in the CeA of the HAD2-LAD2 line-pair(Table 3).
Overall ANOVA for all the line-pairs combinedThe overall ANOVA revealed some possible common biological networks involvingcellular assembly and organization, and cell-to-cell signaling in both the AcbSh and CeAacross the 5 line-pairs (Table 4). However, there were few genes in common between the 2regions or across the 5 line-pairs, further supporting the idea that various combinations ofmultiple cellular mechanisms may be involved in mediating the disparate alcohol-drinkingbehaviors of the 5 selectively bred rat line-pairs. Networks involved in growth andproliferation, cell-to-cell signaling and interaction, as well as cellular assembly andorganization were observed (Table 4). The genes within these networks and the networksalone had little in common with the networks and genes in the AcbSh and CeA altered byalcohol binge drinking (McBride et al., 2010).
In the CeA, but not in the AcbSh, there were several significant KEGG categories in theoverall ANOVA that were also significant in 3 or more individual line-pairs (Table 5).Interestingly, the complement system appears to be involved to some degree in differencesbetween the high vs. low ethanol consuming lines. Complement components have beenidentified within a list of candidate genes that influence alcohol consumption in mice (Sabaet al., 2011). Moreover, the complement system may have a role in synaptic reorganization(see review by Stephan et al., 2012).
In the AcbSh, there were 6 genes that significantly differed in the overall ANOVA and werealso significantly changed in at least 3 line-pairs (Table 7). These included: a) Advillin(Avil), a member of the gelsolin/villin family of actin regulatory proteins (Marks et al.,1998) that is involved in neurite-like outgrowth (Shibata et al., 2004); b) 5-azacytidineinduced 2 (Azi2 also known as Nap1), which produces a protein that i) activates IKK-relatedkinases and by extension NF-kappa B-dependent gene expression (Fujita et al., 2003), ii)activates TLR3/TLR4-mediated IFN-beta induction (Sasai et al., 2005), and iii) regulateshistone 3 (H3K9) acetylation during transcription elongation (Xue et al., 2013); c) myocyteenhancer factor 2C (Mef2c), a transcription factor involved in short-term synaptic plasticity(Akhtar et al., 2012) and neuronal response to cellular stress (She et al., 2012); d) NIMA-related expressed kinase 1 (Nek1), which plays an important role in preventing cell deathinduced by DNA damage (Chen et al., 2010; Pelegrini et al., 2010); e) RT1 class 1, locusT24, gene 4 (RT1-T24-4), which produces a protein that is primarily located in the cellmembrane of astrocytes where it processes immune responses (Muotri et al., 2005); and f)zinc finger, CCHC domain containing 9 (Zcchc9), a nuclear protein involved in regulatingMAPK signaling pathways (Zhou et al., 2008). Overall, the sum effects of these differences
McBride et al. Page 11
Alcohol. Author manuscript; available in PMC 2014 November 01.
NIH
-PA Author Manuscript
NIH
-PA Author Manuscript
NIH
-PA Author Manuscript

in gene expression may promote neurite outgrowth, modify gene transcription, and processmultiple cellular, immune, and stress responses.
In the CeA, there were 5 genes that significantly differed in the overall ANOVA and werealso significantly changed in at least 3 line-pairs (Table 7). These included: a) ankyrin repeatdomain (ARD) 12 (Ankrd12), which may facilitate the formation of the I-kappa-B-alpha-NF-kappa B complex in the nucleus (Ferreiro & Komives, 2010; Zhang et al., 2004), as wellas modulating the cellular stress response (Miller et al., 2003); b) glutathione S-transferasealpha 4 (Gsta4), involved in reduction of oxidative stress (Raza, 2011) and other cellularstresses (Ström et al., 2012), with some evidence that Gst expression may play a role inethanol preference and longevity (Björk et al., 2006); c) pleckstrin homology domaincontaining family H member 1 (Plekhh1), involved in regulation of guanine nucleotide-exchange activity (Baumeister et al., 2006; Cheng et al., 2004); d) RT1 class Ia, locus A2(RT1-A2), which processes cellular immune responses in a brain-region dependent and rat-line dependent manner (Blaveri et al., 2010); and e) sushi, van Willebrand factor type A,EGF and pentraxin domain containing 1 (Svep1), a cell adhesive molecule (Shefer &Benayahu, 2010). Overall, these results suggest that gene expression differences between theHEC and LEC rats may alter gene transcription, as well as processing multiple cellular,immune, and stress responses, along with cell-to-cell and altered guanine nucleotide cellularsignaling.
None of the genes in Table 7 were observed among the list of candidate genes reported foralcohol consumption in HXB/BXH RI rats (Tabakoff et al., 2009), among the candidategenes within chromosome 10 QTL of the high and low alcohol-drinking rats (Bice et al.,2010), or among candidate genes for alcohol preference expressed in congenic rat strains(Carr et al., 2007). In addition, none of these genes were among the list of candidate genesfor alcohol drinking identified through transcriptome meta-analysis (Mulligan et al., 2006),and none appeared to be related to GABAergic transmission identified in a systems geneticanalysis of alcohol drinking (Saba et al., 2011). In addition, none of the genes in Table 7appeared in any of the GWAS results (Edenberg et al., 2010; Johnson et al., 2011; Kendleret al., 2011). On the other hand, genes associated with alcohol abuse produced changes inthe human Acb in general categories of transcription and DNA repair, proliferation anddevelopment, and signaling and cell structure and adhesion (Flatscher-Bader et al., 2010).All of these categories were also evident in the overall ANOVA of the AcbSh of the 5 line-pairs (Table 4). These results suggest that either some of the differences in gene expressionattributed to alcohol abuse may be evident before exposure to alcohol, and/or thesebiological systems are innately vulnerable to the effects of alcohol in alcoholic populations.
No enrichment of probe sets in established rat QTLs for ethanol consumption was found.This may reflect the complexity of factors (and brain regions) that contribute to alcoholdrinking and the multiple biological systems involved in regulating gene expression.However, a search for potentially interesting genes was conducted using significantWGCNA modules; several genes associated with neurons were selected that were within arat alcohol QTL and were significant (FDR = 0.10) in at least 2 line-pairs. In the AcbSh,these genes were Gsn (gelsolin), A2bp1 (ataxin 2 binding protein 1), Ankrd28 (ankyrinrepeat domain 28), Siae (sialic acid acetylesterase), Ppp3ca (protein phosphatase 3, catalyticsubunit, alpha isoform), Plvap (plasmalemma vesicle associated protein), and Dph3 (DPH3,KYI11 homolog). In the CeA, only 1 gene was identified, i.e., Cxxc4 (CXXC finger 4).Differences in expression of Gsn, Ankrd28, and Ppp3ca could alter formation of proteinsinvolved in transmitter release (Kim & Ryan, 2013), cell-cell interaction (Tachibana et al.,2009), and dendrite formation (Khaitlina et al., 2013).
McBride et al. Page 12
Alcohol. Author manuscript; available in PMC 2014 November 01.
NIH
-PA Author Manuscript
NIH
-PA Author Manuscript
NIH
-PA Author Manuscript

Both the AcbSh and CeA displayed altered protection against oxidative or other cellularstress factors, and cell-to-cell signaling in the HEC vs. LEC lines. In contrast, thecomplement system may be a significant factor in the CeA but not AcbSh. However, thesedifferences appear to be too general to relate to a predisposition toward high alcoholdrinking behavior.
A recent study reporting on gene expression differences in the VTA of these same 5 line-pairs found that the interactions of different combinations of multiple biological systemsmediating transcription, oxidative stress protection, synaptic function, and intracellularsignaling were observed between the HEC and LEC line-pairs (McBride et al., 2012). Theoxidative stress category for the VTA overlaps somewhat with the CeA, with 1 gene incommon, i.e., Gsta4. The synaptic function category for the VTA would fall within the cell-to-cell signaling category observed for both the AcbSh and CeA, but there were no genes incommon. The intracellular signaling system in the VTA involved cAMP-PKA and CREB,whereas the system in the CeA involved guanine nucleotide exchange activities. Thus, therewere no apparent biological categories or genes that were common across all 3 regions forthe 5 HEC-LEC line-pairs. This latter finding likely reflects the impact of the uniqueneurobiology and functional interactions of each of the regions on gene expression.
Validation studies were conducted on a small number of genes in the AcbSh (Table 8). The3 genes (Avil, Mef2c, and Zcchc9) were selected because they were significantly different inthe ANOVAs of the 5 line-pairs, were significantly changed in the same direction in at least3 line-pairs, and the fold difference was at least 1.4 (Tables 7 and 8). There was excellentagreement between the microarray and qRT-PCR results. In addition, previous studies fromour laboratory reported good agreement, in 30 of 32 genes tested, between the data obtainedwith microarrays and the results found with qRT-PCR (Bell et al., 2009; Kimpel et al., 2007;Rodd et al., 2008). For example, Gsta4 (Table 7) has been previously validated with qRT-PCR in 3 different brain regions of inbred P vs. inbred NP rats (Kimpel et al., 2007).
ConclusionsIn summary, as measured with the present microarray procedure, no single gene or pathwayappears to account for the disparate alcohol drinking characteristics of all 5 line-pairs ofmale HEC and LEC rats within the AcbSh or CeA. Instead, the interactions of differentcombinations of multiple biological systems within the AcbSh and CeA appear to becontributing to the disparate alcohol drinking characteristics of the 5 line-pairs. Althoughthere were some common general categories between the 2 regions (Table 9), there were nogenes in common within these categories. The cell-to-cell signaling and intracellularsignaling pathways, as well as cellular organization, could produce innate high sensitivity tothe reinforcing actions of ethanol in the AcbSh and/or CeA of the HEC rats, which wouldresult in increased acquisition and maintenance of high alcohol drinking. The cellularmechanisms that respond to oxidative stress and other cellular stress factors may beprotective and allow the HEC rats to consume high amounts of alcohol over a long period.Therefore, the combination of these and other biological processes (Table 9) within eachregion of the HEC rats may respond to the initial and repeated exposure to ethanol topromote its continued use and abuse. The current analysis is not likely to be sensitive to SNPartifacts since the array technology uses multiple probe-sets to measure each gene, whichminimizes the effect of an SNP that happens to fall within a probe-set. The likelihood thatSNPs influence the measurement of a gene in multiple line-pairs in the same direction issmall. Additional studies, using more advanced technology to address alternative splicingand examining other CNS regions, may be needed to provide more complete information onmolecular mechanisms and biological pathways that contribute to the alcohol drinkingbehaviors of the HEC and LEC rats.
McBride et al. Page 13
Alcohol. Author manuscript; available in PMC 2014 November 01.
NIH
-PA Author Manuscript
NIH
-PA Author Manuscript
NIH
-PA Author Manuscript

Supplementary MaterialRefer to Web version on PubMed Central for supplementary material.
AcknowledgmentsThis project was supported in part by AA07611, INIA grants AA013522, AA016652, AA016660 & AA020892,and INGEN (which is partially funded by Lilly Endowment, Inc.). The authors thank the Institute for Health andWelfare (Helsinki, Finland) for providing the AA and ANA rats. None of the authors has a conflict of interestassociated with this research. The content of this manuscript is solely the responsibility of the authors and does notnecessarily represent the official views of the NIAAA or NIH.
ReferencesAkhtar MW, Kim MS, Adachi M, Morris MJ, Qi X, Richardson JA, et al. In vivo analysis of MEF2
transcription factors in synapse regulation and neuronal survival. PLoS One. 2012; 7:e34863.[PubMed: 22496871]
Arlinde C, Sommer W, Björk K, Reimers M, Hyytiä P, Kiianmaa K, et al. A cluster of differentiallyexpressed signal transduction genes identified by microarray analysis in a rat genetic model ofalcoholism. The Pharmacogenomics Journal. 2004; 4:208–218. [PubMed: 15052257]
Ashburner M, Ball CA, Blake JA, Botstein D, Butler H, Cherry JM, et al. Gene ontology: tool for theunification of biology. The Gene Ontology Consortium. Nature Genetics. 2000; 25:25–29.[PubMed: 10802651]
Baumeister MA, Rossman KL, Sondek J, Lemmon MA. The Dbs PH domain contributesindependently to membrane targeting and regulation of guanine nucleotide-exchange activity. TheBiochemical Journal. 2006; 400:563–572. [PubMed: 17007612]
Bell RL, Kimpel MW, McClintick JN, Strother WN, Carr LG, Liang T, et al. Gene expression changesin the nucleus accumbens of alcohol-preferring rats following chronic ethanol consumption.Pharmacology, Biochemistry, and Behavior. 2009; 94:131–147.
Bell RL, Sable HJ, Colombo G, Hyytia P, Rodd ZA, Lumeng L. Animal models for medicationsdevelopment targeting alcohol abuse using selectively bred rat lines: neurobiology andpharmacological validity. Pharmacology, Biochemistry, and Behavior. 2012; 103:119–155.
Bice P, Foroud T, Bo R, Cadtelluccio P, Lumeng L, Li T-K, et al. Genomic screen for QTLsunderlying alcohol consumption in the P and NP rat lines. Mammalian Genome. 1998; 9:949–955.[PubMed: 9880658]
Bice PJ, Liang T, Zhang L, Graves TJ, Carr LG, Lai D, et al. Fine mapping and expression ofcandidate genes within the chromosome 10 QTL region of the high and low alcohol-drinking rats.Alcohol. 2010; 44:477–485. [PubMed: 20705418]
Björk K, Saarikoski ST, Arlinde C, Kovanen L, Osei-Hyiaman D, Ubaldi M, et al. Glutathione-S-transferase expression in the brain: possible role in ethanol preference and longevity. FASEBJournal. 2006; 20:1826–1835. [PubMed: 16940154]
Blaveri E, Kelly F, Mallei A, Harris K, Taylor A, Reid J, et al. Expression profiling of a genetic animalmodel of depression reveals novel molecular pathways underlying depressive-like behaviours.PLoS ONE. 2010; 5:e12596. [PubMed: 20830301]
Cahoy JD, Emery B, Kaushal A, Foo LC, Zamanian JL, Christopherson KS, et al. A transcriptomedatabase for astrocytes, neurons, and oligodendrocytes: a new resource for understanding braindevelopment and function. The Journal of Neuroscience. 2008; 28:264–278. [PubMed: 18171944]
Carr LG, Foroud T, Bice P, Gobbett T, Ivashina J, Edenberg H, et al. A quantitative trait locus foralcohol consumption in selectively bred rat lines. Alcoholism: Clinical and ExperimentalResearch. 1998; 22:884–887.
Carr LG, Habegger K, Spence J, Ritchotte A, Liu L, Lumeng L, et al. Analyses of quantitative traitloci contributing to alcohol preference in HAD1/LAD1 and HAD2/LAD2 rats. Alcoholism:Clinical and Experimental Research. 2003; 27:1710–1717.
McBride et al. Page 14
Alcohol. Author manuscript; available in PMC 2014 November 01.
NIH
-PA Author Manuscript
NIH
-PA Author Manuscript
NIH
-PA Author Manuscript

Carr LG, Kimpel MW, Liang T, McClintick JN, McCall K, Morse M, et al. Identification of candidategenes for alcohol preference by expression profiling of congenic rat strains. Alcoholism: Clinicaland Experimental Research. 2007; 31:1089–1098.
Cassell MD, Freedman LJ, Shi C. The intrinsic organization of the central extended amygdala. Annalsof the New York Academy of Sciences. 1999; 877:217–241. [PubMed: 10415652]
Chen Y, Gaczynska M, Osmulski P, Polci R, Riley DJ. Phosphorylation by Nek1 regulates openingand closing of voltage dependent anion channel 1. Biochemical and Biophysical ResearchCommunications. 2010; 394:798–803. [PubMed: 20230784]
Cheng L, Mahon GM, Kostenko EV, Whitehead IP. Pleckstrin homology domain-mediated activationof the rho-specific guanine nucleotide exchange factor Dbs by Rac1. The Journal of BiologicalChemistry. 2004; 279:12786–12793. [PubMed: 14701795]
Colombo G. ESBRA-Nordmann 1996 Award Lecture: ethanol drinking behaviour in Sardinianalcohol-preferring rats. Alcohol and Alcoholism. 1997; 32:443–453. [PubMed: 9269852]
Degrelle SA, Hennequet-Antier C, Chiapello H, Piot-Kaminski K, Piumi F, Robin S, et al.Amplification biases: possible differences among deviating gene expressions. BMC Genomics.2008; 9:46. [PubMed: 18226214]
Edenberg HJ, Koller DL, Xuei X, Wetherill L, McClintick JN, Almasy L, et al. Genome-wideassociation study of alcohol dependence implicates a region on chromosome 11. Alcoholism:Clinical and Experimental Research. 2010; 34:840–852.
Edenberg HJ, Strother WN, McClintick JN, Tian H, Stephens M, Jerome RE, et al. Gene expression inthe hippocampus of inbred alcohol-preferring and -nonpreferring rats. Genes, Brain, and Behavior.2005; 4:20–30.
Engleman EA, Ding Z-M, Oster SM, Toalston JE, Bell RL, Murphy JM, et al. Ethanol is self-administered into the nucleus accumbens shell, but not the core: evidence of genetic sensitivity.Alcoholism: Clinical and Experimental Research. 2009; 33:2162–2171.
Eriksson, CJ. Finnish selection studies on alcohol-related behaviors: factors regulating voluntaryalcohol consumption. In: McClearn, GE.; Erwin, G., editors. Development of Animal Models asPharmacogenetic Tools. Rockville, MD: US Government Printing Office; 1981. p. 119-145.
Eriksson K. Genetic selection for voluntary alcohol consumption in the albino rat. Science. 1968;159:739–741. [PubMed: 17795073]
Fadda F, Mosca E, Colombo G, Gessa GL. Effect of spontaneous ingestion of ethanol on braindopamine metabolism. Life Sciences. 1989; 44:281–287. [PubMed: 2915601]
Ferreiro DU, Komives EA. Molecular mechanisms of system control of NF-kappaB signaling byIkappaBalpha. Biochemistry. 2010; 49:1560–1567. [PubMed: 20055496]
Flatscher-Bader T, Harrison E, Matsumoto I, Wilce PA. Genes associated with alcohol abuse andtobacco smoking in the human nucleus accumbens and ventral tegmental area. Alcoholism:Clinical and Experimental Research. 2010; 34:1291–1302.
Flatscher-Bader T, van der Brug M, Hwang JW, Gochee PA, Matsumoto I, Niwa S, et al. Alcohol-responsive genes in the frontal cortex and nucleus accumbens of human alcoholics. Journal ofNeurochemistry. 2005; 93:359–370. [PubMed: 15816859]
Flatscher-Bader T, Zuvela N, Landis N, Wilce PA. Smoking and alcoholism target genes associatedwith plasticity and glutamate transmission in the human ventral tegmental area. Human MolecularGenetics. 2008; 17:38–51. [PubMed: 17928304]
Foroud T, Bice P, Castelluccio P, Bo R, Ritchotte A, Stewart R, et al. Mapping of QTL influencingsaccharin consumption in the selectively bred alcohol-preferring and -nonpreferring rat lines.Behavioral Genetics. 2002; 32:57–67.
Foroud T, Ritchotte A, Spence J, Liu L, Lumeng L, Li T-K, et al. Confirmation of alcohol preferencequantitative trait loci in the replicate high alcohol drinking and low alcohol drinking rat lines.Psychiatric Genetics. 2003; 13:155–161. [PubMed: 12960747]
Fujita F, Taniguchi Y, Kato T, Narita Y, Furuya A, Ogawa T, et al. Identification of NAP1, aregulatory subunit of IkappaB kinase-related kinases that potentiates NF-kappaB signaling.Molecular and Cellular Biology. 2003; 23:7780–7793. [PubMed: 14560022]
Gentleman RC. Using GO for statistical analysis. Proceedings COMPSTAT. 2004:171–180.
McBride et al. Page 15
Alcohol. Author manuscript; available in PMC 2014 November 01.
NIH
-PA Author Manuscript
NIH
-PA Author Manuscript
NIH
-PA Author Manuscript

Gentleman RC, Carey VJ, Bates DM, Bolstad B, Dettling M, Dudoit S, et al. Bioconductor: opensoftware development for computational biology and bioinformatics. Genome Biology. 2004;5:R80. [PubMed: 15461798]
Hansen C, Spuhler K. Development of the National Institute of Health genetically heterogeneous ratstock. Alcoholism: Clinical and Experimental Research. 1984; 8:477–479.
Harris MA, Clark J, Ireland A, Lomax J, Ashburner M, Foulger R, et al. The Gene Ontology (GO)database and informatics resource. Nucleic Acids Research. 2004; 32:D258–D261. [PubMed:14681407]
Ikemoto S, Glazier BS, Murphy JM, McBride WJ. Role of dopamine D1 and D2 receptors in thenucleus accumbens in mediating reward. Journal of Neuroscience. 1997; 17:8580–8587. [PubMed:9334429]
Irizarry RA, Hobbs B, Collin F, Beazer-Barclay YD, Antonellis KJ, Scherf U, et al. Exploration,normalization, and summaries of high density oligonucleotide array probe level data. Biostatistics.2003; 4:249–264. [PubMed: 12925520]
Jiang Z, Gentleman R. Extensions to gene set enrichment. Bioinformatics. 2007; 23:306–313.[PubMed: 17127676]
Johnson C, Drgon T, Walther D, Uhl GR. Genomic regions identified by overlapping clusters ofnominally-positive SNPs from genome-wide studies of alcohol and illegal substance dependence.PLoS One. 2011; 6:e19210. [PubMed: 21818250]
Kendler KS, Kalsi G, Holmans PA, Sanders AR, Aggen SH, Dick DM, et al. Genomewide associationanalysis of symptoms of alcohol dependence in the molecular genetics of schizophrenia (MGS2)control sample. Alcoholism: Clinical and Experimental Research. 2011; 35:963–975.
Kerns RT, Ravindranathan A, Hassan S, Cage MP, York T, Sikela JM, et al. Ethanol-responsive brainregion expression networks: implications for behavioral responses to acute ethanol in DBA/2Jversus C57BL/6J mice. The Journal of Neuroscience. 2005; 25:2255–2266. [PubMed: 15745951]
Khaitlina S, Fitz H, Hinssen H. The interaction of gelsolin with tropomyosin modulates actindynamics. The FEBS Journal. 2013; 280:4600–4611. [PubMed: 23844991]
Kiianmaa, K.; Hyytia, P.; Sinclair, JD. Development of an animal model of ethanol abuse: geneticapproach. In: Boulton, A.; Baker, G.; Wu, PH., editors. Neuromethods, Vol. 24; Animal Model ofDrug Addiction. Totowa, NJ: The Humana Press; 1992. p. 29-63.
Kim SH, Ryan TA. Balance of calcineurin Aα and CDK5 activities sets release probability at nerveterminals. Journal of Neuroscience. 2013; 33:8937–8950. [PubMed: 23699505]
Kimpel MW, Strother WN, McClintick JN, Carr LG, Liang T, Edenberg HJ, et al. Functional geneexpression differences between inbred alcohol-preferring and -non-preferring rats in five brainregions. Alcohol. 2007; 41:95–132. [PubMed: 17517326]
Koob GF, Roberts AJ, Schulteis G, Parsons LF, Heyser CJ, Hyytiä P, et al. Neurocircuitry targets inethanol reward and dependence. Alcoholism: Clinical and Experimental Research. 1998; 22:3–9.
Langfelder P, Horvath S. WGCNA: an R package for weighted correlation network analysis. BMCBioinformatics. 2008; 9:559. [PubMed: 19114008]
Langfelder P, Horvath S. Fast R functions for robust correlations and hierarchical clustering. Journalof Statistical Software. 2012; 46
Lewohl JM, Wang L, Miles MF, Zhang L, Dodd PR, Harris RA. Gene expression in humanalcoholism: microarray analysis of frontal cortex. Alcoholism: Clinical and ExperimentalResearch. 2000; 24:1873–1882.
Li T-K, Lumeng L, Doolittle DP. Selective breeding for alcohol preference and associated responses.Behavioral Genetics. 1993; 23:163–170.
Lumeng, L.; Hawkins, TD.; Li, T-K. New strains of rats with alcohol preference and non-preference.In: Thurman, RG.; Williamson, JR.; Drott, H.; Chance, B., editors. Alcohol and AldehydeMetabolizing Systems. Vol. Vol. III. New York: Academic Press; 1977. p. 537-544.
Marks PW, Arai M, Bandura JL, Kwiatkowski DJ. Advillin (p92): a new member of the gelsolin/villinfamily of actin regulatory proteins. Journal of Cell Science. 1998; 111:2129–2136. [PubMed:9664034]
McBride et al. Page 16
Alcohol. Author manuscript; available in PMC 2014 November 01.
NIH
-PA Author Manuscript
NIH
-PA Author Manuscript
NIH
-PA Author Manuscript

Mayfield RA, Lewohl JM, Dodd PR, Herlihy A, Liu J, Harris RA. Patterns of gene expression arealtered in the frontal and motor cortices of human alcoholics. Journal of Neurochemistry. 2002;81:802–813. [PubMed: 12065639]
McBride WJ. Central nucleus of the amygdala and the effects of alcohol and alcohol-drinking behaviorin rodents. Pharmacology, Biochemistry, and Behavior. 2002; 71:509–515.
McBride WJ, Li T-K. Animal models of alcoholism: neurobiology of high alcohol-drinking behaviorin rodents. Critical Reviews in Neurobiology. 1998; 12:339–369. [PubMed: 10348615]
McBride WJ, Kimpel MW, McClintick JN, Ding Z-M, Hyytiä P, Colombo G, et al. Gene expression inthe ventral tegmental area of 5 pairs of rat lines selectively bred for high or low ethanolconsumption. Pharmacology, Biochemistry, and Behavior. 2012; 102:275–285.
McBride WJ, Kimpel MW, Schultz JA, McClintick JN, Edenberg HJ, Bell RL. Changes in geneexpression in regions of the extended amygdala of alcohol-preferring rats after binge-like alcoholdrinking. Alcohol. 2010; 44:171–183. [PubMed: 20116196]
McClintick JN, Edenberg HJ. Effects of filtering by Present call on analysis of microarrayexperiments. BMC Bioinformatics. 2006; 7:49. [PubMed: 16448562]
McClintick JN, Jerome RE, Nicholson CR, Crabb DW, Edenberg HJ. Reproducibility ofoligonucleotide arrays using small samples. BMC Genomics. 2003; 4:4. [PubMed: 12594857]
Meredith GE. The synaptic framework for chemical signaling in nucleus accumbens. Annals of theNew York Academy of Sciences. 1999; 877:140–156. [PubMed: 10415648]
Miller MK, Bang ML, Witt CC, Labeit D, Trombitas C, Watanabe K, et al. The muscle ankyrin repeatproteins: CARP, ankrd2/Arpp and DARP as a family of titin filament-based stress responsemolecules. Journal of Molecular Biology. 2003; 333:951–964. [PubMed: 14583192]
Mulligan MK, Ponomarev I, Hitzemann RJ, Belknap JK, Tabakoff B, Harris RA, et al. Towardunderstanding the genetics of alcohol drinking through transcriptome meta-analysis. Proceedingsof the National Academy of Sciences of the United States of America. 2006; 103:6368–6373.[PubMed: 16618939]
Muotri AR, Chu VT, Marchetto MC, Deng W, Moran JV, Gage FH. Somatic mosaicism in neuronalprecursor cells mediated by L1 retrotransposition. Nature. 2005; 435:903–910. [PubMed:15959507]
Murphy JM, Stewart RB, Bell RL, Badia-Elder NE, Carr LG, McBride WJ, et al. Phenotypic andgenotypic characterization of the Indiana University rat lines selectively bred for high and lowalcohol preference. Behavioral Genetics. 2002; 32:363–388.
Oron A, Jiang Z, Gentleman R. Gene set enrichment analysis using linear models and diagnostics.Bioinformatics. 2008; 24:2586–2591. [PubMed: 18790795]
Paxinos, G.; Watson, C. The Rat Brain in Stereotaxic Coordinates. 4th ed.. New York: AcademicPress; 1998.
Pelegrini AL, Moura DJ, Brenner BL, Ledur PF, Maques GP, Henriques JA, et al. Nek1 silencingslows down DNA repair and blocks DNA damage-induced cell cycle arrest. Mutagenesis. 2010;25:447–454. [PubMed: 20501547]
Raza H. Dual localization of glutathione S-transferase in the cytosol and mitochondria: implications inoxdative stress, toxicity and disease. The FEBS Journal. 2011; 278:4243–4251. [PubMed:21929724]
Roberts AJ, Cole M, Koob GF. Intra-amygdala muscimol decreases operant ethanol self-administration in dependent rats. Alcoholism: Clinical and Experimental Research. 1996;20:1289–1298.
Rodd ZA, Kimpel MW, Edenberg HJ, Bell RL, Strother WN, McClintick JN, et al. Differential geneexpression in the nucleus accumbens with ethanol self-administration in inbred alcohol-preferringrats. Pharmacology, Biochemistry, and Behavior. 2008; 89:481–498.
Saba LM, Bennett B, Hoffman PL, Barcomb K, Ishi T, Kechris K, et al. A systems genetic analysis ofalcohol drinking by mice, rats and men: influence of brain GABAergic transmission.Neuropharmacology. 2011; 60:1269–1280. [PubMed: 21185315]
Sasai M, Oshiumi H, Matsumoto M, Inoue N, Fujita F, Nakanishi M, et al. Cutting edge: NF-kappaB-activating kinase-associated protein 1 participates in TLR3/Toll-IL-1 homology domain-
McBride et al. Page 17
Alcohol. Author manuscript; available in PMC 2014 November 01.
NIH
-PA Author Manuscript
NIH
-PA Author Manuscript
NIH
-PA Author Manuscript

containing adaptor molecule-1-mediated IFN regulatory factor 3 activation. Journal ofImmunology. 2005; 174:27–30.
She H, Yang Q, Mao Z. Neurotoxin-induced selective ubiquitination and regulation of MEF2Aisoform in neuronal stress response. Journal of Neurochemistry. 2012; 122:1203–1210. [PubMed:22764880]
Shefer G, Benayahu D. SVEP1 is a novel marker of activated pre-determined skeletal muscle satellitecells. Stem Cell Reviews. 2010; 6:42–49. [PubMed: 20052625]
Shibata M, Ishii J, Koizumi H, Shibata N, Dohmae N, Takio K, et al. Type F scavenger receptorSREC-1 interacts with advillin, a member of the gelsolin/villin family, and induces neurite-likeoutgrowth. The Journal of Biological Chemistry. 2004; 279:40084–40090. [PubMed: 15247299]
Sinclair JD, Lê AD, Kiianmaa K. The AA and ANA rat lines, selected for differences in voluntaryalcohol consumption. Experientia. 1989; 45:798–805. [PubMed: 2673834]
Sommer W, Hyytiä P, Kiianmaa K. The alcohol-preferring AA and alcohol-avoiding ANA rats:neurobiology of the regulation of alcohol drinking. Addiction Biology. 2006; 11:289–309.[PubMed: 16961760]
Stephan AH, Barres BA, Stevens B. The complement system: an unexpected role in synaptic pruningduring development and disease. Annual Review of Neuroscience. 2012; 35:369–389.
Storey JD, Taylor JE, Siegmund D. Strong control, conservative point estimation, and simultaneousconservative consistency of false discovery rates: a unified approach. Journal of the RoyalStatistical Society: Series B Statistical Methodology. 2004; 66:187–205.
Ström M, Al Nimer F, Lindblom R, Nyengaard JR, Peihl F. Naturally occurring genetic variablity inexpression of Gsta4 is associated with differential survival of axotomized rat motoneurons.Neuromolecular Medicine. 2012; 14:15–29. [PubMed: 22160604]
Subramanian A, Tamayo P, Mootha VK, Mukherjee S, Ebert BL, Gillette MA, et al. Gene setenrichment analysis: a knowledge-based approach for interpreting genome-wide expressionprofiles. Proceedings of the National Academy of Sciences of the United States of America. 2005;102:15545–15550. [PubMed: 16199517]
Tabakoff B, Saba L, Kechris K, Hu W, Bhave SV, Finn DA, et al. The genomic determinants ofalcohol preference in mice. Mammalian Genome. 2008; 19:352–365. [PubMed: 18563486]
Tabakoff B, Saba L, Printz M, Flodman P, Hodgkinson C, Goldman D, et al. Genetical genomicdeterminants of alcohol consumption in rats and humans. BMC Biology. 2009; 7:70. [PubMed:19874574]
Tachibana M, Kiyokawa E, Hara S, Iemura S, Natsume T, Manabe T, et al. Ankyrin repeat domain 28(ANKRD28), a novel binding partner of DOCK180, promotes cell migration by regulating focaladhesion formation. Experimental Cell Research. 2009; 315:863–876. [PubMed: 19118547]
Xue Y-M, Kowalska AK, Grabowska K, Przbyt K, Cichewicz MA, Del Rosario BC, et al. Histonechaperones Nap1 and Vps75 regulate histone acetylation during transcription elongation.Molecular and Cellular Biology. 2013; 33:1645–1656. [PubMed: 23401858]
Zhang A, Yeung PL, Li C-W, Tsai S-C, Dinh GK, Wu X, et al. Identification of a novel family ofankyrin repeats containing cofactors for p160 nuclear receptor coactivators. The Journal ofBiological Chemistry. 2004; 279:33799–33805. [PubMed: 15184363]
Zhang B, Horvath S. A general framework for weighted gene co-expression network analysis.Statistical Applications in Genetics and Molecular Biology. 2005; 4 article 17.
Zhou A, Zhou J, Yang L, Liu M, Li H, Xu S, et al. A nuclear localized protein ZCCHC9 is expressedin cerebral cortex and suppresses the MAPK signal pathway. Journal of Genetics and Genomics.2008; 35:467–472. [PubMed: 18721783]
McBride et al. Page 18
Alcohol. Author manuscript; available in PMC 2014 November 01.
NIH
-PA Author Manuscript
NIH
-PA Author Manuscript
NIH
-PA Author Manuscript
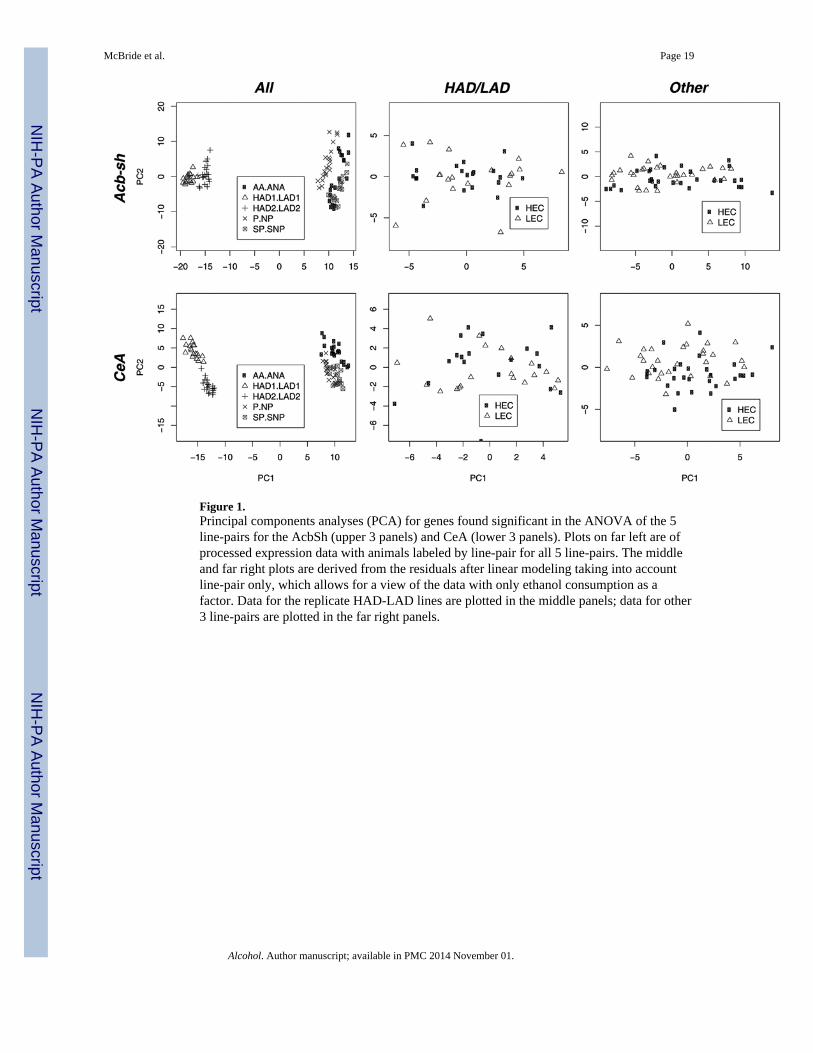
Figure 1.Principal components analyses (PCA) for genes found significant in the ANOVA of the 5line-pairs for the AcbSh (upper 3 panels) and CeA (lower 3 panels). Plots on far left are ofprocessed expression data with animals labeled by line-pair for all 5 line-pairs. The middleand far right plots are derived from the residuals after linear modeling taking into accountline-pair only, which allows for a view of the data with only ethanol consumption as afactor. Data for the replicate HAD-LAD lines are plotted in the middle panels; data for other3 line-pairs are plotted in the far right panels.
McBride et al. Page 19
Alcohol. Author manuscript; available in PMC 2014 November 01.
NIH
-PA Author Manuscript
NIH
-PA Author Manuscript
NIH
-PA Author Manuscript

NIH
-PA Author Manuscript
NIH
-PA Author Manuscript
NIH
-PA Author Manuscript
McBride et al. Page 20
Tabl
e 1
Num
ber
of p
robe
set
s th
at s
igni
fica
ntly
dif
fere
d (F
DR
= 0
.1; f
old-
chan
ge ≥
1.2
) in
exp
ress
ion
in th
e A
cbSh
and
CeA
bet
wee
n ea
ch o
f th
e se
lect
ivel
y br
edpa
irs
of h
igh
(HE
C)
and
low
(L
EC
) et
hano
l-co
nsum
ing
lines
of
rats
P-N
PsP
-sN
PH
AD
1-L
AD
1H
AD
2-L
AD
2A
A-
AN
A
Acb
Sh
Nam
ed g
enes
a17
7240
215
756
512
7
Un-
nam
ed g
enes
286
7823
9130
CeA
Nam
ed g
enes
a29
349
415
851
81
Un-
nam
ed g
enes
5110
229
870
Prob
e-se
ts r
emai
ning
aft
er r
emov
ing
thos
e no
t det
ecta
bly
expr
esse
d w
as 2
0,74
5 in
the
Acb
Sh a
nd 2
0,59
6 in
the
CeA
.
a Om
its a
ny a
nnot
ated
as
“rik
en”,
“pr
edic
ted”
or
“sim
ilar
to”.
Alcohol. Author manuscript; available in PMC 2014 November 01.

NIH
-PA Author Manuscript
NIH
-PA Author Manuscript
NIH
-PA Author Manuscript
McBride et al. Page 21
Tabl
e 2
Sign
ific
ant G
ene
Ont
olog
y (G
O)
biol
ogic
al c
ateg
orie
s in
the
Acb
Sh a
nd C
eA o
f th
e in
divi
dual
line
-pai
rs
Bio
logi
cal c
ateg
ory
P-N
PsP
-sN
PH
AD
1-L
AD
1H
AD
2-L
AD
2A
A-
AN
A
Acb
Sh
Gla
nd m
orph
ogen
esis
XX
X
Mus
cle
cell
prol
ifer
atio
nX
XX
Reg
ulat
ion
of n
euro
tran
smitt
erle
vels
XX
X
Res
pons
e to
glu
coco
rtic
oid
stim
ulus
XX
X
Res
pons
e to
ret
inoi
c ac
idX
XX
Res
pons
e to
ste
roid
hor
mon
est
imul
usX
XX
Tis
sue
mor
phog
enes
isX
XX
Vas
cula
r pr
oces
s in
cir
cula
tory
syst
emX
XX
CeA
Cir
cadi
an r
hyth
mX
XX
X
Leu
kocy
te c
hem
otax
isX
XX
X
Wou
nd h
ealin
gX
XX
X
Dio
l met
abol
ic p
roce
ssX
XX
Posi
tive
regu
latio
n pr
otei
n ki
nase
B s
igna
ling
casc
ade
XX
X
Res
pons
e to
mol
ecul
e of
bac
teri
alor
igin
XX
X
Res
pons
e to
oth
er o
rgan
ism
XX
X
GO
cat
egor
ies
sign
ific
ant a
t p <
0.0
5 an
d ob
serv
ed in
3 o
r m
ore
line-
pair
s
Alcohol. Author manuscript; available in PMC 2014 November 01.

NIH
-PA Author Manuscript
NIH
-PA Author Manuscript
NIH
-PA Author Manuscript
McBride et al. Page 22
Table 3
Networks identified by Ingenuity Pathway Analysis of significant differences in genes with higher or lowerexpression in the AcbSh and CeA of the P, HAD1, HAD2, AA and sP lines compared to their respective lowethanol consuming lines
AcbSh
Line-pair Canonical Pathway Higher gene expression Lower gene expression
HAD2-LAD2
ILK Signaling 9 genes: Map2k6, Pik3ca, Pik3c2a, Pik3r1,Vim, Myl9, Vegfb, Ppp1r12a, Rps6ka5
6 genes: Mapk8, Rhog, Rnd3, Pik3c3,Rsu1, Acta1
P-NP cAMP-mediatedsignaling
19 genes: Camk2d, Htr7, Atf4, Cnr1,Rapgef3, Pde8a, Pkib, Rps6ka1, Camk2g,Akap12, Pde4a, Chrm3, Ppp3cb, Adcy8,Adcy2, Adcy6, Crhr1, Gabbr2, Pth1r
36 genes: Mapk1, Grm3, Camk2a, Adcy5,Ppp3r1, Rgs14, Pde2a, Grm8, Pde10a,Rgs4, Grm4, Drd2, Mc4r, Grm7, Pde1b,Pkig, Grm2, Camk4, Htr4, Chrm4, Htr1d,Pde1a, Hrh3, Akap11, Vipr1, Map2k1,Ppp3ca, Akap5, Npy1r, Prkar2b, Oprk1,Adra2c, Htr1f, Pde8b, Adora2a, Akap1
P-NP G-Protein CoupledReceptor Signaling
40 genes: Gpr37, Htr7, Atf4, Cnr1, Sstr1,Npy5r, Pde8a, Hcrtr1, Rps6ka1, Camk2g,Fzd1, Gprc5b, Pik3c3, Adcy6, Crhr1,Gpr64, Pth1r, Ntsr1, Gpr162, Casr,Gpr116, Camk2d, Adra1b, Grm1, Rapgef3,Hcrtr2, Cxcr7, Nfkbie, Pde4a, Nfkb1,Chrm3, Tacr1, Nfkbia, Smo, Adcy8, Adcy2,Trhr, Ednrb, Gabbr2, Plcb4
52 genes: Grm3, Gpr149, Camk2a, Pde2a,Grm8, Lphn3, Grm7, Pde1b, Fyn, Gpr12,Htr4, Ptk2b, Chrm4, Htr1d, Hrh3, Vipr1,Gpr155, Pik3r2, Bai2, Htr2a, Prkcg, Grm5,Rasgrp1, Adora2a, Prkcb, Mapk1, Pthlh,Pdpk1, Adcy5, Mras, Rgs14, Bai3, Pde10a,Rgs4, Grm4, Drd2, Mc4r, P2ry1, Grm2,Camk4, Pde1a, Map2k1, Npy1r, Gpr88,Gipr, Prkar2b, Sstr2, Oprk1, Calcr, Adra2c,Htr1f, Pde8b
P-NP Synaptic LongTerm Potentiation
12 genes: Gria4, Camk2d, Ppp3cb, Atf4,Adcy8, Ppp1r14c, Grm1, Ppp1r14a,Rapgef3, Plcb4, Rps6ka1, Camk2g
24 genes: Grm2, Camk4, Mapk1, Grm3,Gria1, Camk2b, Camk2a, Ppp1r7, Ppp3r1,Mras, Map2k1, Ppp3ca, Grm8, Gria2, Itpr1,Grm4, Prkcg, Grm7, Grm5, Prkar2b,Ppp1r12a, Prkch, Gria3, Prkcb
P-NP GlutamateReceptor Signaling
6 genes: Slc17a6, Grm1, Grip1, Gria4,Gng2, Grik1
16 genes: Grm2, Camk4, Grm3, Grm8, Gls,Gria1, Gria2, Slc1a3, Grm4, Gng7, Grm5,Grm7, Dlg4, Grik2, Homer1, Gria3
P-NP Protein Kinase ASignaling
28 genes: Dusp15, Camk2d, Atf4, Cdc16,Cdc25a, Ppp1r14c, Ptprd, Ppp1r14a,Gng3, Pde8a, Pygm, Dusp19, Gng2,Camk2g, Anapc2, Akap12, Nfkbie, Pde4a,Nfkb1, Nfkbia, Ppp3cb, Smo, Tgfb2, Adcy8,Adcy2, Adcy6, Pygb, Plcb4
37 genes: Mapk1, Ptpla, Ptk2, Gnb4,Camk2b, Camk2a, Ppp1r7, Adcy5, Ppp3r1,Ryr3, Ptpre, Pde2a, Pde10a, Ppp1r1b,Ptpn18, Itpr1, Pde1b, Tgfb3, Ppp1r12a,Prkch, Camk4, Ptk2b, Pde1a, Ptpn5, Gng7,Akap11, Dusp14, Map2k1, Ppp3ca, Akap5,Pygl, Prkcg, Prkar2b, Pde8b, Ptgs2, Prkcb,Akap1
P-NP CREB Signaling inNeurons
14 genes: Gria4, Camk2d, Pik3c3, Atf4,Adcy8, Grik1, Adcy2, Grm1, Adcy6, Gng3,Plcb4, Gng2, Rps6ka1, Camk2g
26 genes: Grm2, Camk4, Mapk1, Grm3,Gria1, Gng7, Gnb4, Camk2b, Camk2a,Adcy5, Mras, Grik2, Pik3r2, Map2k1, Grm8,Gria2, Grm4, Itpr1, Prkcg, Grm5, Grm7,Prkar2b, Prkch, Gnal, Gria3, Prkcb
P-NP Calcium Signaling 14 genes: Tnnc1, Atp2a2, Gria4, Camk2d,Ppp3cb, Atf4, Grik1, Hdac4, Myh14, Tpm2,Trpc4, Atp2b2, Tpm4, Camk2g
21 genes: Tnnt1, Camk4, Mapk1, Atp2b1,Gria1, Tpm1, Camk2b, Camk2a, Ppp3r1,Ryr3, Ppp3ca, Casq2, Akap5, Tnnc2,Gria2, Itpr1, Prkar2b, Htr3a, Mef2c,Camkk2, Gria3
P-NP Relaxin Signaling 12 genes: Nfkbie, Pde4a, Nfkb1, Nfkbia,Pik3c3, Adcy8, Adcy2, Adcy6, Gng3,Pde8a, Gng2, Npr2
16 genes: Mapk1, Pde1a, Gng7, Gnb4,Adcy5, Mras, Pik3r2, Map2k1, Gucy1b3,Pde2a, Gucy1a3, Pde10a, Prkar2b, Pde1b,Pde8b, Gnal
P-NP Phospholipase CSignaling
20 genes: Nfkb1, Rhog, Ppp3cb, Gpld1,Atf4, Adcy8, Adcy2, Hdac4, Pld3, Adcy6,Ppp1r14a, Arhgef17, Rapgef3, Gng3,Rhov, Plcb4, Rhoq, Rnd3, Gng2, Fnbp1
20 genes: Fyn, Camk4, Mapk1, Rps6ka3,Gng7, Gnb4, Adcy5, Ppp3r1, Mras,Arhgef2, Map2k1, Ppp3ca, Itpr1, Prkcg,Ppp1r12b, Ppp1r12a, Mef2c, Prkch,Arhgef9, Prkcb
P-NP Signaling by Rho 21 genes: Pip5k1b, Sept9, Nfkb1, Limk1, 20 genes: Mapk1, Ptk2b, Gng7, Ptk2,
Alcohol. Author manuscript; available in PMC 2014 November 01.

NIH
-PA Author Manuscript
NIH
-PA Author Manuscript
NIH
-PA Author Manuscript
McBride et al. Page 23
AcbSh
Line-pair Canonical Pathway Higher gene expression Lower gene expression
Family GTPases Stmn1, Rhog, Pik3c3, Gfap, Cdc42ep1,Mapk8, Rdx, Arhgef17, Gng3, Mapk12,Rhov, Rhoq, Rnd3, Gng2, Pip4k2a, Sept6,Fnbp1
Gnb4, Ezr, Baiap2, Mras, Arhgef2, Arpc1a,Pik3r2, Map2k1, Cdc42ep3, Wasf1,Pip5k1a, Ppp1r12b, Ppp1r12a, Pard3,Arhgef9, Gnal
P-NP Axonal GuidanceSignaling
28 genes: Bmp4, Ephb2, Adam11, Limk1,Tubb3, Sema5a, Gng3, Sema6d, Gng2,Rgs3, Slit1, Pdgfa, Fzd1, Tubb2b, Ppp3cb,Igf1, Tuba8, Pik3c3, Ntrk1, Smo, Rassf5,Plcb4, Ntrk2, Sema4d, Mag, Epha5,Sema3c, Gli1
34 genes: Slit3, Mapk1, Itsn1, Ptk2, Gnb4,Ephb1, Ppp3r1, Baiap2, Mras, Arpc1a,Ablim2, Epha7, Ngef, Kalrn, Vegfc, Prkch,Gnal, Fyn, Bmp2, Epha4, Plxna2, Gng7,Wnt7a, Pik3r2, Robo2, Shank2, Map2k1,Ppp3ca, Plxnc1, Slit2, Plxnd1, Prkcg,Prkar2b, Prkcb
P-NP Synaptic LongTerm Depression
8 genes: Gria4, Lcat, Igf1, Ppm1l, Grm1,Crhr1, Plcb4, Npr2
20 genes: Grm2, Mapk1, Grm3, Gria1,Ryr3, Mras, Map2k1, Gucy1b3, Gucy1a3,Grm8, Gria2, Itpr1, Grm4, Prkcg, Grm5,Grm7, Prkch, Gnal, Prkcb, Gria3
P-NP α-AdrenergicSignaling
7 genes: Adcy2, Adcy6, Pygb, Gng3,Pygm, Gng2, Adcy8
13 genes: Camk4, Mapk1, Pygl, Itpr1,Gng7, Prkcg, Gnb4, Prkar2b, Adcy5, Mras,Prkch, Map2k1, Prkcb
P-NP Gap JunctionSignaling
10 genes: Tubb2b, Ppp3cb, Tuba8, Pik3c3,Adcy8, Adcy2, Tubb3, Adcy6, Plcb4, Npr2
17 genes: Csnk1g1, Mapk1, Adcy5,Ppp3r1, Mras, Pik3r2, Map2k1, Ppp3ca,Gucy1b3, Htr2a, Gucy1a3, Itpr1, Drd2,Prkcg, Prkar2b, Prkch, Prkcb
P-NP DopamineReceptor Signaling
10 genes: Ppp1r14c, Adcy2, Adcy6,Ppp1r14a, Slc18a3, Ppm1l, Smox, Adcy8,Pcbd1, Qdpr
6 genes: Ppp1r1b, Drd2, Prkar2b, Ppp1r7,Adcy5, Ppp1r12a
P-NP CorticotropinReleasing HormoneSignaling
10 genes: Smo, Atf4, Adcy8, Adcy2, Cnr1,Adcy6, Crhr1, Mapk12, Gli1, Npr2
13 genes: Camk4, Mapk1, Adcy5, Map2k1,Gucy1b3, Gucy1a3, Itpr1, Prkcg, Prkar2b,Mef2c, Prkch, Ptgs2, Prkcb
P-NP Dopamine-DARPP32Feedback in cAMPSignaling
13 genes: Kcnj16, Atp2a2, Ppp3cb, Ppm1l,Atf4, Adcy8, Ppp1r14c, Adcy2, Adcy6,Ppp1r14a, Plcb4, Kcnj5, Kcnj6
19 genes: Camk4, Csnk1g1, Kcnj4, Adcy5,Ppp1r7, Ppp3r1, Ppp3ca, Gucy1b3,Cacna1d, Gucy1a3, Ppp1r1b, Itpr1, Drd2,Prkcg, Prkar2b, Ppp1r12a, Prkch, Camkk2,Prkcb
P-NP CXCR4 Signaling* 14 genes: Rhog, Pik3c3, Adcy8, Adcy2,Mapk8, Adcy6, Gng3, Mapk12, Plcb4,Rhov, Rhoq, Rnd3, Gng2, Fnbp1
14 genes: Mapk1, Gng7, Ptk2, Gnb4,Adcy5, Mras, Pik3r2, Map2k1, Egr1, Itpr1,Prkcg, Prkch, Gnal, Prkcb
P-NP ILK Signaling 18 genes: Nfkb1, Ccnd1, Tgfb1i1, Rhog,Pik3c3, Ppm1l, Atf4, Itgb5, Myh14, Fermt2,Mapk8, Mapk12, Rhov, Rhoq, Rnd3,Sh2b2, Rsu1, Fnbp1
14 genes: Map2k6, Mapk1, Bmp2, Pdpk1,Ptk2, Myc, Pik3r2, Actn1, Casp3, Actn2,Vegfc, Ppp1r12a, Rps6ka5, Ptgs2
P-NP Renin-AngiotensinSignaling*
10 genes: Adcy2, Adcy6, Mapk8, Nfkb1,Mapk12, Pik3c3, Stat1, Adcy8, Ace, Agt
13 genes: Ptk2b, Mapk1, Itpr1, Jak2,Prkcg, Ptk2, Prkar2b, Adcy5, Mras, Prkch,Pik3r2, Map2k1, Prkcb
P-NP IL-1 Signaling 10 genes: Adcy2, Nfkbie, Mapk8, Adcy6,Gng3, Mapk12, Nfkb1, Nfkbia, Gng2,Adcy8
9 genes: Map2k6, Mapk1, Gng7, Gnb4,Prkar2b, Adcy5, Mras, Gnal, Irak2
CeA
Line-pair Canonical Pathway Higher gene expression Lower gene expression
HAD1-LAD1
IL-8 Signaling 6 genes: Ccnd2, Mapk1, Mapk8, Nfkb1,Ccnd1, Tek
4 genes: Itgb2, Pik3ca, Pik3c2a, Mmp2
HAD2-LAD2
IGF-1 Signaling 7 genes: Csnk2a2, Igfbp6, Pik3ca, Jun,Pik3c2a, Stat3, Igfbp2
3 genes: Pik3c3, Mapk8, Igfbp5
HAD2-LAD2
CardiacHypertrophySignaling
8 genes: Adcy9, Pik3ca, Pik3c2a, Gng13,Myl9, Jun, Eif2b1, Hspb1
6 genes: Mapk8, Eif4e, Rock2, Pik3c3,Eif2b5, Mef2c
Alcohol. Author manuscript; available in PMC 2014 November 01.

NIH
-PA Author Manuscript
NIH
-PA Author Manuscript
NIH
-PA Author Manuscript
McBride et al. Page 24
AcbSh
Line-pair Canonical Pathway Higher gene expression Lower gene expression
HAD2-LAD2
Breast CancerRegulation byStathmin1
Adcy9, Pik3ca, Pik3c2a, Gng13, Rb1cc1,Arhgef18, Prkd3
Rock2, Camk2a, Camk2d, Pik3c3, Arhgef9
HAD2-LAD2
IL-8 Signaling 8 genes: Pik3ca, Pik3c2a, Gng13, Myl9,Jun, Vegfb, Prkd3, Itgb5
6 genes: Mapk8, Irak3, Rock2, Traf6, Pik3c3, Tek
HAD2-LAD2
Role of NFAT inCardiacHypertrophy
6 genes: Adcy9, Akap5, Pik3ca, Pik3c2a,Gng13, Prkd3
5 genes: Mapk8, Camk2d, Camk2a,Pik3c3, Mef2c
There were no significant canonical pathways in the AcbSh or CeA for the AA-ANA and sP-sNP line-pairs. For the AcbSh, only pathways with 15or more genes are listed. For the CeA, only pathways with 10 or more genes are listed.
*Indicates that similar pathways were found in the AcbSh of the HAD2-LAD2 line-pair, but are not listed because there were less than 15 genes in
each pathway. There were no genes in common within these pathways between the P-NP and HAD2-LAD2 line-pairs.
Alcohol. Author manuscript; available in PMC 2014 November 01.

NIH
-PA Author Manuscript
NIH
-PA Author Manuscript
NIH
-PA Author Manuscript
McBride et al. Page 25
Table 4
Networks identified by Ingenuity Pathway Analysis of significant differences in higher or lower geneexpression in the AcbSh and CeA of the HEC compared to the LEC lines
AcbSh
Network/main theme Gene expression highera Gene expression lowerb
Network 1: Developmentand Function
19 genes: Acss1, Cpne8,Ext2, Grk6, Grm8, Hsd17b7,Kif1a, Lcat, Maoa, Myh11,Nav2, Nfix, Phf20, Pias2,Sncg, Sp1, Suds3, Tagln,Tnrc6a
11 genes: Arid4b, Gas7, Hk2,Igfbp4, Ing2, Lpxn, Nap1l1,Nr2f6, Rps19, Sf3a1, Wdr5
Network 2: Cellular Growthand Proliferation
11 genes: Adcy9, Capn1,Cpt1a, Creg1, Dctn6, Gfap,Pou6f1, S100a6, Scg2, Stat3,Tgfa
19 genes: Akt1s1, Axl, Blvrb,Bzw2, Epn2, Fkbp1a, Kitlg,Laptm5, Mlxipl, Myo5a, Npy,Ppp3ca, Ppp3r1, Pygl, Rock2,S100b, Sst, Txnl1, Wars
Network 3: Nervous SystemDevelopment and Function
12 genes: Bcan, Dnm1,Grb14, Gria4, Grin3a,Hexim1, Mpp6, Numb, Reln,Rhot2, Rnf41, Zeb2
20 genes: Arf4, Camk2a, Cbr1,Efnb3, Egfr, Ephb1, Fyn,Gabbr1, Gda, Grin2b, Grm5,Kars, Lin7a, Map2, Mpp5,Pip5k1a, Scarf2, Sdc2, Shc2,Trak2
Network 4: Cell-To-CellSignaling and Interaction
14 genes: Ankrd12, B4galt1,Bag3, Caprin1, Cdk9,Cxcl12, Dlat, Dnajb1,Dync1h1, Hs2st1, Ppm1b,Sdf4, Tubgcp3, Yme1l1
17 genes: Arpc4, Copg, Copz1,Dad1, Dap3, Exosc2, Exosc5,Gapdhs, Lancl1, Mapk3, Mzf1,Pdk1, Phb2, Ptprz1, Ralgds,Sod3, Tmed9
Network 5: CellularAssembly and Organization
14 genes: Dhx36, Hif1a,Lrrc59, Map4, Pank2, Pfkp,Pgk1, Pik3r4, Plod2, Rb1cc1,Sephs1, Sh3glb1, Vps33a,Wdfy3
17 genes: Acp6, Aldh2, Atg10,Atg12, Atg4b, Camkk2, Ccs,Echs1, Erh, Fyco1, Gsto1,Mdh1, Prkaa2, Rgs10, Tars,Uba5, Wdr41
CeA
Network/main theme Gene expression highera Gene expression lowerb
Network 1: DNA Repair,RNA Damage and Repair
18 genes: Abce1, Aifm2,Ccnl2, Col14a1, Comt,Creg1, Cul5, Gstm4, Hint1,Iqcb1, Morc3, Ncapd3,Ncaph, Ppm1a, Rnasel,Scn3b, Setd2, Vps33a
17 genes: Cstf1, Fech, Mbnl2,Mcam, Nthl1, Phkg1, Polg,Ppp2r2a, Ppp2r5a, Rab40c,Rnf40, Sh3bgrl2, Slc6a6,Spsb1, Tbxas1, Tp53, Trio
Network 2: DevelopmentalDisorder, NeurologicalDisease
18 genes: Adam9, Bbs1,Cep290, Eps8, Ercc8, Grb14,H1f0, Hdgfrp3, Hook3, Ipo5,MAST1, Pcm1, Pldn, Rnf41,Tmco3, Tmod2, Ttc8,Wdyhv1
16 genes: Ahnak, Apbb3, Axl,Cbr1, Ccng2, Egfr, Inppl1,Kif5c, Lin7a, Mdh1, Mpp3,Rab31, Shc1, Tmod1, Tpm1,Trak2
Network 3: CellularAssembly and Organization,Cell-To-Cell Signaling andInteraction
13 genes: Dcun1d4, Dhx36,Etv4, Flnb, Ipo4, Mlh1,Nedd9, Nup107, Phf20, Reln,Tgfb1i1, Trim23, Vav2
18 genes: Abcd3, C1qa, Fn1,Kdm5b, Map2, Nup93, Pde3b,Pex19, Phyh, Plec, Psd3,Ptp4a3, Rnaset2, Rragd,Swap70, Tmem14a, Tnfrsf11b,Tnfsf13
Network 4: MolecularTransport, RNA Trafficking
13 genes: Bmpr1a, Bud13,Crmp1, Fam107b, Hif1a,Hnrnpul1, Ncbp1, Pias2,Plod2, Rad1, Tdg, Tgfb2,Thoc4
20 genes: Abcg1, Aldh2, Chd1l,Csf1r, Echs1, Fyco1, Hbegf,Hexb, Hk2, Il33, Nfia, Pias4,Ptafr, Purb, Rad51, Rpa1,S100a4, Sash3, Smad7, Uba5
Network 5: CellularFunction and Maintenance
11 genes: Cul2, Eps15l1,Kif1a, Klf5, Lama1, Pcgf2,Rac1, Sap130, Sqstm1,
16 genes: E2f6, Efna2, Elmo1,Enpp1, Epn2, Gas7, Kars,Laptm5, Limd1, Nqo1,
Alcohol. Author manuscript; available in PMC 2014 November 01.

NIH
-PA Author Manuscript
NIH
-PA Author Manuscript
NIH
-PA Author Manuscript
McBride et al. Page 26
AcbSh
Network/main theme Gene expression highera Gene expression lowerb
Suds3, Usp7 Slc40a1, Snap23, Stx6,Timm44, Tomm70a, Usf2
aGenes with higher expression in high vs. low ethanol consuming lines
bGenes with lower expression in high vs. low ethanol consuming lines
Alcohol. Author manuscript; available in PMC 2014 November 01.

NIH
-PA Author Manuscript
NIH
-PA Author Manuscript
NIH
-PA Author Manuscript
McBride et al. Page 27
Table 5
Significant KEGG categories (p < 0.05) in the overall ANOVA that were also significant in the CeA of 3 ormore individual line-pairs
Category P-NP sP-sNP HAD1-LAD1 HAD2-LAD2
Viralmyocarditis
SgcbFynRT1-CE16RT1-EC2RT1-S3Sgcb
Myh11Rac1RT1-DaRT1-DMbRT1-EC2RT1-S3
Ccnd1Itgb2Myh11RT1-EC2
ItgalMyh11RT1-CE16RT1-S3SgcaSgcbMyh9RT1-CE12RT1-DMbRT1-EC2RT1-M3-1Sgcb
Antigenprocessingandpresentation
RT1-CE16RT1-EC2RT1-S3
Cd74RT1-DaRT1-DMbRT1-EC2CtssRT1-S3
RT1-CE16RT1-S3RT1-CE12RT1-DMbRT1-EC2RT1-M3-1
Systemiclupuserythematosus
C1rC1sC3Hist1h2bhHist1h4b
C3Fcgr3aRGD1562378RT1-DaRT1-DMbHist2h2be
C1qaC1qcFcgr1a
There were no significant KEGG categories in the AcbSh that were also significant in at least 3 line-pairs. The AA-ANA line-pair had nosignificant KEGG categories in either region.
Underlined genes indicate lower expression levels in the high ethanol consuming line compared to the low ethanol consuming line.
Alcohol. Author manuscript; available in PMC 2014 November 01.

NIH
-PA Author Manuscript
NIH
-PA Author Manuscript
NIH
-PA Author Manuscript
McBride et al. Page 28
Tabl
e 6
Sign
ific
ant G
O b
iolo
gica
l cat
egor
ies
of s
tatis
tical
ly r
elev
ant W
GC
NA
mod
ules
*
Cat
egor
y ID
Ter
mp
valu
eO
ddsR
atio
Exp
Cou
ntC
ount
Size
Acb
Sh (
grey
60)
GO
:000
6605
prot
ein
targ
etin
g0.
009
4.3
1.3
528
0
GO
:000
6606
prot
ein
impo
rt in
to n
ucle
us0.
001
7.4
0.8
516
7
GO
:000
6913
nucl
eocy
topl
asm
ic tr
ansp
ort
0.00
54.
91.
15
248
GO
:003
2496
resp
onse
to li
popo
lysa
ccha
ride
0.00
74.
51.
25
265
Acb
Sh (
mid
nigh
t blu
e)
GO
:001
0975
regu
latio
n of
neu
ron
proj
ectio
nde
velo
pmen
t0.
004
5.4
1.0
522
5
GO
:005
1960
regu
latio
n of
ner
vous
sys
tem
deve
lopm
ent
0.00
43.
82.
17
453
GO
:190
0542
regu
latio
n of
pur
ine
nucl
eotid
em
etab
olic
pro
cess
0.00
94.
31.
35
276
CeA
(lig
ht y
ello
w)
GO
:000
6469
nega
tive
regu
latio
n of
pro
tein
kina
se a
ctiv
ity0.
002
6.3
0.9
511
7
GO
:000
6511
ubiq
uitin
-dep
ende
nt p
rote
inca
tabo
lic p
roce
ss0.
004
3.9
2.0
726
5
GO
:001
0563
nega
tive
regu
latio
n of
phos
phor
us m
etab
olic
pro
cess
0.00
54.
11.
66
215
GO
:003
0111
regu
latio
n of
Wnt
rec
epto
rsi
gnal
ing
path
way
0.00
54.
91.
15
148
GO
:003
1400
nega
tive
regu
latio
n of
pro
tein
mod
ific
atio
n pr
oces
s0.
006
4.0
1.6
622
0
GO
:004
2326
nega
tive
regu
latio
n of
phos
phor
ylat
ion
0.00
24.
91.
36
180
GO
:004
3065
posi
tive
regu
latio
n of
apo
ptot
icpr
oces
s0.
008
3.0
2.9
838
8
GO
:004
3632
mod
ific
atio
n-de
pend
ent
mac
rom
olec
ule
cata
bolic
proc
ess
0.00
43.
82.
07
273
GO
:004
5862
posi
tive
regu
latio
n of
prot
eoly
sis
0.00
012
.60.
55
61
GO
:005
1348
nega
tive
regu
latio
n of
tran
sfer
ase
activ
ity0.
003
5.4
1.0
513
6
GO
:005
1603
prot
eoly
sis
invo
lved
in c
ellu
lar
0.00
73.
42.
27
300
Alcohol. Author manuscript; available in PMC 2014 November 01.

NIH
-PA Author Manuscript
NIH
-PA Author Manuscript
NIH
-PA Author Manuscript
McBride et al. Page 29
Cat
egor
y ID
Ter
mp
valu
eO
ddsR
atio
Exp
Cou
ntC
ount
Size
prot
ein
cata
bolic
pro
cess
* Con
sens
us, a
cros
s lin
e-pa
ir, W
GC
NA
mod
ules
iden
tifie
d w
ith G
SEA
wer
e te
sted
with
in li
ne-p
air
for
enri
chm
ent w
ith G
O B
P ca
tego
ry g
enes
. Mod
ules
with
sig
nifi
cant
enr
ichm
ent (
p <
0.0
5) in
> 3
line
-pa
irs
and
cont
aini
ng a
t lea
st 5
gen
es a
re p
rese
nted
.
Alcohol. Author manuscript; available in PMC 2014 November 01.

NIH
-PA Author Manuscript
NIH
-PA Author Manuscript
NIH
-PA Author Manuscript
McBride et al. Page 30
Tabl
e 7
Gen
es th
at w
ere
sign
ific
antly
dif
fere
nt in
the
AN
OV
As
of th
e 5
line-
pair
s an
d w
ere
sign
ific
antly
cha
nged
in th
e sa
me
dire
ctio
n in
at l
east
3 li
ne-p
airs
Sym
bol
Des
crip
tion
Dir
ecti
ona
Pb
sPH
1H
2A
A
Acb
Sh
Avi
lA
dvill
inhi
gher
XX
X
Azi
25-
azac
ytid
ine
indu
ced
2hi
gher
XX
X
Mef
2cm
yocy
te e
nhan
cer
fact
or 2
Clo
wer
XX
X
Nek
1N
IMA
-rel
ated
exp
ress
ed k
inas
e 1
low
erX
XX
RT
1-T
24-4
RT
1 cl
ass
I, lo
cus
T24
, gen
e 4
high
erX
XX
Zcc
hc9
zinc
fin
ger,
CC
HC
dom
ain
cont
aini
ng 9
low
erX
XX
CeA
Ank
rd12
anky
rin
repe
at d
omai
n 12
high
erX
XX
Gst
a4gl
utat
hion
e S-
tran
sfer
ase
alph
a 4
low
erX
XX
X
Plek
hh1
plec
kstr
in h
omol
ogy
dom
ain
cont
aini
ngfa
mily
H (
with
MyT
H4
dom
ain)
mem
ber
1hi
gher
XX
X
RT
1-A
2R
T1
clas
s Ia
, loc
us A
2hi
gher
XX
X
Svep
1Su
shi,
von
Will
ebra
nd f
acto
r ty
pe A
,E
GF
and
pent
raxi
n do
mai
n co
ntai
ning
1lo
wer
XX
X
a Indi
cate
s th
at v
alue
s w
ere
high
er (
or lo
wer
) in
the
high
eth
anol
con
sum
ing
lines
com
pare
d to
the
low
eth
anol
con
sum
ing
lines
.
b Abb
revi
atio
ns: P
= P
-NP;
H1
= H
AD
1-L
AD
1; H
2 =
HA
D2-
LA
D2;
AA
= A
A-A
NA
; sP
= s
P-sN
P
Alcohol. Author manuscript; available in PMC 2014 November 01.

NIH
-PA Author Manuscript
NIH
-PA Author Manuscript
NIH
-PA Author Manuscript
McBride et al. Page 31
Tabl
e 8
Val
idat
ion
with
qR
T-P
CR
of
3 ke
y ge
nes
that
wer
e si
gnif
ican
tly d
iffe
rent
in th
e A
NO
VA
s of
the
5 lin
e-pa
irs
and
wer
e si
gnif
ican
tly c
hang
ed in
the
sam
edi
rect
ion
in a
t lea
st 3
line
-pai
rs in
the
Acb
Sh
qRT
-PC
RM
icro
arra
y
Gen
eP
NP
F-C
p va
lue
F-C
Avi
l2.
6 ±
0.1
2.1
± 0
.11.
250.
000
1.36
Mef
2c0.
7 ±
0.1
1.0
± 0
.11.
450.
008
1.59
Zcc
hc4.
1 ±
0.2
5.0
± 0
.21.
230.
004
1.42
Dat
a ar
e th
e m
eans
± S
EM
(n
= 8
/line
). F
-C =
fol
d-ch
ange
Alcohol. Author manuscript; available in PMC 2014 November 01.

NIH
-PA Author Manuscript
NIH
-PA Author Manuscript
NIH
-PA Author Manuscript
McBride et al. Page 32
Table 9
Summary of key findings from the results of the overall ANOVAs in the AcbSh and CeA of the HEC andLEC line-pairs
AcbSh CeA
Cell-to-cell signaling Cell-to-cell signaling
Cellular organization Cellular organization
Cellular stress factors Cellular and oxidative stress
Neurite outgrowth RNA trafficking
Synaptic pruning (complement)
Guanine nucleotide cellular signaling
Alcohol. Author manuscript; available in PMC 2014 November 01.