ZignegoD0815.pdf - ScholarWorks - Montana State University
278
IN VITRO AND IN VIVO SYSTEMS MECHANOBIOLOGY OF OSTEOARTHRITIC CHONDROCYTES by Donald Lee Zignego A dissertation submitted in partial fulfillment of the requirements for the degree of Doctor of Philosophy in Mechanical Engineering MONTANA STATE UNIVERSITY Bozeman, Montana July 2015
-
Upload
khangminh22 -
Category
Documents
-
view
3 -
download
0
Transcript of ZignegoD0815.pdf - ScholarWorks - Montana State University

IN VITRO AND IN VIVO SYSTEMS MECHANOBIOLOGY
OF OSTEOARTHRITIC CHONDROCYTES
by
Donald Lee Zignego
A dissertation submitted in partial fulfillment
of the requirements for the degree
of
Doctor of Philosophy
in
Mechanical Engineering
MONTANA STATE UNIVERSITY
Bozeman, Montana
July 2015

©COPYRIGHT
by
Donald Lee Zignego
2015
All Rights Reserved

ii
ACKNOWLEDGEMENTS
First and foremost I would like to thank my graduate advisor Dr. Ron June who
not only provided me with guidance, scientific input, and motivation throughout my
research, but forced me to learn subjects far outside my comfort zone. With limited
biology experience prior to my doctoral studies, Dr. June continually pushed the limits of
my knowledge, which has made me a more well-rounded scientist/engineer. I would like
to thank my committee members: Dr. Chris Jenkins for his guidance throughout my
academic career as both an undergraduate and graduate student at Montana State
University, Dr. Brian Bothner for his critical insight into mass spectrometry,
metabolomics, and proteomics, Dr. William Schell for his input with statistical analysis,
and Dr. Anthony Hartshorn for his critical input. I would also like to thank Dr. Jonathan
Hilmer and Tim Hamerly for their assistance and expertise in the mass spectrometry
facility, Betsey Pitts for her assistance using the confocal microscope, Dr. Francisco
Blanco at INIBIC for allowing me the opportunity to study in his lab, and all the
members of the Blanco Lab especially Dr. Carolina Fernández Costa, Dr. Angel Soto
Hermida, Dr. Valentina Calamia, and Lucia Lourido Salas, for their expertise and insight
into proteomics. I would also like to acknowledge all of my friends and especially my
family for their continual support throughout my academic endeavors. Last but certainly
not least I would like to thank all members of the June lab for their help, in particular
Aaron Jutila and Sarah Mailhiot.

iii
TABLE OF CONTENTS
1. INTRODUCTION .......................................................................................................... 1
Background ..................................................................................................................... 1 Arthritis ....................................................................................................................4 Osteoarthritis ............................................................................................................5 Osteoarthritis Prevalence ........................................................................................ 6
Osteoarthritis Risk Factors ...................................................................................... 7
Age .............................................................................................................. 8
Gender ......................................................................................................... 9 Genetics....................................................................................................... 9 Obesity ...................................................................................................... 10 Trauma ...................................................................................................... 10
Physical Exercise ...................................................................................... 11 Osteoarthritis Related Costs .................................................................................. 11
Biological Structure of Cartilage ...........................................................................13 Extracellular Matrix .............................................................................................. 15 Articular Chondrocyte and the PCM .................................................................... 16
Mechanotransduction .............................................................................................20 Scientific Studies ...................................................................................................23
Metabolomics .........................................................................................................28 Mass Spectrometry................................................................................................ 29
Liquid Chromatography ........................................................................................ 31 Normal-Phase Chromatography................................................................ 33
Reverse-Phase Chromatography ............................................................... 34 Hydrophilic-Interaction Chromatography ................................................ 35 Hydrophobic-Interaction Chromatography ............................................... 35
Metabolomic Analysis .......................................................................................... 36 Proteomics..............................................................................................................37
Dissertation Outline ....................................................................................................... 43 Intellectual Merit ........................................................................................................... 46
Broader Impacts ............................................................................................................ 47
2. DEVELOPMENT OF EXPERIMENTAL METHODOLOGY ................................... 48
Physiological Characterization of Agarose Hydrogels ................................................. 48 Introduction ............................................................................................................48 Methods..................................................................................................................49 Results & Conclusion ............................................................................................52
The Mechanical Microenvironment of High Concentration Agarose for
Applying Deformation to Primary Chondrocytes ......................................................... 55

iv
TABLE OF CONTENTS - CONTINUED
Contribution of Authors Page ................................................................................55
Manuscript Information Page ................................................................................56 Abstract ..................................................................................................................57 Introduction ............................................................................................................58 Methods..................................................................................................................61
Encapsulation of Fluorescent Microspheres in
Physiologically Stiff Agarose ................................................................... 61
Mechanical Loading and Confocal Imaging ............................................. 61
Particle Tracking and Finite Deformation Evaluation .............................. 62 Chondrocyte Encapsulation ...................................................................... 66 Viability Analysis and Induced Deformations on Primary
Chondrocytes ............................................................................................ 66
Results ....................................................................................................................67 Discussion ..............................................................................................................68
Conclusions ............................................................................................................73 Candidate Mediators of Chondrocyte Mechanotransduction via Targeted
and Untargeted Metabolomic Measurements ................................................................ 76
Contribution of Authors Page ................................................................................76
Manuscript Information Page ................................................................................78
Abstract ..................................................................................................................79 Introduction ............................................................................................................80
Materials and Methods ...........................................................................................82 Chondrocyte Culture and Encapsulation .................................................. 82
Mechanical Stimulation ............................................................................ 83 Metabolite Extraction................................................................................ 83 Untargeted and Targeted LC-MS.............................................................. 84
Data Processing ......................................................................................... 85 Data Analysis and Candidate Selection .................................................... 86 Compound Identification .......................................................................... 89
Results ....................................................................................................................89
Untargeted Metabolomics ......................................................................... 89
Targeted Metabolomics ............................................................................ 92
Discussion ..............................................................................................................94 Conclusions ............................................................................................................98
3. METABOLOMICS....................................................................................................... 99
Mechanotransduction in Primary Human Osteoarthritic Chondrocytes is
Mediated by Metabolism of Energy, Lipids, and Amino Acids ................................. 101 Contribution of Authors Page ..............................................................................101
Manuscript Information Page ..............................................................................102
v
TABLE OF CONTENTS - CONTINUED
Abstract ................................................................................................................103 Introduction ..........................................................................................................105 Materials and Methods .........................................................................................107
Chondrocyte Culture and Encapsulation ................................................ 107
Mechanical Stimulation .......................................................................... 108 Metabolite Extraction.............................................................................. 108 Untargeted and Targeted Metabolomic Profiling ................................... 108
Compound Identification and Enrichment Analysis ............................... 110 Results ..................................................................................................................110
Untargeted Analysis ................................................................................ 111
Targeted Analysis ................................................................................... 115 Discussion ............................................................................................................118
Conclusions ..........................................................................................................124
4. PHOSPHOPROTEOMICS ......................................................................................... 126
Shotgun Phosphoproteomics Identifies Activation of Vimentin,
Ankyrin, Vam6/Vps39-Like Protein in Primary Human Osteoarthritic
Chondrocytes after Mechanical Stimulation ............................................................... 128
Contribution of Authors Page ..............................................................................128
Manuscript Information Page ..............................................................................129
Abstract ................................................................................................................130 Introduction ..........................................................................................................132
Materials and Methods .........................................................................................134 Chondrocyte Culture and Encapsulation ................................................ 134 Mechanical Stimulation .......................................................................... 135
Protein Preparation and Extraction ......................................................... 135 Proteolysis, TiO2 Phosphopeptide Enrichment, and
Graphite Cleanup .................................................................................... 136 Shotgun Phosphoproteomics LC-MS/MS............................................... 136
Data Processing ....................................................................................... 137
Data Analysis and Candidate Selection .................................................. 138
Results ..................................................................................................................139 Discussion ............................................................................................................146 Conclusions ..........................................................................................................152
5. IN VIVO MODEL ....................................................................................................... 154
Alterations in Joint Metabolomics Following Surgical Destabilization
and Exercise in a Novel Cartilage Reporter Mouse Model ......................................... 156

vi
TABLE OF CONTENTS - CONTINUED
Contribution of Authors Page ..............................................................................156
Manuscript Information Page ..............................................................................157 Abstract ................................................................................................................158 Introduction ..........................................................................................................160 Materials and Methods .........................................................................................162
Animals ................................................................................................... 162
Luciferase Induction, Imaging and Image Processing ............................ 162
Treadmill Running and Surgical Destabilization .................................... 164
Joint Harvest and Metabolite Extraction ................................................. 165 Histology ................................................................................................. 166 LC-MS Data Processing ......................................................................... 166 Data Analysis .......................................................................................... 167
Results ..................................................................................................................169 Bioluminescent Analysis. ....................................................................... 169
LC-MS Analysis ..................................................................................... 171 Discussion ............................................................................................................174 Conclusions ..........................................................................................................180
CONCLUSION ............................................................................................................... 182
REFERENCES CITED ................................................................................................... 187
APPENDICES ................................................................................................................ 217
APPENDIX A: Encapsulation of Chondrocytes in High-Stiffness
Agarose Microenvironments for In Vitro
Modeling of Osteoarthritis Mechanotransduction ....................218 APPENDIX B: Supplemental Material for Chapter 2 –
Development of Experimental Methodology ...........................245
APPENDIX C: Supplemental Material for Chapter 3 –
Metabolomics............................................................................252
APPENDIX D: Supplemental Material for Chapter 5 – In Vivo
Model ........................................................................................263

vii
LIST OF TABLES
Table Page
1. Kellgren-Lawrence (K/L) grading scheme for scoring OA. .............................. 6
2. Prevalence data from radiographic OA from three US population-
based studies in the hands, knees, and hips. ...................................................... 8
3. Pathways and metabolites altered by mechanical loading.. ........................... 114
4. Statistically significant changes in metabolites for all five donors................ 116
5. Key signaling pathways determined from pathway over-
representation analysis ................................................................................... 145
S1. Stiffness values from mechanical testing experiments. ............................... 231
S2. Mechanically-induced changes in metabolites targeted to central
energy metabolism depended on agarose concentration ............................. 237
S3. Untargeted metabolites of interest following 15 minutes of
dynamic compression in either 4.5% or 2% agarose ................................... 238
S4. PCM and agarose stiffness measurements ................................................... 240
S5. Average Exx, Eyy, and Exy strains ± SEM for each gel
concentration. .............................................................................................. 248
S6. Cell viability after 24 and 72 hours for primary human
chondrocytes.. .............................................................................................. 249
S7. Candidate mediators of chondrocyte mechanotransduction from
the targeted metabolite analysis................................................................... 260
S8. Up-regulated candidate mediators of chondrocyte
mechanotransduction. .................................................................................. 261
S9. Down-regulated candidate mediators of chondrocyte
mechanotransduction. .................................................................................. 262

viii
LIST OF FIGURES
Figure Page
1. Healthy vs. diseased knee joint .......................................................................... 2
2. Joint types in the human body. .......................................................................... 5
3. Principal risk factors for OA. ............................................................................. 8
4. Cross sectional diagram of the four zones of articular cartilage. ..................... 13
5. The three main components of articular cartilage. ........................................... 15
6. Young's Modulus values for the ECM and PCM ............................................ 15
7. Anabolic and catabolic enzymes in cartilage. .................................................. 19
8. Schematic of tensile, compressive, and shear loads on cells.. ......................... 21
9. Simplified schematic of a mass spectrometer .................................................. 30
10. Schematic of a liquid chromatography (LC) system .................................... 32
11. Normal-phase chromatography. ..................................................................... 33
12. Reverse-phase chromatography. .................................................................... 34
13. Total ion chromatogram and the corresponding mass spectra. ...................... 37
14. Central dogma of modern biology. ................................................................ 39
15. 2D-GE of the proteome mapping of all proteins altered in OA ..................... 40
16. Schematic of collision induced dissociation (CID) ....................................... 42
17. Dissertation workflow .................................................................................... 43
18. Agarose hydrogel mold. ................................................................................. 50
19. Custom built bioreactor with sub-micron precision........................................ 52
20. Equilibrium and dynamic moduli values for 3-5% [w/v] agarose .................. 53
21. Approach for measuring micron-level deformations within
agarose gels .................................................................................................... 63

ix
LIST OF FIGURES – CONTINUED
Figure Page
22. Two-dimensional displacement measurement.. ............................................. 64
23. Finite deformation Lagrangian strain fields within 4.5% agarose
hydrogel. ........................................................................................................ 69
24. Axial displacement and strain as functions of gel position and
agarose concentration .................................................................................... 70
25. Viability of primary human chondrocytes in high concentration
agarose gels after 24 and 72 h ........................................................................ 71
26. Deformation of primary human chondrocytes in 2.0% and 4.5%
agarose ........................................................................................................... 72
27. Schematic of experimental methods for SW1353 cell
encapsulation ................................................................................................. 88
28. Loading-specific differences in untargeted metabolite expression.. .............. 91
29. Dynamic compression results in both accumulation and depletion
of untargeted metabolites ............................................................................... 92
30. Changes in expression of targeted central-energy-related
metabolites over from 0-30 minutes of applied compression ........................ 93
31. Applied compression resulted in distinct untargeted metabolomic
profiles for primary OA chondrocytes ......................................................... 113
32. Dynamic compression results in both accumulation and depletion
of untargeted metabolites. ............................................................................ 114
33. Aging-related chondrocyte mechanotransduction. ...................................... 116
34. Patient-specific heterogeneity in chondrocyte
mechanotransduction ................................................................................... 117
35. Loading-induced changes in expression of targeted metabolites
specific to central-energy-metabolism ......................................................... 120

x
LIST OF FIGURES – CONTINUED
Figure Page
36. Experimental design in phosphoproteomic study ........................................ 140
37. Dynamic compression alters phosphoprotein expression in
primary OA chondrocytes. ........................................................................... 142
38. Applied compression resulted in distinct untargeted
phosphoproteomic profiles for primary OA chondrocytes .......................... 147
39. Experimental design and transgenic strategy for mouse with
aggrecan-specific bioluminescence ............................................................. 163
40. The combination of exercise and joint destabilization resulted in
decreased bioluminescence compared with controls ................................... 170
41. Metabolomic profiling captured joint-wide changes induced by the
combination of vigorous treadmill running and joint
destabilization .............................................................................................. 172
42. Unsupervised clustering identifies patterns of metabolites
differentially regulated by exercise and joint destabilization ...................... 175
43. Representative histological images for one mouse from the
exercised/destabilized group ........................................................................ 177
S1. Agarose stiffness was concentration dependent as determined in
stress-relaxation experiments. ...................................................................... 231
S2. Concentration-dependent dynamics of agarose stress-relaxation. ............... 232
S3. Complex agarose stiffness as high as ~225 kPa from cyclical
loading experiments ..................................................................................... 233
S4. Encapsulation of SW1353 chondrocytes in high-stiffness agarose
gels resulted in high viability ....................................................................... 234
S5. Primary human chondrocyte mechanotransduction is affected by
agarose concentration .................................................................................. 236
S6. Model for studying mechanotransduction in joint disease.. ........................ 242

xi
LIST OF FIGURES – CONTINUED
Figure Page
S7. Pilot study to determine confidence interval for bead
displacements.. ............................................................................................. 246
S8. Concentration-dependent displacement fields within 4.5% agarose
hydrogels. ..................................................................................................... 247
S9. Propagation of displacement errors for axial strain (Eyy)
calculation .................................................................................................... 248
S10. Analysis workflow for quantifying metabolite intensities
following LC-MS analysis. ....................................................................... 249
S11. Scatter plots of untargeted metabolites ...................................................... 250
S12. Representative chromatograms of targeted metabolites.. .......................... 251
S13. Experimental design for primary human chondrocyte
metabolomic study .................................................................................... 257
S14. Two-sample Kolmogorov-Smirnov tests identify significant
difference in metabolomic distributions. ................................................... 258
S15. Age-correlated increases in the number of significant metabolites
for donors 1 - 5.. ........................................................................................ 258
S16. Venn-diagram for untargeted metabolomic comparisons.......................... 259
S17. Patterns of distinct metabolite distribution for 37 targeted
metabolites common to central energy metabolism. ................................. 264
S18. Untargeted Principal Components Analysis .............................................. 265

xii
ABSTRACT
All cells are subjected to and respond to mechanical forces, but the underlying
processes linking the mechanical stimuli to biological responses are poorly understood.
In the joints of the body (e.g. the knee, hip, etc…) articular cartilage serves as a low
friction, load bearing material and is subjected to near-constant mechanical loading.
Through excessive loading of the joint, usually caused by obesity or injury, the protective
articular cartilage begins to diminish, leading to the progression of osteoarthritis (OA).
Osteoarthritis is the most common joint disorder in the world and is characterized by the
deterioration of articular cartilage. Determining the link between cartilage deterioration
and mechanical loading is one motivation that drove this research. Articular cartilage is
composed of a dense extracellular matrix (ECM), a less-stiff pericelluar matrix (PCM),
and highly specialized cells called chondrocytes. As the sole cell type in cartilage,
chondrocytes are responsible for the healthy turnover of the ECM by creating,
maintaining, and repairing the matrix. Multiple lines of evidence suggest chondrocytes
can transduce mechanical stimuli into biological signals. The hypothesis for this research
is that physiologically pertinent loading of chondrocytes results in a specific set of bio-
signals resulting in matrix synthesis. To test this hypothesis, two unbiased, large-scale
metabolomic and phosphoproteomic datasets were generated by modeling physiological
compressive loading on 3D-embedded chondrocytes. To assess loading-induced changes
in metabolites (e.g. small molecules representing the functional state of the cell) and
proteome-wide patterns of post-translational modifications (i.e. phosphorylation),
chondrocytes were encapsulated in physiologically stiff agarose, compressively loaded in
tissue culture, and analyzed via liquid chromatography – mass spectrometry (LC-MS).
The results helped identify global and local biological patterns in the chondrocytes which
are a direct result from mechanical loading. In addition, a novel mouse model that
expresses cartilage specific bioluminescence was used to assess loading induced changes
in vivo. The results from the mouse model allowed for in vivo validation and integration
of the in vitro results from the metabolomic and phosphoproteomic results. To my
knowledge, such research has never been done, and considerably expands the scientific
knowledge of chondrocyte mechanotransduction.

1
INTRODUCTION
Background
Osteoarthritis (OA) is the most common joint disorder, affecting over 200 million
individuals worldwide, ~40 million of them in the United States [1-7]. By the age of 65,
approximately 50% of individuals may develop OA. OA is most commonly associated
with excessive loading of the aging joint (e.g. caused by obesity or injury), leading to
deterioration of articular cartilage and joint inflammation (Figure 1). With aging and
wear, OA incidence rates increase substantially. In most cases, after the age of 18,
humans lose the ability to repair or replace damaged articular cartilage [3]. As the
cartilage begins to deteriorate, bone-to-bone contact is imminent, leading to joint
stiffness, swelling, and pain. At these articulating regions of the body (e.g. the knee), the
articular cartilage, and thus articular chondrocytes, are subjected to almost-constant
mechanical loading (e.g. walking, running, etc…). Repetitive action has been shown to
be crucial for joint health, yet excessive loading can lead to OA [8]. Individuals with a
history of heavy mechanical work (heavy lifting, bending, etc.) are ~7-fold less likely to
have OA at the age of 90 [9], suggesting that long-duration, but sub-injurious, mechanical
loading may induce protective biological responses. Therefore, the biological responses
of chondrocytes to mechanical loading are extremely important to understanding and
improving joint health. Currently, the only treatments for OA, are only partially-
effective, and include joint replacement surgery and weight loss. The caveats for these

2
treatment strategies are (1) they fail to restore healthy cartilage and (2) they are often
infeasible or impossible for many patients due to the extreme costs of a joint replacement.
Figure 1. Schematic (top left and bottom left) and actual scoped (top right and bottom
right) depictions of both a healthy knee joint (top) and a diseased or arthritic knee joint
(bottom).
The overall goal of this research is to develop a comprehensive understanding of
the cellular response of the chondrocyte to applied, dynamic compression. Well-
controlled data are needed to define the complex, intracellular responses. The objective
of these experiments is to determine changes in metabolite and protein phosphorylation
profiles for late OA chondrocytes as a function of applied dynamic compression. These
studies will test the hypothesis that dynamic compression alters both the metabolite levels

3
and protein phosphorylation in chondrocytes to promote matrix synthesis. My approach
will start by encapsulating chondrocytes in physiologically-stiff agarose, and applying
dynamic compression to simulate physiological loading conditions (i.e. walking).
Immediately following dynamic loading, samples will be flash-frozen in liquid nitrogen
and pulverized. Metabolites will be extracted, and identified via liquid chromatography-
mass spectrometry (LC-MS) at the MSU Cobre Mass Spectrometry Core Facility.
Similarly, proteins will be extracted, digested, and enriched for phosphopeptides prior to
quantification via liquid chromatography-mass spectrometry/mass spectrometry (LC-
MS/MS). This research generated a well-controlled dataset of the intracellular response
to mechanical loading, and helped confirm our hypothesis that dynamic compression
induces matrix synthesis in the context of OA.
To my knowledge, such research has never been performed, and considerably
advances the scientific knowledge of chondrocyte mechanobiology. Most existing
studies focus on individual signaling pathways which have the potential to exclude
important data [2]. This research is advantageous since it is unbiased, by not excluding
pathways a priori. By collecting data on multiple stages (protein phosphorylation and
metabolite levels) of the central dogma, this research provides a valuable contribution to
basic science in addition to the potential to discover new, therapeutic strategies to combat
OA. This research lays a strong foundation for future work in this field, specifically
understanding how mechanotransduction plays a role in OA. The results from this study
dramatically expands the knowledge and understanding of chondrocyte

4
mechanotransduction, and may be implemented in treatment strategies and preventative
measures for OA.
Arthritis
The term arthritis is derived from the Greek words arthro, meaning joint, and itis,
meaning inflammation. Arthritis is defined as any type of joint disorder that involves
inflammation of one or multiple joints in the body. Joint locations include any area of the
body were articulation is present, such as the knee, hip, spine, fingers, etc... At these
articulating locations, cartilage covers the joints to allow for fluid movement and to
prevent bone on bone contact. In the human body, there are six different types of joints
that can be affected by arthritis (Figure 2): A pivot joint (the neck between the C1 and
C2 vertebrae), a ball-and-socket joint (hip, shoulder), hinge joint (knee, elbow), saddle
joint (between the trapezium carpal bone and 1st metacarpal bone), condyloid joint
(between radius and carpal bone of the wrist), and a planar joint (between the tarsal bones
in the foot).
There are over 100 different types of arthritis, including the most common,
osteoarthritis, rheumatoid arthritis, osteoporosis or fibromyalgia, and gout. Each of the
specific forms of arthritis attacks the joints differently. Rheumatoid arthritis is an
autoimmune disease, or inflammatory disease, in which the individual’s immune system
actually attacks the tissue in the joints. Rheumatoid arthritis most commonly occurs in
the fingers, wrists, and knees and the symptoms normally include deformed and painful
joints. Gout, another form of inflammatory arthritis, is characterized by the deposition of
uric acid crystals in the joints, and is also characterized by a swollen and tender joint.

5
Figure 2. Schematic illustrating the six unique joint types in the human body [10].
The most common form of arthritis is osteoarthritis (OA). OA is not an inflammatory
form of the disease, but rather a disease resulting from mechanical “wear and tear.”
Osteoarthritis
The word osteoarthritis comes from the Greek words osteo meaning bone, arthro,
meaning joint, and itis, meaning inflammation. OA can occur in all of the joints of the
body, but most commonly affects the knee, hip, and hands. The disease is characterized
by the breakdown of the protective, load-bearing tissue that covers the joint surface, and
is usually caused from “abnormal” joint loading (i.e. obesity or injury). When the
protective cartilage begins to deteriorate, the bones begin to rub on one another. The loss
of cartilage significantly hinders joint mobility and the bone on bone contact results in

6
intense pain, stiffness, and joint inflammation. OA is primarily diagnosed through a
medical examination and radiographic images. Radiographic images can be taken of the
joint, and the severity of the disease can be assessed to determine if surgical intervention
is necessary. The most common form of radiographic characterization to assess the
severity of OA is the Kellgren-Lawrence (K/L) grading scheme [11]. The K/L scale
scores patients on a scale from 0 – 4 depending on the progression of the disease [12]
(Table 1).
Table 1. Kellgren-Lawrence (K/L) grading scheme for scoring OA [13].
Osteoarthritis Prevalence. Osteoarthritis is the most common joint disease in the
world, and mainly affects individuals over the age of 50. In the United States alone, OA
affects 13.9% of the adults over the age of 25, and 33.6% of those over 65 years of age
accounting for approximately 40 million of the population [14]. This value has risen
from 21 million Americans in 1990, meaning that better understanding this disease is
extremely crucial to curtail the rising OA incidence rates. It is quite hard to estimate the
exact number of individuals with OA (prevalence), since the symptoms and severity of
Grade OA Description
0 None - No radiographic features of OA
1Doubtful - Possible joint space narrowing
(JSN) and osteophyte formation
2Minimal - Definite osteophyte formation
with possible JSN
3Moderate - Multiple osteophytes, definite
JSN, sclerosis and possible bony deformity
4Severe - Large osteophytes, marked JSN,
severe sclerosis and definite bony deformity

7
the disease can differ greatly, and a true quantitative measure of OA has yet to be
determined. There are essentially three ways to assess the prevalence of OA; self-
diagnosed OA, clinically defined OA, and radiographically defined OA. Most of the
statistical data on OA prevalence in the U.S. are based on radiographically and clinically
defined OA. These values are usually considered an underestimate. A recent study done
by Lawrence et al., summarized the prevalence data from three US population-based
studies: The National Health and Nutrition Examination Survey III (NHANES III), the
Framingham Osteoarthritis Study, and the Johnston County Osteoarthritis Project [14].
The NHANES III study assessed the prevalence of knee OA in U.S. adults over the age
of 60 years [15]. The Framingham OA Study surveyed ~2600 adults ≥ 26 years of age
with knee and hand OA from suburban Boston, Massachusetts [16]. Finally, the Johnston
County OA Project surveyed ~3000 African Americans and white adults ≥ 45 years of
age with hip and knee OA in a rural county in North Carolina [17]. All individuals in
these studies underwent radiographic OA testing. The prevalence rates from these three
studies can be seen in Table 2. As aforementioned, prevalence of OA is an extremely
difficult measure to quantify. However, from these data on OA incidence rates, risk
factors of OA can be determined, such as sex, age, race, etc…
Osteoarthritis Risk Factors. Osteoarthritis is a disease that can manifest from a
number of different factors, both endogenous and exogenous. The endogenous risk
factors that can predispose an individual to OA include age, gender, race, genetics, and
bone density. Exogenous factors that can lead to OA include obesity, injury or trauma,
8
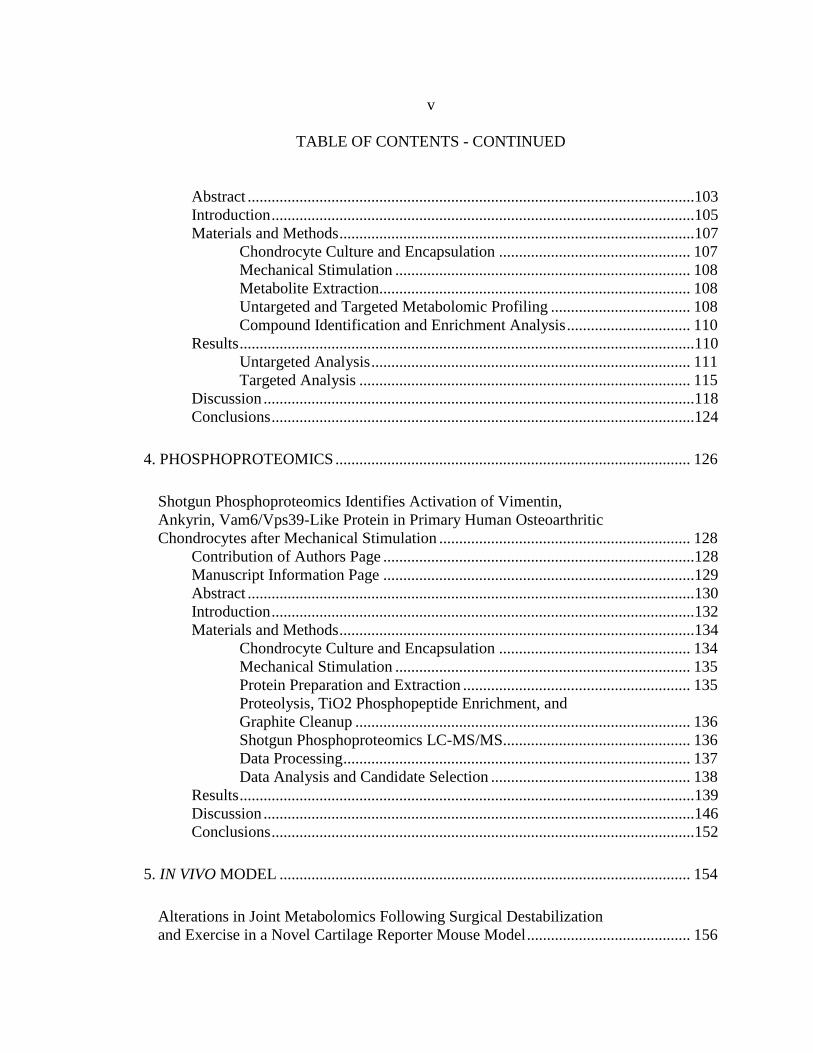
surgery, and even professional occupation [18]. The most important risk factors of OA
include age, gender, genetics, obesity, trauma, and physical exercise (Figure 3).
Table 2. Prevalence data from radiographic OA from three US population-based studies
in the hands, knees, and hips [14].
Diseased
area, age Source [ref.]
% with symptomatic OA
Male Female Total
Hands, ≥ 26 Framingham OA Study [16] 3.8 9.2 6.8
Knees
≥ 26 Framingham OA Study [16] 4.6 4.9 4.9
≥ 45 Framingham OA Study [16] 5.9 7.2 6.7
≥ 45 Johnston County OA Project [17] 13.5 18.7 16.7
≥ 60 NHANES III [15] 10.0 13.6 12.1
Hips, ≥ 45 Johnston County OA Project [17] 8.7 9.3 9.2
Figure 3. Principal risk factors for OA.
Age. Age is one of the strongest risk factors correlated with OA for all of the
joints [14]. The reason being that age is a combination of both biological (aging) and
mechanical (excessive loading) factors. Through aging, a number of biological changes
take effect: the muscles in the body begin to weaken, along with the bones, cartilage, and

9
everything holding the joint together. These weakening components create a destabilized
joint, which usually results in “abnormal” loading of the joint. This abnormal loading
creates heightened and localized states of stress within the joint, which in turn wears out
the cartilage more rapidly.
Gender. Gender is also a major risk factor of OA. It is has been shown that
women are more likely to have OA than men [11]. Also, women are not just more likely
to have OA, but they tend to have a more severe form of OA when compared to men
[19]. The higher prevalence of women with OA is thought to be associated with
increased hormone levels. Articular chondrocytes have a number of estrogen receptors,
and the higher abundances of estrogen in women have been thought to effect the
operation of these cells. A recent study has linked estrogen replacement therapy with a
decreased risk of developing OA in post-menopausal women [7, 20].
Genetics. Several studies have showed that genetic factors play an important role
in the development of OA, including a number of twin and family studies that have
revealed a genetic component of OA [21-23]. Growth and differentiation factor 5
(GDF5) is a ligand of the transforming growth factor (TGF-β) family, and encodes for a
bone morphogenetic protein (BMP). These BMP’s play a critical role in the development
of synovial joints, and have been associated with both hip and knee OA [24]. A recent
study has also shown a number of genes that play a role in the development of knee OA,
including HPB1, COG5, BCAP29, DUS4L, GPR22, and PRKAR2B [25]. These 6 genes
play an important role in the development of cartilage as well as regulating chondrocyte

10
metabolism. If the joint is improperly formed in the development stages, loads cannot be
distributed evenly resulting in “abnormal” joint loading, and eventually OA.
Obesity. Obesity has long been linked as the most potent exogenous risk factor of
OA, especially of the knee [7]. It has been shown that weight loss in obesity patients,
even as little as 10 pounds, can reduce an individual’s risk of knee OA up to 50% [26].
Another study showed that weight loss combined with exercise in elders reduced the risk
of symptomatic knee OA [27]. In this same study, neither exercise or weight loss alone
reduced the risk of knee OA, but rather both were needed to minimize the risk. This
emphasizes the potential regenerative effects that exercise has on cartilage and
chondrocyte metabolism. Exercise could potentially promote restorative mechanisms in
the chondrocytes increase matrix protein synthesis to help rebuild or repair the damaged
cartilage. The increased risk of OA in obese individuals is fairly clear. The excessive
weight creates a more severe loading scenario for the joint. The joint is easily overloaded
which breaks down the protective cartilage covering the bones. If the overloading
continues, the cartilage completely deteriorates until ultimately the pain and
inflammation of the joint causes the individual to seek medical intervention (usually
through a total joint replacement).
Trauma. Analogous to the endogenous risk factor of age, trauma or injury has
been linked as one of the strongest exogenous risk factors of OA. Joint injuries that
increase an individual’s risk of OA include: trans-articular fracture, meniscal tearing
requiring meniscectomy (surgical removal of all or part of a torn meniscus), or anterior or

11
medial cruciate ligament (ACL or MCL) injury [7]. In fact, previous trauma to the knee
can increase a man’s risk of knee OA up to 5-6 times, and ~3 times for women [16]. The
trauma to the joint usually creates a destabilized joint, which results in “abnormal”
loading of the joint. As aforementioned, this “abnormal” loading of the joint creates
extremely localized stress states to develop, which wears down the cartilage more rapidly
when compared to a normal joint.
Physical Exercise. Physical exercise in high-intensity sports has been linked as a
risk factor of OA, due to the continual, extreme loading of the joint. Recent studies
suggest evidence that elite long distance runners [28] and professional soccer players [29]
are at a higher risk of developing knee and hip OA when compared to non-athletes. On
the contrary, individuals with a history of heavy mechanical work are ~7-fold less likely
to have OA at the age of 90 [3]. Also, in the absence of injury, recreational running or
jogging did not increase the risk of OA [30]. This suggests that overloading the joint
through excessive exercise can result in the development of OA, but moderate or
recreational exercise can improve the health of the joint and can even protect against the
development of OA.
Osteoarthritis Related Costs. There is currently no cure for OA, and once the
disease progresses (i.e. the articular cartilage begins to deteriorate) it usually worsens due
to the limited regenerative ability of cartilage. Because OA has no permanent cure, OA
is usually treated through weight loss, rest, drugs, and if the disease has progressed too
far, joint replacement. The limitations for these treatments are that they are usually

12
infeasible for most patients due to the extreme costs of a total joint replacement. In the
United States, a typical total knee joint replacement costs on average ~$50,000 [31].
Most insurance companies will cover a total knee joint replacement, but for individuals
without health insurance, surgical intervention is impossible. In fact, in 2003, total
osteoarthritis related costs were estimated to be 128 billion dollars (not including time
spent away from work), with direct medical expenditures totaling ~81 billion dollars [32].
Due to the extreme costs and trauma for joint replacement surgery, another treatment plan
for OA is essential.
As suggested from a number of studies [3, 9, 30, 33, 34], moderate exercise can
actually induce protective mechanisms in cartilage against OA. With that being said,
what if exercise could be used as a treatment plan? If early diagnosis of OA was more
effective, what if a doctor could prescribe 30 minutes of daily exercise as a treatment
option for the patient. Not only would the exercise increase the patient’s overall health, it
could potentially reduce the patient’s risk of developing OA. These are the main
questions driving the motivation for this research. Determining the link between
mechanical loading and chondrocyte metabolism is extremely important in understanding
how these highly specialized cells sense and respond to their mechanical environment.
Because OA is considered a whole joint disease, it is important to look at the overall
composition of cartilage to observe the interactions between the chondrocytes and their
micro-environment and how mechanical loading can alter the functions of these cells.

13
Biological Structure of Cartilage
Cartilage is a non-vascular, flexible, connective tissue that is found primarily in
the joints throughout the human body (e.g. the knee, hip, elbow, etc…). Cartilage serves
as a protective, low-friction material (cartilage on cartilage coefficient of friction,
µ~0.001) at these load bearing surfaces and allows bones to articulate smoothly. In OA
instances, when cartilage has deteriorated, the bones begin to rub on each other (bone on
bone coefficient of friction, µ>0.3), which is usually accompanied with extreme pain and
inflammation (Figure 1). Cartilage can be classified into three groups: hyaline cartilage,
fibrocartilage, and elastic cartilage. The cartilage found primarily in human joints is
hyaline cartilage [35]. Articular cartilage can be broken up into four different zones: the
superficial zone, the middle zone, the deep zone, and a region of calcified cartilage
(Figure 4) [36].
Figure 4. Cross sectional diagram showing the cellular (A) and collagen fiber (B)
organization in the four zones of articular cartilage [37].

14
The outermost surface of the cartilage, the superficial or tangential zone, accounts
for approximately 10 to 20 percent of the cartilage thickness. The superficial zone
contains the highest concentration of type II collagen fibers, which are oriented parallel to
the surface of the joint. As we move further from the surface, the amount of type II
collagen fibers decreases in each zone. The next zone is the middle zone (~60% of the
cartilage thickness). In the middle zone, the collagen fibers are more randomly oriented
most of them at a 45° angle with respect to the articular surface. Following the middle
zone is the deep zone. The deep zone accounts for approximately 20-30 percent of the
cartilage thickness, with collagen fibers oriented perpendicularly to the articular surface.
The final zone contains calcified cartilage, which is in direct contact with subchondral
bone. Calcium salts begin to develop in the matrix and this region provides the needed
bone to cartilage interface [36]. If we compare the constitution and orientation of type II
collagen fibers in cartilage to a standard carbon fiber composite material, we see many
similarities. The collagen fibers in the superficial zone are oriented parallel to the
articular surface (0° layup in a composite), which provide cartilage the ability to resist
various tensile and shear loads. Next, we see the collagen fibers oriented at a 45° angle
with respect to the articular surface, providing the cartilage with the ability to resist shear
and compressive loading that the joint might encounter. Finally, we have the deep zone,
where the fibers are oriented perpendicular to the articular surface (90° layup), and
provide the joint the ability to resist compressive loading. This unique layered structure
provides the cartilage with its exceptional mechanical properties and the ability to handle
a wide array of loading scenarios.
15
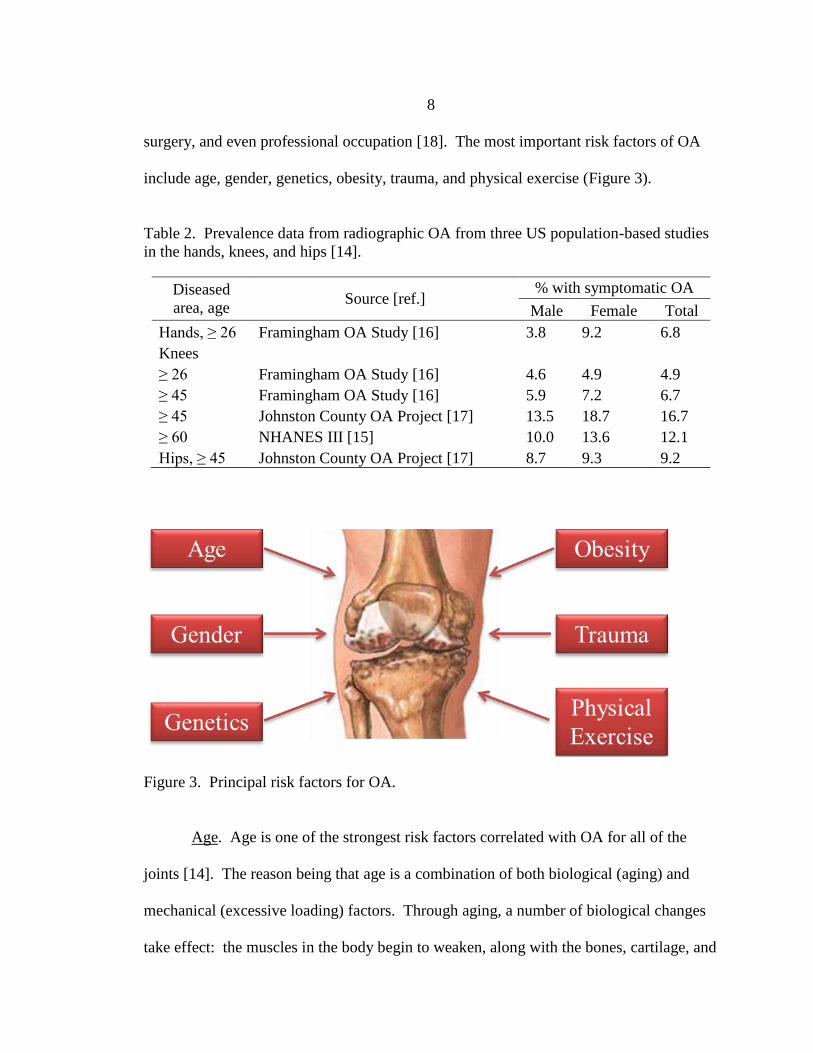
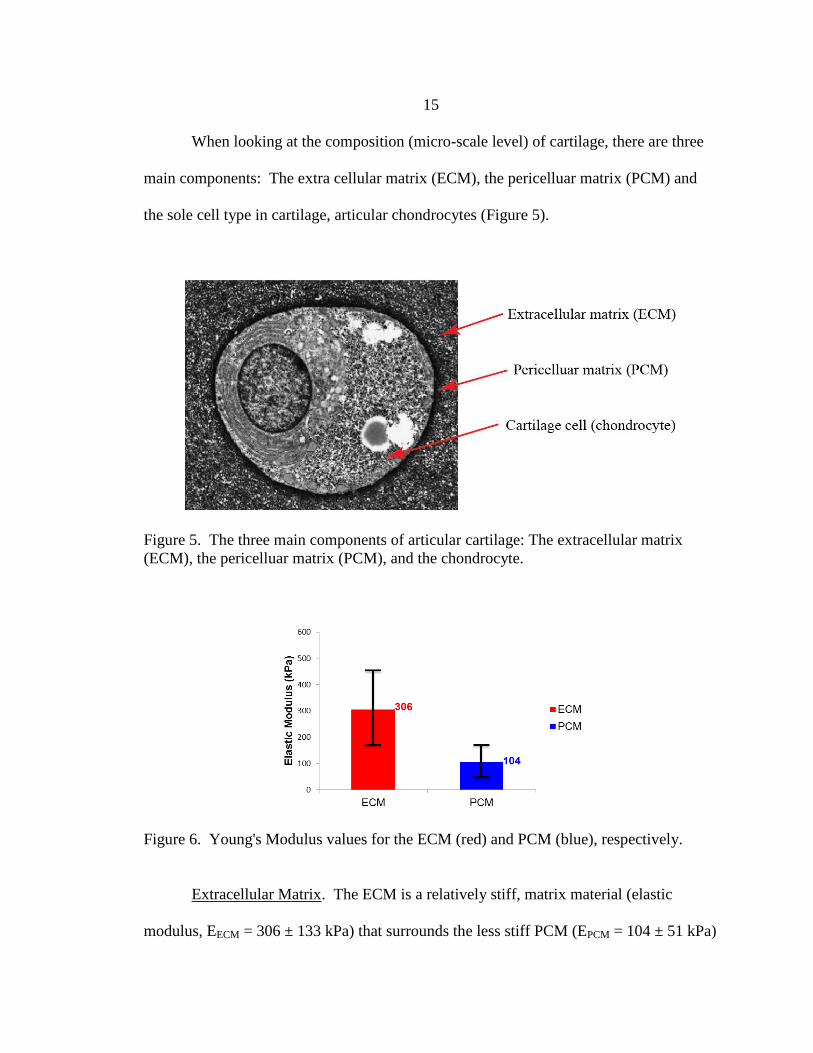
When looking at the composition (micro-scale level) of cartilage, there are three
main components: The extra cellular matrix (ECM), the pericelluar matrix (PCM) and
the sole cell type in cartilage, articular chondrocytes (Figure 5).
Figure 5. The three main components of articular cartilage: The extracellular matrix
(ECM), the pericelluar matrix (PCM), and the chondrocyte.
Figure 6. Young's Modulus values for the ECM (red) and PCM (blue), respectively.
Extracellular Matrix. The ECM is a relatively stiff, matrix material (elastic
modulus, EECM = 306 ± 133 kPa) that surrounds the less stiff PCM (EPCM = 104 ± 51 kPa)

16
(Figure 6). The ECM provides a physical microenvironment for the chondrocytes to exist
in. The ECM is composed primarily of water, collagen, and proteoglycans, and is
responsible for the transmission of various biological signals to the chondrocytes which
affects cell proliferation (growth), cell differentiation (less specialized cell becoming
more specialized), and cell apoptosis (death). The ECM accounts for approximately 80%
of the total wet weight of cartilage [37]. Within the ECM, collagen accounts for 60% of
the dry weight making it the most abundant macromolecule. Collagen is classified into
“types” (i.e. type I, II, III, IV, etc…). Type II collagen represents ~95% of the collagen
found in the ECM and provides the ECM with exceptional strength and resistance to a
variety of mechanical loads (i.e. tensile, shear, etc…). The second most abundant
molecules found in articular cartilage are proteoglycans. Proteoglycans are heavily
glycosylated protein monomers and the most significant proteoglycan is aggrecan.
Aggrecan interacts with hyaluronan to form long polymer chains that interlace with the
collagen fibers. Both aggrecan and hyaluronan are extremely hydrophilic molecules,
which allow them to easily bind with water molecules. From a mechanical standpoint,
the aggrecan, hyaluronan and water molecules help fill the voids between collagen fibers
(similar to epoxy in a composite material) allowing the cartilage the ability to resist high
compressive loads. In direct contact with the ECM are the PCM and articular
chondrocytes.
Articular Chondrocyte and the PCM. The sole cell type found in articular
cartilage is the chondrocyte. These cells play an extremely important, metabolically
active role in synthesizing, maintaining, and repairing the ECM. Chondrocytes only

17
constitute to about 2-5% of the total volume in articular cartilage [38]. Similarly to the
ECM collagen fibers, chondrocytes vary in shape and size depending on where they are
located throughout the cartilage (Figure 4A). Chondrocytes in the superficial zone (the
outermost zone) tend to be flatter and smaller in size than cells in the deeper regions of
cartilage. Chondrocytes are an extremely slow proliferating cell type, and in some cases
may not proliferate at all [34]. This low or even non-existent proliferation rate is one of
the reasons cartilage has such a narrow capacity for healing in response to injury. The
limited ability of cartilage to repair itself indicates that chondrocyte metabolism plays a
functional role in maintaining the overall health of the articular cartilage.
Metabolism is defined as the management of material and energy resources
utilized by a cell that allow organisms to grow, reproduce, maintain their structures, and
respond to their environments [39]. In articular cartilage, chondrocyte metabolism
involves both anabolic and catabolic processes. For chondrocytes, the anabolic process
usually involves the synthesis and production of ECM and PCM molecules through
secretions of various enzymes such as growth factors, cytokines, and protease inhibitors
[40-42]. In cartilage, the most common growth factors are fibroblast growth factor
family (FGF), insulin-like growth factor family (IGF), transforming growth factor family
(TGF-β), and bone morphogenetic proteins (BMPs). The most common anti-
inflammatory cytokines in cartilage include interleukin 4, 10, 13, and 1Ra (IL-4, IL-10,
IL-13, and IL-1Ra). These cytokines and protease inhibitors are enzymes that are
secreted by the cells that help block proteolysis in the cells. Proteolysis is defined as the
breakdown of proteins into peptides or amino acids, and in chondrocytes, specific

18
proteases (e.g. MMPs) breakdown the proteins that make the ECM and PCM, and have
been associated with OA [43]. These degradative processes are known as catabolic
processes.
The most common proteases found in cartilage that are responsible for the
breakdown of ECM and PCM molecules (such as collagen, proteoglycans, and
fibronectin [44]), are matrix metalloproteinase (MMPs). MMPs have not only been
found to degrade collagen, but have also been known to degrade aggrecan by cleaving the
Asn341~Phe342 bond in aggrecan [45] . MMPs include MMP-1, -2, -3, -7, -9, and -13.
Another family of catabolic enzymes that have been known to degrade ECM molecules
are the Adamalysin with Thrombospondin Motifs (ADAMTS) family (also known as
aggrecanase [45]). ADAMTS include ADAMTS-1, -4, -5, and -11.
Because chondrocytes are the sole cell type in cartilage, they must maintain a
delicate balance both the anabolic and catabolic processes (Figure 7). A number of
molecules involved in both the anabolic and catabolic processes of cartilage can be seen
in Figure 7 (note this list is not comprehensive). When in balance, the chondrocytes can
secrete catabolic enzymes to degrade old matrix molecules, and then replace them with
new molecules by initiating an anabolic response. This harmonic balance allows for
healthy turnover rates of the ECM and PCM, and keeps the cartilage functioning
properly. However, during aging or in diseased (OA) conditions, the equilibrium is
disrupted, and the catabolic (degradative) process dominates.

19
Figure 7. Anabolic and Catabolic Enzymes in Cartilage. The delicate balance between
the anabolic and catabolic processes in cartilage. The molecules on the left (green) are
involved in the anabolic process or synthesis of matrix (ECM and PCM molecules). The
molecules on the right (red) are involved in the catabolic or degradative processes of the
matrix in cartilage. Note, this list does not include all of the molecules known to be
involved in the anabolic or catabolic processes of cartilage.
As aforementioned, articular cartilage is avascular, meaning chondrocyte
metabolism is heavily dependent on glycolysis [46]. In light, ATP is created in either the
TCA (citric acid cycle) or in glycolysis, and energy is released when ATP (adenosine
triphosphate) is broken down into ADP (adenosine diphosphate). In the presence of
oxygen, the TCA cycle is the primary metabolic pathway used by cells to create ATP.
On the contrary, in the absence of oxygen or in low levels of oxygen, glycolysis is the
dominating pathway. Due to the low oxygen levels found in cartilage (ranging from 10%
at the surface to <1% in the deep layers), the majority of the chondrocyte’s energy
utilization come almost exclusively from glycolysis [46]. Glycolysis is a metabolic
pathway where extracellular glucose (C6H12O6) is broken down into pyruvate
(CH3COCOO- + H+) through a number of metabolic reactions. Throughout glycolysis,

20
ATP is broken into ADP, which gives the cells the energy they need to maintain and
repair their own individual microenvironment. Due to the low density of chondrocytes in
cartilage, each chondrocyte is responsible for its immediate surroundings and very rarely
do chondrocytes form cell-to-cell contacts for signal transduction and intercellular
communications [37].
Surrounding each chondrocyte is a thin membrane known as the pericelluar
matrix (PCM). The PCM plays an important role in that it provides an interface between
the stiff ECM and the more compliant chondrocytes [47]. As seen in Figure 5, the PCM
is in direct contact with both the ECM and chondrocyte as seen by the darker black ring
surrounding the cell. It is believed that the PCM serves as a transducer of physical
signals within the chondrocyte’s microenvironment, therefore playing a very important
role in chondrocyte mechanotransduction and thus the overall metabolism of cartilage
[48].
Mechanotransduction
Mechanotransduction describes the processes by which cells convert mechanical
stimuli into biochemical responses [49]. It is well known that cells can convert a
mechanical input into a biological signal, but the underlying processes remain unclear
[50]. An example of mechanotransduction, one in which we have all experienced, is
touching a hot plate. When we touch the hot plate (heat is the mechanical stimuli), our
cells on the surface of our hand translate the stimuli into a biochemical signal (we
recognize this as pain). This signal informs us to quickly remove our hand to prevent
injury. The process of mechanotransduction provides cells the unique ability to adapt to

21
their physical environment [51]. As one could imagine, the heavily-loaded joint surfaces
of our bodies (i.e. knees, hips, etc...) provide a very specialized physical environment for
chondrocytes to live in. At these locations, the articular cartilage, and thus the
chondrocytes, are exposed to near-constant mechanical loading including compressive,
tensile, and shear loads (Figure 8). In fact, during normal, sub-injurious human activities
(i.e. walking, jumping, running, etc.) cartilage is subjected to millions of loading cycles
with in vivo compressions as large as 20% [52-54].
Figure 8. Schematic of tensile, compressive, and shear loads on cells. The process in
which cells convert mechanical stimuli into biological signals is known as
mechanotransduction.
The average human gait has been measured to be at approximately 1 Hz, meaning
during a 1 hour walk, each knee joint is loaded 1800 times with contact pressures as high
as 5-6 MPa from forces up to 10 times the individual’s body weight [55]. Physiological
loading conditions such as running or jumping can produce substantially increased
loading rates (as high as 140 Hz) with contact pressures up to 18 MPa [56]. Joint motion

22
and variable loads are important to maintain normal articular cartilage function and
health, yet excessive loading can result in OA [8, 57].
The threshold between healthy joint loading and unhealthy loading is an
extremely fine line, and remains to be highly controversial. Joint loading under
physiologic conditions (i.e. healthy joint loading) has been shown to have no adverse
effects on cartilage or other joint tissues, and clinical studies even suggest exercise in
osteoarthritic patients [58]. In fact, a study in the Netherlands showed that people with a
history of heavy mechanical loading had a 7.2 less likely of a chance to get OA than
people without a history of heavy mechanical work [3]. This study suggests that joint
loading can potentially promote protective mechanisms against OA. Unhealthy joint
loading, also classified as “abnormal” joint loading, is most commonly a direct result
from obesity, trauma, overuse, immobilization, and joint instability [55]. Obesity is
strongly linked with OA, and studies have shown that a decrease of ~10 lbs. of body
weight in obesity patients can decrease the risk of OA up to 50% [26, 59]. Joint stability
issues are also a common precursor to OA, and a number of models have been developed
and validated to show how joint destabilization promotes OA [60, 61]. A number of
other studies have shown how these abnormal loading conditions play an important role
in the onset of OA, yet the underlying biomechanical processes that cause this still
remains unclear. In order to determine whether or not joint loading can be used as an
effective therapeutic strategy in combating or preventing OA, chondrocyte
mechanotransduction needs to be heavily explored in the scientific community.

23
Scientific Studies
Cartilage experiences a variety of in vivo loading mechanisms. Due to the
difficulty of studying human articular cartilage in vivo, scientists have developed a
number of in vitro studies to explore cartilage mechanics and chondrocyte
mechanotransduction. Plus, who really wants to give up their healthy knee in the name
of science? Two approaches are commonly used in the scientific community in studying
these topics. The first method is removing cartilage samples surgically from animals (i.e.
mice, rats, bovine, etc…) or human donors (i.e. joint replacement), and then mechanically
stimulating the entire tissue. This approach is most commonly used in studying cartilage
mechanics/behavior as well as characterizing ECM and PCM material properties on
macro-scale, micro-scale, and nano-scale levels [47, 62-66]. The second approach
involves studying the chondrocytes themselves. Chondrocytes are most commonly
obtained by harvesting cartilage from an animal or human donor joint, and then digesting
the cartilage (usually in in collagenase, an enzyme that breaks down the peptide bonds in
collagen). After digestion, the cells can be removed, cultured, mechanically stimulated,
and their biological outputs observed. Most chondrocyte mechanotransduction studies
generally involve encapsulating the cells in some sort of hydrogel, creating a 3D
microenvironment in which they may be studied. A variety of hydrogels are utilized in
creating these 3D cell suspensions, such as photo cross-linked polyethylene glycol [43],
self-assembling peptides [67], alginate [68], and agarose [69, 70]. Agarose hydrogels are
of particular interest because the stiffness can be manipulated to match the stiffness of
cartilage PCM [71] without potential complications of UV photo-crosslinking (e.g.

24
induction of the DNA damage response [72]). Currently, most existing studies utilize 3D
microenvironments (e.g. agarose or alginate) for cell encapsulation with a much lower
stiffness (< 5 kPa) than the cartilage pericelluar matrix (25-200 kPa) [47, 73]. These
lower stiffness gels don’t appropriately emulate the microenvironment that the actual in
vivo chondrocytes reside in. By utilizing higher stiffness gels that match the mechanical
properties of the PCM, the chondrocyte mechanotransduction studies will more
effectively simulate the physiological environment of the in vivo chondrocyte.
To emulate physiological loading conditions for in vitro mechanotransduction
studies, dynamic stimulation is often applied with matched load amplitudes and
frequencies similar to the human gait (both walking and running). To simulate walking
in vitro, cartilage explants or 3D cell cultures can be subjected to low levels of oscillatory
strain with frequencies less than 5 Hz. Higher frequencies and strains can be used to
emulate running or jumping. It has been shown that dynamic, mechanical stimulation has
both an anabolic and catabolic effects on articular cartilage [43]. As aforementioned, an
anabolic process is defined as the synthesis of larger molecules from smaller units, which
requires energy. In eukaryotic cells, this energy is usually harvested by the hydrolysis of
ATP. On the contrary, a catabolic process is defined as breakdown of larger molecules
into smaller units, which often releases energy. In regards to chondrocytes, an anabolic
process can be characterized by the synthesis of PCM and ECM molecules, and a
catabolic process would be the breakdown of these molecules. In healthy tissue, resident
chondrocytes maintain the cartilage by remodeling the tissue with a good balance

25
between these two processes, which lead to a healthy turnover rates for the PCM and
ECM [43, 74].
Exogenous dynamic compression has been shown to substantially alter
chondrocyte metabolism in both an anabolic and catabolic manner, but the balance
between matrix synthesis and matrix degradation is not yet fully understood [75, 76].
Dynamic loading performed directly on cartilage samples has been shown to increase
[35
S] sulfate and [3H] proline uptake which is a strong indication of proteoglycan and
protein biosynthesis [77]. Proline is of significance, since it has been found to be a
marker in the synthesis of the ECM. Proline is a non-essential amino acid, and is
incorporated with the synthesis of collagen inside the cells cytoplasm. Note that a non-
essential amino acid can by synthesized within the body, whereas an essential amino acid
cannot be synthesized within the body and must be supplied externally. Changes in
proline levels could potentially be associated with the synthesis or breakdown of
collagen.
Short duration dynamic compression (as little as 5 minutes) as shown to induce
phosphorylation of multiple enzymes, such as MAPK and SEK [78, 79], Akt [80], ERK -
1 and -2 [81-83], and Rho kinase [84]. MAPK (mitogen-activated protein kinases) and
ERK (extracellular signal-regulated kinases) pathways are heavily involved in
extracellular stimulation, and have been hypothesized to regulate anabolic and catabolic
changes of chondrocytes [76]. Dynamic compression has also been shown to promote
Smad2 phosphorylation [85], gene expression of MMP-13 [86], which is the marker for

26
catabolic changes in the ECM, alter Superficial Zone Protein expression [87], induce
transcription of ECM genes [9], and activate Rho kinase and RhoA [84].
Rho kinase (ROCK) and RhoA (Ras homolog gene family, member A) are
proteins which are heavily involved in regulating the shape and movement of cells
through the actin cytoskeleton [84]. Cell shape and size is extremely important when
dealing with chondrocytes. As aforementioned, chondrocytes vary with shape and size
throughout the layers of cartilage (from the superficial tangential zone to the deep zones).
Chondrocytes in to the outer zones tend to be flatter and smaller and generally have
greater density than that of the cells in the deeper zones of the matrix [37] (Figure 4B).
These flatter, denser cells are better for handling the intensive loads seen at the joint
surface and are designed to protect the deeper zones. As we move deeper into the matrix,
the cells become more rounded in shape and less dense. The cells in the deeper zones
(more rounded cells) have been associated with an increase in cartilage matrix production
[88]. Cell shape has been shown to be dependent on the cytoskeleton as well as
interactions with the extracellular matrix [89]. Where ROCK and RhoA come into play
is that they both play a central role in actin cytoskeleton dynamics, which as mentioned
above, affects the shape and size of the cell. Studies show that by inhibiting ROCK cells
become more rounded, which increases in cartilage matrix synthesis [84].
Many experimental studies have also been performed on OA tissues. The
material properties of articular cartilage, mainly Young’s modulus, are derived almost
extensively from the ECM [62]. The ECM has a much greater stiffness than that of the
PCM (~3X), and dominates the overall stiffness of cartilage. It has been shown that the

27
PCM and ECM in OA cartilage is significantly less when compared with healthy
cartilage [62, 90]. In fact, decreases in both ECM and PCM moduli have been reported
as large as 45% and 30% respectively [62]. The catabolic activity of chondrocytes
increases significantly in OA joints, which results in a decrease in cartilage matrix
production [91]. A recent study was performed to compare changes in gene expression
of chondrocytes in OA cartilage to normal cartilage [92]. Significant gene expression
changes occurred in the OA cartilage. OA cartilage explants have also been found to
express p53R2, a tumor suppressor protein. When this protein was inhibited, an increase
in Akt phosphorylation was observed [93]. Akt is a protein of the kinase family, whose
role is primarily involved in cell proliferation. This may suggest that if the p53R2 protein
is suppressed, then cell proliferation may increase.
These studies demonstrate the sensitivity of chondrocytes to mechanical loading
and indicate that a complete understanding chondrocyte mechanotransduction remains to
be determined. Many of current scientific studies primarily focus on individual signaling
pathways, which have the potential to exclude important data or findings. Also, many of
these studies utilize 3D cell constructs with a much lower stiffness than the cartilage
PCM, which does not accurately emulate the physiological environment of the
chondrocytes. Because the exact mechanisms of how chondrocytes sense and respond to
mechanical deformation is not yet fully understood, it is important to study chondrocyte
mechanotransduction in an unbiased manner, meaning looking at the entire picture and
not excluding pathways a priori.
28
Metabolomics
Metabolomics, as the name suggests, is the comprehensive analysis of metabolites
or small molecules in a biological system [94]. Metabolomics is the study of metabolite
profiling, and has been adapted into many fields such as pharmaceutics, clinical
diagnostics, etc… The metabolome (analogous to the proteome for proteins, and the
genome for genetics), is defined as the set of small-molecules found within a biological
sample including substrates, co-factors, and many other molecules [95]. The metabolome
can be viewed as a collection of state variables describing the cellular phenotype [96].
Metabolomics studies the metabolites of a biological system which are direct products of
cellular metabolism. Metabolites give insight on functional readout of the cellular state,
essentially a snapshot of the physiology of the cell. Unlike genes and proteins,
metabolites serve as direct signatures of biochemical activity which are easier to correlate
with phenotype [96].
Metabolomics can be used for metabolite profiling in two basic approaches:
targeted metabolomics, and untargeted metabolomics. Targeted metabolomics refers to
the method of looking at a predefined, specified list of metabolites after a sample is run.
Targeted metabolomics typically focus on one or more related pathways of interest and
are usually driven by a specific biochemical question or hypothesis [96]. For example, in
chondrocytes, metabolism is heavily driven by glycolysis. So, by studying the specific
metabolites in the glycolytic cycle, one could gain a wealth of knowledge regarding the
energy re-localization of the chondrocytes. Untargeted metabolomics is just the
opposite. An untargeted approach aims to study global metabolite levels under various

29
conditions, with the potential to discover new cellular pathways to biological mechanisms
[96].
With the increasing advances in technology, metabolomics is now becoming a
widely used and powerful method for studying many of nature’s biological foundations.
Mass spectrometry (MS) and liquid chromatography (LC) are the most common
engineering tools used in metabolomics, and are often coupled together (LC-MS) to give
an abundance of information about the sample. Recent developments in LC-MS have
enabled scientists to rapidly measure thousands of metabolites simultaneously from only
minimal amounts of samples [97]. Mass spectrometry has been described as the smallest
scale in the world since it measures the masses of individual molecules. A mass
spectrometer actually measures a mass-to-charge ratio (denoted m/z), but masses are
easily backed out since the charge state is usually known.
Mass Spectrometry. A mass spectrometer can be broken down into four basic
components (Figure 9): a sample inlet, an ionization source, a mass analyzer, and an ion
detector [98]. All mass spectrometers incorporate these four components, even though
the processes can vary from instrument to instrument.
The sample is introduced through the sample inlet (Figure 9A), which can be done
so in a couple of different ways; direct insertion and direct infusion. Direct insertion
methods involve the physical insertion of the sample into the mass spectrometer, usually
via a slide or sample plate. The most common type of instrument that utilizes direct
insertion methods is a matrix assisted laser desorption ionization (MALDI) mass
spectrometer. One main advantage of direct insertion over direct infusion, is that it can

30
Figure 9. Simplified schematic of a mass spectrometer. Usually the liquid sample going
to the ionization source comes from the output of some sort of chromatographer.
Usually, mass spectrometers are coupled to a liquid chromatographer (i.e. LC-MS).
be used to analyze whole tissue samples (i.e. sample does not need to be in solution).
Direct infusion methods require samples to be in solution, and utilize capillary columns
to introduce small amounts of sample into the mass spectrometer. These columns
(typically liquid chromatography (LC) columns) are used to separate the solution into its
different components prior to sending it through the mass spectrometer. Quite often mass
spectrometry and liquid chromatography are coupled together, as denoted by LC-MS.
Once the sample is in the MS, it is ionized using a high powered ionization source
(Figure 9B). There are many different ionization methods (MALDI, electrospray
ionization (ESI), etc…), but the purpose of each is the same; adding a charge to a neutral
molecule (i.e. ionizing the molecule). ESI is often the ionization source when coupling
LC-MS since it can handle the continuous flow of sample from the LC. Once ionized or
charged, the molecules are electrically propelled through the mass analyzer (Figure 9C).
Mass analyzers also vary across the board, but their main purpose is to separate the ions
according to their specific m/z values. Mass analyzers include quadrupoles, quadrupole
ion traps, time-of-flight (TOF), and quad time-of-flight (Q-TOF), and each varies in

31
performance with respect to speed, accuracy, and resolution. Once the ions are analyzed
through the mass analyzer, they ultimately reach an ion detector (Figure 9D), where the
ion energies are converted into electrical signals. Note this is simply an extremely brief
overview on mass spectrometers, and merely scratches the surface of their descriptions.
Liquid Chromatography. Liquid chromatography (LC) is an analytical chemistry
technique that is used to separates the various components of a mixture [99]. Liquid
chromatography first came about in the early 1900s, and the word chromatography comes
from the Greek words chroma, meaning color, and graph, meaning writing [100]. The
most common and most powerful form of liquid chromatography involves passing the
sample through a column which is filled with tiny particles, or packing material. This is
known as the “stationary phase”. On the contrary, the solvent that passes through the
column is known as the “mobile phase.” A liquid chromatographer can be broken down
into a few main components (Figure 10).
First, the column is usually conditioned or washed using the mobile phase. This
preps the column to receive the sample. Depending on the type of sample, different types
of columns can be used along with different solvents (mobile phase). The sample is then
injected or loaded onto the column, where it binds to the stationary phase. The column is
then washed by pumping the mobile phase through it. Then, depending on the sample,
the mobile phase is adjusted causing the molecules to elute (come off the column).
Normally, the mobile phase is composed of two or more solvents, and the amount of each
solvent can be adjusted depending on the sample type. For example, if the sample is

32
Figure 10. Schematic of a typical liquid chromatography (LC) system [100].
extremely hydrophobic (water-hating/non-polar), then a typical mobile phase will include
water and some type of organic solvent (usually acetonitrile or methanol). In this
scenario, the water attracts the hydrophilic molecules, or the molecules that bind weakly
to the stationary phase, and they will elute first. The amount of acetonitrile in the mobile
phase is then increased using a solution gradient (adjusting the amount of water and
acetonitrile with respect to time), which out-competes the hydrophobic molecules, or
molecules that were strongly bound to the stationary phase, causing them to elute later.
As a result of the different hydrophobic and hydrophilic interactions of the molecules, the
sample components separate out into discrete fractions, allowing them to be analyzed
separately. These discrete fractions elute from the column and pass through a detector
which records the chromatogram.
With the rise in technology and the advances in instrumentation, chromatographic
methods have increased dramatically. These advances allow samples to be pumped with

33
greater pressures through columns with much higher stationary phase densities, which
significantly increases the resolution, speed, and sensitivity of the system. These liquid
chromatography systems are called high-performance liquid chromatography (HPLC)
and ultra-performance liquid chromatography (UPLC). Most LC systems in today’s
research society are either HPLC or UPLC systems.
The most widely used chromatographic methods in metabolomics and proteomics
are normal-phase chromatography (NPC), reverse-phase chromatography (RPC),
hydrophilic-interaction chromatography (HILIC), and hydrophobic-interaction
chromatography (HIC).
Normal-Phase Chromatography. In normal-phase chromatography the stationary
phase of the column is extremely polar and the mobile phase is non-polar (Figure 11).
Typical stationary phase media of NPC includes silica or other organic molecules and
mobile phases include solvents such as hexane or other nonpolar solvents.
Figure 11. Normal-phase chromatography [99].
In Figure 11, the sample is injected into the column. The polar stationary phase
binds the more polar molecules (yellow band) much stronger than the more nonpolar
molecules (red and blue bands). When the nonpolar mobile phase is pumped through the
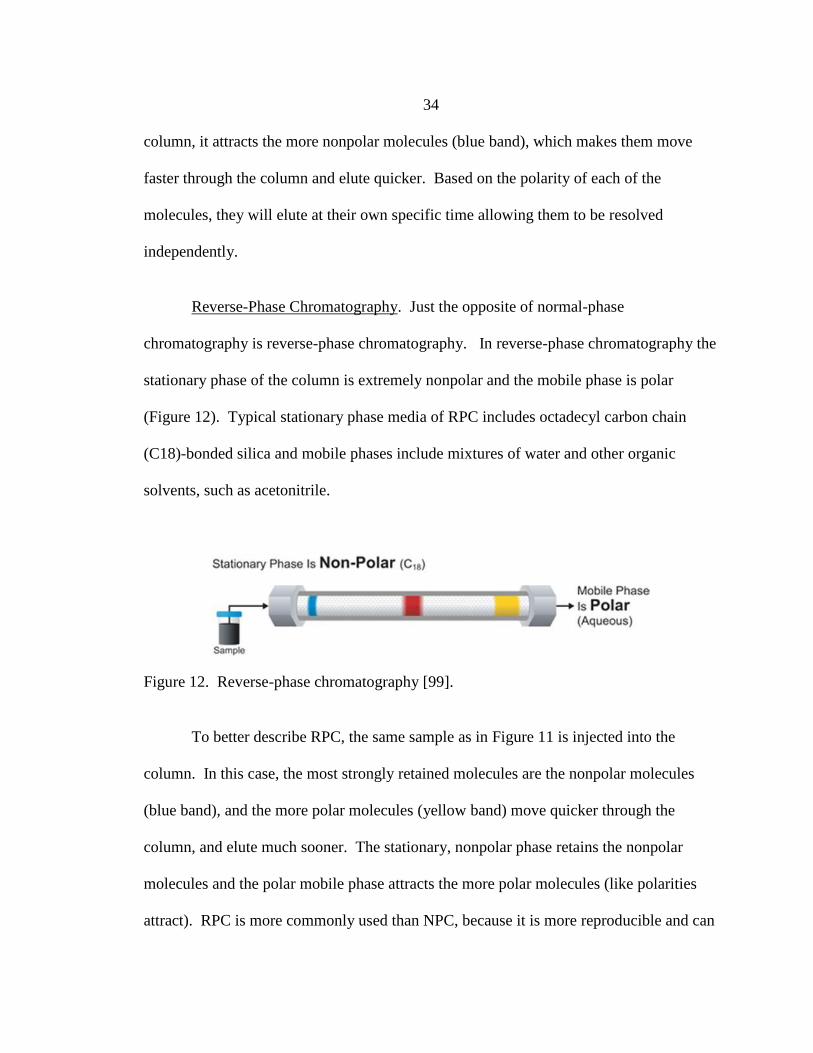
34
column, it attracts the more nonpolar molecules (blue band), which makes them move
faster through the column and elute quicker. Based on the polarity of each of the
molecules, they will elute at their own specific time allowing them to be resolved
independently.
Reverse-Phase Chromatography. Just the opposite of normal-phase
chromatography is reverse-phase chromatography. In reverse-phase chromatography the
stationary phase of the column is extremely nonpolar and the mobile phase is polar
(Figure 12). Typical stationary phase media of RPC includes octadecyl carbon chain
(C18)-bonded silica and mobile phases include mixtures of water and other organic
solvents, such as acetonitrile.
Figure 12. Reverse-phase chromatography [99].
To better describe RPC, the same sample as in Figure 11 is injected into the
column. In this case, the most strongly retained molecules are the nonpolar molecules
(blue band), and the more polar molecules (yellow band) move quicker through the
column, and elute much sooner. The stationary, nonpolar phase retains the nonpolar
molecules and the polar mobile phase attracts the more polar molecules (like polarities
attract). RPC is more commonly used than NPC, because it is more reproducible and can

35
be applied to a broader range of applications. RPC accounts for approximately 75% of
all HPLC methods [100].
Hydrophilic-Interaction Chromatography. Hydrophilic-interaction
chromatography or HILIC is a type of normal-phase chromatography since it uses a polar
stationary phase and a nonpolar mobile phase. Typically, with HILIC, the mobile phase
is adjusted throughout the run. First, a very nonpolar solvent (100% organic) is used to
elute the nonpolar molecules from the column. Then, water (an extremely polar solvent)
is mixed in with the mobile phase, starting at low concentrations, and increasing until the
mobile phase is 100% water. By increasing the amount of water in the mobile phase, the
polar molecules that are bound to the stationary phase are out –competed by the water,
and thus are eluted. The process of adjusting the ratio of the mobile phase throughout the
course of the run is called a gradient separation.
Hydrophobic-Interaction Chromatography. Hydrophobic -interaction
chromatography, or HIC, is a type of reverse-phase chromatography. HIC uses a
nonpolar stationary phase and a polar mobile phase, and is usually used to separate larger
molecules, such as proteins. Proteins by nature are extremely hydrophobic molecules,
meaning they are not attracted to water. When the samples are injected into the column,
the hydrophobic stationary phase binds the hydrophobic molecules. The column is then
washed with a hydrophilic or aqueous mobile phase. The amount of hydrophobic or
organic solvent in the mobile phase is then increased, which out-competes the

36
hydrophobic molecules that are bound to the stationary phase. The molecules are then
eluted in order of increasing hydrophobicity.
Metabolomic Analysis. An output from an LC-MS run gives an abundance of
information. Directly from the LC, a total ion chromatogram (TIC) is produced when the
sample reaches the detector, which displays relative abundance, or intensity values on the
vertical axis and elution time (usually in minutes) on the horizontal axis (Figure 13A). A
TIC displays the abundance of sample at any time throughout the LC-MS run. The
elution time is defined as the time when the samples elute off of the column and then
enter the into the ionization source of the MS. Each elution time point in the TIC
corresponds with a specific mass spectrum for the compounds eluting at that specific
time, hence why LC-MS runs generate so much data. The mass spectra give the intensity
of the signal (unit less) on the vertical axis, and the mass to charge (m/z) ratios along the
horizontal axis (Figure 13B).

37
Figure 13. (A) Total ion chromatogram (TIC), and the (B) corresponding mass spectra
for the sample that is eluted at ~3.25 minutes. For this figure, the sample is processed
through the liquid chromatographer (LC) from ~2 minutes until ~15 minutes. For the
TIC, the x-axis represents elution time and the y-axis the intensity of the signal. As the
sample elutes from the LC, it goes directly into the ionization source (ESI) of the mass
spectrometer (MS). For each elution time, we get a corresponding mass spectra, which
gives us the individual mass to charge (m/z) ratios (x-axis) and their representative
intensity (y-axis).
Proteomics
Proteomics is defined as the large-scale study of proteins. Again, analogous to
the genome (the study of genetics) and the metabolome (the study of metabolomics), the
proteome is defined as the entire set of proteins that are expressed by the genome, cell,
tissue or organism at a certain time [101]. In mammalian cells, proteins are created from
DNA (through many complicated processes), which is commonly referred to as the
central dogma of modern biology Figure 14. DNA (deoxyribonucleic acid), is a molecule
that encodes the genetic instructions used in the development and functioning of all living

38
organisms, and in eukaryotic organisms most of the DNA is stored within the cell nucleus
(Figure 14A) [102]. According to the central dogma of modern biology, DNA is
transcribed into messenger ribonucleic acid (mRNA) (Figure 14B), which is a single
stranded copy of the gene. This process is commonly known as transcription. mRNA is
then translated into long strings of amino acids in the cell’s cytoplasm by ribosomes, and
eventually become proteins, in a process called translation (Figure 14C). Each protein
serves a unique purpose, and are considered the building blocks and workers of our cells.
After translation (post-translation), proteins can be subjected to an array of chemical
alterations, which can affect the protein’s function. These changes are called post-
translational modifications. An important post-translation modification in studying
proteomics, in which a phosphate group is added to an amino acid (most commonly
serine and threonine) is known as protein phosphorylation [103]. Protein
phosphorylation gives insight of specific signaling pathways that could potentially reflect
changes in protein activity. Phosphoproteomics is aimed at determining these specific
phosphorylated proteins in a cell under some response.
The field of proteomics is awakening more interest in the scientific community,
mainly in part to the Human Genome Project (HGP). In the 2003, the National Human
Genome Research Institute (NHGRI) announced the successful sequencing of the human
genome [104]. After the human genome was successfully sequenced, it was important to
understand the relationships between gene expression and the biological functions of the
cells. Understanding this important relationship is only possible through the study of the
proteins. In most organisms, the genome is more or less static in all of their cells.

39
Figure 14. Central dogma of modern biology.
However, the proteome of the cells is highly dynamic, and the functions of the individual
proteins can change dramatically in response to their environment, stress, physiological
conditions, etc… These factors significantly increase the complexity in studying
proteomics; however studying these dynamic characteristics of proteins has an advantage
over studying genomics in that it gives more insight into the physiology of the cell.
Proteomics is similar to metabolomics (but on a slightly longer time scale), in that it
paints a picture of what a cell is doing at a given instant in time.

40
The breakthrough in proteomics has risen in part to important technological
advancements in the past few decades. The first major breakthrough came about in 1975,
which was two-dimensional gel electrophoresis (2D-GE) [105]. 2D-GE is used to
analyze proteins by first separating them in one-dimension (1D-GE) by their mass. The
proteins are then further separated in a second-dimension according to their isoelectric
point. A typical 2D-GE gel can be seen in Figure 15.
Figure 15. 2D-GE showing the proteome mapping of all of the proteins altered in OA
[106]. Each black dot represents in an individual protein. Proteins are separated by
increasing mass (kDa) in one-dimension, and by increasing isoelectric point (pH) in the
second-dimension.
The second major breakthrough in the study of proteomics was mass
spectrometry. Initially, and even currently, both techniques (2D-GE and mass
spectrometry) are combined in the study of proteomics. First, the proteins are separated

41
in the 2D-GE, and then are analyzed and identified using mass spectrometry. The
downside to this type of analysis is it is very labor and time extensive. However, with
rise of technology, the sensitivity and speed for identifying and sequencing the proteins
has improved dramatically. Usually, in mass spectrometry based proteomics analysis,
sample preparation requires the proteins to be enzymatically digested using a
proteolyzing enzyme, such as trypsin. Trypsin is a serine protease whose main function
is in the hydrolyzing of proteins (breakdown of proteins in to smaller fragments called
peptides). Trypsin hydrolyzes or cleaves the peptide bonds typically at the carboxyl sites
of either the amino acids, lysine (Lys) or arginine (Arg) [107]. This digestion process is
usually part of the sample preparation steps, and usually takes around 12 to 16 hours to
completely digest the protein samples. Once the sample has been digested it can be
analyzed using liquid chromatography and mass spectrometry (with fragmentation).
Liquid chromatography and mass spectrometry (with fragmentation) is typically
denoted as LC-MS/MS. LC-MS/MS is typically used in proteomics analysis, and protein
identification is only made possible through the information gained from the fragmented
peptides. Fragmentation is usually performed by injecting an inert, collision gas (usually
nitrogen) into the flight path of the charged, precursor ions, which is known as collision
induced dissociation (CID) (Figure 16) [108].
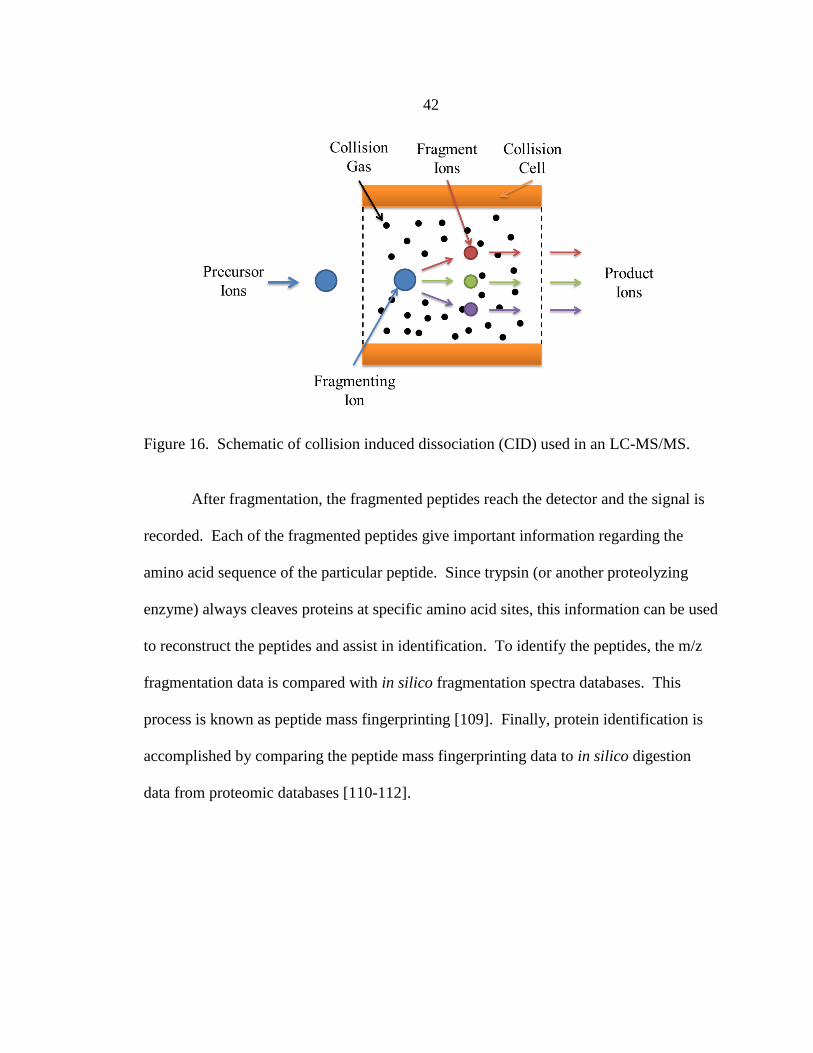
42
Figure 16. Schematic of collision induced dissociation (CID) used in an LC-MS/MS.
After fragmentation, the fragmented peptides reach the detector and the signal is
recorded. Each of the fragmented peptides give important information regarding the
amino acid sequence of the particular peptide. Since trypsin (or another proteolyzing
enzyme) always cleaves proteins at specific amino acid sites, this information can be used
to reconstruct the peptides and assist in identification. To identify the peptides, the m/z
fragmentation data is compared with in silico fragmentation spectra databases. This
process is known as peptide mass fingerprinting [109]. Finally, protein identification is
accomplished by comparing the peptide mass fingerprinting data to in silico digestion
data from proteomic databases [110-112].

43
Dissertation Outline
The over-arching goal of the research described in this dissertation is to better
understand the chondrocyte response to applied, mechanical compression, and whether or
not mechanical loading can be used as a potential therapeutic for treating or preventing
osteoarthritis. To determine the effects of mechanical loading on chondrocytes, the
biological outputs were analyzed utilizing novel in vitro and in vivo models. To my
knowledge, such approaches have never been used to study chondrocyte
mechanotransduction, and this research lays a strong foundation for future work in this
field. The research in this dissertation is partitioned into four unique parts (Figure 17).
Figure 17. Dissertation workflow. (1) Methods development for the in vitro models used
for the (2) metabolomics and (3) phosphoproteomics studies. Finally, the (4) in vivo
model allows for integration and interpretation of the in vitro results. All of Chapters
combined will help answer will provide a systems understanding of chondrocyte
mechanotransduction.

44
Because chondrocytes are a very specific cell type, and the environment they
reside in is highly specialized, controlling the environmental factors for the experiments
were extremely important. The second chapter of this dissertation (Figure 17), builds off
of previous work [113], and expands the characterization and development of the
experimental methodology for the in vitro studies (metabolomics and
phosphoproteomics). To emulate the physiological loads and environment seen by
chondrocytes, a bioreactor (mechanical loading device) was needed, capable of applying
well defined static and dynamic loads, as well characterizing the material properties of
agarose for physiological, 3D cell constructs [114]. Once completed, it was necessary to
characterize the strain homogeneity in the agarose constructs (hydrogels) under applied
loading [115]. To ensure the biological outputs of the chondrocytes in response to
loading were valid, the deformation, or strain, seen by each cell needed to be the same.
After validating the strain homogeneity in the gels, the next step was to determine the
viability of chondrocytes in the high-stiffness agarose hydrogels. Following viability
assessment, it was necessary to validate that the chondrocytes were capable of being
deformed in the hydrogels. The final step of the experimental methodology, was to
perform initial metabolomic studies using human SW1353 chondrosarcoma cells
embedded physiologically stiff agarose at time intervals of 0, 15, or 30 minutes [116].
Once completed, this in vitro model could be applied to explore the mechanosensitive
mechanisms in primary human OA chondrocytes.
Following the development of the in vitro methodology, the mechanistic data sets
(both metabolomics and phosphoproteomics) were developed and generated. The third
45
chapter of this dissertation delves into the metabolomics studies on mechanically
stimulated chondrocytes that were harvested from 5 patients with grade IV OA. The
objective of Chapter 3 is to quantify changes in the metabolome for primary human
chondrocytes in response to physiological dynamic compression. In this objective,
primary human chondrocytes were encapsulated in physiologically stiff agarose,
dynamically stimulated with physiological loading values, immediately flash-frozen in
liquid nitrogen post-loading and pulverized. Metabolites were extracted and quantified
via liquid chromatography-mass spectrometry (HPLC-MS) at the MSU Cobre Mass
Spectrometry Core Facility. The objective was to analyze metabolite changes in
chondrocytes in direct response to short-duration mechanical compression (0, 15, and 30
minute stimulation). Both untargeted and targeted approaches were used to quantify
changes in metabolite levels. The results from this study provided both a global
(untargeted) and a more focused (targeted) understanding of the metabolic changes in
chondrocytes under mechanical compression.
Similarly, Chapter 4 looks at the same grade IV OA patients but in a
phosphoproteomics approach. The objective of this chapter was to quantify protein
phosphorylation profiles of primary chondrocytes in response to physiological dynamic
compression. Using methods from Chapter 2, and an experimental design similar to
Chapter 3, I assessed proteome-wide phosphorylation patterns in chondrocytes as a
function of dynamic loading. However, once samples were finished being loaded and
flash frozen, proteins were extracted, digested, enriched for phosphopeptides, and then
quantified via tandem liquid chromatography-mass spectrometry/mass spectrometry

46
(HPLC-MS/MS). The results from this study provided a quantification of protein
phosphorylation patterns in response to a time course of physiological dynamic
compression.
The objective for the final Chapter of this dissertation was to develop novel
methods for quantifying changes in cartilage in response to in vivo dynamic, mechanical
loading on cartilage reporter mice. This Chapter helped validate the in vitro results in
Chapters 3 and 4 by comparing metabolites with macro-scale imaging obtained in the
context of an exercise-induced mouse loading model. This objective was aimed to
develop novel methods for studying in vivo chondrocyte mechanobiology. Utilizing
these novel transgenic mice that express cartilage specific bioluminescence, in vivo
cartilage quantification was made without mouse euthanization. Two sets of mice were
compared in these study; un-exercised, control mice and exercised mice. A custom-built
mouse treadmill was used to exercise mice once a day for 30 minutes over a 2 week time
span. Un-exercised mice were used as controls to compare cartilage amount against the
exercised mice. Following the experimental time course, all of the mice were imaged and
then euthanized prior to full-joint, metabolomic analysis. The results allowed for in vivo
validation and integration of the in vitro results from Chapters 3 and 4.
Intellectual Merit
This research substantially expanded the scientific knowledge of chondrocyte
mechanobiology (the science of how cartilage cells sense and respond to mechanical
loads). To my knowledge, metabolomics, phosphoproteomics, and our in vivo mouse

47
model have not been previously used to study chondrocyte mechanotransduction. This
unique approach laid a solid foundation of data for a systems understanding of
chondrocyte responses to compressive, mechanical loading. Currently, the only effective
OA treatments are surgical, and there are no pharmacological interventions with proven
efficacy. This dissertation laid the groundwork to explore specific signaling pathways
that could potentially promote loading-induced matrix synthesis. This knowledge could
lead to the discovery of new therapeutics to help repair damaged or degenerated cartilage
based on mechanical loading. These therapeutic strategies could lead to ground breaking
clinical progress in combating the most prevalent joint disorder, osteoarthritis.
Broader Impacts
The successful completion of this dissertation considerably advanced our
knowledge of cellular mechanobiology. Currently, most studies focus on individual
signaling pathways which have the potential to exclude important data [9]. This research
was novel and advantageous since it removes bias, by not excluding pathways a priori.
By using an unbiased approach, I was able to identify compression-induced changes in
levels of metabolites and proteins which were not known. Since the number of
mechanosensitive pathways remains unknown, a conservative estimate is that this project
increased the known number by a substantial amount. This research provided a valuable
contribution to basic science in addition to the potential to discover new, therapeutic
strategies to combat OA.

48
DEVELOPMENT OF EXPERIMENTAL METHODOLOGY
As aforementioned, the research performed in this dissertation is extremely novel.
Due to the fact that minimal work has been done in this field, a lot of the experimental
methodologies needed to be developed, validated, and optimized. The main objective of
Chapter 2 was to develop and optimize the in vitro methods used for Chapters 3 and 4.
These objectives included (1) characterizing the stiffness properties (Young’s Modulus)
for various concentrations of agarose hydrogels, (2) evaluate the spatial homogeneity in
physiologically stiff agarose under applied compression, (3) determine the feasibility of
encapsulating primary human chondrocytes in physiologically stiff agarose, and assess
viability of the cells after 24 and 72 hour time points, and (4) quantify metabolite changes
in SW1353 chondrocytes in response to physiological, dynamic compression.
Physiological Characterization of Agarose Hydrogels
Introduction
The biological responses of chondrocytes in response to mechanical loading are
crucial in understanding how chondrocytes sense and respond to various mechanical
cues. To model in vivo mechanotransduction studies on chondrocytes, the first goal was
to create a physiologically stiff microenvironment for in vitro testing. The first milestone
was to characterize the material properties for agarose with matched stiffness values to
human PCM. A majority of the material characterization was performed by Aaron Jutila
for his Master’s dissertation [113], but an equal contribution was made by the author and
Aaron in developing our 3D, agarose model. The results from this work laid the initial

49
building blocks for this entire project. It was determined that the agarose concentrations
that best matched the human PCM ranged between 3% and 5% (w/v). This is a
significant finding because current studies utilize a much lower stiffness for chondrocyte
encapsulation (1.5-3% w/v agarose concentration) which could greatly affect chondrocyte
mechanotransduction experiments [117-119]. By using a more representative stiffness
(3-5% w/v agarose concentration) for chondrocyte mechanotransduction studies, we can
more accurately model physiological loading scenarios.
Methods
Agarose hydrogels were prepared by dissolving low-gelling-temperature agarose
(Sigma: Type VII-A A0701), in PBS at 1.1X of desired hydrogel concentration. For
example, for 4% (w/v) final concentration, agarose was initially mixed at 4.4% (w/v).
Concentrations tested were 3, 3.5, 4, 4.5, and 5 (%w/v). After approximately 5 minutes,
the dissolved agarose was diluted to 1X with PBS (40°C). Note that this procedure is
readily applied to encapsulating cells [120, 121]. Once the entire agarose solution was
equilibrated to ~40°C, the agarose was cast in an anodized aluminum mold (Figure 18).
The mold produced cylindrical samples with heights of 12.7 ± 0.1mm and diameters of
7.0 ± 0.1mm (aspect ratio, h/r = 3.6). This specific sample geometry was selected to
provide spatially homogeneous strain fields under uniaxial deformations [122]. When
gels solidified (after ~5 min.), gels were removed and stored in PBS at 4C for 1-2 days
prior to testing consistent with standard mechanotransduction protocols [123, 124].

50
Figure 18. Agarose hydrogel mold. Gel dimensions were approximately 12.7 mm tall by
6.5 mm wide.
Samples were removed from the fridge, equilibrated in PBS at 37C for 30
minutes, and tested on a custom-built bioreactor [113] (Figure 19A). The bioreactor was
designed to allow for testing in an incubator under tissue culture conditions (humidified
5% CO2 atmosphere and operating temperature of 37C). Samples were loaded
vertically in polysulfone cups and completely covered in PBS to prevent dehydration of
the samples during testing. The polysulfone cups were loaded into the trays of the
bioreactor, which sat on top of a load cell (Futek) to give force feedback during testing.
The forcing platens of the bioreactor were loaded until sample contact was made, as
visualized from a measured load change (~0.089 N). The sample was allowed to relax
for approximately 10 minutes before mechanical stimulation. For all tests, both

51
displacement and load data was measured. Displacement data was measured using a
laser displacement sensor (Acuity AR200-6), and load was measured using a 10lb.
capacity load cell (Futek).
For the stepwise stress-relaxation tests, the samples were subjected to 4 steps of
4% compressive, Lagrangian strain [113]. Each strain step was held for 90 minutes.
Both dynamic and equilibrium moduli values were calculated by performing linear
regression on their appropriate stress and strain values over the 4 deformation steps. This
was performed for the entire range of agarose concentrations with n = 5 samples for each.
To test the hydrogels, our custom-built bioreactor with sub-micron precision was used
[113] (Figure 19A). Stepwise stress-relaxation tests were used to characterize the
dynamic and equilibrium moduli of a visco-elastic material by applying a prescribed
strain level and holding it constant over a period of time. The strain is then increased,
held constant and repeated “n” number of times (Figure 19B). When the strain is applied,
the resulting stress in the material has an initial response (dynamic), and relaxes
exponentially over time to an equilibrium position (Figure 19C). The dynamic modulus
is characterized from the initial dynamic response (peak stress value divided by
associated strain value), and the equilibrium modulus is characterized by the material’s
equilibrium stress value divided by associated equilibrium strain value.

52
Figure 19. (A) Custom built bioreactor with sub-micron precision [113]. This bioreactor
is capable of applying static and dynamic compression to up to 9 samples simultaneously.
For agarose stiffness characterization, (B) step relaxation tests were performed by
incrementally compressing the samples and (C) computing stress and strain values from
experimentally determined displacement and load values.
For all tests, a low-gelling temperature (Sigma: Type VII-A A0701) was used. A
low-gelling temperature agarose was selected to allow for encapsulation of chondrocytes
without killing the cells (encapsulation had to be performed <37°C). The gelling
temperature of the agarose refers to the temperature at which the agarose changes from an
aqueous solution into a gelatin state upon cooling. For the agarose hydrogels, a range of
concentrations were tested (3-5% w/v), and their appropriate moduli determined.
Results & Conclusion
Stepwise stress-relaxation results show an increasing trend of agarose stiffness
with respect to agarose concentration (Figure 20). Equilibrium moduli were 18.9 0.77

53
kPa, 26.0 1.58 kPa, 34.3 1.65 kPa, 35.7 0.95 kPa, and 42.0 2.88 kPa for agarose
concentrations of 3, 3.5, 4, 4.5, and 5% (w/v), respectively. Dynamic moduli were
determined to be of 39.4 4.5 kPa, 52.3 1.9 kPa, 64.4 3.1 kPa, 55.5 3.5 kPa, and
78.4 3.2 kPa for the range of agarose gels, respectively. A significant relationship
between the calculated stiffness values and the gel concentration (dynamic, r = 0.78, p <
0.001, and equilibrium r = 0.91, p < 0.001) was determined.
Figure 20. Equilibrium (red) and dynamic (gray) moduli values for 3-5% [w/v] agarose.
Modulus value (kPa) is given on the vertical axis and increase gel concentration on the
horizontal axis [113].
The dynamic modulus can be thought of as the materials initial, elastic
response/stiffness to a rapidly induced mechanical deformation. The equilibrium
modulus is the materials stiffness in response to a more relaxed, slower induced
deformation. Recalling our goal of creating a physiologically stiff environment for

54
chondrocyte encapsulation, we find that 3-4% agarose provides a stiffness perfect for
modeling OA PCM (~25 kPa), and 4.5-5% agarose provides a stiffness matched to
healthy PCM (~40 kPa). This is a significant finding because current studies utilize a
much lower stiffness for chondrocyte encapsulation (1.5-3% w/v agarose concentration)
which could greatly affect chondrocyte mechanotransduction experiments [117-119]. By
using a more representative stiffness (3-5% w/v agarose concentration) for chondrocyte
mechanotransduction studies, we can more accurately model real life loading scenarios.
This research was published in the Annals of Biomedical Engineering in November, 2014
[114]. The work in this publication was a joint effort between the author and Aaron
Jutila, and can be seen in APPENDIX A.
Following the material property characterization for the agarose hydrogels, the
next goal was to assess the strain homogeneity of the hydrogels under applied
deformation. It was necessary to validate the homogeneity of the mechanical
deformations in the agarose hydrogels for the chondrocyte mechanotransduction studies
(Chapters 3 and 4). Because these two in vitro studies are looking into the metabolomic
and phosphoproteomic profiles of the chondrocytes in response to mechanical loading,
the deformations applied to each of the individual, encapsulated cells needed to be
similar. If the applied deformations were not similar, then the biological outputs of the
chondrocytes could be a result of the inhomogeneous mechanical loading. However, if
the deformations were similar, then the differences in results could signify loading
induced changes within the cells.

55
THE MECHANICAL MICROENVIROMENT OF HIGH
CONCENTRATION AGAROSE FOR APPLYING
DEFORMATION TO PRIMARY
CHONDROCYTES
Contribution of Authors and Co-Authors
Author: Donald L. Zignego1
Contributions: Acquired, analyzed, and interpreted the data. Drafted and wrote the
manuscript.
Co-Author: Aaron A. Jutila1
Contributions: Interpreted data and revised the manuscript.
Co-Author: Martin K. Gelbke2
Contributions: Acquired samples and reviewed the manuscript.
Co-Author: Daniel M. Gannon2
Contributions: Acquired samples and reviewed the manuscript.
Corresponding Author: Ronald K. June1,3
Contributions: Designed the study, analyzed and interpreted the data, and wrote the
manuscript.
1Department of Mechanical and Industrial Engineering, Montana State University,
Bozeman, MT 59717-3800, USA
2Bridger Orthopedic and Sports Medicine, Bozeman, MT 59715, USA
3Department of Cell Biology and Neuroscience, Montana State University, Bozeman, MT
59717-3800, USA

56
Manuscript Information Page
Donald L. Zignego, Aaron A. Jutila, Martin K. Gelbke, Daniel M. Gannon, and Ronald
K. June.
Journal of Biomechanics
Status of Manuscript:
___ Prepared for submission to a peer-reviewed journal
___ Officially submitted to a peer-reviewed journal
___ Accepted by a peer-reviewed journal
_X_ Published in a peer-reviewed journal
Publisher: Elsevier for the American Society of Biomechanics
Issue: June 27th, 2014, Vol. 47, Issue 9, Pages 2143-2148
Copyright 2014. Elsevier Inc.

57
Abstract
Cartilage and chondrocytes experience loading that causes alterations in
chondrocyte biological activity. In vivo chondrocytes are surrounded by a pericellular
matrix with a stiffness of ~25-200 kPa. Understanding the mechanical loading
environment of the chondrocyte is of substantial interest for understanding chondrocyte
mechanotransduction. The first objective of this study was to analyze the spatial
variability of applied mechanical deformations in physiologically stiff agarose on cellular
and sub-cellular length scales. Fluorescent microspheres were embedded in
physiologically stiff agarose hydrogels. Microsphere positions were measured via
confocal microscopy and used to calculate displacement and strain fields as a function of
spatial position. The second objective was to assess the feasibility of encapsulating
primary human chondrocytes in physiologically stiff agarose. The third objective was to
determine if primary human chondrocytes could deform in high-stiffness agarose gels.
Primary human chondrocyte viability was assessed using live-dead imaging following 24
and 72 hours in tissue culture. Chondrocyte shape was measured before and after
application of 10% compression. These data indicate that (1) displacement and strain
precision are ~1% and 6.5% respectively, (2) high-stiffness agarose gels can maintain
primary human chondrocyte viability of >95%, and (3) compression of chondrocytes in
4.5% agarose can induce shape changes indicative of cellular compression. Overall,
these results demonstrate the feasibility of using high-concentration agarose for applying
in vitro compression to chondrocytes as a model for understanding how chondrocytes
respond to in vivo loading.

58
Introduction
Osteoarthritis (OA) is the most common joint disorder, affecting over 100 million
individuals [6]. OA is most commonly associated with excessive loading of aging joints
(e.g. caused by obesity or injury), leading to deterioration of articular cartilage and joint
inflammation. Articular cartilage is located at the surfaces of joints, and serves as a low-
friction material between bones. Articular cartilage is composed of articular
chondrocytes (cartilage cells), the pericelluar matrix (PCM), and the extracellular matrix
(ECM) [125]. In these regions of the body (e.g. the knee), the articular cartilage, and thus
articular chondrocytes, are subjected to almost-constant mechanical loading (e.g.
walking, running, etc…). Repetitive action is crucial for joint health, yet excessive
loading can lead to OA [8]. Individuals with a history of heavy mechanical work (e.g.
heavy lifting) are ~7-fold less likely to have OA at the age of 90 [3], suggesting that long-
duration, but sub-injurious, mechanical loading may induce protective biological
responses. Therefore, understanding the biological responses of chondrocytes to
mechanical loading are extremely important to improving joint health. These data
emphasize the need for development of fundamental knowledge regarding how
chondrocytes and other joint cells sense and respond to mechanical loads, a process
defined as mechanotransduction [49]. This paper characterizes the deformational
environment of a stiff 3D hydrogel for use in cartilage mechanotransduction studies.
Exogenous dynamic compression can substantially alter chondrocyte metabolism
in both an anabolic and catabolic manner, but the balance between matrix synthesis and
matrix degradation is not yet fully understood [75, 76]. Dynamic compression can

59
induce phosphorylation of multiple enzymes, including MAPK and SEK [78, 79], Akt
[80], Erk -1 and -2 [81-83], and Rho kinase [84]. Additionally, exogenous loading can
alter Superficial Zone Protein expression [87], induce transcription of ECM genes [9],
and activate RhoA [84]. Cyclic dynamic compression can promote Smad2
phosphorylation [85], gene expression of MMP-13 [86], which is the marker for
catabolic changes in the ECM, and increases in ATP release [126]. These studies
demonstrate the sensitivity of chondrocytes to mechanical loading and indicate that a
complete understanding chondrocyte mechanotransduction remains to be determined.
A variety of hydrogels have been utilized including photo cross-linked
polyethylene glycol [43], self-assembling peptides [67], alginate [68], and agarose [69,
70]. Most existing studies utilize 3D microenvironments (e.g. agarose or alginate) for
cell encapsulation with a much lower stiffness (< 5 kPa) than the cartilage pericelluar
matrix (25-200 kPa) [47, 73]. Agarose hydrogels are of particular interest because the
stiffness can be selected to match the stiffness of cartilage PCM [71] without potential
complications of UV photo crosslinking (e.g. induction of the DNA damage response
[72]). This study characterizes the deformational environment of high-stiffness (~35
kPa) agarose gels. To our knowledge, chondrocyte mechanotransduction studies have
never been performed using agarose with PCM stiffness.
Cartilage experiences a variety of in vivo loading. The motivation for this study is
to characterize the micro-level deformation fields in a physiologically stiff, 3D culture
environment, to study how chondrocytes sense and respond to mechanical loading.
Using a bioreactor capable of applying sub-micron precision, displacement-controlled

60
loading to agarose hydrogels during confocal microscopy, this study describes (1) the
cellular-level deformation fields in agarose hydrogels under mechanical compression, (2)
the encapsulation of primary human chondrocytes in agarose hydrogels with stiffness
matched to human PCM (25-200 kPa) [47, 114, 127], and (3) the ability to apply uniform
compression to embedded cells.
To minimize experimental variability when applying in vitro loads to 3D
chondrocyte cultures, applied deformations must be spatially homogeneous throughout
the hydrogels to avoid spatially-distinct mechanical stimuli. The first objective of this
study was to analyze the spatial variability of applied mechanical deformations in
physiologically stiff agarose on cellular and sub-cellular length scales. Fluorescent
microspheres were used as fiducial markers within agarose hydrogels, which were
compressed uniaxially during confocal imaging. Microsphere positions were tracked
with 2D-Cartesian coordinates over a range of ~250 μm. These data were used to
calculate the displacement and strain fields at multiple locations with spatial resolution of
~5 μm.
The second objective was to assess the feasibility of encapsulating primary human
chondrocytes in physiologically stiff agarose, and the third objective was to determine if
primary human chondrocytes could deform in high-stiffness gels. Primary chondrocytes
were isolated from discarded joint replacement tissue and encapsulated in agarose, and
viability was assayed via live-dead staining. The results of this study indicate that (1)
applied deformations have minimal spatial variability and strain bias, (2) primary
chondrocytes can maintain high viability through 72 hours, and (3) human chondrocytes

61
can be deformed in physiologically stiff agarose. Future studies may use this system to
elucidate cellular mechanisms of chondrocyte mechanotransduction.
Methods
Encapsulation of Fluorescent Microspheres in Physiologically Stiff Agarose.
Agarose hydrogels were prepared by dissolving low-gelling-temperature agarose (Sigma:
Type VII-A A0701), in PBS at 1.25X of desired hydrogel concentration. For example,
for 4% (w/v) final concentration, agarose was initially mixed at 5% (w/v). Fluorescent
microspheres (Molecular Probes: Constellation Microspheres, diameter 1-5μm) were
added to the agarose (~40C and 25% w/v) to reduce to the final, desired agarose
concentration. Microspheres were vigorously vortexed to distribute them evenly
throughout the liquid hydrogel. Gels were then cast in an anodized aluminum mold at
23C, which produced cylindrical hydrogels with a height of 12.7 0.1 mm and diameter
of 7.0 0.1mm (aspect ratio 3.62). The sample geometry was selected to provide
uniaxial deformations consistent with spatially homogeneous strain fields [122]. Agarose
concentrations were 3, 3.5, 4, 4.5, and 5% (w/v) based on previous stiffness data with
n=3 replicates for each concentration [128]. Gels were removed from the mold after 5
minutes and stored in PBS at 4C until testing.
Mechanical Loading and Confocal Imaging. Samples were bisected
longitudinally and placed into the loading tray of a custom-built loading device (Figure
21A & B) mounted to an upright confocal microscope (Leica SP5). The device delivers
high-precision compression via displacement control to the hydrogel samples and is
62
capable of applying displacements from 12.7 µm to 12.7 mm. These displacements can
be delivered over a range of speeds as low as 12.7 µm / s and as fast as 12.7 mm / s. The
loading platen was moved until contact with the gel was achieved as defined visually
through the microscope. 50 mL of 0.15 M PBS was then added to the tray to maintain
gel hydration. This preloading process required ~5 minutes to complete. The objective
(0.9 NA water objective with x-y resolution of 200 nanometers and z resolution of 600
nanometers) was lowered into the PBS and the fluorescent beads were viewed using
TRITC fluorescence (excitation: 547nm, emission: 572nm). Samples were compressed
serially for a total of 20 steps at 25.4µm increments followed by a 3 minute relaxation
period to accommodate agarose stress-relaxation. Six unique locations (Figure 21C)
were tested in each gel to evaluate the spatial homogeneity in the hydrogels.
Particle Tracking and Finite Deformation Evaluation. Following confocal
imaging, datasets were input into imaging software (Imaris, Bitplane, South Windsor,
CT) for image processing and particle tracking. Each dataset included a 3-dimensional
image of the gel for every loading step (20 images total) which was projected onto 2D for
further analysis (Figure 22). Images were thresholded and particles (fluorescent
microsphere) were tracked over 20 time steps giving a unique x, y, and z location for
>90% of particles at each time step using Imaris software. About 600 particles (range
400-800) were tracked in each gel over the course of the applied compressive
deformations.

63
Figure 21. Approach for measuring micron-level deformations within agarose gels. (A)
Custom-built loading machine for applying controlled displacements to soft biological
samples. (B) This device was designed to be mounted on the platform of an upright
confocal microscope and be capable of viewing bisected hydrogel samples using
fluorescence imaging techniques. Actuation is provided by a linear stepper motor
(Haydon Kerk K57H43-3.25-081ENG, Waterbury, CT). (C) Spatial sampling protocol.
Six images (1-6) were taken of each gel during compression to evaluate the spatial
homogeneity of the induced deformations. These sampling locations are based on the
symmetry of the boundary conditions assuming frictionless contact. Compression was
applied in the positive y-direction.
Particle displacements were calculated directly from the position data.
Displacements were then input into Matlab to calculate finite deformations and strains
using previously-validated techniques [129, 130]. Displacement field smoothing was
performed on all displacement data according to common methods [131]. In order to

64
minimize the amplification of errors we incorporated a Gaussian smoothing filter into our
data processing.
Figure 22. Two-dimensional displacement measurement. Bead displacements, δ, were
measured by automated tracking of ~500 beads in each field of view. Displacements
were calculated from particle (bead) positions after each displacement step. Final
displacement steps were used to evaluate the spatial homogeneity for each gel location.
A total displacement of 508 m was applied to each gel in increments of 25.4 µm
followed by 3 minutes of stress-relaxation prior to imaging. Gels were excited using
TRITC fluorescence and images recorded after each loading step. Scale bar is 30 m.
We applied a 5 x 5 box-sized Gaussian filter to the displacement data with 100 iterative
smoothing cycles prior to evaluation of the strain fields. To assess the potential for
displacement measurement error to propagate, we added random noise to our
displacement measurements prior to strain calculation. Green-Lagrangian finite strain
values were derived directly from displacement data as follows:
𝐸 = 1
2∙ (𝐹𝑇𝐹 − 𝐼)

65
Where I is the identity matrix and the deformation tensor F is defined as:
𝐹 = 𝜕𝑥𝑡
𝜕𝑥0
At a fixed time t the deformation gradient is a function of the actual position
vector xt and the initial position vector x0.
The calculated deformation variables were: displacements in the direction of
loading (Uy), displacements perpendicular to loading (Ux), finite strains in the direction
of loading (Eyy), finite strains perpendicular to loading (Exx), and finite shear strains
(Exy). Note that z-displacements were not measured in this study. Due to the high
density of particles in each image required for the high spatial resolution, the particle
tracking software occasionally identified incorrect particles for tracking (e.g. in a
particular displacement step, particle A was obscured by particle B resulting in missing
displacement data for particle A in this step.) These errors presented themselves as
abnormally large or small displacements when comparing against the entire displacement
dataset. An 85% confidence interval for bead displacement was used to mitigate these
random errors. The average displacement value at the final loading step was calculated,
and displacements that were outside of 1.44 standard deviations were discarded. This
process was selected based on a pilot study which determined the coefficient of
determination (R2) as a function of the confidence interval for displacement processing.
This study found that a confidence interval of 85% achieved the R2 value to be expected
for calculation of finite Lagrangian strain based on the observed deformation gradients
(Supplemental Figure 7).

66
Chondrocyte Encapsulation. Primary human chondrocytes were embedded in
agarose of varying concentrations. Chondrocytes were harvested from discarded joint
replacement cartilage from human donors (Informed consent obtained under an IRB-
approved human subjects exemption), digested in Type IV collagenase (2 mg/mL for 12-
14 hrs. at 37C), and then cultured in DMEM with 10% fetal bovine serum and
antibiotics (10,000 I.U./mL penicillin and 10000 µg/mL streptomycin) in 5% atmospheric
CO2. For encapsulation, cells were trypsinized, counted, and re-suspended in media at
11X. Agarose was autoclaved and prepared as described above. The cell-suspension was
added to the agarose with gentle vortexing to distribute the cells throughout the liquid
hydrogel. Gels were subsequently cast for 5 minutes at 23C. Cell-seeded agarose
constructs were removed from the molds and placed in tissue culture for 24 and 72 hours
prior to viability analysis.
Viability Analysis and Induced Deformations on Primary Chondrocytes. To
assess the feasibility of the encapsulation process, we assessed viability using standard
methods [132]. Cells were incubated in 8 M calcein-AM and 75 M propidium iodide
for 30 min. at 37 C. Following incubation, constructs were examined by confocal
microscopy for calcein-AM fluorescence (excitation: 496 nm, emission: 516 nm)
indicating live cells via intracellular thioesterase activity and propidium iodide
fluorescence (excitation: 536 nm, emission: 617 nm) indicating dead cells via DNA
binding indicative of compromised plasma membranes. Confocal images were acquired
from 6 positions (Figure 21C) within each hydrogel to assess potential spatial variability
in cell viability. To determine if deformations could be induced on embedded primary

67
chondrocytes, hydrogels were compressed uniaxially using the loading device described
above. Constructs were compressed to 10% strain over 1 minute. Stress-relaxation was
allowed to proceed for 10 minutes prior to confocal imaging. Uncompressed control
images (aspect ratio width/height = 1) were used to compare against compressed images
(10% axial compression).
Results
The spatial homogeneity of each gel concentration was evaluated by comparing
the final loading step displacement and strain values at six unique locations in each gel.
For each gel concentration we found displacement and strain fields with minimal
variability from all six gel locations (Figure 23,
Figure 24, & Supplemental Figure 8). Axial finite strains, (Eyy) were 2.01
0.08, 1.65 0.11, 1.33 0.10, 1.11 0.08, and 0.98 0.07 for 3, 3.5, 4, 4.5, and 5%
agarose, respectively (Figure 23A,
Figure 24B, & Supplemental Table 5). Transverse finite strains (Exx) and shear
strains (Exy) were minimal for all agarose concentrations (Figure 23B and C,
Supplemental Table 5). Error analysis indicated that the observed displacement precision
resulted in errors in Eyy strain of ~1% (Supplemental Figure 9). We found high viability
which was independent of spatial position, indicating a homogeneous distribution of
viable cells (Figure 25, Supplemental Table 6). All average viability measures were ≥
96.2%. Deformations were applied to agarose constructs containing embedded primary
chondrocytes. Cellular geometry was identified with Calcein AM fluorescence, and
compressed images showed the cross sections of uncompressed cells to be circular

68
(width/height of 1.00 0.00) and the compressed cells to be ellipsoidal (Figure 26).
Cells in 4.5% agarose exhibited greater deformation than cells in 4.5% agarose as
quantified by the aspect ratio of chondrocyte width to height (p < 0.001. 2%: 1.07 0.06.
4.5%: 1.28 0.04. ). For chondrocytes in 4.5% agarose, the coefficient of variation of
the aspect ratio was 3.1% indicating the uniformity of applied compression to the
embedded cells.
Discussion
The objectives of this study were to (1) assess the spatial variability of mechanical
deformations in physiologically stiff agarose on a sub-cellular length scale, and (2)
determine if it is possible to encapsulate live primary human chondrocytes in
physiologically-stiff agarose, maintain viability, and induce deformations on the
embedded cells. We determined the spatial homogeneity in each gel by assessing
displacements and strains at six spatial locations in each gel over an array of pre-
determined agarose concentrations (3-5% w/v) which result in stiffness values in the
range of the human PCM [47, 114, 127].
When computing strain fields from experimental data, noise is capable of skewing
results and requires preliminary filtering of the displacement data [129]. In this study,
displacements were calculated directly from individual particle locations within the
hydrogels during the twenty steps of applied compression. Displacements at each step
were calculated with respect to the undeformed particle locations of the first loading step.
A 5x5 box-sized Gaussian filter was applied to the displacement data in order to increase
the precision of the calculated strain fields [131].

69
Figure 23. Finite deformation Lagrangian strain fields within 4.5% agarose hydrogel.
Strains were calculated using a finite deformation code in Matlab [129]. The axial (Eyy),
transverse (Exx), and shear (Exy) strain fields for 4.5% agarose are plotted. Axial strains
were calculated to be 1.11±0.08 [mm/mm]. Transverse strains were calculated to be
0.01±0.00 [mm/mm]. Shear strains were calculated to be 0.18±0.02 [mm/mm]. (A)
Representative axial strain image Eyy. (B) Axial strain Eyy as a function of agarose
concentration. (C) Representative transverse strain Exx. (D) Transverse strain Exx as a
function of concentration. (E) Representative shear strain Exy. (F) Shear strain Exy as a
function of concentration.

70
Figure 24. Axial displacement (A) and strain (B) as functions of gel position and agarose
concentration. We found a significant relationship for Uy (r=−0.8466 and p<0.001)
and Eyy (r=−0.71 and p<0.001) between agarose gel concentration and bead
deformations, and indicating that the stiffer, higher-concentration gels resulted in smaller
bead displacements and strains, as expected. Locations as defined in Figure 21C.
Once the data was filtered, it was input into a finite deformation code in Matlab
for strain field calculation [129]. The finite deformation code utilizes a 2D-continuum
mechanics approach where Green-Lagrange strain fields are calculated from discretely
sampled displacement fields. The code calculates the finite deformation tensor, F, and
the Green-Lagrange strain tensor, E, from experimental particle position data. The
random spacing of the beads may induce error into the in the strain calculation because
larger distances between neighboring particles, will result in larger discretization error.
While this may affect the magnitude of the strain values, the objective of this study was
to evaluate the homogeneity of the displacement and strain fields, and this error was
mitigated by the displacement field smoothing prior to strain calculation.

71
Figure 25. Viability of primary human chondrocytes in high concentration agarose gels
after 24 and 72 h. Primary human chondrocytes were harvested from joint replacement
tissue (Bridger Orthopedic, Bozeman, MT), digested in Type IV collagenase (2 mg/mL
for 12–14 h. at 37 °C), cultured, encapsulated in physiologically-stiff agarose (3–5%
w/v), and assessed for viability after 24 and 72 h using confocal microscopy. Live cells
were identified with Calcein AM fluorescence (ex. 497 em. 516) and dead cells with
propidium iodide fluorescence (ex. 537 em. 617). All six gel locations were imaged
showing minimal variability in cell viability throughout the gel. Average viability was
>97% and >95% for 24 and 72 h time periods, respectively.

72
Figure 26. Deformation of primary human chondrocytes in 2.0% and 4.5% agarose. To
examine deformations to chondrocytes in typical stiffness (2.0%) and high stiffness
(4.5%) agarose, primary human chondrocytes were cast into agarose hydrogels,
equilibrated in culture for 72 h, and imaged before and after a 10% nominal compression.
Deformations were quantified via the aspect ratio (width/height). Aspect ratios were
significantly greater following 10% compression in 4.5% agarose compared with 2.0%
(p<0.001). Left panels (A and C) show representative uncompressed images. Right panels
(B and D) show images following 10% nominal compression. Top row (A and B) shows
data for 4.5% agarose. Bottom row (C and D) shows data for 2.0% agarose. A total
of n~150 cells were measured for aspect ratio in each condition.

73
Conclusions
These data demonstrate the ability to apply compressions to physiologically stiff
agarose hydrogels with absolute displacement precision of ~1% and absolute strain
precision of ~6.5% (e.g. application of nominal 10% strain would result in strains
between 9.35 and 10.65%). This minimal variability in displacement and strain fields
between different spatial locations in each gel implies spatial homogeneity and
demonstrates the utility of using this system to apply well-defined strains to primary
human chondrocytes and other cells to study cellular mechanotransduction. This study
also demonstrated the feasibility of encapsulating primary human chondrocytes in
physiologically stiff agarose gels while maintaining high viability. Finally, this study
found that 4.5% agarose was capable of physically deforming primary human
chondrocytes. These results provide a robust methodological foundation for future
studies investigating how chondrocytes respond to mechanical cues: using this system,
we can now apply a uniform mechanical stimulus which is necessary to minimize
biological variability when dissecting mechanisms of mechanotransduction.
Acknowledgements
The authors thank Professor Marc Geers from Eindhoven University of
Technology, The Netherlands, for providing his custom strain computation code and Ms.
Betsey Pitts, Montana State University, Center for Biofilm Engineering, for assistance
with the confocal imaging. This work was funded by NIH P20 GM103394 and startup
funds from Montana State University, Vice President for Research.

74
Role of Funding Source
The funding source was not involved in study design or performance.
Conflict of Interest
The authors have no conflict of interest regarding this work.
References
See REFERENCES CITED.

75
After successfully validating the homogeneity of the mechanical deformations in
the agarose hydrogels, the next step was to validate the feasibility of measuring
differences in the chondrocyte metabolome in response to applied, dynamic loading. To
perform these studies, SW1353 chondrosarcoma chondrocytes were encapsulated in
physiologically stiff agarose, and were subjected to various lengths of cyclical,
mechanical compression. Then following compression, metabolites were extracted and
analyzed via LC-MS. The reason for using SW1353 cells is that they are an extremely
fast proliferating chondrocyte cell line, and they are extremely hardy. If the metabolite
profiles were not observed in the SW1353 cells, then measurements on a primary
chondrocytes (cells harvested from human tissue) would be extremely difficult.

76
CANDIDATE MEDIATORS OF CHONDROCYTE
MECHANOTRANSDUCTION VIA TARGETED
AND UNTARGETED METABOLOMIC
MEASUREMENTS
Contribution of Authors and Co-Authors
Author: Donald L. Zignego1,*
Contributions: Acquired, analyzed, and interpreted the data. Drafted and wrote the
manuscript.
Author: Aaron A. Jutila1,*
Contributions: Acquired, analyzed, and interpreted the data. Drafted and wrote the
manuscript.
Co-Author: Bradley K. Hwang1
Contributions: Interpreted data and reviewed the manuscript.
Co-Author: Jonathan K. Hilmer2
Contributions: Interpreted data and reviewed the manuscript.
Co-Author: Timothy Hamerly2
Contributions: Interpreted data and reviewed the manuscript.
Co-Author: Cody A. Minor1
Contributions: Interpreted data and reviewed the manuscript.
Co-Author: Seth T. Walk3
Contributions: Performed ordination analysis on data and reviewed the manuscript.
Corresponding Author: Ronald K. June1,4
Contributions: Designed the study, analyzed and interpreted the data, and wrote the
manuscript.
77
Contribution of Authors and Co-Authors – Continued
1Department of Mechanical and Industrial Engineering, Montana State University,
Bozeman, MT 59717-3800, USA
2Department of Chemistry and Biochemistry, Montana State University, Bozeman, MT
59717-3800, USA
3Department of Immunology and Microbiology, Montana State University, Bozeman,
MT 59717-3800, USA
4Department of Cell Biology and Neuroscience, Montana State University, Bozeman, MT
59717-3800, USA
* Authors made equal contributions to this work.

78
Manuscript Information Page
Donald L. Zignego, Aaron A. Jutila, Bradley K. Hwang, Jonathan K. Hilmer, Timothy
Hamerly, Cody A. Minor, Seth T. Walk, and Ronald K. June
Archives of Biochemistry and Biophysics
Status of Manuscript:
___ Prepared for submission to a peer-reviewed journal
___ Officially submitted to a peer-reviewed journal
___ Accepted by a peer-reviewed journal
_X_ Published in a peer-reviewed journal
Publisher: Elsevier for the Archives of Biochemistry and Biophysics
Issue: March 1st, 2014, Vol. 545, Pages 116-123
Copyright 2014. Elsevier Inc.

79
Abstract
Chondrocyte mechanotransduction is the process by which cartilage cells
transduce mechanical loads into biochemical and biological signals. Previous studies
have identified several pathways by which chondrocytes transduce mechanical loads, yet
a general understanding of which signals are activated and in what order remains elusive.
This study was performed to identify candidate mediators of chondrocyte
mechanotransduction using SW1353 chondrocytes embedded in physiologically stiff
agarose. Dynamic compression was applied to cell-seeded constructs for 0-30 minutes,
followed immediately by whole-cell metabolite extraction. Metabolites were detected via
LC-MS, and compounds of interest were identified via database searches. We found
several metabolites which were statistically different between the experimental groups,
and we report the detection of 5 molecules which are not found in metabolite databases of
known compounds indicating potential novel molecules. Targeted studies to quantify the
response of central energy metabolites to compression found a transient increase in the
ratio of NADP+ to NADPH and a continual decrease in the ratio of GDP to GTP,
suggesting a flux of energy into the TCA cycle. These data are consistent with the
remodeling of cytoskeletal components by mechanically induced signaling, and add
substantial new data to a complex picture of how chondrocytes transduce mechanical
loads.

80
Introduction
The field of cellular mechanotransduction seeks to identify mechanisms by which
cells respond to their mechanical loading environments. Mammalian cells have the
ability to respond to a variety of loads by altering signaling pathways in a diverse set of
cells and tissues [87, 133-135]. These and other studies demonstrate the ability of
mammalian cells to respond to exogenous mechanical loading. However, knowledge of
the mechanisms by which cells sense and respond to loading remains incomplete.
Articular cartilage is the smooth tissue lining the surfaces of articulating joints
(e.g. knee) which deforms during physiological activity [136, 137]. Articular
chondrocytes, the cells of articular cartilage, respond to applied loading via multiple
pathways, including activation of GTPase signaling via Rho-A and ROCK [123, 138].
Osteoarthritis (OA) is a major medical problem that involves deterioration of articular
cartilage [139], and osteoarthritic chondrocytes demonstrate differences in
mechanotransduction compared with healthy chondrocytes. For example, cyclical strain
reduces AKT phosphorylation in OA chondrocytes [93], and OA chondrocytes fail to
produce sulfated glycosaminoglycans (sGAG) in response to load whereas normal
chondrocytes exhibit loading-induced increases in sGAG production [140]. In the
present study, we provide high-dimensional data regarding changes in expression levels
and flux of thousands of metabolites (i.e. cytosolic molecules smaller than ~1000 Da) in
response to highly controlled compression of SW1353 chondrocytes [141].
Chondrocytes within articular cartilage are surrounded by a pericellular matrix
(PCM) which is composed primarily of Type VI collagen and other proteins [142-144].

81
The chondrocyte PCM has a stiffness of ~25-200 kPa [47] which is diminished in OA
[62]. Previous studies of chondrocyte mechanotransduction have utilized various three
dimensional culture methods [43, 67, 68, 70, 145] most with stiffness values of 5-10 kPa
or less, which are markedly lower than those present in the human pericellular matrix [47,
62]. The present study sought to build on previous methodology [146, 147] by using
high concentrations of agarose to support the chondrocytes and form a high-stiffness gel
capable of applying physiological deformation to chondrocytes.
Previous research indicates that central energy metabolism is altered both in
inflammation and OA, including the balance between glycolysis and oxidative
phosphorylation [148, 149]. Energy metabolism may be affected by loading because
activation of AMP-activated protein kinase can prevent catabolism induced by
mechanical injury [150]. Based on these and other data, we hypothesized that dynamic
compression within the physiological range will increase glycolytic metabolism to
maintain the environment of the PCM. As a first step in evaluating this hypothesis, we
conducted the present study to develop and demonstrate methods for targeted
quantification of metabolites associated with the central metabolism of SW1353
chondrosarcoma chondrocytes in response to applied dynamic compression in the
physiological range. To our knowledge, this is the first application of either targeted or
untargeted metabolomics studying chondrocyte mechanotransduction.
The objective of this study was to use targeted and untargeted metabolomics to
identify candidate mediators of chondrocyte mechanotransduction. We identified
loading-induce changes in ~4000 metabolites in untargeted studies and measured

82
quantitative changes in 36 targeted metabolites relevant to central metabolism and protein
production. From this untargeted metabolomics detection, 54 novel mediators of
chondrocyte mechanotransduction were identified. These data define the functional
response of chondrocytes to applied loading. Future studies to build on these results will
aim to develop a more detailed systems understanding of chondrocyte
mechanotransduction.
Materials and Methods
Chondrocyte Culture and Encapsulation. Human SW1353 chondrosarcoma cells
were cultured in 5% CO2 in DMEM with 10% fetal bovine serum and antibiotics (10,000
I.U. / mL penicillin and 10,000 g / mL streptomycin). For encapsulation, cells were
trypsinized, counted, and resuspended in media at 11X. Agarose/PBS solution was
prepared using low-gelling-temperature agarose (Sigma: Type VII-A A0701) at 1.1X of
desired final concentration and placed into a water bath at 40C. The cell-suspension was
added to the agarose with vortexing to distribute the cells throughout the liquid hydrogel.
Gels were subsequently cast in an anodized aluminum mold for 5 minutes at 23C with
diameter of 7mm and height of 12.7 mm [113]. Cell-seeded agarose constructs were
removed from the molds and cultured in antibiotic free media for 72 hours at 37°C under
5% CO2. These methods have been shown to provide uniform compressive deformations
[151] to chondrocytes by modeling the stiffness of the pericellular matrix [62]. The
stiffness of the pericellular matrix provides in vivo deformations to the relatively less-stiff
chondrocytes [152], and the advantage of this approach is that it provides observable

83
cellular deformations while providing homogeneous, uniaxial unconfined compression as
the defined mechanical stimulus[151].
Mechanical Stimulation. Cell-seeded agarose gels were subjected to cyclic
compression via a custom made bioreactor for 0, 15, and 30 minutes (Figure 27A).
Dynamic unconfined compression was applied between impermeable platens in culture
media at a frequency of 1.1 Hz [153] with an average compressive strain of 5% and an
amplitude of 1.9% based on the initially measured height of 12.7 0.1 mm. This
sampling interval is based on previous observations of changes in central energy
metabolism within a 30 minute timescale [154]. Physiological conditions (culture media
at 37˚C, 5% CO2) were maintained through the duration of the tests. To assess
specificity of the mechanobiological response, unloaded control samples were placed in
the bioreactor without deformational loading and analyzed for each time point.
Metabolite Extraction. After each time point samples were removed from the
bioreactor, immediately wrapped in sterile foil and frozen in liquid nitrogen. Samples
were then placed inside individual wells of a custom-made frozen aluminum mold for
pulverization (Figure 18) [113]. From here each sample was crushed using a sterilized
stainless steel platen and a ballpeen hammer. Crushed gel particulate was then collected
into 2 mL micro-centrifuge tubes. Metabolites were extracted by adding 1 mL of a 70:30
solution of Methanol:Acetone and vortexing every 4-5 minutes for twenty minutes.
Samples were extracted further at -20C overnight. Solid content was pelleted by
centrifugation at 13,000 rpm for 10 minutes at 4C. The supernatant was placed into new

84
1.6 mL micro-centrifuge tubes where solvent was removed via speed-vac for six hours.
The dried samples were then resuspended in 100 µL of a 50:50 Water:Acetonitrile
solution for metabolomics analysis.
Untargeted and Targeted LC-MS. Detection of metabolites was performed via
HPLC separation with ESI-MS (electrospray mass spectrometry) detection in the
Montana State University Mass Spectrometry Core Facility [155-157]. HPLC was
performed with an aqueous normal-phase, hydrophilic interaction chromatography
(ANP/HILIC) HPLC column. A Cogent Diamond Hydride Type-C column with 4 m
particles and dimensions of 150 mm length and 2.1 mm diameter was used with an
Agilent 1290 HPLC system. The column was maintained at 50 C with a flow rate of
600 L/min. Chromatography was as follows: solvent consisted of H2O with 0.1% (v/v)
formic acid for channel "A" and acetonitrile with 0.1% formic acid for channel "B".
Following column equilibration at 95% B, the sample was injected via auto-sampler, and
the column was flushed for 2.0 min to waste. From 2.0 min to the end of the run, the
column eluent was directed to the MS source. From 2.0 min to 12.5 min, the gradient
was linearly ramped from 95% to 25% B. From 12.5 to 13.5 min the column was held
isocratically at 25% B, and from 13.5 to 15 minutes the column was re-equilibrated with
95% B. Blank solvent samples were run following each sample.
The mass spectrometer used was an Agilent 6538 Q-TOF with dual-ESI source.
Resolution is ~20,000 and accuracy is ~5 ppm. Source parameters were: drying gas 12
L/min, nebulizer 60 psi, capillary voltage 3500 V, capillary exit 120 V. Spectra were
collected in positive mode from 50 to 1000 m/z at a rate of 1 Hz. Quality control testing

85
including mass accuracy calibration of all instruments is performed regularly and
documented by the Mass Spectrometry Core Facility staff as part of routine operation.
Metabolites known to be involved in central metabolism [102, 154] were targeted
for LC-MS analysis. Using the isotopic distributions of these targeted masses (Agilent
Technologies), a list of H+ and Na+ adducts was used to create 20 ppm mass windows
for each ion, and pilot data was scanned to determine the range of retention times for
each ion based on data from analytical standards (Biolog, Hayward, CA) run by the mass
spectrometry core facility for 15 of the 36 targeted metabolites. These standard
metabolites were run by Core staff under controlled conditions, and target validation
ensured retention times within 0.1 min of core values for samples run on identical
instruments under identical conditions. Targeted metabolite intensity was defined as the
sum of the intensities of the isotopes of the ions and adducts associated with each
metabolite as determined by the Quantitative Analysis package within MassHunter
Workstation B.04.00 (Agilent Technologies).
Data Processing. Data analysis involved multiple software packages used to
process the raw LC-MS data for feature identification, quantification, and metabolite
identification (Supplemental Figure 10). Raw LC-MS scans were converted to mzXML
files using Agilent MassHunter and processed in MZmine2 [158] for the untargeted
analysis. Unrefined lists of detected metabolites (i.e. detected mass values) with
corresponding intensities were generated by aligning all LC-MS scans. These unrefined
lists resulted in the identification of approximately 25K independent m/z values for
positive mode and 18K m/z values for negative mode scans.

86
Using established methods [159], filtered datasets were generated as follows.
Chromatograms were built using centroidal mass detection with a minimum signal level
of 1000, minimum timespan of 0.02 seconds, minimum peak height of 1000, and an m/z
tolerance of 0.05. Peak deconvolution was performed with a chromatographic threshold
of 85%, search minimum in retention time of 0.03 seconds, minimum relative height of
5%, minimum absolute height of 10000, and minimum ratio of top/edge of 1.0. The
chromatograms were then normalized by retention times with a retention time tolerance
of 0.25 min and a minimum standard intensity of 1000. Chromatograms were aligned
and a duplicate peak filter was applied with an m/z tolerance of 0.1 and a retention time
difference maximum of 1 minute. These refined lists were used for statistical analysis
and candidate metabolite identification. Intensity was quantified via peak height in the
total ion intensity chromatogram.
Data Analysis and Candidate Selection. The experimental procedures were
repeated for n = 5 independent samples. To assess the biological effects of physiological
loading, compressed samples were compared to unloaded controls. The cell-seeded
agarose gels that received no mechanical stimulation (0 minute time point extraction)
acted as the unloaded controls (UC), while cell-seeded agarose gels that received either
15 or 30 minutes of mechanical stimulation made up the dynamically compressed groups,
DC15 and DC30 respectively. Data analysis started with the unrefined lists generated in
MZmine2. We defined detected masses as those present in the majority of samples (i.e. ≥
3 samples). To minimize false positives associated with multiple comparisons,
conservative statistical methods were used to make comparisons between groups.

87
Comparisons were performed using t-tests [160] and p-value corrections using a standard
false discovery rate (FDR) calculation [160]. For metabolites detected in one group (e.g.
DC15) but not in another, statistical comparisons were enabled by the use of small
random values for the non-detected intensities. These small values were < 2% of the
minimally detected value and <0.04% of the median value, and were required to calculate
the appropriate FDR. Two comparisons were performed: UC vs. DC15 and UC vs.
DC30.
Ordination techniques were subsequently used to help identify candidate
metabolites from the untargeted data for which statistical significance was not achieved.
The point of this analysis was to generate a list of potentially important metabolites for
future studies. Data matrices were generated with data binned according to masses and
time points. Only masses that were detected in at least three of five time point replicates
were analyzed. Principal components analysis was performed using the rda function of
the Vegan package in R statistical software [161]. All masses were standardized to unit
variance and displayed using the biplot function (scaling=-1). This approach allowed us
to visually identify candidate mediators with relatively large magnitudes that were
responsible for differentiating between 0, 15, and 30 minutes of loading.
In order to assess metabolite flux over the 30 minute experimental time course,
Pearson’s correlation coefficients were determined using loading time (0, 15, or 30
minutes) as the independent variable and the intensity of each detected metabolite as the
dependent variable. Significant positive correlations indicated metabolite accumulation,
and negative correlations indicated metabolite consumption. Candidate mediators were

88
defined as the twenty largest (i.e. accumulated) and twenty smallest (i.e. depleted)
statistically significant correlations. Targeted metabolite profiles were analyzed by
cluster and correlation analyses. Additionally, the median ratios of ATP:ADP,
NADP+:NADPH, NAD+:NADH, and GDP:GTP were calculated as a function of time to
assess relative changes in energy metabolism.
Figure 27. (A) Schematic of Experimental Methods. SW1353 Chondrocytes were
encapsulated in 4.5% agarose (stiffness ~35 kPa), cultured for 72 hours, and exposed to
0, 15, or 30 minutes of dynamic compression. Metabolites were extracted and analyzed
via LC-MS. Inset shows loading apparatus for applying unconfined compression. (B) 59
metabolites were identified as candidate mediators of chondrocyte mechanotransduction
in the untargeted studies. These were detected by either significant correlation with time
of loading or ordination based on principal components analysis. Underlined values were
not detected in database searches and may indicate novel metabolites. (C) List of
targeted metabolites.

89
Compound Identification. Putative compound identifications were made by
comparing the metabolite mass to charge (m/z) ratio to previous results using the
METLIN and HMDB databases, which contain over 80,000 identifiable metabolites [162,
163] using a mass tolerance of 20 ppm. METLIN parameters were charged masses and
adducts of either +1H+ or +1Na+. Compounds with LipidMAPS identifications [164]
were designated as human unless detected in a non-human species at the time of database
search.
Results
These data provide an initial systems-level view of the cytosolic metabolite
profile of human chondrocytes in response to applied compression. We defined 54 novel
compounds as candidate mediators (Figure 27B) of chondrocyte mechanotransduction, 40
from correlation analysis of untargeted metabolites and 14 from ordination analysis of
targeted metabolites. No identification was possible for 5 of the 54 (11%) mediator
masses based on database searches, indicating that these may be novel compounds. The
remaining 49 (89%) masses map to a total of 180 metabolites due to isobaric redundancy
and structural isomers.
Untargeted Metabolomics. Untargeted studies detected 2438 to 3211 individual
metabolites per sample. 1481 metabolites were detected in unloaded samples that were
not detected following 15 minutes of loading, whereas 1528 unique metabolites were
detected following 15 minutes of loading that were not present in unloaded control
samples (Figure 28A). 1574 unique metabolites were detected in unloaded samples that

90
were not detected following 30 minutes of loading, whereas 1623 metabolites were
detected in samples subjected to 30 minutes of dynamic compression that were not
detected in unloaded samples (Figure 28B).
Many of the metabolites were significantly regulated in response to dynamic
compression. Fifteen minutes of dynamic compression resulted in significant changes in
255 metabolites with 223 metabolites having increased intensity and 32 metabolites
having decreased intensity compared with unloaded control samples. Thirty minutes of
dynamic compression resulted in significant changes in 787 metabolites with 689
metabolites having increased intensity and 98 metabolites having decreased intensity
compared with unloaded control samples. LC-MS analysis of naïve agarose control
samples without chondrocytes found <15 metabolites (data not shown), which also
served as solvent, reagent, and process controls.
Untargeted metabolite intensity was significantly correlated with time of loading
for 254 metabolites (Figure 29). Of the significantly correlated metabolites, 157 were
negatively correlated with time indicating cellular consumption and 97 were positively
correlated with time indicating accumulation. Identification of these metabolites found
peptides, lipids, substrates, and products.

91
Figure 28. Loading-specific differences in untargeted metabolite expression. Mechanical
loading resulted in statistically significant changes in expression of targeted and
untargeted metabolites. Left shows Venn diagrams of unique metabolites detected in
each group. Right shows quantitative comparisons for metabolites detected in both
groups. (A) Unloaded controls versus 15 minutes of dynamic compression (DC). (B)
Unloaded controls versus 30 minutes of DC. (C) Principal Components Analysis used
for ordination analysis. The first two principal components contained 37.8% of the
overall variance for this dataset (3-3-5). The time points are represented as follows:
unloaded control: T1-3, DC15: T4-6, and DC30: T7-11. Ellipses represent unloaded
controls (T1, T2, and T3) and dynamically compressed samples (≥T4). Principal
Component 1 and Principal Component 2 were associated with 22.3% and 15.5% of the
total variance among masses.

92
Figure 29. Dynamic compression results in both accumulation and depletion of
untargeted metabolites. (A) The cumulative distribution of correlation coefficients of
untargeted metabolites were used to identify accumulating (blue) and consumed (red)
metabolites. The top and bottom twenty correlations were identified as candidate
mediators of chondrocyte mechanotransduction. (B) Accumulation of selected candidate
mediators of mechanotransduction. Metabolites were database-matched as gulonic acid
(left) and harderoporphyrin (right). (C) Depletion of selected candidate mediators of
mechanotransduction, which were database-matched as kynurenine and 4-methylene-L-
glutamine.
Targeted Metabolomics. Targeted metabolites related to central energy
metabolism exhibited distinct expression patterns with loading time (Figure 30A).
Clustering of targeted data resulted in groups of metabolites with increasing intensities
with respect to time, intensities peaking at 15 minutes of compression, and decreasing
intensities with respect to time. Guanosine tri-phosphate (GTP) was positively correlated
with time (Figure 30B, p = 0.042). The ratio of NADP+ to NADPH peaked at 15
minutes of loading, as did the ratio of ATP to ADP to a lesser extent (Figure 30C). There
were small changes in the ratio of NAD+ to NADH, and the ratio of GDP to GTP

93
declined substantially with respect to loading time, consistent with the accumulation of
GTP (Figure 30B).
Figure 30. Changes in expression of targeted central-energy-related metabolites over
from 0-30 minutes of applied compression. Metabolites associated with central energy
metabolism and protein production (e.g. amino acids) were targeted for detailed analysis
via detection of multiple ionized adducts and ions. (A) Clustered heatmap of co-
expressed metabolites. (B) Significant accumulation (correlation) of GTP and
marginally-significant depletion of GDP in response to applied compression. (C) Ratios
of upstream to downstream mediators of central energy metabolism. The peak in
NADP+ to NADPH indicates decreased energy flow toward the pentose phosphate
pathway, and the continual decrease in GDP to GPT indicates increased flux through the
TCA cycle.

94
Discussion
The objective of this study was to identify mediators of chondrocyte
mechanotransduction using targeted and untargeted metabolomics. SW1353
chondrocytes were embedded in agarose with stiffness in the physiologic range of the
human PCM. By providing quantitative measures of presence, absence, and relative
abundance of cytosolic metabolites (i.e. reactant and product levels for biochemical
reactions involved in multiple pathways) these data provide a systems-level view of how
the functional chondrocyte fingerprint changes in response to mechanical compression.
The significance of this study is that to our knowledge this is the first report of
mechanically induced changes in the cellular metabolome. Furthermore, by
encapsulating chondrocytes in physiologically-stiff agarose capable of inducing cellular
deformations, we were able to identify 54 metabolites mediating chondrocyte
mechanotransduction.
The untargeted metabolome is a high-dimensional measure of the functional state
of the cell as defined by the individual metabolite levels. The targeted metabolome of
central-energy-related metabolites can be used for rigorous hypothesis testing via systems
biology. Future studies can utilize these data to map the full mechanisms of chondrocyte
mechanotransduction. Below we discuss specific pathways motivated by this initial
analysis.
Untargeted experiments found hundreds of metabolites that were statistically
different between loading time points (Figure 28). Among these molecules were 54
mediators that have not been previously associated with chondrocyte

95
mechanotransduction. Database searching of these candidates resulted in the
identification of 180 compounds from 49 of the masses: such a non-unique expansion of
targets is inevitable due to structural isomers with identical formulae and masses.
Molecular mass is a linear Diophantine function of elemental composition, and multiple
different molecular formulas can produce the same overall mass [165]. Future work will
employ MS / MS analyses to examine these candidate molecules.
These data suggest several specific signaling pathways, many of which have not
previously been associated with mechanotransduction. Accumulated molecules of m / z
values ~219 and ~631 may include gulonic acid and harderoporphyrin, respectively. The
accumulation of gulonic acid may indicate decreased pentose phosphate pathway-related
energy metabolism [166]. The accumulation of harderoporphyrin, an intermediate in
heme biosynthesis [167], may indicate compression-induced expression of oxidative
phosphorylation consistent with the targeted results (see below), although chondrocytes
likely reside in a hypoxic environment and have not been demonstrated to produce
hemoglobin [168]. Compounds identified from depleted metabolites include kynurenine
and 4-methylene-L-glutamine (Figure 29C). Consistent with the presently observed
changes in GDP to GTP ratio (Figure 30C) and the known metabolism of pyruvate [166,
169], the depletion of kynurenine and 4-methylene-L-glutamine may represent
mechanically-induced re-direction of cellular energy via increased TCA cycle flux.
Human central energy metabolism of glucose involves the pentose phosphate
pathway, glycolysis, and the tri-carboxylic acid cycle [102]. The ratio of upstream to
downstream metabolites for a particular pathway (e.g. glycolysis) can be used as a

96
surrogate measure of energy flux, under the assumptions of constant enzyme
concentration and activity which are reasonable for the short timeframe employed by
these experiments. For example, energy flow to the pentose phosphate pathway can be
inferred by the ratio of NADP to NADPH with larger ratios indicating decreased flux.
Our data show a transient increase in NADP:NADPH at 15 minutes (Figure 30C) which
suggests decreased energy flow to the pentose phosphate pathway, which is typically
used for nucleic acid production [154]. The ratio of GDP to GTP may represent energy
flow to the tri-carboxylic acid cycle. We found a continual decrease in the ratio of
GDP:GTP suggesting increased flux through the tri-carboxylic acid cycle, which may
represent a re-direction of cellular energy in response to mechanical loading.
GTP, guanosine tri-phosphate, is a substrate required for activation of GTPase
signaling pathways. In this study, GTP was significantly upregulated following 30
minutes of dynamic compression (Results and Figure 30B). Previous studies have found
early-time (i.e. 15 minutes and shorter) activation of the GTPase RhoA [123] which is
involved in activation of ROCK to stimulate cytoskeletal remodeling [123] and can also
activate the master chondrogenic transcription factor of Sox9 [170]. These data add to a
complex picture of chondrocyte mechanotransduction involving directed changes in
energy metabolism to maintain and remodel the cytoskeleton. Future studies will build
on this work to elucidate both mechanisms and consequences of modifying energy
metabolism in response to mechanical loading.
While this study found several candidate mediators of chondrocyte
mechanotransduction using targeted and untargeted metabolomics some limitations

97
apply. First, the temporal resolution of the metabolome was limited to sampling at 15
minute intervals in these initial experiments, and flux inferences assume constant enzyme
concentration and activity. Future studies may build on these results by using shorter
time intervals, measuring enzyme concentrations and activities, and extending the loading
duration. Second, this study quantified and compared the levels of thousands of
metabolites. Although we used previously published LC-MS data analysis procedures,
the possibility of both false positive and false negative results remains. We controlled the
risk of false positive comparisons using a false discovery rate of 0.05 [160]. Third, these
studies were performed using SW1353 chondrocytes encapsulated in 4.5% agarose.
While the high concentration of agarose modeled the stiffness of the human chondrocyte
pericellular environment [47, 62], the in vivo chondrocyte pericellular matrix likely
contains substantial additional signals for regulating cellular behavior. Additionally,
dynamic loading of cartilage can result in a diverse set of mechanical signals including
streaming potentials and fluid flow [171, 172] which have been observed previously for
lower concentrations of agarose, but have not been measured in the high stiffness in vitro
system used in this study. Therefore, the pathways and mechanisms reported herein
likely represent a subset of mechanically-activated pathways, which represent cell-
intrinsic mechanisms of mechanotransduction. Finally, although putative compound
identifications were made, a general limitation of metabolomics is the challenge of
unique identification, which future studies may address using NMR and MS / MS.
Despite these limitations, to our knowledge, this is the first report of the mechanically-

98
induced metabolome for human chondrocytes, which provides substantial new data
describing how chondrocytes respond to mechanical loads.
Conclusions
This study demonstrates the power and challenges associated with high-
dimensional data for systems biology and provides both a methodological and data-based
foundation for future studies. In untargeted experiments, we found hundreds of
statistically-significant changes in metabolites induced by mechanical loading and using
advanced statistical methods identified 54 candidate mediators of chondrocyte
mechanotransduction. In targeted experiments, we found that mechanical loading
induces significant changes in metabolites associated with cellular energy usage. Future
studies will identify the mechanisms of these changes and address the cell-type
specificity of these responses.
Acknowledgements
We thank Drs. Ross Carlson, Brian Bothner, and Edward Dratz, MSU, for critical
insight provided during discussions. The SW1353 cell line was kindly donated by Martin
Lotz. Funding was provided by NIH P20GM10339405S1, Montana State University, and
the Murdock Charitable Trust.
References
See REFERENCES CITED.

99
METABOLOMICS
Following the development of the experimental methodology in Chapter 2, the
next step in this research was to characterize the metabolite profiles for primary human
chondrocytes as a function of dynamic compression. This chapter builds of the
foundational groundwork laid in Chapter 2 by using the high-stiffness agarose model to
study the in vitro response of primary human OA chondrocytes in response to applied,
mechanical compression. To my knowledge, this study is the first of its kind in using a
systems biology approach along with our novel in vitro agarose model for 3D cell
encapsulation to study chondrocyte mechanotransduction. This study focuses on
studying the metabolomic response of primary human OA chondrocytes in response to
short term (<30 minutes) of dynamic compression. By studying the chondrocyte
metabolome we can observe significant biological changes in as little as 15 minutes of
compression. Metabolomics studies are extremely useful in these short response time
studies because the metabolites give insight on functional readout of the cellular state,
essentially a snapshot of the physiology of the cell.
The overall objective of this study was to evaluate and define the metabolite
profiles for primary human OA chondrocytes as a function of dynamic compression by
comparing samples loaded at either 0 minutes (control), 15 minutes, or 30 minutes.
Briefly, the methods involve encapsulating primary human OA chondrocytes in
physiologically stiff agarose, dynamically stimulating the agarose constructs with
physiological loading values, flash-freezing the samples in liquid nitrogen post-loading,
and pulverizing them. The metabolites are then extracted and quantified via liquid

100
chromatography-mass spectrometry (LC-MS) at the MSU Cobre Mass Spectrometry
Core Facility. Both untargeted and targeted approaches were used to quantify changes in
metabolite levels. To my knowledge, such a study has never been done before and the
results from this study provided both a global (untargeted) and a more focused (targeted)
understanding of chondrocyte mechanotransduction. Future work may build on this
research to use metabolomics as a tool for elucidating potential biomarkers of OA.
101
MECHANOTRANSDUCTION IN PRIMARY HUMAN
OSTEOARTHRITIC CHONDROCYTES IS
MEDIATED BY METABOLISM
OF ENERGY, LIPIDS, AND
AMINO ACIDS
Contribution of Authors and Co-Authors
Author: Donald L. Zignego1
Contributions: Acquired, analyzed, and interpreted the data. Drafted and wrote the
manuscript.
Co-Author: Carley N. McCutchen1
Contributions: Interpreted data and reviewed the manuscript.
Co-Author: Jonathan K. Hilmer2
Contributions: Interpreted data and reviewed the manuscript
Corresponding Author: Ronald K. June1,3
Contributions: Designed the study, analyzed and interpreted the data, and wrote the
manuscript.
1Department of Mechanical and Industrial Engineering, Montana State University,
Bozeman, MT 59717-3800, USA
2Department of Chemistry and Biochemistry, Montana State University, Bozeman, MT
59717-3800, USA
3Department of Cell Biology and Neuroscience, Montana State University, Bozeman, MT
59717-3800, USA

102
Manuscript Information Page
Donald L. Zignego, Carley N. McCutchen, Jonathan K. Hilmer, and Ronald K. June
Arthritis and Rheumatology
Status of Manuscript:
___ Prepared for submission to a peer-reviewed journal
_X_ Officially submitted to a peer-reviewed journal
___ Accepted by a peer-reviewed journal
___ Published in a peer-reviewed journal
Publisher: Arthritis and Rheumatology.
Submitted: July 2015

103
Abstract
Objective. Chondrocytes are the sole cell type found in articular cartilage and are
constantly subjected to mechanical loading in vivo. We hypothesized that physiological
dynamic compression results in changes in energy metabolism to produce proteins for
maintenance of the pericellular and extracellular matrices. The objective of this study
was to develop an in-depth understanding for the short term (<30 min.) chondrocyte
response to sub-injurious, physiological compression by analyzing metabolomic profiles
for human chondrocytes harvested from femoral heads of osteoarthritic donors.
Design. Cell-seeded agarose constructs were randomly assigned to experimental
groups, and dynamic compression was applied for 0, 15, or 30 minutes. Following
dynamic compression, metabolites were extracted and detected by HPLC-MS.
Untargeted analyses examined changes in global metabolomics profiles and targeted
analysis examined the expression of specific metabolites related to central energy
metabolism.
Results. We identified hundreds of metabolites that were regulated by applied
compression, and we report the detection of 16 molecules not found in existing
metabolite databases. We observed patient-specific mechanotransduction with aging
dependence. Targeted studies found a transient increase in the ratio of NADP+ to
NADPH and an initial decrease in the ratio of GDP to GTP, suggesting a flux of energy
into the TCA cycle.

104
Conclusions. To our knowledge, this is the first study to characterize
metabolomics profiles of primary chondrocytes in response to applied dynamic
compression. These results are consistent with increases in glycolytic energy utilization
by mechanically induced signaling, and add substantial new data to a complex picture of
how chondrocytes transduce mechanical loads.

105
Introduction
Osteoarthritis (OA) is the most common joint disorder, affecting more than 40
million individuals in the United States [1, 5]. OA is characterized by the deterioration of
the protective, low-friction, load-bearing cartilage that surrounds the joint. The highly
specialized chondrocyte plays an important metabolic role in synthesizing, maintaining,
and repairing the tissue and is the sole cell type in articular cartilage [37]. At these load-
bearing joint surfaces (e.g. the femoral head), the articular cartilage, and thus the articular
chondrocyte, is subjected to near constant mechanical loading (e.g. standing, walking,
running, etc.). Chondrocytes and other mammalian cells sense and respond to these
mechanical stimuli through biochemical and biological outputs, but the intracellular
pathways behind chondrocyte mechanotransduction remain unclear [51, 84, 135].
Mechanical stimulation has both anabolic and catabolic effects on articular
chondrocytes [43, 173]. In chondrocytes, anabolic responses promote the synthesis and
production of the extracellular matrix (ECM) and the pericellular matrix (PCM) through
the secretion of cytokines and protease inhibitors [173]. Catabolic responses involve
secretion of proteases (e.g. MMP-13) which results in the breakdown of ECM molecules.
Dynamic loading has been shown to promote these anabolic responses in chondrocytes
whereas static loading has been shown to inhibit them [174, 175]. Dynamic compression
has been shown to alter signal transduction including activation of GTPase signaling via
the Rho-A and ROCK pathways, Erk-1 and -2, MAPK and SEK, and Smad2 [81, 174,
176, 177].

106
In addition to signal transduction, chondrocytes can alter their energy metabolism
in response to mechanical loading. The enzyme AKT is important in regulating FoxO
signaling for energy homeostasis [178], and cyclic loading has been shown to reduce
phosphorylation of AKT in OA chondrocytes [93] whereas mechanical stimulation
induced AKT phosphorylation in healthy cells [80]. These energy-related signaling
responses may affect matrix synthesis because healthy chondrocytes show increases in
sulfated glycosaminoglycans (sGAG) in response to mechanical loading in contrast to
OA chondrocytes [140]. However, changes in chondrocyte metabolite levels which can
mark changes in biosynthetic activity remain to be determined in response to loading.
Previous research suggests that both inflammation and OA alter central energy
metabolism, including the balance between glycolysis and oxidative phosphorylation
[148]. One potential mechanism of energy-related mechanotransduction involves
regulation of AMP-activated protein kinase which can prevent catabolism induced by
mechanical injury [150]. Based on these and other data, we hypothesized that
physiological dynamic compression increases chondrocyte glycolytic energy flux to
promote the anabolic response to maintain the environment of the ECM and PCM. The
objective of this study was to use both untargeted (global) and targeted metabolomics to
identify candidate mediators of chondrocyte mechanotransduction in primary human OA
chondrocytes. This study evaluates our hypothesis using primary human OA
chondrocytes subjected to applied dynamic compression following encapsulation in
physiologically stiff agarose.

107
Chondrocyte mechanotransduction happens on both short- and long- timescales.
Because early responses have the potential to set the trajectory for longer-term behavior,
in this study, we focus on short term (<30 min), loading-induced changes in small
molecules (i.e. cellular metabolites smaller than ~1000 Da). Building upon previous
methodology to encapsulate chondrocytes in agarose similar in stiffness to the human
PCM, we profiled the metabolomic responses of primary human OA chondrocytes in
response to applied compression at physiological levels [114, 115].
This study identified changes in 1421 untargeted metabolites and 48 metabolites
pertinent to central energy metabolites and protein production. Metabolites were
identified via database searches (METLIN, and HMDB), and 16 of the 1421 metabolites
were not found in database searches, potentially representing novel mediators of
chondrocyte mechanotransduction. Future research may build on these results to
potentially utilize mechanical loading as a therapeutic strategy for OA.
Materials and Methods
Chondrocyte Culture and Encapsulation. Primary human chondrocytes were
harvested from hip cartilage of five Grade IV OA patients undergoing joint replacement
surgery (mean age: 63 years, age range: 54-80, mean weight: 80.4 kg, weight range: 56.9-
99 kg). The cartilage was digested in Type IV collagenase (2 mg/mL for 12-14 hrs. at
37C), and then cultured in DMEM with 10% fetal bovine serum and antibiotics (10,000
I.U./mL penicillin and 10000 µg/mL streptomycin) in 5% atmospheric CO2. Cells were
encapsulated using previously optimized methods [116], at a concentration of ~500,000
cells/gel (gel diameter = 7mm, gel height = 12.7mm).

108
Mechanical Stimulation. From each donor (N = 5), cell-seeded agarose gels were
randomly assigned to a loading group (n = 5 biological replicates for each loading group).
Loading groups consisted of unloaded controls (i.e. 0 minutes of loading), 15, or 30
minutes of dynamic, cyclic compression (Supplemental Figure 13). The rationale for the
short loading timescale is that initial early-time responses can set the trajectory for
longer-term behavior. The loading protocol followed previously optimized methods
[116], in which homogeneous deformations [115] were applied to the cell-seeded gels
using a custom built bioreactor emulating physiological loading conditions: frequency of
1.1 Hz [153] and average sinusoidal compressive strains of 5% with an amplitude of
1.9% based on initial gel height.
Metabolite Extraction. Metabolite extraction was performed using identical
methods from our previous study [116]. Gels were flash frozen, pulverized, and
metabolites were extracted by adding 1 mL of a 70:30 Methanol:Acetone solution and
vigorously vortexing the mixture every 5 minutes for 20 minutes. Samples were kept at -
20C overnight for further metabolite extraction. Proteins were removed by
centrifugation, the supernatant extracted, and the solvent removed via centrifugation
under a vacuum for 6.5 hours. The dried samples were then resuspended in 100 µL of
mass spectrometry grade water and acetonitrile (50:50 v/v).
Untargeted and Targeted Metabolomic Profiling. Metabolomics is an
experimental technique for characterizing large numbers of small molecules (<1000 Da)
in biological samples [96]. Recent studies of joint tissues and fluids have used

109
metabolomic analysis to examine OA phenotypes, identify candidate biomarkers, and
explore the inflammatory responses [179-182]. In this study, metabolites were extracted
following dynamic compression and analyzed by nano-liquid chromatography and mass
spectrometry (Supplemental Methods, [116]). Untargeted metabolites were detected in
positive mode on an Agilent 6538 Q-TOF spectrometer with a resolution of ~20,000 and
accuracy of ~5 ppm. For the targeted approach, ~50 metabolites known to be involved in
central energy metabolism were analyzed using the Quantitative Analysis package within
the Agilent MassHunter Workstation B.04.00 (Agilent Technologies) and a database of
the calculated isotopic distributions (including H+ and Na+ adducts) of these targeted
masses (Isotope Distribution Calculator, Agilent Technologies).
To assess the effects of physiological loading on chondrocyte biology, three
experimental groups were used: unloaded control samples (UC) and samples that
received either 15 (DL15) or 30 (DL30) minutes of dynamic compression. Principal
components analysis (PCA) was utilized to assess metabolome-scale changes caused by
mechanical loading. Pearson’s correlation coefficients were used to estimate the flux of
metabolite intensities over the timecourse of loading. To assess the differences in
intensity distributions (m/z spectra plots for the various loading groups), two-sample
Kolmogorov-Smirnov tests were implemented. Targeted metabolite profiles were
analyzed by PCA, hierarchical agglomerative cluster analysis and correlation analyses.
Additionally, the median ratios of NADP+:NADPH, NAD+:NADH, ATP:ADP, and
GDP:GTP were calculated as a function of time to assess relative changes in energy
metabolism.
110
Compound Identification and Enrichment Analysis. To putatively identify
compounds, a batch search of all of the untargeted metabolite mass to charge (m/z)
values was performed in METLIN and HMDB. Both databases contain over 80,000
identifiable metabolites [162, 163]. Search parameters included using a mass tolerance of
20 ppm, and positively charged molecules with potential +1H+ or +1Na
+ adducts.
Compounds with LipidMAPS identifications [164] were designated as human and not
considered further if detected in a non-human species at the time of database search.
Untargeted metabolites were then examined by unsupervised clustering to identify groups
of co-regulated metabolites. Clusters of co-regulated metabolites were analyzed for
pathway enrichment using IMPaLA [183].
Results
The objective of this study was to characterize the cellular response to applied
compression for primary human OA chondrocytes by examining changes in metabolomic
profiles. Chondrocytes were harvested from donor joint tissue, grown in tissue culture,
embedded in agarose with stiffness similar to the human PCM, and dynamically loaded in
tissue culture. Samples were then flash frozen, pulverized, and the metabolites were
extracted and analyzed using HPLC-MS. We analyzed untargeted metabolomics profiles
to minimize bias from a priori selection of relevant pathways which inherently excludes
potentially important data. To evaluate our hypothesis, we also analyzed metabolomics
profiles of targeted metabolites related to energy metabolism and protein production.
To our knowledge, the present study is the first application of metabolomics to
analyze mechanotransduction in primary OA chondrocytes, and these data demonstrate

111
that applied dynamic compression alters both untargeted and targeted metabolomic
responses of primary human OA chondrocytes in vitro. Using a systems biology
approach, we find key difference between loaded and unloaded OA chondrocytes and
identified 70 metabolites as potential mediators for chondrocyte mechanotransduction.
Untargeted Analysis. We detected 4955 metabolites present in at least one of the
datasets. We refined the 4955 metabolite list to 1421 metabolites by focusing on
metabolites that were present in over half of the samples for each loading group. To
determine the effects of dynamic compression on chondrocyte metabolism, unloaded
control samples were compared to samples subjected to either 15 or 30 minutes of
dynamic compression. Statistical analyses found loading-associated differences that were
both shared between human donors (n = 5) and specific to individual donors (examined
with 5 replicates per donor).
Unsupervised clustering identified four clusters of interest in the untargeted
metabolomic profiles (Figure 31A). These clusters suggest that pathways related to
calcium signaling, energy metabolism, redox regulation, amino acid and lipid metabolism
are regulated by mechanical loading (Supplemental Information). Comparisons between
unloaded control (UC) and DL15 samples revealed changes in 456 metabolites (Figure
31B-C). Of these 456 metabolites, 334 were increased (↑) with dynamic loading and 122
were decreased (↓) in response to loading (Figure 31B-C). Comparisons between UC and
DL30 found changes in 705 metabolites, of which 348 increased and 357 decreased, in
response to dynamic compression (Figure 31B-C). Finally, we found differences in 512
metabolites between DL15 and DL30 groups. 145 metabolites increased and 367

112
decreased for 15 minutes of compression compared with 30 minutes of compression
(Figure 31B-C).
These differences in mechanically-induced metabolomic profiles are supported by
both principal component analysis (PCA) and comparisons of the distributions of
metabolites between experimental groups. The log-transformed and normalized
metabolite intensity data showed distinct separation in the first 3 principal components
between the experimental groups (UC, DL15, and DL30, Figure 31D). The first three
principal components contained 99.7% of the overall variance. The first principal
component contained 49.4% of the variance, and the second and third principal
components contained 31.8% and 18.5% of the total variance, respectively.
Kolmogorov-Smirnov two-sample distribution tests revealed significant differences
between the distributions of the median metabolite expression levels for the various
loading groups (Supplemental Figure 14).
Correlation analysis examined the effects of the duration of dynamic compression
(0, 15, or 30 minutes) on metabolite expression levels (Figure 32). There were 249
statistically significant metabolites that correlated with loading time. 119 metabolites
were positively correlated (i.e. accumulated) and 130 were negatively correlated (i.e.
depleted) with loading time (Figure 32A). The strongest positively and negatively
correlated metabolites were defined as candidate mediators of chondrocyte
mechanotransduction.

113
Figure 31. Applied compression resulted in distinct untargeted metabolomic profiles for
primary OA chondrocytes. (A) Patterns of metabolite expression displayed via heatmap
following hierarchical clustering. Clusters of interest denoted on the right-hand side (see
Table 3). for enrichment analysis).Cluster 1: increasing with loading. Cluster 2: on after
30 min. Cluster 3: off with loading. Cluster 4: on at 15 min. (B) Loading-induced up-
down regulation plots for UC vs. DL15, UC vs. DL30, and DL15 vs. DL30, respectively.
Up regulated metabolites represent molecules that accumulate with respect to mechanical
loading, and down regulated metabolites are being depleted with respect to mechanical
loading. (C) Of the 1421 metabolites in common to all groups, 334 were upregulated
and 122 were downregulated after 15 minutes of compression. 348 were upregulated and
357 were downregulated after 30 minutes of compression. (D) Principal Components
Analysis for the untargeted data to assess differences between sample groups. The first
three principal components contained 99.7% of the overall variance. For each of the
sample groups, UC ( ), DL15 ( ), and DL30 ( ), there are n = 5 donors each sampled
with 5 replicates.

114
Table 3. Pathways and metabolites altered by mechanical loading. Clusters refer to
untargeted clusters identified in Figure 31A.
Figure 32. Dynamic compression results in both accumulation and depletion of
untargeted metabolites. (A) The cumulative distribution of correlation coefficients of
untargeted metabolites was used to identify metabolites that were either accumulating
(blue) or being depleted (red). The strongest correlated metabolites were identified as
candidate mediators of chondrocyte mechanotransduction. (B and C) Metabolite
expression levels versus loading time used for correlation analysis. (B) Accumulation of
selected candidate mediators of mechanotransduction which were database-matched as L-
homoserine (left) and glutamic acid (right). (C) Depletion of selected candidate
mediators of mechanotransduction. Deoxyuridine triphosphate as matched in the
METLIN database (left) and a metabolite with m/z = 141.9573 which did not match any
database molecules (unknown, right).

115
The number of significant mechanosensitive metabolites correlated with patient
age (Figure 33-4, Table 4, and Supplemental Figure 15). Different donors displayed
heterogeneity in their responses to applied compression. For each of the donors, (1-5),
both 15 and 30 minutes of dynamic compression resulted in hundreds of statistically
significant changes in metabolite expression (Table 4 and Figure 34). These results
indicate that there are both shared and patient-specific responses to applied compression
that are affected by aging.
Targeted Analysis. By focusing on metabolites common to central energy
metabolism and protein production, we examined our hypothesis that that physiological
dynamic compression increases chondrocyte glycolytic energy flux to promote the
anabolic response to maintain the environment of the ECM and PCM. In this analysis,
central energy metabolism focused on glucose metabolism including the pentose
phosphate pathway (PPP), glycolysis (Glyc), and the tricarboxylic acid (TCA) cycle.
Cluster analysis identified groups of metabolites with similar responses to applied
dynamic compression (Figure 35A). PCA on targeted metabolites revealed that central
energy metabolites are strongly regulated by applied compression (Figure 35B).
Targeted metabolomics profiles from mechanically loaded groups clustered separately
from unloaded controls, and the first three principal components contained 94.1% of the
overall variance (1st component: 89.1%, 2
nd component: 3.5%, and 3
rd component: 1.5%).

116
Figure 33. Aging-related chondrocyte mechanotransduction. We observed a significant
correlation (r = 0.996, p < 0.01) when comparing the number of significant
mechanosensitive metabolites with the age of the femoral head donor. (A) Age-
correlated increases in the number of significant metabolites. (B) Characteristics of
femoral head articular cartilage used in the correlation analysis. Note that Donor 1 was
male and is included in
Supplemental Figure 15.
Table 4. Statistically significant changes in metabolites for all five donors. Hundreds of
metabolites were both up and down regulated for each of the donors.
Donor
Number
(age)
0 vs. 15 0 vs. 30
Up -
regulated
Down -
regulated
Up -
regulated
Down -
regulated
1 (54) 220 171 156 232
2 (80) 152 161 712 706
3 (60) 245 291 185 193
4 (59) 237 167 283 315
5 (64) 256 404 431 167

117
Figure 34. Patient-specific heterogeneity in chondrocyte mechanotransduction
Upon compression chondrocytes from each donor resulted in different numbers of
significant mechanically up- (A) or down- (B) regulated metabolites. These differences
may stem from variations in both type of end-stage osteoarthritis and patient-specific
differences in the cellular response to mechanical loading.
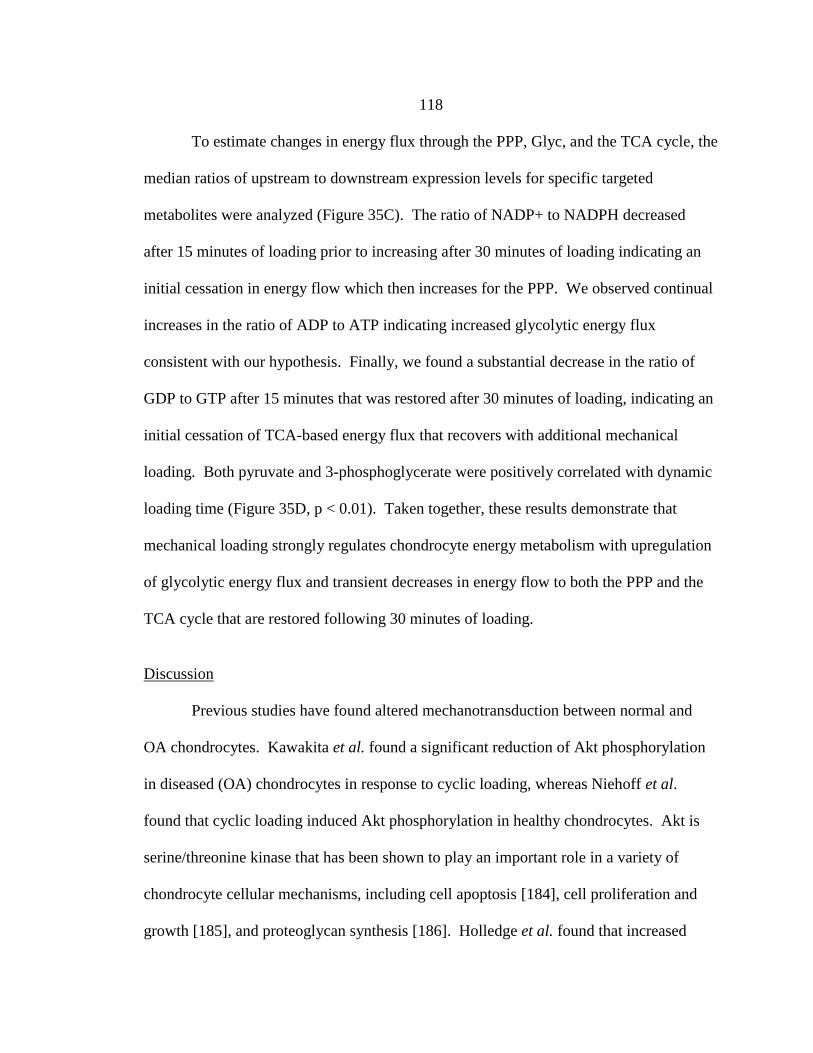
118
To estimate changes in energy flux through the PPP, Glyc, and the TCA cycle, the
median ratios of upstream to downstream expression levels for specific targeted
metabolites were analyzed (Figure 35C). The ratio of NADP+ to NADPH decreased
after 15 minutes of loading prior to increasing after 30 minutes of loading indicating an
initial cessation in energy flow which then increases for the PPP. We observed continual
increases in the ratio of ADP to ATP indicating increased glycolytic energy flux
consistent with our hypothesis. Finally, we found a substantial decrease in the ratio of
GDP to GTP after 15 minutes that was restored after 30 minutes of loading, indicating an
initial cessation of TCA-based energy flux that recovers with additional mechanical
loading. Both pyruvate and 3-phosphoglycerate were positively correlated with dynamic
loading time (Figure 35D, p < 0.01). Taken together, these results demonstrate that
mechanical loading strongly regulates chondrocyte energy metabolism with upregulation
of glycolytic energy flux and transient decreases in energy flow to both the PPP and the
TCA cycle that are restored following 30 minutes of loading.
Discussion
Previous studies have found altered mechanotransduction between normal and
OA chondrocytes. Kawakita et al. found a significant reduction of Akt phosphorylation
in diseased (OA) chondrocytes in response to cyclic loading, whereas Niehoff et al.
found that cyclic loading induced Akt phosphorylation in healthy chondrocytes. Akt is
serine/threonine kinase that has been shown to play an important role in a variety of
chondrocyte cellular mechanisms, including cell apoptosis [184], cell proliferation and
growth [185], and proteoglycan synthesis [186]. Holledge et al. found that increased

119
sulfated glycosaminoglycan production was significantly larger for normal than OA
chondrocytes in response to 0.33 Hz oscillatory fluid flow in monolayer. These studies
emphasize the differences in cellular phenotypes between normal and OA chondrocytes
in response to mechanical stimulation.
We applied dynamic compression to primary chondrocytes and observed both
increases and decreases in hundreds of untargeted metabolites. These metabolomic
changes represent an altered cellular phenotype resulting from exogenous, dynamic
loading. The ability of metabolomic characterization to capture chondrocyte responses to
compression is highlighted by our observation that, when comparing between 0, 15, and
30 minutes of loading, 99.7% of the variance is contained in the first 3 principal
components (Figure 31D). The importance of compression in regulating chondrocyte
behavior is further emphasized by the numerous differences between unloaded and
loaded samples (Figure 31-2, and Supplemental Figure 14). These significant differences
demonstrate both the importance of mechanical loading to chondrocyte biology and the
ability of metabolomics to describe large-scale changes in chondrocyte physiology.
The metabolome is defined as the set of small-molecules found within a
biological sample including substrates, co-factors, and other cytosolic molecules that
comprise the physiology of cellular biochemistry [95]. The metabolome can be viewed
as a collection of state variables describing the cellular phenotype [96]. These
measurements provide valuable insight into how chondrocytes sense and respond to
applied loading. Future studies may build on this untargeted dataset by creating
mathematical models (e.g. Hidden Markov Models) between normal and OA cells to

120
Figure 35. Loading-induced changes in expression of targeted metabolites specific to
central-energy-metabolism. Metabolites associated with central energy metabolism and
protein production (e.g. amino acids) were targeted for detailed analysis via detection of
multiple ionized adducts and ions. (A) Hierarchical agglomerative cluster analysis
reveals changes in metabolite intensities with respect to increased dynamic loading. (B)
Principal Components Analysis for the targeted data was used for comparing
differences/separations among sample groups. The first three principal components
contained 94.1% of the overall variance. For each of the sample groups,
UC( ), DL15( ), and DL30( ), there were n = 5 donors sampled 5 times. (C) Ratios of
upstream to downstream mediators of central energy metabolism. Note error bars are
smaller than the symbols and do not display on this plot. PPP = pentose phosphate
pathway. Glyc = Glycolysis. TCA = Tricarboxylic Acid Cycle. (D) Significant
accumulation of pyruvate and 3-phosphoglycerate in response to applied dynamic
compression.

121
identify candidate pathways for therapeutic intervention. For example, if specific
mechanosensitive pathways are found that enable anabolic processes in chondrocytes,
mechanical loading (i.e. exercise) could potentially be administered as an effective
therapeutic method for healing damaged cartilage. Many of the therapeutic strategies
available for OA patients today (e.g. joint replacement) are extremely expensive, and
inaccessible to certain patient populations. Extending these results to determine optimal
daily loading of cartilage (e.g. exercise) as a therapeutic treatment for OA would be
extremely valuable to combat OA and other associated comorbidities simultaneously.
In this study, we identify mechanosensitive pathways using enrichment analysis
of clusters of co-regulated metabolites (Figure 31A, Table 3, Supplemental Tables).
Dynamic compression notably decreased expression of several metabolites compared
with unloaded controls (Figure 31A, Cluster 3), including valine, leucine, and isoleucine
biosynthesis. Several other metabolites increase dynamic loading. These metabolites
were enriched for ion-channel signaling and glutathione synthesis, which are consistent
with prior chondrocyte data [187, 188] and support physiological compression as a
mechanism to produce cartilage matrix. Riboflavin metabolism and glycogenoloysis also
gradually increased with loading suggesting that cellular energy utilization can be altered
by the mechanical environment [189, 190].
Additionally, there was increased expression of metabolites specific to either 15
or 30 minutes of dynamic compression. Fifteen minutes of dynamic compression
resulted in glycine, serine, and threonine metabolism (Figure 31A, Cluster 4). Thirty
minutes of dynamic compression resulted in upregulation of metabolites enriched for

122
amino acid and lipid metabolism (Figure 31A, Cluster 2). Metabolites relating to
phenylalanine, tyrosine, and tryptophan synthesis were upregulated, in addition to those
for arginine and proline metabolism, consistent with the biosynthetic effects of dynamic
compression.
Certain pathways were represented in multiple clusters (Table 3). This result may
represent differential regulation of distinct pathway components (e.g. upstream vs.
downstream) or technical limitations. Technical limitations include the inability of the
mass spectrometry to distinguish between isomers (e.g. changes in phospholipid
structure) or between identified masses within 20 ppm database search tolerances.
Dynamic compression appeared to increase remodeling of chondroitin sulfate and
increase glycine, serine, and threonine metabolism emphasizing the importance of
loading to matrix remodeling. Several metabolites related to lipid synthesis, transport,
and metabolism were affected suggesting alterations of the cell membrane in response to
dynamic compression [191]. Finally, galactose metabolism was upregulated by loading,
further suggesting the importance of energy metabolism in defining the chondrocyte
response to loading.
Because cartilage is a viscoelastic material, cyclical loading results in internal
energy dissipation within the tissue [171, 172]. To date, it is unknown whether or not
applied mechanical deformation can alter cellular energy utilization. We hypothesized
that physiological dynamic compression will increase glycolytic energy flux to promote
the anabolic response in chondrocytes to maintain the environment of the ECM and
PCM. This project provides fundamental data for understanding potential mechanical-to-

123
cellular energy conversion by quantifying relative levels of metabolites targeted to central
energy metabolism (Figure 35).
Hierarchical clustering clearly demonstrated that dynamic compression regulates
energy-related metabolites, and we found accumulation of key amino acid precursors
including pyruvate and 3-phosphoglycerate which may indicate increased glycolytic flux
(Figure 35). These glycolytic changes were also marked by the consumption of fructose-
1,6-bisphosphate and 1,3-bisphosphoglycerate which may serve to increase pyruvate flux
for maximizing protein synthesis. The future application of a stoichiometric matrix
model for flux balance analysis will enable full evaluation of our hypothesis by
simultaneous analysis of the complete dataset to infer whether observed consumption and
accumulation indicate increased or decreased metabolic flux [192]. The significant
changes in expression of these specific metabolites in response to dynamic loading may
indicate energy utilization towards matrix protein production.
In this study, chondrocytes were harvested from hip replacement patients with
Grade IV osteoarthritis. In our analysis, we found a strong correlation between the
number of mechanically sensitive metabolites and patient age (p < 0.01, r = 0.996).
These data suggest a relationship between aging and mechanotransduction as measured
by the chondrocyte metabolome in response to applied physiological compression.
Future studies may build on this work to identify differences in clinical patient
populations, by utilizing untargeted LC-MS-based metabolomics as potential mechanism
to identify biomarkers in osteoarthritis [193]. The candidate mediators identified in this
study (Supplemental Tables) may prove useful as indicators of normal and OA

124
mechanotransduction. To our knowledge, this is the first time that metabolomics has
been used to assess the loading induced differences for primary human OA chondrocytes.
Conclusions
This study demonstrates the power of utilizing high-dimensional metabolomics as
a tool for understanding chondrocyte mechanotransduction. In our targeted analysis, we
discovered significant correlations with increased mechanical loading and central energy
reorganization. Similarly, our untargeted analysis revealed hundreds of significant
metabolites, including potential novel mediators for chondrocyte mechanotransduction
via energy, lipid, and amino acid metabolism. Finally, we found a positive correlation
between the number of mechanically-induced metabolites and patient age, suggesting that
metabolomics can characterize aging-dependent changes in chondrocyte
mechanotransduction. Metabolomics may yield important biomarker candidates for
tracking the progression of OA in clinical populations. Future work will expand on these
data to elucidate the mechanosensitive differences between OA and normal human
chondrocytes.
Acknowledgements
We acknowledge Drs. Ross Carlson, Brian Bothner, and Edward Dratz, MSU, for
critical insight provided during discussions. We thank Timothy Hamerly for generating
and sharing the standards data. The SW1353 cell line was kindly donated by Martin
Lotz. Funding was provided by NIH P20GM10339405S1, NSF 1342420, Montana State
University, and the Murdock Charitable Trust.

125
References
See REFERENCES CITED.

126
PHOSPHOPROTEOMICS
To further explore the biological outputs of chondrocytes under applied
deformation, this chapter is aimed at evaluating the phosphoproteomic response of
primary human OA chondrocytes in response to applied dynamic compression. This
chapter builds off of Chapter 3 by using the same in vitro model that was developed in
Chapter 2, to understand what proteins are phosphorylated when the chondrocytes are
exposed to dynamic loading. Again, to my knowledge, this study is the first of its kind,
and has yet to be reported to date.
Proteomics is defined as the large-scale study of proteins. In mammalian cells,
proteins are coded by genomic DNA sequences (through many complex processes),
which is commonly referred to as the central dogma of modern biology. DNA
(deoxyribonucleic acid), is a molecule that encodes the genetic instructions used in the
development and functioning of all living organisms, and in eukaryotic organisms most
of the DNA is stored within the cell nucleus [102]. For production of protein, DNA is
transcribed into mRNA (messenger ribonucleic acid), which is a single stranded message
containing the genetic code. mRNA is then translated into long strings of amino acids
(polypeptides) in the cell’s cytoplasm by ribosomes, and eventually fold into complex
structures which are known as proteins. Proteins are considered the building blocks and
workers of our cells, and each protein serves a unique purpose. After translation (post-
translation), proteins can be subjected to an array of chemical alterations, which can
affect the protein’s function, including the ability to process metabolites. These changes
are called post-translational modifications. An important post-translation modification

127
occurs when a phosphate group is added to an amino acid (most commonly serine and
threonine) and is known as protein phosphorylation [103]. Protein phosphorylation
modifies the functional activity of a protein and gives insight of specific signaling
pathways affected by environmental stimuli, including mechanical loading.
Phosphoproteomics is aimed at determining these specific phosphorylated proteins in a
cell under some external stimulus.
This Chapter builds off of the methods developed in Chapter 3 to analyze the
global phosphoproteomic profiles of chondrocytes in response to mechanical stimulation.
This chapter uses identical encapsulation and mechanical stimulation methods as in
Chapter 3; however, instead of extracting metabolites, proteins are extracted. Following
extraction, proteins are proteolyzed (i.e. enzymatically digested), and then the digested
proteins (or peptides) are enriched for phosphopeptides using TiO2 enrichment. Samples
are then analyzed using liquid chromatography (LC) and mass spectrometry with
fragmentation (MS/MS). The objective of this study is to assess phosphoproteomic
changes for primary human OA chondrocytes as a function of dynamic compression from
0-30 minutes. The rationale for this objective is to provide mechanistic insight into the
metabolomic data from Chapter 3.

128
SHOTGUN PHOSPHOPROTEOMICS IDENTIFIES ACTIVATION OF
VIMENTIN, ANKYRIN, VAM6/VPS39-LIKE PROTEIN IN
PRIMARY HUMAN OSTEOARTHRITIC
CHONDROCYTES AFTER MECHANICAL
STIMULATION
Contribution of Authors and Co-Authors
Author: Donald L. Zignego1
Contributions: Acquired, analyzed, and interpreted the data. Drafted and wrote the
manuscript.
Co-Author: Jonathan K. Hilmer2
Contributions: Interpreted data and reviewed the manuscript.
Corresponding Author: Ronald K. June1,3
Contributions: Designed the study, analyzed and interpreted the data, and wrote the
manuscript.
1Department of Mechanical and Industrial Engineering, Montana State University,
Bozeman, MT 59717-3800, USA
2Department of Chemistry and Biochemistry, Montana State University, Bozeman, MT
59717-3800, USA
3Department of Cell Biology and Neuroscience, Montana State University, Bozeman, MT
59717-3800, USA

129
Manuscript Information Page
Donald L. Zignego, Jonathan K. Hilmer, and Ronald K. June
eLife
Status of Manuscript:
_X_ Prepared for submission to a peer-reviewed journal
___ Officially submitted to a peer-reviewed journal
___ Accepted by a peer-reviewed journal
___ Published in a peer-reviewed journal
Publisher: eLife Sciences Publications.
Prepared: July 2015

130
Abstract
Objective. Articular cartilage is comprised of dense extra cellular matrix (ECM),
less dense pericelluar matrix (PCM), water, ions, and the sole cell type found in cartilage,
chondrocytes. Chondrocytes are directly responsible for maintaining cartilage
homeostasis through a variety of catabolic and anabolic processes. Articular cartilage,
and thus chondrocytes, are constantly subjected to mechanical loading in vivo. Prior
research has shown that chondrocytes have the ability to transduce these mechanical
stimuli into biochemical signals; however, many mechanosensitive signaling pathways
and processes by which this mechanotransduction occurs remain elusive. In this study
we hypothesize that physiological, dynamic compression results specific
phosphoproteomic changes that promote matrix synthesis. The objective of this study
was to use shotgun proteomics to identify changes in protein phosphorylation to
understand mechanotransduction in primary human OA chondrocytes.
Design. Primary human chondrocytes were harvested from the femoral heads of
osteoarthritic (OA) donors undergoing total hip replacement (n=5). Physiologically stiff,
cell-seeded agarose constructs were randomly assigned to one of three experimental
groups: (1) unloaded control samples, and samples loaded for either (2) 15 minutes or (3)
30 minutes of dynamic compression (n=5 samples per experimental group with 5
replicates for each donor). Following dynamic compression, proteins were extracted,
digested, peptides enriched for phosphorylation, and detected by HPLC-MS/MS.
Untargeted, shotgun analyses examined changes in global phosphoproteomic profiles in
response to applied compression.

131
Results. This study identified over 2000 phosphoproteins in each of loading
groups, with 514 phosphoproteins unique to dynamically stimulated samples. We
identify novel signaling pathways for each of the loading groups. For loaded samples we
identified statistically significant pathways regulated as a result of dynamic compression,
including Rho GTPase signaling, hyaluronan synthesis, MAPK signaling, and hedgehog
signaling.
Conclusions. To our knowledge, this is the first study to characterize
phosphoproteomic profiles of primary human chondrocytes in response to applied
dynamic compression. These results complement previous data regarding chondrocyte
mechanotransduction, and add significant new data to a developing model of how
chondrocytes transduce mechanical loads.

132
Introduction
Osteoarthritis (OA) is the most common joint disorder worldwide [1-7], and is
characterized by the breakdown of the protective articular cartilage the covers the joint
surfaces. Articular cartilage is composed primarily of a dense extra cellular matrix
(ECM), a less dense pericellular matrix (PCM), and highly specialized cells termed
chondrocytes [37]. At these joint surfaces of the body (e.g. the hip and knee), the
chondrocytes are subjected to repetitive mechanical loading which has been shown to
reach magnitudes as high as 10 times an individual’s body weight [55]. Cellular
mechanotransduction is the process by which cells sense and respond to mechanical
stimulation through an array of biological and biochemical outputs [49]. It is well
established that chondrocytes [49, 84, 87, 93], and other mammalian cells [133-135, 141]
have transduce mechanical inputs into biological signals, but the link between these two
processes remains unclear [51].
Chondrocytes are the sole cell type in articular cartilage, and play a critical role in
maintaining the homeostasis of the tissue. Cartilage homeostasis is maintained through
both anabolic and catabolic chondrocyte metabolism, and it has been shown that the
delicate balance between these two processes can be altered with mechanical stimulation
[43, 173]. The role of healthy chondrocytes is primarily anabolic in nature. The anabolic
program includes protecting, maintaining, and repairing the joint tissue by synthesizing
collagen (mostly type II collagen), and proteoglycans [194] through the secretion of
cytokines , growth factors, and protease inhibitors [173]. However, in diseased cartilage
(e.g. OA), the catabolic program dominates, and usually involves the breakdown of ECM

133
and PCM molecules through the secretion of proteases (e.g. matrix metalloproteinase
(MMPs)). It has been shown that dynamic loading can promote anabolic responses in
chondrocytes, whereas static loading inhibits chondrocyte matrix anabolism [174, 175,
195, 196].
Signaling in chondrocytes has been previously studied, specifically the
intercellular pathways involving proliferation [197], cell differentiation and
dedifferentiation [198], matrix catabolism (via MMPs and ADAM/ADAM-TS gene
expression) [199], and programmed cell death [200]. Proteomics has also been used as a
tool for revealing potential biomarkers of OA through analysis of cartilage secreted
proteins [201], synovial fluid [202, 203], and serum [204, 205] These studies provide a
detailed understanding of various processes in chondrocyte mechanically induced
signaling; however many signaling mechanisms remain unclear, including many
pathways in which protein phosphorylation is thought to mediate signaling. Previous
phosphoproteomic analysis of primary human chondrocytes provided high-dimensional
insight into the pathophysiology of degradative diseases in cartilage [194]. However, to
our knowledge, few, if any, studies have utilized phosphoproteomics as a tool for
elucidating signaling mechanisms of chondrocyte mechanotransduction. In this paper,
we seek to expand understanding of chondrocyte mechanotransduction via protein
phosphorylation. The objective of this study was to use shotgun proteomics to identify
phosphorylated proteins as candidate mediators of chondrocyte mechanotransduction in
primary human OA chondrocytes. We hypothesize that physiological dynamic
compression results in a phosphoproteomic signature consistent with matrix anabolism.

134
In the study presented here, we analyze the short term (<30 min)
phosphoproteomic changes of primary human OA chondrocytes in response to
physiological compression. We have previously demonstrated large-scale metabolomic
changes in primary human OA chondrocytes as a result of dynamic compression [206]
utilizing cell-seeded agarose hydrogels with stiffness similar to the human PCM [114,
115, 207]. In this study we perform phosphoproteomic profiling of primary chondrocytes
following applied compression. Using shotgun proteomics, we identified over 2000
phosphoproteins in each of the loading groups, with 514 phosphoproteins unique to
samples subjected to dynamic compression. To our knowledge, such a study has not
been reported previously. Future work may build on these results to explore the
therapeutic potential of mechanical loading in OA and to identify drug targets for
modulating protein phosphorylation to improve cartilage repair strategies.
Materials and Methods
Chondrocyte Culture and Encapsulation. Primary human chondrocytes were
harvested, isolated, and encapsulated using previously optimized methods [116, 206].
Briefly, chondrocytes were harvested from five Grade IV OA patients undergoing total
hip joint replacement surgery (mean age: 63 years (range: 54-80), and mean mass: 80.4
kg (range: 56.9-99 kg)). Cartilage shavings were digested in Type IV collagenase (2
mg/mL for 12-14 hrs. at 37C), and cultured in DMEM with 10% fetal bovine serum and
1% antibiotics (10,000 I.U. /mL penicillin and 10000 µg/mL streptomycin) in 5%
atmospheric CO2. Cells were encapsulated at a concentration of ~500,000 cells/gel, and
equilibrated in tissue culture conditions for 72 hours.

135
Mechanical Stimulation. Mechanical stimulation was performed using identical
methods from Zignego, et al. [116, 206]. Briefly, for each donor (N=5, female), cell-
seeded agarose gels were randomly assigned to one of three loading groups: unloaded
controls (i.e. 0 minutes of loading), 15, or 30 minutes of dynamic, cyclic compression (n
= 5 biological replicates for each loading group). Homogenous deformations [115] were
applied to cell-seeded gels using previously optimized methods [116, 206], using a
custom-built bioreactor emulating physiological loading conditions (3.1-6.9% strain,
calculated from initial gel height and a frequency = 1.1 Hz [153]).
Protein Preparation and Extraction. Using methods described previously [116,
206], gels were flash frozen in liquid N2, pulverized, and stored at -80C prior to cell
lysis. Gels were lysed by sonication and vigorous vortexing in RIPA buffer (50mM Tris-
HCL (pH 8.0), 50mM NaCl, 1% NP-40, 0.5% sodium deoxycholate, and 0.1% SDS
[208]). Samples were then centrifuged at 21,000 x g at 4C for 10 minutes. The
supernatant was extracted, and the proteins were precipitated using ice-cold acetone
overnight at -20C. Samples were centrifuged the next day at 21,000 x g at 4C for 10
min, and the acetone supernatant was removed. The purified protein pellet was then re-
suspended in 0.5M triethylammonium bicarbonate (TEAB), and all replicates for each
loading group from the individual donors were combined (i.e. n=5 replicates for the
unloaded control samples for donor 1 were combined into one vial, etc…). The
combined samples now consisted of one unloaded control sample, one sample at 15
minutes of dynamic compression, and one sample at 30 minutes of dynamic compression
for each donor (N=5 donors, n=5 replicates for each loading group).

136
Proteolysis, TiO2 Phosphopeptide Enrichment, and Graphite Cleanup. Protein
concentration was quantified using absorbance at 280 nm (NandDrop 2000c, Thermo
Scientific). 400 µg of protein was then reduced for 1 hour at 60C with 10mM tris (2-
carboxyethy) phosphine (TCEP) and cysteine-blocked with 8mM iodoacetamide at room
temperature in the dark for 30 minutes prior to proteolysis. Samples were then digested
with mass-spectrometry grade trypsin (1:20, Trypsin :Substrate, Promega Gold Trypsin,
San Luis Obispo, CA) overnight at 37C [201]. After digestion, samples were acidified,
and solvent was removed using a Speed-Vac concentrator. Digested peptides were
resuspended in sample buffer (MS-grade H20, acetonitrile and TFA, 20:80:0.4 (v/v)),
enriched for phosphopeptides, and purified using graphite columns according to the
manufacturer’s instructions (Pierce TiO2 Phosphopeptide Enrichment and Clean-up Kit
#88301). Enriched samples were then dried a second time using a Speed-Vac
concentrator.
Shotgun Phosphoproteomics LC-MS/MS. MS data collection for the prepared
peptide samples was performed with nanospray UHPLC-MS in the Montana State
University Mass Spectrometry Core Facility [155-157]. The dried peptides were
resuspended in 50 µL of mass spectrometry grade water, acetonitrile, and formic acid
(98:2:0.1v/v/v) with shaking for 15 minutes, and transferred to auto sampler vials.
Aliquots of 5 µL each were sampled via Dionex Ultimate 3000 nano UHPLC, with an
Acclaim PepMap100 C18 column used for trapping (100 [MICRO]m x 2cm) and an
Acclaim PepMap RSLC C18 (75 µm x 50 cm, C18 2 um 100A) for final peptide
separation. The loading pump used 97% H2O, 3% acetonitrile, with 0.1% formic (v/v).

137
The analytical/elution pump solvent consisted of H2O with 0.1% (v/v) formic acid for
channel "A" and acetonitrile for channel "B". Chromatography was as follows: for 10
minutes, the sample was loaded onto the trapping column at a flow rate of 10 µL/min.
From 10 to 11 minutes, the loading pump flow rate was ramped down to 5 µL/min. At
12 minutes, the loading valve was switched to place the trapping column in-line with the
analytical column, and from 12 to 17 minutes the loading pump flow rate was ramped
from 5 to 40 µL/min. From 106 to 108 minutes the loading pump was ramped back from
40 to 5 µL/min. The analytical/elution pump was maintained at 500 nL/min for the entire
run. From 12 to 90 minutes the analytical pump solvents were ramped from 5% to 30%
B. From 90 to 105 minutes the analytical pump solvents were ramped from 30% to 95%
B. At 110 minutes, the loading valve was switched to divert the trapping column to
waste. From 119 to 120 minutes the analytical pump solvents were ramped from 95% to
5% B, and at 120 minutes each run was completed.
The mass spectrometer was a Bruker maXis Impact with CaptiveSpray ESI
source: resolution is ~40,000 and accuracy is better than 1 ppm. Spectra were collected
in positive mode from 150 to 2200 m/z at a minimum rate of 2 Hz for both precursor and
fragment spectra, and with adaptive acquisition time for highly-abundant ions (16 Hz for
>= 25000 counts to 4 Hz for < 2500 counts).
Data Processing. The resulting data files converted with MSConvert
(ProteoWizard [209]) to 32-bit .mzML format. These files were then processed with a
variety of bioinformatics tools. OpenMS TOPPAS [210] was used to create XTandem
workflows to search all of SwissProt and TrEMBL to evaluate all possible matches. Both

138
fixed (f) and variable (v) modifications were considered in the database search
(carbamidomethyl modification of cysteine (f), oxidation of methionine (v),
phosphorylation of serine (v), phosphorylation of threonine (v), and phosphorylation of
tyrosine (v)), allowing for up to two missed cleavage sites. Precursor tolerance was set to
50 ppm and MS/MS fragmentation tolerance was 0.05 Da [173]. Instrument type was set
to ESI-quad-TOF, and peptide charges up to 3+ were permitted. The search database
included the reviewed, Homo sapiens database (Uniprot/Swissprot) which was modified
to contain both targets and “reversed” decoys for FDR (false discovery rate) analysis
[211, 212]. The processed data files were then exported into Excel (Microsoft, Redmond,
WA), and used for statistical and pathway-over representation analysis using Integrated
Molecular Pathway Level Analysis (IMPaLA, http://impala.molgen.mpg.de [213]).
Data Analysis and Candidate Selection. To assess the effects of mechanical
loading on chondrocyte protein phosphorylation, three randomly assigned groups of cell-
seeded agarose hydrogels were established: unloaded control samples (UC), samples
undergoing 15 minutes of dynamic compression (DL15), and samples undergoing 30
minutes of dynamic compression (DL30). Statistical analysis was performed using the
combined samples for each loading group, from each donor (n=5 replicates/loading
group). We defined detected phosphoproteins as those present in the majority of the
replicates. To determine loading induced differences between samples, each dataset was
compared against the others to determine (1) unique phosphoproteins to that loading
group, and (2) overlapped or shared phosphoproteins between loading groups. Four
separate comparisons were made: (1) UC vs. DL15, (2) UC vs. DL30, (3) DL15 vs.

139
DL30, and (4) UC vs. DL15 vs. DL30. For phosphoproteins identified in all three groups
(i.e. UC, DL15, and DL30), statistical comparisons were made using Wilcoxon signed
rank tests and Kruskal-Wallis one-way analysis of variance.
Results
The objective of this study was to characterize the phosphoproteomic response of
primary human OA chondrocytes in response to applied, dynamic compression. In short,
chondrocytes were harvested from donor joint tissue (n=5 donors with Grade IV OA),
grown in tissue culture, embedded in physiologically stiff agarose (matched to human
PCM), and dynamically compressed in tissue culture. Samples were flash frozen,
pulverized, and lysed. Proteins were concentrated, purified, and proteolyzed. Digested
peptides were then TiO2 enriched for phosphopeptides, and finally analyzed via shotgun
proteomics using HPLC-MS/MS (Figure 36). We analyzed the untargeted (global)
phosphoproteomic profiles to minimize bias by the exclusion of important, but
unexpected, data (i.e. if only a single specific signaling pathway was selected a priori).
To our knowledge, the present study is the first application of phosphoproteomics to
analyze mechanotransduction in primary OA chondrocytes. These data demonstrate that
applied dynamic compression alters the phosphoproteomic response of primary human
OA chondrocytes in vitro.

140
Figure 36. Experimental Design. (A) Schematic for both untargeted experimental
methods. (i) Primary human OA chondrocytes are encapsulated in physiologically stiff
agarose (4.5% agarose, stiffness ~35 kPa), cultured for 72 hours, and then dynamically
compressed in tissue culture for 0, 15, or 30 minutes (Control, DL15, or DL30) at 1.1 Hz.
(ii) Proteins are extracted by flash freezing the samples, pulverizing, and lysing the cells
followed by overnight enzymatic digestion. (iii) Samples are enriched for
phosphopeptides using TiO2 enrichment, (iv) phosphoproteomic profiles identified via
HPLC-MS/MS, and (v) the untargeted data analyzed.
For data processing, each of the individual samples (n=5 replicates per loading
group) for each of the loading groups (UC, DL15, and DL30) were processed
individually through the TOPPAS pipeline. For UC samples, 13,838 ± 249 (mean ±

141
SEM) phosphoproteins were identified, which included decoy protein hits. 13,650 ± 525
and 13,088 ± 287 phosphoproteins were identified for DL15 and DL30 samples,
respectively. Following false discovery rate (FDR) filtering using the decoy protein hits
and combining all replicates from each loading group, we identified 2858, 2246, and
2570 phosphoproteins for UC, DL15, and DL30, respectively. We then further refined
these data by focusing only on phosphoproteins that were present in more than half of the
samples for each loading group. The final list consisted of 767, 359, and 623
phosphoproteins for UC, DL15, and DL30, respectively. To analyze the effects of
dynamic compression on chondrocyte metabolism, we made individual comparisons
between unloaded control samples and samples loaded for either 15 or 30 minutes of
dynamic compression.
The first comparison between unloaded controls (UC) and DL15 samples revealed
685 phosphoproteins unique to UC, 277 unique to DL15, and 82 phosphoproteins
common between the two samples. Of the 82 shared phosphoproteins, 3 of them were
significantly (p<0.05) up-regulated as a result of mechanical loading, one being proline-
rich basic protein 1. For the second comparison, UC was compared against DL30
samples. 658 phosphoproteins were unique to UC, 514 unique to DL30, and 109
common between both samples. Of the 109, 4 were statistically (p<0.05) up-regulated
and 2 of them statistically down-regulated. For the third comparison (DL15 vs. DL30),
287 phosphoproteins were unique to DL15, 551 unique to DL30, and 72 common
between them. Of the 72, one phosphoprotein was down-regulated with increased
loading. The final comparison compared UC, DL15, and DL30 together (Figure 37).

142
612 phosphoproteins were unique to UC, 241 unique to DL15, 273 unique to DL30, and
36 common between all three of them.
Figure 37. Dynamic compression alters phosphoprotein expression in primary OA
chondrocytes. To further explore the effects of dynamic compression on the chondrocyte
phosphoproteome, we determined the number of phosphoproteins which were unique to
each of the experimental comparisons (UC vs. DL15, UC vs. DL30, DL15 vs. DL30, and
UC vs. DL15 vs. DL30). 685 phosphoproteins were identified in control samples (UC)
that were not detected in samples subjected to 15 minutes of dynamic compression
(DL15), 277 phosphoproteins were identified in DL15 samples that were not detected in
UC, and 82 phosphoproteins were common to both samples. 658 phosphoproteins were
identified in UC that were not detected in DL30, 514 phosphoproteins were detected in
DL30 that were not in UC, and 109 phosphoproteins were common to both samples. 287
phosphoproteins were identified in DL15 that were not detected in DL30, 551
phosphoproteins were detected in DL30 that were not in DL15, and 72 phosphoproteins
were common to both samples. 36 phosphoproteins were common to all three samples.
Unsupervised, agglomerative cluster analysis revealed three unique groups of
phosphoprotein profiles which were regulated as a result of dynamic compression (Figure
3). Cluster group 1 reveled phosphoproteins which were up-regulated with only 15
minutes of dynamic compression, cluster group 2 revealed phosphoproteins which were

143
down-regulated as a result of dynamic compression, and cluster group 3 revealed
phosphoproteins which were up-regulated only after 30 minutes of dynamic compression.
Specific phosphorylated proteins to cluster group 1 included microtubule cross-linking
factor 1, unconventional myosin-Va, ankyrin-2, and obscurin. Specific phosphorylated
proteins to cluster group 2 included cofilin-1, microtubule-actin crosslinking-factor 1, E3
ubiquitin-protein ligase UBR4, and calreticulin. Phosphorylated proteins from cluster
group 3 included vimentin, unconventional myosin-IXb, Titin, Protein AF-9, mediator of
RNA polymerase II transcription subunit 13, Zinc-finger protein 592, and Vam6/Vps39-
like protein.
The phosphoproteins from each of the comparisons (UC vs. DL15, UC vs. DL30,
and DL15 vs. DL30) were used to identify key signaling pathways using the pathway
over-representation analysis. We observed hundreds of significant (p<0.05) pathways
which were identified through the IMPaLA database (Table 5). Significant pathways
were determined by comparing the number of overlapping phosphoproteins between
specific signaling pathways and phosphoproteins identified in each sample group. For
UC vs. DL15, we observed 201 significant (p<0.05) signaling pathways which were
determined from phosphoproteins unique to UC samples. Specific pathways included
collagen formation and biosynthesis (p<0.01. 92 significant pathways were identified
from phosphoproteins unique to DL15 samples, including Acetyl-CoA biosynthesis
(p=0.0157) and Hedgehog signaling (p=0.0386). Phosphoproteins common to both UC
and DL15 resulted in 61 significant signaling pathways, including RhoA activity
(p<0.01), and Rho GTPase signaling (p<0.01).

144
For the UC vs. DL30 comparison, 215 significant (p<0.05) signaling pathways
were identified which were unique to UC, 119 unique to DL30, and 71 shared by both
UC and DL30. Specific pathways for UC included collagen formation and biosynthesis
(p<0.01), and extracellular matrix organization (p=0.0134). Pathways for DL30 samples
included MAPK signaling (p<0.01), Rho GTPase signaling (p<0.01), hyaluronan
biosynthesis (p=0.0252), and glucose-6-phosphate dehydrogenase deficiency (p=0.0473).
Overlapping pathways between UC and DL30 included ECM proteoglycan synthesis
(p=0.0374), and Erk2 activation (p=0.0489).
For DL15 vs. DL30, 80 significant (p<0.05) signaling pathways were identified
via database searches which were unique to DL15, 100 unique to DL30, and 90 were
shared by both DL15 and DL30. Specific pathways to DL15 samples included Hedgehog
signaling (p<0.01), and calcium signaling (p=0.0453). Specific pathways to DL30
samples included MAPK signaling (p<0.01), fatty acid activation (p<0.01), and Rho
GTPase signaling (p<0.01). Common pathways between both DL15 and DL30 samples
included RhoA activity (p=0.0168) and nucleotide sugars metabolism (p=0.342).

145
Table 5. Key signaling pathways determined from pathway over-representation analysis.
Comparisons made were UC vs. DL15, UC vs. DL30, and DL15 vs. DL30. The first
column of the table represents the comparison being made, and the specific sample group
is shown in parenthesis.
Sample
Comparison
(Exp. Group)
Pathway NamePathway
Source
#
Overlapping
Genes
# Genes in
Pathwayp-value
UC vs. DL15
(UC)Collagen formation Reactome 10 88 (91) 1.45E-03
UC vs. DL15
(UC)
Collagen biosynthesis
and modifying enzymesReactome 8 65 (68) 2.57E-03
UC vs. DL15
(DL15)Vitamin B12 Metabolism Wikipathways 4 50 (51) 7.75E-03
UC vs. DL15
(DL15)
acetyl-CoA biosynthesis
from citrateHumanCyc 1 1 (1) 1.57E-02
UC vs. DL15
(DL15)Signaling by Hedgehog Reactome 4 81 (87) 3.86E-02
UC vs. DL15
(UC & DL15)
Regulation of RhoA
activityPID 3 46 (47) 9.51E-04
UC vs. DL15
(UC & DL15)
Signaling by Rho
GTPasesReactome 4 122 (129) 1.72E-03
UC vs. DL30
(UC)Collagen formation Reactome 10 88 (91) 1.10E-03
UC vs. DL30
(UC)
Collagen biosynthesis
and modifying enzymesReactome 8 65 (68) 2.05E-03
UC vs. DL30
(DL30)
p130Cas linkage to
MAPK signaling for
integrins
Reactome 4 15 (15) 4.35E-04
UC vs. DL30
(DL30)Rho GTPase cycle Reactome 10 122 (129) 1.02E-03
UC vs. DL30
(DL30)
Signaling by Rho
GTPasesReactome 10 122 (129) 1.02E-03
UC vs. DL30
(DL30)
Hyaluronan biosynthesis
and exportReactome 1 1 (1) 2.52E-02
UC vs. DL30
(DL30)MAPK Cascade Wikipathways 3 29 (29) 3.58E-02
UC vs. DL15
(UC & DL30)ECM proteoglycans Reactome 2 55 (56) 3.74E-02
DL15 vs. DL30
(DL15)Signaling by Hedgehog Reactome 5 81 (87) 8.68E-03
DL15 vs. DL30
(DL30)fatty acid activation HumanCyc 3 8 (9) 9.31E-04
DL15 vs. DL30
(DL30)Rho GTPase cycle Reactome 10 122 (129) 1.46E-03
DL15 vs. DL30
(DL30)
Signaling by Rho
GTPasesReactome 10 122 (129) 1.46E-03
DL15 vs. DL30
(DL15 & DL30)
Nucleotide Sugars
MetabolismSMPDB 1 8 (8) 3.42E-02

146
Discussion
In this study, we demonstrate the ability to successfully extract and analyze
phosphoproteins from primary human OA chondrocytes embedded and dynamically
stimulated in physiologically stiff agarose. We analyzed the short term (<30 min)
phosphoproteomic changes of primary human OA chondrocytes by comparing unloaded
control samples (0 min. of loading), to samples subjected to either 15 (DL15) or 30
(DL30) minutes of dynamic compression. These data compliment previous metabolic
findings [206], and expand the basic knowledge of chondrocyte signaling pathways as a
result of mechanical stimulation. Previous chondrocyte mechanotransduction studies
have found proteomic changes as a result of dynamic compression, but little work has
been done in analyzing phosphoproteomic alterations.
In mammalian cells, proteins are created from DNA through a number of
processes known as the central dogma of molecular biology. Accordingly, DNA is
transcribed into mRNA, then mRNA is then translated into proteins in the cytoplasm by
ribosomes [102]. Proteins are macromolecules, and considered the building blocks and
machines of cells. Following translation, post-translational modifications (i.e.
phosphorylation) can occur, which have the potential to regulate the function of a specific
protein. Protein phosphorylation is a post-translational modification in which a
phosphate group is added to a specific protein. To evaluate the effects of dynamic
compression on protein phosphorylation profiles, we analyzed 36 phosphoproteins that
were shared between all samples (UC, DL15, and DL30) using unsupervised,
agglomerative cluster analysis (Figure 38).

147
Figure 38. Applied compression resulted in distinct untargeted phosphoproteomic
profiles for primary OA chondrocytes. Clustering identified three groups of
mechanically-regulated protein phosphorylation. Patterns of overlapped phosphoprotein
expression displayed via heatmap following unsupervised, hierarchical clustering on
differentially phosphorylated proteins common to the dynamic compression (15 and 30
minutes) and unloaded control groups.
Three unique groups were evident in the cluster analysis. Cluster group 1 reveled
phosphoproteins which were up-regulated with 15 minutes of dynamic compression
(Figure 3). These phosphorylated proteins were highly phosphorylated after 15 minutes
of dynamic compression, and then were dephosphorylated at 30 minutes. Specific
phosphorylated proteins to this group included 4 proteins which regulate cytoskeletal
dynamics, including ankyrin-2. Ankyrins are adaptor proteins that help mediate
attachment of membrane proteins to the cytoskeleton [214]. Ankyrin not only affects
chondrocyte cytoskeletal dynamics, but important for maintaining cartilage homeostasis
through the single-pass transmembrane protein CD44 which can bind extracellular

148
hyaluronan providing a potential mechanism for ECM deformation to be transmitted
intracellularly[215]. Cluster group 3 also contained phosphorylated proteins that play a
role in the arrangement of actin cytoskeletal structures. The actin cytoskeleton is a key
component of chondrocyte shape, which has been linked with the matrix synthesis
chondrocyte phenotype [216, 217]. Under mechanical deformation in 3D suspension, the
actin cytoskeleton is actively remodeled [84, 217, 218], which suggests increased matrix
synthesis as a result of as little as 15 minutes of dynamic compression.
Cluster group 2 includes phosphoproteins down-regulated (i.e. de-
phosphorylated) as a result of mechanical loading, and includes E3 ubiquitin-protein
ligase UBR4, and calreticulin. E3 ubiquitin-protein ligase UBR4 is a phosphorylated
protein in the ubiquitin-ligase pathway, which may be associated with protein
degradation [219]. Given that these data demonstrate de-phosphorylation in response to
dynamic loading; this provides a potential protective mechanism for mechanical
stimulation which may also increase matrix synthesis. Calreticulin is de-phosphorylated
in response to applied compression. Calreticulin is lectin-independent chaperone, which
binds and deactivates Ca2+ ions, and ADAMTS. The ADAMTS (a disintegrin and
metalloproteinase with thrombospondin motifs) family of peptidases has been shown to
inhibit chondrocyte differentiation [220] and promote aggrecan degradation [45].
ADAMTS enzymes are upregulated in OA [221, 222]. Therefore, the observation that
Calreticulin is de-phosphorylated in DL15 and DL30 samples, suggests another potential
protective mechanism by which mechanical loading may reduce matrix degradation.

149
Cluster group 3 identified proteins which were highly phosphorylated in response
to 30 minutes of mechanical stimulation. This group included a number of actin-
associated proteins that were phosphorylated in response to loading, including vimentin.
Vimentin is an intermediate filament which is integral to the chondrocyte cytoskeleton.
Disruption of vimentin networks in chondrocytes leads to decreased matrix synthesis and
cell stiffness [223], as well as OA progression [68]. In this study, vimentin was highly
phosphorylated in response to mechanical loading, which may result in increased matrix
synthesis as well as other protective mechanisms against OA.
In Cluster group 3, transcriptional regulating proteins (DNAmRNA) including
AF-9, mediator of RNA polymerase II transcription subunit 13, and zinc finger protein
582 were highly phosphorylated in response to mechanical loading. Cam6/Cps39-like
protein was also highly phosphorylated in DL30 samples, which is a regulator of TGF-
beta activity through activation of SMAD2-dependent gene expression. SMAD2
expression [224] and increased TGF-beta signaling [225] have been shown to affect
chondrocyte differentiation and play critical roles in inducing gene expression of
cartilage-specific molecules (i.e. collagen II). Protein phosphorylation leading to up-
regulation of TGF-beta signaling and SMAD expression further strengthen the potential
protective mechanisms of mechanical loading against the progression of OA.
To further examine mechanically induced changes in chondrocyte protein
phosphorylation, pathway enrichment analysis examined pathway-specific differences
between loading groups. In comparisons for UC samples (UC vs. DL15 and UC vs.
DL30), collagen biosynthesis and formation were identified as signaling pathways

150
present in UC samples, and were either in low levels or not detected in loaded samples,
and support the 3D agarose culture system used in these experiments. This complements
previous [206], where proline levels were down-regulated in response to increased time
of dynamic compression. Collagen is synthesized in the chondrocyte’s cytoplasm, which
incorporates proline and hydroxyproline into the formation of the triple-helix [226], and
proline has been shown to be a marker of ECM synthesis [77]. Down-regulation (i.e.
consumption) of proline in response to mechanical loading, suggests loading-induced
collagen synthesis.
Signaling pathways specific to dynamically stimulated samples were identified as
those unique to either DL15 or DL30 samples. DL15 samples contained phosphorylated
proteins specific to the Hedgehog signaling pathway (p<0.05). The hedgehog signaling
pathway regulates many fundamental processes in embryonic development, including cell
proliferation and differentiation [227], and has also been shown to play an important role
in chondrocyte differentiation [228]. Lin et. al [228], demonstrated that the hedgehog
pathway was upregulated in dedifferentiated in rat chondrocytes, and this phenotype is
similar to diseased (OA) chondrocytes [229]. By redifferentiating the dedifferentiated
chondrocyte phenotype through activation of the hedgehog signaling pathway, loading
may enable OA chondrocytes to recapitulate the normal chondrocyte phenotype, further
demonstrating the potential for loading to promote cartilage repair. These data suggest
that the hedgehog signaling pathway is activated in as short as 15 minutes. If the
hedgehog pathway initiates a healing response of diseased chondrocytes, short duration,
mechanical loading may be used as a potential clinical therapy for OA.

151
DL30 samples contained phosphorylated proteins associated with Rho GTPase
signaling, mitogen activated protein kinase (MAPK) signaling, and hyaluronan synthesis.
Rho-associated protein kinases (ROCK), from the serine-threonine kinase family, have
been previously studied in the chondrocyte mechanotransduction field [84, 123, 170], and
rho kinase activation occurs after less than 10 minutes of dynamic compression [123].
Rho kinase plays an important role in actin dynamics which regulate cell shape and size
[230]. Cell shape defines the in vivo chondrocyte phenotype[37], and reorganization of
the actin cytoskeleton is a result of Rho GTPase signaling. In this study, we dynamically
stimulated primary human OA chondrocytes in high-stiffness agarose [114], and have
previously observed homogenous ellipsoidal deformations induced on the cells which are
spherical in the undeformed case [115]. These deformations promote remodeling of the
cytoskeleton via the Rho GTPase signaling pathway, which has been linked with increase
cartilage matrix production [170]. Increased matrix production is consistent with
hyaluronan synthesis, which was identified as a significant (p<0.05) pathway in DL30
samples. Hyaluronan has been found to be responsible for organization of proteoglycans
in cartilage, and hyaluronan-chondrocyte interactions are important for the production
and maintenance of cartilage matrix [231].
The MAPK signaling pathway was also significantly enriched (p<0.05) in DL30
samples. The MAPK pathway is present in most eukaryotic cells and controls functions
such as cell proliferation, differentiation, survival, and apoptosis [83, 232], and includes
protein kinases such as ERK1 and ERK2. Previous studies have found that mechanical
compression of articular cartilage induces cell proliferation through activation of the

152
ERK1/2 pathways [83]. Therefore, if the present data represent MAPK signaling
activation for cell proliferation, future studies may explore using applied dynamic
compression to expand chondrocytes for cartilage repair.
Conclusions
In summary, this study demonstrates the power of using phosphoproteomics as a
tool for understanding the chondrocyte response to short duration (<30 min), dynamic
compression. By expanding upon prior metabolomic analysis of primary human OA
chondrocytes in response to dynamic compression [206], in this study we were able to
identify 514 phosphoproteins unique to dynamically stimulated samples. To our
knowledge, this was the first study to successfully identify phosphoproteomic profiles for
OA human chondrocytes in response to mechanical loading. This work identified the
potential to use mechanical stimulation (i.e. short-duration, low-impact exercise) as a
therapeutic to promote cartilage repair in OA clinical populations. Future work will
expand on this work to elucidate latent biomarkers for OA by comparing
phosphoproteomic differences between OA and normal human chondrocytes.
Acknowledgements
We acknowledge Drs. Brian Bothner MSU, for critical insight provided during
discussions. We thank Dr. Jonathan Hilmer for assistance and insight provided during
LC-MS/MS sample runs and data analysis. Funding was provided by NIH
P20GM10339405S1, NSF 1342420, Montana State University, and the Murdock
Charitable Trust.

153
References
See REFERENCES CITED.

154
IN VIVO MODEL
The final chapter of this dissertation is aimed to provide in vivo validation and
interpretation of the in vitro results obtained in Chapters 3 and 4. This study will use a
novel in vivo mouse model that allows for in vivo quantification of cartilage abundance.
Again, this is a novel study, and has never been reported to date.
Mouse models have been used for decades in the scientific community as tools for
understanding and treating OA. Current studies utilize a number of different techniques
to induce OA in mice, including surgical destabilization of the knee joint [60, 233],
injection of proteolytic enzymes [234], and naturally via aging [235]. The caveat for
these studies is all of the mice are euthanized for joint dissection and sectioning, and then
stained so the deteriorated cartilage can be graded. These grading scales (usually from 0-
6) are subject to bias and don’t actually quantify the amount of cartilage in the joint [233,
235-237]. This study is unique in that it provides the first ever non-invasive, in vivo
quantification of the cartilage amount in a mouse model by a genetically encoded
reporter. It also carries the benefit of being able to longitudinally monitor each mouse,
and their relative amounts of cartilage quantified without having to sacrifice the mouse.
Our working mouse model is defined as follows: A novel transgenic mouse has
been generated that expresses firefly luciferase in aggrecan, the most abundant
proteoglycan found in cartilage. This bioluminescent signal is identical to how a firefly
lights up, hence the name firefly luciferase. These mice have been genetically modified
to express Cre-ERT2 in the presence of tamoxifen. When tamoxifen is present, Cre is
activated in aggrecan-producing cells (e.g. chondrocytes), which excises a stop codon in

155
the genetic code to initiate transcription of luciferase. When luciferase comes in contact
with the substrate luciferin (i.e. through an external injection), a bioluminescent signal of
light is omitted. The amount of aggrecan in chondrocytes is directly proportionally to the
amount of cartilage in the joint. Therefore, the amount of emitted light is directly
proportional to the amount of cartilage.
This is an extremely novel study in that it not only validated the in vitro results
from the metabolomics and phosphoproteomics data sets generated in Chapters 3 and 4,
but it also laid the foundational building blocks to allow in vivo monitoring of
chondrocyte mechanotransduction.

156
ALTERATIONS IN JOINT METABOLOMICS FOLLOWING
SURGICAL DESTABILIZATION AND EXERCISE IN A
NOVEL CARTILAGE REPORTER MOUSE MODEL
Contribution of Authors and Co-Authors
Author: Donald L. Zignego1
Contributions: Acquired, analyzed, and interpreted the data. Drafted and wrote the
manuscript.
Co-Author: Sarah E. Mailhiot1
Contributions: Interpreted data and reviewed the manuscript.
Co-Author: Timothy Hamerly2
Contributions: Interpreted data and reviewed the manuscript.
Co-Author: Edward E. Schmidt3
Contributions: Interpreted data and revised the manuscript.
Corresponding Author: Ronald K. June1,4
Contributions: Designed the study, analyzed and interpreted the data, and wrote the
manuscript.
1Department of Mechanical and Industrial Engineering, Montana State University,
Bozeman, MT 59717-3800, USA
2Department of Chemistry and Biochemistry, Montana State University, Bozeman, MT
59717-3800, USA.
3Department of Microbiology and Immunology, Montana State University, Bozeman,
MT 59717-3800, USA.
2Department of Cell Biology and Neuroscience, Montana State University, Bozeman, MT
59717-3800, USA

157
Manuscript Information Page
Donald L. Zignego, Sarah E. Mailhiot, Timothy Hamerly, Edward E. Schmidt, and
Ronald K. June
Annals of Biomedical Engineering
Status of Manuscript:
_X_ Prepared for submission to a peer-reviewed journal
___ Officially submitted to a peer-reviewed journal
___ Accepted by a peer-reviewed journal
___ Published in a peer-reviewed journal
Publisher: Annals of Biomedical Engineering, Springer US.
Prepared: July 2015

158
Abstract
The structure and inaccessibility of synovial joints hinders studies on the dynamic
pathophysiology of osteoarthritis (OA). Here we developed advanced methods for
quantifying changes in cartilage in a novel post-traumatic model of OA. Using a recently
developed mouse model that expresses luciferase in chondrocytes [238], cartilage-
specific bioluminescence was quantified by non-invasive in vivo imaging. To evaluate
the effects of exercise and injury, we established two independent groups of mice
(female, 8 weeks old, n=5 per group). Mice that were unexercised and subjected to a
sham procedure served as the control group. Mice subjected to intensive forced treadmill
exercise and surgical destabilization of the left knee (Ex-des mice) was used to assess
osteoarthritic changes. In vivo cartilage abundance was quantified bioluminescently over
15 days, after which mice were sacrificed and full-joint metabolomic profiles were
determined. Ex-des mice, but not controls, showed progressive cartilage loss over time
as determined by decreasing cartilage-specific bioluminescence. Metabolomic profiling
detected 496 molecules whose levels differed significantly between groups and 391 of
these were identified. These data showed that aliphatic amino acids, arachidonic acid
metabolism, and mineral absorption were increased in response to both exercise and
injury; the creatine-phosphate biosynthesis pathway was induced by exercise but
repressed by injury; and either exercise or injury repressed levels of sugar transport,
amino-sugar metabolism, and proline catabolism. The results from this study show the
effects of exercise and injury on both cartilage and whole-joint metabolic activity. Future

159
studies will use these techniques for longitudinal evaluation of murine OA in applications
such as disease progression, biomarker development, and candidate drug evaluation.

160
Introduction
Osteoarthritis (OA) is considered the most prevalent joint disorder in the world
and involves the breakdown of the protective, load bearing articular cartilage that covers
the joint surface [1-7]. The predominant view is that excessive joint loading causes OA.
Articular cartilage is subjected to repetitious mechanical loading, and contact
forces through the joints can be up to 10 times an individual’s body weight [55]. Studies
indicate there is a delicate balance between healthy and unhealthy joint loading, which
can either establish protective mechanisms against OA or result in cartilage deterioration
leading to OA [8, 9]. It has been shown that chondrocytes, the sole cell type in articular
cartilage, sense and respond to mechanical deformations, but the biological processes
describing these mechanisms remain elusive [49, 84, 87, 93, 116]. This study utilized
forced exercise via treadmill running after surgical destabilization to model excessive
loading in OA.
OA is challenging to study in humans because of (1) the timescale of slow disease
progression, and (2) availability of healthy control samples for age-matched comparison.
However, mouse models of OA provide the opportunity to study the disease under
controlled conditions. While mouse disease may not recapitulate all components of
human OA, these models provide a means to study the pathological evolution of OA
under controlled conditions [239-241].
Mouse models of OA have been used extensively in predicting the efficacy of
pharmacological intervention for OA [242-244], as well as in determining the role
mechanical loading on cartilage physiology in vivo [60, 222, 245-248]. Experimental OA

161
in mice can be induced by a variety of methods including surgical destabilization [60,
233], intra-articular chemical injections [241, 249, 250], and applied external loading
[251]. Surgical destabilization is the most common, and induces a progression of
experimental OA that mimics the pathology of human OA.
The most common methods for quantifying cartilage deterioration in murine OA
models include histopathological grading scales [237, 252] and micro-CT imaging [253-
255]. One challenge to these studies is longitudinal evaluation to measure progression of
the disease over time in the same animal. Current methods for studying the progression
of OA require euthanizing animals at specific time points throughout the study, and
therefore render longitudinal observations in the same animal impossible. In this study
we address this issue by using a transgenic reporter mouse and quantitative non-invasive
bioluminescent imaging.
Recently we developed a novel transgenic mouse for non-invasive in vivo
cartilage quantification [256]. This model includes a tamoxifen-inducible Cre
recombinase driven by an IRES (internal ribosomal entry site) within the 3’-untranslated
region of the endogenous chondrocyte-specific aggrecan mRNA. In tamoxifen-exposed
chondrocytes, Cre removes a “floxed-STOP” cassette from a ROSA26-targeted luciferase
reporter, resulting in chondrocyte-restricted luciferase expression (Figure 1). In vivo
imagining is then used to quantify the bioluminescent signal produced in aggrecan-
expressing tissues of the mouse (i.e. knee, tail, hip, and toes). The objective of this study
was to analyze the effects of intensive physical exercise and surgical destabilization (via
MCL transection and medial meniscectomy) utilizing both longitudinal in vivo

162
bioluminescence imaging of cartilage in transgenic reporter mice and terminal
metabolomic profiling of joint tissues.
We observed significant decreases in the bioluminescent signal in the exercised
and destabilized mouse joint when compared to the contralateral sham controls, reflecting
changes in cartilage and joint health. Furthermore we observed significant differences in
metabolite profiles between mouse groups. This study establishes an important model
that will be useful for studies of (1) the progression of OA in murine models, (2) specific
metabolites as OA biomarkers, and (3) longitudinal studies of therapeutic strategies for
OA.
Materials and Methods
Animals. This study was approved by the Montana State University Institutional
Animal Care and Use Committee (IACUC). Two separate cages of mice were used as
controls or as experimental animals for this study (female, n = 5 mice for each group)
(Figure 39A). Mice were housed with ad libitum access to food and water in 12 hour
light-day cycles. The transgenic reporter mouse has been described previously [238].
Briefly, this line expresses chondrocyte-specific bioluminescence following Cre
induction via tamoxifen.
Luciferase Induction, Imaging and Image Processing. Cre-ERT2 activity was
induced via subcutaneous scruff injections of tamoxifen (10mg/mL in vegetable oil)
serially for 3 days (2 mg/day) (Figure 39B). Following a 5-day rest period, mice were
imaged. D-luciferin potassium salt, a substrate required for bioluminescence, was
administered via subcutaneous scruff injection (1.5 ml/mouse at 15 mg/mL).

163
Figure 39. Experimental design and transgenic strategy for mouse with aggrecan-specific
bioluminescence. (A) Schematic of the experimental methods for both the exercised and
destabilized and unexercised and intact (ctrl) mouse groups. The experimental group
consisted of mice subjected to exercise with one knee surgically destabilized (Ex-ctrl, Ex-
des). Control mice were not subjected to exercise (ctrl-L, ctrl-R). (i) The transgenic
reporter mice are randomly assigned into two experimental groups. (ii) n = 5 female
mice are assigned to each experimental group (ctrl or exercised/destabilized), and (iii) are
given 3 consecutive days of tamoxifen injections. (iv) Both groups are then imaged to
establish baseline intensity values for each mouse, and (v) then exercised/destabilized
mice are trained on the treadmill. (vi) Exercised/destabilized mice are then subjected to a
destabilization surgery on each of their left hind legs, whereas ctrl mice are used as
contralateral sham controls. (vii) Following 96 hours of rest, exercised/destabilized mice
are then exposed to vigorous treadmill exercise for 15 consecutive days. (viii) All mice
are then euthanized and their joints dissected followed by (ix) either histology (n=1
mouse per group) or full joint LC-MS (n=4 mice per group). Throughout the running
protocol ctrl mice resumed routine activity (v-vii). (B) In this mouse model, luciferase
expression is induced specifically in aggrecan producing cells (i.e. chondrocytes). These
mice contain an inducible Cre-recombinase which was inserted into the 5’ untranslated
region of the endogenous mouse aggrecan transcript. The insert contains an internal
ribosomal entry site followed by the tamoxifen-inducible CRE-ERT2 injection. (C)
Stereographic images of ctrl Ex-ctrl and Ex-des mouse joints showing the successful
destabilization surgery of the left medial (M) side of an Ex-des mouse joint.

164
After 15 minutes, for luciferin distribution, mice were anesthetized via isoflurane
inhalation (2-3% v/v at 2.5 ml/min in oxygen), and imaged using an anterior view with
15 min exposures in no-light conditions (Kodak ImageStation 2000MM). 16-bit TIFF
images were analyzed with Matlab. Images were contrasted, inverted, and thresholded
before smoothing with a 50 pixel median ball filter [256]. A region of interest (ROI) was
selected around each knee, and total pixel intensity was calculated by summing the pixel
values in each specific ROI. All mice were imaged serially for 3 days to establish
baseline values for bioluminescent intensity.
Treadmill Running and Surgical Destabilization. In order to detect
bioluminescent changes in response to exercise, mice were randomized into two groups;
unexercised and non-destabilized control mice (n = 5 female), and exercised/destabilized
mice (n = 5 female). The exercised/destabilized mice were subjected to extensive
treadmill training for 10 consecutive days (maximum speed of 30 cm/s for 20 min at 15°
incline) [257]. Following training, these mice had each of their left knees surgically
destabilized by MCL transection and medial meniscectomy [233], which we will denote
as the “Ex-des” joint (Figure 39C). For surgery, mice were anesthetized via isoflurane
inhalation (~3% isoflurane). Following surgery, incisions were sutured, and mice
administered analgesics per IACUC protocol (subcutaneous Buprenex at 0.5 mg/kg).
Mice were monitored for 7 consecutive days for post-surgical complications. Following
96 hours of recovery, the Ex-des group were run for 15 consecutive days (30 cm/s, 15°
incline, 25 min daily). Control mice were handled daily without running as a control.
All mice were imaged every other day for 14 days.
165
Joint Harvest and Metabolite Extraction. Both groups of mice were euthanized by
cervical dislocation. To obtain joint-related metabolites, the tibiofemoral joints (n=4,
each group) were harvested as follows. Skin was removed from mouse limbs, and
muscle was removed from the proximal femur using scissors. Periosteum and other soft
tissues were scraped away from the shaft of the femur, and an incision was made along
the trochlear groove to access the joint. The patella and associated soft tissue (synovium,
fat pad) were removed with scissors, and remaining soft tissue was scraped away from
the tibia to the extent possible. The joint was harvested using scissors with a tibial cut
immediately below the articular cartilage and a femoral cut which included both condyles
and the distal ~80% of the trochlear groove. Joints were flash-frozen in liquid N2 for 5
minutes and pulverized using a stainless steel platen and a ball peen hammer.
Metabolites were then extracted using previously optimized protocols [116, 206]. 1 ml of
a 70:30 methanol:acetone solution was added to each pulverized joint in a vial. Vials
were vigorously vortexed every 5 min for 20 min, and then stored at -20C for further
metabolite extraction and precipitation of macromolecules. Samples were centrifuged
(20,000 x g, 10 min, 4oC), the supernatant was transferred to an Eppendorf tube, and the
solvent evaporated using a centrifugal vacuum concentrator for 6 hours. Dried samples
were resuspended in 100 µL of 50:50 mass spectrometry grade H2O:Acetonitrile.
Metabolite detection was performed in the Montana State University Mass Spectrometry
Core Facility [155-157]. A HILIC HPLC column (Cogent Diamond Hydride Type-C)
was used with an Agilent 1290 HPLC system. The column was coupled to an Agilent
6538 Q-TOF dual-ESI source mass spectrometer (~20,000 resolution, and ~5 ppm

166
accuracy). Mass spectra were collected in positive mode with a mass range of 50-1000
m/z.
Histology. To confirm histological joint changes, knee joints were dissected from
the exercised right and left of representative mouse (n=1). The joints were frozen in
gelatin and stored at -20○ C. Transparent tape (Cryofilm Type 2C, Section-Lab,
Hiroshima, Japan [256, 258]) was placed on the front face of the sample and a 20 micron
section of tape and sample was cut on a microtome. The samples were stained with 1%
Safarin O for 1 min, washed in tap water, stained with 1% Fast Green FCF for 1 min, and
washed in tap water. The samples were imaged at 4x and 10x objective magnification
(Figure 43).
LC-MS Data Processing. Liquid chromatography-mass spectrometry (LC-MS)
data analysis involved an untargeted and targeted strategies. Untargeted analysis was
used to examine global changes in the metabolome, whereas the targeted analysis focused
on changes in ~40 metabolites involved in central energy metabolism [102, 154].
For the untargeted analysis, data processing followed previously optimized
protocols [116, 206]. Briefly, raw HPLC-MS data was converted into .mzXML files
(MS-Convert, ProteoWizard), and processed with MZmine2.0 [158]. Datasets were
analyzed by filtering chromatograms based on a maximum signal level (1000 m/z with a
15 ppm tolerance), normalized (0.25 min retention time (RT) tolerance), and aligned
(mass and RT tolerance of 15ppm). This generated list of metabolites was then used for

167
statistical analysis and metabolite identification via METLIN (ref -Smith et al., 2005,
METLIN: a metabolite mass spectral database).
For the targeted approach, a database of calculated isotopic distributions
(including +H and +Na adducts) for the ~40 targeted masses was created using the
Quantitative Analysis package within MassHunter Workstation B.04.00 (Agilent
Technologies). Retention times were matched to those from standard analytical samples
(MSU Mass Spectrometry Core), and a 20 ppm m/z tolerance was used to evaluate the
targeted metabolites.
Data Analysis. For the analysis, four analytical groups were established for
comparative purposes. Control mice were not subjected to exercise or injury and joints
were categorized as control left knees (“ctrl-L”) or control right knees (“ctrl-R”) to assess
differences between stifle joints of the same mouse. Joints from mice that were exposed
to exercise and injury were grouped as exercised left knees (“Ex-des”) and exercised
right knees (“Ex-ctrl”). Ex-des knees were surgically destabilized after training and
rested prior to the exercise protocol. To determine the effects of exercise and injury on
our murine OA model, we compared both the bioluminescent signal intensities and
metabolomic profiles obtained by LC-MS between the experimental groups.
To analyze the bioluminescent data, first, the total pixel intensity was calculated
for each ROI for each mouse. Next, the total pixel intensity was normalized to the
baseline intensity data for each mouse. Normalized total pixel intensities were then
compared among knee joint groups using a non-parametric Kruskal-Wallis one-way

168
analysis of variance (n=5 knees/group). To determine if the bioluminescent signal
decreased with respect to time (increased exercise), correlation analyses were performed.
For the LC-MS data analysis, we defined metabolites as detected masses present
in at least half of the samples for each group. To assess differences in metabolite
intensities between groups, comparisons were made using Wilcoxon signed rank tests and
two-factor Kruskal-Wallis analysis of variance, with multiple-testing corrections using a
false discovery rate (FDR) of 0.05 [259]. Four comparisons were made: (1) ctrl-L vs.
ctrl-R, (2) Ex-des vs. Ex-ctrl, (3) ctrl-L vs. Ex-des, and (4) ctrl-R vs. Ex-ctrl. Principal
components analysis (PCA) was utilized to assess global changes caused by both exercise
and injury. To assess differences in metabolite intensity distributions, two-sample
Kolmogorov-Smirnov tests were used with a null hypothesis that sample groups result
from a population with identical distributions. For all statistical analysis, the significance
was set at p < 0.05, a priori.
To assess the role of injury and exercise on joint health, unsupervised hierarchical
agglomerative cluster analysis assessed the patterns of co-regulated metabolites for each
sample group. To putatively identify compounds of interest, metabolite m/z values from
each group were compared to the METLIN database of known metabolites [163]. Search
parameters included m/z values with potential +1H+ or +1Na
+ adducts and a 20 ppm mass
tolerance. The METLIN database contains over 240,000 identifiable metabolites
developed over the past decade [162, 163]. The most significant metabolites from the
database searches were searched for pathway-specific over representation, using
Integrated Molecular Pathway Level Analysis (IMPaLA, http://impala.molgen.mpg.de

169
[213]). For the targeted analysis, hierarchical agglomerative cluster analysis was used to
identify patterns of energy metabolism between the experimental groups.
Results
The objective of this study was to characterize the effects of forced treadmill
running and injury on a novel mouse model by examining changes in metabolomic
profiles and bioluminescent intensity. Transgenic mice (n = 5 female mice per group),
with cartilage specific bioluminescence, were randomly assigned to one of two groups:
the unexercised/non-destabilized control group and the exercised/destabilized group. All
mice were imaged over the course of 15 days to evaluate changes in bioluminescence,
followed by euthanization, joint dissection, and full joint LC-MS analysis. To evaluate
our hypothesis, we analyzed changes in cartilage specific bioluminescence for each
mouse and assessed changes in metabolomic profiles between experimental groups.
Bioluminescent Analysis. Bioluminescent signal was evaluated between the four
knee groups (ctrl-L, ctrl-R, Ex-des, and Ex-ctrl) by comparing the normalized total pixel
intensities. Following day 10 of the exercise protocol, there were significant differences
between the control group and the Ex-des joints (Figure 40A,**p<0.01, *p<0.05).
Significant differences were also observed between Ex-des and Ex-ctrl knee groups
(p<0.05) at days 10 and 12. Analysis of the bioluminescent signal for Ex-des joints
showed a significant, negative correlation with time (p = 0.046, r = -0.954) after one
week of exercise, suggesting the onset of cartilage deterioration (Figure 40B&C).

170
Figure 40. The combination of exercise and joint destabilization resulted in decreased
bioluminescence compared with controls. (A) Normalized total signal intensity vs.
running day for each of the mouse knee joints (average ± sem). A two-factor Kruskal-
Wallis found significant differences on days 12 and 15 comparing Ex-des joints to ctrl-L,
ctrl-R, and Ex-ctrl joints (*p < 0.05, **p < 0.01). (B) Significant decreases (r = -0.954, p
= 0.046) in bioluminescent signal with time were observed in Ex-des joints following day
8 of the running protocol. This decrease indicates a decrease in cartilage health due to
either chondrocyte death or loss during the experimental protocol. No differences (r =
0.856, p = 0.144) were observed for the contralateral sham control joints (ctrl-L). (C)
Control mice (top) exhibited stable bioluminescence whereas experimental mice
exhibited changes in bioluminescence over the experimental time course. Representative
bioluminescence heat maps overlaid with photographs obtained prior to bioluminescence
imaging.

171
Contralateral sham controls showed no significant changes in bioluminescent
signal over the course of the experiment (p = 0.144, r = 0.856, Figure 40B&C).
LC-MS Analysis. Untargeted LC-MS analysis revealed metabolomic differences
between the joints of control and experimental mice. Two-sample Kolmogorov-Smirnov
distribution tests revealed significant differences between Ex-des and Ex-ctrl spectra
distributions (p < 0.05), whereas no difference was found between the right and left knees
for the control mice (p = 0.626, Figure 41A). To identify metabolites differentially
regulated by injury and exercise, jointly detected molecule were compared using a false
discovery rate of 0.05 and plotted in two-dimensional space (Figure 41B). Right and left
joints exhibited similar metabolomic profiles: only 1 metabolite was significantly present
in ctrl-R joints that was not found in ctrl-L joints, and 16 metabolites were found in ctrl-L
joints that were not found ctrl-R joints (Figure 41B). However, exercise and injury
induced changes in hundreds of metabolites: 176 metabolites were present in Ex-ctrl
samples that were not found in Ex-des samples, and 280 metabolites were found in Ex-
des samples that were not in Ex-ctrl samples (Figure 41B). After resolving the
metabolomic profiles onto their principal component axes, we observed differential
clustering between sample groups with the Ex-des samples being the most distinct
(Figure 41C, Supplementary Figure 2, Supplemental Figure 18). The first three principal
components contained 87% of the variance.

172
Figure 41. Metabolomic profiling captured joint-wide changes induced by the
combination of vigorous treadmill running and joint destabilization. (A) Two-sample
Kolmogorov-Smirnov tests reveal statistically significant changes between the
distributions of median metabolites for Ex-des vs. Ex-ctrl (p < 0.05), ctrl-L vs. Ex-des (p
< 0.001), and ctrl-R vs. Ex-ctrl (p < 0.001) m/z spectra distributions. No differences
were observed for ctrl-L vs. ctrl-R (p = 0.626) m/z spectra distributions. (B) Exercise and
injury induce changes in individual metabolite profiles. Up-down regulation plots for
ctrl-L vs. ctrl-R, Ex-des vs. Ex-ctrl, ctrl-L vs. Ex-des, and ctrl-R vs. Ex-ctrl. (C)
Principal Components Analysis for the untargeted metabolomic data was used to assess
global differences between sample groups. The first three principal components
contained 87% of the overall variance, and the first principal component contained 71.2%
of the experimental variance indicating that exercise and joint destabilization
dramatically alter whole-joint metabolomics. For each of the sample groups ctrl-L ( ),
ctrl-R ( ), Ex-des ( ), and Ex-ctrl ( ), there are n=4 replicates.

173
In addition to changes in untargeted metabolomic profiles, there were changes in
energy-related metabolites as a result of exercise and injury. Expression patterns of
metabolites targeted to central energy metabolism were first analyzed through
hierarchical agglomerative cluster analysis (Supplemental Figure 17). Cluster analysis
identified ctrl-L and ctrl-R samples to have the most similar metabolite distributions, and
Ex-des samples were the most distinct.
Untargeted hierarchical agglomerative clustering found distinct groups of
metabolites (Figure 42A, Cluster Groups 1-4). Of the 496 metabolites in this group, there
were 391 metabolites found in the METLIN database and 105 metabolites that were not
identified. Cluster group 1 (Figure 42A & B) revealed metabolites that were up-regulated
in exercise joints (Ex-ctrl) and down-regulated in the destabilized joints (Ex-des).
Cluster group 2 (Figure 42A &C) revealed metabolites which were highly regulated as a
result of injury only (Ex-des only). Cluster group 3 (Figure 42A & D) revealed
metabolites that were down-regulated as a result of exercise or injury, and finally cluster
group 4 (Figure 42A & E) revealed metabolites which were down-regulated as a result of
exercise and injury.
The metabolites from each of the cluster groups were then used to identify key
metabolic pathways affected by intensive exercise and injury by using established
pathway over-representation analysis [213]. Hundreds of significant (p < 0.05) pathways
were identified by determining the number of overlapping metabolites between a specific
metabolic pathway and metabolites from each of the cluster groups. Cluster group 1 (up
in exercise, down in injury) contained metabolites which were significantly overlapped

174
with the creatine-phosphate biosynthesis pathway (p = 0.022). Cluster group 2 (up in
exercise and injury) contained metabolites which were significantly overlapped with
valine, leucine, and isoleucine biosynthesis (p<<0.01), arachidonic acid metabolism (p
<< 0.01), and mineral absorption (p < 0.01). Cluster group 3 (down with exercise and/or
injury) contained metabolites which were significantly overlapped with the transport of
glucose and other sugars (p << 0.01) and mineral absorption (p=0.026). Finally, the
metabolites contained in cluster group 4 (down with exercise and injury) were
significantly overlapped amino acid synthesis and interconversion (p < 0.01), proline
catabolism (p < 0.01), and amino sugar metabolism (p < 0.01).
Discussion
In the present study, we demonstrate the utility of a novel mouse model to
monitor in vivo changes in cartilage as a result of an OA model comprising both injury
and forced exercise. To observe these changes, bioluminescent imaging was used to
quantify cartilage-specific luminescence between two independent groups of mice.
Furthermore, whole joint LC-MS-based metabolomics revealed global differences in
small molecule abundance between the two mouse groups using established methods
[116, 206]. This novel murine model has the potential to advance osteoarthritis research
using longitudinal monitoring of OA for repeated measures in the same mouse.
In this study we observed significant changes in bioluminescent signal between
mice exposed to exercise and injury compared with control mice. Examining the
differences in bioluminescent intensity between the two independent groups of mice, we

175
observe the development of significant differences beginning on day 12 after surgical
destabilization and exercise (Figure 40A, *p<0.05, and **p<0.01).
Figure 42. Unsupervised clustering identifies patterns of metabolites differentially
regulated by exercise and joint destabilization. (A) Unsupervised clustering revealed 4
distinct clusters (1-4, right hand side) within the experimental groups of ctrl-L, ctrl-R,
Ex-des, and Ex-ctrl. (B) Cluster 1 represents metabolites that increase expression in
injured joints relative to both negative controls and exercise and destabilized joints.
Enriched pathway analysis for cluster 1 included the creatine-phosphate biosynthesis
pathway. (C) Cluster 2 involved metabolites with increased expression in joints exposed
to both exercise and destabilization. This cluster includes metabolites enriched in valine,
leucine, and isoleucine biosynthesis and mineral absorption pathways. (D) Cluster 3
contains metabolites that are down-regulated in both exercised and exercised/destabilized
joints. Enriched pathways include glucose/sugar transport and mineral absorption
pathways. (E) Cluster 4 represents metabolites that are down-regulated solely in joints
subjected to both exercise and destabilization. Enriched pathways include proline and
amino sugar metabolism.

176
The bioluminescent signal represents chondrocyte-specific luciferase expression
and changes in this signal have been shown to correlate with histological cartilage
changes [238]. In this study, we observed a significant decrease in bioluminescent signal
intensity in the joints which were surgically destabilized and subjected to injury (Ex-des,
Figure 40B). This decreasing signal results from less chondrocyte-specific
bioluminescence and likely represents the progression of OA-like cartilage deterioration
(Figure 40A & B). These in vivo results were obtained using non-invasive imaging and
demonstrate the importance of measuring longitudinal changes in cartilage during the
course of experimental OA development. Similar studies in this transgenic mouse line
may be used to evaluate candidate therapeutic intervention strategies for OA.
To acquire the luminescence data, all mice were imaged every two days
throughout the duration of the running protocol (14 days). The images were then
processed in Matlab to quantify the bioluminescent signal. We observed a consistently
lower signal in the experimental group when compared to the control group. The lower
intensity values are likely a result of ATP depletion following the vigorous treadmill
exercise, and terminal metabolomics analyses found the lowest ATP level in the Ex-ctrl
group.
There are two chemical reactions required to create a bioluminescent signal using
firefly luciferase [260]: in the first reaction, luciferase catalyzes the substrate luciferin in
the presence of ATP to produce luciferyl-AMP. In the second reaction, luciferyl-AMP is
oxidized, resulting in the production of CO2, oxyluciferin, AMP, and light [260]. Prior
research has shown that the quantity of emitted light is directly proportional to the

177
Figure 43. Representative histological images for one mouse from the
exercised/destabilized group. (A) Histological images for the left knee (destabilized, Ex-
des) highlighting the (B) lateral and (C) medial menisci. (B) The lateral side of the joint
contains relatively uniform cartilage thickness and the presence of the lateral meniscus.
(C) The medial side of the joint shows a lack of medial meniscus and thinned articular
cartilage where the meniscus is removed. Scale bar in (A) is 200 µm; scale bar in (B) and
(C) is 50 µm.

178
quantity of ATP present in the reaction [261]. Therefore, decreased joint ATP levels
following exercise may explain the decreased signal in the experimental mice compared
to the control mice. Following the treadmill exercise, the experimental mice were given
10 minutes of rest prior to imaging. These data suggest that 10 minutes may be
insufficient to restore ATP reserves in the mouse joint.
To further examine joint-related molecular changes following forced exercise and
destabilization, metabolomic profiles for each mouse joint were analyzed using LC-MS,
following whole-joint dissection at the conclusion of the experiment. We observed
significant differences in global metabolite expression between control and experimental
mice (Figure 41). The distinct metabolomic profiles represent biological changes
between groups as a direct result of forced treadmill running and injury. As expected, we
found few differences between ctrl-L and ctrl-R joints (Figure 41A & B). However, we
observe substantive and significant differences when comparing destabilized and
exercised joints to controls (e.g. Ex-des vs. Ex-ctrl, ctrl-L vs. Ex-des, and ctrl-R vs. Ex-
ctrl). The differences in metabolomic profiles for the Ex-des and Ex-ctrl joints are a
direct result of the destabilization surgery. Ex-des-specific metabolomic changes are
therefore the results of the combination of mechanical joint destabilization and surgical
incision.
Prior results have demonstrated that the destabilization surgery results in OA-like
changes in both the destabilized and contralateral joints [60, 233]. These differences are
clearly described by untargeted metabolomic profiling (e.g. Figure 41A & B). In this
study, the observed differences in metabolomic profiles between ctrl-L and Ex-des are a

179
result of the combination of treadmill exercise and the destabilization surgery. Using the
ctrl-L joint to compare between an intact joint and our induced OA joint, we found
changes induced by exercise alone (ctrl-R vs. Ex-ctrl, Figure 41A & B).
Mechanical stimulation has been shown to alter chondrocyte metabolism [43, 84,
116, 173-175, 195, 206, 262, 263], and these data provide additional insight into
mechanotransduction at the whole-joint level. We identified metabolites of interest using
hierarchical agglomerative cluster analysis. Clusters were used to define metabolites of
interest (Figure 42). The first cluster (Figure 42) identifies metabolites which were
highly expressed in exercise (Ex-ctrl) and down-regulated in the remaining groups (ctrl-
L, ctrl-R, and Ex-des). These metabolites represent mediators of exercise in joint
physiology. Pathway analysis revealed enrichment of metabolites in the creatine-
phosphate biosynthesis pathway, which is stimulated during periods of high energy
demands in the cells. This observation is consistent with the high levels of energy
requirements were needed as a result of forced treadmill running.
Additional clusters (2 and 4, Figure 42) identify key metabolites that are either
highly expressed or depleted only in joints subjected to both surgical injury and exercise
(Ex-des). These metabolites are unique to the destabilized joint, demonstrating
substantial alterations in metabolic pathways likely due to the progression of OA in the
joint. The pathway analysis for cluster group 2 revealed enrichment in the biosynthesis
of the amino acids valine, leucine and isoleucine, which shares common metabolites with
pyruvate metabolism. In order for valine, leucine, and isoleucine to be synthesized,
pyruvate flux must be elevated, suggesting increased glycolytic metabolism. This
180
observation suggests a shift of energy utilization toward matrix synthesis OA joint of the
mouse (Ex-des) which may be an attempt at repair.
Similarly, the cluster of metabolites depleted in exercise and destabilized joints
(Ex-des, 4, Figure 42) contained metabolites enriched in proline catabolism, suggesting
the consumption of proline by the chondrocytes to synthesize matrix proteins. Proline
contributes more than 20% of the total amino acid residues in type II collagen [264].
These results agree with previous findings using low-strain stimulation of primary human
OA chondrocytes [206], and future studies will examine injury and low-dose loading
separately to deconvolute this important in vivo observation.
The 3rd
cluster identifies metabolites that were depleted as a result of injury and/or
exercise. These metabolites may represent metabolites that are consumed due to either
vigorous exercise or injury, and pathway enrichment analysis identified decreases in
glucose transport and mineral absorption. Future studies may elucidate the role of this
consumption in the progression of experimental OA which may yield novel targets for
therapeutic intervention.
Conclusions
In summary, non-invasive cartilage quantification methods in a novel transgenic
reporter mouse found a decrease in in vivo bioluminescent signal for mice exposed to
injury and forced treadmill running, indicating changes in cartilage and the likely onset of
experimental post-traumatic OA. These results were further confirmed through whole
joint metabolomic profiling, where injury and exercise caused many metabolomic
changes. Extension of these methods may link molecular changes with macroscale

181
pathology and help identify candidate metabolomic biomarkers in the mouse. The
combination of this unique mouse model and high dimensional metabolomics analysis
provides an important tool for in vivo and longitudinal monitoring of disease progression
in murine OA models.
Acknowledgements
We thank Drs. Brian Bothner, and Edward Dratz, Montana State University, for
critical insight provided during discussions, and J. Kundert Montana State University for
assistance with animal experiments. Funding was provided by NIH P20GM10339405S1,
Montana State University, and the Murdock Charitable Trust.
References
See REFERENCES CITED.

182
CONCLUSION
The overall goal of this research was to develop a comprehensive understanding
of the cellular response of the chondrocyte to applied, dynamic compression. To my
knowledge, the experiments performed in the various chapters of this dissertation had
never been previously done, and considerably advanced the scientific knowledge of
chondrocyte mechanobiology. This research generated well-controlled datasets of the
intracellular response to mechanical loading and tested our hypothesis that dynamic
compression induces matrix synthesis in the context of OA using a number of novel
techniques. To test our hypothesis and meet our objectives, this research was portioned
into three parts: (1) the methods development, (2) mechanistic data sets, and (3) in vivo
validation.
The objective of Chapter 2, or the methods development section, was to develop
novel in vitro methods for studying chondrocyte mechanotransduction. Most of the
current research in the chondrocyte mechanotransduction field utilizes agarose gels for
cellular encapsulation with much lower stiffness than the physiological environment that
chondrocytes reside in our cartilage. This Chapter focused on developing methods for
encapsulating chondrocytes in a more effective, philological environment. By better
representing the physiological environment of the chondrocytes, biological studies will
more effectively represent in vivo conditions. In this Chapter we developed and
optimized methods for encapsulating chondrocytes in high stiffness agarose (agarose
stiffness was matched to the human PCM stiffness). To validate our method we
confirmed (1) the spatial homogeneity in physiologically stiff agarose under applied

183
compression, (2) viability of the cells following 72 hours of encapsulation, and (3)
capability of extracting and analyzing inter/extracellular metabolites. These methods
were the first of their kind, and not only laid the essential building blocks for my
research, but potentially changed the way chondrocyte mechanotransduction studies will
be performed in the future.
Following the in vitro methods development in Chapter 2, Chapters 3 and 4 were
designed to generate well-defined, mechanistic data sets of the chondrocytes response to
applied, dynamic compression. Both chapters utilized mechanically stimulated
chondrocytes, encapsulated in physiologically stiff agarose, which were harvested from 5
patients with grade IV OA. The objective for these chapters were to analyze
metabolomic and phosphoproteomic changes in chondrocytes in direct response to short-
duration mechanical compression (0, 15, and 30 minute stimulation), respectively.
Chapter 3 was designed to quantify changes in the metabolome for primary human
chondrocytes in response to physiological, dynamic compression utilizing both
global/untargeted and targeted approaches. Chapter 4 was designed nearly identical to
Chapter 3, however, phosphoproteins were analyzed.
The results from Chapter 3 demonstrate the power of utilizing high-dimensional
metabolomics as a tool for understanding chondrocyte mechanotransduction. In our
targeted analysis (analysis of metabolites associated with central energy metabolism), we
discovered significant correlations with increased mechanical loading and central energy
reorganization, including key amino acid precursors for protein synthesis. Similarly, our
untargeted analysis revealed hundreds of significant metabolites, which were putatively

184
identified through database searches. We also observed many metabolites which were
not found in database searches, which have the potential to be novel mediators for
chondrocyte mechanotransduction. Finally, we found a significant, positive correlation
between the number of mechanically-induced metabolites and patient age. This was an
accidental finding, but none the less suggests the potential of using metabolomics as a
tool to characterize aging-dependent changes in chondrocyte mechanotransduction.
Metabolomics has huge potential to reveal important biomarker candidates for tracking
the progression of OA in clinical populations. This was the first ever application of
metabolomics to study mechanotransduction of chondrocytes encapsulated in
physiologically stiff agarose. Future work may build off of this work to elucidate the
mechanosensitive differences between OA and normal human chondrocytes.
The results from Chapter 4 compliment the results from Chapter 3 and
demonstrates the power of using phosphoproteomics as a tool for understanding the
chondrocyte response to short duration (<30 min), dynamic compression. We expanded
off of previous work, where we analyzed the metabolomic changes of primary human OA
chondrocytes as a result of dynamic compression, and were able to identify 514
phosphoproteins unique to dynamically stimulated samples. To our knowledge, this was
the first ever chondrocyte mechanotransduction study to successfully identify
phosphoproteomic profiles for late OA human chondrocytes. This work identified the
potential to use mechanical stimulation (i.e. short-duration, low-impact exercise) as a
potential therapeutic to promote cartilage repair in OA clinical populations. Future work

185
will expand on this work to elucidate latent biomarkers for OA by comparing
phosphoproteomic differences between OA and normal human chondrocytes.
The final Chapter of this dissertation was designed to validate the in vitro results
in Chapters 3 and 4 using a novel, in vivo model. The objective of this chapter was to
quantify changes in cartilage in response to in vivo dynamic, mechanical loading on
cartilage reporter mice. This Chapter was highly crucial in that it helped validate the in
vitro results by comparing metabolites with macro-scale imaging obtained in the context
of an exercise-induced mouse loading model. This study was unique in that we utilized
novel, transgenic mice that express cartilage specific bioluminescence to quantify
cartilage in vivo without mouse euthanization. Currently, cartilage quantification changes
in mouse models of OA are studied utilizing histopathological grading scales or micro-
CT imaging. While these techniques have aided in important findings, they lack the
ability to monitor longitudinal cartilage changes in vivo. On the contrary, our murine
model allows for longitudinal monitoring of cartilage and the progression of OA using
the same mouse. In this Chapter we developed methods for quantifying in vivo changes
in cartilage utilizing a novel, post traumatic model of OA involving surgical
destabilization and forced exercise via treadmill running. Using these novel methods we
analyzed the effects of forced treadmill running (FTR) and injury by comparing an
unexercised/uninjured control group of mice to mice that were exposed to both exercise
and injury. Our results suggest that our non-invasive cartilage quantification methods in
a novel transgenic reporter mouse found a decrease in in vivo bioluminescent signal for
mice exposed to injury and FTR. The decreased bioluminescent signal correlated well

186
with histological scoring for decreasing cartilage thickness, suggesting that the changes in
cartilage are most likely due to the onset of experimental, post-traumatic OA. These
results were further confirmed through whole joint LC-MS analysis, where injury and
exercise caused many significant, metabolomic changes. Future work may build on these
methods to link molecular changes with macroscale pathology and help identify potential
metabolomic biomarkers in the mouse. The results from this Chapter also suggest the
extension of using this unique mouse model as a promising tool in the scientific field for
in vivo, longitudinal monitoring in murine OA progression.
All of the studies performed in this dissertation were extremely novel, and to our
knowledge, had not been previously reported. This research considerably advanced the
scientific knowledge of chondrocyte mechanobiology and laid many fundamental
building blocks for future work in this field, specifically in understanding how
mechanotransduction plays a role in OA. This work dramatically expanded the
fundamental knowledge and understanding of chondrocyte mechanotransduction
identified the potential to utilize mechanical loading as a therapeutic in preventing or
treating OA.

187
REFERENCES CITED
188
[1] Cicuttini, F. M., Wluka, A. E., Urquhart, D., Tanamas, S. K., and Wang, Y., 2011,
"Epidemiology should not be forgotten in osteoarthritis imaging," Osteoarthritis
Cartilage, 19(9), pp. 1165-1166.
[2] Cobb, J. P., 2011, "Osteoarthritis excess mortality. Painful limping and early death,"
BMJ, 342, p. d2137.
[3] Goekoop, R. J., Kloppenburg, M., Kroon, H. M., Dirkse, L. E. V., Huizinga, T. W. J.,
Westendorp, R. G. J., and Gussekloo, J., 2011, "Determinants of absence of
osteoarthritis in old age," Scandinavian Journal of Rheumatology, 40(1).
[4] Hayashi, D., Guermazi, A., and Hunter, D. J., 2011, "Response to Letter to the Editor:
'Epidemiology should not be forgotten in osteoarthritis imaging'," Osteoarthritis
and cartilage / OARS, Osteoarthritis Research Society, 19(9), p. 1167.
[5] Woolf, A. D., Erwin, J., and March, L., 2012, "The need to address the burden of
musculoskeletal conditions," Best Practice & Research in Clinical Rheumatology,
26(2).
[6] Woolf, A. D., and Pfleger, B., 2003, "Burden of major musculoskeletal conditions,"
Bulletin of the World Health Organization, 81(9), pp. 646-656.
[7] Zhang, Y., and Jordan, J. M., 2010, "Epidemiology of osteoarthritis," Clin Geriatr
Med, 26(3), pp. 355-369.
[8] Harada, Y., Tomita, N., Nakajima, M., Ikeuchi, K., and Wakitani, S., 2005, "Effect of
low loading and joint immobilization for spontaneous repair of osteochondral
defect in the knees of weightless (tail suspension) rats," Journal of Orthopaedic
Science, 10(5), pp. 508-514.
[9] Bougault, C., Paumier, A., Aubert-Foucher, E., and Mallein-Gerin, F., 2008,
"Molecular analysis of chondrocytes cultured in agarose in response to dynamic
compression," BMC Biotechnol., 8, p. 10.
[10] Biology, B., 2015, "Types of Synovial Joints,"
https://www.boundless.com/biology/textbooks/boundless-biology-textbook/the-
musculoskeletal-system-38/joints-and-skeletal-movement-217/types-of-synovial-
joints-822-12066/.
[11] Zhang, Y., and Jordan, J. M., 2010, "Epidemiology of Osteoarthritis," Clinics in
Geriatric Medicine, 26(3).
[12] KELLGREN, J. H., and LAWRENCE, J. S., 1957, "Radiological assessment of
osteo-arthrosis," Ann Rheum Dis, 16(4), pp. 494-502.

189
[13] www.Radiopaedia.org, 2015, "Kellgren and Lawrence system for classification of
osteoarthritis of knee," http://radiopaedia.org/articles/kellgren-and-lawrence-
system-for-classification-of-osteoarthritis-of-knee.
[14] Lawrence, R. C., Felson, D. T., Helmick, C. G., Arnold, L. M., Choi, H., Deyo, R.
A., Gabriel, S., Hirsch, R., Hochberg, M. C., Hunder, G. G., Jordan, J. M., Katz,
J. N., Kremers, H. M., Wolfe, F., and Workgroup, N. A. D., 2008, "Estimates of
the prevalence of arthritis and other rheumatic conditions in the United States.
Part II," Arthritis Rheum, 58(1), pp. 26-35.
[15] Dillon, C. F., Rasch, E. K., Gu, Q., and Hirsch, R., 2006, "Prevalence of knee
osteoarthritis in the United States: arthritis data from the Third National Health
and Nutrition Examination Survey 1991-94," J Rheumatol, 33(11), pp. 2271-
2279.
[16] Felson, D. T., Naimark, A., Anderson, J., Kazis, L., Castelli, W., and Meenan, R. F.,
1987, "The prevalence of knee osteoarthritis in the elderly. The Framingham
Osteoarthritis Study," Arthritis Rheum, 30(8), pp. 914-918.
[17] Jordan, J. M., Helmick, C. G., Renner, J. B., Luta, G., Dragomir, A. D., Woodard, J.,
Fang, F., Schwartz, T. A., Abbate, L. M., Callahan, L. F., Kalsbeek, W. D., and
Hochberg, M. C., 2007, "Prevalence of knee symptoms and radiographic and
symptomatic knee osteoarthritis in African Americans and Caucasians: the
Johnston County Osteoarthritis Project," J Rheumatol, 34(1), pp. 172-180.
[18] Murphy, L., and Helmick, C. G., 2012, "The impact of osteoarthritis in the United
States: a population-health perspective: A population-based review of the fourth
most common cause of hospitalization in U.S. adults," Orthop Nurs, 31(2), pp.
85-91.
[19] Srikanth, V. K., Fryer, J. L., Zhai, G., Winzenberg, T. M., Hosmer, D., and Jones,
G., 2005, "A meta-analysis of sex differences prevalence, incidence and severity
of osteoarthritis," Osteoarthritis Cartilage, 13(9), pp. 769-781.
[20] Wluka, A. E., Davis, S. R., Bailey, M., Stuckey, S. L., and Cicuttini, F. M., 2001,
"Users of oestrogen replacement therapy have more knee cartilage than non-
users," Ann Rheum Dis, 60(4), pp. 332-336.
[21] Loughlin, J., 2005, "The genetic epidemiology of human primary osteoarthritis:
current status," Expert Rev Mol Med, 7(9), pp. 1-12.
[22] Spector, T. D., Cicuttini, F., Baker, J., Loughlin, J., and Hart, D., 1996, "Genetic
influences on osteoarthritis in women: a twin study," BMJ, 312(7036), pp. 940-
943.

190
[23] Palotie, A., Väisänen, P., Ott, J., Ryhänen, L., Elima, K., Vikkula, M., Cheah, K.,
Vuorio, E., and Peltonen, L., 1989, "Predisposition to familial osteoarthrosis
linked to type II collagen gene," Lancet, 1(8644), pp. 924-927.
[24] Valdes, A. M., Evangelou, E., Kerkhof, H. J., Tamm, A., Doherty, S. A., Kisand, K.,
Kerna, I., Uitterlinden, A., Hofman, A., Rivadeneira, F., Cooper, C., Dennison, E.
M., Zhang, W., Muir, K. R., Ioannidis, J. P., Wheeler, M., Maciewicz, R. A., van
Meurs, J. B., Arden, N. K., Spector, T. D., and Doherty, M., 2011, "The GDF5
rs143383 polymorphism is associated with osteoarthritis of the knee with
genome-wide statistical significance," Ann Rheum Dis, 70(5), pp. 873-875.
[25] Evangelou, E., Valdes, A. M., Kerkhof, H. J., Styrkarsdottir, U., Zhu, Y.,
Meulenbelt, I., Lories, R. J., Karassa, F. B., Tylzanowski, P., Bos, S. D., Akune,
T., Arden, N. K., Carr, A., Chapman, K., Cupples, L. A., Dai, J., Deloukas, P.,
Doherty, M., Doherty, S., Engstrom, G., Gonzalez, A., Halldorsson, B. V.,
Hammond, C. L., Hart, D. J., Helgadottir, H., Hofman, A., Ikegawa, S.,
Ingvarsson, T., Jiang, Q., Jonsson, H., Kaprio, J., Kawaguchi, H., Kisand, K.,
Kloppenburg, M., Kujala, U. M., Lohmander, L. S., Loughlin, J., Luyten, F. P.,
Mabuchi, A., McCaskie, A., Nakajima, M., Nilsson, P. M., Nishida, N., Ollier, W.
E., Panoutsopoulou, K., van de Putte, T., Ralston, S. H., Rivadeneira, F., Saarela,
J., Schulte-Merker, S., Shi, D., Slagboom, P. E., Sudo, A., Tamm, A.,
Thorleifsson, G., Thorsteinsdottir, U., Tsezou, A., Wallis, G. A., Wilkinson, J. M.,
Yoshimura, N., Zeggini, E., Zhai, G., Zhang, F., Jonsdottir, I., Uitterlinden, A. G.,
Felson, D. T., van Meurs, J. B., Stefansson, K., Ioannidis, J. P., Spector, T. D.,
Consortium, a., and (TreatOA), T. R. i. E. A. T. f. O., 2011, "Meta-analysis of
genome-wide association studies confirms a susceptibility locus for knee
osteoarthritis on chromosome 7q22," Ann Rheum Dis, 70(2), pp. 349-355.
[26] Felson, D. T., Zhang, Y., Anthony, J. M., Naimark, A., and Anderson, J. J., 1992,
"Weight loss reduces the risk for symptomatic knee osteoarthritis in women. The
Framingham Study," Ann Intern Med, 116(7), pp. 535-539.
[27] Messier, S. P., Loeser, R. F., Miller, G. D., Morgan, T. M., Rejeski, W. J., Sevick,
M. A., Ettinger, W. H., Pahor, M., and Williamson, J. D., 2004, "Exercise and
dietary weight loss in overweight and obese older adults with knee osteoarthritis:
the Arthritis, Diet, and Activity Promotion Trial," Arthritis Rheum, 50(5), pp.
1501-1510.
[28] Puranen, J., Ala-Ketola, L., Peltokallio, P., and Saarela, J., 1975, "Running and
primary osteoarthritis of the hip," Br Med J, 2(5968), pp. 424-425.
[29] Kujala, U. M., Kettunen, J., Paananen, H., Aalto, T., Battié, M. C., Impivaara, O.,
Videman, T., and Sarna, S., 1995, "Knee osteoarthritis in former runners, soccer
players, weight lifters, and shooters," Arthritis Rheum, 38(4), pp. 539-546.
191
[30] Lane, N. E., Michel, B., Bjorkengren, A., Oehlert, J., Shi, H., Bloch, D. A., and
Fries, J. F., 1993, "The risk of osteoarthritis with running and aging: a 5-year
longitudinal study," J Rheumatol, 20(3), pp. 461-468.
[31] 2015, "Total Knee Replacement Cost," http://www.kneereplacementcost.com/.
[32] Control, C. f. D., May 16th, 2104, "Osteoarthritis,"
http://www.cdc.gov/arthritis/basics/osteoarthritis.htm.
[33] Newton, P. M., Mow, V. C., Gardner, T. R., Buckwalter, J. A., and Albright, J. P.,
1997, "Winner of the 1996 Cabaud Award. The effect of lifelong exercise on
canine articular cartilage," Am J Sports Med, 25(3), pp. 282-287.
[34] Goekoop, R. J., Kloppenburg, M., Kroon, H. M., Dirkse, L. E., Huizinga, T. W.,
Westendorp, R. G., and Gussekloo, J., 2011, "Determinants of absence of
osteoarthritis in old age," Scand J Rheumatol, 40(1), pp. 68-73.
[35] Stockwell, R. A., "Biology of Cartilage Cells."
[36] Pearle, A. D., Warren, R. F., and Rodeo, S. A., 2005, "Basic science of articular
cartilage and osteoarthritis," Clin Sports Med, 24(1), pp. 1-12.
[37] Sophia Fox, A. J., Bedi, A., and Rodeo, S. A., 2009, "The basic science of articular
cartilage: structure, composition, and function," Sports Health, 1(6), pp. 461-468.
[38] Alford, J. W., and Cole, B. J., 2005, "Cartilage restoration, part 1: basic science,
historical perspective, patient evaluation, and treatment options," Am J Sports
Med, 33(2), pp. 295-306.
[39] Campbell, N. A., Reece, J. B., and Mitchell, L. G., 1999, Biology Fifth Edition,
Benjamin/Cummings, Menlo Park, CA.
[40] Jenniskens, Y. M., Koevoet, W., de Bart, A. C., Weinans, H., Jahr, H., Verhaar, J.
A., DeGroot, J., and van Osch, G. J., 2006, "Biochemical and functional
modulation of the cartilage collagen network by IGF1, TGFbeta2 and FGF2,"
Osteoarthritis Cartilage, 14(11), pp. 1136-1146.
[41] van den Berg, W. B., and van Riel, P. L., 2005, "Uncoupling of inflammation and
destruction in rheumatoid arthritis: myth or reality?," Arthritis Rheum, 52(4), pp.
995-999.
[42] Fernandes, J. C., Martel-Pelletier, J., and Pelletier, J. P., 2002, "The role of cytokines
in osteoarthritis pathophysiology," Biorheology, 39(1-2), pp. 237-246.

192
[43] Farnsworth, N. L., Antunez, L. R., and Bryant, S. J., 2013, "Dynamic compressive
loading differentially regulates chondrocyte anabolic and catabolic activity with
age," Biotechnol Bioeng.
[44] Loeser, R. F., 2006, "Molecular mechanisms of cartilage destruction: mechanics,
inflammatory mediators, and aging collide," Arthritis Rheum, 54(5), pp. 1357-
1360.
[45] Troeberg, L., and Nagase, H., 2012, "Proteases involved in cartilage matrix
degradation in osteoarthritis," Biochim Biophys Acta, 1824(1), pp. 133-145.
[46] Archer, C. W., and Francis-West, P., 2003, "The chondrocyte," Int J Biochem Cell
Biol, 35(4), pp. 401-404.
[47] Darling, E. M., Wilusz, R. E., Bolognesi, M. P., Zauscher, S., and Guilak, F., 2010,
"Spatial mapping of the biomechanical properties of the pericellular matrix of
articular cartilage measured in situ via atomic force microscopy," Biophysical
journal, 98(12), pp. 2848-2856.
[48] Alexopoulos, L. G., Setton, L. A., and Guilak, F., 2005, "The biomechanical role of
the chondrocyte pericellular matrix in articular cartilage," Acta Biomater, 1(3),
pp. 317-325.
[49] Vincent, T. L., 2013, "Targeting mechanotransduction pathways in osteoarthritis: a
focus on the pericellular matrix," Curr Opin Pharmacol.
[50] Garcia, M., and Knight, M. M., 2010, "Cyclic Loading Opens Hemichannels to
Release ATP as Part of a Chondrocyte Mechanotransduction Pathway," Journal of
Orthopaedic Research, 28(4), pp. 510-515.
[51] Jaalouk, D. E., and Lammerding, J., 2009, "Mechanotransduction gone awry," Nat
Rev Mol Cell Biol, 10(1), pp. 63-73.
[52] Choi, J. B., Youn, I., Cao, L., Leddy, H. A., Gilchrist, C. L., Setton, L. A., and
Guilak, F., 2007, "Zonal changes in the three-dimensional morphology of the
chondron under compression: the relationship among cellular, pericellular, and
extracellular deformation in articular cartilage," Journal of biomechanics, 40(12),
pp. 2596-2603.
[53] Guilak, F., 2000, "The deformation behavior and viscoelastic properties of
chondrocytes in articular cartilage," Biorheology, 37(1-2), pp. 27-44.
[54] Liu, F., Kozanek, M., Hosseini, A., Van de Velde, S. K., Gill, T. J., Rubash, H. E.,
and Li, G., 2010, "In vivo tibiofemoral cartilage deformation during the stance
phase of gait," Journal of biomechanics, 43(4), pp. 658-665.

193
[55] Guilak, F., 2011, "Biomechanical factors in osteoarthritis," Best Practice & Research
in Clinical Rheumatology, 25(6), pp. 815-823.
[56] Morrell, K. C., Hodge, W. A., Krebs, D. E., and Mann, R. W., 2005, "Corroboration
of in vivo cartilage pressures with implications for synovial joint tribology and
osteoarthritis causation," Proc Natl Acad Sci U S A, 102(41), pp. 14819-14824.
[57] Buckwalter, J. A., Mow, V. C., and Ratcliffe, A., 1994, "Restoration of Injured or
Degenerated Articular Cartilage," J Am Acad Orthop Surg, 2(4), pp. 192-201.
[58] Ytterberg, S. R., Mahowald, M. L., and Krug, H. E., 1994, "Exercise for arthritis,"
Baillieres Clin Rheumatol, 8(1), pp. 161-189.
[59] Oliveria, S. A., Felson, D. T., Cirillo, P. A., Reed, J. I., and Walker, A. M., 1999,
"Body weight, body mass index, and incident symptomatic osteoarthritis of the
hand, hip, and knee," Epidemiology, 10(2), pp. 161-166.
[60] Glasson, S. S., Blanchet, T. J., and Morris, E. A., 2007, "The surgical destabilization
of the medial meniscus (DMM) model of osteoarthritis in the 129/SvEv mouse,"
Osteoarthritis and cartilage / OARS, Osteoarthritis Research Society, 15(9), pp.
1061-1069.
[61] Clements, K. M., Price, J. S., Chambers, M. G., Visco, D. M., Poole, A. R., and
Mason, R. M., 2003, "Gene deletion of either interleukin-1beta, interleukin-1beta-
converting enzyme, inducible nitric oxide synthase, or stromelysin 1 accelerates
the development of knee osteoarthritis in mice after surgical transection of the
medial collateral ligament and partial medial meniscectomy," Arthritis Rheum,
48(12), pp. 3452-3463.
[62] Wilusz, R. E., Zauscher, S., and Guilak, F., 2013, "Micromechanical Mapping of
Early Osteoarthritic Changes in the Pericellular Matrix of Human Articular
Cartilage," Osteoarthritis and cartilage / OARS, Osteoarthritis Research Society.
[63] Armstrong, C. G., and Mow, V. C., 1982, "Variations in the intrinsic mechanical
properties of human articular cartilage with age, degeneration, and water content,"
J Bone Joint Surg Am, 64(1), pp. 88-94.
[64] Setton, L. A., Elliott, D. M., and Mow, V. C., 1999, "Altered mechanics of cartilage
with osteoarthritis: human osteoarthritis and an experimental model of joint
degeneration," Osteoarthritis Cartilage, 7(1), pp. 2-14.
[65] Stolz, M., Gottardi, R., Raiteri, R., Miot, S., Martin, I., Imer, R., Staufer, U.,
Raducanu, A., Düggelin, M., Baschong, W., Daniels, A. U., Friederich, N. F.,
Aszodi, A., and Aebi, U., 2009, "Early detection of aging cartilage and
osteoarthritis in mice and patient samples using atomic force microscopy," Nat
Nanotechnol, 4(3), pp. 186-192.

194
[66] Desrochers, J., Amrein, M. A., and Matyas, J. R., 2010, "Structural and functional
changes of the articular surface in a post-traumatic model of early osteoarthritis
measured by atomic force microscopy," J Biomech, 43(16), pp. 3091-3098.
[67] Kisiday, J. D., Lee, J. H., Siparsky, P. N., Frisbie, D. D., Flannery, C. R., Sandy, J.
D., and Grodzinsky, A. J., 2009, "Catabolic responses of chondrocyte-seeded
peptide hydrogel to dynamic compression," Annals of biomedical engineering,
37(7), pp. 1368-1375.
[68] Haudenschild, D. R., Chen, J., Pang, N., Steklov, N., Grogan, S. P., Lotz, M. K., and
D'Lima, D. D., 2011, "Vimentin contributes to changes in chondrocyte stiffness in
osteoarthritis," Journal of orthopaedic research : official publication of the
Orthopaedic Research Society, 29(1), pp. 20-25.
[69] Knight, M. M., Toyoda, T., Lee, D. A., and Bader, D. L., 2006, "Mechanical
compression and hydrostatic pressure induce reversible changes in actin
cytoskeletal organisation in chondrocytes in agarose," Journal of Biomechanics,
39(8).
[70] Vaughan, N. M., Grainger, J., Bader, D. L., and Knight, M. M., 2010, "The potential
of pulsed low intensity ultrasound to stimulate chondrocytes matrix synthesis in
agarose and monolayer cultures," Med Biol Eng Comput, 48(12), pp. 1215-1222.
[71] Normand, V., Lootens, D. L., Amici, E., Plucknett, K. P., and Aymard, P., 2000,
"New insight into agarose gel mechanical properties," Biomacromolecules, 1(4).
[72] Filatov, D., Bjorklund, S., Johansson, E., and Thelander, L., 1996, "Induction of the
mouse ribonucleotide reductase R1 and R2 genes in response to DNA damage by
UV light," Journal of Biological Chemistry, 271(39), pp. 23698-23704.
[73] Alexopoulos, L. G., Williams, G. M., Upton, M. L., Setton, L. A., and Guilak, F.,
2005, "Osteoarthritic changes in the biphasic mechanical properties of the
chondrocyte pericellular matrix in articular cartilage," J Biomech, 38(3), pp. 509-
517.
[74] Buckwalter, J. A., and Mankin, H. J., 1998, "Articular cartilage: tissue design and
chondrocyte-matrix interactions," Instructional course lectures, 47.
[75] Buschmann, M. D., Kim, Y. J., Wong, M., Frank, E., Hunziker, E. B., and
Grodzinsky, A. J., 1999, "Stimulation of aggrecan synthesis in cartilage explants
by cyclic loading is localized to regions of high interstitial fluid flow," Archives
of biochemistry and biophysics, 366(1), pp. 1-7.

195
[76] Fitzgerald, J. B., Jin, M., Chai, D. H., Siparsky, P., Fanning, P., and Grodzinsky, A.
J., 2008, "Shear- and compression-induced chondrocyte transcription requires
MAPK activation in cartilage explants," The Journal of biological chemistry,
283(11), pp. 6735-6743.
[77] Jin, M., Frank, E. H., Quinn, T. M., Hunziker, E. B., and Grodzinsky, A. J., 2001,
"Tissue shear deformation stimulates proteoglycan and protein biosynthesis in
bovine cartilage explants," Arch Biochem Biophys, 395(1), pp. 41-48.
[78] Bougault, C., Paumier, A., Aubert-Foucher, E., and Mallein-Gerin, F., 2008,
"Molecular analysis of chondrocytes cultured in agarose in response to dynamic
compression," BMC biotechnology, 8, p. 71.
[79] Fanning, P. J., Emkey, G., Smith, R. J., Grodzinsky, A. J., Szasz, N., and Trippel, S.
B., 2003, "Mechanical regulation of mitogen-activated protein kinase signaling in
articular cartilage," The Journal of biological chemistry, 278(51), pp. 50940-
50948.
[80] Niehoff, A., Offermann, M., Dargel, J., Schmidt, A., Bruggemann, G. P., and Bloch,
W., 2008, "Dynamic and static mechanical compression affects Akt
phosphorylation in porcine patellofemoral joint cartilage," Journal of orthopaedic
research : official publication of the Orthopaedic Research Society, 26(5), pp.
616-623.
[81] De Croos, J. N., Jang, B., Dhaliwal, S. S., Grynpas, M. D., Pilliar, R. M., and
Kandel, R. A., 2007, "Membrane type-1 matrix metalloproteinase is induced
following cyclic compression of in vitro grown bovine chondrocytes,"
Osteoarthritis and cartilage / OARS, Osteoarthritis Research Society, 15(11), pp.
1301-1310.
[82] Li, K. W., Wang, A. S., and Sah, R. L., 2003, "Microenvironment regulation of
extracellular signal-regulated kinase activity in chondrocytes: effects of culture
configuration, interleukin-1, and compressive stress," Arthritis and rheumatism,
48(3), pp. 689-699.
[83] Ryan, J. A., Eisner, E. A., DuRaine, G., You, Z., and Reddi, A. H., 2009,
"Mechanical compression of articular cartilage induces chondrocyte proliferation
and inhibits proteoglycan synthesis by activation of the ERK pathway:
implications for tissue engineering and regenerative medicine," Journal of tissue
engineering and regenerative medicine, 3(2), pp. 107-116.
[84] Haudenschild, D. R., D'Lima, D. D., and Lotz, M. K., 2008, "Dynamic compression
of chondrocytes induces a Rho kinase-dependent reorganization of the actin
cytoskeleton," Biorheology, 45(3-4).

196
[85] Bougault, C., Aubert-Foucher, E., Paumier, A., Perrier-Groult, E., Huot, L., Hot, D.,
Duterque-Coquillaud, M., and Mallein-Gerin, F., 2012, "Dynamic Compression
of Chondrocyte-Agarose Constructs Reveals New Candidate Mechanosensitive
Genes," PLoS One, 7(5), p. 11.
[86] Nebelung, S., Gavenis, K., Lüring, C., Zhou, B., Mueller-Rath, R., Stoffel, M.,
Tingart, M., and Rath, B., 2012, "Simultaneous anabolic and catabolic responses
of human chondrocytes seeded in collagen hydrogels to long-term continuous
dynamic compression.," Ann Anat.
[87] Neu, C. P., Khalafi, A., Komvopoulos, K., Schmid, T. M., and Reddi, A. H., 2007,
"Mechanotransduction of bovine articular cartilage superficial zone protein by
transforming growth factor beta signaling," Arthritis and rheumatism, 56(11), pp.
3706-3714.
[88] Zanetti, N. C., and Solursh, M., 1984, "Induction of chondrogenesis in limb
mesenchymal cultures by disruption of the actin cytoskeleton," J Cell Biol, 99(1
Pt 1), pp. 115-123.
[89] Woods, A., Wang, G., and Beier, F., 2007, "Regulation of chondrocyte
differentiation by the actin cytoskeleton and adhesive interactions," J Cell
Physiol, 213(1), pp. 1-8.
[90] Alexopoulos, L. G., Williams, G. M., Upton, M. L., Setton, L. A., and Guilak, F.,
2005, "Osteoarthritic changes in the biphasic mechanical properties of the
chondrocyte pericellular matrix in articular cartilage," Journal of Biomechanics,
38(3), pp. 509-517.
[91] Buckwalter, J. A., and Martin, J. A., 2006, "Osteoarthritis," Advanced Drug
Delivery Reviews, 58(2), pp. 150-167.
[92] Fukui, N., Ikeda, Y., Ohnuki, T., Tanaka, N., Hikita, A., Mitomi, H., Mori, T., Juji,
T., Katsuragawa, Y., Yamamoto, S., Sawabe, M., Yamane, S., Suzuki, R.,
Sandell, L. J., and Ochi, T., 2008, "Regional differences in chondrocyte
metabolism in osteoarthritis: a detailed analysis by laser capture microdissection,"
Arthritis Rheum, 58(1), pp. 154-163.
[93] Kawakita, K., Nishiyama, T., Fujishiro, T., Hayashi, S., Kanzaki, N., Hashimoto, S.,
Takebe, K., Iwasa, K., Sakata, S., Nishida, K., Kuroda, R., and Kurosaka, M.,
2012, "Akt phosphorylation in human chondrocytes is regulated by p53R2 in
response to mechanical stress," Osteoarthritis and cartilage / OARS, Osteoarthritis
Research Society, 20(12), pp. 1603-1609.
[94] Adams, S. B., Setton, L. A., and Nettles, D. L., 2013, "The role of metabolomics in
osteoarthritis research," J Am Acad Orthop Surg, 21(1), pp. 63-64.

197
[95] Oliver, S. G., Winson, M. K., Kell, D. B., and Baganz, F., 1998, "Systematic
functional analysis of the yeast genome," Trends in biotechnology, 16(9), pp. 373-
378.
[96] Patti, G. J., Yanes, O., and Siuzdak, G., 2012, "Innovation: Metabolomics: the
apogee of the omics trilogy," Nat Rev Mol Cell Biol, 13(4), pp. 263-269.
[97] Smith, C. A., Want, E. J., O'Maille, G., Abagyan, R., and Siuzdak, G., 2006,
"XCMS: processing mass spectrometry data for metabolite profiling using
nonlinear peak alignment, matching, and identification," Anal Chem, 78(3), pp.
779-787.
[98] Spectrometry, S. C. f. M. a. M., 2015, "What is Mass Spectrometry?,"
http://masspec.scripps.edu/mshistory/whatisms_toc.php.
[99] Snyder, L. R., Kirkland, J. J., and Dolan, J. W., 2009, Introduction to Modern Liquid
Chromatography, Wiley-Blackwell,, Hoboken, NJ.
[100] Corp., W., 2015, "HPLC - High Performance Liquid Chromatography,"
http://www.waters.com/waters/en_US/HPLC---High-Performance-Liquid-
Chromatography-Beginner%27s-Guide/nav.htm?locale=en_US&cid=10048919.
[101] Wilkins, M., 2009, "Proteomics data mining," Expert Rev Proteomics, 6(6), pp.
599-603.
[102] Alberts, B., Johnson, A., Lewis, J., Raff, M., Roberts, K., and Walter, P., 2002,
Molecular Biology of the Cell, Garland Science, New York, NY.
[103] Olsen, J. V., Blagoev, B., Gnad, F., Macek, B., Kumar, C., Mortensen, P., and
Mann, M., 2006, "Global, in vivo, and site-specific phosphorylation dynamics in
signaling networks," Cell, 127(3), pp. 635-648.
[104] Health, N. I. o., 2014, "All About the Human Genome Project,"
http://www.genome.gov/.
[105] O'Farrell, P. H., 1975, "High resolution two-dimensional electrophoresis of
proteins," J Biol Chem, 250(10), pp. 4007-4021.
[106] Ruiz-Romero, C., Calamia, V., Mateos, J., Carreira, V., Martínez-Gomariz, M.,
Fernández, M., and Blanco, F. J., 2009, "Mitochondrial dysregulation of
osteoarthritic human articular chondrocytes analyzed by proteomics: a decrease in
mitochondrial superoxide dismutase points to a redox imbalance," Mol Cell
Proteomics, 8(1), pp. 172-189.
[107] Rawlings, N. D., and Barrett, A. J., 1994, "Families of serine peptidases," Methods
Enzymol, 244, pp. 19-61.

198
[108] Wells, J. M., and McLuckey, S. A., 2005, "Collision-induced dissociation (CID) of
peptides and proteins," Methods Enzymol, 402, pp. 148-185.
[109] Blackstock, W. P., and Weir, M. P., 1999, "Proteomics: quantitative and physical
mapping of cellular proteins," Trends Biotechnol, 17(3), pp. 121-127.
[110] Pappin, D. J., Hojrup, P., and Bleasby, A. J., 1993, "Rapid identification of proteins
by peptide-mass fingerprinting," Curr Biol, 3(6), pp. 327-332.
[111] James, P., Quadroni, M., Carafoli, E., and Gonnet, G., 1993, "Protein identification
by mass profile fingerprinting," Biochem Biophys Res Commun, 195(1), pp. 58-
64.
[112] Yates, J. R., Speicher, S., Griffin, P. R., and Hunkapiller, T., 1993, "Peptide mass
maps: a highly informative approach to protein identification," Anal Biochem,
214(2), pp. 397-408.
[113] Jutila, A. A., 2013, "Development and Validation of a System for Studying
Chondrocyte Mechanotransduction wtih Preliminary Metabolomic Results,"
MSME, Montana State University, Bozeman, MT.
[114] Jutila, A. A., Zignego, D. L., Schell, W. J., and June, R. K., 2014, "Encapsulation
of Chondrocytes in High-Stiffness Agarose Microenvironments for In Vitro
Modeling of Osteoarthritis Mechanotransduction," Annals of biomedical
engineering.
[115] Zignego, D. L., Jutila, A. A., Gelbke, M. K., Gannon, D. M., and June, R. K., 2013,
"The mechanical microenvironment of high concentration agarose for applying
deformation to primary chondrocytes," Journal of biomechanics.
[116] Jutila, A. A., Zignego, D. L., Hwang, B. K., Hilmer, J. K., Hamerly, T., Minor, C.
A., Walk, S. T., and June, R. K., 2014, "Candidate mediators of chondrocyte
mechanotransduction via targeted and untargeted metabolomic measurements,"
Arch Biochem Biophys, 545, pp. 116-123.
[117] Knight, M. M., Ghori, S. A., Lee, D. A., and Bader, D. L., 1998, "Measurement of
the deformation of isolated chondrocytes in agarose subjected to cyclic
compression," Med Eng Phys, 20(9), pp. 684-688.
[118] Lee, D. A., and Knight, M. M., 2004, "Mechanical loading of chondrocytes
embedded in 3D constructs: in vitro methods for assessment of morphological and
metabolic response to compressive strain," Methods Mol Med, 100, pp. 307-324.

199
[119] Bougault, C., Aubert-Foucher, E., Paumier, A., Perrier-Groult, E., Huot, L., Hot,
D., Duterque-Coquillaud, M., and Mallein-Gerin, F., 2012, "Dynamic
compression of chondrocyte-agarose constructs reveals new candidate
mechanosensitive genes.," PLoS One, 7(5), p. e36964.
[120] Lee, D. A., Knight, M. M., Bolton, J. F., Idowu, B. D., Kayser, M. V., and Bader,
D. L., 2000, "Chondrocyte deformation within compressed agarose constructs at
the cellular and sub-cellular levels," J Biomech, 33(1), pp. 81-95.
[121] Bougault, C., Paumier, A., Aubert-Foucher, E., and Mallein-Gerin, F., 2009,
"Investigating conversion of mechanical force into biochemical signaling in three-
dimensional chondrocyte cultures," Nat Protoc, 4(6), pp. 928-938.
[122] Kim, Y. J., Bonassar, L. J., and Grodzinsky, A. J., 1995, "The role of cartilage
streaming potential, fluid flow and pressure in the stimulation of chondrocyte
biosynthesis during dynamic compression," J Biomech, 28(9), pp. 1055-1066.
[123] Haudenschild, D. R., Nguyen, B., Chen, J., D'Lima, D. D., and Lotz, M. K., 2008,
"Rho kinase-dependent CCL20 induced by dynamic compression of human
chondrocytes," Arthritis Rheum, 58(9), pp. 2735-2742.
[124] Lee, D. A., Brand, J., Salter, D., Akanji, O. O., and Chowdhury, T. T., 2011,
"Quantification of mRNA using real-time PCR and Western blot analysis of
MAPK events in chondrocyte/agarose constructs," Methods Mol Biol, 695, pp.
77-97.
[125] Muir, H., 1995, "The chondrocyte, architect of cartilage. Biomechanics, structure,
function and molecular biology of cartilage matrix macromolecules," Bioessays,
17(12), pp. 1039-1048.
[126] Garcia, M., and Knight, M. M., 2010, "Cyclic loading opens hemichannels to
release ATP as part of a chondrocyte mechanotransduction pathway," Journal of
orthopaedic research : official publication of the Orthopaedic Research Society,
28(4), pp. 510-515.
[127] McLeod, M. A., Wilusz, R. E., and Guilak, F., 2013, "Depth-dependent anisotropy
of the micromechanical properties of the extracellular and pericellular matrices of
articular cartilage evaluated via atomic force microscopy," J Biomech, 46(3), pp.
586-592.
[128] Normand, V., Lootens, D. L., Amici, E., Plucknett, K. P., and Aymard, P., 2000,
"New insight into agarose gel mechanical properties," Biomacromolecules, 1(4),
pp. 730-738.

200
[129] Geers, M. G. D., DeBorst, R., and Brekelmans, W. A. M., 1996, "Computing strain
fields from discrete displacement fields in 2D-solids," International Journal of
Solids and Structures, 33(29), pp. 4293-4307.
[130] Neu, C. P., Hull, M. L., and Walton, J. H., 2005, "Heterogeneous three-dimensional
strain fields during unconfined cyclic compression in bovine articular cartilage
explants," Journal of Orthopaedic Research, 23(6), pp. 1390-1398.
[131] Chan, D. D., Toribio, D., and Neu, C. P., 2012, "Displacement smoothing for the
precise MRI-based measurement of strain in soft biological tissues," Comput
Methods Biomech Biomed Engin.
[132] Ohlendorf, C., Tomford, W. W., and Mankin, H. J., 1996, "Chondrocyte survival in
cryopreserved osteochondral articular cartilage," J Orthop Res, 14(3), pp. 413-
416.
[133] Ward, C. W., Prosser, B. L., and Lederer, W. J., 2013, "Mechanical stretch induced
activation of ROS/RNS signaling in striated muscle," Antioxid Redox Signal.
[134] Ko, F. C., Dragomir, C., Plumb, D. A., Goldring, S. R., Wright, T. M., Goldring,
M. B., and van der Meulen, M. C., 2013, "In vivo cyclic compression causes
cartilage degeneration and subchondral bone changes in mouse tibiae," Arthritis
and rheumatism, 65(6), pp. 1569-1578.
[135] Grygorczyk, R., Furuya, K., and Sokabe, M., 2013, "Imaging and characterization
of stretch-induced ATP release from alveolar A549 cells," J Physiol, 591(Pt 5),
pp. 1195-1215.
[136] Niehoff, A., Muller, M., Bruggemann, L., Savage, T., Zaucke, F., Eckstein, F.,
Muller-Lung, U., and Bruggemann, G. P., 2011, "Deformational behaviour of
knee cartilage and changes in serum cartilage oligomeric matrix protein (COMP)
after running and drop landing," Osteoarthritis and cartilage / OARS,
Osteoarthritis Research Society, 19(8), pp. 1003-1010.
[137] Coleman, J. L., Widmyer, M. R., Leddy, H. A., Utturkar, G. M., Spritzer, C. E.,
Moorman, C. T., 3rd, Guilak, F., and DeFrate, L. E., 2013, "Diurnal variations in
articular cartilage thickness and strain in the human knee," Journal of
biomechanics, 46(3), pp. 541-547.
[138] Haudenschild, D. R., D'Lima, D. D., and Lotz, M. K., 2008, "Dynamic
compression of chondrocytes induces a Rho kinase-dependent reorganization of
the actin cytoskeleton," Biorheology, 45(3-4), pp. 219-228.
[139] Adatia, A., Rainsford, K. D., and Kean, W. F., 2012, "Osteoarthritis of the knee and
hip. Part I: aetiology and pathogenesis as a basis for pharmacotherapy," The
Journal of pharmacy and pharmacology, 64(5), pp. 617-625.
201
[140] Holledge, M. M., Millward-Sadler, S. J., Nuki, G., and Salter, D. M., 2008,
"Mechanical regulation of proteoglycan synthesis in normal and osteoarthritic
human articular chondrocytes--roles for alpha5 and alphaVbeta5 integrins,"
Biorheology, 45(3-4), pp. 275-288.
[141] Fogh, J., 1986, "Human tumor lines for cancer research," Cancer investigation,
4(2), pp. 157-184.
[142] Mansfield, J., Yu, J., Attenburrow, D., Moger, J., Tirlapur, U., Urban, J., Cui, Z.,
and Winlove, P., 2009, "The elastin network: its relationship with collagen and
cells in articular cartilage as visualized by multiphoton microscopy," Journal of
anatomy, 215(6), pp. 682-691.
[143] Hansen, U., Allen, J. M., White, R., Moscibrocki, C., Bruckner, P., Bateman, J. F.,
and Fitzgerald, J., 2012, "WARP interacts with collagen VI-containing
microfibrils in the pericellular matrix of human chondrocytes," PloS one, 7(12), p.
e52793.
[144] Macdonald, D. W., Squires, R. S., Avery, S. A., Adams, J., Baker, M.,
Cunningham, C. R., Heimann, N. B., Kooyman, D. L., and Seegmiller, R. E.,
2013, "Structural variations in articular cartilage matrix are associated with early-
onset osteoarthritis in the spondyloepiphyseal dysplasia congenita (sedc) mouse,"
International journal of molecular sciences, 14(8), pp. 16515-16531.
[145] Knight, M. M., Toyoda, T., Lee, D. A., and Bader, D. L., 2006, "Mechanical
compression and hydrostatic pressure induce reversible changes in actin
cytoskeletal organisation in chondrocytes in agarose," Journal of biomechanics,
39(8).
[146] Campbell, J. J., Blain, E. J., Chowdhury, T. T., and Knight, M. M., 2007, "Loading
alters actin dynamics and up-regulates cofilin gene expression in chondrocytes,"
Biochem Biophys Res Commun, 361(2), pp. 329-334.
[147] Chen, J., Irianto, J., Inamdar, S., Pravincumar, P., Lee, D. A., Bader, D. L., and
Knight, M. M., 2012, "Cell mechanics, structure, and function are regulated by
the stiffness of the three-dimensional microenvironment," Biophys J, 103(6), pp.
1188-1197.
[148] Nishida, T., Kubota, S., Aoyama, E., and Takigawa, M., 2013, "Impaired glycolytic
metabolism causes chondrocyte hypertrophy-like changes via promotion of
phospho-Smad1/5/8 translocation into nucleus," Osteoarthritis and cartilage /
OARS, Osteoarthritis Research Society, 21(5), pp. 700-709.
[149] O'Neill, L. A., and Hardie, D. G., 2013, "Metabolism of inflammation limited by
AMPK and pseudo-starvation," Nature, 493(7432), pp. 346-355.

202
[150] Petursson, F., Husa, M., June, R., Lotz, M., Terkeltaub, R., and Liu-Bryan, R.,
2013, "Linked decreases in liver kinase B1 and AMP-activated protein kinase
activity modulate matrix catabolic responses to biomechanical injury in
chondrocytes," Arthritis Res Ther, 15(4), p. R77.
[151] Zignego, D. L., Jutila, A. A., Gelbke, M. K., Gannon, D. M., and June, R. K., 2013,
"The mechanical microenvironment of high concentration agarose for applying
deformation to primary chondrocytes," Journal of biomechanics, In Press.
[152] Darling, E. M., Zauscher, S., and Guilak, F., 2006, "Viscoelastic properties of zonal
articular chondrocytes measured by atomic force microscopy," Osteoarthritis and
cartilage / OARS, Osteoarthritis Research Society, 14(6), pp. 571-579.
[153] Umberger, B. R., and Martin, P. E., 2007, "Mechanical power and efficiency of
level walking with different stride rates," J Exp Biol, 210(Pt 18), pp. 3255-3265.
[154] Munger, J., Bennett, B. D., Parikh, A., Feng, X. J., McArdle, J., Rabitz, H. A.,
Shenk, T., and Rabinowitz, J. D., 2008, "Systems-level metabolic flux profiling
identifies fatty acid synthesis as a target for antiviral therapy," Nature
biotechnology, 26(10), pp. 1179-1186.
[155] Heinemann, J., Hamerly, T., Maaty, W. S., Movahed, N., Steffens, J. D., Reeves,
B. D., Hilmer, J. K., Therien, J., Grieco, P. A., Peters, J. W., and Bothner, B.,
2013, "Expanding the paradigm of thiol redox in the thermophilic root of life,"
Biochim Biophys Acta.
[156] Ortmann, A. C., Brumfield, S. K., Walther, J., McInnerney, K., Brouns, S. J., van
de Werken, H. J., Bothner, B., Douglas, T., van de Oost, J., and Young, M. J.,
2008, "Transcriptome analysis of infection of the archaeon Sulfolobus solfataricus
with Sulfolobus turreted icosahedral virus," J Virol, 82(10), pp. 4874-4883.
[157] Secor, P. R., Jennings, L. K., James, G. A., Kirker, K. R., Pulcini, E. D.,
McInnerney, K., Gerlach, R., Livinghouse, T., Hilmer, J. K., Bothner, B.,
Fleckman, P., Olerud, J. E., and Stewart, P. S., 2012, "Phevalin (aureusimine B)
production by Staphylococcus aureus biofilm and impacts on human keratinocyte
gene expression," PLoS One, 7(7), p. e40973.
[158] Pluskal, T., Castillo, S., Villar-Briones, A., and Oresic, M., 2010, "MZmine 2:
modular framework for processing, visualizing, and analyzing mass spectrometry-
based molecular profile data," BMC Bioinformatics, 11, p. 395.
[159] Katajamaa, M., and Oresic, M., 2005, "Processing methods for differential analysis
of LC/MS profile data," BMC Bioinformatics, 6, p. 179.

203
[160] Benjamini, Y., Drai, D., Elmer, G., Kafkafi, N., and Golani, I., 2001, "Controlling
the false discovery rate in behavior genetics research," Behav Brain Res, 125(1-
2), pp. 279-284.
[161] Team, R. C., 2013, "R: A language and environment for statistical computing.," R
Foundation for Statistical Computing, Vienna, Austria.
[162] Wishart, D. S., Jewison, T., Guo, A. C., Wilson, M., Knox, C., Liu, Y., Djoumbou,
Y., Mandal, R., Aziat, F., Dong, E., Bouatra, S., Sinelnikov, I., Arndt, D., Xia, J.,
Liu, P., Yallou, F., Bjorndahl, T., Perez-Pineiro, R., Eisner, R., Allen, F., Neveu,
V., Greiner, R., and Scalbert, A., 2013, "HMDB 3.0--The Human Metabolome
Database in 2013," Nucleic acids research, 41(Database issue), pp. D801-807.
[163] Zhu, Z. J., Schultz, A. W., Wang, J., Johnson, C. H., Yannone, S. M., Patti, G. J.,
and Siuzdak, G., 2013, "Liquid chromatography quadrupole time-of-flight mass
spectrometry characterization of metabolites guided by the METLIN database,"
Nature protocols, 8(3), pp. 451-460.
[164] Fahy, E., Subramaniam, S., Murphy, R. C., Nishijima, M., Raetz, C. R., Shimizu,
T., Spener, F., van Meer, G., Wakelam, M. J., and Dennis, E. A., 2009, "Update
of the LIPID MAPS comprehensive classification system for lipids," Journal of
lipid research, 50 Suppl, pp. S9-14.
[165] Kind, T., and Fiehn, O., 2007, "Seven Golden Rules for heuristic filtering of
molecular formulas obtained by accurate mass spectrometry," BMC
Bioinformatics, 8, p. 105.
[166] Kanehisa, M., 2013, "Molecular network analysis of diseases and drugs in KEGG,"
Methods in molecular biology, 939, pp. 263-275.
[167] Schmitt, C., Gouya, L., Malonova, E., Lamoril, J., Camadro, J. M., Flamme, M.,
Rose, C., Lyoumi, S., Da Silva, V., Boileau, C., Grandchamp, B., Beaumont, C.,
Deybach, J. C., and Puy, H., 2005, "Mutations in human CPO gene predict
clinical expression of either hepatic hereditary coproporphyria or erythropoietic
harderoporphyria," Human molecular genetics, 14(20), pp. 3089-3098.
[168] Rajpurohit, R., Koch, C. J., Tao, Z., Teixeira, C. M., and Shapiro, I. M., 1996,
"Adaptation of chondrocytes to low oxygen tension: relationship between hypoxia
and cellular metabolism," Journal of cellular physiology, 168(2), pp. 424-432.
[169] Wang, W., Mazurkewich, S., Kimber, M. S., and Seah, S. Y., 2010, "Structural and
kinetic characterization of 4-hydroxy-4-methyl-2-oxoglutarate/4-carboxy-4-
hydroxy-2-oxoadipate aldolase, a protocatechuate degradation enzyme
evolutionarily convergent with the HpaI and DmpG pyruvate aldolases," The
Journal of biological chemistry, 285(47), pp. 36608-36615.

204
[170] Haudenschild, D. R., Chen, J., Pang, N., Lotz, M. K., and D'Lima, D. D., 2010,
"Rho kinase-dependent activation of SOX9 in chondrocytes," Arthritis Rheum,
62(1), pp. 191-200.
[171] Grodzinsky, A. J., Lipshitz, H., and Glimcher, M. J., 1978, "Electromechanical
properties of articular cartilage during compression and stress relaxation," Nature,
275(5679), pp. 448-450.
[172] Mow, V. C., Kuei, S. C., Lai, W. M., and Armstrong, C. G., 1980, "Biphasic creep
and stress relaxation of articular cartilage in compression? Theory and
experiments," Journal of biomechanical engineering, 102(1), pp. 73-84.
[173] Ruiz-Romero, C., Carreira, V., Rego, I., Remeseiro, S., López-Armada, M. J., and
Blanco, F. J., 2008, "Proteomic analysis of human osteoarthritic chondrocytes
reveals protein changes in stress and glycolysis," Proteomics, 8(3), pp. 495-507.
[174] Bougault, C., Aubert-Foucher, E., Paumier, A., Perrier-Groult, E., Huot, L., Hot,
D., Duterque-Coquillaud, M., and Mallein-Gerin, F., 2012, "Dynamic
compression of chondrocyte-agarose constructs reveals new candidate
mechanosensitive genes," PloS one, 7(5), p. e36964.
[175] Buschmann, M. D., Gluzband, Y. A., Grodzinsky, A. J., and Hunziker, E. B., 1995,
"Mechanical compression modulates matrix biosynthesis in chondrocyte/agarose
culture," J Cell Sci, 108 ( Pt 4), pp. 1497-1508.
[176] Haudenschild, D. R., Chen, J., Pang, N., Lotz, M. K., and D'Lima, D. D., 2010,
"Rho Kinase-Dependent Activation of SOX9 in Chondrocytes," Arthritis and
rheumatism, 62(1).
[177] Fitzgerald, J. B., Jin, M., Chai, D. H., Siparsky, P., Fanning, P., and Grodzinsky, A.
J., 2008, "Shear- and compression-induced chondrocyte transcription requires
MAPK activation in cartilage explants," Journal of Biological Chemistry,
283(11).
[178] Lehtinen, M. K., Yuan, Z., Boag, P. R., Yang, Y., Villen, J., Becker, E. B.,
DiBacco, S., de la Iglesia, N., Gygi, S., Blackwell, T. K., and Bonni, A., 2006, "A
conserved MST-FOXO signaling pathway mediates oxidative-stress responses
and extends life span," Cell, 125(5), pp. 987-1001.
[179] Zhang, W., Likhodii, S., Zhang, Y., Aref-Eshghi, E., Harper, P. E., Randell, E.,
Green, R., Martin, G., Furey, A., Sun, G., Rahman, P., and Zhai, G., 2014,
"Classification of osteoarthritis phenotypes by metabolomics analysis," BMJ
Open, 4(11), p. e006286.

205
[180] Mickiewicz, B., Heard, B. J., Chau, J. K., Chung, M., Hart, D. A., Shrive, N. G.,
Frank, C. B., and Vogel, H. J., 2015, "Metabolic profiling of synovial fluid in a
unilateral ovine model of anterior cruciate ligament reconstruction of the knee
suggests biomarkers for early osteoarthritis," Journal of orthopaedic research :
official publication of the Orthopaedic Research Society, 33(1), pp. 71-77.
[181] Attur, M., Dave, M., Abramson, S. B., and Amin, A., 2012, "Activation of diverse
eicosanoid pathways in osteoarthritic cartilage: a lipidomic and genomic
analysis," Bull NYU Hosp Jt Dis, 70(2), pp. 99-108.
[182] Mickiewicz, B., Kelly, J. J., Ludwig, T. E., Weljie, A. M., Wiley, J. P., Schmidt, T.
A., and Vogel, H. J., 2015, "Metabolic analysis of knee synovial fluid as a
potential diagnostic approach for osteoarthritis," Journal of orthopaedic research :
official publication of the Orthopaedic Research Society.
[183] Cavill, R., Kamburov, A., Ellis, J. K., Athersuch, T. J., Blagrove, M. S., Herwig,
R., Ebbels, T. M., and Keun, H. C., 2011, "Consensus-phenotype integration of
transcriptomic and metabolomic data implies a role for metabolism in the
chemosensitivity of tumour cells," PLoS Comput Biol, 7(3), p. e1001113.
[184] Oh, C. D., and Chun, J. S., 2003, "Signaling mechanisms leading to the regulation
of differentiation and apoptosis of articular chondrocytes by insulin-like growth
factor-1," J Biol Chem, 278(38), pp. 36563-36571.
[185] Priore, R., Dailey, L., and Basilico, C., 2006, "Downregulation of Akt activity
contributes to the growth arrest induced by FGF in chondrocytes," Journal of
cellular physiology, 207(3), pp. 800-808.
[186] Starkman, B. G., Cravero, J. D., Delcarlo, M., and Loeser, R. F., 2005, "IGF-I
stimulation of proteoglycan synthesis by chondrocytes requires activation of the
PI 3-kinase pathway but not ERK MAPK," The Biochemical journal, 389(Pt 3),
pp. 723-729.
[187] O'Conor, C. J., Leddy, H. A., Benefield, H. C., Liedtke, W. B., and Guilak, F.,
2014, "TRPV4-mediated mechanotransduction regulates the metabolic response
of chondrocytes to dynamic loading," Proc Natl Acad Sci U S A, 111(4), pp.
1316-1321.
[188] Knight, M. M., Roberts, S. R., Lee, D. A., and Bader, D. L., 2003, "Live cell
imaging using confocal microscopy induces intracellular calcium transients and
cell death," Am J Physiol Cell Physiol, 284(4), pp. C1083-1089.
[189] Lakshmi, A. V., 1998, "Riboflavin metabolism--relevance to human nutrition,"
Indian J Med Res, 108, pp. 182-190.
206
[190] Terkeltaub, R., Yang, B., Lotz, M., and Liu-Bryan, R., 2011, "Chondrocyte AMP-
activated protein kinase activity suppresses matrix degradation responses to
proinflammatory cytokines interleukin-1beta and tumor necrosis factor alpha,"
Arthritis and rheumatism, 63(7), pp. 1928-1937.
[191] Anishkin, A., Loukin, S. H., Teng, J., and Kung, C., 2014, "Feeling the hidden
mechanical forces in lipid bilayer is an original sense," Proc Natl Acad Sci U S A,
111(22), pp. 7898-7905.
[192] Stephanopoulos, G. N., Aristidou, A. A., and Nielsen, J., 1998, Metabolic
Engineering: Principles and Methodologies, Academic Press.
[193] Adams, S. B., Jr., Setton, L. A., Kensicki, E., Bolognesi, M. P., Toth, A. P., and
Nettles, D. L., 2012, "Global metabolic profiling of human osteoarthritic
synovium," Osteoarthritis and cartilage / OARS, Osteoarthritis Research Society,
20(1), pp. 64-67.
[194] Melas, I. N., Chairakaki, A. D., Chatzopoulou, E. I., Messinis, D. E., Katopodi, T.,
Pliaka, V., Samara, S., Mitsos, A., Dailiana, Z., Kollia, P., and Alexopoulos, L.
G., 2014, "Modeling of signaling pathways in chondrocytes based on
phosphoproteomic and cytokine release data," Osteoarthritis Cartilage, 22(3), pp.
509-518.
[195] Sah, R. L. Y., Kim, Y. J., Doong, J. Y. H., Grodzinsky, A. J., Plaas, A. H. K., and
Sandy, J. D., 1989, "BIOSYNTHETIC RESPONSE OF CARTILAGE
EXPLANTS TO DYNAMIC COMPRESSION," Journal of Orthopaedic
Research, 7(5), pp. 619-636.
[196] Jones, I. L., Klämfeldt, A., and Sandström, T., 1982, "The effect of continuous
mechanical pressure upon the turnover of articular cartilage proteoglycans in
vitro," Clin Orthop Relat Res(165), pp. 283-289.
[197] Hayashi, S., Nishiyama, T., Miura, Y., Fujishiro, T., Kanzaki, N., Hashimoto, S.,
Matsumoto, T., Kurosaka, M., and Kuroda, R., 2011, "DcR3 induces cell
proliferation through MAPK signaling in chondrocytes of osteoarthritis,"
Osteoarthritis Cartilage, 19(7), pp. 903-910.
[198] Nishihara, A., Fujii, M., Sampath, T. K., Miyazono, K., and Reddi, A. H., 2003,
"Bone morphogenetic protein signaling in articular chondrocyte differentiation,"
Biochem Biophys Res Commun, 301(2), pp. 617-622.

207
[199] Koshy, P. J., Lundy, C. J., Rowan, A. D., Porter, S., Edwards, D. R., Hogan, A.,
Clark, I. M., and Cawston, T. E., 2002, "The modulation of matrix
metalloproteinase and ADAM gene expression in human chondrocytes by
interleukin-1 and oncostatin M: a time-course study using real-time quantitative
reverse transcription-polymerase chain reaction," Arthritis Rheum, 46(4), pp. 961-
967.
[200] Notoya, K., Jovanovic, D. V., Reboul, P., Martel-Pelletier, J., Mineau, F., and
Pelletier, J. P., 2000, "The induction of cell death in human osteoarthritis
chondrocytes by nitric oxide is related to the production of prostaglandin E2 via
the induction of cyclooxygenase-2," J Immunol, 165(6), pp. 3402-3410.
[201] Lourido, L., Calamia, V., Mateos, J., Fernández-Puente, P., Fernández-Tajes, J.,
Blanco, F. J., and Ruiz-Romero, C., 2014, "Quantitative proteomic profiling of
human articular cartilage degradation in osteoarthritis," J Proteome Res, 13(12),
pp. 6096-6106.
[202] Mateos, J., Lourido, L., Fernández-Puente, P., Calamia, V., Fernández-López, C.,
Oreiro, N., Ruiz-Romero, C., and Blanco, F. J., 2012, "Differential protein
profiling of synovial fluid from rheumatoid arthritis and osteoarthritis patients
using LC-MALDI TOF/TOF," J Proteomics, 75(10), pp. 2869-2878.
[203] Liao, H., Wu, J., Kuhn, E., Chin, W., Chang, B., Jones, M. D., O'Neil, S., Clauser,
K. R., Karl, J., Hasler, F., Roubenoff, R., Zolg, W., and Guild, B. C., 2004, "Use
of mass spectrometry to identify protein biomarkers of disease severity in the
synovial fluid and serum of patients with rheumatoid arthritis," Arthritis Rheum,
50(12), pp. 3792-3803.
[204] Fernández-Costa, C., Calamia, V., Fernández-Puente, P., Capelo-Martínez, J. L.,
Ruiz-Romero, C., and Blanco, F. J., 2012, "Sequential depletion of human serum
for the search of osteoarthritis biomarkers," Proteome Sci, 10(1), p. 55.
[205] Fernández-Puente, P., Mateos, J., Fernández-Costa, C., Oreiro, N., Fernández-
López, C., Ruiz-Romero, C., and Blanco, F. J., 2011, "Identification of a panel of
novel serum osteoarthritis biomarkers," J Proteome Res, 10(11), pp. 5095-5101.
[206] Zignego, D. L., Hilmer, J. K., Minor, C. A., Gelbke, M. K., and June, R. K., 2015,
"Candidate Mediators of Osteoarthritic Human Chondrocyte
Mechanotransduction via Targeted and Untargeted Metabolomic Measurements,"
Osteoarthritis and Cartilage. In review.
[207] Darling, E. M., Wilusz, R. E., Bolognesi, M. P., Zauscher, S., and Guilak, F., 2010,
"Spatial Mapping of the Biomechanical Properties of the Pericellular Matrix of
Articular Cartilage Measured In Situ via Atomic Force Microscopy," Biophysical
Journal, 98(12), pp. 2848-2856.

208
[208] Ikeda, D., Ageta, H., Tsuchida, K., and Yamada, H., 2013, "iTRAQ-based
proteomics reveals novel biomarkers of osteoarthritis," Biomarkers, 18(7), pp.
565-572.
[209] Kessner, D., Chambers, M., Burke, R., Agus, D., and Mallick, P., 2008,
"ProteoWizard: open source software for rapid proteomics tools development,"
Bioinformatics, 24(21), pp. 2534-2536.
[210] Kenar, E., Franken, H., Forcisi, S., Wörmann, K., Häring, H. U., Lehmann, R.,
Schmitt-Kopplin, P., Zell, A., and Kohlbacher, O., 2014, "Automated label-free
quantification of metabolites from liquid chromatography-mass spectrometry
data," Mol Cell Proteomics, 13(1), pp. 348-359.
[211] Moore, R. E., Young, M. K., and Lee, T. D., 2002, "Qscore: an algorithm for
evaluating SEQUEST database search results," J Am Soc Mass Spectrom, 13(4),
pp. 378-386.
[212] Käll, L., Storey, J. D., MacCoss, M. J., and Noble, W. S., 2008, "Assigning
significance to peptides identified by tandem mass spectrometry using decoy
databases," J Proteome Res, 7(1), pp. 29-34.
[213] Kamburov, A., Cavill, R., Ebbels, T. M., Herwig, R., and Keun, H. C., 2011,
"Integrated pathway-level analysis of transcriptomics and metabolomics data with
IMPaLA," Bioinformatics, 27(20), pp. 2917-2918.
[214] Bennett, V., and Baines, A. J., 2001, "Spectrin and ankyrin-based pathways:
metazoan inventions for integrating cells into tissues," Physiol Rev, 81(3), pp.
1353-1392.
[215] Knudson, W., and Loeser, R. F., 2002, "CD44 and integrin matrix receptors
participate in cartilage homeostasis," Cell Mol Life Sci, 59(1), pp. 36-44.
[216] Daniels, K., and Solursh, M., 1991, "Modulation of chondrogenesis by the
cytoskeleton and extracellular matrix," J Cell Sci, 100 ( Pt 2), pp. 249-254.
[217] Haudenschild, D. R., Chen, J., Steklov, N., Lotz, M. K., and D'Lima, D. D., 2009,
"Characterization of the chondrocyte actin cytoskeleton in living three-
dimensional culture: response to anabolic and catabolic stimuli," Mol Cell
Biomech, 6(3), pp. 135-144.
[218] Knight, M. M., Toyoda, T., Lee, D. A., and Bader, D. L., 2006, "Mechanical
compression and hydrostatic pressure induce reversible changes in actin
cytoskeletal organisation in chondrocytes in agarose," J Biomech, 39(8), pp.
1547-1551.

209
[219] Pickart, C. M., and Eddins, M. J., 2004, "Ubiquitin: structures, functions,
mechanisms," Biochim Biophys Acta, 1695(1-3), pp. 55-72.
[220] Bai, X. H., Wang, D. W., Luan, Y., Yu, X. P., and Liu, C. J., 2009, "Regulation of
chondrocyte differentiation by ADAMTS-12 metalloproteinase depends on its
enzymatic activity," Cell Mol Life Sci, 66(4), pp. 667-680.
[221] Stanton, H., Rogerson, F. M., East, C. J., Golub, S. B., Lawlor, K. E., Meeker, C.
T., Little, C. B., Last, K., Farmer, P. J., Campbell, I. K., Fourie, A. M., and
Fosang, A. J., 2005, "ADAMTS5 is the major aggrecanase in mouse cartilage in
vivo and in vitro," Nature, 434(7033), pp. 648-652.
[222] Glasson, S. S., Askew, R., Sheppard, B., Carito, B., Blanchet, T., Ma, H. L.,
Flannery, C. R., Peluso, D., Kanki, K., Yang, Z., Majumdar, M. K., and Morris,
E. A., 2005, "Deletion of active ADAMTS5 prevents cartilage degradation in a
murine model of osteoarthritis," Nature, 434(7033), pp. 644-648.
[223] Blain, E. J., Gilbert, S. J., Hayes, A. J., and Duance, V. C., 2006, "Disassembly of
the vimentin cytoskeleton disrupts articular cartilage chondrocyte homeostasis,"
Matrix Biol, 25(7), pp. 398-408.
[224] Hellingman, C. A., Davidson, E. N., Koevoet, W., Vitters, E. L., van den Berg, W.
B., van Osch, G. J., and van der Kraan, P. M., 2011, "Smad signaling determines
chondrogenic differentiation of bone-marrow-derived mesenchymal stem cells:
inhibition of Smad1/5/8P prevents terminal differentiation and calcification,"
Tissue Eng Part A, 17(7-8), pp. 1157-1167.
[225] Li, T. F., O'Keefe, R. J., and Chen, D., 2005, "TGF-beta signaling in
chondrocytes," Front Biosci, 10, pp. 681-688.
[226] Brodsky, B., and Persikov, A. V., 2005, "Molecular structure of the collagen triple
helix," Adv Protein Chem, 70, pp. 301-339.
[227] Rubin, L. L., and de Sauvage, F. J., 2006, "Targeting the Hedgehog pathway in
cancer," Nat Rev Drug Discov, 5(12), pp. 1026-1033.
[228] Lin, L., Shen, Q., Xue, T., Duan, X., Fu, X., and Yu, C., 2014, "Sonic hedgehog
improves redifferentiation of dedifferentiated chondrocytes for articular cartilage
repair," PLoS One, 9(2), p. e88550.
[229] Aigner, T., Zhu, Y., Chansky, H. H., Matsen, F. A., Maloney, W. J., and Sandell, L.
J., 1999, "Reexpression of type IIA procollagen by adult articular chondrocytes in
osteoarthritic cartilage," Arthritis Rheum, 42(7), pp. 1443-1450.
[230] Ridley, A. J., 2001, "Rho family proteins: coordinating cell responses," Trends Cell
Biol, 11(12), pp. 471-477.

210
[231] Aguiar, D. J., Knudson, W., and Knudson, C. B., 1999, "Internalization of the
hyaluronan receptor CD44 by chondrocytes," Exp Cell Res, 252(2), pp. 292-302.
[232] Kolch, W., 2000, "Meaningful relationships: the regulation of the
Ras/Raf/MEK/ERK pathway by protein interactions," Biochem J, 351 Pt 2, pp.
289-305.
[233] Kamekura, S., Hoshi, K., Shimoaka, T., Chung, U., Chikuda, H., Yamada, T.,
Uchida, M., Ogata, N., Seichi, A., Nakamura, K., and Kawaguchi, H., 2005,
"Osteoarthritis development in novel experimental mouse models induced by
knee joint instability," Osteoarthritis and cartilage / OARS, Osteoarthritis
Research Society, 13(7), pp. 632-641.
[234] van Lent, P. L., Blom, A. B., Schelbergen, R. F., Sloetjes, A., Lafeber, F. P., Lems,
W. F., Cats, H., Vogl, T., Roth, J., and van den Berg, W. B., 2012, "Active
involvement of alarmins S100A8 and S100A9 in the regulation of synovial
activation and joint destruction during mouse and human osteoarthritis," Arthritis
Rheum, 64(5), pp. 1466-1476.
[235] Mahr, S., Menard, J., Krenn, V., and Muller, B., 2003, "Sexual dimorphism in the
osteoarthritis of STR/ort mice may be linked to articular cytokines," Ann Rheum
Dis, 62(12), pp. 1234-1237.
[236] Bomsta, B. D., Bridgewater, L. C., and Seegmiller, R. E., 2006, "Premature
osteoarthritis in the Disproportionate micromelia (Dmm) mouse," Osteoarthritis
Cartilage, 14(5), pp. 477-485.
[237] Glasson, S. S., Chambers, M. G., Van Den Berg, W. B., and Little, C. B., 2010,
"The OARSI histopathology initiative - recommendations for histological
assessments of osteoarthritis in the mouse," Osteoarthritis and cartilage / OARS,
Osteoarthritis Research Society, 18 Suppl 3, pp. S17-23.
[238] Mailhiot, S., Zignego, D., Prigge, J., Wardwell, E., Schmidt, E., and June, R., 2015,
"Non-invasive quantification of cartilage using a novel in vivo bioluminescent
reporter mouse,"PLOS ONE.
[239] Kim, B. J., Kim, D. W., Kim, S. H., Cho, J. H., Lee, H. J., Park, D. Y., Park, S. R.,
Choi, B. H., and Min, B. H., 2013, "Establishment of a reliable and reproducible
murine osteoarthritis model," Osteoarthritis and cartilage / OARS, Osteoarthritis
Research Society, 21(12), pp. 2013-2020.
[240] Little, C. B., and Zaki, S., 2012, "What constitutes an "animal model of
osteoarthritis"--the need for consensus?," Osteoarthritis and cartilage / OARS,
Osteoarthritis Research Society, 20(4), pp. 261-267.

211
[241] Bendele, A. M., 2001, "Animal models of osteoarthritis," J Musculoskelet
Neuronal Interact, 1(4), pp. 363-376.
[242] Bendele, A. M., Bendele, R. A., Hulman, J. F., and Swann, B. P., 1996,
"[Beneficial effects of treatment with diacerhein in guinea pigs with
osteoarthritis]," Rev Prat, 46(6 Spec No), pp. S35-S39.
[243] Smith, G. N., Myers, S. L., Brandt, K. D., Mickler, E. A., and Albrecht, M. E.,
1999, "Diacerhein treatment reduces the severity of osteoarthritis in the canine
cruciate-deficiency model of osteoarthritis," Arthritis and rheumatism, 42(3), pp.
545-554.
[244] Kobayashi, K., Amiel, M., Harwood, F. L., Healey, R. M., Sonoda, M., Moriya, H.,
and Amiel, D., 2000, "The long-term effects of hyaluronan during development of
osteoarthritis following partial meniscectomy in a rabbit model," Osteoarthritis
and cartilage / OARS, Osteoarthritis Research Society, 8(5), pp. 359-365.
[245] Sanchez-Adams, J., Leddy, H. A., McNulty, A. L., O'Conor, C. J., and Guilak, F.,
2014, "The mechanobiology of articular cartilage: bearing the burden of
osteoarthritis," Curr Rheumatol Rep, 16(10), p. 451.
[246] Kuroki, K., Cook, C. R., and Cook, J. L., 2011, "Subchondral bone changes in three
different canine models of osteoarthritis," Osteoarthritis and cartilage / OARS,
Osteoarthritis Research Society, 19(9), pp. 1142-1149.
[247] Little, C. B., Barai, A., Burkhardt, D., Smith, S. M., Fosang, A. J., Werb, Z., Shah,
M., and Thompson, E. W., 2009, "Matrix metalloproteinase 13-deficient mice are
resistant to osteoarthritic cartilage erosion but not chondrocyte hypertrophy or
osteophyte development," Arthritis and rheumatism, 60(12), pp. 3723-3733.
[248] Clark, A. L., Votta, B. J., Kumar, S., Liedtke, W., and Guilak, F., 2010,
"Chondroprotective role of the osmotically sensitive ion channel transient
receptor potential vanilloid 4: age- and sex-dependent progression of
osteoarthritis in Trpv4-deficient mice," Arthritis and rheumatism, 62(10), pp.
2973-2983.
[249] van Osch, G. J., van der Kraan, P. M., and van den Berg, W. B., 1994, "Site-
specific cartilage changes in murine degenerative knee joint disease induced by
iodoacetate and collagenase," Journal of orthopaedic research : official
publication of the Orthopaedic Research Society, 12(2), pp. 168-175.
[250] van der Kraan, P. M., Vitters, E. L., van Beuningen, H. M., van de Putte, L. B., and
van den Berg, W. B., 1990, "Degenerative knee joint lesions in mice after a single
intra-articular collagenase injection. A new model of osteoarthritis," Journal of
experimental pathology, 71(1), pp. 19-31.

212
[251] Christiansen, B. A., Anderson, M. J., Lee, C. A., Williams, J. C., Yik, J. H., and
Haudenschild, D. R., 2012, "Musculoskeletal changes following non-invasive
knee injury using a novel mouse model of post-traumatic osteoarthritis,"
Osteoarthritis and cartilage / OARS, Osteoarthritis Research Society, 20(7), pp.
773-782.
[252] Pritzker, K. P., Gay, S., Jimenez, S. A., Ostergaard, K., Pelletier, J. P., Revell, P.
A., Salter, D., and van den Berg, W. B., 2006, "Osteoarthritis cartilage
histopathology: grading and staging," Osteoarthritis and cartilage / OARS,
Osteoarthritis Research Society, 14(1), pp. 13-29.
[253] Palmer, A. W., Guldberg, R. E., and Levenston, M. E., 2006, "Analysis of cartilage
matrix fixed charge density and three-dimensional morphology via contrast-
enhanced microcomputed tomography," Proceedings of the National Academy of
Sciences of the United States of America, 103(51), pp. 19255-19260.
[254] Siebelt, M., Waarsing, J. H., Kops, N., Piscaer, T. M., Verhaar, J. A., Oei, E. H.,
and Weinans, H., 2011, "Quantifying osteoarthritic cartilage changes accurately
using in vivo microCT arthrography in three etiologically distinct rat models,"
Journal of orthopaedic research : official publication of the Orthopaedic Research
Society, 29(11), pp. 1788-1794.
[255] Ruan, M. Z., Dawson, B., Jiang, M. M., Gannon, F., Heggeness, M., and Lee, B.
H., 2013, "Quantitative imaging of murine osteoarthritic cartilage by phase-
contrast micro-computed tomography," Arthritis and rheumatism, 65(2), pp. 388-
396.
[256] Mailhiot, S. E., Zignego, D. L., Prigge, J. R., Wardwell, E. R., Schmidt, E. E., and
June, R. K., 2015, "Non-invasive quantification of cartilage using a novel in vivo
bioluminescent reporter mouse," PLoS One, In Press.
[257] Kotwal, N., Li, J., Sandy, J., Plaas, A., and Sumner, D. R., 2012, "Initial
application of EPIC-muCT to assess mouse articular cartilage morphology and
composition: effects of aging and treadmill running," Osteoarthritis and cartilage /
OARS, Osteoarthritis Research Society, 20(8), pp. 887-895.
[258] Ushiku, C., Adams, D. J., Jiang, X., Wang, L., and Rowe, D. W., 2010, "Long bone
fracture repair in mice harboring GFP reporters for cells within the osteoblastic
lineage," Journal of orthopaedic research : official publication of the Orthopaedic
Research Society, 28(10), pp. 1338-1347.
[259] Benjamini, Y., and Yekutieli, D., 2001, "The control of the false discovery rate in
multiple testing under dependency," Ann Stat, 29(4), pp. 1165-1188.

213
[260] de Wet, J. R., Wood, K. V., DeLuca, M., Helinski, D. R., and Subramani, S., 1987,
"Firefly luciferase gene: structure and expression in mammalian cells," Mol Cell
Biol, 7(2), pp. 725-737.
[261] DeLuca, M., and McElroy, W. D., 1984, "Two kinetically distinguishable ATP
sites in firefly luciferase," Biochem Biophys Res Commun, 123(2), pp. 764-770.
[262] Buschmann, M. D., Kim, Y. J., Wong, M., Frank, E., Hunziker, E. B., and
Grodzinsky, A. J., 1999, "Stimulation of aggrecan synthesis in cartilage explants
by cyclic loading is localized to regions of high interstitial fluid flow," Archives
of Biochemistry and Biophysics, 366(1), pp. 1-7.
[263] Haudenschild, D. R., Chen, J., Pang, N., Lotz, M. K., and D'Lima, D. D., 2010,
"Rho Kinase-Dependent Activation of SOX9 in Chondrocytes," Arthritis and
Rheumatism, 62(1).
[264] Smith, R. J., and Phang, J. M., 1978, "Proline metabolism in cartilage: the
importance of proline biosynthesis," Metabolism, 27(6), pp. 685-694.
[265] Harris, M. D., Anderson, A. E., Henak, C. R., Ellis, B. J., Peters, C. L., and Weiss,
J. A., 2012, "Finite element prediction of cartilage contact stresses in normal
human hips," J Orthop Res, 30(7), pp. 1133-1139.
[266] Alexopoulos, L. G., Haider, M. A., Vail, T. P., and Guilak, F., 2003, "Alterations in
the mechanical properties of the human chondrocyte pericellular matrix with
osteoarthritis," J Biomech Eng, 125(3), pp. 323-333.
[267] Wilusz, R. E., Defrate, L. E., and Guilak, F., 2012, "A biomechanical role for
perlecan in the pericellular matrix of articular cartilage," Matrix Biol, 31(6), pp.
320-327.
[268] Engler, A. J., Sen, S., Sweeney, H. L., and Discher, D. E., 2006, "Matrix elasticity
directs stem cell lineage specification," Cell, 126(4), pp. 677-689.
[269] Eisenberg, J. L., Safi, A., Wei, X., Espinosa, H. D., Budinger, G. S., Takawira, D.,
Hopkinson, S. B., and Jones, J. C., 2011, "Substrate stiffness regulates
extracellular matrix deposition by alveolar epithelial cells," Research and reports
in biology, 2011(2), pp. 1-12.
[270] Yeh, Y. T., Hur, S. S., Chang, J., Wang, K. C., Chiu, J. J., Li, Y. S., and Chien, S.,
2012, "Matrix stiffness regulates endothelial cell proliferation through septin 9,"
PLoS One, 7(10), p. e46889.
[271] Candiello, J., Singh, S. S., Task, K., Kumta, P. N., and Banerjee, I., 2013, "Early
differentiation patterning of mouse embryonic stem cells in response to variations
in alginate substrate stiffness," Journal of biological engineering, 7(1), p. 9.

214
[272] Thomasy, S. M., Morgan, J. T., Wood, J. A., Murphy, C. J., and Russell, P., 2013,
"Substratum stiffness and latrunculin B modulate the gene expression of the
mechanotransducers YAP and TAZ in human trabecular meshwork cells,"
Experimental eye research, 113, pp. 66-73.
[273] Mauck, R. L., Soltz, M. A., Wang, C. C., Wong, D. D., Chao, P. H., Valhmu, W.
B., Hung, C. T., and Ateshian, G. A., 2000, "Functional tissue engineering of
articular cartilage through dynamic loading of chondrocyte-seeded agarose gels,"
J Biomech Eng, 122(3), pp. 252-260.
[274] Huang, C. Y., Soltz, M. A., Kopacz, M., Mow, V. C., and Ateshian, G. A., 2003,
"Experimental verification of the roles of intrinsic matrix viscoelasticity and
tension-compression nonlinearity in the biphasic response of cartilage," J
Biomech Eng, 125(1), pp. 84-93.
[275] June, R. K., Mejia, K. L., Barone, J. R., and Fyhrie, D. P., 2009, "Cartilage stress-
relaxation is affected by both the charge concentration and valence of solution
cations," Osteoarthritis Cartilage, 17(5), pp. 669-676.
[276] June, R. K., and Fyhrie, D. P., 2013, "A comparison of cartilage stress-relaxation
models in unconfined compression: QLV and stretched exponential in
combination with fluid flow," Computer methods in biomechanics and biomedical
engineering, 16(5), pp. 565-576.
[277] June, R. K., Neu, C. P., Barone, J. R., and Fyhrie, D. P., 2011, "Polymer Mechanics
as a Model for Short-Term and Flow-Independent Cartilage Viscoelasticity,"
Materials science & engineering. C, Materials for biological applications, 31(4),
pp. 781-788.
[278] de Gennes, P.-G., 2002, "Relaxation Anomalies in Linear Polymer Melts,"
Macromolecules, 35(9), pp. 3785-3786.
[279] June, R. K., Ly, S., and Fyhrie, D. P., 2009, "Cartilage stress-relaxation proceeds
slower at higher compressive strains," Arch Biochem Biophys, 483(1), pp. 75-80.
[280] June, R. K., and Fyhrie, D. P., 2009, "Enzymatic digestion of articular cartilage
results in viscoelasticity changes that are consistent with polymer dynamics
mechanisms," Biomedical engineering online, 8, p. 32.
[281] Bracewell, R., 1999, The Fourier Transform and Its Applications, McGraw-Hill.
[282] Zignego, D. L., Jutila, A. A., Gelbke, M. K., Gannon, D. M., and June, R. K., 2014,
"The mechanical microenvironment of high concentration agarose for applying
deformation to primary chondrocytes," J Biomech, 47(9), pp. 2143-2148.

215
[283] Lima, E. G., Tan, A. R., Tai, T., Bian, L., Ateshian, G. A., Cook, J. L., and Hung,
C. T., 2008, "Physiologic deformational loading does not counteract the catabolic
effects of interleukin-1 in long-term culture of chondrocyte-seeded agarose
constructs," J Biomech, 41(15), pp. 3253-3259.
[284] Ng, K. W., Lima, E. G., Bian, L., O'Conor, C. J., Jayabalan, P. S., Stoker, A. M.,
Kuroki, K., Cook, C. R., Ateshian, G. A., Cook, J. L., and Hung, C. T., 2010,
"Passaged adult chondrocytes can form engineered cartilage with functional
mechanical properties: a canine model," Tissue engineering. Part A, 16(3), pp.
1041-1051.
[285] Ng, K. W., O'Conor, C. J., Kugler, L. E., Cook, J. L., Ateshian, G. A., and Hung,
C. T., 2011, "Transient supplementation of anabolic growth factors rapidly
stimulates matrix synthesis in engineered cartilage," Ann Biomed Eng, 39(10),
pp. 2491-2500.
[286] Blanco, F. J., and Ruiz-Romero, C., 2012, "Osteoarthritis: Metabolomic
characterization of metabolic phenotypes in OA," Nature reviews. Rheumatology,
8(3), pp. 130-132.
[287] Wishart, D. S., Tzur, D., Knox, C., Eisner, R., Guo, A. C., Young, N., Cheng, D.,
Jewell, K., Arndt, D., Sawhney, S., Fung, C., Nikolai, L., Lewis, M., Coutouly,
M. A., Forsythe, I., Tang, P., Shrivastava, S., Jeroncic, K., Stothard, P., Amegbey,
G., Block, D., Hau, D. D., Wagner, J., Miniaci, J., Clements, M., Gebremedhin,
M., Guo, N., Zhang, Y., Duggan, G. E., Macinnis, G. D., Weljie, A. M.,
Dowlatabadi, R., Bamforth, F., Clive, D., Greiner, R., Li, L., Marrie, T., Sykes, B.
D., Vogel, H. J., and Querengesser, L., 2007, "HMDB: the Human Metabolome
Database," Nucleic acids research, 35(Database issue), pp. D521-526.
[288] Doi, M., and Edwards, S. F., 1988, The Theory of Polymer Dynamics, Oxford
University Press, Oxford, UK.
[289] Jimenez-Barbero, J., Bouffar-Roupe, C., Rochas, C., and Perez, S., 1989,
"Modelling studies of solvent effects on the conformational stability of agarobiose
and neoagarobiose and their relationship to agarose," International journal of
biological macromolecules, 11(5), pp. 265-272.
[290] Erickson, I. E., Huang, A. H., Chung, C., Li, R. T., Burdick, J. A., and Mauck, R.
L., 2009, "Differential maturation and structure-function relationships in
mesenchymal stem cell- and chondrocyte-seeded hydrogels," Tissue engineering.
Part A, 15(5), pp. 1041-1052.
[291] Knight, M. M., McGlashan, S. R., Garcia, M., Jensen, C. G., and Poole, C. A.,
2009, "Articular chondrocytes express connexin 43 hemichannels and P2
receptors - a putative mechanoreceptor complex involving the primary cilium?,"
Journal of anatomy, 214(2), pp. 275-283.

216
[292] Tan, A. R., Dong, E. Y., Ateshian, G. A., and Hung, C. T., 2010, "Response of
engineered cartilage to mechanical insult depends on construct maturity,"
Osteoarthritis Cartilage, 18(12), pp. 1577-1585.
[293] Sysi-Aho, M., Katajamaa, M., Yetukuri, L., and Oresic, M., 2007, "Normalization
method for metabolomics data using optimal selection of multiple internal
standards," BMC bioinformatics, 8, p. 93.
[294] Dieterle, F., Ross, A., Schlotterbeck, G., and Senn, H., 2006, "Probabilistic quotient
normalization as robust method to account for dilution of complex biological
mixtures. Application in 1H NMR metabonomics," Anal Chem, 78(13), pp. 4281-
4290.
[295] Veselkov, K. A., Vingara, L. K., Masson, P., Robinette, S. L., Want, E., Li, J. V.,
Barton, R. H., Boursier-Neyret, C., Walther, B., Ebbels, T. M., Pelczer, I.,
Holmes, E., Lindon, J. C., and Nicholson, J. K., 2011, "Optimized preprocessing
of ultra-performance liquid chromatography/mass spectrometry urinary metabolic
profiles for improved information recovery," Anal Chem, 83(15), pp. 5864-5872.

217
APPENDICES

218
APPENDIX A
ENCAPSULATION OF CHONDROCYTES IN HIGH-STIFFNESS
AGAROSE MICROENVIRONMENTS FOR IN VITRO MODELING
OF OSTEOARTHRITIS MECHANOTRANSDUCTION

219
ENCAPSULATION OF CHONDROCYTES IN HIGH-STIFFNESS
AGAROSE MICROENVIRONMENTS FOR IN VITRO
MODELING OF OSTEOARTHRITIS
MECHANOTRANSDUCTION
Contribution of Authors and Co-Authors
Author: Aaron A. Jutila1,*
Contributions: Acquired, analyzed, and interpreted the data. Drafted and wrote the
manuscript.
Co-Author: Donald L. Zignego1,*
Contributions: Acquired, analyzed, and interpreted the data. Drafted and wrote the
manuscript.
Co-Author: William J. Schell1
Contributions: Acquired samples and reviewed the manuscript.
Corresponding Author: Ronald K. June1,2
Contributions: Designed the study, analyzed and interpreted the data, and wrote the
manuscript.
1 Department of Mechanical and Industrial Engineering, Montana State University,
Bozeman, MT 59717-3800, USA
2 Department of Cell Biology and Neuroscience, Montana State University, Bozeman,
MT 59717-3800, USA
* Authors made equal contributions to this work.

220
Manuscript Information Page
*Aaron A. Jutila, *Donald L. Zignego, William J. Schell, and Ronald K. June
Annals of Biomedical Engineering
Status of Manuscript:
___ Prepared for submission to a peer-reviewed journal
___ Officially submitted to a peer-reviewed journal
___ Accepted by a peer-reviewed journal
_X_ Published in a peer-reviewed journal
Publisher: Springer US
Issue: May 2015, Vol. 43, Issue 5, Pages 1132-1144
Copyright 2014. Springer US
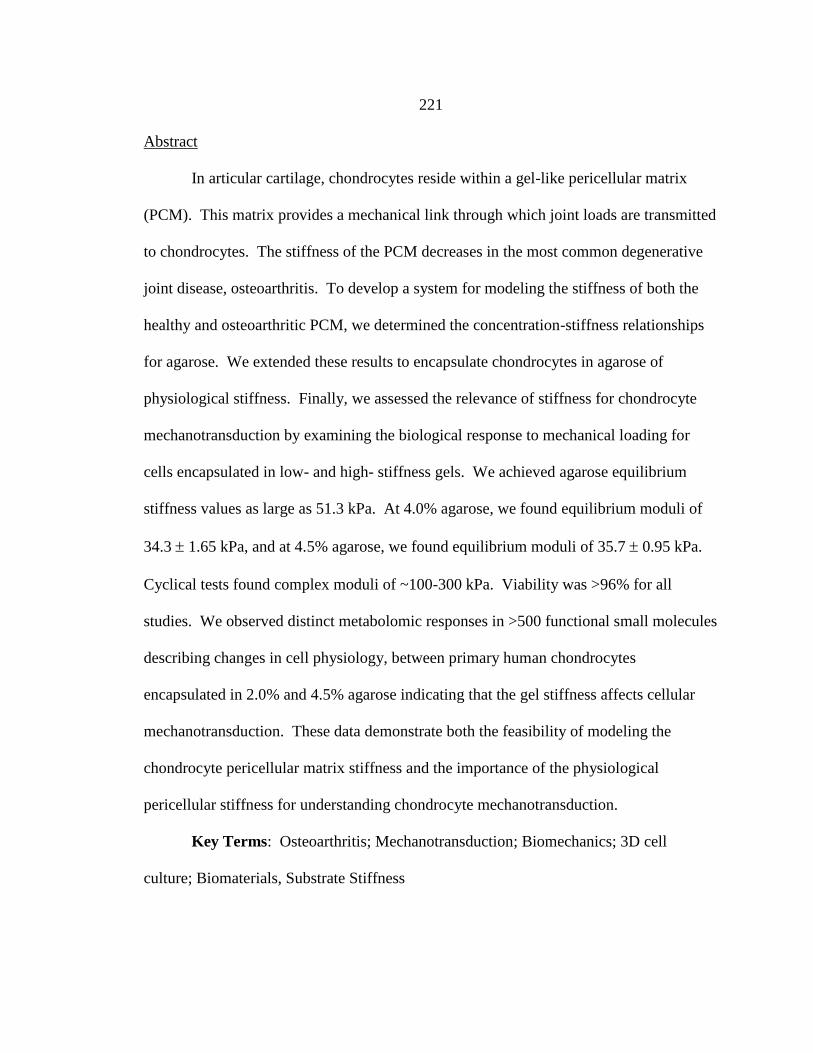
221
Abstract
In articular cartilage, chondrocytes reside within a gel-like pericellular matrix
(PCM). This matrix provides a mechanical link through which joint loads are transmitted
to chondrocytes. The stiffness of the PCM decreases in the most common degenerative
joint disease, osteoarthritis. To develop a system for modeling the stiffness of both the
healthy and osteoarthritic PCM, we determined the concentration-stiffness relationships
for agarose. We extended these results to encapsulate chondrocytes in agarose of
physiological stiffness. Finally, we assessed the relevance of stiffness for chondrocyte
mechanotransduction by examining the biological response to mechanical loading for
cells encapsulated in low- and high- stiffness gels. We achieved agarose equilibrium
stiffness values as large as 51.3 kPa. At 4.0% agarose, we found equilibrium moduli of
34.3 1.65 kPa, and at 4.5% agarose, we found equilibrium moduli of 35.7 0.95 kPa.
Cyclical tests found complex moduli of ~100-300 kPa. Viability was >96% for all
studies. We observed distinct metabolomic responses in >500 functional small molecules
describing changes in cell physiology, between primary human chondrocytes
encapsulated in 2.0% and 4.5% agarose indicating that the gel stiffness affects cellular
mechanotransduction. These data demonstrate both the feasibility of modeling the
chondrocyte pericellular matrix stiffness and the importance of the physiological
pericellular stiffness for understanding chondrocyte mechanotransduction.
Key Terms: Osteoarthritis; Mechanotransduction; Biomechanics; 3D cell
culture; Biomaterials, Substrate Stiffness

222
Introduction
Articular cartilage is the smooth, load-bearing tissue which lines the surfaces of
bones in joints such as the knee and the hip. As a result of normal human activity (e.g.
walking), cartilage experiences mechanical loading which varies with both time and
spatial position in the joint.[265] The hierarchy of cartilage structure includes a dense
hydrated extracellular matrix (ECM) which encapsulates a pericellular matrix (PCM) that
directly surrounds articular chondrocytes.[125] The PCM transmits tissue-level
deformations to the cells of cartilage termed chondrocytes.
The stiffness of the PCM is a relevant environmental input since it applies
external loads to chondrocytes and can direct their biological behavior via cellular
mechanotransduction. For example, exogenous loading has been shown to change
Superficial Zone Protein expression,[87] RhoA activation,[123] and induce transcription
of ECM genes.[76] Dynamic compression of cell seeded agarose constructs can promote
Smad2 phosphorylation as an early response to mechanical stimuli.[119] To obtain a
deeper understanding of chondrocyte mechanotransduction, which is necessary for
designing improved therapeutic strategies for joint disease, advanced in vitro models are
needed which simulate the varying stiffness of the chondrocyte PCM during osteoarthritis
progression.
While several studies have examined in vitro chondrocyte responses to applied
loading, the stiffness of the hydrogel responsible for applying these loads has received
little emphasis. In vitro model stiffness is important because in vivo chondrocytes are
linked to their extracellular environment by the PCM which provides information

223
regarding the extracellular biomechanical and biochemical microenvironment. Previous
studies have found the stiffness of the PCM for human chondrocytes to be in the range of
25-200 kPa.[47, 127, 266] Importantly, the PCM stiffness appears to decline in
osteoarthritic tissue,[266] which may be a patho-mechanical signaling mechanism in the
most common degenerative joint disease osteoarthritis (OA).[267]
Furthermore, several studies demonstrate the importance of substrate stiffness as a
relevant environmental variable for cellular mechanotransduction in other cell types.[268-
272] Thus in vitro models which mimic the stiffness of the chondrocyte PCM modeling
may provide an improved understanding of how chondrocytes sense and respond to
mechanical loads. Here we defined the concentration-stiffness relationships for agarose
as an in vitro substrate for chondrocyte mechanotransduction studies. We extended these
results to determine if chondrocytes can be encapsulated within agarose of physiological
stiffness. Finally, we assessed the relevance of stiffness for chondrocyte
mechanotransduction by examining the biological response to mechanical loading for
cells encapsulated in low- and high- stiffness gels.
We found concentration-dependent agarose stiffness (equilibrium, dynamic, and
complex) of ~20-300 kPa for agarose ranging between 3 and 5% (weight / volume, w/v).
Building upon previous methods,[121, 124] we were able to encapsulate chondrocytes in
high-stiffness agarose with high viability (>96%). Agarose stiffness affected
chondrocyte biology as demonstrated by distinct metabolomics differences between
chondrocytes encapsulated in 2.0% and 4.5% agarose. These data show that agarose can
be used as a 3D culture medium for mimicking the stiffness of the cartilage PCM.

224
Furthermore, by changing the concentration of agarose, it is possible to model disease-
dependent changes in the in vitro stiffness as seen in human osteoarthritis.[266] To our
knowledge, this is the first successful demonstration of chondrocyte encapsulation in
agarose >3%.
Materials and Methods
Agarose Constructs. Agarose constructs were prepared using low-gelling-
temperature agarose (Sigma: Type VII-A A0701) which was selected because of previous
success for mechanotransduction studies.[120, 121] Concentrations of 2-5% (w / v)
agarose were dissolved in PBS at 1.1X strength at 40C. After ~5 minutes, dissolved
agarose was diluted to 1X with 40C PBS. This procedure is readily applied to
encapsulating cells based on the methods of Lee et al and Bougalt et al.[120, 121] The
final agarose solution was cast in anodized aluminum molds at 23C. These molds
produced cylindrical samples with heights of 12.7 0.1 mm and diameters of 7.0 0.1
mm as measured using digital calipers on >20 independent samples. This sample
geometry was selected to provide uniaxial deformations consistent with spatially
homogeneous mechanical strain fields[122] for applying well-defined mechanical stimuli
to embedded cells.
Mechanical Testing. Samples were tested on a custom-built bioreactor capable of
applying displacement-controlled loading with sub-micron precision (Supplementary
Figures 1-3). Because most previous studies have characterized the response for gels of
concentration ≤3% for this study, the agarose concentration was 3-5%.[147, 273] Prior to

225
testing, samples were equilibrated in PBS at 37C for 30 minutes. Samples were placed
in polysulfone loading cups, and the compression platens were lowered until sample
contact was achieved as demonstrated by a load change of 0.089 N, the smallest possible
preload and consistent with previous methodology.[274] The sample was then allowed to
relax to an equilibrium state. Based on pilot studies (n = 3), complete preload relaxation
was achieved in < 10 minutes. Therefore, we used a preload time of 10 minutes in this
study. Two mechanical tests were performed in unconfined compression: stepwise
stress-relaxation and cyclical loading with n = 5 samples for each experiment from
multiple agarose castings.
Stepwise stress-relaxation tests were performed to measure dynamic and
equilibrium stiffness values for agarose gels at various concentrations. For these tests,
samples were subjected to four consecutive steps of 4% nominal compressive Lagrangian
strain. Each strain step was maintained for 90 minutes at 37C in tissue culture
conditions (humidified 5% CO2 atmosphere). Load data was sampled at 1000 Hz for the
duration of the test. Average stress was calculated by normalizing the load data by the
sample cross sectional area.
Dynamic stiffness was calculated by performing linear regression on the strain
versus peak stress data for each sample, and equilibrium stiffness was calculated
similarly for the equilibrium stress data. The transient response for each strain step of
each sample was analyzed using three measures.[275] First, a model-independent
parameter termed �̂� was used to quantify the dynamics of stress-relaxation for each strain
step. �̂� was calculated by quantifying the area under normalized stress-relaxation curves.

226
Second, the stretched exponential model (𝑦 = exp (− (𝑡
𝜏𝑆𝐸)
𝛽
) [276, 277] was fit to the
normalized stress-relaxation data to determine the parameters SE and . This model has
been linked mechanistically to fundamental polymer physics[278] and successfully used
to model cartilage viscoelastic behavior.[279, 280]
Cyclical loading tests were performed to assess the complex stiffness and phase
lag of agarose gels. In these experiments, samples were subjected to a 5% prestrain for 2
hours followed by 100 cycles of sinusoidal compression from 3.1 to 6.9% based on the
initially measured height. Samples were tested at 0.55, 1.1, and 5.5 Hz. These
frequencies were selected to bound the preferred stride rates for humans.[153] Load and
displacement values were sampled simultaneously at 100 Hz to ensure sampling above
the Nyquist limit.[281] Average stresses were calculated as described above. Cyclical
loading data were analyzed to determine the complex modulus (i.e. stiffness) defined as
the amplitude of the stress divided by the amplitude of the strain and the phase lag of the
stress relative to the strain.
Chondrocyte Encapsulation. To assess the potential for using agarose of varying
stiffness to model the chondrocyte pericellular matrix, cells were embedded in agarose of
varying concentrations. Human SW1353 chondrosarcoma cells were cultured at 5% CO2
in DMEM with 10% fetal bovine serum and antibiotics (10,000 I.U. / mL penicillin and
10000 ug / mL streptomycin). For encapsulation, cells were trypsinized, counted, and
resuspended in media at 11X. Agarose was prepared as described above. The cell-
suspension was added to the agarose during vortexing to distribute the cells throughout

227
the liquid hydrogel. Gels were subsequently cast as described above for 5 minutes at
23C. Cell-seeded agarose constructs were removed from the molds and placed in tissue
culture for 24 and 72 hours prior to viability analysis to examine a relevant timeframe for
molecular biology experiments.
Viability Assays. To assess feasibility of the encapsulation process, we assessed
chondrocyte viability using standard methods.[132] Cells were incubated in 8 M
calcein-AM and 75 M propidium iodide. Following incubation, constructs were
examined by confocal microscopy for calcein-AM fluorescence (excitation: 496 nm
emission: 516 nm) indicating live cells via intracellular thioesterase activity and
propidium iodide fluorescence (excitation: 536 nm emission: 617 nm) defining dead cells
via DNA binding indicative of compromised plasma membranes. Confocal images were
acquired from 6 positions within each hydrogel to assess potential spatial variability in
cell viability.[282] Images were thresholded, and the number of viable and dead cells
were quantified.
Chondrocyte Mechanotransduction and Metabolomics. Following successful
encapsulation of SW1353 chondrocytes in high-concentration agarose, we expanded to
study primary human osteoarthritic chondrocytes. Discarded joint replacement tissue
(Bridger Orthopedics, informed consent obtained under IRB-approved human subjects
exemption) was used to harvest primary human chondrocytes from a single donor via
collagenase digestion. Primary chondrocytes were passaged once and embedded in high-
stiffness agarose (4.5% w/v) and low-stiffness agarose (2% w/v) using previously
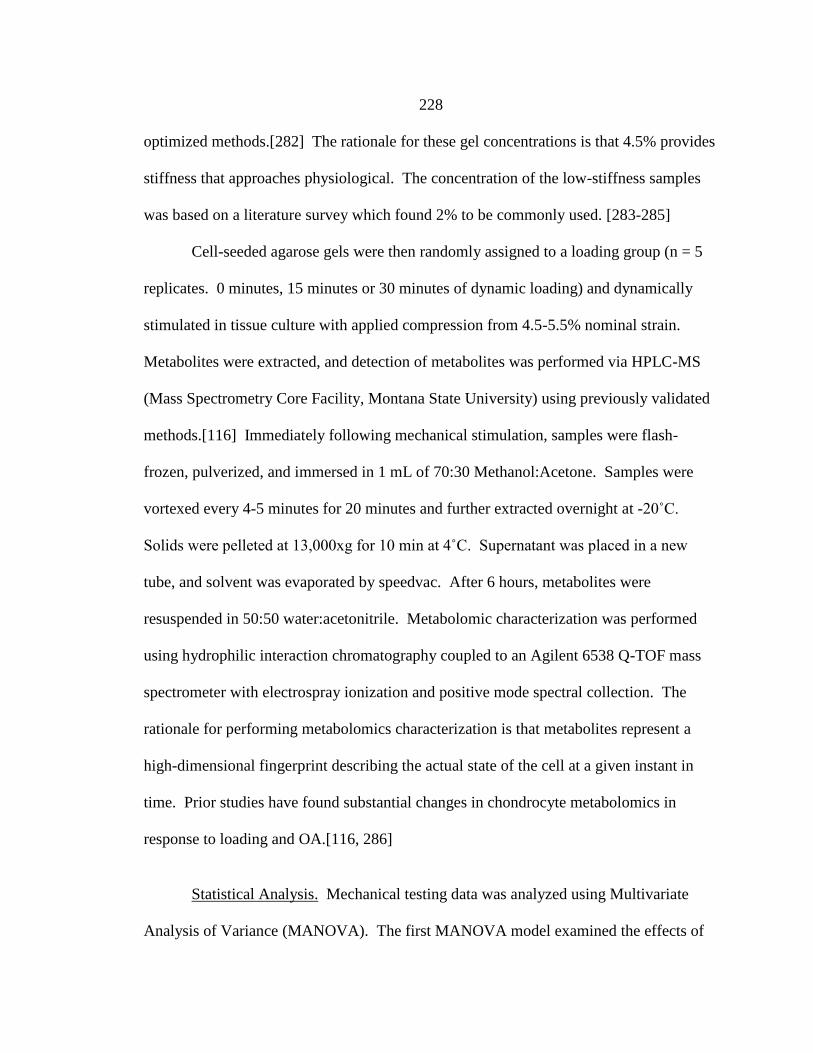
228
optimized methods.[282] The rationale for these gel concentrations is that 4.5% provides
stiffness that approaches physiological. The concentration of the low-stiffness samples
was based on a literature survey which found 2% to be commonly used. [283-285]
Cell-seeded agarose gels were then randomly assigned to a loading group (n = 5
replicates. 0 minutes, 15 minutes or 30 minutes of dynamic loading) and dynamically
stimulated in tissue culture with applied compression from 4.5-5.5% nominal strain.
Metabolites were extracted, and detection of metabolites was performed via HPLC-MS
(Mass Spectrometry Core Facility, Montana State University) using previously validated
methods.[116] Immediately following mechanical stimulation, samples were flash-
frozen, pulverized, and immersed in 1 mL of 70:30 Methanol:Acetone. Samples were
vortexed every 4-5 minutes for 20 minutes and further extracted overnight at -20˚C.
Solids were pelleted at 13,000xg for 10 min at 4˚C. Supernatant was placed in a new
tube, and solvent was evaporated by speedvac. After 6 hours, metabolites were
resuspended in 50:50 water:acetonitrile. Metabolomic characterization was performed
using hydrophilic interaction chromatography coupled to an Agilent 6538 Q-TOF mass
spectrometer with electrospray ionization and positive mode spectral collection. The
rationale for performing metabolomics characterization is that metabolites represent a
high-dimensional fingerprint describing the actual state of the cell at a given instant in
time. Prior studies have found substantial changes in chondrocyte metabolomics in
response to loading and OA.[116, 286]
Statistical Analysis. Mechanical testing data was analyzed using Multivariate
Analysis of Variance (MANOVA). The first MANOVA model examined the effects of

229
agarose concentration on both the dynamic and equilibrium stiffness. The second
MANOVA model utilized repeated measures to examine the effects of gel concentration,
compression level, and stress-relaxation model on the peak stress, equilibrium stress, �̂�,
stress-relaxation model parameters, and fit quality measures. The third MANOVA
examined the effects of loading frequency and gel concentration on the complex modulus
and phase lag. The final MANOVA examined the effects of gel concentration and spatial
position on cell viability. Bonferroni post hoc tests were used to ascertain specific
differences with an a priori significance level of α = 0.05.
For an aggregate comparison between experimental groups, distributions of
metabolites were compared using the Kolmogorov-Smirnov test. Expression of
individual metabolites was compared using T-tests to assess differences between low and
high-stiffness agarose gels with corrections for multiple comparisons. Comparisons were
performed using a false discovery rate (FDR) of p = 0.05.[259] For each of the two
concentrations of agarose gels, two comparisons were made: unloaded control (UC) vs.
15 minutes of dynamic loading 15 (DL15) and unloaded controls vs. 30 minutes of
dynamic loading (DL30). For both 15 and 30 minutes of loading, chondrocyte
metabolomics responses in 2.0% and 4.5% were compared to assess using the
Kolmogorov-Smirnov test the effect of gel stiffness on chondrocyte
mechanotransduction. Statistical models and tests were performed in both MiniTab
(MANOVA) and MATLAB (metabolomics data). Metabolites of interest were searched
against available databases to identify putative molecules associated with metabolomic
features.[163, 287]

230
Results
Stepwise Stress-Relaxation. Agarose stiffness as measured by the dynamic and
equilibrium moduli from stepwise stress-relaxation tests was a function of agarose
concentration from 3-5%. Agarose samples demonstrated viscoelasticity via time-
dependent stress relaxation while held at a constant strain (Supplemental Figure 1A). 5%
agarose reached higher peak and equilibrium loads than 3% agarose under the same
strain. Increasing gel concentration increased mechanical stiffness (Dynamic: p < 0.0001
Equilibrium: p < 0.0001, n = 25).
We achieved agarose equilibrium stiffness as large as 51.3 kPa and dynamic
stiffness as large as 90.7 kPa with 5% agarose gels, and as expected lower agarose
concentrations resulted in lower stiffness (Supplemental Figure 1B-C, Supplemental
Table 1). At 4.5% agarose, we found equilibrium stiffness of 35.7 0.95 kPa (mean
standard error of the mean). Dynamic stiffness was approximately twice as large as
corresponding equilibrium stiffness (Supplemental Figure 1C, Supplemental Table 1),
with 3.0% dynamic stiffness of 39.4 4.5 kPa 5.0% yielding 78.4 3.2 kPa.
The stretched exponential fit the stepwise stress-relaxation data (R2
= 0.90
0.03). Stretched Exponential parameter SE decreased with agarose gel concentration (p <
0.0001), while β remained relatively constant with gel concentration (Supplemental
Figure 2A-B). Model independent parameter �̂� was not affected by concentration (p =
0.442) with an overall average of 8.24 .05 sec.

231
Supplemental Figure 1. Agarose stiffness was concentration dependent as determined in
stress-relaxation experiments. (A). Representative stress-relaxation load curves for 3 and
5% (w / v) agarose. (B). Equilibrium modulus as a function of agarose
concentration. (C). Dynamic modulus as a function of agarose concentration. * Indicates
significant planned comparison (p < 0.05). Both Equilibrium and Dynamic Stiffness
expressed strong dependence on concentration (both p<0.0001 for main effects).
Supplemental Table 1. Stiffness values from mechanical testing experiments. Repeated
stress-relaxation (SR) tests were used to measure stiffness as defined by the equilibrium
and dynamic moduli. Complex stiffnesses were defined from the complex modulus
determined at 1.1 Hz which mimics the preferred stride rate of human walking
[Umberger et al 2007]. Data are mean ± standard error in kPa.

232
Supplemental Figure 2. Concentration-dependent dynamics of agarose stress-relaxation.
The dynamics of agarose stress-relaxation were modeled using the stretched exponential
model. (A) The relaxation time constant, 𝜏𝑆𝐸 increased with agarose concentration
expressing a strong dependence on gel concentration (main effect: p<0.0001). (B) There
were no significant effects of gel concentration on the stretching parameter Beta (p
=0.834).
Cyclical Loading. Sinusoidal applied strain induced sinusoidal stress profiles for
all gel concentrations at all frequencies suggesting linear elastic material behavior
(Supplemental Figure 3A). Cyclical tests found complex moduli of ~100-300 kPa
(Supplemental Figure 3B, Supplemental Table 1). Low-concentration gels had similar
complex stiffness between 3-4% agarose, while the complex stiffness of 4-5% agarose
was larger. For a normal walking rate (~1.1 Hz), 4.5% agarose gels yielded complex
moduli values of 216.5 26.6 kPa.
The phase lag between stress and strain is a measure of the energy absorption
within a viscoelastic material. Phase lag decreased with increasing frequency
(Supplemental Figure 3C). Loading frequency significantly impacted phase lag (p <

233
0.0001), but agarose concentration had no effects (p = 0.934). The concentration-
averaged phase lag at 1.1 Hz was 0.11 0.002 s.
Supplemental Figure 3. Complex agarose stiffness as high as ~225 kPa from cyclical
loading experiments. (A) Representative stress and strain profiles as a function of time
for applied compression frequencies of 0.55, 1.0, and 5.5 Hz. (B) Complex modulus
values were a function of agarose concentration (Main Effect: p<0.0001). (C) Phase lag
data, indicating energy dissipation within the agarose, were determined to be function of
frequency (p<0.0001) and not a function of agarose concentration (p=0.934).
Chondrocyte Viability in 3D Constructs. To assess the relevance of using high-
concentration agarose as an in vitro model to mimic the stiffness of the human
pericellular matrix, viability was assessed using confocal microscopy for 3-5% agarose.

234
We found high viability both 24 and 72 hours following encapsulation (Supplemental
Figure 4A). Imaging revealed high viability which was not location-specific (p = 0.496)
indicating that the methods resulted in an even spatial distribution of cells. Viability rates
for all agarose gel concentrations were >96% both 24 and 72 h following encapsulation.
Supplemental Figure 4. Encapsulation of SW1353 chondrocytes in high-stiffness agarose
gels resulted in high viability. Gels were incubated with Calcein-AM and propidium
iodide to assess viability via fluorescent microscopy (A) Representative images. (B)
Viability >96% was observed in all gel concentrations both 24 and 72 hours after
encapsulation. There were no significant differences in viability rates between agarose
concentration, spatial position within the gel, or time point.
Metabolomics. Changes in agarose concentration, and therefore gel stiffness,
resulted in metabolomics changes following mechanical loading. After both 15 and 30

235
minutes of dynamic compression, distributions of metabolites harvested from low
stiffness 2%- and high stiffness 4.5%-agarose were distinct as determined by a non-
parametric, two-sample Kolmogorov-Smirnov (15 minutes: p = 0.032 and 30 minutes: p
= 0.021, Supplemental Figure 5A-B).
Agarose concentration differentially regulated the profiles of mechanosensitive
metabolites. For 15 minutes of dynamic compression, 204 metabolites (FDR corrected p-
value < 0.05) were significantly upregulated and 101 metabolites were significantly
down-regulated in 4.5% agarose compared with 2.0% agarose (Supplemental Figure 5C).
For 30 minutes of dynamic compression, 212 metabolites were significantly upregulated
and 99 were significantly down-regulated in 4.5% compared with 2.0% agarose
(Supplemental Figure 5D).
Individual metabolite expression in response to applied dynamic compression was
also affected by agarose stiffness. Loading of primary human chondrocytes in both 2%
and 4.5% agarose gels resulted in both up- and down- regulation of several metabolites
(Supplemental Figure 5E-F). In the 2% low-stiffness gels 15 minutes of dynamic
compression resulted in up-regulation of 47 unique metabolites and down-regulation of
56 unique metabolites. In contrast, for the 4.5% high-stiffness gels, 15 minutes of
dynamic compression resulted in up-regulation of 108 unique metabolites and down-
regulation of 97 unique metabolites. Similar results were seen in response to 30 minutes
of dynamic compression (Supplemental Figure 5F). Metabolites targeted to central
energy metabolism were differentially regulated by mechanical loading in 4.5% and 2%
agarose (Supplemental Table 2). We found 97 metabolites of interest, as defined by

236
differential response to loading between 4.5% and 2% agarose gels (Supplemental Table
3) which resulted in database identification of many putative compounds relevant to
chondrocyte mechanotransduction.
Supplemental Figure 5. Primary human chondrocyte mechanotransduction is affected by
agarose concentration. Primary human chondrocytes were harvested from joint
replacement tissue, passaged once in culture, and encapsulated in either 2% or 4.5%
agarose prior to applied dynamic compression and metabolomics analysis. Summary
results comparing unloaded and 15 minutes of loading for (A) 2% agarose and (B) 4.5%
agarose. (C) Representative mass spectra after 15 minutes of loading for 2% (bottom)
agarose and 4.5% (top) agarose gels. A two-sample Kolmogorov-Smirnov test revels a
statically significant difference between the two mass spectra distributions (p = 0.032).

237
(D) Representative mass spectra after 30 minutes of loading for 2% (bottom) agarose and
4.5% (top) agarose gels, with statistically significant mass spectra distributions (two-
sample Kolmogorov-Smirnov test, p = 0.021). (E) After 15 minutes of loading, 204
metabolites were significantly upregulated (FDR corrected, p <0.05) in high-stiffness
4.5% gels, and 101 metabolites were upregulated in low-stiffness gels (F) After 30
minutes of loading 212 and 99 metabolites were upregulated in the high and low-stiffness
gels, respectively. (G) 4.5% agarose resulted in increased numbers of unique
mechanosensitive metabolites after 15 minutes of loading and (H) 30 minutes of loading.
Supplemental Table 2. Mechanically-induced changes in metabolites targeted to central
energy metabolism depended on agarose concentration. We observed more changes in
central energy metabolites in 4.5% gels than 2% gels. In each agarose concentration,
distinct metabolites accumulated and were depleted following 15 minutes of dynamic
compression. Phosphoglucanolactone decreased and pyruvate accumulated in both gel
concentrations. m/z represents detected mass, and RT represents the retention time in
minutes.
m/z RT [min] Metabolite Name Observation
277.0319 6.11 6-P-gluconate ↑ in 4.5%
111.0053 8.46 pyruvate ↑ in 4.5%
291.0476 6.06 sedoheptulose-7-phosphate ↑ in 4.5%
444.0321 5.84 GDP ↑ in 4.5%
523.9985 6.92 GTP ↓ in 4.5%
119.0343 5.50 succinate ↓ in 4.5%
154.9951 7.45 oxaloacetate ↓ in 4.5%
215.0148 2.71 citrate ↓ in 4.5%
259.0213 6.37 p-glucanoalactone ↓ in 4.5%
135.0273 3.47 L-malate ↓ in 4.5%
136.9845 6.27 fumarate ↓ in 4.5%
111.0053 8.45 pyruvate ↑ in 2%
91.0388 2.58 lactic acid ↑ in 2%
786.1644 6.04 FAD ↓ in 2%
259.0213 6.37 p-glucanoalactone ↓ in 2%
215.0148 2.67 citrate ↓ in 2%
↑ in 4.5% ↑ in 2%
↓ in 4.5% ↓ in 2%KEY

238
Supplemental Table 3. Untargeted metabolites of interest following 15 minutes of
dynamic compression in either 4.5% or 2% agarose. Several metabolites were
differentially regulated between agarose concentrations following compression. m/z
represents detected mass, and RT represents the retention time in minutes. These
detected masses were used to identify putative molecules using database searches.
m/z RT [min] Observation m/z RT [min] Observation
137.08084 8.09 ↑ in 4.5% 186.0346 6.48 ↑ in 2%
141.07072 8.36 ↑ in 4.5% 227.1094 8.79 ↑ in 2%
163.05245 5.78 ↑ in 4.5% 254.1334 3.52 ↑ in 2%
211.10299 8.47 ↑ in 4.5% 255.1326 8.48 ↑ in 2%
256.12723 7.94 ↑ in 4.5% 257.0735 2.78 ↑ in 2%
263.14452 10.48 ↑ in 4.5% 264.0744 2.64 ↑ in 2%
283.09727 2.71 ↑ in 4.5% 276.9984 2.92 ↑ in 2%
289.08812 2.75 ↑ in 4.5% 281.0945 8.46 ↑ in 2%
291.06743 2.71 ↑ in 4.5% 283.1003 2.66 ↑ in 2%
316.18734 8.34 ↑ in 4.5% 291.0676 2.64 ↑ in 2%
332.11198 6.59 ↑ in 4.5% 293.0819 2.67 ↑ in 2%
350.06474 5.61 ↑ in 4.5% 307.0982 2.50 ↑ in 2%
365.27303 11.47 ↑ in 4.5% 316.1876 8.37 ↑ in 2%
367.12609 2.51 ↑ in 4.5% 325.1586 8.80 ↑ in 2%
483.26462 8.35 ↑ in 4.5% 327.1247 5.51 ↑ in 2%
496.33422 6.39 ↑ in 4.5% 349.0567 2.55 ↑ in 2%
671.21398 5.60 ↑ in 4.5% 350.2307 8.16 ↑ in 2%
754.52638 5.65 ↑ in 4.5% 351.2324 8.16 ↑ in 2%
154.08382 5.59 ↓ in 4.5% 359.0387 6.05 ↑ in 2%
206.05397 8.88 ↓ in 4.5% 384.1130 2.62 ↑ in 2%
250.09049 6.19 ↓ in 4.5% 397.1263 5.64 ↑ in 2%
258.10844 8.45 ↓ in 4.5% 404.0614 6.10 ↑ in 2%
263.14460 9.10 ↓ in 4.5% 406.1677 2.55 ↑ in 2%
269.08677 2.96 ↓ in 4.5% 429.0746 5.63 ↑ in 2%
276.04639 6.54 ↓ in 4.5% 479.2364 8.42 ↑ in 2%
283.10171 2.71 ↓ in 4.5% 483.2663 8.39 ↑ in 2%
306.10092 2.57 ↓ in 4.5% 505.2536 8.31 ↑ in 2%
311.12921 2.64 ↓ in 4.5% 521.2117 8.39 ↑ in 2%
312.17139 8.48 ↓ in 4.5% 585.1268 3.32 ↑ in 2%
314.08337 2.74 ↓ in 4.5% 138.09062 8.52 ↓ in 2%
314.10655 2.49 ↓ in 4.5% 159.09076 3.34 ↓ in 2%
319.11918 3.27 ↓ in 4.5% 165.07411 3.01 ↓ in 2%
319.14839 8.03 ↓ in 4.5% 202.06991 6.65 ↓ in 2%
353.11473 2.57 ↓ in 4.5% 258.10851 8.46 ↓ in 2%
355.11317 2.54 ↓ in 4.5% 260.07247 6.51 ↓ in 2%
361.10664 3.08 ↓ in 4.5% 261.10929 4.08 ↓ in 2%
369.06443 6.61 ↓ in 4.5% 270.14686 3.46 ↓ in 2%
378.14547 2.48 ↓ in 4.5% 303.12273 5.83 ↓ in 2%
379.11824 3.49 ↓ in 4.5% 312.17153 8.52 ↓ in 2%
393.20667 3.26 ↓ in 4.5% 351.15742 8.40 ↓ in 2%
427.09147 7.42 ↓ in 4.5% 361.10828 3.09 ↓ in 2%
428.09458 7.43 ↓ in 4.5% 362.30227 3.41 ↓ in 2%
449.07337 7.41 ↓ in 4.5% 379.11859 3.49 ↓ in 2%
464.12472 3.51 ↓ in 4.5% 383.11378 2.75 ↓ in 2%
537.18981 8.46 ↓ in 4.5% 427.09152 7.43 ↓ in 2%
673.23737 8.48 ↓ in 4.5% 428.09424 7.45 ↓ in 2%
959.31243 3.96 ↓ in 4.5% 449.07386 7.42 ↓ in 2%
451.12837 2.68 ↓ in 2%
↑ in 4.5% ↑ in 2% 455.05226 3.02 ↓ in 2%
↓ in 4.5% ↓ in 2% 673.23789 8.50 ↓ in 2%KEY

239
Discussion
The objectives of this study were to (1) determine the a range of agarose gel
concentrations necessary to mimic the physiological stiffness of both OA pericellular
matrix (PCM) and healthy PCM, (2) assess the feasibility of encapsulating human
chondrocytes in physiologically stiff agarose, and (3) determine the effect of gel stiffness
on chondrocyte mechanotransduction. We measured various viscoelastic properties as a
function of agarose gel concentration which can aid in designing future studies of
chondrocyte mechanotransduction. We assessed viability for all gel concentrations at 24
and 72 hours following encapsulation. Chondrocytes encapsulated in high-stiffness 4.5%
agarose gels demonstrated metabolomic responses to mechanical compression that were
markedly different than compression-induced changes observed for chondrocytes in
lower-stiffness 2.0% agarose, which demonstrates the importance of using high-stiffness
substrates to model healthy human pericellular matrix in mechanotransduction studies.
In articular cartilage, chondrocytes reside within a pericellular matrix defining
their immediate surroundings and providing biochemical and mechanical signals. One
biomechanical cue for chondrocytes is PCM stiffness. Previous studies have found the
range of PCM stiffness for human PCM to be 17-200 kPa.[47, 127, 266] Osteoarthritic
PCM appears to have a lower stiffness than healthy PCM.[73] In this study, viscoelastic
stiffness measures tended to increase with agarose concentration, and we found dynamic,
equilibrium, and complex moduli of 55.5, 35.7, and 216.5 kPa, respectively for 4.5%
agarose (Supplemental Table 4). These data suggest that modeling osteoarthritis-induced
changes in chondrocyte PCM stiffness is feasible using variable-concentration agarose.

240
Agarose of ≤3% w/v may simulate osteoarthritic PCM, and agarose of ≥4.5% may
simulate the mechanical microenvironment of the healthy chondrocyte.
Supplemental Table 4. PCM and agarose stiffness measurements. Darling et al 2010
used AFM at low- and high- force to characterize the stiffness of 3 μm fresh-frozen
sections of human PCM. Alexopolous et al used micropipetting to characterize the
stiffness of extracted human normal and OA chondrons. This study performed
macroscale tests on cylinders of agarose. 4.5% was selected as the most-stiff
concentration feasible for cell encapsulation.
These viscoelastic data provide insight into the macroscale mechanics of agarose.
We observed differences in in dynamic, equilibrium, and complex stiffness at 4.5%
agarose (Supplemental Figure 1B-C and Supplemental Figure 3B). These data may
indicate an overlap concentration at 4.5% w/v defining distinct physical regimes of
polymeric behavior.[288] Furthermore, the stretched exponential time constant was
strongly dependent on gel concentration (p < 0.0001, n = 100) while we saw no changes
in the stretching factor β (p = 0.834), which suggests that the distribution of relaxation
dynamics is similar between gel concentrations as expected for a monodisperse
preparation of agarose.[278] Finally, for this range of loading frequencies, there were no
effects on complex modulus. These data suggest that the complex modulus of agarose is
an intrinsic material property, dependent on gel concentration, but independent of loading
Measurement Stiffness [kPa]
17 +/- 14 (low force)
104 +/- 51 (high force)
66.5 +/- 23.3 (normal)
41.3 +/- 21.1 (OA)
216.5 +/- 26.6 (complex)
55.5 +/- 3.5 (dynamic)
35.7 +/- 1.0 (equilibrium)
Darling et al 2010 (AFM on
PCM)
Alexopoulos et al
(Micropipette on PCM)
This study 4.5% agarose
(Macroscale)

241
frequency. Future studies may evaluate the role of viscoelastic properties in chondrocyte
mechanotransduction.
For studies encapsulating chondrocytes and other cells, in vitro models must
maintain cellular viability. Agarose is a linear polysaccharide with a monomeric unit of
agarobiose which is a dissacharide linked by both α- and β- glycosidic bonds with similar
structure to cartilage glycosaminoglycans chondroitin- and keratin- sulfate [289].
Consistent with previous studies,[290-292] we found viability greater than 96% for all
gel concentrations tested in this study. This indicates that chondrocytes can be
successfully encapsulated in agarose gels of variable stiffness. Importantly, we are
interested in cytosolic mechanisms of chondrocyte mechanotransduction independent of
potential biochemical cues provided by the PCM. As such, these studies were conducted
3 days after encapsulation prior to the observation of substantial pericellular matrix
formation. Stiffness is only one mechanical measure of the pericellular matrix. In vivo
mechanotransduction is likely guided by a combination of mechanical and biochemical
cues, and this approach represents an experimental model of a single variable (i.e.
stiffness) in a complex system. Future studies should combine mechanical and
biochemical cues to further our understanding of chondrocyte mechanotransduction.
The metabolome defines a functional fingerprint of cellular physiology via
quantification of the abundance of large numbers of small biological molecules (e.g.
peptides, oligonucleic acids, substrates, etc.).[163] In this study, we successfully
detected thousands of metabolites in both low- and high- stiffness gels seeded with
primary human osteoarthritic chondrocytes. We found differences in the distributions of

242
compression-induced metabolites between the 4.5% high stiffness and the 2.0% lower
stiffness agarose gels (Supplemental Figure 5A-B). Furthermore, we found several
compression-induced metabolites that were unique to either the high- or the low-stiffness
gels (Supplemental Figure 5C-F). In conjunction with the stiffness results (Supplemental
Figure 1), these metabolomic data demonstrate the ability of dynamic compression to
regulate chondrocyte mechanobiology in a manner dependent on substrate stiffness.
These stiffness-dependent changes may result from chondrocyte compression in the 4.5%
agarose gels that is not observed in the 2.0% agarose gels.[282] These data demonstrate
the feasibility of modeling mechanical changes in the chondrocyte pericellular matrix
stiffness which occur in osteoarthritis (Supplemental Figure 6).[73]
Supplemental Figure 6. Model for studying mechanotransduction in joint disease.
Previous studies have found differences in pericellular matrix stiffness between
osteoarthritic (OA) and normal studies [37]. The data and methods presented herein
suggest that agarose can be used to model both the normal and the OA pericellular
matrix. Agarose concentrations of 4.5% and higher would model the stiffness of healthy
pericellular matrix (PCM) and agarose concentrations of 3% and lower would model the
decreased stiffness of the OA PCM.

243
The metabolomic responses induced by 15 minutes of dynamic compression were
distinct between 4.5% and 2% agarose gels. For metabolites targeted to central energy
metabolism, only phosphoglucanoalactone and pyruvate were similarly regulated. The
observed accumulation of pyruvate may indicate direction of energy metabolism toward
matrix synthesis, as pyruvate is a precursor to the synthesis of many proteins. In general,
4.5% gels exhibited greater regulation of energy-related metabolites than 2% gels (11
changed in 4.5% vs. 4 changed in 2%). Several untargeted metabolites were
differentially regulated by 4.5% and 2% gels following compression (Supplemental Table
3).
Conclusions
These data demonstrate the feasibility of encapsulating chondrocytes in agarose of
both physiological and pathological stiffness. Because the stiffness of the pericellular
matrix is affected by osteoarthritis, these results provide a foundation for both improving
the physiological relevance of in vitro culture systems and applying relevant mechanical
stimulation to chondrocytes. The advantage of the agarose system is that cells can be
manipulated with modern tools of molecular biology (e.g. viral transduction) prior to
encapsulation within a microenvironment of physiological stiffness. These results
establish the basis for future studies should encapsulate healthy and OA chondrocytes in
low- and high- stiffness agarose using these methods. Continuation of this work may
yield insight into how healthy and OA chondrocytes respond to mechanical loads which
may inform therapeutic strategies for cartilage repair in OA.

244
Acknowledgements
This work was funded by NIH P20 GM103394, NSF EEC-1342420, and funds
from the Vice President for Research at Montana State University. To view the database
search data in Supplementary Tables 1 and 2, email the corresponding author at
References
See REFERENCES CITED.

245
APPENDIX B
SUPPLEMENTAL MATERIAL FOR CHAPTER 2
DEVELOPMENT OF EXPIRIMENTAL METHODOLOGY

246
Supplemental Figure 7. Pilot study to determine confidence interval for bead
displacements. To determine the largest confidence interval of bead displacements
required to mitigate errors in displacement tracking (e.g. missed observations due to
obstruction by a neighboring bead), the coefficient of determination (R2) was determined
for the linear regression between the analytical relationship between finite strain and
deformation gradient (𝑑𝑢
𝑑𝑌) (panel A). The 85% confidence interval was selected to utilize
the largest confidence interval for experimentally-measured bead displacements that
provide the theoretically predicted R2 value.

247
Supplemental Figure 8. Concentration-dependent displacement fields within 4.5%
agarose hydrogels. Uy Displacements were calculated from bead positions within the
hydrogels following application of a validated 2D filter [Chan et al 2012]. Average axial
(Uy) displacement values (A and B) were 89.89 1.05 µm, 88.20 0.78 µm, 79.89
1.06 µm, 74.99 0.94 µm, and 73.98 0.90 µm for 3, 3.5, 4, 4.5, and 5% agarose (w/v),
respectively. Across all agarose concentrations, the precision in axial displacement was
1.17%. Average transverse (Ux) displacement values (C and D) were below the 5 μm
pixel size (i.e. ~1.00 µm) for all agarose concentrations. Results are shown as mean ±
SEM. The precision of displacement measurements between all locations was 5.3% of
the mean value for 4.5% gels. Blue dots in Figures B & D represent the average
displacement values. Red dots are data points from all positions and concentrations.
Compression applied in the positive y-direction.

248
Supplemental Figure 9. Propagation of displacement errors for axial strain (Eyy)
calculation. Random noise of varying amplitude from 0-3000 nm was added to the raw
displacement data. Without the filtering, error propagation was substantial (A). The
addition of a validated filter [131] resulted in minimal error propagation (B). The
precision of the displacement measurements was ~700-1000 nm (Supplemental Table 5)
indicating ~1% propagated error for calculating Eyy. Note the vertical scale has been
magnified in panel B to visualize the data.
Supplemental Table 5. Average Exx, Eyy, and Exy strains ± SEM for each gel
concentration. Note that the average strains were taken from 6 unique locations in 3
separate gels (total of 18 total data points).
Gel Conc.
[%w/v]
Exx Strain
(mm/mm)
Eyy Strain
(mm/mm)
Exy Strain
(mm/mm)
3 0.01 ± 0.00 2.01 ± 0.08 0.20 ± 0.02
3.5 0.00 ± 0.00 1.65 ± 0.11 0.21 ± 0.03
4 0.01 ± 0.00 1.33 ± 0.10 0.19 ± 0.03
4.5 0.01 ± 0.00 1.11 ± 0.08 0.18 ± 0.02
5 0.00 ± 0.00 0.98 ± 0.07 0.14 ± 0.02
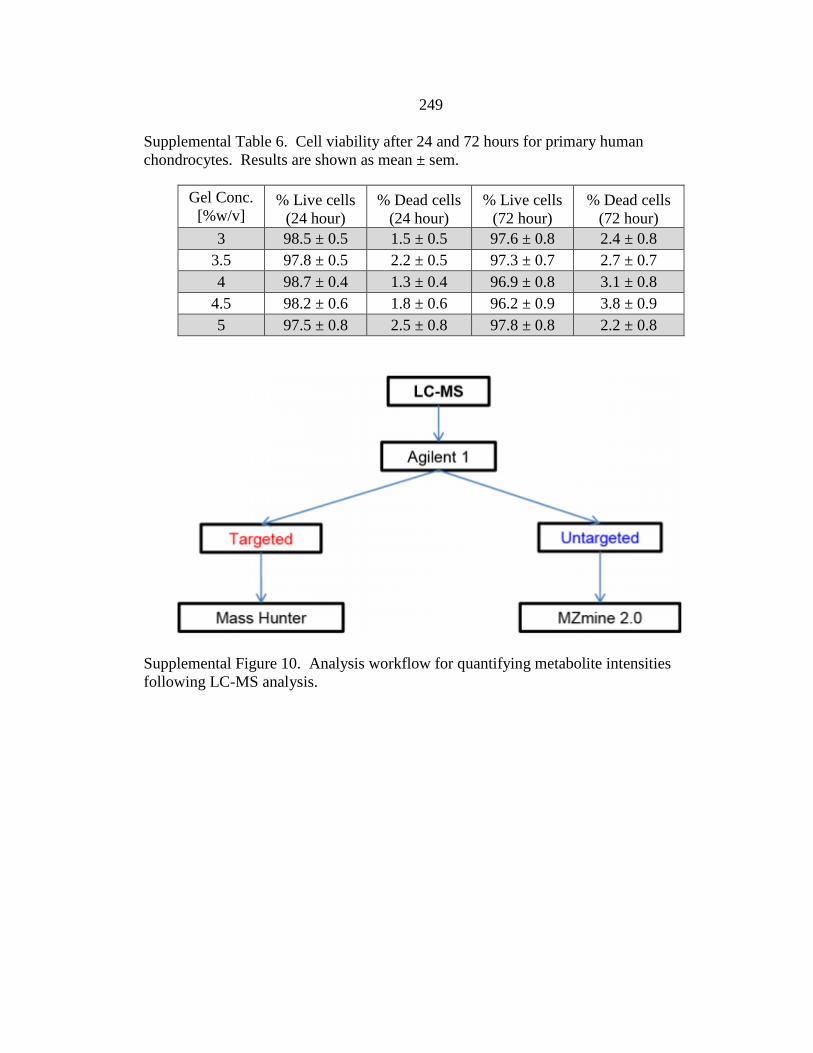
249
Supplemental Table 6. Cell viability after 24 and 72 hours for primary human
chondrocytes. Results are shown as mean ± sem.
Gel Conc.
[%w/v] % Live cells
(24 hour)
% Dead cells
(24 hour)
% Live cells
(72 hour)
% Dead cells
(72 hour)
3 98.5 ± 0.5 1.5 ± 0.5 97.6 ± 0.8 2.4 ± 0.8
3.5 97.8 ± 0.5 2.2 ± 0.5 97.3 ± 0.7 2.7 ± 0.7
4 98.7 ± 0.4 1.3 ± 0.4 96.9 ± 0.8 3.1 ± 0.8
4.5 98.2 ± 0.6 1.8 ± 0.6 96.2 ± 0.9 3.8 ± 0.9
5 97.5 ± 0.8 2.5 ± 0.8 97.8 ± 0.8 2.2 ± 0.8
Supplemental Figure 10. Analysis workflow for quantifying metabolite intensities
following LC-MS analysis.

250
Supplemental Figure 11. Scatter plots of untargeted metabolites. Comparing unloaded
controls to both 15 minutes of loading (A) and 30 minutes of loading (B), we observe
clusters of metabolites that are either induced or suppressed by mechanical loading.

251
Supplemental Figure 12. Representative chromatograms of targeted metabolites.
Representative chromatograms are shown for the extracted ion intensity of targeted
metabolites of median intensity. Intensity is summed over all ions and adducts. (A) ADP
(B) Citrate (C) NADPH (D) Oxaloacetate (E) Pyruvate.

252
APPENDIX C
SUPPLEMENTAL MATERIAL FOR CHAPTER 3
METABOLOMICS
253
Supplemental Materials and Methods
Untargeted and Targeted Metabolomic Profiling. Metabolomics is an
experimental technique for characterizing large numbers of small molecules (<1000 Da)
in biological samples [96]. Recent studies of joint tissues and fluids have used
metabolomic analysis to examine OA phenotypes, identify candidate biomarkers, and
explore the inflammatory responses [179-182]. Metabolite detection was performed in
the Montana State University Mass Spectrometry Core Facility [155-157] via HPLC-MS.
An aqueous normal-phase, hydrophilic interaction chromatography (ANP/HILIC) HPLC
column was used (Cogent Diamond Hydride Type-C) with 4 m particles, 150 mm
length, and 2.1 mm diameter. The column was used with an Agilent 1290 HPLC system.
Chromatography was performed using previously developed methods [116]. Buffer A
consisted of H2O with 0.1% (v/v) formic acid and buffer B consisted of acetonitrile with
0.1% formic acid. The sample was injected (4 µL per injection) via an autosampler
following column equilibration at 95% B. The column as flushed for 2.0 min, and then
from 2.0 min until the end of the run, the eluant was directed to the mass spectrometer
(MS). For each run, the gradient was linearly ramped from 95% B at 2 minutes to 25% B
at 12.5 minutes. . The column was then held isocratically at 25% B from 12.5 min to
13.5 min prior to re-equilibration at 95% B from 13.5 min to 15 min. Following each
run, blank solvent samples were run to ensure complete washing of the column and
fluidics. Metabolites were detected using an Agilent 6538 Q-TOF dual-ESI source mass
spectrometer with a resolution of ~20,000 and accuracy of ~5 ppm. The spectra were
collected in positive mode for a mass range of 50 m/z to 1000 m/z at a frequency of 1 Hz.

254
Data Processing. Data analysis involved both an untargeted and targeted
approach (Supplemental Figure 13). For the untargeted approach, raw HPLC-MS data
was converted into .mzXML files using MS Convert (ProteoWizard), and then processed
using MZmine2.0 [158]. In MZmine2.0 the datasets were then filtered using established
methods [116, 158] as follows: the chromatograms were generated using a minimum
signal level of 1000 m/z with m/z tolerance of 15 ppm, and a minimum time span of 0.1
minutes. Chromatograms were then normalized using a retention time tolerance of 0.25
min and a minimum standard intensity of 1000 m /z, with a tolerance of 15 ppm.
Following chromatogram normalization, chromatograms were then aligned using the
retention time tolerance, and a mass tolerance of 15 ppm. The generated lists were then
used for statistical analysis and metabolite identification.
For the targeted approach, ~50 metabolites known to be involved in central
energy metabolism [102, 154] were analyzed. Using the Quantitative Analysis package
within MassHunter Workstation B.04.00 (Agilent Technologies), a database of the
calculated isotopic distributions (including H+ and Na+ adducts) of these targeted masses
(Isotope Distribution Calculator, Agilent Technologies) was created. To identify these
targeted metabolites, retention times were used with matched values to those from
standard analytical samples determined and maintained by the MSU Mass Spectrometry
Core. A 20 ppm window for each m/z value was used to evaluate each of the targeted
metabolites.
Data Analysis and Candidate Selection. To assess the effects of physiological
loading on chondrocyte biology, unloaded control samples were compared against
255
dynamically compressed samples. Three groups of cell-seeded agarose hydrogels were
established for comparative purposes. Samples that did not undergo dynamic
compression served as the unloaded control samples (UC), and then samples that
received either 15 (DL15) or 30 (DL30) minutes of dynamic compression comprised the
loaded samples. Statistical analysis was performed both on individual donors and
pooling the data from all the donors together. We defined detected masses as those
present in the majority of samples and replicates. To determine statistically significant
differences between unloaded samples and loaded samples comparisons were made using
t-tests [160] with p-value corrections using standard false discovery rate (FDR)
calculations [259] to minimize false positives associated with multiple comparison
testing. Three comparisons were made: (1) between individual donors and (2) between
groups within the pooled data: UC vs. DL15, UC vs. DL30, and DL15 vs. DL30.
Principal components analysis (PCA) was utilized to assess metabolome-scale
changes caused by mechanical loading. HPLC-MS data were normalized using both
variance-stabilizing logarithmic transformation [293] and median fold change
normalization [294, 295]. Median fold change normalization has been shown to be a
robust method in normalizing HPLC-MS data with dilution and concentration-induced
variations [295]. This technique normalizes each of the intensities by the median of the
fold changes of peak intensities (Equation 1).
𝑀𝐹𝐶𝑗 = 𝑚𝑒𝑑𝑖𝑎𝑛(𝑥𝑖𝑗
𝑥𝑟𝑣) (1)
where xij are the individual intensity values and xrv is the reference variable for
normalizing the intensity values. The choice of the reference variable (i.e. median) is not
256
critical for this normalization technique and is usually chosen to be the median profile
value [295]. To account for heteroscedastic noise in the data, a logarithmic-based
transformation was used to help stabilize the variance by transforming the peak intensity
variance from a multiplicative error into an additive error.
Pearson’s correlation coefficients were used to estimate the flux of metabolite
intensities over the time course of loading. For the correlation analysis, the duration of
dynamic loading (0, 15, or 30 minutes) was chosen as the independent variable and the
dependent variable was chosen to be the intensity values for each detected metabolite.
Metabolite accumulations with increased loading were identified by positive correlations
values, and negative correlations were indicative of metabolite depletion. Candidate
mediators were defined as the top 25 (i.e. accumulated) and bottom 25 (i.e. depleted)
statistically significant correlations. Data are presented as mean +/- standard error of the
mean.
To assess the differences in intensity distributions (m/z spectra plots for the
various loading groups), two-sample Kolmogorov-Smirnov tests were implemented.
Kolmogorov-Smirnov tests are a non-parametric test for the equality of distributions
between two samples. Mass values were the independent variables and detected
metabolite intensities were the dependent variables for distribution analysis. Three
sample distribution comparisons were made: UC vs. DL15, UC vs. DL30, and DL15 vs.
DL30.

257
Targeted metabolite profiles were analyzed by PCA, hierarchical agglomerative
cluster analysis and correlation analyses. Additionally, the median ratios of
NADP+:NADPH, NAD+:NADH, ATP:ADP, and GDP:GTP were calculated as a
function of time to assess relative changes in energy metabolism.
Supplemental Figure 13. Experimental design. (A) Schematic for both targeted and
untargeted experimental methods. (i) Primary human OA chondrocytes are encapsulated
in physiologically stiff agarose (4.5% agarose, stiffness ~35 kPa), cultured for 72 hours,
and then compressed in tissue culture for 0, 15, or 30 minutes (Control, DL15, or DL30).
(ii) Metabolites are extracted following freezing and pulverization. (iii) Metabolite
profiles are identified using HPLC-MS, and (iv) the data is processed using Agilent
software prior to (v) untargeted and targeted analyses.

258
Supplemental Figure 14. Statistically significant differences (two-sample Kolmogorov-
Smirnov tests) in m/z spectra distributions for UC vs. DL15 (pks < 0.01), UC vs. DL30
(pks << 0.01), and DL15 vs. DL30 (pks << 0.01), respectively.
Supplemental Figure 15. (A) Age-correlated increases in the number of significant
metabolites for donors 1 - 5. (B) Characteristics of femoral head articular cartilage for
all donors used in this study. All patients had Grade IV osteoarthritis at the time of joint
replacement.

259
Supplemental Figure 16. To further explore the effects of dynamic compression on the
chondrocyte metabolome, we determined the number of metabolites unique to each
experimental group (UC, DL15, and DL30). 107 metabolites were detected in the
unloaded control samples (UC) that were not detected in the samples subjected to 15
minutes of dynamic loading (DL15), and 155 metabolites were detected in DL15 that
were not detected in UC. 287 metabolites were detected in UC that were not detected in
samples subjected to 30 minutes of dynamic loading (DL30), whereas 148 metabolites
were detected in DL30 that were not in UC. 291 metabolites were detected in DL15 that
were not detected in DL30, whereas 104 metabolites were detected in DL30 that were not
in DL15 samples.

260
Supplemental Table 7. Candidate mediators of chondrocyte mechanotransduction from
the targeted metabolite analysis.
m/z RT Metabolite Name Observation
664.1164 5.6318 NAD+ ↑ w/ loading
147.0764 6.4786 Glutamine ↑ w/ loading
810.1620 5.5304 FADH2 ↑ w/ loading
810.1330 5.5775 Acetyl CoA ↑ w/ loading
277.0319 6.0896 6-P-Gluconate ↑ w/ loading
119.0343 5.5587 Succinate ↑ w/ loading
291.0476 6.0405 Sedoheptulose-7-Phosophate ↑ w/ loading
170.0913 8.7273 Glutamate ↑ w/ loading
283.0189 5.4653 Hexose-P ↑ w/ loading
111.0053 8.9530 Pyruvate ↑ w/ loading
208.9821 7.3474 3-phosphoglycerate ↑ w/ loading
768.0803 5.5285 NADPH ↑ w/ loading
790.1044 5.6345 HS-CoA ↓ w/ loading
529.9850 5.9012 ATP ↓ w/ loading
259.0213 6.3640 p-glucanolactone ↓ w/ loading
203.0508 2.7622 Glucose ↓ w/ loading
444.0321 5.8544 GDP ↓ w/ loading
167.9818 6.0890 Phosphoenolpyruvate ↓ w/ loading
112.0369 8.4078 Alanine ↓ w/ loading
156.0751 8.1884 Aspartate ↓ w/ loading
215.0148 2.5620 Citrate ↓ w/ loading
116.0700 8.3419 Proline ↓ w/ loading

261
Supplemental Table 8. Up-regulated candidate mediators of chondrocyte
mechanotransduction from the untargeted metabolite analysis.
m/z RT Condition Compound
84.9592 8.9222 ↑ w/ loading Unknown
111.0433 3.0974 ↑ w/ loading 3R-Hydroxybutan-2-one
120.0788 5.5073 ↑ w/ loading Unknown
129.0541 3.0800 ↑ w/ loading Ascorbic acid
138.0713 3.5688 ↑ w/ loading Unknown
143.0746 3.3049 ↑ w/ loading Unknown
147.1252 6.4780 ↑ w/ loading Unknown
156.1286 8.0259 ↑ w/ loading Unknown
163.0577 5.7755 ↑ w/ loading 2-Dehydro-3-deoxy-L-rhamnonate
164.9203 5.7195 ↑ w/ loading Unknown
176.0903 10.3790 ↑ w/ loading N-Guanylhistamine
182.1348 3.4106 ↑ w/ loading Unknown
186.0340 6.4681 ↑ w/ loading Syringic acid
208.0134 5.6282 ↑ w/ loading Quinoclamin
218.1365 6.0933 ↑ w/ loading O-propanoyl-carnitine
257.1117 3.4792 ↑ w/ loading Dihydrothymine
328.1359 5.4860 ↑ w/ loading 3-Methyladipic acid
350.0643 5.6207 ↑ w/ loading O-Desmethyloxotolrestat
382.0866 5.5249 ↑ w/ loading Mesosulfuran-Methyl
404.1211 7.9940 ↑ w/ loading Tryptamine
426.0650 7.3623 ↑ w/ loading Unknown
639.2869 8.4505 ↑ w/ loading 1,1-Dimethoxyethane
650.0662 5.9640 ↑ w/ loading Unknown
911.1567 6.4476 ↑ w/ loading Unknown

262
Supplemental Table 9. Down-regulated candidate mediators of chondrocyte
mechanotransduction from the untargeted metabolite analysis.
m/z RT Condition Compound
113.0651 8.2841 ↓ w/ loading Unknown
122.0699 9.3803 ↓ w/ loading Unknown
125.9847 9.1663 ↓ w/ loading Taurine
133.0587 9.3807 ↓ w/ loading Unknown
141.9573 3.1275 ↓ w/ loading Unknown
143.0569 8.1949 ↓ w/ loading 2-Methyl-5-vinylpyrazine
144.0463 9.3821 ↓ w/ loading 2-Propionyl-2-thiazoline
162.0889 2.4060 ↓ w/ loading 1-Indolizidinone
177.0410 2.8854 ↓ w/ loading 5-Dehydro-4-deoxy-D-glucuronate
184.0590 2.7111 ↓ w/ loading 5-Methoxy-3-hydroxyanthranilate
204.0545 5.5727 ↓ w/ loading Unknown
259.0252 6.3637 ↓ w/ loading 2-Keto-3-deoxy-6-phosphogluconic acid
319.1379 8.1488 ↓ w/ loading 12S-HHT
326.1550 8.2630 ↓ w/ loading alpha-Ethyl-alpha,beta-diphenyl-2-pyridineethanol
369.0816 2.7279 ↓ w/ loading Methyl 6-O-galloyl-beta-D-glucopyranoside
400.9953 3.2679 ↓ w/ loading Unknown
408.0922 3.4148 ↓ w/ loading Zeanoside C
438.1920 2.5692 ↓ w/ loading Fluphenazine
468.9914 3.0655 ↓ w/ loading Cromoglicic acid
505.9194 6.0645 ↓ w/ loading dCTP
535.1237 6.4521 ↓ w/ loading (R)-Isobyakangelicin 3'-glucoside
542.1715 5.0268 ↓ w/ loading Unknown
564.2168 9.2873 ↓ w/ loading Unknown
663.1087 6.3861 ↓ w/ loading Nelumboside

263
APPENDIX D
SUPPLEMENTAL MATERIAL FOR CHAPTER 5
IN VIVO MODEL

264
Supplemental Figure 17. Patterns of distinct metabolite distribution for 37 targeted
metabolites common to central energy metabolism. Unsupervised agglomerative
clustering reveals changes in metabolite intensities for each of the sample groups (ctrl-L,
ctrl-R, Ex-des, and Ex-ctrl).

265
Supplemental Figure 18. Untargeted Principal Components Analysis. The first three
principal components contained 87% of the overall variance. For each of the sample
groups ctrl-L ( ), ctrl-R ( ), Ex-des ( ), and Ex-ctrl ( ), there are n=4 replicates.