Extended ecophysiological analysis of Gomphiocephalus hodgsoni (Collembola): flexibility in life...
15
1 23 Polar Biology ISSN 0722-4060 Volume 34 Number 11 Polar Biol (2011) 34:1713-1725 DOI 10.1007/s00300-011-1001-6 Extended ecophysiological analysis of Gomphiocephalus hodgsoni (Collembola): flexibility in life history strategy and population response A. McGaughran, I. D. Hogg & P. Convey
Transcript of Extended ecophysiological analysis of Gomphiocephalus hodgsoni (Collembola): flexibility in life...
1 23
Polar Biology ISSN 0722-4060Volume 34Number 11 Polar Biol (2011) 34:1713-1725DOI 10.1007/s00300-011-1001-6
Extended ecophysiological analysis ofGomphiocephalus hodgsoni (Collembola):flexibility in life history strategy andpopulation response
A. McGaughran, I. D. Hogg & P. Convey

1 23
Your article is protected by copyright and
all rights are held exclusively by Springer-
Verlag. This e-offprint is for personal use only
and shall not be self-archived in electronic
repositories. If you wish to self-archive your
work, please use the accepted author’s
version for posting to your own website or
your institution’s repository. You may further
deposit the accepted author’s version on a
funder’s repository at a funder’s request,
provided it is not made publicly available until
12 months after publication.
ORIGINAL PAPER
Extended ecophysiological analysis of Gomphiocephalus hodgsoni(Collembola): flexibility in life history strategy and populationresponse
A. McGaughran • I. D. Hogg • P. Convey
Received: 22 September 2010 / Revised: 21 March 2011 / Accepted: 22 March 2011 / Published online: 9 April 2011
� Springer-Verlag 2011
Abstract The springtail Gomphiocephalus hodgsoni
(Arthropoda: Collembola) has been the focus of extensive
ecophysiological and molecular genetic work and is now
arguably the most well-studied of the continental Antarctic
springtails. Here, we further the ecophysiological cata-
logue of this species. First, we provide experimental data
on G. hodgsoni from one summer season at Cape Bird
(Ross Sea Region) examining dispersal ability and desic-
cation tolerance. Next, we expand an existing metabolic
rate dataset that encompasses individual metabolic rate
measurements across both temporal and spatial scales in
southern Victoria Land, adding an additional season of
metabolic rate measurements taken at a cooler, drier
continental location (Garwood Valley). Our data show that
some G. hodgsoni individuals can survive at least ten days
of suspension on the surface of both fresh and sea water.
This, coupled with the presence of G. hodgsoni specimens
in air and pitfall traps suggests that dispersal over local
scales (i.e. metres) is possible for this species. Our meta-
bolic data show that different populations within the same
Antarctic region have different average metabolic rates at
both temporal and spatial scales, indicating that distinct
populations may respond differently to environmental
variables. We suggest that G. hodgsoni maintains a flexi-
ble life history strategy that allows its ecophysiological
response(s) to be dependent on local environmental con-
ditions. Accordingly, there may be no ‘typical’ response to
environmental changes—a factor that should be considered
in both future ecophysiological work and conservation
approaches.
Keywords Activity � Antarctica � Desiccation �Dispersal � Invertebrate � Metabolism � Physiology �Springtail
Introduction
The Antarctic terrestrial ecosystem consists of a large
expanse of seemingly inhospitable continental landscape.
However, within this cold, dry desert are small ice-free
pockets of accommodating habitat that collectively cover
some 0.34% (equating to a total of 46,200 km2; see
Table 1 in Convey et al. 2009) of an otherwise frozen
milieu. These ice-free areas contain remarkable micro-
habitats—home to a suite of largely endemic terrestrial
taxa that includes nematodes, rotifers, tardigrades, mites
and springtails (Pugh and Convey 2008).
This article is an invited contribution on Global Tipping Points
(Global Change and Antarctic Terrestrial Biodiversity) and part of the
SCAR EBA programme. I. Hogg and D. Wall (Guest Editors).
A. McGaughran
Allan Wilson Centre for Molecular Ecology and Evolution,
Massey University, Private Bag 11-222, Palmerston North,
New Zealand
I. D. Hogg
Centre for Biodiversity and Ecology Research, University
of Waikato, Private Bag 3105, Hamilton, New Zealand
P. Convey
British Antarctic Survey, Natural Environment Research
Council, High Cross, Madingley Rd, Cambridge CB3 OET, UK
Present Address:A. McGaughran (&)
Max Planck Institute for Developmental Biology,
Department for Evolutionary Biology, Spemannstrasse 37-39/IV,
72076 Tubingen, Germany
e-mail: [email protected]
123
Polar Biol (2011) 34:1713–1725
DOI 10.1007/s00300-011-1001-6
Author's personal copy
Springtails, the largest microfauna of this group, are
nevertheless small in size (\1 mm), and collectively
dominate the Antarctic landscape in terms of diversity and
abundance (Wise and Gressitt 1965; Block 1994; Sinclair
et al. 2006). Springtail habitat in Antarctica is restricted to
moist ice-free areas such as lake and snow patch edges,
river beds, glacier foregrounds, and vegetated and other
damp soils (Kennedy 1993). At such sites, springtails
generally occur in the soil, vegetation, and/or on the
underside of rocks (Stevens and Hogg 2002). Within their
microhabitats, springtails are thought to feed on algae,
bacteria and fungal fragments, although few specific
studies have been completed (Davidson and Broady 1996;
Worland and Lukesova 2000).
To tolerate large fluctuations in temperature (sometimes
of[30�C daily) and multiple freeze/thaw events, Antarctic
springtails employ a multi-faceted operational strategy
(Block 1981; Block et al. 1988; Block 1990). First, they
exploit above-zero temperatures during the short austral
summer—maximising activity, growth/development and
reproduction and, in some cases, elevating their metabolic
rates to enhance this strategy (Block and Tilbrook 1975,
1978; McGaughran et al. 2009). The characteristics of this
first approach collectively enable springtails to adapt to
their chronically cold environment. Second, they have
some capacity for cold tolerance, achieved by supercool-
ing—maintaining body fluids in the liquid phase below the
freezing point of water (Block 1990; Sinclair and Sjursen
2001).
In addition to cold adaptation/tolerance, springtails must
tolerate elevated UV radiation and long periods of low
water and nutrient availability (Convey 1996; Peck et al.
2006). With their permeable cuticles and large surface
area: volume ratio, springtails should be highly susceptible
to desiccation stress in particular, and early physiological
work has demonstrated this. For example, in field studies
on Cryptopygus antarcticus (Antarctic Peninsula), animals
tested at 4�C lost water at all relative humidities except
water saturation (Elnitsky et al. 2008). Earlier laboratory
and field-work on this species has also shown a limited
resistance to desiccation and no physiological control over
water loss (Block et al. 1990; Harrisson et al. 1991; Block
and Harrisson 1995; Worland and Block 2003). With the
probable restrictions this places on movement between
microhabitats, taxa-specific dispersal mechanisms likely
contribute heavily to distribution patterns of Antarctic
invertebrates. Indeed, springtails are presumed to stay
within the (moist) soil column during dispersal in order to
avoid exposure to desiccating conditions.
Evidence for springtail dispersal has been largely cir-
cumstantial (Coulson et al. 2002; Hayward et al. 2004;
Nolan et al. 2006), with just one study addressing local
dispersal ability in the springtail C. antarcticus on the
Antarctic Peninsula (Hawes et al. 2007). Analysis of pop-
ulation genetic structure amongst species has shown that
contemporary springtail populations retain genetic links
even over distances exceeding 100 km—and that this has
involved occasional long-distance dispersal events (e.g.
Stevens and Hogg 2003; McGaughran et al. 2008, 2010a).
In the face of desiccating and other dispersal-related
stresses, how have springtails achieved their current
widespread Antarctic distributions and maintained (albeit
limited) gene flow amongst locations?
In addition to questions about springtail dispersal abil-
ity, little is known about other responses springtails may
have to their local environmental conditions. An evolu-
tionary assumption is often made that Antarctic taxa must
respond optimally to favourable environmental conditions
on the basis that costs (and hence selection) will be
incurred if they do not (Worland and Convey 2001). While
it is likely that environmental characteristics of the Ant-
arctic environment (e.g. length of growing season) may
drive the evolution of certain aspects of an organism’s life
history (Convey 1996), differences amongst Antarctic
springtail taxa, or even populations at the local scale, are
largely unquantified. In fact, physiological and ecological
investigations of Antarctic springtails have been dominated
by research, mostly using a single species (C. antarcticus),
in the maritime Antarctic. Some variables, such as meta-
bolic rate, were until recently, not measured anywhere on
the Antarctic continent (McGaughran et al. 2009, 2010b).
However, the springtail Gomphiocephalus hodgsoni has
been the focus of extensive ecophysiological and molecular
genetic work and is now one of the best-studied Antarctic
springtails.
Here, we further the ecophysiological research on this
species. Because recent work has shown that G. hodgsoni
Table 1 Table of temperature measures (average (SD), maximum,
minimum and range, �C) in air, taken at various times from automatic
weather stations located at Cape Bird and Taylor Valley (see
McGaughran et al. 2009)
Location Period Taverage (SD) Tmaximum Tminimum Trange
Cape Bird Dec 2006 -2.7 (2.2) 7.1 -9.6 18.1
Jan 2007 0.6 (1.3) 7.5 -3.6 11.1
Nov 2007 -7.5 (4.7) 7.2 -31.6 38.8
Dec 2007 -1.2 (3.0) 7.9 -7.4 15.3
Jan 2008 -0.9 (2.0) 7.2 -11.6 18.8
Taylor Valley Dec 2006 -3.8 (2.8) 2.6 -10.2 12.9
Jan 2007 -0.2 (1.2) 5.5 -5.5 11.0
Dec 2007 -2.0 (3.4) 6.7 -10.2 16.9
See the relevant soil data in Table 3 to see how the under-rock
microhabitat is buffered from air temperatures
1714 Polar Biol (2011) 34:1713–1725
123
Author's personal copy
(as well as other species) has persisted in Antarctica
through long evolutionary periods (e.g. Fanciulli et al.
2001; Frati et al. 2001; Stevens and Hogg 2003; Convey
et al. 2008; McGaughran et al. 2008), we are particularly
interested in how, over time, this species has both: (1)
maintained links amongst isolated populations; and (2)
tolerated variable environmental conditions. Thus, we first
examined dispersal ability/desiccation tolerance in
G. hodgsoni during a season at Cape Bird, Ross Island (see
Fig. 1). Given the persistence of genetic relationships
amongst isolated populations, we expected that G. hodg-
soni would show some degree of dispersal ability. We
tested this hypothesis specifically by examining whether
individuals could survive periods of suspension on fresh or
sea water. We also monitored dispersal/activity-levels of
this species throughout the field season using aerial and
pitfall trapping. Next, in order to examine population
responses to environmental variables, we measured meta-
bolic rates of G. hodgsoni in Garwood Valley (Fig. 1),
which has both a cooler and drier climate than Cape Bird
(e.g. Table 1) (McGaughran et al. 2010b). We compared
these measurements to an existing metabolic rate dataset
that encompasses individual metabolic rate measurements
across both temporal and spatial scales in southern Victoria
Land (McGaughran et al. 2009, 2010b). Based on these
previous findings, we expected to see differences between
population metabolic rates measured across locations, due
to the variability of the environmental conditions they
experience.
Materials and methods
Study sites and animals
The work presented here covered two Antarctic field
seasons. During the first field season, ecophysiological
experiments were performed at Cape Bird (77�130S,
166�260E), an ice-free region at the northern tip of Ross
Island, Victoria Land, Antarctica (Fig. 1). All samples at
this location were collected under permit in Antarctic
Specially Protected Area (ASPA) 116 (http://www.era.
gs/resources/apa), which lies approximately 50 m south-
east of the Cape Bird research hut, during the periods:
12–23 November 2007 and 7–23 January 2008. During the
second field season, metabolic rate experiments were per-
formed at Garwood Valley (78�010S, 163�550E), a largely
ice-free inland southern Dry Valley (see Fig. 1), during the
period 22 December 2008–21 January 2009. The field site
was approximately 100 m east of the south-eastern outlet
of Lake Colleen, the main lake in Garwood Valley. In both
seasons, field periods incorporated the active period for G.
hodgsoni, and dates were further defined by logistical
constraints.
Microclimate measurements were taken at both study
sites using iButton thermochron temperature loggers
(DS1921; Dallas Semiconductors, Dallas, USA) placed
beneath rocks in vegetated areas around pitfall traps. These
logged temperature (±0.1�C) every 10 min throughout the
field seasons. Additional microclimate (temperature vari-
ables) data were used from McGaughran et al. (2009,
2010b), including both iButton data, and measures down-
loaded from automatic weather stations at Cape Bird and
Taylor Valley (see Table 1).
The springtail G. hodgsoni, endemic to Victoria Land,
was used for all analyses in this study. In all instances,
collections of large (presumed non-juvenile) animals were
made by either gently sweeping individuals off the
underside of small rocks into a collection vessel using a
very fine paintbrush, or by aspiration.
Cape Bird
We assessed dispersal ability in G. hodgsoni at Cape Bird
using three approaches. Our first approach was to assess
whether G. hodgsoni had any capacity for survival of the
likely timescales involved in local dispersal on water sur-
faces. We placed groups of ten springtails onto the water
surface of small containers (3 cm diameter; 5 cm depth),
filled with either freshwater (from melted snow) or sea-
water. In order to assess survival on the water surface at a
range of temperatures, five containers were placed at each
of three locations corresponding to: (1) an unheated room
inside the research hut (*13�C); (2) an auxiliary storageFig. 1 Study area showing the locations of Cape Bird and Garwood
Valley in southern Victoria Land, Antarctica
Polar Biol (2011) 34:1713–1725 1715
123
Author's personal copy
hut (*4�C); and (3) an external space under the research
hut (*-3�C). Since no facility was available for precise
temperature control at this remote location, iButtons were
used to provide an estimate of the temperature ranges
experienced at each location. One container was removed
from each location every two days. Springtails were then
removed to damp filter paper and kept in a Petri dish, with
survival (the presence of directed movement) assessed
immediately, and at 24 h following removal. The con-
tainers from the external space froze overnight with
springtails still adhering to the surface, so these were also
used to determine whether springtails could potentially
survive contact with ice in this manner. This experiment
was performed in both the November and January field
periods.
Our second approach was to examine potential for local
near-surface wind dispersal. This was tested through the
use of aerial traps, deployed on 13 November 2007. Five
circular plastic containers (5 cm diameter; 10 cm depth)
were placed at each of two sites: a vegetated (moss) ‘val-
ley’ site known to harbour springtails and a nearby
(*10–20 m) shallow moraine ‘ridge’ site where springtails
are not known to be present. To exclude non-aerial matter
and to prevent springtails from crawling into the traps, a
ring of double-sided sticky tape was adhered to the top lip
of each trap. Each trap was held in place using large stones
and filled with a water-glycol mixture. Traps were sur-
veyed daily for evidence of wind-deposited springtails
during both the November and January field periods. Traps
were closed between the November and January periods
due to the absence of field personnel.
Our third assessment of dispersal (and activity), under-
taken in both the November and January periods, used
pitfall trapping. Ten small plastic containers (4.5 cm
diameter; 6 cm depth) were partially filled with glycol,
placed in a plastic (PVC) sleeve, and sunk into the ground
in the vegetated area on 13 November 2007. Each trap was
checked twice daily (at 0900 and 2100; encompassing the
period of direct sunlight at this site) for presence of
springtails (whereby presence in the trap indicated dis-
persal/activity of the species over the previous 12 h). Traps
were closed between the November and January periods
due to the absence of field personnel.
Garwood valley
Standard metabolic rates were measured at Garwood Val-
ley following the protocol used previously at Cape Bird
(see McGaughran et al. 2009, 2010b). In brief, this protocol
employed a fibre-optic oxygen sensing system (Ocean
Optics Inc., USA) to monitor oxygen partial pressure (pO2)
over time for individual animals in a closed respirometry
system with a 10-ll volume chamber. Oxygen partial
pressure was recorded continuously during each metabolic
run and completed partial pressure profiles were used to
calculate oxygen consumption rates on a per animal basis
for each individual, using the observed drop in pO2 over a
given time period in conjunction with the chamber volume.
Because accurate mass measurement was not possible at
this remote study location, individual animal mass was
calculated using a photographic technique (based on the
relationship between weight and length: W = 6.1894 L3.119
9 10-9, where W = weight (lg), L = length (mm), as
modelled for the similar sized maritime Antarctic springtail
C. antarcticus; see Block and Tilbrook 1975), and the
programme Screen Calipers ver. 3.3 (Iconico, Inc. 2006)
(see McGaughran et al. 2010b).
Following machine calibration, the above protocol was
employed over four successive five-day periods throughout
the field season (24 December 2008–19 January 2009) to
evaluate temporal variability in metabolic rates. Specifi-
cally, fresh animals were collected daily at a defined
location lying *100 m east of the camp site from the
underside of rocks and then stored for a *1-h acclimation
period in the tent alcove before metabolic measurement.
Each metabolic run was performed on groups of ten indi-
viduals, and lasted for a 2-h period, where the temperature
was maintained at 10�C (which is within the range expe-
rienced within the species’ typical microhabitats; see
McGaughran et al. 2010b), using a modified incubator
accurate to 0.1�C, and a 240 V generator as a power
source. Five runs (with ten fresh individuals per run) were
performed each day, such that each five-day period con-
sisted of 25 replicates (i.e. total n = 100). For consistency
with the literature, we present metabolic rates in units of
llO2 lg-1 hr-1. To achieve this, we divided the final result
of each metabolic run (i.e. the total drop in pO2) by the
calculated mass of the ten individuals in each run.
Following previously established quality control proce-
dures (see McGaughran et al. 2009, 2010b), blank runs
(n = 10) were completed during the experimental period
following the protocol above except without the addition of
animals to the measurement chamber. This provided an
estimate of the drift or ‘noise’ of the equipment used (data
not shown; see www.oceanoptics.com for information on
the resolution limits of the oxygen sensing system).
Statistics
All statistics were calculated using the programmes Mini-
tab (v. 14, Minitab Inc., Pennsylvania, United States) and
Microsoft Office Excel (v. 2003, Microsoft Corp., Wash-
ington, United States).
Specifically, paired t-tests were performed to evaluate
the difference in number of springtails caught per day in
pitfall traps between the two experimental periods at Cape
1716 Polar Biol (2011) 34:1713–1725
123
Author's personal copy
Bird. An ANOVA was used to determine whether there
was any difference in average metabolic rate over the four
measurement periods at Garwood Valley. Significant dif-
ferences (P \ 0.05) in ANOVA were further analysed with
Tukey’s post hoc pairwise comparisons. Finally, regression
analyses were used to evaluate potential correlations
between both pitfall data (Cape Bird) and metabolic rate
(Garwood Valley), and environmental microclimate vari-
ables, including daily average, maximum, and minimum
temperature, and daily temperature range.
Results
Cape Bird
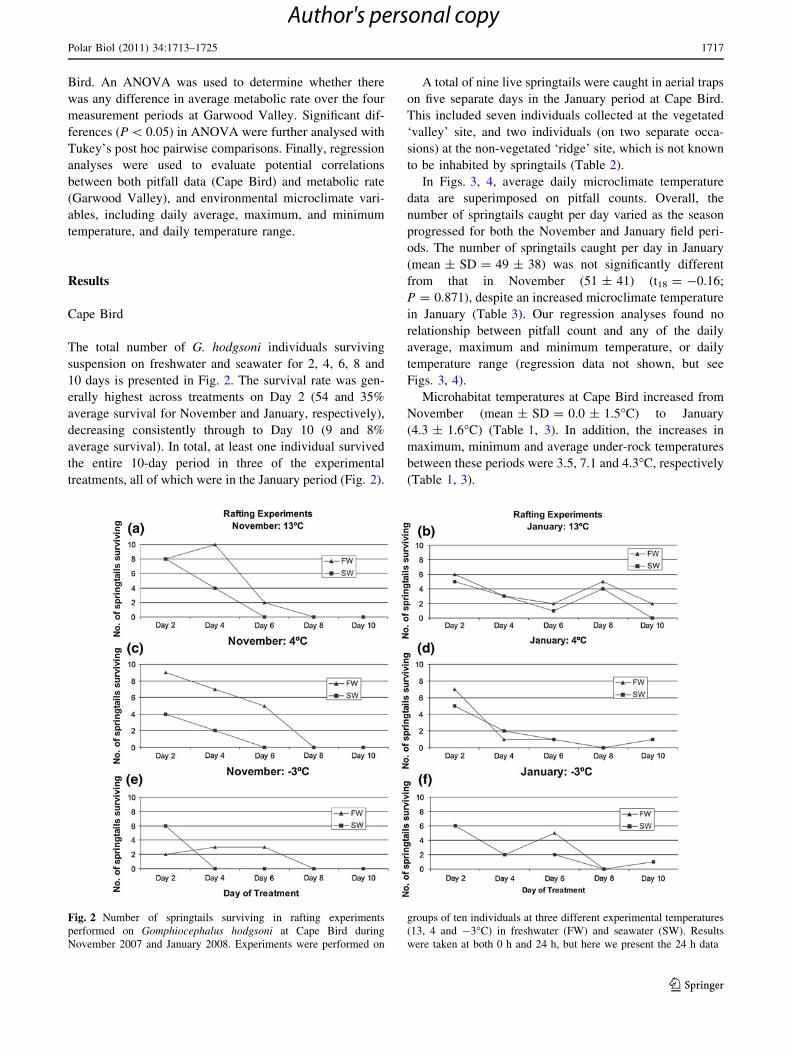
The total number of G. hodgsoni individuals surviving
suspension on freshwater and seawater for 2, 4, 6, 8 and
10 days is presented in Fig. 2. The survival rate was gen-
erally highest across treatments on Day 2 (54 and 35%
average survival for November and January, respectively),
decreasing consistently through to Day 10 (9 and 8%
average survival). In total, at least one individual survived
the entire 10-day period in three of the experimental
treatments, all of which were in the January period (Fig. 2).
A total of nine live springtails were caught in aerial traps
on five separate days in the January period at Cape Bird.
This included seven individuals collected at the vegetated
‘valley’ site, and two individuals (on two separate occa-
sions) at the non-vegetated ‘ridge’ site, which is not known
to be inhabited by springtails (Table 2).
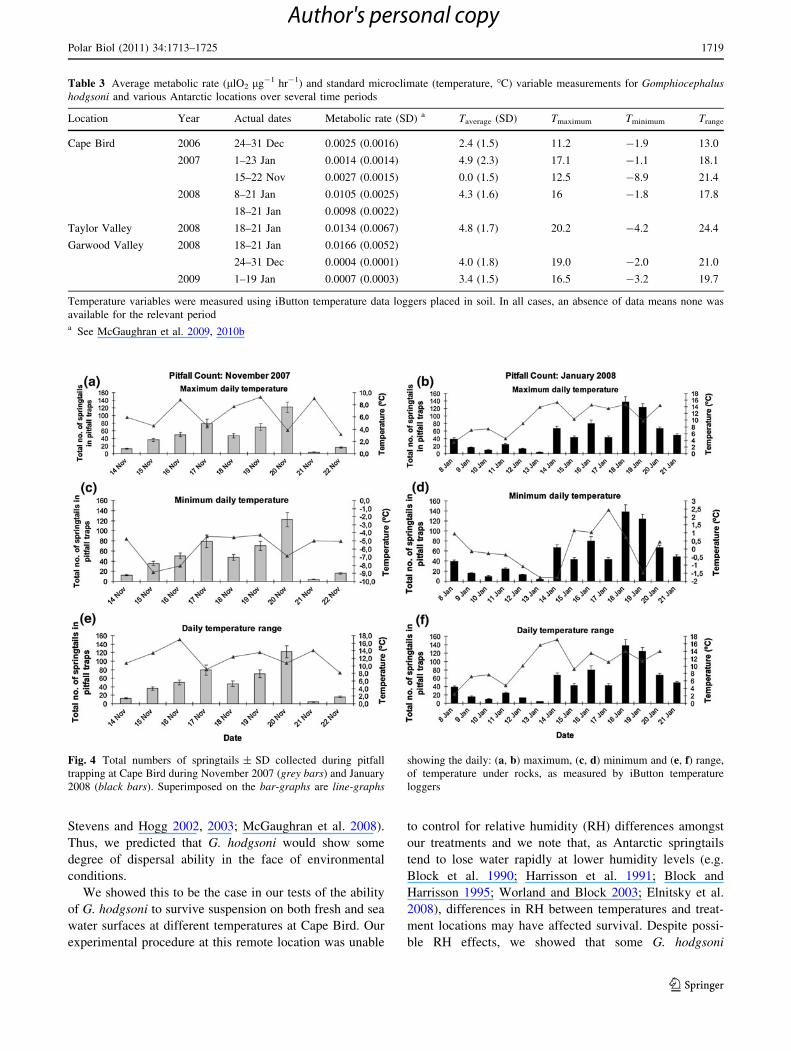
In Figs. 3, 4, average daily microclimate temperature
data are superimposed on pitfall counts. Overall, the
number of springtails caught per day varied as the season
progressed for both the November and January field peri-
ods. The number of springtails caught per day in January
(mean ± SD = 49 ± 38) was not significantly different
from that in November (51 ± 41) (t18 = -0.16;
P = 0.871), despite an increased microclimate temperature
in January (Table 3). Our regression analyses found no
relationship between pitfall count and any of the daily
average, maximum and minimum temperature, or daily
temperature range (regression data not shown, but see
Figs. 3, 4).
Microhabitat temperatures at Cape Bird increased from
November (mean ± SD = 0.0 ± 1.5�C) to January
(4.3 ± 1.6�C) (Table 1, 3). In addition, the increases in
maximum, minimum and average under-rock temperatures
between these periods were 3.5, 7.1 and 4.3�C, respectively
(Table 1, 3).
Fig. 2 Number of springtails surviving in rafting experiments
performed on Gomphiocephalus hodgsoni at Cape Bird during
November 2007 and January 2008. Experiments were performed on
groups of ten individuals at three different experimental temperatures
(13, 4 and -3�C) in freshwater (FW) and seawater (SW). Results
were taken at both 0 h and 24 h, but here we present the 24 h data
Polar Biol (2011) 34:1713–1725 1717
123
Author's personal copy
Garwood valley
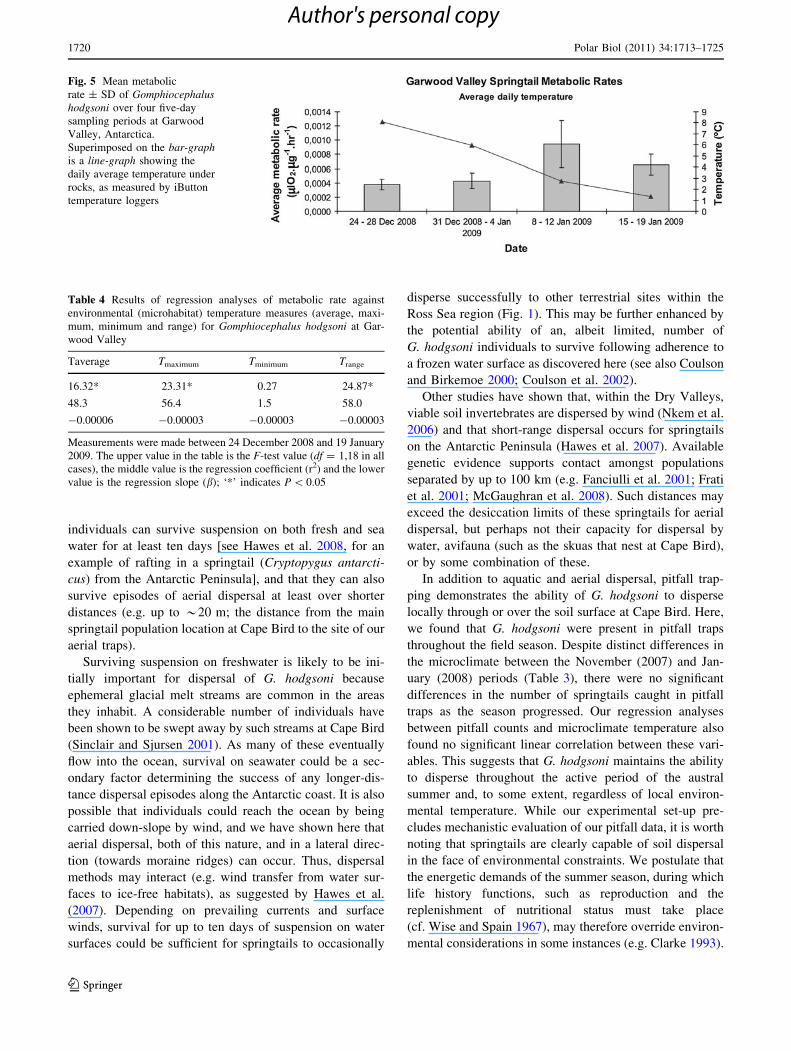
Metabolic rates measured at Garwood Valley were signif-
icantly different amongst the four, five-day measurement
periods (F3,96 = 45.47; P \ 0.001). In particular, mass-
specific metabolic rate increased as the season progressed,
with the highest average rate (0.00095 ± 0.00033 (SD)
llO2 lg-1 hr-1), measured in the third measurement per-
iod (8–12 January 2009), despite average microhabitat
temperatures decreasing over this time (Table 3, Figs. 5,
6). Regression analyses showed a degree of weak, but
significant, correlation between metabolic rate measure-
ments and average daily maximum temperature and daily
temperature range, but not minimum daily temperature
(Table 4).
The temperature profile measured at Garwood Valley
showed some differences to the temperatures previously
recorded at Cape Bird, although we unfortunately lack
directly comparable microclimate data (Table 1, 3). We
interpret the data available to suggest that daily minimum
temperatures may be slightly lower at Garwood Valley
than at Cape Bird (-1.8 and -3.2�C for Cape Bird, Jan-
uary 2008 and Garwood Valley, January 2009, respec-
tively; Table 3), with the range of temperature variability
slightly greater at Garwood Valley (17.8� and 19.7�C;
Table 3).
In addition to evaluating temporal variability in meta-
bolic rates at Garwood Valley, we used data from previous
field seasons (2006–2008; see McGaughran et al. 2009,
2010b) to evaluate the spatial and temporal variation
amongst metabolic rate measurements for all measures
made to date, with temperature variables superimposed
(Figs. 7; 8). These figures highlight the uncoupling of daily
mean temperature from springtail metabolic rate (e.g.
12–22 November 2007 at Cape Bird and 1–19 January
2009 at Garwood Valley; Fig. 7).
Discussion
Historically, authors have presumed that the dry Antarctic
atmosphere would cause desiccation of springtails during
any dispersal attempts (e.g. Gressitt et al. 1960; Frati et al.
2001). Genetic patterns seemed to counter this assumption,
finding support for occasional long-distance dispersal
amongst populations in southern Victoria Land (e.g.
Table 2 Results of aerial trapping observations performed at Cape
Bird
Date Location No. of springtails
10 Jan Valley 2
14 Jan Ridge 1
15 Jan Valley 2
17 Jan Valley 2
Ridge 1
19 Jan Valley 1
Fig. 3 Total numbers of
springtails ± SD collected
during pitfall trapping at Cape
Bird in: a November 2007; and
b January 2008. Superimposed
on the bar-graph is a line-graphshowing the daily average
temperature under rocks, as
measured by iButton
temperature loggers
1718 Polar Biol (2011) 34:1713–1725
123
Author's personal copy
Stevens and Hogg 2002, 2003; McGaughran et al. 2008).
Thus, we predicted that G. hodgsoni would show some
degree of dispersal ability in the face of environmental
conditions.
We showed this to be the case in our tests of the ability
of G. hodgsoni to survive suspension on both fresh and sea
water surfaces at different temperatures at Cape Bird. Our
experimental procedure at this remote location was unable
to control for relative humidity (RH) differences amongst
our treatments and we note that, as Antarctic springtails
tend to lose water rapidly at lower humidity levels (e.g.
Block et al. 1990; Harrisson et al. 1991; Block and
Harrisson 1995; Worland and Block 2003; Elnitsky et al.
2008), differences in RH between temperatures and treat-
ment locations may have affected survival. Despite possi-
ble RH effects, we showed that some G. hodgsoni
Fig. 4 Total numbers of springtails ± SD collected during pitfall
trapping at Cape Bird during November 2007 (grey bars) and January
2008 (black bars). Superimposed on the bar-graphs are line-graphs
showing the daily: (a, b) maximum, (c, d) minimum and (e, f) range,
of temperature under rocks, as measured by iButton temperature
loggers
Table 3 Average metabolic rate (llO2 lg-1 hr-1) and standard microclimate (temperature, �C) variable measurements for Gomphiocephalushodgsoni and various Antarctic locations over several time periods
Location Year Actual dates Metabolic rate (SD) a Taverage (SD) Tmaximum Tminimum Trange
Cape Bird 2006 24–31 Dec 0.0025 (0.0016) 2.4 (1.5) 11.2 -1.9 13.0
2007 1–23 Jan 0.0014 (0.0014) 4.9 (2.3) 17.1 -1.1 18.1
15–22 Nov 0.0027 (0.0015) 0.0 (1.5) 12.5 -8.9 21.4
2008 8–21 Jan 0.0105 (0.0025) 4.3 (1.6) 16 -1.8 17.8
18–21 Jan 0.0098 (0.0022)
Taylor Valley 2008 18–21 Jan 0.0134 (0.0067) 4.8 (1.7) 20.2 -4.2 24.4
Garwood Valley 2008 18–21 Jan 0.0166 (0.0052)
24–31 Dec 0.0004 (0.0001) 4.0 (1.8) 19.0 -2.0 21.0
2009 1–19 Jan 0.0007 (0.0003) 3.4 (1.5) 16.5 -3.2 19.7
Temperature variables were measured using iButton temperature data loggers placed in soil. In all cases, an absence of data means none was
available for the relevant perioda See McGaughran et al. 2009, 2010b
Polar Biol (2011) 34:1713–1725 1719
123
Author's personal copy
individuals can survive suspension on both fresh and sea
water for at least ten days [see Hawes et al. 2008, for an
example of rafting in a springtail (Cryptopygus antarcti-
cus) from the Antarctic Peninsula], and that they can also
survive episodes of aerial dispersal at least over shorter
distances (e.g. up to *20 m; the distance from the main
springtail population location at Cape Bird to the site of our
aerial traps).
Surviving suspension on freshwater is likely to be ini-
tially important for dispersal of G. hodgsoni because
ephemeral glacial melt streams are common in the areas
they inhabit. A considerable number of individuals have
been shown to be swept away by such streams at Cape Bird
(Sinclair and Sjursen 2001). As many of these eventually
flow into the ocean, survival on seawater could be a sec-
ondary factor determining the success of any longer-dis-
tance dispersal episodes along the Antarctic coast. It is also
possible that individuals could reach the ocean by being
carried down-slope by wind, and we have shown here that
aerial dispersal, both of this nature, and in a lateral direc-
tion (towards moraine ridges) can occur. Thus, dispersal
methods may interact (e.g. wind transfer from water sur-
faces to ice-free habitats), as suggested by Hawes et al.
(2007). Depending on prevailing currents and surface
winds, survival for up to ten days of suspension on water
surfaces could be sufficient for springtails to occasionally
disperse successfully to other terrestrial sites within the
Ross Sea region (Fig. 1). This may be further enhanced by
the potential ability of an, albeit limited, number of
G. hodgsoni individuals to survive following adherence to
a frozen water surface as discovered here (see also Coulson
and Birkemoe 2000; Coulson et al. 2002).
Other studies have shown that, within the Dry Valleys,
viable soil invertebrates are dispersed by wind (Nkem et al.
2006) and that short-range dispersal occurs for springtails
on the Antarctic Peninsula (Hawes et al. 2007). Available
genetic evidence supports contact amongst populations
separated by up to 100 km (e.g. Fanciulli et al. 2001; Frati
et al. 2001; McGaughran et al. 2008). Such distances may
exceed the desiccation limits of these springtails for aerial
dispersal, but perhaps not their capacity for dispersal by
water, avifauna (such as the skuas that nest at Cape Bird),
or by some combination of these.
In addition to aquatic and aerial dispersal, pitfall trap-
ping demonstrates the ability of G. hodgsoni to disperse
locally through or over the soil surface at Cape Bird. Here,
we found that G. hodgsoni were present in pitfall traps
throughout the field season. Despite distinct differences in
the microclimate between the November (2007) and Jan-
uary (2008) periods (Table 3), there were no significant
differences in the number of springtails caught in pitfall
traps as the season progressed. Our regression analyses
between pitfall counts and microclimate temperature also
found no significant linear correlation between these vari-
ables. This suggests that G. hodgsoni maintains the ability
to disperse throughout the active period of the austral
summer and, to some extent, regardless of local environ-
mental temperature. While our experimental set-up pre-
cludes mechanistic evaluation of our pitfall data, it is worth
noting that springtails are clearly capable of soil dispersal
in the face of environmental constraints. We postulate that
the energetic demands of the summer season, during which
life history functions, such as reproduction and the
replenishment of nutritional status must take place
(cf. Wise and Spain 1967), may therefore override environ-
mental considerations in some instances (e.g. Clarke 1993).
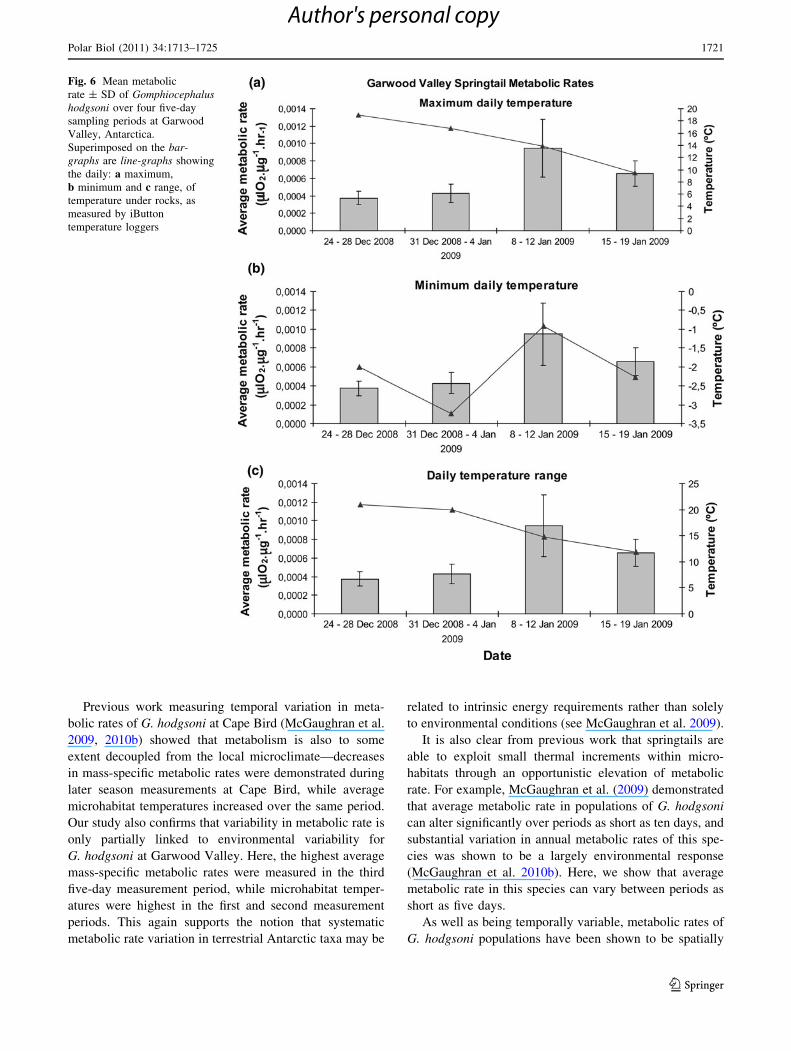
Fig. 5 Mean metabolic
rate ± SD of Gomphiocephalushodgsoni over four five-day
sampling periods at Garwood
Valley, Antarctica.
Superimposed on the bar-graphis a line-graph showing the
daily average temperature under
rocks, as measured by iButton
temperature loggers
Table 4 Results of regression analyses of metabolic rate against
environmental (microhabitat) temperature measures (average, maxi-
mum, minimum and range) for Gomphiocephalus hodgsoni at Gar-
wood Valley
Taverage Tmaximum Tminimum Trange
16.32* 23.31* 0.27 24.87*
48.3 56.4 1.5 58.0
-0.00006 -0.00003 -0.00003 -0.00003
Measurements were made between 24 December 2008 and 19 January
2009. The upper value in the table is the F-test value (df = 1,18 in all
cases), the middle value is the regression coefficient (r2) and the lower
value is the regression slope (b); ‘*’ indicates P \ 0.05
1720 Polar Biol (2011) 34:1713–1725
123
Author's personal copy
Previous work measuring temporal variation in meta-
bolic rates of G. hodgsoni at Cape Bird (McGaughran et al.
2009, 2010b) showed that metabolism is also to some
extent decoupled from the local microclimate—decreases
in mass-specific metabolic rates were demonstrated during
later season measurements at Cape Bird, while average
microhabitat temperatures increased over the same period.
Our study also confirms that variability in metabolic rate is
only partially linked to environmental variability for
G. hodgsoni at Garwood Valley. Here, the highest average
mass-specific metabolic rates were measured in the third
five-day measurement period, while microhabitat temper-
atures were highest in the first and second measurement
periods. This again supports the notion that systematic
metabolic rate variation in terrestrial Antarctic taxa may be
related to intrinsic energy requirements rather than solely
to environmental conditions (see McGaughran et al. 2009).
It is also clear from previous work that springtails are
able to exploit small thermal increments within micro-
habitats through an opportunistic elevation of metabolic
rate. For example, McGaughran et al. (2009) demonstrated
that average metabolic rate in populations of G. hodgsoni
can alter significantly over periods as short as ten days, and
substantial variation in annual metabolic rates of this spe-
cies was shown to be a largely environmental response
(McGaughran et al. 2010b). Here, we show that average
metabolic rate in this species can vary between periods as
short as five days.
As well as being temporally variable, metabolic rates of
G. hodgsoni populations have been shown to be spatially
Fig. 6 Mean metabolic
rate ± SD of Gomphiocephalushodgsoni over four five-day
sampling periods at Garwood
Valley, Antarctica.
Superimposed on the bar-
graphs are line-graphs showing
the daily: a maximum,
b minimum and c range, of
temperature under rocks, as
measured by iButton
temperature loggers
Polar Biol (2011) 34:1713–1725 1721
123
Author's personal copy
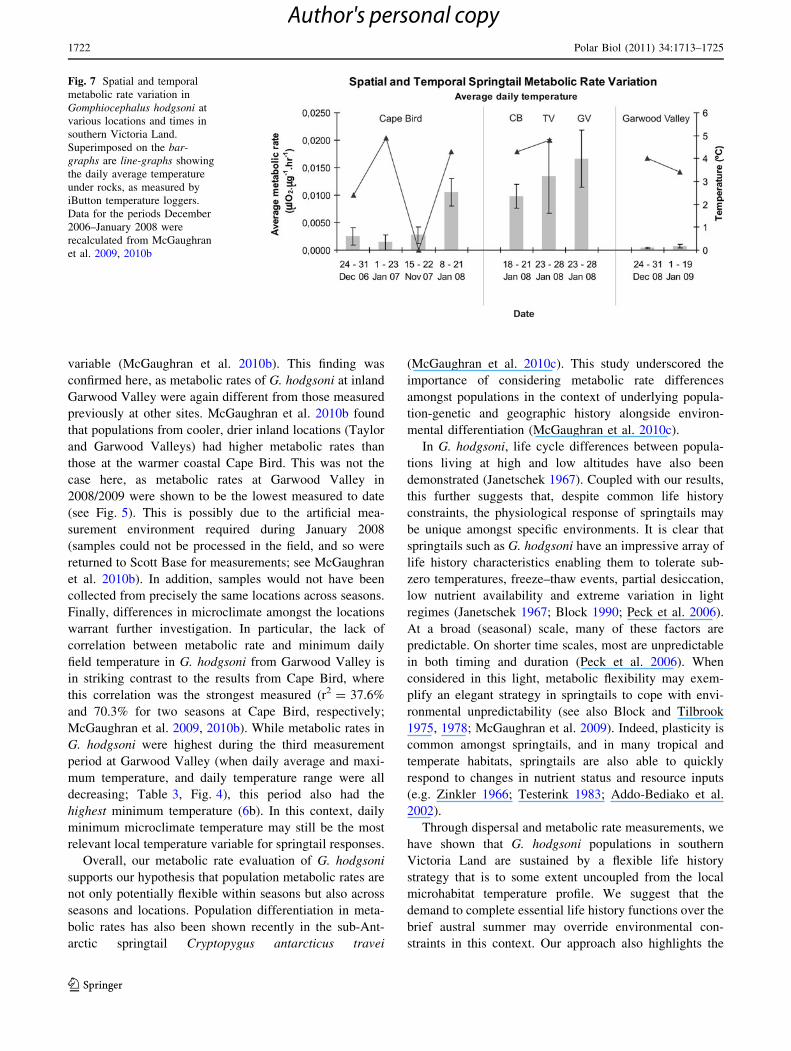
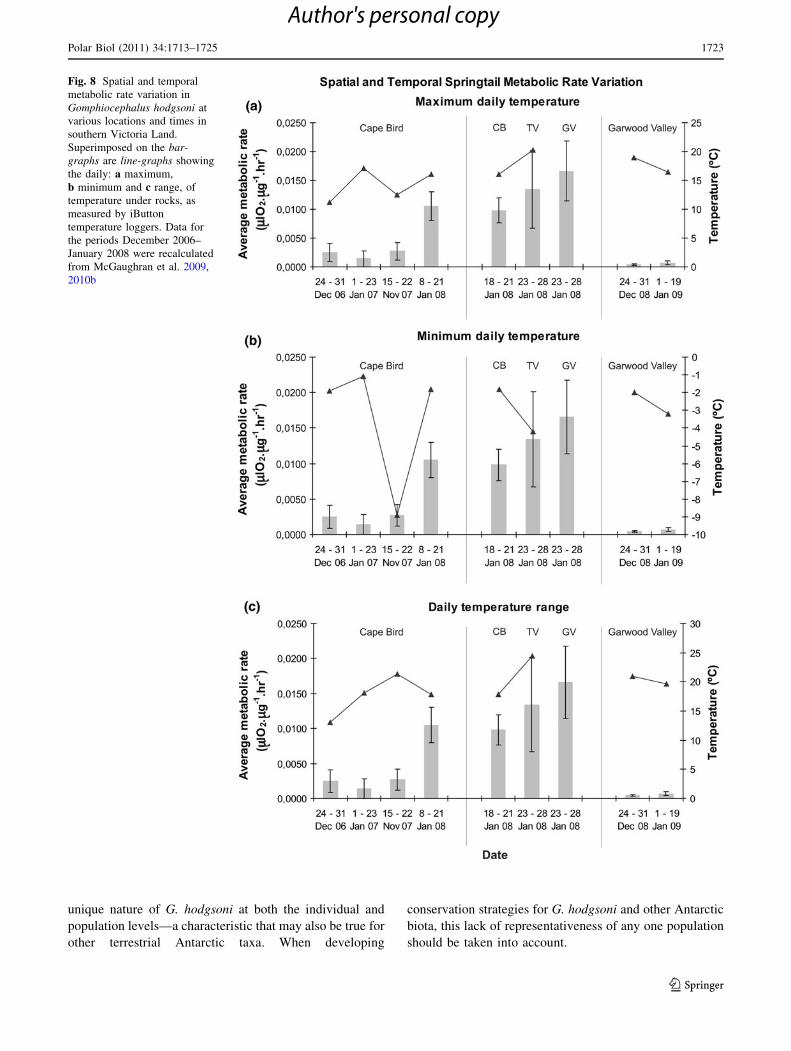
variable (McGaughran et al. 2010b). This finding was
confirmed here, as metabolic rates of G. hodgsoni at inland
Garwood Valley were again different from those measured
previously at other sites. McGaughran et al. 2010b found
that populations from cooler, drier inland locations (Taylor
and Garwood Valleys) had higher metabolic rates than
those at the warmer coastal Cape Bird. This was not the
case here, as metabolic rates at Garwood Valley in
2008/2009 were shown to be the lowest measured to date
(see Fig. 5). This is possibly due to the artificial mea-
surement environment required during January 2008
(samples could not be processed in the field, and so were
returned to Scott Base for measurements; see McGaughran
et al. 2010b). In addition, samples would not have been
collected from precisely the same locations across seasons.
Finally, differences in microclimate amongst the locations
warrant further investigation. In particular, the lack of
correlation between metabolic rate and minimum daily
field temperature in G. hodgsoni from Garwood Valley is
in striking contrast to the results from Cape Bird, where
this correlation was the strongest measured (r2 = 37.6%
and 70.3% for two seasons at Cape Bird, respectively;
McGaughran et al. 2009, 2010b). While metabolic rates in
G. hodgsoni were highest during the third measurement
period at Garwood Valley (when daily average and maxi-
mum temperature, and daily temperature range were all
decreasing; Table 3, Fig. 4), this period also had the
highest minimum temperature (6b). In this context, daily
minimum microclimate temperature may still be the most
relevant local temperature variable for springtail responses.
Overall, our metabolic rate evaluation of G. hodgsoni
supports our hypothesis that population metabolic rates are
not only potentially flexible within seasons but also across
seasons and locations. Population differentiation in meta-
bolic rates has also been shown recently in the sub-Ant-
arctic springtail Cryptopygus antarcticus travei
(McGaughran et al. 2010c). This study underscored the
importance of considering metabolic rate differences
amongst populations in the context of underlying popula-
tion-genetic and geographic history alongside environ-
mental differentiation (McGaughran et al. 2010c).
In G. hodgsoni, life cycle differences between popula-
tions living at high and low altitudes have also been
demonstrated (Janetschek 1967). Coupled with our results,
this further suggests that, despite common life history
constraints, the physiological response of springtails may
be unique amongst specific environments. It is clear that
springtails such as G. hodgsoni have an impressive array of
life history characteristics enabling them to tolerate sub-
zero temperatures, freeze–thaw events, partial desiccation,
low nutrient availability and extreme variation in light
regimes (Janetschek 1967; Block 1990; Peck et al. 2006).
At a broad (seasonal) scale, many of these factors are
predictable. On shorter time scales, most are unpredictable
in both timing and duration (Peck et al. 2006). When
considered in this light, metabolic flexibility may exem-
plify an elegant strategy in springtails to cope with envi-
ronmental unpredictability (see also Block and Tilbrook
1975, 1978; McGaughran et al. 2009). Indeed, plasticity is
common amongst springtails, and in many tropical and
temperate habitats, springtails are also able to quickly
respond to changes in nutrient status and resource inputs
(e.g. Zinkler 1966; Testerink 1983; Addo-Bediako et al.
2002).
Through dispersal and metabolic rate measurements, we
have shown that G. hodgsoni populations in southern
Victoria Land are sustained by a flexible life history
strategy that is to some extent uncoupled from the local
microhabitat temperature profile. We suggest that the
demand to complete essential life history functions over the
brief austral summer may override environmental con-
straints in this context. Our approach also highlights the
Fig. 7 Spatial and temporal
metabolic rate variation in
Gomphiocephalus hodgsoni at
various locations and times in
southern Victoria Land.
Superimposed on the bar-
graphs are line-graphs showing
the daily average temperature
under rocks, as measured by
iButton temperature loggers.
Data for the periods December
2006–January 2008 were
recalculated from McGaughran
et al. 2009, 2010b
1722 Polar Biol (2011) 34:1713–1725
123
Author's personal copy
unique nature of G. hodgsoni at both the individual and
population levels—a characteristic that may also be true for
other terrestrial Antarctic taxa. When developing
conservation strategies for G. hodgsoni and other Antarctic
biota, this lack of representativeness of any one population
should be taken into account.
Fig. 8 Spatial and temporal
metabolic rate variation in
Gomphiocephalus hodgsoni at
various locations and times in
southern Victoria Land.
Superimposed on the bar-
graphs are line-graphs showing
the daily: a maximum,
b minimum and c range, of
temperature under rocks, as
measured by iButton
temperature loggers. Data for
the periods December 2006–
January 2008 were recalculated
from McGaughran et al. 2009,
2010b
Polar Biol (2011) 34:1713–1725 1723
123
Author's personal copy
Acknowledgments We thank Laurie Beth Connell and two anon-
ymous reviewers for their constructive comments on an earlier ver-
sion of the manuscript. We are also grateful to Antarctica New
Zealand for their logistical support. Funding for this project was
provided by a New Zealand Tertiary Education Commission Top
Achiever Doctoral Scholarship and a Sir Robin Irvine Doctoral
Scholarship to AM, with the latter also supporting PC’s fieldwork;
and by a New Zealand Foundation for Research Science and Tech-
nology Grant (UOWX0710) to IH. This paper forms a contribution to
SCAR’s Evolution and Biodiversity in the Antarctic (EBA), Antarc-
tica New Zealand’s Latitudinal Gradient Project (LGP), and British
Antarctic Survey’s Polar Science for Planet Earth (PSPE) research
programmes.
References
Addo-Bediako A, Chown SL, Gaston KJ (2002) Metabolic cold
adaptation in insects: a large scale perspective. Funct Ecol
16:332–338
Block W (1981) Terrestrial arthropods and low temperature. Cryo-
biology 18:436–444
Block W (1990) Cold tolerance of insects and other arthropods. Philos
T Roy Soc B 326:613–633
Block W (1994) Terrestrial ecosystems: Antarctica. Polar Biol
14:293–300
Block W, Harrisson PM (1995) Collembolan water relations and
environmental change in the maritime Antarctic. Global Change
Biol 1:347–359
Block W, Tilbrook PJ (1975) Respiration studies on the Antarctic
collembolan Cryptopygus antarcticus. Oikos 26:15–25
Block W, Tilbrook PJ (1978) Oxygen uptake by Cryptopygusantarcticus (Collembola) at South Georgia. Oikos 30:61–67
Block W, Sømme L, Ring R, Ottesen P, Worland MR (1988)
Adaptations of arthropods to the sub-Antarctic environment. Brit
Antarct Surv B 81:65–67
Block W, Harrisson PM, Vannier G (1990) A comparative study of
relative water loss from two Antarctic springtails (Insecta,
Collembola). J Insect Physiol 36:181–187
Clarke A (1993) Seasonal acclimation and latitudinal compensation in
metabolism: do they exist? Funct Ecol 7:139–149
Convey P (1996) The influence of environmental characteristics on
life history attributes of Antarctic terrestrial biota. Biol Rev
71:191–225
Convey P, Gibson JAE, Hillenbrand C-D, Hodgson DA, Pugh PJA,
Smellie JL, Stevens MI (2008) Antarctic terrestrial life–challeng-
ing the history of the frozen continent? Biol Rev 83:103–117
Convey P, Stevens MI, Hodgson DA, Smellie JL, Hillenbrand C-D,
Barnes DKA, Clarke A, Pugh PJA, Linse K, Cary SC (2009)
Exploring biological constraints on the glacial history of
Antarctica. Quat Sci Rev 28:3035–3048
Coulson SJ, Birkemoe T (2000) Long-term cold tolerance in Arctic
invertebrates: recovery after 4 years at below -20�C. Can J
Zoolog 78:2055–2058
Coulson SJ, Hodkinson ID, Webb NR, Harrison JA (2002) Survival of
terrestrial soil-dwelling arthropods on and in seawater: implica-
tions for trans-oceanic dispersal. Funct Ecol 16:353–356
Davidson MM, Broady PA (1996) Analysis of gut contents of
Gomphiocephalus hodgsoni Carpenter (Collembola: Hypoga-
struridate) at Cape Geology, Antarctica. Polar Biol 16:463–467
Elnitsky MA, Benoit JB, Denlinger DL, Lee RE Jr (2008) Desiccation
tolerance and drought acclimation in the Antarctic collembolan
Cryptopygus antarcticus. J Insect Physiol 54:1432–1439
Fanciulli PP, Summa D, Dallai R, Frati F (2001) High levels of genetic
variability and population differentiation in Gressittacantha
terranova (Collembola, Hexapoda) from Victoria Land, Antarc-
tica. Antarct Sci 13:246–254
Frati F, Spinsanti G, Dallai R (2001) Genetic variation of mtCOII
gene sequences in the collembolan Isotoma klovstadi from
Victoria Land, Antarctica: evidence for population differentia-
tion. Polar Biol 24:934–940
Gressitt JL, Larch RE, O’Brien CW (1960) Trapping air-borne insects
in the Antarctic area. Pac Insects 2:245–250
Harrisson PM, Rothery P, Block W (1991) Drying processes in the
Antarctic collembolan Cryptopygus antarcticus (Willem).
J Insect Physiol 37:883–890
Hawes TC, Worland MR, Convey P, Bale JS (2007) Aerial dispersal
of springtails on the Antarctic Peninsula: implications for local
distribution and demography. Antarct Sci 19:3–10
Hawes TC, Worland MR, Bale JS, Convey P (2008) Rafting in
Antarctic Collembola. J Zool 274:44–50
Hayward SAL, Worland MR, Convey P, Bale JS (2004) Effects of
moisture on the local distribution of the Antarctic Collembo-
la Cryptopygus antarcticus and Friesea grisea. Soil Biol Bio-
chem 36:927–934
Janetschek H (1967) Arthropod ecology of South Victoria Land.
In: Gressitt JL (ed) Entomology of Antarctica. American Geo-
physical Union, Washington DC, pp 205–293
Kennedy AD (1993) Water as a limiting factor in the Antarctic
terrestrial environment—a biogeographical synthesis. Arctic
Alpine Res 25:308–315
McGaughran A, Hogg ID, Stevens MI (2008) Patterns of population
structure for springtails and mites in southern Victoria Land,
Antarctica. Mol Phylogenet Evol 46:606–618
McGaughran A, Redding GP, Stevens MI, Convey P (2009) Temporal
metabolic rate variation in an Antarctic springtail. J Insect
Physiol 55:129–134
McGaughran A, Torricelli G, Carapelli A, Frati F, Stevens MI,
Convey P, Hogg ID (2010a) Contrasting phylogeographic
patterns for springtails reflect different evolutionary histories
between the Antarctic Peninsula and continental Antarctica.
J Biogeogr 37:103–119
McGaughran A, Convey P, Redding GP, Stevens MI (2010b)
Temporal and spatial metabolic rate variation in the Antarctic
springtail Gomphiocephalus hodgsoni. J Insect Physiol 56:57–64
McGaughran A, Convey P, Stevens MI, Chown SL (2010c) Metabolic
rate, genetic and microclimate variation among springtail popu-
lations from sub-Antarctic Marion Island. Polar Biol 33:909–918
Nkem JN, Wall DH, Virginia RA, Barrett JE, Broos EJ, Porazinska
DL, Adams BJ (2006) Wind dispersal of soil invertebrates in the
McMurdo Dry Valleys, Antarctica. Polar Biol 29:346–352
Nolan L, Hogg ID, Stevens MI, Haase M (2006) Fine scale
distribution of mtDNA haplotypes for the springtail Gomphio-cephalus hodgsoni (Collembola) corresponds to an ancient
shoreline in Taylor Valley, continental Antarctica. Polar Biol
29:813–819
Peck LS, Convey P, Barnes DKA (2006) Environmental constraints
on life histories in Antarctic ecosystems: tempos, timings and
predictability. Biol Rev 81:75–109
Pugh PJA, Convey P (2008) Surviving out in the cold: Antarctic
endemic invertebrates and their refugia. J Biogeogr 35:2176–2186
Sinclair BJ, Sjursen H (2001) Cold tolerance of the Antarctic
springtail Gomphiocephalus hodgsoni (Collembola, Hypogastr-
uridae). Antarct Sci 13:271–279
Sinclair BJ, Terblanche JS, Scott MB, Blatch GL, Klok CJ, Chown
SL (2006) Environmental physiology of three species of
Collembola at Cape Hallett, North Victoria Land, Antarctica.
J Insect Physiol 52:29–50
Stevens MI, Hogg ID (2002) Expanded distributional records of
Collembola and Acari in southern Victoria Land, Antarctica.
Pedobiologia 46:485–496
1724 Polar Biol (2011) 34:1713–1725
123
Author's personal copy
Stevens MI, Hogg ID (2003) Long-term isolation and recent range
expansion revealed for the endemic springtail Gomphiocephalushodgsoni from southern Victoria Land, Antarctica. Mol Ecol
12:2357–2369
Testerink GJ (1983) Metabolic adaptations to seasonal changes in
humidity and temperature in litter-inhabiting Collembola. Oikos
40:234–240
Wise KAJ, Gressitt JL (1965) Far southern animals and plants. Nature
207:101–102
Wise KAJ, Spain AV (1967) Entomological investigations in
Antarctica 1963–64 season. Pac Insects 9:271–293
Worland MR, Block W (2003) Desiccation at sub-zero temperatures
in polar terrestrial arthropods. J Insect Physiol 49:193–203
Worland MR, Convey P (2001) Rapid cold hardening in Antarctic
microarthropods. Funct Ecol 15:515–524
Worland MR, Lukesova A (2000) The effect of feeding on specific
soil algae on the cold tolerance of two Antarctic microarthropods
(Alaskozetes antarcticus and Cryptopygus antarcticus). Polar
Biol 23:766–774
Zinkler D (1966) Vergleichende untersuchungen zur atmungs-phys-
iologie von Collembolen (Apterygota) und andereen bodenkle-
inarthropoden. Z Vergleichende Physiol 52:99–144
Polar Biol (2011) 34:1713–1725 1725
123
Author's personal copy