Phytoplankton dynamic and bioindication in the Kondopoga Bay, Lake Onego (Northern Russia)
16
INTRODUCTION The main characteristics of the North European region include the low range of altitudes and sharp seasonality of climate. The latitudinal distribution plays a major role in patterning plant species richness. Ecosystems of the large lakes in the region absorb the regional air and surface water pollution as well as enhancing the regional self-purification processes. Therefore, it is important to study the biotic re- sponses to the long-term dynamics of environmental varia- bles in the great northern lakes. Phytoplankton diversity of the Lake Ladoga (Petrova, 1968; Genkal and Trifonova, 2009; Petrova et al., 2010), the largest lake in the region, has received more attention in regional studies; the Lake Onego, next in the water area, is less studied though having a long history of research (Petrova, 1971, 1975, 1990; Vi- sljanskaya, 1990, 1999; Chekryzheva, 2008a, 2008b, 2012a, 2012b). The Lake Ladoga rates as mesotrophic, whereas the Lake Onego is oligotrophic; correspondingly, its ecosy- stem is more sensitive to environmental impact. At this stage, we focused on phytoplankton diversity responses to environmental impacts in the most polluted Kondopoga Bay of the Lake Onego ecosystem that was formed under strong climatic as well as various anthropogenic impacts. In the process of natural eutrophication of the lake eco- system structural adjustments and functional characteri- stics of phytoplankton are regulated mainly by two factors: temperature and nutrient concentration. Anthro- pogenic eutrophication of deep lakes like the Lake Onego affects nutrient concentration in the first place; the thermal J. Limnol., 2014; 73(2): ORIGINAL ARTICLE DOI: 10.4081/jlimnol.2014.820 Phytoplankton dynamic and bioindication in the Kondopoga Bay, Lake Onego (Northern Russia) Sophia BARINOVA, 1* Tatjana CHEKRYZHEVA 2 1 Institute of Evolution, University of Haifa, Mount Carmel, Haifa 3498838, Israel; 2 Northern Water Problems Institute, Karelian Research Centre, Russian Academy of Science, 50 Al. Nevskiy Pr., 185003, Petrozavodsk, Karelia, Russia *Corresponding author: [email protected] ABSTRACT On the basis of our collected material and historical information we assess phytoplankton dynamics in Kondopoga Bay, the Lake Onego in 1993-2011. The summer communities from continuously studied sampling stations contain 100 species belonging to eight divisions: Bacillariophyta, 40; Chlorophyta, 25; Cyanobacteria, 13; Chrysophyta, 12; Euglenophyta, 2; Dinophyta, 4; Cryp- tophyta, 3; and Xanthophyta, 1. Sample richness varied between 16 and 54 species, with a negative overall trend during the study period, but increases in Cyanobacteria and Dinophyta. Bioindication analysis shows that water acidification slowly rising from 1993 to 2011 with organic pollution (Index saprobity S) and the number of species with heterotrophic ability. In 1990s, the total abundance and biomass were on average 1.5 times higher than in 2000-2011, having similar fluctuation ranges (Pearson 0.74), with peaks in 1996 and 2006. At the same time, species richness decreased, showing a depletion of algal communities. Two critically impacted periods are revealed with the Shannon index in 1996 and 2007 and on the basis of the Aquatic Ecosystem State Index (WESI) calculation in 1995 and 2007, related to Kondopoga industrial wastewater influx enriched in nutrients and other contami- nants. As a whole, the WESI was extremely high, reflecting a high self-purification capacity in respect to phosphate concentration in the bay. The canonical corresponded analysis (CCA) shows two different sets of taxa, those stimulated by temperature and nitric nitrogen (Anabaena scheremetievii Elenkin, Dolichospermum lemmermannii (Ricter) P. Wacklin, L. Hoffmann & J. Komárek, and Aulacoseira alpigena (Grunow) Krammer), and sensitive autotroph species inhabiting cool to temperate clear waters (Aulacoseira distans (Ehrenberg) Simonsen, Ankistrodesmus fusiformis Corda ex Korshikov, Mucidosphaerium pulchellum (H.C. Wood) C. Bock, Proschold & Krienitz). The comparative statistics with GRAPS program revealed two cores of species richness in years 1996 and 2011 that included most of species. The long-term dynamics of relative cell volume shows that phytoplankton communities were en- riched with small-celled species, such as Cyanobacteria (Microcystis aeruginosa (Kützing) Kützing) and Cryptophyta (Cryptomonas sp. and Katablepharis ovalis Skuja) in the period between 1998 and 2006. Pearson correlation for Shannon index and relative cell biovolume is negative (-0.79), showing high stability of species rich communities under environmental impacts. Two periods of di- noflagellate blooms (1998, 2007) followed the peaks of total abundance and biomass (1996, 2006). Such correlation makes the Kon- dopoga Bay ecosystem comparable to those of large lakes in spite of a heavier anthropogenic impact from Kondopoga pulp and paper mill wastewater. Key words: phytoplankton, great lake, ecosystem, diversity, productivity, temporal dynamic. Received: June 2013. Accepted: January 2014. Non commercial use only
Transcript of Phytoplankton dynamic and bioindication in the Kondopoga Bay, Lake Onego (Northern Russia)

INTRODUCTION
The main characteristics of the North European regioninclude the low range of altitudes and sharp seasonality ofclimate. The latitudinal distribution plays a major role inpatterning plant species richness. Ecosystems of the largelakes in the region absorb the regional air and surface waterpollution as well as enhancing the regional self-purificationprocesses. Therefore, it is important to study the biotic re-sponses to the long-term dynamics of environmental varia-bles in the great northern lakes. Phytoplankton diversity ofthe Lake Ladoga (Petrova, 1968; Genkal and Trifonova,2009; Petrova et al., 2010), the largest lake in the region,has received more attention in regional studies; the LakeOnego, next in the water area, is less studied though havinga long history of research (Petrova, 1971, 1975, 1990; Vi-
sljanskaya, 1990, 1999; Chekryzheva, 2008a, 2008b,2012a, 2012b).
The Lake Ladoga rates as mesotrophic, whereas theLake Onego is oligotrophic; correspondingly, its ecosy-stem is more sensitive to environmental impact. At thisstage, we focused on phytoplankton diversity responsesto environmental impacts in the most polluted KondopogaBay of the Lake Onego ecosystem that was formed understrong climatic as well as various anthropogenic impacts.In the process of natural eutrophication of the lake eco-system structural adjustments and functional characteri-stics of phytoplankton are regulated mainly by twofactors: temperature and nutrient concentration. Anthro-pogenic eutrophication of deep lakes like the Lake Onegoaffects nutrient concentration in the first place; the thermal
J. Limnol., 2014; 73(2): ORIGINAL ARTICLEDOI: 10.4081/jlimnol.2014.820
Phytoplankton dynamic and bioindication in the Kondopoga Bay, Lake Onego(Northern Russia)
Sophia BARINOVA,1* Tatjana CHEKRYZHEVA2
1Institute of Evolution, University of Haifa, Mount Carmel, Haifa 3498838, Israel; 2Northern Water Problems Institute, Karelian ResearchCentre, Russian Academy of Science, 50 Al. Nevskiy Pr., 185003, Petrozavodsk, Karelia, Russia*Corresponding author: [email protected]
ABSTRACTOn the basis of our collected material and historical information we assess phytoplankton dynamics in Kondopoga Bay, the
Lake Onego in 1993-2011. The summer communities from continuously studied sampling stations contain 100 species belonging toeight divisions: Bacillariophyta, 40; Chlorophyta, 25; Cyanobacteria, 13; Chrysophyta, 12; Euglenophyta, 2; Dinophyta, 4; Cryp-tophyta, 3; and Xanthophyta, 1. Sample richness varied between 16 and 54 species, with a negative overall trend during the studyperiod, but increases in Cyanobacteria and Dinophyta. Bioindication analysis shows that water acidification slowly rising from1993 to 2011 with organic pollution (Index saprobity S) and the number of species with heterotrophic ability. In 1990s, the totalabundance and biomass were on average 1.5 times higher than in 2000-2011, having similar fluctuation ranges (Pearson 0.74),with peaks in 1996 and 2006. At the same time, species richness decreased, showing a depletion of algal communities. Two criticallyimpacted periods are revealed with the Shannon index in 1996 and 2007 and on the basis of the Aquatic Ecosystem State Index(WESI) calculation in 1995 and 2007, related to Kondopoga industrial wastewater influx enriched in nutrients and other contami-nants. As a whole, the WESI was extremely high, reflecting a high self-purification capacity in respect to phosphate concentrationin the bay. The canonical corresponded analysis (CCA) shows two different sets of taxa, those stimulated by temperature and nitricnitrogen (Anabaena scheremetievii Elenkin, Dolichospermum lemmermannii (Ricter) P. Wacklin, L. Hoffmann & J. Komárek, andAulacoseira alpigena (Grunow) Krammer), and sensitive autotroph species inhabiting cool to temperate clear waters (Aulacoseiradistans (Ehrenberg) Simonsen, Ankistrodesmus fusiformis Corda ex Korshikov, Mucidosphaerium pulchellum (H.C. Wood) C. Bock,Proschold & Krienitz). The comparative statistics with GRAPS program revealed two cores of species richness in years 1996 and2011 that included most of species. The long-term dynamics of relative cell volume shows that phytoplankton communities were en-riched with small-celled species, such as Cyanobacteria (Microcystis aeruginosa (Kützing) Kützing) and Cryptophyta (Cryptomonassp. and Katablepharis ovalis Skuja) in the period between 1998 and 2006. Pearson correlation for Shannon index and relative cellbiovolume is negative (-0.79), showing high stability of species rich communities under environmental impacts. Two periods of di-noflagellate blooms (1998, 2007) followed the peaks of total abundance and biomass (1996, 2006). Such correlation makes the Kon-dopoga Bay ecosystem comparable to those of large lakes in spite of a heavier anthropogenic impact from Kondopoga pulp andpaper mill wastewater.
Key words: phytoplankton, great lake, ecosystem, diversity, productivity, temporal dynamic.
Received: June 2013. Accepted: January 2014.Non co
mmercial
use o
nly

81Phytoplankton bioindication in Lake Onego
regime remains essentially unchanged, except on accountof seasonal fluctuations regulating algal growth in respectto the level of nutrient supply (Petrova, 1990). The fluc-tuations of the phytoplankton biomass show seasonalpeaks in spring, autumn, and summer, associated with themain feature of the large lakes: the complexity of theirthermal structure.
In order to reveal the long-term tendencies of the lakeecosystem development, we selected the summer seasonsamples representing the most prominent peak of planktonbiomass (Bilous et al., 2013) of the most anthropogenicallyimpacted Kondopoga Bay. While the phytoplankton studyof the Lake Onego has long story, the data on KondopogaBay have been never published. The aim of current researchwas ecological analysis of algal species preferences withhelp of bioindication and statistics during last twenty years.Methods used to reveal environmental impacts with thehelp of ecological indicators are the community structurefluctuation analysis, bio-indication of major impacting fac-tors, calculations of integral density-diversity indices, andstatistical approaches, linking structural and functionalaspects of lacustrine communities with environmental fluc-tuations (Heywood, 2004).
METHODS
Study area
The Lake Onego is one of the largest and most nor-therly dimictic lakes in the world with the climatic definedthermal radiation mode and low biological productivity.The lake has an average depth of 30 m (maximum 120m), volume of water weight 291 km3, and the major waterturnover period about 13.6 years. The lake water has alow mineral content (39-46 mg L–1) and a low concentra-tion of nutrients, the transparency of 4-5 m, and euphoticzone about 9-12 m. The water quality is high, and its tro-phic status is oligotrophic, with phosphate load 0.10 g m2
per year (Filatov, 2010; Sabylina et al., 2012). The Kondopoga Bay is located in the northwestern
part of the Lake Onego in Northern Russia (Fig. 1), about62° 10’ N, 34° 18’ E. This area has a lowland landscapeand represents a part of the large lake which is elevatedby 33 m above sea level (asl). Soils are composed ofsands, silt, peat, and pebble, overgrown with lichens andlichen-moss communities, which are replaced in the coa-stal area of the lake by sedges and grasses. Mean annualtemperature measured by thermometer in parallel withsampling in August is less than 16°C (Sabylina, 1999).For 6-6.5 months, from December to May, the lake is co-vered with ice. In spring (May-June) and autumn (Octo-ber) a thermocline is formed with an epilimnion thicknessabout 20 m (Kukharev and Lukin, 2008; Filatov, 2010).The studied part of the lake is mostly of thermokarst ori-gin; the lake surface is about 223 km2, mean depth 10-50
m and 110 m in the deepest part, fairly insulated from themain body of Lake Onego. It is periodically diluted bysmelt waters during spring and autumn seasons. Sedi-ments of the lake are diverse, varying from sand and gra-vel to peat. Water is slightly yellow or colorless with pH6.5-7.5, and total dissolved solids about 39-46 mg L–1.Aquatic macrophyte vegetation is developed along theshore line for over 1.26 km2 (up to 2% of littoral zone).
The water chemistry of the bay is governed by the in-flow of the Suna River, as well as the industrial and mu-nicipal wastewater. For a long time, since 1929, the bayhas been under the impact from the Kondopoga’s pulp andpaper mill wastewater and air pollution (Sabylina et al.,2012). Even with remediation of the bay waters, it is stillsubject to pollution and eutrophication impacts (Tima-kova et al., 2011; Sabylina et al., 2012). The bay is nar-row, and an intermittent circulation of water masses dueto wind currents, especially in the summer, provides forremoval of sporadic pollution substances from the Kon-dopoga Bay to the pelagic area of the lake (Boyarinov andRudnev, 1990). Water flow stirred by winds promotes re-moval of waste water (with north-west winds), or their
Fig. 1. Location of the studied site in the Kondopoga Bay of theLake Onego with sampling points as white (sporadically) andblack (continuously) triangles. Black rectangles are samplingstations with continuous monitoring during 1993-2011.
Non co
mmercial
use o
nly

82 S. Barinova and T. Chekryzheva
blocking (with south-east winds). Thus, with blocking ofsewage in the apical part of the bay, as well as in calmweather, the concentration of certain chemicals in the nar-row north-western part of the bay is higher than in themiddle and the widest south-eastern parts of it (Sabylinaand Ryzhakov, 2007).
Sampling and laboratory studies
We used the previously collected material (1999,2005-2008, 2011) and historical data provided by theNorthern Water Problems Institute, Karelian ResearchCentre, Russian Academy of Science (1993-1998) onabundance and biomass of summer phytoplankton of theKondopoga bay from three major sampling stations(black triangles) with continuous monitoring (Fig. 1).Water samples for chemistry and phytoplankton analyses(1 L) were collected in parallel with sampling from thesame stations (Fig. 1) in the epilimnion, 0.5 m below thewater surface of the pelagic zone in July-August, 1993-2011. Samples were taken with a bathometer, filteredwith membrane filters of 0.95-1.02 µm and fixed with3% lugol-formaldehyde fixator solution. Species defini-tion and counting were performed in the Nageotte cham-ber of 0.02 mL. The biovolume of each species wascalculated on the basis of the geometric cell volumes(Morduhay-Boltovskiy, 1975; Fedorov, 1979). Nutrientsconcentration data (Pmin, Ptot, N-NH4, N-NO2, N-NO3,Norg, Ntot, Si, Fetot), were taken from the database ofThe Laboratory of Hydrochemistry and Hydrobiologyof Northern Water Problems Institute (Sabylina, 1999;Sabylina and Ryzhakov, 2007; Sabylina et al., 2010). Fortaxonomic identification, a series of monographic stu-dies have been used (Zabelina et al., 1951; Hollerbachet al., 1953; Kiselev, 1954; Matvienko, 1954; Popova,1955; Dedusenko-Schegoleva et al., 1959; Dedusenko-Schegoleva and Hollerbach, 1962; Palamar-Mordvin-tseva, 1982; Korshikov, 1953; Kosinskaya, 1960;Matviyenko and Litvinenko, 1977; Starmach, 1985; Ko-márek and Anagnostidis, 1986; Anagnostidis and Komá-rek, 1988; Krammer and Lange-Bertalot, 1986, 1988,1991a, 1991b).
Bio-indication and indices calculation
Our ecological analysis has revealed a grouping of fre-shwater algae indicators in respect to pH, salinity and sa-probity and the other habitat conditions (Barinova et al.,2006). Each group was separately assessed for its bio-in-dication significance. The species that predictably respon-ded to environmental variables can be used asbio-indicators of the aquatic ecosystem’s response to eu-trophication, pH levels (acidifications), salinity, and or-ganic pollutants. Saprobic Index (S) was calculated afterSládeček (1973, 1986) for the algal community on the
basis of the species-specific saprobity level (Barinova etal., 2006) and the relative abundance of each species inthe community as:
(eq. 1)
where: S is the Saprobity Index of algal community; si
is the species-specific saprobity index; ai is the speciesabundance.
The Saprobic Index S indicates the saprobic zone andhas been adapted for classes of water quality based on theecological classification widely used in European andAsian countries (Barinova et al., 2006; Romanenko et al.,1990; Whitton et al., 1991; European Commission, 2000).
The calculated integral index of aquatic ecosystem su-stainability (Aquatic Ecosystem State Index, WESI) isbased on the water-quality classes (Barinova et al., 2006,2010a,b; Barinova, 2011; Barinova and Krassilov, 2012;Barinova and Sivaci, 2013) reflecting self-purification ca-pacities for each of the sampling stations. If WESI is equalto or larger than 1, the photosynthetic level is positivelycorrelated with the level of nitrate concentration. TheWESI is less than 1 attests to photosynthesis being sup-pressed, presumably owing to a toxic, light intensity orother disturbance (Barinova, 2011; Barinova et al., 2006,2010b; Saks et al., 1976).
For environmental variables, we applied the 5-Class Sy-stem adapted to water-quality evaluation based on morethan 30 parameters (Sladecek, 1973; Barinova et al., 2006).
The Shannon’s diversity index (Odum, 1969) was cal-culated as:
(eq. 2)
where: N is the total cells (individuals) number, l; s is thespecies number; ni is the individuals number of every spe-cies; H̄ is the Shannon diversity index. The mean phyto-plankton community cell size was estimated from the ratiobetween total biovolume and total abundance (accordingto Pugnetti et al., 2004). Statistical methods of compara-tive floristic analysis (Novakovsky, 2004) were used forcalculating similarity of algal communities in the sam-pling stations.
Statistical analysis
Structural diversity was calculated using statisticalmethods recommended by Heywood (2004) for floristicand taxonomic studies. At the same time, the statistical si-gnificance of variables was assessed using Pearson cor-relation method. Statistical analysis of relationshipsbetween species diversity of algal communities and theirenvironmental variables were studied by canonical corre-spondence analysis (CCA) with CANOCO for Windows4.5 package (Ter Braak and Šmilauer, 2002).
Non co
mmercial
use o
nly
83Phytoplankton bioindication in Lake Onego
Statistical significance of each variable was assessedusing the Monte Carlo unrestricted permutation test in-volving 999 permutations (Ter Braak, 1990). Variables ofgreatest correlation values have been included in analysis.For CCA analysis we choose species with abundance va-lues from 4% to 25% (maximal).
RESULTS
Species richness and bio-indication
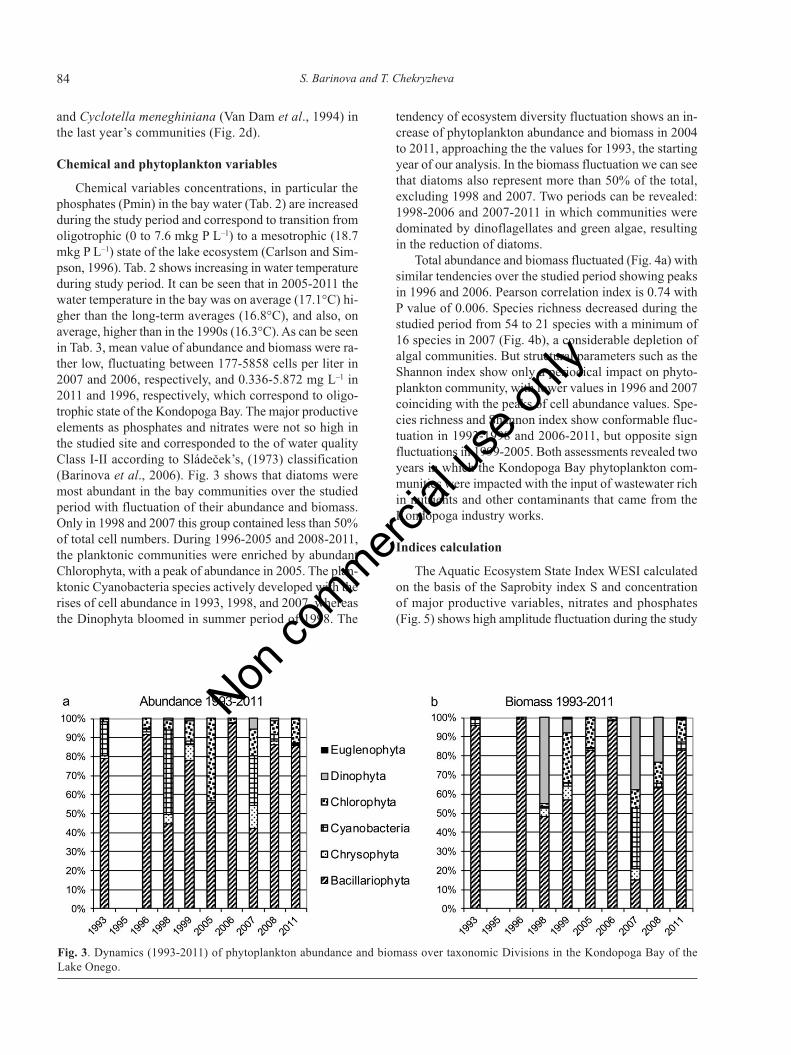
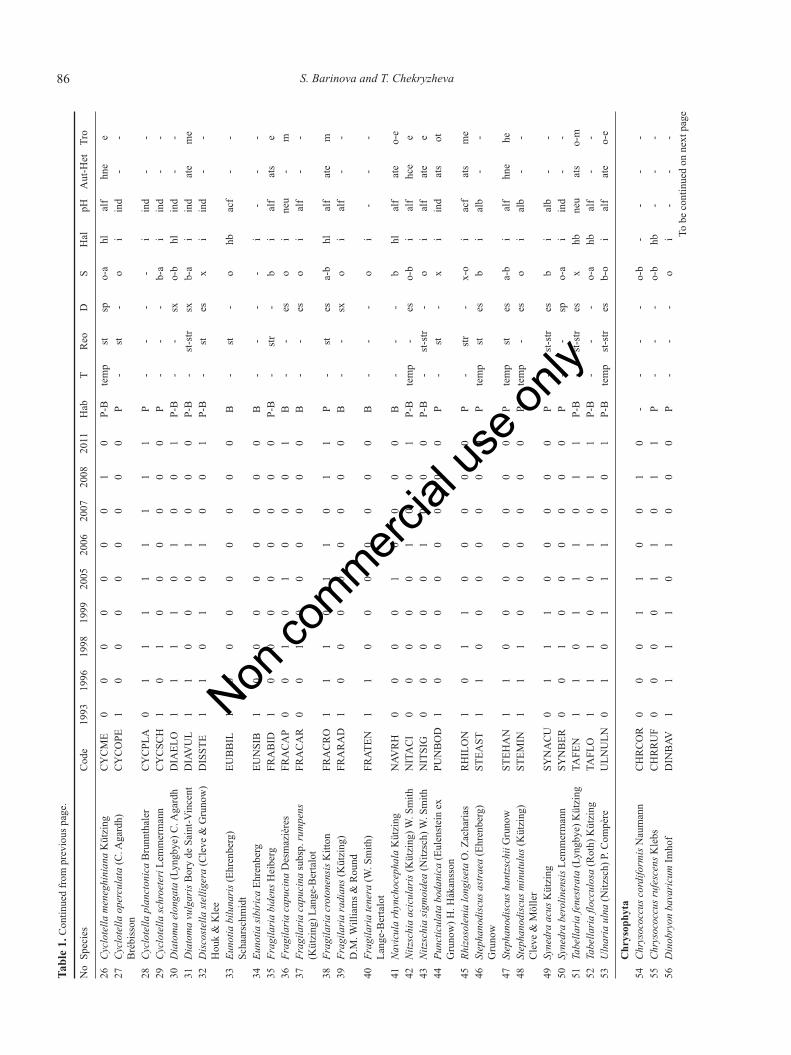
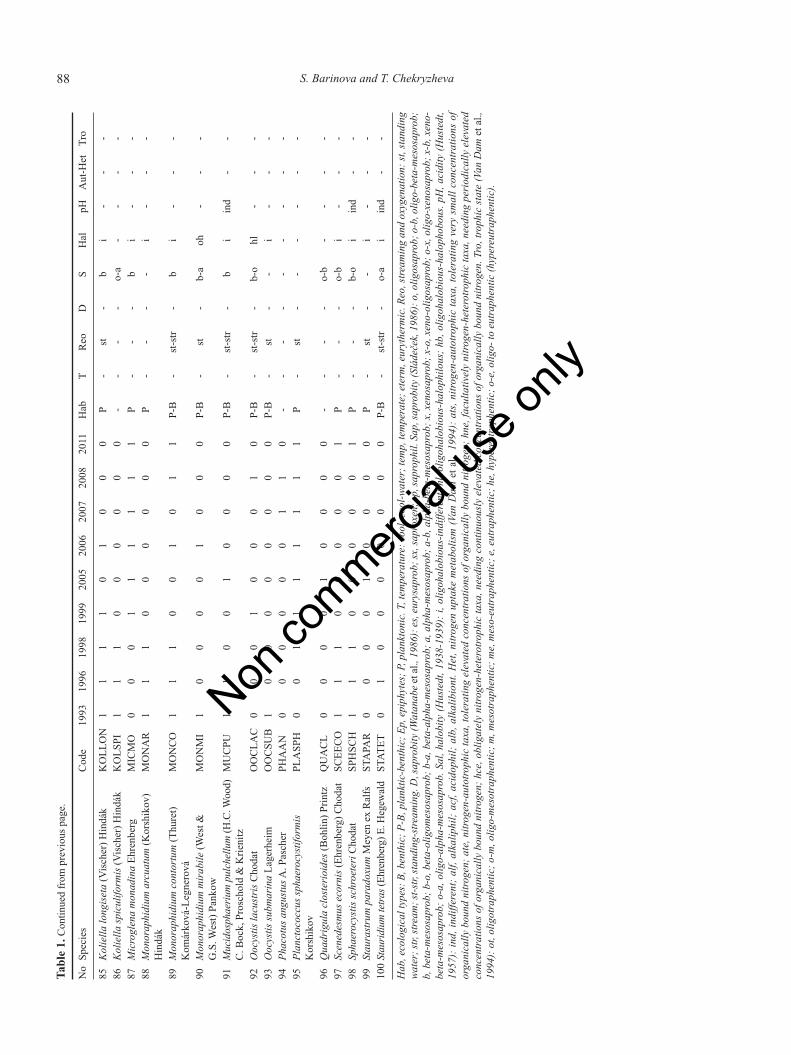
In the bathometric phytoplankton of the KondopogaBay of Lake Onego in the summer period, there are 100taxa below the rank of genus, belonging to eight divisions:Bacillariophyta, 40; Chlorophyta, 25; Cyanobacteria, 13;Chrysophyta, 12; Euglenophyta, 2; Dinophyta, 4; Cryp-tophyta, 3; and Xanthophyta, 1 (Tab. 1). With large foroligotrophic lakes species richness, phytoplankton wasdominated by diatoms in all seasons of the year. The most
abundant of them are the cool temperate species of springand autumn communities (Aulacoseira islandica, A. ita-lica var. italica, and A. alpigena), as well as the summertemperate species (Tabellaria fenestrata, Asterionella for-mosa, and Fragilaria crotonensis).
Species richness in the summer planktonic commu-nities varied between 54 in 1993 and 16 in 2007 and hada negative linear trend (R2=0.69) during the study pe-riod, with increases in Cyanobacteria and flagellate spe-cies, such as dinophytes (Tab. 1; Figs. 2a; 3b).Bio-indication analysis on the basis of the species list(Tab. 1) suggests that water acidification is slowly in-creasing during the study period with removal of alkali-biontes from the communities (Fig. 2b). Organicpollution slightly increased with winnowing of saproxe-nes (Fig. 2c) and the rise of diatom species with abilityto heterotrophic type of nutrition in unfavorable envi-ronment (Saks et al., 1976) such as Nitzschia acicularis
Fig. 2. Dynamics (1993-2011) of phytoplankton divisional species richness (a), bio-indication of pH (b), organic pollution (c), and nu-trition type (d) in the Kondopoga Bay of the Lake Onego. Abbreviation of ecological groups are given in Tab. 1.
Non co
mmercial
use o
nly
84 S. Barinova and T. Chekryzheva
and Cyclotella meneghiniana (Van Dam et al., 1994) inthe last year’s communities (Fig. 2d).
Chemical and phytoplankton variables
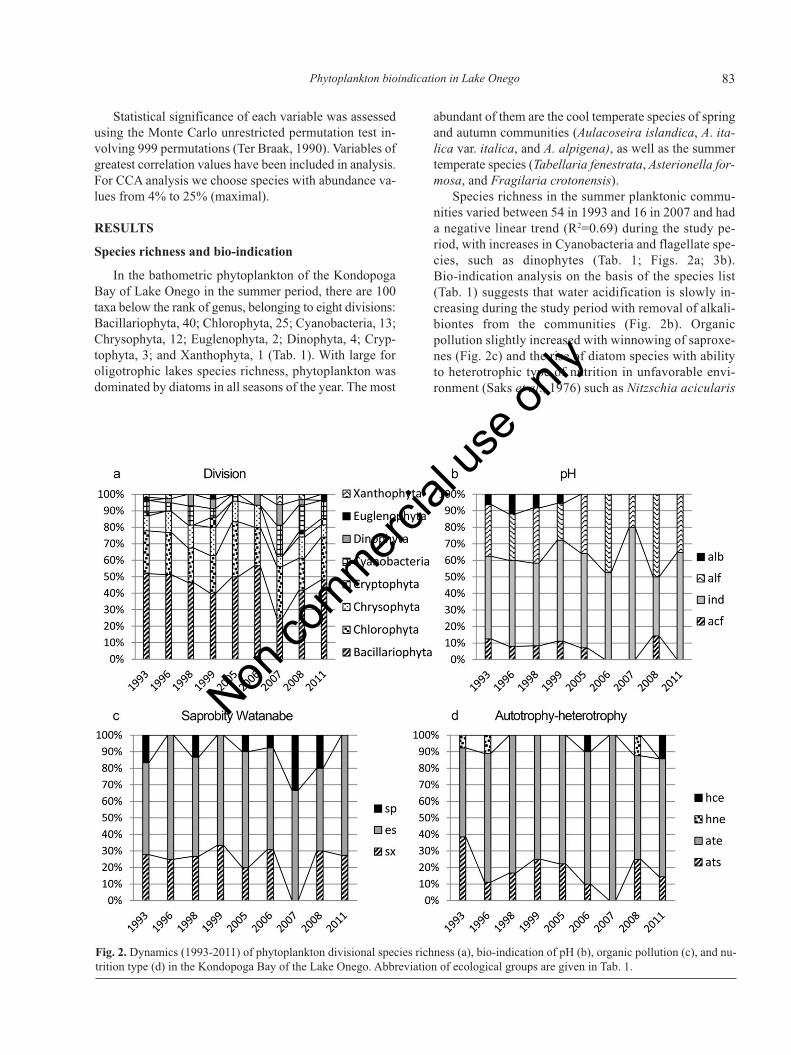
Chemical variables concentrations, in particular thephosphates (Pmin) in the bay water (Tab. 2) are increasedduring the study period and correspond to transition fromoligotrophic (0 to 7.6 mkg P L–1) to a mesotrophic (18.7mkg P L–1) state of the lake ecosystem (Carlson and Sim-pson, 1996). Tab. 2 shows increasing in water temperatureduring study period. It can be seen that in 2005-2011 thewater temperature in the bay was on average (17.1°C) hi-gher than the long-term averages (16.8°C), and also, onaverage, higher than in the 1990s (16.3°C). As can be seenin Tab. 3, mean value of abundance and biomass were ra-ther low, fluctuating between 177-5858 cells per liter in2007 and 2006, respectively, and 0.336-5.872 mg L–1 in2011 and 1996, respectively, which correspond to oligo-trophic state of the Kondopoga Bay. The major productiveelements as phosphates and nitrates were not so high inthe studied site and corresponded to the of water qualityClass I-II according to Sládeček’s, (1973) classification(Barinova et al., 2006). Fig. 3 shows that diatoms weremost abundant in the bay communities over the studiedperiod with fluctuation of their abundance and biomass.Only in 1998 and 2007 this group contained less than 50%of total cell numbers. During 1996-2005 and 2008-2011,the planktonic communities were enriched by abundantChlorophyta, with a peak of abundance in 2005. The plan-ktonic Cyanobacteria species actively developed with therises of cell abundance in 1993, 1998, and 2007, whereasthe Dinophyta bloomed in summer period of 1998. The
tendency of ecosystem diversity fluctuation shows an in-crease of phytoplankton abundance and biomass in 2004to 2011, approaching the the values for 1993, the startingyear of our analysis. In the biomass fluctuation we can seethat diatoms also represent more than 50% of the total,excluding 1998 and 2007. Two periods can be revealed:1998-2006 and 2007-2011 in which communities weredominated by dinoflagellates and green algae, resultingin the reduction of diatoms.
Total abundance and biomass fluctuated (Fig. 4a) withsimilar tendencies over the studied period showing peaksin 1996 and 2006. Pearson correlation index is 0.74 withP value of 0.006. Species richness decreased during thestudied period from 54 to 21 species with a minimum of16 species in 2007 (Fig. 4b), a considerable depletion ofalgal communities. But structural parameters such as theShannon index show only a periodical impact on phyto-plankton community, with lower values in 1996 and 2007coinciding with the peaks of cell abundance values. Spe-cies richness and Shannon index show conformable fluc-tuation in 1993-1998 and 2006-2011, but opposite signfluctuations in 1999-2005. Both assessments revealed twoyears in which the Kondopoga Bay phytoplankton com-munities were impacted with the input of wastewater richin nutrients and other contaminants that came from theKondopoga industry works.
Indices calculation
The Aquatic Ecosystem State Index WESI calculatedon the basis of the Saprobity index S and concentrationof major productive variables, nitrates and phosphates(Fig. 5) shows high amplitude fluctuation during the study
Fig. 3. Dynamics (1993-2011) of phytoplankton abundance and biomass over taxonomic Divisions in the Kondopoga Bay of theLake Onego.
Non co
mmercial
use o
nly
85Phytoplankton bioindication in Lake OnegoTa
b. 1
. Div
ersi
ty a
nd e
colo
gica
l pre
fere
nces
(Bar
inov
a et
al.,
200
6) o
f phy
topl
ankt
on sp
ecie
s in
sum
mer
com
mun
ities
of t
he K
ondo
poga
Bay
of t
he O
nego
Lak
e in
199
3-20
11.
No
Spec
ies
Cod
e19
9319
9619
9819
9920
0520
0620
0720
0820
11H
abT
Reo
DS
Hal
pHA
ut-H
etTr
o
Cya
noba
cter
ia1
Anab
aena
sche
rem
etie
viiE
lenk
inA
NA
SCH
00
00
00
11
0P
--
--
i-
--
2Ap
hani
zom
enon
flos
-aqu
aeR
alfs
APH
FLA
00
01
00
01
1P
--
-b
hl-
--
ex B
orne
t & F
laha
ult
3C
hroo
cocc
us d
ispe
rsus
(Kei
ssle
r)C
HR
DIS
10
00
00
00
1P
-st
-b-
o-
--
-Le
mm
erm
ann
4C
oelo
spha
eriu
m k
uetz
ingi
anum
Näg
eli
CO
EKU
T1
11
00
00
00
P-
--
b-o
i-
--
5D
olic
hosp
erm
um le
mm
erm
anni
i(R
icte
r)D
OLL
E0
00
11
01
11
P-
--
bi
--
-P.
Wac
klin
, L. H
offm
ann
& J.
Kom
árek
6Li
mno
thri
x pl
anct
onic
a(W
olos
zyns
ka)
LIM
PLA
01
10
00
00
0P
--
-o-
bi
--
-M
effe
rt7
Mer
ism
oped
ia te
nuis
sim
aLe
mm
erm
ann
MER
TEN
00
00
00
01
0P-
B-
--
b-a
hl-
--
8M
icro
cyst
is a
erug
inos
a(K
ützi
ng)
MIC
AER
00
10
00
00
0P
--
-o-
ahl
--
-K
ützi
ng9
Osc
illat
oria
tenu
isC
. Aga
rdh
ex G
omon
tO
SCTE
N1
00
00
00
00
P-B
-st
-str
-b-
ahl
--
-10
Plan
ktol
yngb
ya li
mne
tica
(Lem
mer
man
n)PL
ALI
M1
00
00
00
00
P-B
-st
-str
-o-
bhl
--
-J.
Kom
árko
vá-L
egne
rová
& G
. Cro
nber
g11
Plan
ktot
hrix
aga
rdhi
i(G
omon
t)PL
AA
GA
00
10
00
11
0P-
B-
st-
b-o
hl-
--
Ana
gnos
tidis
& K
omár
ek12
Pseu
dana
baen
a en
doph
ytic
aPS
EEN
D0
01
00
00
00
Ep-
--
-i
--
-(E
lenk
in &
Hol
lerb
ach)
Ana
gnos
tidis
13W
oron
ichi
nia
naeg
elia
na(U
nger
)W
OR
NA
00
00
00
00
0P
-st
-o-
b-
--
-El
enki
n
Bac
illar
ioph
yta
14Am
phor
a ov
alis
var.
grac
ilis(
Ehre
nber
g)A
MPO
L0
01
00
00
00
B-
-sx
a-b
ial
f-
-va
n H
eurc
k15
Aste
rion
ella
form
osa
Has
sall
var.
form
osa
AST
FOR
11
11
11
01
1P
-st
-str
sxo
ial
fat
em
e16
Aste
rion
ella
form
osa
var.
grac
illim
aA
STFO
G1
11
10
00
10
P-
-es
xi
acf
--
(Han
ztsc
h) G
runo
w17
Aula
cose
ira
alpi
gena
(Gru
now
) Kra
mm
erA
ULA
LP1
01
00
11
00
P-B
cool
-sp
-i
alf
--
18Au
laco
seir
a am
bigu
a(G
runo
w) S
imon
sen
AU
LAM
10
00
00
00
0P
-st
-str
spa-
bi
alf
ate
e19
Aula
cose
ira
dist
ans(
Ehre
nber
g) S
imon
sen
AU
LDIS
10
00
10
01
0P-
Bco
olst
rsp
x-o
iac
fat
sot
20Au
laco
seira
isla
ndic
a(O
.Mül
ler)
Sim
onse
nA
ULI
SL1
11
11
10
11
Pco
olst
-str
eso-
xi
neu
ate
o-e
21Au
laco
seir
a ita
lica
(Ehr
enbe
rg) S
imon
sen
AU
LITA
11
11
11
11
1P-
Bco
olst
-str
eso-
ai
neu
ate
me
var.
italic
a22
Aula
cose
ira
italic
ava
r. te
nuis
sim
aA
ULI
TT1
11
11
11
00
Pco
olst
-str
esb
ine
uat
em
e(G
runo
w) S
imon
sen
23C
occo
neis
ped
icul
usEh
renb
erg
CO
CPE
D0
00
10
00
10
B-
st-s
trsx
o-a
ial
fat
ee
24C
yclo
tella
com
ta(E
hren
berg
) Küt
zing
CY
CC
O1
11
11
10
11
P-
stsx
b-o
ial
f-
-va
r. co
mta
25Cy
clot
ella
com
tava
r. ol
igac
tis(E
hren
berg
)C
YC
OO
11
10
01
01
0P
--
--
ial
f-
-G
runo
wTo
be
cont
inue
d on
nex
t pag
eNon
commerc
ial us
e only
86 S. Barinova and T. ChekryzhevaTa
ble
1. C
ontin
ued
from
pre
viou
s pag
e.
No
Spec
ies
Cod
e19
9319
9619
9819
9920
0520
0620
0720
0820
11H
abT
Reo
DS
Hal
pHA
ut-H
etTr
o
26C
yclo
tella
men
eghi
nian
aK
ützi
ngC
YC
ME
00
00
00
01
0P-
Bte
mp
stsp
o-a
hlal
fhn
ee
27C
yclo
tella
ope
rcul
ata
(C. A
gard
h)C
YC
OPE
10
00
00
00
0P
-st
-o
iin
d-
-B
rébi
sson
28C
yclo
tella
pla
ncto
nica
Bru
nnth
aler
CY
CPL
A0
11
11
11
11
P-
--
-i
ind
--
29C
yclo
tella
schr
oete
riLe
mm
erm
ann
CY
CSC
H1
01
00
00
00
P-
--
b-a
iin
d-
-30
Dia
tom
a el
onga
ta(L
yngb
ye) C
. Aga
rdh
DIA
ELO
11
11
01
00
1P-
B-
-sx
o-b
hlin
d-
-31
Dia
tom
a vu
lgar
isB
ory
de S
aint
-Vin
cent
DIA
VU
L1
10
00
10
00
P-B
-st
-str
sxb-
ai
ind
ate
me
32D
isco
stel
la st
ellig
era
(Cle
ve &
Gru
now
)D
ISST
E1
10
10
10
01
P-B
-st
esx
iin
d-
-H
ouk
& K
lee
33Eu
notia
bilu
nari
s(Eh
renb
erg)
EUB
BIL
10
00
00
00
0B
-st
-o
hbac
f-
-Sc
haar
schm
idt
34Eu
notia
sibi
rica
Ehre
nber
gEU
NSI
B1
00
00
00
00
B-
--
-i
--
-35
Frag
ilari
a bi
dens
Hei
berg
FRA
BID
10
00
00
00
0P-
B-
str
-b
ial
fat
se
36Fr
agila
ria
capu
cina
Des
maz
ière
sFR
AC
AP
00
10
10
00
1B
--
eso
ine
u-
m37
Frag
ilari
a ca
puci
nasu
bsp.
rum
pens
FRA
CA
R0
01
00
00
00
B-
-es
oi
alf
--
(Küt
zing
) Lan
ge-B
erta
lot
38Fr
agila
ria
crot
onen
sisK
itton
FRA
CR
O1
11
01
10
11
P-
stes
a-b
hlal
fat
em
39Fr
agila
ria
radi
ans(
Küt
zing
)FR
AR
AD
10
00
00
00
0B
--
sxo
ial
f-
-D
.M. W
illia
ms &
Rou
nd40
Frag
ilari
a te
nera
(W. S
mith
)FR
ATEN
11
00
00
00
0B
--
-o
i-
--
Lang
e-B
erta
lot
41N
avic
ula
rhyn
choc
epha
laK
ützi
ngN
AVR
H0
00
01
00
00
B-
--
bhl
alf
ate
o-e
42N
itzsc
hia
acic
ular
is(K
ützi
ng) W
. Sm
ithN
ITA
CI
00
00
01
00
1P-
Bte
mp
-es
o-b
ial
fhc
ee
43N
itzsc
hia
sigm
oide
a(N
itzsc
h) W
. Sm
ithN
ITSI
G0
00
00
10
00
P-B
-st
-str
-o
ial
fat
ee
44Pu
nctic
ulat
a bo
dani
ca(E
ulen
stei
n ex
PUN
BO
D1
00
00
00
00
P-
st-
xi
ind
ats
otG
runo
w) H
. Håk
anss
on45
Rhiz
osol
enia
long
iset
aO
. Zac
haria
sR
HIL
ON
10
11
00
00
0P
-st
r-
x-o
iac
fat
sm
e46
Step
hano
disc
us a
stra
ea(E
hren
berg
)ST
EAST
11
00
00
00
0P
tem
pst
esb
ial
b-
-G
runo
w47
Step
hano
disc
us h
antz
schi
iGru
now
STEH
AN
11
00
00
00
0P
tem
pst
esa-
bi
alf
hne
he48
Step
hano
disc
us m
inut
ulus
(Küt
zing
)ST
EMIN
11
10
00
00
0P
tem
p-
eso
ial
b-
-C
leve
& M
ölle
r49
Syne
dra
acus
Küt
zing
SYN
AC
U0
11
10
00
00
P-
st-s
tres
bi
alb
--
50Sy
nedr
a be
rolin
ensi
sLem
mer
man
nSY
NB
ER0
01
00
00
00
P-
-sp
o-a
iin
d-
-51
Tabe
llari
a fe
nest
rata
(Lyn
gbye
) Küt
zing
TAFE
N1
10
11
10
11
P-B
-st
-str
esx
hbne
uat
so-
m52
Tabe
llari
a flo
ccul
osa
(Rot
h) K
ützi
ngTA
FLO
11
10
01
01
1P-
B-
--
o-a
hbal
f-
-53
Uln
aria
uln
a(N
itzsc
h) P
. Com
père
ULN
ULN
01
01
11
00
1P-
Bte
mp
st-s
tres
b-o
ial
fat
eo-
e
Chr
ysop
hyta
54C
hrys
ococ
cus c
ordi
form
isN
aum
ann
CH
RC
OR
00
01
10
01
0-
--
-o-
b-
--
-55
Chr
ysoc
occu
s ruf
esce
nsK
lebs
CH
RR
UF
00
00
11
01
1P
--
-o-
bhb
--
-56
Din
obry
on b
avar
icum
Imho
fD
INB
AV1
11
10
10
00
P-
--
oi
--
-To
be
cont
inue
d on
nex
t pag
e
Non co
mmercial
use o
nly

87Phytoplankton bioindication in Lake OnegoTa
ble
1. C
ontin
ued
from
pre
viou
s pag
e.
No
Spec
ies
Cod
e19
9319
9619
9819
9920
0520
0620
0720
0820
11H
abT
Reo
DS
Hal
pHA
ut-H
etTr
o
57D
inob
ryon
cyl
indr
icum
O.E
. Im
hof
DIN
CY
L1
01
10
00
00
P-
--
o-b
i-
--
58D
inob
ryon
div
erge
nsO
.E. I
mho
fD
IND
IV1
11
10
10
01
P-
st-s
tr-
o-a
iin
d-
-59
Din
obry
on se
rtul
aria
Ehre
nber
gD
INSE
R1
10
00
00
00
P-
--
o-a
i-
--
60D
inob
ryon
soci
ale
(Ehr
enbe
rg) E
hren
berg
DIN
SOC
10
10
00
00
0P
--
-b
i-
--
61K
ephy
rion
cup
ulifo
rme
Con
rad
KEP
CU
P0
00
00
10
10
--
--
--
--
-62
Mal
lom
onas
akr
okom
osR
uttn
erM
ALA
K0
01
11
00
10
P-
--
oi
--
-63
Mal
lom
onas
cau
data
Iwan
off
MA
LCA
00
01
00
00
0P
--
-o
i-
--
64M
allo
mon
as c
oron
ata
Bol
ocho
nzew
MA
LCO
01
10
00
00
0P
--
--
i-
--
65St
enok
alyx
inco
nsta
nsSc
hmid
leST
EIN
C0
10
00
00
00
--
--
--
--
-
Xan
thop
hyta
66Tr
ibon
ema
affin
e(K
ützi
ng) G
.S. W
est
TRIA
FF1
10
00
01
10
B-
--
-hb
--
-
Eug
leno
phyt
a67
Lepo
cinc
lis a
cus(
O.F
. Mül
ler)
Mar
in &
LEPA
CU
00
01
00
00
0P
eter
mst
-b
iin
d-
-M
elko
nian
in M
arin
et a
l.68
Trac
helo
mon
as v
olvo
cina
(Ehr
enbe
rg)
TRAV
OL
10
00
00
00
1B
eter
mst
-str
-b
iin
d-
-Eh
renb
erg
Cry
ptop
hyta
69C
rypt
omon
as o
vata
Ehre
nber
gC
RYO
V1
00
00
00
00
P-
st-s
tr-
b-a
hl-
--
70C
rypt
omon
assp
.C
RYPT
O0
00
10
01
11
--
--
--
--
-71
Kat
able
phar
is o
valis
Skuj
aK
ATO
V0
00
10
00
00
--
--
a-
--
-
Din
ophy
ta72
Cer
atiu
m h
irun
dine
lla(O
.F. M
ülle
r)C
ERH
IR0
01
10
01
10
P-
st-s
tr-
oi
--
-D
ujar
din
73G
ymno
dini
umsp
.G
YM
NO
00
11
00
00
0-
--
--
--
--
74Pe
ridi
niop
sis t
hom
pson
ii(T
hom
pson
)PE
RTH
O0
00
00
11
00
P-
--
--
--
-B
ourr
elly
75Pe
ridi
nium
aci
culif
erum
Lem
mer
man
nPE
RA
CI
01
10
01
00
0-
--
-o-
b-
--
-
Chl
orop
hyta
76Ac
tinas
trum
han
tzsc
hiiL
ager
heim
AC
THA
10
01
00
00
0P-
B-
st-s
tr-
bi
--
-77
Anki
stro
desm
us fu
sifo
rmis
Cor
da e
xA
NK
FUS
00
00
10
00
0P-
B-
st-s
tr-
b-o
i-
--
Kor
shik
ov78
Chl
orop
hyta
spp.
CH
LOR
O0
00
00
11
00
--
--
--
--
-79
Cru
cige
nia
quad
rata
Mor
ren
CR
UQ
U0
10
00
00
00
P-B
-st
-str
-b-
oi
acf
--
80C
ruci
geni
a te
trap
edia
(Kirc
hner
) Kun
tze
CR
UTE
T1
11
10
00
11
P-B
-st
-str
-o-
ai
ind
--
81D
esm
idiu
m sw
artz
iiC
. Aga
rdh
ex R
alfs
DES
SWA
00
00
10
00
0-
--
-o
i-
--
82D
esm
odes
mus
qua
dric
auda
tus(
Turp
in)
DES
QU
A1
01
11
11
00
P-
--
bi
ind
--
Heg
ewal
d83
Elak
atot
hrix
gen
even
sis(R
ever
din)
Hin
dák
ELA
GEN
10
00
00
00
0P-
B-
st-s
tr-
o-a
--
--
84Eu
dori
na e
lega
nsEh
renb
erg
EUD
ELE
00
01
00
00
1P
-st
-str
-b
i-
--
To b
e co
ntin
ued
on n
ext p
age
Non co
mmercial
use o
nly
88 S. Barinova and T. ChekryzhevaTa
ble
1. C
ontin
ued
from
pre
viou
s pag
e.
No
Spec
ies
Cod
e19
9319
9619
9819
9920
0520
0620
0720
0820
11H
abT
Reo
DS
Hal
pHA
ut-H
etTr
o
85K
olie
lla lo
ngis
eta
(Vis
cher
) Hin
dák
KO
LLO
N1
11
10
10
00
P-
st-
bi
--
-86
Kol
iella
spic
ulifo
rmis
(Vis
cher
) Hin
dák
KO
LSPI
11
10
00
00
0-
--
-o-
a-
--
-87
Mic
rogl
ena
mon
adin
aEh
renb
erg
MIC
MO
00
01
11
11
1P
--
-b
i-
--
88M
onor
aphi
dium
arc
uatu
m(K
orsh
ikov
)M
ON
AR
11
10
00
00
0P
--
--
i-
--
Hin
dák
89M
onor
aphi
dium
con
tort
um(T
hure
t)M
ON
CO
11
10
01
01
1P-
B-
st-s
tr-
bi
--
-K
omár
ková
-Leg
nero
vá90
Mon
orap
hidi
um m
irab
ile(W
est &
MO
NM
I1
00
00
10
00
P-B
-st
-b-
aoh
--
-G
.S. W
est)
Pank
ow91
Muc
idos
phae
rium
pul
chel
lum
(H.C
. Woo
d)M
UC
PU1
10
01
00
00
P-B
-st
-str
-b
iin
d-
-C
. Boc
k, P
rosc
hold
& K
rieni
tz92
Ooc
ystis
lacu
stri
sCho
dat
OO
CLA
C0
00
10
00
10
P-B
-st
-str
-b-
ohl
--
-93
Ooc
ystis
subm
arin
aLa
gerh
eim
OO
CSU
B1
00
00
00
00
P-B
-st
--
i-
--
94Ph
acot
us a
ngus
tusA
. Pas
cher
PHA
AN
00
00
00
11
0-
--
--
--
--
95Pl
anct
ococ
cus s
phae
rocy
stifo
rmis
PLA
SPH
00
11
11
11
1P
-st
--
--
--
Kor
shik
ov96
Qua
drig
ula
clos
teri
oide
s(B
ohlin
) Prin
tzQ
UA
CL
00
00
10
00
0-
--
-o-
b-
--
-97
Scen
edes
mus
eco
rnis
(Ehr
enbe
rg) C
hoda
tSC
EEC
O1
11
00
00
01
P-
--
o-b
i-
--
98Sp
haer
ocys
tis sc
hroe
teri
Cho
dat
SPH
SCH
11
10
00
00
1P
--
-b-
oi
ind
--
99St
aura
stru
m p
arad
oxum
Mey
en e
x R
alfs
STA
PAR
00
00
10
00
0P
-st
--
i-
--
100
Stau
ridiu
m te
tras(
Ehre
nber
g) E
. Heg
ewal
dST
ATET
01
00
00
00
0P-
B-
st-s
tr-
o-a
iin
d-
-
Hab
, eco
logi
cal t
ypes
: B, b
enth
ic; P
-B, p
lank
tic-b
enth
ic; E
p, e
piph
ytes
; P, p
lank
toni
c. T
, tem
pera
ture
: coo
l, co
ol-w
ater
; tem
p, te
mpe
rate
; ete
rm, e
uryt
herm
ic. R
eo, s
tream
ing
and
oxyg
enat
ion:
st, s
tand
ing
wat
er; s
tr, st
ream
; st-s
tr, st
andi
ng-s
tream
ing.
D, s
apro
bity
(Wat
anab
e et
al.,
198
6): e
s, eu
rysa
prob
; sx,
sapr
oxen
; sp,
sapr
ophi
l. Sa
p, sa
prob
ity (S
láde
ček,
198
6): o
, olig
osap
rob;
o-b
, olig
o-be
ta-m
esos
apro
b;b,
bet
a-m
esos
apro
b; b
-o, b
eta-
olig
omes
osap
rob;
b-a
, bet
a-al
pha-
mes
osap
rob;
a, a
lpha
-mes
osap
rob;
a-b
, alp
ha-b
eta-
mes
osap
rob;
x, x
enos
apro
b; x
-o, x
eno-
olig
osap
rob;
o-x
, olig
o-xe
nosa
prob
; x-b
, xen
o-be
ta-m
esos
apro
b; o
-a, o
ligo-
alph
a-m
esos
apro
b. S
al, h
alob
ity (H
uste
dt, 1
938-
1939
): i,
olig
ohal
obio
us-in
diffe
rent
; hl,
olig
ohal
obio
us-h
alop
hilo
us; h
b, o
ligoh
alob
ious
-hal
opho
bous
. pH
, aci
dity
(Hus
tedt
,19
57):
ind,
indi
ffere
nt; a
lf, a
lkal
iphi
l; ac
f, ac
idop
hil;
alb,
alk
alib
iont
. Het
, nitr
ogen
upt
ake
met
abol
ism
(Van
Dam
et a
l., 1
994)
: ats
, nitr
ogen
-aut
otro
phic
taxa
, tol
erat
ing
very
sm
all c
once
ntra
tions
of
orga
nica
lly b
ound
nitr
ogen
; ate
, nitr
ogen
-aut
otro
phic
taxa
, tol
erat
ing
elev
ated
con
cent
ratio
ns o
f org
anic
ally
bou
nd n
itrog
en; h
ne, f
acul
tativ
ely
nitro
gen-
hete
rotro
phic
taxa
, nee
ding
per
iodi
cally
ele
vate
dco
ncen
trat
ions
of o
rgan
ical
ly b
ound
nitr
ogen
; hce
, obl
igat
ely
nitro
gen-
hete
rotro
phic
taxa
, nee
ding
con
tinuo
usly
ele
vate
d co
ncen
trat
ions
of o
rgan
ical
ly b
ound
nitr
ogen
. Tro
, tro
phic
stat
e (V
anD
am e
t al.,
1994
): o
t, ol
igot
raph
entic
; o-m
, olig
o-m
esot
raph
entic
; m, m
esot
raph
entic
; me,
mes
o-eu
trap
hent
ic; e
, eut
raph
entic
; he,
hyp
ereu
trap
hent
ic; o
-e, o
ligo-
to e
utra
phen
tic (h
yper
eutr
aphe
ntic
).
Non co
mmercial
use o
nly
89Phytoplankton bioindication in Lake Onego
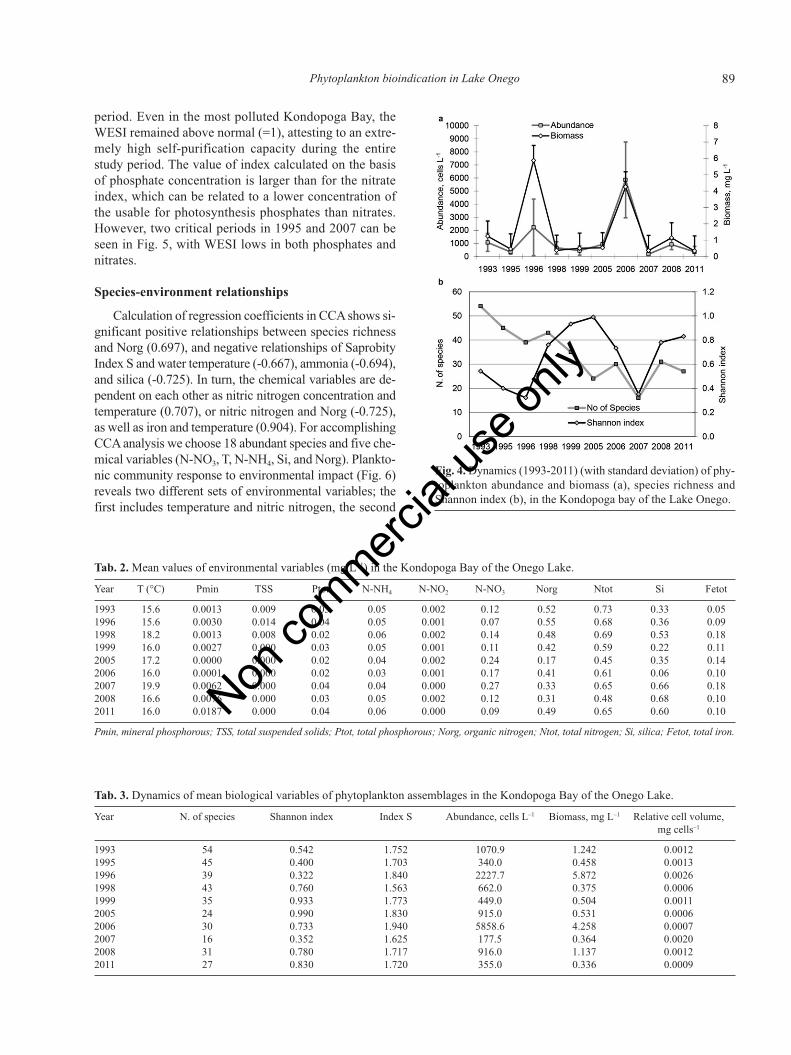
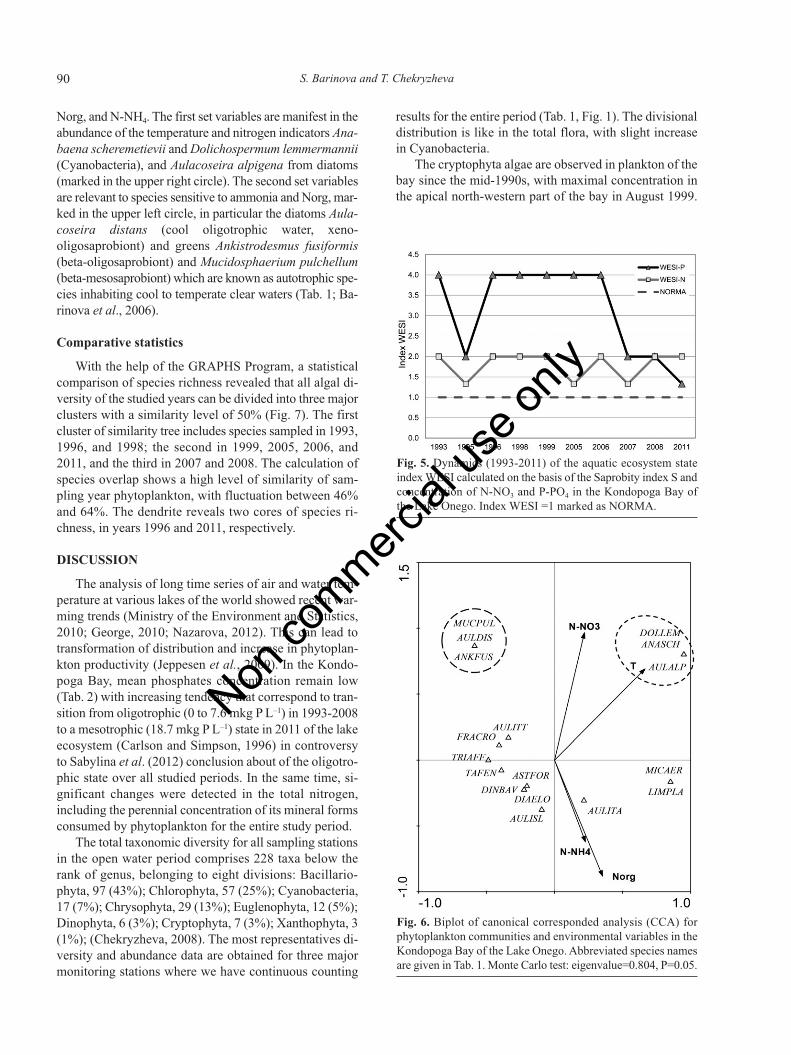
period. Even in the most polluted Kondopoga Bay, theWESI remained above normal (=1), attesting to an extre-mely high self-purification capacity during the entirestudy period. The value of index calculated on the basisof phosphate concentration is larger than for the nitrateindex, which can be related to a lower concentration ofthe usable for photosynthesis phosphates than nitrates.However, two critical periods in 1995 and 2007 can beseen in Fig. 5, with WESI lows in both phosphates andnitrates.
Species-environment relationships
Calculation of regression coefficients in CCA shows si-gnificant positive relationships between species richnessand Norg (0.697), and negative relationships of SaprobityIndex S and water temperature (-0.667), ammonia (-0.694),and silica (-0.725). In turn, the chemical variables are de-pendent on each other as nitric nitrogen concentration andtemperature (0.707), or nitric nitrogen and Norg (-0.725),as well as iron and temperature (0.904). For accomplishingCCA analysis we choose 18 abundant species and five che-mical variables (N-NO3, T, N-NH4, Si, and Norg). Plankto-nic community response to environmental impact (Fig. 6)reveals two different sets of environmental variables; thefirst includes temperature and nitric nitrogen, the second
Tab. 2. Mean values of environmental variables (mg L–1) in the Kondopoga Bay of the Onego Lake.
Year T (°C) Pmin TSS Ptot N-NH4 N-NO2 N-NO3 Norg Ntot Si Fetot
1993 15.6 0.0013 0.009 0.03 0.05 0.002 0.12 0.52 0.73 0.33 0.051996 15.6 0.0030 0.014 0.04 0.05 0.001 0.07 0.55 0.68 0.36 0.091998 18.2 0.0013 0.008 0.02 0.06 0.002 0.14 0.48 0.69 0.53 0.181999 16.0 0.0027 0.000 0.03 0.05 0.001 0.11 0.42 0.59 0.22 0.112005 17.2 0.0000 0.000 0.02 0.04 0.002 0.24 0.17 0.45 0.35 0.142006 16.0 0.0001 0.000 0.02 0.03 0.001 0.17 0.41 0.61 0.06 0.102007 19.9 0.0062 0.000 0.04 0.04 0.000 0.27 0.33 0.65 0.66 0.182008 16.6 0.0076 0.000 0.03 0.05 0.002 0.12 0.31 0.48 0.68 0.102011 16.0 0.0187 0.000 0.04 0.06 0.000 0.09 0.49 0.65 0.60 0.10
Pmin, mineral phosphorous; TSS, total suspended solids; Ptot, total phosphorous; Norg, organic nitrogen; Ntot, total nitrogen; Si, silica; Fetot, total iron.
Tab. 3. Dynamics of mean biological variables of phytoplankton assemblages in the Kondopoga Bay of the Onego Lake.
Year N. of species Shannon index Index S Abundance, cells L–1 Biomass, mg L–1 Relative cell volume,mg cells–1
1993 54 0.542 1.752 1070.9 1.242 0.00121995 45 0.400 1.703 340.0 0.458 0.00131996 39 0.322 1.840 2227.7 5.872 0.00261998 43 0.760 1.563 662.0 0.375 0.00061999 35 0.933 1.773 449.0 0.504 0.00112005 24 0.990 1.830 915.0 0.531 0.00062006 30 0.733 1.940 5858.6 4.258 0.00072007 16 0.352 1.625 177.5 0.364 0.00202008 31 0.780 1.717 916.0 1.137 0.00122011 27 0.830 1.720 355.0 0.336 0.0009
Fig. 4. Dynamics (1993-2011) (with standard deviation) of phy-toplankton abundance and biomass (a), species richness andShannon index (b), in the Kondopoga bay of the Lake Onego.
Non co
mmercial
use o
nly
90 S. Barinova and T. Chekryzheva
Norg, and N-NH4. The first set variables are manifest in theabundance of the temperature and nitrogen indicators Ana-baena scheremetievii and Dolichospermum lemmermannii(Cyanobacteria), and Aulacoseira alpigena from diatoms(marked in the upper right circle). The second set variablesare relevant to species sensitive to ammonia and Norg, mar-ked in the upper left circle, in particular the diatoms Aula-coseira distans (cool oligotrophic water, xeno-oligosaprobiont) and greens Ankistrodesmus fusiformis(beta-oligosaprobiont) and Mucidosphaerium pulchellum(beta-mesosaprobiont) which are known as autotrophic spe-cies inhabiting cool to temperate clear waters (Tab. 1; Ba-rinova et al., 2006).
Comparative statistics
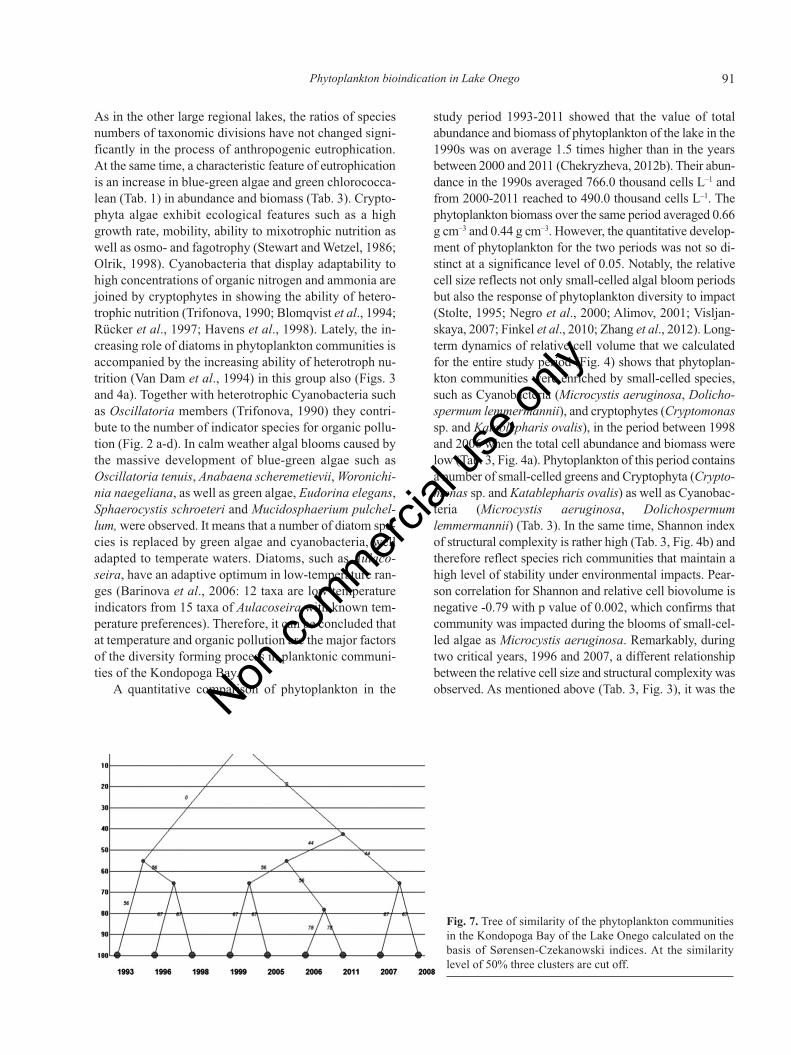
With the help of the GRAPHS Program, a statisticalcomparison of species richness revealed that all algal di-versity of the studied years can be divided into three majorclusters with a similarity level of 50% (Fig. 7). The firstcluster of similarity tree includes species sampled in 1993,1996, and 1998; the second in 1999, 2005, 2006, and2011, and the third in 2007 and 2008. The calculation ofspecies overlap shows a high level of similarity of sam-pling year phytoplankton, with fluctuation between 46%and 64%. The dendrite reveals two cores of species ri-chness, in years 1996 and 2011, respectively.
DISCUSSION
The analysis of long time series of air and water tem-perature at various lakes of the world showed recent war-ming trends (Ministry of the Environment and Statistics,2010; George, 2010; Nazarova, 2012). This can lead totransformation of distribution and increase in phytoplan-kton productivity (Jeppesen et al., 2009). In the Kondo-poga Bay, mean phosphates concentration remain low(Tab. 2) with increasing tendency that correspond to tran-sition from oligotrophic (0 to 7.6 mkg P L–1) in 1993-2008to a mesotrophic (18.7 mkg P L–1) state in 2011 of the lakeecosystem (Carlson and Simpson, 1996) in controversyto Sabylina et al. (2012) conclusion about of the oligotro-phic state over all studied periods. In the same time, si-gnificant changes were detected in the total nitrogen,including the perennial concentration of its mineral formsconsumed by phytoplankton for the entire study period.
The total taxonomic diversity for all sampling stationsin the open water period comprises 228 taxa below therank of genus, belonging to eight divisions: Bacillario-phyta, 97 (43%); Chlorophyta, 57 (25%); Cyanobacteria,17 (7%); Chrysophyta, 29 (13%); Euglenophyta, 12 (5%);Dinophyta, 6 (3%); Cryptophyta, 7 (3%); Xanthophyta, 3(1%); (Chekryzheva, 2008). The most representatives di-versity and abundance data are obtained for three majormonitoring stations where we have continuous counting
results for the entire period (Tab. 1, Fig. 1). The divisionaldistribution is like in the total flora, with slight increasein Cyanobacteria.
The cryptophyta algae are observed in plankton of thebay since the mid-1990s, with maximal concentration inthe apical north-western part of the bay in August 1999.
Fig. 5. Dynamics (1993-2011) of the aquatic ecosystem stateindex WESI calculated on the basis of the Saprobity index S andconcentration of N-NO3 and P-PO4 in the Kondopoga Bay ofthe Lake Onego. Index WESI =1 marked as NORMA.
Fig. 6. Biplot of canonical corresponded analysis (CCA) forphytoplankton communities and environmental variables in theKondopoga Bay of the Lake Onego. Abbreviated species namesare given in Tab. 1. Monte Carlo test: eigenvalue=0.804, P=0.05.
Non co
mmercial
use o
nly
91Phytoplankton bioindication in Lake Onego
As in the other large regional lakes, the ratios of speciesnumbers of taxonomic divisions have not changed signi-ficantly in the process of anthropogenic eutrophication.At the same time, a characteristic feature of eutrophicationis an increase in blue-green algae and green chlorococca-lean (Tab. 1) in abundance and biomass (Tab. 3). Crypto-phyta algae exhibit ecological features such as a highgrowth rate, mobility, ability to mixotrophic nutrition aswell as osmo- and fagotrophy (Stewart and Wetzel, 1986;Olrik, 1998). Cyanobacteria that display adaptability tohigh concentrations of organic nitrogen and ammonia arejoined by cryptophytes in showing the ability of hetero-trophic nutrition (Trifonova, 1990; Blomqvist et al., 1994;Rücker et al., 1997; Havens et al., 1998). Lately, the in-creasing role of diatoms in phytoplankton communities isaccompanied by the increasing ability of heterotroph nu-trition (Van Dam et al., 1994) in this group also (Figs. 3and 4a). Together with heterotrophic Cyanobacteria suchas Oscillatoria members (Trifonova, 1990) they contri-bute to the number of indicator species for organic pollu-tion (Fig. 2 a-d). In calm weather algal blooms caused bythe massive development of blue-green algae such asOscillatoria tenuis, Anabaena scheremetievii, Woronichi-nia naegeliana, as well as green algae, Eudorina elegans,Sphaerocystis schroeteri and Mucidosphaerium pulchel-lum, were observed. It means that a number of diatom spe-cies is replaced by green algae and cyanobacteria, welladapted to temperate waters. Diatoms, such as Aulaco-seira, have an adaptive optimum in low-temperature ran-ges (Barinova et al., 2006: 12 taxa are low temperatureindicators from 15 taxa of Aulacoseira with known tem-perature preferences). Therefore, it can be concluded thatat temperature and organic pollution are the major factorsof the diversity forming process in planktonic communi-ties of the Kondopoga Bay.
A quantitative comparison of phytoplankton in the
study period 1993-2011 showed that the value of totalabundance and biomass of phytoplankton of the lake in the1990s was on average 1.5 times higher than in the yearsbetween 2000 and 2011 (Chekryzheva, 2012b). Their abun-dance in the 1990s averaged 766.0 thousand cells L–1 andfrom 2000-2011 reached to 490.0 thousand cells L–1. Thephytoplankton biomass over the same period averaged 0.66g cm–3 and 0.44 g cm–3. However, the quantitative develop-ment of phytoplankton for the two periods was not so di-stinct at a significance level of 0.05. Notably, the relativecell size reflects not only small-celled algal bloom periodsbut also the response of phytoplankton diversity to impact(Stolte, 1995; Negro et al., 2000; Alimov, 2001; Visljan-skaya, 2007; Finkel et al., 2010; Zhang et al., 2012). Long-term dynamics of relative cell volume that we calculatedfor the entire study period (Fig. 4) shows that phytoplan-kton communities were enriched by small-celled species,such as Cyanobacteria (Microcystis aeruginosa, Dolicho-spermum lemmermannii), and cryptophytes (Cryptomonassp. and Katablepharis ovalis), in the period between 1998and 2006 when the total cell abundance and biomass werelow (Tab. 3, Fig. 4a). Phytoplankton of this period containsa number of small-celled greens and Cryptophyta (Crypto-monas sp. and Katablepharis ovalis) as well as Cyanobac-teria (Microcystis aeruginosa, Dolichospermumlemmermannii) (Tab. 3). In the same time, Shannon indexof structural complexity is rather high (Tab. 3, Fig. 4b) andtherefore reflect species rich communities that maintain ahigh level of stability under environmental impacts. Pear-son correlation for Shannon and relative cell biovolume isnegative -0.79 with p value of 0.002, which confirms thatcommunity was impacted during the blooms of small-cel-led algae as Microcystis aeruginosa. Remarkably, duringtwo critical years, 1996 and 2007, a different relationshipbetween the relative cell size and structural complexity wasobserved. As mentioned above (Tab. 3, Fig. 3), it was the
Fig. 7. Tree of similarity of the phytoplankton communitiesin the Kondopoga Bay of the Lake Onego calculated on thebasis of Sørensen-Czekanowski indices. At the similaritylevel of 50% three clusters are cut off.
Non co
mmercial
use o
nly

92 S. Barinova and T. Chekryzheva
time of large-celled Dinophyta bloom involving Ceratiumhirundinella and Peridinium aciculiferum. Therefore, Di-nophyta co-exist with the other plankters at low densities,but disrupt the structure of plankton communities at blo-oms. Causation of Dinophyta blooms in large lakes has notbeen given the attention it deserves, but a few examples(Zohary et al., 1998; Grigorszky et al., 2003) point to theblooms enhancing instability under increasing temperatureand organic impacts. Even small northern lakes show highbuffer capacity under industrial pollution impact (Blais etal., 1999), and for the large lakes as Onego the delay canbe more significant. On the other hand, periods of dinofla-gellate blooms (1998, 2007) are strongly followed by peaksof total abundance and biomass (1996, 2006).
We tried to relate the anthropogenic impacts to self-purification capacities in the bay and extrapolate overthe lake ecosystem as a whole. The saprobity indices re-flect organic pollution that stimulate photosynthetic ac-tivity on the one hand, and species richness, on the other(Barinova, 2011), showing high self-purification capa-cities (Tab. 3). This conclusion is confirmed by WESIvalues which were more than 1.0 over the studied period,being relatively low in 1995 and 2007 (Fig. 5). It can berelated to increases in nitrate and phosphate concentra-tions in these years, but with organic pollution (the Sa-probity index S) concomitantly decreasing. To clarifythe problem, we compare WESI with ecological infor-mation summarized in Tab. 3. While in critical years theSaprobity index S scarcely increased, the phosphate andnitrate concentrations levels are considerably elevated.This tendency can be seen in Fig. 5 during the last years(2007-2011) in respect to phosphates, which increasedsignificantly. Therefore, the WESI conveys the increasein inorganic pollution during the last few years, at thesame time attesting to self-purification capacities. Stati-stical analysis of species-environmental relationshipswith CCA (Fig. 6) of 18 abundant species and five mostcorrelated chemical variables reveals increasing of abun-dance of the temperature and nitrogen indicators Ana-baena scheremetievii, Dolichospermum lemmermannii,and Aulacoseira alpigena, as well as decreasing of sen-sitive to ammonia and Norg species Aulacoseira distans,Ankistrodesmus fusiformis, and Mucidosphaerium pul-chellum.
We also analyzed regression coefficients for most si-gnificant pairs of variables. Our calculations shows signi-ficant positive relationships of species richness and Norg(0.697), and negative relationships of saprobity index Sand water temperature (-0.667), ammonia (-0.694), andsilica (-0.725). In turn, the chemical variables are depen-dent each other as nitric nitrogen and temperature (0.707),or nitric nitrogen and Norg (-0.725), as well as iron andtemperature (0.904). The comparative species richnessanalysis (Novakovsky, 2004) has divided phytoplankton
into years representing three different clusters (Fig. 7), re-lated to fluctuations in species diversity and nutrients.Species richness overlap analysis shows a high level ofsimilarity of studied communities with similarity cores in1996 and 2011. It looks like a very important change ofenvironmental situations (years 1998 and 2011) in whichthe planktonic communities of the Kondopoga bay wereformed. We speculate that turnover might have been rela-ted to a 100-fold increase of total nitrogen, which comesfrom the Kondopoga treatment plants to the Kondopogabay after 1998 (Sabylina, 1999; Sabylina et al., 2010; Ru-khovets and Filatov, 2010; Kalinkina et al., 2012).
On the other hand, the long-term study of the great lakesecosystem (Petrova et al., 2010) revealed a multiparametricstressors impact (Summers et al., 2012), which can be in-flicted not only by water pollution but also by the air dust(Psenner, 1999) and acidification (Skjelkvåle et al., 2005),but mostly related to anthropogenic load. In deep lakes ofthe humid zone such as the Lake Ladoga (Petrova et al.,2010) and Lake Superior (Pourriot and Meybeck, 1995),the ecosystem trends toward the allochthonous, heterotro-phic type even notwithstanding the absence of significantincrease in anthropogenic load (Petrova et al., 2010). In thecase of the Onego Lake, the eutrophication trend is asso-ciated not only with the nutrients increase (Timakova et al.,2011) but also with multiparametric stressors, which in ourbio-indication result are manifest in the rise of species withheterotrophic nutrition ability (Saks et al., 1976).
CONCLUSIONS
Our results suggest that the Kondopoga Bay ecosystemhas high self-purification ability in spite of its anthropoge-nic impact from the Kondopoga pulp and paper mill wa-stewater. Bio-indication shows a trend of slightacidification and eutrophication of the bay waters. Our re-sults characterize the Kondopoga Bay as similar to ecosy-stems of large lakes, such as the Lake Ladoga, under lowyear-round insolation as well as having the highest watertemperatures in summer. The anthropogenic eutrophicationprocess is localized in deep bays like the Kondopoga Bay.Its morphometric features and thermodynamics contributeto slowing down of the eutrophication process, at the sametime spreading it over the entire area of the Lake Onego.Temperature and nutrients emerge from this study as themajor factors of the lake ecosystem dynamics.
Future investigations of phytoplankton in this greatnorthern lake would allow for more exact estimate of pol-lution intensity and the impact of the Kondopoga Bay eu-trophication confers to the whole great lake ecosystem.
ACKNOWLEDGMENTS
This work has been partly funded by the Ministry ofAbsorption of Israel.
Non co
mmercial
use o
nly
93Phytoplankton bioindication in Lake Onego
REFERENCES
Alimov AF, 2001. [Elements of the theory of the functioning ofaquatic ecosystems].[Book in Russian]. Nauka: 148 pp.
Anagnostidis K, Komárek J, 1988. Modern approach to the clas-sification system of cyanophytes. 3. Oscillatoriales. Arch.Hydrobiol. Algological Studies 50/53:327-472.
Barinova S, 2011. Algal diversity dynamics, ecological asses-sment, and monitoring in the river ecosystems of the easternMediterranean. Nova Science Publishers, New York: 363 pp.
Barinova S, Sivaci R, 2013. Experimental approach to a lakeecosystem assessment in the Great Lota, Turkey. Experiment9:566-586.
Barinova S, Tavassi M, Glassman H, Nevo E, 2010a. Algal in-dication of pollution in the Lower Jordan River, Israel. Appl.Ecol. Env. Res. 8:19-38.
Barinova SS, Krassilov VA, 2012. Algal diversity and bio-indica-tion of water resources in Israel. Int. J. Environ. Res. 1:62-72.
Barinova SS, Medvedeva LA, Anissimova OV, 2006. [Diversityof algal indicators in environmental assessment]. [Book inRussian]. Pilies Studio: 498 pp.
Barinova SS, Tavassi M, Nevo E, 2010b. Algal communities ofthe Hadera River (Israel) under dramatic niche change.Centr. Eur. J. Biol. 5:507-521.
Belous EP, Lilitzkaya GG, Krivenda AA, 2013. Seasonal fluc-tuation of phytoplankton in the upper part of the SouthernBug River (Ukraine). Algologia 1:53-64.
Blais JM, Duff KE, Laing TE, Smol JP, 1999. Regional conta-mination in lakes from the Noril’sk region in Siberia, Russia.Water Air Soil Pollut. 110:389-404.
Blomqvist P, Peterson A, Hyenstrand P, 1994. Ammonium ni-trogen: A key regulatory factor causing dominance of non-nitrogen-fixing cyanobacteria in aquatic systems. Arch.Hydrobiol. 132:141-164.
Boyarinov PM, Rudnev SF, 1990. [Instrumental methods of re-search trends], p. 53-71. In: Z.S. Kaufman (ed.), [The eco-system of the Onego Lake and the trends of itschanges].[Book in Russian]. Nauka, Leningrad.
Carlson RE, Simpson J, 1996. A coordinator’s guide to volunteerlake monitoring methods. North American Lake Manage-ment Society: 96 pp.
Chekryzheva TA, 2008a. [Changes in the structure of summerphytoplankton in the Kondopozhskaya Bay of the LakeOnego in the process of anthropogenic eutrophication], p.156-163. Proceedings Karelian Research Centre of RussianAcademy of Sciences, Issue 12. Ser. Biogeography. [Articlein Russian]. Karelian Research Centre of Russian Academyof Sciences, Petrozavodsk.
Chekryzheva TA, 2008b. [Phytoplankton as a component of thebase of the lake bioresource. Biological resources of theLake Onego], p. 24-35.[Article in Russian]. Karelian Rese-arch Centre of Russian Academy of Sciences, Petrozavodsk.
Chekryzheva TA, 2012a. [Long-term changes in the structure ofthe phytoplankton biomass of the Lake Onego. Ecologicalproblems of the northern regions and their solutions], p. 250-255. [Article in Russian]. Proceedings IV Scientific Confe-rence Kola Scientific Centre RAS. Institute of NorthIndustrial Ecology Problems, Apatity.
Chekryzheva TA, 2012b. [Taxonomic and ecological characte-ristics of phytoplankton in Lake Onego], p. 56-69. Procee-dings Karelian Research Centre of Russian Academy of
Sciences. Issue 13. Ser. Biogeography. [Article in Russian].Karelian Research Centre of Russian Academy of Sciences,Petrozavodsk.
Dedusenko-Schegoleva NT, Hollerbach MM, 1962. [Yellow-green algae].[Book in Russian]. USSR Academy of Scien-ces: 272 pp.
Dedusenko-Schegoleva NT, Matvienko A, Shkorbatov LA,1959. [Green algae].[Book in Russian]. USSR Academy ofSciences: 230 pp.
European Commission, 2000. Parliament and Council decisionof 23 October 2000 establishing a framework for Commu-nity action in the field of water policy, 2000/60/EC. In: Of-ficial Journal, L 327, 22/12/2000, p. 1-73.
Fedorov VD, 1979. [On methods of studying phytoplankton andits activity].[Book in Russian]. Moscow State University:166 pp.
Filatov NN, 2010. [The Lake Onego. Atlas].[Book in Russian].Karelian Research Centre of Russian Academy of Sciences:151 pp.
Finkel ZV, Beardall J, Flynn KJ, Quigg A, Alwyn V, Rees TV,Raven JA, 2010. Phytoplankton in a changing world: cell sizeand elemental stoichiometry. J. Plankton Res. 32:119-137.
Genkal SI, Trifonova IS, 2009. [Diatoms in the plankton of theLadoga Lake and waterbodies of its basin].[Book in Rus-sian]. Rybinsk Printing House: 72 pp.
George G, 2010. The impact of climate change on Europeanlakes. 1st edn. Springer, Berlin: 507 pp.
Grigorszky I, Borics G, Padisak J, Totmeresz B, Vasas G, NagyS, Borbely G, 2003. Factors controlling the occurrence ofDinophyta species in Hungary. Hydrobiologia 506:203-207.
Havens KE, Phlips EJ, Cichra MF, Li B-L, 1998. Light availa-bility as a possible regulator of cyanobacteria species com-position in a shallow subtropical lake. Freshwater Biol.39:547-556.
Heywood V, 2004. Modern approaches to floristics and their im-pact on the region of SW Asia. Turk. J. Bot. 28:7-16.
Hollerbach MM, Kosinskaya EK, Polanski VI, 1953. [Blue-green algae].[Book in Russian]. Soviet Science: 652 pp.
Hustedt F, 1938-1939. [Systematisch und Oekologische Untersu-chungen ueber die Diatomeen-Flora von Java, Bali und Su-matra, nach dem Material der Deutschen LimnologischenSunda-Expedition: Allgemeiner Teil].[Book in German]. E.Schweizerbart’sche Verlagsbuchhandlung (E. Nägele). 709 pp.
Hustedt F, 1958. [Diatomeen aus der Antarktis und dem Süda-tlantik. Deutsche Antarktische Expedition 1938/1939].[Ar-ticle in German]. Geographisch-kartographische AnstaltMundus 2:103-191.
Jeppesen E, Kronvang B, Meerhoff M, Sondergaard M, HansenKM, Andersen HE, Lauridsen TL, Liboriussen L, BekliogluM, Ozen A, Olesen JE, 2009. Climate change effects on ru-noff, catchment phosphorus loading and lake ecological state,and potential adaptations. J. Envir. Qual. 38:1930-1941.
Kalinkina NM, Kulikova TP, Litvinova IA, Polyakova TN,Syarki MT, Tekanova EV, Timakova TM, Chekryzheva TA,2012. Indication of Water and Bottom Sediment Pollutionin the Kondopozhskaya Bay of Lake Onego. Water Resour.39:776-783.
Kukharev VI, Lukin AA, 2008. [Bioresources of the LakeOnego].[Book in Russian]. Karelian Research Centre ofRussian Academy of Sciences: 272 pp.
Non co
mmercial
use o
nly

94 S. Barinova and T. Chekryzheva
Kiselev IA, 1954. [Pyrrophyta algae].[Book in Russian]. SovietScience: 212 pp.
Komárek J, Anagnostidis K, 1986. Modern approach to the clas-sification system of cyanophytes. 2. Chlorococcales. Arch.Hydrobiol. 73:157-226.
Korshikov OA, 1953. [Handbook of freshwater algae of Ukrai-nian SSR].[Book in Russian]. USSR Academy of Sciences439 pp.
Kosinskaya EK, 1960. [Flora of spore-bearing plants in theUSSR].[Book in Russian]. USSR Academy of Sciences:704 pp.
Krammer K, Lange-Bertalot H, 1986. [Bacillariophyceae. 1. Na-viculaceae], p. 1-876. In: H. Ettl, J. Gerloff, H. Heying andD. Mollenhauer (eds.), [Süsswasserflora von Mitteleu-ropa].[Book in German]. Fischer.
Krammer K, Lange-Bertalot H, 1988. [Bacillariophyceae. 2. Ba-cillariaceae, Epithemiaceae, Surirellaceae], p. 1-596. In: H.Ettl, J. Gerloff, H. Heying and D. Mollenhauer (eds.), [Süs-swasserflora von Mitteleuropa].[Book in German]. Fischer.
Krammer K, Lange-Bertalot H, 1991. [Bacillariophyceae. 3.Centrales, Fragilariaceae, Eunotiaceae], p. 1-576. In: H. Ettl,J. Gerloff, H. Heying and D. Mollenhauer (eds.), [Süsswas-serflora von Mitteleuropa].[Book in German]. Fischer.
Matvienko AM, 1954. [Freshwater algae of the USSR. Goldenalgae].[Book in Russian]. Soviet Science: 188 pp.
Matvienko AM, Litvinenko RM, 1977. [Pyrrophytaalgae].[Book in Russian]. Nauka: 386 pp.
Ministry of the Environment and Statistics, 2010. Finland’s FirstNational Communication under the United Nations Frame-work Conventions on climate change. Ministry of the Envi-ronment and Statistics Finland: 282 pp.
Morduhay-Boltovskiy FD, 1975. [Method of study biogeoceno-sis of inland waters].[Book in Russian]. Nauka: 250 pp.
Nazarova LE, 2012. Features of the dynamics of the temperatureregime of Karelia. Geogr. Nat. Res. 4:170-174.
Negro AI, De Hoyos C, Vega JC, 2000. Phytoplankton structureand dynamics in Lake Sanabria and Valparaíso reservoir(NW Spain). Hydrobiologia 424:25-37.
Novakovsky AB, 2004. [Abilities and base principles of pro-gram module GRAPHS].[Article in Russian]. Scientific re-ports of Komi Scientific Centre. Ural Division of theRussian Academy of Sciences 27:1-28.
Odum EP, 1969. The strategy of ecosystem development.Science 164:262-270.
Olrik K, 1998. Ecology of mixotrophic flagellates with specialreference to Chrysophyceae in Danish lakes. Hydrobiologia369/370:329-338.
Palamar-Mordvintseva GM, 1982. [Desmid algae of UkrainianSSR].[Book in Russian]. Naukova Dumka: 619 pp.
Petrova NA, Petrova TN, Susareva OM, Iofina IV, 2010. Featu-res of evolution the Lake Ladoga ecosystem due to anthro-pogenic eutrophication. Water Resour. 37:580-589.
Petrova NA, 1968. [Phytoplankton of the Ladoga Lake], p. 73-130. In: S.V. Kalesnik and I.M. Raspopov (eds.), [Plant re-sources of the Ladoga Lake].[Book in Russian]. LeningradUniv. Press.
Petrova NA, 1971. [Phytoplankton of the Onego Lake], p. 88-127. In: I.M. Raspopov (ed.), [Plant resources of the OnegoLake].[Book in Russian]. Nauka.
Petrova NA, 1975. [Phytoplankton of the littoral zone of the
Onego Lake], p. 138-144. In: I.M. Raspopov (ed.), [Littoralzone of the Onego Lake].[Book in Russian]. Nauka.
Petrova NA, 1986. Seasonality of Melosira - plankton of thegreat northern lakes. Hydrobiologia 138:65-73.
Petrova NA, 1990. [Succession of phytoplankton under anthro-pogenic eutrophication of large lakes].[Book in Russian].Nauka: 200 pp.
Pourriot R, Meybeck M, 1995. [Limnologie generale].[Book inFrench]. Masson: 956 pp.
Popova TG, 1955. [Euglenophyta (Euglenophyta) - Key to fre-shwater algae of the USSR].[Book in Russian]. SovietScience: 282 pp.
Psenner R, 1999. Living in a dusty world: airborne dust as a keyfactor for alpine lakes. Water Air Soil Poll. 112:217-227.
Pugnetti A, Acri F, Alberighi L, Barletta D, Bastianini M, Ber-nardi-Aubry F, Berton A, Bianchi F, Socal G, Totti C, 2004.Phytoplankton photosynthetic activity and growth rates inthe NW Adriatic Sea. Chem. Ecol. 20:399-409.
Romanenko VD, Oksijuk OP, Zhukinsky VN, Stolberg FV, La-vrik VI, 1990.[Ecological impact assessment of hydrotechni-cal constructions on water bodies].[Book in Russian].Naukova Dumka: 256 pp.
Rukhovets L, Filatov N, 2010. Ladoga and Onego - Great Eu-ropean lakes: observation and modeling. Springer-Praxis:320 pp.
Rücker J, Wiedner C, Zippel P, 1997. Factors controlling the do-minance of Planktothrix agardhii and Limnothrix redekei ineutrophic shallow lakes. Hydrobiologia 342/343:107-115.
Sabylina AV, 1999. [Modern hydrochemical regime of the lake],p. 58-108. In: N.N. Filatov (ed.), [The Lake Onego. Ecolo-gical problems].[Book in Russian]. Karelian Research Cen-tre of Russian Academy of Sciences.
Sabylina AV, Ryzhakov AV, 2007. [The Onego Lake and its tri-butaries. The chemical composition of the water of the lake],p. 29-40. In: P.A. Lozovik, T.P. Kulikova, N.N. Martynova(eds.), [Status of water objects in Republic of Karelia. Ac-cording to 1998-2006 monitoring results].[Book in Russian].Karelian Research Centre of Russian Academy of Sciences.
Sabylina AV, Lozovik PA, Zobkov MB, 2010. The chemicalcomposition of the water of the Lake Onego and its tributa-ries. Water Resour. 37:717-729.
Sabylina AV, Efremova TA, Ryzhakov AV, Zobkov MB, 2012.[Biogenic elements and organic matter in the Lake Onegoand its bays], p. 75-79. In: P.A. Lozovik (ed.), [Organic mat-ter and nutrients in inland waters and marine waters].[Bookin Russian]. Karelian Research Centre of Russian Academyof Sciences.
Saks NN, Stone RJ, Lee JJ, 1976. Autotrophic and heterotrophicnutritional budget of salt marsh epiphytic algae. J. Phycol.12:443-448.
Skjelkvåle BL, Stoddard JL, Jeffries DS, Tørseth K, Høgåsen T,Bowman J, Mannio J, Monteith DT, Mosello R, Rogora M,Rzychon D, Vesely J, Wieting J, Wilander A, WorsztynowiczA, 2005. Regional scale evidence for improvements in surfacewater chemistry 1990-2001. Environ. Poll. 137:165-176.
Sládeček V, 1973. System of water quality from the biologicalpoint of view. Adv. Limnol. 7:1-28.
Sládeček V, 1986. Diatoms as indicators of organic pollution.Acta Hydroch. Hydrob. 14:555-566.
Starmach K, 1985. [Chrysophyceae und Haptophyceae], p. 1-
Non co
mmercial
use o
nly
95Phytoplankton bioindication in Lake Onego
594. In: H. Ettl, J. Gerloff, H. Heynig and D. Mollenhauer(ed.), [Süsswasserflora von Mitteleuropa, Band 1].[Book inGerman]. Gustav Fischer Verlag.
Stewart AJ, Wetzel RG, 1986. Cryptophytes and other microfla-gellates as couplers in planktonic community dynamics.Arch. Hydrobiol. 106:1-19.
Stolte W, Riegman R, 1995. Effect of phytoplankton cell size ontransientstate nitrate and ammonium uptake kinetics. Micro-biology 141:1221-1229.
Summers JC, Ruhland KM, Kurek J, Quinlan R, Peterson AM,Smol JP, 2012. Multiple stressor effects on water quality inPoplar Bay, Lake of the Woods, Canada: a midge-based as-sessment of hypolimnetic oxygen conditions over the lasttwo centuries. J. Limnol. 71:34-44.
Ter Braak CJF, Šmilauer P, 2002. CANOCO Reference Manualand CanoDraw for Windows User’s Guide: Software for ca-nonical community ordination, ver. 4.5. MicrocomputerPower Press: 500 pp.
Ter Braak CJF, 1987. The analysis of vegetation-environmentrelationships by canonical correspondence analysis. Vege-tatio 69:69-77.
Ter Braak CJF, 1990. Interpreting canonical correlation analysisthrough biplots of structural correlations and weights. Psy-chometrica 55:519-531.
Timakova TM, Sabylina AV, Polyakova, TP, Syarki MT, Teka-nova EV, Chekryzheva TA, 2011. [The current state of theecosystem of the Lake Onego and the tendencies of its chan-ges over the past decades], p. 42-49. In: Proceedings Kare-lian Research Centre of Russian Academy of Sciences.[Article in Russian]. Karelian Research Centre of RussianAcademy of Sciences.
Trifonova IS, 1990. [Ecology and succession of the lake phyto-plankton].[Book in Russian]. Nauka: 184 pp.
Van Dam H, Mertens A, Sinkeldam J, 1994. A coded checklistand ecological indicator values of freshwater diatoms fromThe Netherlands. Neth. J. Aquat. Ecol. 28: 17-133.
Vislyanskaya IG, 1990. [Phytoplankton], p. 183-192. In: Z.S.Kaufman (ed.), [The ecosystem of the Lake Onego andtrends of its change]. [Book in Russian]. Nauka.
Vislyanskaya IG, 1999. [Structure and dynamics of phytoplan-kton biomass], p. 146-158. In: N.N. Filatov (ed.), [The LakeOnego. Environmental problems]. [Book in Russian]. Ka-relian Research Centre of Russian Akademy of Sciences.
Vislyanskaya IG, 2007. [Phytoplankton], p. 49-54. In: P.A. Lo-zovik, T.P. Kulikova, N.N. Martynova (eds.), [Status ofwater objects in Republic of Karelia. According to 1998-2006 monitoring results].[Book in Russian]. Karelian Rese-arch Centre of Russian Academy of Sciences.
Whitton BA, Rott E, Friedrich G, 1991. Use of algae for moni-toring rivers. Institut für Botanik, Innsbruck UniversityPress: 193 pp.
Zabelina MN, Kiselev IA, Proshkina-Lavrenko AI, SheshukovaVS, 1951. [Diatoms]. [Book in Russian]. Soviet Science:619 pp.
Zhang Y, Yin Y, Wang M, Liu X, 2012. Effect of phytoplanktoncommunity composition and cell size on absorption proper-ties in eutrophic shallow lakes: field and experimental evi-dence. Opt. Express 20:11882-11898.
Zohary T, Pollingher U, Hadas O, Hambright KD, 1998. Bloomdynamics and sedimentation of Peridinium gatunense inLake Kinneret. Limnol. Oceanogr. 43:175-186.
Non co
mmercial
use o
nly