Calibration and Instrumental Errors in Early Measurements of Air Temperature
33
CALIBRATION AND INSTRUMENTAL ERRORS IN EARLY MEASUREMENTS OF AIR TEMPERATURE DARIO CAMUFFO Consiglio Nazionale delle Ricerche, Institute of Atmospheric Sciences and Climate, Corso Stati Uniti 4, I-35127 Padova, Italy Abstract. Calibration and instrumental errors of early thermometers are analysed. The first con- cepts, the development of scientific ideas, the main problems linked to the construction of early thermometers and the calibration are considered in order to evaluate errors. The operating principle of the ‘constant-volume’ air thermometer is presented and its limits are discussed. The theory shows that for an ideal Amontons’ thermometer, only one calibration point is sufficient from which the other can be calculated; it is therefore possible to determine the difference from an ideal instru- ment. A comparison is made between calibrations and instruments made by G. Amontons (1699), G. Poleni (Venice, 1709; Padova 1725), and J.H. Lambert (1779). Amontons’ thermometer needs to be integrated with a barometric reading; an important error arises from the different density of mercury during calibration and usage. The calibration was made in winter and at the upper point the thermometer was at 100 ◦ C, while the barometer remained near 0 ◦ C. However, field observations were made with both instruments at the same temperature and this caused an error that in the cold season is negligible, but in the hot season reaches 1 ◦ C. Problems connected with the calibration and scale linearity are discussed in view of the beliefs of the time and the operative methodologies used in early meteorology. Emphasis is given to comparability of different instruments, thermometric scales and calibration methodologies used in Padova in the 18th century for Amontons’, Poleni’s, Fahrenheit’s, Réaumur’s and Delisle’s thermometers. The instrument supports and the incision of the scale were subject to expand or contract depending on temperature or humidity changes, and this was a source of error that can be corrected with the help of observed or estimated data. Problems linked to the construction of thermometers have been evaluated, as well as the linearity of displacements of the thermometric liquid, or the drift due to ageing and transformation of the thermometric liquid, the glass or the support. All these errors have been evaluated and some of them have been found negligible, but some are of the order of 0.5 ◦ C. The quantitative results obtained here can also be usefully applied to correct and validate other long series. 1. The Invention of the Air Thermometer and Its Improvements From December 1592 to 1610, Galileo Galilei (1564–1642) was appointed to the chair of Mathematics at Padova University and invented the early prototype of the air thermometer slightly after his arrival, very probably in 1593 (Giovanfrancesco Sagredo, 1612; 1613; 1615; Benedetto Castelli, 1638; Vincenzio Viviani, 1654; Targioni Tozzetti, 1780; Renou, 1875; Favaro, 1883; Boffito, 1929; Middleton, 1966; Frisinger, 1983). The instrument was a glass vessel filled with air and fitted to a vertical tube with the lower extremity immersed in water, or in red wine, to better show the height of the column of liquid in the tube when the vessel was heated. Climatic Change 53: 297–329, 2002. © 2002 Kluwer Academic Publishers. Printed in the Netherlands.
Transcript of Calibration and Instrumental Errors in Early Measurements of Air Temperature

CALIBRATION AND INSTRUMENTAL ERRORS INEARLY MEASUREMENTS OF AIR TEMPERATURE
DARIO CAMUFFOConsiglio Nazionale delle Ricerche, Institute of Atmospheric Sciences and Climate,
Corso Stati Uniti 4, I-35127 Padova, Italy
Abstract. Calibration and instrumental errors of early thermometers are analysed. The first con-cepts, the development of scientific ideas, the main problems linked to the construction of earlythermometers and the calibration are considered in order to evaluate errors. The operating principleof the ‘constant-volume’ air thermometer is presented and its limits are discussed. The theory showsthat for an ideal Amontons’ thermometer, only one calibration point is sufficient from which theother can be calculated; it is therefore possible to determine the difference from an ideal instru-ment. A comparison is made between calibrations and instruments made by G. Amontons (1699),G. Poleni (Venice, 1709; Padova 1725), and J.H. Lambert (1779). Amontons’ thermometer needsto be integrated with a barometric reading; an important error arises from the different density ofmercury during calibration and usage. The calibration was made in winter and at the upper point thethermometer was at 100 ◦C, while the barometer remained near 0 ◦C. However, field observationswere made with both instruments at the same temperature and this caused an error that in the coldseason is negligible, but in the hot season reaches 1 ◦C. Problems connected with the calibration andscale linearity are discussed in view of the beliefs of the time and the operative methodologies usedin early meteorology. Emphasis is given to comparability of different instruments, thermometricscales and calibration methodologies used in Padova in the 18th century for Amontons’, Poleni’s,Fahrenheit’s, Réaumur’s and Delisle’s thermometers. The instrument supports and the incision of thescale were subject to expand or contract depending on temperature or humidity changes, and this wasa source of error that can be corrected with the help of observed or estimated data. Problems linkedto the construction of thermometers have been evaluated, as well as the linearity of displacementsof the thermometric liquid, or the drift due to ageing and transformation of the thermometric liquid,the glass or the support. All these errors have been evaluated and some of them have been foundnegligible, but some are of the order of 0.5 ◦C. The quantitative results obtained here can also beusefully applied to correct and validate other long series.
1. The Invention of the Air Thermometer and Its Improvements
From December 1592 to 1610, Galileo Galilei (1564–1642) was appointed to thechair of Mathematics at Padova University and invented the early prototype of theair thermometer slightly after his arrival, very probably in 1593 (GiovanfrancescoSagredo, 1612; 1613; 1615; Benedetto Castelli, 1638; Vincenzio Viviani, 1654;Targioni Tozzetti, 1780; Renou, 1875; Favaro, 1883; Boffito, 1929; Middleton,1966; Frisinger, 1983). The instrument was a glass vessel filled with air and fitted toa vertical tube with the lower extremity immersed in water, or in red wine, to bettershow the height of the column of liquid in the tube when the vessel was heated.
Climatic Change 53: 297–329, 2002.© 2002 Kluwer Academic Publishers. Printed in the Netherlands.

298 DARIO CAMUFFO
In reality, the instrument was a thermo-baroscope, as it responded to both the airtemperature and pressure, and it needed improvement. Santoro Santorio (1561–1636), a medicinal doctor appointed to the same University to teach Medicine oneyear after Galileo’s departure, applied a quantitative scale to the air thermoscopeto measure human body temperature during illness. As the thermoscope respondedto both temperature and pressure, Santorio eliminated the undesired pressure in-fluence with the help of a compass, by adding or subtracting the variation of theday from the reference value which was established by measuring a healthy bodytemperature.
The first attempt to transform the thermo-baro-scope into a thermometer wasjointly made by Ferdinand II of Tuscany (1610–1670) and Evangelista Torricelli(1608–1647) in 1641. They invented various thermometers, but the key point wasthat they hermetically sealed the tube by melting the glass tip, allowing heat, butnot pressure exchanges across the instrument. Another key step was the use of spiritas a thermometric fluid; the Florentine thermometer used later by the Accademiadel Cimento was a spirit-in-glass thermometer.
Towards the end of the 1600s, the air thermometer was studied by numerousscientists and the most important work was carried out be Guillaume Amontons(1663–1705). On the basis of his experiments, Amontons (1695; 1702) showedthat the pressure of different quantities of air increased by the corresponding risein temperature and that the relationship between pressure and temperature wasindependent of initial pressure. He thus postulated a linear relationship betweenpressure and temperature (Taton, 1961; Middleton, 1966).
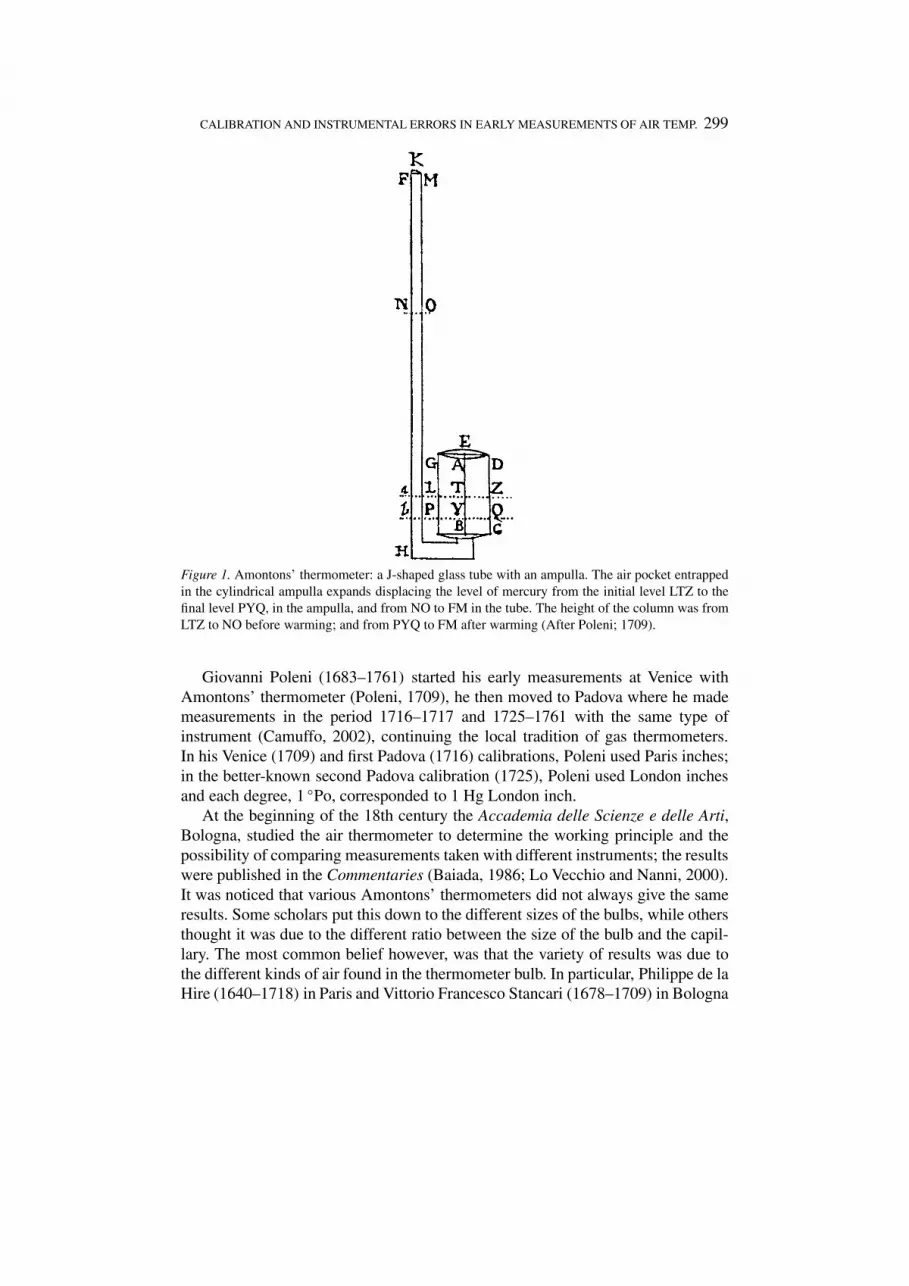
Amontons’ thermometer was popular at the end of the 17th century and begin-ning of the 18th. It was essentially derived from the Galileo’s thermo-baro-scope,and the measuring apparatus is similar to that of a manometer. It consists of a J-shaped glass tube (a capillary) with an ampulla; the upper end of the tube is openand the other is sealed to a closed ampulla (Figure 1). An air pocket entrappedby mercury in the upper part of the ampulla acts as a thermometric substance; themercury also fills the capillary up to a certain height, compressing the air pocket.
In practice a rise in the ambient temperature T results in a rise of the mercurycolumn in the capillary. However, the capillary being open, an increase in the at-mospheric pressure is reflected in a lowering of the mercury in the capillary, so thatthis apparent depression must be compensated by adding the barometric variationto the thermoscopic reading. From this point of view, the name ‘thermometer’ forthis instrument is inappropriate, as it gives only one of the two readings necessaryto determine the temperature, and only the sum of the two readings, i.e. Amontons’thermometer and the barometer, gives the real temperature. As these pressures weregiven by the heights of the mercury columns in the thermometer and the barom-eter, a measure of length represented either the pressure in the ampulla or the airtemperature. The disadvantage was the need of two instruments to determine thetemperature.
CALIBRATION AND INSTRUMENTAL ERRORS IN EARLY MEASUREMENTS OF AIR TEMP. 299
Figure 1. Amontons’ thermometer: a J-shaped glass tube with an ampulla. The air pocket entrappedin the cylindrical ampulla expands displacing the level of mercury from the initial level LTZ to thefinal level PYQ, in the ampulla, and from NO to FM in the tube. The height of the column was fromLTZ to NO before warming; and from PYQ to FM after warming (After Poleni; 1709).
Giovanni Poleni (1683–1761) started his early measurements at Venice withAmontons’ thermometer (Poleni, 1709), he then moved to Padova where he mademeasurements in the period 1716–1717 and 1725–1761 with the same type ofinstrument (Camuffo, 2002), continuing the local tradition of gas thermometers.In his Venice (1709) and first Padova (1716) calibrations, Poleni used Paris inches;in the better-known second Padova calibration (1725), Poleni used London inchesand each degree, 1 ◦Po, corresponded to 1 Hg London inch.
At the beginning of the 18th century the Accademia delle Scienze e delle Arti,Bologna, studied the air thermometer to determine the working principle and thepossibility of comparing measurements taken with different instruments; the resultswere published in the Commentaries (Baiada, 1986; Lo Vecchio and Nanni, 2000).It was noticed that various Amontons’ thermometers did not always give the sameresults. Some scholars put this down to the different sizes of the bulbs, while othersthought it was due to the different ratio between the size of the bulb and the capil-lary. The most common belief however, was that the variety of results was due tothe different kinds of air found in the thermometer bulb. In particular, Philippe de laHire (1640–1718) in Paris and Vittorio Francesco Stancari (1678–1709) in Bologna
300 DARIO CAMUFFO
demonstrated that thermometers behaved differently when very humid air was used(because of the problem of moisture condensation). They underlined the need toutilise dry air when constructing instruments in order to get comparable readings.Around 1707 Stancari sealed the longer arm of the tube, thus leaving a vacuumbetween the surface of the mercury and the end of the tube, in order to make the airthermometer independent from the barometric pressure. This instrument was lesspopular than Amontons’ thermometer, probably because Stancari was less renownand had a short life, and also because the need for an additional barometer readingwas not a problem for weather observers.
The observations carried out from 1716 to 1737 in Bologna by Jacopo Bar-tolomeo Beccari (1682–1766), and called ‘Meteorological Ephemerides’, weretaken with Stancari’s thermometer whose original calibration is reported in theregister. The register with an original copy of the data (i.e., collected by Beccari)is still preserved in the Astronomic Observatory of the University of Padova. Ina previous study of these data (Comani, 1987), the scale passed unobserved andwas erroneously considered unknown, so that the instrument was calibrated withthe comparison with some series from Tuscany. However, the crucial error wasthat the instrument was, by mistake, believed to be Amontons’ thermometer and,consequently, the barometric heights were summed to the temperature readings.The result was the addition of noise with the same order of magnitude of theobservation. The early part of the Bologna series needs complete careful revision,with the recovery, validation, correction and homogenisation of the original data,and this is underway.
In the early period of meteorology, Amontons’ air thermometer was a keyinstrument. In general, the interest for the air thermometer started to decline inmid-17th century, and sealed glass thermometers containing a liquid became moreand more popular.
2. The Operating Principle of Amontons’ Air Thermometer
In the ampulla, a change in ambient temperature dT determines a change in thepressure dP and volume dV of the air pocket, which is obtained by differentiatingthe equation of state for perfect gases, i.e.,
dT = P0 dV + V0 dP
nR, (1)
where n is the number of air moles entrapped in the pocket, and R the gasconstant for air. From the instrument features, it is easily seen that
dV = Sadha = Scdhc (2)
dP = ρ g dhc , (3)

CALIBRATION AND INSTRUMENTAL ERRORS IN EARLY MEASUREMENTS OF AIR TEMP. 301
where S is the section, h the height of the mercury; the labels a and c refer respec-tively to the ampulla and the capillary; ρ is the density of the mercury and g theacceleration of gravity. After substitution of the formulae for dV and dP in theabove equation, one obtains
dT = P0 Sc + V0 ρ g
nRdhc , (4)
i.e., a change dT results in a change dhc observable in the capillary, and the sen-sitivity of the instrument dhc/dT is directly proportional to the number of molesentrapped in the air pocket, and inversely proportional to the sum P0 Sc + V0 ρg
where the second term is the dominant one.In the capillary, the change dhc in the height of mercury, determines in the
ampulla a change in volume dVc = −dVa = Scdhc and a change in pressuredP = ρ g dhc. The ratio
dVa
dP= Sc
ρg(5)
is of the order of 2.5 × 10⁻³ cm3/hPa for a capillary radius r = 1 mm, and 6.1 ×10⁻² cm3/hPa for r = 5 mm (1 mm-Hg = 1.333 hPa). The smaller the capillarysection Sc, the smaller dV compared to dP and the better the ‘constant-volume’approximation.
When the capillary is very thin and Sc approaches zero, and at the same timethe air pocket volume Va is large enough, then in Equation (4) the term P0 Sc canbe neglected when compared to V0 ρg. In this case,
dT = V0ρg
nRdhc = V0
nRdP (6)
which is the equation for constant-volume gas thermometers. Under these con-ditions, P is proportional to T , the coefficient of proportionality being V0/nR.In Amontons’ real themometer, V remains (nearly) constant and P is (nearly)linearly proportional to T . Finally, the change in level of mercury in the ampulla�ha = �hc × �Sc/Sa depends on the ratio of the sections of the capillary Sc andthe ampulla Sa. The smaller this ratio, the more stable the level of mercury in theampulla, to which the ‘zero’ of the scale refers, and the more reliable the readingson instruments with (necessarily) fixed scale. A good Amontons’ thermometer has,therefore, a thin capillary and a wide ampulla.
The thermometer regularly used by Giovanni and Francesco Poleni in Venice(1709) and Padova (1716–1717 and from 1725 to 1764) was built and calibrated byG. Poleni following Amontons’ indications, and was described in a paper (Poleni,1709) and a letter to James Jurin (Poleni, 1731). Unfortunately, the original ther-mometer did not survive, although four drawings in Poleni’s (1709) paper presentthe same ratio 1:25 between the section of the capillary and the ampulla. As theratio is always the same, we are induced to suppose that this was not casual. Some

302 DARIO CAMUFFO
58 years later, when practice and theory were more consolidated, Hemmer (1783)used the ratio 1:81 for his measurements in Mannheim.
In conclusion, every imbalance in T reflects in a well-determined change in P
and a very small change in V . If the capillary is thin, and �V is negligible, thenin a good approximation, �P is linearly proportional to �T , with two practicalconsequences: (i) changes in ambient temperature can be measured by observingchanges in the height of mercury in the column; (ii) the actual value of the tem-perature is obtained by measuring the total pressure in the ampulla, i.e., the sum ofpressures in the thermometer and the barometer.
Another problem arises with this thermometer. A drift toward lower temper-atures has been noted for Amontons’ thermometer used by Poleni in Padova. Inthe period 1740–1758, when comparison with other independent and reliable ther-mometers was possible, the drift was of the order of 0.2 ◦C/yr. Another similar driftwas found for the Beccari series in Bologna, but for Stancari’s air thermometer. Thedrift occurred because of a progressive displacement of the zero reference level, buta downward slipping of the scale occurring at constant speed for tens of years is notcredible. In fact, the scale was stuck on the frame and the capillary was attached toit with an iron wire, so that in the case of slipping we would expect a downwarddisplacement of both the capillary and the ampulla, which would have the oppositeeffect, i.e., a relative rise of the scale. The other alternative is a constant rise in thefree level of mercury in the ampulla, as if the air pocket were being progressivelyreduced. We should exclude air migrating and escaping across the glass ampulla.Water vapour can interact with the glass and disappear from the gas phase, but theamount is too little and insufficient to have this effect. A tentative explanation mightbe that some air escaped through an accidental crack in the glass of the ampulla,under the pressure exerted by the mercury column. Another tentative explanationmight be that, in the long run, the oxygen entrapped in the ampulla may combinewith the mercury and possible impurities, thus diminishing the air pocket. In theliterature we find that mercury and oxygen are unstable with respect HgO at roomtemperature, and that their rate of combination is exceedingly slow; the reactionproceeds at useful rate at 300 to 350 ◦C, and reverses over 400 ◦C (Cotton andWilkinson, 1972). The very slow kinetic might explain why the drift (and thereaction) was still continuing in 1758, i.e., at least 33 years after the calibrationin 1725. Another possible explanation might be that the glass ampulla and tubeunderwent a plastic drift which altered the volume. Angelo Bellani (1808) analysedthe drift of the zero in thermometers with accurate laboratory tests. He found twocauses: the first due to abrupt changes in temperature, e.g., during calibration; thesecond due to glass ageing with the shift continuing for about one year. Accordingto César Mansuète Despretz (1837), the drift for glass ageing (of course glass ofhis century) can continue for four or five years. However, a drift for glass ageingwhich continued for more than thirty years is hardy believable. None of the abovehypotheses is fully convincing.

CALIBRATION AND INSTRUMENTAL ERRORS IN EARLY MEASUREMENTS OF AIR TEMP. 303
Returning to the gas thermometer, if the reason for drift is some air escap-ing from the ampulla, or the subtraction of oxygen through oxidation, we candistinguish two cases. When P0 Sc � V0ρg, the air pressure in the ampulla isproportional to the actual temperature through the coefficient n/V0, and the lossof air or oxygen diminishes in the same proportion both n and V0, leaving theirratio unchanged. The response of the instrument remains the same, i.e., the samedisplacement of the column for the same change in temperature, except for a shiftin the values. Therefore, a good Amontons’ thermometer is unaffected by the re-duction of the air pocket, e.g., for oxidation of mercury, except for the zero of thescale that is displaced. When P0 Sc is not much smaller than V0 ρg, the thermometerneeds to be re-calibrated.
3. The Operating Principle of the ‘Constant-Volume’ Air Thermometer
In a ‘constant-volume’ thermometer, a change in temperature is reflected in achange in pressure, with the volume remaining constant, and Amontons’ andStancari’s thermometers can be thus classified in a first approximation becauseof certain complicating factors which cause small departures (McGee, 1988). Itis possible to demonstrate that this thermometer tends to keep the volume V =constant. In fact, we can suppose that changes in ambient air temperature T inducechanges in both P and V in the air pocket entrapped in the ampulla, which passesfrom the initial state T0, P0V0 to a new state T1, P1V1. The latter is not defined byany of the infinite pairs P1V1 lying on the isothermal hyperbola T1 = constant inthe phase diagram, but only by the pair in which V1 = V0, or with V1 very closeto V0. In fact, in the air pocket �T1 determines a rise in pressure �P1 = P0 − P1
which, in the capillary, generates a rise of mercury �hc such that �P1 = ρg�hc.Similarly, �T1 may expand the air pocket by �V1 = V0 − V1, and in turn �V1
displaces the same volume of mercury �V1 = �ha × Sa and forces it to rise intothe capillary by �h2 = �ha × Sa/Sc increasing the hydrostatic pressure, at thebase of the column and in the air pocket, by �P2 = ρg�h2. Actually, �P2 isoverpressure in excess above the equilibrium value P1, whose effects are: (i) tooppose expansion �V1 which has generated �P2; (ii) to compress the air pocket;and (iii) to return to the initial volume V0. The opposite occurs if �V1 is negative.Therefore, the equilibrium is displaced toward the pair P1V0, although in practicethere is a minor departure �V due to the volume of mercury transferred from theampulla to the capillary and the adjustment for the differential expansions of theother materials (i.e., mercury, glass).
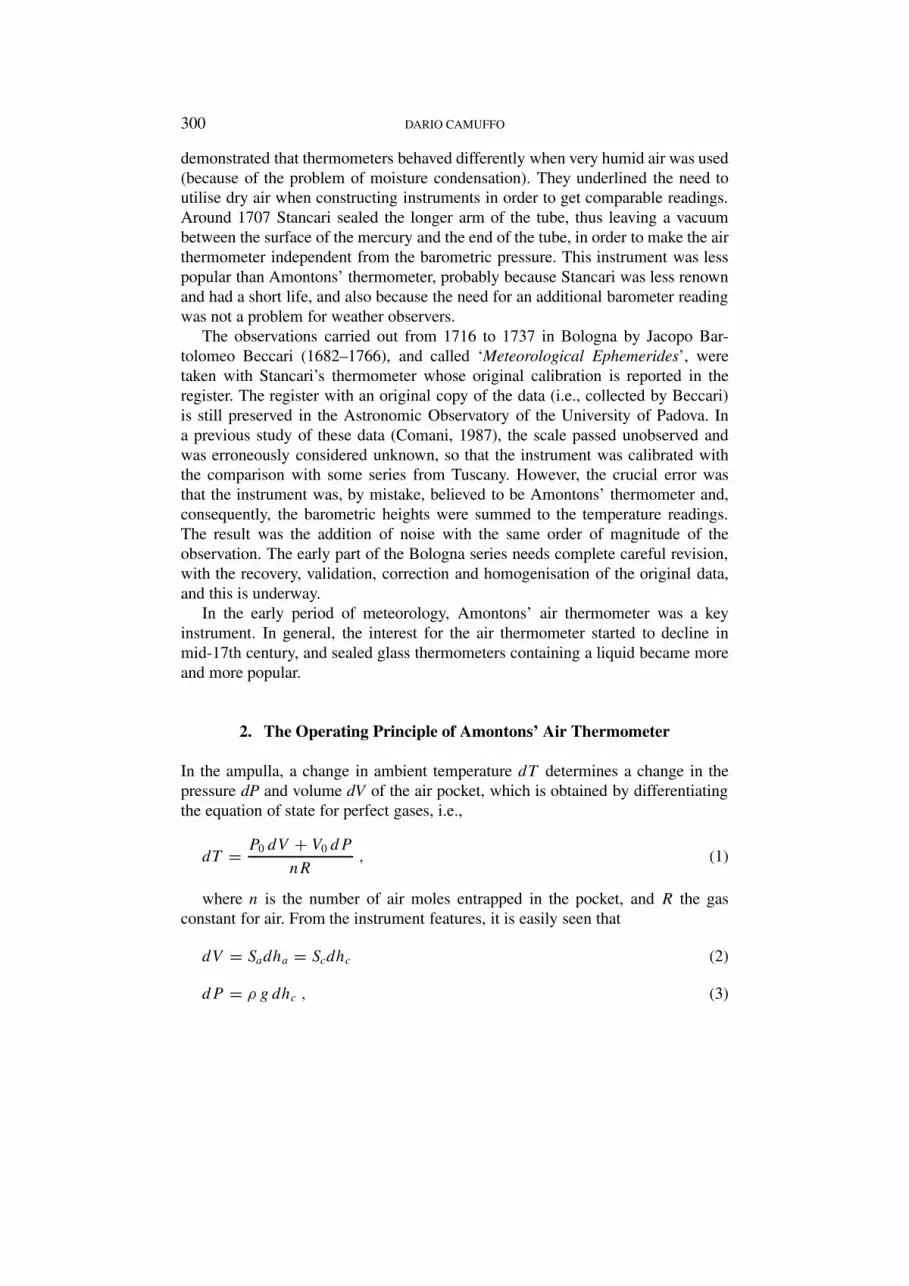
Typical causes of error in early gas thermometers were not only the undesiredexpansion of mercury and glass, but also condensation of moisture in the air pocket,or release of air bubbles which initially adhered to the glass. For this reason, themercury was inserted gradually, at high temperature, and mixed with an iron wire,when the tube was wide enough. In the case of a thin capillary, the top was provided

304 DARIO CAMUFFO
Figure 2. Filling the bulb with mercury. C is a reservoir on the top of the capillary that will beremoved after operation (after Ganot, 1860).
with a reservoir-funnel and the bulb was heated over a flame so that some of thebubbles of dilated air escaped from the capillary (Figure 2). The operation wasrepeated until all the air escaped. Then the mercury was brought to ebullition tocompletely remove any residual part of air. At this point, the mercury was expandedup to the end of the capillary, the reservoir was removed, and the top of the capillarysealed. At room temperature, the mercury retreated leaving only mercury vapour inthe upper part of the capillary. Many early thermometers were not sealed and stillpreserve the reservoir at the top.
As opposed to the ‘constant-volume’ thermometer, the ‘constant-pressure’ typehas a (nearly) constant pressure, and the volume expansion is the main variable onwhich measurements are based. Henri Victor Regnault (1847) demonstrated thatthese two thermometers are very nearly equivalent, although the constant-volumeis to be preferred for its better manageability (Middleton, 1966). In modern gasthermometers, the manometer tube is free so has to be displaced vertically, to makethe level of the mercury in the ampulla coincide with the zero of the scale, thuskeeping the volume of the air pocket constant (Yavorsky and Pinsky, 1979). Thesame goal can be attained with a fixed apparatus, but by adding or subtractingmercury (Doebelin, 1990).

CALIBRATION AND INSTRUMENTAL ERRORS IN EARLY MEASUREMENTS OF AIR TEMP. 305
4. A Comparison between Calibrations and Instruments Made by G. Poleni(Venice, 1709; Padova, 1731), G. Amontons (1699) and J. H. Lambert
(1779) and the Equation for an Ideal ‘Constant-Volume’ Thermometer
G. Poleni built and calibrated Amontons’ thermometer when he lived in Venice(Poleni, 1709). After going to Padova, he took measurements in his first housefor a short period (1716–1717) with an unknown scale, and then made regularobservations in his second Padova house from 1725 to 1761. In these three cases,however, the response of the thermometer was different, and we found it extremelyinstructive to understand why. Possibly the instrument was the same, and the scalechanged after having replaced the mercury (and the air pocket) after the move fromVenice to Padova in 1709, and/or after the second move in 1718. When the mercurywas again poured into the instrument, a slightly different air pocket was included.Another possibility is that the thermometer was transported first from Venice toPadova, and then from the first house to the second one, without removing themercury, and that a small bubble of air escaped from the air pocket as a conse-quence of a shock during the move. The distance from Venice to Padova is some37 km and the transport needed was first a boat and then a chariot; the distancefrom the two houses in Padova was slightly more than one mile, and required theuse of a chariot. In the Venice calibration (Poleni, 1709), when the ampulla wasimmersed in boiling water, the difference in the level between the free surface ofthe mercury in the capillary and the ampulla was 45 Paris inches (one Paris inchbeing equal to 27.07 mm) when the barometer indicated the ‘standard’ atmosphericpressure corresponding to 28 Paris inches (i.e., 758 mm Hg). This is equivalent tosaying that the air pressure in the ampulla corresponded to 45 + 28 = 73 Parisinches = 68.5 ◦Po, which was the upper fixed point. Poleni, and his colleagues,disregarded the atmospheric pressure during the calibration and the error (thatat 758 mm was −0.074 ◦C) will be discussed later. When the thermometer wasimmersed in water with melting ice, the mercury dropped by 21 inches, i.e., 52Paris inches = 48.9 ◦Po. In the second, and the only known Padova calibration, theboiling point was 63.1 ◦Po and the freezing point was 47.3 ◦Po.
We can verify the quality of Poleni’s instrument. First we will look at the ratioRp = P(100 ◦C)/P(0 ◦C) of the pressures in the ampulla at the two calibrationpoints. In the Venice calibration (Poleni, 1709), Rp = 1.404; in the Padova calibra-tion (Poleni, 1731), Rp = 1.33. These findings can be compared with the similarresults by G. Amontons (1699), i.e., Rp = 1.404 (identical to Poleni), and JohanHeinrich Lambert (1779), i.e., Rp = 1.370 (Schooley, 1986). In theory, this ratioshould equal 1.366 as we will see later. It is now possible to pass to calculate theratio Rv = V (100 ◦C)/V (0 ◦C) of the volumes of the air pocket at the two fixedpoints. From the equation of the state for perfect gases, one obtains
Rv = P(0◦C) × nR 373
P(100◦C) × nR 273= RT
RP
(7)

306 DARIO CAMUFFO
where RT = 373/273 = 1.366 is the ratio of the calibration temperatures, in K.In the case of Poleni, Venice calibration, Rv = 0.973; in the Padova calibration,Rv = 1.024, i.e., still close to 1, within ± 2.7%. The same ratio can be calculatedfor Amontons’ and Lambert’s instruments, i.e., Rv = 0.973 and Rv = 0.997,respectively. The closer to 1 this ratio, the more accurate the instrument and itscalibration. This comparison shows that the quality of Amontons’ and Poleni’soriginal instruments was substantially the same; Lambert’s was better, i.e., 3�.These departures are justifiable in terms of the limits of the instrument, smallexperimental errors, the approximation used to make a round figure of the readings,and the absence of further corrections for thermal expansions.
Poleni built his instruments and described them in his papers; the hypothesis thatPoleni made more than one of Amontons’ thermometers is not confirmed by docu-mentary research, and this induces us to think that the instrument in Venice and thetwo in Padova were the same, although with different fixed points. In Padova, thescale was changed from Paris to London inches following Jurin’s (1723) invitation,but this is not overly relevant. It is reasonable to think that the substantial changeoccurred when the mercury was removed and then poured back into the instrumentor with the loss of small air bubbles during one or both of the moves.
The size of the air pocket, the number of moles in the ampulla and the pressureimpressed by the mercury in the capillary tube characterise the response of eachinstrument. Calculating the ratio PV /PP between the air pressures in the ampullain the Venice and the second Padova calibration, one obtains for the freezing point(PV /PP )0 = 1.032 and for the boiling point (PV /PP )100 = 1.085. As PV /PP =nV VP/nP VV , where the labels V and P refer to Venice and Padova, respectively.This suggests that in Venice and in Padova the instrument was essentially the samealthough it met with some mishaps during its journeys with the consequent changein calibration. The calculation of the ratio n/V allows one to compute the massof air per unit of volume of the ampulla and, therefore, the ratio δ between thedensity of the air in the ampulla and the standard atmosphere in Venice and Padovaat the two fixed points, i.e., δV (100) = 2.77; δV (0) = 1.98; δP (100) = 1.99;δP (0) = 1.63. The ratio δP /δV for the two fixed points gives (δP /δV )0 = 0.823and (δP /δV )100 = 0.718, which supports the hypothesis of the same instrument,but with a loss of air, or a re-filling with less air.
If the same instrument was used in 1709 and after 1725, it was also used in theearly Padova period 1716–1717, prior to the move to the second Padova house,when the mercury was possibly removed again for the move. With a good Amon-tons’ thermometer, it is possible to calculate an unknown scale, i.e., the secondfixed point, when the first is known. In fact, the zero can be approximately deter-mined after days of snow and rain, and the unknown boiling point can be calculatedwith the help of Equation (7), which assumes the form:
P(100 ◦C) = P(0 ◦C) × RT /Rv = 1.366 × P(0 ◦C) , (8)

CALIBRATION AND INSTRUMENTAL ERRORS IN EARLY MEASUREMENTS OF AIR TEMP. 307
where P (0 ◦C) is the temperature in ◦Po (which equals the pressure in Londoninches) at 0 ◦C, RT = 1.366 and Rv = 1. For an ideal Amontons’ thermometer,only one calibration point is sufficient and the other can be calculated, giving theunknown scale. For the above thermometers, the departures � of Equation (8) fromthis thumb rule lay between � = +2.78% (Amontons and Poleni at Venice) and� = −2.63% (Poleni at Padova); the best instruments were built by Lambert, with� = 0.29%. The absolute error increases as far as T departs from 0 ◦C, if thecalibration is made with freezing point. Using constant-pressure air thermometers,which are regulated by the same Equation (8), but with V instead of P , Joseph-Louis Gay Lussac (1802) found ratios Rv from 1.375 to 1.380 (Schooley, 1986).The departures � were 0.66 and 1.02%. In the worst case (i.e., Amontons, or Poleniat Venice), in winter the error is negligible, and in summer the error remains smallerthan 1 ◦C even when the ambient temperature reaches 35 ◦C.
It is now possible to examine the first, unknown, Padova calibration (observa-tions 1716–1717). The register reports, among others, a column named ‘barometricheight’ and one named ‘thermometric height’; the unit is Paris inches, for the dataof atmospheric pressure range around 27 and 28 inches. Snow occurred on 1, 13,20, 22, 28 and 29 January 1716 and the previous and the next of each of thesedays were slightly milder and above zero (e.g., rainfall), so that on these days thetemperature was close to 0 ◦C. Summing the two heights, the freezing point wasdetermined as the average of these days, i.e., 71.93 inches = 67.49 ◦Po, and theupper point calculated with Equation (8) was 92.19 ◦Po. These values are too ele-vated when compared with the other two calibrations, and application is unrealistic,as summer temperature would reach some 15 ◦C. As a consequence, we shouldassume that the ‘thermometric height’ represents the so-called ‘true thermometricheight’ i.e., the sum of the two heights in the thermometer and the barometercolumns. Under this hypothesis, the freezing point is 44.47 Paris inches and theupper point is calculated at 60.75 inches; a transformation to ◦Po gives 41.72 and57.00 ◦Po, slightly below the previous and the next calibrations. The hypothesis ofair bubbles escaped during the moves should be rejected for it requires the fixedpoints midway between the Venice and the second Padova calibration. We shouldconclude that the mercury was removed at each move, except in 1761 when themercury was preserved inside to avoid changes in the calibration.
An application of the above scale to the 1716–1717 series gives realistic results,in agreement with the local seasonal averages and can therefore be accepted.
5. Errors Due to Different Density of Mercury in Amontons’ Thermometer
This section is necessary to understand the corrections that have been applied to theseries of Padova for the period 1725–1764 (Cocheo and Camuffo, 2002) to correctdata for calibration errors and dimensional changes in the wooden support.
308 DARIO CAMUFFO
Poleni called ‘true thermometric height’ h the sum h = hc + hb of the heightof mercury columns hc and hb observed in his Amontons’ thermometer and thebarometer, and noted h in his register (Poleni, 1731). The sum hc + hb representsthe actual value of T only when both hc and hb are determined at the same ambienttemperature T . This can be demonstrated as follows. The pressure P inside theampulla is given by the sum of the two pressures that can be written according toStevin’s law:
P = ρghc + ρghb , (9)
where ρ is the density of mercury, g the acceleration of gravity. By substitutingP from equation of state for perfect gases, one obtains:
T = (hc + hb)ρgV/nR , (10)
where the sum hc + hb is proportional to T . This sum was independent ofatmospheric pressure, in that in the case of changes of atmospheric pressure Amon-tons’ thermometer was similar to an inverse barometer and its decreasing mercurycolumn compensated exactly for the increase of the barometer, and vice versa, sothat �hc = −�hb. In the case of the Padova series hc was in the region of 50–60cm and hb was 70–80 cm.
The height hc was not affected by large errors resulting from the variation in thedensity of mercury induced by temperature changes, in that the calibration includedthis effect at two fixed points, and each intermediate temperature was correctlyevaluated, except for a slight departure from linearity, typical of mercury.
On the other hand, the barometric reading hb caused an error, which wasparticularly large in the summer, which is evaluated as follows. If, in the firstapproximation, ρ is independent of T , Equation (10) is always true. However, withreference to the explicit expression of ρ(T ):
ρ(T ) = ρ0/(1 + βT ) , (11)
where ρ0 is the density at T = 0 ◦C and β = 0.1818 × 10⁻³ ◦C−1 is the cubicexpansion coefficient of mercury, the problem arises when the mercury in the twocolumns has different temperatures Tc and Tb. Therefore, in Equation (10) eachheight, hc and hb, should be multiplied by the respective density ρ(Tc) and ρ(Tb),while hc +hb is no longer proportional to Tc. This problem does not depend on theobservational procedure, in that Poleni had the barometer and the thermometer inthe same room, therefore, Tc was close to Tb. The error may arise in the case of thebarometer at room temperature Tb and the thermometer exposed outdoors at a verydifferent temperature Tc.
In the realistic case that the calibration was made in winter (in order to havesnow or ice), the thermometer was immersed in snow or melting ice, and thebarometer was at ambient temperature close to 0 ◦C. At the zero point T (0),T is proportional to hc + hb in the resulting calibration, as seen above. At the

CALIBRATION AND INSTRUMENTAL ERRORS IN EARLY MEASUREMENTS OF AIR TEMP. 309
upper point, the actual problem consists in the method of calibration, becausethe thermometer was at boiling point, while the barometer remained at ambienttemperature, near 0 ◦C. With regards to the point T (100) corresponding to boilingwater, the thermometer was situated at a temperature of 100 ◦C while the barometerremained at 0 ◦C so that the situation at the two fixed points was, respectively:
T (0) = [hc(0) + hb(0)]ρ(0)gV/nR (12)
T (100) = [hc(100)ρ(100) + hb(0)ρ(0)]gV/nR (13)
Field observations were made under conditions which were different from the cal-ibration, i.e., with the two instruments at the same temperature. There is no errorif the two readings are made separately and multiplied by the appropriate mercurydensity. For example, in the event of a field observation at 30 ◦C, the direct readingof the two instruments gives:
Tobs = [hc(30) + hb(30)]ρ(30)gV/nR (14)
while reference to the calibration conditions gives
Tcal = [hc(30)ρ(30) + hb(0)ρ(0)]gV/nR (15)
However, Equations (14) and (15) give the same result because of the difference
[hb(30)ρ(30) − hb(0)ρ(0)]gV/nR = 0 (16)
for the elongation of the mercury column is directly compensated by its diminisheddensity, as can be easily demonstrated with the help of Stevin’s law. However, alarge error derives from the fact that only the heights hc and hb were read, withoutmultiplying them by the due density value or correcting the barometer reading forexpansion. In winter, temperatures were close to calibration conditions (cold ther-mometer and barometer) and therefore reliable, while summer measurements wereless accurate. It is possible to evaluate the order of magnitude of the error whichderives from an incorrect reading of the barometer with the help of Equation (11). Ifthe average height of the mercury column is hb = 760 mm, then for T = 30 ◦C, theexpansion �hb = 4.12 mm which corresponds to an overvaluation �T = 1.03 ◦C.A more exact evaluation of the error could be made by also taking into considera-tion the real behaviour of a fixed well barometer, that is, the dilatation of the readingscale, the glass capillary and the metal ampulla of the well containing the mercury.A detailed analysis of the problem, found in all writings on meteorology, leads toan evaluation that is only slightly inferior to the above, that is �hb = 3.8 mm,equivalent to �T = 0.94 ◦C. This error has been corrected in the Padova series.If Amontons’ thermometer and the barometer are both displaced to a level whichis different from that of calibration, the variations in the two mercury columnscompensate each other exactly. A problem could arise instead, when only one ofthe instruments had been moved to a different level, for example the barometer. The

310 DARIO CAMUFFO
variation in pressure can be calculated from the hypsometric formula which gives,for each rise of 10 m, a drop in the column of about �hb = −0.9 mm, whichcorresponds to a temperature error of �T = −0.2 ◦C. This is not a particularlyhigh value, especially because Poleni’s house had a ground floor and first floor,with a margin of error of �T = ± 0.1 ◦C only.
6. The Problem of Establishing Comparable Scales
The need to compare meteorological observations made in different sites led to thestandardisation of instruments and calibrations. In occasion of the first meteorolog-ical networks, i.e., the Rete Medicea established 1654 by Ferdinand II de’ Medici(Targioni Tozzetti, 1780), the Royal Society, London (established 1723 by JamesJurin (1723) and the Academia Meteorologica Palatina, Mannheim (establishedin 1781 by Karl Theodor von Pfalz (Hemmer, 1783), identical instruments weremade by the same craftsman, or following precise recommendations and then sentto the various stations (Camuffo, 2002). Unfortunately, the greater part of earlyinstruments has been destroyed, so that it is not possible to verify, today, theircalibration, unlike in the case of the Little Florentine Thermometer (Vittori andMestitz, 1981) and other rare exceptions. Even though early thermometers and theircalibration have been described in a number of historical works (e.g., Amontons,1695, 1702; Poleni, 1709; Boerhaave, 1749; Deluc, 1772; Toaldo, 1775; Lambert,1779; Hemmer, 1783; Ganot, 1860; Negretti and Zambra, 1864; Guillaume, 1889)and a few modern papers (Middleton, 1966; Frisinger, 1983; Baiada, 1986; LoVecchio and Nanni, 2000), our knowledge is far from being complete.
During the first stages of meteorology, the expansion of different bodies as aresponse to changing temperature or humidity, could not be expressed in terms of aphysical law or a thermodynamic principle. This was only an empirical, repeatablefinding that resulted in an apparently different response typical of each materialused to detect environmental variations. The “degree” was only one space intervalon the scale, generally in the local length unit, or in a unit determined by cultural orpolitical reasons (e.g., the troops of the French Revolution), without being conven-tionally related to the extent of change in the variable. The quantitative change ofthe variable was absolutely unknown, and defined only in terms of the effect. Theuse of different instruments based on different principles soon required a standard-isation. The substances used for the sensor of thermometers were air, spirit, linseedoil, or mercury. The problem was even more complex for humidity sensors, madeof cotton, seeds, straw, wood, ivory, goose quill, whalebone, hair or parchment.The response of thermometric fluid was either linear (e.g., gas) or non-linear (e.g.,spirit); the scale was forward or reverse (e.g., Delisle, early Celsius) and manytypes of units were used. After people had recognised that all bodies respondedin a slightly different way, but following the same physical principle, the law wasdiscovered.

CALIBRATION AND INSTRUMENTAL ERRORS IN EARLY MEASUREMENTS OF AIR TEMP. 311
To establish a standardised temperature scale, which could be easily reproduced,it was necessary to define the type of instrument, choose one or more repeatablefixed points and find a way of graduating the scale. When only one fixed pointwas used, e.g., the gas thermoscope by Santorio, it was logically expected that onedegree should correspond to a stated proportion of the increase in the volume, orthe pressure, or the length of the thermometric substance, above or below the fixedpoint. When two or more fixed points were used, the interval between them waslinearly subdivided into a number of equal parts, called degrees. Both methodsassumed that the change of the thermometric substance, taken as an index, waslinearly related to changes in the actual air temperature, so that equal increasesin the index would indicate equal increases in temperature. This situation wasnot verified, except in the case of the gas thermometer (e.g., Amontons) and ingeneral the departures from linearity varied with the substances used. This createdmany problems given that the various instruments utilised different liquids. Themost common liquid used in thermometers was spirit, which was then graduallysubstituted in the 18th century by mercury, but other liquids were used.
A number of fixed points, or supposed constant and repeatable points, were sug-gested for the calibration of thermometers, namely: the temperature of the humanbody, freezing water, melting ice, the temperature of a mixture of ice and salts,the cellars of the Paris Observatory (which repeated measurements had shown tobe more or less constant), or that of boiling water. The combination of the waterfreezing point and human body temperature was an apparently uncertain scale, butappropriate for the seasonal range of air temperature and its application was noworse than the use of freezing and boiling points. In fact, the upper point was toofar from a realistic range, with two negative consequences: (i) the introduction oflarge errors in the case of non-linearly expanding liquids, (ii) a low resolution forhaving calibrated the whole capillary and practically using only a small portion.
Numerous scales were used in the 18th century. Louis Cotte (1774) publisheda table that compared the 15 most popular scales of his times, including Poleni’s.Landsberg (1985) reported a table comparing the 36 main scales, in use at his times,to centigrade one with some inaccuracies. In fact, in Poleni’s scale the freezingpoint is at 47.5 ◦Po instead of 47.3 ◦Po and 1 ◦C is said to correspond to 0.22 ◦Poinstead of 0.158 ◦Po. This paper will examine some scales that were particularlycommon and were used to measure the temperature of the air in the Padova series,i.e., Fahrenheit’s, Réaumur’s, Delisle’s, Amontons’ and Poleni’s.
6.1. FAHRENHEIT’S SCALE
Daniel Gabriel Fahrenheit (1686–1736) used both spirit and mercury thermometersand described their calibration (Fahrenheit, 1724). He used three fixed points forgraduating his thermometer: the first, at the beginning of the scale, was obtainedfrom a mixture of ice, water and ‘ammonia salt’ or sea salt. This corresponded to0 ◦F. The second was obtained by mixing ice and water without any addition of

312 DARIO CAMUFFO
salt and corresponded to 32 ◦F. The third point was found at 96 ◦F and representedthe temperature of a healthy human body. The scale was practically dimensionedto cover the yearly temperature range of the air in Europe. The boiling point ofwater was not originally used as a fixed point, in that it was considered too faraway from the usual range of meteorological temperatures, but Fahrenheit didactually measure it by extrapolating the scale upwards, whereby he calculated itat 212 ◦F. Middleton (1966) was of the opinion that there were only two fixedpoints: the temperature of melting ice and that of the human body, which are morerepresentative of the temperature range of the air in the U.K.
Poleni, in a letter (Poleni, 1740) discussed his methodology to obtain Fahren-heit’s scale following the instructions given by Pieter van Musschenbroek (1731–1732). From this description it appears that Poleni adopted only two fixed points:one obtained when the thermometer was immersed in a mixture of snow (or crushedice) and an equal amount of ammonia salt, whereby the height of the mercurywas given as 0 ◦F. The other fixed point was obtained when the thermometer wasimmersed in pure ice. The interval between these two points was then divided into32 parts, called degrees. These degrees were then used as the basis for extend-ing the scale upwards. Successively placing the thermometer in boiling water (butwithout paying attention to the barometric pressure), it was seen that the mercuryrose to 214 ◦F and not 212 ◦F as written by Fahrenheit. Poleni used Fahrenheit’sthermometer for his meteorological observations, but he did not specify the cali-bration, i.e., whether it was the original Fahrenheit’s thermometer with three fixedpoints, or as described by Peter Musschenbroek (1731–1732), with two fixed pointsonly. The calibration was in any case not the standard one, as the observationsdeparted too far from the other parallel series. Poleni wrote that the mixture of iceand ammonia salt should not be regarded as a true fixed point, in that the heightof the mercury in the thermometer varied with the proportion of ice to salt. Hetherefore followed the tendency of using pure ice and boiling water as fixed points,graduating the thermometer between these two extremes. In any case, around 1740,it had become quite common to consider that the temperature at which water boiledwas 212 ◦F and this was also taken as a fixed point for calibration, thus excludingthe temperature of the human body.
Fahrenheit’s thermometer built and used by Poleni departed by some 5 ◦C to7 ◦C with reference to the other thermometers exposed in different parts of hishouse. This departure can be interpreted in terms of bad calibration of the lowerpoint. Probably for this reason, and for this thermometer, Giuseppe Toaldo com-mented that ‘In the mixture of crushed ice and salts there can be an uncertainty ofmore than 5 degrees’ (Toaldo, 1775).
In reality, Fahrenheit also wrote (1724) that the lowest point, obtained witha mixture of ice, water, and salt-ammoniac or sea-salt succeeds better in winterthan in summer. Middleton (1966) interpreted this sentence and method optimisti-cally. Probably, some decades were needed before all instrument makers had thepossibility of having sufficiently pure salts to obtain a reliable calibration.

CALIBRATION AND INSTRUMENTAL ERRORS IN EARLY MEASUREMENTS OF AIR TEMP. 313
6.2. RÉAUMUR’S SCALE
The scale proposed by René-Antoine Ferchault de Réaumur (1683–1757) becameparticularly popular in France, Italy and central Europe. In Padova it was used by,among others, Morgagni and Toaldo and was abandoned in the second half of the19th century. For instance, the description of the calibrations performed 31 Dec.1864, found in the original registers mentions that the thermometer associated withthe barometer had Réaumur’s scale and the readings were converted into Centi-grade with the help of a table. This French scale was commonly used in mercurythermometers, which were uniformly graduated between two fixed points: the melt-ing point of ice (0 ◦R) and the boiling point of water (80 ◦R). This scale differed,however, from Réaumur’s (1730, 1731) original one, which was described, notalways clearly. The calibration was based on only one fixed point, ‘zero’ on thescale, i.e., the degree of cold at which water began to freeze. The subdivision indegrees corresponded to a constant increase in the volume occupied by spirit atzero, after having established a standard dilution: Réaumur knew, in fact, that theexpansion of spirit varied according to the proportion of water. This method hastwo weak points, i.e., the imprecise definition of the temperature in which the water‘begins’ to freeze, and the non-linear expansion of spirit. These modifications in themethod of calibration, which was, however, always indicated as Réaumur’s, causeda certain amount of confusion, as Toaldo underlined in a treatise on improvingbarometers and thermometers (Toaldo, 1775), in which he summarised a famousarticle by Jean André Deluc (1772). In order to clarify the situation, Toaldo drewup a table whereby three scales were compared: (i) the most widespread scalewhich Toaldo advised, relating to a mercury thermometer graduated between 0˚and 80 ◦R corresponding to two fixed points, melting ice and boiling water; (ii) thescale referring to a spirit thermometer, also calibrated between the same two fixedpoints; (iii) Réaumur’s original scale, with spirit, but based on only one fixed point,‘Réaumur’s Zero’ which corresponded to -0.8 degrees on the mercury thermometerscale.
Gradually, mercury became more popular than spirit. Toaldo (1775) advisedusing it for the following reasons: ‘(i) because its expansions and contractionsare greater and more regular than all the other graduated materials; (ii) becausemercury, more than any other material, is more easily cleared of air, because itbears the heat of boiling water better than all other liquids; (iii) because more thanany liquid it is suitable for measuring great heat <i.e., temperature> differences . . . ;(iv) mercury conforms more readily to variations in the air . . . ; (v) because allmercury follows the same expansion and contraction being a wholly homogeneousmetal . . . ’ unlike spirit whose variable composition and behaviour created seriouscomparison problems.

314 DARIO CAMUFFO
6.3. DELISLE’S SCALE
Another scale invented by Joseph Nicolas Delisle (1688–1768) and utilised byPoleni, was based on only one fixed point. The original scale, established in 1732,took the temperature of boiling water as the fixed point, considered ‘zero’ on thescale, and the degrees were marked on the basis of the contraction of mercury withrespect to the volume occupied at ‘zero’ (Delisle, 1734). This was an ‘inverted’scale that, as Toaldo said, showed ‘the degrees, so to say, of cold’. Celsius alsopresented the original centigrade scale in its inverted form. Some experiments car-ried out in St. Petersburg by J. Weitbrecht, on Delisle’s suggestion, showed that thecontraction of mercury between the boiling point and freezing point of water wasquite close to 150 parts per 10,000 of the volume at boiling point. A scale with twofixed points was therefore established: the boiling point being represented by 0◦ andthe freezing point at 150◦. Delisle sent thermometers which had been calibratedby himself to various scholars, among whom Celsius in Uppsala and Poleni inPadova, who then carried out meteorological observations with them. Fortunately,the thermometer sent to Uppsala survived, and is still preserved at the University(Bergström and Moberg, 2002).
7. Calibration Points and Scale Linearity
In 1665, Christian Huygens (1629–1695) suggested using melting ice and boilingwater as fixed points. However, this suggestion was not too popular for these fixedpoints were not always correctly defined, the corresponding temperature was notalways exactly the same and invariable, and the boiling temperature was too highcompared with the meteorological span or the body temperature. This, obviously,led to a great deal of confusion and made the comparison of measurements takenwith different thermometers difficult. In Italy, the immersion of a thermometer insnow was a fairly reliable method, according to a tradition that began with Sebas-tiano Bartolo in 1679, Carlo Renaldini in 1681. This practice became widespreadwith Newton’s (1701) authoritative suggestion. Summarising and commenting thetreatise by Deluc (1772) on the construction, calibration and use of barometersand thermometers, Toaldo (1775) wrote that the calibration was made according toRenaldini’s method.
Outside of Italy, the lower fixed point was obtained with the freezing of water(e.g., Réaumur and Jean Antoine Nollet before the year 1732), or the melting of ice(e.g., Fahrenheit, Réaumur and Nollet after the year 1732) (Middleton, 1966). Intheory, the point of equilibrium between the liquid and solid state is well defined,and in very slow dynamic conditions the point of change of state from liquid tosolid coincides with the inverse one which, for water, corresponds to 0 ◦C undernormal pressure. Moreover, from a practical point of view, the two processes canlead to departures when there are sufficient differences between ambient tempera-ture, water and ice. In the case of freezing, the water temperature proceeds from an
CALIBRATION AND INSTRUMENTAL ERRORS IN EARLY MEASUREMENTS OF AIR TEMP. 315
initial higher value to zero towards a final lower one (e.g., the environment or thecontainer). It is unusual to reach superfusion but there are, however, temperaturegradients between the two phases, and the temperature might not be homogeneousinside each phase, especially if the dynamics are fairly rapid. It is not advisableto place the thermometer in such a way that it becomes imprisoned in the ice,otherwise it might break on being removed. The bulb was in contact with the liquidphase which, for the greater part, was at a still higher temperature than zero, whilethe capillary was often exposed to air, where the temperature could well be belowzero. Glass was a relatively good heat conductor and the mercury in the capillarymay, under such conditions, further complicate the problem.
The problems linked to the choice of the lower fixed point are clearly sum-marised in the following words by Toaldo (1775): ‘The term freezing is unclear:one time it means the degree of cold that is sufficient to freeze, as Réaumursuggests; later . . . Fahrenheit took the forced freezing with ammonia salt, whichoccurs at 32 <degrees> on the Fahrenheit scale below the zero defined by Réaumur.These definitions are different, and both uncertain. It is necessary to take ice that ismelting as Newton first did; this degree is fixed. Neither ice, nor snow ever melt attemperatures that are different from this fixed point’.
In the above-mentioned comments on the construction and calibration ofbarometers and thermometers, Toaldo (1775) wrote that the method suggestedby Réaumur of using the freezing point of water was imprecise, leading to anuncertainty of 3◦, 4◦ and sometimes 5 ◦R.
In the case of melting ice, the inner part of the ice remains below zero, whilethe liquefied part reaches temperatures above zero because of exchanges with theexternal environment, of necessity above zero, otherwise the ice would not melt.Melting occurs, in fact, when there is a time variation in the temperature (that is,under dynamic conditions) and the various components of the system are not inequilibrium, creating internal temperature gradients. Even continuous mixing doesnot completely eliminate this state of affairs. This could be mitigated if a mixtureof crushed ice were used, in order to redistribute the existing gradients aroundeach grain of ice, over a very small scale. In order to further reduce any adverseeffects during the liquid phase, the melted water was drained off following thesuggestion of the Abbé Jean Antoine Nollet (1740/48). However, it is impossibleto remix the mixture and there could be small temperature imbalances. Even if themixture reaches a temperature very close to zero, for thermometers not completelyimmersed, overlying air is a source of error.
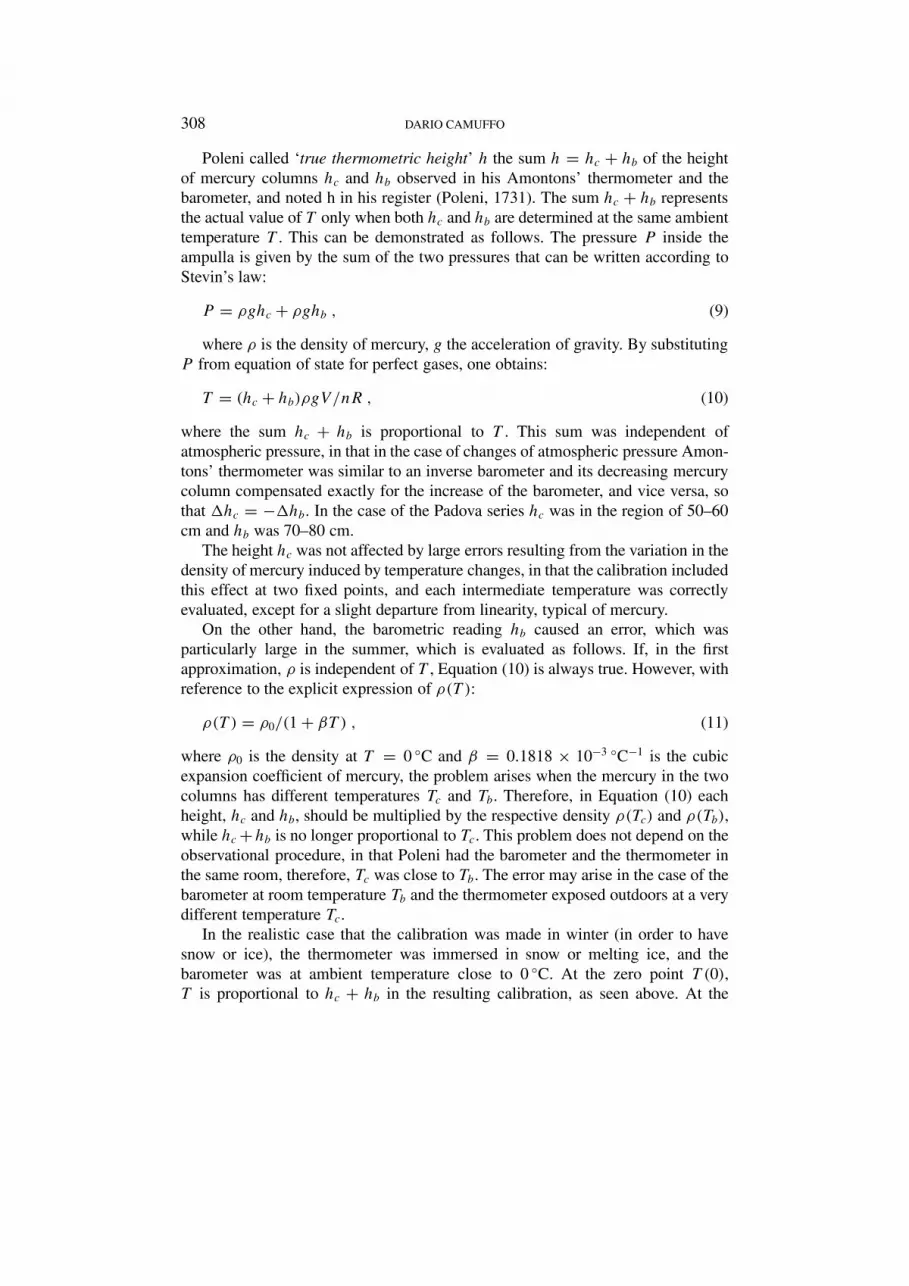
Refrigeration mixtures that were already in use in the Accademia del Cimentoin the 1600s (Targioni Tozzetti, 1780), were also utilised and became popular inthe following period (Boerhaave, 1749). Moreover, this habit was not adopted inPadova because the variable composition of these mixtures made them unaccept-able, as Poleni (1740) and Toaldo (1775) pointed out, suggesting that the error was‘more than 5 degrees’. Poleni described the calibration as follows: ‘The ampullaof my thermometer immersed in ice, the mercury rose to the height of 47 inches
316 DARIO CAMUFFO
and 30 tenths; immersed in boiling water, the mercury rose to the height of 63inches and 10 tenths’ (Poleni, 1731). It was not specified whether a mixture of iceand water was used (as Amontons did). In a letter to A. de Pompeis (Poleni, 1740),referring to Fahrenheit’s calibration, Poleni indicated pure ice but as opposed to themixture of ice and salts. The ice used in Padova was formed naturally and thereforecalibrations were possible only in winter. No mention of summer calibrations withcrushed hailstones was found, or with old snow preserved in wells insulated andtopped with straw.
Another problem with the early period concerns the non-standard pressure inestablishing the fixed points. First of all, the boiling point was not so well definedespecially because it was observed that the temperature of boiling water was notconstant. Toaldo noted that ‘from the water that started to boil, up to actual boilingwhen water swirls in vortexes, there is one degree’ of difference in the readingof the thermometer (Toaldo, 1775). Poleni proved that only after the water hadreached a certain degree of ebullition, did the mercury level in the thermometerremain constant even if the heat source, i.e., the flame, was increased or continuedfor longer (Poleni, 1709). Anders Celsius, in 1742, observed that when ebullitionwas ‘complete’, i.e., there were large bubbles on the whole surface of the water,the temperature shown by the thermometer was stationary.
The fact that atmospheric pressure could influence the boiling point of waterwas noted at the beginning of the 18th century, but Poleni refused to accept suchobservation. It should be noted that Poleni believed in Amontons’ affirmation thatboiling water had a fixed point, in that ‘completely boiling water remains at aboutthe same degree of heat’. However, he initially claimed that boiling temperaturewas independent of atmospheric pressure, and was against the opinion that ‘waterbegins to boil at different temperatures depending on the different weight of theair’ (Poleni, 1709).
Fahrenheit (1724), re-examining the question, discovered that the boiling pointvaried according to pressure and that pressure had to be specified at each calibra-tion. Although a standard pressure was not established, it was, however, possible todetermine the differences in temperature between boiling points fixed under differ-ent conditions, once the pressure was known. For example, Toaldo, referring to thework by de Luc on this very point, said that ‘one inch more or less on the barometerleads to one degree of difference in the heat of boiling water, and it is necessaryto regulate the graduation of the scale’ (Toaldo, 1775). Further discussion on thispoint can be found in Boerhaave (1749).
The boiling point of water Tbp depends on atmospheric pressure P according tothe law:
�Tbp = 100 + (P − 1013.25)/35.8 [◦C] (17)
from which �Tbp = 1/35.8 = 2.8×10⁻² ◦C/hPa. With normal atmospheric rangesof ± 30 hPa, �Tbp = ± 0.84 ◦C, which shows that the value given by Toaldo was,substantially, correct. In fact 1 inch [Hg, London] = 0.93 inches [Hg, Paris] = 33.9

CALIBRATION AND INSTRUMENTAL ERRORS IN EARLY MEASUREMENTS OF AIR TEMP. 317
hPa, and as a result of the variation of 1 Paris inch in the barometric pressure thevariation in the boiling point was �Tbp = (33.9 × 0.028)/0.93 = 1.02 ◦C. Thethermometer readings should therefore be corrected on the basis of the indicationabout the calibration procedure, when this is specified. In the case of missing indi-cation, the error is proportional to the distance from zero, and is therefore negligiblein the winter. In the summer, when T = 30 ◦C, this error may range from 0 ◦C (nocalibration error) to (30/100) �Tb = ± 0.25 ◦C (maximum calibration error).
Also the temperature of melting ice Tmi depends on atmospheric pressure, butsuch dependence is fortunately negligible, in that the variation is �Tmi = 8 ×10⁻⁶ ◦C/hPa (Rivosecchi, 1975).
Calibration methodology became correct after 1777, when a Commissioncharged by the Royal Society, London, formed by Cavendish, Heberden, Alex-Aubert, Deluc, Maskelyne, Horsley and Planta published in the PhilosophicalTransactions (Cavendish et al, 1777a) recommendations for finding the referencepoints and how to operate. The paper become so popular that an Italian translationof it (Cavendish, 1777b) was published at Venice together with other more or lessfamous papers collected after the Transactions. The main suggestions were: (1)find the boiling point at 29.8 London inches air pressure, or correct the data inaccordance with the enclosed table; (2) the bulb of the thermometer should beimmersed in boiling water for 1 or 2 inches only, and on the side rising convectivemotions; (3) the capillary with mercury should be immersed in hot steam; detailsare given on how to build the pot and lid; (4) prefer intense boiling and wait fora few minutes; (5) the pot must be covered to avoid mixture with external air; (6)an alternative method suggested by Deluc was to envelope the thermometer withscraps of cloth and wet them continually with boiling water; (7) when the capillaryis at a different temperature, the readings should be corrected in accordance withcorrection tables; (8) insert bulb and the part of the capillary with mercury intocrushed ice; when the capillary is out of the ice, correct on the basis of a giventable and linear interpolation.
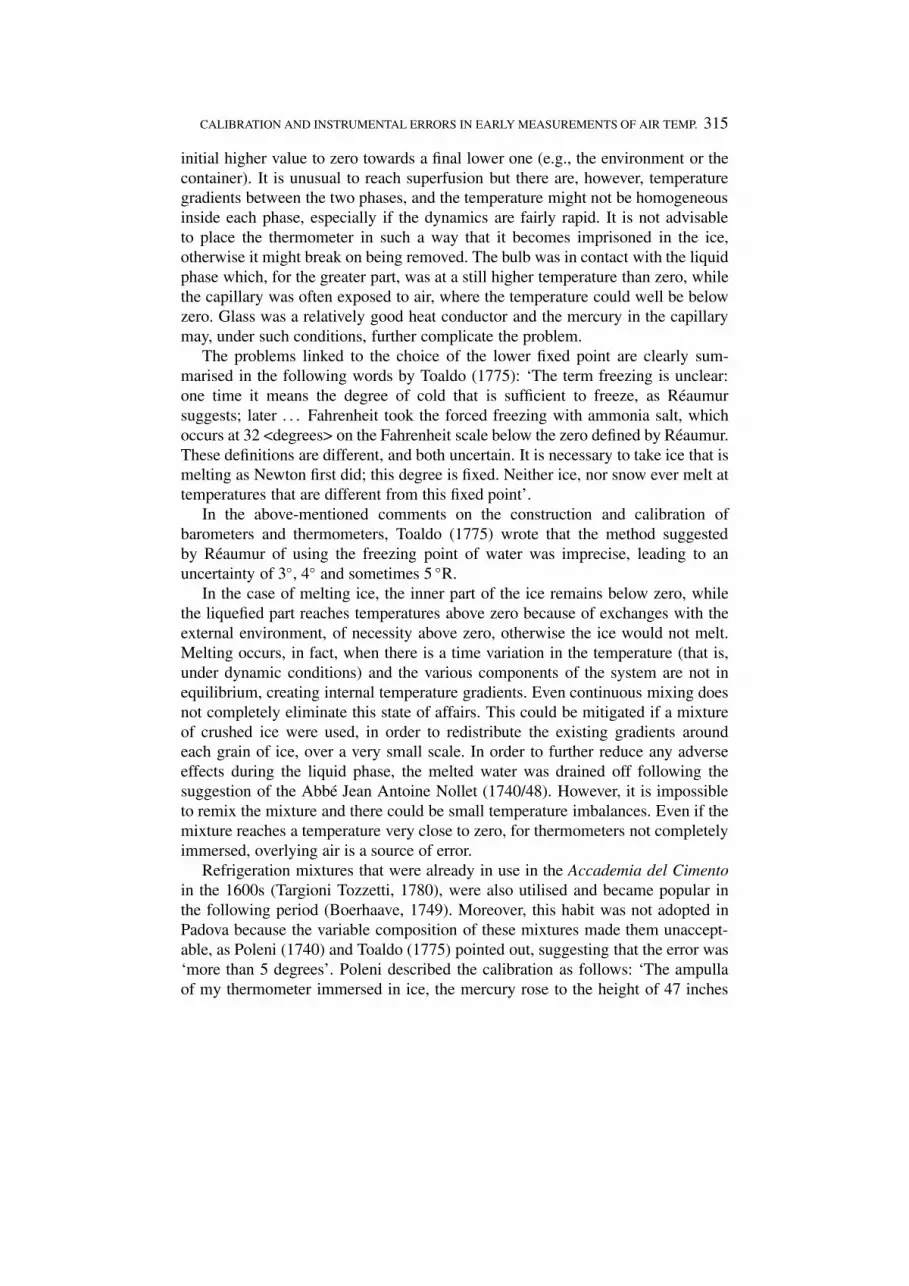
Calibration was generally made by fastening a silk thread or a woollen yarn onto the capillary in correspondence to the fixed points, and then fixing the capillaryon to a support (Toaldo, 1775; Hemmer, 1783). Some slipping was possible, andwhen the capillary slipped, re-calibration was necessary. The wooden frame ofsome instruments had a hole in correspondence with the bulb in order to allow bet-ter ventilation and check the fixed points without damaging the frame and the scale.It was possible to expose the bulb to hot steam or envelope it with compressedsnow or scraps of cloth wetted with boiling water; another method to facilitate thisoperation was to use folding frames which kept the bulb free during calibration(Figure 3).

318 DARIO CAMUFFO
Figure 3. (a) Amontons’ thermometer with a hole in the wooden frame around the bulb to hostthe sensor and allow a better exchange of air (making re-calibration easier). (b) Thermometer withfolding panel in order to free the bulb in case of re-calibration. In both cases, the capillary was tiedwith an iron wire to a wood panel used as a support; the scale was painted on the frame. Museum ofScientific Instruments, Physics Department, Padova University, by courtesy of Prof. G. A. Salandin.
8. Instrument Supports and Scale Incision
In early instruments, the glass thermometer (i.e., bulb and capillary) was generallyseparate from the scale. Only a few instruments, like the Florentine thermometersof the Accademia del Cimento had the scale impressed on the glass tube; moreusually, the thermometer was tied with a iron wire to a wood frame used as asupport (visible in Figure 3). The scale was directly drawn on the support or overa paper strip glued to the frame. The Societas Meteorologica Palatina, Mannheim,suggested aged walnut supports (Hemmer, 1783). Toaldo advised using ‘a thinboard of fir wood, a wood that is the least likely of all to alter, is light, and very

CALIBRATION AND INSTRUMENTAL ERRORS IN EARLY MEASUREMENTS OF AIR TEMP. 319
common’ and to fix the thermometer in such a way that ‘the bulb is as isolatedas possible, by boring a hole in the board’ (Toaldo, 1775). Seasoned wood hasa moisture content outdoors equal to 15–18%; 8–10% indoors in a hot modernbuilding; 15% is a reasonable reference in unheated rooms, especially for Padovawhich is characterised by relatively high relative humidity (RH). The coefficientof linear expansion for this kind of wood for an average moisture content of 15%is 5.4 × 10⁻⁶ ◦C−1 in the direction along the grains and 34 × 10−6 ◦C−1 perpen-dicularly to them; more specifically 25 × 10−6 ◦C−1 radially and 35 × 10−6 ◦C−1
tangentially to the tree rings. Fortunately, for practical reasons capillary and scalewere fixed along the grains of the wood, to obtain minimum expansion. Underthese conditions, at a rise of temperature �T = 30 ◦C, a frame 100 cm long (moreor less the size of early instruments), expanded by �L = 0.16 mm, correspondingto an error of �T = 0.04 ◦C in Poleni’s thermometer. If the error is calculated noton the expansion of the entire support, but only on the part corresponding to theactual temperature range, this error is further reduced by 2/3 in the summer (whenit is at its maximum) and tends to vanish in winter, when the temperature is closeto calibration conditions. In brief, this error is of the order of �T = 0.01 ◦C in thehot season, and totally negligible in the cold season.
On the other hand, hygrometric expansion is much more relevant, and unfor-tunately, the data available leave room for greater uncertainty, the RH not beingmeasured in the very early period. In order to have a crude estimate of the RH inthis period, the days have been classified into three classes, i.e., humid (e.g., duringfog and rainfall), intermediate (e.g., cloud cover) and dry (e.g., clear sky). If formoisture absorption a realistic expansion coefficient (representative of several sea-soned wood species) of 0.2% is considered, this could lead to an error �T = 0.5 ◦Cfor a board 1 m long. However, in Poleni’s thermometer, the reading was the sumof the thermometric and barometric columns (the first ranged between 17 and 23inches, the second was 28 inches in average), which were both affected by theexpansion and bulk error which may be of the order of 1 ◦C or more. In the caseof Toaldo or Vincenzo Chiminello, who used seasoned fir wood, the coefficient is1� (Giordano et al., 1993) and the error is half the previous one. In the Mannheiminstrument, the coefficient for walnut is even smaller, i.e., 0.8�.
Except for Amontons’ thermometer, only the portion of the frame correspond-ing to the height of the mercury column should be considered and the largesterror occurs in the hot season. For example, by making reference to a Réaumurthermometer, preserved at the Botanical Gardens of Padova University, made byPaolo Rocchetta (active 1842–1877), who was Chief Technician of the Specola,the scale started from −14 ◦R, so that when the temperature was 30 ◦C (i.e., 24 R),the error due to changes in RH was 1� of (14◦ +24 ◦R) i.e., 0.047 ◦C. It is difficultto compute the exact correction as a function of the difference between the actualRH during observation and the original value during calibration, except for thecrude classification above and assuming that at boiling point, excess vapour wettedthe support.

320 DARIO CAMUFFO
Things improved when metal supports (mainly brass), with the scale engraved,became popular. Thermal expansion of metals has the same order of magnitude asthat of wood, and in addition metals are not expanded by humidity. For example,bronze with tin has a linear expansion coefficient 1.7 × 10⁻⁵ ◦C−1, about threetimes that of fir wood, but still negligible in practical terms.
The method of fixing thermometers and marking the scale, also caused otherinconveniences. Above all, the fact that the capillary protruded with respect tothe plane of the scale meant that parallax errors were introduced, because of thealignment between the meniscus of the liquid and scale graduation. Some madereference to the base of the meniscus, others to the top, as we do today. To eliminatethese errors, Deluc suggested that the capillary should be fixed in a groove in thesupport, so that the plane of the scale passed through the axis of the capillary. Inany case, when performing observations, care was taken to avoid such errors in thefollowing way: ‘it is necessary to place the eye well at the level of the mercury,which is confirmed when the lines dividing the scale at that site lie in the directionof their images in the capillary’ (Toaldo, 1775).
The capillary would also slip accidentally, or continually, on the scale fixed tothe support, or the scale became progressively deformed. In such cases, a system-atic, or a slowly variable error was introduced. An example of the above was foundwhen examining the original registers of Toaldo’s meteorological observations. Inthe comments at the end of each month, for the 23 July 1770, we read: ‘having<controlled> the barometer scale above which I had made a mark, I found the cardhigher than it should have been by 3 lines, so that all the heights marked must haveincreased by 3 lines’. And again, in November 1775, ‘there was disorder in thebarometer card that was mobile . . . and this morning the 19 it was regulated andfixed’. In the case of the Padova series a few mentions of such errors were foundbut, although not always noticed from the metadata, some instrumental drift ordiscontinuity appear in the data after statistical analysis. In the absence of preciseinformation from metadata, the starting date and the trend have been detected andcorrected with the help of the Alexandersson (1984) test.
The problems with slipping scale started to disappear in the second half of the18th and in the 19th century, when the capillary and paper scale were enclosed andsealed in another glass capillary. This problem was eliminated when the scale wasdirectly engraved on the glass capillary or on a thin, flat glass base to which thecapillary was attached, the whole then being enclosed in another glass tube thatwas soldered at the top of the bulb.
9. Problems Linked to Thermometer Construction
Great care was always devoted in constructing and controlling instruments. Thegreat Academies like the Accademia del Cimento, the Royal Society and theSocietas Meteorologica Palatina, which collected data from different observers,

CALIBRATION AND INSTRUMENTAL ERRORS IN EARLY MEASUREMENTS OF AIR TEMP. 321
underlined the necessity of homogenising instruments and methods. The SocietasMeteorologica Palatina sent Mannheim thermometers to observers, and very prob-ably also to Toaldo and Chiminello. Comparable thermometers needed a ‘perfectlycylindrical’ tube for the displacement of thermometric liquid, or at least a tube witha constant internal section along its entire length. The first to dream up a reasonablyprecise method for determining the regularity of the section was the astronomerOle Christensen Rømer, around 1702 (Middleton, 1966). The method consisted inchecking that the length of the mercury cylinder, that was obtained by introducinga drop of this liquid into the tube, was still the same when it was displaced into thecapillary. This same method is, substantially, still used today.
When a thermometer is heated, not only the liquid in the thermometer expands,but also the glass. The height reached by the thermometric column indicates the dif-ference between these two counteracting effects, where the expansion of the liquidis dominant (the cubic expansion coefficient β of glass is about 1/10 of mercury:for ‘Jena glass’ β = 1.7 × 10⁻⁵ ◦C−1, while for mercury β = 1.818 × 10⁻⁴ ◦C−1
(Rivosecchi, 1975). Scientists from the Accademia del Cimento already knew this.It was also observed that different types of glass dilated to different degrees. In1749, the chemist Hermann Boerhaave, recording the results of some experimentscarried out by Fahrenheit, wrote that ‘the glass worked in Bohemia, Britain andBatavia, dilated, at the same heat <i.e., temperature> more or less easily, more orless at the same speed’ (Boerhaave, 1749). He therefore advised that glass of thesame type should be used if instruments that could be compared with each otherwere required. Fahrenheit thought that two thermometers made by him, one withspirit and the other with mercury and which did not agree with each other, couldbe explained by the different expansion of glass. He was not, obviously, aware thatthe main cause was due to the fact that the expansion of spirit and mercury are notlinear and are different.
9.1. NON-LINEARITY OF THE DILATATION OF THERMOMETRIC LIQUID
The fact that different types of glass have different expansion coefficients doesnot create problems of comparison when close to reference points, in that therethe expansion of glass is automatically taken into consideration. Problems arisefrom the fact that the expansion coefficient of glass varies with temperature and isdifferent for different types of glass. In the intermediate points on the scale, thiscan cause different departures from linearity, depending on the type of glass used,and can determine different readings with different thermometers. This happens forthe method used in the construction of the scale (subdividing the interval betweenthe two fixed points in equal parts), which assumes that the relationship betweentemperature and height reached by the liquid in the thermometer is linear.
The fact that the thermal expansion of a substance is linear with the temperatureis only valid for perfect gases in accordance with the Charles-Gay Lussac law:
V = Vo(1 + βT ) , (18)

322 DARIO CAMUFFO
Table I
Departure (◦C) from linearity of mercury and spirit
Temperature −38 −20 0 +20 +40 ◦C
Mercury +0.42 +0.17 0.0 −0.08 −0.11
Spirit +0.9 +0.8 0.0 −3.0
where β = 3.66 × 10⁻³ ◦C−1 is the cubic expansion coefficient for air; β =1.58 × 10⁻⁴ ◦C−1 for mercury in normal glass and β = 1.04 × 10⁻³ ◦C−1 forethanol in normal glass (Michalski et al., 1991). However, this is only strictlytrue with the first approximation, as in the case of the majority of liquids used inthermometers. The non-linear response of thermometers is accentuated moreover,by irregular expansion of the glass container. The overall deviation for some typesof thermometers is shown in Table I (Rivosecchi, 1975).
The non-linearity of mercury is, on average, rather limited, generally below0.1 ◦C, while spirit departs much more (e.g., –3 ◦C at T = 20 ◦C) and the readingsshould be corrected, especially in the hot season. The large departure found insummer between spirit and mercury thermometers has contributed in justifying, inearly meteorology, the choice of the human body as the upper calibration point,e.g., as Fahrenheit did after the example of Santorio who chose this referencefor medical purposes. Even though this point may not be precise, nevertheless asummer temperature reading performed with a spirit thermometer calibrated athuman temperature is more accurate than with a calibration at boiling point andwith linear interpolation.
Toaldo knew that the departure of spirit from linearity was very high and de-scribed a method of calibration in use at that time (Toaldo, 1775) in order to reducethe error especially in the hot season. The spirit thermometer was compared witha mercury thermometer: both were attached to a frame and immersed in meltingice in order to mark the zero and then immersed in water at 40 ◦R in order to markthis upper point. The intermediate degrees were then interpolated. The error wasnegligible near the calibration points, and was larger in the middle of the span, i.e.,around 20 ◦R (25 ◦C) which is close to summer temperatures. In a time series oftemperature, the change from spirit to mercury thermometer introduces an apparentcooling in winter and heating in summer. Fortunately, most of the Padova serieswas taken with mercury thermometers and the early measurements were made witha gas thermometer.
9.2. DRIFT
Drift may be due to a permanent deformation of the support due to ageing of thewood (that may be considered within 0.25% along the grains) and therefore of thescale attached to it or engraved on it, as discussed earlier.

CALIBRATION AND INSTRUMENTAL ERRORS IN EARLY MEASUREMENTS OF AIR TEMP. 323
Another cause of drift was the alteration in thermometric liquid, especiallywhen organic liquids were used, such as spirit. In the 18th century it was observedthat in some thermometers of this type, zero gradually became lower and lowerover the years. Various explanations were proposed; however, today it is knownthat the phenomenon was due to the diminishing volume of organic liquid as aresult of polymerisation. Mercury thermometers (as those used in Padova) are ofcourse free from this problem.
Also the glass container (capillary and bulb) is subject to hysteresis: when it un-dergoes sharp temperature variations, it does not immediately return to its originalsize. As a consequence, there is a temporary drop in the zero in the thermometerafter it has been exposed to high temperatures, for example after the upper fixedpoint determination. Glass used in modern thermometers has a small hysteresis: thetemperature cycle 0 – 100 – 0 ◦C, produces an error that does not generally exceed−0.2 ◦C (Rivosecchi, 1975).
Although the cause was not known, this effect had been observed even in the18th century and for this reason it was suggested that thermometers were cali-brated by marking first the point of ebullition and only successively the ‘freezing’point, in that this latter ‘could again become incorrect if it had been marked first’(Strohmeyer, 1775, in Middleton, 1966). In practice, the problem was linked tocalibration, for the determination of each point displaced the calibration of theother. This kind of hysteresis was not increased for meteorological observations,given that temperature variations are generally gradual.
Modifications in the structure of glass are more relevant. These cause, in thelong run, a decrease in bulb capacity. As a result, part of the liquid is transferred tothe capillary, bringing about a permanent change of calibration. This slow rising ofthe zero, that often goes on for years, is particularly evident in certain mercury ther-mometers, and was clearly described for the first time in 1808 by Angelo Bellaniwho correctly attributed this shift to a gradual contraction of the glass in the firstyear, or a sudden contraction when calibration was incorrectly made immersingthe thermometer first in boiling water and then in melting ice (Bellani, 1808, 1841;Guillaume, 1889).
In the 19th century, also other speculative explanations were suggested, e.g.,one which attributed the rise to the fact that there was a small amount of air in the‘pores’ of the liquid that, although they did not cause any change in the volumeof the liquid itself, could later join up to form small bubbles that then caused anincrease in the apparent volume of mercury, thus bringing about a rise in the zero.Although there was no general agreement about the cause of this phenomenon, apartial solution was, however, found. This consisted in calibrating thermometersseveral months after they had been made and sealed.
Towards the end of the 19th century, it was discovered that the composition ofglass could influence upward movement of the zero. Glass containing lead oxidewas abandoned, and ‘hard glass’ was used instead, thanks to which the rise couldbe reduced to one tenth. The use of more stable glass made it possible to reduce

324 DARIO CAMUFFO
the rise of zero to 0.03 ◦C over three years. Thermometers used in the 1700s wereless accurate, being built with low quality glass and without precautions, like thatof waiting for at least one month before calibration. The upward displacement ofthe zero in mercury thermometers used in the Specola in the second half of the19th century was about 0.3–0.6 ◦C, as demonstrated by the accurate measurementscarried out in the second half of the 19th century, noted in the observation registers.
10. Conclusions
The early period of meteorological observations was extremely fruitful and com-plex, with new ideas, uncertain beliefs, and different instruments, scales andcalibrations. Fortunately, the first steps were well documented although only littleinformation can be found in modern papers in comparison with the huge amount oforiginal documents. The use of different scales is not a problem: the key problemis whether calibration was carefully made and described, with well-defined fixedpoints.
The operating principle of Amontons’ thermometer and the other ‘constant-volume’ air thermometers, where the pressure is (nearly) proportional to airtemperature, is simple and reliable from the general point of view, but complexin details, especially when a high precision is required. For a rise in ambient tem-perature, the increase in pressure inside the ampulla is compensated by an equalincrease in the pressure of mercury in the capillary, and this is determined by anincrease in height of the column. On the other hand, in the capillary, the volumeof mercury required for this compensation displaces an equal volume from theampulla, slightly changing the volume of the air pocket. Therefore, the thinnerthe capillary the better the constant-volume approximation; the smaller the ratiobetween the capillary and the ampulla sections, the more stable the level of mercuryin the ampulla, and the smaller the departure from zero on the reference scale.
The comparison between calibrations of instruments built and used by G.Amontons (1699), G. Poleni (Venice, 1709, and Padova 1731), and J. H. Lambert(1779) has shown that these instruments were of good quality, with departuressmaller than 3%. Amontons’ thermometer needed to be integrated with a baromet-ric reading, and an important error arose for the different conditions of mercurydensity during calibration and operation. Calibration was made in winter: at thelower fixed point the thermometer was immersed into snow or melting ice, andthe barometer was at ambient temperature close to 0 ◦C. At the upper point, thethermometer was at boiling temperature, while the barometer remained at ambienttemperature, near to 0 ◦C. On the other hand, field observations were made withboth instruments at the same temperature and this was a cause of error. In the coldseason this error was negligible, but in the hot season it reached 1 ◦C.
For an ideal Amontons’ thermometer, only one calibration point is sufficient (ifunknown, this can be derived from knowledge of its readings during snowy days)

CALIBRATION AND INSTRUMENTAL ERRORS IN EARLY MEASUREMENTS OF AIR TEMP. 325
and the other can be calculated with a simple equation. In the case of a real ther-mometer, this approximation is good in winter, and the error may approach 1 ◦C inthe summer. This equation allows us to interpret data taken with an unknown scaleand calibration, e.g., the first period in Padova, 1716–1717. In addition, the formuladerived for an ideal thermometer allows us to verify how a real thermometer departsfrom ideal conditions and a test on calibrations of famous thermometers (Amon-tons’, Lambert’s, Gay Lussac’s, Poleni’s at Venice and Padova) gives departureslying between ± 2.7%.
The above instrument analysis has been useful to know how an Amontons’thermometer works, and the Poleni observations 1725–1764 have been correctedonly for working conditions different from the calibration (i.e., thermometer andbarometer at the same temperature) and for hygrometric expansion of the woodsupport with the scale. However, we know too little about the details of the specificinstrument used in Padova to undertake a more sophisticated second-order correc-tion concerning the oscillations of the reference level in comparison with the scaleor the differential expansion between mercury and glass.
The supports of the instrument, and the incision of the scale, were subject toexpand or contract with temperature or humidity changes, and this was a source oferrors that have been corrected (Cocheo and Camuffo, 2002) with the knowledge ofambient temperature and humidity, or with estimated data, i.e., by classifying daysinto the following classes: ‘humid’ (during fog and rain), ‘average’ (cloudy days)and ‘dry’ (sunny days) and attributing to each class the average level of relativehumidity found today for the same classification. Problems linked to the construc-tion of thermometers have been analysed, as well as the linearity of displacementsof thermometric liquid, or drift due to ageing and transformation of thermometricliquid, glass or the support.
Most of the errors are fairly limited, usually less than 0.5 ◦C, often near to0.3 ◦C. Only in some cases did individual errors reach or exceed 1 ◦C. One problemis that possible errors are manifold and the sum of absolute values often reachesimpressive values. However, sometimes they tend to compensate each other out inthe same reading (e.g., expansion of different materials), or in the case of medium(e.g., monthly) or long term (e.g., yearly) averages concerning random errors, ase.g., daily scale expansions when data are used to find monthly averages. The mostimportant problem does not consist in random errors, but in systematic ones, andespecially when a change in methodology was applied. Accurate knowledge of aseries, its history and its metadata, constitutes the primary step for reliable correc-tion of data. Then, further validation can be performed by comparing the actualseries with other highly correlated, reliable series, or with the help of statisticaltests.
The excellent results for the early instruments show that the dawn of modernmeteorology, and subsequent period, was due to incredibly careful and preciseinstruments. After such a good start, however, we should not underestimate theproblems in the more recent periods. In reality, each series can be subdivided in a

326 DARIO CAMUFFO
number of more or less small portions, each one homogeneous, with measurementsperformed by different observers, with different instruments and methods. The casestudy of the Padova series (1725–today), which is one of the longest and bestdocumented, has shown that careful corrections, validations and homogenisationare necessary before drawing any climatic analysis, in order to avoid unreliableconclusions.
The critical analysis of instruments and operative methodologies has shownthat daily inadvertent climate changes which affect trends extremely slowly, canbe hardly detected because they generally remain below the uncertainty thresholddetermined by observational accuracy, instrument resolution and errors. On theother hand, a change in frequency of extreme events, which largely exceed theaverage values as well as the observational uncertainty, is soundly detected. Ananalysis of the frequency of extreme events seems the most reliable method todetect climate changes.
The complex problem of correcting calibration and instrumental errors must befaced individually for each series, first on the basis of metadata from an accuratehistorical and critical analysis concerning instruments, operative methodology andthen on a statistical analysis of errors, comparing teleconnected series. However,metadata are more relevant: it is not sufficient to hold that an increase or decreasein local or global temperature has been proven simply because it has appearedsimultaneously in the trend of a number of series in different locations. In fact,the scientists of the time were in close contact with each other and followed ideasor directives from the most prestigious Academies, or international Conferences.When a number of observers simultaneously applied a change in the method ofcalibration, construction of instruments, exposition, or time of observation, they, infact, generated an apparent climatic signal on a wide scale.
Acknowledgements
This work was supported by the European Commission, DG XII, Programme Cli-mate and Environment, contract ENV4-CT97-0511 (IMPROVE). Special thanksfor very useful discussions and support are due to: Prof. Luisa Pigatto, SpecolaAstronomic Observatory and Prof. Gianantonio Salandin, Instrument Museum,Department of Physics, Padova University, for making historical documents andinstruments available; Drs Claudio Cocheo, Rosa Alba Gambicchia, Franco Zar-dini, and M. Zaupa for their precious co-operation in this research. Last but notleast, sincere thanks to Prof. Rudolf Brazdil, Masaryk University, Brno, and Dr.Rüdiger Glaser, University of Würzburg, for their careful reading and preciouscomments.

CALIBRATION AND INSTRUMENTAL ERRORS IN EARLY MEASUREMENTS OF AIR TEMP. 327
References
Literature (after 1900)Alexandersson, H.: 1984, A Homogeneity Test Based on Ratios and Applied to Precipitation Series,
Report No. 79, Dept. of Meteorology, Uppsala, Sweden, p. 55.Baiada, E.: 1986, ‘Da Beccari a Ranuzzi: la meteorologia nell’Accademia bolognese nel XVIII sec-
olo’, in Finzi R. (ed.), Le meteore e il frumento. Clima, agricoltura, meteorologia a Bologna nel’700, Il Mulino, Bologna, pp. 99–261.
Bergström, H. and Moberg, A.: 2002, ‘Daily Air Temperature and Pressure Series for Uppsala (1722–1998)’, Clim. Change, this volume.
Boffito, G.: 1929, Gli strumenti della scienza e la scienza degli strumenti, Seeber, Florence.Camuffo, D.: 2002, ‘History of the Long Series of Daily Air Temperature in Padova (1725–1998)’,
Clim. Change, this volume.Cocheo, C. and Camuffo, D.: 2002, ‘Corrections of Systematic Errors and Data Homogenisation in
the Daily Temperature Padova Series (1725–1998), Clim. Change, this volume.Comani S.: 1987, ‘The Historical Temperature Series of Bologna (Italy): 1716–1774’, Clim. Change
11, 375–390.Cotton, F. A. and Wilkinson, G.: 1972, Advanced Inorganic Chemistry – A Comprehensive Text, John
Wiley and Sons, New York.Doebelin, E. O.: 1990, Measurement Systems - Application and Design, McGraw Hill, New York, p.
960.Frisinger, H. H.: 1983, The History of Meteorology: to 1800, American Meteorological Society,
Boston, p. 147.Giordano, G., Ceccotti, A., and Uzielli, L.: 1993, Tecnica delle costruzioni in legno, Hoepli, Milano.Landsberg H.E.: 1985, ‘Historic Weather Data and Early Meteorological Observations’, in Hecht,
A. D. (ed.), Paleoclimate Analysis and Modeling, Wiley, New York, pp. 27–70.Lo Vecchio, G. and Nanni, T.: 2000, ‘Gli strumenti meteorologici a Bologna nel Settecento’, in L.
Pigatto (ed.), Giuseppe Toaldo e il suo tempo, Centro per la Storia dell’Università di Padova eOsservatorio Astronomico di Padova, Padova, pp. 763–777.
McGee, T. D.: 1988, Principles and Methods of Temperature Measurement, Wiley, New York, p.581.
Michalski, L., Eckersdorf, K., and McGee, J.: 1991, Temperature Measurement, Wiley, New York,p. 514.
Middleton, K. W. E.: 1966, A history of the Thermometer and its use in Meteorology, Hopkins,Baltimore, p. 249.
Rivosecchi, I.: 1975, Osservazioni e strumenti di meteorologia, Vol. I, CNR IFA, DP 5, Rome.Schooley, J. F.: 1986, Thermometry, CRC Press, Boca Raton, Fla., p. 245.Taton, R.: 1961, Histoire générale des Sciences, Vol. II, Presses Universitaires de France, Paris, pp.
533–545.Vittori, O. and Mestitz, A.: 1981, ‘Calibration of the Florentine Little Thermometer’, Endeavour 5,
3, 113–118.Yavorsky, B. M. and Pinsky, A. A.: 1979, Fundamentals of Physics, Vol. 1, Mir, Moscow, p. 542.
Sources (before 1900)Amontons, G.: 1695, Remarques et expériences physiques sur la construction d’une nouvelle
clepsydre, sur les baromètres et hygromètres, Jombert, Paris.Amontons, G.: 1699, ‘Moyen de substituer commodément l’action du Feu à la force des Hommes et
des Chevaux pour mouvoir des Machines’, Mémoires de l’Académie Royale des Sciences, Paris,pp. 112–126.

328 DARIO CAMUFFO
Amontons, G.: 1702, ‘Discours sur quelques propriétés de l’air, et le moyen d’en connaître la tem-pérature dans tous les climats de la Terre’, Mémoires de l’Académie Royale des Sciences, Paris,pp. 155–174.
Bartolo, S.: 1679, Thermologia Aragonia, Naples.Bellani, A.: 1808, ‘Trattativi per determinare l’aumento di volume che acquista l’acqua prima e dopo
la congelazione, Giornale di Fisica’, Pavia, 2, 429–439.Bellani, A.: 1841, ‘Sullo spostamento del mercurio osservato al punto del ghiaccio sulla scala dei
termometri’, Memorie della Società Italiana delle Scienze 22, Camera, Modena, 76–95.Boerhaave, H.: 1749, Elementa chemiae, Vol. I, Coleti, Venice.Castelli, B.: 1638, ‘Letter to Monsignor Ferdinand Cesarini dated 20 September 1638’, in Buc-
ciantini, M. (ed.), Carteggio di Benedetto Castelli, Archivio della corrispondenza degli scienziatiitaliani, Olschki, Florence (1988), p. 313.
Cavendish, H., Heberden, Alex-Aubert, Deluc, Maskelyne, Horsley, Planta: 1777a, ‘The report of theCommittee of the Royal Society to consider of the Best Method of Adjusting the Fixed Pointsof Thermometers; and the Precautions Necessary to be Used in Making Experiments with theseInstruments’, Philosophical Transactions 67, 816–857 .
Cavendish, H., Heberden, Alex-Aubert, Deluc, Maskelyne, Horsley, Planta: 1777b, ‘Ragguaglio deiCommissari scelti dalla Società Reale per esaminare quale sia il miglior metodo per segnarei punti delle divisioni dei termometri, e quali precauzioni siano necessarie per ben servirsi diquesti strumenti nelle sperienze’, translated by A. Collalto in Gibelin and Reynier, 1794: FisicaSperimentale compresa nelle Transazioni Filosofiche della Società Reale di Londra, Compendiodelle Transazioni Filosofiche della Società Reale di Londra, Vol. 9, translated by Pepoli, Venice,pp. 240–282.
Celsius, A.: 1742, ‘Observationer om twänne beständiga grader på en thermometer (Observa-tions on two persistent degrees on a thermometer)’, Kungliga Svenska Vetenskaps AkademiensHandlingar (Annals of the Royal Swedish Academy of Science) 4, 197–205.
Cotte, L.: 1774, Traité de Météorologie: contenant 1. l’histoire des observations météorologiques,2. un traité des météores, 3. l’histoire & la description du baromètre, du thermomètre & desautres instruments météorologiques, 4. les tables des observations météorologiques & botanico-météorologiques, 5. les résultats des tables & des observations, 6. la méthode pour faire lesobservations météorologiques, Imprimérie Royale, Paris, p. 635.
Delisle, J. N.: 1734, Unpublished letter presented to the Académie Royale, Paris, and read by MrGodin the 3rd and 10th February, as mentioned in the Registers of the Academy.
Deluc, J. A.: 1772, Recherches sur les modifications de l’atmosphère, contenant l’histoire critiquedu baromètre et du thermomètre, un traité sur la construction de ces instruments, des experi-ences relatives à leur usages, et principalement à la mesure des hauteurs et à la correction desréfractions moyennes, Printer not specified, Geneva; reprinted 1784 Veuve Duquesne, Paris.
Despretz, C. M: 1837, ‘Observations sur le déplacement et sur les oscillations du zéro duthermomètre’, Annales de Chimie et de Physique 64, 312.
Fahrenheit, D. G.: 1724, ‘Experimenta et observationes de congelatione acquae in vacuo factae’,Philosophical Transactions 33, 78–84.
Favaro, A.: 1883, Galileo Galilei e lo studio di Padova, Le Monnier, Florence.Ganot, A.: 1860, Traité élémentaire de Physique expérimentale et appliquée et de Météorologie, 9th
edn., Claye, Paris.Gay Lussac, J. L.: 1802, ‘Sur la dilatation des gaz et des vapeurs (lues à l’Institut National le 11
Pluviose, An X) – Précis historique de ce qu’on a fait sur la dilatation des gaz – Description desappareils’, Annales de Chimie, 1st series, 43, 137–175.
Guillaume, C. E.: 1889, Traité pratique de la Thermométrie de précision, Gauthier Villars, Paris.Hemmer, J. J.: 1783, ‘Descriptio instrumentorum meteorologicorum, tam eorum, quam Societas
distribuit, quam quibus praeter haec Manheimii utitur’, Ephemerides Societatis MeteorologicaePalatinae, Vol. 1, 57–90.

CALIBRATION AND INSTRUMENTAL ERRORS IN EARLY MEASUREMENTS OF AIR TEMP. 329
Huygens, C.: 1665, Letter to Robert Moray, dated 2 January 1665 in Oeuvres complètes de ChristiaanHuygens publiées par la Société Hollandaise des Sciences, The Hague (1893); also in Frisinger(1983).
Jurin J.: 1723, ‘Invitatio ad observationes Meteorologicas communi consilio instituendas a JacoboJurin M. D. Soc. Reg. Secr. et Colleg. Med. Lond. Socio.’, Philosophical Transactions 379,422–427.
Lambert, J. H.: 1779, Pyrometrie, oder, vom Maasse des Feuers und der Wärme, Haude und Spener,Berlin, p. 360.
Musschenbroek P.: 1731–1732, ‘Ephemerides Meteorologicae, Barometricae, Thermometricae, Epi-demicae, Magneticae, Ultrajectinae, conscripta à Petro Van Muschenbroek, L. A. M. Med.& Phil. & Mathes. Profess. in Acad. Ultraj. Anno 1729’, Philosophical Transactions 37, p.357–384.
Negretti and Zambra: 1864, A Treatise on Meteorological Instruments, Strahan and Williams,London, p. 152 (reprinted in 1955 by Baros Books, Trowbridge, U.K.).
Newton, I. (published anonymous): 1701, ‘Scala graduum caloris’, Philosophical Transactions 22,824–829.
Nollet, J. A.: 1740–1748, Leçons de physique expérimentale, Guerin, Paris.Poleni G.: 1709, Johannis Poleni Miscellanea hoc est: I Dissertatio de Barometris et Termometris;
II Machinae Aritmeticae, eiusque Descriptio; III, De Sectionibus Conicis Parallelorum inHorologiis Solaribus Tractatus, Aloysium Pavinum, Venice.
Poleni, G.: 1731, ‘Viri Celeberrimi Johannis Marchionis Poleni, R. S. S. ad virum Doctissi-mum Jacobum Jurinum, M. D.R.S.S. Epistola, qua continetur Summarium ObservationumMeteorologicarum per sexennium Patavij habitarum’, Philosophical Transactions 421, 201–216.
Poleni, G.: 1740, ‘Ioannis Poleni ad nobilissimum virum comitem Alexandrum de Pompeiispatricium veronensem Epistola, qua nonnullae observationes astronomicae et meteorologicaecontinentur’, Commentaria Academiae Scientifacae Petropolitanae 8, 439–452.
Réaumur, R. A.: 1730, ‘Règles pour construire des thermomètres dont les degrés sont compatibles’,Mémoires de l’Académie Royale des Sciences, Paris, pp. 452–457.
Réaumur, R. A.: 1731, ‘Second mémoire sur la construction des thermomètres dont les degrés soientcompatibles’, Mémoires de l’Académie Royale des Sciences, Paris, pp. 250–296.
Regnault, H. V.: 1847, Relation des expériences entreprises par ordre de Monsieur le Ministre detravaux publics et sur la proposition de la Commission centrale des machines à vapeur pourdéterminer les principales lois et les données numériques qui entrent dans le calcul des machinesà vapeur. Typ. de Firmin Didot frères, Paris. Also: Mémoires de l’Académie Royale des Sciences,Paris, Vol. 21, pp. 1–748.
Renaldini, C.: 1681, Philosophia rationalis, naturalis atque moralis, Frambotti, Padua.Renou, M. E.: 1875, Histoire du thermomètre, Gautier-Villars, Paris.Sagredo, G.: 1612; 1613 and 1615, Letters to Galileo, dated 30 June 1612, 9 May 1613, 7 February
1615, 15 March 1615. (Favaro, 1966; Middleton, 1966).Targioni Tozzetti, G.: 1780, Notizie degli aggrandimenti delle Scienze Fisiche accaduti in Toscana
nel corso di anni LX del secolo XVII, Tomo I, Bouchard, Florence.Toaldo, G.: 1775, ‘Emendazione de’ barometri e de’ termometri’, Giornale d’Agricoltura, Venice.
Item, 1803, posth. in Completa raccolta di opuscoli, osservazioni e notizie diverse contenutenei giornali Astro Meteorologici dall’anno 1773 sino all’anno 1798 del fu Sig. Abate G. Toaldocoll’aggiunta di alcune altre sue produzioni meteorologiche e pubblicate e inedite, Tomo IV,Andreola, Venice, pp. 48–120.
Viviani, V.: 1654, Vita di Galileo. Edited posthumous 1717 by S. Salvini in Fasti Consolaridell’Accademia Fiorentina, Florence, pp. 397–431.
(Received 10 August 2000; in revised form 22 October 2001)