Calibrate and Validate SIMWASER Simulation Model Using Different Transpiration Efficiency for Varied...
19
Res. J. of Aleppo Univ. Agricultural Science Series No. 73 2009 1 Calibrate and Validate SIMWASER Simulation Model Using Different Transpiration Efficiency for Varied Durum Wheat Genotypes Ammar Wahbi*, Elmar Stenitzer**, Eduard Klaghofer **, Rami Keff Al-Ghazal***, Lukman Al-Krayem***, Miloudi Nachit****, Ahmad Shams Aldien Shaaban***** *Soil Science Dept. Faculty of Agriculture, University of Aleppo, Aleppo **Institute for Soil Water Management, A-3252 Petzenkirchen, Austria. ***Field Crops Dept. Faculty of Agriculture, University of Aleppo, Aleppo, Syria. ****Durum Wheat Breeder –ICARDA, Aleppo, Syria. *****Postgraduate Student (PhD) Field Crops Dept. Faculty of Agriculture, University of Aleppo, Aleppo, Syria Abstract Six durum wheat genotypes were studied at Tel Hadya for three seasons 2004/05, 2005/06 and 2006/07. The details results were used to calibrate and validate the simulation model SIMWASER. Results showed very good conformity between simulated and measured soil water status and yield production therefore one may suppose that SIMWASER is able to reproduce the water balance of the investigated site in a very realistic manner as well as yield production throughout the season. After, the validation, the model was run for the period between 1980 and 2007 for Tel Hadya site using daily weather data. Also, different genetic scenarios were used present different transpiration value. The different values used were ∆ 13 C values which were measured for the three years field trial, since, ∆ 13 C values are closely related to transpiration at plant level. The simulated results of yields were similar to that of measured rainfall to some extended. However, better relation was shown between yield and plant transpiration. Moreover, when grouping the years into two depending on rain quantity: 1 st : dry years (rain <175 mm), and 2 nd : wet years (rain >175 mm), a stronger relations between yield and rainfall were found. It was showed clearly, that the dry years produced much higher yield per unite rain compared with the wetter years (ranged between 13 and 90 kg/ha/mm for the wet years and dry years respectively). Results of the different transpiration scenarios showed that the higher ∆ 13 C value genotypes transpired more water and higher yields and therefore had higher water use efficiency compared with low ∆ 13 C values genotype. Key words: durum wheat – simulation – transpiration efficiency - ∆ 13 C - water use efficiency - Syria Received 3/2/2009 Accepted 17/3/2009
-
Upload
independent -
Category
Documents
-
view
2 -
download
0
Transcript of Calibrate and Validate SIMWASER Simulation Model Using Different Transpiration Efficiency for Varied...

Res. J. of Aleppo Univ. Agricultural Science Series No. 73 2009
1
Calibrate and Validate SIMWASER Simulation Model Using Different Transpiration Efficiency for Varied
Durum Wheat Genotypes Ammar Wahbi*, Elmar Stenitzer**, Eduard Klaghofer **, Rami Keff Al-Ghazal***, Lukman Al-Krayem***, Miloudi Nachit****,
Ahmad Shams Aldien Shaaban***** *Soil Science Dept. Faculty of Agriculture, University of Aleppo, Aleppo **Institute for Soil Water Management, A-3252 Petzenkirchen, Austria.
***Field Crops Dept. Faculty of Agriculture, University of Aleppo, Aleppo, Syria. ****Durum Wheat Breeder –ICARDA, Aleppo, Syria.
*****Postgraduate Student (PhD) Field Crops Dept. Faculty of Agriculture, University of Aleppo, Aleppo, Syria
Abstract Six durum wheat genotypes were studied at Tel Hadya for three seasons 2004/05, 2005/06 and 2006/07. The details results were used to calibrate and validate the simulation model SIMWASER. Results showed very good conformity between simulated and measured soil water status and yield production therefore one may suppose that SIMWASER is able to reproduce the water balance of the investigated site in a very realistic manner as well as yield production throughout the season. After, the validation, the model was run for the period between 1980 and 2007 for Tel Hadya site using daily weather data. Also, different genetic scenarios were used present different transpiration value. The different values used were ∆13C values which were measured for the three years field trial, since, ∆13C values are closely related to transpiration at plant level. The simulated results of yields were similar to that of measured rainfall to some extended. However, better relation was shown between yield and plant transpiration. Moreover, when grouping the years into two depending on rain quantity: 1st: dry years (rain <175 mm), and 2nd: wet years (rain >175 mm), a stronger relations between yield and rainfall were found. It was showed clearly, that the dry years produced much higher yield per unite rain compared with the wetter years (ranged between 13 and 90 kg/ha/mm for the wet years and dry years respectively). Results of the different transpiration scenarios showed that the higher ∆13C value genotypes transpired more water and higher yields and therefore had higher water use efficiency compared with low ∆13C values genotype. Key words: durum wheat – simulation – transpiration efficiency - ∆13C - water use efficiency - Syria
Received 3/2/2009 Accepted 17/3/2009

Dr. Wahbi et al..
2
1. Introduction Durum wheat is an important crop for the human diet particularly in the Mediterranean basin where 75% of the World’s durum is produced. Durum wheat is primarily grown under rainfed condition where the frequent occurrence of drought combined with heat stress [1], fragile soil [2], and limited renewable water resources [3] are the major factor limiting grain yield. Today, the sustainability of crop production systems is at stake because of the degradation of agriculturally productive soil [4] and water resources [5]. For agricultural production in the West Asia–North Africa (WANA) region to meet the demand imposed by today’s demographic developments requires the more efficient use of water within cropping systems, and crop management [3, 4]. In such water-limited environments, the long-term consequences of agricultural practices on crop productivity, and water-use efficiency are difficult to assess because rainfall variability may mask existing trends. A complement to traditional field experimentation is cropping-systems analysis using simulation techniques that integrate long-term climatic records, and consequently allow the outcomes of agricultural interventions to be quantified across the observed rainfall variability [6]. Climate of a given area is considered to be the average situation of weather during long period of time during which, it fluctuated in an average or exceptional ways. The, long period of time, weather cycle considered to be about 35 years [7]. However, it is now known by the metrological scientists that ground temperature was increased by about half centigrade during the last century, and the concentration of CO2 had increased during the last 250 years from 270 PPM to 370 PPM [8]. When temperature increased, evaporation of the water will increase, therefore, reduce the water uses by plants [9]. This Mediterranean type of environment like Syria [10] received rainfall ranged between 200 and 800 mm per year, and rainy days are less than 100 days during the winter month [11]. And it could be noticed a hot spot temperature accompanied by shortage of rain, this is very difficult to predict on time and duration, which could had a negative consequences on the growth and yield of crops [12]. According to FAO, it is only 20% of the total agricultural areas could be irrigated, therefore, most research concentrated in the rainfed areas which is about 80% of the total agricultural areas and most research aimed to maximized the efficiency of water uses. On the other hand, a
Res. J. of Aleppo Univ. Agricultural Science Series No. 73 2009
3
dramatic increase in world population which is expected to be above 6.800 billion habitants in the year 2010 [13], also, habitants density increased from 170.2 habitants/km2 in the year 1995 to 312.6 habitants/km2 in the year 2004 [14]. So, drought is the most critical component causing yield reductions in all over the world and in our region. For all mentioned reasons, the agricultural researchers faces a great challenges in getting higher production per unit area, since the horizontal expansion was very limited by the end of twenty centuries [15, 16]. As mentioned above, a real challenge occurred, and a solution should be found to minimize or reduce the drought occurrence. One of the solution could be the use of crop simulation model, aiming to predict what could happened during the weather cycle and using different cropping scenarios. These scenarios include, cropping managements (e.g. planting date, using different crops etc…) as well as genetic (using early or late maturity genotypes, different morphological and physiological traits such as: different transpiration and water use efficiency or Carbon Isotope Discrimination CID, etc…). Carbon Isotope Discrimination has been shown to have sustainable, potential application as a screening tool in breeding programs to increase transpiration efficiency and therefore yield specially when extreme events such as drought [17, 18]. And since the main challenge is shortage of water, then a plant trait that could use water more effectively in "transpiration" is used. The plant has a high transpiration rate consume high quantity of water in transpiration, so it has a high ∆ 13C value in limited rainfall environment region [19]. The isotopic ratio of 13C to 12C in plant tissue is less than the isotopic ratio of 13C to 12C in atmospheric CO2, indicating that plants discriminate against 13C during photosynthesis, particularly C3 plants such as wheat, peanuts and cotton. Positive correlation between CID and productivity has been reported in wheat, beans and cowpea [20] and cotton [21]. 2. Objectives: Validate and using SIMWASER simulation model to predict the production and water use efficiency for different wheat (varied in transpiration efficiency, different ∆13C values) grown in Syria under rainfed conditions. 3. Materials and Methods: Field experiment was conducted at Tel Hadya "TH" (2004/05, 2005/06 & 2006/07). TH is the main research station of the
Dr. Wahbi et al..
4
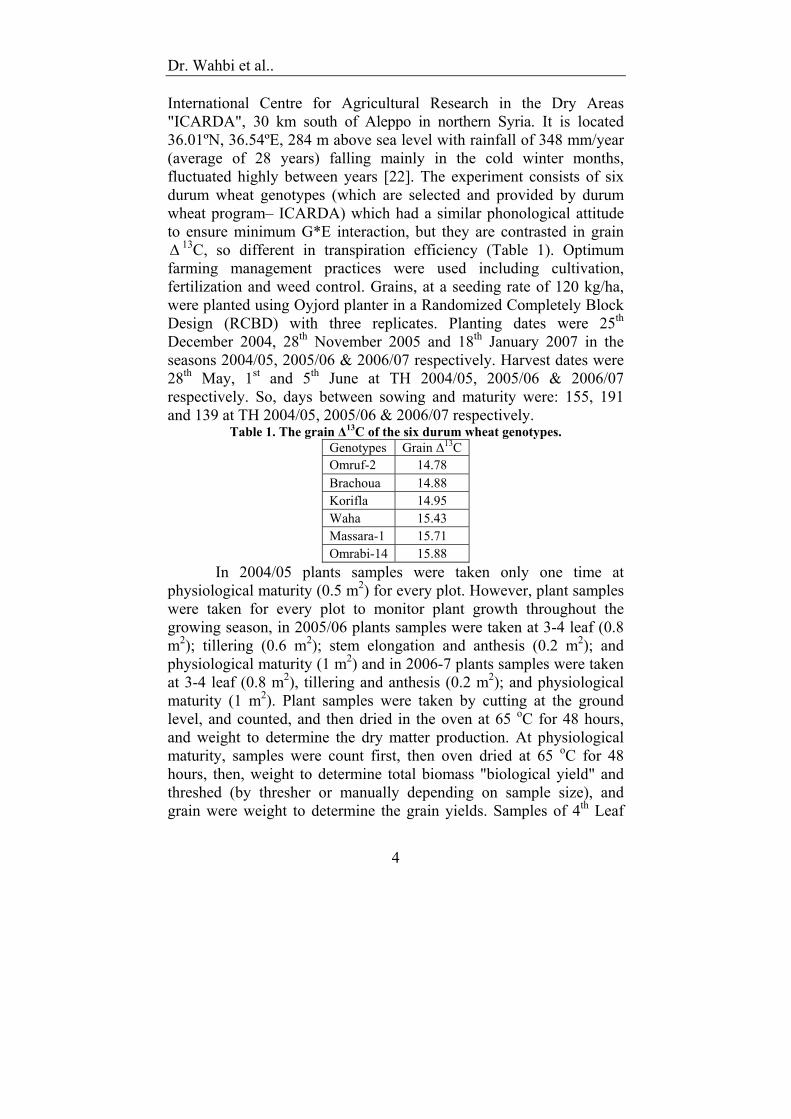
International Centre for Agricultural Research in the Dry Areas "ICARDA", 30 km south of Aleppo in northern Syria. It is located 36.01ºN, 36.54ºE, 284 m above sea level with rainfall of 348 mm/year (average of 28 years) falling mainly in the cold winter months, fluctuated highly between years [22]. The experiment consists of six durum wheat genotypes (which are selected and provided by durum wheat program– ICARDA) which had a similar phonological attitude to ensure minimum G*E interaction, but they are contrasted in grain ∆ 13C, so different in transpiration efficiency (Table 1). Optimum farming management practices were used including cultivation, fertilization and weed control. Grains, at a seeding rate of 120 kg/ha, were planted using Oyjord planter in a Randomized Completely Block Design (RCBD) with three replicates. Planting dates were 25th December 2004, 28th November 2005 and 18th January 2007 in the seasons 2004/05, 2005/06 & 2006/07 respectively. Harvest dates were 28th May, 1st and 5th June at TH 2004/05, 2005/06 & 2006/07 respectively. So, days between sowing and maturity were: 155, 191 and 139 at TH 2004/05, 2005/06 & 2006/07 respectively.
Table 1. The grain ∆13C of the six durum wheat genotypes. Genotypes Grain ∆13C Omruf-2 14.78 Brachoua 14.88 Korifla 14.95 Waha 15.43 Massara-1 15.71 Omrabi-14 15.88
In 2004/05 plants samples were taken only one time at physiological maturity (0.5 m2) for every plot. However, plant samples were taken for every plot to monitor plant growth throughout the growing season, in 2005/06 plants samples were taken at 3-4 leaf (0.8 m2); tillering (0.6 m2); stem elongation and anthesis (0.2 m2); and physiological maturity (1 m2) and in 2006-7 plants samples were taken at 3-4 leaf (0.8 m2), tillering and anthesis (0.2 m2); and physiological maturity (1 m2). Plant samples were taken by cutting at the ground level, and counted, and then dried in the oven at 65 oC for 48 hours, and weight to determine the dry matter production. At physiological maturity, samples were count first, then oven dried at 65 oC for 48 hours, then, weight to determine total biomass "biological yield" and threshed (by thresher or manually depending on sample size), and grain were weight to determine the grain yields. Samples of 4th Leaf
Res. J. of Aleppo Univ. Agricultural Science Series No. 73 2009
5
(full expanded) for every plot of the six genotypes at 2005/06 and for two replicates at 2006/07 were taken. However, grains for every plot at the physiological maturity stage were taken. Samples were oven dried at 65 oC for 48 hours, and dried for ∆13C analysis at the International Atomic Energy Agency (IAEA), Vienna, Austria. Soil water content was monitored, for every plot, at Tel Hadya (2005/06 and 2006/07) using the Diviner 2000. PVC access tubes were manually installed to a depth of about 130 Cm. Measurements was done throughout the season and in 10 Cm intervals. Calibration was done by the end of the season when soil becoming very dry and wetted artificially for the calibration. 3.1. Weather data: Air temperature (minimum and maximum), relative humidity (minimum and maximum), wind speed, rainfall and solar radiation were recorded on a daily base. Also, the daily detailed weather data from 1980 till 2007 were used as long term weather data in simulation model. 3.2. Soil condition: Soil profile was made, and samples were taken from each horizon (0-20, 20-60, 60-100, 100-120, 120-170 cm). Some physical and chemical properties were determined such as texture analysis, bulk density, pH, EC, total N, organic matter, and CaCO3. However, P-Olsen was determined at the upper two levels; 0-20 and 20-40 cm. The soil was classified as a very fine (clayey), montmorillonitic, Thermic, Chromic Calcixert merging into a Calcixerollic Xerochrept. Soil was red when dry and dark red when wet, with fine to medium granular structure. Calcium carbonate is about 15-20% in the top 60-80 cm, calcareous concretions were visible below that depth. Due to its clay texture, available moisture was comparatively small, e.g., field capacity (-33 kPa) at 36% volumetric water content and permanent wilting point (-1500 kPa) at 23% volumetric water content [23]. 3.3. Modelling features [24, 25]: The deterministic simulation model SIMWASER describes the one dimensional vertical water flux within a soil profile, neglecting inter-flow and preferential flow. The water balance and the growth of plants is interrelated by the physiological interaction between transpiration and assimilation: accumulation of plant material depends on the amount of CO2 incorporated via the stomata, by which at the same time water vapor is lost from the saturated vacuole into the unsaturated ambient air. Potential assimilation and therefore potential

Dr. Wahbi et al..
6
growth is only possible as long as the water supply towards the stomata can meet the potential transpiration loss. If this is not the case stomata will close and formation of plant material will be restricted. All these processes depend on the respective plant development stage as for example the partition of the daily assimilates between leaves, stem and roots. SIMWASER calculates the actual development stage by dividing the currently accumulated growing degree days by the sum of growing degree days necessary for ripeness of the respective crop: a growing degree day corresponds to the mean daily temperature minus a base temperature which is specific to that crop.
Actual plant growth is calculated from potential plant growth rate as the proportion of the actual transpiration to the potential one (eq. 1): Pact = Ppot * Tact / Tpot (1) Pact, Ppot: actual & potential plant growth (kg CH2O/m2/d); Tact, Tpot: actual & potential transpiration (mm/d).
Potential evapotranspiration PET is calculated according to Penman-Monteith (eq. 2). PET = (ft*Q+0.864*H0/rair)/(ft+rcrop/rrair) (2) Where: PET : potential evapotranspiration (mm/d); ft : weighing factor depending on temperature; Q : evaporation equivalent of available energy (mm/d); 0.864 : factor converting (g H2O/m3)/(s/cm) to (mm/d); H0 : saturation deficit of air (g H2O/m3 air); rair : aerodynamic resistance against water vapour exchange (s/cm); rcrop : crop resistance (s/cm). The both rair and rcrop are variables, depending on weather as well as on actual plant development stage. Potential transpiration Tpot is deduced from PET proportional to the global energy absorbed by the leaves of the crop stand (eq. 3): Tpot = PET * [1.0 – exp(-0.6*totlai)] (3) Where: Totlai : total leaf area per unit soil surface (m2/m2); Exp : exponent Actual transpiration Tact is determined by comparison of potential Transpiration Tpot to the amount of water SUMROOT which can be withdrawn by the roots from the soil. If SUMROOT is larger than Tpot then Tact = Tpot otherwise Tact = SUMROOT, which will be the larger the deeper the roots are growing into the soil profile. Actual

Res. J. of Aleppo Univ. Agricultural Science Series No. 73 2009
7
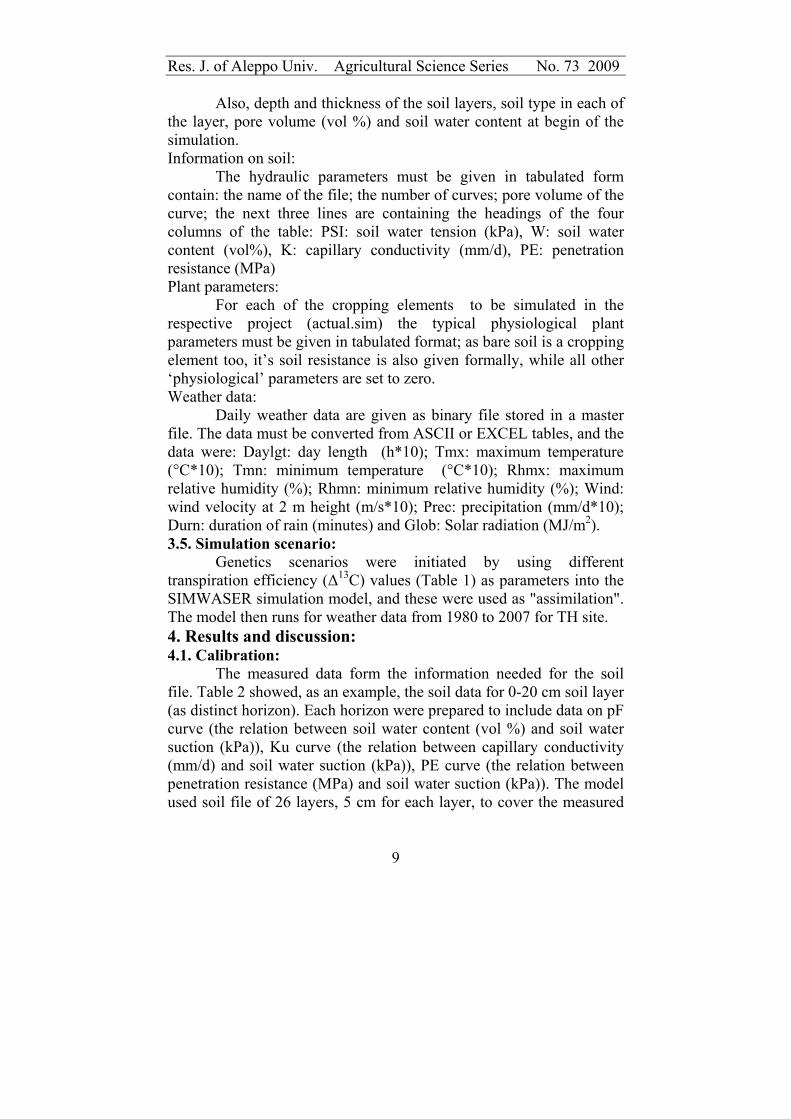
rooting depth depends on the respective crop as well as on the penetration resistance of the soil and is calculated at each day. When calculating the soil water flux within the soil profile (fig. 1) one must take into account if it may be influenced by the ground water level or not: in latter case it may be assumed that there exists no capillary rise from the coarse aquifer, whereas in the former case the variable ground water level will form the lower boundary of the profile.
W1 (1) W2 (2) W3 (3)
W (1) W (2) W (3)
W (N)
Soil surfacee
Lower boundary
Percolation orCapillary rise
Boundary condition atLower end of profile
Precipitation PSoil evaporation E akt
Balance atSoil surface
W1 = root extraction
W = water content
Fig.1: Schematic illustration of the soil water flux taken into account by
SIMWASER [24] Water flux between the soil layers is calculated according to DARCY’s law as function of the capillary conductivity and the gradient of the matric potential using small but variable time steps which restrict changes of water content to 0.1 Vol%. Filter velocity at the lower end of a soil layer Vi is calculated according to equation 4:
VK K
Zii i i i
i=
+ −++ +( )
.( )1 12
1Ψ Ψ (4)
Vi : Filter velocity Ki, Ki+1: capillary conductivity of layers i, i+1 ψi, ψi+1 : matric potential of layers i, i+1 Zi : distance from centre of layer i to centre of layer i+1 The filter velocity Vi of the water flowing out of the bottom of layer i is at the same time the filter velocity of the water flowing at the top of the next layer i+1 into it. The soil profile model may be divided into 50 layers maximum, each 5–10 cm thick and must reach down to a depth which is outside the range of plant roots. A soil profile influenced by ground water must be deeper than the deepest ground
Dr. Wahbi et al..
8
water level at that site. Input data: There are groups of input data: - The daily weather data are: Minimum and Maximum air
temperature (ºC); Rainfall (mm); Minimum and Maximum relative humidity (%); Wind speed (2 m height); Solar radiation (MJ/m2); Rain duration and Day length.
- Soil Data (for every soil horizon) are: Soil texture (USA, UK,…); Soil structure; Organic matter (%); Bulk density (gr/cm3); pF Curve; Hydraulic conductivity; Salinity level (dS/m); Gravel (%); Compaction (loose, normal, dense, hard, sever) and Pores volume (%).
- Plant parameters data are: Ext: Extinction coefficient; Lawgt: Leaf area weight; Hgt: Plant height; Rs: Stomatal resistance; Ass: Assimilation; Ft: Temperature class; Rlg: Root length; Rd: Root density; Rr: Root strength; Lfw: Leaf width; Ripe: Ripping; lai0: LAI at emergence; amin: Minimum air content and cdayl: Critical day length.
Output data: The output data are: Date: (day); SUMWG: Sum water content (mm); SRAIN: Sum rain (mm); SETA: Sum evapotranspiration (mm); SPER: Sum deep percolation (mm); STR: Sum transpiration (mm); SROFF: Sum run off (mm); ETA: Evapotranspiration of current day (mm/d); RAIN: Daily rain (mm); SNOW: Daily snow (mm); FLXG: Accumulated flux during current day (mm/d); GWRIS: Accumulated capillary rise (mm/d); GRNLAI: Green leaf area index (m2/m2); CROOTL: Root length (dm); DRYMAT: Daily dry matter accumulation (kg/ha) and GRAIN: Daily grain yield (kg/ha). 3.4. Calibration and validation of the model: Calibration of the model SIMWASER normally is restricted to the soil and plant parameters. Plant parameters to be calibrated mostly are the stomatal resistance and the sum of growing degree day necessary for ripeness as well as the potential root length. So, calibrating the simulation model need to prepare some essential files which are contains the input data as follow: Information on soil profile: (File “soilprofile”): Name of the site and its elevation given in meters above sea level; name of the relevant weather station and number of the layer (layer of balance) at which the soil water balance will be calculated; number of last soil layer of the profile.
Res. J. of Aleppo Univ. Agricultural Science Series No. 73 2009
9
Also, depth and thickness of the soil layers, soil type in each of the layer, pore volume (vol %) and soil water content at begin of the simulation. Information on soil: The hydraulic parameters must be given in tabulated form contain: the name of the file; the number of curves; pore volume of the curve; the next three lines are containing the headings of the four columns of the table: PSI: soil water tension (kPa), W: soil water content (vol%), K: capillary conductivity (mm/d), PE: penetration resistance (MPa) Plant parameters: For each of the cropping elements to be simulated in the respective project (actual.sim) the typical physiological plant parameters must be given in tabulated format; as bare soil is a cropping element too, it’s soil resistance is also given formally, while all other ‘physiological’ parameters are set to zero. Weather data: Daily weather data are given as binary file stored in a master file. The data must be converted from ASCII or EXCEL tables, and the data were: Daylgt: day length (h*10); Tmx: maximum temperature (°C*10); Tmn: minimum temperature (°C*10); Rhmx: maximum relative humidity (%); Rhmn: minimum relative humidity (%); Wind: wind velocity at 2 m height (m/s*10); Prec: precipitation (mm/d*10); Durn: duration of rain (minutes) and Glob: Solar radiation (MJ/m2). 3.5. Simulation scenario: Genetics scenarios were initiated by using different transpiration efficiency (∆13C) values (Table 1) as parameters into the SIMWASER simulation model, and these were used as "assimilation". The model then runs for weather data from 1980 to 2007 for TH site. 4. Results and discussion: 4.1. Calibration: The measured data form the information needed for the soil file. Table 2 showed, as an example, the soil data for 0-20 cm soil layer (as distinct horizon). Each horizon were prepared to include data on pF curve (the relation between soil water content (vol %) and soil water suction (kPa)), Ku curve (the relation between capillary conductivity (mm/d) and soil water suction (kPa)), PE curve (the relation between penetration resistance (MPa) and soil water suction (kPa)). The model used soil file of 26 layers, 5 cm for each layer, to cover the measured
Dr. Wahbi et al..
10
soil depth of 130 cm. Plant file was done using default values of the parameters used, except for the assimilation values, where, averaged (the three years results) grain ∆13C values were used for the different genotypes.
Table 2. The soil file used for simulation for TH 00-20 cm Psi kPa w.cont %vol Ku mm/d PE Mpa 1.0E-2 58.0 7.6E+03 2.4E+00 1.0E-1 57.9 6.2E+03 2.4E+00 2.0E-1 57.8 5.6E+03 2.4E+00 4.0E-1 57.7 4.7E+03 2.3E+00 1.0E+0 57.2 2.8E+03 2.3E+00 2.0E+0 56.3 1.2E+03 2.4E+00 4.0E+0 54.1 5.4E+02 2.4E+00 1.0E+1 49.8 6.3E+01 2.6E+00 2.0E+1 44.9 1.6E+01 2.8E+00 4.0E+1 41.0 3.7E+00 3.0E+00 1.0E+2 37.7 4.7E-01 3.2E+00 2.0E+2 34.6 1.0E-01 3.5E+00 4.0E+2 32.0 2.3E-02 3.7E+00 1.0E+3 29.1 3.2E-03 4.0E+00 2.0E+3 26.8 8.3E-04 4.3E+00 4.0E+3 24.3 1.2E-04 4.6E+00 1.0E+4 20.9 1.8E-05 5.3E+00 4.0E+4 14.8 5.4E-07 7.0E+00 1.0E+5 10.8 5.6E-08 8.9E+00 1.0E+6 0.1 1.2E-12 5.1E+01
PSI: soil water tension (kPa), W: soil water content (vol %), Ku: capillary conductivity (mm/d), PE: penetration resistance (MPa). Table 3 showed the 4th fully expanded leaf and grain ∆13C values for the different seasons at TH, and illustrated that values were higher for the leaf compared with grain. This is due mainly to the reason, that no shortage of water was occurred at early season (4th leaf stage) compared with the end of the season (grain). Also, it is almost, similar trend of results were evident for the different season, despite the fact that rainfall was very different across the three seasons, with slight decreased in the last season, due to lower rainfall during the growing season. The numbers used for assimilation are, therefore, grain ∆13C values (average of three seasons) of 14.9, 15.3, 15.4, 15.5, 15.6 and 15.7‰ for Omruf-2, Brachoua, Korifla, Waha, Massara-1 and Omrabi-14 respectively (Table 4). These values are in similar trend to that of Table 1.
Res. J. of Aleppo Univ. Agricultural Science Series No. 73 2009
11
Table 3. The 4th fully expanded leaf and grain ∆13C of the six durum wheat genotypes at TH (2004/05, 2005/06 and 2006/07 seasons).
Leaf ∆13C Grain ∆13C 2005/06 2006/07 2004/05 2005/06 2006/07
Omruf-2 21.95 21.45 15.36 15.35 14.08 Brachoua 22.36 21.12 15.34 15.70 14.78 Korifla 22.52 21.71 15.72 15.68 14.83 Waha 22.51 22.08 15.80 15.81 14.88 Massara-1 22.39 21.96 16.13 15.62 15.21 Omrabi-14 22.76 22.20 16.26 15.71 15.17
Fpr. *** * *** *** ** Se(+) 0.073 0.22 0.078 0.072 0.192
Table 4. The plant parameters of the six durum wheat genotypes used for simulation model.
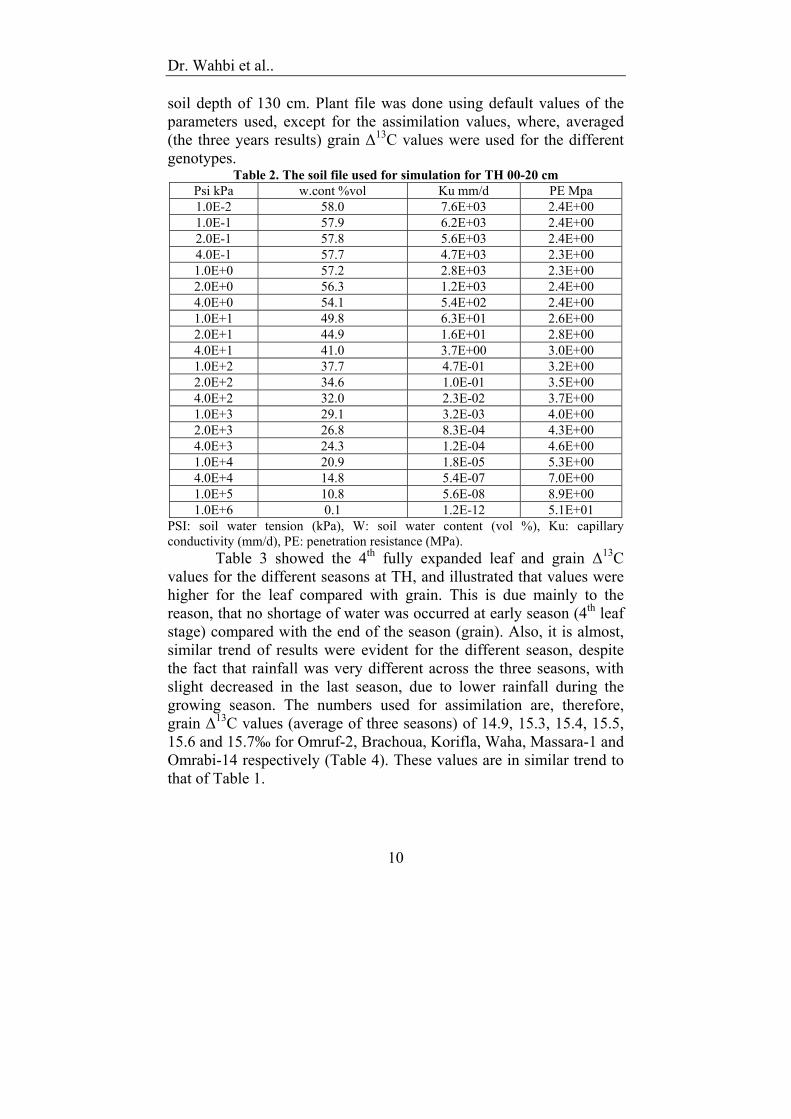
Crop Code ext lawgt hgt rs ass ft rlg rdf rr lfw ripe lai0 amin cdayl Fallow 0 0.0 .000 0 5 00.0 0 00 0 0 0.0 0000 .00 0 00.0 Wheat 1 0.4 .003 1 1 15.0 1 10 9 1 0.5 1600 .05 5 10.5 Omruf-2 1 0.4 .003 1 1 14.9 1 10 9 1 0.5 1600 .05 5 10.5 Brachoua 1 0.4 .003 1 1 15.3 1 10 9 1 0.5 1600 .05 5 10.5 Korifla 1 0.4 .003 1 1 15.4 1 10 9 1 0.5 1600 .05 5 10.5 Waha 1 0.4 .003 1 1 15.5 1 10 9 1 0.5 1600 .05 5 10.5 Massara-1 1 0.4 .003 1 1 15.6 1 10 9 1 0.5 1600 .05 5 10.5 Omrabi-14 1 0.4 .003 1 1 15.7 1 10 9 1 0.5 1600 .05 5 10.5 Ext: Extinction coefficient; Lawgt: Leaf area weight; Hgt: Plant height; Rs: Stomatal resistance; Ass: Assimilation; Ft: Temperature class; Rlg: Root length; Rd: Root density; Rr: Root strength; Lfw: Leaf width; Ripe: Ripping; lai0: LAI at emergence; amin: Minimum air content and cdayl: Critical day length. 4.2. Validation: The assimilation value used in this simulation for the wheat plot is 15, which is the average values of the six genotypes (Table 3 and 4). Good agreement was shown between measured and simulated values of soil water storage (Fig. 2), and these results were confirmed with [26] were they said that the SIMWASER model will be used to prove its eligibility to simulate the influence of water availability on crop yield). This was valid throughout the two seasons for both, fallow and wheat plot. However, it was slightly below and over simulation at the early and late in the season respectively (Fig. 2). As shown a very good conformity exists between simulated and measured volumetric soil water content therefore one may suppose that SIMWASER is able to reproduce the water balance of the investigated site in a very realistic manner as well as dry matter accumulation. The dry matter accumulation as well as grain yield showed to be very close to that
Dr. Wahbi et al..
12
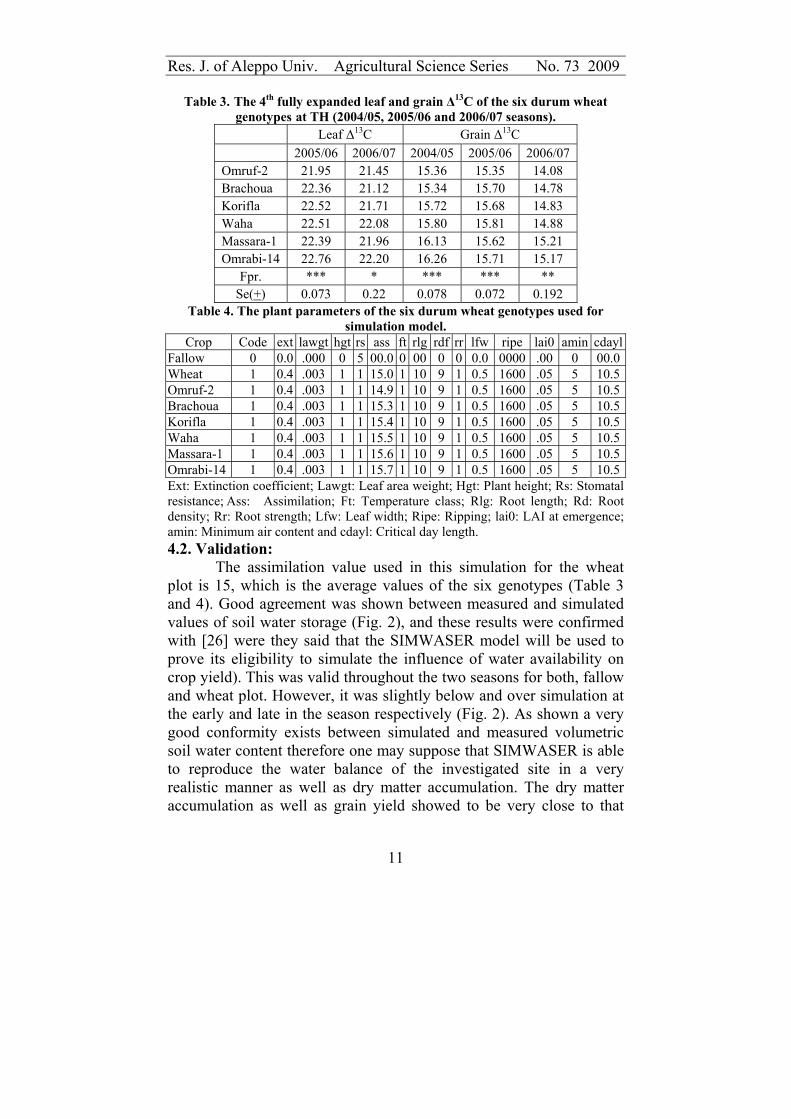
simulated by SIMWASER model for the two seasons (Fig. 3), despite the very different growing conditions at the two seasons, which reflect on the yield difference of about two folds.
200
250
300
350
400
450
500
8/9/2005 11/7/2005 2/5/2006 5/6/2006 8/4/2006 11/2/2006 1/31/2007 5/1/2007 7/30/2007
Time
VW
C %
SUMWG Omruf-2 Brachoua Korifla Waha Massara-1 Omrabi-14 Fallow
Fig. 2. Simulated volumetric water content (SUMWG, continues line) and
measured VWC% of the six genotypes of wheat (symbols) as well as fallow plot during the two season (2005/06-2006/07) at TH
Fig. 3. Measured (symbols) and simulated (continues line) dry matter
accumulation and grain yield (DRYMAT and GRAIN) during the two seasons (2005/06 and 2006/07) at TH.
4.3. Simulation using long-term weather data & genetics scenarios: Fig. 4 showed the simulation of volumetric soil water content (SUMWG), transpiration (STR) and evapo-transpiration (SETA) and

Res. J. of Aleppo Univ. Agricultural Science Series No. 73 2009
13
measured rain (SRAIN) for the period of 1980-2007 at TH. The simulated results of volumetric water contents fallowed similar trend as the measured rainfall to great extend with some exceptional, which could be due to not effective rainfall which could cause run off.
0
100
200
300
400
500
600
700
10/0
6/80
10/0
1/81
09/2
6/82
09/2
1/83
09/1
5/84
09/1
0/85
09/0
5/86
08/3
1/87
08/2
5/88
08/2
0/89
08/1
5/90
08/1
0/91
08/0
4/92
07/3
0/93
07/2
5/94
07/2
0/95
07/1
4/96
07/0
9/97
07/0
4/98
06/2
9/99
06/2
3/00
06/1
8/01
06/1
3/02
06/0
8/03
06/0
2/04
05/2
8/05
05/2
3/06
05/1
8/07
Years
(mm
)
SUMWG SRAIN SETA STR
Fig. 4. Simulated VWC%, Evapo-transpiration and Transpiration (mm) and
measured rainfall for TH 1980-2007 using SIMWASER model.
0
5
10
15
20
25
30
35
40
45
50
55
60
65
10/6/1980
10/6/1981
10/6/1982
10/6/1983
10/5/1984
10/5/1985
10/5/1986
10/5/1987
10/4/1988
10/4/1989
10/4/1990
10/4/1991
10/3/1992
10/3/1993
10/3/1994
10/3/1995
10/2/1996
10/2/1997
10/2/1998
10/2/1999
10/1/2000
10/1/2001
10/1/2002
10/1/2003
9/30/2004
9/30/2005
9/30/2006
9/30/2007
Years
Prec
ipita
tion
(mm
)
Fig. 5. Daily measured rain at TH 1980-2007
This could be illustrated by the high daily rainfall of over 40 mm of rain occurred in one day (Fig. 5), which is difficult to penetrate, and could be lost by run off. The fluctuation of volumetric soil water contents and evapo-transpiration were similar to that of the simulated

Dr. Wahbi et al..
14
dry matter production and grain yield (Fig. 6). Also, Fig. 6 showed that yield (either total or grain) fallowed the rainfall pattern but not to great extend due to the "un-effective rainfall distribution" (Fig. 5).
0
1000
2000
3000
4000
5000
6000
7000
8000
9000
10000
11000
12000
1982
1983
1984
1985
1986
1987
1988
1989
1990
1991
1992
1993
1994
1995
1996
1997
1998
1999
2000
2001
2002
2003
2004
2005
2006
2007
Years
Prod
uctio
n (k
g/ha
)
0
50
100
150
200
250
300
350
400
450
Prec
ipita
tion
(mm
)
GRAIN DRYMAT SRAIN
Fig. 6. Simulated dry matter production and grain yields using SIMWASER
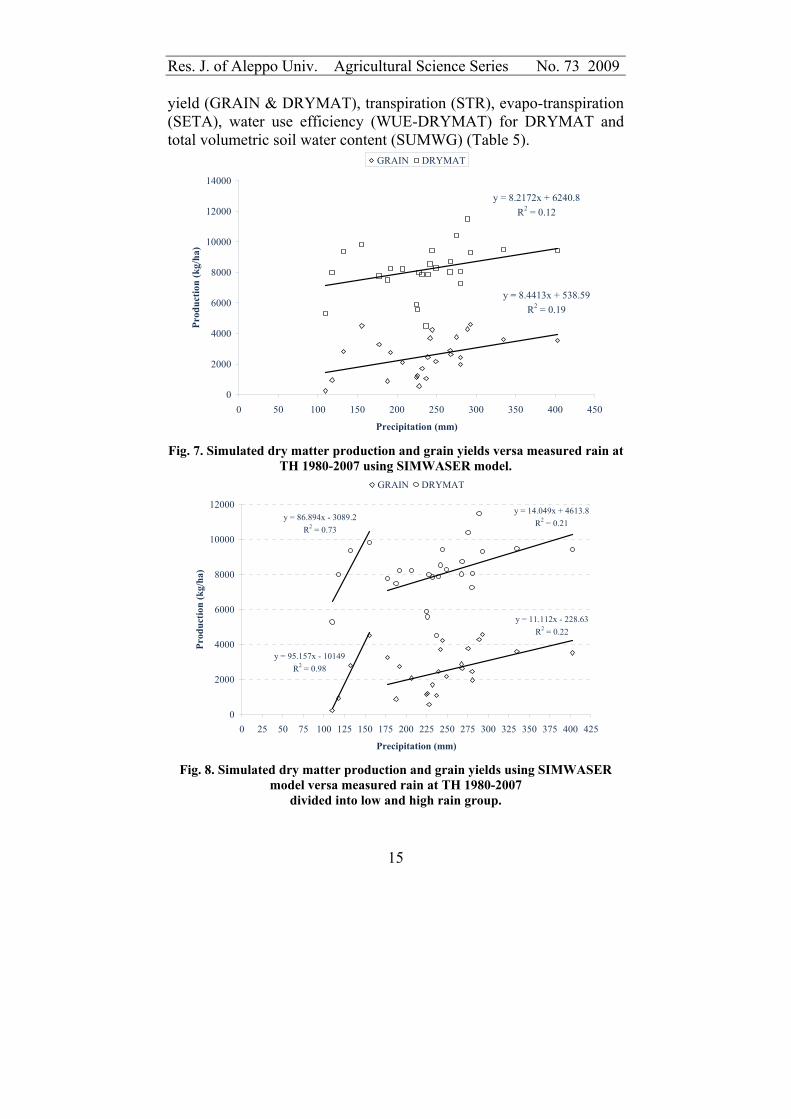
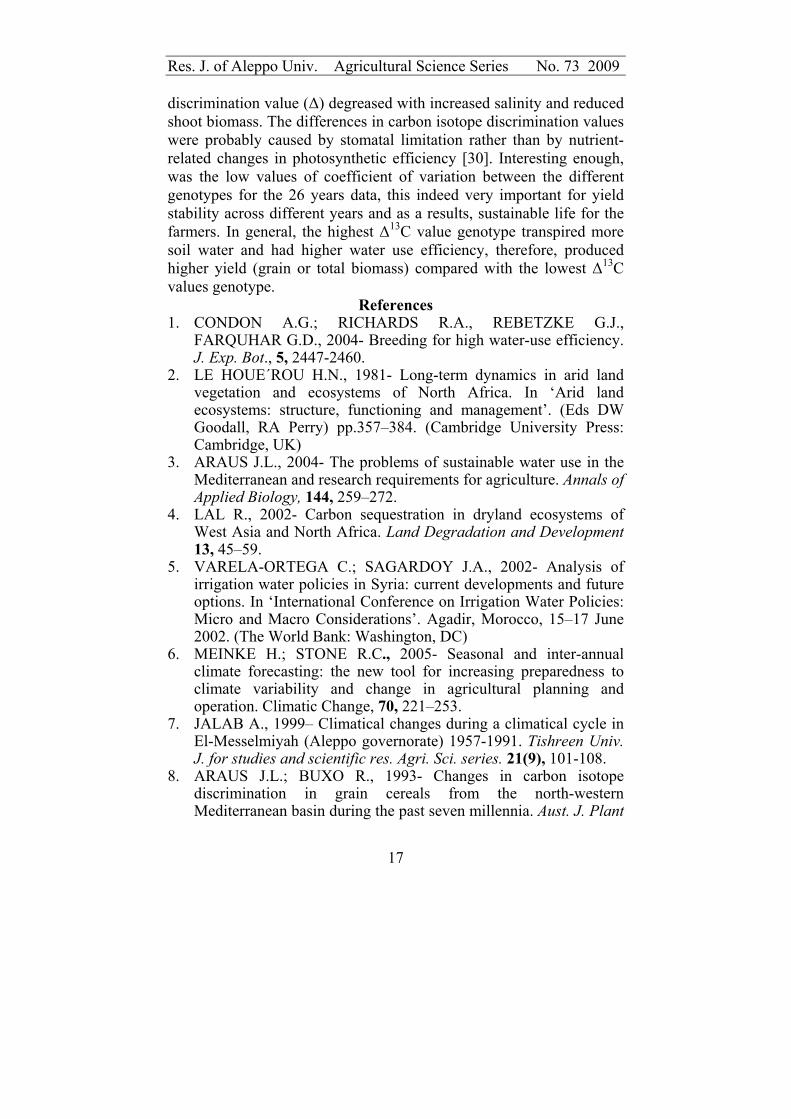
model with measured precipitation at TH 1980-2007. Furthermore, relation between yield (total or grain) and precipitation was straight line relation with, indeed, low R2 (Fig. 7). However, when, dividing the data into low rain (less than 175 mm) and high rain (higher than 175 mm) to find much better relation and R2 had increased dramatically (Fig. 8). As shown in Fig. 8, that the slope of line was much higher in the dry rainfall years reaching about 90 kg/ha/mm, whilst, in the wetter years it was about 13 kg/ha/mm which were about 7 folds differences. This suggest, that water produced higher dry matter production at lower rainfall and the low yield elasticity of genetics variation to positively respond to high rainfall. The above indicate to use other than rainfall to relate to yield production, Fig. 9 illustrated better relation between yield and plant transpiration compared with relation with rainfall. And much higher R2 was reported for total biomass compared with grain yield, and this is true, since, grain yield could be forced by the temperature and rainfall during grain filling. The simulation of the different scenarios of assimilation presented by ∆13C values for the period between 1980 and 2007 at TH showed a highly significant differences (at (P<0.001) occurred between the different six genotypes in the grain and total
Res. J. of Aleppo Univ. Agricultural Science Series No. 73 2009
15
yield (GRAIN & DRYMAT), transpiration (STR), evapo-transpiration (SETA), water use efficiency (WUE-DRYMAT) for DRYMAT and total volumetric soil water content (SUMWG) (Table 5).
y = 8.2172x + 6240.8R2 = 0.12
y = 8.4413x + 538.59R2 = 0.19
0
2000
4000
6000
8000
10000
12000
14000
0 50 100 150 200 250 300 350 400 450
Precipitation (mm)
Prod
uctio
n (k
g/ha
)
GRAIN DRYMAT
Fig. 7. Simulated dry matter production and grain yields versa measured rain at
TH 1980-2007 using SIMWASER model.
y = 95.157x - 10149R2 = 0.98
y = 11.112x - 228.63R2 = 0.22
y = 86.894x - 3089.2R2 = 0.73
y = 14.049x + 4613.8R2 = 0.21
0
2000
4000
6000
8000
10000
12000
0 25 50 75 100 125 150 175 200 225 250 275 300 325 350 375 400 425
Precipitation (mm)
Prod
uctio
n (k
g/ha
)
GRAIN DRYMAT
Fig. 8. Simulated dry matter production and grain yields using SIMWASER
model versa measured rain at TH 1980-2007 divided into low and high rain group.

Dr. Wahbi et al..
16
y = 44.461x + 3374.5R2 = 0.5758
y = 26.986x + 237.13R2 = 0.3092
0
2000
4000
6000
8000
10000
12000
14000
0 25 50 75 100 125 150 175 200 225
Transpiration (mm)
Prod
uctio
n (k
g/ha
)
BY GY
Fig.9. Simulated dry matter production and grain yields versa transpiration
using SIMWASER model at TH 1980-2007. Table 5. Simulation for different ∆13C of durum wheat at TH (1980-2007)
GRAIN DRYMAT STR SETA WUE-DRYMAT
WUE-GRAIN SUMWG
Omruf-2 2437 7853 136 186 42.5 13.22 458 Brachoua 2507 8107 140 190 42.9 13.29 454 Korifla 2522 8172 141 191 43.1 13.31 453 Waha 2534 8232 142 191 43.2 13.30 453 Massara-1 2549 8287 143 192 43.3 13.30 452 Omrabi-14 2552 8347 144 193 43.5 13.27 451 Fpr. <0.001 <0.001 <0.001 <0.001 <0.001 0.884 <0.001 SE(+) 17.9 16.7 0.69 0.68 0.17 0.08 0.66 LSD0.05 35.43 33.13 1.37 1.35 0.33 0.16 1.31 C.V% 2.6 0.7 1.8 1.3 1.4 2.1 0.5 It was noticed a systematical increased in yield (grain or total), STR, SETA, and WUE-DRYMAT whilst, the total volumetric soil water content SUMWGT was decreased, in other words, the highest ∆13C genotypes used more water as transpiration and evapo-transpiration and therefore produced higher yield compared with the lowest ∆13C values genotypes and this results were the same with [27]. (Table 5, genotypes listed ranked from the lowest to the highest ∆13C values). The physiological behaviour was different between genotypes and this result was the same with [28] which found a genetic variation in TE and that TE is strongly influenced by environment. Also, [29] was notice that the stable carbon isotope fractionation in shoot tissue was a good cumulative stress indicator of the crop as the
Res. J. of Aleppo Univ. Agricultural Science Series No. 73 2009
17
discrimination value (∆) degreased with increased salinity and reduced shoot biomass. The differences in carbon isotope discrimination values were probably caused by stomatal limitation rather than by nutrient-related changes in photosynthetic efficiency [30]. Interesting enough, was the low values of coefficient of variation between the different genotypes for the 26 years data, this indeed very important for yield stability across different years and as a results, sustainable life for the farmers. In general, the highest ∆13C value genotype transpired more soil water and had higher water use efficiency, therefore, produced higher yield (grain or total biomass) compared with the lowest ∆13C values genotype.
References 1. CONDON A.G.; RICHARDS R.A., REBETZKE G.J.,
FARQUHAR G.D., 2004- Breeding for high water-use efficiency. J. Exp. Bot., 5, 2447-2460.
2. LE HOUE´ROU H.N., 1981- Long-term dynamics in arid land vegetation and ecosystems of North Africa. In ‘Arid land ecosystems: structure, functioning and management’. (Eds DW Goodall, RA Perry) pp.357–384. (Cambridge University Press: Cambridge, UK)
3. ARAUS J.L., 2004- The problems of sustainable water use in the Mediterranean and research requirements for agriculture. Annals of Applied Biology, 144, 259–272.
4. LAL R., 2002- Carbon sequestration in dryland ecosystems of West Asia and North Africa. Land Degradation and Development 13, 45–59.
5. VARELA-ORTEGA C.; SAGARDOY J.A., 2002- Analysis of irrigation water policies in Syria: current developments and future options. In ‘International Conference on Irrigation Water Policies: Micro and Macro Considerations’. Agadir, Morocco, 15–17 June 2002. (The World Bank: Washington, DC)
6. MEINKE H.; STONE R.C., 2005- Seasonal and inter-annual climate forecasting: the new tool for increasing preparedness to climate variability and change in agricultural planning and operation. Climatic Change, 70, 221–253.
7. JALAB A., 1999– Climatical changes during a climatical cycle in El-Messelmiyah (Aleppo governorate) 1957-1991. Tishreen Univ. J. for studies and scientific res. Agri. Sci. series. 21(9), 101-108.
8. ARAUS J.L.; BUXO R., 1993- Changes in carbon isotope discrimination in grain cereals from the north-western Mediterranean basin during the past seven millennia. Aust. J. Plant

Dr. Wahbi et al..
18
Physiol. 20, 117-128. 9. KARL T.R.; NICHOLAS R., GREGORI J., 1997– The coming
climate. Aloloom Journal. Kuwait. 13(11), 46-52. 10. NAHAL I., 1996- Historique de changements climatiques et de la
couverture forestière naturelle. R. J. of Aleppo Univ. Agricultural Sciences Series, 26, 57-74.
11. BALDY C., 1986- Comportement des blés dans les climats méditerranéens. Ecol. Medit. XII. 3-4, 73-88.
12. LOSS S.P.; SIDDIQUE K.H.M., 1994- Morphological and physiological traits associated with wheat yield increases in Mediterranean environments. Adv. Agron., 52, 229-276.
13. FAO., 2004. http//www.faostat.fao.org. 14. AQUASTAT., 2004. http//www.Aquastat.fao.org. 15. SLAFER G.A.; SATORRE E.H., ANDRADE F.H., 1994-
Increases in grain yield in bread wheat from breeding and associated physiological changes. In: Slafer, G. A., ed. Genetic improvement of field crops. New York: Marcel Dekker Inc., 1-68.
16. SLAFER G.A.; GALDERINI D.F., MIRALLS D.J., 1996- Yield components and compensation in wheat: opportunities for further increasing yield potential. In: Reynolds et. al., ed. Increasing Yield Potential in Wheat: breaking the barriers. Mexico D. F. CIMMYT, 101-134.
17. STASTNA M., 2006- Use of crop models in assessment of soil drought. Agric. Conspec. Sci., 72(1), 95-101.
18. MONNEVEUX P.; SHEOHSHAYEE S.M., AKHTER J., RIBAUST J.M., 2007-Using carbon isotope discrimination to select maize (Zea mais L.) inhered lines and hybrids for drought tolerance. Plant science, 173(4), 390-396.
19. FARQUHAR G.D.; EHLERRINGER J.R., HUBICKK. T., 1989– Carbon isotope discrimination and photosynthesis. Annu. Rev. Plant Physiol. Plant Mol. Biol., 40, 503-537.
20. HUANG J.; CUI K., ZHANG X., NIE L., WANG Q., CUI X., PAN J., WEI D., SHAH F., PENG S., 2008- Development and application of techniques in breeding for greater grain yield of rice under favorable conditions in southern China. Research report with the project CPR13098 In: Fourth and final research Co-ordination meeting of the research Co-ordinated project on "selection for greater agronomic water-use efficiency in wheat and rice using carbon isotope discrimination", 3-7 Nov. 2008. Vienna. Austria.
21. TSIATAS J.T.; TORTALIDIS L.S., TSIKRIRONI C.T., LITHOYORGIDIS A.S., 2008- Leaf carbon isotope discrimination, ash content and K relationships with seed cotton
Res. J. of Aleppo Univ. Agricultural Science Series No. 73 2009
19
yield and lint quality in lines of Gossypium hirsutum L., Field Crops Research, 107(1), 70-77.
22. ICARDA., 2006- Germplasm Enhancement. Annual Report. ICARDA, Aleppo, Syria.
23. RYAN J.; MASRI S., GARABET S., DIECKMANN J., HABIB. H., 1997- Soils of ICARDA’s agricultural experimental station and sites: climate classification, physical and chemical properties and land use. The International Centre for Agricultural Research in the Dry Areas, Aleppo, Syria (Technical Bulletin).
24. STENITZER E.; DIESTEL H., ZENKER T.H., SCHWATENGRABER R., 2007- Assessment of capillary rise from shallow groundwater by the simulation model SIMWASER using either estimated pedotransfer functions or measured hydraulic parameters. Water Resour. Manage., 21, 1567-1584.
25. WAHBI A.; STENITZER E., 2007- Two new simulation models for plant breeders and agronomists- theory and applications. Presented orally at the Eighth International Conference on Development of Drylands. Human and nature-working together for sustainable development in dry lands. 25-28 Feb. Beijing, China.
26. STASTNA M.; STENITZER E., 2005- SIMWASER model as a tool for the assessment of soil water balance. Plant Soil Environ, 51(8), 343-350.
27. IQBALA M.M.; AKHTER J., MOHSMMADB W., SHAHB S.M., NAWAZB H., MAHMOODA K., 2005- Effect of tillage and fertilizer levels on wheat yield, nitrogen uptake and their correlation with carbon isotope discrimination under rainfed conditions in north-west Pakistan. Soil and Tillage Research, 80(1-2), 47-57.
28. XIN Z.; AIKEN R., BURKE J., 2009- Genetic diversity of transpiration efficiency in sorghum. Field Crops Research, 111(1-2), 74-80.
29. FRANCISCO J.; DIAZ A., GRATTAN S.R., 2009- Performance of tall wheatgrass (Thinopyrum ponticum, cv. 'Jose') irrigated with saline-high boron drainage water: Implications on ruminant mineral nutrition. Agriculture, Ecosystems & Environment, Article in press.
30. MA J.Y.; CHEN K., XIA D.S., WANG G., CHEN F.H., 2007- Variation in foliare stable carbon isotope among population of desert plant, Reaumuria soongorica (Pall) Maxim. Different Environments Journal of Arid Environments, 69(3), 365-374.