Role of Transpiration Reduction during Center-Pivot Sprinkler Irrigation in Application Efficiency
12
Role of Transpiration Reduction during Center-Pivot Sprinkler Irrigation in Application Efficiency Yenny Urrego-Pereira 1 ; José Cavero 2 ; Eva T. Medina 3 ; and Antonio Martínez-Cob 4 Abstract: The magnitude and duration of corn transpiration reduction during center-pivot sprinkler irrigation was analyzed on a commercial plot. The irrigation event was defined as the period during which the pivot arm was passing over the transect AC and water droplets were moistening the plants (moist treatment). Corn transpiration rates were measured at three spots of that transect and simultaneously at another spot (dry treatment) located approximately 270 m east from the transect AC. Corn transpiration rates for the moist treatment location were reduced by 30–36% compared to the dry treatment location during the irrigation event. After irrigation, the transpiration reduction lasted for 1.8–2.6 h, and ranged from 22–29%. The gross wind drift and evaporation losses ranged from 10–13% of the applied water, whereas the net interception losses were 2% of the applied water. Considering the observed corn transpiration reduction during and after the irrigation, the net sprinkler evaporation losses ranged from 11–13% of the applied water, with no relevant differences along the pivot arm. DOI: 10.1061/ (ASCE)IR.1943-4774.0000532. © 2013 American Society of Civil Engineers. CE Database subject headings: Evapotranspiration; Sprinkler irrigation; Water loss; Crops. Author keywords: Transpiration reduction; Center pivot; Sprinkler irrigation; Water losses; Application efficiency. Introduction The search for efficiency in irrigation is one of the most important issues in irrigated agriculture because of water scarcity and the in- crease in food demand. For field crops such as alfalfa (Medicago sativa L.), corn (Zea mays L.), and winter cereals, sprinkler irriga- tion systems are adequate because they allow accurate scheduling of irrigation and can attain high potential efficiency with an ad- equate cost. Two types of sprinklers irrigation systems can be in- stalled in the field, static and movable. Within the movable systems, the linear move laterals and the center pivots are the most important (Tarjuelo et al. 1999). The use of center-pivot systems has increased by more than 50% from 1986–1996 in the United States (Evans 2001). This growth continues in many irrigated areas around the world because of the low investment costs per irrigated hectare, low energy and labor requirements, possibility of applying agrochemicals, high degree of automation, and their adaptability to different field topographies and soil textures (Allen et al. 2000). Many factors affect the uniformity and irrigation efficiency of sprinkler systems, which may decrease the net water application efficiency and therefore the crop yield. Some factors are technical, such as the design (spacing and height of sprinklers, nozzle num- ber, and size) and management of irrigation facilities (working pressure) (Tarjuelo 1999). Environmental conditions such as high wind speed increase the wind drift and evaporation water losses (WDEL), which are the fraction of water droplets emitted by the sprinkler nozzles that do not reach the soil or crop being irri- gated. There are also interception water losses (IL), which is the fraction of the water emitted by the sprinklers that is intercepted by crop leaves and stems and it is evaporated before reaching the soil. WDEL and IL can be added together to obtain the sprinkler evaporation losses (SEL) (Martínez-Cob et al. 2008). For solid-set sprinkler irrigation systems, several authors have reported that WDEL range between 0 and 20% of the water applied, with greater losses during daytime irrigation (Yazar 1984; Kincaid et al. 1996; Dechmi et al. 2003; Playán et al. 2005; Martínez-Cob et al. 2008). During some particularly windy irrigation events, WDEL as high as 30–50% have been reported (Playán et al. 2005). For center-pivot systems, Steiner et al. (1983a) reported WDEL of 15% of the water applied, whereas Ortiz et al. (2009) reported WDEL values of 3–8% during nighttime irrigations and 8–14% during daytime irrigations for center-pivot systems using rotating or fixed spray plate sprinklers. However, IL depends primarily on the water storage capacity of a crop canopy, which is a function of crop architecture. Gross IL includes the stored water in the crop canopy during sprinkler irrigation. Thus, Norman and Campbell (1983) and Steiner et al. (1983a) reported storage capac- ity values (gross IL) for corn ranging between 0.4 and 2.7 mm. Martínez-Cob et al. (2008) reported net IL of 0.3 mm for corn. Net IL was computed as the gross IL minus the transpiration re- duction after the irrigation event. During sprinkler irrigation the vapor pressure deficit (VPD) and temperature of the air within the crop canopy decrease be- cause of water evaporating from soil and leaf surfaces (Robinson 1970; Steiner et al. 1983b; Tolk et al. 1995; Cavero et al. 2009). 1 Ph.D. Student, Dept. of Soil and Water, Estación Experimental Aula Dei, Consejo Superior de Investigaciones Científicas, Avda. Montañana 1005, 50059 Zaragoza, Spain (corresponding author). E-mail: yurrego@ eead.csic.es 2 Researcher, Dept. of Soil and Water, Estación Experimental Aula Dei, Consejo Superior de Investigaciones Científicas, Avda. Montañana 1005, 50059 Zaragoza, Spain. E-mail: [email protected] 3 Student, Unidad de Suelos y Riegos (Unidad Asociada EEAD-CSIC), Centro de Investigación y Tecnología Agroalimentaria (CITA-DGA), Avda. Montañana 930, 50059 Zaragoza, Spain. E-mail: [email protected] 4 Researcher, Dept. of Soil and Water, Estación Experimental Aula Dei, Consejo Superior de Investigaciones Científicas, Avda. Montañana 1005, 50059 Zaragoza, Spain. E-mail: [email protected] Note. This manuscript was submitted on October 19, 2011; approved on August 8, 2012; published online on February 15, 2013. Discussion period open until August 1, 2013; separate discussions must be submitted for individual papers. This paper is part of the Journal of Irrigation and Drai- nage Engineering, Vol. 139, No. 3, March 1, 2013. © ASCE, ISSN 0733- 9437/2013/3-221-232/$25.00. JOURNAL OF IRRIGATION AND DRAINAGE ENGINEERING © ASCE / MARCH 2013 / 221 J. Irrig. Drain Eng. 2013.139:221-232. Downloaded from ascelibrary.org by Enrique Playan on 02/27/13. Copyright ASCE. For personal use only; all rights reserved.
-
Upload
independent -
Category
Documents
-
view
1 -
download
0
Transcript of Role of Transpiration Reduction during Center-Pivot Sprinkler Irrigation in Application Efficiency

Role of Transpiration Reduction during Center-PivotSprinkler Irrigation in Application Efficiency
Yenny Urrego-Pereira1; José Cavero2; Eva T. Medina3; and Antonio Martínez-Cob4
Abstract: The magnitude and duration of corn transpiration reduction during center-pivot sprinkler irrigation was analyzed on a commercialplot. The irrigation event was defined as the period during which the pivot arm was passing over the transect AC and water droplets weremoistening the plants (moist treatment). Corn transpiration rates were measured at three spots of that transect and simultaneously at anotherspot (dry treatment) located approximately 270 m east from the transect AC. Corn transpiration rates for the moist treatment location werereduced by 30–36% compared to the dry treatment location during the irrigation event. After irrigation, the transpiration reduction lasted for1.8–2.6 h, and ranged from 22–29%. The gross wind drift and evaporation losses ranged from 10–13% of the applied water, whereas the netinterception losses were 2% of the applied water. Considering the observed corn transpiration reduction during and after the irrigation, the netsprinkler evaporation losses ranged from 11–13% of the applied water, with no relevant differences along the pivot arm. DOI: 10.1061/(ASCE)IR.1943-4774.0000532. © 2013 American Society of Civil Engineers.
CE Database subject headings: Evapotranspiration; Sprinkler irrigation; Water loss; Crops.
Author keywords: Transpiration reduction; Center pivot; Sprinkler irrigation; Water losses; Application efficiency.
Introduction
The search for efficiency in irrigation is one of the most importantissues in irrigated agriculture because of water scarcity and the in-crease in food demand. For field crops such as alfalfa (Medicagosativa L.), corn (Zea mays L.), and winter cereals, sprinkler irriga-tion systems are adequate because they allow accurate schedulingof irrigation and can attain high potential efficiency with an ad-equate cost. Two types of sprinklers irrigation systems can be in-stalled in the field, static and movable. Within the movable systems,the linear move laterals and the center pivots are the most important(Tarjuelo et al. 1999).
The use of center-pivot systems has increased by more than 50%from 1986–1996 in the United States (Evans 2001). This growthcontinues in many irrigated areas around the world because ofthe low investment costs per irrigated hectare, low energy and laborrequirements, possibility of applying agrochemicals, high degree ofautomation, and their adaptability to different field topographiesand soil textures (Allen et al. 2000).
Many factors affect the uniformity and irrigation efficiency ofsprinkler systems, which may decrease the net water applicationefficiency and therefore the crop yield. Some factors are technical,such as the design (spacing and height of sprinklers, nozzle num-ber, and size) and management of irrigation facilities (workingpressure) (Tarjuelo 1999). Environmental conditions such as highwind speed increase the wind drift and evaporation water losses(WDEL), which are the fraction of water droplets emitted bythe sprinkler nozzles that do not reach the soil or crop being irri-gated. There are also interception water losses (IL), which is thefraction of the water emitted by the sprinklers that is interceptedby crop leaves and stems and it is evaporated before reachingthe soil. WDEL and IL can be added together to obtain the sprinklerevaporation losses (SEL) (Martínez-Cob et al. 2008).
For solid-set sprinkler irrigation systems, several authors havereported that WDEL range between 0 and 20% of the water applied,with greater losses during daytime irrigation (Yazar 1984; Kincaidet al. 1996; Dechmi et al. 2003; Playán et al. 2005; Martínez-Cobet al. 2008). During some particularly windy irrigation events,WDEL as high as 30–50% have been reported (Playán et al.2005). For center-pivot systems, Steiner et al. (1983a) reportedWDEL of 15% of the water applied, whereas Ortiz et al. (2009)reported WDEL values of 3–8% during nighttime irrigations and8–14% during daytime irrigations for center-pivot systems usingrotating or fixed spray plate sprinklers. However, IL dependsprimarily on the water storage capacity of a crop canopy, whichis a function of crop architecture. Gross IL includes the stored waterin the crop canopy during sprinkler irrigation. Thus, Norman andCampbell (1983) and Steiner et al. (1983a) reported storage capac-ity values (gross IL) for corn ranging between 0.4 and 2.7 mm.Martínez-Cob et al. (2008) reported net IL of 0.3 mm for corn.Net IL was computed as the gross IL minus the transpiration re-duction after the irrigation event.
During sprinkler irrigation the vapor pressure deficit (VPD)and temperature of the air within the crop canopy decrease be-cause of water evaporating from soil and leaf surfaces (Robinson1970; Steiner et al. 1983b; Tolk et al. 1995; Cavero et al. 2009).
1Ph.D. Student, Dept. of Soil and Water, Estación Experimental AulaDei, Consejo Superior de Investigaciones Científicas, Avda. Montañana1005, 50059 Zaragoza, Spain (corresponding author). E-mail: [email protected]
2Researcher, Dept. of Soil and Water, Estación Experimental Aula Dei,Consejo Superior de Investigaciones Científicas, Avda. Montañana 1005,50059 Zaragoza, Spain. E-mail: [email protected]
3Student, Unidad de Suelos y Riegos (Unidad Asociada EEAD-CSIC),Centro de Investigación y Tecnología Agroalimentaria (CITA-DGA), Avda.Montañana 930, 50059 Zaragoza, Spain. E-mail: [email protected]
4Researcher, Dept. of Soil and Water, Estación Experimental Aula Dei,Consejo Superior de Investigaciones Científicas, Avda. Montañana 1005,50059 Zaragoza, Spain. E-mail: [email protected]
Note. This manuscript was submitted on October 19, 2011; approved onAugust 8, 2012; published online on February 15, 2013. Discussion periodopen until August 1, 2013; separate discussions must be submitted forindividual papers. This paper is part of the Journal of Irrigation and Drai-nage Engineering, Vol. 139, No. 3, March 1, 2013. © ASCE, ISSN 0733-9437/2013/3-221-232/$25.00.
JOURNAL OF IRRIGATION AND DRAINAGE ENGINEERING © ASCE / MARCH 2013 / 221
J. Irrig. Drain Eng. 2013.139:221-232.
Dow
nloa
ded
from
asc
elib
rary
.org
by
Enr
ique
Pla
yan
on 0
2/27
/13.
Cop
yrig
ht A
SCE
. For
per
sona
l use
onl
y; a
ll ri
ghts
res
erve
d.

This decrease of VPD during the irrigation reduces crop transpira-tion and evapotranspiration (ET), leading to the conservation of soilwater that would otherwise be depleted by the crop (McNaughton1981; Steiner et al. 1983a). McNaughton (1981) argued that anyreduction in crop ET and transpiration from a wetted area as com-pared with a dry area (i.e., an area not being irrigated at the sametime but kept in the same conditions, including water availability)can be subtracted from the gross irrigation water losses, resultingin the net irrigation water losses. In other words, the part of SELreplacing crop ET should be regarded as beneficial. This leads tothe introduction of gross (SELg, i.e., the sum of gross WDEL andIL) and net sprinkler evaporation losses (SELn, i.e., the sum of netWDEL and IL). Consideration of net evaporation losses instead ofgross evaporation losses would result in an increase of applicationefficiency for a given application depth. This should be taken intoaccount when calculating crop irrigation requirements.
Several studies have analyzed the differences in ET rates be-tween wet and dry surfaces immediately after irrigation events,but very few have analyzed them during the events themselves.For solid-set sprinkler irrigation, Frost and Schwalen (1960) re-ported an almost complete suppression of ET, whereas Sternberg(1967) and Martínez-Cob et al. (2008) reported an average reduc-tion of 33% for rye-grass and corn, respectively. Thompson et al.(1993) used modelling to forecast an evapotranspiration decreaseof 40% for corn during solid-set irrigation events. For linear movesprinkler irrigation systems, a reduction of ET has also beenobserved (Wiersma 1970; Kohl and Wright 1974). Tolk et al.(1995) reported a corn transpiration reduction of 32%, somewhatsmaller than the 58% reported by Martínez-Cob et al. (2008) forsolid-set sprinkler irrigation. Thompson et al. (1997) modelledand measured transpiration and ET rates during irrigation eventsusing linear move sprinkler irrigation systems, and showed a tran-spiration decrease during the irrigation events of approximately80%. To the authors’ knowledge, no previous research has reportedfield measurements of the changes in ET and plant transpirationduring irrigation at the different pivot arm portions of a center-pivotsystem.
The purpose of this research is to analyze the reduction ofplant transpiration during sprinkler irrigation events of corn (Zeamays L.) with a center pivot and how much it would contributeto an increase in the irrigation application efficiency. The magni-tude and duration of the reduction of transpiration along differentsegments of a transect of the center-pivot system were assessed.
Materials and Methods
The experiment was performed from July–September 2008 at acommercial corn field located in Valfarta (Huesca, northeastSpain). Geographical coordinates are 41°33′N latitude and 0°07′Wlongitude. The elevation is 354 m above sea level. The long-termyearly averages of total precipitation and mean air temperature inthe area are 400 mm and 14.3°C, respectively. The field wasplanted with the cultivar Pioneer PR34N44 on April 15, 2008,the plant density at harvest was 68;000 plants ha−1, and the rowspacing was 0.75 m. All of the agronomical practices (irrigation,fertilization and herbicide applications, and so on) were performedaccording to the farmer’s technical criteria. The soil is classified asTypic Torrifluvents and the texture is silty loam.
The field occupied an area of 32.3 ha and was irrigated with acenter pivot with impact sprinklers located in the top of the mainpivot pipe. The total length of the pivot lateral was 322 m, and itwas divided into six spans (49.4 m length each) and a final over-hang of 25.6 m length (Table 1). The diameter of the primary pipe
was 0.163 m. All of the sprinklers had a pressure regulator (ModelPSR30, Senninger Irrigation Inc., Clement, FL). Table 1 lists thenumber of sprinklers and nozzles, the corresponding nozzle diam-eters, and the spacing between the sprinklers.
The measurements were performed in three spots of the transectAC running from north-northeast to the central axis of the pivot,corresponding to pivot arm portions 2, 4, and 5 (Fig. 1). An addi-tional spot D, located approximately 270 m east from the transectAC, was also monitored. This spot D was irrigated approximately8 h before the pivot arm moved over the transect AC. The centerpivot was almost continuously irrigating the field and approxi-mately 31 h were required to complete a turn. In this research, amonitored irrigation event was the period that took the pivot to runover a distance of 18 m, 9 m either side of the transect AC. Thisvalue of 9 m was established by visual inspection of the moisteningradius of the pivot sprinklers at the catch can height previously tothe measurement period. Seven irrigation events were monitoredin this research. Two treatments were established during eachmonitored irrigation event, as follows: (1) moist treatment, mea-surements taken in the transect AC, and (2) dry treatment, measure-ments taken at the same time in the spot D.
Table 1. General Characteristics of the Center-Pivot System
Pivotarmportion
Number of sprinklersNozzle
diameters(mm)
Distancea
(m)
Spacingbetweensprinklers
(m)Onenozzle
Twonozzles Total
1 5 5 2.8–4.8 48.3 9.32 7 7 4.8–5.4 97.8 7.03 2 6 8 4.2–5.8 147.2 6.24 8 8 4.8–6.0 196.6 6.25 12 4 16 4.2–6.0 246.1 3.16 16 16 4.4–5.6 295.5 3.1Wing 8 8 4.6–5.4 321.1 2.9aDistance of the corresponding tower to the central axis of the pivot.
Fig. 1. Layout of the experimental plot: A–C = sap flow and meteor-ological stations along the transect AC (moist treatment); D = sap flowand meteorological station at the dry treatment; Mp = pivot arm; Pr =irrigation pressure transducers; R1–6 = radius from each pivot towerto the center pivot; M = movement of the center pivot in a counter-clockwise direction [Sistema de Información Geográfica de ParcelasAgrícolas (SIGPAC) 2011]
222 / JOURNAL OF IRRIGATION AND DRAINAGE ENGINEERING © ASCE / MARCH 2013
J. Irrig. Drain Eng. 2013.139:221-232.
Dow
nloa
ded
from
asc
elib
rary
.org
by
Enr
ique
Pla
yan
on 0
2/27
/13.
Cop
yrig
ht A
SCE
. For
per
sona
l use
onl
y; a
ll ri
ghts
res
erve
d.

The sprinkler irrigation pressure was continuously measured us-ing pressure transducers (model 2200/2600, Gems Basingstoke,Hampshire, UK) placed in the last sprinkler of pivot arm portions2, 4, and 5 (Fig. 1). The pressure transducers were placed betweenthe pressure regulator and the sprinkler, and were connected to log-gers (model Dickson ES120), which stored instantaneous pressurevalues every 5 min. The average of these values (Pi, kiloPascals)during each monitored irrigation event was used to compute theirrigation water depth applied (Is, millimeters) for a given pivotarm portion during the monitored irrigation events assuming thatall sprinklers of that pivot arm portion had a pressure equal toPi. For this computation, the following expression based on theTorricelli’s Theorem and the Orifice equation (Norman et al.1990) was used:
Is ¼0.00035 πcdP0.5
i S2bTp
Asð1Þ
where cd = discharge coefficient, 0.98 (Playán et al. 2005); Tp =time (seconds) to complete a turn; As = surface area (square meters)irrigated by the sprinklers of the tower; and the corresponding sur-face area for pivot arm portions 2, 4, and 5 were 23,177, 53,887,and 69; 242 m2, respectively. For sprinklers with two nozzles,S2b ¼ d2l þ d2s , where dl is the large nozzle diameter (millimeters);and ds is the small nozzle diameter (millimeters); for sprinklerswith one nozzle, S2b ¼ d2n, where dn is the nozzle diameter(millimeters).
Tp (seconds) was determined for each pivot arm portion, asfollows:
Tp ¼ 36002π · rω
ð2Þ
where r = radius of the pivot at the end of the evaluated pivot armportion (meters); and ω = angular speed of the pivot (metersper hour) computed from the time required for the pivot to runalong the distance of 18 m (this time was determined by visualinspection).
A line of 50 plastic catch cans (AITIIP, Zaragoza, Spain) wasplaced along the transect AC at a spacing of 3 m to collect the ir-rigation water depth that was used to determine the gross wind driftand evaporation losses (WDELg) for pivot arm portions 2, 4, and 5.The catch cans were conical in its lower part (200 mm length) andcylindrical in its upper part (100 mm length); the diameter of theupper part was 160 mm. The catch cans were marked in millimetersfor direct readout up to 45 mm. The catch cans were placed justabove the crop canopy, and they were moved up as the crop grewalong the season. The maximum catch can height was about 2.5 m.Just after the pivot has moved beyond the transect AC, the waterdepth at each can was read. The water collected in the catch canswas measured immediately after the irrigation event finished ineach pivot arm portion. The values of the cans corresponding toeach pivot arm portion were averaged to obtain the mean collectedwater depth Icc (mm). Next, WDELg, expressed inmillimeters, wasdetermined from the following:
WDELg ¼ Is − Icc ð3Þ
and WDELg, expressed as a percentage, was determined from thefollowing:
WDELg ¼Is − Icc
Is100 ð4Þ
Three meteorological stations were installed at the transect AC(stations A, B, and C, respectively) and a fourth meteorological
station (station D) was installed at spot D (Fig. 1) to measurethe microclimatic changes attributable to sprinkler irrigation. Eachmeteorological station was equipped with a datalogger (modelCR10X, Campbell Scientific, Logan, UT) that monitored a probefor air temperature and relative humidity (model HMP45C, Vaisala,Helsinki, Finland). The HMP45C probe was installed at 2.9 mabove ground and its accuracy was �0.3°C for air temperatureand �2% for relative humidity. The air temperature and relativehumidity were measured each 10 s and the 5-min averages of thesetwo variables were continuously recorded. The 5-min values ofvapor pressure deficit (VPD) were calculated from the recordedvalues of air temperature and relative humidity following Allenet al. (1998). The meteorological station installed at the spot D alsohad a cup anemometer (Vector Instruments, model A100R) and anet radiometer (Kipp and Zonen, model NR-Lite) located approx-imately 3.0 m above ground. Data collected by both sensors werealso monitored each 10 s and the corresponding 5-min averages ofwind speed and net radiation were recorded by the dataloggerthrough the season. Table 2 presents relevant meteorological con-ditions that were reported by a nearby station, owned by theSpanish Irrigation Advisory System.
During each monitored irrigation event, corn plant transpirationrates were measured every 10 min from 2 h before to 6 h after thepivot moved over the transect AC (Fig. 1) taking into account thedifferent duration of the irrigation events at the measurement spotsA to C. In other words, the total measurement period during eachirrigation event was different at each spot. The transpiration rateswere determined from sap flow measurements using the heatbalance method (Baker and van Bavel 1987; Weibel and Boersma1995; Van Bavel 2005). This method was chosen because it hadbeen previously used on corn in similar studies to this (Tolk et al.1995; Martínez-Cob et al. 2008). At each spot, a Flow4 datalogger(Dynamax, Houston, TX) was installed to monitor, log, and processdata collected by four sap gauges SGB19 (Dynamax), each of theminstalled in a plant. These gauges are appropriate for stems of18–23 mm in diameter. The sap gauges were moved to a secondset of four plants within the same area of the field on July 25 andAugust 14, 2008, to avoid any possible damage to the plants (VanBavel 2005). Each gauge had a soft foam collar surrounding theelectronics. In addition, once installed in the plant, a weather shieldsurrounded each gauge (aluminium bubble foil) such that eachgauge held a cylindrical shape. The aluminium top shield wassecured using insulation tape. The shield kept out water and pre-vented radiation from affecting the readings (Van Bavel 2005).Following this author, the datalogger was set to apply a continuousaverage voltage of 4.0 V, and the heater resistance of the different
Table 2. Average Meteorological Conditions Recorded during theMonitored Irrigation Events at the Nearby Weather Station of Valfarta
Date
Airtemperature
(°C)
Air vaporpressuredeficit(kPa)
Windspeed(m s−1)
Solarradiation(Wm−2)
July 24 28.0 1.9 2.0 742July 31 32.5 3.6 1.5 880August 6 29.9 2.6 1.8 772August 13 22.8 1.7 3.5 723August 21 27.4 1.7 2.0 780August 28 26.6 1.6 0.9 768September 10 27.3 1.8 1.6 651
Note: The weather station belongs to the Spanish Irrigation AdvisorySystem (http://www.marm.es/es/agua/temas/observatorio-del-regadio-espanol/sistema-de-informacion-agroclimatica-para-el-regadio/).
JOURNAL OF IRRIGATION AND DRAINAGE ENGINEERING © ASCE / MARCH 2013 / 223
J. Irrig. Drain Eng. 2013.139:221-232.
Dow
nloa
ded
from
asc
elib
rary
.org
by
Enr
ique
Pla
yan
on 0
2/27
/13.
Cop
yrig
ht A
SCE
. For
per
sona
l use
onl
y; a
ll ri
ghts
res
erve
d.

gauges varied between 58.9 and 64.6 W. Van Bavel (2005) thor-oughly describes the elements of the gauges, electronics, recordedvalues, and equations used to process them to obtain transpirationrates at each gauge. The transpiration rates at each spot before, dur-ing, and after the pivot moved over the transect AC were deter-mined as the average of those obtained from the four sampledplants per spot. These average transpiration rates were determinedin grams per hour and transformed into millimeters per hourusing the average number of total plant area measured at each spot(6.8 plants m−2).
During each monitored irrigation event, the differences in corntranspiration rates between the moist and dry treatments were com-puted for pivot arm portions 2, 4, and 5. These differences allowedestablishing different periods before, during, and after each irriga-tion event for each pivot arm portion, as follows: (1) B1, before theirrigation event, when the difference between the individual 10-minvalues of both treatments was below the resolution of the sapgauges, 0.1 mmh−1; (2) B2, before the irrigation event, whenthe difference between the individual 10-min values of both treat-ments was greater than 0.1 mmh−1; (3) Du, during the irrigationevent; (4) A1, after the irrigation event, when the difference be-tween the individual 10-min values of both treatments was greaterthan 0.2 mmh−1; (5) A2, after the irrigation event, when the differ-ence between the individual 10-min values of both treatments wasbetween 0.1 and 0.2 mmh−1; and (6) A3, after the irrigation event,when the difference between the individual 10-min values of bothtreatments was less than 0.1 mmh−1. In some cases, the differencesbetween the individual 10-min values of both treatments did notmeet the criteria to establish the phases B2 and A1 for a particularpivot arm and irrigation event. The computed values of air VPDwere also grouped for analysis in accordance with the previouslynoted phases for analysis of corn transpiration. For each phase andpivot arm portion, the corn transpiration rate and air VPD of themoist and dry treatments were compared using a paired t testand a level of significance of P ¼ 0.05.
In accordance with Martínez-Cob et al. (2008), the net sprinklerevaporation losses (SELn) for the center-pivot system of this studywere estimated from the following:
SELn ¼ WDELn þ ILn ð5Þ
where WDELn and ILn are the net wind drift and evaporationlosses and the net interception losses, respectively. The WDELnof the center pivot of this study was estimated as the differencebetween WDELg and the reduction of evapotranspiration attribut-able to the irrigation, i.e., that occurring before (period B2) andduring (phase Du) the sprinkler irrigation events (McNaughton1981; Martínez-Cob et al. 2008), as follows:
WDELn ¼ WDELg − ðETredÞdi ð6Þ
where ðETredÞdi ¼ ðETDT − ETMTÞdi is the reduction of evapo-transpiration attributable to irrigation (di); and ETDT and ETMTare the evapotranspiration rates in the dry and moist treatments,respectively, during the irrigation events.
In this research, transpiration rates were measured instead ofevapotranspiration rates. Martínez-Cob et al. (2008) showed thatthe average reductions of evapotranspiration (measured with aweighing lysimeter) and transpiration (measured with sap flowgauges) during solid-set sprinkler irrigation of corn were 32 and58%, respectively. Because the crop and climatic conditions of thiswork were similar to those of Martínez-Cob et al. (2008), it wasassumed, as a first rough approximation, that the ratio of transpi-ration to evapotranspiration reduction (0.559) reported by those
authors could be used to estimate the reduction of evapotranspira-tion attributable to irrigation (phases B2 and Du) in this research.Further studies should be performed to determine a ratio of tran-spiration to evapotranspiration reduction that is more appropriatefor center pivots. Thus, the authors used the following equation:
ðETredÞdi ¼ 0.559ðTredÞdi ð7Þwhere ðTredÞdi ¼ ðTDT − TMTÞb2 þ ðTDT − TMTÞdu being ðTDT−TMTÞb2 the reduction of transpiration before irrigation (phase B2)and ðTDT − TMTÞdu the reduction of transpiration during (phaseDu) the center pivot irrigation events; and TDT and TMT are thetranspiration rates in the dry and moist treatments, respectively,before and during the irrigation events.
The ILn of the center-pivot system of this study were estimatedfrom the following:
ILn ¼ ðETMTÞai − ðETDTÞai ð8Þwhere ½ðETMTÞai − ðETDTÞai� is the increase of evapotranspirationin the moist treatment after (ai) the sprinkler irrigation events; andðETMTÞai and ðETDTÞai are the evapotranspiration rates in the dryand moist treatments, respectively, after the irrigation events. Thisincrease of evapotranspiration after the irrigation is the net balancebetween the increase of evaporation of intercepted water (gross in-terception losses, ILg) and the reduction of transpiration thatoccurred some time after the irrigation (McNaughton 1981; Tolket al. 1995; Martínez-Cob et al. 2008). Martínez-Cob et al.(2008) reported that ðETMTÞai is approximately 35% greater thanðETDTÞai. Because ILg depends primarily on the water storagecapacity of a crop (Norman and Campbell 1983; Steiner et al.1983a) and the climatic and cropping conditions in this researchwere similar to those of Martínez-Cob et al. (2008), it was assumedthat ðETMTÞai is approximately 35% greater than the estimatedðETDTÞai obtained from the data recorded in the meteorologicalstation at the spot D in the Appendix. Further research should de-termine more appropriate values of these evapotranspiration ratesfor central pivots. Thus, ILn was estimated from the following:
ILn ¼ 1.35ðETDTÞai − ðETDTÞai ð9ÞHalf-hour values of several meteorological variables (wind
speed and direction, solar radiation, air temperature, and relativehumidity) were collected to characterize the general standardmeteorological conditions occurring during the monitored irriga-tion events. These values were recorded at a standard weatherstation located over grass in accordance with the guidelines ofAllen et al. (1998) (termed grass station in this paper), approxi-mately 3 km southeast from the experimental plot. This stationbelongs to a network named SIAR, installed and managed bythe Spanish Ministry of Natural, Rural, and Marine Environment(MARM 2011).
Results and Discussion
There were some differences between the meteorological condi-tions recorded at the grass station during the irrigation events atthe different dates (Table 2). The overall mean temperature duringthe irrigation events (phase Du) was 27.8°C, but the average tem-peratures ranged between 22.8 (August 13) and 32.5°C (July 31).The cooler irrigation event (August 13) was also the windiest, andthe hottest irrigation event (July 31) exhibited the highest vaporpressure deficit of the air (3.6 kPa). The WDELg values are highlyaffected by the meteorological conditions, particularly wind speedand vapor pressure deficit (Playán et al. 2005, and references
224 / JOURNAL OF IRRIGATION AND DRAINAGE ENGINEERING © ASCE / MARCH 2013
J. Irrig. Drain Eng. 2013.139:221-232.
Dow
nloa
ded
from
asc
elib
rary
.org
by
Enr
ique
Pla
yan
on 0
2/27
/13.
Cop
yrig
ht A
SCE
. For
per
sona
l use
onl
y; a
ll ri
ghts
res
erve
d.

therein). Therefore, the observed differences on the meteorologicalconditions could explain some of the differences found for WDELgbetween the monitored irrigation events, as subsequently discussed.No precipitation was recorded during, just before, or just after themonitored irrigation events.
On average required approximately 30.8 h were required for thepivot to complete a turn. The starting time for the irrigation wasapproximately the same for all of the monitored irrigation eventsand ranged from 8:25–10:30 a.m. Greenwich Mean Time (Table 3).The duration of the irrigation event along the transect AC in thedifferent monitored pivot arm portions decreased as the distanceto the center of the pivot increased (Table 3). On average, thetransect AC was irrigated during 1.6 (pivot arm portion 2), 0.6(pivot arm portion 4), and 0.5 h (pivot arm portion 5). The averageirrigation pressure in these three pivot arm portions along the moni-tored irrigation events was 197 kPa. The corresponding coefficientof variation (CV) value is 3%. This low CV value indicated a quiteconstant irrigation pressure during the irrigation events. On aver-age, the irrigation pressure in the pivot arm portion 2 was slightlygreater (210 kPa) than that in the pivot arm portions 4 and 5 (190and 192 kPa, respectively); see Table 3. The average applied waterin the three monitored pivot arm portion was quite similar, as fol-lows: 14.4 (pivot arm portion 2), 13.3 (pivot arm portion 4), and14.1 mm (pivot arm portion 5); see Table 3.
The time evolution of the 10-min transpiration rates and air VPDrecorded at the two treatments from 2 h before until 6 h after theirrigation event of July 31 is shown in Fig. 2. These results arerepresentative of those observed in the remainder of the irrigationevents. Before the irrigation, phase B1, the transpiration rates andair VPD for both treatments were similar. As the pivot arm wasarriving near the transect AC, the transpiration rates and airVPD for the moist treatment decreased compared to those forthe dry treatment (phase B2). This decrease was greater duringthe irrigation event (phase Du) and remained similar some timeafter the irrigation (phase A1). Subsequently, the transpiration rates
and air VPD for both treatments became closer and finally weresimilar during the phase A3. In general terms, this time evolutionof the transpiration rates and air VPD observed at the two treat-ments during (phase Du) and after (phases A1 and A2) the irriga-tion events was similar to that described in previous research that ispertinent to sprinkler irrigation (Thompson et al. 1993; Tolk et al.1995; Liu and Kang 2006; Martínez-Cob et al. 2008; Cavero et al.2009). However, in the research described in this paper, the de-crease of transpiration rates and air VPD for the moist treatmentwas observed immediately before (phase B2) the beginning of mostmonitored irrigation events. The existence of this phase is discussedin a subsequent section.
For all of the irrigation events, the values of air VPD recordedfor the two treatments before irrigation (phase B1) were similar andthe average difference did not exceed 0.08 kPa (Fig. 3, Table 4).This difference although significant was within the expectedaccuracy of the air VPD computations, in accordance with the ac-curacy of the air temperature and relative humidity measure-ments. The average differences between treatments graduallyincreased immediately before and during the irrigation, as fol-lows: 0.18–0.24 kPa (15.0–18.3%) during the phase B2, and0.54–0.68 kPa (38.0–49.3%) during the phase Du (Fig. 3, Table 4).After the irrigation events, the average differences between treat-ments become gradually smaller, as follows: 0.36–0.45 kPa(20.7–26.8%) during the phase A1, 0.17–0.20 kPa (8.4–9.1%) dur-ing the phase A2, and 0.08–0.10 kPa during the phase A3 whenessentially the air VPD became similar in both treatments (Fig. 3,Table 4).
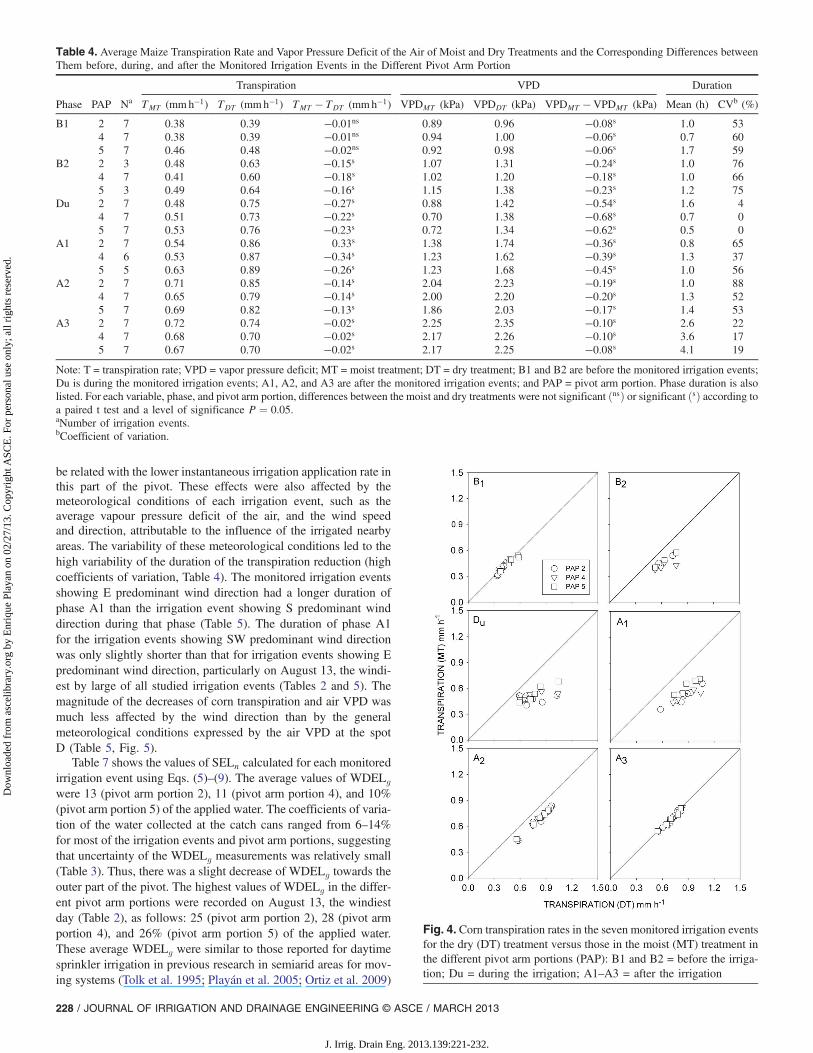
Table 4 and Fig. 4 show that the transpiration rates for bothtreatments were not significantly different (P < 0.05) before theirrigation during phase B1. However, both treatments were signifi-cantly different before the irrigation during phase B2. On average,the transpiration rate decrease for the moist treatment was0.16 mmh−1 (Fig. 4, Table 4) in each pivot arm portion. Monteithand Unsworth (2008) indicate that all the recorded values in a
Table 3. General Characteristics of the Monitored Irrigation Events in the Different Parts of the Center Pivot during the Period That the Pivot Arm WasMoving over the Transect AC (Phase Du)
Pivot armportion Date
Startingtimea (h)
Duration(h)
Pressure Applied water(Is) (mm)
Collected water depth (Icc)
Mean (kPa) CVb (Percent) Mean (mm) CV (Percent)
2 July 24 8:25 a.m. 1.70 208 14.6 13.0 18July 31 9:35 a.m. 1.62 218 0.8 14.9 13.4 15August 6 9:00 a.m. 1.62 214 0.5 14.8 12.6 14August 13 9:05 a.m. 1.55 216 0.6 14.2 10.6 19August 21 9:20 a.m. 1.55 198 1.0 13.6 12.8 14August 28 9:45 a.m. 1.62 207 1.0 14.5 12.3 12
September 10 10:15 a.m. 1.62 208 3.3 14.6 13.3 10
4 July 24 8:40 a.m. 0.62 193 2.2 13.6 11.9 7July 31 9:55 a.m. 0.60 197 1.6 13.8 12.3 11August 6 9:15 a.m. 0.60 194 1.9 13.6 12.3 10August 13 9:20 a.m. 0.57 197 1.0 13.1 9.5 13August 21 9:35 a.m. 0.57 177 2.4 12.4 11.9 6August 28 10:00 a.m. 0.60 181 1.9 13.2 11.9 8
September 10 10:30 a.m. 0.60 194 1.6 13.7 12.9 7
5 July 24 8:40 a.m. 0.50 195 0.3 14.4 13.3 12July 31 9:55 a.m. 0.48 199 1.3 14.5 13.4 14August 6 9:20 a.m. 0.48 197 1.5 14.5 12.9 14August 13 9:20 a.m. 0.45 200 0.7 13.9 10.4 13August 21 9:40 a.m. 0.45 174 0.8 13.0 12.6 10August 28 10:00 a.m. 0.48 179 0.9 13.8 12.6 12
September 10 10:30 a.m. 0.48 202 0.6 14.7 13.3 10aGreenwich Mean Time.bCoefficient of variation.
JOURNAL OF IRRIGATION AND DRAINAGE ENGINEERING © ASCE / MARCH 2013 / 225
J. Irrig. Drain Eng. 2013.139:221-232.
Dow
nloa
ded
from
asc
elib
rary
.org
by
Enr
ique
Pla
yan
on 0
2/27
/13.
Cop
yrig
ht A
SCE
. For
per
sona
l use
onl
y; a
ll ri
ghts
res
erve
d.

particular weather station, such as air temperature, relative humid-ity, and wind are influenced by vegetation type and characteristicsthat are at a distance of approximately 100× the average cropheight, primarily in the direction from which the wind comes.As the pivot arm is continuously moving over the field, the areasnearby the transect AC have been irrigated already when the pivotarm arrives to that transect. Thus, the transpiration and VPD de-creases observed before the irrigation water droplets moistenedthe transect AC were likely attributable to the effect of the micro-climatic changes in these nearby areas. The influence of the pre-dominant wind direction on the length of phase B2 is difficultto analyze because the incidence angle of wind on the pivot armis continuously changing because of the rotation movement ofthe pivot. Nevertheless, the duration of phase B2 was somewhatlonger for the monitored irrigation events showing east (E) pre-dominant wind direction during that phase compared to irrigation
events showing west (W) or southwest (SW) predominant winddirection (Table 5). This difference would have been even largerif the irrigation event on August 13 (the windiest by far) wouldhave not been taken into account. According to Fig. 1, east windsblow over recently irrigated field areas towards the pivot arm andthe transect, whereas west or southwest winds blow against thepivot arm rotation over field areas that have been irrigated some-time previously and therefore should be less humid.
The transpiration decrease in the moist treatment was greaterduring (phase Du) the irrigation of transect AC than that observedin the phase B2 (Fig. 4, Table 4). On average, this decrease wasapproximately 0.22 − 0.27 mmh−1 and quite similar for the threemonitored pivot arm portions. Accounting for the duration ofthe irrigation of transect AC, the average total transpiration forthe moist treatment was 0.78 (pivot arm portion 2), 0.34 (pivotarm portion 4), and 0.26 mm (pivot arm portion 5). This was
Fig. 2. 10-min average corn transpiration rates and vapor pressure deficit of air (VPD) at pivot arm portions 2, 4, and 5, from 2 h before until 6 h afterthe irrigation event monitored on July 31: MT = moist treatment; DT = dry treatment; vertical solid lines indicate the start and the end of the irrigationover the transect AC (water droplets falling over the plants); vertical dashed lines indicate the periods during which transpiration rates were differentbetween the two treatments; Du = irrigation of the transect AC; B1 and B2 = before the irrigation; A1–A3 = after the irrigation
226 / JOURNAL OF IRRIGATION AND DRAINAGE ENGINEERING © ASCE / MARCH 2013
J. Irrig. Drain Eng. 2013.139:221-232.
Dow
nloa
ded
from
asc
elib
rary
.org
by
Enr
ique
Pla
yan
on 0
2/27
/13.
Cop
yrig
ht A
SCE
. For
per
sona
l use
onl
y; a
ll ri
ghts
res
erve
d.

approximately 36 (pivot arm portion 2) and 30% (pivot arm por-tions 4 and 5) less than the average total transpiration for the drytreatment of 1.23, 0.49, and 0.38 mmh−1 for pivot arm portions 2,4, and 5, respectively. Thus, the transpiration reduction was slightlygreater for the pivot arm portion closer to the center of the pivot,given that irrigation in this spot lasted longer. Tolk et al. (1995),using a lateral move sprinkler irrigation system, reported a transpi-ration reduction similar to the observations in this research,whereas the transpiration reduction during irrigation in solid-setsprinkler systems reported by Martínez-Cob et al. (2008) wasgreater. These differences likely were because of the duration ofthe irrigation, which was longer in the research of Martínez-Cobet al. (2008).
The transpiration decrease for the moist treatment just after theirrigation (phase A1) was 0.26 − 0.34 mmh−1, slightly greaterthan that observed during the irrigation (Fig. 4, Table 4). Similartranspiration reductions were observed in all three pivot arm loca-tions. Accounting for the duration of this phase, the average totaltranspiration for the moist treatment was 0.45 (pivot arm portion 2),0.69 (pivot arm portion 4), and 0.61 mm (pivot arm portion 5),approximately 38, 39, and 29% less than the average total transpi-ration for the dry treatment of 0.72, 1.13, and 0.86 mm forpivot arm portions 2, 4, and 5, respectively. These results are
different from those reported in previous research (Tolk et al. 1995;Martínez-Cob et al. 2008), which found lower transpiration re-duction after rather than during the irrigation. The research of Tolket al. (1995) was conducted with a linear lateral move but irrigationof the field was completed in 2 h. The research of Martínez-Cobet al. (2008) was conducted on a solid-set system, irrigation lastedfor 2–3 h, and there were not nearby irrigated areas after theirrigation concluded. Because of the rotation movement of thecenter pivot, it is clear that the pivot arm was irrigating nearby areasduring a time after passing for the transect AC. Consequently, themicroclimatic changes in the nearby areas to the transect AC (bothsides) were also affecting the transpiration rates in the transect AC.Thus, the transpiration reduction in phase A1 was slightly greaterthan that found during the irrigation and it lasted longer in the pivotthan in solid-set systems (Martínez-Cob et al. 2008; Caveroet al. 2009).
The corn transpiration rates for the moist treatment in phase A2after the irrigation were approximately 17 (pivot arm portions 2 and4) and 16% (pivot arm portion 5), significantly lower than those forthe dry treatment (Table 4, Fig. 4), but the average reduction wassmaller (<0.14 mmh−1). In phase A3 after the irrigation, the differ-ences among the treatments, although significant (P < 0.05), wereonly 0.02 mmh�1 on average and thus should be considered neg-ligible (Table 4, Fig. 4).
Fig. 5 shows the average corn transpiration rates versus the airVPD measured at each meteorological station (three at the transectAC, moist treatment, and one at spot D, dry treatment) before(B2 phase), during (Du phase) and after (A1 phase) the center-pivotsprinkler irrigation events. There was a moderate to high relation-ship between these two variables at both treatments, as indicatedby the corresponding coefficients of determination (r2). These weregreater during the irrigation events (phase Du), ranging from0.75–0.82, than before (phase B2) and after (phase A1) the irriga-tions, ranging from 0.53–0.56 except for the pivot arm portion 4during phase B2 (r2 ¼ 0.69). The direct effect of sprinkler irriga-tion is the increase of the air relative humidity and thus the decreaseof air VPD resulting in a concomitant decrease of corn transpirationrate, and this effect is greater during the irrigation event. Before andafter the irrigation event this effect still exists but to a lesser extent.
Analogously, the magnitude of the decrease of air VPD and corntranspiration rates during the irrigation (phase Du) was dependenton the general meteorological conditions in the study area ex-pressed by the VPD at spot D. Table 6 lists the results of the linearregressions between the decreases of air VPD and corn transpira-tion at each measurement spot of the transect AC versus the averageair VPD recorded at the spot D during the phase Du. There was astrong relationship between the decrease of air VPD at the meas-urement spots of transect AC and the VPD at spot D. That relation-ship was not so strong (smaller r2) for the case of the decrease oftranspiration. The decrease of air VPD and corn transpiration wasgreater as the air VPD at the dry treatment increased. Martínez-Cobet al. (2008) reported similar relationships.
Martínez-Cob et al. (2008) reported that the transpiration reduc-tion for the moist treatment lasted less than 1 h after the irrigation insolid-set sprinkler systems. However, the average duration of thisreduction in the center pivot studied in this research was longer.Moreover, the largest differences among the different pivot armportions were found in the duration of transpiration reduction afterthe irrigation. Thus, the sum of the average duration of phases A1and A2 (when differences among the treatments were above theresolution of the sap flow gauges used) for the monitored irrigationevents was 1.8 (pivot arm portion 2), 2.6 (pivot arm portion 4), and2.4 h (pivot arm portion 5); see Table 4. This lower duration oftranspiration reduction after the irrigation in the pivot arm 2 could
Fig. 3. Vapor pressure deficit (VPD) of the air measured in the dry(DT) treatment versus VPD of the air measured in the moist (MT) treat-ment during the seven monitored irrigation events: B1 and B2 = beforeirrigation; Du = during irrigation = A1–A3 = after irrigation; PAP =pivot arm portion
JOURNAL OF IRRIGATION AND DRAINAGE ENGINEERING © ASCE / MARCH 2013 / 227
J. Irrig. Drain Eng. 2013.139:221-232.
Dow
nloa
ded
from
asc
elib
rary
.org
by
Enr
ique
Pla
yan
on 0
2/27
/13.
Cop
yrig
ht A
SCE
. For
per
sona
l use
onl
y; a
ll ri
ghts
res
erve
d.
be related with the lower instantaneous irrigation application rate inthis part of the pivot. These effects were also affected by themeteorological conditions of each irrigation event, such as theaverage vapour pressure deficit of the air, and the wind speedand direction, attributable to the influence of the irrigated nearbyareas. The variability of these meteorological conditions led to thehigh variability of the duration of the transpiration reduction (highcoefficients of variation, Table 4). The monitored irrigation eventsshowing E predominant wind direction had a longer duration ofphase A1 than the irrigation event showing S predominant winddirection during that phase (Table 5). The duration of phase A1for the irrigation events showing SW predominant wind directionwas only slightly shorter than that for irrigation events showing Epredominant wind direction, particularly on August 13, the windi-est by large of all studied irrigation events (Tables 2 and 5). Themagnitude of the decreases of corn transpiration and air VPD wasmuch less affected by the wind direction than by the generalmeteorological conditions expressed by the air VPD at the spotD (Table 5, Fig. 5).
Table 7 shows the values of SELn calculated for each monitoredirrigation event using Eqs. (5)–(9). The average values of WDELg
were 13 (pivot arm portion 2), 11 (pivot arm portion 4), and 10%(pivot arm portion 5) of the applied water. The coefficients of varia-tion of the water collected at the catch cans ranged from 6–14%for most of the irrigation events and pivot arm portions, suggestingthat uncertainty of the WDELg measurements was relatively small(Table 3). Thus, there was a slight decrease of WDELg towards theouter part of the pivot. The highest values of WDELg in the differ-ent pivot arm portions were recorded on August 13, the windiestday (Table 2), as follows: 25 (pivot arm portion 2), 28 (pivot armportion 4), and 26% (pivot arm portion 5) of the applied water.These average WDELg were similar to those reported for daytimesprinkler irrigation in previous research in semiarid areas for mov-ing systems (Tolk et al. 1995; Playán et al. 2005; Ortiz et al. 2009)
Table 4. Average Maize Transpiration Rate and Vapor Pressure Deficit of the Air of Moist and Dry Treatments and the Corresponding Differences betweenThem before, during, and after the Monitored Irrigation Events in the Different Pivot Arm Portion
Phase PAP Na
Transpiration VPD Duration
TMT (mmh−1) TDT (mmh−1) TMT − TDT (mmh−1) VPDMT (kPa) VPDDT (kPa) VPDMT − VPDMT (kPa) Mean (h) CVb (%)
B1 2 7 0.38 0.39 −0.01ns 0.89 0.96 −0.08s 1.0 534 7 0.38 0.39 −0.01ns 0.94 1.00 −0.06s 0.7 605 7 0.46 0.48 −0.02ns 0.92 0.98 −0.06s 1.7 59
B2 2 3 0.48 0.63 −0.15s 1.07 1.31 −0.24s 1.0 764 7 0.41 0.60 −0.18s 1.02 1.20 −0.18s 1.0 665 3 0.49 0.64 −0.16s 1.15 1.38 −0.23s 1.2 75
Du 2 7 0.48 0.75 −0.27s 0.88 1.42 −0.54s 1.6 44 7 0.51 0.73 −0.22s 0.70 1.38 −0.68s 0.7 05 7 0.53 0.76 −0.23s 0.72 1.34 −0.62s 0.5 0
A1 2 7 0.54 0.86 0.33s 1.38 1.74 −0.36s 0.8 654 6 0.53 0.87 −0.34s 1.23 1.62 −0.39s 1.3 375 5 0.63 0.89 −0.26s 1.23 1.68 −0.45s 1.0 56
A2 2 7 0.71 0.85 −0.14s 2.04 2.23 −0.19s 1.0 884 7 0.65 0.79 −0.14s 2.00 2.20 −0.20s 1.3 525 7 0.69 0.82 −0.13s 1.86 2.03 −0.17s 1.4 53
A3 2 7 0.72 0.74 −0.02s 2.25 2.35 −0.10s 2.6 224 7 0.68 0.70 −0.02s 2.17 2.26 −0.10s 3.6 175 7 0.67 0.70 −0.02s 2.17 2.25 −0.08s 4.1 19
Note: T = transpiration rate; VPD = vapor pressure deficit; MT = moist treatment; DT = dry treatment; B1 and B2 are before the monitored irrigation events;Du is during the monitored irrigation events; A1, A2, and A3 are after the monitored irrigation events; and PAP = pivot arm portion. Phase duration is alsolisted. For each variable, phase, and pivot arm portion, differences between the moist and dry treatments were not significant ðnsÞ or significant ðsÞ according toa paired t test and a level of significance P ¼ 0.05.aNumber of irrigation events.bCoefficient of variation.
Fig. 4. Corn transpiration rates in the seven monitored irrigation eventsfor the dry (DT) treatment versus those in the moist (MT) treatment inthe different pivot arm portions (PAP): B1 and B2 = before the irriga-tion; Du = during the irrigation; A1–A3 = after the irrigation
228 / JOURNAL OF IRRIGATION AND DRAINAGE ENGINEERING © ASCE / MARCH 2013
J. Irrig. Drain Eng. 2013.139:221-232.
Dow
nloa
ded
from
asc
elib
rary
.org
by
Enr
ique
Pla
yan
on 0
2/27
/13.
Cop
yrig
ht A
SCE
. For
per
sona
l use
onl
y; a
ll ri
ghts
res
erve
d.

but lower than those found in solid-set systems (Dechmi et al. 2003;Martínez-Cob et al. 2008).
On average, the estimated reduction of evapotranspiration duringthe irrigation of the transect AC in the seven monitored irrigationevents was 0.33 (pivot arm portion 2), 0.18 (pivot arm portion 4),and 0.17 mm (pivot arm portion 5); see Table 7. The correspondingWDELn estimated from Eq. (6) were the following: 1.5 (pivot armportion 2) and 1.3 mm (pivot arm portions 4 and 5), whichamounted to 11 (pivot arm portion 2), 10 (pivot arm portion 4),and 9% (pivot arm portion 5) of the applied water (Table 7). Thus,the evapotranspiration reduction attributable to irrigation repre-sented an 18 (pivot arm portion 2) and 12% (pivot arm portions4 and 5) of the WDELg. In terms of the applied water, the evapo-transpiration reduction attributable to irrigation amounted to 2.3(pivot arm portion 2) and 1.3% (pivot arm portions 4 and 5).Considering these values and those of Martínez-Cob et al. (2008)in solid-set systems, it seems that during sprinkler irrigation, as
Table 5. Average Reduction of Vapor Pressure Deficit of the Air, Maize Transpiration, and Average Duration of Reduction for the Different MonitoredIrrigation Events Grouped in Accordance with the Predominant Wind Direction before and after the Irrigation Events
Phase WDa DateWind speed(m s−1)
Observed decreases
ΔVPD (KPa) ΔT (mmh−1) Duration (h)
B2 E July 24, July 31, August 6, August 21, August 28 1.7 0.20 0.17 1.0SW September 10, August 13 2.9 0.24 0.14 0.8
A1 E July 24, July 31, August 6, August 21 1.6 0.41 0.35 1.2S August 28 0.9 0.49 0.26 0.4SW September 10, August 13 2.4 0.29 0.26 1.0
Note:ΔVPD = reduction of vapor pressure deficit;ΔT = reduction of transpiration; WD = wind direction; B2 is the phase before the irrigation event; and A1 isthe phase after the irrigation event. The average wind speed for these groups is also listed.aRecorded at the nearby grass station: E = east (67.5–112.5°); S = south (157.5–202.5°); SW = southwest (202.5–247.5°); W = west (247.5–292.5°).
Table 6. Analysis of Linear Regression (y ¼ b0 þ b1 x) between the VPDAverages Recorded at Station D and the Average Decreases of VaporPressure Deficit and Transpiration Rate Observed during the IrrigationEvents
Variable Y Variable X PAP
Linear regression
b0 b1 r2
ΔVPD VPD 2 −0.21 0.53 0.874 −0.14 0.48 0.835 −0.30 0.68 0.87
ΔT VPD 2 −0.10 0.26 0.614 −0.16 0.27 0.795 −0.07 0.12 0.51
Note: Vapor pressure deficit (VPD) averages recorded at station D is theindependent variable x; decrease in VPD (ΔVPD) and transpiration rate(ΔT) are the independent variables; Du is during the irrigation events;b0 and b1 = slope and intercept of the linear regression, respectively;r2 = coefficient of determination; and PAP = pivot arm portion.
Fig. 5. Relationship between the average transpiration rates of maize and the average VPD of the air measured before (B2 phase), during (Du phase)and after (A1 phase) the center-pivot sprinkler irrigation events for the moist (MT) and dry (DT) treatments in the different pivot arm portions (PAP)
JOURNAL OF IRRIGATION AND DRAINAGE ENGINEERING © ASCE / MARCH 2013 / 229
J. Irrig. Drain Eng. 2013.139:221-232.
Dow
nloa
ded
from
asc
elib
rary
.org
by
Enr
ique
Pla
yan
on 0
2/27
/13.
Cop
yrig
ht A
SCE
. For
per
sona
l use
onl
y; a
ll ri
ghts
res
erve
d.

the WDELg increases, the reduction of ET (attributable to thereduction of plant transpiration) increases.
As discussed previously, ILn is the balance between the evapo-ration of intercepted water and the reduction of the transpiration afterthe irrigation, i.e., the difference between the evapotranspiration ratesof the moist and dry treatments. For a solid-set sprinkler system,Martínez-Cob et al. (2008) found that this difference between theevapotranspiration rates of both treatments was limited to a periodof 1 h after the irrigation finished. Tolk et al. (1995) also foundsimilar results for a lateral-move sprinkler system. Given thatevapotranspiration rates were not measured in this research, itwas assumed, as a rough approximation, a period of 1 h afterthe irrigation event in order to calculate the ILn. After that hour,it was considered that the observed corn transpiration reduction wascompletely compensated by the evaporation of intercepted watersuch that ILn were negligible. Next, Eq. (9) was only appliedduring the first hour after the irrigation event. The ILn estimatedfrom Eq. (9) was on average 0.3 mm in all the pivot arm portionsmonitored (Table 7), similar to those values reported by Tolk et al.(1995) and Martínez-Cob et al. (2008).
Assuming the estimated ILn values, the average SELn valueswere 1.8 (pivot arm portion 2) and 1.6 mm (pivot arm portions4 and 5); see Table 7. Thus, the SELn would represent 13, 12,and 11% of the applied water in the pivot arm portion 2, 4, and5, respectively (Table 7). These SELn values were even slightlygreater than the observed WDELg values. Estimation of water ap-plication efficiency requires knowledge of the SELn (McNaughton1981; Tolk et al. 1995; Martínez-Cob et al. 2008). However, theresults listed in Table 7 suggest that although corn transpirationwas reduced during the irrigation with center pivot, the WDELgcould be a good estimate of SELn. The estimates of SELn listedin Table 7 suggest that the net sprinkler and evaporation losses
in pivots with impact sprinklers are relatively small in terms ofthe applied water and slightly decrease along the pivot arm becauseof the differences in WDELg and the magnitude and duration ofthe transpiration reduction during and after the irrigation eventsin the different pivot arm portions. Because of the rough estimatesof some terms in Eqs. (7)–(9), these results must be considered aspreliminary and further research is required, primarily for measur-ing the evapotranspiration rather than transpiration rates during andafter the irrigation events.
There is some uncertainty regarding to the calculation of ILnvalue. In this paper, the increase of evapotranspiration in the moisttreatment 1 h after the irrigation events reported by Martínez-Cobet al. (2008) has been used to estimate the ILn, resulting in a valueof approximately 2% of the applied water. However, other authorshave reported that ILn for corn can range between 5 and 7% forapplication depth between 15 and 25 mm in lateral-move sprinklerirrigation systems (Tolk et al. 1995).
There is a need for further research to quantify the magnitudeand duration of the plants’ transpiration reduction for center-pivotsystems using other types of sprinklers (for instance, rotating sprayplate sprinklers), because the WDEL and the magnitude or durationof the possible transpiration reduction could be different, in turnbecause of the manner in which the water is applied, closer tothe crop canopy and to the ground.
Conclusions
During irrigation of corn using a center-pivot system with impactsprinklers, plant transpiration was reduced by 36% for pivot armportion 2 (close to the center) and 30% for pivot arm portions 4and 5 (far from the center). Some transpiration reduction wasobserved before water droplets began to moisten the corn plants.
Table 7. Irrigation Applied Water, Evapotranspiration Reduction during the Irrigation, Gross and Net Wind Drift and Evaporation Losses, Net InterceptionLosses, and Net Sprinkler Evaporation Losses in the Different Irrigation Events in the Different Parts of the Center Pivot
Pivot armportion Date Is (mm) ðETredÞdi (mm)
WDEL
ILn (mm) SELn (mm) SELn (Percent)Gross (mm) Net (mm)
2 July 24 14.6 0.25 1.5 1.3 0.3 1.6 11July 31 14.9 0.58 1.5 1.0 0.3 1.3 9August 6 14.8 0.47 2.2 1.8 0.3 2.1 14August 13 14.2 0.15 3.5 3.4 0.3 3.7 26August 21 13.6 0.31 0.7 0.4 0.3 0.7 5August 28 14.5 0.17 2.2 2.1 0.3 2.3 16
September 10 14.6 0.07 1.2 1.2 0.2 1.4 9Mean 14.4 0.33 1.9 1.5 0.3 1.8 13
4 July 24 13.6 0.13 1.7 1.6 0.2 1.8 13July 31 13.8 0.37 1.4 1.0 0.3 1.4 10August 6 13.6 0.20 1.4 1.2 0.3 1.5 11August 13 13.1 0.14 3.6 3.5 0.3 3.8 29August 21 12.4 0.17 0.5 0.4 0.2 0.6 5August 28 13.2 0.14 1.3 1.2 0.2 1.4 11
September 10 13.7 0.10 0.7 0.6 0.2 0.8 6Mean 13.3 0.18 1.5 1.3 0.3 1.6 12
5 July 24 14.4 0.12 1.1 1.0 0.2 1.3 9July 31 14.5 0.24 1.2 0.9 0.3 1.2 9August 6 14.5 0.16 1.6 1.4 0.3 1.7 12August 13 13.9 0.07 3.6 3.5 0.3 3.8 27August 21 13.0 0.07 0.3 0.3 0.3 0.5 4August 28 13.8 0.07 1.2 1.1 0.3 1.4 10
September 10 14.7 0.04 1.4 1.3 0.2 1.5 11Mean 14.1 0.17 1.5 1.3 0.3 1.6 11
Note: Is = irrigation applied water; ðETredÞdi = evapotranspiration reduction during the irrigation; WDEL = gross and net wind drift and evaporation losses;ILn = net interception losses; SELn (in mm and percentage of Is) = net sprinkler evaporation losses.
230 / JOURNAL OF IRRIGATION AND DRAINAGE ENGINEERING © ASCE / MARCH 2013
J. Irrig. Drain Eng. 2013.139:221-232.
Dow
nloa
ded
from
asc
elib
rary
.org
by
Enr
ique
Pla
yan
on 0
2/27
/13.
Cop
yrig
ht A
SCE
. For
per
sona
l use
onl
y; a
ll ri
ghts
res
erve
d.

After the pivot arm passed by the studied area, transpirationcontinued to be reduced for 1.8 (pivot arm portion 2), 2.6 (pivotarm portion 4) and 2.4 h (pivot arm portion 5), and amountedto percentages of 27 (pivot arm portion 2), 29 (pivot arm portion4), and 22% (pivot arm portion 5).
The measured gross wind drift and evaporation losses (WDELg)were 13, 11, and 10% of applied water for pivot arm portions 2, 4,and 5, respectively. When discounting the evapotranspirationreduction during the irrigation (estimated from the measured tran-spiration reduction), the net wind drift and evaporation losses(WDELn) were slightly lower, as follows: 11, 10, and 9% of theapplied water in the pivot arm portions 2, 4, and 5.
The net sprinkler evaporation losses (SELn) amounted to 13(pivot arm portion 2), 12 (pivot arm portion 4), and 11% (pivotarm portion 5) of the applied water. These SELn values were similarto the observed WDELg values. Consequently, in center pivots withimpact sprinklers, the readily measured WDELg is a good estimateof total evaporation losses. Thus, for these systems, it would notbe required to estimate SELn for estimation of water applicationefficiency.
Further research is required for center-pivot systems using othertype of water emitters.
Appendix. Estimation of Corn Evapotranspiration
The 5-min averages of the meteorological variables recorded atspot D were used to estimate corn evapotranspiration at the drytreatment (ETDT ) during each monitored irrigation event usingthe Penman-Monteith equation directly applied to the corn crop(Allen et al. 1996), as follows:
ETDT ¼ 300
106λ
ΔðRn − GÞ þ ρacpVPD=ra
Δþ γ�1þ rc
ra
� ð10Þ
where l = latent heat of vaporization (MJ kg−1); Rn = net radiation(Wm−2); G = soil heat flux (Wm−2); D = slope of the saturationvapor pressure curve versus the temperature (kPa°C−1); ra = airdensity (kgm−3); cp = specific heat of the air (J kg−1°C−1);VPD = vapor pressure deficit (kPa); ra = aerodynamic resistance(sm−1); rc = bulk stomatal (canopy) resistance (sm−1); and g is apsychrometric constant (kPa°C−1).
The variables l, D, ra, g, and cp were estimated from mea-sured air temperature and relative humidity following standardprocedures described by Allen et al. (1998). G was estimatedfrom net radiation, in accordance with Allen et al. (1996), asfollows:
G ¼ 0.4e−0.5LAIRn ð11Þwhere LAI is the daily leaf area index estimated from measuredcrop height, as suggested by Allen et al. (1996).
The aerodynamic resistance ra (s m−1) to vapor transfer wasestimated in accordance with Allen et al. (1996):
ra ¼jln�zu−dz0m
�kjln�zh−dz0h
�kk2uzu
ð12Þ
where uzu = wind speed (m s−1) measured at a height zu; k = vonKarman’s constant (0.41); zu and zh = measurement heights (m)above ground of wind speed, and air temperature and relativehumidity, respectively; and d, z0m, and z0h (all three in m) are thezero-plane displacement and roughness lengths for momentum andheat transfer, respectively, estimated (daily) as a function of crop
height (hc) and LAI in accordance with Farahani and Bausch (1995)and Kjelgaard et al. (1994), as follows:
d ¼ 1.1hc ln½1þ ðcdLAIÞ1=4� ð13Þ
zom ¼ 0.3hcð1 − d=hcÞ ð14Þand
z0h ¼ 0.2 z0m ð15Þwhere cd = mean drag coefficient for individual leaves (0.07).Eq. (14) was chosen, given that the product (cd LAI) was greaterthan 0.2 (Farahani and Bausch 1995), because of the LAI values ofapproximately 4.0, estimated during the monitoring period, giventhat the crop height was approximately 2.5 m.
The bulk canopy resistance rc (sm−1) was estimated in accor-dance with Farahani and Bausch (1995), as follows:
rc ¼�c0LAIþ
c1c2C
ln
�1þ c2CRs
1þ c2CRs expð−CLAIÞ��−1
ð16Þ
where Rs = incoming solar radiation (Wm−2) estimated from thelinear regression between the measured net radiation at the spot Dand the incoming solar radiation measured in a nearby weatherstation also located at Valfarta; c0 = minimum stomatal conduct-ance (0.0005 ms−1); c1 and c2 are constants (3.2 × 10⁻⁵ and5.7 × 10−5 ms−1); and C = light extinction coefficient, assumedto be 0.50, as suggested by Cavero et al. (1999, 2000) for similarcrop and climatic conditions to those in this research.
Acknowledgments
This research was supported by the project AGL-2007-66716-CO3-01 (Ministerio de Ciencia e Innovación). The authors expresstheir gratitude to Manuel Labrador for allowing the use of hisfarm and his complete support over the course of the experiment.We also thank Ana Bielsa, Miguel Izquierdo, Jesús Gaudó, JuanManuel Acín, and Ricardo Santolaria for field assistance.
References
Allen, R. G., Keller, J., and Martin, D. (2000). Center pivot system design,Irrigation Association, Falls Church, VA.
Allen, R. G., Pereira, L. S., Raes, D., and Smith, M. (1998). “Crop evapo-transpiration: Guidelines for computing crop water requirements.” Irri-gation and Drainage Paper 56, Food and Agricultural Organization,Rome.
Allen, R. G., Pruitt, W. O., Businger, J. A., Fritschen, L. J., Jensen, M. E.,and Quinn, F. H. (1996). “Evaporation and transpiration.” Hydrologyhandbook (Manuals and reports on engineering practice No. 28),ASCE, New York.
Baker, J. M., and Van Bavel, C. H. M. (1987). “Measurement of mass flowof water in the stems of herbaceous plants.” Plant Cell Environ., 10(9),777–782.
Cavero, J., Medina, E. T., Puig, M., and Martinez-Cob, A. (2009).“Sprinkler irrigation changes maize canopy microclimate and cropwater status, transpiration, and temperature.” Agron. J., 101(4),854–864.
Cavero, J., Zaragoza, C., Bastiaans, L., Suso, M. L., and Pardo, A. (2000).“The relevance of morphological plasticity in the simulation of compe-tition between maize and Datura stramonium.” Weed Res.., 40(2),163–180.
Cavero, J., Zaragoza, C., Suso, M. L., and Pardo, A. (1999). “Competitionbetween maize and Datura stramonium in an irrigated field undersemi-arid conditions.” Weed Res., 39(3), 225–240.
JOURNAL OF IRRIGATION AND DRAINAGE ENGINEERING © ASCE / MARCH 2013 / 231
J. Irrig. Drain Eng. 2013.139:221-232.
Dow
nloa
ded
from
asc
elib
rary
.org
by
Enr
ique
Pla
yan
on 0
2/27
/13.
Cop
yrig
ht A
SCE
. For
per
sona
l use
onl
y; a
ll ri
ghts
res
erve
d.

Dechmi, F., Playán, E., Cavero, J., Faci, J. M., and Martínez-Cob, A.(2003). “Wind effects on solid set sprinkler irrigation depth and yieldof maize (Zea mays).” Irrig. Sci., 22(2), 67–77.
Evans, R. G. (2001). “Center pivot irrigation.” Research Rep., AgriculturalResearch Service, USDA, Sidney, MT.
Farahani, H. J., and Bausch, W. C. (1995). “Performance of evapotranspi-ration models for maize-bare soil to closed canopy.” Trans. ASAE,38(4), 1049–1059.
Frost, K. R., and Schwalen, H. C. (1960). “Evapotranspiration duringsprinkler irrigation.” Trans. ASAE, 3(1), 18–20.
Kincaid, D. C., Solomon, K. H., and Oliphant, J. C. (1996). “Drop sizedistributions for irrigation sprinklers.” Trans. ASAE, 39(3), 839–845.
Kjelgaard, J. F., Stockle, C. O., Villar, J. M., Evans, R. G., and Campbell,G. S. (1994). “Evaluating methods to estimate corn evapotranspirationfrom short-time interval weather data.” Trans. ASAE, 37(6),1825–1833.
Kohl, R. A., and Wright, J. L. (1974). “Air temperature and vapor-pressurechanges caused by sprinkler irrigation.” Agron. J., 66(1), 85–87.
Liu, H. J., and Kang, Y. H. (2006). “Effect of sprinkler irrigation on micro-climate in the winter wheat field in the North China Plain.” Agric. WaterManage., 84(1–2), 3–19.
Martinez-Cob, A., Playan, E., Zapata, N., Cavero, J., Medina, E. T.,and Puig, M. (2008). “Contribution of evapotranspiration reductionduring sprinkler irrigation to application efficiency.” J. Irrig. Drain.Eng., 134(6), 745–756.
McNaughton, K. G. (1981). “Net interception losses during sprinklerirrigation.” Agr. Meteorol., 24(1), 11–27.
Monteith, J. L., and Unsworth, M. H. (2008). Principles of environmentalphysics, 3rd Ed., Academic Press, Burlington, MA.
Norman, E., Joyce, R., and Whittaker, M. (1990). Advanced design andtechnology, 3rd Ed., Longman, Harlow, Essex, U.K.
Norman, J. M., and Campbell, G. (1983). “Application of a plant-environment model to problems in irrigation.” Advances in irrigation,Vol. 2, D. Hillel, ed., Academic Press, New York, 155–188.
Ortiz, J. N., Tarjuelo, J. M., and de Juan, J. A. (2009). “Characterisation ofevaporation and drift losses with centre pivots.” Agric. Water Manage.,96(11), 1541–1546.
Playán, E., Salvador, R., Faci, J. M., Zapata, N., Martínez-Cob, A., andSánchez, I. (2005). “Day and night wind drift and evaporation lossesin sprinkler solid-sets and moving laterals.” Agric. Water Manage.,76(3), 139–159.
Robinson, F. E. (1970). “Modifying an arid microclimate with sprinklers.”Agric. Eng., 51(8), 465.
Sistema de Información Geográfica de Parcelas Agrícolas (SIGPAC).(2011). “Sistema de información geográfica de parcelas agrícolas.”⟨http://sigpac.mapa.es/fega/visor/⟩ (Jan. 2011).
Spanish Ministry of Natural, Rural and Marine Environment (MARM).(2011). “Sistema de información agroclimática para el regadío (SIAR).”⟨http://www.marm.es/es/agua/temas/observatorio-del-regadio-espanol/sistema-de-informacion-agroclimatica-para-el-regadio⟩ (Jan. 2011).
Steiner, J. L., Kanemasu, E. T., and Clark, R. N. (1983a). “Spray losses andpartitioning of water under a center pivot sprinkler system.” Trans.ASAE, 26(4), 1128–1134.
Steiner, J. L., Kanemasu, E. T., and Hasza, D. (1983b). “Microclimatic andcrop responses to center pivot sprinkler and to surface irrigation.” Irrig.Sci., 4(3), 201–214.
Sternberg, Y. M. (1967). “Analysis of sprinkler irrigation losses.” J. Irrig.Drain. Div., 93(4), 111–124.
Tarjuelo, J. M. (1999). El riego por aspersión y su tecnología, 2nd Ed.,Mundi Prensa, Madrid, Spain.
Tarjuelo, J. M., Montero, J., Honrubia, F. T., Ortiz, J. J., and Ortega, J. F.(1999). “Analysis of uniformity of sprinkle irrigation in a semi-aridarea.” Agric. Water Manage., 40(2), 315–331.
Thompson, A. L., et al. (1997). “Testing of a water loss distribution modelfor moving sprinkler systems.” Trans. ASAE, 40(1), 81–88.
Thompson, A. L., Gilley, J. R., and Norman, J. M. (1993). “A sprinklerwater droplet evaporation and plant canopy model: II. Model applica-tion.” Trans. ASAE, 36(3), 743–750.
Tolk, J. A, Howell, T. A., Steiner, J. L., Krieg, D. R., and Schneider, A. D.(1995). “Role of transpiration suppression by evaporation of inter-cepted water in improving irrigation efficiency.” Irrig. Sci., 16(2),89–95.
Van Bavel, M. G. (2005). Flow4 installation and operation manual,Dynamax Inc., Houston, TX.
Weibel, F. P., and Boersma, K. (1995). “An improved stem heat balancemethod using analog heat control.” Agric. Forest Meteorol., 75(1),191–208.
Wiersma, J. L. (1970). “Influence of low rates of water application by sprin-klers on the microclimate.” Rep. Prepared for the Water ResourcesInstitute, South Dakota State Univ., Brookings, SD.
Yazar, A. (1984). “Evaporation and drift losses from sprinkler irrigationsystems under various operating conditions.” Agric. Water Manage.,8(4), 439–449.
232 / JOURNAL OF IRRIGATION AND DRAINAGE ENGINEERING © ASCE / MARCH 2013
J. Irrig. Drain Eng. 2013.139:221-232.
Dow
nloa
ded
from
asc
elib
rary
.org
by
Enr
ique
Pla
yan
on 0
2/27
/13.
Cop
yrig
ht A
SCE
. For
per
sona
l use
onl
y; a
ll ri
ghts
res
erve
d.