Results Presentation - Incitec Pivot Limited
32
ASX: IPL US ADR: INCZY Financial Year ended 30 September 2018 Results Presentation
-
Upload
khangminh22 -
Category
Documents
-
view
0 -
download
0
Transcript of Results Presentation - Incitec Pivot Limited

ASX: IPLUS ADR: INCZY
Financial Year ended 30 September 2018
Results Presentation
Financial Year 2018 Review
Disclaimer
2
This presentation has been prepared by Incitec Pivot Limited (“IPL”). The informationcontained in this presentation is for information purposes only. The information contained inthis presentation is not investment or financial product advice and is not intended to be usedas the basis for making an investment decision. This presentation has been prepared withouttaking into account the investment objectives, financial situation or particular needs of anyparticular person.
No representation or warranty, express or implied, is made as to the fairness, accuracy,completeness or correctness of the information, opinions and conclusions contained in thispresentation. To the maximum extent permitted by law, none of IPL, its directors, employeesor agents, nor any other person accepts any liability, including, without limitation, any liabilityarising out of fault or negligence for any loss arising from the use of the information containedin this presentation.
In particular, no representation or warranty, express or implied, is given as to the accuracy,completeness or correctness, likelihood of achievement or reasonableness of any forecasts,prospects or returns (“forward-looking statements”) contained in this presentation nor is anyobligation assumed to update such information. Such forward-looking statements are basedon information and assumptions known to date and are by their nature subject to significantuncertainties and contingencies. Actual results, performance or achievements could besignificantly different from those expressed in, or implied by, this presentation. Forward-looking statements are not guarantees of future performance.
Before making an investment decision, you should consider, with or without the assistance of afinancial adviser, whether an investment is appropriate in light of your particular investmentneeds, objectives and financial circumstances. Past performance is no guarantee of futureperformance.
Incitec Pivot Limited ABN 42 004 080 264

Jeanne JohnsManaging Director & Chief Executive Officer
Financial Year ended 30 September 2018
Welcome and Introduction

Financial Year 2018 Review
Overview
4
1 Financial Year ReviewZero Harm
Results Overview
Jeanne JohnsManaging Director & Chief Executive Officer
2 Group Financial ResultsFinancial Year 2018 Overview
Balance Sheet and Capital Management
Corporate and Group
Frank MicallefChief Financial Officer
3 Operational ReviewDyno Nobel Americas
Dyno Nobel Asia Pacific
Fertilisers Asia Pacific
Technology
Sustainability
Jeanne JohnsManaging Director & Chief Executive Officer
4 Outlook & Priorities Jeanne JohnsManaging Director & Chief Executive Officer
5 Questions & Answers

Financial Year 2018 Review
Zero Harm
5
Refocussed our strategy for Health, Safety & Environment (HSE)
Broadened our HSE strategy, focus on driving output improvements
Continuous improvement on broader set of HSE targets:
• 30% improvement in TRIFR by 2021 (vs 1H18: 1.02)
• Sustainable year-on-year reduction in Tier 1/2 Process Safety Incidents
• Sustainable year-on-year reduction in High Potential Severity Incidents
• Zero Significant Environmental Incidents
Zero Harm Performance
TRIFR for FY18 of 0.96, consistent with our target of < 1
• High Potential Severity Incidents up 2% to 42 (pcp:41)
• Process Safety Incidents improved 7% to 26 (pcp:28)
• Significant Environmental Incidents flat at 1 (pcp:1)

Financial Year 2018 Review
Results Overview
6
Strong result in FY18 with improved outlook
• Explosives earnings up 9.8% or $33.6m, with strong volume growth
• Waggaman earnings up 50.9% or $32.5m, world class operational performance
• Fertilisers earnings up 1.1%, or 23.5% underlying1, benefits of firming prices and improved value chain management
• Delivered increased shareholder returns
‒ FY18 dividend increased to 10.7 cps (pcp: 9.4 cps), maintaining dividend payout ratio of 50%
‒ $210m (70%) of share buyback completed
NPAT: $207.9m, down $110.8m (including IMIs of $139.5m)
EBIT excluding IMIs of $556.7m 11.1% vs pcp
NPAT excluding IMIs of $347.4m 9.0% vs pcp
Group EBIT Movements
1. Fertilisers (Asia Pacific and US) EBIT excluding FY17 profit on sale of assets in Fertilisers Asia Pacific
A$ million

Financial Year 2018 Review
FY18 Strategic & Operational Highlights
7
Strategy delivery on track & building momentum
People priorities
• Team engagement and collaboration reset
• Leadership team refresh, energised and aligned to deliver on strategy
Growth opportunities
• Leveraging differentiated technology across geographies, introducing DeltaE into Asia Pacific
• Strengthened technology pipeline for the future, building on leading technology platform
Performance excellence
• Record production at Waggaman and Moranbah, a benchmark for Manufacturing Excellence agenda
• Delivered against BEx target
• Strong fertiliser sales volumes through diversification and improved value chain management
• Growing profitability and market share in the US by optimising our asset base and our technology
Focus areas
• Mitigated take-or-pay volume commitment in Western Australia, adding a new major customer
• Extended Gibson Island gas contract to end of calendar 2019, involved in exploration of gas tenement in Qld
IPL Value Drivers

Group Financial Results
Financial Year ended 30 September 2018
Frank MicallefChief Financial Officer

Financial Year 2018 Review
FY18 Performance Overview
9
Strong performance in major turnaround year
Continued profit growth in explosives• Results benefited $22.2m from strong customer demand and US market share gains
• Benefits somewhat offset by lost business in Western Australia
Waggaman delivering strong manufacturing performance • Waggaman earnings benefited $79.7m from improved manufacturing performance and
higher ammonia prices
• Construction delay damages of $47.2m in FY17
Fertilisers performance resilient, benefitted from firming prices and diversification • $97.9m benefits from higher global fertiliser prices, distribution volumes of 2.2m tonnes
• Benefits somewhat offset by:
‒ Dry weather impact of $19.8m on sales volumes/mix and supply chain cost
‒ Non repeat of FY17 Property sales of $20.0m
Manufacturing• Turnarounds net impact of $34.1m
‒ Extended turnarounds at Phosphate Hill, Cheyenne and St Helens
‒ Full year of Moranbah vs FY17 turnaround
• Outages/Efficiency net impact of $12.9m
‒ Unplanned outages at Cheyenne, Phosphate Hill and Gibson Island
‒ Moranbah plant efficiencies from ongoing investment
Group movements in EBIT
A$ million Explosives Fertilisers Waggaman Manufacturing
EBIT excluding IMIs of $556.7m, up 11.1% pcp

Financial Year 2018 Review
Balance Sheet and Capital Management
10
Robust Balance Sheet
• Credit metrics well inside target ranges
‒ Net Debt / EBITDA2:1.6x (pcp: 1.7x)
‒ Interest Cover3:7.3x (pcp: 7.9x)
• Investment grade credit ratings maintained
‒ S&P: BBB with stable outlook
‒ Moody’s: Baa2 with stable outlook
• Expected refinancing of maturing debt in FY19
• Remain capital disciplined
• Funded capital expenditure in intensive turnaround year and with share buyback program
Increased Shareholder Returns
• FY18 dividend increased to 10.7 cps (pcp: 9.4 cps), 12% franked
• 50% payout ratio maintained
• On-market share buyback 70% completed
‒ 57 million ordinary shares bought back for $210m
‒ program expected to be completed in 1HCY19
1. Net Debt aggregates interest bearing liabilities plus the fair value of derivative instruments in place economically to hedge the Group’s interest bearing liabilities, less available cash and cash equivalents2. Net debt / EBITDA ex IMIs ratio is calculated using the last twelve months rolling EBITDA ex IMIs3. Interest Cover = 12 month rolling EBITDA ex IMIs / net interest expense before accounting adjustments
2
Net Debt & Tenor
As at 30 September 2018
Total Debt 2,385.6
Fair Value and Other Adjustments (10.8)
Cash and Cash Equivalents (588.5)
Fair Value of Hedges (414.7)
Net Debt 1,371.6
Net Debt / EBITDA 1.6x
-
200.0
400.0
600.0
800.0
1,000.0
1,200.0
BondAUD200m
144A /reg SUSD800m
Bank facilityAUD260m
Bank facilityUSD220m
Bank facilityUSD500m
Reg SUSD400m
A$MillionAvailable limits Drawn funds
Maturity Date
Aug 27Aug 21 Oct 21Aug 21Dec 19Feb 19

Financial Year 2018 Review
Corporate and Group
11
Net Borrowing Costs up $19.3m to $128.0m
• Impact of higher average US interest rates and cessation of Waggamancapitalised interest
• Average interest rate of 5.68% (pcp: 4.69%)
Corporate costs up $10.9m to $31.3m
• Investment in additional capability in Commercial and Technology functions
• Investment in technology development pipeline
Tax Expense pre-IMIs1 up $7.5m to $78.4m
• Increased tax expense primarily driven by higher earnings compared to pcp
• Effective tax rate on operating profit was 18.3% (pcp: 18.1%)
Hedging Program
• Average realised A$:US$ exchange rate was $0.76
• 50% of estimated 1H19 US$ linked fertilisers sales hedged at $0.75, full participation in downward rate movements
1. FY18 IMIs reducing tax expense by $96.5m

Operational Review
Jeanne JohnsManaging Director & Chief Executive Officer
Financial Year ended 30 September 2018
Financial Year 2018 Review
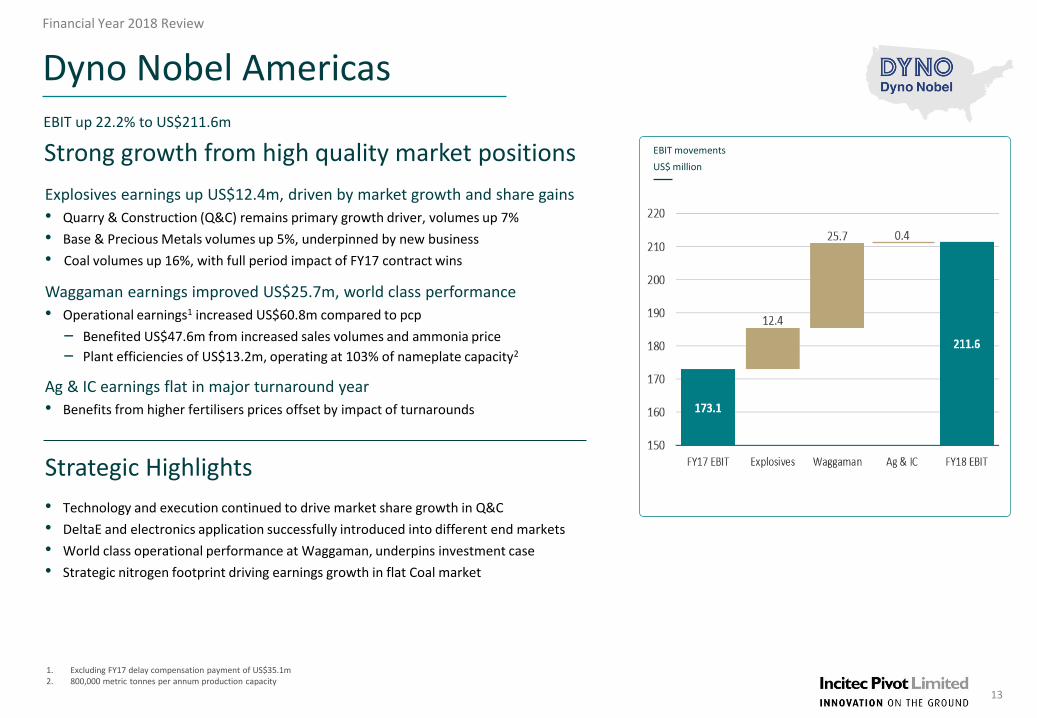
Dyno Nobel Americas
13
Strong growth from high quality market positions
Explosives earnings up US$12.4m, driven by market growth and share gains
• Quarry & Construction (Q&C) remains primary growth driver, volumes up 7%
• Base & Precious Metals volumes up 5%, underpinned by new business
• Coal volumes up 16%, with full period impact of FY17 contract wins
Waggaman earnings improved US$25.7m, world class performance
• Operational earnings1 increased US$60.8m compared to pcp
‒ Benefited US$47.6m from increased sales volumes and ammonia price
‒ Plant efficiencies of US$13.2m, operating at 103% of nameplate capacity2
Ag & IC earnings flat in major turnaround year
• Benefits from higher fertilisers prices offset by impact of turnarounds
Strategic Highlights
• Technology and execution continued to drive market share growth in Q&C
• DeltaE and electronics application successfully introduced into different end markets
• World class operational performance at Waggaman, underpins investment case
• Strategic nitrogen footprint driving earnings growth in flat Coal market
EBIT movements
US$ million
1. Excluding FY17 delay compensation payment of US$35.1m2. 800,000 metric tonnes per annum production capacity
EBIT up 22.2% to US$211.6m

Financial Year 2018 Review
Waggaman Operations
14
Earnings up 50.9%, production at 103%
Project overview
• Construction completed under budget
• Compensation payments received of ~ US$50.7m1
• FY17, 1st year of operations, production at 74% of nameplate capacity
FY18 world class performance
• Production at 103% of nameplate capacity
• Operational earnings up US$60.8m
2
1. Delay compensation received in FY16: US$15.6m, FY17: US$35.1m
0
50
100
150
200
250
300
350
400
450
500
Sep-13 Mar-14 Sep-14 Mar-15 Sep-15 Mar-16 Sep-16 Mar-17 Sep-17 Mar-18 Sep-18
Spre
ad
(U
SD)
WALA Implied Gas to Ammonia Spread
Gas to Ammonia Spread

Financial Year 2018 Review
Earnings up $6.9m from strong volumes growth in Metallurgical Coal sector
• Increased demand driven by mining activity in Bowen Basin
Moranbah operating at record production levels, delivered $16.5m benefits
• Continued investment in asset over last 5 years
• Record production at 371 thousand tonnes of ammonium nitrate
Strategic Highlights• Acquired major new full service customer in Western Australia, take-or-pay commitment
covered
• Successfully trialed and launched DeltaE at customer sites in Asia Pacific
• Strong electronic detonator sales growth in Australia
• Reliable manufacturing performance at Moranbah, underpins security and flexibility of supply for Bowen Basin customers
Dyno Nobel Asia Pacific
15
Well positioned to leverage manufacturing assets and differentiated technology
2
EBIT movements
A$ million
EBIT up 8.7% to $205.4m

Financial Year 2018 Review
Asia Pacific Fertilisers
16
Strong volumes despite dry weather, global fertiliser demand firmed pricing
Underlying earnings1 up 24.6% excluding one off FY17 asset sales of $20m
Global fertilisers prices firmer in FY18, driving earnings up $88.5m
Impact of $45.1m from Phosphate Hill turnaround and Gibson Island outages
• Largest turnaround completed in history of Phosphate Hill / Mt Isa
Drought conditions in NSW and Southern QLD impact of $19.8m
• Lower sales volumes and unfavorable sales mix in drought affected areas
Higher distribution margins, benefits of $7.5m in challenging market
• Improved co-ordination of trading activities and supply chain
Strong distribution volumes of 2.2 million tonnes
• Higher volumes sold in non-drought affected areas
Net Other of $10.4m, bad debt and environmental costs in FY18
Strategic Highlights• Improvements in value chain management and market segmentation starting to deliver value
• New management team established, combining strong operational execution with customer and marketing focus
• Gibson Island gas supply contract extended to December 2019
EBIT movements
A$ million
EBIT up 0.7% to $104.6m
1. Fertilisers Asia Pacific EBIT excluding FY17 profit on sale of assets

EZShot
• Transformation in shock tube Initiation Systems
• Nonel triggered electronic delay element
Innovation On The Ground
• Rapid market uptake of premium product suite offering
• Enables energy to be customised to variable ground conditions creating new blast design opportunities and enhanced blasting results
• Superior platform for maximising customer benefits and automated drill and blast activities
17
O FP R O D U C T F I R E D
M T
O V E R
3YEARS SINCE LAUNCH
S H O T S F I R E D
2,000
300,000
50CUSTOMERS WITH VARYING GROUND HARDNESS TYPES
+60T R U C K S
I N S E R V I C E
+ O V E R
Differential Energyin use
Jumbo Trucks Generation 4 Electronics
DigiShot Plus

Innovation On The Ground – the future is here
Full Spectrum Integration
• Plant Process & Equipment
• Bulk Products
• Initiation Systems (Electronics, NONEL, Wireless)
• Digital
• Mining Applications Technology
18

Sustainability
Managing Impacts of Climate Change
• Completed detailed assessment of the financial risks and opportunities associated with climate change
• IPL’s financial resilience assessed against two future climate scenario, being a 2-degree and 4-degree change
• IPL’s risk assessment and treatment strategies are detailed in the Group’s 2018 Annual Report
Diversity• IPL remains committed to expanding diversity
• Committed to increasing gender diversity by 10% year-on-year to reach 25% by 2022
• 2.6% Indigenous employment across IPL’s Australian businesses
19
Gender Diversity FY18 FY17
Board1 43% 25%
Executive Team 22%1 33%
Senior Management 17% 19%
Management 18% 11%
Global workforce 16% 16%
Environmental, Social and Governance (ESG)• Dow Jones Sustainability Index (DJSI) Assessment
‒ Continue to outperform Chemicals sector average
• Member of FTSE4Good Index and ECPI Indices
1. The Board and Executive Team include the Managing Director & CEO
Jeanne JohnsManaging Director & Chief Executive Officer
Financial Year ended 30 September 2018
FY19 Outlook and Priorities
Financial Year 2018 Review
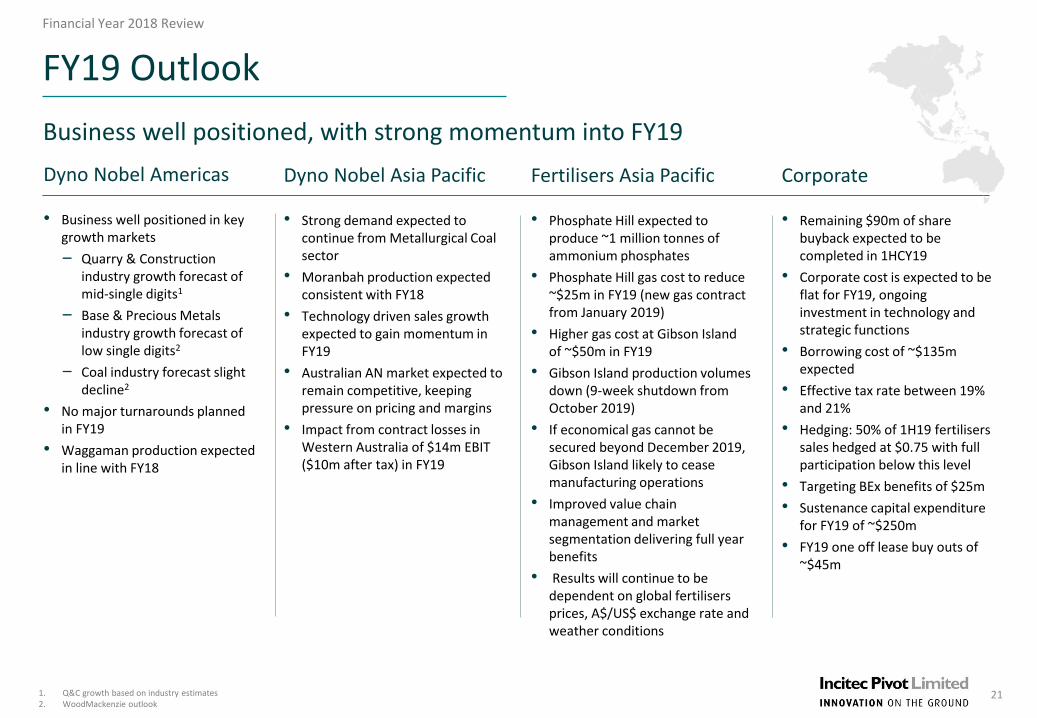
FY19 Outlook
21
Business well positioned, with strong momentum into FY19
1. Q&C growth based on industry estimates2. WoodMackenzie outlook
Dyno Nobel Americas
• Business well positioned in key growth markets
‒ Quarry & Construction industry growth forecast of mid-single digits1
‒ Base & Precious Metals industry growth forecast of low single digits2
‒ Coal industry forecast slight decline2
• No major turnarounds planned in FY19
• Waggaman production expected in line with FY18
Dyno Nobel Asia Pacific
• Strong demand expected to continue from Metallurgical Coal sector
• Moranbah production expected consistent with FY18
• Technology driven sales growth expected to gain momentum in FY19
• Australian AN market expected to remain competitive, keeping pressure on pricing and margins
• Impact from contract losses in Western Australia of $14m EBIT ($10m after tax) in FY19
Fertilisers Asia Pacific
• Phosphate Hill expected to produce ~1 million tonnes of ammonium phosphates
• Phosphate Hill gas cost to reduce ~$25m in FY19 (new gas contract from January 2019)
• Higher gas cost at Gibson Island of ~$50m in FY19
• Gibson Island production volumes down (9-week shutdown from October 2019)
• If economical gas cannot be secured beyond December 2019, Gibson Island likely to cease manufacturing operations
• Improved value chain management and market segmentation delivering full year benefits
• Results will continue to be dependent on global fertilisersprices, A$/US$ exchange rate and weather conditions
Corporate
• Remaining $90m of share buyback expected to be completed in 1HCY19
• Corporate cost is expected to be flat for FY19, ongoing investment in technology and strategic functions
• Borrowing cost of ~$135m expected
• Effective tax rate between 19% and 21%
• Hedging: 50% of 1H19 fertilisers sales hedged at $0.75 with full participation below this level
• Targeting BEx benefits of $25m
• Sustenance capital expenditure for FY19 of ~$250m
• FY19 one off lease buy outs of ~$45m

FY19 Priorities
• Safety remains top priority
• Manufacturing Excellence to drive performance improvement
‒ Drive Manufacturing Excellence under new leadership over next 3 years to 2021
‒ Focus on improvement in reliability and optimising turnaround cycles and execution
• Further expanding technology offer in Asia Pacific and deepening of technology uptake in Americas
‒ Launch EZShot in Asia Pacific/Americas in FY19
‒ Continue to expand DeltaE across Asia Pacific
• Strengthening technology pipeline, building on leading capability and products
• Maintain growth momentum in Explosives Americas, continue to leverage premium technology and strategic nitrogen footprint
• Explosives Asia Pacific, key focus on customer contract renewals
• Fertilisers Asia Pacific, continue strategy implementation driving value chain improvements and growth in new customer segments
• Relentless search for economical gas supply to Gibson Island
• Maintain capital discipline
• Complete remaining $90m of share buyback
22
IPL Value Drivers

Financial Year ended 30 September 2018
Questions
Financial Year ended 30 September 2018
Appendix 1

Financial Year 2018 Review
1. Based on actual FY18 Waggaman manufactured ammonia for sale of 824 kmt2. Based on actual FY18 Waggaman natural gas consumption3. Based on St Helens plant capacity of 175 metric tonnes of urea equivalent product4. Based on FY18 Americas EBIT of $US211.6m at the FY18 average exchange rate of A$/US$ 0.765. Based on actual FY18 Phosphate Hill Ammonium Phosphate sales of 861 kmt; FY18 average realised DAP price of US$400 and FY18 average exchange rate of A$/US$ 0.766. Based on actual FY18 Gibson Island urea equivalent sales through IPF network of 335 kmt; FY18 average realised urea price of US$259 and FY18 average exchange rate of A$/US$ 0.76
EBIT Sensitivities
25
IPL earnings are sensitive to external influences
• Global fertiliser prices and foreign exchange are key factors impacting the Group’s earnings
• US Natural gas and global ammonia prices are also important factors
FY18 EBIT Sensitivities
2
Commodity Proxy Index EBIT Sensitivity
Americas
Ammonia1 CFR Tampa +/- US$10/mt = +/-US$6.5m
Natural Gas2 Henry Hub +/-US$0.10/mmbtu=-/+US$2.7m
Urea3 FOB NOLA +/-US$10/mt=+/-US$1.7m
FX EBIT Translation4 +/-A$/US$0.01=-/+A$3.6m
Asia Pacific
DAP5 FOB Tampa +/-US$10/mt=+/-A$11.3m
Urea6 FOB Middle East +/-US$10/mt=+/-A$4.4m
FX Transactional 5,6 +/-A$/US0.01=-/+A$7.4m

Financial Year 2018 Review
Gibson Island
26
Gas supply to Gibson Island
Interim gas supply to 31 December 2019, will increase manufacturing costs by ~$50m in FY19
IPL is continuing to assess options for sourcing gas for calendar years 2020 and 2021
Carrying value of plant written down in FY16
Additional maintenance (9-week shutdown) of ~$10m required to operate to end of 2019
Arrangements for development of gas tenement finalised
Drilling and appraisal works to be completed during calendar 2019, commitment to spend up to $20m
Should a decision to close Gibson Island be taken at the end of 2019, closure costs estimated to be ~$70m
Closure costs consist of cash costs $60m and non-cash costs of $10m
Likely to be offset in part by sale of land (estimated land value up to ~$60m, depending on operational requirements)
Cash flow from sale of land likely to lag closure costs

Financial Year ended 30 September 2018
Appendix 2 – Commodity Statistics

Financial Year 2018 Review
US Coal Inventories and Production
28Source: Bloomberg
2
2
145.8
101.7
0
50
100
150
200
250
30/09/2008 30/09/2009 30/09/2010 30/09/2011 30/09/2012 30/09/2013 30/09/2014 30/09/2015 30/09/2016 30/09/2017 30/09/2018
US Electrical Power Coal Inventories - Last 10 Years
22881
15176
0
5000
10000
15000
20000
25000
30/09/2008 30/09/2009 30/09/2010 30/09/2011 30/09/2012 30/09/2013 30/09/2014 30/09/2015 30/09/2016 30/09/2017 30/09/2018
US Coal Production - Last 10 Years

Financial Year 2018 Review
US Quarry and Construction Indicators
29Source: Bloomberg
2
2
2080422966
0
5000
10000
15000
20000
25000
30000
30/09/2008 30/09/2009 30/09/2010 30/09/2011 30/09/2012 30/09/2013 30/09/2014 30/09/2015 30/09/2016 30/09/2017 30/09/2018
Crushed Stone US Freight Rail Carloads - Last 10 Years
232.6
485.4
0
100
200
300
400
500
600
30/09/2008 30/09/2009 30/09/2010 30/09/2011 30/09/2012 30/09/2013 30/09/2014 30/09/2015 30/09/2016 30/09/2017 30/09/2018
ISE Engineering and Construction Index - Last 10 Years
Financial Year 2018 Review
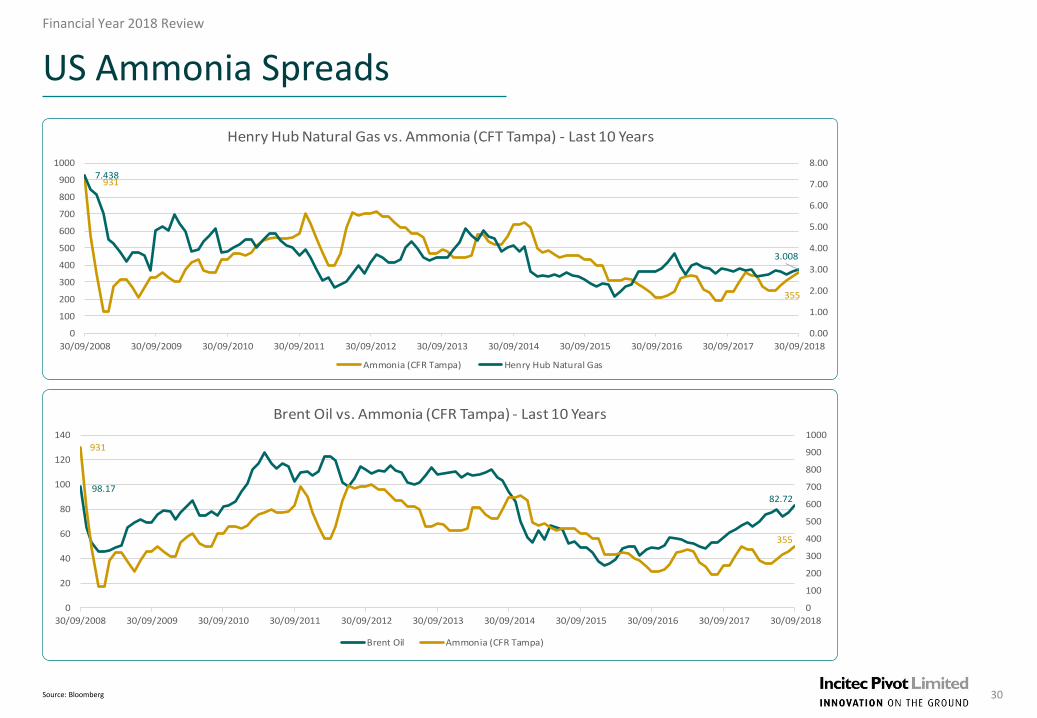
US Ammonia Spreads
30Source: Bloomberg
2
2
931
355
7.438
3.008
0.00
1.00
2.00
3.00
4.00
5.00
6.00
7.00
8.00
0
100
200
300
400
500
600
700
800
900
1000
30/09/2008 30/09/2009 30/09/2010 30/09/2011 30/09/2012 30/09/2013 30/09/2014 30/09/2015 30/09/2016 30/09/2017 30/09/2018
Henry Hub Natural Gas vs. Ammonia (CFT Tampa) - Last 10 Years
Ammonia (CFR Tampa) Henry Hub Natural Gas
98.1782.72
931
355
0
100
200
300
400
500
600
700
800
900
1000
0
20
40
60
80
100
120
140
30/09/2008 30/09/2009 30/09/2010 30/09/2011 30/09/2012 30/09/2013 30/09/2014 30/09/2015 30/09/2016 30/09/2017 30/09/2018
Brent Oil vs. Ammonia (CFR Tampa) - Last 10 Years
Brent Oil Ammonia (CFR Tampa)

Financial Year 2018 Review
US Ammonia Spreads
31Source: Bloomberg
2
707
320
931
355
0
100
200
300
400
500
600
700
800
900
1000
0
100
200
300
400
500
600
700
800
30/09/2008 30/09/2009 30/09/2010 30/09/2011 30/09/2012 30/09/2013 30/09/2014 30/09/2015 30/09/2016 30/09/2017 30/09/2018
Urea (FOB Middle East) vs. Ammonia (CFR Tampa) - Last 10 Years
Urea FOB Middle East Ammonia (CFR Tampa)

Financial Year 2018 Review
Fertiliser Benchmark Pricing
32Source: Bloomberg
2
2
1215
439
0
200
400
600
800
1000
1200
1400
30/09/2008 30/09/2009 30/09/2010 30/09/2011 30/09/2012 30/09/2013 30/09/2014 30/09/2015 30/09/2016 30/09/2017 30/09/2018
DAP (FOB Tampa) - Last 10 Years
707
320
0
100
200
300
400
500
600
700
800
30/09/2008 30/09/2009 30/09/2010 30/09/2011 30/09/2012 30/09/2013 30/09/2014 30/09/2015 30/09/2016 30/09/2017 30/09/2018
Urea (FOB Middle East) - Last 10 Years