
results presentation - Cromwell European REIT - Investor ...
Upload
khangminh22Category
view
0download
0
1
Results Presentation4Q20
The emerging market fintech investor

2
c
— Results presentation
4Q20 Highlights
Strong Finish In Banner Year For All Things Digital • Q4 ended 2020 on a strong note as our companies continue to benefit from the shift to digital financial services across the emerging
world, which saw a step change in growth through 2H20 due to COVID-19.
NAV• 4Q20 NAV/share rose to a fresh all-time high of SEK 3.83 and NAV to USD 388.1m, driven by continued strong performance across the
portfolio. In USD terms, NAV/share grew 24% YoY to USD 0.47.
Creditas• VEF’s lighthouse investment, Creditas, closed a Series E funding round of USD 255m, valuing the company at USD 1.75b. VEF invested an
additional USD 25m as part of the round and Creditas now accounts for 44% of total NAV.
VEF Share Placement• VEF raised SEK 522m (USD 61m) in November via a direct market placement, with support of existing and new investors to continue its
investment mandate in EM Fintech.
New Name - VEF• At the Special General Meeting (SGM) in October, Vostok Emerging Finance resolved to change the Company’s name to VEF.
3
NAV
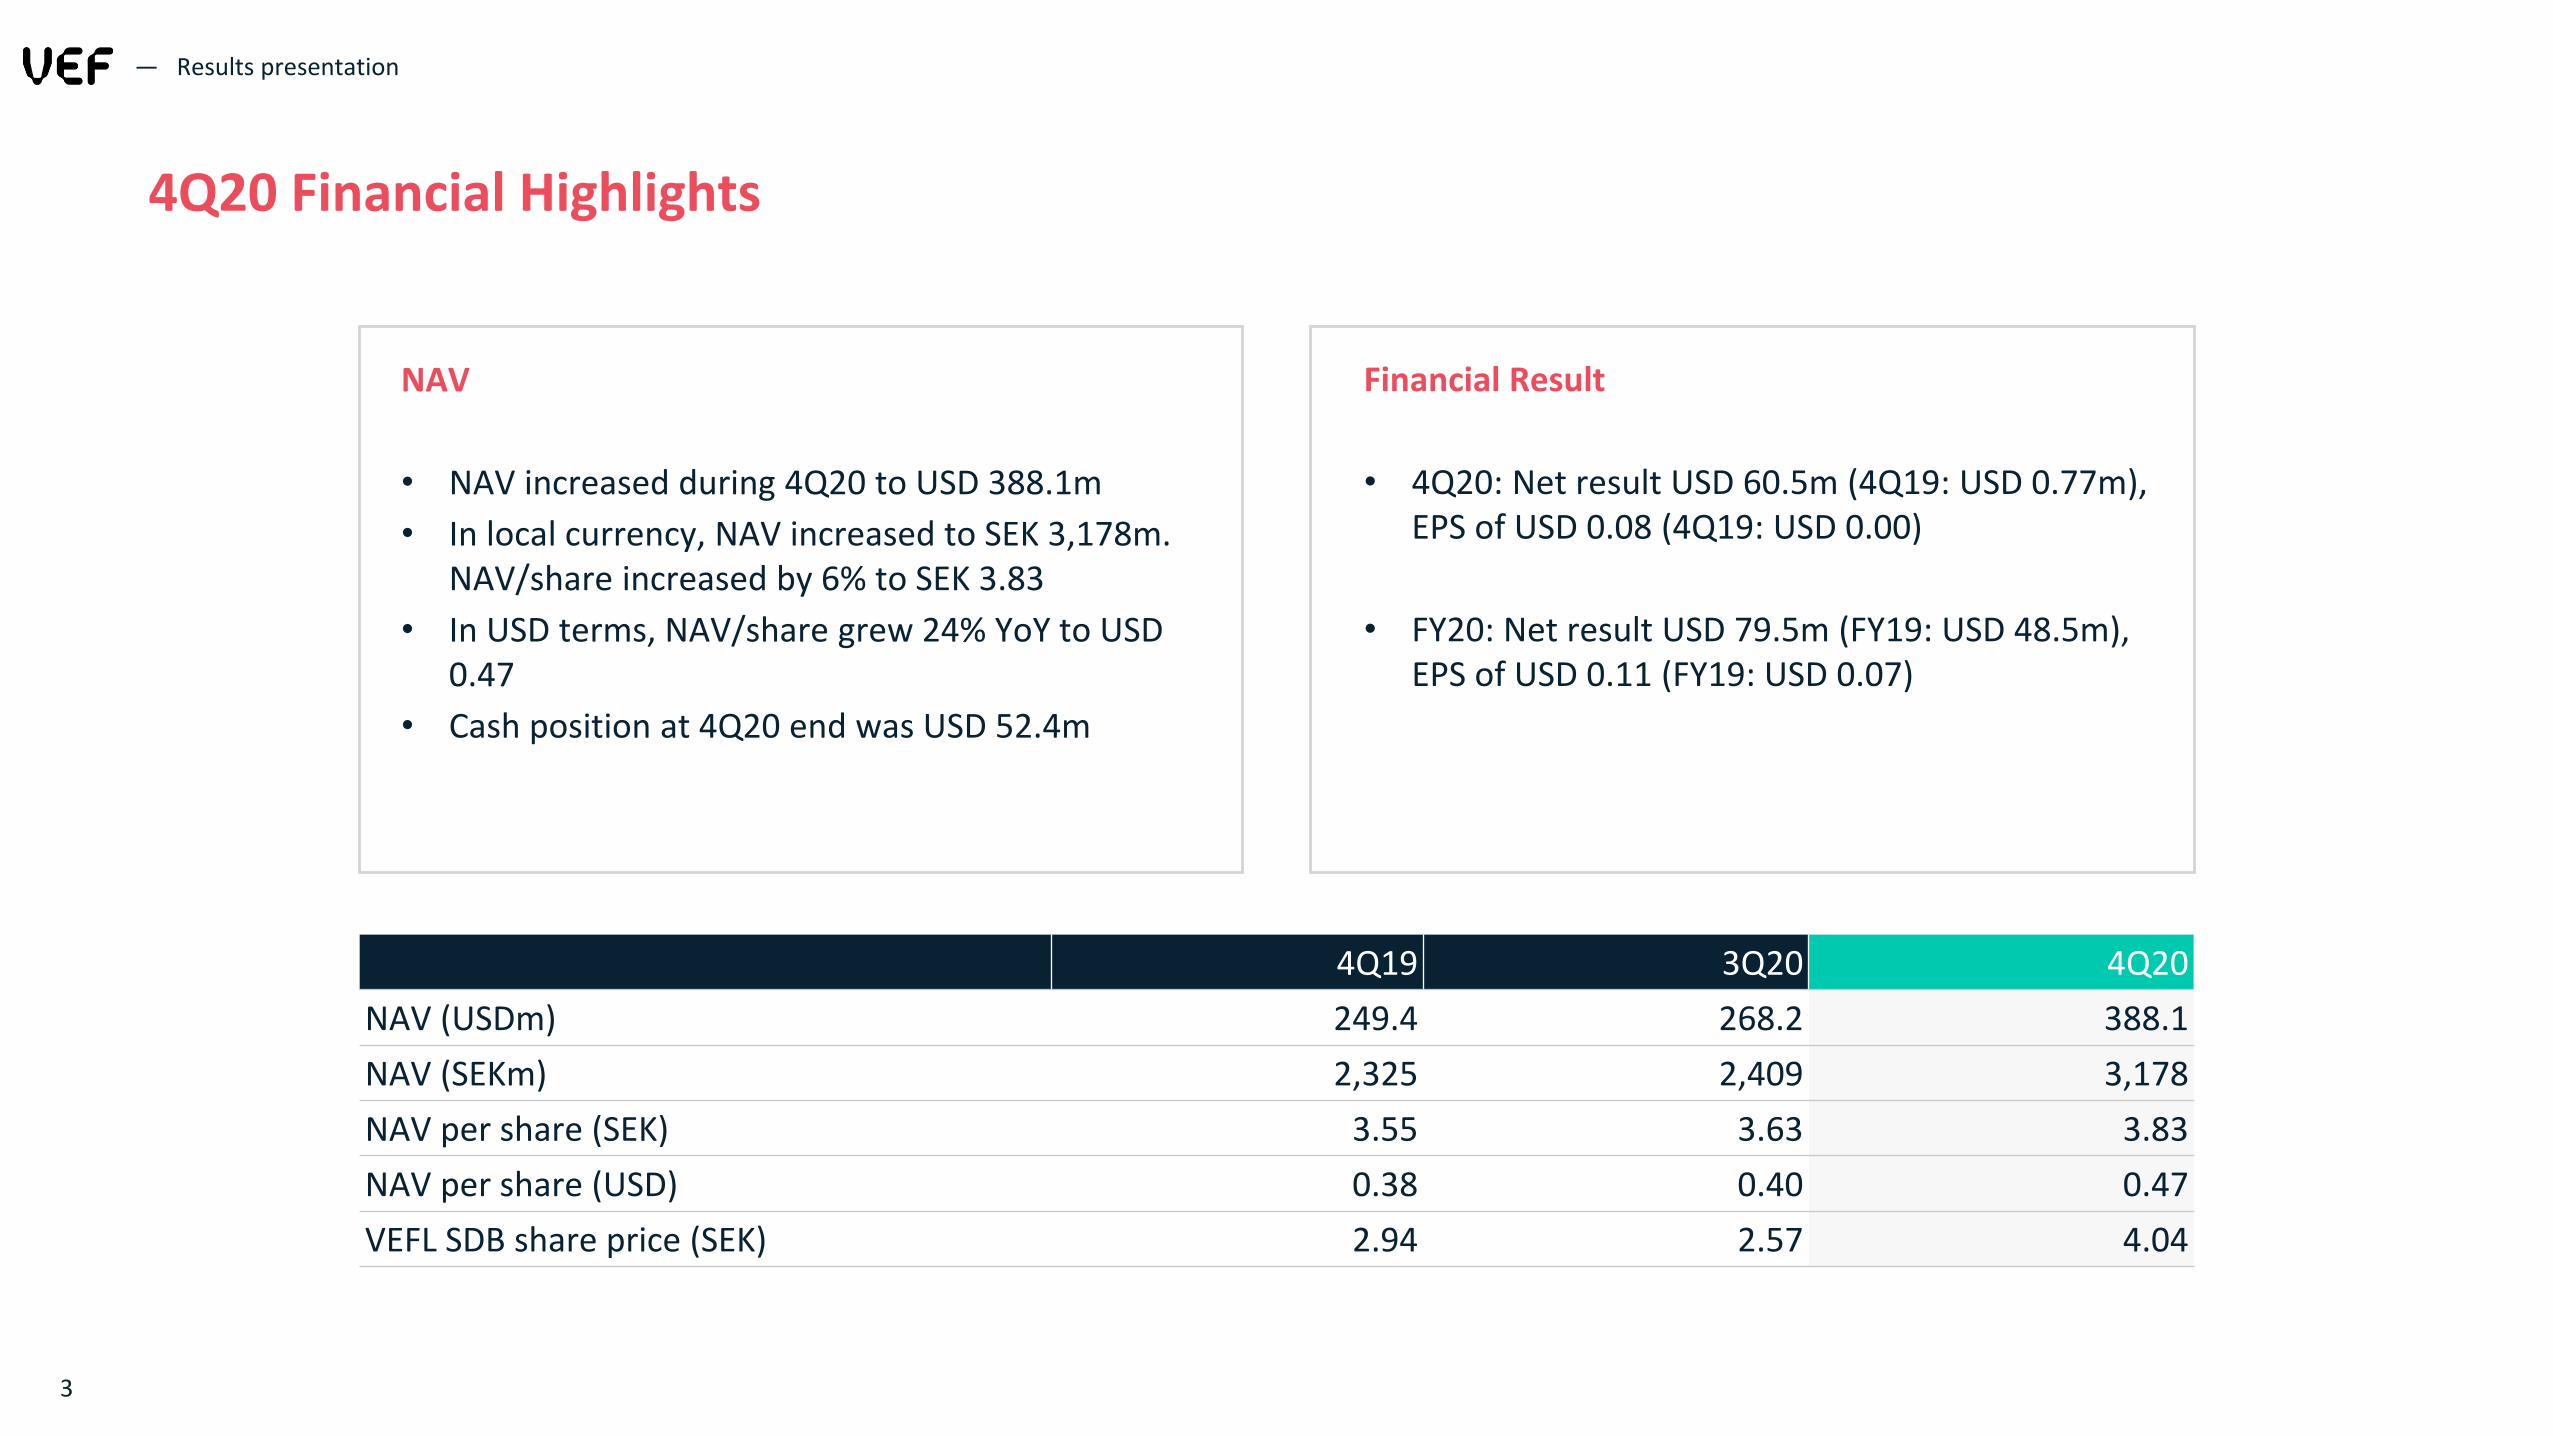
• NAV increased during 4Q20 to USD 388.1m
• In local currency, NAV increased to SEK 3,178m. NAV/share increased by 6% to SEK 3.83
• In USD terms, NAV/share grew 24% YoY to USD 0.47
• Cash position at 4Q20 end was USD 52.4m
— Results presentation
4Q19 3Q20 4Q20
NAV (USDm) 249.4 268.2 388.1
NAV (SEKm) 2,325 2,409 3,178
NAV per share (SEK) 3.55 3.63 3.83
NAV per share (USD) 0.38 0.40 0.47
VEFL SDB share price (SEK) 2.94 2.57 4.04
4Q20 Financial Highlights
Financial Result
• 4Q20: Net result USD 60.5m (4Q19: USD 0.77m), EPS of USD 0.08 (4Q19: USD 0.00)
• FY20: Net result USD 79.5m (FY19: USD 48.5m), EPS of USD 0.11 (FY19: USD 0.07)

0
50
100
150
200
250
300
350
400
Dec
-15
Mar
-16
Jun
-16
Sep
-16
Dec
-16
Mar
-17
Jun
-17
Sep
-17
Dec
-17
Mar
-18
Jun
-18
Sep
-18
Dec
-18
Mar
-19
Jun
-19
Sep
-19
Dec
-19
Mar
-20
Jun
-20
Sep
-20
Dec
-20
4
VEF NAV Evolution (USDm)
— Results presentation
.NAV Reaches a New High of USD 388.1m
Q1COVID impact
Q2 & Q3 Post-COVID
growth
Q1
• COVID-19 impact; NAV decrease of 25%
Q2
• Clarity and confidence returns coupled with market recovery; 20% NAV recovery
Q3
• Portfolio back on a growth footing; NAV growth of 20%
Q4
• NAV growth of 45% QoQ to USD 388.1m, part driven by capital raise
Q4NAV reaches
fresh high
Net proceeds from capital
raise
Note: growth metrics displayed are in USD terms

5
— Results presentation
4Q20 NAV Evolution

Focus Secured Consumer Lending
Founded 2012
Key region Brazil
Share of NAV: 44%
Key facts
Fair value USD 169.0 mln
Investment USD 73.5 mln
Ownership stake 9.8%
Year of investment 2017
Origination Revenue
“In early March, due to the pandemic, we preferred to be cautious, as we did not know how the markets would react. Although our pace slowed, we have continued growing and this allowed us to monitor credit quality and capital markets liquidity. Both have remained very strong for Creditas and, in July, we returned to hyper-growth keeping the plan to triple in size in the next 12 months”, comments Sergio Furio, Creditas CEO.
— Results presentation
-
50
100
150
200
250
300
350
Origination (BRLm)
6
-
20
40
60
80
100
120
Recurring revenue (BRLm) Upfront revenue (BRLm)

0
50
100
150
200
20
17
20
18
2Q
19
1Q
20
2Q
20
3Q
20
4Q
20
New investment USDm
— Results presentation
Creditas – North Star Investment and Driving NAV
Series E Fundraising
• In 4Q20 Creditas raised a USD 255m Series E funding round, giving the business a USD 1.75b post-money valuation.
• New investors include LGT Lightstone, Tarsadia Capital, e.ventures, Sunley House and Wellington Management.
• Post the fundraising, Creditas now accounts for 44% of VEF’s NAV.
• Now on a path towards IPO, Creditas has begun to share quarterly results of key operational metrics, with the objective of increasing transparency to the market, something which we welcome as a listed investment company.
Creditas Stake Valuation Since Initial Investment (USDm)
Investment Series D
(USD 23.5m)
Mark-to-model
Initial investment
Series C (USD 25m)
Investment Series E
(USD 25m)
7
25.0 25.0
73.2
50.4
80.7
102.1
169.0

Focus Diversified financial services for Mexican SMEs
Founded 2014
Key region Mexico
Share of NAV: 13%
Key facts
Fair value USD 48.5 mln
Investment USD 27.5 mln
Ownership stake 11.0%
Year of investment 2018
— Results presentation
8

Juspay solves these challenges for customers with theirunifying layer of products and value-added services, withmore than 200 mln downloads of its SDK
Juspay improves conversion rates for merchants andothers in the payment value chain, facilitating more than USD 20 bln of annualised GMV and 5m transactions per day
Based in Bangalore, Juspay is backed by Accel India,Wellington Management, and serves some of India’slargest merchants including Amazon, Flipkart and Uber
Our first investment into India, Juspay is the country’sleading mobile payments platform for onlinemerchants
01
India has one of the most advanced and complex electronic payment infrastructures globally, resulting in friction and challenges for merchants and banks in the country02
Growing digitization of Indian paymentsValue and volume of UPI transactions in India
0
500
1,000
1,500
2,000
2,500
0
500
1,000
1,500
2,000
2,500
3,000
3,500
4,000
4,500
Aug-16 Dec-16 Apr-17 Aug-17 Dec-17 Apr-18 Aug-18 Dec-18 Apr-19 Aug-19 Dec-19 Apr-20 Aug-20 Dec-20
Value in INR billion (LHS) Volume in million (RHS)
Focus Mobile Payments
Founded 2012
Key region India
Share of NAV: 4%
Key facts
Fair value USD 17.4 mln
Investment USD 13.0 mln
Ownership stake 9.9%
Year of investment 2020
— Results presentation
9
``
``
``
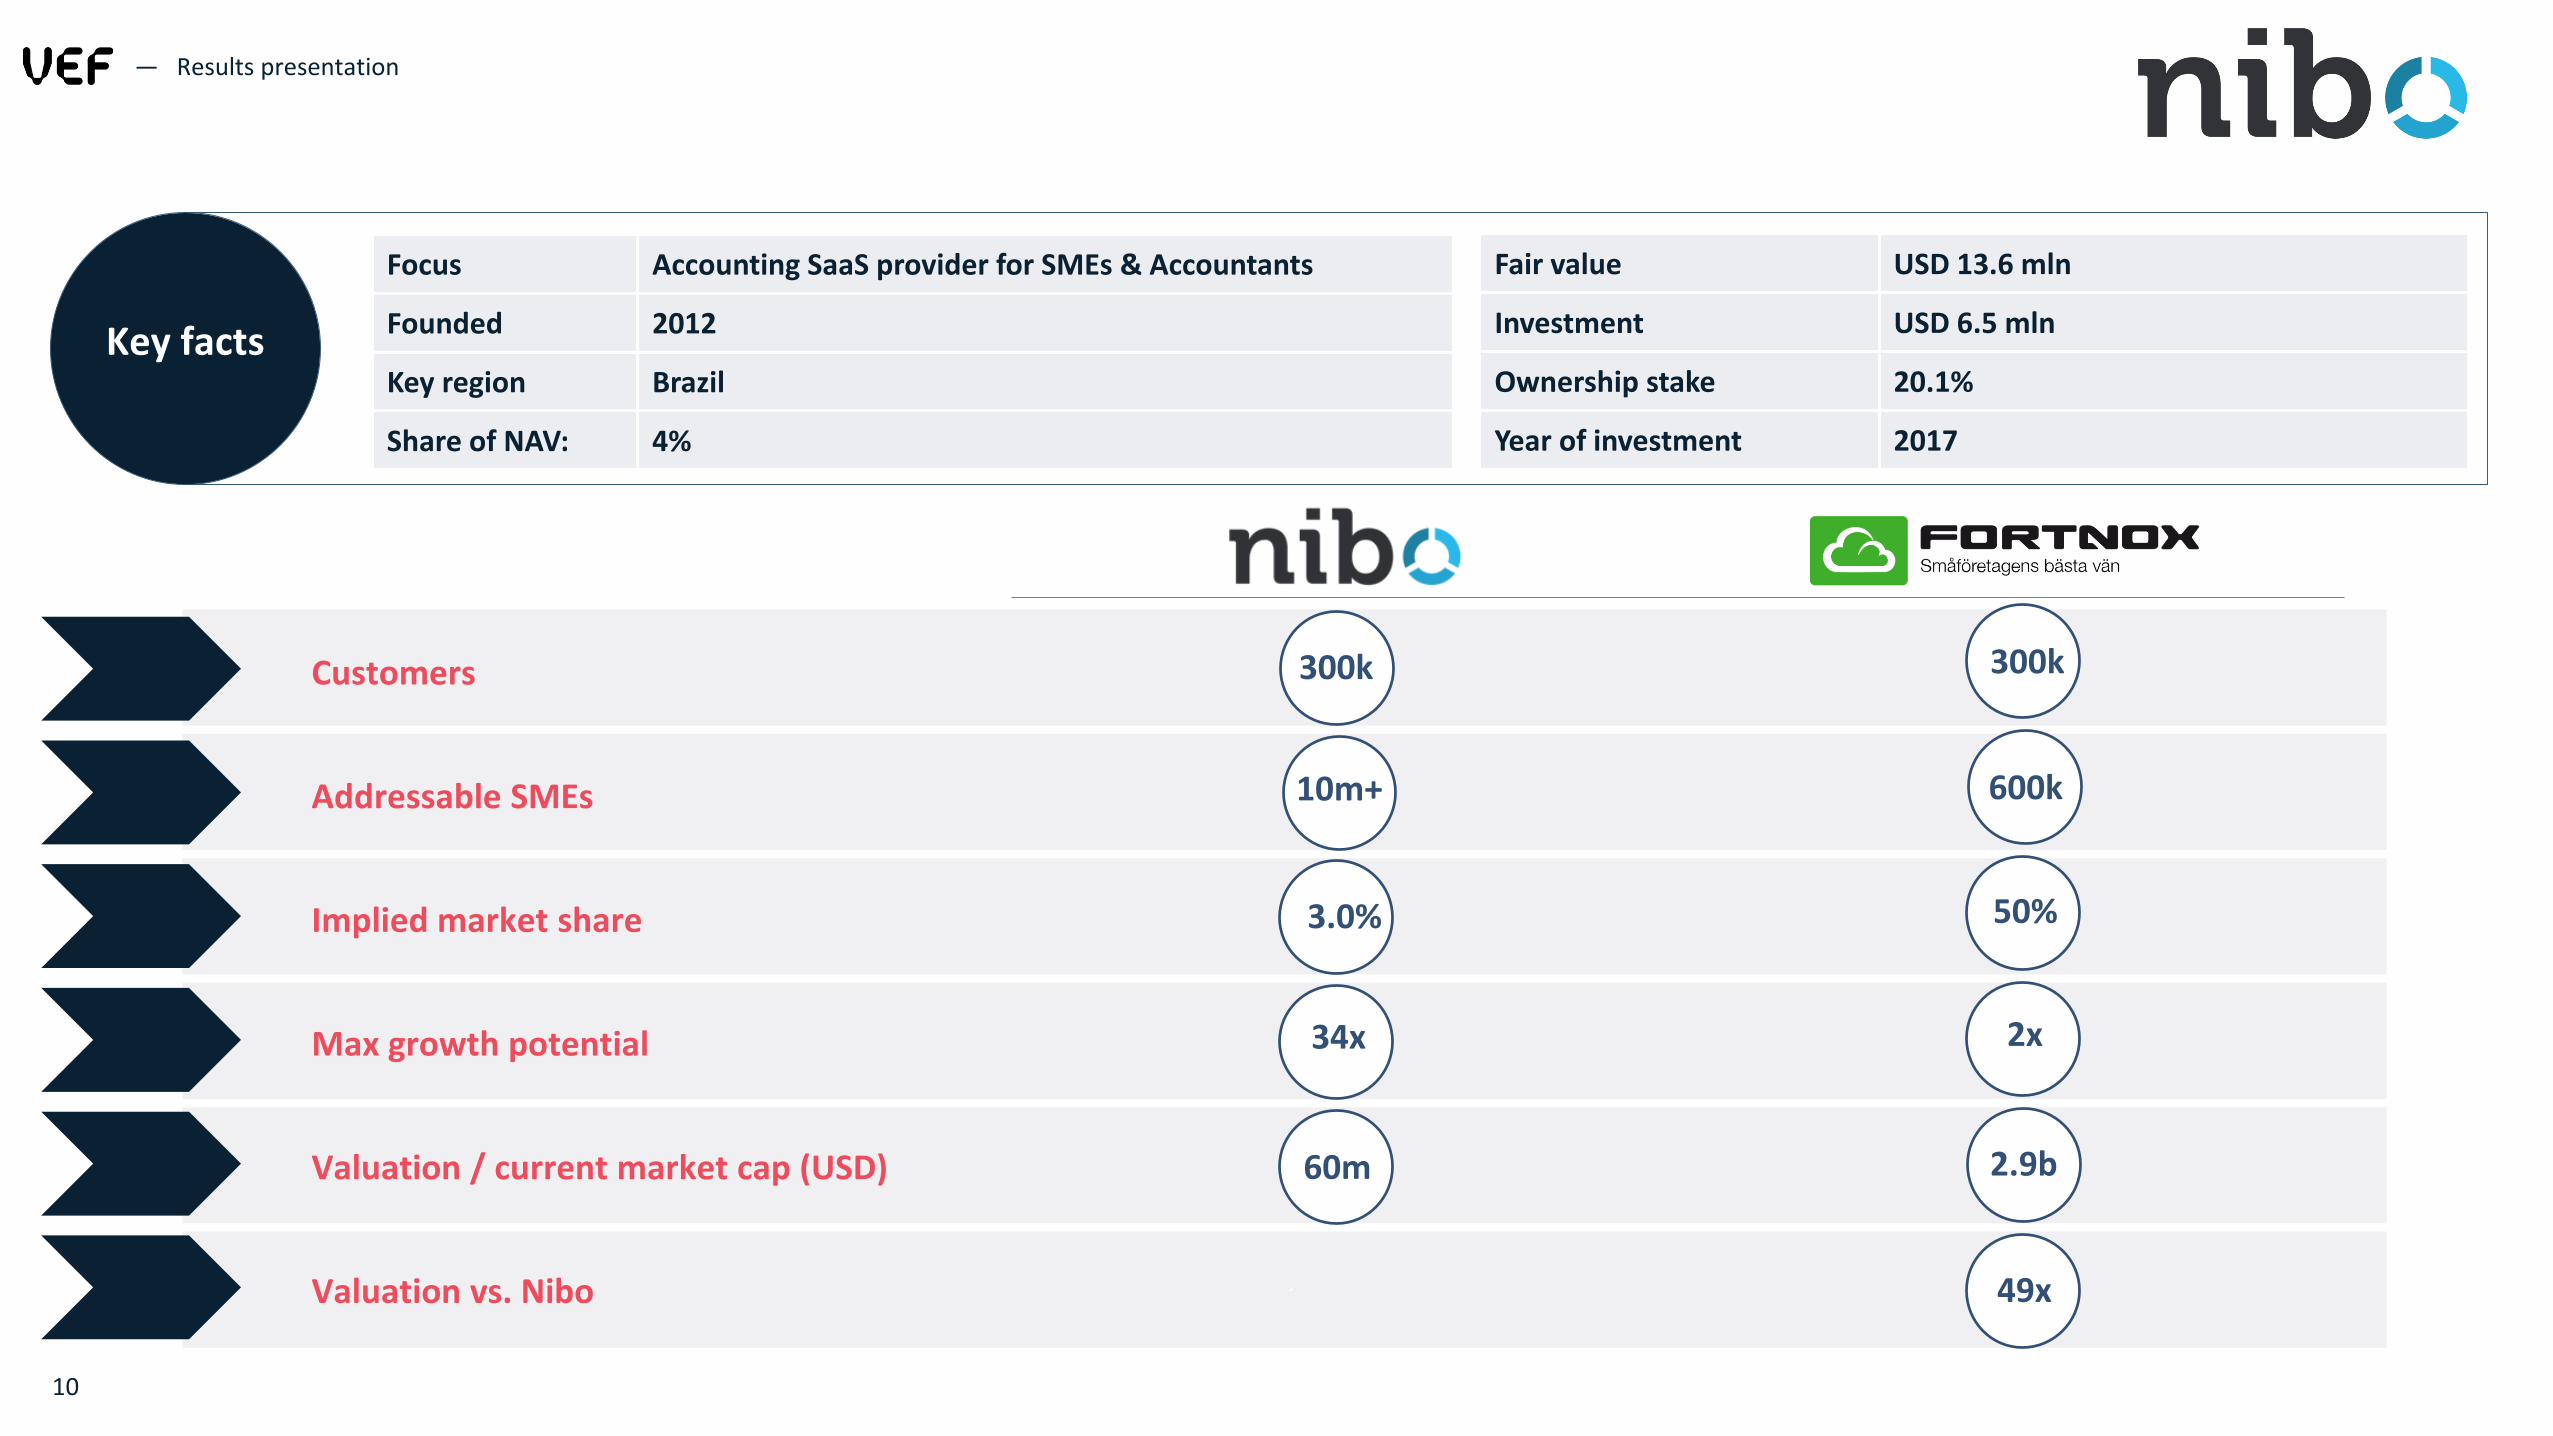
Focus Accounting SaaS provider for SMEs & Accountants
Founded 2012
Key region Brazil
Share of NAV: 4%
Key facts
Fair value USD 13.6 mln
Investment USD 6.5 mln
Ownership stake 20.1%
Year of investment 2017
— Results presentation
300k
600k
50%
2x
2.9b
49x
300k
10m+
3.0%
34x
60m
Customers
Addressable SMEs
Implied market share
Max growth potential
Valuation / current market cap (USD)
Valuation vs. Nibo
10
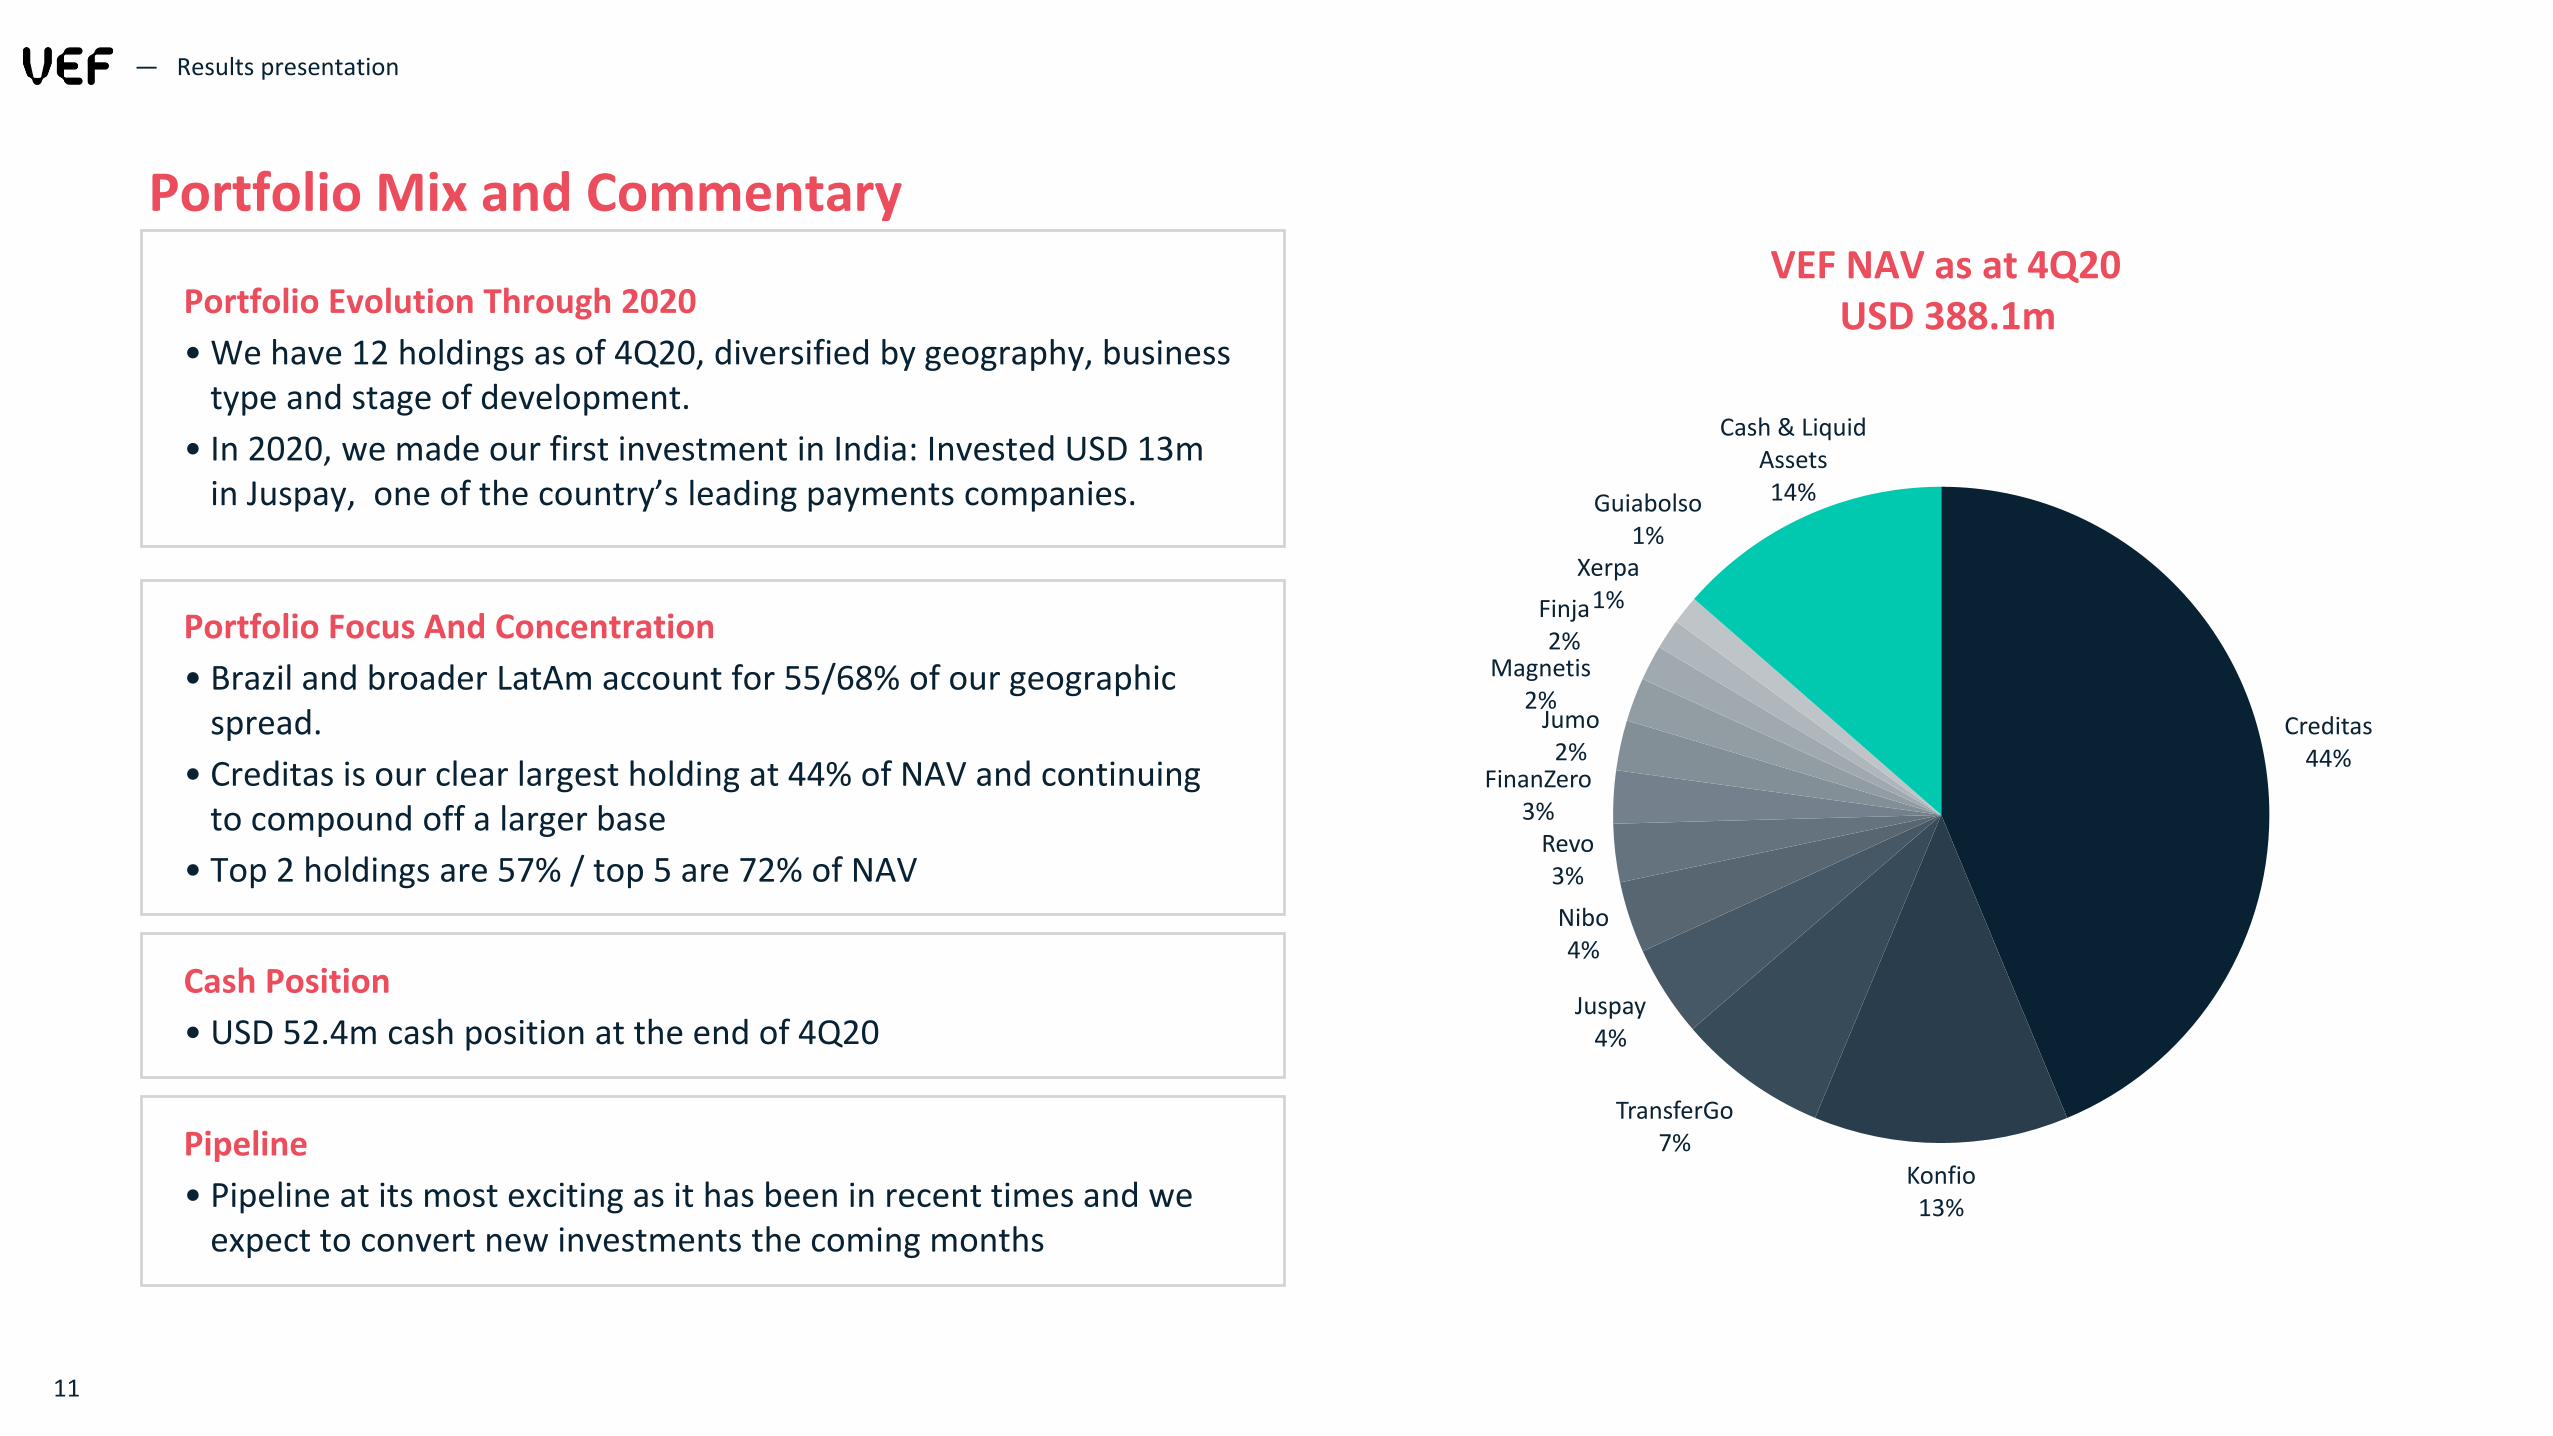
Creditas44%
Konfio13%
TransferGo7%
Juspay4%
Nibo4%
Revo3%
FinanZero3%
Jumo2%
Magnetis2%
Finja2%
Xerpa1%
Guiabolso1%
Cash & Liquid Assets14%
11
VEF NAV as at 4Q20USD 388.1mPortfolio Evolution Through 2020
• We have 12 holdings as of 4Q20, diversified by geography, business type and stage of development.
• In 2020, we made our first investment in India: Invested USD 13m in Juspay, one of the country’s leading payments companies.
Portfolio Focus And Concentration
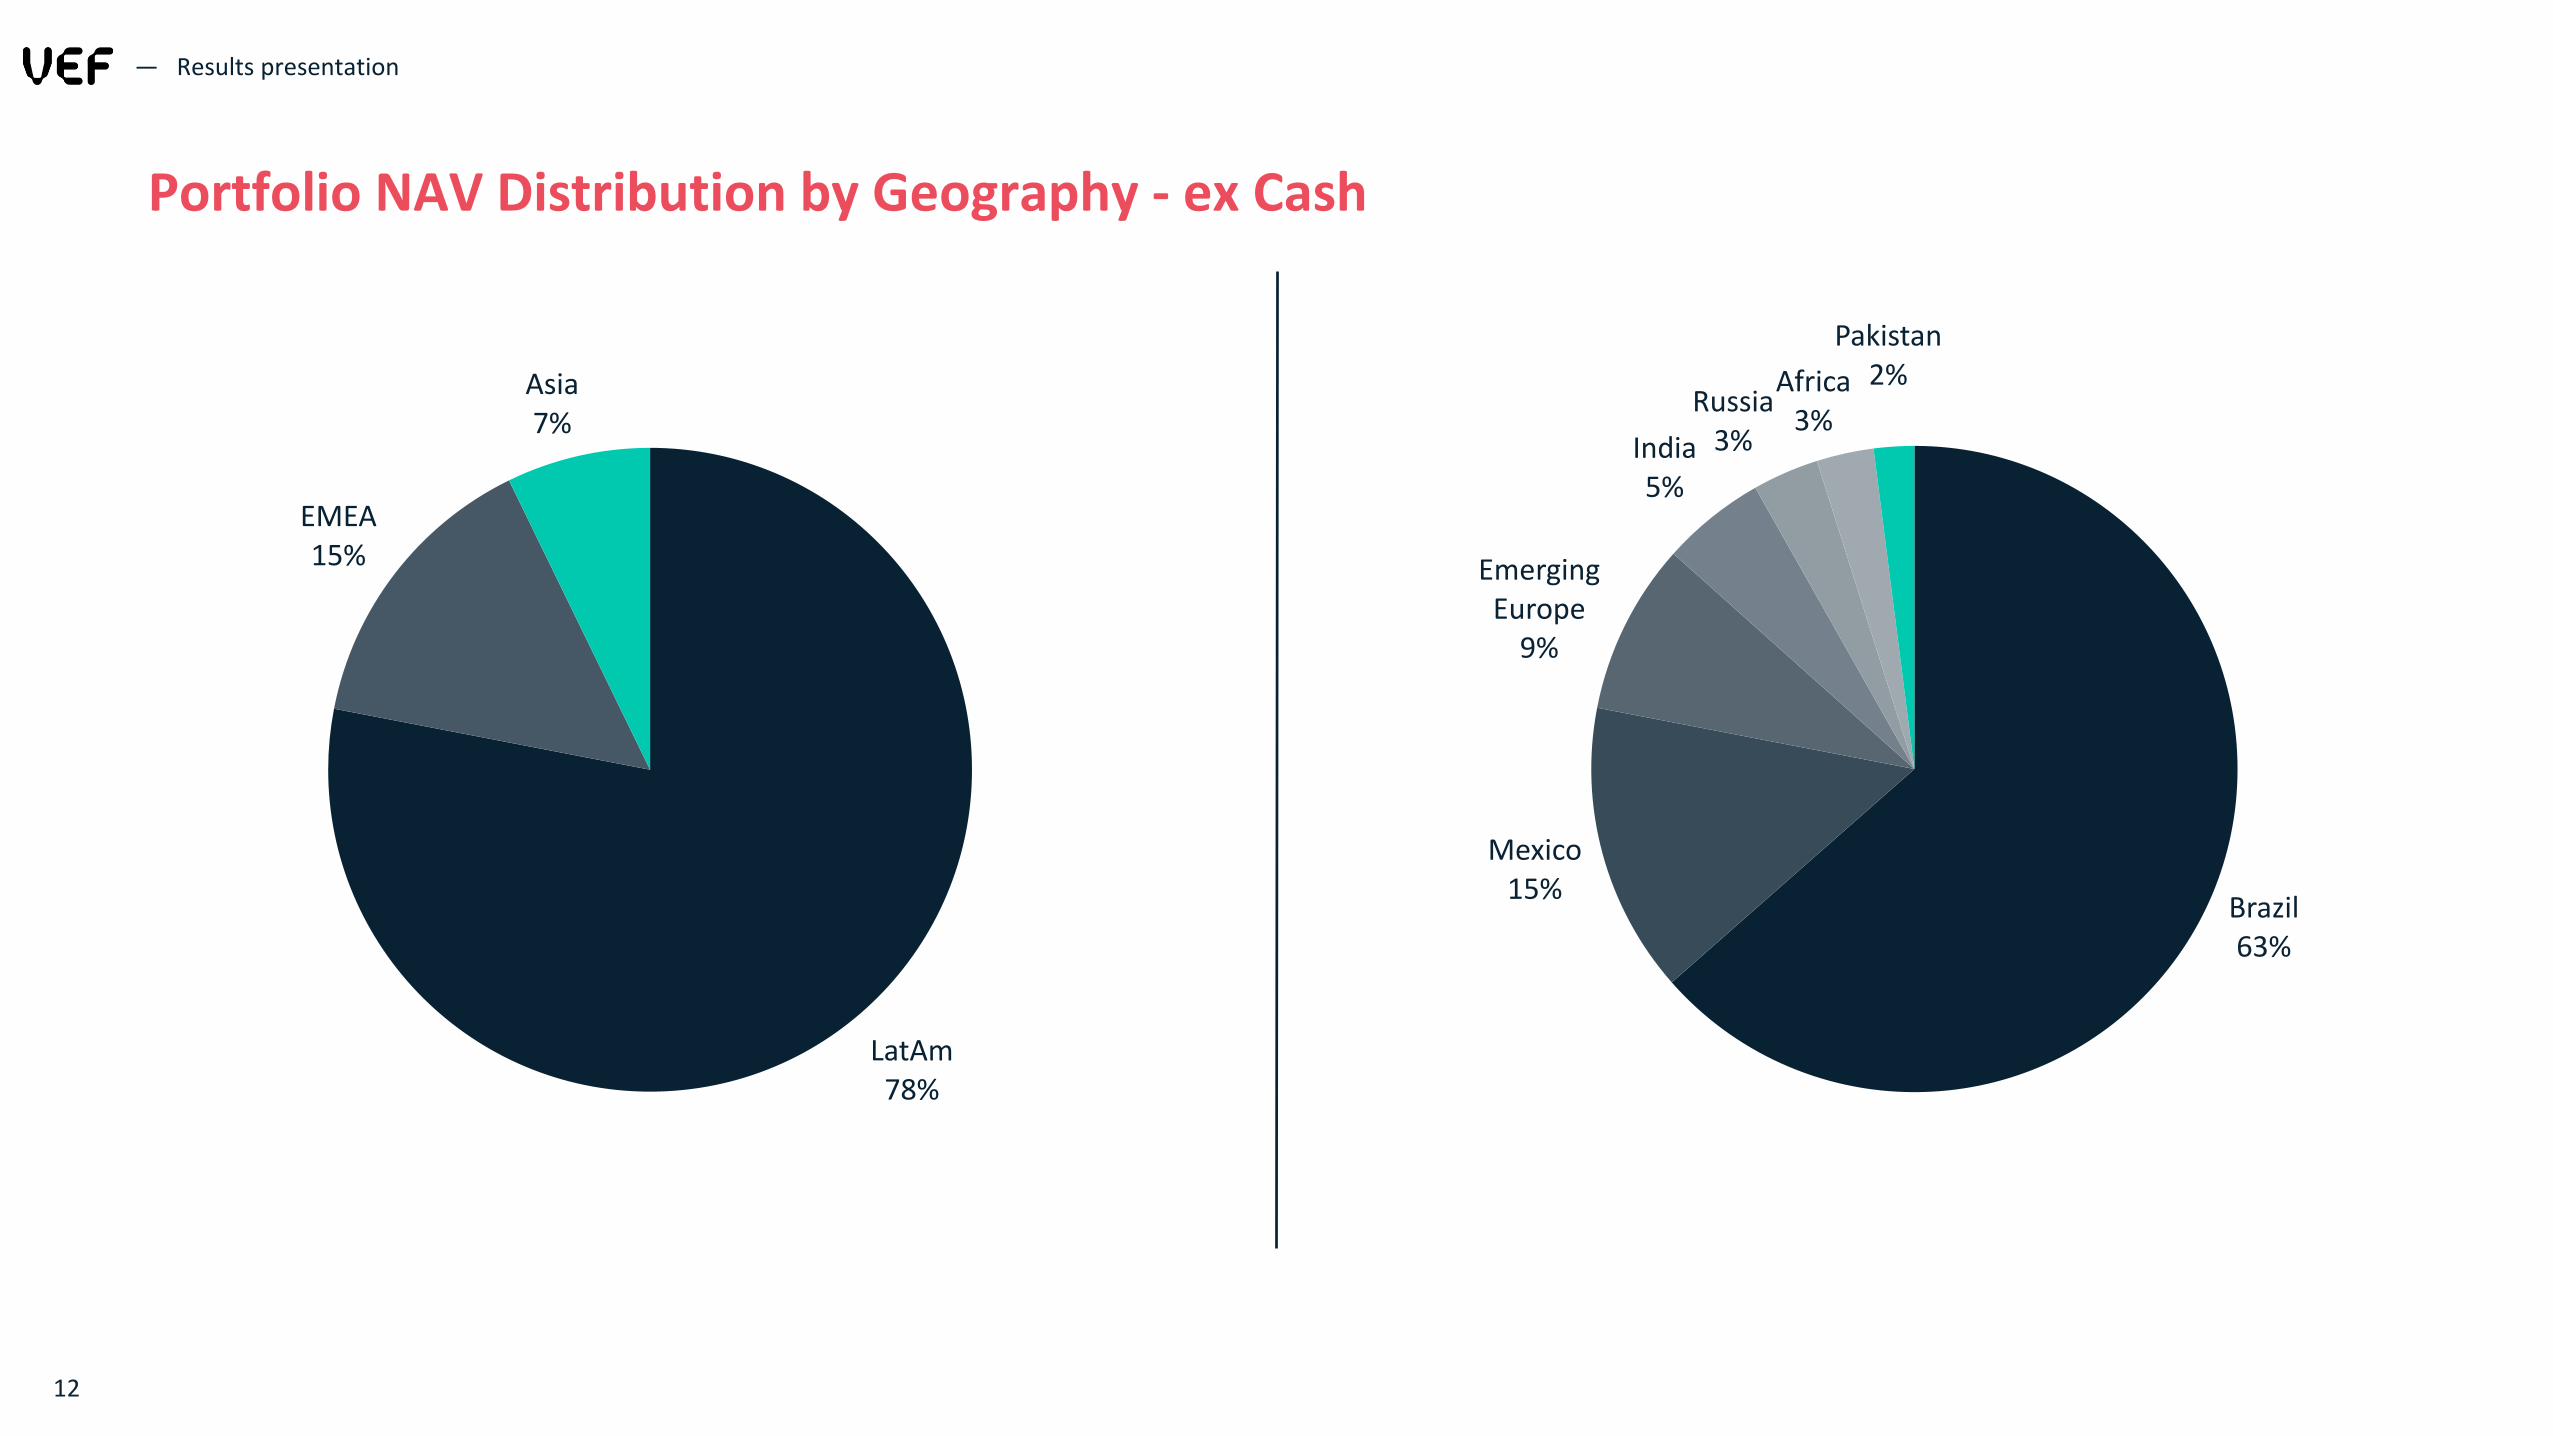
• Brazil and broader LatAm account for 55/68% of our geographic spread.
• Creditas is our clear largest holding at 44% of NAV and continuing to compound off a larger base
• Top 2 holdings are 57% / top 5 are 72% of NAV
Cash Position
• USD 52.4m cash position at the end of 4Q20
Portfolio Mix and Commentary
Pipeline
• Pipeline at its most exciting as it has been in recent times and we expect to convert new investments the coming months
— Results presentation
12
Portfolio NAV Distribution by Geography - ex Cash
— Results presentation
LatAm78%
EMEA15%
Asia7%
Brazil63%
Mexico15%
Emerging Europe
9%
India5%
Russia3%
Africa3%
Pakistan2%

13
— Results presentation
Pipeline Heating Up
India
Egypt Pakistan
Brazil
Mexico
• Deal flow as healthy as ever with fintech in emerging markets gaining momentum and high profile exits.
• Country by country approach to searching for opportunities and teams that we believe will be winners in their space.
• Leverage our deep fintech expertise, global lens on financial services and strong local partner network to identify opportunities that exceed our expected IRR hurdle.
• Have core countries and company target lists to focus our efforts.
• Countries of focus are Brazil, India and Mexico with large volume of big deals and frontiers like Egypt and Pakistan with a less developed ecosystem and smaller ticket opportunities.
• We are likely to make new investments in 2021 as we convert a busy pipeline
14
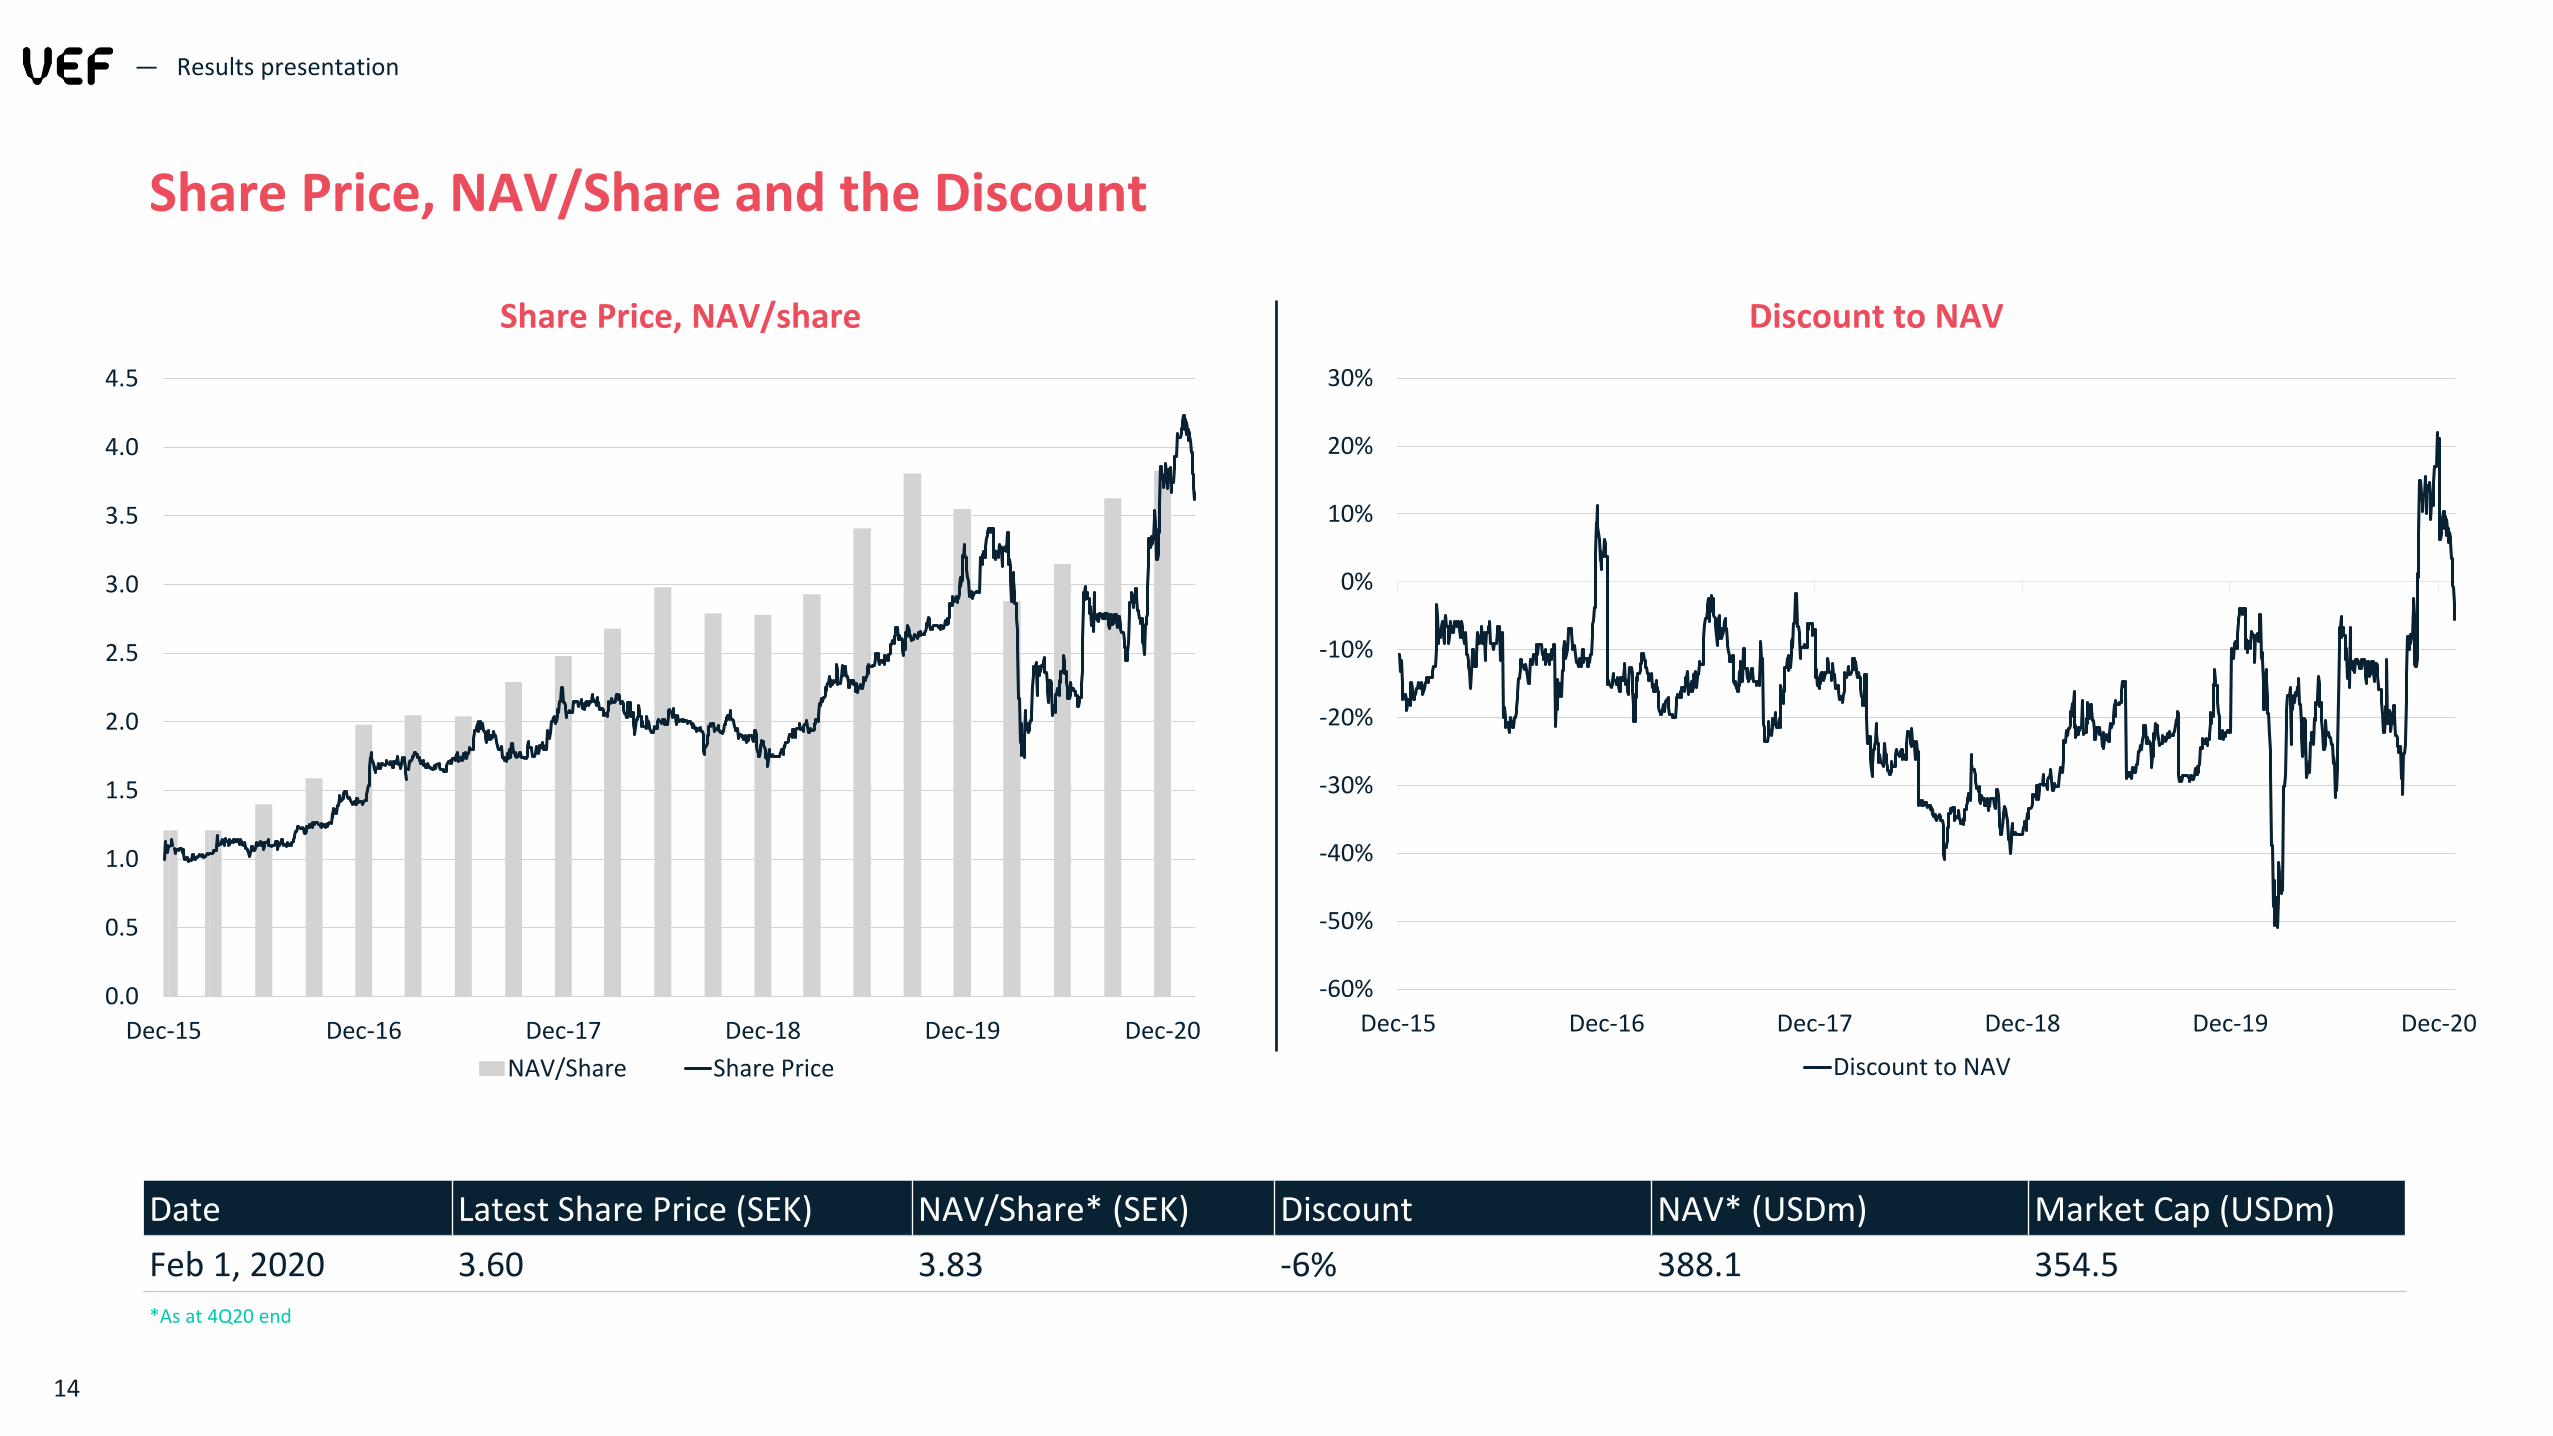
Share Price, NAV/Share and the Discount
— Results presentation
Discount to NAVShare Price, NAV/share
*As at 4Q20 end
Date Latest Share Price (SEK) NAV/Share* (SEK) Discount NAV* (USDm) Market Cap (USDm)
Feb 1, 2020 3.60 3.83 -6% 388.1 354.5
0.0
0.5
1.0
1.5
2.0
2.5
3.0
3.5
4.0
4.5
Dec-15 Dec-16 Dec-17 Dec-18 Dec-19 Dec-20
NAV/Share Share Price
-60%
-50%
-40%
-30%
-20%
-10%
0%
10%
20%
30%
Dec-15 Dec-16 Dec-17 Dec-18 Dec-19 Dec-20
Discount to NAV
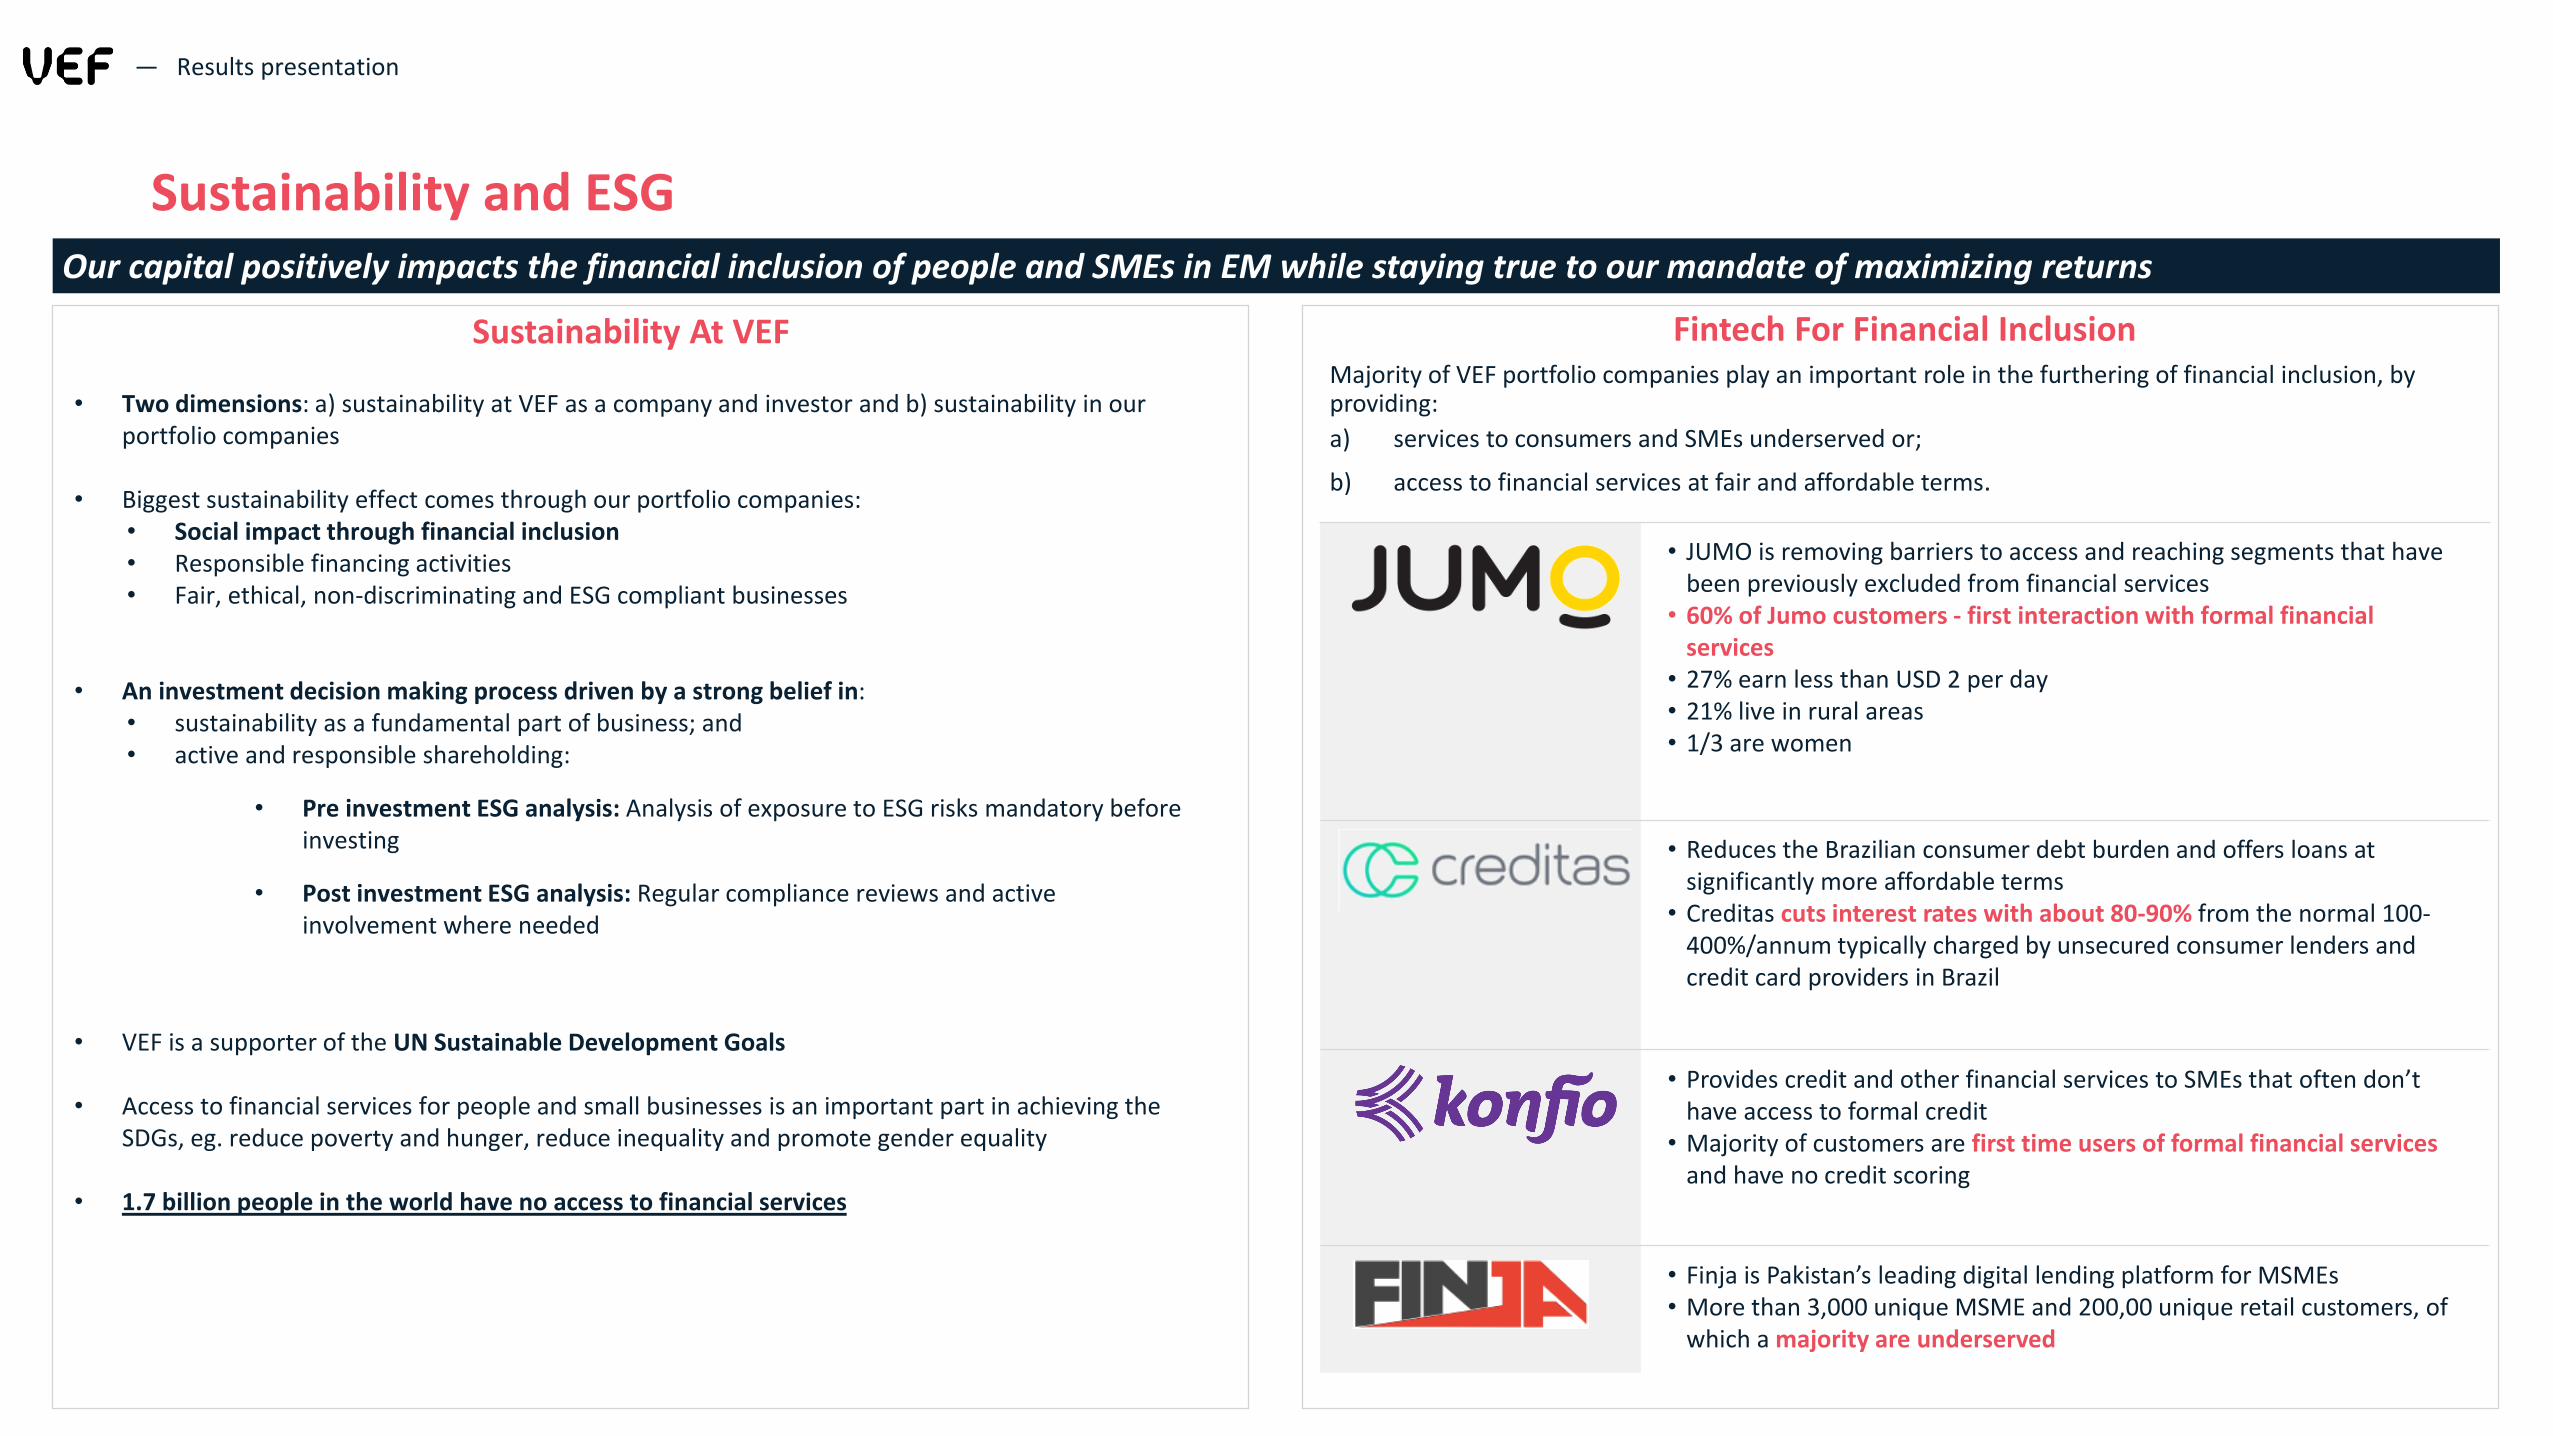
• JUMO is removing barriers to access and reaching segments that have been previously excluded from financial services
• 60% of Jumo customers - first interaction with formal financial services
• 27% earn less than USD 2 per day• 21% live in rural areas• 1/3 are women
• Reduces the Brazilian consumer debt burden and offers loans at significantly more affordable terms
• Creditas cuts interest rates with about 80-90% from the normal 100-400%/annum typically charged by unsecured consumer lenders and credit card providers in Brazil
• Provides credit and other financial services to SMEs that often don’t have access to formal credit
• Majority of customers are first time users of formal financial servicesand have no credit scoring
• Finja is Pakistan’s leading digital lending platform for MSMEs • More than 3,000 unique MSME and 200,00 unique retail customers, of
which a majority are underserved
Sustainability and ESGOur capital positively impacts the financial inclusion of people and SMEs in EM while staying true to our mandate of maximizing returns
Sustainability At VEF
• Two dimensions: a) sustainability at VEF as a company and investor and b) sustainability in our portfolio companies
• Biggest sustainability effect comes through our portfolio companies:• Social impact through financial inclusion• Responsible financing activities• Fair, ethical, non-discriminating and ESG compliant businesses
• An investment decision making process driven by a strong belief in: • sustainability as a fundamental part of business; and • active and responsible shareholding:
• Pre investment ESG analysis: Analysis of exposure to ESG risks mandatory before investing
• Post investment ESG analysis: Regular compliance reviews and active involvement where needed
• VEF is a supporter of the UN Sustainable Development Goals
• Access to financial services for people and small businesses is an important part in achieving the SDGs, eg. reduce poverty and hunger, reduce inequality and promote gender equality
• 1.7 billion people in the world have no access to financial services
Fintech For Financial InclusionMajority of VEF portfolio companies play an important role in the furthering of financial inclusion, by providing:
a) services to consumers and SMEs underserved or;
b) access to financial services at fair and affordable terms.
— Results presentation
16
— Results presentation
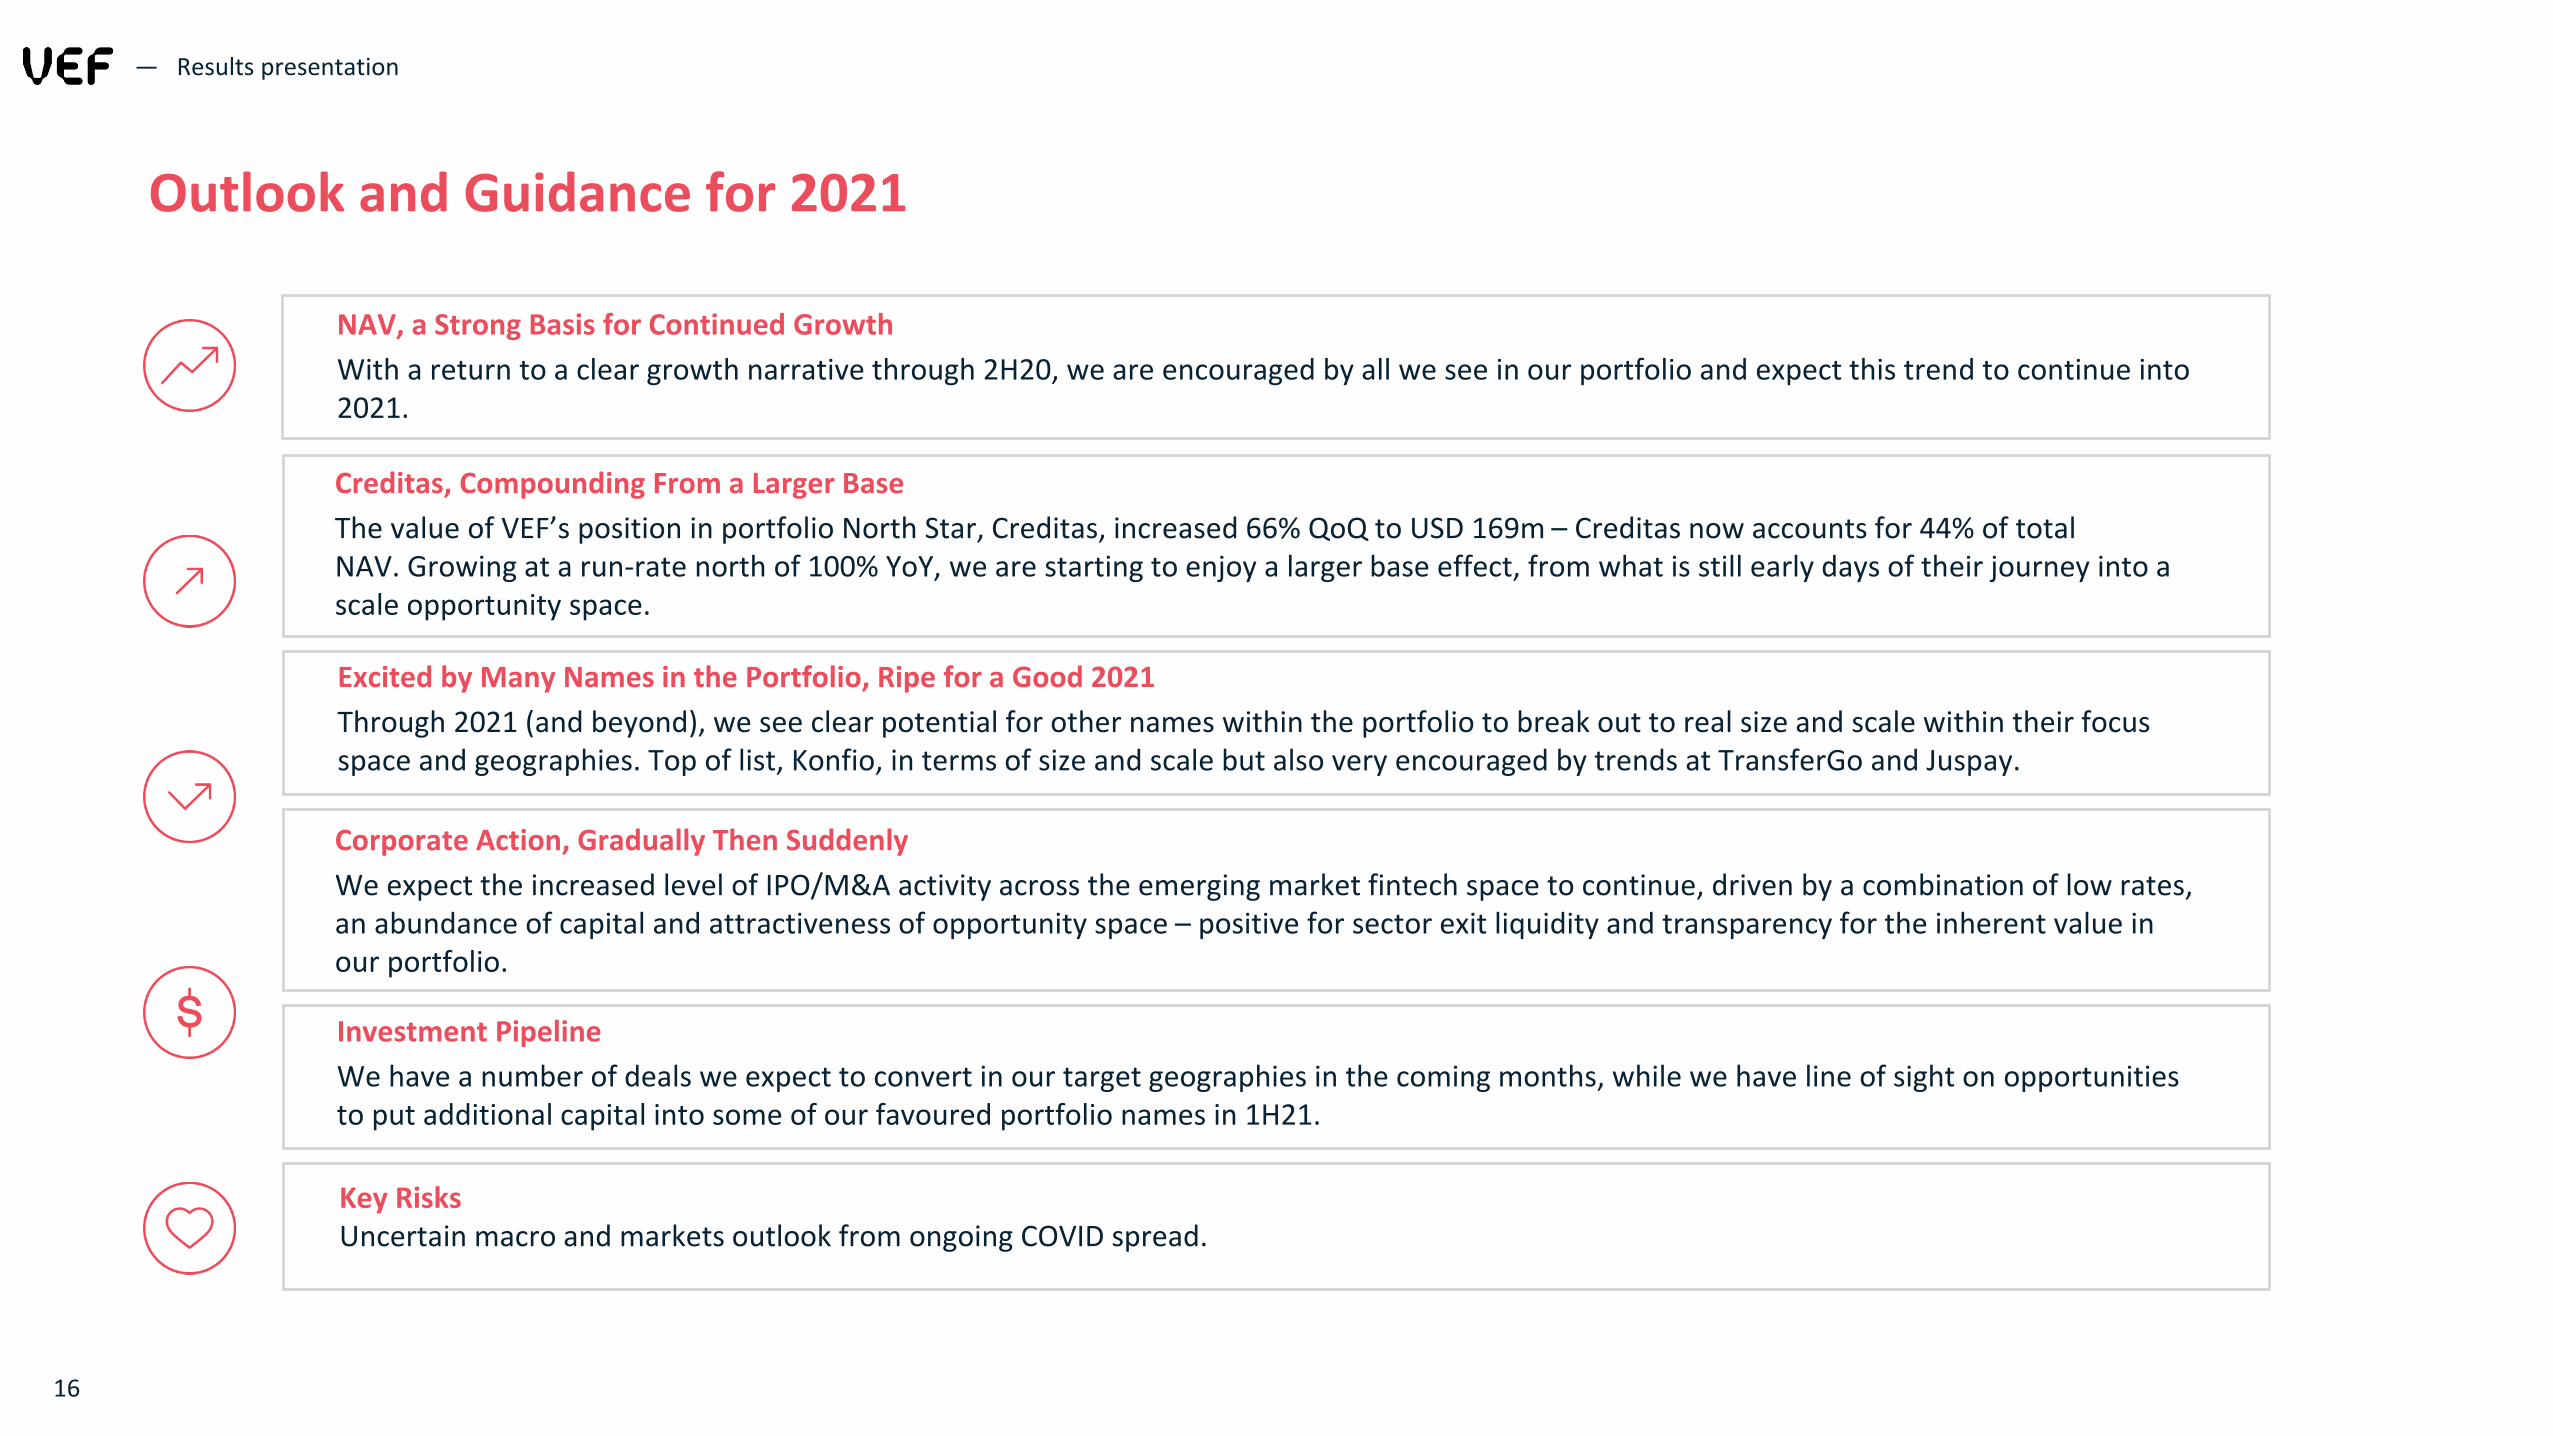
Outlook and Guidance for 2021
Creditas, Compounding From a Larger Base
The value of VEF’s position in portfolio North Star, Creditas, increased 66% QoQ to USD 169m – Creditas now accounts for 44% of total NAV. Growing at a run-rate north of 100% YoY, we are starting to enjoy a larger base effect, from what is still early days of their journey into a scale opportunity space.
NAV, a Strong Basis for Continued Growth
With a return to a clear growth narrative through 2H20, we are encouraged by all we see in our portfolio and expect this trend to continue into 2021.
Excited by Many Names in the Portfolio, Ripe for a Good 2021
Through 2021 (and beyond), we see clear potential for other names within the portfolio to break out to real size and scale within their focus space and geographies. Top of list, Konfio, in terms of size and scale but also very encouraged by trends at TransferGo and Juspay.
Corporate Action, Gradually Then Suddenly
We expect the increased level of IPO/M&A activity across the emerging market fintech space to continue, driven by a combination of low rates, an abundance of capital and attractiveness of opportunity space – positive for sector exit liquidity and transparency for the inherent value in our portfolio.
Investment Pipeline
We have a number of deals we expect to convert in our target geographies in the coming months, while we have line of sight on opportunities to put additional capital into some of our favoured portfolio names in 1H21.
Key RisksUncertain macro and markets outlook from ongoing COVID spread.

17
— Results presentation.
Appendix
16
18
— Results presentation
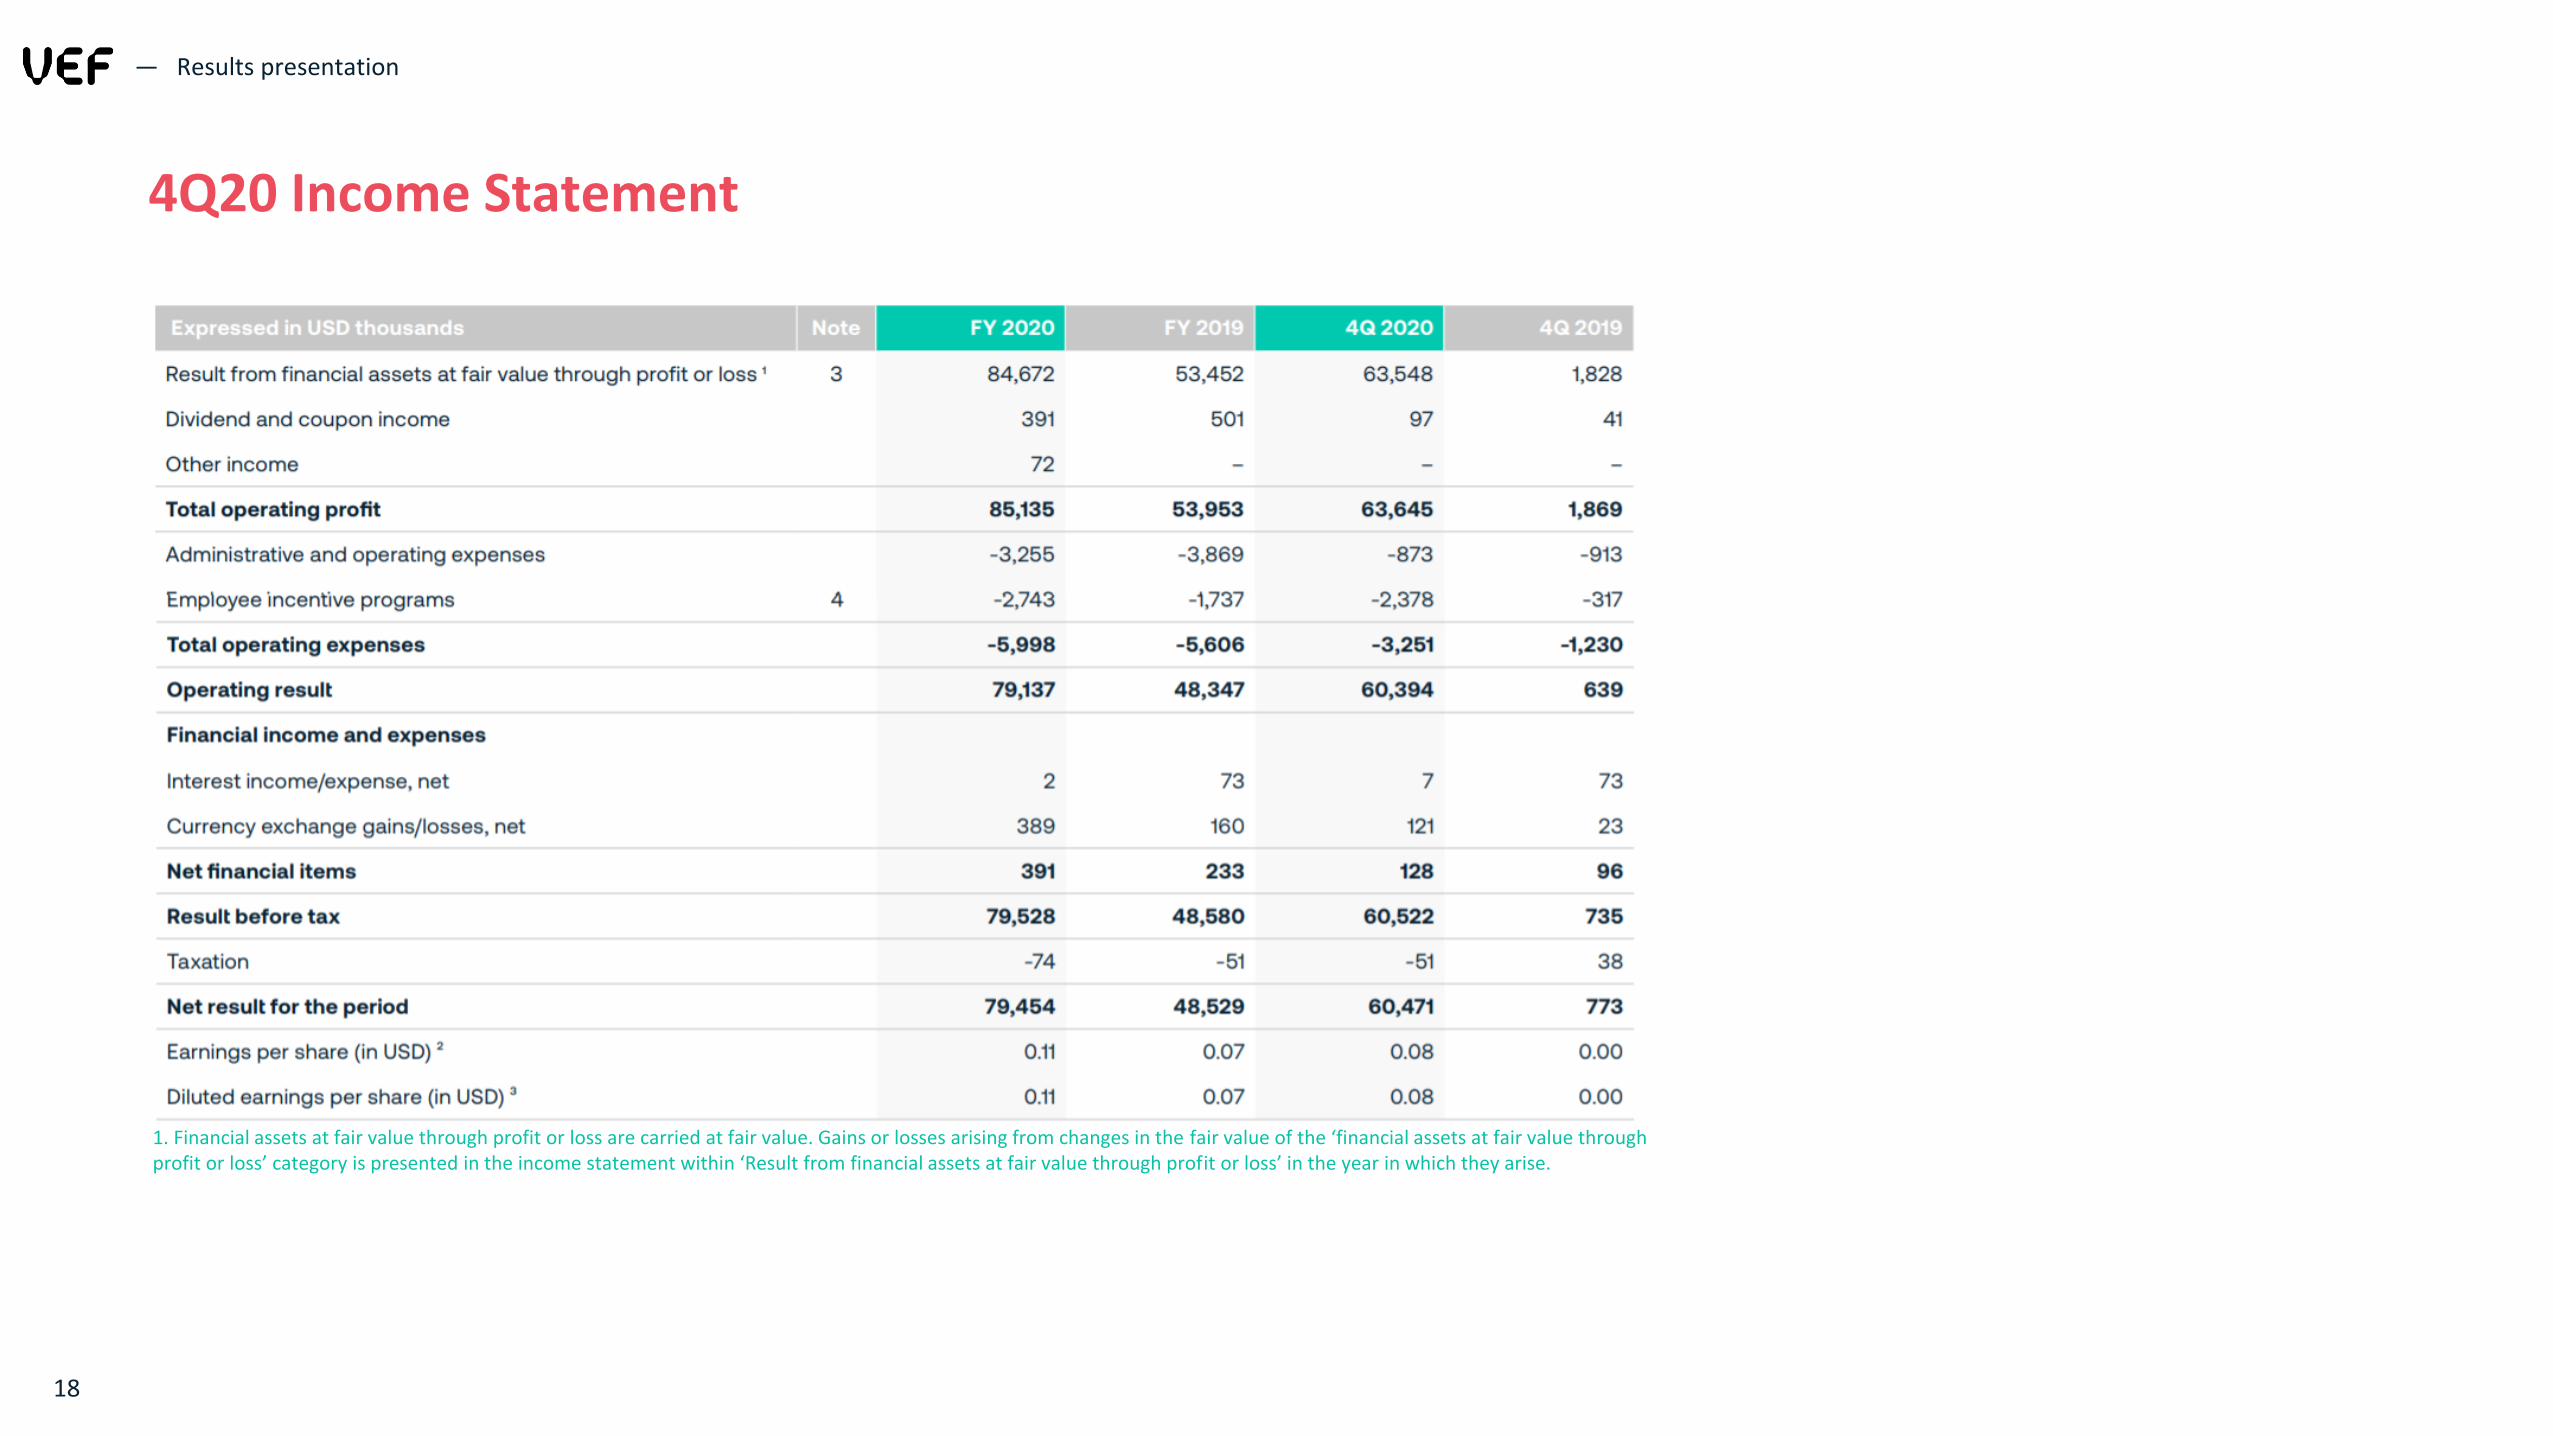
4Q20 Income Statement
1. Financial assets at fair value through profit or loss are carried at fair value. Gains or losses arising from changes in the fair value of the ‘financial assets at fair value through profit or loss’ category is presented in the income statement within ‘Result from financial assets at fair value through profit or loss’ in the year in which they arise.
19
— Results presentation
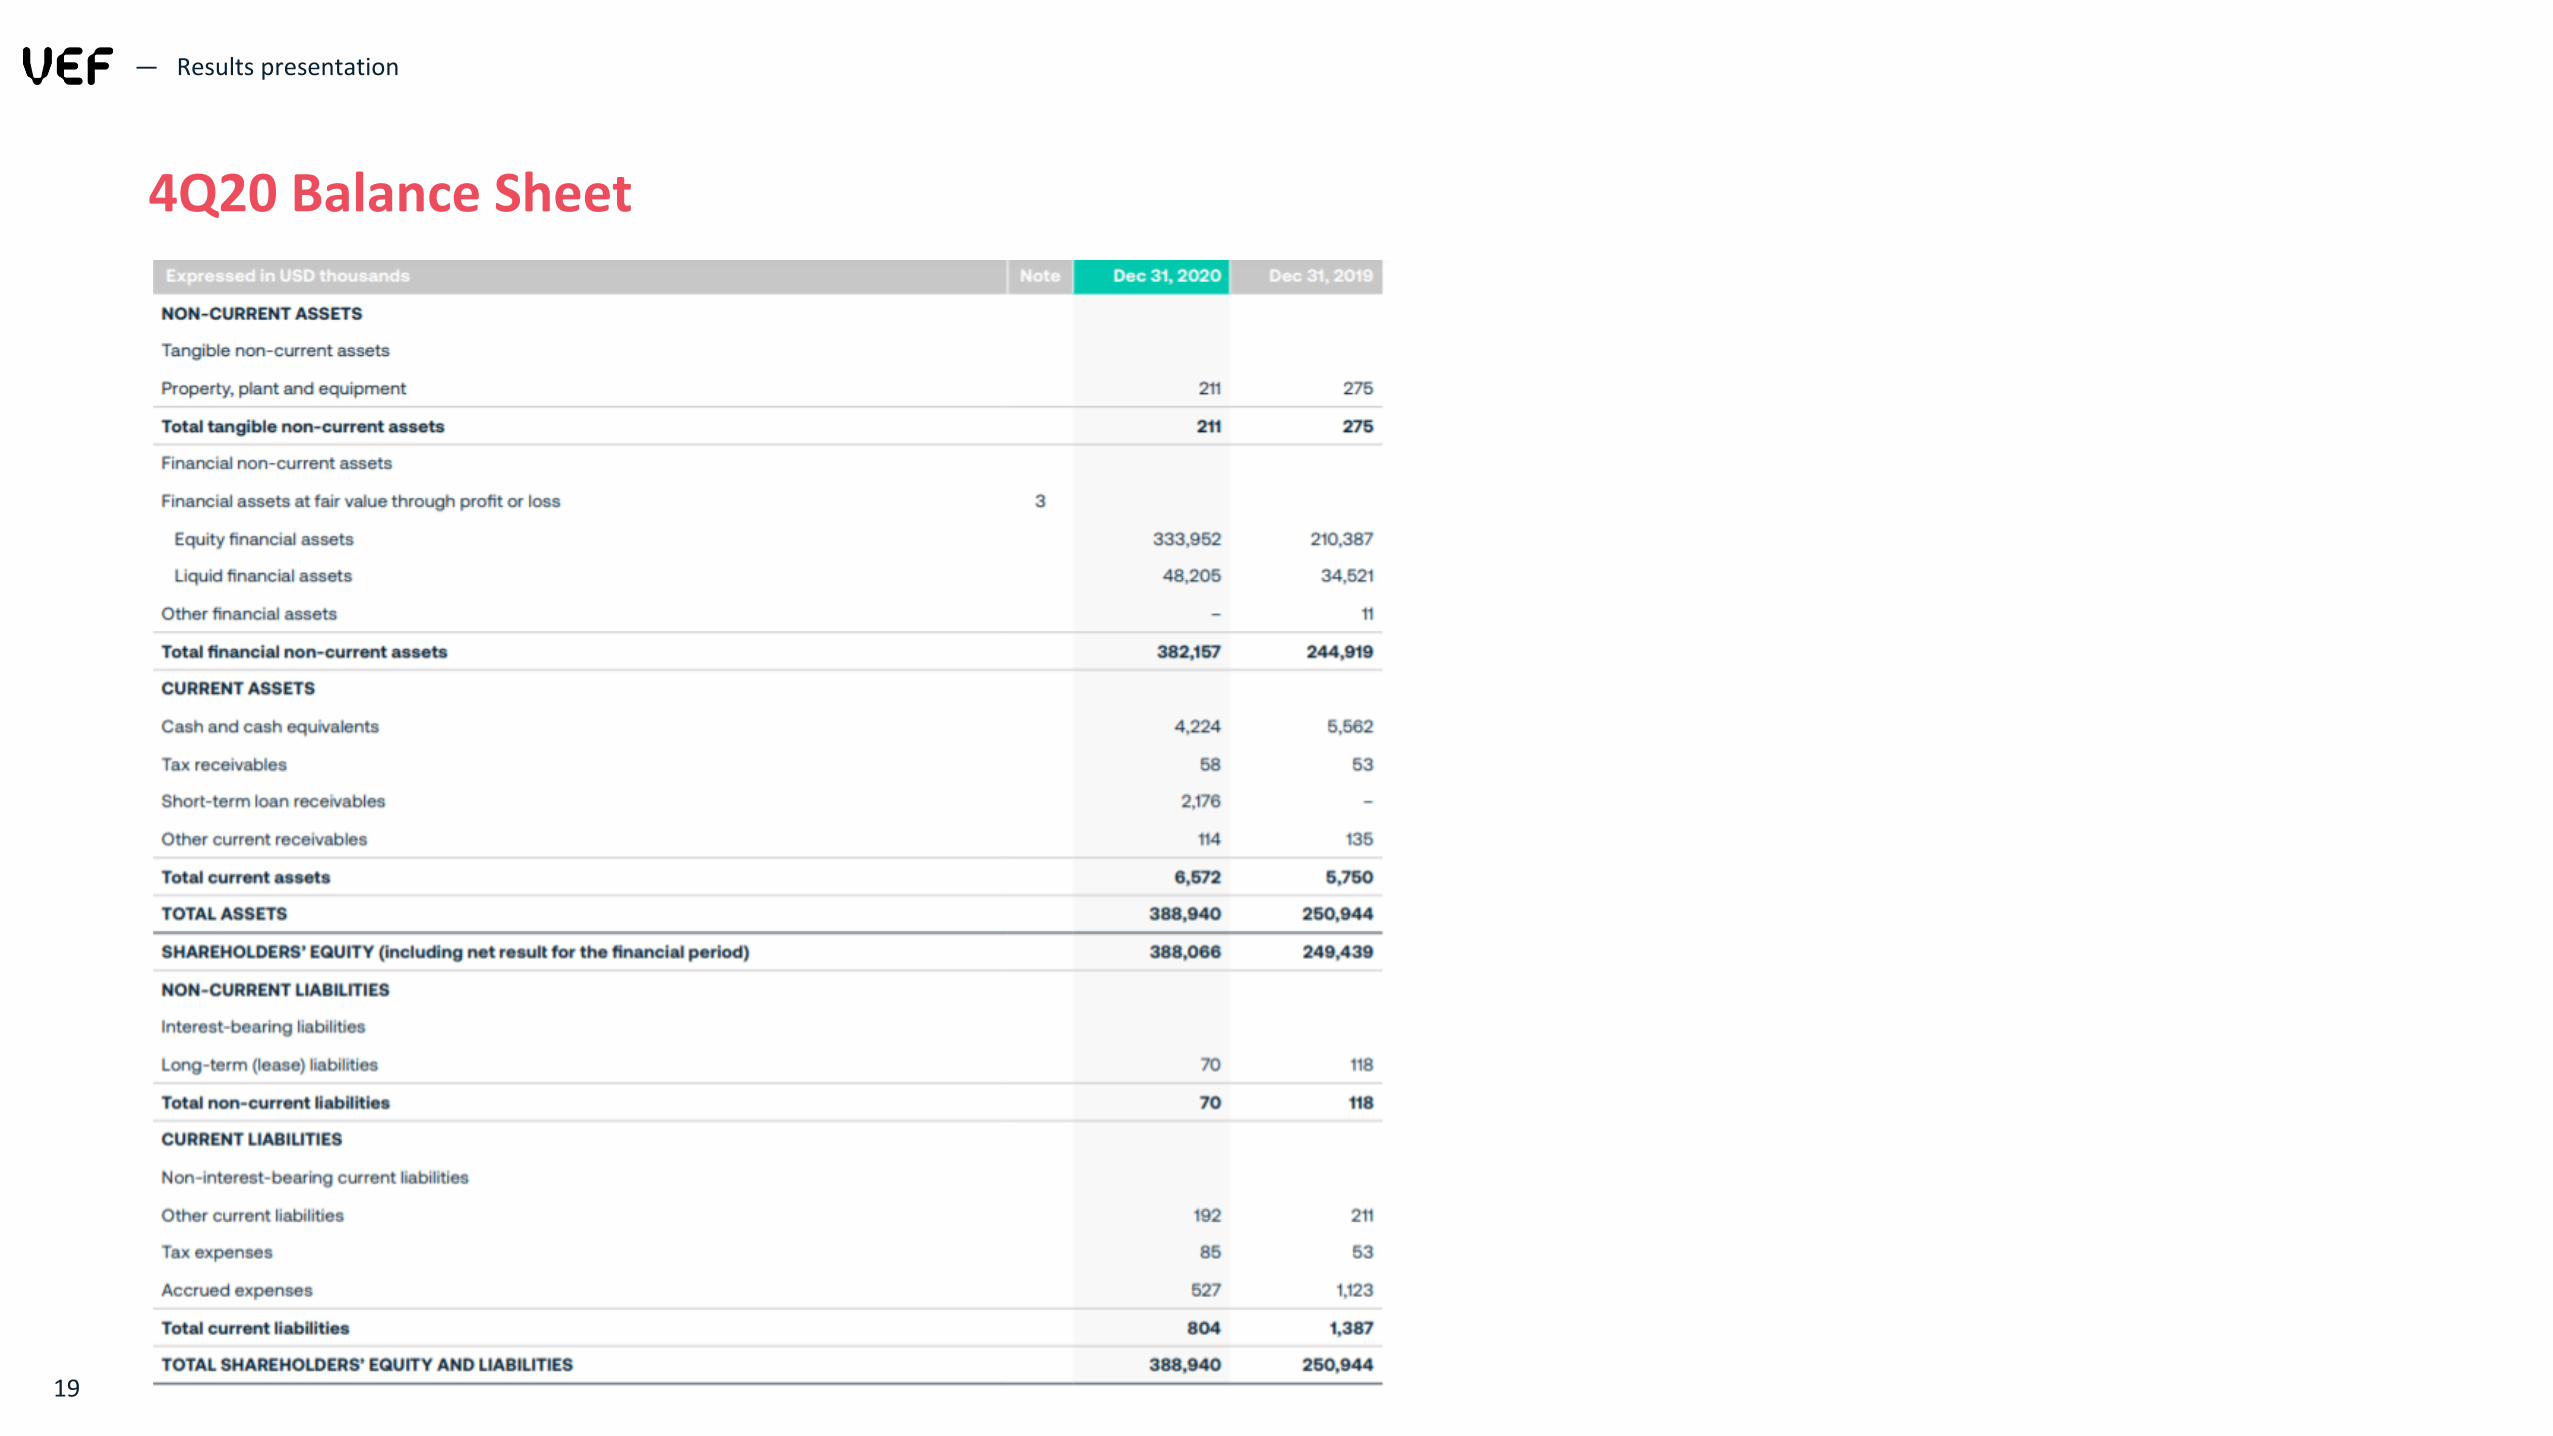
4Q20 Balance Sheet
Copyright © 2022 FDOKUMEN