Rentokil 2007 Results Presentation (FINAL)
59
. 1 2007 Preliminary Results 28 February 2008
-
Upload
khangminh22 -
Category
Documents
-
view
0 -
download
0
Transcript of Rentokil 2007 Results Presentation (FINAL)

.
1
2007 Preliminary Results
28 February 2008

.
2
Doug Flynn

.
3
2007 Group Overview
� Revenue up 20.3% to £2,216.7m
� Adjusted PBITA up 8.8% to £280.8m
� Adjusted PBTA up 1.1% to £211.4m
• Profit before income tax from continuing operations of £142.0 million
(2006: £165.4 million)
• Total dividend maintained at 7.38p
� Performance from Textiles & Washroom, Pest Control, Asia Pacific, Facilities
Services and Ambius divisions in line with expectation
� Overall group performance marred by City Link

.
4
City Link – What Happened (Overview)
� Not wholly a market issue – largely self inflicted problems
� New business dropped significantly
� Account losses increased
� Further decline in revenue per consignment
� Revenues fell well short of expectation
� Carried some excess cost in Q4, but anticipated pre-Christmas volume
surge failed to materialise
� Dropping straight through to bottom line = significant profit shortfall in Q4
and into 2008
� May not trade better than break even in 2008

.
5
City Link – What Happened (Details)
� Foundation for integration not solid enough and trying to make too many
changes concurrently:
– City Link franchises not fully bedded down since acquisition
– Inadequate account management of the former franchise customer base
– Management stretch in taking on integration of Target Express
� Hiatus in new business pipeline development:
– Sales structure and accountability unclear
– Sales team under-manned
� Integration programme impacted service levels (Hub change, Swindon pilot):
– Decline in RPC greater than planned
– Customers lost
– Some downtrading by remaining customers (volumes through other carriers)
– Increase in service credits
� Compounded by cost – Christmas didn’t happen for us

.
6
City Link – Why we didn’t see it coming
� Operational issues masked by strong revenue growth in first nine months
� Financial performance tracked budget until October
� November management accounts made it clear there was a year end problem
� KPIs, data capture and financial systems found wanting in providing visibility

.
7
What happened: Profit
Profit Variance
(17)
(12)
(7)
(2)
3
8
Jan Feb Mar Apr May Jun Jul Aug Sep Oct Nov Dec
Pro
fit V
aria
nce
£'m
0
10
20
30
40
50
60
Pro
fit £
'm
Monthly Variance Forecast Budget Actual Profit Cum. Budget Cum
Forecast Full YearBudget Full Year

.
8
City Link - Actions & Solutions
� Go back to basics and ensure ongoing service quality
� Establish the right leadership team
� Deliver strong account management for customers
� Improve customer facing systems and processes
� Ensure information systems provide visibility and control
� New sales generation both through key accounts and field sales activity
� Tighter management of cost
� Pause physical integration until systems, processes, account management &
culture are brought together

.
9
Actions – Account Management
� Roll out of new account management structure:
– Customers managed at local, not regional level
– Direct customer relationships at depot level
– Recruitment of additional customer relationship managers
– Training programmes underway

.
10
Actions – Sales
� New senior leadership team in place
� Sales team restructured
� Pipeline development improved
� Conversion of pipeline into new account wins
� Recruitment continuing for field sales

.
11
Actions – Service
� Pausing and reviewing depot integration to ensure service continuity
� Hub sort times and last trunk arrivals on plan
� Roll-out of mechanical handling equipment improving depot sort
� Roll-out of hand-held, real-time PODs for C&D drivers continues:
– Speed, transparency, quality of information and service
� Improved depot scanners ensure end-to-end visibility and control
� Autogazetteer on customer sites to ensure correct labelling & routing

.
12
Integration – The Next Steps
� Ongoing:
– Roll-out of Phase 1 integration programme:
• mechanical handling equipment and hand held scanners
– Systems harmonisation – finance and operations
– Establishment of a strong and unified culture
– Single customer proposition
– Network wide “Platform for Growth” leadership training programme
� On hold:
– Depot rationalisation/closure programme
– Alignment of hub and trunking systems

.
13
City Link – Summary
� New measures to increase transparency on key business drivers
� Close ongoing scrutiny at plc level
� 2008 will be about:
– Service
– Account management
– New business generation
– Process & systems harmonisation
� Physical integration to follow later
� Significant impact on profitability, but long-term potential remains

.
14
Andrew Macfarlane

.
15
Basis of Preparation
� Electronic Security Discontinued
� UK/NL/US: sold for £533.4m on 2 July
� France: sold for £91.6m on 27 December
� Interest benefit £15m in 2H
� German hospital services
� NL Cleaning
Continuing up to sale at various dates during 2007
Proceeds £3.3m; loss on disposal £1.0m
Continuing up to sale in August 2007
Proceeds £2.8m; profit on sale £1.2m
� Wipers Closed Q4 2007; costs treated as one-off

.
16
Financial Highlights
Continuing operations Q4 FULL YEAR
Constant Exchange Rates 2007 2006 % 2007 2006 %
Revenue
576.0
517.8
11.2
2,216.7
1,843.2
20.3
EBITA
63.0
57.9
8.8
252.4
235.6
7.1
Interest
(17.8)
(16.4)
(8.5)
(71.6)
(51.1)
(40.1)
Associates
0.4
0.4
-
2.2
2.0
10.0
PBTA
45.6
41.9
8.8
183.0
186.5
(1.9)
Add back one-off items
18.1
16.7
8.4
28.4
22.6
25.7
Adjusted PBTA
63.7
58.6
8.7
211.4
209.1
1.1
Free cash flow (actual exchange rates)
102.1
128.6
(20.6)
Basic EPS (continuing operations)
6.00p
7.20p
(16.7)
Final Dividend
5.25p
5.25p
-
FCF per share
5.65p
7.12p
(20.6)

.
17
Adjusted PBTA
Constant Exchange Rates Q4 FULL YEAR
£m % £m %
City Link 6.3 (59.6) 44.8 24.1
Textiles & Washrooms 26.8 0.8 108.0 (0.4)
Pest Control 17.8 15.6 66.1 (3.1)
Facilities Services 11.5 42.0 38.9 24.7
Asia Pacific 10.2 27.5 31.0 31.4
Ambius 5.1 13.3 9.1 13.8
Other 3.3 (2.9) 11.4 -
Central Costs 0.1 - (28.5) 0.7
Adjusted EBITA 81.1 8.7 280.8 8.8
Associates 0.4 - 2.2 10.0
Interest (17.8) (8.5) (71.6) (40.1)
Adjusted PBTA 63.7 8.7 211.4 1.1

.
18
City Link
1 Excluding integration costs
Q1 Q2 Q3 Q4 FULL YEAR 2007
FULL YEAR 2006
£m £m £m £m £m £m
Revenue
2007 Budget
93.1
112.5
102.9
127.9
436.4
181.3
2007 Actual
94.5
108.5
107.6
106.5
417.1
213.3
Variance 1.4 (4.0) 4.7 (21.4) (19.3) 32.0
Adjusted PBITA¹
2007 Budget
10.0
13.8
13.1
22.9
59.8
31.4
2007 Actual
10.2
13.9
14.4
6.3
44.8
36.1
Variance 0.2 0.1 1.3 (16.6) (15.0) 4.7
.
19
Combined Weekly Network Revenue
City Link & Target Express - Combined Weekly Networ k Revenue
6,000,000
6,500,000
7,000,000
7,500,000
8,000,000
8,500,000
9,000,000
9,500,000
10,000,000
10,500,000
05/0
1/07
19/0
1/07
02/0
2/07
16/0
2/07
02/0
3/07
16/0
3/07
30/0
3/07
13/0
4/07
27/0
4/07
11/0
5/07
25/0
5/07
08/0
6/07
22/0
6/07
06/0
7/07
20/0
7/07
03/0
8/07
17/0
8/07
31/0
8/07
14/0
9/07
28/0
9/07
12/1
0/07
26/1
0/07
09/1
1/07
23/1
1/07
07/1
2/07
21/1
2/07
£ M
2005 2006 2007
Q1 Q2 Q3 Q4
Easter
May Bank Holiday
August Bank
Holiday

.
20
Estimated YOY change in network revenue
(15)
(10)
(5)
0
5
10
15
20
25
Q1 2006 Q2 2006 Q3 2006 Q4 2006 Q1 2007 Q2 2007 Q3 2007 Q4 2007
£'m
Total - net wins Total - net uptrades Total change in revenue
ESTIMATED
2006 Vs 2005 2007 Vs 2006
City Link – Year-on-year change in network revenue
Caution: Some ambiguity between “new customer” and “uptrading” and between “lost business” and “downtrading” but trends are meaningful.

.
21
Sector and B2B/B2C Revenue split
69%
31%
2007 Total Network
B2C / B2B split
34%
15%13%
6%
3%2%
5%2%
12%
4%
4%
Industrial Goods & Services Personal & Household GoodsTechnology RetailHealth Care MediaTelecommunications Automobiles & PartsConstruction & Materials Basic ResourcesOther
FY 2007 Sector Revenue55% ‘close
to consumer’
B 2 BB 2 C
.
22
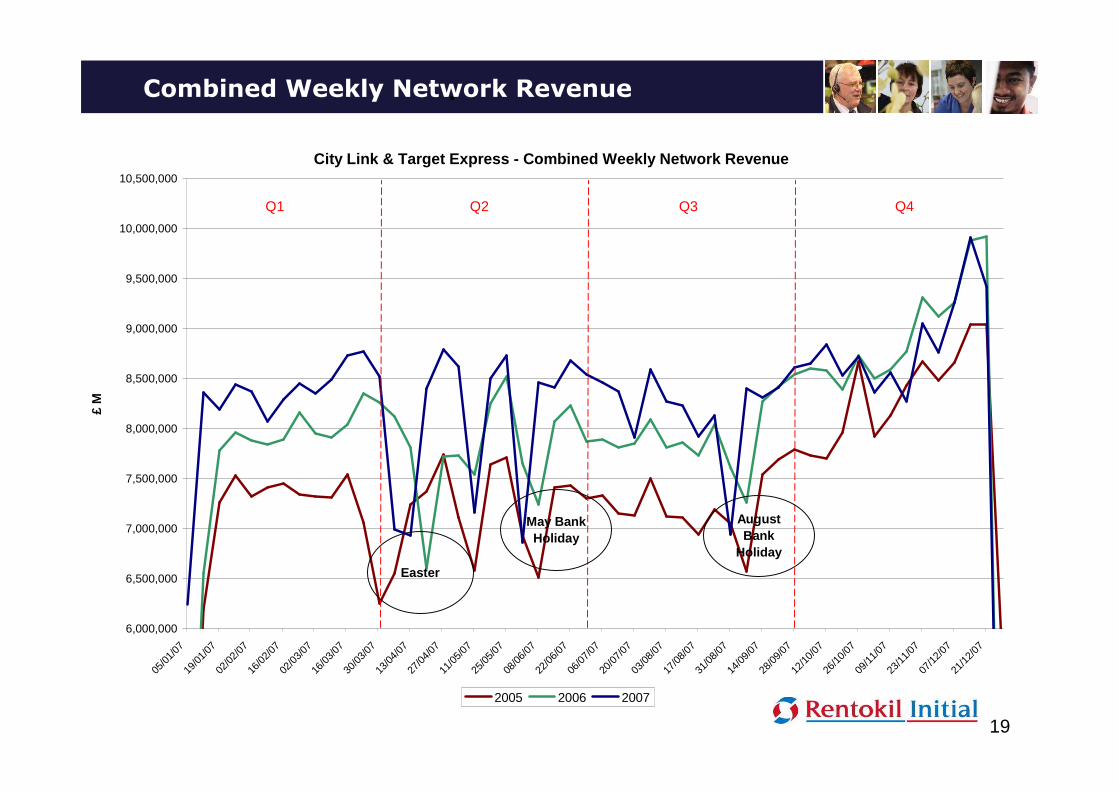
Combined Network RPC: 2005 to 2007
Combined Network: RPC 2005 to 2007
7.60
7.80
8.00
8.20
8.40
8.60
8.80
9.00
Q1 2005 Q2 2005 Q3 2005 Q4 2005 Q1 2006 Q2 2006 Q3 2006 Q4 2006 Q1 2007 Q2 2007 Q3 2007 Q4 2007
£

.
23
City Link – 2007 Cost Base
Fixed & Variable Costs - % of total base
0%
10%
20%
30%
40%
50%
60%
70%
80%
90%
100%
Agency & Overtime
Sales & Sales Bonus
Other Variable
Subcontract Drivers
Fuel
Employed Drivers
Fixed Employee
Fixed Vehicle Mngt
Fixed Other Cost
Fixed Property & FMCosts
Fixed & Variable Costs - Value
0
50
100
150
200
250
300
350
400
£'m
Increasingly
Variable

.
24
City Link – Effect on Q4 profits
£m
� Budget Profit 23
� £25m revenue shortfall (down-trading, poor new
business) at 40% budgeted drop through
(10)
� 14m consignments at lower - than - expected RPC (4)
� 14m consignments at higher cost per delivery (3)
Actual profits Q4 6

.
25
City Link/Target Express Integration
Synergies
� Interims estimate of 2007 in year benefit £2-3m : achieved
� Potential >£15m p.a. unchanged. Timing subject to depot integration
programme.
Costs
* Includes £16.3m leasehold property exit provision
� Property costs about £8m higher than expected – softer market
� Future costs around £5m. Timing subject to depot integration programme.
21.0
12.0
9.0
Interim
Estimate
30.4*
5.02008
25.4*2007
Actual /
Revised

.
26
City Link – 2008 Outlook
� Adverse trends continuing in January and February
– Volumes between 2005 and 2006 levels
– RPC at Q4 levels
– Poor 2007 new business continues to hurt revenue
– January loss-making - £4m worse than 2007
� Recovery actions underway, but in-year benefit hard to assess at the
moment
– Sales pipeline good – main benefit in 2H
– Risk of service disruption associated with depot integration may
constrain ability to remove cost in the short term
– 2008 synergies dependent on timing of integration
� Possible business may not trade better than breakeven this year
.
27
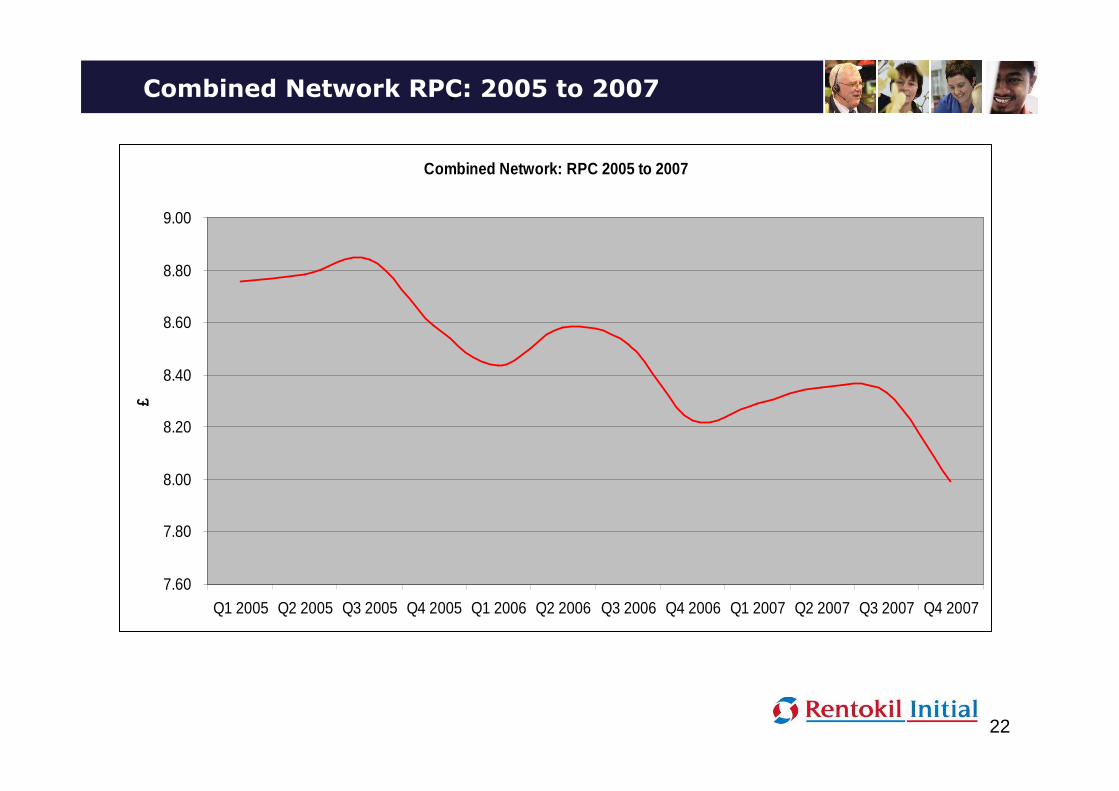
Initial Textiles & Washroom Services
Constant exchange rates % change versus prior year
2006 vs. 2005 2007 vs. 2006
Q1 Q2 Q3 Q4 Q1 Q2 Q3 Q4
Revenue (%) 1.0 (1.2) (0.7) 3.5 1.8 2.0 2.0 (0.5)
Organic revenue (%) (0.3) (1.4) (0.8) 3.5 2.3¹ 2.8¹ 3.21 1.01
Adjusted EBITA (%) (16.5) (21.0) (22.5) (14.4) (8.1) 1.4 4.5 0.8
Retention rate (pa) 89.1 89.4 90.6 90.7 89.7 90.2 92.2 90.5
Net gain2 – change
in quarter (£m)
£0.3m £0.4m £2.2m £6.6m £6.4m1 £2.7m1 £5.3m1 £5.3m1
1Excludes German hospital services and the last UK garment contract 2Includes acquisitions

.
28
Initial Textiles & Washroom Services
Constant exchange rates
Revenue £m
Portfolio ave.
price change
%
Change in
adjusted EBITA
£m
2007 2006 Change
2007
v.
2006
2006
v.
2005
2007
v.
2006
2006
v.
2005
France 221.2 213.2 3.8% +0.6% +0.8% 3.1 (6.6)
Netherlands 75.4 73.9 2.0% +0.7% +0.4% 2.0 (0.9)
Belgium 67.9 65.7 3.3% +0.8% +3.3% 0.2 (0.4)
Germany1 67.9 73.0 (7.0)% - +1.4% 0.8 (0.8)
Others/divisional
centre
88.3 79.1 11.6% (2.9) (2.4)
520.7 504.9 3.1% 3.2 (11.1)
UK2 82.3 90.5 (9.1)% (3.6) (13.9)
Divisional Total 603.0 595.4 1.3% (0.4) (25.0)
1 Includes German Hospital Services sold during 2007 – Revenue £4.7m (2006: £12.2m)2 Includes Wipers activities closed during Q4 2007 - Revenue £5.8m (2006: £7.3m)

.
29
Initial Textiles & Washroom Services
-10
-5
0
5
10
15
20
25
Q1 06 Q2 06 Q3 06 Q4 06 Q1 07 Q2 07 Q3 07 Q4 07
Continental Europe UK Ex garments
Portfolio Organic Net Gain (MATs)
£m
ex GHS

.
30
Rentokil Pest Control
Revenue Retention Change in adj.
PBITA
2007
£m
2006
£m
2007
%
2006
%
2007 v.
2006
2006 v.
2005
USA 97.4 76.7 82.1 84.3 1.0 5.5
Europe 126.1 114.7 87.0 86.3 2.7 2.6
UK 65.3 65.8 81.5 81.5 (3.4) (4.5)
Divisional
Costs/other
21.6 21.1 90.0 88.6 (2.4) (0.6)
310.4 278.3 84.5 84.6 (2.1) 3.0
2007 2006
TOTAL PBITA £66.1m £68.2m
Organic growth 5.7% 1.2%
Constant exchange rates

.
31
UK Pest Control
2005 2006 2007
H1 H2 H1 H2 H1 H2
Revenue £m 34.1 34.4 33.0 32.8 31.2 34.1
Portfolio net gain £m 0.1 (0.4) (0.6) (0.5) 0.3 1.0
Adjusted EBITA change £m (2.1) (2.4) (2.1) (1.3)

.
32
Initial Facilities Services
Revenue Retention Change in adj.
PBITA
2007
£m
2006
£m
2007
%
2006
%
2007 v.
2006
2006 v.
2005
Cleaning 376.7 318.7 85.4 92.3 1.5 (1.2)
Catering 59.7 66.5 NA NA 1.5 (1.2)
Hospitals 62.8 56.8 93.4 96.4 0.9 0.5
Other / Div. overheads 86.5 77.2 82.6 78.7 3.8 (2.5)
585.7 519.2 86.2 91.1 7.7 (4.4)
2007 2006
TOTAL PBITA £38.9m £31.2m
Organic growth 3.9% 8.2%
Constant exchange rates

.
33
Rentokil Initial Asia Pacific
Revenue Retention Change in adj.
PBITA
2007
£m
2006
£m
2007
%
2006
%
2007 v.
2006
2006 v.
2005
North Asia 25.4 10.4 78.5 80.6 1.4 0.1
South Asia 43.6 27.6 81.3 77.0 2.1 1.4
Pacific 89.4 64.1 89.1 88.2 5.2 0.6
Div. Overheads - - - - (1.3) (1.2)
158.3 102.1 86.0 84.6 7.4 0.9
2007 2006
TOTAL PBITA £31.0m £23.6
Organic growth 12.0% 5.7%
Constant exchange rates

.
34
Central Costs
Adjusted PBITA
2007 2006
Q1 Q2 Q3 Q4 FY
£m £m £m £m £m £m
Central Costs (10.4) (10.2) (8.0) 0.1 (28.5) (28.9)
___________________________________________
� Costs higher in 1H due to set up of UK Shared Service Centre
� Run-rate fell in Q3 – efficiency savings
� Q4 reflects bonus and property provision adjustments
� 2008 costs are estimated at £9m per quarter

.
35
Interest
*After interest received on fair value hedges
Actual exchange rates 2007 2007 2006
Continuing operations Q1
£m
Q2
£m
Q3
£m
Q4
£m
FY
£m
FY
£m
Net interest on bank/bond/finance
lease debt*
(17.7) (20.0) (14.4) (17.4) (69.5) (48.6)
Expected return on pension scheme
assets
12.7 12.7 13.4 13.5 52.3 47.4
Interest on pension scheme liabilities (12.9) (12.8) (12.8) (13.0) (51.5) (48.4)
(0.2) (0.1) 0.6 0.5 0.8 (1.0)
Fees and South Africa BEE note (0.1) (0.6) (0.1) (0.4) (1.2) (1.4)
Unwind of discount on provisions (0.6) (0.5) (0.4) - (1.5) (2.0)
Mark-to-market/forex adjustments (0.5) 1.7 (1.1) (0.6) (0.5) 1.9
Per income statement (19.1) (19.5) (15.4) (17.9) (71.9) (51.1)
Average interest rate on
bank/bond/finance/lease debt (incl
margin)
5.7% 6.1% 6.4% 6.9% 6.2% 4.9%
Average net debt 1,267 1,320 890 992 1,116 987

.
36
Taxation
2007 2006
£ % £ %
Profit before tax (continuing ops) 140.7 100.0 165.4 100.0
Explanation of tax charge
Expected charge1 42.6 30.0 50.8 30.7
Recurring factors affecting tax charge (4.3) (3.1) (3.0) (1.8)
38.3 26.9 47.8 28.9
Deferred tax on unremitted profits 0.7 0.5 (0.4) (0.2)
One-off items 1.1 0.8 1.1 0.6
Prior year adjustments (9.8) (6.9) (15.2) (9.2)
Actual tax charge 30.3 21.3 33.3 20.1
Current tax 20.9 14.7 15.9 9.6
Deferred tax 9.4 6.6 17.4 10.5
Tax charge 30.3 21.3 33.3 20.1
Cash tax paid 27.1 38.5
1 Expected charge = Profit before tax x blended rate. The 2008 blended rate is estimated at 29.3%
At actual exchange rates

.
37
Actual exchange rates
1 As reported in 2006, adjusted to exclude Electronic Security2 Excluding computer software and development costs3 Impairment charges, profit on sale of fixed assets, pension curtailment etc.4 Net of disposal proceeds of £57.9m (2006: £42.5m – includes finance leases)
Operating Cash Flow
� European major plant capex £11.5m (2006: £27.1m)
2006 2007 2006
Continuing
activities
before
one-off
items¹
Continuing
activities
before one-
off items
Discontinued
activities
One-off
items
Total Total
EBIT 237.1 240.3 24.1 (28.4) 236.0 239.6
Amortisation2 21.1 39.2 1.4 - 40.6 27.5
Depreciation 153.4 155.6 2.3 - 157.9 162.1
Non-cash items3 (7.7) (7.4) (0.1) - (7.5) (38.4)
EBITDA 403.9 427.7 27.7 (28.4) 427.0 390.8
Working Capital-divs 4.9 (20.2) 2.5 (0.7) (18.4) 16.5
Working Capital-centre (38.6) (49.7) - - (49.7) (38.6)
Net capex4 (171.3) (166.2) (4.6) - (170.8) (157.7)
Operating cash flow 198.9 191.6 25.6 (29.1) 188.1 211.0

.
38
£ million
2007 2006
Total operating cash flow 188.1 211.0
Interest1 (58.9) (43.9)
Tax (27.1) (38.5)
Free cash flow 102.1 128.6
Equity dividend (133.4) (133.3)
Acquisitions2 (197.4) (417.8)
Disposals 596.8 144.2
Pension contribution (80.0) -
FX/other (47.0) 30.4
Decrease\(Increase) in net debt 241.1 (247.9)
1 Including finance leases2 Cash plus acquired debt
Free Cash Flow and Movement in Net Debt
Actual exchange rates

.
39
Net Debt and Liquidity
At
31/12/07
£m
Cash / Bank 55.6- £252m facility to February 2010 (inc 12 month term-out option)
- £500m RCF to October 2012
€100m note (74.5) July 2008
£250m bond (250.1) November 2008
€500m bond (373.4) March 2014
£300m bond (304.7) March 2006
NET DEBT (947.1)

.
40
Doug Flynn
.
41
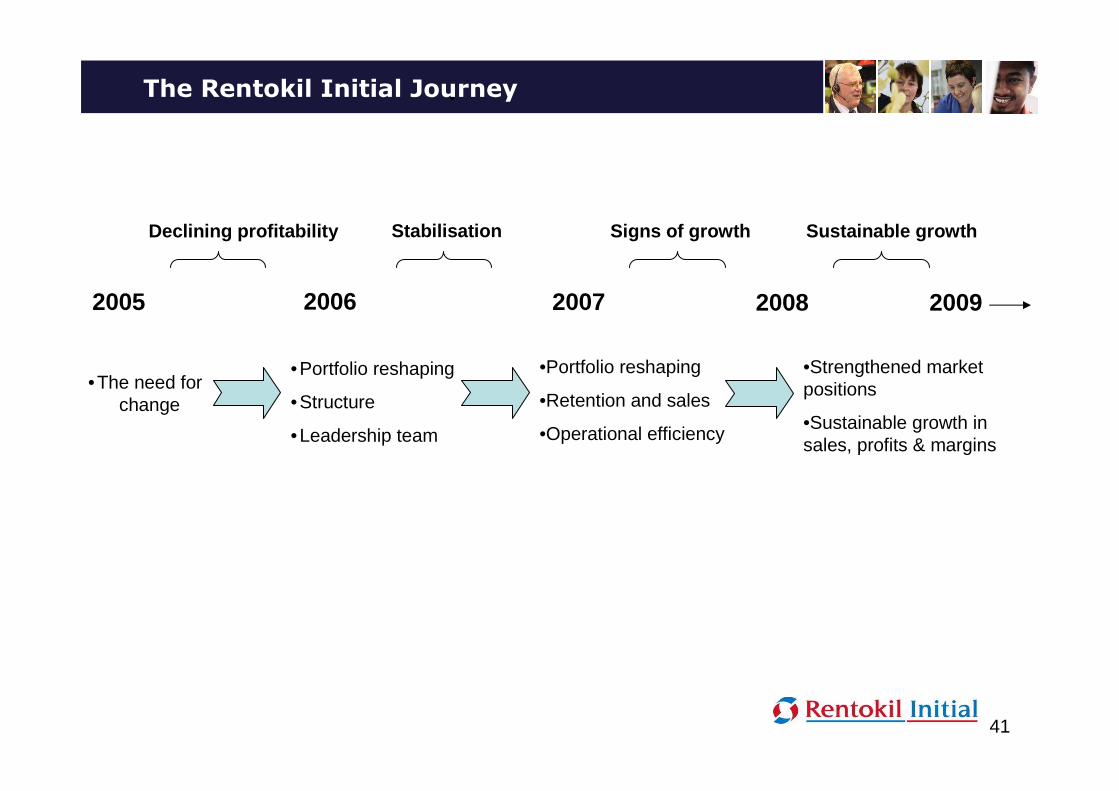
The Rentokil Initial Journey
•Portfolio reshaping
•Structure
•Leadership team
•Portfolio reshaping
•Retention and sales
•Operational efficiency
•Strengthened market positions
•Sustainable growth in sales, profits & margins
2005
•The need for change
2008 2006 2007
Declining profitability Stabilisation Signs of growth
2009
Sustainable growth

.
42
Group strategic objectives
� To return the company to sustainable profits growth thereby
maximising shareholder value:
1. Restart revenue growth
• Improve service � increase retention
• Improve sales and marketing effectiveness
• Leverage power of brands
2. Reshape the portfolio
• Dispose of businesses where limited opportunity to add value
• Build towards leading market positions
• Growth sectors
3. Improve efficiency and productivity across divisions
• Sales & service productivity
• Cost reductions
• IT systems & processes improvements

.
43
2007 actions
� New structures in place within UK Pest Control and UK Washroom
– Stable platform on which to build
� Exited unprofitable contracts (hospitals/catering) and business (wipers)
– Although negative short term impact on retention rate
� Ongoing drive to deliver operational & financial efficiencies across the group
– Procurement delivered £8m savings across 56 projects
� £201 million invested towards building stronger market positions/growth
businesses
� Disposal of businesses where limited opportunity to add value including
completion of sale of Electronic Security for £595m

.
44
� Group strategic objectives:
1. Restart revenue growth
2. Reshape the portfolio
3. Improve efficiency and productivity
� Divisional strategic objectives:
1. Textiles & Washroom Services
2. Pest Control
3. City Link
4. Facilities Services
5. Ambius
6. Asia Pacific
Strategic Direction - Division

.
45
Initial Textiles & Washroom Services
� The objective
– To become Europe’s leading textiles and washroom operator, driving value
through operational efficiencies and organic sales growth
� Strategic priorities
– Operational efficiency improvements (processing, route logistics, supply
chain)
– Organic sales growth in continuing tough markets (cross selling, range
selling, new accounts)
– Opportunity to participate in value-enhancing consolidation of European
textiles and washroom markets

.
46
Textiles & Washroom – Progress against Plan
� New seven-region divisional structure
– Maximising efficiencies: across borders, people, facilities, logistics, supply chain
� Driving strong growth in higher margin segments
– Medical, clean room, mats, safety equipment and high-visibility
� Considerable operational improvement
– French business now on growth trajectory
– New processing facilities in Austria, France & Belgium completed on time/budget
– New facility in Prague is due to open on schedule this autumn
� Physical restructuring complete in UK Washroom
– New infrastructure in place – processing and service centres
– Exit of last textiles contract, closure of wipers business in Q4
– Portfolio attrition declining

.
47
Rentokil Pest Control
� The objective
– To create the world’s finest & most profitable specialist pest control
company, establishing leadership positions in mostly fragmented markets
� Strategic priorities
– Organic growth through improved retention and new sales
– Ensure strong and sustainable platform through service and operational
excellence
– Return UK to profit growth

.
48
Rentokil Pest Control – Progress Against Plan
� Establishing strong position in world’s largest market
– Presto-X delivering to expectation; expands footprint into additional 16 states
– JC Ehrlich – strong finish - improvements in off-season productivity & cost flexibility
� New sales driving European growth
– Revenue , retention , contract portfolio , profit
– 5.7% organic growth: 10.6% Spain, 9.3% Ireland, 7.6% Italy, 7.3% Netherlands
– Brand strength and building on-line presence
� New UK structure in place
– Revenue , retention , contract portfolio
– Good growth in national accounts; challenge remains to deliver growth in SME sector
– Productivity improvement in H2 following the bedding in of new structure in H1
– 200% increase in on-line enquiries
– Return to profit growth in 2008
� Re-energised culture with rising self belief

.
49
Initial Facilities Services
� The objective
– To become the UK’s leading cleaning and facilities services company
exploiting high quality client list to drive specialist & bundled cleaning and
support services
� Strategic priorities
– Drive organic sales in core cleaning disciplines
– Single minded focus on cost and productivity
– Optimise non-cleaning service offering

.
50
Facilities Services – Progress Against Plan
� Cleaning: increased contract turnover and portfolio growth
– Greater use of “RAPID” and “SmartClean” initiatives
– Expansion of group services into existing customers showing rewards
– Streamlining operational structure
� Catering/Hospital Services: active client profitability management
– Exited unprofitable contracts
• Revenue loss largely offset by new contracts effective Q4 2007
– Greater focus on business catering segment; education returns improving
– Procurement initiatives (food purchasing & distribution)

.
51
Ambius
� The objective
– To leverage existing positions to become the premier creator of
workplace ambience products & service
� Strategic priorities
– Organic growth through new sales and sales productivity
– Focus on increasing operating profit margins
– Use Ambius brand to increase revenue per customer through
product/service extensions
– Turnaround UK

.
52
Ambius – Progress Against Plan
� Improved operating margins in larger businesses - US, Sweden and Netherlands
– US top line growth up 6.4%; adjusted operating profit up 17% year on year
– Leveraging scale to drive bottom line
� Record holiday season in US business
– Sales up 8.4% to $12.4m – improved processes to handle greater volume
� Successfully launched Ambius brand throughout Europe
– N. America to follow Q1 2008
– Customer and employee feedback very positive
� Expansion of service offering
– Exploring a range of options to access bigger market opportunity than plants
– Ambient scenting in US and Europe, artwork, fresh fruit delivery in Europe
� New management addressing performance issues in UK
– Signs of customer retention improvements

.
53
Rentokil Initial Asia Pacific
� The objective
– To build and capitalise upon market leading positions in core group
businesses in the world’s fastest growing markets
� Strategic priorities
– Drive organic growth ahead of market
– Deepen pest control market positions
– Secure acquisition synergy benefits in Washroom (Australia and South
East Asia)

.
54
Asia Pacific – Progress Against Plan
� Excellent growth in pest control
– Particularly in Australia, New Zealand, Malaysia and Indonesia
– Hong Kong contract (largest in group); redefining pest control standard in region
� Entered Chinese residential pest control market
– Taiming: unique business model; strong relationships with government
� Launched service extensions
– Launch of fumigation services in Australia, New Zealand, Philippines, Singapore &
Thailand; residential proposition in Australia and China
– Security and IT Hygiene
� Integration benefits (CWS Washrooms) in South East Asia
� Website launches
– 16 sites launched to support local businesses; establishes e-marketing platform
� Expansion of geographic footprint in high growth markets
– Inc. Korea, Vietnam, India, Brunei, China and Macau

.
55
Washroom 45%
Other 2%
Pest 42%
Plants 4% Australia 45%
Other 5%
NZ 7%
Malaysia 7%
Indonesia 3%
Singapore 5%
S Korea 3%
Revenue Analysis (pro forma)1
1 Includes full year of 2007 acquisitions plus our share of Japanese associate.
Electronic Security 7%
Japan 15%
Asia Pacific – Revenue by Geography & business
G China 10%

.
56
� Restore City Link to profitability
� Whilst maintaining momentum across the rest of the group
Group Priorities for 2008

.
57
Outlook for 2008
� Expect a limited impact from softer global market conditions:
– Spread of business activities, geographic reach and self-help
measures offer resilience to economic downturn
� Modest growth expected from Textiles & Washroom, Pest Control, Asia
Pacific, Facilities Services and Ambius
� City Link – may not trade better than break even
� Group adjusted PBTA for 2008 significantly lower than 2007 but predicated
by City Link performance

.
58
2007 Preliminary Results
28 February 2008
APPENDICES
.
59
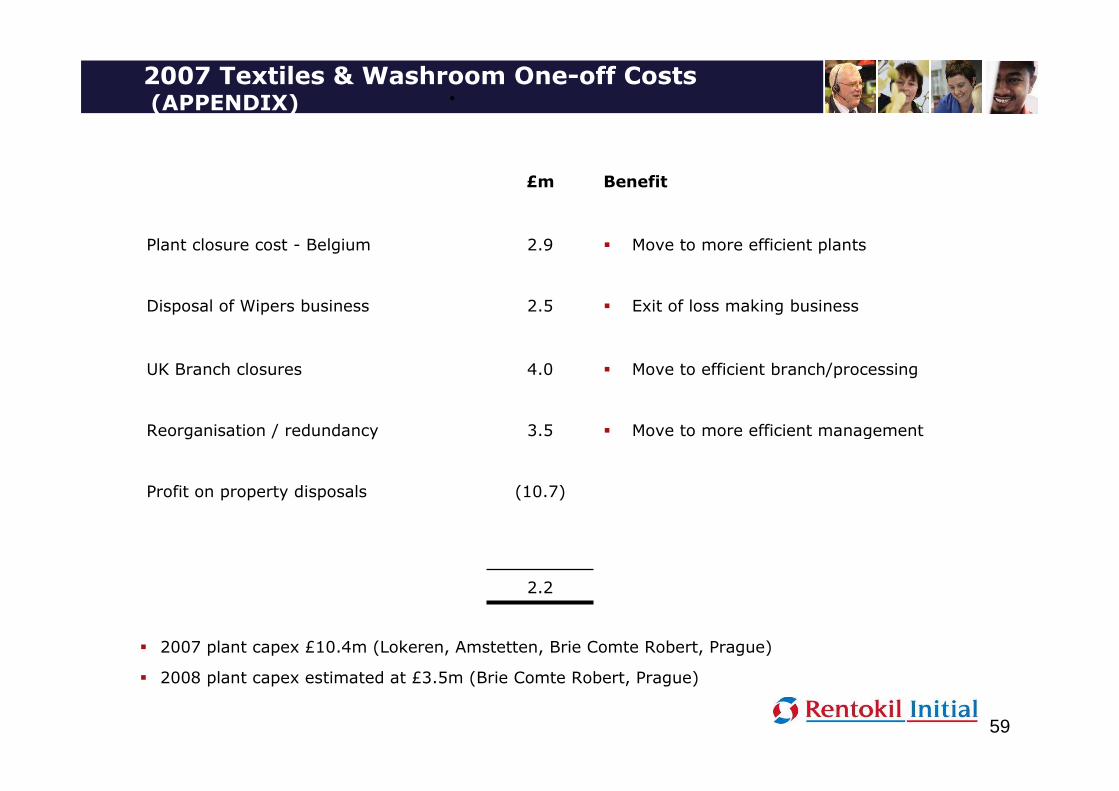
2007 Textiles & Washroom One-off Costs(APPENDIX)
£m Benefit
Plant closure cost - Belgium
Disposal of Wipers business
2.9
2.5
� Move to more efficient plants
� Exit of loss making business
UK Branch closures
Reorganisation / redundancy
Profit on property disposals
4.0
3.5
(10.7)
� Move to efficient branch/processing
� Move to more efficient management
2.2
� 2007 plant capex £10.4m (Lokeren, Amstetten, Brie Comte Robert, Prague)
� 2008 plant capex estimated at £3.5m (Brie Comte Robert, Prague)