fy21 results presentation - Food Delivery Brands
30
FY21 22.04.2022
-
Upload
khangminh22 -
Category
Documents
-
view
1 -
download
0
Transcript of fy21 results presentation - Food Delivery Brands

FY21
22.04.2022
FY21 RESULTS PRESENTATION
DISCLAIMER
2
This presentation (the “Presentation”) has been prepared and is issued by, and is the sole responsibility of Tasty Bidco, S.L. (together withits consolidated subsidiaries, "Telepizza" or the "Company"). For the purposes hereof, the Presentation shall mean and include the slidesthat follow, any prospective oral presentations of such slides by the Company, as well as any question-and-answer session that mayfollow that oral presentation and any materials distributed at, or in connection with, any of the above.
Prior to March 31, 2020, the Company reported at the level of Telepizza Group, S.A. As of March 31, 2020, and, as permitted by Section4.02(b) of the indenture governing Foodco Bondco, S.A.'s €335,000,000 6 1⁄4% Senior Secured Notes due 2026, Foodco Bondco S.A. haselected to report at the level of the Company as a parent entity, in lieu of providing consolidated financial statements of Foodco BondcoS.A. Accordingly, comparative figures included in this presentation correspond to the financial results of Telepizza Group, S.A. and itssubsidiaries as of and for the periods presented. There are no material differences between the consolidated financial statements ofFoodco Bondco S.A. and the Company.
The information contained in the Presentation has not been independently verified and some of the information is in summary form. Norepresentation or warranty, express or implied, is made by the Company or its affiliates, nor by their directors, officers, employees,representatives or agents as to, and no reliance should be placed on, the fairness, accuracy, completeness or correctness of theinformation or opinions expressed herein. Neither Telepizza, nor its directors, officers, employees, representatives or agents shall haveany liability whatsoever (in negligence or otherwise) for any direct or consequential loss, damages, costs or prejudices whatsoever arisingfrom the use of the Presentation or its contents or otherwise arising in connection with the Presentation, save with respect to any liabilityfor fraud, and expressly disclaim any and all liability whether direct or indirect, express or implied, contractual, tortious, statutory orotherwise, in connection with the accuracy or completeness of the information or for any of the opinions contained herein or for anyerrors, omissions or misstatements contained in the Presentation.
Telepizza cautions that the Presentation contains forward looking statements with respect to the business, financial condition, results ofoperations, strategy, plans and objectives of the Company. The words "believe", " expect", " anticipate", "intends", " estimate","forecast", " project", "will", "may", "should" and similar expressions identify forward-looking statements. Other forward-lookingstatements can be identified from the context in which they are made. While these forward-looking statements represent our judgmentand future expectations concerning the development of our business, a certain number of risks, uncertainties and other importantfactors, including risk factors currently unknown or not foreseeable, which may be beyond Telepizza’s control, could adversely affect ourbusiness and financial performance and cause actual developments and results to differ materially from those implied in the forward-looking statements. There can be no assurance that forward-looking statements will prove to be accurate, as actual results and futureevents could differ materially from those anticipated in such statements. Accordingly, readers should not place undue reliance onforward-looking statements due to the inherent uncertainty therein.
The information contained in the Presentation, including but not limited to forward-looking statements, is provided as of the date hereofand is not intended to give any assurances as to future results. No person is under any obligation to update, complete, revise or keepcurrent the information contained in the Presentation, whether as a result of new information, future events or results or otherwise. Theinformation contained in the Presentation may be subject to change without notice and must not be relied upon for any purpose.
This Presentation contains financial information derived from Telepizza’s audited consolidated financial statements for the twelve-monthperiod ended December 31, 2021. In addition, the Presentation contains Telepizza’s unaudited quarterly financial information for 2020and 2021 prepared according to internal Telepizza’s criteria. Financial information by business segments is as well prepared according toTelepizza’s internal criteria as a result of which each segment reflects the true nature of its business. These criteria do not follow anyparticular regulation and can include internal estimates and subjective valuations which could be subject to substantial change should adifferent methodology be applied.
In addition, the Presentation contains certain quarterly alternative performance measures which have not been prepared in accordancewith International Financial Reporting Standards, as adopted by the European Union, nor in accordance with any accounting standards,such as “system sales”, “like-for-like chain sales growth”, “EBITDA” and “digital sales” and others. These measures have not been auditedor reviewed by our auditors nor by independent experts, should not be considered in isolation, do not represent our revenues, margins,results of operations or cash flows for the periods indicated and should not be regarded as substitutes to revenues, cash flows or netincome as indicators of operational performance or liquidity.
Market and competitive position data in the Presentation have generally been obtained from industry publications and surveys orstudies conducted by third-party sources. There are limitations with respect to the availability, accuracy, completeness and comparabilityof such data. Telepizza has not independently verified such data and can provide no assurance of its accuracy or completeness. Certainstatements in the Presentation regarding the market and competitive position data are based on the internal analyses of Telepizza, whichinvolve certain assumptions and estimates. These internal analyses have not been verified by any independent source and there can beno assurance that the assumptions or estimates are accurate. Accordingly, no undue reliance should be placed on any of the industry,market or Telepizza’s competitive position data contained in the Presentation.
You may wish to seek independent and professional advice and conduct your own independent investigation and analysis of theinformation contained in this Presentation and of the business, operations, financial condition, prospects, status and affairs of Telepizza.The Company is not nor can it be held responsible for the use, valuations, opinions, expectations or decisions which might be adopted bythird parties following the publication of this Presentation.
No one should purchase or subscribe for any securities in the Company on the basis of this Presentation. This Presentation does notconstitute or form part of, and should not be construed as, (i) an offer, solicitation or invitation to subscribe for, sell or issue, underwriteor otherwise acquire any securities, nor shall it, or the fact of its communication, form the basis of, or be relied upon in connection with,or act as any inducement to enter into any contract or commitment whatsoever with respect to any securities; or (ii) any form of financialopinion, recommendation or investment advice with respect to any securities.
The distribution of this Presentation in certain jurisdictions may be restricted by law. Recipients of this Presentation should informthemselves about and observe such restrictions. Telepizza disclaims any liability for the distribution of this Presentation by any of itsrecipients.
By receiving or accessing this Presentation, you accept and agree to be bound by the foregoing terms, conditions and restrictions.

FY21 RESULTS PRESENTATION
EXECUTIVE SUMMARY
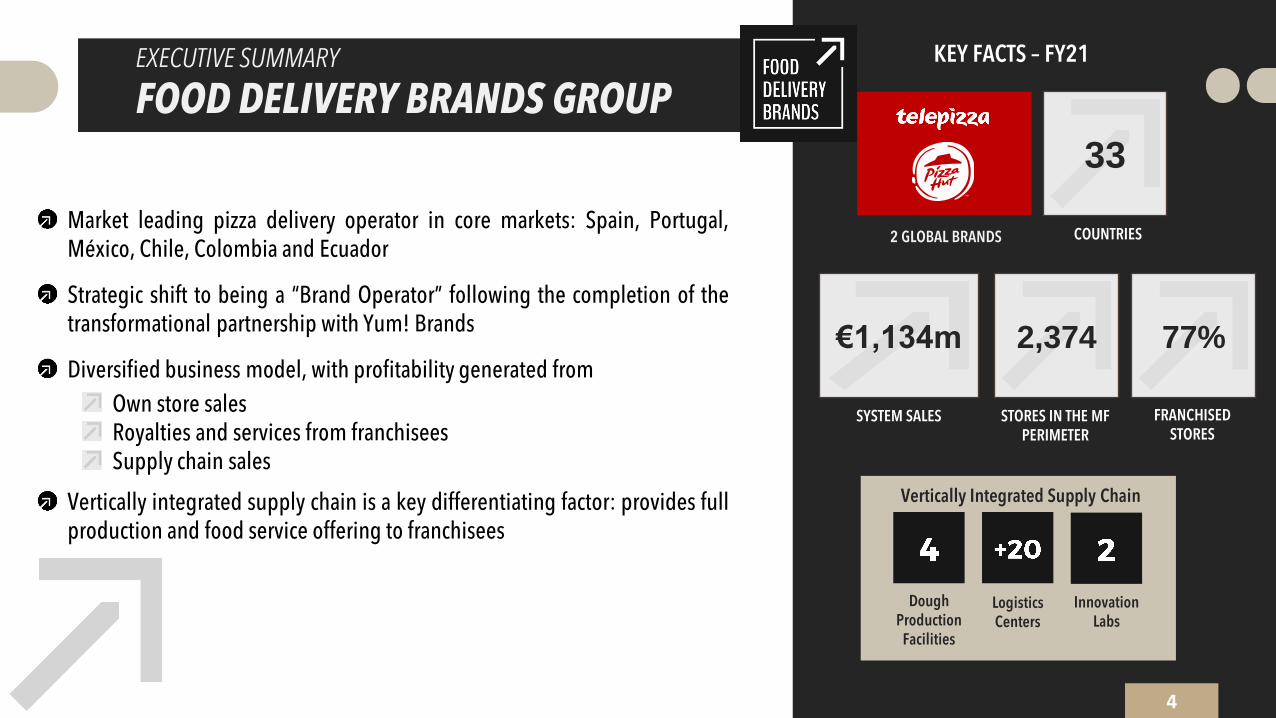
FOOD DELIVERY BRANDS GROUPKEY FACTS – FY21
33
€1,134m 2,374
2 GLOBAL BRANDS
STORES IN THE MF PERIMETER
SYSTEM SALES
COUNTRIES
Vertically Integrated Supply Chain
DoughProduction
Facilities
LogisticsCenters
InnovationLabs
Market leading pizza delivery operator in core markets: Spain, Portugal,México, Chile, Colombia and Ecuador
Strategic shift to being a “Brand Operator” following the completion of thetransformational partnership with Yum! Brands
Diversified business model, with profitability generated fromOwn store salesRoyalties and services from franchiseesSupply chain sales
Vertically integrated supply chain is a key differentiating factor: provides fullproduction and food service offering to franchisees
4
77%
FRANCHISED STORES
EXECUTIVE SUMMARY
KEY MESSAGES 1/3
5
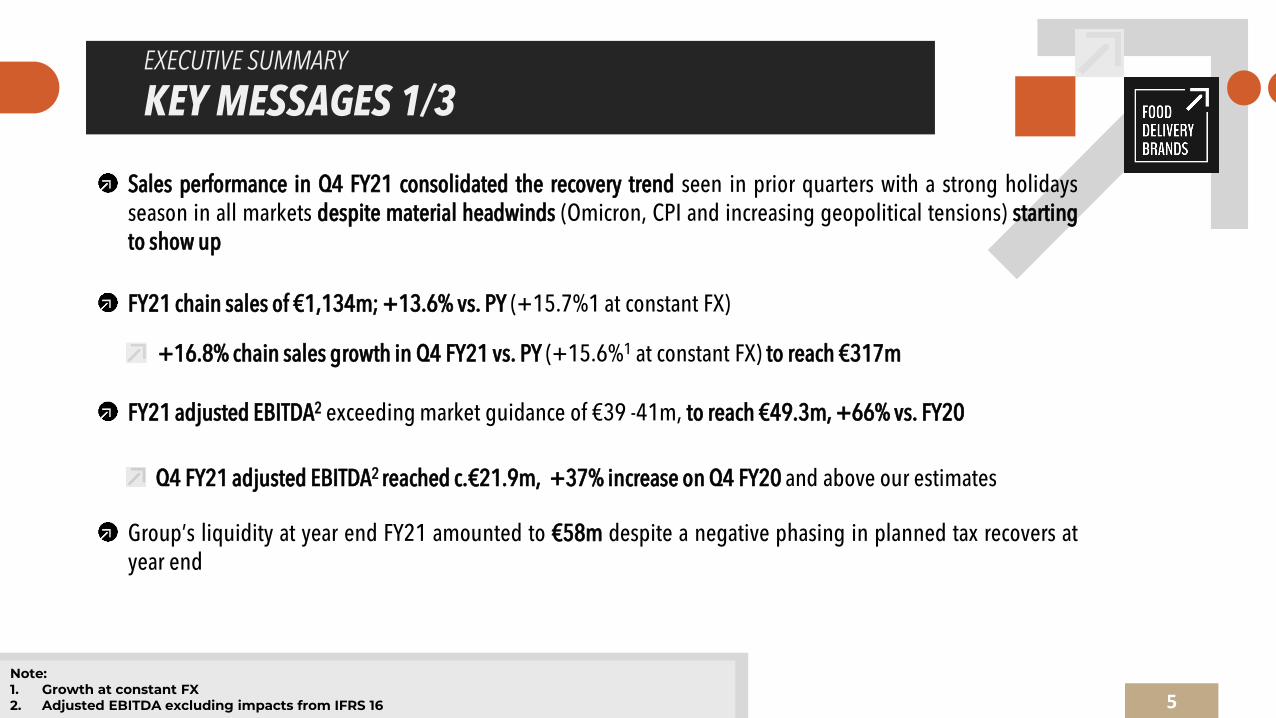
Note: 1. Growth at constant FX2. Adjusted EBITDA excluding impacts from IFRS 16
Sales performance in Q4 FY21 consolidated the recovery trend seen in prior quarters with a strong holidaysseason in all markets despite material headwinds (Omicron, CPI and increasing geopolitical tensions) startingto show up
FY21 chain sales of €1,134m; +13.6% vs. PY (+15.7%1 at constant FX)
+16.8% chain sales growth in Q4 FY21 vs. PY (+15.6%1 at constant FX) to reach €317m
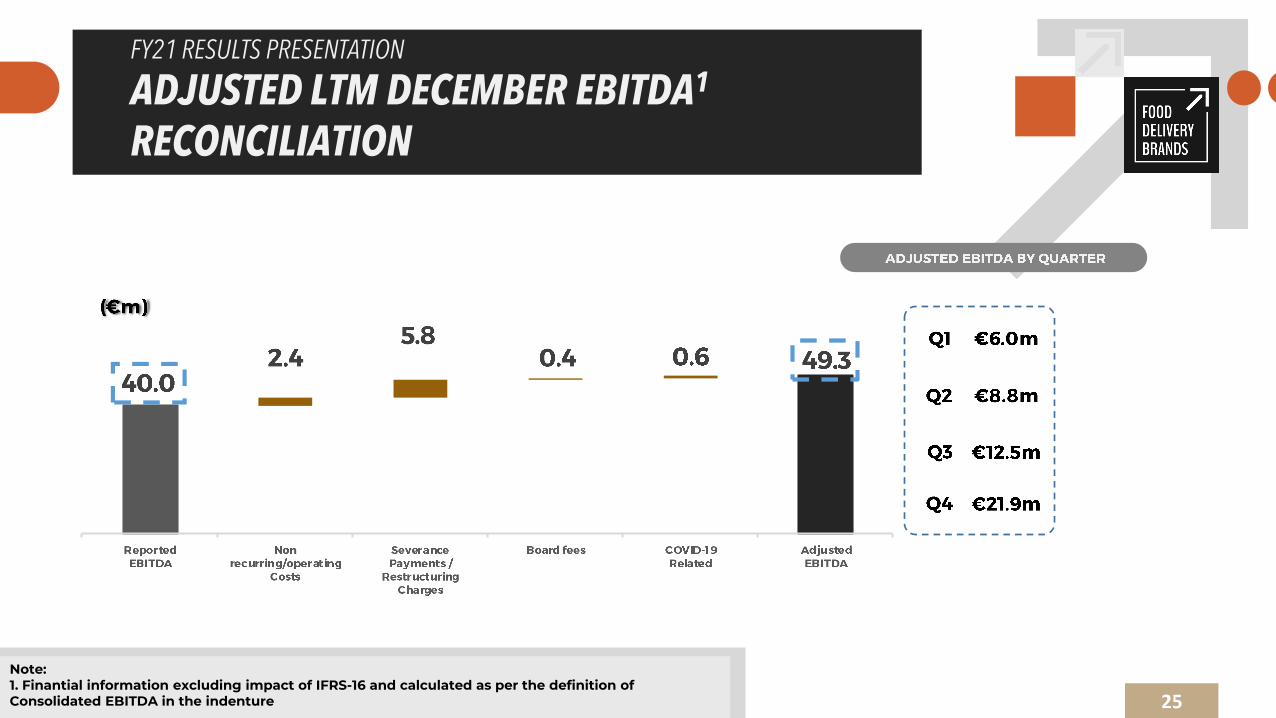
FY21 adjusted EBITDA2 exceeding market guidance of €39 -41m, to reach €49.3m, +66% vs. FY20
Q4 FY21 adjusted EBITDA2 reached c.€21.9m, +37% increase on Q4 FY20 and above our estimates
Group’s liquidity at year end FY21 amounted to €58m despite a negative phasing in planned tax recovers atyear end

EXECUTIVE SUMMARY
KEY MESSAGES 2/3
6
As of December 31, 99.3% of our stores were opened (100% in EMEA; 99% in Latam) and restrictions were mostly released inall markets
Total store count (within the YUM’s perimeter1) reached 2,374; +143 gross openings over the LTM and +74 units in Q4+113 Net openings in FY21, allowing us to capture opening incentives from YUM
Inflationary pressure started in Q3 2021 seems to be now uncontrolled as result on the war in Ukraine, triggeringunpredictable price increases in goods, transport and energy prices in the short/mid term as well as potential supply chaindisruptions
Note: 1. Pizza Hut master franchise perimeter (Spain, Portugal, Switzerland and Latam ex-Brazil),
including Telepizza and Pizza Hut stores

EXECUTIVE SUMMARY
KEY MESSAGES 3/3
7
Current macro-economic uncertainty limits our visibility on the evolution of the business during the remaining of 2022
In this scenario, the company’s guidance for this FY22 is:
System sales: high single digit growth1 vs. 2021EBITDA: €42-44m, in line with 2021 results2
CFADS: €0-5m
However, we might need to update this outlook if the evolution of the year is not the expected
The company will focus on actions to preserve margins and liquidity by transferring, to the extend possible, futureincremental costs to franchisees and consumers, and adapting its expansion plan to these new circumstances
Note: 1. Growth at constant FX2. Excluding opening incentives in 2021

EXECUTIVE SUMMARY
FY21 TRADING
8
Note: 1. Only includes stores in the MF YUM! Perimeter2. YoY Chain Sales at constant currency: 15.7%
(2)
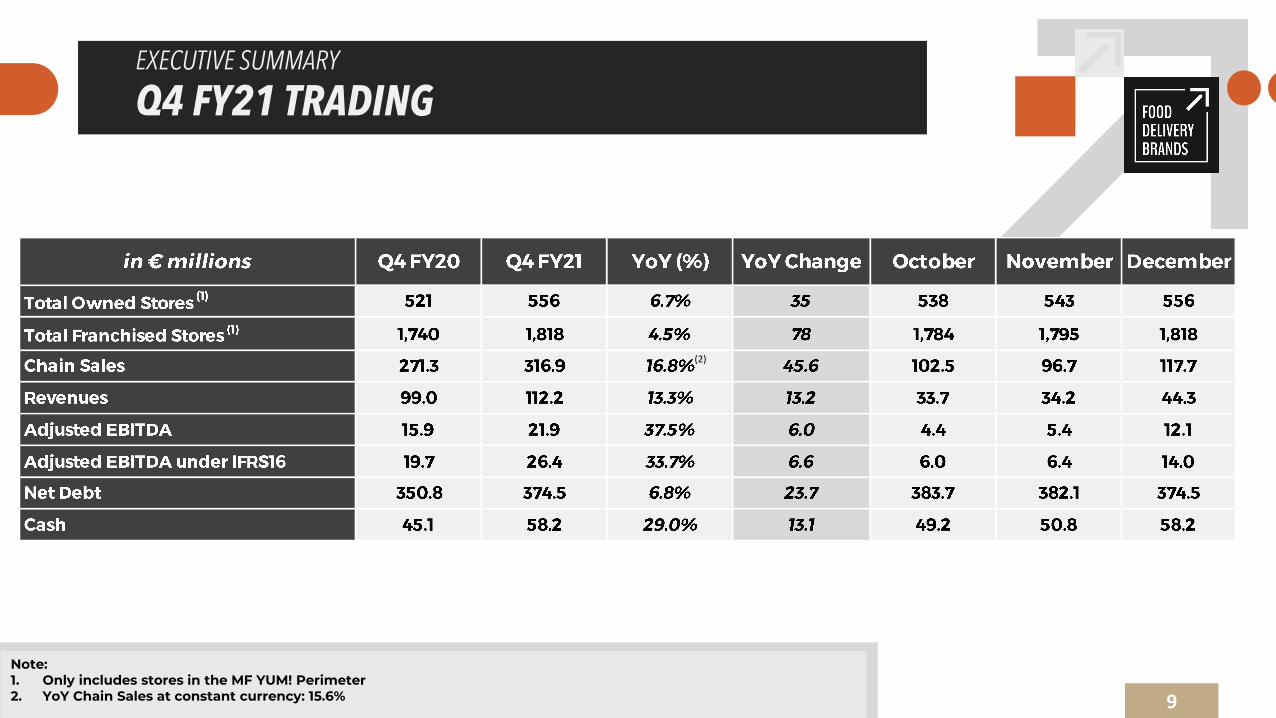
EXECUTIVE SUMMARY
Q4 FY21 TRADING
9
Note: 1. Only includes stores in the MF YUM! Perimeter2. YoY Chain Sales at constant currency: 15.6%
(2)
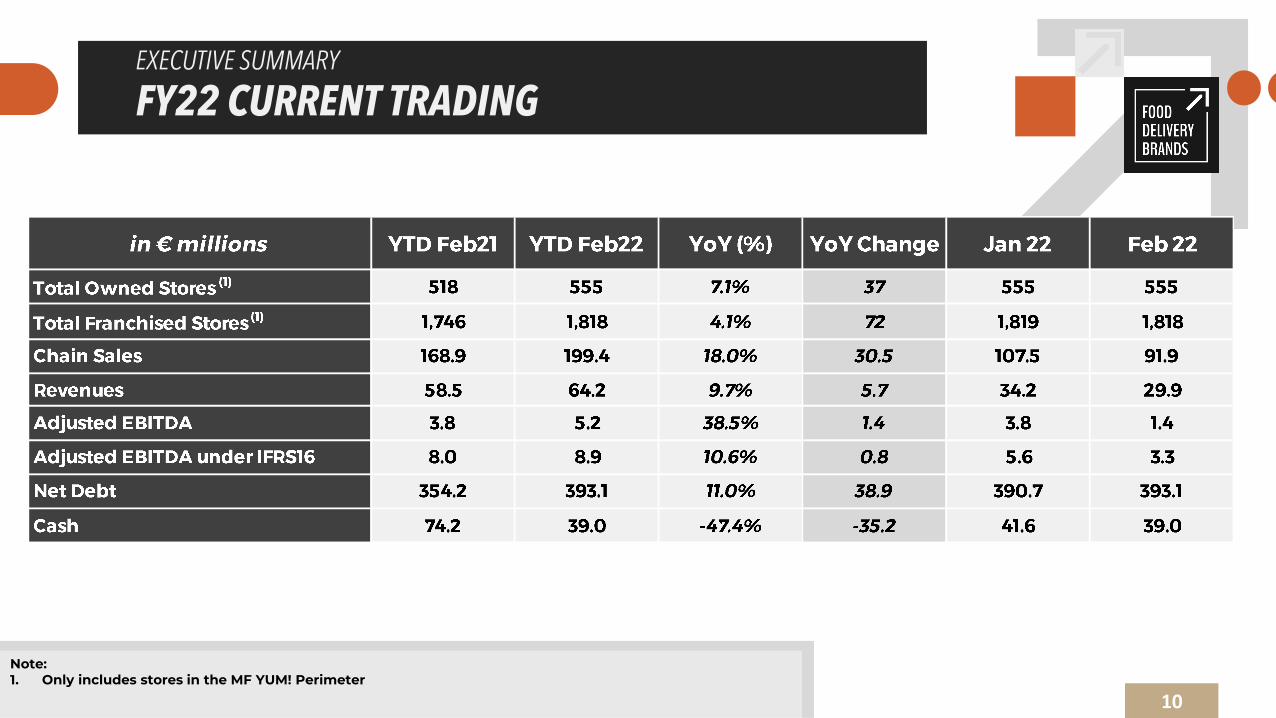
EXECUTIVE SUMMARY
FY22 CURRENT TRADING
10
Note: 1. Only includes stores in the MF YUM! Perimeter

FY21 RESULTS PRESENTATION

168 184
830950
9971,134
14.5%
13.6%
9.3%
FINANCIAL UPDATE
SYSTEM SALES AND REVENUES
12
Group System Sales and Revenues (€m)
188 210
16 8184
35639 3
1 1.7%
10.6%
9 . 3%

FINANCIAL UPDATE
SEGMENT PERFORMANCE – FY21
EMEA Spain and Portugal:
Strong Q4 sales growth of +8.6% vs. PY,confirming the positive steady trend as alreadyseen in prior Q’s despite some headwinds atyear end
FY 21 growth of +5.2% and 99% of the storesworking normally at year end
Rest of Europe: continued solid growth in Q42021 vs. PY (+10.8%) (at constant FX), with FYgrowth reaching +17.3%
LATAMSystem sales grew by c. 23% (at constant FX) duringQ4 (Telepizza: +18%; PH +24%), leaving FY21growth at +27% (at constant)
As of December 31th 2021, 99% of stores in theregion were opened although still a few restrictionsin place in some countries (food courts capacity andopening hours)
13
System sales across regions
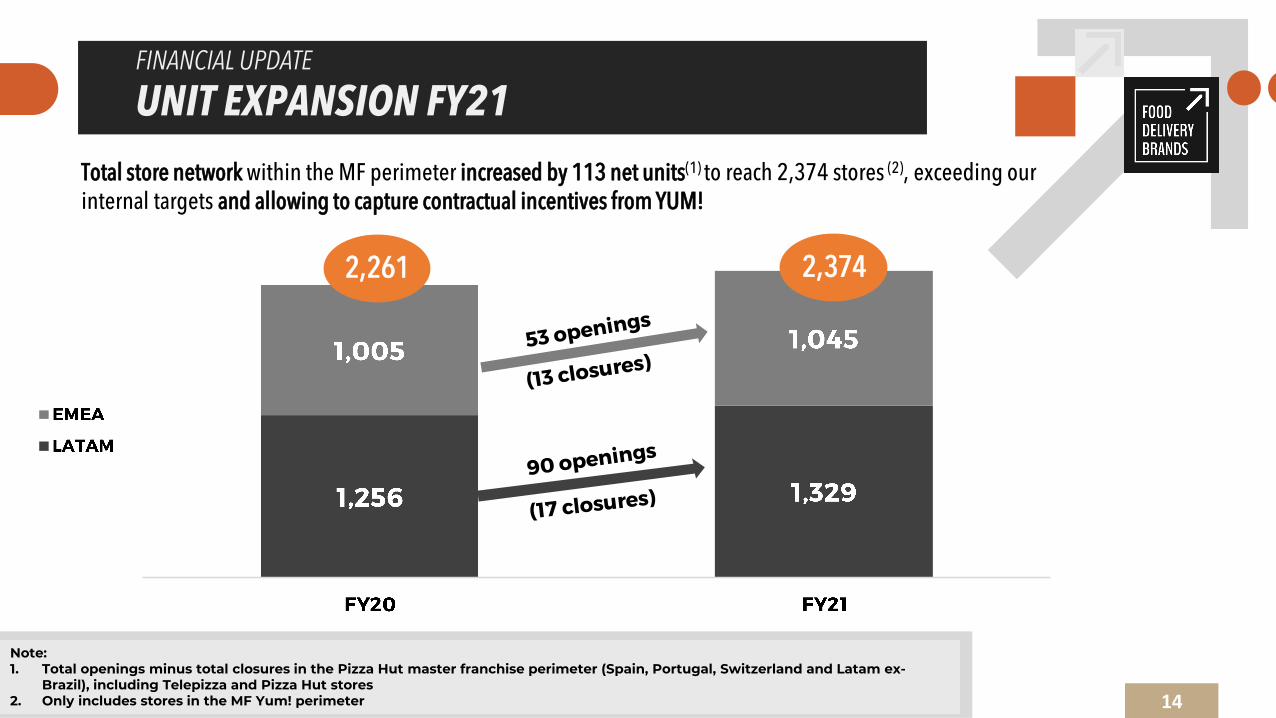
2,261 2,374
FINANCIAL UPDATE
UNIT EXPANSION FY21
14
Total store network within the MF perimeter increased by 113 net units(1) to reach 2,374 stores (2), exceeding our internal targets and allowing to capture contractual incentives from YUM!
Note:1. Total openings minus total closures in the Pizza Hut master franchise perimeter (Spain, Portugal, Switzerland and Latam ex-
Brazil), including Telepizza and Pizza Hut stores2. Only includes stores in the MF Yum! perimeter
Chequeado dato 2020 con presen 2020 OK

FINANCIAL UPDATE
ADJUSTED EBITDA BRIDGE –FY20 TO FY21
15
9.1

FINANCIAL UPDATE
ADJUSTED EBITDA BRIDGE – FY21 (IFRS16 RECONCILIATION)
16
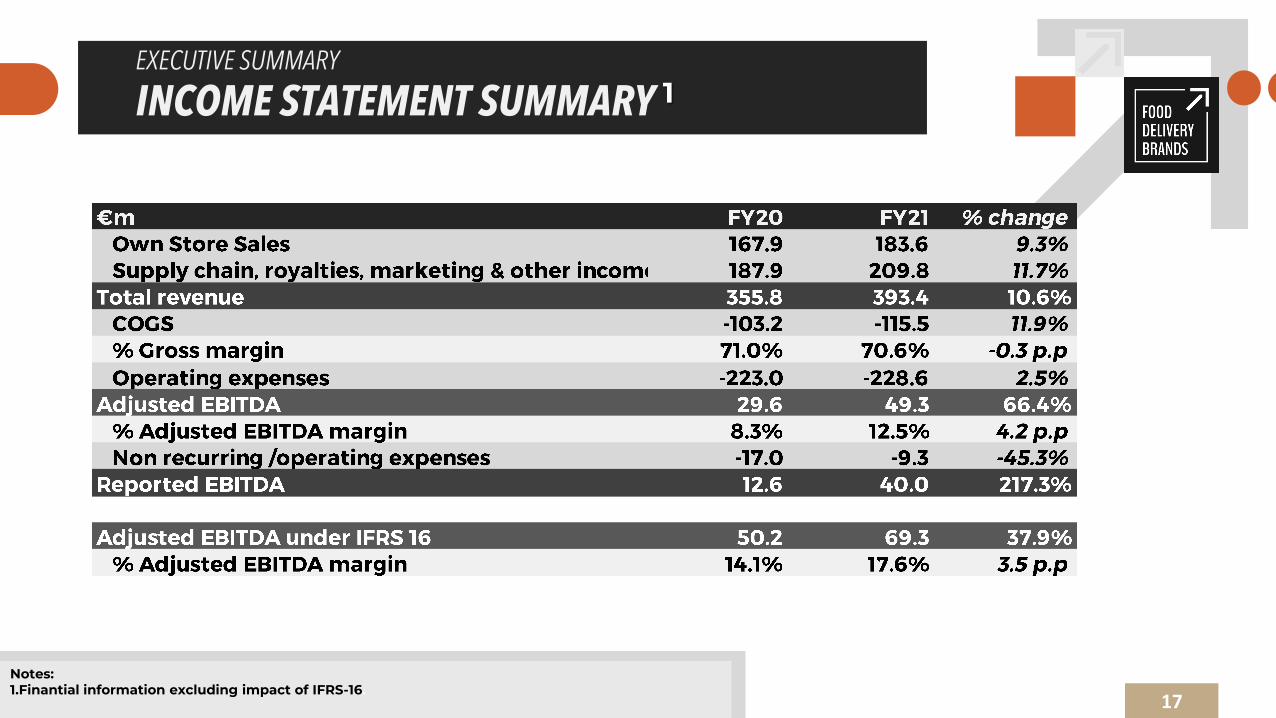
EXECUTIVE SUMMARY
INCOME STATEMENT SUMMARY 1
17
Notes:1.Finantial information excluding impact of IFRS-16.

FY21 Capex of c.€40.6m, +€15.7m vs. PY
(excluding M&A Capex) reflecting the strong effort made by the company in developing and reinforcing its digital and industrial capabilities, and its aggressive network expansion plan, with its main focus in México
M&A capex in 2021 relates to the acquisition of the remaining 25% minority stake of PH Mexico
18
FINANCIAL UPDATE
CAPITAL EXPENDITURE1 – 12M FY21
Note:1. Capex does not include non cash-out investments (e.g . Non cash Buybacks)
0.9 0.4
1.23.2
10.23.8
2.76.7
9.05.7
11.2
4.6
6.0
6.5
2.2

FINANCIAL UPDATE
CASH FLOW STATEMENT SUMMARY
Note:1. Maintenance capex is recurring capex for existing stores required to support
continued operation2. Expansion capex is growth capex associated with i) new store openings,
relocations, refurbishment, ii) IT & digital improvements, iii) investments infactories and iv) other growth initiatives. Excludes non-cash out capex (e.g.buybacks)
3. Cash Flow Available for Debt Service defined as Cash Flow from Operationsless Cash Flow from Investing
4. Underlying free cash flow is Adjusted EBITDA minus tax and others,expansion incentive and maintenance capex
5. Cash position of new perimeter with Tasty Bidco6. Tax and others includes VAT payments
19

20
FINANCIAL UPDATE
NET DEBT AND LEVERAGE –FY21
Bond Debt: €335mRCF: €45mICO Loan: €40mShareholders Loan: €3.5mReverse Factoring: €7.1mChilean Credit Line: €2.1m
Notes:1. Calculated on Adjusted EBITDA due to the complexity to reliably estimate pro forma adjustments in the current environment2. Net Leverage is the ratio between Senior Secured Indebtedness minus cash and cash equivalents and LTM adjusted EBITDA. LTM
EBITDA does not include any pro forma on acquisitions due to COVID uncertainty3. Fixed charge coverage ratio is the ratio between LTM Adjusted EBITDA and Consolidated Interest Expense
Net Leverage(2)
7.3x

FY21 RESULTS PRESENTATION
FY21 RESULTS PRESENTATION
CLOSING REMARKS 1/2
22
Q4 2021 confirmed the sustained recovery in sales and EBITDA reported in prior quarters with FY21 resultsexceeding the guidance to the market and our own internal financial and operational targets
The company ends 2021 stronger, both financial and operationally, overcoming the impacts from thepandemic and setting down the proper grounds for a sustained future growth
The war in Ukraine and the current economic uncertainty and volatility might have an impact in our initialoutlook for 2022 but shouldn’t change the long term run of the business

FY21 RESULTS PRESENTATION
CLOSING REMARKS 2/2
23
We are closely monitoring the impacts resulting from these circumstances to adapt our operations rapid andeffectively and preserve our margins and liquidity
Although we might need to update our guidance for 2022 if the evolution of the economy and the inflation isnot the expected, we forecast:
High single digit system sales growth1 vs. 2021€42-44m EBITDA, in line with 20212
Positive CFADS of €0-5m
Note: 1. Growth at constant FX2. Excluding opening incentives in 2021

FY21 RESULTS PRESENTATION
-
FY21 RESULTS PRESENTATION
ADJUSTED LTM DECEMBER EBITDA1
RECONCILIATION
25
Note:1. Finantial information excluding impact of IFRS-16 and calculated as per the definition of Consolidated EBITDA in the indenture
FY21 RESULTS PRESENTATION
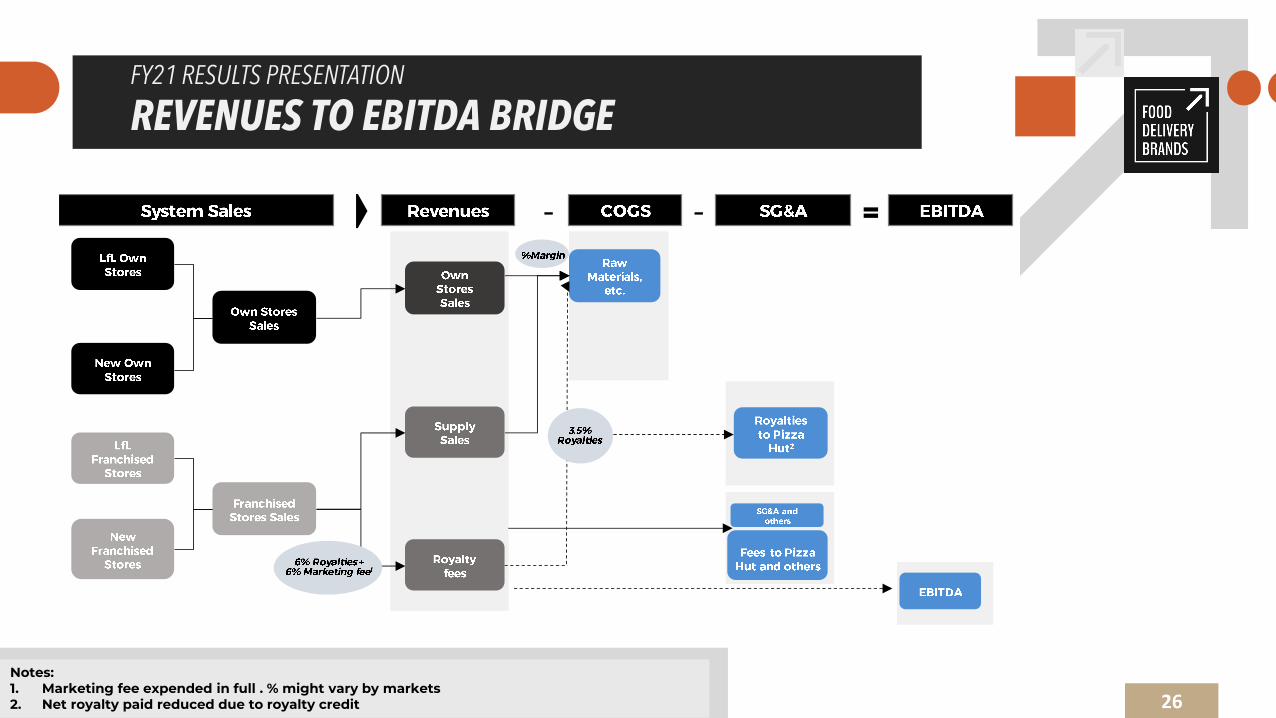
REVENUES TO EBITDA BRIDGE
26
Notes:1. Marketing fee expended in full . % might vary by markets2. Net royalty paid reduced due to royalty credit

STORE COUNT
STORE COUNT1 – FY21
27
Notes:1. Includes stores within the MF YUM! perimeter plus other geographies
(Ireland

FY21 RESULTS PRESENTATION
GLOSSARY 1/2
28
System sales / chain sales: System sales / chain sales are own store sales plusfranchised and master franchised store sales as reported to us by thefranchisees and master franchisees
LfL system sales growth: LfL system sales growth is system sales growth afteradjustment for the effects of changes in scope and the effects of changes inthe euro exchange rate as explained below
Scope adjustment. If a store has been open for the full month, we considerthat an “operating month” for the store in question; if not, that month isnot an “operating month” for that store. LfL system sales growth takes intoaccount only variation in a store’s sales for a given month if that month wasan “operating month” for the store in both of the periods being compared.The scope adjustment is the percentage variation between two periodsresulting from dividing (i) the variation between the system sales excludedin each of such periods (“excluded system sales”) because they wereobtained in operating months that were not operating months in thecomparable period, by (ii) the prior period’s system sales as adjusted todeduct the excluded system sales of such period (the “adjusted systemsales”). In this way, we can see the actual changes in system sales betweenoperating stores, removing the impact of changes between the periodsthat are due to store openings and closures; and
Euro exchange rate adjustment. We calculate LfL system sales growth on aconstant currency basis in order to remove the impact of changes betweenthe euro and the currencies in certain countries where the Group operates.
To make this adjustment, we apply the monthly average euro exchangerate of the operating month in the most recent period to the comparableoperating month of the prior period
Reported EBITDA: EBITDA is operating profit plus asset depreciation andamortization and other losses, excluding the effect of IFRS 16
Adjusted EBITDA: Adjusted EBITDA is Reported EBITDA adjusted for costs thatare non-operating in nature, non cash adjustments, and non-recurring costsrelated to; severance payments of restructuring processes, the Pizza Hutalliance, the new corporate structure, the refinance and COVID relatedexpenses
Non-operating items: Certain expenses, mainly related to onerous leases thatare non-operating in nature
Non-recurring costs: Extraordinary expenses related to the set-up of the PizzaHut alliance (strategy consulting, legal fees, performance bonuses and otherexpenses), also extraordinary expenses related to the set-up of new corporatestructure (finance consulting, legal fees and other expenses), severancepayments of restructuring process, non-recurring COVID related expenses,onerous leases and minor impact related to discontinued operations
FY21 RESULTS PRESENTATION
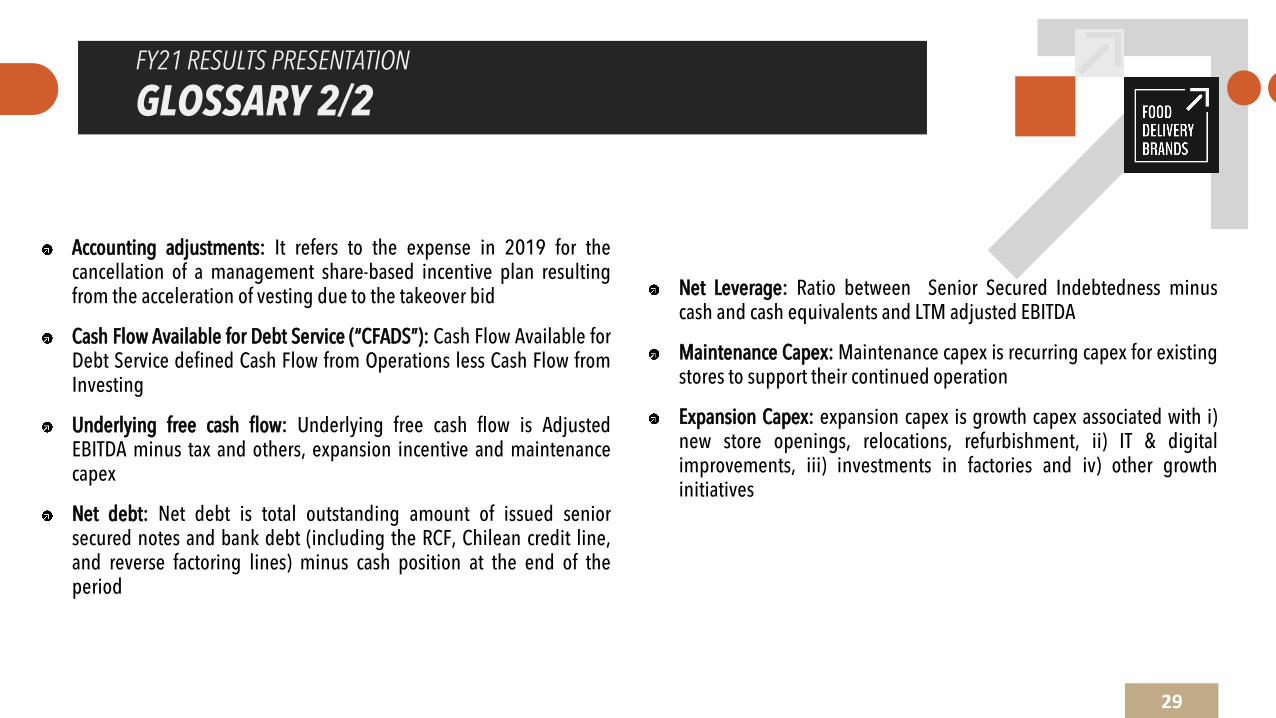
GLOSSARY 2/2
29
Accounting adjustments: It refers to the expense in 2019 for thecancellation of a management share-based incentive plan resultingfrom the acceleration of vesting due to the takeover bid
Cash Flow Available for Debt Service (“CFADS”): Cash Flow Available forDebt Service defined Cash Flow from Operations less Cash Flow fromInvesting
Underlying free cash flow: Underlying free cash flow is AdjustedEBITDA minus tax and others, expansion incentive and maintenancecapex
Net debt: Net debt is total outstanding amount of issued seniorsecured notes and bank debt (including the RCF, Chilean credit line,and reverse factoring lines) minus cash position at the end of theperiod
Net Leverage: Ratio between Senior Secured Indebtedness minuscash and cash equivalents and LTM adjusted EBITDA
Maintenance Capex: Maintenance capex is recurring capex for existingstores to support their continued operation
Expansion Capex: expansion capex is growth capex associated with i)new store openings, relocations, refurbishment, ii) IT & digitalimprovements, iii) investments in factories and iv) other growthinitiatives

30