Mahindra Holidays & Resorts India Limited Q3 FY21 Earnings ...
Upload
khangminh22Category
view
2download
0
This report is subject to review and acceptance by the Auditor of State’s office, and the requirements of Ohio Revised Code § 117.25 are not met until the Auditor of State certifies this report. This process will be completed by the Auditor of State in a reasonable timeframe and reports are subject to change if the Auditor of State determines that modification of a report is necessary to comply with required accounting or auditing standards or Uniform Requirements.

UNIVERSITY OF CINCINNATI A COMPONENT UNIT OF THE STATE OF OHIO
HAMILTON COUNTY
FINANCIAL STATEMENTS AS OF AND FOR THEYEAR ENDED JUNE 30, 2021 ANDINDEPENDENT AUDITOR'S REPORT

This page intentionally left blank

BOARD OF TRUSTEES
Trustees Term Expires
Ronald D. Brown Chair 2027
Thomas E. Mischell Vice Chair 2022
Kim Heiman Secretary 2024
Margaret K. Valentine 2023
Phil D. Collins 2025
Monica Turner 2026
J. Phillip Holloman 2028
Gregory Hartmann 2029
Jill T. McGruder 2030
Student Trustees
Abigail Klare, Undergraduate Student 2021
Jack Cohen, Graduate Student 2022
UNIVERSITY OF CINCINNATIA COMPONENT UNIT OF THE STATE OF OHIO

This page intentionally left blank

Table of Contents
Financial Statements
Independent Auditor's Report ........................................................................................................... 1
Management's Discussion and Analysis (unaudited) ................................................................... 3
Statement of Net Position ................................................................................................................. 18
Statement of Revenues, Expenses, and Changes in Net Position ............................................ 19
Statement of Cash Flows .................................................................................................................. 20
Notes to Financial Statements ......................................................................................................... 22
Required Supplementary Information
Schedules of the University’s Proportionate Share of the Net Pension Liability ...................... 66
Schedules of the University’s Contributions - Pension ................................................................. 67
Schedules of the University’s Proportionate Share of the Net OPEB Liability (Asset) ............ 68
Schedules of the University’s Contributions - OPEB .................................................................... 69
Independent Auditor's Report on Internal Control Over Financial Reporting and on Compliance and Other Matters Based on an Audit of the Financial Statements Performed in Accordance with Government Auditing Standards ................................................................... 73
UNIVERSITY OF CINCINNATIA COMPONENT UNIT OF THE STATE OF OHIO

Independent Auditor’s Report
Board of Trustees University of Cincinnati Cincinnati, Ohio
Report on the Financial Statements
We have audited the accompanying financial statements of the business-type activities and discretely presented component unit of the University of Cincinnati (University), collectively a component unit of the State of Ohio, as of and for the year ended June 30, 2021, and the related notes to the financial statements, which collectively comprise the University’s basic financial statements as listed in the table of contents.
Management’s Responsibility for the Financial Statements
Management is responsible for the preparation and fair presentation of these financial statements in accordance with accounting principles generally accepted in the United States of America; this includes the design, implementation and maintenance of internal control relevant to the preparation and fair presentation of financial statements that are free from material misstatement, whether due to fraud or error.
Auditor’s Responsibility
Our responsibility is to express opinions on these financial statements based on our audit. We did not audit the financial statements of the University of Cincinnati Foundation, the discretely presented component unit of the University. Those statements were audited by other auditors whose report has been furnished to us, and our opinion, insofar as it relates to the amounts included for the University of Cincinnati Foundation, is based solely on the report of the other auditors. We conducted our audit in accordance with auditing standards generally accepted in the United States of America and the standards applicable to financial audits contained in Government Auditing Standards, issued by the Comptroller General of the United States. Those standards require that we plan and perform the audit to obtain reasonable assurance about whether the financial statements are free from material misstatement.
An audit involves performing procedures to obtain audit evidence about the amounts and disclosures in the financial statements. The procedures selected depend on the auditor’s judgment, including the assessment of the risks of material misstatement of the financial statements, whether due to fraud or error. In making those risk assessments, the auditor considers internal control relevant to the entity’s preparation and fair presentation of the financial statements in order to design audit procedures that are appropriate in the circumstances, but not for the purpose of expressing an opinion on the effectiveness of the entity’s internal control. Accordingly, we express no such opinion. An audit also includes evaluating the appropriateness of accounting policies used and the reasonableness of significant accounting estimates made by management, as well as evaluating the overall presentation of the financial statements.
We believe that the audit evidence we have obtained is sufficient and appropriate to provide a basis for our audit opinions.

2
Opinions
In our opinion, based on our audit and the report of other auditors, the financial statements referred to above present fairly, in all material respects, the respective financial position of the business-type activities and the discretely presented component unit of the University, as of June 30, 2021, and the respective changes in financial position and, where applicable, cash flows thereof for the year then ended in accordance with accounting principles generally accepted in the United States of America.
Report on Summarized Comparative Information
We have previously audited the University’s 2020 financial statements, and we expressed unmodified audit opinions on those audited financial statements in our report dated October 15, 2020, which contained a reference to the report of other auditors. In our opinion, the summarized comparative information presented herein as of and for the year ended June 30, 2020, is consistent, in all material respects, with the audited financial statements from which it has been derived.
Other Matter
Required Supplementary Information
Accounting principles generally accepted in the United States of America require that the management’s discussion and analysis, pension and other postemployment benefit information as listed in the table of contents be presented to supplement the basic financial statements. Such information, although not a part of the basic financial statements, is required by the Governmental Accounting Standards Board, who considers it to be an essential part of financial reporting for placing the basic financial statements in an appropriate operational, economic or historical context. We have applied certain limited procedures to the required supplementary information in accordance with auditing standards generally accepted in the United States of America, which consisted of inquiries of management about the methods of preparing the information and comparing the information for consistency with management’s responses to our inquiries, the basic financial statements and other knowledge we obtained during our audit of the basic financial statements. We do not express an opinion or provide any assurance on the information because the limited procedures do not provide us with sufficient evidence to express an opinion or provide any assurance.
Other Reporting Required by Government Auditing Standards
In accordance with Government Auditing Standards, we also have issued our report dated October 15, 2021, on our consideration of the University of Cincinnati’s internal control over financial reporting and on our tests of its compliance with certain provisions of laws, regulations, contracts and grant agreements and other matters. The purpose of that report is solely to describe the scope of our testing of internal control over financial reporting and compliance and the results of that testing, and not to provide an opinion on the effectiveness of the University’s internal control over financial reporting or on compliance. That report is an integral part of an audit performed in accordance with Government Auditing Standards in considering the University’s internal control over financial reporting and compliance.
Cincinnati, Ohio October 15, 2021

Management’s Discussion and Analysis
Introduction
The following discussion and analysis provides an overview of the financial position of the University of Cincinnati (the university) as of and for the year ended June 30, 2021. The university originated in 1819 and is a comprehensive research-based public institution of higher learning. Comparative information as of and for the year ended June 30, 2020 has been provided where applicable. Comments relate to the university and University Heights Community Urban Redevelopment Corporation (UHCURC), a blended component unit of the university. Comments do not pertain to the university’s discretely presented component unit, the University of Cincinnati Foundation (the Foundation). The Foundation’s financial results are presented in a columnar format with further information found in the notes to the financial statements. Management has prepared this discussion, which should be read in conjunction with the financial statements and notes that follow this section.
The university is leading urban, public universities into a new era of innovation and impact through its strategic direction, Next Lives Here, underscoring the power of creativity, ingenuity, invention and inclusion. Next Lives Here focuses on our platforms of academic excellence, urban impact and the innovation agenda. The university is committed to student success, faculty excellence and enrichment, staff excellence and development, cutting-edge research that has a local and global impact, re-imagining cooperative education so that we provide even greater opportunity for students to gain work-integrated learning experience, and enhancing equity and inclusion.
Total enrollment for fall 2020 (fiscal year 2021) included 46,798 students, an increase of 410 students over the prior year. This is the highest enrollment in our history thanks to nearly a decade of steadily rising enrollment. Among the university’s student population are 3,015 international students representing 119 countries. The university offers a diverse range of degree programs from baccalaureate to post-doctoral levels through 14 colleges. University campuses include Clifton Campus, UC Blue Ash, and UC Clermont with student populations of 85%, 10%, and 5%, respectively. Faculty members on the three campuses totaled 4,155. The university employs approximately 10,397 people, including graduate assistants, making it one of the largest employers in the Cincinnati region. Our endeavors as a university encompass science, medicine, business, education, engineering, technology, the humanities, and the arts.
Throughout their academic careers, university students earn many external honors and awards, including Fulbright and Goldwater scholarships as well as grants and research project support from internal and external entities as varied as the National Science Foundation, National Endowment for the Humanities, the U.S. Air Force and others. At the university, both undergraduates and graduate students receive both funding and mentoring support to pursue research through specialized programs like ROSE (Research, Observation, Service and Education Experiences), WISE (Women in Science and Engineering), and SURF (Summer Undergraduate Research Fellowship). Such opportunities allow students to directly contribute to innovation, build a meaningful portfolio, engage with faculty and other thought leaders outside the classroom, and hone their inquiry and investigative skills according to the scientific method.
During the 2021 academic year, the university awarded 13,280 academic credentials. Degrees awarded include 1,190 associate degrees, 6,589 bachelor's degrees, 3,108 master's degrees, and 787 doctoral degrees. Professional certificates awarded total 1,606 (923 undergraduate and 683 graduate).
Many university faculty members have been awarded significant honors at the local, state, national, and international levels. These include numerous National Science Foundation Career awards as well as Fulbright awards and Guggenheim grants. University faculty and their work routinely receive support from the Ohio Board of Regents, Department of Health and Human Services, National Institutes of Health, Department of Defense, Department of Education, Department of Energy, U.S. EPA, National Science Foundation, National Endowment for the Humanities, National Endowment for the Arts, National Geographic Society, National Oceanic and Atmospheric Administration, U.S. Geological Survey, Andrew W. Mellon Foundation, Robert Wood Johnson Foundation, National Heart, Lung and Blood Institute and many others.
The Ohio Department of Higher Education has designated the university as one of only two major comprehensive research-based universities within the state’s higher educational system that comprises 14 public universities. The National Science Foundation places the university at No. 33 among America’s public research universities, and one of only 130 institutions classified as housing the very highest activity by the Carnegie Classification of Institutions of
UNIVERSITY OF CINCINNATI JUNE 30, 2021 A COMPONENT UNIT OF THE STATE OF OHIO
3

Higher Education. Reuters has named UC among the world’s top 100 most-innovative universities, one of only 46 U.S. universities to make that prestigious list.
The university is home to a number of Ohio Centers of Excellence where faculty research as well as their scholarly and creative endeavors serves to advance innovation and entrepreneurial activity as well as draw gifted students seeking to augment and apply their skills. The university is home to Ohio Centers of Excellence dedicated to advanced energy and sustaining the urban environment, transforming healthcare in the 21st century, intelligent air and space vehicle energy systems, nanoscale sensor technology, design and innovation, and music and theater arts.
The latest 2022 issue of the U.S. News & World Report's influential Best Colleges guide ranks the university among the top tier of national universities (no. 148), with the university outpacing almost all national rivals on performance indicators important to students and their families. As the global founder of cooperative education, the university remains a world-class leader in experience-based learning. U.S. News & World Report ranks the university's co-op program in the Top 4 in the country, and our students earned a collective $58 million in 2020-21 working for more than 1,600 international employers via their co-op work placements, alternating academic semesters with professional, paid work directly tied to their majors. In the past academic year, the average earnings in the university's mandatory, full-time co-op programs comes to $10,500 per student each semester.
Princeton Review’s 2022 edition of “The Best 387 Colleges” identified the university for the 14th year in a row among the nation’s best institutions for an undergraduate education. University rankings are based on The Princeton Review’s surveys of 154,000 students.
The university's campus setting continues to garner worldwide acclaim, with The New York Times highlighting the university's dramatic campus renovation of the past quarter century “the most ambitious campus design program in the country.” In addition, Forbes, Delta Sky and Travel + Leisure magazines have all highlighted the university as one of the world’s most beautiful campuses. It’s also a sustainable one where all new construction and major renovations are completed to LEED Silver standards or higher whenever possible.
In 2021, the university received HEERF II and HEERF III Federal grant awards totaling $109.6 million. HEERF II was appropriated through the Coronavirus Response and Relief Supplemental Appropriations Act (CRRSAA). HEERF III was appropriated through the American Rescue Plan Act (ARPA). Part A of the combined awards requires the university to spend no less than $47.2 million for student aid. Part B allows for $62.4 million of the award to be used for institutional purposes. Grant funds totaling $67.3 million were spent during 2021, of which $34.6 million was reported as deferred revenue on the Statement of Net Position. The university can only recognize Part B revenue proportionate to spending occurring on Part A. The disbursement of Part A has been deferred until fiscal year 2022.
In 2021, the university also received an allocation of Coronavirus Aid, Relief and Economic Security (CARES) Act funds through the State of Ohio through the Coronavirus Relief Funds (CRF) and Governor's Emergency Education Relief (GEER) awards. The allocation to the university totaled $22.1 million. The full amount of the award was expended in 2021.
Using the Financial Statements
The university’s financial report includes three financial statements and related notes:
• The Statement of Net Position• The Statement of Revenues, Expenses, and Changes in Net Position• The Statement of Cash Flows
These financial statements are prepared in accordance with Governmental Accounting Standards Board (GASB) principles, which establish standards for external financial reporting for public colleges and universities.
UNIVERSITY OF CINCINNATI JUNE 30, 2021 A COMPONENT UNIT OF THE STATE OF OHIO
4

Statement of Net Position
The Statement of Net Position is the university's balance sheet. It reflects the financial position of the university at the end of the fiscal year. Liabilities due within one year and assets available to pay those liabilities are classified as current. Other assets and liabilities are classified as noncurrent. Investment assets are carried at fair value. Capital assets are separated into two lines on the statement: those assets that are depreciated and those that are not depreciated. Items that are depreciated include buildings, equipment, infrastructure, land improvements, and library books. Items that are not depreciated include land, construction in progress, art, and rare book collections.
In addition to assets, liabilities, and net position, the university's balance sheet includes deferred outflows of resources and deferred inflows of resources. Deferred outflows are similar to assets and will be recognized as expense in future periods. Deferred inflows are similar to liabilities and will be recognized as revenue (or reductions of expense) in future periods.
A summary of the university’s net financial position at June 30, 2021 and June 30, 2020 follows:
Summary Statement of Net Position
Increase/(Decrease)(in thousands) 2021 2020 Amount Percent
Current assets $ 548,183 $ 333,945 $ 214,238 64.2 %Noncurrent assets
Investments 420,679 399,640 21,039 5.3 %Endowment investments 746,183 600,071 146,112 24.3 %Accounts and notes receivable 20,551 22,477 (1,926) -8.6 %Net other postemployment benefits asset 49,205 25,711 23,494 91.4 %Other noncurrent assets 18,196 8,936 9,260 103.6 %UC Health intangible asset 420,645 420,645 — 0.0 %Capital assets, net of depreciation 1,658,380 1,699,827 (41,447) -2.4 %
Total assets 3,882,022 3,511,252 370,770 10.6 %
Deferred outflows of resources 123,991 167,769 (43,778) -26.1 %
Current liabilities 339,485 269,469 70,016 26.0 %Noncurrent liabilities 1,755,549 1,977,778 (222,229) -11.2 %Total liabilities 2,095,034 2,247,247 (152,213) -6.8 %
Deferred inflows of resources 204,811 135,635 69,176 51.0 %
Net position $ 1,706,168 $ 1,296,139 $ 410,029 31.6 %
Current Assets
Current assets consist primarily of cash and cash equivalents, short-term investment of operating funds, and accounts receivable. Current assets increased by $214.2 million in 2021. The university invests its operating funds and borrowed proceeds to provide, in order of priority, safety of principal, liquidity, and maximum total return consistent with safety and liquidity.
UNIVERSITY OF CINCINNATI JUNE 30, 2021 A COMPONENT UNIT OF THE STATE OF OHIO
5

Noncurrent Assets
Investments
Investments (excluding endowment investments) at June 30, 2021 totaled $420.7 million, an increase of $21.0 million from June 30, 2020. The funds are invested in the university’s temporary investment pool with the exception of $68.5 million, which is invested in the endowment. Investments with a maturity date less than one year totaled $200.8 million, and are classified as current investments with the exception of $76.7 million of debt issued for capital projects which is classified as noncurrent.
Endowment Investments
The university’s endowment totaled $1.81 billion at June 30, 2021. The endowment includes Fund A (actively managed pooled investments), Fund B (certain real estate), Fund C (community development real estate investments funded with endowment funds), separately invested assets, and beneficial interests in irrevocable trusts. Principal repayments and interest collected on Fund C investments are subsequently invested in Fund A. Below is a summary of the market value for each category of the university’s endowment:
Increase/(Decrease)(in thousands) 2021 2020 Amount Percent
Fund A (University's share) $ 757,103 $ 588,646 $ 168,457 28.6 %Fund A (Foundation's share) * 506,920 384,065 122,855 32.0 %Total Fund A 1,264,023 972,711 291,312 29.9 %Fund B 816 816 — 0.0 %Fund C (University's share) 40,280 41,343 (1,063) -2.6 %Fund C (Foundation's share) * 20,523 20,474 49 0.2 %Total Fund C 60,803 61,817 (1,014) -1.6 %Separately Invested 29,941 26,701 3,240 12.1 %Beneficial Interests in Irrevocable Trusts 458,399 355,969 102,430 28.8 %Total Endowment Investments $ 1,813,982 $ 1,418,014 $ 395,968 27.9 %
* Includes accrued income/expense
Endowment investments reported on the Statement of Net Position totaled $746.2 million and include the following:• The university’s share of Fund A, excluding temporary investment pool funds of $67.4 million, accrued
income, accrued expense, and valuation timing adjustments• Fund B• The university's share of Fund C, excluding temporary investment pool funds of $1.1 million, an $8.1 million
loan to UHCURC, and $4.0 million of accrued income• Separately invested funds excluding accrued income of $2.5 million
All endowment investments, including cash and cash equivalents, are reported as noncurrent endowment investments due to the restrictions placed upon these assets.
Endowment funds consist of both permanent endowments and funds functioning as endowment (quasi-endowments and term endowments). Permanent endowments are funds received from donors with the stipulation that the principal remain inviolate and be invested in perpetuity to produce income that is expended for a specific purpose. Funds functioning as endowment consist of amounts (restricted gifts or unrestricted funds) that have been allocated by the university for the purpose of long-term investment, but are not limited by donor stipulations requiring the university to preserve principal in perpetuity. Programs supported by endowment funds include scholarships, fellowships, professorships, research efforts, and other major programs and activities.
UNIVERSITY OF CINCINNATI JUNE 30, 2021 A COMPONENT UNIT OF THE STATE OF OHIO
6

Fund A, the university’s principal investment pool, increased in 2021 from $972.7 million to $1.26 billion, an increase of $291.3 million. which equates to a 29.9% increase. The increase is net of a 4.3% endowment spending distribution and a 1.0% distribution to the Foundation. Fund A consists of approximately 12.2% cash and fixed income, 39.6% corporate stocks, 20.1% hedge funds, 26.4% private equity, and 1.7% real estate.
The university manages the endowment to support current operations in a way that generates a predictable stream of support while maintaining the purchasing power of endowment funds adjusted for inflation. The spending policy provides for annual distributions of 4.3% of the three-year quarterly moving-average market value of assets in the investment pool. The income distribution for endowment spending for fiscal year 2022 will be reduced by 0.1 percentage points to 4.2% times the previous twelve-quarter moving average of market value.
At June 30, 2021, Fund A summary of activity and information is as follows (in thousands):
Fund AOutstanding
Shares Per Unit PriceTotal
(in thousands)Beginning balance 13,783,887 $ 70.5687 $ 972,711 Ending balance 14,322,033 88.2572 1,264,023 Increase in Fund A 538,146 $ 17.6885 $ 291,312
Fund A ActivityReturn on Investments $ 309,108 Gifts Received 23,753 Funds available for spending, net transfers, and fees (fundraising, administrative and custody) (41,549)
Total Fund A Activity $ 291,312
The university is the beneficiary of numerous perpetual trusts held and administered by external trustees. The market value of these external trustee assets totaled $458.4 million and $356.0 million as of June 30, 2021 and June 30, 2020, respectively. These external trusts are irrevocable, and the university has a vested beneficial interest in the net income payable by the trusts. External trust assets are not reported on the Statement of Net Position unless they are recognized as beneficial interest in trusts recognized under GASB 81, Irrevocable Split-Interest Agreements. Income is received annually and reported on the university’s Statement of Revenues, Expenses, and Changes in Net Position. The university received income of $11.8 million and $10.4 million in 2021 and 2020, respectively.
Endowment investments recorded in the university’s column of the financial report exclude both the Foundation’s share of Funds A and C, and the university’s beneficial interests in irrevocable trusts.
UC Health Affiliation Agreement
The university’s intangible asset valuation for its interest in UC Health is valued at $420.6 million. The valuation is based on the cost method of accounting as of July 1, 2011. For further discussion of UC Health, please refer to Note 5, UC Health Affiliation Agreement. The affiliation agreement supports the mission of UC Health and the university through the commitment to patient care, education, and research.
UNIVERSITY OF CINCINNATI JUNE 30, 2021 A COMPONENT UNIT OF THE STATE OF OHIO
7

Capital Assets
The university's campus has a 200 year history. Since 1889, buildings, landscapes, athletic fields, functional elements and site improvements have been integrated into the campus. Today's architecture, landscape architecture and site elements of the transformed campus are set over a landlocked foundation of landform, landscape, historical buildings and access as well as a framework of contemporary master planning efforts.
During 2021, the university completed and capitalized significant projects including:
• Engineering Research Center Roof & Facade Restoration• French West HVAC Upgrade• Rhodes Hall Fire Protection Upgrades and Roof Replacement• Rieveschl Lab/Classroom/Office Renovations• UC Blue Ash Muntz Hall Rehabilitation (Phase 3)
Capital projects currently in construction include:
• Calhoun Hall Renovation• Clifton Court Hall• College of Law Renovation• Digital Futures Building• Memorial Hall Roof and Facade Improvements• Probasco Auditorium Renovation• UC Blue Ash Muntz Hall Rehabilitation (Phase 4)• Vontz Center Exterior Envelope Improvements
Projects currently in design include:
• 121 East McMillan Renovation• UC Bioscience Center
Capital asset additions are funded using a combination of state capital appropriations, debt, gifts, and university funds. Capital additions (net of depreciation) totaled $(39.5) million in 2021 and $(50.0) million in 2020. Depreciation expense totaled $133.3 million in 2021 and $131.1 million in 2020. Capital additions are primarily comprised of capital projects that were either completed during the fiscal year or are in the construction or design phase at June 30 of each fiscal year.
UNIVERSITY OF CINCINNATI JUNE 30, 2021 A COMPONENT UNIT OF THE STATE OF OHIO
8

Liabilities
Debt
Total debt representing bonds and capital leases was $1.19 billion at June 30, 2021; a decrease of $22.6 million from $1.21 billion at June 30, 2020.
During 2021, the university refunded $102.5 million and retired $9.2 million, a total of $111.7 million of existing debt to reduce interest rates and achieve debt service savings (see Note 7). These strategic transactions reduced interest payments over the life of the debt outstanding by $59.7 million.
The university continues to invest and expand its educational and research facilities beyond the level provided by state capital appropriations and donor gifts, through the issuance of debt. The extensive investment in facilities is necessary to attract and maintain high quality students, faculty, and research funding in an increasingly competitive environment. During 2021, the university issued $39.7 million of new debt to provide funding for capital projects.
Standard & Poor’s Ratings Services reaffirmed its previously assigned AA- long-term rating with a stable outlook. Moody’s Investors Service also reaffirmed its previously assigned Aa3 rating with a stable outlook. The ratings were assigned after extensive reviews of the university’s financial activities, strategic plans, and future prospects.
Net Position
The four net position categories represent the residual interest in the university’s assets and deferred outflows of resources less liabilities and deferred inflows of resources. The university’s net position at June 30, 2021 and June 30, 2020 is summarized below:
Increase/(Decrease)(in thousands) 2021 2020 Amount Percent
Net investment in capital assets $ 558,112 $ 570,098 $ (11,986) -2.1 %Restricted for:
Nonexpendable 845,599 762,587 83,012 10.9 %Expendable 449,132 393,546 55,586 14.1 %
Unrestricted (146,675) (430,092) 283,417 65.9 %Total Net Position $ 1,706,168 $ 1,296,139 $ 410,029 31.6 %
Net investment in capital assets represents both the university’s non-depreciable and depreciable assets. Non-depreciable assets include land, construction in progress, and collections of art and rare books. Capital assets being depreciated include land improvements, buildings, infrastructure, building equipment, movable equipment, computer software and library books. Net investment in capital assets is also net of outstanding principal balances of debt attributable to the acquisition, construction, and improvement of those assets. During fiscal year 2021, net investment in capital assets decreased by $12.0 million. Restricted nonexpendable net position includes, as a primary component, the university’s permanently invested endowment and gift funds. These funds increased by $83.0 million and are net of annual endowment spending distributions and Foundation fees. Restricted nonexpendable net position also includes the university’s investment in UC Health.
Restricted expendable net position is subject to externally imposed provisions governing its use. This category of net position mainly includes unspent expendable endowment funds (available through the endowment spending policy), gifts, support from affiliates, and restricted quasi-endowment funds. Restricted expendable funds increased by $55.6 million due, in part, to increases in debt proceeds, current use gift funds, and expendable endowment funds.
Pension reporting standards require the university to recognize net assets, liabilities, expenses, and deferred outflows and inflows of resources for both the pension plans and OPEB based on the university’s proportionate share of collective amounts for all participating employers in these defined benefit cost sharing, multiple-employer plans. The cumulative net impact of the pension and OPEB standards at June 30, 2021 was a reduction of $579.9 million ($49.2
UNIVERSITY OF CINCINNATI JUNE 30, 2021 A COMPONENT UNIT OF THE STATE OF OHIO
9

million addition to restricted expendable and $629.1 million reduction to unrestricted) to the university's total net position. Additional detail relating to the pension and OPEB standards is in the table below:
Increase/(Decrease)(in thousands) 2021 2020 Amount Percent
Impact of Pension and OPEB StandardsNet OPEB Asset $ 49,205 $ 25,711 $ 23,494 91.4 %Deferred Outflows of Resources
OPEB 15,614 33,909 (18,295) -54.0 %Pension 88,466 110,196 (21,730) -19.7 %
Net Pension and OPEB LiabilityOPEB — 173,629 (173,629) -100.0 %Pension 546,204 581,569 (35,365) -6.1 %
Deferred Inflows of ResourcesOPEB 99,414 54,897 44,517 81.1 %Pension 87,572 71,802 15,770 22.0 %
Net Impact of Pension and OPEB Standards $ (579,905) $ (712,081) $ 132,176 -18.6 %* See note 11 for retirement plans and OPEB
UNIVERSITY OF CINCINNATI JUNE 30, 2021 A COMPONENT UNIT OF THE STATE OF OHIO
10

STATEMENT OF REVENUES, EXPENSES, AND CHANGES IN NET POSITION
The Statement of Revenues, Expenses, and Changes in Net Position presents the results of the university’s activities for the year. Listed below are summarized statements of the university’s revenues, expenses, and changes in net position for the years ended June 30, 2021 and June 30, 2020:
SUMMARY STATEMENT OF REVENUES, EXPENSES, AND CHANGES IN NET POSITION
Increase/(Decrease)(in thousands) 2021 2020 Amount Percent
Operating Revenues $ 917,326 $ 914,677 $ 2,649 0.3 %Operating Expenses 1,114,449 1,325,353 (210,904) -15.9 %
Operating Loss (197,123) (410,676) 213,553 -52.0 %Nonoperating Revenues (Expenses)
State educational appropriations 231,500 217,224 14,276 6.6 %Federal nonexchange grants 100,783 63,580 37,203 58.5 %State nonexchange grants 5,209 5,384 (175) -3.3 %Gifts 30,986 33,928 (2,942) -8.7 %Support from affiliates 23,184 25,966 (2,782) -10.7 %Net investment income 226,478 40,839 185,639 454.6 %Net interest on capital asset-related debt (47,303) (46,082) (1,221) 2.6 %Other nonoperating revenues (expenses) 4,025 4,324 (299) -6.9 %
State capital appropriations 22,095 17,105 4,990 29.2 %Capital gifts and grants 9,763 9,492 271 2.9 %Additions to permanent endowments 432 392 40 10.2 %Increase (Decrease) in Net position 410,029 (38,524) 448,553 -1,164.3 %
Net position, beginning of year 1,296,139 1,334,663 (38,524) -2.9 %Net position, end of year $ 1,706,168 $ 1,296,139 $ 410,029 31.6 %
Revenues and expenses are categorized as either operating or nonoperating. Significant recurring sources of the university’s revenues, including state appropriations, federal nonexchange grants, state nonexchange grants, gifts, and support from affiliates are considered nonoperating. Consequently, the operating loss of $197.1 million does not account for these important revenue sources. Adding these five revenue sources, which total $391.7 million for 2021, offsets much of the operating loss.
UNIVERSITY OF CINCINNATI JUNE 30, 2021 A COMPONENT UNIT OF THE STATE OF OHIO
11

REVENUES
The university’s revenues for the years ended June 30, 2021 and June 30, 2020, are summarized below:
SUMMARY OF REVENUES
Increase/(Decrease)(in thousands) 2021 2020 Amount Percent
Operating Revenues Net student tuition and fees $ 497,219 $ 495,973 $ 1,246 0.3 %
Federal, state, & local grants and contracts 158,465 139,307 19,158 13.8 % Nongovernmental grants and contracts 26,356 24,286 2,070 8.5 %
Sales and services of educational departments 143,595 135,096 8,499 6.3 %Auxiliary enterprises, net 80,726 107,998 (27,272) -25.3 %Other 10,965 12,017 (1,052) -8.8 %
Total operating revenues 917,326 914,677 2,649 0.3 %Nonoperating Revenues State educational appropriations 231,500 217,224 14,276 6.6 % Federal and state nonexchange grants 105,992 68,964 37,028 53.7 % Gifts 30,986 33,928 (2,942) -8.7 % Support from affiliates 23,184 25,966 (2,782) -10.7 % Net investment income 226,478 40,839 185,639 454.6 % Other nonoperating revenues 4,025 4,324 (299) -6.9 %Capital appropriations, gifts, and grants 31,858 26,597 5,261 19.8 %Additions to permanent endowments 432 392 40 10.2 %Total nonoperating and other revenues 654,455 418,234 236,221 56.5 %Total revenues $ 1,571,781 $ 1,332,911 $ 238,870 17.9 %
Operating Revenues
Net student tuition and fees are the primary source of operating revenue for the university. During 2021, the net revenue from student tuition and fees increased from $496.0 million to $497.2 million, an increase of $1.2 million. The university increased undergraduate instructional fees for incoming freshman by 4.1% through its tuition guarantee program. The program guarantees no additional tuition increases for four or five year programs, dependent on the undergraduate degree-seeking student's degree program.
The university has a high level of commitment to its research mission. In 2021, revenue from federal, state, and local grants and contracts totaled $158.5 million, an increase of $19.2 million. The increase was mainly a result of an increase in federal grant funds. Nongovernmental grants and contracts revenue increased from $24.3 million to $26.4 million in 2021, an increase of $2.1 million. The increase was a result of an expansion of private grant funds. Annual research revenue as a percent of total operating revenue accounted for 20% of revenue in 2021.
Revenue from sales and service of educational departments totaled $143.6 million, an increase of $8.5 million. The increase is attributable to a continued expansion of services provided by the College of Medicine and Hoxworth Blood Center.
Auxiliary enterprises, net revenue, decreased from $108.0 million to $80.7 million, a decrease of $27.3 million. The decrease is attributable to the COVID-19 pandemic that began in spring 2020, which resulted in a reduction of the number of students on campus in 2021.
UNIVERSITY OF CINCINNATI JUNE 30, 2021 A COMPONENT UNIT OF THE STATE OF OHIO
12

Nonoperating Revenues
State educational appropriations increased from $217.2 million in 2020 to $231.5 million in 2021, an increase of $14.3 million. State funding support remains a vital source of funding for academic programs and administrative costs.
Federal and state nonexchange grants increased from $69.0 million in 2020 to $106.0 million in 2021, an increase of $37.0 million. Federal higher education pandemic relief funds accounted for this increase. Funds were awarded directly through Federal HEERF grants and indirectly through State of Ohio CRF grants.
The results of fundraising efforts are an important component of the university’s financial resources. Expendable gifts to the university received during 2021 totaled $31.0 million, compared to $33.9 million in 2020, a decrease of $2.9 million. The Foundation is working with the university to develop the next fundraising campaign to support the work of the university's Next Lives Here strategic direction.
Support from affiliates revenue decreased from $26.0 million to $23.2 million in 2020 and 2021 respectively, a decrease of $2.8 million. Funds reported as support from affiliates are contributions from UC Health to the College of Medicine in support of the academic mission. The decrease in support during 2021 is mainly attributable to UC Health funding reductions resulting from pandemic uncertainty. Support funds are budgeted, committed and made available to the College of Medicine mainly based on strategic education and research needs identified by the Dean of the College of Medicine .
The university’s net investment income totaled $226.4 million and $40.8 million in 2021 and 2020 respectively, an increase of $185.6 million. Investment income includes both endowment income and temporary investment pool income. The increase in investment income for 2021 is mainly attributable to growth in domestic and global equities' markets.
Capital appropriations, gifts, and grants included in other revenue, increased from $26.6 million in 2020 to $31.9 million in 2021, an increase of $5.3 million. State capital is appropriated on a biannual basis, of which 2021 is the first year of the biennium. In 2021, State capital appropriations were $22.1 million, an increase of $5.0 million. Capital gifts and grants received for construction projects increased from $9.5 million in 2020 to $9.8 million in 2021, an increase of $0.3 million.
UNIVERSITY OF CINCINNATI JUNE 30, 2021 A COMPONENT UNIT OF THE STATE OF OHIO
13

The chart below portrays all funding sources including revenues used for operating activities and those classified as nonoperating:
Summary of Revenues (in thousands)
$497,219
$158,465
$26,356
$143,595
$80,726
$10,965
$231,500
$105,992
$30,986
$23,184
$226,478
$31,858
$432
$4,025
$495,973
$139,307
$24,286
$135,096
$107,998
$12,017
$217,224
$68,964
$33,928
$25,966
$40,839
$26,597
$392
$4,324
2021 2020
Net student tuition and fees
Federal, state, & local grants andcontracts
Nongovernmental grants andcontracts
Sales and services of educationaldepartments
Auxiliary enterprises, net
Other
State educational appropriations
Federal and state nonexchangegrants
Gifts
Support from affiliates
Net investment income
Capital appropriations, gifts, andgrants
Additions to permanentendowments
Other nonoperating revenues
UNIVERSITY OF CINCINNATI JUNE 30, 2021 A COMPONENT UNIT OF THE STATE OF OHIO
14

EXPENSES
The university’s expenses for the years ended June 30, 2021 and June 30, 2020, are summarized below:
SUMMARY OF EXPENSES
Increase/(Decrease)(in thousands) 2021 2020 Amount Percent
Operating expensesInstruction $ 353,442 $ 351,055 $ 2,387 0.7 %Research 169,627 158,339 11,288 7.1 %Public service 77,509 76,474 1,035 1.4 %Academic support 111,627 127,589 (15,962) -12.5 %Student services 53,656 57,717 (4,061) -7.0 %Institutional support 143,636 132,237 11,399 8.6 %Operations and maintenance of plant 39,007 52,178 (13,171) -25.2 %Scholarships and fellowships 59,363 65,781 (6,418) -9.8 %Auxiliary enterprises 105,464 114,094 (8,630) -7.6 %Pension and other postemployment benefit (revenue) expense (132,176) 58,808 (190,984) -324.8 %Depreciation 133,294 131,081 2,213 1.7 %
Total operating expenses $ 1,114,449 $ 1,325,353 $ (210,904) -15.9 %Nonoperating expenses
Net interest on capital asset-related debt 47,303 46,082 1,221 2.6 %Total nonoperating expenses $ 47,303 $ 46,082 $ 1,221 2.6 %Total expenses $ 1,161,752 $ 1,371,435 $ (209,683) -15.3 %
Total university expenses (operating and nonoperating) decreased by $209.7 million in 2021. Pension (GASB 68) and OPEB (GASB 75) adjustments accounted for $191.0 million of the decrease in expenses. Excluding pension and OPEB related expenses, university expenses decreased by $18.7 million. Decreases to academic support, student services, operations and maintenance of plant, and auxiliary enterprises are due to a majority of coursework transitioning to online learning, which greatly reduced the number of students, faculty and staff on campus. Increases in institutional support are mainly attributable to increases in fringe benefit expenses and distribution within the fringe benefit pool. Increases in research expenses are offset by increases in grants and contracts revenue.
UNIVERSITY OF CINCINNATI JUNE 30, 2021 A COMPONENT UNIT OF THE STATE OF OHIO
15

The chart below portrays both operating and nonoperating expenses:
Summary of Expenses (in thousands)
$353,442
$169,627
$77,509
$111,627
$53,656
$143,636
$39,007
$59,363
$105,464
$(132,176)
$133,294
$47,303
$351,055
$158,339
$76,474
$127,589
$57,717
$132,237
$52,178
$65,781
$114,094
$58,808
$131,081
$46,082
2021 2020
Instruction
Research
Public service
Academic support
Student services
Institutional support
Operations and maintenance ofplant
Scholarships and fellowships
Auxiliary enterprises
Pension and OPEB
Depreciation
Interest on capital asset-related debt
UNIVERSITY OF CINCINNATI JUNE 30, 2021 A COMPONENT UNIT OF THE STATE OF OHIO
16

ECONOMIC FACTORS THAT WILL AFFECT THE FUTURE
Fall 2021 enrollment totaled 46,710 students, a decrease of 88 students from the university's all-time high of 46,798 students. The university is home to students from all 50 states plus the District of Columbia (Washington, D.C.) and from 113 countries outside the U.S. Fall 2021 has brought the largest Uptown student enrollment in history. Uptown campus boasts more than 40,000 students. The average GPA for incoming students at the Uptown campus is 3.7. The university continues to increase its diversity with racial and ethnic minorities making up 24.1% of the 2021 student body, an increase over last year's 23.2%.
Today, the university consists of nine research and campus locations in the Greater Cincinnati region with an impact and reach that extends from the local to the global. This includes strategic partnerships in subject areas like engineering, economics, humanities and business administration with the University of Bordeaux, France; Ludwig Maximilian University, Germany; Chongqing University, China; Hong Kong Polytechnic University; Future University, Egypt, and many more, including institutional partnerships with 43 colleges and universities in Europe alone.
The university has nearly 200 years of history as a research pioneer, with a culture strongly emphasizing collaboration in order to achieve innovative results that can be applied to solving complex problems and furthering scientific advancement. The university fosters early stage research and launches start-up companies via an expanding innovation incubator, the 1819 Innovation Hub, providing a key location amidst Cincinnati’s rising Innovation Corridor. The UC innovation hub is the nexus for business and industry to partner with university faculty and students. Partnering with UC’s 1819 Innovation Hub are a wide range of visionaries: From seed-stage investors like CincyTech (one of the most active in the nation) to established corporations like Procter & Gamble to consultancies like the Live Well Collaborative that partners with international firms to improve products and services for those aged 50 and over.
Our endeavors as a university encompass science, medicine, business, education, engineering, technology, the humanities and the arts. Specific and cross-disciplinary areas of focus include analytics, digital media, precision cancer medicine, water and urban futures.
“Uptown,” where the main campus is located is the second largest employment center in the Cincinnati region behind the central business district. Adjacent to downtown, Uptown is a diverse and vibrant urban area made up of an eclectic array of small businesses plus five major medical and research institutions, including the university and the nationally-acclaimed Cincinnati Zoo & Botanical Gardens.
Uptown’s five anchor institutions (Cincinnati Children’s Hospital Medical Center, the Zoo, UC Health, Tri-Health, and UC), formed a non-profit development group in 2004 called the Uptown Consortium, Inc., which has secured more than $400 million in redevelopment, new construction and neighborhood improvements in Uptown Cincinnati since its inception.
The recently completed $80 million Martin Luther King (MLK) / I-71 highway interchange, coupled with UCI’s acquisition of nearly 44 acres of land along the MLK corridor less than a mile east of the university's campus and a mile north of downtown, creates an alignment of the necessary elements for the development of a new innovation district.
The university remains vigilant in addressing the operational and financial challenges created by the pandemic. Thoughtful and timely financial decisions such as cost-containment measures have been implemented. As the situation continues to change, the university responds rapidly through flexibility, diligence and collaboration.
UNIVERSITY OF CINCINNATI JUNE 30, 2021 A COMPONENT UNIT OF THE STATE OF OHIO
17

Statement of Net Position (in thousands) University of CincinnatiThe University of
Cincinnati Foundation
as of June 30, 2021 (with comparative information as of June 30, 2020) 2021 2020 2021 2020AssetsCurrent assets
Cash and cash equivalents $ 227,408 $ 108,740 $ 29,992 $ 18,088 Current portion of investments 200,837 144,495 Current portion of accounts receivable, net 103,231 62,117 2,575 2,562 Current portion of pledges receivable, net 25,790 29,331 Current portion of notes receivable, net 2,194 3,854 Current portion of other assets 14,513 14,739 18,972 16,494 Total current assets 548,183 333,945 77,329 66,475
Noncurrent assetsInvestments 420,679 399,640 Endowment investments 746,183 600,071 608,718 481,575 Accounts receivable, net 4,834 5,729 Pledges receivable, net 71,528 67,723 Notes receivable, net 15,717 16,748 Net other postemployment benefits asset 49,205 25,711 Other noncurrent assets 18,196 8,936 UC Health intangible asset 420,645 420,645 Capital assets not being depreciated 115,955 86,660 Capital assets being depreciated, net 1,542,425 1,613,167 347 553 Total noncurrent assets 3,333,839 3,177,307 680,593 549,851
Total Assets 3,882,022 3,511,252 757,922 616,326 Deferred Outflows of Resources
Loss on refunding 19,911 23,664 Other postemployment benefits 15,614 33,909 Pension 88,466 110,196
Total Deferred Outflows of Resources 123,991 167,769
LiabilitiesCurrent liabilities
Accounts payable 80,614 61,076 6,296 6,836 Accrued liabilities 20,672 21,759 Current portion of accrued compensation 86,188 82,849 Current portion of bonds, notes, and leases payable 39,871 51,539 Deposits and advances 112,140 52,246 Total current liabilities 339,485 269,469 6,296 6,836
Noncurrent liabilitiesAccrued compensation 22,377 20,965 Government loan advances 14,963 17,234 Bonds, notes, and leases payable 1,145,964 1,156,908 Net other postemployment benefits liability 173,629 Net pension liability 546,204 581,569 Other noncurrent liabilities 26,041 27,473 34,988 28,723 Total noncurrent liabilities 1,755,549 1,977,778 34,988 28,723
Total Liabilities 2,095,034 2,247,247 41,284 35,559 Deferred Inflows of Resources
Split-interest agreements 12,355 8,936 Gain on refunding 2,257 Hedging derivative 3,213 Other postemployment benefits 99,414 54,897 Pension 87,572 71,802
Total Deferred Inflows of Resources 204,811 135,635 Net Position
Net investment in capital assets 558,112 570,098 347 553 Restricted for:
Nonexpendable 845,599 762,587 519,371 407,055 Expendable 449,132 393,546 179,424 154,505
Unrestricted (146,675) (430,092) 17,496 18,654 Total Net Position $ 1,706,168 $ 1,296,139 $ 716,638 $ 580,767
The accompanying Notes to Financial Statements are an integral part of this statement.
University of CincinnatiA COMPONENT UNIT OF THE STATE OF OHIO
18

Statement of Revenues, Expenses, and Changes in Net Position (in thousands) University of Cincinnati
The University of Cincinnati Foundation
for the year ended June 30, 2021 (with comparative information for the year ended June 30, 2020) 2021 2020 2021 2020
Operating RevenuesStudent tuition and fees $ 618,204 $ 604,373 Less scholarship allowances 120,985 108,400
Net student tuition and fees 497,219 495,973 Federal grants and contracts 151,194 133,712 State and local grants and contracts 7,271 5,595 Nongovernmental grants and contracts 26,356 24,286 Sales and services of educational departments 143,595 135,096 Auxiliary enterprises (net of scholarship allowances of 80,726 107,998
$10,965 in 2021 and $12,356 in 2020)Other operating revenues 10,965 12,017 $ 25,169 $ 27,863
Total Operating Revenues 917,326 914,677 25,169 27,863
Operating ExpensesEducational and general:
Instruction 353,442 351,055 Research 169,627 158,339 Public service 77,509 76,474 Academic support 111,627 127,589 Student services 53,656 57,717 Institutional support 143,636 132,237 27,867 33,047 Operations and maintenance of plant 39,007 52,178 Scholarships and fellowships 59,363 65,781
Auxiliary enterprises 105,464 114,094 Pension expense 1,829 45,676 Other postemployment benefit (revenue) expense (134,005) 13,132 Depreciation 133,294 131,081 273 1,090
Total Operating Expenses 1,114,449 1,325,353 28,140 34,137 Operating Loss (197,123) (410,676) (2,971) (6,274)
Nonoperating Revenues (Expenses)State educational appropriations 231,500 217,224 Federal nonexchange grants 100,783 63,580 State nonexchange grants 5,209 5,384 Gifts 30,986 33,928 67,851 70,632 Support from affiliates 23,184 25,966 Net investment income (loss) 226,478 40,839 136,401 (4,468) Net interest on capital asset-related debt (47,303) (46,082) Payments to University of Cincinnati (65,187) (54,700) Other nonoperating revenues (expenses) 4,025 4,324 (223) (5,084)
Net Nonoperating Revenues 574,862 345,163 138,842 6,380 Income (Loss) Before Other Revenues 377,739 (65,513) 135,871 106
Other RevenuesState capital appropriations 22,095 17,105 Capital gifts and grants 9,763 9,492 Additions to permanent endowments 432 392
Total Other Revenues 32,290 26,989 Increase (Decrease) in Net Position 410,029 (38,524) 135,871 106
Net Position, beginning of year 1,296,139 1,334,663 580,767 580,661 Net Position, End of Year $ 1,706,168 $ 1,296,139 $ 716,638 $ 580,767
The accompanying Notes to Financial Statements are an integral part of this statement.
University of CincinnatiA COMPONENT UNIT OF THE STATE OF OHIO
19

Statement of Cash Flows (in thousands) University of Cincinnatifor the year ended June 30, 2021 (with comparative information for the year ended June 30, 2020) 2021 2020
Cash Flows from Operating Activities Student tuition and fees $ 510,018 $ 484,286 Federal, state, and local grants and contracts 195,265 191,593 Sales and services of educational departments and auxiliary enterprises 225,061 252,469 Expenditures and other deductions:
Compensation (762,386) (761,579) Payments for materials, services and other (368,798) (385,084)
Loans issued (2,101) (2,004) Loan principal collected 4,936 5,256 Interest on loans receivable 117 119 Custodial funds received 14,112 17,640 Custodial funds disbursed (14,535) (17,217) Other revenue 10,031 7,014
Net Cash Used for Operating Activities (188,280) (207,507)
Cash Flows from Noncapital Financing Activities State educational appropriations 231,458 217,279 Federal nonexchange grants 122,828 63,580 State nonexchange grants 5,209 5,384 Gift receipts for current use 31,601 31,829 Support from affiliates 23,184 25,966 Drawdowns of federal direct loan proceeds 242,217 256,051 Disbursements of federal direct loans to students (242,189) (255,842) Additions to permanent endowments 716 934
Net Cash Provided by Noncapital Financing Activities 415,024 345,181
Cash Flows from Capital and Related Financing Activities State capital appropriations 17,636 19,058 Private gifts 9,364 9,492 Other 458 1,607 Proceeds from issuance of capital debt 101,040 424,808 Purchases of capital assets (79,762) (84,551) Proceeds from sale of capital assets 384 4,681 Principal paid on capital debt and leases (112,455) (472,113) Interest payments on capital debt and leases (47,411) (48,649)
Net Cash Used for Capital and Related Financing Activities (110,746) (145,667)
Cash Flows from Investing Activities Interest and dividends on investments, net 44,806 44,513 Proceeds from sales and maturities of investments 1,201,050 1,134,752 Purchases of investments (1,231,418) (1,130,999) Other endowment expenditures (11,768) (2,789)
Net Cash Provided by Investing Activities 2,670 45,477
Net Increase in Cash and Cash Equivalents 118,668 37,484 Cash and Cash Equivalents , Beginning of Year 108,740 71,256
Cash and Cash Equivalents, End of Year $ 227,408 $ 108,740
University of CincinnatiA COMPONENT UNIT OF THE STATE OF OHIO
20

Statement of Cash Flows (in thousands) University of Cincinnatifor the year ended June 30, 2021 (with comparative information for the year ended June 30, 2020) 2021 2020
Reconciliation of Operating Loss to Net Cash Used for Operating Activities: Operating loss $ (197,123) $ (410,676) Adjustments to reconcile operating loss to net cash used for operating activities:
Depreciation expense 133,294 131,081 Changes in assets and liabilities:
Accounts receivable, net (29,975) 514 Notes receivable, net 2,835 3,252 Other assets (2,381) (2,723) Net OPEB asset (23,494) (1,613) Deferred outflows 40,026 57,822 Accounts payable 11,355 16,403 Accrued compensation and other 1,295 (1,954) Advances 30,898 1,493 Compensated absences 4,101 2,799 Deposits (402) 1,769 Net OPEB liability (173,629) 14,678 Net pension liability (35,365) (72,747) Deferred inflows 60,286 60,668 Other liabilities (10,001) (8,273)
Net Cash Used for Operating Activities $ (188,280) $ (207,507)
Noncash Transactions Accrued liabilities for capital assets $ 15,238 $ 6,719 Net increase (decrease) in fair value of investments $ 213,344 $ (55,682) Gifts and other additions to capital assets $ 5,429 $ 226
The accompanying Notes to Financial Statements are an integral part of this statement.
University of CincinnatiA COMPONENT UNIT OF THE STATE OF OHIO
21

NOTES TO FINANCIAL STATEMENTSFor the Year Ended June 30, 2021
1. Organization and Summary of Significant Accounting Policies
Organization
The University of Cincinnati (the university) originated in 1819 with the founding of Cincinnati College. In 1977, the university formally became part of the Ohio public university system. As such, it is a component unit of the State of Ohio. Under provisions of the Internal Revenue Code, Section 115, and the applicable income tax regulations of the State of Ohio, the university, as a state institution, is exempt from taxes on income other than unrelated business income. Since the university has no material net unrelated business income during the year ended June 30, 2021, there are no provisions for income taxes.
Under Ohio Revised Code 3361.01, the University of Cincinnati’s Board of Trustees is the governing body of the University of Cincinnati. The board is composed of 11 members: nine (9) voting members and two (2) nonvoting student members. All board members are appointed by the Governor of Ohio with the advice and consent of the State Senate. Trustees are appointed to nine-year terms of office, with the exception of student trustees who are appointed to two-year terms.
The Board is responsible for selecting and appointing the president; setting the operating budget; approving personnel appointments; granting all degrees awarded by the university, including honorary degrees; establishing tuition and fee rates; approving contracts; approving significant capital projects and debt issuances; and approving all rules, regulations, curriculum changes, new programs and degrees of the university.
Basis of Presentation
The accompanying financial statements present the accounts of the university and of the following entities:
▪ University Heights Community Urban Redevelopment Corporation (UHCURC), described more fully in Note 16, is a legally separate not-for-profit organization which owns a residence complex offering housing for university students. UHCURC is reported as a blended component unit of the university in accordance with the provisions of the Governmental Accounting Standards Board (GASB) and is included in the university’s Statement of Net Position, the Statement of Revenues, Expenses, and Changes in Net Position and Statement of Cash Flows.
▪ The University of Cincinnati Foundation (the Foundation), described more fully in Note 17, is a legally separate not-for-profit organization engaged in fundraising activities almost exclusively for the benefit of the university. The Foundation is a discretely presented component unit of the university in accordance with the provisions of GASB on the Statement of Net Position and the Statement of Revenues, Expenses, and Changes in Net Position.
Basis of Accounting
The financial statements have been prepared in accordance with accounting principles generally accepted in the United States of America, as prescribed by GASB. The university reports as a special purpose government engaged primarily in business type activities (BTA), as defined by GASB, on the accrual basis. Business type activities are those that are financed in whole or in part by fees charged to external parties for goods and services. In accordance with BTA reporting, the university presents Management’s Discussion and Analysis, Statement of Net Position, Statement of Revenues, Expenses, and Changes in Net Position, Statement of Cash Flows, and Notes to the Financial Statements.
The university’s financial resources are classified for accounting and reporting purposes into the following four net position categories:
UNIVERSITY OF CINCINNATI JUNE 30, 2021 A COMPONENT UNIT OF THE STATE OF OHIO
22

• Net Investment in Capital Assets: Capital assets, net of accumulated depreciation, reduced by outstanding debt attributable to the acquisition, construction or improvement of those assets.
• Restricted for nonexpendable and expendable purposes:
◦ Nonexpendable – The net position subject to externally-imposed restrictions, which must be retained in perpetuity by the university, is classified as nonexpendable net position. Such assets include the university’s permanent endowment and the university’s investment in UC Health.
◦ Expendable – The net position whose use by the university is subject to externally-imposed restrictions that can be fulfilled by actions of the university pursuant to those restrictions or that expire by the passage of time are classified as expendable net position. Such assets include the spendable portion of endowment and gifts and other assets including debt service, debt proceeds, and capital appropriations.
• Unrestricted: The remaining net position that is neither the net investment in capital assets or restricted for nonexpendable and expendable purposes. The university’s unrestricted net position may be designated for specific purposes by action of management or the Board of Trustees. Substantially, all of the university’s unrestricted net position is allocated for academic and research initiatives or programs, for capital programs, or for other purposes.
Changes in Financial Accounting and Reporting
During 2021, the university implemented Statement No. 84, Fiduciary Activities. The statement establishes criteria for identifying and reporting fiduciary activities of all state and local governments including public universities. In general, if the university controls the assets of the fiduciary activity and the beneficiaries with whom a fiduciary relationship exists, then the activity should be presented in a statement of fiduciary net position and a statement of changes in fiduciary net position. An exception to this requirement is provided for a business type activity that expects to hold assets in a custodial fund for three months or less. This statement did not have a material impact on the university's financial statements.
Recent Accounting Pronouncements In June 2017, GASB issued Statement No. 87, Leases, effective for the university's fiscal year ending June 30, 2022. The statement establishes a single approach for lease accounting based on the principle that all leases are a means for financing the use of an underlying asset. The new guidance applies to all leases with terms greater than 12 months, including any options to extend. Under this statement, a lessee is required to recognize an intangible right-to-use asset and corresponding lease liability. Lessors are required to record a lease receivable and a corresponding deferred inflow of resources. The university is evaluating the impact Statement No. 87 will have on its financial statements.
In May 2019, GASB issued Statement No. 91, Conduit Debt Obligations, effective for the university's fiscal year ending June 30, 2023. The statement provides a single method of reporting conduit debt obligations and any related commitments. This standard clarifies what a conduit debt obligation is by specifying certain characteristics of these debt instruments, and it eliminates the option for government issuers to recognize conduit debt obligations unless qualitative factors indicate that the issuer is more likely than not to support one or more conduit debt service payments. The university is evaluating the impact Statement No. 91 will have on its financial statements.
In January 2020, GASB issued Statement No. 92, Omnibus 2020, effective for the university's fiscal year ending June 30, 2022. The statement addresses a variety of topics and includes specific provisions about GASB 87 and Implementation Guide 2019-3 effective dates, reporting intra-entity transfers of assets, reporting assets accumulated for postemployment benefits, applicability of certain requirements of Statement No. 84 to postemployment benefit arrangements, exception to acquisition value in a government acquisition, reinsurance recoveries, reference to nonrecurring fair value measurements of assets or liabilities in authoritative literature and terminology used to refer to derivative instruments. The university is evaluating the impact Statement No. 92 will have on its financial statements.
UNIVERSITY OF CINCINNATI JUNE 30, 2021 A COMPONENT UNIT OF THE STATE OF OHIO
23

In March 2020, GASB issued Statement No. 93, Replacement of Interbank Offered Rates, effective for the university's fiscal year ending June 30, 2022. The statement addresses the accounting and financial reporting implications that result from the replacement of an Interbank Offered Rate (IBOR) for hedging derivative instruments and leases. The university is evaluating the impact Statement No. 93 will have on its financial statements.
In March 2020, GASB issued Statement No 94, Public-Private and Public-Public Partnerships and Availability Payment Arrangements, effective for the university's fiscal year ending June 30, 2023. The statement establishes definitions of public-private and public-public partnership arrangements (P3s) and availability payment arrangements (APAs), and it provides guidance for the accounting and financial reporting for transactions that meet those definitions. A P3 is defined as an arrangement in which a government transferor contracts with an operator to provide public services by conveying control of the right to operate or use a nonfinancial asset, such as infrastructure or other capital asset, for a period of time in an exchange or exchange-like transaction. An APA is defined as an arrangement in which a government compensates an operator for services that may include designing, constructing, financing, maintaining or operating an underlying infrastructure or other nonfinancial asset for a period of time in an exchange or exchange-like transaction. The university is evaluating the impact Statement No. 94 will have on its financial statements.
In May 2020, GASB issued Statement No. 96, Subscription-Based Information Technology Arrangements, effective for the university's fiscal year ending June 30, 2023. The statement defines a subscription-based technology arrangement (SBITA) as a contract that conveys the control of the right to use a SBITA vendor's IT software, alone or in combination with tangible capital assets (the underlying IT assets), as specified in the contract for a period of time in an exchange or exchange-like transaction. This guidance requires the university to recognize a right-to-use subscription asset and a corresponding subscription liability under these type of contracts. The standard provides an exception for short-term SBITAs that have a maximum possible term of 12 months. The university is evaluating the impact Statement 96 will have on its financial statements.
In June 2020, GASB issued Statement No. 97, Certain Component Unit Criteria, and Accounting and Financial Reporting for Internal Revenue Code Section 457 Deferred Compensation Plans - an amendment of GASB Statements No. 14 and No. 84, and a supersession of GASB Statement No. 32. The statement establishes guidance for determining financial accountability for a potential component unit in certain instances where the legally separate organization does not have a governing board. This guidance does not apply to a potential component unit that is a defined contribution pension plan, a defined contribution other postemployment plan (OPEB) and an other employee benefit plan such as certain Section 457 plans. Additionally, the standard limits the financial burden criterion in paragraph 7 of Statement 84 to defined pension plans and defined OPEB plans. These provisions were effective for the university's fiscal year ending June 30, 2020. There was no financial impact to the university's financial statements. Other provisions outlined in the statement that pertain to Section 457 plan are effective for the university's fiscal ending June 30, 2022. The university is evaluating the impact Statement 97 will have on its financial statements.
Summary of Significant Accounting Policies
Investments are reported in three categories in the Statement of Net Position. Investments identified as current and noncurrent are used for operating and capital activities. Investments identified as endowment are those funds invested in portfolios that are considered by management to be of a long duration.
Investments in marketable securities are carried at fair value, as established by the major securities markets. Purchases and sales of investments are accounted for on the trade date basis. Investment income is recorded on the accrual basis. Realized and unrealized gains and losses are reported in investment income.
The university’s endowment portfolio includes alternative investments, such as limited partnerships, that are not publicly traded. These investments are generally measured at fair value using the net asset value per share (or its equivalent) practical expedient. Statements provided by the managers of the investment partnerships may lag the financial year-end close. If the June 30 statements are not available, the March 31 statements are adjusted for cash receipts, cash disbursements and securities distributions through June 30.
UNIVERSITY OF CINCINNATI JUNE 30, 2021 A COMPONENT UNIT OF THE STATE OF OHIO
24

Additionally, the carrying amount of these investments is adjusted for June 30 information from the investment partnerships when necessary to provide a reasonable estimate of fair value as of June 30, 2021. Because these investments are not readily marketable, the estimated value is subject to uncertainty. Therefore, the estimated value may differ from the value that would have been used had a ready market for the investments existed. Such differences could be material.
Accounts receivable are recorded net of an allowance for uncollectible accounts. The allowance is based on management’s judgment of potential uncollectible amounts, based on historical experience and type of receivable. Accounts receivable primarily include tuition and fee charges to students and charges for auxiliary enterprise services provided to students, faculty and staff.
Pledged gifts for endowments from individuals, foundations, or corporations do not meet eligibility requirements as defined by GASB, to be recognized on the university’s Statement of Net Position. The Foundation receives pledges and bequests for the benefit of the university and as a FASB entity, recognizes those gifts on its financial report. Once the gift is received by the Foundation and transferred to the university, the university recognizes the gift income.
Notes receivable are mainly loans made to students under various federal loan programs. Such loans are recorded net of estimated uncollectible amounts.
Capital assets are comprised of land, land improvements, infrastructure, buildings and equipment. Land, works of art and historical treasures are capitalized but not depreciated. All university capital assets are recorded at cost at date of acquisition, or acquisition value at date of donation. The university’s capitalization threshold is $100,000 for major construction projects and related costs are capitalized as they are incurred. Projects that have not been completed as of the date of the Statement of Net Position are classified as construction in progress. Intangible assets such as software have a capitalization threshold of $100,000, except for internally generated software which has a threshold of $500,000. For all other items, the capitalization threshold is $5,000, except for library books and fine art.
The university and its blended component unit’s property and equipment are depreciated using the straight-line method over the estimated useful lives (from three to fifty years) of the respective assets. When plant assets are sold or disposed of, the carrying value of such assets and the associated depreciation are removed from the university’s records.
Deferred outflows of resources are a consumption of net position by the university that is applicable to a future reporting period. Deferred outflows of resources are reported in the Statement of Net Position but are not recognized in the financial statements as expenses until the periods to which they relate. Deferred outflows of resources of the university consist of deferred losses on debt refundings related to defeasance, certain changes in net pension and OPEB liabilities not included in pension and OPEB expense and employer pension contributions subsequent to the measurement date of the net pension liability.
Deferred inflows of resources are a gain in net position by the university that is applicable to a future reporting period. Deferred inflows of resources are reported in the Statement of Net Position but are not recognized in the financial statements as revenue until the periods to which they relate. Deferred inflows of resources of the university consist of deferred gains on debt refundings related to defeasance, hedging derivatives, certain changes in net pension and OPEB liabilities not included in pension and OPEB expense and beneficial interests in irrevocable split-interest agreements.
Compensated absences, reported as accrued compensation, include liabilities related to vacation and sick leave accruals. University employees earn vacation and sick leave on a monthly basis. All accrued vacation is considered a current liability. Employees hired before January 1, 2015 may accrue vacation benefits up to a maximum of three years’ credit. Employees hired on or after January 1, 2015 may accrue up to a maximum of 30 days of vacation benefits. Earned but unused vacation days are payable upon termination. Sick leave accrues without limit; however, unused days are payable only upon retirement from the university, subject to 30- or 60-day limits depending on the date of hire. The termination payment method is utilized to compute the liability for sick leave.
Advances include receipts relating to tuition, student fees, athletic events and rents received in advance of services to be provided. Advances also include the amounts received from grant and contract sponsors that
UNIVERSITY OF CINCINNATI JUNE 30, 2021 A COMPONENT UNIT OF THE STATE OF OHIO
25

have not yet been earned under the terms of the agreement. The university will recognize such amounts as revenue when services are provided.
Cost-Sharing Defined Benefit Pension Plans— The university participates in two cost-sharing, multiple-employer defined benefit pension plans, the Ohio Public Employees Retirement System and the State Teachers Retirement System of Ohio, (the Plans). For purposes of measuring the net pension liability, deferred outflows of resources and deferred inflows of resources related to pensions and pension expense, information about the fiduciary net position of the Plans and additions to/deductions from the Plans’ fiduciary net position have been determined on the same basis as they are reported by the Plans. For this purpose, benefit payments (including refunds of employee contributions) are recognized when due and payable in accordance with the benefit terms. Investments are reported at fair value.
Cost-Sharing Defined Benefit Other Postemployment Benefit Plans— The Plans mentioned in the preceding paragraph provide other postemployment benefits (OPEB) in addition to pension benefits. For purposes of measuring the net OPEB liability, deferred outflows of resources and deferred inflows of resources related to OPEB, and OPEB expense, information about the fiduciary net position of the OPEB Plans and additions to/deductions from the OPEB Plans' fiduciary net position have been determined on the same basis as they are reported by the OPEB Plans. For this purpose, benefit payments are recognized when due and payable in accordance with the benefit terms. Investments are reported at fair value.
Endowment spending policy— For donor-restricted endowments, the Uniform Prudent Management of Institutional Funds Act, as adopted in Ohio, permits the university to distribute an amount of realized and unrealized endowment appreciation as the Board of Trustees determines to be prudent. The university’s policy is to accumulate the undistributed realized and unrealized appreciation within the endowment, which is discussed in Note 2.
Student tuition and residence hall fees— Stipends and other payments made directly to students are presented as scholarship and fellowship expenses that offset tuition and fee revenue. Fee authorizations provided to graduate teaching, research and administrative associates as part of employment arrangement are presented in instruction, research and other functional categories of operating expense.
Auxiliary enterprise revenues primarily represent revenues generated by athletics, bookstores, the conference center, dining, housing, and parking.
Operating activities, as reported on the Statement of Revenues, Expenses,and Changes in Net Position are those that generally result from exchange transactions such as payments received for providing services and payments made for services or goods received. Nearly all of the university’s expenses are from exchange transactions. Certain significant revenue streams available to support operations are classified as nonoperating revenues (i.e. state educational appropriations, nonexchange federal and state grants, gifts, and investment income) in accordance with GASB standards.
Management estimates— The preparation of financial statements in conformity with accounting principles generally accepted in the United States of America requires management to make estimates and assumptions that affect the reported amounts of assets, liabilities, deferred inflows and outflows of resources, and disclosure of contingent assets and liabilities at the date of the financial statements, and the reported amounts of revenue and expenses during the reporting period. Actual results could differ from those estimates.
Comparative Information— Financial information presented by the university for 2020 is for comparative purposes. This information should be read in conjunction with the university’s financial statements for the year ended June 30, 2020, which were previously audited. An unmodified audit opinion was expressed on those financial statements.
Reclassifications— Certain amounts from the prior year have been reclassified to conform to current-year presentation. There reclassifications had no effect on the change in net position
UNIVERSITY OF CINCINNATI JUNE 30, 2021 A COMPONENT UNIT OF THE STATE OF OHIO
26
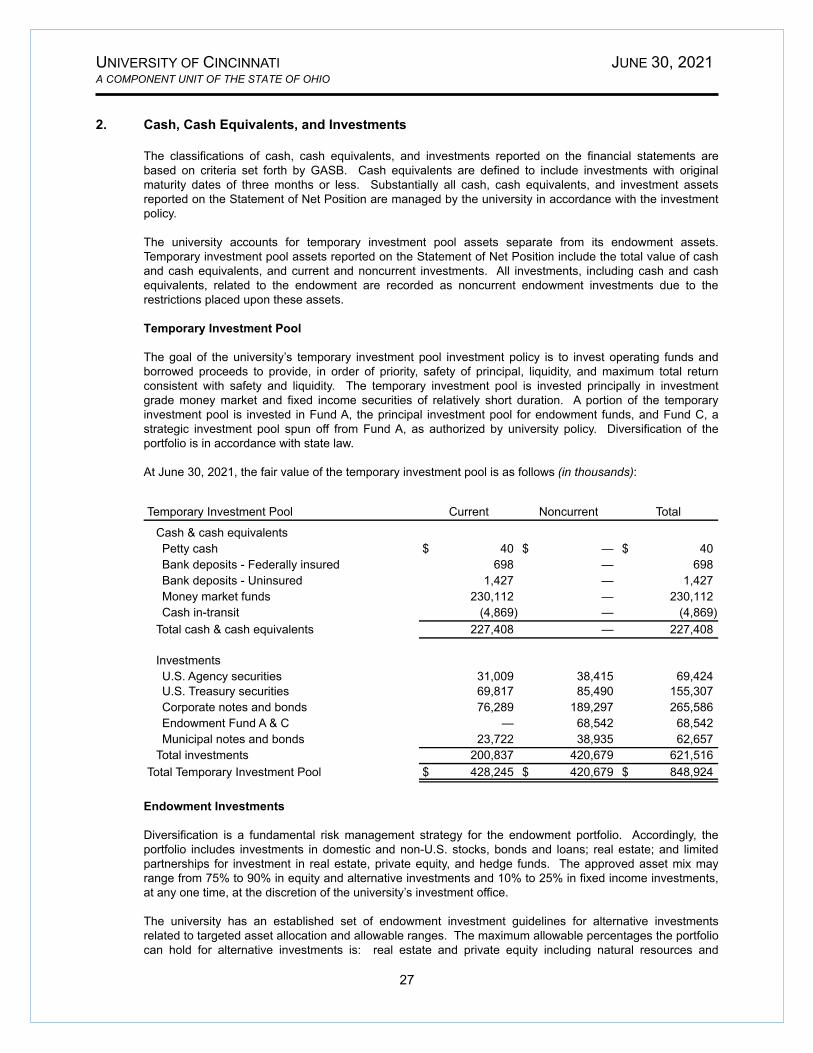
2. Cash, Cash Equivalents, and Investments
The classifications of cash, cash equivalents, and investments reported on the financial statements are based on criteria set forth by GASB. Cash equivalents are defined to include investments with original maturity dates of three months or less. Substantially all cash, cash equivalents, and investment assets reported on the Statement of Net Position are managed by the university in accordance with the investment policy.
The university accounts for temporary investment pool assets separate from its endowment assets. Temporary investment pool assets reported on the Statement of Net Position include the total value of cash and cash equivalents, and current and noncurrent investments. All investments, including cash and cash equivalents, related to the endowment are recorded as noncurrent endowment investments due to the restrictions placed upon these assets.
Temporary Investment Pool
The goal of the university’s temporary investment pool investment policy is to invest operating funds and borrowed proceeds to provide, in order of priority, safety of principal, liquidity, and maximum total return consistent with safety and liquidity. The temporary investment pool is invested principally in investment grade money market and fixed income securities of relatively short duration. A portion of the temporary investment pool is invested in Fund A, the principal investment pool for endowment funds, and Fund C, a strategic investment pool spun off from Fund A, as authorized by university policy. Diversification of the portfolio is in accordance with state law.
At June 30, 2021, the fair value of the temporary investment pool is as follows (in thousands):
Temporary Investment Pool Current Noncurrent Total
Cash & cash equivalentsPetty cash $ 40 $ — $ 40 Bank deposits - Federally insured 698 — 698 Bank deposits - Uninsured 1,427 — 1,427 Money market funds 230,112 — 230,112 Cash in-transit (4,869) — (4,869)
Total cash & cash equivalents 227,408 — 227,408
InvestmentsU.S. Agency securities 31,009 38,415 69,424 U.S. Treasury securities 69,817 85,490 155,307 Corporate notes and bonds 76,289 189,297 265,586 Endowment Fund A & C — 68,542 68,542 Municipal notes and bonds 23,722 38,935 62,657
Total investments 200,837 420,679 621,516 Total Temporary Investment Pool $ 428,245 $ 420,679 $ 848,924
Endowment Investments
Diversification is a fundamental risk management strategy for the endowment portfolio. Accordingly, the portfolio includes investments in domestic and non-U.S. stocks, bonds and loans; real estate; and limited partnerships for investment in real estate, private equity, and hedge funds. The approved asset mix may range from 75% to 90% in equity and alternative investments and 10% to 25% in fixed income investments, at any one time, at the discretion of the university’s investment office.
The university has an established set of endowment investment guidelines for alternative investments related to targeted asset allocation and allowable ranges. The maximum allowable percentages the portfolio can hold for alternative investments is: real estate and private equity including natural resources and
UNIVERSITY OF CINCINNATI JUNE 30, 2021 A COMPONENT UNIT OF THE STATE OF OHIO
27

venture capital 45% and hedge funds 20% with the total not exceeding 55% in illiquid strategies. The Investment Committee determines target allocations and allowable ranges.
The Uniform Prudent Management of Institutional Funds Act (UPMIFA) provides statutory rules for the management and investment of endowment funds owned and controlled by charitable institutions. The university’s endowment policies are governed and authorized under university rules and are structured to meet or exceed Ohio's version of UPMIFA requirements.
At June 30, 2021, the fair value of the endowment is as follows (in thousands):
Endowment Investments Fund A Fund B Fund CSeparately Invested
Beneficial Interests in Perpetual
Trusts Total
Investment TypeCash & cash equivalents $ 12,159 $ — $ 139 $ 194 $ — $ 12,492 U.S. Agency securities 25,388 — — — — 25,388 U.S. Treasury securities 39,035 — — — — 39,035 Corporate notes and bonds 71,346 — — 150 — 71,496 Municipal notes and bonds 5,918 — — — — 5,918 NDCL* - principal — — 50,541 12,740 — 63,281 NDCL* - accrued income — — 3,713 2,462 — 6,175 Corporate stocks 500,668 — — 5,040 — 505,708 Alternative investmentsPrivate equity 333,758 — — 8,246 — 342,004 Hedge funds 254,581 — — — — 254,581 Real estate 21,170 816 6,410 1,109 — 29,505
Beneficial interests in perpetual trusts — — — — 458,399 458,399
Total endowment investments 1,264,023 816 60,803 29,941 458,399 1,813,982
Shares held by UC Foundation (506,920) — (20,523) — — (527,443) Loan to UHCURC (component unit) — — (8,146) — — (8,146) NDCL* - accrued income — — (3,713) (2,462) — (6,175) Accrued income - other (1,185) — (260) — — (1,445) Accrued expense 1,153 — — — — 1,153 TIP investment in Fund A & C (67,450) — (1,092) — — (68,542) Valuation timing adjustment 1,198 — — — — 1,198 Beneficial interests in perpetual trusts — — — — (458,399) (458,399)
Endowment investments as reported $ 690,819 $ 816 $ 27,069 $ 27,479 $ — $ 746,183
* Neighborhood Development Corporation Loans (NDCL)
Endowment shares held by UC Foundation, investments held in irrevocable external perpetual trusts, a note payable from University Heights Community Urban Redevelopment Corporation (UHCURC), accrued income and expense, and temporary investment pool's investment in Fund A and Fund C are excluded from endowment investments reported on the Statement of Net Position. The Foundation’s share of Fund A and Fund C is included in the Foundation’s assets listed in a discretely presented column on the Statement of Net Position. External trust assets are not reported on the Statement of Net Position unless they are recognized as beneficial interest in trusts under GASB 81, Irrevocable Split-Interest Agreements. As explained in Note 16, UHCURC is a blended component unit of the university and as such, the note receivable is eliminated from endowment investments recorded on the Statement of Net Position. The
UNIVERSITY OF CINCINNATI JUNE 30, 2021 A COMPONENT UNIT OF THE STATE OF OHIO
28

temporary investment pool's investment in Fund A and Fund C is included in noncurrent investments recorded on the Statement of Net Position. Fund A valuation timing adjustment is included in endowment investments recorded on the Statement of Net Position.
Fund A
Fund A is the principal investment pool for both university and Foundation endowment funds that may be pooled legally or by donor concurrence. The university’s endowment investment policy goal for Fund A is to produce real growth in assets net of administrative and investment fees, by generating a total rate of return which is greater than, or equal to, the combination of the spending rate established by the university’s endowment spending policy, the Foundation’s fundraising fee, and the rate of inflation. The university employs the share method of accounting for Fund A investments and for proportionate distribution of income to each fund that participates in the pool.
The university has adopted a spending rate policy which smooths the distribution of income earned in Fund A. Distributions are made from Fund A to university departments that benefit from those funds. The 2021 endowment spending policy provided for an annual distribution of 4.3% of the twelve-quarter moving-average market value of endowment units.
At June 30, 2021, Fund A shares totaled 14,322,033 with a market value of $1,264,023,000. The Foundation owned 5,749,052 of those shares with a market value of $506,920,000 (excludes accrued income). The Foundation’s share of Fund A is approximately 40.1%. Substantially all Foundation endowments have been invested in Fund A.
Fund A also includes alternative investments consisting of private equity, hedge funds, and real estate. The private equity portion of the portfolio totals $333,758,000. In cases where the June 30, 2021 investment values are not available, certain of these private equity investments are valued based on their value as of March 31, 2021 adjusted for cash receipts, cash disbursements, and securities distributions through June 30, 2021 (please refer to Note 1, Summary of Significant Accounting Policies, regarding valuation of alternative investments). The hedge fund portion of the portfolio totals $254,581,000. Real estate holdings in Fund A total $21,170,000. The university’s outstanding commitment to purchase various alternative investments at June 30, 2021, is $316,064,000 and is comprised of undrawn commitments to private equity funds.
Fund C
Fund C is comprised of strategic loans made to certain non-profit neighborhood development corporations and certain real estate holdings. Fund C is not actively managed by the investment office, has no spending policy, and pays no Foundation fundraising fees.
Fund C loans made to certain nonprofit neighborhood development corporations for the purpose of developing residential and commercial facilities on the borders of the campus total $54,254,000. The total includes principal of $50,541,000, net of $17,615,000 of loan loss reserves and accrued interest of $3,713,000, net of $35,103,000 of interest reserves. A loan to UHCURC (a blended component unit) for $8,146,000, net of reserves is eliminated for the purpose of financial statement presentation. These loans are secured primarily by mortgages on parcels of land purchased by these nonprofit entities. Some of these mortgages are subordinated to external financing arranged by these entities. These university loans bear interest at 6%. The university expects repayment once the residential and commercial facilities have streams of rental income. Loan loss reserves are estimated based on aggregate cash flow projections for the projects and independent appraisals of the underlying real estate. Changes in loan loss reserves are reflected in nonoperating revenues (expenses), as a component of net investment income.
Fund C real estate holdings are valued at $6,410,000.
The value of Fund C will change based on interest and principal payments by the loan holders, plus or minus changes to the reserves. It will also change based on the valuation of the direct real estate values. On a periodic basis, cash flow interest and principal payments received, as well as from the liquidation of assets in Fund C will be distributed to Fund C shareholders to be used to purchase shares in Fund A. It is projected
UNIVERSITY OF CINCINNATI JUNE 30, 2021 A COMPONENT UNIT OF THE STATE OF OHIO
29

that over time all of Fund C investments will be liquidated and the entire value of the assets will be transferred to Fund A.
At June 30, 2021, Fund C shares totaled 10,987,649 with market value of $60,803,000. The Foundation owned 3,968,064 of those shares with a market value of $20,523,000 (excludes accrued income). The Foundation's share of Fund C is approximately 36.1%.
Fund B and Separately Invested Assets
Fund B is comprised primarily of real estate holdings received through donor bequest and is valued at $816,000. Separately invested funds include neighborhood development corporation loans, corporate stocks held per donor stipulation, strategic private equity investments, and donated real estate; their value totaled $29,941,000 (including accrued income) at June 30, 2021.
Real Estate
Fund A, Fund B, Fund C, and separately invested assets include land or other real estate held as investments. At June 30, 2021, the fair market value totaled $29,505,000 including $21,170,000 in Fund A, $816,000 in Fund B, $6,410,000 in Fund C and $1,109,000 in separately invested endowments. Independent real estate appraisals are obtained on a three-year cycle; however, relevant real estate markets are reviewed between appraisal periods to determine if the reported market values remain reasonable. Appraisers usually consider the use of three valuation approaches when developing a market value opinion for real property. These are the cost approach, sales comparison approach, and income capitalization approach. The most recent appraisals were received for June 2021.
Beneficial Interest in Irrevocable External Perpetual Trusts
The university is the beneficiary of numerous perpetual trusts held and administered by external trustees. The market value of these external trustee assets totaled $458,399,000 at June 30, 2021. These external trusts are irrevocable, and the university has a vested beneficial interest in the net income payable by the trusts. External trust assets are not reported on the Statement of Net Position unless they are recognized as beneficial interest in trusts recognized under GASB 81, Irrevocable Split-Interest Agreements. Income is received annually and reported on the university’s Statement of Revenues, Expenses, and Changes in Net Position. In 2021, the university received income of $11,828,000. The university expects income from the trusts will be received in perpetuity.
Off-Balance-Sheet Risk
The university’s investment strategy incorporates certain financial instruments which involve, to varying degrees, elements of risk that could reduce the value of investment assets reported on the financial statements. These risks include interest rate, credit, and custodial credit. Policies established by the university have been developed to balance the university’s exposure to risk while maximizing investment returns.
Interest Rate Risk
Interest rate risk is the risk an investment portfolio may encounter should interest rate variances affect the fair value of investments. The university’s investment policy minimizes the risk of the loss of value due to changing interest rates through the use of targeted durations. The university’s investment policy stipulates that the maximum duration range of investments in the temporary investment pool will not exceed three years. There is no stipulation for the endowment portfolio.
UNIVERSITY OF CINCINNATI JUNE 30, 2021 A COMPONENT UNIT OF THE STATE OF OHIO
30
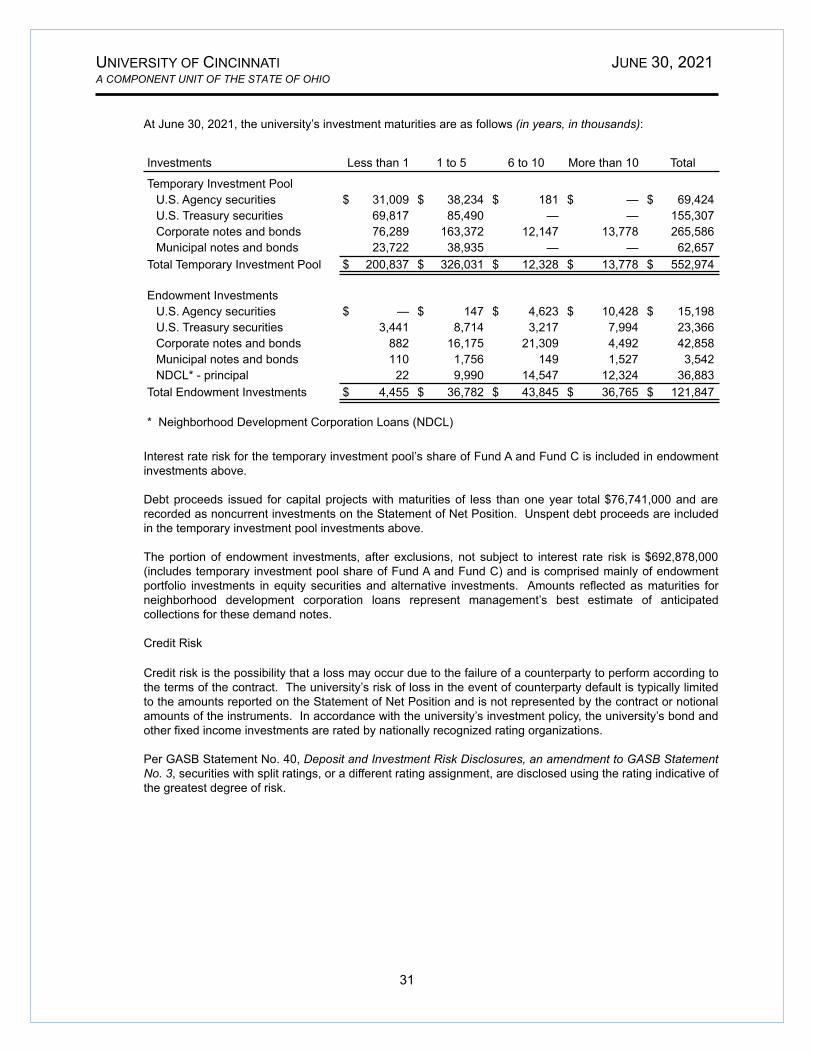
At June 30, 2021, the university’s investment maturities are as follows (in years, in thousands):
Investments Less than 1 1 to 5 6 to 10 More than 10 Total
Temporary Investment PoolU.S. Agency securities $ 31,009 $ 38,234 $ 181 $ — $ 69,424 U.S. Treasury securities 69,817 85,490 — — 155,307 Corporate notes and bonds 76,289 163,372 12,147 13,778 265,586 Municipal notes and bonds 23,722 38,935 — — 62,657
Total Temporary Investment Pool $ 200,837 $ 326,031 $ 12,328 $ 13,778 $ 552,974
Endowment InvestmentsU.S. Agency securities $ — $ 147 $ 4,623 $ 10,428 $ 15,198 U.S. Treasury securities 3,441 8,714 3,217 7,994 23,366 Corporate notes and bonds 882 16,175 21,309 4,492 42,858 Municipal notes and bonds 110 1,756 149 1,527 3,542 NDCL* - principal 22 9,990 14,547 12,324 36,883
Total Endowment Investments $ 4,455 $ 36,782 $ 43,845 $ 36,765 $ 121,847
* Neighborhood Development Corporation Loans (NDCL)
Interest rate risk for the temporary investment pool’s share of Fund A and Fund C is included in endowment investments above.
Debt proceeds issued for capital projects with maturities of less than one year total $76,741,000 and are recorded as noncurrent investments on the Statement of Net Position. Unspent debt proceeds are included in the temporary investment pool investments above.
The portion of endowment investments, after exclusions, not subject to interest rate risk is $692,878,000 (includes temporary investment pool share of Fund A and Fund C) and is comprised mainly of endowment portfolio investments in equity securities and alternative investments. Amounts reflected as maturities for neighborhood development corporation loans represent management’s best estimate of anticipated collections for these demand notes.
Credit Risk
Credit risk is the possibility that a loss may occur due to the failure of a counterparty to perform according to the terms of the contract. The university’s risk of loss in the event of counterparty default is typically limited to the amounts reported on the Statement of Net Position and is not represented by the contract or notional amounts of the instruments. In accordance with the university’s investment policy, the university’s bond and other fixed income investments are rated by nationally recognized rating organizations.
Per GASB Statement No. 40, Deposit and Investment Risk Disclosures, an amendment to GASB Statement No. 3, securities with split ratings, or a different rating assignment, are disclosed using the rating indicative of the greatest degree of risk.
UNIVERSITY OF CINCINNATI JUNE 30, 2021 A COMPONENT UNIT OF THE STATE OF OHIO
31

At June 30, 2021, the university’s investment credit risk is as follows (in thousands):
AAA AA A BBB BB & BNot
Rated Total Temporary Investment Pool
U.S. Agency securities $ — $ 69,424 $ — $ — $ — $ — $ 69,424 U.S. Treasury securities — 155,307 — — — — 155,307 Corporate notes and bonds 28,394 22,251 125,585 89,356 — — 265,586 Municipal notes and bonds 2,977 30,883 28,797 — — 62,657
Total Temporary Investment Pool $ 31,371 $ 277,865 $ 154,382 $ 89,356 $ — $ — $ 552,974
Endowment InvestmentsU.S. Agency securities $ — $ 14,398 $ 25 $ 391 $ 384 $ — $ 15,198 U.S. Treasury securities — 23,366 — — — — 23,366 Corporate notes and bonds 969 564 9,977 28,010 3,189 149 42,858 Municipal notes and bonds 51 578 1,692 942 279 — 3,542 NDCL* - principal — — — — — 36,883 36,883
Total Endowment Investments $ 1,020 $ 38,906 $ 11,694 $ 29,343 $ 3,852 $ 37,032 $ 121,847
* Neighborhood Development Corporation Loans (NDCL)
Credit risk for the temporary investment pool’s share of Fund A and Fund C is included in the endowment investment amounts above.
The temporary investment pool permits investments in unrated investment grade securities of 10% or less of the temporary investment pool portfolio measured at the time of purchase. Endowment investment grade bonds are limited to those in the first four grades of any rating system. Below-investment grade high yield bond investments and certain unrated investments having strategic value to the university are permitted. Securities ratings downgraded below investment grade after purchase are permitted to be retained.
The portion of endowment investments, after exclusions, not subject to credit risk is $692,878,000 (includes temporary investment pool share of Fund A and Fund C) and is comprised mainly of endowment portfolio investments in equity securities and alternative investments.
Custodial Credit Risk
The university does not have exposure to custodial credit risk. Custodial credit risk is the risk that in the event of the failure of the counterparty to a transaction, a government entity will not be able to recover the value of its investment or collateral securities that are in possession of an outside party. The university’s investments are held in trust or by a custodian in the university’s name or directly held in the university’s name.
Concentration of Credit Risk
Concentration of credit risk is the risk of loss attributed to the magnitude of the university’s investment in a single issuer. The university has separate investment policies for the endowment and its temporary investment pool that limit the concentration of credit risk. As of June 30, 2021, the university had no investment in any one issuer that was 5% or more of investments for either the endowment or the temporary investment pool.
UNIVERSITY OF CINCINNATI JUNE 30, 2021 A COMPONENT UNIT OF THE STATE OF OHIO
32

3. Fair Value Measurements
Fair value is the price that would be received to sell an asset or paid to transfer a liability in an orderly transaction between market participants at the measurement date. Fair value measurements must maximize the use of observable inputs and minimize the use of unobservable inputs. There is a hierarchy of three levels of inputs that may be used to measure fair value.
Level 1 Quoted prices in active markets for identical assets or liabilities.
Level 2 Observable inputs other than Level 1 prices, such as quoted prices for similar assets or liabilities; quoted prices in markets that are not active; or other inputs that are observable or can be corroborated by observable market data for substantially the full term of the assets or liabilities.
Level 3 Unobservable inputs supported by little or no market activity and are significant to the fair value of the assets or liabilities.
UNIVERSITY OF CINCINNATI JUNE 30, 2021 A COMPONENT UNIT OF THE STATE OF OHIO
33

Recurring Measurements
The following tables present the fair value measurements of assets and liabilities recognized in the accompanying financial statements measured at fair value on a recurring basis and the level within the fair value hierarchy in which the fair value measurements fall at June 30, 2021 (in thousands):
Investments, Endowment Investments, and Derivative Instruments Measured at Fair Value
Quoted Prices in Active
Markets for Identical Assets
Significant Other
Observable Inputs
Significant Unobservable
Inputs
Fair Value (Level 1) (Level 2) (Level 3)Investments by fair value level
Debt securitiesU.S. Agency securities $ 94,812 $ — $ 94,812 $ — U.S. Treasury securities 194,342 194,342 — — Corporate notes and bonds 337,082 — 337,082 — Municipal notes and bonds 68,575 — 68,575 — NDCL - principal 55,135 — — 55,135
Equity securitiesU.S equities 259,235 259,235 — — Non-U.S. equities 80,636 80,636 — — Commingled funds 138,045 80,738 — 57,307 Public real assets 27,792 — — 27,792
Real estate 29,505 — — 29,505 Total investments by fair value level $ 1,285,159 $ 614,951 $ 500,469 $ 169,739
Investments measured at net asset value (NAV)Hedge funds $ 254,581 Private equity funds 342,004
Total investments measured at NAV 596,585 1,881,744
Cash, cash equivalents and other 13,398 Shares held by UC Foundation (527,443) Total investments measured at fair value $ 1,367,699
Hedging derivative instrumentsInterest rate swap $ 1,049 $ 1,049 Interest rate cap 2,164 2,164
Total hedging derivative instruments $ 3,213 $ 3,213
Investment derivative instrumentsInterest rate swap (liability) $ (3,332) -
3$ (3,332)
UNIVERSITY OF CINCINNATI JUNE 30, 2021 A COMPONENT UNIT OF THE STATE OF OHIO
34

Money market funds included within the Temporary Investment Pool and classified as cash and cash equivalents are measured at fair market value. Certain investments that are measured at fair value using the net asset value per share (or its equivalent) practical expedient have not been classified in the fair value hierarchy. The fair value amounts included above are intended to permit reconciliation of the fair value hierarchy to the amounts presented in the Statement of Net Position.
Investments
Where quoted prices are available in an active market, securities are classified within Level 1 of the valuation hierarchy. If quoted market prices are not available, then fair values are estimated by using quoted prices of securities with similar characteristics or independent asset pricing services and pricing models, the inputs of which are market-based or independently sourced market parameters, including, but not limited to, yield curves, interest rates, volatilities, prepayments, defaults, cumulative loss projections and cash flows. Such securities are classified in Level 2 of the valuation hierarchy. In certain cases where Level 1 or Level 2 inputs are not available, securities are classified within Level 3 of the hierarchy. See the table below for inputs and valuation techniques used for Level 3 securities (in thousands):
Fair Value Valuation Method
NDCL - principal $ 55,135 Based on aggregrate cash flow projections and independent appraisals of underlying real estate
Commingled funds; Public real assets 85,099
Positions are valued by a general or managing partner (or functional equivalent)
Real estate 29,505 Independent appraisals every three years for tangible real assets
$ 169,739
The valuation method for investments measured at the net asset value (NAV) per share (or its equivalent) is presented below (in thousands):
Fair ValueUnfunded
Commitments Redemption FrequencyRedemption
Notice Period
Hedge funds (A) $ 254,581 $ — Quarterly/Annually, after
lock-up period 45-90 days Private equity funds (B) 342,004 316,064 Non-redeemable none
$ 596,585 $ 316,064
(A) This category includes investment vehicles that take both long and short positions, primarily in common stocks and credit instruments. Management of the funds has the ability to shift investments among differing investment strategies. Liquidity offered by these vehicles ranges from one quarter to 2.5 years after initial lock-ups of one to two years.
(B) This category mainly includes private equity funds that invest primarily in domestic companies. These investments are non-redeemable and terminate or liquidate over varying periods.
UNIVERSITY OF CINCINNATI JUNE 30, 2021 A COMPONENT UNIT OF THE STATE OF OHIO
35

Derivative Instruments
The fair value of the interest rate swap agreements were estimated using the income approach, which converts future cash flows to a single present value using discounting. The value of the 2009 interest rate swap agreement is then adjusted to incorporate non-performance risk for the university since the swap is a liability. The valuations are considered Level 2 since a quoted price can be obtained from a number of dealer counterparties and other independent market sources based on observable interest rates and yield curves for the full term of the asset or liability.
The value of the interest rate cap agreement was estimated using the income approach which converts future cash flows to a single present value using discounting. The fair value of the interest rate cap was developed by an independent third party with no vested interest in the cap transaction. The valuations are considered Level 2 since a quoted price can be obtained from a number of dealer counterparties and other independent market sources based on observable interest rates and yield curves for the full term of the asset or liability.
4. Accounts and Notes Receivable
Accounts and notes receivable as of June 30, 2021 is as follows (in thousands):
Accounts receivable, net $ 98,959 Notes receivable, net 17,911 Accrued interest receivable, net 9,106 Total 125,976 Less current receivables 105,425 Noncurrent receivables $ 20,551
Allowances for uncollectible receivables included in the amounts above are approximately $9,347,000 for accounts receivable, $6,425,000 for notes receivable, and $23,566,000 for accrued interest receivable related to loans made to certain nonprofit entities as of June 30, 2021.
5. UC Health Affiliation Agreement
The organization known as UC Health consists of UC Healthcare System (“UCHS”) and affiliates. UCHS is an Ohio nonprofit corporation formed October 15, 2010, and is the sole member of UC Health, LLC. UC Health, LLC (“UC Health”) is an Ohio nonprofit limited liability company that includes University of Cincinnati Medical Center (UCMC), West Chester Hospital, Daniel Drake Center, and University of Cincinnati Physicians Company (UCPC).
UC Health operates under an affiliation agreement entered into between the university, UC Health, and UC Healthcare System on June 28, 2012. The affiliation agreement supports the mission of UC Health and its commitment to patient care, education, and research. Pursuant to the agreement, the university retained its interest in the net assets of UC Health. This intangible asset is recorded on the university’s Statement of Net Position as a noncurrent asset at $420,645,000 and is valued based on the cost method. Management believes that the cost method is the preferred valuation method based on the university's participation interest defined in the affiliation agreement. The university monitors any potential changes to the asset valuation such as impairment. There has been no change to the value of the asset since 2011.
UCMC purchases common services from the university, such as utilities and various other administrative services for which the university charges UCMC. Charges for 2021 were approximately $14,239,000.
UC Health provides support for education and research activities of the academic departments of the College of Medicine. The level of funding is based on a percentage of clinical departmental net patient revenues. UC Health also provides support which may be used at the discretion of the Dean of the College
UNIVERSITY OF CINCINNATI JUNE 30, 2021 A COMPONENT UNIT OF THE STATE OF OHIO
36

of Medicine for the growth and development of teaching, research, and service programs. Support payments received from UC Health and related affiliates for 2021 were $23,184,000 and are included in support from affiliates on the Statement of Revenues, Expenses, and Changes in Net Position.
Additionally, faculty and non-faculty UCPC physicians and certain other UCPC clinical staff members are dually compensated by both the university and UC Health. The university charges UCPC for these employees' salaries and benefits. Total salaries and benefits for 2021 were approximately $66,528,000 and are included in sales and services of educational departments on the Statement of Revenues, Expenses, and Changes in Net Position.
6. Capital Assets
Capital asset activity for the year ended June 30, 2021 is summarized as follows (in thousands):
Beginning EndingBalance Additions Retirements Transfers Balance
Capital assets not being depreciated:
Land $ 25,196 $ 7,405 $ — $ — $ 32,601 Construction in progress 45,455 65,077 — (43,244) 67,288 Collections 16,009 57 — — 16,066 Total nondepreciable assets 86,660 72,539 — (43,244) 115,955
Capital assets being depreciated:Land improvement 116,968 — — 1,750 118,718 Buildings 2,845,265 2,479 (5,607) 38,062 2,880,199 Infrastructure 149,392 103 — 462 149,957 Building equipment 17,698 — — 87 17,785 Moveable equipment 259,416 12,089 (9,505) 2,883 264,883
Computer software 73,539 — (16) — 73,523 Library books 221,893 6,617 (88) — 228,422 Total 3,684,171 21,288 (15,216) 43,244 3,733,487
Less: Accumulated depreciation 2,071,004 133,294 (13,236) — 2,191,062 Total depreciable assets 1,613,167 (112,006) (1,980) 43,244 1,542,425
Capital assets, net $ 1,699,827 $ (39,467) $ (1,980) $ — $ 1,658,380
UNIVERSITY OF CINCINNATI JUNE 30, 2021 A COMPONENT UNIT OF THE STATE OF OHIO
37

7. Debt
The university finances certain construction, renovation, and acquisition of facilities through the issuance of debt obligations, which include general receipts bonds, capital lease obligations, and other borrowings.
Debt activity for the year ended June 30, 2021 is as follows (in thousands):
Interest Final Beginning Ending Current
Rates Maturity Balance Additions Reductions Balance Portion
General Receipts Bonds - Fixed Rate2010C (a,b) 4.03-6.48% 2039 $ 21,045 $ — $ 21,045 $ — $ — 2010F 3.00-5.00% 2034 1,545 — 1,545 — — 2011A 3.50-5.00% 2021 2,095 — 2,095 — — 2011C 3.00-5.25% 2031 7,870 — 6,320 1,550 — 2011E 3.38-5.00% 2028 8,650 — — 8,650 1,005 2012A 2.00-5.00% 2031 14,270 — 6,965 7,305 7,305 2012C 4.00-5.00% 2033 49,245 — 46,765 2,480 2,325 2013A 3.12-5.00% 2034 2,405 — — 2,405 — 2013D (a) 4.64-5.15% 2033 9,230 — — 9,230 — 2014B 3.00-5.00% 2036 79,220 — 5,090 74,130 5,350 2014C 3.25-5.00% 2041 30,415 — 445 29,970 440 2014D 5.00% 2036 45,060 — 4,870 40,190 5,305 2016A 5.00% 2034 46,215 — — 46,215 — 2016B (a) 3.95% 2042 25,165 — — 25,165 — 2016C 5.00% 2046 37,980 — — 37,980 — 2017A 4.54% 2047 93,545 — — 93,545 — 2017B 4.32% 2031 21,935 — — 21,935 — 2018A 3.00-5.00% 2048 76,020 — 180 75,840 195 2018B (a) 3.88-4.18% 2035 20,645 — — 20,645 — 2019A 2.513% 2039 86,145 — 2,025 84,120 2,115 2019B (a) 2.82% 2039 232,795 — 13,790 219,005 7,290 2020A (a) 3.011% 2050 74,115 — — 74,115 — 2020B (a) 1.99% 2050 28,135 — — 28,135 — 2021A (a) 3.19% 2051 — 39,655 — 39,655 — 2021B (a) 0.30-2.46% 2033 — 42,685 — 42,685 —
Total Fixed Rate 1,013,745 82,340 111,135 984,950 31,330
General Receipts Bonds - Variable Rate2017C (a,c) 0.99% 2027 50,150 — — 50,150 — 2021C (a,c) 1.29% 2031 — 18,700 — 18,700 —
50,150 18,700 — 68,850 —
Capital Lease Obligations
King Highland-Stetson/Turner 3.00-5.00% 2038 37,585 — — 37,585 1,585
Other DebtStratford Heights 2020 (c,d) 1.60% 2025 42,395 — 1,320 41,075 —
Premium 64,572 — 11,197 53,375 6,956
Less: Current portion of debt (51,539) — — (39,871)
Net long-term debt $ 1,156,908 $ 101,040 $ 123,652 $ 1,145,964 $ 39,871
Notes:(a) Taxable bonds(b) Build America Bonds(c) Direct placement debt(d) University Heights Community Urban Redevelopment Corporation (see Note 16)
UNIVERSITY OF CINCINNATI JUNE 30, 2021 A COMPONENT UNIT OF THE STATE OF OHIO
38

Debt Issuances
During 2021, the university issued fixed rate general receipts obligations totaling $82,340,000. Debt issued included taxable bonds in the amount of $39,655,000 (Series 2021A) and $42,685,000 (Series 2021B). Bond proceeds were utilized to provide capital project funding of $39,655,000 and to refund existing debt of $42,685,000 (Series 2012C). The cash flow differential from this debt refunding is $4,361,000 after a university equity contribution of $3,087,000 and will be realized over a 12-year period as a reduction of interest expense.
Deferred inflows associated with the university’s 2021 refunding activities totaled $2,793,000 and has been recorded within the deferred inflows of resources on the Statement of Net Position.
Debt Retirement
During 2021, the university retired $9,225,000 of callable obligations. Debt retired included $2,920,000 of fixed rate bonds (Series 2010C), $970,000 of fixed rate bonds (Series 2010F), and $5,335,000 of fixed rate bonds (Series 2011C). All of these series are fully retired except for $1,550,000 remaining for Series 2011C.
Variable Rate Direct Placement and Other Debt
On June 3, 2021, Series 2021C taxable variable rate bonds, with an aggregate principal amount up to $49,075,000, were issued via direct placement with a bank. These bonds were issued as "drawndown" bonds whereby purchaser of the bonds will fund the purchase price of the bonds in installments. As of June 30, 2021, a total of $18,700,000 of the purchase price was advanced under the contract and was used to refund a portion of various maturities related to Series 2010C and Series 2010F fixed rate bonds. Proceeds of $30,375,000 will be used to finance all or a portion of the design and renovation of the Calhoun Hall Renovation capital project.
These bonds bear interest at an index-based rate (LIBOR) plus a spread. The LIBOR period can range from one month to twelve months as selected by the university at each reset date. The effective interest rate for the bonds on June 30, 2021 is 1.29%. Interest is payable semi-annually on December 1 and June 1; the bonds mature on June 1, 2031. These bonds will be held by the registered holder(s) through bond maturity. Accordingly, the university has classified the outstanding principal on these bonds as a long-term liability.
Subsequent to UHCURC's fiscal year ending August 31, 2020, taxable variable rate bonds were issued for Stratford Heights on December 16, 2020 via a direct placement contract with a bank, in an aggregate principal amount of $41,075,000. Therefore, the transaction is not reflected in the university's financial statements (see Note 16). Proceeds were used to refinance the 2010 Stratford Heights fixed rate bonds in the amount of $41,075,000.
Stratford Heights 2020 direct placement bonds bear interest at an index-based rate (1-Month LIBOR) plus a spread. The effective interest rate for the bonds on June 30, 2021 is 1.60%. Interest is payable semi-annually on December 1 and June 1; the bonds mature on December 1, 2025. These bonds will be held by the registered holder(s) through bond maturity. Accordingly, the university has classified the outstanding principal balance on these bonds as a long-term liability. The debt activity table has been updated to reflect the interest rate and final maturity date of the new debt.
Capital Lease Obligations
The university has capital lease obligations of $37,585,000 in connection with the financing of two buildings (One Stetson Square and Turner Center), which are owned by King Highland Community Urban Redevelopment Corporation and occupied, all or in part, by the university. Economic development revenue bonds were issued by the County of Hamilton, Ohio (the “King Highland Bonds”) to finance the buildings. The leases for One Stetson Square and Turner Center require unconditional obligations for the university to make lease payments, which pay the principal and interest on the King Highland Bonds.
UNIVERSITY OF CINCINNATI JUNE 30, 2021 A COMPONENT UNIT OF THE STATE OF OHIO
39

Collateralization
General receipts obligations are collateralized by a pledge of the university’s general receipts. Capital lease obligations (One Stetson Square and Turner Center) are secured by base rent payments under the leases and are not general receipts obligations. The net book value of assets for the capital lease obligations is $20,027,000 as of June 30, 2021.
Derivative Transactions
Interest Rate Swaps
The university has two pay-fixed interest rate swaps in effect at June 30, 2021. The swaps were entered into to protect the university against the potential of rising interest rates. The first swap, entered into in 2009, has been determined to be an ineffective hedge and is reported as an investment derivative. The second swap, entered into in fiscal year 2021, has been determined to be an effective hedge and is reported as a hedging derivative.
The following table summarizes the university’s swap agreements as of June 30, 2021 (in thousands):
EffectiveDate Counterparty Counterparty
RatingAssociated
Debt Series
OutstandingNotionalAmount
FixedRatePaid
Variable RateIndex Received
FairValue
SwapTermination
Date
5/1/2009Royal Bank of Canada
(RBC)AA-/Aa3 2017C $24,075 3.16%
USD-67%LIBOR-BBA-1M
($3,332) 6/1/2030
7/8/2020 PNC Bank A2/A 2017C $34,020 0.39%USD-100% LIBOR-
BBA-1M$1,049 6/1/2027
Based on the swap agreements, the university calculates a fixed rate interest owed to the counterparty. Correspondingly, the swap counterparty calculates interest based on a specified index. Only the net difference in interest payments is exchanged between the parties. The university continues to pay interest on the Series 2017C Direct Placement obligations as due. There are no collateral posting requirements on these swaps.
The fair value of the RBC swap on June 30, 2021 is ($3,332,000), which is reported as a noncurrent liability on the Statement of Net Position and indicates the amount the university would be required to pay to the counterparty to terminate the swap agreement. The fair value was estimated using the income approach, which converts future cash flows to a single present value using discounting. That value is then adjusted to incorporate non-performance risk for the university since the swap is a liability. The fair value of the swap agreement was developed by an independent third party with no vested interest in the swap transaction. During 2021, the fair value of the swap increased $1,195,000, which is reported as investment income within the Statement of Revenues, Expenses, and Changes in Net Position.
The fair value of the PNC Bank swap on June 30, 2021 is $1,049,000, which is reported as a noncurrent asset and offset by a deferred inflow of resources on the Statement of Net Position. The fair value was also estimated using the income approach described above.
Interest Rate Cap
On March 23, 2021, the university paid $3,004,400 to purchase an interest rate cap from PNC Bank. Based on the terms of the interest rate cap the university will receive a payment from PNC Bank if 100% of 1-Month LIBOR exceeds:
1) 1.00% (cap rate) during the period of March 23, 2021 through May 31, 20262) 2.00% (cap rate) during the period June 1, 2026 to May 31, 2031
UNIVERSITY OF CINCINNATI JUNE 30, 2021 A COMPONENT UNIT OF THE STATE OF OHIO
40

The PNC Bank interest rate cap has been determined to be an effective hedge and is reported as a hedging derivative.
The following table summarizes the university's interest rate cap agreement as of June 30, 2021:
EffectiveDate Counterparty
CounterpartyRating
AssociatedDebt Issue
OutstandingNotionalAmount
Floating Rate Option
FairValue
CapTermination
Date
3/23/2021 PNC Bank A2/A Stratford Heights $41,075
USD-100% LIBOR-BBA-1M
$2,164 6/01/2031
The fair value of the interest rate cap on June 30, 2021 is $2,164,000, which is reported as a noncurrent asset and offset by a deferred inflow of resources on the Statement of Net Position. The fair value was estimated using the income approach which converts future cash flows to a single present value using discounting. The fair value of the interest rate cap agreement was developed by an independent third party with no vested interest in the cap transaction.
Risks
Credit: There are no counterparty collateral posting requirements on the derivative contracts. However, the university is exposed to $3,213,000 in credit risk associated with the PNC swap and interest rate cap agreements with a positive fair value through fiscal year 2021. A derivative management guideline is in place at the university, which addresses diversifying counterparty risk and limiting the university’s credit exposure on derivative transactions.
General Interest Rate: The fair value of the swaps and interest rate cap are sensitive to interest rate changes.
Debt Service Commitments
General receipts and Stratford Heights annual debt service obligations are as follows (in thousands):
Fixed Rate Bonds Direct Placement/Variable Debt
Fiscal Year Principal Interest Principal Interest Total
2022 $ 31,330 $ 36,983 $ — $ 1,399 $ 69,712 2023 33,160 35,698 — 1,400 70,258 2024 41,295 34,650 1,555 1,400 78,900 2025 43,955 33,234 42,665 1,385 121,239 2026 46,840 31,889 1,630 712 81,071
2027-2031 235,410 133,461 64,075 3,417 436,363 2032-2036 161,385 96,892 — — 258,277 2037-2041 125,195 67,668 — — 192,863 2042-2046 118,495 41,659 — — 160,154 2047-2051 147,885 16,920 — — 164,805
Total $ 984,950 $ 529,054 $ 109,925 $ 9,713 $ 1,633,642
UNIVERSITY OF CINCINNATI JUNE 30, 2021 A COMPONENT UNIT OF THE STATE OF OHIO
41

Capital Lease annual principal and interest obligations are as follows (in thousands):
FiscalYear Principal Interest Total2022 $ 1,585 $ 1,581 $ 3,166 2023 1,630 1,534 3,164 2024 1,680 1,485 3,165 2025 1,745 1,418 3,163 2026 1,815 1,348 3,163
2027-2031 10,240 5,582 15,822 2032-2036 12,920 2,909 15,829 2037-2038 5,970 361 6,331
Total $ 37,585 $ 16,218 $ 53,803
Defeased Debt
The university defeased all or a portion of various general receipts obligations as identified in the table below (in thousands):
AmountAmount Outstanding at
Bond Series Maturity Dates Interest Rate(s) Defeased June 30, 2021Series 2010C 2028-2039 6.38% - 6.48% $ 18,125 $ 18,125 Series 2010F* 2019-2034 3.50% - 5.00% 45 — Series 2010F 2021-2034 3.50% - 5.00% 62,865 575 Series 2010G 2021-2032 5.62% - 6.28% 13,185 — Series 2011C 2022-2031 4.25% - 5.25% 12,840 — Series 2011E 2022-2028 3.38% - 5.00% 20,070 20,070 Series 2012A 2023-2031 3.00% - 5.00% 39,750 39,750 Series 2012C 2023-2033 4.00% - 5.00% 56,035 56,035 Series 2013A 2030-2034 5.00% 13,715 13,715 Series 2013C 2033-2039 5.00% 54,125 54,125 Series 2013D 2029-2033 5.15% 28,135 28,135
Total $ 318,890 $ 230,530
* Defeasance of Kingsgate Conference Center
Neither the outstanding indebtedness nor the related irrevocable trust accounts for the above bonds are included in the university’s financial statements. Funds have been deposited with a trustee in accordance with the defeasance of the debt.
Other
Interest expense on capital asset related debt in 2021 was $47,303,000.
UNIVERSITY OF CINCINNATI JUNE 30, 2021 A COMPONENT UNIT OF THE STATE OF OHIO
42

8. Other Long-Term Liabilities
Other long-term liabilities as of June 30, 2021 are as follows (in thousands):
Beginning Ending Current NoncurrentBalance Additions Reductions Balance Portion Portion
Other long-term liabilities:Compensated absences $ 67,214 $ 9,071 $ 4,970 $ 71,315 $ 48,938 $ 22,377 Government loan advances 17,234 296 2,567 14,963 — 14,963 Rent advances 23,184 — 237 22,947 238 22,709 Interest rate swap liability 4,527 — 1,195 3,332 — 3,332
Total other long-term liabilities $ 112,159 $ 9,367 $ 8,969 $ 112,557 $ 49,176 $ 63,381
9. Operating Leases
The university leases various office space, campus housing and equipment under operating lease arrangements. These facilities and equipment are not recorded as assets on the Statement of Net Position. The total rental expense under all arrangements was $24,418,000 for the year ended June 30, 2021.
In 2019, the university entered into a 99-year term agreement to lease the Kingsgate Hotel and Conference Center to GCOH Owner LLC. The university received a one-time lump sum rent advance of $23,500,000. Rent revenue is recognized on a straight-line basis over the term of the agreement. Rent revenue for 2021 was approximately $237,000. As of June 30, 2021, the remaining amount considered noncurrent is approximately $22,709,000, which is included in other noncurrent liabilities on the Statement of Net Position. The future minimum rental income from this operating lease for each of the next five years is approximately $237,000. Thereafter, $21,761,000 will be recognized over the remaining years.
The university also has entered into a number of significant lease arrangements to expand housing capacity for students to meet increasing demand and enrollment. These agreements range from one to five year terms with various renewal options. The expense for these leases in 2021 was $22,343,000.
Future minimum payments for the above operating leases as of June 30, 2021 are as follows (in thousands):
Year Ended June 30,
2022 $ 27,395 2023 15,830
$ 43,225
10. Federal and State Support
The university is a state-assisted institution of higher education and receives from the State of Ohio a state share of instruction that is student-enrollment based. This subsidy is determined annually by the Ohio Board of Regents. The State also provides line-item appropriations that support, in part, the current operations of various activities including clinical teaching expenditures.
In addition to the operating subsidies, the State of Ohio provides funding for construction and renovation of major plant facilities on the university’s campuses. The state passes a capital appropriations bill biannually for both major capital projects and basic renovation projects of which the university receives a share. Such facilities are reported as capital assets on the Statement of Net Position.
UNIVERSITY OF CINCINNATI JUNE 30, 2021 A COMPONENT UNIT OF THE STATE OF OHIO
43

In May 2020, the Higher Education Emergency Relief Fund I (HEERF I) was enacted under the Coronavirus Aid, Relief, and Economic Security (CARES) Act from the US Department of Education to provide budgetary relief to institutions. The university received an emergency financial aid grant of $23.5 million and spent $22.5 million during 2020. During 2021, the university spent the remaining $991,000 of the HEERF I award.
In August 2020, the university was awarded $21.6 million in Coronavirus Relief Funds (CRF) from the State of Ohio. Funds were awarded to the State of Ohio as Federal Financial Assistance from the US Department of Treasury. The grant is comprised of two parts, Institutional and Mental Health. CRF institutional funds can only be used to cover expenses that (1) are necessary expenditures incurred due to the public health emergency with respect to COVID-19; (2) were not accounted for in the budget approved as of March 27, 2020; and (3) were incurred during the period that began on March 1, 2020 and ends December 31, 2021. This portion amounted to $21.2 million. The mental health portion is used to provide mental health services to the university community. This portion totaled $345,000. Grant funds totaling $21.3 million were spent during 2021.
The Higher Education Emergency Relief Fund II (HEERF II) was authorized by the Coronavirus Response and Relief Supplemental Appropriation (CRRSA) Act signed into law on December 27, 2020. Under HEERF II, there was not a direct correlation between the student aid portion and the institution portion. The student portion was based on the aid received under HEERF I. The university was awarded $11.8 million for aid to students and $27.8 million for institutional aid. HEERF III was authorized by the American Rescue Plan Act (ARPA) in March 2021. Under HEERF III at least half of the institution’s allocation must be used to make emergency financial aid grants to students (Student Aid Portion), the remainder may be used for institutional purposes (Institutional Portion). Two new required uses of HEERF III Institutional Portion are (1) implement evidence-based practices to monitor and suppress coronavirus in accordance with public health guidelines; and (2) conduct direct outreach to financial aid applicants about the opportunity to receive a financial aid adjustment due to the recent unemployment of a family member or independent student, or other circumstances. The university was awarded $35.4 million in aid for students and $34.6 for the institution. Both HEERF II and HEERF III are awarded from the US Department of Education. In total the university spent $67.3 million of HEERF II and HEERF III money during 2021.
11. Retirement Plans and Other Postemployment Benefits
Retirement benefits are available for substantially all employees under one of three contributory retirement plans. Employees not certified as teachers are covered by the Ohio Public Employees Retirement System (OPERS). Certified teachers are covered by the State Teachers Retirement System (STRS Ohio). Employees may opt out of OPERS and STRS Ohio and participate in the Alternative Retirement Plan (ARP) if they meet certain eligibility requirements.
OPERS and STRS Ohio are cost-sharing, multiple-employer statewide retirement systems each comprised of three separate plans: (1) a defined benefit plan, (2) a defined contribution plan, and (3) a combined defined benefit/defined contribution plan. Each of the three options is discussed in greater detail in the following sections. In addition to retirement benefits, the systems also provide disability, survivor and postretirement health benefits to qualifying members of the defined benefit plan, combined plan and beneficiaries. Benefits provided under the plans are established by state statute.
Both plans issue separate, publicly available financial reports that include financial statements and required supplementary information. These reports may be obtained by contacting each organization as follows:
OPERS277 East Town StreetColumbus, Ohio 43215-4642Telephone (800) 222‑7377www.opers.org
STRS Ohio275 East Broad StreetColumbus, Ohio 43215-3771Telephone (888) 227‑7877www.strsoh.org
UNIVERSITY OF CINCINNATI JUNE 30, 2021 A COMPONENT UNIT OF THE STATE OF OHIO
44

Benefits Provided
Plan benefits for OPERS are established under Chapter 145 of the Ohio Revised Code (ORC). Members are categorized into three groups with varying provisions of the law applicable to each group. Members who were eligible to retire on January 7, 2013 and those eligible to retire no later than five years after that date comprise transition group A. Members who have 20 years of service credit prior to January 7, 2013 or are eligible to retire no later than 10 years after January 7, 2013 are included in transition group B. Group C includes those members who are not in either of the other groups and members who were hired on or after January 7, 2013. Additionally, OPERS has three separate divisions with varying degrees of benefits: (1) state and local, (2) law enforcement and (3) public safety. The university does not have any employees included in the public safety division.
Benefits for state and local members are calculated on the basis of age, final average salary, and service credit. State and local members in transition groups A and B are eligible for retirement benefits at age 60 with 60 contributing months of service credit or at age 55 with 25 or more years of service credit. Group C for state and local is eligible for retirement at age 57 with 25 years of service or at age 62 with 5 years of service. For groups A and B, the annual benefit is based on 2.2% of final average salary multiplied by the actual years of service for the first 30 years of service credit and 2.5% for years of service in excess of 30 years. For group C the annual benefit applies a factor of 2.2% for the first 35 years and a factor of 2.5% for the years of service in excess of 35. Final average salary represents the average of the three highest years of earnings over a member’s career for groups A and B. Group C is based on the average of the five highest years of earnings over a member’s career. Members who retire before meeting the age and years of service credit requirement for unreduced benefit receive a percentage reduction in the benefit amount.
Members within the law enforcement division, as defined in ORC Chapter 145, are eligible for special retirement options under the defined benefit plan and are not eligible to participate in the defined contribution plan or combined plan. Group A law enforcement officers are eligible for full retirement at age 52 or older with 15 or more years of credited service. Law enforcement group B is eligible at age 48 or older with 25 years or at age 52 or older with 15 years of service. Law enforcement group C is eligible at age 48 or older with 25 years of service or at age 56 with 15 years of service. Annual benefits are calculated by multiplying 2.5% of final average salary by the actual years of service for the first 25 years of service credit, and 2.1% of final average salary for each year of service over 25 years. These options also permit early retirement under qualifying circumstances as early as age 48 with a reduced benefit.
OPERS offers a combined plan that has elements of both a defined benefit and defined contribution plan. In the combined plan, employee contributions are invested in self-directed investments, and the employer contribution is used to fund a reduced defined benefit. Eligibility requirements under the combined plan for age and years of service are identical to the defined benefit plan described earlier. The benefit formula for the defined benefit component of the plan for state and local members in transition groups A and B applies a factor of 1.0% to the member’s final average salary for the first 30 years of service. A factor of 1.25% is applied to years of service in excess of 30. The benefit formula for transition group C applies a factor of 1.0% to the member’s final average salary for the first 35 years of service and a factor of 1.25% is applied to years in excess of 35. Members retiring before age 65 with less than 30 years of service credit receive a percentage reduction in benefit.
A cost-of-living adjustment is provided each year and is calculated on the base retirement benefit at the date of retirement and is not compounded. For those retiring prior to January 7, 2013, the COLA will continue to be a 3% simple annual COLA. For those retiring subsequent to January 7, 2013, beginning in calendar year 2019, the COLA will be based on the average percentage increase in the Consumer Price Index, capped at 3%.
Plan benefits for STRS Ohio are established by ORC Chapter 3307. The STRS Ohio defined benefit plan offers an annual retirement allowance based on final average salary multiplied by a percentage that varies based on years of service. Effective August 1, 2015, the calculation will be 2.2% of final average salary for the five highest years of earnings multiplied by all years of service. With certain exceptions, the basic benefit is increased each year by 2% of the original base benefit. For members retiring August 1, 2013 or later, the first 2% is paid on the fifth anniversary of the retirement benefit. Members are eligible to retire at age 60 with five years of qualifying service credit, or at age 55 with 25 years of service, or 30 years of service regardless of age. Age and service requirements for retirement will increase effective August 1,
UNIVERSITY OF CINCINNATI JUNE 30, 2021 A COMPONENT UNIT OF THE STATE OF OHIO
45

2015, and will continue to increase periodically until they reach age 60 with 35 years of service or age 65 and five years of service on August 1, 2026.
STRS Ohio also offers a combined plan that features elements of both a defined benefit and a defined contribution plan. In the combined plan, employee contributions are invested in self-directed investments, and the employer contribution is used to fund a reduced defined benefit. The defined benefit portion payment is payable to the member on or after age 60 with five years of service. The defined contribution portion of the account may be taken as a lump sum payment or converted to a lifetime monthly annuity at age 50.
In April 2017, the STRS Ohio Board reduced the cost of living adjustment granted on or after July 1, 2017 to 0% for all retirees in order to preserve the financial integrity of the retirement system. Benefit recipients' base benefit and past COLA increases were not affected by this change. The board will evaluate and consider upward adjustments to COLA no later than the next five-year actuarial experience review.
Pension Contributions
The ORC provides OPERS and STRS Ohio statutory authority over employee and employer contributions. The required contractually determined contribution rates, respectively of annual payroll, actuarially determined as an amount that, when combined with employee contributions, is expected to finance the costs of benefits earned by employees during the year, with an additional amount to finance any unfunded accrued liability. The contractually required contribution rates for the employee and the university are as follows for the year ended June 30, 2021:
Contribution Rates
Employee UniversityOPERS State and local divisions 10% 14%OPERS Law enforcement division 13% 18.1%STRS Ohio 14% 14%
For the year ended June 30, 2021, contributions to the pension plans from the university were $27,133,000 for OPERS and $21,194,000 for STRS Ohio.
Pension Liabilities, Pension Expense, and Deferred Outflows of Resources and Deferred Inflows of Resources Related to Pensions
At June 30, 2021, the university reported a liability of $174,810,000 and $371,394,000 for OPERS and STRS Ohio, respectively, for its proportionate share of the net pension liability. This was a decrease of $63,463,000 for OPERS and an increase of $28,098,000 for STRS Ohio compared to the liabilities reported as of June 30, 2020. The net pension liability was measured as of December 31, 2020 for OPERS and June 30, 2020 for STRS Ohio and the total pension liability used to calculate the net pension liability was determined by actuarial valuations as of those dates. The university’s proportion of the net pension liability was based on the university's actual contributions, employee and employer, for OPERS Traditional Pension Plan, employer only for OPERS Combined Plan and employer only for STRS Ohio, during the respective measurement periods in relation to total contributions for the same groups by all employers for the same periods. At June 30, 2021, the university’s proportion was 1.22% for OPERS Traditional Pension Plan, 1.92% for OPERS Combined Plan and 1.53% for STRS Ohio.
For the year ended June 30, 2021, the university recognized pension expense of $6,138,000 for OPERS and $48,786,000 for STRS Ohio, for a total of $54,924,000. The difference between this total and the $1,829,000 reported separately as pension expense on the Statement of Revenue, Expenses, and Changes in Net Position is $52,789,000, which is recorded as employee benefits within functional expenses.
UNIVERSITY OF CINCINNATI JUNE 30, 2021 A COMPONENT UNIT OF THE STATE OF OHIO
46

At June 30, 2021, the university reported deferred outflows of resources and deferred inflows of resources related to pensions from the following sources (in thousands):
Deferred Outflows of Resources
OPERS STRS Ohio Total
Differences between expected and actual experience $ — $ 836 $ 836
Changes in assumptions 315 19,446 19,761 Net difference between projected and actual earnings on pension plan investments — 18,644 18,644
Changes in proportion 1,684 6,218 7,902 University’s contributions subsequent to the measurement date 15,091 26,232 41,323
$ 17,090 $ 71,376 $ 88,466
Deferred Inflows of Resources
OPERS STRS Ohio Total
Differences between expected and actual experience $ 8,520 $ 2,357 $ 10,877 Net difference between projected and actual earnings on pension plan investments 71,931 — 71,931
Changes in proportion 1,436 3,328 4,764 $ 81,887 $ 5,685 $ 87,572
At June 30, 2021, the university reported $15,091,000 and $26,232,000 for OPERS and STRS Ohio, respectively, as deferred outflows of resources related to pensions resulting in university contributions subsequent to the measurement date that will be used as a reduction of the net pension liability in the year ending June 30, 2022. Other amounts reported as deferred outflows of resources and deferred inflows of resources at June 30, 2021 related to pensions will be recognized in pension expense as follows (in thousands):
Year ended June 30, OPERS STRS Ohio Total
2022 $ (29,345) $ 13,095 $ (16,250) 2023 (11,182) 7,347 (3,835) 2024 (29,262) 11,531 (17,731) 2025 (9,825) 7,486 (2,339) 2026 (110) — (110) Thereafter (164) — (164)
$ (79,888) $ 39,459 $ (40,429)
UNIVERSITY OF CINCINNATI JUNE 30, 2021 A COMPONENT UNIT OF THE STATE OF OHIO
47

Actuarial Assumptions
For OPERS, the total pension liability was determined by an actuarial valuation as of December 31, 2020 using the following actuarial assumptions, applied to all prior periods in the measurement:
OPERS Traditional Pension Plan Combined Plan
Valuation date December 31, 2020 December 31, 2020
Date of last experience studyPeriod ended December 31, 2015
Period ended December 31, 2015
Inflation 3.25% 3.25%
Projected salary increases3.25% - 10.75% including inflation at 3.25%
3.25% - 8.25% including inflation at 3.25%
Investment rate of return 7.20% 7.20%
Cost-of-living adjustmentsPre-1/7/2013 retirees: 3.00% simple; post-1/7/2013 retirees: 0.50% simple through 2021, then 2.15% simple
Pre-1/7/2013 retirees: 3.00% simple; post-1/7/2013 retirees: 0.50% simple through 2021, then 2.15% simple
For STRS Ohio, the total pension liability was determined by an actuarial valuation as of June 30, 2020 using the following actuarial assumptions, applied to all prior periods included in the measurement:
STRS Ohio
Valuation date June 30, 2020Date of last experience study Period ended June 30, 2016Inflation 2.50%Projected salary increases 12.50% at age 20 to 2.50% at age 65Investment rate of return 7.45%, net of investment expenses, including inflationPayroll increases 3.00%Cost-of-living adjustments 0% effective July 1, 2017
Pre-retirement mortality rates for OPERS are based on the RP-2014 Employees Mortality Table for males and females, adjusted for mortality improvement back to the observation period base year of 2006. The base year for males and females was then established to be 2015 and 2010, respectively. Post-retirement mortality rates are based on the RP-2014 Healthy Annuitant Mortality Table for males and females, adjusted for mortality improvement back to the observation period base year of 2006. The base year for males and females was then established to be 2015 and 2010, respectively. Post-retirement mortality rates for disabled retirees are based on the RP-2014 Disabled Mortality Table for males and females, adjusted for mortality improvement back to the observation period base year of 2006. The base year for males and females was then established to be 2015 and 2010, respectively. Mortality rates for a particular calendar year are determined by applying the MP-2015 mortality improvement scale to all of the above described tables.
Pre-retirement mortality rates for STRS Ohio are based on RP-2014 Employee Mortality Table, projected forward generationally using mortality improvement scale MP-2016. Post-retirement mortality rates for healthy retirees are based on the RP-2014 Annuitant Mortality Table with 50% of rates through age 69, 70% of rates between ages 70 and 79, 90% of rates between ages 80 and 84, and 100% of rates thereafter, projected forward generationally using mortality improvement scale MP-2016. Post-retirement disabled mortality rates are based on the RP-2014 Disabled Mortality Table with 90% of rates for males and 100% of rates for females, projected forward generationally using mortality improvement scale MP-2016.
The long-term expected rate of return on OPERS defined benefit investment assets was determined using a building-block method in which best-estimate ranges of expected future real rates of return were developed for each major asset class. These ranges are combined to produce the long-term expected rate of return by weighting the expected future real rates of return by the target allocation percentage, adjusted for inflation.
UNIVERSITY OF CINCINNATI JUNE 30, 2021 A COMPONENT UNIT OF THE STATE OF OHIO
48

The target allocation and best estimates of arithmetic real rates of return for each major asset class are summarized in the following table:
OPERS
Asset ClassTarget
Allocation
Long-Term Expected Real Rate of Return
Domestic equities 21% 5.64%International equities 23% 7.36%Fixed income 25% 1.32%Real estate 10% 5.39%Private equity 12% 10.42%Other investments 9% 4.75%
100%
STRS Ohio utilizes investment consultants to determine the long-term expected rate of return by developing best estimates of expected future real rates for each major asset class. The target allocation and best estimates of arithmetic real rates of return for each major asset class are summarized in the following table:
STRS Ohio
Asset ClassTarget
Allocation
Long-Term Expected Real Rate of Return
Domestic equities 28% 7.35%International equities 23% 7.55%Fixed income 21% 3.00%Real estate 10% 6.00%Alternatives 17% 7.09%Liquidity reserves 1% 2.25%
100%
Discount Rate
The discount rate used to measure the total pension liability was 7.2% for OPERS and 7.45% for STRS Ohio. The projection of cash flows used to determine the discount rate assumed that employee contributions will be made at the current contribution rate and that participating employer contributions will be made at statutorily required rates. Based on those assumptions, the pension plans’ fiduciary net position was projected to be available to make all projected future benefit payments of current active and inactive employees. Therefore, the long-term expected rate of return on pension plan investments was applied to all periods of projected benefit payments to determine the total pension liability.
The following presents the university’s proportionate share of the OPERS and STRS Ohio net pension liability using a discount rate 1% higher and 1% lower than the plans’ current rate (in thousands):
Current1% Decrease Discount Rate 1% Increase
(6.2%) (7.2%) (8.2%)
OPERS $340,167 $174,810 $37,461
UNIVERSITY OF CINCINNATI JUNE 30, 2021 A COMPONENT UNIT OF THE STATE OF OHIO
49

Current1% Decrease Discount Rate 1% Increase
(6.45%) (7.45%) (8.45%)
STRS Ohio $528,800 $371,394 $238,005
Pension Plan Fiduciary Net Position
Detailed information about the pension plans’ fiduciary net position is available in the separately issued OPERS and STRS Ohio financial reports.
Defined Contribution Plans
OPERS also offers a defined contribution plan, the Member-Directed Plan (MD). The MD plan does not provide disability benefits, annual cost-of-living adjustments, postretirement health care benefits or death benefits to plan members and beneficiaries. Benefits are entirely dependent on the sum of contributions and investment returns earned by each participant’s choice of investment options.
STRS Ohio also offers a defined contribution plan in addition to its long established defined benefit plan. All employee contributions and employer contributions at a rate of 9.53% are placed in an investment account directed by the employee. Disability benefits are limited to the employee’s account balance. Employees electing the defined contribution plan receive no postretirement health care benefits.
On June 23, 1998, pursuant to Ohio House Bill 586, the university created an Ohio Alternative Retirement Plan (ARP), which is designed to aid the university in recruiting and retaining employees by offering a portable retirement option. The ARP is a defined contribution plan that provides full and immediate vesting of all contributions made on behalf of the participant. Contributions are directed to one of four investment management companies, which allow the participant to manage the investment of all retirement funds. New employees who qualify for the ARP have 120 days from the date of hire to elect the ARP option. Once this window has passed, the employee will not have the option to elect into the ARP. ARP does not provide disability benefits, annual cost-of-living adjustments, postretirement health care benefits or death benefits to plan members and beneficiaries. Benefits are entirely dependent on the sum of contributions and investment returns earned by each participant’s choice of investment options.
At June 30, 2021, there were 2,642 members in the plan. Under the provisions of ARP, the required rate for plan participants electing out of OPERS and STRS Ohio was 10% and 14%, respectively. The employer contribution rate for participants electing out of OPERS and STRS Ohio was 14% for 2021. During 2021, the employer contributions were $21,935,000. A portion of the employer contribution rate for those employees that elect to participate in the ARP is directed to the unfunded liability accounts for both OPERS and STRS Ohio. The rates for fiscal year 2021 were 2.44% to OPERS and 4.47% to STRS Ohio. The employer contributions to the OPERS and STRS Ohio unfunded liability accounts during 2021, were $2,395,000 and $5,038,000, respectively.
Payables to the Pension Plans
At June 30, 2021, the university reported a payable of $4,455,000 and $4,143,000 for OPERS and STRS Ohio, respectively, for the outstanding amount of contributions to the pension plans required for the year ended June 30, 2021.
UNIVERSITY OF CINCINNATI JUNE 30, 2021 A COMPONENT UNIT OF THE STATE OF OHIO
50

Other Postemployment Benefits
OPERS provides postemployment health care benefits to retirees of the Traditional and Combined pension plans. Prior to January 1, 2015, 10 or more years of service were required to qualify for health care coverage. Beginning January 1, 2015, generally, members must be at least age 60 with 20 years of qualifying service credit to qualify for health care coverage or 30 years of qualifying service at any age. Beginning 2016, retirees enrolled in Medicare A and B are eligible to participate in the OPERS Medicare Connector (Connector). The Connector, a vendor selected by OPERS, assists eligible retirees in the selection and purchase of Medicare supplemental coverage through the Medicare market. Retirees who purchase supplemental coverage through the Connector may receive a monthly allowance in their health reimbursement arrangement (HRA) account that can be used to reimburse health care expenses.
Members of the Member-Directed Plan do not qualify for ancillary benefits, including postemployment health care coverage. OPERS funds a Retiree Medical Account (RMA) that Member-Directed Plan participants can use for reimbursement of qualified medical expenses from their vested RMA balance. The Ohio Revised Code (ORC) permits, but does not require OPERS to provide Other Postemployment Benefits (OPEB) to its eligible benefit recipients. Authority to establish and amend health care coverage is provided in Chapter 145 of the ORC.
All health care assets are consolidated into the OPERS 115 Health Care Trust that funds multiple health care plans including medical coverage, prescription drug coverage and deposits to a HRA to qualifying benefit recipients of both the Traditional Pension and Combined Plans. Health care coverage for disability benefit recipients and qualified survivor benefit recipients is available.
Each year the OPERS Board of Trustees determines the portion of the employer contribution rate that will be set aside for funding of post employment health care benefits. Since January 1, 2018, OPERS has not allocated any portion of employer contributions to fund the health care program for members in the Traditional Pension Plan and Combined Plan, and is expected to remain at that level. Therefore, no university employer contributions to OPERS were allocated to fund OPEB for 2021. The OPERS Board is also authorized to establish rules for the retiree or their surviving beneficiaries to pay a portion of the health care provided. Payment amounts vary depending on the number of covered dependents and the coverage selected. A portion of employer contributions for Member-Directed Plan participants is allocated to an RMA.
On January 15, 2020, the OPERS Board of Trustees approved several changes to the health care plan offered to retirees in an effort to decrease costs and increase the solvency of the health care plan. These changes, are effective January 1, 2022 and include changes to base allowances and eligibility for Medicare retirees, as well as replacing OPERS-sponsored medical plans for non-Medicare retirees with monthly allowances, similar to the program for Medicare retirees.
STRS Ohio also provides access to health care coverage to eligible retirees who participate in the Defined Benefit and Combined Plans. Coverage under the current program includes hospitalization, physicians’ fees, prescription drugs, and partial reimbursement of monthly Medicare Part B premiums. Medicare Part B premium reimbursements was discontinued effective January 1, 2020. Pursuant to Chapter 3307 of the ORC, STRS Ohio has discretionary authority over how much, if any, of the associated health care costs will be absorbed by STRS Ohio. All benefit recipients pay a portion of the health care cost in the form of monthly premiums. Since July 1, 2014, STRS Ohio has not allocated any employer contributions of covered payroll to the Health Care Fund from which payments for health care benefits are paid.
OPEB Assets, Liabilities, OPEB Expense and Deferred Outflows of Resources and Deferred Inflows of Resources Related to OPEB
At June 30, 2021, the university reported an asset of $22,229,000 for OPERS for its proportionate share of the net OPEB asset. This was an increase of $195,858,000 compared to the liability reported as of June 30, 2020. The net OPEB asset was measured as of December 31, 2020 and the total OPEB asset used to calculate the net OPEB asset was determined by actuarial valuations as of that date. The university's proportion of the net OPEB asset was based on the university's actual contributions during the measurement period to the plan relative to the contributions to the plan of all participating employers for the same period. At June 30, 2021, for the measurement period, the university’s proportion was 1.25% for OPERS.
UNIVERSITY OF CINCINNATI JUNE 30, 2021 A COMPONENT UNIT OF THE STATE OF OHIO
51

At June 30, 2021, the university reported an asset of $26,976,000 for STRS Ohio for its proportionate share of the net OPEB asset. This was an increase of $1,265,000 compared to the asset reported as of June 30, 2020. The net OPEB asset was measured as of June 30, 2020 for STRS Ohio and the total OPEB asset used to calculate the net OPEB asset was determined by actuarial valuations as of that date. The university's proportion of the net OPEB asset was based on the university's actual contributions during the measurement period to the plan relative to the contributions to the plan of all participating employers for the same period. At June 30, 2021, for the measurement period, the university’s proportion was 1.53% for STRS Ohio.
For the year ended June 30, 2021, the university recognized OPEB reduction of expense of $132,931,000 for OPERS and reduction of expense of $1,074,000 for STRS Ohio, for a total reduction of expense of $134,005,000.
UNIVERSITY OF CINCINNATI JUNE 30, 2021 A COMPONENT UNIT OF THE STATE OF OHIO
52

At June 30, 2021, the university reported deferred outflows of resources and deferred inflows of resources related to OPEB from the following sources (in thousands):
Deferred Outflows of Resources
OPERS STRS Ohio Total
Differences between expected and actual experience $ — $ 1,686 $ 1,686
Changes in assumptions 11,010 450 11,460 Net difference between projected and actual earnings on OPEB plan investments — 975 975
Changes in proportion 1,180 313 1,493 $ 12,190 $ 3,424 $ 15,614
Deferred Inflows of Resources
OPERS STRS Ohio Total
Differences between expected and actual experience $ 20,109 $ 5,352 $ 25,461
Changes in assumptions 36,019 25,110 61,129 Net difference between projected and actual earnings on OPEB plan investments 12,015 — 12,015
Changes in proportion 785 24 809 $ 68,928 $ 30,486 $ 99,414
Amounts reported as deferred outflows of resources and deferred inflows of resources at June 30, 2021 related to OPEB will be recognized in OPEB expense as follows (in thousands):
Year ended June 30, OPERS STRS Ohio Total
2022 $ (29,055) $ (6,753) $ (35,808) 2023 (21,115) (6,130) (27,245) 2024 (5,173) (5,910) (11,083) 2025 (1,395) (5,778) (7,173) 2026 — (1,183) (1,183) Thereafter — (1,308) (1,308)
$ (56,738) $ (27,062) $ (83,800)
UNIVERSITY OF CINCINNATI JUNE 30, 2021 A COMPONENT UNIT OF THE STATE OF OHIO
53

Actuarial Assumptions
For OPERS, the total OPEB asset was determined by an actuarial valuation as of December 31, 2019 rolled forward to December 31, 2020 using the following actuarial assumptions, applied to all prior periods in the measurement.
OPERSActuarial Valuation Date December 31, 2019Rolled-Forward Measurement Date December 31, 2020Experience Study 5-Year Period Ended December 31, 2015Actuarial Cost Method Individual entry age normalSingle Discount Rate 6.00%Investment Rate of Return 6.00%Municipal Bond Rate 2.00%Wage Inflation 3.25%Projected Salary Increases 3.25% - 10.75% (includes wage inflation at 3.25%)Health Care Cost Trend Rate 8.50% initial, 3.50% ultimate in 2035
For STRS Ohio, the total OPEB asset was determined by an actuarial valuation as of June 30, 2020 using the following actuarial assumptions, applied to all prior periods in the measurement.
STRS OhioActuarial Valuation Date June 30, 2020Inflation 2.50%Salary increases 12.50% at age 20 to 2.50% at age 65Payroll increases 3.00%
Investment Rate of Return7.45%, net of investment expenses, including inflation
Health Care Cost Trend Rate -6.69 to 11.87% initial,4.00%ultimateCost-of-living adjustments 0% effective July 1, 2017
For OPERS, pre-retirement mortality rates are based on the RP-2014 Employees mortality table for males and females, adjusted for mortality improvement back to the observation period base year of 2006. The base year for males and females was then established to be 2015 and 2010, respectively. Post-retirement mortality rates are based on the RP-2014 Healthy Annuitant mortality table for males and females, adjusted for mortality improvement back to the observation period base year of 2006. The base year for males and females was then established to be 2015 and 2010, respectively. Post-retirement mortality rates for disabled retirees are based on the RP-2014 Disabled mortality table for males and females, adjusted for mortality improvement back to the observation period base year of 2006. The base year for males and females was then established to be 2015 and 2010, respectively. Mortality rates for a particular calendar year are determined by applying the MP-2015 mortality improvement scale to all of the above described tables.
For STRS Ohio, for healthy retirees the mortality rates are based on the RP-2014 Annuitant Mortality Table with 50% of rates through age 69, 70% of rates between ages 70 and 79, 90% of rates between ages 80 and 84, and 100% of rates thereafter, projected forward generationally using mortality improvement scale MP-2016. For disabled retirees, mortality rates are based on the RP-2014 Disabled Mortality Table with 90% of rates for males and 100% of rates for females, projected forward generationally using mortality improvement scale MP-2016.
The long-term expected rate of return on OPERS health care investment assets was determined using a building-block method in which best-estimate ranges of expected future real rates of return are developed for
UNIVERSITY OF CINCINNATI JUNE 30, 2021 A COMPONENT UNIT OF THE STATE OF OHIO
54

each major asset class. These ranges are combined to produce the long-term expected real rate of return by weighting the expected future real rates of return by the target asset allocation percentage, adjusted for inflation. The target allocation and best estimates of arithmetic real rates of return for each major asset class are summarized in the following table:
OPERS
Asset ClassTarget
Allocation
Long-Term Expected Real Rate of Return
Domestic equities 25% 5.64%International equities 25% 7.36%Fixed income 34% 1.07%REITs 7% 6.48%Other investments 9% 4.02%
100%
STRS Ohio utilizes investment consultants to determine the long-term expected rate of return by developing best estimates of expected real rates for each major asset class. The target allocation and best estimates of arithmetic real rates of return for each major asset class are summarized in the following table:
STRS Ohio
Asset ClassTarget
Allocation
Long-Term Expected Real Rate of Return
Domestic equities 28% 7.35%International equities 23% 7.55%Fixed income 21% 3.00%Real estate 10% 6.00%Alternatives 17% 7.09%Liquidity reserves 1% 2.25%
100%
Discount Rate
The discount rates used to measure the total OPEB asset were 6.00% for OPERS and 7.45% for STRS Ohio.
For OPERS, a single discount rate of 6.00% was used to measure the OPEB asset on the measurement date of December 31, 2020. Projected benefit payments are required to be discounted to their actuarial present value using a single discount rate that reflects (1) a long-term expected rate of return on OPEB plan investments (to the extent that the health care fiduciary net position is projected to be sufficient to pay benefits), and (2) tax-exempt municipal bond rate based on an index of 20-year general obligation bonds with an average AA credit rating as of the measurement date (to the extent that the contributions for use with the long-term expected rate are not met). This single discount rate was based on an expected rate of return on the health care investment portfolio of 6.00% and a municipal bond rate of 2.00%. The projection of cash flows used to determine this single discount rate assumed that employer contributions will be made at rates equal to the actuarially determined contribution rate. Based on these assumptions, the OPEB plan’s fiduciary net position and future contributions were sufficient to finance the health care costs through the year 2120. As a result, the long-term expected rate of return on health care investments was applied to
UNIVERSITY OF CINCINNATI JUNE 30, 2021 A COMPONENT UNIT OF THE STATE OF OHIO
55

projected costs through the year 2120, and the municipal bond rate was applied to all health care costs after that date.
For STRS Ohio, the projection of cash flows used to determine the discount rate assumes STRS Ohio continues to allocate no employer contributions to the health care fund. Based on these assumptions, the OPEB plan's fiduciary net position was projected to be available to make all projected future benefit payments to current plan members as of June 30, 2020. Therefore, the long-term expected rate of return on health care plan investments of 7.45% was applied to all periods of projected health care costs to determine the total OPEB asset as of June 30, 2020.
Sensitivity of the University's Proportionate Share of the Net OPEB Liability (Asset) to Changes in the Discount Rate and Health Care Cost Trend Rates
The following presents the university's proportionate share of the net OPEB liability (asset) calculated using a discount rate 1% higher and 1% lower than the current discount rate (in thousands):
Current1% Decrease Discount Rate 1% Increase
(5.00%) (6.00%) (7.00%)
OPERS ($5,527) ($22,229) ($35,960)
Current1% Decrease Discount Rate 1% Increase
(6.45%) (7.45%) (8.45%)
STRS Ohio ($23,471) ($26,976) ($29,950)
The university's proportionate share of the net OPEB liability (asset) has been calculated using health care trend rates of 8.5% for OPERS and a range of -6.7% to 11.9% for STRS Ohio. The following presents the university's proportionate share of the net OPEB liability (asset) calculated using health care cost trend rates 1% higher and 1% lower than the current health care cost trend rates.
Current HealthCare Cost
1% Decrease Trend Rate 1% Increase
OPERS ($22,771) ($22,229) ($21,623)
Current HealthCare Cost
1% Decrease Trend Rate 1% Increase
STRS Ohio ($29,765) ($26,976) ($23,578)
OPEB Plans' Fiduciary Net Position
Detailed information about the OPEB plans' fiduciary net position is available in the separately issued OPERS and STRS Ohio financial reports.
UNIVERSITY OF CINCINNATI JUNE 30, 2021 A COMPONENT UNIT OF THE STATE OF OHIO
56

12. Risk Management and Self-Insurance Funds
The university is exposed to various risks of loss related to torts; theft of, damage to and destruction of assets; business interruption; errors and omissions; employee injuries and illnesses; natural disasters and employee health and accident benefits. Settled claims have not exceeded commercial coverage in any of the three preceding years. The state of Ohio self-insures workers’ compensation benefits for all state employees, including university employees. Under the direction of the university and the Ohio Bureau of Workers’ Compensation, CareWorks and Sheakley UniService, Inc. assist in the administration and disposition of workers’ compensation claims.
The university provides for medical professional and general liability insurance through a combination of an actuarially funded self-insurance program sponsored by the university and has purchased commercial insurance coverage in excess of the self-insurance amount. The medical professional liability insurance program also includes qualified not-for-profit physician practice corporations, largely subsumed into University of Cincinnati Physicians, Inc. Medical professional self-insurance limits were $4 million per occurrence for 2021. An additional $30 million in commercial excess professional liability insurance was provided above the self-insured retention.
The university’s self-insurance program is based on calculations by independent actuaries and funds are deposited directly into two irrevocable self-insurance trust funds, one for medical and professional liability and one for general liability. In the opinion of management, trust assets totaling approximately $28,911,000 are adequate to cover estimated liabilities resulting from known claims and incidents and incurred-but-not-reported incidents as of June 30, 2021 for the university and University of Cincinnati Physicians, Inc. Trust assets related to the university total $5,273,000 and are included in current portion of other assets; liabilities of $722,000 are included in accrued liabilities in the Statement of Net Position as of June 30, 2021.
General liability coverage is also provided as part of a group insurance program of Ohio state universities known as the Inter-University Council Risk Management & Insurance Consortium (IUC-RMIC). This program provided for $10 million retention per occurrence with the first $100,000 funded by the university, $900,000 funded by pooled funds held through the IUC-RMIC and $9 million reinsured through a commercial reinsurance agreement. Excess commercial coverage for general liability was provided with total limits of $30 million shared with the other participating universities. In addition, educators’ legal liability coverage was provided through the IUC-RMIC program with $50 million in total limits also shared among the participating institutions. The IUC-RMIC self-insurance pools are funded by an agreed formula among the participating universities. This program qualifies as a public entity risk pool as defined by GASB standards and is classified as a risk-sharing pool. Under this arrangement, there is a transfer of risk from the university to the pool. Therefore, there is no recognition in the university’s financial statements of assets or liabilities related to the IUC-RMIC program.
Property and casualty insurance is also provided through the IUC-RMIC program, consisting of commercial property insurance with a $350,000 retention, and a self-insurance pool to fund retained losses subject to a $100,000 university deductible. Total insurance expense paid through the IUC-RMIC program was $2,219,000.
The university is also self-insured for a portion of medical, dental, and pharmacy benefits provided to employees. Changes to the self-insured health care claims liability as of June 30, 2021 and 2020 are as follows (in thousands):
2021 2020Liability at beginning of fiscal year $ 9,205 $ 10,526
Current year claims including changes in estimates 88,570 83,906 Claim payments (90,386) (85,227)
Liability at the end of fiscal year $ 7,389 $ 9,205
UNIVERSITY OF CINCINNATI JUNE 30, 2021 A COMPONENT UNIT OF THE STATE OF OHIO
57

13. Capital Project Commitments
At June 30, 2021, the university is committed to future capital expenditures as follows (in thousands):
Contractual commitments $ 188,889 Estimated completion costs of projects 129,770 Total $ 318,659
These projects are being funded through various resources, including the State of Ohio, as follows (in thousands):
State appropriations $ 41,515 Internal and other sources 277,144 Total $ 318,659
14. Other Commitments and Contingencies
The university is currently a defendant in various legal actions. Although the final outcome of such actions cannot currently be determined, the university's administration is of the opinion that the eventual liability, if any, will not have a material effect on the financial position or operations of the university.
The university receives grants and contracts from certain federal, state and local agencies to fund research and other activities. The costs, both direct and indirect, that have been charged to the grants or contracts are subject to examination and approval by the granting agency. It is the opinion of management that any disallowance or adjustment of such costs would not have a material effect on the financial statements.
The university’s utility plant is exposed to market price fluctuations on its purchase of natural gas. Purchase commitments have been issued with certain suppliers of natural gas whereby the university has locked in the price of natural gas for specified amounts to stabilize costs.
As a result of the COVID-19 pandemic, economic uncertainties remain, which may negatively affect the financial position, results of operations and cash flows of the university. The duration of these uncertainties and the ultimate financial effects cannot be reasonably estimated at this time.
UNIVERSITY OF CINCINNATI JUNE 30, 2021 A COMPONENT UNIT OF THE STATE OF OHIO
58

15. Restricted Net Position
Restricted net position is either nonexpendable or expendable. Nonexpendable restricted net position consists primarily of endowments whose corpus is held in perpetuity. Only the income and net appreciation is used for the purpose specified by the donor. The principal of expendable restricted net position may be used for the donor-specified purpose or is related to a net OPEB asset. Restricted nonexpendable and expendable net position is held for the following purposes (in thousands):
Restricted nonexpendable:Instruction $ 126,429 Research 42,041 Academic support 51,897 College/programs 103,258 Scholarships 92,600 Interest in UC Health 420,645 Other 16,875
853,745 Less: UHCURC Elimination 8,146
Total $ 845,599
Restricted expendable:Instruction $ 36,181 Research 97,604 Academic support 28,974 College/programs 165,520 Scholarships 48,169 Student loans 11,406
Capital projects 12,073 Net OPEB asset 49,205
Total $ 449,132
UNIVERSITY OF CINCINNATI JUNE 30, 2021 A COMPONENT UNIT OF THE STATE OF OHIO
59

16. University Heights Community Urban Redevelopment Corporation
University Heights Community Urban Redevelopment Corporation (UHCURC) is organized as a not-for-profit corporation under the laws of the state of Ohio. Its mission is to revitalize the University Heights neighborhood adjacent to the University of Cincinnati. UHCURC was organized by three founding members: The Heights Community Council, the Greek Affairs Council and the University of Cincinnati. The corporation owns a student housing complex that consists of 20 buildings with the capacity to house approximately 700 students.
The governance structure of UHCURC’s Board of Trustees gives the university a voting majority on the board. Due to this structure and the fact the university can impose its will on UHCURC, the organization is reported as a blended component unit of the university. Accordingly, all significant intercompany accounting transactions have been eliminated as required by generally accepted accounting principles.
UHCURC’s fiscal year end is August 31. As required, the reporting entity should incorporate financial statements for the blended component unit’s fiscal year ended during the reporting entity’s fiscal year. Therefore, UHCURC’s financial statements for the year ended August 31, 2020 have been blended with the university’s financial statements for the fiscal year ended June 30, 2021.
A condensed statement of net position for UHCURC as of August 31, 2020 and the related statement of revenues, expenses, and changes in net position and statement of cash flows for the year then ended are as follows (in thousands):
Statement of Net Position
8/31/2020Current assets $ 24 Capital assets not being depreciated 4,788 Capital assets being depreciated, net 34,731
Total assets 39,543
Deferred outflows of resources 493
Current liabilities 1,860 Accrued interest payable – University of Cincinnati 16,662 Notes payable – University of Cincinnati 16,998 Other long-term debt 39,156
Total liabilities 74,676
Net investment in capital assets (1,731) Unrestricted (32,909)
Total net position $ (34,640)
UNIVERSITY OF CINCINNATI JUNE 30, 2021 A COMPONENT UNIT OF THE STATE OF OHIO
60

Statement of Revenues, Expenses, and Changes in Net Position
8/31/2020Operating revenues $ 3,349 Operating expenses 70 Depreciation 1,390
Operating income 1,889 Other nonoperating expenses 3,049
Decrease in net position (1,160)
Net position, beginning of the year (33,480) Net position, end of the year $ (34,640)
Statement of Cash Flows
8/31/2020Net cash from operating activities $ 1,343 Net cash used for capital and financing activities (1,344) Net decrease in cash and cash equivalents (1)
Cash and cash equivalents, beginning of the year 25 Cash and cash equivalents, end of the year $ 24
17. University of Cincinnati Foundation
The University of Cincinnati Foundation is a legally separate, tax-exempt component unit of the university. The foundation complies with Financial Accounting Standards Board (FASB) pronouncements for reporting purposes. The principal function of the foundation is to solicit, receive, hold, invest and administer funds and to make distributions to or for the benefit of the university. Since these resources held by the foundation can be used only by or for the benefit of the university, the foundation is considered a component unit of the university and is discretely presented in the university’s financial statements.
Separate financial information regarding the foundation may be obtained by contacting the foundation at University of Cincinnati Foundation, University Hall, Suite 100, 51 Goodman Drive, Cincinnati, Ohio 45221-0064. Selected disclosures from the University of Cincinnati Foundation financial statements can be found beginning on the following page.
UNIVERSITY OF CINCINNATI JUNE 30, 2021 A COMPONENT UNIT OF THE STATE OF OHIO
61

THE UNIVERSITY OF CINCINNATI FOUNDATION NOTES TO FINANCIAL STATEMENTS
PLEDGES RECEIVABLE
Contributors to the Foundation have made unconditional pledges totaling approximately $110,193,000 as of June 30, 2021. For payments that extend beyond one year, these pledges receivable have been discounted at rates ranging from 0.5% to 6% to a net present value of approximately $102,982,000 as of June 30, 2021.
As of June 30, the unpaid pledges are due as follows:
2021Less than one year $ 29,949,523 One to five years 52,769,900 More than five years 27,473,745
110,193,168
Less discount to present value (7,210,945) Less allowance for uncollectible pledges (5,664,500)
$ 97,317,723
The Foundation records unconditional promises to give at fair value on the date the promise to give is received using the expected present value technique (EPV). EPV calculates present value by discounting risk-adjusted expected cash flows using a risk-free interest rate (yield to maturity on U.S. Treasuries representing the average pledge term). Amortization of the discount is recorded as additional contribution revenue.
Amounts due from irrevocable bequests, which are unconditional promises to give, as of June 30, 2021 of approximately $16,604,000 are included in the total amount of unconditional pledges due and fall within the due in more than five years category. The allowance for uncollectible pledges includes approximately $135,000 associated with the irrevocable bequests, as of June 30, 2021.
As of June 30, 2021, eighteen donors currently have outstanding conditional pledges to the Foundation. As of June 30, 2021, the conditions were not substantially met, therefore, the net present value of the pledges is not included in the carrying amount of pledges receivable. The net present value of the conditional pledges approximated $7,761,000 as of June 30, 2021.
ENDOWMENT FUNDS
Endowment assets are invested in a manner consistent with statutory fiduciary responsibilities and policies adopted by the Foundation’s Board of Trustees. The primary objective is to produce long-term real growth in assets, net of administrative and investment fees, by generating a total endowment rate of return which is greater than the spending rate plus the Consumer Price Index. Strategies to achieve the primary objective at a prudent level of risk include: (a) diversification of assets among various classes; (b) diversification of investment styles within asset class; and (c) ongoing review of investment manager performance with respect to rate of return, adherence to investment style and compliance with investment guidelines.
The Foundation’s endowment pool and separately invested endowment funds include donor restricted endowment funds, funds designated by the Board of Trustees for reinvestment in the endowment funds, and investment income on the endowment funds that have been appropriated for expenditure. As required by US GAAP, net assets associated with endowment funds, including funds designated by the Board of Trustees to function as endowments, are classified and reported based on the absence or existence of donor-imposed restrictions.
The Board of Trustees has interpreted the State of Ohio’s UPMIFA as requiring the preservation of the fair value of the original gift as of the gift date of the donor-restricted endowment fund absent explicit donor stipulations to the contrary. As a result of this interpretation, the Foundation classifies as net assets with donor restrictions (a) the original value of gifts donated to the endowment, (b) the original value of subsequent gifts to the endowment, and
UNIVERSITY OF CINCINNATI JUNE 30, 2021 A COMPONENT UNIT OF THE STATE OF OHIO
62
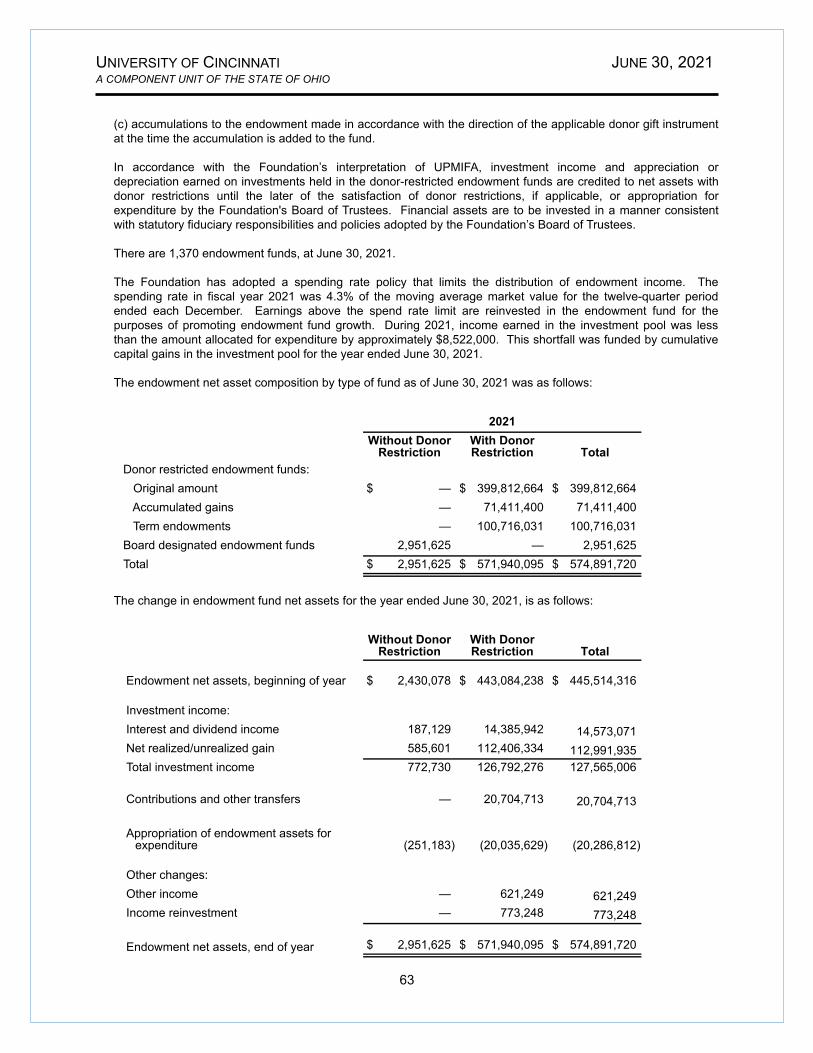
(c) accumulations to the endowment made in accordance with the direction of the applicable donor gift instrument at the time the accumulation is added to the fund.
In accordance with the Foundation’s interpretation of UPMIFA, investment income and appreciation or depreciation earned on investments held in the donor-restricted endowment funds are credited to net assets with donor restrictions until the later of the satisfaction of donor restrictions, if applicable, or appropriation for expenditure by the Foundation's Board of Trustees. Financial assets are to be invested in a manner consistent with statutory fiduciary responsibilities and policies adopted by the Foundation’s Board of Trustees.
There are 1,370 endowment funds, at June 30, 2021.
The Foundation has adopted a spending rate policy that limits the distribution of endowment income. The spending rate in fiscal year 2021 was 4.3% of the moving average market value for the twelve-quarter period ended each December. Earnings above the spend rate limit are reinvested in the endowment fund for the purposes of promoting endowment fund growth. During 2021, income earned in the investment pool was less than the amount allocated for expenditure by approximately $8,522,000. This shortfall was funded by cumulative capital gains in the investment pool for the year ended June 30, 2021.
The endowment net asset composition by type of fund as of June 30, 2021 was as follows:
2021Without Donor
RestrictionWith Donor Restriction Total
Donor restricted endowment funds: Original amount $ — $ 399,812,664 $ 399,812,664 Accumulated gains — 71,411,400 71,411,400 Term endowments — 100,716,031 100,716,031 Board designated endowment funds 2,951,625 — 2,951,625 Total $ 2,951,625 $ 571,940,095 $ 574,891,720
The change in endowment fund net assets for the year ended June 30, 2021, is as follows:
Without Donor Restriction
With Donor Restriction Total
Endowment net assets, beginning of year $ 2,430,078 $ 443,084,238 $ 445,514,316
Investment income:Interest and dividend income 187,129 14,385,942 14,573,071 Net realized/unrealized gain 585,601 112,406,334 112,991,935 Total investment income 772,730 126,792,276 127,565,006
Contributions and other transfers — 20,704,713 20,704,713
Appropriation of endowment assets for expenditure (251,183) (20,035,629) (20,286,812)
Other changes:Other income — 621,249 621,249 Income reinvestment — 773,248 773,248
Endowment net assets, end of year $ 2,951,625 $ 571,940,095 $ 574,891,720
UNIVERSITY OF CINCINNATI JUNE 30, 2021 A COMPONENT UNIT OF THE STATE OF OHIO
63

INVESTMENTS
The Foundation combines its pooled investment securities with the investment pool of the university in order to maximize investment diversification and realize economies of scale with respect to costs of managing the investments. The Foundation continues to serve as trustee for these assets. The Foundation maintains individual records of each fund included in the transfer of assets to the investment pool of the university. Each fund subscribes to, or disposes of, units in the pool at the unit market value at the end of each month. Income is allocated to each fund in the pool based on units of participation. The investment pool consists of Fund A and Fund C. In July 2016, Fund C was created by segregating each share of Fund A into one share of Fund A, which owns the diversified portfolio of investment funds in separate accounts, and one share of Fund C, which owns neighborhood development corporations loans (NDCL) and strategic real estate. As NDCLs and strategic real estate produce distributions to Fund C unitholders, the proceeds will be used to periodically purchase newly-created Fund A units for the Fund C unitholders. No additional assets will be purchased within Fund C. It is expected that Fund C will cease to exist by June 30, 2040, as the last distributions are made from NDCLs. As of June 30, 2021, the university is holding approximately $2,632,000 that is to be invested in the university pooled investments. These amounts are recorded as other investments in the Statements of Financial Position.
The Foundation also manages other investments, which amounted to approximately $76,832,000 as of June 30, 2021. These funds represent separately invested endowments, temporary cash investments, and split-interest trusts where the Foundation is the remainderman.
The following presents investments held by the Foundation as of June 30, 2021:
2021Fair Value
2021Cost
Cash equivalents $ 5,426,712 $ 5,423,479
U.S. Government and agency obligations 6,010,406 5,819,546 Corporate bonds 9,727,032 9,584,460 Mutual funds 26,985,097 19,099,658
Equities 20,514,232 13,633,851 Real estate and other 10,800,000 10,800,000 University pooled investments 529,254,236 473,973,897 Total $ 608,717,715 $ 538,334,891
The number of units in Fund A owned by the Foundation totaled 5,749,052, which represents 40.1% share of the university investment pool as of June 30, 2021. Fund A holds primarily common stock, mutual funds, and corporate and government fixed income obligations, which are stated at fair value as determined by market prices. In addition, the Foundation owned 3,968,064 shares or 36.1% of Fund C as of June 30, 2021. Fund C invests in loans to certain not-for-profit entities for the purpose of developing residential and commercial facilities near the university’s main campus. These loans are secured by mortgages, some of which are subordinated to external financing arrangements, on parcels of land purchased by these not-for-profit entities for development. Certain investments in the university pooled investments are stated at fair value, as provided by the investment managers. Audited financial statements of the underlying investments in the university pooled investments as of June 30, 2021, are used as a basis for fair value when available. When not available, the fair value is based upon financial information as of an interim date, adjusted for cash receipts, cash disbursements and other distributions made through June 30, 2021. The Foundation believes that the carrying value of these investments is a reasonable estimate of fair value at June 30, 2021. Certain underlying investments in the university pooled investments are not readily marketable; therefore, the estimated values of these investments are subject to certain risks. As a result, the fair value of the university pooled investments could differ from the value that may have been determined had a market for certain investments in the university investment pool existed.
UNIVERSITY OF CINCINNATI JUNE 30, 2021 A COMPONENT UNIT OF THE STATE OF OHIO
64

The underlying investments that comprise university pooled investments as of June 30 are as follows:
2021Fund A
U.S. and international equity securities 38 %Hedge funds and private equity capital 44 %Fixed income securities 12 %
Fund CReal estate and community development 6 %
Total 100 %
BENEFICIAL INTEREST IN TRUSTS – OTHER TRUSTEES
The Foundation has been notified of twelve trusts held by other trustees where the remainder interest will irrevocably benefit the university. In addition, the Foundation has been notified of one charitable lead unitrust held by other trustees where annual payments are received by the Foundation. The Foundation values these assets by projecting the value of the trust assets to future periods and then discounting the anticipated cash flows at a rate reflective of the credit risk involved. Beneficial interest in trusts held by other trustees amounted to approximately $16,910,000 as of June 30, 2021. Per GASB 81, Irrevocable Split-Interest Agreements, the university includes $11,707,000 of these trust values on its Statement of Net Position.
UNIVERSITY OF CINCINNATI JUNE 30, 2021 A COMPONENT UNIT OF THE STATE OF OHIO
65

Required Supplementary Information
Schedules of the University’s Proportionate Share of the Net Pension LiabilityOhio Public Employees Retirement System (OPERS)
State Teachers Retirement System of Ohio (STRS Ohio)Last 10 Years*
(Dollar amounts in millions)
OPERS 2021 2020 2019 2018 2017 2016 2015
University’s proportion of the net pension liability 1.22 % 1.23 % 1.19 % 1.18 % 1.17 % 1.13 % 1.13 %
University’s proportionate share of the net pension liability $ 174.8 $ 238.3 $ 324.6 $ 183.0 $ 265.4 $ 195.2 $ 135.9
University’s covered-employee payroll $ 188.8 $ 189.4 $ 178.5 $ 172.3 $ 163.6 $ 153.8 $ 150.5 University’s proportionate share of the net pension liability as a percentage of its covered-employee payroll 92.61 % 125.80 % 181.85 % 106.22 % 162.22 % 126.88 % 90.32 %
Plan fiduciary net position as a percentage of the total pension liability 87.19 % 82.44 % 74.90 % 84.85 % 77.38 % 81.19 % 86.53 %
STRS Ohio 2021 2020 2019 2018 2017 2016 2015
University’s proportion of the net pension liability 1.53 % 1.55 % 1.50 % 1.50 % 1.51 % 1.48 % 1.46 %
University’s proportionate share of the net pension liability $ 371.4 $ 343.3 $ 329.7 $ 355.6 $ 503.8 $ 408.0 $ 354.4
University’s covered-employee payroll $ 151.0 $ 149.3 $ 139.8 $ 136.7 $ 132.8 $ 131.1 $ 128.9 University’s proportionate share of the net pension liability as a percentage of its covered-employee payroll 246.04 % 230.01 % 235.84 % 260.23 % 379.23 % 311.11 % 275.03 %
Plan fiduciary net position as a percentage of the total pension liability 75.48 % 77.40 % 77.31 % 75.29 % 66.78 % 72.09 % 74.71 %
*The amounts presented for each fiscal year were determined as of December 31 for OPERS and June 30 of the previous fiscal year for STRS Ohio. These are 10-year schedules – however, the information is not required to be presented retroactively. Years will be added to these schedules in future fiscal years until 10 years of information is available.
UNIVERSITY OF CINCINNATI JUNE 30, 2021 A COMPONENT UNIT OF THE STATE OF OHIO
66

Schedules of the University’s Contributions - PensionOhio Public Employees Retirement System (OPERS)
State Teachers Retirement System of Ohio (STRS Ohio)Last 10 Years*
(Dollar amounts in millions)
OPERS 2021 2020 2019 2018 2017 2016 2015
Contractually required contribution $ 27.1 $ 27.0 $ 25.9 $ 24.6 $ 23.9 $ 22.3 $ 21.7 Contributions in relation to the contractually required contribution (27.1) (27.0) (25.9) (24.6) (23.9) (22.3) (21.7)
Contribution deficiency (excess) $ — $ — $ — $ — $ — $ — $ —
University’s covered-employee payroll $ 192.3 $ 191.7 $ 183.8 $ 174.3 $ 169.2 $ 157.8 $ 154.0 Contributions as a percentage of covered-employee payroll 14.11 % 14.11 % 14.12 % 14.11 % 14.11 % 14.11 % 14.12 %
STRS Ohio 2021 2020 2019 2018 2017 2016 2015
Contractually required contribution $ 21.2 $ 21.1 $ 20.9 $ 19.6 $ 19.1 $ 18.6 $ 18.4 Contributions in relation to the contractually required contribution (21.2) (21.1) (20.9) (19.6) (19.1) (18.6) (18.4)
Contribution deficiency (excess) $ — $ — $ — $ — $ — $ — $ —
University’s covered-employee payroll $ 151.4 $ 151.0 $ 149.3 $ 139.8 $ 136.7 $ 132.8 $ 131.1 Contributions as a percentage of covered-employee payroll 14.00 % 14.00 % 14.00 % 14.00 % 14.00 % 14.00 % 14.00 %
*The amounts presented for each fiscal year were determined as of June 30. These are 10-year schedules – however, the information is not required to be presented retroactively. Years will be added to these schedules in future fiscal years until 10 years of information is available.
UNIVERSITY OF CINCINNATI JUNE 30, 2021 A COMPONENT UNIT OF THE STATE OF OHIO
67

Schedules of the University’s Proportionate Share of the Net OPEB Liability (Asset)Ohio Public Employees Retirement System (OPERS)
State Teachers Retirement System of Ohio (STRS Ohio)Last 10 Years*
(Dollar amounts in millions)
OPERS 2021 2020 2019 2018
University’s proportion of the net OPEB liability (asset) 1.25 % 1.26 % 1.22 % 1.21 %
University’s proportionate share of the net OPEB liability (asset) $ (22.2) $ 173.6 $ 159.0 $ 131.2
University’s covered-employee payroll $ 188.8 $ 189.4 $ 178.5 $ 172.3
University’s proportionate share of the net OPEB liability (asset) as a percentage of its covered-employee payroll -11.76 % 91.65 % 89.08 % 76.15 %
Plan fiduciary net position as a percentage of the total OPEB liability (asset) 115.57 % 47.80 % 46.33 % 54.14 %
STRS Ohio 2021 2020 2019 2018
University’s proportion of the net OPEB liability (asset) 1.53 % 1.55 % 1.50 % 1.50 %
University’s proportionate share of the net OPEB liability (asset) $ (27.0) $ (25.7) $ (24.1) $ 58.4
University’s covered-employee payroll $ 151.0 $ 149.3 $ 139.8 $ 136.7
University’s proportionate share of the net OPEB liability (asset) as a percentage of its covered-employee payroll -17.82 % -17.22 % -17.24 % 42.73 %
Plan fiduciary net position as a percentage of the total OPEB liability (asset) 182.13 % 174.74 % 176.00 % 47.11 %
*The amounts presented for each fiscal year were determined as of December 31 for OPERS and June 30, for STRS Ohio of the previous fiscal year. These are 10-year schedules – however, the information is not required to be presented retroactively. Years will be added to these schedules in future fiscal years until 10 years of information is available.
UNIVERSITY OF CINCINNATI JUNE 30, 2021 A COMPONENT UNIT OF THE STATE OF OHIO
68

Schedules of the University’s Contributions - OPEBOhio Public Employees Retirement System (OPERS)
State Teachers Retirement System of Ohio (STRS Ohio)Last 10 Years*
(Dollar amounts in millions)
OPERS 2021 2020 2019 2018
Contractually required contribution $ — $ — $ — $ 0.9 Contributions in relation to the contractually required contribution — — — (0.9)
Contribution deficiency (excess) $ — $ — $ — $ —
University’s covered-employee payroll $ 192.3 $ 191.7 $ 183.8 $ 174.3 Contributions as a percentage of covered-employee payroll 0.00 % 0.00 % 0.00 % 0.50 %
STRS Ohio 2021 2020 2019 2018
Contractually required contribution $ — $ — $ — $ — Contributions in relation to the contractually required contribution — — — —
Contribution deficiency (excess) $ — $ — $ — $ —
University’s covered-employee payroll $ 151.4 $ 151.0 $ 149.3 $ 139.8 Contributions as a percentage of covered-employee payroll 0.00 % 0.00 % 0.00 % 0.00 %
*The amounts presented for each fiscal year were determined as of June 30. These are 10-year schedules – however, the information is not required to be presented retroactively. Years will be added to these schedules in future fiscal years until 10 years of information is available.
UNIVERSITY OF CINCINNATI JUNE 30, 2021 A COMPONENT UNIT OF THE STATE OF OHIO
69

Notes to Required Supplementary Information
Defined Benefit Pension Plans
Changes of Benefit Terms
Amounts reported in 2015 for OPERS reflect the following plan changes:
• The minimum age and number of years of service required to receive an unreduced benefit were each increased by two years for members in the state and local divisions. The number of years of service required for law enforcement members did not change, however, the minimum retirement age was increased by two years.
• Final average salary (FAS) increased to the highest five years (up from three years).• The benefit multiplier used for the first 30 years (2.2% of FAS) was increased to the first 35
years of service.• Age and service reduction factors changed to represent actuarially determined rates for each
year a member retires before attaining full retirement.• The Cost of Living Adjustment (COLA) was changed for new retirees from a simple 3% applied
to the benefit value at date of retirement, to a rate based on the change in the Consumer Price Index, not to exceed 3%.
Amounts reported in 2015 for STRS Ohio reflect the following plan changes:
• No COLAs were granted for the fiscal year ended June 30, 2014 and reduced to 2% for future periods. COLA deferred until the fifth anniversary of retirement for members retiring after July 1, 2013.
• New members require five years of qualifying service credit to be eligible for survivor benefits and 10 years of service to be eligible for disability benefits.
Amounts reported in 2018 for STRS Ohio reflect COLA reduced to 0% effective July 1, 2017.
Changes of Assumptions
Amounts reported in 2017 for OPERS reflect the following change of assumptions based on a experience study for the five year period ending December 31, 2015:
• Expected rate of investment return decreased from 8.0% to 7.5%.• Wage inflation assumption decreased from 3.75% to 3.25%.• Projected salary increases range changed as 0.00% to 7.50% per year; a slight change from
the 0.50% to 6.30% pre-experience study assumption. • Increase in the mortality assumptions to reflect longer life expectancies.
Amounts reported in 2018 for STRS Ohio reflect the following change of assumptions based on a experience study for the five year period ending June 30, 2016:
• Expected rate of investment return decreased from 7.75% to 7.45%.• Inflation assumption decreased from 2.75% to 2.50%.• Payroll growth assumption decreased to 3.0%.• Total salary increases rate lowered by decreasing the merit component of the individual salary
increases.• Increase in mortality assumptions to reflect longer life expectancies.• Rates of retirement, termination and disability modified to better reflect anticipated future
experience.
Amounts reported in 2019 for OPERS reflect a decrease in the expected rate of investment return from 7.5% to 7.2% based on a experience study for the five year period ending December 31, 2015.
UNIVERSITY OF CINCINNATI JUNE 30, 2021 A COMPONENT UNIT OF THE STATE OF OHIO
70

Notes to Required Supplementary Information
Other Postemployment Benefits
Changes of Benefit Terms
Amounts reported in 2021 for OPERS reflect the following plan changes, effective January 1, 2022:
• Group plans offered to non-Medicare retirees and re-employed retirees discontinued and replaced with an allowance that can be used for reimbursement of individual marketplace plan premiums and other qualified medical expenses.
• Changes to eligibility requirements to receive an allowance for those retirees in Traditional Pension Plan or Combined Plan:
◦ Medicare Retirees - Medicare eligible with a minimum of 20 years of qualifying service credit.
◦ Non-Medicare Retirees - 30 years of qualifying service at at any age for Group A; 32 years of qualifying service credit at any age or 31 years of qualifying service credit and minimum age 52 for Group B; 32 years of qualifying service credit and minimum age 55 for Group C; or, a retiree from Groups A, B or C who qualifies for an unreduced pension, but a portion of their service credit is not health care qualifying service, can still qualify for health care at age 60 if he/she has at least 20 years of qualifying health care service credit.
• Methodology for calculating monthly allowances changed.• Discontinuance of allowances provided for dependent children.
Changes of Assumptions
Amounts reported in 2018 for OPERS reflect the following change of assumptions based on a experience study for the five year period ending December 31, 2015:
• Wage inflation assumption decreased from 3.75% to 3.25%.• Health care cost trend rate decreased from 9.50%, before leveling off to 3.75% in 2026 to
7.50%, before leveling off to 3.25%.• Increase in the mortality assumptions to reflect longer life expectancies.
Amounts reported in 2018 for STRS Ohio reflect the following change of assumptions based on a experience study for the five year period ending June 30, 2016:
• Discount rate increased from 3.26% to 4.13%.• Expected rate of investment return decreased from 7.75% to 7.45%.• Valuation year per capita health care costs updated and salary scale modified.• Percentage of future retirees electing each option updated based on current data and the
percentage of future disabled retirees and terminated vested participants electing health coverage decreased.
• Assumptions related to mortality, disability, retirement withdrawal and future health care cost trend rates modified along with the portion of rebated prescription drug costs.
Amounts reported in 2019 for OPERS reflect the following change of assumptions based on a experience study for the five year period ending December 31, 2015:
• Expected rate of investment return decreased from 6.5% to 6.0%.• Discount rate increased from 3.85% to 3.96%
Amounts reported in 2019 for STRS Ohio reflect the following change of assumptions based on a experience study for the five year period ending June 30, 2016:
• Discount rate increased from the blended rate of 4.13% to the long-term expected rate of return of 7.45%.
• Valuation year per capita health care costs updated.
UNIVERSITY OF CINCINNATI JUNE 30, 2021 A COMPONENT UNIT OF THE STATE OF OHIO
71

Amounts reported in 2020 for OPERS reflect the following change of assumptions based on a experience study for the five year period ending December 31, 2015:
• Discount rate decreased from 3.96% to 3.16%.• Health care cost trend rate changed from 10.0% initial rate and 3.25% ultimate rate in 2029 to
10.5% initial rate and 3.5% ultimate rate in 2030.
Amounts reported in 2020 for STRS Ohio reflect the following change of assumptions based on a experience study for five year period ending June 30, 2016:
• Health care cost trend rates for 2019 valuation ranging from 4.9% to 9.6% initially and a 4.0% ultimate rate compared to prior year health care cost trend rates for 2018 valuation ranging from -5.2% to 9.6% initially and 4% ultimate rate.
Amounts reported in 2021 for OPERS reflect the following change of assumptions based on a experience study for the five year period ending December 31, 2015:
• Discount rate increased from 3.16% to 6.00%.• Health care cost trend rate changed from 10.5% initial rate and 3.5% ultimate rate in 2030 to
8.5% initial rate and 3.5% ultimate rate in 2035
Amounts reported in 2021 for STRS Ohio reflect the following change of assumptions based on a experience study for five year period ending June 30, 2016:
• Health care cost trend rates for 2020 valuation ranging from -6.7% to 11.9% initially and a 4.0% ultimate rate compared to prior year health care cost trend rates for 2019 valuation ranging from 4.9% to 9.6% initially and 4% ultimate rate.
UNIVERSITY OF CINCINNATI JUNE 30, 2021 A COMPONENT UNIT OF THE STATE OF OHIO
72

Report on Internal Control Over Financial Reporting and on Compliance and Other Matters Based on an Audit of Financial Statements
Performed in Accordance With Government Auditing Standards
Independent Auditor’s Report Board of Trustees University of Cincinnati Cincinnati, Ohio We have audited, in accordance with auditing standards generally accepted in the United States of America and the standards applicable to financial audits contained in Government Auditing Standards, issued by the Comptroller General of the United States, the basic financial statements of the University of Cincinnati (University) and its discretely presented component unit, collectively a component unit of the State of Ohio, which comprise the statement of net position as of June 30, 2021, and the related statements of revenues, expenses and changes in net position and cash flows, where applicable, for the year then ended, and the related notes to the basic financial statements, and have issued our report thereon dated October 15, 2021, which contained a reference to the report of other auditors. Other auditors audited the financial statements of the University of Cincinnati Foundation, as described in our report on the University’s financial statements. This report does not include the results of the other auditors’ testing of internal control over financial reporting or compliance and other matters that are reported on separately by those auditors.
Internal Control Over Financial Reporting
In planning and performing our audit of the financial statements, we considered the University’s internal control over financial reporting (internal control) as a basis for designing audit procedures that are appropriate in the circumstances for the purpose of expressing our opinions on the financial statements, but not for the purpose of expressing an opinion on the effectiveness of the University’s internal control. Accordingly, we do not express an opinion on the effectiveness of the University’s internal control.
A deficiency in internal control exists when the design or operation of a control does not allow management or employees, in the normal course of performing their assigned functions, to prevent, or detect and correct, misstatements on a timely basis. A material weakness is a deficiency, or a combination of deficiencies, in internal control, such that there is a reasonable possibility that a material misstatement of the entity’s financial statements will not be prevented, or detected and corrected, on a timely basis. A significant deficiency is a deficiency, or a combination of deficiencies, in internal control that is less severe than a material weakness, yet important enough to merit attention by those charged with governance.
Our consideration of internal control was for the limited purpose described in the first paragraph of this section and was not designed to identify all deficiencies in internal control that might be material weaknesses or significant deficiencies. Given these limitations, during our audit, we did not identify any deficiencies in internal control that we consider to be material weaknesses. However, material weaknesses may exist that have not been identified.
73

Compliance and Other Matters
As part of obtaining reasonable assurance about whether the University’s financial statements are free from material misstatement, we performed tests of its compliance with certain provisions of laws, regulations, contracts and grant agreements, noncompliance with which could have a direct and material effect on the financial statements. However, providing an opinion on compliance with those provisions was not an objective of our audit, and accordingly, we do not express such an opinion. The results of our tests disclosed no instances of noncompliance or other matters that are required to be reported under Government Auditing Standards.
Purpose of this Report
The purpose of this report is solely to describe the scope of our testing of internal control and compliance and the results of that testing, and not to provide an opinion on the effectiveness of the entity’s internal control or on compliance. This report is an integral part of an audit performed in accordance with Government Auditing Standards in considering the entity’s internal control and compliance. Accordingly, this communication is not suitable for any other purpose.
Cincinnati, Ohio October 15, 2021
74
Copyright © 2022 FDOKUMEN