HAYS CONSTRUCTION & NZIOB SALARY GUIDE FY21/22
23
HIRING TRENDS & INSIGHTS SKILLS IN HIGH DEMAND HAYS CONSTRUCTION & NZIOB SALARY GUIDE FY21/22 NEW ZEALAND TYPICAL SALARIES & BENEFITS
-
Upload
khangminh22 -
Category
Documents
-
view
3 -
download
0
Transcript of HAYS CONSTRUCTION & NZIOB SALARY GUIDE FY21/22

HIRING TRENDS & INSIGHTS
SKILLS IN HIGH DEMAND
HAYS CONSTRUCTION & NZIOB SALARY GUIDE FY21/22 NEW ZEALAND
TYPICAL SALARIES & BENEFITS
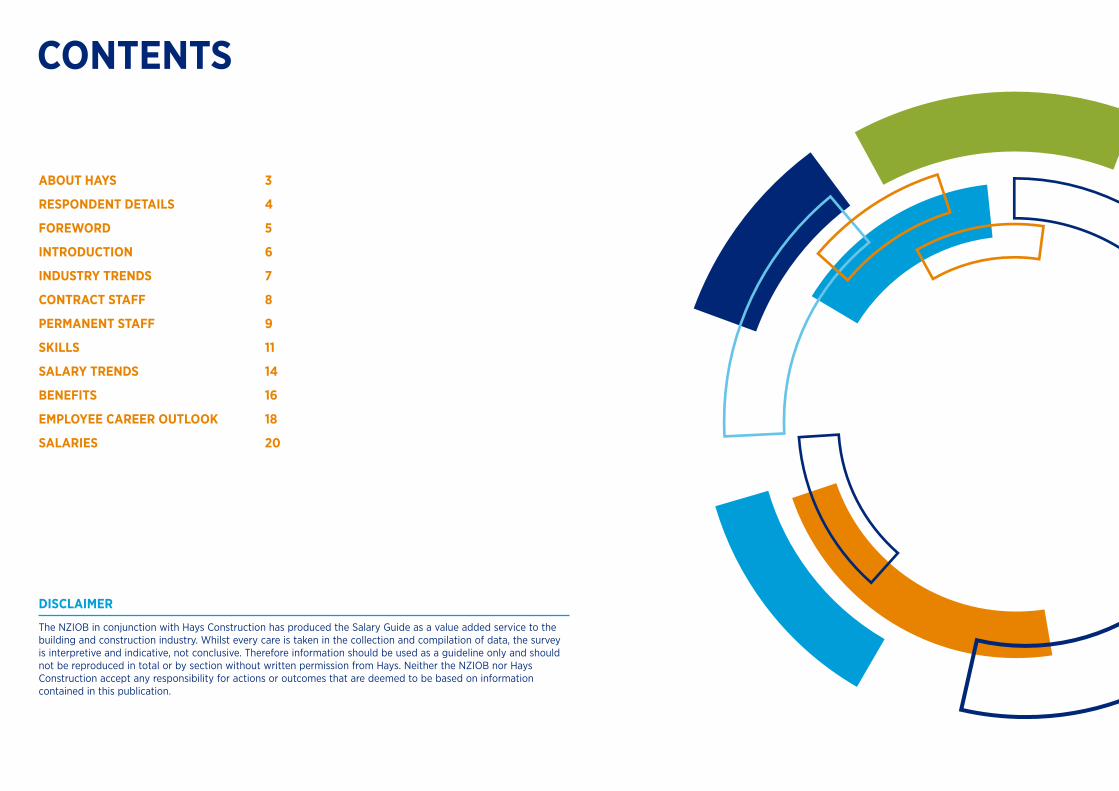
ABOUT HAYS 3
RESPONDENT DETAILS 4
FOREWORD 5
INTRODUCTION 6
INDUSTRY TRENDS 7
CONTRACT STAFF 8
PERMANENT STAFF 9
SKILLS 11
SALARY TRENDS 14
BENEFITS 16
EMPLOYEE CAREER OUTLOOK 18
SALARIES 20
The NZIOB in conjunction with Hays Construction has produced the Salary Guide as a value added service to the building and construction industry. Whilst every care is taken in the collection and compilation of data, the survey is interpretive and indicative, not conclusive. Therefore information should be used as a guideline only and should not be reproduced in total or by section without written permission from Hays. Neither the NZIOB nor Hays Construction accept any responsibility for actions or outcomes that are deemed to be based on information contained in this publication.
DISCLAIMER
CONTENTS
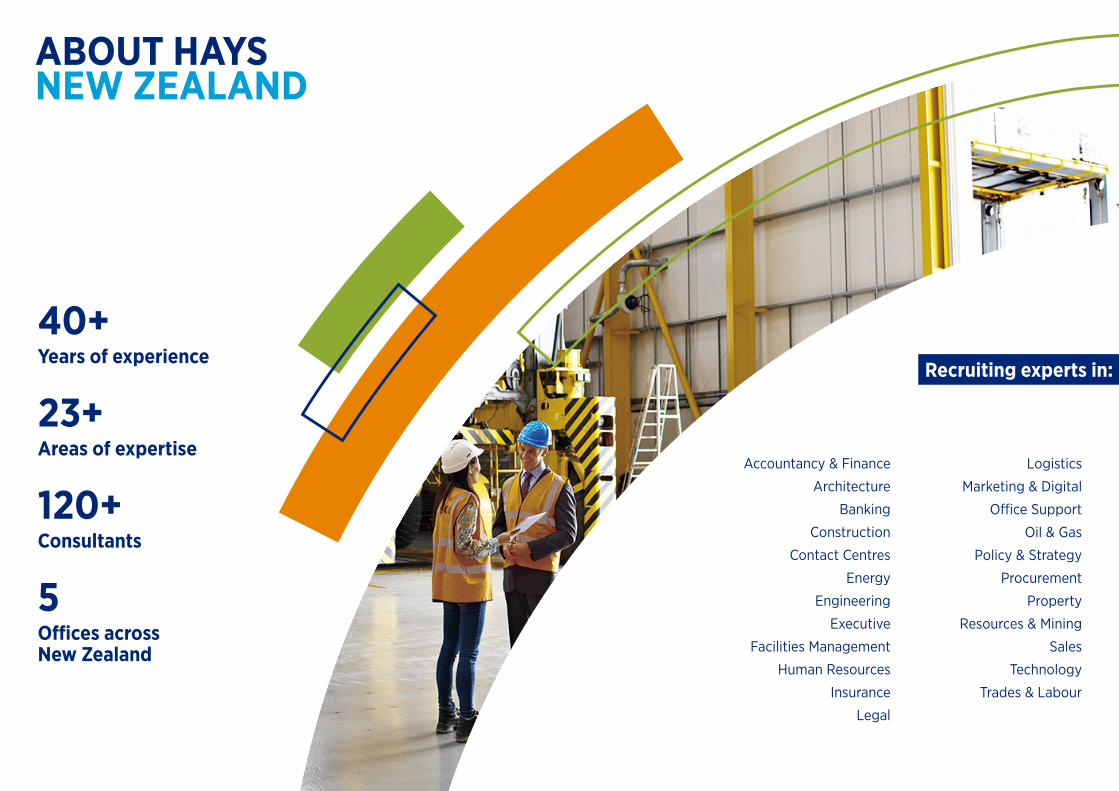
40+Years of experience
23+Areas of expertise
120+Consultants
5Offices across New Zealand
ABOUT HAYS NEW ZEALAND
Accountancy & Finance
Architecture
Banking
Construction
Contact Centres
Energy
Engineering
Executive
Facilities Management
Human Resources
Insurance
Legal
Logistics
Marketing & Digital
Office Support
Oil & Gas
Policy & Strategy
Procurement
Property
Resources & Mining
Sales
Technology
Trades & Labour
Recruiting experts in:
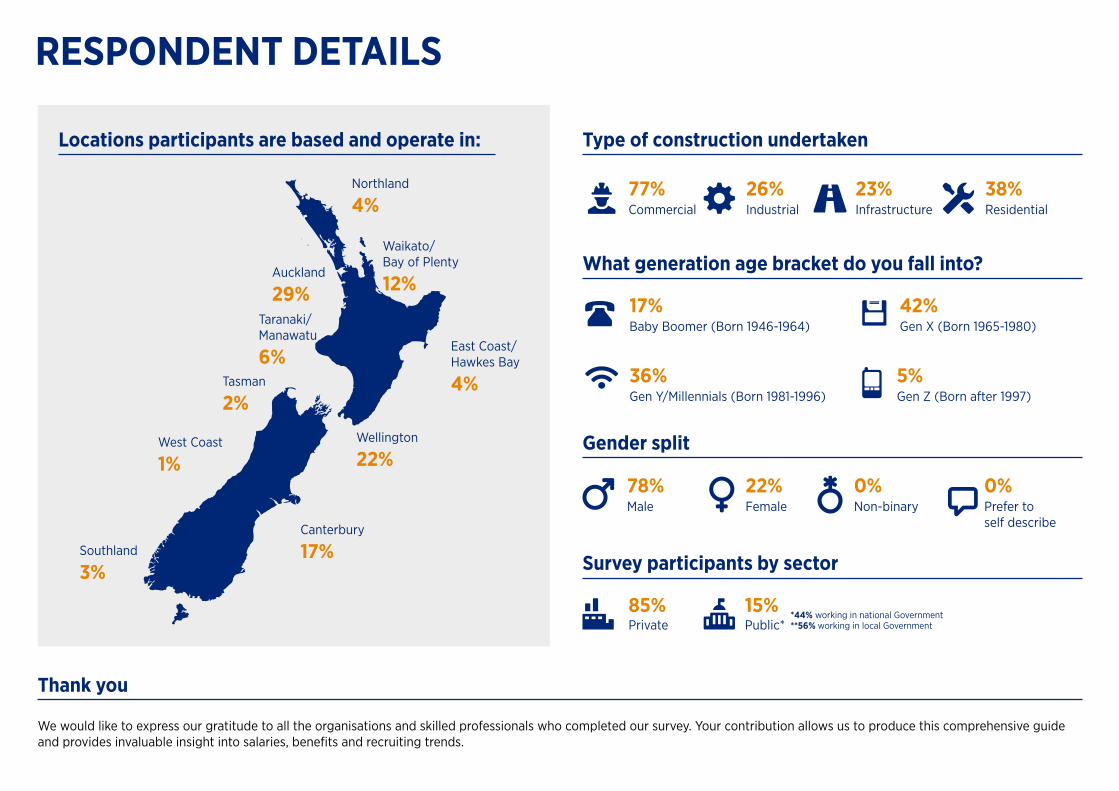
RESPONDENT DETAILS
Locations participants are based and operate in:
Auckland
29%
Northland
4%
Taranaki/ Manawatu
6%
Wellington
22%
East Coast/ Hawkes Bay
4%Tasman
2%
Canterbury
17%Southland
3%
West Coast
1%
What generation age bracket do you fall into?
36%Gen Y/Millennials (Born 1981-1996)
17%Baby Boomer (Born 1946-1964)
78%Male
22%Female
0%Non-binary
0%Prefer to self describe
Gender split
77%Commercial
26%Industrial
23%Infrastructure
38%Residential
Survey participants by sector
Type of construction undertaken
85%Private Public*
15%*44% working in national Government **56% working in local Government
We would like to express our gratitude to all the organisations and skilled professionals who completed our survey. Your contribution allows us to produce this comprehensive guide and provides invaluable insight into salaries, benefits and recruiting trends.
Thank you
42%Gen X (Born 1965-1980)
5%Gen Z (Born after 1997)
Waikato/ Bay of Plenty
12%

FOREWORD FROM HAYS
Adam Shapley
Managing Director, Hays New Zealand
If there’s one word that sums up today’s construction recruitment market, it must be resilient. I am writing this foreword from home, with our nation back in a lockdown that has seen much of the construction sector take a pause. But rather than focus on the negatives, many employers are using this time to reflect on what they can do better in the year ahead.
Further proving the irrepressible nature of the construction industry is the pleasing levels of business activity our survey respondents have experienced. Despite the challenges of a global pandemic and its impact on supply chain and human movement, 75% of employers have seen business activity increase. Looking ahead, most expect the economy to either remain steady or strengthen over the coming six to 12 months, too.
Permanent headcounts tipped to riseAnother sign of this industry’s enduring strength is the 71% of employers who plan to increase their permanent headcount this year. However, this has also seen an old challenge rear its head: skills shortages.
A critical skills shortageIndeed, throughout the pandemic we have seen the exacerbation of skills shortages to a critical point, thanks to the lack of inward talent migration combined with fewer people gaining the necessary qualifications or experience. With unemployment near record lows, a large percentage of employers are finding it ‘hard’ or ‘very difficult’ to recruit the core delivery professionals they require, both site based and commercial.
The situation is no less acute for sub-contractors looking for tradespeople. In fact, almost all organisations surveyed (93%) say they’ll feel the effects of skills shortages this financial year. Only half (53%) say they have the talent required to achieve their objectives.
The impact of this skills shortfall will be greatest on project delivery, with 83% of those surveyed seeing projects slow down due to a lack of experienced people. Meanwhile, 77% said workloads will increase for existing staff.
There has also been an increase in the use of temporary or contract staff augmentation, with site management contractors increasingly now used alongside the traditional areas of site labour and health and safety.
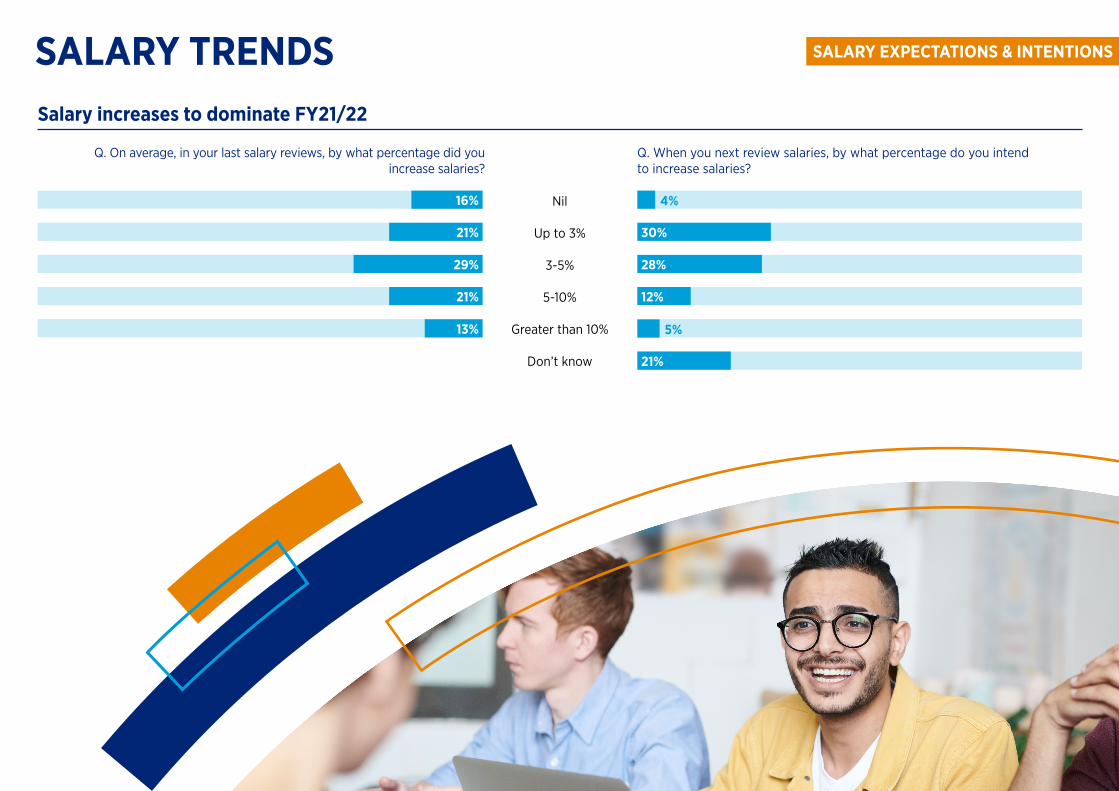
Skills shortages increase pay pressure Unsurprisingly then, most organisations plan to increase salaries over the coming year, with 30% increasing by up to 3% and 45% increasing by greater than 3%.
Staff engagement comes to the foreWhere does this leave you as a leader in the construction sector this year? The most critical area to focus on is employee engagement. Universities and colleges are not producing enough talent to meet the needs of the industry. With offshore recruitment a challenging prospect at present, retaining your existing team has never been more important.
Interestingly, our survey of industry professionals provides a clear pathway to achieve this. Of the construction professionals we surveyed, a pay rise is their number one priority for the year ahead, nominated by 45%. This is followed by more challenging or exciting work (38%). Along with aiding staff engagement and retention, offering new challenges can help you offset the impending risk of skills shortages by upskilling staff to fill gaps.
This doesn’t need to be an expensive process – indeed, many employers use on-the-job stretch opportunities to both provide new challenges and upskill staff where needed. I hope you find this report helpful in navigating today’s world of work and we look forward to supporting you to do so.

Malcolm Fleming
Chief Executive Officer for NZIOB
The general sentiment and forward workload confidence expressed by businesses and employees alike in the 2021 Hays Construction & NZIOB Salary Guide contrasts markedly to mid-2020 industry predictions.
When comparing 2021 actuals with 2020 forecasts, the major theme is that companies are in better shape compared to their expectations a year ago, when the ramifications of COVID-19 were still largely unknown. In parallel, employees have become more bullish about their prospects in the subsequent 12 months.
For companies, a stark example is that in 2020, 88% of respondents expected their business activity to decrease or remain the same over the preceding 12 month period.
Today, 90% of respondents say their business activity over the previous year either increased or stayed the same. For salaries, only 5% of companies in 2020 allowed for salary increases of 5% or greater; in actuality, 34% lifted salaries by 5% or more in 2020-2021.
For employees, the number one career consideration a year ago was that their employer had a good forward pipeline of work. A pay rise was at the bottom of the list, being seventh (of seven) in terms of importance. In 2021, this perspective has reversed, with employees now considering a pay rise to be their number one priority, while concerns about job security have halved to 30%.
Perhaps underpinning this growing employee confidence is the fact that many practitioners have upskilled themselves this past year and now want to be compensated for the greater value they can offer an employer.
Some general observations on skills demand and salaries:
• It has become tougher than it was a year ago to employ people for senior roles. In 2020 there was only one role that at least a third of respondents cited as being ‘very difficult’ to recruit for. 12 months later, there are nine roles that meet this same benchmark
• The main areas of salary growth have been for higher skilled roles, although the trend is uneven across the various project sizes and regions. Conversely, there was a consistent lift in salaries for General Managers across the full project size spectrum. The latter trend reinforces the view that in times of crisis, companies value strong business management and leadership skills above all else.
• The distinction between salaries for those working on larger projects and those on smaller projects is more pronounced than in previous years. That salaries for Commercial Managers reduced for projects below $15M, but increased for projects above $15M, highlights this trend.
Like its predecessors, this year’s Hays Construction & NZIOB Salary Guide will prove a valuable tool for employers and employees alike. Companies and employees fared better across the last year than originally forecast. While companies in 2021 are optimistic about the year ahead, they expect that salary increases, while higher than forecast in mid-2020, will be at lower levels than what was delivered this past year.
INTRODUCTION FROM NZIOB
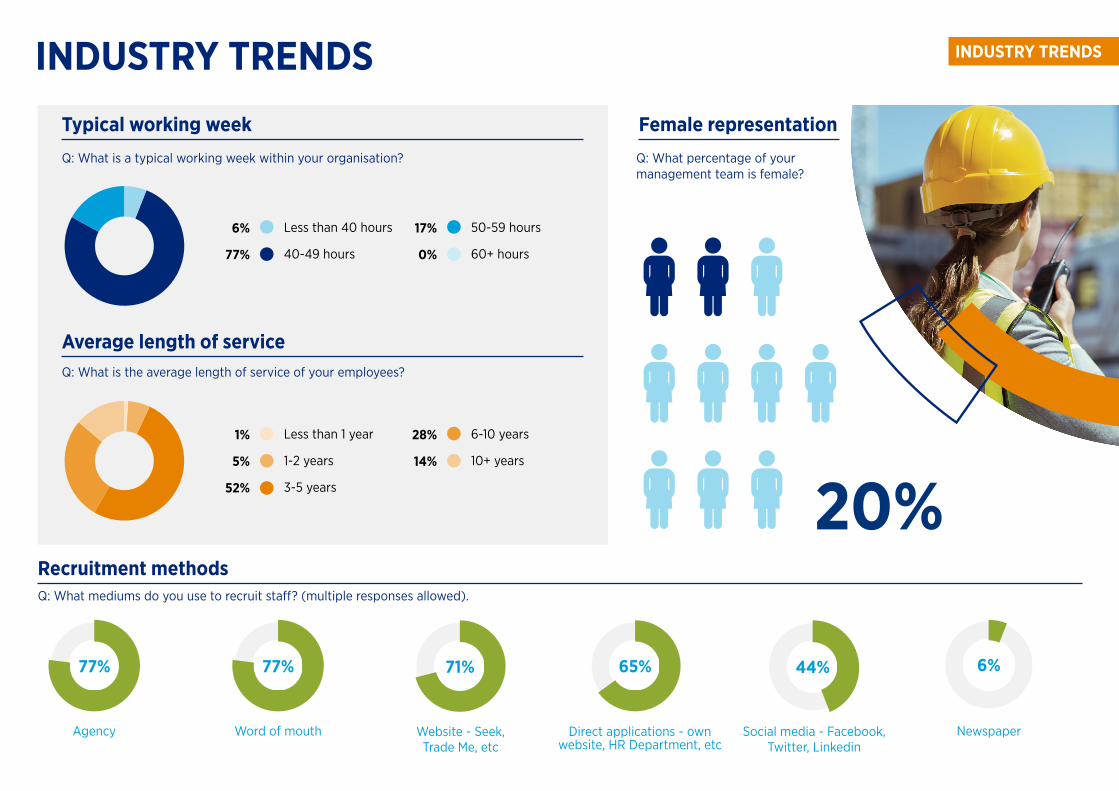
INDUSTRY TRENDS
Recruitment methods
Agency
77%
Word of mouth
77%
Direct applications - own website, HR Department, etc
65%
Newspaper
6%
Social media - Facebook, Twitter, Linkedin
44%
Website - Seek, Trade Me, etc
71%
Q: What mediums do you use to recruit staff? (multiple responses allowed).
Female representationQ: What percentage of your management team is female?
Typical working week
Average length of service
Less than 1 year
1-2 years
3-5 years
6-10 years
10+ years
1%
5%
52%
28%
14%
Less than 40 hours
40-49 hours
50-59 hours
60+ hours
6%
77%
17%
0%
Q: What is a typical working week within your organisation?
Q: What is the average length of service of your employees?
20%
INDUSTRY TRENDS

CONTRACT STAFF
Current temporary/contract staff levels
Temporary/contract investment in the coming year
Above pre-COVID-19 level
Equal to pre-COVID-19 level
Below pre-COVID-19 level
30%
56%
14%
Q: Are temporary and contract staffing levels in your department:
Q: Over the coming year, do you expect temporary/contract recruitment to:
Decrease
Increase
Remain unchanged
Recruitment freeze
Don’t know
9%
39%
43%
0%
9%
Reasons employers engage contract staff
Q. Which areas have you employed staff on a contract basis over the last year (multiple responses allowed).
Business management17%Early contract involvement (ECI) consultancy to client roles16%
Health & safety25%
Procurement/bid roles14%
Labour74%Site management37%
CONTRACT STAFF
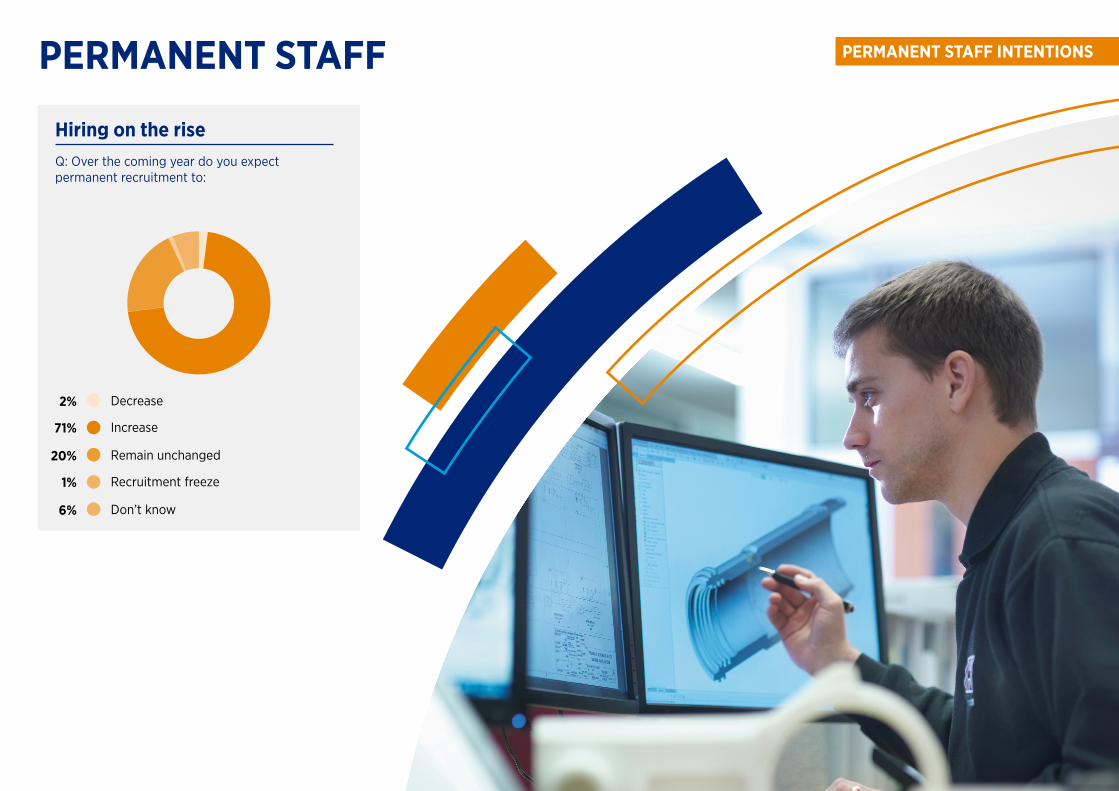
Hiring on the riseQ: Over the coming year do you expect permanent recruitment to:
Decrease
Increase
Remain unchanged
Recruitment freeze
Don’t know
2%
71%
20%
1%
6%
PERMANENT STAFF INTENTIONSPERMANENT STAFF
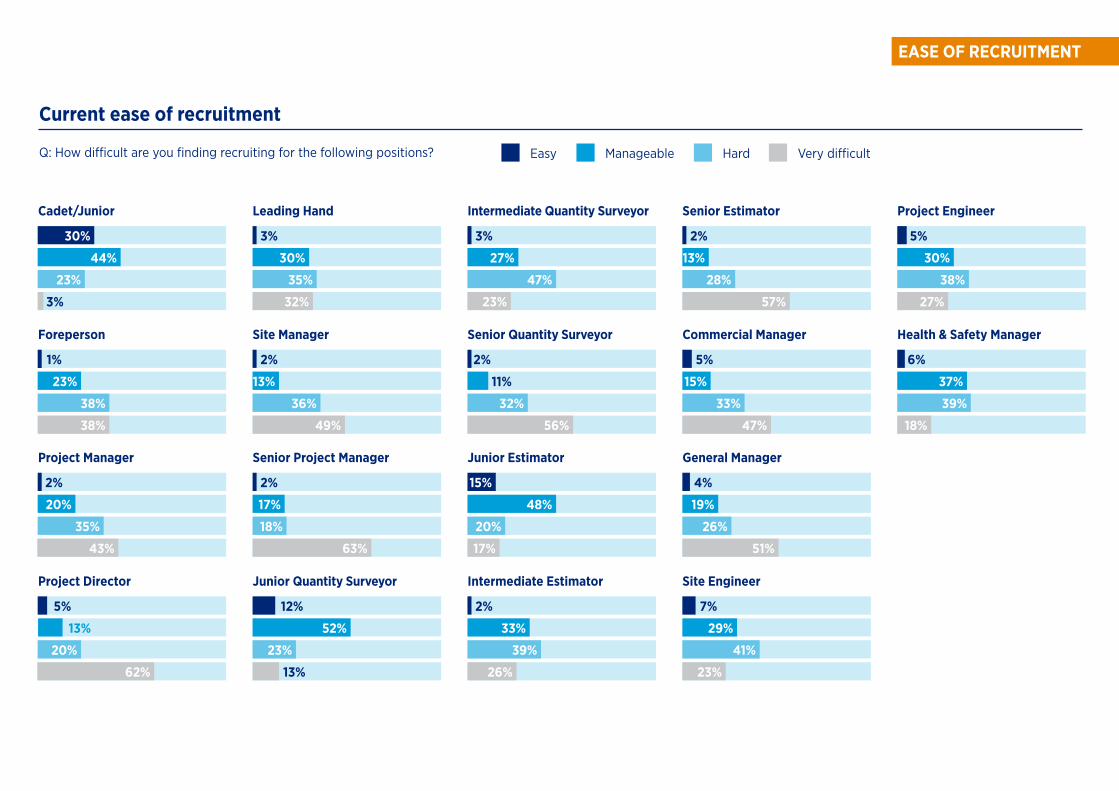
Current ease of recruitment
Q: How difficult are you finding recruiting for the following positions? Easy HardManageable Very difficult
Cadet/Junior
Project Manager
Foreperson
Project Director
30%
23%
35%
38%
38%
20%
44%
20%
23%
3%
1%
2%
5%
35%
18%
36%
23%
30%
17%
13%
52%
32%
63%43%
62%
49%
Leading Hand
Senior Project Manager
Site Manager
Junior Quantity Surveyor
3%
2%
2%
12%
13%
47%
20%
32%
39%
27%
48%
15%
33%
23%
17%
56%
26%
Intermediate Quantity Surveyor
Junior Estimator
Senior Quantity Surveyor
Intermediate Estimator
3%
2%
2%
28%
26%
33%
41%
13%
19%
15%
29%
57%
51%
47%
23%
Senior Estimator
General Manager
Commercial Manager
Site Engineer
2%
4%
5%
7%
38%
39%
30%
37%
27%
18%
Project Engineer
Health & Safety Manager
5%
6%
11%
EASE OF RECRUITMENT
13%

Q. Do you think that skills shortages are likely to have an impact on the effective operation of your business/department?
Q: Do you have the talent required to achieve your organisation’s strategic objectives in FY 21/22?
No
Yes - in a minor way
Yes - significantly
7%
50%
43%
Yes
No
Unsure
53%
28%
19%
Almost all will be impacted by skills shortages in the year ahead
Only half have the talent to achieve their objectives in FY21/22
SKILLSSKILLS
Technical skills76% Communication
skills61% Softwareskills11%General
soft skills25%Organisationalskills46%
Q: Which skills have the highest impact on the effectiveness of your organisation? (multiple responses allowed).
High impact skills
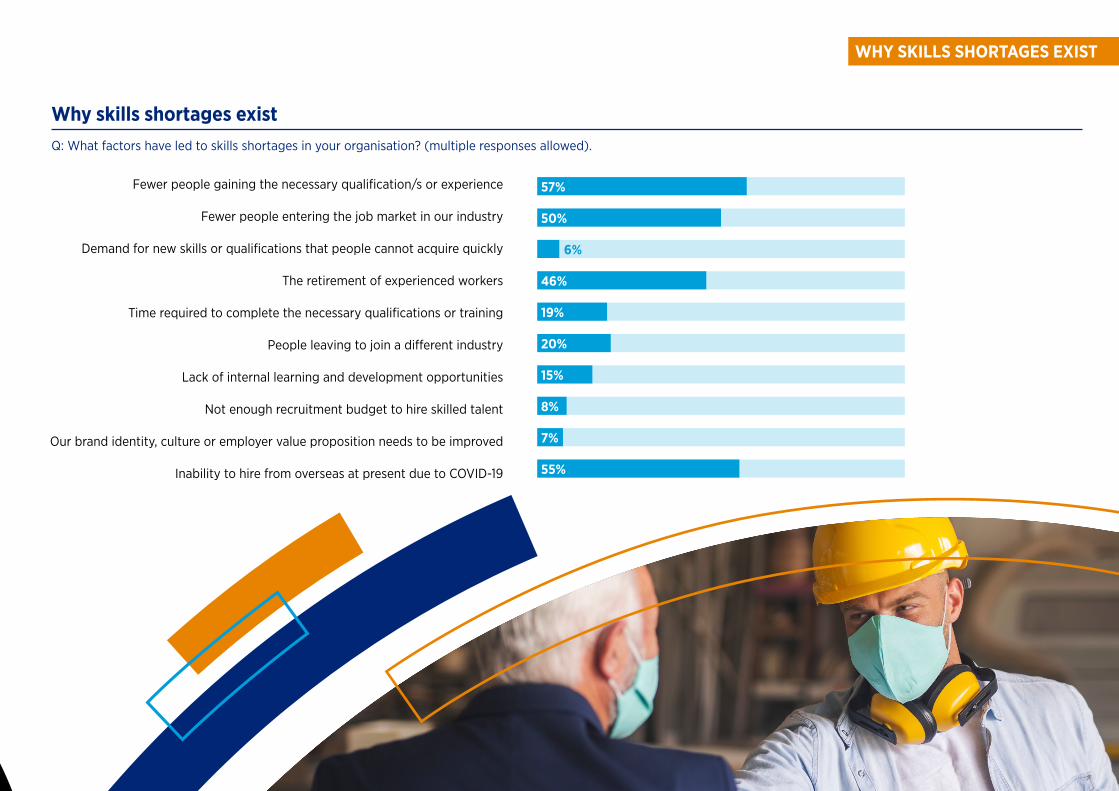
Fewer people gaining the necessary qualification/s or experience
Fewer people entering the job market in our industry
Demand for new skills or qualifications that people cannot acquire quickly
The retirement of experienced workers
Time required to complete the necessary qualifications or training
People leaving to join a different industry
Lack of internal learning and development opportunities
Not enough recruitment budget to hire skilled talent
Our brand identity, culture or employer value proposition needs to be improved
Inability to hire from overseas at present due to COVID-19
Q: What factors have led to skills shortages in your organisation? (multiple responses allowed).
Why skills shortages exist
57%
8%
50%
7%
19%
55%
20%
46%
15%
6%
WHY SKILLS SHORTAGES EXIST

What factors will be impacted by skills shortages? (multiple responses allowed).
The impact of skills shortages
71%
57%
55%
83%
50%
24%
19%
Productivity
Revenue/profit
Project delivery
Innovation/creativity
Growth/expansion
Customer service
Our adaptability
New technological adoption
Increased workloads for existing staff
Take advantage of new opportunities
Absenteeism due to stress
Employee engagement and morale
Increased overtime pay
Our competitiveness
31%
16%
8%
77%
31%
37%
32%
THE IMPACT OF SKILLS SHORTAGES
SALARY TRENDS
Q. On average, in your last salary reviews, by what percentage did you increase salaries?
Q. When you next review salaries, by what percentage do you intend to increase salaries?
Nil
Up to 3%
3-5%
5-10%
Greater than 10%
Don’t know
16%
21%
29%
21%
13%
Salary increases to dominate FY21/22
21%
30%
28%
12%
4%
5%
SALARY EXPECTATIONS & INTENTIONS
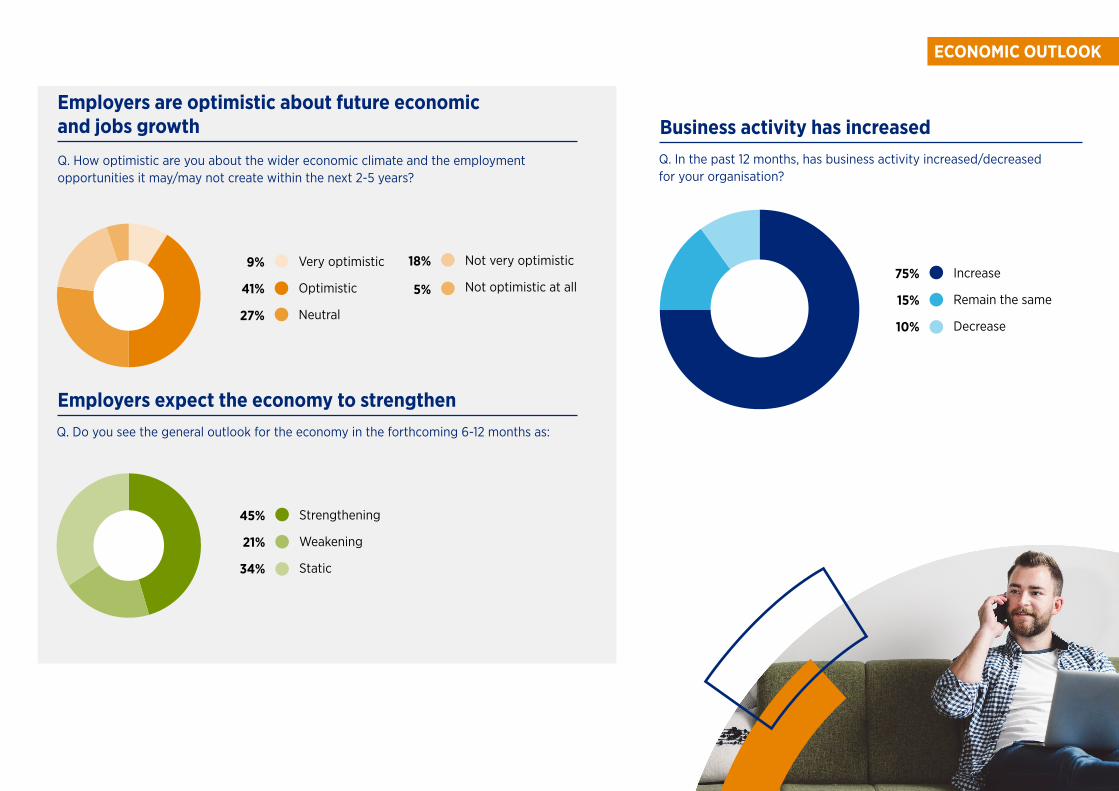
Strengthening
Weakening
Static
45%
21%
34%
Q. Do you see the general outlook for the economy in the forthcoming 6-12 months as:
Employers expect the economy to strengthen
Employers are optimistic about future economic and jobs growth
Q. How optimistic are you about the wider economic climate and the employment opportunities it may/may not create within the next 2-5 years?
Very optimistic
Optimistic
Neutral
9%
41%
27%
Not very optimistic
Not optimistic at all
18%
5%
ECONOMIC OUTLOOK
Increase
Remain the same
Decrease
75%
15%
10%
Q. In the past 12 months, has business activity increased/decreased for your organisation?
Business activity has increased

BENEFITSRoles vs benefits Employee benefits
Q: Have you reviewed your benefits offering to employees as a result of COVID-19 pandemic?
Yes - we’ve changed our benefits46%
No - but we intend to20%No - this is not planned34%
Vehicle Mobile phone
Health insurance
KiwiSaver contributions over 3%
Bonus Vehicle allowance
Share options
Flexible working
Cadet/Junior 5% 60% 47% 60% 19% 11% 2% 37%
Leading Hand 28% 77% 44% 44% 25% 11% 5% 23%
Foreperson 69% 94% 37% 48% 28% 6% 8% 22%
Site Manager 86% 97% 40% 51% 43% 14% 5% 26%
Project Manager 72% 93% 33% 51% 44% 18% 4% 42%
Senior Project Manager 77% 97% 42% 51% 49% 20% 10% 48%
Project Director 68% 93% 48% 58% 63% 33% 20% 58%
Junior Quantity Surveyor 10% 90% 52% 48% 31% 12% 5% 36%
Intermediate Quantity Surveyor 17% 56% 32% 29% 26% 13% 2% 25%
Senior Quantity Surveyor 37% 73% 35% 37% 40% 20% 6% 40%
Junior Estimator 1% 20% 17% 13% 7% 3% 1% 8%
Intermediate Estimator 10% 29% 22% 18% 13% 6% 2% 13%
Senior Estimator 20% 34% 22% 21% 14% 10% 7% 20%
Commercial Manager 32% 38% 25% 25% 25% 13% 11% 19%
Site Engineer 20% 28% 18% 15% 10% 5% 2% 7%
Project Engineer 23% 31% 20% 18% 9% 7% 3% 9%
Health & Safety Manager 32% 41% 22% 23% 15% 7% 5% 21%
General Manager 40% 48% 26% 30% 34% 11% 13% 32%
Q: What benefits are available for the following positions? (multiple answes allowed.)
BENEFITS
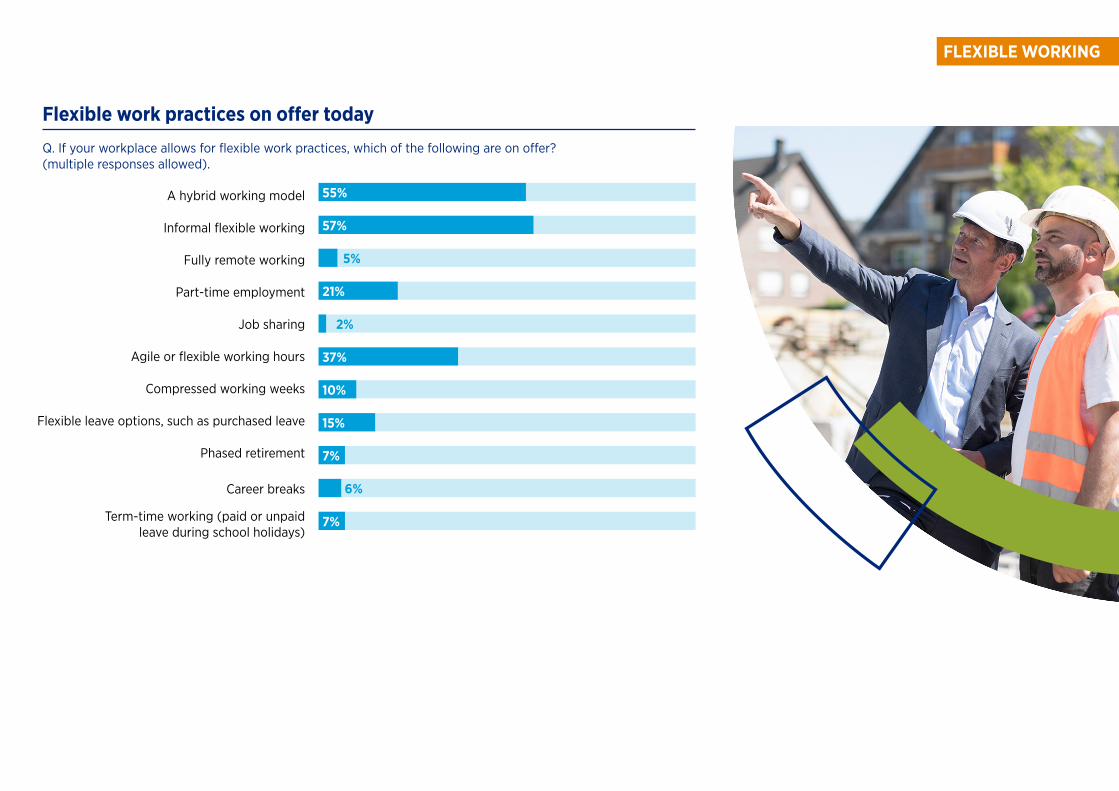
Q. If your workplace allows for flexible work practices, which of the following are on offer? (multiple responses allowed).
57%
55%
21%
37%
10%
15%
7%
A hybrid working model
Informal flexible working
Fully remote working
Part-time employment
Job sharing
Agile or flexible working hours
Compressed working weeks
Flexible leave options, such as purchased leave
Phased retirement
Career breaks
Term-time working (paid or unpaid leave during school holidays)
7%
5%
2%
6%
Flexible work practices on offer today
FLEXIBLE WORKING

EMPLOYEE CAREER OUTLOOK
Q. Thinking of your career, what is important in the year ahead? (multiple responses allowed).
24%
31%
23%
34%
34%
45%
Enhancing my digital skills
Learning additional theoretical skills
Developing my trade specific skills
Gaining a promotion
Securing strong temporary/contract roles
Securing a permanent position
Being able to work flexibly
Support from my boss
A pay rise
More challenging or exciting work
Job security
Alignment between the values and philosophies of my employer, and my own
30%
4%
6%
What’s most important to employees in the year ahead?
24%
38%
27%
Professionals have upskilled to improve job prospectsQ. In the past year, have you undertaken any of the following to improve your job prospects? (multiple responses allowed).
Changing careers or fields14%Higher or additional qualifications28%
Developed my soft skills 66%Developed my technical skills 49%
EMPLOYEE CAREER OUTLOOK
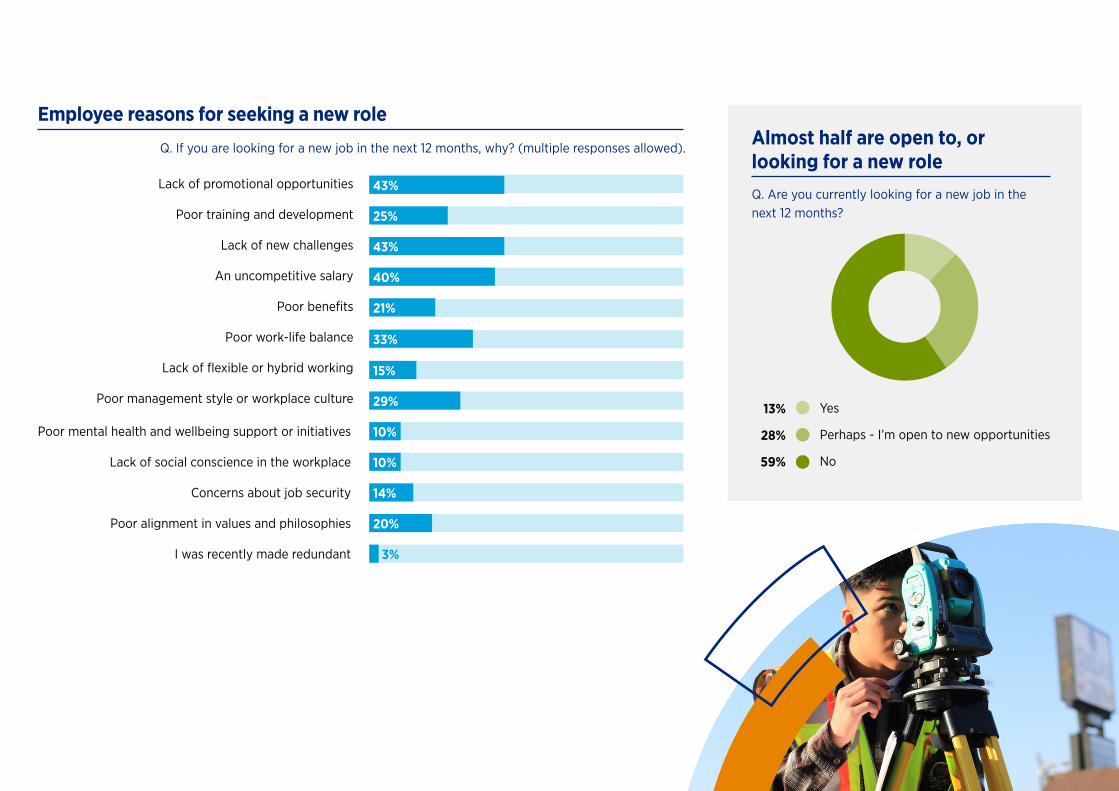
Yes
Perhaps - I’m open to new opportunities
No
13%
28%
59%
Q. Are you currently looking for a new job in the next 12 months?
Almost half are open to, or looking for a new role
Q. If you are looking for a new job in the next 12 months, why? (multiple responses allowed).
Lack of promotional opportunities
Poor training and development
Lack of new challenges
An uncompetitive salary
Poor benefits
Poor work-life balance
Lack of flexible or hybrid working
Poor management style or workplace culture
Poor mental health and wellbeing support or initiatives
Lack of social conscience in the workplace
Concerns about job security
Poor alignment in values and philosophies
I was recently made redundant
Employee reasons for seeking a new role
25%
43%
40%
15%
29%
43%
10%
10%
20%
3%
14%
21%
33%
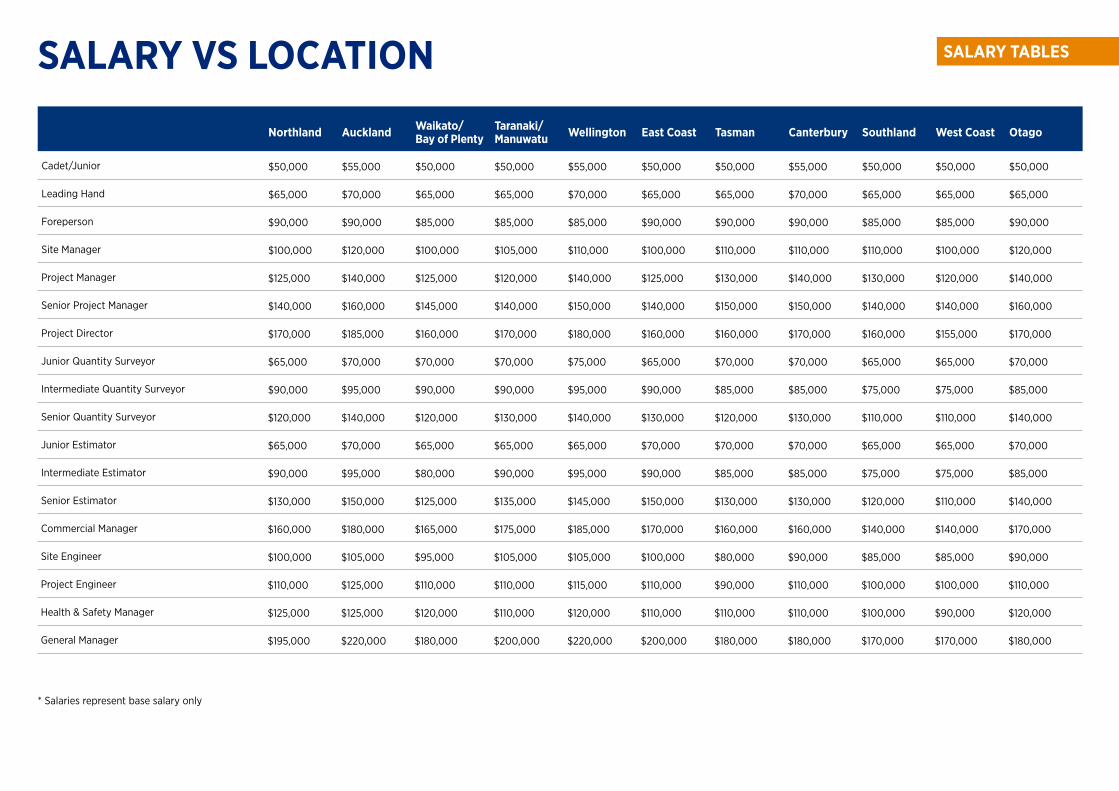
Northland Auckland Waikato/ Bay of Plenty
Taranaki/ Manuwatu Wellington East Coast Tasman Canterbury Southland West Coast Otago
Cadet/Junior $50,000 $55,000 $50,000 $50,000 $55,000 $50,000 $50,000 $55,000 $50,000 $50,000 $50,000
Leading Hand $65,000 $70,000 $65,000 $65,000 $70,000 $65,000 $65,000 $70,000 $65,000 $65,000 $65,000
Foreperson $90,000 $90,000 $85,000 $85,000 $85,000 $90,000 $90,000 $90,000 $85,000 $85,000 $90,000
Site Manager $100,000 $120,000 $100,000 $105,000 $110,000 $100,000 $110,000 $110,000 $110,000 $100,000 $120,000
Project Manager $125,000 $140,000 $125,000 $120,000 $140,000 $125,000 $130,000 $140,000 $130,000 $120,000 $140,000
Senior Project Manager $140,000 $160,000 $145,000 $140,000 $150,000 $140,000 $150,000 $150,000 $140,000 $140,000 $160,000
Project Director $170,000 $185,000 $160,000 $170,000 $180,000 $160,000 $160,000 $170,000 $160,000 $155,000 $170,000
Junior Quantity Surveyor $65,000 $70,000 $70,000 $70,000 $75,000 $65,000 $70,000 $70,000 $65,000 $65,000 $70,000
Intermediate Quantity Surveyor $90,000 $95,000 $90,000 $90,000 $95,000 $90,000 $85,000 $85,000 $75,000 $75,000 $85,000
Senior Quantity Surveyor $120,000 $140,000 $120,000 $130,000 $140,000 $130,000 $120,000 $130,000 $110,000 $110,000 $140,000
Junior Estimator $65,000 $70,000 $65,000 $65,000 $65,000 $70,000 $70,000 $70,000 $65,000 $65,000 $70,000
Intermediate Estimator $90,000 $95,000 $80,000 $90,000 $95,000 $90,000 $85,000 $85,000 $75,000 $75,000 $85,000
Senior Estimator $130,000 $150,000 $125,000 $135,000 $145,000 $150,000 $130,000 $130,000 $120,000 $110,000 $140,000
Commercial Manager $160,000 $180,000 $165,000 $175,000 $185,000 $170,000 $160,000 $160,000 $140,000 $140,000 $170,000
Site Engineer $100,000 $105,000 $95,000 $105,000 $105,000 $100,000 $80,000 $90,000 $85,000 $85,000 $90,000
Project Engineer $110,000 $125,000 $110,000 $110,000 $115,000 $110,000 $90,000 $110,000 $100,000 $100,000 $110,000
Health & Safety Manager $125,000 $125,000 $120,000 $110,000 $120,000 $110,000 $110,000 $110,000 $100,000 $90,000 $120,000
General Manager $195,000 $220,000 $180,000 $200,000 $220,000 $200,000 $180,000 $180,000 $170,000 $170,000 $180,000
SALARY VS LOCATION
* Salaries represent base salary only
SALARY TABLES

Commercial Industrial Infrastructure Residential
Cadet/Junior $50,000 $50,000 $50,000 $50,000
Leading Hand $70,000 $70,000 $70,000 $75,000
Foreperson $90,000 $75,000 $80,000 $80,000
Site Manager $110,000 $105,000 $105,000 $100,000
Project Manager $140,000 $115,000 $120,000 $120,000
Senior Project Manager $160,000 $145,000 $140,000 $140,000
Project Director $180,000 $180,000 $170,000 $165,000
Junior Quantity Surveyor $70,000 $65,000 $70,000 $70,000
Intermediate Quantity Surveyor $95,000 $95,000 $85,000 $95,000
Senior Quantity Surveyor $140,000 $130,000 $130,000 $130,000
Junior Estimator $70,000 $65,000 $70,000 $70,000
Intermediate Estimator $95,000 $95,000 $90,000 $95,000
Senior Estimator $150,000 $135,000 $135,000 $150,000
Commercial Manager $180,000 $165,000 $160,000 $170,000
Site Engineer $105,000 $110,000 $85,000 $100,000
Project Engineer $120,000 $115,000 $95,000 $120,000
Health & Safety Manager $120,000 $115,000 $120,000 $110,000
General Manager $200,000 $190,000 $185,000 $185,000
SALARY VS CONSTRUCTION TYPE
* Salaries represent base salary only

Under $5M $5M to $15M $15M to $50M $50M +
Cadet/Junior $45,000 $50,000 $55,000 $55,000
Leading Hand $60,000 $70,000 $70,000 $70,000
Foreperson $75,000 $80,000 $95,000 $95,000
Site Manager $85,000 $100,000 $115,000 $115,000
Project Manager $100,000 $125,000 $135,000 $145,000
Senior Project Manager $125,000 $145,000 $160,000 $160,000
Project Director $145,000 $170,000 $180,000 $180,000
Junior Quantity Surveyor $60,000 $65,000 $65,000 $65,000
Intermediate Quantity Surveyor $75,000 $85,000 $85,000 $100,000
Senior Quantity Surveyor $100,000 $130,000 $150,000 $160,000
Junior Estimator $55,000 $70,000 $70,000 $70,000
Intermediate Estimator $65,000 $95,000 $115,000 $115,000
Senior Estimator $130,000 $140,000 $165,000 $170,000
Commercial Manager $125,000 $145,000 $175,000 $215,000
Site Engineer $85,000 $105,000 $110,000 $115,000
Project Engineer $100,000 $115,000 $125,000 $130,000
Health & Safety Manager $85,000 $100,000 $115,000 $125,000
General Manager $180,000 $220,000 $260,000 $270,000
SALARY VS PROJECT SIZE
* Salaries represent base salary only

For more information visit our website hays.net.nz