NACE Salary Survey - University Career Services
64
DATA REPORTED BY EMPLOYERS Starting salary projections for Class of 2022 new college graduates NATIONAL ASSOCIATION OF COLLEGES AND EMPLOYERS www.naceweb.org WINTER 2022 SALARY SURVEY NACE
-
Upload
khangminh22 -
Category
Documents
-
view
2 -
download
0
Transcript of NACE Salary Survey - University Career Services
DATA REPORTED BY EMPLOYERS
Starting salary projections for Class of 2022 new college graduates
NATIONAL ASSOCIATION OF COLLEGES AND EMPLOYERSwww.naceweb.org
WINTER 2022
SALARY SURVEYNACE

2 | WINTER 2022 SALARY SURVEY | NATIONAL ASSOCIATION OF COLLEGES AND EMPLOYERS
No experience, no problem. Leverage better talent insights to identify graduate potential and hire tomorrow’s leaders, today.
Next generation talent from next generation assessments.Visit criteriacorp.com/solutions/college
Better tests. Better decisions. Better results.
Candidate FriendlyCriteria offers a comprehensive suite of both game-based and traditional assessments that candidates can take on any device. 96% of candidates positively rate their experience using our assessments.
Improved DiversityDiversify your new grad hires by focusing on objective qualities that are 4x more predictive of job performance than traditional methods like resumes and interviews.
Scientifi cally ProvenSave time and money with our science-backed assessments that are rigorously validated to predict job success and drive outcomes that matter.
NATIONAL ASSOCIATION OF COLLEGES AND EMPLOYERS | WINTER 2022 SALARY SURVEY | 1
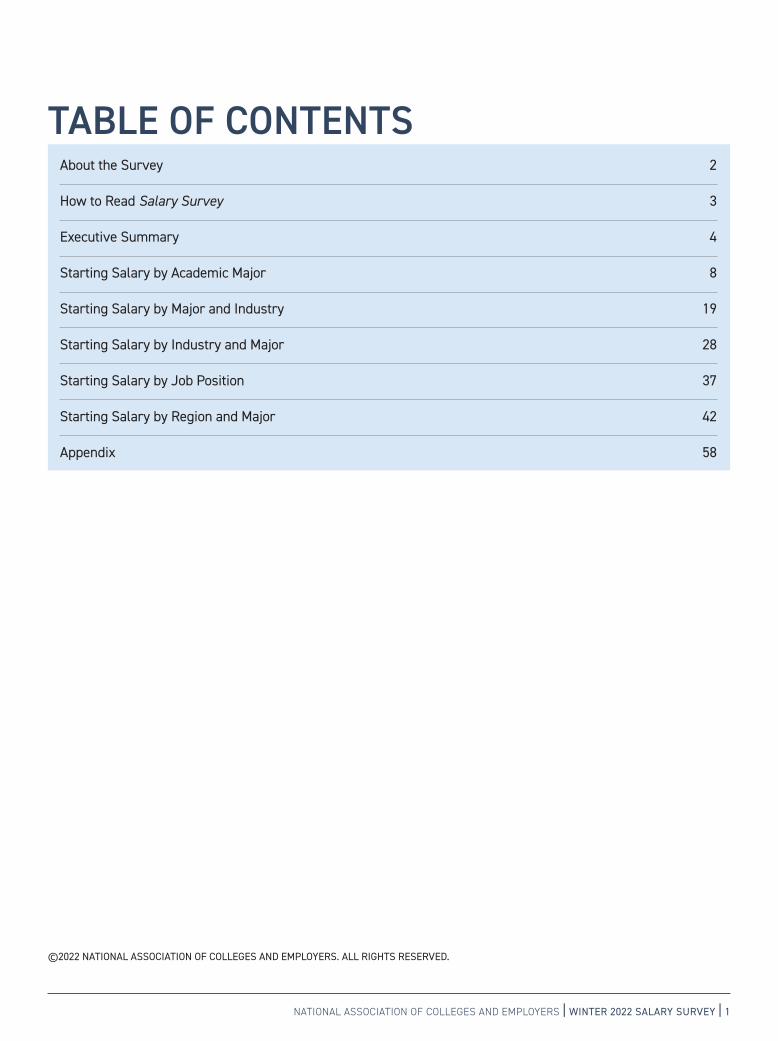
TABLE OF CONTENTS About the Survey 2
How to Read Salary Survey 3
Executive Summary 4
Starting Salary by Academic Major 8
Starting Salary by Major and Industry 19
Starting Salary by Industry and Major 28
Starting Salary by Job Position 37
Starting Salary by Region and Major 42
Appendix 58
©2022 NATIONAL ASSOCIATION OF COLLEGES AND EMPLOYERS. ALL RIGHTS RESERVED.
2 | WINTER 2022 SALARY SURVEY | NATIONAL ASSOCIATION OF COLLEGES AND EMPLOYERS
ABOUT THE SURVEYThe Winter 2022 Salary Survey report contains annual salary projections for Class of 2022 college graduates. The figures reported are for base salaries only and do not include bonuses, commissions, fringe benefits, or overtime rates. The report provides the detailed salary projections by academic major, job position, and degree level, along with breakouts by both industry and geographic region.
The National Association of Colleges and Employers (NACE) obtained the data in this report by surveying its employer members from October 4, 2021, through December 3, 2021. A total of 124 surveys were returned—a 17% response rate. Of those responding, 7.3% of respondents were from the New England region, 6.5% were from the Plains, 12.9% were from the Rocky Mountain/Far West region, 11.3% were from the Southwest, 14.5% were from the Southeast, 12.9% were from the Mideast, and 34.7% were from the Great Lakes region. A list of respondents by industry and size, and a partial list of organizations that supplied data for this report can be found in the Appendix.
RESEARCH STAFFDirector of Research and Public Policy—Mary Gatta
Assistant Director of Research and Public Policy—Joshua KahnResearch Manager—Andrea J. Koncz
Research Associate—Angelena GalbraithResearch Assistant—Anna Longenberger
SALARY SURVEY ISSUES FOR THE CLASS OF 2022The Winter issue features starting salary projections by major from employer-provided data. The Winter 2022 Salary Survey report is the first report for the Class of 2022. Data are available by major, job position, industry, and region. There are also data for advanced-degree candidates; the report includes data for 38 master’s and 18 doctoral degree disciplines.
The Summer issue serves as the final report for the graduating class—the previous year’s class, that is. The report features data provided through the national First-Destination Survey initiative; the data represent actual starting salaries (not projections) reported by graduates to their institutions. Data are by major, region, and Carnegie Classification. The Summer 2022 Salary Survey is the final report on starting salaries for the Class of 2021, while the Summer 2023 Salary Survey will serve as the final report for the Class of 2022.
SALARY DATA FOR THE CLASS OF 2022REPORT WHAT DATA SOURCE
First Report—Winter 2022 Pre-graduation projected starting salaries Employers
Final Report—Summer 2023 Final results, post-graduation actual starting salaries First-Destination Survey (Students/Schools)
Salary Survey (ISSN 1520-8648) is available to individuals holding membership in NACE; it is also available on a subscription basis. NACE publishes the Salary Survey report two times a year—January and July. For more information, see www.naceweb.org/store/subscription/salary-survey/ or contact NACE at 610.868.1421.

NATIONAL ASSOCIATION OF COLLEGES AND EMPLOYERS | WINTER 2022 SALARY SURVEY | 3
HOW TO READ SALARY SURVEYASSOCIATE / BACHELOR’S / MASTER’S / DOCTORAL
STARTING SALARY BY ACADEMIC MAJOR | PAGE 8In this section, you will find the average starting salary according to the major field of study, with no regard to the type of employer reporting the salary. Refer to this section when you want to know the starting salary for a graduate holding a degree in a specific discipline, such as accounting or computer science.
STARTING SALARY BY MAJOR AND INDUSTRY | PAGE 19This section shows data first by the major field of study, then by the type of employer (industry) reporting the salaries. Employer types are listed in alphabetical order under each major. See this section when you want the average starting salary reported by a specific type of employer to a graduate earning a degree in a specific major. (Example: Average salary that chemical [pharmaceutical] manufacturing firms are reporting for chemical engineering graduates.)
STARTING SALARY BY INDUSTRY AND MAJOR | PAGE 28This section contains the same basic information as “Starting Salaries by Major and Industry,” but in a different order. You will see data listed by a specific type of employer (industry), then according to the average salary by major field of study. Industries are arranged in alphabetical order. Majors are listed under each industry in the typical report order by broad category, then alphabetical within the category. Use this section to find the average starting salary reported by a specific type of employer to a graduate in a specific major. (Example: Majors hired by construction firms and their corresponding average starting salaries.)
STARTING SALARY BY JOB POSITION | PAGE 37In this section, you will find the average starting salary according to job position, with no regard to the type of employer reporting the salary. Refer to this section when you want to know the starting salary for a graduate hired for a specific job position, such as financial specialists or computer occupations.
STARTING SALARY BY JOB POSITION AND INDUSTRY (BACHELOR’S DEGREE) | PAGE 40This section shows data first by job position, then by the type of employer (industry) reporting the salaries. Employer types are listed in alphabetical order under each job position. See this section when you want the average starting salary reported by a specific type of employer to a graduate hired for a specific job position. (Example: Average salary that sales positions are projected to earn from finance, insurance, and real estate employers.)
STARTING SALARY BY INDUSTRY AND JOB POSITION (BACHELOR’S DEGREE) | PAGE 41This section contains the same basic information as “Starting Salaries by Job Position and Industry,” but in a different order. You will see data by a specific type of employer (industry), then according to their reported job positions. Industries are arranged in alphabetical order. Job positions are also listed under each industry in alphabetical order. Use this section to find the projected average starting salary reported by a specific type of employer for a specific job position. (Example: Projected starting salaries reported by miscellaneous manufacturing firms for financial specialists.)
STARTING SALARY BY REGION AND MAJOR | PAGE 42In this section, you will find the average starting salary according to the major field of study within seven geographic regions (New England, Mideast, Great Lakes, Plains, Southeast, Southwest, and Rocky Mountain/Far West. Note: For the master’s and doctoral degree levels, regions have been combined due to limited data.) The regional data are based upon the locations of the participating organizations that supplied information for the majors within each region. The majors are reported in typical report order by broad category, then alphabetical within the category. Averages are provided strictly by major field of study with no regard to the type of employer reporting the salary. Refer to this section when you want to know the starting salary for a graduate holding a degree in a specific discipline in a regional location, such as mechanical engineering majors hired by participants in the Southwest.
4 | WINTER 2022 SALARY SURVEY | NATIONAL ASSOCIATION OF COLLEGES AND EMPLOYERS
EXECUTIVE SUMMARYSALARY SURVEY WINTER 2022 KEY INSIGHTS
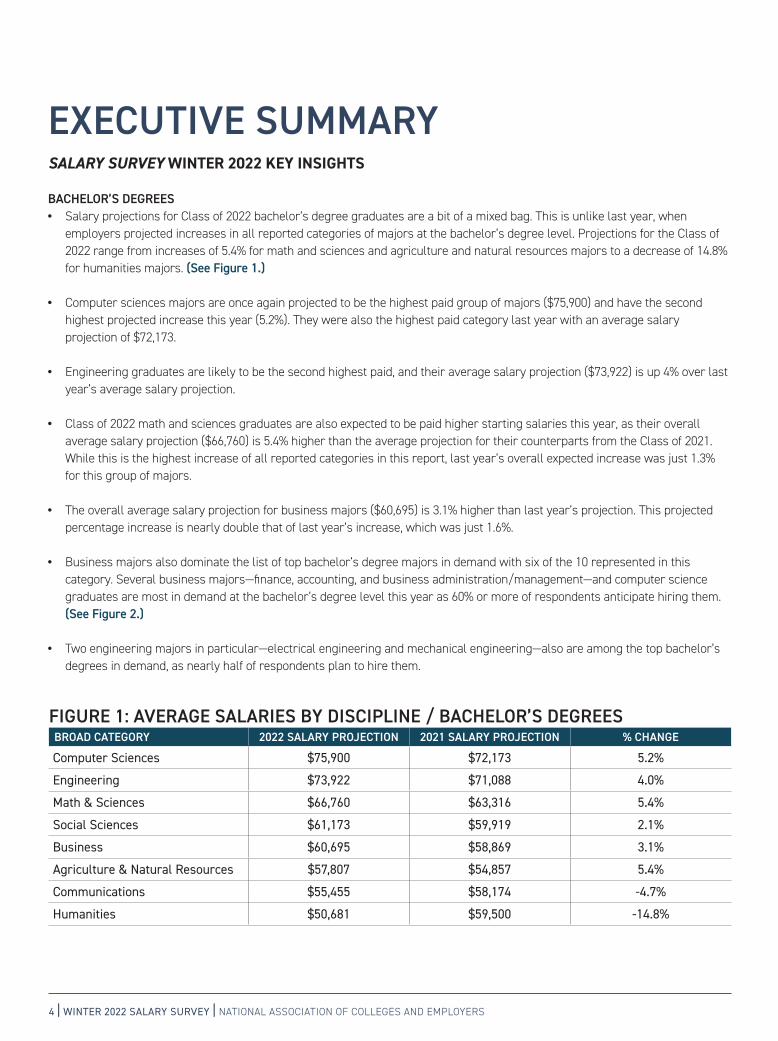
BACHELOR’S DEGREES • Salary projections for Class of 2022 bachelor’s degree graduates are a bit of a mixed bag. This is unlike last year, when
employers projected increases in all reported categories of majors at the bachelor’s degree level. Projections for the Class of 2022 range from increases of 5.4% for math and sciences and agriculture and natural resources majors to a decrease of 14.8% for humanities majors. (See Figure 1.)
• Computer sciences majors are once again projected to be the highest paid group of majors ($75,900) and have the second highest projected increase this year (5.2%). They were also the highest paid category last year with an average salary projection of $72,173.
• Engineering graduates are likely to be the second highest paid, and their average salary projection ($73,922) is up 4% over last year’s average salary projection.
• Class of 2022 math and sciences graduates are also expected to be paid higher starting salaries this year, as their overall average salary projection ($66,760) is 5.4% higher than the average projection for their counterparts from the Class of 2021. While this is the highest increase of all reported categories in this report, last year’s overall expected increase was just 1.3% for this group of majors.
• The overall average salary projection for business majors ($60,695) is 3.1% higher than last year’s projection. This projected percentage increase is nearly double that of last year’s increase, which was just 1.6%.
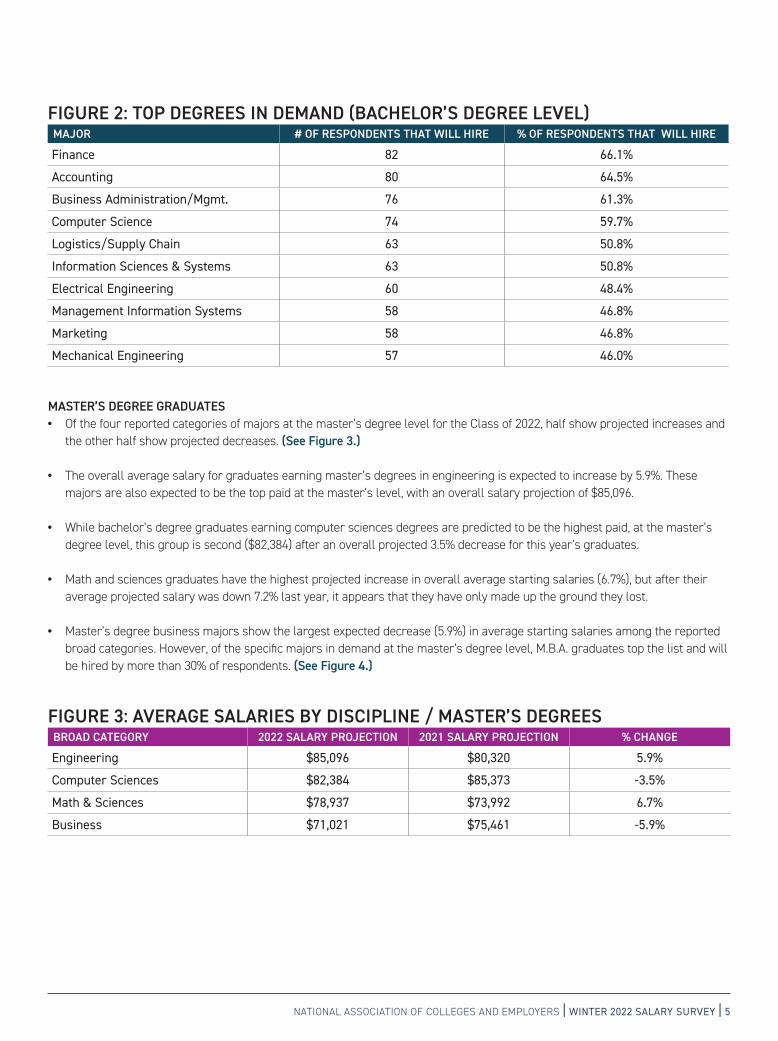
• Business majors also dominate the list of top bachelor’s degree majors in demand with six of the 10 represented in this category. Several business majors—finance, accounting, and business administration/management—and computer science graduates are most in demand at the bachelor’s degree level this year as 60% or more of respondents anticipate hiring them. (See Figure 2.)
• Two engineering majors in particular—electrical engineering and mechanical engineering—also are among the top bachelor’s degrees in demand, as nearly half of respondents plan to hire them.
FIGURE 1: AVERAGE SALARIES BY DISCIPLINE / BACHELOR’S DEGREESBROAD CATEGORY 2022 SALARY PROJECTION 2021 SALARY PROJECTION % CHANGE
Computer Sciences $75,900 $72,173 5.2%
Engineering $73,922 $71,088 4.0%
Math & Sciences $66,760 $63,316 5.4%
Social Sciences $61,173 $59,919 2.1%
Business $60,695 $58,869 3.1%
Agriculture & Natural Resources $57,807 $54,857 5.4%
Communications $55,455 $58,174 -4.7%
Humanities $50,681 $59,500 -14.8%
NATIONAL ASSOCIATION OF COLLEGES AND EMPLOYERS | WINTER 2022 SALARY SURVEY | 5
MASTER’S DEGREE GRADUATES • Of the four reported categories of majors at the master’s degree level for the Class of 2022, half show projected increases and
the other half show projected decreases. (See Figure 3.)
• The overall average salary for graduates earning master’s degrees in engineering is expected to increase by 5.9%. These majors are also expected to be the top paid at the master’s level, with an overall salary projection of $85,096.
• While bachelor’s degree graduates earning computer sciences degrees are predicted to be the highest paid, at the master’s degree level, this group is second ($82,384) after an overall projected 3.5% decrease for this year’s graduates.
• Math and sciences graduates have the highest projected increase in overall average starting salaries (6.7%), but after their average projected salary was down 7.2% last year, it appears that they have only made up the ground they lost.
• Master’s degree business majors show the largest expected decrease (5.9%) in average starting salaries among the reported broad categories. However, of the specific majors in demand at the master’s degree level, M.B.A. graduates top the list and will be hired by more than 30% of respondents. (See Figure 4.)
FIGURE 3: AVERAGE SALARIES BY DISCIPLINE / MASTER’S DEGREESBROAD CATEGORY 2022 SALARY PROJECTION 2021 SALARY PROJECTION % CHANGE
Engineering $85,096 $80,320 5.9%
Computer Sciences $82,384 $85,373 -3.5%
Math & Sciences $78,937 $73,992 6.7%
Business $71,021 $75,461 -5.9%
FIGURE 2: TOP DEGREES IN DEMAND (BACHELOR’S DEGREE LEVEL)MAJOR # OF RESPONDENTS THAT WILL HIRE % OF RESPONDENTS THAT WILL HIRE
Finance 82 66.1%
Accounting 80 64.5%
Business Administration/Mgmt. 76 61.3%
Computer Science 74 59.7%
Logistics/Supply Chain 63 50.8%
Information Sciences & Systems 63 50.8%
Electrical Engineering 60 48.4%
Management Information Systems 58 46.8%
Marketing 58 46.8%
Mechanical Engineering 57 46.0%

6 | WINTER 2022 SALARY SURVEY | NATIONAL ASSOCIATION OF COLLEGES AND EMPLOYERS
FIGURE 4: TOP DEGREES IN DEMAND (MASTER’S DEGREE LEVEL)MAJOR # OF RESPONDENTS THAT WILL HIRE % OF RESPONDENTS THAT WILL HIRE
Business Administration/Mgmt. - MBA 38 30.6%
Computer Science 35 28.2%
Accounting 29 23.4%
Human Resources 29 23.4%
Mechanical Engineering 28 22.6%
Software Engineering 28 22.6%
Finance 27 21.8%
Electrical Engineering 26 21.0%
Computer Engineering 25 20.2%
Software Applications 24 19.4%
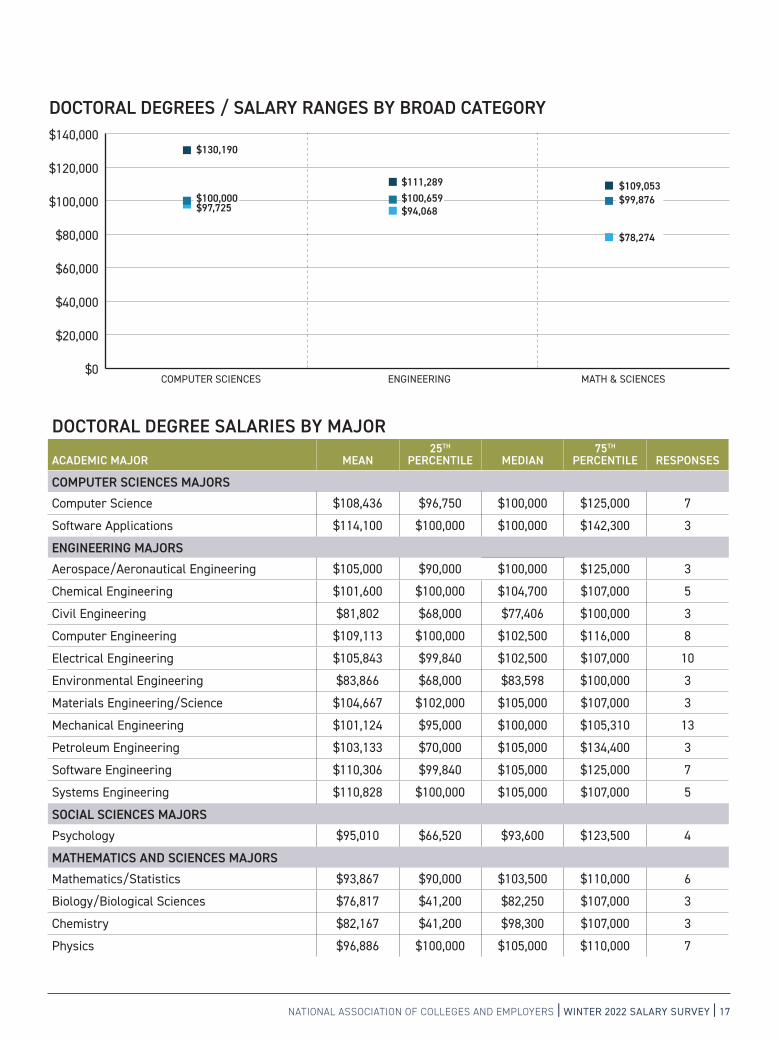
DOCTORAL DEGREE GRADUATES • Limited data reported at the doctoral degree level allows for salary projections in just three categories: computer sciences,
engineering, and math and sciences. (See Figure 5.)
• Although the projected average salary for graduates in the computer sciences is expected to drop by 4%, they remain the highest paid at the doctoral degree level ($110,135).
• Graduates earning doctoral degrees in the engineering fields have now topped six figures, as their overall average salary is up 6.5% to $103,423. Two years ago, the overall average for Class of 2020 engineering graduates at this degree level was also greater than $100,000, but last year’s 4.3% projected decrease dropped it to $97,136.
• Average starting salary projections for Class of 2022 graduates earning doctoral degrees in math and sciences are expected to increase by 2.8% to $90,439. This small increase helps to make up for the 15% drop last year for the Class of 2021, which lowered the overall average salary projection to $87,933.
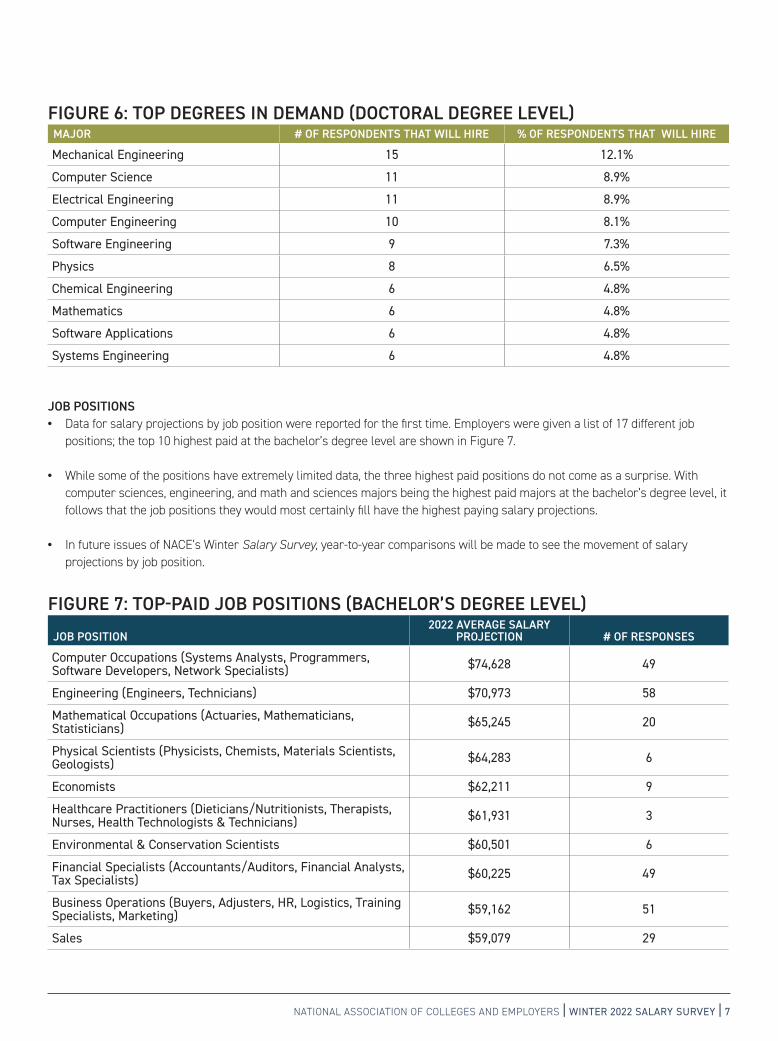
• Overall demand for majors at the doctoral degree level shows interest on the part of employers in all reported categories (computer sciences, engineering, and math and sciences), with the top spot going to mechanical engineering graduates. (See Figure 6.)
FIGURE 5: AVERAGE SALARIES BY DISCIPLINE / DOCTORAL DEGREESBROAD CATEGORY 2022 SALARY PROJECTION 2021 SALARY PROJECTION % CHANGE
Computer Sciences $110,135 $114,778 -4.0%
Engineering $103,423 $97,136 6.5%
Math & Sciences $90,439 $87,933 2.8%
NATIONAL ASSOCIATION OF COLLEGES AND EMPLOYERS | WINTER 2022 SALARY SURVEY | 7
FIGURE 6: TOP DEGREES IN DEMAND (DOCTORAL DEGREE LEVEL)MAJOR # OF RESPONDENTS THAT WILL HIRE % OF RESPONDENTS THAT WILL HIRE
Mechanical Engineering 15 12.1%
Computer Science 11 8.9%
Electrical Engineering 11 8.9%
Computer Engineering 10 8.1%
Software Engineering 9 7.3%
Physics 8 6.5%
Chemical Engineering 6 4.8%
Mathematics 6 4.8%
Software Applications 6 4.8%
Systems Engineering 6 4.8%
FIGURE 7: TOP-PAID JOB POSITIONS (BACHELOR’S DEGREE LEVEL)
JOB POSITION2022 AVERAGE SALARY
PROJECTION # OF RESPONSES
Computer Occupations (Systems Analysts, Programmers, Software Developers, Network Specialists) $74,628 49
Engineering (Engineers, Technicians) $70,973 58
Mathematical Occupations (Actuaries, Mathematicians, Statisticians) $65,245 20
Physical Scientists (Physicists, Chemists, Materials Scientists, Geologists) $64,283 6
Economists $62,211 9
Healthcare Practitioners (Dieticians/Nutritionists, Therapists, Nurses, Health Technologists & Technicians) $61,931 3
Environmental & Conservation Scientists $60,501 6
Financial Specialists (Accountants/Auditors, Financial Analysts, Tax Specialists) $60,225 49
Business Operations (Buyers, Adjusters, HR, Logistics, Training Specialists, Marketing) $59,162 51
Sales $59,079 29
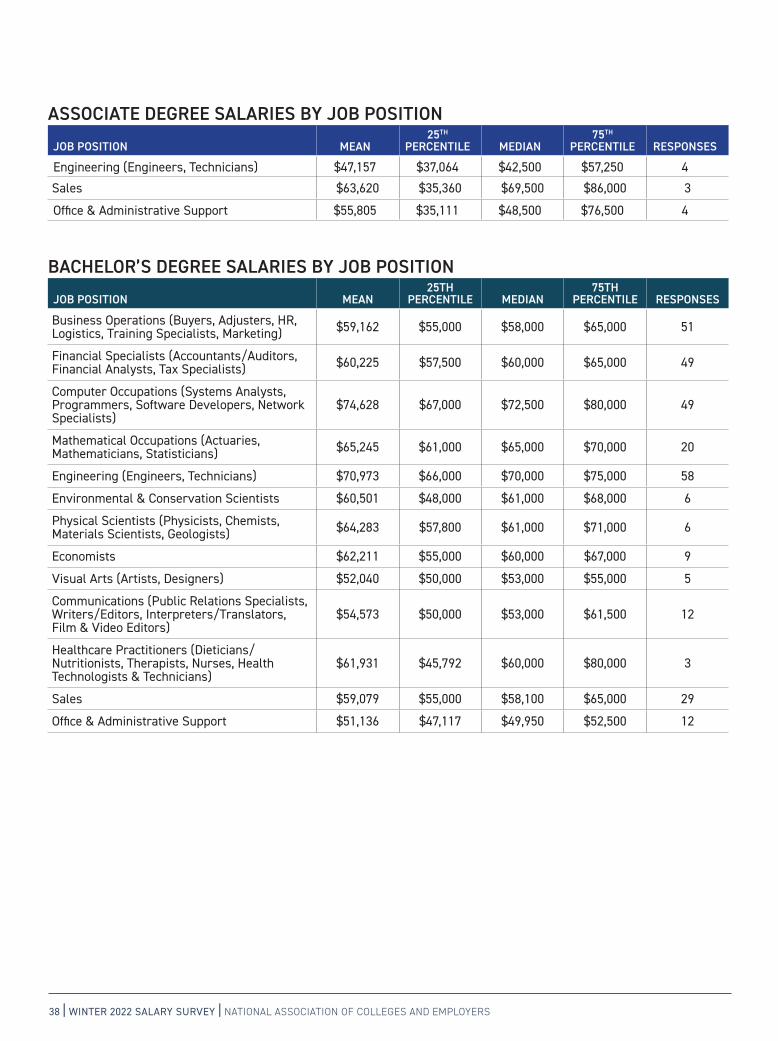
JOB POSITIONS • Data for salary projections by job position were reported for the first time. Employers were given a list of 17 different job
positions; the top 10 highest paid at the bachelor’s degree level are shown in Figure 7.
• While some of the positions have extremely limited data, the three highest paid positions do not come as a surprise. With computer sciences, engineering, and math and sciences majors being the highest paid majors at the bachelor’s degree level, it follows that the job positions they would most certainly fill have the highest paying salary projections.
• In future issues of NACE’s Winter Salary Survey, year-to-year comparisons will be made to see the movement of salary projections by job position.

8 | WINTER 2022 SALARY SURVEY | NATIONAL ASSOCIATION OF COLLEGES AND EMPLOYERS8 | WINTER 2022 SALARY SURVEY | NATIONAL ASSOCIATION OF COLLEGES AND EMPLOYERS
STARTING SALARY BY ACADEMIC
MAJOR

NATIONAL ASSOCIATION OF COLLEGES AND EMPLOYERS | WINTER 2022 SALARY SURVEY | 9
ASSOCIATE DEGREE SALARIES BY MAJOR
ACADEMIC MAJOR MEAN25TH
PERCENTILE MEDIAN75TH
PERCENTILE RESPONSES
BUSINESS MAJORSAccounting $46,799 $42,959 $45,817 $55,000 6
Business Administration/Management $44,428 $33,221 $42,717 $55,000 5
Finance $47,967 $46,634 $47,000 $55,000 5
Human Resources $43,618 $33,221 $38,667 $55,000 5
Logistics/Supply Chain $48,733 $31,200 $55,000 $60,000 3
Management Information Systems $44,807 $31,200 $33,221 $70,000 3
COMPUTER SCIENCES MAJORSComputer Science $42,909 $34,128 $39,750 $54,850 3
EDUCATION MAJORSElementary Education $38,003 $32,508 $33,500 $48,000 3
ENGINEERING MAJORSComputer Engineering $52,043 $34,128 $52,000 $70,000 3
Electrical Engineering $51,533 $33,000 $51,600 $70,000 3
Software Engineering $51,909 $34,128 $51,600 $70,000 3
SOCIAL SCIENCES MAJORSPsychology $40,293 $34,128 $34,750 $52,000 3
$0
$10,000
$20,000
$30,000
$40,000
$50,000
$60,000
$70,000
$80,000
BUSINESS
$57,222$51,733
$33,752
$43,759
$37,420
ENGINEERING
$70,000
ASSOCIATE DEGREES / SALARY RANGES BY BROAD CATEGORY

10 | WINTER 2022 SALARY SURVEY | NATIONAL ASSOCIATION OF COLLEGES AND EMPLOYERS
BACHELOR’S DEGREE SALARIES BY MAJOR
ACADEMIC MAJOR MEAN25TH
PERCENTILE MEDIAN75TH
PERCENTILE RESPONSES
AGRICULTURE AND NATURAL RESOURCES MAJORSAgricultural Business/Management $59,586 $55,000 $63,500 $65,000 7
Animal Science $55,367 $47,600 $55,000 $63,500 3
Food Science $56,525 $51,300 $57,500 $61,750 4
BUSINESS MAJORSAccounting $59,884 $55,000 $60,000 $65,000 61
Actuarial Science $65,543 $62,000 $65,000 $67,500 14
Business Administration/Management $59,514 $55,000 $60,000 $65,000 55
$0
$10,000
$20,000
$30,000
$40,000
$50,000
$60,000
$70,000
$80,000
$90,000
AGRICULTURAL& NATURALRESOURCES
$63,750 $65,491
$83,355
$66,000
$52,357
BUSINESS COMMUNICATIONS COMPUTERSCIENCES
SOCIALSCIENCES
MATH &SCIENCES
ENGINEERING HUMANITIES
$56,382
$65,068
$73,526
$66,668$60,670$60,966
$55,346
$47,554$44,086
BACHELOR'S DEGREES / SALARY RANGES BY BROAD CATEGORY
$55,773 $54,556$49,844
$77,913$72,986$68,638$71,076
$60,534 $60,467$59,964
$0
$10,000
$20,000
$30,000
$40,000
$50,000
$60,000
$70,000
$80,000
ACCOUNTING BUSINESSADMINISTRATION
FINANCE LOGISTICS/SUPPLY CHAIN
SALESMANAGEMENTINFORMATION
SYSTEMS
MARKETING
BUSINESS MAJORS / SALARY RANGES
$65,000$60,000$55,000
$60,000$55,000 $55,000
$60,000 $60,000$55,395
$58,913$60,000$55,000
$60,000$56,760
$65,000 $65,000 $65,000 $65,000$64,500$66,000
$72,000
NATIONAL ASSOCIATION OF COLLEGES AND EMPLOYERS | WINTER 2022 SALARY SURVEY | 11
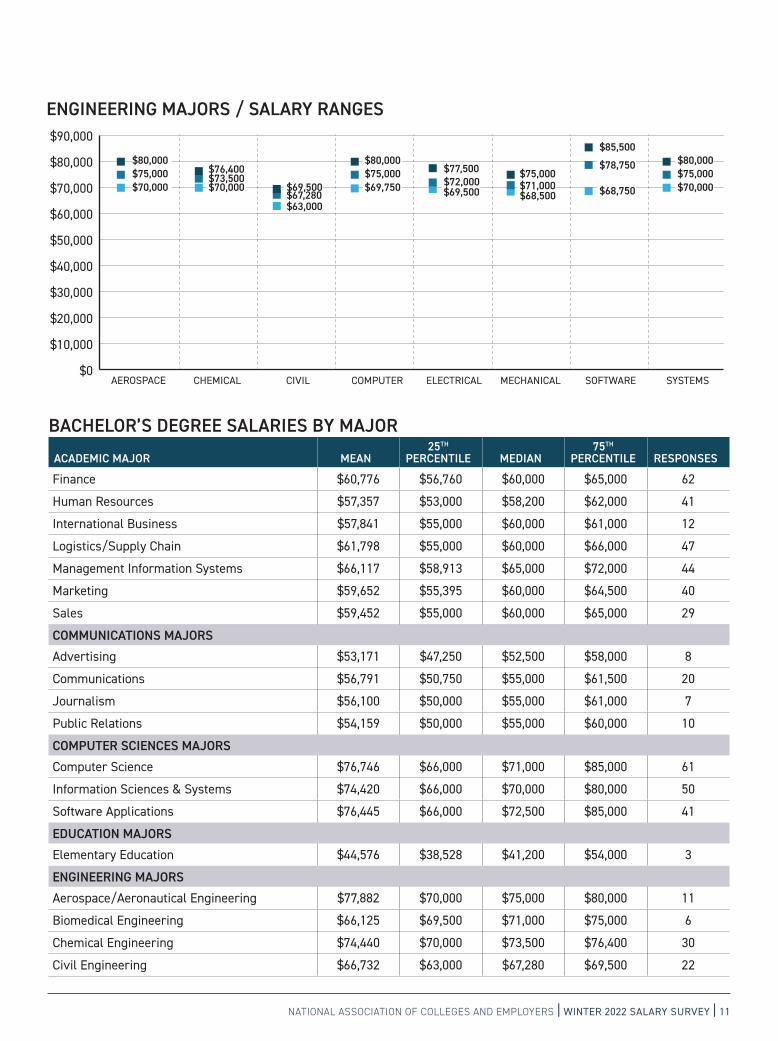
BACHELOR’S DEGREE SALARIES BY MAJOR
ACADEMIC MAJOR MEAN25TH
PERCENTILE MEDIAN75TH
PERCENTILE RESPONSES
Finance $60,776 $56,760 $60,000 $65,000 62
Human Resources $57,357 $53,000 $58,200 $62,000 41
International Business $57,841 $55,000 $60,000 $61,000 12
Logistics/Supply Chain $61,798 $55,000 $60,000 $66,000 47
Management Information Systems $66,117 $58,913 $65,000 $72,000 44
Marketing $59,652 $55,395 $60,000 $64,500 40
Sales $59,452 $55,000 $60,000 $65,000 29
COMMUNICATIONS MAJORSAdvertising $53,171 $47,250 $52,500 $58,000 8
Communications $56,791 $50,750 $55,000 $61,500 20
Journalism $56,100 $50,000 $55,000 $61,000 7
Public Relations $54,159 $50,000 $55,000 $60,000 10
COMPUTER SCIENCES MAJORSComputer Science $76,746 $66,000 $71,000 $85,000 61
Information Sciences & Systems $74,420 $66,000 $70,000 $80,000 50
Software Applications $76,445 $66,000 $72,500 $85,000 41
EDUCATION MAJORSElementary Education $44,576 $38,528 $41,200 $54,000 3
ENGINEERING MAJORSAerospace/Aeronautical Engineering $77,882 $70,000 $75,000 $80,000 11
Biomedical Engineering $66,125 $69,500 $71,000 $75,000 6
Chemical Engineering $74,440 $70,000 $73,500 $76,400 30
Civil Engineering $66,732 $63,000 $67,280 $69,500 22
$0
$10,000
$20,000
$30,000
$40,000
$50,000
$60,000
$70,000
$80,000
$90,000
AEROSPACE CHEMICAL CIVIL COMPUTER SOFTWARE SYSTEMSELECTRICAL MECHANICAL
ENGINEERING MAJORS / SALARY RANGES
$80,000
$70,000 $70,000
$76,400$73,500
$69,500$67,280$63,000
$75,000$80,000
$85,500
$78,750
$68,750 $70,000$75,000
$80,000
$69,750 $69,500 $68,500
$75,000$72,000
$75,000$71,000
$77,500
12 | WINTER 2022 SALARY SURVEY | NATIONAL ASSOCIATION OF COLLEGES AND EMPLOYERS
$0
$10,000
$20,000
$30,000
$40,000
$50,000
$60,000
$70,000
$80,000
ENGLISH HISTORY LIBERAL ARTS/GENERAL STUDIES
PHILOSOPHY
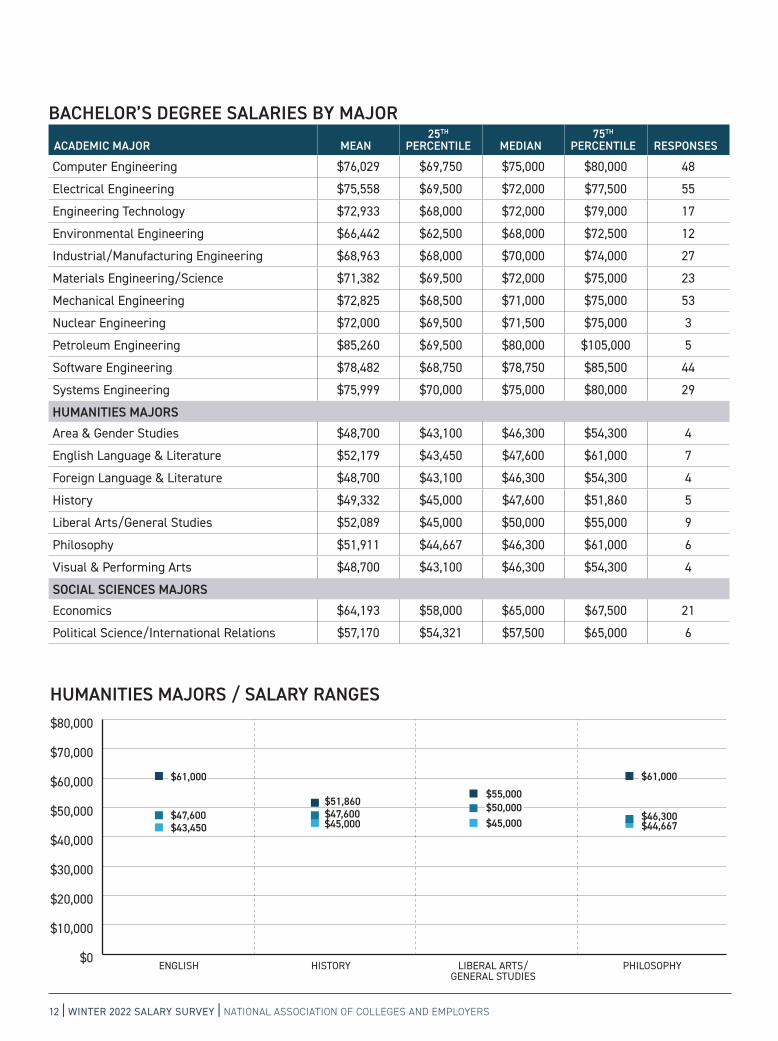
HUMANITIES MAJORS / SALARY RANGES
$61,000
$45,000
$55,000
$61,000
$45,000 $44,667$46,300
$50,000$47,600 $47,600
$51,860
$43,450
BACHELOR’S DEGREE SALARIES BY MAJOR
ACADEMIC MAJOR MEAN25TH
PERCENTILE MEDIAN75TH
PERCENTILE RESPONSES
Computer Engineering $76,029 $69,750 $75,000 $80,000 48
Electrical Engineering $75,558 $69,500 $72,000 $77,500 55
Engineering Technology $72,933 $68,000 $72,000 $79,000 17
Environmental Engineering $66,442 $62,500 $68,000 $72,500 12
Industrial/Manufacturing Engineering $68,963 $68,000 $70,000 $74,000 27
Materials Engineering/Science $71,382 $69,500 $72,000 $75,000 23
Mechanical Engineering $72,825 $68,500 $71,000 $75,000 53
Nuclear Engineering $72,000 $69,500 $71,500 $75,000 3
Petroleum Engineering $85,260 $69,500 $80,000 $105,000 5
Software Engineering $78,482 $68,750 $78,750 $85,500 44
Systems Engineering $75,999 $70,000 $75,000 $80,000 29
HUMANITIES MAJORSArea & Gender Studies $48,700 $43,100 $46,300 $54,300 4
English Language & Literature $52,179 $43,450 $47,600 $61,000 7
Foreign Language & Literature $48,700 $43,100 $46,300 $54,300 4
History $49,332 $45,000 $47,600 $51,860 5
Liberal Arts/General Studies $52,089 $45,000 $50,000 $55,000 9
Philosophy $51,911 $44,667 $46,300 $61,000 6
Visual & Performing Arts $48,700 $43,100 $46,300 $54,300 4
SOCIAL SCIENCES MAJORSEconomics $64,193 $58,000 $65,000 $67,500 21
Political Science/International Relations $57,170 $54,321 $57,500 $65,000 6

NATIONAL ASSOCIATION OF COLLEGES AND EMPLOYERS | WINTER 2022 SALARY SURVEY | 13
$0
$10,000
$20,000
$30,000
$40,000
$50,000
$60,000
$70,000
$80,000
ECONOMICS POLITICAL SCIENCE PSYCHOLOGY SOCIOLOGY
SOCIAL SCIENCES MAJORS / SALARY RANGES
$67,500$65,000 $65,000 $65,000
$58,840$55,000 $56,729
$53,500
$47,600
$57,500$54,321
$58,000
$0
$10,000
$20,000
$30,000
$40,000
$50,000
$60,000
$70,000
$80,000
MATH/STATISTICS BIOLOGY CHEMISTRY ENVIRONMENTALSCIENCE
PHYSICS
MATH & SCIENCES MAJORS / SALARY RANGES
$74,000 $74,500$70,500
$67,000 $67,500 $67,500 $67,500$65,000
$75,000$74,000
$66,125
$56,800 $56,400
$49,410
$64,200
BACHELOR’S DEGREE SALARIES BY MAJOR
ACADEMIC MAJOR MEAN25TH
PERCENTILE MEDIAN75TH
PERCENTILE RESPONSES
Psychology $62,294 $55,000 $58,840 $65,000 9
Sociology $52,922 $47,600 $53,500 $56,729 6
MATHEMATICS AND SCIENCES MAJORSMathematics/Statistics $68,572 $64,200 $67,000 $74,000 25
Biology/Biological Sciences $58,701 $49,410 $56,800 $67,500 7
Chemistry $66,156 $56,400 $66,125 $74,500 8
Environmental Science $63,960 $65,000 $67,500 $70,500 5
Geology/Geological Sciences $62,622 $41,200 $65,000 $81,667 3
Physics $71,467 $67,500 $74,000 $75,000 9
14 | WINTER 2022 SALARY SURVEY | NATIONAL ASSOCIATION OF COLLEGES AND EMPLOYERS
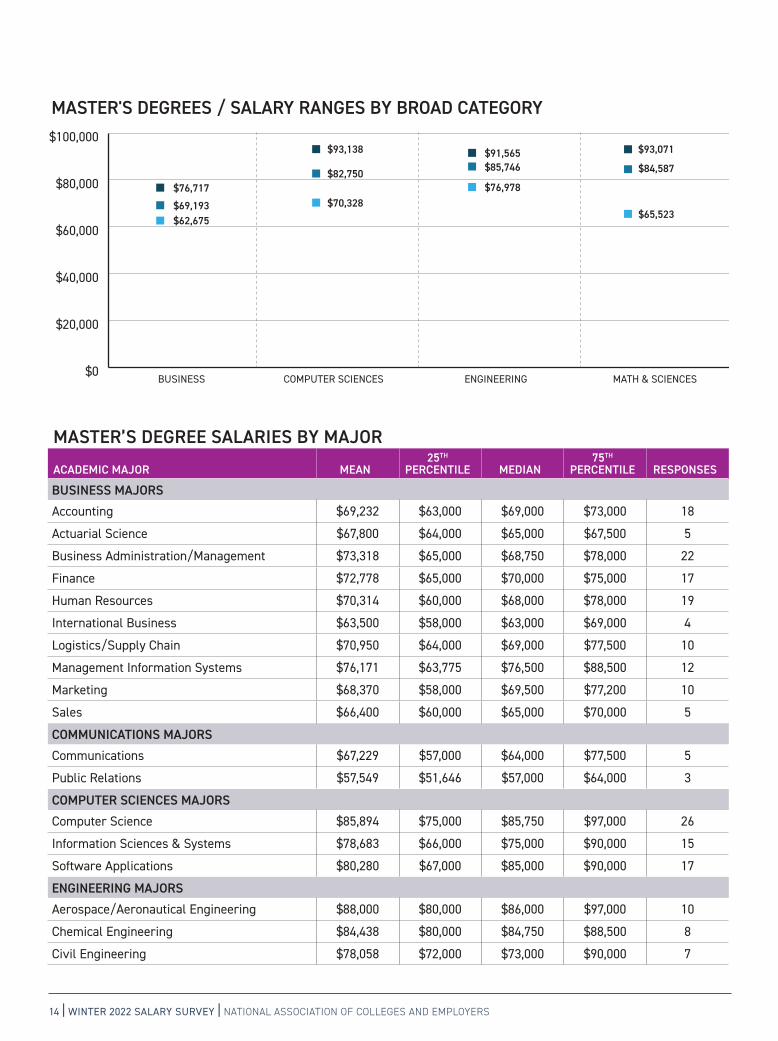
MASTER’S DEGREE SALARIES BY MAJOR
ACADEMIC MAJOR MEAN25TH
PERCENTILE MEDIAN75TH
PERCENTILE RESPONSES
BUSINESS MAJORSAccounting $69,232 $63,000 $69,000 $73,000 18
Actuarial Science $67,800 $64,000 $65,000 $67,500 5
Business Administration/Management $73,318 $65,000 $68,750 $78,000 22
Finance $72,778 $65,000 $70,000 $75,000 17
Human Resources $70,314 $60,000 $68,000 $78,000 19
International Business $63,500 $58,000 $63,000 $69,000 4
Logistics/Supply Chain $70,950 $64,000 $69,000 $77,500 10
Management Information Systems $76,171 $63,775 $76,500 $88,500 12
Marketing $68,370 $58,000 $69,500 $77,200 10
Sales $66,400 $60,000 $65,000 $70,000 5
COMMUNICATIONS MAJORSCommunications $67,229 $57,000 $64,000 $77,500 5
Public Relations $57,549 $51,646 $57,000 $64,000 3
COMPUTER SCIENCES MAJORSComputer Science $85,894 $75,000 $85,750 $97,000 26
Information Sciences & Systems $78,683 $66,000 $75,000 $90,000 15
Software Applications $80,280 $67,000 $85,000 $90,000 17
ENGINEERING MAJORSAerospace/Aeronautical Engineering $88,000 $80,000 $86,000 $97,000 10
Chemical Engineering $84,438 $80,000 $84,750 $88,500 8
Civil Engineering $78,058 $72,000 $73,000 $90,000 7
$0
$20,000
$40,000
$60,000
$80,000
$100,000
BUSINESS COMPUTER SCIENCES ENGINEERING MATH & SCIENCES
MASTER'S DEGREES / SALARY RANGES BY BROAD CATEGORY
$76,717
$93,138 $93,071
$82,750
$70,328
$91,565$85,746 $84,587
$65,523
$76,978
$69,193$62,675

NATIONAL ASSOCIATION OF COLLEGES AND EMPLOYERS | WINTER 2022 SALARY SURVEY | 15
MASTER’S DEGREE SALARIES BY MAJOR
ACADEMIC MAJOR MEAN25TH
PERCENTILE MEDIAN75TH
PERCENTILE RESPONSES
Computer Engineering $87,548 $80,000 $87,000 $90,000 21
Electrical Engineering $86,235 $74,880 $85,500 $90,286 22
Engineering Technology $84,714 $74,000 $87,000 $90,000 7
Environmental Engineering $80,100 $73,000 $78,299 $90,000 6
Industrial/Manufacturing Engineering $82,000 $71,000 $84,000 $90,000 8
Materials Engineering/Science $87,093 $86,000 $90,000 $90,000 9
Mechanical Engineering $84,463 $76,500 $83,500 $90,000 24
$0
$10,000
$20,000
$30,000
$40,000
$50,000
$60,000
$70,000
$80,000
$90,000
ACCOUNTING BUSINESSADMINISTRATION
FINANCE LOGISTICS/SUPPLY CHAIN
SALESMANAGEMENTINFORMATION
SYSTEMS
MARKETING
BUSINESS MAJORS / SALARY RANGES
$73,000$78,000
$75,000 $77,500 $77,200
$70,000
$60,000$65,000
$76,500
$63,775
$88,500
$70,000$65,000 $64,000
$58,000
$69,000 $69,500$69,000 $68,750$63,000 $65,000
$0
$20,000
$40,000
$60,000
$80,000
$100,000
AEROSPACE CHEMICAL CIVIL COMPUTER SOFTWARE SYSTEMSELECTRICAL MECHANICAL
ENGINEERING MAJORS / SALARY RANGES
$97,000
$86,000$80,000
$84,750$88,500
$80,000 $80,000
$90,000 $90,000 $90,000 $90,000
$74,000
$94,000$87,000
$74,880 $76,500 $77,500
$90,286$85,500 $83,500 $86,500$87,950
$73,000$72,000
16 | WINTER 2022 SALARY SURVEY | NATIONAL ASSOCIATION OF COLLEGES AND EMPLOYERS
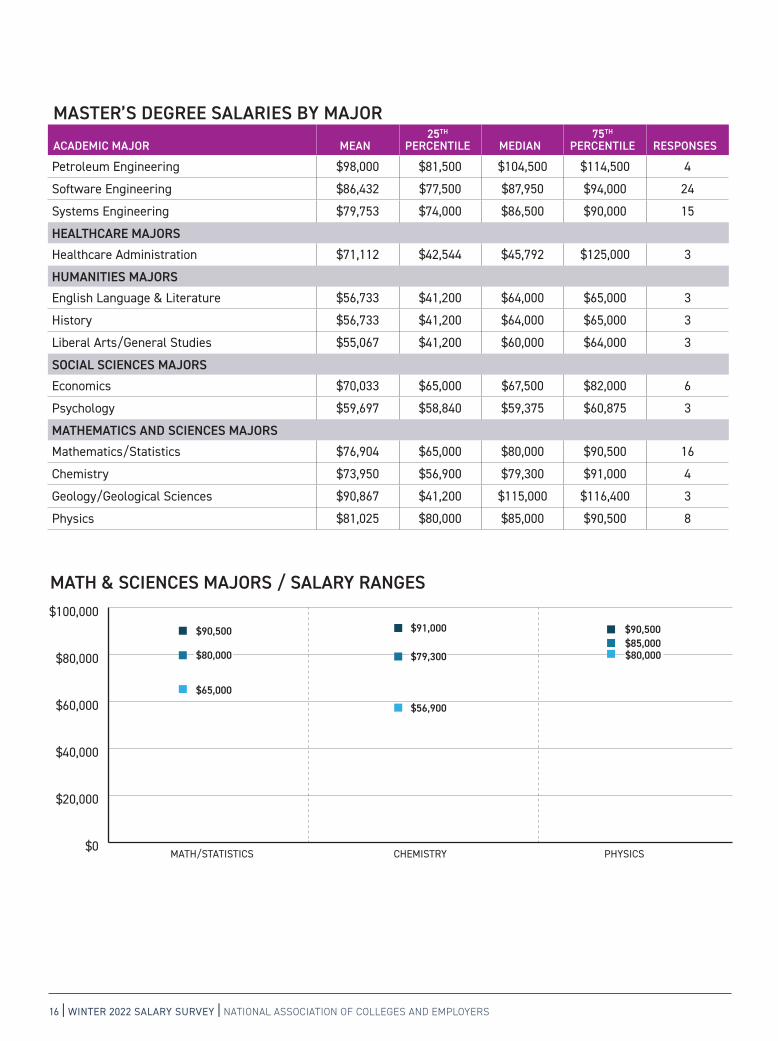
MASTER’S DEGREE SALARIES BY MAJOR
ACADEMIC MAJOR MEAN25TH
PERCENTILE MEDIAN75TH
PERCENTILE RESPONSES
Petroleum Engineering $98,000 $81,500 $104,500 $114,500 4
Software Engineering $86,432 $77,500 $87,950 $94,000 24
Systems Engineering $79,753 $74,000 $86,500 $90,000 15
HEALTHCARE MAJORSHealthcare Administration $71,112 $42,544 $45,792 $125,000 3
HUMANITIES MAJORSEnglish Language & Literature $56,733 $41,200 $64,000 $65,000 3
History $56,733 $41,200 $64,000 $65,000 3
Liberal Arts/General Studies $55,067 $41,200 $60,000 $64,000 3
SOCIAL SCIENCES MAJORSEconomics $70,033 $65,000 $67,500 $82,000 6
Psychology $59,697 $58,840 $59,375 $60,875 3
MATHEMATICS AND SCIENCES MAJORSMathematics/Statistics $76,904 $65,000 $80,000 $90,500 16
Chemistry $73,950 $56,900 $79,300 $91,000 4
Geology/Geological Sciences $90,867 $41,200 $115,000 $116,400 3
Physics $81,025 $80,000 $85,000 $90,500 8
$0
$20,000
$40,000
$60,000
$80,000
$100,000
MATH/STATISTICS CHEMISTRY PHYSICS
MATH & SCIENCES MAJORS / SALARY RANGES
$90,500 $90,500$91,000
$79,300$85,000$80,000
$56,900
$80,000
$65,000
NATIONAL ASSOCIATION OF COLLEGES AND EMPLOYERS | WINTER 2022 SALARY SURVEY | 17
DOCTORAL DEGREE SALARIES BY MAJOR
ACADEMIC MAJOR MEAN25TH
PERCENTILE MEDIAN75TH
PERCENTILE RESPONSES
COMPUTER SCIENCES MAJORSComputer Science $108,436 $96,750 $100,000 $125,000 7
Software Applications $114,100 $100,000 $100,000 $142,300 3
ENGINEERING MAJORSAerospace/Aeronautical Engineering $105,000 $90,000 $100,000 $125,000 3
Chemical Engineering $101,600 $100,000 $104,700 $107,000 5
Civil Engineering $81,802 $68,000 $77,406 $100,000 3
Computer Engineering $109,113 $100,000 $102,500 $116,000 8
Electrical Engineering $105,843 $99,840 $102,500 $107,000 10
Environmental Engineering $83,866 $68,000 $83,598 $100,000 3
Materials Engineering/Science $104,667 $102,000 $105,000 $107,000 3
Mechanical Engineering $101,124 $95,000 $100,000 $105,310 13
Petroleum Engineering $103,133 $70,000 $105,000 $134,400 3
Software Engineering $110,306 $99,840 $105,000 $125,000 7
Systems Engineering $110,828 $100,000 $105,000 $107,000 5
SOCIAL SCIENCES MAJORSPsychology $95,010 $66,520 $93,600 $123,500 4
MATHEMATICS AND SCIENCES MAJORSMathematics/Statistics $93,867 $90,000 $103,500 $110,000 6
Biology/Biological Sciences $76,817 $41,200 $82,250 $107,000 3
Chemistry $82,167 $41,200 $98,300 $107,000 3
Physics $96,886 $100,000 $105,000 $110,000 7
$0
$20,000
$40,000
$60,000
$80,000
$100,000
$120,000
$140,000
COMPUTER SCIENCES ENGINEERING MATH & SCIENCES
DOCTORAL DEGREES / SALARY RANGES BY BROAD CATEGORY
$130,190
$100,000 $100,659$94,068
$111,289 $109,053$99,876
$78,274
$97,725

18 | WINTER 2022 SALARY SURVEY | NATIONAL ASSOCIATION OF COLLEGES AND EMPLOYERS
$0
$20,000
$40,000
$60,000
$80,000
$100,000
$120,000
$140,000
AEROSPACE CHEMICAL CIVIL COMPUTER SOFTWARE SYSTEMSELECTRICAL MECHANICAL
ENGINEERING MAJORS / SALARY RANGES
$125,000
$100,000 $100,000 $100,000 $100,000 $100,000 $99,840
$125,000
$105,310 $105,000
$95,000$100,000
$107,000$105,000
$99,840$102,500$107,000
$102,500
$116,000
$77,406$68,000
$104,700$107,000
$90,000
$0
$20,000
$40,000
$60,000
$80,000
$100,000
$120,000
$140,000
MATH/STATISTICS CHEMISTRY PHYSICS
MATH & SCIENCES MAJORS / SALARY RANGES
$110,000$103,500
$98,300
$41,200
$107,000 $110,000$105,000$100,000
$90,000

STARTING SALARY BY MAJOR AND INDUSTRY
NATIONAL ASSOCIATION OF COLLEGES AND EMPLOYERS | WINTER 2022 SALARY SURVEY | 19
20 | WINTER 2022 SALARY SURVEY | NATIONAL ASSOCIATION OF COLLEGES AND EMPLOYERS
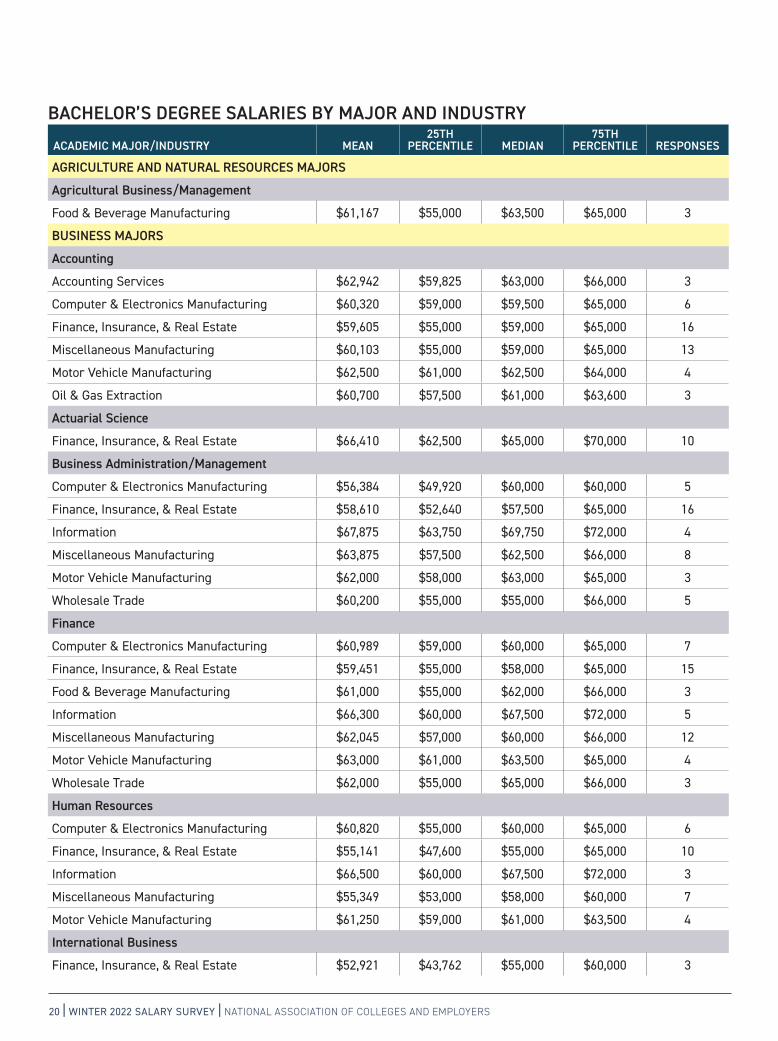
BACHELOR’S DEGREE SALARIES BY MAJOR AND INDUSTRY
ACADEMIC MAJOR/INDUSTRY MEAN25TH
PERCENTILE MEDIAN75TH
PERCENTILE RESPONSES
AGRICULTURE AND NATURAL RESOURCES MAJORS
Agricultural Business/Management
Food & Beverage Manufacturing $61,167 $55,000 $63,500 $65,000 3
BUSINESS MAJORS
Accounting
Accounting Services $62,942 $59,825 $63,000 $66,000 3
Computer & Electronics Manufacturing $60,320 $59,000 $59,500 $65,000 6
Finance, Insurance, & Real Estate $59,605 $55,000 $59,000 $65,000 16
Miscellaneous Manufacturing $60,103 $55,000 $59,000 $65,000 13
Motor Vehicle Manufacturing $62,500 $61,000 $62,500 $64,000 4
Oil & Gas Extraction $60,700 $57,500 $61,000 $63,600 3
Actuarial Science
Finance, Insurance, & Real Estate $66,410 $62,500 $65,000 $70,000 10
Business Administration/Management
Computer & Electronics Manufacturing $56,384 $49,920 $60,000 $60,000 5
Finance, Insurance, & Real Estate $58,610 $52,640 $57,500 $65,000 16
Information $67,875 $63,750 $69,750 $72,000 4
Miscellaneous Manufacturing $63,875 $57,500 $62,500 $66,000 8
Motor Vehicle Manufacturing $62,000 $58,000 $63,000 $65,000 3
Wholesale Trade $60,200 $55,000 $55,000 $66,000 5
Finance
Computer & Electronics Manufacturing $60,989 $59,000 $60,000 $65,000 7
Finance, Insurance, & Real Estate $59,451 $55,000 $58,000 $65,000 15
Food & Beverage Manufacturing $61,000 $55,000 $62,000 $66,000 3
Information $66,300 $60,000 $67,500 $72,000 5
Miscellaneous Manufacturing $62,045 $57,000 $60,000 $66,000 12
Motor Vehicle Manufacturing $63,000 $61,000 $63,500 $65,000 4
Wholesale Trade $62,000 $55,000 $65,000 $66,000 3
Human Resources
Computer & Electronics Manufacturing $60,820 $55,000 $60,000 $65,000 6
Finance, Insurance, & Real Estate $55,141 $47,600 $55,000 $65,000 10
Information $66,500 $60,000 $67,500 $72,000 3
Miscellaneous Manufacturing $55,349 $53,000 $58,000 $60,000 7
Motor Vehicle Manufacturing $61,250 $59,000 $61,000 $63,500 4
International Business
Finance, Insurance, & Real Estate $52,921 $43,762 $55,000 $60,000 3
NATIONAL ASSOCIATION OF COLLEGES AND EMPLOYERS | WINTER 2022 SALARY SURVEY | 21
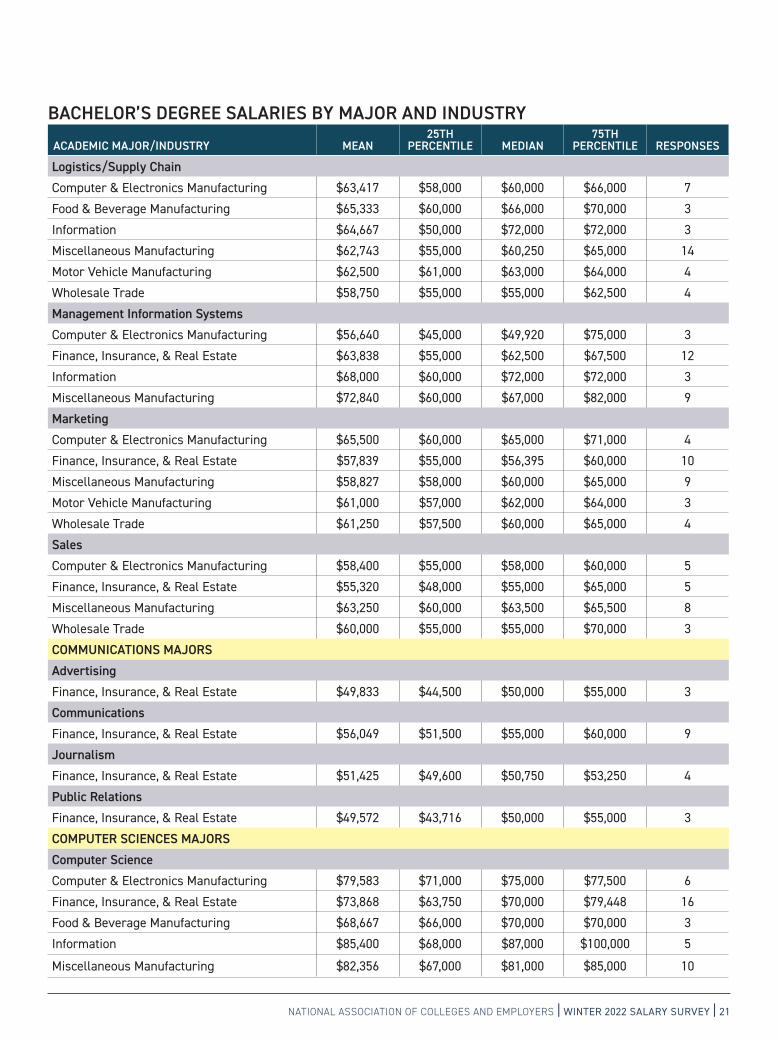
BACHELOR’S DEGREE SALARIES BY MAJOR AND INDUSTRY
ACADEMIC MAJOR/INDUSTRY MEAN25TH
PERCENTILE MEDIAN75TH
PERCENTILE RESPONSES
Logistics/Supply ChainComputer & Electronics Manufacturing $63,417 $58,000 $60,000 $66,000 7
Food & Beverage Manufacturing $65,333 $60,000 $66,000 $70,000 3
Information $64,667 $50,000 $72,000 $72,000 3
Miscellaneous Manufacturing $62,743 $55,000 $60,250 $65,000 14
Motor Vehicle Manufacturing $62,500 $61,000 $63,000 $64,000 4
Wholesale Trade $58,750 $55,000 $55,000 $62,500 4
Management Information SystemsComputer & Electronics Manufacturing $56,640 $45,000 $49,920 $75,000 3
Finance, Insurance, & Real Estate $63,838 $55,000 $62,500 $67,500 12
Information $68,000 $60,000 $72,000 $72,000 3
Miscellaneous Manufacturing $72,840 $60,000 $67,000 $82,000 9
MarketingComputer & Electronics Manufacturing $65,500 $60,000 $65,000 $71,000 4
Finance, Insurance, & Real Estate $57,839 $55,000 $56,395 $60,000 10
Miscellaneous Manufacturing $58,827 $58,000 $60,000 $65,000 9
Motor Vehicle Manufacturing $61,000 $57,000 $62,000 $64,000 3
Wholesale Trade $61,250 $57,500 $60,000 $65,000 4
SalesComputer & Electronics Manufacturing $58,400 $55,000 $58,000 $60,000 5
Finance, Insurance, & Real Estate $55,320 $48,000 $55,000 $65,000 5
Miscellaneous Manufacturing $63,250 $60,000 $63,500 $65,500 8
Wholesale Trade $60,000 $55,000 $55,000 $70,000 3
COMMUNICATIONS MAJORSAdvertisingFinance, Insurance, & Real Estate $49,833 $44,500 $50,000 $55,000 3
CommunicationsFinance, Insurance, & Real Estate $56,049 $51,500 $55,000 $60,000 9
JournalismFinance, Insurance, & Real Estate $51,425 $49,600 $50,750 $53,250 4
Public RelationsFinance, Insurance, & Real Estate $49,572 $43,716 $50,000 $55,000 3
COMPUTER SCIENCES MAJORSComputer ScienceComputer & Electronics Manufacturing $79,583 $71,000 $75,000 $77,500 6
Finance, Insurance, & Real Estate $73,868 $63,750 $70,000 $79,448 16
Food & Beverage Manufacturing $68,667 $66,000 $70,000 $70,000 3
Information $85,400 $68,000 $87,000 $100,000 5
Miscellaneous Manufacturing $82,356 $67,000 $81,000 $85,000 10

22 | WINTER 2022 SALARY SURVEY | NATIONAL ASSOCIATION OF COLLEGES AND EMPLOYERS
BACHELOR’S DEGREE SALARIES BY MAJOR AND INDUSTRY
ACADEMIC MAJOR/INDUSTRY MEAN25TH
PERCENTILE MEDIAN75TH
PERCENTILE RESPONSES
Miscellaneous Professional Services $86,487 $45,760 $93,700 $120,000 3
Oil & Gas Extraction $84,600 $69,000 $79,800 $105,000 3
Information Sciences & SystemsFinance, Insurance, & Real Estate $75,143 $65,000 $70,000 $80,000 14
Food & Beverage Manufacturing $68,667 $66,000 $70,000 $70,000 3
Information $79,875 $67,750 $70,000 $92,000 4
Miscellaneous Manufacturing $79,062 $68,000 $80,000 $85,000 9
Motor Vehicle Manufacturing $70,167 $66,000 $72,000 $72,500 3
Software ApplicationsComputer & Electronics Manufacturing $75,833 $75,000 $75,000 $77,500 3
Finance, Insurance, & Real Estate $77,208 $65,000 $73,000 $82,500 12
Miscellaneous Manufacturing $82,951 $67,000 $80,000 $90,000 9
Miscellaneous Professional Services $86,487 $45,760 $93,700 $120,000 3
Motor Vehicle Manufacturing $70,167 $66,000 $72,000 $72,500 3
ENGINEERING MAJORSBiomedical EngineeringMiscellaneous Manufacturing $73,750 $70,000 $75,000 $76,250 3
Chemical EngineeringChemical (Pharmaceutical) Manufacturing $79,800 $75,000 $76,400 $88,000 3
Computer & Electronics Manufacturing $75,400 $72,000 $73,000 $75,000 5
Food & Beverage Manufacturing $70,833 $69,500 $71,000 $72,000 3
Miscellaneous Manufacturing $70,510 $70,000 $73,000 $75,000 9
Motor Vehicle Manufacturing $76,333 $74,000 $75,000 $80,000 3
Civil EngineeringConstruction $64,713 $63,000 $64,500 $65,780 6
Engineering Services $66,872 $63,000 $67,280 $70,000 6
Computer EngineeringComputer & Electronics Manufacturing $80,500 $72,000 $77,500 $80,000 7
Finance, Insurance, & Real Estate $76,331 $65,000 $70,000 $85,000 11
Information $82,500 $71,500 $81,000 $93,500 4
Miscellaneous Manufacturing $78,293 $68,250 $76,000 $85,000 8
Miscellaneous Professional Services $71,487 $45,760 $75,000 $93,700 3
Motor Vehicle Manufacturing $75,833 $72,500 $75,000 $80,000 3
Wholesale Trade $79,333 $72,000 $80,000 $86,000 3
Electrical EngineeringComputer & Electronics Manufacturing $76,398 $70,000 $75,000 $80,000 9
Construction $61,880 $46,800 $65,000 $73,840 3

NATIONAL ASSOCIATION OF COLLEGES AND EMPLOYERS | WINTER 2022 SALARY SURVEY | 23
BACHELOR’S DEGREE SALARIES BY MAJOR AND INDUSTRY
ACADEMIC MAJOR/INDUSTRY MEAN25TH
PERCENTILE MEDIAN75TH
PERCENTILE RESPONSES
Engineering Services $71,094 $66,560 $71,300 $75,000 6
Finance, Insurance, & Real Estate $87,600 $70,000 $71,000 $107,000 5
Food & Beverage Manufacturing $70,500 $69,500 $70,000 $72,000 3
Miscellaneous Manufacturing $74,439 $68,500 $72,000 $76,250 15
Motor Vehicle Manufacturing $76,250 $73,500 $74,500 $79,000 4
Engineering TechnologyMiscellaneous Manufacturing $80,875 $68,250 $71,750 $93,500 4
Motor Vehicle Manufacturing $74,750 $72,000 $74,500 $77,500 4
Environmental EngineeringEngineering Services $69,242 $64,780 $68,280 $73,703 4
Industrial/Manufacturing EngineeringComputer & Electronics Manufacturing $74,667 $69,000 $75,000 $80,000 3
Miscellaneous Manufacturing $69,392 $68,500 $71,000 $73,000 13
Motor Vehicle Manufacturing $73,000 $70,000 $74,000 $75,000 3
Materials Engineering/ScienceComputer & Electronics Manufacturing $76,000 $73,000 $75,000 $80,000 3
Miscellaneous Manufacturing $70,809 $68,500 $71,750 $75,000 10
Motor Vehicle Manufacturing $76,333 $74,000 $75,000 $80,000 3
Mechanical EngineeringChemical (Pharmaceutical) Manufacturing $78,033 $71,100 $75,000 $88,000 3
Computer & Electronics Manufacturing $74,750 $72,000 $75,000 $77,500 6
Construction $62,917 $62,000 $65,000 $68,500 6
Engineering Services $72,530 $65,000 $70,000 $75,000 7
Food & Beverage Manufacturing $70,500 $69,500 $70,000 $72,000 3
Miscellaneous Manufacturing $73,131 $68,250 $71,250 $75,000 16
Motor Vehicle Manufacturing $73,750 $72,000 $74,500 $75,500 4
Software EngineeringComputer & Electronics Manufacturing $78,369 $72,000 $77,500 $80,000 7
Finance, Insurance, & Real Estate $81,250 $70,000 $78,000 $85,000 10
Miscellaneous Manufacturing $77,871 $68,000 $80,000 $82,000 9
Miscellaneous Professional Services $84,865 $62,880 $86,850 $106,850 4
Motor Vehicle Manufacturing $75,875 $72,750 $74,000 $79,000 4
Systems EngineeringComputer & Electronics Manufacturing $72,895 $65,790 $78,750 $80,000 4
Finance, Insurance, & Real Estate $81,571 $70,000 $76,000 $85,000 7
Miscellaneous Manufacturing $79,700 $71,500 $72,000 $75,000 5
Motor Vehicle Manufacturing $75,500 $72,000 $74,500 $79,000 4

24 | WINTER 2022 SALARY SURVEY | NATIONAL ASSOCIATION OF COLLEGES AND EMPLOYERS
BACHELOR’S DEGREE SALARIES BY MAJOR AND INDUSTRY
ACADEMIC MAJOR/INDUSTRY MEAN25TH
PERCENTILE MEDIAN75TH
PERCENTILE RESPONSES
HUMANITIES MAJORSEnglish Language & LiteratureFinance, Insurance, & Real Estate $45,350 $43,450 $45,000 $47,600 3
HistoryFinance, Insurance, & Real Estate $48,153 $45,000 $47,600 $51,860 3
Liberal Arts/General StudiesFinance, Insurance, & Real Estate $47,920 $45,000 $47,600 $50,000 5
PhilosophyFinance, Insurance, & Real Estate $45,756 $44,667 $45,000 $47,600 3
SOCIAL SCIENCES MAJORSEconomicsFinance, Insurance, & Real Estate $64,041 $58,000 $61,850 $69,600 11
Wholesale Trade $56,667 $55,000 $55,000 $60,000 3
Political Science/International RelationsFinance, Insurance, & Real Estate $59,774 $54,321 $60,000 $65,000 3
PsychologyFinance, Insurance, & Real Estate $56,221 $52,145 $55,000 $61,360 5
SociologyFinance, Insurance, & Real Estate $55,332 $49,800 $54,365 $60,865 4
MATHEMATICS AND SCIENCES MAJORSMathematics/StatisticsFinance, Insurance, & Real Estate $66,286 $64,200 $65,000 $70,000 11
Miscellaneous Professional Services $86,487 $45,760 $93,700 $120,000 3
Biology/Biological SciencesFinance, Insurance, & Real Estate $61,803 $53,105 $60,900 $70,500 4
ChemistryFinance, Insurance, & Real Estate $75,417 $65,000 $67,250 $94,000 3

NATIONAL ASSOCIATION OF COLLEGES AND EMPLOYERS | WINTER 2022 SALARY SURVEY | 25
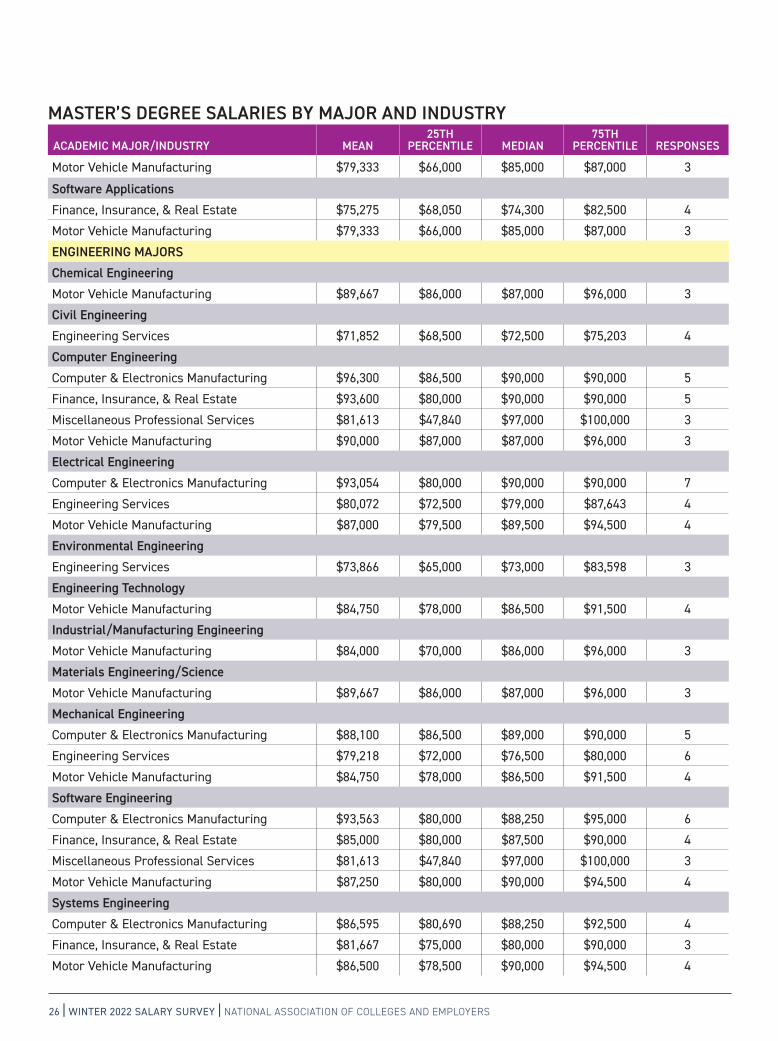
MASTER’S DEGREE SALARIES BY MAJOR AND INDUSTRY
ACADEMIC MAJOR/INDUSTRY MEAN25TH
PERCENTILE MEDIAN75TH
PERCENTILE RESPONSES
BUSINESS MAJORS
Accounting
Accounting Services $63,850 $62,550 $63,000 $66,000 3
Computer & Electronics Manufacturing $73,000 $70,000 $71,000 $78,000 3
Finance, Insurance, & Real Estate $77,771 $65,000 $77,500 $90,542 4
Motor Vehicle Manufacturing $68,667 $65,000 $68,000 $73,000 3
Actuarial Science
Finance, Insurance, & Real Estate $68,833 $62,500 $64,000 $80,000 3
Business Administration/Management
Computer & Electronics Manufacturing $75,000 $70,000 $74,000 $80,000 4
Finance, Insurance, & Real Estate $64,938 $65,000 $67,257 $67,433 5
Motor Vehicle Manufacturing $66,667 $62,000 $65,000 $73,000 3
Finance
Computer & Electronics Manufacturing $72,667 $70,000 $70,000 $78,000 3
Finance, Insurance, & Real Estate $81,463 $65,000 $72,314 $75,000 5
Motor Vehicle Manufacturing $69,333 $65,000 $68,000 $75,000 3
Human Resources
Computer & Electronics Manufacturing $78,500 $65,500 $74,000 $91,500 4
Finance, Insurance, & Real Estate $66,000 $60,000 $64,500 $72,000 6
Motor Vehicle Manufacturing $67,000 $58,000 $68,000 $75,000 3
Logistics/Supply Chain
Computer & Electronics Manufacturing $69,667 $61,000 $70,000 $78,000 3
Motor Vehicle Manufacturing $75,625 $66,000 $72,750 $85,250 4
Management Information Systems
Finance, Insurance, & Real Estate $81,500 $55,000 $90,000 $99,500 3
Marketing
Finance, Insurance, & Real Estate $69,067 $55,000 $75,000 $77,200 3
Motor Vehicle Manufacturing $69,500 $57,000 $74,000 $77,500 3
COMPUTER SCIENCES MAJORS
Computer Science
Computer & Electronics Manufacturing $97,875 $83,250 $88,250 $112,500 4
Finance, Insurance, & Real Estate $77,730 $75,000 $80,000 $81,150 5
Information $99,667 $87,000 $100,000 $112,000 3
Miscellaneous Manufacturing $84,000 $67,000 $85,000 $100,000 3
Information Sciences & Systems
Finance, Insurance, & Real Estate $75,833 $62,500 $75,000 $90,000 3
26 | WINTER 2022 SALARY SURVEY | NATIONAL ASSOCIATION OF COLLEGES AND EMPLOYERS
MASTER’S DEGREE SALARIES BY MAJOR AND INDUSTRY
ACADEMIC MAJOR/INDUSTRY MEAN25TH
PERCENTILE MEDIAN75TH
PERCENTILE RESPONSES
Motor Vehicle Manufacturing $79,333 $66,000 $85,000 $87,000 3
Software ApplicationsFinance, Insurance, & Real Estate $75,275 $68,050 $74,300 $82,500 4
Motor Vehicle Manufacturing $79,333 $66,000 $85,000 $87,000 3
ENGINEERING MAJORSChemical EngineeringMotor Vehicle Manufacturing $89,667 $86,000 $87,000 $96,000 3
Civil EngineeringEngineering Services $71,852 $68,500 $72,500 $75,203 4
Computer EngineeringComputer & Electronics Manufacturing $96,300 $86,500 $90,000 $90,000 5
Finance, Insurance, & Real Estate $93,600 $80,000 $90,000 $90,000 5
Miscellaneous Professional Services $81,613 $47,840 $97,000 $100,000 3
Motor Vehicle Manufacturing $90,000 $87,000 $87,000 $96,000 3
Electrical EngineeringComputer & Electronics Manufacturing $93,054 $80,000 $90,000 $90,000 7
Engineering Services $80,072 $72,500 $79,000 $87,643 4
Motor Vehicle Manufacturing $87,000 $79,500 $89,500 $94,500 4
Environmental EngineeringEngineering Services $73,866 $65,000 $73,000 $83,598 3
Engineering TechnologyMotor Vehicle Manufacturing $84,750 $78,000 $86,500 $91,500 4
Industrial/Manufacturing EngineeringMotor Vehicle Manufacturing $84,000 $70,000 $86,000 $96,000 3
Materials Engineering/ScienceMotor Vehicle Manufacturing $89,667 $86,000 $87,000 $96,000 3
Mechanical EngineeringComputer & Electronics Manufacturing $88,100 $86,500 $89,000 $90,000 5
Engineering Services $79,218 $72,000 $76,500 $80,000 6
Motor Vehicle Manufacturing $84,750 $78,000 $86,500 $91,500 4
Software EngineeringComputer & Electronics Manufacturing $93,563 $80,000 $88,250 $95,000 6
Finance, Insurance, & Real Estate $85,000 $80,000 $87,500 $90,000 4
Miscellaneous Professional Services $81,613 $47,840 $97,000 $100,000 3
Motor Vehicle Manufacturing $87,250 $80,000 $90,000 $94,500 4
Systems EngineeringComputer & Electronics Manufacturing $86,595 $80,690 $88,250 $92,500 4
Finance, Insurance, & Real Estate $81,667 $75,000 $80,000 $90,000 3
Motor Vehicle Manufacturing $86,500 $78,500 $90,000 $94,500 4

NATIONAL ASSOCIATION OF COLLEGES AND EMPLOYERS | WINTER 2022 SALARY SURVEY | 27
MASTER’S DEGREE SALARIES BY MAJOR AND INDUSTRY
ACADEMIC MAJOR/INDUSTRY MEAN25TH
PERCENTILE MEDIAN75TH
PERCENTILE RESPONSES
SOCIAL SCIENCES MAJORSEconomicsFinance, Insurance, & Real Estate $72,333 $65,000 $70,000 $82,000 3
MATHEMATICS AND SCIENCES MAJORSMathematics/StatisticsFinance, Insurance, & Real Estate $75,854 $63,750 $72,500 $87,959 4
Miscellaneous Professional Services $76,613 $47,840 $85,000 $97,000 3

28 | WINTER 2022 SALARY SURVEY | NATIONAL ASSOCIATION OF COLLEGES AND EMPLOYERS28 | WINTER 2022 SALARY SURVEY | NATIONAL ASSOCIATION OF COLLEGES AND EMPLOYERS28 2828 28 ||| WINTER 2022 SALARY SURVEYWINTER 2022 SALARY SURVEYWINTER 2022 SALARY SURVEY ||| NATIONAL ASSOCIATION OF COLLEGES AND EMPLOYERSNATIONAL ASSOCIATION OF COLLEGES AND EMPLOYERSNATIONAL ASSOCIATION OF COLLEGES AND EMPLOYERS
STARTING SALARY BY INDUSTRY
AND MAJOR

NATIONAL ASSOCIATION OF COLLEGES AND EMPLOYERS | WINTER 2022 SALARY SURVEY | 29
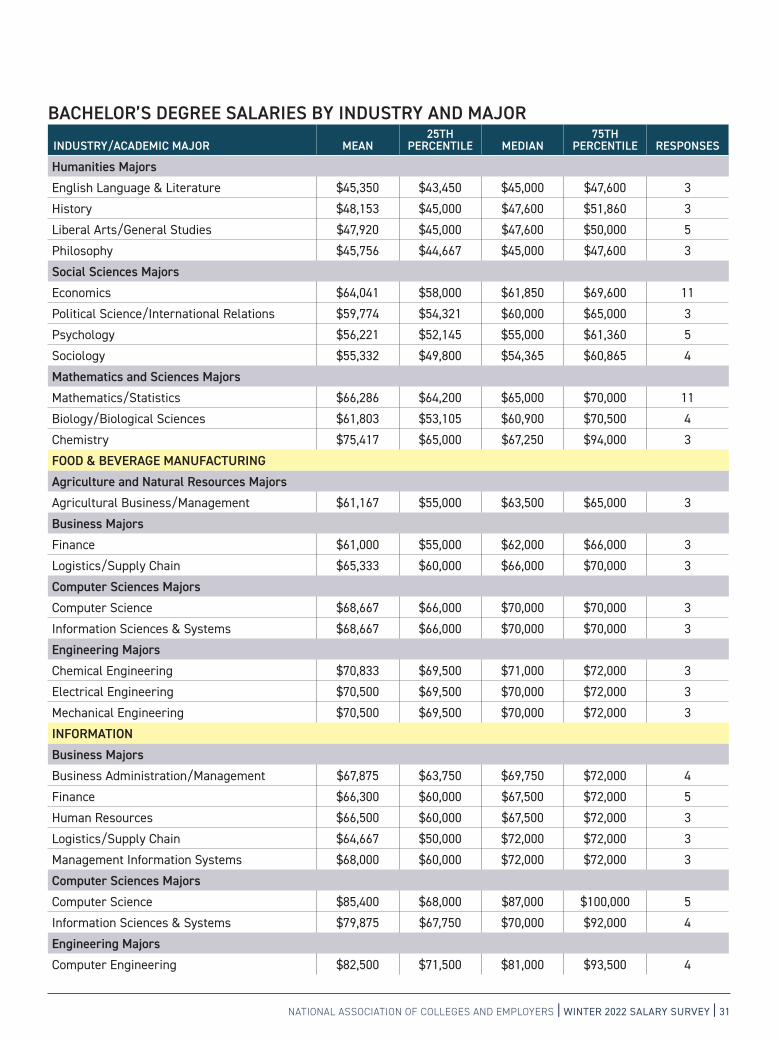
BACHELOR’S DEGREE SALARIES BY INDUSTRY AND MAJOR
INDUSTRY/ACADEMIC MAJOR MEAN25TH
PERCENTILE MEDIAN75TH
PERCENTILE RESPONSES
ACCOUNTING SERVICES
Business Majors
Accounting $62,942 $59,825 $63,000 $66,000 3
CHEMICAL (PHARMACEUTICAL) MANUFACTURING
Engineering Majors
Chemical Engineering $79,800 $75,000 $76,400 $88,000 3
Mechanical Engineering $78,033 $71,100 $75,000 $88,000 3
COMPUTER & ELECTRONICS MANUFACTURING
Business Majors
Accounting $60,320 $59,000 $59,500 $65,000 6
Business Administration/Management $56,384 $49,920 $60,000 $60,000 5
Finance $60,989 $59,000 $60,000 $65,000 7
Human Resources $60,820 $55,000 $60,000 $65,000 6
Logistics/Supply Chain $63,417 $58,000 $60,000 $66,000 7
Management Information Systems $56,640 $45,000 $49,920 $75,000 3
Marketing $65,500 $60,000 $65,000 $71,000 4
Sales $58,400 $55,000 $58,000 $60,000 5
Computer Sciences Majors
Computer Science $79,583 $71,000 $75,000 $77,500 6
Software Applications $75,833 $75,000 $75,000 $77,500 3
Engineering Majors
Chemical Engineering $75,400 $72,000 $73,000 $75,000 5
Computer Engineering $80,500 $72,000 $77,500 $80,000 7
Electrical Engineering $76,398 $70,000 $75,000 $80,000 9
Industrial/Manufacturing Engineering $74,667 $69,000 $75,000 $80,000 3
Materials Engineering/Science $76,000 $73,000 $75,000 $80,000 3
TOPPAYING INDUSTRIES / BACHELOR’S DEGREESINDUSTRY AVERAGE SALARY PROJECTION NUMBER OF SALARY PROJECTIONS
Miscellaneous Professional Services $83,269 16
Chemical (Pharmaceutical) Mfg. $78,917 6
Information $73,452 31
Oil & Gas Extraction $72,650 6
Miscellaneous Manufacturing $70,386 200

30 | WINTER 2022 SALARY SURVEY | NATIONAL ASSOCIATION OF COLLEGES AND EMPLOYERS
BACHELOR’S DEGREE SALARIES BY INDUSTRY AND MAJOR
INDUSTRY/ACADEMIC MAJOR MEAN25TH
PERCENTILE MEDIAN75TH
PERCENTILE RESPONSES
Mechanical Engineering $74,750 $72,000 $75,000 $77,500 6
Software Engineering $78,369 $72,000 $77,500 $80,000 7
Systems Engineering $72,895 $65,790 $78,750 $80,000 4
CONSTRUCTIONEngineering MajorsCivil Engineering $64,713 $63,000 $64,500 $65,780 6
Electrical Engineering $61,880 $46,800 $65,000 $73,840 3
Mechanical Engineering $62,917 $62,000 $65,000 $68,500 6
ENGINEERING SERVICESEngineering MajorsCivil Engineering $66,872 $63,000 $67,280 $70,000 6
Electrical Engineering $71,094 $66,560 $71,300 $75,000 6
Environmental Engineering $69,242 $64,780 $68,280 $73,703 4
Mechanical Engineering $72,530 $65,000 $70,000 $75,000 7
FINANCE, INSURANCE, & REAL ESTATEBusiness MajorsAccounting $59,605 $55,000 $59,000 $65,000 16
Actuarial Science $66,410 $62,500 $65,000 $70,000 10
Business Administration/Management $58,610 $52,640 $57,500 $65,000 16
Finance $59,451 $55,000 $58,000 $65,000 15
Human Resources $55,141 $47,600 $55,000 $65,000 10
International Business $52,921 $43,762 $55,000 $60,000 3
Management Information Systems $63,838 $55,000 $62,500 $67,500 12
Marketing $57,839 $55,000 $56,395 $60,000 10
Sales $55,320 $48,000 $55,000 $65,000 5
Communications MajorsAdvertising $49,833 $44,500 $50,000 $55,000 3
Communications $56,049 $51,500 $55,000 $60,000 9
Journalism $51,425 $49,600 $50,750 $53,250 4
Public Relations $49,572 $43,716 $50,000 $55,000 3
Computer Sciences MajorsComputer Science $73,868 $63,750 $70,000 $79,448 16
Information Sciences & Systems $75,143 $65,000 $70,000 $80,000 14
Software Applications $77,208 $65,000 $73,000 $82,500 12
Engineering MajorsComputer Engineering $76,331 $65,000 $70,000 $85,000 11
Electrical Engineering $87,600 $70,000 $71,000 $107,000 5
Software Engineering $81,250 $70,000 $78,000 $85,000 10
Systems Engineering $81,571 $70,000 $76,000 $85,000 7
NATIONAL ASSOCIATION OF COLLEGES AND EMPLOYERS | WINTER 2022 SALARY SURVEY | 31
BACHELOR’S DEGREE SALARIES BY INDUSTRY AND MAJOR
INDUSTRY/ACADEMIC MAJOR MEAN25TH
PERCENTILE MEDIAN75TH
PERCENTILE RESPONSES
Humanities MajorsEnglish Language & Literature $45,350 $43,450 $45,000 $47,600 3
History $48,153 $45,000 $47,600 $51,860 3
Liberal Arts/General Studies $47,920 $45,000 $47,600 $50,000 5
Philosophy $45,756 $44,667 $45,000 $47,600 3
Social Sciences MajorsEconomics $64,041 $58,000 $61,850 $69,600 11
Political Science/International Relations $59,774 $54,321 $60,000 $65,000 3
Psychology $56,221 $52,145 $55,000 $61,360 5
Sociology $55,332 $49,800 $54,365 $60,865 4
Mathematics and Sciences MajorsMathematics/Statistics $66,286 $64,200 $65,000 $70,000 11
Biology/Biological Sciences $61,803 $53,105 $60,900 $70,500 4
Chemistry $75,417 $65,000 $67,250 $94,000 3
FOOD & BEVERAGE MANUFACTURINGAgriculture and Natural Resources MajorsAgricultural Business/Management $61,167 $55,000 $63,500 $65,000 3
Business MajorsFinance $61,000 $55,000 $62,000 $66,000 3
Logistics/Supply Chain $65,333 $60,000 $66,000 $70,000 3
Computer Sciences MajorsComputer Science $68,667 $66,000 $70,000 $70,000 3
Information Sciences & Systems $68,667 $66,000 $70,000 $70,000 3
Engineering MajorsChemical Engineering $70,833 $69,500 $71,000 $72,000 3
Electrical Engineering $70,500 $69,500 $70,000 $72,000 3
Mechanical Engineering $70,500 $69,500 $70,000 $72,000 3
INFORMATION Business MajorsBusiness Administration/Management $67,875 $63,750 $69,750 $72,000 4
Finance $66,300 $60,000 $67,500 $72,000 5
Human Resources $66,500 $60,000 $67,500 $72,000 3
Logistics/Supply Chain $64,667 $50,000 $72,000 $72,000 3
Management Information Systems $68,000 $60,000 $72,000 $72,000 3
Computer Sciences MajorsComputer Science $85,400 $68,000 $87,000 $100,000 5
Information Sciences & Systems $79,875 $67,750 $70,000 $92,000 4
Engineering MajorsComputer Engineering $82,500 $71,500 $81,000 $93,500 4

32 | WINTER 2022 SALARY SURVEY | NATIONAL ASSOCIATION OF COLLEGES AND EMPLOYERS
BACHELOR’S DEGREE SALARIES BY INDUSTRY AND MAJOR
INDUSTRY/ACADEMIC MAJOR MEAN25TH
PERCENTILE MEDIAN75TH
PERCENTILE RESPONSES
MISCELLANEOUS MANUFACTURINGBusiness MajorsAccounting $60,103 $55,000 $59,000 $65,000 13
Business Administration/Management $63,875 $57,500 $62,500 $66,000 8
Finance $62,045 $57,000 $60,000 $66,000 12
Human Resources $55,349 $53,000 $58,000 $60,000 7
Logistics/Supply Chain $62,743 $55,000 $60,250 $65,000 14
Management Information Systems $72,840 $60,000 $67,000 $82,000 9
Marketing $58,827 $58,000 $60,000 $65,000 9
Sales $63,250 $60,000 $63,500 $65,500 8
Computer Sciences Majors
Computer Science $82,356 $67,000 $81,000 $85,000 10
Information Sciences & Systems $79,062 $68,000 $80,000 $85,000 9
Software Applications $82,951 $67,000 $80,000 $90,000 9
Engineering Majors
Biomedical Engineering $73,750 $70,000 $75,000 $76,250 3
Chemical Engineering $70,510 $70,000 $73,000 $75,000 9
Computer Engineering $78,293 $68,250 $76,000 $85,000 8
Electrical Engineering $74,439 $68,500 $72,000 $76,250 15
Engineering Technology $80,875 $68,250 $71,750 $93,500 4
Industrial/Manufacturing Engineering $69,392 $68,500 $71,000 $73,000 13
Materials Engineering/Science $70,809 $68,500 $71,750 $75,000 10
Mechanical Engineering $73,131 $68,250 $71,250 $75,000 16
Software Engineering $77,871 $68,000 $80,000 $82,000 9
Systems Engineering $79,700 $71,500 $72,000 $75,000 5
MISCELLANEOUS PROFESSIONAL SERVICES
Computer Sciences Majors
Computer Science $86,487 $45,760 $93,700 $120,000 3
Software Applications $86,487 $45,760 $93,700 $120,000 3
Engineering Majors
Computer Engineering $71,487 $45,760 $75,000 $93,700 3
Software Engineering $84,865 $62,880 $86,850 $106,850 4
Mathematics and Sciences Majors
Mathematics/Statistics $86,487 $45,760 $93,700 $120,000 3
MOTOR VEHICLE MANUFACTURING
Business Majors
Accounting $62,500 $61,000 $62,500 $64,000 4
Business Administration/Management $62,000 $58,000 $63,000 $65,000 3

NATIONAL ASSOCIATION OF COLLEGES AND EMPLOYERS | WINTER 2022 SALARY SURVEY | 33
BACHELOR’S DEGREE SALARIES BY INDUSTRY AND MAJOR
INDUSTRY/ACADEMIC MAJOR MEAN25TH
PERCENTILE MEDIAN75TH
PERCENTILE RESPONSES
Finance $63,000 $61,000 $63,500 $65,000 4
Human Resources $61,250 $59,000 $61,000 $63,500 4
Logistics/Supply Chain $62,500 $61,000 $63,000 $64,000 4
Marketing $61,000 $57,000 $62,000 $64,000 3
Computer Sciences Majors
Information Sciences & Systems $70,167 $66,000 $72,000 $72,500 3
Software Applications $70,167 $66,000 $72,000 $72,500 3
Engineering Majors
Chemical Engineering $76,333 $74,000 $75,000 $80,000 3
Computer Engineering $75,833 $72,500 $75,000 $80,000 3
Electrical Engineering $76,250 $73,500 $74,500 $79,000 4
Engineering Technology $74,750 $72,000 $74,500 $77,500 4
Industrial/Manufacturing Engineering $73,000 $70,000 $74,000 $75,000 3
Materials Engineering/Science $76,333 $74,000 $75,000 $80,000 3
Mechanical Engineering $73,750 $72,000 $74,500 $75,500 4
Software Engineering $75,875 $72,750 $74,000 $79,000 4
Systems Engineering $75,500 $72,000 $74,500 $79,000 4
OIL & GAS EXTRACTIONBusiness MajorsAccounting $60,700 $57,500 $61,000 $63,600 3
Computer Sciences MajorsComputer Science $84,600 $69,000 $79,800 $105,000 3
WHOLESALE TRADEBusiness MajorsBusiness Administration/Management $60,200 $55,000 $55,000 $66,000 5
Finance $62,000 $55,000 $65,000 $66,000 3
Logistics/Supply Chain $58,750 $55,000 $55,000 $62,500 4
Marketing $61,250 $57,500 $60,000 $65,000 4
Sales $60,000 $55,000 $55,000 $70,000 3
Engineering MajorsComputer Engineering $79,333 $72,000 $80,000 $86,000 3
Social Sciences MajorsEconomics $56,667 $55,000 $55,000 $60,000 3

34 | WINTER 2022 SALARY SURVEY | NATIONAL ASSOCIATION OF COLLEGES AND EMPLOYERS
MASTER’S DEGREE SALARIES BY INDUSTRY AND MAJOR
INDUSTRY/ACADEMIC MAJOR MEAN25TH
PERCENTILE MEDIAN75TH
PERCENTILE RESPONSES
ACCOUNTING SERVICES
Business Majors
Accounting $63,850 $62,550 $63,000 $66,000 3
COMPUTER & ELECTRONICS MANUFACTURING
Business Majors
Accounting $73,000 $70,000 $71,000 $78,000 3
Business Administration/Management $75,000 $70,000 $74,000 $80,000 4
Finance $72,667 $70,000 $70,000 $78,000 3
Human Resources $78,500 $65,500 $74,000 $91,500 4
Logistics/Supply Chain $69,667 $61,000 $70,000 $78,000 3
Computer Sciences Majors
Computer Science $97,875 $83,250 $88,250 $112,500 4
Engineering Majors
Computer Engineering $96,300 $86,500 $90,000 $90,000 5
Electrical Engineering $93,054 $80,000 $90,000 $90,000 7
Mechanical Engineering $88,100 $86,500 $89,000 $90,000 5
Software Engineering $93,563 $80,000 $88,250 $95,000 6
Systems Engineering $86,595 $80,690 $88,250 $92,500 4
ENGINEERING SERVICES
Engineering Majors
Civil Engineering $71,852 $68,500 $72,500 $75,203 4
Electrical Engineering $80,072 $72,500 $79,000 $87,643 4
Environmental Engineering $73,866 $65,000 $73,000 $83,598 3
Mechanical Engineering $79,218 $72,000 $76,500 $80,000 6
FINANCE, INSURANCE, & REAL ESTATE
Business Majors
Accounting $77,771 $65,000 $77,500 $90,542 4
TOP-PAYING INDUSTRIES / MASTER’S DEGREESINDUSTRY AVERAGE SALARY PROJECTION NUMBER OF SALARY PROJECTIONS
Information $99,667 3
Computer & Electronics Mfg. $86,097 48
Miscellaneous Manufacturing $84,000 3
Motor Vehicle Manufacturing $80,404 57
Miscellaneous Professional Services $79,947 9
NATIONAL ASSOCIATION OF COLLEGES AND EMPLOYERS | WINTER 2022 SALARY SURVEY | 35
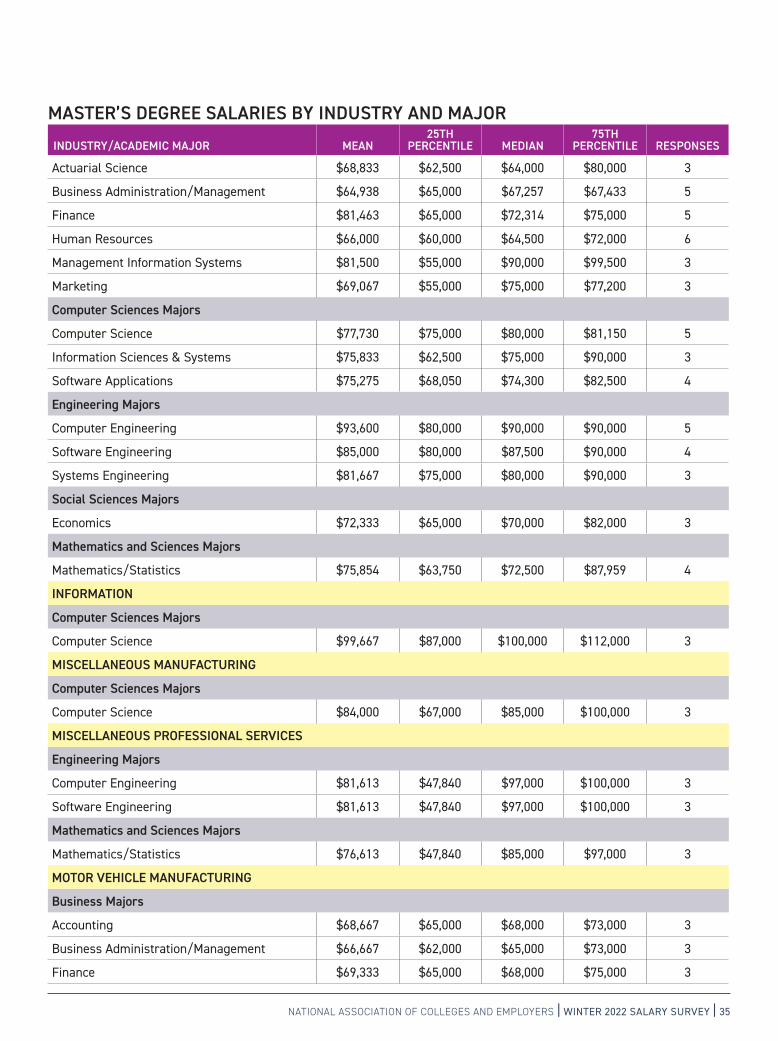
MASTER’S DEGREE SALARIES BY INDUSTRY AND MAJOR
INDUSTRY/ACADEMIC MAJOR MEAN25TH
PERCENTILE MEDIAN75TH
PERCENTILE RESPONSES
Actuarial Science $68,833 $62,500 $64,000 $80,000 3
Business Administration/Management $64,938 $65,000 $67,257 $67,433 5
Finance $81,463 $65,000 $72,314 $75,000 5
Human Resources $66,000 $60,000 $64,500 $72,000 6
Management Information Systems $81,500 $55,000 $90,000 $99,500 3
Marketing $69,067 $55,000 $75,000 $77,200 3
Computer Sciences Majors
Computer Science $77,730 $75,000 $80,000 $81,150 5
Information Sciences & Systems $75,833 $62,500 $75,000 $90,000 3
Software Applications $75,275 $68,050 $74,300 $82,500 4
Engineering Majors
Computer Engineering $93,600 $80,000 $90,000 $90,000 5
Software Engineering $85,000 $80,000 $87,500 $90,000 4
Systems Engineering $81,667 $75,000 $80,000 $90,000 3
Social Sciences Majors
Economics $72,333 $65,000 $70,000 $82,000 3
Mathematics and Sciences Majors
Mathematics/Statistics $75,854 $63,750 $72,500 $87,959 4
INFORMATION
Computer Sciences Majors
Computer Science $99,667 $87,000 $100,000 $112,000 3
MISCELLANEOUS MANUFACTURING
Computer Sciences Majors
Computer Science $84,000 $67,000 $85,000 $100,000 3
MISCELLANEOUS PROFESSIONAL SERVICES
Engineering Majors
Computer Engineering $81,613 $47,840 $97,000 $100,000 3
Software Engineering $81,613 $47,840 $97,000 $100,000 3
Mathematics and Sciences Majors
Mathematics/Statistics $76,613 $47,840 $85,000 $97,000 3
MOTOR VEHICLE MANUFACTURING
Business Majors
Accounting $68,667 $65,000 $68,000 $73,000 3
Business Administration/Management $66,667 $62,000 $65,000 $73,000 3
Finance $69,333 $65,000 $68,000 $75,000 3

36 | WINTER 2022 SALARY SURVEY | NATIONAL ASSOCIATION OF COLLEGES AND EMPLOYERS36 | WINTER 2022 SALARY SURVEY | NATIONAL ASSOCIATION OF COLLEGES AND EMPLOYERS
MASTER’S DEGREE SALARIES BY INDUSTRY AND MAJOR
INDUSTRY/ACADEMIC MAJOR MEAN25TH
PERCENTILE MEDIAN75TH
PERCENTILE RESPONSES
Human Resources $67,000 $58,000 $68,000 $75,000 3
Logistics/Supply Chain $75,625 $66,000 $72,750 $85,250 4
Marketing $69,500 $57,000 $74,000 $77,500 3
Computer Sciences Majors
Information Sciences & Systems $79,333 $66,000 $85,000 $87,000 3
Software Applications $79,333 $66,000 $85,000 $87,000 3
Engineering MajorsChemical Engineering $89,667 $86,000 $87,000 $96,000 3
Computer Engineering $90,000 $87,000 $87,000 $96,000 3
Electrical Engineering $87,000 $79,500 $89,500 $94,500 4
Engineering Technology $84,750 $78,000 $86,500 $91,500 4
Industrial/Manufacturing Engineering $84,000 $70,000 $86,000 $96,000 3
Materials Engineering/Science $89,667 $86,000 $87,000 $96,000 3
Mechanical Engineering $84,750 $78,000 $86,500 $91,500 4
Software Engineering $87,250 $80,000 $90,000 $94,500 4
Systems Engineering $86,500 $78,500 $90,000 $94,500 4

NATIONAL ASSOCIATION OF COLLEGES AND EMPLOYERS | WINTER 2022 SALARY SURVEY | 37NATIONAL ASSOCIATION OF COLLEGES AND EMPLOYERS | WINTER 2022 SALARY SURVEY | 37
STARTING SALARY BY JOB
POSITION
NATIONAL ASSOCIATION OF COLLEGES AND EMPLOYERS | WINTER 2022 SALARY SURVEY | 37
38 | WINTER 2022 SALARY SURVEY | NATIONAL ASSOCIATION OF COLLEGES AND EMPLOYERS
ASSOCIATE DEGREE SALARIES BY JOB POSITION
JOB POSITION MEAN25TH
PERCENTILE MEDIAN75TH
PERCENTILE RESPONSES
Engineering (Engineers, Technicians) $47,157 $37,064 $42,500 $57,250 4
Sales $63,620 $35,360 $69,500 $86,000 3
Office & Administrative Support $55,805 $35,111 $48,500 $76,500 4
BACHELOR’S DEGREE SALARIES BY JOB POSITION
JOB POSITION MEAN25TH
PERCENTILE MEDIAN75TH
PERCENTILE RESPONSES
Business Operations (Buyers, Adjusters, HR, Logistics, Training Specialists, Marketing) $59,162 $55,000 $58,000 $65,000 51
Financial Specialists (Accountants/Auditors, Financial Analysts, Tax Specialists) $60,225 $57,500 $60,000 $65,000 49
Computer Occupations (Systems Analysts, Programmers, Software Developers, Network Specialists)
$74,628 $67,000 $72,500 $80,000 49
Mathematical Occupations (Actuaries, Mathematicians, Statisticians) $65,245 $61,000 $65,000 $70,000 20
Engineering (Engineers, Technicians) $70,973 $66,000 $70,000 $75,000 58
Environmental & Conservation Scientists $60,501 $48,000 $61,000 $68,000 6
Physical Scientists (Physicists, Chemists, Materials Scientists, Geologists) $64,283 $57,800 $61,000 $71,000 6
Economists $62,211 $55,000 $60,000 $67,000 9
Visual Arts (Artists, Designers) $52,040 $50,000 $53,000 $55,000 5
Communications (Public Relations Specialists, Writers/Editors, Interpreters/Translators, Film & Video Editors)
$54,573 $50,000 $53,000 $61,500 12
Healthcare Practitioners (Dieticians/Nutritionists, Therapists, Nurses, Health Technologists & Technicians)
$61,931 $45,792 $60,000 $80,000 3
Sales $59,079 $55,000 $58,100 $65,000 29
Office & Administrative Support $51,136 $47,117 $49,950 $52,500 12
NATIONAL ASSOCIATION OF COLLEGES AND EMPLOYERS | WINTER 2022 SALARY SURVEY | 39
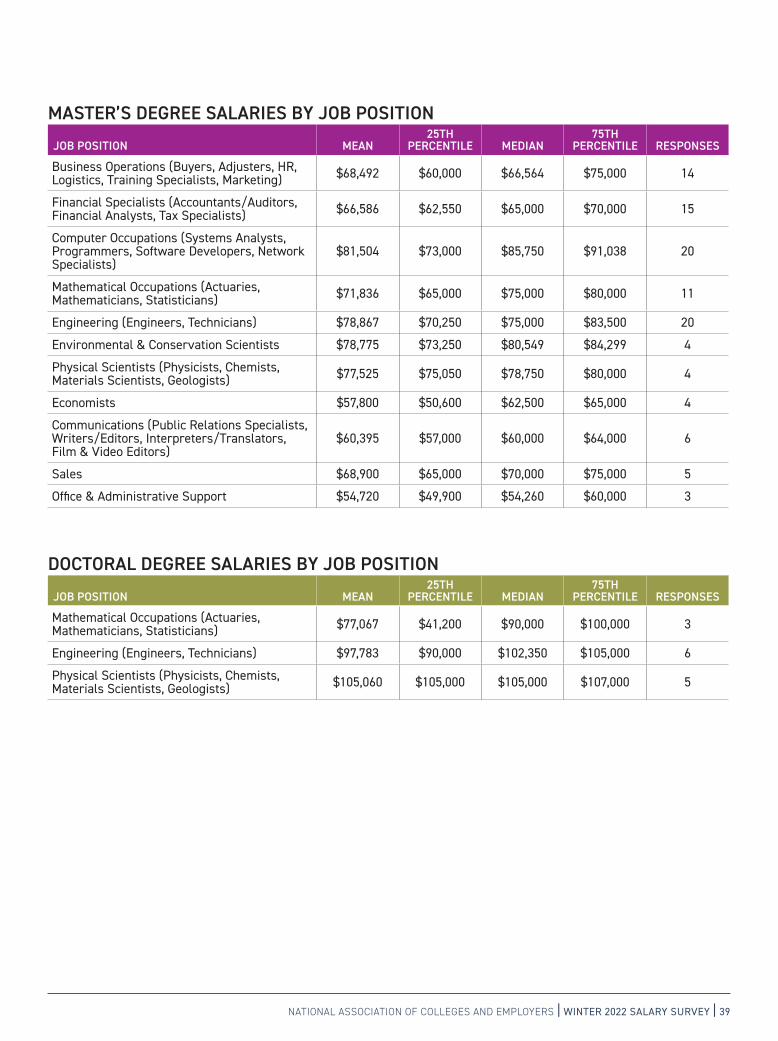
DOCTORAL DEGREE SALARIES BY JOB POSITION
JOB POSITION MEAN25TH
PERCENTILE MEDIAN75TH
PERCENTILE RESPONSES
Mathematical Occupations (Actuaries, Mathematicians, Statisticians) $77,067 $41,200 $90,000 $100,000 3
Engineering (Engineers, Technicians) $97,783 $90,000 $102,350 $105,000 6
Physical Scientists (Physicists, Chemists, Materials Scientists, Geologists) $105,060 $105,000 $105,000 $107,000 5
MASTER’S DEGREE SALARIES BY JOB POSITION
JOB POSITION MEAN25TH
PERCENTILE MEDIAN75TH
PERCENTILE RESPONSES
Business Operations (Buyers, Adjusters, HR, Logistics, Training Specialists, Marketing) $68,492 $60,000 $66,564 $75,000 14
Financial Specialists (Accountants/Auditors, Financial Analysts, Tax Specialists) $66,586 $62,550 $65,000 $70,000 15
Computer Occupations (Systems Analysts, Programmers, Software Developers, Network Specialists)
$81,504 $73,000 $85,750 $91,038 20
Mathematical Occupations (Actuaries, Mathematicians, Statisticians) $71,836 $65,000 $75,000 $80,000 11
Engineering (Engineers, Technicians) $78,867 $70,250 $75,000 $83,500 20
Environmental & Conservation Scientists $78,775 $73,250 $80,549 $84,299 4
Physical Scientists (Physicists, Chemists, Materials Scientists, Geologists) $77,525 $75,050 $78,750 $80,000 4
Economists $57,800 $50,600 $62,500 $65,000 4
Communications (Public Relations Specialists, Writers/Editors, Interpreters/Translators, Film & Video Editors)
$60,395 $57,000 $60,000 $64,000 6
Sales $68,900 $65,000 $70,000 $75,000 5
Office & Administrative Support $54,720 $49,900 $54,260 $60,000 3

40 | WINTER 2022 SALARY SURVEY | NATIONAL ASSOCIATION OF COLLEGES AND EMPLOYERS
BACHELOR’S DEGREE SALARIES BY JOB POSITION AND INDUSTRY
JOB POSITION/INDUSTRY MEAN25TH
PERCENTILE MEDIAN75TH
PERCENTILE RESPONSES
Business Operations (Buyers, Adjusters, HR, Logistics, Training Specialists, Marketing)Finance, Insurance, & Real Estate $55,425 $50,000 $55,000 $60,000 14
Miscellaneous Manufacturing $64,869 $55,000 $60,000 $65,000 11
Financial Specialists (Accountants/Auditors, Financial Analysts, Tax Specialists)Finance, Insurance, & Real Estate $59,981 $55,000 $60,000 $62,000 15
Miscellaneous Manufacturing $65,090 $59,000 $62,500 $67,000 10
Computer Occupations (Systems Analysts, Programmers, Software Developers, Network Specialists)Computer & Electronics Manufacturing $74,500 $71,000 $77,000 $77,500 5
Finance, Insurance, & Real Estate $77,421 $65,000 $75,500 $85,000 14
Miscellaneous Manufacturing $76,625 $67,500 $71,500 $84,500 8
Mathematical Occupations (Actuaries, Mathematicians, Statisticians)Finance, Insurance, & Real Estate $66,389 $62,500 $67,000 $70,000 9
Engineering (Engineers, Technicians)Computer & Electronics Manufacturing $74,600 $69,000 $71,000 $73,000 5
Construction $68,000 $66,000 $68,000 $68,500 5
Engineering Services $65,669 $63,000 $70,000 $70,680 7
Finance, Insurance, & Real Estate $67,000 $60,000 $65,000 $70,000 5
Miscellaneous Manufacturing $73,205 $69,000 $71,250 $75,000 14
Communications (Public Relations Specialists, Writers/Editors, Interpreters/Translators, Film & Video Editors)Finance, Insurance, & Real Estate $50,200 $50,000 $50,000 $51,000 5
SalesFinance, Insurance, & Real Estate $51,743 $47,600 $50,000 $55,000 7
Miscellaneous Manufacturing $63,667 $62,000 $65,000 $65,000 6
Office & Administrative SupportFinance, Insurance, & Real Estate $52,100 $47,600 $50,000 $55,000 6
STARTING SALARY BY JOB POSITION AND INDUSTRY (Bachelor’s Degree)

NATIONAL ASSOCIATION OF COLLEGES AND EMPLOYERS | WINTER 2022 SALARY SURVEY | 41
STARTING SALARY BY INDUSTRY AND JOB POSITION (Bachelor’s Degree)
BACHELOR’S DEGREE SALARIES BY INDUSTRY AND JOB POSITION
INDUSTRY/JOB POSITION MEAN25TH
PERCENTILE MEDIAN75TH
PERCENTILE RESPONSES
Computer & Electronics ManufacturingComputer Occupations (Systems Analysts, Programmers, Software Developers, Network Specialists)
$74,500 $71,000 $77,000 $77,500 5
Engineering (Engineers, Technicians) $74,600 $69,000 $71,000 $73,000 5
ConstructionEngineering (Engineers, Technicians) $68,000 $66,000 $68,000 $68,500 5
Engineering ServicesEngineering (Engineers, Technicians) $65,669 $63,000 $70,000 $70,680 7
Finance, Insurance, & Real EstateBusiness Operations (Buyers, Adjusters, HR, Logistics, Training Specialists, Marketing) $55,425 $50,000 $55,000 $60,000 14
Financial Specialists (Accountants/Auditors, Financial Analysts, Tax Specialists) $59,981 $55,000 $60,000 $62,000 15
Computer Occupations (Systems Analysts, Programmers, Software Developers, Network Specialists)
$77,421 $65,000 $75,500 $85,000 14
Mathematical Occupations (Actuaries, Mathematicians, Statisticians) $66,389 $62,500 $67,000 $70,000 9
Engineering (Engineers, Technicians) $67,000 $60,000 $65,000 $70,000 5
Communications (Public Relations Specialists, Writers/Editors, Interpreters/Translators, Film & Video Editors)
$50,200 $50,000 $50,000 $51,000 5
Sales $51,743 $47,600 $50,000 $55,000 7
Office & Administrative Support $52,100 $47,600 $50,000 $55,000 6
Miscellaneous ManufacturingBusiness Operations (Buyers, Adjusters, HR, Logistics, Training Specialists, Marketing) $64,869 $55,000 $60,000 $65,000 11
Financial Specialists (Accountants/Auditors, Financial Analysts, Tax Specialists) $65,090 $59,000 $62,500 $67,000 10
Computer Occupations (Systems Analysts, Programmers, Software Developers, Network Specialists)
$76,625 $67,500 $71,500 $84,500 8
Engineering (Engineers, Technicians) $73,205 $69,000 $71,250 $75,000 14
Sales $63,667 $62,000 $65,000 $65,000 6

42 | WINTER 2022 SALARY SURVEY | NATIONAL ASSOCIATION OF COLLEGES AND EMPLOYERS42 | WINTER 2022 SALARY SURVEY | NATIONAL ASSOCIATION OF COLLEGES AND EMPLOYERS42 4242 42 ||| WINTER 2022 SALARY SURVEYWINTER 2022 SALARY SURVEYWINTER 2022 SALARY SURVEY ||| NATIONAL ASSOCIATION OF COLLEGES AND EMPLOYERSNATIONAL ASSOCIATION OF COLLEGES AND EMPLOYERSNATIONAL ASSOCIATION OF COLLEGES AND EMPLOYERS
STARTING SALARY BY
REGION AND MAJOR

NATIONAL ASSOCIATION OF COLLEGES AND EMPLOYERS | WINTER 2022 SALARY SURVEY | 43
BACHELOR’S DEGREE SALARIES BY REGION AND MAJOR NEW ENGLAND
NEW ENGLAND MEAN25TH
PERCENTILE MEDIAN75TH
PERCENTILE RESPONSES
Business MajorsAccounting $61,500 $58,000 $62,500 $65,000 4
Business Administration/Management $62,600 $58,000 $65,000 $65,000 5
Finance $64,050 $60,600 $63,100 $67,500 4
Human Resources $60,750 $59,000 $60,000 $62,500 4
Logistics/Supply Chain $61,280 $57,400 $60,000 $64,000 5
Marketing $61,250 $56,000 $60,000 $66,500 4
Sales $60,667 $55,000 $57,000 $70,000 3
Computer Sciences MajorsInformation Sciences & Systems $73,000 $66,000 $73,000 $80,000 3
Software Applications $88,667 $66,000 $80,000 $120,000 3
Engineering MajorsComputer Engineering $86,750 $73,500 $77,500 $100,000 4
Electrical Engineering $77,500 $72,500 $74,000 $82,500 4
Engineering Technology $75,000 $70,000 $75,000 $80,000 3
Industrial/Manufacturing Engineering $72,333 $70,000 $72,000 $75,000 3
Materials Engineering/Science $77,333 $72,000 $75,000 $85,000 3
Mechanical Engineering $76,750 $71,000 $73,500 $82,500 4
Software Engineering $87,000 $74,000 $77,500 $100,000 4
AVERAGE BACHELOR’S DEGREE SALARIES BY BROAD CATEGORY NEW ENGLANDBROAD CATEGORY 2022 AVERAGE SALARY RESPONSES
Business $61,779 29
Computer Sciences $80,833 6
Engineering $79,440 25
44 | WINTER 2022 SALARY SURVEY | NATIONAL ASSOCIATION OF COLLEGES AND EMPLOYERS
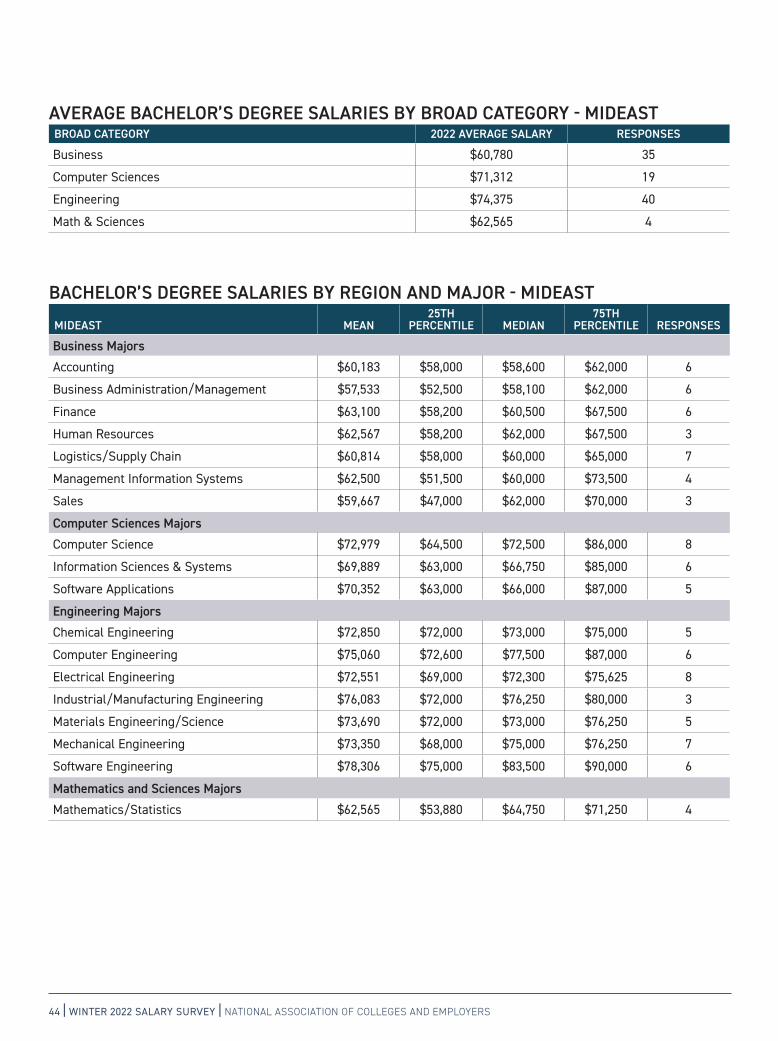
BACHELOR’S DEGREE SALARIES BY REGION AND MAJOR - MIDEAST
MIDEAST MEAN25TH
PERCENTILE MEDIAN75TH
PERCENTILE RESPONSES
Business MajorsAccounting $60,183 $58,000 $58,600 $62,000 6
Business Administration/Management $57,533 $52,500 $58,100 $62,000 6
Finance $63,100 $58,200 $60,500 $67,500 6
Human Resources $62,567 $58,200 $62,000 $67,500 3
Logistics/Supply Chain $60,814 $58,000 $60,000 $65,000 7
Management Information Systems $62,500 $51,500 $60,000 $73,500 4
Sales $59,667 $47,000 $62,000 $70,000 3
Computer Sciences MajorsComputer Science $72,979 $64,500 $72,500 $86,000 8
Information Sciences & Systems $69,889 $63,000 $66,750 $85,000 6
Software Applications $70,352 $63,000 $66,000 $87,000 5
Engineering MajorsChemical Engineering $72,850 $72,000 $73,000 $75,000 5
Computer Engineering $75,060 $72,600 $77,500 $87,000 6
Electrical Engineering $72,551 $69,000 $72,300 $75,625 8
Industrial/Manufacturing Engineering $76,083 $72,000 $76,250 $80,000 3
Materials Engineering/Science $73,690 $72,000 $73,000 $76,250 5
Mechanical Engineering $73,350 $68,000 $75,000 $76,250 7
Software Engineering $78,306 $75,000 $83,500 $90,000 6
Mathematics and Sciences MajorsMathematics/Statistics $62,565 $53,880 $64,750 $71,250 4
AVERAGE BACHELOR’S DEGREE SALARIES BY BROAD CATEGORY - MIDEASTBROAD CATEGORY 2022 AVERAGE SALARY RESPONSES
Business $60,780 35
Computer Sciences $71,312 19
Engineering $74,375 40
Math & Sciences $62,565 4
NATIONAL ASSOCIATION OF COLLEGES AND EMPLOYERS | WINTER 2022 SALARY SURVEY | 45
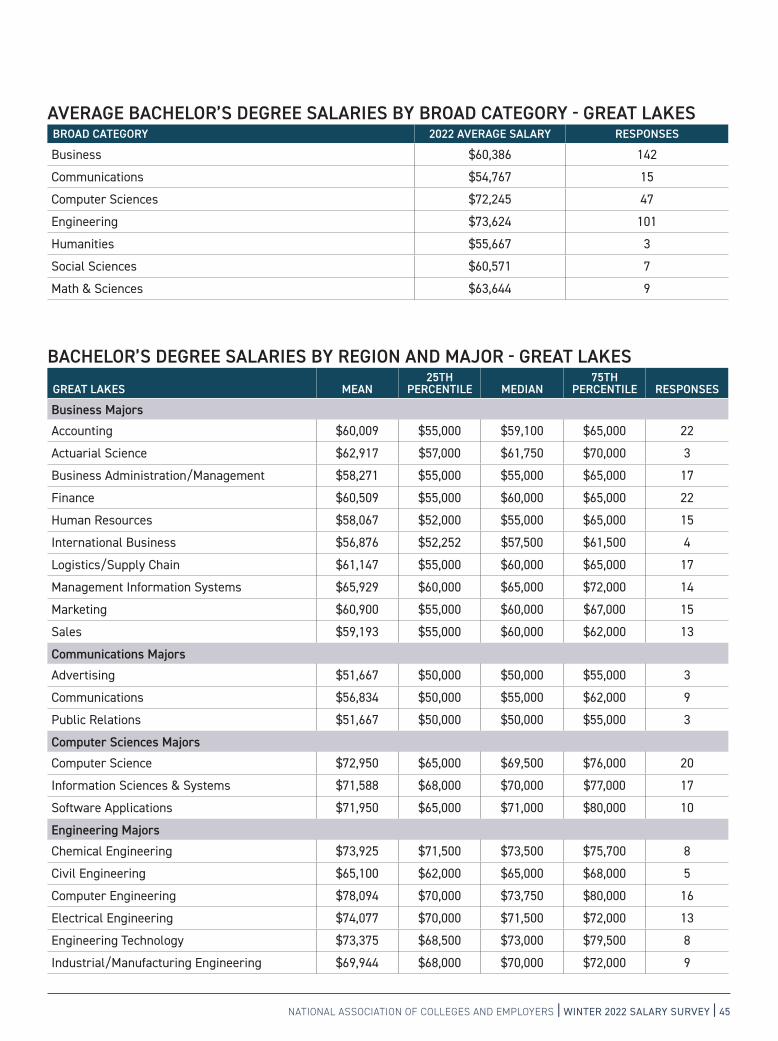
BACHELOR’S DEGREE SALARIES BY REGION AND MAJOR - GREAT LAKES
GREAT LAKES MEAN25TH
PERCENTILE MEDIAN75TH
PERCENTILE RESPONSES
Business MajorsAccounting $60,009 $55,000 $59,100 $65,000 22
Actuarial Science $62,917 $57,000 $61,750 $70,000 3
Business Administration/Management $58,271 $55,000 $55,000 $65,000 17
Finance $60,509 $55,000 $60,000 $65,000 22
Human Resources $58,067 $52,000 $55,000 $65,000 15
International Business $56,876 $52,252 $57,500 $61,500 4
Logistics/Supply Chain $61,147 $55,000 $60,000 $65,000 17
Management Information Systems $65,929 $60,000 $65,000 $72,000 14
Marketing $60,900 $55,000 $60,000 $67,000 15
Sales $59,193 $55,000 $60,000 $62,000 13
Communications MajorsAdvertising $51,667 $50,000 $50,000 $55,000 3
Communications $56,834 $50,000 $55,000 $62,000 9
Public Relations $51,667 $50,000 $50,000 $55,000 3
Computer Sciences MajorsComputer Science $72,950 $65,000 $69,500 $76,000 20
Information Sciences & Systems $71,588 $68,000 $70,000 $77,000 17
Software Applications $71,950 $65,000 $71,000 $80,000 10
Engineering MajorsChemical Engineering $73,925 $71,500 $73,500 $75,700 8
Civil Engineering $65,100 $62,000 $65,000 $68,000 5
Computer Engineering $78,094 $70,000 $73,750 $80,000 16
Electrical Engineering $74,077 $70,000 $71,500 $72,000 13
Engineering Technology $73,375 $68,500 $73,000 $79,500 8
Industrial/Manufacturing Engineering $69,944 $68,000 $70,000 $72,000 9
AVERAGE BACHELOR’S DEGREE SALARIES BY BROAD CATEGORY - GREAT LAKESBROAD CATEGORY 2022 AVERAGE SALARY RESPONSES
Business $60,386 142
Communications $54,767 15
Computer Sciences $72,245 47
Engineering $73,624 101
Humanities $55,667 3
Social Sciences $60,571 7
Math & Sciences $63,644 9
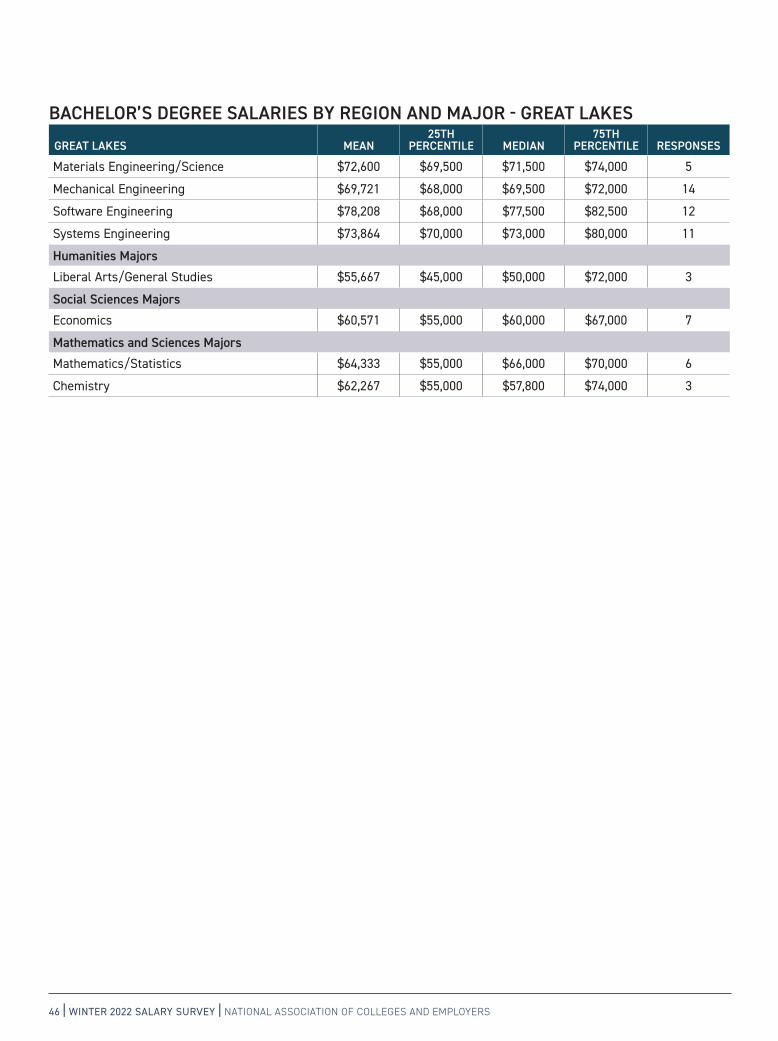
46 | WINTER 2022 SALARY SURVEY | NATIONAL ASSOCIATION OF COLLEGES AND EMPLOYERS
BACHELOR’S DEGREE SALARIES BY REGION AND MAJOR - GREAT LAKES
GREAT LAKES MEAN25TH
PERCENTILE MEDIAN75TH
PERCENTILE RESPONSES
Materials Engineering/Science $72,600 $69,500 $71,500 $74,000 5
Mechanical Engineering $69,721 $68,000 $69,500 $72,000 14
Software Engineering $78,208 $68,000 $77,500 $82,500 12
Systems Engineering $73,864 $70,000 $73,000 $80,000 11
Humanities MajorsLiberal Arts/General Studies $55,667 $45,000 $50,000 $72,000 3
Social Sciences MajorsEconomics $60,571 $55,000 $60,000 $67,000 7
Mathematics and Sciences MajorsMathematics/Statistics $64,333 $55,000 $66,000 $70,000 6
Chemistry $62,267 $55,000 $57,800 $74,000 3
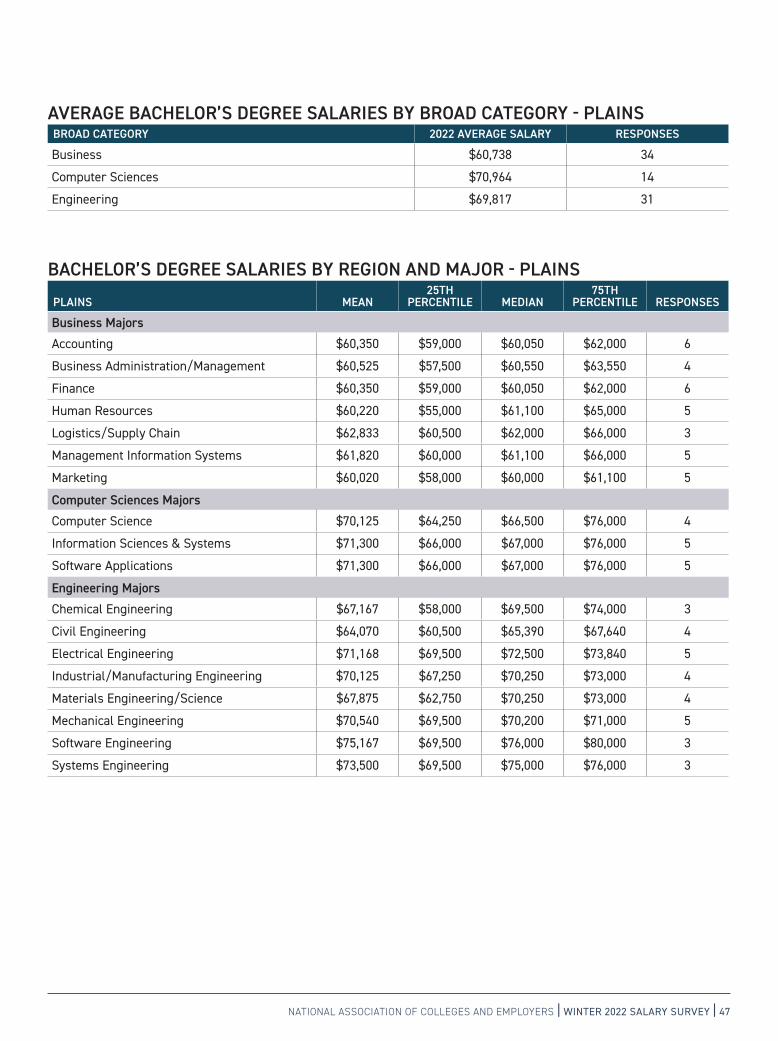
NATIONAL ASSOCIATION OF COLLEGES AND EMPLOYERS | WINTER 2022 SALARY SURVEY | 47
AVERAGE BACHELOR’S DEGREE SALARIES BY BROAD CATEGORY - PLAINSBROAD CATEGORY 2022 AVERAGE SALARY RESPONSES
Business $60,738 34
Computer Sciences $70,964 14
Engineering $69,817 31
BACHELOR’S DEGREE SALARIES BY REGION AND MAJOR - PLAINS
PLAINS MEAN25TH
PERCENTILE MEDIAN75TH
PERCENTILE RESPONSES
Business MajorsAccounting $60,350 $59,000 $60,050 $62,000 6
Business Administration/Management $60,525 $57,500 $60,550 $63,550 4
Finance $60,350 $59,000 $60,050 $62,000 6
Human Resources $60,220 $55,000 $61,100 $65,000 5
Logistics/Supply Chain $62,833 $60,500 $62,000 $66,000 3
Management Information Systems $61,820 $60,000 $61,100 $66,000 5
Marketing $60,020 $58,000 $60,000 $61,100 5
Computer Sciences MajorsComputer Science $70,125 $64,250 $66,500 $76,000 4
Information Sciences & Systems $71,300 $66,000 $67,000 $76,000 5
Software Applications $71,300 $66,000 $67,000 $76,000 5
Engineering MajorsChemical Engineering $67,167 $58,000 $69,500 $74,000 3
Civil Engineering $64,070 $60,500 $65,390 $67,640 4
Electrical Engineering $71,168 $69,500 $72,500 $73,840 5
Industrial/Manufacturing Engineering $70,125 $67,250 $70,250 $73,000 4
Materials Engineering/Science $67,875 $62,750 $70,250 $73,000 4
Mechanical Engineering $70,540 $69,500 $70,200 $71,000 5
Software Engineering $75,167 $69,500 $76,000 $80,000 3
Systems Engineering $73,500 $69,500 $75,000 $76,000 3

48 | WINTER 2022 SALARY SURVEY | NATIONAL ASSOCIATION OF COLLEGES AND EMPLOYERS
AVERAGE BACHELOR’S DEGREE SALARIES BY BROAD CATEGORY - SOUTHEASTBROAD CATEGORY 2022 AVERAGE SALARY RESPONSES
Business $57,914 63
Communications $54,808 7
Computer Sciences $77,279 19
Engineering $70,702 52
Social Sciences $70,051 7
Math & Sciences $69,475 6
BACHELOR’S DEGREE SALARIES BY REGION AND MAJOR - SOUTHEAST
SOUTHEAST MEAN25TH
PERCENTILE MEDIAN75TH
PERCENTILE RESPONSES
Business MajorsAccounting $57,018 $54,685 $58,000 $65,000 7
Actuarial Science $65,270 $62,500 $62,852 $65,000 5
Business Administration/Management $59,644 $57,500 $60,000 $63,438 8
Finance $55,275 $53,380 $59,000 $60,000 8
Human Resources $53,893 $46,809 $58,000 $60,000 7
International Business $54,691 $49,381 $57,500 $60,000 4
Logistics/Supply Chain $57,288 $58,000 $60,000 $65,000 5
Management Information Systems $61,579 $58,000 $60,000 $65,000 7
Marketing $57,654 $56,895 $60,000 $62,500 8
Sales $57,250 $53,000 $58,000 $61,500 4
Communications MajorsCommunications $56,235 $52,469 $57,500 $60,000 4
Public Relations $52,905 $43,716 $55,000 $60,000 3
Computer Sciences MajorsComputer Science $78,399 $70,000 $70,000 $78,895 9
Information Sciences & Systems $77,600 $68,000 $70,000 $70,000 5
Software Applications $74,940 $68,000 $70,000 $75,000 5
Engineering MajorsAerospace/Aeronautical Engineering $91,233 $75,000 $93,700 $105,000 3
Chemical Engineering $73,777 $60,320 $73,250 $88,000 6
Computer Engineering $67,648 $55,440 $70,000 $77,500 8
Electrical Engineering $74,904 $68,500 $72,000 $80,000 10
Industrial/Manufacturing Engineering $58,548 $47,840 $62,400 $68,500 5
Materials Engineering/Science $66,368 $68,500 $70,000 $72,500 5
Mechanical Engineering $68,032 $63,000 $68,500 $73,000 9
Software Engineering $72,173 $66,500 $72,500 $80,000 6

NATIONAL ASSOCIATION OF COLLEGES AND EMPLOYERS | WINTER 2022 SALARY SURVEY | 49
BACHELOR’S DEGREE SALARIES BY REGION AND MAJOR - SOUTHEAST
SOUTHEAST MEAN25TH
PERCENTILE MEDIAN75TH
PERCENTILE RESPONSES
Social Sciences MajorsEconomics $70,788 $59,925 $65,725 $81,650 4
Psychology $69,068 $52,145 $61,360 $93,700 3
Mathematics and Sciences MajorsMathematics/Statistics $69,475 $64,200 $64,725 $67,000 6
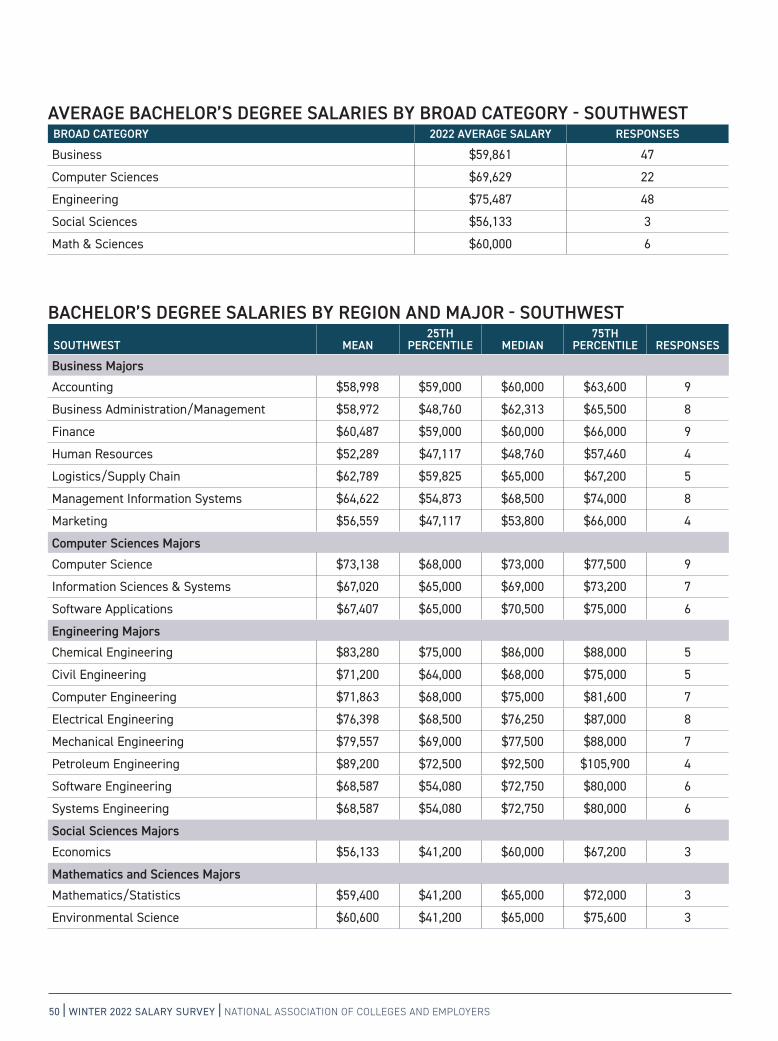
50 | WINTER 2022 SALARY SURVEY | NATIONAL ASSOCIATION OF COLLEGES AND EMPLOYERS
BACHELOR’S DEGREE SALARIES BY REGION AND MAJOR - SOUTHWEST
SOUTHWEST MEAN25TH
PERCENTILE MEDIAN75TH
PERCENTILE RESPONSES
Business MajorsAccounting $58,998 $59,000 $60,000 $63,600 9
Business Administration/Management $58,972 $48,760 $62,313 $65,500 8
Finance $60,487 $59,000 $60,000 $66,000 9
Human Resources $52,289 $47,117 $48,760 $57,460 4
Logistics/Supply Chain $62,789 $59,825 $65,000 $67,200 5
Management Information Systems $64,622 $54,873 $68,500 $74,000 8
Marketing $56,559 $47,117 $53,800 $66,000 4
Computer Sciences MajorsComputer Science $73,138 $68,000 $73,000 $77,500 9
Information Sciences & Systems $67,020 $65,000 $69,000 $73,200 7
Software Applications $67,407 $65,000 $70,500 $75,000 6
Engineering MajorsChemical Engineering $83,280 $75,000 $86,000 $88,000 5
Civil Engineering $71,200 $64,000 $68,000 $75,000 5
Computer Engineering $71,863 $68,000 $75,000 $81,600 7
Electrical Engineering $76,398 $68,500 $76,250 $87,000 8
Mechanical Engineering $79,557 $69,000 $77,500 $88,000 7
Petroleum Engineering $89,200 $72,500 $92,500 $105,900 4
Software Engineering $68,587 $54,080 $72,750 $80,000 6
Systems Engineering $68,587 $54,080 $72,750 $80,000 6
Social Sciences MajorsEconomics $56,133 $41,200 $60,000 $67,200 3
Mathematics and Sciences MajorsMathematics/Statistics $59,400 $41,200 $65,000 $72,000 3
Environmental Science $60,600 $41,200 $65,000 $75,600 3
AVERAGE BACHELOR’S DEGREE SALARIES BY BROAD CATEGORY - SOUTHWESTBROAD CATEGORY 2022 AVERAGE SALARY RESPONSES
Business $59,861 47
Computer Sciences $69,629 22
Engineering $75,487 48
Social Sciences $56,133 3
Math & Sciences $60,000 6
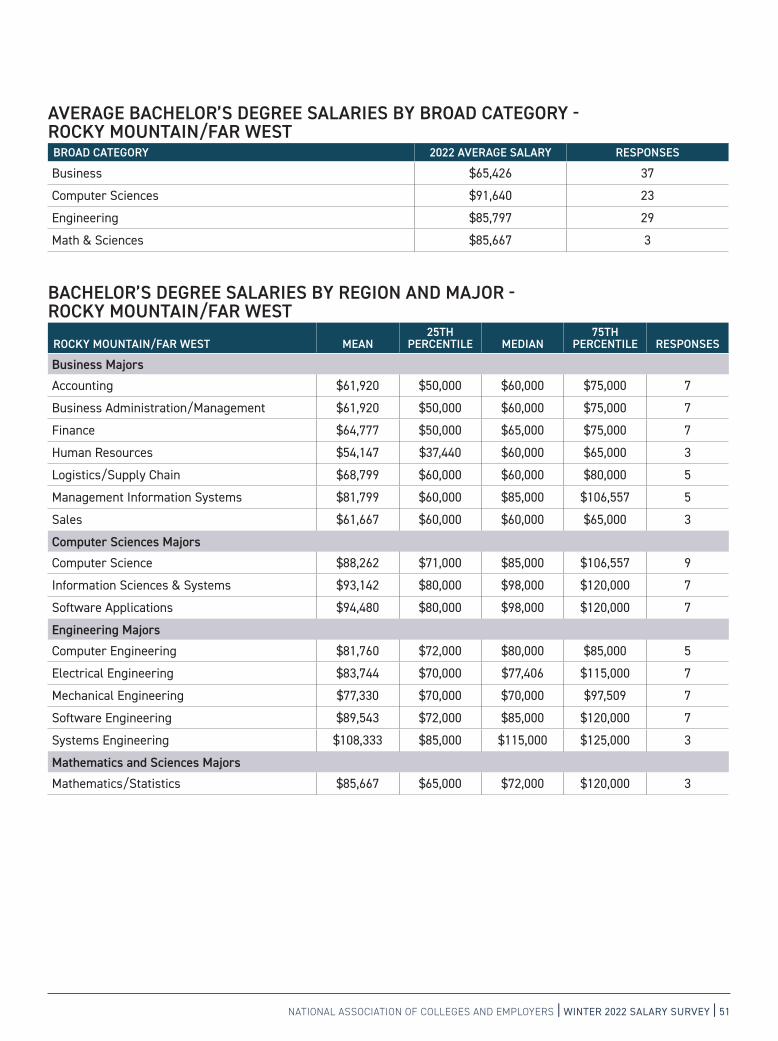
NATIONAL ASSOCIATION OF COLLEGES AND EMPLOYERS | WINTER 2022 SALARY SURVEY | 51
BACHELOR’S DEGREE SALARIES BY REGION AND MAJOR - ROCKY MOUNTAIN/FAR WEST
ROCKY MOUNTAIN/FAR WEST MEAN25TH
PERCENTILE MEDIAN75TH
PERCENTILE RESPONSES
Business MajorsAccounting $61,920 $50,000 $60,000 $75,000 7
Business Administration/Management $61,920 $50,000 $60,000 $75,000 7
Finance $64,777 $50,000 $65,000 $75,000 7
Human Resources $54,147 $37,440 $60,000 $65,000 3
Logistics/Supply Chain $68,799 $60,000 $60,000 $80,000 5
Management Information Systems $81,799 $60,000 $85,000 $106,557 5
Sales $61,667 $60,000 $60,000 $65,000 3
Computer Sciences MajorsComputer Science $88,262 $71,000 $85,000 $106,557 9
Information Sciences & Systems $93,142 $80,000 $98,000 $120,000 7
Software Applications $94,480 $80,000 $98,000 $120,000 7
Engineering MajorsComputer Engineering $81,760 $72,000 $80,000 $85,000 5
Electrical Engineering $83,744 $70,000 $77,406 $115,000 7
Mechanical Engineering $77,330 $70,000 $70,000 $97,509 7
Software Engineering $89,543 $72,000 $85,000 $120,000 7
Systems Engineering $108,333 $85,000 $115,000 $125,000 3
Mathematics and Sciences MajorsMathematics/Statistics $85,667 $65,000 $72,000 $120,000 3
AVERAGE BACHELOR’S DEGREE SALARIES BY BROAD CATEGORY - ROCKY MOUNTAIN/FAR WESTBROAD CATEGORY 2022 AVERAGE SALARY RESPONSES
Business $65,426 37
Computer Sciences $91,640 23
Engineering $85,797 29
Math & Sciences $85,667 3

52 | WINTER 2022 SALARY SURVEY | NATIONAL ASSOCIATION OF COLLEGES AND EMPLOYERS
MASTER’S DEGREE SALARIES BY REGION AND MAJOR - NEW ENGLAND/MIDEAST
NEW ENGLAND/MIDEAST MEAN25TH
PERCENTILE MEDIAN75TH
PERCENTILE RESPONSES
Business MajorsAccounting $64,000 $61,500 $65,000 $66,500 4
Business Administration/Management $70,750 $62,000 $65,000 $67,500 6
Finance $64,700 $65,000 $65,000 $67,500 5
Human Resources $64,625 $61,500 $66,250 $67,750 4
Logistics/Supply Chain $63,750 $61,000 $64,500 $66,500 4
Marketing $60,000 $57,000 $58,000 $65,000 3
Computer Sciences MajorsComputer Science $75,583 $71,000 $80,000 $87,000 5
Information Sciences & Systems $74,144 $66,750 $69,250 $81,538 4
Software Applications $74,667 $66,000 $71,000 $87,000 3
Engineering MajorsAerospace/Aeronautical Engineering $84,000 $75,000 $85,000 $93,000 4
Chemical Engineering $83,000 $73,000 $80,000 $96,000 3
Computer Engineering $80,168 $80,000 $87,000 $90,000 5
Electrical Engineering $83,400 $73,000 $85,000 $90,000 5
Industrial/Manufacturing Engineering $85,333 $70,000 $90,000 $96,000 3
Mechanical Engineering $81,500 $73,000 $80,000 $90,000 6
Software Engineering $80,845 $73,000 $87,000 $92,075 7
Systems Engineering $75,960 $58,920 $80,000 $93,000 4
Mathematics and Sciences MajorsMathematics/Statistics $76,768 $65,000 $80,000 $95,000 5
Physics $90,333 $80,000 $95,000 $96,000 3
AVERAGE MASTER’S DEGREE SALARIES BY BROAD CATEGORY - NEW ENGLAND/MIDEAST BROAD CATEGORY 2022 AVERAGE SALARY RESPONSES
Business $65,288 26
Computer Sciences $74,874 12
Engineering $81,557 37
Math & Sciences $81,855 8
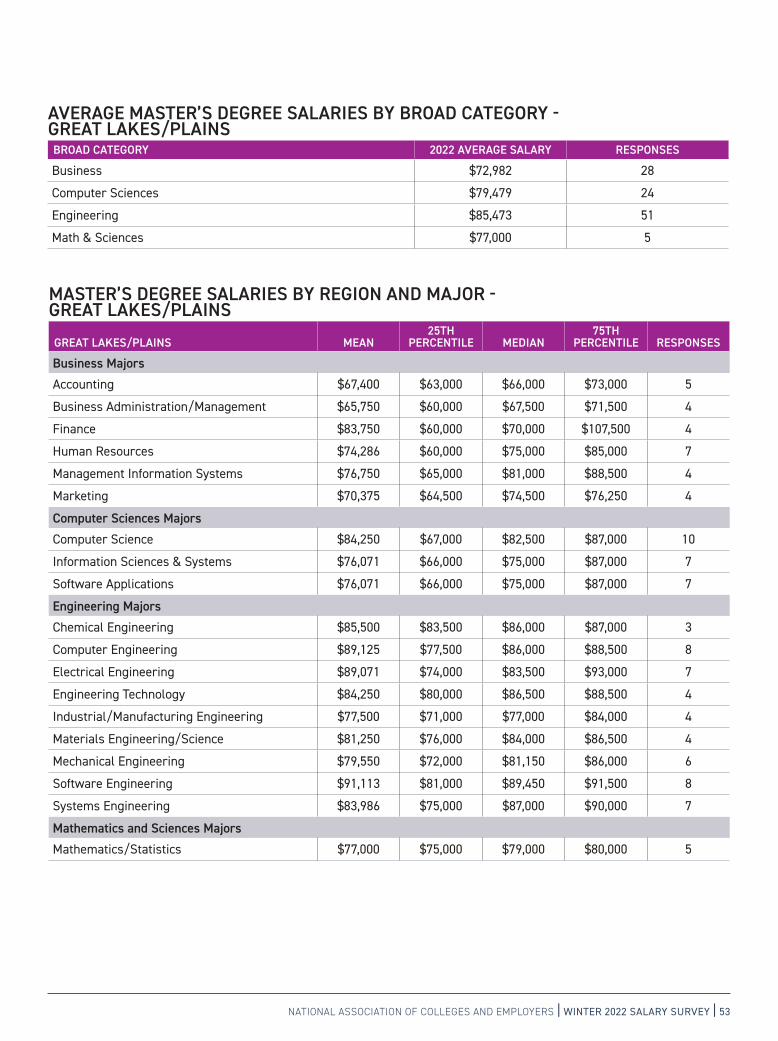
NATIONAL ASSOCIATION OF COLLEGES AND EMPLOYERS | WINTER 2022 SALARY SURVEY | 53
MASTER’S DEGREE SALARIES BY REGION AND MAJOR - GREAT LAKES/PLAINS
GREAT LAKES/PLAINS MEAN25TH
PERCENTILE MEDIAN75TH
PERCENTILE RESPONSES
Business MajorsAccounting $67,400 $63,000 $66,000 $73,000 5
Business Administration/Management $65,750 $60,000 $67,500 $71,500 4
Finance $83,750 $60,000 $70,000 $107,500 4
Human Resources $74,286 $60,000 $75,000 $85,000 7
Management Information Systems $76,750 $65,000 $81,000 $88,500 4
Marketing $70,375 $64,500 $74,500 $76,250 4
Computer Sciences MajorsComputer Science $84,250 $67,000 $82,500 $87,000 10
Information Sciences & Systems $76,071 $66,000 $75,000 $87,000 7
Software Applications $76,071 $66,000 $75,000 $87,000 7
Engineering MajorsChemical Engineering $85,500 $83,500 $86,000 $87,000 3
Computer Engineering $89,125 $77,500 $86,000 $88,500 8
Electrical Engineering $89,071 $74,000 $83,500 $93,000 7
Engineering Technology $84,250 $80,000 $86,500 $88,500 4
Industrial/Manufacturing Engineering $77,500 $71,000 $77,000 $84,000 4
Materials Engineering/Science $81,250 $76,000 $84,000 $86,500 4
Mechanical Engineering $79,550 $72,000 $81,150 $86,000 6
Software Engineering $91,113 $81,000 $89,450 $91,500 8
Systems Engineering $83,986 $75,000 $87,000 $90,000 7
Mathematics and Sciences MajorsMathematics/Statistics $77,000 $75,000 $79,000 $80,000 5
AVERAGE MASTER’S DEGREE SALARIES BY BROAD CATEGORY - GREAT LAKES/PLAINS BROAD CATEGORY 2022 AVERAGE SALARY RESPONSES
Business $72,982 28
Computer Sciences $79,479 24
Engineering $85,473 51
Math & Sciences $77,000 5
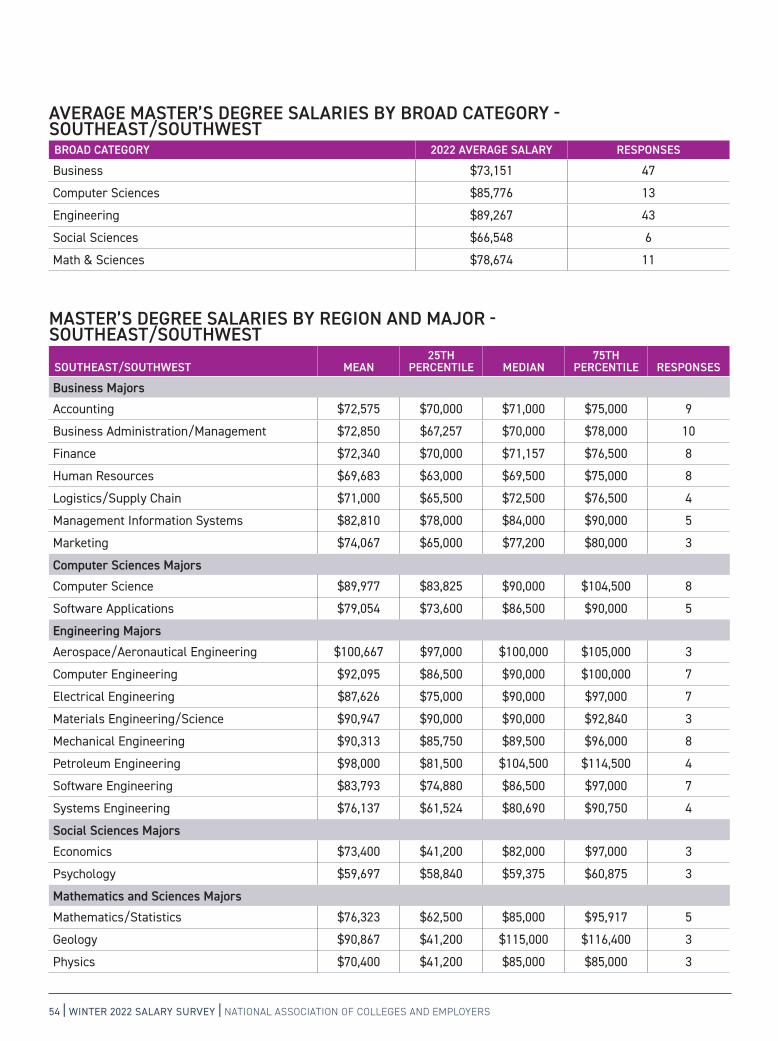
54 | WINTER 2022 SALARY SURVEY | NATIONAL ASSOCIATION OF COLLEGES AND EMPLOYERS
MASTER’S DEGREE SALARIES BY REGION AND MAJOR - SOUTHEAST/SOUTHWEST
SOUTHEAST/SOUTHWEST MEAN25TH
PERCENTILE MEDIAN75TH
PERCENTILE RESPONSES
Business MajorsAccounting $72,575 $70,000 $71,000 $75,000 9
Business Administration/Management $72,850 $67,257 $70,000 $78,000 10
Finance $72,340 $70,000 $71,157 $76,500 8
Human Resources $69,683 $63,000 $69,500 $75,000 8
Logistics/Supply Chain $71,000 $65,500 $72,500 $76,500 4
Management Information Systems $82,810 $78,000 $84,000 $90,000 5
Marketing $74,067 $65,000 $77,200 $80,000 3
Computer Sciences MajorsComputer Science $89,977 $83,825 $90,000 $104,500 8
Software Applications $79,054 $73,600 $86,500 $90,000 5
Engineering MajorsAerospace/Aeronautical Engineering $100,667 $97,000 $100,000 $105,000 3
Computer Engineering $92,095 $86,500 $90,000 $100,000 7
Electrical Engineering $87,626 $75,000 $90,000 $97,000 7
Materials Engineering/Science $90,947 $90,000 $90,000 $92,840 3
Mechanical Engineering $90,313 $85,750 $89,500 $96,000 8
Petroleum Engineering $98,000 $81,500 $104,500 $114,500 4
Software Engineering $83,793 $74,880 $86,500 $97,000 7
Systems Engineering $76,137 $61,524 $80,690 $90,750 4
Social Sciences MajorsEconomics $73,400 $41,200 $82,000 $97,000 3
Psychology $59,697 $58,840 $59,375 $60,875 3
Mathematics and Sciences MajorsMathematics/Statistics $76,323 $62,500 $85,000 $95,917 5
Geology $90,867 $41,200 $115,000 $116,400 3
Physics $70,400 $41,200 $85,000 $85,000 3
AVERAGE MASTER’S DEGREE SALARIES BY BROAD CATEGORY - SOUTHEAST/SOUTHWEST BROAD CATEGORY 2022 AVERAGE SALARY RESPONSES
Business $73,151 47
Computer Sciences $85,776 13
Engineering $89,267 43
Social Sciences $66,548 6
Math & Sciences $78,674 11
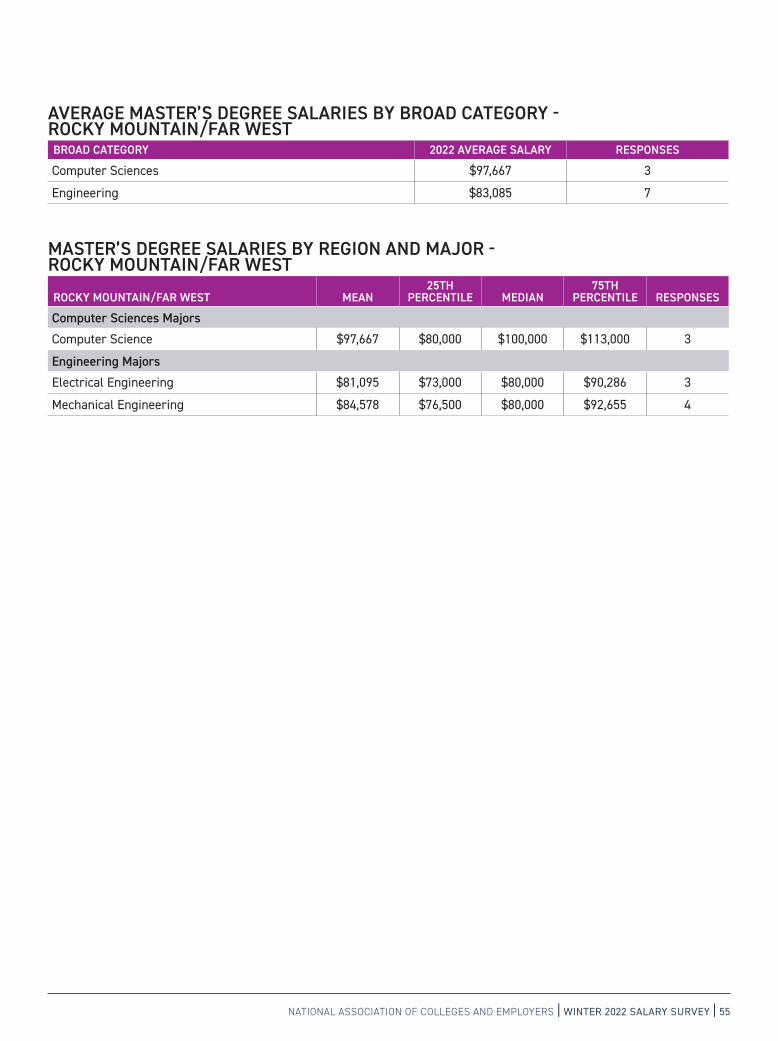
NATIONAL ASSOCIATION OF COLLEGES AND EMPLOYERS | WINTER 2022 SALARY SURVEY | 55
MASTER’S DEGREE SALARIES BY REGION AND MAJOR - ROCKY MOUNTAIN/FAR WEST
ROCKY MOUNTAIN/FAR WEST MEAN25TH
PERCENTILE MEDIAN75TH
PERCENTILE RESPONSES
Computer Sciences MajorsComputer Science $97,667 $80,000 $100,000 $113,000 3
Engineering MajorsElectrical Engineering $81,095 $73,000 $80,000 $90,286 3
Mechanical Engineering $84,578 $76,500 $80,000 $92,655 4
AVERAGE MASTER’S DEGREE SALARIES BY BROAD CATEGORY - ROCKY MOUNTAIN/FAR WESTBROAD CATEGORY 2022 AVERAGE SALARY RESPONSES
Computer Sciences $97,667 3
Engineering $83,085 7

56 | WINTER 2022 SALARY SURVEY | NATIONAL ASSOCIATION OF COLLEGES AND EMPLOYERS
DOCTORAL DEGREE SALARIES BY REGION AND MAJOR - NEW ENGLAND/MIDEAST
NEW ENGLAND/MIDEAST MEAN25TH
PERCENTILE MEDIAN75TH
PERCENTILE RESPONSES
Engineering MajorsMechanical Engineering $103,000 $95,000 $107,000 $107,000 3
AVERAGE DOCTORAL DEGREE SALARIES BY BROAD CATEGORY - NEW ENGLAND/MIDEAST BROAD CATEGORY 2022 AVERAGE SALARY RESPONSES
Engineering $103,000 3
AVERAGE DOCTORAL DEGREE SALARIES BY BROAD CATEGORY - SOUTHEAST/SOUTHWEST BROAD CATEGORY 2022 AVERAGE SALARY RESPONSES
Computer Sciences $113,017 3
Engineering $108,853 27
Social Sciences $95,010 4
Math & Sciences $90,343 7
DOCTORAL DEGREE SALARIES BY REGION AND MAJOR - SOUTHEAST/SOUTHWEST
SOUTHEAST/SOUTHWEST MEAN25TH
PERCENTILE MEDIAN75TH
PERCENTILE RESPONSES
Computer Sciences MajorsComputer Science $113,017 $96,750 $100,000 $142,300 3
Engineering MajorsComputer Engineering $115,225 $96,800 $112,500 $133,650 4
Electrical Engineering $108,523 $99,840 $100,000 $125,000 6
Mechanical Engineering $100,883 $93,000 $100,000 $102,000 6
Petroleum Engineering $103,133 $70,000 $105,000 $134,400 3
Software Engineering $113,028 $99,840 $105,000 $125,000 5
Systems Engineering $115,713 $99,840 $105,000 $142,300 3
Social Sciences MajorsPsychology $95,010 $66,520 $93,600 $123,500 4
Mathematics and Sciences MajorsMathematics/Statistics $88,733 $41,200 $110,000 $115,000 3
Physics $91,550 $70,600 $105,000 $112,500 4
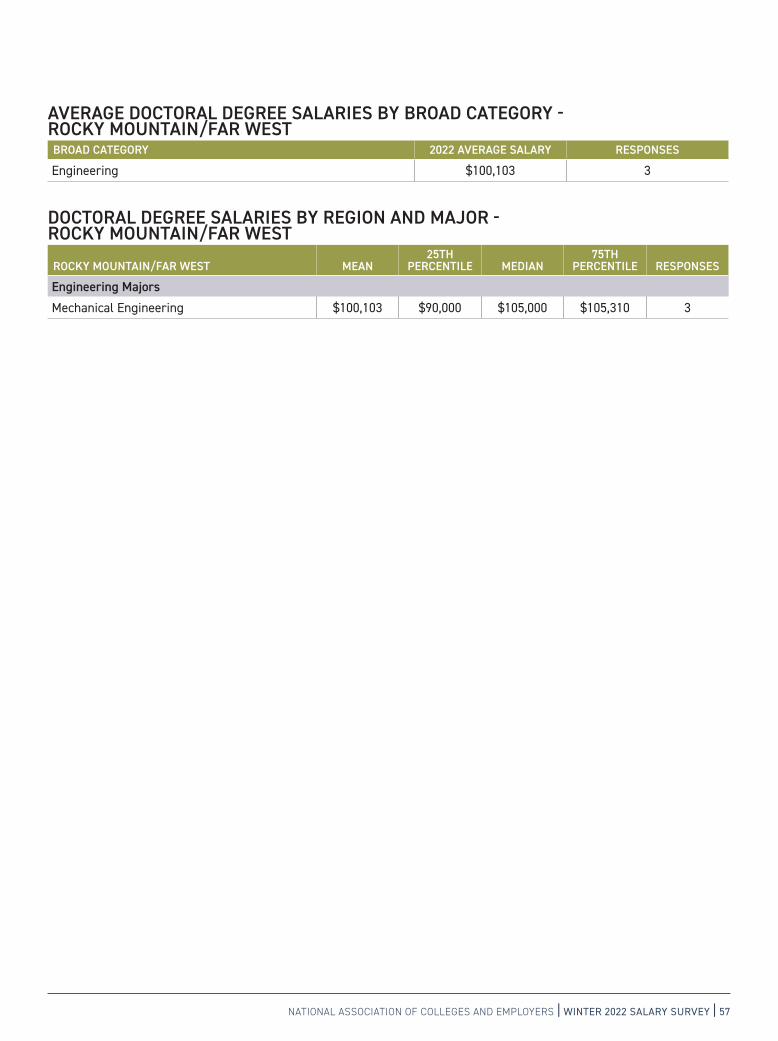
NATIONAL ASSOCIATION OF COLLEGES AND EMPLOYERS | WINTER 2022 SALARY SURVEY | 57
DOCTORAL DEGREE SALARIES BY REGION AND MAJOR - ROCKY MOUNTAIN/FAR WEST
ROCKY MOUNTAIN/FAR WEST MEAN25TH
PERCENTILE MEDIAN75TH
PERCENTILE RESPONSES
Engineering MajorsMechanical Engineering $100,103 $90,000 $105,000 $105,310 3
AVERAGE DOCTORAL DEGREE SALARIES BY BROAD CATEGORY - ROCKY MOUNTAIN/FAR WESTBROAD CATEGORY 2022 AVERAGE SALARY RESPONSES
Engineering $100,103 3

58 | WINTER 2022 SALARY SURVEY | NATIONAL ASSOCIATION OF COLLEGES AND EMPLOYERS58 | WINTER 2022 SALARY SURVEY | NATIONAL ASSOCIATION OF COLLEGES AND EMPLOYERS58 5858 58 ||| WINTER 2022 SALARY SURVEYWINTER 2022 SALARY SURVEYWINTER 2022 SALARY SURVEY ||| NATIONAL ASSOCIATION OF COLLEGES AND EMPLOYERSNATIONAL ASSOCIATION OF COLLEGES AND EMPLOYERSNATIONAL ASSOCIATION OF COLLEGES AND EMPLOYERS
APPENDIX
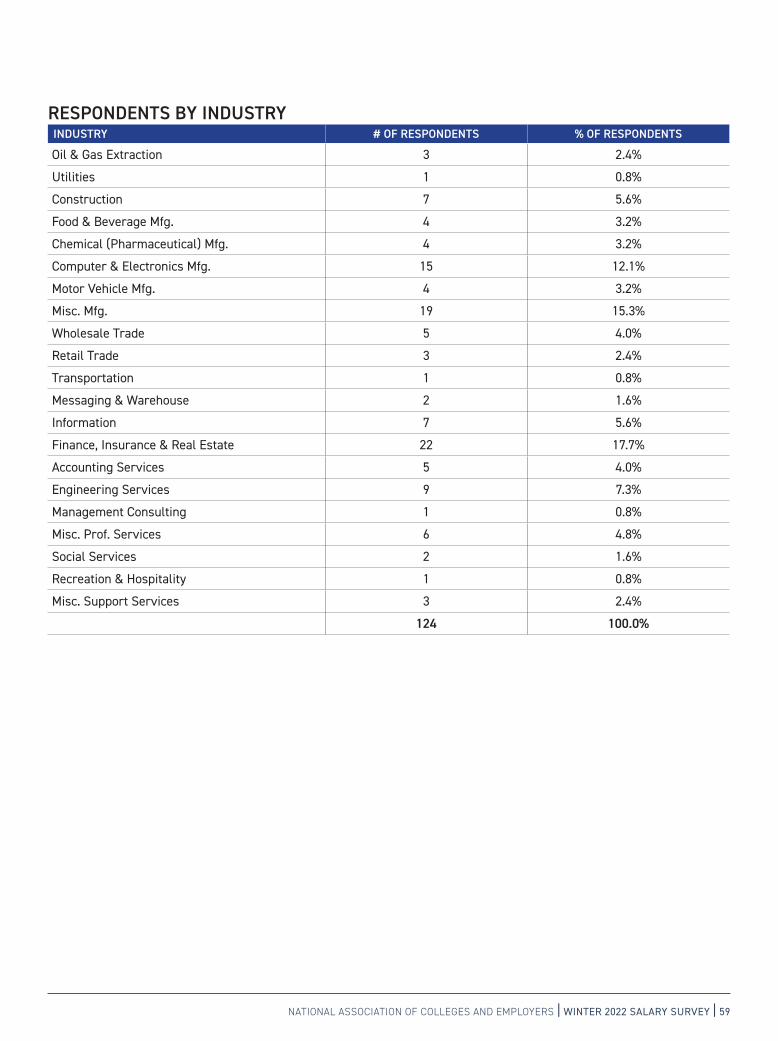
NATIONAL ASSOCIATION OF COLLEGES AND EMPLOYERS | WINTER 2022 SALARY SURVEY | 59
RESPONDENTS BY INDUSTRYINDUSTRY # OF RESPONDENTS % OF RESPONDENTS
Oil & Gas Extraction 3 2.4%
Utilities 1 0.8%
Construction 7 5.6%
Food & Beverage Mfg. 4 3.2%
Chemical (Pharmaceutical) Mfg. 4 3.2%
Computer & Electronics Mfg. 15 12.1%
Motor Vehicle Mfg. 4 3.2%
Misc. Mfg. 19 15.3%
Wholesale Trade 5 4.0%
Retail Trade 3 2.4%
Transportation 1 0.8%
Messaging & Warehouse 2 1.6%
Information 7 5.6%
Finance, Insurance & Real Estate 22 17.7%
Accounting Services 5 4.0%
Engineering Services 9 7.3%
Management Consulting 1 0.8%
Misc. Prof. Services 6 4.8%
Social Services 2 1.6%
Recreation & Hospitality 1 0.8%
Misc. Support Services 3 2.4%
124 100.0%

60 | WINTER 2022 SALARY SURVEY | NATIONAL ASSOCIATION OF COLLEGES AND EMPLOYERS
PARTICIPATING ORGANIZATIONSBelow is a list of the organizations that supplied salary projections for the NACE Winter 2022 Salary Survey report. (Please note: Although 124 organizations responded, the list below includes 88, as 36 organizations preferred not to be listed.)
Alight SolutionsAmerican Axle & Manufacturing Holdings, Inc.American Family InsuranceAndersen CorporationArcher Daniels Midland CompanyArmstrong World IndustriesAssured Information Security, Inc.ATA Engineering, Inc.Avery Dennison CorporationBecton Dickinson & CompanyBuro HappoldCleveland-Cliffs Inc.CNO Financial Group, Inc.CohnReznickColliers Engineering & DesignColony HardwareCon EdisonConocoPhillips CompanyCree, Inc.Crowe Horwath LLPCrown Cork & Seal Company USA, Inc.Cummins Inc.Cushman & Wakefield Inc.Dell TechnologiesDick’s Sporting GoodsDiscover Financial ServicesDot FoodsEmerson Climate TechnologiesEOG Resources, Inc.First Republic BankFirst SolarFreese and NicholsGeneral Dynamics Electric BoatGeneral Electric CompanyGenworth FinancialGhafari Associates LLCGraphic Packaging InternationalHormel Foods CorporationINEOSInfo TechKellogg CompanyKeyBankKiewit CorporationKPMG LLP
Liberty Mutual Insurance CompanyLink-Belt Construction Equipment Co.LPL FinancialMagellan Midstream Partners, L.P.MarkforgedMedtronic, Inc.Meijer, Inc.MetLifeMilwaukee Electric Tool CorporationMoffatt & NicholMoog Inc.NokiaNTT DATA ServicesOlive AIOwens CorningPaylocityPerdue Inc.PlanMember Financial CorporationRegeneron Pharmaceuticals, Inc.Ryan, LLCSamsung Austin SemiconductorSeagate TechnologySelden Fox LTDShaw Industries, Inc.Smith & Nephew Inc.Speedway LLCSTMicroelectronics, Inc.Stryker CorporationT-Mobile USA, Inc.TerraconTextron Inc.The Aerospace CorporationThe Cincinnati Insurance CompaniesThe Kleingers GroupThe Lubrizol CorporationThe Walsh GroupTokio Marine HCCTucson Unified School DistrictUberUlineUnumUScellularVeriskXylem

NATIONAL ASSOCIATION OF COLLEGES AND EMPLOYERS | WINTER 2022 SALARY SURVEY | 61
HBCU SUMMITNACE’s
COLLEGE RECRUITING: LEADING AND EMERGING PRACTICES THAT WORK
IN PARTNERSHIP WITH
LEARN MORE www.naceweb.org/hbcu-summit
NACE’s HBCU Summit brings together leaders from HBCUs, talent acquisition, and partner
organizations—NACE and INROADS—to share employer relations and
recruiting strategies and insights that will lead to robust, sustainable, and scalable partnerships among
HBCUs and employer organizations committed to diversity.
REGISTER NOW!
JOIN US VIRTUALLY ON FEBRUARY 23, 2022

SALARY SURVEY1 E Broad StSte 130 - 1005Bethlehem, PA 18018-5934