effect of salary schemes on employee productivity - KIU ...
62
EFFECT OF SALARY SCHEMES ON EMPLOYEE PRODUCTIVITY A CASE STUDY OF SONY SUGAR COMPANY OF RONGO DISTRICT, NYANZA PROVINCE BY FARAH ABDIRAHMAN MOHAMED BHR/20024/82/DF A RESEARCH REPORT SUBMITTED TO THE SCHOOL OF BUSINESS AND MANAGEMENT IN PARTIAL FULFILLMENT OF THE REQUIREMENT FOR THE AWARD OF BACHELOR DEGREE IN HUMAN RESOURCE MANAGEMENT OF KAMPALA INTERNATIONAL UNIVERSITY. OCTOBER, 2011
-
Upload
khangminh22 -
Category
Documents
-
view
3 -
download
0
Transcript of effect of salary schemes on employee productivity - KIU ...
EFFECT OF SALARY SCHEMES ON EMPLOYEE PRODUCTIVITY
A CASE STUDY OF SONY SUGAR COMPANY OF
RONGO DISTRICT, NYANZA PROVINCE
BY
FARAH ABDIRAHMAN MOHAMED
BHR/20024/82/DF
A RESEARCH REPORT SUBMITTED TO THE SCHOOL OF BUSINESS AND
MANAGEMENT IN PARTIAL FULFILLMENT OF THE REQUIREMENT
FOR THE A WARD OF BACHELOR DEGREE IN HUMAN
RESOURCE MANAGEMENT OF KAMPALA
INTERNATIONAL UNIVERSITY.
OCTOBER, 2011

DECLARATION
I FARAH ABDIRAHMAN MOHAMED declare that this research report is from my own findings for the award of degree in Human Resource Management in Kampala International University.
NAME: FARAH ABDIRAHMAN MOHAMED.
SIGNATURE: .. ... .
DATE: ....................... io.f..\v. .. .f .... ~\8.\ .. ~ .... .

APPROVAL
This is to satisfy that my approval has been given for this report to be submitted to the school of
business and management as a requirement for the partial fulfillment for the award of degree in
human resource management.
NAME: Mr. RUTEGANDA MICHAEL
SIGNATURE:··~ ········ · ············
DATE: ... . ...... 2.0_\. \d..~ .... 1
••••••••••••••••••••••
11

DEDICATION
This research project is dedicated to my beloved parents and family, Hajj Jamal, Haretha Elmi,
Maslah, Ifrah, Halima Adawe, Hiddig, Isnino and all my friends.
iii
ACKNOWLEDGEMENT
I thank the almighty Allah for giving me all the necessary strengths, knowledge, wisdom,
financial and moral ability to complete my research report.
I wish sincerely to express my heartily felt gratitude to everyone who assisted me in the completion of this research report. My primarily obligations is to Kan1pala International University Management and to my supervisor Mr. Ruteganda Michael for his useful comments and suggestions on the original manuscript of this report.
I would like to thank also to the management Sony Sugar company for giving me a chance of two month period of undertaking field attachment with them.
Much appreciation extends to my family specifically to my parents hajj Jamal, haretha elmi, my uncles hiddig, Hassan Hussein, Hassan daud , my aunt isnino , amina elmi, muhba , and my sisters ifrah, faiza, bisharo , khadija yunis , zamzam ,Aisha, sowda. my brothers maslah ,mzamil, Omar ,yussuf,Mohamed,Hussein,dahir who supported me the most education,financially and morally as well. Also I acknowledge the efforts of my including, Mohamed mrefu, Ricky, ficane,abdullahiGedi,osman sheikh Gabow, abdilatif,Ibrahim Kenyan ,Farah Kenyan ,zeitun ugas ,naso, bashirow, bishar,abdalla,ndugu sharks and without forgetting my angel riyaq saney.
111 my friends shueb,
dakane
It would be impossible to mention all the names of people who helped me in preparing this research report. I therefore take this extend my appreciation to all whom in one way or another have contributed to the successful completion of this research report.
IV
TABLE OF CONTENTS
PAGE
DECLARATION .......................................................................................... i
ACKNOWLEDGEMENT .................................................................. ............ ii
DEDICATION .................................................................... : ...... : ................ iii
TABLE OF
CONTENTS .............................................................................................. iv
LIST OF
TABLES ........................................................................... ......................... vii
LIST OF
FIGURES ................................................................................................. viii
ABBREVIATIONS AND ACRONYMS ............................................................. ix
ABSTRACT ................................................................................................. x
CHAPTER ONE ........... : ............................................................................................................... 1
INTRODUCTION .......................................................................................................................... 1
BACKGROUND TO THE STUDY ............................................................................................... I
COMP ANY BACKGROUND ....................................................................................................... 2
STATEMENT OF THE PROBLEM .............................................................................................. 5
RESEARCH OBJECTIVES ........................................................................................................... 6
RESEARCH QUESTIONS ............................................................................................................ 7
RESEARCH HYPOTHESIS .......................................................................................................... 8
SIGNIFICA.NCE OF THE STUDY ............................................................................................... 9
THE SCOPE AND LIMITATIONS OF THE STUDY ............................................................... 10
V
CHAPTER TWO ........................................................................................................................ 11
LITERATURE REVIEW ............................................................................................................. 11
INTRODUCTION ........................................................................................................................ 11
CONCEPTUAL DEBATE ........................................................................................................... I I
SALARY SCHEME .......................................................................... "'····················· .................... 11
THEORETICAL FRAMEWORK ..................................................... : ......... : ................................ 13
EMPIRICAL DEBATE ................................................................................................................ 17
SALARY SCHEME ..................................................................................................................... 17
ANNUALIZED SALARY SCHEME .......................................................................................... 17
PENSION SCHEME .................................................................................................................... 17
CAREER DEVELOPMENT PROGRAMMES ........................................................................... 18
FRIDGE BENEFIT ...................................................................................................................... 18
THE CONCEPTUAL FRAMEWORK ........................................................................................ 18
CHAPTER THREE .................................................................................................................... 20
RESEARCH METHODOLOGY .........•....•..............••.................•................•.............................•. 20
INTRODUCTION ........................................................................................................................ 20
RESEARCH DESIGN .................................................................................................................. 20
TARGET POPULATION ............................................................................................................ 20
SAMPLING DESIGN AND PROCEDURE ................................................................................ 21
DATA COLLECTION INSTRUMENT AND METHODS ........................................................ 21
DATA ANALYSIS TECHNIQUES AND PRESENTATION METHOD .................................. 22
CHAPTER FOUR ...................................................................................................................... 23
DATA ANALYSIS AND INTERPRETATION .......................................................................... 23
INTRODUC"l'ION ........................................................................................................................ 23 vi
BACKGROUND INFORMATION ............................................................................................. 23
SALARY SCHEME ..................................................................................................................... 27
CHAPTER FIVE ........................................................................................................................ 3 6
SUMMARY AND CONCLUSION ............................................................................................. 36
ANALYSIS FROM HUMAN RESOURCE DEPARTMENT ......... .-......................................... 37
CONCLUSION ............................................................................................................................ 40
RECOMMENDATIONS .............................................................................................................. 40
REFERENCE .............................................................................................................................. 44
APPENDIX I ............................................................................................................................... 46
APPENDIX II ............................................................................................................................. 47
APPENDIX III ........................................................................ ............................ 50
APPENDIX IV: Duration of the study ...................................................................... 53
APPENDIX V: Estimated Budget for the dissertation ............................................. 54
vii
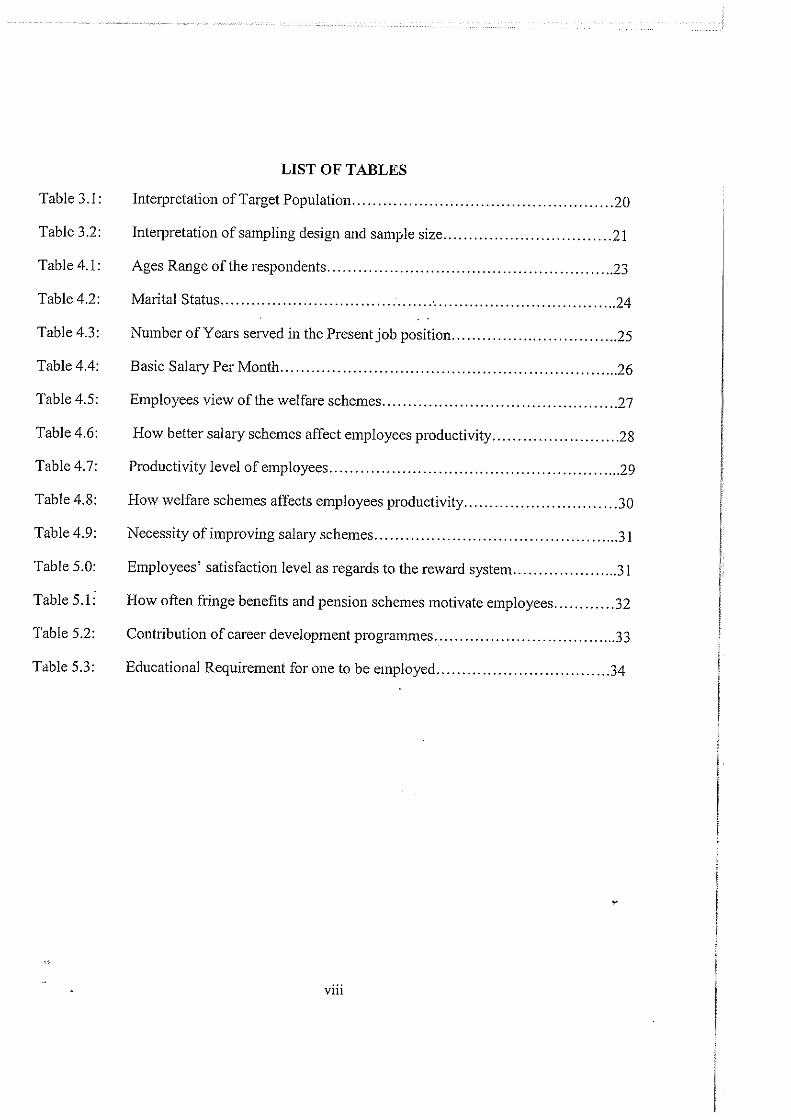
Table 3.1:
Table 3.2:
Table 4.1:
Table 4.2:
Table 4.3:
Table 4.4:
Table 4.5:
Table 4.6:
Table 4.7:
Table 4.8:
Table 4.9:
Table 5.0:
Table 5.1:·
Table 5.2:
Table 5.3:
LIST OF TABLES
Interpretation of Target Population ................................................... 20
Interpretation of sampling design and sample size ................................. 21
Ages Range of the respondents ....................................................... .23
Marital Status ......................................... · .................................... 24
Number of Years served in the Present job position ................................. 25
Basic Salary Per Month .................................................................. 26
Employees view of the welfare schemes .............................................. 27
How better salary schemes affect employees productivity ........................ .28
Productivity level of employees ......................................................... 29
How welfare schemes affects employees productivity .............................. 30
Necessity of improving salary schemes ............................................... .31
Employees' satisfaction level as regards to the reward system ..................... 31
How often fringe benefits and pension schemes motivate employees ............ 32
Contribution of career development programmes ................................... .33
Educational Requirement for one to be employed ................................. .34
Vlll

LIST OF FIGURES
Fig. 1: Conceptual Frame Work .................................................................. 19
Fig. 4.1: Age Range of the respondents ............................................................ 24
Fig. 4.2: Number of Years Served in the Presentjob·position ................................. 25
Fig. 4.3: Basic Salary Per Month ................................................................... 26
Fig. 4.4: Employees view of the welfare schemes ............................................... 27
Fig. 4.5: How better salary schemes affect employees productivity ........................... 28
Fig. 4.6: Productivity level of employees ......................................................... 29
Fig. 4.7: How welfare schemes affects employees productivity .............................. 30
Fig. 4.8: Necessity of improving salary schemes ................................................. 31
Fig. 4.9: Employees' satisfaction level as regards to the reward system ..................... .32
Fig. 5.0: How often fringe benefits and pension schemes motivate employees ............. .33
Fig. 5.1: Contribution of career development programmes ..................................... 34
Fig. 5.2: Educational Requirement for one to be employed .................................... 35
IX

!CDC
IDB
JCT
QWL
PPS
PPP
UK
HRM
ABBREVIATIONS AND ACRONYMS
Industrial and Commercial Development Corporation
Industrial Development-Bank·
Information Communication Technology
Quality of Work Life
Personal Pension Scheme
Personal Pension Plan
United Kingdom
Human Resource Management
X
ABSTRACT
The topic of studying this research was the effect of welfare schemes on employee productivity
in Sony Sugar Company of Kenya. This was born out of the fact that welfare schemes are meant
to improve employee productivity thus o•·ganization productivity. The objectives in this study
included to establish the effect of salary schemes on the perfonnance and motivational level of
the employees in the company , to identify the indicators of good employees productivity, to
establish how career development oppo1tuniti~s act as int1insic salary schemes to employees.
A review of literature was done, this was based on the variables identified which included the
review based on previous studies canied out in the area of the finding where majority of the
respondents felt that competition affected the growth of salary schemes of the Sony Sugar
company as well as majority of welfare schemes of employees' production for organization
dealing with business in Kenya.
Employees see themselves as perfonners where efficiency and effectiveness is concerned and
they are mostly affected by welfare schemes practiced in the company.
xi
1.0 INTRODUCTION
CHAPTER ONE
INTRODUCTION
The purpose of this study is to evaluate the effects of salary schemes on employee productivity
at Sony Sugar Company. This chapter will present the background of the study, statement of the
problem, research objective, research questions,. research hypothesis, and justification of the
study, limitation anj the scope of the study.
1.1 BACKGROUND TO THE STUDY
Welfare is a corporate attitude or commitment reflected in the expressed care for employees at
all levels, underpinning their work and the environment in which it is perfonned (Cowling and
Mailer, I 992). Specifically, Coventry and Barker (I 988) asseii that staff welfare includes
providing social club and spo1is facilities as appropriate, supervising staff and works' canteens,
rnnning sick clubs and savings schemes; dealing with superannuation, pension funds and leave
grants, making loans on hardship cases; arranging legal aid and giving advice on personal
problems; making long service grants; providing assistance to staff transferred to another area
and providing fringe benefits (such as payment during sickness, luncheon vouchers and other
indirect expenses).
Productivity, on the other hand, means goods and services produced in a specified period of time
in relation to the resources utilized (Singh, 2009). It is, however, contended by Cohen et al
(I 995) to be more than a narrow economic measure, as it also measures how well the group
perfonns its required tasks to satisfy its customers inside and outside the organization. In effect,
productivity suggests effectiveness and efficiency of the employees.
Apparently, there are some scholarly works on staff welfare and productivity (Owusu-Acheaw,
2010; Ostennan, 2010; Singh, 2009; Cowling and Mailer, 1992; Coventry and Barker, 1988),
but they mostly dwelt on industrial settings to the neglect of service organizations typified in
government ministries and parastatals. There is therefore the need to extend in know volunteers
edge on the aforementioned theme that this study focused on staff welfare and productivity,
using Sony Sugar Company Limited in Rongo District in Kisii as a reference. Specifically, the
study enquired into:
(a) Awareness of employee welfare schemes
(b) Components of employee welfare in the study area
(c) The existence of employee welfare in the study area and
1

( d) The perceived effect of employee welfare on perfonnance (productivity) in the study area.
1.1.1 COMPANY BACKGROUND
South Nyanza Sugar Company Limited (Sony Sugar) was established in 1976 with the objective
of increasing national sugar production to reduce dependence on imp01iation, creating
employment opportunities and enhancing regional development.
Sony Sugar is located in Rongo District ofNyanza Province, lies 160 km south ofKisumu City
at an altitude of 1,454 meters (4,800ft) abo'-'.e sea level. Sony Sugar also has offices in Nairobi
for liaison puI;Joses and for availing it products and services closer to its customers.
Sony Sugar is a key player in the sugar sub-sector serving over 30,000 fanners spread in the
seven districts ofHomaBay, Gucha, Transmara, Kuria, Migori, Uriri and Rongo.
VISION STATEMENT
A world class manufacturer of sugar and associated products
MISSION STATEMENT
To manufacturing high quality sugar and associated products by utilizing leading edge
technology and investing in our people in order to deliver superior customer value, maximize
shareholder returns and satisfy other stakeholder interests.
CORE VALUES
The mission and vision of the company shall be accomplished and realized respectively while
embracing the following core values.
TEAMWORK
► Integrity
► Professionalism
► Transparency and Accountability
► Innovation and Creativity
► Customer focus
► Social responsibility
2
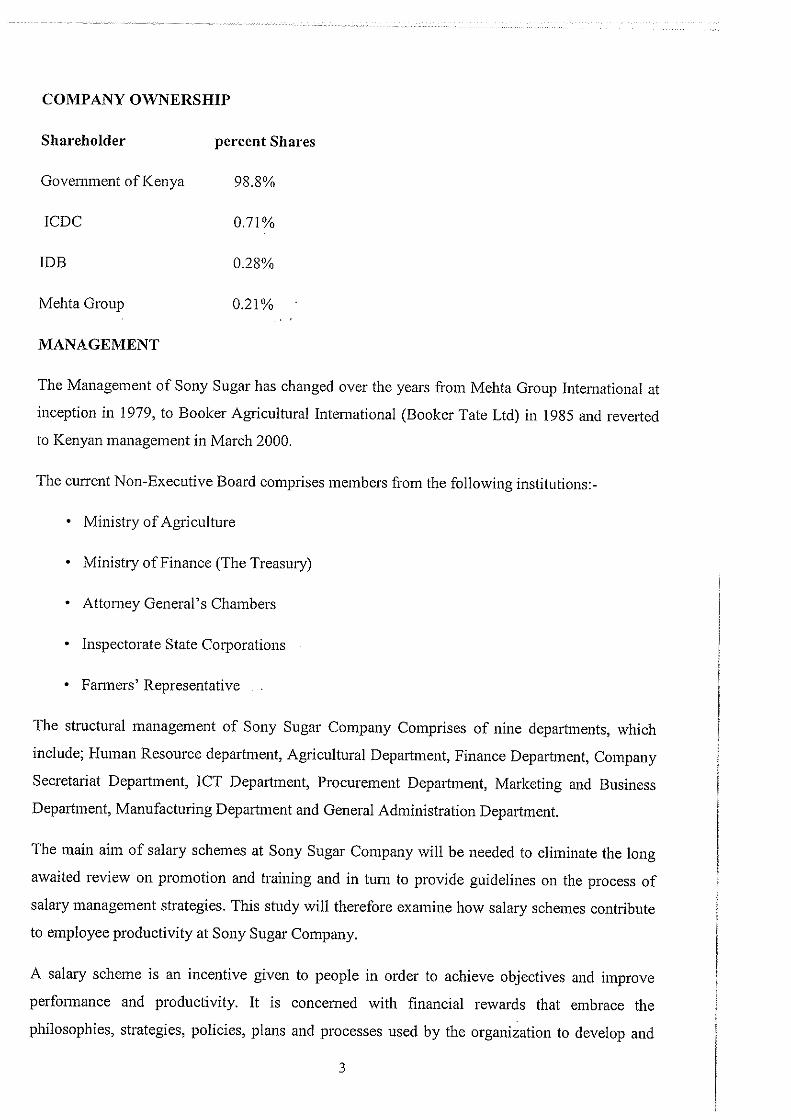
COMPANY OWNERSHIP
Shareholder
Government of Kenya
ICDC
IDB
Mehta Group
MANAGEMENT
percent Shares
98.8%
0.71%
0.28%
0.21%
The Management of Sony Sugar has changed over the years from Mehta Group International at
inception in 1979, to Booker Agricultural International (Booker Tate Ltd) in 1985 and reverted
to Kenyan management in March 2000.
The current Non-Executive Board comprises members from the following institutions:-
• Ministry of Agriculture
• Ministry of Finance (The Treasury)
• Attorney General's Chambers
• Inspectorate State Corporations
• Fanners' Representative
The structural management of Sony Sugar Company Comprises of nine depmtments, which
include; Human Resource depmtment, Agricultural Department, Finance Deparhnent, Company
Secretariat Department, ICT Depa1tment, Procurement Department, Marketing and Business
Department, Manufacturing Department m1d General Administration Depmtment.
The main aim of salary schemes at Sony Sugar Compa11y will be needed to eliminate the long
awaited review on promotion and training and in turn to provide guidelines on the process of
salary ma11agement strategies. This study will therefore examine how salary schemes contribute
to employee productivity at Sony Sugar Company.
A salary scheme is an incentive given to people in order to achieve objectives and improve
performance and productivity. It is concerned with financial rewards that embrace the
philosophies, strategies, policies, pla11s and processes used by the organization to develop and
3

maintain employees. Therefore salary schemes are geared to motivate people and also to
improve organizational team and individual perfonnance thus reducing low productivity, labour
turn over and job dissatisfaction.
There problem is mainly featured from the fact that importance of salary schemes are not made
clear to employees, since it is based between sections of the management and therefore
minimizing involvement of employees. Lack of well trained and experienced personnel officers
also hindered the search of salary schemes required at Sony Sugar Company for better
improvement of perfonnance, productivity and efficiency. Moreover lack of welfare depmiment
in this organization also lead to low understanding of the importance of salary scheme.
Therefore it is against this background that the researcher will need to look into salary schemes
and its effect on employee performance at Sony Sugar Company so that the organization will be
in a position to make the necessary changes ranging from educating employees on the
importance of salary scheme and its effect on employee productivity, involving employees in
fonnulation of salary scheme system, employing well trained and experienced personnel officers
and creation of welfare department so as to achieve organizational goals and objectives.
4
1.2 STATEMENT OF THE PROBLEM
Salary scheme is a provision given to employees for their achievements in the shape of attaining
or exceeding their productivity targets or reaching ce1iain level of competence or skill. The main
objective of salary scheme is to motivate the employees so as to achieve organizational goals
and objectives.
Since the success of the' organization depends on the way the Human Resource Management is
conducted, it is essential to ii:ivolve employees in the development of salary scheme system and
be·treated fairly, equally and consistently in relation to the work they do and their contribution.
Most organizations carry out the process of salary scheme on employee productivity but it is the
management which generally decides upon strategy to be adopted even where the employees
have taken part in negotiation. This is the case at Sony Sugar Company. This problem therefore
made the company to lag behind as this has affected the productivity of employees in the
organization thus leading to low morale, lack of commitment, job dissatisfaction and higher
inefficiency rate.
Therefore the purpose of this study will be to enable the researcher to shed light on the
importance of providing salary scheme to employees as a management tool used for enhancing
job satisfaction, reduce labour turnover, prevent um1ecessary absenteeism and improve the
relationship between the management and the employees.
5

1.3 RESEARCH OBJECTIVES
1.3.1 General Objective
To establish how welfare schemes affect employee productivity in Sony Sugar Company.
1.3.2 Specific objective
I. To establish the effect of pension scheme on employee productivity 111 Sony Sugar
Company.
2. To detennine how annualized salary schemes influence employee productivity 111 the
Company.
3. To establish how career development opportunities act as intrinsic salary schemes to
employees in the company.
4. To determine the effects of fridge benefit on the performance of employees.
6
1.4 RESEARCH QUESTIONS
► What are the effects of pension scheme on employee productivity in the Sony Sugar
company?
► What influence does annualized salary schemes have on employee productivity in Sony
Sugar Company?
► What are the effects of opportunities for career development as intrinsic salary schemes to
employees _in ·sony Sugar Company?
► What are the effects of fridge benefit on the performance of employees in the company?
7
1.5 RESEARCH HYPOTHESIS
The study endeavored to test the following hypothesis:
I. There is association between effective salary scheme and employees productivity.
2. There is direct relationship between support received in tenn of pension scheme and the
productivity level of the employees.
3. There is no direct association between career development programmes and employee
productivity.
4. There· is no association between annualized salary scheme and the employees'
productivity.
8
1.6 SIGNIFICANCE OF THE STUDY
Many people lack skill, awareness, knowledge, capital, process and practices for e-cycling their
employees in accordance with their conl!ibution, skills and competence. Thus, it is necessary to
carry out this study so that c1itical issues which need the attention of both the organization and
the employees can be brought into book and the necessary actions be taken. Therefore in view of
the above, it is necessary for the organization like Sony Sugar Company to tame and train their
huP1an resources so as to achieve its goals and objectives. This is because no activity can take
place without their presence regardless of the availability of the most advanced technology. This
could only be achieved through the motivation and provision of good salary scheme which are
r'3garded to be the best tools for instilling good spirit and willingness to perfonn thus enabling
the organization achieve its goals and retain its employees.
However, little research has been done in this area by many organizations. This because of the
fact that they are not conversant with the effects and the importance of this scheme to the
organization hence they are faced with poor perfonnance, inefficiencies and low productivity.
Moreover, other research conducted revealed that the selected organization is not exempted from
this problem experienced by other organization hence fall victim of the problem.
9
1.7 THE SCOPE AND LIMITATIONS OF THE STUDY
The scope of the study will be limited to Sony Sugar Company where much of the infonnation
will be obtained by the researcher from the human resource department and Finance depmiment.
The researcher will also disllibute questionnaires and pamphlets to all other depmiments within
the organization so as to obtain accurate data. This is because of the fact of time and financial
constraints that limit the researcher.
The. researcher may as well encounter some limitations such as the inaccessibility of some
information that the employees of Sony Sugar Company may deem sensitive. The respondents
may also give biased infonnation due to non-response and partial filling in of the questionnaires
which the researcher may not have control over.
10

2.0 INTRODUCTION
CHAPTER TWO
LITERATURE REVIEW
This chapter gives an overview of what other writers have said concerning the provisions of
salary schemes to the employees. Literature is reviewed in the following areas; conceptual,
Theoretical and empirical debates. This will be followed by the summary of the gaps to be filled
in the study and the Conceptual framework.
In this chapter the researcher intends to make an evaluation of reports of previous studies which
have been identified and read in order to assess the observations and opinions related to the
study. This will lead to appreciating and understanding the research which has been done in the
subject of welfare schemes on employee productivity.
2.1 CONCEPTUAL DEBATE
2.1.1 Salary Scheme
A salary scheme expresses what the organization values and it is prepared to pay for it. It is
governed by the need to reward right things so as to get the right message across about what -is
imp01iant.
Armstrong (2000) outlined that, the overall aim of salary scheme is to suppo1i the attainment of
the organizations strategic and operational objectives by ensuring that it has skilled, competent,
committed and well-motivated workforce.
An organization through a good salary scheme should always try to ensure that it encourages
behavior and employees who will perfonn effectively to the achievement of the organizational
objectives.
Northcott (1960) argues that, salary schemes are stimulus towards efficiency upon provision; it
creates more efficient management procedures, better arrangements and sounder policies
especially in respect to personnel, stricter control and budgetary control of both human and
material resources.
Donbrelly, Gibson and Ivance Vich (1995) states that salary schemes create a belief ihat good
performance leads to high level of pay hence negative consequence of productivity are
minimized.
11

Aswithappa (2000) agrees that, salary schemes enable an organization to attract, retain and
motivate competent people. From these we can say that, this is why fresh employees non11ally
flock around organizations that offer attractive remuneration packages.
Nzuve (1997) points out that salary schemes as being a financial te1ms and that they vary from
one organization to another and from industry to industry. He states that a salary formulation is
influenced by the following factors; externally imposed systems, job evaluation systems and
collective bargaining agreements. In connection with this therefore pay rates must be equitable
both externally and internally. Each employee will try to view his or her pay as equitable with
other employees of the same cadre in other organization. When employees become aware of
inequities in the pay systems then disappointments and conflict can result thus leading to
resignation.
Cole (1993) states that there are three principles of a payment policy in an organization. They
are; to attract sufficient and suitable employees, to retain employees and to reward employees
for their effort, loyalty, experience and achievement.
Victor Vroom (I 959) points out the essentials of salary schemes as being flexible, attractive,
economic, equitable and attainable.
Gan·y dazzler (I 997) says that employees should be paid for their competence rather than just
for their job responsibilities. He further stresses that in order to build employees commitment an
assessment of the reward packages should be done through a work plan that encourages
employees to think of themselves as partners with the organization.
Keitner and Kinicki (1992) both agree that a good salary scheme should attract talented people,
motivate and satisfy them once they have joined the organization. The objective will therefore
assist in the implementation of salary scheme system and should be fon11ulated properly and a
full and frank discussion with concerned people be done so as to avoid dissatisfaction
There is no doubt that we live in a money motivated world where the amount of human relation
is dependent upon salary provisions. It is true that pay is an important monetary reward which is
highly valued hence it should be clearly understood in order to satisfy needs and increase
motivation intensity of employees.
Therefore according to An11strong (1996) the purpose of salary scheme is to p~ovide an
attractive and competitive total remuneration package which both attracts and retain high quality
employees. It also increases employees' commitment towards the organization.
12
According to Nzuve(l 997), the objective of salary scheme is to motivate the workers to perform
effectively, attract workers from outside to join the organization, increase workers earning
without forcing the finn into a higher wage structure and induce the effective employees to stick
to the enterprise.
Deverell (1966) states that, salary scheme provide emotive for acting in a ce1iain way. He
indicates that it is the motivational pattern of the human being himself that detern1ines the
particular salary scheme to which he will respond.
Therefore in conclusion salary is of the most technical and sensitive factor of motivation as
revealed by the authors.
For example; Strauss/Sayles(4th Edition) concluded that , salary scheme is the pmnary
motivation for most employees since it helps to satisfy both lower level needs and higher level
needs thus help in maintaining a highly motivated workforce.
2.2 THEORETICAL FRAMEWORK
Quality of Work Life (QWL), patronized in employee welfare, is the degree to which the
employees are able to satisfy impo1iant personal need through their experiences in the
organization (Singh, 2009). It involves physical, mental, moral and emotional well-being of the
employee (Aswathappa, 2004), conceptualized by Singh (2009) as occupational health which
together with suitable working time and appropriate salary increase motivation and satisfaction.
Singh's positive correlation of working time and salary with productivity is doubtful. He
generalized on what is rather sometimes the case, as if it is always the case.
Gray and Starke (] 988) argued that in spite of the assumption of the Hawthorne experiment that
a positive work environment makes for an increased productivity, there is a proviso. There are
intervening variables that include task and technology, individual group, organizational and
enviromnental factors. Explicitly, if tasks to be performed are poorly designed, production will
be low; if an individual's abilities with respect to the task are low; high motivation cannot lead
to high productivity; informal groups within formal structures moderate compliance of their
group members to task needs, in order to achieve group (employees' personal) needs; the
existence of interactive entities (customers, clients, middle management etc) influence speed in
the organization task performance.
Correspondingly Trist and Bamford (1951), using the Longwall Shift Cyc:~ method of coal
getting in a coalmine (which was a socio-technical system adjudged to be ·excs:llent as it had
intrinsic good work practices), observed that it resulted rather to a decline in productivity. It
neglected considerations for the employees' needs, which are aspects of welfare. 13
In some organizations, job behaviors' have a more direct relationship to rewards than in others
(Gray and Starke, 1988), due perhaps, as argued by Gannon (1979) and Reynolds (1971) to the
employees' needs (such as urgent need for money to meet certain obligations or the absence of
this) and the comparison of his reward with that of his colleagues that perform similar task. The
relativity of pay (salary and bonuses) in task perfonnance has also been observed by other
scholars such as Kohn and Schooler (1969), who observed that, as social class increases, the
need for money declines. Similarly, Lawler (1971) asse1is that the importance of pay decreases
with age and it is more important to males than females.
A part explanation to Lawler's findings is that younger persons have comparatively numerous
needs to pursue than their elderly counterparts, so also with the males especially as they
traditionally assume headship of their homes. Nevertheless, Mckersie and Hunter (1973) found
that in comparison with American and Japanese industries, labour productivity in Britain was
anywhere between one-half and one third, due to low remuneration (in Britain) amongst other
reasons. This is a quintessence of a direct relationship between reward and productivity, which
exists in several other articles.
Occupational health as highlighted by Singh (2009) and Aswathappa (2004) amongst other
scholars is inex!iicable from welfare, especially when the latter is perceived in the words of
Cowling and Mailer (1992) as ' ... the support that can reasonably be expected by employees
from their employer'. It appears a truism that the absence of health and safety at workplace
makes the employees easy victims of occupational hazards that could depress morale and
productivity. It is therefore, obligatory on employers by law to provide a safe workplace for
employees (Cole, 1996) to increase efficiency and productivity of workers (Nwachukwu, 2007)
and to guard against a possible accusation of negligence arising from injuries to employees
(Okereke, 2007).
It has been observed, however, that the relationship between safe workplace and increased
productivity of workers is not direct, as was earlier put in this paper in respect of positive work
environment and productivity. An interviewing variable, the authors argue in the fonn of
motivation, could be identified. Mitchell (1978) points that there is consensus amongst most
theorists that 'ability to work' goes hand in glove with 'motivaaon' to produce performance, as
ability of the employees to do the job does not mean that they would do it.
Most managers have recognized the vital role job satisfaction (satisfaction of members of the
organization) plays on productivity (Cohen, Fink, Gadon and Willitts, 1995; Mitchell, 1978), but
job satisfaction and motivation whichever that precedes the other is akin to ~e riddle of the 'egg
and chicken', which one that comes first. According to Ibbetson and Whitmore (1977), several
researches suggest that people must find their work Chukv,unenye and Amgbare 315 satisfying
14
in order to be motivated to do a satisfactory job. This contrasts with the wisdom of the foremost
theorists on management and productivity.
2.2.1 THEORY X AND THEORY Y
Theory X of McGregor (Upton, 2001; Ibbetson and Whitmore, 1977) conceives an average
worker as naturally lazy, hates work and might avoid work such that he has to be motivated
through monetary incentives for increased productivity or negatively sanctioned ( coerced,
threatened with punishment) for poor task perfonnance.
In criticism, the thesis lacked hindsight of the influence of job satisfaction on production. It
portrayed the employee as an 'economic man', whose motivation was attributed to a single
phenomenon (money) and has therefore been faulted by Gray and Starke (1988) as "gross
oversimplification of human motivation' with the orchestrated emphasis on money as a
motivator widely criticized by scholars that include Lawler (1971) and Kohn and Schooler
(1969). Yet, McGregor's Theory Xis widely applied by several managers. It has been observed
that employees in most organizations in Nigeria are denied wages or experience cuts in wages or
threats thereunto for poor job performance ( due to reasons that include inability to submit
returns within specified timelines).
McGregor's Theory Y, on the other hand, assumes that people at work can be self-motivated
(Ibbetson and Whitmore, 1977) as motivation is the basis for commitment to duty and is relative
to environment (Upton, 2001).
2.2.2 MASLOW'S HIERARCHY OF NEEDS
In supp01i, Maslow (Cole, 2002) highlighted on a hierarchy of five needs (physiological, safety,
esteem, social and self-actualization) each of which can motivate a worker towards increased
output, depending on his circumstance at a particular point in time. Piven (2007) classified needs
into existence, relatedness and growth in contrast to Maslow.
Correspondingly, however, the 'existence needs' are in tandem with Maslow's lower level
(physiological, safety and esteem needs) 'relatedness needs' are Maslow's social needs, while
'Growth needs' are Maslow's high level needs (self-actualization or self fulfillment needs).
The constituents of the environment detennine the level of productivity. Typically, Patterson et
al. (2004) found that company production was more strol'gly correlated with those aspects of
climate that had stronger satisfaction loadings. Invariably, satisfaction and dissatisfaction are
inliinsic features of the climate/environment.
According to Shafiitz and Rusell (2001 ), Herzberg argned that positive elements (the
'satisfiers') are job content factors such as a sense of achievement, recognition, interest in the
work itself and advancement. Conversely, the 'dissatisfies' or 'hygiene factors' are associated
with the workers relation to the environment in which he performs his task, such as the company
15
policies, ineffective administration among others. The balance between satisfaction and
dissatisfaction detennines the level of motivation the worker obtains. He1izberg's work
suggested that the addition of motivators will lead to greater employee job 316 J. Econ. Int.
Finance. Satisfaction (Gray and Starke, 1988), but Mitchell (1978) argues that numerous reviews
of literature show that perfonnance (productivity) are only weakly related and that very little
evidence exists that satisfaction causes increased productivity.
Accordingly, many people can be excited with a high remuneration, interpersonally pleasant job
and yet lack the requisite skill for effective job performance. In brief, there should be an
adequate blend of ability to do a work, job satisfaction and motivation for a satisfactory job
performance. Consistently, Gray and Starke (1988) explain that satisfying an individual does not
automatically lead to job motivation, but could make the employee to remain with the
organization and to exhibit job behaviours that are indicative of job motivation.
2.2.3 CONFLICT THEORY OF RALPH DAHRENDOF
According to Ritzer (2000), conflict theorists are oriented toward the study of social strnctures
and institutions. Dahrendorf and Simmel who were ardent proponents of the social conflict
theory had opined that every society at every point in time was subject to processes of change.
For them, many societal elements contribute to disintegration and change, but orderliness is
maintained through power.
Dahrendorf was the major exponent of two faces of society (conflict and consensus) and the
need for sociological theory to be split into two, namely conflict theory and consensus theory.
He, however, constrncted a single theory 'conflict theory of society' and argues that 'the
differential distributing of authority invariably becomes the dete1mining factor of systematic
social conflict'. Naturally, the management and workers are often antagonistic to each other. The
management through a strong management philosophy seeks to maximize profit (financial
resources); to maintain the status-quo; to minimize the organization's expenses on rnnning cost
including wage bill etc.
The workers, on the other hand, through Union Power make attempts to extricate themselves
from a relative deplorable and oppressed state. The conflict is pursuit of incompatible goals for
which ,J11e paiiy gains at the expense of the other (BarP,lson and Steiner, 1985) and an opposition
that may not break out into open dispute or physical violence (Sanderson, 1989). The effect,
however, of these contrasting positions in Sony Sugar depresses motivation and productivity in
the Company.
16

2.3 EMPIRICAL DEBATE
2.3.1 Salary scheme
This is the money that is paid to the employees for the work they have done, the staff of this
company should be paid full and addition to this they should be provided with other importance
allowance such as housing allowance, health allowance and also 1isk allowance which is paid
because employee officer undergo various risks such as poor skills of manufacturing Sugar
through the provision of remuneration, employee products staff members may perfonn their
duties effectively because they feel valued in the Salary Scheme system. Vaiious organizations
rely on specific policies and procedures that enable them to attain their specific goals and
objectives. The organization must provide ways of improving salary scheme so as to motivate
employees to enhance their work performance in the organization.
2.3.2. Annualized salary scheme
Annnalized salary scheme has pay rates which earn as wages or salary per year. This is the
money that is paid to employees for the work they have done. It provides flexibility in
remuneration for seasonal or part-time staff members. During the period of the calendar year
that the staff members not required to perfonn work, the staff members' employment contract
will continue. Remuneration for the periods of work and aiu-iual leave will be spread over a
twelve (I 2) months or 52 wee period on a pro rata basis. This will also have effects on the
followings:
i) Application Conditions
ii) Annual leave
iii) Public holiday and university concession days
2.3.3. Pension Scheme
Pension scheme is a sum of money paid regularly as post-retirement benefits that an employee
might receive from some employers. A pension is essentially compensation received by the
employee after he/she has retired.
Personal Pension Scheme (PPS) sometimes called a Personal Pension Plan (PPP) is a UK tax
privileged investment vehicle with the primary purpose of°building a capital sum to provide
retirement benefits, although it may also be used to provide death benefits.
17
2.3.4 Career development opportunity
Opportunity is the process of foregone alternative, best or next foregone alternative of an
opportunity for career development.
Therefore, Employees with new skills need to perfonn their jobs more efficiently. It consists of
those activities which are designed to improved individuals productivity in currently held job or
one related to it. Thus it is aimed at helping employees do there career job more c01Tectly and
effectively.
Development career are programs designed to educate employee beyond the req,.iireinent of their
career development of position so that they will be prepared for promotion and able to make a
broader view of their role in the organization employee and oppo1iunity career development is
any attempt to improve productivity of salary scheme by imparting knowledge changing
attitudes or increasing skills
2.3.5 Fridge benefit
Compensation in additional to direct wages or salaries as company, house allowance, medical
insurance, paid holidays, and pensions schemes, subsidized meals.
Compensation to employees in addition to salary, examples of fridge benefits are paid holiday s,
plans, life and health insurance plans, subsidized catering, company cars, stock rates and
expenses. fridge benefits can add significantly to an employee's total compensation and are key
in attracting and retaining employees for the most part, fridge benefits are not taxable to the
employees are generally tax-deductible for the employer, When an employee exchange (cash)
wages for some other fom1s of benefits this is generally refereed to as a salary sacrifice
arrangements in most countries, most kinds of employees benefits are taxable to at least some
degree
2.4 THE CONCEPTUAL FRAMEWORK
Salary scheme has been defined differently_ by different writers; however, research has been
defined by writers who are;
According to Northcott (1960), salary or pay is a stimuli directed to awaken, maintain and
strengthen the desire to attain a given end. Gillennan(l963) define salary as a motivator factor
that is a catalyst for improved perfonnance and productivity.
18
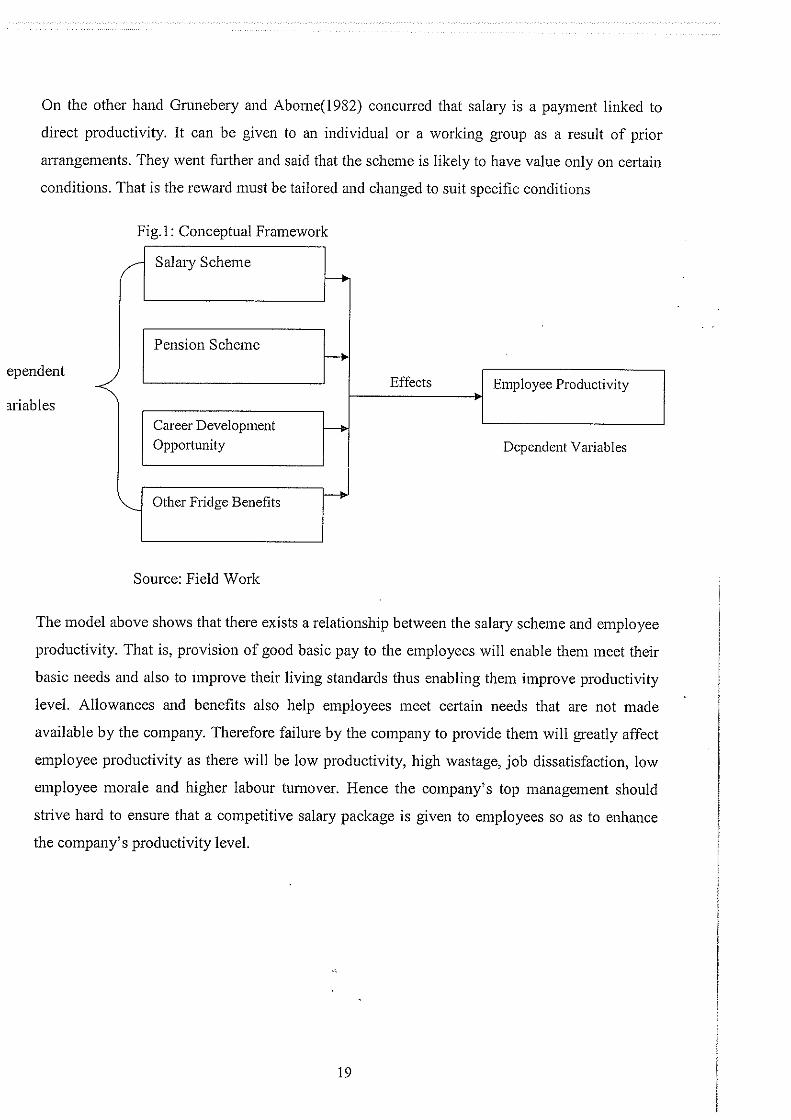
On the other hand Grunebery and Aborne(l 982) concurred that salary is a payment linked to
direct productivity. It can be given to an individual or a working group as a result of prior
arrangements. They went further and said that the scheme is likely to have value only on ce1iain
conditions. That is the reward must be tailored and changed to suit specific conditions
ependent
1riables
Fig. l: Conceptual Framework
/ Salaiy Scheme J---1,
Pension Scheme J---1,
Career Development 1----1 Opportunity
"--- Other Fridge Benefits J---1,
Source: Field Work
Effects Employee Productivity .
Dependent Variables
The model above shows that there exists a relationship between the salary scheme and employee
productivity. That is, provision of good basic pay to the employees will enable them meet their
basic needs and also to improve their living standards thus enabling them improve productivity
level. Allowances and benefits also help employees meet certain needs that are not made
available by the company. Therefore failure by the company to provide them will greatly affect
employee productivity as there will be low productivity, high wastage, job dissatisfaction, low
employee morale and higher labour turnover. Hence the company's top management should
strive hard to ensure that a competitive salary package is given to employees so as to enhance
the company's productivity level.
19

CHAPTER THREE
RESEARCH METHODOLOGY
3.0 INTRODUCTION
This chapter focuses on the methodology of the study. The research therefore will present the
research design, the target population, sampling design and size, data collection methods and
data analysis techniques.
3.1 RESEARCH DESIGN
The researcher will use the descriptive research method the method is convenient and
economical since it does not involve a lot of time and financial resources. The method is also
anticipated to yield maximum infonnation that will help in the achievement of the research
objectives. The researcher will use data collection instrnments such as questionnaires and
interview schedules so as to collect relevant findings on the ground and also data collection
procedure and data analysis methods which will help in analyzing the data so as to determine the
current status of the salary systems used
3.2 TARGET POPULATION
The main aim of the study is to evaluate the effect of salary schemes on the employee
productivity at Sony Sugar Company. The estimated population of the organization is 2000
employees consisting of permanent employees of 1350and temporary staff of 620.
The researcher will therefore sample 50 respondents to fonn the subject of the study. The
sample will be drawn mainly from the human resources department, manufacturing depaiiment
and the general administration using random sampling techniques.
Table 3.1: Interpretation of Target Population
Category Target Population Sample Total
Permanent 1350 69 1419
Temporary 620 31 651 .
Total 2000 100 2070
Source: Field Work
20
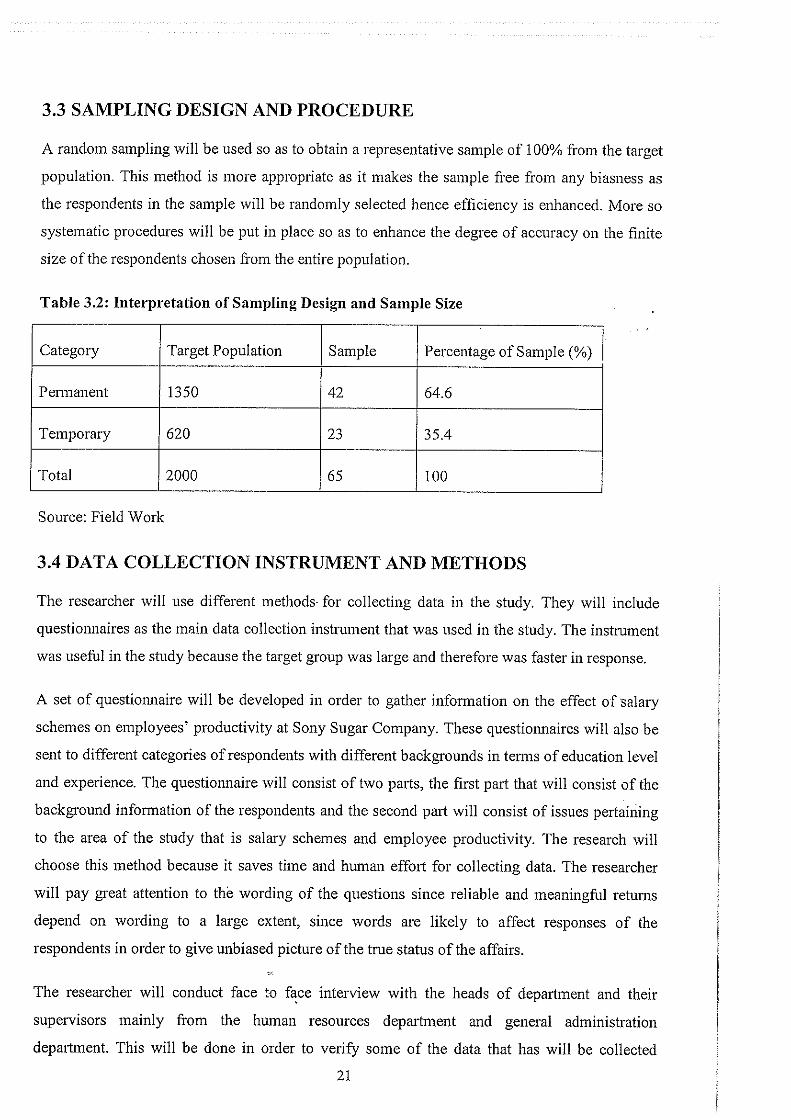
3.3 SAMPLING DESIGN AND PROCEDURE
A random sampling will be used so as to obtain a representative sample of 100% from the target
population. This method is more appropriate as it makes the sample free from any biasness as
the respondents in the sample will be randomly selected hence efficiency is enhanced. More so
systematic procedures will be put in place so as to enhance the degree of accuracy on the finite
size of the respondents chosen from the entire population.
Table 3.2: Interpretation of Sampling Design and Sample Size
Category Target Population Sample Percentage of Sample(%) I Pennanent 1350 42 64.6
Temporary 620 23 35.4
Total 2000 65 100
Source: Field Work
3.4 DATA COLLECTION INSTRUMENT AND METHODS
The researcher will use different methods- for collecting data in the study. They will include
questionnaires as the main data collection instrument that was used in the study. The instrument
was useful in the study because the target group was large and therefore was faster in response.
A set of questionnaire will be developed in order to gather information on the effect of salary
schemes on employees' productivity at Sony Sugar Company. These questiom1aires will also be
sent to different categories of respondents with different backgrounds in tenns of education level
and experience. The questionnaire will consist of two paiis, the first part that will consist of the
background information of the respondents and the second pmi will consist of issues pertaining
to the area of the study that is salary schemes and employee productivity. The research will
choose this method because it saves time and huma11 effo1i for collecting data. The researcher
will pay great attention to the wording of the questions since reliable and meaningful returns
depend on wording to a large extent, since words are likely to affect responses of the
respondents in order to give unbiased picture of the true status of the affairs.
The researcher will conduct face to f~ce interview with the heads of depmiment and their
supervisors mainly from the human resources department and general administration
department. This will be done in order to verify some of the data that has will be collected
21
through the questionnaires. This method will help the researcher in obtaining more detailed
information as well as seeking clarification in areas where the information given will be
insufficient or unclear thus enhances quick feedback.
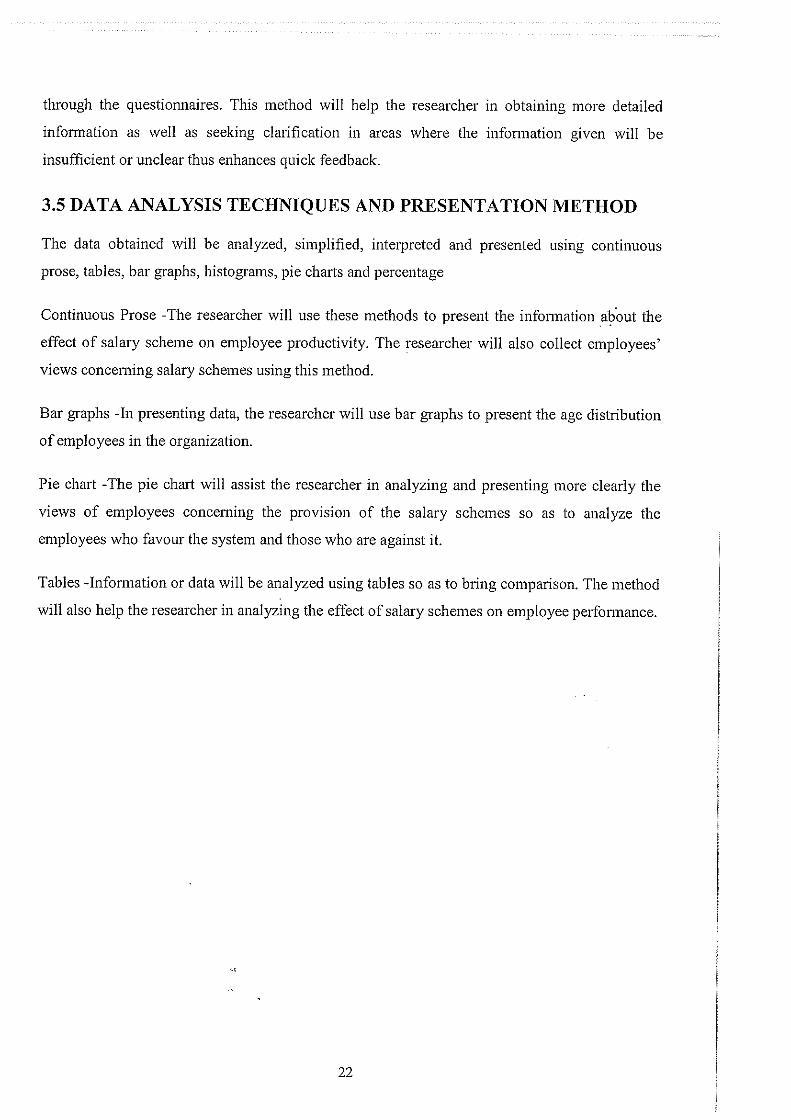
3.5 DATA ANALYSIS TECHNIQUES AND PRESENTATION METHOD
The data obtained will be analyzed, simplified, interpreted and presented using continuous
prose, tables, bar graphs, histograms, pie charts and percentage
Continuous Prose -The researcher will use these methods to present the infonnation _ab.out the
effect of salary scheme on employee productivity. The researcher will also collect employees'
views concerning salary schemes using this method.
Bar graphs -In presenting data, the researcher will use bar graphs to present the age distribution
of employees in the organization.
Pie chart -The pie chart will assist the researcher in analyzing and presenting more clearly the
views of employees concerning the provision of the salary schemes so as to analyze the
employees who favour the system and those who are against it.
Tables -Infonnation or data will be analyzed using tables so as to b1ing comparison. The method
will also help the researcher in analyzing the effect of salary schemes on employee pe1fonnance.
22

CHAPTER FOUR
DATA ANALYSIS AND INTERPRETATION
4.1 INTRODUCTION
After the research has collected the data from the field', the next stage was analysis and
interpretation of the data. The analysis was done in accordance with the research objective and
variable of the study.
The variables under study were the salary scheme, penSion scheme, career .development
opportunities, fridge benefits annualized salary scheme, bonus, holidays and allowance as the
motivation factor for the improvement in employees productivity.
The researcher employed various tools to analyze the data collected employed various tools to
analyze the data collected including but not limited to frequency distributions tables, simple bar
graphs, pie charts and percentages.
A descriptive analysis has also been given to enable easy understanding of the infonnation given
by various respondents.
4.2 BACKGROUND INFORMATION.
To investigate the ages of the workers, the results were presented in table 4.1.
Table 4.1 Showing Ages of the respondents
Age-range Frequency Percentage
21-25 10 15.4%
26-30 13 20%
31-35 8 12.3%
36-40 15 23%
41-45 12 18.5%
46-50 5 7.7%
50 and above 2 3.1%
Total 65 100% ~•
23
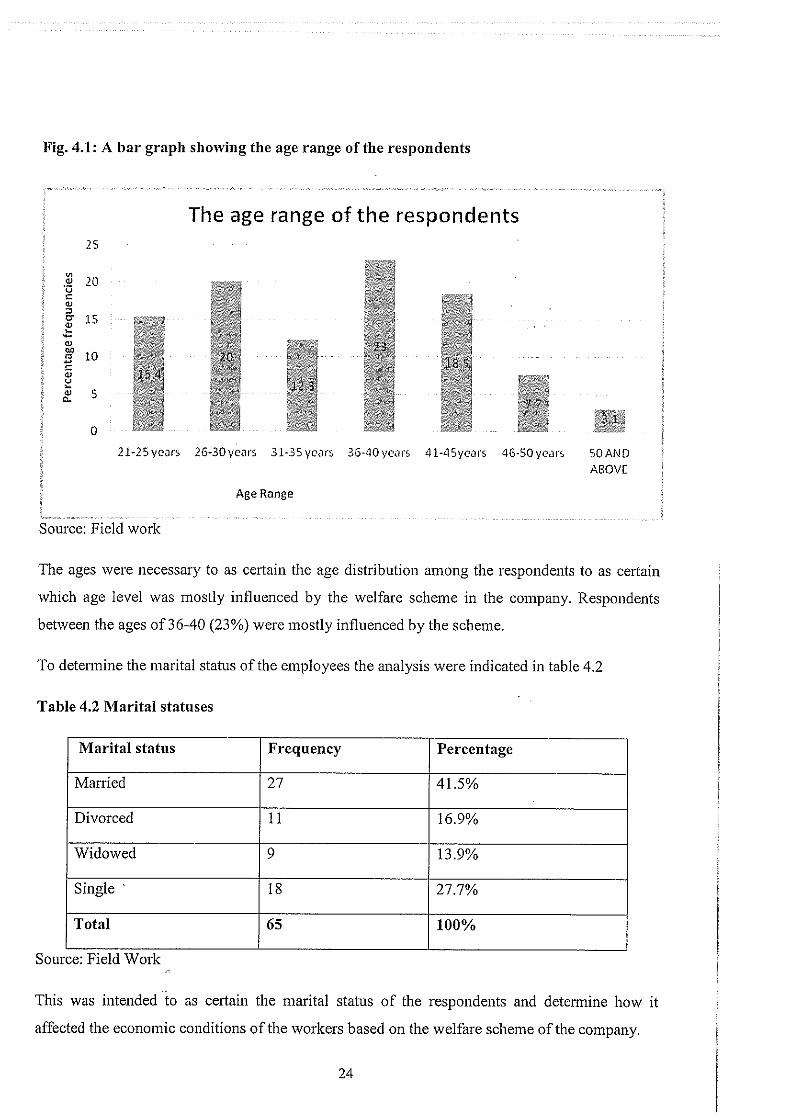
Fig. 4.1: A bar graph showing the age range of the respondents
The age range of the respondents 25
v> 20 (IJ
·c; ,:: (IJ :::, er 15 (IJ ~ -(IJ ..
10 " -,:;; (IJ u ~
(IJ 5 Cl.
0
21-25yc<1rs 26-30ycJrs 31-35yc<1rs 36·40yctirs 41-45ycars 46-SOycars
Age Range
Source: Field work
50AND ABOVE
The ages were necessary to as certain the age distribution among the respondents to as ce1iain
which age level was mostly influenced by the welfare scheme in the company. Respondents
between the ages of36-40 (23%) were mostly influenced by the scheme.
To detennine the marital status of the employees the analysis were indicated in table 4.2
Table 4.2 Marital statuses
Marital status Frequency Percentage
Married 27 41.5%
Divorced 11 16.9%
Widowed 9 13.9%
Single 18 27.7%
Total 65 100%
Source: Field Work
This was intended to as certain the marital status of the respondents and determine how it
affected the economic conditions of the workers based on the welfare scheme of the company.
24
Majority of the respondent were married (41.5%) while only 27.7% were single.
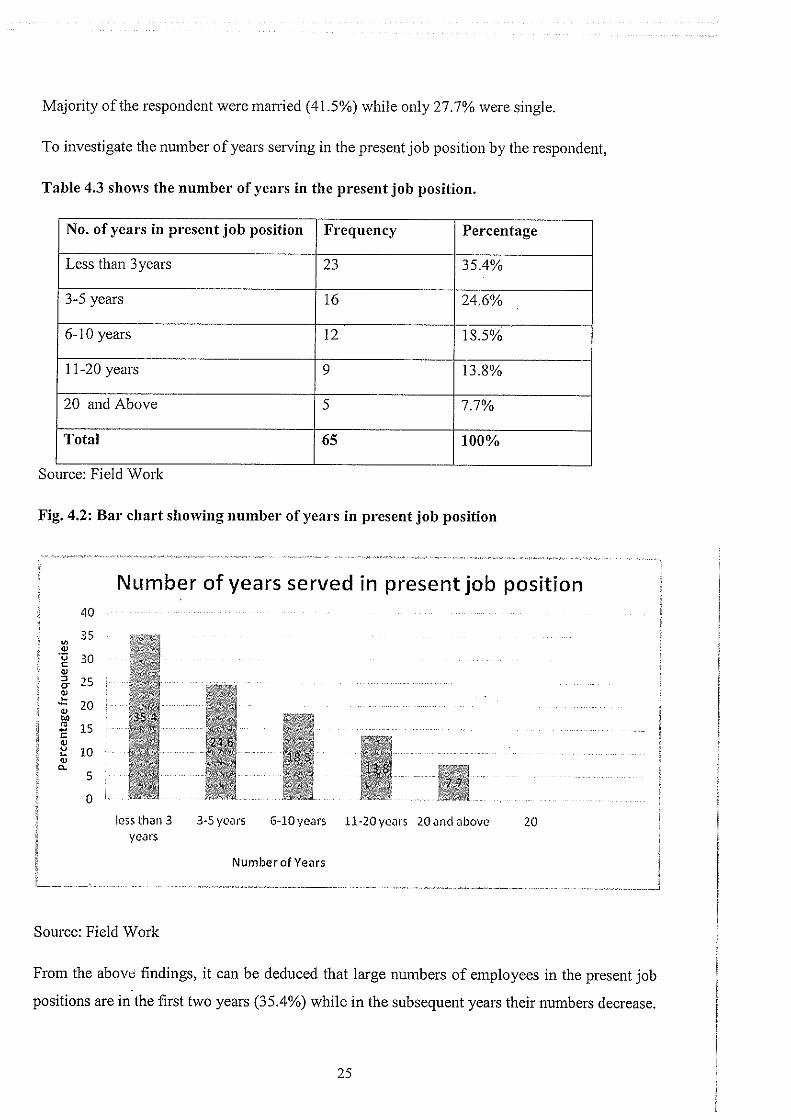
To investigate the number of years serving in the present job position by the respondent,
Table 4.3 shows the number of years in the present job position.
No. of years in present job position Frequency Percentage
Less than 3 years 23 35.4%
3-5 years 16 24.6%
6-10 years 12 13.5%
11-20 years 9 13.8%
20 and Above 5 7.7%
Total 65 100%
Source: Field Work
Fig. 4.2: Bar chart showing number of years in present job position
Number of years served in present job position 40
35 "' .,
·.:; 30 C: ., ::, 25 CT ., ~ - 20 ., M
"' 15 ~
C: ., u 10 ~ ., 0..
5
0
less than 3 3-5 years 6-l0years 11-20ycars 20.:ind above 20 years
Number of Years
Source: Field Work
From the abovt findings, it can be deduced that large numbers of employees in the present job
positions are in the first two years (35.4%) while in the subsequent years their numbers decrease.
25

To investigate the basic salary per month by the respondents, Table 4.4 shows the findings
Table 4.4: Shows basic salary per month.
Basic salary Frequency Percentage
Less than 30,000 15 23 .. ]% ..
30,000-50,000 24 36.9%
50,000- 70,000 10 15.4%
70,000 - 90,000 5 7.7%
90,000 and above 11 16.9%
Total 65 100%
Source: Field Work
Figure 4.3: Bar graph showing basic salary of the employees per month
40
35
"' QJ 30 ·.:; C: QJ :, ET
25 QJ ~ - 20 QJ .. "' 15 ~ C: QJ V ~ 10 QJ 0.
5
0
Basic Salary per Month -------~5:0-------------------------
---2:L
1----------------------,5:::,------------15.4
1-----------------l.+'---------------
Less than 30000
30000-50000 50000-70000 70000-90000 90000 and above
Basic Salary Per Month
Source: Field Work
From the .above findings it can be deduced that majority of the employees lies between the
salary scales of sh. 30,000- sh. 50,000 (36.9%). The few can be between 70,000- 100,000
(7.7%). However, those earning above sh. 100,000 are the 11 Board Directors of the company.
26

4.3 SALARY SCHEME
The first variable of the study was the salary schemes. This variable was intended to detennine
whether the scheme is very good, good, fair, poor for employees. Several questions were
administered to measure the variable.
In detennine whether the respondent factor the scheme or not, the results is analyzed in the bar
graph below.
Table 4.5: A bar graph showing the employees view of the view of schemes
.. Response Frequency Percentage
Very good 32 49.3%
Good 19 29%
Fair 8 12.3%
Poor 6 9.2%
Total 65 100%
Source: Field Work
Fig. 4.4: A Bar Graph Showing, employees' view of the welfare schemes
Employee's view of the welfare schemes at
60 Sony Sugar Com pa_n~y,___ _____ _
50 ~ .,
·,:; C: 40 ., ::, C" .,
.):: 30 ., bl>
"' ~ C: ., 20 u ~ ., 0.
10
0
Very Good Poor
Source: F.ield Work
27
According to the findings from the above figure, majority of the respondent interviewed were
the views of the salary scheme being very favorable. Only about 5 individuals view the scheme
to be poor. These findings confirm that the company is at a better position in tenns of
employee's welfare.
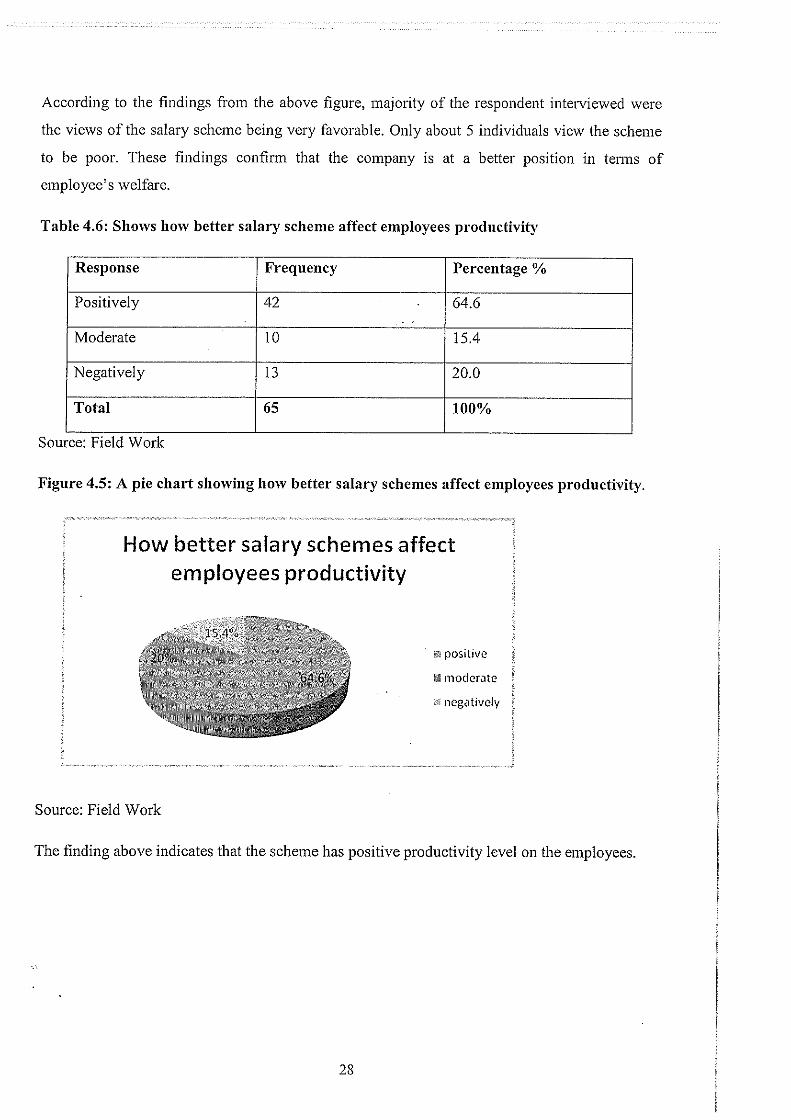
Table 4.6: Shows how better salary scheme affect employees productivity
Response Frequency Percentage %
Positively 42 64.6 ..
Moderate 10 15.4
Negatively 13 20.0
Total 65 100%
Source: Field Work
Figure 4.5: A pie chart showing how better salary schemes affect employees productivity.
How better salary schemes affect employees productivity
Source: Field Work
EE positive
!@:I rnodcrJtc
negatively
The finding above indicates that the scheme has positive productivity level on the employees.
28
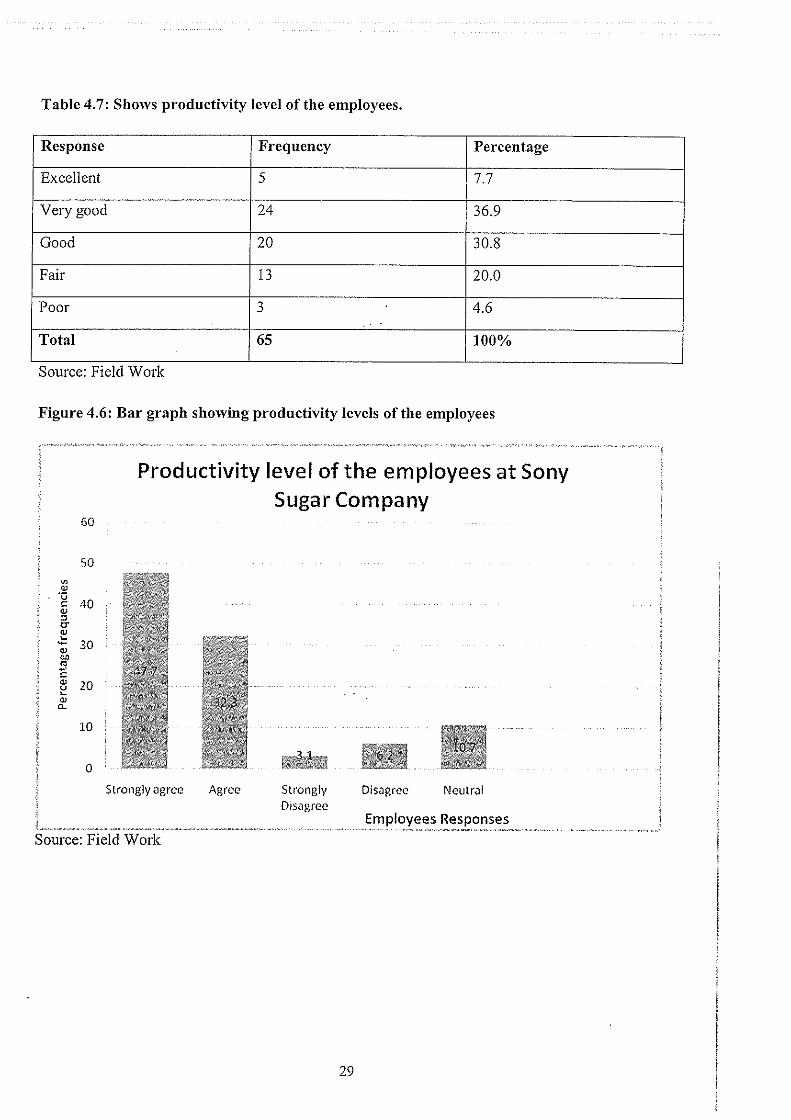
Table 4.7: Shows productivity level of the employees.
Response Frequency Percentage
Excellent 5 7.7
Very good 24 36.9
Good 20 30.8
Fair 13 20.0
Poor 3 4.6
Total 65 100%
Source: Field Work
Figure 4.6: Bar graph showing productivity levels of the employees
60
so ~
" ·;:; 40 C
" ::, O" ., ~ - 30 " 0.0
" ~-C .,
20 u ~
" c..
10
0
Productivity level of the employees at Sony Sugar Company
Strongly Jgrcc Agree Strongly Disagree
DisJgrec NeutrJI
Employ_ees Rese~ns~s, .. Source: Field Work
29
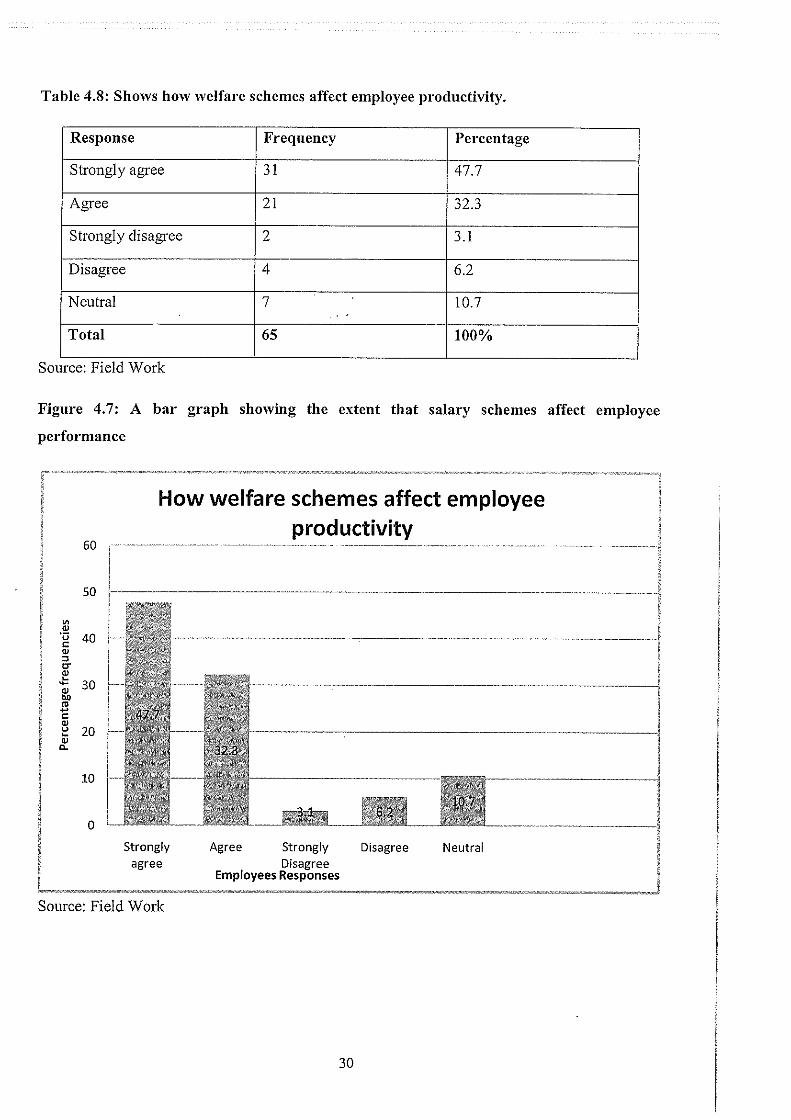
Table 4.8: Shows how welfare schemes affect employee productivity.
Response Frequency Percentage
Strong! y agree 31 47.7
Agree 21 32.3
Strongly disagree 2 3.1
Disagree 4 6.2
Neutral 7 10.7 .. Total 65 100%
Source: Field Work
Figure 4.7: A bar graph showing the extent that salary schemes affect employee
performance
60
50
~ <1l ·.::; 40 C: <1l :, CT <1l ~
30 .... <1l bJ) Ill ... C: <1l u 20 ~
QJ 0.
0
How welfare schemes affect employee
·"-"'_"_,, __ ,, ··-
Strongly agree
productivity ·~----- --"··--·--·-
Agree Strongly Disagree Disagree
Employees Responses
Neutral
Source: Field Work
30
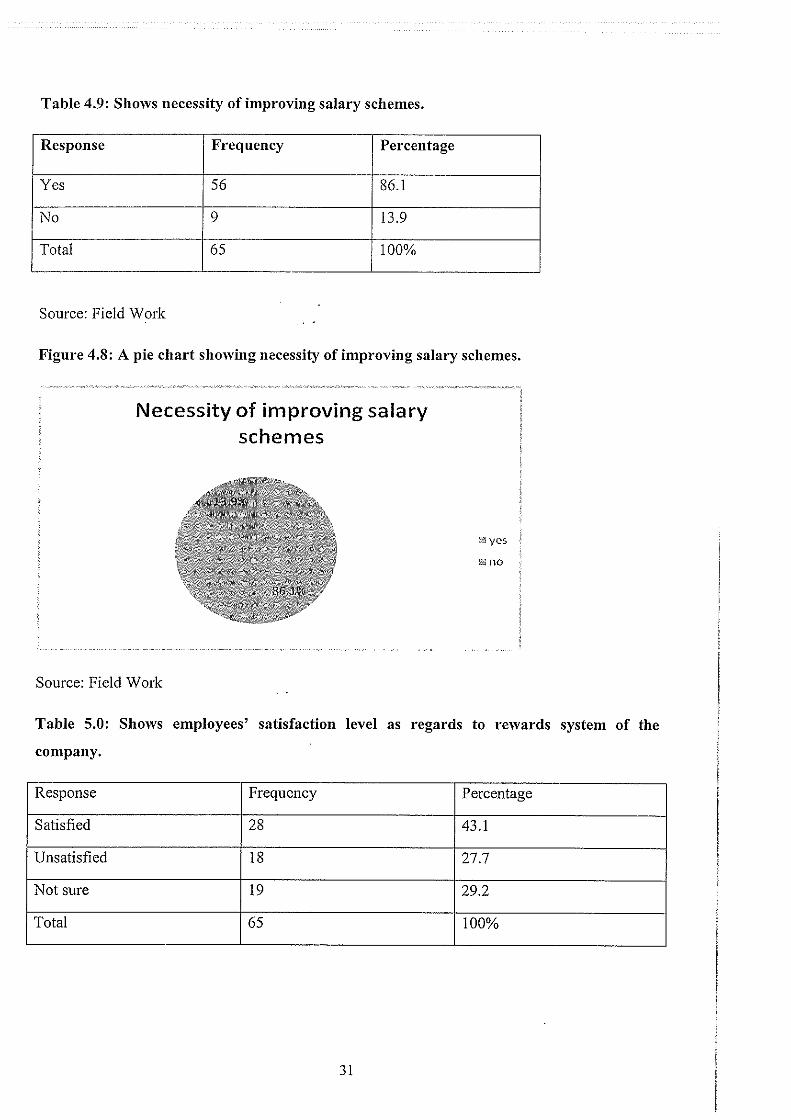
Table 4.9: Shows necessity of improving salary schemes.
Response Frequency Percentage
Yes 56 86.1
No 9 13.9
Total 65 100%
Source: Field Work
Figure 4.8: A pie chart showing necessity of improving salary schemes.
Necessity of improving salary schemes
Source: Field Work
!Blycs
till! no
Table 5.0: Shows employees' satisfaction level as regards to rewards system of the
company.
Response Frequency Percentage
Satisfied 28 43.1
Unsatisfied 18 27.7
Not snre 19 29.2
Total 65 100%
31

Figure 4.9: A pie chart showing employees level of satisfaction as regards to reward system
of the company.
Employees level of satisfaction as regards to reward system
Source: Field Work
n unsullsficd
not sure
Table 5.1: Shows how often fringe benefits and pension schemes motivate employee's
productivity level.
Response Frequency Percentage
Very likely 31 47.7
Likely 17 26.1
Very unlikely 3 4.6
Unlikely 7 10.8
Neutral 7 10.8
Totals 65 100%
Source: Field Work
32

Figure 5.0: Bar chart showing, how often fringe benefits and pension schemes motivate
employee productivity level.
60
"' -~ 50 u. ,:: w :, er
40 (]J '-....
30 "' w QI) ro
20 .., ,:: w u '- 10 (]J a.
0
How often fringe benefits and pension schemes motivate employee productivity
level
47.7
26.1
10.8 10.8
4.6
very likely likely very unlikely unlikely neutral
Motivational effect of fringe and pension schemes
Source: Field Work
Table 5.2: Show contributions of career development programmes to employee
productivity
Response Frequency Percentage
Yes 42 64.6 .
No 23 35.4
Total 65 100%
Source: Field Work
33

Figure 5.1: Pie chart showing contributions of career development programmes to
employee productivity
Contributions of career development programmes to employee
productivity at Sony Sugar Company.
Source: Field Work
yes
!ill no
Table 5.3: Shows educational requirements for one to be employed in Sony Sugar
Company
. Response Frequency Percentage
0 -level 13 20.0
Under graduate 18 27.7
Graduate 2.7 41.5
Post graduate 7 10.8
Totals 65 100%
Source: Field Work
34

Fig 5.2: Bar graph showing educational requirements for one to be employed in Sony
sugar company.
Vl
.!!! u C
"' ::, er OJ ~ ..... Vl
"' bl) ro ..., C OJ u ~
OJ 0.
45
40
35
30
25
20
15
10
5
0
Educational requirement for one to be employed at Sony Sugar
0-level under gr.:iclu~1tc grnc!u.:itc post gradUtllC
Level of Education
Source: Field Work
35
CHAPTER FIVE
5.1 SUMMARY AND CONCLUSION
The study investigated effects of welfare scheme on employees' productivity in Sony Sugar
Company. The variables of the study were salary scheme, pension scheme, career development
programmes, bonus pay, overtime pay and other allowance.
Chapter one comp1ises background infonnation, problem statement, hypotheses, scope and
limitations and justification of the sttidy among others. This infonnation is important for
providing the introduction to the ptciblem understudy. It also provides the objectives and
justifications of the study.
Chapter two involves review of related literature materials and throws more light on the problem
under study. Various theories have been used to explain the variables of the study for example
theory x and y by Mccgrager.
Survey design was used in collecting the data for the study. Various sampling techniques were
employed to obtain information and the researcher sampled sixty five respondents out of a
population of hundred.
The researcher used frequency distribution tables, percentages, pie charts and bar graphs to
present and analyses the findings. The researcher selected the site of the study conveniently
considering time and resources available ..
The following conclusions were drawn from the findings:
Few employees got basic salary ranging from Ksh 50,000 and above while large number of the
workers (36.9%) got less than Ksh 50,000. Majority of the respondents suggested that their basic
pay given was not enough. This indicated that the company generally gives smaller amounts of
basic pay to employee.
On the ways of overcoming the financial constraints are through devising effective and efficient
salary scheme. 49 .3 % of the respondents suggested that the scheme is nry good hence better
motivation for the employees to be more productivity. These include issues of adequate bonuses
and other benefits in terms of allowances and other benefits.
To investigate whether the fridge benefits and pension scheme motivate the employees to be
more productive, majority (47.7%) of the respondents were for the view of it been very likely.
36
Only (4.6%) sees it as been very unlikely. The results showed increased production level, better
performance and the company's reputation.
Findings of the study showed that majority of the respondents were Graduate. This is shown by
41.5% while only 10.8% of the respondents from the sample are postgraduate. This indicates
that the company favours or requires employee with high knowledge and skills. This will enable
the company's perfo1mance to boost.
The findings shows that the career development programmes that the company offers to
employees usually boost their productivity level. This is shown by majority (64.6%) response
that proposed the idea. This usually builds the employees morale toward the company hence will
enable them to give back.
To investigate whether the welfare scheme of the employees in the company is a better position,
majority of the respondent (47.7%) agreed strongly. This showed that company's is at a better
position in terms of production.
5.2 ANALYSIS FROM HUMAN RESOURCE DEPARTMENT
Compensation may be defined as money received for the perfonnance of work plus many kinds of benefits and services that organizations provide their employee.
Compensation is recompense, reward, wage or salary given by an organization to persons or a group of persons in return to a work done, services rendered, or a contribution made towards the accomplishment of organizational goals. Wage, dearness allowance, bonus and other allowance are examples of monetary compensation, while good accommodation, children education, transport facilities, subsidized. ration of essential commodities, etc. come under non-monetary compensation. In short, wage paid to collar workers or salaries paid to white collar employee can be classified as compensation.
A good compensation package is a good motivator. Hence, the primary responsibility of the HR manager is to ensure that the company's employees are well paid.
OBJECTIVES OF COMPENSATION:
To attract capable applicants: To retain cu1Tent employee so that they don't quit. The employee is motivated for better perfonnance:
► Reward desired behavior. ► To ensure equity. ► To control cost. ► Facilitate easy understanding by all 1.e. employee operating manager and Human
Resource personnel
37
BASIC COMPENSATION
WAGE: The remuneration paid, for the service of labour in production, periodically to an employee/ worker. Wages means any economic compensation paid by the employer under some contract to his workers for the services rendered by them. Usually refer to the hourly rate paid to such groups as production and maintenance employees' wages include family allowance, relief, pay, financial support etc.
SALARY: Salary is influenced by the size of a company by the specific industry, and in part by the contribution of the incumbent· to the process of decision-making. Salary refers to the weekly or monthly rates paid to clerical, administrative and professional employees. Salary is dete1mined by mutual agreement between the individual and the employer.
INCENTIVE: An incentive scheme is a plan or programs to motivate industries or group performance. An incentive program is most frequently built on monetary, but may also include a variety of nonmonetary rewards or prizes.
DETERMINA TS The effective use of incentives depends on three variables. They are: 1. The individual. 2. The work situation. 3. The incentive plan.
Factors influencing compensation: 1. Organization's capacity to pay 2. Prevailing pay and benefits in the industry: 3. Compensation in the industry and availability of special competent personnel 4. Flexibility, i.e. kind of competencies and abilities in managers: 5. Performance/productivity/responsibilities of individual. 6. Organization philosophy such as to be leader or pay prevailing rates. 7. Qualifications and relevant experience. 8. Stability of employment and advancement opportunities.
"Compensation literally means to counterbalance to offset, and to make up for. It implies an exchange. Compensation translates into different meaning among countries and even overtime."
Employees: Employee may see compensation as an exchange of service rendered or as a reward for a job well done. Compensation to some reflects the value for their personal skills and abilities, or the return for the education training they have acquired. The pay individual receive for the work they perform is usually the major source of personal income and financial security and hence a vital determinants of an individual economic and social well being.
Managers: Managers also have a stake in compensation: it directly influences their success in two ways. First it is a major expense competitive pressure both internationally and domestically, forces managers to consider the affordability of their compensation decisions. Studies show that many
38

enterprises labor costs account for more than 50% of total costs. Among some industries, such as service or public employment, this figure is even higher.
In addition to treating pay as an expense, a manager also treats compensation as a possible influence on employee work attitude and behavior and their organization perfonnance. The way the people are paid affects the quality of their work, their focus on customer needs, and their willingness to be flexible and learn new skills, to suggest innovation and improvement, and even their interest in union or legal action against their employer.
FORMS OF PAY
Total compensation includes pay received directly as cash ( e.g., base wage, merit increases, incentives, and cost of living adjustment) or indirectly through benefits and services ( e.g., pensions, health insurance, paid time off). Programs that distribute compensation to employees can be designed in an unlimited number of ways, and a single employer typically uses more than one program. The major categories of compensation include base wage, merit pay, short and long term incentives, and employee benefits and services.
Base wage
Base wage is the basic cash compensation that an employer pays for the work performed. Base wage tends to reflect the value of the work or skills and generally ignores difference att1ibutable to individual employees. Some pay systems set base wage as a function of the skill or education an employee possesses; this is common for engineers and scientists. Periodic adjustments to base wages may be made on the basis of change in the overall cost ofliving or inflation, changes in what other employers are paying for the same work, or changes in experience/ perfonnance/ skills of employees.
Incentives Incentives also tie pay directly to perfonnance. Sometimes 1eferred to as variable compensation, incentives may be long or shmi tenn, and can be tied to the perfonnance of an individual employee, a team of employees, combination of individuals, team of employees, a total business unit, or some combination of individuals, teamed unit. Performance objectives may be defined as cost savings, volume produced, quality standards met, revenues, return on investments or increased profits; the possibilities are endless.
Long-term incentives are intended to focus employee efforts on multi year result. Top managers or professionals are often offered stock ownership or bonuses to focus on long-term organizational objectives such return on investments, market share, return on net assets and the like. Coca-Cola grants shares of stock to selected "key contributors" who make outstanding contribution to the firm's success. Microsoft, Pepsi, Wal Mart and Proctor & Gamble offer stock options to all their employees. These companies believe that having a stake in the company supports a culture of ownership. Employees will behave like owners.
Incentives and merit pay differs. Although both may influence perfo1mance, incentives do so by offering pay to influence future behavior. Merit on the other hand, recognizes outstanding past performance. The distinction is a matter of timing. Incentives systems are offered prior to the actual performance; merit pay on the other hand, typically is not communicated beforehand.
39

BENEFITS & SERVICES
The fringe benefit systems purported to develop a climate for healthy employer-employee relationship, minimize excessive labor turnover costs and provide a feeling of individual security against hazards and problems of life with a view to eventually enhancing employee loyalty to the company and improving productivity.
In addition, other facilities enjoyed by the workers include medical and health care, restaurants, cooperative credit societies and consumer stores, company housing, house rent allowance. Recreational ·and cultural services, clubs, cash assistance. Some employers also provide education, transpon facilities and conveyance allowance.
5.3 CONCLUSION
HRM strives to achieve organizational goals and the goals of employees through effective
personnel programs policies and procedures. Successful perfonnances of the personnel function
can greatly enhance the bottom line of any organization. The personnel practitioners however
are challenged more today than at any time in the history by a changing and more demanding
labor force that has high expectation about the work place. At the same time, rapidly advancing
technologies and outside influences are changing the nature of our jobs. It is thus more critical
and more difficult to maintain a work environment that motivates and satisfies Human
Resources.
5.4 RECOMMENDATIONS
The twin factors of economic downturn and high unemployment can seem on the surface to indicate an einployer's market when it comes to either reviewing employee's productivity or picking and choosing new applicants from the filled-to-bursting pool of unemployed workers. With an abundance of talent to choose from, companies can choose to set higher qualifications for their applicants, or consider raising productivity levels for the existing team, knowing the candidate pool today is inexhaustible. Yet, every company - regardless of the team it has in place - has to keep its eyes firmly focused on productivity. Bon-owing a baseball analogy: a good manager must use a variety of methods to put his players in a position to win.
1. Communicate - Listen - Instill Trust
Sometimes the communication flow in a business i~ a one-way street, coming only from the direction of the employer-owner-supervisor. Make it possible for your employees to feel like they have a say in the way things are done. Let them know their input (if constructive) will not put them in a bad light or jeopardize their job. Whether it's the warehouse floor, the assembly line or the office cubicles, your employees know how production can really improve - if the company culture allows them to communicate it. But in order for that to happen, the employees must trust that their suggestions will can-y weight and will be welcomed.
40
2. Incentives / Rewards
Programs that set realistic yet positive benchmarks for above-average production give employees a standard in mind that will keep them geared toward productive activity. The reward for overall production can be shared with everyone and can build team unity. Individual recognition can stimulant healthy competition in sales; in production jobs, employees know their efforts can bring them more than just a paycheck - maybe it could mean a promotion or a bonus as well.
3. Give Them the Tools
Sometimes arr employee will be slowed by the tools he's been given. Whether it's an older computer or ·ru1 inefficient order system, it's important that the employee isn't constantly compensating for a lack of modernity or efficiency when it comes to the daily ( or hourly) duties of their job. Ask them if they have what they need to do the job and do they understand what is being asked of them. Maybe the answers will surprise you.
4. Give Them the Training
Consistently good output is a result of good training and the application of that training to the day-to-day activity. Is your training specific to each position or do you employ a one-size-fits-all approach to training new employees? Or if you delegate the training of new employees, does the company trainer or supervisor completely understand each position's duties and responsibilities? Do you use a manual? Is it updated regularly? Have your long-term employees fallen into nonproductive habits? Reviewing policies and procedures regularly will keep production methods and skills fresh and top-of-mind. Training doesn't have to be dull, either. Keep it light, make it fun, let the veterans contribute ru1d watch the results improve.
S. Help Remove the Distractions
Employees spend 2/3 of the day away from the job. As in anyone's life, there will be times when personal problems arise and may create stress as well as carry an emotional toll. It's widely known in ·Small Business that employees that have problems off the job carry them to the job. One method to alleviate these distractions is to offer Voluntary Benefits to the employees in the way of a Legal Services Plan along with some kind of Identity Theft protection. Stndies have shown that prodnctivity increases when such benefit programs are in place. These two benefits in tandem can resolve many of the modern day issues that cru1 affect anyone. They are relatively affordable and carry no expense whatsoever to the employer, unless he wishes to share in the premium costs with his employees.
The following recommendation with respect to incentives can be deduced:
(a) The application of incentives schemes has usually to be selected and restricted to industrie~. and occupations where it is possible to measure on an agreed basis, the output of workers or a group of concerned workers and maintain a substantial amount of control over its quality.
(b) Incentive schemes have to embrace as many employees of an enterprise as possible and need not be limited only to operative or direct workers.
(c) A careful selection of occupations should be made for launching incentives scheme with the help ofwork-stndy teruns commanding the confidence ofboili the employer and employees. The incentive scheme is required to be simple so that the workers are able to understand its full
41
implications. The employers need to ensure that external factors such as non-availability of raw material and components, transp01i difficulties and accumulation of stock do not exe1i an unfavorable impact on incentive schemes. ( d) Production has to be organized in such a way, which does not provide incentive wage on one day, and unemployment on the other day- there should be a provision of the fullback wage as a safeguard against it.
(e) . According to Subramanian, there are several prerequisites to the effective installation and operation of payment system:
✓ It should be developed and introduced with the involvement of the workers concerned in a · harmonious climate of industrial relations.
✓ V/oi-k-study precedes the installation of incentive programs. ✓ The wage structure should be rationalized on the basis of job evaluation before devising an
incentive plan. ✓ The objective to be accomplished through incentives should be defined and accordingly, an
attempt should be made to select a scheme, which is most suitable to accomplish them.
Motivational factors are always essential for the growth of an organization. Employee motivation instills confidence among employees and helps them handle any crisis situation with absolute ease. But then does motivation alone helps in employee retention? Is it possible to motivate employees to continue work without raising their pay? Let's explore IO significant ways by which you can keep motivation strong without raising their pay:
Know and care about the concerns of your employees - Motivation deals with working on the benefits for bettennent of employees and their concerns. Taking care to ensure their rights and working styles enables to foster better working relationships among the team members and promotes employee motivation.
Develop and communicate a compelling organizational vision - Having a focused vision is a key attribute of motivation. It creates and develops a strong bond for pursuing long tenn goals. Communication is another impo1iant facet of employee motivation and strengthens the ties between team members.
Address ineffective teamwork - Being responsive towards work will help you address issues that demoralize employee motivation. It is by acceptance of faults and modifying strategies, better standards can be achieved. An organizational behavior with effective working skills displays motivation as a higher role.
Be a role model for your organization - Donning the role of a superior model and showing the way for others makes the team look up to you for guidance and support. It also makes for a good example of employee motivation. It is highly beneficial from the organizational point of view for team members to idealize their mentors and to follow on their footsteps.
Communicate with everyone respectfully - Employee motivation employs effective use of communication. Every team member is a support to the organization and proper communication helps ease out things without any bitter feeling whatsoever. Motivation bridges barriers by settling disputes on a healthy ground.
Provide employees with the opportunity to be creative - Providing the needed ventilation for team members to be creative is a key aspect of employee motivation. Honing the skills and allowing them to pursue their thoughts brings out better solutions through motivation.
42
Invest in developing employees - New employees need to be trained and encouraged to strengthen the organization. Motivation often instills the fighting spirit in new comers to battle out strategies and renews ties with seniors. Employee motivation is about investing the future of an organization in secured hands.
Regularly recognize and reward effort and results -Employee motivation rewards the organization with huge benefits and employs better standards among team members. Appreciating hardworking people through motivation creates a better ambience for organizational growth.
Ensure fair compensation and rewards - Making efforts to reward hardworking people tremendously benefit the organization in the long run and that cannot be achieved without motivation. Moreover, motivating your employees will boost the confidence level of team members and will help them come up with valuable solutions at times of crisis.
Ensure each person understands their role well - Prioritizing key roles in an organization helps straighten the hurdles out of the way. Ensuring that the work is delivered on time and that it is nothing less than perfect can only be achieved through high motivation level.
43

REFERENCES
Annstrong (2000) Strategic Human resource management. A guide to action Kogan page
limited, London
Barelson T, Steiner S (1985). How to find Out: Management and Productivity. Oxford:
Pergamom Press Limited.
_ . · C.H Northcott (1960) Personnel management principles and practices. M.A PhD
Cohen AR, Fink SL, Gadon H, Willitts RD (I 995). Effective Behaviour in Organizations: Cases,
Concepts and Student Experiences. 6thEdition. USA: Irwin McGraw-Hill.
Cole G (I 996). Management Theory and Practice. Berwick Upon Tweed: Martins the Printer
Limited.
Cole G.A (1997) Personal management theory and practice. Martins the printers limited.
London.
Cole G.A(l 995) Organizational behavior, Ashford Colour Press. London.
Coventry, W.F. and Barker, J.K. (1988). Management. International Edition: Heinemann
Professional Publishing.
Cowling A, Mailer C (1992). Managing Human Resources. 2nd Edition. London: Edward
Arnold.
Curwen PJ (1974). Managerial Economics. Great Britain: Mac. Pub. Gannon MJ (1979).
Organizational Behaviour: A Managerial and Organizational Perspective. USA: Little, Brown
and Company Limited.
Dezzler Garry(l997) Human Resource management. Prentice Hall. New Jersey
DonHoley, Gibson and Ivance Vich (1995) Fundamentals of management. USA
Gray JL, Starke FA (1988). Organizational Behaviour: Concepts and Applications. 3rd Edition.
Columbia, Ohio: Merrill Pub. Company.
Ibbetson JFR, Whitmore DA (1977). The Management of Motivation and Remuneration.
London: Business Books.
Kohn M, Schooler C (1969). 'Class Occupation and Orientation'. Am. Socio!. Rev., '.;46: 659
678. Lawler E (1971). Pay and Organizational Effectiveness. New York: McGraw-Hill Pub. -
Mckersie RB, Hunter LC (1973).
44

Mitchell TR (1978). People in Organizations: Understanding their Behaviour. USA: McGraw
Hill Incorporated.
Nzuve S.N.M(l997) Management of Human Resources. Kenya Perspective Tech and Pro
Associate Publishers.
Owusu-Acheaw M (2010). 'Staff Development and Employee Welfare Practices and their Effect
on Productivity in Three Special Libraries in Ghana'. Assessed Online on 14 May, 2010
Patterson M, Warr P, West M (2004). Organizational Climate and Company Production: The
Role of Employee Affect and Employee Level. London:
Sanderson M (1989). Pay, Productivity and Collective Bargaining. London: Macmillan St
Mmiins Press.
SAUL N. Gellennan (1963) motivation and productivity. America management
Singh RK (2009).Welfare Measures and its impact on Manpower Productivity. Assessed Online
on April 11, 2009.
Trevor J. Bently (1984) The management services, handbook Holt, Rinehmi and Wilson
Limited.
45
Dear sir/madam
APPENDIX I
TRANSMITTAL LETTER
KAMPALA INTERIONATIONAL UNIVERSITY
SCHOOL OF BUSINESS & MANAGEMENT
DEPARTMENT OF HUMAN RESOURCE
Questionnaire for employees at Sony Sugar Company
I am conducting a study on effect of welfare schemes on employees' productivity within Sony
Sugar Company of Rongo District, Nyanza Province. The following questionnaire has been
prepared in order for you as an employee/employer to give your opinion on the issues that have
been raised.
Your honest and frank answers to the following questions will help me to understand the extent
to which employees are being productive in their jobs and how the welfare schemes affect their
productivity. Please know that there will be no financial assistance or other immediate rewards
for answering this questionnaire, however, the out come this study will definitely contributes in
providing useful infonnation on effects of welfare schemes on employees' productivity in Sony
Sugar Company.
Be assured that your answers will be treated with utmost confidentiality. Do not therefore write
your name or the name of your department anywhere on this questionnaire. This questionnaire is
divided into two parts, 1 and 2. Please kindly answer all questions in all sections and do not
leave any section blank.
Thank you for taking part in this important exercise and May God bless you abundantly.
Yours faithfully,
Farah abdirahrnan Mohamed
46

APPENDIX II
QUESTIONNAIRE
PART ONE: BACKGROUND INFORMATION OF THE RESPONDENTS
INSTRUCTIONS: PLEASE TICK AS APPROPRIATE.
1. Which of the following groups in include your age?
21-25
26-30
31-35
40-45
50 and above
2. What is the educational requirement for your job?
O-level
Non-Graduate
Graduate
Post Graduate
3. State your marital status
Single
Married
Divorced
Widow
Widower
47
4. State your sex
Male ~I--~ Female~' --~
5. State your job title?
Department manager
Supervisor
Senior clerk
Subordinate
6. State your department of work?
Manufacturing department
Human Resource department
General administration department
Other- Specify ................................. .
7. For how long are you serving in the present job position?
Up to 2 years
3-5 years
6-10 years
11-20 years
20 onwards
48
8. What is your basic salary per month?
Less than 30000
30000-50000
20000-25000
50000-70000
90000-and above J'---~
9. What level of experience is needed to perfonn your job?
None
Less than a year
More than two years
More than 5 years
Others Specify ............................. .
49

5. Ifit is positive, how is the productivity level?
Excellent
Very good
Good
Fair
Poor
6. How often do fringe benefits and pension scheme motivate employee's productivity in your
company?
Very likely
Likely
Very unlikely
Unlikely
Neutral
7. Do you think salary scheme affect productivity level of your company? Please specify
. . . . . . . . . . . . . . . . . . . . . . . . . . . . . . . . . . . . . . . . . . . . . . . . . . . . . . . . . . . . . . . . . . . . . . . . . . . . . . . . . . . . . . . . . . . . . . . . . . . . . .
······································································································
······································································································
8. State the indicators of good employee productivity
··································································································
··································································································
································································································ .. "
51