Revitalizing Brands and Brand Portfolios
194
Revitalizing Brands and Brand Portfolios Essays on Brand and Brand Portfolio Management Strategies BARIS DEPECIK
-
Upload
khangminh22 -
Category
Documents
-
view
0 -
download
0
Transcript of Revitalizing Brands and Brand Portfolios

Revitalizing Brands and Brand Portfolios Essays on Brand and Brand Portfolio Management Strategies
BARIS DEPECIK
Erasmus University Rotterdam (EUR)Erasmus Research Institute of ManagementMandeville (T) Building
Burgemeester Oudlaan 50
3062 PA Rotterdam, The Netherlands
P.O. Box 1738
3000 DR Rotterdam, The Netherlands
T +31 10 408 1182
W www.erim.eur.nl
How should consumer products manufacturers and retailers keep their portfolio of brand offerings relevant and energetic when large numbers of new brands are continuously launched into a world of increasingly nonloyal customers with evolving needs? The harsh reality is, at a time when the demise of old brands has accelerated and even established brands are vulnerable, it stands to be a great deal of challenge. Fortunately, a number of ‘revitalization’ strategies can add relevance and energy to brands and brand portfolios.
This dissertation comprises three essays each of which explores the outcomes of a commonly utilized revitalization strategy. In Chapter 2 and Chapter 3, strategies involving simplification of brand offerings are at the center of interest. Chapter 4 departs from these chapters in that it focuses on sponsorship, a widely utilized external brand energizer.
The essays included in this dissertation show that companies can revitalize their offerings to maintain growth even in proliferating environments. My findings collectively lay out the importance of pursuing a portfolio approach to achieve greater success in executing revitalization strategies. Firms should acquire a thorough understanding of how their revitalization efforts can be linked to the performance of each brand in their portfolio by carefully considering individual brands’ roles and their relationships with one another.
The Erasmus Research Institute of Management (ERIM) is the Research School (Onderzoekschool) in the field of management of the Erasmus University Rotterdam. The founding participants of ERIM are the Rotterdam School of Management (RSM), and the Erasmus School of Economics (ESE). ERIM was founded in 1999 and is officially accredited by the Royal Netherlands Academy of Arts and Sciences (KNAW). The research under taken by ERIM is focused on the management of the firm in its environment, its intra- and interfirm relations, and its business processes in their interdependent connections.
The objective of ERIM is to carry out first rate research in management, and to offer an advanced doctoral programme in Research in Management. Within ERIM, over three hundred senior researchers and PhD candidates are active in the different research programmes. From a variety of academic backgrounds and expertises, the ERIM community is united in striving for excellence and working at the forefront of creating new business knowledge.
ERIM PhD Series Research in Management
BA
RIS
DE
PE
CIK
- Re
vita
lizing
Bra
nd
s an
d B
ran
d P
ortfo
lios
406
26680_dissertatie_cover_Baris_Depecik.indd Alle pagina's 06-09-16 10:47

REVITALIZING
BRANDS AND BRAND PORTFOLIOS
Essays on Brand and Brand Portfolio Management
Strategies

REVITALIZING BRANDS AND BRAND PORTFOLIOS
Essays on Brand and Brand Portfolio Management Strategies
Revitalisering van merken en merkenportfolio’s Essays over merken en merkenportfolio management strategieën
Thesis
To obtain the degree of Doctor from the
Erasmus Universiteit Rotterdam by command of the rector magnificus
Prof.dr. H.A.P. Pols
and in accordance with the decision of the Doctorate Board.
The public defence shall be held on Thursday 6 October 2016, at 13.30 hours.
by Barış Erman DEPECİK
born in Eskişehir, Turkey

Doctoral Committee
Promotor: Prof.dr.ir. G.H. van Bruggen
Committee members: Prof.dr. S. Puntoni Prof.dr. D. Fok Prof.dr. E. Gijsbrechts
Co-promotors: Dr. Y.M. van Everdingen Dr. M.B. Ataman
Erasmus Research Institute of Management – ERIM The joint research institute of the Rotterdam School of Management (RSM) and the Erasmus School of Economics (ESE) at the Erasmus University Rotterdam Internet: http://www.erim.eur.nl ERIM Electronic Series Portal: http://hdl.handle.net/1765/1 ERIM PhD Series in Research in Management, 406 ERIM reference number: EPS-2016-406-MKT ISBN 978-90-5892-461-2 © 2016, Baris Depecik. Design: PanArt, www.panart.nl This publication (cover and interior) is printed by Tuijtel on recycled paper, BalanceSilk® The ink used is produced from renewable resources and alcohol free fountain solution. Certifications for the paper and the printing production process: Recycle, EU Ecolabel, FSC®, ISO14001. More info: www.tuijtel.com All rights reserved. No part of this publication may be reproduced or transmitted in any form or by any means electronic or mechanical, including photocopying, recording, or by any information storage and retrieval system, without permission in writing from the author.

To my family


7
Acknowledgements
When I was first accepted to the PhD program at RSM, I knew it was going to be an
arduous journey and I was going to learn a lot along the way but little did I know that my
life was about to take a path that would change me forever. Difficult times and challenges,
I’ve had a few. Yet, I’ve made more wonderful memories, and many more friends.
I have had the privilege of knowing and working with many great people who, in
countless ways, supported me as I take on this journey and new path in life. First and
foremost, I would like to express my greatest gratitude to my supervisors, Gerrit van
Bruggen, Yvonne van Everdingen, and Berk Ataman. Dear Gerrit, I will always remember
your wisdom, professionalism, and excellent advices with great admiration and undying
gratitude. Working with you has been such an inspiration. I cannot thank you enough for
your trust, encouragement, patience, and tireless efforts in guiding my scientific endeavor. I
also want to say I’m already very much missing those intelligent conversations on football
we used to have. What a fantastic way to end our weekly meetings! Dear Yvonne, you have
always been generous in sharing your knowledge along the way. I am very grateful to you
for your expertise, insights, guidance, support, and willingness to help. Dear Berk, I’ve
always felt like you are the best person around to turn to for an advice. You have always
been of tremendous help at every step in my PhD study. It is a blessing to have you as a
supervisor and as a friend. Your professionalism has been exemplary and I know it is

8
through your efforts that I arrive at this point. I have learnt a lot from you. I appreciate it
more than words can say.
I am indebted to the members of the doctoral committee, Stefano Puntoni, Els
Gijsbrechts, and Dennis Fok for generosity of their time, their assessment, and extremely
valuable suggestions. I would like to thank excellent researchers and colleagues at RSM
who, besides sharing their insights and advices along the way, made RSM a great place to
learn, to study, and to conduct research. Thank you Nailya, Stefano, Bram, Carlos, Peeter,
Steven, Stijn, Ale, Berend, Clement, Maciej, Martijn, Ralf, Jason, Ilona, Nicole, Carlos,
Gabriele, Maarten, Christoph, and Monika. Big thanks to Annette, Jolanda, and Anna for
all their support during the past years. It is an extraordinary group of people and I am so
proud to have been a small part of it.
I would like to extend a special thank you to long-lasting friends who I saw almost
every day, at the 10th floor, and every day was just better in their presence. Adnan, you are
the best conference buddy, best road trip buddy, best shopping, partying, or drinking
buddy. I very much hope one day we will again eat lots of tacos at a countrified Mexican
restaurant on our way to Las Vegas. Zeynep, your friendship was always one big reason for
me to have fun and be happy in Rotterdam, especially on the Queen’s Day. You and Alper
are the cutest couple I know and I really don’t know which one of you I like more.
Thomas, I wish you could always be in the next office to mine. Every morning I grab a
coffee going to my office in Ankara and I wish you were there just like in Rotterdam.
Discussing everything and anything (it includes cycling as well) on a daily basis has always
felt like the best way to start a workday. I am very much missing those moments my friend.
No matter the circumstances, your enthusiasm and positive attitude always encouraged me

9
to be a happier and livelier person. Thank you very much! Oguz, I asked you to have a late
afternoon drink in campus at least a hundred times. Thank you because every time it took
less than 30 seconds for you to resist the urge to drink. I don’t know how you do it but you
were always the one who added most to the fun. Thank you for that! Ezgi, you were always
cheerful, happy, and friendly. I loved sharing the office with you. Yannis, thank you for
being the funniest and coolest guy around. Irene, thank you for being the kindest and
sweetest. Big thanks to Pinar, Ivan, Anika, Linda, Laura, Elisa, Esther, Catalina, Bart,
Daniel, and Gaby for the awesome PhD environment.
I want to thank everyone at my new home Bilkent FBA for welcoming me with open
arms. I especially want to thank Erdal Erel for believing in my efforts and his endless
support. I want to thank Orsan and Itır for making my time in Ankara fun and meaningful.
I am so fortunate to have you standing by my side as I’m about to end one journey and
start another. I couldn’t wish for more delightful companions.
I am lucky to have so many friends who made my life outside the office much more
colorful. Alper, Nufer, Melek, Ihsan, Diana, Dilan, Minke, Evsen, Murat, Gizem, Mumtaz,
Aybars, Serhat, Pitosh, Amir, Nima, Riccardo, Ron, and Joanne, thank you! Ihsan, a very
heartfelt thank you for opening your home to me in Tilburg. My dear friends whom I had
to be away from during my time in Rotterdam: Eren, Fehmi, Arda, Murat, Ahmet, Aysegul,
Burcu, Burak, and Fikret. Your visits to Rotterdam are among my best memories. Ozgun,
Melih, Crystal, Ismail, Milay, Angela, Uygar, and Umut, thank you very much for your
friendship, hospitality, and guidance during my conference visits to Boston, Chicago,
Atlanta, and London. Emre, you are the best holiday buddy. Every winter, I looked
forward to our holidays in Marmaris as much as I craved for sunshine in Holland. Serhat,

10
you deserve a very special thank you as you were the one who encouraged me to apply to
the RSM. If we hadn’t had that conversation at the balcony of our dormitory at Sabanci,
this thesis would have not been written.
One of the most difficult things in life is living away from closed ones. I am lucky,
however, to have the kind of friends you only see a few times a year and it always feels like
time hasn’t past at all. The ones you can start right up on a conversation you left off. Kaan,
it is hard to believe we have been friends for 25 years! Thanks for endless memories and
always being a wonderful friend living on the other end of the world. Koray, you’ve always
been a brother to me. You understand me in ways that no one else ever will. We have
shared so many precious and delightful memories that will last us no matter where we go in
life. Thank you!
I do know that I have received so much more than my fair share of good fortune in
my life. I am blessed with a wonderful family. I am sorry I had to spend years away from
you. Ersan and Erhan, my dear brothers, thank you for your unconditional love and always
being there no matter what. Senel, Tolga, Bora, and Sena, thank you for bringing joy to my
life. Mom & Dad, you are the best teachers I have ever had! In your presence I’ve always
felt like the things I have are so valuable and great, and the things I don’t are so
insignificant. Thank you for your endless love! Annecim, babacim, buralara gelmemde en
büyük fedakarlığı ve özveriyi siz gösterdiniz. Hayattaki en iyi öğretmenlerim sizsiniz. Sizi
cok seviyorum.
Ezgi, you had to endure the brunt of my stress and craziness during the final stages of
my PhD. I cannot thank you enough for your patience and never-ending support. I
couldn't have done this without you. The moment I met you, I felt I had done everything

11
right in my life as they all eventually lead to meeting you. Now I don’t have any regrets in
life and it is all because of you. Journeys will end, new journeys will begin and we will
always share stories, tears, hugs, and laughs. Thank you my love.
Ankara, 2016
Baris Depecik
12
Table of Contents
Chapter 1 ..................................................................................................................... 17
1.1 Overview of This Dissertation ...................................................................................................... 19
1.2 Declaration of Contribution .......................................................................................................... 21
Chapter 2 ..................................................................................................................... 23
2.1 Research Framework ....................................................................................................................... 27
2.2 Hypotheses ....................................................................................................................................... 32
2.3 Methodology and Data ................................................................................................................... 38
2.4 Analysis and Results ........................................................................................................................ 44
2.5 Conclusion ........................................................................................................................................ 51
Chapter 3 ..................................................................................................................... 57
3.1 Extant Research and Modeling Challanges .................................................................................. 61
3.2 Model ................................................................................................................................................. 67
3.3 Data ................................................................................................................................................... 73
3.4 Results ............................................................................................................................................... 82
3.5 Discussion of Findings and Implications ..................................................................................... 89
3.6 Concluding Remarks ....................................................................................................................... 94
APPENDIX ................................................................................................................................................. 97
Chapter 4 .................................................................................................................... 101
4.1 Background: the NFL and Its Sponsorship Deals ................................................................... 106
4.2 Literature Review .......................................................................................................................... 108
4.3 Theoretical Framework ................................................................................................................ 111
4.4 Data and Descriptives .................................................................................................................. 116
4.5 Model .............................................................................................................................................. 119
4.6 Estimation Results ........................................................................................................................ 123
4.7 Discussion ...................................................................................................................................... 134
APPENDIX .............................................................................................................................................. 138
13
Chapter 5 .................................................................................................................... 141
5.1 Firm Value Effects of Brand Divestitures ................................................................................ 141
5.2 Who Benefits from Brand Exits? Why? .................................................................................... 144
5.3 Energizing Sales Through Sponsorships ................................................................................... 147
5.4 Revitalizing Brands and Brand Portfolios ................................................................................. 151
References ................................................................................................................ 152
Summary (in English) .............................................................................................. 167
Summary (in Dutch) ................................................................................................. 169
Summary (in Turkish) ............................................................................................... 171
About the author ....................................................................................................... 173
Portfolio .................................................................................................................... 174
The ERIM PhD Series ............................................................................................. 176

14
List of Figures
Figure 1: Characteristics of divested brands and motives for brand divestments ................. 29
Figure 2: Team performances during 2002-2006 seasons ...................................................... 118
Figure 3: Baseline sales response to a sponsorship for sponsored brands ........................... 131
Figure 4: Baseline sales response to a sponsorship for non-sponsored brands .................. 132
Figure 5: Price promotion response to a sponsorship for sponsored brands...................... 133
Figure 6: Non-price promotion response to a sponsorship for sponsored brands ............ 134
15
List of Tables
Table 1: List of variables, operationalization, and sources ....................................................... 42
Table 2: Brand divestitures: frequency and effect sizes ............................................................ 44
Table 3: Mean cumulative abnormal returns (CARs) ................................................................ 45
Table 4 : Cross-sectional regressions of local and regional brands in core business ............ 50
Table 5: Overview of selected studies in related literature streams ......................................... 62
Table 6: Descriptive statistics for exit events ............................................................................. 76
Table 7: Variables and operationalization ................................................................................... 77
Table 8: Average weekly sales, assortment sizes, and promotion frequencies ....................... 80
Table 9: Attributes and attribute levels ....................................................................................... 81
Table 10: Estimates of the observation equation parameters .................................................. 83
Table 11: Estimates of the evolution equation parameters ...................................................... 84
Table 12: Estimated variances of error terms ............................................................................ 86
Table 13: Drivers of response to brand exits ............................................................................. 88
Table 14: Descriptive statistics - Average weekly sales and promotion frequencies........... 117
Table 15: Estimates of the non-sponsorship parameters ....................................................... 125
Table 16: Estimates of the sponsorship parameters in baseline sales equation ................... 126
Table 17: Estimates of sponsorship parameters in promotion response equations ........... 128
Table 18: Estimates of autoregressive parameters ................................................................... 129
Table 19: The number of weeks needed to realize the 90% of the long-term effect.......... 129
Table 20: Estimated variances of error terms .......................................................................... 130

16
17
Chapter 1
Introduction
“I wish they were SKUs. It's really 1,600 brands. Most of them you’ve never heard of… It takes a lot of resources… That brand may have had a viable position 15 years ago, but not today…Some we will try and fold into a power brand. That is one way of doing it. Another way of doing it is just letting it fade away and see where it stops. And some may be disposed of.
What we're doing is not so much the paring of the brands. We're selecting the brands we see as future winners…Some of them will be very large brands... By concentrating all the efforts we have [against] selective brands, we expect them to accelerate in growth. By concentrating the resources there, where it matters and where the return is the highest, it will allow us to operate more effectively and efficiently”
Anthony Bergmans, Unilever Chairman (when asked about ‘Power Brands’ strategy)
ow should consumer products manufacturers and retailers keep their
portfolio of brand offerings relevant and energetic when large numbers of
new brands are continuously launched into a world of increasingly nonloyal
customers with evolving needs? The harsh reality is, at a time when the demise of old
brands has accelerated and even established brands are vulnerable, it stands to be a great
deal of challenge. Fortunately, a number of brand and brand portfolio management
strategies, if crafted well with a good understanding of brands' roles and their relationship
with each other, can add relevance and energy to brands and brand portfolios (Aaker,
H
Chapter 1
18
2004). Over the last decade, several firms have implemented these strategies in an attempt
to energize their brands and rework their brand portfolios. Unilever, for example, launched
a ‘Power Brands’ strategy under which it restructured its brand portfolio to support and
renovate a small set of selected power brands and to encourage customers to migrate from
weak brands to the power brands (Pierce & Moukanas, 2002).
One commonly utilized strategy for keeping brand portfolios strong, fresh, and
relevant is pruning them through brand divestitures. The divestiture of a brand releases
resources, which can be reallocated to retained brands to make them stronger and more
competitive. When executed systematically and methodically, a brand divestiture has the
ability to increase sales and profitability through increasing focus and generating greater
economies of scale (Kumar, 2003). Accordingly, brand divestitures are often viewed as bit
of a savior for firms that struggle with scale inefficiencies resulted from the complexities of
managing proliferated brand portfolios. Brand divestitures, however, should not be
regarded as a sure-win strategy as it brings risks along with them. For example, retained
brands may fail to claim the sales of divested brands or may be unsuccessful to deliver on
their promises despite increased focus and support. Unmet performance goals may result in
stressful relations with shareholders impatient for returns. Therefore, in order to maximize
the benefits and eliminate the risks, it is imperative to thoroughly understand how brand
divestitures benefit individual brands and how they influence the firm performance overall.
Next to eliminating underperforming brand offerings, achieving relevant and
powerful brand portfolios also involves energizing retained brands in the portfolio. While
almost all brands could benefit from some support, some established brands, especially the
ones in mature and low involvement product categories, may struggle with generating
energy. A very effective brand portfolio management strategy to revitalize these brands is
Introduction
19
to exploit external brand energizers such as sponsorships and endorsers (Aaker, 2004).
These energizers can be used to receive exposure, build awareness, generate interest, create
and deliver emotional and self-expressive benefits. A pertinent question for firms investing
in these brand energizers is that, considering their increasing costs, whether they also
trigger sales and profits (e.g., Chung, Derdenger, & Srinivasan, 2013).
The growing need for, and the strategic importance of, revitalizing brands and brand
portfolios to maintain growth in proliferating, ever-changing, and increasingly competitive
environments call for a profound understanding of the key considerations involved in the
successful implementation of a ‘revitalization’ strategy. This dissertation, accordingly, aims
to bring a better understanding of some of the most commonly utilized revitalization
strategies, outcomes of those strategies, and the factors which influence the outcomes.
1.1 Overview of This Dissertation
In the chapters that follow, I focus on the aforementioned revitalization strategies
utilized by consumer products manufacturers and retailers to energize their portfolio of
brand offerings. In Chapter 2 and Chapter 3, strategies involving simplification of brand
offerings are at the center of interest. Chapter 4 departs from these chapters in that it
focuses on sponsorship, a widely utilized external brand energizer.
Although all three chapters are related to each other as they all fall under the common
theme of ‘brand and brand portfolio revitalization strategies’, each chapter is presented as a
stand-alone research paper and can be read independently. Below, I briefly introduce each
of the chapters included in this dissertation.
Chapter 2 focuses on a particular form of brand divestment: the sale of brand assets
within a brand portfolio rationalization (BPR) program. This form of brand divestments is

Chapter 1
20
undertaken to release resources and reallocate them to advance retained brands in the
portfolio. Two common motives for such brand divestitures –global branding and
refocusing on core businesses– are integrated in a single common framework to examine
the effects of divesting local/regional/global brands in core businesses and
local/regional/global brands in non-core businesses on firm value. Analysis of 205
divestment announcements in the global food and beverages industry shows that, in most
cases, brand divestments hurt firm value. Only when firms divest local or regional brands
in non-core businesses is the effect on firm value positive.
Chapter 3 focuses on the removal of a brand from a market either by a manufacturer
or a retailer, to which is referred as ‘brand exit’ throughout the text. The increasing
frequency of brand exits raises two questions pertinent for both manufacturers and
retailers: When a brand disappears from the market, (1) what brands are better positioned
to benefit from the exit? and (2) what marketing efforts influence the realignment of sales
after the exit? To answer these questions, a dynamic brand sales response model is
developed. The model allows for examination of the long-term effects of a brand exit on
sales and identification of the drivers of excess demand redistribution following the exit. I
apply the model to 96 brand exit events and analyze the sales response of 555 incumbent
brands across 2 repeat-purchase product categories. Results indicate that the market shares
of a deleted and an incumbent brand, and the incumbent brand’s similarity to the deleted
brand on a multidimensional attribute space explain variations in sales response to exits
across brands. Results further reveal what underlying product attributes are most critical in
attracting consumers of the deleted brand in each category. Analyzing what marketing
efforts influence the realignment of sales after the exit, two post-exit marketing strategies –
increasing an incumbent brand’s product alternatives in the market and non-price
Introduction
21
promotion frequency– are found to be effective in picking up the sales of the deleted
brand. The implications of these findings for managers of manufacturers and retailers on
how to better manage their brand/product portfolios and marketing efforts in the
aftermath of brand exits are also discussed to conclude this chapter.
Chapter 4 focuses on sponsorships as a way to energize established brands in mature
product categories. Specifically, the main research question addressed in this study is how a
partnership between a brand and a major sports franchise affects the sales performance of
the partnering brand, other brands of the sponsoring firm, and competing brands within
the corresponding product category. A dynamic linear model of brand sales is developed
and applied to partnership deals between beer brands and National Football League
franchises. The results indicate that a sponsored brand experiences a gain in baseline sales
and an increased effectiveness for its sales promotion instruments. The magnitudes of the
effects are contingent on team performance. The results also show that a sponsorship
generates brand switching from competitors including competing brands of the sponsoring
firm.
Chapter 5 summarizes the scientific and managerial relevance of each research
included in this dissertation, reviews their main findings, highlights their implications for
research and practice, and suggests avenues for future research.
1.2 Declaration of Contribution
The research presented in chapter 2 was conducted with Yvonne van Everdingen and
Gerrit van Bruggen. It was published in the Global Strategy Journal. The research presented in
Chapter 3 was conducted with Berk Ataman and Chapter 4 was conducted with Gerrit van

Chapter 1
22
Bruggen. Overall, I have done the majority of the work in all chapters. I received valuable
feedback on all steps from Gerrit van Bruggen, Yvonne van Evedingen, and Berk Ataman.
23
Chapter 2
Firm Value Effects of Brand Divestitures1
any multi-national enterprises (MNEs) operating in the consumer
packaged goods (CPG) industry, such as Unilever, Procter & Gamble,
Nestle, and Diageo, own brand portfolios that span multiple country and
industry markets. Starting around the early 1990s, these companies expanded their
portfolios through acquisitions and new brand introductions in multiple geographies and
industries. This was done to generate growth by reaching almost anyone around the globe.
It led to a profusion of brands, most of them regional or national, with many brands
making only a small contribution to companies’ bottom lines. For example, Unilever
managed a portfolio of 1,600 brands in 1999, with 80 percent of these brands generating
less than 10 percent of their profits (Kumar, 2003).
From a management’s viewpoint, the proliferation of brands led to high costs and
managerial complexity (Hill, Ettenson, & Tyson, 2005). Furthermore, it brought other ills,
1 This chapter was published in the Global Strategy Journal: Depecik, B., Everdingen, Y. M., & Bruggen, G. H. (2014). Firm Value Effects of Global, Regional, and Local Brand Divestments in Core and Non‐Core Businesses. Global Strategy Journal, 4(2), 143-160
M
Chapter 2
24
like inefficiencies in production, distribution, and marketing (Knudsen, Finskud,
Törnblom, & Hogna, 1997; Laforet & Saunders, 1999). The troubles of supersizing brand
portfolios were further exacerbated by a variety of retailer-related factors. The rise of
private label brands, difficulties in getting supermarket shelf space, and growing retailer
power promoted the need for a small set of strong brands rather than a larger set of smaller
ones. Pulling back from gains achieved in the previous years, starting around the mid-
1990s, many firms realized the undesired consequences of the proliferation of their brand
portfolios and started Brand Portfolio Rationalization (BPR) programs. A BPR program
contains detailed plans to divest particular brands from the brand portfolio in order to
release resources and reallocate these to meet the needs of the remaining brands in the
portfolio (Aaker, 2004).
Companies followed different strategies in divesting brands leading to diverse
outcomes. P&G, for example, deleted several food and beverage brands to strengthen its
focus on personal care and healthcare brands. An increased focus on laundry, baby care,
hair care, and feminine protection brands let the company become the global leader in all
of these four businesses (P&G, 2003; USA Today, 2006). P&G’s growth from the brands
they kept outweighed the revenue losses from divested brands and as a result the company
experienced both top- and bottom-line growth (P&G, 2004). In contrast with P&G’s
strategy of shifting focus across industries, Unilever shifted its focus toward the top brands
in its portfolio. Unilever divested nearly 1200 brands to enhance its resources behind a core
portfolio of 400 brands. The divested brands were relatively small within the overall
portfolio in terms of revenues, were available only in a few country markets, and had a
small customer base. Most of the retained top brands, e.g., Knorr soup, Calvin Klein
perfumes, Dove soap, and Magnum ice cream, had a strong international presence. The

Firm Value Effects of Brand Divestitures
25
five-year makeover resulted in increased brand focus, improved global buying, cost savings,
and debt reduction. Yet, it failed to deliver on its promises in terms of revenues and
shareholder value (Unilever, 2004).
These and other brand divestment examples with diverse outcomes made the
uncertainty about the value-creating effects of different types of focus-increasing brand
divestiture strategies grow. The objective of the study reported in this paper is to
empirically investigate the effects of two types of focus-increasing brand divestitures (i.e.,
focus on core industries vs. focus on core, global brands) on firm value.
Findings in two different research fields are relevant for our study. First, the
divestment literature discusses divestitures of non-core business assets (not specifically
brand assets though) to overcome problems of over-diversification (Haynes, Thompson, &
Wright, 2002) and to release resources to reinforce core assets. It shows the firm value
enhancing effect of these divestitures (Desai & Jain, 1999; John & Ofek, 1995). Although
this type of divestment is in line with the P&G example discussed above, so far the
emphasis in these studies has been on tangible assets. In our study we focus on brands as
intangible assets. Second, the international branding literature suggests the potential, mainly
financial, advantages of deleting local brands and subsequently enhancing released
resources behind a few core, global brands (Kapferer, 2002; Schuiling & Kapferer, 2004).
This is the strategy outlined in the Unilever case above. So far, this literature fails to
provide empirical evidence of possible firm value-enhancing effects.
We contribute to the international business literature by empirically investigating
brand divestitures from a multidisciplinary perspective. We integrate the effects of the two
focus-increasing strategies, i.e., to refocus on core businesses (‘the P&G approach’) and the
global branding strategy (‘the Unilever approach’), into a single common framework.
Chapter 2
26
(Meyer, 2006; Meyer, 2009) argues that both forces are simultaneously redesigning
conglomerates’ business activities, and discusses the potential benefits of switching to a so-
called ‘global-focusing’ strategy. However, so far no empirical evidence exists on the
potential positive effects of this strategy on the firm value. Our study addresses this gap,
and argues that the value-creating effects of brand divestitures depend on the divested
brand’s industry relatedness (i.e., the relatedness of the brand to the primary or core
business activities of the company) and geographical scope (i.e., the geographical reach of
the brand in terms of country markets). We distinguish four types of brand divestitures, i.e.,
divesting (1) a local brand in a non-core industry, (2) a local brand in the core industry, (3)
a global brand in a non-core industry, and finally a (4) global brand in a core industry.
To investigate the effects of these four types of brand divestments on firm value, we
conducted an event study, i.e., a method that investigates whether the announcement of an
event –in this study the sale of a brand asset within the context of a BPR program– creates
an abnormal change in the firm’s stock price and hence the firm value. The stock price is a
forward-looking variable that reflects the present value of all current and projected earnings
of the company. Any abnormal change in the stock price reflects the effect of the event on
firm value. Our empirical findings provide evidence for our multidisciplinary perspective in
studying the effect of brand divestments, which helps to understand how and why brand
divestments affect firm value.
The remainder of this paper is organized as follows. The next section presents our
research framework, followed by hypothesis development. Subsequently, we describe the
event study methodology and our data collection procedure. After presenting the results,
we conclude with a discussion of the implications and areas for further research.

Firm Value Effects of Brand Divestitures
27
2.1 Research Framework
2.1.1 Divestiture research
Research on divestitures focuses mainly on two research questions: (1) what are the
determinants of firm divestitures, and (2) what are the implications of these divestitures. To
investigate these questions, this research stream has adopted a variety of perspectives, such
as the industrial organization, the financial-accounting, and the corporate portfolio
approach (see Hamilton & Chow, 1993). The industrial organization approach considers a
divestment activity as a rational response to changing dynamics of the general economic
environment or the industry, such as divestments due to a permanent decrease in demand,
low profits, or the entry of an aggressive competitor (Siegfried & Evans, 1994). Financial-
accounting studies focus on the effects of divestments on the financial position of the firm,
such as its profitability (see Haynes et al., 2002), or shareholder wealth (Hite & Owers,
1983). Finally, corporate strategy scholars investigate how divestitures change the
configuration of a firm’s business portfolio (Brauer, 2006). Taken together, a diverse set of
approaches spanning multiple levels of analysis (e.g., macro, industry, or firm) have been
used to develop insights into the multidisciplinary characteristics of divestments. The
adopted perspective is often based on the motives for the divestment activity and the
relevant level of analysis. In line with the recent shift in interest toward the firm level rather
than the macro or industry level (Brauer, 2006), this paper builds on the corporate portfolio
approach in investigating the effects of brand divestitures on shareholder wealth for firms
with large brand portfolios.
Chapter 2
28
2.1.2 The portfolio approach
Companies can be viewed as portfolios of assets, products, and activities (Benito,
2005), and within these portfolios, business units compete with one another for resources.
As a consequence, firms should systematically review their portfolios from both a strategic
and a financial perspective (Hamilton & Chow, 1993), and subsequently reallocate
resources between businesses to match changing business/market opportunities, build new
competitive advantages (Prahalad & Hamel, 1994), and improve the effectiveness of their
resources (Kogut & Zander, 1992).
We can easily apply the corporate portfolio approach to brand portfolios for the
following reasons. First, many corporations offer multiple brands within the same product
category (Lei, Dawar, & Lemmink, 2008) to serve different customer segments (Keller,
2000). Therefore, they own and manage brand portfolios consisting of multiple brands
(Aaker, 2004; Laforet & Saunders, 1999; Morgan & Rego, 2009). Second, in many cases,
brand divestitures are undertaken as part of a BPR program, also called a portfolio
restructuring strategy. The divestiture of a brand releases resources, which can be
reallocated to the retained brands to improve their performance (Varadarajan, DeFanti, &
Busch, 2006).
2.1.3 Brand characteristics and divestment motives
Within brand portfolios, firms own a variety of brands that are offered in different
industries and in different geographical markets (Douglas, Craig, & Nijssen, 2001). These
brands can be characterized along two dimensions: (1) the industry relatedness of the brand
(see Y-axis in Figure 1), and (2) the geographical scope of the brand (see X-axis in Figure
1). Figure 1 graphically presents the research framework of our study.
Firm Value Effects of Brand Divestitures
29
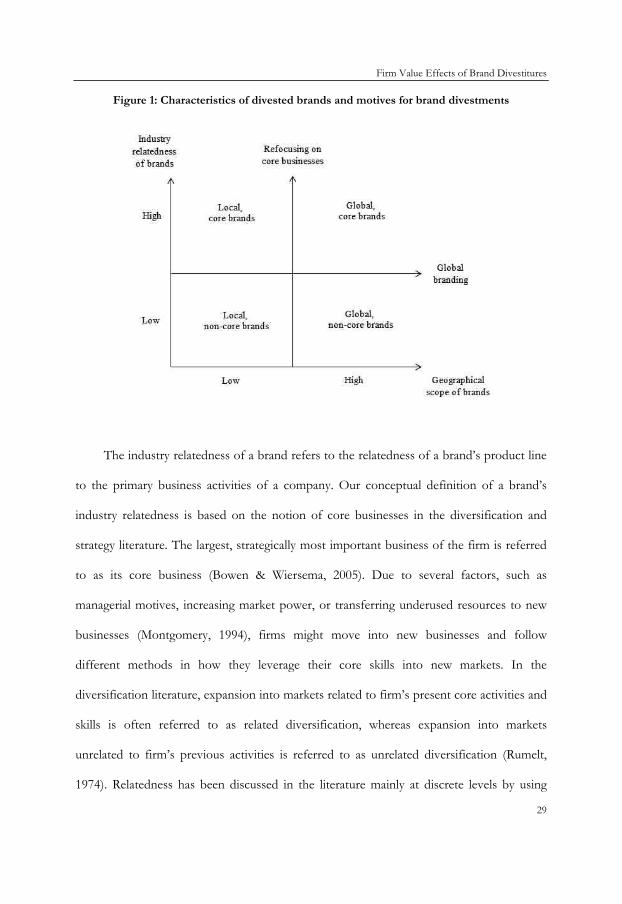
Figure 1: Characteristics of divested brands and motives for brand divestments
The industry relatedness of a brand refers to the relatedness of a brand’s product line
to the primary business activities of a company. Our conceptual definition of a brand’s
industry relatedness is based on the notion of core businesses in the diversification and
strategy literature. The largest, strategically most important business of the firm is referred
to as its core business (Bowen & Wiersema, 2005). Due to several factors, such as
managerial motives, increasing market power, or transferring underused resources to new
businesses (Montgomery, 1994), firms might move into new businesses and follow
different methods in how they leverage their core skills into new markets. In the
diversification literature, expansion into markets related to firm’s present core activities and
skills is often referred to as related diversification, whereas expansion into markets
unrelated to firm’s previous activities is referred to as unrelated diversification (Rumelt,
1974). Relatedness has been discussed in the literature mainly at discrete levels by using
Chapter 2
30
concepts such as ‘core’ and ‘non-core.’ Operationally, it is defined by 4-digit Standard
Industrial Classification (SIC) codes of the business in which the company has the largest
percentage of its sales (e.g., Chatterjee & Wernerfelt, 1991). The distance of a business
from the core business is typically defined by the similarity between the SIC code of the
core business and that of the business in question. Relatedness is higher (lower) when two
businesses share higher (lower) number of digits in their SIC codes (Caves, Porter, &
Spence, 1980).
A brand’s geographical scope refers to its geographical reach in terms of country
markets. Various levels of geographical scope (i.e., local, regional, and global) can be
distinguished. Global brands are marketed under the same name in multiple countries, with
generally similar and centrally coordinated marketing strategies (Yip, 1989). Brands that are
marketed in only one or a few country markets in a particular region are referred to as local
and regional brands respectively (Wolfe, 1991). Local brands have a low geographical
scope, while global brands have a high geographical scope.
The decision to delete a particular brand may stem from various divestment motives,
such as poor performance of a business unit (Duhaime & Grant, 1984) exiting declining
industries (Davis, 1974; Harrigan, 1980), the entry of new competitors (Siegfried & Evans,
1994), competition in home markets (Hutzschenreuter & Gröne, 2009), and the necessity
of meeting corporate liquidity requirements (Ofek, 1993). Refocusing on core businesses
appears to be the most common motive (Hoskisson & Johnson, 1992; Kaplan & Weisbach,
1992). Firms experiencing performance declines usually adopt a ‘refocus on the core
business’ strategy (John, Lang, & Netter, 1992). This is also prevalent in the CPG industry,
where many firms lost their focus and have experienced performance declines (Kumar,
2003). In the international branding literature, the adoption of global branding strategies

Firm Value Effects of Brand Divestitures
31
and the development of international brand portfolios have been mentioned as the most
important motive for why MNEs have been slimming down their brand portfolios (e.g.,
Aaker & Joachimsthaler, 2000; Schuiling & Kapferer, 2004). Summarizing the above, we
consider two main motives why companies divest brands, i.e., (1) to refocus on core
businesses (e.g., the P&G case), and (2) to build (strong) global brands (e.g., the Unilever
case). In Figure 1 we present these two divestment motives and their relationship with the
brand characteristic dimensions graphically, resulting in four possible brand divestment
options.
2.1.4 Brand divestment options
We expect brands in the upper right quadrant of Figure 1, i.e., global, core brands, to
be the least likely ones to be divested, but it sometimes happens. For example, Diageo, the
world’s largest spirits company, sold Cinzano, the world’s second best-selling global
vermouth brand behind Martini, to the Campari Group. This was done to reverse a
downward trend in the sales of their key brands such as Smirnoff vodka and Gordon’s gin.
Another, more likely, option is to divest local, non-core brands (see Figure 1, lower
left quadrant). An example of such a case is the sales of Ambrosia, a rice-pudding brand
that has a particular appeal to UK consumers, by Unilever. Similarly, H.J. Heinz Company,
famous for its ketchup brand, sold its profitable but local and non-core ice-cream brand
Tip Top in New Zealand.
Interesting situations arise when the two strategic motives do not coincide. In order
to focus on core businesses, companies may divest their non-core brands even if these
have high international presence and geographical scope (i.e., brands in the lower right
quadrant of Figure 1). For example, P&G recently completed its attempt to quit the food
Chapter 2
32
and beverage industry by divesting its truly global Pringles snacks brand in order to focus
on their core beauty and personal care businesses. Similarly, companies may divest brands
in their core businesses to increase focus on their global brands (i.e., brands in the upper
left quadrant in Figure 1). For example, during the last decade Diageo divested many of its
local brewery and whiskey brands. These brands were strong in their home markets but not
travelling well across national boundaries. These sales allowed them to concentrate their
resources on their global brands like Guinness beer or Johnnie Walker whiskey.
In this article we study the firm value effects of divesting brands from each of the
four quadrants in Figure 1. In the next section we develop hypotheses for these effects.
2.2 Hypotheses
2.2.1 The value relevance of brands
Branding and brand portfolio management strategies are important for firm value.
Particularly for firms operating in the CPG industry the management of brand portfolios is
an integral part of the execution of their marketing strategies (Aaker, 2004). Brands are
recognized as intangible assets that have an effect on firm performance (e.g., Ailawadi,
Lehmann, & Neslin, 2003; Barth, Clement, Foster, & Kasznik, 1998; Kallapur & Kwan,
2004). Brand portfolio characteristics, such as the number of brands in the portfolio and
the competition and relatedness between these brands, also influence firm performance
(Morgan & Rego, 2009).
Bahadir, Bharadwaj, and Srivastava (2008) show that, in the context of mergers and
acquisitions, in case a firm considers selling brand assets, the transaction value of these
assets may be higher than the value-in-use. The difference between these values depends

Firm Value Effects of Brand Divestitures
33
on the brand portfolio diversity and marketing capabilities of both the acquirer and the
seller. If a brand has a better fit with the brand portfolio and activities of the acquiring
company, the value of the brand is enhanced within the new brand portfolio and such
divergent valuations between the seller and buyer present opportunities for firm value gains
for both parties. The divestiture of a brand also releases resources, which can be reallocated
to the retained brands to improve their performance (Varadarajan et al., 2006). The
alternative allocation of released resources such as launching new brands, enhancing core
brands, or expanding the reach of global brands may lead to (increased) growth (Carlotti,
Coe, & Perry, 2004).
We will now link the four brand divestiture options to firm value and argue that the
value-creating effects of divestitures depend on the divested brands’ industry relatedness
and geographical scope.
2.2.2 The divestment of brands with low industry relatedness and low geographical scope
Caused by merger and acquisition activities, many corporations have experienced
diversification in their operating businesses. Many MNEs extended their product range
from their core businesses to other related but also unrelated businesses. Empirical studies
in the strategic management literature provide evidence for negative effects of over-
diversification on firm value (e.g., Lang & Stulz, 1993). This is because at some point the
marginal costs of diversification exceed the benefits (Montgomery & Wernerfelt, 1988).
Diversification then no longer improves firm performance, but creates problems of
managing an overlarge set of business activities (Markides, 1995). In such cases, economies
of scale and scope can be achieved through asset reduction, i.e., removing units, or in our
case brands, in unrelated businesses to increase the focus on core operations again. This
Chapter 2
34
type of restructuring is associated with an increase in the firm’s profitability (Markides,
1995), and enhanced firm value (Desai & Jain, 1999; John & Ofek, 1995). In line with these
considerations we expect that such firm value enhancing effects also apply to divesting
non-core brand assets.
MNEs not only operate in multiple industries, but generally also follow a multi-tier
branding strategy, i.e., they market both local and global brands. This is especially common
when companies face difficulties in reaching price sensitive segments of the market (Schuh,
2007). A multi-tier branding strategy allows them to enjoy higher profit margins by
simultaneously targeting premium segments with their global brands and by better
satisfying fragmented consumer needs with local brands. However, offering (too) many
brands also increases manufacturing costs (Hill et al., 2005) and marketing expenditures
(Ehrenberg, Goodhardt, & Barwise, 1990), and it may dilute brand loyalty (Bawa,
Landwehr, & Krishna, 1989). The proliferation of brands also causes difficulties in
managing brands in a coordinated way (Kumar, 2003). As the number of brands in the
portfolio increases, investment and resource allocation decisions between brands becomes
a tedious task, which might lead to a lack of support on smaller, non-core brands by top
management talent. Given these considerations, firms adopt global branding strategies by
changing the mix of their brand offerings in favor of global ones (Aaker & Joachimsthaler,
2000; Douglas et al., 2001; Schuiling & Kapferer, 2004; Steenkamp & de Jong, 2010).
Following such a global branding strategy fosters firms’ intentions to divest brands with a
lower geographical reach and invest released resources in enhancing global ones. Shifting
towards global brands entails several cost-side benefits. It leads to savings in packaging and
communication costs, and it provides economies of scale due to the standardization of
Firm Value Effects of Brand Divestitures
35
product platforms and marketing and communication strategies (Kapferer, 2002;
Steenkamp, Batra, & Alden, 2003).
Divesting local brands in favor of global brands is also in line with consumer
responses to local and global brands. In general consumers pick global brands, because of
affective feelings (Dimofte, Johansson, & Ronkainen, 2008) or because these brands are
associated with a higher quality, esteem, and prestige (Holt, Quelch, & Taylor, 2004;
Johansson & Ronkainen, 2005; Steenkamp et al., 2003). Although Steenkamp & De Jong
(2010) have shown that there is considerable heterogeneity in attitudes towards local and
global products in the four largest economies, other studies have shown that a huge
percentage of their respondents express strong preferences for global brands both in
developed and developing countries (Holt et al., 2004; Strizhakova, Coulter, & Price, 2008).
In line with these arguments, we expect that the divestment of brands with a lower
geographical scope may lead to a more efficient use of retained brand assets when
compared to the divestment of brands with a higher geographical scope. Given the
expected firm value enhancing effects of divesting non-core brands as well as local brands,
we hypothesize:
Hypothesis 1. Divesting brands with low industry relatedness as well as low
geographical scope will be positively related to the firm value.
2.2.3 The divestment of brands with high industry relatedness and high geographical scope
The divestment of global, core brands is least likely to occur, because according to the
widely advocated global-focus strategy, firms should aim for brand portfolios located in the
upper right quadrant of Figure 1 (e.g., Meyer, 2009). Nowadays, the marketplace has been
witnessing a proliferation of brands, growing retailer power, and increasing competition of

Chapter 2
36
private labels. Therefore, companies need strong core brands more than ever. A large
number of flagship brands within the brand portfolio of many companies are marketed in
core businesses. These are important for firms in building up solid customer bases (Aaker,
2012; Keller, 1998) and, therefore, in the development of strong bargaining power in their
relationships with retailers (Barwise & Robertson, 1992). Moreover, the removal of brands
with high geographical scope will not result in cost advantages, because such brands already
have cost advantages as marketing efforts are standardized across countries. In fact, cost-
based arguments mostly favor the globalization strategy. We therefore expect that divesting
a global brand has negative supply-side consequences for the firm value.
At the demand-side, with the divestiture of any type of brand, firms run the risk of
losing the market share of the divested brands, because they may fail to migrate customers
to the remaining brands in their portfolio. Also, the retained brands may not be able to
deliver higher revenues, covering the loss of demand for the divested brands. This might
be especially true for the divestment of global, core brands. By definition the core business
is the strategically most important business of the company. Most successful companies,
which increase their revenues sustainably and profitably, often have strong core businesses
in which they offer their most critical products to the potentially most profitable
customers. Superior profitability may also be achieved through high market power and
market share dominance in core businesses (Zook & Allen, 2013). Therefore, firm
performance is more sensitive to any loss of demand in core businesses as compared to
non-core businesses. Also, companies generally have only one or a few global brands
within a product category (Varadarajan et al., 2006). Global brands are perceived to be
more prestigious (Steenkamp et al., 2003), familiar (Ozsomer, 2007), of higher quality (Holt
et al., 2004), and of higher esteem (Johansson & Ronkainen, 2005). As a consequence,

Firm Value Effects of Brand Divestitures
37
global brands usually target a premium segment with higher profit margins as compared to
local brands (Meyer & Tran, 2006), leading to an increase in companies’ profit (Kapferer,
2002). Therefore, we argue that firms run a greater risk of losing market share when they
divest a global, core brand as compared to a local, non-core brand.
Following the reasoning outlined above we hypothesize:
Hypothesis 2. Divesting brands with high industry relatedness as well as high
geographical scope will be negatively related to the firm value.
2.2.4 The focus strategies combined
Hypotheses 1 and 2 discuss the consequences of divesting brands that have low
(high) scores on both dimensions in our research framework (Figure 1). However, as
mentioned before, companies may also divest brands that are scoring high on one of the
dimensions, but low on the other, i.e., divesting local, core brands or global, non-core
brands. The effects of divesting such brands on firm value are less clear. Divesting a local,
core brand brings the cost advantages of divesting a local brand as indicated in the
international branding literature, such as savings in packaging and communication costs. At
the same time it may negatively influence firm value due to destroying a core brand.
Companies generally put a lot of managerial and financial effort in building strong core
brands and making consumers loyal to these brands (Aaker, 2012). Destroying such brands
will most likely give a negative signal to investors. Whether the cost advantages of divesting
a local brand outweigh the disadvantages of divesting a core brand is not clear in advance.
The same applies for the divestment of global, non-core brands. As argued above, we
expect that divesting a global brand has negative consequences for the firm value, while the
divestment of non-core assets are generally found to be firm value-enhancing (John &

Chapter 2
38
Ofek, 1995). We, therefore, refrain from formulating directional hypotheses for the
divestment of local, core brands and that of global, non-core brands and will empirically
investigate these effects.
2.3 Methodology and Data
2.3.1 Methodology
A firm’s market value is likely to be influenced by a large number of firm specific
events and factors with long-run implications, which are difficult to be adequately
controlled for in cross-sectional research designs. A brand divestiture is such an event with
long-run implications, and therefore, we conducted an event study to analyze the forward
looking effects of it. Event studies allow for isolating and individually assessing the value
created by events, and has been used regularly in the strategic management literature (see
Wright, Chiplin, & Thompson, 1993) as well as in the marketing and branding literature
(e.g., Gielens, van de Gucht, Steenkamp, & Dekimpe, 2008; Sood & Tellis, 2009; Wiles,
Morgan, & Rego, 2012).
In our study, we investigate the stock price reaction to an announcement of a brand
divestiture as part of a BPR program by a firm. The stock price reflects the present value of
all current and projected earnings of the company. Any abnormal change in stock price, i.e.,
the part of the return that is not due to systematic influences, also called abnormal return,
is associated with the unanticipated information about an event that comes to the public
realm through an announcement. As such, it provides a direct measure for the present
value of all expected current and future profits triggered by the event, i.e., the brand
divestiture (see Fama, 1970)
Firm Value Effects of Brand Divestitures
39
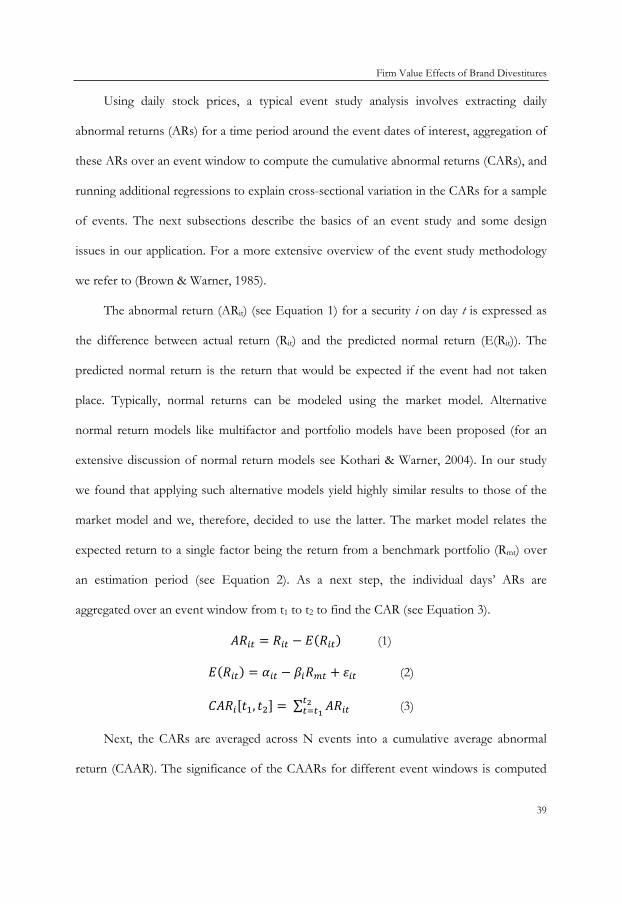
Using daily stock prices, a typical event study analysis involves extracting daily
abnormal returns (ARs) for a time period around the event dates of interest, aggregation of
these ARs over an event window to compute the cumulative abnormal returns (CARs), and
running additional regressions to explain cross-sectional variation in the CARs for a sample
of events. The next subsections describe the basics of an event study and some design
issues in our application. For a more extensive overview of the event study methodology
we refer to (Brown & Warner, 1985).
The abnormal return (ARit) (see Equation 1) for a security i on day t is expressed as
the difference between actual return (Rit) and the predicted normal return (E(Rit)). The
predicted normal return is the return that would be expected if the event had not taken
place. Typically, normal returns can be modeled using the market model. Alternative
normal return models like multifactor and portfolio models have been proposed (for an
extensive discussion of normal return models see Kothari & Warner, 2004). In our study
we found that applying such alternative models yield highly similar results to those of the
market model and we, therefore, decided to use the latter. The market model relates the
expected return to a single factor being the return from a benchmark portfolio (Rmt) over
an estimation period (see Equation 2). As a next step, the individual days’ ARs are
aggregated over an event window from t1 to t2 to find the CAR (see Equation 3).
𝐴𝑅𝑖𝑡 = 𝑅𝑖𝑡 − 𝐸(𝑅𝑖𝑡) (1)
𝐸(𝑅𝑖𝑡) = 𝛼𝑖𝑡 − 𝛽𝑖𝑅𝑚𝑡 + 𝜀𝑖𝑡 (2)
𝐶𝐴𝑅𝑖[𝑡1, 𝑡2] = ∑ 𝐴𝑅𝑖𝑡𝑡2𝑡=𝑡1 (3)
Next, the CARs are averaged across N events into a cumulative average abnormal
return (CAAR). The significance of the CAARs for different event windows is computed

Chapter 2
40
using the standardized test statistic described by (Patell, 1976). Assuming cross-sectional
independence, the test estimates a separate standard error for each event, and each
abnormal return is then standardized as follows:
𝑠𝐴𝑅𝑖𝑡2 =
∑ 𝐴𝑅𝑖𝑗2𝐸2
𝑗=𝐸1𝑇𝑖−2
�1 + 1𝑇𝑖
+ (𝑅𝑚𝑡− 𝑅𝑚,𝐸𝑠𝑡����������)2
∑ ( 𝑅𝑚𝑗−𝑅𝑚,𝐸𝑠𝑡����������)2𝐸2𝑗=𝐸1
� (4)
𝑆𝐴𝑅𝑖𝑡 = 𝐴𝑅𝑖𝑡𝑠𝐴𝑅𝑖𝑡
(5)
where Ti is the number of days in the estimation window starting at E1 and ending at E2,
𝑅𝑚,𝐸𝑠𝑡�������� is the mean market return over the estimation window.
For each event i, we estimated the expected returns for the market model using an
estimation period of 255 days (which equals to one trading year), ending 30 days before the
event date. We used adjusted share prices as some firms had undergone stock splits
between 1995 and 2010. To quantify the market rate of return, we collected index returns.
For firms that had their common stocks included in multiple indices, we chose the index
registered in the home country of the firm. Stock prices and information on indices were
drawn from the Thomson Reuters database.
The choice of an event window is one of the most important design issues in an event
study. Including pre-event days in the event window accounts for leakage of information
prior to the official announcement, while including post-event dates ensures capturing the
delayed impact of the announcement. However, using longer event windows increases the
likelihood of confounding events and may lead to biased results. Therefore, we report the
CAARs for several different narrow event windows around the event date, namely, (-3,+1),
(-3,0), (-2,+1), (-2,0), (-1,+1), (-1,0), and (0,+1). We use parametric (Patell Z test) and non-
parametric (Wilcoxon signed-rank test) tests to determine the significance of the CAARs.
Firm Value Effects of Brand Divestitures
41
2.3.2. Sample design and descriptive statistics
The empirical setting of our study is the food and beverage industry. To construct a
sample of brand divestiture announcements of multinational enterprises operating in this
industry, we followed a stepwise approach: (i) we identified sample firms, (ii) we collected
brand asset divestiture announcements for those firms, (iii) we screened the
announcements for the objective of the divestment activity, and (iv) we checked for
confounding events. Below we describe in detail how we developed our sample.
First, we identified all publicly listed multinational enterprises that appeared in the
2010 list of the Global Food Market Database. This list ranks the top 100 global food
groups by their revenues in the food and beverage industry. We then collected
announcements of these firms by using the database of Lexis Nexis, which covers a
multitude of information sources. Since many corporations started to engage in brand
disposal activities in the late 1990s (Kumar, 2003), we started gathering announcements as
of 1995 until 2010. Multiple search terms (e.g., sale, sell, sold, disposal, divesture,
divestment, deletion, brand, rationalization, portfolio, focus) were used to identify relevant
announcements. Afterwards, we scanned all articles to select the ones that included an
announcement of brand asset divestitures. We then used Thomson One Banker’s M&A
Deals Analysis module to confirm that the transaction had actually been enacted.
Announcements of pending or cancelled transactions were excluded.
To separate BPR announcements from divestitures with other strategic objectives, we
used a similar approach as used by (Byerly, Lamont, & Keasler, 2003; Markides, 1992) to
identify restructuring announcements. We screened all announcements for content and
selected those that report a brand portfolio restructuring strategy by looking for terms such
Chapter 2
42
as ‘refocusing,’ ‘concentrate on (shifting focus to) core businesses,’ ‘concentrate on
(shifting focus to) core brands,’ ‘concentrate on (shifting focus to) core markets,’
‘concentrate on (shifting focus to) global markets,’ or some other wording clearly revealing
that the divestment is executed within the context of a BPR program and in order to focus
on other brands in the portfolio. Finally, we examined our sample for confounding events
and filtered out those with a confounding event from three days before to three days after
the announcement. By doing this, we ensured that the stock price reactions could solely be
attributed to the announced brand divestitures. This resulted in a sample of 205 BPR
announcements.
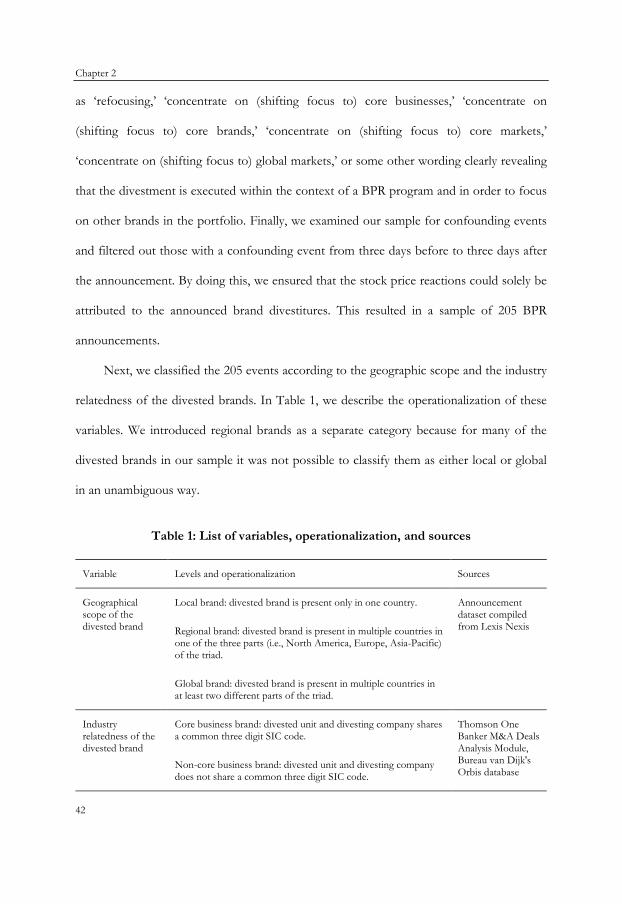
Next, we classified the 205 events according to the geographic scope and the industry
relatedness of the divested brands. In Table 1, we describe the operationalization of these
variables. We introduced regional brands as a separate category because for many of the
divested brands in our sample it was not possible to classify them as either local or global
in an unambiguous way.
Table 1: List of variables, operationalization, and sources
Variable Levels and operationalization Sources
Geographical scope of the divested brand
Local brand: divested brand is present only in one country. Announcement dataset compiled from Lexis Nexis Regional brand: divested brand is present in multiple countries in
one of the three parts (i.e., North America, Europe, Asia-Pacific) of the triad.
Global brand: divested brand is present in multiple countries in at least two different parts of the triad.
Industry relatedness of the divested brand
Core business brand: divested unit and divesting company shares a common three digit SIC code.
Thomson One Banker M&A Deals Analysis Module, Bureau van Dijk's Orbis database
Non-core business brand: divested unit and divesting company does not share a common three digit SIC code.
Firm Value Effects of Brand Divestitures
43
To determine the geographical scope of the divested brand, we adopted conceptual
and operational definitions similar to those of Townsend, Yeniyurt, & Talay (2009). We
classify the divested brand as being: (i) a local brand, (ii) a regional brand, or a (iii) global
brand. For all divested brands, we scanned Lexis Nexis to find information regarding the
country markets where the divested brands were present. To determine the industry
relatedness of the divested brands we compared the Standard Industrial Classification (SIC)
codes of the divested units with the primary SIC codes of the divesting companies. This
approach is in line with other studies in divestment research (e.g., Doukas & Kan, 2004;
Schlingemann, Stulz, & Walkling, 2002). We distinguish between divestitures in core (i.e.,
high relatedness) business and non-core (i.e., low relatedness) business activities. The SIC
codes for the divested units are collected from Thomson One Banker’s M&A Deals
Analysis module, while the primary SIC codes are collected from Bureau van Dijk’s Orbis
database.
Table 2 (Panel A) presents an overview of the sample sizes for the different levels of
the divested brands’ geographical scope and industry relatedness. We observe a decrease in
the number of divested cases with an increase in the geographical scope and in the industry
relatedness of the divested brand. About half of the cases involve the divestiture of local
brands, followed by regional brands (28% of the cases). The divestiture of global brands
occurs in less than 20 percent of the cases. Furthermore, 60 percent of the divested brands
are non-core business brands while 40 percent are core business brands. As expected, the
divestment of brands with low relatedness and low geographical scope appeared most
frequently. The divestments of brands with high relatedness and high geographical scope
were rare events; the removal of global, core business brands appeared in only four percent
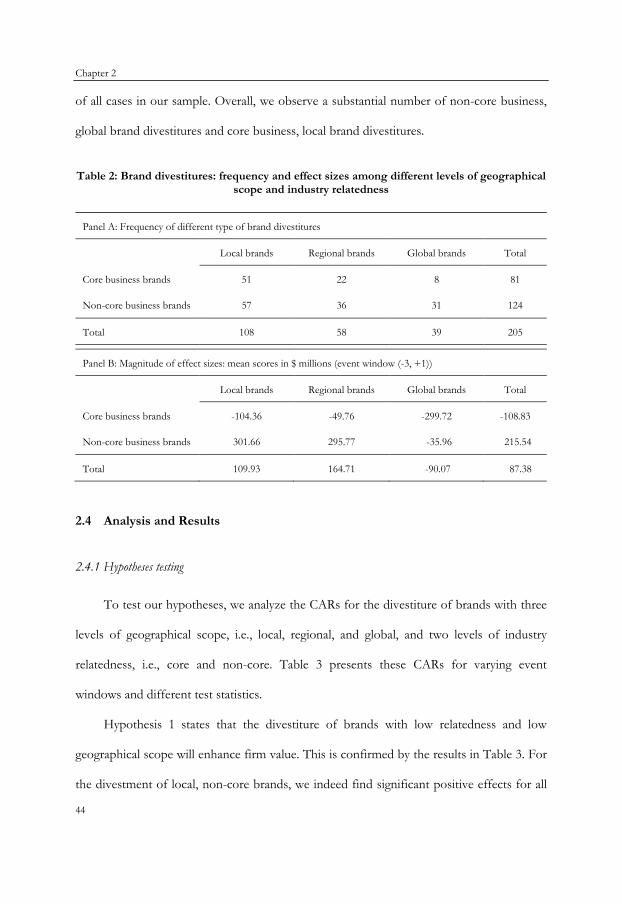
Chapter 2
44
of all cases in our sample. Overall, we observe a substantial number of non-core business,
global brand divestitures and core business, local brand divestitures.
Table 2: Brand divestitures: frequency and effect sizes among different levels of geographical scope and industry relatedness
Panel A: Frequency of different type of brand divestitures
Local brands Regional brands Global brands Total
Core business brands 51 22 8 81
Non-core business brands 57 36 31 124
Total 108 58 39 205
Panel B: Magnitude of effect sizes: mean scores in $ millions (event window (-3, +1))
Local brands Regional brands Global brands Total
Core business brands -104.36 -49.76 -299.72 -108.83
Non-core business brands 301.66 295.77 -35.96 215.54
Total 109.93 164.71 -90.07 87.38
2.4 Analysis and Results
2.4.1 Hypotheses testing
To test our hypotheses, we analyze the CARs for the divestiture of brands with three
levels of geographical scope, i.e., local, regional, and global, and two levels of industry
relatedness, i.e., core and non-core. Table 3 presents these CARs for varying event
windows and different test statistics.
Hypothesis 1 states that the divestiture of brands with low relatedness and low
geographical scope will enhance firm value. This is confirmed by the results in Table 3. For
the divestment of local, non-core brands, we indeed find significant positive effects for all

Firm Value Effects of Brand Divestitures
45
reported event windows. In contrast, but as expected, we find significant negative effects
on firm value for the divestment of global, core brands, for all but one reported event
windows. This confirms Hypothesis 2.
Table 3: Mean cumulative abnormal returns (CARs) with respect to geographical scope and industry relatedness
Panel A Local brands (N=108)
Event window
(-3,+1) (-3,0) (-2,+1) (-2,0) (-1,+1) (-1,0) (0,+1)
Core business brands (N=51)
Mean CAR -0.746 -0.458 -0.853 -0.565 -0.920 -0.632 -0.624
Z-value a -1.95† -1.51 -2.18* -1.75† -2.36* -1.95† -1.93†
% of positive CARs 29.41 33.33 29.41 31.37 25.49 23.53 29.41
Z-value b -2.54* -1.99* -3.29*** -2.79** -3.42*** -2.94** -3.07**
Non-core business brands (N=57)
Mean CAR 0.824 0.716 0.830 0.723 0.906 0.798 0.567
Z-value a 1.78† 1.96† 1.99* 2.16* 2.42* 2.78** 1.87†
% of positive CARs 59.65 59.65 66.67 70.18 66.67 71.93 61.40
Z-value b 1.74† 2.13* 2.66** 3.29*** 3.31*** 4.03*** 2.04*
Panel B Regional brands (N=58)
Event window
(-3,+1) (-3,0) (-2,+1) (-2,0) (-1,+1) (-1,0) (0,+1)
Core business brands (N=22)
Mean CAR -0.667 -0.442 -0.730 -0.505 -0.813 -0.588 -0.652
Z-value a -1.38 -0.96 -1.85† -1.45 -2.35* -2.05** -2.32*
% of positive CARs 31.82 27.27 31.82 36.36 31.82 27.27 36.36
Z-value b -1.87† -1.38 -1.74† -1.06 -2.35* -1.67† -1.80†
Non-core business brands (N=36)
Mean CAR 0.861 0.607 1.053 0.800 0.799 0.545 0.525
Z-value a 1.70† 1.05 2.22* 1.58 2.22* 1.51 1.81†
% of positive CARs 61.11 55.56 61.11 55.56 66.67 55.56 58.33
Z-value b 1.87† 1.12 1.96* 1.24 2.31* 1.45 2.00*

Chapter 2
46
Panel C Global brands (N=39)
Event window
(-3,+1) (-3,0) (-2,+1) (-2,0) (-1,+1) (-1,0) (0,+1)
Core business brands (N=8)
Mean CAR -1.386 -1.453 -1.458 -1.525 -0.858 -0.925 -0.076
Z-value a -1.88† -2.04* -2.06* -2.32* -1.70† -2.01* -0.92
% of positive CARs 12.50 12.50 12.50 12.50 0.00 25.00 37.50
Z-value b N/A N/A N/A N/A N/A N/A N/A
Non-core business brands (N=31)
Mean CAR -0.333 -0.424 -0.542 -0.633 -0.658 -0.749 -0.158
Z-value a -0.30 -0.66 -1.12 -1.67† -1.66† -2.50* -0.67
% of positive CARs 48.39 48.39 48.39 48.39 48.39 41.94 45.16
Z-value b -0.43 -0.41 -0.94 -0.71 -0.55 -0.61 -0.61 † P<0.10; *P<0.05, **P<0.01; ***P<0.001 a Patell z-statistic (Patell, 1976) is used to test for the statistical significance of CARs. b Wilcoxon signed-rank test is used to test-values are derive z-values.
For the divestment options in the off diagonal quadrants in Figure 1, i.e., local, core
brands and global, non-core brands, we did not formulate hypotheses in advance. The
CARs in Table 3 reveal that both divestment options destroy value. The effects are
strongest for the local, core brand divestments.
For the divestments of regional brands, we observe a similar pattern as for the
divestment of local brands. The divestment of regional, core brands has a negative impact
on firm value, while the divestment of regional, non-core brands has a positive effect. Both
effects are significant for four out of the seven reported event windows.
In sum, the cumulative abnormal returns reported in Table 3 demonstrate that
divesting core business brands has a negative effect on firm value regardless of the divested
brand’s geographical scope. Divesting non-core brands also has a negative effect in case of
global brands (for three event windows). However, the divestment of non-core brands has
a positive impact on firm value in case of local (for all event windows) and regional brands
Firm Value Effects of Brand Divestitures
47
(for four event windows). Our results clearly emphasize the importance of integrating the
two strategic perspectives, i.e., the divested brand’s industry relatedness and its
geographical scope, in a single common framework.
The reported CARs in the analysis are measured as the percentage change in share
price after it has been adjusted for changes resulting from general market movements. To
provide insight into the magnitude of the monetary value of the implied performance
effects, we calculated the monetary effect sizes across all events belonging to a particular
type of brand divestment (see Table 2, Panel B). Effect sizes in monetary value are
calculated by multiplying the CAR for the longest event window (-3, +1) with the market
capitalization of the firm, which is calculated by multiplying a company's number of
outstanding shares with the current market price of one share. In our analysis, the number
of outstanding shares stays constant during the event window, because we excluded
announcements with confounding events such as stock splits, dividends/distributions, and
right offerings. Therefore, the percentage change in the market price of one share can be
directly translated to a percentage change in the market capitalization of the firm.
The results in Table 2 (Panel B) are in line with the reported mean CARs for each
type of divestment. Deleting core brands leads to an average decrease in market
capitalization of $108.83 million, while deleting non-core brands leads to an average
increase in market capitalization of $215.54 million. Deleting non-core, global brands,
however, entails a decrease in market capitalization of $35.96 million. Only in case of
deleting a local or regional, non-core brand we find a positive effect on the market
capitalization.
In a subsequent cross-sectional analysis, we controlled for the effect of the divested
brand’s relative size, calculated as the ratio of the prior year sales of the divested brand

Chapter 2
48
relative to the prior year sales of the divesting firm. The data on brand sales were mainly
gathered from the announcements, while in some cases companies’ financial reports were
used. We do not find a statistically significant effect for the relative size of the divested
brand, and moreover, controlling for this effect does not change the main findings of our
study.
2.4.2 Post-hoc analysis
Our results show that, on average, firms experience negative abnormal returns due to
the divestment of core brands, even if the removed brand has a low geographical scope
(i.e., local and regional brands). Apparently, the advantages of divesting a local (or regional)
brand do not outweigh the disadvantages of divesting a core brand, or alternatively
divesting local (and regional) brands may also entail severe disadvantages. However, in
practice many firms experience proliferation not only in their non-core businesses, but in
their core businesses as well. Furthermore, as shown in Table 2 (Panel A), removing core
business brands with low geographical scope is one of the most common forms of focus-
increasing divestitures (i.e., about 36% of all cases in our data). Therefore, it is important to
understand why divesting local and regional brands in core businesses have, on average,
negative effects. Below we offer two explanations.
First, certain local brands may have a very particular ‘appeal’ to local customers; they
may be perceived as highly esteemed, and familiar, and therefore have a strong and loyal
consumer base (Schuiling & Kapferer, 2004). Moreover, local brands may have strong
appeals in their home markets due to their perceived local iconness, i.e., the extent to
which a brand is perceived as a symbol of the local culture and tradition. In food
categories, which are the focus of this paper, local icons are perceived to be of higher
Firm Value Effects of Brand Divestitures
49
quality. Further, a close connection to national identity, local culture, and heritage may
enhance a brand’s prestige, which in turn may increase the purchase likelihood of the local
brand (Özsomer, 2012). Therefore, a local brand’s contribution to top-line performance
might seem limited, but once divested companies may fail to migrate these brands’
customers to other core-business brands. As a result, benefits of such divestitures may not
go beyond cost-saving while revenues also suffer. A second explanation may be that, due to
an information advantage, companies can better identify consumer needs and their buying
behavior in their ‘home regions’ than in away regions. For example, there might be a
potential negative effect of cultural distance on products related to national identity (e.g.,
food) or products carrying country-specific quality associations (e.g., wines) (Ghemawat,
2001). Better understanding of the local culture, tastes, and needs help local brands in
delivering higher quality and higher prestige products (Özsomer, 2012). Companies have an
apparent advantage in building and managing local brands in their home regions, because
assets such as knowledge of local culture are accumulated relatively more easily in home
markets than in away markets. Moreover, home region brands tend to be managed more
effectively and monitored more closely by the best managers, because of geographic
proximity to the head-office. Therefore, in their home regions they can offer brands that
meet consumer needs more effectively. After the divestiture of such brands, retained
brands may not regain the lost market share. Moreover, in such cases, any top-line drop
due to the loss of divested brands’ demand is likely to have negative effects on bottom-line
performance, since companies usually have higher profit margins in their home regions
(McGahan & Victer, 2010).
We ran cross sectional regressions to examine the effect of these two variables on the
abnormal returns due to divesting core brands with low geographical scope. For this

Chapter 2
50
purpose we took the subsample of 73 announcements of the divestment of local and
regional core brands (see Table 2, Panel A). To operationalize brand appeal to consumers,
we used information from the announcement. We looked for terms, such as ‘well-known,’
‘iconic,’ ‘familiar,’ or ‘esteemed’ to code our dummy variable ‘Appeal,’ which takes the
value 1 when the divested brand is appealing to consumers. To operationalize the variable
‘Home Region,’ we categorized brands according to the geographical markets where they
were present and then compared this to the geographical location of the company. If these
two geographical locations were the same, the dummy variable was coded as 1. We also
include a dummy variable to indicate whether the brand is local (=1) or regional (=0). The
results of these regression analyses are reported in Table 4.
Table 4 : Cross-sectional regressions of local and regional brands in core business (sub sample N = 73)
Dependent variable
CAR CAR CAR CAR CAR CAR CAR
Independent variable (-3,+1) (-3,0) (-2,+1) (-2,0) (-1,+1) (-1,0) (0,+1) Intercept 0.816 0.843 0.448 0.474 0.042 0.068 -0.059
(0.61) (0.57) (0.52) (0.44) (0.41) (0.35) (0.38)
Appeal -1.331* -1.252* -1.139* -1.060** -1.063** -0.983** -0.664*
(0.55) (0.51) (0.47) (-0.39) (0.37) (0.31) (0.34)
Home Region -1.720** -1.416** -1.304** -1.00* -0.769* -0.465 -0.591†
(0.56) (0.53) (0.48) (0.41) (0.38) (0.32) (0.35)
Local 0.204 0.230 0.101 0.128 0.058 0.084 0.142
(0.60) (0.56) (0.51) (0.43) (0.40) (0.34) (0.37)
Adjusted R2 0.16 0.14 0.14 0.14 0.13 0.13 0.06
F-statistic 5.67*** 4.93*** 5.02*** 4.90*** 4.66*** 4.46*** 2.49* † P<0.10; *P<0.05, **P<0.01; ***P<0.001 For each independent variable, unstandardized coefficients are reported. The numbers in parentheses are standard errors.

Firm Value Effects of Brand Divestitures
51
In line with our expectations, the results indicate that divesting a brand with a
particular appeal to consumers has a significant, negative effect on firm value. The same
applies for the divestment of a home-region brand. Home-region brands may address
customer needs better than away-region brands, and we, therefore, argue that divesting
home-region brands assets can be more risky than divesting away-region brand assets.
2.5 Conclusion
2.5.1 Discussion of findings
In this paper we have empirically investigated the effects of focus-increasing brand
divestitures using a multidisciplinary perspective. Previous studies on divestitures focused
on the effects of divesting either non-core business assets (strategic
management/divestment literature) or local brands (international branding literature). This
study contributes to both literatures by investigating the stock market’s reaction to a firm’s
brand divestment activities and by showing that both brand divestment characteristics, i.e.,
core versus non-core, and local/regional versus global, in parallel determine the value
creating/destroying effects such divestments. Moreover, in line with (Meyer, 2006), who
discusses the benefits of a global-focus strategy, this is the first study that provides
empirical evidence for the positive effects of such a strategy. We show that divesting
brands scoring low on both industry relatedness and geographical scope, i.e., the
local/regional, non-core brands increases firm value, while the opposite is true for brand
divestments that score high on both dimensions.
We show that divesting non-core brands in order to focus on core brands creates
firm value, but only if the divested brands are local or regional ones. We cannot see the
Chapter 2
52
same positive effect for divesting global, non-core brands. Actually, for three out of the
seven event windows we find a significant negative impact of divesting a global, non-core
brand. For the other event windows we also find a negative parameter, though not
significant. Our results suggest that divesting a non-core brand does not always enhance
firm value. Although the divestment of a non-core, global brand happens in a minority of
the cases in our sample (15%), it is an interesting finding, which contributes to the
divestment literature. So far this literature only showed value-enhancing effects of divesting
non-core assets (Daley, Mehrotra, & Sivakumar, 1997; Desai & Jain, 1999; John & Ofek,
1995). By also taking into account the geographical scope of the divested brand asset, we
develop a more nuanced picture.
Divesting a global brand appears, on average, to lead to negative reactions from
investors, no matter whether the brand is a core or non-core business brand. Apparently,
the value of global brands due to the economies of scale in production, R&D, and
marketing as well as the economies of scope is high (Hankinson & Cowking, 1996), leading
firm value to decrease when divesting such brands.
As far as we know, this is the first empirical study showing that the strategy advocated
in the international branding literature to divest brands with low geographical scope in
order to focus more on strong global brands (see e.g., Kumar, 2003) will not always create
positive firm value. When taking into account the industry relatedness of the divested
brand, we see a different picture. The divestment of local and regional, core business
brands appears, on average, to destroy firm value. Although global brands offer numerous
advantages, such as cost efficiencies, they may fail to appeal to local tastes. The attitude
toward local products is still ubiquitous in many countries (Steenkamp & de Jong, 2010).
Local brands, especially in core businesses, generally have a high brand equity, because they
Firm Value Effects of Brand Divestitures
53
are well known in their markets, develop a true local value by responding to local needs,
and consequently local consumers often have strong relationships and emotional ties with
these brands (Schuiling & Kapferer, 2004; Steenkamp et al., 2003). In case a company sells
a local, core business brand to another company, consumers may be hesitant to give up
their favorite local brands just because the owner has been changed. Alternatively, replacing
them with global brands may not warrant customers’ switch to this global brand. For
example, when P&G gave up the local dishwasher detergent ‘Fairy’ for its global brand
‘Dawn’ in Germany, the company’s market share in dishwashing fell. The global brand that
replaced ‘Fairy’ received an unanticipated negative reaction from consumers who were
strongly tied to the once popular ‘Fairy’ brand, and even reverting to the original ‘Fairy’
brand name did not bring the brand back to its former glory (Kapferer, 2008).
The results of our post-hoc analyses provide more insight into this negative effect of
divesting local/regional, core brands, and show that if the divested brand is appealing this
negatively influences the abnormal return. Furthermore, the divestment of core brands
with limited geographical scope has more dramatic consequences when undertaken in
home regions. One possible explanation is that companies are more likely to offer very
effective brands in their home regions than in away regions because they are better
informed about these home regions consumers’ needs and preferences. Home regions are
often the markets where companies have been active the longest time. Such tenure of
operations has been found to be positively related to organizational knowledge (Benito &
Gripsrud, 1992). This makes it more likely that they build strong and loyal customer bases
and enjoy higher profit margins for home region brands than for brands in foreign regions.
Chapter 2
54
2.5.2 Managerial implications
Our findings yield important implications for managers who are responsible for brand
portfolios and who consider brand divestments. In practice, brand managers are often
reluctant to make brand divestment decisions. The reasons can be many, including fear of
losing jobs, being hesitant in admitting failure of a brand, or the managers’ emotional ties
with the divested brands. Moreover, most brand managers give high consideration to
develop strategies to enhance their brands’ performance, but they may have little or no
concern about whether other businesses of the company have more profitable uses for the
resources of their brands.
Our study clearly shows that in certain instances focus-increasing brand asset sales
may increase firm value. However, our results also demonstrate that divesting brands can
be risky as well. If we look at the strategies of P&G and Unilever as outlined in the
beginning of this paper, we conclude that both strategies bear the risk of destroying firm
value. P&G divested non-core brands in order to focus on their core businesses, and even
divested global brands (e.g., Pringles) for this purpose. We show that such divestments
certainly do not lead to positive reactions from investors, and might even entail a negative
impact on firm value. Unilever divested mainly local and regional brands in order to reduce
the number of brands and shifted its resources to fewer important global brands. Our
study shows that this strategy only increases firm value if non-core brands are divested, but
destroys value if core brands are divested.
Our study indicates a single pathway when companies are faced with problems of
proliferated brand portfolios, i.e., refocusing and internationalization forces to act in the
same direction. More specifically, looking from a firm value perspective, non-core business

Firm Value Effects of Brand Divestitures
55
brands with low international presence should be the primary candidates for divestitures,
while divesting core or global brands should be avoided.
To summarize, companies should rationalize their offerings towards a portfolio that
follow a multi-tier branding strategy in core businesses. Many leading CPG companies
offer a collection of local, regional, and global brands in their core businesses. For example,
Kraft Foods’ portfolio of brands includes several local (e.g., Opavia biscuit in Czech
Republic), regional (e.g., LU biscuit in Western Europe), and global (e.g., Oreo biscuit all
over the world) ones in their core snacks and confectionary business. Similarly, Diageo’s
portfolio of brands include some local beer brands such as Serengeti Premium in Tanzania,
regional brands such as Tusker in Africa, and a global Smithwick's brand that is sold in
North America, Europe, and Australia. Another company that successfully manages a
portfolio of local and global brands is Anheuser-Busch InBev (Steenkamp & de Jong,
2010). Such an approach allows them to enjoy higher profit margins by targeting premium
segments with global brands and to enjoy greater market share by better satisfying
fragmented consumer needs with their local brands. This is especially important in their
home regions. Companies have higher earning margins in both core businesses and home
regions. In other words, simplification should be avoided in industry and country markets
where earning margins are high. Otherwise, the possible demand losses after divestitures
may hurt bottom-line growth. For non-core business activities companies should pursue a
global branding strategy only.
2.5.3 Future research
This study focused on brand asset sales in the food and beverages industry. Future
research could focus on similar divestitures in other industries to determine whether our
Chapter 2
56
results generalize beyond the current setting. Second, we used stock prices to operationalize
the change in the firm value, and therefore focus on the return at the aggregate firm level.
Future research could reveal the performance effects of brand divestments by linking them
to a multitude of other financial performance indicators, such as revenues, operating
margins, advertisement expenses and employee efficiency. Third, due to data
considerations, we used only a limited number of variables that characterize the brand
portfolios and divested brands. However, a wider range of brand- (e.g., strategic role, age,
modifiability) and brand portfolio-level factors (e.g., degree of cannibalization, intra-
portfolio competition, the number and strengths of the retained brands in the selling firm’s
portfolio) could moderate the effects of focus-increasing brand divestiture decisions. The
study by (Varadarajan et al., 2006) provides a comprehensive list of such factors that trigger
these decisions. Further research could assess their value relevance. Finally, an interesting
extension could be looking at abnormal returns in the stock value of the acquiring firms to
find out how acquiring firms benefit from core/non-core and local/global brand
acquisitions.
57
Chapter 3
Who Benefits from Brand Exits? Why?
n an attempt to meet the changing needs of the fast-paced and fiercely competitive
marketplace, both manufacturers and retailers frequently update their brand
portfolios; they add new brands, extend existing brands, or drop slow moving
brands to build portfolios that ultimately maximize performance. Given the frequency with
which these events occur, marketing scholars have paid close attention to modeling market
response to changes in the set of product or brand alternatives. For example, with more
than 180,000 new grocery products launched globally every year –one every 3 minutes–
firms are spending millions annually on product innovation (Information Resources Inc.,
2005). Extant research, accordingly, has made significant headway in developing a better
understanding of market response to new brand (product) introductions (e.g., Aaker &
Joachimsthaler, 2000; Bowman & Gatignon, 1996; Chintagunta, 1996; Chintagunta, 1999;
Pauwels & Srinivasan, 2004; van Heerde, Mela, & Manchanda, 2004; van Heerde,
I
Chapter 3
58
Srinivasan, & Dekimpe, 2010). While the spotlight has rightfully been on newcomer brands
so far, brands that have been driven off the shelves have quietly become an important
piece of the puzzle in the management of manufacturer brand portfolios and retailer
assortments. Accordingly, this study takes up this relatively understudied phenomenon of
brand exits.2
The rising importance of brand exits is perhaps most readily apparent in the ongoing
transition from “more is better” to “more is too much” approach. In the 90s, one of the
most fundamental tenets of marketing was that more choice was better for the consumer.
Manufacturers, who were already following an acquisition-led growth strategy at the time,
accelerated new brand activity to meet consumers’ ever-increasing need for variety. As a
result, the average number of items in a US grocery store more than tripled (Broniarczyk &
Hoyer, 2010).
Conventional wisdom has it that increasing variety gives the consumers more options,
but proliferation, more often than not, brings problems along with it. From consumers’
perspective, choosing from a large number of alternatives can increase choice difficulty and
decrease purchase likelihood (Iyengar & Lepper, 2000). From manufacturers’ standpoint,
managing proliferated brand portfolios increase managerial complexity and decrease focus
(Hill et al., 2005). Finally, from retailers’ perspective, a large number of brands limits
growth opportunities for private labels because of scarce shelf space for private label
ranges and a higher level of competitor marketing activity. Consequently, retailers and
manufacturers have started to rethink the very basic tenets of how to effectively address
consumer needs and set their sights on streamlining their brand offerings.
2 We define brand exit as the removal of a brand from store shelves either by a manufacturer or a retailer and use the terms exit, deletion, and delisting interchangeably.
Who Benefits from Brand Exits? Why?
59
Realizing the negative consequences of brand proliferation on consumers (Schwartz,
2004) and the undesirable effects of bloated and unfocused portfolios on company
performance (Aaker & Joachimsthaler, 2000; Morgan & Rego, 2009), manufacturers, such
as Unilever and Procter and Gamble have been eliminating their underperforming or
redundant offerings (Ng, 2014; Watrous, 2014). Retailers adopt a similar approach to the
proliferation problem. In order to increase focus on their private labels with high margin
potential, improve their negotiation posture with brand manufacturers, and ultimately
maximize category profitability, retailers implement major assortment changes three to four
times a year. Minor assortment changes can be observed as often as weekly (Sloot, Fok, &
Verhoef, 2006; Sloot & Verhoef, 2008). In sum, portfolio rationalization efforts of
manufacturers and assortment optimization efforts of retailers make brand exits rather
frequent events.
The ever-increasing frequency of brand exits coupled with the sheer amount of
demand that frees-up following these events begs the question whether and which brands
benefit (or suffer) from the exit and why? Accordingly, this study seeks to shed light on the
long-term effects of brand exits by analyzing the drivers of excess demand redistribution
following the event. Research on assortment reduction offers insights into what happens
after a choice alternative is withdrawn from the market (e.g., Borle, Boatwright, Kadane,
Nunes, & Galit, 2005). However, these studies (1) primarily consider SKU reductions, (2)
almost exclusively focus on the category level effects of assortment reductions (e.g., Sloot
et al., 2006), and (3) fail to explain why certain brands benefit from the deletion while
others do not (see Zhang & Krishna, 2007 for an exception). Our goal, on the other hand,
is to uncover what influences realignment of brand sales after a brand exit and generate
profound insights that will help manufacturers deleting the brands, the manufacturers of
Chapter 3
60
competing brands, and the retailers better manage their marketing efforts in the aftermath
of brand exits.
To that end, we develop a Dynamic Linear Model (DLM) model, which examines
how the sales of incumbent brands respond to a brand exit. Specifically, we model the
long-term effect of a brand exit on an incumbent brand’s baseline sales. As incumbent
brands with product portfolios similar to that of the delisted brand stand to gain more
from the exit, we assume that the effect on baseline sales is related to the proximity of the
two brands in a multidimensional attribute space. We also assume that the realignment of
sales after the exit can be influenced by the post-exit marketing efforts of the incumbent
brand in question. Finally, as exits typically have permanent, but not necessarily
instantaneous, effects on remaining brands’ sales, we allow the market adjust to its new
normal gradually. Using MCMC techniques, we calibrate this model on aggregate store
level data acquired from Information Resources, Inc. (see Bronnenberg, Kruger, & Mela,
2008).
We apply our methodology to 96 brand exit events in the deodorant and milk product
categories and examine the effects of these exits on 555 incumbent brands’ sales. The
results indicate that the market shares of a deleted and an incumbent brand, and the
incumbent brand’s similarity to the deleted brand explain variations in sales response to
exits across brands. We examine the effect of similarity on multiple dimensions and reveal
what underlying product attributes are most critical in attracting consumers of the deleted
brand. We further find that increasing the number of an incumbent brand’s product
alternatives and an incumbent brand’s non-price oriented promotion frequency are
effective post-exit marketing efforts to claim a higher portion of the sales of the deleted
brand.
Who Benefits from Brand Exits? Why?
61
We believe that the results of this study will help (i) owners of the delisted brands
determine what portion of the demand that frees up can be recovered by surviving brands
in their own portfolios, (ii) owners of competing brands in the product category how to
best manage their product portfolios to meet the freed up demand, and (iii) both parties
focus their marketing efforts on where it will have the most impact following a brand exit.
The remainder of this chapter is structured as follows: In Section 3.1, we position our
study against existing literature and identify modeling challenges imposed by the findings of
extant research and the nature of the problem. We discuss our model specification in
Section 3.2. In Section 3.3, we discuss our data and operationalization of variables. We
present the results in Section 3.4. We discuss our findings and offer managerial implications
in Section 3.5 and we end up in Section 3.6 with concluding remarks.
3.1 Extant Research and Modeling Challanges
3.1.1 Background for the study
Our study builds on two related streams in the marketing literature, namely literature
on stock-outs and on assortment reductions. Studies in both streams focus on consumer
reactions to some form of product unavailability and offer complementary insights to the
problem at hand. Table 5 provides a selective overview of prior research and discusses
extant work along four dimensions: (1) type of unavailability studied (brand vs. item), (2)
duration of unavailability (temporary vs. permanent), (3) level of analysis (category-level vs.
brand-level), and (4) the speed of adjustment (immediate vs. gradual).
The first dimension, type of unavailability, distinguishes between unavailability of an
item and unavailability of a brand. While most of the research on assortment reductions

Chapter 3
62
(e.g., Boatwright & Nunes, 2001; Borle et al., 2005; Dreze, Hoch, & Purk, 1994; Sloot et al.,
2006; Zhang & Krishna, 2007) and stock-outs (e.g., Campo, Gijsbrechts, & Nisol, 2000;
Campo, Gijsbrechts, & Nisol, 2003; Campo, Gijsbrechts, & Nisol, 2004; Sloot, Verhoef, &
Franses, 2005) investigate the effect of SKU unavailability on various performance
dimensions, some studies also provide insights on what happens when all SKUs of a brand
are delisted (e.g., Peckham, 1963; Sloot & Verhoef, 2008; Verbeke, Farris, & Thurik, 1998;
Wiebach & Hildebrandt, 2012). What distinguishes the two types of unavailability from
each other is that in one case, consumers still have the option of switching to another item
of the same brand. Our work is in line with studies focusing on brand delistings
(unavailability of all SKUs of a brand).
Table 5: Overview of selected studies in related literature streams
Study Research Focus
Unavailability Level of Analysis
Speed of Adjustment Type Duration
Emmelhainz et al. (1991) OoS Item T Category I Campo et al. (2000) OoS Item T Category I Zinn and Liu (2001) OoS Item T Category I Sloot et al. (2005) OoS Item T Category I Kalyanam et al. (2007) OoS Item T Item G Che et al. (2012) OoS Item T Item I Campo et al. (2003) OoS Item T Brand G Peckham (1963) OoS Brand T Category I Verbeke et al. (1998) OoS Brand T Category I Campo et al. (2004) OoS & AR Item T & P Category I Drèze et al. (1994) AR Item P Item I Boatwright and Nunes (2001) AR Item P Category I Borle et al. (2005) AR Item P Category I Sloot et al. (2006) AR Item P Category G Zhang and Krishna (2007) AR Item P Brand I Tan and Cadeaux (2011) AR Item & Brand P Category I Sloot and Verhoef (2008) AR Brand P Category I Wiebach and Hildebrandt (2012) AR Brand P Category I This study BE Brand P Brand G Notes: OoS stands for out-of-stock, AR for assortment reduction, and BE for brand exit. T represents temporary unavailability while P is permanent unavailability. The speed of adjustments can either be immediate (I) or gradual (G).
The second dimension, duration of unavailability, makes a distinction between short-
term (or temporary) unavailability and long-term (or permanent) unavailability. Literature
Who Benefits from Brand Exits? Why?
63
on stock-outs (e.g., Campo et al., 2000; Campo et al., 2003; Sloot et al., 2005) provides
insights on how consumers respond to short term unavailability of products, whereas
assortment reduction studies (e.g., Boatwright & Nunes, 2001; Borle et al., 2005; Dreze et
al., 1994; Sloot et al., 2006; Sloot & Verhoef, 2008; Wiebach & Hildebrandt, 2012; Zhang &
Krishna, 2007) advance our understanding of consumer response to permanent
unavailability. Campo and colleagues (2004) investigate whether consumers react differently
to temporary unavailability of a product than to permanent unavailability. The authors
argue that as a result of differences between the two cases –by and large due to lack of
short term solutions (e.g., deferring the purchase) to permanent unavailability– losses due
to permanent unavailability are larger than losses due to temporary unavailability. In this
study we focus on the permanent unavailability case.
Extant research also differs in terms of the level of analysis. Table 5 indicates that
majority of the studies examine category level effects of product unavailability (e.g.,
Boatwright & Nunes, 2001; Borle et al., 2005; Sloot et al., 2006). Moreover, while some
studies in the literature offer insights on behavioral consequences of unavailability by
modeling consumers’ item, size, brand, and store switching decisions (e.g., Campo et al.,
2000; Campo et al., 2004; Kalyanam, Borle, & Boatwright, 2007; Sloot et al., 2005; Verbeke
et al., 1998; Wiebach & Hildebrandt, 2012), only a handful considers brand level effects
(e.g., Campo et al., 2003; Dreze et al., 1994; Zhang & Krishna, 2007). Our study
investigates the brand level effects.
A final dimension along which studies differ is the market’s assumed speed of
adjustment. Prior research typically compares sales or behavior of individuals before and
after assortment reductions and assumes that consumer response to product unavailability
is immediate (e.g., Sloot et al., 2005; Sloot et al., 2006; Zhang & Krishna, 2007). On the

Chapter 3
64
other hand, several studies argue that the effect may not materialize instantaneously but
instead adjust gradually (Campo et al., 2003; Kalyanam et al., 2007; Sloot et al., 2006). In
this study we allow for gradual adjustment of brand exit effects.
In sum, motivated by the ubiquity of strategic assortment reductions and stock-outs,
the question of “how do consumers respond to product/brand unavailability?” has drawn
great interest from marketing scholars. Studying the multi-layered features of these events
(e.g., permanent vs. temporary unavailability, brand vs. item delisting), prior research offers
valuable insights from a variety of perspectives (e.g., immediate effects vs. long term
effects, category level effects vs. brand level effects). Yet, several questions remain
unanswered. How does permanent unavailability of a brand affect performance of other
brands? Are these effects are temporary or permanent? What underlying factors drive
differences in effects across brands? What brands are better positioned to claim sales of a
dropped brand? What is the effect of post-exit marketing efforts of incumbent brands on
realignment of sales after exits?
Our study investigates the effects of permanent removal of a brand in a particular
store on all of the remaining brands in that store (who benefits from brand exits?). We are
agnostic about who is behind the delisting decision (manufacturer or retailer). Our main
focus is to identify the underlying factors of the redistribution of demand that frees up
following a brand exit (why?). Consistent with recent work, we allow the market to
gradually adjust to its new equilibrium.
Who Benefits from Brand Exits? Why?
65
3.1.2 Modeling challenges
The findings of the aforementioned studies coupled with the nature of the managerial
problem at hand impose several modeling challenges and requirements, which we discuss
subsequently.
First, as our goal is to investigate how an exit affects the performance of incumbent
brands within the product category, the model should be specified at the brand level. Brand
sales series are typically characterized by short-term fluctuations –due to marketing
activity– around a base sales level. To avoid misattributing the effect of an exit to potential
changes in marketing activity, the model should filter out short-term fluctuations from base
sales. Furthermore, markets are characterized by frequent brand introductions as well as
exits and brand sales can change in response to introductions. The model, therefore,
should separate out the long-term effect of brand introductions on sales. We assume that
the effect of an exit will exhibit itself in the baseline sales of the incumbent brand. It is
possible that the incumbent brand’s baseline sales might evolve over time due to marketing
activity and unaccounted factors. Therefore, the model, while capturing the effect of brand
exits on baseline sales, should control for the effect of marketing activity and incorporate
unexplained changes in baseline sales as well.
Second, consumer preferences evolve over time as consumers accumulate
consumption experiences (Ho & Chong, 2003). Therefore, faced with the unavailability of
their preferred brand, consumers might shop around till they find their new favorite brand.
Hence, sales may not realign instantaneously after a brand exits the market. Addressing a
related yet opposite problem, research on market response to new brand and product
introductions emphasizes the importance of gradual adjustment of effects when there is a
Chapter 3
66
change in the set of available products and brands in the market (e.g., Pauwels &
Srinivasan, 2004; van Heerde et al., 2004; van Heerde et al., 2010). Accordingly, the model
should be flexible enough to capture gradual adjustment patterns and easily handle
estimation of time-varying parameters.
Third, consumers make their product choices by considering the underlying attributes
of each product (e.g., Bell, Bonfrer, & Chintagunta, 2005; Fader & Schmittlein, 1993). In
other words, they are more likely to select certain brands because they seek out specific
attributes. They develop tastes and preferences for certain attributes as they accumulate
shopping experiences; and eventually become familiar with them. They use these attribute-
level familiarities to narrow down available alternatives (Ho & Chong, 2003). When two
products share a set common attributes and positioned very similarly, they will attract
similar types of consumers, those who value particular set of attributes that the two brands
share. Therefore, to the extent that an incumbent brand is similarly positioned to the
delisted brand, that brand is better positioned to pick up share of the removed brand. In
that regard, the model should relate the gains (or losses) from exits to brand similarities.
Yet, each brand hosts several SKUs. Given that each SKU represent a unique combination
of attribute levels within the brand, positioning of a brand on attribute space should be
based on attribute levels of each SKU hosted under that brand name. The model,
accordingly, needs to operationalize similarity between two brands as a function of
attributes of each SKU under those brands.
Fourth, while the realignment of sales after exits may happen organically, managers of
incumbent brands might also use marketing activity to pick up the sales of the removed
brand (e.g., Ataman, Mela, & van Heerde, 2008). Therefore, the model should relate the
effect of brand exits to marketing efforts.
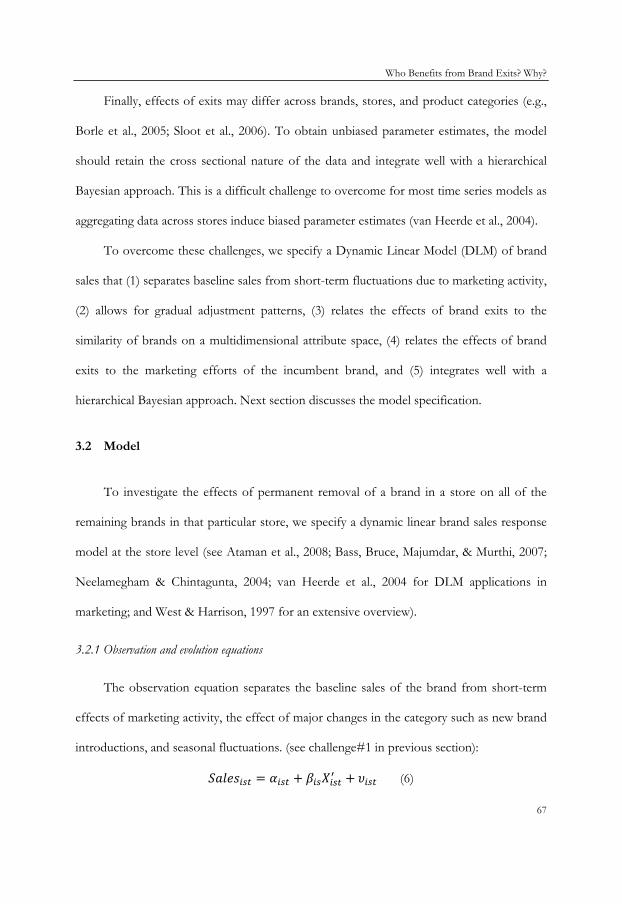
Who Benefits from Brand Exits? Why?
67
Finally, effects of exits may differ across brands, stores, and product categories (e.g.,
Borle et al., 2005; Sloot et al., 2006). To obtain unbiased parameter estimates, the model
should retain the cross sectional nature of the data and integrate well with a hierarchical
Bayesian approach. This is a difficult challenge to overcome for most time series models as
aggregating data across stores induce biased parameter estimates (van Heerde et al., 2004).
To overcome these challenges, we specify a Dynamic Linear Model (DLM) of brand
sales that (1) separates baseline sales from short-term fluctuations due to marketing activity,
(2) allows for gradual adjustment patterns, (3) relates the effects of brand exits to the
similarity of brands on a multidimensional attribute space, (4) relates the effects of brand
exits to the marketing efforts of the incumbent brand, and (5) integrates well with a
hierarchical Bayesian approach. Next section discusses the model specification.
3.2 Model
To investigate the effects of permanent removal of a brand in a store on all of the
remaining brands in that particular store, we specify a dynamic linear brand sales response
model at the store level (see Ataman et al., 2008; Bass, Bruce, Majumdar, & Murthi, 2007;
Neelamegham & Chintagunta, 2004; van Heerde et al., 2004 for DLM applications in
marketing; and West & Harrison, 1997 for an extensive overview).
3.2.1 Observation and evolution equations
The observation equation separates the baseline sales of the brand from short-term
effects of marketing activity, the effect of major changes in the category such as new brand
introductions, and seasonal fluctuations. (see challenge#1 in previous section):
𝑆𝑎𝑙𝑒𝑠𝑖𝑠𝑡 = 𝛼𝑖𝑠𝑡 + 𝛽𝑖𝑠𝑋𝑖𝑠𝑡′ + 𝜐𝑖𝑠𝑡 (6)
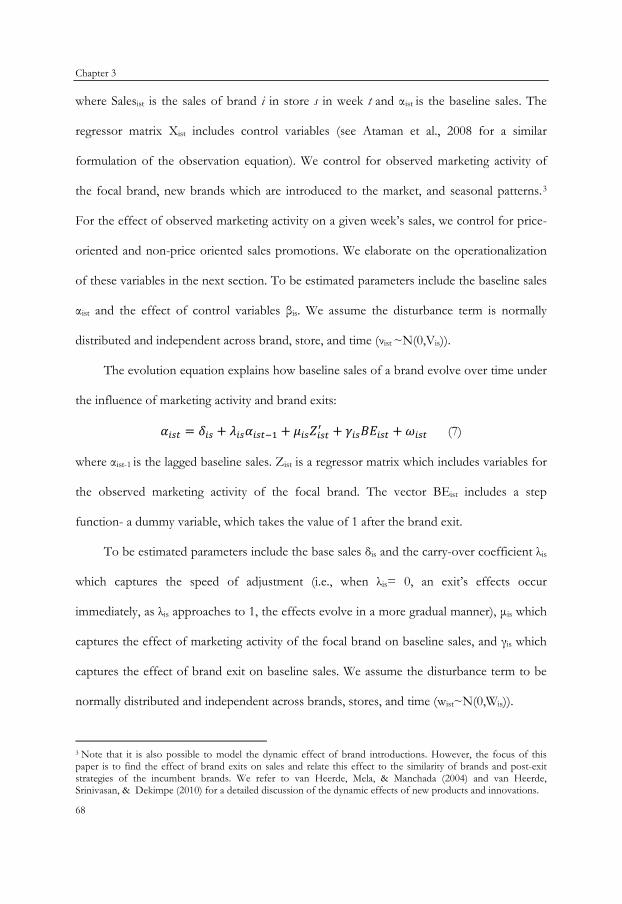
Chapter 3
68
where Salesist is the sales of brand i in store s in week t and αist is the baseline sales. The
regressor matrix Xist includes control variables (see Ataman et al., 2008 for a similar
formulation of the observation equation). We control for observed marketing activity of
the focal brand, new brands which are introduced to the market, and seasonal patterns.3
For the effect of observed marketing activity on a given week’s sales, we control for price-
oriented and non-price oriented sales promotions. We elaborate on the operationalization
of these variables in the next section. To be estimated parameters include the baseline sales
αist and the effect of control variables βis. We assume the disturbance term is normally
distributed and independent across brand, store, and time (νist ~N(0,Vis)).
The evolution equation explains how baseline sales of a brand evolve over time under
the influence of marketing activity and brand exits:
𝛼𝑖𝑠𝑡 = 𝛿𝑖𝑠 + 𝜆𝜆𝑖𝑠𝛼𝑖𝑠𝑡−1 + 𝜇𝑖𝑠𝑍𝑖𝑠𝑡′ + 𝛾𝑖𝑠𝐵𝐸𝑖𝑠𝑡 + 𝜔𝑖𝑠𝑡 (7)
where αist-1 is the lagged baseline sales. Zist is a regressor matrix which includes variables for
the observed marketing activity of the focal brand. The vector BEist includes a step
function- a dummy variable, which takes the value of 1 after the brand exit.
To be estimated parameters include the base sales δis and the carry-over coefficient λis
which captures the speed of adjustment (i.e., when λis= 0, an exit’s effects occur
immediately, as λis approaches to 1, the effects evolve in a more gradual manner), μis which
captures the effect of marketing activity of the focal brand on baseline sales, and γis which
captures the effect of brand exit on baseline sales. We assume the disturbance term to be
normally distributed and independent across brands, stores, and time (wist~N(0,Wis)).
3 Note that it is also possible to model the dynamic effect of brand introductions. However, the focus of this paper is to find the effect of brand exits on sales and relate this effect to the similarity of brands and post-exit strategies of the incumbent brands. We refer to van Heerde, Mela, & Manchada (2004) and van Heerde, Srinivasan, & Dekimpe (2010) for a detailed discussion of the dynamic effects of new products and innovations.
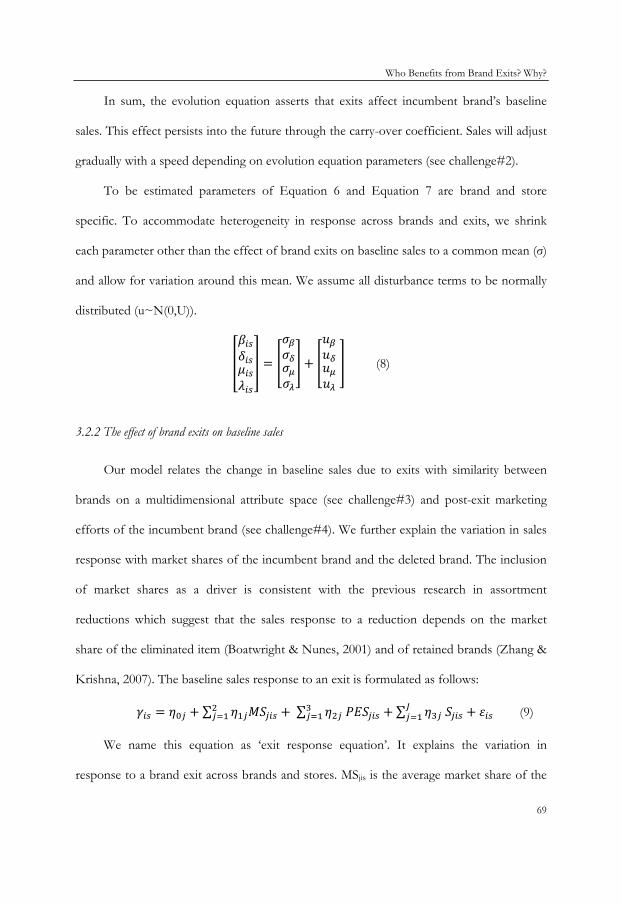
Who Benefits from Brand Exits? Why?
69
In sum, the evolution equation asserts that exits affect incumbent brand’s baseline
sales. This effect persists into the future through the carry-over coefficient. Sales will adjust
gradually with a speed depending on evolution equation parameters (see challenge#2).
To be estimated parameters of Equation 6 and Equation 7 are brand and store
specific. To accommodate heterogeneity in response across brands and exits, we shrink
each parameter other than the effect of brand exits on baseline sales to a common mean (σ)
and allow for variation around this mean. We assume all disturbance terms to be normally
distributed (u~N(0,U)).
�
𝛽𝑖𝑠𝛿𝑖𝑠𝜇𝑖𝑠𝜆𝜆𝑖𝑠
� = �
𝜎𝛽𝜎𝛿𝜎𝜇𝜎𝜆
� + �
𝑢𝛽𝑢𝛿𝑢𝜇𝑢𝜆
� (8)
3.2.2 The effect of brand exits on baseline sales
Our model relates the change in baseline sales due to exits with similarity between
brands on a multidimensional attribute space (see challenge#3) and post-exit marketing
efforts of the incumbent brand (see challenge#4). We further explain the variation in sales
response with market shares of the incumbent brand and the deleted brand. The inclusion
of market shares as a driver is consistent with the previous research in assortment
reductions which suggest that the sales response to a reduction depends on the market
share of the eliminated item (Boatwright & Nunes, 2001) and of retained brands (Zhang &
Krishna, 2007). The baseline sales response to an exit is formulated as follows:
𝛾𝑖𝑠 = 𝜂0𝑗 + ∑ 𝜂1𝑗𝑀𝑆𝑗𝑖𝑠2𝑗=1 + ∑ 𝜂2𝑗 𝑃𝐸𝑆𝑗𝑖𝑠3
𝑗=1 + ∑ 𝜂3𝑗 𝑆𝑗𝑖𝑠𝐽𝑗=1 + 𝜀𝑖𝑠 (9)
We name this equation as ‘exit response equation’. It explains the variation in
response to a brand exit across brands and stores. MSjis is the average market share of the

Chapter 3
70
incumbent brand (j=1) and the deleted brand (j=2) within the store where the exit took
place. PESjis are three variables for post-exit strategies: the frequency of the focal brand’s
price-oriented promotions (j=1), the frequency of the focal brand’s non-price oriented
promotions (j=2), and the changes to the number of the focal brand’s products (j=3) in the
post-exit period. Sjis are variables that indicate the similarity between the focal brand i and
the dropped brand in store s. We elaborate on how similarity between two brands is
constructed in the next sub-section. We assume all disturbance terms to be normally
distributed (ε~N(0,Σ)).
3.2.3 Formulating similarity between two brands
Measuring similarity between two brands is complicated by the fact that each brand
hosts multiple SKUs within the brand. Furthermore, each SKU represents a combination
of attribute levels. Therefore, our model formulates similarity between two brands based
on similarities of their SKUs.
Representing each SKU by an attribute vector and the brand as a set of attribute
vectors, our formulation uses a nearest neighbor approach to match each element of an
attribute vector in one set to another element in an attribute vector from the other set. This
gives the smallest distance between each element of the vector pairs from different sets. In
other words, when brand Y is deleted for example, the procedure matches an SKU of the
deleted brand Y to the most similar SKU of brand X for each attribute and then does the
same for all SKUs of the deleted brand Y. Next, these similarities are weighted by the
relative importance of each SKU. Weights of SKUs are computed according to relative
contribution of each SKU to the sales of the deleted brand Y in the pre-exit period.
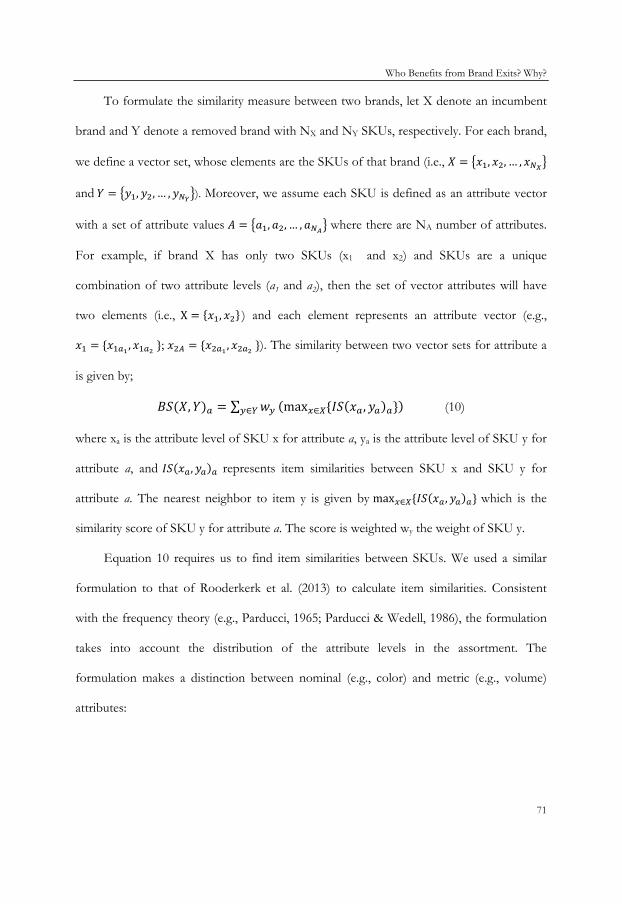
Who Benefits from Brand Exits? Why?
71
To formulate the similarity measure between two brands, let X denote an incumbent
brand and Y denote a removed brand with NX and NY SKUs, respectively. For each brand,
we define a vector set, whose elements are the SKUs of that brand (i.e., 𝑋 = �𝑥1, 𝑥2, … , 𝑥𝑁𝑋�
and 𝑌 = �𝑦1,𝑦2, … , 𝑦𝑁𝑌�). Moreover, we assume each SKU is defined as an attribute vector
with a set of attribute values 𝐴 = �𝑎1, 𝑎2, … , 𝑎𝑁𝐴� where there are NA number of attributes.
For example, if brand X has only two SKUs (x1 and x2) and SKUs are a unique
combination of two attribute levels (a1 and a2), then the set of vector attributes will have
two elements (i.e., X = {𝑥1, 𝑥2} ) and each element represents an attribute vector (e.g.,
𝑥1 = {𝑥1𝑎1 , 𝑥1𝑎2 }; 𝑥2𝐴 = {𝑥2𝑎1 , 𝑥2𝑎2 }). The similarity between two vector sets for attribute a
is given by;
𝐵𝑆(𝑋,𝑌)𝑎 = ∑ 𝑤𝑦𝑦∈𝑌 (max𝑥∈𝑋{𝐼𝑆(𝑥𝑎,𝑦𝑎)𝑎}) (10)
where xa is the attribute level of SKU x for attribute a, ya is the attribute level of SKU y for
attribute a, and 𝐼𝑆(𝑥𝑎,𝑦𝑎)𝑎 represents item similarities between SKU x and SKU y for
attribute a. The nearest neighbor to item y is given by max𝑥∈𝑋{𝐼𝑆(𝑥𝑎,𝑦𝑎)𝑎} which is the
similarity score of SKU y for attribute a. The score is weighted wy the weight of SKU y.
Equation 10 requires us to find item similarities between SKUs. We used a similar
formulation to that of Rooderkerk et al. (2013) to calculate item similarities. Consistent
with the frequency theory (e.g., Parducci, 1965; Parducci & Wedell, 1986), the formulation
takes into account the distribution of the attribute levels in the assortment. The
formulation makes a distinction between nominal (e.g., color) and metric (e.g., volume)
attributes:
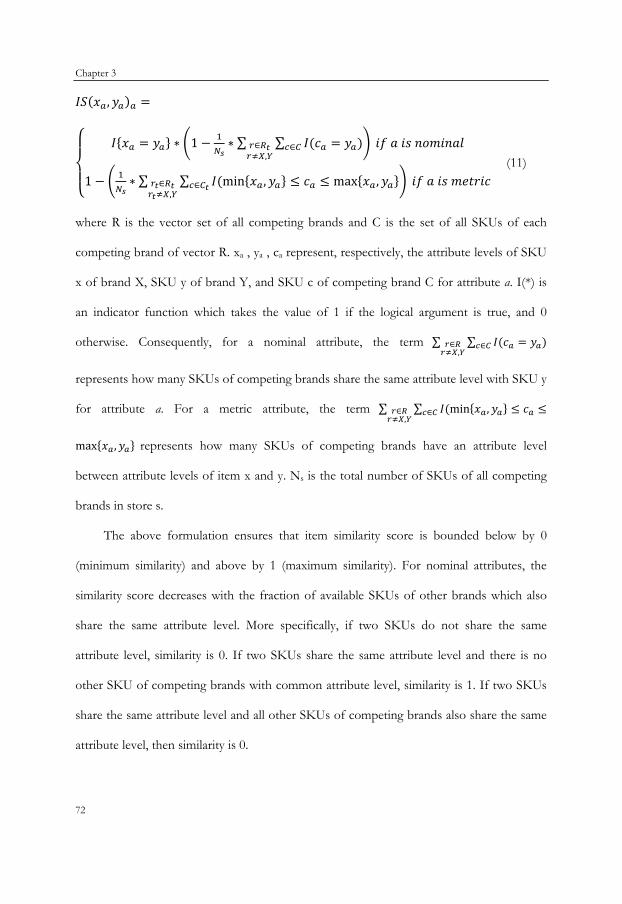
Chapter 3
72
𝐼𝑆(𝑥𝑎,𝑦𝑎)𝑎 =
⎩⎪⎨
⎪⎧ 𝐼{𝑥𝑎 = 𝑦𝑎} ∗ �1 − 1
𝑁𝑠∗ ∑ ∑ 𝐼(𝑐𝑎 = 𝑦𝑎𝑐∈𝐶 )𝑟∈𝑅𝑡
𝑟≠𝑋,𝑌� 𝑖𝑓 𝑎 𝑖𝑠 𝑛𝑜𝑚𝑖𝑛𝑎𝑙
1 − � 1𝑁𝑠∗ ∑ ∑ 𝐼(min{𝑥𝑎,𝑦𝑎} ≤ 𝑐𝑎 ≤ max {𝑥𝑎,𝑦𝑎}𝑐∈𝐶𝑡𝑟𝑡∈𝑅𝑡
𝑟𝑡≠𝑋,𝑌� 𝑖𝑓 𝑎 𝑖𝑠 𝑚𝑒𝑡𝑟𝑖𝑐
(11)
where R is the vector set of all competing brands and C is the set of all SKUs of each
competing brand of vector R. xa , ya , ca represent, respectively, the attribute levels of SKU
x of brand X, SKU y of brand Y, and SKU c of competing brand C for attribute a. I(*) is
an indicator function which takes the value of 1 if the logical argument is true, and 0
otherwise. Consequently, for a nominal attribute, the term ∑ ∑ 𝐼(𝑐𝑎 = 𝑦𝑎𝑐∈𝐶 )𝑟∈𝑅𝑟≠𝑋,𝑌
represents how many SKUs of competing brands share the same attribute level with SKU y
for attribute a. For a metric attribute, the term ∑ ∑ 𝐼(min{𝑥𝑎,𝑦𝑎} ≤ 𝑐𝑎 ≤𝑐∈𝐶𝑟∈𝑅𝑟≠𝑋,𝑌
max {𝑥𝑎,𝑦𝑎} represents how many SKUs of competing brands have an attribute level
between attribute levels of item x and y. Ns is the total number of SKUs of all competing
brands in store s.
The above formulation ensures that item similarity score is bounded below by 0
(minimum similarity) and above by 1 (maximum similarity). For nominal attributes, the
similarity score decreases with the fraction of available SKUs of other brands which also
share the same attribute level. More specifically, if two SKUs do not share the same
attribute level, similarity is 0. If two SKUs share the same attribute level and there is no
other SKU of competing brands with common attribute level, similarity is 1. If two SKUs
share the same attribute level and all other SKUs of competing brands also share the same
attribute level, then similarity is 0.
Who Benefits from Brand Exits? Why?
73
Similarly, for metric attributes, the similarity score decreases with the fraction of
available SKUs of competing brands which has an attribute level between attribute levels of
item x and item y. If there is no other SKU of competing brands which has an attribute
level between levels of two SKUs, then similarity is 1. If all SKUs of competing brands
have an attribute level between levels of two SKUs, then similarity is 0.
3.2.4 Model estimation
We estimate equations using the Gibbs sampling procedure. We use forward-filtering,
backward-sampling algorithm (see Carter & Kohn, 1994; Frühwirth‐Schnatter, 1994) to
obtain the time varying intercept estimates. Assuming a diagonal error covariance matrix
for both observation and evolution equations, we place inverse Gamma prior on diagonal
elements of matrices. We place normal priors on other parameters.
3.3 Data
To answer the research questions posed earlier, we estimate the model described in
Section 3.2 using the IRI academic dataset (Bronnenberg et al., 2008). The data are from
the upstate New York area and include the stores in Buffalo, Rochester, and Syracuse. The
data span the eleven year time period (573 weeks) from January 2001 to December 2011.
The data include weekly sales, sales promotions (price reductions, feature, and displays),
and product attributes for SKUs in different categories. To see whether we can replicate
our findings, we applied our model to two different product categories: deodorant and
milk.4
4 The milk product category excludes non-dairy milk substitutes (e.g., coconut/soy/rice/almond milk).
Chapter 3
74
We aggregate the SKU-store level data to brand-store level, as we are interested in the
effects of the removal of a brand from a store on the sales of other brands within that
store. The data maps each SKU to a brand (e.g., Axe). We combine sub-brands which are
carrying a common parent brand name (e.g., Old Spice High Endurance, Old Spice High
Endurance Red) into a single brand and named it with the parent brand name (e.g., Old
Spice). Following the aggregation we obtain brand-store level data from 73 stores for 55
brands in the deodorant category and 35 brands in the milk category.
3.3.1 Identification of brand exits
Both markets in our dataset are characterized by frequent changes in the set of brand
alternatives due to seasonal brands and stock-outs. We develop an algorithm to
systematically and accurately identify and separate brand exits from short-term (or
temporary) unavailability of brands.
For each store in our dataset, we first find brands which disappear from the store for
at least 2 years. Next we check whether the disappearing brand is regularly sold in the store
for the 2-year period before the exit and filter out brands which are seasonal and/or
available for only a limited period of time. If a brand is available in a store at least for 75%
of the time in the 2-year period, we classify it as a candidate deleted brand. We consider
other brands as seasonal or an unsuccessful new brand. These excluded brands are
introduced to the market for only a very short period of time and removed from the
market before establishing a customer base.
For each candidate exit, we specify two time windows: pre-exit and post-exit. Pre-exit
window spans a period of 13 weeks (a quarter) prior to the week the brand first disappears
from the store. Post-exit window spans a period of 13 weeks starting from the week of exit.
Who Benefits from Brand Exits? Why?
75
We screen all candidate exit events to check whether multiple brands disappear from the
same store in the pre-exit and post-exit period. A major assortment reduction, for example,
may cause multiple exit events which take place simultaneously. When two or more brands
are deleted close to each other over time, surviving brands will respond to multiple exits
simultaneously. We filter out these exit events from our analysis and focus on isolated exit
events (i.e., there is no other exit in the pre-exit and post-exit period) for two reasons: First,
the model identifies the effect of an exit on sales of an incumbent brand more accurately
when there is no confounding exit event. Second, one of our goals is to examine whether
exit specific factors (e.g., the similarity between a focal brand and a removed brand)
influence the incumbent brand’s sales response to the exit. When surviving brands respond
to multiple exits simultaneously, the observed effect is likely to be misattributed to exit
specific factors.
We use further criteria for identifying the final list of exits. We check whether missing
store data appear frequently in the post-exit period. We filter out exits when there is a
missing store data rate higher than 25% in the post exit period for two reasons: First,
frequent missing data makes it difficult to identify the exact time of a brand exit. Second,
even if we accurately identify the time of an exit, frequent missing data in the post-exit
period causes difficulties in understanding how sales response to brand exits adjust over
time and how post-exit strategies influence the sales response to brand exits.
By applying the algorithm described above, we identify a total number of 18 exit
events by 3 brands in the deodorant category and 78 exit events by 11 brands in the milk
category. Table 6 displays the descriptive statistics on brand exit events.
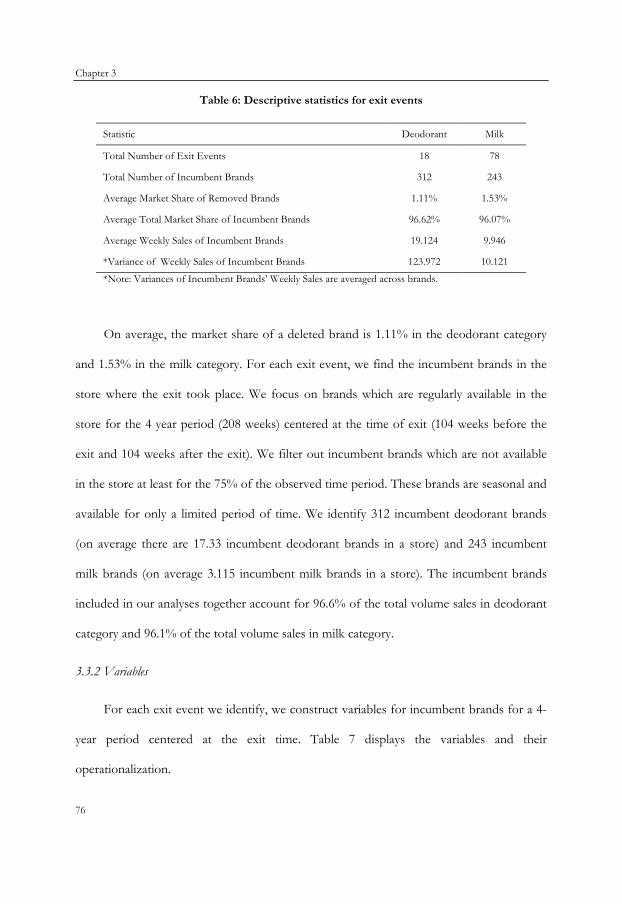
Chapter 3
76
Table 6: Descriptive statistics for exit events
Statistic Deodorant Milk
Total Number of Exit Events 18 78
Total Number of Incumbent Brands 312 243
Average Market Share of Removed Brands 1.11% 1.53%
Average Total Market Share of Incumbent Brands 96.62% 96.07%
Average Weekly Sales of Incumbent Brands 19.124 9.946
*Variance of Weekly Sales of Incumbent Brands 123.972 10.121
*Note: Variances of Incumbent Brands’ Weekly Sales are averaged across brands.
On average, the market share of a deleted brand is 1.11% in the deodorant category
and 1.53% in the milk category. For each exit event, we find the incumbent brands in the
store where the exit took place. We focus on brands which are regularly available in the
store for the 4 year period (208 weeks) centered at the time of exit (104 weeks before the
exit and 104 weeks after the exit). We filter out incumbent brands which are not available
in the store at least for the 75% of the observed time period. These brands are seasonal and
available for only a limited period of time. We identify 312 incumbent deodorant brands
(on average there are 17.33 incumbent deodorant brands in a store) and 243 incumbent
milk brands (on average 3.115 incumbent milk brands in a store). The incumbent brands
included in our analyses together account for 96.6% of the total volume sales in deodorant
category and 96.1% of the total volume sales in milk category.
3.3.2 Variables
For each exit event we identify, we construct variables for incumbent brands for a 4-
year period centered at the exit time. Table 7 displays the variables and their
operationalization.
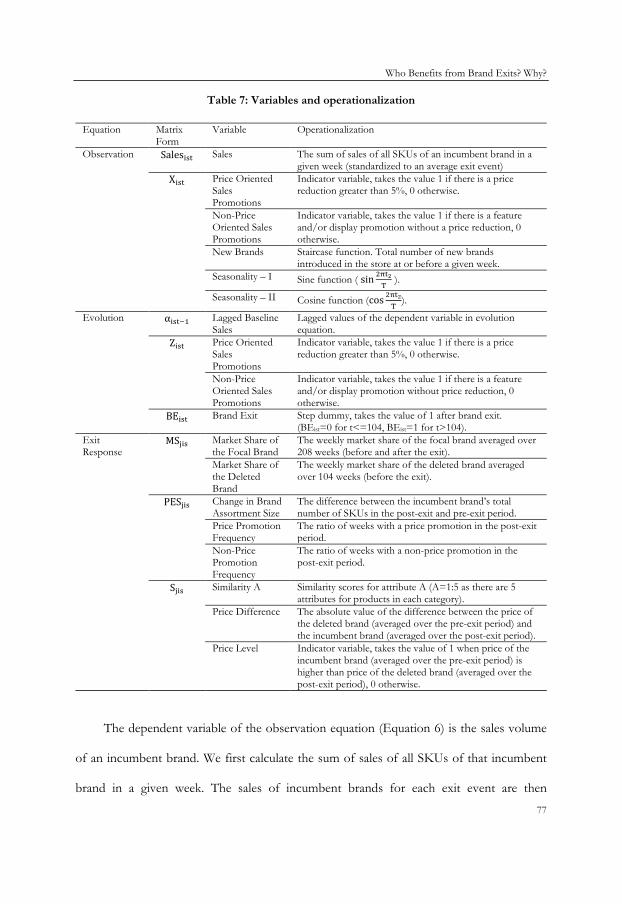
Who Benefits from Brand Exits? Why?
77
Table 7: Variables and operationalization
Equation Matrix Form
Variable Operationalization
Observation Salesist Sales The sum of sales of all SKUs of an incumbent brand in a given week (standardized to an average exit event)
Xist Price Oriented Sales Promotions
Indicator variable, takes the value 1 if there is a price reduction greater than 5%, 0 otherwise.
Non-Price Oriented Sales Promotions
Indicator variable, takes the value 1 if there is a feature and/or display promotion without a price reduction, 0 otherwise.
New Brands Staircase function. Total number of new brands introduced in the store at or before a given week.
Seasonality – I Sine function ( sin 2πt2T
).
Seasonality – II Cosine function (cos 2πt2T
).
Evolution αist−1 Lagged Baseline Sales
Lagged values of the dependent variable in evolution equation.
Zist Price Oriented Sales Promotions
Indicator variable, takes the value 1 if there is a price reduction greater than 5%, 0 otherwise.
Non-Price Oriented Sales Promotions
Indicator variable, takes the value 1 if there is a feature and/or display promotion without price reduction, 0 otherwise.
BEist Brand Exit Step dummy, takes the value of 1 after brand exit. (BEist=0 for t<=104, BEist=1 for t>104).
Exit Response
MSjis Market Share of the Focal Brand
The weekly market share of the focal brand averaged over 208 weeks (before and after the exit).
Market Share of the Deleted Brand
The weekly market share of the deleted brand averaged over 104 weeks (before the exit).
PESjis Change in Brand Assortment Size
The difference between the incumbent brand’s total number of SKUs in the post-exit and pre-exit period.
Price Promotion Frequency
The ratio of weeks with a price promotion in the post-exit period.
Non-Price Promotion Frequency
The ratio of weeks with a non-price promotion in the post-exit period.
Sjis Similarity A Similarity scores for attribute A (A=1:5 as there are 5 attributes for products in each category).
Price Difference The absolute value of the difference between the price of the deleted brand (averaged over the pre-exit period) and the incumbent brand (averaged over the post-exit period).
Price Level Indicator variable, takes the value of 1 when price of the incumbent brand (averaged over the pre-exit period) is higher than price of the deleted brand (averaged over the post-exit period), 0 otherwise.
The dependent variable of the observation equation (Equation 6) is the sales volume
of an incumbent brand. We first calculate the sum of sales of all SKUs of that incumbent
brand in a given week. The sales of incumbent brands for each exit event are then

Chapter 3
78
standardized to an average event to remove variation across stores where the event took
place. For each exit, we find the total sales in the store over the 4 year period (208 weeks)
centered at the time of exit. Then, total store sales are averaged over all exits in the
category. We divide an incumbent brand’s sales in a given week in a store by the total sales
in that store and then multiply it by the average total store sales.
The observation equation (Equation 6) states that sales are affected by a number of
variables including price and non-price promotions of the focal brand, new brand
introductions, and seasonality. We use indicator variables for the price and non-price
oriented promotion activity. The price promotion variable indicates whether there is a price
reduction equal or greater than 5%.
We combine feature and display promotions into a compound variable named ‘non-
price oriented promotion’. The data on non-price oriented sales promotion indicates
whether there is a display and/or feature without a price discount. We control for new
brands by applying a staircase function. It takes the value of 0 when there is no brand
introduction and it increases by 1 after each introduction. The variable indicates the total
number of new brands introduced to the market at or before a given week. We identify
introductions using an algorithm similar to the one we use to identify brand exits. We
control for seasonal patterns by applying sine and cosine functions (sin 2π𝑡2T
and cos 2π𝑡2T
).5
The evolution equation (Equation 7) states that baseline sales evolve under the
influence of marketing activity (price and non-price oriented promotions) and change and
adjust to a new level after a brand exit. The dependent variable is the time-varying intercept
in the observation equation. For marketing activity, we employ the same variables we used
5 𝑡2 indicates the week of the year (e.g., 𝑡2=1 at the first week of the year). T indicates the total number of weeks in a given year.
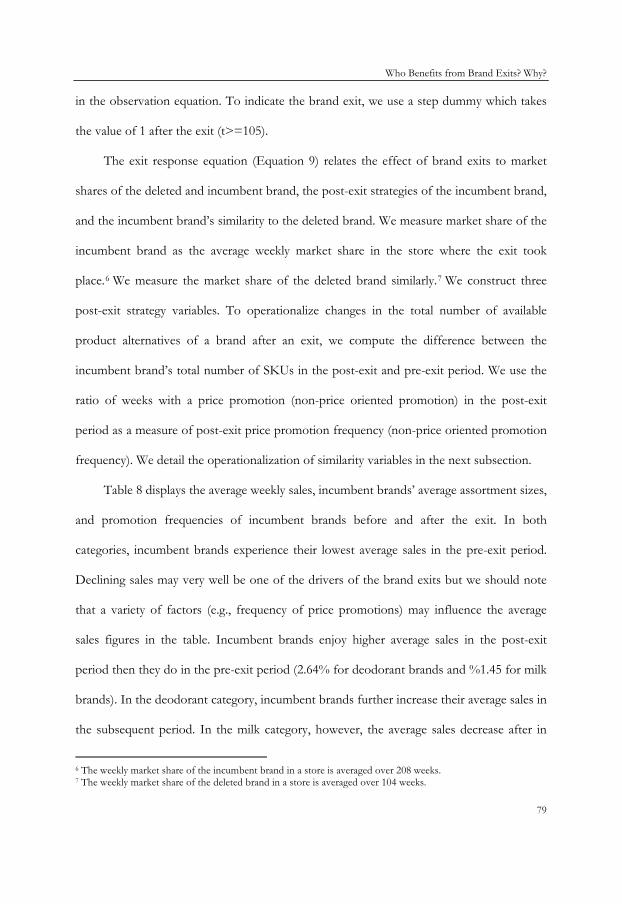
Who Benefits from Brand Exits? Why?
79
in the observation equation. To indicate the brand exit, we use a step dummy which takes
the value of 1 after the exit (t>=105).
The exit response equation (Equation 9) relates the effect of brand exits to market
shares of the deleted and incumbent brand, the post-exit strategies of the incumbent brand,
and the incumbent brand’s similarity to the deleted brand. We measure market share of the
incumbent brand as the average weekly market share in the store where the exit took
place.6 We measure the market share of the deleted brand similarly.7 We construct three
post-exit strategy variables. To operationalize changes in the total number of available
product alternatives of a brand after an exit, we compute the difference between the
incumbent brand’s total number of SKUs in the post-exit and pre-exit period. We use the
ratio of weeks with a price promotion (non-price oriented promotion) in the post-exit
period as a measure of post-exit price promotion frequency (non-price oriented promotion
frequency). We detail the operationalization of similarity variables in the next subsection.
Table 8 displays the average weekly sales, incumbent brands’ average assortment sizes,
and promotion frequencies of incumbent brands before and after the exit. In both
categories, incumbent brands experience their lowest average sales in the pre-exit period.
Declining sales may very well be one of the drivers of the brand exits but we should note
that a variety of factors (e.g., frequency of price promotions) may influence the average
sales figures in the table. Incumbent brands enjoy higher average sales in the post-exit
period then they do in the pre-exit period (2.64% for deodorant brands and %1.45 for milk
brands). In the deodorant category, incumbent brands further increase their average sales in
the subsequent period. In the milk category, however, the average sales decrease after in
6 The weekly market share of the incumbent brand in a store is averaged over 208 weeks. 7 The weekly market share of the deleted brand in a store is averaged over 104 weeks.
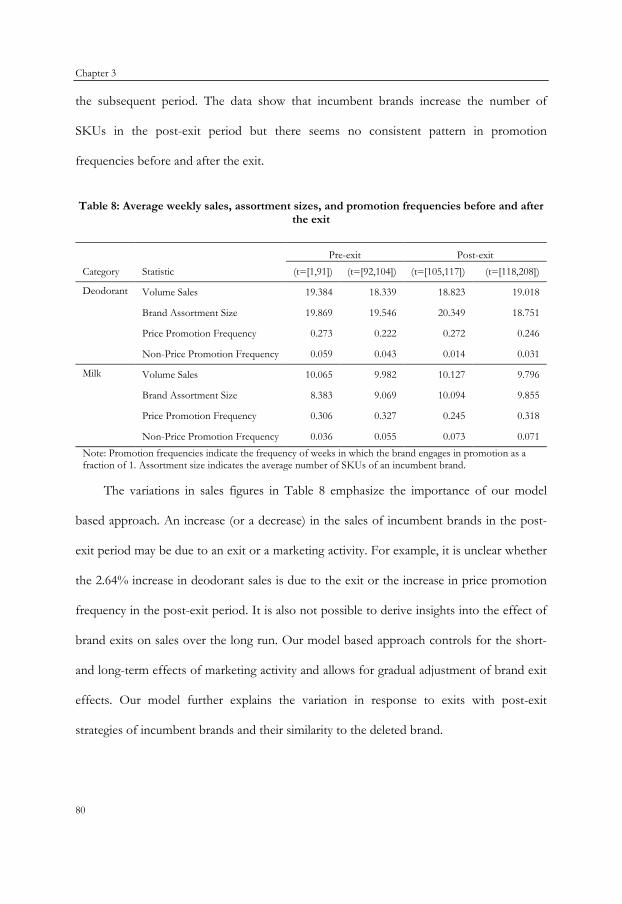
Chapter 3
80
the subsequent period. The data show that incumbent brands increase the number of
SKUs in the post-exit period but there seems no consistent pattern in promotion
frequencies before and after the exit.
Table 8: Average weekly sales, assortment sizes, and promotion frequencies before and after the exit
Category Statistic Pre-exit Post-exit
(t=[1,91]) (t=[92,104]) (t=[105,117]) (t=[118,208])
Deodorant Volume Sales 19.384 18.339 18.823 19.018
Brand Assortment Size 19.869 19.546 20.349 18.751
Price Promotion Frequency 0.273 0.222 0.272 0.246
Non-Price Promotion Frequency 0.059 0.043 0.014 0.031
Milk Volume Sales 10.065 9.982 10.127 9.796
Brand Assortment Size 8.383 9.069 10.094 9.855
Price Promotion Frequency 0.306 0.327 0.245 0.318
Non-Price Promotion Frequency 0.036 0.055 0.073 0.071 Note: Promotion frequencies indicate the frequency of weeks in which the brand engages in promotion as a fraction of 1. Assortment size indicates the average number of SKUs of an incumbent brand.
The variations in sales figures in Table 8 emphasize the importance of our model
based approach. An increase (or a decrease) in the sales of incumbent brands in the post-
exit period may be due to an exit or a marketing activity. For example, it is unclear whether
the 2.64% increase in deodorant sales is due to the exit or the increase in price promotion
frequency in the post-exit period. It is also not possible to derive insights into the effect of
brand exits on sales over the long run. Our model based approach controls for the short-
and long-term effects of marketing activity and allows for gradual adjustment of brand exit
effects. Our model further explains the variation in response to exits with post-exit
strategies of incumbent brands and their similarity to the deleted brand.
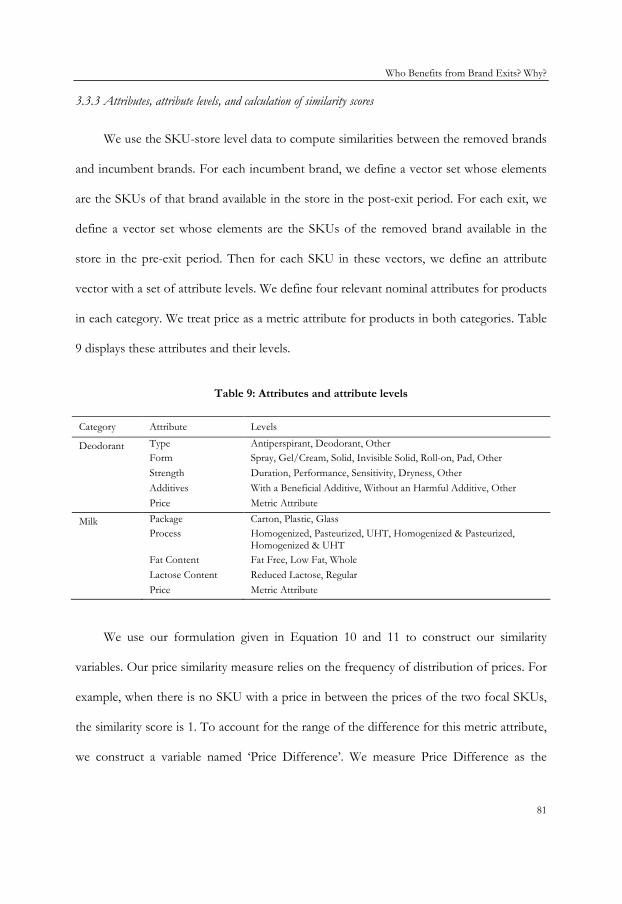
Who Benefits from Brand Exits? Why?
81
3.3.3 Attributes, attribute levels, and calculation of similarity scores
We use the SKU-store level data to compute similarities between the removed brands
and incumbent brands. For each incumbent brand, we define a vector set whose elements
are the SKUs of that brand available in the store in the post-exit period. For each exit, we
define a vector set whose elements are the SKUs of the removed brand available in the
store in the pre-exit period. Then for each SKU in these vectors, we define an attribute
vector with a set of attribute levels. We define four relevant nominal attributes for products
in each category. We treat price as a metric attribute for products in both categories. Table
9 displays these attributes and their levels.
Table 9: Attributes and attribute levels
Category Attribute Levels
Deodorant Type Antiperspirant, Deodorant, Other
Form Spray, Gel/Cream, Solid, Invisible Solid, Roll-on, Pad, Other
Strength Duration, Performance, Sensitivity, Dryness, Other
Additives With a Beneficial Additive, Without an Harmful Additive, Other
Price Metric Attribute
Milk Package Carton, Plastic, Glass
Process Homogenized, Pasteurized, UHT, Homogenized & Pasteurized, Homogenized & UHT
Fat Content Fat Free, Low Fat, Whole
Lactose Content Reduced Lactose, Regular
Price Metric Attribute
We use our formulation given in Equation 10 and 11 to construct our similarity
variables. Our price similarity measure relies on the frequency of distribution of prices. For
example, when there is no SKU with a price in between the prices of the two focal SKUs,
the similarity score is 1. To account for the range of the difference for this metric attribute,
we construct a variable named ‘Price Difference’. We measure Price Difference as the
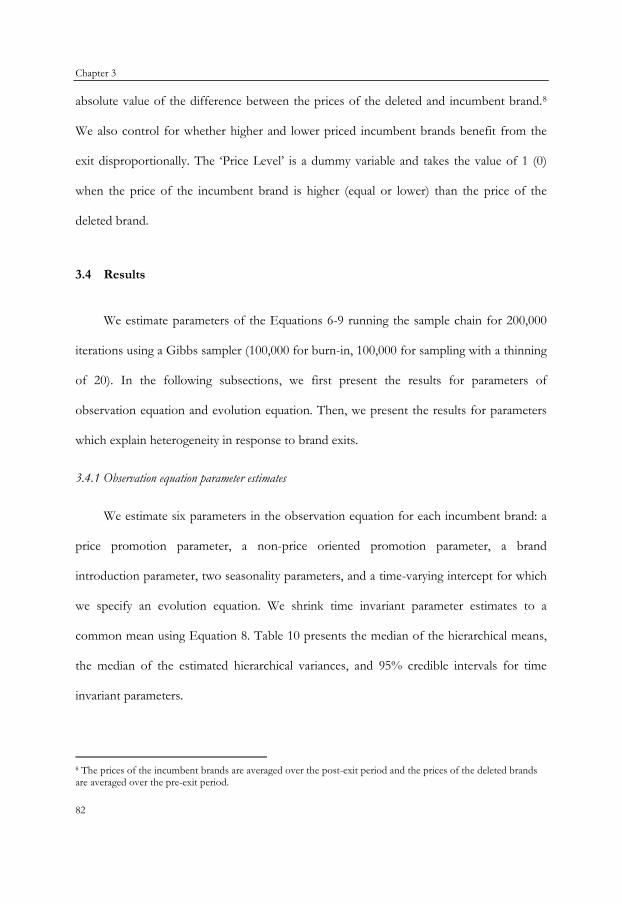
Chapter 3
82
absolute value of the difference between the prices of the deleted and incumbent brand.8
We also control for whether higher and lower priced incumbent brands benefit from the
exit disproportionally. The ‘Price Level’ is a dummy variable and takes the value of 1 (0)
when the price of the incumbent brand is higher (equal or lower) than the price of the
deleted brand.
3.4 Results
We estimate parameters of the Equations 6-9 running the sample chain for 200,000
iterations using a Gibbs sampler (100,000 for burn-in, 100,000 for sampling with a thinning
of 20). In the following subsections, we first present the results for parameters of
observation equation and evolution equation. Then, we present the results for parameters
which explain heterogeneity in response to brand exits.
3.4.1 Observation equation parameter estimates
We estimate six parameters in the observation equation for each incumbent brand: a
price promotion parameter, a non-price oriented promotion parameter, a brand
introduction parameter, two seasonality parameters, and a time-varying intercept for which
we specify an evolution equation. We shrink time invariant parameter estimates to a
common mean using Equation 8. Table 10 presents the median of the hierarchical means,
the median of the estimated hierarchical variances, and 95% credible intervals for time
invariant parameters.
8 The prices of the incumbent brands are averaged over the post-exit period and the prices of the deleted brands are averaged over the pre-exit period.
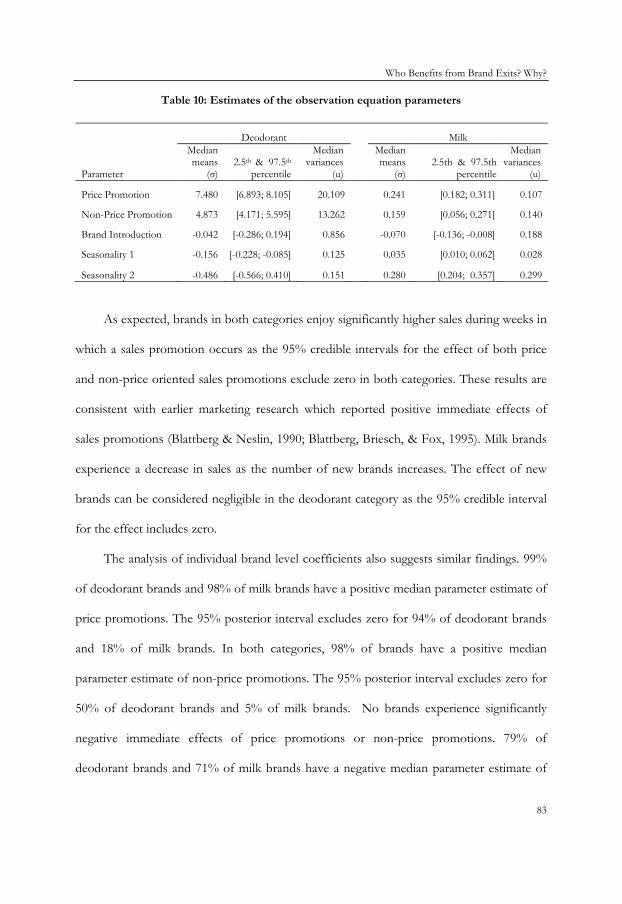
Who Benefits from Brand Exits? Why?
83
Table 10: Estimates of the observation equation parameters
Deodorant
Milk
Parameter
Median means
(σ) 2.5th & 97.5th
percentile
Median variances
(u)
Median means
(σ) 2.5th & 97.5th
percentile
Median variances
(u)
Price Promotion 7.480 [6.893; 8.105] 20.109
0.241 [0.182; 0.311] 0.107
Non-Price Promotion 4.873 [4.171; 5.595] 13.262
0.159 [0.056; 0.271] 0.140
Brand Introduction -0.042 [-0.286; 0.194] 0.856
-0.070 [-0.136; -0.008] 0.188
Seasonality 1 -0.156 [-0.228; -0.085] 0.125
0.035 [0.010; 0.062] 0.028
Seasonality 2 -0.486 [-0.566; 0.410] 0.151
0.280 [0.204; 0.357] 0.299
As expected, brands in both categories enjoy significantly higher sales during weeks in
which a sales promotion occurs as the 95% credible intervals for the effect of both price
and non-price oriented sales promotions exclude zero in both categories. These results are
consistent with earlier marketing research which reported positive immediate effects of
sales promotions (Blattberg & Neslin, 1990; Blattberg, Briesch, & Fox, 1995). Milk brands
experience a decrease in sales as the number of new brands increases. The effect of new
brands can be considered negligible in the deodorant category as the 95% credible interval
for the effect includes zero.
The analysis of individual brand level coefficients also suggests similar findings. 99%
of deodorant brands and 98% of milk brands have a positive median parameter estimate of
price promotions. The 95% posterior interval excludes zero for 94% of deodorant brands
and 18% of milk brands. In both categories, 98% of brands have a positive median
parameter estimate of non-price promotions. The 95% posterior interval excludes zero for
50% of deodorant brands and 5% of milk brands. No brands experience significantly
negative immediate effects of price promotions or non-price promotions. 79% of
deodorant brands and 71% of milk brands have a negative median parameter estimate of

Chapter 3
84
new brand introductions, however the 95% posterior interval excludes zero for only 2% of
deodorant brands and 11% of milk brands.
The sales exhibit a seasonal pattern in both categories. More specifically, deodorant
sales increase during summer months and reach a peak at the 29th week in a 52 week year
(around mid-July). Milk sales increase during winter months and reach a peak at the first
week of the year.
3.4.2 Evolution equation parameter estimates
We estimate five parameters in the evolution equation for each incumbent brand: a
constant, the effect of price promotions, the effect of non-price oriented promotions, the
effect of brand exit, and the autoregressive parameter which represents the amount of
carry-over effects in the baseline sales. We shrink all parameter estimates to a common
mean using Equation 8 except for the effect of brand exits. Table 11 presents the median
of the hierarchical means, the median of the estimated hierarchical variances, and 95%
credible intervals.
Table 11: Estimates of the evolution equation parameters
Deodorant Milk
Parameter
Median means
(σ) 2.5th & 97.5th
percentile
Median variances
(u)
Median means
(σ) 2.5th & 97.5th
percentile
Median variances
(u)
Constant 6.701 [6.277; 7.181] 12.155
7.014 [5.370; 8.669] 172.188
Price Promotion -1.018 [-1.273; -0.776] 1.076
-0.031 [-0.069; 0.009] 0.038
Non-Price Promotion -0.251 [-0.655; 0.170] 0.957
0.003 [-0.115; 0.126] 0.201
Carry-over 0.417 [0.367; 0.467] 0.057 0.199 [0.110; 0.318] 0.044
The effect of price promotions on baseline sales is negative. The effect is significant
in the deodorant category. The effect crosses zero at about 94th percentile in the milk
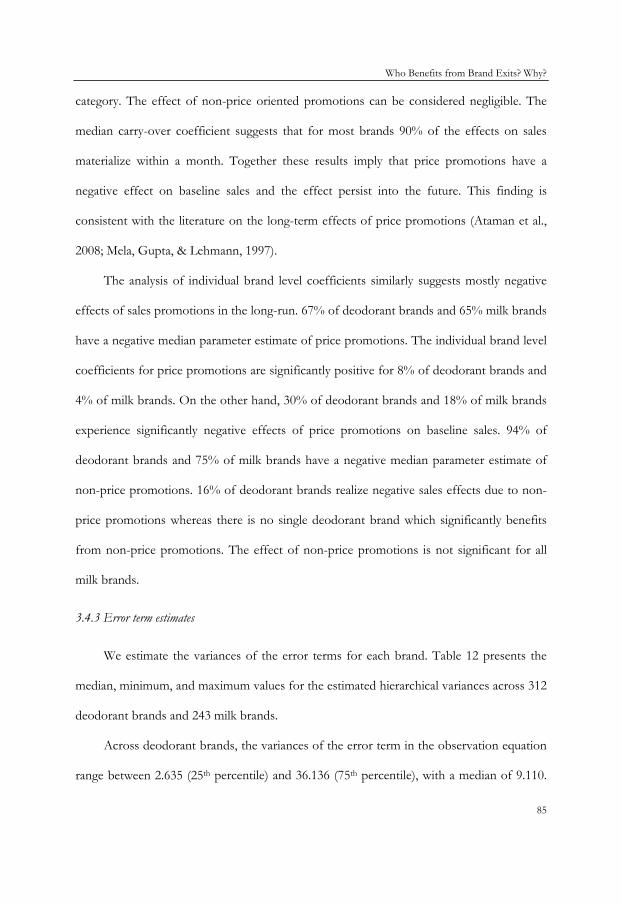
Who Benefits from Brand Exits? Why?
85
category. The effect of non-price oriented promotions can be considered negligible. The
median carry-over coefficient suggests that for most brands 90% of the effects on sales
materialize within a month. Together these results imply that price promotions have a
negative effect on baseline sales and the effect persist into the future. This finding is
consistent with the literature on the long-term effects of price promotions (Ataman et al.,
2008; Mela, Gupta, & Lehmann, 1997).
The analysis of individual brand level coefficients similarly suggests mostly negative
effects of sales promotions in the long-run. 67% of deodorant brands and 65% milk brands
have a negative median parameter estimate of price promotions. The individual brand level
coefficients for price promotions are significantly positive for 8% of deodorant brands and
4% of milk brands. On the other hand, 30% of deodorant brands and 18% of milk brands
experience significantly negative effects of price promotions on baseline sales. 94% of
deodorant brands and 75% of milk brands have a negative median parameter estimate of
non-price promotions. 16% of deodorant brands realize negative sales effects due to non-
price promotions whereas there is no single deodorant brand which significantly benefits
from non-price promotions. The effect of non-price promotions is not significant for all
milk brands.
3.4.3 Error term estimates
We estimate the variances of the error terms for each brand. Table 12 presents the
median, minimum, and maximum values for the estimated hierarchical variances across 312
deodorant brands and 243 milk brands.
Across deodorant brands, the variances of the error term in the observation equation
range between 2.635 (25th percentile) and 36.136 (75th percentile), with a median of 9.110.
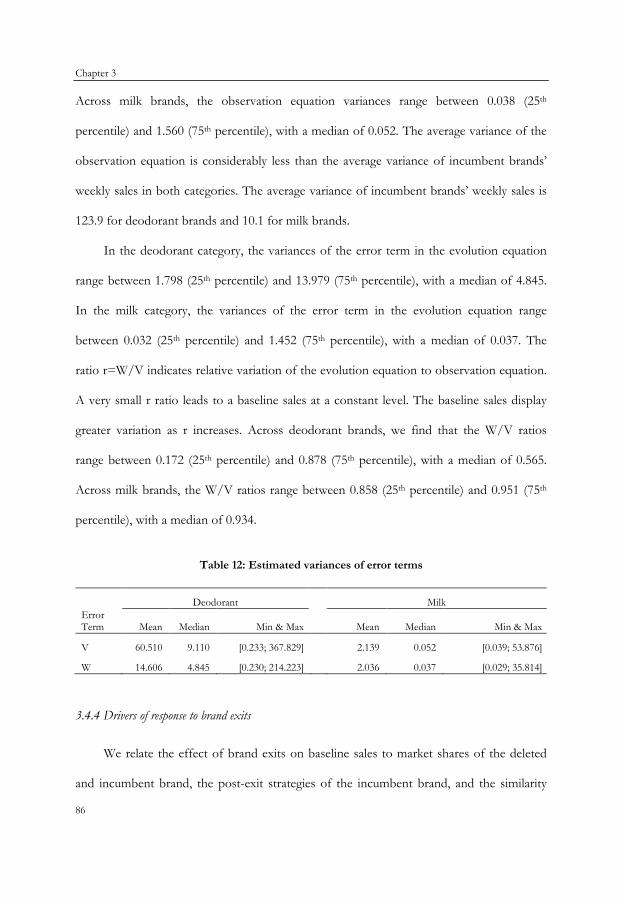
Chapter 3
86
Across milk brands, the observation equation variances range between 0.038 (25th
percentile) and 1.560 (75th percentile), with a median of 0.052. The average variance of the
observation equation is considerably less than the average variance of incumbent brands’
weekly sales in both categories. The average variance of incumbent brands’ weekly sales is
123.9 for deodorant brands and 10.1 for milk brands.
In the deodorant category, the variances of the error term in the evolution equation
range between 1.798 (25th percentile) and 13.979 (75th percentile), with a median of 4.845.
In the milk category, the variances of the error term in the evolution equation range
between 0.032 (25th percentile) and 1.452 (75th percentile), with a median of 0.037. The
ratio r=W/V indicates relative variation of the evolution equation to observation equation.
A very small r ratio leads to a baseline sales at a constant level. The baseline sales display
greater variation as r increases. Across deodorant brands, we find that the W/V ratios
range between 0.172 (25th percentile) and 0.878 (75th percentile), with a median of 0.565.
Across milk brands, the W/V ratios range between 0.858 (25th percentile) and 0.951 (75th
percentile), with a median of 0.934.
Table 12: Estimated variances of error terms
Deodorant Milk Error Term Mean Median Min & Max
Mean Median Min & Max
V 60.510 9.110 [0.233; 367.829]
2.139 0.052 [0.039; 53.876]
W 14.606 4.845 [0.230; 214.223] 2.036 0.037 [0.029; 35.814]
3.4.4 Drivers of response to brand exits
We relate the effect of brand exits on baseline sales to market shares of the deleted
and incumbent brand, the post-exit strategies of the incumbent brand, and the similarity

Who Benefits from Brand Exits? Why?
87
between product lines of the deleted brand and incumbent brands in exit response
equation (Equation 9). Table 13 presents the median and 95% credible intervals.
We obtain mixed results regarding the effect of the market shares of a deleted and an
incumbent brand on realignment of brand sales. In the milk category, the response to a
brand exit is significantly correlated to the market share of the deleted and incumbent
brand. Higher market share incumbent brands tend to gain less after brand exits.
Incumbent brands tend to gain more from an exit as the market share of the deleted brand
increases. In the deodorant category, however, both effects are negligible. We consider
alternative explanations for these effects such as the number of consumers who can be
targeted and the rate of store switching after the deletion of high market share brands. We
elaborate on these explanations in the next section.
Results suggest that post-exit strategies are mostly effective in claiming higher sales
after brand exits and that the effects are consistent across two categories. Increasing an
incumbent brand’s assortment size and the frequency of non-price oriented promotions
both have positive effects on sales response to a brand exit. The effect of price
promotions, however, is not significant.
The similarity between a deleted brand and an incumbent brand also influences sales
response to brand exits. Incumbent deodorant brands which are similar to the deleted
brand on ‘type’ and ‘form’ attributes gains more after brand exits. Incumbent milk brands
which are similar on ‘package’ attribute can be considered more likely to gain more after
brand exits as the effect crosses zero at about 9th percentile. The effect of similarity on
other attributes can be considered negligible.
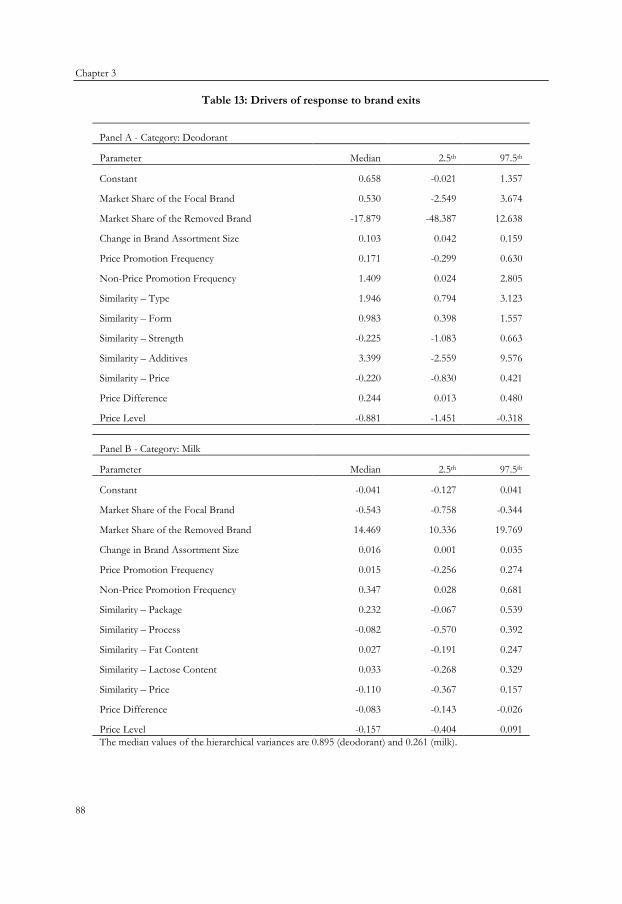
Chapter 3
88
Table 13: Drivers of response to brand exits
Panel A - Category: Deodorant
Parameter Median 2.5th 97.5th
Constant 0.658 -0.021 1.357
Market Share of the Focal Brand 0.530 -2.549 3.674
Market Share of the Removed Brand -17.879 -48.387 12.638
Change in Brand Assortment Size 0.103 0.042 0.159
Price Promotion Frequency 0.171 -0.299 0.630
Non-Price Promotion Frequency 1.409 0.024 2.805
Similarity – Type 1.946 0.794 3.123
Similarity – Form 0.983 0.398 1.557
Similarity – Strength -0.225 -1.083 0.663
Similarity – Additives 3.399 -2.559 9.576
Similarity – Price -0.220 -0.830 0.421
Price Difference 0.244 0.013 0.480
Price Level -0.881 -1.451 -0.318
Panel B - Category: Milk
Parameter Median 2.5th 97.5th
Constant -0.041 -0.127 0.041
Market Share of the Focal Brand -0.543 -0.758 -0.344
Market Share of the Removed Brand 14.469 10.336 19.769
Change in Brand Assortment Size 0.016 0.001 0.035
Price Promotion Frequency 0.015 -0.256 0.274
Non-Price Promotion Frequency 0.347 0.028 0.681
Similarity – Package 0.232 -0.067 0.539
Similarity – Process -0.082 -0.570 0.392
Similarity – Fat Content 0.027 -0.191 0.247
Similarity – Lactose Content 0.033 -0.268 0.329
Similarity – Price -0.110 -0.367 0.157
Price Difference -0.083 -0.143 -0.026
Price Level -0.157 -0.404 0.091 The median values of the hierarchical variances are 0.895 (deodorant) and 0.261 (milk).
Who Benefits from Brand Exits? Why?
89
We obtain contradicting results for the effect of price difference and price level. In
the deodorant category, the magnitude of price difference has a positive and significant
effect on sales response to brand exits. Results further show that lower priced incumbent
brands tend to gain more than higher priced ones. In the milk category, however, the effect
of price difference on exit response is negative and significant. This difference can be
attributed to category specific features which influence consumers’ price sensitivity. We
provide a more detailed explanation to this mixed finding in the next section.
3.5 Discussion of Findings and Implications
Our results reveal who benefits from brand exits and why. In this section, we first
point out and briefly discuss a number of questions which we address in this study. Then,
we discuss how answers to these questions help managers better manage their brands to
maximize their benefits from brand exits.
3.5.1 Discussion of findings
Do higher market share brands tend to gain more from brand exits? High market share brands
enjoy greater visibility, familiarity, and awareness. Therefore, one might expect larger
brands to claim a higher portion of the untapped demand after a brand exit given that they
would make an easy choice for consumers who want to avoid the costs of searching a new
alternative. However, our results do not validate such an expectation. In fact, we find that
smaller brands tend to gain more after a brand exits in the milk category. A possible reason
behind this finding is that consumers may already have a few beliefs about larger brands
before the exit as these brands are more visible and more familiar. The exit may encourage
customers to explore and discover new brands rather than switching to an alternative,

Chapter 3
90
which was not favored in preference to the deleted brand prior to the exit. Such a behavior
is likely to be observed when purchasing a milk product because milk is more of a search
good and it requires few trials to be evaluated (e.g., consumers can learn the taste of a
particular milk product only after one trial). It is a low involvement category with lower
brand variations in quality. Therefore, the risks and information costs are low in the milk
category and consumers can more easily switch to a smaller and less familiar brand.
Do brands tend to gain more when deleted brands have higher market shares? Two opposing
forces may be at work in determining the effect of deleted brand’s market share on sales
response to brand exits. First, and most obvious, the deletion of a larger brand will free up
a larger amount of demand. There will be higher number consumers who cannot find their
favorite product in the store; therefore there will be more consumers who can be targeted
by incumbent brands. Second, higher market share brands enjoy significantly greater loyalty
(Fader & Schmittlein, 1993). They attract more buyers than small brands and their buyers
make more frequent purchases of these brands. If large brands command greater loyalty,
then deletion of these brands may drive consumers to switch stores rather than to switch
brands within a store. Our results imply that the former effect outweighs the latter one in
the milk category as incumbent brands enjoy bigger gains when larger brands are deleted.
In the deodorant category, however, the effect is negligible. A possible explanation for this
difference across two categories is that the loyalty effect is also profound in the deodorant
category because of the low purchase incidence for deodorant products. Milk can be
considered as a basic daily consumption product with high purchase frequency, whereas
deodorants have a medium to low purchase frequency. Given that consumer loyalty
increases as category purchase incidence decreases (Stern & Hammond, 2004), consumers
Who Benefits from Brand Exits? Why?
91
may be less willing to switch to another brand after an exit in a low purchase incidence
category if the deleted brand is available in another store.
Are post-exit marketing strategies successful in picking up a larger portion of a deleted brand’s sales?
Consumers of the deleted brand, who now faced with the unavailability of their preferred
brand, may look for other brand alternatives within the category. Marketing activity in the
post-exit period may attract some of these consumers. For example, sales promotions
stimulate interest, encourage trial, and attract brand switchers. Our results imply that non-
price oriented sales promotions and increasing brand’s product line in the store are
effective in attracting consumers of the deleted brand. Price promotions, however, do not
help in claiming a larger share of removed brand’s sales in the long run. These findings are
consistent with, and complement, earlier marketing studies which empirically investigate
the long run effects of promotions and marketing strategy on sales. Ataman et al. (2010)
documented a positive effect of line length and a negative effect of discounting on base
sales. Ataman et al. (2008) found that line length and feature/display promotions increases
the market potential of a new brand whereas the effect of discounting is negative.
If similar brands are indeed better positioned to pick up the sales of a deleted brand, similarity on
what underlying product attributes are most critical in attracting consumers of the deleted brand?
Considering that consumers of the deleted brand develop tastes and preferences for certain
attribute levels of that brand, they can look for the same or similar attribute-levels in other
brands when their preferred alternative is not present. Therefore, an incumbent brand
which is similarly positioned to the deleted brand stands to benefit from the exit
disproportionally. Our results show that similarity on certain attributes positively influences
the gain from brand exits. Similarity in terms of type and form brings bigger gains for
incumbent deodorant brands. The gains of incumbent milk brands increase with package
Chapter 3
92
similarity. These findings are consistent with those of Wiebach & Hildebrandt (2012) who
showed that choice probability of a similar brand increases disproportionally after a brand
delisting.
What is the effect of price similarity on realignment of sales after exits? Are similarly priced brands
more or less likely to benefit from brand exits? Our results indicate that price similarity, which is
based on the frequency of distribution of prices, has a negligible effect on the redistribution
of sales after a brand exit. However, we find that deodorant brands tend to gain more after
brand exits as the gap between their prices and the price of a deleted brand increases. In
the milk category, however, brands which are priced closely to the deleted brand tend to
gain more. The mixed results across categories can be explained with the category-specific
features that may affect consumer sensitivity to uncertainty about product attributes and
therefore price sensitivity. For example, deodorant is perceived more as an experience good
(positive or negative consequences of deodorant may not be realized until long use),
whereas milk is perceived more as a search good. Therefore, purchase decisions in these
two categories may involve different levels of uncertainty about product attributes.
Consumers become more price seeking or price aversive if information on product
attributes decreases (Tellis & Gaeth, 1990). Consumers may engage in more price seeking
(choosing the highest price brand to maximize expected benefits) or more price aversion
behavior (choosing the lowest price to minimize immediate costs) when they make
switching decisions in the deodorant category because of higher uncertainty on experiential
product attributes. Therefore, deodorant brands may gain more after brand exits as the gap
between their prices and the price of a deleted brand increases.
Does the redistribution of demand after an exit occur instantaneously or gradually? Considering
that consumers may shop around for a while after exits till they find their new favorite
Who Benefits from Brand Exits? Why?
93
brand, we allowed for gradual adjustment of brand exit effects. Our results show that 90%
of the effects on sales materialize within two weeks in the milk category and within 4 weeks
in the deodorant category. A possible explanation to this difference in adjustment rate is
that deodorant products have lower purchase incidence and longer inter-purchase time
than milk products. Therefore, it may take longer for a consumer to find the new favorite
brand in the deodorant category.
3.5.2 How to manage brand exits
Our findings provide a number of insights to owners of deleted brands. First,
managers can forecast how excess demand will be redistributed among existing brands
using our model. A thorough understanding of what brands are better positioned to pick
up the sales of a deleted brand would lead to a wiser and more rational brand deletion
decisions. For example, our model can aid a growing number of companies which simplify
their brand offerings within a brand portfolio rationalization program. These firms cut
some brands from their portfolios with the expectation that the ones they retain can claim
the sales of the deleted ones. However, most brand deletion attempts do fail and
rationalizing firms realize a lower level of sales after deletions (Kumar, 2003). Using our
model they can assess whether and to what extent retained brands in their portfolio can
claim the sales of deleted brands. Second, our model assesses the effects of post-exit
strategies on incumbent brands’ response to brand exits. Firms which are simplifying their
brand offerings often allocate resources of the deleted brands to retained brands
(Varadarajan et al., 2006). Our findings indicate that increasing non-price promotion
frequency and the number of brand’s products in the store are sound investments whereas
increasing price-oriented promotions is likely an unworthy investment.
Chapter 3
94
Retailers, which should make necessary delisting decisions to free up shelf space for
their expanding private label offerings, can similarly benefit from our model and findings.
Understanding drivers of demand redistribution is a principal component of delisting
decisions as profit margins can vary by brand. Retailers would also be able to accurately
identify largely redundant brand offerings by foreseeing brand switching patterns.
Our findings provide insights to managers of competing brands on how to best
manage their product portfolios to meet the freed up demand and how to focus their
marketing efforts on where it will have the most impact following a brand exit. For
example, competing brands can change the set of product alternatives within a store to
look more similar to the deleted brand on critical product attributes.
3.6 Concluding Remarks
The increasing frequency of brand exits begs the question whether and which brands
benefit from the exit and why? Accordingly, this study develops a model to examine the
long-term effects of brand exits on sales and identify the drivers of excess demand
redistribution following an exit. In our application, we find that two post-exit strategies –
increasing an incumbent brand’s assortment size and non-price promotion frequency – are
successful investments to pick up the sales of a removed brand. We further show that
incumbent brands, which are similar to the deleted brand on certain attributes are better
positioned to claim higher sales.
Our findings are subject to a number of caveats, limitations, and extensions. First, in
our empirical application we examine exits in milk and deodorant categories taking place in
stores in the upstate New York area. Additional research can extend our findings by
studying the effect of brand exits across multiple product categories and multiple
Who Benefits from Brand Exits? Why?
95
geographies. For example, across two categories we examine in this article, we report
different effects of market shares and price similarity on sales response to exit. These
differences can be related to category specific factors through an examination of exit events
in multiple product categories. Second, we use brand-store level data which limits our
ability to delve into consumer preferences and decision drivers. Further research can
provide profound insights on how consumers’ preferences change after an exit. Third, we
focus on identifying the underlying factors of the redistribution of demand that frees up
following a brand exit and we are agnostic about who is behind the delisting decision
(manufacturer or retailer). Further research can make a distinction between decision makers
and provide deeper insights for retailers and manufacturers. Fourth, we focus on isolated
exit events in this study. As manufacturers and retailers frequently update their brand
offerings, multiple exits and/or introductions might occur simultaneously. Future research
can examine the sales response to multiple events taking place simultaneously. Fifth, we
make several assumptions throughout this analysis to enhance the feasibility. For example,
we assumed that the short- and long-term effects of control variables (e.g., marketing
activity, seasonality) do not evolve over time. We also do not control for the dynamic
effects of each new brand introduced to the market. The effect of brand introductions
could also be modeled similar to brand exits. We made these assumptions for parsimony as
increasing the number of time-varying parameters –hence the number of state equations-
increases computational complexity and slows convergence time dramatically.
Despite these limitations, we believe to have contributed to enhance the
understanding on the long-term effects of brand exits by analyzing the drivers of excess
demand redistribution following the exit. Brand exits –just like brand introductions– have

Chapter 3
96
become increasingly common. We hope our study encourages additional research on brand
exits.
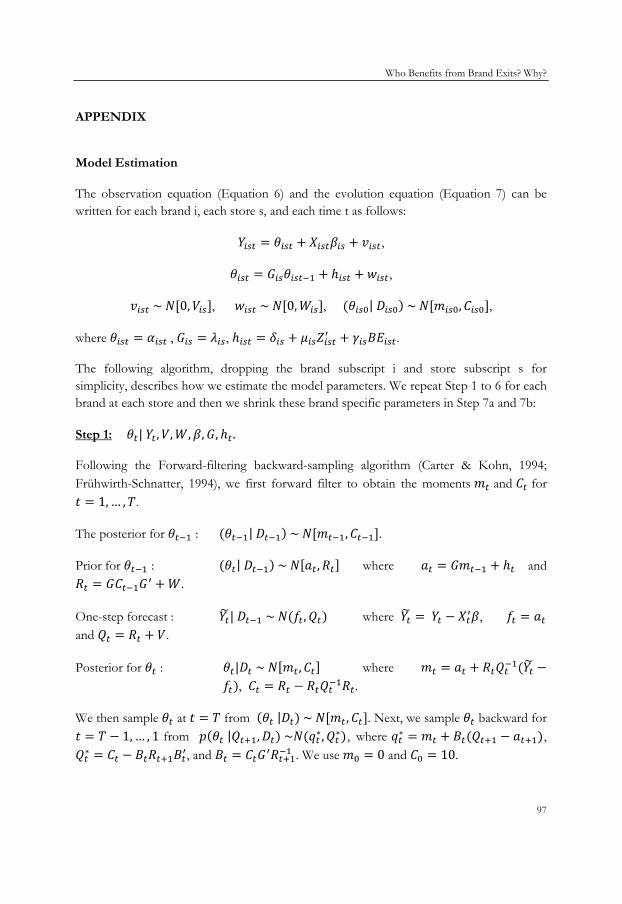
Who Benefits from Brand Exits? Why?
97
APPENDIX
Model Estimation
The observation equation (Equation 6) and the evolution equation (Equation 7) can be written for each brand i, each store s, and each time t as follows:
𝑌𝑖𝑠𝑡 = 𝜃𝑖𝑠𝑡 + 𝑋𝑖𝑠𝑡𝛽𝑖𝑠 + 𝑣𝑖𝑠𝑡,
𝜃𝑖𝑠𝑡 = 𝐺𝑖𝑠𝜃𝑖𝑠𝑡−1 + ℎ𝑖𝑠𝑡 + 𝑤𝑖𝑠𝑡,
𝑣𝑖𝑠𝑡 ~ 𝑁[0,𝑉𝑖𝑠], 𝑤𝑖𝑠𝑡 ~ 𝑁[0,𝑊𝑖𝑠], (𝜃𝑖𝑠0| 𝐷𝑖𝑠0) ~ 𝑁[𝑚𝑖𝑠0,𝐶𝑖𝑠0],
where 𝜃𝑖𝑠𝑡 = 𝛼𝑖𝑠𝑡 , 𝐺𝑖𝑠 = 𝜆𝜆𝑖𝑠, ℎ𝑖𝑠𝑡 = 𝛿𝑖𝑠 + 𝜇𝑖𝑠𝑍𝑖𝑠𝑡′ + 𝛾𝑖𝑠𝐵𝐸𝑖𝑠𝑡.
The following algorithm, dropping the brand subscript i and store subscript s for simplicity, describes how we estimate the model parameters. We repeat Step 1 to 6 for each brand at each store and then we shrink these brand specific parameters in Step 7a and 7b:
Step 1: 𝜃𝑡| 𝑌𝑡,𝑉,𝑊,𝛽,𝐺,ℎ𝑡 .
Following the Forward-filtering backward-sampling algorithm (Carter & Kohn, 1994; Frühwirth-Schnatter, 1994), we first forward filter to obtain the moments 𝑚𝑡 and 𝐶𝑡 for 𝑡 = 1, … ,𝑇.
The posterior for 𝜃𝑡−1 : (𝜃𝑡−1| 𝐷𝑡−1) ~ 𝑁[𝑚𝑡−1,𝐶𝑡−1].
Prior for 𝜃𝑡−1 : (𝜃𝑡| 𝐷𝑡−1) ~ 𝑁[𝑎𝑡 ,𝑅𝑡] where 𝑎𝑡 = 𝐺𝑚𝑡−1 + ℎ𝑡 and 𝑅𝑡 = 𝐺𝐶𝑡−1𝐺′ + 𝑊.
One-step forecast : 𝑌𝑡� | 𝐷𝑡−1 ~ 𝑁(𝑓𝑡 ,𝑄𝑡) where 𝑌𝑡� = 𝑌𝑡 − 𝑋𝑡′𝛽, 𝑓𝑡 = 𝑎𝑡 and 𝑄𝑡 = 𝑅𝑡 + 𝑉.
Posterior for 𝜃𝑡 : 𝜃𝑡|𝐷𝑡 ~ 𝑁[𝑚𝑡 ,𝐶𝑡] where 𝑚𝑡 = 𝑎𝑡 + 𝑅𝑡𝑄𝑡−1(𝑌𝑡� −𝑓𝑡), 𝐶𝑡 = 𝑅𝑡 − 𝑅𝑡𝑄𝑡−1𝑅𝑡.
We then sample 𝜃𝑡 at 𝑡 = 𝑇 from (𝜃𝑡 |𝐷𝑡) ~ 𝑁[𝑚𝑡 ,𝐶𝑡]. Next, we sample 𝜃𝑡 backward for 𝑡 = 𝑇 − 1, … , 1 from 𝑝(𝜃𝑡 |𝑄𝑡+1,𝐷𝑡) ~𝑁(𝑞𝑡∗,𝑄𝑡∗), where 𝑞𝑡∗ = 𝑚𝑡 + 𝐵𝑡(𝑄𝑡+1 − 𝑎𝑡+1), 𝑄𝑡∗ = 𝐶𝑡 − 𝐵𝑡𝑅𝑡+1𝐵𝑡′, and 𝐵𝑡 = 𝐶𝑡𝐺′𝑅𝑡+1−1 . We use 𝑚0 = 0 and 𝐶0 = 10.
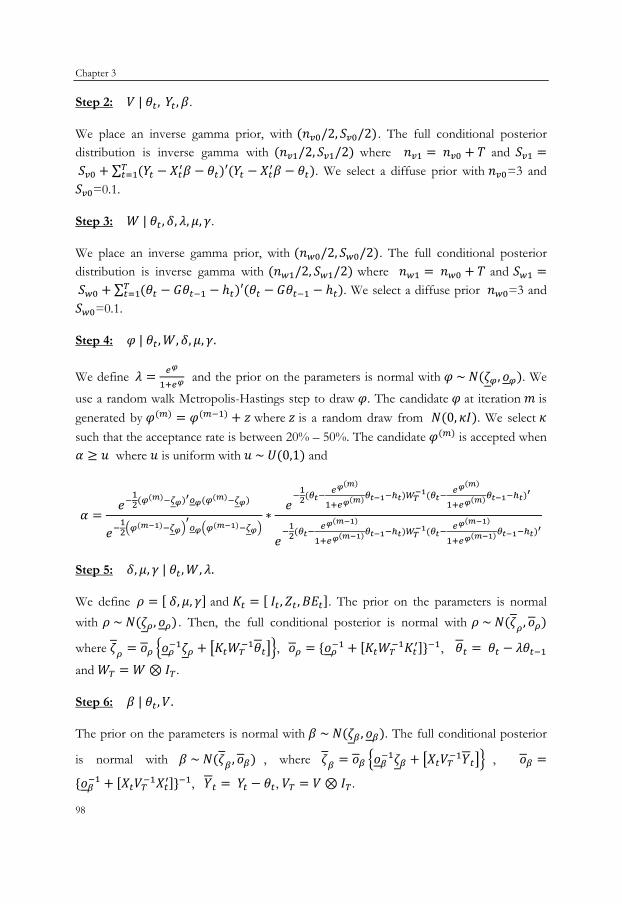
Chapter 3
98
Step 2: 𝑉 | 𝜃𝑡 , 𝑌𝑡 ,𝛽.
We place an inverse gamma prior, with (𝑛𝑣0/2, 𝑆𝑣0/2). The full conditional posterior distribution is inverse gamma with (𝑛𝑣1/2, 𝑆𝑣1/2) where 𝑛𝑣1 = 𝑛𝑣0 + 𝑇 and 𝑆𝑣1 = 𝑆𝑣0 + ∑ (𝑌𝑡 − 𝑋𝑡′𝛽 − 𝜃𝑡)′(𝑌𝑡 − 𝑋𝑡′𝛽 − 𝜃𝑡)𝑇
𝑡=1 . We select a diffuse prior with 𝑛𝑣0=3 and 𝑆𝑣0=0.1.
Step 3: 𝑊 | 𝜃𝑡 ,𝛿, 𝜆𝜆, 𝜇, 𝛾.
We place an inverse gamma prior, with (𝑛𝑤0/2, 𝑆𝑤0/2). The full conditional posterior distribution is inverse gamma with (𝑛𝑤1/2, 𝑆𝑤1/2) where 𝑛𝑤1 = 𝑛𝑤0 + 𝑇 and 𝑆𝑤1 = 𝑆𝑤0 + ∑ (𝜃𝑡 − 𝐺𝜃𝑡−1 − ℎ𝑡)′(𝜃𝑡 − 𝐺𝜃𝑡−1 − ℎ𝑡)𝑇
𝑡=1 . We select a diffuse prior 𝑛𝑤0=3 and 𝑆𝑤0=0.1.
Step 4: 𝜑 | 𝜃𝑡 ,𝑊, 𝛿, 𝜇, 𝛾.
We define 𝜆𝜆 = 𝑒𝜑
1+𝑒𝜑 and the prior on the parameters is normal with 𝜑 ~ 𝑁(𝜁𝜑, 𝑜𝜑). We
use a random walk Metropolis-Hastings step to draw 𝜑. The candidate 𝜑 at iteration 𝑚 is generated by 𝜑(𝑚) = 𝜑(𝑚−1) + 𝑧 where 𝑧 is a random draw from 𝑁(0, 𝜅𝐼). We select 𝜅 such that the acceptance rate is between 20% – 50%. The candidate 𝜑(𝑚) is accepted when 𝛼 ≥ 𝑢 where 𝑢 is uniform with 𝑢 ~ 𝑈(0,1) and
𝛼 =𝑒−
12(𝜑(𝑚)−𝜁𝜑)′𝑜𝜑(𝜑(𝑚)−𝜁𝜑)
𝑒−12�𝜑
(𝑚−1)−𝜁𝜑�′𝑜𝜑�𝜑(𝑚−1)−𝜁𝜑�
∗𝑒−12(𝜃𝑡−
𝑒𝜑(𝑚)
1+𝑒𝜑(𝑚)𝜃𝑡−1−ℎ𝑡)𝑊𝑇−1(𝜃𝑡−
𝑒𝜑(𝑚)
1+𝑒𝜑(𝑚)𝜃𝑡−1−ℎ𝑡)′
𝑒−12(𝜃𝑡−
𝑒𝜑(𝑚−1)
1+𝑒𝜑(𝑚−1)𝜃𝑡−1−ℎ𝑡)𝑊𝑇−1(𝜃𝑡−
𝑒𝜑(𝑚−1)
1+𝑒𝜑(𝑚−1)𝜃𝑡−1−ℎ𝑡)′
Step 5: 𝛿, 𝜇, 𝛾 | 𝜃𝑡 ,𝑊, 𝜆𝜆.
We define 𝜌 = [ 𝛿, 𝜇, 𝛾] and 𝐾𝑡 = [ 𝐼𝑡 ,𝑍𝑡 ,𝐵𝐸𝑡]. The prior on the parameters is normal with 𝜌 ~ 𝑁(𝜁𝜌, 𝑜𝜌) . Then, the full conditional posterior is normal with 𝜌 ~ 𝑁(𝜁𝜌, 𝑜𝜌)
where 𝜁𝜌 = 𝜊𝜌 �𝜊𝜌−1𝜁𝜌 + �𝐾𝑡𝑊𝑇−1𝜃𝑡��, 𝜊𝜌 = {𝜊𝜌−1 + [𝐾𝑡𝑊𝑇
−1𝐾𝑡′]}−1, 𝜃𝑡 = 𝜃𝑡 − 𝜆𝜆𝜃𝑡−1
and 𝑊𝑇 = 𝑊⊗ 𝐼𝑇.
Step 6: 𝛽 | 𝜃𝑡,𝑉.
The prior on the parameters is normal with 𝛽 ~ 𝑁(𝜁𝛽 , 𝜊𝛽). The full conditional posterior
is normal with 𝛽 ~ 𝑁(𝜁𝛽 , 𝜊𝛽) , where 𝜁𝛽 = 𝜊𝛽 �𝜊𝛽−1𝜁𝛽 + �𝑋𝑡𝑉𝑇−1𝑌𝑡�� , 𝜊𝛽 =
{𝜊𝛽−1 + [𝑋𝑡𝑉𝑇−1𝑋𝑡′]}−1, 𝑌𝑡 = 𝑌𝑡 − 𝜃𝑡, 𝑉𝑇 = 𝑉 ⊗ 𝐼𝑇.
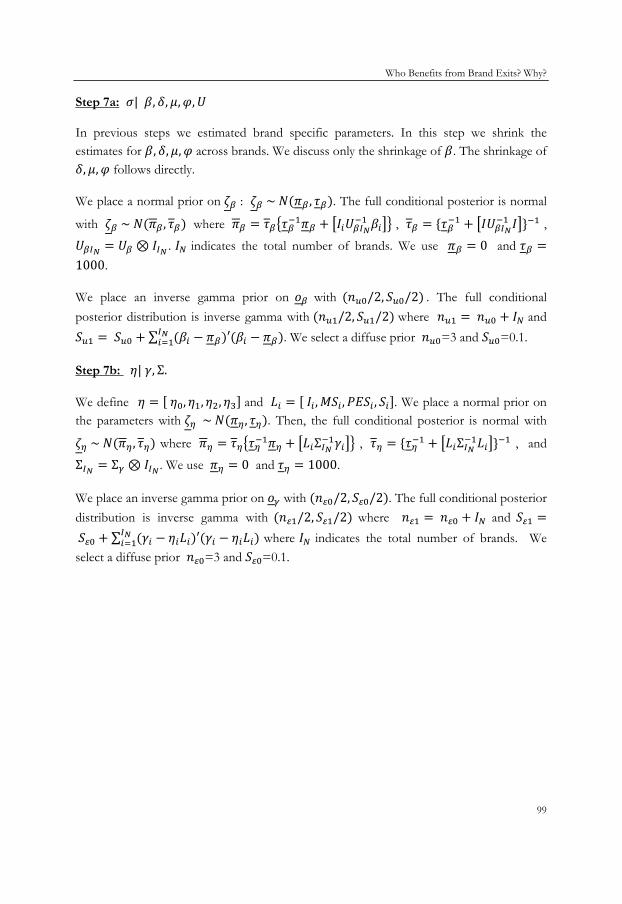
Who Benefits from Brand Exits? Why?
99
Step 7a: 𝜎| 𝛽, 𝛿, 𝜇,𝜑,𝑈
In previous steps we estimated brand specific parameters. In this step we shrink the estimates for 𝛽, 𝛿, 𝜇,𝜑 across brands. We discuss only the shrinkage of 𝛽. The shrinkage of 𝛿, 𝜇,𝜑 follows directly.
We place a normal prior on 𝜁𝛽 : 𝜁𝛽 ~ 𝑁(𝜋𝛽 , 𝜏𝛽). The full conditional posterior is normal
with 𝜁𝛽 ~ 𝑁(𝜋𝛽 , 𝜏𝛽) where 𝜋𝛽 = 𝜏𝛽�𝜏𝛽−1𝜋𝛽 + �𝐼𝑖𝑈𝛽𝐼𝑁−1 𝛽𝑖�� , 𝜏𝛽 = {𝜏𝛽−1 + �𝐼𝑈𝛽𝐼𝑁
−1 𝐼�}−1 ,
𝑈𝛽𝐼𝑁 = 𝑈𝛽 ⊗ 𝐼𝐼𝑁 . 𝐼𝑁 indicates the total number of brands. We use 𝜋𝛽 = 0 and 𝜏𝛽 =1000.
We place an inverse gamma prior on 𝑜𝛽 with (𝑛𝑢0/2, 𝑆𝑢0/2) . The full conditional posterior distribution is inverse gamma with (𝑛𝑢1/2, 𝑆𝑢1/2) where 𝑛𝑢1 = 𝑛𝑢0 + 𝐼𝑁 and 𝑆𝑢1 = 𝑆𝑢0 + ∑ (𝛽𝑖 − 𝜋𝛽)′(𝛽𝑖 − 𝜋𝛽)𝐼𝑁
𝑖=1 . We select a diffuse prior 𝑛𝑢0=3 and 𝑆𝑢0=0.1.
Step 7b: 𝜂| 𝛾, Σ.
We define 𝜂 = [ 𝜂0, 𝜂1, 𝜂2, 𝜂3] and 𝐿𝑖 = [ 𝐼𝑖 ,𝑀𝑆𝑖 ,𝑃𝐸𝑆𝑖 , 𝑆𝑖]. We place a normal prior on the parameters with 𝜁𝜂 ~ 𝑁(𝜋𝜂 , 𝜏𝜂). Then, the full conditional posterior is normal with
𝜁𝜂 ~ 𝑁(𝜋𝜂 , 𝜏𝜂) where 𝜋𝜂 = 𝜏𝜂�𝜏𝜂−1𝜋𝜂 + �𝐿𝑖Σ𝐼𝑁−1𝛾𝑖�� , 𝜏𝜂 = {𝜏𝜂−1 + �𝐿𝑖Σ𝐼𝑁
−1𝐿𝑖�}−1 , and
Σ𝐼𝑁 = Σ𝛾 ⊗ 𝐼𝐼𝑁 . We use 𝜋𝜂 = 0 and 𝜏𝜂 = 1000.
We place an inverse gamma prior on 𝑜𝛾 with (𝑛𝜀0/2, 𝑆𝜀0/2). The full conditional posterior distribution is inverse gamma with (𝑛𝜀1/2, 𝑆𝜀1/2) where 𝑛𝜀1 = 𝑛𝜀0 + 𝐼𝑁 and 𝑆𝜀1 = 𝑆𝜀0 + ∑ (𝛾𝑖 − 𝜂𝑖𝐿𝑖)′(𝛾𝑖 − 𝜂𝑖𝐿𝑖)
𝐼𝑁𝑖=1 where 𝐼𝑁 indicates the total number of brands. We
select a diffuse prior 𝑛𝜀0=3 and 𝑆𝜀0=0.1.

100
101
Chapter 4
Energizing Sales Through Sponsorships
n recent years, many companies have enthusiastically increased their investments in
sports sponsorships. According to a recent survey of IEG Sponsorship Research,
total sports sponsorship spending in North America has reached approximately $13
billion in 2013 with an annual growth rate of 6%, exceeding the growth rate of spending on
several other elements of the promotional mix such as advertising through traditional
media, public relations, direct marketing, and promotions (IEG, 2014a). This growth is
partly due to the record breaking economic value of partnerships formed between major
professional sports franchises and corporate partners, which see those franchises as a
passion point for both their existing and potential customers. For example, General Motors
paid $560 million to become the official partner of Manchester United football club, so
that they could connect their Chevrolet brand with the passionate supporters of the club all
around the world (O'Leary, 2014). Similarly, Dallas Cowboys, a National Football League
I
Chapter 4
102
(NFL) franchise commonly referred to as ‘America’s team’, recently signed partnership
deals with American Airlines, Miller Lite, and Hublot Watches. Through these deals it
became the most valuable sports franchise in the world thanks to its annual sponsorship
revenues, which exceeds the $100 million mark (Forbes, 2015).
Firms invest substantial amounts in sponsorships for a variety of reasons: to increase
brand awareness, to establish and strengthen brand image, and to enhance brand recall,
brand loyalty, and sales (Catherwood & van Kirk, 1992; Chien, Cornwell, & Pappu, 2011;
Cornwell & Maignan, 1998; Crowley, 1991; Gwinner & Eaton, 1999; Marshall & Cook,
1992). In line with the expectations of firms entering into sponsorship deals, marketing
research has shown that sponsorships have resulted in brand identification (Lardinoit &
Quester, 2001), enhanced consumer awareness and attitude (Quester & Thompson, 2001),
increased brand preference and brand recall (Levin, Joiner, & Cameron, 2001; Nicholls,
Roslow, & Dublish, 1999), and improved brand loyalty (Mazodier & Merunka, 2012; Sirgy,
Lee, Johar, & Tidwell, 2008). However, there has been an uncertainty whether the positive
effects of sponsorship on consumer liking and other behavioral measures also translate into
economic value. Yet, few studies have attempted to quantify this economic value of
sponsorships, despite the large amounts of money involved. The studies that did address
this topic commonly applied event study analyses to assess the firm performance effects of
sponsorships but provided mixed findings. Cornwell, Pruitt, & Clark (2005), Cornwell,
Pruitt, & van Ness (2001), Miyazaki & Morgan (2001), and Pruitt, Cornwell, & Clark (2004)
reported significant positive shareholder returns to sponsorship announcements, while
Tsiotsou & Lalountas (2005) found no effect. While the effect of sponsorship on
shareholder returns is poorly understood, there is even greater uncertainty regarding the
impact on sales, arguably a metric of high relevance to marketing (communications)
Energizing Sales Through Sponsorships
103
practitioners. According to a recent survey on how marketers measure the effectiveness of
sponsorships, a substantial percentage of marketers (38%) are dissatisfied with their ability
to measure sponsorship effectiveness and most of them (86%) agree that the most valuable
metric for measuring the effectiveness of sponsorship is sales (ANA, 2013). Understanding
the effects on sales is critical for making decisions on how much to spend on sponsorship
fees and on how to manage other promotion mix instruments over the course of the
sponsorship.
Accordingly, in this paper we address the value of sponsorship deals by investigating
whether firms’ partnerships with professional sports franchises actually improve the sales
performance of partnering brands. Understanding the sales response to sponsorship will
provide the missing link between the positive behavioral results and the mixed effects on
stock prices. Next to answering this whether question, we further aim to shed light on a
number of key issues explaining how sponsorships affect sales performance. First, studies
focusing on longitudinal effects over the course of a sponsorship contract documented that
these effects on key metrics such as brand awareness, positioning, recall, and knowledge
evolve over time (Armstrong, 1988; Parker, 1991; Quester & Farrelly, 1998). In a similar
fashion, we do not expect the effects of sponsorships on sales to materialize
instantaneously. Therefore, we aim at understanding how the effect of sponsorships on
sales evolves over time. Second, the effect of sponsorship is contingent on franchise-
specific factors such as team performance (Cornwell & Coote, 2005; Fisher & Wakefield,
1998; Gwinner & Swanson, 2003; Lings & Owen, 2007; Ngan, Prendergast, & Tsang, 2011;
Speed & Thompson, 2000). Following the immediate effects of sponsorships, subsequent
positive or negative team performance may spill over to perceptions of brand quality
(Pope, Voges, & Brown, 2009). Therefore, we link the effect of sponsorship to team

Chapter 4
104
performance in a dynamic setting. Third, sponsorships do not necessarily work standalone.
Advertising affects consumer’s sensitivity to sales promotions (Mela et al., 1997).
Sponsorships, if considered as a specific form of advertising, may also interact with sales
promotions, which may change their effectiveness. Accordingly, we aim to explain whether
sponsorships affect sales through changing the effectiveness of sales promotions. Fourth,
in order to develop insights for managers of sponsoring brands that are as complete as
possible, we examine the effects of sponsorships on competing brands as well. Some of
those competing brands and the sponsored brand may be in the same brand family, i.e.,
they might be marketed under the same parent brand and carry similar sets of values.
Practitioners will want to understand whether the effects of sponsorships on sales spill over
positively (or negatively) to other brands in their brand portfolios given that those brands
are linked to the sponsored brand but also compete with the sponsored brand.
Practitioners might also want to evaluate whether a sponsorship can draw sales from
competing brands of other firms. Therefore, we explain the differences in sales response to
sponsorships across competing brands.
In our empirical study we develop a Dynamic Linear Model (DLM), which examines
how a partnership with a major sports franchise affects the sales performance of the
partnering brand and competing brands within the product category. We assume that the
effects of sponsoring partnerships may evolve over time as a consequence of team
performance. We allow sponsorships to influence the effect of sales promotion
instruments on sales. Using MCMC techniques, we calibrate the model on store-level data
acquired from Information Resources, Inc. (see Bronnenberg et al., 2008).
We evaluate the effectiveness of sponsoring partnerships with major sports franchises
in the setting of the NFL teams’ beer sponsorship deals. We believe that this setting is
Energizing Sales Through Sponsorships
105
appropriate for four reasons. First, NFL is the most popular annual sporting event in the
USA for sports fans, corporate marketers, advertisers, and sponsors. For example, 46 of
the top 50 most watched sporting events of 2013 were NFL games (Sports Media Watch,
2013). NFL fans seem to care about sponsorships more than fans of other major
professional sports leagues such as MLB, NBA, and NHL (Broughton, 2012). Therefore,
NFL and its 32 teams command the highest sponsorship revenues among professional
leagues with over $1 billion (IEG, 2015). Second, several beer brands, including Budweiser,
BudLight, Miller Light, and Coors Light, have consistently been among the most active
sponsors of NFL teams and among the highest spenders in the sponsorship market for
years. They typically sign longer term contracts –e.g., 5 year contracts instead of a single
season contract– which allows us to analyze the effects of sponsorships in the long run.
Third, most of the partnerships between teams and partnering firms are regulated by the
NFL. Therefore, the content of the deals and the rights given to partnering firms do not
differ across deals with different franchises. This allows us to analyze and compare the
effects of partnership deals with different teams. Fourth, there is a great variation in the
strength, success, and popularity of NFL franchises over time due to the short careers of
star players, transfers, and injuries. The draft and salary cap system ensure an appropriate
level of competitive balance. The changes in team performance over time allow us to
analyze how this influences the effects of sponsorships in a dynamic setting.
We believe that the results of our study help marketing (communications) executives
of sponsoring brands to better manage their sponsorship strategies by (i) uncovering how
the potential effects of sponsorships evolve over the course of the sponsorship contract;
(ii) understanding the synergetic effects which might be created by combining sponsorship
with other promotional instruments; (iii) foreseeing the risks and returns of team-related
Chapter 4
106
factors which may change over time. Our results, furthermore, help managers of
competing brands to better anticipate on how the performance of their brands may be
influenced by sponsorship deals as we address the effects of sponsorship on competing
brand sales as well.
This chapter is organized as follows. Section 4.1 provides background information on
the NFL and on sponsorship deals with NFL franchises. Section 4.2 discusses the literature
on sponsorship effectiveness. We present our theoretical framework in the Section 4.3.
Section 4.4 describes the data we use in our analyses, while Section 4.5 discusses our model
specification. We present the results in Section 4.6 and conclude in Section 4.7 with a
discussion of our findings and their implications.
4.1 Background: the NFL and Its Sponsorship Deals
We evaluate the effectiveness of partnerships with major sports franchises in the
setting of the NFL and its teams’ beer sponsorship deals. We previously explained why
studying sponsorships in the context of the NFL team’s sponsorship deals is appropriate
and relevant. Here we provide background information about the NFL, sport franchises
competing in the NFL, and characteristics of the NFL’s beer sponsorship deals.
4.1.1 The NFL and NFL franchises
The NFL is the highest professional American football league in North America. It is
composed of 32 franchises and runs a 17-week regular season from Labor Day week to
Christmas. The NFL has the highest average attendance of any professional sport
(Pudasaini, 2014) and it is by far the most popular sport on TV in the US (Sports Media
Watch, 2013). Therefore, it is the most preferred medium for sports sponsorships in North
Energizing Sales Through Sponsorships
107
America. In 2013, it enjoyed more than $1 billion sponsorship revenues up 5.7 percent
from the previous year (IEG, 2015). The average NFL team is worth $1.43 billion in 2013,
23% more than a year before. Most active NFL sponsors include beer manufacturers (e.g.,
Anheuser Busch, MillerCoors); quick service restaurants (e.g., Papa John’s Pizza), branded
food and beverage manufacturers (e.g., Coca-Cola, Pepsi, Gatorade), cars (e.g., Ford,
Toyota), mobile service carriers (e.g., AT&T, Verizon), airlines (e.g., American Airlines,
Southwest Airlines), and insurance firms (e.g., Geico, MetLife) (IEG, 2015).
4.1.2 Beer sponsorship deals
Forming partnerships with NFL franchises has been a widely adopted promotional
strategy among beer manufacturers for years. According to a report of IEG, beer
manufacturers are 3.4 times more likely to sponsor the NFL than the average of all
sponsors (IEG, 2014b). Anheuser Busch has been one of the biggest spenders on
sponsorship deals and has sponsorship agreements with 28 of the 32 NFL franchises.
MillerCoors has individual sponsorship deals with 21 franchises. While most franchises
have sponsorship deals with multiple beer brands, some franchises enter into an exclusive
agreement, which secures the right of a sponsor to be the only company within its product
category. MillerCoors has exclusive partnership deals with 4 franchises. In addition to long-
time exclusive sponsorship deals with the Dallas Cowboys and the Minnesota Vikings, in
2002 Miller Coors formed partnership deals with two respectable and popular franchises,
the Chicago Bears and the Green Bay Packers. MillerCoors’ exclusive sponsorship deals
with the Bears and the Packers allowed Miller Lite to use the logos and trademarks of the
sports franchises and engage in promotional activities within a 75-mile radius of the
sponsored teams’ home stadiums.

Chapter 4
108
In this study we examine these very two sponsorship cases. We do this for a number
of reasons. First, these two partnerships are exclusive deals; therefore, competing beer
brands do not have the right to enter into local sponsorship arrangements with the Bears
and the Packers. This means that they do not have the right to use those two teams’ logos
and trademarks in their products, advertisements, and marketing efforts. Second, these
deals were signed in 2002, so the time window following the sponsorship deal is long
enough to analyze how the effects of sponsorships evolve over time. Third, there has been
a strong variation in the strength, performance, and popularity of these two franchises
since 2002 which allows us to address the dynamic effect of team performance and
popularity.
4.2 Literature Review
4.2.1 Sponsorship effectiveness
Due to the growing popularity of sponsorship as part of the marketing activities of
firms, there is a wide array of research on sponsorship effectiveness. Numerous studies
measured sponsorship effectiveness in terms of brand recall. Hansen & Scotwin (1995)
found that sponsorships create a brand recall of a magnitude similar to that of advertising,
and it becomes even more effective when it is combined with advertising. Several other
studies also documented the positive effects of sponsorships on brand recall (e.g., Levin et
al., 2001; Nicholls et al., 1999; Turco, 1995). Pope & Voges (2015) analyzed the recall of
advertising messages and found that effects of sponsorships and advertising are cumulative.
Furthermore, marketing research has also documented positive effects of sponsorships on
brand awareness (e.g., Sandler & Shani, 1989), brand image (e.g., d'Astous & Bitz, 1995;

Energizing Sales Through Sponsorships
109
Gwinner, 1994; Hansen & Scotwin, 1995; Otker & Hayes, 1987; Turco, 1995), consumer
preferences for the brand (Nicholls, Roslow, & Laskey, 1994), purchase intentions
(Cornwell et al., 2005; Olson & Thjømøe, 2009), and brand loyalty (Mazodier & Merunka,
2012; Sirgy et al., 2008). The factors which influence sponsorship effectiveness were also
investigated. Several studies showed that sponsorship effectiveness is contingent on team-
related factors (e.g., team performance, star players, team image) and fan characteristics
(Cornwell & Coote, 2005; Fisher & Wakefield, 1998; Gwinner & Swanson, 2003; Lings &
Owen, 2007; Madrigal, 2000; Madrigal, 2001; Smith, Graetz, & Westerbeek, 2008; Speed &
Thompson, 2000).
To understand the effectiveness of sponsorship deals for firm performance, a group
of studies measured sponsorships’ effects on the stock price fluctuations of sponsoring
firms following sponsorship announcements. Cornwell et al. (2005) observed an increase in
shareholders’ wealth due to official product sports sponsorships with five professional
sports leagues –NFL, NHL, NBA, MLB, and PGA– in the USA. Cornwell, Pruitt, & van
Ness (2001), Miyazaki & Morgan (2001), Pruitt et al., (2004), Spais & Filis (2008) also
found increasing shareholder returns due to sponsorship deals. However, studying
shareholder returns to 2004 Olympic Games sponsorship announcements, Tsiotsou &
Lalountas (2005) found no significant effect on the stock prices of sponsoring firms.
In this paper, we study sponsorship effectiveness in terms of its effects on sales.
Although sales is a highly relevant metric to many marketing (communications)
practitioners, there has been an uncertainty whether the positive effects of sponsorship on
consumer liking and other behavioral measures indeed also translate into positive sales
figures. Therefore, our study complements the findings of extant research and enhances
the existing knowledge on the economic value of sponsorship deals by providing a missing
Chapter 4
110
link between the behavioral results and the positive effects on stock prices by addressing
the question whether positive behavioral effects do also lead to positive sales results,
thereby leading to higher firm value.
4.2.2 The economic value of marketing communications instruments
Numerous studies in marketing science linked the use of marketing communication
instruments to sales. A wide array of research examined the effects of traditional
communication elements such as advertising (e.g., Bass & Clarke, 1972; Bass & Leone,
1983; Blattberg & Jeuland, 1981; Hanssens, Parsons, & Schultz, 2003) and sales
promotions (e.g., van Heerde, Leeflang, & Wittink, 2000; Zhang, Wedel, & Pieters, 2009).
As companies are shifting to alternative communication tools due to the highly cluttered
market environment, recent studies focused on some increasingly popular communication
tools. Elberse & Verleun (2012) studied the effect of celebrity endorsements on sales and
documented a positive effect, which increased with the achievements of the endorsers.
Chung et al. (2013) studied the effect of celebrity endorsements on sales by examining the
effects of the endorsement deal of Tiger Woods' on the sales of Nike golf balls. They
found that there is a both a primary demand effect and a brand switching effect of celebrity
endorsements. To the best of our knowledge, the growing literature on the sales effects of
marketing communication contains no studies that focus on the sales effects of
sponsorship deals. This is despite of the distinctiveness of sponsorship deals as a
promotional activity and the fact that the expenditures on sponsorship deals in the past
decade have grown at rates faster than expenditures for mass media advertising and sales
promotion (Roy & Cornwell, 2003). Therefore, our study complements extant research,
which links the use of marketing communication elements to sales.
Energizing Sales Through Sponsorships
111
4.3 Theoretical Framework
The sponsorship literature has examined sponsorship responses through different
theoretical lenses. However, it has “not adopted any specific framework that could guide
investigations of consumers’ reactions to sponsorship” (Cornwell & Maignan, 1998, p.14)
yet. None of the approaches to sponsorship response models has proven its superiority
over others so far (Walliser, 2003). Therefore, in the following subsections we first analyze
customer responses to the NFL’s beer sponsorship deals by discussing our research
problem using three different theoretical frameworks, which are commonly used to explain
sponsorship responses. We then discuss how sponsorships might influence the
effectiveness of sales promotions.
4.3.1 Mere exposure effects
The link between exposures to marketing communications and consumer behavior
tools has been extensively investigated as repeated exposures to a stimulus (e.g., pictures,
logos, slogans) evoke affective responses (Zajonc, 1968). The mere-exposure effect
framework suggests that customers’ attitudes towards brands are influenced merely because
they are familiar with the brands and repeated exposures to brand-related stimuli generate
such feelings of familiarity (Zajonc, 1980). Higher levels of mere-exposure result in higher
preferences for the brand (Olson & Thjømøe, 2009) and also a higher brand recall
(Bennett, 1999). Additional brand-related information, as well as intervening attributes such
as liking, interest, and congruence, is not a necessary condition for creating responses to
the stimuli. The mere-exposure effect persists even when initial exposures to brand-related
stimuli are incidental (Janiszewski, 1993).

Chapter 4
112
According to this framework we can expect an increased preference for a brand due
to sponsorship, which may also translate into higher sales. For low-involvement products,
information about only a few attribute levels is usually available and consumers may
primarily pay attention to non-product attributes. In the case of beer sponsorship deals,
therefore, the repeated exposure to brand-related stimuli is likely to result in favorable
attitude changes towards the product and to higher sales.
The mere-exposure effect of sponsorship can further increase with the success of the
sponsored team. This is because such teams are more likely to find greater coverage on
national and local media as well as on the social media. Greater coverage will lead to a
larger mere-exposure effect for two reasons: (i) consumers will be more frequently exposed
to brand-related stimuli, and (ii) a higher number of customers will be exposed to brand-
related stimuli.
4.3.2 Associative learning
A growing body of research considers mere-exposure as a necessary but not a
sufficient condition for creating a response to sponsorships. Based on the belief that
consumers generate attitudes and feelings towards a brand through the linkage of two
stimuli, several marketing studies used associative learning approaches in explaining
responses to marketing communication and advertising (e.g., Burke & Edell, 1989; Mitchell
& Olson, 1981; Sweldens, van Osselaer, & Janiszewski, 2010). The two dominant
approaches to associative learning, both the classical conditioning and the evaluative
conditioning have been used in the sponsorship context. Speed and Thompson (2000) used
classical conditioning to explain sponsorship responses. According to this view, the
consumer links the unconditioned stimulus (the sponsored team) and the conditioned
Energizing Sales Through Sponsorships
113
stimulus (the brand) to learn about one of these through what is known about the other.
Therefore, attitudes towards the unconditioned stimulus (the sponsored team), attitudes
towards the conditioned stimulus (the brand), and the congruence between the conditioned
and the unconditioned stimulus may influence the sponsorship response. Tsiotsou et al.
(2014) used evaluative conditioning to explain sponsorship responses. According to this
perspective, when a sports team is coupled with a brand, there is a direct effect. Consumers
transfer associations from the unconditioned stimulus (the sponsored team) to the
conditioned stimulus (the brand) and will extend the features of the team to the brand. The
difference between the classical conditioning and the evaluative conditioning is that in the
evaluative conditioning, unlike the classical conditioning, the brand does not need to
develop a predictive relation with the team.
In the case of NFL’s beer sponsorship deals, both the sponsoring brand and the
sponsored team are likely to have a favorable image within the geographic reach of the
sponsorship. Brands can engage in promotional activities within the 75-mile radius of the
sponsored team’s home stadium. It is safe to assume that fans of the local teams are pre-
dominantly located in those areas and that they mostly have favorable attitudes towards the
sponsored team. In other words, consumers living in Illinois are more likely to have
positive attitudes towards the Chicago Bears while consumers living in Wisconsin are more
likely to have positive attitudes towards the Green Bay Packers. Since we are focusing on
the deals of Miller Lite with the Chicago Bears and the Green Bay Packers in this study, we
can also safely assume that this brand enjoys favorable images in both markets as it is the
market leader in several Midwest markets and it is based in Milwaukee, Wisconsin. The fit
between the sponsored teams and the brand is high given that beer consumption is
commonly associated with sports events and with American football in particular.
Chapter 4
114
Consumers are also familiar with beer sponsorships in this sports industry as beer
manufacturers are avid sponsors of the game. In the case of NFL’s beer sponsorship deals,
therefore, the formation of a relationship between the brand and the sponsored team are
likely to result in favorable attitude changes and higher sales through associative learning
processes.
4.3.3 Transferring effects
Another research stream emphasizes the role of image, meaning, and attitude
transfers in the effectiveness of marketing communications and advertising. One common
application of this framework is the response model to celebrity endorsement deals
through the image and meaning transfer from celebrities to endorsed brands (McCracken,
1989). In a sponsorship context, the consumer response can be explained through an image
transfer at the perception level (Gwinner & Eaton, 1999), a meaning transfer at the
cognitive level (Gwinner, 1997), and an attitude transfer at the attitudinal level (Crimmins
& Horn, 1996). According to this framework, a team’s image, meaning, or the attitudes
towards that team can become associated with the brand’s image, the meaning, or the
attitudes towards that brand.
We can expect a transfer of positive effects from the sponsored team to the brand as
the team enjoys consumer liking in home markets, has a favorable image and meaning, and
as consumers generally have favorable attitudes towards that team. We expect this effect to
increase with team success as it is a very important driver of customer-based brand equity
for sports teams (Gladden & Funk, 2002).

Energizing Sales Through Sponsorships
115
4.3.4 Sponsorship and sales promotions
Taken together the three perspectives we have discussed imply that a sponsorship
deal can result in increased awareness, consideration, preference, and attitude. In that
regard, two opposing mechanisms may intervene between sponsorship and sales
promotion effectiveness. On the one hand, sponsorships and sales promotions can have
complimentary functions within the integrated marketing communications program of a
company. Sponsorships are particularly effective in the earlier stages of the purchase
funnel. Sales promotions are mostly incentive-based and especially effective in the later
stages of the purchase funnel. They are commonly used to encourage trial and repeat usage,
attract brand switchers and price sensitive-buyers (Huff & Alden, 2000). As sponsorships
increase awareness and consideration, consumers also become more attentive and
responsive to the sales promotions of the sponsored brand. On the other hand,
sponsorships may increase product differentiation and the strength of brand preference,
which will lead to a decrease in price sensitivity. It may make consumers less sensitive to
price-oriented sales promotions. Therefore, we believe sponsorships are likely to interact
with price-oriented sales promotions and non-price-oriented sales promotions differently.
Sponsorships should increase the response to non-price-oriented sales promotions. The
effects of sponsorships on consumer’s responses to price-oriented sales promotions,
however, is contingent on which of these opposing mechanisms predominates. Mela, et al.
(1997) addressed a similar problem in their examination of the long-term effects of
promotion and advertising on brand choice behavior. They found that advertising increases
consumers’ sensitivity to non-price-oriented sales promotions in the non-loyal segment but
has no significant effect on their sensitivity to price-oriented promotions.
Chapter 4
116
4.4 Data and Descriptives
4.4.1 Store level brand sales and sales promotion data
The data used in this study is acquired from Information Resources, Inc. (see
Bronnenberg et al., 2008). The data include weekly beer sales of brands sold in 45 stores in
4 US states from January 1st 2001 to December 31st 2006. Two of these states are Illinois
and Wisconsin where Miller Lite gained the exclusive rights to use logos and trademarks of
the sports franchises and engage in promotional activities due to sponsorship deals with the
Chicago Bears and the Green Bay Packers in 2002. The other two states are Ohio and
Missouri, which are in close geographical proximity to each other and to Illinois and
Wisconsin. Ohio and Missouri each host their own NFL franchises which compete with
the Bears and the Packers in the NFL. Data from these two states are combined into a
single market named ‘unsponsored markets’. In total there were 881 different beer brands
sold in these markets during this time period. However, many of these brands are local,
available in only a few stores, or seasonal and available for only a limited period of time.
Therefore, many of the brands have a very small market share. We combined brands with a
market share smaller than 3% in each state into one group and named it ‘small brands’. The
sponsored brand and the competing brands with a market share larger than 3% together
account for 60.1% of the total volume sales in selected markets.
The data set also covers weekly price oriented (price reductions) and non-price
oriented (feature and display) promotions for all brands. The data on price oriented sales
promotions indicate whether there was a price reduction equal or greater than 5%. We
combined feature and display promotions into a compound variable named ‘non-price
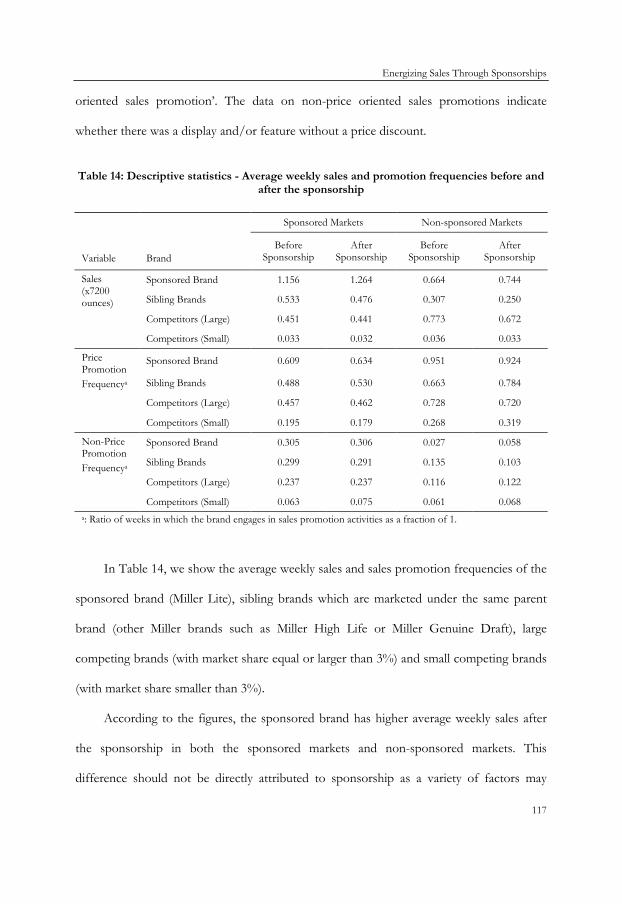
Energizing Sales Through Sponsorships
117
oriented sales promotion’. The data on non-price oriented sales promotions indicate
whether there was a display and/or feature without a price discount.
Table 14: Descriptive statistics - Average weekly sales and promotion frequencies before and after the sponsorship
Sponsored Markets Non-sponsored Markets
Variable Brand Before
Sponsorship After
Sponsorship Before
Sponsorship After
Sponsorship
Sales (x7200 ounces)
Sponsored Brand 1.156 1.264 0.664 0.744
Sibling Brands 0.533 0.476 0.307 0.250
Competitors (Large) 0.451 0.441 0.773 0.672
Competitors (Small) 0.033 0.032 0.036 0.033
Price Promotion Frequencya
Sponsored Brand 0.609 0.634 0.951 0.924
Sibling Brands 0.488 0.530 0.663 0.784
Competitors (Large) 0.457 0.462 0.728 0.720
Competitors (Small) 0.195 0.179 0.268 0.319
Non-Price Promotion Frequencya
Sponsored Brand 0.305 0.306 0.027 0.058
Sibling Brands 0.299 0.291 0.135 0.103
Competitors (Large) 0.237 0.237 0.116 0.122
Competitors (Small) 0.063 0.075 0.061 0.068 a: Ratio of weeks in which the brand engages in sales promotion activities as a fraction of 1.
In Table 14, we show the average weekly sales and sales promotion frequencies of the
sponsored brand (Miller Lite), sibling brands which are marketed under the same parent
brand (other Miller brands such as Miller High Life or Miller Genuine Draft), large
competing brands (with market share equal or larger than 3%) and small competing brands
(with market share smaller than 3%).
According to the figures, the sponsored brand has higher average weekly sales after
the sponsorship in both the sponsored markets and non-sponsored markets. This
difference should not be directly attributed to sponsorship as a variety of factors may

Chapter 4
118
influence the sales. The sponsored brand also seems to increase the frequency of price
promotions over the years in sponsored markets while increasing the frequency of non-
price promotions in non-sponsored markets. Sibling brands and competing brands have
lower average weekly sales volumes during the post-sponsorship period but again the
difference is not necessarily due to the sponsorship.
4.4.2 Team performance
To study the effect of team performance on sales responses to sponsorships, we
collect data on how the performance of sponsored teams changed over the course of the
sponsorships. We use ESPN weekly power rankings to operationalize team performance.
Team rankings are a measure of how the team performed lately. The rankings are
determined by a poll of ESPN.com's senior writers.
Figure 2 shows how team performances change over time. From the figure, it is clear
that there is a great variation in the success of NFL franchises over time. Both teams were
ranked as the top and bottom teams during a 5-year period. For example, the Chicago
Bears earned a trip to the Super Bowl in 2006 only two years after being ranked as the least
successful team in the NFL.
Figure 2: Team performances during 2002-2006 seasons
Energizing Sales Through Sponsorships
119
4.5 Model
To investigate the effects of sponsorship deals on the sales performance of the
partnering and of competing brands, we specify a dynamic linear brand sales model at the
store level (see Ataman et al., 2008; van Heerde et al., 2004 for DLM applications in
marketing; and West & Harrison, 1997 for an extensive overview of DLM models in
general). DLM models capture gradual adjustment patterns (e.g., the effect of sponsorship
on baseline sales and sales promotion effectiveness), neatly incorporate multiple time-
varying parameters and effectively assess how market response parameters vary over time
(e.g., the effect of sales promotions), and retain the hierarchical nature of the data (e.g.,
differences in sales response to sponsorship across brands and markets).
The model includes three types of equations: the observation equation, state
equations, and equations, which accommodate heterogeneity in responses across brands.
4.5.1 The observation equation
The model includes an observation equation for the observed series, which are the
weekly brand sales at the store level. The observation equation distinguishes the baseline
sales of the brand and the short-term fluctuations due to promotional activities and/or
seasonality:
𝑆𝑎𝑙𝑒𝑠𝑖𝑠𝑡 = 𝛼𝑖𝑠𝑡 + 𝛽1𝑖𝑠𝑡𝑋1𝑖𝑠𝑡′ + 𝛽2𝑖𝑠𝑋2𝑖𝑠𝑡′ + 𝜐𝑖𝑠𝑡 (12)
Salesist is the sales of brand i in store s in week t. The sales are standardized to remove
variation across stores. The regressor matrix X1ist includes variables for observed price
oriented sales promotions and non-price oriented sales promotions, which generate short
term fluctuations around the baseline sales αist. The regressor matrix X2ist includes control
variables for seasonality, public holidays, and missing data. We test for seasonal patterns by
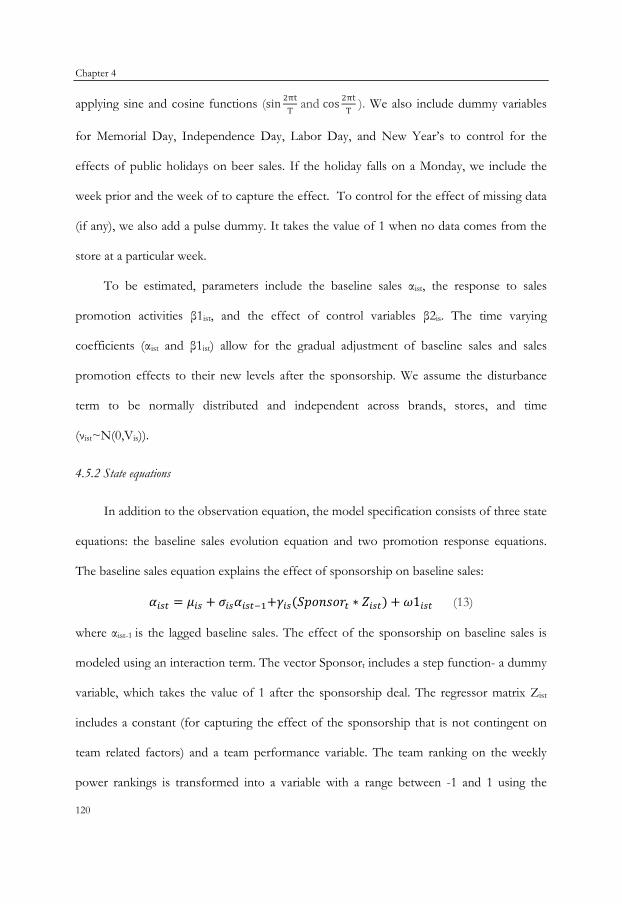
Chapter 4
120
applying sine and cosine functions (sin 2πtT
and cos 2πtT
). We also include dummy variables
for Memorial Day, Independence Day, Labor Day, and New Year’s to control for the
effects of public holidays on beer sales. If the holiday falls on a Monday, we include the
week prior and the week of to capture the effect. To control for the effect of missing data
(if any), we also add a pulse dummy. It takes the value of 1 when no data comes from the
store at a particular week.
To be estimated, parameters include the baseline sales αist, the response to sales
promotion activities β1ist, and the effect of control variables β2is. The time varying
coefficients (αist and β1ist) allow for the gradual adjustment of baseline sales and sales
promotion effects to their new levels after the sponsorship. We assume the disturbance
term to be normally distributed and independent across brands, stores, and time
(νist~N(0,Vis)).
4.5.2 State equations
In addition to the observation equation, the model specification consists of three state
equations: the baseline sales evolution equation and two promotion response equations.
The baseline sales equation explains the effect of sponsorship on baseline sales:
𝛼𝑖𝑠𝑡 = 𝜇𝑖𝑠 + 𝜎𝑖𝑠𝛼𝑖𝑠𝑡−1+𝛾𝑖𝑠(𝑆𝑝𝑜𝑛𝑠𝑜𝑟𝑡 ∗ 𝑍𝑖𝑠𝑡) + 𝜔1𝑖𝑠𝑡 (13)
where αist-1 is the lagged baseline sales. The effect of the sponsorship on baseline sales is
modeled using an interaction term. The vector Sponsort includes a step function- a dummy
variable, which takes the value of 1 after the sponsorship deal. The regressor matrix Zist
includes a constant (for capturing the effect of the sponsorship that is not contingent on
team related factors) and a team performance variable. The team ranking on the weekly
power rankings is transformed into a variable with a range between -1 and 1 using the

Energizing Sales Through Sponsorships
121
following formula: (33-2*Team Ranking)/31. For a team that ranks first among 32 teams in
the power rankings, the team performance is 1. For the lowest ranked team, the team
performance is -1.
To be estimated, parameters include the base sales μis and the carry-over coefficient
σis which captures the speed of adjustment (i.e., when σis = 0, a sponsorship’s effects occur
immediately, as σis approaches to 1, the effects evolve more gradually), γis which captures
the effects of sponsorship on baseline sales. We assume the disturbance term to be
normally distributed and independent across brands, stores, and time (w1ist~N(0, W1is)).
The promotion response equations explain how the effect of sales promotion
activities of the focal brand on sales evolves over time under the influence of the
sponsorship deal. There are two promotional mix equations, one for the effect of price
oriented promotions (β1istpp ) and the other one for the effect of non-price oriented
promotions (β1istnpp).
�𝛽1𝑖𝑠𝑡𝑝𝑝𝛽1𝑖𝑠𝑡𝑛𝑝𝑝
� = �𝜆𝜆𝑖𝑠𝑝𝑝𝜆𝜆𝑖𝑠𝑛𝑝𝑝
� + �𝜑𝑖𝑠𝑝𝑝
00
𝜑𝑖𝑠𝑛𝑝𝑝� �𝛽1𝑖𝑠𝑡−1𝑝𝑝𝛽1𝑖𝑠𝑡−1𝑛𝑝𝑝
� + �𝜓𝑖𝑠𝑝𝑝𝜓𝑖𝑠𝑛𝑝𝑝
� (𝑆𝑝𝑜𝑛𝑠𝑜𝑟𝑡 ∗ 𝑍𝑖𝑠𝑡) + �𝑤2𝑡𝑝𝑝𝑤2𝑡𝑛𝑝𝑝
� (14)
β1ist-1 is the lagged effect of promotional activities. To be estimated, parameters
include the intercept 𝜆𝜆is, ψis which captures how the effect of marketing activities on sales
changes due to the sponsorship, and the adjustment rate φis. The adjustment rate captures
the speed of adjustment to a new equilibrium. When φis =0, a sponsorship’s effect on
promotion response occurs immediately. As φis approaches to 1, the promotion response
adjusts to its new level in a more gradual manner. We assume the disturbance term to be
normally distributed and independent across brands, stores, and time (w2ist~N(0, W2is)).
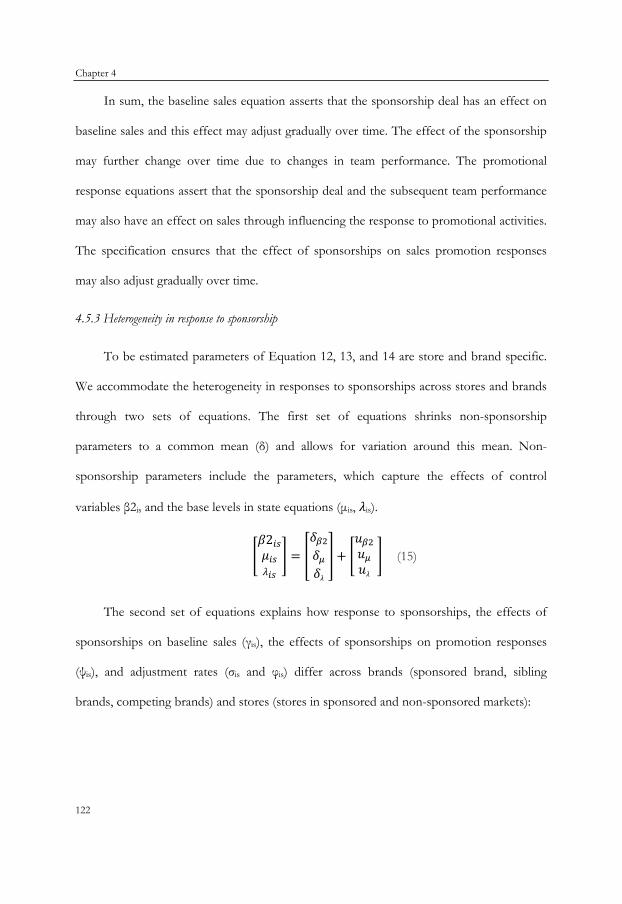
Chapter 4
122
In sum, the baseline sales equation asserts that the sponsorship deal has an effect on
baseline sales and this effect may adjust gradually over time. The effect of the sponsorship
may further change over time due to changes in team performance. The promotional
response equations assert that the sponsorship deal and the subsequent team performance
may also have an effect on sales through influencing the response to promotional activities.
The specification ensures that the effect of sponsorships on sales promotion responses
may also adjust gradually over time.
4.5.3 Heterogeneity in response to sponsorship
To be estimated parameters of Equation 12, 13, and 14 are store and brand specific.
We accommodate the heterogeneity in responses to sponsorships across stores and brands
through two sets of equations. The first set of equations shrinks non-sponsorship
parameters to a common mean (δ) and allows for variation around this mean. Non-
sponsorship parameters include the parameters, which capture the effects of control
variables β2is and the base levels in state equations (μis, 𝜆𝜆is).
�𝛽2𝑖𝑠𝜇𝑖𝑠𝜆𝜆𝑖𝑠
� = �𝛿𝛽2𝛿𝜇𝛿𝜆𝜆� + �
𝑢𝛽2𝑢𝜇𝑢𝜆𝜆
� (15)
The second set of equations explains how response to sponsorships, the effects of
sponsorships on baseline sales (γis), the effects of sponsorships on promotion responses
(ψis), and adjustment rates (σis and φis) differ across brands (sponsored brand, sibling
brands, competing brands) and stores (stores in sponsored and non-sponsored markets):

Energizing Sales Through Sponsorships
123
�
𝛾𝑖𝑠𝜓𝑖𝑠𝜎𝑖𝑠𝜑𝑖𝑠
� =
⎣⎢⎢⎡𝜂0𝛾𝜂0𝜓𝜂0𝜎𝜂0𝜑⎦
⎥⎥⎤
+
⎣⎢⎢⎡𝜂1𝛾𝜂1𝜓𝜂1𝜎𝜂1𝜑⎦
⎥⎥⎤𝑆𝐵𝑖 +
⎣⎢⎢⎡𝜂2𝛾𝜂2𝜓𝜂2𝜎𝜂2𝜑⎦
⎥⎥⎤𝐿𝐵𝑖 +
⎣⎢⎢⎡𝜂3𝛾𝜂3𝜓𝜂3𝜎𝜂3𝜑⎦
⎥⎥⎤𝑆𝑀𝑠
+
⎣⎢⎢⎡𝜂4𝛾𝜂4𝜓𝜂4𝜎𝜂4𝜑⎦
⎥⎥⎤
(𝑆𝐵𝑠 ∗ 𝑆𝑀𝑖) +
⎣⎢⎢⎡𝜂5𝛾𝜂5𝜓𝜂5𝜎𝜂5𝜑⎦
⎥⎥⎤
(𝐿𝐵𝑖 ∗ 𝑆𝑀𝑠) + �
𝜀𝛾𝜀𝜓𝜀𝜎𝜀𝜑
� (16)
where SBi and LBi are dummy variables, which respectively indicate whether the focal
brand is a sponsored brand or a sibling brand. SMs is the dummy variable, which takes the
value of 1 if the store s is in the sponsored market. To be estimated, parameters include the
intercept, the coefficients of three dummy variables and the interaction terms. The
parameters of the interaction terms (SBs*SMi) and (LBi*SMs) are of central importance to
test for the effects of sponsorship on sponsored brands and sibling brands’ sales
performance. We assume all disturbance terms to be normally distributed (ε~N(0, Σ)).
4.5.4 Estimation procedure
We estimate the equation parameters using the Gibbs sampling procedure. We apply
the forward-filtering, backward-sampling algorithm (see Carter & Kohn, 1994; Frühwirth‐
Schnatter, 1994) to obtain the estimates of the time varying parameters, namely the baseline
sales, the effect of sponsorship, and the effect of marketing activities. Assuming a diagonal
error covariance matrix for both observation and state equations, we place an inverse
Gamma prior on the diagonal elements of matrices. We place multivariate normal priors on
the other parameters.
4.6 Estimation Results
We estimate the DLM model running the sample chain for 55,000 iterations using a
Gibbs sampler (25000 for burn-in and 30000 for sampling). We estimate the parameters for

Chapter 4
124
the sponsored brand, the sibling brands, and each of the competing brands with a market
share larger than 3%. We estimate three sets of non-time varying parameters: (1) non-
sponsorship parameters, which capture the effect of control variables and base levels in
state equations; (2) sponsorship parameters, which capture the effect of sponsorship on
state variables; and (3) autoregressive parameters, which capture the amount of carryover
effects.
4.6.1 Estimates of non-sponsorship parameters
In the observation equation (Equation 12) we estimate the control variable
parameters such as seasonality parameters and the time-varying parameters. For each time
varying parameter we specify a state equation (Equation 13 and 14). There are three state
equations in our model: the baseline sales equation and two promotion response equations.
Each state equation includes a constant variable. The parameter for the constant in baseline
sales equation captures the base sales (i.e., the long run equilibrium sales before the
sponsorship). The parameters for constants in the promotion response equations indicate
the base level of additional sales during promotion weeks. We shrink each of the non-
sponsorship parameter in the observation equation and state equations to a common mean
(Equation 15). Table 15 shows the median of the hierarchical means, the median of the
estimated hierarchical variances, and 95% credible intervals for non-sponsorship
parameters.
Table 15 indicates that the 95% confidence interval excludes zero for all seasonality
variables. According to the results, the sales exhibit a seasonal pattern increasing during
summer months and reaching a peak at 30th week in a 52 week year (around late July). Sales
also increase during public holidays. Independence Day, July 4th, seems to be the biggest
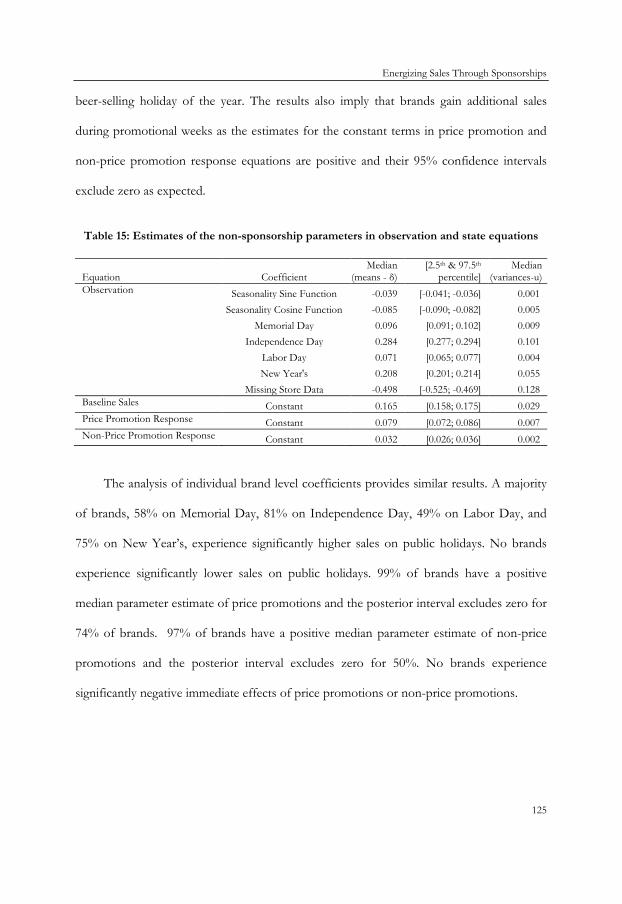
Energizing Sales Through Sponsorships
125
beer-selling holiday of the year. The results also imply that brands gain additional sales
during promotional weeks as the estimates for the constant terms in price promotion and
non-price promotion response equations are positive and their 95% confidence intervals
exclude zero as expected.
Table 15: Estimates of the non-sponsorship parameters in observation and state equations
Equation Coefficient Median
(means - δ) [2.5th & 97.5th
percentile] Median
(variances-u) Observation Seasonality Sine Function -0.039 [-0.041; -0.036] 0.001
Seasonality Cosine Function -0.085 [-0.090; -0.082] 0.005 Memorial Day 0.096 [0.091; 0.102] 0.009
Independence Day 0.284 [0.277; 0.294] 0.101 Labor Day 0.071 [0.065; 0.077] 0.004 New Year's 0.208 [0.201; 0.214] 0.055
Missing Store Data -0.498 [-0.525; -0.469] 0.128 Baseline Sales Constant 0.165 [0.158; 0.175] 0.029 Price Promotion Response Constant 0.079 [0.072; 0.086] 0.007 Non-Price Promotion Response Constant 0.032 [0.026; 0.036] 0.002
The analysis of individual brand level coefficients provides similar results. A majority
of brands, 58% on Memorial Day, 81% on Independence Day, 49% on Labor Day, and
75% on New Year’s, experience significantly higher sales on public holidays. No brands
experience significantly lower sales on public holidays. 99% of brands have a positive
median parameter estimate of price promotions and the posterior interval excludes zero for
74% of brands. 97% of brands have a positive median parameter estimate of non-price
promotions and the posterior interval excludes zero for 50%. No brands experience
significantly negative immediate effects of price promotions or non-price promotions.
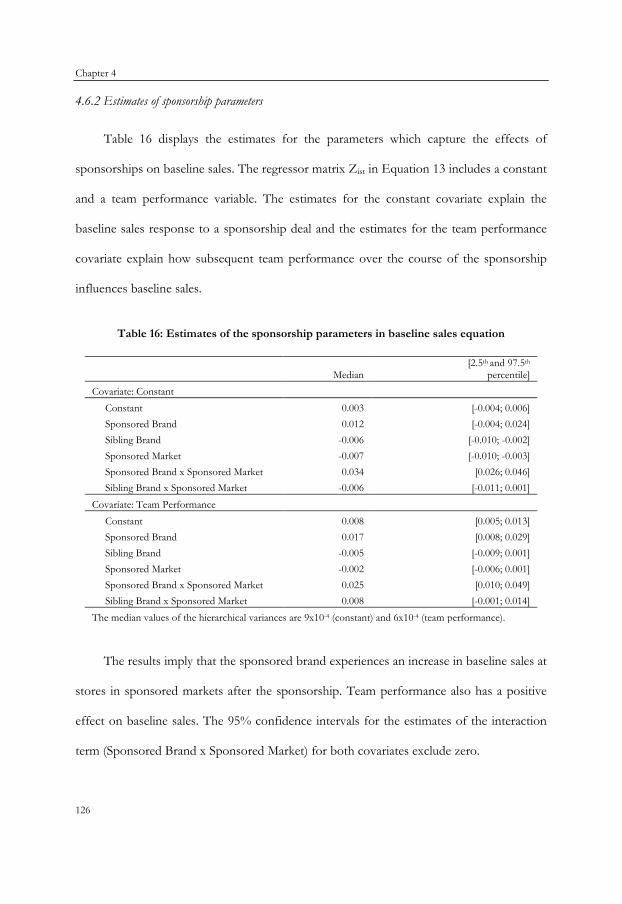
Chapter 4
126
4.6.2 Estimates of sponsorship parameters
Table 16 displays the estimates for the parameters which capture the effects of
sponsorships on baseline sales. The regressor matrix Zist in Equation 13 includes a constant
and a team performance variable. The estimates for the constant covariate explain the
baseline sales response to a sponsorship deal and the estimates for the team performance
covariate explain how subsequent team performance over the course of the sponsorship
influences baseline sales.
Table 16: Estimates of the sponsorship parameters in baseline sales equation
Median [2.5th and 97.5th
percentile] Covariate: Constant
Constant 0.003 [-0.004; 0.006] Sponsored Brand 0.012 [-0.004; 0.024] Sibling Brand -0.006 [-0.010; -0.002] Sponsored Market -0.007 [-0.010; -0.003] Sponsored Brand x Sponsored Market 0.034 [0.026; 0.046] Sibling Brand x Sponsored Market -0.006 [-0.011; 0.001]
Covariate: Team Performance Constant 0.008 [0.005; 0.013] Sponsored Brand 0.017 [0.008; 0.029] Sibling Brand -0.005 [-0.009; 0.001] Sponsored Market -0.002 [-0.006; 0.001] Sponsored Brand x Sponsored Market 0.025 [0.010; 0.049] Sibling Brand x Sponsored Market 0.008 [-0.001; 0.014]
The median values of the hierarchical variances are 9x10⁻⁴ (constant) and 6x10⁻⁴ (team performance).
The results imply that the sponsored brand experiences an increase in baseline sales at
stores in sponsored markets after the sponsorship. Team performance also has a positive
effect on baseline sales. The 95% confidence intervals for the estimates of the interaction
term (Sponsored Brand x Sponsored Market) for both covariates exclude zero.
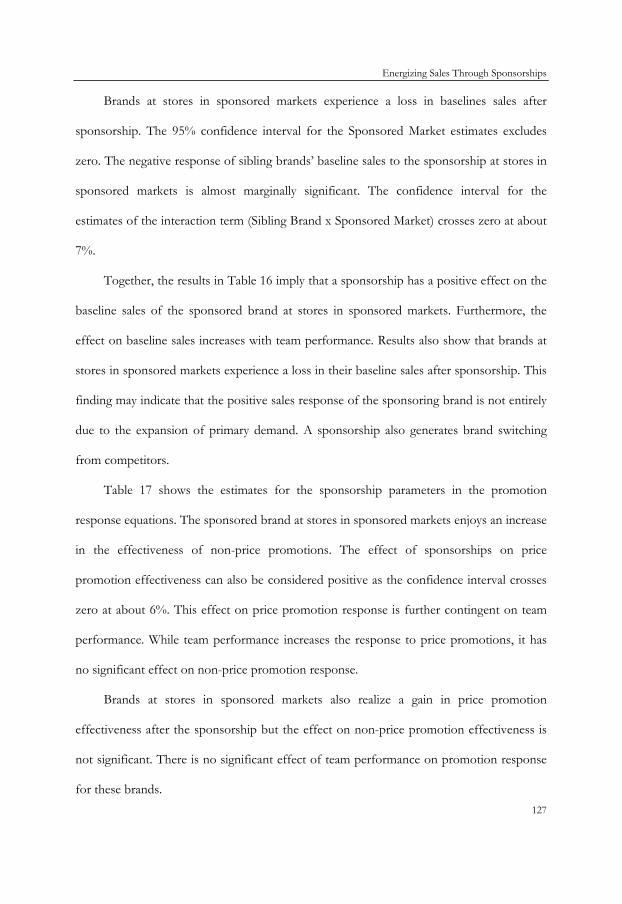
Energizing Sales Through Sponsorships
127
Brands at stores in sponsored markets experience a loss in baselines sales after
sponsorship. The 95% confidence interval for the Sponsored Market estimates excludes
zero. The negative response of sibling brands’ baseline sales to the sponsorship at stores in
sponsored markets is almost marginally significant. The confidence interval for the
estimates of the interaction term (Sibling Brand x Sponsored Market) crosses zero at about
7%.
Together, the results in Table 16 imply that a sponsorship has a positive effect on the
baseline sales of the sponsored brand at stores in sponsored markets. Furthermore, the
effect on baseline sales increases with team performance. Results also show that brands at
stores in sponsored markets experience a loss in their baseline sales after sponsorship. This
finding may indicate that the positive sales response of the sponsoring brand is not entirely
due to the expansion of primary demand. A sponsorship also generates brand switching
from competitors.
Table 17 shows the estimates for the sponsorship parameters in the promotion
response equations. The sponsored brand at stores in sponsored markets enjoys an increase
in the effectiveness of non-price promotions. The effect of sponsorships on price
promotion effectiveness can also be considered positive as the confidence interval crosses
zero at about 6%. This effect on price promotion response is further contingent on team
performance. While team performance increases the response to price promotions, it has
no significant effect on non-price promotion response.
Brands at stores in sponsored markets also realize a gain in price promotion
effectiveness after the sponsorship but the effect on non-price promotion effectiveness is
not significant. There is no significant effect of team performance on promotion response
for these brands.

Chapter 4
128
Table 17: Estimates of sponsorship parameters in promotion response equations
Effect on
Price Promotion Response Non-Price Promotion Response
Median [2.5th and 97.5th percentile] Median [2.5th and 97.5th
percentile] Covariate: Constant
Constant -0.010 [-0.015; -0.005] 0.001 [-0.003; 0.005] Sponsored Brand 0.019 [0.004; 0.034] 0.004 [-0.015; 0.020] Sibling Brand 0.003 [-0.003; 0.009] -0.001 [-0.003; 0.002] Sponsored Market 0.010 [0.004; 0.017] 0.003 [-0.001; 0.008] Sponsored Brand x Sponsored Market 0.016 [-0.002; 0.032] 0.005 [0.001; 0.024] Sibling Brand x Sponsored Market -0.005 [-0.012; 0.004] 0.001 [-0.003; 0.003]
Covariate: Team Performance Constant -0.001 [-0.009; 0.005] 0.002 [-0.002; 0.008] Sponsored Brand -0.003 [-0.017; 0.012] -0.008 [-0.033; 0.023] Sibling Brand -0.001 [-0.002; 0.002] -0.001 [-0.002; 0.002] Sponsored Market 0.006 [-0.002; 0.014] 0.002 [-0.004; 0.009] Sponsored Brand x Sponsored Market 0.036 [0.015; 0.118] 0.014 [-0.043; 0.071] Sibling Brand x Sponsored Market 0.001 [-0.002; 0.004] 0.001 [-0.003; 0.003]
The median values of the hierarchical variances are 4x10⁻⁴ (constant) and 3x10⁻⁴ (team performance) in the price promotion response equation. The median values of the hierarchical variances are 1x10⁻⁴ (constant) and 1x10⁻⁴ (team performance) in the price promotion response equation.
4.6.3 Estimates of autoregressive parameters
Our model includes three state equations and each state equation includes an
autoregressive parameter which represents the amount of carry-over effects (or the speed
of adjustment into a new equilibrium after the sponsorship). Table 18 displays the
parameter estimates for autoregressive parameters.
To better interpret the results for the autoregressive parameters, we compute 90%
duration intervals for the sponsored brands, sibling brands, and competing brands in the
sponsored market using the median values of autoregressive parameters. The 90% duration
intervals, reported in Table 19, indicate the time needed to realize the 90% of the long term
effect of the sponsorship.

Energizing Sales Through Sponsorships
129
Table 18: Estimates of autoregressive parameters
Equation
Median [2.5th and 97.5th percentile]
Baseline Sales Constant 0.626 [0.610; 0.644]
Sponsored Brand 0.109 [0.051; 0.120] Sibling Brand -0.057 [-0.071; -0.036] Sponsored Market 0.009 [0.002; 0.014] Sponsored Brand x Sponsored Market -0.196 [-0.210; -0.146] Sibling Brand x Sponsored Market 0.110 [0.082;0.129]
Price Promotion Response
Constant 0.212 [0.185; 0.243]
Sponsored Brand -0.017 [-0.146; 0.078] Sibling Brand -0.097 [-0.189; 0.029] Sponsored Market -0.028 [-0.063; 0.009] Sponsored Brand x Sponsored Market -0.105 [-0.210; 0.024] Sibling Brand x Sponsored Market 0.089 [-0.034; 0.185]
Non-Price Promotion Response
Constant 0.169 [0.119; 0.215]
Sponsored Brand -0.008 [-0.144; 0.175] Sibling Brand 0.020 [-0.079; 0.126] Sponsored Market -0.040 [-0.082; 0.008] Sponsored Brand x Sponsored Market -0.105 [-0.303; 0.047] Sibling Brand x Sponsored Market -0.034 [-0.129;0.052]
Table 19: The number of weeks needed to realize the 90% of the long-term effect
Equation
Baseline Sales Price Promotion Response
Non-Price Promotion Response
Sponsored Brands 4 1 1
Sibling Brands 7 2 2 Competing Brands 6 2 2
Sponsored brands realize the 90% of the long-term effects of sponsorship in only 4
weeks. The effect of sponsorship on promotion response parameters materializes almost
instantaneously. The system parameters for sibling brands and competing brands adjust in
a relatively gradual manner. The 90% of the long-term effects of sponsorship on baseline
sales are realized after 7 weeks for sibling brands and 6 weeks for competing brands. The
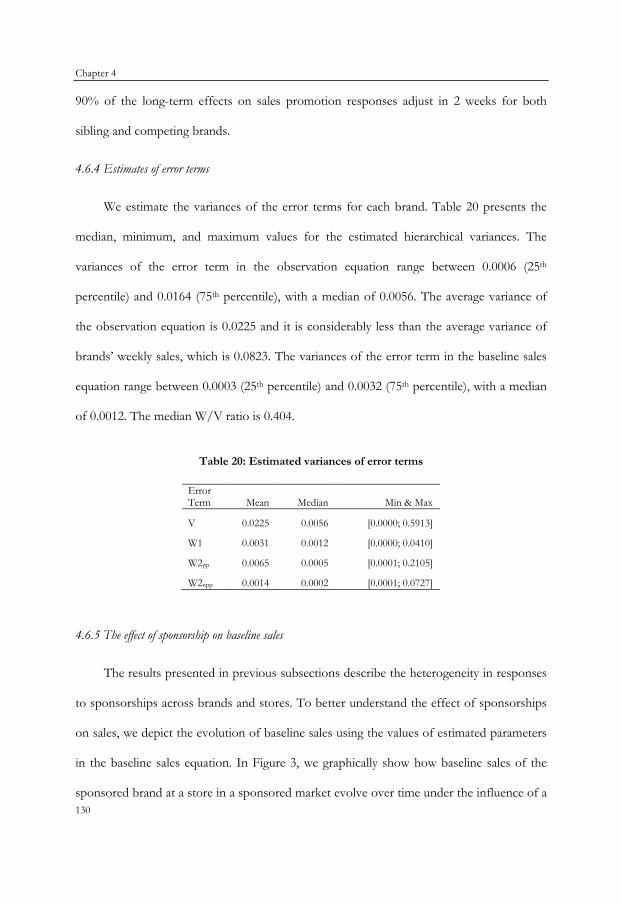
Chapter 4
130
90% of the long-term effects on sales promotion responses adjust in 2 weeks for both
sibling and competing brands.
4.6.4 Estimates of error terms
We estimate the variances of the error terms for each brand. Table 20 presents the
median, minimum, and maximum values for the estimated hierarchical variances. The
variances of the error term in the observation equation range between 0.0006 (25th
percentile) and 0.0164 (75th percentile), with a median of 0.0056. The average variance of
the observation equation is 0.0225 and it is considerably less than the average variance of
brands’ weekly sales, which is 0.0823. The variances of the error term in the baseline sales
equation range between 0.0003 (25th percentile) and 0.0032 (75th percentile), with a median
of 0.0012. The median W/V ratio is 0.404.
Table 20: Estimated variances of error terms
Error Term Mean Median Min & Max
V 0.0225 0.0056 [0.0000; 0.5913]
W1 0.0031 0.0012 [0.0000; 0.0410]
W2pp 0.0065 0.0005 [0.0001; 0.2105]
W2npp 0.0014 0.0002 [0.0001; 0.0727]
4.6.5 The effect of sponsorship on baseline sales
The results presented in previous subsections describe the heterogeneity in responses
to sponsorships across brands and stores. To better understand the effect of sponsorships
on sales, we depict the evolution of baseline sales using the values of estimated parameters
in the baseline sales equation. In Figure 3, we graphically show how baseline sales of the
sponsored brand at a store in a sponsored market evolve over time under the influence of a
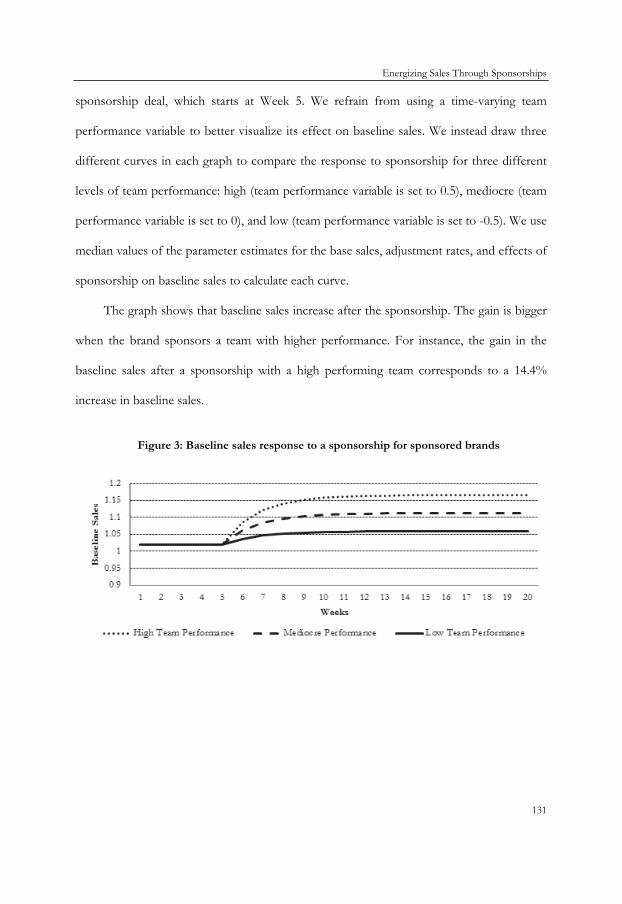
Energizing Sales Through Sponsorships
131
sponsorship deal, which starts at Week 5. We refrain from using a time-varying team
performance variable to better visualize its effect on baseline sales. We instead draw three
different curves in each graph to compare the response to sponsorship for three different
levels of team performance: high (team performance variable is set to 0.5), mediocre (team
performance variable is set to 0), and low (team performance variable is set to -0.5). We use
median values of the parameter estimates for the base sales, adjustment rates, and effects of
sponsorship on baseline sales to calculate each curve.
The graph shows that baseline sales increase after the sponsorship. The gain is bigger
when the brand sponsors a team with higher performance. For instance, the gain in the
baseline sales after a sponsorship with a high performing team corresponds to a 14.4%
increase in baseline sales.
Figure 3: Baseline sales response to a sponsorship for sponsored brands

Chapter 4
132
Figure 4: Baseline sales response to a sponsorship for non-sponsored brands
Figure 4 displays the baseline sales response to a sponsorship for two different types
of brands: a sibling brand and a competing brand. We refrain from depicting different
curves for different levels of team performance to avoid clutter as team performance has
no significant effect on the baseline sales of these brands. Both types of brands experience
a loss in their baseline sales after the sponsorship and the effects evolve gradually. The loss
corresponds to a 10.9% decrease in baseline sales for sibling brands and a 2.8% decrease
for competing brands. Figure 3 and 4 together indicate that the sponsored brand enjoys an
increase in baseline sales after sponsorship and this gain is partly due to brand switching.
However, the sponsoring firm’s other brands which are linked to the sponsored brand are
the ones which experience a relatively bigger loss in their baseline sales.
We compute the long-run effect of sponsorship and team performance on baseline
sales for each brand with 𝛾𝑖𝑠/(1 − 𝜎𝑖𝑠). The long-run effect ranges between 0.062 (25th
percentile) and 0.210 (75th percentile) with a median of 0.116 for sponsoring a mediocre
performance team. The long-run effect of sponsorship on baseline sales is negative for the
majority of competing and sibling brands in the sponsored markets. For competing brands
the effect ranges between -0.033 (25th percentile) and -0.002 (75th percentile) with a median
Energizing Sales Through Sponsorships
133
of -0.014. For sibling brands, the effect ranges between -0.124 (25th percentile) and -0.053
(75th percentile) with a median of -0.071.
4.6.6 The effect of sponsorship on promotion response
The estimates for the sponsorship parameters of the promotional response equations
reveal that the sponsored brand at a store in a sponsored market realizes an increase in the
effectiveness of price-oriented and non-price-oriented sales promotions. The effect on
price promotion effectiveness further increases with team performance. In Figure 5, we
graphically show the evolution of price promotion effectiveness of the sponsored brand at
a store in a sponsored market. The price promotion response evolves under the influence
of a sponsorship deal which starts at Week 5. Similarly, we depict the evolution of non-
price promotion response in Figure 6. Both graphs show that the sponsored brand at a
store in sponsored markets realizes a gain in sales promotion effectiveness after the
sponsorship started.
Figure 5: Price promotion response to a sponsorship for sponsored brands
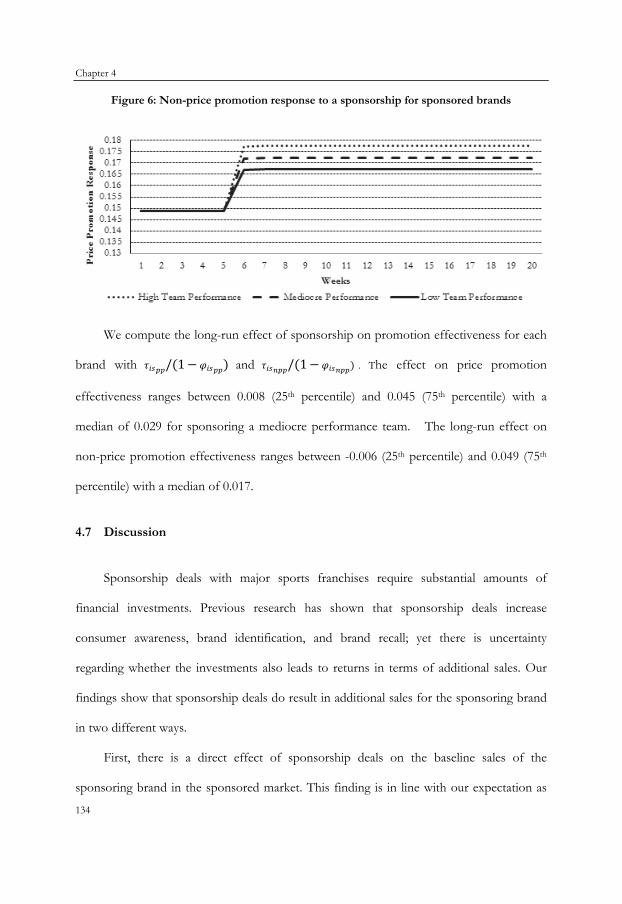
Chapter 4
134
Figure 6: Non-price promotion response to a sponsorship for sponsored brands
We compute the long-run effect of sponsorship on promotion effectiveness for each
brand with 𝜏𝑖𝑠𝑝𝑝/(1−𝜑𝑖𝑠𝑝𝑝) and 𝜏𝑖𝑠𝑛𝑝𝑝/(1−𝜑𝑖𝑠𝑛𝑝𝑝) . The effect on price promotion
effectiveness ranges between 0.008 (25th percentile) and 0.045 (75th percentile) with a
median of 0.029 for sponsoring a mediocre performance team. The long-run effect on
non-price promotion effectiveness ranges between -0.006 (25th percentile) and 0.049 (75th
percentile) with a median of 0.017.
4.7 Discussion
Sponsorship deals with major sports franchises require substantial amounts of
financial investments. Previous research has shown that sponsorship deals increase
consumer awareness, brand identification, and brand recall; yet there is uncertainty
regarding whether the investments also leads to returns in terms of additional sales. Our
findings show that sponsorship deals do result in additional sales for the sponsoring brand
in two different ways.
First, there is a direct effect of sponsorship deals on the baseline sales of the
sponsoring brand in the sponsored market. This finding is in line with our expectation as
Energizing Sales Through Sponsorships
135
we expected a transfer of positive effects from the sponsored team to the sponsoring brand
as the team enjoys consumer liking in their home markets, has a favorable image and
meaning, and consumers have favorable attitudes towards that team. Results further
indicate that the effect increases with team performance. This finding is also in line with
our expectations as stronger team performance drives customer-based brand equity for the
team and allows for a transfer of an increased positive effect.
Second, we find that a sponsoring brand experiences an increased effectiveness of its
sales promotion instruments. This might be due to complimentary functions of sales
promotions and sponsorship deals within the integrated marketing communications
program of a company. A sponsorship deal might influence the earlier stages of the
consumer decision process either by increasing the brand awareness, leading the brand to
enter the consideration set of consumers, or increasing consumers’ liking for the brand.
The reaction to sales promotions, therefore, might increase as consumers become more
attentive and responsive to the sales promotions of the sponsored brand.
In sum, our results reveal that sponsorship deals lead to higher sales of the sponsored
brand. Our results provide insights on how to further increase the economic worth of
sponsorship deals. First, we find that the effect of sponsorship on sales increases with
higher team performance. Therefore, according to our results, the sponsorship decision
should also be based on the (potential) team performance on the field.
Second, firms should give consideration to how a sponsorship might influence the
performance of other brands in their brand portfolio. We show how other brands in the
market are affected by a sponsorship. These results imply that sponsorships generate sales
due to brand switching from competitors. Brands which are linked to the sponsoring brand
seem to experience relatively bigger sales losses after sponsorship. Managers of other
Chapter 4
136
competing brands should also evaluate the effects of sponsorship as the sponsorship has a
negative effect on the baseline sales performance of competing brands.
Third, managers should consider possible interactions with other promotional mix
elements when they engage in sponsorship deals. Our results indicate that sponsorship
increases the effectiveness of sales promotions. Considering synergies between different
promotional mix elements would lead to a more effective allocation of a promotion budget
across different promotional mix elements.
Our study is not without limitations. First, we focus exclusively on the effects of
sponsorship deals on the sales performance of beer brands. The consumers’ response
process to sponsorship activity might be different for product categories where the
perceived product differentiation among leading brands is relatively larger. Further research
should therefore analyze the effects of sponsorship deals in other product categories.
Other active sports sponsors include quick service restaurants, branded food and beverage
manufacturers, insurance firms, airlines, mobile service carriers, and cars. Second, we
examine two sponsorship deals between one brand and two sports franchises. The effect of
sponsorship might be contingent on (i) some team-specific factors such as the size of the
team’s fan base, the overall image of the team, the strength of the bond between the team
and its fans; (ii) some brand specific factors such as brand awareness and brand equity; and
(iii) the fit between the brand and the team. Therefore, further research should address the
effects of sponsorships cross-sectionally for different brands and different teams. Third, we
evaluated the effectiveness of sponsorship deals with NFL teams. NFL is the most
lucrative professional sports league in the world and fans are more likely to recognize the
sponsors of the NFL than the sponsors of other professional sports leagues. Further
research should investigate the effectiveness of sponsorship deals with franchises in other

Energizing Sales Through Sponsorships
137
leagues such as MLB, NBA, NHL, PGA Tour, and NASCAR. Fourth, we only focused on
exclusive sponsorship deal in our study. Further research should investigate how
sponsorship works when two or more competing brands become sponsor of the same
team. In light of our findings and limitations, we hope our study will encourage further
research on sponsorship effects towards a more comprehensive understanding of this
increasingly preferred and economically highly relevant form of marketing communication.
Chapter 4
138
APPENDIX
Model Estimation
The observation equation (Equation 12) and the evolution equations (Equation 13-15) can be written for each brand i, each store s, and each time t as follows:
𝑌𝑖𝑠𝑡 = 𝐹𝑖𝑠𝑡′ 𝜃𝑖𝑠𝑡 + 𝑋𝑖𝑠𝑡𝛽𝑖𝑠 + 𝑣𝑖𝑠𝑡,
𝜃𝑖𝑠𝑡 = 𝐺𝑖𝑠𝜃𝑖𝑠𝑡−1 + ℎ𝑖𝑠𝑡 + 𝑤𝑖𝑠𝑡,
𝑣𝑖𝑠𝑡 ~ 𝑁[0,𝑉𝑖𝑠], 𝑤𝑖𝑠𝑡 = ( 𝑤1𝑖𝑠𝑡 ,𝑤2𝑖𝑠𝑡) ~ 𝑁[0,𝑊𝑖𝑠],
�𝛼𝑖𝑠0𝛽1𝑖𝑠0| 𝐷𝑖𝑠0� ~ 𝑁 ��
𝑚𝛼𝑖𝑠0𝑚𝛽1𝑖𝑠0
� , �𝐶𝛼𝑖𝑠0 0
0 𝐶𝛽1𝑖𝑠0��,
where 𝐹𝑖𝑠𝑡 = [1, 𝑋1𝑖𝑠𝑡]′ , 𝜃𝑖𝑠𝑡 = [𝛼𝑖𝑠𝑡 , 𝛽1𝑖𝑠𝑡]′ , 𝐺𝑖𝑠 = [𝜎𝑖𝑠, 𝜑𝑖𝑠]′ , ℎ𝑖𝑠𝑡 = [𝜇𝑖𝑠, 𝜆𝜆𝑖𝑠]′ +[𝛾𝑖𝑠,𝜓𝑖𝑠]′ ∗ (𝑆𝑝𝑜𝑛𝑠𝑜𝑟𝑡 ∗ 𝑍𝑡)
The following algorithm, dropping the brand subscript i and store subscript s for simplicity, describes how we estimate the model parameters. We repeat Step 1 to 6 for each brand at each store and then we shrink these brand specific parameters in Step 7a and 7b:
Step 1: 𝜃𝑡| 𝑌𝑡,𝑉,𝑊,𝛽,𝐺,ℎ𝑡 .
Following the Forward-filtering backward-sampling algorithm (Carter & Kohn, 1994; Frühwirth-Schnatter, 1994), we first forward filter to obtain the moments 𝑚𝑡 and 𝐶𝑡 for 𝑡 = 1, … ,𝑇.
The posterior for 𝜃𝑡−1 : (𝜃𝑡−1| 𝐷𝑡−1) ~ 𝑁[𝑚𝑡−1,𝐶𝑡−1].
Prior for 𝜃𝑡−1 : (𝜃𝑡| 𝐷𝑡−1) ~ 𝑁[𝑎𝑡 ,𝑅𝑡] where 𝑎𝑡 = 𝐺𝑚𝑡−1 + ℎ𝑡 and 𝑅𝑡 = 𝐺𝐶𝑡−1𝐺′ + 𝑊.
One-step forecast : 𝑌𝑡� | 𝐷𝑡−1 ~ 𝑁(𝑓𝑡 ,𝑄𝑡) where 𝑌𝑡� = 𝑌𝑡 − 𝑋𝑡′𝛽, 𝑓𝑡 =𝐹𝑡𝑎𝑡 and 𝑄𝑡 = 𝐹𝑡𝑅𝑡𝐹𝑡′ + 𝑉.
Posterior for 𝜃𝑡 : 𝜃𝑡|𝐷𝑡 ~ 𝑁[𝑚𝑡 ,𝐶𝑡] where 𝑚𝑡 = 𝑎𝑡 + 𝑅𝑡𝐹𝑡′𝑄𝑡−1(𝑌𝑡� −𝑓𝑡), 𝐶𝑡 = 𝑅𝑡 − 𝑅𝑡𝐹𝑡′𝑄𝑡−1𝐹𝑡𝑅𝑡.
We then sample 𝜃𝑡 at 𝑡 = 𝑇 from (𝜃𝑡 |𝐷𝑡) ~ 𝑁[𝑚𝑡 ,𝐶𝑡]. Next, we sample 𝜃𝑡 backward for 𝑡 = 𝑇 − 1, … , 1 from 𝑝(𝜃𝑡 |𝑄𝑡+1,𝐷𝑡) ~𝑁(𝑞𝑡∗,𝑄𝑡∗), where 𝑞𝑡∗ = 𝑚𝑡 + 𝐵𝑡(𝑄𝑡+1 − 𝑎𝑡+1), 𝑄𝑡∗ = 𝐶𝑡 − 𝐵𝑡𝑅𝑡+1𝐵𝑡′, and 𝐵𝑡 = 𝐶𝑡𝐺′𝑅𝑡+1−1 . We use 𝑚0 = 0 and 𝐶0 = 10.

Energizing Sales Through Sponsorships
139
Step 2: 𝑉 | 𝜃𝑡 ,𝑌𝑡,𝛽.
We place an inverse gamma prior, with (𝑛𝑣0/2, 𝑆𝑣0/2). The full conditional posterior distribution is inverse gamma with (𝑛𝑣1/2, 𝑆𝑣1/2) where 𝑛𝑣1 = 𝑛𝑣0 + 𝑇 and 𝑆𝑣1 = 𝑆𝑣0 + ∑ (𝑌𝑡 − 𝑋𝑡′𝛽 − 𝐹𝑡𝜃𝑡)′(𝑌𝑡 − 𝑋𝑡′𝛽 − 𝐹𝑡𝜃𝑡)𝑇
𝑡=1 . We select a diffuse prior with 𝑛𝑣0=3 and 𝑆𝑣0=0.1.
Step 3: 𝑊 | 𝜃𝑡 ,𝜎,𝜑, 𝜇, 𝛾, 𝜆𝜆,𝜓.
We place an inverse gamma prior, with (𝑛𝑤0/2, 𝑆𝑤0/2). The full conditional posterior distribution is inverse gamma with (𝑛𝑤1/2, 𝑆𝑤1/2) where 𝑛𝑤1 = 𝑛𝑤0 + 𝑇 and 𝑆𝑤1 = 𝑆𝑤0 + ∑ (𝜃𝑡 − 𝐺𝜃𝑡−1 − ℎ𝑡)′(𝜃𝑡 − 𝐺𝜃𝑡−1 − ℎ𝑡)𝑇
𝑡=1 . We select a diffuse prior 𝑛𝑤0=3 and 𝑆𝑤0=0.1.
Step 4: 𝜎,𝜑 | 𝜃𝑡,𝑊, 𝜇, 𝛾, 𝜆𝜆,𝜓.
We discuss the estimation of 𝜎. The estimation of 𝜑 follows directly. We define 𝜎 = 𝑒𝜉
1+𝑒𝜉
and the prior on the parameters is normal with 𝜉 ~ 𝑁(𝜁𝜉 , 𝑜𝜉). We use a random walk
Metropolis-Hastings step to draw 𝜉 . The candidate 𝜉 at iteration 𝑚 is generated by 𝜉(𝑚) = 𝜉(𝑚−1) + 𝑧 where 𝑧 is a random draw from 𝑁(0, 𝜅𝐼). We select 𝜅 such that the acceptance rate is between 20% – 50%. The candidate 𝜉(𝑚) is accepted when 𝛼 ≥ 𝑢 where 𝑢 is uniform with 𝑢 ~ 𝑈(0,1) and
𝛼 =𝑒−
12(𝜉(𝑚)−𝜁𝜉)′𝑜𝜉(𝜉(𝑚)−𝜁𝜉)
𝑒−12�𝜉
(𝑚−1)−𝜁𝜉�′𝑜𝜉�𝜉(𝑚−1)−𝜁𝜉�
∗𝑒−12(𝜃𝑡−
𝑒𝜉(𝑚)
1+𝑒𝜉(𝑚)𝜃𝑡−1−ℎ𝑡)𝑊𝑇−1(𝜃𝑡−
𝑒𝜉(𝑚)
1+𝑒𝜉(𝑚)𝜃𝑡−1−ℎ𝑡)′
𝑒−12(𝜃𝑡−
𝑒𝜉(𝑚−1)
1+𝑒𝜉(𝑚−1)𝜃𝑡−1−ℎ𝑡)𝑊𝑇−1(𝜃𝑡−
𝑒𝜉(𝑚−1)
1+𝑒𝜉(𝑚−1)𝜃𝑡−1−ℎ𝑡)′
Step 5: 𝜇, 𝛾, 𝜆𝜆,𝜓 | 𝜃𝑡 ,𝑊,𝜎,𝜑.
We define 𝜌 = [𝜇, 𝛾] and 𝐾𝑡 = [ 𝐼𝑡 , (𝑆𝑝𝑜𝑛𝑠𝑜𝑟𝑡 ∗ 𝑍𝑡)] . The prior on the parameters is normal with 𝜌 ~ 𝑁(𝜁𝜌, 𝑜𝜌) . Then, the full conditional posterior is normal with
𝜌 ~ 𝑁(𝜁𝜌, 𝑜𝜌) where 𝜁𝜌 = 𝜊𝜌 �𝜊𝜌−1𝜁𝜌 + �𝐾𝑡𝑊𝑇−1𝜃𝑡�� , 𝜊𝜌 = {𝜊𝜌−1 + [𝐾𝑡𝑊𝑇
−1𝐾𝑡′]}−1 ,
𝜃𝑡 = 𝜃𝑡 − 𝜆𝜆𝜃𝑡−1 and 𝑊𝑇 = 𝑊⊗ 𝐼𝑇. The estimation of 𝜌 = [𝜆𝜆,𝜓] follows directly.
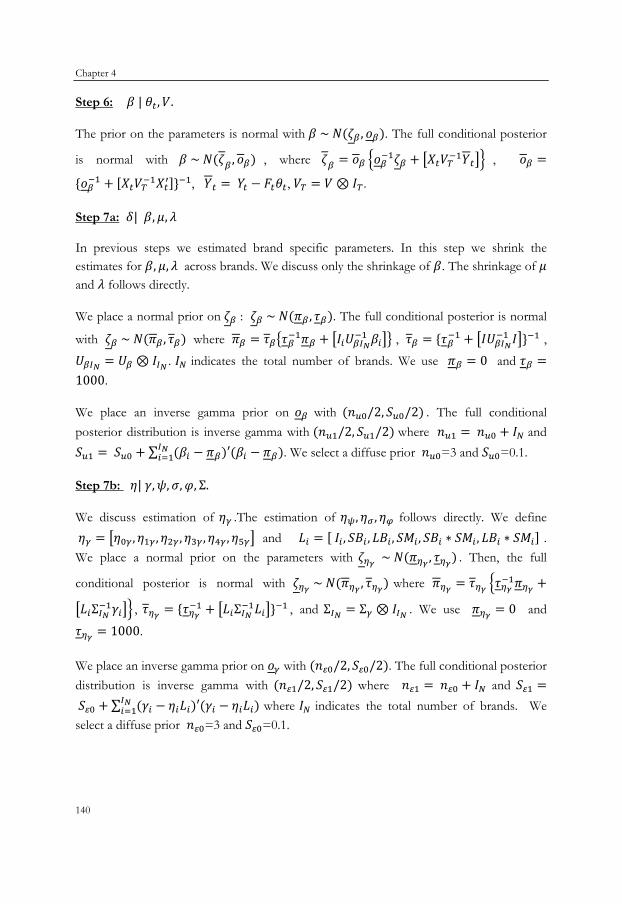
Chapter 4
140
Step 6: 𝛽 | 𝜃𝑡,𝑉.
The prior on the parameters is normal with 𝛽 ~ 𝑁(𝜁𝛽 , 𝜊𝛽). The full conditional posterior
is normal with 𝛽 ~ 𝑁(𝜁𝛽 , 𝜊𝛽) , where 𝜁𝛽 = 𝜊𝛽 �𝜊𝛽−1𝜁𝛽 + �𝑋𝑡𝑉𝑇−1𝑌𝑡�� , 𝜊𝛽 =
{𝜊𝛽−1 + [𝑋𝑡𝑉𝑇−1𝑋𝑡′]}−1, 𝑌𝑡 = 𝑌𝑡 − 𝐹𝑡𝜃𝑡, 𝑉𝑇 = 𝑉 ⊗ 𝐼𝑇.
Step 7a: 𝛿| 𝛽, 𝜇, 𝜆𝜆
In previous steps we estimated brand specific parameters. In this step we shrink the estimates for 𝛽, 𝜇, 𝜆𝜆 across brands. We discuss only the shrinkage of 𝛽. The shrinkage of 𝜇 and 𝜆𝜆 follows directly.
We place a normal prior on 𝜁𝛽 : 𝜁𝛽 ~ 𝑁(𝜋𝛽 , 𝜏𝛽). The full conditional posterior is normal
with 𝜁𝛽 ~ 𝑁(𝜋𝛽 , 𝜏𝛽) where 𝜋𝛽 = 𝜏𝛽�𝜏𝛽−1𝜋𝛽 + �𝐼𝑖𝑈𝛽𝐼𝑁−1 𝛽𝑖�� , 𝜏𝛽 = {𝜏𝛽−1 + �𝐼𝑈𝛽𝐼𝑁
−1 𝐼�}−1 ,
𝑈𝛽𝐼𝑁 = 𝑈𝛽 ⊗ 𝐼𝐼𝑁 . 𝐼𝑁 indicates the total number of brands. We use 𝜋𝛽 = 0 and 𝜏𝛽 =1000.
We place an inverse gamma prior on 𝑜𝛽 with (𝑛𝑢0/2, 𝑆𝑢0/2) . The full conditional posterior distribution is inverse gamma with (𝑛𝑢1/2, 𝑆𝑢1/2) where 𝑛𝑢1 = 𝑛𝑢0 + 𝐼𝑁 and 𝑆𝑢1 = 𝑆𝑢0 + ∑ (𝛽𝑖 − 𝜋𝛽)′(𝛽𝑖 − 𝜋𝛽)𝐼𝑁
𝑖=1 . We select a diffuse prior 𝑛𝑢0=3 and 𝑆𝑢0=0.1.
Step 7b: 𝜂| 𝛾,𝜓,𝜎,𝜑, Σ.
We discuss estimation of 𝜂𝛾 .The estimation of 𝜂𝜓, 𝜂𝜎 , 𝜂𝜑 follows directly. We define 𝜂𝛾 = �𝜂0𝛾, 𝜂1𝛾, 𝜂2𝛾, 𝜂3𝛾, 𝜂4𝛾, 𝜂5𝛾� and 𝐿𝑖 = [ 𝐼𝑖 , 𝑆𝐵𝑖 , 𝐿𝐵𝑖 , 𝑆𝑀𝑖 , 𝑆𝐵𝑖 ∗ 𝑆𝑀𝑖 , 𝐿𝐵𝑖 ∗ 𝑆𝑀𝑖] . We place a normal prior on the parameters with 𝜁𝜂𝛾 ~ 𝑁(𝜋𝜂𝛾 , 𝜏𝜂𝛾) . Then, the full
conditional posterior is normal with 𝜁𝜂𝛾 ~ 𝑁(𝜋𝜂𝛾 , 𝜏𝜂𝛾) where 𝜋𝜂𝛾 = 𝜏𝜂𝛾 �𝜏𝜂𝛾−1𝜋𝜂𝛾 +
�𝐿𝑖Σ𝐼𝑁−1𝛾𝑖�� , 𝜏𝜂𝛾 = {𝜏𝜂𝛾
−1 + �𝐿𝑖Σ𝐼𝑁−1𝐿𝑖�}−1 , and Σ𝐼𝑁 = Σ𝛾 ⊗ 𝐼𝐼𝑁 . We use 𝜋𝜂𝛾 = 0 and
𝜏𝜂𝛾 = 1000.
We place an inverse gamma prior on 𝑜𝛾 with (𝑛𝜀0/2, 𝑆𝜀0/2). The full conditional posterior distribution is inverse gamma with (𝑛𝜀1/2, 𝑆𝜀1/2) where 𝑛𝜀1 = 𝑛𝜀0 + 𝐼𝑁 and 𝑆𝜀1 = 𝑆𝜀0 + ∑ (𝛾𝑖 − 𝜂𝑖𝐿𝑖)′(𝛾𝑖 − 𝜂𝑖𝐿𝑖)
𝐼𝑁𝑖=1 where 𝐼𝑁 indicates the total number of brands. We
select a diffuse prior 𝑛𝜀0=3 and 𝑆𝜀0=0.1.
141
Chapter 5
Conclusion
his dissertation consists of three research papers on the effectiveness of some
of the most commonly utilized revitalization strategies in consumer products
markets. This final chapter reviews their main findings of each study included
in this dissertation, highlights theoretical contributions, discusses managerial implications
for practitioners, and finally, suggests future research avenues.
5.1 Firm Value Effects of Brand Divestitures
For several years, consumer products manufacturers have devoted much of their
attention to expanding their brand offerings through launching new brands or subbrands
to sustain growth in their corresponding markets. For example, the 70s and 80s were the
golden age of mergers, brand acquisitions, and brand creations, as popular ways for
companies to extend their geographical footprint, expand market power, meet consumers’
T
Chapter 5
142
evolving and ever-increasing need for variety, and gain economies of scale. These efforts,
however, often resulted in increased complexity and decreased brand strength. As new
brands frequently come in to the market and consumer preferences continually evolve,
brand portfolios have been littered with brands which were once strong and relevant but
were unsuccessful to meet the changing needs of the competitive marketplace. For many
firms, the bulk of the profits come from only a small number of brands (Kumar, 2003).
Bloated brand portfolios have increased managerial complexity, decreased focus, and
eventually, pulled back large gains achieved in previous years. Several consumer product
manufacturers, therefore, have engaged in rationalization efforts to release resources and
reallocate them to meet the needs of the retained brands in the portfolio. They have
followed different strategies and realized diverse outcomes of brand divestitures in terms of
firm performance. In line with these considerations, the first research paper in my
dissertation empirically investigates the effects of different types of focus-increasing brand
divestitures on firm value.
I integrate two common motives for focus-increasing brand divestitures, global
branding and refocusing on core businesses, in a single common framework. Utilizing an
event study, I assess the stock market's reaction to a firm's brand divestment activities and
investigate whether the divested brand’s industry relatedness and geographical scope
influence firm value effects of focus increasing brand divestitures. Analyzing a large set of
divestment announcements in the global food and beverage industries, I find that the
divestiture of brands with low relatedness and low geographical scope enhances firm value.
However, my results also show that, on average, firms experience negative firm value
effects of divesting brands with high geographical scope or high relatedness. Although
divesting core business brands with low geographical scope, for the purpose of focusing on
Conclusion
143
global brands, is a very common form of brand divestitures, it appears to destroy firm
value, especially in home regions where companies typically enjoy higher profit margins.
This study contributes to both the international business literature and the strategic
marketing literature by empirically investigating the firm value effects of brand divestitures
from a multidisciplinary perspective. The international business literature provides insights
on the firm value effects of divesting non-core business assets but the focus is not
specifically on brand assets (Desai & Jain, 1999; John & Ofek, 1995). The international
branding literature discusses the advantages of rationalizing local brands and focusing on a
few number of core, global brands (e.g., Kapferer, 2002; Schuiling & Kapferer, 2004) but
does not provide any empirical evidence for possible firm value-enhancing effects of brand
divestitures.
This study provides relevant implications for managers of rationalizing firms. The
findings indicate that companies should rationalize their portfolio through eliminating
brands with low geographical scope and low relatedness. Earlier marketing studies (Meyer,
2006; Meyer, 2009) argue that refocusing on core businesses and global branding are
simultaneously redesigning firms’ business activities. In this study, I show that brand
divestitures undertaken for global-focusing purposes do not always enhance firm value.
Eliminating local favorites in favor of global brands in core businesses can be risky.
Therefore, companies should rationalize their brand offerings toward a portfolio that
follow a multi-tier branding strategy in core businesses. Such a portfolio of global and local
brands will serve different segments of the market. Companies can enjoy higher margins
by attracting premium segments with global brands and enjoy greater market shares by
fulfilling fragmented consumer needs with local brands.
Chapter 5
144
In this research I conducted an event study which uses shareholder returns as a proxy
for firm value. It would be interesting to investigate how brand divestitures influence other
measures of firm performance such as revenues, profits, production efficiency, and
operating margins (see Srinivasan & Hanssens, 2009 for a review of methods and metrics
used in assessing the effect of marketing on firm value). Further research could also
explore whether other brand (e.g., age, perceived quality, channel specificity, brand
performance), firm (e.g., number of brands in the portfolio, liquidity, managerial
experience), and market (e.g., market size, market growth rate) characteristics moderate the
effects of brand divestitures on firm value (see Varadarajan et al., 2006 for a comprehensive
list of brand, firm, and market characteristics which drive firms' divestiture decisions).
5.2 Who Benefits from Brand Exits? Why?
As it was also discussed in Chapter 2, the number of brands in many consumer
products categories has increased dramatically in recent years (Carlotti et al., 2004).
Meanwhile, the rise of private label products has encouraged retailers to devote less shelf
space for branded products. While the number of brands is continually increasing while
shelf space becomes scarce, several consumer brand manufacturers have faced with
complex decisions about which brands to place on shelves. They have started pruning weak
brands and built their strategies around a small set of leading brands rather than negotiating
shelf space for a large number of small brands (Court, French, Knudsen, & Webb, 2006).
Retailers, simultaneously, have reduced the number of national brands to free up shelf
space for their expanding private label offerings and/or optimize their assortments (Sloot
& Verhoef, 2008). As a result several brands have disappeared from store shelves.
Conclusion
145
The increasing number of brand exits raises several questions regarding what might
happen in the aftermath of an exit. When a brand disappears from the market, which of
the remaining brands are best positioned to claim the demand that frees up? How should
firms manage their brand portfolios to cover the market segment of the deleted brand?
Given the wider managerial relevance of these questions, the second research paper in my
dissertation focuses on the aftermath of brand exits and investigates who benefits from
brand exits and why. More specifically, I examine how sales of an incumbent brand
respond to a brand exit and identify the long term drivers of demand redistribution
following the exit. I develop a dynamic linear brand sales response model that allows for
gradual adjustment of brand exit effects and relates these effects to brand characteristics,
attribute similarity of brands, and marketing efforts of the incumbent brand.
Applying the model to 96 brand exit events and analyzing the sales response of 555
incumbent brands across 2 repeat-purchase product categories (deodorant and milk), I find
that brand characteristics, attribute similarities, and post-exit marketing strategies explain
variations in sales response to a brand exit. Results of the analysis in the milk category
imply that higher market share incumbent brands tend to gain less after brand exits.
Incumbent brands tend to gain more from an exit as the market share of the deleted brand
increases. In the deodorant category, however, both effects are negligible. Results also
suggest that incumbent brands which are similar to the deleted brands on certain product
attributes stand to gain from the exit disproportionally. For example, gains from an exit
increase with package similarity for incumbent milk brands. In the deodorant category,
similarities on type (e.g., antiperspirant) and form attributes (e.g., cream, gel, spray) give an
edge to incumbent brands in claiming freed up demand. I find that increasing brand
assortment size and the frequency of non-price oriented sales promotions are two effective
Chapter 5
146
post-exit strategies that bring higher gains from exits. Price oriented promotions, on the
contrary; seem to be ineffective in attracting consumers of the deleted brand. The effects
of post-exit strategies are consistent across two product categories.
This study extends the existing literature on brand exits by identifying the long term
drivers of demand redistribution among incumbent brands following an exit. Earlier
research on ‘how consumers respond to unavailability of product/brand alternatives’
mostly focused on permanent (e.g., assortment reductions) or temporary unavailability (e.g.,
stock-outs) of products and provided valuable insights mostly on category level effects
(e.g., Boatwright & Nunes, 2001; Borle et al., 2005) and to a lesser extent on brand level
effects (Zhang & Krishna, 2007). To the best of my knowledge, the currently described
study is the first to investigate the brand level effects of brand exits (i.e., permanent
unavailability of brands).
The findings of this study, taken together, provide a number of insights to
manufacturers of deleted brands, competing brands, and retailers. First, companies
rationalizing their brand offerings need a thorough understanding of what brands are more
likely to benefit from an exit to take wiser decisions on what brands to delete. Using our
model, they will be able to assess how freed up demand will be redistributed among
existing brands after an exit.
Second, our results help managers of incumbent brands better manage the post-exit
process. Rationalizing firms often enhance resources behind retained brands to improve
their performance (Varadarajan et al., 2006). Competing firms want to claim consumers of
a deleted brand. Managers of both rationalizing and competing firms, therefore, would
prefer focusing their marketing efforts on where they will have the most impact following a
brand exit. Our results imply that these managers should prefer increasing non-price
Conclusion
147
promotion frequency and the number of brand’s products in the store over increasing the
frequency of price-oriented sales promotions.
Third, retailers, which frequently delist national brands to free up shelf space for their
own private labels, can also benefit from our model and findings. As retailers enjoy
different profit margins from different brands, redistribution of demand after an exit has a
direct effect on their profitability. By foreseeing possible brand switching patterns
following an exit, (1) they can accurately identify redundant brand offerings and take wiser
brand delisting decisions and (2) they will be able to mitigate sales losses after
manufacturer’s brand deletion decisions by adjusting their portfolio of offerings
accordingly.
Our results indicate that the long-term drivers of demand distribution can change
across product categories. In the milk category, for example, smaller market share brands
stand to gain more than larger ones after a brand exit. However, the market share of the
incumbent brand has no effect on excess demand redistribution in the deodorant category.
Further research could analyze the sales response to a brand exit across multiple categories
and investigate whether differences in effects can be related to category specific factors
(e.g., category purchase incidence, uncertainty about product attributes).
5.3 Energizing Sales Through Sponsorships
Today’s competitive and ever-changing markets pose significant challenges for
marketers. It is difficult to keep brands and brand portfolios relevant and differentiated as
consumer tastes and preferences continue to evolve and fragment. Such challenges are
perhaps even greater for mature brands in low involvement product categories where
brands do not differ markedly from one another with respect to their functional benefits.

Chapter 5
148
Those brands often get tired, lack energy, and need external brand energizers to stay
relevant (Aaker, 2004). A sponsorship deal offers a number of opportunities for energizing
a brand as it influences consumers’ decision making process in a multitude of ways. It can
provide exposure, develop or transform a brand image, create favorable attitudes, deliver
additional emotional and self-expressive benefits, encourage trial, and enhance loyalty (e.g.,
Levin et al., 2001; Mazodier & Merunka, 2012; Nicholls et al., 1999; Quester & Thompson,
2001; Sirgy et al., 2008).
Consistent with the well documented influential role of sponsorship on consumers’
brand evaluations, over the last several years, companies have invested increasing amounts
of money in sponsorships. As a result, the total volume of global sponsorship spending is
expected to reach $60 billion by the end of 2016, corresponding to a 4.6% increase over
the previous year (IEG, 2016). Considering the vast sums of money involved, a thorough
understanding of sponsorship effectiveness and an accurate measurement of the return on
investment in sponsorship initiatives have become vital necessities for sponsoring firms. A
majority of the managers of sponsoring brands indicate that the need to certify sponsorship
results has grown over the past years (ANA, 2013). In parallel to this need, the third
research paper in my dissertation addresses the issue of sponsorship effectiveness.
In Chapter 4, more specifically, I examine the effect of a partnership deal with a
major sports franchise on the sales performance of the partnering and of competing firms
in a mature and low involvement product category. I develop a dynamic linear model of
brand sales, which (1) identifies the effect of a sponsorship deal on baseline sales of a
brand and (2) explains variations in sales responses across markets (sponsored vs. non-
sponsored) and brands (partnering brands of a sponsored firm, other brands in the
portfolio of the sponsored firm, and brands of competing firms). I apply my model to
Conclusion
149
partnership deals between beer brands and sports franchises in the National Football
League. I find that a partnering brand enjoys a gain in baseline sales and an increased
effectiveness for its sales promotion instruments. The effect of sponsorship on baseline
sales evolves over the course of a sponsorship contract contingent on team performance.
The findings also indicate that a sponsorship generates brand switching from competitors
including sponsoring firm’s other brands.
My study contributes to the marketing literature in a number of ways. First, it
addresses uncertainty about the sales effects of sponsorships. Existing research has mainly
focused on drivers of sponsorship deals (e.g., Chien et al., 2011; Cornwell & Maignan,
1998; Crowley, 1991; Gwinner & Eaton, 1999) and the effects of sponsorships on
consumer liking (e.g., Lardinoit & Quester, 2001; Quester & Thompson, 2001). The
findings indicate that positive effects of sponsorship on consumer liking and other
behavioral measures also translate into positive sales results. Second, we offer a method to
assess the effectiveness of sponsorships. Our model isolates the effect from that of other
concurrent marketing activities and can relate sponsorship effects to brand, market, and
team factors in a dynamic setting. Third, although sponsorships have been considered as an
important component of the integrated marketing communication mix, existing research
has not empirically investigated how sponsorship interacts with other promotional mix
elements. In my study I show that a sponsorship increases the effectiveness of sales
promotions. Fourth, I provide empirical evidence on the negative effects of a sponsorship
on competing brand sales and show that other brands of the sponsoring firm are likely to
experience sales declines after the sponsorship.
My study provides valuable implications for practitioners. According to a recent
survey on measuring sponsorship effectiveness, managers of the sponsoring brands

Chapter 5
150
indicate that sales is the most valuable, but less utilized metric to measure return on
investment in sponsorships (ANA, 2013). It is often considered difficult to evaluate the
long-term effect of a sponsorship on sales as a variety of marketing activities influence sales
(Crompton, 2004). For example, according to the abovementioned survey, only half of the
managers attempt to isolate the effect of sponsorship from that of other marketing
initiatives (ANA, 2013). This study provides a method for measuring the effect of
sponsorship on sales, a very relevant and valuable metric for the majority of sponsoring
brands managers.
My findings provide additional insights for managers of sponsoring brands. First, they
should consider interactions between sponsorships and other promotional elements to
achieve an effective promotional mix. Results imply that sponsorships and sales
promotions may have complimentary functions within the integrated marketing
communications program and that they interact in ways that create synergistic effects.
Second, the sponsorship decision should be based not only on previous or current team
performance, but also on the future performance. The expected performance obviously
becomes more important when brands are sponsoring teams competing in highly
competitive leagues with a great variation in team performance over time. Most
professional leagues in Northern America consistently try to maintain competitive balance
among teams through salary cap and draft systems. Third, managers should pay attention
to the effects of sponsorships on sales performance of other brands in their brand
portfolio. My results indicate a threat of cannibalization as sibling brands of the sponsoring
firm, the ones which are marketed under the same parent brand name with the sponsored
brand, experience a decline in their baseline sales in sponsored markets.
Conclusion
151
It is important to note that there are some limitations in this study. I examine sales
responses to sponsorship deals in the beer category. Further research may extend the
findings of this study by investigating sponsorship deals in other product categories. An
examination of sponsorships in another product category where a large number of
different brands sponsor different teams would provide valuable insights. It would lead to a
better understanding of how team specific (e.g., fan size) and brand specific (e.g.,
awareness, equity) factors drive sales responses to sponsorships.
5.4 Revitalizing Brands and Brand Portfolios
In this thesis, I show that certain revitalization strategies can energize brands and
brand portfolios. However, it should be recognized that there are risks inherent to these
strategies. My findings collectively lay out the importance of pursuing a portfolio approach
to achieve greater success in executing them. Firms should acquire a thorough
understanding of how their revitalization efforts can be linked to the performance of each
brand in their portfolio by carefully considering individual brands’ roles and their
relationships with one another.
Finally, to return to the very first question posed in this dissertation, it can be very
challenging to stay relevant and energetic in today’s competitive and ever-changing
markets. Brands can lack energy and brand portfolios can get bloated. However, if
executed wisely and discerningly, companies can revitalize their offerings to maintain
growth even in proliferating environments. It kind of resembles navigating through rough
seas. It is difficult to navigate a bloated ship with a tired crew across a rough sea, yet “the
wind and the waves are always on the side of the ablest navigator” (Gibbon, 1776).
152
References
Aaker, D. A. (2004). Brand portfolio strategy: Creating relevance, differentiation, energy, leverage, and clarity New York: Free Press.
Aaker, D. A. (2012). Building strong brands Simon and Schuster.
Aaker, D. A., & Joachimsthaler, E. (2000). The brand relationship spectrum: The key to the brand architecture challenge. California Management Review, 42(4), 8-23.
Ailawadi, K. L., Lehmann, D. R., & Neslin, S. A. (2003). Revenue premium as an outcome measure of brand equity. Journal of Marketing, 67(4), 1-17.
ANA. (2013). Sponsorship survey. Association of National Advertisers.
Armstrong, C. (1988). Sports sponsorship: A case-study approach to measuring its effectiveness. European Research, 16(2), 97-103.
Ataman, M. B., Mela, C. F., & van Heerde, H. J. (2008). Building brands. Marketing Science, 27(6), 1036-1054.
Ataman, M. B., van Heerde, H. J., & Mela, C. F. (2010). The long-term effect of marketing strategy on brand sales. Journal of Marketing Research, 47(5), 866-882.
Bahadir, S. C., Bharadwaj, S. G., & Srivastava, R. K. (2008). Financial value of brands in mergers and acquisitions: Is value in the eye of the beholder? Journal of Marketing, 72(6), 49-64.
Barth, M. E., Clement, M. B., Foster, G., & Kasznik, R. (1998). Brand values and capital market valuation. Review of Accounting Studies, 3(1-2), 41-68.
Barwise, P., & Robertson, T. (1992). Brand portfolios. European Management Journal, 10(3), 277-285.
Bass, F. M., Bruce, N., Majumdar, S., & Murthi, B. (2007). Wearout effects of different advertising themes: A dynamic bayesian model of the advertising-sales relationship. Marketing Science, 26(2), 179-195.
Bass, F. M., & Clarke, D. G. (1972). Testing distributed lag models of advertising effect. Journal of Marketing Research, , 298-308.
References
153
Bass, F. M., & Leone, R. P. (1983). Temporal aggregation, the data interval bias, and empirical estimation of bimonthly relations from annual data. Management Science, 29(1), 1-11.
Bawa, K., Landwehr, J. T., & Krishna, A. (1989). Consumer response to retailers' marketing environments: An analysis of coffee purchase data. Journal of Retailing, 65
Bell, D. R., Bonfrer, A., & Chintagunta, P. K. (2005). Recovering stockkeeping-unit-level preferences and response sensitivities from market share models estimated on item aggregates. Journal of Marketing Research, 42(2), 169-182.
Benito, G. R. (2005). Divestment and international business strategy. Journal of Economic Geography, 5(2), 235-251.
Benito, G. R., & Gripsrud, G. (1992). The expansion of foreign direct investments: Discrete rational location choices or a cultural learning process? Journal of International Business Studies, , 461-476.
Bennett, R. (1999). Sports sponsorship, spectator recall and false consensus. European Journal of Marketing, 33(3/4), 291-313.
Blattberg, R. C., Briesch, R., & Fox, E. J. (1995). How promotions work. Marketing Science, 14(3_supplement), G122-G132.
Blattberg, R. C., & Jeuland, A. P. (1981). A micromodeling approach to investigate the advertising-sales relationship. Management Science, 27(9), 988-1005.
Blattberg, R. C., & Neslin, S. A. (1990). Sales promotion: Concepts, methods, and strategies Prentice Hall Englewood Cliffs, NJ.
Boatwright, P., & Nunes, J. C. (2001). Reducing assortment: An attribute-based approach. Journal of Marketing, 65(3), 50-63.
Borle, S., Boatwright, P., Kadane, J. B., Nunes, J. C., & Galit, S. (2005). The effect of product assortment changes on customer retention. Marketing Science, 24(4), 616-622.
Bowen, H. P., & Wiersema, M. F. (2005). Foreign‐based competition and corporate diversification strategy. Strategic Management Journal, 26(12), 1153-1171.
Bowman, D., & Gatignon, H. (1996). Order of entry as a moderator of the effect of the marketing mix on market share. Marketing Science, 15(3), 222-242.
Brauer, M. (2006). What have we acquired and what should we acquire in divestiture research? A review and research agenda. Journal of Management, 32(6), 751-785.
References
154
Broniarczyk, S. M., & Hoyer, W. D. (2010). Retail assortment: More≠ better. Retailing in the 21st century (pp. 271-284) Springer.
Bronnenberg, B. J., Kruger, M. W., & Mela, C. F. (2008). Database paper-the IRI marketing data set. Marketing Science, 27(4), 745-748.
Broughton, D. (2012, Fen 20.). Avid fans know their NFL sponsors. Sports Business Daily
Brown, S. J., & Warner, J. B. (1985). Using daily stock returns: The case of event studies. Journal of Financial Economics, 14(1), 3-31.
Burke, M. C., & Edell, J. A. (1989). The impact of feelings on ad-based affect and cognition. Journal of Marketing Research, , 69-83.
Byerly, R., Lamont, B., & Keasler, T. (2003). Business portfolio restructuring, prior diversification posture and investor reactions. Managerial and Decision Economics, 24(8), 535-548.
Campo, K., Gijsbrechts, E., & Nisol, P. (2000). Towards understanding consumer response to stock-outs. Journal of Retailing, 76(2), 219-242.
Campo, K., Gijsbrechts, E., & Nisol, P. (2003). The impact of retailer stockouts on whether, how much, and what to buy. International Journal of Research in Marketing, 20(3), 273-286.
Campo, K., Gijsbrechts, E., & Nisol, P. (2004). Dynamics in consumer response to product unavailability: Do stock-out reactions signal response to permanent assortment reductions? Journal of Business Research, 57(8), 834-843.
Carlotti, S. J., Coe, M. E., & Perry, J. (2004). Making brand portfolios work. McKinsey Quarterly, 4(4), 24-36.
Carter, C. K., & Kohn, R. (1994). On gibbs sampling for state space models. Biometrika, 81(3), 541-553.
Catherwood, D. W., & van Kirk, R. L. (1992). The complete guide to special event management: Business insights, financial advice, and successful strategies from ernst & young, advisors to the olympics, the emmy awards and the PGA tour John Wiley & Sons.
Caves, R. E., Porter, M. E., & Spence, A. M. (1980). Competition in the open economy: A model applied to canada Harvard University Press.
Chatterjee, S., & Wernerfelt, B. (1991). The link between resources and type of diversification: Theory and evidence. Strategic Management Journal, 12(1), 33-48.
References
155
Chien, P. M., Cornwell, T. B., & Pappu, R. (2011). Sponsorship portfolio as a brand-image creation strategy. Journal of Business Research, 64(2), 142-149.
Chintagunta, P. K. (1996). Investigating the effects of a line extension or new brand introduction on market structure. Marketing Letters, 7(4), 319-328.
Chintagunta, P. K. (1999). Measuring the effects of new brand introduction on inter-brand strategic interaction. European Journal of Operational Research, 118(2), 315-331.
Chung, K. Y., Derdenger, T. P., & Srinivasan, K. (2013). Economic value of celebrity endorsements: Tiger woods' impact on sales of nike golf balls. Marketing Science, 32(2), 271-293.
Cornwell, T. B., & Coote, L. V. (2005). Corporate sponsorship of a cause: The role of identification in purchase intent. Journal of Business Research, 58(3), 268-276.
Cornwell, T. B., & Maignan, I. (1998). An international review of sponsorship research. Journal of Advertising, 27(1), 1-21.
Cornwell, T. B., Pruitt, S. W., & Clark, J. M. (2005). The relationship between major-league sports’ official sponsorship announcements and the stock prices of sponsoring firms. Journal of the Academy of Marketing Science, 33(4), 401-412.
Cornwell, T. B., Pruitt, S. W., & van Ness, R. (2001). The value of winning in motorsports: Sponsorship-linked marketing. Journal of Advertising Research, 41(1), 17-31.
Court, D., French, T., Knudsen, T., & Webb, A. (2006). The proliferation challenge. The McKinsey Quarterly,
Crimmins, J., & Horn, M. (1996). Sponsorship: From management ego trip to marketing success. Journal of Advertising Research, 36(4), 11-22.
Crompton, J. L. (2004). Conceptualization and alternate operationalizations of the measurement of sponsorship effectiveness in sport. Leisure Studies, 23(3), 267-281.
Crowley, M. G. (1991). Prioritising the sponsorship audience. European Journal of Marketing, 25(11), 11-21.
Daley, L., Mehrotra, V., & Sivakumar, R. (1997). Corporate focus and value creation evidence from spinoffs. Journal of Financial Economics, 45(2), 257-281.
d'Astous, A., & Bitz, P. (1995). Consumer evaluations of sponsorship programmes. European Journal of Marketing, 29(12), 6-22.
Davis, J. V. (1974). The strategic divestment decision. Long Range Planning, 7(1), 15-18.
References
156
Desai, H., & Jain, P. C. (1999). Firm performance and focus: Long-run stock market performance following spinoffs. Journal of Financial Economics, 54(1), 75-101.
Dimofte, C. V., Johansson, J. K., & Ronkainen, I. A. (2008). Cognitive and affective reactions of US consumers to global brands. Journal of International Marketing, 16(4), 113-135.
Douglas, S. P., Craig, C. S., & Nijssen, E. J. (2001). Integrating branding strategy across markets: Building international brand architecture. Journal of International Marketing, 9(2), 97-114.
Doukas, J. A., & Kan, O. B. (2004). Excess cash flows and diversification discount. Financial Management, , 71-88.
Dreze, X., Hoch, S. J., & Purk, M. E. (1994). Shelf management and space elasticity. Journal of Retailing, 70(4), 301-326.
Duhaime, I. M., & Grant, J. H. (1984). Factors influencing divestment decision‐making: Evidence from a field study. Strategic Management Journal, 5(4), 301-318.
Ehrenberg, A. S., Goodhardt, G. J., & Barwise, T. P. (1990). Double jeopardy revisited. The Journal of Marketing, , 82-91.
Elberse, A., & Verleun, J. (2012). The economic value of celebrity endorsements. Journal of Advertising Research, 52(2), 149-165.
Fader, P. S., & Schmittlein, D. C. (1993). Excess behavioral loyalty for high-share brands: Deviations from the dirichlet model for repeat purchasing. Journal of Marketing Research, , 478-493.
Fama, E. F. (1970). Efficient capital markets: A review of theory and empirical work. The Journal of Finance, 25(2), 383-417. doi:10.2307/2325486
Fisher, R., & Wakefield, K. (1998). Factors leading to group identification: A field study of winners and losers. Psychology & Marketing, 15(1), 23-40.
Forbes. (2015). The business of football. ().
Frühwirth‐Schnatter, S. (1994). Data augmentation and dynamic linear models. Journal of Time Series Analysis, 15(2), 183-202.
Ghemawat, P. (2001). Distance still matters. Harvard Business Review, 79(8), 137-147.
Gibbon, E. (1776). The history of the decline and fall of the roman empire W. Strahan and T. Cadell.

References
157
Gielens, K., van de Gucht, Linda M, Steenkamp, J. E., & Dekimpe, M. G. (2008). Dancing with a giant: The effect of wal-mart's entry into the united kingdom on the performance of european retailers. Journal of Marketing Research, 45(5), 519-534.
Gladden, J., & Funk, D. (2002). Developing an understanding of brand associations in team sport: Empirical evidence from consumers of professional sport. Journal of Sport Management, 16(1), 54-81.
Gwinner, K. (1994). Event sponsorship as a promotional tool: The impact on brand awareness and brand image., 133-139.
Gwinner, K. (1997). A model of image creation and image transfer in event sponsorship. International Marketing Review, 14(3), 145-158.
Gwinner, K. P., & Eaton, J. (1999). Building brand image through event sponsorship: The role of image transfer. Journal of Advertising, 28(4), 47-57.
Gwinner, K., & Swanson, S. R. (2003). A model of fan identification: Antecedents and sponsorship outcomes. Journal of Services Marketing, 17(3), 275-294.
Hamilton, R. T., & Chow, Y. K. (1993). Why managers divest?evidence from new zealand's largest companies. Strategic Management Journal, 14(6), 479-484. doi:10.1002/smj.4250140606
Hankinson, G., & Cowking, P. (1996). The reality of global brands: Cases and strategies for the successful management of international brands Mcgraw-Hill Book.
Hansen, F., & Scotwin, L. (1995). An experimental enquiry into sponsoring: What effects can be measured? Marketing and Research Today, 23(3), 173-173.
Hanssens, D. M., Parsons, L. J., & Schultz, R. L. (2003). Market response models: Econometric and time series analysis Springer Science & Business Media.
Harrigan, K. R. (1980). Strategies for declining businesses Lexington Books Lexington, MA.
Haynes, M., Thompson, S., & Wright, M. (2002). The impact of divestment on firm performance: Empirical evidence from a panel of UK companies. The Journal of Industrial Economics, 50(2), 173-196.
Hill, S., Ettenson, R., & Tyson, D. (2005). Achieving the ideal brand portfolio. Sloan Management Review, 46(2), 85-90.
Hite, G. L., & Owers, J. E. (1983). Security price reactions around corporate spin-off announcements. Journal of Financial Economics, 12(4), 409-436.

References
158
Ho, T., & Chong, J. (2003). A parsimonious model of stockkeeping-unit choice. Journal of Marketing Research, 40(3), 351-365.
Holt, D. B., Quelch, J. A., & Taylor, E. L. (2004). How global brands compete. Harvard Business Review, 82(9), 68-75.
Hoskisson, R. O., & Johnson, R. A. (1992). Research notes and communications corporate restructuring and strategic change: The effect on diversification strategy and R & D intensity. Strategic Management Journal, 13(8), 625-634. doi:10.1002/smj.4250130805
Huff, L. C., & Alden, D. L. (2000). A model of managerial response to sales promotions: A four-country analysis. Journal of Global Marketing, 13(3), 7-28.
Hutzschenreuter, T., & Gröne, F. (2009). Product and geographic scope changes of multinational enterprises in response to international competition. Journal of International Business Studies, 40(7), 1149-1170.
IEG. (2014a). IEG sponsorship report. IEG.
IEG. (2014b). NFL sponsorship revenue totals $1.07 billion in 2013 season. IEG.
IEG. (2015). NFL sponsorship revenue totals 1.15$ billion in 2014 season. IEG.
Information Resources Inc. (2005). New product pacesetters. Chicago:
Iyengar, S. S., & Lepper, M. R. (2000). When choice is demotivating: Can one desire too much of a good thing? Journal of Personality and Social Psychology, 79(6), 995.
Janiszewski, C. (1993). Preattentive mere exposure effects. Journal of Consumer Research, , 376-392.
Johansson, J. K., & Ronkainen, I. A. (2005). The esteem of global brands. The Journal of Brand Management, 12(5), 339-354.
John, K., Lang, L. H., & Netter, J. (1992). The voluntary restructuring of large firms in response to performance decline. The Journal of Finance, 47(3), 891-917.
John, K., & Ofek, E. (1995). Asset sales and increase in focus. Journal of Financial Economics, 37(1), 105-126.
Kallapur, S., & Kwan, S. Y. (2004). The value relevance and reliability of brand assets recognized by UK firms. The Accounting Review, 79(1), 151-172.
Kalyanam, K., Borle, S., & Boatwright, P. (2007). Deconstructing each item's category contribution. Marketing Science, 26(3), 327-341.
References
159
Kapferer, J. N. (2008). The new strategic brand management: Creating and sustaining brand equity..
Kapferer, J. N. (2002). Is there really no hope for local brands? The Journal of Brand Management, 9(3), 163-170.
Kaplan, S. N., & Weisbach, M. S. (1992). The success of acquisitions: Evidence from divestitures. The Journal of Finance, 47(1), 107-138.
Keller, K. L. (1998). Strategic brand management: Building, measuring, and managing brand equity Prentice Hall, Upper Saddle River.
Keller, K. L. (2000). The brand report card. Harvard Business Review, 78(1), 147-158.
Knudsen, T. R., Finskud, L., Törnblom, R., & Hogna, E. (1997). Brand consolidation makes a lot of economic sense. McKinsey Quarterly, , 189-193.
Kogut, B., & Zander, U. (1992). Knowledge of the firm, combinative capabilities, and the replication of technology. Organization Science, 3(3), 383-397.
Kothari, S., & Warner, J. B. (2004). The econometrics of event studies. Available at SSRN 608601,
Kumar, N. (2003). Kill a brand, keep a customer. Harvard Business Review, 81(12), 86-95, 126.
Laforet, S., & Saunders, J. (1999). Managing brand portfolios: Why leaders do what they do. Journal of Advertising Research, 39(1), 51-51.
Lang, L. H., & Stulz, R. M. (1993). Tobin's q, Corporate Diversification and Firm Performance,
Lardinoit, T., & Quester, P. G. (2001). Attitudinal effects of combined sponsorship and sponsor's prominence on basketball in europe. Journal of Advertising Research, 41(1), 48-58.
Lei, J., Dawar, N., & Lemmink, J. (2008). Negative spillover in brand portfolios: Exploring the antecedents of asymmetric effects. Journal of Marketing, 72(3), 111-123.
Levin, A. M., Joiner, C., & Cameron, G. (2001). The impact of sports sponsorship on consumers' brand attitudes and recall: The case of NASCAR fans. Journal of Current Issues & Research in Advertising, 23(2), 23-31.
Lings, I. N., & Owen, K. M. (2007). Buying a sponsor's brand: The role of affective commitment to the sponsored team. Journal of Marketing Management, 23(5-6), 483-496.
Madrigal, R. (2000). The influence of social alliances with sports teams on intentions to purchase corporate sponsors' products. Journal of Advertising, 29(4), 13-24.

References
160
Madrigal, R. (2001). Social identity effects in a belief–attitude–intentions hierarchy: Implications for corporate sponsorship. Psychology & Marketing, 18(2), 145-165.
Markides, C. C. (1992). Consequences of corporate refocusing: Ex ante evidence. Academy of Management Journal, 35(2), 398-412.
Markides, C. C. (1995). Diversification, restructuring and economic performance. Strategic Management Journal, 16(2), 101-118.
Marshall, D. W., & Cook, G. (1992). The corporate (sports) sponsor. International Journal of Advertising, 11(4), 307-324.
Mazodier, M., & Merunka, D. (2012). Achieving brand loyalty through sponsorship: The role of fit and self-congruity. Journal of the Academy of Marketing Science, 40(6), 807-820.
McCracken, G. (1989). Who is the celebrity endorser? cultural foundations of the endorsement process. Journal of Consumer Research, , 310-321.
McGahan, A. M., & Victer, R. (2010). How much does home country matter to corporate profitability&quest. Journal of International Business Studies, 41(1), 142-165.
Mela, C. F., Gupta, S., & Lehmann, D. R. (1997). The long-term impact of promotion and advertising on consumer brand choice. Journal of Marketing Research, , 248-261.
Meyer, K. E. (2006). Globalfocusing: From domestic conglomerates to global specialists*. Journal of Management Studies, 43(5), 1109-1144.
Meyer, K. E. (2009). Globalfocusing: Corporate strategies under pressure. Strategic Change, 18(5‐6), 195-207.
Meyer, K. E., & Tran, Y. T. T. (2006). Market penetration and acquisition strategies for emerging economies. Long Range Planning, 39(2), 177-197.
Mitchell, A. A., & Olson, J. C. (1981). Are product attribute beliefs the only mediator of advertising effects on brand attitude? Journal of Marketing Research, 18(3), 318.
Miyazaki, A. D., & Morgan, A. G. (2001). Assessing the market value of sponsoring: Corporate olympic sponsorships. Journal of Advertising Research, 41(1), 9-15.
Montgomery, C. A. (1994). Corporate diversification. The Journal of Economic Perspectives, 8(3), 163-178.
Montgomery, C. A., & Wernerfelt, B. (1988). Diversification, ricardian rents, and tobin's q. The Rand Journal of Economics, , 623-632.
References
161
Morgan, N. A., & Rego, L. L. (2009). Brand portfolio strategy and firm performance. Journal of Marketing, 73(1), 59-74.
Neelamegham, R., & Chintagunta, P. K. (2004). Modeling and forecasting the sales of technology products. Quantitative Marketing and Economics, 2(3), 195-232.
Ng, S. (2014, Aug 1). P&G to shed more than half its brands. The Wall Street Journal
Ngan, H. M., Prendergast, G. P., & Tsang, A. S. (2011). Linking sports sponsorship with purchase intentions: Team performance, stars, and the moderating role of team identification. European Journal of Marketing, 45(4), 551-566.
Nicholls, J., Roslow, S., & Laskey, H. A. (1994). Sports event sponsorship for brand promotion. Journal of Applied Business Research, 10(4), 35.
Nicholls, J. A., Roslow, S., & Dublish, S. (1999). Brand recall and brand preference at sponsored golf and tennis tournaments. European Journal of Marketing, 33(3/4), 365-387.
Ofek, E. (1993). Capital structure and firm response to poor performance: An empirical analysis. Journal of Financial Economics, 34(1), 3-30.
O'Leary, N. (2014, ). Chevy paid $560 million to sponsor manchester united and now it's pulling out of europe. Adweek
Olson, E. L., & Thjømøe, H. M. (2009). Sponsorship effect metric: Assessing the financial value of sponsoring by comparisons to television advertising. Journal of the Academy of Marketing Science, 37(4), 504-515.
Otker, T., & Hayes, P. (1987). Judging the efficiency of sponsorship, experiences from the 1986 soccer world cup. European Research, 15(4), 53-58.
Ozsomer, A. (2007). How consumers choose between global and local brands: Drivers of global brand purchase likelihood. Proceedings of Consortium for International Marketing Research Conference,
Özsomer, A. (2012). The interplay between global and local brands: A closer look at perceived brand globalness and local iconness. Journal of International Marketing, 20(2), 72-95.
P&G. (2003). A.G. Lafley tells shareholders P&G's business strategies are working. ( No. 2012).
P&G. (2004). Annual report. P&G.
Parducci, A. (1965). Category judgment: A range-frequency model. Psychological Review, 72(6), 407.
References
162
Parducci, A., & Wedell, D. H. (1986). The category effect with rating scales: Number of categories, number of stimuli, and method of presentation. Journal of Experimental Psychology: Human Perception and Performance, 12(4), 496.
Parker, K. (1991). Sponsorship: The research contribution. European Journal of Marketing, 25(11), 22-30.
Patell, J. M. (1976). Corporate forecasts of earnings per share and stock price behavior: Empirical test. Journal of Accounting Research, , 246-276.
Pauwels, K., & Srinivasan, S. (2004). Who benefits from store brand entry? Marketing Science, 23(3), 364-390.
Peckham, J. O. (1963). The consumer speaks. The Journal of Marketing, , 21-26.
Pierce, A., & Moukanas, H. (2002). Portfolio power: harnessing a group of brands to drive profitable growth. Strategy & Leadership, 30(5), 15-21.
Pope, N. K., & Voges, K. E. (2015). Short term recall and recognition of advertising and signage in telecast stadium sporting events. Proceedings of the 1995 World Marketing Congress, 13-20.
Pope, N., Voges, K. E., & Brown, M. (2009). Winning ways. Journal of Advertising, 38(2), 5-20.
Prahalad, C., & Hamel, G. (1994). Competing for the future: Breakthrough strategies for seizing control of your industry and creating the markets of tomorrow. Harvard Business School Press.Boston, Ma, , 5-7.
Pruitt, S. W., Cornwell, T. B., & Clark, J. M. (2004). The NASCAR phenomenon: Auto racing sponsorships and shareholder wealth. Journal of Advertising Research, 44(03), 281-296.
Pudasaini, P. (2014). Top 10 sports leagues with the highest attendance per game. Retrieved from http://www.therichest.com/sports/top-10-sports-leagues-with-the-highest-average-per-game-attendance-in-the-world/?view=all
Quester, P. G., & Thompson, B. (2001). Advertising and promotion leverage on arts sponsorship effectiveness. Journal of Advertising Research, 41(1), 33-47.
Quester, P., & Farrelly, F. (1998). Brand association and memory decay effects of sponsorship: The case of the australian formula one grand prix. Journal of Product & Brand Management, 7(6), 539-556.
Rooderkerk, R. P., van Heerde, H. J., & Bijmolt, T. H. (2013). Optimizing retail assortments. Marketing Science, 32(5), 699-715.
References
163
Roy, D. P., & Bettina Cornwell, T. (2003). Brand equity's influence on responses to event sponsorships. Journal of Product & Brand Management, 12(6), 377-393.
Rumelt, R. P. (1974). Strategy, structure, and economic performance.
Sandler, D. M., & Shani, D. (1989). Olympic sponsorship vs ambush marketing-Who gets the gold. Journal of Advertising Research, 29(4), 9-14.
Schlingemann, F. P., Stulz, R. M., & Walkling, R. A. (2002). Divestitures and the liquidity of the market for corporate assets. Journal of Financial Economics, 64(1), 117-144.
Schuh, A. (2007). Brand strategies of western MNCs as drivers of globalization in central and eastern europe. European Journal of Marketing, 41(3), 274-291. doi:10.1108/03090560710728336
Schuiling, I., & Kapferer, J. (2004). Executive insights: Real differences between local and international brands: Strategic implications for international marketers. Journal of International Marketing, 12(4), 97-112.
Schwartz, B. (2004). The paradox of choice. New York: Ecco.
Siegfried, J. J., & Evans, L. B. (1994). Empirical studies of entry and exit: A survey of the evidence. Review of Industrial Organization, 9(2), 121-155.
Sirgy, M. J., Lee, D., Johar, J., & Tidwell, J. (2008). Effect of self-congruity with sponsorship on brand loyalty. Journal of Business Research, 61(10), 1091-1097.
Sloot, L. M., Fok, D., & Verhoef, P. C. (2006). The short-and long-term impact of an assortment reduction on category sales. Journal of Marketing Research, 43(4), 536-548.
Sloot, L. M., & Verhoef, P. C. (2008). The impact of brand delisting on store switching and brand switching intentions. Journal of Retailing, 84(3), 281-296.
Sloot, L. M., Verhoef, P. C., & Franses, P. H. (2005). The impact of brand equity and the hedonic level of products on consumer stock-out reactions. Journal of Retailing, 81(1), 15-34.
Smith, A., Graetz, B., & Westerbeek, H. (2008). Sport sponsorship, team support and purchase intentions. Journal of Marketing Communications, 14(5), 387-404.
Sood, A., & Tellis, G. J. (2009). Do innovations really pay off? total stock market returns to innovation. Marketing Science, 28(3), 442-456.
Spais, G. S., & Filis, G. N. (2008). Measuring stock market reaction to sponsorship announcements: The case of fiat and juventus. Journal of Targeting, Measurement and Analysis for Marketing, 16(3), 169-180.
References
164
Speed, R., & Thompson, P. (2000). Determinants of sports sponsorship response. Journal of the Academy of Marketing Science, 28(2), 226-238.
Sports Media Watch. (2013). 2013 ratings wrap. ().Sports Media Watch.
Srinivasan, S., & Hanssens, D. M. (2009). Marketing and firm value: Metrics, methods, findings, and future directions. Journal of Marketing Research, 46(3), 293-312.
Steenkamp, J. E., Batra, R., & Alden, D. L. (2003). How perceived brand globalness creates brand value. Journal of International Business Studies, 34(1), 53-65.
Steenkamp, J. E., & de Jong, M. G. (2010). A global investigation into the constellation of consumer attitudes toward global and local products. Journal of Marketing, 74(6), 18-40.
Stern, P., & Hammond, K. (2004). The relationship between customer loyalty and purchase incidence. Marketing Letters, 15(1), 5-19.
Strizhakova, Y., Coulter, R. A., & Price, L. L. (2008). Branded products as a passport to global citizenship: Perspectives from developed and developing countries. Journal of International Marketing, 16(4), 57-85.
Sweldens, S., van Osselaer, S. M., & Janiszewski, C. (2010). Evaluative conditioning procedures and the resilience of conditioned brand attitudes. Journal of Consumer Research, 37(3), 473-489.
Tellis, G. J., & Gaeth, G. J. (1990). Best value, price-seeking, and price aversion: The impact of information and learning on consumer choices. The Journal of Marketing, , 34-45.
Townsend, J. D., Yeniyurt, S., & Talay, M. B. (2009). Getting to global: An evolutionary perspective of brand expansion in international markets. Journal of International Business Studies, 40(4), 539-558.
Tsiotsou, R., & Lalountas, D. (2005). Applying event study analysis to assess the impact of marketing communication strategies: The case of sponsorship. Applied Financial Economics Letters, 1(4), 259-262.
Tsiotsou, R. H., Alexandris, K., & Bettina Cornwell, T. (2014). Using evaluative conditioning to explain corporate co-branding in the context of sport sponsorship. International Journal of Advertising, 33(2), 295-327.
Turco, D. M. (1995). Measuring the tax impacts of an international festival: Justification for government sponsorship. Festival Management and Event Tourism, 2(3-1), 191-195.
Unilever. (2004). Annual reports and accounts..
References
165
USA Today. (2006). Focus on strategies, core business helps P&G progress.. Available at:http://usatoday30.usatoday.com/money/companies/management/2006-02-05-pandg_x.htm
Van Heerde, H. J., Leeflang, P. S., & Wittink, D. R. (2000). The estimation of pre-and postpromotion dips with store-level scanner data. Journal of Marketing Research, 37(3), 383-395.
Van Heerde, H. J., Mela, C. F., & Manchanda, P. (2004). The dynamic effect of innovation on market structure. Journal of Marketing Research, 41(2), 166-183.
Van Heerde, H. J., Srinivasan, S., & Dekimpe, M. G. (2010). Estimating cannibalization rates for pioneering innovations. Marketing Science, 29(6), 1024-1039.
Varadarajan, R., DeFanti, M. P., & Busch, P. S. (2006). Brand portfolio, corporate image, and reputation: Managing brand deletions. Journal of the Academy of Marketing Science, 34(2), 195-205.
Verbeke, W., Farris, P., & Thurik, R. (1998). Consumer response to the preferred brand out-of-stock situation. European Journal of Marketing, 32(11/12), 1008-1028.
Walliser, B. (2003). An international review of sponsorship research: Extension and update. International Journal of Advertising, 22(1), 5-40.
Watrous, M. (2014, Jan 21). Food back in focus for Unilever. Food Business News
West, M., & Harrison, J. (1997). Bayesian forecasting & dynamic models Springer.
Wiebach, N., & Hildebrandt, L. (2012). Explaining customers' switching patterns to brand delisting. Journal of Retailing and Consumer Services, 19(1), 1-10.
Wiles, M. A., Morgan, N. A., & Rego, L. L. (2012). The effect of brand acquisition and disposal on stock returns. Journal of Marketing, 76(1), 38-58.
Wolfe, A. (1991). The single european market: National or euro-brands? International Journal of Advertising, 10(1), 49-58.
Wright, M., Chiplin, B., & Thompson, R. (1993). The market for corporate control: Divestments and buy-outs. European Mergers and Merger Policy, , 96-104.
Yip, G. S. (1989). Global strategy... in a world of nations? Sloan Management Review, 31(1), 29.
Zajonc, R. B. (1968). Attitudinal effects of mere exposure. Journal of Personality and Social Psychology, 9(2p2), 1.
Zajonc, R. B. (1980). Feeling and thinking: Preferences need no inferences. American Psychologist, 35(2), 151.

References
166
Zhang, J., & Krishna, A. (2007). Brand-level effects of stockkeeping unit reductions. Journal of Marketing Research, 44(4), 545-559.
Zhang, J., Wedel, M., & Pieters, R. (2009). Sales effects of attention to feature advertisements: A bayesian mediation analysis. Journal of Marketing Research, 46(5), 669-681.
Zook, C., & Allen, J. (2013). Profit from the core: A return to growth in turbulent times Harvard Business Press.
Executive Summaries
167
Summary (in English)
In today’s ever-changing and proliferating consumer products markets, manufacturers
and retailers pursue a variety of strategies to keep their portfolio of brand offerings relevant
and energetic. In this dissertation, I explore the effectiveness of some of the most
commonly utilized ‘revitalization’ strategies.
In chapter 2, I examine firm value effects of focus-increasing brand divestitures.
These divestitures are undertaken to release resources and reallocate them to support the
retained brands in the portfolio. I propose that divesting brands with low geographical
scope and low industry relatedness can enhance firm value. In line with this prediction, I
document positive shareholder returns due to such divestments. However, I find divesting
local brands in core industries, a common form of brand divestitures, has negative effects
on firm value.
In chapter 3, I focus on brand exits (i.e., the removal of a brand from a market either
by a manufacturer or a retailer). I examine how sales of an incumbent brand respond to a
brand exit and identify the long term drivers of demand redistribution following the exit. I
find that brand characteristics (market shares of an incumbent and a deleted brand), the
incumbent brand’s similarity to the deleted brand on a multidimensional attribute space,
and post-exit marketing strategies (frequency of non-price promotions and change in brand
assortment size) explain variations in sales response to a brand exit.
In chapter 4, I move away from strategies involving simplification of brand offerings
and focus on sponsorships which is a commonly utilized strategy to energize established
brands in mature product categories. I investigate how a sponsorship deal affects the sales
performance of the partnering brand, other brands of the sponsoring firm, and competing
brands in the product category. I find that the sponsoring brand experiences a gain in
baseline sales and an increased effectiveness for its sales promotion instruments. The effect
on baseline sales evolves over time contingent on team performance. The results also
indicate that sponsorship generates brand switching from competitors including competing
brands of the partnering firm.

Executive Summaries
168
This dissertation provides insight on how to revitalize brands and brand portfolios.
My findings collectively highlight the importance of pursuing a portfolio approach in
successfully executing revitalization strategies. Firms, therefore, should acquire a thorough
understanding of how their revitalization efforts can be linked to the performance of each
brand in their portfolio by carefully considering individual brands’ roles and their
relationships with one another.

Executive Summaries
169
Summary (in Dutch)
In de voortdurend veranderende consumentengoederen markten van vandaag de
dag, streven producenten en retailers er door middel van verschillende strategieën naar om
hun merkportfolio’s relevant en te houden. In dit proefschrift onderzoek ik de effectiviteit
van een aantal van de meest gebruikte ‘revitaliseringstrategieën’.
In hoofdstuk 2 onderzoek ik de effecten van focus vergrotende merkafstotingen op
de waarde van ondernemingen. Deze afstotingen worden ondernomen om middelen vrij te
maken ter ondersteuning van de behouden merken in de portfolio. Ik veronderstel dat het
afstoten van merken met een geringe geografische omvang en lage industrie verbondenheid
de waarde van ondernemingen kan verhogen. In lijn met deze verwachting neem ik een
positief rendement voor aandeelhouders als gevolg van dergelijke afstotingen waar.
Daarentegen, observeer ik dat het afstoten van lokale merken in kernsectoren, een veel
voorkomende vorm van het merkafstotingen, een negatief effect heeft op de waarde van
ondernemingen.
In hoofdstuk 3 richt ik mij op exits uit de markt van merken (i.e., het verwijderen van
een merk uit de markt, hetzij door de producent of door de retailer). Ik onderzoek hoe de
verkopen van een gevestigd merk reageeen op een merk exit en identificeer de lange
termijn effecten van de herverdeling van vraag en aanbod naar aanleiding van zo’n exit.
Mijn observatie is dat merk karakteristieken (marktaandeel van gevestigd en verdwenen
merk), de gelijkenis tussen het gevestigde merk en verdwenen merk, en post-exit
marketingstrategieën (frequentie van niet prijs gerelateerde reclames en verandering in merk
assortiment grootte) de variatie in reacties op merk extits verklaren.
In hoofdstuk 4 verleg ik mijn aandacht van strategieën met betrekking tot de
vereenvoudiging van het merk aanbod naar sponsoring, een wijd gebruikte strategie is om
gevestigde merken in volwassen productcategorieën te revitaliseren. Ik onderzoek hoe een
sponsorovereenkomst van invloed is op de verkoopresultaten van het sponsorende merk ,
andere merken van het sponsorende bedrijf, en concurrerende merken binnen de
productcategorie. Mijn observatie is dat het sponsorende merk een toename ervaart in de
verkopen en een toename in de effectiviteit van verkoop promotie-instrumenten. Het
Executive Summaries
170
effect op de verkopen ontwikkelt zich in de loop van de tijd afhankelijk van de team
prestaties. De resultaten geven ook aan dat sponsoring leidt tot het overstappen van
consumenten van concurrerende merken waaronder de concurrerende merken van het
sponsorende bedrijf zelf.
Samenvattend geven de studies in dit proefschrift inzicht in de wijze waarop merken
en merkportfolio’s gerevitaliseerd kunnen worden. Mijn bevindingen benadrukken het
belang van het nastreven van een portfolio benadering voor het succesvol uitvoeren van
revitaliseringstrategieën. Ondernemingen moeten inzicht krijgen in de wijze waarop hun
revitaliseringsinspanningen gekoppeld kunnen worden aan de prestaties van ieder merk in
hun portfolio, door zorgvuldig de rollen van individuele merken en de relaties van deze
individuele merken met elkaar te overwegen.

Executive Summaries
171
Summary (in Turkish)
Günümüzün sürekli değişen ve kalabalıklaşan hızlı tüketim ürünleri pazarlarında,
üreticiler ve perakendeciler müşterilere sundukları marka ve marka portföylerini sürekli
canlı ve güncel tutmak adına farklı stratejiler izler. Bu doktora tezi sıklıkla takip edilen bazı
marka ve marka portföyü canlandırma stratejilerinin verimliliğini araştırmaktadır.
Giriş bölümünden sonra yer alan ikinci bölümde, üreticilerin odak arttırma amacıyla
gerçekleştirdikleri portföy sadeleştirme stratejileri ele alınmaktadır. Bu stratejiler bazı
markaların portföyden çıkarılması sonucu elde edilen kaynakların kalan markaların
desteklenmesi ve canlandırılması için kullanımını içerir. Farklı sanayi bölümlerinden düşük
coğrafi kapsama sahip markaların elden çıkarılmasının firma değerine olumlu etkilerinin
olacağı önerilmiş ve analizler sonucunda bu tarz sadeleştirmelerin firmanın hissedar değeri
üzerinde artı yönde etkileri gözlemlenmiştir. Uygulamada oldukça fazla görülmesine rağmen
ana sanayi bölümlerinde faaliyet gösteren yerel markaların elden çıkarılmasının firma
değerine olumsuz etki yaptığı saptanmıştır.
Üçüncü bölüm pazardan çıkan bir markanın ardından boşta kalan talebin kalan
markalar tarafından uzun vadede nasıl paylaşıldığını incelemektedir. Talebin dağılımına etki
eden faktörler arasında çıkan ve kalan markaların pazar payları, çıkan ve kalan markaların
ürünlerinin nitelik olarak birbirine benzerliği ve kalan markaların pazarlama stratejileri yer
almaktadır.
Dördüncü bölüm marka portföyünü sadeleştirmeyi öncelikli hedef olarak alan
stratejilerden uzaklaşıp portföy içinde kalan markaların nasıl desteklenebileceğine
odaklanmaktadır. Bu amaçla olgun pazarlarda yerleşik markalara yeniden enerji vermek için
sıklıkla kullanılan bir iletişim stratejisi olan sponsorluk anlaşmaları incelenmektedir.
Sponsorluk anlaşmalarının sponsor olan markanın ve rakiplerinin satış performansına olan
etkisi araştırılmış ve sponsor markanın temel satış çizgisinde ve satış promosyonlarının
verimliliğinde bir artış gözlemlenmiştir. Ana satış çizgisinde olan artış sponsorluk süresince
takım performansına bağlı olarak değişmektedir. Ayrıca sonuçlar sponsorluk dolayısıyla
sponsor firmanın diğer markaları dahil rakiplerin satış kaybı yaşadıklarını göstermektedir.

Executive Summaries
172
Bu tez marka ve marka portföyünün nasıl canlandırılması gerektiğine dair bir anlayış
sunmaktadır. Sonuçlar bir bütün olarak marka portföyü yönetiminin önemine işaret
etmektedir. Firmalar, canlandırma stratejilerinde başarıya ulaşmak adına, portföylerinde
bulunan her bir markanın rolünü ve diğer markalarla etkileşimini dikkatlice gözetip ve her
bir markanın stratejilerinden nasıl etkileneceğini hesaplamalıdırlar.
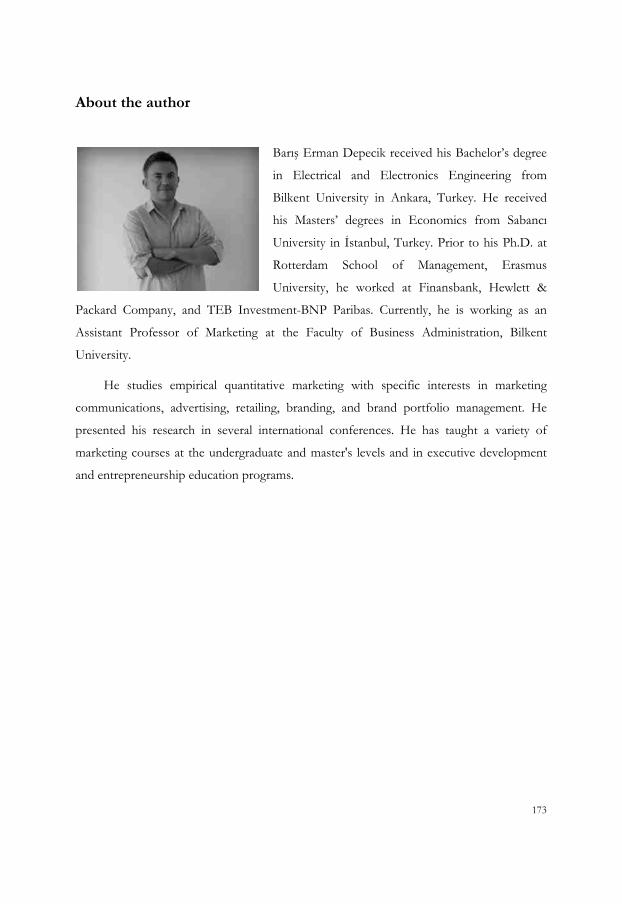
173
About the author
Barış Erman Depecik received his Bachelor’s degree
in Electrical and Electronics Engineering from
Bilkent University in Ankara, Turkey. He received
his Masters’ degrees in Economics from Sabancı
University in İstanbul, Turkey. Prior to his Ph.D. at
Rotterdam School of Management, Erasmus
University, he worked at Finansbank, Hewlett &
Packard Company, and TEB Investment-BNP Paribas. Currently, he is working as an
Assistant Professor of Marketing at the Faculty of Business Administration, Bilkent
University.
He studies empirical quantitative marketing with specific interests in marketing
communications, advertising, retailing, branding, and brand portfolio management. He
presented his research in several international conferences. He has taught a variety of
marketing courses at the undergraduate and master's levels and in executive development
and entrepreneurship education programs.
Portfolio
174
Portfolio
Journal Articles
Depecik, B., Everdingen, Y. M. van, & Bruggen, G. H. van (2014). “Firm Value Effects of Global, Regional, and Local Brand Divestments in Core and Non‐Core Businesses.” Global Strategy Journal, 4(2), 143-160.
Proceedings & Professional Publications:
Depecik, B. & Bruggen, G. H (2016). “Do Partnerships with Major Sports Franchises Pay Off?” Sport Marketing and Sponsorship Conference 2016 - Conference Proceedings (p. 13).
Everdingen, Y.M. van, Depecik, B. & Bruggen, G.H. van (2015). “Het effect van mersaneringen op de waarde van ondernemingen.” Ontwikkelingen in het Marktonderzoek / Jaarboek MOA.
Selected Research in Progress:
Depecik, B. & Ataman, B. “Who Benefits from Brand Exits? Why?”
Depecik, B. & Bruggen, G. H. “Energizing Sales Through Sponsorships.”
Depecik, B. “How to Reap the Rewards of a Brand Acquisition?”
Invited Talks, Seminars, and Conference Presentations
2016 Sport Marketing and Sponsorship Conference, Salzburg, Austria.
2013 Bilkent University
2013 American Marketing Association Conference, Boston, USA
2013 Transatlantic Doctoral Conference, London, UK.
2013 Doctoral Consortium, Marketing Science Conference, İstanbul, Turkey.
2012 Doctoral Consortium, Marketing Science Conference, Boston, USA.
2011 Doctoral Colloquium, European Marketing Academy, Ljubljana, Slovenia.
Portfolio
175
Teaching Experience
Bilkent University
2016 – Fundamentals of Marketing (undergraduate)
2015 – Business Practice Course (MBA)
2015 – Digital Marketing (entrepreneurship education program)
2014 – 2016 Digital Marketing (executive development program)
2014 – 2016 Global Marketing and Emerging Markets (undergraduate)
2014 – 2016 Integrated Marketing Communications (undergraduate & MBA)
Rotterdam School of Management, Erasmus University
2013 – 2014 Master Thesis Supervisor
2010 – 2013 Bachelor Thesis Supervisor
Selected Coursework (Course-Instructor-University)
Marketing Models Philip Hans Franses (Erasmus) Managerial Decision Making Jehoshua Eliashberg (Erasmus) Behavioral Decision Theory Stijn van Osselaer (Erasmus) Research Methodology Albert Jolink (Erasmus) Applied Econometrics Marno Verbeek (Erasmus) Bayesian Econometrics Richard Paap (Erasmus) Statistical Methods Patrick Groenen (Erasmus) Advanced Econometrics Fırat İnceoğlu (Sabancı) Quantitative Research Methods Alper Filiztekin (Sabancı) Microeconomics
Mehmet Barlo (Sabancı) Macroeconomics
Mehmet Yörükoglu (Sabancı) Industrial Organization
İzak Atiyas (Sabancı) Financial Instability in Emerging Markets Caroline van Rijckeghem (Sabancı)

176
The ERIM PhD Series
The ERIM PhD Series contains PhD dissertations in the field of Research in Management defended at Erasmus University Rotterdam and supervised by senior researchers affiliated to the Erasmus Research Institute of Management (ERIM). All dissertations in the ERIM PhD Series are available in full text through the ERIM Electronic Series Portal: http://repub.eur.nl/pub. ERIM is the joint research institute of the Rotterdam School of Management (RSM) and the Erasmus School of Economics at the Erasmus University Rotterdam (EUR).
Dissertations in the last five years Abbink, E.J., Crew Management in Passenger Rail Transport, Promotors: Prof. L.G. Kroon & Prof. A.P.M. Wagelmans, EPS-2014-325-LIS, http://repub.eur.nl/pub/76927 Acar, O.A., Crowdsourcing for Innovation: Unpacking Motivational, Knowledge and Relational Mechanisms of Innovative Behavior in Crowdsourcing Platforms, Promotor: Prof. J.C.M. van den Ende, EPS-2014-321-LIS, http://repub.eur.nl/pub/76076 Akin Ates, M., Purchasing and Supply Management at the Purchase Category Level: strategy, structure and performance, Promotors: Prof. J.Y.F. Wynstra & Dr E.M. van Raaij, EPS-2014-300-LIS, http://repub.eur.nl/pub/50283 Akpinar, E., Consumer Information Sharing, Promotor: Prof. A. Smidts, EPS-2013-297-MKT, http://repub.eur.nl/pub/50140 Alexander, L., People, Politics, and Innovation: A Process Perspective, Promotors: Prof. H.G. Barkema & Prof. D.L. van Knippenberg, EPS-2014-331-S&E, http: //repub.eur.nl/pub/77209 Almeida e Santos Nogueira, R.J. de, Conditional Density Models Integrating Fuzzy and Probabilistic Representations of Uncertainty, Promotors: Prof. U. Kaymak & Prof. J.M.C. Sousa, EPS-2014-310-LIS, http://repub.eur.nl/pub/51560 Bannouh, K., Measuring and Forecasting Financial Market Volatility using High-frequency Data, Promotor: Prof. D.J.C. van Dijk, EPS-2013-273-F&A, http://repub.eur.nl/pub/38240 Ben-Menahem, S.M., Strategic Timing and Proactiveness of Organizations, Promotors: Prof. H.W. Volberda & Prof. F.A.J. van den Bosch, EPS-2013-278-S&E, http://repub.eur.nl/pub/39128 Benning, T.M., A Consumer Perspective on Flexibility in Health Care: Priority Access Pricing and Customized Care, Promotor: Prof. B.G.C. Dellaert, EPS-2011-241-MKT, http://repub.eur.nl/pub/23670
The ERIM PhD Series
177
Benschop, N, Biases in Project Escalation: Names, frames & construal levels, Promotors: Prof. K.I.M. Rhode, Prof. H.R. Commandeur, Prof. M.Keil & Dr A.L.P. Nuijten, EPS-2015-375-S&E, hdl.handle.net/1765/79408 Berg, W.E. van den, Understanding Salesforce Behavior using Genetic Association Studies, Promotor: Prof. W.J.M.I. Verbeke, EPS-2014-311-MKT, http://repub.eur.nl/pub/51440 Betancourt, N.E., Typical Atypicality: Formal and Informal Institutional Conformity, Deviance, and Dynamics, Promotor: Prof. B. Krug, EPS-2012-262-ORG, http://repub.eur.nl/pub/32345 Beusichem, H.C. van, Firms and Financial Markets: Empirical Studies on the Informational Value of Dividends, Governance and Financial Reporting, Promotors: Prof. A. de Jong & Dr. G. Westerhuis, EPS-2016-378-F&A, http://repub.eur.nl/pub/93079 Bliek, R. de, Empirical Studies on the Economic Impact of Trust, Promotor: Prof. J. Veenman & Prof. Ph.H.B.F. Franses, EPS-2015-324-ORG, http://repub.eur.nl/pub/78159 Blitz, D.C., Benchmarking Benchmarks, Promotors: Prof. A.G.Z. Kemna & Prof. W.F.C. Verschoor, EPS-2011-225-F&A, http://repub.eur.nl/pub/22624 Boons, M., Working Together Alone in the Online Crowd: The Effects of Social Motivationsand Individual Knowledge Backgrounds on the Participation and Performance of Members of Online Crowdsourcing Platforms, Promotors: Prof. H.G. Barkema & Dr D.A. Stam, EPS-2014-306-S&E, http://repub.eur.nl/pub/50711 Brazys, J., Aggregated Marcoeconomic News and Price Discovery, Promotor: Prof. W.F.C. Verschoor, EPS-2015-351-F&A, http://repub.eur.nl/pub/78243 Burger, M.J., Structure and Cooptition in Urban Networks, Promotors: Prof. G.A. van der Knaap & Prof. H.R. Commandeur, EPS-2011-243-ORG, http://repub.eur. nl/pub/26178 Byington, E., Exploring Coworker Relationships: Antecedents and Dimensions of Interpersonal Fit, Coworker Satisfaction, and Relational Models, Promotor: Prof. D.L. van Knippenberg, EPS-2013-292-ORG, http://repub.eur.nl/pub/41508 Camacho, N.M., Health and Marketing: Essays on Physician and Patient Decision-Making, Promotor: Prof. S. Stremersch, EPS-2011-237-MKT, http://repub.eur.nl/pub/23604 Cankurtaran, P., Essays on Accelerated Product Development, Promotors: Prof. F.Langerak & Prof.G.H. van Bruggen, EPS-2014-317-MKT, http://repub.eur.nl/pub/76074 Caron, E.A.M., Explanation of Exceptional Values in Multi-dimensional Business Databases, Promotors: Prof. H.A.M. Daniels & Prof. G.W.J. Hendrikse, EPS-2013-296-LIS, http://repub.eur.nl/pub/50005

The ERIM PhD Series
178
Carvalho, L. de, Knowledge Locations in Cities: Emergence and Development Dynamics, Promotor: Prof. L. Berg, EPS-2013-274-S&E, http://repub.eur.nl/pub/38449 Cranenburgh, K.C. van, Money or Ethics: Multinational corporations and religious organisations operating in an era of corporate responsibility, Prof. L.C.P.M. Meijs, Prof. R.J.M. van Tulder & Dr D. Arenas, EPS-2016-385-ORG, http://repub.eur.nl/pub/93104 Consiglio, I., Others: Essays on Interpersonal and Consumer Behavior, Promotor: Prof. S.M.J. van Osselaer, EPS-2016-366-MKT, http://repub.eur.nl/pub/79820 Cox, R.H.G.M., To Own, To Finance, and To Insure - Residential Real Estate Revealed, Promotor: Prof. D. Brounen, EPS-2013-290-F&A, http://repub.eur.nl/pub/40964 Deichmann, D., Idea Management: Perspectives from Leadership, Learning, and Network Theory, Promotor: Prof. J.C.M. van den Ende, EPS-2012-255-ORG, http://repub.eur.nl/pub/31174 Deng, W., Social Capital and Diversification of Cooperatives, Promotor: Prof. G.W.J. Hendrikse, EPS-2015-341-ORG, http://repub.eur.nl/pub/77449 Desmet, P.T.M., In Money we Trust? Trust Repair and the Psychology of Financial Compensations, Promotor: Prof. D. de Cremer, EPS-2011-232-ORG, http://repub.eur.nl/pub/23268 Dollevoet, T.A.B., Delay Management and Dispatching in Railways, Promotor: Prof. A.P.M. Wagelmans, EPS-2013-272-LIS, http://repub.eur.nl/pub/38241 Doorn, S. van, Managing Entrepreneurial Orientation, Promotors: Prof. J.J.P. Jansen, Prof. F.A.J. van den Bosch, & Prof. H.W. Volberda, EPS-2012-258-STR, http://repub.eur.nl/pub/32166 Douwens-Zonneveld, M.G., Animal Spirits and Extreme Confidence: No Guts, No Glory? Promotor: Prof. W.F.C. Verschoor, EPS-2012-257-F&A, http://repub.eur.nl/pub/31914 Duca, E., The Impact of Investor Demand on Security Offerings, Promotor: Prof. A. de Jong, EPS-2011-240-F&A, http://repub.eur.nl/pub/26041 Duyvesteyn, J.G. Empirical Studies on Sovereign Fixed Income Markets, Promotors: Prof. P.Verwijmeren & Prof. M.P.E. Martens, EPS-2015-361-F&A, hdl.handle.net/1765/79033 Duursema, H., Strategic Leadership: Moving Beyond the Leader-Follower Dyad, Promotor: Prof. R.J.M. van Tulder, EPS-2013-279-ORG, http://repub.eur.nl/pub/39129 Eck, N.J. van, Methodological Advances in Bibliometric Mapping of Science, Promotor: Prof. R. Dekker, EPS-2011-247-LIS, http://repub.eur.nl/pub/26509 Elemes, A, Studies on Determinants and Consequences of Financial Reporting Quality, Promotor: Prof. E.Peek, EPS-2015-354-F&A, http://hdl.handle.net/1765/79037
The ERIM PhD Series
179
Ellen, S. ter, Measurement, Dynamics, and Implications of Heterogeneous Beliefs in Financial Markets, Promotor: Prof. W.F.C. Verschoor, EPS-2015-343-F&A, http://repub.eur.nl/pub/78191 Erlemann, C., Gender and Leadership Aspiration: The Impact of the Organizational Environment, Promotor: Prof. D.L. van Knippenberg, EPS-2016-376-ORG, http://repub.eur.nl/pub/79409 Eskenazi, P.I., The Accountable Animal, Promotor: Prof. F.G.H. Hartmann, EPS-2015-355-F&A, http://repub.eur.nl/pub/78300 Essen, M. van, An Institution-Based View of Ownership, Promotors: Prof. J. van Oosterhout & Prof. G.M.H. Mertens, EPS-2011-226-ORG, http://repub.eur.nl/pub/22643 Evangelidis, I., Preference Construction under Prominence, Promotor: Prof. S.M.J. van Osselaer, EPS-2015-340-MKT, http://repub.eur.nl/pub/78202 Faber, N., Structuring Warehouse Management, Promotors: Prof. MB.M. de Koster & Prof. Ale Smidts, EPS-2015-336-LIS, http://repub.eur.nl/pub/78603 Fernald, K., The Waves of Biotechnological Innovation in Medicine: Interfirm Cooperation Effects and a Venture Capital Perspective, Promotors: Prof. E.Claassen, Prof. H.P.G. Pennings & Prof. H.R. Commandeur, EPS-2015-371-S&E, http://hdl.handle.net/1765/79120 Fliers, P.T., Essays on Financing and Performance: The role of firms, banks and board, Promotor: Prof. A. de Jong & Prof P.G.J. Roosenboom, EPS-2016-388-F&A, http://repub.eur.nl/pub/93019 Fourne, S.P., Managing Organizational Tensions: A Multi-Level Perspective on Exploration, Exploitation and Ambidexterity, Promotors: Prof. J.J.P. Jansen & Prof. S.J. Magala, EPS-2014-318-S&E, http://repub.eur.nl/pub/76075 Gharehgozli, A.H., Developing New Methods for Efficient Container Stacking Operations, Promotor: Prof. M.B.M. de Koster, EPS-2012-269-LIS, http://repub.eur.nl/pub/37779 Gils, S. van, Morality in Interactions: On the Display of Moral Behavior by Leaders and Employees, Promotor: Prof. D.L. van Knippenberg, EPS-2012-270-ORG, http://repub.eur.nl/pub/38027 Ginkel-Bieshaar, M.N.G. van, The Impact of Abstract versus Concrete Product Communications on Consumer Decision-making Processes, Promotor: Prof. B.G.C. Dellaert, EPS-2012-256-MKT, http://repub.eur.nl/pub/31913 Gkougkousi, X., Empirical Studies in Financial Accounting, Promotors: Prof. G.M.H. Mertens & Prof. E. Peek, EPS-2012-264-F&A, http://repub.eur.nl/pub/37170
The ERIM PhD Series
180
Glorie, K.M., Clearing Barter Exchange Markets: Kidney Exchange and Beyond, Promotors: Prof. A.P.M. Wagelmans & Prof. J.J. van de Klundert, EPS-2014-329-LIS, http://repub.eur.nl/pub/77183 Hekimoglu, M., Spare Parts Management of Aging Capital Products, Promotor: Prof. R. Dekker, EPS-2015-368-LIS, http://hdl.handle.net/1765/79092 Heij, C.V., Innovating beyond Technology. Studies on how management innovation, co-creation and business model innovation contribute to firm’s (innovation) performance, Promotors: Prof. F.A.J. van den Bosch & Prof. H.W. Volberda, EPS-2012-370-STR, http://repub.eur.nl/pub/78651 Heyde Fernandes, D. von der, The Functions and Dysfunctions of Reminders, Promotor: Prof. S.M.J. van Osselaer, EPS-2013-295-MKT, http://repub.eur.nl/pub/41514 Heyden, M.L.M., Essays on Upper Echelons & Strategic Renewal: A Multilevel Contingency Approach, Promotors: Prof. F.A.J. van den Bosch & Prof. H.W. Volberda, EPS-2012-259-STR, http://repub.eur.nl/pub/32167 Hoever, I.J., Diversity and Creativity, Promotor: Prof. D.L. van Knippenberg, EPS-2012-267-ORG, http://repub.eur.nl/pub/37392 Hogenboom, A.C., Sentiment Analysis of Text Guided by Semantics and Structure, Promotors: Prof. U. Kaymak & Prof. F.M.G. de Jong, EPS-2015-369-LIS, http://hdl.handle.net/1765/79034 Hogenboom, F.P., Automated Detection of Financial Events in News Text, Promotors: Prof. U. Kaymak & Prof. F.M.G. de Jong, EPS-2014-326-LIS, http://repub.eur.nl/pub/77237 Hollen, R.M.A., Exploratory Studies into Strategies to Enhance Innovation-Driven International Competitiveness in a Port Context: Toward Ambidextrous Ports, Promotors: Prof. F.A.J. Van Den Bosch & Prof. H.W.Volberda, EPS-2015-372-S&E, hdl.handle.net/1765/78881 Hoogendoorn, B., Social Entrepreneurship in the Modern Economy: Warm Glow, Cold Feet, Promotors: Prof. H.P.G. Pennings & Prof. A.R. Thurik, EPS-2011-246-STR, http://repub.eur.nl/pub/26447 Hoogervorst, N., On The Psychology of Displaying Ethical Leadership: A Behavioral Ethics Approach, Promotors: Prof. D. de Cremer & Dr M. van Dijke, EPS-2011-244-ORG, http://repub.eur.nl/pub/26228 Hout, D.H. van, Measuring Meaningful Differences: Sensory Testing Based Decision Making in an Industrial Context; Applications of Signal Detection Theory and Thurstonian Modelling, Promotors: Prof. P.J.F. Groenen & Prof. G.B. Dijksterhuis, EPS-2014-304-MKT, http://repub.eur.nl/pub/50387 Houwelingen, G.G. van, Something To Rely On, Promotors: Prof. D. de Cremer & Prof. M.H. van Dijke, EPS-2014-335-ORG, http://repub.eur.nl/pub/77320
The ERIM PhD Series
181
Hurk, E. van der, Passengers, Information, and Disruptions, Promotors: Prof. L.G. Kroon & Prof. P.H.M. Vervest, EPS-2015-345-LIS, http://repub.eur.nl/pub/78275 Hytonen, K.A., Context Effects in Valuation, Judgment and Choice: A Neuroscientific Approach, Promotor: Prof. A. Smidts, EPS-2011-252-MKT, http://repub.eur.nl/pub/30668 Iseger, P. den, Fourier and Laplace Transform Inversion with Applications in Finance, Promotor: Prof. R. Dekker, EPS-2014-322-LIS, http://repub.eur.nl/pub/76954 Jaarsveld, W.L. van, Maintenance Centered Service Parts Inventory Control, Promotor: Prof. R. Dekker, EPS-2013-288-LIS, http://repub.eur.nl/pub/39933 Jalil, M.N., Customer Information Driven After Sales Service Management: Lessons from Spare Parts Logistics, Promotor: Prof. L.G. Kroon, EPS-2011-222-LIS, http://repub.eur.nl/pub/22156 Kappe, E.R., The Effectiveness of Pharmaceutical Marketing, Promotor: Prof. S. Stremersch, EPS-2011-239-MKT, http://repub.eur.nl/pub/23610 Karreman, B., Financial Services and Emerging Markets, Promotors: Prof. G.A. van der Knaap & Prof. H.P.G. Pennings, EPS-2011-223-ORG, http://repub.eur.nl/pub/22280 Khanagha, S., Dynamic Capabilities for Managing Emerging Technologies, Promotor: Prof. H.W. Volberda, EPS-2014-339-S&E, http://repub.eur.nl/pub/77319 Kil, J., Acquisitions Through a Behavioral and Real Options Lens, Promotor: Prof. H.T.J. Smit, EPS-2013-298-F&A, http://repub.eur.nl/pub/50142 Klooster, E. van ’t, Travel to Learn: the Influence of Cultural Distance on Competence Development in Educational Travel, Promotors: Prof. F.M. Go & Prof. P.J. van Baalen, EPS-2014-312-MKT, http://repub.eur.nl/pub/51462 Koendjbiharie, S.R., The Information-Based View on Business Network Performance: Revealing the Performance of Interorganizational Networks, Promotors: Prof. H.W.G.M. van Heck & Prof. P.H.M. Vervest, EPS-2014-315-LIS, http://repub.eur.nl/pub/51751 Koning, M., The Financial Reporting Environment: The Role of the Media, Regulators and Auditors, Promotors: Prof. G.M.H. Mertens & Prof. P.G.J. Roosenboom, EPS-2014-330-F&A, http://repub.eur.nl/pub/77154 Konter, D.J., Crossing Borders with HRM: An Inquiry of the Influence of Contextual Differences in the Adoption and Effectiveness of HRM, Promotors: Prof. J. Paauwe & Dr L.H. Hoeksema, EPS-2014-305-ORG, http://repub.eur.nl/pub/50388 Korkmaz, E., Bridging Models and Business: Understanding Heterogeneity in Hidden Drivers of Customer Purchase Behavior, Promotors: Prof. S.L. van de Velde & Prof. D. Fok, EPS-2014-316-LIS, http://repub.eur.nl/pub/76008
The ERIM PhD Series
182
Kroezen, J.J., The Renewal of Mature Industries: An Examination of the Revival of the Dutch Beer Brewing Industry, Promotor: Prof. P.P.M.A.R. Heugens, EPS-2014- 333-S&E, http://repub.eur.nl/pub/77042 Kysucky, V., Access to Finance in a Cros-Country Context, Promotor: Prof.dr. L. Norden, EPS-2015-350-F&A, http://repub.eur.nl/pub/78225 Lam, K.Y., Reliability and Rankings, Promotor: Prof. Ph.H.B.F. Franses, EPS-2011-230-MKT, http://repub.eur.nl/pub/22977 Lander, M.W., Profits or Professionalism? On Designing Professional Service Firms, Promotors: Prof. J. van Oosterhout & Prof. P.P.M.A.R. Heugens, EPS-2012-253-ORG, http://repub.eur.nl/pub/30682 Langhe, B. de, Contingencies: Learning Numerical and Emotional Associations in an Uncertain World, Promotors: Prof. B. Wierenga & Prof. S.M.J. van Osselaer, EPS-2011-236-MKT, http://repub.eur.nl/pub/23504 Lee, C.I.S.G, Big Data in Management Research: Exploring New Avenues, Promotors: Prof. S.J. Magala & Dr W.A. Felps, EPS-2016-365-ORG, http://repub.eur.nl/pub/79818 Legault-Tremblay, P.O., Corporate Governance During Market Transition: Heterogeneous responses to Institution Tensions in China, Promotor: Prof. B. Krug, EPS-2015-362-ORG, http://repub.eur.nl/pub/78649 Lenoir, A.S. Are You Talking to Me? Addressing Consumers in a Globalised World, Promotors: Prof. S. Puntoni & Prof. S.M.J. van Osselaer, EPS-2015-363-MKT, http://hdl.handle.net/1765/79036 Leunissen, J.M., All Apologies: On the Willingness of Perpetrators to Apologize, Promotors: Prof. D. de Cremer & Dr. M. van Dijke, EPS-2014-301-ORG, http://repub.eur.nl/pub/50318 Li, D., Supply Chain Contracting for After-sales Service and Product Support, Promotor: Prof. M.B.M. de Koster, EPS-2015-347-LIS, http://repub.eur.nl/pub/78526 Li, Z., Irrationality: What, Why and How, Promotor(s): Prof. H. Bleichrodt, Prof. P.P. Wakker, & Prof. K.I.M. Rohde, EPS-2014-338-MKT, http://repub.eur.nl/pub/77205 Liang, Q.X., Governance, CEO Identity, and Quality Provision of Farmer Cooperatives, Promotor: Prof. G.W.J. Hendrikse, EPS-2013-281-ORG, http://repub.eur.nl/pub/39253 Liket, K., Why ’Doing Good’ is not Good Enough: Essays on Social Impact Measurement, Promotors: Prof. H.R. Commandeur & Dr K.E.H. Maas, EPS-2014-307-STR, http://repub.eur.nl/pub/51130
The ERIM PhD Series
183
Loos, M.J.H.M. van der, Molecular Genetics and Hormones: New Frontiers in Entrepreneurship Research, Promotors: Prof. A.R. Thurik, Prof. P.J.F. Groenen, & Prof. A. Hofman, EPS-2013-287-S&E, http://repub.eur.nl/pub/40081 Lovric, M., Behavioral Finance and Agent-Based Artificial Markets, Promotors: Prof. J. Spronk & Prof. U. Kaymak, EPS-2011-229-F&A, http://repub.eur.nl/pub/22814 Lu, Y., Data-Driven Decision Making in Auction Markets, Promotors: Prof. H.W.G.M. van Heck & Prof. W. Ketter, EPS-2014-314-LIS, http://repub.eur.nl/pub/51543 Ma, Y., The Use of Advanced Transportation Monitoring Data for Official Statistics, Promotors: Prof. L.G. Kroon and Dr Jan van Dalen, EPS-2016-391-LIS, hdl.handle.net/1765/80174 Manders, B., Implementation and Impact of ISO 9001, Promotor: Prof. K. Blind, EPS-2014-337-LIS, http://repub.eur.nl/pub/77412 Markwat, T.D., Extreme Dependence in Asset Markets Around the Globe, Promotor: Prof. D.J.C. van Dijk, EPS-2011-227-F&A, http://repub.eur.nl/pub/22744 Mees, H., Changing Fortunes: How China’s Boom Caused the Financial Crisis, Promotor: Prof. Ph.H.B.F. Franses, EPS-2012-266-MKT, http://repub.eur.nl/pub/34930 Mell, J.N., Connecting Minds: On The Role of Metaknowledge in Knowledge Coordination, Promotor: Prof. D.L. van Knippenberg, EPS-2015-359-ORG, http://hdl.handle.net/1765/78951 Meuer, J., Configurations of Inter-firm Relations in Management Innovation: A Study in China’s Biopharmaceutical Industry, Promotor: Prof. B. Krug, EPS-2011-228-ORG, http://repub.eur.nl/pub/22745 Micheli, M.R., Business Model Innovation: A Journey across Managers’ Attention and Inter-Organizational Networks, Promotor: Prof. J.J.P. Jansen, EPS-2015-344-S&E, http://repub.eur.nl/pub/78241 Mihalache, O.R., Stimulating Firm Innovativeness: Probing the Interrelations between Managerial and Organizational Determinants, Promotors: Prof. J.J.P. Jansen, Prof. F.A.J. van den Bosch, & Prof. H.W. Volberda, EPS-2012-260-S&E, http://repub.eur.nl/pub/32343 Milea, V., News Analytics for Financial Decision Support, Promotor: Prof. U. Kaymak, EPS-2013-275-LIS, http://repub.eur.nl/pub/38673 Moniz, A, Textual Analysis of Intangible Information, Promotor(s): Prof C.B.M. van Riel, Prof. F.M.G de Jong & Dr G.A.J.M. Berens, EPS-2016-393-ORG, http://repub.eur.nl/pub/93001 Mulder, J. Network design and robust scheduling in liner shipping, Promotors: Prof. R. Dekker & Dr W.L. van Jaarsveld, Eps-2016-384-LIS, http://repub.eur.nl/pub/80258

The ERIM PhD Series
184
Naumovska, I., Socially Situated Financial Markets: A Neo-Behavioral Perspective on Firms, Investors and Practices, Promotors: Prof. P.P.M.A.R. Heugens & Prof. A. de Jong, EPS-2014-319-S&E, http://repub.eur.nl/pub/76084 Nielsen, L.K., Rolling Stock Rescheduling in Passenger Railways: Applications in short term planning and in disruption management, Promotor: Prof. L.G. Kroon, EPS- 2011-224-LIS, http://repub.eur.nl/pub/22444 Nuijten, A.L.P., Deaf Effect for Risk Warnings: A Causal Examination applied to Information Systems Projects, Promotors: Prof. G.J. van der Pijl, Prof. H.R. Commandeur & Prof. M. Keil, EPS-2012-263-S&E, http://repub.eur.nl/pub/34928 Oord, J.A. van, Essays on Momentum Strategies in Finance, Promotor: Prof. H.K. van Dijk, EPS-2016-380-F&A, hdl.handle.net/1765/80036 Osadchiy, S.E., The Dynamics of Formal Organization: Essays on bureaucracy and formal rules, Promotor: Prof. P.P.M.A.R. Heugens, EPS-2011-231-ORG, http://repub.eur.nl/pub/23250 Ozdemir, M.N., Project-level Governance, Monetary Incentives, and Performance in Strategic R&D Alliances, Promotor: Prof. J.C.M. van den Ende, EPS-2011-235-LIS, http://repub.eur.nl/pub/23550 Peers, Y., Econometric Advances in Diffusion Models, Promotor: Prof. Ph.H.B.F. Franses, EPS-2011-251-MKT, http://repub.eur.nl/pub/30586 Peters, M., Machine Learning Algorithms for Smart Electricity Markets, Promotor: Prof. W. Ketter, EPS-2014-332-LIS, http://repub.eur.nl/pub/77413 Porck, J., No Team is an Island: An Integrative View of Strategic Consensus between Groups, Promotors: Prof. P.J.F. Groenen & Prof. D.L. van Knippenberg, EPS- 2013-299-ORG, http://repub.eur.nl/pub/50141 Porras Prado, M., The Long and Short Side of Real Estate, Real Estate Stocks, and Equity, Promotor: Prof. M.J.C.M. Verbeek, EPS-2012-254-F&A, http://repub.eur.nl/pub/30848 Poruthiyil, P.V., Steering Through: How organizations negotiate permanent uncertainty and unresolvable choices, Promotors: Prof. P.P.M.A.R. Heugens & Prof. S.J. Magala, EPS-2011-245-ORG, http://repub.eur.nl/pub/26392 Pourakbar, M., End-of-Life Inventory Decisions of Service Parts, Promotor: Prof. R. Dekker, EPS-2011-249-LIS, http://repub.eur.nl/pub/30584 Pronker, E.S., Innovation Paradox in Vaccine Target Selection, Promotors: Prof. H.J.H.M. Claassen & Prof. H.R. Commandeur, EPS-2013-282-S&E, http://repub.eur.nl/pub/39654
The ERIM PhD Series
185
Protzner, S. Mind the gap between demand and supply: A behavioral perspective on demand forecasting, Promotors: Prof. S.L. van de Velde & Dr L. Rook, EPS-2015-364-LIS, http://repub.eur.nl/pub/79355 Pruijssers, J.K., An Organizational Perspective on Auditor Conduct, Promotors: Prof. J. van Oosterhout & Prof. P.P.M.A.R. Heugens, EPS-2015-342-S&E, http://repub.eur.nl/pub/78192 Retel Helmrich, M.J., Green Lot-Sizing, Promotor: Prof. A.P.M. Wagelmans, EPS- 2013-291-LIS, http://repub.eur.nl/pub/41330 Rietdijk, W.J.R. The Use of Cognitive Factors for Explaining Entrepreneurship, Promotors: Prof. A.R. Thurik & Prof. I.H.A. Franken, EPS-2015-356-S&E, http://repub.eur.nl/pub/79817 Rietveld, N., Essays on the Intersection of Economics and Biology, Promotors: Prof. A.R. Thurik, Prof. Ph.D. Koellinger, Prof. P.J.F. Groenen, & Prof. A. Hofman, EPS-2014-320-S&E, http://repub.eur.nl/pub/76907 Rijsenbilt, J.A., CEO Narcissism: Measurement and Impact, Promotors: Prof. A.G.Z. Kemna & Prof. H.R. Commandeur, EPS-2011-238-STR, http://repub.eur.nl/pub/23554 Rösch, D. Market Efficiency and Liquidity, Promotor: Prof. M.A. van Dijk, EPS-2015-353-F&A, http://hdl.handle.net/1765/79121 Roza-van Vuren, M.W., The Relationship between Offshoring Strategies and Firm Performance: Impact of innovation, absorptive capacity and firm size, Promotors: Prof. H.W. Volberda & Prof. F.A.J. van den Bosch, EPS-2011-214-STR, http://repub.eur.nl/pub/22155 Rubbaniy, G., Investment Behaviour of Institutional Investors, Promotor: Prof. W.F.C. Verschoor, EPS-2013-284-F&A, http://repub.eur.nl/pub/40068 Schoonees, P. Methods for Modelling Response Styles, Promotor: Prof.dr P.J.F. Groenen, EPS-2015-348-MKT, http://repub.eur.nl/pub/79327 Schouten, M.E., The Ups and Downs of Hierarchy: the causes and consequences of hierarchy struggles and positional loss, Promotors; Prof. D.L. van Knippenberg & Dr L.L. Greer, EPS-2016-386-ORG, http://repub.eur.nl/pub/80059 Shahzad, K., Credit Rating Agencies, Financial Regulations and the Capital Markets, Promotor: Prof. G.M.H. Mertens, EPS-2013-283-F&A, http://repub.eur.nl/pub/39655 Sousa, M.J.C. de, Servant Leadership to the Test: New Perspectives and Insights, Promotors: Prof. D.L. van Knippenberg & Dr D. van Dierendonck, EPS-2014-313-ORG, http://repub.eur.nl/pub/51537 Spliet, R., Vehicle Routing with Uncertain Demand, Promotor: Prof. R. Dekker, EPS-2013-293-LIS, http://repub.eur.nl/pub/41513
The ERIM PhD Series
186
Staadt, J.L., Leading Public Housing Organisation in a Problematic Situation: A Critical Soft Systems Methodology Approach, Promotor: Prof. S.J. Magala, EPS-2014-308- ORG, http://repub.eur.nl/pub/50712 Stallen, M., Social Context Effects on Decision-Making: A Neurobiological Approach, Promotor: Prof. A. Smidts, EPS-2013-285-MKT, http://repub.eur.nl/pub/39931 Tarakci, M., Behavioral Strategy: Strategic Consensus, Power and Networks, Promotor: Prof. D.L. van Knippenberg & Prof. P.J.F. Groenen, EPS-2013-280-ORG, http://repub.eur.nl/pub/39130 Teixeira de Vasconcelos, M., Agency Costs, Firm Value, and Corporate Investment, Promotor: Prof. P.G.J. Roosenboom, EPS-2012-265-F&A, http://repub.eur.nl/pub/37265 Troster, C., Nationality Heterogeneity and Interpersonal Relationships at Work, Promotor: Prof. D.L. van Knippenberg, EPS-2011-233-ORG, http://repub.eur.nl/pub/23298 Tsekouras, D., No Pain No Gain: The Beneficial Role of Consumer Effort in Decision- Making, Promotor: Prof. B.G.C. Dellaert, EPS-2012-268-MKT, http://repub.eur.nl/pub/37542 Tuijl, E. van, Upgrading across Organisational and Geographical Configurations, Promotor: Prof. L. van den Berg, EPS-2015-349-S&E, http://repub.eur.nl/pub/78224 Tuncdogan, A., Decision Making and Behavioral Strategy: The Role of Regulatory Focus in Corporate Innovation Processes, Promotors: Prof. F.A.J. van den Bosch, Prof. H.W. Volberda, & Prof. T.J.M. Mom, EPS-2014-334-S&E, http://repub.eur.nl/pub/76978 Uijl, S. den, The Emergence of De-facto Standards, Promotor: Prof. K. Blind, EPS-2014-328-LIS, http://repub.eur.nl/pub/77382 Vagias, D., Liquidity, Investors and International Capital Markets, Promotor: Prof. M.A. van Dijk, EPS-2013-294-F&A, http://repub.eur.nl/pub/41511 Valogianni, K. Sustainable Electric Vehicle Management using Coordinated Machine Learning, Promotors: Prof. H.W.G.M. van Heck & Prof. W. Ketter, Eps-2016-387-LIS, http://repub.eur.nl/pub/93018 Veelenturf, L.P., Disruption Management in Passenger Railways: Models for Timetable, Rolling Stock and Crew Rescheduling, Promotor: Prof. L.G. Kroon, EPS-2014-327-LIS, http://repub.eur.nl/pub/77155 Venus, M., Demystifying Visionary Leadership: In search of the essence of effective vision communication, Promotor: Prof. D.L. van Knippenberg, EPS-2013-289-ORG, http://repub.eur.nl/pub/40079
The ERIM PhD Series
187
Vermeer, W., Propagation in Networks:The impact of information processing at the actor level on system-wide propagation dynamics, Promotor: Prof. P.H.M.Vervest, EPS-2015-373-LIS, http://repub.eur.nl/pub/79325 Versluis, I., Prevention of the Portion Size Effect, Promotors: Prof. Ph.H.B.F. Franses & Dr E.K. Papies, EPS-2016-382-MKT, http://repub.eur.nl/pub/79880 Vishwanathan, P., Governing for Stakeholders: How Organizations May Create or Destroy Value for their Stakeholders, Promotors: Prof. J. van Oosterhout & Prof. L.C.P. M. Meijs, EPS-2016-377-ORG, http://repub.eur.nl/pub/93016 Visser, V.A., Leader Affect and Leadership Effectiveness: How leader affective displays influence follower outcomes, Promotor: Prof. D.L. van Knippenberg, EPS-2013-286-ORG, http://repub.eur.nl/pub/40076 Vlam, A.J., Customer First? The Relationship between Advisors and Consumers of Financial Products, Promotor: Prof. Ph.H.B.F. Franses, EPS-2011-250-MKT, http://repub.eur.nl/pub/30585 Vries, J. de, Behavioral Operations in Logistics, Promotors: Prof. M.B.M de Koster & Prof. D.A. Stam, EPS-2015-374-LIS, http://repub.eur.nl/pub/79705 Waltman, L., Computational and Game-Theoretic Approaches for Modeling Bounded Rationality, Promotors: Prof. R. Dekker & Prof. U. Kaymak, EPS-2011-248- LIS, http://repub.eur.nl/pub/26564 Wang, T., Essays in Banking and Corporate Finance, Promotors: Prof. L. Norden & Prof. P.G.J. Roosenboom, EPS-2015-352-F&A, http://repub.eur.nl/pub/78301 Wang, Y., Information Content of Mutual Fund Portfolio Disclosure, Promotor: Prof. M.J.C.M. Verbeek, EPS-2011-242-F&A, http://repub.eur.nl/pub/26066 Wang, Y., Corporate Reputation Management: Reaching Out to Financial Stakeholders, Promotor: Prof. C.B.M. van Riel, EPS-2013-271-ORG, http://repub.eur.nl/pub/38675 Weenen, T.C., On the Origin and Development of the Medical Nutrition Industry, Promotors: Prof. H.R. Commandeur & Prof. H.J.H.M. Claassen, EPS-2014-309-S&E, http://repub.eur.nl/pub/51134 Wolfswinkel, M., Corporate Governance, Firm Risk and Shareholder Value, Promotor: Prof. A. de Jong, EPS-2013-277-F&A, http://repub.eur.nl/pub/39127 Yang, S., Information Aggregation Efficiency of Prediction Markets, Promotor: Prof. H.W.G.M. van Heck, EPS-2014-323-LIS, http://repub.eur.nl/pub/77184 Yuferova, D. Price Discovery, Liquidity Provision, and Low-Latency Trading, Promotors: Prof. M.A. van Dijk & Dr D.G.J. Bongaerts, EPS-2016-379-F&A, http://repub.eur.nl/pub/93017

The ERIM PhD Series
188
Zaerpour, N., Efficient Management of Compact Storage Systems, Promotor: Prof. M.B.M. de Koster, EPS-2013-276-LIS, http://repub.eur.nl/pub/38766 Zhang, D., Essays in Executive Compensation, Promotor: Prof. I. Dittmann, EPS-2012-261-F&A, http://repub.eur.nl/pub/32344 Zwan, P.W. van der, The Entrepreneurial Process: An International Analysis of Entry and Exit, Promotors: Prof. A.R. Thurik & Prof. P.J.F. Groenen, EPS-2011-234-ORG, http://repub.eur.nl/pub/23422

189


Revitalizing Brands and Brand Portfolios Essays on Brand and Brand Portfolio Management Strategies
BARIS DEPECIK
Erasmus University Rotterdam (EUR)Erasmus Research Institute of ManagementMandeville (T) Building
Burgemeester Oudlaan 50
3062 PA Rotterdam, The Netherlands
P.O. Box 1738
3000 DR Rotterdam, The Netherlands
T +31 10 408 1182
W www.erim.eur.nl
How should consumer products manufacturers and retailers keep their portfolio of brand offerings relevant and energetic when large numbers of new brands are continuously launched into a world of increasingly nonloyal customers with evolving needs? The harsh reality is, at a time when the demise of old brands has accelerated and even established brands are vulnerable, it stands to be a great deal of challenge. Fortunately, a number of ‘revitalization’ strategies can add relevance and energy to brands and brand portfolios.
This dissertation comprises three essays each of which explores the outcomes of a commonly utilized revitalization strategy. In Chapter 2 and Chapter 3, strategies involving simplification of brand offerings are at the center of interest. Chapter 4 departs from these chapters in that it focuses on sponsorship, a widely utilized external brand energizer.
The essays included in this dissertation show that companies can revitalize their offerings to maintain growth even in proliferating environments. My findings collectively lay out the importance of pursuing a portfolio approach to achieve greater success in executing revitalization strategies. Firms should acquire a thorough understanding of how their revitalization efforts can be linked to the performance of each brand in their portfolio by carefully considering individual brands’ roles and their relationships with one another.
The Erasmus Research Institute of Management (ERIM) is the Research School (Onderzoekschool) in the field of management of the Erasmus University Rotterdam. The founding participants of ERIM are the Rotterdam School of Management (RSM), and the Erasmus School of Economics (ESE). ERIM was founded in 1999 and is officially accredited by the Royal Netherlands Academy of Arts and Sciences (KNAW). The research under taken by ERIM is focused on the management of the firm in its environment, its intra- and interfirm relations, and its business processes in their interdependent connections.
The objective of ERIM is to carry out first rate research in management, and to offer an advanced doctoral programme in Research in Management. Within ERIM, over three hundred senior researchers and PhD candidates are active in the different research programmes. From a variety of academic backgrounds and expertises, the ERIM community is united in striving for excellence and working at the forefront of creating new business knowledge.
ERIM PhD Series Research in Management
BA
RIS
DE
PE
CIK
- Re
vita
lizing
Bra
nd
s an
d B
ran
d P
ortfo
lios
406
26680_dissertatie_cover_Baris_Depecik.indd Alle pagina's 06-09-16 10:47