C I T Y O F O R E M - City of Orem
199
ANNUAL COMPREHENSIVE FINANCIAL REPORT FOR FISCAL YEAR ENDED JUNE 30, 2021 STATE OF UTAH CITY OF OREM OREM
-
Upload
khangminh22 -
Category
Documents
-
view
0 -
download
0
Transcript of C I T Y O F O R E M - City of Orem
A N N U A LC O M P R E H E N S I V E
F I N A N C I A L R E P O R TF O R F I S C A L Y E A R E N D E D J U N E 3 0 , 2 0 2 1
S T A T E O F U T A H
C I T Y O F O R E M
OREM
CITY OF OREM STATE OF UTAH
ANNUAL COMPREHENSIVE FINANCIAL REPORT
FOR THE YEAR ENDED JUNE 30, 2021 Prepared by: City of Orem, Finance Department Brandon C. Nelson, CPA, Finance Director
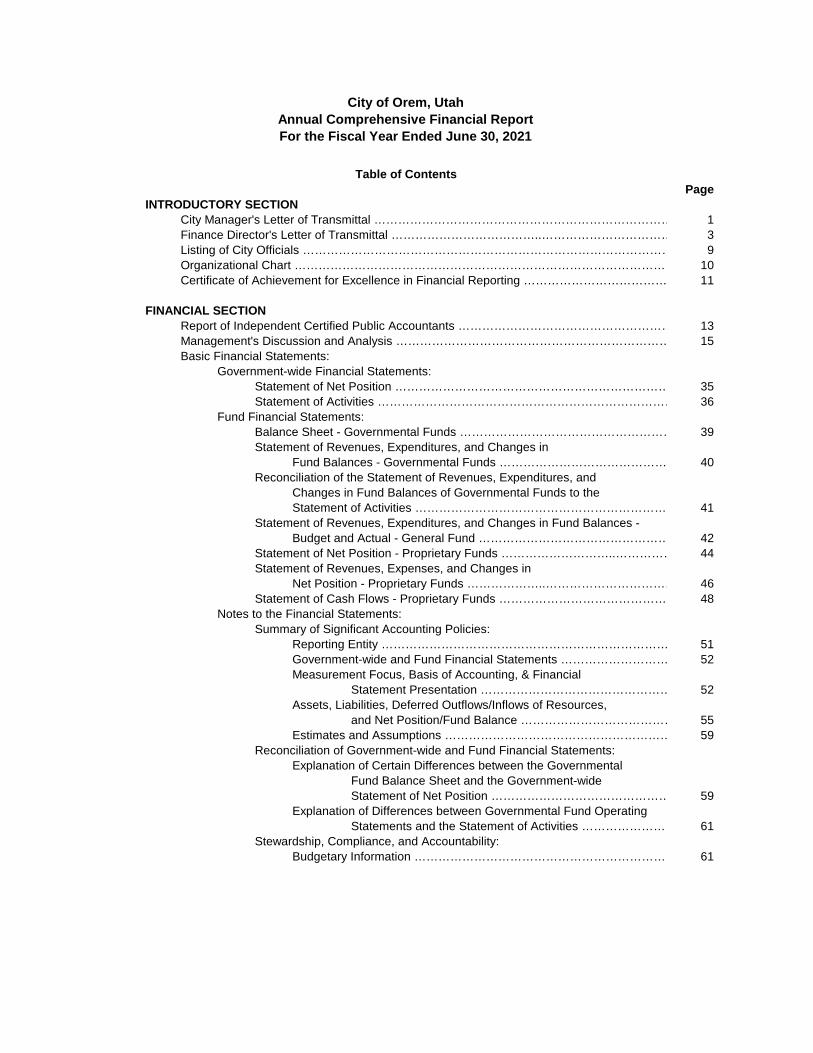
City of Orem, UtahAnnual Comprehensive Financial ReportFor the Fiscal Year Ended June 30, 2021
PageINTRODUCTORY SECTION
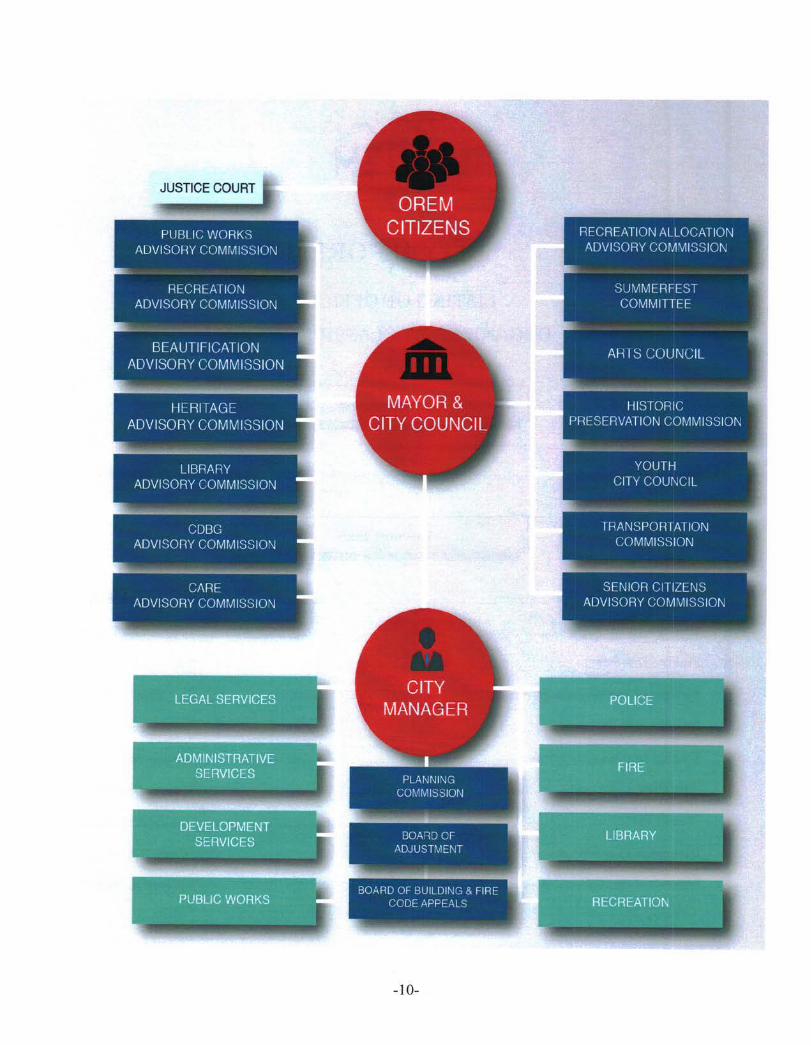
City Manager's Letter of Transmittal ………………………………………………………………… 1Finance Director's Letter of Transmittal ………………………………..…………………………… 3Listing of City Officials ………………………………………………………………………………… 9Organizational Chart …………………………………………………………………………………… 10Certificate of Achievement for Excellence in Financial Reporting ……………………………… 11
FINANCIAL SECTIONReport of Independent Certified Public Accountants ……………………………………………… 13Management's Discussion and Analysis …………………………………………………………… 15Basic Financial Statements:
Government-wide Financial Statements:Statement of Net Position …………………………………………………………… 35Statement of Activities ………………………………………………………………… 36
Fund Financial Statements:Balance Sheet - Governmental Funds ……………………………………………… 39Statement of Revenues, Expenditures, and Changes in
Fund Balances - Governmental Funds …………………………………… 40Reconciliation of the Statement of Revenues, Expenditures, and
Changes in Fund Balances of Governmental Funds to theStatement of Activities ……………………………………………………… 41
Statement of Revenues, Expenditures, and Changes in Fund Balances -Budget and Actual - General Fund ………………………………………… 42
Statement of Net Position - Proprietary Funds ………………………..…………… 44Statement of Revenues, Expenses, and Changes in
Net Position - Proprietary Funds ………………..…………………………… 46Statement of Cash Flows - Proprietary Funds …………………………………… 48
Notes to the Financial Statements:Summary of Significant Accounting Policies:
Reporting Entity ……………………………………………………………… 51Government-wide and Fund Financial Statements ……………………… 52Measurement Focus, Basis of Accounting, & Financial
Statement Presentation ………………………………………… 52Assets, Liabilities, Deferred Outflows/Inflows of Resources,
and Net Position/Fund Balance ………………………………… 55Estimates and Assumptions ………………………………………………… 59
Reconciliation of Government-wide and Fund Financial Statements:Explanation of Certain Differences between the Governmental
Fund Balance Sheet and the Government-wideStatement of Net Position ……………………………………… 59
Explanation of Differences between Governmental Fund OperatingStatements and the Statement of Activities …………………… 61
Stewardship, Compliance, and Accountability:Budgetary Information ………………………………………………………… 61
Table of Contents
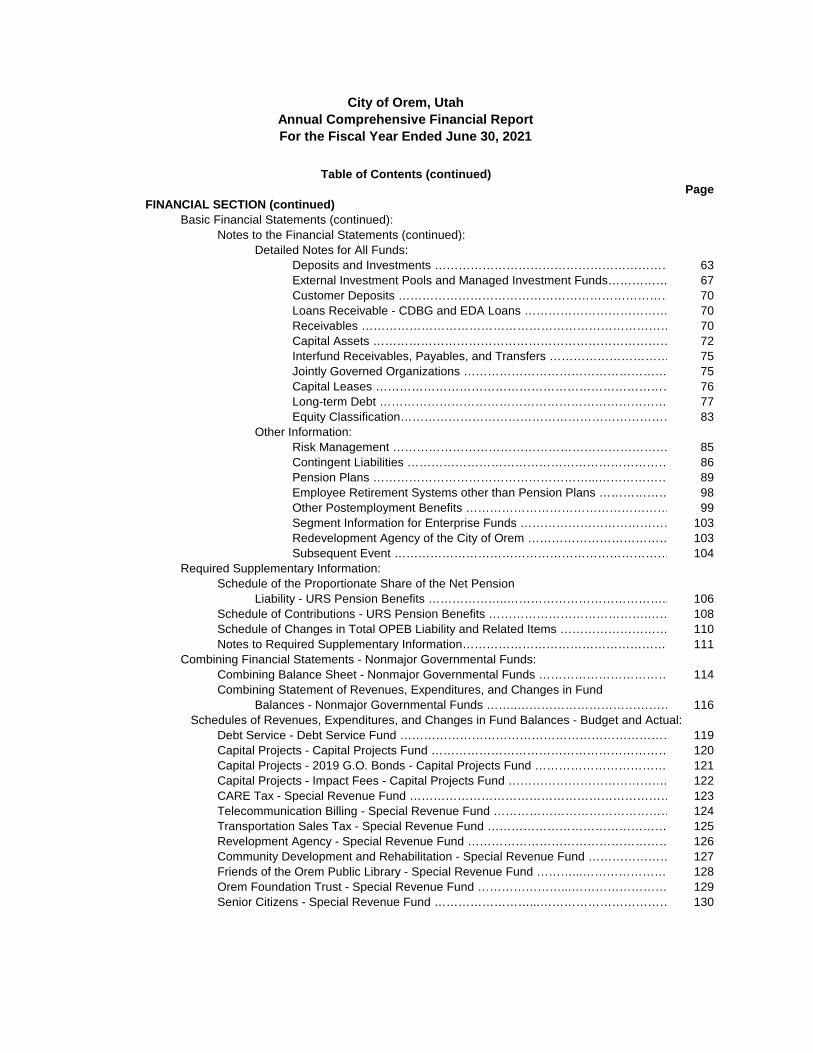
City of Orem, UtahAnnual Comprehensive Financial ReportFor the Fiscal Year Ended June 30, 2021
PageFINANCIAL SECTION (continued)
Basic Financial Statements (continued):Notes to the Financial Statements (continued):
Detailed Notes for All Funds:Deposits and Investments …………………………………………………… 63External Investment Pools and Managed Investment Funds…………… 67Customer Deposits …………………………………………………………… 70Loans Receivable - CDBG and EDA Loans ……………………………… 70Receivables …………………………………………………………………… 70Capital Assets ………………………………………………………………… 72Interfund Receivables, Payables, and Transfers ………………………… 75Jointly Governed Organizations …………………………………………… 75Capital Leases ………………………………………………………………… 76Long-term Debt ……………………………………………………………… 77Equity Classification…………………………………………………………… 83
Other Information:Risk Management …………………………………………………………… 85Contingent Liabilities ………………………………………………………… 86Pension Plans ………………………………………………...……………… 89Employee Retirement Systems other than Pension Plans ……………… 98Other Postemployment Benefits …………………………………………… 99Segment Information for Enterprise Funds ………………………………… 103Redevelopment Agency of the City of Orem ……………………………… 103Subsequent Event …………………………………………………………… 104
Required Supplementary Information:Schedule of the Proportionate Share of the Net Pension
Liability - URS Pension Benefits ………………..………………………………….. 106Schedule of Contributions - URS Pension Benefits ………………………………….…… 108Schedule of Changes in Total OPEB Liability and Related Items ……………………… 110Notes to Required Supplementary Information……………………………………………… 111
Combining Financial Statements - Nonmajor Governmental Funds:Combining Balance Sheet - Nonmajor Governmental Funds …………………………… 114Combining Statement of Revenues, Expenditures, and Changes in Fund
Balances - Nonmajor Governmental Funds ……..………………………………… 116 Schedules of Revenues, Expenditures, and Changes in Fund Balances - Budget and Actual:
Debt Service - Debt Service Fund …………………………………………………………… 119Capital Projects - Capital Projects Fund …………………………………………………… 120Capital Projects - 2019 G.O. Bonds - Capital Projects Fund …………………………… 121Capital Projects - Impact Fees - Capital Projects Fund …………………………………. 122CARE Tax - Special Revenue Fund ………………………………………………………… 123Telecommunication Billing - Special Revenue Fund ……………………………………… 124Transportation Sales Tax - Special Revenue Fund ……………………………………… 125Revelopment Agency - Special Revenue Fund …………………………………………… 126Community Development and Rehabilitation - Special Revenue Fund ………………… 127Friends of the Orem Public Library - Special Revenue Fund ………...………………… 128Orem Foundation Trust - Special Revenue Fund …………………...…………………… 129Senior Citizens - Special Revenue Fund ……………………...…………………………… 130
Table of Contents (continued)
City of Orem, UtahAnnual Comprehensive Financial ReportFor the Fiscal Year Ended June 30, 2021
PageFINANCIAL SECTION (continued)
Combining Financial Statements - Nonmajor Proprietary Funds:Combining Statement of Net Position - Nonmajor Proprietary Funds …………………… 132Combining Statement of Revenues, Expenses, and Changes in
Net Position - Nonmajor Proprietary Funds ….…………….……………………… 134Combining Statement of Cash Flows - Nonmajor Proprietary Funds …………………… 136
Combining Statement of Net Position - Internal Service Funds ……………………………… 139 Combining Statement of Revenues, Expenses, and Changes in
Net Position - Internal Service Funds ……………………………………………………… 140 Combining Statement of Cash Flows - Internal Service Funds ………………………………… 141 Schedules of Capital Assets Used in the Operation of Governmental Funds:
Comparative Schedules by Source ………………………………………………………… 143Schedule by Function and Activity …………………………………………………………… 144Schedule of Changes by Function and Activity …………………………………………… 146
STATISTICAL SECTIONFinancial Trends:
Net Position by Component ………………………………………………………………… 148Changes in Net Position ……………………………………………………………………… 150Fund Balances - Governmental Funds ……………………………………………………… 152Changes in Fund Balances - Governmental Funds ……………………………………… 154
Revenue Capacity:Assessed Value and Estimated Actual Value of Taxable Property ……………………… 156Direct and Overlapping Property Tax Rates ………………………………………………… 158Principal Property Tax Payers ……………………………………………………………… 159Property Tax Levies and Collections ………………………………………………………… 160Sales Taxes by Category ……………………………………………………………………… 162Other Sales Tax Revenue Information by Category ……………………………………… 164Principal Sales Tax Payers …………………………….…………………………………… 165Direct and Overlapping Sales Tax Rates ……..…………………………………………… 166
Debt Capacity and Other Debt Information:Pledged-Revenue Coverage ………………………………………………………………… 167Ratios of Outstanding Debt by Type ………………………………………………………… 168Ratios of Net General Obligation Bonded Debt Outstanding …………………………… 170Direct and Overlapping Governmental Activities Debt …………………………………… 171Legal Debt Margin Information ……………………………………………………………… 172Long-term Bonded Indebtedness Paid by Primary Government ……………….………… 174Other Long-term Liabilities Paid by Primary Government ……………….……………… 176
Demographic and Economic Information:Demographic and Economic Statistics ……………………………………………………… 177Other Demographic Statistics - Census Data ……………………………………………… 178Principal Employers …………………………………………………………………………… 179Full-Time-Equivalent City Government Employees by Function / Program …………… 180
Operating and Other Information:Operating Indicators by Function / Program ……………………………………………… 182Capital Asset Statistics by Function / Program …………………………………………… 184General Fund - Revenues and Expenditures Chart………………………………………… 186
Table of Contents (continued)

INTRODUCTORY SECTION
~ OREM
December 14, 2021
To: Mayor and City Council
Of=J:ICE OJ: THE CITY MANAGER
56 N . State Stree t I Orem, UT 84057
Subject: Annual Comprehensive Financial Report
In our ongoing efforts to provide more comprehensive financial information regarding the City, the Finance Department has now completed its thirty-fourth Annual Comprehensive Financial Report (ACFR).
The report contains critical financial information regarding the city's activities over the past fiscal year. The report of Gilbert & Stewart CPA, PC, resulting from their annual independent audit is included as a part of this annual report. Responsibility for both the accuracy of the presented data and the completeness and fairness of the presentation, including all disclosures, rests with city management.
We believe the data, as presented, is accurate in all material aspects and fairly sets forth the financial position and results of operations of the city as measured by the financial activities of its various funds. Disclosures necessary to enable the reader to gain an understanding of the city's financial affairs have also been included.
The city concluded the year ended June 30, 2021, in sound financial condition. The following is an overview of the city's financial condition.
Operating Revenues
General Fund sales tax revenues grew 18% in Fiscal Year 2021. Sales taxes continue to be the city's single largest revenue source. Water and sewer rates were not increased as originally planned as the City Council wanted to evaluate the use of debt for those large capital projects that are generational in nature rather than continuing to use only the current cash funding model (especially considering the low interest rate environment we are currently in). Thus, water and sewer revenues were relatively flat or even decreased for the fiscal year.
Revenues for other service areas such as residential solid waste collection and street lighting are stable. While Recreation Fund revenues suffered due to the reconstruction of the fitness center and the COVID-19 pandemic, t he fitness center was finally completed and opened to the public in March 2021. It has been well received by the public and has been performing well since its reopening.
The city was awarded $16,087,350 in federal American Rescue Plan Act (ARPA) funding from the U.S. Treasury Department. As of June 30, 2021, the city had received $8,043,675 of the total awarded amount. The city will be using these funds to improve city operations and facilities to provide a safer environment for individuals, customers, and citizens visiting city facilities, while also providing employees with the tools necessary to continue to do their
-1-
CITY OF OQ~M Pl-ION!; 801.229.7035 1-AX 801.229.7031 W[B WWW.ORtM.ORG
jobs in an effective, efficient, and safe manner. A large portion of these funds will be used to complete a new city park located in an underserved low-income area of the city.
Expenditures
The city allocated $3,746,962 from General Fund reserves for general capital improvement projects. This was made possible by the city's steady economy resulting in revenue growth coupled with one-time building permit funds for one-time uses along with the city's policy of setting its available General Fund reserves at 15% of revenues.
The city's infrastructure is in a stable condition. As mentioned previously, the City Council wanted to evaluate a hybrid approach to infrastructure funding and mid-year decided to move forward with it by issuing $29,320,000 of water, sewer, and storm water bonds in April 2021. Within the last year, the city has continued, initiated, and/or completed several significant capital improvement projects. These projects include:
• Continued street maintenance plans of systematic preventative maintenance such as crack seals, seal coats, micro-surfacing, and overlays.
• Replacement of old four- inch ( 4") water lines. • Completed construction of the new Library Hall and the Orem Family Fitness Center. • Purchased the Hillcrest Elementary School property from Alpine School District with
the intent to expand the city's adjacent park. • Purchased property to construct a 10-million-gallon culinary water storage tank. • Continued deployment of automated water meter reading infrastructure in portions
of the city.
Additional capital and operational funding is needed for:
• Expansion of the city's storm water system (e.g. West Union Canal abandonment). • Installation of automated water meter reading infrastructure throughout the
remainder of the city. • Continued preventative road and sidewalk maintenance. • Improving transportation in the city through street improvements, mixed-use trails,
bike paths, and mass transit. • Construction and/or renovation of existing city buildings, including the city center
and multiple fire stations.
While many of these needs will be funded over the next several years through structured fee increases, many of these projects and issues rely on one-time monies, such as unanticipated revenues, grants, and other resources.
The preparation of this Annual Comprehensive Financial Report could not have been accomplished without the dedicated efforts of many individuals. In particular, the efforts of the Finance Department staff who continue to upgrade and improve the city's accounting and financial reporting systems which improve the quality of information being reported to you, state oversight boards, and the citizens of the City of Orem.
If you have questions regarding this Annual Comprehensive Financial Report, please feel free to discuss them with Finance Director Brandon Nelson or myself.
Respectfully Submitted,
~r•Dw\h,~ James P. Davidson City Manager
-2-
~ OREM
;"
December 14, 2021
James P. Davidson City Manager
City of Orem, Utah
J: l NANC t DtP A RTMtNT
56 N . State Street I Orem, UT 84057
The State of Utah requires that all local governments publish, within six months of the close of each fiscal year, a complete set of financial statements presented in conformity with generally accepted accounting principles (GAAP) as prescribed in the Uniform Accounting Manual for Utah Cities and audited in accordance with generally accepted auditing standards by a firm of licensed certified public accountants. This Annual Comprehensive Financial Report (ACFR) of the City of Orem, Utah for the fiscal year ended June 30, 2021, is hereby submitted to you, in accordance with these requirements.
This financial report has been prepared according to the guidelines set forth by the Governmental Accounting Standards Board's (GASB) Statement 34. This report consists of management's representations concerning the finances of the City of Orem. Consequently, management assumes full responsibility for completeness and reliability of all information presented in this report. To provide a reasonable basis for making these representations, management has established an internal control framework designed to both protect the assets of the City from loss, theft, or misuse and to allow for the compiling of sufficient reliable information for the preparation of the City's financial statements in conformity with GAAP. Because the cost of internal controls should not outweigh their benefits, the City's internal control procedures have been designed to provide reasonable, rather than absolute, assurance that the financial statements will be free from material misstatement. To the best of management's knowledge and belief, this financial report is complete and reliable in all material respects.
Gilbert & Stewart CPA, PC, a firm of licensed certified public accountants have audited the City of Orem' s financial records. The goal of the independent audit was to provide reasonable assurance the financial statements of the City of Orem fo1· the fiscal year ended June 30, 2021, are free of material misstatement. The independent audit involved examining on a test basis, evidence supporting the amounts and disclosures in the financial statements; assessing the accounting principles used and significant estimates made by management; and evaluating the overall financial statement presentation. The independent auditor concluded based upon the audit, that there was a reasonable basis for rendering. an unmodified opinion that the City of Orem's
-3-
CITY OF OREM Pl-lorn; 801.229.7010 ~AX &01 229.7049 WtB WWW.ORtM.ORG
financial statements for the fiscal year ended June 30, 2021, are fairly presented in conformity with GAAP. The independent auditor's report i s presented as the first component of the financial section of this report (see pages 13·14).
Gene1·ally accepted accounting principles require management to provide a narrative introduction, overview, and analysis to accompany the basic financial statements in the form of Management's Discussion and Analysis (MD&A). This letter of transmittal is designed to complement MD&A and should be read in conjunction with it.
Government Profile
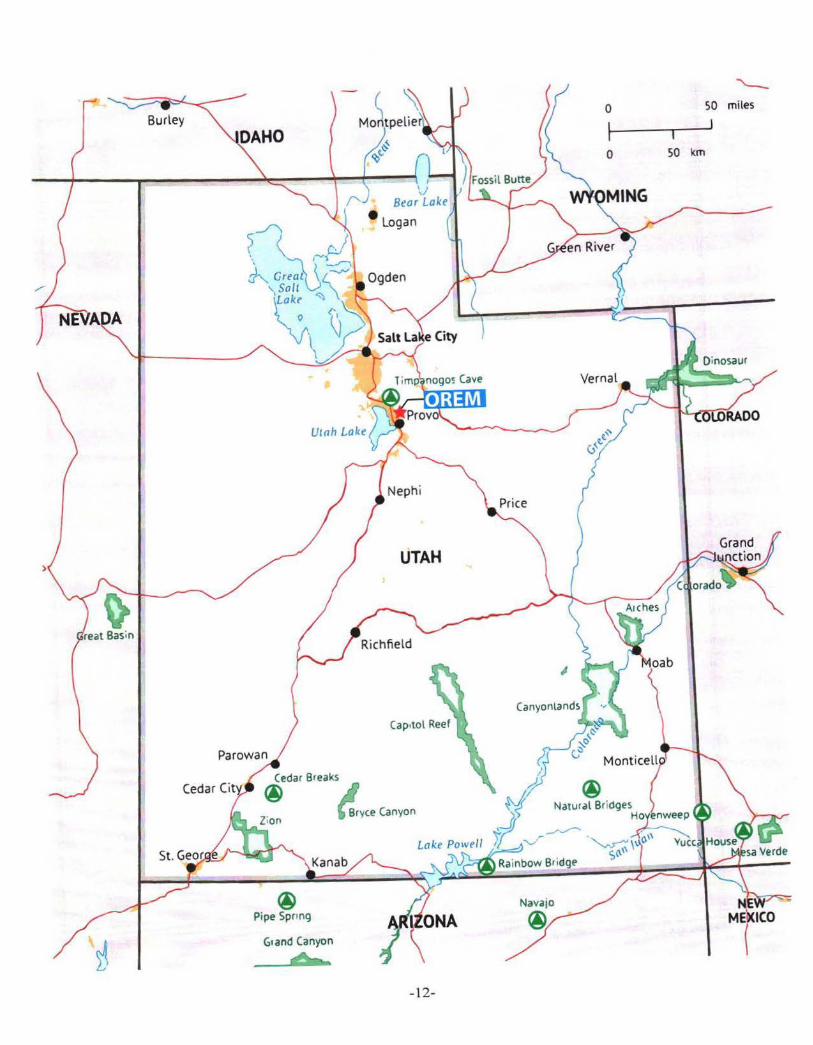
The City of Orem is located in north central Utah and is currently the fifth largest city in the state with a 2020 census population of 98,129 and an estimated population at June 30, 2021, of 98,812. Orem is located 45 miles south of Salt Lake City.
City operations include public safety (police and fire), economic development, administration, recreation, library, water, sewer, storm water, traffic and streets, solid waste, and street lighting.
The City of Orem has a Manager/Council fo1·m of government which allows for a full·time City Manager and a part-time Mayor. The City Council consists of the Mayor and six Council members who are all elected "at large" and while the Mayor leads the City Council, all members have only one vote. The Mayor and Council members serve staggered four-year terms on a part·time basis. Elections in the City of Orem are non-partisan.
The City Manager must submit a proposed annual budget to the City Council for all funds no later than the fu·st regularly scheduled meeting in May. The final adoption must be no later than June 22nd, unless a property tax increase is proposed. If a property tax is proposed, adoption must occur no later than August 31st. The City Council is the administrator of the legal level of budgetary control. Additional information can be found on pages 61 ·62.
Economic Condition and Outlook
The City is constantly involved in driving economic development. The primary area of economic development has centered around University Place. University Place is in the midst of a transformation from a traditional "mall" to becoming an entertainment, professional business office, and 1·esidential living center. Currently, one laTge office building has been constructed along with underground parking as well as a new above ground parking structure. Th1·ee large upscale apartment complexes have been completed. Plans for the a1·ea include a multi-story hotel, a professional live performance theater and additional multi-story professional business office. This transformation will ensure the area continues to be a growing and vibrant economic anchor for the community.
-4-
Utah Valley University (UVU) is a major employer in the City with over 5,000 employees serving over 40,000 students. UVU is now the State's largest university and plays a pivotal role in the growth of the city.
Employment in Utah is doing extremely well. The county unemployment rate at June 30, 2021, was 2.8% compared to 3.1 % for the state and 5. 9% nationally (see page 33 for a historical comparison).
Sales tax revenues, the City's largest source of tax revenue, continue to grow despite the COVID-19 pandemic. General Fund sales tax revenues have increased from FY 2012 by 70% (see pages 162·163) and have increased every year since FY 2010. The housing industry continues to be strong as building permit and associated development revenues have increased year over year, on ave1·age, since FY 2011. Although the City expects these major revenue sources to continue to grow, the pace at which they grow is expected to decrease to a more sustainable rate.
Long-term Financial Planning & Policies
The City remains optimistic regarding the future and is pro-actively planning its financial future through strategic plans and economic sustainability models.
All three major enterprise funds will be completing master plan updates in the year ahead as the City Council reassessed the cash funding plan being employed by the City and switched to a hybrid plan using cash for smaller capital projects and regular operations and employing debt (which currently offers historically low interest rates) for large multi-generational utility capital projects.
Along with the master plan updates, the City's impact fees for police, fire, transportation, parks, water, sewer, and storm water will all be analyzed and updated.
The Mayor and City Council have targeted a 15% of revenues General Fund assigned/unassigned fund balance (the State of Utah requires municipalities have at least 5% but no more than 30%). Amounts exceeding this target are transferred to the City's Capital Projects Fund to complete capital purchases/projects identified by city staff and approved by the Mayor and City Council. This allows the City to cash fund one·time capital purchases/projects as well as providing sufficient "reserves" in case of economic downturns.
Major Initiatives
For the Year
During the year, the City has worked on several needed projects to benefit the residents and businesses of the community. These projects include, but were not limited to the following:
-5-
• Installation of automated water meter reading technology throughout the entire city.
• On·going preventive maintenance on City·owned streets. • Identifying operational and facility needs related to American
Rescue Plan Act (ARP A) funds to provide a safer environment for individuals, customers, citizens, and employees.
• Completed construction on the new community library hall and reconstructing the forty·year-old fitness center.
• Purchased the Hillcrest Elementary School property from Alpine School District with the intent to expand the City's small community park located adjacent to the school property to a regional park
• Purchased property to construct a l0·million·gallon culinary water storage tank to provide improved water pressure and needed storage.
For the Future
The City faces many challenges in the future. Some of the most significant are as follows:
• Continued road and sidewalk maintenance. • Complete expansion of the storm water system (especially for areas
previously serviced by the West Union Canal which is being abandoned).
• Construction and/or renovation of existing city buildings, including the city center and multiple fire stations.
• Complete installation of the new automated water meter reading technology throughout the entire city.
• Complete construction of a new l0·million·gallon water storage tank. • Maintaining levels of service for all General Fund operations.
Other Information
Awards
The Government Finance Officers Association of the United States and Canada (GFOA) awarded a Certificate of Achievement for Excellence in Financial Reporting to the City for its Annual Comprehensive Financial Report (ACFR) for the fiscal year ended June 30, 2020. This was the thirty·third consecutive year the City has received this prestigious award. In orde1· to be awarded a Certificate of Achievement for Excellence in Financial Reporting, the City published an easily readable and efficiently organized annual comprehensive financial report, the contents of which conform to program standards. This report must satisfy both generally accepted accounting principles (GAAP) and applicable legal requii·ements.
A Certificate of Achievement is valid for a period of one year only. We believe this current annual comprehensive financial report continues to conform to the Certificate of Achievement Program's requirements and we will be submitting it to the GFOA to determine its eligibility for another certificate.
-6-

Acknowledgments
The preparation of this report could not be accomplished without the efficient and dedicated services of the entire Finance Department staff. I would like to express my appreciation to all members of the department who assisted and contributed to its preparation. I would like to thank the Mayor and City Council for their interest and support in planning and conducting the financial operations of the City in a responsible and prudent manner.
Respectfully Submitted,
~-~ C. tlL-- I Cf/t Brandon C. Nelson, CPA Finance Director
-7-

(This page left blank intentionally)
-8-

~ OREM
CITY OF OREM
LISTING OF OFFICIALS
ORGANIZED BY CLASSIFICATIONS
Chief Executive Officer I City Manager ..... ........... .......... .. ......... .... ...... .. ... .. ......................... ........ ... .... James P. Davidson
Executive Staff I Assistant City Manager ... ...................................................................................... Brenn Bybee
Deputy City Manager ................................................. ... ................................. Steven M. Downs
Finance Director ..................... ...... ..... ......... ................ ................................ Brandon C. Nelson
Director of Development Se1·vices ..................... ... .................................................. Ryan L. Clark
Director of Legal Services .. ... ......... .... .............. ... ...... ... .................... .. ....... .... .. Heather Schriever
Director of Library Services ....................................... ...... .. ............ . ... ........ .. Charlene M. Crozier
Fire Chief .... .. ............... .... .. ... ... ...... ... .. ....... .............................. ... ..... .......... Marc R. Sanderson
Police Chief ............... .. ................ ........ .. ............. ..... ....... .... .. ............ . ... ..... .. ... ... Josh T. Adams
Director of Public Works .... .............. .. ... ................... ....................................... Chris R. Tschirki
Director of Recreational Services .............. ......... ..................... ......... .................. Bryce E. Menill
-9-
JUSTICE COURT
PlJFII I(; WORKS AUVISOHY COMMISSION
RECREATION ADVISORY COMMISSION
BEAUTIFICATIOr--J ADVISORY COMMISSION
I l[RITAG[ ADVISORY COMfV':ISSION
LIBRARY ADVISORY COM11111SSION
CDE3G ADVISOnY COMMISSION
C/\RE /\DVISORY C0Mfi111SSIO\J
MAYOR & CITY COUNCIL
ElOAno er ADJUSTMENT
BOARD OF BUILDING & FIRE CODE APPEALS
~ ... - -~ .
-10-
RECREATION Al.LOCATION ADVISORY COMMISSION
SUMMERFEST COMMITTEE
AH I S CUUNCIL
HISTORIC PHESERVATION COMMISSION
YOUTH CITY COUNCIL
I HANSPOH IAI ION COMMISSION
SENIOR crnzrns ADVISORY COMMISSION
•
G _ ... [ ., ~·' ~ f;
Government Finance 'Officers Association
Certificate of Achievement for Excellence
in Financial Reporting
Presented to
City of Orem Utah
For its Comprehensive Annual 1 Financial Report
For the Fiscal Year Ended
June 30, 2020
Executive Director/CEO
-11-
I \/
I' Bear Lake
• Logan
~_/'\~ ~.J \ ~c. ~ Great \L__..,. Ogden
\ Sall 1
\
~~
UTAH
G, and Canyon
Or,
- 12-
0 50 miles
I
0 SO km

FINANCIAL SECTION
GILBERT & STEWART CERTIFIED PUBLIC ACCOUNTANTS A PROFESSIONAL CORPORATION ESTABLISHED 1974
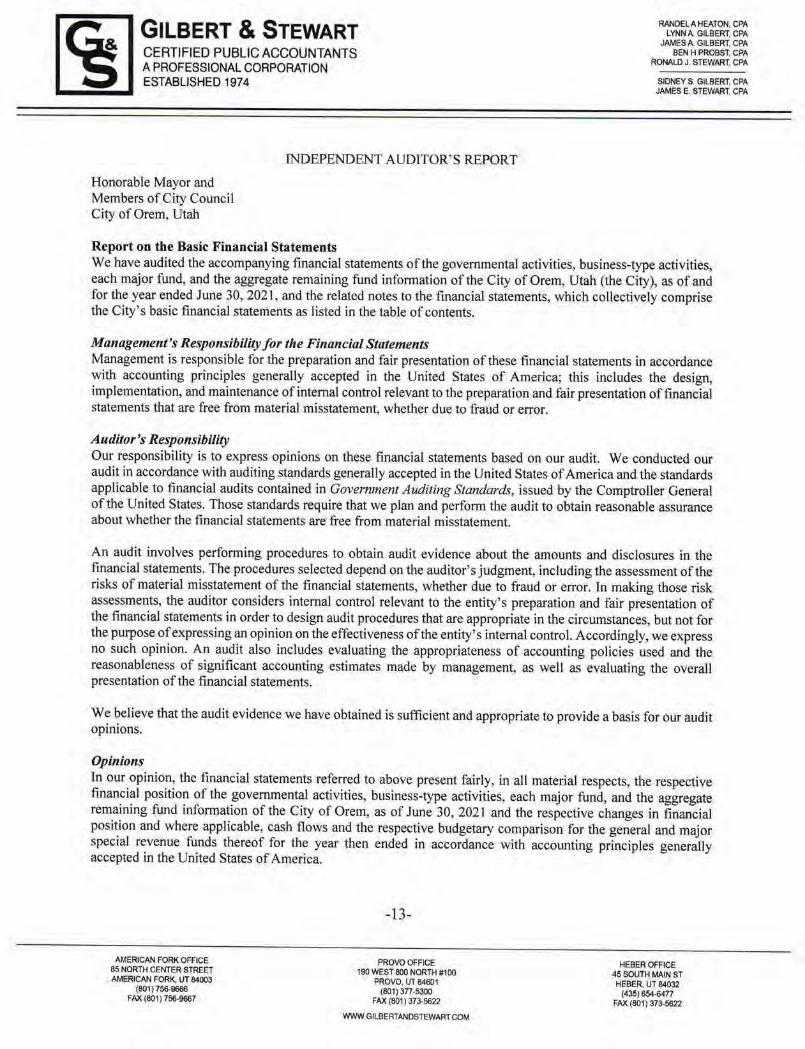
INDEPENDENT AUDITOR'S REPORT
Honorable Mayor and Members of City Council City of Orem, Utah
Report on the Basic Financial Statements
RANDELAHEATON, CPA LYNN A, GILBERT, CPA
JAMES A. GILBERT, CPA BEN H PROBST, CPA
RONALD J. STEWART, CPA
SIDNEY S. GILBERT, CPA JAMES E. STEWART, CPA
We have audited the accompanying financial statements of the governmental activities, business-type activities, each major fund, and the aggregate remaining fund infonnation of the City of Orem, Utah (the City), as of and for the year ended J w1e 30, 2021 , and the related notes to the financial statements, which collectively comprise the City's basic financial statements as listed in the table of contents.
Management's Responsibility for the Financial Statements Management is responsible for the preparation and fair presentation of these financial statements in accordance with accounting principles generally accepted in the United States of America; this includes the design, implementation, and maintenance of internal control relevant to the preparation and fair presentation of financial statements that are free from material misstatement, whether due to fraud or error.
Auditor 's Responsibility Our responsibility is to express opinions on these fu,ancial statements based on our audit. We conducted our audit in accordance with auditing standards generally accepted in the United States of America and the standards applicable to financial audits contained in Government Auditing Standards, issued by the Comptroller General of the United States. Those standards require that we plan and perform the audit to obtain reasonable assurance about whether the financial statements are free from material misstatement.
An audit involves performing procedures to obtain audit evidence about the amounts and disclosures in the financial statements. The procedures selected depend on the auditor' s jtrdgment, including the assessment of the risks of material misstatement of the financial statements, whether due to fraud or error. In making those risk assessments, the auditor considers internal control relevant to the entity's preparation and fair presentation of the financial statements in order to design audit procedures that are appropriate in the circumstances, but not for the purpose of expressing an opinion on the effectiveness of the entity' s internal control. Accordingly, we express no such opinion. An audit also includes evaluating the appropriateness of accounting policies used and the reasonableness of significant accounting estimates made by management, as well as evaluating the overall presentation of the financial statements.
We believe that the audit evidence we have obtained is sufficient and appropriate to provide a basis for our audit opinions.
Opinions
In our opinion, the financial statements referred to above present fairly, in all material respects, the respective financial position of the governmental activities, business-type activities, each major fund, and the aggregate remaining fund infonnation of the City of Orem, as of June 30, 2021 and the respective changes in financial position and where applicable, cash flows and the respective budgetary comparison for the general and major special revenue funds thereof for the year then ended in accordance with accounting principles generally accepted in the United States of America.
AMERICAN FORK OFFICE 65 NORTH CENTER STREET AMERICAN FORK, UT 84003
(801) 756-9666 FAX (801) 756-9667
-13-
PROVO OFFICE 190 WEST 800 NORTH #100
PROVO, UT 84601 (801)3TT-5300
FAX (801) 373-5622
WWW GILBERTANOSTEWARTCOM
HEBER OFFICE 45 SOUTH MAIN ST HEBER, UT 84032
(435) 654-64TT FAX (801) 373-5622

Other Matters Required Supplementary Information Accounting principles generalJy accepted in the United States of America require that the management' s discussion and analysis and budgetary comparison information, the OPEB schedule offunding progress, and the required supplementary information regarding pensions, as noted in the table of contents, be presented to supplement the basic financial statements. Such information, although not a part of the basic financial statements, is required by the Governmental Accounting Standards Board, who considers it to be an essential part of financial reporting for placing the basic financial statements in an appropriate operational, economic, or historical context. We have applied certain limited procedures to the required supplementary information in accordance with auditing standards generally accepted in the United States of America, which consisted of inquiries of management about the methods of preparing the information and comparing the information for consistency with management' s responses to our inquiries, the basic financial statements, and other knowledge we obtained during our audit of the basic financial statements. We do not express an opinion or provide any assurance on the i11fonn.ation because the limited procedures do not provide us with sufficient evidence to express an opinion or provide any assurance.
Supplementary and Other Information Our audit was conducted for the purpose of forming opinions on the financial statements that collectively comprise the City's basic financial statements. The introductory section, supplemental infonnation, and the statistical section are presented for purposes of additional analysis and are not a required part of the basic financial statements.
The combining statements, budgetary comparisons, and capital assets as listed as supplemental information in the table of contents are the responsibiJjty of management and were derived from and relate directly to the underlying accounting and other records used to prepare the basic financial statements. Such information has been subjected to the auditing procedures applied in the audit of the basic financial statements and certain additional procedures, including comparing and reconciling such information directly to the underlying accounting and other records used to prepare the basic financial statements or to the basic financial statements themselves, and other additional procedures in accordance with auditing standards generally accepted in the United States of America. ln our opinion, the combining statements, budgetary comparisons, and capital assets are fairly stated in all material respects in relation to the basic financial statements as a whole.
The introductory and statistical sections have not been subjected to the auditing procedures applied to the audit of the basic financial statements and, accordingly we do not express an opinion or provide any assurance on them.
Other Reporting Required by Government Auditing Standards
In accordance with Government Auditing Standards, we have also issued our report dated December 1, 202 l , on our consideration of the City' s internal control over financial reporting and on our tests of its compliance with certain provisions of laws, regulations, contracts, and grant agreements and other matters. The purpose of that report is to describe the scope of our testing of internal control over financial reporting and compliance and the results of that testing, and not to provide an opinion on internal control over financial reporting or on compliance. That report is an integral part of an audit performed in accordance with Government Auditing Standards in considering tbe City' s internal control over financial reporting and compliance.
f/i/le,,t&SfMMlrt GILBERT & STEWART, CPA, PC Provo, Utah December I, 2021
-14-
MD & A
City of Orem Management's Discussion and Analysis
June 30, 2021
The City of Orem's management presents this overview and analysis of its financial activities for the fiscal year ended June 30, 2021. This discussion and analysis focuses on significant financial issues, provides an overview of the City's financial activity, highlights significant changes in the City's financial position, and identifies material variances between the approved budget and actual spending.
The City encourages readers to consider the information presented here in conjunction with additional information furnished in the letter of transmittal and provided throughout this 1·eport.
Financial Highlights
• As of the end of the current fiscal yea1·, the government-wide assets and defened outflows of the City exceeded its liabilities and deferred inflows by $384,243,782 (total net position). Of this amount, $64,750,760 (unrestricted net position) may be used to meet the government's ongoing obligations to citizens and creditors.
• Total government-wide net position consists of $231,543,448 in net investment in capital assets, $87,949,574 in restricted assets, and $64,750,760 in unrestricted assets. Total government-wide net position increased by 11.65%.
• As of the end of the current fiscal year, the City's governmental funds reported combined ending fund balances of $76,347,440. Of this amount, $18,424,509 (24.13%) is available for spending at the City's discretion (unassigned fund balance). Total fund balance decreased by $4,354,924 compared to the prior yeai·'s decrease of $6,543,394. This change is discussed in greater detail later in this overview and analysis.
• As of the end of the current fiscal year, the City's enterprise funds reported an increase in total net position of $14,735,778 compai·ed to the prior year's increase of $18,849,150. The changes to fund balance are discussed in greater detail later in this overview and analysis.
• In April of 2021, the City sold $29.3 million in water, sewer, and storm water bonds to fund the construction of a new culinary water tank, pressure booster station, two new culinary water wells, a water reuse treatment facility, a biosolids dewatering system, two sewer lift stations, various storm water conveyance projects, and various water and sewer distribution and collection infrastructure improvements. During FY 2021, the City was able to begin work on several of these prnjects and spent just over $2.9 million.
• The City completed construction of a new Library Hall and the reconstruction of the City's Family Fitness Center. These projects were funded by 2019 general obligation bonds, donations, and existing capital projects funds.
Overview of the Financial Statements
The following discussion and analysis serves as an introduction to the City's basic financial statements. The City's basic financial statements comprise of
-I 5-
City of Orem Management's Discussion and Analysis
June 30, 2021
three components: 1) government·wide financial statements, 2) fund financial statements, and 3) notes to the financial statements. This report also includes other supplementa1·y information in addition to the basic financial statements.
The government-wide financial statements are designed to provide readers with a bl'Oad overview of the City of Orem's finances, in a manne1· similar to a private·secto1· business.
• The Statement of Net Position presents information on all of the City's assets, deferred outflows, liabilities, and deferred inflows, with the difference between the four reported as net position. Over t ime, increases or decreases in net position may serve as a useful indicator of whether the financial position of t he City is improving or deteriorat ing. However, you will also need to consider other non·financial factors.
• The Statement of Activities presents information showing how the City's net position changed during the fiscal year r eported. All changes in net position are reported as soon as the underlying event giving rise to the change occurs, regardless of the timing of related cash flows. Thus, all of the current year's revenues and expenses are included 1·egardless of when cash is received or paid.
Both of the government·wide financial statements distinguish functions of t he City that are principally supported by taxes and intergovernmental revenues (governmental activities) from other functions that aTe intended to recover all or a significant portion of their costs through user fees and service charges (business·type activities). The governmental activities of the City include the general government, public safety, redevelopment, highways and public improvements, parks, 1·ecreation and arts (which includes the library), and economic and physical development. The business·type activit ies of the City include culinary water distribution, water reclamation (sewer), storm water operations, recreation (fitness center and outdoor pool), solid waste disposal, and street lighting.
Fund financial statements. A fund is a grouping of related accounts that is used to maintain control over resources that have been segregated for specific activities or objectives. The City, like other state and local governments , uses fund accounting to ensure and demonstrate compliance with finance·related legal requirements. All of the funds of the City can be divided into two categories: governmental funds and proprietary funds.
• Governmental funds. These funds are used to account for essentially the same functions repo1·ted as governmental activities in the government·wide financial statements . However, unlike the government-wide financial statements, governmental fund financial statements focus on near-term inflows and outflows of spendable resources, as well as on balances of spendable resources available at the end of the fiscal year. Such information may be useful in evaluating the City's near-term financing requirements.
-16-
City of Orem Management's Discussion and Analysis
June 30, 2021
Because the focus of governmental funds is narrower than that of the government-wide financial statements, it is useful to compare the information presented for governmental funds with similar information presented for governmental activHies in the government-wide financial statements. By doing so, readers may bette1· understand the long·term impact of the City's near term financing decisions. Both the governmental fund balance sheet and the governmental fund statement of revenues, expenditures, and changes in fund balances provide a 1·econciliation to facilitate this comparison between governmental funds and governmental activities.
The City maintains thirteen individual governmental funds. Information is presented separately in the governmental fund balance sheet and in the governmental fund statement of revenues, expenditures, and changes in fund balances for the General, Debt Service, Capital Projects, and 2019 G.O. Bonds Capital Projects funds, which are considered major funds of the City. Data from the other nine governmental funds are combined into a single, aggregated presentation. Individual fund data for each of these nonmajor governmental funds is provided in the form of combining statements elsewhere in this report.
• Proprieta1-y funds. The City of Orem maintains two different types of proprietary funds. Enterprise funds are used to report the same functions presented as business·type activities in the government-wide financial statements. The City uses enterprise funds to account for its Water, Water Reclamation, Storm Water, Recreation, Solid Waste, and Street Lighting activities. Internal service funds are an accounting device used to accumulate and allocate costs internally among the City's various functions . The City uses internal service funds to account for servicing its fleet of vehicles, providing insurance, procuring and warehousing supplies and materials, maintaining the City's technological needs, and to maintain physical city facilities. Because these services predominantly benefit governmental rather than business-type functions, they have been included within governmental activities in the government-wide financial statements.
Proprieta1·y funds provide the same type of information as the government-wide financial statements, only in more detail. The proprietary fund financial statements provide separate information for the Water, Water Reclamation, and Storm Water funds, which are considered major funds of the City. The Recreation, Solid Waste, and the Street Lighting funds ru·e classified as nonmajor and are included in the combining statements within this report. Conversely, the five internal service funds are combined into a single, aggregated presentation in the prop1·ietary fund financial statements. Individual fund data for the internal service funds is provided in the form of combining statements within this report.
Notes to the financial statements. The notes to the financial statements provide additional information that is essential to a full understanding of the
-17-

City of Orem Management's Discussion and Analysis
June 30, 2021
data provided in the government·wide and fund financial statements .
Government-wide Financial Analysis
As noted earlier, net position may serve over time as a useful indicator of the City's financial position. As mentioned in the highlights section, assets exceeded liabilities and deferred inflows by $384,243,782 at June 30, 2021.
By far the largest portion of the City's net position (60.26%) is its investment in capit al assets (e.g. land, buildings, improvements other than buildings, vehicles, machinery and equipment, and infrastructure assets) less any outstanding debt related to the acquisition of those assets. The City uses these capital assets to provide services to citizens . Consequently, these assets are not available for future spending. Although the City1s investment in its capital assets is 1·eported net of related debt, it should be noted that the resources needed to repay this debt must be provided from other som·ces, since the capital assets themselves cannot be used to liquidate these liabilities .
City of Orem's Total Net Position
Governmental Business·type Activities Activities Total
2021 2020 2021 2020 2021 2020
Current Assets $ 110,460,961 $ 106,9 15,610 $ ll 3,686,835 $ 68,230.646 s 224, 147,796 $ J 76,146,266 Noncurrent Assets: Capital Assets 192,683,852 167,998,8 19 98, 191,5IO 94,158,727 290,875,362 262, 152,546
Other 6,205,080 3,098.207 111,544 6,316,624 3,098,207
Total Assets 309,349,893 278,012,636 21 1,989,889 162,384,373 52 1,339,782 440,397,009
Deferred Outflows of Resources 7,365,0 16 6,419,401 966,073 1,692,066 8,33 1,089 8,11 1.467
Total Assets & Deferred Outflows of Resources s 316,714,909 s 284,432,037 $ 212,955,962 $ 164,076,439 $ 529,670,87 I $ 448,508,476
Long·term Liabilities Outstanding $ 44,873,967 $ 51,134,236 $ 54,818,997 $ 22,353,604 $ 99,692,964 s 73,487,840
Other Liabilit ies 20,517,179 11,978,786 4,542,114 2,630,528 25,059,293 14,609,314
Total Liabiliti.es 65,391,146 63,113,022 59,361, U I 24,984, 132 124,752,257 88,097,)54
Deferred Inflows of Resources 20,213.046 15,568,782 461.786 695,020 20,674,832 16,263,802
Net Position: Net Investment in
Capital Assets 154,447,536 188,676,061 77,095,9 12 74, 134,249 231.543.4.48 212,810,310 Restricted 31.237,909 il0,395,628 56,7 J 1,665 3,215,064 87,949,674 33,610,692 Unrestricted 45,425,272 36,678,544 19,325,488 6 1,047,974 64,750,760 97,726,518
Total Net Position 231, 110,7 17 205,750,233 153,133,065 138,397,287 384,243,782 344,147,520
Total Liabilities,
Deferred Inflows
of Resources, and Net Position $ 3 16,7 14,909 $ 284.432.037 $ 212,955,962 $ 164,076,<139 $ 529,670,871 s 448,508.476
A portion of the City of Orem's net posit ion (22.89%) represent resources that are subject to external restrictions on how they may be used. The amount listed as unrestricted net position ($64,750,760) may be used to meet the City's ongoing obligations to citizens and creditors.
-18-
City of Orem Management's Discussion and Analysis
June 30, 2021
At the end of the current fiscal year, there were no funds reporting a deficit in unrestricted net position. At the end of the cunent fiscal year, the City of Orem is able to report positive balances in all three categories of net position, for the City as a whole, as well as for its separate business-type activities.
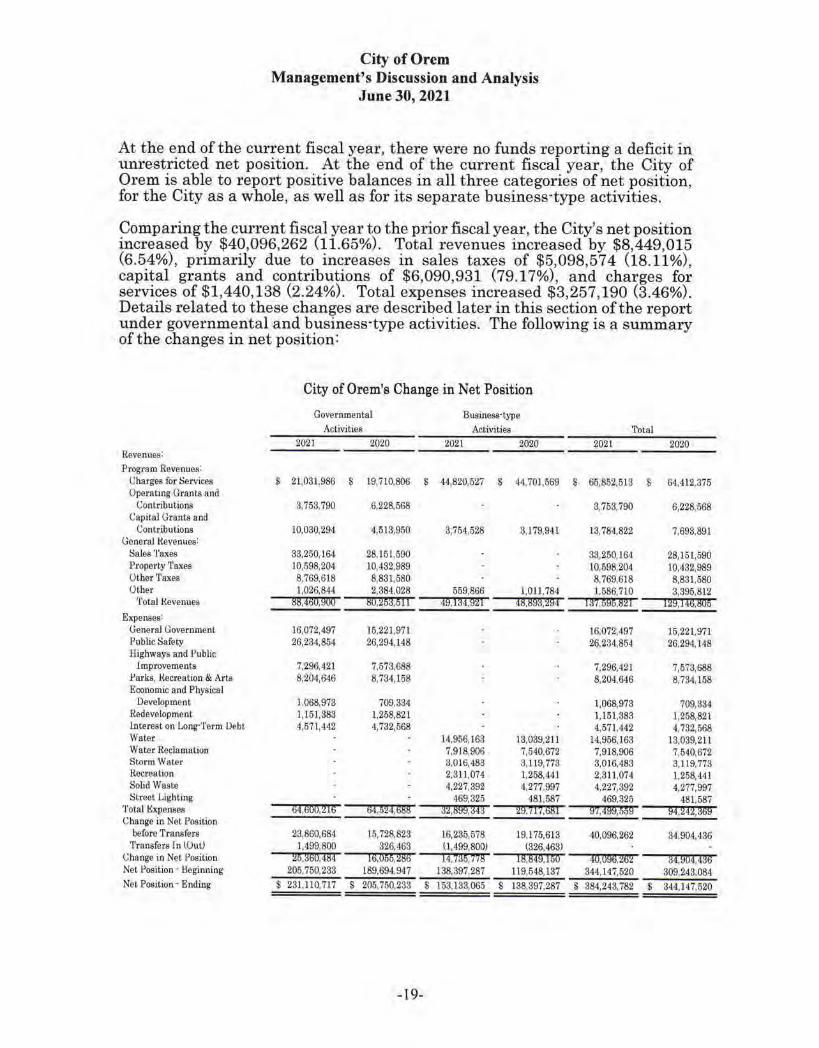
Comparing the current fiscal year to the prior fiscal year, the City's net position increased by $40,096,262 (11.65%). Total revenues increased by $8,449,015 (6.54%), primarily due to increases in sales taxes of $5,098,574 (18.11%), capital grants and contributions of $6,090,931 (79.17%), and charges for services of $1,440,138 (2.24%). Total expenses increased $3,257,190 (3.46%). Details related to these changes are described later in this section of the report under governmental and business-type activities. The following is a summary of the changes in net position:
Revenues: Program Revenues:
Charges for Services Operating Grants and
Contributions Capital Grants and
Contributions General &venues:
Sales Taxes Property Taxes Other Taxes Other
'J'otal l{evenues
Expenses: General Government Public Safety Highways and Public
Improvements Parks, Kecreation & Art.s Economic and Physical
Development Redevelopment Interest on Long·Term Debt Water Water Reclamation Storm W11ter Recreation Solid Waste Street Lighting
Total Expenses Change in Net Position
before Transfers Transfers In \Out)
Change in Net Position Net Position· l:leginnfng Net Position· Endiug
City of Orem's Change in Net Position
Governmental Activities
Business-type Activities Total
2021
$ 21,031,986
3,753,790
10,030.294
33,250,164 10,598,204 8,769,618 1,026,844
88,460,900
16,072,497 26,234,854
7,296,421 8,204,646
1,068,973 1,161.383 4,571,442
64,600,2l6
2020 2021
~ 19,7l0,806 $ 44,820,527 S
6,228,568
4,513,950 8,754,628
2020
44,701,569
3, l 79,94 1
2021
$ 65,852,513 $
3,753,790
13,784,822
2020
64,412,375
6,228,568
7,693,891
28,151,590 38,250,164 28,151,590 10,432,989 10,598,204 10,432,989 8,831,580 8,769,618 8,831,680 2,384,028 559,866 1,011,784 1,586,710 3,395,812
8o,263,5ll - -,.,49'"', 1 ... 34"',9"'2~1 - ...,,asn,gm93iri,2llll9:r4 - .,.13~1'"!!,5m95!""!,8"'2 I,.... --,..12111'§,'1-14:!!S,"11Slfflo5!'""
15,221,971 26,294,148
7,573,688 8,784,168
709,334 1,258,821 4,732,568
64,624,688
14,956,163 7,918,906 3,016,483 2,311,074 4,227,392
469,325 32,899,343
13,039,21 I 7,540,672 3,119,773 1,258.44 I 4,277,997
481,587 29.?l/,Mt
.16,072,497 26,234,854
7,296,421 8,204,646
1,068,973 1,151,388 4,571.442
14,956,163 7,918,906 3,016.483 2,311,074 4,227,392
469,326 97,499,659
15,221,971 26,294,148
7,573,688 8,734.158
709,334 1,258,821 4,732,568
13,039,211 7,540,672 3,119,773 1,258,441 ,i,277,997
481,587 94.242,369
23,860,684 15,728,823 16,235,578 19,175,613 40,096,262 34,904,436 1,499,800 326,463
20.3So,4sa --rn-,o-55 ... ,2 ... ss-\1,499,800) (326,463) 14. 735, 11S - --.-.18""',8""49'"', i""oo,,.. ---,4"'o ... , 09"'S'""', 2"'S2""
2os,150_2sa 189,694,947 138,397,287 ll9,648,137 844,147,520 $ 231,110,717 $ 205,750,233 $ 153,133,065 $ 138,397,287 $ 884,243,782
- 19-
34,904,436 309,243,084
$ 344,147.520
City of Orem Management's Discussion and Analysis
June 30, 2021
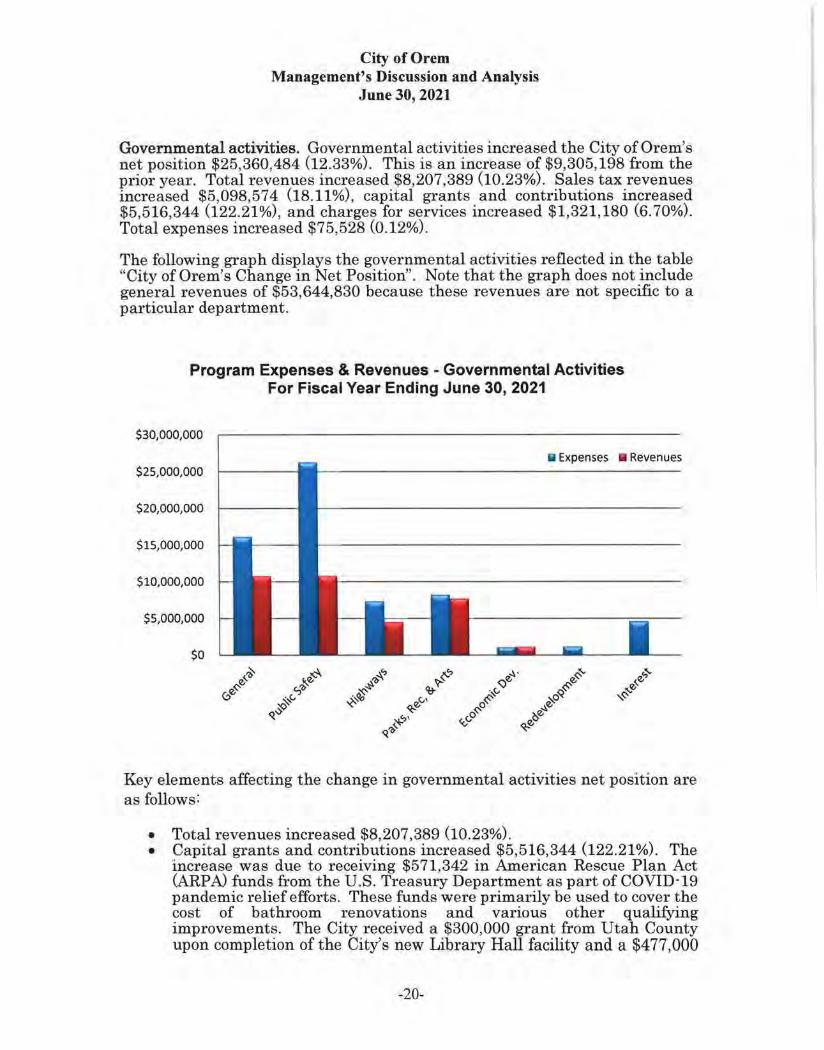
Governmental activities. Governmental activities increased the City of Orem's net position $25,360,484 (12.33%). This is an incTease of $9,305,198 from the prior year. Total revenues increased $8,207,389 (10.23%). Sales tax revenues increased $5,098,574 (18.11%), capital grants and contributions increased $5,516,344 (122.21%), and charges for services increased $1,321,180 (6.70%). Total expenses increased $75,528 (0.12%).
The following graph displays the governmental activities reflected in the table "City of Orem's Change in Net Position". Note that the graph does not include general revenues of $53,644,830 because these revenues are not specific to a particular department.
Program Expenses & Revenues - Governmental Activities For Fiscal Year Ending June 30, 2021
$30,000,000
$25,000,000
$20,000,000
$15,000,000
$10,000,000
$5,000,000
$0
Iii Expenses • Revenues
Key elements affecting the change in governmental activities net position are as follows:
• Total revenues increased $8,207,389 (10.23%). • Capital grants and contributions increased $5,516,344 (122.21 %). The
increase was due to receiving $571,342 in American Rescue Plan Act (ARPA) funds from the U.S. Treasury Department as part of COVID· l 9 pandemic relief efforts. These funds were primarily be used to cover the cost of bath.room renovations and various other qualifying improvements. The City received a $300,000 grant from Utah County upon completion of the City's new Library Hall facility and a $477,000
-20-
City of Orem Management's Discussion and Analysis
June 30, 2021
grant from the State of Utah related to the Volkswagen mitigation settlement award they have been managing. The grant the City received was used to improve fuel efficiency by replacing certain qualifying vehicles. The City also received a donation of p1·operty from Orem Community Hospital valued at $3,760,000 for the purpose of outdoor recreational use.
• Operating grants and contributions decreased $2,474,778 (39.73%). The decrease was due to receiving $4,011,796 in CARES Act CRF funds from Utah County as part of the COVID-19 pandemic relief in the prior fiscal year but the City received no funding in the current fiscal year. These funds were primarily used to cover the costs of public safety personnel who dealt with various aspects of the pandemic.
• General revenues increased $3,844,643 (7.72%). The increase was due, in large part, to sales tax revenues increasing by $5,098,574 (18.11 %). The benefits of having a strong retail base became evident as local sales tax revenues continued to be strong even during the COVID· 19 pandemic.
• Total expenses increased by $75,528 (0.12%). • Salary and benefit costs across all expense categories increased, in total,
by approximately $1,563,000 due to general salary and benefit increases given during the fiscal year. However, total pe1·sonnel costs were decreased by approximately $1,890,000 in lower pension costs due to improved investment pe1·formance.
• Various materials, supplies and contracted service costs increased by approximately $300,000 as city departments returned to normal spending as the financial effects of the COVID-19 pandemic were more positive than anticipated when compared to the prior fiscal year.
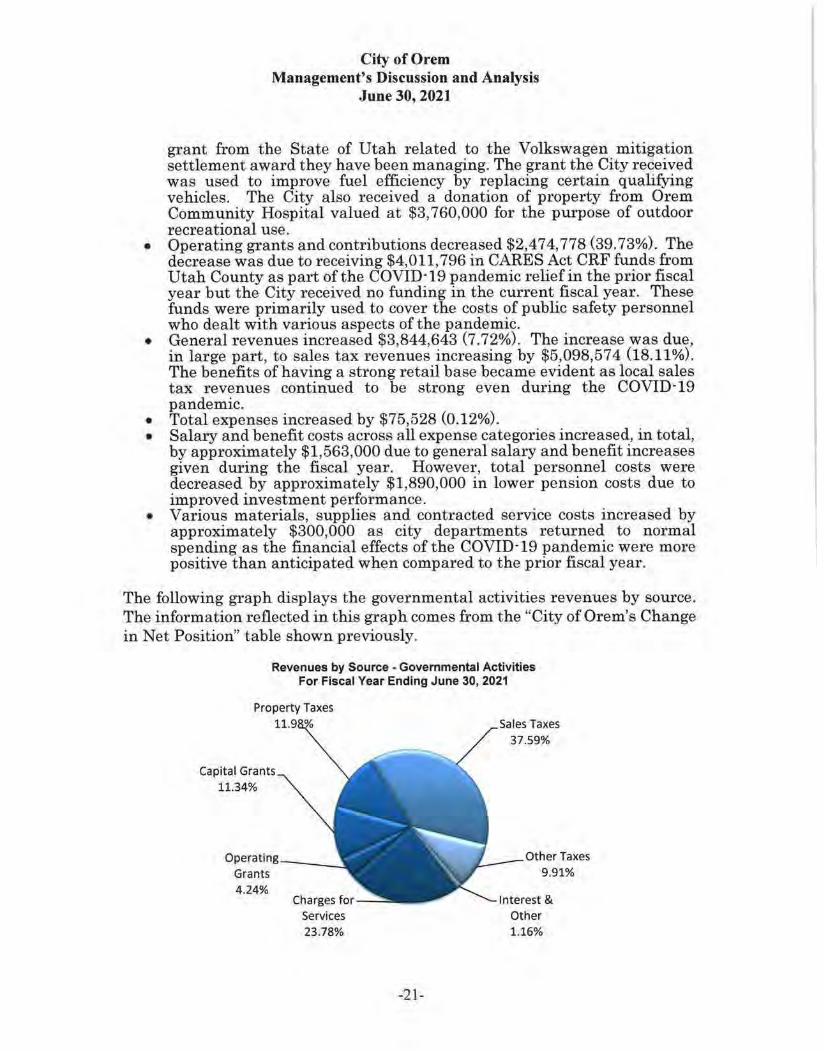
The following graph displays the governmental activities revenues by source. The information reflected in this graph comes from the "City of Ore m's Change in Net Position" table shown previously.
Revenues by Source - Governmental Activities For Fiscal Year Ending June 30, 2021
Property Taxes
Capital Grants 11.34%
Operating ___ _,
Grants
4.24%
Services 23.78%
-21-
Sales Taxes 37.59%
Other Taxes 9.91%
Interest & Other 1.16%

City of Orem Management's Discussion and Analysis
June 30, 2021
Business-type activities. Business-type activities increased the City's net position by $14,735,778. The increase in net position represents a 10.65% increase for the current year. Total revenues increased $241,627 (0.49%) and total expenses increased $3,181,662 (10.71%). As of the end of the current fiscal year, all of the City's business-type activities reported a positive net position.
The following graph displays the business-type activities for enterprise funds reflected in the table "City of Orem's Change in Net Position".
Program Expenses & Revenues - Business-type Activities For Fiscal Year Ending June 30, 2021
$25,000,000 Iii Expenses w Revenues
$20,000,000
$15,000,000
$10,000,000
$5,000,000
$0
Key elements affecting the change in business·type activities net assets are as follows:
• Business-type activities repo1·ted an increase in total revenues over the prior year of $241,627 (0.49%). Total revenues increased or decreased as follows:
-22-

City of Orem Management's Discussion and Analysis
June 30, 2021
o Water fund total ope1·ating revenues decreased $479,830 or 2.30%. The City did not raise either the base rate or the tiered usage rates for the fiscal year evaluate the use of debt for those large capital projects that a1·e generational in nature rather than continuing to use only the current cash funding model (especially considering the low interest rate environment we are in). The result of this evaluation was the issuance of bonds in April 2021. Despite not raising any rates, charges for services revenues increased by $615,394 or 3.39% due to an increase in usage of 5%. The increase in usage is probably due to the very d1·y water year.
as the City Council wanted to Revenues by Source • Business-type Actlvllle•
For Flscal Year Ending June 30, 2021
Operating Revenues-
S1orm Watet 10.8%
Opef&llng Revonues .. All Others
1M%
Operating Reven.ues
Water Recfama!ion
25.6%
Caprtal Grants &
CQntlibu1iOfl$
7 8%1
Gain on Salei ofC-apitaJ
As.sets 0.1%
un,..,ricte<t , __,,,,.- ln\'eslment .,,,..- Eam!ngs
11%
O?eraUng Reveflues
Wa1er '1 ,,,.
Other revenues decreased by $1,095,224. The primary reason for the decrease in other revenues was a $1,000,000 decrease in the funds Teceived from the Metropolitan Water District of Orem. The funds received in the prior fiscal year are going to be used to construct a large water storage tank but no such funding occurred in the current fiscal year primarily because the city opted to issue debt to pay for a portion of the project instead of paying for the project entirely with cash.
o Water Reclamation fund total operating revenues decreased $478,959 or 3.66%. As with water rates, the City Council also put a pause on raising sewer rates until the evaluation mentioned was completed. The decrease in revenues is due to an 8. 70% decrease in sewer volume.
o Storm Water fund total operating revenues increased $250,044 or 4.95%. The increase was due to a $0.25 rate increase in the "equivalent service units (ESU)" 1·ate. The rate went from $7.35/month/ESU to $7.60/month/ESU (3.40% increase).
The graph above displays the business-type activities rnvenues by source. The information reflected in this graph comes from the "City of Orem's Change in Net Position" table shown previously.
-23-
City of Orem Management's Discussion and Analysis
June 30, 2021
• Business-type activities reported a increase in operating expenses from the prior year of $3,181,662 (10.71%). Operating expenses increased or decreased as follows:
o Personnel costs decreased $347,749 (5.13%). While salary and benefits costs increased, the total costs of personnel decreased due to dec1·eases in pension costs due to good investment performance.
o Utility electric costs increased $287,722 (19.57%). The decrease was due primarily to the opening of the City's newly reconstructed fitness center which had been closed.
o Contract services costs increased $1,375,210 (16.30%). The increase is due, in large part, to increases in water costs to third parties for treatment, storage, conveyance or loss. These include Jordanelle reservoir, Utah Power & Light, and the Olmstead power plant.
o Bond issuance costs increased $354,793 (100%). The City issued water, sewer, and storm water bonds in April 2021.
o Impact fee expenditures increased $517,954 (52.83%). As water rights impact fees are collected, they are remitted to the Metropolitan Water District of Orem to pay for Jordanelle reservoii· water rights. The water rights impact fees received and remitted were significantly more in this current fiscal year than in the prior fiscal year.
Financial Analysis of the Government's Funds
As noted earlier, the City of Orem uses fund accounting to ensure and demonstrate compliance with finance-related legal requfrements.
Governmental Funds The focus of the City's governmental funds is to provide information on near term inflows, outflows, and balances of spendable resources. Such information is useful in assessing the City's financing requirements. In particular, unassigned fund balance may serve as a useful measure of the gove1·nment's net resources available for spending at fiscal year-end.
As of the end of the current fiscal yea1\ the City's governmental funds reported combined ending fund balances of $76,347,440. Of this total amount, $18,424,509 (24.13%) constitutes unassigned fund balance, which is available for spending at the government's discretion. Unassigned fund balance increased from the prior year by $6,048,396. The remaining fund balance of $57,922,931 is "reserved" in one capacity or another indicating that it is not available for new spending because it has already been committed to pay for debt service, capital projects, or a variety of other purposes.
-24-

City of Orem Management's Discussion and Analysis
June 30, 2021
The General Fund is the chief operating fund of the City. At the end of the current fiscal year, unassigned fund balance of the general fund was $18,424,509 and total fund balance increased to $8,780,341. As a measui-e of the general fund's liquidity, it may be useful to compare both unassigned fund balance and total fund balance to total fund expenditures. Unassigned fund balance represents 33.54% (prior year was 22.42%) of total General Fund expenditul'es, while total fund balance represents 73.05% (prior year was 56. 79%) of total General Fund expenditures.
General Fund· Total fund balance increased $8,780,341 in the current fiscal year (the prior year had an increase of $3,857,581). Thus, there was a positive variance from the prior year of $4,922,760. The following elements were key factors conh·ibuting to the total fund balance change:
• Total revenues of the fund increased $3,596,567 (5.40%). Taxes and special assessments increased $4,496,929 (11.64%), intergovernmental revenues decreased $1,747,240 (19.54%), and charges for services revenues increased $926,397 (10.71%). Details about these variances are as follows:
o Taxes and special assessments increased primarily due to sales tax revenues increasing $4,267,039 (17.98%). As mentioned previously, the City's strong retail base continued to do well despite the COVID-19 pandemic with significant gains in the general merchandise and groceries, building materials and tools, recreational supplies, and auto dealers and supplies categories.
o Intergovernmental revenues decreased due to receiving and using a larger portion of CARES Act CRF funds from Utah County in the prior fiscal year than in the cunent fiscal yea1·. While the City did receive American Rescue Plan Act (ARPA) funds in t he current fiscal year, it was so late in the fiscal year that the City had very little time to spend much of these new funds by fiscal year-end.
o Charges for services revenues increased but not due to any specific source or reason. The largest increase was in cemetery lot sales and interment fees which increased by 37 .12% and accounted for $321,975 of the increase in this category. Ambulance services revenues increased $174,958 or 8.78% due to higher volume.
• Total expendit ures decreased $27~066 (0.50%). General government expenditures increased $533,870 \3.62%), public safety expenditures increased $1,188,579 (4.84%), and capital outlay expenditures decreased $2,125,071 (37.68%). Details about these variances a1·e as follows:
o General Government expenditures increased as t he result of higher materials, supplies and maintenance cost s of $411,131 (7 .09%) primarily due to expending CARES Act CRF funds.
o Public Safety expenditures increased as the result of higher personnel costs due to general wage and benefit increases of $1,241,774 (5.93%). Police department wages and benefits increased $824,839 (6.31 %) and fu·e department wages and benefits increased $416,935 (5.29%).
-25-
City of Orem Management's Discussion and Analysis
June 30, 2021
o Capital outlay expenditures decreased due to vehicle purchases in the prior fiscal year that were not duplicated in the current fiscal yea1·. These vehicle purchases from the prior year included vehicles for additional police officer hires authorized as part of the City's property tax rate increase as well as the initial payment for a new fire engine. While $662,414 of street micro·surfacing expenditures occurred in the pri01· fiscal year, no such projects occurred in the current fiscal year.
Debt Service Fund· Total fund balance is $1,960,402, all of which is to be used for the payment of debt service. There was a net decrease in fund balance in the current year of $801,313. The decrease was the result of using the 2019 General Obligation Bonds capitalized internst funds to make the 2019 General Obligation Bonds payments for the fiscal year.
Capital Projects Fund· Total fund balance is $19,806,641, all of which is to be used for capital improvements and large equipment purchases. There was a net increase in fund balance in the current year of $1,636,703 (9.01%). The increase was due to $7,924,340 in "transfers in'' from other funds which will be used to improve several parks and streets as well as making improvements to va1·ious city facilities including the city center, cemetery buildings, library, public safety buildings, fitness center, and outdoor pools.
2019 G.0. Bonds Capital Projects Fund· Total fund balance is $0. This fund accounted for the use of bond proceeds used for capital improvements and large equipment purchases for the new Library Hall and reconstructed Fitness Center. The remaining $10,966,453 of bond funds were exhausted leaving no available bond funds at fiscal year-end.
Proprietary Funds The City's proprietary funds provide the same type of information found in the government·wide financial statements, but in greater detail.
Wate1· Fund· Unrestricted net position at the end of the year amounted to $4,292,301, a decrease of $26,504,333 (86.06%). Total net position increased by $6,848,473 (10.07%) during the current fiscal year (prior fiscal year had an increase of $9,632,547 or 16.51%). Items affecting the change in total net position of the fund are as follows:
• Operating revenues decreased $479,830 (2.30%). Charges for services increased due to a 5% increase is usage despite no increase to either the base rate or tier rates. However, the Metropolitan Water District of Orem (MWDO) provided $1,000,000 less in funding in the current fiscal year than the prior fiscal year as they had provided additional funding for the City's storage tank project in the prior year.
• Ope1·ating expenses increased $1,270,685 (10.62%) in comparison with the prior yeai-. The increase includes $1,154,839 (31.60%) in increased contract se1·vices for water storage, conveyance and power loss as well as increased depreciation expense of $127,433 (4.90%) due to additional automated meter reading installation project costs being capitalized.
-26-

City of Orem Management's Discussion and Analysis
June 30, 2021
Water Reclamation Fund· Unresti·icted net position at the end of the year amounted to $4,225,108, a decrease of $13,658,987 (76.38%). Total net position increased $6,037,689 (14.98%) during the current fiscal year (prior fiscal year had an increase of $6,130,290 or 17. 93%). Items affecting the change in total net position of the fund are as follows:
• Operating revenues decreased $478,959 (3.66%). The decrease was due to a decrease in sewer volume of 8.70%.
• Operating expenses increased $16,889 (0.23%) in comparison with the prior year. Personnel services decreased $282,689 (12.54%) due to a reduction in pension costs caused by positive investment 1·eturns. Insurance charges increased $255,935 (193.04%) due to adjusting the insurance allocation associated with sewer infrastructure and facilities.
Storm Water Fund· Unrestricted net position at the end of the year amounted to $7,109,314, a decrease of $1,283,757 (15.30%). Total net position increased $2,406,640 (10.37%) during the current fiscal year (prior fiscal year had an increase of $2,258,564 or 10.78%). Items affecting the change in total net position of the fund are as follows:
• Operating revenues increased $250,044 (4.95%), due to a $0.25 increase in the "equivalent service units (ESU)" rate which went from $7.35/month/ESU to $7.60/month/ESU.
• Ope1·ating expenses decreased $103,625 (3.42%) in comparison with the prior year. Personnel services decreased $190,948 (18.19%) due to a l'eduction in pension costs caused by positive investment returns. Conti·act services expenses increased $114,057 (34.46%) due to paying for a storm water master plan study update in the current fiscal year.
General Fund Budgetary Highlights
During the fiscal year, the General Fund's original budget was amended from an original budget expenditm·e total (including net transfers) of $56,793,746 to a final budget of $84,288,326, an increase of $27,494,580 (48.41 %). The changes to the General Fund budget are briefly summarized as follows:
• Various public safety grants and donations received during the year totaled $448,395 and various fines and forfeitures related to the drug task force increased by $57,003.
• The lib1·ary received several grants during the year totaling $35,421. Various other parks, recreation, and arts grants and donations were added to the budget totaling $70,279.
• Various capital project, equipment, and other accounts were carried over from the prior year and, therefore, were added to the budget in the current year. This increased the budget by $4,316,178.
• Various outstanding purchases were carried over from the p1·ior year and, therefore, were added to the budget in the current year. This increased the budget by $309,034.
-27-

City of Orem Management's Discussion and Analysis
June 30, 2021
• Various outstanding road projects were carried over from the prior yea1· and, therefore, were added to the budget in the current year. This increased the budget by $1,688,737.
• The City transferred $3,765,462 to the Capital Projects Fund. The transfer was done as an appropriation of surplus funds in order to stay within the State of Utah's General Fund fund balance limitation.
• The City was awarded CARES Act CRF grant funding through Utah County of $6,978,967 for COVID· 19 pandemic relief.
• The City was awarded American Rescue Plan Act CARP A) grant funding of $8,043,675 to aid in public health and economic recovery from the COVID·19 pandemic.
• The City increased its estimate of sales tax revenues by $1,275,000 as the effects of the COVID· 19 pandemic did not have the anticipated negative affect the City budgeted for. As a result, the city increased budgeted sales tax revenues and used the additional funds to give merit increases to all city personnel where no increases had been originally budgeted.
Several General Fund revenue and expenditure categ01·ies were significantly higher or lower than their final budgeted amounts. These variances ai-e briefly summarized as follows:
• Taxes and Special Assessments - Revenues - Actual amount was higher than the budgeted amount by $7,916,804 (22.48%). Actual sales tax revenues were higher than budgeted revenues by $7,928,948. The City only made one amendment of $1,275,000 during the year to increase the budgeted sales tax revenues for general wage and salary increases.
• Licenses and Pe1·mits - Revenues - Actual amount was higher than the budgeted amount by $903,933 (79.05%). Actual 1·evenues were higher than budgeted revenues due to building permits exceeding budget by $644,001 and business licenses exceeding budget by $189,112. The housing and commercial markets in the area were quite stTong despite concerns surrounding the COVID· 19 pandemic elsewhere in the nation.
• Intergovernmental - Revenues - Actual amount was lowe1· than the budgeted amount by $11,882,095 (62.29%). Actual revenues were lower than budgeted Tevenues because the City amended its budget for the full $6,978,967 of CARES Act funds it was awa1·ded through Utah County even though actual revenues for the current fiscal year were only $2,117,690 (the difference being recognized as revenue in the prior fiscal year). The City also received $8,043,675 in ARPA grant funding which was added to the budget but the City was only able to spend $571,342 by fiscal year-end.
• Investment Earnings - Revenues - Actual amount was lower than the budgeted amount by $475,729 (59.92%). The City's investments saw significant deterioration in the interest rates being earned compared to the prior year as a result of the continuing impact of the pandemic.
• General Government - Expenditures - Actual amounts were lower than budgeted by $14,542,112 (47.94%). The following narrative provides details about this variance from budget:
-28-
City of Orem Management's Discussion and Analysis
June 30, 2021
o Grant expenditures related to COVID-19 were lower than budgeted because the City amended its budget for the full $6,978,967 of CARES Act funds it was awarded through Utah County even though actual expenditures for the current fiscal year were only $1,135,292. The City also received $8,043,675 in ARPA grant funding which was added to the budget but the City was only able to spend $465,236 by fiscal yea.rend.
o Wages and employee benefit costs were lower than budget by $311,170. The variance is primarily due to vacant positions that occur naturally throughout the fiscal year.
o Professional and technical services accounts were lower than budget by $470,807 as expected service costs were either delayed or determined to not be necessary. The City's justice court has had ve1·y little need of a bailiff as much of the activity has been via electronic means rather than in person. Also, t ransports to the county jail have been very negligible and thus, the time needed to perform these t1·ansports has not been needed.
o Employee development costs were lower than budgeted by $81,192 pr imarily due to conference travel cancelations due to COVID-19 related issues.
o Various contingency accounts were not used and thus, were lower than budget by $185,382.
• Public Safety - Expenditures - Actual amounts were lower than budgeted by $4,113,235 (13.40%).
o Regular pay, overtime, and fringe benefits were lower than expected by $473,720 due to fully funding all positions in the budget even though employee turnover regularly occurs leaving gaps in positions being occupied.
o Various vehicle, equipment, and uniform costs totaling $426,620 did not get purchased by the end of the fiscal year but were budgeted.
o Fire apparatus totaling $716,006 was budgeted but not spent because it is being accumulated until there are enough funds to pay for the equipment with cash.
o Contracted Vineyard City future fire station start-up costs are being accumulated and thus, while being budgeted are not being spent as of yet. The accumulated budgeted funds cunently total $1,600,000 at the end of the current fiscal year .
o Employee development costs were lower than budgeted by $106,698 primai·ily due to conference travel cancelations due to COVID-19 related issues.
• Highways and Public Improvements - Expenditui·es - Actual amounts were lower than budgeted by $3,073,514 (38.77%). Most of this variance can be atti·ibuted to various street over·lay/reconstruction projects, sluny seal projects, micro-surfacing, and st1·eet striping projects t hat were not completed by fiscal year end but are expected to be completed in the next fiscal year.
-29-

City of Orem Management's Discussion and Analysis
June 30, 2021
• Parks, Recreation, and Arts - Expenditm·es - Actual amounts were lower than budgeted by $1,049,121 (12.31%). Per sonnel costs were lower t han budgeted by $348,839 due primarily to several posit ions being vacant for some of the fiscal year and difficulties in finding enough temporary workers to fill all of the City's open positions. There were also several budgeted equipment purchases and capital projects that had funds remaining totaling approximately $436,000.
Capital Assets and Debt Administration
Capital assets. The City's investment in capital assets for its governmental and business-type activities as of June 30, 2021, amounts to $290,875,362 (net of accumulated depreciation). This investment in capital assets includes land, buildings, improvements other than buildings, machinery and equipment (including vehicles and office equipment), infrastructm·e, intangibles, and construction in progress.
Major capital asset events during the current fiscal year include the following:
• Public safety purchased seven new vehicles totaling $274,989 and modified a new fire engine purchase which cost $359,917.
• The parks division pm·chased one new tractor for $44,740 and a new riding mower for $97,742. They a lso completed the Geneva Park & Westmo1·e Park renovation projects spending $242,672 this fiscal year, completed additions to the bike-skills park for $81,161, and completed landscaping at the new Library Hall and Orem Family Fitness Center for $124,478.
• The parks and recreation divisions also received a $3. 7 million property donation from Intermountain Healthcare (IHC). The property is part of the Orem Community Hospital campus and has been used regularly by the city for recreation purposes (primarily as a soccer field). IHC donated the property to the city with the rest riction that it continue to only be used fo1· outdoor recreational purposes.
• The cemetery reconstructed their upper cemetery road system at a total cost of $143,691.
• The streets division completed the purchase of a brine maker, tanks and building for $96,730, purchased two new vehicles totaling $180,367, and purchased two new dump trucks totaling $410,911 as part of the VW mitigation settlement grant through the State of Utah.
• Various road, street light, and landscaping projects completed or added to construction in process were approximately $2,400,000.
• The Finance department purchased additional audio and video equipment for the City's justice court for $5,514, 1·emodeled the front reception counter for $14,878, and installed a new fingerprint machine for $24,826.
• Recreation purchased p1·operty from the Alpine School District for $5,605,295 in order to construct a new city park on the site of the former Hillcrest Elementary School. Fitness Center reconstruction costs added to construction in progress totaled $15,013,539.
-30-
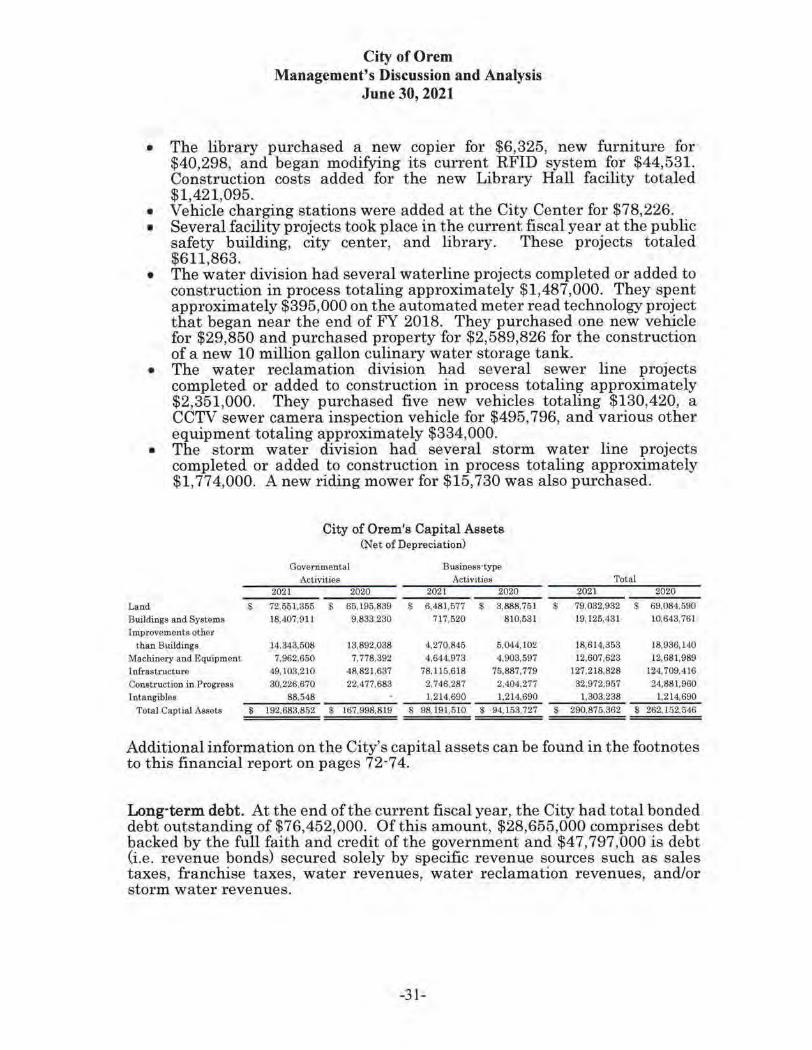
City of Orem Management's Discussion and Analysis
June 30, 2021
• The library purchased a new copie1· for $6,325, new furnitlll'e for $40,298, and began modifying its current RFID system for $44,531. Construction costs added for the new Librai·y Hall facility totaled $1,421,095.
• Vehicle charging stations were added at the City Center for $78,226. • Several facility projects took place in the current fiscal year at the public
safety building, city center, and library. These projects totaled $611,863.
• The water division h ad several waterline projects completed or added to construction in process totaling approximately $1,487,000. They spent approximately $395,000 on the automated meter read technology project that began near the end of FY 2018. They purchased one new vehicle for $29,850 and purch ased property for $2,589,826 for the construction of a new 10 million gallon culinary water storage tank.
• The water reclamation division had several sewer line projects completed or added to construction in process totaling approximately $2,351,000. They pw·chased five new vehicles totaling $130,420, a CCTV sewer came1·a inspection vehicle for $495,796, and various other equipment totaling approximately $334,000.
• The storm water division had several storm wate1· line projects completed or added to construction in process totaling approximately $1,774,000. A new riding mower for $15,730 was a lso purchased.
City of Orem's Capital Assets (Net of D e preciation)
Governmental Business·type Activiwea Acwvities Total
2021 2020 2021 2020 2021 2020
Land $ 72,551,355 s 65,195,839 $ 6,481,577 s 3,888,751 $ 79,032,932 $ 69,084,590
Buildings and Systems 18,407,911 9,833,230 717,520 810,631 19,125,431 10.643,761
Improvements other than Buildings 14,343,508 13,892,038 4,270,845 6,044.102 18,614,353 l8,936, 140
Machinery and Equipment 7,962,650 7,778,392 4,644,973 4,903,597 12,607,623 12,681,989
I o.frastrucLure 49,103,210 48,821.637 78.116,618 75,887,779 127.218.828 124,709.416
Conatruction in Prog-rnss 30,226,670 22,477,683 2,746,287 2,404.277 32,972,957 24,881,960
lnte.ngibles 88,548 1,214,690 1,214,690 1,303,238 1,214,690
Total Ce.pLial AMeta $ 192,683.852 $ 167,998,8 19 $ 98,191.510 s 94.153,727 s 290.875.362 $ 262.152.546
Addit ional information on the City's capital assets can be found in the footnotes to this financial report on pages 72·74.
Long·term debt. At the end of the current fiscal year, the City had total bonded debt outstanding of $76,452,000. Of this amount, $28,655,000 comprises debt backed by the full faith and credit of the government and $47,797,000 is debt (i.e. revenue bonds) secured solely by specific 1·evenue sources such as sales taxes, franchise taxes, water revenues, water reclamation revenues, and/or storm water revenues.
-31-
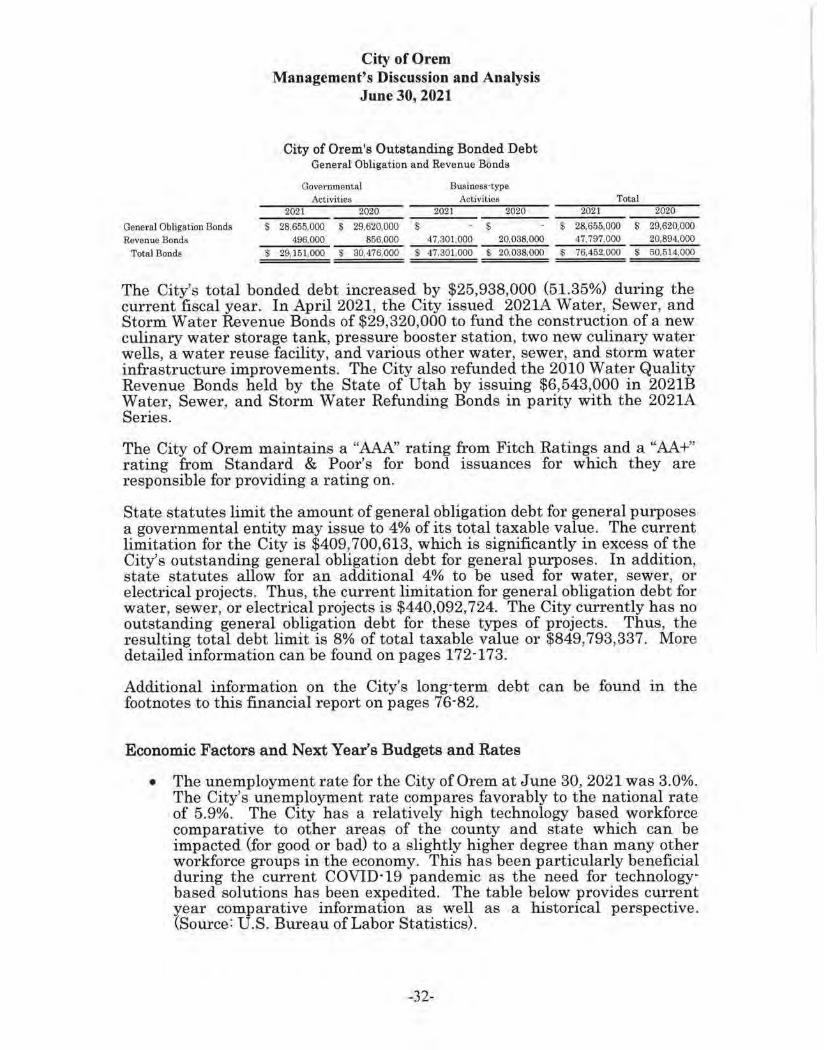
General Obligation Bonds $
Revenue Bonds Total Bonds $
City of Orem Management's Discussion and Analysis
June 30, 2021
City of Orem's Outstanding Bonded Debt General Obligation and Revenue Bonds
Governmental Activities
2021 2020
28.655,000 s 29,620,000 496,000 856,000
29,151,000 $ 30,476,000
$
Bll~iness·type Activities
2021 2020
$ 47,301.000 20,038,000
$ 47,301.000 $ 20,038,000
Total 2021 2020
S 28,655.000 $ 29,620,000 47. 797,000 20,894,000
$ 76,452,000 S 50,614,000
The City's total bonded debt increased by $25,938,000 (51.35%) during the current fiscal year. In April 2021, the City issued 2021A Water, Sewer, and Storm Water Revenue Bonds of $29,320,000 to fund the construction of a new culinary water storage tank, pressure booster station, two new culinary water wells, a water reuse facility, and various other water, sewer, and storm water infrastructure improvements. The City also refunded the 2010 Water Quality Revenue Bonds held by the State of Utah by issuing $6,543,000 in 2021B Water, Sewer, and Storm Water Refunding Bonds in parity with the 2021A Series.
The City of Orem maintains a ''AAA" rating from Fitch Ratings and a "AA+" rating from Standard & Poor's for bond issuances for which they are responsible for p1·oviding a rating on.
State statutes limit the amount of general obligation debt for general purposes a governmental entity may issue to 4% of its total taxable value. The current limitation for the City is $409,700,613, which is significantly in excess of the City's outstanding general obligation debt for general purposes. In addition, state statutes allow for an additional 4% to be used for water, sewer, or electrical projects. Thus, the cuuent limitation for general obligation debt for water, sewer, or electrical projects is $440,092,724. The City currently has no outstanding general obligation debt for these types of projects. Thus, the resulting total debt limit is 8% of total taxable value or $849,793,337. More detailed information can be found on pages 172-173.
Additional information on the City's long-term debt can be found in the footnotes to this financial report on pages 76-82.
Economic Factors and Next Year's Budgets and Rates
• The unemployment 1·ate for the City of Orem at June 30, 2021 was 3.0%. The City's unemployment rate compares favorably to the national rate of 5.9%. The City has a relatively high technology based workforce comparative to other areas of the county and state which can be impacted (for good or bad) to a slightly higher degree than many other workforce groups in the economy. This has been particularly beneficial during the current COVID-19 pandemic as the need for technologybased solutions has been expedited. The table below provides current year comparative information as well as a historical perspective. (Source: U.S. Bm·eau of Labor Statistics).
-32-

City
County State Nation
City of Orem Management's Discussion and Analysis
June 30, 2021
IllSTORICAL ANNUAL UNEMPLOYMENT RATES
2017 2018 2019 2020
3.7% 3.3% 3.1% 5.0%
3.6% 3.4% 3.1% 4.5%
3.9% 3.5% 3.2% 5.7%
4.5~ 4.2% 3.8% 11.1%
2021
3.0%
2.8%
3.1%
5.9%
• The General Fund budget for the fiscal year ending June 30, 2022 reflects a decrease of $7,697,886 or 11.80% in revenues, excluding appropriations of suTplus, compared to the final actual revenues for the fiscal year ended June 30, 2021. The decrease in budgeted revenues is due primarily to a decrease in intergovernmental revenues (primarily gi·ants) of $2,6761274 as the city does not budget for grants until they have actually been awarded and a decrease in sales tax revenues of $2,683,948 as the city believes FY 2021 was inflated by the spending of federal stimulus funds which is not anticipated to occm in FY 2022. Budgeted expenditures increased by $1,082,455 or 1.66% over the final fiscal year ended June 30, 2021, expenditures. Most of this is due to the personnel cost increases and additional capital projects and acquisitions in next year's budget.
• Despite some negative impacts of the current pandemic, the state and the city continue to compare favorably to national indices. Sales tax revenues continue to increase in compai·ison to the prior year while other revenue sources are comparable or gradually improving when compared to the prior fiscal year. These revenue sources as well as others are monitored very closely so the City can identify what futme spending may be able to be added should positive revenue trends continue.
All of these factors were considered in preparing the City's budget for the 2021· 2022 fiscal year.
Request For Information
This financial report provides a general overview of the City of Orem's finances for all those with an interest in the government's finances. Questions concerning any of the information provided in this report or requests for additional financial information should be add1·essed to:
Brandon C. Nelson, CPA City of Orem Finance Dirnctor 56 North State Street, Orem, UT 84057 or via email at [email protected]
-33-
(This page left blank intentionally)
-34-

BASIC FINANCIAL
STATEMENTS
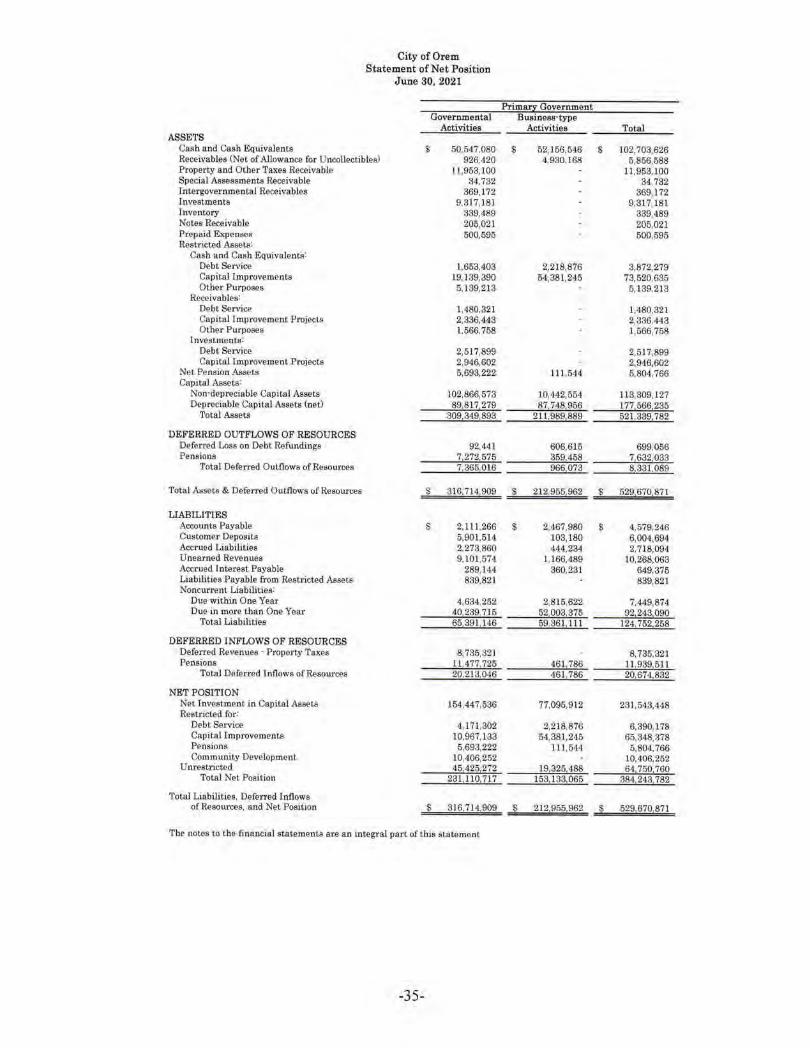
City of Orem Statement of Net Position
June 30, 2021
Governmental Prim!!!I Government
Business-type Activities Activities Total
ASSETS Cash and Cash Equivalents $ 50,547,080 s 62,156,546 $ l 02, 703,626 Receivables (Net of Allowance for Uncollectibles) 926,420 4.930,168 5,856,588 Property and Other Taxes Receivable 11,953, 100 11,953,100 Special Assessments Receivable 34,732 34,732 Intergovernmental Receivables 369,172 369,172 Investments 9,317,181 9,317, 181 Inventory 339,489 339,489 Notes Receivable 205,021 205,021 Prepaid EX1>ensea 500,595 500,595 Restricted Asaef..8'.
Cash and Caah Equivalent.s: Debt Service 1.653,403 2,218,876 3,872,279 Capital looprovemcnt.s 19, 139,390 54,381,245 73,520,635 Other Purposes 5,139,213 5,139,213
Receivables: Debt Service 1,480,321 1.480,321 Capital Improvement Projects 2,336,443 2,336,443 Other Purposes 1.566,758 1,566,758
Investments: Debt Service 2,517,899 2,517,899 Capital r mprovement Projects 2,946,602 2,946,602
Net Pension Assets 5,693,222 l ll ,544 5,804,766 Capital Assets:
Non-depreciable Capital Assets 102,866,573 10,442,554 I l3,309,127 Depreciable Capital Assets (net) 89,817,279 87,748.956 177,566,236
Total Assets 809 349,893 2ll,9891889 521,339,782
DEFERRED OUTFLOWS OF RESOURCES Deferred Loss on Debt Refundings 92,441 606,615 699,056 Pensions 7 272,575 359 458 7,632,033
Total Deferred Outflows of Resources 7 365,016 966,073 8 331,089
Total Asseta & Deferred Outflows of Resources $ 316.714,909 $ 212,955,962 ~ 529,670,871
LIABILITIES Account;, Payable $ 2, ll l ,266 $ 2,467,980 $ 4,579,246 Customer Deposits 5,901,514 103,180 6,004.694 Ace.rued Liabllitiea 2,273,860 444,234 2,718,094 Unearned Revenues 9,101,574 1,166,489 10,268.063 Accrued Interest Payable 289, 144 360,231 649,375 Liabilities Payable from Restricted Assets 839,821 839,821 Noncurrent Liabilities:
Due within One Year 4,634,252 2,815,622 7,449,874 Due in more than One Year 40.239.715 52,003,375 92,243,090
Total Liabilities 65,391,146 59 361,111 124,752,258
DEFERRED INFLOWS OF RESOURCES Deferred Revenues • Property Taxes 8,735,321 8,735,321 Pen!!ions 11,477.725 461 786 11,989,511
Total Deferred Inflows of Resources 20,213,046 461 786 20,674,832
NET POSITION Net Investment in Capital Asset.s [54,447,536 Restricted for:
77,095,912 231.543,448
Debt Service 4,171,302 2,218,876 6,390,178 Capital Improvements 10,967,133 64,381.246 65,348,378 Pensions 5,693,222 111,544 5,804,766 Community Development 10,406,252 10,406,252
U nrest.ricted 45 425 272 19,325.488 64 750 760 Total Net Position 231 llO 717 163,183,065 384,243,782
Total Liabilities, Deferred Inflows of Resources, and Net Position $ 316,7 14,909 $ 212,955.962 ~ 529,670,871
The notee co the financial statements are an integral parl of Lhia statement
-35-

Functions/Programs Primary Government:
Governmental Activities: General Government P ublic Safety Highways and Public Improvements Parks, Recreation and Arts Economic and Physical Development Redevelopment Interest on Long·term Debt
Total Governmental Activities
Business-type Activities: Water Water Reclamation Storm Water Recreation Solid Waste Street Lighting
Total Business-type Activities Total Primary Government
City of Orem Statement of Activities
For The Year Ended June 30, 2021
Ex~enses
$ 16,072,497 $ 26,234,854
7,296,421 8,204,646 1,068,973 1,151,383 4,571,442
6~600,216
14,956,163 7,918,906 3,016,483 2,311,074 4,227,392
469,325 32,899,343
$ 97!499,559 $
Proi!am Revenues Operating Capital
Charges for Grants and Grants and Services Contributions Contributions
10,747,410 $ 7,568,475
254,280 2,318,692
143,129
21,031,986
20,341,587 12,591,825 5,300,968 1,159,731 4,370,759 1,055,657
44,820,527 65,852,513 $
General Revenues: Sales Taxes Property Taxes Franchise Taxes Vehicle Taxes
1,400 $ 3,048,399
51,778 631,768
20,445
3,753.790
3,753,790 $
Othel' Taxes & Special Assessments Unresti·icted Investinent Earnings Gain (Loss) on Sale of Capital Assets
Transfers In (Out)
160,028 4,228,492 5,287,954
353,820
10!0301294
1,948,777 1,420,572
385.179
3,754,528 13,784,822
Total General Revenues and Transfers Change in Total Net Position
Total Net Position - Beginning
Total Net Position · Ending
The notes to the financial statements a.re an integral part of this statement
-36-
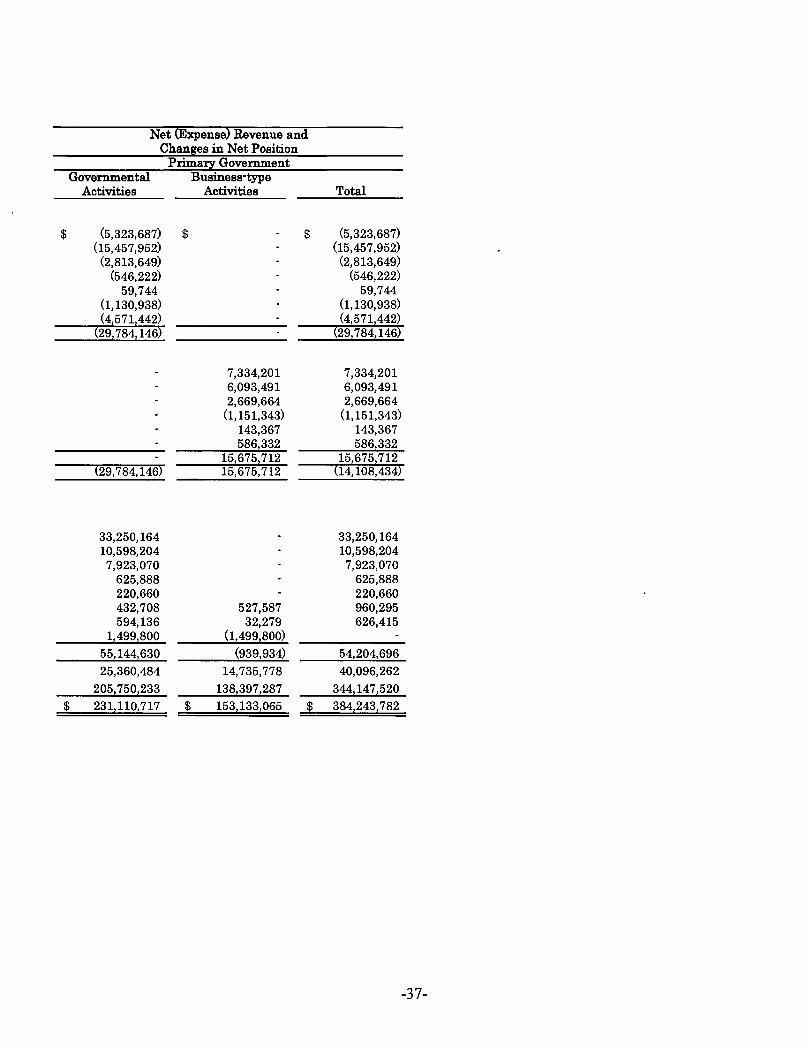
Net {Expense) Revenue and Changes in Net Position
Primary Government Governmental Business·type
Activities Activities Total
$ (5,323,687) $ $ (5,323,687)
$
(15,457,952) (2,813,649)
(546,222) 59,744
(1,130,938) (4,571,442)
(29,784,146)
(29,784,146)
33,250,164 10,598,204 7,923,070
625,888 220,660 432,708 594,136
1,499,800
55,144,630
25,360,484
205,750,233 231,110,717 $
7,334,201 6,093,491 2,669,664
(1,151,343) 143,367 586,332
15,675,712 15,675,712
527,587 32,279
(1,499,800)
(939,934)
14,735,778
138,397,287 153,133,065 $
(15,457,952) (2,813,649)
(546,222) 59,744
(1,130,938) (4,571,442)
(29,784,146)
7,334,201 6,093,491 2,669,664
(1,151,343) 143,367 586,332
15,675,712 (14,108,434)
33,250,164 10,598,204 7,923,070
625,888 220,660 960,295 626,415
54,204,696
40,096,262
344,147,520 384,243,782
-37-

(This page left blank intentionally)
-38-

City of Orem Balance Sheet
Governmental Funds June 30, 2021
Capital Other Total Debt Capit al Projects·2019 Governmental Governmental
General Se.rvice Projects ASSETS
G.O. Bonds Funds Funds
Cash and Ca8h .Equivalents s 23,886,609 $ 1,144,437 $ 20,229,415 $ $ 358,271 $ 46,618,732 Receivables (Net of Allowance for Uncollectibles) 821,367 55,053 50,000 926,420 Property Taxes Recejvable 5,700,000 5,700,000 Other Taxes Receivable 6,253,100 6,253,100 Special Assessments Receivable 34,732 34,732 intergovernmental Receivables 112, 169 223 256,780 369,172 Due from Other Funds 174,809 174,809 Not.es Receivable 205,021 205,021 Investments 9,317,181 9,317,181 Prepeids 413,604 413,604 Restricted Cash and Cash Equivalents:
Debt Service 837,438 815,965 1,653,403 Capital Improvement Projects 9,054,045 10,085,345 19,139,390 Other Purposes 1,474,480
Restricted Receivables: 3,664.733 5,139,213
Debt Service 1,480,321 1,480,321 Capital Improvement Projects 781,443 1,555,000 2,336,443 Other Purposes 178,673 1,378,766 1,557,439
'Restricted Investments: Debt Service 2,517,899 2,517,899 Capital Improvement Projects 2,946,602 2,946,602
Total Assets $ 6-1,504,151 $ 3,<140,723 s 20,284,691 s s 17,653,916 $ 105,783,481
LIABILITIES Accounts Payable $ 667,485 $ $ 284,94.2 $ s l.044,182 $ l,996,609 Customer Deposits 6.901,514 5,901,5 14 Accrued Liabilities 2,108,103 7,695 2,110,798 Unearned Revenues 8,898,372 193,108 10,094 9,101,674 Liabilities Payable from Restricted Assets 839,821 839,821
Total Liabilities 18,410,295 478,050 t.236,780 20,125,125
DEFERRED INFLOWS OF RESOURCES Deferred Revenues · Property Taxes 5,700,000 1,480,321 1,555,000 8,735,321 Deferred Revenues· Receivables 261,517 314,078 675,695
Total Defeucd lnOows of Resourr.es 5,961,517 1,480,321 1,869,078 9,310,916
FUND BALANCES Noospendable 413,604 413,604 Restricted 10,183,252 815,965 19,088 14,025,787 25,044,092 Assigned 11,110,974 1,144,487 19,787,553 422,271 32,465,235 Unassigned 18,424,509 18,424,509
Total Fund Balances 40,132,339 1,960,402 19,806,641 14,448,058 76,347,440
Total Liabilities, Deferred Inflows of Resources. and Fund Balances s 64,504,151 $ 3,440,723 s 20,284,691 s s 17,553,916 s 105, 783,,181
Amount& teported for government.al activities in the St-atement of Net Position are different because: Car,ital a88et8 used in governmental fund& are not financial resow-cee. I 92,683,852 Net Penaion Assets and Deferred Out0owa of ReaoUJ"ceB a.re not available. financial resources and are nol
n,port<d in the governmental funds. 13.058,238 Other restrict-ed assets are not available financial resourcee and ore not reported in the. governmental funds, 9,319 Cert.a.in revenue is unearned in governmental funds but not in the Statement of Net Position because it
qualifies for recognition under the economic resources me&Burement focus. 575,595 Internal service fund.a ere ueed by management to charge the cost of fleet man,agcroenL. eelf-ineurance,
pu.rchaainglwarehou.eing, information technology, and facilitie.e maintenance. The cunent. aMeta and liabilities of internal 1J.e.rvic-e funda are included in governmental activities Ln the Statement o{ Net Position. 4,593,005
Long-term liabilities, including bonds payable, compensated abs,nces, and pensioM, are not due and payabl• in t.he currenl period. (44,389.864)
Other 6nancial obligat.ions not due and payabl• in the current period. lntere-st paya,ble on long·tenn obligations do not require current financial resources and are not
rep0rted in t.be governmental funds. C289, 144) Deferred In.flows of Resources related- to pensions do not. require cUJTC.nt. 6.nanciaJ re8ot1rces and are not
reported in the governmental funds. (11,477,725)
Net .Position of Governmental Activities $ 281,110,717
Tho notes to the financial statements are an integl'!ll part of this staLement
-39-

City of Orem Statement of Revenues, Expenditures, and Changes in Fund Balances
Governmental Funds For The Year Ended June 30, 2021
Capital Other Total Debt Capital Projects·2019 Governmental Governmental
General Service Projects G.O. Bonds Funds Funds REVENUES
Taxes and Special Assessments $ 43,139,072 s l ,474,696 $ $ $ 8.088,605 $ 52,702,373 Licenses and Permits 2,047,433 2,047,433 Intergovernmental 7,195,585 825.358 985,588 9,006,531 Charges for Services 9,575.052 152,875 9,727,927 Fines and Forfeitures 1,219,631 1,219,631 Charges for Services · Other Funds 4,761,991 4,761,991 impact Fees 1,017,553 1,017,553 Investment Earnings 318,271 6,604 106,018 430,893 Miscellaneous Revenue 1,895,752 474,616 322,516 2,692,884
Total Revenues 70,152,787 1,481,300 1,299.974 10,673,155 83,607.216
EXPENDITURES Current:
General Government 15,264,157 15,264,157 Public Safety 25,742,327 25,742,327 Highways and Public Improvements 2,956,344 257,724 3,214,068 Parks, Recreation and Arts 7,223,479 931,798 8,155,277 Economic and Physical Development 235,253 129,894 4,614 467,266 837,027 Redevelopment 1,051,628 1,051,628
Debt Service: Principal Retirement 1,352,255 80,000 1,432,266 lnterest and Fiscal Charges 4,626,422 13,001 4,639,423 Capital Leases · Principal 444,000 444,000 Capital Leases · Interest 108,284 108,284
Capital Outlay 3,514,994 7,429,704 10,961,839 7,217,474 29,124,011 Total Expenditures 64,936,554 6,530.961 7,559.598 10,966,453 10,018,891 90,012,457
Excess (Deficiency) of Revenues over (under) Expenditures 16,216,233 (5,049,661) tG,259,624) (10,966,453) 654,264 (6,405,241/
OTHER FINANCING SOURCES (USES) Proceeds from Asset Disposals 101,661 492,485 594,136 Transfers ln 2,668,068 4,248,348 7,924,340 14,840,756 Transfers Out (9,205,611) (28,013) (4,150,961) (I 3,384,575)
Total Other Financing Sources (Uses) (6,435,892) 4.248,348 7,896.327 (3,658,466) 2,050,317
Net Change in Fund Balances 8,780,341 (801,313) 1,636,703 (10,966,453) (3,004,202) (4.354,924)
Fund Balance · Beginning 31,351,998 2,761,715 18,169,938 10.966,463 17,452,260 80,702,364
Fund Balance · Ending s 40,132,339 $ 1,960.402 s 19,806,641 $ $ 14, 448,058 s 76,347,440
The notes to the financial statements are an integral part ofthis statement
-40-

City of Orem Reconciliation of The Statement of Revenues,
Expenditures, and Changes in Fund Balances of Governmental Funds To The Statement of Activities
For The Year Ended June 30, 2021
Amounts reported for Governmental activities in the Statement of Activities arn different because:
Net Change in Fund Balances · Total Governmental Funds
Governmental funds report capital outlays as expenditures. However, in the Statement of Activities the cost of those assets is allocated over their estimated useful lives and 1·eported as depreciation expense.
Capital Asset Purchases Capitalized Depreciation Expense
The issuance of long·term debt provides current financial resow·ces to governmental funds, while the payment of the p1incipal of long·term debt consumes the current financial resources of governmental funds.
Principal Payments recorded as a reduction of the long·term liability
Governmental funds report the effect of premiums, discounts, and similar items when debt is first issued, whereas these amounts are amortized in the Statement of Activities.
Amortization of Bond Refundings · Loss on Defeasance Amortization of Bond Premiums (Discounts)
Some expenses reported in the Statement of Activities do not require the use of current financial resources and therefore, are not reported as e~-penditures in the governmental funds.
Compensated Absences Interest Expense Pension Expense Other Post Employment Benefits (OPEB) Expense
Revenues in t he Statement of Activities that do not provide current financial resources are not reported as revenues in the funds.
Special Assessment Revenues Charges for Services Revenues Pension Revenues · Nonemployer Contributions
Internal service funds are used by management to charge the costs of fleet management, purchasing/warebousing, self-insurance, information technology, and facilities maintenance to individual funds. The net revenue of certain activities of internal service funds is reported with governmental activities.
Change in Net Position of Governmental Activities
The notes to the financial statements are an integral part of this statement
-41-
$ 31,579,763 (7:076,509)
$ 118761255
$ (38,865) 2091650
$ (142,653) 5,479
1,861,333 5 1 455
$ (82,572) 44,319
537,801
$ (4,354,924)
24,503,254
1,876,255
170,786
1,775,614
499,548
889,951
$ 25,360,484
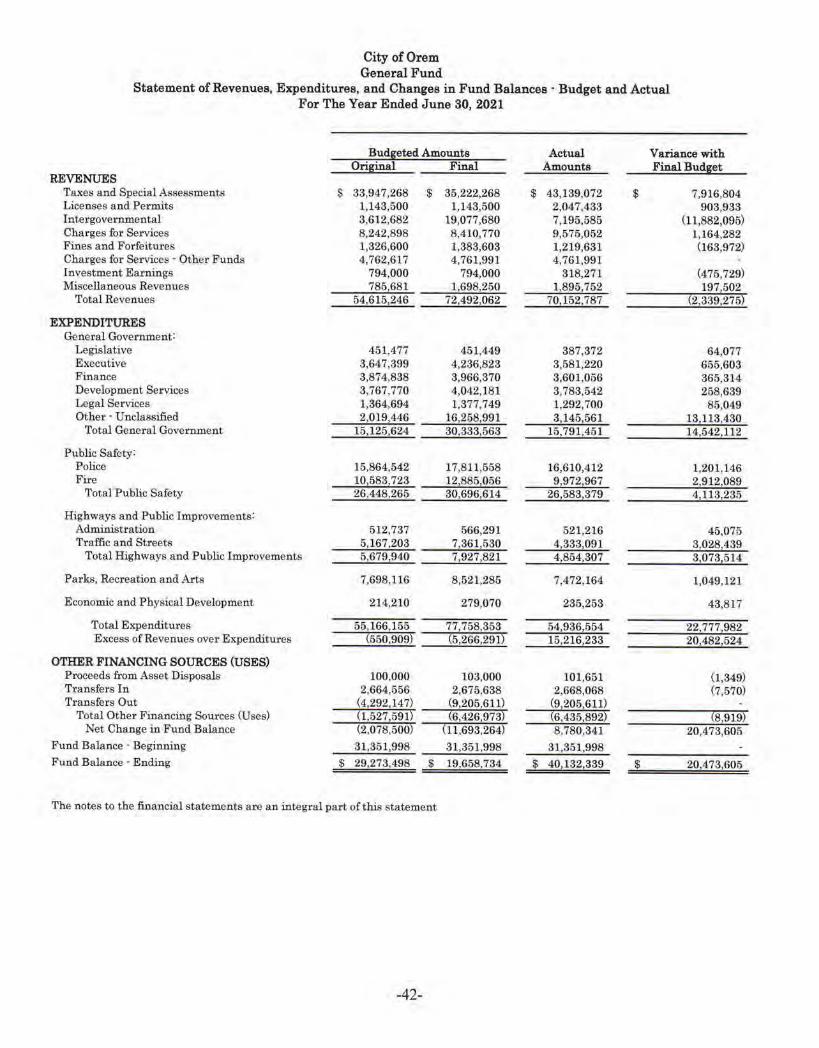
City of Orem General Fund
Statement of Revenues, Expenditures, and Changes in Fund Balances · Budget and Actual For The Year Ended June 30, 2021
Budgeted Amounts Actual Variance with Original Final Amounts Final Bud!Iet
REVENUES Taxes and Special Assessments $ 33,947,268 $ 35,222,268 $ 43,139,072 $ 7,916,804 Licenses and Permits 1,143,500 1,143,500 2,047,433 903,933 Intergovernmental 3 ,612,682 19,077,680 7,195,585 (11,882,095) Charges for Services 8,242,898 8,410,770 9,575,052 1,164,282 Fines and Forfeitures 1,326,600 1,383,603 1,219,631 (163,972) Charges for Services · Other Funds 4,762,617 4,761,991 4,761,991 Investment Earnings 794,000 794,000 318,271 (475,729) Miscellaneous Revenues 785,681 1,698.250 1,895,752 1971502
Total Revenues 54,615,246 72!492,062 70,152,787 (21339,275)
EXPENDITURES General Government:
Legislative 451,477 451,449 387,372 64,077 Executive 3,647,399 4,236,823 3,581,220 655,603 Finance 3,874,838 3,966,370 3,601,056 365,314 Development Services 3,767,770 4,042,181 3,783,542 258,639 Legal Services 1,364,694 1,377,749 1,292,700 85,049 Other· Unclassified 2,019,446 16,258,991 3,145,561 13,113,430
Total General Government 15,125,624 30,333,563 15,791,451 14,542,112
Public Safety: Police 16,864,542 17,811,558 16,610,412 1,201,146 Fire 10,583,723 12,885,056 9!972,967 2,912!089
Total Public Safety 26,448,265 30,696,614 26,583,379 4,113,235
Highways and Public Improvements: Administration 512,737 566,291 621,216 45,075 Traffic and Streets 51167,203 7,361,530 4,333,091 3,028 439
Total Highways and Public Improvements 5,679,940 71927,821 4,864,307 3,073,614
Parks, Recreation and Arts 7,698,116 8,521,286 7,472,164 1,049,121
Economic and Physical Development 214,210 279,070 235,253 43,817
Total Expenditures 55,166,155 77,758,353 54,936,554 22,777,982 Excess of Revenues over Expenditures (650!909) (5,266,291) 16,216,233 20,482,524
OTHER FINANCING SOURCES (USES) Proceeds from Asset Disposals 100,000 103,000 101,651 (1,349) Transfers In 2,664,556 2,675,638 2,668,068 (7,670) Transfers Out (4,292,147) (9,2061611) (9,205,611)
Total Other Financing Sources (Uses) (11527,591) (6,426,973) (6,435,892) (8,919) Net Change in Fund Balance (2,078,500) (11,693,264) 8,780,341 20,473,605
Fund Balance · Beginning 31,351,998 31,351,998 31,351,998 Fund Balance · Ending $ 29,273,498 $ 19,668,734 $ 40,132,339 $ 20,473,605
The notes to the financial statements are an integral part of this statement
-42-
(This page left blank intentionally)
-43-

City of Orem Statement of Net Position
Proprietary Funds June 30, 2021
'.B:uainea.a·!ne Activitiee · Ente!]!riac Funds Water Water
Water Water Reclamatioo Reclamation Storm Water Storm Water Fund Fund Fund Fund Fund Fund
Current Yea.r Prior Year Current Year Prior Year Current Year Prior Year ASSETS
Current AlrJ!eta: Cash and Ca8h Eqwvalents $ 25,799,101 $ 30,318,763 $ 12,762.781 $ 17,485,355 s 8,959,914 $ 8,336,490 Accounts Receivable (Neto( Allowa.noe for
Doubtful Acoountal 2,506,792 2,438,879 l,310,119 l ,327,4 17 615,152 484,138
Inventories Prepwds Reatrkted Cub & Cash E<1uivalenUJ~
Debt Scrv1ce 1,683,376 1,681,258 535, 500 476,000 Capital lmprove.ment.s 34,070,162 289 880 18,047,230 6l'!,794 2,263,853 153,132
Total Current Assets 64,059,431 34,728,280 32,645,630 19,903,566 11 738,919 8,973,760 Noncurrent Asset.e:
Capital Asoeta: Land 2,592,826 570,209 570,209 3,278,720 3,278,720 Buildings and SyawDlB 903,086 903,086 3,097,885 S,097,885 679,293 679,293 Improvement.a other than Buildings 9,262,916 9,262,916 2,028,934 2,028,934 I 15,667 115,667
M•chinery and Equipment 3,308,335 8,278,485 7,338,784 6,813,077 2,552.842 2,570,729 lnfrastrudure 65,046.855 63,651 ,782 52,059,097 48,484,574 2o,.\40,087 19,453,299
Construction in Progress 1,059,465 753,294 180,807 1,232,152 1,495,724 415,232 Intangibles 997,276 997,276 195,900 195.900 21 .511 21,514
Lesa Accumulated Deprecaatlon (35,954,607) (33,228,924) (35,,181,102) (83,944,279) 00,218,680) (9,378 388) Totol Capital Asseta (Net or Accumulated
Depreci~tion) 47,216,150 45,617,916 29,990,514 28,478,462 18.865,167 17,156,066
Net ·Pension A1set.e l ll 544 Total Noncurrent Meets 47,216.160 45,617,915 30,102,058 28,478,452 18,365.167 17,156,066
Total AlrJ!eU! 111,276 681 80,346, 195 62,747,688 48,382.0 18 30 104,086 26.129 826
DEFERRED OUTFLOWS OF RESOURCES Deferred:Lo6t, on Debt Refunding• 495,865 689,436 110,760 138,152 .Pe.osiona 129.340 370,993 112643 287,258 76,142 204 276
Total Deferred Out0ow• or Resources 625 205 960.429 112,543 287,268 186,892 342,428
Tnl•I AS8et,, & Deforred Outflows of Resources s 111,900,786 81,306,624 s 62.860,231 48,669,276 s 30,290,978 s 26.472,254
LlA.BTL!TfES Current Liabilities:
Account& Payable $ 985,745 s 1,000,150 $ 947,662 $ 404,722 $ 154,554 74,623 Customer Deposits 103,180 106,995 Accrued Liabilities 130,454 110.722 105,704 101,839 53,250 46.377
Accrue<! Vacation Leave 122,861 98,942 123,232 121.337 81,240 68,078 Claims and Judgment.a Unearned Revenue 282,580 ll.6,427 Accrued Interest Payable 277,208 141,857 49,728 33,295 25,645 Capital Leases Payable · Current Portion Bonda Payable · Current Portion 1,346.443 l,148 969 654,329 594,000 438 627 415,942
Total C~rrent Liabilities 3 198 471 2,724,062 1880.655 1,221 ,898 760,966 630 565 Noncurrent LlahiUtiea:
Accrued Vocation Leave 6.467 6,207 6,486 6,386 •l,276 3,582 Claim,, and Judgment& Capitol Leases Payable · Long·term Portion Bonda Poyable • Long·term Portion 33,656,806 9,839,452 14,379,409 6,543,000 3.780,303 2,205,703 Net Penaion Liab,lity 62,641 483 g5; 47471 374,648 36.879 266,423
Tot.al Nonc1Arrem Liabilities 33 725 914 10,328,516 14.433 366 6,924,034 3.821 457 2 476,708 Tot.ru Liabilitiea 36,924,385 13,052,578 16314021 8,145,932 4,582 423 S 106 278
DEFERRED INFLOWS OF RESOURCES Pensions 141,226 267 344 192 180 207 003 83.189 147 205
Total Deferred Inflows or Resources 141,226 267 344 192 180 207,003 83,139 147 205
NET POSITION Net I a vestment in Capital Aaseta 34,789,336 35,218,930 23,434,648 21,341,452 16.252,249 14,672,573 Reatncted for Debt Service 1,683,376 1,681,258 535,600 476,000 Restricted for Capital lmprovementB 34,070,162 289,880 18,047,230 614,794 2,263,853 163,132 Reetricted (or Pensions 111.544 Unrestricted 4.292,SO I 30,796,63,t 4,225 108 17,884 095 7 109 3 14 8,393,0;J
Total Net Posit.ion 74,835, 176 67 986.702 46,354,030 40,316,341 25,625 416 23,218,776
Total Liabilities, Deferred Inflows or Reso=•· & Net Pooition 111.900, 786 $ 81,306,624 $ 62,860,231 s 48,669,276 $ 30,290.978 $ 26,472,254
The notes to the financtal atawment.8 arc an mtegra.1 part of th1a .statement
-44-
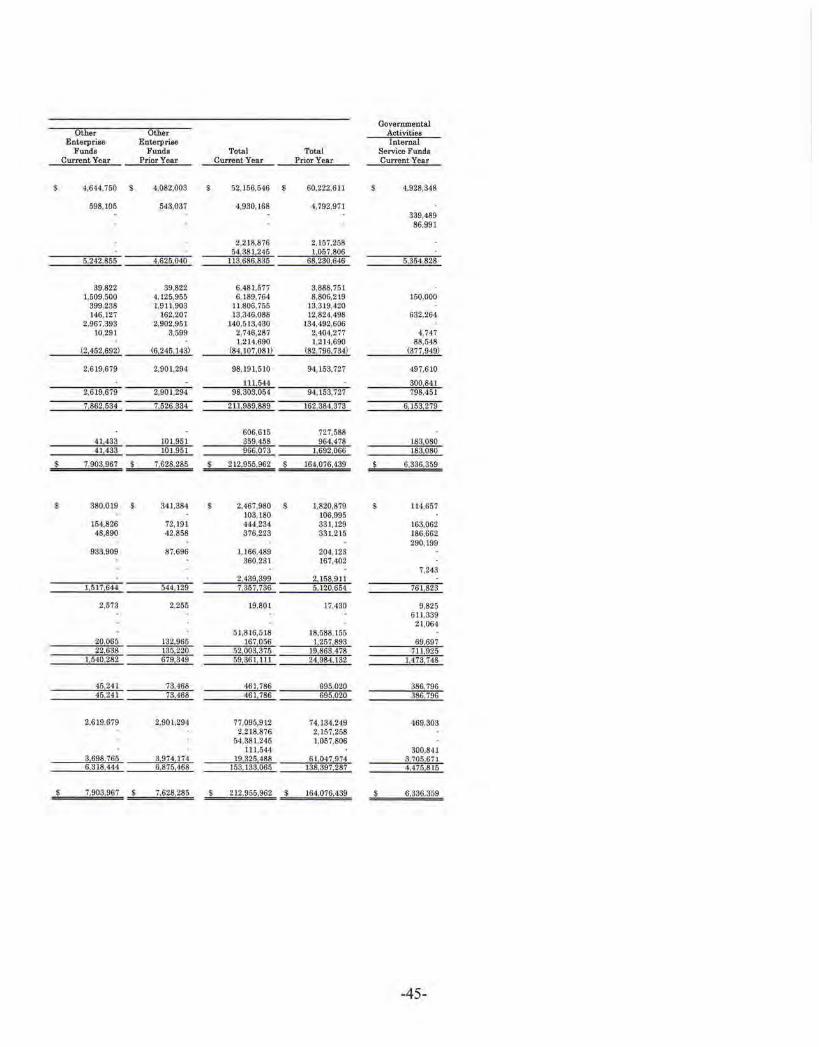
Other Other Governmental
Activities Enterprise Enterpme Internal
Funds Fund• Totsl Total Service Fund• Current Year Prior Year Current Year Prior Year Current Year
s 4,644,750 4,082.003 s 52,156,546 $ 60,222,611 $ 4,928,348
698,105 51131037 4,930,168 4,792,971 339,489
86,991
2,218,876 2,157,258 54,381,245 1,057,806
5.242,855 •l,625.040 113,686,885 68 230,646 5,354,828
39,822 39,822 6.481,577 3,888,751 1,509,500 4,125,955 6,189.764 8,806,219 150.000
399,288 1,911,903 11,806,755 13,3 19,420 146,127 162,207 13,346.088 12,824,498 632,264
2,967,393 2,902,951 140.613,430 [34,492,606 l0,291 3,599 2,746,287 2,404,277 4,747
1,2 14,690 1,214,690 88,648 (2,452.692) (6 245.143) (84.107,081) (82 796,734) (377.949)
2,619,679 2,901,294 98,191,610 94,153,727 497,610
111644 300,841 2,619,679 2,901,294 98,303,054 94,153,727 7911.45]
7,862,534 7,526,334 2 11,989 889 162,384,373 6 153 279
606.615 727,588 41433 101.951 859,458 964,478 183,080 41.433 101,951 966,073 1692 066 183 080
s 7,903,967 s 7,628,285 s 212,955,962 $ 164,076,439 $ 6,336.359
s 880,0 19 $ 841,384 $ 2.467,980 $ 1,820,879 s I 14.657 103,180 106,995
154,826 72,191 444,234 331, 129 163,062 48,890 •12,858 376,223 331,2 15 186.662
290.199 933,909 87,696 I, 166,489 204, 123
360,231 167,402 7,243
2,439 399 2,168,911 1,517,644 544,129 7,357.736 6.120.661 761 823
2,573 2.255 19,801 17,HO 9,825 611,339
21,064 51,816,518 18 .588,155
20.066 132,965 167 056 I 257 893 69 697 22638 135,220 52,003,375 19 863.478 711 925
1,540,282 679,349 59.361, 111 24 984.132 1,473 748
45,24 1 78,468 461 786 696 020 386,796 45,24 I 73,468 461186 695.020 386,796
2,619,679 2,901,294 77,095,912 74,134,249 469.303 2,218,876 2,157.258
M .381,245 1.057.806 111,544 300,84 1
S 698 765 3 974.174 19 325 488 61,0•17,974 8.705,671 6,318,444 6,875,468 153,133.065 138.397 287 4 476 815
s 7,903,967 $ 7,62S,285 s 212,955,962 $ 164.076,439 $ 6,336,359
-45-

City of Orem Statement of Revenues, Expenses, and Changes in Net Position
Proprietary Funds For The Year Ended June 30, 2021
Bueiness·tll!e Activities · Enter11rise Funds Water Water
Water Water Reclamation Reclamation Storm Water Fund Fund Fund Fund Fund
Current Year Prior Year Current Year Prior Year Current Year OPERATING REVENUES
Charges for Services s 18,754,194 s 18.138,800 $ 12,100,616 $ 12,635,219 $ 5,207,126
Other Revenues 1 587,393 2,682,617 491,209 435,565 93 842 Total Operating Revenues 20,341,587 20,821,417 12,591.825 13,070 784 5.,300,968
OPERATING EXPE NSES Personnel Services 2,279,065 2,446,818 1,972,312 2,255,001 858,723 Supplies and Maintenance 908,761 729,684 815,941 671,779 282,510 Administrative Fee 1.428,617 1.452,347 827.017 891,001 351,587 Utilities 676,352 622,432 614,283 615,903 8,462 Cont ract Services 4,808,978 3,654,139 771,091 729,261 445,018 Equipment Lease and Rentals 44,197 48,638 2,335 5,900 Insurance 169,781 178,740 388,515 132,580 21,542 Charges in Lieu of Property Tax 71,787 7l,787 52,665 52,665 29,316 Depreciation Expense 2,725,683 2,598,250 l ,803,070 1,831,040 867,618 Miscellaneous 125.)04 164,805 115,779 162,219 59,070
Total Operating Expenses 13,238,325 11,967,640 7,360,673 7,343,784 2,929,746 Operating Income (Loss) 7,103,262 8,853,777 5,231,152 5,727,000 2,371,222
NONOPERATING REVENUES AND EXPENSES Investment Earnings 309,3 11 542,809 150,686 290,071 60,505 Gain (Loss) on Sale of Capital Assets (17,628) 15,179 (7,982) 12,445 Bond lssuance Coats (254,244) (85,221) (15,828) I mp act Fee ExpenditllJ'es (1,064,966) (767,866) (433,339) (196,888) Interest Expense (398,628) (303,705) (39,673) (71,409)
Total Nonoperating Revenues & Expenses (1,408,527~ (546,390) (392,369) 85,201 ~23,787) Income (Loss) before Transfers
and Contributions 5,694,735 8,307,387 4,838,788 5,8)2,201 2,347,435
Contributions · Impact Fees & Developers l.948,777 2, l25,400 1,420.572 640,985 385,179 Contributions to Governmental Fnnds (6,291) '!Tansfers In 174,571 172,705 Transfers Out (969,610) (972,945) (221,666) (222,896) (319,683)
Change in Net Position 6,848.473 9,632,547 6,037,689 6,130,290 2,406,640 Total Net Position · Beginning 67,986,702 58,354,155 40,316,341 34,186,051 23,218,776 Total Net Position · Ending $ 74,835,176 $ 67,986,702 s 46,354,030 s 40,316,341 s 25,625,416
The notes to the financial statements are an integral part of this statement
-46-
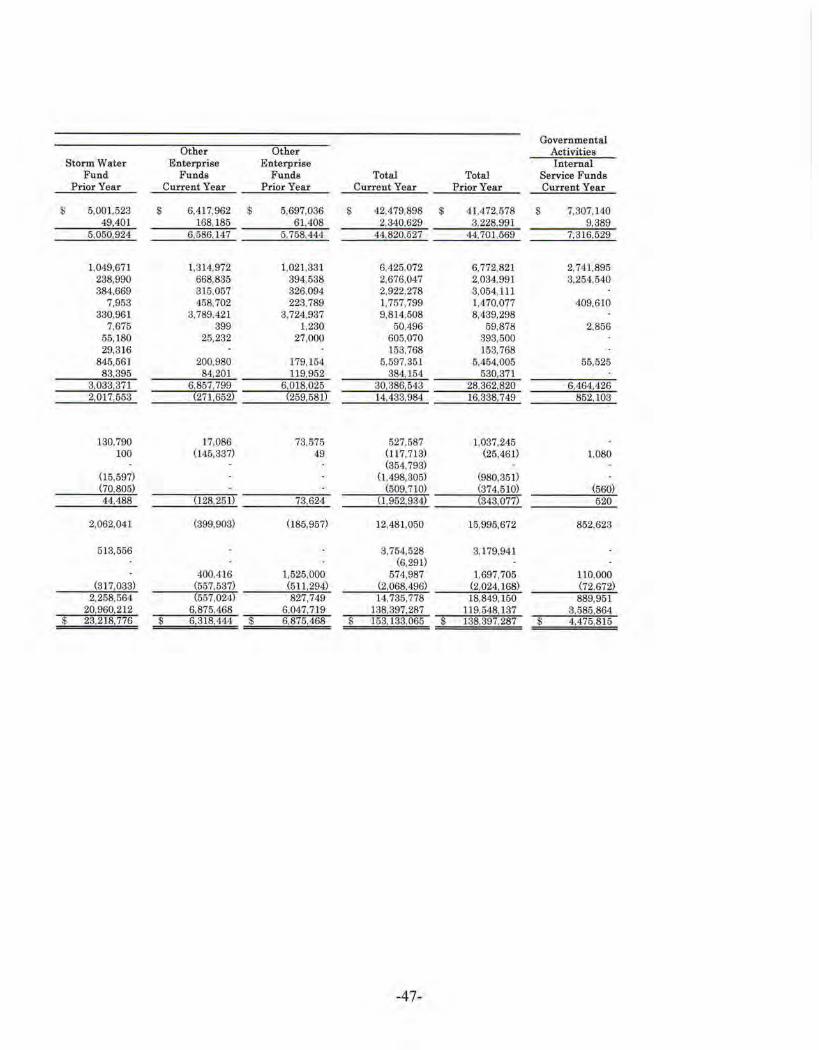
Governmental Other Other Activities
Storm Water Enterprise Enterprise Internal Fund Funds Funds Total Total Service Funds
Prior Year Current Year Prior Year Current Year Prior Year Current Year
$ 5,001,523 $ 6,417,962 $ 5,697,036 $ 42,479,898 $ 41.472,578 $ 7,307, 140 49,401 168,185 61408 2 340,629 3,228,991 9,389
5,050,924 6,586,147 5,758,444 44,820,627 44,701,569 7,316,529
1,049,671 1,314,972 1,021,331 6.425,072 6,772,821 2,741,895 238,990 668,835 394,538 2,676,047 2,034,991 3,254,540 384,669 315,057 326,094 2,922,278 3,054,111
7,953 458,702 223,789 1,757,799 1,470,077 409,610 330,961 3,789.421 3,724,937 9,814,508 8,439,298
7,675 399 1,230 50,496 59,878 2,856 55,180 25,232 27,000 605,070 393,500 29,316 153.768 153,768
845,561 200,980 179.154 5,597,351 5,464,005 55,525 83,395 84,201 119,952 384 154 530,371
3,033,371 6,857,799 6,018,025 30,386,543 28.362,820 6 464,426 2,017 553 (271,652) (259,581) 14.433,984 16.338 749 852,103
130,790 17,086 73.575 527,687 1,037,245 100 (145,337) 49 (I 17,713) (26,461) 1,080
(354,793) (15,597) (1 ,498,305) (980,351) (70,805) (509,710) (374,510) (560) 44.488 (128,251) 73,624 (1.952,934) (343,077) 620
2,062,041 (399,903) (185,957) 12,481,050 15,995,672 852,623
513,556 3,754,528 3,179,941 (6,291)
400.416 1,525,000 574,987 1,697,705 110,000 (317,033) (557,537) (511,294) (2,068.496) (2,024,168) (72,672)
2.258,564 (657,024) 827,749 14,735.778 18,849,160 889,951 20,960,212 6,875.468 6,047,719 138,397,287 119,548,137 3.585,864
$ 23,218,776 $ 6,318,444 $ 6,875,468 $ 153,133,065 $ 138,397,287 $ 4, 475,815
-47-
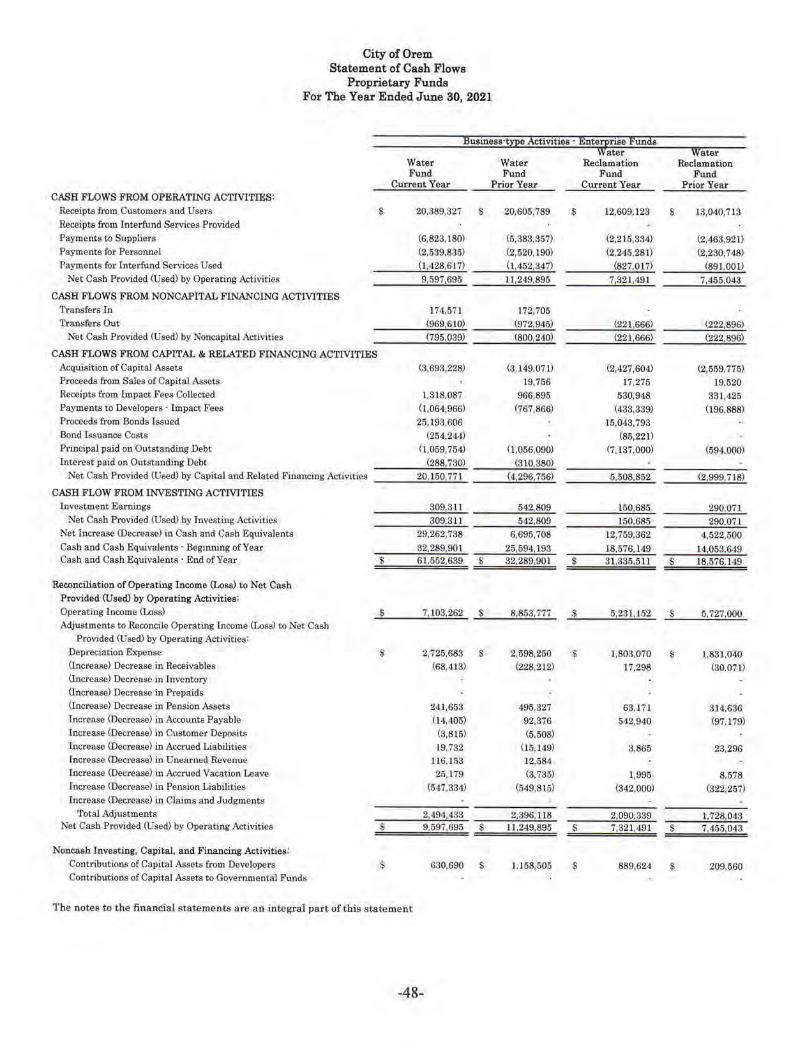
City of Orem Statement of Cash Flowe
Proprietary Funde For The Year Ended June 30, 2021
l!usiness·!lJ!e Actlvltles · ~ntw,rise i:'unila ater Water
Water Water Reclamation Reclamation Fund Fund Fund Fund
Current Year Prior Year Current Year Prior Year CASH FLOWS FROM OPERATING ACTIVITIES:
Receipts from Customers and Users $ 20,389,327 $ 20,605,789 s 12,609,123 s 13,040,713 Receipts from Interfund Services Provided Payments to Suppliers (6,823,180) (5,383,357) (2,215,334) (2,463,921) Payments for Personnel (2,589,835) (2,520, 190) (2,245,281) (2,230,748) Payments for Interfund Services Used (1,428,617) (1,452,347) (827,017) (891.001)
Net Cash Provided <used) by Operating Activities 9,597,695 11,249,895 7,321,491 7,455,048
CASH FLOWS FROM NONCAPITAL FINANCING ACTIVITIES Transfers In 171,571 172,705 Transfers Out (969,610) (972,945) 1.221,666) (222,896)
Net Cash Provided (Used) by Noncapital Activities (795,039) (800,240) (221,666) (222,896)
CASH FLOWS FROM CAPITAL & RELATED FINANCING ACTIVITIES Acquisition of Capital Assets (3,693,228) (3, 149,07 L) (2,427,604) (2,559,775) Proceeds from Sales of Capital Assets 19,756 17,275 19,520 Receipts from Impact Fees Collected 1,318,087 966,895 530,948 381,425 Payments to Developers · Impact Fees (1,064, 966) (767,866) (433,389) (196,888) Proceeds from Bonds Issued 25, 193,606 15,043,793 Bond Issuance Costs (254,244) (85,221) Principal paid on Outstanding Debt (1,059,754) 0,056,090) (7,137,000) (594,000) Interest paid on Out.standing Debt (288,780) (310,380)
Net Cash Provided (Used) by Capital and Related Financing Activities 20,160,771 (4,296,756) 5,508,852 (2,999,718)
CASH FLOW FROM INVESTING ACTIVITIES lnvestment Earnings 309,311 542,809 150,685 290,071
Net Cash Provided CUsed) by Investing Activities 309,311 542,809 150,685 290,071 Net Increase (Decrease) in Cash and Cash Equivalents 29,262,788 6,695,708 12,759,362 4,522,oOO Casb and Cash Equivalents· Beginning of Year 32,289,901 25.594,193 18,576, 149 14,053,649 Cash :uid Cash Equivalents· End of Year $ 61,552,639 $ 32,289,901 $ 31.,335,5 ll s 18,576,149
Reconciliation of Operating Income (Loss) to Net Ca11h Provided (Used) by Operating Activities: Operating Income (Loss) s 7,103,262 s 8,853,777 $ 5,281,152 $ 5,727,000 A(ljustmcnts to Reconcile Operating Income (Loss) to Net Cash
Provided msed) by Operatin_g Activities: Depreciation Expense 2,725,683 $ 2,598,250 $ 1,803,070 $ 1,831,040 (Increase) Decrease in Receivables (68,413) (228,212) 17,298 (30,071) (Increase) Decrease in Inventory Uncrease) Decrease in Prepaids Uncrease) Decrease in Pension Assets 241,653 495,327 63, I 71 314,636 Increase (Decrease) in Accounts Payable (14,405) 92,376 542,940 (97,179) Increase <Decrease) in Customer Deposits (13,815) (5,508) In,crease (Decrease) in Accrued Liabilities 19,732 (15,149) 3,865 23,296 Increase (Decrease) in Unearned Revenue 116,153 12,584 Increase (Decrease) in Accrued Vacation Leave 25,179 (3,735) 1,995 8,578 Increase (Decrease) in Pension Liabilities (547,334) (549,815) (342,000) (322,257) Increase (Decrease) in Claims and Judgments
Total A(ljustments 2,494,433 2,396,118 2.090,339 1,728,043 Net Cash Provided <Used) by Operating Activities $ 9,597,695 s 11,249,895 $ 7.321,491 s 7,455,043
Noncash Investing, Capital, and Financing Activities: Contributions of Capital Assets from Developers s 630,690 s l.158,505 $ 889,624 $ 209,560 Contributions of Capital Assets to Goverumental Funds
The notes to the financial statements are an integral part of this stateme nt
-48-
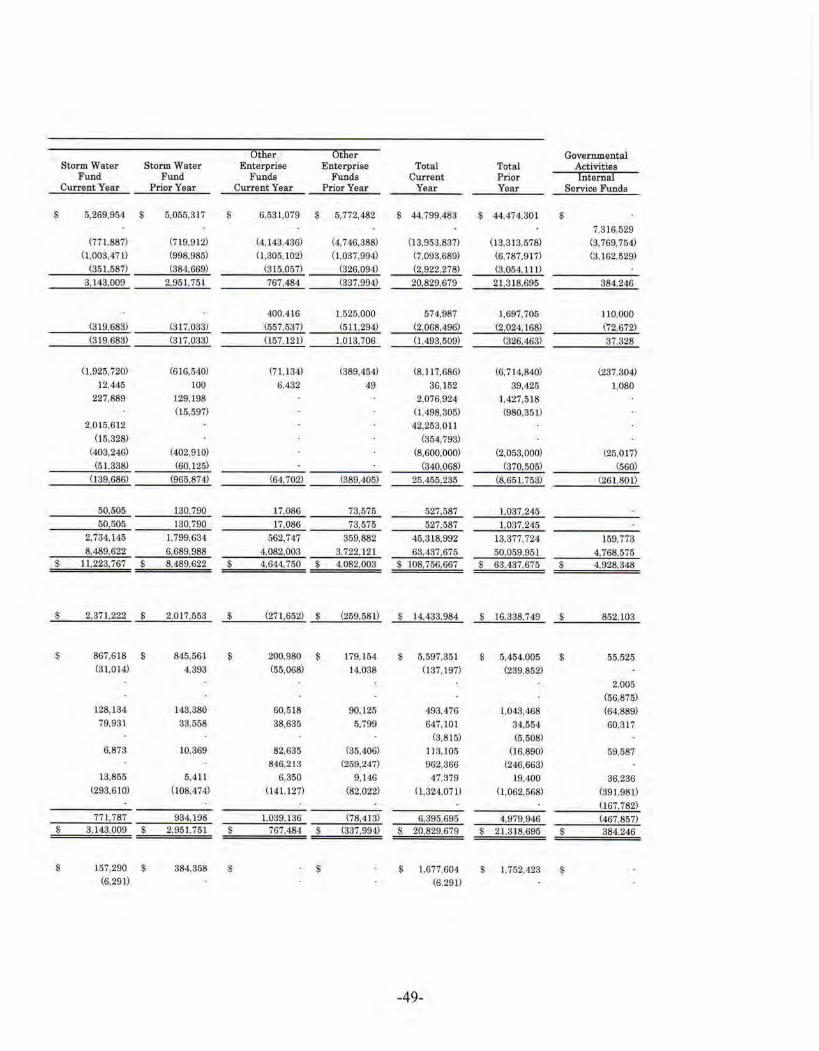
Other Other Governmental Storm Water Storm Water Enterprise Enterprise Total Total Activities
Fund Fund Funds Funds Current Prior Internal Current Year Prior Year Current Yea.r Prior Year Year Year Service Funds
$ 5,269,954 $ 5,055,317 $ 6,631,079 $ 5,772,482 s 44,799,483 $ 44,474,301 $
7,316,529 (771,887) (719,912) (4,143,436) (4,746,388) (13,953,837) (13,313,578) (3,769,754)
(1,003,47 t) (998,985) (1,305, 102) (1,037,994) (7,093,689) (6,787,917) (3, 162,529) (351,587) (384,669) (315,057) (326,094) (2,922,278) (3,054,111)
3,143,009 2,951,751 767,484 (337,994) 20,829,679 21.318,695 384,246
400,416 1,525,000 574,987 1,697,705 JJ0,000 (319,683) (317,033) (557,537) (511,294) (2,068,496) (2,024, 168) (72,672) (319,688) (317,033) (157,121) J.013.706 (I ,493,509) (326,463) 37.328
(I, 925,720) (616,540) (71,134) (389,454) (8,117,686) (6. 714,840) (237,304) 12,445 100 6,432 49 36,152 39,425 1,080
227,889 129,198 2,076,924 1,427,518 (15,597) (1,498,305) (980,351)
2,015,612 42,253,011 (15,328) (354,798)
(403,246) (402,910) (8,600,000) (2,053,000) (25,017) (51,338) (60,125) (340,068) (370,505) (560)
(139,686) (965,874) (64.702) (389,405) 25,455,235 (8,651,753) (261,801)
50.505 130,790 17,086 73,575 527,587 1,037,245 50 505 130,790 17,086 73,575 527,587 1,087,245
2,734,145 1,799,634 562,747 359,882 45,318,992 13,377,724 159,773 8.489,622 6,689.988 4,082,003 3,722, 121 63,437,675 50,059,951 4,768,575
$ 11,223,767 $ 8,489,622 $ 4,644,750 $ 4,082,003 $ 108,756,667 s 68,487,675 $ 4,928,348
$ 2,871,222 $ 2,017,553 $ (271,652) $ (259,581) $ 14,433.984 s 16,338,749 $ 852,103
s 867,618 $ 845,561 $ 200,980 $ 179,154 $ 5,597,351 $ 5,454,005 $ 55,525 (3 1,014) 4,393 (55,068) 14,088 (137, 197) (239,852)
2,005 (56,875)
128,134 143,380 60,5 18 90,125 493,476 1,048,468 (64,889) 79,931 33,558 38,635 5,799 647,101 34,554 60,317
(3,815) (5,508) 6,873 10,369 82.635 (35.406) 113,105 (16,890) 59,587
846,213 (259,247) 962,366 (246,663) 13,855 5,411 6,350 9,146 47,379 19,400 36,236
(298,610) (108,474) (141,127) (82,022) (1.324,071) (1,062.568) (391,981) (167,782)
77 1,787 934,198 1,039.136 (78,413) 6,395,695 4,979,946 (467,857) $ 3,143,009 $ 2,951,751 $ 767.484 $ (337,994) $ 20,829,679 s 21,318,695 $ 384,246
$ 157,290 $ 384,358 $ $ $ 1,677,604 $ 1.752,423 $ (6.291) (6,291)
-49-

(This page left blank intentionally)
-50-

NOTES TO THE
FINANCIAL STATEMENTS
City of Orem Notes to the Financial Statements
June 30, 2021
1. Summary of Significant Accounting Policies
A. Reporting Entity
The basic financial statements of the City of Orem (the City) have been prepared in conformity with accounting principles generally accepted in the United States of America (GAAP) as applicable to governmental units. The Governmental Accounting Standards Board (GASB) is the accepted standard· setting body for establishing accounting and financial reporting principles.
The City of Orem was incorpo1·ated in 1919 and covers apprnximately 18.66 square miles. The City operates under a Council-Manager form of government. As required by GAAP, the City and its component units (entities for which the City is conside1·ed to be financially accountable) present this Annual Comprehensive Financial Report (ACFR). The City is considered to be financially accountable for an organization if the City appoints a voting majority of the organization or there is a potential for the organization to provide specific financial benefits to or impose specific financial bui·dens on the City. The City is also considered to be financially accountable for an organization if the organization is fiscally dependent (i.e. , it is unable to adopt its budget, levy taxesi, set rates or charges, or issue bonded debt without approval from the City J.
The component units discussed below are included as part of the City's reporting entity as blended component units within its governmental funds.
• The Redevelopment Agency of the City of Orem (RDA) was established to prepare and carry out plans to improve, rehabilitate and redevelop project areas within the City. The RDA is governed by a board of trustees composed of the Mayor and members of the City Council. Although it is a legally separate entity from the City, the RDA is reported as if it were part of the primary government because of the City's ability to impose its will upon the operations of the RDA. The RDA is included in these financial statements as the Redevelopment Agency Special Revenue Fund. Separate financial statements are not issued for the RDA.
• The City of Orem Foundation is a nonprofit charitable foundation. The Internal Revenue Service (IRS) gave the City permission to fo1·m and operate the trust as an approved section 50Hc)3 charitable foundation. This enables donors broader charitable donation capabilities since all donations may be fully tax deductible. Although it is a legally separate entity from the City, the City of Orem Foundation is reported as if it were part of the primary government because of the City's ability to impose its will upon its operations, its board of directors is substantively the same as the City's, and all of its services are for the benefit of the City. It is included in these financial statements as the Orem Foundation Trust Special Revenue Fund. Separate financial statements are not issued for this entity.
-51-

City of Orem Notes to the Financial Statements
June 30, 2021
1. Summary of Significant Accounting Policies (continued)
A. Reporting Entity (continued)
The component unit discussed below is included as part of the City's reporting entity as a blended component unit within its proprietary funds.
• The Special Service Lighting District of the City of Orem (SSLD) was established to pui·chase, install, and maintain street lights, poles, and fixtures within the City. The SSLD collects fees to pay for the street lighting system and the electricity to operate it. The SSLD is governed by a board of directors composed of the Mayor and members of the City Council. Although a legally separate entity from the City, the SSLD is reported as if it were part of the primary government because of the City's ability to impose its will upon the operations of the SSLD. The SSLD is included in these financial statements as the Street Lighting Fund. Separate financial statements are not issued for the SSLD.
B. Government-wide and Fund Financial Statements
The government·wide financial statements (i.e. , the Statement of Net Position and the Statement of Activities) report information on all activities of the City and its component units. For the most part, the effect of interfund activity has been removed from these statements. Governmental activities, which normally are supported by taxes and intergovernmental revenues, are reported separately from business·type activities, which rely to a significant extent on fees and charges for support.
C. Measurement Focus, Basis of Accounting and Financial Statement Presentation
The statement of activities demonstrates the degree to which the direct expenses of a given function or segment is offset by program revenues. Direct expenses are those which are clearly identifiable with a specific function or segment. Program revenues include 1) charges to customers or applicants who pul"chase, use or directly benefit from goods, services or privileges provided by a given function 01· segment and 2) grants and contributions that are restricted to meeting the operational or capital requirements of a particul8.1· function or segment. Taxes and other items not properly included among program revenues are reported instead as general revenues.
Separate financial statements are provided for governmental funds and proprieta1-y funds. Major individual governmental and enterprise funds are reported as separate columns in the fund financial statements. The government-wide financial statements are reported using the economic resources measurement focus and the accrual basis of accounting, as are the proprietary fund financial statements. Revenues are recorded when earned and expenses are recorded when a liability is incurred, regardless of the timing of related cash flows. Property taxes are recognized as revenues in
-52-

City of Orem Notes to the Financial Statements
June 30, 2021
1. Summary of Significant Accounting Policies (continued)
C. Measurement Focus, Basis of Accounting and Financial Statement Presentation (continued)
the year for which they are levied. Grants and similar items ai·e recognized as revenue as soon as all eligibility requirements imposed by the provider have been met.
The use of financial resmuces to acqufre capital assets are capitalized as assets in the government-wide financial statements, 1·athe1· than reported as expenditures. Proceeds of long·term debt are recorded as liabilities in the government-wide financial statements, rather than an "other financing source''. Amounts paid to reduce long·term debt of the City are reported as a reduction of the related liability, rather than an expense in the government· wide financial statements.
Governmental fund financial statements are reported using the current financial resources measurement focus and the modified accrual basis of accounting. Revenues are recognized as soon as they are both measurable and available. Revenues ru·e considered to be available when they are collectible within the current period or soon enough thereafter (within sixty days) to pay liabilities of the current period. Expenditures generally are recorded when a liability is incurred, as under accrual accounting. However, debt-service expenditures, as well as expenditures related to compensated absences and claims and judgments, are recorded only when payment is due.
Sales and use taxes, franchise taxes, and earned but unreimbursed state, federal, and other grants associated with the current fiscal pe1·iod are all considered to be susceptible to accrual and therefore have been recognized as revenues of the current fiscal period. Property taxes are measurable as of the date levied (assessed) and are recognized as revenues when they become available. Available means when due, or past due, and received within the current period or collected soon enough the1·eafter to be used to pay liabilities of the current period. All other revenues are considered to be measurable and available only when the City receives cash.
The City reports the following major governmental funds:
• The General Fund is the government's primary operating fund. It accounts for all financial resources of the general government, except for those 1·equired to be accounted for in another fund.
• The Debt Service Fund is used to account for a ll general obligation debt of the City of Orem. Operating transfers are made from the General Fund to service the debt payments made by this fund. The source of fund 1·evenue for retiring the general obligation debt is principally the power of the City to levy general property tax; however, certain debt is serviced by sales tax revenues.
-53-
City of Orem Notes to the Financial Statements
June 30, 2021
1. Summary of Significant Accounting Policies (continued)
C. Measurement Focus, Basis of Accounting and Financial Statement Presentation (continued)
• The Capital Projects Fund is used to account for the acquisition or construction of majo1· capital facilities and equipment of the City of Orem (other than those financed by proprietary funds) as well as the use of resources for the improvement, rehabilitation, or const1·uction of roads (including sidewalks and intersections) and parks.
• The 2019 G.O. Bonds Capital Projects Fund is used to account for the expendit ure of gene1·al obligation bond funds for the con struction of two new city facilities (Libra1·y Hall and Fitness Center) and associated equipment of the City of Orem.
The City reports the following major proprietary funds=
• The Water Fund accounts for the activities of the City's water production, treatment, and distribution operations.
• The Water Reclamation Fund accounts fo1· the City's sewer collection, treatment, and maintenance operations.
• The Storm Water Fund accounts for t he operation and maintenance of the City's storm water system.
The City reports the following internal service funds:
• The Self-insurance Fund accounts for the insurance activities of the vaTious funds thToughout the City.
• The Fleet Maintenance Fund accounts for the costs of operating and maintaining vehicles and equip ment owned by the City.
• The Purchasing/Warehousing Fund accounts for the centralized purchasing and warehousing operations of the City.
• The Jnforma tion Technology Fund accounts for the technological needs of t he City primarily related to computers, networks, serve1·s, software programs, and phones.
• The Facilities Maintenance Fund accounts for the costs of operating, repairing, and maintaining City owned facilit ies.
The effect of interfund activity has, generally, been eliminated from the government-wide financial statements. Exceptions to t his are payments to the General Fund by various enterprise funds for providing administrative and billing services. Elimination of these charges would distort the direct costs and program revenues reported for the various functions concerned.
Proprietary funds distinguish operating revenues and expenses from non· operating items. Operating Tevenues and expenses generally result from providing services and producing and delivering goods in connection with a
-54-

City of Orem Notes to the Financial Statements
June 30, 2021
1. Summary of Significant Accounting Policies (continued)
C. Measurement Focus, Basis of Accounting and Financial Statement Presentation (continued)
proprietary fund's principal ongoing operations. The principal operating revenues of all enterprise funds are charges to customers fo1· sales and services.
Operating expenses for en terprise funds include the cost of sales and services, administrative expenses, and depreciation on capital assets. All revenues and expenses not meeting this definition are reported as non-operating revenues and expenses.
When both restricted and unrestricted resources are available for use, it is the City's policy to use restricted 1·esom·ces first, t hen unrestricted resources as they am needed.
D. Assets, Liabilities, Deferred Outflows/Inflows of Resources, and Net Position/Fund Balance
1. Cash and Cash Equivalents
Cash includes cash on hand, demand deposits with banks and othe1· financial institutions, and deposits in other types of accounts or cash management pools having the general characteristics of demand deposit accounts. City policy allows for the investment of funds in the following types of investments (in compliance with the State of Utah's Money Management Act):
• Time certificates of deposit with federally insured depositories.
• Investment in the Utah Public Treasw·er's Investment Fund (PTIF).
• Open·end managed money market mutual funds. • Qualified repurchase agreements with qualified
depositories, certified dealers, or certified deposito1·ies. • Other investments allowed by the State of Utah's Money
Management Act.
Investments are reported at fair value in accordance with GASB Statement No. 72, Fair Value Measurement and Application. The Utah Public Treasurer's Investment Fund (PTIF), Zions Bank Institutional Liquidity Management Fund (ILM), and Moreton Asset Management Fund all operate in accordance with state laws and regulations.
Cash equivalents are defined as short·term, highly liquid investments readily convertible to known amounts of cash and so near matm·ity that they present insignificant risk of changes in value because of changes in interest rates. Investments with maturities of three months or less when pm·chased meet this definition.
-55-
City of Orem Notes to the Financial Statements
June 30, 2021
1. Summary of Significant Accounting Policies (continued)
D. Assets, Liabilities, Deferred Outflows/Inflows of Resources, and Net Position/Fund Balance (continued)
2. Receivables and Payables
Activities between funds that are rep1·esentative of lending/borrowing arrangements outstanding at the end of the fiscal year are referred to as "due to" or "due from" other funds.
In the Water, Water Reclamation, Storm Water, Solid Waste, and Street Lighting funds, the City records utility revenues billed to customers on a monthly basis. Unbilled service accounts receivable at fiscal year-end have been accrued as revenues and receivables.
3. Inventories and Prepaid Items
Inventories of materials and supplies in the Pui·chasing/Warehousing internal service fund consist principally of materials used to repair the transmission, disti·ibution, collection and treatment systems of the City's proprietary type services. These inventories are valued at cost and accounted for on a first-in, first-out basis (FIFO). The inventory of materials and supplies are charged to both enterprise and governmental funds when they are used/consumed by the specific fund.
Certain payments to vendors reflect costs applicable to future accounting periods and are recorded as prepaid items, using the consumption method, in both government-wide and fund financial statements.
4. Restricted Assets
Restricted assets are primarily comprised of cash and receivables restricted for future payments of principal and interest on debt se1·vice, unexpended portions of bonds issued for capital construction pm·poses, and unexpended taxes and/or appropriations collected for very specific uses under state law.
5. Net Pension Assets
The Net Pension Assets of the City were determined by Utah Retirement Systems (URS) actuarial valuations and roll-forwards using gene1·ally accepted actuarial procedures and were based upon actual historical contributions and census data provided to URS. Net Pension Assets represent the net difference between assets of the plan and the actuarially determined liabilities.
-56-
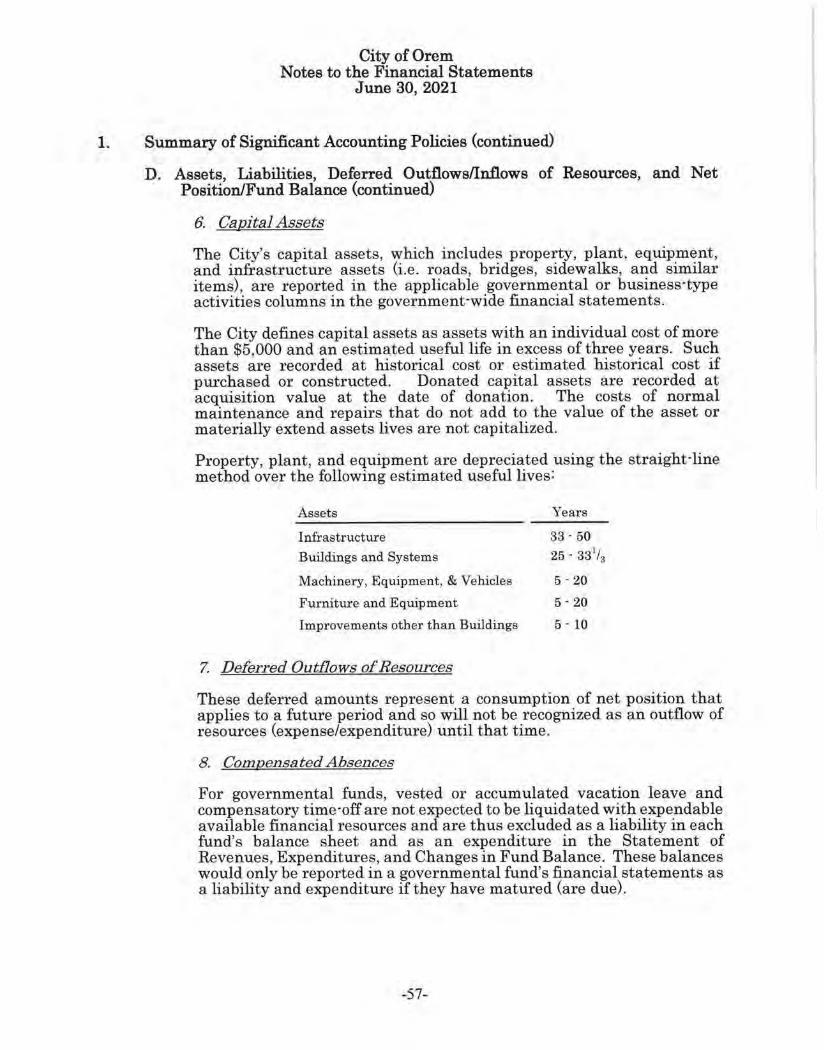
City of Orem Notes to the Financial Statements
June 30, 2021
1. Summary of Significant Accounting Policies (continued)
D. Assets, Liabilities, Deferred Outflows/Inflows of Resources, and Net Position/Fund Balance (continued)
6. Capital Assets
The City's capital assets, which includes prope1·ty, plant, equipment, and infrastructure assets (i.e. roads, bridges, sidewalks, and similar items), are reported in the applicable governmental or business·type activities columns in the government·wide financial statements.
The City defines capital assets as assets with an individual cost of more than $5,000 and an estimated useful life in excess of three years. Such assets are recorded at historical cost or estimated historical cost if purchased or constructed . Donated capital assets are r ecorded at acquisition value at the date of donation. The costs of normal maintenance and repairs that do not add to the value of the asset or materially extend assets lives are not capitalized.
Property, plant , and equipment are depreciated using the straight·line method over the following estimated useful lives:
Assets
Infrastructure
Buildings and Systems
Machinery, Equipment, & Vehicles
Furniture and Equipment
Improvements other than Buildings
7. Deferred Outflows of Resources
Years
33 · 50
25 . 331/3
5 · 20
5 · 20
5 · 10
These deferred amounts represent a consumption of net position that applies to a futm·e period and so will not be recognized as an outflow of resources (expense/expenditure) until that time.
8. Compensated Absences
For governmental funds, vested 01· accumulated vacation leave and compensatory time·off a re not expected to be liquidated with expendable available financial resources and are thus excluded as a liability in each fund's balance sheet and as an expenditure in the Statement of Revenues, Expenditures, and Changes in Fund Balance. These balances would only be reported in a governmental fund's financial statements as a liability and expenditure if they have matured (are due).
-57-

City of Orem Notes to the Financial Statements
June 30, 2021
1. Summary of Significant Accounting Policies (continued)
D. Assets, Liabilities, Deferred Outflows/Inflows of Resources, and Net Position/Fund Balance (continued)
8. Compensated Absences (continued)
For proprietary funds, vested or accumulated vacation leave and compensatory time-off is recorded as an expense and a liability of those funds as the benefits accrue to the employees.
The government-wide financial statements reflect the entire amount of vested and/or accumulated vacation leave and compensatory time·off for all governmental and proprietary funds and are thus recorded as a liability in the Statement of Net Position and as an expense in the Statement of Activities.
Employees are limited to two years of accumulated vacation leave. Employees earn twelve days of sick leave per year. While sick leave may be accumulated without limitation, no benefits accrue to the employees. Therefore, no liability exists and the costs of accumulated sick leave are charged to expenditures only when used.
9. Pensions
For pui·poses of measuring the net pension liability, deferred outflows of 1·esources and deferred inflows of resources related to pensions, and pension expense, information about the fiduciary net position of the Utah Retirement Systems (URS) Pension Plan and additions to/deductions from URS's fiduciary net position have been determined on the same basis as they are 1·eported by URS. For this purpose, benefit payments (including refunds of employee conti·ibutions) are recognized when due and payable in accordance with the benefit terms. Investments are reported at fair value.
10. Long-term Obligations
In the government-wide and proprietary fund financial statements, long-term debt, net pension liabilities, and other long-term obligations are reported as liabilities in the applicable governmental activities, business-type activities, or proprietary fund type Statement of Net Position. Bond premiums, discounts, and losses on bond refundings are deferred and amortized over the life of the applicable debt. In the fund financial statements, governmental fund types recognize bond premiums and discounts dU1·ing the cunent period. The face amount of debt issued is reported as othe1· financing sources while discounts on debt issuances are reported as other financing uses. Bond issuance costs, whether or not withheld from the actual debt proceeds rnceived, are reported as debt service expenditui·es.
-58-
City of Orem Notes to the Financial Statements
June 30, 2021
1. Summary of Significant Accounting Policies (continued)
D. Assets, Liabilities, Deferred Outflows/Inflows of Resources, and Net Position/Fund Balance (continued)
11. Deferred Inflows of Resources
These deferred amounts represent an acquisition of net position that applies to a future period and so will not be recognized as an inflow of r esources (revenue) unt il that time.
12.Fund Balance/ N et Position
Fund Balance In the governmental fund financial st atements, classifications comprising a hiera1·chy based p rimarily on the extent to which the City is bound to honor constraints on the specific purposes for which amounts in these funds can be spent.
Net Position In the government-wide and p roprietary fund financial statements, classifications are based upon the accessibility of the underlying resom·ces. Restricted items, while generally expendable, ar e legally restricted by outside parties for a specific purpose.
13. Contributions from Developers
Contributions from developers in the proprietary fund financial statements a1·ise from outside contributions of capital assets, OT from gran ts or outside contribut ions of resources restricted to capital acquisit ion and construction .
E. Estimates and Assumptions
The preparation of financial statements in conformity with generally accepted accounting principles requires management to make estimates a nd assumptions affecting the t·eported amounts of assets and liabilities and disclosure of contingent assets and liabilities at the date of t he financial statements and the reported amounts of rnvenues, expenditures and expenses during the 1·eporting period. Actual results could differ from those estimates.
2. Reconciliation of Government-wide and Fund Financial Statements
A. Explanation of certain differences between the Governmental Fund Balance Sheet and the Government-wide Statement of Net Position
The governmental fund balance sheet includes a reconciliation between total governmental fund balances and net posi tion of governmental activities as reported in the government -wide Statemen t of Net Position . This difference
-59-
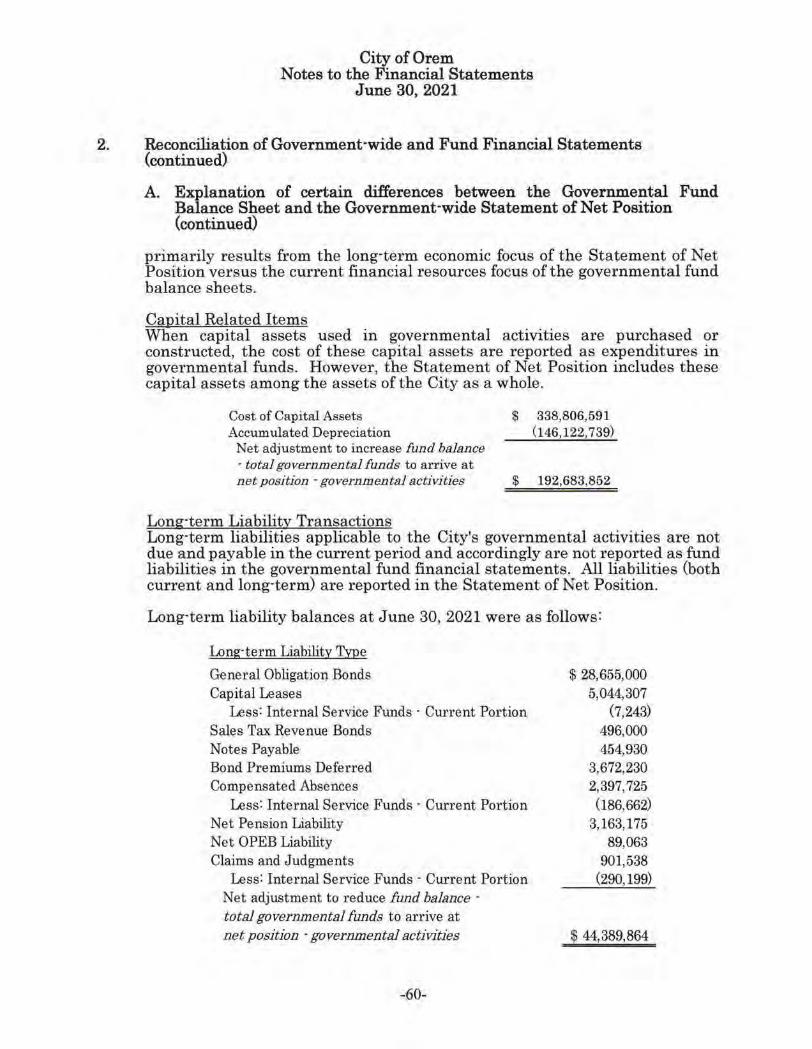
City of Orem Notes to the Financial Statements
June 30, 2021
2. Reconciliation of Government-wide and Fund Financial Statements (continued)
A. Explanation of certain differences between the Governmental Fund Balance Sheet and the Government-wide Statement of Net Position (continued)
primarily results from the long-term economic focus of the Statement of Net Position versus the current financial resources focus of the governmental fund balance sheets.
Capital Related Items When capital assets used in governmental activities are pm·chased or constructed, the cost of these capital assets are reported as expenditm·es in governmental funds. However, the Statement of Net Position includes these capital assets among the assets of the City as a whole.
Cost of Capital Assets Accumulated Depreciation
$ 338,806,591 (146,122,739)
Net adjustment to increase fund balance · total gove1·nmentsl funds to arrive at net p osition • governmental activities $ 192,683,852
Long·term Liability Transactions Long·term liabilities applicable to the City's governmental activit ies are not due and payable in the current pedod and accordingly are not reported as fund liabilities in the governmental fund financial statements. All liabilities (both current and long·term) are 1·eported in the Statement of Net Position.
Long·term liability balances at June 30, 2021 were as follows:
Long·term Liability Type
General Obligation Bonds Capital uiases
Less: Internal Service Funds · Current Portion Sales Tax Revenue Bonds Notes Payable Bond Premiums Deferred Compensated Absences
Less: Internal Service Funds· Current Portion Net Pension Liability Net OPEB Liability Claims and Judgments
uiss: Internal Service Funds · Current Portion Net adjustment to reduce fund balance · total governmental funds to arrive at net position · governmental activi_ties
-60-
$ 28,655,000 5,044,307
(7,243) 496,000 454,930
3,672,230 2,397,725
(186,662) 3,163, 175
89,063 901,538
(290,199)
$ 44,389,864
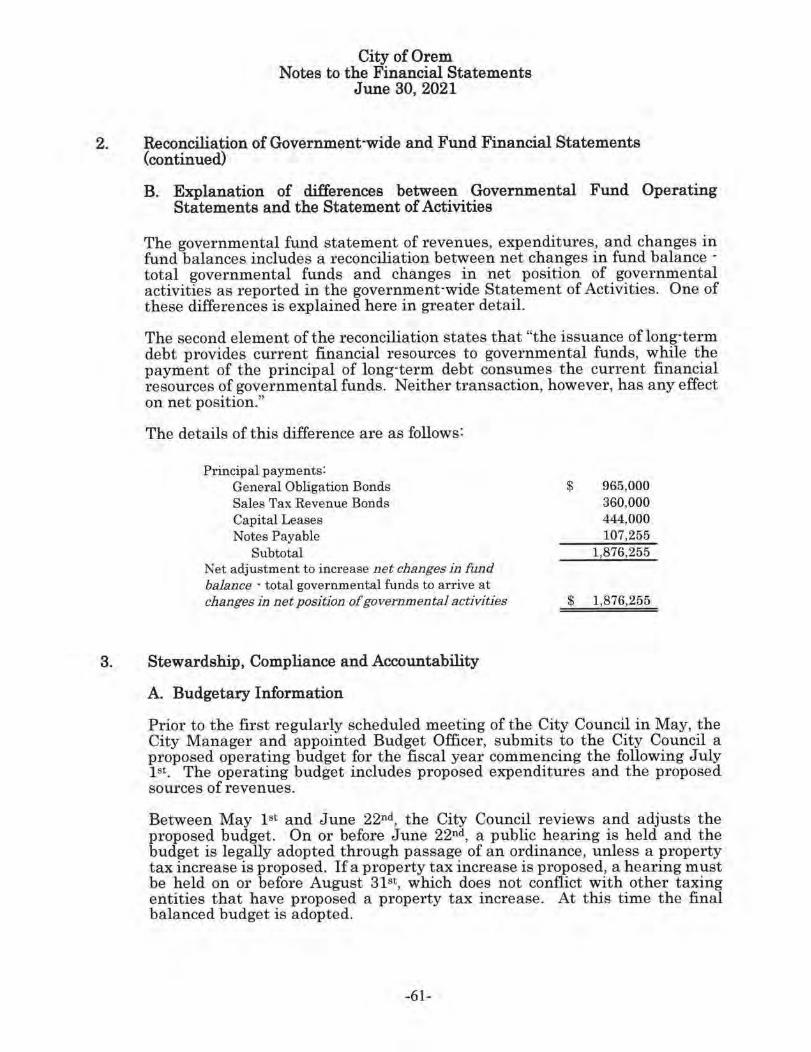
City of Orem Notes to the Financial Statements
June 30, 2021
2. Reconciliation of Government-wide and Fund Financial Statements (continued)
B. Explanation of differences between Governmental Fund Operating Statements and the Statement of Activities
The governmental fund statement of revenues, expenditures, and changes in fund balances includes a reconciliation between net changes in fund balance · total governmental funds and changes in net position of governmental activities as reported in the government-wide Statement of Activities. One of these differences is explained here in greater detail.
The second element of the 1·econciliation states that "the issuance of long·term debt provides current financial resources to governmental funds, while the payment of the principal of long·term debt consumes the current financial resources of governmental funds. Neither transaction, however, has any effect on net position."
The details of this difference are as follows:
Principal payments: General Obligation Bonds Sales Tax Revenue Bonds Capital Leases Notes Payable
Subtotal Net adjustment to increase net changes in fund balance · total governmental funds to anive at changes in net position of govfil:n.mental activities
3. Stewardship, Compliance and Accountability
A. Budgetary Information
$ 965,000 360,000 444,000 107,255
1,876,255
$ 1,876,255
Prior to the fu·st regularly scheduled meeting of the City Council in May, the City Manager and appointed Budget Officer, submits to the City Council a proposed operating budget for the fiscal year commencing the following July 1st. The operating budget includes proposed expenditures and the proposed sources of revenues.
Between May 1st and June 22nd, the City Council reviews and adjusts the proposed budget. On or before June 22°d, a public hearing is held and the budget is legally adopted through passage of an ordinance, unless a property tax increase is proposed. If a property tax increase is proposed, a hearing must be held on or before August 31st, which does not conflict with other taxing entities that have proposed a property tax increase. At this time the final balanced budget is adopted.
-61-
City of Orem Notes to the Financial Statements
June 30, 2021
3. Stewardship, Compliance and Accountability (continued)
A. Budgetary Information (continued)
The City Manager, in conjunction with the Budget Officer and the appropriate department head, has the budget authority to transfer budget appropriations within and between any divisions of any budgetary fund. However, the "fund level" is the legal level of control and the City Manager must obtain apprnval from the City Council to increase 1·evenues or expenditures for any fund.
An individual department is composed of several divisions. Budget transfers may be made between divisions within a fund as long as they ai·e in the same department. However, they may not transfer from one fund to another fund without City Council approval.
The City Council (administratms of the legal level of control), by resolution, have the authority to transfe1· budget appropriations between individual budgetary funds. A public hearing must be held to increase the total appropriations of any one governmental fund type; however, after the original public hearing, operating and capital budgets of proprietary fund types may be increased by resolution without an additional hearing.
Annual budgets for the General Fund, all Special Revenue Funds, Debt Se1·vice Funds, and Capital Projects Funds were legally adopted by the City and are prepared on the modified·accrual method of accounting. Although Utah State law requires the initial preparation of budgets for all City funds (both governmental and proprietary), it only requires the reporting of actual versus such budgets for governmental funds.
Tax Revenues Property taxes are collected by the Utah County Treasurer and remitted to the City in two to three installments in Decembe1·, Januai·y, and a final settlement generally in March of the new calendai· year. Taxes are levied and arn due and payable on November 1st and delinquent after November 30th of each year at which time they become liens if not paid. An accrual of uncollected current and prior year's property taxes beyond those received within 60 days after the fiscal year end has not been made, as the amounts are not deemed to be material.
Sales taxes are collected by the Utah State Tax Commission and remitted to the City monthly. An accrual has been made for all taxes received by the State for the period ended June 30 and thus are due and payable to the City.
Franchise taxes are chal'ged to various utility companies doing business within the City including telephone, cable television, gas utility, and electric utility companies. The fees are remitted on a monthly, quarterly, or annual basis. All fees due and payable to the City at June 30 have been accrued.
-62-

City of Orem Notes to the Financial Statements
June 30, 2021
4. Detailed Notes for all Funds
A. Deposits and Investments
The City's deposit and investment activities are governed by the Utah Money Management Act (Utah Code, Title 51, Chapter 7). The State of Utah Money Management Council has the responsibility to advise the Utah State Treasu1·er about investment policies, promote measures and rules that will assist in strengthening the banking and credit structure of the State of Utah, and review the rules adopted unde1· the authority of the Utah Money Management Act that relate to the deposit and investment of public funds .
The Money Management Act requires deposits be in a qualified depository. The Act defines a qualified depository as any financial institution whose deposits are insured by an agency of the federal government and which has been certified by the State Commissioner of Financial Institutions as meeting the requirements of the Act and adhering to the rules of the Utah Money Management Council.
Deposits The City's deposits (including cash on hand) at June 30, 2021, ru·e as follows:
Cash on Hand & On Deposit
Cash on Hand Cash on Deposit · Checking Cash on Deposit· Payroll
Total Cash on Hand & On Deposit
Custodial Credit Risk
Fair Value
$ 34,005 16,123,959
975,967 $ 17,133,931
The custodial credit risk for deposits is the risk that in the event of a bank failure, the City's deposits may not be recovered. Deposits in the bank in excess of the insured amount are uninsured and uncollateralized. Deposits are not collateralized nor are they requirnd to be by state statute. The City has no formal policy regarding custodial credit risk for these deposits. As of June 30, 2021, $17,239,894 of the City's bank balance of $18,429,608 is exposed to custodial credit risk as uninsm·ed and uncollateralized. The carrying amount of the deposits at June 30, 2021, is $17,133,931.
Investments The Money Management Act defines the types of securities au thorized as appropriate investments and the conditions for making investment transactions. Investment transactions may be conducted only thl'Ough qualified depositories, certified dealers, or directly with issuets of investment securities.
The Act authorizes investments in both negotiable and non-negotiable deposits of qualified depositories and permitted negotiable deposit01·ies;
-63-
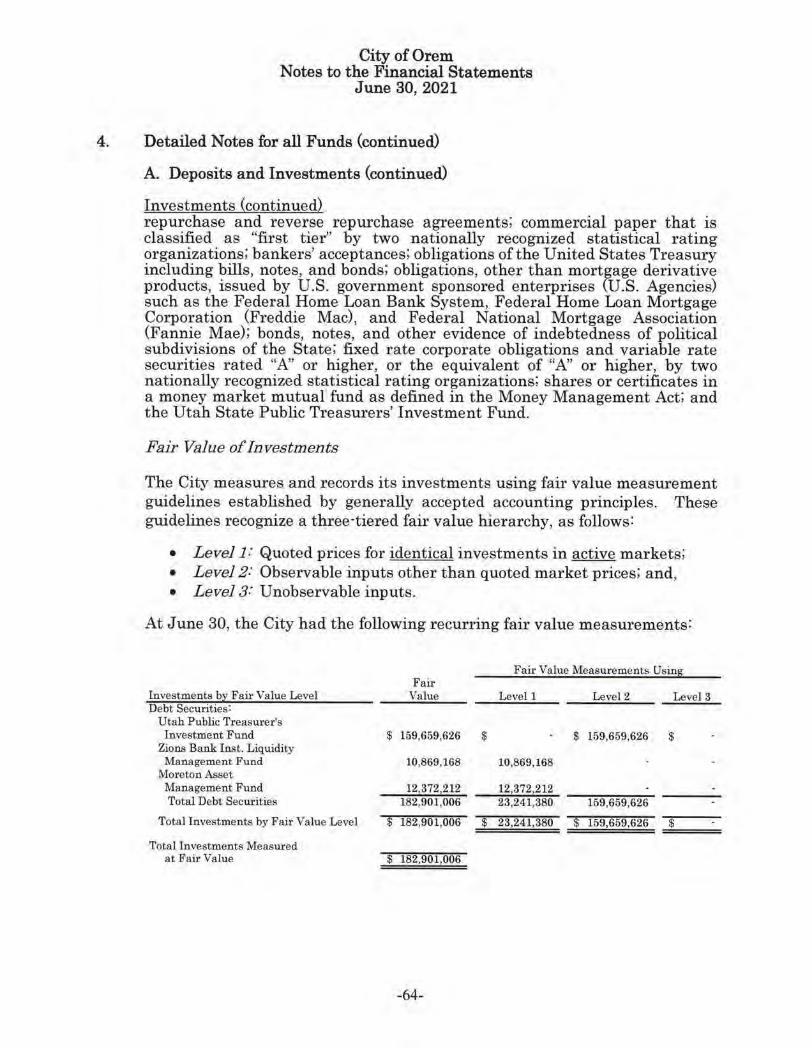
City of Orem Notes to the Financial Statements
June 30, 2021
4. Detailed Notes for all Funds (continued)
A. Deposits and Investments (continued)
Investments (continued) repurchase and reverse repurchase agreements; commercial paper that is classified as "first ti01·1' by two n ationally recognized statistical rating organizations; bankers' acceptances; obligations of the United States Treasury including bills, notes, and bonds; obligations, other than mortgage de1·ivative products, issued by U.S. government sponsored enterprises (U.S. Agencies) such as the Federal Home Loan Bank System, Federal Home Loan Mortgage Corporation (Freddie Mac), and Federal National Mortgage Association (Fannie Mae); bonds, notes, and othe1· evidence of indebtedness of political subdivisions of the State; fixed rate corporate obligations and variable rate securities rated ".A:' or higher, or the equivalent of "A" or higher, by two nationally recognized statistical rating organizations; shares or certificates in a money market mutual fund as defined in the Money Management Act; and the Utah State Public Treasurers' Investment Fund.
Fair Value of Investments
The City measm·es and records its investments using fair value measurement guidelines established by generally accepted accounting principles. These guidelines recognize a three-tiered fair value hieraTchy, as follows:
• Level 1: Quoted prices for identical investments in active markets; • Level 2: Observable inputs other than quoted market prices; and, • Level 3: Unobservable inputs.
At June 30, the City had the following recurring fair value measurements:
Fair Fair Value Measurements Using:
Investments bl Fair Value Level Debt Securities:
Value Level I Level 2 Level 3
Utah Public Treasurer's Investment Fund $ 159,659.626 $ $ 159,659,626 $
Zions Bank Inst. Liquidity Management Fund 10,869,168 10,869,168
Moreton Asset Management Fund 12,372,212 12,3721212 Total Debt Securities 182,901,006 23,241,380 159,659,626
Total Investments by Fair Value Level $ 182,901,006 $ 23,241,380 $ 159,659,626 $
Total Investments Measured at Fair Value $ 182,901,006
-64-
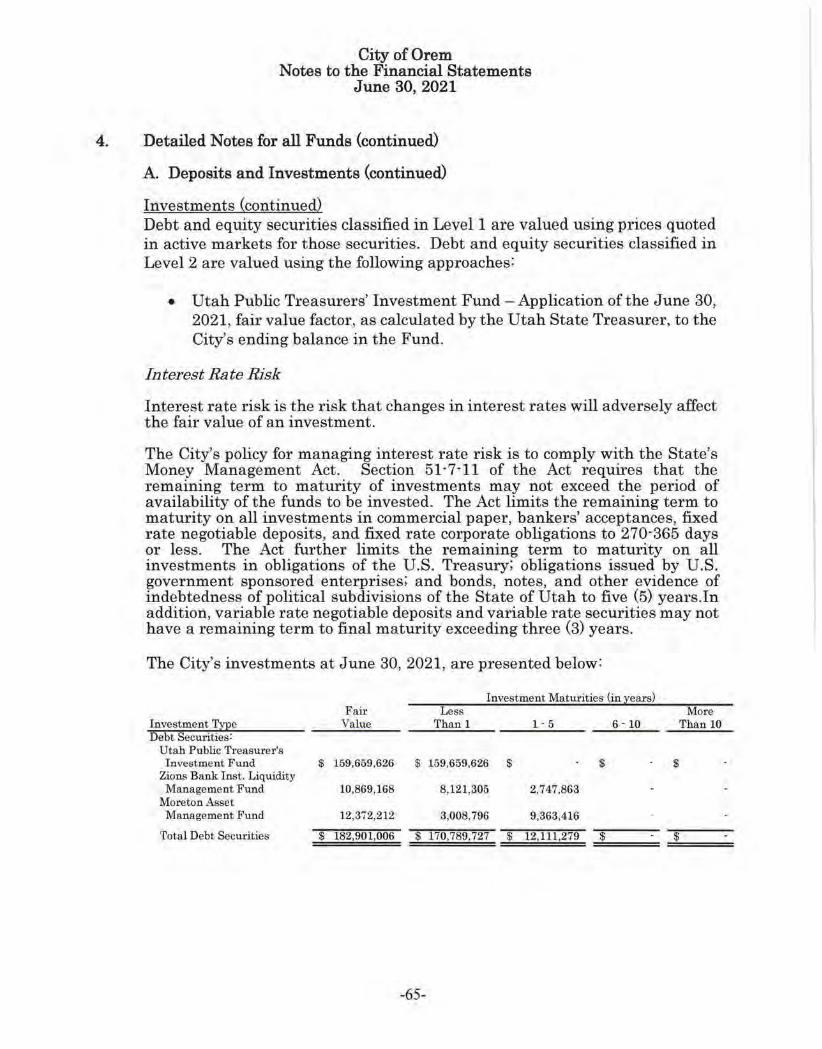
City of Orem Notes to the Financial Statements
June 30, 2021
4. Detailed Notes for all Funds (continued)
A. Deposits and Investments (continued)
Investments (continued) Debt and equity securities classified in Level 1 are valued using prices quoted in active markets for those securities. Debt and equity securities classified in Level 2 are valued using the following approaches:
• Utah Public Treasurers' Investment Fund -Application of the June 30, 2021, fair value factor, as calculated by the Utah State Treasurer, to the City's ending balance in the Fund.
Interest Rate Risk
Interest rate risk is the risk that changes in interest rates will adversely affect the fair value of an investment.
The City's policy for managing interest rate risk is to comply with the State's Money Management Act. Section 51·7·11 of the Act requires that the remaining term to maturity of investments may not exceed the period of availability of the funds to be invested. The Act limits the remaining term to maturity on all investments in commercial paper, bankers' acceptances, fixed rate negotiable deposits, and fixed rate corporate obligations to 270·365 days or less. The Act further limits the remaining term to matuTity on all investments in obligations of the U.S. Treasury; obligations issued by U.S. government sponsored enterprises; and bonds, notes, and other evidence of indebtedness of political subdivisions of the State of Utah to five (5) years.In addition, variable rate negotiable deposits and variable rate securities may not have a remaining term to final matm·ity exceeding three (3) years.
The City's investments at June 30, 2021, are presented below:
Investment Maturities (in years) Fair Less More
Investment T~e Debt Securities:
Value Than l 1 · 5 6 · 10 Than 10
Utah Public Treasurer's Investment Fund $ 159,659,626 $ 159,659,626 $ $ $
Zions Bank Inst. Liquidity Management Fund 10,869,168 8,121,305 2,747,863
Moreton Asset Management Fund 12,372,212 3,008,796 9,363,416
Total Debt Securities $ 182,901,006 $ 170,789, 727 $ 12,111,279 $ $
-65-
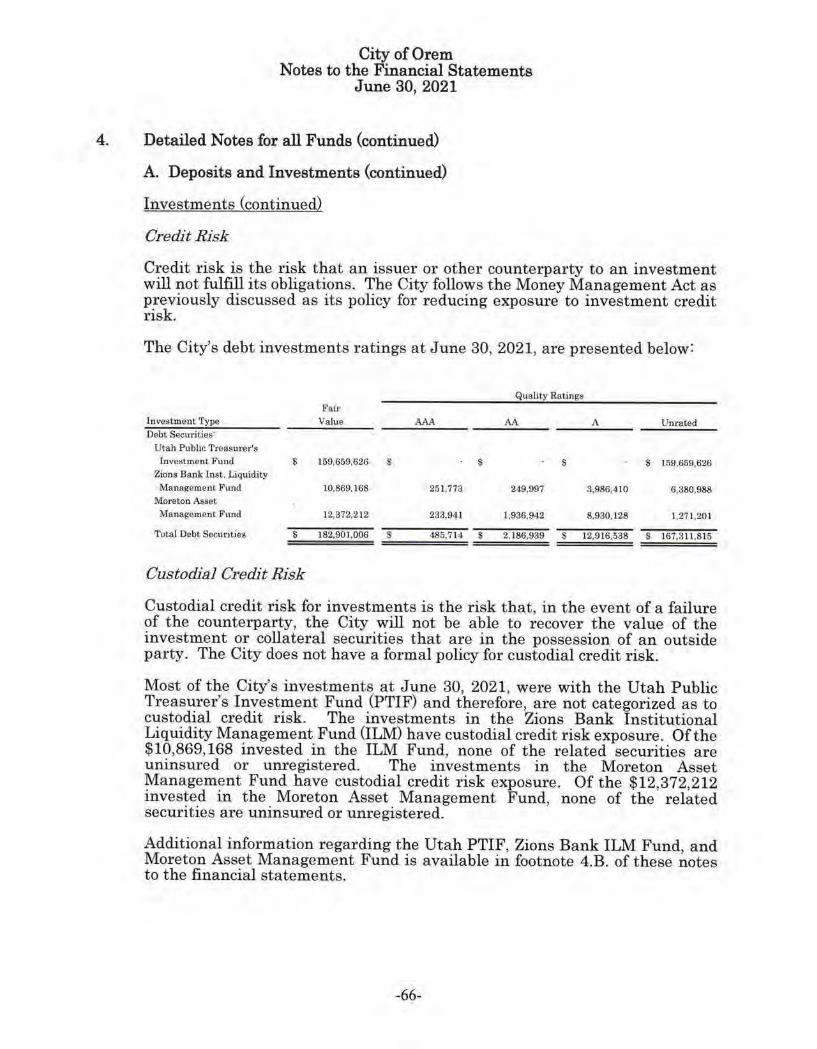
City of Orem Notes to the Financial Statements
June 30, 2021
4. Detailed Notes for all Funds (continued)
A. Deposits and Investments (continued)
Investments (continued)
Credit Risk
Credit risk is the risk that an issuer 01· other counterparty to an investment will not fulfil} its obligations . The City follows the Money Management Act as previously discussed as its policy for reducing exposure to investment credit risk.
The City's debt investments ratings at June 30, 2021, are presented below:
Quality Ratings Fair
In vestment Type Value MA AA A Unrated Debt Securities'
Utah Public Treasurer's Investment Fund $ 159.659.626 $ $ s $ 159,659,626
Zions Bank Inst. Liquidity Management Fund 10,869,168 251,773 Z.19,997 3,986,410 6,380,988
Moreton Asset Management Fund 12,372,2 12 233,941 1,936,942 8,930,128 1,271.201
Total Debt Securities s 182,901.006 $ 485,714 $ 2,186,939 $ 12,9 16,538 s 167,311.815
Custodial Credit Risk
Custodial credit risk for investments is the risk that, in the event of a failure of the counterparty, the City will not be able to recover the value of the investment or collateral securities that are in the possession of an outside party. The City does not have a formal policy for custodial credit risk.
Most of the City's investments at June 30, 2021, were with the Utah Public Treasm·er's Investment Fund (PTIF) and therefore, are not categorized as to custodial credit risk. The investments in the Zions Bank Institutional Liquidity Management Fund (ILM) have custodial credit risk exposure. Of the $10,869,168 invested in the ILM Fund, none of the related securities are uninsured or um·egistered. The investments in the Moreton Asset Management Fund have custodial credit 1·isk exposure. Of the $12,372,212 invested in the Moreton Asset Management Fund, none of the related securit ies are uninsured or unregistered.
Additional information regarding t he Utah PTIF, Zions Bank ILM Fund, and Moreton Asset Management Fund is available in footnote 4.B. of these notes to the financial statements.
-66-
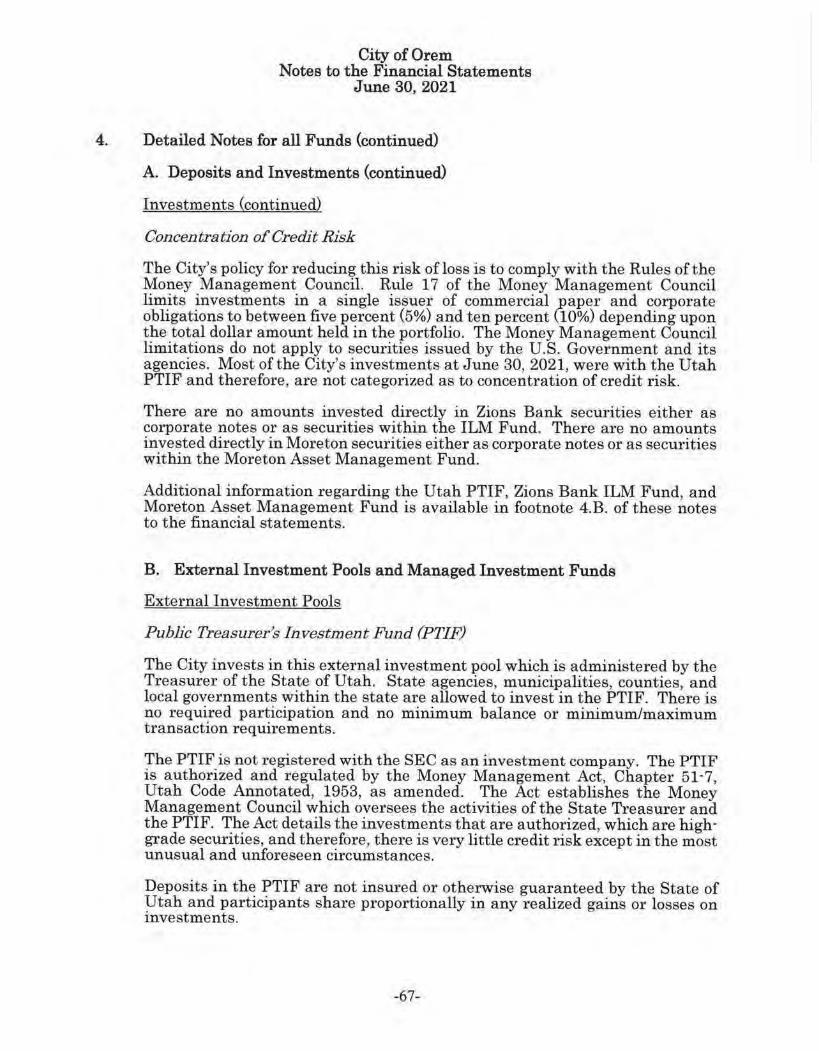
City of Orem Notes to the Financial Statements
June 30, 2021
4. Detailed Notes for all Funds (continued)
A. Deposits and Investments (continued)
Investments (continued)
Concentration of Credit Risk
The City's policy for reducing this risk of loss is to comply with the Rules of the Money Management Council. Rule 17 of the Money Management Council limits investments in a single issuer of commercial _paper and corporate obligations to between five percent (5%) and ten percent U0%) depending upon the total dollar amount held in the portfolio. The Money Management Council limitations do not apply to securities issued by the U.S. Government and its agencies. Most of the City's investments at June 30, 2021, were with the Utah PTIF and therefore, are not categorized as to concentration of credit 1·isk.
There are no amounts invested directly in Zions Bank securities either as corporate notes or as securities within the ILM Fund. There are no amounts invested directly in Moreton securities either as corporate notes or as securities within the Moreton Asset Management Fund.
Additional information regai·ding the Utah PTIF, Zions Bank ILM Fund, and Moreton Asset Management Fund is available in footnote 4.B. of these notes to the financial statements.
B. External Investment Pools and Managed Investment Funds
External Investment Pools
Public Treasure1·'s Investment Fund (PTJF)
The City invests in this extei-nal investment pool which is administered by the Treasurer of the State of Utah. State agencies, municipalities, counties, and local governments within the state ai·e allowed to invest in the PTIF. There is no required participation and no minimum balance or minimum/maximum transaction requirements.
The PTIF is not registered with the SEC as an investment company. The PTIF is authorized and regulated by the Money Management Act, Chapte1· 51 ·7, Utah Code Annotated, 1953, as amended. The Act establishes the Money Management Council which oversees the activities of the State Treasurer and the PTIF. The Act details the investments that are authorized, which are highgi·ade secm·ities, and therefore, there is very little credit risk except in the most unusual and unforeseen circumstances.
Deposits in the PTIF are not insured or otherwise guaranteed by the State of Utah and participants share pmportionally in any realized gains or losses on investments.
-67-

City of Orem Notes to the Financial Statements
June 30, 2021
4. Detailed Notes for all Funds (continued)
B. External Investment Pools and Managed Investment Funds (continued)
External Investment Pools (continued)
The PTIF allocates income and issues statements on a monthly basis. The PTIF operates and reports to participants on an amortized cost basis. The participants' balance is their investment deposited in the PTIF plus their share of income, gains and losses, net of administration fees, which are allocated to each participant on the ratio of each pru'ticipant's share to the total funds in the PTIF.
Twice a year, at June 30 and December 31, the investments are valued at fair value to enable participants to adjust thefr investments in this pool at fair value. The Bank of New York and the State of Utah sep. arately determine each security's fair value in accordance with GASB 31 (i.e. for almost all pool investments the quoted market price as of June 30, 2021) and then compare those values to come up with an agreed upon fair value of the securities.
As of June 30, 2021, the City had $159,126,177 invested in the PTIF which had a fair value of $159,659,626 for an uru·ealized gain of $533,449.
The following table shows statistical information about this investment pool:
Investment Type Corporate Bonds and Notes Money Market Accounts and Certificates of Deposit U.S. Government SectU·ities
Total
Managed Investment Funds
Investment Percentage
84.48 % 7.90 % 7.62 %
100.00 %
Zions Bank Institutional Liquidity Management Fund (ILM)
The City invests in this managed investment fund which is administered by the Investment Management and Capital Markets Division of Zions Bancorporation. The 1·equired minimum balance is $5,000,000. There are no minim um/maxim um transaction requfrements.
The ILM is not registered with the SEC as an investment company. The ILM is a registered investment advisor and is certified by the Utah Money Management Council. The Utah Money Management Act details the investments that are autho1·ized, which are high-grade securities, and therefo1·e, there is very little credit risk except in the most unusual and unforeseen circumstances.
Deposits in the ILM are not insured or otherwise guaranteed by Zions Bank. The ILM issues statements on a monthly basis. It operates and reports on an amortized cost basis. The ILM balance is the City's investment plus income
-68-
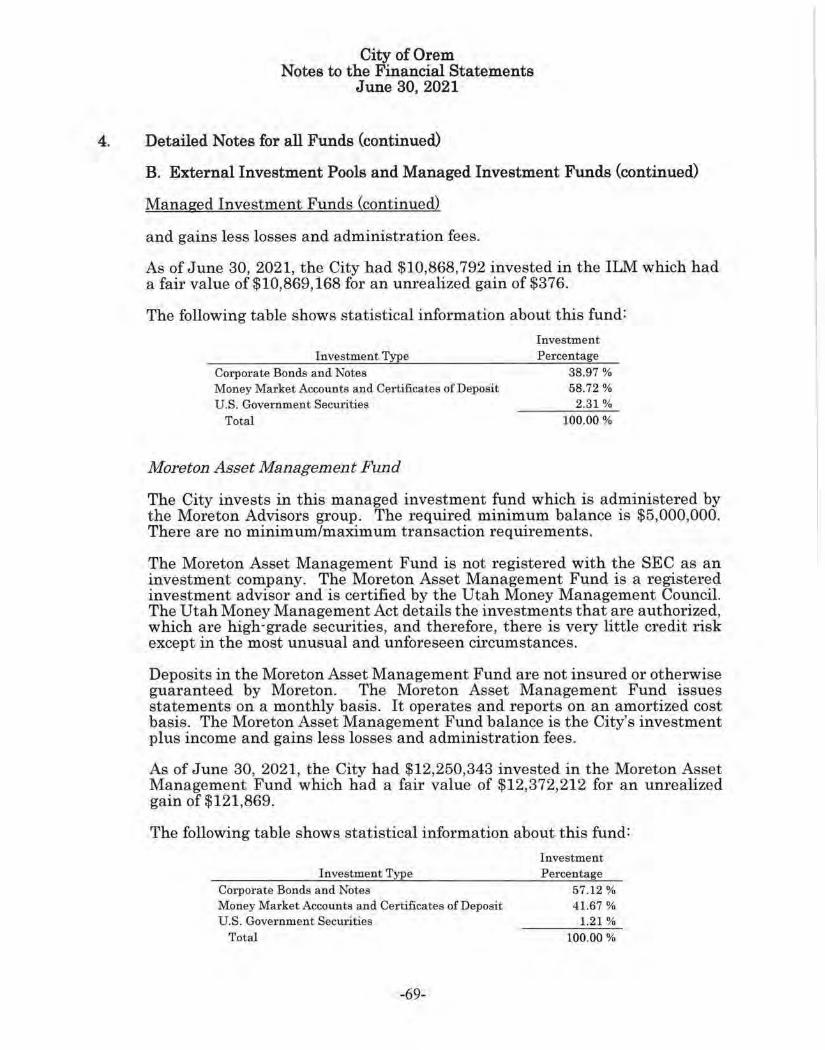
City of Orem Notes to the Financial Statements
June 30, 2021
4. Detailed Notes for all Funds (continued)
B. External Investment Pools and Managed Investment Funds (continued)
Managed Investment Funds (continued)
and gains less losses and administration fees.
As of June 30, 2021, the City had $10,868,792 invested in the ILM which had a fair value of $10,869,168 for an unrealized gain of $376.
The following table shows statistical information about this fund:
Investment Type Corporate Bonds and Notes Money Market Accounts and Certificates of Deposit U.S. Government Securities
Total
Moreton Asset Management Fund
Investment Percentage
38.97 %
58.72 % 2.31 %
100.00 %
The City invests in this managed investment fund which is administered by the Moreton Advisors grnup. The required minimum balance is $5,000,000. There are no minimum/maximum transaction requirements.
The Moreton Asset Management Fund is not registered with the SEC as an investment company. The Moreton Asset Management Fund is a registered investment advisor and is certified by the Utah Money Management Council. The Utah Money Management Act details the investments that are authorized, which are high-grade securities, and therefore, there is very little credit risk except in the most unusual and unforeseen cfrcumstances.
Deposits in the Moreton Asset Management Fund are not insured or otherwise guaranteed by Moreton. The Moreton Asset Management Fund issues statements on a monthly basis. It operates and reports on an amortized cost basis. The Moreton Asset Management Fund balance is the City s investment plus income and gains less losses and administration fees.
As of June 30, 2021, the City had $12,250,343 invested in the Moreton Asset Management Fund which had a fair value of $12,372,212 for an unrealized gain of $121,869.
The following table shows statistical information about this fund:
Investment Type Corporate Bonds and Notes Money Mai-ketAccounts and Ce1·tificates of Deposit U.S. Government Securities
Total
-69-
Investment Percentage
57.12 % 41.67 %
1.21 %
100.00 %
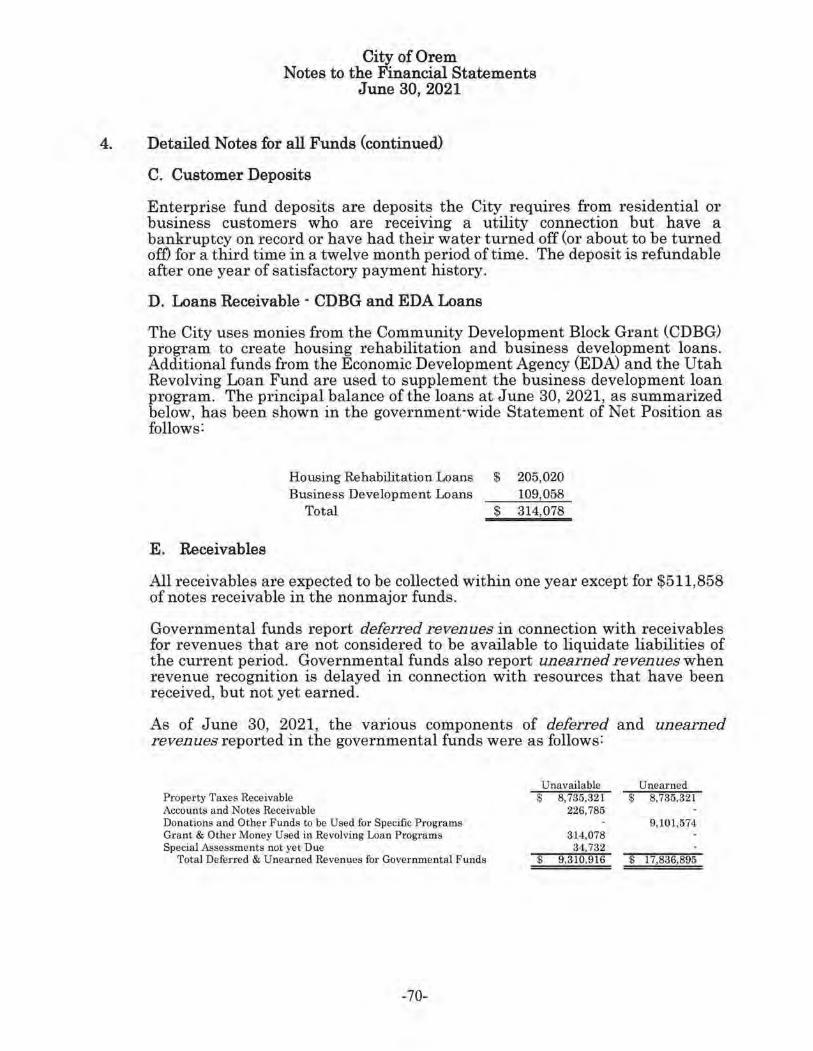
City of Orem Notes to the Financial Statements
June 30, 2021
4. Detailed Notes for all Funds (continued)
C. Customer Deposits
Enterprise fund deposits al'e deposits the City requires from residential or business customers who are receiving a utility connection but have a bankxuptcy on record or have had their water turned off (or about to be turned off) for a third time in a twelve month period of time. The deposit is refundable after one year of satisfactory payment history.
D. Loans Receivable· CDBG and EDA Loans
The City uses monies from the Community Development Block Grant (CDBG) program to c1·eate housing rehabilitation and business development loans. Additional funds from the Economic Development Agency (EDA) and the Utah Revolving Loan Fund are used to supplement the business development loan program. The principal balance of the loans at June 30, 2021, as summarized below, has been shown in the government-wide Statement of Net Position as follows:
E . Receivables
Housing Rehabilitation Loans Business Development Loans
Total
$ 205,020 109,058
$ 314,078
All receivables are expected to be collected within one year excep t for $511,858 of notes receivable in the nonmajor funds.
Governmental funds report deferred revenues in connection with receivables for revenues that are not considered to be available to liquidate liabilities of the current period. Governmental funds also report unearned revenues when revenue recognition is delayed in connection with resources that have been received, but not yet earned.
As of June 30, 2021, the various components of deferred and unearned revenues reported in the governmental funds were as follows:
Property Taxes Receivable Accounts and Notes Receivable Donations and Other Funds to be Used for Specific Programs Grant & Other Money Used in Revolving Loan Programs Special Assessments not yet Due
Total Deferred & Unearned Revenues for Governmental Funds
-70-
Unavailable Unearned $ 8,735,321 $ 8,735,321
226,785 9,101,574
314,078 34,732
$ 9,310,916 $ 17,836,895
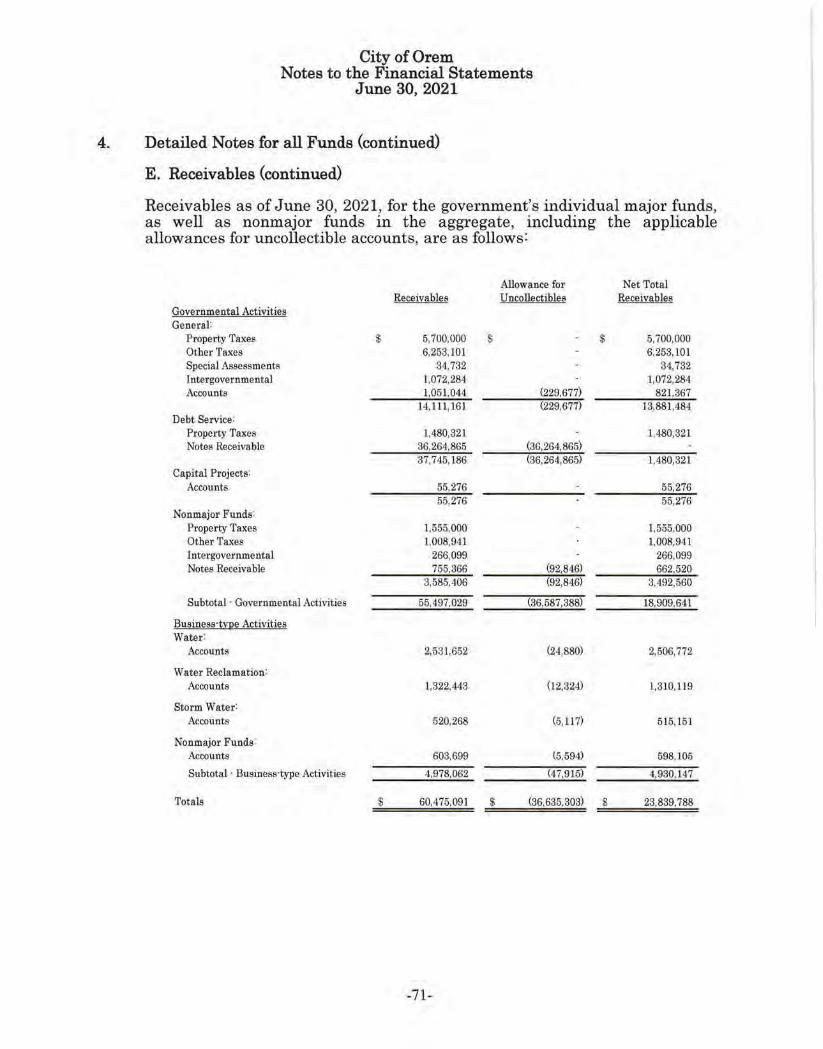
City of Orem Notes to the Financial Statements
June 30, 2021
4. Detailed Notes for all Funds (continued)
E. Receivables (continued)
Receivables as of J une 30, 2021, for the government 's individual major funds, as well as nonmaJor funds m the aggregate, including the applicable allowances for uncollectible accounts, are as follows:
Governmental Activities General:
Property Taxes Other 'faxes Special Assessments Intergovernmental Accounts
Debt Service: Proper ty Taxes Notes Receivable
Capital Projects: Accounts
Nonmajor Funds : Property Taxes Other Taxes i ntergovernmental Notes Receivable
Subtotal · Governmental Activities
Business·type Activities Water :
Accounts
Water Reclamation: Accounts
Storm Water: Accounts
Nonmajor Funds: Accounts
Subtotal · Business-type Activities
Totals
$
$
Receivables
6,700,000 S 6,263,101
34,732 1,072,284 1,051,044
14,111,161
l,480,321 36,264,865 37,745,186
55,276 55,276
l ,555,000 1.008,941
266,099 755,366
3,585,406
55,497,029
2,531,652
1,322,443
520,268
603,699
4,978,062
60,475,091
-71-
$
Allowance for U ncollectibles
(229,677) (229,677)
(36,264,865) (36,264,865)
(92,846) (92,846)
(36,587,388)
(24,880)
(12,324)
(5,117)
(5,594}
(47,915)
$
Net Total Receivables
5,700,000 6,253,101
34,732 1,012,284
821.367 13,881,484
1.480,321
1,480,321
55,276 55,276
1,555,000 1,008,941
266,099 662,520
3,492,560
18,909,641
2,506,772
1,310,119
515,151
598,105
4,930,147
(36,635,303) $ 23,839,788 ===============
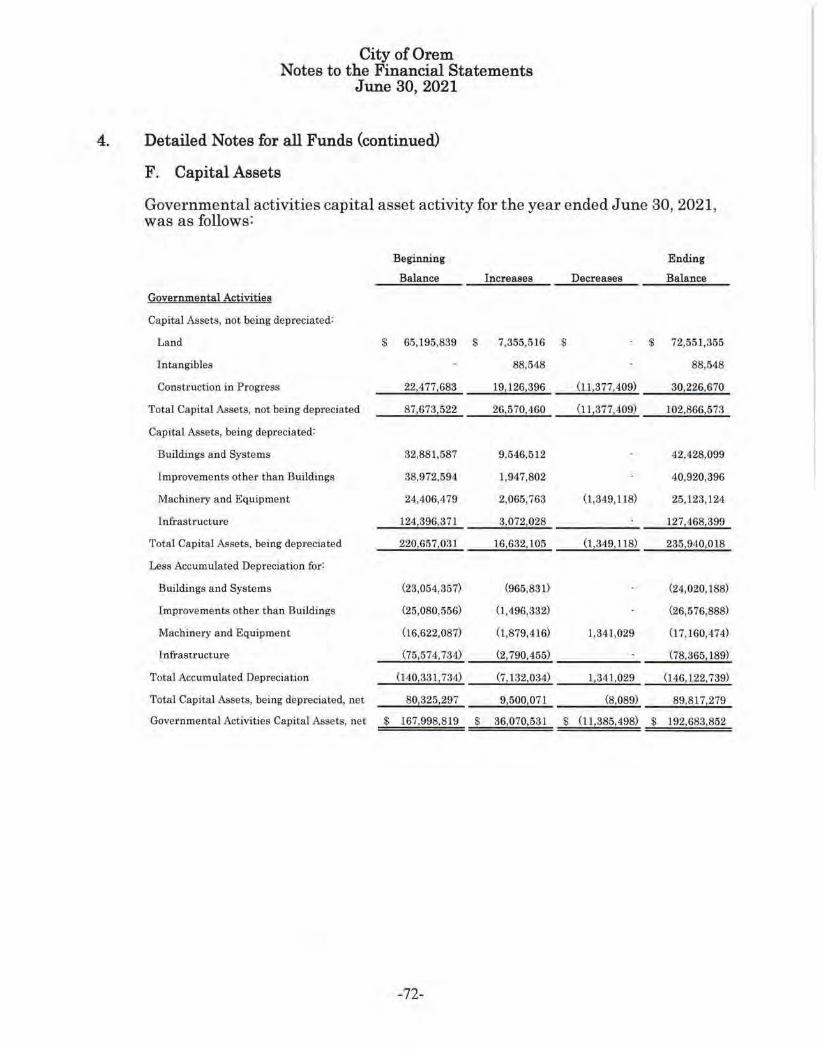
City of Orem Notes to the Financial Statements
June 30, 2021
4. Detailed Notes for all Funds (continued)
F. Capital Assets
Governmental activities capital asset activity fo1· t he year ended June 30, 2021, was as follows:
Beginning Ending
Balance Increases Decreases Balance
Governmental Activities
Capital Assets, not being depreciated:
Land $ 65,195,839 $ 7,355,516 $ $ 72,551,355
Intangibles 88,548 88,548
Construction in Progress 22,477,683 19,126,396 (11,377,409) 30,226,670
Total Capital Assets, not being depreciated 87,673,522 26,570,460 (11,377,409) 102,866,573
Capital Assets, being depreciated:
Buildings and Systems 32,881,587 9,546,512 42,428,099
Improvements other than Buildings 38,972,594 1,947,802 40,920,396
Machinery and Equipment 24,406,479 2,065,763 (1,349,118) 25,123,124
Infrastructure 124,396.371 3,072,028 127,468,399
'fotal Capital Assets, being depreciated 220,657,031 16,632,105 (1,349,118) 235,940,018
Less Accumulated Depreciation for:
Buildings and Systems (23,054,357) (965,831) (24,020,188)
tmprovements other than Buildings (25,080,556) (1,496,332) (26,576,888)
Macltinery and Equipment (16,622,087) (1,879,416) 1,341,029 (17,160,474)
Infrastructure (75,574,734) (2,790,455) (78,365,189)
Total Accumulated Depreciation (1401331, 734) (7,132,034) 11341,029 (14.6, 122,739)
Total Capital Assets, being depreciated, net 80,325,297 9,500,071 (8,089) 89,817,279
Governmental Activities Capital Assets, net $ 167,998,819 $ 36,070,531 $ (111385,498) $ 192,683,852
-72-
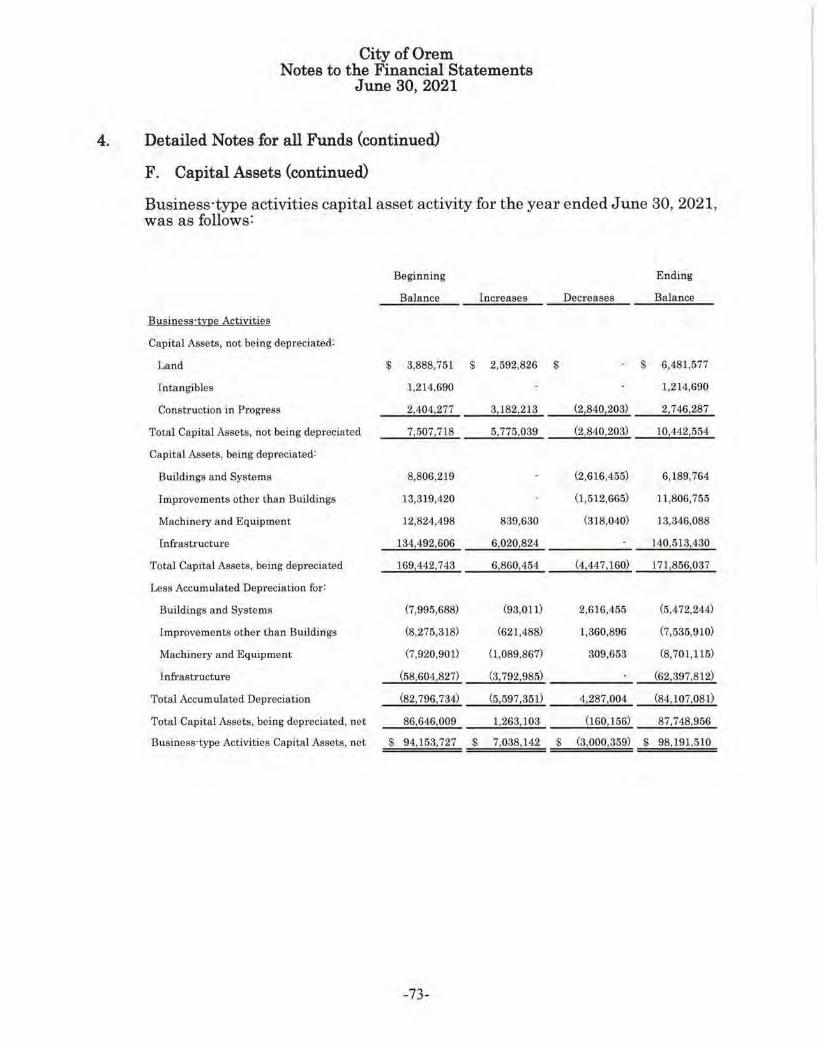
City of Orem Notes to the Financial Statements
June 30, 2021
4. Detailed Notes for all Funds (continued)
F. Capital Assets (continued)
Business-type activit ies capital asset activity for the year ended June 30, 2021, was as follows:
Beginning Ending
Balance Increases Decreases Balance
Busines11·roe Ac1iviti11s
Capital Assets, not being depreciated:
Land $ 3,888,751 $ 2,592,826 $ $ 6,481,577
Intangibles 1,214,690 1,214,690
Construction in Progress 2,404,277 311821213 (218401203) 2,746,287
Total Capital Assets, not being depreciated 7,507,718 5,775,039 (2,840,203) 10,442,554
Capital Assets, being depreciated:
Buildings and Systems 8,806,219 (2,616,455) 6,189,764
Improvements other than Buildings 13,319,420 (1,512,665) 11,806,755
Machinery and Equipment 12,824,498 839,630 (318,040) 13,346,088
Infrastructure 134,492,606 6,0201824 140,513,430
Total Capital Assets, being depreciated 169,442,743 6,860,454 (4,447, 160) 171,856,037
Less Accumulated Depreciation for:
Buildings and Systems (7,995,688) (93.011) 2,616,455 (5,472,244)
Improvements other than Buildings (8,275,318) (621,488) 1,360,896 (7,535,910)
Machinery and Equipment (7,920,901) (1.089,867) 309,653 (8,701,115)
Infrastructure (58,604,827) (3,792,985) (621397,812)
Total Accumulated Depreciation (82,796,734) (5,597,351) 4,287,004 (84,107,081)
Total Capital Assets, being depreciated, net 86,646,009 1,263,103 (160,156) 87,748,956
Business·type Activities Capital Assets, net $ 94,153,727 $ 7,038,142 $ (3,000,359) $ 98,191,510
-73-
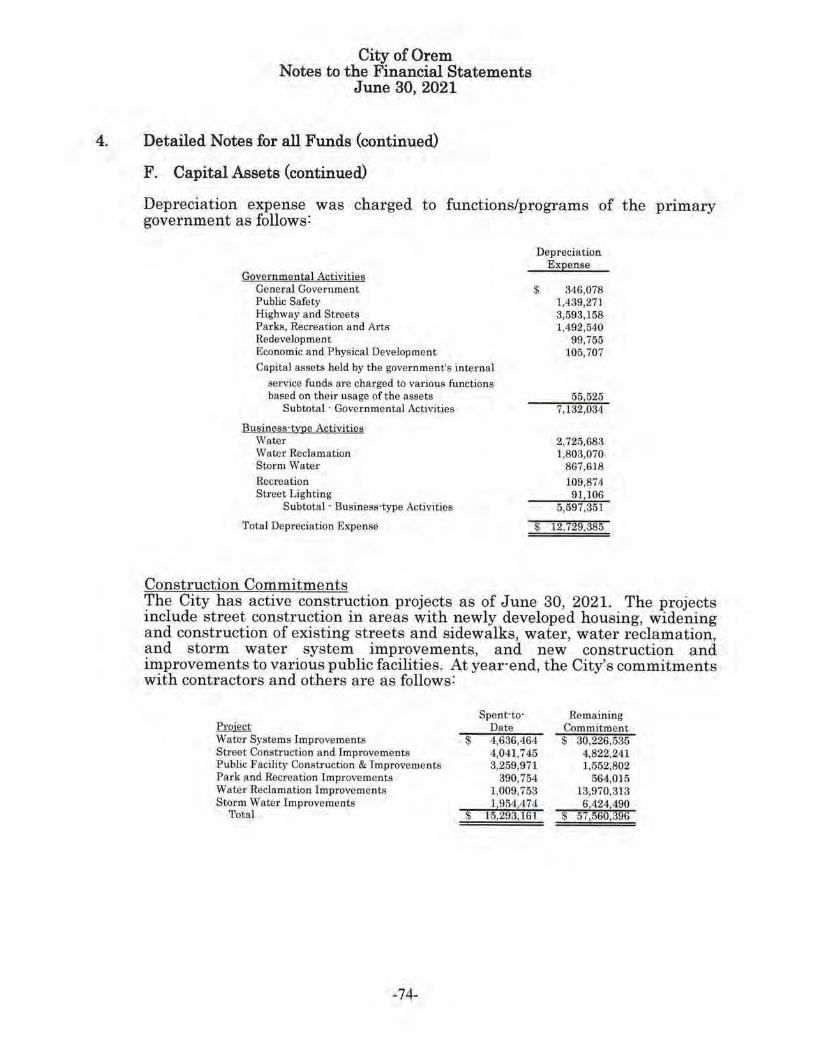
City of Orem Notes to the Financial Statements
June 30, 2021
4. Detailed Notes for all Funds (continued)
F. Capital Assets (continued)
Depreciat ion expense was charged to functions/progi·ams of the primary government as follows:
Depreciation
Governmental Activities Expense
General Government $ 346,078 Public Safety 1,439,271 Highway and Streets 3,593,158 Parks, Recreation and Arts 1,492,540 Redevelopment 99,755 Economic and Physical Development 105,707 Capital assets held by the government's internal
service funds are charged to various functions based on their usage of the assets 55,525
Subtotal· Governmental Activities 7,132,034
Business·type Activities Water 2,725,683 Water Reclamation 1,803,070 Storm Water 867,618 Recreation 109,874 Street Lighting 91,106
Subtotal - Business-type Activities 5,597,351
Total Depreciation Expense $ 12,729,385
Construction Commitments The City has active construction prnjects as of June 30, 2021. The projects include street construction in areas with newly developed housing, widening and construction of existing streets and sidewalks, water, wate1· reclamation, and storm water system improvements, and new construction and improvements to va1·ious public facilities. At year-end, the City's commitments with cont r actors and others are as follows:
Project Water Systems Improvements Street Construction and Improvements Public Facility Construction & Improvements Park and Recreation Improvements Water Reclamation Improvements Storm Water Improvements
Total
-74-
Spent·to· Date
$ 4,636,464 4,041,745 3,259,971
390,754 1,009,753 1,954,474
$ 15,293,161
Remaining Commitment $ 30,226,535
4,822,241 1,552,802
564,015 13,970,313 6,424,490
$ 57,560,396

City of Orem Notes to the Financial Statements
June 30, 2021
4. Detailed Notes for all Funds (continued)
G. Interfund Receivables, Payables and Transfers
The composition of interfund balances as of June 30, 2021, is as follows:
Interfund Transfers Transfers between funds occur primarily to finance programs accounted for in one fund with resources collected in othe1· funds in accordance with budgetary authorizations. Fiscal year interfund transfers are as follows:
Major Funds:
Ge neral
D e bt Service Fund
Ca1,it al Projects Fund
Water Fund
Wat e r Rec1am alcion F und
S torm Wa ter Fund
Nonmajor Governmental Funds
la
$ 2 ,668,068
4 ,248.348
7,924,340
174,571
Non.major Enterprise F unds 400.416
Inte rna l Serv ice Funds 110,000
$ 15,525,743
H. Jointly Governed Organizations
Out
$ 9,205,611
28 ,013
969,610
221,666
319,683
4 ,150,951
557,537
72,672
$ 15 ,525,743
The City in conjunction with other governmental entities, jointly governs several organizations. Each organization's board is comprised of one member from each participating entity. A brief description of the City's relationship with each organization follows:
Utah Risk Management Agency (URMA) · The City p1·ovides for its gene1·al liability risks and worker's compensation through a joint protection agreement with URMA. During the year ended June 30, 2021, the City paid premiums of approximately $226,000 to URMA.
North Pointe Solid Waste Special Service District (NPSWSSD) · The district is a component unit of Utah County and represents thirteen cities in the northern part of the county. NPSWSSD was created to process and dispose of municipal solid waste. The City disposes of its solid waste thrnugh an agreement with NPSWSSD, which operates a solid waste transfer station. The City is represented on the NPSWSSD board and has voting 1·ights related to the operations and financing of NPSWSSD. NPSWSSD has a service contract for the ultimate disposal of waste at a landfill located in an adjacent county. During the year ended June 30, 2021, the City paid solid waste t ipping fees of approximately $1,056,000 to NPSWSSD. The City's waste, by weight, represents approximately 25% of all of the solid waste processed by NPSWSSD.
-75-
City of Orem Notes to the Financial Statements
June 30, 2021
4. Detailed Notes for all Funds (continued)
H. Jointly Governed Organizations (continued)
N01·th Utah Valley Animal Services Special Service District (N1NAS) · The Utah County Board of Commissioners l"The Commission) created the district. The Commission delegated all powe1·s to manage the district to an Administrative Control Board which has three members appointed by the Commission and a member from each of the fourteen participating cities. Each participating city delivers stray, homeless, endangered, injured or other animals to the district's shelter facility. NUV AS is charged with identifying and/or locating the animal's rightful owne1·. Personnel of the district also evaluate, house, treat and/or humanely dispose of any animal brought to them by the City. NUV AS also handles all licensing and licensing renewals. During the yea1· ended June 30, 2021, the City paid participation fees of approximately $134,000 to N1NAS.
Utah Telecommunication Open Infrastructw·e Agency (UTOPIA) - UTOPIA was formed under the Utah Inter local Cooperation Act by its eighteen founding cities, of which, the City of Orem is a member. This agency has the assignment to design, finance, build, operate and maintain a fiber-to· home and fiber-to· business fiber optic communication network. UTOPIA will build the infrastructure but private companies will deliver the services over the network. During the year ended June 30, 2021, the City paid UTOPIA approximately $31,000 in customer service fees. The City also paid $3,289,546 in pledge funds into a debt service reserve fund which was used to pay UTOPIA debt obligations for the fiscal year. A corresponding long·term note receivable was also increased by this amount. See footnote 5.B. (Other information, contingent liabilities) for additional information.
Utah Infrastructure Agency (UIA)-UIA was formed under the Utah Interlocal Cooperation Act by its nine member cities, of which, the City of Orem is a member. This agency was organized to provide for the acquisition, construction, and installation of telecommunication and cable television lines to a customer's premises using a demand utility model. Dm·ing the year ended June 30, 2021, the City forwarded Contract Utility Enhancement (CUE) agreement 1·eceipts of approximately $105,000 to UIA and paid approximately $3,000 in customer service fees.
I. Capital Leases
The City has entered into certain lease agreements under which the related equipment will become the property of the City when the te1·ms of the lease agreement are met. All City lease contracts contain a fiscal non·funding clause allowing the City Council the option of terminating the lease agreement at the end of any fiscal year. In the opinion of City management, the likelihood of this clause being exercised is remote.
The following is a schedule, by yeaT, of future minimum lease payments of all
-76-
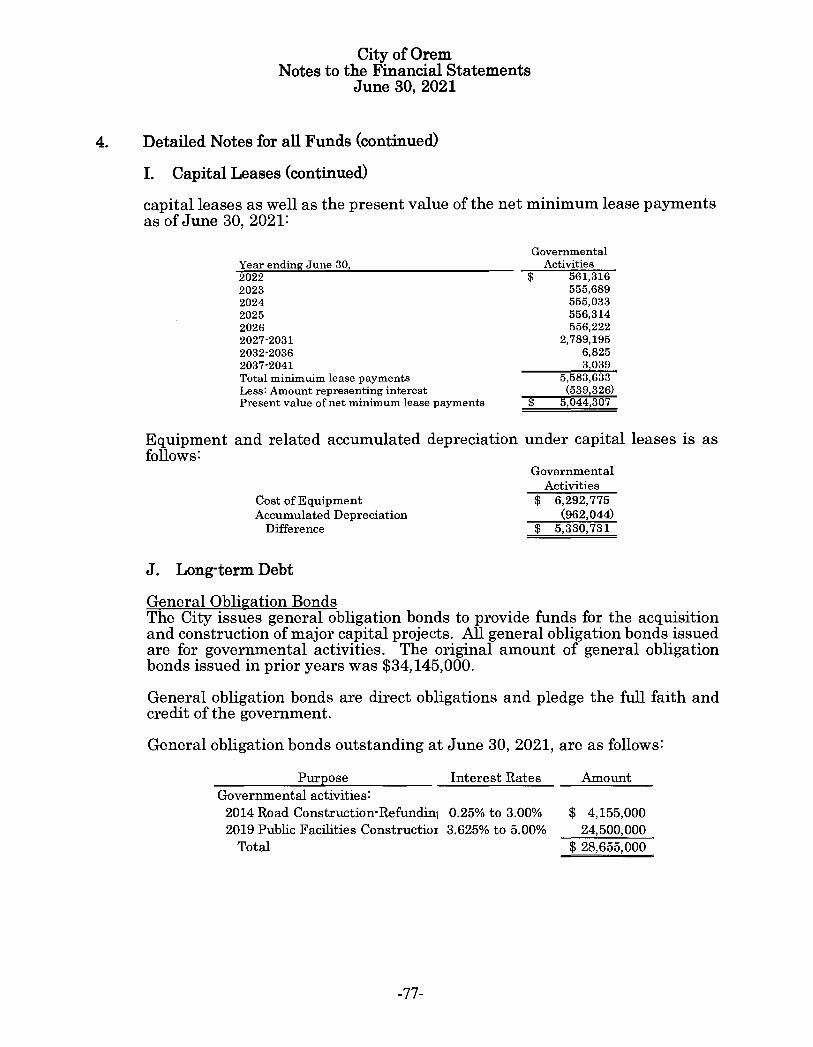
City of Orem Notes to the Financial Statements
June 30, 2021
4. Detailed Notes for all Funds (continued)
I. Capital Leases (continued)
capital leases as well as the present value of the net minimum lease payments as of June 30, 2021:
Year ending June 30, 2022 2023 2024 2025 2026 2027·2031 2032·2036 2037·2041 Total minimuim lease payments Less: Amount representing interest Present value of net minimum lease payments
Governmental Activities
$ 561,316 555,689 555,033 556,314 556,222
2,789,195 6,825 3,039
5,583,633 (539,326)
$ 5,044,307
Equipment and related accumulated depreciation under capital leases is as follows:
Cost of Equipment Accumulated Depreciation
Difference
J. Long·term Debt
General Obligation Bonds
Governmental Activities
$ 6,292,775 (962,044)
$ 5,330,731
The City issues general obligation bonds to provide funds for the acquisition and construction of major capital projects. All general obligation bonds issued are for governmental activities. The original amount of general obligation bonds issued in prior years was $34,145,000.
General obligation bonds are direct obligations and pledge the full faith and credit of the government.
General obligation bonds outstanding at June 30, 2021, are as follows:
Purpose Interest Rates Governmental activities:
2014 Road Construction· Refundin1 0.25% to 3.00% 2019 Public Facilities Constructior 3.625% to 5.00%
Total
-77-
Amount
$ 4,155,000 24,500,000
$ 28,655,000
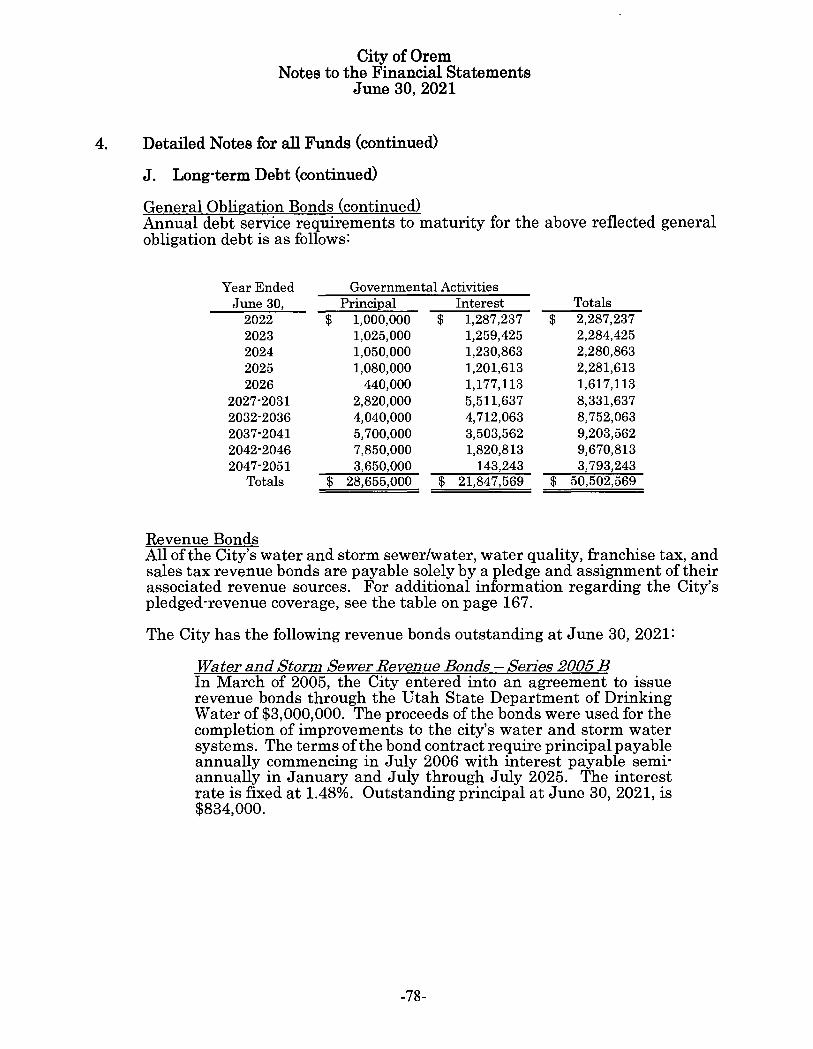
City of Orem Notes to the Financial Statements
June 30, 2021
4. Detailed Notes for all Funds (continued)
J. Long-term Debt (continued)
General Obligation Bonds (continued) Annual debt service requirements to maturity for the above reflected general obligation debt is as follows:
Year Ended Governmental Activities June 30, Princi:eal Interest Totals
2022 $ 1,000,000 $ 1,287,237 $ 2,287,237 2023 1,025,000 1,259,425 2,284,425 2024 1,050,000 1,230,863 2,280,863 2025 1,080,000 1,201,613 2,281,613 2026 440,000 1,177,113 1,617,113
2027·2031 2,820,000 5,511,637 8,331,637 2032·2036 4,040,000 4,712,063 8,752,063 2037·2041 5,700,000 3,503,562 9,203,562 2042·2046 7,850,000 1,820,813 9,670,813 2047·2051 3,650,000 143,243 3,793,243
Totals $ 28,655,000 $ 21,847,569 $ 50,502,569
Revenue Bonds All of the City's water and storm sewer/water, water quality, franchise tax, and sales tax revenue bonds are payable solely by a pledge and assignment of their associated revenue sources. For additional information regarding the City's pledged-revenue coverage, see the table on page 167.
The City has the following revenue bonds outstanding at June 30, 2021:
Water and Storm Sewer Revenue Bonds - Series 2005 B In March of 2005, the City entered into an agreement to issue revenue bonds through the Utah State Department of Drinking Water of $3,000,000. The proceeds of the bonds were used for the completion of improvements to the city's water and storm water systems. The terms of the bond contract require principal payable annually commencing in July 2006 with interest payable semi· annually in January and July through July 2025. The interest rate is fixed at 1.48%. Outstanding principal at June 30, 2021, is $834,000.
-78-
City of Orem Notes to the Financial Statements
June 30, 2021
4. Detailed Notes for all Funds (continued)
J. Long·term Debt (continued)
Revenue Bonds (continued)
Water and Storm Sewer Revenue Refunding Bonds- Series 2013 In July of 2013, the City issued revenue refunding bonds of $12,801,000 tlu:ough private placement. The proceeds were placed in an irrevocable tTust for the purpose of generating resouTces fOT future debt service payments of the Series 2005A water and storm sewer revenue bonds. The terms of the bond contract require pTincipal payable annually commencing in July 2014 and interest payable semi-annually in January and July through July 2025. The interest rate is fixed at 2.18%. Outstanding principal at June 30, 2021, is $6,424,000.
Water and Storm Sewer Revenue Refunding Bonds - Series 2016 In October of 2016, the City issued revenue refunding bonds of $4,380,000 through a public offe1·ing. The proceeds were placed in an irrevocable ti·ust for the purpose of generating resources for future debt se1·vice payments of the Series 2008 water and storm sewer revenue bonds. The terms of the bond contract require principal payable annually commencing in July 2019 and interest payable beginning in January 2017 and payable semi·annually through July 2028. The interest rate varies between 2.00% and 4.50%. Outstanding principal at June 30, 2021, is $4,180,000.
Sales Tax Revenue Refunding Bonds - Series 2017 In Februai·y of 2017, the City issued sales tax revenue refunding bonds of $2,898,000 through a public offering. The proceeds were placed in a trust account and used to pay the remaining outstanding principal balance of the Series 2007 sales tax rnvenue refunding bonds. The terms of the bond contract require principal payable annually commencing in April 2018 with interest payable semi-annually in April and October through April 2023. The interest rate is fixed at 1.94%. Outstanding principal at June 30, 2021, is $496,000.
Water. Sewer & Storm Water Revenue Bonds - Series 2021A In April of 2021, the City issued revenue bonds of $29,320,000 through a public offering for improvements to the City's wate1·, sewer and storm sewer systems. The terms of the bond contract requii·e principal payable annually commencing in July 2022 and interest payable semi-annually in January and July through July 2046. The interest rate varies between 3.00% and 5.00%. Outstanding principal at June 30, 2021, is $29,320,000.
-79-

City of Orem Notes to the Financial Statements
June 30, 2021
4. Detailed Notes for all Funds (continued)
J. Long·term Debt (continued)
Revenue Bonds (continued)
Water. Sewer & Storm Water Revenue Refunding Bonds - Series 2021B In April of 2021, the City issued revenue parity bonds simultaneously with the Series 2021A bonds. The parity bonds were used to refinance the 2010 Water Quality Revenue Bonds issued through the State of Utah's Department of Environmental Quality. The new pa1·ity bonds maintain the same contract terms as the originally issued bonds which required principal to be paid annually in February until 2032. Payments on the bonds are paid from sewer charges to customers. The interest rate is fixed at 0.00%. Outstanding principal at June 30, 2021, is $6,543,000.
Revenue bonds currently outstanding at June 30, 2021, are as follows:
PurEose Interest Rates Amount Governmental Activities:
Recreation Projects 1.94% $ 496,000
Business·type Activities: Water 1.48%·5.00% 29,969,675 Wastewater Treatment 0.00%·5.00% 13,523,000 Storm Water 1.48%·5.00% 3,808,325
47,301,000
Total $ 47,797,000
Annual debt service requfrements to maturity fOl' the above reflected revenue bond debt is as follows:
Yea1·Ended Governmental Activities Business·~ e Activities June 30, PrinciEal Inte1·est PrinciEal Interest Totals
20 22 $ 243,000 $ 9,622 $ 2,084,000 $ 1 ,193,179 $ 3,529,801 2023 253,000 4,908 2,763,000 1,495,389 4,516,297 2024 2,837,000 1,427,776 4,264,776 2025 2,897,000 1.357,736 4,254,736 2026 2,970,000 1.285,284 4,255,284
2027·2031 10,995,000 5,223,125 16,218,125 2032·2036 6 ,060,000 3,908,125 9,968,125 2037·2041 6 ,690,000 2,691,000 9,381,000 2042·2046 8,170,000 1,210,000 9,380,000 2047·2051 1,8351000 36.700 1,871,700
Totals $ 496,000 $ 14,530 $ 47,301,000 $ 19,8281314 $ 67,639,844
-80-
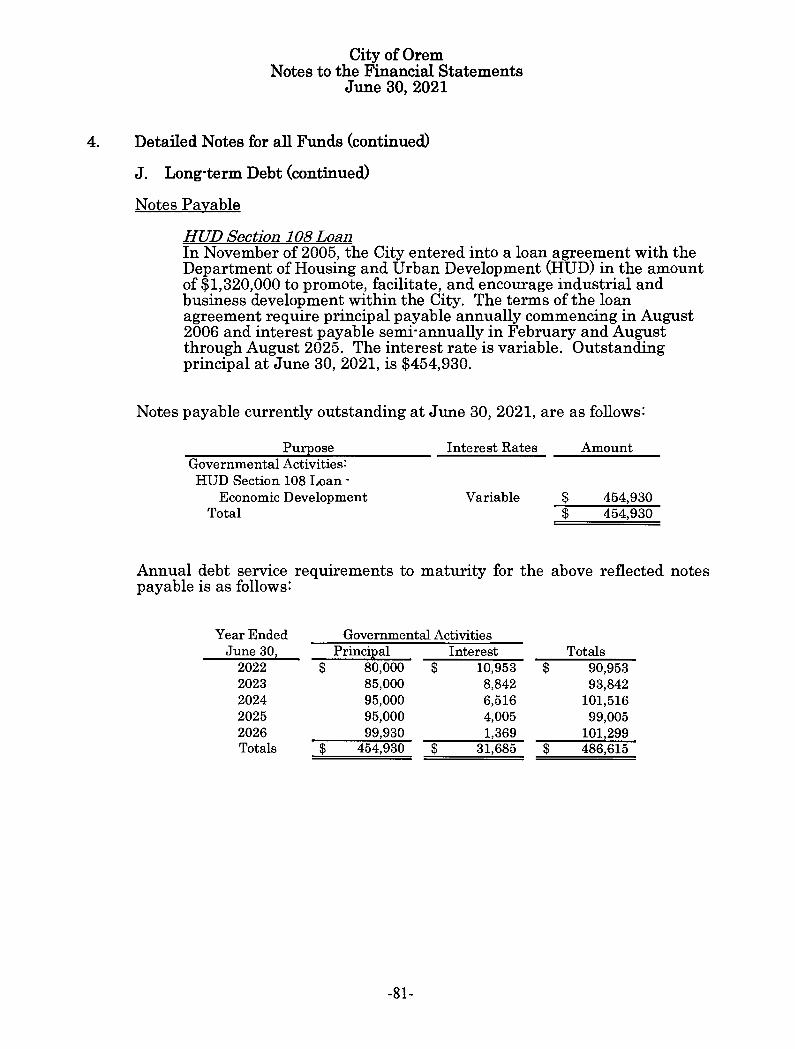
City of Orem Notes to the Financial Statements
June 30, 2021
4. Detailed Notes for all Funds (continued)
J. Long·term Debt (continued)
Notes Payable
HUD Section 108 Loan In November of 2005, the City entered into a loan agreement with the Department of Housing and Urban Development (HUD) in the amount of $1,320,000 to promote, facilitate, and encourage industrial and business development within the City. The terms of the loan agreement require principal payable annually commencing in August 2006 and interest payable semi·annually in February and August through August 2025. The interest rate is variable. Outstanding principal at June 30, 2021, is $454,930.
Notes payable currently outstanding at June 30, 2021, are as follows:
Purpose Governmental Activities:
HUD Section 108 Loan· Economic Development
Total
Interest Rates
Variable
Amount
$ 454,930 $ 454,930
Annual debt service requirements to maturity for the above reflected notes payable is as follows:
Year Ended Governmental Activities June 30, PrinciEal Interest Totals
2022 $ 80,000 $ 10,953 $ 90,953 2023 85,000 8,842 93,842 2024 95,000 6,516 101,516 2025 95,000 4,005 99,005 2026 99,930 1,369 101,299 Totals $ 454,930 $ 31,685 $ 486,615
-81-
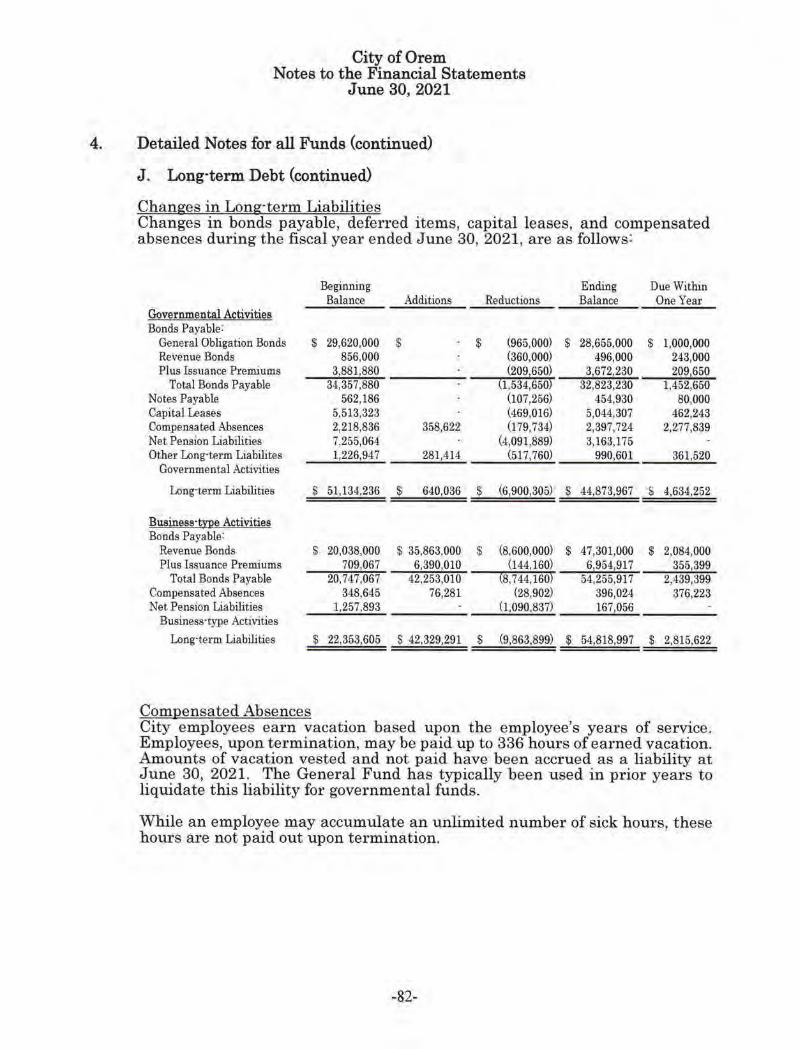
4.
City of Orem Notes to the Financial Statements
June 30, 2021
Detailed Notes for all Funds (continued)
J . Long-term Debt (continued)
Changes in Long·term Liabilities Changes in bonds payable, deferred items, capital leases, and compensated absences during the fiscal year ended June 30, 2021, are as follows :
Beginning Ending Due Within Balance Additions Reduct.ions Balance One Year
Governmental Activities Bonds Payable:
General Obligation Bonds $ 29,620,000 $ $ (965,000) $ 28,655,000 $ 1,000,000 Revenue Bonds 856,000 (360,000) 496,000 243,000 Plus Issuance Premiums 318811880 (209,650) 3,6721230 209,650
Total Bonds Payable 34,357,880 (1,534,650) 32,823,230 1,452,650 Notes Payable 562,186 (107,256) 454,930 80,000 Capital Leases 5,513,323 (469,016) 5,044,307 462,243 Compensat,ed Absences 2,218,836 358,622 (179,734) 2,397,724 2,277,839 Net Pension Liabilities 7,255,064 (4,091,889) 3,163,175 Other Long-term Liabilites 1,226,947 281,414
Governmental Activities (517,760) 9901601 361,520
Long·term Liabilities $ 51,134,236 $ 640,036 $ (6,900,305) $ 44,873,967 $ 4,634,252
Business·tYI1e Activities Bonds Payable:
Revenue Bonds $ 20,038,000 $ 35,863,000 $ (8,600,000) $ 47,301,000 $ 2,084,000 Plus Issuance Premiums 709,067 6,3901010 (144,160) 6,954,917 355,399
Total Bonds Payable 20,747,067 42,253,010 (8,744,160) 54,255,917 2,439,399 Compensated Absences 348,645 76,281 (28,902) 396,024 376,223 Net Pension Liabilities 1,257,893 (1,090,837) 167,056
Business·type Activities
Long·term Liabilities $ 22,353,605 $ 42,329,291 $ (9,863,899) $ 54,818,997 $ 2,815,622
Compensated Absences Ci ty employees earn vacation based upon the employee's years of service. Employees, upon termination, may be paid up to 336 hours of earned vacation. Amounts of vacation vested and not paid have been accrued as a liability at June 30, 2021. The General Fund has typically been used in prior years to liquidate t his liability for governmental funds.
While an employee may accumulate an unlimited number of sick hours, these hours are not paid out upon te1·mination.
-82-

City of Orem Notes to the Financial Statements
June 30, 2021
4. Detailed Notes for all Funds (continued)
K. Equity Classification
Government-wide and Proprietary Fund Financial Statements Equity is classified in the government-wide and proprietary fund financial statements as net position and is displayed in three components:
1) Net Investment in Capital Assets - consists of capital assets including restricted capital assets, net of accumulated depreciation and reduced by the outstanding balances of any bonds, mortgages, notes, or other borrowings that are attributable to the acquisition, construction, or improvement of those capital assets.
2) Restricted Net Position - resources with constraints placed on their use either by (a) external gi:·oups such as creditors, grantors, contJ:ibutors, or laws or regulations of other governments, or (b) are imposed by law through constitutional p1·ovisions or enabling legislation.
3) Unrestricted Net Position -consists of all other resources that do not meet the definition of "1·estricted" or "net investment in capital assets" as defined above.
Governmental Fund Financial Statements Equity is classified in the governmental fund financial statements as fund balance. Governmental fund balances are further classified as Nonspendable, Restricted, Committed, Assigned, 01· Unassigned.
1) Nonspendable Fund Balance - this classification includes amounts that cannot be spent because they are either (a) not in spendable form, or (b) are legally or contractually required to be maintained intact.
2) Restricted Fund Balance - this classification includes amounts that are restricted by enabling legislation. Other amounts are also reported in this classification if they are (a) externally imposed by creditors, grantors, contributors, or laws 01· regulations of other governments, or (b) are imposed by law through constitutional provisions or enabling legislation.
3) Committed Fund Balance - this classification includes amounts that can only be used for specific purP.oses pursuant to constraints imposed by formal action (ordinance) of the City Council, which is the City's highest level of decision making authority. It also includes contractual obligations to the extent that existing resources are specifically committed for use in satisfying those contractual requirements.
-83-
City of Orem Notes to the Financial Statements
June 30, 2021
4. Detailed Notes for all Funds (continued)
K. Equity Classification (continued)
Governmental Fund Financial Statements (continued)
4) Assigned Fund Balance - this classification includes amounts that are constrained by the City's intent to use the funds for specific purposes, but are neither restricted nor committed, as established by the City Manager. The City Manager received the authority to place constraints on city funds through an ordinance created by the City Council. It also includes all remaining amounts that are repo1·ted in governmental funds (other than the General Fund) which have specific purposes and that are not classified in one of the previous classifications.
5) Unassigned Fund Balance - this classification is generally the residual classification for the General Fund. However, it may be necessary to report a negative unassigned fund balance for other governmental funds if expenditures incurred for specific purposes exceeds the amounts restricted, committed, or assigned for those purposes. Thus, this classification is normally a positive amount within the General Fund and represents fund balance that has not been restricted, committed, or assigned for any specific purposes.
When restricted and unrestricted resources are available, it is the City's accounting policy to use restricted resources first.
When committed, assigned, or unassigned 1·esom·ces are available for use, it is the City's accounting policy to use committed resources fi1·st, followed by assigned resources, and then unassigned resources as they are needed.
The City has not formally adopted any minimum fund balance policy. However, the State of Utah does require the City to maintain 5% of the current fiscal year's actual revenues as a minimum fund balance. The City is cognizant of and adheres to this requirement.
The following page provides greater detail of the fund balance classifications and categmies for all governmental funds for the fiscal year ended June 30, 2021. The governmental fund balance classifications and categories at the end of the cm-rent fiscal yea1· are as follows:
-84-

City of Orem Notes to the Financial Statements
June 30, 2021
4. Detailed Notes for all Funds (continued)
K. Equity Classification (continued)
Governmental Fund Financial Statements {continued}
Debt Capital Nonmajor Total General Service Projects Governmental Governmental
Fund Fund Fund Funds 1 Funds Fund Balances: NonspendabJe:
Prepaids $ 413,604 s s $ s 413,604 413,604 413,604
Restricted: Class "C" Roads 5,249,123 5,249,123 Utopia DSR Pledge 3,355,337 3,355,337 Task Force 1,548,792 L,548,792 Parks. Rec .. & Arts 2.685,320 2,685,320 Fitness Center 1.066, 171 1.066, 171 Debt Service 8 15,965 815,965 Capital Improvements 19,088 4,622,751 4,641,839 Otber Purposes 30,000 5,651,545 6,681,645
10,183,252 8 15,965 19,088 14,025,787 25,044,092 Assigned:
Veltlcles 763,805 763,806 Public Safety Equip. 616.210 60,306 676,616 Library Media Funds 110,377 110,877 Economic Dev. Funds 63,787 63,787 Facility Improvements 1,108,042 1,108,042 CARES Act Funds 5,526,759 5,526,769 Street/Street Light Imp. 2,628,628 2,623,628 Park Improvements 756,595 756,595 Fitness Ce.n ter 1,017,244 1,017,244 Library Hall 313,482 313,482 Debt Service I, 144,<137 l ,14•1,437 Capital Improvements 777.180 13,908,256 14,685,436 Other Purposes 3.252,856 422,271 3.675, 127
11,110,974 1, 144,437 19,787,553 422,271 32,465,235
Unassigned 18,424,509 18,424,509
Total Fund Balances $ 40,132,839 s 1,960,402 $ 19,806,641 $ 14,448,058 s 76,347,440
1 See pages 114· l 15 fo1• a bl'eakdown by inclividual fund
5. Other Information
A. Risk Management
The City is exposed to various 1·isks of loss related to torts; theft of, damage to and destruction of assets; errors and omissions; injuries to employees; and natural disasters. The City maintains this fund to account for and finance its risks of loss. The City provides coverage for worker's compensation claims through the Workers Compensation Fund of Utah which was effective as of January 1, 2019. The Self-insurance fund also provides coverage up to $15,000 fm general liability and $10,000 for property damage. The City is
-85-
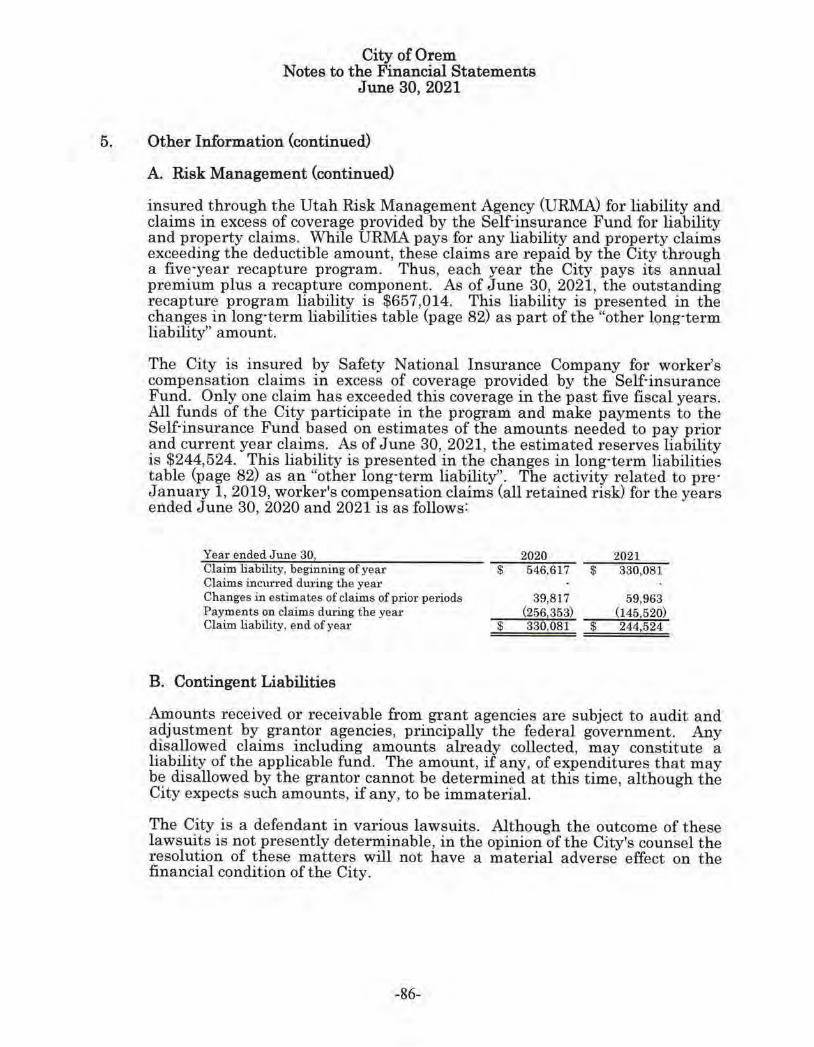
City of Orem Notes to the Financial Statements
J une 30, 2021
5. Other Information (continued)
A. Risk Management (continued)
insured through the Utah Risk Management Agency (URMA) for liability and claims in excess of covera ge provided by the Self-insurance Fund for liability and property claims. While URMA pays for any liability and property claims exceeding the deductible amount, these claims are repaid by the City through a five·year recaptui·e prog1:am. Thus, each year the City pays its annual premium plus a recapturn component. As of June 30, 2021, the outstanding recapture program liability is $657,014. This liability is presented in the changes in long·term liabilities t able (page 82) as part of the "other long·term liability" amount.
The City is insm·ed by Safety National Insurance Company for worker's compensation claims in excess of coverage provided by the Self-insurance Fund. Only one claim has exceeded this coverage in the past five fiscal years. All funds of the City participate in the program and make payments to the Self-insurance Fund based on estimates of the amounts needed to pay prior and current yeal.' claims. As of June 30, 2021, the estimated reserves liability is $244,524. This liability is presented in the changes in long·term liabilit ies table (page 82) as an "otheT long·term liability". The activity related to pre· January 1, 2019, worker's compensation claims (all retained risk) for the years ended June 30, 2020 and 2021 is as follows:
Year ended June 301 2020 2021 Claim liability, beginning of year $ 546,617 $ 330,081 Claims incurred during the yea1· Changes in estimates of claims of prior periods 39,817 59,963 Payments on claims during the year (256!353) (1451520) Claim liability, end of year $ 330,081 $ 244,524
B. Contingent Liabilities
Amounts received or receivable from grant agencies are subject to audit and adjustment by gi·antor agencies, principally the federal government. Any disallowed claims including amounts already collected, may constitute a liability of the applicable fund. The amount, if any, of expenditures that may be disallowed by the grantor cannot be determined at this time, although the City expects such amounts, if any, to be immaterial.
The City is a defendant in various lawsuits. Although the outcome of these lawsuits is not presently determinable, in the opinion of the City's counsel the resolut ion of these matters will not have a material adverse effect on the financial condition of the City.
-86-
City of Orem Notes to the Financial Statements
June 30, 2021
5. Other Information (continued)
B. Contingent Liabilities (continued)
Utah Telecommunication Open InfrastructID·e Agency (UTOPW The City is a member of UTOPIA, an interlocal, nonprofit agency. UTOPIA was fo1·med under the Utah Interlocal Cooperation Act by its eighteen founding cities, of which the City is one of the eleven pledged members. This agency has the assignment to design, finance, build, operate and maintain a fiber·to·home and fiberto·business fiber optic communication network. UTOPIA will build the infrastructm·e but private companies will deliver the services over the network. UTOPIA acts as the wholesaler, not the retailer.
In July 2004, UTOPIA issued an $85,000,000 revenue bond. In June 2008, UTOPIA issued $185,000,000 in new revenue bonds to pay and cancel the 2004 revenue bonds, pay and cancel other related debt, pay outstanding unfunded construction commitments, provide two years of capitalized interest and LOC payments, provide approximately $10,000,000 in operational and construction funds, and to pay the costs of issuing the 2008 bonds.
In December 2011, UTOPIA refinanced the existing 2008 variable rate bonds and replaced them with a long·term relatively fixed rate debt structure (SW AP arrangement). The new debt structure eliminated the letter of credit fee and will result in an estimated savings of $117 million over the life of the bonds. The new 2011 revenue bonds still have principal payments due quarterly commencing in Decembe1· 2013 and continuing through June 2040 with interest payments due monthly commencing in January 2012 and continuing through June 2040.
Net revenues from the communication network will reimburse a debt service reserve fund for payments on the bond debt. To the extent that there are insufficient net revenues to pay the debt service, the eleven pledged members are required to reimburse the UTOPIA debt service reserve fund of any shortfall by their respective percentages up to a specific dollar amount. Each member city has pledged sales tax revenues to pay their respective percentage of any shortfall amount. None of the pledge requirements were modified by the 2011 bond refinancing. The City's liability limit (pledge) for the current fiscal yeaT was set at a maximum of $3,289,545. The pledge limit has an annual increase which is not to exceed 2%. The City's total Temaining maximum pledge amount for all fiscal years through 2040 (end of the bond term) is $76,231,100.
-87-
City of Orem Notes to the Financial Statements
June 30, 2021
5. Other Information (continued)
B. Contingent Liabilities (continued)
Utah Infrastructure Agency (UIA) The City is a member ofUIA, an interlocal, nonprofit agency. U1A was formed under the Utah Interlocal Cooperation Act by its nine member cities, of which the City is one of the eight contracting members.
This agency was organized to provide for the acquisition, construction, and installation of telecommunication and cable television lines to a custome1·'s premises using a demand utility model.
The UIA network will be connected to the fiber optic network of UTOPIA (see previous page) pursuant to an Indefeasible Right of Use (IRU) agreement which provides UIA access to certain facilities of and capacity in the UTOPIA network. Construction of the UIA network began in May of 2011.
In May 2011, UIA issued $29,390,000 in revenue bonds ($20,275,000 tax exempt and $9,115,000 taxable). In July 2013, UIA issued $11,205,000 (all tax exempt) of revenue bonds. In October 2015, UIA issued $24,295,000 (all tax exempt) of revenue bonds. The total of these bond issuances is $64,890,000 and they were all refunded with the Series 2017 refunding bonds described below.
In December 2017, UIA issued $77,405,000 ($73,905,000 tax exempt and $3,500,000 taxable) of revenue and refunding bonds. The bonds were issued to refund the Series 2011, 2013, and 2015 bonds and to obtain additional funding for infrastructure. The Series 2017 bonds have principal payments due annually commencing in October 2018 and continuing through October 2040 with interest payments due semi-annually in April and October beginning in April 2018. The interest rate on these bonds varies between 2% and 5%.
Se1·vice fee revenues from the UIA network will be used to make the debt service payments. To the extent there are insufficient service fee revenues to pay a debt service payment, the eight contracting members are required to pay to UIA any shortfall by their respective percentages up to a specific dollar amount. Each contracting city has pledged franchise tax revenues to pay their respective percentage of any shortfall amount. The City's liability limit (pledge) is set at $1,223,786. The City did not have to make any pledge payments in Fiscal Year 2021.
-88-
City of Orem Notes to the Financial Statements
June 30, 2021
5. Other Information (continued)
C. Pension Plans
General Information and Plan Description The City is an eligible plan participant whose pension plans are administered by and provided through the Utah Retirement Systems (URS). URS administers the following pension t1·ust funds (collectively referred to as "The Systems"):
• Public Employees Nonconb·ibutory Retirement System (Noncontributory System); Public Employees Contributory Retirement System (Contributory System); and the Firefighters Retirement System (Firefighters System). Each of these systems is a cost-sharing, multipleemployer, public employee retirement system.
• Public Safety Retirement System (Public Safety System). This plan is a mixed agent and cost-sharing, multiple-employer public employee retirement system.
• Tier 2 Public Emplo:yees Contributory Retirement System (Tier 2 Public Employees System) and Tier 2 Public Safety and Firefighter Contributory Retirement System (Tier 2 Public Safety and Firefighter System). Both of these systems are cost-sha1·ing, multiple-employer, public employee retirement systems.
The Tier 2 Retirement Systems became effective July 1, 2011. All eligible employees hired on or after July 1, 2011, who had no previous service credit with any of the Utah Retirement Systems, are members of the Tier 2 Retirement System.
The Systems are established and governed by the respective sections of Title 49 of the Utah Code Annotated 1953, as amended. The Systems' defined benefit plans are amended statutorily by the Utah State Legislature. The Utah State Retirement Office Act in Title 49 provides for the administration of the Systems under the direction of the Utah State Retirement Boa1·d (Board), whose members are appointed by the Governor. The Systems are fiduciary funds defined as pension (and other employee benefit) trust funds. URS is a component unit of the State of Utah. Title 49 of the Utah Code grants the authority to establish and amend the benefit terms.
URS issues a publicly available financial rnport which includes financial statements and required supplementary information for the Systems. The financial report may be obtained by writing to the Utah Retirement Systems, 560 East 200 South, Salt Lake City, UT 84102 or by visiting the URS website at www.urs.org/general/publications.
Summary of Retirement Benefits by System The Systems currently provide retirement benefits, annual cost of living adjustments, disability benefits, and death benefits.
-89-
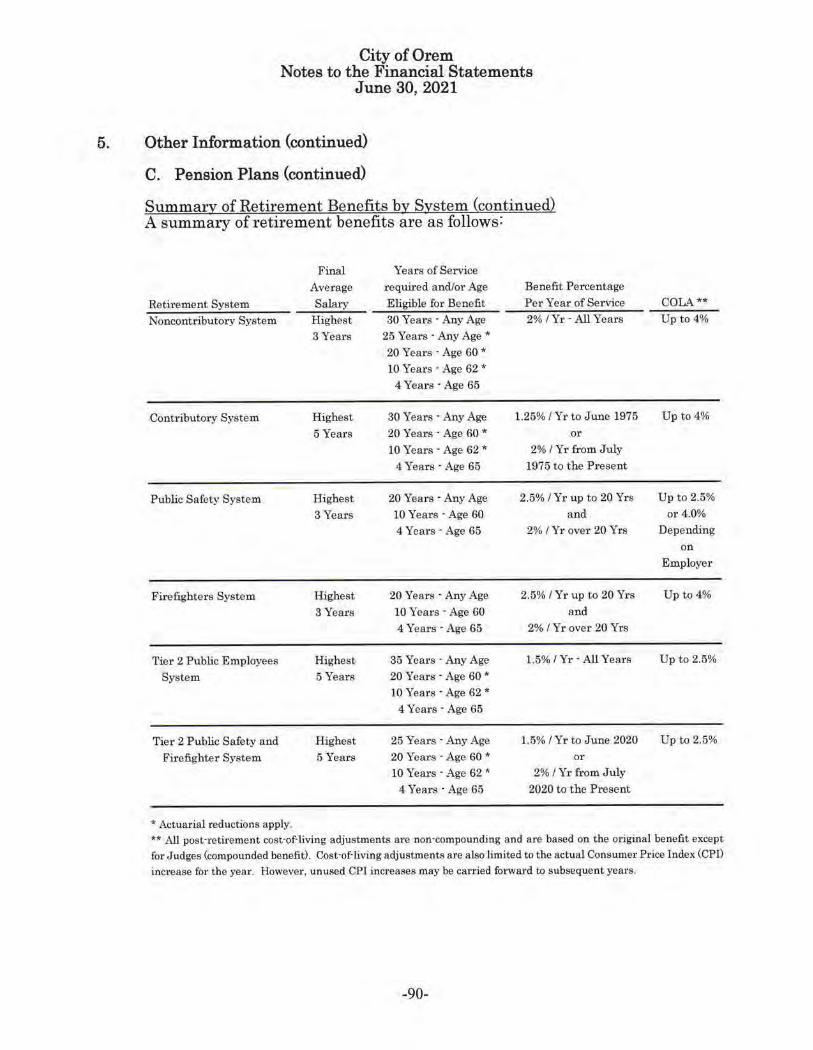
City of Orem Notes to the Financial Statements
June 30, 2021
5. Other Information (continued)
C. Pension Plans (continued)
Summary of Retirement Benefits by System (continued) A summary of retirement benefits are as follows:
Final Years of Service
Average required and/or Age Benefit Percentage
Retirement System Salary Eligible for Benefit Per Year of Service
Noncontributory System Highest 30 Years· Any Age 2% /Yr· All Years
3 Years 25 Years· Any Age*
20 Years· Age 60 * 10 Years· Age 62 *
4 Years· Age 65
Contributory System Highest 30 Years· Any Age 1.25% / Yr to June 1975
5 Years 20 Years· Age 60 * or
10 Years · Age 62 " 2% I Yr from July
4 Years · Age 65 1975 to the Present
Public Safety System Highest 20 Years · Any Age 2.5% I Yr up to 20 Yrs
3 Years 10 Years· Age 60 and
4 Years · Age 65 2% /Yr over 20 Yrs
Firefighters System Highest 20 Years· Any Age 2.5% / Yr up to 20 Yrs
3 Years 10 Years · Age 60 and
4 Years· Age 65 2% / Yr over 20 Yrs
Tier 2 Public Employees Highest 35 Years · Any Age 1.5% /Yr· All Years
System 5 Years 20 Years · Age 60 * 10 Years· Age 62 *
4 Years · Age 65
Tier 2 Public Safety and Highest 25 Years· Any Age 1.5% / Yr to June 2020
Firefighter System 5 Years 20 Years· Age 60 * or
10 Years · Age 62 * 2% / Yr from July
4 Years · Age 65 2020 to the Present
* Actuarial reductions apply.
COLA ..
Up to 4%
Up to 4%
Up to 2.5%
or 4.0% Depending
on Employer
Up to4%
Up to 2.5%
Up to 2.5%
** All post·retirement cost·of·living adjustments are non-compounding and are based on the original benefit except for J udges (compounded benefit). Cost·of·living adjustments are also limited to the actual Consumer Price lnde.x (CPI) increase for the year. However, unused CPI increases may be carried forward to subsequent years.
-90-
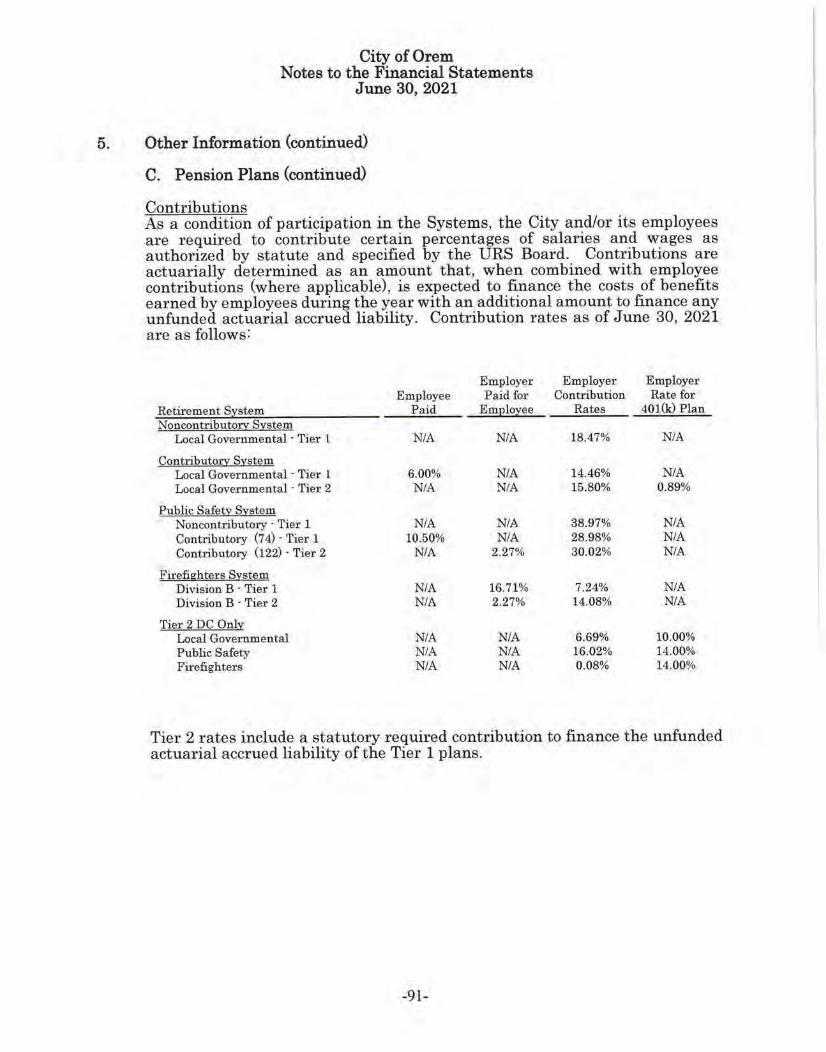
City of Orem Notes to the Financial Statements
June 30, 2021
5. Other Information (continued)
C. Pension Plans (continued)
Contributions As a condition of participation in the Systems, the City and/or its employees are required to contribute certain percentages of sala1·ies and wages as authorized by statute and specified by the URS Board. Contributions are actuarially determined as an amount that, when combined with employee contributions (where applicable), is expected to finance the costs of benefits earned by employees during the year with an additional amount to finance any unfunded actuarial accrued liability. Contribution rates as of June 30, 2021 are as follows:
Employer Employer Employer Employee Paid for Contribution Rate for
Retirement System Paid EmElo;ree Rates 40l(k) Plan NoncontributoD:'. Sistem
Local Governmental · Tier 1 NIA NIA 18.47% NIA
ContributoD:'. System Local Governmental· Tier l 6.00% NIA 14.46% NIA Local Governmental · Tier 2 NIA NIA 15.80% 0.89%
Public Safety System Noncontributory · Tier l NIA NIA 38.97% NIA Contributory (7 4) - Tier 1 10.50% NIA 28.98% NIA Conti·ibutory (122) · Tier 2 NIA 2.27% 30.02% NIA
Firefighters System Division B · Tier 1 NIA 16.71% 7.24% NIA Division B - Tier 2 NIA 2.27% 14.08% NIA
Tier 2 DC Only Local Governmental NIA NIA 6.69% 10.00% Public Safety NIA NIA 16.02% 14.00% Firefighters NIA NIA 0.08% 14.00%
Tier 2 rates include a statutory required contribution to finance the unfunded actuarial accrued liability of the Tier 1 plans.
-91-
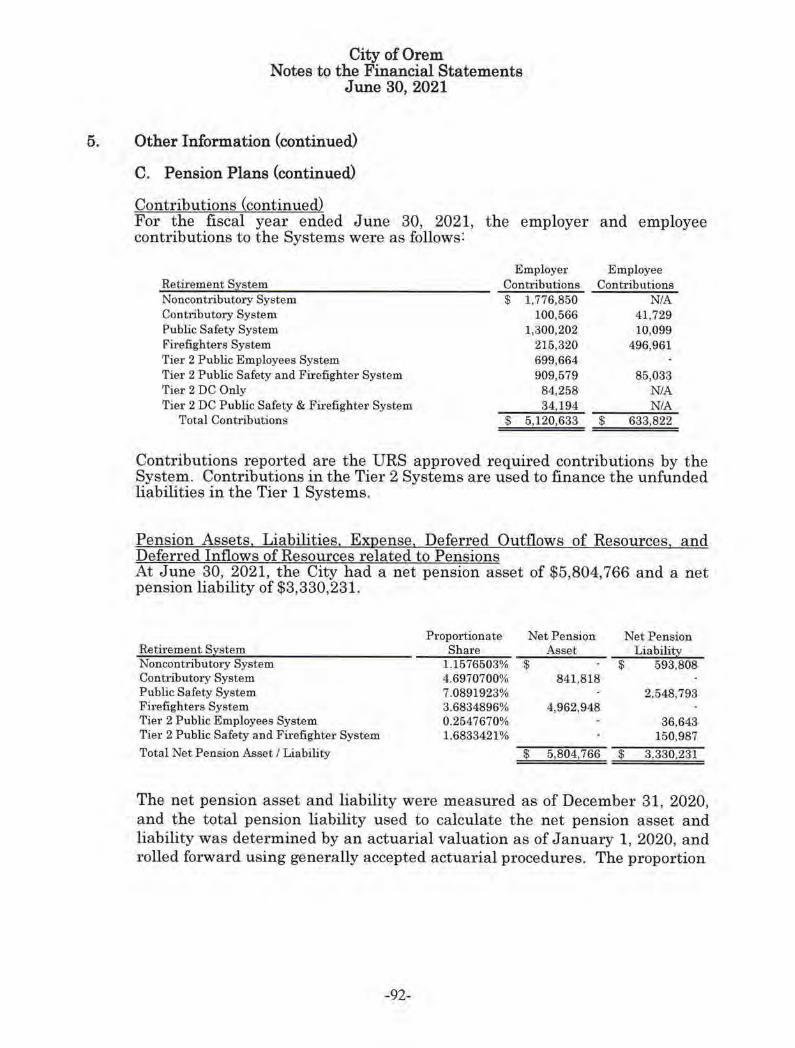
City of Orem Notes to the Financial Statements
J une 30, 2021
5. Other Information (continued)
C. Pension Plans (continued)
Contributions (continued) For the fiscal year ended June 30, 2021, the employer and employee contributions to the Systems were as follows:
Retirement System Noncontributory System Contribut01')' System Public Safety System l<'irefighters System Tier 2 Public Employees System Tier 2 Public Safety and Firefighte1· System Tier 2 DC Only Tier 2 DC Public Safety & Firefighter System
Total Contributions
Employer Contributions $ 1,776, 850
100,566 1,300,202
215,320 699,664 909,579
84,258 34,194
$ 5,120,633
Employee Contributions
NIA 41,729 10,099
496,961
85,033 NIA NIA
$ 633,822
Contributions reported are the URS approved required contributions by the System. Contributions in the Tier 2 Systems are used to finance the unfunded liabilities in the Tier 1 Systems.
Pension Assets, Liabilities , Expense, Deferred Outflows of Resources, and Deferred Inflows of Resom·ces related to Pensions At June 30, 2021, the City had a net pension asset of $5,804,766 and a net pension liability of $3,330,231.
Proportionate Net Pension Net Pension Retirement System Share Asset Liabili~ Noncontributory System 1.1576503% $ $ 593,808 Contributo1.-y System 4.6970700% 841,818 Public Safety System 7.0891923% 2,548,793 Firefighters System 3.6834896% 4,962,948 Tier 2 Public Employees System 0.2547670% 36,643 Tier 2 Public Safety and Firefighter System 1.6833421% 150,987 Total Net Pension Asset I Liability $ 5,804,766 $ 3,330,231
The net pension asset and liability were measw·ed as of December 31, 2020, and the total pension liability used to calculate the net pension asset and liability was determined by an actuarial valuation as of January 1, 2020, and rolled forward using generally accepted actuarial procedures. The proportion
-92-
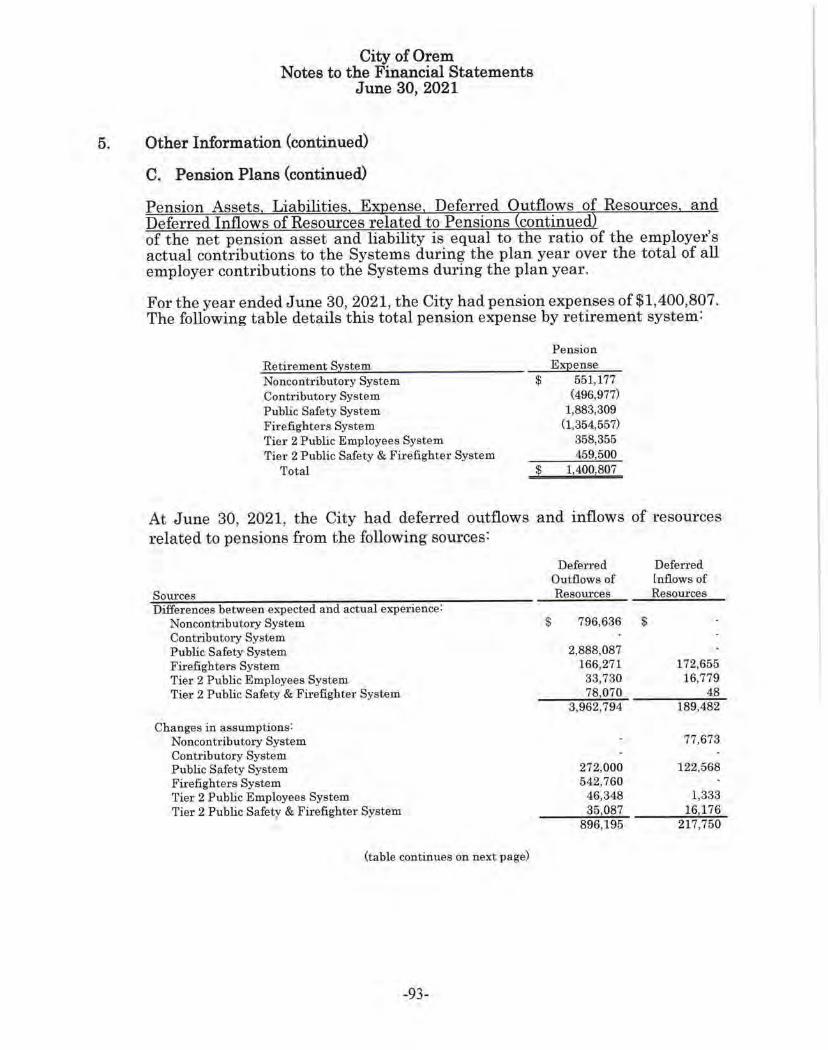
City of Orem Notes to the Financial Statements
June 30, 2021
5. Other Information (continued)
C. Pension Plans (continued)
Pension Assets Liabilities ense Deferred Outflows of Resources and Deferred Inflows of Resources related to Pensions continued of the net pension asset and liability is equal to the ratio of the employer's actual contributions to the Systems during the plan yeru· over the total of all employer contributions to the Systems during the plan year.
For the year ended June 30, 2021, the City had pension expenses of $1,400,807. The following table details this total pension expense by retirement system:
Retirement System Noncontributory System Contributory System Public Safety System Firefighters System Tier 2 Public Employees System Tier 2 Public Safety & Firefighter System
Total
Pension Expense
$ 551,177 (496,977)
1,883,309 (1,354,557)
358,355 459,500
$ 1,400,807
At June 30, 2021, the City had deferred outflows and inflows of 1·esources related to pensions from the following sotu·ces:
Sources Diffe1·ences between expected and actual experience:
Noncontributory System Contributory System Public Safety System Firefighters System Tier 2 Public Employees System Tier 2 Public Safety & Firefigbte1· System
Changes in assumptions: Noncontributory System Contributory System Public Safety System Firefighters System Tier 2 Public Employees System Tier 2 Public Safety & Firefighter System
(table continues on next page)
-93-
Deferred Outflows of Resources
$ 796,636
2,888,087 166,271
33,730 78,070
8,962,794
272,000 542,760
46,348 35 087
896,195
Deferred Inflows of Resources
$
172,655 16,779
48 189,482
77,673
122,568
1,333 16176
217,750
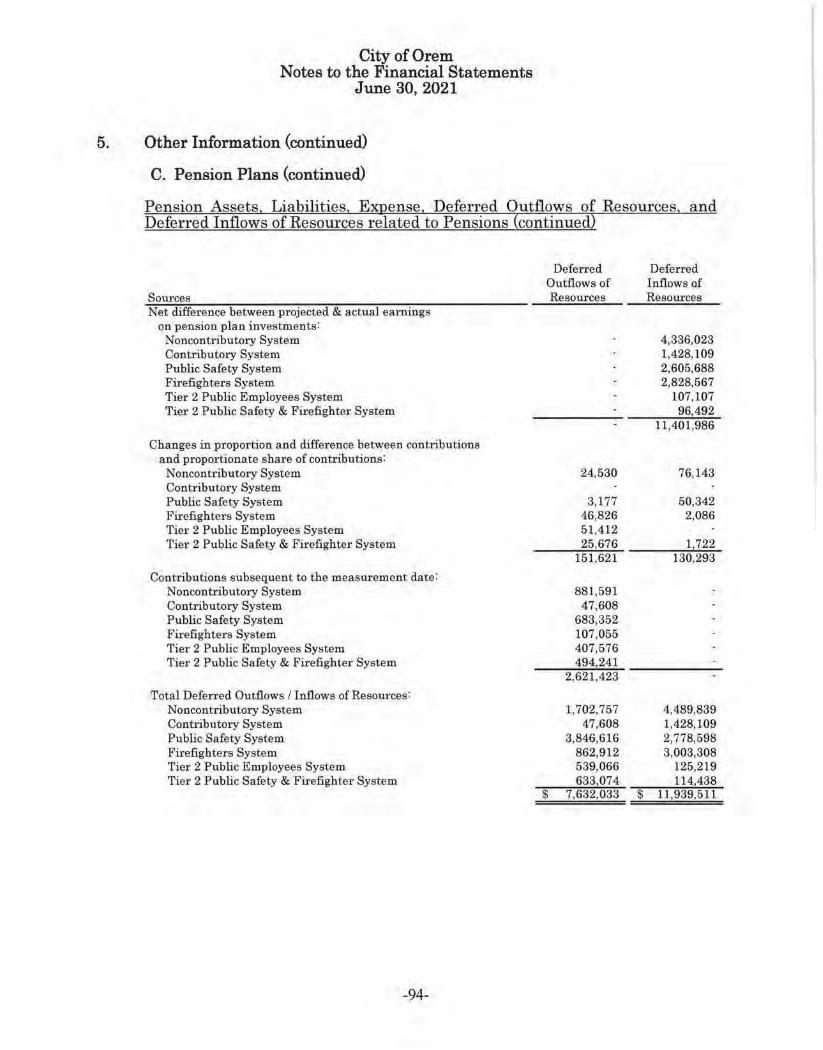
City of Orem Notes to the Financial Statements
June 30, 2021
5. Other Information (continued)
C. Pension Plans (continued)
Pension Assets Liabilities Ex ense Deferred Outflows of ResoU1·ces and Deferred Inflows of Resources related to Pensions continued
Sources Net difference between projected & actual earnings
on pension plan investments: Noncontributory System Contributo1-y System Public Safety System Firefighters System Tier 2 Public Employees System Tier 2 Public Safety & Firefighter System
Changes in proportion and difference between contributions and proportionate share of contributions:
Noncontributory System Contributory System Public Safety System Fire.fighters System Tier 2 Public Employees System Tier 2 Public Safety & Firefighter System
Contributions subsequent to the measurement date: Noncontributory System Contributory System Public Safety System Firefighters System Tier 2 Public Employees System Tier 2 Public Safety & Firefighter System
Total Deferred Outflows / Inflows of Resources: Noncontributory System Contribut01-y System Public Safety System Firefighters System Tier 2 Public Employees System Tier 2 Public Safety & Firefighter System
-94-
Deferred Defened Outflows of Inflows of Resources Resources
4,336,023 1,428,109 2,605,688 2,828,567
107,107 96,492
11,401,986
24,530 76,143
3,177 50,342 46,826 2,086 51,412 25 676 1 722
151,621 130,293
881,591 47,608
683,352 107,055 407,576 494 241
2,621 ,423
1,702,757 4,489,839 47,608 1,428,109
3,846,616 2,778,598 862,912 3,003,308 539,066 125,219 633,074 114,438
$ 7,632,033 $ 11,939,511
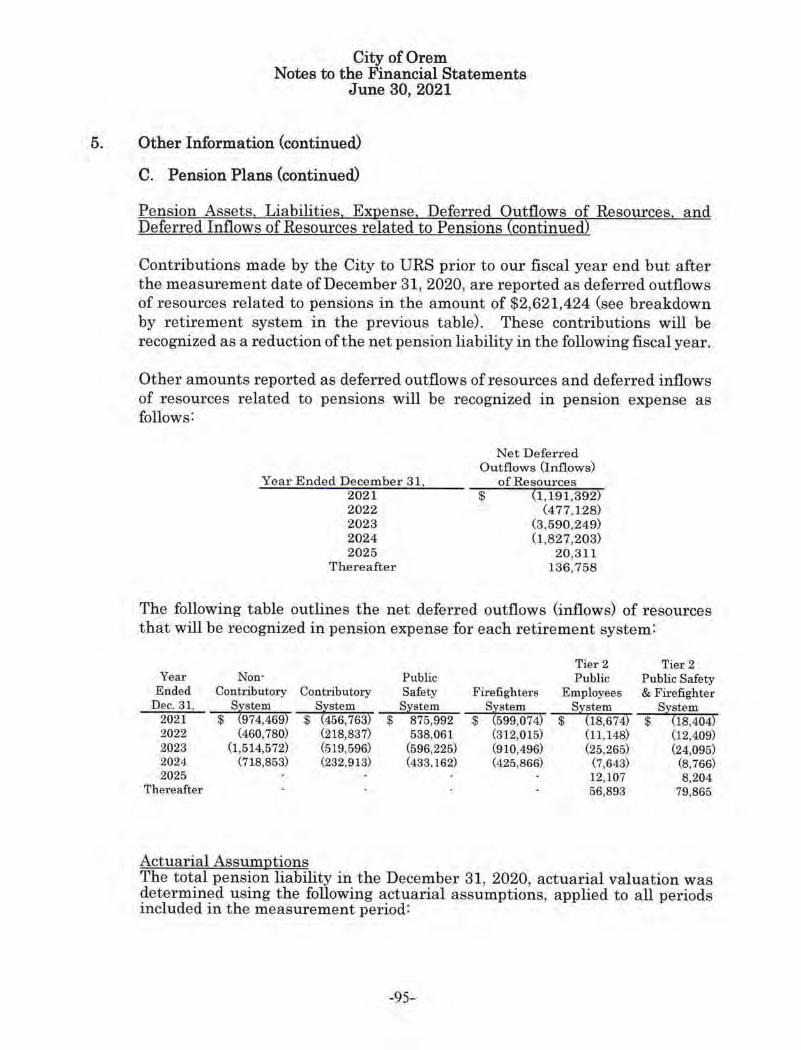
City of Orem Notes to the Financial Statements
June 30, 2021
5. Other Information (continued)
C. Pension Plans (continued)
Pension Assets Liabilities E ense Deferred Outflows of Resources and Deferred Inflows of Resources related to Pensions continued
Contributions made by the City to URS prior to our fiscal year end but after the meas\ll'ement date of December 31, 2020, a1·e reported as deferred outflows of resources related to pensions in the amount of $2,621,424 (see breakdown by retirement system in the previous table). These contributions will be recognized as a reduction of the net pension liability in the following fiscal year.
Other amounts reported as defened outflows of resources and defened inflows of 1·esources related to pensions will be recognized in pension expense as follows:
Year Ended December 31, 2021 2022 2023 2024 2025
Thereafter
Net Deferred Outflows (Inflows)
of Resources $ (1,191,392)
(477, 128) (3,590,249) (1,827,203)
20,311 136,758
The following table outlines the net deferred outflows (inflows) of resources that will be recognized in pension expense for each retirement system :
Year Ended
Dec. 311
2021 2022 2023 2024 2025
Thereafter
Non· Contributory
S~stem $974,469)
(460,780) (1,514,572)
(718,853)
Contributory System
$ (456,763) (218,837) (519,596) (232,913)
Public Safety
System $ 875,992
538,061 (596,225) (433,162)
Firefighters Stfstem
$599,074) (312,015) (910,496) (425,866)
Tier 2 Public
Employees System
$ (18,674) (11,148) (25,265)
(7,643) 12, 107 56,893
Tier 2 Public Safety & Firefighter
System $ (18,404)
(12,409) (24,095)
(8,766) 8,204
79,865
Actuarial Assumptions The total pension liability in the December 31, 2020, actuarial valuation was determined using the following actuarial assumptions, applied to all periods included in the measurnment period:
-95-
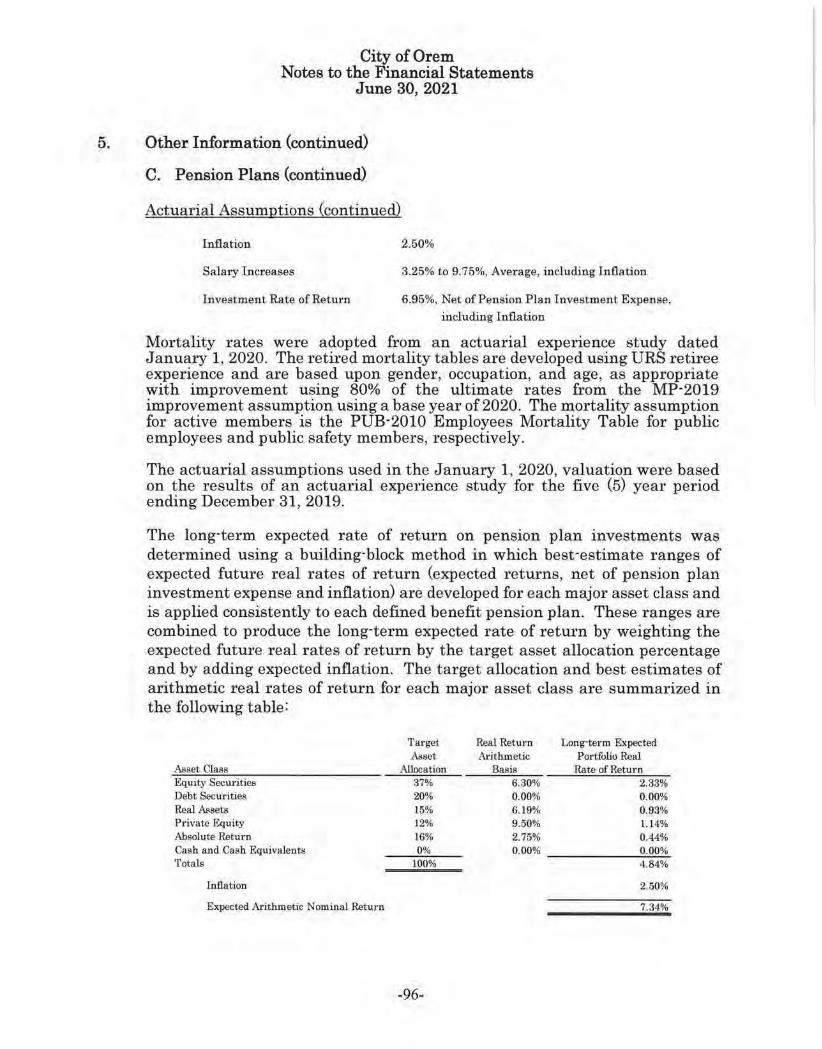
City of Orem Notes to the Financial Statements
June 30, 2021
5. Other Information (continued)
C. Pension Plans (continued)
Actuarial Assumptions (continued)
Inflation
Salary Increases
Investment Rate of Retw·n
2.50%
3.25% to 9.75%, Average, includ.ing Inflation
6.95%, Net of Pension Plan Investment Expense, includ.ing Inflation
Mortality rates were adopted from an actuarial experience study dated January 1, 2020. The retired mortality tables are developed using URS retiree experience and are based upon gender, occupation, and age, as appropriate with improvement using 80% of the ultimate rates from the MP-2019 improvement assumption using a base year of 2020. The mortality assumption for active members is the PUB-2010 Employees Mo1·tality Table for public employees and public safety members, respectively.
The actuarial assumptions used in the January 1, 2020, valuation were based on the results of an actuarial experience study fo1· the five (5) year period ending December 31, 2019.
The long·term expected rate of return on pension plan investments was determined using a building-block method in which best-estimate ranges of expected future real rates of return (expected returns, net of pension plan investment expense and inflation) are developed for each major asset class and is applied consistently to each defined benefit pension plan. These ranges are combined to produce the long·term expected rate of return by weighting the expected futU1·e real rates of return by the target asset allocation percentage and by adding expected inflation. The target allocation and best estimates of arithmetic real 1·ates of 1·eturn for each major asset class are summarized in the following table:
Asset Class Equity Securities Debt Securities Real Assets Private Equity Absolute Return Cash and Cash Equivalents Totals
Inflation
Expected Aritb.metic Nominal Return
Target Asset
Allocation 37% 20% 15% 12% 16% 0%
100%
~96-
Real Return Long·term Expected Arithmetic Portfolio Real
Basis Rate of Return 6.30% 2.33% 0.00% 0.00% 6.19% 0.93% 9.50% 1.14% 2.75% 0.44% 0.00% 0.00%
4.84%
2.50%
7.34%

City of Orem Notes to the Financial Statements
June 30, 2021
5. Other Information (continued)
C. Pension Plans (continued)
Actuarial Assumptions (continued) The 6.95% assumed investment rate of return is comprised of an inflation rate of 2.50% and a real return of 4.45% that is net of investment expense.
Discount Rate The discount rate used to measure the total pension liability was 6.95%. The projection of cash flows used to determine the discount rate assumed that employee contributions will be made at the current contribution rate and that contributions from all padicipating employers will be made at conti·actually required rates that are actuarially determined and certified by the URS Board. Based upon those assumptions, the pension plan's fiduciary net position was projected to be available to make all projected future benefit payments of current active and inactive employees. Therefore, the long·term expected rate of return on pension plan investments was applied to all periods of projected benefit payments to determine the total pension liability. The discount rate does not use the Municipal Bond Index Rate. The discount rate remained unchanged at 6.95%.
Sensitivity of the Proportionate Share of the Net Pension Asset and Liability to changes in the Discount Rate The proportionate share of the net pension liability calculated using the discount rate of 6.95%, as well as what the proportionate share of the net pension liability would be if it were calculated using a discount rate that is 1.00% lower (5.95%) or 1.00% higher (7.95%) than the current rate is presented in the following table:
1.00% Discount 1.00% Dectease Rate Increase
Retirement S:z'.stem (5.95%) (6.95%) (7.95%) Noncontributory System $ 10,294,875 $ 593,808 $ (7,493,490) Contributory System 1,252,053 (841,818) (2,609,739) Public Safety System 9,317,705 2,548,793 (2,966,613) Firefighters System 651,564 (4,962,948) (9,571,650) Tier 2 Public Employees System 616,585 36,643 (406,998) Tier 2 Public Safety & Firefighter System 711,852 150,987 (2961339)
Total $ 22,844,634 $ (2,474,535) $ {23,344,829)
Pension Plan Fiduciary Net Position Detailed information about the pension plan's fiduciary net position is available in the separately issued URS financial report (www.urs.org).
Funding and Allocation Method The City used each active URS participating employee's current wage and years of service to calculate a weighted amount. These weighted amounts were used to establish a percentage of each system1s total applicable net liability or asset (as provided by URS). Each employee is then assigned their applicable
-97-

City of Orem Notes to the Financial Statements
June 30, 2021
5. Other Information (continued)
C. Pension Plans (continued)
Funding and Allocation Method (continued) amount based upon the prior calculations and grouped according to their job assignment. The total amount for all employees associated with a governmental fund is recorded as a governmental activity in the governmentwide statements. Obligations for these employees are generally liquidated through the General Fund. Amounts for all employees associated with a proprietary fund a1·e identified and all associated transactions are recorded within the applicable proprietary fund. Each proprietary fund is responsible to liquidate its own pension obligations.
D. Employee Retirement Plans other than Pension Plans
401 k Defined Contribution Plan The City's 401 k defined contribution plan is administered by ICMA Retirement Corporation (ICMA·RC). The payroll covered by the defined contribution plan for the year ended June 30, 2021, was $32,695,810. The City's expense for this plan for the year ended June 30, 2021 was approximately $327,000 or 1.00% of the total participants' salai-y.
The contribution rates were previously fixed by the City Council and the contributions were remitted on a timely basis. All employees are fully vested for the contl'ibutions made by the City.
In the early 1980's, the City elected to withdraw from the Utah Retirement Systems (URS) pension plan and contribute these funds to each employee's 40l(k) account. However, State lawmakers soon mandated that all employees were required to join the URS except certain classes of employees. The City Council was allowed to identify which employees qualified. They elected to allow department heads, the City Manager, and City Council members the option of whether or not to participate in the URS. There are cuuently three employees, the Mayor, and all six City Council members who have elected to not participate in the URS.
The City also participates in the URS 401(k) defined contribution savings plan which is generally a supplemental plan to the basic pension benefits of the URS, but may be used as a primary retirement plan. Employee and employer contributions to the URS 40l(k) defined contribution savings plan for the fiscal years ended June 30 were as follows:
Contribution Type Employer Contributions Employee Contributions
2021 $ 274,072 $ $ $
-98-
2020 2019 267,198 $ 235,362
$
City of Orem Notes to the Financial Statements
June 30, 2021
5. Other Information (continued)
D. Employee Retirement Plans other than Pension Plans (continued)
457 Deferred Compensation Plan The deferred compensation plan was created in 1981 as a Social Security replacement program for the employees of the City. The deferred compensation is not available to employees until termination, retirement, death, or unforeseeable emergency. The City participates in four plans. The assets associated with these plans are not included in the basic financial statements, as they are not legal assets of the City.
All elected officials and permanent employees may also elect to participate in the City's deferred compensation plan and all temporary employees ai·e required to participate in a deferred compensation plan. Under this plan, participants defer a percentage of their compensation up to 7 .5% for executive management personnel and up to 5.5% for all other employees (except for the City Manager, whose participation in the plan is determined through negotiation with the City Council, and employees required to pay Medicare insurance premiums) for employees hired prior to March 1986. For those hired after March 1986 the percentage is 6.0% and 4.0% respectively. The City matches the amount deferred by the participants, not to exceed the maximums listed previously or the IRS legal limit . The payroll covered by the deferred compensation plan for the year ended June 30, 2021, was $32,695,810. The City's expense for this plan for the year ended June 30, 2021, was approximately $1,241,000 or 3.80% of the total participants' salai·y. The contribution rates were determined by the City Council and the contributions were remitted on a timely basis.
The City also participates in the URS 457 defined contribution savings plan which is generally a supplemental plan to the basic pension benefits of the URS, but may be used as a primary retirement plan. Employee and employer contributions to the URS 457 defined contribution savings plan for the fiscal years ended June 30 were as follows:
Contribution Tzye Employer Contributions Employee Contributions
2021 2020 2019 $ 103,249 $ 88,353 $ 106,355 $ 133,345 $ 106,929 $ 127,678
E. Other Postemployment Benefits
General Information about the OPEB Plan
Plan Description
The City provides postemployment healthcare benefits through a single· employer defined benefit plan to all employees who retired from t he City prior to January 1, 2007, and who were qualified to retire from any of the Utah State Retirement Systems. The benefit, benefit level, employee and
-99-
City of Orem Notes to the Financial Statements
June 30, 2021
5. Other Information (continued)
E. Other Postemployment Benefits (continued)
Plan Description (continued)
employer cont1·ibutions are governed by City policy and can be amended at any time. The plan is not accounted for as a trust fund and no assets are being accumulated in a trust that meet the criteria in paragraph 4 of Statement 75. The plan does not issue a separate financial report.
Employees who retire(d) on or after January 1, 2007, are not eligible to participate in this plan unless retiree health insurance is offered as an option to an employee under a voluntary separation plan which are unusual and infrequent. Otherwise, no new entrants to the plan will occur. As of June 30, 2021, there are four (4) retirees or retirees spouses participating in the plan.
The City currently pays for postemployment benefits other than pensions on a "pay·as·you·go" basis. Contribution amounts for the City and the plan members may be amended at any time and for any reason. For the fiscal year ended June 30, 2021, total p lan premiums paid were $60,399. The City contributed $33,683 (55. 77% of total premiums) and retiree plan members receiving benefits contributed $26,716 (44.23% of total premiums). The activity of the plan is reported in the City's General Fund and all obligations are liquidated through the General Fund.
Total OPEB Liability
The City's total OPEB liability of $89,063 was determined by an actuarial valuation as of January 1, 2020, and measurement date of Decembe1· 31, 2020.
Actuarial Assumptions and Other Inputs
The total OPEB liability in the January 1, 2020, actuarial valuation was determined using the following actuarial assumptions and other inputs, applied to all periods included in the measurement, unless othe1-wise noted:
lnflation
Salary Increases
Discount Rate
Healthca1·e Cost '!'rend Rates
Ret irees' Share of Benefit· Related Costs
2.20%
NIA
2.16%
4.10% scaling down to 3.70% over 54 years.
55% of projected health insm·a nce premiums
The discount rate was based on the 20-year Bond Buyer General Obligation Municipal Index.
-100-
City of Orem Notes to the Financial Statements
June 30, 2021
5. Other Information (continued)
E. Other Postemployment Benefits (continued)
Actuarial Assumptions and Other Inputs (continued)
Mortality rates were based on 2010 Pub General Healthy Retiree with 100% of MP Ultimate scale for retirees and 2010 Pub General Disabled Retiree with 100% of MP Ultimate scale for disabled pa1·ticipants.
The actuarial assumptions used in the January 1, 2020, valuation were based on the results of an actuarial experience study for the period January 1, 2020 to December 31, 2020.
Changes in the Total OPEB Liability
The following table shows the changes in the City's total OPEB liability:
Total OPEB Liability as of January 1, 2020 Changes for the Year:
Service Cost Interest on 'l'otal OPEB Liability Effect of Economic/Demographic Gains/Losses Changes in Assumptions or Other Inputs Expected Benefit Payments
Net Changes Total OPEB Liability as of January 1, 2021
Total OPEB
Liability $ 157,627
$
2,700
58 (71,322) (68,564) 89,063
Sensitivity of the Total OPEB Liabih'ty to Changes in the Discount Rate
The following table p1·esents the total OPEB liability of the City, calculated using the discount rate of 2.16%, as well as what the City's total OPEB liability would be if it were calculated using a discount rate that is 1.00% lower (1. 16%) or 1.00% higher (3.16%) than the current rate:
Total OPEB Liability at January 1, 2021
1.00% Decrease (1.16%)
$ 90,276
Discount Rate
(2.16%) $ 89,063
1.00% Increase (3.16%)
$ 87,889
Sensitivity of the Total OPEB Liability to Changes in the Healthcare Cost Trend Rates
The following table presents the total OPEB liability of the City, calculated using the current healthcare cost trend rates, as well as what the City's total
-101-

City of Orem Notes to the Financial Statements
June 30, 2021
5. Other Information (continued)
E . Other Postemployment Benefits (continued)
Sensitivity of the Total OPEB Liability to Changes in the Healthcare Cost Trend Rates
OPEB liability would be if it were calculated using trend r a tes tha t are 1.00% lower or 1.00% higher than the current 1·ate:
1.00% Current TI'end
Decrease Rate 1.00%
Increase Total OPEB Liability at January 1, 2021 $ 87,489 $ 89,063 $ 90,661
OPEB Expense and Deferred Outflows of Resources and Deferred Inflows of Resources related to OPEB
For the yeai· ended June 30, 2021, the City had OPEB expenses of $22,451.
The following t able details this total OPEB expense:
Description Service Cost Interest on Total OPEB Liability Effect of Plan Changes Recognition of Deferred Ouflows/Inflows of ResoU1·ces:
Recognition of Economic/Demog1:aphic Gains/Losses Recognition of Assumption Changes or Inputs
Total
OPEB E xEense
$ 2,700
3.549 16 202
$ 22,451
OPEB Ex ense and Deferred Outflows of Resources and Deferred Inflows of Resources rela ted to OPEB cont inued
At June 30, 2021, the City reported the following deferred outflows of r esources or inflows of resources related to OPEB:
OPEB Deferred Out0ows I Inflows of Resourcea
Differences between expected and actual experience
Chaagea in assumptions
Total OPEB Defen-ed Outflows / Inflows of .Resources
-102-
Deferred
Outflows of
Resources
$
$
Deferred
Inflows of
Resources
$ 1, 135
5,209
$ 6,344

City of Orem Notes to the Financial Statements
June 30, 2021
5. Other Information (continued)
E. Other Postemployment Benefits (continued)
Amounts reported as deferred outflows of resources and deferred inflows of resources related to OPEB will be recognized in OPEB expense as follows:
Year Ended December 311 2021 2022 2023 2024 2025
Thereafter
Net Deferred Outflows (Inflows)
of Resources $ 6,336
8
F. Segment Information for Enterprise Funds
The City has issued revenue bonds to finance certain improvements to its culinary water distribution system, water reclamation plant, and storm sewer system. Because each of these activities is accounted for in separate funds and all of those funds arn reported as major funds in the fund financial statements, segment disclosures herein are not required.
G. Redevelopment Agency of the City of Orem
The following Redevelopment Agency information is p1·esented as required by Utah State Code Section 17A·2·1217(3).
For the year ended June 30, 2021, the following activity occurred in the City's Redevelopment Agency:
Tax Increment Collected From Other Taxing Agencies For The P1·oject Area
Orem 85·01: Orem Tek Development Orem 85-02: Timpanogos Technological Center Orem 85·03A: University Padrway Development Orem 85·03B: University Parkway Development Orem 85·04,: Economic Zone in Central Orem Orem 87· 10: Boyer Project on Center and State Street Orem 90·08: 800 North and State Street Economic Zone Orem CDA: University Place
Total
Outstanding Loans to Finance RDA Projects
-103-
Total Received $ 336,644
184,859 213,862 346,178 104,842 216,693 259,613
1,149,872 $ 2,812,563
$
Orem City's Portion
177,867 97,184
112,885 182,471 55,358
114,389 51,718
169 174 $ 961,046
City of Orem Notes to the Financial Statements
June 30, 2021
5. Other Information (continued)
G. Redevelopment Agency of the City of Orem (continued)
During the year ending June 30, 2021, the RDA expended momes in the categories below as follows:
Economic Development Capital Outlay
Total
$
$
1,051,628 170 048
1,221,676
The Redevelopment Agency did not pay tax increment funds to any taxing agencies for projects during the current fiscal year.
The Redevelopment Agency has one contractual arrangement in the University Place CDA area. The contract was entered into to help fund infrastructure improvements being made as part of an economic development plan for the area. The agreement specifies that 90% of the property taxes collected for this project area are to be remitted to the property owner, 5% to be held within the RDA for future improvements in the project area, and 5% to be paid to the city for administration costs. The agreement term is for twenty years and ends in Fiscal Year 2038. The amount remitted to the property owner for the current fiscal year was $1,034,885.
H. Subsequent Event
The City has been involved in a breach of contract lawsuit alleging certain clean·up obligations were not disclosed related to the sale of real property the City owned. The case progressed through discovery and into the pretrial and trial·setting phase during the 2021 calendar year. The parties are in the process of finalizing a settlement and dismissing the litigation. The City estimates its potential liability is $1,150,000 but the actual settlement amount is currently unknown. The Utah Risk Management Agency (URMA) will provide the funds for any settlement and repayment to URMA will be handled pursuant to the City's standard agreement with URMA.
-104-
REQUIRED SUPPLEMENTARY
INFORMATION
-105-
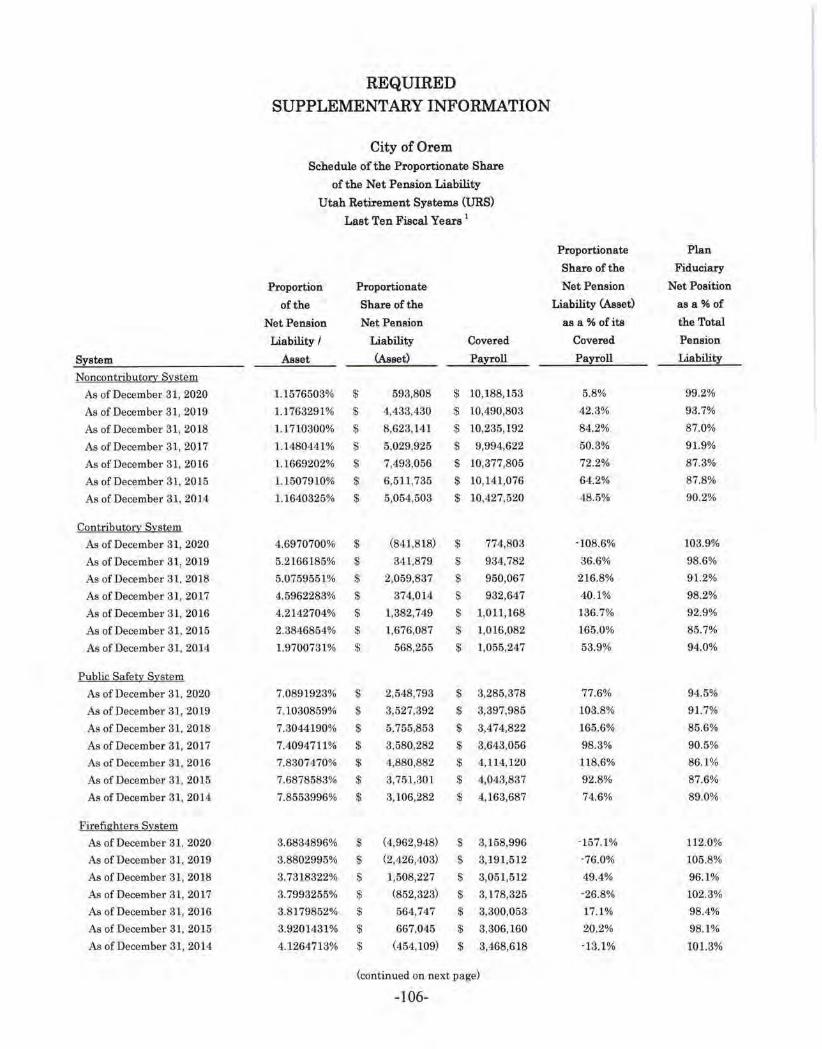
REQUIRED SUPPLEMENTARY INFORMATION
City of Orem Schedule of the Proportionate Share
of the Net Pension Liability Utah Retirement Systems (URS)
Last Ten Fiscal Years 1
Proportionate Plan
Share of the Fiduciary
Proportion Proportionate Net Pension Net Position
of the Share of the Liability <Aaaet) as a% of
Net Pension Net Pension as a% ofita the Total
Liability/ Liability Covered Covered Pension
System Aaset <Asset) Payroll Payroll Liability
NoncontributQry Systgm
As of December 31, 2020 1.1576503% $ 593,808 $ 10,188,153 5.8% 99.2%
As of December 31, 2019 1.1763291% $ 4,433,430 $ l0A90,803 42.3% 93.7%
As of December 31, 2018 1.1710300% $ 8,623,14] $ 10,235,192 84.2% 87.0%
As of December 31, 2017 1.148044]% $ 5,029,925 $ 9,994,622 50.3% 91.9%
As of December 31, 2016 1.1669202% $ 7,493,056 $ 10,377,805 72.2% 87.3%
As of December 31, 2015 1.1507910% $ 6,511,735 $ 10,141,076 64.2% 87.8%
As of December 3 J, 20 J 4 l.1640325% $ 5,054,503 $ 10,427,520 48.5% 90.2%
CgntrihutQ!:~ Syst~m
As of December 31, 2020 4.6970700% $ (84 1,818) s 774,803 · 108.6% 103.9%
As of December 31, 2019 5.2166185% $ 341,879 $ 934,782 36.6% 98.6%
As of Decembel' 31, 2018 5.0759551% $ 2,059,837 $ 950,067 216.8% 91.2%
As of December 31, 2017 4.5962283% $ 374,014 $ 932,647 40.1% 98.2%
As of December 31, 2016 4.2142704% $ 1,382,749 $ 1,011,168 136.7% 92.9%
As of December 31, 2015 2.3846854% $ 1,676,087 $ 1.016,082 165.0% 85.7%
As of December 31, 2014 1.9700731% $ 568,255 $ 1,055,247 53,9% 94,0%
Publi~ S!!f!.:U: Systgm
As of December 31, 2020 7.0891923% $ 2,548,793 $ 3,285,378 77.6% 94.5%
As of December 31, 2019 7.1030859% $ 3,527,392 $ 3,397,985 103.8% 91.7%
As of December 31, 2018 7.3044190% $ 5,755,853 $ 3,474,822 165.6% 85.6%
As of December 31, 2017 7.4094711% $ 3,580,282 $ 3,643,056 98.3% 90.5%
As of December 31, 2016 7.8307470% $ 4,880,882 $ 4,114,120 118,6% 86.1%
As of December 31, 2015 7.6878683% $ 3,751,301 $ 4,043,837 92.8% 87.6%
As of December 31, 2014 7.8553996% $ 3,106,282 $ 4.163,687 74.6% 89.0%
Firefighters System
As of December 31, 2020 3.6834896% $ (4,962,948) $ 3,158,996 -157.1% 112.0%
As of December 31. 2019 3.8802995% $ (2,4-26,403) $ 3,191.512 ·76.0% 105.8%
As of December 31, 2018 3.7318322% $ 1,508,227 $ 3,051,512 49.4% 96.1%
As of December 31, 2017 3.7993255% $ (852,323) $ 3, L78,325 ·26.8% 102.3%
As of December 31, 201G 3.8179852% $ 564,747 $ 3,300,053 17.1% 98.4%
As of December 31, 2015 3.9201431% $ 667.045 $ 3,306,160 20.2% 98.1%
As of Decem her 31, 2014 4.1264713% $ (454,109) $ 3,468,618 ·13.1% 101.3%
(continued on next page)
-106-
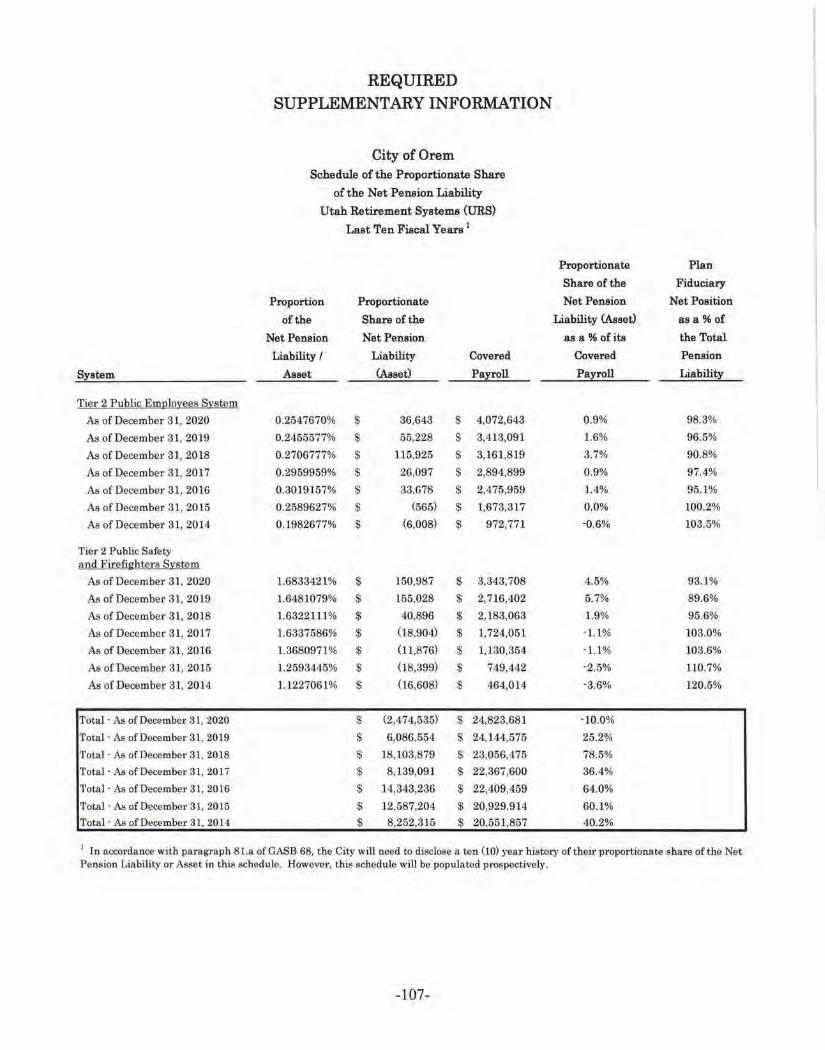
System
Tier 2 Public Employees System
As of December 3l, 2020
As of December 31, 2019
As of December 31, 2018
As of December 31, 2017
As of December 31, 2016
As of December 31, 2015
As of December 31, 2014
Tier 2 Public Safety and Firefighters System
As of December 31, 2020
As of December 31, 2019
As of December 31, 2018
As of December 31, 2017
As of December 31, 2016
As of December 31, 2015
As of December 31, 2014
Total· As of December 31, 2020
Total· As of December 31, 2019
Total · As of December 31, 2018
Total · As of December 31, 2017
Total· As of December 31, 2016
'l'otal · As of December 31, 2016
Total · As of December 31, 2014
REQUIRED SUPPLEMENTARY INFORMATION
City of Orem Schedule of the Proportionate Share
of the Net Pension Liability
Utah Retirement Systems (URS)
Last Ten Fiscal Years 1
Proportion Proportionate
ofthe Share of the
Net Pension Net Pension
Liability/ Liability Covered
Asset CAaset) Payroll
0.2547670% $ 36,643 $ 4.072,643
0.2455577% $ 55,228 $ 3,413,091
0.2706777% $ 115,925 $ 3,161,819
0.2959959% s 26,097 $ 2,894,899
0.3019157% $ 33,678 $ 2,475,959
0.2589627% $ (565) $ 1,673,317
0.1982677% $ (6,008) $ 972,771
1.6833421% $ 150,987 $ 3,343.708
1.6481079% $ 155,028 $ 2,716,402
1.6322111% $ 40,896 $ 2,183,063
1.6337586% $ (18,904) $ 1,724,051
1.3680971% $ (11,876) $ 1. 130,354
1.2593445% $ (18,399) $ 749,442
1.1227061% $ (16,608) $ 464,014
$ (2,474,535) $ 24,823,681
$ 6,086,554 $ 24,144,575
$ 18, 103,879 $ 23,056,475
$ 8,139,091 $ 22,367,600
$ 14,343,236 $ 22,409,459
$ 12,587,204 $ 20,929,914
$ 8,252,315 $ 20,551,857
Proportionate Plan
Share of the Fiduciary
Net Pension Net Position
Liability (Asset) as a% of
as a% ofite the Total
Covered Pension
Payroll Liability
0.9% 98.3%
1.6% 96.5%
3.7% 90.8%
0.9% 97.4%
1.4% 95.1%
0.0% 100.2%
·0.6% 103.5%
4.5% 93.1%
5.7% 89.6%
1.9% 95.6%
· 1.1% 103.0%
·1.1% 103.6%
·2.5% 110.7%
·3.6% 120.5%
·10.0%
25.2%
78.5%
36.4%
64.0%
60.1%
40.2%
1 In acco.rdance with paragraph 81.a of OASB 68, the City will need to disclose a ten (10) year history of their proportionate share of the Net Pension Liability or Asset in this schedule. However, th.is schedule will be populated prospectively.
-107-

REQUIRED SUPPLEMENTARY INFORMATION
City of Orem Schedule of Contributions
Utah Retirement Systems (URS)
Last Ten Fiscal Years L
Contributions
in relation to the Contribution
Contractually Contractually Contribution as a% of
Required Required Deficiency Covered Covered
S;i::stem Contribution Contribution (Excess) Pa;i::!oll Payroll 2
l:!!11n!:2nil:ibutllo: S:i~l~m As of June 30, 2021 $ 1,776,850 $ 1,776,850 $ $ 10,096,295 17.60% As of June 30, 2020 s 1,835,859 $ 1,835,859 $ $ 10,508,753 17.47% As of June 30, 2019 $ 1,849,063 $ 1,849,063 $ s 10,576,380 17.48% As of June 30, 2018 $ 1,826,860 $ 1.826,860 $ $ 10,413.456 J 7.54% As of June 30, 2017 $ 1,733,503 $ 1,733.503 $ $ 9,986,591 17.36% As of June 30, 2016 $ 1,742,920 $ 1,742,920 $ $ 10,082,347 17.29% As of June 30, 2015 $ 1,785,144 s 1,785,144 s $ 10,274,003 17.38% As of June 30, 2014 $ 1,720,949 $ 1,720,949 s $ 10,573,678 16.28%
Q11nttibl!1m Si~tem Aa of June 30, 2021 $ 100,566 s l00,566 $ $ 695,479 14.46% As of June 30, 2020 $ 124,700 $ 124,700 $ $ 862,379 14-.46% As of June 30. 2019 $ 139,613 $ 139,613 $ s 965,512 14.46% As of June 30, 2018 s 139,995 $ 139,995 s s 968,153 14.46% As of June 30. 2017 s 136,617 $ 136,617 $ s 944,788 14.46% As of June 30, 2016 s 146, M9 $ 146, 149 $ $ 1,010,709 14.46% As of June 30, 2015 $ 146,64,5 $ 146,645 $ $ 1,014,143 14.46% As of June 30, 2014 $ 145,300 $ 145,300 $ $ 1,094,124 13.28%
Publi~ Si!f!ltl'. S;i§tem As of June 30, 2021 $ 1,300,202 $ 1,300,202 $ $ 3,450,026 37.69% As of June 30, 2020 $ 1,207,483 $ 1,207,483 $ $ 3, 173,176 38.05% As of June 30, 2019 $ 1,286,440 s 1,286,440 s $ 3,324,661 38.69% As of June 30, 2018 $ 1,379,976 $ 1,379,976 $ s 3,609,633 38.23% As of June 30, 2017 $ 1,4-17,405 $ 1,417,405 $ $ 3,768,298 37.61% As of June 30, 2016 $ 1.534.707 $ 1,534.707 $ $ 4,080,078 37.61% As of June 30, 2015 $ 1,527,206 $ 1,527,206 $ $ •1,050,464 37.70% As of June 30, 2014 $ 1,557,376 $ 1,557,376 $ s 4,247,643 36.66%
fi.r1:fightrn1 S~•st~rn As of June 30, 2021 $ 215,320 $ 2 15,320 $ $ 3,240,242 6.65% As of June 30, 2020 $ 228,761 $ 228, 761 $ $ 3,179,830 7.19% As of June 30, 2019 $ 226.592 $ 226,592 $ $ 3,129,730 7.24% As of June 30, 2018 $ 215,452 $ 215,452 $ $ 3,200.968 6.73% As of June 30, 2017 $ 210,460 $ 210,460 $ $ 3,160,058 6.66% As of June 30, 2016 $ 219,686 $ 219,686 s $ 3,249,791 6.76% As of June 30, 2015 $ 220,389 s 220,389 $ $ 3,344,592 6.59% As of June 30, 2014 $ 160,554 $ 160,554 $ $ 3,601,273 4.46%
Ii!lt g fllblic Em11l!lY!l!l~ S:t§1!lm • As of June 30, 2021 $ 699,664 $ 699,664 $ $ 4,428,258 15.80% As of June 30, 2020 $ 580,300 $ 580,300 $ $ 3,705,620 15.66% As of June 30, 2019 $ 519,00l $- 519,001 $ $ 3,339,834 15.54% Al, of June 30, 2018 $ 479,329 $- 479,329 s $ 3,172,260 15.11% All of June 30, 2017 $ 402,025 $ 402,025 $ $ 2,696,348 14.91% As of June 30, 2016 s 800,882 s 300,882 $ $ 2,017,989 14.91% As of June 30, 2015 $ 186,143 $ 185,143 $ $ 1,239,243 14.94% As of June 80, 2014 $ 113,677 $ 113,677 $ s 812,557 13.99%
(continued on next page)
-108-

REQUIRED SUPPLEMENTARY INFORMATION
City of Orem Schedule of Contributions
Utah R~tireme nt Systems (URS)
Last Ten Fiscal Years 1
Contributions
in relation to the Contribution
Contractually Contractually Contribution as a% of
Required Required Deficiency Covered Covered
Siatem Contribution Contribution Ti!lr 2 Publi~ Safetx ~ fil:l!fiKll!!!tB SY§~Wn *
(Excess) Pal!!!ll Payroll 2
As of June 30, 2021 $ 909,579 $ 909,579 $ $ 3,747,569 24.27% Aa of June 30, 2020 $ 658,136 $ 658,136 $ s 3,056,839 21.63% As of June 30, 2019 $ 521,389 $ 521,389 $ s 2,434,086 21.42% As of June 30, 2018 $ 412,572 $ 412,572 $ $ 2,002,958 20.60% As of June 30, 2017 $ 275,954 $ 275,954 s $ 1,415,167 19.50% As of June 30, 2016 $ 156,487 $ 156.487 $ $ 867,683 18.04% Aa of June 30, 2015 $ 103,493 $ 103,493 $ $ 585,142 17.69% As of ,June 30, 2014 $ 70,564 $ 70,564 $ $ 366,223 19.27%
'.ri~r 2 Public Em11Joy!les DQ Only SYitl:!D * As of June 30, 2021 $ 84,258 $ 84,258 $ $ 1,259,452 6.69% As of Jnne 30, 2020 $ 65,955 s 65,955 s $ 988,073 6.68¾ As of Jnne 30, 2019 $ 51. 762 $ 51,752 s $ 773,571 6.69% AsofJ1me 30, 2018 $ 42,785 $ 42,785 $ $ 639,540 6.69% Aa of June 30, 2017 s 31,690 $ 31,690 $ $ 473,700 6.69% As of June 30, 2016 $ 27,955 $ 27,955 $ $ 417,869 6.69% As of June 30, 2015 $ 20,253 $ 20,253 $ $ 300,44.2 6.711% As of June 30, 2014 s 9,492 $ 9,492 $ $ 170,441 5.57%
Tiu 2 Public Safetx & Fi!:d'ii:hti:r [!Q QlllY S~st!lm * AB of June 30, 2021 s 34,194 $ 34,194 $ $ 239,719 14.26% As of June 30, 2020 $ 34,667 $ 34,667 $ s 317,640 10.91% Ail of June 30, 2019 $ 28,973 $ 28,973 $ s 309,371 9.37% As of June 30, 2018 $ 33,792 $ 33,792 $ $ 307,332 11.00% As of June 30, 2017 $ 35,814 $ 35,814 $ $ 272,236 13.16% As of June 30. 2016 $ 34,337 $ 34,337 $ $ 260,874 13.16% All of June 30, 2015 s 20,094 $ 20,094 $ $ 137,956 14.57% As of June 30, 2014 $ $ $ $ 0.00%
Total · As of June SO. 2021 $ 5,120,633 $ 5,120,633 $ $ 27,157,040 18.86% Total · As of June SO, 2020 $ 4,735,861 $ 4,735,86 1 s . $ 25,792,310 18.36% Total · As of June 30, 2019 $ 4,622,823 $ 4,622,823 $ . $ 24,853,145 18.60% Total· As of June 30, 2018 $ 4,530,761 $ 4,530,761 $ . $ 24,314,300 18.63% Total · As of June 30, 2017 $ 4,243,468 $ 4,243,468 $ $ 22,717.186 18.68% Total · As of June 80, 2016 $ 4,163,123 $ 4,163,123 $ $ 21,987,340 18.93% Total· As of June 30, 2015 $ 4,008,367 $ ,t,008,367 s . $ 20,945,985 19.14% Total· As of June SO, 2014 $ 3,777,912 $ 3,777,912 $ $ 20,865,939 18.11%
* Contributions in Tier 2 inr.lude an amortization rate to help fund the unfunded liabilitiee in the Tier 1 systems. Tier 2 systems were created effective July 1. 201 I.
1 In accordance with GASB 68 (paragraph 81.b), the City will need to disclose a ten (IQ) yeat history in this schedule. However, this schedule will be
populated prospectively,
• Contributions as a percentage of covered payroll may be tlifferent th11n the Board certified rate due to rounding or other administrative isaues ..
-1 09-
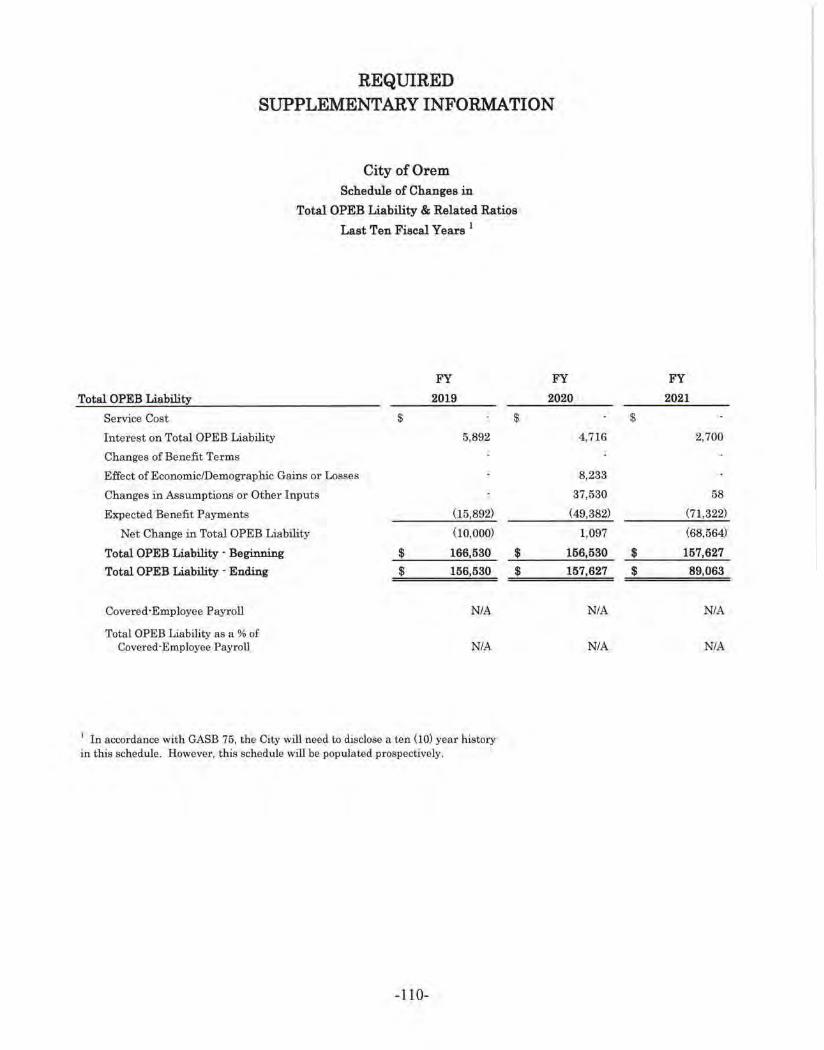
REQUIRED SUPPLEMENTARY INFORMATION
City of Orem Schedule of Changes in
Total OPEB Liability & Related Ratios
Last Ten Fiscal Years 1
FY
Total OPEB Liability 2019
Service Cost $
Interest on Total OPEB Liability 5,892
Changes of Bene.fit Terms
Effect of Economic/Demographic Ga.ins or Losses
Changes in Assumptions or Other Inputs
Expected Benefit Payments (15,892)
Net Change in Total OPEB Liability (10,000)
Total OPEB Liability · Beginning $ 166,530
Total OPEB Liability - Ending $ 156,530
Covered-Employee Payroll NIA
Total OPEB Liability as a % of Covered-Employee PayroU NIA
1 In accordance with GASB 75, the City will need to disclose a ten (10) year history in this schedule. However, this schedule will be populated prospectively.
-110-
$
$
$
FY
2020
4.716
8,233
37,530
(49,382)
1,097
156,530
157,627
NIA
NIA
FY
2021
$
2,700
58
(71,322)
(68,564)
$ 157,627
$ 89,063
NIA
NIA
NOTES TO REQUIRED SUPPLEMENTARY INFORMATION
JUNE 80, 2021
Utah Retirement Systems Pensions
Changes in Assumptions
There were a ourober of demographic assumptions (e.g. rates of termination, disability, retirement, as well as an updated mortality and salary increase assumption) updated for use in the January l , 2020 actuarial valuation. These assumption updates were adopted by the Utah State Retirement Board as a result of an Actuarial Experience Study performed for the Utah Retirement Systems. In aggregate, those assumption changes resulted in a $201 million increase in the Total Pension Liahifay, which is about 0.50% of the Total Pension Liability as of December 31, 2019 for all systems combined. The Actuarial Experience Study report as of December 31, 2019 provides detailed information regarding those assumption changes. which may be accessed online at newsroom.urs.org under the "Retirement Office" column using the "Reports and Stats" tab.
Other Post Employment Benefits (OPEB)
Changes in Assumptions
The discount rate was changed to 2.16% (from 2.21%) since this is the discount rate that will be used to measure the Total OPEB Liability for purposes of GASB 75.
-111-
(This page left blank intentionally)
-112-

OTHER STATEMENTS
& SCHEDULES
Combining Financial Statements Nonmajor Governmental Funds
Capital Projects Funds
Capital projects funds a re used to account for the acquisition and construction of major capital facilities and equipment other than those financed by proprietary funds.
Capital Projects· impact Fees Fund - This fund is used to account for the acquisition, construction, and/or improvement of major capital facilities of the City as part of funding provided by impact fees collected from developers.
Special Revenue Funds
Special revenue funds are used to account for specific revenues that are legally restricted to expenditures for particular purposes.
CARE Tax Fund - This fund is used to account for the preparation and implementation of plans to improve, rehabilitate and/or develop culttll'al arts and recreation facilities within the City.
Telecommunication Billing Fund -This fund is used to account for billing activities related to the Utopia Infrastructure Agency (UW contract utility enhancement agreements.
Transportation Sales Tax Fund - This fund is used to account for revenues and expenditures related to permissible transportation needs such as streets, sidewalks, ctll'b and gutters, traffic safety features, traffic signs and signals, street lighting, and trails for non-motorized vehicles connecting an origin with a destination.
Redevelopment Fund-This fund is used to account for the preparation and implementation of plans to improve, rehabilitate and redevelop project areas within the City.
Community Development & Rehabilitation Fund-This fund is used to account for a variety of efforts to assist development. It is financed principally by federal entitlements from the U.S. Department of Housing and Urban Development, Community Development Block Grants. Grants and loans are made from this fund to assist housing rehabilitation, business development, and equipment and services that aid the indigent, handicapped, elderly, etc.
Friends of the Orem Public Library Fund - This fund is used to support various library and community oriented programs.
Orem Foundation Trust Fund-This fund is used to account for the financial transactions of the Orem Foundation Trust, an approved IRS Section 501(c)3 charitable organization. All funds received are used to support and enhance services and programs provided by the City.
Senior Citizens Fund - This fund is used to account for the financial transactions of those activities related to the Senior Citizen Friendship Center and its senior citizen patrons .
-113-
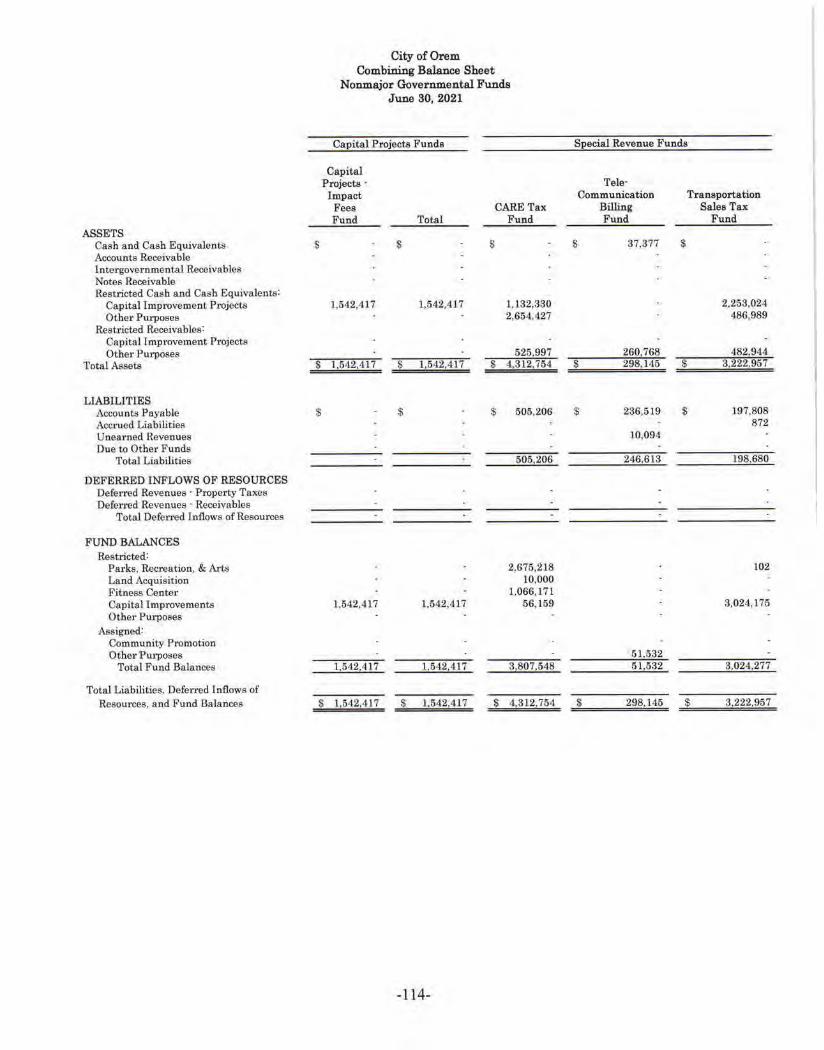
City of Orem Combining Balance Sheet
Nonmejor Governmental Funds June 30, 2021
Capita l P rojects Funds Special Revenue F unds
Capital Projects· Tele· Impact Communication Transportation
Fees CARE Tax Billing Sales Tax Fund Total Fund Fund Fund
ASSETS Cash and Cash Equivalents $ $ $ $ 37,377 $
Accounts Receivable Intergovernmental Receivables Notes Receivable Restricted Cash and Cash Equivalents:
Capital Improvement Projects 1,542,417 1,542,417 1,132,330 2,253,024 Other Purposes 2,654,427 486,989
Restricted Receivables: Capital Improvement Projects Other Purposes 525,997 260,768 482 944
Total Assets $ 1,542,417 $ 1,542,417 $ 4,312,754 $ 298,145 $ 3,222.957
LIABILITIES Accounts Payable $ $ s 505,206 $ 236,519 $ 197,808 Accrued Liabilities 872 Unearned Revenues 10,094 Due to Other Funds
Total Liabilities 506,206 246,613 198,680
DEFERRED INFLOWS OF RESOURCES Deferred Revenues · Property Taxes Deferred Revenues · Receivables
Total Deferred Inflows of Resources
FUND BALANCES Restricted:
Pal'ks, Recreation, & Arts 2,675,218 102 Land Acquisition 10,000 Fitness Center 1,066,171 Capital Improvements 1,542.417 1,542,417 56, 159 3,024,175 Qt.her Purposes
Assigned: Community Promotion Other Purposes 51,532
Total Fund Balances 11542.417 I 542,<117 3,807,548 51,532 3,024 277
Total Liabilities. Deferred Inflows of Resom·ces, and Fund Balances $ 1,542,417 $ 1,542,417 $ 4,312,764 $ 298,146 $ 3,222,957
-114-
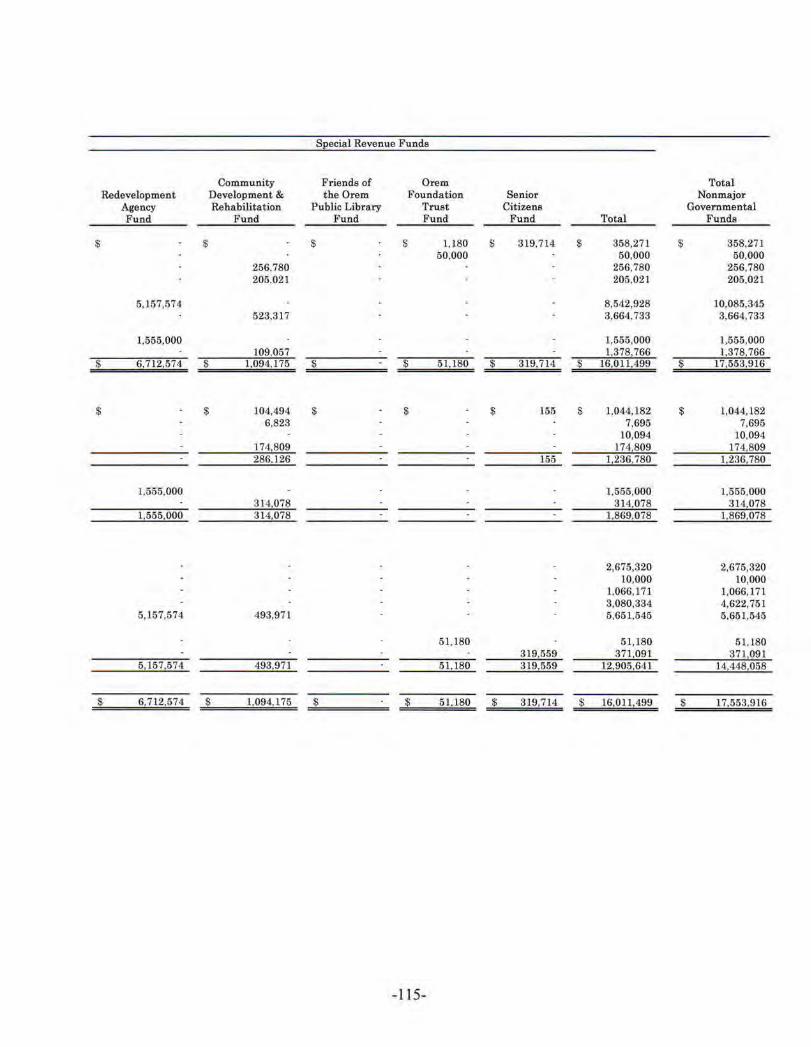
Special Revenue Funds
Community Friends of Orem Total Redevelopment Development & the Orem Foundation Senior Nonmajor
Agency Rehabilitation Public Library Trust Citizens Governmental Fund Fund Fund Fund Fund Total Funds
$ $ $ $ 1,180 $ 319.714 $ 358,271 $ 358,271 50,000 50,000 50,000
256,780 256,780 256,780 205,021 205,021 205,021
5,157,574 8,542,928 10,085,345 523.317 3,664,733 3,664,733
1,555,000 1,555,000 1,555,000 109,057 1.378,766 1 378,766
$ 6,712,574 $ 1,094 175 $ $ 51, 180 $ 319,714 $ 16,011,499 $ 17,553,916
$ $ 104,494 $ $ $ 155 $ 1,044,182 $ 1,044, 182 6.823 7,695 7,695
10,094 10,094 174,809 174,809 174,809 286.126 155 1,236,780 1.236,780
1,555,000 1,555,000 1,555,000 314,078 314 078 314 078
1 555,000 314,078 1,869,078 l 869,078
2,675,320 2,675,320 10,000 10,000
1,066,171 1.066,171 3,080,334 4,622,751
5,157,574 493,971 5,651,545 5,651,545
51,180 51,180 51,180 319,559 371,091 371 091
5,157,574 493 971 51,180 319,559 12,905,641 14 448,058
$ 6 ,712,574 $ 1,094,175 $ $ 51,180 $ 319,714 s 16,011,499 s 17,553,916
-115-
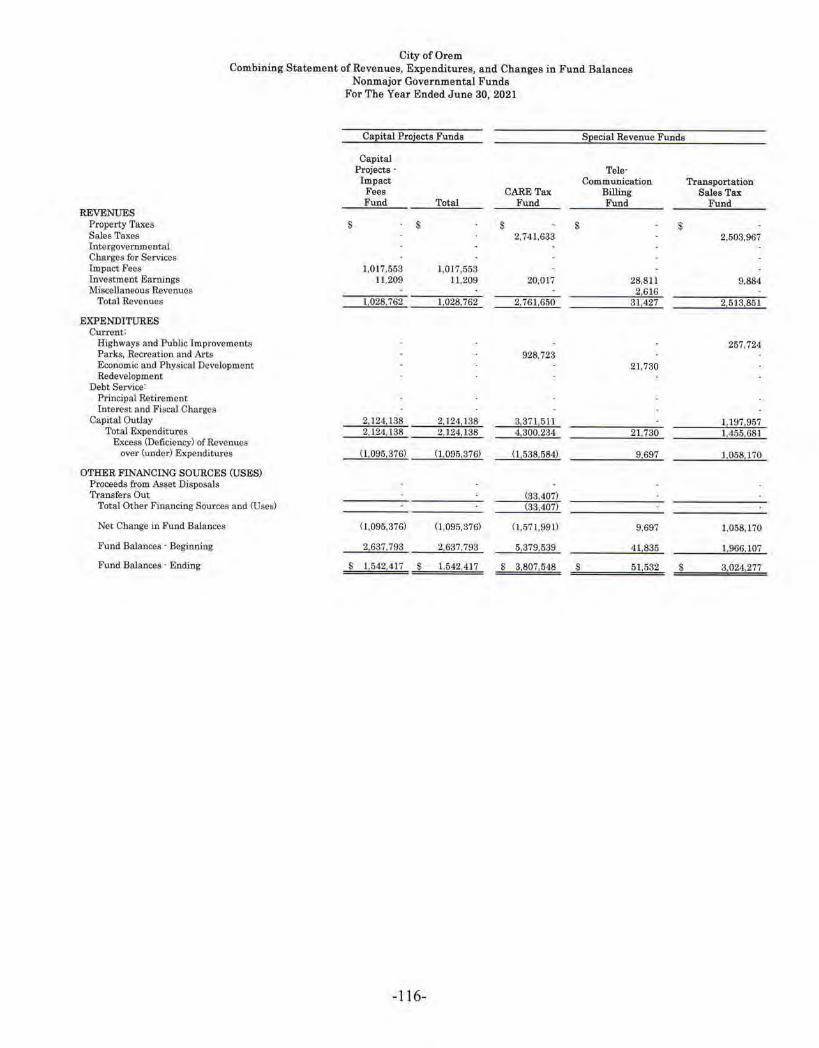
City of Orem Combining Statement of Reve nues, Expenditures, and Changes in Fund Balances
Nonma.jor Governmental Funds F or The Yeax Ended June 30, 2021
Ca2ital Projects Funds S2ecial Revenue Funds
Capital Projects· Tele· Impact Communication Transportation
Fees CARE Tax Bill.mg Sales Tax Fund Tot al Fund Fund Fund
REVENUES Property Taxes s s $ $ $ Sales Taxes 2,741,633 2,503,967 Intergovernmental Charges for Services Impact Fees 1,0 17,553 1,017,553 Investment Earnings 11,209 ll.209 20,017 28,8 11 9,884 Miscellaneous Revenues 2,616
Total Revenues 1,028,762 1,028,762 2,761,650 31,427 2,513,851
EXPENDITURES Current:
Highways and Public Improvements 257,724 Parks, Recreation and Arts 928,723 Economic and Physical Development 2 1,730 Redevelopment
Debt Service: Principal Retirement Interest and Fiscal Charges
Capital Outlay 2,124.138 2,124,138 3,371,51) l 197 957 Total Expenditures 2.124,ISS 2,124,138 4,300.234 21,730 1 455,681
Excess (Deficiency) of Revenues over (under) Expenditures (1,095,376) (1,095,376) (1,538,584) 9,697 1,058, 170
OTHER FINANCING SOURCES (USES) P roceeds from Asset Disposals Transfers Out (33,407)
Total Other Financing Sources and <uses) (33,407)
Net Change in Fund Balances (1,095,376) ( l ,095,376) (J,571,99ll 9,697 1,058,170
Fu.nd Balances · Beginning 2,637.793 2,637,793 5,379,539 41,835 1,966,107
Fund Bala.nces · Ending $ 1,542,4 17 $ l,642,417 $ 3,807,648 $ 5 1.532 $ 3.024.277
-116-

Special Revenue Funds
Community Friends of Orem Total Redevelopment Development & the Orem Foundation Senior Nonmajor
Agency Rehabilitation Public Library Trust Citizelll! Governmental Fund Fund Fund Fund Fund Total Funds
$ 2,843,005 $ $ $ s $ 2,843,005 $ 2,843,005 5,245,600 5,245,600
985,588 985,588 985,588 143,129 9,746 152,875 152,875
1,017,553 32,249 2,252 1,596 94,809 106,018
8,800 297,621 13,479 322,516 322 516 2,884,054 1.130,969 297.621 24821 9,644,393 10 673 155
257,724 257,724 2 3,073 931,798 931,798
445,536 467,266 467,266 1,05 1,628 1,051.628 1,051,628
80,000 80,000 80,000 13,001 13,001 13,001
170,048 353,820 5,093,836 7,217,474 1,221,676 892,357 2 3 073 7,894,753 10,018,891
1,662,378 238,612 (2) 297,621 21.748 1,749,640 654,264
492,485 492,485 492,485 (3,691,577) ls, 199,092)
(177,077) (177,077)
(1,299) (1 299)
(247,591) 1247,591)
(41150195 L) 13,658,466l
(4,150,951) (3,658,466)
(1,536,714) 61.535 (1,301) 50,080 21,748 (1,908.826) (3,004,202)
6 694,288 432 436 1,301 1,150 297,811 14,814,467 17 452,260
$ 5 157 574 $ 493,971 $ $ 51,180 $ 319,559 $ 12,905,641 $ 14,448,058
-1 17-
GOVERNMENTAL FUNDS SCHEDULES OF REVENUES, EXPENDITURES
AND CHANGES IN FUND BALANCE -BUDGET AND ACTUAL
DEBT SERVICE FUNDS DEBT SERVICE FUND
CAPITAL PROJECTS FUNDS CAPITAL PROJECTS FUND
CAPITAL PROJECTS-2019 G.O. BOND FUND CAPITAL PROJECTS-IMPACT FEES FUND
SPECIAL REVENUE FUNDS CARE TAX FUND
TELECOMMUNICATION BILLING FUND TRANSPORTATION SALES TAX FUND
REDEVELOPMENT AGENCY FUND COMMUNITY DEVELOPMENT & REHABILITATION FUND
FRIENDS OF THE OREM PUBLIC LIBRARY FUND OREM FOUNDATION TRUST FUND
SENIOR CITIZENS FUND
-118-

City of Orem Debt Service· Debt Service Fund
Schedule of Revenues, Expenditures and Changes in Fund Balances · Budget and Actual For The Year Ended June 30, 2021
Bud~eted Amounts Actual Variance with OriiE;nal Final Amounts Final Bud~et
REVENUES Property Taxes $ 1,474,796 $ 1,474,796 $ 1,474,696 $ (100) Investment Earnings 6,604 6 604
Total Revenues 1,474,796 1,474,796 1,481,300 6,504
EXPENDITURES Debt Service:
Principal Retirement 1,352,255 1,352,255 1,352,255 Interest and Fiscal Charges 4,626,522 4,626,522 4,626,422 100 Capital Lease Payments - Principal 444,000 444,000 444,000 Capital Lease Payments - Interest 108,284 108,284 108,284
Total Expenditures Excess (Deficiency) of Revenues
6,531,061 6,531,061 6,530,961 100
over (under) Expenditures (5,056,265) (5,056,265) (5,049,661) 6,604
OTHER FINANCING SOURCES (USES) Transfers In 4,248,348 4,248,348 4,248,348 Transfers Out
Total Other Financing Sources (Uses) 4,248,348 4,248,348 4,248,348
Net Change in Fund Balance (807,917) (807,917) (801,313) 6,604
Fund Balance - Beginning 2,761,715 2,761,715 2,761,715
Fund Balance - Ending $ 1,953,798 $ 1,953,798 $ 1,960,402 $ 6,604
-119-
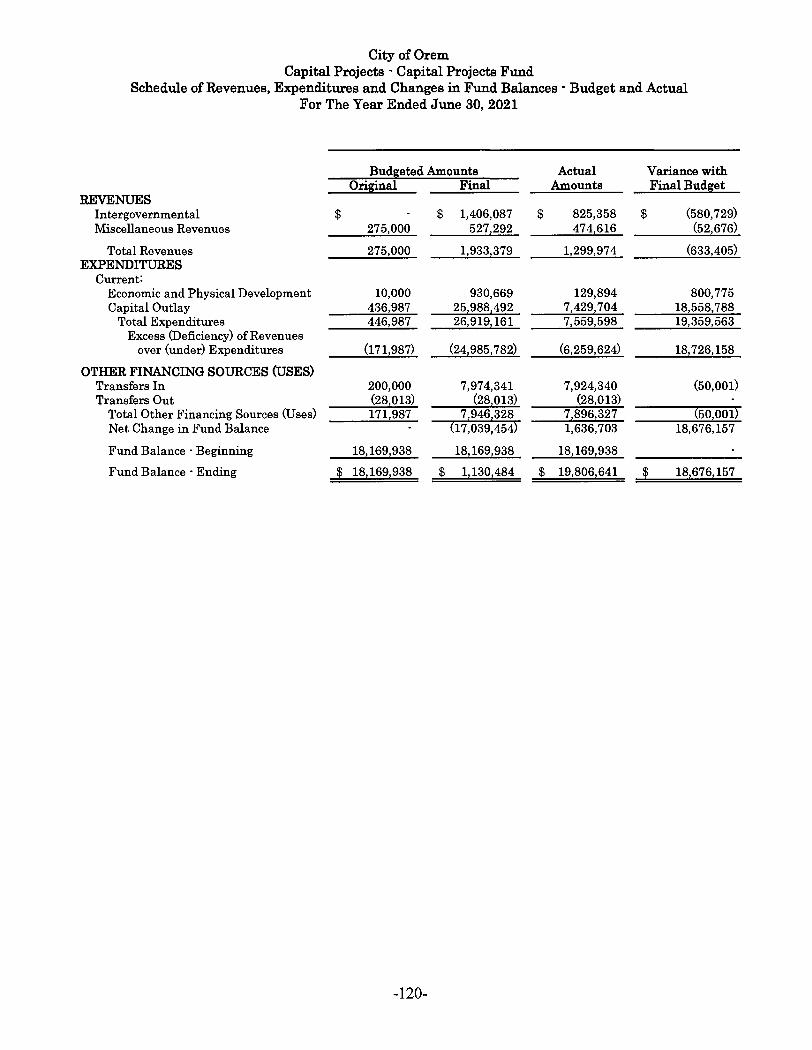
City of Orem Capital Projects · Capital Projects Fund
Schedule of Revenues, Expenditures and Changes in Fund Balances · Budget and Actual For The Year Ended June 30, 2021
Budg:eted Amounts Actual Variance with Original Final Amounts Final Bud;et
REVENUES Intergovernmental $ $ 1,406,087 $ 825,358 $ (580,729) Miscellaneous Revenues 275,000 527!292 474,616 (52,676)
Total Revenues 275,000 1,9331379 1,299,974 (633,405) EXPENDITURES
Current: Economic and Physical Development 10,000 930,669 129,894 800,775 Capital Outlay 436,987 2519881492 7,429,704 18,558,788
Total Expenditures 446,987 26,9191161 7,559,598 19,359,563 Excess (Deficiency) of Revenues
over fonder) Expenditures (171,987) (241985 z 7 82) (61259,624) 18,726,158
OTHER FINANCING SOURCES (USES) Transfers In 200,000 7,974,341 7,924,340 (50,001) Transfers Out (28
1013) (28
1013) (28,013)
Total Other Financing Sources (Uses) 171,987 7,9461328 71896,327 (50,001) Net Change in Fund Balance (17,039,454) 1,636,703 18,676,157
Fund Balance - Beginning 18,169,938 18,1691938 18,169,938
Fund Balance · Ending $ 18,1691938 $ 111301484 $ 191806,641 $ 18,676,157
-120-
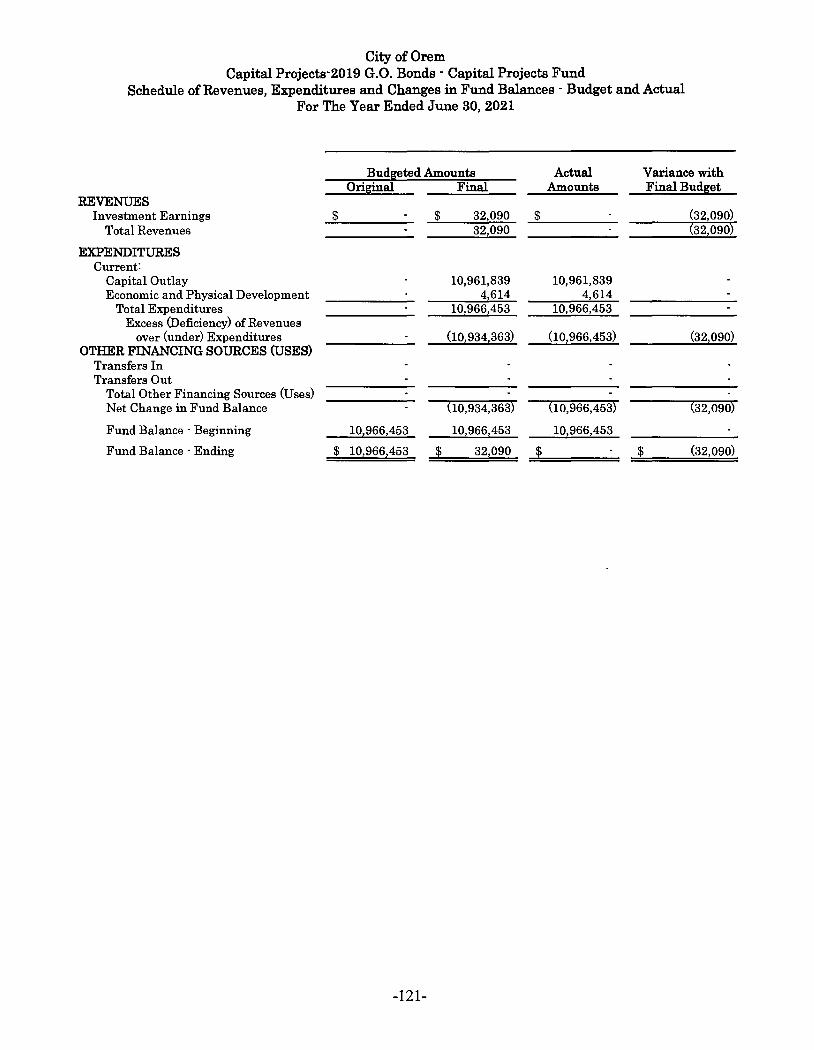
City of Orem Capital Projects·2019 G.O. Bonds · Capital Projects Fund
Schedule of Revenues, Expenditures and Changes in Fund Balances · Budget and Actual For The Year Ended June 30, 2021
Bud~eted Amounts Actual Variance with Original Final Amounts Final Bud~et
REVENUES Investment Earnings $ $ 321090 $ (32,090)
Total Revenues 32,090 fa2,090)
EXPENDITURES Current:
Capital Outlay 10,961,839 10,961,839 Economic and Physical Development 4,614 4,614
Total Expenditures 10,966,453 10,966,453 Excess (Deficiency) of Revenues
over (under) Expenditures (10,934,363) (10,966,453) (32,090) OTHER FINANCING SOURCES (USES)
Transfers In Transfers Out
Total Other Financing Sources (Uses) Net Change in Fund Balance (10,934,363) (10,966,453) (32,090)
Fund Balance - Beginning 10,966,453 10,966,453 10,966,453
Fund Balance - Ending $ 10,966,453 $ 32,090 $ $ (32,090)
-121-
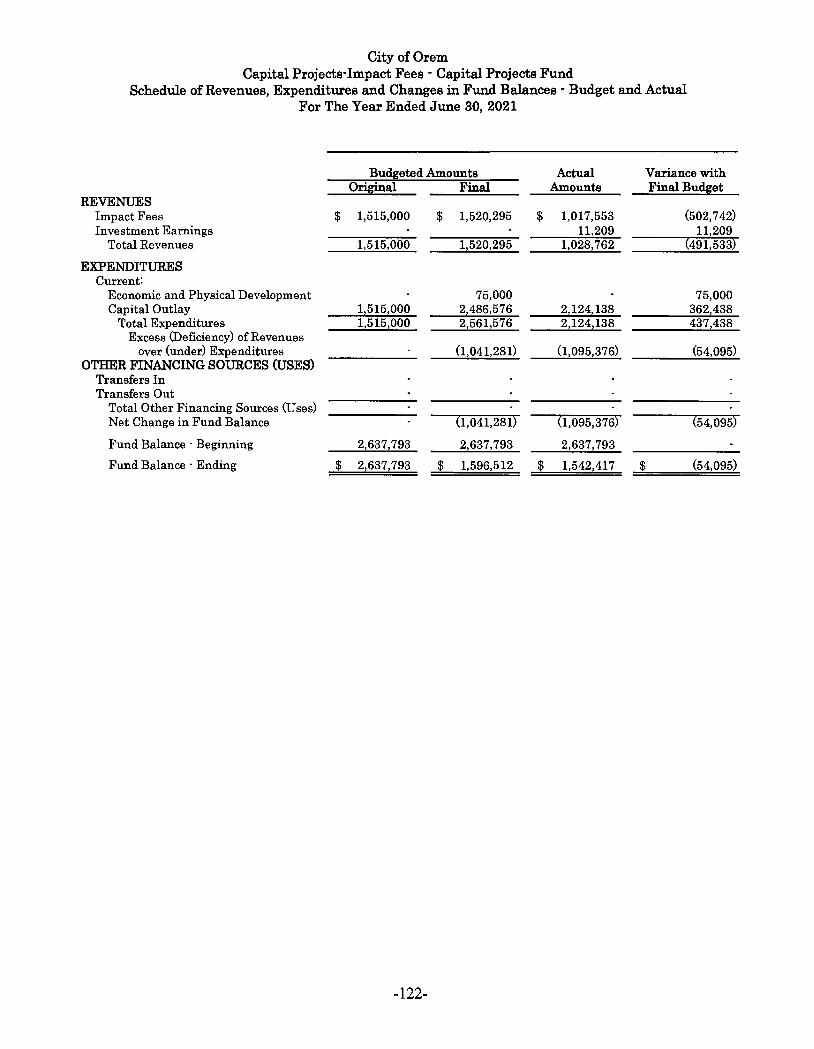
City of Orem Capital Projects· Impact Fees · Capital Projects Fund
Schedule of Revenues, Expenditures and Changes in Fund Balances · Budget and Actual For The Year Ended June 30, 2021
Bud~eted Amounts Actual Variance with Original Final Amounts Final Budg:et
REVENUES Impact Fees $ 1,515,000 $ 1,520,295 $ 1,017,553 (502,742) Investment Earnings 11,209 11,209
Total Revenues 1,515,000 1,520,295 1,028,762 (491,533)
EXPENDITURES Current:
Economic and Physical Development 75,000 75,000 Capital Outlay 1,515,000 2,486,576 2,124,138 362,438
Total Expenditures 1,515,000 2,561,576 2,124,138 437,438 Excess (Deficiency) of Revenues
over (under) Expenditures (1,041,281) (1,095,376) (54,095) OTHER FINANCING SOURCES (USES)
Transfers In Transfers Out
Total Other Financing Sources (Uses) Net Change in Fund Balance (1,041,281) (1,095,376) (54,095)
Fund Balance - Beginning 2,637,793 2,637,793 2,637,793
Fund Balance · Ending $ 2,637,793 $ 1,596,512 $ 1,542,417 $ (54,095)
-122-
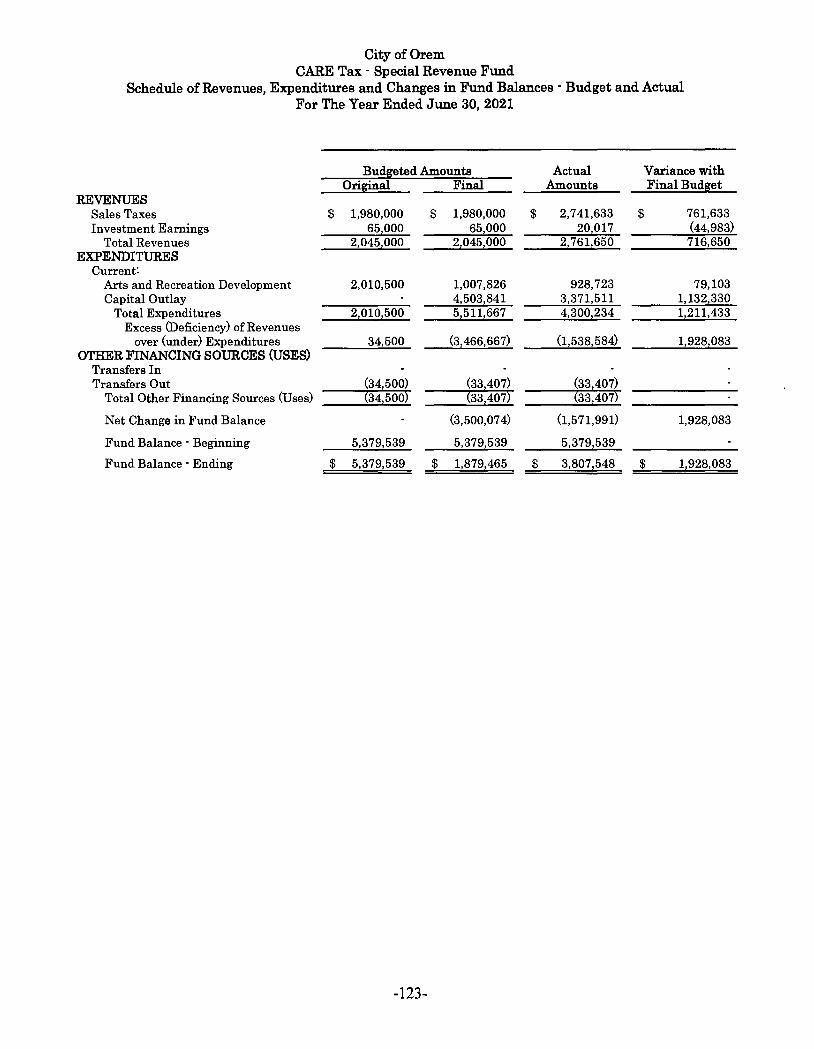
City of Orem CARE Tax - Special Revenue Fund
Schedule of Revenues, Expenditures and Changes in Fund Balances - Budget and Actual For The Year Ended June 30, 2021
Budg:eted Amounts Actual Variance with Original Final Amounts Final Budg:et
REVENUES Sales Taxes $ 1,980,000 $ 1,980,000 $ 2,741,633 $ 761,633 Investment Earnings 65,000 65,000 20,017 (44,983)
Total Revenues 2,045,000 2,045!000 2,761,650 716,650 EXPENDITURES
Current: Arts and Recreation Development 2,010,500 1,007,826 928,723 79,103 Capital Outlay 4,503,841 3,371,511 1,132,330
Total Expenditures 2,010,500 Excess (Deficiency) of Revenues
5,511,667 4,300,234 1!211,433
over (under) Expenditures 34,500 (3,466,667) (1,538,584) 1,928,083 OTHER FINANCING SOURCES (USES)
Transfers In Transfers Out (34,500) (33,407) (33,407)
Total Other Financing Sources (Uses) {34!500) fa3,407) {33,407)
Net Change in Fund Balance (3,500,074) (1,571,991) 1,928,083
Fund Balance · Beginning 5,379,539 5,379,539 5,379,539
Fund Balance · Ending $ 5!379,539 $ 1,879,465 $ 3,807,548 $ 1,928,083
-123-

City of Orem Telecommunication Billing Fund · Special Revenue Fund
Schedule of Revenues, Expenditures and Changes in Fund Balances · Budget and Actual For The Year Ended June 30, 2021
Budgeted Amounts Actual Original Final Amounts
REVENUES Investment Earnings $ 40,000 $ 40,000 $ 28,811 $ M.iscellaneous Revenues 4,000 4,000 2,616
Total Revenues 44,000 44000 31,427 EXPENDITURES
Current: Miscellaneous Expenditures 44,000 44,000 21,730
Total Expenditures 44,000 44,000 21,730 Excess <Deficiency) of Revenues
over (under) Expenditures OTHER FINANCING SOURCES (USES)
9 697
'l'r:ansfers In Transfers Out
Total Other Financing Sources (Uses)
Net Change in Fund Balance 9,697
Fund Balance· Beginning 41,835 41,835 41,835
Variance with Final Budget
(11,189) (1,384)
(12,573)
22,270 22,270
9,697
9,697
Fund Balance · Ending $ 41,835 $ 41,835 $ 51,532 $ 9 697
-124-

City of Orem Transportation Sales Tax - Special Revenue Fund
Schedule of Revenues, Expenditures and Changes in Fund Balances - Budget and Actual For The Year Ended June 30, 2021
Budgeted Amounts Actual Variance with Original Final Amounts Final Budg:et
REVENUES Sales Taxes $ 1,900,000 $ 1,900,000 $ 2,503,967 $ 603,967 Investment Earnings 15,000 15,000 9,884 (5,116)
Total Revenues 1,915,000 1,915,000 2,513,851 598,851 EXPENDITURES
Current: Highways & Public Improvements 218,748 293,748 257,724 36,024 Capital Outlay 1,696,252 3,450,982 1,197,957 2,253,025
Total Expenditures 1,915,000 3,744,730 1,455,681 2,289,049 Excess <Deficiency) of Revenues
over (under) Expenditures (1,829,730) 1,058,170 2,887,900 OTHER FINANCING SOURCES (USES)
Transfers In Transfers Out
Total Other Financing Sources (Uses)
Net Change in Fund Balance (1,829,730) 1,058,170 2,887,900
Fund Balance - Beginning 1,966,107 1,966,107 1,966,107
Fund Balance - Ending $ 1,966,107 $ 136,377 $ 3,024,277 $ 2,887,900
-125-
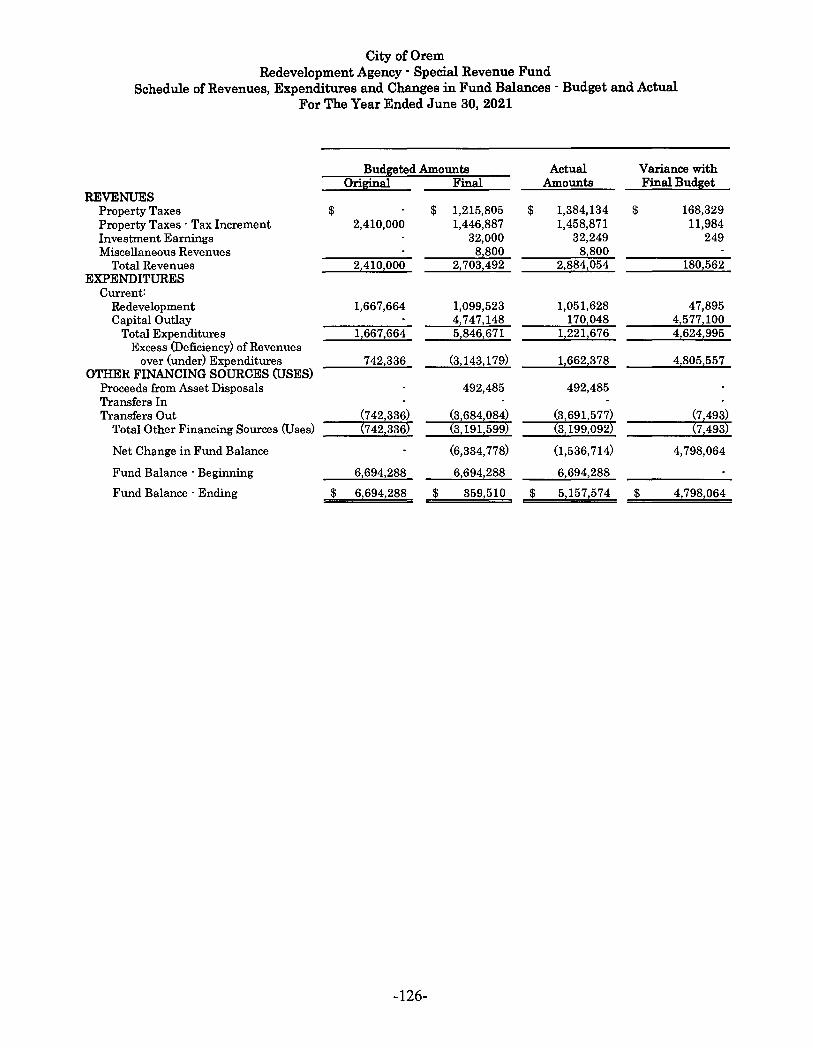
City of Orem Redevelopment Agency · Special Revenue Fund
Schedule of Revenues, Expenditures and Changes in Fund Balances · Budget and Actual For The Year Ended June 30, 2021
Budgeted Amounts Actual Variance with Ori~al Final A.mounts Final Budget
REVENUES Property Truces $ $ 1,215,805 $ 1,384,134 $ 168,329 Property Taxes · Tax Increment 2,410,000 1,446,887 1,458,871 11,984 Investment Earnings 32,000 32,249 249 Miscellaneous Revenues 8 800 8 800
Total Revenues 21410,000 217031492 218841054 1801562 EXPENDITURES
Current: Redevelopment 1,667,664 1,099,523 1,051,628 47,895 Capital Outlay 41747,148 170,048 41577,100
Total Expenditures Excess (Deficiency) of Revenues
116671664 518461671 11221,676 4,624,995
over (under) Expenditures 742,336 OTHER FINANCING SOURCES (USES)
(3,143,179) 1!662,378 4,805,557
Proceeds from Asset Disposals 492,485 492,485 Transfers In Transfers Out (742,336) (3,684,084) (3,691,577) (7,493)
Total Other Financing Sources (Uses) (742,336) (3,191,599) (3,199,092) (7 493)
Net Change in Fund Balance (6,334,778) (1,536,714) 4,798,064
Fund Balance · Beginning 6,694,288 6,694,288 6,694,288
Fund Balance · Ending $ 6,694,288 $ 359,510 $ 5,157,574 $ 4,798,064
-126-
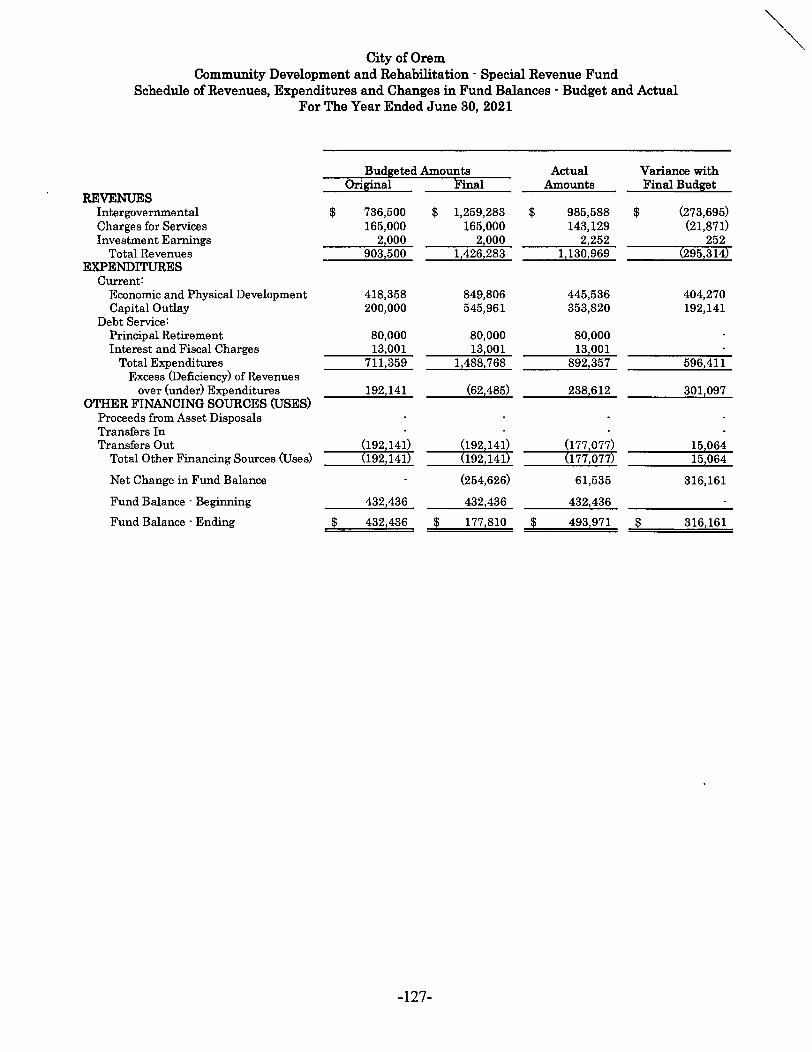
City of Orem Community Development and Rehabilitation - Special Revenue Fund
Schedule of Revenues, Expenditures and Changes in Fund Balances · Budget and Actual For The Year Ended June 30, 2021
Bud~ted Amounts Actual Variance with Original Final Amounts Final Budg:et
REVENUES Intergovernmental $ 736,500 $ 1,259,283 $ 985,588 $ (273,695) Charges for Services 165,000 165,000 143,129 (21,871) Investment Earnings 2 000 2 000 2 252 252
Total Revenues 903,500 1,426,283 1,130,969 l295,314) EXPENDITURES
Current: Economic and Physical Development 418,358 849,806 445,536 404,270 Capital Outlay 200,000 545,961 353,820 192,141
Debt Service: Principal Retirement 80,000 80,000 80,000 Interest and Fiscal Charges 13 001 13 001 13 001
Total Expenditures Excess (Deficiency) of Revenues
711,359 1,488,768 892,357 596,411
over (under) Expenditures 192,141 (62,485) 238,612 301,097 OTHER FINANCING SOURCES (USES)
Proceeds from Asset Disposals Transfers In Transfers Out (192,141) (192,141) (177,077) 15,064
Total Other Financing Sources (Uses) ~192,141) ~192,141) ~177 077) 15 064
Net Change in Fund Balance (254,626) 61,535 316,161
Fund Balance · Beginning 432,436 432,436 432,436
Fund Balance · Ending $ 432,436 $ 177,810 $ 493,971 $ 316,161
-127-
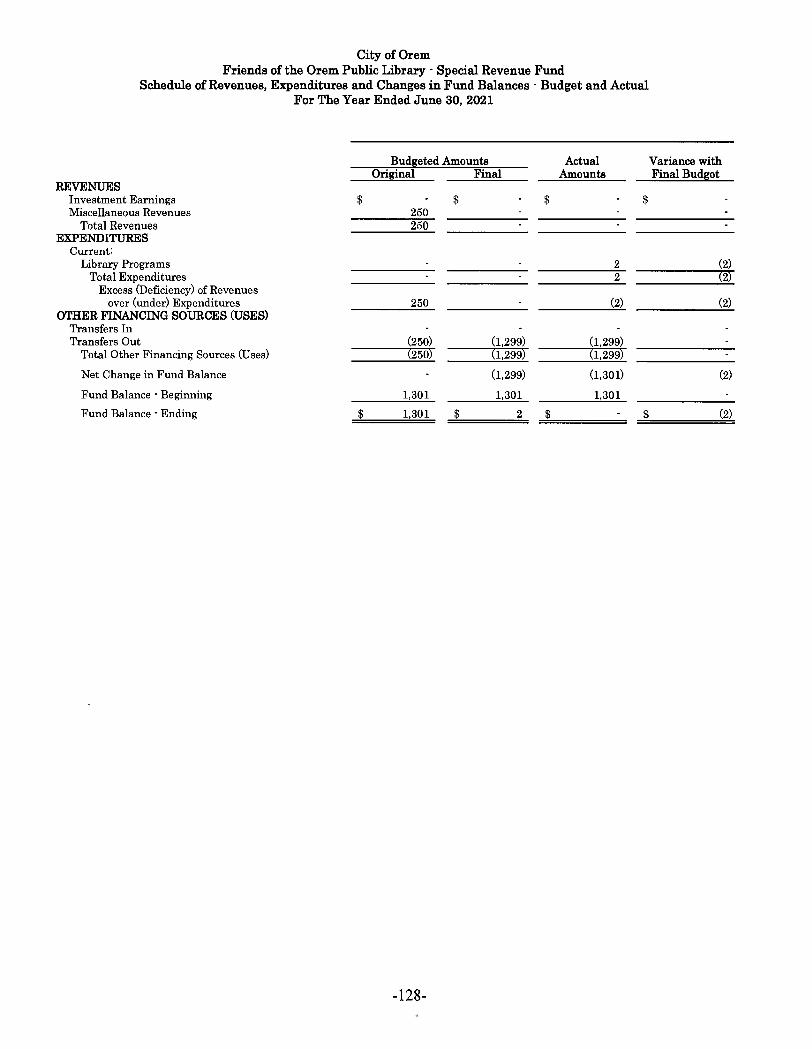
City of Orem Friends of the Orem Public Library · Special Revenue Fund
Schedule of Revenues, Expenditures and Changes in Fund Balances · Budget and Actual For The Year Ended June 30, 2021
Budieted Amounts Actual Ori~nal Final Amounts
REVENUES Investment Earnings $ $ $ $ Miscellaneous Revenues 250
Total Revenues 250 EXPENDITURES
Current: Library Programs 2
Total Expenditures 2 Excess (Deficiency) of Revenues
over (under) Expenditures 250 (2) OTHER FINANCING SOURCES (USES)
Transfers In Transfers Out (250) (1,299) (1,299)
Total Other Financing Sources (Uses) (250) (1,299) (1,299)
Net Change in Fund Balance (1,299) (1,301)
Fund Balance · Beginning 1,301 1,301 1,301
Fund Balance · Ending $ 1,301 $ 2 $ $
-128-
Variance with Final Budget
(2) (2)
(2)
(2)
(2)
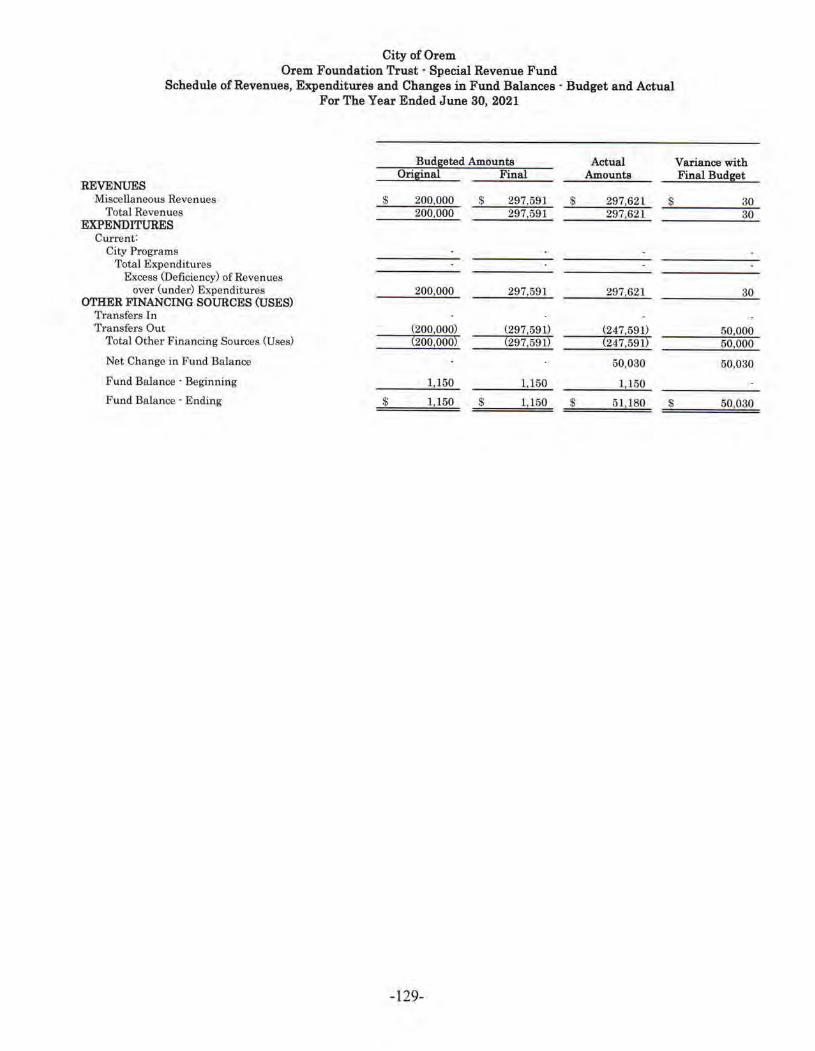
City of Orem Orem Foundation Trust · Special Revenue Fund
Schedule of Revenues, Expenditures and Changes in Fund Balances · Budget and Actual For The Year Ended June 30, 2021
Budgeted Amounts Actual Variance with Original Final Amounts Final Budget
REVENUES Miscellaneous Revenues $ 200,000 $ 297,591 $ 297,621 $ 30
Total Revenues 200,000 297,591 297,621 30 EXPENDITURES
Current: City Programs
Total Expenditures Excess (Deficiency) of Revenues
over (under) Expenditures 200,000 OTHER FINANCING SOURCES (USES)
297 591 297,621 30
Transfers In Transfers Out (200,000) (297,591) (247,591) 50,000
Total Other Financing Sources (Uses) {200,000) (297,591) (247,591) 50 000
Net Change in Fund Balance 50,030 60,030
Fund Balance · Beginning 1,150 1,150 1,150
Fund Balance · Ending $ 1,150 $ 1,150 $ 51.180 $ 50 030
-1 29-
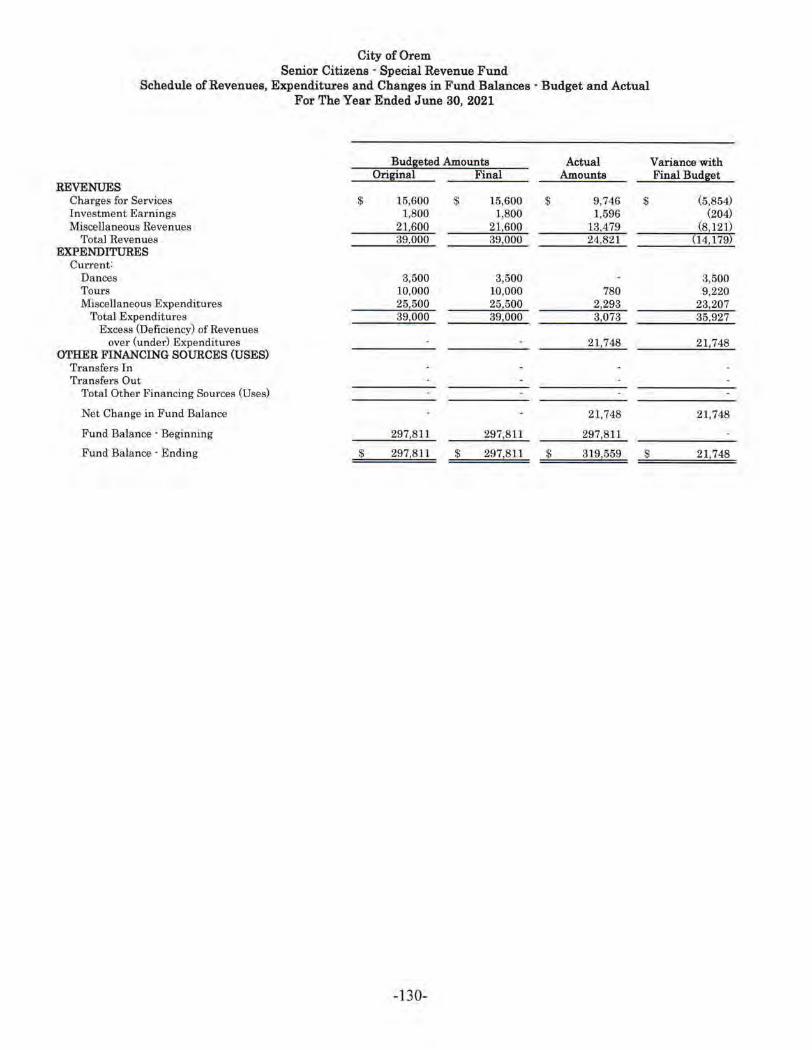
City of Orem Senior Citizens · Special Revenue Fund
Schedule of Revenues, Expenditures and Changes in Fund Balances · Budget and Actual For The Year Ended June 30, 2021
Budgeted Amounts Actual Original Final Amounts
REVENUES Charges for Services $ 15,600 $ 15,600 $ 9,746 $ 1nvestment Earnings 1,800 1,800 1,596 MisceUaneous Revenues 21,600 21.600 13,479
Total Revenues 39,000 39,000 24,821 EXPENDITURES
Current: Dances 3,500 3,500 Tours 10,000 10,000 780 Miscellaneous Expenditures 25,500 25,500 2,293
Total Expenditures 39,000 39 000 3,073 Excess (Deficiency) of Revenues
over (under) Expenditures 21,748 OTHER FINANCING SOURCES (USES)
Transfers In Transfers Out
Total Other Financing Sources (Uses)
Net Change in Fund Balance 21,748
Fund Balance · Beginning 297,811 297,S ll 297,811
Fund Balance· Ending $ 297,811 $ 297,811 $ 3191559 $
-130-
Variance with Final Budget
(5,854) (204)
(8,121) (14,179~
3,500 9 ,220
23,207 35,927
21,748
21,748
21,748

Combining Financial Statements Nonmajor Proprietary Funds
Recreation Fund - This fund is to account for the services provided by the City's Fitness Center. The Fitness Center complex includes an indoor swimming pool, indoor track, basketball court, handball courts, racquetball courts, an outdoor swimming pool/water park (Scera Park), and other facilities. A variety of classes and open play are made available to residents and non-residents on a fee basis.
Solid Waste Fund - This fund is to account for the collection of residential garbage within the City. Residential garbage collection services are provided by a private contractor through a contract with the City. Businesses and commercial concerns with_in the City are no.t serviced, but may contract with private firms for these same services.
Street Lighting Fund - This fund is to account for providing the residents and businesses of the City with a new street lighting system. Lease Revenue Bonds were issued to cover the purchase and installation of the system. Payment and costs of these bonds are not accounted for here, but are in the Debt Service Fund.
-131-
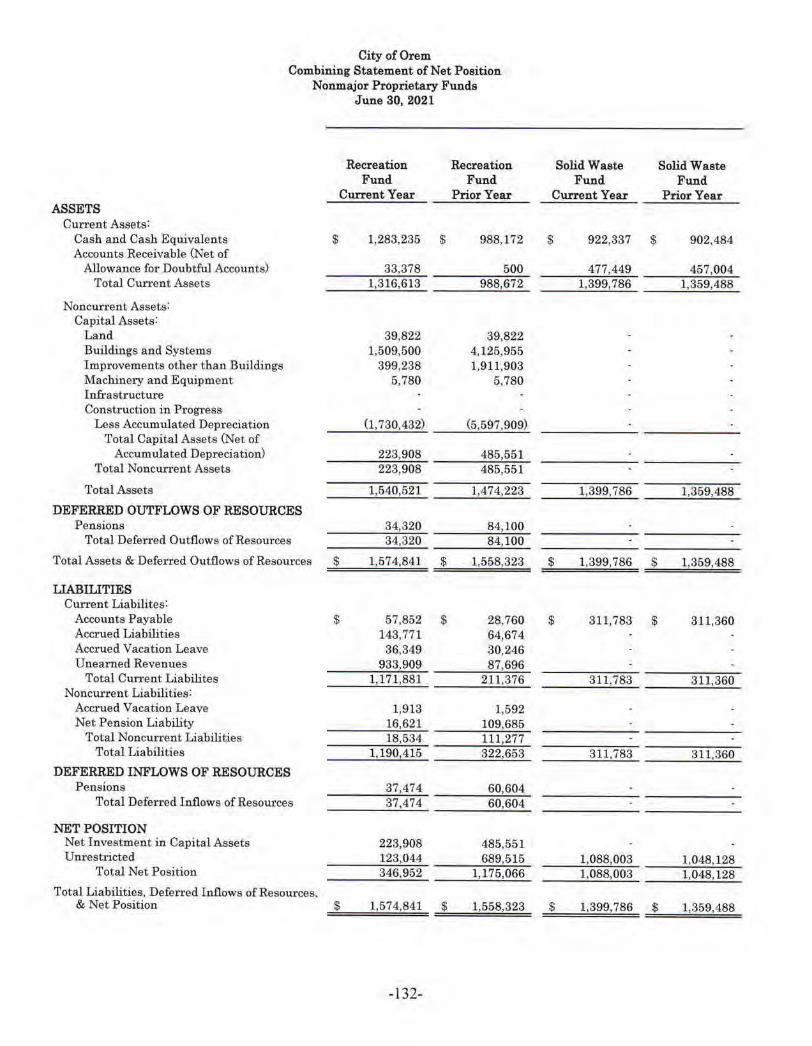
City of Orem Combining Statement of Net Position
Nonmajor Proprietary Funds June 30, 2021
Recreation Recreation Fund Fund
Current Year Prior Year ASSETS
Current Assets: Cash and Cash Equivalents $ 1,283,235 $ 988,172 Accounts Receivable (Net of
Allowance for Doubtful Accounts) 33,378 500 Total Cuxrent Assets 1,316,613 988,672
Noncurrent Assets: Capital Assets:
Land 39,822 39,822 Buildings and Systems 1,509,500 4,125,955 Improvements other than Buildings 399,238 1,911,903 Machinery and E quipment 5,780 5,780 Infi:astructure Construction in Progress
Less Accumulated Depreciation (1,730,432) (5,597,909) Total Capital Assets (Net of
Accumulated Depreciation) 223,908 485,551 Total Noncurrent Assets 223,908 485,551
Total Assets 1,540,521 1,474,223
DEFERRED OUTFLOWS OF RESOURCES Pensions 34,320 84,100
Total Deferred Outflows of Resources 34,320 84,100
Total Assets & Defened Outflows of Resources $ 1,574,841 $ 1,558,323
LIABILITIES Current Llabilites:
Accounts Payable $ 57,852 $ 28,760 Accrued Liabilities 143,771 64,674 Accrued Vacation Leave 36,349 30,246 Unearned Revenues 933,909 87,696
Total Current Liabilites 1,171,881 211,376 Noncunent Liabilities:
Accrued Vacation Leave 1,913 1,592 Net Pension Liability 16,621 109,685
Total Noncunent Liabilities 18,534 111,277 Total Liabilities 1,190,415 322,653
DEFERRED INFLOWS OF RESOURCES Pensions 37,474 60,604
Total Deferred Inflows of Resources 37,474 60,604
NET POSITION Net Investment in Capital Assets 223,908 485,551 Unrestricted 123,044 689,515
Total Net Position 346,952 1, 175,066
Total Liabilities, Deferred Inflows ofResomces, & Net Position $ 1,574,841 $ 1,558,323
-132-
Solid Waste Solid Waste Fund Fund
Current Year Prior Year
$ 922,337 $ 902,484
477,449 457,004 1,399,786 1,359,488
1,399,786 1,359,488
$ 1,399,786 $ 1,359,488
$ 311,783 $ 3 11,360
311,783 311,360
311,783 311,360
1,088,003 1,048,128 1,088,003 1,048,128
$ 1,399,786 $ 1,359,488
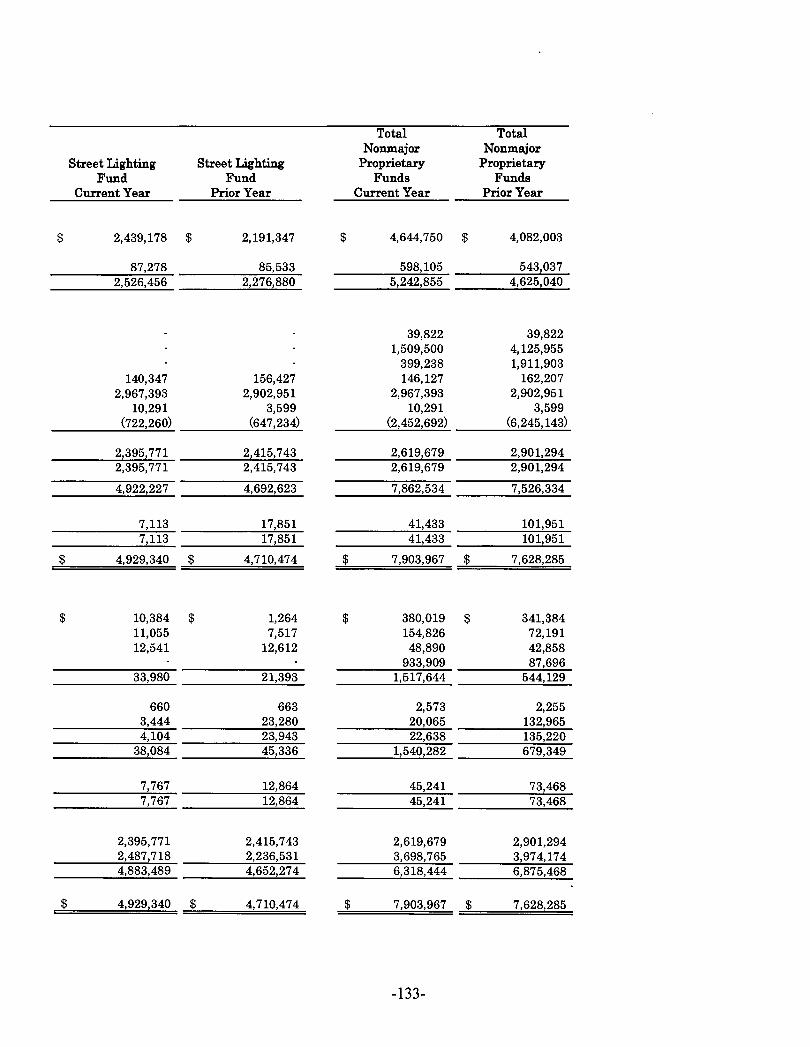
Total Total Nonmajor Nonmajor
Street Lighting Street Lighting Proprietary Proprietary Fund Fund Funds Funds
Current Year Prior Year Current Year Prior Year
$ 2,439,178 $ 2,191,347 $ 4,644,750 $ 4,082,003
87,278 85,533 598,105 543,037 2,526,456 2,276,880 5,242,855 4,625,040
39,822 39,822 1,509,500 4,125,955
399,238 1,911,903 140,347 156,427 146,127 162,207
2,967,393 2,902,951 2,967,393 2,902,951 10,291 3,599 10,291 3,599
(722,260) (647,234) (2,452,692) (6,245,143)
2,395,771 2,415,743 2,619,679 2,901,294 2,395,771 2,415,743 2,619,679 2,901,294
4,922,227 4,692,623 7,862,534 7,526,334
7,113 17,851 41,433 101,951 7,113 17,851 41,433 101,951
$ 4,929,340 $ 4,710,474 $ 7,903,967 $ 7,628,285
$ 10,384 $ 1,264 $ 380,019 $ 341,384 11,055 7,517 154,826 72,191 12,541 12,612 48,890 42,858
933,909 87,696 33,980 21,393 1,517,644 544,129
660 663 2,573 2,255 3,444 23,280 20,065 132,965 4,104 23,943 22,638 135,220
38,084 45,336 1,540,282 679,349
7,767 12,864 45,241 73,468 7,767 12,864 45,241 73,468
2,395,771 2,415,743 2,619,679 2,901,294 2,487,718 2,236,531 3,698,765 3,974,174 4,883,489 4,652,274 6,318,444 6,875,468
$ 4,929,340 $ 4,710,474 $ 7,903,967 $ 7,628,285
-133-
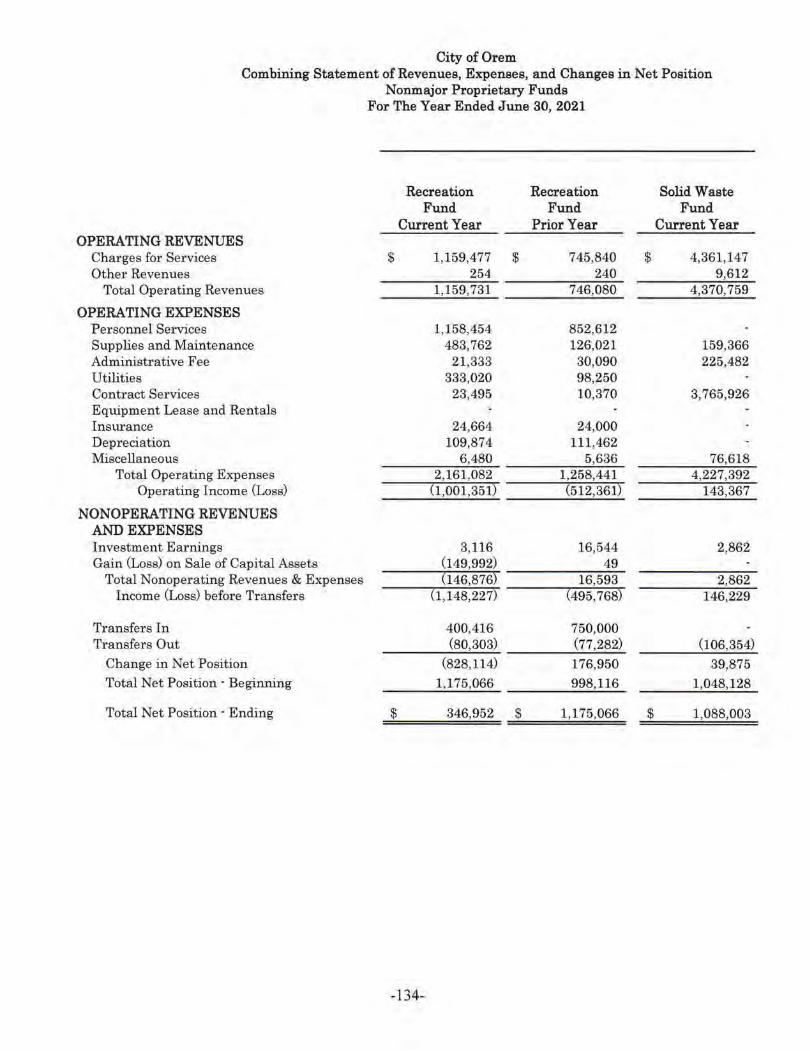
City of Orem Combining Statement of Revenues, Expenses, and Changes in Net Position
Nonmajor Proprietary Funds For The Year Ended June 30, 2021
Recreation Recreation Solid Waste Fund Fund Fund
Current Year Prior Year Current Year OPERATING REVENUES
Charges for Services $ 1,159,477 $ 745,840 $ 4,361,147 Other Revenues 254 240 9,612
Total Operating Revenues 1,159,731 746,080 4,370,759
OPERATING EXPENSES Personnel Services 1,158,454 852,612 Supplies and Maintenance 483,762 126,021 159,366 Administrative Fee 21,333 30,090 225,482 Utilities 333,020 98,250 Contract Services 23,495 10,370 3,765,926 Equipment Lease and Rentals I nsurance 24,664 24,000 Depreciation 109,874 111,462 Miscellaneous 6,480 5,636 76,618
Total Operating Expenses 2,161,082 1,258,441 4,227,392 Operating Income (Loss) (1,001,351) (512,361) 143,367
NONOPERATINGREVENUES AND EXPENSES Investment Ear nings 3,116 16,544 2,862 Gain (Loss) on Sale of Capital Assets (149,992) 49
Total Nonoperating Revenues & Expenses (146,876) 16,593 2,862 Income <Loss) before Transfers (1,148,227) (495,768) 146,229
Transfers In 400,416 750,000 Transfers Out (80,303) (77,282) (106,354)
Change in Net Position (828,114) 176,950 39,875 Total Net Position · Beginning 1,175,066 998,116 1,048,128
Total Net Position · Ending $ 346,952 $ 1,175,066 $ 1,088,003
-134-
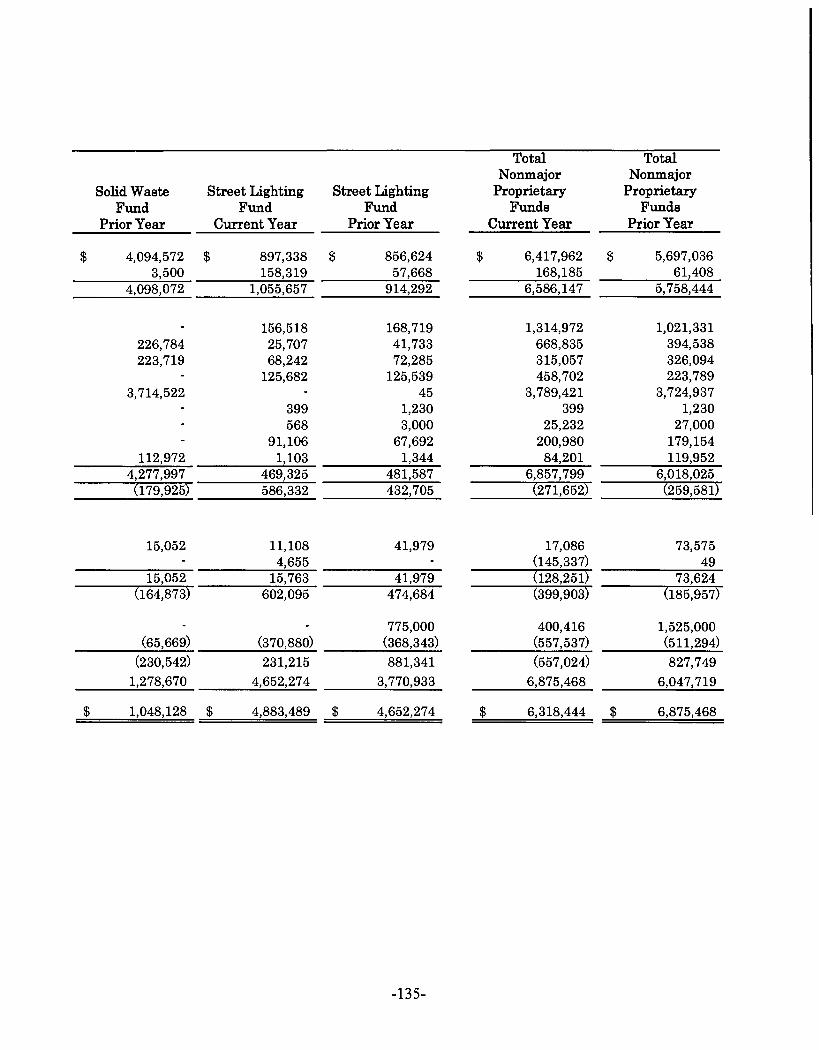
Total Total Nonmajor Nonmajor
Solid Waste Street Lighting Street Lighting Proprietary Proprietary Fund Fund Fund Funds Funds
Prior Year Current Year Prior Year Current Year Prior Year
$ 4,094,572 $ 897,338 $ 856,624 $ 6,417,962 $ 5,697,036 3,500 158,319 57,668 168,185 61,408
4,098,072 1,055,657 914,292 6,586,147 5,758,444
156,518 168,719 1,314,972 1,021,331 226,784 25,707 41,733 668,835 394,538 223,719 68,242 72,285 315,057 326,094
125,682 125,539 458,702 223,789 3,714,522 45 3,789,421 3,724,937
399 1,230 399 1,230 568 3,000 25,232 27,000
91,106 67,692 200,980 179,154 112,972 1,103 1,344 84,201 119,952
4,277,997 469,325 481,587 6,857,799 6,018,025 (179,925) 586,332 432,705 (271,652) (259,581)
15,052 11,108 41,979 17,086 73,575 4,655 (145,337) 49
15,052 15,763 41,979 (128,251) 73,624 (164,873) 602,095 474,684 (399,903) (185,957)
775,000 400,416 1,525,000 (65,669) (370,880) (368,343) (557,537) (511,294)
(230,542) 231,215 881,341 (557,024) 827,749
1,278,670 4,652,274 3,770,933 6,875,468 6,047,719
$ 1,048,128 $ 4,883,489 $ 4,652,274 $ 6,318,444 $ 6,875,468
-135-
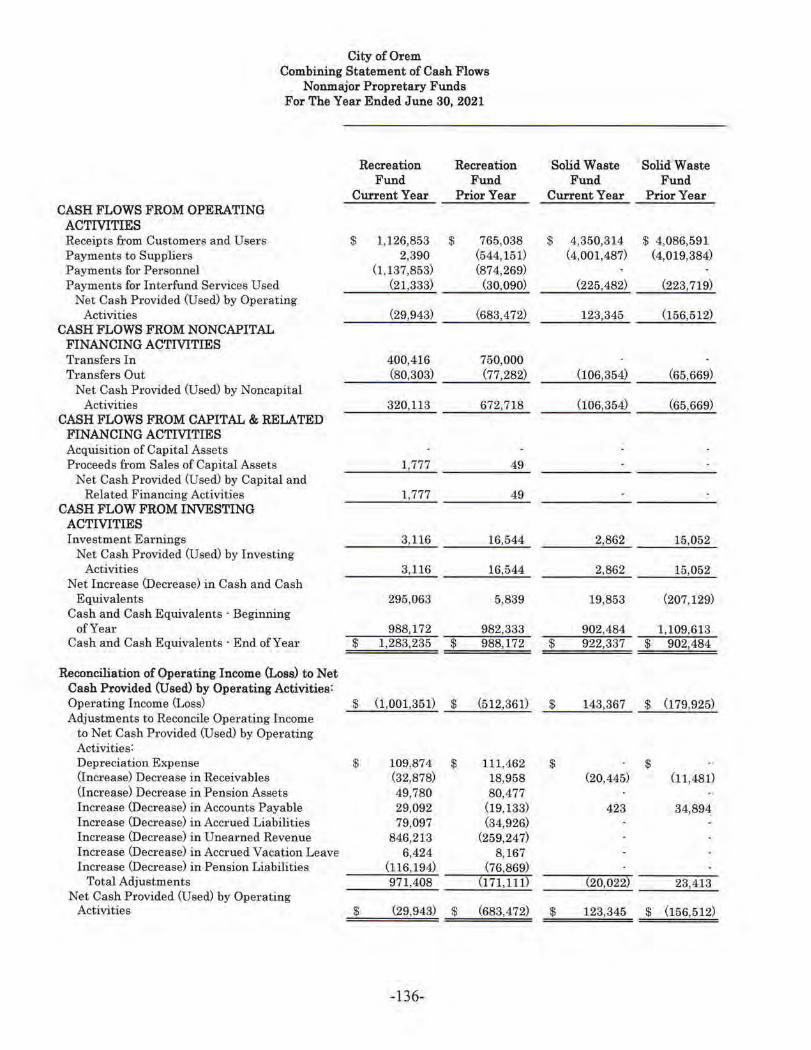
City of Orem Combining Statement of Cash Flows
Nonmajor Propretary Funds For The Year Ended J une 30, 2021
Recreation Recreation Fund Fund
Current Year Prior Year CASH FLOWS FROM OPERATING
ACTIVITIES Receipts from Customer s and Users $ 1,126,853 $ 765,038 Payments to Suppliers 2,390 (544,151) Payments for Personnel (1,137,853) (874,269) Payments for Interfund Services Used (21,333) (30,090)
Net Cash Provided (Used) by Operating Activities (29,943) (683,472)
CASH FLOWS FROM NONCAPITAL FINANCING ACTIVITIES Transfers In 400,416 750,000 Transfers Out (80,303) (77,282)
Net Cash Provided (Used) by Noncapital Activities 320,113 672,718
CASH FLOWS FROM CAPITAL & RELATED FINANCING ACTMTIES Acquisition of Capital Assets Proceeds from Sales of Capital Assets 1,777 49
Net Cash Provided (Used) by Capital and Related Financing Activities 1,777 49
CASH FLOW FROM INVESTING ACTIVITIES Investment Eal'nings 3,116 16,544
Net Cash Provided (Used) by Investing Activities 3,116 16,544
Net Increase <Decrease) in Cash and Cash Equivalents 295,063 5,839
Cash and Cash Equivalents · Beginning of Year 988,172 982,333
Cash and Cash Equivalents· End of Year $ 1,283,235 $ 988, 172
Reconciliation of Operating Income <Loss) to Net Cash Provided (Used) by Operating Activities: Operating Income (Loss) $ (1,001,351) $ (512,361) Adjustments to Reconcile Operating Income
to Net Cash Provided (Used) by Operating Activities: Depreciation Expense $ 109,874 $ 111,462 (Increase) Decrease in Receivables (32,878) 18,958 (Increase) Decrease in Pension Assets 49,780 80,477 Increase <Decrease) in Accounts Payable 29,092 (19,133) Increase (Decrease) in Accrued Liabilities 79,097 (34,926) Increase <Decrease) in Unearned Revenue 846,213 (259,247) Increase <Decrease) in Accrued Vacation Leave 6,424 8,167 Increase (Decrease) in Pension Liabilities (116,194) (76,869)
Total Adjustments 971,408 (171,lll~ Net Cash Provided (Used) by Operating
Activities $ (29,943) $ (683,472)
-136-
Solid Waste Solid Waste Fund Fund
Current Year Prior Year
$ 4,350,314 $ 4,086,591 (4,001,487) (4,019,384)
(225,482) (223,719)
123,345 (156,512)
(106,354) (65,669)
(106,354) (65,669)
2,862 15,052
2,862 15,052
19,853 (207,129)
902,484 1,109,613 $ 922,337 $ 902,484
$ 143,367 $ (179,925)
$ $ (20,445) (11,481)
423 34,894
(20,022~ 23,413
$ 123,345 $ (156,512)
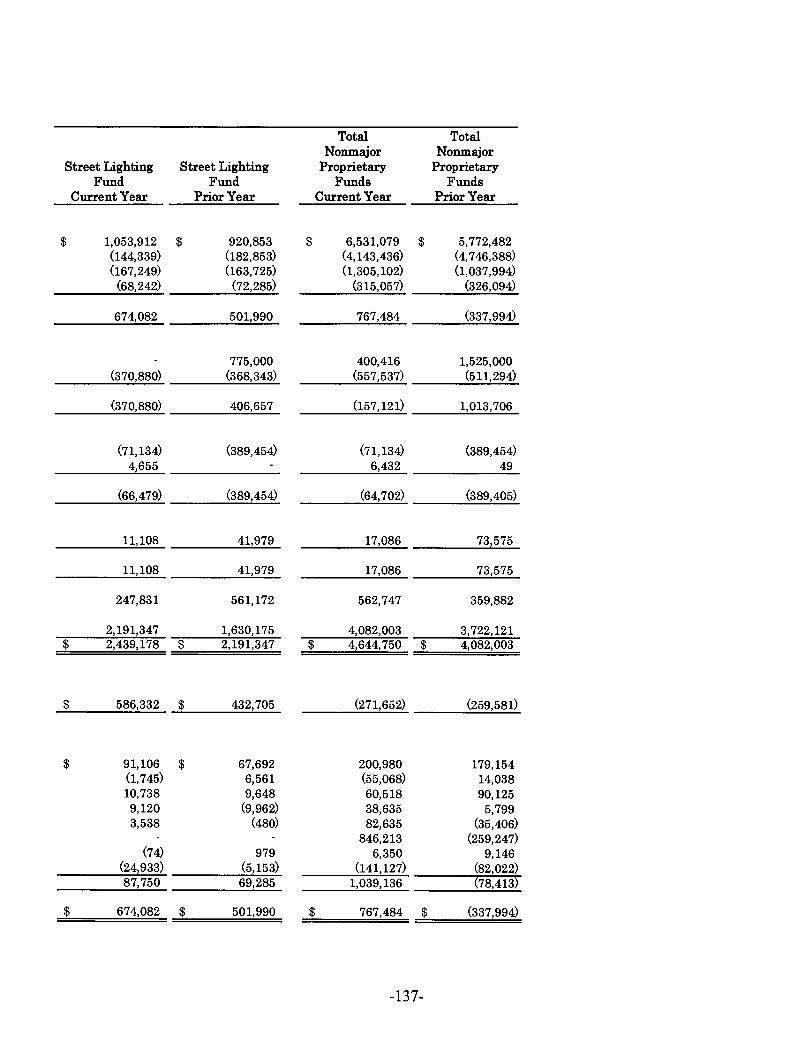
Total Total Nonmajor Nonmajor
Street Lighting Street Lighting Proprietary Proprietary Fund Fund Funds Funds
Current Year Prior Year Current Year Prior Year
$ 1,053,912 $ 920,853 $ 6,531,079 $ 5,772,482 (144,339) (182,853) (4,143,436) (4,746,388) (167,249) (163,725) (1,305,102) (1,037,994)
(68,242) (72,285) (315,057) (326,094)
674,082 501,990 767,484 (337,994)
775,000 400,416 1,525,000 (370,880) (368,343) (557,537) (511,294)
(370,880) 406,657 (157,121) 1,013,706
(71,134) (389,454) (71,134) (389,454) 4,655 6,432 49
(66,479) (389,454) (64,702) (389,405)
11,108 41,979 17,086 73,575
11,108 41,979 17,086 73,575
247,831 561,172 562,747 359,882
2,191,347 1,630,175 4,082,003 3,722,121 $ 2,439,178 $ 2,191,347 $ 4,644,750 $ 4,082,003
$ 586,332 _$;___ __ 4_32...:,,_70_5_ (271,652) (259,581) ----'--'-'--;.,___;_
$ 91,106 $ 67,692 200,980 179,154 (1,745) 6,561 (55,068) 14,038 10,738 9,648 60,518 90,125 9,120 (9,962) 38,635 5,799 3,538 (480) 82,635 (35,406)
846,213 (259,247) (74) 979 6,350 9,146
(24,933) (5,153) (141,127) (82,022) 87,750 69,285 1,039,136 (78,413)
$ 674,082 $ 501,990 $ 767,484 $ (337,994)
-137-
Internal Service Funds
Internal service funds are used to account for the financing of goods or services provided by one department or agency to other depa1·tments or agencies of the gove1·nment and to other government units, on a cost reimbw·sement basis.
Fleet Maintenance Fund - This fund accounts for the repair and maintenance of vehicles and equipment for all City ope1·ations. It is financed by charges made to other funds for use of its services. Supplies and materials are charged at cost to the specific fund. Pe1·sonnel, administration and overhead costs ai·e charged on an estimated basis established at the beginning of each fiscal year.
Purchasing/Warehousing Fund - This fund accounts fo1· the central pw·chasing and warehousing functions for the City. It provides the service to all governmental and proprietary funds. It is financed by charges made to the other funds. Funds are charged for supplies and materials at cost. Personnel, administrative and overhead costs are charged on an estimated allocation basis established at the beginning of each fiscal yeai·.
Self-Insurance Fund - This fund accounts for the costs of insurance premiums and claims made against the City. Monies are accumulated in this fund to pay premiums for liability and property damage insm·ance and other claims. The City participates in the Utah Risk Management Mutual Association for its liability and p1·operty damage insurance. Insurance for large vehicles and equipment is pm·chased from private insm·ers. The fund also accounts for the insurance benefits of employees (i.e., state unemployment insurance, workers compensation insm·ance). The fund is financed by allocated charges made to the other funds for liability and property damage insurance. Charges for employee insurance benefits are made directly to each fund as a part of the payroll system. See footnote 5.A. for additional information regarding this fund.
Information Technology Fund - This fund accounts for the technological needs of the City including, but not limited to, computers, servers, networks, telephone systems, cell phone services, software, internet se1·vices, and all maintenance needs related thereto. It provides these services to all governmental and proprietary funds. It is financed by chai·ges made to the other funds. Funds ai·e charged fo1· supplies and materials at cost. Pe1·sonnel, administrative and overhead costs are charged on an estimated allocation basis established at the beginning of each fiscal year.
Facilities Maintenance Fund - This fund accounts fo1· the repair and maintenance of all city facilities. It is financed by charges made to other funds for use of its services. Supplies and materials a1·e charged at cost to the specific fund. Personnel, administrative and overhead costs are charged on an estimated allocation basis established at the beginning of each fiscal year.
-138-
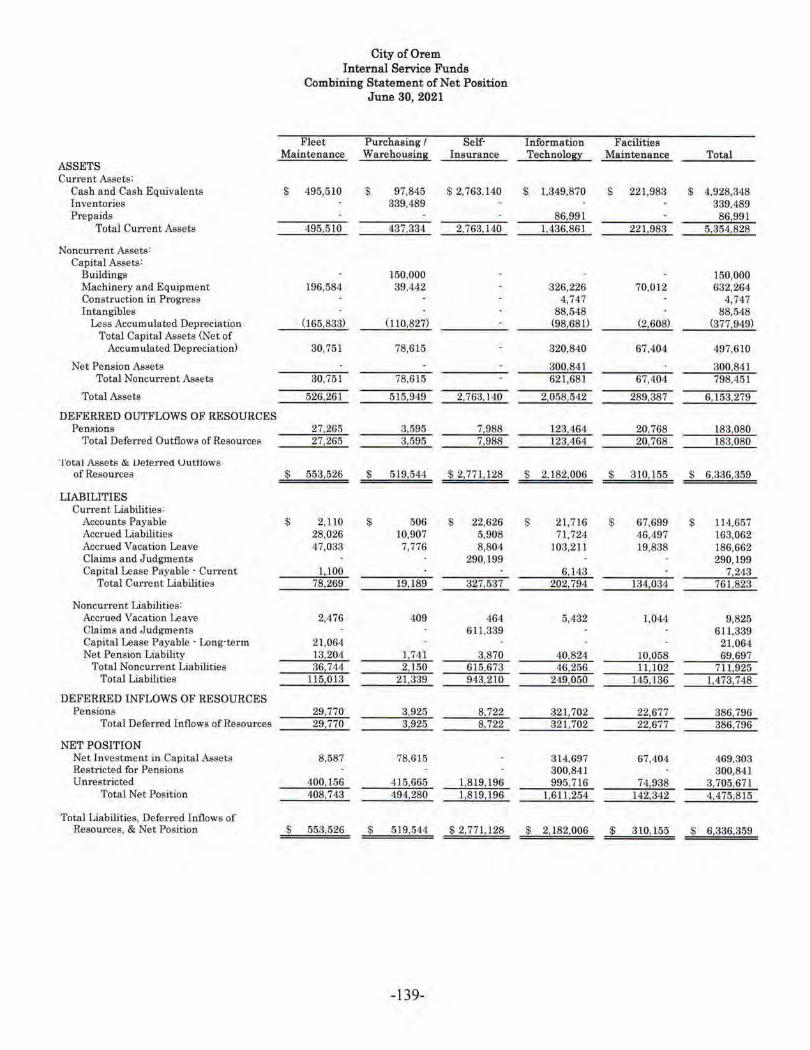
City of Orem Internal Service Funds
Combining Statement of Net Position June 30, 2021
Fleet Purchasing / Self- Information Facilities Maintenance
ASSETS WarehousinR Insurance TechnologI Maintenance Total
Current Assets: Cash and Cash Equivalents $ 495,510 s 97,845 $ 2,763, 140 $ 1,349,870 $ 221,983 $ 4,928,348 lnventories 339,489 339,489 Prepaids 86,991 86,991
Total Current Assets 495,510 437,334 2.763,l•JO 1,436,861 221,983 5,354,828
Noncurrent Assets: Capital Assets:
Buildings 150,000 150,000 Machinery and Equipment 196,584 39.442 326,226 70,012 632,264 Construction in Progress 4,747 4,747 Intangibles 88,548 88,548
Less Accumulated Depreciation (165,833) (110,827) (98,681) (21608) (377,949) Total Capital Assets (Net of
Accumulated Depreciation) 30,751 78,615 320,840 67,404 497,610
Net Pension Assets 300 841 300,841 Total Noncurrent Assets 30,751 78.615 621,681 67,404 798.451
Total Assets 526.261 515,949 2,763,140 2,058,542 289,387 6,153,279
DEFERRED OUTFLOWS OF RESOURCES Pensions 27,265 3,595 7,988 123,464 20,768 183,080
Total Defened Outflows of Resources 27,265 3 595 7 988 123,464 20.768 183,080
Total Assets & Ueterred Uuttiows of Resources $ 553,526 $ 519,544 $ 2,771.128 $ 2,182.006 $ 310,155 $ 6,336,359
LIABILITIES Current Liabilities:
Accounts Payable $ 2,110 $ 506 $ 22,626 $ 21.716 $ 67,699 $ 114,657 Accrued Liabilities 28,026 10,907 5,908 71,724 46,497 163,062 Accrued Vacation Leave 47,033 7,776 8,804 103,21 L 19,838 186,662 Clain1s and Judgments 290,199 290,199 Capital Lease Payable - Cu_rrent 1,100 6,143 7,243
Total Current Liabilities 78,269 19,189 327,537 202,794 134,034 761.823
Noncunent Liabilities: Accrued Vacation Leave 2,476 409 464 5,432 1,044 9,825 Claims and Judgments 611,339 611,339 Capital Lease Payable - Long·term 21,0S4 21.064 Net Pension Liability 13,204 1,74 1 3,870 40,824 10,058 69,697
Total Noncurrent Liabilities 36,744 2 150 615,673 46,256 11,102 711,925 Total Liabilities 115,013 21,339 943,210 249,050 145 136 l.473,748
DEFERRED INFLOWS OF RESOURCES Pensions 29,770 3,925 8,722 321,702 22,677 386,796
Total Deferred [nflows of Resources 29,770 3,925 8,722 321,702 22,677 386,796
NET POSITION Net Investment in Capital Assets 8,587 78,615 314,697 67,404 469,303 Restricted for Pensions 300,841 300,841 Unrestricted 400,156 415,665 1,819,196 995,716 74,938 3,705,671
Total Net Position 408 743 494,280 1,819.196 1,611,254 142,342 4,475,815
Total Liabilities, Deferred I n_flows of Resources, & Net Position $ 553,526 $ 519,544 $ 2,771,128 $ 2,182,006 $ 310,155 $ 6,336,359
-139-
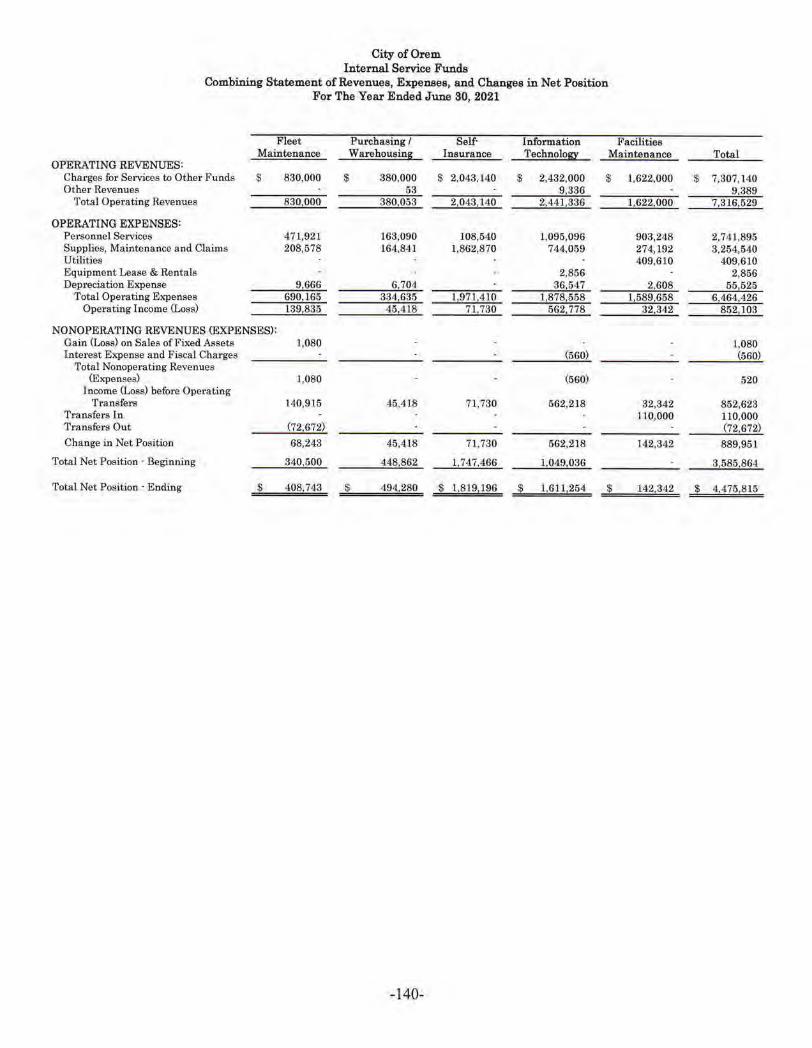
City of Orem Internal Service Funds
Combining Statement of Revenues, Expenses, and Changes in Net Position For The Year Ended June 30, 2021
Fleet Purchasing/ Self· Information Facilities Maintenance
OPERATING REVENUES: Warehousing Insurance Technolo~ Maintenance Total
Charges for Services to Other Funds $ 830,000 $ 380,000 $ 2,043,140 $ 2,432,000 $ 1,622,000 $ 7,307,140 Other Revenues 53 9 336 9,389
Total Operating Revenues 830,000 380,053 2,043,140 2,44] 336 1,622,000 7,316,529
OPERATING EXPENSES: Personnel Sernces 471,921 163,090 108,540 1,095,096 903,248 2,741,896 Supplies, Maintenance and Claims 208,578 164,841 1,862,870 744,059 274,192 3,254,640 Utilities 409,610 409,610 Equipment Lease & Rentals 2,856 2,856 Depreciation Expense 9666 6,704 36,547 2608 55,625
Total Operating Ei,..penses 690.165 334 635 1,971.410 1,878,568 1,589,658 6,464,426 Operating Inconie <Loss) 139 835 45 418 71.730 562,778 32,342 852,103
NONOPERATING REVENUES (EXPENSES): Gain <Loss) on Sales of Fixed Assets 1,080 1,080 Interest Expense and Fiscal Charges (560) (560)
Total Nonoperating Revenues (Expenses)
Income (Loss) before Operating 1,080 (560) 520
Transfers 140,915 45,418 71,730 562,218 32,342 852,623 Transfers In 110,000 110,000 1'1·ansfers Out (72,672) (72,672) Change in Net Position 68,243 45,418 71,730 562,218 142,342 889.951
Total Net Position · Beginning 340,500 448,862 1,747,466 1,049,036 3,585,864
Total Net Position · Ending $ 408 743 $ 494,280 $ 1,819,196 $ 1,611.254 $ 142,342 $ 4,475,815
-140-
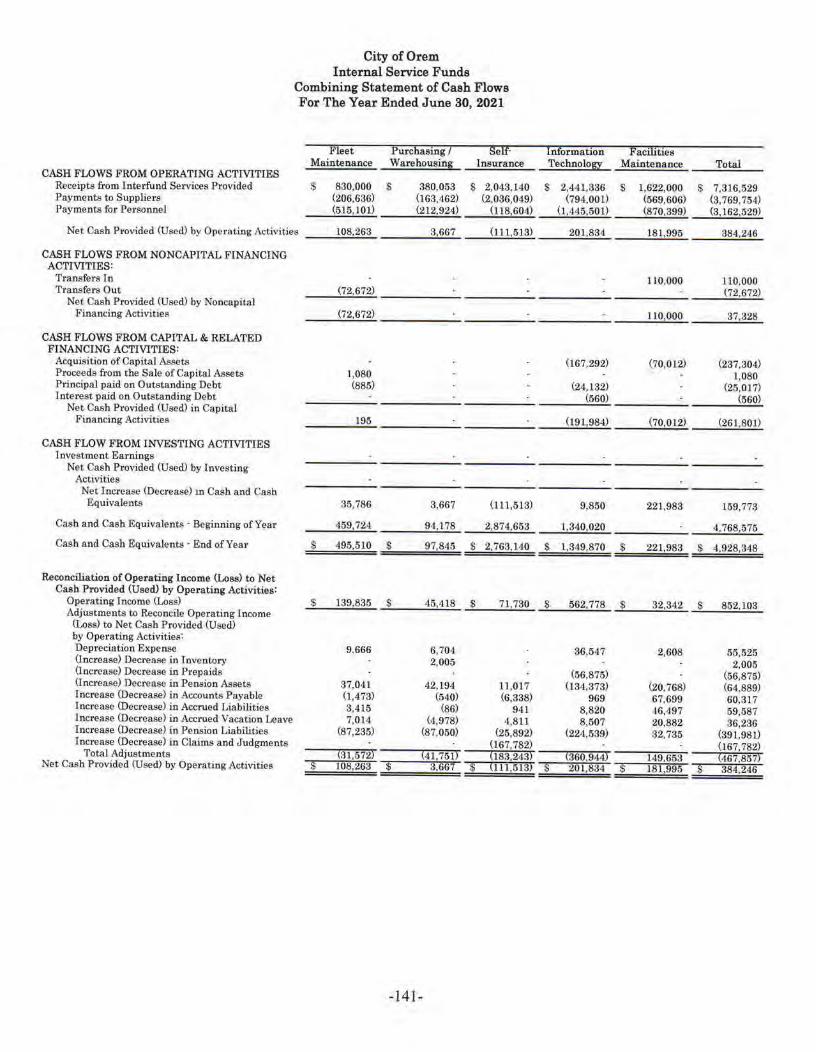
City of Orem Internal Service Funds
Combining Statement of Cash Flows For The Year Ended June 30, 2021
Fleet Purchasing I Self· Information Facilities Maintenance W arehousin~ Insurance Technoloil Maintenance Total
CASH FLOWS FROM OPERATING ACTMTIES Receipts from I nterfund Services Provided s 830,000 s 380,053 $ 2,043,140 $ 2,441,336 $ 1,622,000 $ 7,316,529 Payments to Suppliers (206,636) (163,462) (2,036,049) (794,001) (569,606) (3,769,754) Payments for Personnel (515,101) (212,924) (118,604) {1,445,501) (870,399) {3,162,529)
Net Cash Provided (Used) by Operating Activities 108,263 3,667 (111,513) 201,834 181,995 384,246
CASH FLOWS FROM NONCAPITAL FINANCING ACTIVITIES:
Transfers ln 110,000 110,000 Transfers Out {72,672) (72,672)
Net Cash Provided (Used) by Noncapital Financing Activities (72,672} 1 l0,000 37,328
CASH FLOWS FROM CAPITAL & RELATED FINANCING ACTIVITIES:
Acquisition of Capital Assets (167,292) (70,012) (237,304) Proceeds from the Sale of Capital Assets 1,080 1,080 Principal paid on Outstanding Debt {885) (24,132) (25,017) Interest paid on Outstanding Debt (560) (560)
Net Cash Provided (Used) in Capital Financing Activities 195 (191,984) {70,012) (261,801)
CASH FLOW FROM INVESTING ACTIVITIES Investment Earnings
Net Cash Prnvided {Used} by Investing Activities
Net Increase CDecrease) in Cash and Cash Equivalents 35,786 3,667 (lll,513) 9,850 221,983 159,773
Cash and Cash Equivalents · Beginning of Year 459,724 94,178 2.874,653 1,340,020 4,768,575
Cash and Cash Equivalents · End of Year s 495,510 $ 97,845 $ 2,763,140 $ 1,349,870 $ 221,983 $ 4,928,348
Reconciliation of Operating Income <Loss) to Net Cash Provided (Used) by Operating Activities:
Operating Income (Lo$S) $ 139,835 $ 45,418 $ 71,730 $ 562,778 $ 32,342 $ 852,103 Adjustments to Reconcile Operati,ng fncome
G...oss) to Net Cash Provided (Used) by Operating Activities: Depreciation Expense 9,666 6,704 36,547 2,608 55,525 (increase) Decrease in Inventory 2,005 2,005 Uncrease) Decrease in Prepaids (56,875) (56,875) Uncrease} Decrease in Pension Assets 37,041 42,194 11,017 (134,373) (20,768} (64,889) Increase (Decrease) in Accounts Payable (1,473) (540) (6,338) 969 67,699 60,317 Increase (Decrease) in Accrued Liabilities 3,415 (86) 941 8,820 46,497 59,587 Increase (Decrease) in Accrued Vacation Leave 7,014 (4,978} 4,811 8,507 20,882 36,236 Increase (Decrease) in Pension Liabilities (87,235) (87,050} (25,892) (224,539) 32,735 (391,981) Increase (Decrease) in Claims and Judgments (167,782) 067,782)
Total Adjustments (31,572) (41,751) (183,243) faG0,944) 149,653 {467,857) Net Cash Provided (Used) by Ope1·ating Activities $ 108,263 $ 3,667 $ 011,513) s 201,834 s 181,995 $ 384,246
-141-
SCHEDULES OF CAPITAL ASSETS
USED IN THE OPERATION OF GOVERNMENTAL FUNDS
-142-

City of Orem Schedules of Capital Assets Used in The Operations of Governmental Funds
Schedules By Source · Comparative1
June 30, 2021 and 2020
Governmental Funds Capit al Assets: Land $ Buildings Improvements other than Buildings Machinery and Equipment Infrastructure Construction in Progress
Total Governmental Funds Capital Assets $
Investments in Governmental Funds Capital Assets by Source: General Fund $ Capital Projects Fund Federal Grants Road Funds Redevelopment Community Development
Total Governmental Funds Capital Assets $
1 This schedule presents only the capital asset balances related to governmental funds. Accordingly, the capital assets reported in internal service funds are excluded from the above amounts. Generally, the capital assets of internal service funds are included as governmental activities in the statement of net assets.
-143-
2021
72,551,355 $ 42,278,099 40,920,396 24,490,860
127,468,399 30,221,923
337,931,032 $
252,996,139 $ 55,867,019
635,635 19,556,366
4,329,828 4,546,045
337,931,032 $
2020
65,195,839 32,731,587 38,972,594 23,969,453
124,396,371 22,426,454
307,692,298
245,162,644 35,489,358
635,635 17,928,501 4,159,780 4,316,380
307,692,298
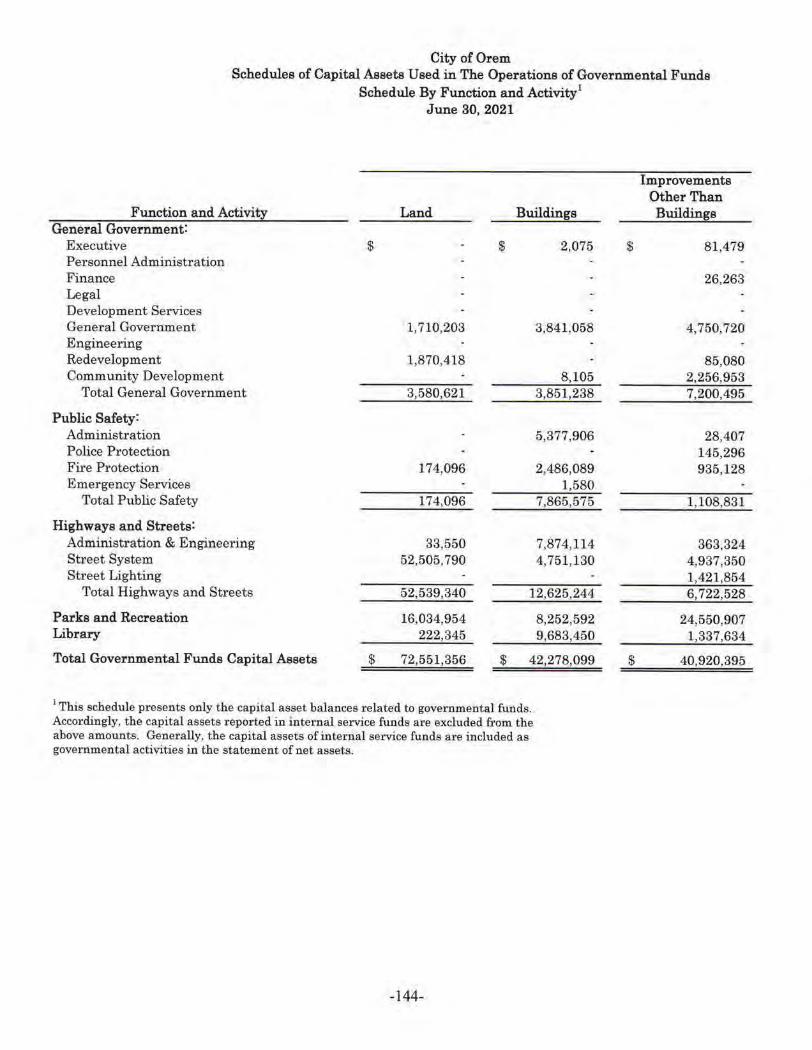
City of Orem Schedules of Capital Assets Used in The Operations of Governmental Funds
Schedule By Function and Activity 1
June 30, 2021
Improvements Other Than
Function and Activity Land Buildings Buildings General Government:
Executive $ $ 2,075 $ 81,479 Pe1·sonnel Administration Finance 26,263 Legal Development Services General Government 1,710,203 3,841,058 4,750,720 Engineering Redevelopment 1,870,418 85,080 Community Development 8,105 2,256,953
Total General Government 3,580,621 3,851,238 7,200,495
Public Safety: Administration 5,377,906 28,407 Police Protection 145,296 Fire Protection 174,096 2,486,089 935,128 Emergency Services 1,580
Total Public Safety 174,096 7,865,575 1,108,831
Highways and Streets: Administration & Engineering 33,550 7,874,114 363,324 Street System 52,505,790 4,751,130 4,937,350 Street Lighting 1,421,854
Total Highways and Streets 52,539,340 12,625,244 6,722,528
Parks and Recreation 16,034,954 8,252,592 24,550,907 Library 222,345 9,683,450 1,337,634
Total Governmental Funds Capital Assets $ 72,551,356 $ 42,278,099 $ 40,920,395
1 This schedule presents only the capital asset balances related to governmental funds. Accordingly, the capital assets reported in internal service funds are excluded from the above amounts. Gene1·ally, the capital assets of internal service funds are included as governmental activities in the statement of net assets.
-144-
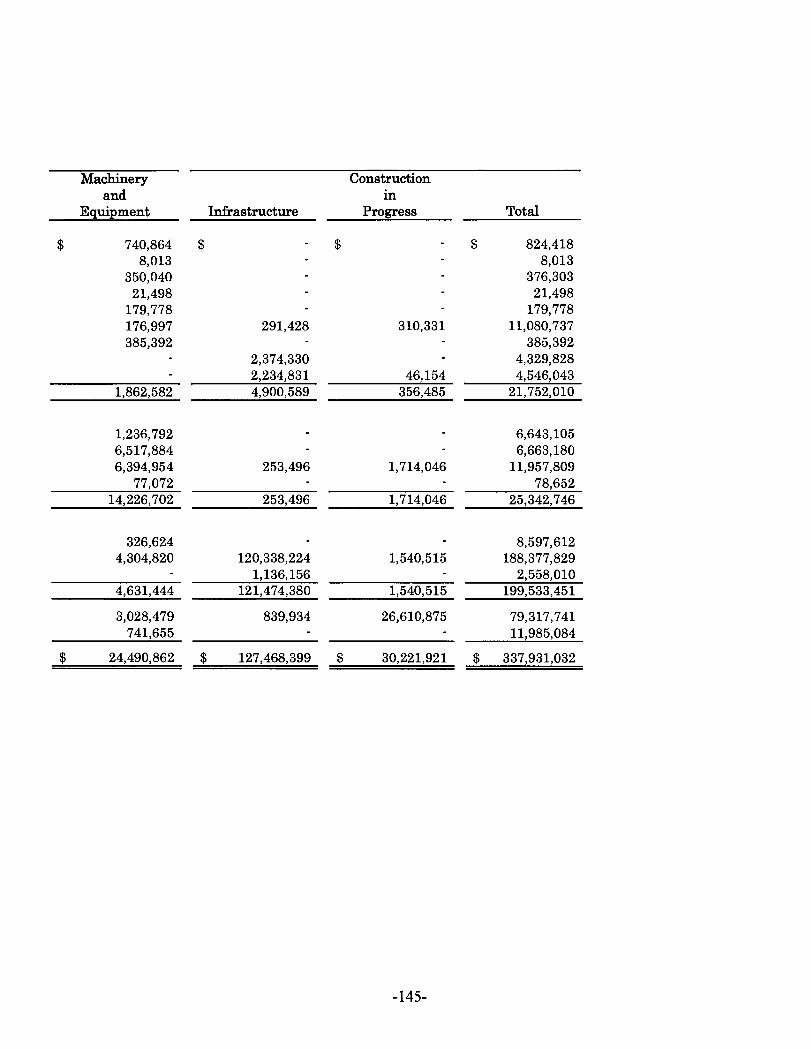
Machinery Construction and in
Equipment Infrastructure Progress Total
$ 740,864 $ $ $ 824,418 8,013 8,013
350,040 376,303 21,498 21,498
179,778 179,778 176,997 291,428 310,331 11,080,737 385,392 385,392
2,374,330 4,329,828 2,234,831 46,154 4,546,043
1,862,582 4,900,589 356,485 21,752,010
1,236,792 6,643,105 6,517,884 6,663,180 6,394,954 253,496 1,714,046 11,957,809
77,072 78,652 14,226,702 253,496 1,714,046 25,342,746
326,624 8,597,612 4,304,820 120,338,224 1,540,515 188,377,829
1,136,156 2,558,010 4,631,444 121,474,380 1,540,515 199,533,451
3,028,479 839,934 26,610,875 79,317,741 741,655 11,985,084
$ 24,490,862 $ 127,468,399 $ 30,221,921 $ 337,931,032
-145-
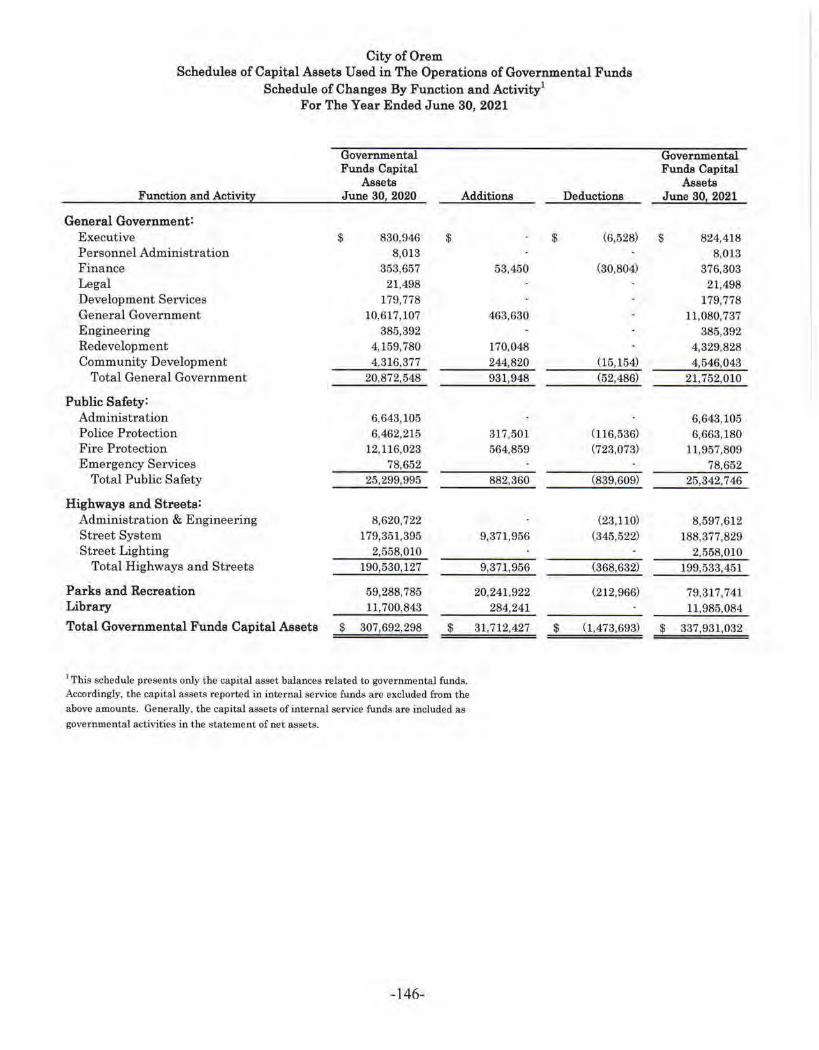
City of Orem Schedules of Capital Assets Used in The Operations of Governmental Funds
Schedule of Changes By Function and Activity1
For The Year Ended June 30, 2021
Governmental Governmental Funds Capital Fun.de Capital
Assets Assets Function and Activi~ June 30, 2020 Additions Deductions June 301 2021
General Government: Executive $ 830,946 $ $ (6,528) $ 824,418 Personnel Administration 8,013 8,013 Finance 353,657 53,450 (30,804) 376,303 Legal 21,498 21,498 Development Services 179,778 179,778 General Government 10,617,107 463,630 11,080,737 Engineering 385,392 385,392 Redevelopment 4,159,780 170,048 4,329,828 Community Development 4,316,377 244,820 (15,154) 4,546,043
Total General Government 20,872,548 931,948 (52,486) 21,752,010
Public Safety: Administration 6,643,105 6,643,105 Police Protection 6,462,215 317,501 (116,536) 6,663,180 Fire Protection 12,116,023 564,859 (723,073) 11,957,809 Eme1·gency Services 78,652 78,652
Total Public Safety 25,299,995 882,360 (839,609) 25,342,746
Highways and Streets: Administration & Engineering 8,620,722 (23,110) 8,597,612 Street System 179,351,395 9,371,956 (345,522) 188,377,829 Street Lighting 2,558,010 2,558,010
Total Highways and Streets 190,530,127 9,371,956 (368,632) 199,533,451
Park.a and Recreation 59,288,785 20,241,922 (212,966) 79,317,741 Library 11,700,843 284,241 11,985,084
Total Governmental Funds Capital Assets $ 307,692,298 $ 31,712,427 $ (1,473,693) $ 337,931,032
1 This schedule presents only the capital asset balances related to governmental funds. Accordingly, the capital assets reported in i.nte~nal service funds are excluded from the
above amounts. Generally, the capital assets of internal service funds are included as
governmental activities in the statement of net assets.
-146-

STATISTICAL SECTION
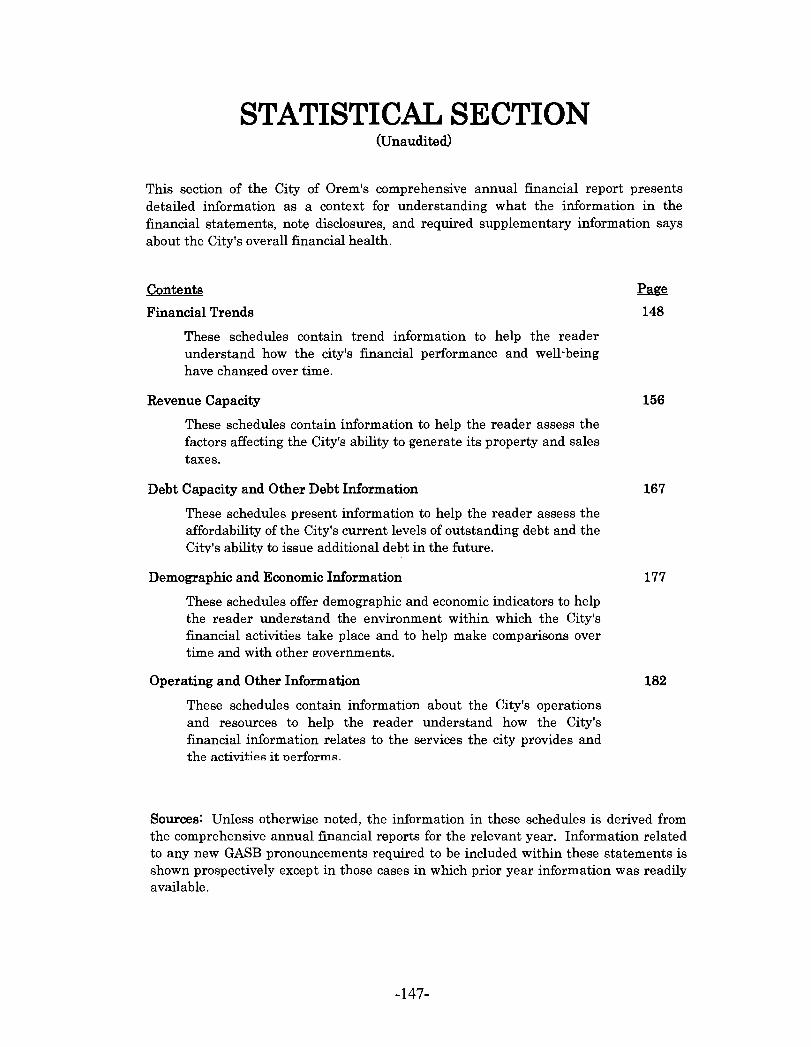
STATISTICAL SECTION (Unaudited)
This section of the City of Orem's comprehensive annual financial report presents detailed information as a context for understanding what the information in the financial statements, note disclosures, and required supplementary information says about the City's overall financial health.
Contents
Financial Trends
These schedules contain trend information to help the reader understand how the city's financial performance and well· being have changed over time.
Revenue Capacity
These schedules contain information to help the reader assess the factors affecting the City's ability to generate its property and sales taxes.
Debt Capacity and Other Debt Information
These schedules present information to help the reader assess the affordability of the City's current levels of outstanding debt and the City's ability to issue additional debt in the future.
Demographic and Economic Information
These schedules offer demographic and economic indicators to help the reader understand the environment within which the City's financial activities take place and to help make comparisons over time and with other ~overnments.
Operating and Other Information
These schedules contain information about the City's operations and resources to help the reader understand how the City's financial information relates to the services the city provides and the activities it nerforms.
Page
148
156
167
177
182
Sources: Unless otherwise noted, the information in these schedules is derived from the comprehensive annual financial reports for the relevant year. Information related to any new GASB pronouncements required to be included within these statements is shown prospectively except in those cases in which prior year information was readily available.
-147-
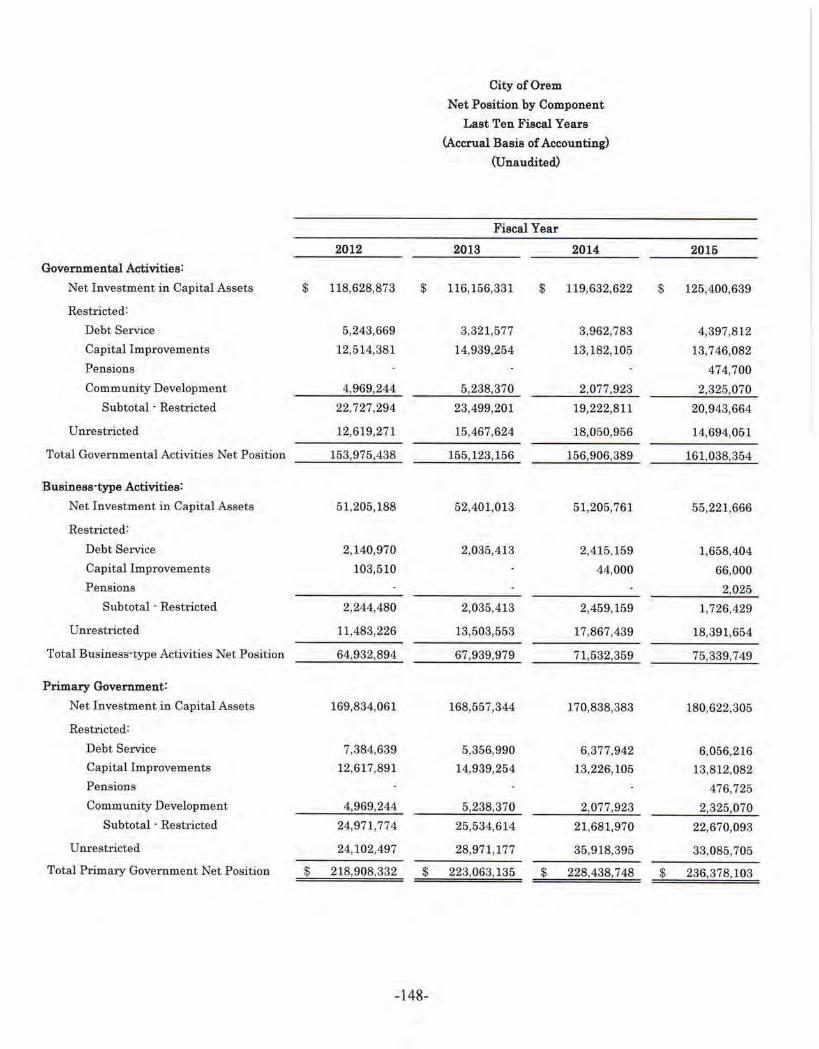
2012 Governmental Activities:
Net Investment in Capital Assets $ 118,628,873 $
Restricted:
Debt Service 5,243,669
Capital Improvements 12,514,381
Pensions
Community Development 4,969,244
Subtotal · Restricted 22,727,294
Unrestricted 12,619,271
Total Governmental Activit.ies Net Position 153,975,438
Business·type Activities:
Net Investment in Capital Assets 51,205,188
Restricted:
Debt Service 2,140,970
Capital Improvements 103,510
Pensions
Subtotal · Restricted 2,244,480
Unrestricted 11,483,226
Total Business-type Activities Net Position 64,932,894
Primary Government:
Net Investment in Capital Assets 169,834,061
Restricted:
Debt Service 7,384,639
Capital Improvements 12,617,891
Pensions
Community Development 4,969,244
Subtotal · Restricted 24,971,774
Unrestricted 24,102,497
Total Primary Government Net Position $ 218,908,332 $
-148-
City of Orem
Net Position by Component
Last Ten Fiscal Years
<Accrual Basis of Accounting)
(Unaudited}
Fiscal Year
2013 2014
116,156,331 $ 119,632,622
3,321,577 3,962,783
14,939,254 13,182,105
5,238,370 2,077,923
23,499,201 19,222,811
15,467,624 18,050,956
155,123,156 156,906,389
52,401,013 51,205,761
2,035,413 2,415,159
44,000
2,035,413 2,459,159
13,503,553 17,867,439
67,939,979 71,532,359
168,557,344 170,838,383
5,356,990 6,377,942
14,939,254 13,226,105
5,238,370 2,077,923
25,534,614 21,681,970
28,971,177 35,918,395
223,063,135 $ 228,438,748
2016
$ 125,400,639
4,397,812
13,746,082
474,700
2,325,070
20.943,664
14,694,051
161,038,354
55,221,666
1,658,404
66,000
2,025
1,726,429
18,391,654
75,339,749
180,622,305
6,056,216
13,812,082
476,725
2,325,070
22,670,093
33,085,705
$ 236,378,103
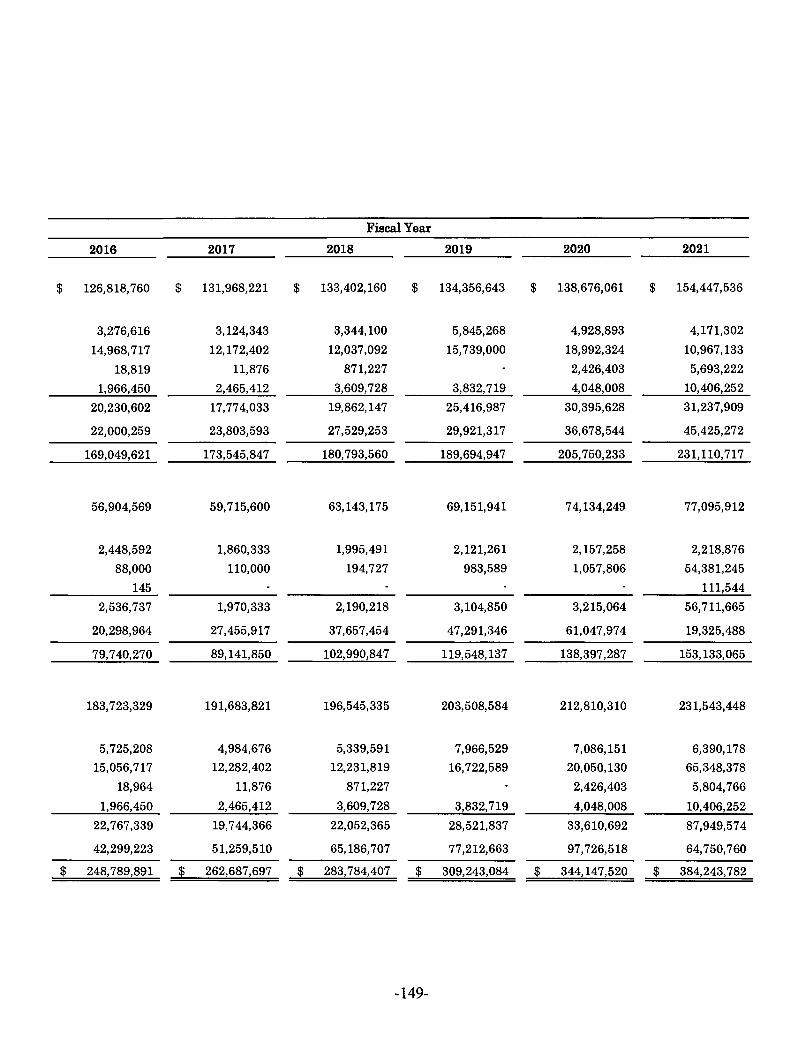
Fiscal Year
2016 2017 2018 2019 2020 2021
$ 126,818,760 $ 131,968,221 $ 133,402,160 $ 134,356,643 $ 138,676,061 $ 154,447,536
3,276,616 3,124,343 3,344,100 5,845,268 4,928,893 4,171,302
14,968,717 12,172,402 12,037,092 15,739,000 18,992,324 10,967,133
18,819 11,876 871,227 2,426,403 5,693,222
1,966,450 2,465,412 3,609,728 3,832,719 4,048,008 10,406,252
20,230,602 17,774,033 19,862,147 25,416,987 30,395,628 31,237,909
22,000,259 23,803,593 27,529,253 29,921,317 36,678,544 45,425,272
169,049,621 173,545,847 180,793,560 189,694,947 205,750,233 231,110,717
56,904,569 59,715,600 63,143,175 69,151,941 74,134,249 77,095,912
2,448,592 1,860,333 1,995,491 2,121,261 2,157,258 2,218,876
88,000 110,000 194,727 983,589 1,057,806 54,381,245
145 111,544
2,536,737 1,970,333 2,190,218 3,104,850 3,215,064 56,711,665
20,298,964 27,455,917 37,657,454 47,291,346 61,047,974 19,325,488
79,740,270 89,141,850 102,990,847 119,548,137 138,397,287 153,133,065
183,723,329 191,683,821 196,545,335 203,508,584 212,810,310 231,543,448
5,725,208 4,984,676 5,339,591 7,966,529 7,086,151 6,390,178
15,056,717 12,282,402 12,231,819 16,722,589 20,050,130 65,348,378
18,964 11,876 871,227 2,426,403 5,804,766
1,966,450 2,465,412 3,609,728 3,832,719 4,048,008 10,406,252
22,767,339 19,744,366 22,052,365 28,521,837 33,610,692 87,949,574
42,299,223 51,259,510 65,186,707 77,212,663 97,726,518 64,750,760
$ 248,789,891 $ 262,687,697 $ 283,784,407 $ 309,243,084 $ 344,147,520 $ 384,243,782
-149-
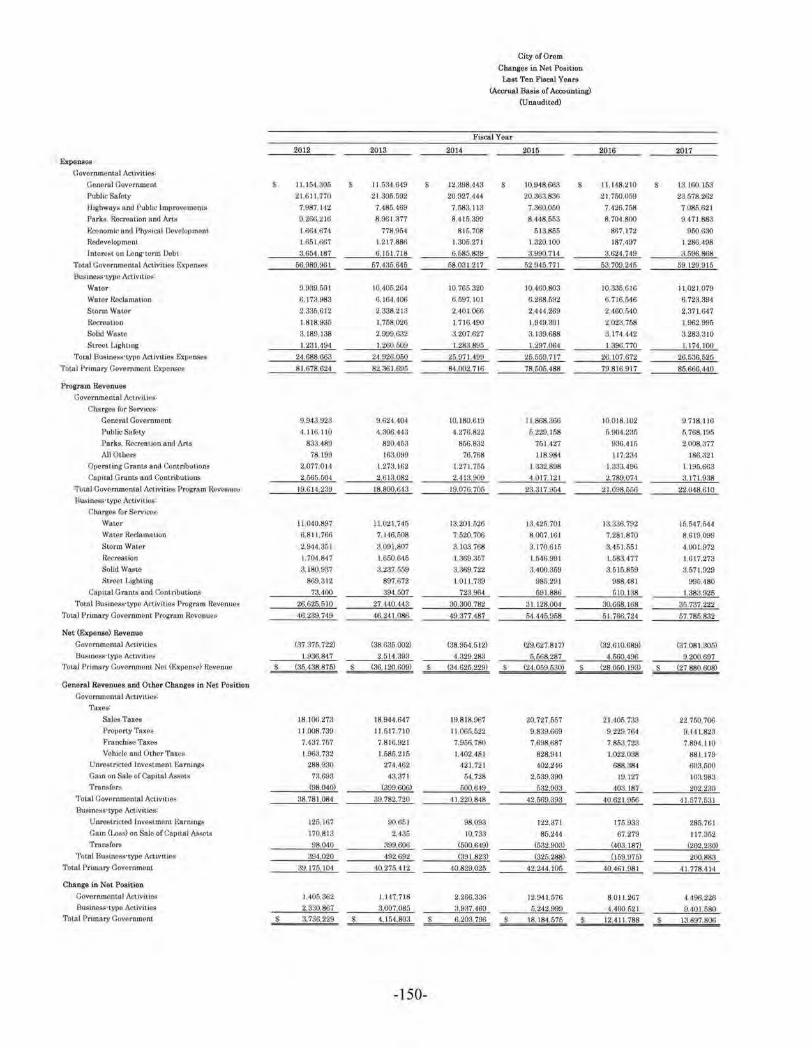
City o(On,m Changes in Net Position
Lwi:t Ten Fiscal Yoan <Aecrual Ba,is of Acc:ow,Ling)
(Unaudited)
Fiscal You
20.12 2013 2014 2016 2016 2017
Expense.a
Governmental Act.iviUoS:: General Government s 11.11>1 306 11,534,649 s 12 a98A43 s 10,948.663 s II, 148.210 s 13,160.153
Pub ht Sa fo1.y 21.611.770 21,3%.692 20,927,441 20.:l63.836 21.i60.059 23.678.262
lfighWA.)'fi fUVI roblic Jm1>1'0v('!rnenti, 7.987, 112 7,486.469 7.583, I 13 7.360.or,o H26.758 7,085.621
Parks. RecromlOn and Aris 9.266,216 S.961.377 8.416.399 8,H8.553 8,704.800 9,47 J.!!33
EconQmic nnd Physical D('voloi,mon, I 664.674 778,954 816,708 6 13.856 867,172 960.630
Redevelopment 1.661.607 1,217,886 1,306.271 1,320. JOO 187.497 1.286.4()8
lnte.rel!ll on Long·term De.bl 3.66'1,187 G, 161.718 6.686 639 ~.fl90,714 3.Gz..t,749 3.600.868 Tot.al Go'iermnetual Aor.ivitics F.x-p11ni;M- 1;6,989.961 57 4:15.645 r,a,031.211 52 946,771 53,709,246 59, 129.9 15
Sus1ness·type At1iv1ties= Water 9,939.601 IOA05 264 l0.765.320 JO 460.803 10.336.6 16 I 1.021 079
Wa1cr Ro<'Jamati<in 6, 173,983 6. 161.400 6,697,101 6.268,692 6,716,646 6,723,394
Slonn Wawr 2.336.6 12 2.338-218 2,•01 ,006 2,144,269 2,460.MO 2.371,647
Rocreauon 1.8 18,936 I 768,026 1,71(),400 119-19,301 2,028,758 1.962.995
Sohd Wa81o 3. 189.138 2.999.6:12 :1.207.627 3 139.688 3. 174.442 3.283,310
Stroot l..ighung l,2:ll,494 1.260,609 1,283.896 1,297,06-1 1396 770 1,174.100
Total Busine~i.·Lype Aet.iv11i~ Ex1,ani,;eti 2-1,688,663 z..t 92G,Oli0 26,971,499 2f>,669,717 26, 101,6n 26,636,625
Total Primnry GovemmcnL Ext,en.6(?& 81.678,624 82,361 ,6»6 84,002,716 78 606,488 79,816,917 86.666 •140
Progn.m Revonues
Covcrnmontal Act1vlt.1l'-8·
Charges for Sor,,,1oos: Cenera.1 Covommam 9,94:),923 9.624.404 10. 180.6!0 11.868 300 10,0 18. 102 9718. 116
Public Saloty 4.116,110 4,306 443 4,276,822 &.2n168 6.9(M.2:16 r.,1sa. 19:;
Par.ks. Rccrcalioo aad Arts 833.4M 820,463 8ho.832 761,427 9:16.41fi 2 008.377
All Other• 78. 199 163,099 76,768 118,984 ll7.234 186,321
Operating GntnLa and Contributions 2,077.014 1,273. 162 1.271 .765 1,332.898 1.333,496 l, 196.663 C81)iLR.I Grnot.JJ, a.nd Ccntributi<m~ 2,666,604 2.613082 2.413.909 4,017.121 2,789,074 3,171 ,938
1f"olaJ Covernm8nt9l AC1 ivitieti Program Rev()ntleti 19.614.239 18,800,643 l9,076,7()r, 28,317,954 21 098,666 22.048,C.10 Hu1.,lno.strly))e Act-iv1th.v,.
Charg~ for Servtccli; Watru' 11,040.897 11,021,746 13,201,526 13,426,701 13,3.16,792 l5,6'17,li44
Water Roclamat1on 6,811,766 7, 146,608 7.520,706 8,007. 161 7,261 ,870 8,6 19.099
SlOrm Water 2,944,361 3,091,807 3. 103,768 3, 170.6 16 3.461,1,51 4 ()Ol.972
lwenlation 1.701,817 1,650,646 U!69,367 1.M6.99! 1.683.477 1,6 17,273
Solid Wosto R, 18(),9!!7 :J.237 659 3.369,722 3,400,359 3.616,859 :J.671.929 Suoot wghllog 869,3 12 897.672 1,011.739 986,291 988,481 995 480
Capital Gnms and Contribm-rons- 73,400 394,607 723 004 591.886 510. 138 I :!83,925
Total Bw;moss·type Activities ProJrram RcvenuPr, 26,625.(,10 27,"40,H 3 30,300,782 31. 128,004 30.668.168 3/i 737 222 Toto I Primary Coverninijn.r Progrru.o Roveoue~ 40.239. 749 46,241,086 49,377 487 &I.H6,9f>8 61 ,766,724 67,785.832
Net (ExpeDAe) Revonuo
Govornmont.BJ Acuvil 1es (S7,S7fi 722) (38,635,002) (38,964.612) (29,627.817) (32,610,689) (37.08 I. 3061
Bus1.nC.Sli-"lYl)e AL1..1\lllle8 1,936.847 2,614,393 4,329,283 6,668,287 1,660.400 9.200 697 Total Prunary Covornmont Nol (Expo~) fwvenuc s (36.438,876) s (361 120. 609) (34,625.229) s (24 .069. 6ll0) s (28,0l\0, 193) s (27,880,608)
Ge11eral Revenues and Other Cbaoges in Net Poaition
Govt1rnmentnl Aalvit.ies: Taxe,'
Sales Taxes 18.106,273 18,914.617 19,818,967 20,727,657 21,105 73:l 22 760,706 Property Taxm:1 11,008,739 11,517,7 10 11 ,()65.622 9.839.669 9,229,764 9, IH,823 F'mnchi.se Taxe.1:1 7.137,767 7,816.92) 7.956.780 7.698.687 7.863,723 7,894,) 10 VehldP and Olhcr Taxes- 1,963,732 1.685,216 1,402,481 828,941 L022,038 881, 179
Unrcljltr1cted tnvcstme.nL Eorn.1.ngs 288,930 271.462 421,721 40'l.246 688.384 (i03.600
Gain on Sale <lrCap1t.a1 AssOIJ' n .693 4il,37l 64.728 2,639,390 19.127 IO:l.983 1'mlll!fer, (98.040) (399,606) 600,849 632.90:i 403.187 202.230
'Total Coveramental Actw1t1cs 38,781.064 39,782,720 •11,220,848 42,669.393 40,621,956 41,677.631 BuHiooss·typo Activ11.1Cs:
Unre@lricied lnvastmt,m P..arnings 126, 167 9(),651 98,093 122,371 17[),933 286,761
G•in <Lo.Ill on Sale or Ca111tal """""' 170.81:1 2,435 10,733 86.244 67,279 117.352 Tra ... r. .. 98,040 :lll'J.606 (600.649) (632,903) (403 187) (202,230)
Total 8u11:irws~·lYJ>e-Ac:tivi1i~ 394,020 492 692 (:191.823) (325,288) (169,975) 200,8/1.l Total Primary Covcrnmc.nt 39, 175, 104 •10,276,,112 10,829,025 42,244, 105 40.461.981 •1778.41'1
Chaogo in Not Positloo Governme.nt8l Aetivitie$ l,40Ji,362 1. 147,7 18 2,200,336 12,941,576 8,01 L267 4 ,196,226 Businoss·typc Al'tiv1tins- 2.330,867 3.007.066 ,'.1.937,460 6,242,999 4,400,621 9,401,680
Tot.al Pnmary Governrnt"nt s 3,736,229 s UM.803 s 6.203,796 s 18, 184.[,76 s 12.~ 11,788 s 13.897 806
-150-
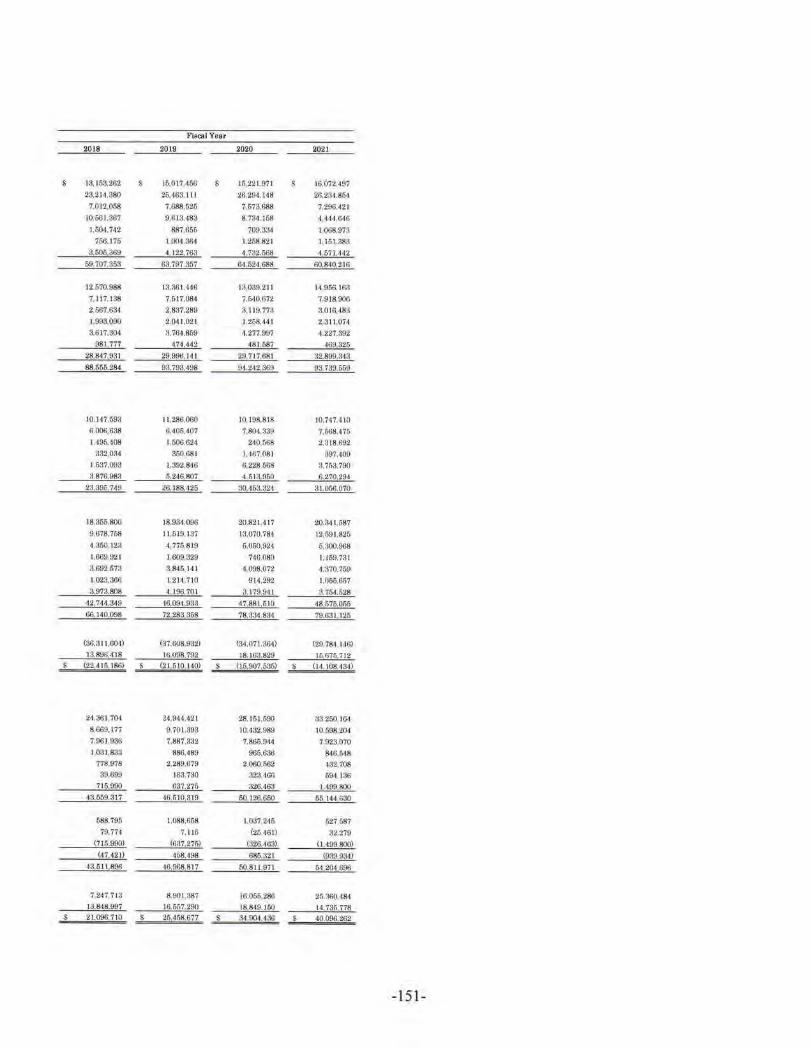
Fiscal Y oa.r
2018 2019 2020 2021
rn, 163,262 s 16,0J7,,1f>6 $ 16,221,971 16,072,497
23,214,380 2M63,Jll iG.294. 148 26.211-1,864
7,012,068 7.61!8,621i 7,573,688 7,296.•21 10,561,367 9,613,483 8 734 158 M44,G46
1,604, 7•2 sa1.1;5i; 109.3a4 1.(168.97:1
756, 175 1,00,1.364 l.25ll.82l 1,161.983
3,605,369 4, 122,76,1 4,7U2.568 •,671 H2
b9,707.363 63,797,357 64.5U,G88 6(),840.216
12,670,988 13,:l61,446 13,039,211 14,9[,6, 16.3
7. 117. 138 7.f,17,08,t 7,540,672 7,9 18,906
2,567,634 2,837.289 3, 119,773 3.016.483 1,993,090 2,041,021 1.268,441 2,3 11 074
3,617,304 a,76•,859 4,277.997 4.227.392 981,777 474 4•2 •81.581 169.325
28.847,931 29,996. 141 29,7 17,681 :12.899,343
88,665,284 98.793.498 9U42 369 93,739,569
10, 147,693 11,286,060 10, 198,8 18 10,747,410
6.006,638 6.406,407 7,804,339 7,f'68.H6
1.495.408 1,f,()6,624 240.668 2,318,692
332,0.<\4 350.681 1,467,081 :197,•09 1,637,093 1,392.846 6,2i8,668 :J,763,790
3,876,983 5,246,807 4.613,9o0 6.270,29,1
23,395.749 26,188,425 30,463,324 :11.066,070
18 355Jl00 18,934,096 20,82 1.H? 20.341,687
9,678,758 11,619, 137 1.1,070,784 12,591,825
4.350 u :1 4,775.819 fi,050,924 6,:l00,968
1.66$),921 1.609,329 740,080 J.169,731
3,69:!.673 3,845.141 4,098,072 4,370.759
I 023,366 1,211,7 10 914,292 l,Or,5,657
3,973,808 4. 196,101 3, 179941 3,764.628
42,74•,a•9 46 09•1,933 47,881,610 48.676.055
66,140,098 72,283.368 78,331,834 79631. 126
(36.:J 11.604) (37,608.932) (34,07 1 364) 129, 784.14G) 13,896,HS 16,098.792 18, 163.829 16676712
(22.416, 186) (21,610, 140) $ (16,907.636) s (14,108,434)
:M,361 704 24.9•4,'121 28, 161,690 33.260, 164 8,669,177 9 701,393 I0,4;12,989 10,698,204
7,961,936 7,887,332 7,866.944 7.923,070 l 031,833 886,•189 965,6.16 846,r.•8
778,978 2,289.679 2,060.662 432,708 39,699 163,730 323A66 694, 1~6
7 16.990 637,276 326.'163 l.499,800 •13,669,317 46,610,319 60, I 26,6f,0 55 144,630
688.796 1,088,668 1,037.246 627,687
79.774 7, ll5 <2s.m> ;12,279 (715.990) (637.275) (326.463) (1.499,800)
(47.421) 4611.49H 686,321 (939,934) 43,511,896 46,008 817 60,811,971 5,J,204,696
7.247713 S.901,337 lG,066,286 in,360.484
13.1148.997 16,667 290 18,849,!60 14_;au.ns s 21,096.7 10 25,468.677 s 34,904.43(; 40,096,262
-151-
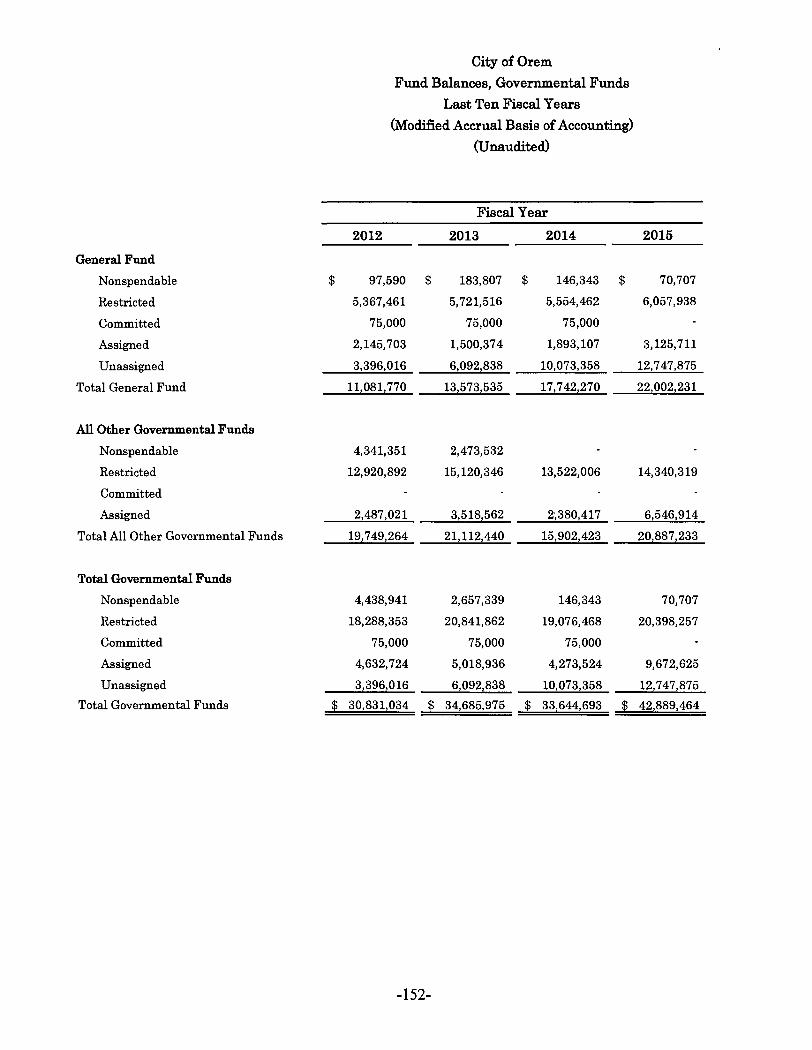
General Fund
Nonspendable $
Restricted
Committed
Assigned
Unassigned
Total General Fund
All Other Governmental Funds
Nonspendable
Restricted
Committed
Assigned
Total All Other Governmental Funds
Total Governmental Funds
Nonspendable
Restricted
Committed
Assigned
Unassigned
Total Governmental Funds $
City of Orem
Fund Balances, Governmental Funds
Last Ten Fiscal Years
(Modified Accrual Basis of Accounting)
(Unaudited)
Fiscal Year
2012 2013 2014
97,590 $ 183,807 $ 146,343 $
5,367,461 5,721,516 5,554,462
75,000 75,000 75,000
2,145,703 1,500,374 1,893,107
3,396,016 6,092,838 10,073,358
11,081,770 13,573,535 17,742,270
4,341,351 2,473,532
12,920,892 15,120,346 13,522,006
2,4871021 3,518,562 21380,417
19,749,264 21,112,440 15,902,423
4,438,941 2,657,339 146,343
18,288,353 20,841,862 19,076,468
75,000 75,000 75,000
4,632,724 5,018,936 4,273,524
3,396,016 6,092,838 101073,358
30,831,034 $ 34,685,975 $ 33!644,693 $
-152-
2015
70,707
6,057,938
3,125,711
12!747,875
2210021231
14,340,319
6!546,914
20!887,233
70,707
20,398,257
9,672,625
12,747,875
42,889,464
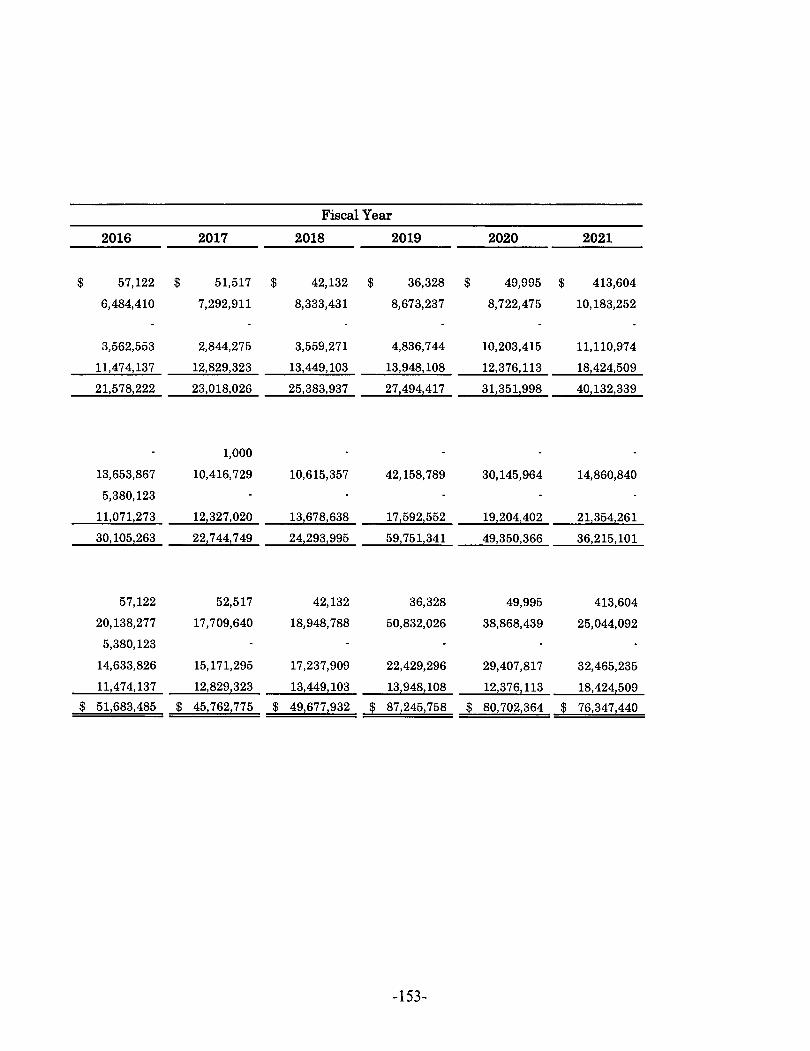
$
$
2016
57,122
6,484,410
3,562,553
11,474,137
21,5781222
13,653,867
5,380,123
11,071,273
30,105,263
57,122
20,138,277
5,380,123
14,633,826
11,474,137
51,683,485
$
$
2017
51,517
7,292,911
2,844,275
12,829,323
23,018,026
1,000
10,416,729
12,327,020
221744,749
52,517
17,709,640
15,171,295
12,8291323
45,7621775
$
$
Fiscal Year
2018
42,132
8,333,431
3,559,271
13,449,103
25,3831937
10,615,357
13,678,638
241293,995
42,132
18,948,788
17,237,909
13,449,103
49,677,932
$
$
2019
36,328
8,673,237
4,836,744
13,948,108
27,494,417
42,158,789
1715921552
59,751,341
36,328
50,832,026
22,429,296
13,948,108
87,2451758
-153-
$
$
2020
49,995
8,722,475
10,203,415
12,3761113
31,351,998
30,145,964
19,204,402
49,350,366
49,995
38,868,439
29,407,817
12,376,113
80,7021364
$
$
2021
413,604
10,183,252
11,110,974
181424,509
40,132,339
14,860,840
21,3541261
36,215,101
413,604
25,044,092
32,465,235
18,4241509
76,347,440

Revenues
Taxes and Special Assessments $
Licenses and Permits
Intergovernmental
Charges for Services
Fines and Forfeitures
Charges for Services · Other Funds
Impact Fees
Investment Earnings
Miscellaneous Revenue
Total Revenues
Expenditures
General Government
Public Safety
Highways and Public Improvements
Parks, Recreation and Arts
Economic and Physical Development
Redevelopment
Debt Service:
Principal Retirement
Interest and Fiscal Charges
Capital Lease Payments · Principal
Capital Lease Payments · Interest
Capital Outlay
Total Expenditures
Excess of Revenues over
Cunder) Expenditures
Other Financing Sources (Uses)
lsauance of Bonds & Otbe.r Debt
Payment to Bond Refunding Agent
Proceeds from Asset Disposals
Proceeds from Lease Relinquishments
Capital Leases
'l'ransfers in
Transfers Out
Total Other Financing Sources (Uses)
Net Change in Fund Balances $
Debt Service as a percentage
of Noncapital Expenditures
City of Orem
Changes in Fund Balances, Governmental Funds
Last Ten Fiscal Years
(Modified Accrual Basis of Accounting) (Unaudited)
Fiscal Year
2012 2013 2014
40,286,108 s 40,595,860 $ 40,004,715 $
1.093,859 1,147.855 1,437, 173
4,642,518 3,886.244 3,685,664
5,789,061 6,026,996 6,387,452
1,343,329 1,358,345 1,587.870
4,478.369 4,447,898 4,498,406
340,126 274,,139 420,619
2,256,723 1,889,659 1,557,414
60,230,092 69,627,296 59,579,313
10,348,586 11,093.324 .ll ,609,569
20,371,289 20,332,951 19,961,315
3,707,727 2,974,008 2,934,326
7,730.925 7,558.171 7,0 16,106
1,588,116 707,403 707, 769
1,562,238 1,128,457 1,215,842
3,834,833 3,130.714 3,814.621
3,821,259 6,233.296 6,706,815
31,132 98,213 108,318
1,989 12,099 10,218
4,435,299 1,963,153 7,180,569
57,433,393 55,231,789 61,255,458
2,796,699 4,395,507 (1,676.145)
1,814,000
(1,785,000)
45.598 48,275 t07, 760
525.147 26,454
5,933, 470 7,199.980 7.452,857
2015
43,549,348
2,524,794
5,350,019
7,624.838
1,792,829
4,042,299
397,648
1,587,285
66,869,060
11,539,358
19,847,226
2,828.824
7,485.247
886,236
1,231,600
5.486.955
4,201,272
108,376
9,177
7,573,606
61,197,877
5,671.183
10,174,331
(9,792.760)
42,869
2,500,000
64, 113
11,483,900
(6,031,510) (7,788,821) (6,952,208) (10,898,865)
501 705 (540,566) 634,863 3,573.588
3,298.404 $ 3.854.941 $ (1,041.282) s 9,244 771
14.3% 17.4% 19.2% 17.7%
-154-
2016
$ 39,473,431
1,745,483
4,122,570
7,671,801
1,588,994
3,666,672
691.037
1,670,552
60,630,540
12,143,760
21,144,586
2,922,708
7,512,284
788.526
99,182
4,369,370
3,802,678
114,173
7,037
6,044,338
58,948,642
1,681.898
19,127
6,739,000
12,998,035
( 12,6•14,039)
7,112.123
$ 8,794,021
15.3%
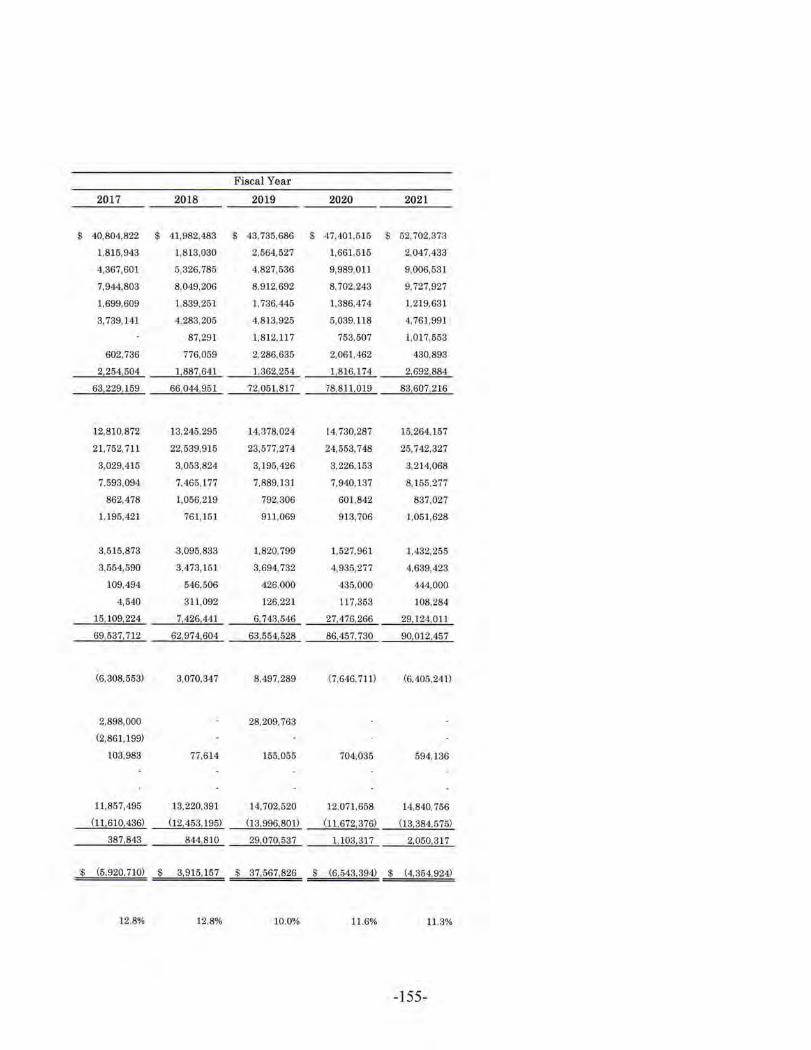
Fiscal Year
2017 2018 2019 2020 2021
$ 40,804,822 $ 41,982.483 $ 43,735,686 s 47,401.615 s 52, i02,373
1,816,943 1,813,030 2,564,527 1,661,515 2,047,433
4,367,601 5,326,785 4,827,536 9,989,0ll 9,006,531
7,944,803 8,049,206 8,912.692 8.702.243 9,727,927
1,699,609 1.839,251 1,736,445 1,386,474 1,219,631
3,739,141 4,283,205 4,813,925 5,039,118 4,761,991
87,291 1,812,117 753.507 1,017,553
602,736 776,069 2,286,635 2,061,462 430,893
2,254,504 1,887,641 1,362,254 1,816,174 2,692,884
63,229.169 66,044,951 72,051,817 78,811,019 83,607,216
12,810,872 13,245,295 14,378,024 14,730,287 15,264,157
21,752,711 22,539,915 23,577,274 24,553,748 2.5, 742,327
3,029,415 3,053,824 3,195,426 3,226,153 3,214,068
7,593,094 7,465,177 7,889,131 7,940,137 8,155.277
862,478 1,056,219 792,306 601,842 837,027
1,196,421 761,151 911,069 913,706 1,051,628
3,515,873 3,095,833 1,820,799 1,527,961 1,432,255
3.554.590 3,473,151 3,694,732 4,935,277 4,639,423
109,494 546,506 426,000 435,000 444,000
4,540 311,092 126,221 117,353 108,284
15,109,224 7,4,26.44 I 6,743,546 27,476,266 29.124,011
69,537,712 62,974,604 63,554,528 86,457,730 90,012,457
(6,308,553) 3,070,347 8,497,289 (7,646,711) (6,405,241)
2,898,000 28,209,763
(2,861,199)
103,983 77,614 155,055 704,035 594,136
11,857,495 13,220,391 14,702,520 12,071,658 14,840,756
(! 1,610,436) (12,453,195) (13,996,801) ( 11,672,376) (13,384,575)
387,843 844,810 29.Q?0,537 1,103,317 2,050,317
$ (5,920,710) $ 3,915,157 $ 37,567,826 $ (6,543,394) $ (4,354,924)
12.8% 12,8% 10.0% 11.6% 11.3%
-155-

City of Orem
Assessed Value and Estimated Actual Value of Taxable Property
Last Ten Calendar Years
(Unaudited)
Taxable Assessed Value
Primary Other Commercial
Calendar Residential Residential & lndUBtrial Agricultural
Year1 Property Property Property Property
2011 $ 2,319,187,515 $ 60,184,441 $ 1,551,035,553 $ 446,286
2012 2,284,573,816 4,073,304 1,451,256,784 544,039
2013 2,372,218,303 4,459,944 1,455,891,528 528,035
2014 2,625,764,385 7,388,684 1,540,311,362 486,609
2015 2,843,531,994 8,234,684 1,591,591,049 496,907
2016 3,107,389,501 11,331,034 1,666,181,801 936,304
2017 3,410,863,935 12,024,179 1,792, 344,368 837,724
2018 3,775,842,951 12,752,600 1,888,362,910 931,418
2019 4,166,790,367 15,841,000 2,053,671,086 904,733
2020 4,477,283,315 26,847,485 2,218,165,060 1,371,812
Source: Utah State Tax Commission - Property Tax Division
Notes: Property in the City of Orem is reassessed once every five years, on average. The county assesses property at approximately 55 percent of actual value for residential property and 100 percent of actual value for all other categories. Estimated actual taxable value is calculated by dividing taxable assessed value by those percentages.
1 ABsessed val\le8 are reported by the county on a calendar year basis rather than July 1 to June 30 fiscal year.
-156-
Unimproved
Real
Property
$ 3,599,142
136,586,644
127,808,953
147,878,177
145,565,291
160,189,356
156,979,408
164,540,170
173,954,008
188.660, 779

Taxable
Total Total Estimated Assessed Value
Taxable Direct Actual as a Percentage
Personal Fee in Lieu Assessed Tax Taxable of Actual
Property Property Value Rate Value Taxable Value
$ 294,715,129 $ 43,727,917 $ 4,273,495,983 0.001879 $ 6,220,745,765 68.70%
310,397,550 43,171,491 4,230,603,628 0.001921 6,103,133,090 69.32%
328,234,567 44,814,165 4,333,955,495 0.001871 6,278,510,424 69.03%
322,456,519 43,654,474 4,687,940,210 0.001716 6,842,338,176 68.51%
299,822,251 45,221,895 4,934,464,071 0.001652 7,267,727,717 67.90%
302,375,000 46,114,051 5,294,517,047 0.001550 7,846, 197,485 67.48%
316,299,118 44,919,303 5,734,268,035 0.001346 8,534,812,856 67.19%
319,419,105 44,102,879 6,205,952,033 0.001281 9,305,712,029 66.69%
339,452,728 43,518,173 6,794,132,095 0.001260 10,216,285,032 66.50%
363,773,499 41,018,229 7,317,120,179 0.001166 11,002,318,106 66.51%
Taxable Assessed Value as a % of Actual Taxable Value
75%
73%
71%
69% --67%
65%
63% 2011 2012 2013 2014 2015 2016 2017 2018 2019 2020
Calendar Year
-157-
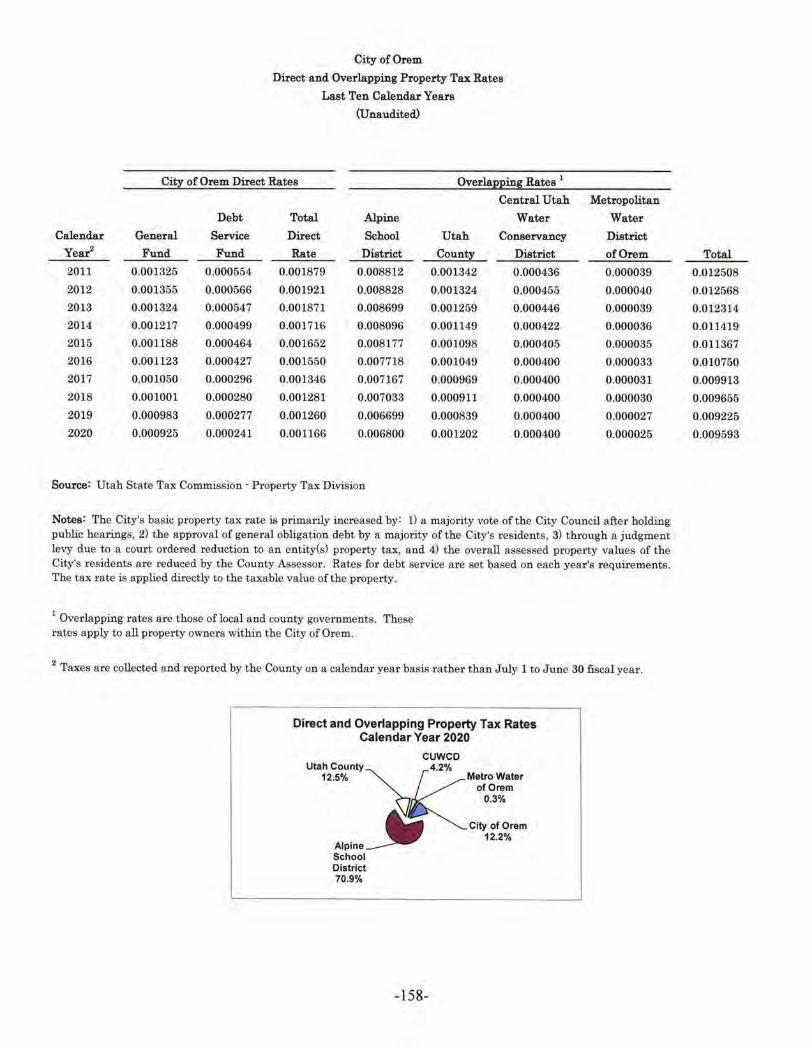
Calendar
Year2
2011
2012
2013
2014
2015
2016
2017
2018
2019
2020
City of Orem
Direct and Overlapping Property Tax Rates
Last Ten Calendar Years
(Unaudited)
Ci!I of Orem Direct Rates OverlaeEing Rates 1
Central Utah
Debt Total Alpine Water
General Service Direct School Utah Conservancy
Fund Fund Rate District County District
0.001325 0.000554 0.001879 0.008812 0.001342 0.000436
0.001355 0.000566 0.001921 0.008828 0.001324 0.000455
0.001324 0.000547 0.001871 0.008699 0.001259 0.000446
0.001217 0.000499 0.001716 0.008096 0.001149 0.000422
0.001188 0.000464 0.00 1652 0.008177 0.001098 0.000405
0.001123 0.000427 0.001550 0.007718 0.001049 0.000400
0.001050 0.000296 0.001346 0.007167 0.000969 0.000400
0.001001 0.000280 0.001281 0.007033 0.000911 0.000400
0.000983 0.000277 0.001260 0.006699 0.000839 0.000400
0.000925 0.000241 0.001166 0.006800 0.001202 0.000400
SolU'Ce: Utah State Tax Commission· Property Tax Division
Metropolitan
Water
District
of Orem
0.000039
0.000040
0.000039
0.000036
0.000035
0.000033
0.000031
0.000030
0.000027
0.000025
Notes: The City's basic property tax rate is primarily increased by: 1) a majority vote of the City Council after holding public hearings, 2) the approval of general obligation debt by a majority of the City's residents, 3) through a judgment levy due to a court ordered reduction to an entity(s) property tax, and 4) the overall assessed property values of the City's residents are reduced by the County Assessor. Rates for debt service are set based on each year's requirements. The ta.x rate is applied directly to the taxable value of the property.
1 Overlapping rates are those of local and county governments. These rates apply to all property owners within the City of Orem.
2 Taxes are collected and reported by the County on a calendar year basis rather than July l to June 30 fiscal year.
Direct and Overlapping Property Tax Rates Calendar Year 2020
cuwco
Utaf 2~5~f nty)R4'2% Metro Water
of Orem 0.3%
_I, City of Orem 12.2%
Alpine School District 70.9%
-158-
Total
0.012508
0.012568
0.012314
0.011419
0.011367
0.010750
0.009913
0.009655
0.009225
0.009593
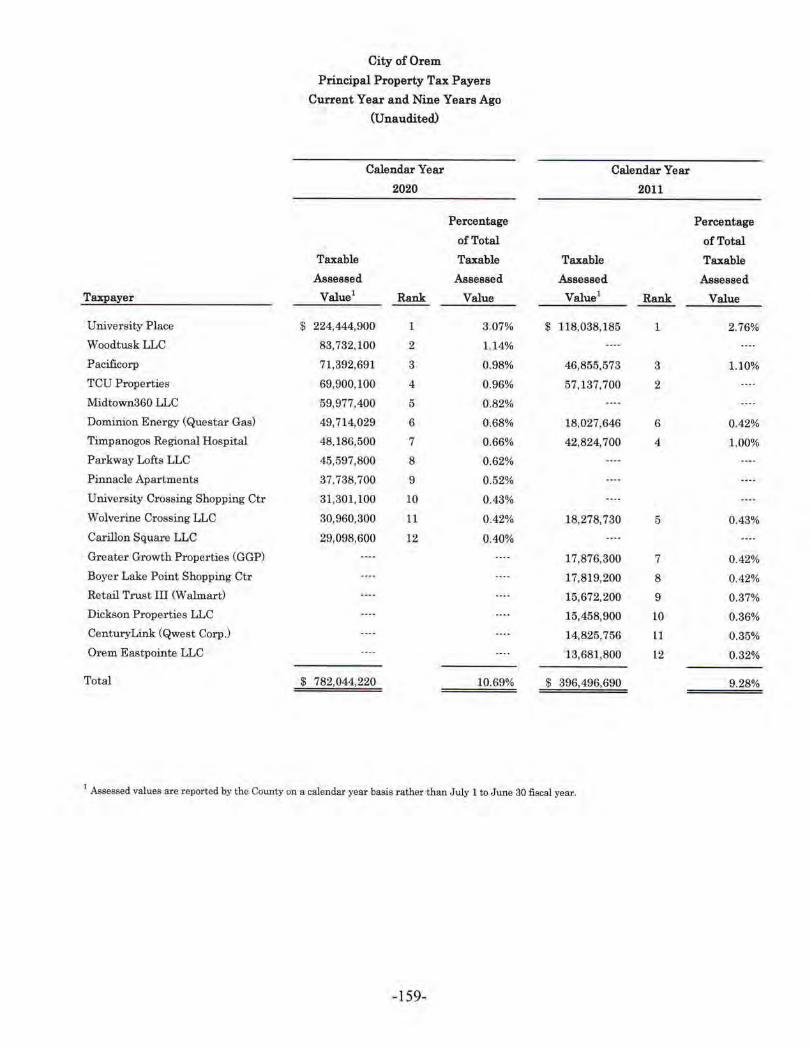
City of Orem
Principal Property Tax Payers
Current Year and Nine Years Ago
(Unaudited)
Calendar Year Calendar Year
2020 2011
Percentage Percentage
of Total of Total
Taxable Taxable Taxable Taxable
Assessed Assessed Assessed Assessed
Taxpayer Value1 Rank Value Value1 Rank Value
University Place $ 224,444,900 1 3.07% $ 118,038,185 1 2.76%
Woodtusk LLC 83,732,100 2 1,14%
Pacifi.corp 71,392,691 3 0.98% 46,855,573 3 1.10%
TCU Proper ties 69,900,100 4 0.96% 57,137,700 2
Midtown360 LLC 59,977,400 5 0.82%
Dominion Energy (Questar Gas) 49,714,029 6 0.68% 18,027,646 6 0.42%
Timpanogos Regional Hospital 48,186,500 7 0.66% 42,824,700 4 1.00% Parkway Lofts LLC 45,597,800 8 0.62%
Pinnacle Apartments 37,738,700 9 0.52%
University Crossing Shopping Ctr 31,301,100 10 0.43%
Wolverine Crossing LLC 30,960,300 11 0.42% 18,278,730 5 0.43%
Carillon Square LLC 29,098,600 12 0.40%
Greater Growth Properties (GGP) 17,876,300 7 0.42% Boyer Lake Point Shopping Ctr 17,819,200 8 0.42% Retail Trust III (W almart) 15,672,200 9 0.37% Dickson Properties LLC 15,458,900 10 0.36% CenturyLink (Qwest Corp.) 14,825,756 11 0.35% Orem Eastpointe LLC 13,681,800 12 0.32%
Total $ 782,044,220 10.69% $ 396,496,690 9.28%
1 Assessed values are reported by the County on a calendar year basis rather than July l to June 30 fiscal year.
-159-
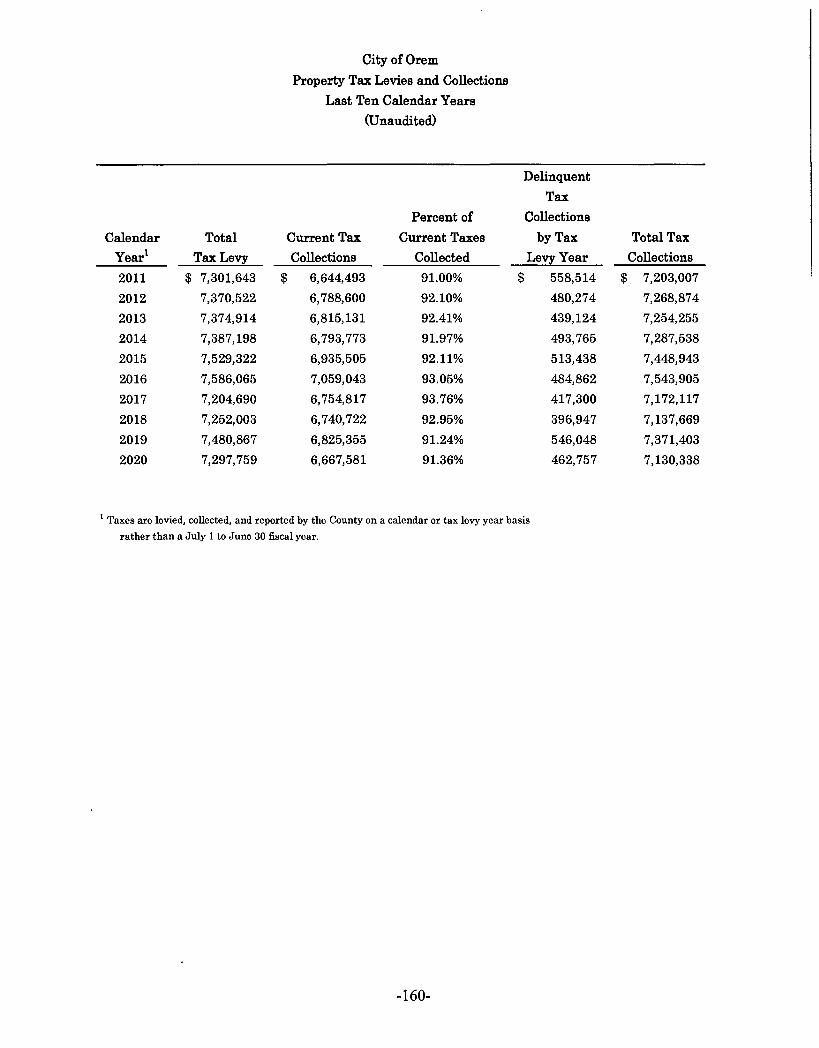
Calendar Total
Year1 Tax Levy
2011 $ 7,301,643
2012 7,370,522
2013 7,374,914
2014 7,387,198
2015 7,529,322
2016 7,586,065
2017 7,204,690
2018 7,252,003
2019 7,480,867
2020 7,297,759
City of Orem
Property Tax Levies and Collections
Last Ten Calendar Years
(Unaudited)
Percent of
Current Tax Current Taxes
Collections Collected
$ 6,644,493 91.00%
6,788,600 92.10%
6,815,131 92.41%
6,793,773 91.97%
6,935,505 92.11%
7,059,043 93.05%
6,754,817 93.76%
6,740,722 92.95%
6,825,355 91.24%
6,667,581 91.36%
Delinquent
Tax
Collections
by Tax
Levy Year
$ 558,514
480,274
439,124
493,765
513,438
484,862
417,300
396,947
546,048
462,757
1 Taxes are levied, collected, and reported by the County on a calendar or tax levy year basis
rather than a July 1 to June 30 fiscal year.
-160-
Total Tax
Collections
$ 7,203,007
7,268,874
7,254,255
7,287,538
7,448,943
7,543,905
7,172,117
7,137,669
7,371,403
7,130,338
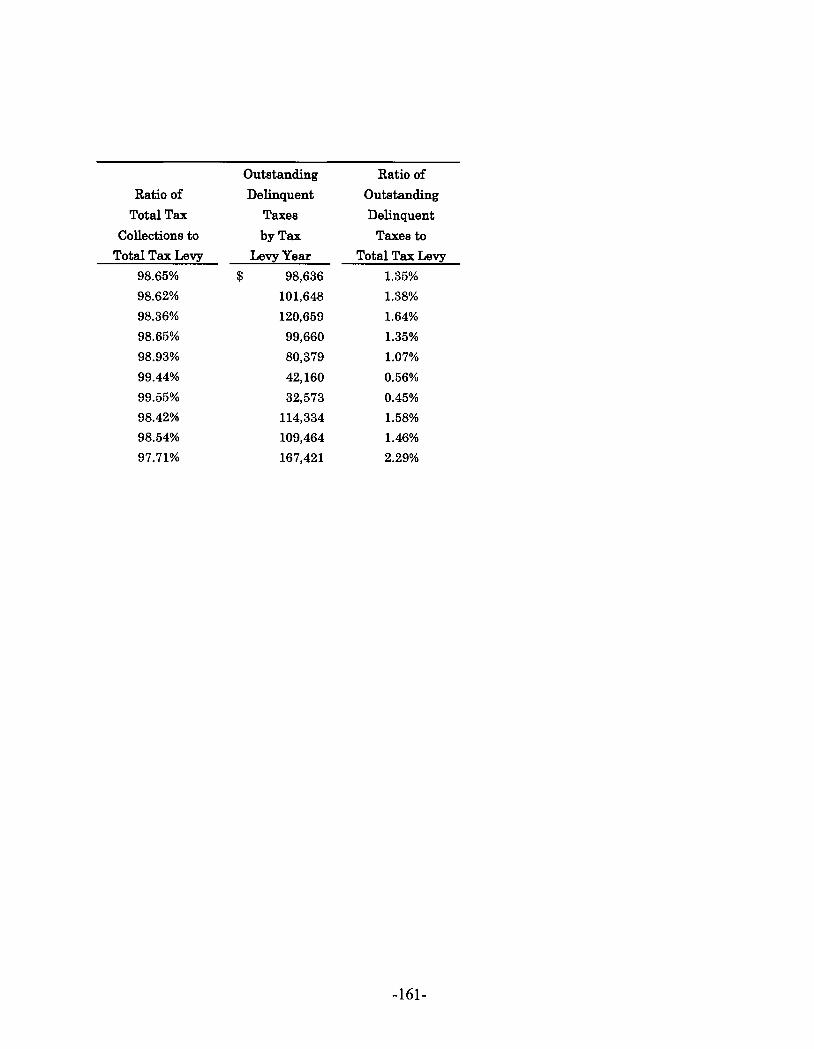
Outstanding Ratio of
Ratio of Delinquent Outstanding
Total Tax Taxes Delinquent
Collections to by Tax Taxes to
Total Tax Levy Levy Year Total Tax Levy
98.65% $ 98,636 1.35%
98.62% 101,648 1.38%
98.36% 120,659 1.64%
98.65% 99,660 1.35%
98.93% 80,379 1.07%
99.44% 42,160 0.56%
99.55% 32,573 0.45%
98.42% 114,334 1.58%
98.54% 109,464 1.46%
97.71% 167,421 2.29%
-161-
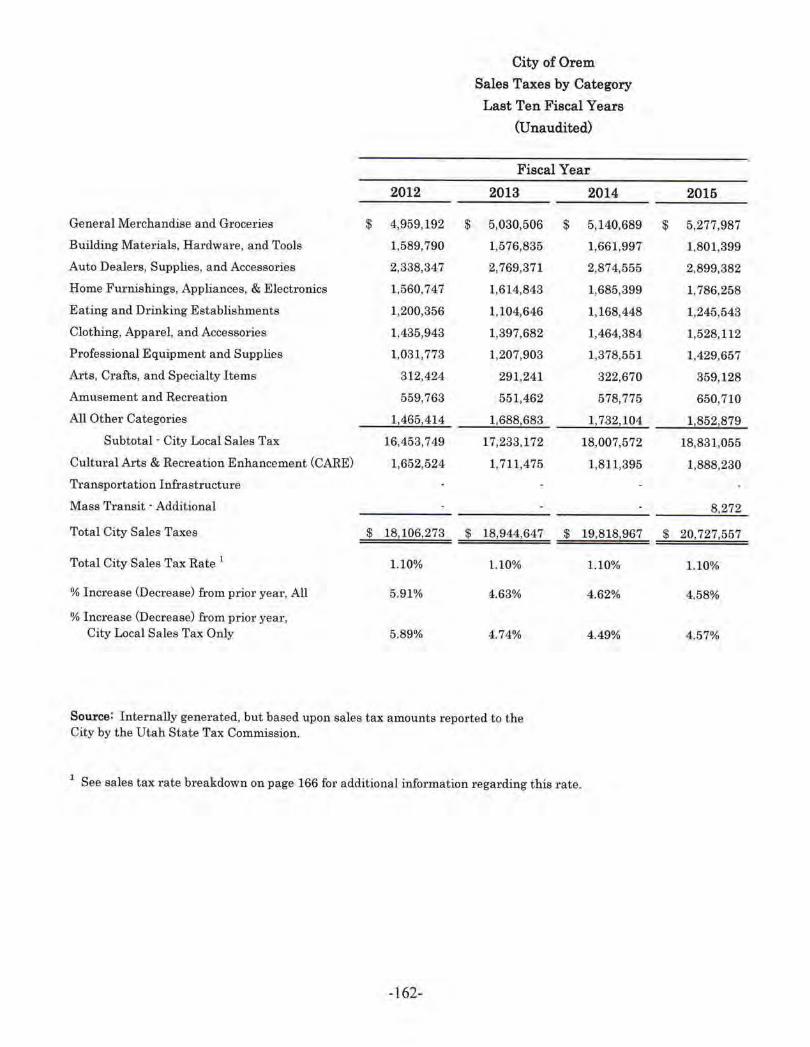
City of Orem
Sales Taxes by Category
Last Ten Fiscal Years
(Unaudited)
Fiscal Year
2012 2013 2014
General Merchandise and Groceries $ 4,959,192 $ 5,030,506 $ 5,140,689
Building Materials, Hardware, and Tools 1,589,790 1,576,835 1,661,997
Auto Dealers, Supplies, and Accessories 2,338,347 2,769,371 2,874,555
Home Furnishings, Appliances, & Electronics 1,560,747 1,614,843 1,685,399
Eating and Drinking Establishments 1,200,356 1.104,646 1,168,448
Clothing, Apparel, and Accessories 1,435,943 1,397,682 1,464,384
Professional Equipment and Supplies 1,031,773 1,207,903 1,378,551
Arts, Crafts, and Specialty Items 312,424 291,241 322,670
Amusement and Recreation 559,763 551,462 578,775
All Other Categories 1,465,414 1,688,683 1,732,104
Subtotal - City Local Sales Tax 16,453,749 17,233,172 18,007,572
Cultural Arts & Recreation Enhancement (CARE) 1,652,524 1,711,475 1,811,395
Transportation Infrastructure
Mass Transit · Additional
Total City Sales Taxes $ 18,106,273 $ 18,944,647 $ 19,818,967
Total City Sales Tax Rate 1 1.10% 1.10% 1.10%
% Increase (Decrease) from prior yea1·, All 5.91% 4.63% 4.62%
% Increase (Decrease) from prior year, City Local Sales Tax Only 5.89% 4.74% 4.49%
Source: Internally generated, but based upon sales tax amounts reported to the City by the Utah State Tax Commission.
1 See sales tax rate b1·eakdown on page 166 for additional information regarding this rate.
-162-
2015
$ 5,277,987
1.801,399
2,899,382
1,786,258
1,245,543
1,528, 112
1.429,657
359,128
650,710
1!852,879
18,831,055
1,888,230
8,272
$ 20,727,557
1.10%
4.58%
4,57%

Fiscal Year
2016 2017 2018 2019 2020 2021
$ 5,333,279 $ 5,637,951 $ 5,934,245 $ 6,105,107 $ 6,578,582 $ 7,702,422
1,952,417
2,979,991
1,822,364
1,314,508
1,573,936
1,526,283
382,199
656,716
1,921,222
19,462,915
1,934,153
8,665
$ 21,405,733
1.10%
3.27%
3.36%
2,299,711
3,151,370
1,964,207
1,499,483
1,552,018
1,554,830
377,497
674,845
2,002,205
20,714,117
2,028,528
8,062
$ 22,750,707
1.10%
6.28%
6.43%
$28,000,000 $26,000,000 $24,000,000 $22,000,000 $20,000,000 $18,000,000 $16,000,000 $14,000,000
2,585,913
3,410,522
2,101,318
1,749,330
1,582,714
1,596,802
387,574
683,181
2,166,357
22,197,956
2,163,259
489
3,028,016
3,694,537
2,082,860
1,809,424
1,299,340
1,602,008
358,450
726,998
2,027,097
22,733,837
2,208,004
2,580
3,479,383
3,802,737
1,807,145
1,664,412
1,129,901
1,893,016
367,346
743,740
2,270,648
23,736,910
2,284,064
2,129,802
814
$ 24,361,704 $ 24,944,421 $ 28,151,590
1.10%
7.08%
7.16%
1.20%
2.39%
2.41%
Total Sales Taxes by Fiscal Year (City Local Sales Taxes Only)
-163-
1.20%
12.86%
4.41%
4,340,120
4,575,230
2,189,728
1,859,596
1,260,997
2,198,583
476,918
870,486
2,529,869
28,003,949
2,741,633
2,503,967
6 17
$ 33,250,166
1.20%
18.11%
17.98%
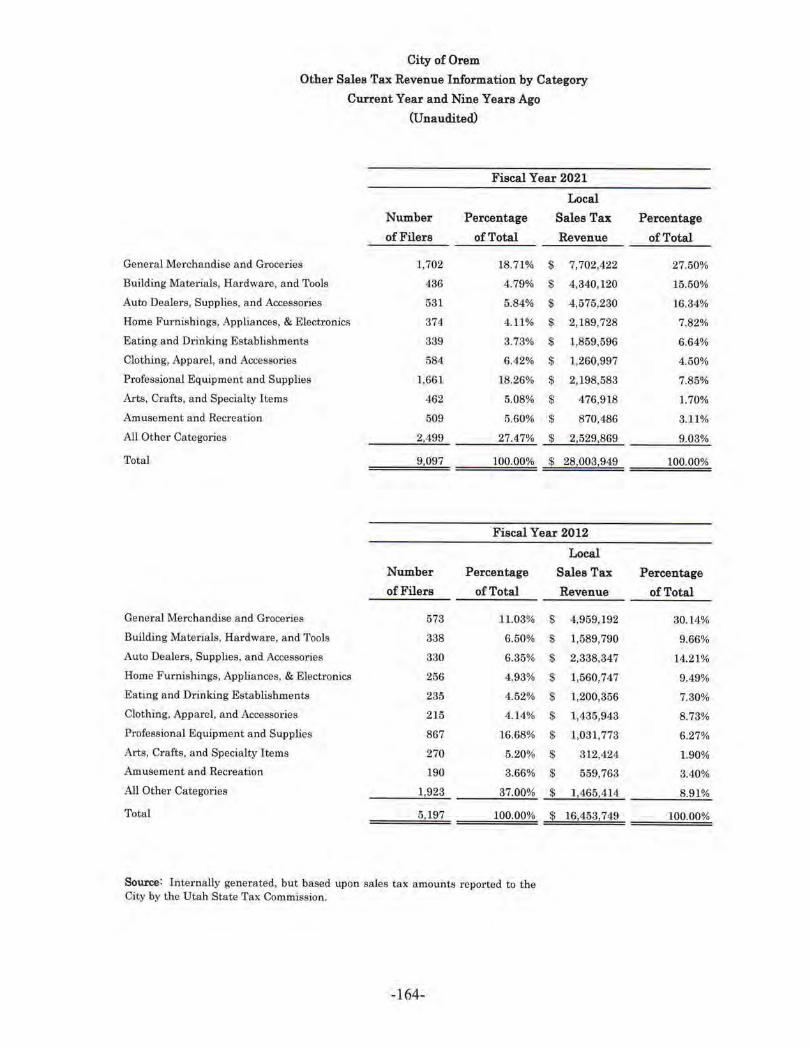
City of Orem
Other Sales Tax Revenue Information by Category
Current Year a.nd Nine Years Ago (Unaudited)
Fiscal Year 2021
Local
Number Percentage Sales Tax
of Filers of Total Revenue
General Merchandise and Groceries 1,702 18.71% $ 7,702,422
Building Materials, Hardware, and Tools 436 4.79% $ 4,340,120
Auto Dealers, Supplies, and Accessories 531 5.84% $ 4,575,230
Home Furnishings, Appliances, & Electronics 374 4.11% $ 2,189,728
Eating and Drinking Establishments 339 3.73% $ 1,859,596
Clothing, Apparel, and Accessories 584 6.42% $ 1,260,997
Professional Equipment and Supplies 1,661 18.26% $ 2,198,583
Arts, Crafts, and Specialty Items 462 5.08% $ 476,918
Amusement and Recreation 509 5.60% $ 870,486
All Other Categories 2,499 27.47% $ 2,529,869
Total 9,097 100.00% $ 28,003,949
Fiscal Year 2012
Local Number Percentage Sales Tax of Filers of Total Revenue
General Merchandise and Groceries 573 11.03% $ 4,959,192
Building Materials, Hardware, and Tools 338 6.50% $ 1,589,790
Auto Dealers, Supplies, and Accessories 330 6.35% $ 2,338,347
Home Furnishings, Appliances, & Electronics 256 4.93% $ 1,560,747
Eating and Drinking Establishments 235 4.52% $ 1,200,356
Clothing, Apparel, and Accessories 215 4.14% $ 1,435,943
Professional Equipment and Supplies 867 16.68% $ 1,031,773
Arts, Crafts, and Specialty Hems 270 5.20% $ 312,424
Amusement and Recreation 190 3.66% $ 559,763
AJJ Other Categories 1,923 37.00% $ 1,465,414
Total 5,197 100.00% $ 16,453,749
Source: Internally generated, but based upon sales tax amounts reported to the City by the Utah State Tax Commission.
-1 64-
Percentage
of Total
27.50%
15.50%
16.34%
7.82%
6.64%
4.50%
7.85%
1.70%
3.11%
9.03%
100.00%
Percentage
of Total
30.14%
9.66%
14.21%
9.49%
7.30%
8.73%
6.27%
1.90%
3.40%
8.91%
100.00%
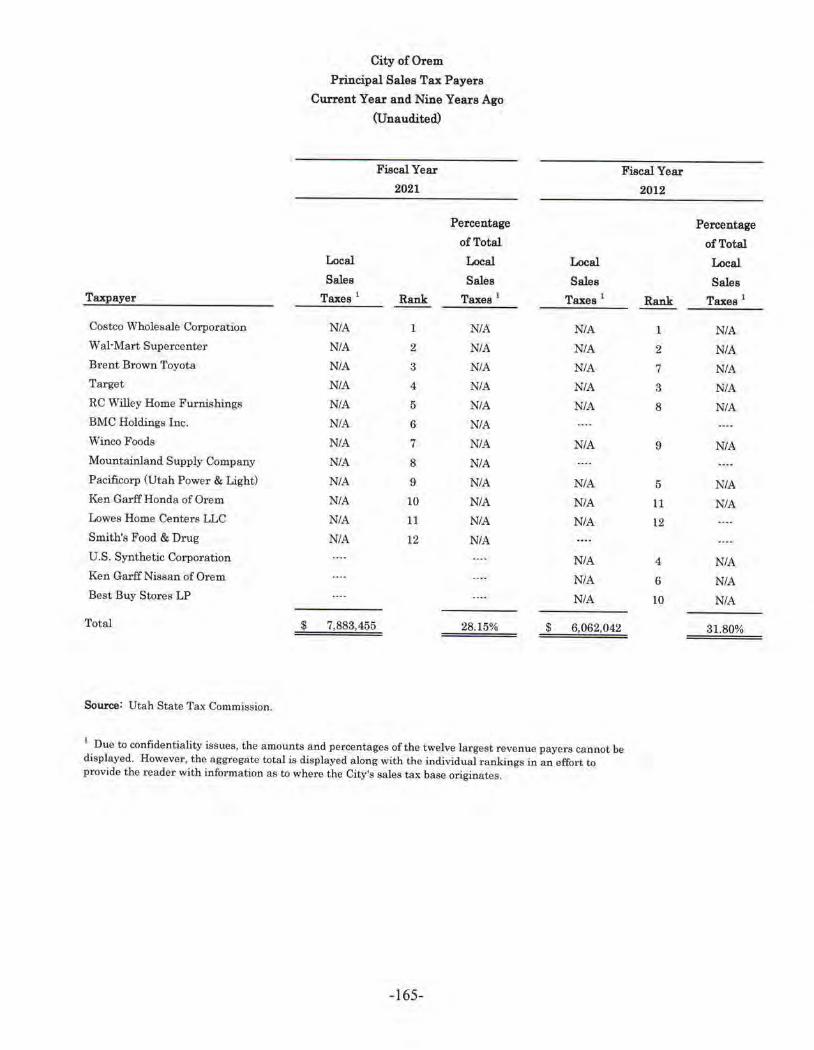
City of Orem
Principal Sales Tax Payers
Curren t Year and Nine Years Ago
(Unau dited)
Fiscal Year Fiscal Year
2021
Percentage
of Total
Local Local Local
Sales Salee Salee Taxpayer Taxes 1 Rank Taxes 1 Taxes 1
Costco Wholesale Corporation NIA 1 NIA NIA Wal-Mar t Supercenter NIA 2 NIA NIA Brent Brown Toyota NIA 3 NIA NIA Target NIA 4 NIA NIA RC Willey Home Furnishings NIA 5 NIA NIA BMC Holdings Inc. NIA 6 NIA Winco Foods NIA 7 NIA NIA Mountainland Supply Company NIA 8 NIA Pacificorp (Utah Power & Light) NIA 9 NIA NIA Ken Garff Honda of Orem NIA 10 NIA NIA Lowes Home Centers LLC NIA 11 NIA NIA Smith's Food & Drug NIA 12 NIA U.S. Synthetic Corporation NIA Ken Garff Nissan of Orem NIA Best Buy Stores LP NIA
Total $ 7,883,455 28.15% $ 6,062,042
Source: Utah State Tax Commission.
1 Due to confidentiality issues, the amounts and percentages of the twelve largest revenue payers cannot be
displayed. However, the aggregate total is displayed a long with the individual rankings in an effort to provide the reader with information as to where the City's sales tax base originates.
-165-
2012
Rank
1
2
7
3
8
9
5
11
12
4
6
10
Percentage
of Tot al
Local
Salee
Taxes 1
NIA
NIA
NIA
NIA
NIA
NIA
NIA
NIA
NIA
NIA
NIA
31.80%
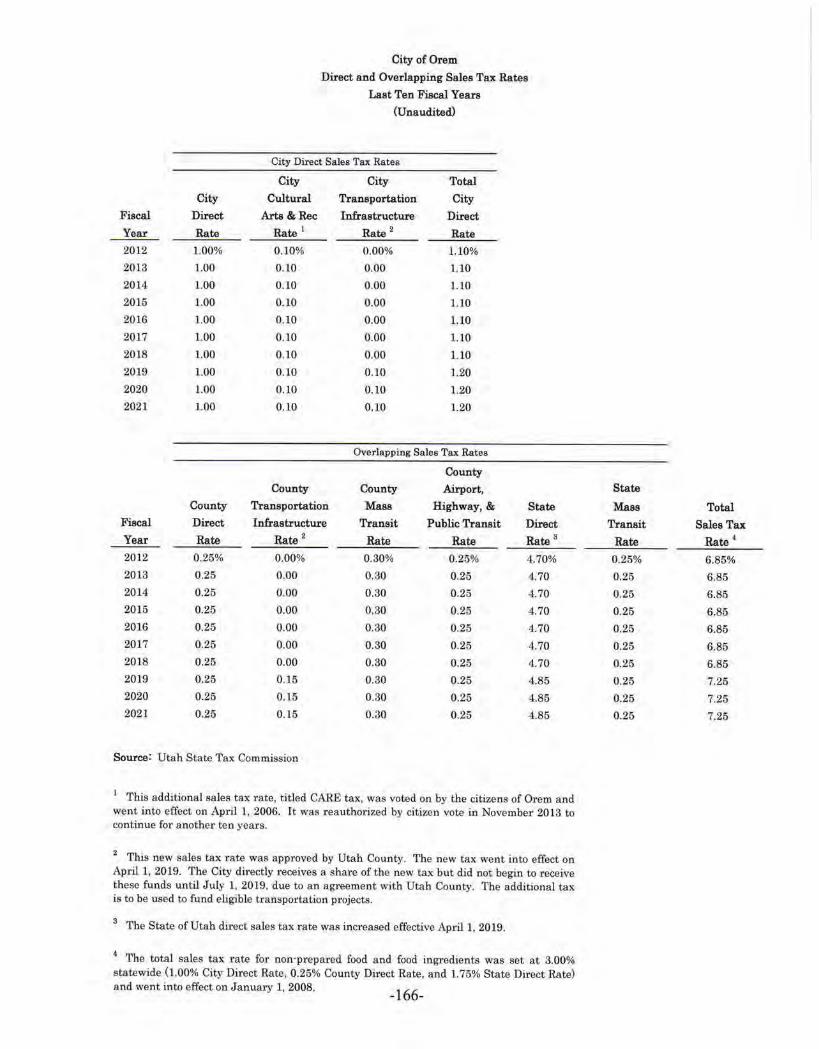
Fiscal
Year
2012
2013
2014
2015
2016
2017
2018
2019
2020
2021
Fiscal
Year
2012
2013
2014
2015
2016
2017
2018
2019
2020
2021
City
Direct
Rate
1.00%
1.00
1.00
1.00
1.00
1.00
1.00
1.00
1.00
1.00
County
Direct
Rate 0.25%
0.25
0.25
0.25
0.25
0.25
0.25
0.25
0.25
0.25
City of Orem
Direct and Overlapping Sales Tax Rates
Last Ten Fiscal Years
(Unaudited}
City Direct Sales Tax Rates
City City Total
Cultural Transportation City
Arte &Rec Infrastructure Direct Rate I Rate 2 Rate 0.10% 0.00% 1.10%
0.10 0.00 1.10
0.10 0.00 1.10
0.10 0.00 1.10
0 .10 0.00 1.10
0.10 0.00 1.10
0.10 0.00 1.10
0.10 0.10 1.20
0.10 0.10 1.20
0.10 0.10 1.20
Overlapping Sales Tax Rates
County County County Airport,
Transportation Mase Highway, & State Infrastructure Transit Public Transit Direct
Rate 2 Rate Rate Rate 3
0.00% 0.30% 0.25% 4.70%
0.00 0,30 0.25 1.70
0.00 0.30 0.25 4.70
0.00 0.30 0.25 4.70
0.00 0.30 0.25 4.70
0.00 0.30 0.25 4.70
0.00 0.30 0.25 4.70 0.15 0.30 0.25 4.85
0.15 0.30 0.25 4.85
0. 15 0.30 0.25 4.85
Source: Utah State Tax Commission
1 This additional sales tax rate, titled CARE tax, was voted on by the citizens of Orem and
went into effect on April 1, 2006. It was reauthorized by citizen vote in November 2013 to continue for a nother ten years.
2 This new sales tax rate was approved by Utah County. The new tax went into e ffect on
April 1, 2019. The City directly receives a share of the new tax but did not begin to receive these funds until July 1, 2019, due to an agreement with Utah County. The additional tax is to be used to fund eligible transportation. projects.
3 The State of Utah direct sales tax rate was increased effective April I , 2019.
4 The total sales tax rate for non-prepared food and food ingredients was set at 3.00%
statewide (1.00% City Direct Rate, 0.25% County Direct Rate, and l. 75% State Direct Rate) and went into effect on January 1, 2008.
-166-
State
Maes Total Transit Sales Tax
Rate Rate 4
0.25% 6.85%
0.25 6.85
0.25 6.85
0.25 6.85
0.25 6.85
0.25 6.85
0.25 6.85
0.25 7.25
0.25 7.25
0.25 7.25
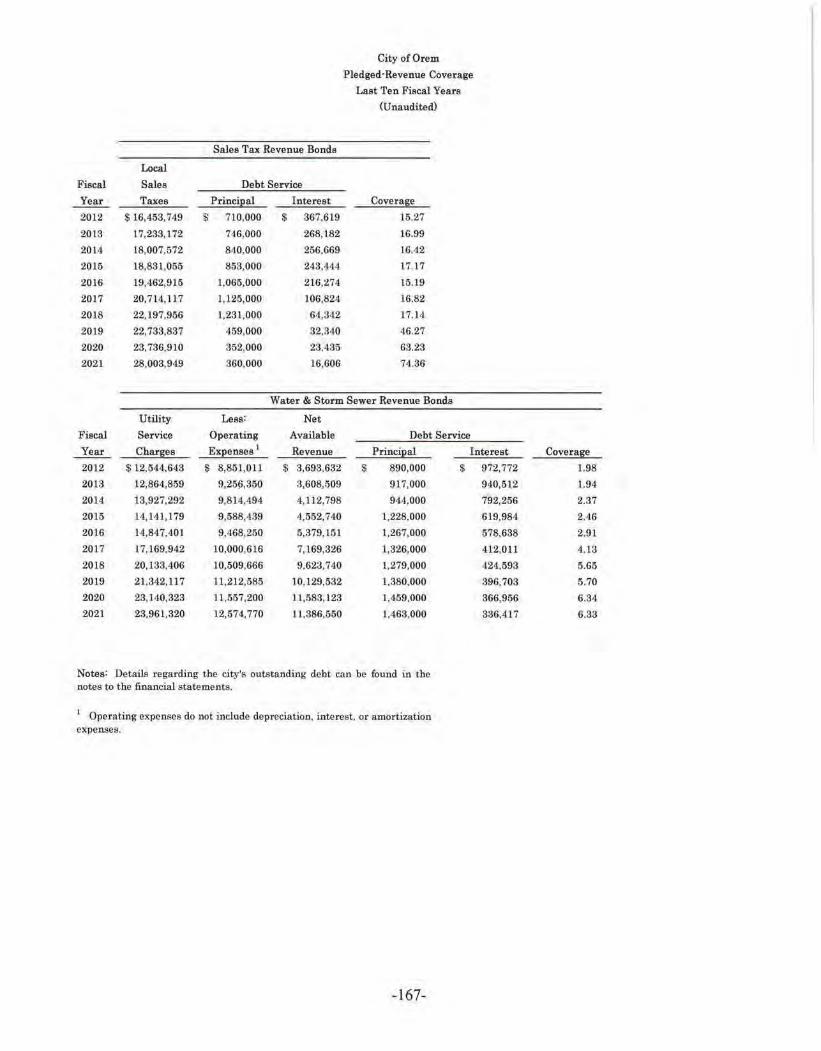
Local
Fiscal Sales
Year Tues 2012 S 16,453,749 $
2013 17,233,172
2014 18,007,572
2015 18,831,055
2016 19,462,915
2017 20,714,117
2018 22,197,956
2019 22,733,837
2020 23. 736,910
2021 28,003,949
Utility
Fiscal Service
Sales Tax Revenue Bonds
Debt Service
PrinciEal Interest 710,000 $ 367,619
746,000 268,182
840,000 256,669
853,000 243.444
1,065,000 216,274
1,125,000 106.824
1,231,000 64,342
459,000 32,340
352,000 23,435
360,000 16,606
City of Orem
Pledged-Revenue Coverage
Last Ten Fiscal Years
<unaudited)
Coverage 15.27
16.99
16.42
17.17
15.19
16.82
17.14
46.27
63.23
74.36
Water & Storm Sewer Revenue Bonds
Less: Net
Operating Available Debt Service
Year Cbarg_es Expenses 1 Revenue PrinciEal Interest
2012 $ 12,544,643 $ 8,851,011 $ 3,693,632 $ 890,000
2013 12,864,859 9,256,350 3,608,509 917,000
2014 13,927,292 9 ,814,494 4,112,798 944,000
2015 14,141, l 79 9,588,439 4,552,740 1,228,000
2016 14,847,401 9,468,250 5,379, 151 1,267,000
2017 17.169,942 l 0,000,616 7,169,326 1,326,000
2018 20,133,406 10,509,666 9.623,740 1,279,000
20[9 21,342.117 11,212.585 10,129,532 1,380,000
2020 23,140,323 ll,557,200 11,583,123 1,459,000
2021 23,961,320 12,574.770 11.386,550 1.463,000
Notes: Details regarding the city's out.standing debt can be found in the notes to the financial statements.
1 Operating expenses do not include depreciation, interest, or amortization expenses.
- 167-
$ 972,772
940,512
792.256
619,984
578,638
412,011
424,593
396,703
366,956
saG,417
Coverage
t.98
l.94
2.37
2.46
2.91
4.13
5.65
5.70
6.34
6.33

City of Orem
Ratios of Outstanding Debt by Type
Last Ten Fiscal Years (Unaudited)
Governmental Activities
Sales Franchise Revenue
General G.O. Bonds Special Tax Tax Bonds
Fiscal Obligation Issuance Assessment Revenue Revenue Issuance Notes
Year Bonds Premiums Bonds Bonds Bonds Premiums Payable
2012 $15,210,000 $ 288,101 $ 5,925,000 $ 7,434,000 $ 3,375,000 $ 428,323 $ 1,268,313
2013 13,900,000 257,636 5,444,000 6,688,000 2,850,000 363,031 1,199,599
2014 12,550,000 227,170 4,446,000 5,848,000 2,300,000 297,740 1,122,977
2015 11,830,000 695,160 1,155,000 4,995,000 1,750,000 232,449 1,045,022
2016 10,200,000 611,762 165,000 3,930,000 1,150,000 167,158 960,652
2017 8,535,000 528,364 155,000 2,898,000 525,000 101,867 869,779
2018 7,310,000 452,969 140,000 1,667,000 52,426 769,946
2019 30,560,000 4,050,044 130,000 1,208,000 41,487 668,147
2020 29,620,000 3,851,333 856,000 30,547 562,186
2021 28,655,000 3,652,623 496,000 19,607 454,930
Business-type Activities
Water Water& Water, Sewer Revenue Total
Quality Storm Sewer & StormSwr Bonds Business·
Fiscal Revenue Revenue Revenue Issuance type
Year Bonds Bonds Bonds Premiums Activities
2012 $12,578,757 $21,300,000 $ $ 560,200 $ 34,438,957
2013 11,762,757 20,383,000 518,391 32,664,148
2014 10,938,757 21,535,000 476,585 32,950,342
2015 10,107,000 20,307,000 434,776 30,848,776
2016 9,513,000 19,040,000 392,965 28,945,965
2017 8,919,000 17,019,000 1,014,797 26,952,797
2018 8,325,000 15,740,000 912,889 24,977,889
2019 7,731,000 14,360,000 810,978 22,901,978
2020 7,137,000 12,901,000 709,067 20,747,067
2021 11,438,000 35,863,000 6,954,912 54,255,912
Notes: Details regarding the city's outstanding debt can be found in the notes to the financial statements.
-168-
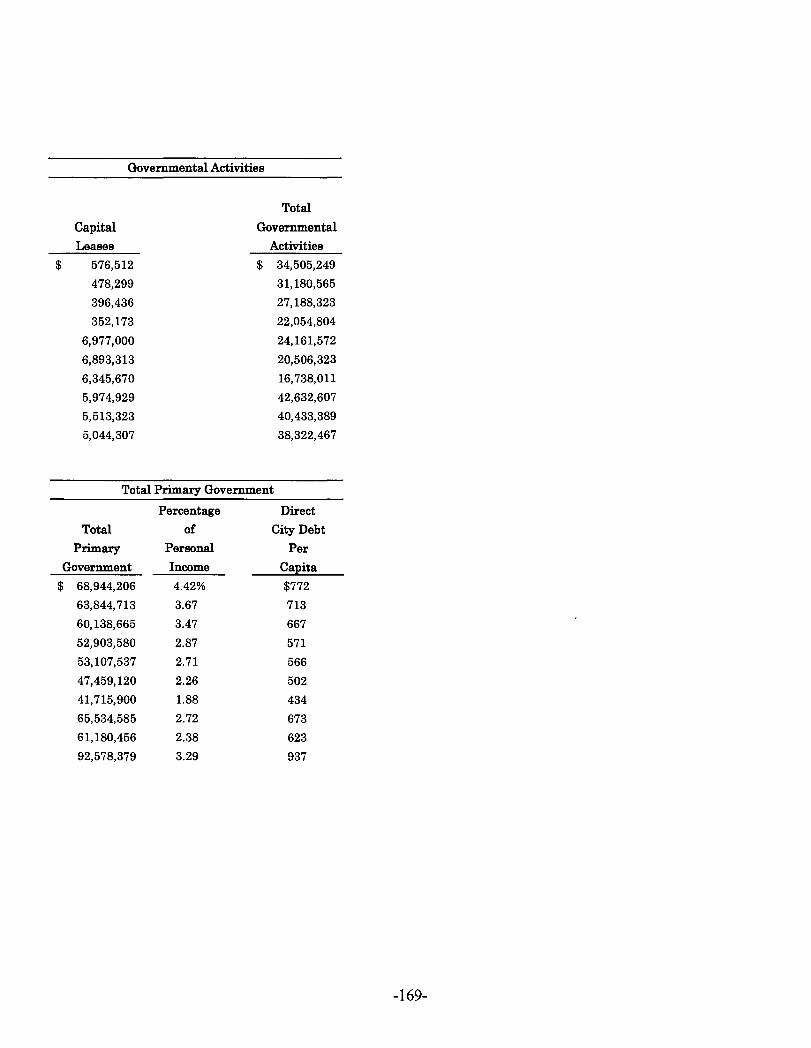
Governmental Activities
Total
Capital Governmental
Leases Activities
$ 576,512 $ 34,505,249
478,299 31,180,565
396,436 27,188,323
352,173 22,054,804
6,977,000 24,161,572
6,893,313 20,506,323
6,345,670 16,738,011
5,974,929 42,632,607
5,513,323 40,433,389
5,044,307 38,322,467
Total Primary Government
Percentage Direct
Total of City Debt
Primary Personal Per
Government Income Capita
$ 68,944,206 4.42% $772
63,844,713 3.67 713
60,138,665 3.47 667
52,903,580 2.87 571
53,107,537 2.71 566
47,459,120 2.26 502
41,715,900 1.88 434
65,534,585 2.72 673
61,180,456 2.38 623
92,578,379 3.29 937
-169-
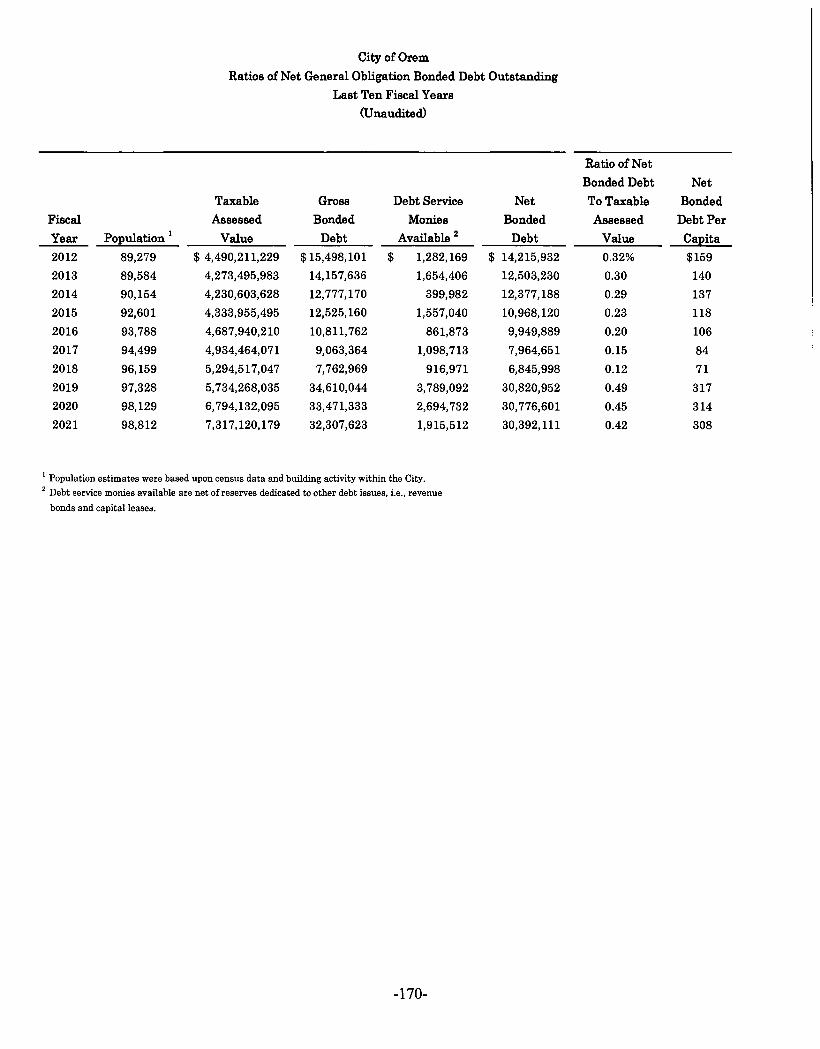
City of Orem
Ratios of Net General Obligation Bonded Debt Outstanding
Last Ten Fiscal Years (Unaudited)
Taxable Gross Debt Service
Fiscal Assessed Bonded Monies
Year Population 1 Value Debt Available 2
2012 89,279 $ 4,490,211,229 $15,498,101 $ 1,282,169
2013 89,584 4,273,495,983 14,157,636 1,654,406
2014 90,154 4,230,603,628 12,777,170 399,982
2015 92,601 4,333,955,495 12,525,160 1,557,040
2016 93,788 4,687,940,210 10,811,762 861,873
2017 94,499 4,934,464,071 9,063,364 1,098,713
2018 96,159 5,294,517,047 7,762,969 916,971
2019 97,328 5,734,268,035 34,610,044 3,789,092
2020 98,129 6,794,132,095 33,471,333 2,694,732
2021 98,812 7,317,120,179 32,307,623 1,915,512
1 Population estimates were based upon census data and building activity within the City. 2 Debt service monies available are net of reserves dedicated to other debt issues, i.e., revenue
bonds and capital leases.
-170-
Net
Bonded
Debt
$ 14,215,932
12,503,230
12,377,188
10,968,120
9,949,889
7,964,651
6,845,998
30,820,952
30,776,601
30,392,111
Ratio of Net
Bonded Debt Net
To Taxable Bonded
Assessed Debt Per
Value Ca;eita
0.32% $159
0.30 140
0.29 137
0.23 118
0.20 106
0.15 84
0.12 71
0.49 317
0.45 314
0.42 308
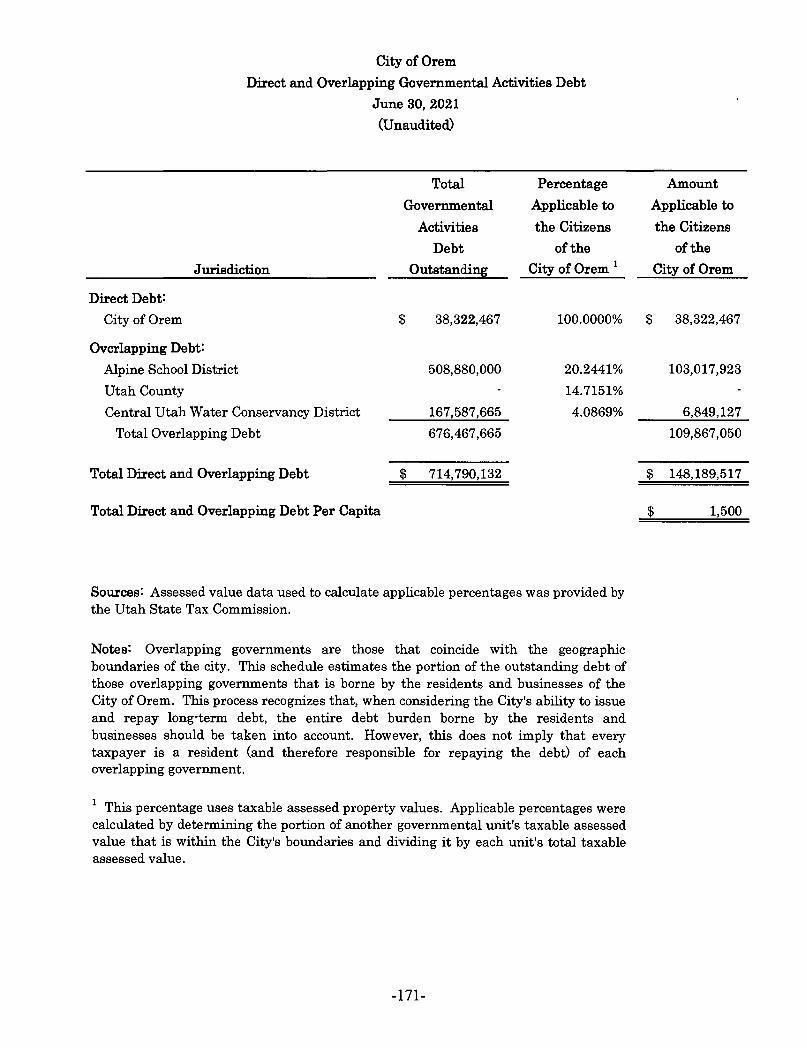
City of Orem
Direct and Overlapping Governmental Activities Debt
June 30, 2021
(Unaudited)
Total Percentage
Governmental Applicable to
Activities the Citizens
Debt ofthe
Jurisdiction Outstanding City of Orem 1
Direct Debt:
City of Orem $ 38,322,467 100.0000%
Overlapping Debt:
Alpine School District 508,880,000 20.2441%
Utah County 14.7151%
Central Utah Water Conservancy District 167,587,665 4.0869%
Total Overlapping Debt 676,467,665
Total Direct and Overlapping Debt $ 714,790,132
Total Direct and Overlapping Debt Per Capita
Sources: Assessed value data used to calculate applicable percentages was provided by the Utah State Tax Commission.
Notes: Overlapping governments are those that coincide with the geographic boundaries of the city. This schedule estimates the portion of the outstanding debt of those overlapping governments that is borne by the residents and businesses of the City of Orem. This process recognizes that, when considering the City's ability to issue and repay long·term debt, the entire debt burden borne by the residents and businesses should be taken into account. However, this does not imply that every taxpayer is a resident (and therefore responsible for repaying the debt) of each overlapping government.
1 This percentage uses taxable assessed property values. Applicable percentages were calculated by determining the portion of another governmental unit's taxable assessed value that is within the City's boundaries and dividing it by each unit's total taxable assessed value.
-171-
Amount
Applicable to
the Citizens
ofthe
City of Orem
$ 38,322,467
103,017,923
6,849,127
109,867,050
$ 148,189,517
$ 1,500
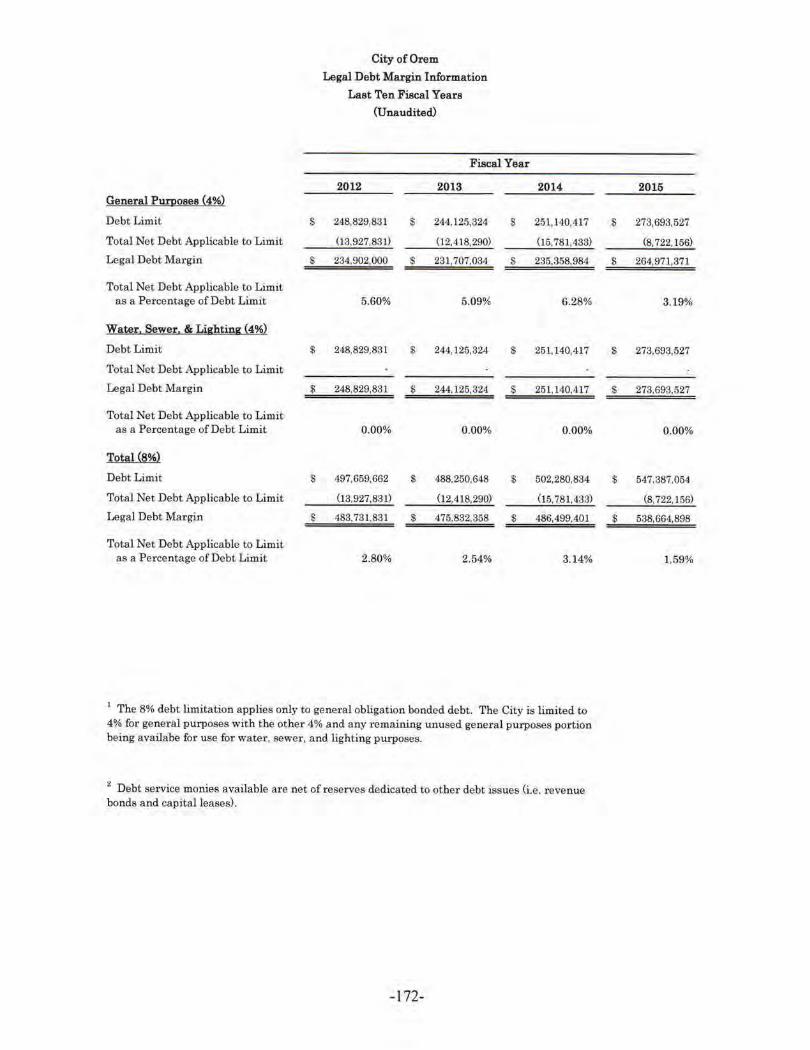
City of Orem
Legal Debt Margin Information
Laet Ten Fiscal Years (Unaudited)
Fiscal Year
2012 2013 2014 General P!!!J!oses (4%)
Debt Limit $ 248,829,831 $ 244,125,324 $ 251,140,417
Total Net Debt Applicable to Limit (13,927,831) (12,418,290) (15,781,433)
Legal Debt Margin s 234,902,000 s 231,707,084 $ 235,358,984
Total Net Debt Applicable to Limit as a Percentage of Debt Limit 5.60% 5.09% 6.28%
Water, Sewer, & Lighting {4%)
Debt Limit $ 248,829,831 $ 244,125,324 $ 251,140,417
Total Net Debt Applicable to Limit
Legal Debt Margin $ 248,829,831 $ 244.125, 32•1 $ 25 1,140,417
Total Net Debt Applicable to Limit as a Percentage of Debt Limit 0 .00% 0.00% 0.00%
Total (8%)
Debt Limit $ 497,659,662 $ 488,250,648 $ 502,280,834
Total Net Debt Applicable to Limit 03,927,831) (12,418,290) ( l 5,781,433)
Legal Debt Margin $ 483,731,831 $ 475,832,358 $ 486,499,401
Total Net Debt Applicable to Limit as a Percentage of Debt Limit 2.80% 2.54% 3.14%
1 The 8% debt limitation applies only to general obligation bonded debt. The City is limited to 4% for general purposes with the other 4% and any remaining unused general purposes po1·t ion being availabe for use for water, sewer, and lighting purposes.
2 Debt service monies available are net of reserves dedicated to other debt issues (i.e. revenue bonds and capital leases).
-172-
2015
$ 273,693,527
(8,722,156)
$ 264,971,371
3.19%
$ 273,693,527
s 273,693,527
0.00%
$ 547,387,054
(8,722,156)
$ 538,664,898
1.59%

Fiscal Year
2016 2017 2018
$ 290, 709, 109 $ 313,847,899 $ 341,392,514
(7,964,651) (7,964,651) (6,845,998)
$ 282,744,458 $ 305,883,248 $ 334,546,516
2.74% 2.54% 2.01%
$ 290, 709, 109 $ 313,847,899 $ 341,392,514
$ 290,709,109 $ 313,847,899 $ 341,392,514
0.00% 0.00% 0.00%
$ 581,418,218 $ 627,695,798 $ 682,785,028
(7,964,651) (7,964,651) (6,845,998)
$ 573,453,567 $ 619,731,147 $ 675,939,030
1.37% 1.27% 1.00%
Legal Debt Margin Calculation for Fiscal Year 2021
Assessed Valuations:
Taxable Value
Estimated Market Value
Legal Debt Margin:
Debt Limitation - 8% of Estimated Market Value 1
Debt Applicable to Limitation:
Total General Obligation Bonded Debt
Less:
Assets in Debt Service Funds Available
for payment of Principal 2
Total Debt Applicable to Limitation
Legal Debt Margin
$
$
$
$
$
$
-173-
2019 2020
372,228,481 $ 408,651,401
(30,859,318) (30,776,601)
341,369,163 $ 377,874,800
8.29% 7.53%
372,228,481 $ 408,651,401
372,228,481 $ 408,651,401
0.00% 0.00%
744,456,962 $ 817,302,802
(30,859,318) (30,776,601)
713,597,644 $ 786,526,201
4.15% 3.77%
$ (32,307,623)
1,915,512
2021
$ 440,092,724
(30,392,111)
$ 409,700,613
6.91%
$ 440,092,724
$ 440,092,724
0.00%
$ 880,185,448
(30,392,111)
$ 849,793,337
3.45%
$ 7,317,120,179
$11,002,318,106
$ 880,185,449
(30,392,111)
$ 849,793,338
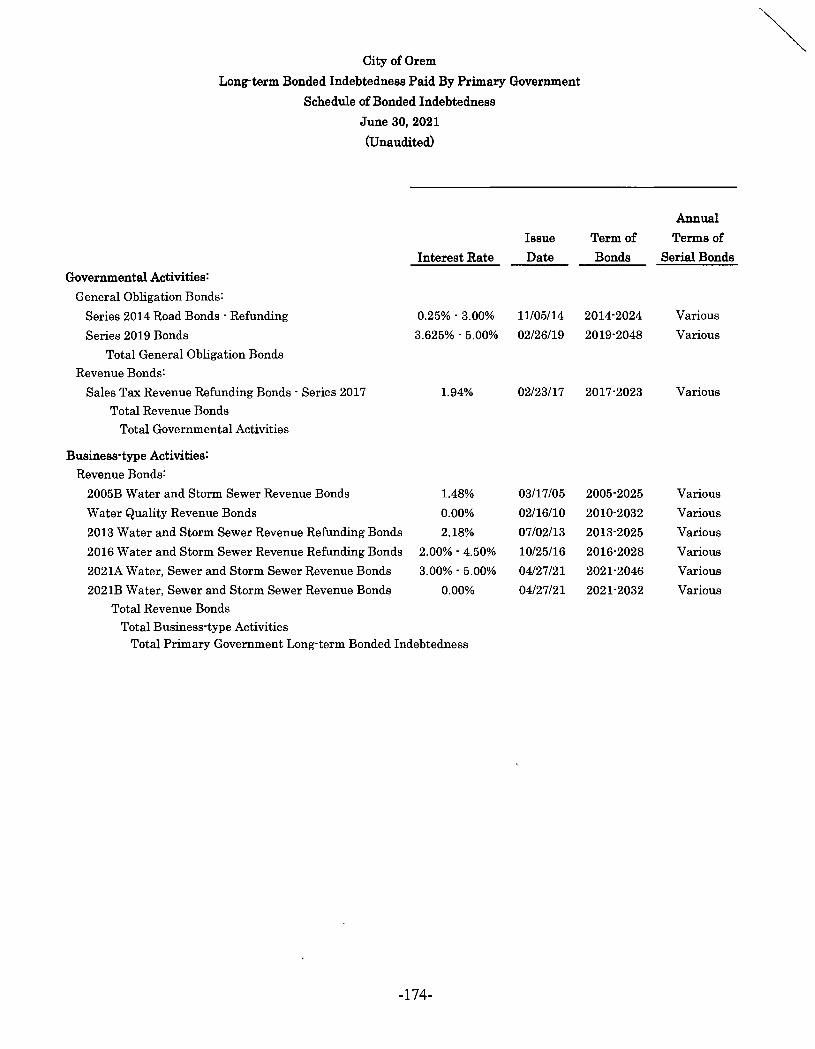
City of Orem
Long-term Bonded Indebtedness Paid By Primary Government
Schedule of Bonded Indebtedness
June 30, 2021
(Unaudited)
Issue
Interest Rate Date
Governmental Activities:
General Obligation Bonds:
Series 2014 Road Bonds - Refunding 0.25% - 3.00% 11/05/14
Series 2019 Bonds 3.625% - 5.00% 02/26/19
Total General Obligation Bonds
Revenue Bonds:
Sales Tax Revenue Refunding Bonds - Series 2017 1.94% 02/23/17
Total Revenue Bonds
Total Governmental Activities
Business-type Activities:
Revenue Bonds:
2005B Water and Storm Sewer Revenue Bonds 1.48% 03/17/05
Water Quality Revenue Bonds 0.00% 02/16/10
2013 Water and Storm Sewer Revenue Refunding Bonds 2.18% 07/02/13
2016 Water and Storm Sewer Revenue Refunding Bonds 2.00% - 4.50% 10/25/16
2021A Water, Sewer and Storm Sewer Revenue Bonds 3.00% - 5.00% 04/27/21
2021B Water, Sewer and Storm Sewer Revenue Bonds 0.00% 04/27/21
Total Revenue Bonds
Total Business-type Activities Total Primary Government Long-term Bonded Indebtedness
-174-
Annual
Term of Terms of
Bonds Serial Bonds
2014-2024 Various
2019-2048 Various
2017-2023 Various
2005-2025 Various
2010-2032 Various
2013-2025 Various
2016-2028 Various
2021-2046 Various
2021-2032 Various

$
Original
Amount
9,645,000
$ 24,500,000
$ 2,898,000
$ 3,000,000
$ 11,889,000
$ 12,801,000
$ 4,380,000
$ 29,320,000
$ 6,543,000
$
$
Principal
Balance
06/30/21
4,155,000
24,500,000
28,655,000
496,000
496,000
29,151,000
834,000
6,424,000
4,180,000
29,320,000
6,543,000
47,301,000
47,301,000 76,452,000
Retired
Year Ended
06/30/21
$ 965,000
965,000
360,000
360,000
1,325,000
160,000
7,137,000
1,203,000
100,000
8,600,000
8,600,000 $ 9,925,000
Interest
Expense
Year Ended
06/30/21
$ 128,600
1,188,112
1,316,712
16,606
16,606
1,333,318
14,711
153,156
168,550
336,417
336,417 $ 1,669,735
-175-
$
$
Payable
In Future
Years
226,688
21,620,882
21,847,570
14,530
14,530
21,862,100
37,400
356,386
982,825
18,451,703
19,828,314
19,828,314 41,690,414
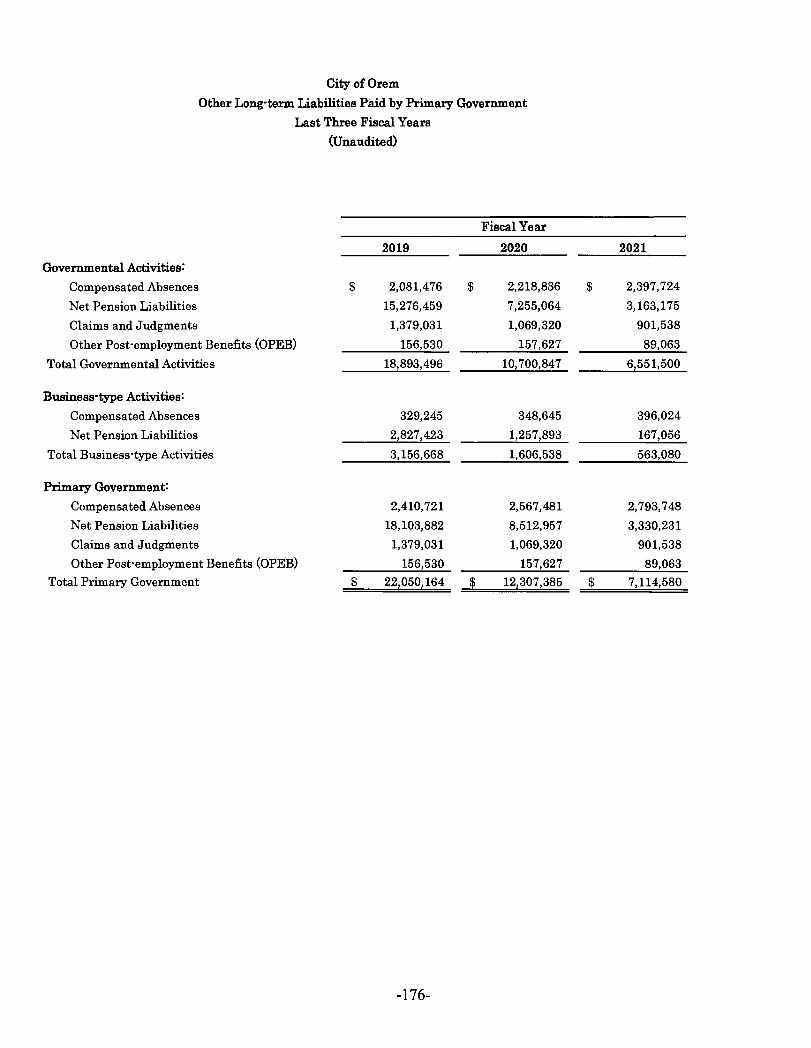
City of Orem
Other Long-term Liabilities Paid by Primary Government
Last Three Fiscal Years
(Unaudited)
Fiscal Year
2019 2020
Governmental Activities:
Compensated Absences $ 2,081,476 $ 2,218,836
Net Pension Liabilities 15,276,459 7,255,064
Claims and Judgments 1,379,031 1,069,320
Other Post-employment Benefits (OPEB) 156,530 157,627
Total Governmental Activities 18,893,496 10,700,847
Business-type Activities:
Compensated Absences 329,245 348,645
Net Pension Liabilities 2,827,423 1,257,893
Total Business-type Activities 3,156,668 1,606,538
Primary Government:
Compensated Absences 2,410,721 2,567,481
Net Pension Liabilities 18,103,882 8,512,957
Claims and Judgments 1,379,031 1,069,320
Other Post-employment Benefits (OPEB) 156,530 157,627
Total Primary Government $ 22,050,164 $ 12,307,385
-176-
2021
$ 2,397,724
3,163,175
901,538
89,063
6,551,500
396,024
167,056
563,080
2,793,748
3,330,231
901,538
89,063
$ 7,114,580
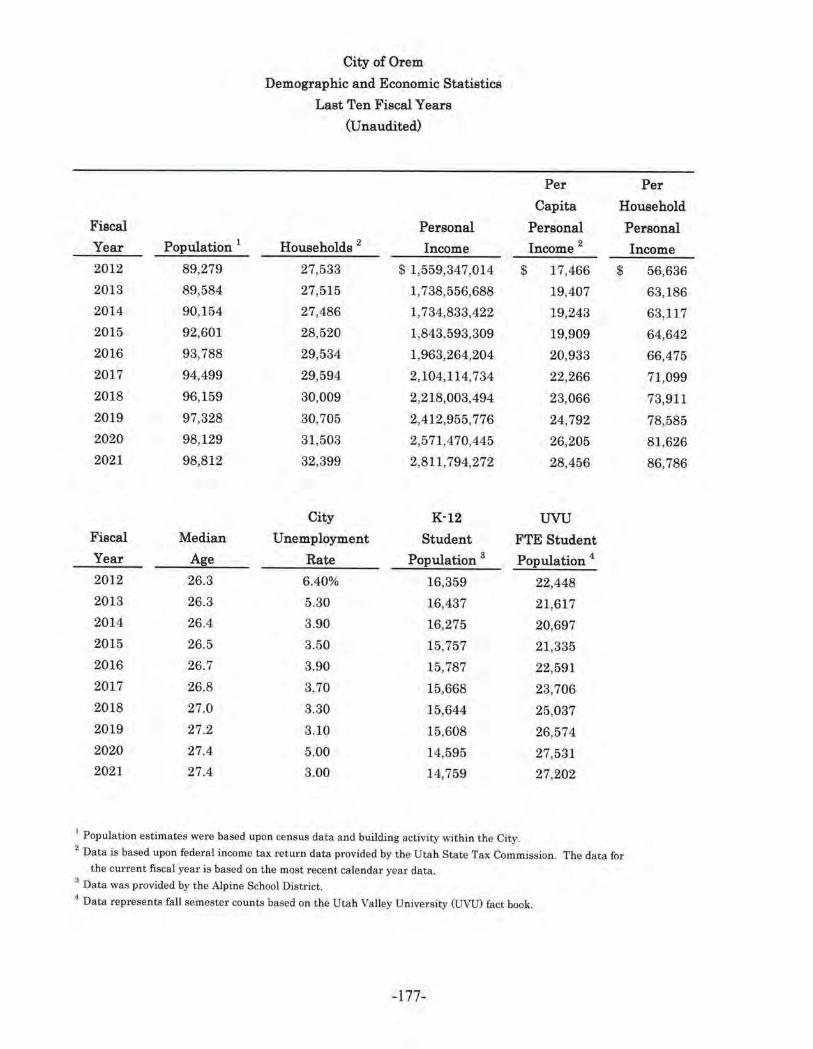
City of Orem
Demographic and Economic Statistics
Last Ten Fiscal Years
(Unaudited)
Per Per
Capita Household
Fiscal Personal Personal
Year Population 1 Households 2 Income Income 2
2012 89,279 27,533 $ 1,559,347,014 $ 17,466 $
2013 89,584 27,515 1,738,556,688 19,407
2014 90,154 27,486 1,734,833,422 19,243
2015 92,601 28,520 1,843,593,309 19,909
2016 93,788 29,534 1,963,264,204 20,933
2017 94,499 29,594 2,104,114,734 22,266
2018 96,159 30,009 2,218,003,494 23,066
2019 97,328 30,705 2,412,955,776 24,792
2020 98,129 31,503 2,571,470,445 26,205
2021 98,812 32,399 2,811,794,272 28,456
City K-12 uvu Fiscal Median Unemployment Student FTE Student Year Age Rate Population 8 Population 4
2012 26.3 6.40% 16,359 22,448 2013 26.3 5.30 16,437 21,617 2014 26.4 3.90 16,275 20,697 2015 26.5 3.50 15,757 21,335 2016 26.7 3.90 15,787 22,591 2017 26.8 3.70 15,668 23,706 2018 27.0 3.30 15,644 25,037 2019 27.2 3.10 15,608 26,574 2020 27.4 5.00 14,595 27,531 2021 27.4 3.00 14,759 27,202
1 Population estimates were based upon census data and building activity within the City. 2
Data is based upon federal income tax return data provided by the Utah State Tax Commission. The data for
the current fiscal year is based on the most recent calendar year data. 3 Data was provided by the Alpine School District.
~ Data represents fall semester counts based on the Utah Valley University (UVU) fact book.
-177-
Personal
Income
56,636
63,186
63,117
64,642
66,475
71,099
73,911
78,585
81,626
86,786

City of Orem
Other Demographic Statistics
(Unaudited)
Census Population Count
Percent Year Population Increase Increase 1890 435 1900 692 257 37.14% 1910 1,064 372 34.96 1920 1,664 600 36.06 1930 1,915 251 13.11 1940 2,914 999 34.28 1950 8,338 5,424 65.05 1960 18,394 10,056 54.67 1970 25,760 7,366 28.59 1980 52,399 26,639 50.84 1990 67,561 15,162 22.44 2000 84,324 16,763 19.88 2010 88,328 4,004 4.53 2020 98,129 9,801 9.99
Age Distribution of Population 1
Total Male Female Age Number Percent Number Percent Number Percent 0-4 8,791 8.96% 4,356 4.44-% 4,435 4.52% 5-9 6,668 6.79% 3,304 3.37% 3,364 3.43%
10 - 14 8,066 8.22% 3,997 4.07% 4,069 4.15% 15 - 19 7,279 7.42% 3,606 3.68% 3,673 3.74% 20 - 24 14,144 14.42% 7,008 7.14% 7,136 7.27% 25 - 34 17,104 17.43% 8,475 8.64% 8,629 8.79% 35 - 44 10,848 11.06% 5,375 5.48% 5,473 5.58% 45 - 54 8,672 8.84% 4,297 4.38% 4,375 4.46% 55 - 59 3,702 3.77% 1,834 1.87% 1,868 1.90% 60 - 64 3,673 3.74% 1,820 1.85% 1,853 1.89% 65 - 74 5,164 5.26% 2,559 2.61% 2,605 2.66% 75 - 84 2,503 2.55% 1,240 1.26% 1,263 1.29%
85+ 1,515 1.54% 750 0.76% 765 0.78% TOTAL 98,129 100.00% 48,621 49.55% 49,508 50.45%
1 Source: Census Bureau · This information is from a 2019 estimate as the Census Bureau has
indicated they will not be releasing their standai·d 2020 estimate because of the impacts of the COVID-19 pandemic on data collection.
-l 78-

City of Orem
Principal Employers
Current Year and Nine Years Ago
(Unaudited)
Fiscal Year
2021
Percentage
Number of Number
of Total City of Taxpayer Employees Rank Employment Employees
Utah Valley University 2,881 1 5.68% 1,956
Alpine School District 1,402 2 2.77% 1,644
U.S. Synthetic Corporation 600 3 L18% 592
City of Orem 554 4 1.09% 521
Timpanogos Regional Hospital 505 5 1.00% 459
Wal-Mart 499 6 0.98% 386
Target Stores 360 7 0.71%
United Parcel Service, Inc. 356 8 0.70%
Any Hour Electric 320 9 0.63%
Mity-Lite lnc. 300 10 0.59%
Adobe Systems Inc. (Omniture) 599
Convergys Corporation 592
Xlear, Inc. 440
Respone Marketing Group 387
Total 7,777 15.34% 7,576
Source: Orem City's business licensing database and personal communications with certain governmental entities by Orem City personnel.
-179-
Fiscal Year
2012
Percentage
of
Total City
Rank Employment
1 4.06%
2 3.41%
5 1.23%
6 1.08%
7 0.95%
10 0.80%
3 1.24%
4 1.23%
8 0.91%
H 0.80%
15.71%
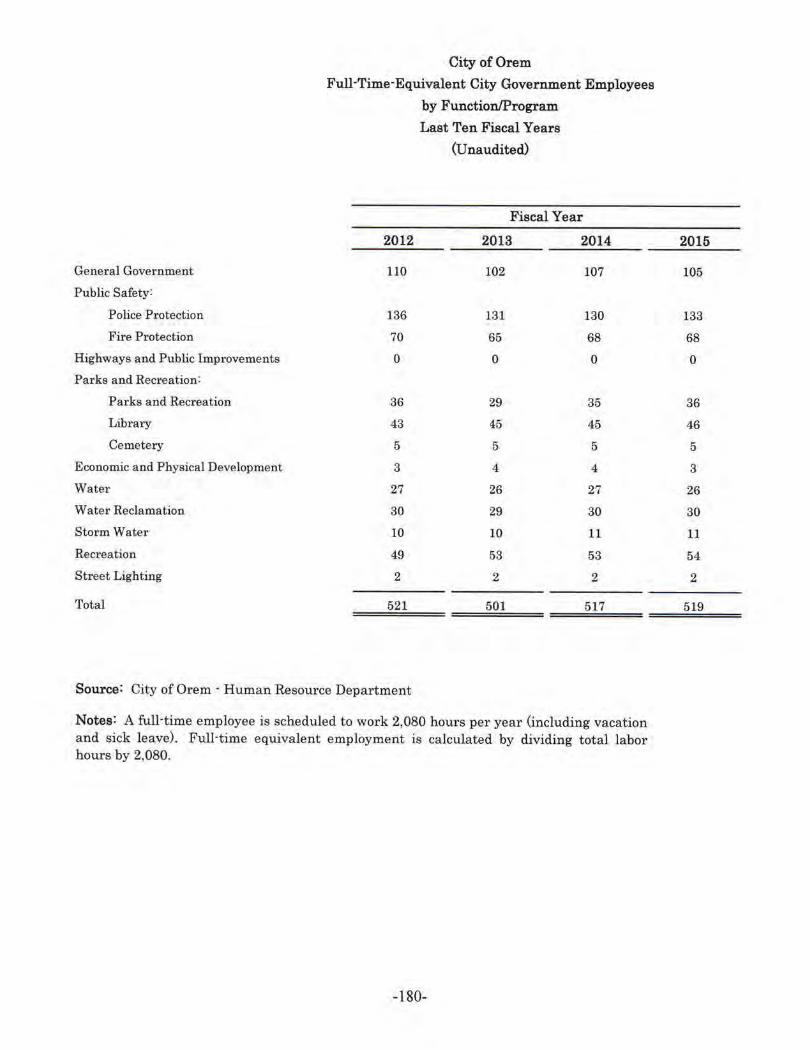
General Government
Public Safety:
Police Protection
Fire P rotection
Highways and Public Improvements
Parks and Recreation:
Parks and Recreation
Libmry
Cemetery
Economic and Physical Development
Water
Water Reclamation
Storm Water
Recreation
Street Lighting
Total
City of Orem
Full-Ti.me-Equivalent City Government Employees
by Function/Program
Last Ten Fiscal Years
(Unaudited)
Fiscal Year
2012 2013 2014
110 102 107
136 131 130
70 65 68
0 0 0
36 29 35
43 45 45
5 5 5
3 4 4
27 26 27
30 29 30
10 10 11
49 53 53
2 2 2
521 501 517
Source: City of Orem · Human Resouxce Department
Notes: A full·time employee is scheduled to work 2,080 hours per year (including vacation and sick leave). Full-time equivalent employment is calculated by dividing total labor hours by 2,080.
-180-
2015
105
133
68
0
36
46
5
3
26
30
11
54
2
519
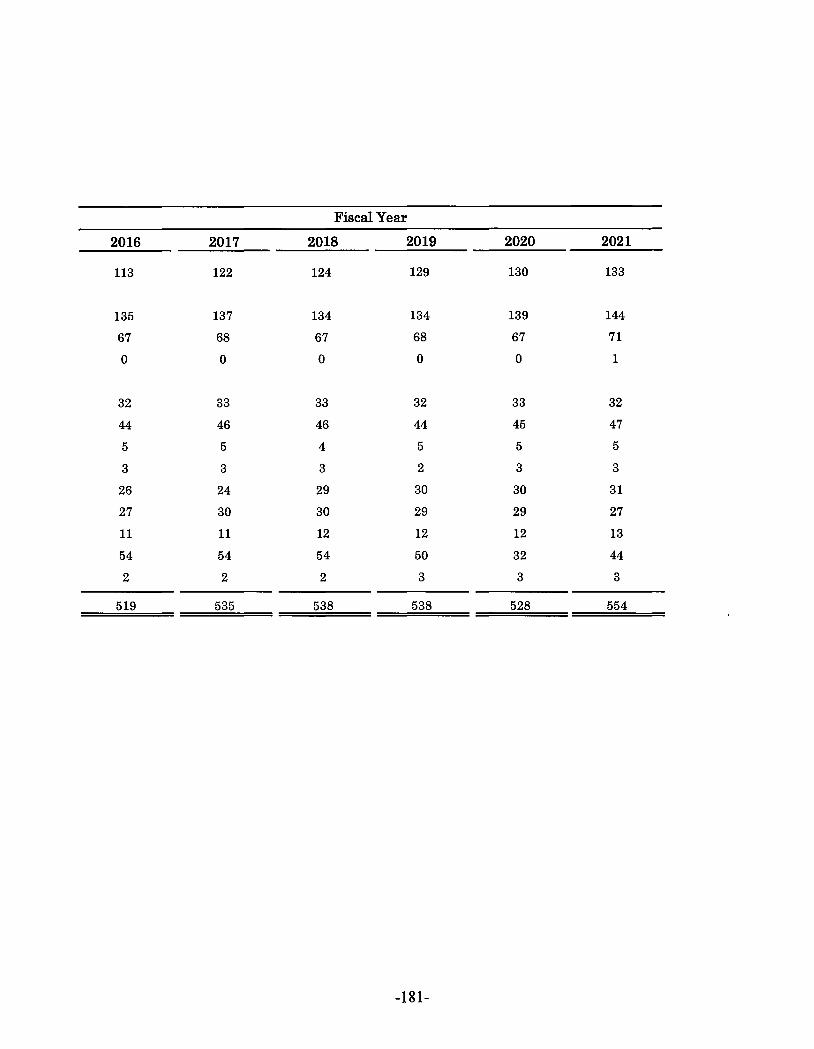
Fiscal Year
2016 2017 2018 2019 2020 2021
113 122 124 129 130 133
135 137 134 134 139 144
67 68 67 68 67 71
0 0 0 0 0 1
32 33 33 32 33 32
44 46 46 44 45 47
5 5 4 5 5 5
3 3 3 2 3 3
26 24 29 30 30 31
27 30 30 29 29 27
11 11 12 12 12 13
54 54 54 50 32 44
2 2 2 3 3 3
519 535 538 538 528 554
-181-
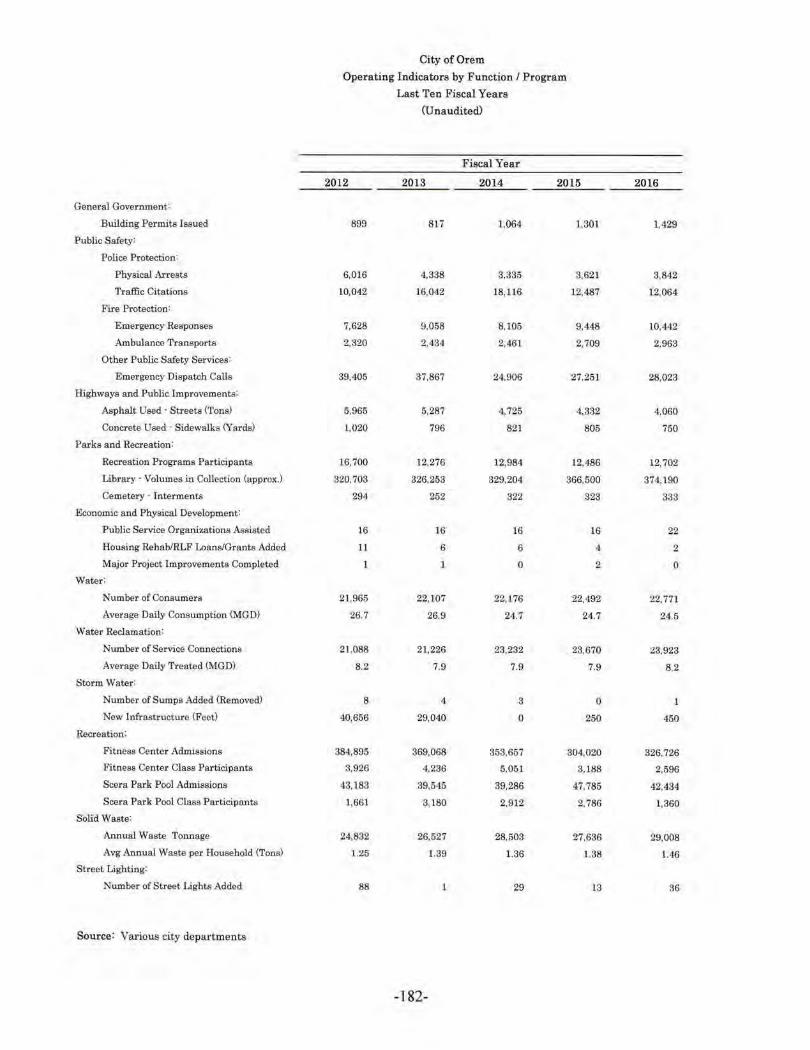
General Government:
Building Permits Issued
Public Safecy:
Police Protection:
Physical Arrest$
'l'raffic Citations
Fire ·Protection'
Emergency Responaes
Ambulance Transports
Other Public Safety Services:
Emergency Dispatch Calls
Highways and Public Improvements:
Asphalt Used · Streets (Tons)
Concrete Used · Sidewalks (Yards)
Parks and Recreation:
Recreation Programs Participants
Library · Volumes in Collection (approx.)
Cemetery· Interments
Economic and Physical Development:
Public Service Organizations Assisted
Housing Rebab/RLF Loans/Grants Added
Major Project Lnp.rovementa Completed
Water:
N um her of Consumers
Average Daily Consumption (MGD)
Water Reclru.nation:
Number of Service Connections
Average Daily Treated (MGD)
Storm Water:
Number of Sumps Added (Removed)
New Infrastructure (Feet)
Recreation:
Fitness Center Admissions
Fitness Center Class Participants
Scera Park Pool Admissions
Seers Park Pool Class Participants
Solid Waste:
Annual Waste Tonnage
Avg Annual Waste per Houaebold (Tons)
Street Lighting:
Number of Street Lights Added
Source: Val'ious city depiu:tments
City of Orem
Operating Indicators by Function / Program
Last Teo Fiscal Years
(Unaudited)
Fiscal Year
2012 2013 2014 2015
899 817 1,064 1,301
6,016 4,338 3.335 3,621
10,042 16,042 18,116 12,487
7,628 9,058 8,105 9,448
2.320 2,434 2,461 2,709
39,405 37,867 24,906 27,251
5,965 5,287 4.725 4,332
1,020 796 821 805
16,700 12.276 12,984 12,486
320,703 326,253 829,204 366,500
294 252 322 323
16 16 Hl 16
11 6 6 4
l 0 2
21,965 22, 107 22,176 22,492
26.7 26.9 24.7 24.7
21.08S 21,226 23,232 23,670
8,2 7.9 7.!l 7.9
8 4 3 0
40,656 29,040 0 250
384,895 369,068 353,657 304,020
3,926 4,236 5.051 3, 188
43,183 39,545 39,286 47,785
1,661 3, 180 2,912 2,786
24,832 26,527 28,503 27,636
1.25 l.39 1.36 1.38
88 1 29 13
-182-
2016
1,429
3,842
12,064
10,442
2,963
28,023
4,060
750
12,702
374. 190
333
22
2
0
22,771
24.5
23,923
8.2
1
450
326,726
2,596
42,<134
1,360
29.008
1.46
36
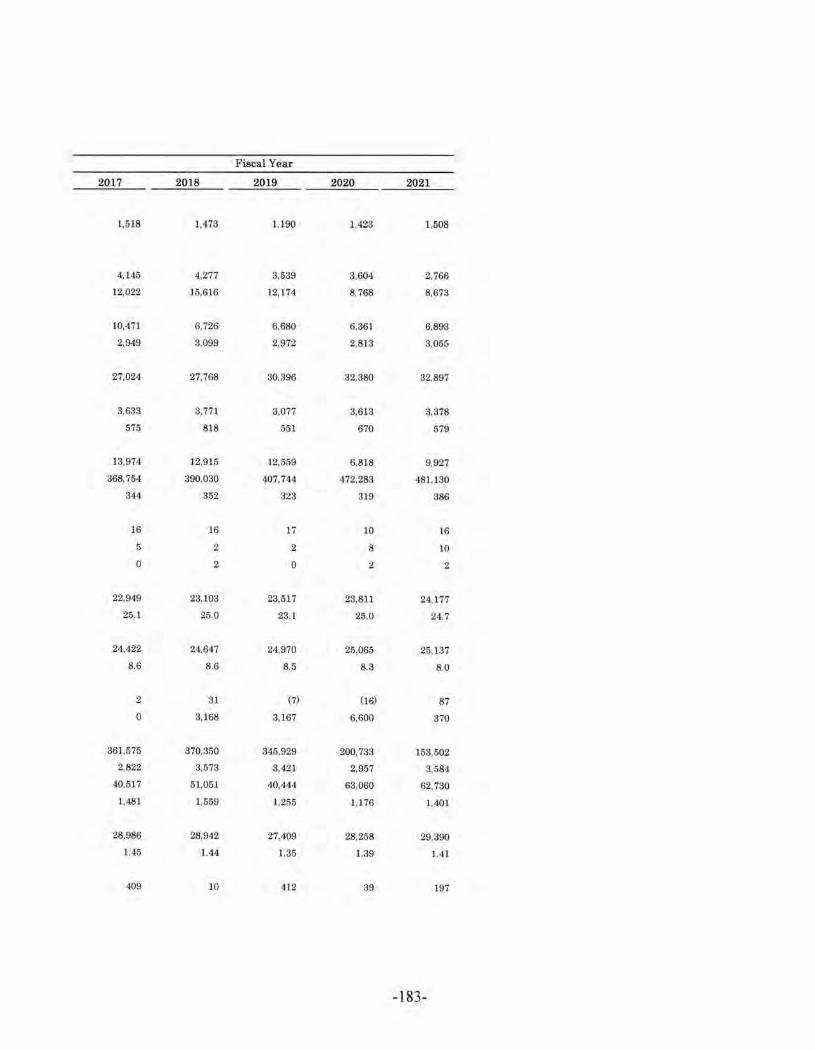
Fiscal Year
2017 2018 2019 2020 2021
1,518 1,473 1,190 1,423 1,508
4,145 4,277 3,539 3,604 2,766
12,022 15,6l6 12,l 74 8,768 8,673
10,471 6,726 6,680 6,361 6.893
2,949 3,099 2,972 2,813 S,055
27,024 27.768 30,396 32,380 32,897
3,633 3,771 3,077 3,613 3,378
575 818 651 670 579
13,974 12,915 12,559 6.818 9,927
368,754 390,030 407,744 472,283 481.130
344 352 323 319 386
16 16 17 JO 16
5 2 2 8 10
0 2 0 2 2
22,949 23,103 23,517 23,811 24,177
25.l 25.0 23.l 25.0 24,7
24,422 24,647 24.970 25.065 25,137
8.6 8.6 8.5 8.3 8.0
2 31 (7) (16} 87
0 3,168 3,167 6,600 870
361,575 370,350 345,929 200,733 153,502
2.822 3,573 3,421 2,957 3,584
40,517 51,051 40,444 63,060 62,730
1.481 1.559 l.255 1,176 l ,401
28,986 28,942 27,409 28,258 29,390
1.45 1.44 1.35 1.39 1.41
409 IO 412 39 197
-183-
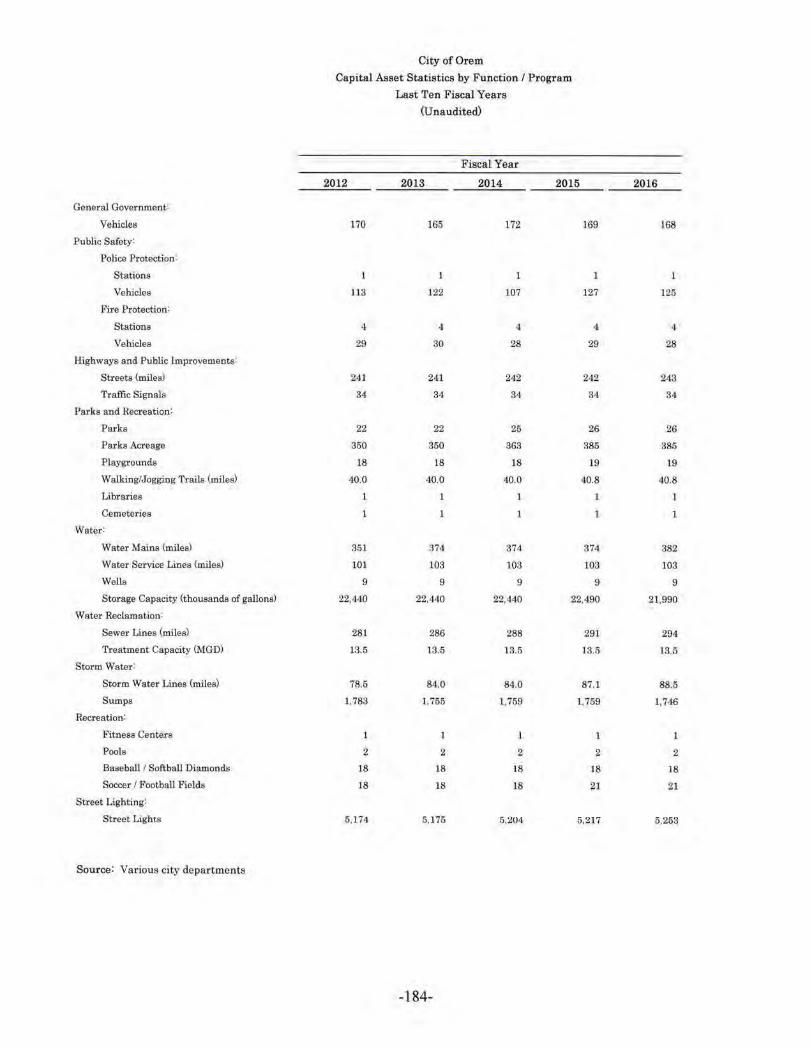
General Government:
Vehicles
Public Safety:
Police Protection:
Stations
Vehicles
Fire Protection:
Stations
Vehicles
Highways and Public lmproveruents:
Streets (miles)
Traffic Signals
Parks and Recreation:
Parks
Parks Acreage
Playgrounds
Walking/Jogging Trails (miles)
Libraries
Cemeteries
Water:
Water Mains (miles>
Water Service Lines (miles)
Wells
Storage Capacity (thousands of gallons)
Water Reclamation:
Sewer Lines (miles)
Treatment Capacity (MGD)
Storm Water:
Storm Water Lines (miles)
Sumps
Recreation:
Fitness Centers
Pools
Baseball / Softball Diamonds
Soccer / Football Fields
Street Lighting:
Street Lights
Source: Various city departments
City of Orem
Capital Asset Statistics by Function / Program
Last Ten Fiscal Years
(Unaudited)
Fiscal Year
2012 2013 2014 2015
170 161i 172 169
l l 1
113 122 107 127
4 4 4, 4
29 30 28 29
241 241 242 242
34 34 34 34
22 22 25 26
350 350 363 385
18 18 18 19
40,0 40.0 40.0 40.8
1
1
351 374 374 374
101 103 103 103
9 9 9 9
22,440 22,440 22,440 22,490
281 286 288 291
13.5 13.5 13.5 13.5
78.5 84,0 84.0 87.1
1.783 1,755 1,759 1,759
2 2 2 2
18 18 18 18
18 18 18 21
5,174 5,175 5,204 5,217
-184-
2016
168
125
4
28
243
34
26
385
19
40.8
1
1
382
103
9
21,990
294
13.5
88.5
1,746
2
18
21
6,253
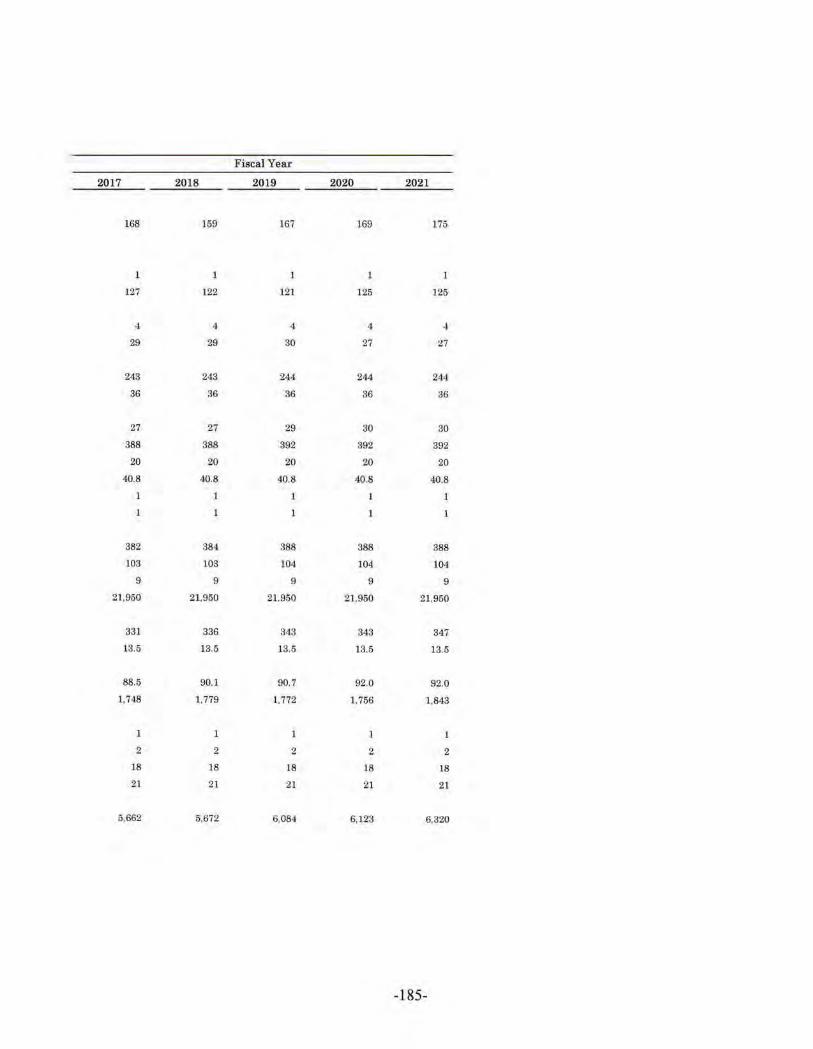
Fiscal Year
2017 2018 2019 2020 2021
168 169 167 169 176
l l 1
127 122 121 126 125
4 4 4 4 4
29 29 30 27 27
243 243 244 244 244
36 36 36 36 36
27 27 29 30 30
388 388 392 392 392
20 20 20 20 20
40.8 40.8 40.8 ,10.8 40.8
1 1
382 384 388 388 388
103 103 104 104 104
9 9 9 9 9
21,950 21,960 21,950 21.950 21,950
331 336 343 343 347
13.5 13.5 13,5 13.5 13.5
88.5 90.1 90.7 92.0 92.0
1,748 1.779 1,772 1.756 1,843
l
2 2 2 2 2
18 18 18 18 18
21 21 21 21 21
ii.662 5,672 6,084 6,123 6,320
-1 85-
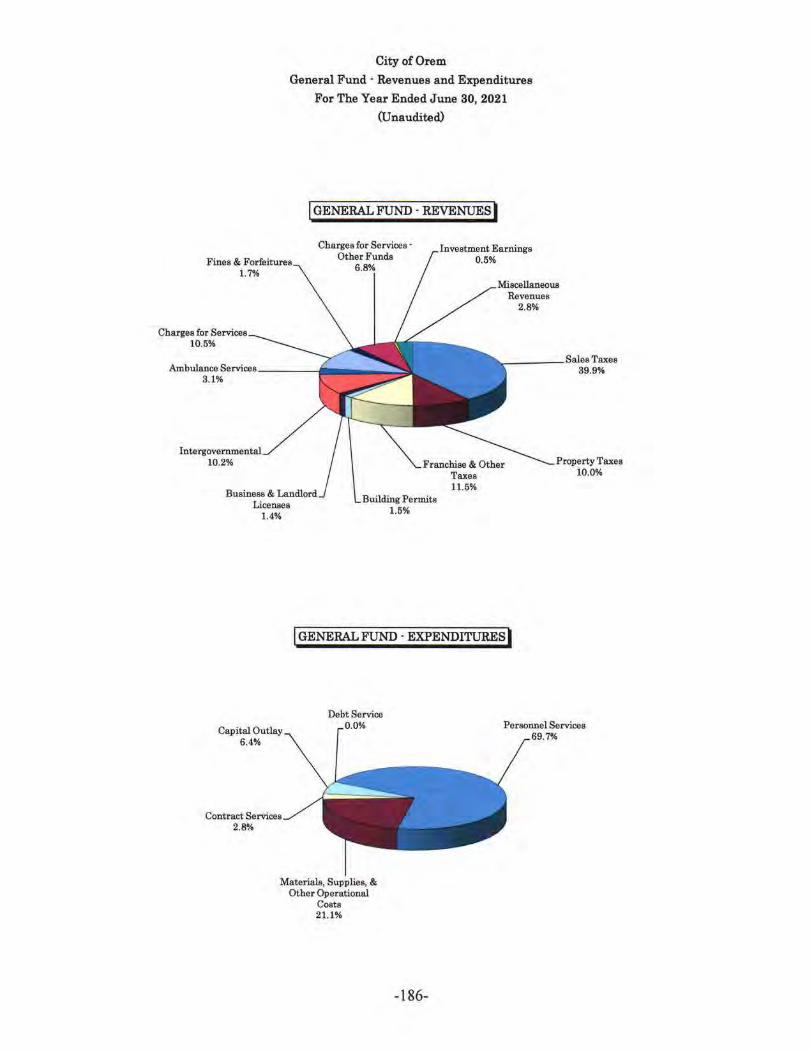
City of Orem
General Fund · Revenues and Expenditures
For The Year Ended June 30, 2021
(Unaudited)
I GENERAL FUND . REVENUES I
Fines & Forfeitures 1.7%
Charges for Services · Other Funds
6.8%
Investment Earnings 0.6%
Charges for Services 10.6%
Revenues 2.8%
..-- ---Sales Taxes 89.9%
Intergovernmental 10.2%
Business & Landlord Licenses
1.4%
Franchise & Other Taxes 11.6%
Building Permits 1.5%
I GENERAL FUND . EXPENDITURES I
Property Taxes 10.0%
Capit.11 Outlay 6.4%
Debt Service 0.0% Personnel Services
69.7%
Contract Services 2.8%
Materials, Supplies, & Other Operational
Costa 21.1%
-186-
8 0 1 . 2 2 9 . 7 0 1 0 | O R E M . O R G5 6 N . S T A T E S T R E E T
O R E M , U T 8 4 0 5 7
OREM