
IN F O R M A T IO N TO USERS
531
INFORMATION TO USERS This manuscript has been reproduced from the microfilm master. UMI films the text directly from the original or copy submitted. Thus, some thesis and dissertation copies are in typewriter free, while others may be from any type of computer printer. The quality of this reproduction is dependent upon the quality of the copy submitted. Broken or indistinct print, colored or poor quality illustrations and photographs, print bleedthrough, substandard margins, and improper alignment can adversely affect reproduction. In the unlikely event that the author did not send UMI a complete manuscript and there are missing pages, these will be noted. Also, if unauthorized copyright material had to be removed, a note will indicate the deletion. Oversize materials (e.g., maps, drawings, charts) are reproduced by sectioning the original, beginning at the upper left-hand comer and continuing from left to right in equal sections with small overlaps. Each original is also photographed in one exposure and is included in reduced form at the back of the book. Photographs included in the original manuscript have been reproduced xerographically in this copy. Higher quality 6” x 9” black and white photographic prints are available for any photographs or illustrations appearing in this copy for an additional charge. Contact UMI directly to order. UMI \ Bell & Howell Information Company 300 North Zeeb Road, Ann Arbor MI 48106-1346 USA 313/761-4700 800/521-0600 Reproduced with permission of the copyright owner. Further reproduction prohibited without permission.
Transcript of IN F O R M A T IO N TO USERS

INFORM ATION TO USERS
This manuscript has been reproduced from the microfilm master. UMI
films the text directly from the original or copy submitted. Thus, some
thesis and dissertation copies are in typewriter free, while others may be
from any type of computer printer.
The quality of this reproduction is dependent upon the quality of the
copy submitted. Broken or indistinct print, colored or poor quality
illustrations and photographs, print bleedthrough, substandard margins,
and improper alignment can adversely affect reproduction.
In the unlikely event that the author did not send UMI a complete
manuscript and there are missing pages, these will be noted. Also, if
unauthorized copyright material had to be removed, a note will indicate
the deletion.
Oversize materials (e.g., maps, drawings, charts) are reproduced by
sectioning the original, beginning at the upper left-hand comer and
continuing from left to right in equal sections with small overlaps. Each
original is also photographed in one exposure and is included in reduced
form at the back of the book.
Photographs included in the original manuscript have been reproduced
xerographically in this copy. Higher quality 6” x 9” black and white
photographic prints are available for any photographs or illustrations
appearing in this copy for an additional charge. Contact UMI directly to
order.
UMI\ Bell & Howell Information Company
300 North Zeeb Road, Ann Arbor MI 48106-1346 USA 313/761-4700 800/521-0600
R eproduced with perm ission of the copyright owner. Further reproduction prohibited without perm ission.

Reproduced with permission of the copyright owner. Further reproduction prohibited without permission.

RHEOLOGY, PROCESSING, AND CHARACTERIZATION OF ISOTROPIC,
ANISOTROPIC, AND MIXED PARTICLE FILLED POLYMER SYSTEM
A Dissertation
Presented to
The Graduate Faculty of The University of Akron
In Partial Fulfillment
of the Requirement for the Degree
Doctor of Philosophy
Kwang-Jea Kim
May, 1998
R eproduced with perm ission of the copyright owner. Further reproduction prohibited without perm ission.
UMI Number: 9826258
UMI Microform 9826258 Copyright 1998, by UMI Company. All rights reserved.
This microform edition is protected against unauthorized copying under Title 17, United States Code.
UMI300 North Zeeb Road Ann Arbor, MI 48103
R eproduced with perm ission of the copyright owner. Further reproduction prohibited without perm ission.

RHEOLOGY, PROCESSING, AND CHARACTERIZATION OF ISOTROPIC,
ANISOTROPIC, AND MIXED PARTICLE FILLED POLYMER SYSTEM
Kwang-Jea Kim
Dissertation •'
Approved: Accented:
.viser
Cnair
o liege
Dean of the Graduate School
yT /YML- [ W bDate
11
R eproduced with perm ission of the copyright owner. Further reproduction prohibited without perm ission.

ABSTRACT
We describe a study of the rheology, processing and
characterization of talc, calcite, and mixtures of their
particles in thermoplastics. Processing operations such as
capillary, slit, rectangular, annular die extrusion, and
compression molding are carried out to investigate the
influence of talc, calcite, and talc/calcite particles on
polymer processing.
The talc and mixed particle orientation in various
processing flows are characterized using wide angle x-ray
diffraction. The talc particles orient with their surface
parallel to the plate surface of the capillary, slit,
rectangular, annular die, and compression molding die wall.
However capillary die extrudate showed complex behavior
i.e. degree of orientation increase with talc volume
loading up to 10 v% and decrease from 20 v% to 40 v%.
Capillary die extrudate sample's cross-sections were
investigated using scanning electron microscope and
iii
R eproduced with perm ission of the copyright owner. Further reproduction prohibited without perm ission.

compared with various other processing samples. Talc
particle showed radial direction orientation in the core
region. The orders of radial direction orientation were
represented as dimensionless analysis as a function of
volume loading, wall shear stress applied etc. Data
between 10-15 v% showed critical points occur in the radial
direction orientation.
A broad range of experimental measurements of the
shear, elongational and oscillatory flow behavior on
thermoplastic melts with high loadings of talc particles is
presented. The talc and calcite, mixed particle filled
thermoplastic melts at higher loadings exhibit yield
values. Elongational yield viscosity existed where shear
yield value existed. In the IUPAC 4.2.1 Working Party
Project "Comparative Rheology & Material Characteristics of
Mineral Filled PP", surface treated calcite showed lower
level of viscosity than untreated calcite particle and talc
particle filled system did not show considerable changes.
The implication of yield values in anisotropic
compounds is considered. A 3-dimensional rheological model
has been developed to interpret the anisotropic and plastic
characteristics of talc-thermoplastic compounds. The
anisotropic plastic viscoelastic fluid model is specializediv
R eproduced with perm ission of the copyright owner. Further reproduction prohibited without perm ission.

to a transversely isotropic form to represent the behavior
of suspensions of oriented disc particles. This model was
derived from the continuum equation. We first expressed
this model on our experimental result from elongational
yield values and shear yield values.
R eproduced with perm ission of the copyright owner. Further reproduction prohibited without perm ission.

ACKNOWLEDGEMENTS
Prof. James L. White my dissertation advisor and post doctoral director.
Prof. Donald N. Robinson my committee.
Prof. Joo-Whan Shon my thesis advisor.
Wife Hyekycng Kim.Daughter Carol Tongyon Kim.
Mother Jung-Ja Choi.Father Jun-Girle Kim.
vi
R eproduced with perm ission of the copyright owner. Further reproduction prohibited without perm ission.

T A B L E O F C O N T E N T S
PageLIST OF TABLES............................................. xxii
LIST OF FIGURES............................................ xxiv
CHAPTER
I. INTRODUCTION ........................................ 1
II. BACKGROUND AND LITERATURE SURVEY ................... 3
2.1 Crystal Structure and Characteristics ofTalc, Mica, and C a l c i t e ........................... 3
2.1.1 T a l c .....................................3
2.1.2 M i c a .....................................6
2.1.3 Calcium Carbonates..................... 9
2.2 Particle Behavior in Suspended Systems and Influence on Rheological Properties............12
2.2.1 Particle Interactions inSuspensions........................... 12
2.2.1.1 Large Isotropic Particles . . . 12
2. 2.1.2 Anisotropic Particle Motionsand Interactions................ 13
2.2.1.2.1 Dilute Systems ........... 13
2.2.1.2.2 Concentrated Anisotropic Particles.................. 13
vii
R eproduced with perm ission of the copyright owner. Further reproduction prohibited without perm ission.

2.2.1.3 Characteristics Of LiquidCrystals......................... 17
2.2.2 Influence of Particles onRheological Properties ............. 18
2. 2.2.1 Shear F l o w ......................18
2.2.2.1.1 Rheological Models of Dilute Suspensions System .18
2.2.2.1.2 Rheological Properties Of Concentrated Particle Suspensions................ 20
2.2.2.1.2.1 Large Particles .20
2.2.2.1.2.2 Small Particles .22
2.2.3 Rheological Properties in MixedParticle S y s t e m .......................27
2.3 Orientation Development of AnisotropicParticles During F l o w ..................... 28
2.3.1 Introduction...........................28
2.3.2 Representation of UniaxialOrientation........................... 29
2.3.3 Representation of BiaxialOrientation........................... 35
2.3.4 Representation of Mixed ParticleOrientation........................... 41
2.4 Characterization by Using X-ray Diffraction . .42
2.4.1 Introduction...........................42
2.4.2 Quantitative Analysis of ParticleFilled Compounds .................... 43
2.4.3 Wide Angle X-ray Flat FilmTechnique............................. 48
viii
R eproduced with perm ission of the copyright owner. Further reproduction prohibited without perm ission.

2.4.4 Wide Angle X-ray Pole FigureTechnique............................. 51
2.5 Scanning Electron Microscopy (SEM) ........... 56
2.6 Modeling of the Flow of Particle FilledCompounds..........................................60
2.6.1 Phenomenological Constitutive Equations for Dilute Suspensionsof Anisotropic Particles ........... 60
2.6.2 Isotropic Compounds with YieldV a l u e s .................................63
2.6.3 Anisotropic Formulation.............. 68
III. EXPERIMENTAL....................................... 81
3.1 G e n e r a l .......................................... 81
3.2 Experimental.....................................82
3.2.1 Materials.............................. 82
3.2.1.1 Particles........................82
3. 2.1.1.1 T a l c s .......................82
3. 2.1.1. 2 M i c a ........................87
3.2.1.1.3 Calcium Carbonates(Calcite).................. 88
3. 2.1.2 Polymers........................ 91
3.2.1.2.1 Polystyrene (PS) ......... 91
3.2.1.2.2 Polypropylene (PP) . . . . 92
3.3 Compounds Prepared ............................ 92
3.4 Compounding......................................96
ix
R eproduced with perm ission of the copyright owner. Further reproduction prohibited without perm ission.

3.5 Rheological Measurements ...................... 97
3.5.1 Steady Shear Flow Measurements . . . 97
3.5.1.1 Sandwich Rheometer.............. 97
3.5.1.2 Cone-Plate Rheometer........... 100
3.5.1.3 Capillary Rheometer............ 104
3.5.2 Elongational Flow Measurements . . .106
3.5.3 Oscillatory Flow Measurements . . . 110
3.6 Processing Studies and Flow Geometries . . . .113
3.6.1 Extrusion Through D i e s .............. 114
3.6.1.1 Capillary D i e ...................114
3.6.1.2 Rectangular Dies .............. 114
3.6.1.3 Annular D i e ..................... 115
3.6.1.4 Converging F l o w .................115
3.6.2 Compression Molding ................ 115
3.7 X-ray Characterization of Fabricated Parts . .116
3.7.1 Orientation Studies from WideAngle X-ray Diffraction (WAXD) . . .116
3.7.1.1 WAXD Bragg Angle Scanning . . .116
3.7.1.1.1 Amorphous H a l o ............118
3.7.1.1.2 Particle Size ........... 119
3.7.1.2 WAXD Flat Film Measurements . .120
3.7.1.3 WAXD Pole Figure Measurements .120
3.7.1.3.1 Uniaxial Orientation . . .122
x
R eproduced with perm ission of the copyright owner. Further reproduction prohibited without perm ission.

3.7.1.3.2 Biaxial Orientation . . . 122
3.7.2 X-ray Intensity Studies forComposition Analysis of Particle Filled S y s t e m ..................... 123
3.7.2.1 Introduction .................. 123
3. 7.2.2 Binary Mixture (SingleParticle) S y s t e m ............... 124
3.7.3 Scanning Electron Microscopy (SEM) .127
3.7.3.1 Introduction .................. 127
3. 7. 3.2 Experimental.................... 129
IV. RHEOLOGICAL MEASUREMENTS IN STEADY ANDOSCILLATORY SHEAR FLOW ........................... 131
4.1 Introduction..................................... 131
4.2 R e s u l t s .......................................... 132
4.2.1 Steady Shear Flow Measurements . . .132
4.2.2 Oscillatory Flow Measurements . . . 151
4. 2.2.1 Dynamic Viscosity...............151
4.2.2.2 Storage and Loss Modulus . . . 153
4.3 Discussion....................................... 160
4.3.1 Particle Loading Dependence ofShear Viscosity.................. 160
4.3.1.1 PS Matrix S y s t e m ................160
4.3.1.2 PP Matrix S y s t e m ................165
4.3.2 Yield V a l u e s ..........................166
4.3.2.1 PS Matrix S y s t e m ................166
xi
R eproduced with perm ission of the copyright owner. Further reproduction prohibited without perm ission.

4.3. 2. 2 PP Matrix S y s t e m ................168
4. 3.2.3 Comparison To EarlierLiterature......................169
4.3.3 Viscosity-Shear Stress Plateau . . .173
4.3.4 Comparison Between Single ParticleFilled System And Mixed Particle Filled S y s t e m .........................175
4.3.4.1 PS Matrix S y s t e m ................175
4.3. 4. 2 PP Matrix S y s t e m ................176
4.3.5 Comparison Between Stearic AcidTreated Particle Filled System And Untreated Particle Filled System . .179
4.3.5.1 PP Matrix S y s t e m ................179
4.3.6 Comparison Between Complex ViscosityAnd Shear Viscosity................. 183
4.3.7 Comparison Between Talc ParticleFilled System and Calcite Particle Filled S y s t e m .........................185
V. ELONGATIONAL FLOW RHEOLOGICAL MEASUREMENTS . . . .188
5.1 Introduction....................................188
5.2 R e s u l t s ......................................... 189
5.2.1 Silicone Oil Bath Elongational Flow(S B M ) .................................189
5.2.1.1 Polystyrene (PS) .............. 189
5. 2.1.2 Calcite Compounds.............. 191
5.2.1.3 Talc Compounds ................ 199
5.2.1.4 Talc/Calcite Compounds . . . . 204
xii
R eproduced with perm ission of the copyright owner. Further reproduction prohibited without perm ission.

5.2.2 Nitrogen Bath Elongational Flow( N C M ) .................................215
5.2.2.1 Polystyrene (PS) .............. 215
5.2.2.2 Calcite Compounds.............. 215
5.2.2.3 Talc Compounds ................ 216
5.2.2.4 Talc/Calcite Compounds . . . . 216
5.3 Discussion...................................... 217
5.3.1 Polystyrene ( P S ) ..................... 217
5.3.1.1 Comparison To Shear ViscosityAnd Earlier Investigation . . .217
5.3.2 Talc Compounds....................... 218
5.3.2.1 Estimation Of Yield Values From Nitrogen Bath Method( N C M ) ........................... 218
5.3.2.2 Comparison Of Silicone BathData To Shear Viscosity . . . .221
5.3.2.3 Investigation Of Silicone OilAbsorption......................222
5.3.2.4 Shear Flow CharacterizationOf SBM Elongational Flow Specimens.......................226
5.3.3 Calcite Compounds .................. 229
5. 3. 3.1 Estimation Of Yield Values FromNitrogen Bath Method (NCM) . . 229
5.3.3.2 Comparison Of Silicone BathData To Shear Viscosity . . . .230
5.3.3.3 Comparison To EarlierInvestigations ............... 233
xiii
R eproduced with perm ission of the copyright owner. Further reproduction prohibited without perm ission.

5. 3. 3. 4 Investigation Of Silicone OilAbsorption......................233
5.3.3. 5 Shear Flow CharacterizationOf SBM Elongational Flow Specimens.......................234
5.3.4 Talc/Calcite Compounds.............. 237
5.3.4.1 Estimation Of Yield Values FromNitrogen Bath Method (NCM) . . 237
5.3.4.2 Comparison Of Silicone Bath ToShear Viscosity................ 237
5.3.4.3 Investigation Of Silicone OilAbsorption......................238
5. 3. 4. 4 Shear Flow CharacterizationOf SBM Elongational Flow Specimens.......................241
VI. WIDE ANGLE X-RAY DIFFRACTION (WAXD)CHARACTERIZATION ................................. 247
6.1 Introduction.....................................247
6.2 R e s u l t s .......................................... 248
6.2.1 Composition Analysis of Particle Filled System Using Bragg AngleX-ray Intensity......................248
6.2.1.1 PS/Calcite S y s t e m ...............248
6.2.1.2 PS/Talc System ................ 256
6.2.2 Flat Film Measurements Of ParticleOrientation.......................... 272
6.2.2.1 Uniaxial Extrudates............ 272
6.2.2.2 Compression Molded Sheets . . .276xiv
R eproduced with perm ission of the copyright owner. Further reproduction prohibited without perm ission.

6.2.3 Pole Figure Measurements............280
6.2.3.1 Capillary Die Extrudates . . . 280
6.2.3.2 Rectangular Die Extrudates . . 282
6. 2.3.3 Slit Die Extrudates............ 282
6.2.3.4 Annular Die Extrudates . . . . 285
6.2.3.5 Compression M o l d i n g ............ 287
6.3 Interpretation...................................289
6.3.1 Composition Analysis of ParticleFilled System Using Bragg Angle X-ray Intensity......................289
6.3.1.1 Theoretical Background . . . . 289
6.3.1.2 Ternary Mixture System . . . . 294
6.3.1.3 PS/Calcite S y s t e m ...............295
6. 3.1.4 PS/Talc S y s t e m .................. 299
6.3.1.5 PS / Talc / Calcite System . . 301
6. 3.1.5.1 Pseudo binary mixture system ofPS/(Talc/Calcite) . . . . 301
6.3.1.5.2 Pseudo binary mixture system of(PS/Talc)/Calcite . . . . 302
6.3.1.6 Summary of PS/Talc,PS Calcite, and PS/Talc/Calcite System ................ 309
6.3.1.6.1 PS/Talc, and PS/Calcite S y s t e m .....................309
6.3.1.6.2 PS/Talc/Calcite System . .310 xv
R eproduced with perm ission of the copyright owner. Further reproduction prohibited without perm ission.

6.3.2 Flat Film Measurements OfOrientation.......................... 311
6.3.3 Orientation Factors And Pole FigureMeasurements......................... 313
6.3.3.1 Capillary Die Extrudates . . . 313
6.3.3.2 Rectangular Die Extrudates . . 316
6.3.3.3 Slit Die Extrudates............ 316
6. 3.3.4 Annular Die Extrudates . . . . 319
6. 3.3.5 Compression M o l d i n g ............ 319
6.3.3.6 Mixed Particle Filled System . 322
6.3.3.6.1 Capillary Die Extrudates .322
6.3.3.6.2 Slit Die Extrudates . . . 324
6.3.3.6.3 Compression Molding . . . 326
6.3.3.7 S u m m a r y ..........................326
VII. CHARACTERIZATION OF LOCAL PARTICLE ORIENTATIONIN PROCESSED COMPOUNDS........................... 332
7.1 Introduction.................................... 332
7.2 R e s u l t s ..........................................333
7.2.1 Compression Molded S a m p l e s .......... 333
7.2.2 Extrudates............................ 336
7. 2. 2.1 Capillary D i e ................... 336
7.2.2.2 Slit D i e .........................346
7.2.2.3 Rectangular D i e .................351
7.2.2.4 Annular D i e ..................... 356xvi
R eproduced with perm ission of the copyright owner. Further reproduction prohibited without perm ission.

7.2.2.5 Capillary Dies For Various Diameter........................359
7.2.2.6 Capillary Die EntranceAngle 135° F l o w ................. 362
1.2.2.1 Capillary Die Attached To Twin Screw Extrusion Machine . . . .364
7.2.3 Flow Into Die Entrance ...............364
7.3 Discussion......................................368
7.3.1 Summary Of Flow Observation InLong D i e s ............................ 368
7.3.2 Correlation Of Observations FromDifferent Experiment................ 369
7.3.2.1 Feed History E f f e c t ............ 369
7.3.2.2 Dimensionless Correlations . .376
7.3.3 Characteristics Of CircumferentialA r r a y s ................................377
7.3.4 Flow Mechanism Hypotheses........... 379
7.3.5 Mechanism Of Particle Orientation . 384
VIII. ALTERNATE MODELS FOR THE YIELD SURFACE OF A TRANSVERSELY ISOTROPIC PLASTIC VISCOELASTIC F L U I D ............................................. 388
8.1 Introduction....................................388
8.2 Constitutive Relationships 391
8.2.1 Three-Dimensional Modeling ofPlastic-Viscous F l u i d s ..............391
8.2.2 Thixotropic Plastic-ViscoelasticF l u i d s ................................393
xvii
R eproduced with perm ission of the copyright owner. Further reproduction prohibited without perm ission.

8.2.3 Three-Dimensional Modeling OfPlastic-Viscoelastic Fluids . . . . 396
8.2.4 Theory Of Transversely IsotropicPlastic Viscoelastic Fluids . . . . 398
8.2.2 New Yield S u r f a c e ....................401
8.3 Application To Shear Flow And UniaxialExtension........................................403
8.3.1 Shear F l o w ............................403
8. 3.1.1 Simple shear flow parallelto disc surfaces (a i 2 = a si, or CT3 2 = CTs 3 ) ........................................... 403
8.3.1.2 Flow direction shear flow perpendicular to disc stacking (CT1 3 = ° s 2 ) ......................... 406
8.3.2 Uniaxial Extension F l o w ............. 409
8. 3.2.1 Perpendicular to the DiscAxes (1-direction, aeii) • • • .409
8.3.2.2 Parallel to the Disc Axes (2-direction, aei2 ) .............415
8.3.3 Two-Dimensional S h e a r ............... 417
8.3. 3.1 Shear Flow Parallel To DiscLayers (CJi 2 + <73 2 ) ............... 417
8. 3.3.2 Two-dimensional shear flownormal to disc layers (a ’i 2 + a i3) .420
8.4 Yield Surface Of Anisotropy Parameter a As AFunction Of Various Yield Stress Ratios . . . 423
8.4.1 Simple shear flow parallel to discsurfaces and 1-direction UniaxialFlow (Yeii/Ysi)........................ 423
xviii
R eproduced with perm ission o f the copyright owner. Further reproduction prohibited without perm ission.

8.4.2 Simple shear flow parallel to discsurfaces and shear flow perpendicular to disc stacking (YS2/Ysi) ............425
8.5 Development of Stress Explicit ConstitutiveEquation for New Yield S u r f a c e ................ 427
8.5.1 M values for Simple Shear Flow . . .431
8.5.2 M Values For 2-Dimensional FlowParallel To Disc Layers (CTi2+CT32) . . 432
8.5.2 M Values For Uniaxial F l o w ......... 433
8.5.3 M Values For Biaxial F l o w ...........434
8.6. Interpretation of M v a l u e s .....................435
8.6.1 Simple Shear F l o w ....................435
8.7 Discussion and Interpretation ................ 437
IX. A THEORY OF TRANSVERSELY ISOTROPIC PLASTICVISCOELASTIC FLUIDS TO REPRESENT THE FLOW OF ANISOTROPIC/ISOTROPIC PARTICLE SUSPENSIONS IN THERMOPLASTICS......................................... 440
9.1 Introduction..................................... 440
9.2 Linear Transversely Isotropic PlasticViscoelastic Fluids ........................... 441
9.2.1 Isotropic Linear PlasticViscoelastic F l u i d .................. 441
9.2.2 Transition of Transversely IsotropicLinear Plastic Viscoelastic Fluid. .443
9.3 Application Of Non-linear TransverselyIsotropic Plastic Viscoelastic Fluid Model . .446
9.4 Considerations from experimental rheologicalmeasurements.................................... 449
xix
R eproduced with perm ission of the copyright owner. Further reproduction prohibited without perm ission.

9.4.1 Shear Flow Behavior For SimpleShear F l o w ........................... 449
9.4.2 Comparison of Experimental Resultswith Constitutive Equation with New Yield S u r f a c e ........................ 452
9.4.2.1 Yield Surface from Constitutive Relationships . . 457
9.4.2.2 Yield Surface of Anisotropy Parameter a as a Function of Various Yield Stress Ratios . .458
9. 4.2.2.1 Simple shear flowparallel to disc surfacesand 1-direction Uniaxial Flow (Yeii/Ysi) ............. 458
9.4.3 Experimental Results for PS/Talc,PS/Calcite, PS/Talc/Calcite System .458
9.4.4 Discussion............................ 462
9.5 Conclusions....................................463
X. CONCLUSIONS AND RECOMMENDATION .................... 4 67
10.1 Introduction.................................... 467
10.2 Conclusions..................................... 468
10.2.1 Orientation Stusies from WideAngle X-ray Diffraction ........... 468
10.2.2 Quantitative Analysis of FillerComposite using X-ray Intensity M e t h o d ................................469
10.2.3 Rheological Considerations-Experimental......................... 469
10.2.4 Rheological M o d e l i n g .................470
xx
R eproduced with perm ission of the copyright owner. Further reproduction prohibited without perm ission.

10.3 Recommendations.................................471
REFERENCES................................................. 473
xx i
R eproduced with perm ission of the copyright owner. Further reproduction prohibited without perm ission.

L I S T O F T A B L E S
Table Page3.1 Characteristics of materials and supplier for
Polystyrene system..................................... 85
3.2 Characteristics of materials and supplier forIUPAC 4.2.1 Working Party Polypropylene Project. . .86
3.3 PS compounds investigated.............................. 94
3.4 PP compounds investigated for IUPAC................... 95
3.5 Various processing geometries and condition in PSmatrix s y s t e m ......................................... 117
4.1 Shear and threshold yield values of particlefilled PS at 200 °C.................................... 167
4.2 Yield values of particle filled PP at 210 °C. . . . 170
4.3 Yield values of particle filled thermoplastics. . .171
4.4 Viscosity reduction by stearic acid coating of talc, calcite, and talc/calcite particles in PPat 25 v % .............................................. 182
5.1 Elongational yield values of particlefilled PSat 200 °C................................................198
5.2 Silicone oil absorption from compounded material. .225
6.1 Mass absorption coefficient of elements for CuKaat *-=1.5418 A ........................................... 293
6.2 Orientation factor for talc, and talc/calcite filled system from capillary die (L/D=28.5,D=1.6 mm) extrudate at Q=29.9 (mm3/s) 200°C......... 315
xxii
R eproduced with perm ission of the copyright owner. Further reproduction prohibited without perm ission.

6.3 Orientation factor of talc, and talc/calcitefilled system from slit die extrudate_ (W/T=20,T=0.3 mm) extrudate at Q = 9049.5 (mmVs) 200°C . . 318
6.4 Orientation factor of talc, and talc/calcitefilled system from compression molding at 5 MPa compression (Thickness = 1 mm) at 200 ° C ............. 321
9.1 Parameters of empirical equations for particle filled thermoplastics................................ 453
9.2 Yield values of shear and elongational flow experiments for PS/talc, PS/calcite, and PS/talc/calcite filled s y s t e m ....................... 461
9.3 The anisotropy parameter a for various particle filled systems as a function of Y e i i / Y s i.............. 465
xxiii
R eproduced with perm ission of the copyright owner. Further reproduction prohibited without perm ission.

LIST OF FIGURES
Figure Page2.1 Unit cell structure of T a l c ........................... 5
2.2 Unit cell structure of Mica............................ 8
2.3 Unit cell structure of Calcite........................11
2.4 Stein coordinate system and definitions forspecifying orientation modes of crystallographicaxes................................................... 33
2.5 White and Spruiell orientation triangle ...... 39
2.6 Schematic representation of x-ray diffractometer. . 44
2.7 WAXD flat film pattern.................................45
2.8 Schematic perspective of diffraction by specimensusing wide angle x-ray beam...........................49
2.9 3-Dimensional expression of the sphericalprojection of a crystal............................... 52
2.10 Angular coordinates used for obtaining a polefigure............................................ 54
2.11 Schematic diagram of scanning electron microscope (SEM)................................................... 58
2.12 Contrast mechanisms of scanning electron microscope (SEM)................................................... 59
2.13 Flow direction coordinates in Cartesian geometry. . 73
3.1 SEM photograph of Talc particles................... 8 4
3.2 SEM photograph of Mica particles................... 8 9xxiv
R eproduced with perm ission of the copyright owner. Further reproduction prohibited without perm ission.

3.3 SEM photograph of Calcite particles.................. 90
3.4 Scheme of modified sandwich rheometer................. 99
3.5 Schematic diagram of cone-plate rheometer...........102
3.6 Schematic diagram of compression mold forRheometrics............................................ 103
3.7 Schematic diagram of capillary rheometer............ 105
3.8 Schematic diagram of silicone oil bath elongationalrheometer.............................................. 108
3.9 Scheme of elongation rheometer for measurementyield value............................................ Ill
3.10 Schematic diagram of parallel plate rheometer. . . 112
4.1 Shear viscosity as a function of shear rate fortalc filled system at 200°C........................... 133
4.2 Shear viscosity as a function of shear stress fortalc filled system at 200°C........................... 134
4.3 Shear strain creep as a function of time at 200°Cfor various creep levels for PS/talc 0.4 volume loading compound...................................... 136
4.4 Shear viscosity as a function of shear rate forcalcite filled PS system at 200°C.....................137
4.5 Shear viscosity as a function of shear stress forcalcite filled PS system at 200°C.....................138
4.6 Shear strain creep as a function of time at 200°Cfor various creep levels for PS/calcite 0.4 volume loading compound...................................... 140
4.7 Shear viscosity as a function of shear rate fortalc/calcite filled PS system at 200°C............... 141
4.8 Shear viscosity as a function of shear stress fortalc/calcite filled PS system at 200°C............... 142
XXV
R eproduced with perm ission of the copyright owner. Further reproduction prohibited without perm ission.

4.9 Shear strain creep as a function of time at 200°C for various creep levels for PS/talc/calcite(a) 0.78/0.10/0.12 (b) 0.60/0.20/0.20 volume loading compounds......................................143
4.10 Shear viscosity of PP/fillers as a function ofshear rate at 210°C.....................................146
4.11 Shear viscosity of PP/fillers as a function ofshear stress at 210°C.................................. 148
4.12 Shear strain creep as a function of time at 210°C for various creep levels for PP/talc/calcite 0.75/0.13/0.13 volume loading compounds.............. 150
4.13 Dynamic viscosity of PP/fillers as a function of frequency at 210°C......................................152
4.14 Storage modulus (G') of PP/fillers as a functionof frequency at 210°C.................................. 155
4.15 Loss modulus (G") of PP/fillers as a function of frequency at 210°C......................................156
4.16 Strain(%) sweep of PP/fillers as a function ofstorage modulus G' at frequency lrad/sec and 210°C .158
4.17 Strain(%) sweep of PP/fillers as a function ofloss modulus G" at frequency 1 rad/sec at 210°C. . .159
4.18 Relative viscosity as a function of shear rate for talc-PS compounds......................................161
4.19 Relative viscosity as a function of shear rate for calcite-PS compounds.................................. 162
4.20 Relative viscosity as a function of shear rate for talc/calcite-PS compounds.............................163
4.21 Relative viscosity as a function of shear rate for talc/PP, calcite/PP, and talc/calcite/PP compounds.164
xxvi
R eproduced with perm ission o f the copyright owner. Further reproduction prohibited without perm ission.

4.22 Viscosity as a function of shear stress for 10 v% talc, calcite, and talc/calcite filled PS systemat 200°C.................................................177
4.23 Viscosity as a function of shear stress for 40 v% talc, calcite, and talc/calcite filled PS systemat 200°C.................................................178
4.24 Comparison between complex viscosity and shear viscosity of PP/fillers as a function of frequency/shear rate at 210°C...........................184
4.25 Viscosity as a function of shear stress for talcand calcite filled system at 200°C...................... 186
5.1 Elongational viscosity measurements of PS systemat 200°C.................................................190
5.2 Elongational viscosity measurements of PS/calcite (95/05 v%) system at 200°C.............................192
5.3 Elongational viscosity measurements of PS/calcite (90/10 v%) system at 200°C.............................193
5.4 Elongational viscosity measurements of PS/calcite (80/20 v%) system at 200°C.............................194
5.5 Elongational viscosity measurements of PS/calcite (60/40 v%) system at 200'C.............................195
5.6 Elongational viscosity as a function of elongational rate for calcite filled systemat 200°C.................................................196
5.7 Elongational viscosity as a function of elongational stress for calcite filled systemat 200°C.................................................197
5.8 Elongational viscosity measurements of PS/talc(95/05 v%) system at.200°C............................ 200
5.9 Elongational viscosity measurements of PS/talc(90/10 v%) system at.200°C............................ 201
xxvii
R eproduced with perm ission of the copyright owner. Further reproduction prohibited without perm ission.

5.10 Elongational viscosity measurements of PS/talc(80/20 v%) system at 200°C............................ 202
5.11 Elongational viscosity measurements of PS/talc(60/40 v%) system at 200°C............................ 203
5.12 Elongational viscosity as a function ofelongational rate for talc filled system at 200°C. .206
5.13 Elongational viscosity as a function of elongational stress for talc filled systemat 200cC ................................................ 207
5.14 Elongational viscosity measurements of PS/talc/calcite (90/05/05 v%) system at 200°C. . . .208
5.15 Elongational viscosity measurements of PS/talc/calcite (84/04/12 v%) system at 200°C. . . .209
5.16 Elongational viscosity measurements of PS/talc/calcite (84/10/06 v%) system at 200°C. . . .210
5.17 Elongational viscosity measurements of PS/talc/calcite (78/10/12 v%) system at 200°C. . . .211
5.18 Elongational viscosity measurements of PS/talc/calcite (60/20/20 v%) system at200°C....................................................212
5.19 Elongational viscosity as a function of elongational rate for talc/calcite filledsystem at 200°C........................................ 213
5.20 Elongational viscosity as a function of elongational stress for talc/calcite filledsystem at 200°C........................................ 214
5.21 Shear/elongational(SBM) viscosity as a function ofshear/elongational stress rate for PS at 200°C. . . 219
5.23 Shear/elongational(SBM) viscosity as a function of shear/elongational rate for talc filled system at 200°C................................................ 223
xxviii
R eproduced with perm ission of the copyright owner. Further reproduction prohibited without perm ission.

5.24 Shear/elongational(SBM) viscosity as a function of shear/elongational stress for talc filledsystem at 200°C.........................................224
5.25 Shear(SBM)/elongational(SBM) viscosity as a function of shear/elongational rate for talc filled system at 200°C.........................................227
5.26 Shear(SBM)/elongational(SBM) viscosity as a function of shear/elongational stress for talc filled system at 200°C................................. 228
5.27 Shear/elongational(SBM) viscosity as a function of shear/elongational rate for calcite filled systemat 200°C................................................ 231
5.28 Shear/elongational(SBM) viscosity as a function of shear/elongational stress for calcite filled systemat 200°C................................................ 232
5.29 Shear(SBM)/elongational(SBM) viscosity as a function of shear/elongational rate for calcite filled system at 200°C................................. 235
5.30 Shear(SBM)/elongational(SBM) viscosity as a function of shear/elongational stress for calcite filled system at 200°C................................. 236
5.31 Shear/elongational(SBM) viscosity as a function of shear/elongational rate for talc/calcite filled system at 200°C.........................................239
5.32 Shear/elongational(SBM) viscosity as a function of shear/elongational stress for talc/calcite filled system at 200°C.........................................240
5.33 Shear(SBM)/elongational(SBM) viscosity as a function of shear/elongational rate for talc/calcite filled system at 200°C.................. 242
5.34 Shear(SBM)/elongational(SBM) viscosity as a function of shear/elongational stress for talc/calcite filled system at 200°C.................. 243
xxix
R eproduced with perm ission o f the copyright owner. Further reproduction prohibited without perm ission.

6.1 Intensity distribution of polystyrene............249
6.2 Intensity distribution of PS and PS/calcite (5 v%).250
6.3 Intensity distribution of PS and PS/calcite(10 vl)................................................. 251
6.4 Intensity distribution of PS and PS/calcite(20 v%)................................................. 252
6.5 Intensity distribution of PS and PS/calcite(40 v%)................................................. 253
6.6 Intensity distribution of calcite powder............254
6.7 Intensity distribution of various calciteloadings................................................ 255
6.8 Intensity distribution of PS and PS/talc (5 v%). . 257
6.9 Intensity distribution of PS and PS/talc (10 v%). .258
6.10 Intensity distribution of PS and PS/talc (20 v%). .259
6.11 Intensity distribution of PS and PS/talc (40 v%). .260
6.12 Intensity distribution of talc powder............261
6.13 Intensity distribution of various rale loadings. . 262
6.14 Intensity distribution of PS and PS/talc/calcite(90/05/05 v%) ........................................ 264
6.15 Intensity distribution of PS and PS/talc/calcite (84/04/12 v % ) ........................................ 265
6.16 Intensity distribution of PS and PS/talc/calcite (54/03/43 v%) ........................................ 266
6.17 Intensity distribution of PS and PS/talc/calcite (85/10/05 v%) ........................................ 267
6.18 Intensity distribution of PS and PS/talc/calcite (78/10/12 v%) ........................................ 268
XXX
R eproduced with perm ission o f the copyright owner. Further reproduction prohibited without perm ission.

6.19 Intensity distribution of PS and PS/talc/calcite (53/05/42 v % ) .........................................269
6.20 Intensity distribution of PS and various PS/talc/calcite (88:12: wt) loadings .............. 270
6.21 Intensity distribution of PS and various PS/talc/calcite (77:23: wt) loadings .............. 271
6.22 Typical x-ray pattern of 20v% talc particles from capillary extrudate (D=1.6mm, L/D=28.5)............273
6.23 Typical x-ray pattern of 20v% calcite particlesfrom capillary extrudate (D=1.6mm, L/D=28.5) . . . 274
6.24 X-ray pattern of PS/talc/calcite (90:05:05 v%) system from capillary die extrusion (D=1.6mm,L/D=28 .5)............................................. 275
6.25 Flow direction x-ray pattern of talc particle filled system from compression molding (a) 5 v%,(b) 10 v%, (c) 20 v%f (d) 40 v%...................... 277
6.26 X-ray pattern of PS/talc/calcite system from compression molding (a) 90:05:05 v%,(b) 84:04:12 v%, (c) 84:10:06 v%,(d) 78:10:12 v%,(e) 75:19:06 v%, (f) 60:20:20 v%.....................278
6.27 The pole figures for the (001) plane of the 5 v% talc compound from capillary die extrusion experiment............................................. 281
6.28 The pole figures for the (001) plane of the 5 v% talc compound from rectangular die extrusion experiment............................................. 283
6.29 The pole figures for the (001) plane of the 5 v% talc compound from the slit die extrusion experiment............................................. 284
6.30 The pole figures for the (001) plane of the 5 v% talc compound from annular die extrusion experiment............................................. 286
xxx i
R eproduced with perm ission of the copyright owner. Further reproduction prohibited without perm ission.

6.31 The pole figures for the (001) plane of the 5 v%talc compound from compression molding
experiment............................................. 288
6.32 Comparison of theoretical intensity-concentration curves (solid line) and experimental measurements (open circle) for PS/calcite mixtures............... 297
6.33 Comparison of theoretical intensity-concentration curves (solid line) and experimental measurements (closed hexagon) for PS/calcite mixtures............298
6.34 Comparison of theoretical intensity-concentration curves (solid line) and experimental measurements (closed circle) for PS/talc mixtures................ 30U
6.35 Relative intensity distribution of various talc/calcite mixed particle as a function of PS concentration........................................ 305
6.36 Relative intensity distribution of various talc/calcite mixed particle as a function of PS concentration........................................ 306
6.37 Relative intensity distribution of various (PS/talc,88:12 wt%)/calcite mixed particle systemas a function of PS+talc concentration ........... 307
6.38 Relative intensity distribution of various (PS/talc,77:23 wt%)/calcite mixed particle systemas a function of PS+talc concentration ........... 308
6.39 White and Spruiell orientation triangle for capillary die extrusion...............................314
6.40 White and Spruiell orientation triangle for slit extrusion.............................................. 317
6.41 White and Spruiell orientation triangle for compression molding................................... 320
6.42 Orientation function of talc as a function of volume loading of calcite from capillary die extrudates............................................. 323
xxx ii
R eproduced with perm ission of the copyright owner. Further reproduction prohibited without perm ission.

6.43 Orientation function of talc as a function of volume loading of calcite from slit die extrudates............................................. 325
6.44 Orientation function of talc as a function of volume loading of calcite from compressionmolding.................................................327
6.45 Orientation function as a function of volume loading of capillary extrudates, sheet extrudates, and compression moldings............................. 330
7.1 Cross-section of 5 v% and 40 v% talc particlefilled compression molded polystyrene sheets. . . .334
7.2 Cross-section of 5 v% and 40 v% mica particlefilled compression molded polystyrene sheets. . . .335
7.3 Cross-section of (a) 5 v%, (b) 10 v%, (c) 20 v%and (d) 40 v% talc particle filled capillary die extrudated filaments.................................. 337
7.4 Dimensionless analysis of radial ratio d/D vs.extrusion rate of capillary extrudates..............340
7.5 Dimensionless analysis of radial ratio d/D vs.volume loadings of capillary extrudates.............341
7.6 Dimensionless analysis of radial ratio vs. diewall shear stress based upon different volume loadings from capillary extrudate................... 342
7.7 Dimensionless analysis of n value vs. Talc v%(L/D 28.5, D=1.6 mm, 200°C, Capillary)............... 344
7.8 Cross-section of 5 v% and 40 v% mica particlefilled capillary die extrudated filaments.......... 345
7.9 Cross-section of 05/05 v% and 04/12 v%talc/calcite particle filled capillary die extrudated filaments ............................... 347
7.10 Cross-section of 10/06 v% and 10/12 v%talc/calcite particle filled capillary die extrudated filaments ............................... 348
xxxiii
R eproduced with perm ission of the copyright owner. Further reproduction prohibited without perm ission.

7.11 Cross-section of 20/10 v% and 20/20 v%talc/calcite particle filled capillary die extrudated filaments ...................... 3 4 9
7.12 Cross-section of 5 v% and 40 v% talc particlefilled slit die extrudated polystyrene sheets. . . 350
7.13 Cross-section of 5 v% and 40 v% mica particlefilled slit die extrudated polystyrene sheets. . . 352
7.14 Cross-section of 5 v% and 40 v% talc particle filled rectangular die extrudated filaments. . . . 354
7.15 Cross-section of 5 v% and 40 v% mica particlefilled rectangular die extrudated filaments. . . . 355
7.16 Cross-section of 5 v% and 40 v% talc particlefilled annular die extrudated sheets................ 357
7.17 Cross-section of 5 v% and 40 v% mica particlefilled annular die extrudates..................... 358
7.18 Cross-section view of 5 v% and 40 v% talc particles from 0.03 inch capillary diameter extrudates..........................................360
7.19 Cross-section view of 5 v% and 40 v% talc particles from 4.6 mm capillary diameter extrudates..........................................361
7.20 Cross-section view of 5 v% and 40 v% talcparticles from capillary die entrance 135°.......... 363
7.21 Cross-section view of 5 v% and 40 v% talc particles from twin screw extruder extrudates. . . 365
7.22 Normal direction cross-section view of 20 v% talc particles from reservoir to capillary die entrance at 45°......................................... 366
7.23 Summary of schematic observation from capillary extrudates with volume and extrusion rate changes .370
xxxiv
R eproduced with perm ission of the copyright owner. Further reproduction prohibited without perm ission.
7.24 Geometric Orientation Instability Effect of talcfrom different capillary dies at 5 v % .............. 371
7.25 Geometric Orientation Instability Effect of talcfrom different capillary dies at 40 v % ............. 372
7.26 Summary of reservoir to capillary entrance flow of talc particles........................................ 374
7.27 Schematic representation of twin screw extruder extrudates of talc filled thermoplastics ......... 375
7.28 Schematic representation of particle-particleangle and their diameter............................. 378
7.29 Geometric Orientation Instability Effect of talcfrom different aspect ratio dies at 5 v % ........ 380
7.30 Geometric Orientation Instability Effect of talc from different aspect ratio dies at 40 v % ..........381
7.31 Geometric Orientation Instability Effect of talc from annular die at 5 v% and 40 v % ............... 382
7.32 Cross-section texture of pitch fibers fromH. H o n d a ............................................ 387
8.1 Schematic representation of simple shear flow parallel to disc surfaces (a) a i2=a si (b) G 32=<Js3 . . .404
8.2 Schematic representation of flow direction shearflow perpendicular to disc stacking (G i 3 = G s2) . . . .407
8.3 Schematic representation of perpendicular to theDisc Axes (1-direction, Geii)......................... 410
8.4 Schematic representation of parallel to the Disc Axes (2-direction, aei2 ).............................414
8.5 Schematic representation of shear flow parallelto disc layers (Gi2+G32) ................................418
8.6 Schematic representation of two-dimensional shear flow normal to disc layers (Gi2+Gi3)................. 421
XXXV
R eproduced with perm ission o f the copyright owner. Further reproduction prohibited without perm ission.

8.7 Yield surface for yield stress ratio Yeii/Ysi
as a function of anisotropy parameter a . . . 424
8.8 Yield surface for yield stress ratio YS2/Ysi as a function of anisotropy parameter a ............... 426
9.1 Comparison of empirical equations with experimental data for talc filled PS systemat 200 ° C .............................................. 454
9.2 Comparison of empirical equations with experimental data for calcite filled PS systemat 200 ° C .............................................. 455
9.3 Comparison of empirical equations with experimental data for talc/calcite filled PSsystem at 200 ° C ......................................456
9.4 Yield surface of anisotropy parameter a as a function of minimum yield stress ratio Yeii/Ysi for talc(40v%), calcite(40v%), and talc/calcite(40v%) filled polystyrene ................................. 460
xxxvi
R eproduced with perm ission of the copyright owner. Further reproduction prohibited without perm ission.

CHAPTER I
INTRODUCTION
Minerals are compounded into plastics for several
purposes: (i) as mechanical reinforcements, (ii) as
pigments, (iii) for enhancement of electrical conductivity
or thermal behavior and (iv) to lower material cost.
Mineral fillers such as talc, mica, clay, wollastonite, and
calcite have obtained an important position in the polymer
industries because of their ability to fulfill some of
those roles.
Many of the mineral particles used are anisotropic in
shape. Such particles may take states of orientation due
to flow or packing processes. The orientations developed
should influence phenomena ranging from rheological
properties to compound processability in industrial
processing equipment to electrical characteristics and
mechanical performance.
1
Reproduced with perm ission o f the copyright owner. Further reproduction prohibited without perm ission.

2In this dissertation we investigate the behavior of
small disc shaped particle compounds in thermoplastics.
Specific variables considered are as follows (i)
rheological behavior from low loadings to high loadings
using various rheological instruments, (ii) orientation of
disc particles developed during different states of flow,
(iii) behavior of mixed particle systems, (iv) development
of a three dimensional rheological model to represent the
behavior of disc-like and mixed particle systems.
R eproduced with perm ission of the copyright owner. Further reproduction prohibited without perm ission.

C H A P T E R I I
BACKGROUND AND LITERATURE SURVEY
2.1 Crystal Structure and Characteristics of Talc, Mica,
and Calcite
2.1.1 Talc
Talc is considered a hydrated magnesium silicate. It
is one of a series of lamella silicate minerals involving 2-
dimensional silicate sandwich with other minerals (1-5).
The structure of this class of minerals was first worked out
by Pauling (5-7) (compare Moeller (8) ) . The basic chemical
composition of talc is (MgO) n (Si02) n (H20) p where n=3, m=4, and
p=l, this has been expressed variously in forms such as
3Mg0'4Si02'H20, Mg3'Si4'O10‘ (OH) 2, Mg3-Si4'H20i2, Mg3‘ (Si05) z (H20) n.
The basic structure of talc is a sheet of brucite (Mg(OH)2)
3
R eproduced with perm ission of the copyright owner. Further reproduction prohibited without perm ission.

4
in between two silicate (Si02) layers (9, 3JD) . Talc layers
are bonded with weak van der Waal type forces. The mean
particle size of most industrial talc is in the 2 to 20
micron range. Talc is usually in plate form with an aspect
ratio between 10 and 30. Depending on the source from which
it is mined, talc is said to show different surface
characteristics. The Montana talcs are hydrophobic in
nature while the California talcs are predominantly
hydrophilic (^). Talc is a soft mineral (having Moh's
hardness of 1.0) and its layers easily slide past each other
by shearing action.
In 1934 Gruner (3J.) reported a monoclinic unit cell
structure of talc based upon x-ray diffraction measurements.
Gruner indexed the diffraction patterns on the basis of a
monoclinic unit cell with a=5.26 A, b=9.10 A, c=18.81 A,
P=100.0°. Subsequently using new x-ray diffraction
measurements, Hendricks (12) , Zvyagin and Pinsker (3 3) , and
Stemple and Brindley (1_4) have also reported monoclinic unit
cells for talc with similar dimensions.
R eproduced with perm ission of the copyright owner. Further reproduction prohibited without perm ission.

5
o Oxygen (O) © Hydroxyl (OH) • Magnesium (Mg)
O and • Silicon (Si)
Figure 2.1 Unit cell structure of Talc
R eproduced with perm ission of the copyright owner. Further reproduction prohibited without perm ission.

6
In 1966 Rayner and Brown (L5,16), using new x-ray
diffraction measurements, carefully reexamined the crystal
structure of talc and reported a triclinic unit cell with
a=5.293 A, b=9.179 A, c=9.496 A, a=90.57°, P=100.0°,
Y=90.03°. Ross et al. (3/7), Akizuki and Zussman (3J3) , and
more recently Perdakatsis and Burzlaff (3 9) have also more
recently reported triclinic unit cells for talc (Figure
2 .1).
2.1.2 Mica
Mica is classified into the phyllosilicate group and
shows platy and flaky habits (5-7). The principal sheet
structured micas with their chemical formulae are very
complex, owing to substitution. The mica group includes
Muscovite [KA12 (AlSi3Oi0) (0H)2], Paragonite [NaAl2 (AlSi3Oi0)
(0H)2], Phlogopite [KMg3 (AlSi3Oi0) (0H)2], Biotite [K(Mg,Fe)3
(AlSijOio) (OH) 2] , Lepidolite [ K L i 2A l ( S i 40ia) (F,OH);],
Zinnwaldite [KLiFeAl (AlSi3Oi0) (F,OH)2] (20). There is also
brittle mica group includes Margarite [CaAl2 (Al2Si2Oi0)
(0H)2], Seybertite [Ca(Mg,Al)3 ( S i , A l ) 4 Oio (OH)2], Chloritoid
[ (Mg, Fe2") 2 Al2 (Al2Si2Oi0) (OH)2] (20). The difference between
R eproduced with perm ission of the copyright owner. Further reproduction prohibited without perm ission.

Muscovite, Phlogopite, and the Biotite mica structure is
that variously Al, Mg, and Fe atoms are located between two
layers of the hexagonal network of silicon-oxygen
tetrahedral groups (Figure 2.2) respectively. Micas, both
Phlogopite and Muscovite types consist of high-aspect-ratio
particles which are generally coarser than talcs and range
from 40 to 600 microns in average particle size. Mica
flakes are large platelets and reinforce in two directions.
Recently, pearlscent pigments have been developed which are
based on synthetic mica (21). These have been used for
coating application in the automotive industry because they
generate brilliant interference colors when combined with
other pigments.
In 1927 Mauguin (22), using wide angle x-ray
diffraction first reported monoclinic (pseudohexagonal) unit
cells and suggested symmetries of different types of mica
structures. Pauling (5) in 1930 established a general
scheme of their structure by determining the sequence of
sheets of atoms parallel to their cleavage planes.
According to Pauling (5), the cell parameters of Muscovite
mica are : a=5.19A, b=8.99A, c=20.14A, a=Y=90°, P=96°. Mica
exhibits perfect cleavage along the (001) plane and thin
R eproduced with perm ission of the copyright owner. Further reproduction prohibited without perm ission.

8
•&*f-OZA
iK c'ZO-OJ-A
Figure 2.2 Unit cell structure of Mica.
R eproduced with perm ission of the copyright owner. Further reproduction prohibited without perm ission.

9
cleavage allow the mineral to be split into very thin sheets
which are flexible and elastic. The first complete
structural analysis of Muscovite mica was made by Jackson
and West (2_3) in 1930.
2.1.3 Calcium Carbonates
Of the rock-forming carbonates, calcite (CaC03, see
Figure 2.3) and dolomite (Ca (Mg,Fe) (C03);) are the most
abundant, accounting for more than 90% of natural
carbonates. Calcium carbonates are popular additives for
thermoplastics because of their combination of low cost,
high brightness, and the ability to be used at high
loadings. They generally are categorized as fillers or
extenders since they are used for cost reduction. However,
they also provide increases in modulus and tensile strength
and must be considered as reinforcements as well.
There is a long history of crystal structure
investigations for the common rhombohedral carbonates. The
general structure of calcite was established in 1914 by
Bragg (2jj) . He determined the unit cell structure of
calcite as rhombohedral by using x-ray diffraction. Modern
R eproduced with perm ission of the copyright owner. Further reproduction prohibited without perm ission.

1 0
descriptions of rhombohedral carbonates are represented
almost exclusively in terms of a hexagonal cell. In 1927
Harrington {21) proposed that the unit cell of calcite is
hexagonal with a:=a2=a3=4.993 A, c=17.061 A, a=46J06' (angle
between any two of the three equal length edges), r=6.37 6 A (the edge length), (Figure 2.3). The structure involves
ions of Ca*+ and C03"~. The general form of the C03 group is
an equilateral triangle with oxygen atoms at the corners and
a carbon atom in the center. Layers of Ca** atoms alternate
with carbonate layers along the c axis.
Carbonates are supplied in five forms: water-ground,
dry-ground, ultra fine-ground, precipitated, and surface-
treated. Precipitated carbonates are chemically produced.
Carbonates usually have a broad mean particle size range.
Some precipitated carbonates have a mean particle size of
less than 0.1 micron while some dry-ground types have a mean
particle size of over 20 micron.
R eproduced with perm ission o f the copyright owner. Further reproduction prohibited without perm ission.

(a) (b) (c)
(a) Closed large circles represent Ca*" ions, small closedcircles surrounded by open circles represent C 4 ionsand open circles represent 0 ions.
(b) Side view of calcite unit cell.(c) Plan view of calcite unit cell.
Figure 2.3 Unit cell structure of Calcite.
R eproduced with perm ission o f the copyright owner. Further reproduction prohibited without perm ission.
1 2
2.2 Particle Behavior in Suspended Systems and Influence on
Rheological Properties
2.2.1 Particle Interactions in Suspensions
2.2.1.1 Large Isotropic Particles
When particles are suspended in a matrix the
interaction between particles increases as the particle
concentration increases. Concentrated suspensions of large
isotropic particles give rise to the phenomenon of
'dilatancy'. Dilatant suspension behavior was originally
hypothesized by Reynolds (2Q_) . He argued that concentrated
systems would dilate (expand) in shear flow because this
should disrupt the packing. Subsequently, Freundlich
described dilatant systems as those whose shear viscosity
increases with shear rate. The relationship of these two
'dilatant' phenomenon has given rise to much discussion.
The best observations were by Hoffman (29-32).
R eproduced with perm ission of the copyright owner. Further reproduction prohibited without perm ission.

1 3
2.2.1.2 Anisotropic Particle Motions and Interactions
2.2.1.2.1 Dilute Systems
Jeffery (33) in 1922 theoretically investigated the
rotary motion of rigid ellipsoids in dilute suspensions of a
Newtonian fluid. During shear flow, the particles undergo
motions involving regular orbits which have become known as
Jeffery orbits. The long axes of prolate and oblate
particles are immersed in a fluid in laminar motion. They
will tend to set themselves parallel to the flow direction.
Taylor (34-26) subsequently verified Jeffery's (33)
analysis for the motion of ellipsoids. Subsequently, Mason
and his coworkers (37-46) made extensive efforts to
visualize anisotropic particle motions in dilute suspensions
during flow. These have also verified the observations of
Jeffery.
2.2.1.2.2 Concentrated Anisotropic Particles
There have been many researches on concentrated
suspensions of small anisotropic particle from the second
R eproduced with perm ission of the copyright owner. Further reproduction prohibited without perm ission.

1 4
decade of the century (47-61) . In 1921 Zocher (_50) observed
the behavior of aniline-blue sol, a rod-like particle
suspension of micron level particle size. These suspensions
showed birefringence in a state of rest.
In 1923 Szegvari (51-54) published a photomicrograph of
a birefringent suspension of V205 obtained using a
polarizing microscope. In 1925, Zocher (5_5, 5_6) described
the characteristics of fine Fe203 suspensions. He argued
that the particles have a disc-like form and exhibit an
anisotropic birefringent phase at high concentrations under
the microscope. Later observations by Zocher et al (57)
using the optical microscope show a parallel orientation of
the Fe203 disks with a uniform spacing of order a micron.
In 1937 Freundlich (6_1) reported that vanadium pentoxide
suspensions become increasingly birefringent over a critical
concentration until their suspensions are completely
birefringent.
In 1936 Bernal, Bawden, Pirie, and Fankuchen (58-60)
observed the development of localized orientation in a
slightly concentrated suspension of tobacco mosaic virus
(diameter 150 A, length 1500 A ) . They found a nematic rod
like order of asymmetric particles using small angle x-ray
R eproduced with perm ission of the copyright owner. Further reproduction prohibited without perm ission.

1 5
scattering. Upon sedimentation, tobacco mosaic virus
suspensions separate into two layers; the top layer is a
dilute isotropic suspension; in the bottom layer the viruses
are arranged in a two dimensional hexagonal close packing
order of parallel rods. The distance between the particles
was found by small angle x-ray scattering to vary from zero
up to 300 A and more, depending upon the concentration of
protein in the bottom layer. Freundlich (61) contrasted
this behavior to the result of his investigations on V;05
suspensions.
In the late 1960s Lees (62), Schierding (63), and Kitao
and his coworkers (64) proposed the quantitative
characterization of chopped fiber orientation in composites
and polymer compounds using wide angle x-ray diffraction.
Schierding (63) used ceramic fibers. Kitao, et al. (64) ,
investigated melt spun polystyrene filaments containing
carbon fibers. In this period other investigations made
quantitative fiber orientation using soft x-rays (65-68 ) . In
1984 Menendez and White (69) investigated chopped aramid
fibers suspended in polymethyl methacrylate matrix through a
circular die. In 1988-90 Lim and White (70, 71)
investigated the orientation of chopped aramid fibers in
R eproduced with perm ission o f the copyright owner. Further reproduction prohibited without perm ission.

1 6
thermoplastic compounds which had been processed in various
fashions.
In 1987 Monge, Vincent and Haudin (7_4) investigated the
orientations of mica and talc particles in injection molded
thermoplastic compounds using wide angle x-ray diffraction.
Their results show that the particles are parallel near the
mold surface and nearly perpendicular in the core. In
papers published in 1990-1991, Lim and White (7_1, 81)
investigated the orientation of suspensions of talc and mica
in extrudates from various shaped dies, calendered sheets
and injection and compression molding using wide angle x-ray
diffraction. They found that the talc and mica particles
are parallel near the mold surface and nearly perpendicular
in the core. In 1991 Fujiyama et.al. (73-79) investigated
the orientation of disc particle filled thermoplastics (PP)
in injection molded bars. The results of their work are
similar to those of the above researches.
More recently, Suh and White (8_2-8_5) investigated the
state of orientation of talc particles in blow molded and
thermoformed thermoplastic parts. They found that the talc
particles are parallel near the mold surface for blow molded
and thermoformed parts independent of thermoplastic matrix.
R eproduced with perm ission of the copyright owner. Further reproduction prohibited without perm ission.

1 7
2.2.1.3 Characteristics Of Liquid Crystals
Common liquids are optically isotropic in the state of
rest. Liquids are sometimes cloudy in the state of rest.
These substances been have known for a century and are
called liquid crystals. The term 'mesomorphic' has been
applied. They possess a state of aggregation midway between
the true crystalline state and irregularity of the amorphous
state. The molecules may lie symmetrically about an axis,
for instance threads in soap, the position of each molecule
being quite accidental; or they may be piled in layers, the
position of the molecules of a single layer being random.
Such states of aggregation Friedel (8_6) are called
mesomorphic. Mesomorphic particles are most likely found in
soap solutions (ammonium oleate). Under some special
conditions these solutions are found to contain very long
threads whose lengths reach up to lOOM-m while their
thickness is often less than micron size (ultramicroscopic)
(92) .
At high loadings some authors have reported, rod and
disc particles orient and arrange in a quasi lattice array
R eproduced with perm ission of the copyright owner. Further reproduction prohibited without perm ission.

to form a mesophase. This occurs in carbonaceous pitches
(82~91.) which have been found to be birefringent. In 1956
Flory (87.) gave a statistical mechanical argument based on
fitting macromolecules into a lattice that suspensions of
rigid rods would not be isotropic at a high concentration
but would form locally anisotropic structures.
2.2.2 Influence of Particles on Rheological Properties
2.2.2.1 Shear Flow
2.2.2.1.1 Rheological Models of Dilute Suspensions System
Hydrodynamic analyses of flow in suspensions date to
Einstein's (^3) study of dilute suspensions of spheres in
1911. He developed a theory for predicting the viscosity
a dilute suspension of rigid spheres in a Newtonian fluid
matrix. He showed that viscosity H of a dilute suspension
is equal to
n = Ho (1 + 2.5$) (2.1)
R eproduced with perm ission of the copyright owner. Further reproduction prohibited without perm ission.

1 9
where Ho is the viscosity of the suspending medium and ^ is
the volume fraction of the spheres. Equation (2.1) is valid
only for extremely dilute suspensions, in which interactions
between neighboring particles are negligible (i.e., in the
absence of hydrodynamic interactions).
Following Einstein (93), Jeffery (33) investigated the
motion of non-spherical particles (rigid ellipsoidal
particles) in a shear field of Newtonian liquid in 1922.
Using the creeping flow Navier-Stokes equations, he derived
an expression for the effective viscosity
n = n0 (i + H>) (2.2)
where v is a parameter which depends on the aspect ratio
and orientation of the ellipsoidal particles. Jeffery
reported that v is less than 2.5, which is the value for
spherical particles derived earlier by Einstein (93). The
significance of Jeffery's studies lies in the derivation of
equations of anisotropic particle motion in a Newtonian
liquid. He predicted the shear flow rotates the disc/rod in
shear planes.
R eproduced with perm ission of the copyright owner. Further reproduction prohibited without perm ission.

2 0
2.2.2.1.2 Rheological Properties Of Concentrated Particle
Suspensions
2.2.2.1.2.1 Large Particles
Particles of varying sizes and shapes have been added
to polymer melrs and solutions. It is convenient to begin
our discussion with large isotropic particles and then
proceed to anisotropic particles and finally to very small
particles. The influence of glass spheres of diameter 10-60
on the viscosity of polypropylene (PP), styrene-
acrylonitrile (SAN), and polystyrene (PS) matrix has been
investigated by Chapman and Lee (105) , Nazem and Hill (96),
and White, Czarnecki and Tanaka (97_) . They all found that
the viscosity is constant at lower shear rates and then
decreases with increasing shear rates. The viscosity vs.
shear rate behavior of the compound resembled that of the
initial pure thermoplastic melt.
Studies of the influence of glass fibers of diameter
10-15 ^m on the viscosity of polymer melts and solutions
have been reported by various investigators (98-102). Most
R eproduced with perm ission of the copyright owner. Further reproduction prohibited without perm ission.

2 1
have been carried out at high shear rates using capillary
rheometers. The studies of Chan et al.(9^) and Czarnecki
and White (9_9) indicate that the melt exhibits a low-shear-
rate Newtonian viscosity and then decreases with increasing
shear rates. Similar observations were made for aramid
fiber and cellulose-filled melts (97, ^9) .
Elongational flow studies have been reported by Chan,
White and Oyanagi in glass fiber-filled high density
polyethylene and polystyrene melts in 197 8. They found the
elongational viscosity to be very high relative to the shear
viscosity and to decrease with increasing elongation rate.
The basis of the behavior comes from the work of Batchelor
(94^, and Batchelor et al. (9_5) later expanded by Goddard
(103, 104). Goddard suggests that the elongational
viscosity function of fiber filled compounds seems to
reproduce the shear viscosity function. This is due to the
shearing motions induced by fibers moving past each other
during the elongational flow.
R eproduced with perm ission of the copyright owner. Further reproduction prohibited without perm ission.

2.2.2.1.2.2 Small Particles22
Measurements of the shear viscosity of particle
suspensions date to early in the century.
In the 1930s Freundlich and his co-workers first
observed time dependent viscosities i.e. thixotropy for
suspensions in low viscosity liquids (108-110) . Freundlich
and Jones (110) contrasted the rheological behavior of a
wide range of concentrated particle suspensions in 1936.
They note that suspensions of small particles differ from
large particles in exhibiting significant agglomeration
which gives rise to yield values of low shear rates and are
time dependent, that is, thixotropic viscosities.
In 1931 Scott (111) investigated small particle filled
natural rubber using a compression rheometer at very low
applied stresses. He found that these compounds exhibit a
yield value, Y. He proposed a relationship between the
shear stress, a , and shear rate, Y. This had form
= Y + K Yn (2.3)
R eproduced with perm ission of the copyright owner. Further reproduction prohibited without perm ission.

2 3
In 1950 Mullins and Whorlow (112) reported that shear
viscosity of concentrated compounds of rubber exhibits a
strong time dependence. Further, if the deformation is
temporarily ended, it takes a very long time for the
material to recover its initial transient stress build up
behavior.
In 1962 Zakharenko et al. (113) studied the flow
behavior of carbon black filled polyisobutylene (PIB) by
using parallel plate viscometer to achieve very low shear
rates. They showed that the flow behavior of carbon black
filled PIB conformed to the power law model i.e. the shear
viscosity varied with the n-th power of the shear rate. The
power law index decreased with increasing loading of carbon
black.
In 1969^1978 Matsumoto and Onogi (114-117) found
various particle-filled polymer solutions appeared to
exhibit yield values. The system included polystyrene
particles in diethyl phthalate solution, and carbon black in
diethyl phthalate solution, carbon black in liquid
paraffins, and polyacrylamide and aluminum hydroxide in
aqueous solutions.
R eproduced with perm ission of the copyright owner. Further reproduction prohibited without perm ission.

2 4
In 197 0 Chapman and Lee (105) investigated the
influence of talc particles on the shear viscosity behavior
of polypropylene (PP). They found apparent yield values at
volume fractions 15-20%. They also studied the effect of
surface treatment and particle size on rheological behavior.
They found that decreasing the particle size increases the
yield value. Adding surface treatments such as stearic acid
to the filler reduces the yield value of the molten polymer
compounds. They suggested that such shear viscosity
behavior could result from the interaction of talc particles
and the resultant agglomeration of the particles within
polymer melts to form a network structure.
Subsequently in 1972, Vinogradov et al. (118) examined
the shear flow of carbon black filled polyisobutylene (PIB)
by using a series of different rheometers. Yield values
were found for carbon black (2.5 -13 % by volume) filled PIB
compounds. They argued that carbon black particles could
form a 3-dimensional structural skeleton which caused the
appearance of yield values in the filled polymers.
In 1978 and 1979 Kataoka et al. (119, 120) observed
apparent yield values in glass bead and calcium carbonate
R eproduced with perm ission o f the copyright owner. Further reproduction prohibited without perm ission.

2 5
filled low density polyethylene (LDPE) and polystyrene (PS)
melts.
More systematic studies of the influence of different
particles were carried out by White et al. (81-85, 97-99,
102, 106, 107, 121-139) beginning in the mid 1970s. They
determined the shear viscosity behavior of compounds
containing carbon black, titanium dioxide, calcium
carbonate, wollastonite, glass beads, glass fibers, aramid
fibers, cellulose fibers, etc. They also investigated the
influence of particle size, volume fraction of particles,
and surface treatment on the rheological properties of
filled polymer melts. Yield values in Ti02 (97, 107, 121,
122, 123), carbon black (97, 106, 107, 124-127, 128-132),
and CaCOi (97_, 107, 123, 133) filled polymer melts were
surmised. They were found to increase with increasing
volume loading of small particles and with decreasing
particle size. Early studies of the flow of suspended
particles in polymer melts used Scott's Equation (2.3) to
represent the flow behavior of these compounds. White
et.al. (125, 126, 131, 132) later developed a second
empirical relationship for the shear viscosity behavior of
carbon black-rubber compounds with the expression,
R eproduced with perm ission of the copyright owner. Further reproduction prohibited without perm ission.

2 6
cx= Y + ------------------ (2.4)i + b r~n
At high shear rate, it could be seen that A/B of Equation
(2.4) was the same as K of Equation (2.3). White and his
coworkers (82, 85) have compared this empirical Equation
(2.4) with their experimental data for various particle
filled systems.
Lobe and White (106), Suetsugu and White (133) and
Montes et al. (139) studied stress transients at the start
up of flow and at the end of flow. Startup transients of
shear stresses were larger than for pure polymer melts and
depended upon volume loading. Yield values were observed in
elongational flow as well as shear flow.
Generally, the magnitude of the yield value increases
with particle loading and with decreases in particle size.
Suetsugu and White (133) found that the apparent yield value
Y varied inversely with the particle diameter in calcium-
carbonate-filled polystyrene.
Most of the above researchers surmised yield values
from low shear stress data. More recent researchers
R eproduced with perm ission of the copyright owner. Further reproduction prohibited without perm ission.

2 7
beginning with Osanaiye et al. (127, 136), and later Li and
White (271) and Araki and White (257) have actually
determined yield values using creep experiments.
The elongational flow of small particle filled polymer
melts has been investigated by several researchers. Lobe
and White (106) and Tanaka and White (107) have studied
carbon black filled polystyrene polymer melts. Tanaka and
White (107) have also investigated calcium carbonate,
titanium dioxide filled polystyrene. They found the
elongational viscosity function appears to exhibit yield
value whenever the shear viscosity exhibits a yield value.
2.2.3 Rheological Properties in Mixed Particle System
Interactions of different types of particles of varying
size, shape, and particle-particle interaction can exist and
may affect the rheological properties of mixed particle
filled compounding systems.
There have been many researches of single particle
filled compounds systems and their rheological behavior has
been reported. However, there seems to be essentially no
researche in multiple particle filled system in
R eproduced with perm ission of the copyright owner. Further reproduction prohibited without perm ission.

28thermoplastics. In 1980 Sugama et al. (141) investigated
mixtures of calcium oxide and silicon dioxide fillers to
make polymer concretes for hydrothermally stable products.
Lim and White (7]J studied the particle orientation
characteristics of compounds containing aramid fiber and
talc/mica flakes. The above studies do not include
rheological researches on multiple particle filled systems.
There seems to be no rheological investigations of particle-
particle interactions in different particle filled systems.
2.3 Orientation Development of Anisotropic Particles During
Flow
2.3.1 Introduction
The reinforcement of thermoplastics with mineral and
organic particles is an important aspect of polymer
technology. In general, such particulates include
reinforcing aramid, carbon and glass fibers, as well as
minerals such as mica, talc, and wollastonite which are
highly anisotropic. The mechanical (142-146), thermal (146-
148), and electrical (149) behavior of these composites
R eproduced with perm ission of the copyright owner. Further reproduction prohibited without perm ission.

2 9
depend upon the orientation of the particulates. In most
polymer processing operations, products are shaped in the
manner of extrusion and injection molding, which influence
but do not fully control the orientation of anisotropic
particulates.
It is clear that the experimental determination of
anisotropic particle orientation in filled thermoplastics is
an area of great importance. It is important that such an
approach be quantitative as it should be applicable to the
relative variations in orientation with processing
conditions.
2.3.2 Representation of Uniaxial Orientation
The representation of uniaxial orientation of
anisotropic particles has an important effect on physical
and mechanical properties.
The first representation of uniaxial orientation seems
to be by Hermans and Platzek (152) in 1939. They argued
that the birefringence of a uniaxially orient filament was
given by
R eproduced with perm ission o f the copyright owner. Further reproduction prohibited without perm ission.

3 0
AnA"~
3cos' <p - 1 2 (2.5)
where ‘t* is the angle between the polymer chain axis and the
fiber axes.
In 1941 Muller (150, 151) built on the earlier work of
Hermans and Platzek (152) and represented the uniaxial
orientation distribution function for oriented polymer
chains as an expansion of Legendre polynomials:
between the fiber axis and the polymer chain axis. Odd
F(4>) = F0[l + AiPi(<t>) + AzPz^) (2 .6)
The Pj (<(>) s are Legendre polynomials in the mean angle
Legendre polynomials involve averaging terms such as cos'(j>
and cos5<t> are zero. The first term in the expansion for
P-j (4*) from Equation (2.6) is of form:
(2.7)
The second term is
R eproduced with perm ission o f the copyright owner. Further reproduction prohibited without perm ission.

3 1
P4 (♦) = ^ [35 cos4 <f> - 30 cos: (j) + 3] (2.8)O
The mean orientation may be represented in terms of
these Legendre polynomials. The first term in P:(§) often
represented as of a fa given by Equation (2.7) is known as
the Herman orientation factor (152-158) . The values of fH
or P;^) range from (+1) to -1/2 according to whether the
chains are parallel to the symmetry axis,
$ = 0 fH = 1 (2.9)
or perpendicular to the symmetry axis,
4> = | f„ = -1/2 (2 .10)
or characterized by isotropy,
— n 1cos-0 = - fH = o (2 .11)
R eproduced with perm ission of the copyright owner. Further reproduction prohibited without perm ission.

3 2
For a crystalline polymer, the angles ^ between the
crystallographic j axis and the fiber axis suggest the
distribution functions f:^) between the crystallographic
axes and the symmetry axis may be defined as in Figure 2.4.
In 1958, the Hermans orientation factor was generalized by
Stein (159) to represent the orientation of crystallographic
axes :
3 cos2! - 1fj = -----J----- (2.12)
where j represents the a, b, c crystallographic axes.
The cos'^ are not independent, but are tied together
through trigonometric relationships. For an orthorhombic
unit cell such as polyethylene, we may use the Pythagorean
theorem:
cos + cos1 <f>b + cos1 = i (2.13a)
f a + f b + f c = 0 (2.13b)
R eproduced with perm ission of the copyright owner. Further reproduction prohibited without perm ission.

3 3
Figure 2.4
1
Stein coordinate system and definitions for specifying orientation modes of crystallographic axes.
R eproduced with perm ission o f the copyright owner. Further reproduction prohibited without perm ission.

3 4
In multiphase polymer blend systems, orientation
distribution functions and orientation factors f: need to be
defined for each individual phase.
Initial attempts at quantitative characterization of
chopped fiber orientation in composites dates to the late
1960s (62) . Schierding ((53) , and Kitao and his coworkers
(64) proposed that if highly oriented crystalline fibers are
used, wide angle x-ray diffraction may be applied to
determine fiber orientation. Schierding (63) used ceramic
fibers. Kitao, et al. (64), investigated melt spun
polystyrene filaments containing chopped carbon fibers.
Subsequently, there have been numerous qualitative studies
of chopped fiber orientation using soft x-rays (65-613) .
Menendes and White (69) used WAXD to determine uniaxial
orientation of aramid fibers in polymethyl methacrylate
(PMMA) .
In 1971, Broady and Ward (142) proposed a theoretical
model for a short fiber reinforced composite. They gave
more explicit discussion of uniaxial orientation of glass
and carbon fibers in terms of Herman's orientation factors.
They introduced second order elastic constants to the
composite. They concluded that a fourth-order description
R eproduced with perm ission of the copyright owner. Further reproduction prohibited without perm ission.

can predict the effect of orientation on mechanical
properties.
i.e.
(2 .2 1 )
where ^ is stress, sKi is strain, ci:ki is a fourth-order
stiffness constant.
2.3.3 Representation of Biaxial Orientation
In 1958 Stein (159) introduced an analytical
representation for biaxial orientation using Euler's angle
This was later greatly extended by Nomura, Kawai et al.
(160-162). White and Spruiell (163) subsequently proposed
orientation factors based on the angles and ^ system in
1981:
fa. = 2 cos20, + cos-0; _ 1 (2.14a)
fB2 = 2 cos” 0, + cos” 0| _ 1 (2.14b)
R eproduced with perm ission of the copyright owner. Further reproduction prohibited without perm ission.

3 6
where is the angle between the 1 laboratory axes (1 =
flow direction) and the polymer chain axis; 2 is the angle
between the 2 laboratory axis (2 = transverse direction) and
the polymer chain axis. The angles ‘ft and ^ are not
independent of each other but are restricted by the
Pythagorean theorem. Equations (2.14a), and (2.14b) are
symmetric with regard to angles ‘K and ■ The and 2
angles have the advantage over the Euler's angles of Stein,
Nomura and Kawai in being symmetric. They yield a symmetric
set of orientation factors. The orientation factors based
on angles and ^ are much more readily interpretable than
those based on Euler's angles and (159, 160-162). It
may be seen from Equations (2.14a) and (2.14b) that for
uniaxial orientation in the 1 direction,
i = 0, ^ = f : fiB = 1 f2S = 0 (2.15)
and in the 2 direction,
R eproduced with perm ission o f the copyright owner. Further reproduction prohibited without perm ission.

♦l = f , *2 = 03 7
fLa = o f23 = 1 (2.16)
For uniaxial orientation in the 3 direction,
For random orientation,
cos2<0, = cos2 , = I : f,a = f,3 = o (2.18)
The characteristics of fiB and f2B suggest representations in
an isosceles triangle of the type shown in Figure 2.5.
These were subsequently applied to characterize biaxiaiiy
stretched films (164-172) and blow molded bottles (166,
173) .
The previous representation of orientation may be
generalized for crystalline polymers to represent all three
crystallographic axes (157). They may be readily obtained
from Equations (2.14a) and (2.14b) by introducing angles
between appropriate crystallographic axes and the laboratory
axes. We may write
R eproduced with perm ission of the copyright owner. Further reproduction prohibited without perm ission.

3 8
fsL , = 2 cos2^ + cos:0Lj - i (2.19a)
fB2>] = 2 cos2^ + cos2 j - i (2.19b)
For an orthorhombic unit cell, the cos'0tJ and cos‘ ,j are
related by the Pythagorean theorem.
cos20Ia + cos20lb + cos2^lc = i (2 .20a)
cos2 <f>2i + cos20:b + cos2 <p2C = 1 (2 .20b)
White and Knutsson (148) have discussed fiber
orientation in terms of two orthogonal axes and biaxial
orientation factors.
In 1987, Monge, Vincent and Haudin(797 investigated
orientation of mica and talc platelets in injection molded
polyamide composites by WAXD. Qualitatively, they showed
that the normals to the platelets are nearly perpendicular
to the plane of the molded plaque in the core, and parallel
to it in the skin.
R eproduced with perm ission of the copyright owner. Further reproduction prohibited without perm ission.

3 9
U niaxial (Flow Direction)
Planar(Film Surface)Planar(Flow Direction and
Perpendicular to the Surface) E q u a l B iaxial
-0.5
U niax ial (Transverse Direction)-0.5Iso tro p ic
(-1 .-1)
Figure 2.5 White and Spruiell orientation triangle
R eproduced with perm ission of the copyright owner. Further reproduction prohibited without perm ission.

4 0
They suggested that these orientations are related to the
shear and elongation rate distribution in the thickness of
the molding.
Subsequently, particle orientation was characterized in
terms of biaxial orientation factors by Lim and White (7 0,
71, 80, 81) , and Suh and White (82-8_5) . Lim and White (71,
81) described the variation of aramid fibers, talc and mica
particles in fabricated thermoplastic parts. They showed
that the particle orientation at the core of injection
molded parts was lower than in the wall region.
In 1987 Advani and Tucker (174) developed a formulation
similar to orientation factors to represent orientation in
fiber filled thermoplastics. They showed planar orientation
states which is biaxial orientation using fourth planar
orientation tensors. They concluded a fourth-order
description can predict the effect of orientation on
mechanical properties more accurately than second-order
description. They subsequently extended this to derive
equations of change for the fourth order tensors to predict
the orientation of fibers by flow,
i.e.
R eproduced with perm ission of the copyright owner. Further reproduction prohibited without perm ission.

<V = l*v'M)p.p,PtPid,i>
4 1
(2 .22 )
where anu is a fourth-order orientation tensor depending on
angle ^ and $. V is the probability distribution function
for orientation. The component p is fiber unit vector
related to & and 0. However, their work was only true for
dilute systems, where the fibers are far enough apart that
they do not interact.
2.3.4 Representation of Mixed Particle Orientation
When two different type of particles are compounded
together the interactions of each particle's varying size,
shape, and particle-particle interaction can exist and may
affect the character of the orientation.
There have been many studies of orientation in
compounds of single particles (62-69, 158, 159, 175).
Particle orientation in mixed particle systems has only been
studied by Lim and White (72., 80) . The particles they used
(71, 80) for mixed particle systems were fibrous aramid
(Dupont KevlarR) and disc-like particles such as talc, and
R eproduced with perm ission o f the copyright owner. Further reproduction prohibited without perm ission.

4 2
mica. They found that when fiber and disc-shaped
anisotropic particles are mixed in a polymer matrix the
degree of orientation of each particle was reduced compared
to the state of orientation in the pure particle filled
systems.
2.4 Characterization by Using X-ray Diffraction
2.4.1 Introduction
Rontgen, the German physicist, discovered x-rays in
18 95. In German they are called Rontgen rays (Rontgen
Strahlung or Rontgen). In English they are called x-rays.
When x-rays are incident upon an object, the diffracted
rays are distributed in all directions in space, centered
upon the object. If the orientation of the object with
respect to the incident x-rays is changed, a different
diffraction pattern results, depending upon the object's
internal structure. The object of all x-ray diffraction
investigations is to find one or more of the following three
essential quantities. First, the Bragg angle direction (in
terms of 2®) in which the scattered x-rays are diffracted
R eproduced with perm ission of the copyright owner. Further reproduction prohibited without perm ission.

4 3
(see Figure 2.6). Second, the features of the diffraction
pattern (whether sharp or broad spots, lines, or arcs, or
broad halos (see Figure 2.7)). Third, the intensity of the
diffraction in the various directions (in the case of a
continuous pattern, the intensity distribution within the
pattern). The importance of these quantities, and the
precision with which they must be determined, will depend on
the objective of the analysis (17 6).
2.4.2 Quantitative Analysis of Particle Filled
Compounds
For a mixed particle system, Hull (177) and others have
pointed cut that each component in a mixture exhibits the
characteristic scattering and absorption intensities of its
corporates proportional to the amount material present in
1919. In 1936 the first quantitative analysis was carried
out by Clark and Reynolds (178) , for mine-dust. Gross and
Martin (179) developed an internal-standard method for
analysis of quartz in mixtures containing sodium chloride.
R eproduced with perm ission of the copyright owner. Further reproduction prohibited without perm ission.

4 4
sample
solar slitsolar slit ^ receiving slitdivergence j
s lit 'scatterslit
x-ray tube counter tube
Figure 2.6 Schematic representation of x-raydiffractometer.
R eproduced with perm ission of the copyright owner. Further reproduction prohibited without perm ission.

4 5
X-Ray
Figure 2.7 WAXD flat film pattern.
R eproduced with perm ission of the copyright owner. Further reproduction prohibited without perm ission.

4 6
Around the same time Taylor (180) and Brindley (181) showed
when the crystal size is large, it absorbs the incident x-
rays and emits lesser quantities. This is called
microabsorption and is associated with crystal size. The
mathematical relationship between the scattered beam
intensity and absorptive properties of a sample has been
discussed by Alexander and Klug (182) in 1948. Alexander
and Klug (182) represented diffraction from a flat specimen
in 1948. Their representation can be used for the analysis
of a binary mixture (single particle) system.
In 1955 Clark and Terford (183) sought to characterize
the amorphous phase in wood pulps quantitatively, using x-
ray intensities. They produced amorphous cellulose by
mechanical degradation of fibers in a vibratory ball mill
and obtained an amorphous halo intensity from x-ray
measurements. They also obtained crystalline peak from the
(002) plane of cellulose. They then determined the
crystalline portion of wood pulps from the ratio of
crystalline to the total (including crystalline) intensity.
Lennox (184) presented an 'Internal Standard Method'
analysis of a two-particle mixture system, in 1957. In 1958
Copeland and Bragg (185) presented a quantitative x-ray
R eproduced with perm ission of the copyright owner. Further reproduction prohibited without perm ission.

4 7
analysis to determine the amount of calcium hydroxide in the
presence of hydrated calcium silicates. They used magnesium
hydroxide as the internal standard. In 1959 Copeland et al.
(186) presented a quantitative x-ray analysis of four phases
of Portland cement by using x-ray peak areas. Jahanbagloo
(187) described a film technique which had restrictions for
mixtures containing amorphous phases in 1968. Following
these investigations there have been few researches on the
quantitative analysis of mixed particle systems. There
seems to be no subsequent quantitative analyses for the x-
ray intensities of crystalline particles suspended in
amorphous media.
Menendez and White (69) sought to characterize
composites using x-ray intensity on chopped aramid fibers to
measure uniaxial orientation of the fibers. They had great
concern for fiber peaks' interferences with the amorphous
halo of the polymer matrix. Uniaxial orientation factors
were reported. More recent studies of this type have been
reported by Lim and White (7£, 11) using aramid, talc and
mica and Suh and White (£2-85) using talc. The latter
authors (70, 71, £2-£5) determined biaxial orientation
systems of the suspended particles.
R eproduced with perm ission of the copyright owner. Further reproduction prohibited without perm ission.

4 8
2.4.3 Wide Angle X-ray Flat Film Technique
The flat film x-ray photographic technique has been
widely used in the study of the state of orientation for
crystalline fibers. This method has been reviewed by
Alexander (189), Kakudo and Kasai (176) , Klug and Alexander
(189), and Samuels (190), among others.
Figures 2.7 and 2.8 show the geometry of diffraction by
specimens using a transmission camera. A is the collimator,
a device used to produce a narrow incident beam made up of
rays as nearly parallel as possible. It usually consists of
two pinholes in line, one in each of two lead disks set into
the light-tight film holder, or cassette, made of frame, a
removable metal back and the paper. B is the beam stop,
designed to prevent the transmitted beam from striking the
film and causing excessive blackening. X-rays are
diffracted from a specific crystallographic(hkl) plane
according to Bragg's law:
^ = 2 dhki s in ®hki (2.23)
R eproduced with perm ission of the copyright owner. Further reproduction prohibited without perm ission.

4 9
I Meridian
Film
-- \ :quator
Figure 2.8 Schematic perspective of diffraction byspecimens using wide angle x-ray beam.
R eproduced with perm ission of the copyright owner. Further reproduction prohibited without perm ission.

5 0
where ^ is the wavelength of the x-ray, dh)ci the interplanar
spacing, and 0hki Bragg's angle.
The Bragg angle 0 corresponding to any transmission
spot is found very simply from the relation
tan 20 = ^ (2.24)
where r = distance of spot from center of film (point of
incident of transmitted beam) and D = specimen-to-film
distance.
The optimum thickness 'tm' of the specimen which will
produce the maximum intensity of diffracted beam is found to
be (181) [compare(188, 18 9) ]
1t» = - (2.25)M
where M- is the linear absorption coefficient of the specimen
for the x-ray wavelength used.
R eproduced with perm ission of the copyright owner. Further reproduction prohibited without perm ission.

5 1
2.4.4 Wide Angle X-ray Pole Figure Technique
Pole figures are stereographic projections of the
diffracted intensities of normals of crystallographic planes
(see Figure 2.9) . Weber (191) introduced the single-crystal
stereographic projection referred to as a pole figure, in
1924. Earlier pole figure analyses were used for metal work
such as Decker, Asp, and Harker (193). Later, Sisson (192)
first applied this to polymers. He exhibited qualitative
classification of the orientation modes observed in
crystalline cellulose forms, in 1936. Later Sisson's pole
figure efforts were modified and extended by Heffelfinger
and Burton (194) in 1960, and subsequently by Wilchinsky
(199-201) in the early 1960s. They were determined in the
reflection mode. The pole figure method (163, 188, 195,
196) is a convenient technique to describe and represent the
degree of preferred orientation of the crystallites in
fabricated specimens as the stereographic projection
procedure. A pole is the point of intersection of the
normal to a crystal plane with the surface of a sphere
having the crystal at its center.
R eproduced with perm ission of the copyright owner. Further reproduction prohibited without perm ission.

5 2
Figure 2.9 3-Dimensional expression of the sphericalprojection of a crystal
R eproduced with perm ission of the copyright owner. Further reproduction prohibited without perm ission.

5 3
If the radius of the sphere is r* = l/d(hkl), the pole
coincides with the reciprocal lattice point density
distribution.
Pole figures can be obtained from the diffraction
intensities measured during a rotating specimen at a fixed
angle, 2®, by using x-ray diffractometer. Figure 2.6 is a
schematic representation of an x-ray diffractometer. Figure
2.10 shows the angles (a , longitude, P, latitude and ^ co
latitude) where the specimen is rotated when measuring the
diffraction intensities. Using this intensity distribution,
I ( , P), the value of the mean square cosines can be
calculated averaging over the entire surface of the
orientation sphere as follows:
The pole figure technique has been applied to oriented
synthetic polymers by Heffelfinger and Burton (194),
Wilchinsky (199-201), Desper (195), Choi, Spruiell, and
cos <f>m , (2.26)
R eproduced with perm ission o f the copyright owner. Further reproduction prohibited without perm ission.

5 4
3
Figure 2.10 Angular coordinates used for obtaining a polefigure
R eproduced with perm ission of the copyright owner. Further reproduction prohibited without perm ission.

5 5
White (165), Shimamura, Spruiell and White (167), Cakmak,
White and Spruiell (169), Maemura and Cakmak (170) , Kang and
White (171, 172) and to the orientation of anisotropic
fillers in polymer matrices by Lim and White (70, 71, 80,
81) , Suh and White (82-8J3) Morales and J. R. White (197) ,
Chen, Finet, Liddell, Thomson, and J. R. White (198) .
Wilchinsky (199-201) developed the analyses for
specifying orientation modes in crystalline materials
especially to calculate values of the mean square cosines
relative to specified axes from pole figures. This method
can be applicable to all crystal systems, including non-
orthogonal crystal systems. His generalized model is where
“1" is the reference direction and a, b, and c are the
crystallographic axes and U, V, c are Cartesian coordinate
axes. From this model, he proposed the generalized equation
cos2 hki.i = e2 cos2 0!U + f2 COS2 IV + g ~ COS2 (f>|c
+ 2 e f COS 01LI -COS0|V
+ 2 f g COS <PXW -COS<f)w
+ 2 e g COS <f)w -COS UJ
(2.27)
R eproduced with perm ission o f the copyright owner. Further reproduction prohibited without perm ission.

5 6
where e, f and g are the direction cosines of (hkl) plane
normal direction with regard to the axes U, V and c
respectively. In general, cos'^, cos' iv, and cos'f; are
determined from five reflections of cos^i.i- On the right-
handed side of Equation (2.27), one or more terms may
cancel, depending on the type of macro- and microsymmetry of
the material (188, 200).
2.5 Scanning Electron Microscopy (SEM)
The SEM is a versatile and powerful machine and
consequently a major tool in research technology (202) . The
basic components of the SEM are the lens system, electron
gun, electron collector, visual and recording cathode ray
tube (CRT's), and the electrons associated with them.
Figure 2.11 shows a basic schematic diagram of the SEM and
Figure 2.12 shows the basic contrast mechanism of SEM.
Development of the scanning microscope was described by
Busch (203) who studied the trajectories of charged
particles in axially-symmetric electric and magnetic fields
in 1926. Busch (203) showed that such fields could act as
R eproduced with perm ission of the copyright owner. Further reproduction prohibited without perm ission.

5 7
electron lenses and thus laid the foundations of geometrical
electron optics. Following this discovery the idea of an
electron microscope began to take shape. The earliest
recognized work describing the concept of a scanning
electron microscope is that of Knoll (204) who was working
at the Technische Hochschule in Berlin, Germany. In 1942
the first SEM used to examine thick specimens was described
by Zworykin et al.(205). They recognized that second-
electron emission would be responsible for topographic
contrast and the secondary-electron collected on it. A
resolution of 11% was attained. In 195 6 Smith (206)
inserted a stigmator (a part of an objective lens that
focuses the image) into the SEM. The first successful
commercial packaging of these components was offered in 1965
from the Cambridge Scientific Instruments Mark I as
"Stereoscan". Subsequently, there were many improvements
such as cathode parts, x-ray detectors (attached to an
electron probe microanalyzer) (207), coupled to a computer
to provide a digital signal, etc. resulting in improved
bright contrast, focus, and resolution.
R eproduced with perm ission o f the copyright owner. Further reproduction prohibited without perm ission.

5 8
Electron gunCathod ray tube (CRT)
1st condenser lens
Stigmator
Scanning coils
Beam deflection system2nd condenser lens
Signal amplifier
Electron detector and scintillation counter
Secondary electronsSample
Figure 2.11 Schematic diagram of scanning electronmicroscope (SEM)
R eproduced with perm ission of the copyright owner. Further reproduction prohibited without perm ission.

5 9
Induced currents
Primary electrons
Elastically scattered primariesCharacteristicx-rays
Low energy secondariesCathodoluminescence
Specimen
VTransmitted primaries
Induced voltages
Figure 2.12 Contrast mechanisms of scanning electronmicroscope (SEM)
R eproduced with perm ission of the copyright owner. Further reproduction prohibited without perm ission.
6 0
Today, the very best modern SEMs have magnification in
the nanometer range and are thus directly comparable in
their performance with Transmission Electron Microscopes
(TEM) in many situations. The SEM has the added advantage
that the specimen need not be made thin enough to transmit
electrons.
2.6 Modeling of the Flow of Particle Filled Compounds
2.6.1. Phenomenological Constitutive Equations
for Dilute Suspensions of Anisotropic
Particles
A 3-dimensional phenomenological anisotropic
rheological model to represent the flow of anisotropic
particles was first developed by Ericksen (208-213),and
subsequently by Hand (215) and Green (216-218) in 1960-5.
This formulation obviously also derives out of Jeffery's
theory for ellipsoids. Ericksen expressed the stress field
for a suspension of anisotropic particles as
= -pi + F[d,n] (2.35)
R eproduced with perm ission of the copyright owner. Further reproduction prohibited without perm ission.

6 1
where d is the deformation rate tensor and n. is a unit
vector indicating the preferred direction of anisotropic
particles. He suggested the simplest properly invariant
theory of anisotropic fluids using the form
cr = -pI + alN + a2d + a3d2 + a4 (Nd + cjjj) +a5 (Nd2 +d2N)
(2.36)
where N = nn and the a 's are polynomials in the invariants,
tr N, tr Nd, tr Nd2, tr d2 and tr d3. As a simplification,
he linearized the stress field with respect to the rate of
deformation so that Equation (2.36) reduced to
= -pi + 2Hd + [ai + a;tr (Nd) ]N + a3 (Nd + dN)
(2.37)
where ai, a2, a3 are constants. This was supplemented by a
second equation which governed the time and deformation rate
variation of n. He showed that the term aiN gave rise to a
yield value.
R eproduced with perm ission of the copyright owner. Further reproduction prohibited without perm ission.

6 2
Subsequently, Hand devised a theory of anisotropic
fluids using Rivlin's (219) general expression for 3 x 3
symmetric matrix expressed as a polynomial in two other
symmetric 3 x 3 matrices with coefficients which were
polynomials in the elements of the invariants of two
matrices.
= -pi + PiN + P2d + P3N2 + P4d2 + P5(Nd + dN)
+ P€(N2d + dN2) + P7(Nd2 + d3N) + P8 (N2d2 + dV)(2.38)
where P's are polynomials in the invariants, tr N, tr N~, tr
N3, tr d, tr d~, tr d\ tr Nd, tr N‘d, tr Nd“, and tr N'd'.
He simplified Equation (2.38) by stipulating that the stress
field was linear in the rate of deformation.
= -pi + 2Tld + [Pi + P2 (tr Nd) + P3(tr N2d) ]N
+ P4 (Nd + dN) + P5(N2d + dN2)(2.39)
R eproduced with perm ission of the copyright owner. Further reproduction prohibited without perm ission.

6 3
His formulation in the form of Equation (2.38) includes
Ericksen's theory as a special case.
2.6.2 Isotropic Compounds with Yield Values
The simplest of plastic viscous fluid models is Bingham
plastic where the shear stress is given by
y = 0 or <r = Gj (<* < Y)
cf = Y + tib y (CT > y ) (2.40)
This equation is first given by Schwedoff (220) and
later in approximate form by Bingham (221). It was restated
correctly by Buckingham as Equation (2.40).
In 1890 Schwedoff (220) developed a theory of plastic
linear viscoelastic fluids of which Equation (2.40) was a
special case.
Scott (111) in 1931 proposed to represent the shear
flow properties of particle filled rubber compounds.
n
a = Y + K y (2.41)
R eproduced with perm ission o f the copyright owner. Further reproduction prohibited without perm ission.

6 4
He applied it to analyze flow in compressional rheometer.
The characteristics of the flows are similar to those of the
Bingham plastic and involve solid plugs at the center of the
cross section.
A 3-dimensional theory of the rheological properties of
particles filled fluid including the existence of yield
values was developed by Hohenemser and Prager (223) in 1932
to represent strain hardening of metals. They introduced
the use of invariants into the theory of non-Newtonian
fluids. Their paper builds on the von Mises theory of
plastic yielding. The von Mises yield criterion is based
upon the theory of invariants. The von Mises yield
criterion for isotropic materials is
tr T‘ = 2 Y‘ (2.42)
where T is the deviatoric stress tensor and Y is the shear
yield stress of isotropic materials. The von Mises yield
criterion is equivalent to a critical distortional strain
energy which is equivalent to Equation (2.42)
R eproduced with perm ission of the copyright owner. Further reproduction prohibited without perm ission.

6 5
(Tn-Tzz)2 + (T2;-T33)2 + (T33-Tu )2 + 6 (T^+'T^+'r^) = 6Y2
( 2 . 4 3 )
Below a stress field magnitude defined by Equation
(2.42), there is no flow. At high stresses they wrote
G = \ (tr a ) I + T (2.44!
T = , -J£ — T+2 nB d (2.45!
T is the deviatoric stress tensor and trT' its second
invariant.
Oldroyd (227) redeveloped Equation (2.45) to apply to
fluid media in 1947. He further showed that
(VtrT2 - V2y| =4^2trd: (2.4 6)
He noted that Equation (2.45) was equivalent to
R eproduced with perm ission of the copyright owner. Further reproduction prohibited without perm ission.

Oldroyd (228) later generalized Equation (2.45) to non-
Newtonian fluids by expressing nB as a function of trd“.
Slibar and Pasley (229) modified Equation (2.47) to
include thixotropy in a paper published in 1964. They did
this by representing the yield value Y as a function of trd2
and time.
Plastic viscous fluid models are unable to represent
the behavior of particle filled systems with their inherent
complex memories. The first effort to develop a three-
dimensional form of a plastic viscoelastic fluid beyond
yield surface was by Hohenemser and Prager (223) who
suggested models with Voigt and Maxwellian behavior. The
problem was reconsidered by White (230) in 197 9 who wrote
T = —f==^L= T + H (2.48)V2 tr T2
where H is a general memory function. The matrix is
viscoelastic in character. Equation (2.46) was shown to be
equivalent to
R eproduced with perm ission of the copyright owner. Further reproduction prohibited without perm ission.

6 7
T = —j = = = H + H V2 tr H- ( 2 . 4 9 )
The viscoelastic contribution is specified by H.A specific simple form for H was proposed by White(231)
for the purpose of illustrating the characteristics of
Equation (2.49). Particular detailed forms of H were
subsequently used by White and Tanaka (232) and White and
Lobe (233) to compare with the experimental data on filled
thermoplastics and elastomers. White and Tanaka (232)
represented H as a single integral constitutive equation
with a Maxwellian relaxation modulus function.
These authors suggested that M-(t) to a first approximate
could be expressed as
(2.50)
(2.51)
R eproduced with perm ission of the copyright owner. Further reproduction prohibited without perm ission.

6 8
where £($) is a factor that depends upon volume loading and
c~l is a Finger deformation tensor (see Equation (2.72).
This theory was compared to experiments on particle filled
polymer melts.
More recently Suetsugu and White (133), and Montes and
White (234, 235) presented models similar to this in which H
depends on time.
2.6.3 Anisotropic Formulation
The plastic yielding of isotropic materials depends
only upon the magnitudes of the applied stresses and not
upon their directions. Von Mises (236) suggested that
yielding occurs when the second invariant of the deviatoric
stress tensor reaches a critical value. We may express his
yield criterion in the form Equation (2.42)
In 1928, von Mises (237) developed a generalized
anisotropic yield criterion for crystals as:
f(<*ij) = -j[ ki (<*22 - CT33)2 + k2 (<*33 - CTu ) 2 + k3 (<*u " <*22 T ]
- <*23 [ k.j (<*n - <*22) + k5 (<*11 - <*33) ]
R eproduced with perm ission of the copyright owner. Further reproduction prohibited without perm ission.

6 9
- CT13 [ k€ (°zz - CT33) + k- (<*22 - G li) ]
— <*12 [ ka (<*33 ~ <*Ll) + kg (<*33 ~ <*22) ]
+ kio <*23 CT13+ k n <*L3 <*:2 + ki2 <*12 <*23
+ \ (ki3 <*‘23 + k:4 <*‘13 + k:5 G ":z)
(2.52)
f (ai:) = Const. (2.53)
where ki is the anisotropic yield criterion constants. In
the case of isotropy, Equation (2.59) reduces to the
isotropic von Mises yield criterion of Equation (2.42).
Subsequently, the problem of anisotropic materials
exhibiting plastic yielding has been also considered by Hill
(238, 239, 224) who re-expressed the anisotropic yield
criterion as
f(CTij) = F (a 22 - CT33)2 + G(<*33 - CTu ) 2 + K(<*u - CT22)2
+ 2L<*223 + 2Mcy2i3 + 2N<*212 = 1
(2.54)
R eproduced with perm ission of the copyright owner. Further reproduction prohibited without perm ission.

7 0
F, G, K, L, M, N are six constants characteristic of the
current state of anisotropy. If Yu, Y22, Y33 are the tensile
yield stresses in the principal anisotropic directions, it
is seen that
G = K = r2 1 K + F = F + G = Y£
(2.55)
If Yu, Y23, Yi3 are the shear yield stresses with respect to
the principal axes of anisotropy, then
2N = tr, 12 2L = 1Y-,2- '
12M = -r13
(2.56)
If there is rotational symmetry about the 2-axis, then
F = K * G
L = N * M
N = F + 2K (2.57)
For complete spherical symmetry or isotropy,
R eproduced with perm ission of the copyright owner. Further reproduction prohibited without perm ission.

7 1
F = G = K
L = M = N = 3F ( 2 . 5 8 )
In this case Equation (2.54) is then identical with the
isotropic von Mises yield criterion of Equation (2.42) when
2F is equal to 1/Y2.
This anisotropic formulation was extended to the
interpretation of the flow of particle suspensions by White
and Suh (240). Using Hill's simplified anisotropic yield
criterion with rotational symmetry about one axes,
subsequently, they presented a phenomenological theory of
flow of oriented disc-like fluids to represent this
behavior, in Cartesian coordinates. This theory represents
the relationship between stress and deformation rate through
the fourth order relaxation modulus tensor of anisotropic
linear viscoelastic materials as later described in Equation
(2.59).
T = Y + ds (2.59)
R eproduced with perm ission of the copyright owner. Further reproduction prohibited without perm ission.

7 2
The relaxation modulus function, Gijicm(t) has 3 or 81
independent components. If we note the symmetry of the
stress and the deformation rate di; tensors, it follows
that
G i ] i o i i ( t ) G j j . ] a a ( t ) — G i:jml c ( t ) G - j l mj c ( t ) (2.60)
This restriction reduces Gijian(t) from 81 to 36 independent
components. For elastic materials, Love (241) and Green and
Zerna (242) have argued that the existence of a strain
energy function requires that
G 1] ) o n ( t ) — G i a n i : ( t ) (2.61)
This reduces the 36 components to 21 constants. We may
write the expression for Gi^ in the form of a symmetric
6 x 6 matrix.
G..
G n u G U 2 2 G 1133 G m 3 G 111 3 G 1112
G 1122 G 2222 G 2233 G 2223 G 2213 G 2212
G 1133 G 2233 G 3333 G 3 323 G 3 313 G 3312
G 1123 G 2223 G 3323 G 2323 G 2313 G 2312
G 1113 G 2213 G 3313 G 2313 G 1313 G 1312
,G 1112 G 2212 G 3312 G 2312 G 1312 G 1212
(2.62)
R eproduced with perm ission of the copyright owner. Further reproduction prohibited without perm ission.

7 3
Figure
(3 )
(1)
(2)
2.13 Flow direction coordinates in Cartesian geometry.
R eproduced with perm ission of the copyright owner. Further reproduction prohibited without perm ission.

Further simplification of the G^^tt) requires
considerations of rotational (transversely isotropic)
symmetry.
There has been substantial discussion given in the
literature to the mechanics of materials with rotational
symmetry about one direction (241-243). We take this
direction to be the '2' direction where 1, 2, and 3
represents flow, transverse, and flow direction,
respectively, in Cartesian geometry (see Figure 2.13). The
yield surface of Hill's deviatoric yield criterion leads to
f(T13) = F (Til - T:2)2 + G (T22 - T33)2 + K (T1: - T3b)2
+ 2LT2u + 2MT'u + 2NT“23 = 1
(2.63)
Equation (2.63) represents the symmetric anisotropic yield
criterion involving six constants. Symmetry about the '2'
axis requires the 21 independent moduli of Equation (2.63)
to reduce to 5 relaxation moduli. Specifically,
G3333 (t ) = G u u (t )
G3322 (t ) = Gi 122 (t )
R eproduced with perm ission of the copyright owner. Further reproduction prohibited without perm ission.

7 5
G3232 ( t ) — Gi212 ( t)
Gllka(t) (k * m) = 0
Gi kk (t) (i * j * k) = 0
GiJkn(t) (i *j ) * (k * m) = 0
1Gi313 (t ) — 2 [Gim(t) - Gl123 (t ) ]
(2.64)
There are then 5 independent relaxation modulus functions,
Gmi (t) , G1122 (t ) , G1133 (t) , G2222 (t) , G1212 (t) . In linear
viscoelasticity we may write each of these moduli in an
expansion such as
- I G eijicm %10
and all the moduli Gi3tal(t) and relaxation times T,:tal for the
5 relaxation modulus functions are independent.
The six independent stress components of the three
dimensional generalization of Boltzmann superposition stress
are according to White and Suh (240) from Equation (2.59)
R eproduced with perm ission of the copyright owner. Further reproduction prohibited without perm ission.

Ti2 = Y12 + 2 £ GlJ12(t - s)d12(s) ds7 6
T32 = Y32 + 2 G1212(t - s) d12(s) ds
T13 = Yi3 + 2 Gl3l3(t - s)d13(s) ds
= Y13 + - s) “ GU3j(t - s)]d,3(s) ds
T u = Y l1
+ J ^ [ G i m (t - s ) d , , ( s ) + G II22(t - s ) d „ ( s ) + G u33(t - s ) d 33(s)] ds
T22 = Y22
+ ^ [ G n a C t - s J d n C s J + G a j j O - s J d n C s J + G n n C t- s J d j jC s jJ d s
T33 = Y33
+ <£<D[ G II33(t — s) d , , ( s ) + G , | „ ( t - s) d „ ( s ) + G , m (t - s) d 33(s)] ds
(2 . 66 . a, b, c, d, e, f)
White and Suh (240) also suggested a 3-dimensional non
linear transversely isotropic plastic viscoelastic model.
They expressed the deviatoric stress tensor in the form
R eproduced with perm ission of the copyright owner. Further reproduction prohibited without perm ission.

7 7
T = Y + H (2 . 67)
To obtain H, they generalize the basic formulation of
Equation (2.59). They put this equation into a formulation
using a deformation tensor. To do this, they introduce the
tensor relaxation function ^(t) defined by
<*>(t) = - T “ G(t) (2.68)dt
°i:i®(t) = - ~ G,:ta,(t) (2.69)dt
Sc Equation (2.59) can be rewritten as
= Y + jjty t - s) • e( s) ds (2 . 7 0 ]
where e is the infinitesimal strain tensor (241, 242)
1 du ^-(— - + -— ) of linear elasticity and ^-^(t) may be seen to2 dx, dx.
be
R eproduced with perm ission of the copyright owner. Further reproduction prohibited without perm ission.

7 8
<D13 tan (t) = £ Titan.a e X:<=..' i3taa,s
(2.71J
For large strains and deformation rates one must expect that
e13 will need to be replaced by a suitable large strain
deformation measure. They suggested the Finger deformation
tensor c,.-,"1 (231, 232) where
, dx1 dx1Cij = -=^ (2.72)dx dx
(t) will become some rru:te (t, deformation) . This leads to
in place of Equation (2.70)
= Y + jj11 “ ' c~l(s) ds
= Y + £ m13kn(t - s) c^ts) ds (2.73)
R eproduced with perm ission of the copyright owner. Further reproduction prohibited without perm ission.

7 9
This is of course a non-unique generalization of the earlier
linear theory. It is one of the finite infinity of proper
non-linear formulations. It further has the restriction
that tr T is zero.
If we accept the symmetries of Equation (2.64) for
itiijioa, the formulation leading to Equation (2.50) gives the
stress components
ds
ds
ds
Tu = Yu
+ j^JmnnCt - s ) c u''(s) + m ll22(t - s ) c I2’l (s) + rni m (t - s ) c 33''(s)j ds
T22 — Y22
+ £ J m 1I22(t - s ) c n''(s) + 1TI2222 (t - s ) c „ ' ( s ) + m ll22(t - ds
R eproduced with perm ission of the copyright owner. Further reproduction prohibited without perm ission.

T33 = y 33
+ L [ m H33(t-
8 0
11 (s) + m u22( . t - s ) c22 (s) + m,|11(t — s)c33 (s)| ds
(2 . 74 . a, b, c, d, e, f)
R eproduced with perm ission of the copyright owner. Further reproduction prohibited without perm ission.

C H A P T E R I I I
EXPERIMENTAL
3.1 General
In the experimental studies of this dissertation we
broadly investigate rheological properties, processing, and
x-ray characterization of compounds containing anisotropic
particles and mixtures of anisotropic particles with
isotropic particles.
81
R eproduced with perm ission o f the copyright owner. Further reproduction prohibited without perm ission.

3.2 Experimental8 2
3.2.1 Materials
This Dissertation involves the investigation of two
families of systems. One of these is based upon
polystyrenes with talc particles and mica particles . The
other system, based upon a polypropylene system, is part of
a program by the IUPAC Working Party 4.2.1.
The materials for the polystyrene system are summarized
in Table 3.1. The materials for the IUPAC polystyrene
system are contained in Table 3.2.
3.2.1.1 Particles
3.2.1.1.1 Talcs
Two types of talc particles were used in this
dissertation. For the polystyrene system the talc particles
used were Ultra talc 609 supplied by Specialty Minerals Inc.
The particle size reported by Specialty Minerals were based
upon the BET nitrogen adsorption method and presumption the
R eproduced with perm ission o f the copyright owner. Further reproduction prohibited without perm ission.

8 3
particles are spheres. We measured the thickness and
diameters of the talc particles using scanning electron
microscopy (SEM) (Hitach S-2150). SEM photographs of talc
are shown in Figure 3.1.
Specialty Minerals supplied an average diameter of talc
particles based upon BET measurements. This diameter
presumes, as mentioned above, that the particles are spheres
Specifically it presumes:
where dp is the particle diameter. The value of dp was
0 . 8 m .
As talc particles are actually discs, the value of AS£r
should be:
(3.1)
rA Bet ~ N • 2 - (3.2)v
R eproduced with perm ission of the copyright owner. Further reproduction prohibited without perm ission.

Figure 3.1 SEM photograph of Talc particles
R eproduced with perm ission of the copyright owner. Further reproduction prohibited without perm ission.

8 5
Table 3.1 Characteristics of materials and supplier for Polystyrene system
Materials SupplierParticle Size &
BET surface area
Aspect RatioMajor Usage
Polystyrene (Polystyrene
1 0 1 )
Talc 1 (Ultra talc
609)
Mica (280
Cosmetic mica)
Calcite 1 (Albaglos SF
Dry)
NOVACOR
Specialty Minerals
Inc.
Whittaker, Clark & Daniels,
Inc.
Specialty Minerals
Inc.
MI = 2.2
D= 1.2 4 Pm 4=0.08 Pm
BET=16.5 m'/g
D=4 5 Pm H=2.2 Pm BET=3 m;/g
0.8 Pm BET=7 m;/g
Amorphous
= 15 : I
20 : 1
= 20 : 1
= 1 : 1
Medical Molding Truck wall housewares
Sheet glaring Co-extrusion Improve heat
resistance with tensile,
compressive propert res
e>:, autcir.c t ; ve appliances, food
packing Mechanical improvement .
Elect: r icai, heat insulation
e:<; ??, ?37 , PETappliances housings, phenolics,■?CO" ’.*9?thermosets
Improve impact s extrusion properties e x ) PVC
R eproduced with perm ission of the copyright owner. Further reproduction prohibited without perm ission.

8 6
Table 3.2 Characteristics of materials and supplier forIUPAC 4.2.1 Working Party Polypropylene Project
Materials SupplierParticle Size
&BET surface
area
Aspect Ratio
Polypropyl Solvay Crystallineene
(Eltex P)MI = 8.5Talc 2 Barrets 2.5 Mm = 15 : 1
(ABT-2500, Minerals Inc. 11.0-12.5 m V g ~Montana talc, 20 : 1
uncoated)Talc 3 Barrets 2. 5 Pm = 15 : 1
(Polytalc Minerals Inc. 11.0-12.5 m"/g2 62, 20 : 1
Montana talc,coated)
Calcite 2 Specialty 3.5 Pm = 1 : 1(Vicron 15- Minerals Inc. ->3 irT/g
15, uncoated)Calcite 3 Specialty 3. 5 Pm = 1 : 1(Hi-Pflex Minerals Inc. 3 nf/g
100,coated)
R eproduced with perm ission of the copyright owner. Further reproduction prohibited without perm ission.

8 7
where H is thickness of talc and D is the diameter of disk
like talc. The average sphere diameter of talc particle was
0.8 ^m. By scanning electron microscopy, D/H is 15. This
indicates that H is 0.08Mm and D is 1.24Mm.
In the IUPAC 4.2.1 Working Party Project "Comparative
Rheology & Material Characteristics of Mineral Filled PP",
talc particles were also used. These are talc (ABT-2500,
Barrets Minerals Inc., 2.5^m) and talc (Polytalc 2 62,
Barrets Minerals Inc., 2.5Mm) stearic acid coated. For
these materials, the following was specified. ABT-2500
uncoated talc and Polytalc 262 stearic acid coated talc were
used to compare ( i) the stearic acid effect (ii) particle
shape effect and (iii) the mixed particle effect on
rheological properties .
3 . 2.1.1.2 Mica
Mica particles used in the polystyrene (see Table 3.1).
They were supplied by Whittaker, Clark & Daniels, Inc. The
trade name is 280 Cosmetic Mica.
R eproduced with perm ission o f the copyright owner. Further reproduction prohibited without perm ission.

8 8
The average equivalent particle sphere diameter, the
aspect ratio and particles suppliers are summarized in Table
3.1. SEM photographs of mica are shown in Figure 3.2. The
average diameter of the mica particles was 45Mm and the
thickness/length ratio was 1:20. The thickness was 2.2Mm.
We could not locate smaller mica particles.
3.2.1.1.3 Calcium Carbonates (Calcite)
The calcite particles used in the polystyrene study
were Albaglos SF Dry supplied by Specialty Minerals Inc.
The average sphere particle diameter indicated by the
suppliers of calcite is 0.8M-m.
We characterized the calcite particles using a SEM
(Hitach S-2150). SEM photographs of calcite are shown in
Figure 3.3. The average diameter of the calcite particle
was found to be 0.9Hm.
In the IUPAC 4.2.1 Working Party Polypropylene project
two calcites were used. These were Vicron 15-15 (Specialty
R eproduced with perm ission of the copyright owner. Further reproduction prohibited without perm ission.

Figure 3.2 SEM photograph of Mica particles
R eproduced with perm ission of the copyright owner. Further reproduction prohibited without perm ission.

9 0
Figure 3.3 SEM photograph of Calcite particles
R eproduced with perm ission of the copyright owner. Further reproduction prohibited without perm ission.

9 1
Minerals Inc., nominal size 3. 5Mm) and Hi-Pflex 100
(Specialty Minerals Inc., nominal size 3.5Mm) .
Calcite (Vicron 15-15) uncoated, and calcite (Hi-Pflex
100) stearic acid, coated, were used to compare the stearic
acid effect and particle shape effect and mixed particle
effect on the rheological properties.
Table 3.2 summarizes the characteristics of the
calcites used and the suppliers.
3. 2.1.2 Polymers
3.2.1.2.1 Polystyrene (PS)
The polymer used in this study was a general purpose
polystyrene (PS) supplied by Novacor Co. (see Table 3.1).
The melt flow index of polystyrene is 2.2 and its specific
gravity is 1.04. The reason we chose this PS was that it is
a chemically stable but non-crystallizing polymer.
R eproduced with perm ission of the copyright owner. Further reproduction prohibited without perm ission.

9 2
3. 2.1.2.2 Polypropylene (PP)
In the IUPAC 4.2.1 Working Party Project "Comparative
Rheology & Material Characteristics of Mineral Filled PP",
polypropylene Eltex P RV001P supplied by Solvay was used
(see Table 3.2). The melt flow index (MI) of the
polypropylene was 8.5 at 230°C.
Irganox B-225 (Phosphite) and calcium stearate were blended
in small quantities into the polypropylene to stabilize the
PP against oxidative degradation.
3.3 Compounds Prepared
Various volume loading (e.g. PS/talc, PS/calcite
0.95:0.05, 0.90:0.10, 0.80:0.20, 0.60:0.40 each) compounds
were made from low loadings to high loadings to see the
effect of particle concentration and particle shape on the
rheological properties, particle orientation, and packing
during the various types of processing.
Various mixed particle systems based primarily on the
PS/talc/calcite system including 0.90/0.05/0.05,
0.84/0.04/0.12, 0.84/0.10/0.06, 0.78/0.10/0.12,
R eproduced with perm ission o f the copyright owner. Further reproduction prohibited without perm ission.

9 3
0.60/0.20/0.20 volume loadings were studied to investigate
calcite-talc particle interaction on the rheoiogical
properties. Table 3.3 summarizes the compounds
investigated.
In the IUPAC 4.2.1 Working Party Project "Comparative
Rheology & Material Characteristics of Mineral Filled PP".
PP/talc/ calcite (xl = 6743/1, 0.6/0.2/0.2 wt%) uncoated,
PP/talc (x2, 0.6/0.4) uncoated, PP/talc (x3, 0.6/0.4)
coated, PP/calcite (x4, 0.6/0.4) uncoated, PP/calcite (x5,
0.6/0.4) coated, PP/talc/calcite (x6, 0.6/0.2/0.2) coated
were used to compare the effects of particle interaction,
shape, and interfacial chemistry upon shear viscosity and
yield stress. Table 3.4 summarizes the IUPAC compounds
investigated.
R eproduced with perm ission o f the copyright owner. Further reproduction prohibited without perm ission.

9 4
Table 3.3 PS compounds investigated.
PS/Talc
(vol%)
PS/Calcite
(vo1%)
PS/Talc/Calcite
(vol%)
1 95/05 95/05 90/05/05
2 90/10 90/10 84/04/12
3 80/20 80/20 84/10/06
4 60/40 60/40 78/10/12
5 60/20/20
R eproduced with perm ission o f the copyright owner. Further reproduction prohibited without perm ission.

9 5
Table 3.4 PP compounds investigated for IUPAC.
PP/Talc PP/Calcite PP/Talc/Calcite
(vol%) (vol%) (vo1%)
stearic 75/25 75/25 75/12.5/12.5acid
uncoated (6743/2) (6743/4) (6743/1)
stearic 75/25 75/25 75/12.5/12.5acid
coated (6743/3) (6743/5) (6743/6)
R eproduced with perm ission of the copyright owner. Further reproduction prohibited without perm ission.

3.4 Compounding9 6
A JSW(Japan Steel Works) TEX-30 modular intermeshing
co-rotating twin screw extruder with three kneading disc
blocks were used to disperse minerals in the polystyrene
matrix. The screw diameter of the extruder is 30 mm and the
length/diameter (L/D) ratio is 32.5. The extrusion
temperature was 200 °C, and a screw speed of 80-100 rpm was
used.
A Werner and Pfleiderer ZSK-40 M32.5 modular
intermeshing co-rotating twin screw extruder was used in the
process laboratories of Werner and Pfleiderer in Ramsey, New
Jersey to disperse minerals in the polypropylene matrix for
the IUPAC 4.2.1 Working Party Project "Comparative Rheologv
& Material Characteristics of Mineral Filled PP". The
temperature of compounding was 210°C. Calcium stearate was
added to all the systems during compounding.
R eproduced with perm ission of the copyright owner. Further reproduction prohibited without perm ission.

3.5 Rheological Measurements9 7
3.5.1 Steady Shear Flow Measurements
Steady shear flow measurements were carried out using a
capillary rheometer, a cone-plate rheometer, and a sandwich
rheometer. The sandwich rheometer was used in any extreme—0low shear rate region down to 10 (sec.) in order to detect
yield values of particle filled compounds experimentally not
from extrapolation.
3.5.1.1 Sandwich Rheometer
A sandwich rheometer (Figure 3.4) which was originally
developed by Toki and White (127) and later modified by
Osanaiye et al. (115) was used to detect rheological behavior
at low shear stresses and to determine the yield value in
creep experiments.
The samples were prepared using a Wabash compression
molding machine at 200 °C for PS/talc, PS/calcite, and
PS/talc/calcite filled compounds. The polypropylene
compounds were molded at 210°C. The molded samples were cut
R eproduced with perm ission of the copyright owner. Further reproduction prohibited without perm ission.

9 8
into sheets 1.9 cm wide, 17.8 cm long and 2.5 mm thickness
and then inserted between the stationary plate and moving
plate which possess the same dimensions as the sample.
The sandwich viscometer experiments for the polystyrene
compounds were carried out at 2003C. The IUPAC Working
Party Project polypropylene based samples were characterized
at 210°C.
The instrument was operated in the creep mode. The
moving plate of the sandwich viscometer was pulled
vertically downward by an attached weight. The displacement
of the moving plate was measured by a micrometer dial gauge
that has gratings as small as 0.01 mm.
The instrument was placed in a heating chamber of
dimensions 30x30x7 0 cm. Nitrogen gas was introduced into
the chamber around the sample to prevent the sample's
oxidation degradation.
The shear rate in the sandwich viscometer was
calculated as follows :
• Vr = ~fi (3.3)
R eproduced with perm ission of the copyright owner. Further reproduction prohibited without perm ission.

9 9
Therm om eter T em peratu re S en so r
Isothermal C ham ber
Stationary S teel P late
Sam ple
i l
O
LN,
Moving Part
D isplacem ent G auge (0.001 mm)
W eight
Figure 3.4 Scheme of modified sandwich rheometer
R eproduced with perm ission of the copyright owner. Further reproduction prohibited without perm ission.

1 0 0
where V is the constant velocity (mm/sec) of the moving
plate and H is the sample thickness (mm) between moving
plate and stationary plate. The shear stress can be
obtained from
F
where F is applied shear force (i.e. the weight in Kg
multiplied 9.8 m/sec2 to obtain Newton) and A is the surface
area (rtf) of the contacting plate.
3.5.1.2 Cone-Plate Rheometer
A cone-plate mode rotational rheometer (Rheometrics,
RMS-800, Figure 3.5) was also used to measure shear
viscosity. Viscosity measurements were made over a range of
shear rates of 10~2 to 10c sec’1. A plate of 2.5 cm diameter
and cone angle of 0.1 radian was used for the upper part and
same diameter of plane plate was used for the bottom
portion.
R eproduced with perm ission o f the copyright owner. Further reproduction prohibited without perm ission.

1 0 1
Compounded pellets were molded in a compression mold
developed in our laboratory (Figure 3.6). This has the same
cavity geometry as that required in a cone-plate rheometer.
The Wabash compression molding machine was used at 200 'C,
and pressures of 5 MPa for the PS matrix compound system,
and 5 MPa for the PP matrix compound system at 210 3C.
Nitrogen gas was introduced into the chamber around the
cone-plate to prevent oxidation degradation of the sample.
The shear rate in the cone-plate mode is given by (284,
285)
shear stress is determined from the torque, M, and the cone
radius, R (284, 285)
• Qy = — (3.5)a
where ^ is the rotation rate and a is the cone angle. The
3 M (3.6)
R eproduced with perm ission of the copyright owner. Further reproduction prohibited without perm ission.

1 0 2
A A A A
\J \l V
T ra n sd u c e r
S ta tio n a ry P a rt
S a m p le
Moving P a r t
Figure 3.5 Schematic diagram of cone-plate rheometer
R eproduced with perm ission of the copyright owner. Further reproduction prohibited without perm ission.

1 0 3
0.1 Radian
25 I mm
Figure 3.6 Schematic diagram of compression mold forRheometrics
R eproduced with perm ission of the copyright owner. Further reproduction prohibited without perm ission.

3.5.1.3 Capillary Rheometer1 0 4
An Instron capillary rheometer (Instron 3211, Figure
3.7) was used to measure steady state shear viscosity at
high shear rates. This involved a series of dies with
diameter of 1.6 mm and length/diameter ratios of 9.3, 19.3,
and 28.5. Measurements were made at 200 °C for the PS
matrix system and at 210 VC for the PP matrix system. The
viscosity measurements were made over a range of shear rates
of 10° to 102 s'1.
The shear rate at the wall in the capillary rheometer
is given by (284, 285)
Yv = 3w’+ l ' 4 ri
32 Q
kD (3.7)
where Q is the flow rate and n' is
n,= dln(a]2)vd \ n ( 3 2 Q / x D 3)
(3.8)
The total pressure, p T in the capillary rheometer may be
expressed in the form
R eproduced with perm ission of the copyright owner. Further reproduction prohibited without perm ission.

1 0 5
T ra n sd u c e r
P lu n g er
S a m p le
C apillary Die
Figure 3.7 Schematic diagram of capillary rheometer
R eproduced with perm ission of the copyright owner. Further reproduction prohibited without perm ission.

1 0 6
P T ~ ^ P d l e ~*~^P&ncrar.ce * ~ ^ P e x .
~ ^ P d i e ~*~^P ends
p r= 4(tj12)w L_
D ' t ' ^ P e n d s
(3.9a)
(3.9b)
where D is the diameter of the capillary, and L the length
of the capillary. Equation (3.9) suggests the Bagley plot
(269) where p r is plotted as a function of L/D and (ai:)w
determined from the slope and ^per.ds from the intercept.
3.5.2 Elongational Flow Measurements
we studied uniaxial extension using a uniaxial
rheometer developed by Yamane and White (283) . It consists
of an isothermal silicone oil bath, a force transducer, and
a take-up system (see Figure 3.8).
Samples were prepared using an Instron capillary
rheometer (Instron 3211) at 200°C for PS matrix system with
the diameter of 1.6 mm and the length/diameter of 28.5 was
used.
R eproduced with perm ission of the copyright owner. Further reproduction prohibited without perm ission.

1 0 7
Constant extensional strain rate measurements were
made. Extruded samples were placed in the silicone oil bath
between a pair of gears on one end and a force transducer at
the other end. The sample is then pulled by the rotating
gears which move at constant angular velocity. The distance
between the gears and the force transducer is 20 cm.
A 1/15 HP B&B electrical motor with rotor diameter 10.9
cm was used to draw out the sample in the range of 0.36 to
1.62 rpm. A force transducer with a maximum capacity of 400
gmf was used. It was connected to a chart recorder for
readout analysis. The elongational viscosity was determined
as a function of time in a range of elongation rates from
0.0005 to 0.0023 sec"1 which corresponds to 0.36 to 1.62
3m.
The elongation rate is given by
1 dL RQ.
r = 7 * ‘ ~ T (3'10:
where R is roll radius, ^ the angular velocity, and L the
sample length. The elongational stress is obtained through
R eproduced with perm ission of the copyright owner. Further reproduction prohibited without perm ission.

1 0 8
thermocouple
LVDT
1/thermostatic fluid bath
Figure 3.8 Schematic diagram of silicone oil bathelongational rheometer
R eproduced with perm ission o f the copyright owner. Further reproduction prohibited without perm ission.

1 0 9
cru ( 0 =F {t) F ( t )
A (t) A0exp(/£0
where F is the elongational force, A the cross-sectional
area, A0 the initial cross-sectional area, and t the time.
Measurements at very low stretch rates were made in the
creep mode. For measurements of the yield value, we used
the same sandwich rheometer chamber (Figure 3.9).
Elongational flow yield values were measured in the nitrogen
gas filled chamber(NCM). We measured only yield values.
Samples were clamped on one end and a weight applied on the
other end. We measured the displacement after various
periods up to 2-3 hours. When there was no change in the
displacement reading at low stresses we considered an
elongational yield value to exist. When there was a change
in displacement reading, the sample generally failed by
necking. The stress where these first occurs is the yield
value.
R eproduced with perm ission of the copyright owner. Further reproduction prohibited without perm ission.

3.5.3 Oscillatory Flow Measurements1 1 0
The complex viscosity was measured using a parallel
plate mode rotational rheometer (Rheometrics, RMS-800,
Figure 3.10) at 210 °C for the PP matrix system.
Measurements were obtained over a range of frequencies of
10"" to 10" rad/sec. The strain amplitude was maintained
constant at 1% for all measurements.
The shear stress for sinusoidal oscillatory flow
experiments has the form
cr12( 0 = G '(a))y sin art + G"(co)y coscot = G 'y sm (c o t + <5) ( 3 . 1 2 )
where Y is the shear strain, G' is the storage modulus, G''
is the loss modulus, G* is the complex modulus, 03 is the
frequency, and 5 is loss angle. The torque M is related to
the shear stress M at the outer radius by
G'(co) = G * cosS = c o s8 n 1 3 ]V I n R *Q I J . I J J
R eproduced with perm ission of the copyright owner. Further reproduction prohibited without perm ission.

Figure
Thermometer Temperature Sensorn i
Isothermal Chamber
Stationary Clamp
Uniaxial Sample
Moving Clamp
' i !
0Displacement Gauge
(0.001 mm)
Weight
.9 Scheme of elongation rheometer formeasurement yield value
R eproduced with perm ission of the copyright owner. Further reproduction prohibited without perm ission.

1 1 2
A A A A
V V U
T ra n sd u c e r
S ta tio n ary P a rt
S am p le
Moving P a r t
Figure 3.10 Schematic diagram of parallel platerheometer.
R eproduced with perm ission of the copyright owner. Further reproduction prohibited without perm ission.

1 1 3
G"(co) = G* s in ^ = a>rj' =2 M H .— 7— siinice
sine) (3.14)
n* = yl(n')2 + (n")2 = -J{G"loo)2 +(n")2 = —CO
(3.15)
The strain Y at the outer radius is
where M is the torque, R is the plate radius, H is the gap
3.6 Processing Studies and Flow Geometries
We have chosen several experimental geometries to
characterize the flow of these particle-filled compounds.
We gave particular attention to particle orientation
distributions through cross-sections of different processing
geometries.
The reason we have chosen these geometries is to see
the orientation and array behavior of the talc and mica
particles.
height, and ^ is the shear angle.
R eproduced with perm ission of the copyright owner. Further reproduction prohibited without perm ission.

3.6.1 Extrusion Through Dies1 1 4
The primary industrial processing operation studied was
extrusion through dies. We made studies through dies with
circular cross-sections and with rectangular and annular
cross-section. In addition we studied converging flow into
a die entrance.
3.6.1.1 Capillary Die
We investigated talc particle flow using various
different capillary dies with different capillary die
diameters (0.8, 1.6, 2.4, 3.2 mm), and capillary L/D ratios
(9.3, 19.3, 28.5 for the 1.6mm diameter die).
3.6.1.2 Rectangular Dies
Specially fabricated rectangular and slit dies were
attached to an Instron capillary rheometer (Instron 3211) to
obtain extruded sheet samples. The slit die thickness was
1mm, 0.6mm, and 0.3mm, respectively. We investigated the
effect of aspect ratios of the slit dies (1:2, 1:10, 1:20).
R eproduced with perm ission of the copyright owner. Further reproduction prohibited without perm ission.

1 1 5
3 . 6.1.3 Annular Die
A specially fabricated annular die was attached to the
Instron capillary rheometer to obtain annular die extrusion
samples. The annular die had a length of 35.6 mm, an inner
diameter of 6.1 mm, and an outer diameter of 7.6 mm.
3.6.1. 4 Converging Flow
We observed converging flow from a cylindrical
reservoir (D = 9.5 mm) into a capillary die. An Instron
capillary rheometer (Instron 3211) was used to investigate
flow from reservoir to capillary entrance (45J). The
investigation of talc particles' capillary entrance flow
using SEM was our point of interest.
Special attention was given to die entrance pressure
losses.
3.6.2 Compression Molding
Molding operations were represented by compression
molding. A Wabash hot press (20-1212-2TMB) was used for
R eproduced with perm ission of the copyright owner. Further reproduction prohibited without perm ission.

1 1 6
preparing compression molded samples. A mold with
dimensions of 15x15 cm was used.
This flow is a squeezing flow.
Table 3.5 summarizes various processing geometries and
condition in PS matrix system.
3.7 X-ray Characterization of Fabricated Parts
3.7.1 Orientation Studies from Wide Angle X-ray
Diffraction (WAXD)
We determined the orientation of talc particles from
various fabricated parts by wide angle x-ray diffraction.
3.7.1.1 WAXD Bragg Angle Scanning
X-ray diffraction Bragg angle(2®) scans of talc and
calcite powders were made using a 12 kW Rigaku Denki x-ray
generator with Ni-filtered Cu-Ka radiation. The operating
voltage and current were 40 kV and 150 mA, respectively. A
reflection technique was used.
R eproduced with perm ission of the copyright owner. Further reproduction prohibited without perm ission.

1 1 7
Table 3.5 Various processing geometries and condition in PS matrix system
Processing Variables DimensionCapillary die (a) capillary die 45°, 135°
extrusion entrance angles(b) capillary die 0.8, 1.6, 2.4, 3.2
diameter mm(c) capillary L/D 9.3, 19.3, 28.5
ratios D=1.6 mmSheet die (a) slit die area 2.0, 3.9, 1.95 mm'
extrusion (b) aspect ratio of 1:2, 1:10, 1:20slit dies
Annular die Di=6.1 mmextrusion Do=7.6 mm
L=35.6 mmConverging flow Entrance angle
45'Compression 5 MPa
molding 15x15 mm
R eproduced with perm ission of the copyright owner. Further reproduction prohibited without perm ission.

3 . 7 .1.1.1 Amorphous Halo1 1 8
If a completely crystalline filler is added to an
amorphous polymer system, we can consider filler portion as
the crystalline portion and amorphous polymer as an
amorphous portion. The amorphous intensity of polystyrene
was measured using a Bragg angle scan of talc and calcite.
The relative intensity of the amorphous halo of a
compound represents the concentration of amorphous polymer
itself (182, 183). We may conclude that measuring the
amorphous halo's relative intensity gives the amorphous
content in a binary mixture system. This method is
convenient and simple for the determination of the
crystalline fraction (filler fraction) in amorphous polymers
and does not require correction for the Lorentz-factor,
polarization or incoherent radiation.
In a polymer crystal the distances between bonded atoms
and second nearest neighbors are subject to little
variation, and furthermore the distance of closest approach
of a neighboring chain is a vector distance with a high
probability of occurrence. These modes of quasi-short-range
R eproduced with perm ission of the copyright owner. Further reproduction prohibited without perm ission.

1 1 9
order are responsible for the interference halos observed in
the diffraction patterns of amorphous polymers.
3. 7.1.1.2 Particle Size
Particle sizes of the mixture components affects the
accuracy of x-ray intensity measurements because of the
microabsorption (or particle-absorption) phenomena (181).
To minimize microabsorption effects, the particle diameter D
should be proper for quantitative x-ray analysis. For fine
(micron) particle samples, using (//D<0.01) is recommended
(181) where M is the linear absorption coefficient.
However, when the particle diameter D' is much less than
optimum size i.e. D' « D, there is an intensity loss (181)
due to the presence of an amorphous surface layer on each
particle. Furthermore, in comparison to a powder-powder
mixture (181), a particle filled polymer matrix system
should have much less free volume. Thus it is considered
that this compounded sample gives more accurate intensity
data than a powder-powder mixture system (181).
When we add crystalline filler into an amorphous
polymer matrix, the intensity of the amorphous halo doesn't
R eproduced with perm ission of the copyright owner. Further reproduction prohibited without perm ission.

1 2 0
change proportional to the filler content because each
material's density and mass absorption coefficient (182,
183) is different. When we specify the x-ray's polarization
factor, the Lorentz factor and absorption factor (x-ray wave
length, sample thickness and shape), a quantitative analysis
is possible for a flat specimen with known density, weight
(or volume) fraction, and mass absorption coefficient (/*,)
of each material.
3.7.1.2 WAXD Flat Film Measurements
X-ray diffraction patterns were obtained using a
General Electric x-ray XRD-6 generator with a copper target
and N i - P filter (*-=1.54 A) . The operating voltage and
current were 30 kV and 30 mA, respectively. A transmission
technique was used. The film used was Kodak Scientific
Imaging Film Direct Exposure 12.5x12.5 cm.
3. 7.1.3 WAXD Pole Figure Measurements
The degree of particle orientation for each compound
was represented by using the pole figure method. We
R eproduced with perm ission of the copyright owner. Further reproduction prohibited without perm ission.

1 2 1
determined biaxial orientation factors also using the pole
figure method. The biaxial orientation factors represented
on White and Spruiell orientation triangle (Figure 2.6).
In our investigation, the effect of isotropic particle
on the orientation of anisotropic particles was
investigated. All the measurements on the degree of
orientations were done quantitatively by WAXD method. X-ray
diffraction patterns were obtained using a General Electric
x-ray XRD-6 generator with a copper target and N i - P filter
(^•=1.54 A) . The operating voltage and current were 30 kV
and 30 mA, respectively. A transmission technique was used.
1.6x1.6x1.6 mm cubic size sample was mounted on a goniometer
and rotated $ angle 3 60 degree and X angle 90 degree while
the x-ray was positioned on the sample. Transmitted x-rays
were detected by photon counts/sec unit as a function of
rotation angle ^ and X and recorded in a connected computer.
Plotting was done by using commercial software Surfer. X-
rays (40KV and 150 mA) with CuKa radiation were generated
using a Rigaku x-ray generator.
R eproduced with perm ission o f the copyright owner. Further reproduction prohibited without perm ission.

3.7.1.3.1 Uniaxial Orientation1 2 2
Equation (2.12) was used to characterize uniaxial
orientation of the talc particles. We characterized
uniaxial orientation function fi. We conducted quantitative
orientation studies by using the pole figure method.
Orientation factors were represented on the White and
Spruiell orientation triangle.
3.7.1.3.2 Biaxial Orientation
Using Equations (2.19a) and (2.19b) for biaxial
orientation, we characterize biaxial orientation functions
fa,jr fBzj for the talc particles quantitatively by using the
pole figure method. These again were represented on a White
and Spruiell orientation triangle.
R eproduced with perm ission of the copyright owner. Further reproduction prohibited without perm ission.

1 2 3
3.7.2 X-ray Intensity Studies for Composition
Analysis of Particle Filled System
3. 7. 2.1 Introduction
A quantitative analysis of particles in a filler
composite were performed for one filler (isotropic or
anisotropic) system and two fillers (isotropic plus
anisotropic) system in thermoplastics to determine the
amounts of particles in a binary (182) and ternary system
(186) using the amorphous intensity of polystyrene.
In this dissertation, we describe a new approach to the
investigation of composite of inorganic filler in an
amorphous thermoplastic matrix (PS/Talc, PS/Calcite,
PS/talc/calcite). The wide angle x-ray diffraction(WAXD)
intensity method for a binary mixture system was used. X-
rays (40KV and 150 mA) with CuKa radiation were generated
using a Rigaku x-ray generator. The Bragg angle scanning
range was from 5° to 45°.
R eproduced with perm ission o f the copyright owner. Further reproduction prohibited without perm ission.

3.7.2.2 Binary Mixture (Single Particle) System1 2 4
The x-ray intensity depends on the position of the
atoms relative to a given set of planes.
Iihki. = P’L'A-IfI2 (3.18)
where Irh is the structure factor that depends on the atomic
scattering factor, P is the polarization factor (incoherent
radiation) that depends on the Bragg angle, L is the Lorentz
factor that depends on reflecting (exposure) time, A is the
absorption factor(transmission factor) that depends not only
on its elemental composition and the wave length of the x-
rays but also on the size and shape of the specimen.
Alexander and Klug represented the absorption of a flat
specimen as:
K|X|li = r , . r ‘ , T~T (3.19)
where
R eproduced with perm ission of the copyright owner. Further reproduction prohibited without perm ission.

1 2 5
1,2,3 = uppercase subscripts designating components of a
powder mixture
M = subscript referring to he "matrix", that is, the sum of
all the components other than 1
II = subscript referring to line I of component 1
P: = density of (solid) component 1
Xi = weight fraction of component 1 in a mixture
‘K = volume fraction of component 1 in a mixture
= linear absorption coefficient of (solid) component 1
for the x-ray wavelength used
P:* = M-: /Pt = mass absorption coefficient of component 1 for
the x-ray wavelength used
M = linear absorption coefficient of a sample consisting of
several components
IlL = intensity of line i of component 1 of a mixture
(Iii) a = intensity of line i of pure component 1
11 = intensity of component 1 of a mixture
In the case of mixture of 2 components, when Ai
for the pure first component (^m = ^), from Equation (3.19)
R eproduced with perm ission of the copyright owner. Further reproduction prohibited without perm ission.

while for a mixture containing a weight fraction Xi of the
first component and Xz=l-X2 of the second component.
. . . K,x, (3.21)
More generally
In = K|ixiP\M
(3.22)
where M-* is mass absorption coefficient of a sample
consisting of several components.
Dividing Equation (3.21) by Equation (3.20) gives
_ *iM\(i \ ~ f • • \ * (3.23)v I 70 X|(^l -P2)+ P2
The quantity Xi and ‘K is related to the volume fraction by
R eproduced with perm ission of the copyright owner. Further reproduction prohibited without perm ission.

1 2 7
x. = — P
so, 1 - / . . \ , , . (3.24)(p \ ~P\ )P\4l +PP2
3.7.3 Scanning Electron Microscopy (SEM)
3.7.3.1 Introduction
The scanning electron microscope (SEM) is a powerful
instrument which permits observation and characterization of
heterogeneous organic and inorganic materials and surfaces
on a local scale. The area to be examined is irradiated
with a finely focused electron beam, which may be static or
swept in a raster across the surface of the specimen. When
the electron beam hits the surface of the specimen, signals
such as secondary electrons, backscattered electrons,
characteristic x-rays, and photons of various energies are
produced. These signals are detected from specific emission
volumes within the sample and can be used to examine many
characteristics of the sample such as surface topography,
crystallography, etc.
R eproduced with perm ission of the copyright owner. Further reproduction prohibited without perm ission.

1 2 8
In the scanning electron microscope (SEM), the signals
of great interest are secondary and backscattered electrons,
since these electrons vary according to the differences of
the specimen's topography as the electron beam scans across
the specimen. Secondary-electron emission is confined to a
volume near the beam's impact area, permitting images to be
obtained at relatively high resolution. Other signals are
available, which are similarly useful in many areas.
The SEM is one of the most versatile instruments
available for the examination and analysis of the
microstructural characteristics of solid objects. The
primary reason for its usefulness is the high resolution
that can be obtained when bulk objects are examined; our
laboratory's SEM achieved resolutions up to 1 run (10 A) at
200,000 magnification under normal operating conditions.
Another important feature of the SEM is the three-
dimensional appearance of the specimen image, a direct
result of the large depth of field, as well as to the
shadow-relief effect of the secondary and backscattered
electron contrast.
R eproduced with perm ission of the copyright owner. Further reproduction prohibited without perm ission.

3. 7. 3. 2 Experimental1 2 9
Two scanning electron microscopes (ISI-SX40 and Hitachi
S-2150) were used to investigate the phase morphology of a
cross section of the talc compounds. The scanning electron
microscope (SEM) of Hitachi s-2150 was used to investigate
high magnification purposes that magnification up to
200,000. This computer was connected to scanning electron
microscope (SEM) to obtain digital signals from SEM. The
SEM image data were saved in computer. Nonconducting
samples need coatings before they can be examined and
analyzed in electron-beam instruments that rely on emitted
signals to provide information. Electron charge build up
rapidly in a nonconducting specimen when it is scanned by a
beam of high-energy electron. Before investigation under
scanning electron microscopes, we coated gold on the
specimens to prevent image distortion, as the primary beam
causes thermal and radiation damage, which can lead to a
significant loss of material from the specimen.
The ISI-SX40 and Hitachi S-2150 SEM were used at 20KV
and 80 ^A and 25KV and 100 ^A respectively. SEM film used
was Polaroid Positive/Negative 4x5 Instant Sheet Film T-55
R eproduced with perm ission of the copyright owner. Further reproduction prohibited without perm ission.

1 3 0
for ISI-SX40 and GE Electronics Inc. Color Printer Papers
B/W Model# UPC-1020 for Hitachi S-2150.
R eproduced with perm ission of the copyright owner. Further reproduction prohibited without perm ission.

C H A P T E R I V
RHEOLOGICAL MEASUREMENTS IN STEADY AND OSCILLATORY
SHEAR FLOW
4.1 Introduction
In this chapter, we describe an experimental study of
the rheological properties of talc, calcite and mixed
particle compounds. Our study includes (i) steady shear
flow, (ii) uniaxial extension and (iii) oscillatory flows.
The studies presented in this chapter include results
for both polystyrene(PS) based compound and IUPAC Working
Party 4.2.1 polypropylene(PP)-particle filled compounds.
131
R eproduced with perm ission o f the copyright owner. Further reproduction prohibited without perm ission.

4.2 Results1 3 2
4.2.1 Steady Shear Flow Measurements
Figure 4.1 represents the steady shear viscosity as a
function of shear rate as determined from sandwich, cone-
plate, and capillary rheometers for polystyrene (PS) and
talc filled PS compounds (0.05, 0.1, 0.2 0.4 volume
loadings) at 200 °C. The data is replotted as a function of
shear stress in Figure 4.2. Generally, the viscosity
decreases with increasing shear rate. As particle loading
increases the shear viscosity increases with the greatest
increases occurring at low shear rates and shear stresses.
There are zero shear viscosities for the PS, and the
PS/talc 0.05 and 0.1 volume loading compound systems. At low
shear rates and shear stresses the shear viscosity becomes
increasingly high for the PS/talc 0.2 and 0.4 compounds.
There are stresses below which there is no flow for the
PS/talc 0.2 and 0.4 loading compounds. The yield values
which were determined from the sandwich creep instrument are
36-82 Pa for the 0.2 and 290-100S Pa for the 0.4 PS/talc
compounds.
R eproduced with perm ission of the copyright owner. Further reproduction prohibited without perm ission.

1 3 3
Figure 4
M i n ing i i ninn 1 1 m iiq l i n ing i i iiiii i i i mij Hi i nq 1 1 nmij 11 mill] r umuj i i n i j
ncdL
DDJn
10°
O PS I~1 PS/TALC (95 05)
A PS/TALC (90 10) 3PS / TALC (80 : 20)
O PS/TALC (60:40)
O san d w ich v isco m e te r O c o n e -p la te v isco m e te r • cap illary rh e o m e te rm J i 11 mill i i mini iiimij iiimij iiiiJ ill ■ i mini ■ i irmil i ! mini in
10-7 10-6 10-5 10-4 10-3 10-2 10- ’ 10° 101 102 103 104- 1 .
SH E A R RATE (se c )
Shear viscosity as a function of shear rate for talc filled system at 200°C
R eproduced with perm ission o f the copyright owner. Further reproduction prohibited without perm ission.

1 3 4
1010
109
108cnCD 107 a£ 106COOco 105 >
104
103
102
“ I "I 11 lllii i i iTim
\
r m i ni|— I i i i iuij— r rnnn]— i i i i iuij— i i t ht s
O ps□ PS/TALC (95 : 05) 1
A PS/TALC (90 10) :
V PS / TALC (80 : 20) 1O PS / TALC (60 40) =
I P san d w ich v isco m eu IO c o n e -p la te v isc o m e te r1
I papillary rh eo m e te r "S fti i i mnl i i i mill t Miiml i i_mml i ... . ml i i 11 mil i i i mu
10° 101 102 1 03 1 04 1 0s 106 107 108
SH E A R S T R E S S (P a)
Figure 4.2 Shear viscosity as a function of shear stressfor talc filled system at 200°C
R eproduced with perm ission of the copyright owner. Further reproduction prohibited without perm ission.

1 3 5
This is shown in Figure 4.3 where we plot creep as a
function of time for different applied shear stresses. To
determine the low shear stress behavior of the 0.2 volume
loading compound we had to introduce a compensation
procedure for the weight of the inner member. This was
discussed in Section 3.5.1.1.
It should be seen in the shear viscosity-shear stress
plots shown in Figure 4.2 for the 0.2 and 0.4 volume loading
talc compounds that there are plateau viscosities just above
the yield values. These are in the range of 5x10' to 5x10“
(Pa.sec).
Figure 4.4 represents the steady shear viscosity for PS
and calcite filled PS compounds (0.05, 0.1, 0.2, 0.4 volume
fraction) as a function of shear rate at 200 3C. The
results are similar to the PS/talc compounds with the shear
viscosity decreasing with shear rate and increasing with
particle loading, especially at low shear rates. The PS and
PS with 0.05 and 0.10 loadings clearly exhibit zero shear
viscosities. The data is replotted as a function of shear
stress in Figure 4.5.
R eproduced with perm ission of the copyright owner. Further reproduction prohibited without perm ission.

1 3 6
Figure 4
2.0
7165 Pa
6
OJ<D 2265 Pa
0.51375 Pa
1009 Pa > 292 Pa0.0
4 0 0100 200 3 0 0
T im e (min.)
3 Shear strain creep as a function of time at200°C for various creep levels for PS/talc 0.4 volume loading compound
R eproduced with perm ission of the copyright owner. Further reproduction prohibited without perm ission.

1 3 7
Figure 4.
0)CD3_
f)0Jn
01' |iniiiiij iiiiiiu) 11inwj~ 'mm^ i iniii~i nniij 11mm iiiimii 11limn i iimiir rrnr
o 10
o9
O ps□ PS / CALCITE (95 A PS / CALCITE (90 V PS/CALCITE (80 O PS/CALCITE (60
02
08
07
06
0s
°4^ sa n d w ic h viscometer*"
° 3 b O c o n e -p la te v isco m ete rE ♦ , cap illary rh e o m e te r . . . . _ ,
i mi nd i 11 nirf i i mud i n mil i i mi r d i i i m i l i i n i i r i t i m u t l L i i m d i h i ^ E i i mud
10'7 10-6 10-5 10-4 10*3 10’2 10*1 10° 101 102 103 104
SH E A R RATE ( s e c 1)
Shear viscosity as a function of shear rate for calcite filled PS system at 200°C
R eproduced with perm ission of the copyright owner. Further reproduction prohibited without perm ission.

1 3 8
1010
109
108'cnaj 107
£ 106 CO OCO 105 >
104
103
10210° 101 102 103 104 10s 106 107 108
SH E A R S T R E S S (P a)
Figure 4.5 Shear viscosity as a function of shear stressfor calcite filled PS system at 200°C
= i i 111:ii( I rTTTTTTj 11 {I ll!l| I 1 r lllllj ill miij I I ! I llll| I I 11 llllj I TTTTTH
O ps□ PS/CALCITE (95 A PS/CALCITE (90 V PS/CALCITE (80 O PS/CALCITE (60
05) = 10)20) _ 4 0 ) !
^ san d w ich v iscom e'0 c o n e -p la te v isco m e te ♦ .capillary rh e o m e te r1 11 mill i. Lniml L i n u n L u m u t i_ iim C -L L liilU I I HUH L i n a
R eproduced with perm ission of the copyright owner. Further reproduction prohibited without perm ission.

1 3 9
At low shear rates and shear stresses the shear
viscosity of many compounds becomes increasingly high.
There are indeed stresses below which there is no flow for
the PS/calcite 0.4 loading compounds. The yield values are
229-428 Pa for the 0.4 PS/calcite compound. This is shown
in Figure 4.6 where we plot creep as a function of time for
different applied shear stresses.
It should be noted that while the 0.2 and 0.4 loading
talc compounds exhibit yield values, only the 0.4 loading
calcite compound clearly exhibits yield value.
Figure 4.7 represents the steady shear viscosity as a
function of shear rate for PS and calcite/talc mixed
particle filled PS compounds (0.05:0.05, 0.04:0.12,
0.10:0.06, 0.10:0.12, 0.20:0.20 volume loadings) at 200 °C.
The data are represented as a function of shear stress in
Figure 4.8. Figure 4.7 shows the viscosity level of the
talc/calcite mixed system was lower than the talc filled
system and higher than the calcite filled system. In Figure
4.9 we plot creep in the sandwich viscometer as a function
of time for different applied shear stresses.
R eproduced with perm ission of the copyright owner. Further reproduction prohibited without perm ission.

Figure 4
1 4 0
3.0
2 .5
~ 2.0JDP-s 1.5 n032 1.0 n
0 .5
0.00 100 2 0 0 3 0 0 4 0 0
Tim e (min.)
6 Shear strain creep as a function of time at200°C for various creep levels for PS/calcite 0.4 volume loading compound
8063 Pa
1074 Pa
239 Pa 194 Pa82 Pa
36 Pa
R eproduced with perm ission of the copyright owner. Further reproduction prohibited without perm ission.

1 4 1
Figure 4
1 0 i°
109
1087)(o 107 L= 106 n D» 10s >
104
103
10210-7 10-6 10-5 10^ 10-3 10-2 10-1 10° 101 102 103 104
SH E A R RATE ( s e c -1)
7 Shear viscosity as a function of shear ratefor talc/calcite filled PS system at 200°C
Hllll l l l j IlllllUj l l l l l l j I l l l U j I i I l l iU| I m i i l l j I I l l l l llj l l l l l l ll ] I 11 M b
PS / TALC / CALCITE (60 : 20 : 20) \ PS / TALC / CALCITE (90 : 05 : 05)
PS / TALC / CALCITE (84 04 12) ! PS / TALC / CALCITE (84 : 10 : 06) I PS / TALC / CALCITE (78 1 0 : 12 n PS
^ sandw ich v isco m ete r r O co n e -p la te v isc o m e te r
♦ capillary rh e o m e te ri iiimil i n i i i n l i imml i i i i n i J i i n i i i J i i n i i i i ) iiiiiiiI
R eproduced with perm ission of the copyright owner. Further reproduction prohibited without perm ission.

1 4 2
Figure 4
1010
109
108
7)CD 107 r“ 106 7)Di 10s >
104
103
10210° 101 102 103 104 105 106 107 108
SH E A R S T R E S S (P a)
8 Shear viscosity as a function of shear stressfor talc/calcite filled PS system at 200°C
E i i i mi l l | | | nnil" i i i ii r r m n i|— i i iimi|— i 11 iinij— i 11 niiij t t t t t t b
O PS / TALC / CALCITE (60:20:20)= □ PS/TALC/CALCITE (90:05:05)- A PS/TALC/CALCITE (84:04:12)1 V7 PS / TALC / CALCITE (84:10:06)= <5> PS/TALC/CALCITE (78:1012)
PS
^ O O C C b c ^ sandwich viscometer0 cone-plate viscometer ^ capillary rheometer
1 i m i n i i i m i n i i—l 11ititi L i - l l i t i l l mi l t m i l l
R eproduced with perm ission of the copyright owner. Further reproduction prohibited without perm ission.

1 4 3
c(0cnCO<1>x :
C/3
51520 Pa
4 514 Pa
3
A 239 Pa2
101 Pa1+ 37 Pa
0
0 100 2 0 0 3 0 0 4 0 0 500
T im e (min.)
Figure 4 . 9
(a) 0.78/0.10/0.12
Shear strain creep as a function of time at 200°C for various creep levels for PS/talc/calcite (a) 0.78/0.10/0.12 (b) 0.60/0.20/0.20 volume loading compounds
R eproduced with perm ission of the copyright owner. Further reproduction prohibited without perm ission.

JO,
cCO•*-*COu_CDCDszCO
53 5 6 2 P a
4 <> 2 9 5 0 P a
31 646 P a
2 1208 P a
1 ^ 9 5 8 P a
282 P a H
0
100 2 0 0 3 0 0 4 0 0 5 0 00
T im e (min.)
(b) 0.60/0.20/0.20
continuedFigure 4.9 Shear strain creep as a function of time
200°C for various creep levels for PS/talc/calcite (a) 0.78/0.10/0.12 (b) 0.60/0.20/0.20 volume loading compounds
R eproduced with perm ission of the copyright owner. Further reproduction prohibited without perm ission.

1 4 5
In Figure 4.8 talc/calcite (0.05:0.05, 0.04:0.12,
0.10:0.06, 0 .10:0 .12) systems do not exhibit a yield value
and a low shear stress constant viscosity plateau at 2x10°
Pa. The high particle loading 0.20/0.20 talc/calcite mixed
particle compound system exhibits yield values. Figure 4.8
shows the viscosity level of a talc/calcite mixed system
depends on the volume fraction of loaded particles.
In Figure 4.9 we present creep data for the 0.10/0.12
and the 0.20/0.20 samples. We see that the yield value from
0.20/0.20 appears to have a magnitude between 280 and 960
Pa.
Figure 4.10 represents the steady shear viscosity as a
function of shear rate for polypropylene (PP) and calcite,
talc, and calcite/talc filled (6743/1, 6743/2, 6743/3,
6743/4, 6743/5, 6743/6) PP compounds (0.25 volume loading)
from a IUPAC Working Party 4.2.1 study at 210 JC. These are
discussed in Section 3.3. Compounds 6743/1, 6743/2, 6743/4
are uncoated particle filled system, 6743/3, 6743/5, 6743/6
are stearic acid coated particle filled system, 6743/1,
6743/6 are talc/calcite mixed particle filled systems,
6743/2, 6743/3 are talc particle filled system, and 6743/4,
6743/5 are calcite particle filled system.
R eproduced with perm ission of the copyright owner. Further reproduction prohibited without perm ission.

1 4 6
toCL<0Ooco
1011
1Q10
109
108
107
106
105
104
103
102
101
; 11 i iiiiij iT i nuij i i i iiiih iiiiu i^ i i i iiii 11 imiij ' i i imiij m i uni) 11 imuj 11 miiij l u n g
% 6743/0 (PP)o 6743/1 (PP/Talc/Calate. uncoated) ~~
□ 6743/2 (PP/Talc, uncoated)
A 6743/3 (PP/Talc, coated) y 6743/4 (PP/Calcite, uncoated)
< 0 6743/5 (PP/Calcite, coated)
O 6743/6 (PP/Talc/Calcite. coated)
10° iJ i i mini i 11 mill iiiimJ iiiiiJ iimJ miiiihI i minil in I mhhhi Mind
10'7 10-6 10*5 10"4 10-3 10-2 10-1 10° 101 102 1 03 1 04
S h e a r R a te ( s e c ’ )
Figure 4.10 Shear viscosity of PP/fillers as a functionof shear rate at 210°C
R eproduced with perm ission of the copyright owner. Further reproduction prohibited without perm ission.

1 4 7
Measurements as with the polystyrene compounds were made at
high shear rates in a capillary rheometer (Instron),
intermediate shear rates in a cone-plate rheometer
(Rheometrics) and lower rates (sandwich creep rheometer).
The data are presented again as a function of shear stress
in Figure 4.11.
The polypropylene (PP) exhibits a shear viscosity which
decreases with increasing shear rate and plateaus at low
shear rate.
The shear viscosity of PP and its compounds orders as;
Y = 100 sec'1 6743/(4 ^ 1 ^ 2 ^ 3 ^ 6 >5) > PP(capillary)
Y = 0.1 sec’1 6743/(2 - 3 > 1 > 4 > 6 >5) > PP(cone-plate)
Y = 0.01 sec'1 6743/(2 > 3 > 1 > 4 > 6 >5) > PP(cone-plate)
Y = 0.00001 sec'1 6743/(2 ^ 3 ^ 1 > 4 > 6 > 5 ) » P P (sandwich)
R eproduced with perm ission of the copyright owner. Further reproduction prohibited without perm ission.

1 4 8
Figure
COcoCLc/)ooCO
1010
109
108
107
106
10s104
103
102
101
11 i iiiiuj i i mi
10°
inmii| iiiiiiii| iiiinii| i i iinii| • i iiiniij i i imiij i i iiiiii| 'i i itti # 6743/0 (PP)O 6743/1 (PP/Talc/Calcite, uncoated)
□ 6743/2 (PP/Talc, uncoated)A 6743/3 (PP/Talc, coated)
SJ 6743/4 (PP/Calcite. uncoated)
0 > 6743/5 (PP/Calcite, coated)0 6743/6 (PP/Talc/Calcite. coated)
-3i mi"! il ill iiimiil i i mini i i mini i i mini immil Liimnl inline
10° 101 102 103 104 105 10s 107 10® 109 1010
S h e a r S tre s s (P a )
l.11 Shear viscosity of PP/fillers as a function of shear stress at 210°C
R eproduced with perm ission of the copyright owner. Further reproduction prohibited without perm ission.

1 4 9
From Figure 4.11 viscosity shows greater increases in
the low shear rate region. The viscosity level of the
talc/calcite mixed system was lower than the talc filled
system and higher than the calcite filled system. The
surface coated filler system showed lower viscosity than the
uncoated filler filled system. Only the three talc filled
systems (0.25 volume loadings) exhibit yield values. The
other systems do not exhibit yield values.
In Figure 4.12 we present creep data for the
talc/calcite uncoated samples. We see that yield value
appears to have a magnitude between 40 and 100 Pa.
R eproduced with perm ission of the copyright owner. Further reproduction prohibited without perm ission.

1 5 0
JOCtok _
COi_(0d)-C
CO
4
4 28 P a
2 40 P a3
2101 P a
13 7 P a
0
100 2 0 0 3 0 0 4 0 0 5 000
T im e (m in.)
Figure 4.12 Shear strain creep as a function of time at210°C for various creep levels for PP/talc/calcite 0.75/0.13/0.13 volume loading compounds
R eproduced with perm ission o f the copyright owner. Further reproduction prohibited without perm ission.

4.2.2 Oscillatory Flow Measurements1 5 1
Oscillatory measurements may be interpreted to yield
the dynamic viscosity and storage modulus.
4.2.2.1 Dynamic Viscosity
Figure 4.13 shows dynamic viscosity 7 (^) measurements
at 1 % strain as a function of frequency 03 for pure PP, 25
volume! uncoated talc, 25 volume! coated talc, 25 v%
uncoated calcite, 25 v% coated calcite, 25 v% uncoated
talc/calcite, 25 v% coated talc/calcite compounds in PP at
210 °C. It may seen that talc, calcite, talc/calcite
particles increase the level of the viscosity especially in
the low frequency region.
Surface treated particles compounds have lower dynamic
viscosity. This includes talc, calcite and talc/calcite
filled polypropylene.
R eproduced with perm ission of the copyright owner. Further reproduction prohibited without perm ission.

1 5 2
cotOcu
10® E— T T T T
10® -
104 -
103 r
102 r
101 -
TTTTI 1 I I m r i l -------1—I I I lllll I TTTTTTT1 I I I I ITTT1 I TTTTTS
10° t i t m i l l t I 1 m i l
# pp
O 1x Calcite,Talc(uncoated) E□ 2xTalc(uncoated)A 3xTalc(coated)
4xCalcite(uncoated) 1<^> 5xCalcite(coated) -
0 6xCalcite,Talc(coated)I I I I I m i l ....................Ill____ I I I ! m i l ____ |__ I I Mi l l ;
10-3 10-2 10-1 10° 101 102 103
co (rad/s)
Figure 4.13 Dynamic viscosity of PP/fillers as aof frequency at 210oC
function
R eproduced with perm ission of the copyright owner. Further reproduction prohibited without perm ission.

1 5 3
Talc particle compounds exhibit higher dynamic viscosity
than calcite particle and talc/calcite particle compounds at
the same 0.2 5 volume loadings. The data orders as 5743/(2 >
3 > 1 > 6 > 4 > 5 ) for rate sweep dynamic viscosity
measurements. This is seen in Figure 4.13. As we increase
the strain amplitude the dynamic viscosity and storage
modulus decreases as the strain amplitude increases. The
data tend to become independent of strain at strains below
2% for PP and below 1% for particle filled systems.
The dynamic viscosity of the uncoated talc compounds is
slightly higher than the coated talc compounds. The
viscosity of the uncoated calcite compound is significantly
higher than the coated calcite compound. The viscosity of
uncoated talc/calcite mixed particle compound is higher than
the coated talc/calcite mixed particle compound.
4.2.2.2 Storage and Loss Modulus
As noted in the previous section, Figure 4.14 shows the
storage modulus G' f03) as a function of frequency for pure
PP, 25 volume% uncoated talc, 25 volume% coated talc, 25
volume% uncoated calcite, 25 volume% coated calcite, 25
R eproduced with perm ission of the copyright owner. Further reproduction prohibited without perm ission.

1 5 4
volume% uncoated talc/calcite, 25 volume% coated
talc/calcite at 210 °C. The presence of particles increases
the level of H' f03) and G' (£°) especially in the low
frequency region. Figure 4.15 shows the loss modulus,
G" I0*} as a function of frequency for pure PP, 25 volume%
uncoated talc, 25 volumes coated talc, 25 volume? uncoated
calcite, 25 volume% coated calcite, 25 volume% uncoated
talc/calcite, 25 volume% coated talc/calcite at 210 °C.
For the pure PP, when 63 decreases toward zero, the
storage modulus G' f03) goes to zero. For the pure PP, when
03 decreases toward zero, loss modulus G" f03) also goes to
zero.
Figure 4.16 and Figure 4.17 show the storage modulus,
G'i03) and loss modulus G" (°3) as a function of strain (?)
for pure PP, 25 volume% uncoated talc, 25 volume% coated
talc, 25 volume% uncoated calcite, 25 vclume% coated
calcite, 25 volume% uncoated talc/calcite, 25 volume% coated
talc/calcite at 210 °C. The storage modulus G' i03) and loss
modulus G" (co) of particle filled systems are higher than
pure PP. In Figures 4.16 and 4.17 as we increase the strain
R eproduced with perm ission of the copyright owner. Further reproduction prohibited without perm ission.

1 0 6 — I l- l I I lll | I TTTTTTTj I I i I 11!i| I TTTTTTTj I TTT7TTT| i i I I 111±
10s
0
3 104i—iDno . S 103
<Dtn
2 102O-PU)
101
# ppO 1x Calcite,Talc(uncoate«) O 2xTalc(uncoated) “A 3xTalc(coated) _
4xCalcite(uncoated) E<3> 5xCalcite(coated) E
, O 6xCalcite,Ta|c(coated)m l t i t i n i t ) i t t i m i l i i i i f i m
10-3 10-2 10-’ 10° 101 102 103
0) (rad/s)
Figure 4.14 Storage modulus (G' ) of PP/fillers asfunction of frequency at 210°C
R eproduced with perm ission of the copyright owner. Further reproduction prohibited without perm ission.

1 5 6
1 06 E 1 I I I ITI1| 1 I I I I ITT] [“ "TTTTTTTj 1 I I I llllj T I ITTrilj I I I I 11 U
uCO3
105 -
104 -
3T3 103OscoCO 102 o►3
10i -
w {+}wct) y <+>
❖f S * ^ °
<£>v O
O pp@ 1x Calcite,Talc(uncoate<) 0 2xTalc(uncoated)A 3xTalc(coated)^ 4xCalcite(uncoated)<+> 5xCalcite(coated)
(+) 6xCalcite,Ta|c(coated)i N n m i l i i i m i l l i » t i f n i
10*3 10-2 10'1 10° 101 102 103
co (rad/s)
Figure 4.15 Loss modulus (G") of PP/fillers as aof frequency at 210°C
function
R eproduced with perm ission of the copyright owner. Further reproduction prohibited without perm ission.

1 5 7
amplitude the storage modulus decreases as the strain
amplitude increases. The data tend to become independent of
strain at strains below 2% for PP.
At low frequencies, in Figures 4.14 and 4.15 it is
found that in the compound system G' f63) and G" i03) remain
finite as 03 goes to zero. For 25 volume% filled talc,
calcite, and the talc/calcite particle filled system, G' i03)
and G" f03) are almost independent of frequency at low
frequencies. The data orders as 6743/(2 > 3 > 1 > 6 > 4 >
5) for rate sweep storage modulus G't03) and 6743/(2 > 3 > 1
> 6 > 4 > 5) for rate sweep loss modulus G" f03) . The data
orders as 6743/(2 > 3 > 1 > 6 > 4 > 5 ) for strain sweep
storage modulus G' f03) and 6743/ (2 > 3 > 1 > 6 > 4 > 5 ) for
strain sweep loss modulus G" f03) .
R eproduced with perm ission o f the copyright owner. Further reproduction prohibited without perm ission.

1 5 8
1 0 5 E— 1— i i 1 1 m i --------1— i i 11 m i ------- 1— r~i 1 1 rrn------- 1— i i 111 ill-------1— t t t t t o
104 =-CD
COZ>_lZ>QOLU 0 < QI O I— CO
103 =-
102 -
101 r
10°
O C X D O O O q Ih wo w o o o o H a
V „
0 5
: • PP ;
= O 1x Calcite,Talc(uncoated) -
- □ 2xTalc(uncoated)
=- A 3xTalc( coated) -
: V 4xCalcite(uncoated) 1: O 5xCalcite(coated) -
' 01 !6xCaldte,Talc(coated)
i i i ml i i i i i ml i i i Mini i I I-J—L1 U_1— i » ........
10-2 10-1 10° 101 102 103
STRAIN (%)
Figure 4.16 Strain(%) sweep of PP/fillers as a functionof storage modulus G' at frequency lrad/sec and 210°C
R eproduced with perm ission of the copyright owner. Further reproduction prohibited without perm ission.

1 5 9
10s
104
<n 103 iz>G O 2 102COCOO—I
101
10°10-2 10-1 10° 101 102 103
STRAIN (%)
Figure 4.17 Strain(%) sweep of PP/fillers as a functionof loss modulus G" at frequency 1 rad/sec at 210°C
R eproduced with perm ission of the copyright owner. Further reproduction prohibited without perm ission.
=— i— i i m ii[--1— i i m m|-- 1— ri 11 i'i11---1— i i 11 iiij---1— i rTTTTj
0 0 0 fV
V V v ^ V v 0 a A a Ao o o o o o o o o o S
O ppO 1x Calcite,Talc(uncoated) [ j 2xTalc(uncoated)A 3xTalc(coated)V7 4xCalcite(uncoated)<(^ 5xCalcite(coated)
Q 6xCalcite,Talc(coated)I I I I 1 Mil I I I t I I III I I . I M I 111 I I I I I I Ml I I I I I l i t

4.3 Discussion1 6 0
4.3.1 Particle Loading Dependence of Shear Viscosity
4.3.1.1 PS Matrix System
Figures 4.1 and 4.2 for the talc filled compound system
and Figures 4.4 and 4.5 for the calcite filled system showed
that shear viscosity increases with increasing particle
loadings and the shear viscosity increases with decreasing
shear rate as noted by various other studies on PS-CaCOj
compounds (120, 133, 232). As the shear stress decreases to
very low levels the shear viscosity was found to exhibit a
plateau as had been previously observed in our laboratories
by Osanaiye et al (136) and Araki and White (257). At still
lower shear stresses, many of the compounds exhibit yield
stresses. The viscosity increases were highest for the talc
compounds and lowest for the calcite compounds. In Figures
4.18 through 4.20 we compare the viscosity nifa/) / 7(^X)
increases at different shear rates with the well established
1 n(0) correlation for Newtonian fluids.
R eproduced with perm ission of the copyright owner. Further reproduction prohibited without perm ission.

1 6 1
105
104o§- 103
•I 102ooCO> 1010.>3s 1 0 °0tx
= I I I lllllj 1 I I 1111!| 1 I I I 11 ll| 1 TTTTTTT] i TTTTTTT] TTTTTTTl
10 •1
10-2
□ PS / TALC (95 : 05)
A PS/TALC (90 : 10)
V PS/TALC (80 :20)
O PS/TALC (60 :40)
i i » i »ni l i i m m l i i i i m u I I m i l l ] 1 1 1 1 Lilli 11 in ii i . i . m i
10-3 10-2 10‘1 10° 101 102 103 104
Shear Rate (sec1)
Figure 4.18 Relative viscosity as a function of shearrate for talc-PS compounds
R eproduced with perm ission of the copyright owner. Further reproduction prohibited without perm ission.
I I I
llffl

1 6 2
□ PS / CALCITE (95 : 05) IA PS/CALCITE (90: 10) T
V PS / CALCITE (80 : 20) :
O PS / CALCITE (60 : 40) _
1•2 1■3
Shear Rate (sec'1)
Figure 4.19 Relative viscosity as a function of shearrate for calcite-PS compounds
R eproduced with perm ission of the copyright owner. Further reproduction prohibited without perm ission.

1 6 3
10s
104
? 103
— 102 co luooCO> 101 <D >JO0) 10° a:
10-1
io-210-3 10'2 10'1 10° 101 102 103 104
S h e a r R a te ( s e c -1)
Figure 4.20 Relative viscosity as a function of shearrate for talc/calcite-PS compounds
O PS / TALC / CALCITE (60 : 20 : 20) :V PS / TALC / CALCITE (78 : 10 : 12 )_A PS / TALC / CALCITE (84 : 10 06)□ PS / TALC / CALCITE (84 04 12)O PS / TALC / CALCITE (90 05 05) -
R eproduced with perm ission of the copyright owner. Further reproduction prohibited without perm ission.

1 6 4
b8 7Welt©g6©g/Q©o;=t ? s A L> a 2??
pr-©*
£•c/ioow>a>>iH0cc
T—I I IlirTj I 1 I I llllj I 1 1 11II!| I M I llllj I i I 11 ni| I i l i n o
O 6743/1 (PP/Talc/Calate, uncoated) : nS nTi! C 2©tCS-W= \ j 6743/2 (PP/Tafc, uncoated)A 6743/3 (PP/Talc, coated)V 6743/4 (PP/Calcite. uncoated)
O 6743/5 (PP/Calcite, coated)
0 6743/6 (PP/Talc/Calate, coated)
10s■
104
103
102
101
10°
10-1
^ q - 2 I i i m i n i t » t 111 nl i i I Mi n i i i i i m i l i i m i n i i i i 11 m l i i i i m i l
10-3 10-2 10*1 10° 101 102 1 03 1 04
S h e a r R a te (s e c ’ )
Figure 4.21 Relative viscosity as a function of shearrate for talc/PP, calcite/PP, and talc/calcite/PP compounds
R eproduced with perm ission of the copyright owner. Further reproduction prohibited without perm ission.

1 6 5
Figure 4.18 presents the viscosity ratios H (<t>) Z1! (0) of
talc-PS compounds system as a function of shear rate. The
ordering of the relative viscosity is talc-PS 5 < 10 < 20 <
4 0 v% compounds.
Figure 4.19 exhibits the order of relative viscosity of
the calcite-PS compounds system. The ordering of the
relative viscosity is calcite-PS 5 < 10 < 20 < 40 v%
compounds.
Figure 4.20 exhibits the order of relative viscosity of
the talc/calcite-PS compounds system. The ordering of the
relative viscosity is talc/calcite-PS 05/05 < 04/12 - 10/06
- 10/12 < 20/20 v% compounds.
4.3.1.2 PP Matrix System
Figures 4.10 and 4.11 for talc, calcite, and
talc/calcite filled compound indicate the shear viscosity of
particle filled compounds exhibit higher shear viscosity
than PP. Shear viscosity increases with decreasing shear
rate. As shear stress decreased the viscosity showed a
plateau region and below this an apparent yield value.
R eproduced with perm ission o f the copyright owner. Further reproduction prohibited without perm ission.

1 6 6
We consider the behavior of relative viscosity
/ 7(0’?') for these compounds in Figure 4.21
Figure 4.21 exhibits the order of relative viscosity of
talc-PP, calcite-PP, and talc/calcite-PP compounds system.
The ordering of the relative viscosity is 6743x 2 > 3 > 1 >
4 > 6 > 5 compounds.
4.3.2 Yield Values
Figures 4.2, 4.5, 4.8, and 4.11 showed plateau near to
yield point below where there were no flow for PS/talc,
PS/calcite, PS/talc/calcite, PP/talc, PP/talc coated, and
PP/talc/calcite system respectively.
4.3.2. 1 PS Matrix System
Figure 4.2 shows at 20 v% and 40 v% loadings of talc
particle filled system. Figure 4.5 shows 40 v% loadings of
calcite particle filled system. Talc and calcite particles
have approximately the same particle size.
R eproduced with perm ission of the copyright owner. Further reproduction prohibited without perm ission.

167
Table 4.1 Shear and threshold yield values of particlefilled PS at 200 3C
Compounds/(Composition)
Shear Yield Value
Ys(Pa)
Threshold Yield Value
(Plateau Region) Ys,acc (Pa)
PS/Talc no no(95:05)PS/Talc r.o no(90:10)PS/Talc 36-82(flow) 245(80:20)PS/Talc 292-1009(flow) 5121(60:40)
PS/Calcite no no(95:05)
PS/Calcite no no(90:10)
PS/Calcite 7 no• Q O • ° n ' V O u . u /
PS/Calcite 239-428(flow) 2378(60:40)
PS/Talc/Calcite no no(90:05:05)
PS/Talc/Calcite 7 no(84:04:12)
PS/Talc/Calcite 7 no(84:10:06)
PS/Talc/Calcite 7 no(78:10:12)
PS/Talc/Calcite 282-958(flow) 3150(60:20:20)
R eproduced with perm ission of the copyright owner. Further reproduction prohibited without perm ission.

1 6 8
Talc has larger BET surface area than calcite, and the yield
value of talc filled system, was higher than calcite filled
system at same volume loading (0.4). At the 20 v% loadings
of talc and calcite particle filled system, the talc filled
system exhibited yield stress but calcite filled system did
not.
4. 3. 2.2 PP Matrix System
Figure 4.11 also indicate the existence of yield values
from talc particle filled system in polypropylene (PP) at 25
v%. However we did not observe yield values from calcite at
25 v%. We could see only plateau region from that
experiment which indicates there might exist a yield value
at lower shear stresses than we might measure. Our sandwich
viscometer can not detect yield values less than 30 Pa due
to machine limit. There may exist yield values at 20 v%
filled calcite particles less than 30 Pa area but our
instrument could not detect below that area. Yield values
for PP matrix system are summarized in Table 4.2.
R eproduced with perm ission of the copyright owner. Further reproduction prohibited without perm ission.

4. 3. 2.3 Comparison To Earlier Literature1 6 9
Earlier studies on small particle filled thermoplastic
melts have also suggested the existence of yield value and
estimated their values. We have summarized reported yield
values of thermoplastic compounds loaded with different
particles such as titanium dioxide, calcite, carbon black
etc. in Table 4.3. It is clear from Tables 4.1, 4.2, and
4.3 that the yield value increases with decreasing particle
size. Yield value also depend upon the particle and
thermoplastic used.
In almost all cases the earlier reports in the
literature are 'apparent' yield values determined by
extrapolation from higher shear stress data. They have
similar values to our 'threshold' yield values. Exceptions
are the work of Osanaiye et al. (127, 136), Li and White
(270) and Araki and White (257). They used creep
measurements. Apparent yield values significantly
overestimated true values as pointed out by Osanaiye et al.
(136) .
R eproduced with perm ission o f the copyright owner. Further reproduction prohibited without perm ission.

170
Table 4.2 Yield values of particle filled PP at 210 3C
Compounds Shear Yield Threshold YieldSurface Treatment value Value(Composition v%) (Pa) (Pa)PP/Talc/Calcite 37-101 239
uncoated(75:12.5:12.5)
PP/Talc 42-101 683uncoated(75:25)PP/Talc 37-101 428coated(75:25)
PP/Calcite no nouncoated(75:25)
PP/Calcite no nocoated(75:25)
PP/Talc/Calcite no nocoated
(75:12.5:12.5)
R eproduced with perm ission of the copyright owner. Further reproduction prohibited without perm ission.

1 7 1
Table 4.3 Yield values of particle filled thermoplastics
Filler Size(Mm)
Matrix Vol%
Temp(°C)
Yield Y3 (KPa)
Reference
T.O; 0 .18 LDPE 25 180 2 . 5' Minagawa and White
t,o2 0.18 HDPE 25 180 0.5' Minagawa and White
T.02 0.18 PS 25 180 1' Minagawa and White
t,o2 0.18 PS 30 180 2 .2' Tanaka and White
CaCOj 2 LDPE 30 200 0 .12' Kataoka et al.
CaC03 0.5 PS 30 180 12' Tanaka and White
CaC03 3 PS 30 180 1.5' Suetsugu and White
CaC03 0.5 PS 30 180 10' Suetsugu and White
CaC03 0.07 PS 30 180 40' Suetsugu and White
CaC03 0.8 PP 30 180 7.0' , 1.08-1.23"
Araki
CarbonBlack
0. 025 PS 20 170 12' Lobe and White
R eproduced with perm ission of the copyright owner. Further reproduction prohibited without perm ission.

1 7 2
continuedTable 4.3 Yield values of particle filled thermoplastics
Filler Size Matrix Vol Temp Yield Ys Reference( m) % (°C) (KPa)
Carbon 0.025 PS 25 170 60' Lobe andBlack WhiteCarbon 0.045 PS 20 180 25' Tanaka andBlack WhiteCarbon 0.045 PS 30 180 9' Tanaka andBlack WhiteCarbon 0.047 LDPE 20 150 15' Ma et al.BlackCarbon 0. 032 LDPE 20 150 20' Ma et al.BlackCarbon 0.029 LDPE 20 150 30' Ma et al.BlackTalc — PP 18 200 0 . 12' Chapman and
LeeCaC03 0.8 PS 40 200 2.4' ,
0.24-0.43"Present work
Talc 0.9 PS 20 200 0.24', 0.04-0.08"
Present work
Talc 0.9 PS 40 200 5.1' , 0.29-1.01"
Present work
Talc/ 0 .8/ PS 20/ 200 3.1', Present workCalcite 0.9 20 0.28-0.96"' threshold (apparent) yield value from extrapolation. " yield value from creep experiment.
R eproduced with perm ission of the copyright owner. Further reproduction prohibited without perm ission.

1 7 3
They carried out creep experiments of carbon black filled ethylene-propylene terpolymer (EPDM) at 100 "C using sandwich viscometer at very low shear stress. Our yield values as summarized in Tables 4.1 and 4.2. The talc particle filled system exhibit higher yield values compared to the calcite filled system.
4.3.3 Viscosity-Shear Stress Plateau
Figures 4.2, 4.5, and 4.11 exhibited a plateau near to
the yield point below where there was no flow. We name the
shear stress at the upper end of the plateau the 'Threshold
Yield Stress' . This threshold yield stress is very close to
the real yield value. Araki (257) described viscosity-shear
stress plateaus in calcite filled PP system, carbon black
filled EPDM systems, and PP-EPDM systems.
Earlier yield values were determined from extrapolation
(compare Table 4.3). Osanaiye and White (127, 136), Li and
White (270, 271) used creep experiments. The papers of
Osanaiye and White (127, 136) detected yield values in
carbon black compounds and indicate the existence of
plateaus. Later Araki and White (257) used same creep
experiments and observed yield values experimentally and
R eproduced with perm ission of the copyright owner. Further reproduction prohibited without perm ission.

1 1 A
found a plateau region. They (257) found yield values and
high viscosity plateaus from higher rubber content TPE(TPE-
2) and ABS(ABS-2) This plateau region corresponds to the
high stress limit of threshold stress in our experiments.
The mechanism of yield values in particle filled
compounds is of interest. It was found by Osanaiye and
White (136) that replacement of EPDM rubber with paraffin
oil at constant carbon black level in compounds leads to a
reduction of yield values. This suggests that the mechanism
of yield values involved particle-polymer networks and not
simply particle-particle compounds.
The speculation for the existence of threshold yield
value is interaction between particle-particle and particle->->/-> "1 t rrr* ea v
R eproduced with perm ission of the copyright owner. Further reproduction prohibited without perm ission.

1 7 5
4.3.4 Comparison Between Single Particle Filled System
And Mixed Particle Filled System
4.3.4.1 PS Matrix System
Figures 4.7, and 4.8 suggest 0.2/0.2 loading system
exhibit highest viscosities while 0.05/0.05 loading system
exhibit low viscosity level. The viscosity level of
0.04/0.12, 0.10/0.06/, and 0.10/0.12 loading system
apparently located lower than 0.2/0.2 loading system and
higher than 0.05/0.05 loading system however they are close
to each other. So the main conclusion is the viscosity
level mainly depends on volume loadings and then particle
shapes. The anisotropic particle increases the viscosity
level.
We compared at the same volume fraction for different
compounds. Figure 4.22 show 10 volume percent PS/talc,
PS/talc/calcite, and PS/calcite compound systems. Figure
4.23 show 40 volume percent PS/talc, PS/talc/calcite, and
PS/calcite compound systems. Figure 4.22 compare the order
of viscosity level on 10 volume percent particle filled
system talc = talc/calcite > calcite the low stress region.
R eproduced with perm ission of the copyright owner. Further reproduction prohibited without perm ission.

1 7 6
Figure 4.22 compares the order of viscosity level on 40
volume percent particle filled system talc > talc/calcite =
calcite at low stress region. The viscosity level of the
talc/calcite filled particle system is lower than the talc
filled system and higher than the calcite particle filled
system at the same volume loadings. This represents calcite
particle contribute to lower the viscosity level while the
talc particle contributes to raising the viscosity level for
both the 10 v% and 40 v% system. This seems more clear in
the 10 volume percent compound. The 40 volume percent
system seems more complicated.
4. 3. 4.2 PP Matrix System
Figures 4.10 and 4.11 exhibit the order of viscosity
level on the uncoated particle-filled system talc >
talc/calcite > calcite and also exhibit the identical order
viscosity level on a coated particle-filled system as
talc>talc/calcite>calcite. The viscosity level of the
talc/calcite filled particle system is lower than the talc
filled system and higher than the calcite particle filled
system at the same volume loadings.
R eproduced with perm ission of the copyright owner. Further reproduction prohibited without perm ission.

1 7 7
COroCL
COooCO>
TTTT1
PS/TALC (90 : 10) PS/CALCITE (90 :10) PS/TALC/CALCITE (90:05:05)
108
10° 101 102 1 03 1 04 1 05 1 06 1 07
SH E A R S T R E S S (P a)
Figure 4.22 Viscosity as a function of shear stress for10 v% talc, calcite, and talc/calcite filled PS system at 200°C
R eproduced with perm ission of the copyright owner. Further reproduction prohibited without perm ission.

1 7 8
Figure
O PS / TALC (60 : 40 ) <3• PS / CALCITE (60 : 40) !© PS/TALC/CALCITE (60:20:20)
SH E A R S T R E S S (P a)
.23 Viscosity as a function of shear stress for 40 v% talc, calcite, and talc/calcite filled PS system at 200°C
R eproduced with perm ission of the copyright owner. Further reproduction prohibited without perm ission.

1 7 9
This indicates calcite particle contribute to lower the
viscosity level while talc particle contribute to raise the
viscosity level for both coated and uncoated system.
4.3.5 Comparison Between Stearic Acid Treated Particle
Filled System And Untreated Particle Filled System
4.3.5.1 PP Matrix System
Surface treatment of the reinforcing fillers is of
importance in industrial practice. Reductions in viscosity
by surface treatment have been reported by several
investigators (105, 273). It would appear that melt flow
properties of suspensions of different types are in large
part due to different levels of inter-particle rather than
purely hydrodynamic considerations. Adding stearic acid to
calcite substantially reduces the yield values of molten
polymer compounds (133, 272). Suetsugu and White (133)
investigated stearic acid effect on calcite filled system.
They found the order of reduction increases with decreasing
particle size and decreasing shear rate. At the shear rate
of 0.063 (sec"1) and 0.16 (sec"1) the order of reduction was
R eproduced with perm ission o f the copyright owner. Further reproduction prohibited without perm ission.

1 8 0
0.7 6 and 0.64 for the 0.5 M-m and 30 volume percent calcite
particles. They presented reduction function as
tr, , rj(y ,<f>, uncoated) - rj(y,<p, coated)H( y) = ---------------------------------- (4.1)
t](y,<p, uncoated)
Tanaka and White (272) investigated stearic acid effect on
calcite filled system. The order of reduction at the shear
rate of 0.001 (sec*1) and 0.1 (sec"1) the order of reduction
was 0.92 and 0.83 for the 0.5 1% and 30 volume percent
calcite particles.
Figures 4.10 and 4.11 exhibit the order of viscosity
level on uncoated talc (x2), calcite (x4), and talc /
calcite (xl) particle filled systems and coated talc (x3),
calcite (x5), and talc / calcite (x6) filled systems. All
systems showed higher viscosity level for the untreated
system i.e. xl>x6, x2>x3, and x4>x5. The talc particle
filled system didn't exhibit large differences between
surface untreated system and stearic acid treated system.
However the calcite particle-filled system did show
considerable differences between surface untreated system
and stearic acid treated system. Stearic acid coated
R eproduced with perm ission of the copyright owner. Further reproduction prohibited without perm ission.

1 8 1
calcite particle filled system lowered viscosity level
considerably compared to talc treated system i.e. stearic
acid effect is higher on calcite than talc particle. Our
system shows the order of reduction at the shear rate of
0.01 (sec"1) and 1 (sec’1) the order of reduction was 0.85
and 0.67 for the 3.5 and 25 volume percent calcite
particles. For the talc particles the order of reduction
was 0.23 and 0.04 for the 2.5 and 25 volume percent talc
particles at the shear rate of 0.01 (sec L) and 1 (sec ') .
For the talc/calcite particles the order of reduction was
0.73 and 0.32 for the 25 volume percent talc/calcite
particles at the shear rate of 0.01 (sec *) and 1 (sec *) .
Table 4.4 summarize the reduction function for each systems.
Surface treating agents seem to reduce particle-
particle, attraction. Stearic acid emulsifies the
individual calcite particles resulting in the reduction of
particle-particle bondings.
R eproduced with perm ission of the copyright owner. Further reproduction prohibited without perm ission.

1 8 2
Table 4.4 Viscosity reduction by stearic acid coating oftalc, calcite, and talc/calcite particles in PP at 25 v%
Compounds Shear Rate (see’*) Reduction Factor
PP/Talc 0 . 01 0.23
1 0.04
PP/Talc/Calcite 0.01 0.73
1 0.32
PP/Calcite 0 .01 0.85
1 0. 67
R eproduced with perm ission of the copyright owner. Further reproduction prohibited without perm ission.

1 8 3
4.3.6 Comparison Between Complex Viscosity And Shear
Viscosity
We compared the complex viscosity with the steady
shear viscosity for polypropylene from Figure 4.24. It was
found that
n'(a) = n(y) (<» = /) (4.n
This is the well known rule of Cox-Merz (263) established
for polystyrene (PS).
For the filled compounds this is generally not the
case. Rather
n'(co)>rj(y) (a = r) (4.2)
For the pure polypropylene melts, the agreement is
quite good. However, the complex viscosity n'i0*) is much
greater than the shear viscosity in the 25 v% PP/talc,
PP/talc/calcite, PP/calcite filled system. For our talc and
calcite filled system, the Cox-Merz relation fails.
R eproduced with perm ission of the copyright owner. Further reproduction prohibited without perm ission.

Figure
102
101
10°
O pp o0 1x Calcite,Talc(uncoated)Q 0 2xTalc(uncoated)A 3xTalc(coatecl)V 4xCalcite(uncoated)< 0 SxCalcite(coated)
I O Steady Shear Viscosity q 6xCalcite,Talc(coated)
E O Complex Viscosity
ill i i i i i ml i i i i i ml » » mil t i i i mil | [ 1 j llll10-3 10-2 10-1 10° 101 102 103
co (rad/s ) /Shear Rate (sec ~)
1.24 Comparison between complex viscosity andshear viscosity of PP/fillers as a function of frequency/shear rate at 210°C
R eproduced with perm ission of the copyright owner. Further reproduction prohibited without perm ission.

1 8 5
The Cox-Merz relation also fails in the stearic acid added
talc, calcite, and talc/calcite filled system. The failure
of the Cox-Merz relation for small particle filled polymer
melts was first reported by Nakajima et al. (274, 275).
Later Suh (6i5) reported the failure of the Cox-Merz relation
from 40 v% talc-PP and talc-PPS compounds.
Clearly, the resistance to flow for small strains is
much larger than for large amplitude flows. It is clearly
associated with forces between the particles of the talc,
calcite, and talc/calcite network.
4.3.7 Comparison Between Talc Particle Filled System and
Calcite Particle Filled System
Figure 4.25 exhibited the comparison between talc and
calcite particles at the same loadings in a polystyrene (PS)
filled system. The talc particle exhibited higher viscosity
level than the calcite at low shear stress range but
exhibited a lower viscosity level at high shear stress
range.
R eproduced with perm ission o f the copyright owner. Further reproduction prohibited without perm ission.

1 8 6
1010 |-rr rmnj— i i rmi— i i i iimii— i i i niiij— i i i unij— i i mm|— mrrr
COCDCL
COooCO>
109
108
107
106
105
104
103
102
□ 95 :05A 90: 10 V 80:20 O 60 :40
0 PS (200°C)I □ PS/TALC■ PS / CALCITE1 i i mill I i i mill i ' ' mill i i i mill i i i i mill I I I null
10° 101 102 103 104 105 106 107SH EA R S T R E S S (P a)
Figure 4.25 Viscosity as a function of shear stress fortalc and calcite filled system at 200°C
R eproduced with perm ission of the copyright owner. Further reproduction prohibited without perm ission.

1 8 7
M e c h a n i s m
The mechanism of yield value in particle filled
compound melts is considered to be particle-particle
interaction, which leads to agglomeration and formation of
3-dimensional network structures. Similar explanations are
widely discussed in the literature (108, 114, 120, 129, 230,
232) also. These compounds form such structures due to
particle-particle interaction above critical concentration.
The 3-dimensional network structures of talc compounds
should depend upon direction. This anisotropic
characteristics of the talc particle leads to different
yield values with stresses being applied to different
directions.
Direction dependence of yield values for plastic
deformation of anisotropic solids has been reported in the
literature for metals and solid polymers (259-262) . The
results indicate the high dependence of yield values with
direction. Figure 4.25 may represent above phenomenon for
talc and calcite compounds.
R eproduced with perm ission of the copyright owner. Further reproduction prohibited without perm ission.

CHAPTER V
ELONGATIONAL FLOW RHEOLOGICAL MEASUREMENTS
5.1 Introduction
In this chapter, we describe an experimental study of
the elongational rheological properties of talc, calcite and
mixed particle compounds of polystyrene. Our uniaxial
extension flow study includes (i) elongational flow in a
silicone oil bath (SBM), (ii) elongational flow in a heated
chamber containing nitrogen gas (NCM).
The studies presented in this chapter are based upon
the polystyrene(PS) compounds described in Chapter 4.
188
R eproduced with perm ission of the copyright owner. Further reproduction prohibited without perm ission.

5.2 Results1 8 9
5.2.1 Silicone Oil Bath Elongational Flow (SBM)
5.2.1.1 Polystyrene (PS)
The elongational viscosity of PS system is shown as a
function of (a)log time/(b)linear time at various elongation
rates in Figure 5.1a,b. For the system Figure 5.1a the
elongational viscosity was independent of time at long
times. The steady state asymptotes of the values of
elongational viscosity are considered to be the steady state
elongational viscosity.
The transient elongational viscosity increases and
reaches a steady state and then decrease with time at low
stretch rate. The decrease of elongational viscosity
behavior is due to the exponential reduction of filament
cross-section area at constant stretch ratio. After the
steady state, in the long time, the values of elongational
viscosity seem to decreases. This behavior probably means
the beginning of filament failure.
R eproduced with perm ission of the copyright owner. Further reproduction prohibited without perm ission.

Visc
osity
(P
a.s)
V
iscos
ity
(Pa
s)
1 9 0
103
10210-1
1 0 7 I — ' - r i-Tn n i : r i i . m f
106
105
104
10°
mi| i tii i:u| :— t i i rtty
O 5.038x1 o'4 (s’1) 3r i -4 -1 i^ 7.832x10 (S ) IA -3 -1^ 1.076x10 (V 2.320x1 O'3 -0 -3 -13.950x10 (S )
I i(s'1) 1
101 102
(a) Time (sec)
103 104
107
106
10s
104
1030 200 400 600 800
(b) Time (sec)
7.832x10 (s )1.076x1 o’3 (s'1) -2.320x1 o'3 (s'1) :
-3 -1 ■3.950x10 (S ) -
Figure 5.1 Elongational viscosity measurements of PSsystem at 200°C
R eproduced with perm ission of the copyright owner. Further reproduction prohibited without perm ission.

5. 2.1.2 Calcite Compounds1 9 1
The elongational viscosities of 5, 10, 20, 40 v%
calcite filled PS compounded systems are shown as a function
of (a)log time, (b)linear time at various elongation rates
in Figures 5.2a,b, 5.3a,b, 5.4a,b, and 5.5a,b. For the
system Figures 5.2a, 5.3a, 5.4a, and 5.5a the elongational
viscosity was independent of time. The steady state
asymptotes of the values of elongational viscosity are
considered to be the steady state elongational viscosity.
The elongational viscosity increases and reaches a
steady state and then decreases with time at low stretch
rate.
Figures 5.6 and 5.7 summarize the elongational
viscosity as a function of elongational rate/stress for the
calcite filled systems. The steady state elongational
viscosity for the compounds usually decreases with increases
in elongation rate. The elongational samples of 40 v%
breaks before the elongational viscosity reaches a steady
state.
R eproduced with perm ission of the copyright owner. Further reproduction prohibited without perm ission

1 9 2
Figure 5.2
C0<0CL‘358(0>
5.038x10 (s )□ -4 -17 .8 3 2 x 1 0 (S )
A - 3 - 1“ 1 .076X 10 (S )
V 2.320x10"3 (s'1)O 3.950x1 O'3 (s'1)
106
-3
10210- 10° 101 102
(a) Time (sec)
103 104
COCOCL
CO8 S2 >
5.038x10 (s ) 7.832x10⁻⁴ (s'1) i Sxio ts'1) 2.320x1 O'3 (s'1) 3.950X10"3 (s '1)
10®
r
200 400 600(b) Time (sec)
800
Elongational viscosity measurements of PS/calcite (95/05 v%) system at 200°C
R eproduced with perm ission o f the copyright owner. Further reproduction prohibited without perm ission.

Figure 5.3
» 104 >
103
O - 4 - 1& 5.038x10 {s )n -4 -1U 7.832x10 (S )A 1.076x10‘3 (s’1) 1
- 3 - 1 1V 2.320x10 (s ) 1O a.osoxiois'1) :
102 10-1 10° 101 102
(a) Time (sec)
103 104
10®
^ 5.038x10 IS )— -4-1^ 7.832x10 (s )A -3 -1** 1.076x10 (S )
O 3.950x1 O' (s’ )
103 600 800200 4000(b) Time (sec)
Elongational viscosity measurements of PS/calcite (90/10 v%) system at 200°C
R eproduced with perm ission of the copyright owner. Further reproduction prohibited without perm ission.

Figure 5.4
CO8CO5 104
103
10210-
□t, o
10°
G□AVo
5.038x1 O'4 (s'1) 7.832x1 O'4 (s*1) 1.076x10"3 (s"1) 2.320x10*3 (s"1) 3.950x1 O'3 (s’1)
101 102
(a) Time (sec)
103
CO<0
CO8CO5
10®
200 400 600(b) Time (sec)
800
Elongational viscosity measurements of PS/calcite (80/20 v%) system at 200°C
R eproduced with perm ission of the copyright owner. Further reproduction prohibited without perm ission.

1 9 5
Figure 5.5
107
106
c/>« 10s■S'<n8 104
103
102
TTTTTTp
o
oV
o
5.038x1O'4 (s*1) 7.832x10"4 (s'1) 1.076x10*3 (s ')
V 2.320x1O'3 (s '1) 3.950x1 O'3 (s '1)
_1_■ ""ill__1 1 Li
o□A
o
10-1 10° 101 102 (a) Time (sec)
103 104
107
106
rr
<0CL105
104
103
Q
1
5.038x10⁻⁴ (s'1) □ 7.832x10⁻⁴ (s '1)^ 1.076x1 O'3 (s'1) V 2.320x1 O'3 (s'1) O 3.950x1 O'3 (s'1)
200 400(b) Time (sec)
600 800
Elongational viscosity measurements of PS/calcite (60/40 v%) system at 200°C
R eproduced with perm ission of the copyright owner. Further reproduction prohibited without perm ission.

1 9 6
Figure 5.
109# PS□ PS / CALCITE (95 : 05 V%) A PS / CALCITE (90 : 10 V%) V PS / CALCITE (80 20 V%) <3> PS / CALCITE (60 40 V%)
106
10°10-6
ELONGATION RA TE ( s e c '1)
6 Elongational viscosity as a function ofelongational rate for calcite filled system at 200°C
R eproduced with perm ission o f the copyright owner. Further reproduction prohibited without perm ission.

1 9 7
C O
C L
U J
109
108
=— i—i i~rm rj----- 1—i ii i ni|----- 1—i i 11 nij i i rn ni| i r r m i
C O 107OoC O > 106 _l < z oF 105 <CD
104
103
E E J L
PS□ PS/CALCITE (95 A PS/CALCITE (90
PS/CALCITE (80 <$> PS/CALCITE (60
05 V%)I 10 V%L_ 20 V%) \40 v%):
■ I I I I m l I I m i n i i i i i i m l i i i l i i i i I i i i m i l l
10° 101 102 1 03 1 04 1 05
ELONGATION S T R E S S (P a)
Figure 5.7 Elongational viscosity as a function ofelongational stress for calcite filled system at 200°C
R eproduced with perm ission of the copyright owner. Further reproduction prohibited without perm ission.

198
Table 5.1 Elongational yield values of particle filled PS at200 °C
Compounds(Composition)
Silicone Bath 'Apparent'
Elongational Yield value (SBM) Yei.apo
Nitrogen Bath Creep
Elongation Yield value
(NCM) YeiPS/Talc no no(95:05)PS/Talc no no(90:10)PS/Talc < 287 221-487(80:20)PS/Talc < 1946 2977-10864(60:40)
PS/Calcite no no(95:05)
PS/Calcite no no(90:10)
PS/Calcite no no(80:20)
PS/Calcite < 1900 770-2961(60:40)
PS/Talc/Calcite no no(90:05:05)
PS/Talc/Calcite no no(84:04:12)
PS/Talc/Calcite no no(84:10:06)
PS/Talc/Calcite no no(78:10:12)
PS/Talc/Calcite < 1939 2682-6486(60:20:20)
R eproduced with perm ission o f the copyright owner. Further reproduction prohibited without perm ission

1 9 9
The result for the silicone oil bath method (SBM)
suggests by extrapolation an elongational flow yield value
for 0.4 volume loading of calcite was 1900 Pa. Table 5.1
summarizes the elongational yield values.
5 . 2 .1. 3 Talc Compounds
The elongational viscosities of the 5, 10, 20, 40 v%
talc filled PS compounded systems are shown as a function of
(a)log time, (b)linear time at various elongation rates in
Figures 5.8a,b, 5.9a,b, 5.10a,b, and 5.11a,b respectively.
The elongational samples of the 40 v% breaks before the
elongational viscosity reaches a steady state. For the
system Figures 5.8a, 5.9a, 5.10a, and 5.11a the elongational
viscosity was independent of time at long times. The long
time asymptotes of the values of elongational viscosity are
considered to be the steady state elongational viscosity.
Figures 5.12 and 5.13 summarize the elongational
viscosity as a function of elongational rate/stress for talc
filled system.
R eproduced with perm ission of the copyright owner. Further reproduction prohibited without perm ission.

200
Figure 5 .8
107
106
W«S 10sQ_
v>OOcfl 104
103 r
10210-1
□ <#
o□AV
3-i
45.038x1 o '4 (s'1) 7.832x1 O'4 (s’1)1.076x10*3 (s"1) -= 2.320x10*3 (s'1)
O 3.950x1 O'3 (s'1)">»ll i- ' ' »»»»< '
10° 101 102 (a) Time (sec)
103 104
cn(OQ.£coooCO
10s
w 5.038x10 (s )Q 7.832x10"4 (s'1) A - 3 - 1^ 1.076x10 (s )V 2.320x1 O'3 (s'1)
- 3 - 1V 3.950x10 (s )
800600200 4000(b) Time (sec)
Elongational viscosity measurements of PS/talc (95/05 v%) system at 200°C.
R eproduced with perm ission of the copyright owner. Further reproduction prohibited without perm ission.

Figure 5.9
v O -4 -1 |^ 5.038x10 (s )— i - 4 - 1 5u 7.832x10 (s ) ^^ 1.076x1o'3 (s'1) ;V 2.320x1 o'3 (s'1) _ / \ -3 -1 =<y 3.950x10 (s ) :
' » ' - ' i l i i i t iLJnl I I I f l l l l i I— i—I 11111
10-1 10° 101 102 103 104 (a) Time (sec)
COCO
Q_
Q 7.832x10 (s'
O 3.950x1o'3 (s '1) -
103 8006004000 200(b) Time (sec)
Elongational viscosity measurements of PS/talc (90/10 v%) system at 200°C.
CO
§ 104
103
R eproduced with perm ission of the copyright owner. Further reproduction prohibited without perm ission.

103
10210-1 10°
□□o
5.038x10 (S ) 37.832x10 '4 (s"1) ]
-3 -1 |1.076x10 (S ) J
- 3 - 1 3 2.320x10 (s ) 33.950x10⁻³ (s '1) 1
101 102 (a) Time (sec)
103 104
107 T
co0.
CO8CO>
106
£ 10s
104
103
□o
-4 -15.038x10 (S j
-4 -17.832x10 (S )1.076x1 O'3 (s '1)2.320x10‘3 (s '1)3.950x1 o"3 (s '1)
200 400 600(b) Time (sec)
800
Figure 5.10 Elongational viscosity measurementsPS/talc (80/20 v%) system at 200°C.
R eproduced with perm ission of the copyright owner. Further reproduction prohibited without perm ission.

2 0 3
e-|| *?£££▼ LaS-H-AS©^*;©^?©©1
107 F
106
m 10s a.i
i 104 >
103 k-
102
Q
V
i i i m p 1 t i i i mi j i i m mj |
A
- 4 - 1U 5.038x10 (s )r i - 4 - 1^ 7.832x10 (S )^ 1.076x1 O'3 (s'1)V 2.320x1 O'3 (s'1)O 3.950x10‘3 (s '1)
10-1 10° 101 102 103(a) Time (sec)
i
j104
£ 105
-4 -1^ 5.038x10 (S )r-l -4 -1^ 7.832x10 (S lA - 3 - 1 - s^ 1.076x10 (S ) 3V 2.320x10'3 (s '1) jO 3.950x1 O'3 (s '1) "
200 400 600(b) Time (sec)
800
Figure 5.11 Elongational viscosity measurements ofPS/talc (60/40 v%) system at 200°C.
R eproduced with perm ission of the copyright owner. Further reproduction prohibited without perm ission.

2 0 4
The results of the silicone oil bath method (SBM)
measurements 'suggest' apparent elongational flow yield
measurements for 0.2 volume loading of talc of order 290 Pa,
and for 0.4 volume loading of talc was the larger of order
1950 Pa. Table 5.1 summarizes the 'suggest' elongational
yield values.
5.2.1.4 Talc / Calcite Compounds
The elongational viscosities of 05/05, 04/12, 10/06,
10/12, 20/20 v% mixed particle talc/calcite filled PS
compounded systems are shown as a function of (a) log time,
(b)linear time at various elongation rates in Figures
5.14a,b, 5.15a,b, 5.16a,b, 5.17a,b, and 5.18a,b. The
elongational viscosity increases and reaches a steady state
and then decrease with time at low stretch rate.
For the systems of Figures 5.14a, 5.15a, 5.16a, 5.17a, and
5.18a the elongational viscosity was independent of time at
long times. The long time asymptotes of the values of
elongational viscosity are considered to be of steady state
elongational viscosity.
R eproduced with perm ission of the copyright owner. Further reproduction prohibited without perm ission.

2 0 5
The steady state elongational viscosity for the
talc/calcite compounds usually decreases with increases in
elongation rate. The elongational sample of 0.2/0.2 volume
loading of talc/calcite filled system breaks before the
elongational viscosity reaches a steady state. This
behavior implies the filament failure.
Figures 5.19 and 5.20 summarize the elongational
viscosity as a function of elongational rate/stress for talc
filled systems.
The silicone oil bath method (SBM) elongational flow
measurements suggest apparent yield values for the 0 .2/0.2
volume loading of talc/calcite of 1900 Pa. The steady state
elongational viscosity for the talc/calcite compounds
decreased as elongation rate increases. Again Table 5.1
summarizes the elongational yield values.
R eproduced with perm ission of the copyright owner. Further reproduction prohibited without perm ission.

2 0 6
Figure
□ PS / TALC (95:05 v%) -A PS/TALC (90 : 10 v%) IS? PS / TALC (80 : 20 v%) -<£> PS / TALC (60 : 40 v%)
CO(6
EE □ □
10°
ELONGATION R A T E (S '1)
.12 Elongational viscosity as a function ofelongational rate for talc filled system at 200°C
R eproduced with perm ission of the copyright owner. Further reproduction prohibited without perm ission.

2 0 7
1010
109
108
COa 107
£ 106COOGO 105 >
104
103
102
£ r r i i t iiti— i i i i inij— i i i i iuij— i 11 n n i |— i i im r i ] i i 11mij i i m i ?
03
□ PS/TALC (95 A PS/TALC (90 S-/ PS/TALC (80 <3> PS/TALC (60
05 v%)10 v%) - 20 v%)40 v%)
I I I mill i I I I i l l mil i i l 'Hill i i i mill i i I I I I mil
10° 101 102 1 03 1 04 1 05 1 06 1 07ELONGATIONAL S T R E S S (P a)
Figure 5.13 Elongational viscosity as a function ofelongational stress for talc filled system at 200°C
R eproduced with perm ission o f the copyright owner. Further reproduction prohibited without perm ission.

2 0 8
107 - IT] ! I I 1 III]
(0(0Q.inoo(0
106 r
10s
104
103
10210-
o
10° 101 Time (sec)
0 5.038x1 o"4 (s'1)□ 7.832x1 o"4 (s'1)□ 1.076x1 O'3 -1
(S )V 2.320x1 O’3 -1
(S )o 3.950x1 O'3 -1
(S )! J mi 1 I 1 1 Ultl :
102 103 104
toCL
tnooin
107
106
2* 10s
104
103
^ O O r
200 400Time (sec)
5.038x1 O'4 (S*
7.832x1 o"4 (S* 3 1.076X1 O'3 (s'V 2.320x10*3 (s' O 3.950x1 O’3 (s'
600
Figure 5.14 Elongational viscosity measurements ofPS/talc/calcite (90/05/05 v%) system at 200°C.
R eproduced with perm ission o f the copyright owner. Further reproduction prohibited without perm ission.

8 io4 </>
103 r
102IQ- 100
0□AVo
5.038x1 o"4 (s '1) 7.832x10"”* (s '1) 1.076x10"3 (s '1) 2.320x10*3 (s '1) 3.950x10"3 (s'1)
1 0 1 102
Time (sec)
103 10“
1e+7
1e+6'35*(0a
1e+5tnootn>
1e+4
1e+30 200 400 600
Time (sec)
mV
o 5.038x10 (s" ) .S 7.832x1 o"4 (s"1)A - 3 - 1^ 1.076x10 (s )T77 “3 *1V 2.320x10 (s )
-3 -1 V 3.950x10 (s
Figure 5.15 Elongational viscosity measurements ofPS/talc/calcite (84/04/12 v%) system at 200°C.
R eproduced with perm ission of the copyright owner. Further reproduction prohibited without perm ission.

210
107
t106
CO
s. io=CO8 104OT
103
102 aulL10- 10°
"T TTllip'
o
.038x10 (s )□A
7.832x10"4 (s’’)1.076x10"3 <s’1)_3 -y _
V 2.320x10 (s’ ) j O 3.950X10’3 (s’1)
101 102
Time (sec)103 104
107
COreo.COoo(0
106
£ 10s
104
103
M
oO□AVo
-c -1 5.038x10 (s )7.832x1 O’4 (s*1) '1.076x1 O*3 (s’1)2.320x1 O'3 (s’1)
-3 -1 3.950x10 (s )I ■ ' ' '200 400Time (sec)
600
Figure 5.16 Elongational viscosity measurements ofPS/talc/calcite (84/10/06 v%) system at 2 00°C.
R eproduced with perm ission o f the copyright owner. Further reproduction prohibited without perm ission.

211
r r 11 h i m i i i rrmj- t—r r i m i j i—rr rm T j-
g 105 >*S 104 fern p>
103
102
o V
n - 4 - 1U 5.038x10 (S ) 3r*l -4 -1^ 7.832x10 (S ) JA - 3 - 1^ 1.076x10 (S )V 2.320x1 O'3 (s'1)O 3.950x1 O'3 (s'1)
"' li «tmi___ L.,1 { 11
10-1 10° 101 102 1 03 1 04
Time (sec)
1e+7 e i r
1e+6
~ 1e+5
1e+4
1e+3
COCO
*c758CO>
Q q 23SG
I- Srs - 4 - 1- 5.038x10 (S )
2 7.832x1 O'4 (s '1) A 1.076x1 O'3 (s’1) V 2.320x1 O'3 (s '1) 0 3.950x1 O'3 (s '1)
200 400
Time (sec)
600
Figure 5.17 Elongational viscosity measurements ofPS/talc/calcite (78/10/12 v%) system at 200°C.
R eproduced with perm ission of the copyright owner. Further reproduction prohibited without perm ission.

212
107 e-r-
106
<n« 10s Q_
CO8 104
103 -
102
t t t i iii "~i—r-r 11 n n 1 i m i mi ( i i 11 mi
oV□VA
- 4 - 1^ 5.038x10 (s )n - 4 -1u 7.832x10 (s )A 1.076x10"3 (s ')V 2.320x1 O'3 (s‘1)O 3.950x1 O'3 (s '1)
■ i mil ■ i i ■ < ■ i ml
10-1 10° 101 102 103 104 (a) Time (sec)
106
3 1V 2.320x10' (s' ) j/S -3 -1 fV 3.950x10 (s ) ]
8006004002000(b) Time (sec)
Figure 5.18 Elongational viscosity measurements ofPS/talc/calcite (60/20/20 v%) system at 200°C .
R eproduced with perm ission of the copyright owner. Further reproduction prohibited without perm ission.

2 1 3
COCOQ_
COOOCO>
<ozo—ILU
109
10®
107
10®
10s
104
= I— 1 | | 11 Uj I I I I I 1111 I I I T 11111 i i I i 11111 i i i i t i II j i i t 1 11 d
□ PS / TALC / CALCITE (90:05:05 V%)A PS/TALC/CALCITE (84:04:12 V%) -^ PS/TALC/CALCITE (84:10:06 V%) ^<3> PS/TALC/CALCITE (78:10:12 V%) E0 PS/TALC/CALCITE (60:20:20 V%)
103
00
i i i 11 m l i i i 11 ml i i i 11 m l i i i i m i l i i i 11 m l i i i i m i
10-e 10-s 10-4 10-3 IQ-2 10- 10°
ELON G ATIO N RATE (s e c )
Figure 5.19 Elongational viscosity as a function ofelongational rate for talc/calcite filled system at 200°C
R eproduced with perm ission o f the copyright owner. Further reproduction prohibited without perm ission.

2 1 4
109
S 108
C O 107ooC O> 106 _l < z op 10s <CD
3 104LU
10310° 101 102 1 03 1 04 1 0s
ELO N G A TIO N S T R E S S (P a)
T— TTTTTTT]--------- 1— TTTTTTTj 1 I I I I 1111 I I l I I II11 i 1 i m i l
□ PS /TALC /CALCITE (90:05:05 V%) ;A PS / TALC / CALCITE (84:04:12 V%) -^ 7 PS / TALC / CALCITE (84:10:06 V%) -<0> PS / TALC / CALCITE (78:10:12 V%) :0 PS / TALC / CALCITE (60:20:20 V%) ;
i i i i 11 i l l i i i i i m l i i i i i m l i i t i u n i i i i i n n
Figure 5.20 Elongational viscosity as a function ofelongational stress for talc/calcite filled system at 200°C
R eproduced with perm ission of the copyright owner. Further reproduction prohibited without perm ission.

5.2.2 Nitrogen Bath Elongational Flow (NCM)2 1 5
5.2.2.1 Polystyrene (PS)
We could not make measurements of the elongational
behavior because the PS filament samples failed in all the
experiments, no matter how small the applied load. This
indicates that polystyrene does not exhibit a yield stress
in elongational flow.
5.2.2.2 Calcite Compounds
The nitrogen gas chamber method (NCM) elongational flow
yield studies indicates that filament samples with 5, 10,
and 20 volume percent calcite fail as did the polystyrene.
However the 40 volume percent sample behaved as if it was a
solid at low applied stresses.
The nitrogen gas chamber method (NCM) elongational flow
measurements indicated that for the 0.4 volume loading
calcite sample, the yield stress was 770-3000 Pa (see Table
5.1) .
R eproduced with perm ission of the copyright owner. Further reproduction prohibited without perm ission.

5 .2.2.3 Talc Compounds2 1 6
The 0.05 and 0.10 volume loading talc compounds behaved
as did the similar low concentration calcite compounds.
They failed in all experiments.
The 0.2 and 0.4 volume loading compounds exhibited
different behavior. They responded as soft solids at low
stresses.
The nitrogen gas chamber method (NCM) elongational flow
measurements indicated that for the 0.2 volume loading talc
sample, the yield stress was 221-487 Pa and for the 0.4
volume loading talc it was about 3000-10,864 Pa (see Table
5.1) .
5.2.2.4 Talc/Calcite Compounds
The mixed particle compounds with composition
0.05/0.05, 0.04/0.12, 0.10/0.06, and 0 .10/0.12 all failed in
all elongational flow experiments. These materials would
seem not to have yield value.
The nitrogen gas chamber method (NCM) elongational flow
yield measurements indicated that for the 0 .2/0.2 volume
R eproduced with perm ission of the copyright owner. Further reproduction prohibited without perm ission.

2 1 7
loading talc/calcite the elongational yield stress was about
5400-6500 Pa (see Table 5.1).
5.3 Discussion
5.3.1 Polystyrene (PS)
5.3.1.1 Comparison To Shear Viscosity And Earlier
Investigation
From Figure 5.21 for the PS melt, the ratio [ ei/ s] is
about 3 at low deformation rates and increased at higher
rates.
Experimental studies of uniaxial elongational flow
behavior of polymer melts in which stable elongational flow
is found generally show that at low stretch rates the
elongational viscosity goes asymptotically to three times of
shear viscosity (263, 265-267). This is identical to
Trouton' theoretical and experimental result for Newtonian
fluids (268). Ide and White (263), Munstedt (264), and
Vinogradov (266, 267) investigated PS melt systems and found
them to exhibit this behavior. Our results indicate an
R eproduced with perm ission of the copyright owner. Further reproduction prohibited without perm ission.
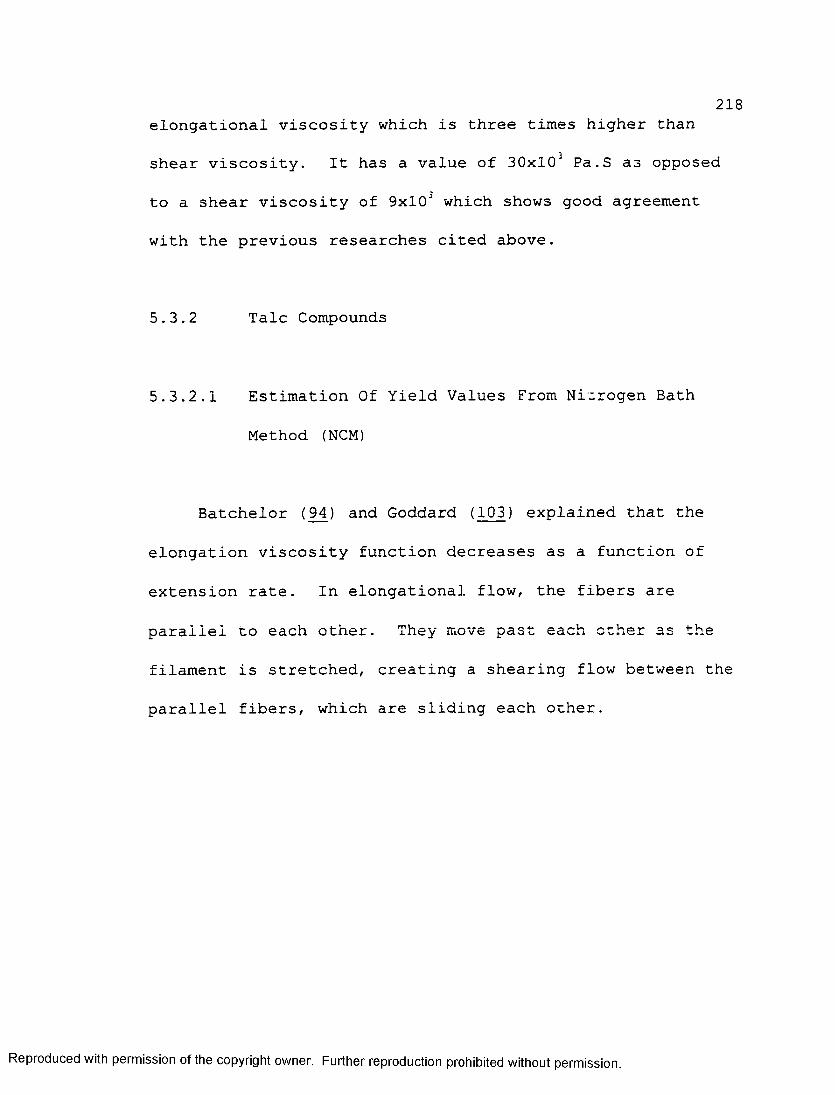
2 1 8
elongational viscosity which is three times higher than
shear viscosity. It has a value of 30xl03 Pa.S as opposed
to a shear viscosity of 9xlOJ which shows good agreement
with the previous researches cited above.
5.3.2 Talc Compounds
5.3.2.1 Estimation Of Yield Values From Nitrogen Bath
Method (NCM)
Batchelor (94) and Goddard (103) explained that the
elongation viscosity function decreases as a function of
extension rate. In elongational flow, the fibers are
parallel to each other. They move past each other as the
filament is stretched, creating a shearing flow between the
parallel fibers, which are sliding each other.
R eproduced with perm ission of the copyright owner. Further reproduction prohibited without perm ission.

2 1 9
<Zof-<CDzo_lLLJXsXCO
106 F-CO(dCL
CO 10s O O CO>
104 -
103 -
— i i m 111 i— i— i i i 1111 i i i i i i rri i i i i t 11,
o % © o
o O o o oo o
; O PS Shear Viscosity
O PS Elongational Viscosity(SBM)
102 I I I I I I III L I L1 I f i l l I I I I I I I I I______ I I I 1 I t It
10° 101 102 103 104
SH EAR/ELON GATIO NAL S T R E S S (P a)
Figure 5.21 Shear/elongational(SBM) viscosity as afunction of shear/elongational stress rate for PS at 200°C
R eproduced with perm ission of the copyright owner. Further reproduction prohibited without perm ission.

220
The elongational flow of polymer melts filled with
small particles have been investigated by White and his
students (106, 135, 272). In studies of carbon black (106,
272)r calcite (135, 272), and titanium dioxide (135) filled
melts, the elongational viscosity function was found to
exhibit a yield value. Lobe and White (106) found Yei is
1.2Ys for their carbon black filled polystyrene melt. The
studies of Tanaka (272) and Suetsugu (135) with White find
that Yel is about 1.8 Ys for several compounds that they
studied.
We compared the nitrogen gas filled chamber method
elongational yield stress and the shear yield stress. When
we compared elongational yield values measured from the
nitrogen gas bath method and shear yield values from
threshold values, the values of Yei/Ys at 0.2 volume loading
talc compound system gives 9.8 and Yei/Ys at 0.4 volume
loading talc compound system gives 10.0. The values of
Yei/Y3 for talc filled systems are higher in the 0.4 volume
loading than the 0.2 volume loading.
Table 5.1 summarizes elongational yield values.
R eproduced with perm ission of the copyright owner. Further reproduction prohibited without perm ission.

2215.3.2.2 Comparison Of Silicone Bath Data To Shear
Viscosity
We plot the elongational (SBM) and shear viscosity
variation with talc volume loadings as a function of
shear/elongational rate/stress in Figure 5.23 and Figure
5.24 using the traditional method (silicone oil bath
elongational method) . The values of at a stretch and
shear rate of 0.001 (sec-1) are 4.8 at 0.05 volume loading,
3.6 at 0.1 loading, 0.9 at 0.2 loading, and 0.2 at 0.4
loading talc. The elongational viscosity exhibit unusually
lower values than shear viscosity especially at higher
loadings (0.2, 0.4). This peculiar behavior suggested
further investigation of the talc particle's absorption of
silicone oil.
We also compared the apparent yield stresses determined
by extrapolation. The values of Yei,app/Y3,app at 0.2 volume
loading talc compound system gives 0.4. The value of
Yei,app/Ys,app at 0.4 volume loading talc is 0.8. These are
also anomalously low.
R eproduced with perm ission of the copyright owner. Further reproduction prohibited without perm ission.

222
5.3.2. 3 Investigation Of Silicone Oil Absorption
We immersed talc compounds into 200 °C silicone oil for
three minutes and measured the sample's weight changes.
Talc compounds absorbed silicone oil up to 18.5 wt%.
Calcite compounds absorb oil up to 9.6%. And talc/calcite
compounds absorb oil up to 14.5%. Table 5.2 summarizes the
talc, calcite, and talc/calcite compounds' silicone oil
absorption.
This absorption of silicone oil seems to be the reason
why the talc compound viscosity exhibited the low values of
rlel/rl3 based upon silicone bath measurements.
R eproduced with perm ission of the copyright owner. Further reproduction prohibited without perm ission.

2 2 3
CO(0
CL
COOOCO>
oH<oZo—IUJQCsXCO
o11O1009
08
07
06
05
04
o3o2o10°
11 nuiij ~i i imuj "ninifl| imiu~i iinnj lining i iiinii|' i iiinii| iTiitiiq lining lima□ PS/TALC (95 : 05 V%) _j A PS/TALC (90:10V% ) \ V PS/TALC (80 :20V % )1 O PS / TALC (60 : 40 V%) -
" □ Shear Viscosity
- □ Elongational Viscosity(SBM)
i i mini i i niial i i mill i i mill iimJ imJ i mini iiimnl iniiiiil i i iiniJ iiimh
10’7 10"6 10'5 10"410'3 10‘2 10'1 10° 101 102 103 1 04SHEAR/ELONGATIONAL R A TE ( s e c '1)
Figure 5.23 Shear/elongational(SBM) viscosity as afunction of shear/elongational rate for talc filled system at 200°C
R eproduced with perm ission of the copyright owner. Further reproduction prohibited without perm ission.

2 2 4
COCOQ.
COOOCO>_l<zoI-<CDzo—ILUi r
xCO
1010
109
108
107
106
105
104
= i 111mi|— r m u ii|— i 11 iiiiii— i 11 niiij— r r r m n j — i 11 niiij i 11 unij m riia
□ PS / TALC(95:05)A PS/TALC(90:10)V PS / TALC(80:20) o PS / TALC(60:40)
a 103
102
=_ A Shear Viscosity
A Elongational Viscosity(SB' I I mill i i I mill i i m i n i i i i mill i l m i n i i ll ll ll 1 I I mill— I LI l ll lt
10° 101 102 1 03 1 04 1 05 1 06 1 07 1 08
SHEAR/ELO N GATIO NA L S T R E S S (Pa)
Figure 5.24 Shear/elongational(SBM) viscosity as afunction of shear/elongational stress for talc filled system at 200°C
R eproduced with perm ission of the copyright owner. Further reproduction prohibited without perm ission.

2 2 5
Table 5.2 Silicone oil absorption from compounded material
Material Weight Increase (%)PS/Talc 3.7(95/05)PS/Talc 4.9(90/10)PS/Talc 11.8
(80/20)PS/Talc 18 . 5(60/40)
PS/Calcite 3.1(95/05)
PS/Calcite 3.9(90/10)
PS/Calcite 6.2
(80/20)PS/Calcite 9.6(60/40)
PS/Talc/Calcite 4.3(90/05/05)
PS/Talc/Calcite 5.6(84/04/12)
PS/Talc/Calcite 7 . 6(84/10/06)
PS/Talc/Calcite 8 . 9(78/10/12)
PS/Talc/Calcite 14.5(60/20/20)
R eproduced with perm ission of the copyright owner. Further reproduction prohibited without perm ission.

2 2 6
5.3.2.4 Shear Flow Characterization of SBM Elongational
Flow Specimens
We carried out shear flow measurements using
elongational specimens to investigate silicone oil
absorption effect on the rheological behavior. We ploted
the elongational (SBM) and shear viscosity measured from the
elongational flow specimens as a function of
shear/elongational rate/stress in Figure 5.25 and Figure
5.26. We see that shear viscosity shift downward by about
one decade.
In this system, elongational viscosity exhibits a
higher viscosity level than shear viscosity. From Figure
5.25 for the talc-filled compounded systems the values of
^ei/^s =2.2 for 0.2 talc loading system and =1.8 for
the 0.4 talc loading system. These values are close to that
found for Polystyrene and what would be expected for a
system exhibiting a von Mises yield value.
R eproduced with perm ission of the copyright owner. Further reproduction prohibited without perm ission.

2 2 7
COcdCL
<Zo
108
107
coOo 106 co>
105
<o 104
LU£ 103 <LU X CO
102
I I I I llllj I I I Mlllj 1 I I 11II1J 1 I I iilJIJ TTTTTTTT] I T'l JIIH
v PS/Talc (80:20 v%) I
O PS/Talc (60:40 v%) 1
% 0
V ^7 OV v o
oV v O
V < > /N
E V Shear Viscosity of SBM Samples
o
- V Elongational Viscosity(SBM)i i i mill i i i i mil ml ' ' ' "ml I I I I lllll I -LI I III
10'5 10-4 10-3 10-2 10-1 10° 101
SHEAR/ELONGATIONAL RATE ( s e c 1)
Figure 5.25 Shear(SBM)/elongational(SBM) viscosity as afunction of shear/elongational rate for talc filled system at 200°C
R eproduced with perm ission of the copyright owner. Further reproduction prohibited without perm ission.

2 2 8
cocda.
108
107
=” “ l— I I I l l l l | " I I l 11 M!j I I I M 1111 i i I i u i i j i ' i" i i i i i i j I TTTTTS
coO0 106 co>1 105o
g 1040—ILU
1 103LU
W 102
$
v PS/Talc (80:20 v%) - O PS/Talc (60:40 v%) 1
oV v £ v O
%
V Shear Viscosity(SBM) =
V Elongational Viscosity 'i i i i mil i i i i mil i i i i mil i ii mill i i i mill I I I I 111!
101 102 103 104 10s 106 107 SHEAR/ELONGATIONAL STR ESS (Pa)
Figure 5.26 Shear(SBM)/elongational(SBM) viscosity as afunction of shear/elongational stress for talc filled system at 200°C
R eproduced with perm ission of the copyright owner. Further reproduction prohibited without perm ission.

2 2 9
We compared silicone oil bath apparent elongational
yield stresses and the apparent shear yield stress from
elongation specimens. The values of Y el,app /Ys ,SBM 3 t 0 . 2
volume loading talc compound system gives 1.3 and Yei.app/Y3,SBM
at 0.4 volume loading talc compound system gives 0.5
respectively. These extrapolated results determined from
apparent yield stresses should not be considered
particularly accurate.
5.3.3 Calcite Compounds
5.3.3.1 Estimation Of Yield Values From Nitrogen Bath
Method (NCM)
We compared the nitrogen gas filled chamber method
elongational yield stress and the previously determined
shear yield stress. The values of Yei/Ys at 0.4 volume
loading calcite compound system gives 2.4. Comparing with
silicone oil bath method, 0.4 volume loading calcite system
did not change in Yei/Y3 ratio considerably.
R eproduced with perm ission of the copyright owner. Further reproduction prohibited without perm ission.

2 3 0
5.3.3.2 Comparison of Silicone Bath Data to Shear
Viscosity
We plot the elongational (SBM) and shear viscosity with
calcite volume loadings as a function of shear/elongational
rate/stress in Figure 5.27 and Figure 5.28.
From Figure 5.27 for the calcite-filled compounded
systems the values of ^ei/^s are 10 at 0.05 loading, 10 at
0.1 loading, 0.5 at 0.2 loading, and 0.6 at 0.4 loading of
calcite particle. High loadings of calcite (0.2, 0.4)
compounds showed an elongational viscosity lower than the
shear viscosity. This result suggests investigation of
silicone oil absorption of calcite particles..
We also compared silicone oil bath apparent
elongational yield stress. The values of Y ej.,app/Y3,app at 0 . 4
volume loading calcite compound system gives 0 .8 .
R eproduced with perm ission of the copyright owner. Further reproduction prohibited without perm ission.

2 3 1
coCDCL
C/DOoC/D>
oH<oZo—IUJXsXCO
o11o 10
o90so7o6o5o4
o3
o2
o1
rnimij— n m ;i iiiimij lining lining i 11 iiiii i riiiiiij i iimiij i niiii n.iuiij i hub
0°
□ PS/CALCITE (95 A PS/CALCITE (90 V PS/CALCITE (80 O PS/CALCITE (60
05 V%) -j 10 V%) : 20 V%) 1 40 V%)
□ Shear Viscosity
□ Elongational Viscosity(SBM)i mini i "'miill I III Mill i 11 mill i 11 mil I 11 mill i miinl i 11 mnl i i iimJ iniiiiil i mi
10-7 10-6 10-5 10-4 10-3 10-2 10-1 10° 101 102 103 104-1.
SH EAR/ELO NGA TIO NA L RATE (se c ')
Figure 5.27 Shear/elongational(SBM) viscosity as afunction of shear/elongational rate for calcite filled system at 200°C
R eproduced with perm ission of the copyright owner. Further reproduction prohibited without perm ission.

2 3 2
COcoCL
1010
109
108
£ 107
b i i i mill— i i i'i nn|— tt
COOoCO><Zo
CDzoUJX
106
10s
104
fi 1°3XCO
102
TTTTTJ I ITI IlIIJ l I 11 mij TTTTTTTTj TTTTTTH
□ PS / CALCITE (95:05) A PS/CALCITE (90:10)- V PS / CALCITE (80:20): O PS / CALCITE (60:40).!
□ Shear Viscosity
□ Elongational Viscosity(SBM)i i 11 hkI i iitmil i iiiiiiiI i i i ttttil i i i mill K4 ii mill I II III)
10° 101 102 1 03 1 04 1 05 1 06 1 07
SHEAR/ELONGATIONAL STRESS (Pa)
Figure 5.28 Shear/elongational(SBM) viscosity as afunction of shear/elongational stress for calcite filled system at 200°C
R eproduced with perm ission of the copyright owner. Further reproduction prohibited without perm ission.

5.3. 3.3 Comparison To Earlier Investigations2 3 3
Our results ( Y e,app/Y3,ap p = 0 . 8 ) from traditional
measurements showed considerable disagreement with earlier
investigations (1 0 7 , 1 3 8 ) of elongational flow of calcite
compounds whose values are close to the von Mises yield
surfaces {Ye/Ys= ^ ) (237) .
Calcite filled PS data from previous Tanaka and White's
(107) result (Ye/Y3=1.8), and Suetsugu and White's (138)
result (Ye/Y3=1.5). Even calcite particles' silicone oil
absorption effect is very small we believe they still lower
down the viscosity levels.
5. 3.3. 4 Investigation of Silicone Oil Absorption
We immersed calcite compounds into 200 °C silicone oil
for 3 min. and measured the sample's weight changes.
Calcite compounds absorbed silicone oil up to 9.6 wt%.
This seems the reason for the calcite compounds
viscosity order being reversed compared to shear (NCM)
viscosity measurements. This is again silicone oil affect
on the particles.
R eproduced with perm ission of the copyright owner. Further reproduction prohibited without perm ission.

2 3 4
5.3.3.5 Shear Flow Characterization Of SBM Elongational
Specimens
We plot the elongational and shear viscosity with
calcite volume loadings as a function of shear/elongational
rate/stress in Figure 5.29 and Figure 5.30. Elongational
specimens were modified to cone-plate samples using a
compression mold (see Figure 3.5). Then we investigated
shear flow measurements using elongational specimens.
From Figure 5.29 for the calcite-filled compounded
systems, the ratio of the apparent rlel/Tls are 2.2 at 0.2
loading, and 1.8 at 0.4 loading calcite particles.
We compared the silicone oil bath elongational yield
stress and shear yield stress of the samples produced in the
silicone oil bath Yei,app/Y3,sEM at 0.4 volume loading calcite
compound system gives 1.9. The shear yield value was
estimated for elongational flow specimens.
R eproduced with perm ission of the copyright owner. Further reproduction prohibited without perm ission.

2 3 5
CO(0
CL
10®
107
=””I—MM lllj “I—t “TTTTirj I i i 11 i i 11 i i i uiii| i i l 111H j I i i i i fb
COoa io6 >
2 1050
1 wOLU| 103LUXCO
102
□ PS/Calcite (80:20v%) A PS/Calcite (60 :40v% )^
A A
A□ A a A A
□ D □ A□ □ Ad d
E □ SBM Sample Shear Viscosity
- □ Elongational Viscosity(SBM)I i i i mil I I l l I i i mill I i i i mil I I II mil I I i I m i l
10-5 10-4 10-3 10-2 10-1 10° 101SHEAR/ELONGATIONAL RATE (se c 1)
Figure 5.29 Shear(SBM)/elongational(SBM) viscosity as afunction of shear/elongational rate for calcite filled system at 200°C
R eproduced with perm ission of the copyright owner. Further reproduction prohibited without perm ission.

_ 109 co
£ 108 £8 107 o co><zo
106
10s
< 10"
103o—I LUX2 102XCO
101
i i i m iij— i i i n iiij— i r1 1 in ij— i T m T n j— i i i i i i i i |— i i i i i i i i |— r r T r r r e
□ PS / Calcite (80 : 20 v%) :A PS/Calcite (60:40 v% )l
&&
V
^ □ SBM Sample Shear Viscosity
□ Elongation Viscosity(SBM)I i ' mill i i ' mill i ' I i mil i I I ' i ' : mil I I 1 mill LI 11II
10° 101 102 103 104 105 106 107
SHEAR/ELONGATIONAL STRESS (Pa)
Figure 5.30 Shear(SBM)/elongational(SBM) viscosity asfunction of shear/elongational stress for calcite filled system at 200°C
R eproduced with perm ission of the copyright owner. Further reproduction prohibited without perm ission.

5.3.4 Talc/Calcite Compounds2 3 7
5.3. 4.1 Estimation of Yield Values from Nitrogen Bath
Method (NCM)
We compared the nitrogen gas filled chamber method
elongational yield stress and the shear yield stress. When
we compare elongational yield values measured from nitrogen
gas bath method (NCM) and shear yield values from minimum
threshold values, the values of Yei/Ys for 0.2/0.2 volume
loading talc/calcite compound system gives 9.5.
Table 4.1 and Table 5.1 summarizes shear and
elongational yield values.
5.3.4.2 Comparison of Silicone Bath Data to Shear (NCM)
Viscosity
We plot the elongational and shear viscosity of the
talc/calcite 0 .2/0.2 volume loadings as a function of
shear/elongational rate/stress in Figure 5.31 and Figure
5.32 using traditional method.
R eproduced with perm ission of the copyright owner. Further reproduction prohibited without perm ission.

2 3 8
When we compare elongational (SBM) viscosity and shear
viscosity at high volume loadings (0.2/0.2), the value of
Hei/Tls is 0.3. Similar behavior was found earlier for the
calcite and talc filled systems. This resulted in
investigations of silicone oil absorption on talc and
calcite particles.
We compared silicone oil bath apparent elongational
yield stress and the apparent shear yield stress, Ye:,app/Y3,acP
for the 0 .2/0.2 volume loading talc/calcite compound system.
The value is 0.6. Talc/calcite data shows lower than
calcite result.
5.3.4.3 Investigation of Silicone Oil Absorption
We immersed talc/calcite compounds into 200 °C silicone
oil for 3 minutes and measured sample's weight changes.
Talc/calcite compounds absorbed silicone oil up to 14.5 wt%.
Table 5.2 indicates talc particle compounds absorb
silicone oil more than talc/calcite particles and calcite
particle absorb less than talc/calcite particle compounds.
R eproduced with perm ission of the copyright owner. Further reproduction prohibited without perm ission.

2 3 9
o PS / TALC / CALCITE (60:20:20 V%)
_J<z
zo_lLU £§ 104
XCO103
£ Shear Flow © Elongational Flow(SBM)
10°10-1
-1.SHEAR/ELONGATION RATE (sec )
Figure 5.31 Shear/elongational(SBM) viscosity as afunction of shear/elongational rate for talc/calcite filled system at 200°C
R eproduced with perm ission of the copyright owner. Further reproduction prohibited without perm ission.
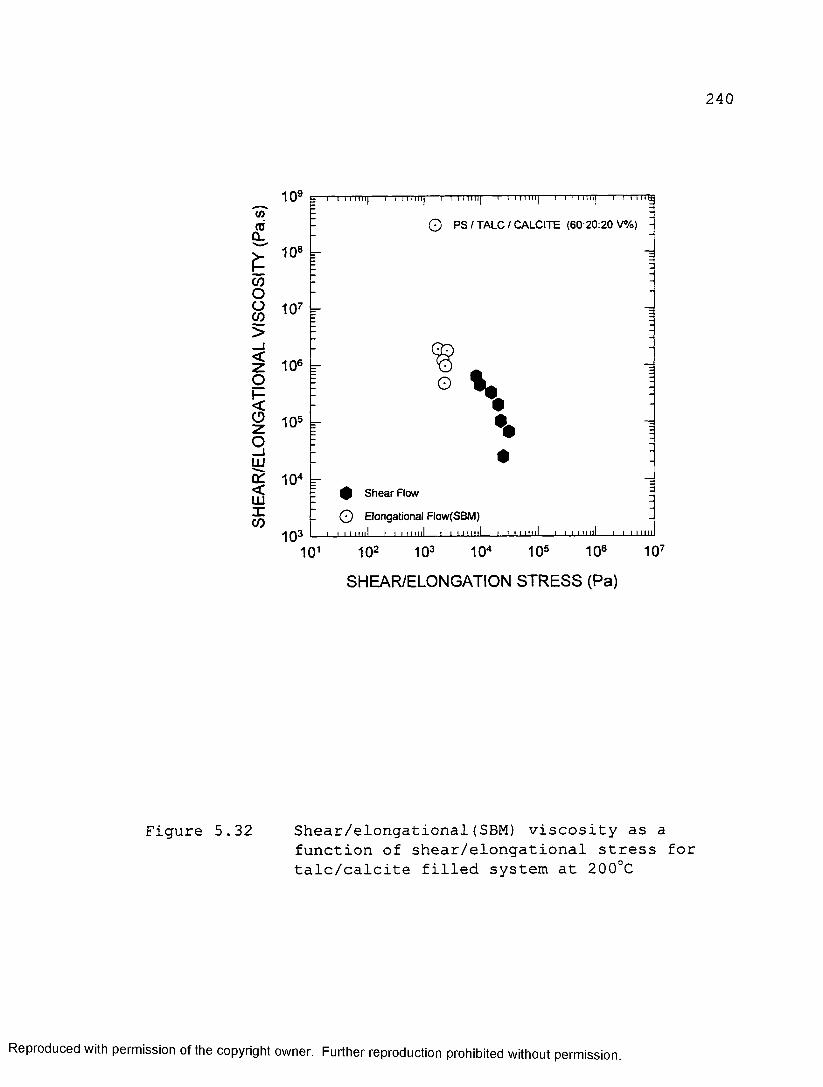
240
COCOCL
COOC_>CO><zoi-<o
UJa:<LUXCO
1 09 £ 1—I I rmi| 1 I I I l ll l j 1— I I i ' t l l l j 1— TTTTTTT]-------!— TTTTTTT] I I I I I l'(io PS / TALC / CALCITE (60:20:20 V%) :
108 t-
107 U
10® —
1 0 s -
104 -
° V
• •
0 Shear Row
© Elongational Flow(SBM)
103 i i i h i i i I i > i m i n i i i i i mi l i i i i i m l t _ i i li_li
101 102 103 104 105 10® 107
SHEAR/ELONGATION STRESS (Pa)
Figure 5.32 Shear/elongational(SBM) viscosity as afunction of shear/elongational stress for talc/calcite filled system at 200°C
R eproduced with perm ission of the copyright owner. Further reproduction prohibited without perm ission.

2 4 1
5.3.4.4 Shear Flow Characterization of SBM Elongational
Specimens
We plot the elongational (SBM) and shear viscosity
(SBM) with talc/calcite 0.2/0.2 volume loadings as a
function of shear/elongational rate/stress in Figure 5.33
and Figure 5.34. Elongational specimens were modified to
cone-plate samples using a compression mold (see Figure
3.5). We investigated shear flow measurements using
elongational specimens.
From Figure 5.33 for the talc/calcite-filled compounded
systems, the ratio nel (*t*) /'Hg (§) is about 7.1 for 0.2/0.2
talc/calcite particle system. This system shows values
higher than von Mises theory.
We compared the silicone oil bath apparent elongational
yield stress and silicone oil bath method shear yield stress
Yei.app/YSlsBM at 0.2/0.2 volume loading from Figure 5.34. The
talc/calcite compound system gives 3.8.
R eproduced with perm ission of the copyright owner. Further reproduction prohibited without perm ission.

2 4 2
COCOCL
107
C0o2 106 >z 10soh-<§ 104 oUJ£ 103sXCO
102
o PS/TALC/CALCITE (60:20:20 V%) :
oo
£ Shear Flow(SBM) :
- O Songational Flow(SBM)i i i i mil i i i 11 ml i i i 11 ml i i i i mil i i i 11 ml i i i 11 in
10-5 10 10-3 10-2 10-1 10° 101
-1,SHEAR/ELONGATION RATE (sec )
Figure 5.33 Shear(SBM)/elongational(SBM) viscosity as afunction of shear/elongational rate for talc/calcite filled system at 200°C
R eproduced with perm ission of the copyright owner. Further reproduction prohibited without perm ission.

</)CD
CL
1 0 s e — i m i n i i |— i m n i t]— i i i i t t i i j— i "i 1111fT|— r n n n q — i i i I 'l iu
o PS /TALC /CALCITE (60:20:20 V%) I
1 0 7 lr
COO% 106 >
10s rO
<2 104
LU X 103
o
t^ E £ Shear Flow(SBM)
XCO102
. Q Elongational Flow(SBM)i i I ..... ill i i i i mil i i i i mil i i i 11 ml i i i i mi
10° 101 102 1 03 1 04 1 05 1 06
SHEAR/ELONGATION STRESS (Pa)
Figure 5.34 Shear(SBM)/elongational(SBM) viscosity asfunction of shear/elongational stress for talc/calcite filled system at 200°C
R eproduced with perm ission of the copyright owner. Further reproduction prohibited without perm ission.

2 4 4
5.3.5 Conclusions
Because of silicone oil absorption we could not measure
the elongational viscosity behavior of talc, calcite, and
talc/calcite compounds using conventional instrumentation.
Measurements of elongational yield values for sure of the
compounds could be made in a chamber containing nitrogen
gas.
We estimated elongational yield values in two different
experiments. One is from a traditional silicone oil bath
filled elongational apparatus. The other measured
elongational creep as a function of applied force (tensile
stress) .
Previous researches (95, 106, 107, 114, 138) obtained
shear yield values from extrapolation using cone-plate (RMS)
and elongational yield values from silicone oil bath method
(SBM). Cone-plate shear yield values from extrapolation are
very close to high threshold yield values in our system.
Earlier investigation did not realize there could be
silicone oil absorption of calcite particles. The Ye/Ys
ratio of Tanaka and White (107) shows 1.8 for calcite filled
R eproduced with perm ission of the copyright owner. Further reproduction prohibited without perm ission.

2 4 5
PS system. However the Ye/Y3 ratio of Suetsugu and White
(138) ranges from 0.25-1.53 for calcite filled PS system
which is low compared to von Mises yield ratio. However if
they knew the existence of minimum threshold stress their
ratio will be raised further.
0.4 volume loading talc filled system investigated in
the nitrogen bath method gave much higher elongational yield
values than 0.2 volume loadings of talc and same content of
calcite compound i.e.
for talc compounds
Y Y(4 0v%) ;2 . 9 - 10 a (2 0v% ) ;2 . 8 ~ 10 » V3Ys Ys
for calcite compounds
* S ~ 3Ys
The mechanism of the yield value seems to be particle-
particle attraction, which leads to aggregation and the
formation of gel structures.
R eproduced with perm ission o f the copyright owner. Further reproduction prohibited without perm ission.

2 4 6
Talc has higher BET surface area (16.5 m2/g) than
calcite (7 m2/g) at same average particle size. Higher BET
surface area gives higher contacting surface area to
polymer. So the high loading gives a higher yield value
than low yield value.
The particle loading dependence of elongational
viscosity indicates it increases with increasing loading and
decreasing elongational rate/stress.
R eproduced with perm ission of the copyright owner. Further reproduction prohibited without perm ission.

C H A P T E R V I
WIDE ANGLE X-RAY DIFFRACTION (WAXD) CHARACTERIZATION
6.1 Introduction
In this chapter, we describe an experimental study of
talc and calcite compound composition analysis and talc
particle orientation using the WAXD technique. Composition
analysis was carried out using the Bragg angle x-ray
intensity method. The concentration of talc and calcite in
polystyrene were represented using the Alexander-Klug
equation (182) which is being applied to a mixed
crystalline particle and amorphous polymer system
apparently for the first time in our research. A
qualitative analysis of particle orientation was carried
out using the flat film method. A quantitative analysis of
particle orientation was determined using the pole figure
analysis method.
247
R eproduced with perm ission of the copyright owner. Further reproduction prohibited without perm ission.

6.2 Results2 4 8
6.2.1 Composition Analysis of Particle Filled System
Using Bragg Angle X-ray Intensity
6.2.1.1 PS / Calcite System
Figures 6.1 to Figure 6.6 show the x-ray intensity
distribution of compounds of 0, 5, 10, 20, 40, and 100v%
calcite in a PS matrix. Figure 6.1 represents the
intensity distribution of PS as a function of 2®. Figure
6.7 summarizes the intensity distributions of calcite-PS
compounds with various loadings of calcite. We see in
Figure 6.7 the intensities of the (110), (211), (101 ),
(210) , and (200) crystallographic planes of calcite
particles for various calcite particle loadings. The
scattering intensity of the polystyrene is reduced with
increasing calcite loading.
R eproduced with perm ission of the copyright owner. Further reproduction prohibited without perm ission.

20000PS
15000
o<uCO
c3
COca)
5000
i
10 20 30 40 50
29
Figure 6.1 Intensity distribution of polystyrene
R eproduced with perm ission of the copyright owner. Further reproduction prohibited without perm ission.

2 5 0
20000PSCALCITE 5V% PS * 0.33
15000'oa>co"coc§ 10000
&coc<D *—* c5000
10 20 3020
40 50
Figure 6.2 Intensity distribution of PS and PS/calcite(5 v%)
R eproduced with perm ission of the copyright owner. Further reproduction prohibited without perm ission.

2 5 1
2 0000
o0)to
c3ootocd)
PSPS/CALCITE (10 V%) PS*0.23
15000
10000
5000
40 5020
Figure 6.3 Intensity distribution of PS and PS/calcite(10 v%)
R eproduced with perm ission of the copyright owner. Further reproduction prohibited without perm ission.

Inten
sity
(cou
nts/
sec)
2 5 2
Figure
20000 PS PS / CALCITE (20 V%) PS*0.14
15000
10000
5000
L.4j
403020 50
26
6.4 Intensity distribution of PS and PS/calcite(20 v%)
R eproduced with perm ission of the copyright owner. Further reproduction prohibited without perm ission.

lity (c
ount
s/se
c)
2 5 3
20000
15000
10000
COc0)c5000
00
Figure 6.5 Intensity distribution of PS and PS/calcite(40 v%)
PSPS / CALCITE (40 V%) PS’0.06
4030 5020
R eproduced with perm ission of the copyright owner. Further reproduction prohibited without perm ission.

Inte
nsity
(c
ount
s/se
c)
2 5 4
Figure
20000
(211)
15000
10000
5000 (210)(200)(101)
(110)
403020 50
20
6.6 Intensity distribution of calcite powder
R eproduced with perm ission of the copyright owner. Further reproduction prohibited without perm ission.

Inten
sity
(cou
nts/
sec)
2 5 5
20000
15000
10000
5000
00
Figure 6.7 Intensity distribution of various calciteloadings
PS05% CALCITE10% CALCITE 20% CALCITE 40% CALCITE
16279 PS
4987 5%
30 40 5020
R eproduced with perm ission of the copyright owner. Further reproduction prohibited without perm ission.

6.2.1.2 PS / Talc System2 5 6
Figure 6.1, Figure 6.8, Figure 6.9, Figure 6.10,
Figure 6.11, and Figure 6.12 show x-ray intensity
distribution of compounds of 0, 5, 10, 20, 40, and 100v%
talc in a PS matrix. Figure 6.13 summarizes the intensity
distribution of talc with various loadings of talc. We see
the intensities of the (001), (002/020), (003), (200/i^l),
(131/131), and (004) crystallographic planes of the talc
particles for various calcite particle loadings in Figure
6.13. The scattering intensity of the polystyrene is
reduced with increasing talc loading. As talc is added
into polystyrene (PS) the scattering intensity of the
polystyrene is modified as shown in Figure 6.13. Figure
6.8 shows the scattering intensity of 100% polystyrene
reduced to 55% at 5 v% talc-PS filled compound. Figure 6.9
shows the scattering intensity of 100% polystyrene reduced
to 40% at 10 v% talc-PS filled compound. Figure 6.10 shows
the scattering intensity of 100% polystyrene reduced to 23%
at 20 v% talc-PS filled compound. Figure 6.11 shows the
scattering intensity of 100% polystyrene reduced to 17% at
40 v% talc-PS filled compound.
R eproduced with perm ission of the copyright owner. Further reproduction prohibited without perm ission.

2 5 7
20000 PS 100% PS/TALC 5V%
PS* 0.55
15000
o 10000
5000
50403020100
2 0
Figure 6.8 Intensity distribution of PS and PS/talc(5 v%)
R eproduced with perm ission o f the copyright owner. Further reproduction prohibited without perm ission.

2 5 8
20000 PS 100% P S/TALC 10V% PS ' 0.4
15000
oa>in«c38. 10000
c©c5000
—-'CL.50403020100
2 6
Figure 6.9 Intensity distribution of PS and PS/talc(10 v%)
R eproduced with perm ission of the copyright owner. Further reproduction prohibited without perm ission.

Inte
nsity
(c
ount
s/se
c)
2 5 9
2 0 0 0 0
PS 100% PS/TALC 20V%
PS * 0.23
15000
10000
5000
5020
Figure 6.10 Intensity distribution of PS and PS/talc(20 v%)
R eproduced with perm ission of the copyright owner. Further reproduction prohibited without perm ission.

2 6 0
20000 PS 100% PS/TALC 40V% PS *0.17
15000
o a> (n"35c3Oo 10000
</>c0)c5000
6050403020
Figure 6.11 Intensity distribution of PS and PS/talc(40 v%)
R eproduced with perm ission of the copyright owner. Further reproduction prohibited without perm ission.

2 6 1
30000(003)(001)25000
o 15000
£ 10000
(002+020)(131+131)5000
(200+131,(004)
40 503010 200
20
Figure 6.12 Intensity distribution of talc powder
R eproduced with perm ission of the copyright owner. Further reproduction prohibited without perm ission.

2 6 2
80000PS
-to
c3outoca>
PS/TALC (5v%) PS/TALC (10v%) PS/TALC (20v%)
PS/TALC (40v%)
70000
60000
50000
40000
30000
20000
10000
300
4020 50
20
Figure 6.13 Intensity distribution of various talcloadings
R eproduced with perm ission of the copyright owner. Further reproduction prohibited without perm ission.

6.2.1.3 PS / Talc / Calcite System2 6 3
Figure 6.22 through Figure 6.27 show x-ray intensity
distribution of compounds of PS/talc/calcite 90/05/05,
85:04:11, 54:03:43, 85:10:05, 78:10:12, 53:05:42, and
60:20:20 v% which has weight fraction of 88:12:14,
88:12:30, 88:12:178, 77:23:14, 77:23:30, 77:23:178, and
61:39:32 wt% each. Figure 6.28 summarizes the intensity
distribution of various loadings of PS/talc/calcite for
talc compounds 100:00:00, 88:12:00, 88:12:14, 88:12:30,
88:12:178 and Figure 6.29 summarizes 100:00:00, 77:23:00,
77:23:14, 77:23:30, and 77:23:178. The crystallographic
planes of the talc/calcite mixed particle occur in the
sequence of talc (001), talc (002/020), calcite (110), talc
(003), calcite (211), calcite (10^), calcite (210), and
calcite (200) with various loadings of talc/calcite
particles in Figure 6.28. The scattering intensity of the
polystyrene is reduced with increasing talc/calcite
loading. As calcite is added into PS/talc system the
scattering intensity of the polystyrene is modified as
shown in Figure 6.28 and Figure 6.29.
R eproduced with perm ission o f the copyright owner. Further reproduction prohibited without perm ission.

2 6 4
o<u10c3oo
25000
20000
15000
£ 10000©c
5000 \cah;lte (110V
PS/TALC/CALCITE(88:12:000 wt%)
PS/TALC/CALCITE(88:12:13.6 wt%)
PS/TALC*0.7
Iclte
10 20
calcite calcite calcite (101) (210) (200)
40
2 6
Figure 6.14 Intensity distribution of PS andPS/talc/calcite (90/05/05 v%)
R eproduced with perm ission of the copyright owner. Further reproduction prohibited without perm ission.

Inte
nsity
(c
ount
s/se
c)
2 6 5
25000
20000
15000
10000
5000
PS/TALC/CALCITE (88:12:000 wt%) PS/TALC/CALCITE
(88:12:29.9 wt%)PS/TALC-0.4
t001 1003
t020
c 2 1 1
f" cm C101 c 2 1 0 C 2 p 0
40302020
Figure 6.15 Intensity distribution of PS andPS/talc/calcite (84/04/12 v%)
R eproduced with perm ission of the copyright owner. Further reproduction prohibited without perm ission.

Intensity (
counts
/sec)
2 6 6
25000
20000
15000
10000
5000
PS/Talc/Calrite (88:12:000 wt%) PS/Talc/Calcite (88:12:177.9 wt%) PS/Talc'0.1
Icite11)
tali: calcite calcite calcite(1 0 1) (2 1 0) (2 00)
catch talc (110
(002/ 020 )
4535 403025
20
Figure 6.16 Intensity distribution of pS andPS/talc/calcite (54/03/43 v%)
R eproduced with perm ission of the copyright owner. Further reproduction prohibited without perm ission.

Intensity (
counts
/sec)
267
25000
20000
15000
10000
5000
00
Figure 6.17
PS/TALC/CALCITE (77:23:000 wt%) PS/TALC/CALCITE (77:23:13.6 wt%) PS/TALC'0.50
talc(003)talc
(001)
calcite(211)
(002/II20)
calcite calcite calcite (10T)taic<210> <200>
(004)_
:alcite talc KiO) (112)
4540353025
29
Intensity distribution of PS and PS/talc/calcite (85/10/05 v%)
R eproduced with perm ission of the copyright owner. Further reproduction prohibited without perm ission.

Inten
sity
(cou
nts/
sec)
2 6 8
25000
20000
15000
10000
5000
00
Figure 6.18
PS/TALC/CALCITE (77:23:000 wt%) PS/TALC/CALCITE (77:23:29.9 wt%) PS/TALC*0.39
calcite(211)
I20)calcite calcite calcite
(lOTjtalc*210) (200) ,(004)|-
ilcKe talc TO) (112)
4535 4030
20
Intensity distribution of PS and PS/talc/calcite (78/10/12 v%)
R eproduced with perm ission of the copyright owner. Further reproduction prohibited without perm ission.

Inten
sity
(cou
nts/
sec)
2 6 9
25000
20000
15000
10000
5000
00
Figure 6.19
5 10
talc(002/020)
talc(003)
-salcfte
calcite(211)
PS/TALC/CALCITE (77:23:000 wt%)PS/TALC/CALCITE (77:23:177.8 wt%)PS/TALC-0.18
calcite calcite calcite< 1 0 T ) t a l c « 2 1 0 ) ( 2 0 0 )
f (0°4),\wiT35 40 45
Intensity distribution of PS and PS/talc/calcite (53/05/42 v%)
R eproduced with perm ission of the copyright owner. Further reproduction prohibited without perm ission.

Inten
sity
(cou
nts/
sec)
25000
20000
15000
10000
5000
00
Figure 6.20
2 7 0
— PS— PS/Talc/Calcite
(88:12:00 wt%)— PS/Talc/Calcite
(88:12:13.9 wt%)— PS/Talc/Calcite
(88:12:29.9 wt%)— - PS/Talc/Calcite
(88:12:177 9 wt%)
calcite calcite calcite (101) taldt210> <200>
35 40 45
Intensity distribution of PS and various PS/talc/calcite (88:12: wt) loadings
talc (002/020)
/ • \
calcite
25 30
20
R eproduced with perm ission of the copyright owner. Further reproduction prohibited without perm ission.

Inten
sity
(cou
nts/
sec)
2 7 1
25000
20000
15000
10000
5000
00
Figure 6.21
talc (002/020)
talc 1 (003)|J
calcite(211)
calcite' r , V o ) ( 1 1 2 )
PSPS/Talc/Caldte (77:23:00 wt%) PS/Talc/Calcite (77:23:13.6 wt%) PS/Talc/Calcite (77:23:29.9 wt%) PS/Talc/Caldte (77:23:177.8 wt%)
calcite calcite calcite(1 0 T )ta l< i(2 1 0 ) (2 0 0 )
(«*♦)-;-- — r
10 15 20 25 30 35 40 45
20
Intensity distribution of PS and various PS/talc/calcite (77:23: wt) loadings
R eproduced with perm ission of the copyright owner. Further reproduction prohibited without perm ission.
4

2 7 26.2.2 Flat Film Measurements of Particle Orientation
6.2.2.1 Uniaxial Extrudates
Figure 6.22 shows x-ray film patterns of a 20v% talc
particle filled polystyrene system which has been extruded
from a 1.6 mm diameter capillary die (L/D=28.5). The
positions of the (001), (002 + 020), (003), (200 + 13]jf
(131+131), and (004) planes of talc particles on the film
patterns indicate the direction of orientation of the talc
particles relative to the flow direction '1'. The normals
to the surfaces of the talc particles are in the radial
direction and the talc particles are circumferentially
arranged.
Figure 6.23 shows typical x-ray film patterns of a
20v% calcite particle-filled polystyrene from the capillary
die extrudate. The (110), (211), (10^), (210), and (200)
planes of the calcite particles show no sign of
orientation.
Figure 6.24 shows a x-ray film pattern based on a beam
normal to a 10% PS/talc/calcite (90/05/05) capillary
extrudate.
R eproduced with perm ission of the copyright owner. Further reproduction prohibited without perm ission.

2 7 3
(001)
(002)
(003)
Figure 6.22 Typical x-ray pattern of 20v% talc particlesfrom capillary extrudate (D=1.6mm, L/D=28.5)
R eproduced with perm ission of the copyright owner. Further reproduction prohibited without perm ission.

2 7 4
«
X-ray
•t'=»- ND (3)
NO (3)
Figure 6.23 Typical x-ray pattern of 20v% calciteparticles from capillary extrudate(D=l.6mm, L/D=28.5)
R eproduced with perm ission of the copyright owner. Further reproduction prohibited without perm ission.

2 7 5
— 0-X-ray "■ •0-.
FD(1)
-2»- ND (3)
ND (3)
Figure 6.24 X-ray pattern of PS/talc/calcite (90:05:05v%) system from capillary die extrusion (D=1.6mm, L/D=28.5)
R eproduced with perm ission o f the copyright owner. Further reproduction prohibited without perm ission.

2 7 6Other compositions (84:04:12, 84:10:06, 78:10:12,
75:19:06, 69:17:14, 60:20:20) were similar. They show the
mixture of the (001), (002/020), (003), (200 + 1
(131+131), and (004) planes of talc particles and the
(110), (211), (10l), (210), and (200) planes of the calcite
particles. It is noted that talc particle planes are not
clearly shown on the film due to calcite particle planes
intensity.
6.2.2.2 Compression Molded Sheets
Figure 6.25 shows x-ray pattern of the talc particle
for compression molded sheets for the 5, 10, 20, 40 v%
compounds. The x-ray beam is directed towards the edge of
the sheet. The normals to the (001), (002), and (003)
plane of the talc particles are concentrated in the
direction perpendicular to the surface of the molded sheet.
This indicates the discs are parallel to the direction of
flow in forming the molded sheet. The (002/020) plane
appears at Bragg angles intermediate between the (001) and
(003) planes. We can also see the (200/1 3l) and (131/131)
planes near the (002/020) planes.
R eproduced with perm ission of the copyright owner. Further reproduction prohibited without perm ission.

(b) 10 v% (d) 40 v%
FD(1)
ND (3)
FD(1)
X-ray
Figure 6.25 Flow direction x-ray pattern of talcparticle filled system from compression molding (a) 5 v%, (b) 10 v%, (c) 20 v%, (d)40 v%
R eproduced with perm ission of the copyright owner. Further reproduction prohibited without perm ission.

(a) PS/talc/calcite (90:05:05)
(b) PS/talc/calcite(84:04:12)
(c) PS/talc/calcite (d) PS/talc/calcite(84:10:06) (78:10:12)
Figure 6.26 X-ray pattern of PS/talc/calcite system fromcompression molding (a) 90:05:05 v%, (b)84:04:12 v%, (c) 84:10:06 v%, (d) 78:10:12v%, (e) 75:19:06 v%, (f) 60:20:20 v%
R eproduced with perm ission of the copyright owner. Further reproduction prohibited without perm ission.

(e) PS/talc/calcite (75:19:06)
(f) PS/talc/calcite(60:20:20)
continued Figure 6.26
X-ray
FD (1)
ND (3)
FD (1)
X-ray pattern of PS/talc/calcite system from compression molding (a) 90:05:05 v%, (b)84:04:12 v%, (c) 84:10:06 v%, (d) 78:10:12v%, (e) 75:19:06 v%, (f) 60:20:20 v%
R eproduced with perm ission of the copyright owner. Further reproduction prohibited without perm ission.

2 8 0Figure 6.26 shows x-ray patterns of PS/talc/calcite
compounds formed by compression molding. These are: (a)
90:05:05 v%, (b) 84:05:12 v%, (c) 84:10:06, (d) 78:10:12,
(e) 75:19:06, and (f) 60:20:20 using the WAXD flat film
method. We see the oriented (001), (002/020), (003),
(200 + 1 ^i) / (131+131), and (004) planes of talc particles
clearly.
6.2.3 Pole Figure Measurements
6.2.3.1 Capillary Die Extrudat.es
The flow direction (FD), normal direction (ND), and
transverse direction (TD) of capillary die extrudates
samples are equivalent to a flow direction (1-direction),
and two normal directions (3-direction) due to the symmetry
of the capillary extrudate and the flow.
A pole figure of the (001) plane for the talc compound
from the capillary extrudates is shown in Figure 6.27.
This pole figure indicates that the c-axis of talc
particles orient along the radial direction normal to the
extrudate surface. The symmetry axis of the capillary
extrudates is the flow direction.
R eproduced with perm ission of the copyright owner. Further reproduction prohibited without perm ission.

TD2 8 1
(a)
Figure 6.27 The pole figures for the (001) plane of the5 v% talc compound from the capillary die extrusion experiment
R eproduced with perm ission of the copyright owner. Further reproduction prohibited without perm ission.

6 . 2 . 3.2 Rectangular Die Extrudates2 8 2
The flow direction (FD), normal direction (ND), and
transverse direction (TD) of rectangular extrudates samples
are equivalent to flow direction (1-direction), the
direction of velocity variation direction (2-direction),
and the transverse direction (3-direction).
A pole figure of the (001) plane for the talc compound
from the rectangular extrudates is shown in Figure 6.28.
This pole figure indicates that the normals to the (001)
plane of talc particles are concentrated in the direction
perpendicular to the rectangular die wall. The discs, not
the normals, are parallel to the flow direction.
6. 2. 3.3 Slit Die Extrudates
The flow direction (FD), normal direction (ND), and
transverse direction (TD) of the slit extrudates samples
are equivalent to the flow direction (1-direction), the
direction of velocity variation direction (2-direction),
and the neutral direction (3-direction).
A pole figure of the (001) plane for the talc compound
from the slit extrudates is shown in Figure 6.29.
R eproduced with perm ission o f the copyright owner. Further reproduction prohibited without perm ission.

(b)
Figure 6.28 The pole figures for the (001) plane of the5 v% talc compound from the rectangular die extrusion experiment
R eproduced with perm ission of the copyright owner. Further reproduction prohibited without perm ission.

2 8 4
ND
(a)
FD
(b)
Figure 6.29 The pole figures for the (001) plane of the5 v% talc compound from the slit die extrusion experiment
R eproduced with perm ission of the copyright owner. Further reproduction prohibited without perm ission.

2 8 5This pole figure indicates that the normals to the (001)
plane of talc particles are concentrated in the direction
perpendicular to the slit die wall. The discs are parallel
to the flow direction.
6.2.3.4 Annular Die Extrudates
The flow direction (FD), normal direction (ND), and
transverse direction (TD) of the annular extrudates samples
are equivalent to flow direction (1-direction), the
direction of velocity variation direction (2-direction) ,
and the normal direction (3-direction).
A pole figure of the (001) plane for the talc compound
from the annular extrudates is shown in Figure 6.30. This
pole figure indicates chat the normals to the (001) plane
of talc particles are concentrated in the direction
perpendicular to the annular die wall and perpendicular to
the flow direction.
R eproduced with perm ission of the copyright owner. Further reproduction prohibited without perm ission.

2 8 6
TD
(b)
Figure 6.30 The pole figures for the (001) plane of the5 v% talc compound from the annular die extrusion experiment
R eproduced with perm ission of the copyright owner. Further reproduction prohibited without perm ission.

6.2.3.5 Compression Molding287
The flow direction (FD), normal direction (ND), and
transverse direction (TD) of compression molded samples are
the flow direction (1-direction), a second flow direction
(2-direction), and normal direction (3-direction). A pole
figure of the (001) plane for the talc compound from the
compression molding sample is shown in Figure 6.31. This
pole figure indicates that the normals to the (001) plane of
talc particles are concentrated in the direction
perpendicular to the compression mold wall and the talc
particles are parallel to the flow direction.
R eproduced with perm ission of the copyright owner. Further reproduction prohibited without perm ission.

Figure
2 8 8
NP
\I
FD
(a)
FD
cn
(b)
5.31 The pole figures for the (001) plane of the 5 v% talc compound from the compression molding experiment
R eproduced with perm ission of the copyright owner. Further reproduction prohibited without perm ission.

6.3 Interpretation2 8 9
6.3.1 Composition Analysis of Particle Filled System
Using Bragg Angle X-ray Intensity
6.3.1.1 Theoretical Background
The x-ray scattering intensity from PS decreases as
calcite and talc particle increases in calcite-PS and talc-
PS compound systems. The PS scattering intensity decreases
more than proportionally as particle content increases.
The x-ray diffraction intensity from crystalline
material depends on the position of the atoms relative to a
given set of planes.
I,,*,, = P-L'A'IfP (6.1)
where IfI2 being the structure factor that depends on atomic
scattering factor, P being the polarization factor
(incoherent radiation) that depends on Bragg angle. L is
the Lorentz factor that depends on reflection (exposure)
time. A is the absorption factor (transmission factor) that
R eproduced with perm ission of the copyright owner. Further reproduction prohibited without perm ission.

2 9 0depends on the elemental composition, the wave length of
the x-rays, and the size and shape of the specimen.
Alexander and Klug (182) represented the diffraction
from a mixture of compound specimen as:
K.x,I i - r . . .1 ( 6 . 2 )
A l[x i(A i ~ Am> + A m ]
where
I: = intensity of scattering from component 1 of a mixture
^ , function of the nature of the component 1 and
the geometry of the apparatus
M = subscript referring to the "matrix"
P: = density of (solid) component 1
x. = weight fraction of component 1 in a mixture
Pi = linear absorption coefficient of (solid) component 1
for the x-ray wavelength used
Pi* = Pi /Pi = mass absorption coefficient of component 1 for
the x-ray wavelength used
R eproduced with perm ission of the copyright owner. Further reproduction prohibited without perm ission.

2 9 1Consider the case of a mixture of 2 components, when
M\
For the case when M m is zero, from Equation (6.2)
(:) = (6-3:
while for a mixture containing a weight fraction Xi with
mass absorption of component Mi of the first component and
a second component with mass absorption of component Mz
Ti = r~ / - K^ -rr-— ri (6.4:Pilx i\Mi ~ Mz) + M z J
For pure material 1
K 1x l(I:): = (6.51
PiMz
Dividing Equation (6.4) by Equation (6.5) gives
I i _ *iM\ „ _(6 .6)W o x i(^i “ Ml) + Ml
R eproduced with perm ission of the copyright owner. Further reproduction prohibited without perm ission.

292
Converting to volume fractions ‘K and 2
x = — <t>- xt p v..
( //; - u \ ) P i<!>2 + p p \so, ~ 1 . . \ , . (6.7)
where
= volume fraction of component i in a mixture
Using Equation (6.6) gives the theoretical intensity
ratio of a binary mixture material. For example calcite 40
v% (x=0.37 wt%) , the absorption coefficient of PS MPS* is 8
and calcite M-calclLe* is 70.87 (cf. Mta>c* is 31.06). This
gives IPS.4a,t>/(I?s) 0 ratio 0.062 which is represented in Figure
6.32 point '(f)' solid line. The real Ifs,4o*/ (I?s) 0 ratio
data from experiments shown on Figure 6.5 is 0.06. The mass
absorption coefficients Mi* of MPS*, Mcaicice*, and Mtalc* were
determined from chemical composition, molecular weight, and
mass absorption coefficients M/P of the elements for a CuKa
wavelength (188). The examples are shown on page 69 of
reference (18 8). Table 6.1 summarizes the mass absorption
coefficient of elements for CuKa at ^-=1.5418 A.
Reproduced with permission of the copyright owner. Further reproduction prohibited without permission.

293
Table 6.1 Mass absorption coefficient of elements for CuKa at *-=1.5418 A.
1
Ho. 4 35
2
Heo.38 3
3 4 5 6 7 8 9 10
Lie.-i6 Be:, so B2 .J5 C4 .sc N7.52 On .5 Fl£.4 Ne2;.9
11 12 13 14 15 16 17 18
Na3o.: Mg3a.€ A I 48.6 S iso. 6 P-4.1 Sas.: Cl:>: A r m
19 20 31 32 33 34 35 36
Kus Ca:£; Gao-. 3 Ge-5.6 As 5 3.4 S e 01.4 Brso.s Kr:;e
Reproduced with permission of the copyright owner. Further reproduction prohibited without permission.

6. 3.1.2 Ternary Mixture System294
Lennox (184) presented an 'Internal Standard Method' to
analyze a binary particle mixture system in 1957. To
analyze an unknown component p in a binary mixture (p+q), we
may add a known weight of the unknown (yF) and do
experiments to determine the unknown composition (xp) . Let
the original weight fraction xF be unknown. Suppose yF
grams of p (per gram of sample) be added. The new weight
fraction of p and q are
xp + y t i + y D and
x„Xq =
1 + Yc (6 .8 )
The new intensity ratio from at scattering angle is
K o :< + vip _ ipr q p I p
kq K<qPp
= const * ( xp + yp. ) (6.9)
Reproduced with permission of the copyright owner. Further reproduction prohibited without permission.

295Using different compositions yp we can measure the
intercept and the absolute value xp can be determined.
6. 3.1.3 PS / Calcite System
The relative intensities Ips (<!>) / (Ips) o may be read from
Figure 6.1 to 6 .6. For ♦ = 0.05, the ratio is 0.33, for ♦ =
0.10, it is 0.23, for ♦ = 0.20, it is 0.14 and for ♦ = 0.40,
it is 0.06. This relative intensity was plotted in Figure
6.32 as a function of weight fraction of PS. This plot was
represented again as a relative calcite particle intensity
in Figure 6.33 due to relationship
1 - Ips (♦calcite) / (Ips) 0 = Icaic-.te ( ♦ ? » ) / ( Icalcite ) 0 ( 6 . 1 0 )
Figure 6.6 presents the (110), (211), (10^), (210),
and (200) planes of calcite particles. The intensity of
scattering of calcite particle loadings is given in Figure
6.7. The scattering intensity of each plane is reduced as
calcite loading decreases.
Reproduced with permission of the copyright owner. Further reproduction prohibited without permission.

296Figure 6.32 contains the calculated Alexander-Klug
(182), Equation (6.2), for PS/calcite (solid line) and
experimental (open circle) relative x-ray absorption
intensity-concentration curves for the calcite-PS compounds
as a function of PS content. The data is replotted in
Figure 6.33 which shows a comparison of theoretical
intensity-concentration curves (solid line) as a function of
calcite content. The PS intensity ratio was determined from
the pure PS amorphous halo. The absorption coefficient of
PS P-ps* is 8 and calcite Pcaic e* is 70.87 (cf. Ptai=* is 31.06)
which is calculated from tables (182) .
The %error from calcite-PS theoretical line is
approximately 0, 3, 1, 3, 5, 0% for the 5, 10, 20, 40, 100
v% calcite filled system. Thus if we multiply the reduced
number from the amorphous halo in Figure 6.32 into pure PS
intensity, we get the PS content within 5% error range
(average 2%). Inversely we can determine the unknown
filler's content from the PS intensity ratio Ips, <t>/ (Ip3) c> as
exhibited on Figure 6.33.
We conclude that intensity ratio I p s . * / ( I Ps) a determine
the composition of PS and calcite from calcite-PS compound
system.
Reproduced with permission of the copyright owner. Further reproduction prohibited without permission.

297
coCL
>*.t; °mC Q.
c— CO<D>J5a:
Theoretical Intensity C oncentration
Experimental M easu rem en ts0.8
0.6
0 .4
0.2
0.00.8 1.00.60.0 0.2 0.4
W eight F raction of P S
Figure 6.32 Comparison of theoretical intensity-concentration curves (solid line) and experimental measurements (open circle) for PS/calcite mixtures
Reproduced with permission of the copyright owner. Further reproduction prohibited without permission.

298
0.8
0.6GOO o
sS 0 .4
T heore tical Intensity C oncen tration E xperim ental M easu rem en ts
0.2
0.0 0.80.6 1.00 .40.20.0W eig h t F rac tion o f C alc ite
Figure 6.33 Comparison of theoretical intensity-concentration curves (solid line) and experimental measurements (closed hexagon) for PS/calcite mixtures
Reproduced with permission of the copyright owner. Further reproduction prohibited without permission.

6.3.1.4 PS / Talc System29S
From Figure 6.1 and Figures 6.8 to 6.12 we may
determine Ips (fy / (IP3) o for the talc-PS compounds . The
relative intensities are 0.55, 0.40, 0.23 and 0.17 for the
= 0.05, 0.10, 0.20 and 0.40 compounds. We plot
I talc (^ ) / ( I e,lc)o in Figure 6.34 as a function of volume
fraction talc. We also compare our data with the Alexander-
Klug equation, Equation (6.2). The calculated absorption
coefficient of PS M'ps* is 8 and talc M-calc* is 31.06 (188) .
Figure 6.34 shows the comparison of theoretical
intensity-concentration curves (solid line) as a function of
talc content. The PS intensity was determined from the pure
PS amorphous halo.
The %error from talc-PS theoretical line is
approximately 7, 4, 5, 4, 3, 0% for the 5, 10, 20, 40, 100
v% talc filled system each. We get the PS content within 7%
error range (average 5%).
We show talc-PS content from PS intensity ratio
Ips,*/(Ips) c on Figure 6.34.
Reproduced with permission of the copyright owner. Further reproduction prohibited without permission.

300
0.8
0.6
0010.4
0.2 T heore tica l Intensity C o n cen tra tio n
• E xperim ental M e a su re m e n ts
0 .0 0 .2 0 .4 0.6
W eight Fraction
0.8 1.0
Figure 6.34 Comparison of theoretical intensity-concentration curves (solid line) and experimental measurements (closed circle) for PS/talc mixtures
Reproduced with permission of the copyright owner. Further reproduction prohibited without permission.

301We conclude that intensity ratio Ips,*/ (Ip3) a may be
used to determine the composition of PS and talc from talc-
PS compound system.
6.3.1.5 PS / Talc / Calcite System
6.3.1.5.1 Pseudo binary mixture system of PS/(Talc/Calcite)
We determined relative intensity I OS / (Ips) : for
the pseudo binary mixture of PS and talc/calcite compounds
from Figures 6.22, 6.23 and Figure 6.24. This system
consists of PS/talc/calcite (90:05:05 v% (88:12:14 wt%),
84:04:12 (88:12:30), 54:03:43 (88:12:178)) system. The
relative intensities are 0.7, 0.4, and 0.1 for the ^ =
90:05:05, 84:04:12, and 88:12:178 wt% compounds. We also
determined the relative intensities for the systems of
PS/talc/calcite (84:10:06 v% (77:23:14 wt%), 78:10:12
(77:23:30), 53:05:42 (77:23:178)) system. The relative
intensities are 0.50, 0.61 and 0.82 for the 4* = 84:10:06,
78:10:12, 53:05:42 v% compounds. We also compared our data
with the Alexander-Klug equation, Equation (6.2). The
absorption coefficient of PS ^PS* is 8 and talc taic/caicite* is
Reproduced with permission of the copyright owner. Further reproduction prohibited without permission.

30245.85, 53.56, 66.31 for talc/calcite 10:05, 10:12, and
05:42 v% (182) . Figure 6.21 shows the intensity
distribution for PS compounds with various talc/calcite
loadings (00:00, 10:00, 10:16, 10:12, 05:42 v%).
Figures 6.35 and 6.36 shows the comparison of
theoretical intensity-concentration curves (line) of mixture
PS as a function of talc/calcite content. The reduced PS
intensity was determined from the PS/talc/calcite amorphous
halo.
6.3.1.5.2 Pseudo binary mixture system of (PS/Talc)/Calcite
We determined the relative intensity
Ips-.aic (♦calcite) / dps-ca.c) u for the pseudo binary mixture of
PS/talc and calcite compounds from Figure 6 . 2 2 through
Figure 6 . 2 7 . This system consists of (PS/talc)/calcite
( ( 9 0 : 0 5 ) : 0 5 v% ( ( 8 8 : 1 2 ) : 1 4 wt%), ( 8 4 : 0 4 ) : 1 2 v% (( 8 8 : 1 2 ) : 3 0
wt%)), ( ( 5 4 : 0 3 ) : 43 v% ( (88:12) : 178 wt%), ( ( 8 5 : 1 0 ) : 05 v%
( ( 7 7 : 2 3 ) : 1 4 wt%), ( ( 7 8 : 1 0 ) :12 v% ( ( 7 7 : 2 3 ) :30 wt%), and
( ( 5 3 : 0 5 ) :42 v% ( ( 7 7 : 2 3 ) : 178 wt%) system. The relative
intensities are 0 . 7 , 0 . 4 , 0 . 1 , 0 . 5 , 0 . 3 9 , and 0 . 1 8 each. We
also compare our data with the Alexander-Klug equation,
Reproduced with permission of the copyright owner. Further reproduction prohibited without permission.

303Equation (6.2). The absorption coefficient of PS ps+taic*
is 13.3 and talc ^caicice* is 70.87 (182) .
Figure 6.35 shows the comparison of theoretical
intensity-concentration curves (line) of mixture PS as a
function of talc/calcite content. The PS intensity was
determined from various PS/talc/calcite (88:12:calcite wt%)
composition.
The %error from PS/talc/calcite (88:12:calcite wt%)
theoretical line is approximately 12, 9, 2 % for the 14, 30,
178 wt% calcite filled system each. We get the PS content
within 12% error range (average is 8%).
Figure 6.36 shows the comparison of theoretical
intensity-concentration curves (line) of mixture PS as a
function of talc/calcite content. The PS intensity was
determined from various PS/talc/calcite (77:23:calcite wt%)
composition.
The %error from PS/talc/calcite (77:23:calcite wt%)
theoretical line is approximately 12, 6 , 1 % for the 14, 30,
178 wt% calcite filled system each. We get the PS content
within 12% error range (average is 8%).
Figure 6.37 shows the comparison of theoretical
intensity-concentration curves (line) of mixture PS/talc as
Reproduced with permission of the copyright owner. Further reproduction prohibited without permission.

304a function of calcite content. The PS/talc intensity was
determined from various calcite (88:12:calcite wt%)
composition.
The %error from (PS/talc, 88:12 wt%)/calcite
theoretical line is approximately 3, 6, 18 % for the 14, 30,
178 wt% calcite filled system each. We get the PS content
within 12% error range (average is 9%) .
Figure 6.38 shows the comparison of theoretical
intensity-concentration curves (line) of mixture PS/talc as
a function of calcite content. The PS/talc intensity was
determined from various calcite (77:23:calcite wt%)
composition.
The terror from (PS/talc, 77:23 wt%)/calcite
theoretical line is approximately 10, 1, 9 % for the 14, 30,
178 wt% calcite filled system each. We get the PS content
within 10% error range (average is 7%) .
We conclude that intensity ratio I ps+taic, (‘t’caicite) / ( Ips-tan) s
determine the composition of PS/talc and calcite in
PS/talc/calcite compound system. The ternary mixture system
exhibited %error result higher than the binary mixture
system. This may due to higher orientation of talc
particles.
Reproduced with permission of the copyright owner. Further reproduction prohibited without permission.

305
Relative Intensity vs. Weight Fraction of PS
1.0
0.8
I 0.6
o>.'</)c<Dc0)>rav(X
0.4
0.0
PS/Talc/Calcite (88:12:000) PS/Talc/Calcite (88:12:13.6) PS/Talc/Calcite (88:12:29.9) PS/Talc/Calcite (88:12:177.8)
• PS/Talc/Calcite (88:12:000)■ PS/Talc/Calcite (88:12:13.6)A PS/Talc/Calcite (88:12:29.9)▼ PS/Talc/Calcite (88:12:177.8)
0.0 0.2 0.4 0.6
Weight Fraction of PS
0.8 1.0
Figure 6.35 Relative intensity distribution of varioustalc/calcite mixed particle as a function of PS concentration
Reproduced with permission of the copyright owner. Further reproduction prohibited without permission.

306
Relative Intensity vs. Weight Fraction of PS
1.0
o32a
"wO2*V)cQ)<D>
(Dir
PS/Talc/Calcite (77/23:000 wt%) PS/Talc/Calcite (77/23:13.6)
PS/Talc/Calcite (77/23:29.9)
PS/Talc/Calcite (77/23:177.8)
PS/Talc/Calcite (77/23:000 wt%) ■ PS/Talc/Calcite (77/23:13.6)A PS/Talc/Calcite (77/23:29.9)▼ PS/Talc/Calcite (77/23:177.8)
0.4 0.6
Weight Fraction of PS
Figure 6.36 Relative intensity distribution of various talc/calcite mixed particle as a function of PS concentration
Reproduced with permission of the copyright owner. Further reproduction prohibited without permission.

307
Relative Intensity vs. Weight Fraction of PS+talc
1.0
^ 0.8 h
0.6
o>.toc£c(1)>raa)a:
0.4 h
0.2
PS:Talc/Calcite (88:12/000 wt%) PS:Talc/Calcite (88:12/13.6) PS:Talc/Calcite (88:12/29.9)
PS:Talc/Calcite (88:12/177.8)
• PS:Talc/Calcite (88:12/000 wt%)■ PS:Talc/Calcite (88:12/13.6)A PS:Talc/Calcite (88:12/29.9)▼ PS:Talc/Calcite (88:12/177.8)
0.00.0 0.2 0.4 0.6
Weight Fraction of PS+talc
0.8 1.0
Figure 6.37 Relative intensity distribution of various(PS/talc,88:12 wt%)/calcite mixed particle system as a function of PS+talc concentration
Reproduced with permission of the copyright owner. Further reproduction prohibited without permission.

Rela
tive
Inte
nsity
of
Ips^
foe-
ateW
ps^a
icJo
308
Figure
Relative Intensity vs. Weight Fraction of PS+talc
■▲▼
PS:Talc/Calcite— PS:Talc/Calcite
- PS:Talc/Calcite
— PS:Talc/Calcite
> PS:Talc/Calcite PS.Talc/Calcite PS:Talc/Calcite PS:Talc/Calcite
(77:23/000 wt%) (77:23/13.6)
(77:23/29.9)
(77:23/177.8)
(77:23/000 wt%) (77:23/13.6) (77:23/29.9) (77:23/177.8)
0.00.0 0.2 0.4 0.6
Weight Fraction of PS+talc
0.8 1.0
6.38 Relative intensity distribution of various (PS/talc,77:23 wt%)/calcite mixed particle system as a function of PS+talc concentration
Reproduced with permission of the copyright owner. Further reproduction prohibited without permission.

3096.3.1.6 Summary of PS / Talc, PS / Calcite, and PS /
Talc / Calcite System
6.3.1.6.1 PS / Talc, and PS / Calcite System
The first quantitative analysis using x-ray absorption
was done by Clark and Reynolds (178) in 1936 for mine-dust
analysis. Hull (177) pointed out each component in a
mixture exhibited a characteristic absorption intensity and
proportional to the amount present. Alexander and Klug
(182, 188, 189) introduced mathematical relationships
between intensity and absorptive properties of the sample.
Their work was mainly applied to particle-particle mixture
systems. In mixed particle compounds, there were
difficulties in quantitative analysis especially for
anisotropic particles because they easily orient during
packing or processing. The degree of orientation of
anisotropic particles gives different peak intensities.
This creates questions in quantitative analysis of particle-
particle mixed system. We considered the Alexander and Klug
(182, 188, 189) mathematical relationship between intensity
and absorptive properties to still apply.
Reproduced with permission of the copyright owner. Further reproduction prohibited without permission.

310The predictions for the binary systems work well
with experiment.
We have investigated the effect of filler content from
various compositions of fillers using WAXD (reflection
technique) and the amorphous halo intensity. Investigation
of filler composition using amorphous halo intensity of PS
is first done in our laboratory. The %error range for
calcite content in the mixture with PS was 5% (average 2 %)
and 7% for talc content (average 5 %). The calcite,
isotropic filler, showed good results in quantitative
analysis because of its isotropy which showed a good
reproduction ability, but in the case of anisotropic filler
talc the measuring of filler intensity from the peak gives
error due to talc particle's orientation which is well known
(183-186, 188, 189) .
6.3.1.6.2 PS / Talc / Calcite System
Using Alexander and Klug (182, 188, 189) mathematical
relationship between intensity and absorptive properties and
pseudo binary mixture method can be applied for calcite-
Reproduced with permission of the copyright owner. Further reproduction prohibited without permission.

311talc-PS filled system. There seems no investigation on
systems such as the calcite-talc-PS system.
The %error range for talc/calcite content in the
mixture with PS was 17% (average 9 %).
The talc/calcite, mixed filler, showed good result in
quantitative analysis due to isotropy contribution which
showed good reproduction ability. For anisotropic talc, the
intensity of amorphous halo gives more accurate results than
using anisotropic filler's plane intensity. In order to get
more accurate intensity distribution data from anisotropic
particle filled system one should consider azimuthal angle
intensity and the degree of orientation of anisotropic
particles.
6.3.2 Flat Film Measurements Of Orientation
The WAXD flat film technique was used to characterize
the state of orientation of talc particles. The
transmission method was used. We have presented an
experimental study of the orientation characteristics of
talc, calcite and talc/calcite particle filled compounds in
Reproduced with permission of the copyright owner. Further reproduction prohibited without permission.

312capillary die extrudates for talc, calcite, and
talc/calcite, and compression molded samples of talc and
talc/calcite at various volume loadings.
Typical results in the form of WAXD flat film technique
are shown in Figure 6.22-6.26. These WAXD flat film
techniques qualitatively shows the state of orientation.
Figure 6.22 shows talc particles in extrudate orients with
their disc surfaces in the circumferential direction.
Figure 6.23 shows calcite particles do not exhibit
orientation. Figure 6.24 exhibits overlapped peaks
indicating orientation of talc/calcite particle. Molded
sheet samples exhibited sharper arcs compared to extrudates;
i.e. The degree of orientation of the molded sheet sample
showed higher than the uniaxial sample. Figure 6.25
exhibits sharp arc for a beam in the normal direction for
the (001), (002+020), and (003) planes. Figure 6.26 is for
compression molded talc/calcite compound. Due to the
overlap of characteristic peaks we can't see talc particle's
(001), (002+020), and (003) planes. Qualitatively the film
technique easily distinguish degree of orientation for
single particle system. Using the flat film technique is
limited when applied to the talc/calcite system.
Reproduced with permission of the copyright owner. Further reproduction prohibited without permission.

313
6.3.3 Orientation Factors And Pole Figure Measurements
Uniaxial and biaxial orientation factors were
determined from the pole figures. Orientation factors were
determined and represented by White and Spruiell's
orientation triangle (163).
6. 3.3.1 Capillary Die Extrudates
Figure 6.31 presents uniaxial orientation factors for
5, 10, 20, 40 v% talc filled system. Table 6.2 summarizes
the orientation factors of capillary extrudates of talc, and
talc/calcite filled systems. The degree of orientation of
talc particle exhibit values at 5 v% of (-0.39) and at 10 v%
(-0.40), at 20 v% (-0.39) and at 40 v% (-0.36). There is a
noticeable decrease at 40 v%.
Reproduced with permission of the copyright owner. Further reproduction prohibited without permission.

314
Figure
: B FD
O 5 v% Talc
□ 10 v% Talc
A 20 v% TalcV 40 v% Talc
.39 White and Spruiell orientation triangle for capillary die extrudates
Reproduced with permission of the copyright owner. Further reproduction prohibited without permission.

315Table 6.2 Orientation factor for talc, and talc/calcite
filled system from capillary die (L/D=28.5, D=1.6mm) extrudate at Q = 29.9 (mm3/s) 200°C.
PS/Talc (95 : 05 v%)
PS/Talc/Calcite (90 : 05 : 05 v%)
PS/Talc/Calcite (84 : 04 : 12 v%)
fooi.FD = ~ 0 . 39 fooi.FD = —0 . 37 fool, FD = -0.38
PS/Talc (90 : 10 v%)
PS/Talc/Calcite (84 : 10 : 06 v%)
PS/Talc/Calcite (78 : 10 : 12 v%)
f 0 0 I, F D = ~ 0 . 4 0 fcoi.FD = —0.38 fooi.FD = -0.39
PS/Talc (80 : 20 v%)
PS/Talc/Calcite (75 : 19 : 06 v%)
PS/Talc/Calcite (69 : 17 : 14 v%)
fooi.FD = -0.39 f 001, FD = — 0 . 3 3 f •• rr = -0.37
PS/Talc (60 : 40 v%)
PS/Talc/Calcite (60 : 20 : 20 v%)
fooi.FD = -0 . 36 fooi.FD = —0.36
Reproduced with permission of the copyright owner. Further reproduction prohibited without permission.

6.3.3.2 Rectangular Die Extrudates316
Figure 6.28 indicates the crystallographic axis of the
normal to the talc particles perpendicular to the surface of
the wall i.e. The talc particles are aligned parallel to the
surface of the rectangular die wall.
6.3.3.3 Slit Die Extrudates
Figure 6.29 shows pole figures for the (001) plane of
talc particles.
Because of the simplicity of the geometry, orientation
factors were determined and represented on White and
Spruiell's orientation triangle in Figure 6.40 for 5, 10,
20, 40 v% talc filled system. Table 6.3 summarizes the
orientation factors of slit die extrudates of talc, and
talc/calcite filled systems. The talc particle's degree of
biaxial orientation for flow (1) direction and transverse
direction of the (001) plane (fB=-D/ f°Tn) is 5 v% (-0.80, -
0.80), 10 v% (-0.82, -0.82), 20 v% (-0.80, -0.80), and 40 v%
(-0.83, -0.83).
Reproduced with permission of the copyright owner. Further reproduction prohibited without permission.

317
Figure
f, BFD
(-1, - 1)
5 v% Talc
10 v% Talc
20 v% Talc 40 v% Talc
f. BTD
.40 White and Spruiell orientation triangle for slit extrusion
Reproduced with permission of the copyright owner. Further reproduction prohibited without permission.

318Table 6.3 Orientation factor of talc, and talc/calcite
filled system from slit die extrudate (W/T=20,T=0.3 mm) extrudate at Q = 9049.5 (mmVs) 200°C
P S / T a l c
(95 : 05 v%)
P S / T a l c / C a l c i t e
(90 : 05 : 05 v%)
P S / T a l c / C a l c i t e
(84 : 04 : 12 v%)
foe:, FD = - 0 . 8 0
foOl.TD = —0 . 7 3
fooi.FD = —0 . 6 2
f 0G1, TD = —0 . 6 3
fooi.FD = - 0 . 4 9
foe 1, TD = —0 . 6 2
P S / T a l c
(90 : 10 v%)
P S / T a l c / C a l c i t e
(84 : 10 : 06 v%)
P S / T a l c / C a l c i t e
(78 : 10 : 12 v%)
f ooi, ?d = —0 . 8 2
fooi.TD = - 0 . 7 9
f 001, FD = —0 . 64
fooi,TD = —0 . 62
f 001, FD = —0 . 5 0
f ooi, td = —0 . 5 6
P S / T a l c
(80 : 20 v%)
P S / T a l c / C a l c i t e
(75 : 19 : 06 v%)
P S / T a l c / C a l c i t e
(69 : 17 : 14 v%)
O C\J
CO 00
O O
1
1It
IICl
QIt.
(4
o O
o o
i
f 001, FD = —0 . 7 8
f 001, TD = —0 . 7 7
f 0 0 I, FD = —0 . 7 4
f 001, TD = —0 . 7 0
P S / T a l c
(60 : 40 v%)
P S / T a l c / C a l c i t e
(60 : 20 : 20 v%)
f 001. FD = —0 . 8 3
foOl.TD = —0 . 8 1
fooi.FD = - 0 . 7 2
f G J I, TD = —0 . 6 9
Reproduced with permission of the copyright owner. Further reproduction prohibited without permission.

319This result represents the talc particle's c-axis. It is
perpendicular to the surface of the slit die wall i.e. The
talc particles are aligned parallel to the surface of the
die wall.
6 .3.3.4 Annular Die Extrudates
The pole figures indicates that the c-axis of talc
particles orient normal to the wall as shown in Figure 6.30.
This result indicates that the talc particle's c-axis
is perpendicular to the surface of the annular die wall i.e.
The talc particles are aligned parallel to the surface of
the annular die wall.
6. 3.3.5 Compression Molded Parts
Orientation factors were represented on White and
Spruiell's orientation triangle in Figure 6.41 for 5, 10,
20, 40 v% talc filled system. Table 6.4 summarizes the
orientation factors of compression molding of talc, and
talc/calcite filled system.
Reproduced with permission of the copyright owner. Further reproduction prohibited without permission.

320
FD1
0.5
0.5
-0.
5 v% Talc
10 v% Talc
20 v% Talc 40 v% Talc
(-1.-1)
f, BFD3
Figure 6.41 White and Spruiell orientation triangle for compression molded parts
Reproduced with permission of the copyright owner. Further reproduction prohibited without permission.

321Table 6.4 Orientation factor of talc, and talc/calcite
filled system from compression molding at 5 MPacompression (Thickness = 1 mm) at 200 'C
PS/Talc (95 : 05 v%)
PS/Talc/Calcite (90 : 05 : 05 v%)
PS/Talc/Calcite (84 : 04 : 12 v%)
f001, FD = “0.90 fooi.TD = —0 . 90
f 001, FD = —0.86fooi, TD — —0.86
fooi.FD = —0.47 f 001, TD = —0.47
PS/Talc (90 : 10 v%)
PS/Talc/Calcite (84 : 10 : 06 v%)
PS/Talc/Calcite (78 : 10 : 12 v%)
f001, FD = “0.90 foOl.TD = “0.90
f 00 1, FD = —0.81 foOl.TD = -0.81
fooi.FD = —0.75 f 0 0 1, TD = —0.75
PS/Talc (80 : 20 v%)
PS/Talc/Calcite (75 : 19 : 06 v%)
PS/Talc/Calcite (69 : 17 : 14 v%)
f 001, FD = —0.87 fooi.TD = —0.87
f 001, FD = “0.86 fooi, TD = —0.8 6
fooi.FD = —0.87 f 001, TD = —0.87
PS/Talc (60 : 40 v%)
PS/Talc/Calcite (60 : 20 : 20 v%)
f 001, FD = —0.83 foOl.TD = —0.83
fooi.FD = — 0.86 foOl.TD = —0.86
Reproduced with permission of the copyright owner. Further reproduction prohibited without permission.

322The talc particle's degree of biaxial orientation (f ?Eif
f%D3) for flow (1) direction at (001) plane is 5 v% (-0.90,
-0.90), 10 v% (-0.90, -0.90), 20 v% (-0.87, -0.87), and 40
v% (-0.83, -0.83). This result represent the talc
particle's c-axis as perpendicular to the surface of the
mold wall i.e. talc particles are aligned parallel to the
surface of the mold wall or flow direction.
6.3.3.6 Mixed Particle Filled System
6. 3. 3.6.1 Capillary Die Extrudates
Capillary die extrudates for mixed particle system did
not show considerable differences as a function of addition
of calcite particles. As the talc fraction changes as
PS/talc/calcite 90:05:05, 84:10:06, and 75:19:06 v% the
orientation order of talc particles exhibited -0.37, -0.38,
and -0.35, and for PS/talc/calcite 84:04:12, 78:10:12, and
69:17:14 v% fraction the orientation order of talc particles
exhibited -0.38, -0.39, and -0.37.
Reproduced with permission of the copyright owner. Further reproduction prohibited without permission.

323
0.0 T T
-0.2 h
-0 .4coro| -0.6
O calc ite 0 vol%
□ ca lc ite 6 vol%A ca lc ite 12 vol%
V ca lc ite 20 vol%-O
-0.8 r
- 1.00 5 10 15 2 0 2 5 30 35 4 0 4 5 50
Talc (vol%)
Figure 6.42 Orientation function of talc as a function ofvolume loading of calcite from capillary die extrudates
Reproduced with permission of the copyright owner. Further reproduction prohibited without permission.

324This indicates the talc particle filled capillary die
extrudate system did not show considerable changes (see
Figure 6.42) in talc particle orientation. The 20/20 v%
talc/calcite filled system exhibited -0.36.
6.3.3.6.2 Slit Die Extrudates
Slit die extrudated mixed particle systems show
considerable differences as a function of addition of
calcite particles. Table 6.3 represents the orientation
factor of mixed talc particles as a function of calcite
volume loading from slit die extrudates. As talc fraction
increases from 5 v%~ 20 v% the orientation order of 06 v%
calcite fraction mixed system showed -0.62--0.78, and 12v%
calcite fraction mixed system showed -0.49~-0.74.
This result indicates that as the relative
concentration of calcite particle fraction increases (or
talc particle fraction decreases) in the mixture of
talc/calcite particle filled system the degree of talc
particle orientation decreases (see Figure 6.43).
Reproduced with permission of the copyright owner. Further reproduction prohibited without permission.

0.0
-0.2O u_*3 -0 .4c0ro
1 -0 6*L-O
- 0.8
- 1.00 5 10 15 2 0 2 5 30 3 5 4 0 4 5 5 0
Talc (vol%)
i i i ~
O ca lc ite 0 vol%□ ca lc ite 6 vol%
A ca lc ite 12 vol%V ca lc ite 20 vol%
i i i i i i i i
Figure 6.43 Orientation function of talc as a functionvolume loading of calcite from slit die extrudates
Reproduced with permission of the copyright owner. Further reproduction prohibited without permission.

6.3.3.6.3 Compression Molding326
Compression molded mixed particle system show
considerable differences as a factor of addition of calcite
particles. Table 6.4 represents the orientation factor of
talc particles as a function of calcite volume loading from
compression molding. As talc fraction increases from 5 v%~
20 v% the biaxial orientation factor of 06 v% calcite
fraction mixed system showed a variation from -0.81 to -
0.86. The 12v% calcite fraction mixed system showed a
variation from -0.47 to -0.87. 20/20 v% talc/calcite mixed
system showed -0 .86.
When calcite particle fraction increases (or talc
particle fraction decreases) in the mixture of talc/calcite
particle filled system, the degree of talc particle
orientation decreases (see Figure 6.44).
6 .3.3.6 Summary
Typical results in the form of WAXD pole figure
technique are shown in Figures 6.27, 6.28, 6.29, 6.30, and
6.31. They indicate that the c-axis of talc particles
orients normal to the walls of dies and molds.
Reproduced with permission of the copyright owner. Further reproduction prohibited without permission.

327
0.0
-0.2QLi.
*3 -0 .4co
’•4— *(0.1 '°-6 V-O
- 0.8
- 1.00 5 10 15 2 0 2 5 30 35 4 0 4 5 50
Talc (vol%)
calc ite 0 vol% calc ite 6 vol%
calc ite 12 vol% calc ite 2 0 vol%
Figure 6.44 Orientation function of talc as a function ofvolume loading of calcite from compression molding
Reproduced with permission of the copyright owner. Further reproduction prohibited without permission.

328These WAXD patterns show high levels of orientation of
talcs; specifically, the particle normals are perpendicular
(i) to the compression mold surface, (ii) to the slit die
surface, (iii) to the capillary extrudate surface, (iv) to
the rectangular die surface and (v) to the annular die
surface.
The data have been converted to orientation factors,
for the compression molded and in extruded sheets. These
give a better quantitative comparison of the levels of
orientation. It is found that the orientation factors fi=
and f3s are equal and less than -0.90. These indicate the
talc particle surfaces being parallel to the surface of the
sheets. In Figure 6.39, 6.40, and 6.41, we plot the
orientation function for the same process conditions in an
orientation triangle which was developed by White and
Spruiell. The orientation factors for the talc particles in
the extruded filaments are different in Figure 6.39.
Generally fiBis negative and f3Bis zero. These calculations
show the talc particle's c-axis is perpendicular to the
surface of the wall i.e. talc particles are aligned parallel
to the flow direction. This is equivalent to a state of
Reproduced with permission of the copyright owner. Further reproduction prohibited without permission.

329uniaxial orientation with the talc particle normals
perpendicular to the axis.
We have also studied the influence of particle loading
on the talc particle orientation in compression molded
sheets, extruded sheets and extruded filaments. The
orientation levels are the highest for the compression
molded samples. We found that for the compression molded
sheets and extruded sheets the degree of orientation
increases with increasing volume fraction as shown in Figure
6.45.
Figure 6.45 shows the fi3orientation factor for the
capillary extrudates. The degree of orientation increases
for the 0.05 and 0.10 volume fraction samples but decreases
for the 0.20 and 0.40 samples which was not observed from
earlier studies in Lim (70, 7_1, 8_0, 8_1) and Suh (82-84) .
This phenomenon which was not observed in the extruded
sheets suggested further investigations using scanning
electron microscope (SEM), where particle orientation
distributions through extrudate cross-section may be studied
more precisely.
Reproduced with permission of the copyright owner. Further reproduction prohibited without permission.

330
0 .0
-0.2
-0 .3
-0 .4Capillary Extrudates (Uniaxial)
-0 .5
- -0.6
-0 .7
S heet Extrudates (Biaxial)
-0.8
-0 .9Com pression Moldings (Biaxial)
i - i 1 I L— I I I U
0 .50.3 0.40.20.0 0.1
Volume Loading
Figure 6.45 Orientation function as a function of volumeloading of capillary extrudates, sheet extrudates, and compression moldings
Reproduced with permission of the copyright owner. Further reproduction prohibited without permission.

331We investigated calcite/talc mixed particle filled
system. We could not see considerable orientation changes
of talc particles in capillary extrudated samples as shown
in Figure 6.42. However slit die extrusion sample showed
decrease in degree of orientation as increase calcite
particle loadings from 6 v% to 12 v% at 10 v% talc and at 20
v% talc respectively as shown in Figure 6.43. Compression
molding showed decrease in degree of orientation as increase
calcite particle loadings from 5 v% to 10 v% at 10 v% talc
as shown in Figure 6.44. However high loading system
(talc/calcite=20:06, 20:12, 20:20) did not show significant
changes in compression molding system.
Reproduced with permission of the copyright owner. Further reproduction prohibited without permission.

CHAPTER VII
CHARACTERIZATION OF LOCAL PARTICLE ORIENTATION
IN PROCESSED COMPOUNDS
7.1 Introduction
In this chapter, we describe an effort to measure
localized orientation of anisotropic particles which arise
in different processing geometries. The primary anisotropic
particles to be studied are talc but investigations were
also made with mica and talc/calcite. Characterization was
carried out using scanning electron microscopy (SEM).
332
Reproduced with permission of the copyright owner. Further reproduction prohibited without permission.

7.2 Results333
We inspected fracture surface of compression molded
sheets, slit die extrudates, capillary die extrudates,
rectangular die extrudates and annular die extrudates using
SEM.
7.2.1 Compression Molded Samples
Talc
SEM photomicrographs of sliced compression molded
sheets of 5 and 40 volume percent compounds of talc in
polystyrene at 5 MPa exhibited cross-sections indicating the
talc disc shaped particles were parallel to the mold
surface. These are shown in Figure 7.1.
M i c a
SEM photomicrographs of sliced compression molded mica
sheets with 5 and 40 volume percent of mica in polystyrene
prepared under the same conditions as the talc particle
filled sheet are shown in Figure 7.2. The mica particles
are also parallel to the mold surface.
Reproduced with permission of the copyright owner. Further reproduction prohibited without permission.

Figure 7.1 Cross-section of 5 v% and 40 v% talc particle filled compression molded polystyrene sheets
Reproduced with permission of the copyright owner. Further reproduction prohibited without permission.

335
(a) 5 v%
(b) 40 v%
Figure 7.2 Cross-section of 5 v% and 40 v% mica particlefilled compression molded polystyrene sheets
Reproduced with permission of the copyright owner. Further reproduction prohibited without permission.

7.2.2 Extrudates336
7.2.2.1 Capillary Die
Tal c
Filaments extruded from capillary dies exhibited a more
complex behavior. This is shown in Figure 7.3. For the
0.05 and 0.10 samples, the talc particle discs are oriented
with their long axes tangential to concentric circles whose
center is the filament axes as shown in Figures 7.3 (a)-(f).
However at the 0.20 and 0.40 concentrations, there appear to
be two regions in the extrudate cross-section each with a
different type of structural order as shown in Figures 7.3
(g)-(l). At the larger radii near the filament surface the
talc particles are circumferentially arranged as at lower
concentrations. At smaller radii, the talc particles appear
to be arranged in a radial manner. There is a surface of
separation.
Reproduced with permission of the copyright owner. Further reproduction prohibited without permission.

337
Figure 7.3 Cross-section of (a) 5 v%, (b) 10 v%, (c) 20v% and (d) 40 v% talc particle filled capillary die extrudated filaments
Reproduced with permission of the copyright owner. Further reproduction prohibited without permission.

338
(g) skin 20 v% (j) skin 40 v%
intermediate 20 v% intermediate 40 v%
(i) core 20 v% continued Figure 7.3
core 40 v%
Cross-section of (a) 5 v%, (b) 10 v%, (c)v% and (d) 40 v% talc particle filled capillary die extrudated filaments
20
Reproduced with permission of the copyright owner. Further reproduction prohibited without permission.

339The position of this surface of separation (radial
direction orientation) is at larger radii for the 0.40
volume fraction sample.
We sought to quantify and expand our observations for
the capillary die. We investigated the variation of the
position of separation of the two ordered states with
extrusion conditions for the capillary die. It was found to
occur in 20 and 40 volume percent compounds not in 5 and 10
volume percent compounds which only exhibited a radial
direction orientation.
We plot the radial ratios defined as the ratio of the
diameter 'd' of the region with radial orientations to the
diameter of the die 'D' i.e. d/D versus 32Q/7rD3 in Figure
7.4. Figure 7.4 shows the radial ratio increases with
extrusion rate at volume fractions 0.20 and 0.40.
Figure 7.5 shows the radial ratio d/D of the disordered
radius d increases with volume loading increases at each of
the die wall shear stresses eA p/4L investigated where
has been corrected by the Bagley method (269). Figure 7.6
shows this radial ratio increases with die wall shear stress
with different volume loadings.
Reproduced with permission of the copyright owner. Further reproduction prohibited without permission.

340
Figure 7.
• TALC 05 V%
■ TALC 10 V%
- A TALC 20 V%0.8▼ TALC 40 V%
Q■oO
_ i<Q<CC
0.2 -
0.010° 1 0 '
Extrusion R ate (32Q/ttD3)
Dimensionless analysis of radial ratio d/D vs. extrusion rate of capillary extrudates.
Reproduced with permission of the copyright owner. Further reproduction prohibited without permission.

341
1.0 r
• 3 2 0 /itD ^ 7 .4 ( s ')■ 32Q/itD3= 74.4 (s ')A 32Q/jeD3=743.9 (s ')0.8
0.4
0.2
0.0 h. 0 10 15 20 25 30 35 40 455
TALC (V %)
Figure 7.5 Dimensionless analysis of radial ratio d/Dvs. volume loadings of capillary extrudates.
Reproduced with permission of the copyright owner. Further reproduction prohibited without permission.

342
T5O
1.0 r
0.8
0.6
<CC. 0.4_i<Q< 0.2
TALC 40V%
0.0 -
A TALC 20V% ■ TALC 10V% • TALC 5V%
■m•rn
5.0x10* 10s 1.5x10s 2 .0x10s
DIE WALL SHEAR S T R E SS (P a)
2.5x10s
Figure 7.6 Dimensionless analysis of radial ratio vs.die wall shear stress based upon different volume loadings from capillary extrudate.
Reproduced with permission of the copyright owner. Further reproduction prohibited without permission.

343Figure 7.7 shows the die wall shear rate ratio
(compound die wall shear rate-PS die wall shear rate/PS-die
wall shear rate) increases with talc volume loadings with
capillary extrusion rate at 32Q/7lD3=2.2 (sec l) . As talc
volume leadings increase shear rate ratio changes after 10
v% or 15 v% talc compounds.
M ic a
SEM photomicrographs exhibit capillary die mica
extrudates prepared at same condition as talc particle
filled capillary die filament are shown in Figure 7.8. The
capillary extrudates containing mica showed concentric
arrays parallel to the die surface at 5 v% (d/D=0.01). At
40 v% mica compounds had only a skin layer with concentric
mica parallel to the die surface (d/D=0.86). These were
core region exhibiting radial direction orientation as in
talc particle filled capillary die extrudated filament.
Reproduced with permission of the copyright owner. Further reproduction prohibited without permission.

344
Figure 7
i
• 32Q/7iD3=2.2(sec'1)
0 5 10 15 20 25 30 35 40 45
TALC (V %)
.7 Dimensionless analysis of shear ratio vsTalc v% (L/D 28.5, D=1.6 mm, 200°C,Capillary).
Reproduced with permission of the copyright owner. Further reproduction prohibited without permission.

345
(b) 40 v%Figure 7.8 Cross-section of 5 v% and 40 v% mica particle
filled capillary die extrudated filaments
Reproduced with permission of the copyright owner. Further reproduction prohibited without permission.
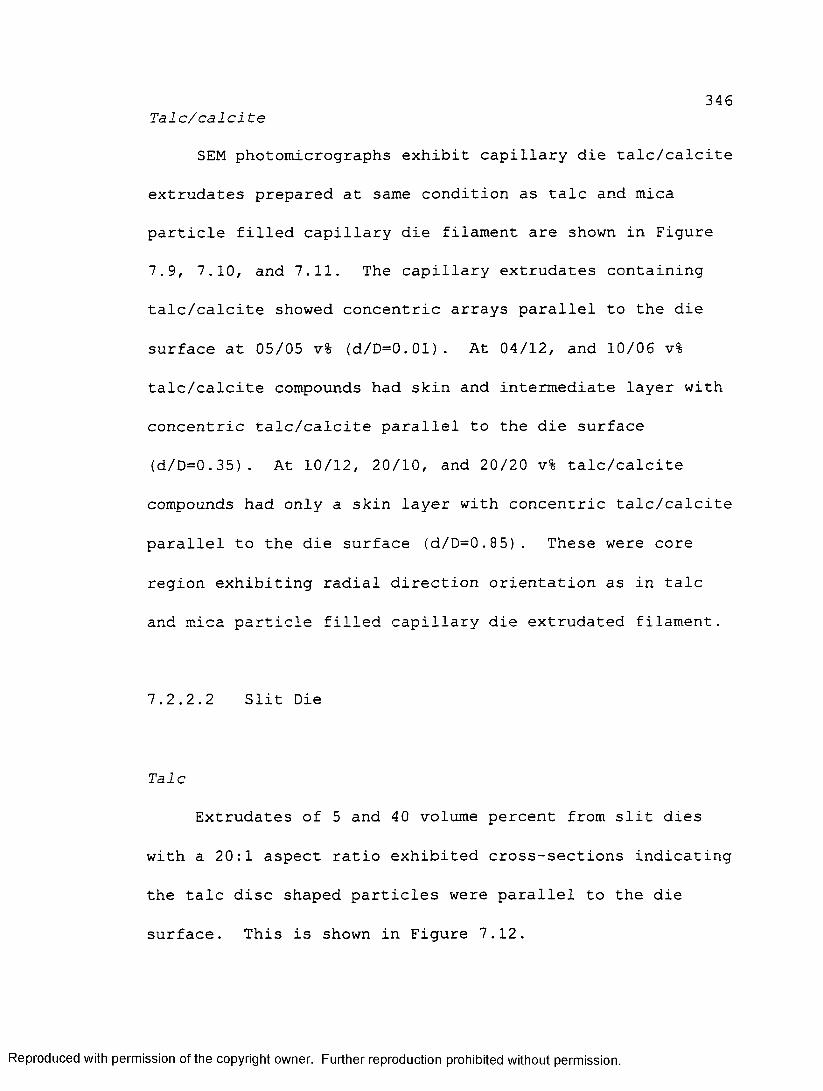
346T a l c / c a l c i t e
SEM photomicrographs exhibit capillary die talc/calcite
extrudates prepared at same condition as talc and mica
particle filled capillary die filament are shown in Figure
7.9, 7.10, and 7.11. The capillary extrudates containing
talc/calcite showed concentric arrays parallel to the die
surface at 05/05 v% (d/D=0.01). At 04/12, and 10/06 v%
talc/calcite compounds had skin and intermediate layer with
concentric talc/calcite parallel to the die surface
(d/D=0.35). At 10/12, 20/10, and 20/20 v% talc/calcite
compounds had only a skin layer with concentric talc/calcite
parallel to the die surface (d/D=0.85). These were core
region exhibiting radial direction orientation as in talc
and mica particle filled capillary die extrudated filament.
7.2.2.2 Slit Die
T al c
Extrudates of 5 and 40 volume percent from slit dies
with a 20:1 aspect ratio exhibited cross-sections indicating
the talc disc shaped particles were parallel to the die
surface. This is shown in Figure 7.12.
Reproduced with permission of the copyright owner. Further reproduction prohibited without permission.

(a) skin 05/05 v% (d) skin 04/12 v%
(b) intermediate 05/05 v% (e) intermediate 04/12 v!
(c) core 05/05 v% (f) core 04/12 v%
Figure 7.9 Cross-section of 05/05 v% and 04/12 v%talc/calcite particle filled capillary die extrudated filaments
Reproduced with permission of the copyright owner. Further reproduction prohibited without permission.

(b) intermediate 10/06 v% (e) intermediate 10/12 v%
(c) core 10/06 v% (f) core 10/12 v:
Figure 7.10 Cross-section of 10/06 v% and 10/12 v%talc/calcite particle filled capillary die extrudated filaments
Reproduced with permission of the copyright owner. Further reproduction prohibited without permission.

349
(d) skin 20/20 v%(a) skin 20/10 v%
(b) intermediate 20/10 v% (e) intermediate 20/20 v%
(c) core 20/10 v% (f) core 20/20 v%
Figure 7.11 Cross-section of 20/10 v% and 20/20 v%talc/calcite particle filled capillary die extrudated filaments
Reproduced with permission of the copyright owner. Further reproduction prohibited without permission.

(c) core 5 v% (f) core 40 v%
Figure 7.12 Cross-section of 5 v% and 40 v% talc particlefilled slit die extrudated polystyrene sheets
Reproduced with permission of the copyright owner. Further reproduction prohibited without permission.

351M i c a
Extruded of 5 and 40 volume percent mica compound
sheets prepared under the same condition as talc particle
filled compounds are shown in Figure 7.13. The mica
particles are also parallel to the die surface.
7.2.2.3 Rectangular Die
The results of the above paragraph (capillary die
extrudates) led to studies of other die cross-sections. We
made experiments with a rectangular die with an aspect ratio
of 2 :1 .
T a l c
Filaments extruded from rectangular die (Q/wh"= 2.2
(sec"1) , h=l, w=2, 1=10 mm) exhibited a complex behavior
similar to capillary extrudates. Figure 7.14 shows scanning
electron microscopy (SEM) photomicrographs of cross-section
of rectangular die extrudates with a 2:1 aspect ratio at
volume loadings 0.05 and 0.4.
Reproduced with permission of the copyright owner. Further reproduction prohibited without permission.

(c) core 5 v% (f) core 40 v%
Figure 7.13 Cross-section of 5 v% and 40 v% mica particlefilled slit die extrudated polystyrene sheets
R eproduced with perm ission of the copyright owner. Further reproduction prohibited without perm ission.

3 5 3For the 0.05 volume loading samples, the talc particles
are oriented with their long axes tangential to concentric
circles whose center is the filament axes as shown in Figure
7.14. However at the 0.4 loading the talc particle
orientations are complex. There appear to be two regions in
the extruded cross-section each with a different type of
structure order as shown in Figure 7.14. The talc particles
appear to be arranged in a radial manner. Again there is a
tendency for parallel orientation near the wall but random
and radial direction orientations are far from the wall.
There is a surface of separation.
M i c a
Rectangular die extrudates with a 2:1 aspect ratio at
volume loadings 0.05 and 0.4 are shown in Figure 7.15. The
SEM photographs of cross-section of mica particles are
parallel to the die surface at 0.05 the loading. However at
the 0.4 loading the mica particle orientations are complex.
Again there is a tendency for parallel orientation near the
wall but random and radial direction orientations far from
the wall.
R eproduced with perm ission of the copyright owner. Further reproduction prohibited without perm ission.

354
(a) skin 5 v%
(b) intermediate 5 v%
(c) core 5 v%
(d) skin 40 v%
(e) intermediate 40 v%
core 40 v%
Figure 7.14 Cross-section of 5 v% and 40 v% talc particlefilled rectangular die extrudated filament
R eproduced with perm ission o f the copyright owner. Further reproduction prohibited without perm ission.

3 5 5
(b) 40 v%
Figure 7.15 Cross-section of 5 v% and 40 v% mica particlefilled rectangular die extrudated filaments
R eproduced with perm ission of the copyright owner. Further reproduction prohibited without perm ission.

7.2.2.4 Annular Die356
T a l c
Figure 7.16 shows SEM photographs of cross-section of
annular die extrudates at volume loadings 0.05 and 0.4. The
talc particles are parallel to annular die surface at 0.05
and 0.4 loadings. The talc particles are parallel to the
die surfaces at 0.05 the loading. However at the 0.4
loading the talc particle orientations are complex. Again
there is a tendency for parallel orientation near the inner
and outer annular walls but random and radial direction
orientations far from the wall.
M i c a
Figure 7.17 shows SEM photographs of mica particles in
the cross-section of the annular die extrudates at volume
loadings of 0.05 and 0.4. The SEM photographs of cross-
section of mica particles are parallel to the annular die
surface at 0.05 the loading. However at the 0.4 loading the
mica particle orientations are complex.
R eproduced with perm ission of the copyright owner. Further reproduction prohibited without perm ission.

357
(a) skin 5 v% (d) skin 40 v%
Figure 7.16 Cross-section of 5 v% and 40 v% talc particlefilled annular die extrudated sheets
R eproduced with perm ission of the copyright owner. Further reproduction prohibited without perm ission.

3 5 8
(a) 5 v%
(b) 40 v%
Figure 7.17 Cross-section of 5 v% and 40 v% mica particlefilled annular die extrudates
R eproduced with perm ission of the copyright owner. Further reproduction prohibited without perm ission.

3 5 9Again there is a tendency for parallel orientation near
the wall but random and radial direction orientations far
from the inner and outer annular walls.
7.2.2.5 Capillary Dies For Various Diameter
The earlier experiments described in section 1.2.2.2
were based on a capillary die of diameter 1.6 mm. We have
looked at other diameters as well.
Figure 7.18 show talc particles' orientation from
capillary die diameter 0.8 mm (0.03 inch, L/D=20) at
32Q/7CD3=17 . 6 (sec"1) . Result shows no considerable difference
compared to capillary die extrudates from die diameter 1.6
mm as shown in Figure 7.2.
Figure 7.19 show talc particles' orientation from
capillary die diameter 4.8 mm (0.18 inch, L/D=20) at
32Q/7CD3=0 . 081 (sec’1) . Result shows no considerable
difference compared to capillary die extrudates from die
diameter 1.6 mm as shown in Figure 7.2. The talc particles
are parallel to the die surface at 0.05 the loading.
R eproduced with perm ission o f the copyright owner. Further reproduction prohibited without perm ission.

3 6 0
(a) skin 5 v%
(b) intermediate 5 v%
(d) skin 40 v%
HHEm
(e) intermediate 40 v%
(c) core 5 v% (f) core 40 v%
Figure 7.18 Cross-section view of 5 v% and 40 v% talcparticles from 0.8 mm capillary diameter extrudates
R eproduced with perm ission of the copyright owner. Further reproduction prohibited without perm ission.

3 6 1
Figure 7.19 Cross-section view of 5 v% and 40 v% talcparticles from 4.6 mm capillary diameter extrudates
R eproduced with perm ission of the copyright owner. Further reproduction prohibited without perm ission.

362However at the 0.4 loading the talc particle orientations
are random and radial direction orientations far from the
capillary die wall.
7.2.2.6 Capillary Die Entrance Angle 135° Flow
Figure 7.20 shows talc particles' orientation from
capillary die of entrance angle of 135° at 32Q/7CD3= 2 .2 (sec :)
as opposed to the 45° angle of the dies used in the
experiments of sections 7. 2. 2. 2 and 7.2.2.5. Result shows
no considerable difference compared to capillary die
extrudates from die entrance angle at 45° shown on Figure
7.2. The talc particles are parallel to the die surface at
0.05 the loading. However at the 0.4 loading the talc
particle orientations are random and radial direction
orientations far from the capillary die wall.
R eproduced with perm ission of the copyright owner. Further reproduction prohibited without perm ission.

363
(a) skin 5 v%
intermediate
m
skin 40 v%
intermediate 40 v%
(c) core 5 v% (f) core 40 v%
Figure 7.20 Cross-section view of 5 v% and 40 v% talc particles from capillary die entrance 135c
R eproduced with perm ission of the copyright owner. Further reproduction prohibited without perm ission.

3647.2.2.7 Capillary Die Attached To Twin Screw Extrusion
Machine
Figure 7.21 shows talc particles' orientation from a
capillary die placed at the end of twin screw extruder with
low and high volume loadings. The die contained a
cylindrical hole of diameter 4.8 mm (0.18 inch, L/D=5,
Q=5Kg/hr, 32Q/7tD3=0.0014 (sec"1)). The results are similar
to Figure 7.18 capillary extrudate samples at 32Q/7tD3=2.2
(sec’1) . The talc particles are parallel to the die surface
at 0.05 the loading. However at the 0.4 loading the talc
particle orientations are random and radial direction
orientations in the core region.
7.2.3 Flow into Die Entrance
We also inspected fracture surfaces of the particle
compounds of 20 talc volume percent flowing into the
entrance angle 45° capillary dies.
R eproduced with perm ission of the copyright owner. Further reproduction prohibited without perm ission.

365
(b) intermediate 5 v% (e) intermediate 40 v%
Figure 7.21 Cross-section view of 5 v% and 40 v% talcparticles from twin screw extruder extrudates
R eproduced with perm ission o f the copyright owner. Further reproduction prohibited without perm ission.

366
(c) plug tip 20 v% (f) plug skin 20 v%
Figure 7.22 Normal direction cross-section view of 20 v%talc particles from reservoir to capillary die entrance at 45°
R eproduced with perm ission o f the copyright owner. Further reproduction prohibited without perm ission.

367Figure 7.22 shows reservoir flow of talc particles
from reservoir to capillary die entrance at entrance angle
45°. The talc particles in the reservoir are oriented only
on the cylinder wall surface as shown in Figure 7.22 (d),
(d) , (f), and (c). This photograph shows the talc particle
normals are perpendicular to the reservoir wall and oriented
to the flow direction. The internal region shows random
orientation of talc particles as shown in Figure 7.22 (a)
and (b) . This photograph shows the talc particles are
oriented randomly in the core region and intermediate
region. As talc particle approaches to capillary die
entrance talc particles orient to flow direction as shown in
Figure 7.22 (c). This photograph shows the talc particles
are well oriented to flow direction as they approach from
reservoir region to capillary die entrance region.
R eproduced with perm ission o f the copyright owner. Further reproduction prohibited without perm ission.

7.3 Discussion368
7.3.1 Summary Of Flow Observation In Long Dies
The main result of the study shows that a careful
investigation of talc and mica particle orientation in a
series of talc-polystyrene, and mica-polystyrene compounds
indicates that in planar geometries such a compression
molding and sheet extrusion, that talc and mica disc
particles are uniformly parallel to the surfaces of the mold
and die. However in extrusion through circular or low
aspect ratio rectangular dies, the talc and mica discs lie
parallel to the die walls only at low particle loadings. At
higher loadings, the particles break down into two regions
one near the walls and a second with radial direction
orientation (see Figure 7.2 and Figure 7.7) in the core of
the die. Variations in the state of orientation of talc
particles in fabricated thermoplastic parts have been
previously noted by Lim and White (7_1) . They found the talc
orientation at the core of injection molded parts was lower
than at the wall region. However there has been no
R eproduced with perm ission of the copyright owner. Further reproduction prohibited without perm ission.

3 6 9observations of phenomena as striking as what we have
presented here.
7.3.2 Correlation Of Observations From Different
Experiment
7.3.2.1 Feed History Effect
C a p i l l a r y E x t r u d e r
The feed from capillary extrudates at diameter 1.6 mm
which has shear rate 32Q/7lD3=2.2 (sec *) showed in Figure
7.2. Schematic representation in Figure 7.2 was shown in
Figure 7.23. The feed from capillary extrudates at diameter
0.8 mm which has shear rate 32Q/7tD'=17 .6 (sec ') showed in
Figure 7.18. Schematic representation in Figure 7.18 was
shown in Figure 7.23 and Figure 7.25. The feed from
capillary extrudates at diameter 4.8 mm which has shear rate
32Q/7CD3=0.081 (sec*1) showed in Figure 7.18. Schematic
representation in Figure 7.18 was shown in Figure 7.23 and
Figure 7.24.
R eproduced with perm ission of the copyright owner. Further reproduction prohibited without perm ission.

370
TALC 0 5 V%
0.03(d/D=0.007)1.0(d/D=0.007) 10.0(d/D=0.01)
TALC 10 V%
0.03(d/D=0.007)1.0(d/D=0.007) 10.0(d/D=0.007;
TALC 20 VI
0.03(d/D=0.148)1.0(d/D=0.596) 10.0(d/D=0.7 6)
TALC 4 0 V%
0.03(d/D=0.661)1.0(d/D=0.764) 10.0(d/D=0.88:
Figure 7.23 Summary of schematic observation fromcapillary extrudates with volume and extrusion rate changes
R eproduced with perm ission of the copyright owner. Further reproduction prohibited without perm ission.

Capillary Die ( D = 0.8, L = 45 mm) Aspect Ratio ( 1 : 1 )Area : 0.46
Capillary Die ( D = 1.6, L = 45 mm) Aspect Ratio ( 1 : 1 )Area : 2.01
Capillary Die ( D = 3.2, L = 45 mm) Aspect Ratio ( 1 : 1 )Area : 8.04
Capillary Die ( D = 4.8, L = 45 mm) Aspect Ratio (1 : 1)Area : 18.1
Figure 7.24 Geometric Orientation Instability Effecttalc from different capillary dies at 5
R eproduced with perm ission o f the copyright owner. Further reproduction prohibited without perm ission.

372Capillary Die ( D = 0.8, L = 45 mm)Aspect Ratio ( 1 : 1 )A rea: 0.46
Capillary Die ( D = 1.6,L = 45 mm) Aspect Ratio ( 1 : 1 )Area : 2.01
Capillary Die ( D = 3.2,L = 45 mm) Aspect Ratio ( 1 : 1 )Area : 8.04
Capillary Die ( D = 4.8, L = 45 mm) Aspect Ratio ( 1 : 1 )Area : 18.1
Figure 7.25 Geometric Orientation Instability Effect oftalc from different capillary dies at 40 v%
R eproduced with perm ission o f the copyright owner. Further reproduction prohibited without perm ission.

3 7 3C a p i l l a r y R e s e r v o i r To D i e E n t r a n c e
In the reservoir (D=9.5mm), the talc particles are
oriented only on the die wall surface region and as they
approach to the capillary die entrance they orient to flow
direction as shown on Figure 7.22c. Schematic
representation of capillary reservoir flow was shown in
Figure 7.26. Figure 7.22c shows plug tip flow at 20 v% talc
particle flow from reservoir to capillary die entrance.
They are well oriented to the flow direction and
circumferential direction on the die wall region and radial
direction in the core. However 40 v% talc filled system
shows radial direction orientation is dominant every where
except on the capillary reservoir die wail surface.
Twin S c r e w E x t r u d e r
The feed from twin screw extrudates at diameter 4.8 mm
which has shear rate 32Q/7tD3 = 1.28xl05 (sec1) showed in
Figure 7.21. Schematic representation in Figure 7.21 was
shown in Figure 7.27.
The results are similar to each other at various shear
rate changes, occurring radial direction orientation.
R eproduced with perm ission o f the copyright owner. Further reproduction prohibited without perm ission.

3 7 4
TALC 5V% TALC 2 0 V% TALC 4 0 V%
Figure 7.26 Summary of reservoir to capillary entranceflow of talc particles
R eproduced with perm ission of the copyright owner. Further reproduction prohibited without perm ission.

375
5 V% 20 V% 40 V%
Figure 7.27 Schematic representation of twin screwextruder extrudates of talc filled thermoplastics
R eproduced with perm ission of the copyright owner. Further reproduction prohibited without perm ission.

376It is evident that talc volume loadings are mainly
dependent on occurring radial direction orientation.
7.3.2.2 Dimensionless Correlations
As shown in Figure 7.3 and Figure 7.4 the radial ratio
increases with extrusion rate increases and volume loading
increases. Volume loading seems more effective on radial
direction orientation as shown in Figures 7.3 and 7.4. Die
wall shear stress is also effective on radial direction
orientation, however much less effective on radial direction
orientation than volume loading increases. The critical
point of occurring radial direction orientation was observed
at 10-15 volume percent talc compounds. The n-value of
power law changes as a function of volume loadings as shown
in Figure 7.9. Figure 7.9 also shows the change of n-value
occurs between 10-15 volume percent talc-polystyrene
compound. We plot the changes of shear rates as a function
of volume loadings at constant extrusion rate at 32Q/7lD3 =
2.2 (sec'1) in Figure 7.6. This figure exhibits changes of
curve at 10-15 volume percent talc compounds. This may
related to formation of the liquid crystalline phase.
R eproduced with perm ission of the copyright owner. Further reproduction prohibited without perm ission.

3777.3.3 Characteristics of Circumferential Arrays
If we imagine the flakes to be arranged
circumferentially with the smallest circumferential array
having six members and being located at the center of the
cross-section as shown in Figure 7.28, for a 0.05 volume
fraction compound the 0.08 Mm thick discs are separated by
1.44 Mm and for a 0.10 volume fraction, the separation
distance is 0.64 Mm. For a 0.20 volume fraction compound
the separation is 0.24 Mm and for a 0.40 volume fraction,
the separation distance is 0.04 Mm. The approximate layer
distance between talc particles in the core is about 0.2
micron and die wall is about 0.03 micron. In the core when
the talc particle distance is less than 0.2 micron there may
exist particle-particle interferences, and on the skin when
talc particle distance is less than 0.03 micron there exists
particle-particle interferences. In compareing 20 v% and 40
v% talc particle distances, calculated 20 v% and 40 v% talc
particle distances are clearly smaller than the talc
distances between six and seven particle rings resulting in
particle interferences. This strongly supports 20 v% and 40
v% talc should have interferences in the core region.
R eproduced with perm ission of the copyright owner. Further reproduction prohibited without perm ission.

378
▲ (a)
▼ y
(b)
y
i .(c)
’(dj
Talc particle
1.24 micron
a.60
/ \.4"
• . • •• > t ■ • •
• • • •• • • •• • • •••••• •••••
• • • ♦ •
J 0.08 micron
Figure 7.28 Schematic representation of particle-particleangle and their diameter.
R eproduced with perm ission o f the copyright owner. Further reproduction prohibited without perm ission.

7.3.4 Flow Mechanism Hypotheses379
We believe that there is an instability during flow
which breakes up circumferential arrays of disc-like
particles with high radii of curvature into discrete random
groups of small random arrays. Figures 7.29 through 7.31
represent a schematic diagram of the aspect ratio from 1:1
to 1:20 and annular die for 5 v% and 40 v% talc-polystyrene
compounds orientation.
As volume loading and flow rate increase, this breakup
of circumferential arrays occurs up to high radii. As the
aspect ratio of the slit die decreases (10:1~1:1), the
radial direction orientation increases from the core region.
So we conclude talc particles orientation is influenced by
the processing geometry and volume loadings of talc
particles and mica particles (disc particles).
The real average distances observed from 5 v% talc is 1.7
micron (skin), 1.7 micron (core), 10 v% talc is 0.8 micron
(skin), 0.8 micron (core), 20 v% talc is 0.30 micron (skin),
0.23 micron (core), 40 v% talc is 0.20 micron (skin), 0.13
micron (core). The real average distances observed by SEM
show higher than calculated talc particle distance.
R eproduced with perm ission o f the copyright owner. Further reproduction prohibited without perm ission.

Capillary Die ( D = 1.6, L = 45 mm) Aspect Ratio ( 1 : 1)A rea: 2.01
3 8 0
Rectangular Die ( 1 x 2 x 23 mm) Aspect Ratio ( 1 : 2 )Area 2
Rectangular Die ( 0.6 x 6.4 x 15 mm) Aspect Ratio (1 : 10)Area 3.9
Rectangular Die ( 0.3 x 6.0 x 10.7 mm) Aspect Ratio (I : 20)Area 1.952
Figure 7.29 Geometric Orientation Instability Effect oftalc from different aspect ratio dies at 5 v%
R eproduced with perm ission of the copyright owner. Further reproduction prohibited without perm ission.

381Capillary Die ( D = 1.6, L = 45 mm)Aspect Ratio (1 : 1)A rea: 2.01
Rectangular Die ( 1 x 2 x 23 mm) Aspect Ratio ( 1 : 2 )Area 2
Rectangular Die ( 0.6 x 6.4 x 15 mm) Aspect Ratio (1 : 10)Area 3.9
Rectangular Die ( 0.3 x 6.0 x 10.7 mm) Aspect Ratio (1 : 20)Area 1.952
Figure 7.30 Geometric Orientation Instability Effect oftalc from different aspect ratio dies at 40 v%
R eproduced with perm ission o f the copyright owner. Further reproduction prohibited without perm ission.

3 8 2
Annular Die Talc 5 v% (Di = 6.096, Do = 7.620, t = 0.762 , L = 36 mm)
Aspect Ratio (1 : 21.5) Area : 16.4
tJt
i' I
11 ti
Annular Die Talc 40 v% (Di = 6.096, Do = 7.620, t = 0.762, L = 36 mm)
Aspect Ratio (1 : 21.5) Area : 16.4
Figure 7.31 Geometric Orientation Instability Effect of talc from annular die at 5 v% and 40 v%
R eproduced with perm ission of the copyright owner. Further reproduction prohibited without perm ission.

We made an empirical equation to relate radial
direction ratio d/D to particle volume loadings $.
3 8 3
dD
[1 +f \ b c
(7.i:
where a is maximum asymptotic radial ratio d / D , b is a
slope parameter, c is value at the inflection point, e is
symmetry parameter makes the curve asymmetric.
Flory (1956) showed the equilibrium degree of disorder
for rod-like particle (1-dimensional particle) as
0'=(-jX l--j) (7.2)
where A is the aspect ratio of a rod-like particle, <t>r is
equilibrium degree of disorder for rod. When A=10, (t>' is
0.64.
For the disc-like particle (2-dimensional particles) we
assume
R eproduced with perm ission of the copyright owner. Further reproduction prohibited without perm ission.

3 8 4
(7.3)
where $ 2 is equilibrium degree of disorder for disc. When
A= 10, $ 2 is about 0.1, and
(7.4)
where is volume fraction measured and $ 2 is volume
fraction for disc particle. For example, for 0.05, 0.10,
0.20, 0.4 volume fraction talc filled system, d/D values are
0, 0, 0.40, 0.62 each, when A=10, m=0.4. The detail d/D
value may vary with shear rate changes.
It is worthwhile to discuss the mechanisms of particle
orientation in talc-thermoplastic or mica-thermoplastic
suspensions. It should seen that there are different
factors determining the orientation of the talc and mica
particles. First there are Jeffery 'torques' by which the
shear flow rotates the discs into shear planes. This tends
7.3.5 Mechanism of Particle Orientation
R eproduced with perm ission o f the copyright owner. Further reproduction prohibited without perm ission.

3 8 5to flow through a tube to set up a concentric particle
state of orientation. Secondly, by a totally different
mechanism-particle packing at higher loadings, disc
particles orient and arrange in a quasi lattice array to
form a mesophase as occurs in carbonaceous pitches (88-91).
This probably involves a mechanism not unlike that described
by Flory (SJ_) for rigid rods. The layered structure
parallel to the walls of dies and molds involves cooperation
between these two mechanisms.
Particle orientation is unstable in extrusion in some
geometries when the system is concentrated. The curvature
radius effect induced by the capillary walls in the disc
layers would seem to make them unstable at high loadings,
high radii of curvature and high shear rates. The reasons
for this are not completely clear, but one can envisage that
as one moves to increasingly lower radii a concentric disc
configuration becomes more difficult. As the shear
viscosity is highly non-Newtonian and indeed a yield value
exists, there is a very high viscous resistance to the
Jeffery torques which would tend to rotate the disc
particles into the concentric rings. This would tend to
decrease orientation especially in the core where the
R eproduced with perm ission of the copyright owner. Further reproduction prohibited without perm ission.

38viscosity is the highest and the shear stresses and
torques the lowest.
The question arises as to whether similar phenomena
have been found in other systems. It is to be noted that
radial orientation structures are also observed in carbon
fibers made from disc-like mesophase carbonaceous pitch (87
91) where researchers discuss 'onion-skin' and 'radial'
fiber structures. Honda (^1) indeed has presented cross-
sectional morphologies (see Figure 7.32) for fibers melt
spun from pitch mesophase which are similar to the results
of this paper.
R eproduced with perm ission of the copyright owner. Further reproduction prohibited without perm ission.

387
-\- \
Radialstructure
Onionskinand
mid-radialStructure
Onionskinand
mid-randomStructure
Figure 7.32 Cross-section texture of pitchHonda
Onion-likeStructure
fibers from H.
R eproduced with perm ission of the copyright owner. Further reproduction prohibited without perm ission.

C H A P T E R V I I I
ALTERNATE MODELS FOR THE YIELD SURFACE OF
A TRANSVERSELY ISOTROPIC PLASTIC VISCOELASTIC FLUID
8.1. Introduction
Concentrated suspensions of small particles in various
matrices including polymer melts have long been known to
exhibit yield values, i.e. stresses below which there is no
flow (ms, 1H£, H I , 1 2 1 , 1 2 2 , 1 2 2 , 2 2 1 , 2 2 1 , 2 2 1 , 2 2 2 ) ■
This primarily has been discussed in terms of shear flow
experiments (1 0 5 . 1 0 6 . Ill. 1 2 1 , 1 3 6 . 1 3 8 . 2 2 1 , 2 5 7 . 2 6 7 .
2 7 1 . 2 7 2 ) , but evidence also exists for this type of
behavior in uniaxial elongational flow (1 0 6 . 2 7 2 ) . Most
studies simply exhibit shear viscosities which appear to
become unbounded at low stresses. However, more recently
results have been published that actually determine
stresses below which there is no flow (1 3 6 . 2 5 7 , 2 7 1 ) .
388
R eproduced with perm ission o f the copyright owner. Further reproduction prohibited without perm ission.

389There is a long history of efforts to develop 3-
dimensional constitutive equations for small particle
filled suspensions. Bingham (221) and Buckingham (222) in
the 1920s developed a 1-dimensional model of a fluid which
is rigid below a certain shear stress and then exhibits
linear viscous flow above it. This was put into 3-
dimensional form by Hohenemser and Prager (223) and Oldroyd
(227. 228) during the next two decades. The 3-dimensional
character of the yield stress was based upon the von Mises
yield criterion (237) for isotropic perfectly plastic
solids. In 1890 Schwedoff (220) developed a 1-dimensional
model of flow of fluid which was rigid below a critical
stress and behaved as a differentially linear viscoelastic
fluid at high stresses. An isotropic 3-dimensional plastic
viscoelastic model was given by White (231) and
subsequently investigated by this author and his coworkers
(1 2 1 , 220 . , 222 . , 2 2 2 ) .
The above cited investigations were concerned with the
behavior of concentrated compounds of isotropic particles.
However, many particles used in industrial compounds are
not isotropic in character but are instead fibrous and disc
like. Most industrial chopped fibers are made from glass
with dimensions of 10 (am or more, meaning that inter-
R eproduced with perm ission o f the copyright owner. Further reproduction prohibited without perm ission.

3 9 0particle associative forces are small. Compounds based
on such glass fibers do not exhibit yield values in shear
flow. The situation is rather different with particles
based upon minerals. Among these are 2-dimensional
covalently bonded silicate polymer sheets which form the
basis of talcs, micas and clays. They are micron scales in
size, giving rise to strong inter-particle forces and
agglomeration. It is also found experimentally that
particles such as talc and mica strongly orient during flow
in rheometers and geometries used in polymer processing
(71. 8 2 . 8 4 . 2 1 6 ) (see Chapter 6). The representation of
their rheological behavior requires an anisotropic flow
model. A theory of anisotropic and specifically
transversely isotropic plastic viscoelastic fluids has been
developed by White and Suh (240) for this purpose. This
model used an anisotropic yield criterion due to Hill (221.
223., 223) -
In the present paper we describe a new formulation of
the yield surface for this theory of transversely isotropic
plastic viscoelastic materials and contrast it to the
earlier theory.
R eproduced with perm ission of the copyright owner. Further reproduction prohibited without perm ission.

8.2. Constitutive Relationships391
8.2.1 Three-Dimensional Modeling of Plastic-Viscous
Fluids
A 3-dimensional theory of the rheological properties
of particle-filled fluid including the existence of yield
values, was developed by Hohenemser and Prager (223) in
1932 to represent strain hardening of metals. They
introduced the use of invariants into the theory of non-
Newtonian fluids.
a = - ( t r a) I + T (8.1)3
Their paper builds on the von Mises theory of plastic
yielding. The von Mises yield criterion is based upon the
theory of invariants. The von Mises yield criterion for
isotropic materials is the second invariant of the
deviatoric stress tensor i.e.
tr T2 = 2 Y2 (8.2)
R eproduced with perm ission of the copyright owner. Further reproduction prohibited without perm ission.

392where T is the deviatoric stress tensor and Y is the
shear yield stress of isotropic materials.
Below a stress field magnitude defined by Equation
(8.2), there is no flow. When yielding occurs in isotropic
materials the deviatoric stress tensor components are set
to the same as the deformation tensor as follows:
T * d (8.3)
2YT = . d (8.4)
v 2 tr d 2
At high stresses Hohenemser and Prager (223) defined the
deviatoric stress tensor T as
T = Y T+2 rig d (8.5)' '1 - — > 2
V2tr T ‘
where trT2 is second invariant.
In 1947 Oldroyd (227) redeveloped Equation (8.5) . He
rewrote Equation (8.5) as
(v/trT7 - J t y J = 47gtrd2 (8.6)
R eproduced with perm ission o f the copyright owner. Further reproduction prohibited without perm ission.

3 9 3
and noted that Equation (8.5) was equivalent to
T = 2Y .v2 tr d * + 277b (8.71
Oldroyd (228) later generalized Equation (8.5) to non-
Newtonian fluids by expressing Hb as a function of trd2.
8 . 2 . 2 Thixotropic Plastic-Viscoelastic Fluids
In 1932 Me Millen (286) and Freundlich and coworkers
(109. 110) and others had associated thixotropy with yield
values. In 1964 Slibar and Pasley (229) modified Equation
(8.7) to include thixotropy in a published paper. They did
this by representing the yield value Y as a function of t r d 2
and time of forms
T =2Y (t , trd2) , ^2 tr d 2
+ 2/7b ( 8 . 8 )
R eproduced with perm ission of the copyright owner. Further reproduction prohibited without perm ission.

3 9 4
and showed that this equation at least qualitatively
agreed with suspension behavior. A specific form of
Y(t,trd2) was presented and discussed.
Subsequently, White (230) had suggested that Y of
Equations (8.16) and (8.17) should similarly be considered
to depend upon time and deformation history. The
formulation of White and Tanaka (232) and White and Lobe
(233) who used Equations (8.16) and (8.17) seems to be
better in the steady states than in transient flows. This
led Suetsugu and White (137) to propose using Equation
(8.17) with
(t, n d) = Yi(nd) - [ f a e an'J 'Zd z l^ttl1/ 2) - Yf] (8.9)
where Yf is the steady state yield value and Y± the initial
yield value. Yi was taken to be
( 8 . 10 )
where n d is 2trd2. Suetsugu and White represented H as a
single integral constitutive equation.
R eproduced with perm ission of the copyright owner. Further reproduction prohibited without perm ission.

3 9 5
Montes and White (235) presented a thixotropic-
plastic-viscoelastic fluid model for highly filled small-
particle filled compounds. For highly filled small-
particle filled compounds
2Ya = - p xI + ■ H + H (8.11)
v2 tr H 2
where
H = p n f2{z, </>) [ c x(z) - - (tr c'1 (z) ) I ] dz (8 .12)
Pr = ~ - tr<L (8.13:
(t , n d ) = - f 'Zd z [y^n^2) - y£\ (8.14:
However, Yl was taken to be
yi(u j ) = y/ + / ? ,ny2+ A n ^ (8.15)
which is the same form as Suetsugu and White (137) with a
modified Equation (8.9). Montes and White (235) also
investigated the influence of carbon black on the steady
R eproduced with perm ission of the copyright owner. Further reproduction prohibited without perm ission.

state and transient rheological properties of gum3 9 6
elastomers.
8.2.3 Three-Dimensional Modeling Of Plastic-
Viscoelastic Fluids
Plastic viscous fluid models are inherently unable to
represent the behavior of particle filled systems with
their inherent complex memories (elasticity). The first
effort to develop a three-dimensional form of a plastic
viscoelastic fluid beyond yield surface was Hohenemser and
Prager (223) who suggested models with Voigt and Maxwellian
behavior. The problems was reconsidered by White (230) in
1979 who wrote
where H is a general memory functional. The matrix is
viscoelastic in character.
Equation (8.6) was shown to be equivalent to
2Y (8.16)T T + HV2 tr T 2
2Y (8.17)T = r H + HV 2 tr H 2
R eproduced with perm ission of the copyright owner. Further reproduction prohibited without perm ission.

3 9 7
The viscoelastic contribution is specified by H.
A specific simple form for H was proposed by White
(231) for the purpose of illustrating the characteristics
of Equation (8.17). Particular detailed forms of H were
subsequently used by White and Tanaka (232), and White and
Lobe (233) to compare with the experimental data on filled
thermoplastics and elastomers. White and Tanaka (232)
represented H as a single integral constitutive equation
with a Maxwellian relaxation modulus function.
These authors suggested that p. (t ) to a first approximate
could be expressed as
where f (<j>) is a factor that depends upon volume loading and
c ’1 is a Finger deformation tensor (see Equation (2.72)).
This theory was compared to experiments ( 2 2 2 . , 233) on
particle filled polymer melts.
3 (8.18)
(8.19)r
R eproduced with perm ission of the copyright owner. Further reproduction prohibited without perm ission.

3 9 8More recently Suetsugu and White (133) , and Montes
and White (2 34. 235) presented thixotropic plastic-
viscoelastic fluid models similar to this in which H
depends on time.
8.2.4 Theory Of Transversely Isotropic Plastic
Viscoelastic Fluids
The formulation of transversely isotropic plastic
viscoelastic fluids as developed by White and Suh (jL2.) has
two parts. One of these relates to a yield surface, at
stresses below which there is no flow. The second is a
constitutive relationship between stress and the history of
the kinematics of strain and flow. Both the yield surface
and the constitutive relationship must satisfy the symmetry
of transverse isotropy.
The formulation may be expressed in terms of total
stress a a s :
a = \^ {trq )l + T (8.31)
where / is the unit tensor and T is the deviatoric stress.
The yield surface may be written
R eproduced with perm ission of the copyright owner. Further reproduction prohibited without perm ission.

3 9 9
/ ( t ) = o (8.32)
The deviatoric stress is related to the history of the flow
kinematics. If this this were to be put in a small strain
form varying linearly with deformation rate we would have
where Y is the yield stress for the particular stress
component, G„kl(t) the relaxation moduli, and d,: is the rate
of deformation tensor. The 81 different Gllkl(t) components
may be reduced to 21 by arguments largely of symmetry.
This is recanted in theory of linear elasticity (240) .
White and Suh (£2) took the yield surface following
Hill's (221. 238. 23 9) treatment for anisotropic materials
to be
(8.33)
(8.34)
R eproduced with perm ission o f the copyright owner. Further reproduction prohibited without perm ission.

4 0 0
For transversely isotropic fluids where '2' is the
symmetry direction this should, according to Hill (221,
238. 239), simplify to
f ( T, ) = /r[<7'» ~ T' ^ +(T* + 2 ^ ] +W{(7'1 " r>J)2 + 4 ^ ] + 2 i ( ^ + 7S) = 1
(8.35)
This reduces the six constants of Equation (8.34) to three
constants. It reduces to the von Mises criteria when F, H,
and L / 3 are the same.
There are similar restrictions on the relaxation
modulus function G,lkt(t) . Symmetry about the '2' axis
requires the 21 independent moduli of Equation (8.35) to
reduce to 5 relaxation moduli. Specifically,
G 3 3 3 3 (t) = Gxm(t)
G 3 3 2 2 (t) = Gxx22 ( t )
G 3 2 3 2 ( t ) = Gx212 ( t )
Gijkm (t ) (k * m) =: 0
Gijkk (t ) (i * j * k) = 0
Gijkm (t ) (i *j) * (k * m)
Gi3i3(t) = — [Gnxi(t) ” Gii3 3 (f)] (8.36)
R eproduced with perm ission of the copyright owner. Further reproduction prohibited without perm ission.

4 0 1
There are then 5 independent relaxation modulus functions,
G i i i i ( t ) , G 1 1 2 2 ( t ) , G 1 1 3 3 ( t ) , G 2 2 2 2 ( t ) / G 1 2 1 2 ( t ) .
It is possible to develop a simpler formulation of the
yield surface than Equation (8.35) . To this we call
attention to the work of Spencer (243-245) , who proposes
that the yield surface for anisotropic plastic solids with
a preferred direction to be of form:
where nt i s a unit vector which specifies this direction.
This formulation was developed to represent plastic flow in
fiber reinforced composites.
If one presumes the yield surface is independent of
hydrostatic pressure one may introduce the deviatoric
stress Tlf of Equation (8.31) in place of <jq i.e.
8.2.5 New Yield Surface
(8.37a)
F(T„,n,) = 0 (8.37b)
R eproduced with perm ission of the copyright owner. Further reproduction prohibited without perm ission.

4 0 2
Equation (8.37b) must be valid independent of the sign of
n, . It follows that
F{T^n,n, ) = 0 (8.37c)
The form of Equation (8.37c) must be independent of a
coordinate system. It is argued by Spencer (243-245) that
this equation may be expressed in terms of three invariants
J . = ( r T 2 J - , = n T ~ n J , = t r T 3 (8.38)
If we limit ourselves to quadratic formulations it follows
that we may write Equation (8.37c) in the form
f[T, l ,n,nl ) = CxJ x + C2J 2 - 1 = 0 (8.39a)
or
t r T2 + a [ n - T 2 -nj = f3 (8.39b)
where Ci, C2, a and (5 are constants.
Equation (8.39) may be seen to simplify to the von Mises
criterion when the parameter a (or C2) is set equal to zero.
R eproduced with perm ission of the copyright owner. Further reproduction prohibited without perm ission.

4 0 3
Clearly T2 must be positive and (3 is positive when a is
zero. It would seem likely that both and a are positive.
Equation (8.39) represents a significant
simplification on Equation (8.35) deriving from the work of
Hill (221. 238. 239). It reduces the number of parameters
of the yield surface from three to two. This is of great
significance from an experimental point of view.
Determination of yield values in shear flow and uniaxial
extension alone can determine the yield surface.
8.3. Application to Shear Flow and Uniaxial Extension
We now consider the application of the two
formulations to simple shear flow and uniaxial extension.
8.3.1 Shear Flow
8. 3.1.1 Simple shear flow parallel to disc surfaces
(CTi 2=CT s 1 / O r 0 ’3 2 = 0 S 3 )
The flow intended is shown in Figure 8.la or Figure
8.1b. It is this type of flow with discs sliding parallel
to each other that occurs in rheometers (22, 24., 240. 276) .
R eproduced with perm ission o f the copyright owner. Further reproduction prohibited without perm ission.

4 0 4
Figure 8.1
2A n
Flow
(b)
Schematic representation of simple shear flow parallel to disc surfaces (a) cri2=crsi (b)< * 3 2 = t f s 3
R eproduced with perm ission of the copyright owner. Further reproduction prohibited without perm ission.

The stress field which must be applied now is;4 0 5
0 Tr. o ! i 0Tr. 0 o ; n = 10 0 o : 0
Ti:: 0 0I2 = 0 T 2 112 0 (8 .40a,b,c
0 0 0
The primary yield stress Yn or for Hill's
formulation is from Equation (8.35) :
K, ( 8 - 4 1 )
In terms of the model of Equation (8.39b) becomes
1T{2 + ccT{2 =/?
= Y = T■l 12 12 2 + a
(8.42a)
(8.42b)
R eproduced with perm ission of the copyright owner. Further reproduction prohibited without perm ission.

4 0 6
where Y12 is Ysl the primary yield stress. Clearly
( 3 / ( 2 +a) must be positive.
When a is zero the yield criteria Y12 reduces to
the new yield surface Equation (8.39) may be written
t rT2 + a - n - T 2 n = (2 + a )Y 2{ (8.44)
8.3.1.2 Flow direction shear flow perpendicular to disc
stacking (a13=as2)
If the flow direction perpendicular to disc stacking
as shown on Figure 8.2, the stress field which must be
applied now is;
0 0 0T = 0 0 0 n = 1
T13 0 0 0
R eproduced with perm ission of the copyright owner. Further reproduction prohibited without perm ission.

4 0 7
Figure 8.2
a n
1
Schematic representation of flow direction shear flow perpendicular to disc stacking( ° ’l 3 = a ’s2 )
R eproduced with perm ission of the copyright owner. Further reproduction prohibited without perm ission.

4 0 8
T,f 0 0T2 =! 0 0 0 I
! 0 o r „ -(8.45a,b)
The shear stress <t 13 for the Hill's formulation is from
Equation (8.35)
The transverse yield stress Y13 or YS 2 is completely
independent of the primary yield stress Ys l . Only if (F+2H)
is equal to L would Ys2 equal Ys l .
In terms of the model of Equation (8.39b) it becomes
where Ys2 is the transverse shear yield stress. Thus must
be positive.
27jj + an2( T 2 )n n2 =/? (8.47a)
(8.47b)
R eproduced with perm ission of the copyright owner. Further reproduction prohibited without perm ission.

Clearly4 0 9
(8.48)
and (l+or/2) must be positive. Thus a must be greater than
(-2) . Ys2 is independent of Ys l .
For a von Mises material a is zero and Ys2 and Ysl are the
8.3.2.1 Perpendicular to the Disc Axes (1-direction, cre l l )
Uniaxial extension with the discs parallel to the
surface of the filament being stretched is shown in Figure
8.3. It is this type of orientation which would arise in a
uniaxially stretched filament exiting from a capillary die.
The stress field which must be applied now is;
same . However when a —> oo , we obtain — - —> oo
8.3.2 Uniaxial Extension Flow
R eproduced with perm ission of the copyright owner. Further reproduction prohibited without perm ission.

4 1 0
Figure 8.3
2' n
Schematic representation of perpendicular to the Disc Axes (1-direction, <Jeii)
R eproduced with perm ission of the copyright owner. Further reproduction prohibited without perm ission.

4 1 1
T = 0
0
1- T.. 2 * *
0
! °
3 = 1 1 0
T..
! J -, 1II
= I 0
o
- T,a
- T ’4 " I
:8.49a,b)
For Hill's formulation
~ ^ * 1 ~ — — ii ^ 2 2 i 33 — rp— 7 7 (8.50)yj F + H
It can be seen that Hill's criteria gives a tensile yield
stress totally independent of the primary shear yield
stress,
, 8 . 5 1 )i;, \ F + f i
I f Yel l is much larger than Ys l , then L is much greater than
F+H. Yell is related to the transverse shear yield stress
by
R eproduced with perm ission o f the copyright owner. Further reproduction prohibited without perm ission.

4 1 2
& M (8.52)Ys2 V F + H
For a von Mises material F=H and Yeu = ^ 2 • in
addition F is L / 3 , then Yell will also equal \Jj Ys1 .
In terms of the model of Equation (8.3 9b) we obtain
- T 2 + an 2(T222)n2 = /? (8 .53)2 "
The uniaxial elongational stress yield stress is
_ r = 3 = 3 I fi = 3 I Pe l l 11 I I 2 2 11 j | 3 a \ 2 j a
A V + V i +V 2 4 V 6
(8.54)
Clearly /?/(3/2+a/4) is positive and (3 is positive. l + a / 6
must be positive which means that a must be greater than
(-6). This is less restrictive than our previous result.
For a von Mises ( a = 0 ) yield criteria Yei reduces to
R eproduced with perm ission of the copyright owner. Further reproduction prohibited without perm ission.

Comparing the elongation to the primary shear yield value
g i v e s
Kn _ 3 1(2 + a )
K,
' / 4- n i ,— i ~ (8.56)
Clearly
Making a comparison to the transverse shear yield stress
for this yield criterion gives
YM J i 2Y* 2
l J +
0 +
a4
= V3a
1 +a
(8.57)
Clearly
R eproduced with perm ission of the copyright owner. Further reproduction prohibited without perm ission.

4 1 4
Figure 8.4 Schematic representation of parallel to theDisc Axes (2-direction, crel2)
R eproduced with perm ission of the copyright owner. Further reproduction prohibited without perm ission.

4 1 5
8. 3. 2. 2 Parallel to the Disc Axes (2-direct ion, a ei 2)
For uniaxial extension with the discs parallel to the
disc axes of the filament being stretched as shown in
Figure 8.4, the stress field which must be applied now is;
- - T 2 “ 0 0 01 = 0 Tmi 0 n = 1
0 0 _Ir 0
- 7 V 4 "
0 0i
t = 0 T 2’J ° ! (8.58a,b)
0 0 - 7 V j 4 - ■
■111/X X X s fcrmulat ion
This transverse elongational stress is independent of the
primary shear yield stress but related to the primary
elongational stress by
R eproduced with perm ission of the copyright owner. Further reproduction prohibited without perm ission.

For a von Mises material F=H and Ye22 equals Yen .
For Spencer's yield surface
~ T22 + cm2(T222)n2 = fi (8.6i:
The uniaxial elongational stress yield stress is
3 - _ 3 \JL3
i 2 + a
Kn.=o-22 = r22- r u = - T 22= - ! (a.62)
Clearly a must be greater than (-3/2).
For a von Mises (a=0) yield criteria Ye22 reduces to the
form for Yen and Yel2 is J3 Ysl.
The ratio of the two different elongational yield stresses
is in general
3 a■h2__4+ a
(8.63!
R eproduced with perm ission o f the copyright owner. Further reproduction prohibited without perm ission.

4 1 7
Clearly
Similarly, comparing Yel2 to the primary shear yield stress
gives
‘■el 2 _ 3 2
2 +
2 +
a
a
(8.64!
Clearly
a —> oo —> -y .i 2
8.3.3 Two-Dimensional Shear
8.3.3.1 Shear Flow Parallel To Disc Layers
1-3 flow direction symmetry to 2-direction shear flow
(cy12+ a 32) is shown in Figure 8.5.
R eproduced with perm ission of the copyright owner. Further reproduction prohibited without perm ission.

4 1 8
Figure 8.5
n
1
Schematic representation of shear flow parallel to disc layers (cr12+cr32)
R eproduced with perm ission of the copyright owner. Further reproduction prohibited without perm ission.

The stress field which must be applied now is;4 1 9
Tx i:T 12 0
*32
t122 0 Tl2 tJ2
o tI22 + 7y’ o tI2 t32 o t322
This leads
= T 2 + T 2 = cr2 + cr2 =s l 12 ^ 1 12 .2 32 >/2L
In cerms of the model of Spencer's Equation (8.39b)
2 (cr[2 + cr;2) + a(cr22 + cr\2) =
2 _ - . 2 , ~ - 2 _s l 12 + ° ^ 2 2 + a
This indicates stresses in directions 1 and 3 i.e.
a 32 are equally able to produce flow.
R eproduced with perm ission of the copyright owner. Further reproduction prohibited without perm ission.
8 .65a,b)
8 .6 6 )
we have
8 .67)
8 . 6 8 )
cr12 and

4 2 0Flow will occur when this criterion is achieved and
in a direction defined by it.
8.3.3.2 Two-dimensional shear flow normal to disc layers
(CXi2 + 0 ' i 3 )
Consider 2-3 direction shear flow (cr12+a13) as shown in
Figure 8.6.
The stress field which must be applied now is;
0 Tn Tn 0
z > T12 0 0 n = 1
T13 0 0 o
I 2
r =0 0 ii
0 T 2 12 TvJv,\\(8
0 T T
(8.69a,b)
For Hill's formulation from Equation (8.35) is
2 (F + 2 H ) T 123 + 2LTl2 = 1 (8.70)
Witn^ut knowledge of the relative values of L and F+2H,
this says little.
R eproduced with perm ission of the copyright owner. Further reproduction prohibited without perm ission.

Figure 8.6 Schematic representation of two-dimensional shear flow normal to disc layers (cr12+ar13)
R eproduced with perm ission of the copyright owner. Further reproduction prohibited without perm ission.

4 2 2However, if Ys2 is much greater than Ys l , then L is much
larger than F+2H and makes flow more easily in the 1-2
plane. A much larger stress is required from the 1-3
plane.
In terms of Spencer's yield surface
2(7;, + T{i ) JraT{l = P (8.7la)
or
2 + a)a*2 + 2cr = P (8.7lb)
Equation (8.71) appears to mean that if a is positive and
large, a very small stress a x2 can induce flow in the 1-2
plane but a very large stress a 13 is required to induce it
in the 1-3 plane. Flow is then much more likely in the 1-2
plane.
R eproduced with perm ission of the copyright owner. Further reproduction prohibited without perm ission.

4 2 38.4 Yield Surface Of Anisotropy Parameter a As A
Function Of Various Yield Stress Ratios
8.4.1 Ratio of Uniaxial Yield Stresses Perpendicular to
Disc Axes to Simple Shear Flow Parallel to Disc
Surfaces
The shear flow intended is shown in Figure 8.la or
Figure 8.1b and uniaxial flow in Figure 8.3. It is this
type of shear flow with discs sliding parallel to each
other that occurs in rheometers (22, 24., 240. 276) and
uniaxial flow stretch to 1-direction.
When we consider Yen / Y sl as Xj., a from Equation (8.56)
can be rewritten as follow
x, = *ei: (8.73)
Figure 8.7 represents the yield surface for Yei i / Y sl as
a function of anisotropy parameter a .
R eproduced with perm ission of the copyright owner. Further reproduction prohibited without perm ission.

-1.5 -1
Figure 8 . 7
! aJ------------------------------------ .— --- ------ ------------- -! : | l l i i i
0 1 2 3 4 5 6 7 8 9 10
Yield surface for yield stress ratio Ye l l / Y sl as a function of anisotropy parameter a
R eproduced with perm ission of the copyright owner. Further reproduction prohibited without perm ission.

4 2 5When the anisotropy parameter a is positive, the yield
stress ratio Yen / Y slv a . r x e s from -J3 to 3.
8.4.2 Ratio of Yield Stresses Perpendicular to Disc
Stacking to Shear Stress Parallel to Disc
Surfaces
We now consider combined shear flow parallel and
perpendicular to the disc layers. It is this type of shear
flow with discs sliding parallel to each other that occurs
in rheometers {32., 3A, 240. 276) and shear flow
perpendicular to disc stacking.
When we consider Ys2/ Y sl as x2, a. from Equation (8.48)
can be rewritten as follows
a = 2{x\ - 1) (8 .76)
Figure 8.8 represents yield surface for Ys2/ Y sl as a
function of anisotropy parameter a .
R eproduced with perm ission of the copyright owner. Further reproduction prohibited without perm ission.

Figure 8.8
_j a 10
Yield surface for yield stress ratio Ys2/ Y sl as a function of anisotropy parameter a
R eproduced with perm ission of the copyright owner. Further reproduction prohibited without perm ission.

4 2 7
When the anisotropy parameter a is positive, the yield
ratio Ys2/ Y si varies from 1 to «.
8.5 Development of Stress Explicit Constitutive Equation
for New Yield Surface
A great advantage of the von Mises yield surface is
the ability to develop following the Oldroyd (227. 228)
constitutive equations which are explicit in the stress.
We will seek to develop a similar formulation here.
Spencer's yield surface can be represented as
2|" a[n ■ T 2 ■ n) nr T 2 1 + -*=— =- — =* = p
t r T(8.77)
We now introduce the parameter M
(8.78)trT"
which is the ratio of the two invariants.
Equation (8.77) can be now written as follows
R eproduced with perm ission o f the copyright owner. Further reproduction prohibited without perm ission.

4 2 8
r T 2 = --- (8.79)1 + cxM 2
Generally, the extra deviatoric stress beyond the
yield surfaces for a transversely isotropic material may be
expressed to start from
a = - (trcr)I + T (8.80)3
when r T 2 > 2Y2
T =
T =
J1-----Tt r T 2V 2
11 P1 1
\l1 + ccM2J.
T + Ht r T '
(8.81)
(8 .82)
We rewrite
1 -
P211 + CXM 2 = H (8.83)
trT'
R eproduced with perm ission of the copyright owner. Further reproduction prohibited without perm ission.

4 2 9square and take the trace of each side. This gives
1 - - trT 2
1 -
P2
l + 1 aM 2
V2 trT"
1 , - trff2 2
root each sides and solve for Equation (8.84)
Equation (8.85)
1 2 - trT2 = 2 2 tr ff2 +
P 2 11 + aM 2
Introducing Equation (8.85) into Equation (8.1
1 - = f f
to solve for Equation (8.86)
(8.84)
then we have
(8.85)
3) we have
(8 .8 6 )
R eproduced with perm ission o f the copyright owner. Further reproduction prohibited without perm ission.

4 3 0
T = 1 4- H ( 8 . 8 7 )
The final form is represented as
T = H + H ( 8 . 8 8 )
For simple shear flow from Equation (8.42b)
2 = & (8.89)2 + a
P can be eliminated from Equation (8.88) in favor of Ysl.
We obtain
R eproduced with perm ission of the copyright owner. Further reproduction prohibited without perm ission.

4 3 1
1 + a
T =
or
«1 , 1 !l + aM 2 (8.90)1 ,
t r H 2
Y.,T =
2 + a 2 + aM H + H (8.91)t r H '
8.5.1 M values for Simple Shear Flow
The quantity M is a stress invariant ratios not
constant. It should vary with the type of flow.
For flow parallel to the disc surfaces
T “ =
T 212 0 0= 0 T 212 0 (8
0 0 0
= 2 n= • T12 ' n 2 = 1 (82T,
An equivalent result is obtained for flow in the 3
direction with shear in the 2-direction.
R eproduced with perm ission of the copyright owner. Further reproduction prohibited without perm ission.

For shear flow perpendicular to the discs4 3 2
. 2 !
^3 0 0 |0 0 0 ' (8.94)0 0 T 213 1
For the reference direction 2 (thickness direction)
n, • 0 • n, . „ „ _,= 2 ’ a = ° 1 8 ' 951Zi13
8.5.2 M Values For 2-Dimensional Flow Parallel To Disc
Layers (cy12+a 32)
T 212 0 T T12 32T 2 = 0 t 22 + t 22 0
T T±12J- 32 0 T 232
For (1+3)-direction shear with reference direction 2
M.shear = 2n. (Tf,
2(T.12
t ;2)t ~;2)
n-,= 1 (8.97)
R eproduced with perm ission of the copyright owner. Further reproduction prohibited without perm ission.

8.5.3 M Values For Uniaxial Flow433
For 1-direction uniaxial extension
l ’n + 1 ’2 2 + 1 ’33 ~ 0
= -2T„ = —2T.33 1 = AT = A T *’■‘22 3 3
IT 2■‘■11 0 0
0 1 2 - T 4 11 0
0 0 - T 2. 4 lA
For 1-direction extension with reference direction
M.2 (a, n2) _ 2(n2 • T 2, • n2) _ 2(n2 njT 2 + T 2± l l ^ ■‘22 + T,33 (4T 2
For 2 -direction uniaxial extension (normal to
surfaces and parallel to axes)
T11+T22+T22 = 0
R eproduced with perm ission of the copyright owner. Further reproduction prohibited without perm ission.
(8.98)
(8.99)
( 8 . 1 0 0 )
2
13
( 8 . 1 0 1 )
disc
(8 .1 0 2 )

4 3 4
- 2T,, = T22 = -2T33, IIIf'
1 1 -I - T ‘ ! 4 0 0
T 2 = j 0I1
r 2■*■11 0 !1 ,
° 0
r 2■33 (8.103
(8.104]
For 2-direction extension with disc reference direction 2
M,2-uni2(n, - T,2, • n,)T.2 + T2. + T 2
2(n2 ■ T 2, • n2)T , ,
2(n2 1 r,22 • nj43 r/a)2 4
43
8.5.4 M Values For Biaxial Flow
For 1 and 3 direction biaxial flow
(8.105)
T 1 1 + T 2 2 + T 3 3 = 0 (8.106)
r33 = ri2i rp __ _3 3 _ „ 224
(8.107)
R eproduced with perm ission of the copyright owner. Further reproduction prohibited without perm ission.

4 3 5
T 2 = j 0
T2-‘■li 0 0
0 4T2 0
0 0 T 2
( 8 . 1 0 8 )
For (1 and 3)-direction flow with reference direction 22
M2(n2 • T 23
b ia x ia l T 2 + r 2 + r 2X 11 ^ 22 ^ 3 3
n.) _ 2 (n2 • 4T,2 • n2) _ 2 (nr 2 -i- 4 r 2 + t 2
t- }4
43
( 8 . 109!
8 .6 . Interpretation of M values
8 . 6 . 1 Simple Shear Flow
The M value of simple shear showed 1 for cr1 2 and cr3 2 and
0 for <t13 at reference direction 2.
0 < M u < 1sh e a r ( 8 . 110 )
This represents 12 or 32 plane direction flow occurs easily
than 13 plane direction flow which imply parallel to
oriented talc particle direction flow occurs easily than
R eproduced with perm ission of the copyright owner. Further reproduction prohibited without perm ission.

436perpendicular to talc particle direction flow. Rewrite
simple shear flow Ysi from Equation (8.90)
1 + a
T =
S l. 1l + aM
2
f:
ff + ff
t rff‘(8 .111)
When M value is equal to 1, which is the case for
shearing perpendicular to the 2-direction, the anisotropy
term a from Equation (8.111) cancels out and becomes
T = Sl___
1 trff22
f f + ff ( 8 . 112 )
This is the same as for isotropic fluids. For a flow in
which M value is equal to 0, the anisotropy term a Equation
(8.111) remains and T is depend on a as shown in Equation
(8.113) .
T =y“ v1 +
a2 f f + ff
trff'(8.113)
R eproduced with perm ission of the copyright owner. Further reproduction prohibited without perm ission.

Thus flow becomes more difficult if a is large and4 3 7
positive.
8.7 Discussion and Interpretation
Comparing the transversely isotropic yield surface
formulations of Spencer (243-245) and Hill (221, 23 8 . 239),
we note that the former is more pleasing as being based cn
an invariant formulation as is generally used in continuum
mechanics. It is thus a logical generalization of the
similarly formulated isotropic criterion of von Mises. The
Hill representation though more widely used is an open
question.
An alternate studies of the 1-dimensional transversely
isotropic yield surface formulation of Spencer (243-245.)
have been published by Robinson et a l . (246-252).
The Spencer formulation is based upon two different
parameters which is determinable from creep experiments in
simple shear and uniaxial extension. Hill's criteria
contains additional parameters i.e. three coefficients,
which make it much more difficult to experimentally specify
the yield surface.
R eproduced with perm ission of the copyright owner. Further reproduction prohibited without perm ission.

4 3 8
The new parameter a or Cx, which enters into the
yield surface of Spencer (243-245) represents the
difficulty of achieving transverse shear as opposed to
inter disc surface shear flow. This is clear from
Equations (8.48) and (8.71). The meaning of the two
parameters F and H of Hill (221. 238. 239) are not clear.
The yield surface, Figures 8.7 through 8.9, showed the
anisotropy parameter a as increasing function on yield
stress ratio Ye l l / Y sl and Ys2/ Y s l . This suggests Yen and Ys2
are an increasing function with anisotropy parameter a .
Experimentally, only Yen / Y sl can be measured from simple
shear Ysl and 1-direction elongation Yen experiments.
Figure 8.7 shows the anisotropy parameter a increases
as a function of Yen / Y si . The anisotropy parameter a
exhibiting infinite at Yel l / Y sl is set equal to 3. The
Yei i /Ysi value of the anisotropic/isotropic mixed particle
filled system exists between the anisotropic and isotropic
particle-filled system at the same content depend on
isotropic particles' concentration. When the isotropic
particle concentration is low in the mixed particle filled
system, the Yen / Y sl value exhibited close to anisotropic
particle filled system at the same concentration. When the
isotropic particle concentration is high in the mixed
R eproduced with perm ission o f the copyright owner. Further reproduction prohibited without perm ission.

4 3 9particle filled system, the Ys l l / Y sl value exhibited close
to isotropic particle filled system which is the same as
the von Mises yield surface at the same concentration.
We have sought a constitutive equation which is
plastic viscoelastic in character and is of the general
type shown in Section 8.5.
The M value, which seems related to the mobility of
the system, is the ratio of normal direction deviatoric
stress invariant versus the other direction stress in the
field of trT2. In shear flow, as M value increases the
memory function H (Hijkm=riBdijkm) which imply deformation rate
of applied stress, increases, which suggests easy mobility
of the system. Comparing the M value of simple shear and
axial extension, the uniaxial direction Muruaxiai showed that
a cerm disappears at 1/3, and the biaxial direction
showed that a term disappears at 1 for and 1 for the simple
shear system. Thus, each system exhibited distinct M
values.
Our model represented as M parameter in Section 8.5
can be well fit for rheometer flow, however it is not good
for varying flow such as converging flow.
R eproduced with perm ission of the copyright owner. Further reproduction prohibited without perm ission.

CHAPTER IX
A THEORY OF TRANSVERSELY ISOTROPIC PLASTIC VISCOELASTIC
FLUIDS TO REPRESENT THE FLOW OF ANISOTROPIC/ISOTROPIC
PARTICLE SUSPENSIONS IN THERMOPLASTICS
9.1 Introduction
A transversely isotropic yield surface developed by
Spencer (243-245) to represent plastic yielding in fiber
reinforced composites was introduced into the theory of
White and Suh (240) for transversely isotropic plastic
viscoelastic fluids in Chapter VIII. The two yield
surfaces were compared and interpreted for different
applied stress fields.
In this chapter, the transversely isotropic model is
applied to mixed particle filled thermoplastics. We begin
by stating the isotropic plastic viscoelastic model and
440
R eproduced with perm ission of the copyright owner. Further reproduction prohibited without perm ission.

4 4 1then indicate how the transversely isotropic model may
be considered to merge in to it.
9.2 Linear Transversely Isotropic Plastic
Viscoelastic Fluids
9.2.1 Isotropic Linear Plastic Viscoelastic Fluid
The yield surface of an isotropic plastic viscoelastic
fluid is represented by the von Mises criteria. Equation
(8.35), Hill's criteria for transversely isotropic
materials, simplifies it when it reduces to the isotropic
case. This occurs when
F = H = — L (9.1)3
For the new Spencer yield criteria of Equation (8.39),
isotropy occurs when
a = 0
and the criteria also reduces to the von Mises form.
R eproduced with perm ission of the copyright owner. Further reproduction prohibited without perm ission.

NOTE TO USERS
Page(s) missing in number only; text follows. Microfilmed received.
UM I
Reproduced with permission of the copyright owner. Further reproduction prohibited without permission.

443
T = Y + (J^t - s)[tzd(s) ]dsJr + 2JCG(t - s)d(s)ds (9.4)
where T is deviatoric, trT is zero.
If we are to have incompressibility
r d = dii+d2 2 +d 3 3 = 0 (9.5)
and
/. (t ) —> co
9.2.2 Transition of Transversely Isotropic Linear
Plastic Viscoelastic Fluid
There are five independent moduli (Gu u , G2222, G 1 2 1 2 ,
G 1 3 1 3 , G1122) for a transversely isotropic material and two
moduli for an isotropic material.
We may specify the relationship to isotropy through
three parameters ki(t), k2(t), and k3 (t) . The two
independent moduli are considered as G12i2(t) and GU u(t) .
These become G(t) and X ( t ) in the isotropic theory
G 1 3 1 3 (t ) = ki (t) Gi2 i2 (t) (9.6a)
G2222 (t ) = k2 (t) G i m (t) (9.6b)
Reproduced with permission of the copyright owner. Further reproduction prohibited without permission.

444Gll2 2 (t) = k 3 (t) G 1 1 3 3 (t)
= k 3 (t) [Gini (t ) -2 kiG1 2 i2 (t ) ] (9.6c)
where kL(t), k 2 (t), and k 3 (t) independently depend on time.
From Equations (9.4) we may write:
12 = y iz + 2 f - s)d,2(s)ds
3 2 = ^ 3 2 + 2 Gl2ia(t - s)d3 2(s)ds
13 = F 13 + 2 L klG,212 ~ Steads
11 = Yn + f d i l u t e " ^ + k2d22^ + d J2{s) )
- 2k.Gl2l2(t - s) (k3d 2 2 (s) + d 3 3(s) ) ]ds
2 2 = Y22 + [ {Gliu(t - s) [k 2d 22{s) + k 7(d,.{s) + d 3 3(s) ) ]- 2k,k,Gl212(t - s) (d1 3 (s) + d 3 3(s) ) }ds
33 = ^ 3 3 + [ x tGnii(t " s) (dn(s) + k id 22{8) + d 3 3(s) )- 2k,G1212(t - s) (d3 1(s) + k 3d 2 2 (s) ) ]ds
(9.7a,b,c,d,e,f)
The parameter k 3 (t) from Equation (9.6c) is related to
differences in Poisson's ratio and compressibility in
different directions. As our materials are incompressible,
we lose little in generality by setting
Reproduced with permission of the copyright owner. Further reproduction prohibited without permission.

k3(t) = l445
(9.8)
Applying Equation (9.8) to Equation (9.7) leaves Equations
(9.7d,e,f) where k 3 (t) occurs to:
The four independent relaxation moduli are Gm i(t) , G 1 2 1 2 (t),
ki (t) , and k 2 (t) .
Isotropy requires the 4 relaxation moduli to go to 2
relaxation moduli.
This involves
[G1113(t - s) (d13(s) + k 2d 22{s) + d33(s) + ^G^jjftJdjJs) ]ds
22 + f {G,1,.(t - s) [k2d 22(s) + (d..(s) + d33(s) ) ]“ — J - » *
+ 2k1G.212(t - s)d22(s) j d s
[Gllll(t - s) (d,,(s) + d22(s) + d 23(s) + 2fc.G.212(t - s)d33(s) Jds
(9.9a,b,c)
kx(t) -> 1 , k 2 (t) 1 (9.10a)
or
Gi3 1 3 (t ) —> Gi2 i2 (t) and G 2 2 2 2 (t) —► G i m (t) (9.10b)
Reproduced with permission of the copyright owner. Further reproduction prohibited without permission.

446Thus remain only two relaxation moduli Gmi(t) and
Gi2 i2 (t) as remains in Equation (9.6) .
9. 3 Application Of Non-linear Transversely
Isotropic Plastic Viscoelastic Fluid Model
A three-dimensional non-linear transversely isotropic
plastic viscoelastic model was developed by White and Suh
(240). They applied Finger deformation tensor (231. 232)
as a large deformation tensor and relaxation modulus
tensor. They expressed the deviatoric stress tensor in the
form
They put this equation into a formulation using a
deformation tensor. To do this, they introduce the tensor
relaxation function 0 ( t ) defined by
T = Y + H (9.12)
0 ( t ) (9.13a)
®ijkm ( £) (9.13b)
Reproduced with permission of the copyright owner. Further reproduction prohibited without permission.

So Equation (9.12) can be rewritten as447
T = Y + - s) • e(s) ds (9.14)
where e is the infinitesimal strain tensor (24JL., 242)
1 du. .- (— - + — -) of linear elasticity and 0 i jkm( t ) may be seen2 ex. d x1
to be
t ) = £ —G ..
ri jkm. s
(9.15)
For large strains and deformation rates one must expect
that e i j will need to be replaced by a suitable large strain
deformation measure. White and Suh (240) suggested using
the Finger deformation tensor Ci j ' 1 (231. 232) where
-i ^ ,Q ^Ch 1 = -------- (9.16)e x e x
will become some mijka (t, deformation) . This leads
to Equation (9.14) as
Reproduced with permission of the copyright owner. Further reproduction prohibited without permission.

448T = Y + fm(t - s) • c 1 (s) ds
= Y + L " s)c^ 1{s) d s(9.17)
where the integral is to be deviatoric. This is of course
a non-unique generalization of the earlier linear theory.
It is one of the finite infinity of proper non-linear
formulations. It further has the restriction that trT is
zero.
If we accept the symmetries of Equation (8.36) for
mijton(t) , the formulation leading to
(9.18)
Equation (9.17) gives the stress components
ds
32
Reproduced with permission of the copyright owner. Further reproduction prohibited without permission.

449T2. = Y22 + [m,122(t - s) c.: 1 (s) + m2222(t - s)c22‘(s
+ m1122(t - s) c33'"(s) ] ds
33 = Yn + I tm n 33(t “ s ) c l l '1{s) + m1122( t - s ) c 221{s«A- x *
+ mlu,(t - s) c^'^s) ] ds
(9 .19 . a, b, c , d, e , f)
9.4 Considerations from experimental rheological
measurements
9.4.1 Shear Flow Behavior For Simple Shear Flow
For simple shear flow
0 y 0 1 + y i t - s) y{t - s)
d = ! y 0 c =0 0 0
l0
01
(9 . 2 0 :
We now seek to generalize the formulation we have
developed to non-linear plastic viscoelastic fluids. Based
on the shear viscosity behavior described in Section
8.3.1.1 we prescribe an empirical relationship for the
shear viscosity behavior of talc-thermoplastic compounds as
Reproduced with permission of the copyright owner. Further reproduction prohibited without permission.

450
y = 0 when cr,2 < Y sX
<7.2 = Ysl + C Y = Ysl + A (°) Y W h e n si < < Ycbreshcld
i.e. threshold = y»! + A(o)/ (low shear rate)
A M y<7-2 = Kl + K Y = r sl + ~ ------- W h en threshold < <*12
b y + i(high shear rate)
(9.21a,b,c)
where lim Aty) = C , Ysl is the yield value in Equationy —>0
A(9.21b) . At the high shear rates lim — (/) = K , Equationy -*x B
(9.21c) becomes the power law with K = A / B . A / B are the
consistency and n the power law index, respectively. To
fit our viscosity-shear stress data Equation (9.21c) can be
rewritten as
rfiy) = ^ + - A[aj n2) - (9.22:Y Y B y + 1
In terms of Equation (9.19) we have
Reproduced with permission of the copyright owner. Further reproduction prohibited without permission.

A(cr ,) r r z t = 2j} zm1212(z)dzBy + 1
451(9.23)
Consider the formulation of Equation (8.92)
T =
P2a1 + M 2
1 2 t r H2
a
H + H =
1 +a1 + M 2
1 t r H 22
H + H (9.24)
For the calcite particle filled system a equals zero.
We may write in general for simple shear where M= 1
=J 1 t r H . . 2V 2
(9.25)
In Figures 9.1 through 9.3, we contrast predictions of
Equation (9.21) with the experimental shear flow behavior
of talc, calcite, and talc/calcite filled thermoplastic
compound melts exhibiting yield values. For the 40 v% talc
filled system we took Y sl equal to 1 kPa and Y chreshoid equal
to 5.1 kPa, and A(0) equal to 825 MPa. Then, A for shear
stresses more than 10 kPa is 0.12 MPa, B is 0.04. For the
Reproduced with permission of the copyright owner. Further reproduction prohibited without permission.

45220/20 v% talc/calcite mixed particle compounds have Y s i
equal to 0.96 kPa and Y chreshoid equal to 3.2 kPa. A(0) equal
to 317 MPa. A for shear stress greater than 5 k Pa is 0.18
MPa, B is 0.04. We have also fit this to the 40 v% calcite
compound Y sl equal to 0.43 kPa and Y chreShoid equal to 2.4 kPa,
A (0) equal to 133 MPa. A for shear stress greater than 5
kPa is 0.15 MPa, B is 0.06. The fit of Equation (9.21) is
quite good. Table 9.1 summarizes the parameters of
empirical equations for particle filled thermoplastics.
9.4.2 Comparison of Experimental Results with
Constitutive Equation with New Yield Surface
The experimental studies used include simple shear stress
measurements and uniaxial stress measurements. The
transition from transverse isotropy to isotropy with talc
particle content is considered.
Alternate models for the yield surface of a
transversely isotropic plastic viscoelastic fluid has been
developed in Chapter 8 following Spencer (243-245) .
Reproduced with permission of the copyright owner. Further reproduction prohibited without permission.

453
Table 9.1 Parameters of empirical equations for
particle filled thermoplastics
Fillers Ysi Yth A (0) B (0) A B n
(vol%)
kPa kPalim A{y
7 -*0
M P a . s
(s1'") lim A{y7 — K
kPa. s
(s1'")
Talc 1.0 5.1 825 . 0 300 1.22 0 . 04 0 .308
(40)
Talc 0 . 1 0.2 44 . 7 33 1.08 0.08 0 .339
(20)
Talc/Calcite 0 . 9 3.2 317 . 0 80 1. 75 0 . 04 0 .311
(20/20)
Calcite 0.4 2.4 132 . 6 55 1. 50 0 . 06 0 .368
(40)
Reproduced with permission of the copyright owner. Further reproduction prohibited without permission.

VIS
CO
SITY
(Pa.
S)
454
O PS/TALC (80:20)
□ PS/TALC (60:40)
106
Mil l. i m i l l
10° 101 102 1 03 1 04 1 0s 10® 107 10s
SHEAR STRESS (Pa)
Figure 9.1 Comparison of empirical equations withexperimental data for talc filled PS system at 200 °C
Reproduced with permission of the copyright owner. Further reproduction prohibited without permission.

VISC
OSIT
Y (P
a.s)
455
1 0 1 0 g - T T T TTTTTj 1 ' I M lll| I I j IIIIIJ TTTTTTTT| I HT[ im ( I TTTTTTTj i i i i im j TTTTTT^
I i - ____„„..J10» r I o PS / CALCITE (60 : 40 ]
108 r ° (C )i -4
f 1 I107 k- \ i
106
i mm -I m ill H il lllili10° 101 102 103 10“ 105 106 107 10®
SHEAR STRESS (Pa)
Figure 9.2 Comparison of empirical equations withexperimental data for calcite filled system at 200 °C
Reproduced with permission of the copyright owner. Further reproduction prohibited without permission.
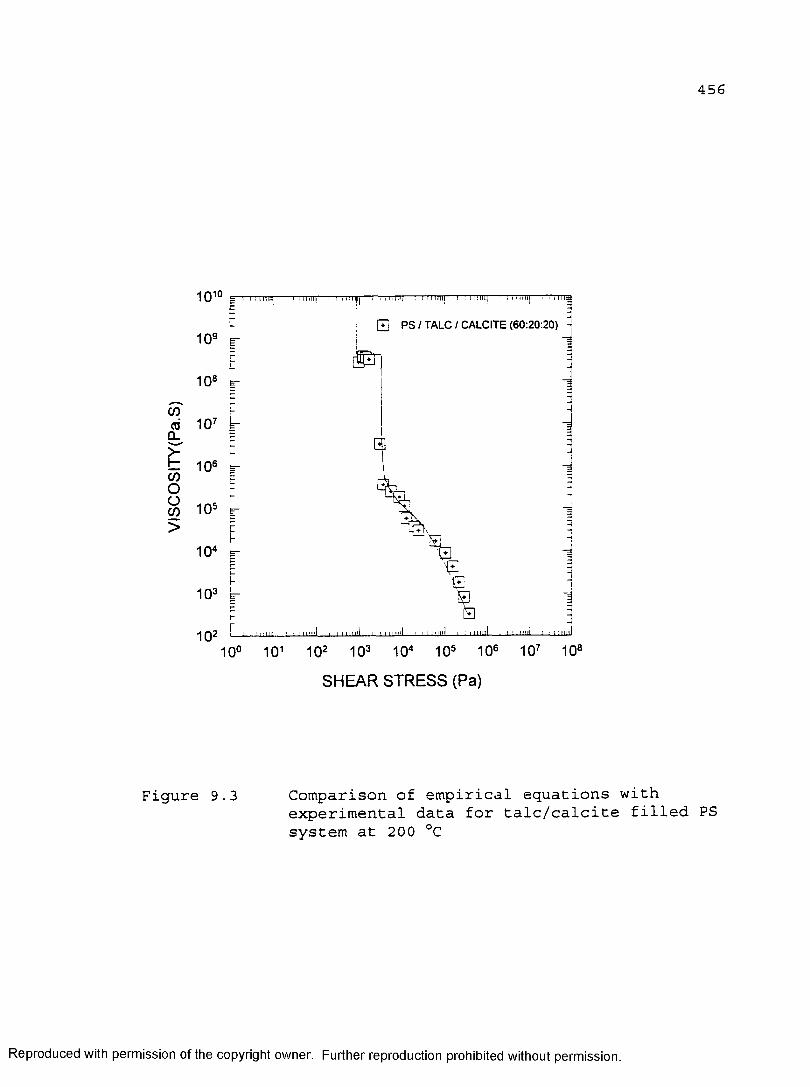
F109
rF108C OCO 107
CL
t 1 0 6 b-C O 5O Fco 105 r
104F
1 0 3 b-
102
E PS / TALC / CALCITE (60:20:20)
4 ♦ N
■4
mmI ! ■ 1111?ii i i m i n i — .L : i mi-'l
00
" " I : : ' m ill___ i ■ i m ill
10° 101 102 103 104 105 106 107 10®
SHEAR STRESS (Pa)
Figure 9.3 Comparison of empirical equations withexperimental data for talc/calcite filled system at 200 °C
Reproduced with permission of the copyright owner. Further reproduction prohibited without permission.

45This formulation contains two parameters (a, p) which can
be determined from creep and uniaxial extension
experimental studies.
9. 4. 2.1 Yield Surface from Constitutive Relationships
The mixed particle-filled system developed in Chapter
8 can be represented as Equation (9.31) .
It involves two parameters material a and P and M is
the ratio of the two invariants which is determined by the
flow. For an isotropic material a is zero ana obtain the
von Mises criteria. The parameter a measures the level of
a isotropy.
In terms of the mixed particle system, we should have
for the yield surface of Equation (9.31),
a = 0 ;isotropic particle filled
t z T(9.31)
system
Reproduced with permission of the copyright owner. Further reproduction prohibited without permission.

4580 < a < maximum ;isotropic/anisotropic particle
filled system
a = maximum ,-anisotropic particle filled
system
(9.32)
9.4.2.2 Yield Surface of Anisotropy Parameter a as a
9.4.2.2.1 Simple shear flow parallel to disc surfaces and
1-direction Uniaxial Flow (Yen/Ysl)
The shear flow intended is shown in Figure 8.la or
Figure 8.1b and uniaxial flow in Figure 8.3. It is this
type of shear flow with discs sliding parallel to each
other that occurs in rheometers (£2., ££, 240. 276) and
uniaxial flow stretch to 1-direction. The relationship
between Yen and Ysi follows from Equation (8.56)
Function of Various Yield Stress Ratios
63 +(9.36)
Reproduced with permission of the copyright owner. Further reproduction prohibited without permission.

4599.4.3 Experimental Results for PS/Talc, PS/Calcite,
PS/Talc/Calcite System
Table 9.2 summarizes the elongational (Yexi) and shear
(Ysl) yield values for PS/talc, PS/calcite, and
PS/talc/calcite system at 40 volume% loadings of fillers.
Figure 9.4 represents yield surface of Yen/Ysl as a
function of the anisotropy parameter a for talc, calcite,
and talc/calcite filled thermoplastics. When the
anisotropy parameter a is positive, the yield stress ratio
Yeii/Y.i ranges from %/i” to 3 . PS/talc 40 v% filled system
showed yield stress ratio Y en / Y sl = 2.95-37.2,
PS/talc/calcite 40 v% filled system showed Yeii/Ysi = 2.8-
23.0, and PS/calcite 40 v% filled system showed Yen/Ysi =
1.8-12.4. The minimum values are as follows
calcite talc/calciteY Y1 fj cl 1 ^ ci.1Y Yxsl Asl
The mean values are as follows
calcite talc/calcite
3 . 2 - ^ < — (9.5)Y.i Ysl
talc< L n
V..
talc< _ 1 0 . 2
YS1
Reproduced with permission of the copyright owner. Further reproduction prohibited without permission.

460
Y /Y1 eir 1 s1
3talc
talc/calcite
AV calcite
1 -
a20 40 60 80 100 120
Figure 9.4 Yield surface of anisotropy parameter a as afunction of minimum yield stress ratio Yeii/Ysi for talc(40v%), calcite (40v%) , and talc/calcite(40v%) filled polystyrene
Reproduced with permission of the copyright owner. Further reproduction prohibited without permission.

461
Table 9.2 Yield values of shear and elongational flowexperiments for PS/talc, PS/calcite, and PS/talc/calcite filled system
Fillers Shear Elongation Yield Stress
Yield Stress Yield Stress Ratio
(Pa) (Pa)
Ysi Yell Yeli/Ysl
Talc 292-1009 2977-10864 2.95-37 .2
4 0v%
Talc/CaC03 282-958 2682-6486 2.80-23 . 0
4 0v%
CaC03 239-428 770-2961 1.80-12 .4
40v%
Reproduced with permission of the copyright owner. Further reproduction prohibited without permission.

9.4.4 Discussion462
In this chapter, we have sought to formulate
constitutive equations suitable for thermoplastics
containing concentrated suspensions of talc particles and
talc/calcite particles, which orient parallel to the metal
surfaces. This constitutive equation in plastic
viscoelastic in character.
Our linear model includes a yield surface with two
parameters and five independent relaxation functions, which
reduce to four with the introduction of incompressibility.
When we consider that flow occurs only in the 1-3 plane
direction such as well oriented talc flow, the relaxation
modulus remains as only one yield value parameter.
We represented a new rheclogical model for mixed
particle filled thermoplastic.
White and Suh (240) represented Hill's five relaxation
moduli as expansion parameter X ( t ) and shear modulus
parameter G(t). We presented Spencer's five relaxation
moduli as expansion parameter Gim(t) and shear modulus
parameter Gi2i2 (t). Both models applied incompressibility.
The final form is similar to a three-dimension non-linear
Reproduced with permission of the copyright owner. Further reproduction prohibited without permission.

463transversely isotropic plastic viscoelastic model,
developed by White and Suh (240).
9.5 Conclusions
We measured anisotropy parameter a, and parameter p, A,
B, and Ysi. Ysl was measured from experiments, a from yield
ratio of Yeii/Ys, p from Equation (8.42b) and Equation
(8.54), and A and B from Equation (9.25) . The values are
summarized in Table 9.1 through Table 9.3.
Experimentally, we measured Yen/Ysi from simple shear
(Ysi) and elongation (Yeii) experiments. As shown on Figure
9.4, the anisotropy parameter a exhibits increasing
function as yield stress ratio Yen/Ysi increases. The yield
stress ratio Yen/Ysi of the talc/calcite mixed particle filled system appeared between the talc and calcite
particle filled system at the same concentration. The
yield stress ratio Yeii/Ysl of the talc/calcite mixed
particle filled system depends on calcite particles
concentration. When the calcite particle concentration is
high in the mixed particle filled system the Yen / Y si value
exhibited close to calcite filled system which is the same
as the von Mises yield surface. The anisotropy parameter a
Reproduced with permission of the copyright owner. Further reproduction prohibited without permission.

464for 40 v% talc particle filled system would be 115 if
Ye11/Ysi is equal to 2.95 where the real yield value measured from experiments Y eii is 2977 Pa and Y si is 1009 Pa. This
ratio is minimum yield stress to fit into the yield surface
curve. When we compare Y eii at 2977 Pa and Ysl at 292 Pa the
ratio is 10.2. For the 40 v% talc particle filled system,
anisotropy parameter a showed a very high number, which
represents the state of highest anisotropy. Anisotropy
parameter a for the 40 v% talc/calcite particle filled
system exhibited 25 at Y e i i / Y si and is set equal to 2.80
where Y e n is 2682 Pa and Y sl is 958 Pa. When we compare Yenat 2682 Pa and Y gl at 282 Pa the ratio is 9.5. At the 40 v%
talc/calcite particle filled system the anisotropy
parameter a is located between zero and infinity, which
represents between the isotropy and anisotropy states.
Anisotropy parameter a for 40 v% calcite particle filled
system exhibited 0.25 at Yen/Ysi and is set equal to 1.80
where Y en is 770 Pa and Y si is 428 Pa. When we compare Y en
at 770 Pa and Y sl at 23 9 Pa the ratio is 3.2. Anisotropy
parameter a showed almost zero at the 40 v% calcite
particle filled system, which represents highest isotropy.
Table 9.3 summarizes the anisotropy parameter a for various
particle-filled systems as a function of Yen/Ysl.
Reproduced with permission of the copyright owner. Further reproduction prohibited without permission.

465
Table 9.3 The anisotropy parameter a for variousparticle filled systems as a function of Y ei i / Y sl
Fillers Anisotropy
Parameter
(a)
Parameter
(P>
Talc 115 9.955x10°
40v%
Talc/CaC03 25 2.147x10s
40v%
CaC03 0 .25 0.125x10s
40v%
Reproduced with permission of the copyright owner. Further reproduction prohibited without permission.

466The Spencer's yield model is valid only if yield
stress ratio Yeii/Ysl is less than three. For the PS/talc
(40 v%) , PS/talc/calcite (20/20 v%) , PS/'calcite (40 v%)
system as shown in Section 9.4.3, the minimum yield stress
ratio Yeii/Ysi ranges from 1.8 to 2.95. This yield stress
ratio can be represented on Spencer's yield surface.
However, the mean value exhibited ranges from 3 to 10 and
is higher than Spencer's yield criteria. This implies that
Spencer's model is valid only for minimum yield stress
ratios in our system. If the yield stress ratio Yen/Ysi exhibits higher than three, Spencer's yield surface is not
valid.
There are two ways to consider this behavior.
First, elongational measurement. The elongational
yield values were measured in the nitrogen gas chamber as
an alternative to the silicone oil bath method. This
nitrogen gas chamber method should be developed further to
obtain accurate elongational viscosity/yield measurements.
Second, Hill's yield criteria. Hill's yield criteria
may be valid to present the yield stress ratio Yeii/YsX
higher than three. However, Hill's yield surface has three
constants that were not possible to be determined by
practical experiments.
Reproduced with permission of the copyright owner. Further reproduction prohibited without permission.

CHAPTER X
CONCLUSIONS AND RECOMMENDATION
10.1 Introduction
It was our purpose in this dissertation to develop a
broad based perspective of the materials science and
engineering behavior of polymer melts filled with high
loadings of talc, calcite, and talc/calcite particles. The
orientation characteristics of particles in simple
rheometers are basic for rheological modeling of
anisotropic compounds and studies of particle orientation
development during the processing of talc-filled
thermoplastics. The rheological behavior of talc, and
calcite-thermoplastic compounds should be important to the
processing of particle filled thermoplastic melts. The
behavior of talc/calcite thermoplastic compounds should be
representative of mixed particle compounds.
467
Reproduced with permission of the copyright owner. Further reproduction prohibited without permission.

468The 3-dimensional rheological model, which was
developed, provides deeper perspectives in interpreting the
experimentally obtained flow behavior of filled compounds.
We now summarize the major conclusions of this
dissertation.
10.2 Conclusions
10.2.1 Orientation Studies from Wide Angle X-ray
Diffraction
We investigated talc, calcite, and talc/calcite
compounds from low loadings to high loadings in various
flow geometries.
The degree of orientation of the talc particles from
capillary extrudates was found to increase and then
decrease as talc volume loading increases. Scanning
electron microscopy studies showed that in the outer radii,
the talc particles are parallel to the die surface but
complex particle orientation occurs in the extrudate core.
There was a general tendency in mixed particle systems
for the talc particles to decrease in orientation with
increasing calcite content.
Reproduced with permission of the copyright owner. Further reproduction prohibited without permission.

46910.2.2 Quantitative Analysis of Filler Composite
using X-ray Intensity Method
We made a new quantitative investigation of x-ray
absorption using the wide angle x-ray diffraction (WAXD)
intensity method for binary mixture (PS/Talc, PS/Calcite)
system and ternary mixtures (PS/talc/calcite) system. The
Alexander and Klug equation (182) was used to interpret the
data. This was the first application to systems of
crystalline mineral particles and amorphous thermoplastic.
We investigated the talc-calcite-polystyrene systems
assuming the pseudo-binary mixture system.
10.2.3 Rheological Considerations-Experimental
We have presented a broad range of experimental
studies of shear, elongational, and oscillatory flow
behavior of talc, calcite, and talc/calcite filled
thermoplastic melts. The viscosity increases with
increasing particle loading and with decreasing particle
size. The talc, calcite, and talc/calcite filled
thermoplastic melts with smaller particles at higher
loadings exhibit yield values, i.e. stresses below which
Reproduced with permission of the copyright owner. Further reproduction prohibited without permission.

470there is no flow. We found a viscosity-shear stress
plateau and named the shear stress at the upper end of the
plateau the 'Threshold Yield Stress'. The true yield
values are much lower than the threshold yield value, which
were usually measured by extrapolation by casual
investigation.
The complex viscosity exhibited much higher than the
steady state shear viscosity at higher loadings of
particles. This represents that the Cox-Merz (263) rule
fails in the filled system.
We found that calcite and talc particle absorb
silicone oil in the elongational viscosity measurement
experiments. In alternative experiments, we measured
elongational creep in the nitrogen gas filled chamber.
This method allowed us to determine elongational yield
values.
10.2.4 Rheological Modeling
A 3-dimensional anisotropic rheological model has been
developed to interpret the anisotropic and plastic
characteristics of talc and talc/calcite particle
compounds.
Reproduced with permission of the copyright owner. Further reproduction prohibited without permission.

The formulation is first developed in a linear 3-
dimensional form and finally in a non-linear 3-dimensional
form. The anisotropic plastic viscoelastic fluid model is
specialized to a transversely isotropic form to represent
the suspension behavior of oriented disc particles,
starting from Spencer's (243-245) invariant theory. This
model was developed from constitutive equations and tested
experimentally and compared with the White and Suh (240)
model.
10.3 Recommendations
We suggest the following as future studies on the
rheology and processing of talc or disc filled
thermoplastics.
(i) A study of disc-like particles, such as mica,
suspensions in thermoplastics during flow and
processing with a broader range of particle loadings
is recommended.
(ii) We observed phase orientation redistribution
phenomena from circular and rectangular cross-
section dies at high loadings of talc particles.
Reproduced with permission of the copyright owner. Further reproduction prohibited without permission.

472T h i s p h e n o m e n o n s h o u l d b e v e r i f i e d w i t h
a d d i t i o n a l e x p e r i m e n t s a n d a f u r t h e r d e v e l o p e d
t h e o r y .
( i i i ) A d d i t i v e s s u c h a s s t e a r i c a c i d s h o u l d b e s t u d i e d f o r
d i f f e r e n t p a r t i c l e - f i l l e d s y s t e m s .
( i v ) E l o n g a t i o n a l v i s c o s i t y m e a s u r e m e n t s u s i n g s i l i c o n e
o i l s h o u l d b e r e p l a c e d b y a d i f f e r e n t t y p e o f o i l o r
m e d i u m t h a t i s n ' t a b s o r b e d b y t h e f i l l e r .
R eproduced with permission of the copyright owner. Further reproduction prohibited without permission.

REFERENCES
1 S . B . H e n d r i c k s , Phys. Review, 5 Z , 4 4 8 ( 1 9 4 0 )
2 E . W. R a d o s l o v i c h , American Mineralogist, 4_Z, 6 1 7( 1 9 6 2 )
3 G . B r o w n , Clay Minerals, £., 7 3 ( 1 9 6 5 )
4 J . H . R a y n e r a n d G . B r o w n , Clays and Clay Minerals, 21/1 0 3 ( 1 9 7 3 )
5 L . P a u l i n g , Proc. Nat. Acad. Sci. U. S., 1 £ , 1 2 3 ( 1 9 3 0 )
6 L . P a u l i n g , Proc. Nat. Acad. Sci. U. S., 1 £ , 5 7 8 ( 1 9 3 0 )
7 L . P a u l i n g , " T h e N a t u r e o f t h e C h e m i c a l B o n d " , 3 r d E d . ,
C o r n e l l , I t h a c a , 1 9 6 0
8 T . M o e l l e r , " I n o r g a n i c C h e m i s t r y " , W i l e y , N e w Y o r k ,1 9 5 2
9 H . S . K a t z a n d J . V . M i l e w s k i , E d s . , " H a n d b o o k o fF i l l e r s a n d R e i n f o r c e m e n t s f o r P l a s t i c s , ( p . 1 6 0 , J . A . R a d o s t a a n d N . C . T r i v e d ) " , V a n N o s t r a n d R e i n h o l d C o m p .
1 0 R . G a c h t e r a n d H . M u l l e r , E d s . , " P l a s t i c s A d d i t i v e s H a n d b o o k ( H . P . S c h l u m p f ) " , 3 r d E d . , H a n s e r P u b l i s h e r s ,
M u n i c h V i e n n a N e w Y o r k , 1 9 9 0 .
1 1 J . W. G r u n e r , Z. Kristallog., i l i i , 4 1 2 ( 1 9 3 4 )
1 2 S . B . H e n d r i c k s , Z. Kristallog., . 2 2 , 2 6 4 ( 1 9 3 8 )
1 3 B . B . Z v y a g i n a n d Z . G . P i n s k e r , D o k l . Acad. Sci. USSR,6 8 . 5 0 5 ( 1 9 4 9 )
4 7 3
R eproduced with permission of the copyright owner. Further reproduction prohibited without permission.

4741 4 I . S . S t e m p l e a n d G . W. B r i n d l e y , J. Am. Ceram.
So c . , 1 2 , 3 4 ( 1 9 6 0 ) '
1 5 J . H . R a y n e r a n d G . B r o w n , Nature, 2 1 2 ., 1 3 5 2 ( 1 9 6 6 )
1 6 J . H . R a y n e r a n d G . B r o w n , Clays Clay Minerals, 2 1 , 1 0 3( 1 9 7 3 )
1 7 M. R o s s , W. L . S m i t h , a n d W. H . A s h t o n , Am. Mineral.,5 3 . 7 5 1 ( 1 9 6 8 )
1 8 M. A k i z u k i a n d J . Z u s s m a n , Mineral. Mag., 1 2 , 1 0 7
( 1 9 7 8 )
1 9 B . P e r d i k a t s i s a n d H. B u r z l a f f , Z. Kristallog. , 1 5 6 .1 7 7 ( 1 9 8 1 )
2 0 S . W. B a i l e y , M i n e r a l . S o c . M o n o g r a p h , 2 , 1 ( 1 9 8 0 )
2 1 J a p a n C h e m i c a l W e e k , N o v . 2 , 1 9 9 5
2 2 C . M a u g u i n , Comp. Rend., 1 8 5 . 2 8 8 ( 1 9 2 7 )
2 3 W. W. J a c k s o n a n d J . W e s t , Z. Kristal., 7 2 , 2 1 1 ( 1 9 3 0 )
2 4 K h . M a m e d o v a n d N . V . B e l o v , Compt. Rend. Acad. Sci.,U R S S , 1 2 7 , 4 6 3 ( 1 9 5 6 )
2 5 J . T o l l i d a y , Nature, 1 8 2 . 1 0 1 2 ( 1 9 5 8 )
2 6 W. L . B r a g g , Proc. Roy. Soc., A 8 9 , 4 1 8 ( 1 9 1 4 )
2 7 E . A . H a r r i n g t o n , Am. J. Soc., 1 2 , 4 6 7 ( 1 9 2 7 )
2 8 O . R e y n o l d s , Phil. Mag., ( 1 8 8 5 )
2 9 R . L . H o f f m a n , Trans. Soc. R h e o l ., 1 2 / 1 5 5 ( 1 9 7 2 )
3 0 R . L . H o f f m a n , J. Col. Int. Sci., 1 2 / 4 9 1 ( 1 9 7 4 )
3 1 R . L . H o f f m a n , J. Col. Int. Sci., 2 2 / 2 2 8 ( 1 9 7 5 )
3 2 R . L . H o f f m a n , J. Col. Int. Sci., 2A, 4 7 0 ( 1 9 8 3 )
R eproduced with permission of the copyright owner. Further reproduction prohibited without permission.

4753 3 G . B . J e f f e r y , Proc. Roy. Soc. (London), & 1 J 2 2 , 1 6 1
( 1 9 2 2 )
3 4 G . I . T a y l o r , Proc. Roy. Soc. (London) , A 1 0 3 . 5 8 ( 1 9 2 3 )
3 5 G . I . T a y l o r , Proc. Roy. Soc. (London), A 1 3 8 , 4 1 ( 1 9 3 2 )
3 6 G . I . T a y l o r , Proc. Roy. Soc. (London), A 1 4 6 . 5 0 1 ( 1 9 3 4 )
3 7 B . J . T r e v e l y a n a n d S . G . M a s o n , J. Colloid Sci., 2,3 5 4 ( 1 9 5 1 )
3 8 S . G . M a s o n a n d R . J . M a n l e y , Proc. Roy. Soc. (London), A 2 3 8 . 1 1 7 ( 1 9 5 6 )
3 9 W. B a r t o k a n d S . G . M a s o n , J. Colloid Sci., 1 2 , 2 4 3( 1 9 5 7 )
4 0 O . L . F o r g a c s a n d S . G . M a s o n , J. Colloid Sci., 1 4 ,4 5 7 ( 1 9 5 9 )
4 1 H . L . G o l d s m i t h a n d S . G . M a s o n , J. Fluid Me c h . , 12,8 8 ( 1 9 6 2 )
4 2 C . E . C h a f f e y a n d S . G . M a s o n , J. Colloid Sci., 12.,5 2 5 ( 1 9 6 4 )
4 3 S . N e w m a n a n d Q . T r e m e n t o z z i , J. A p p l . Polym. Sci., 2, 3 0 7 1 ( 1 9 6 5 )
4 4 A . K a r n i s a n d S . G . M a s o n , Trans. Soc. Rheology, U 2 ,5 7 1 ( 1 9 6 6 )
4 5 F . G a u t h i e r , H . L . G o l d s m i t h , a n d S . G . M a s o n ,Rheologica Acta, JJ1 , 3 4 4 ( 1 9 7 1 )
4 6 F . G a u t h i e r , H . L . G o l d s m i t h , a n d S . G . M a s o n , Trans. Soc. Rheology, 12, 2 9 7 ( 1 9 7 1 )
4 7 D i e s s e l h o r s t , F r e u n d l i c h , a n d L e o n h a r d t , Elaster- Geitel-Festschrift, p . 4 5 3 ( 1 9 1 5 )
4 8 D i e s s e l h o r s t a n d F r e u n d l i c h , Phys. Zeitschr., 12, 4 2 2
( 1 9 1 5 )
R eproduced with permission of the copyright owner. Further reproduction prohibited without permission.

476
4 9 F r e u n d l i c h , Z e i t s c h r . f . E l e k t r o c h e m . , 22., 2 7 ( 1 9 1 6 )
5 0 H . Z o c h e r , Z . P h y s . Chem. , H , 2 9 3 ( 1 9 2 1 )
5 1 E . S c h a l e k a n d A . S z e g v a r i , K o l l o i d - Z . , H , 3 2 6 ( 1 9 2 3 )
5 2 A . S z e g v a r i , P h y s . Z. , 2 4 , 9 1 ( 1 9 2 3 )
5 3 A . S z e g v a r i , Z . P h y s . Chem. , 1 1 2 . 2 7 7 ( 1 9 2 4 )
5 4 A . S z e g v a r i , Z . P h y s . Chem. , 112, 2 9 5 ( 1 9 2 4 )
5 5 H . Z o c h e r , Z . A n o r g . A l l g . Chem. , 1 4 7 . 9 1 ( 1 9 2 5 )
5 6 H . Z o c h e r a n d K . J a c o b s o h n , K o l l o i d Z. , 41, 2 2 0 ( 1 9 2 7 )
5 7 H . Z o c h e r I . e . , W. H e l l e r , Compt . r e n d . , 2 0 1 . 8 3 1
( 1 9 3 5 ) ; P . B e r g m a n n , P . L o w - B e e r a n d H . Z o c h e r , Z . Physik. Chem., A 1 8 1 . 3 0 1 ( 1 9 3 8 )
5 8 J . D . B e r n a l , F . C . B a w d e n , N . W. P i r i e a n d I .F a n k u c h e n , N a t u r e , 1 3 8 . 1 0 5 1 ( 1 9 3 6 )
5 9 J . D . B e r n a l a n d I . F a n k u c h e n , N a t u r e , 1 3 9 . 9 2 3 ( 1 9 3 7 )
6 0 J . D . B e r n a l a n d I . F a n k u c h e n , J . Gen. P h y s i o l o g y , 2 3 ,I l l ( 1 9 4 1 )
6 1 H . F r e u n d l i c h , J . P h y s . Chem. , 4 1 ( 9 ) , 1 1 5 1 ( 1 9 3 7 )
6 2 J . K . L e e s , P o l y m . Eng. S c i . , £l, 1 8 6 ( 1 9 6 8 )
6 3 R . G . S c h i e r d i n g , J . Compos . M a t e r . , 2., 4 4 8 ( 1 9 6 8 )
6 4 K . Y o s h i d a , G . B u d i m a n , Y . O k a y a m a , a n d T . K i t a o , S e n - i - G a k k a i s h i , 1 1 , T - 3 3 5 ( 1 9 7 5 )
6 5 L . A . G o e t t l e r , 2 5 t h A n n . T e c h . C o n f . R e i n f o r c e d P l a s t i c s / C o m p o s i t e s D i v . , S o c i e t y o f t h e P l a s t i c s I n d u s t r y 1 4 - A , 1 ( 1 9 7 0 ) ; L . A . G o e t t l e r , M o d . P l a s t . ,
1 4 0 ( A p r i l 1 9 7 0 )
Reproduced with permission of the copyright owner. Further reproduction prohibited without permission.

4776 6 M. W. D a r l i n g t o n a n d P . L . M c G i n l e y , J . Mater. Sci.,
1 0 . 9 0 6 ( 1 9 7 5 )
6 7 M. J . O w e n a n d K. W h y b r e w , Plast. Rubber, 1 , 2 3 1 ( 1 9 7 6 )
6 8 M. J . O w e n , D . H . T h o m a s , a n d M. S . F o u n d , M o d .P l a s t i c s , 6 1 , ( 1 9 7 8 )
6 9 H . M e n e n d e z a n d J . L . W h i t e , Pol. Eng. & Sci., 2 4 . ( 1 3 ) ,1 0 5 1 ( 1 9 8 4 )
7 0 S . H . L i m , a n d J . L . W h i t e , Adv. Pol. Tech., 2 ( 3 ) , 3 2 5( 1 9 8 8 )
7 1 S . H . L i m , a n d J . L . W h i t e , J. R h e o l ., 2 4 ( 3 ) , 3 4 3( 1 9 9 0 )
7 2 M. F u j i y a m a , T . W a k i n o , J . A p p l . Polym. Sci., 4 2 ,5 7 ( 1 9 9 1 )
7 3 M. F u j i y a m a , T . W a k i n o , J . Appl. Polym. Sci., 4 2 ,9 7 ( 1 9 9 1 )
7 4 M. F u j i y a m a , T . W a k i n o ; Int. Polym. Process., 2 ( 1 ) , 9 7( 1 9 9 2 )
7 5 M. F u j i y a m a , T . W a k i n o ; Int. Polym. Process., 7 ( 2 ) ,1 5 9 ( 1 9 9 2 )
7 6 M. F u j i y a m a , Int. Polym. Process., 2 ( 1 ) , 8 4 ,( 1 9 9 2 )
7 7 M. F u j i y a m a , Int. Polym. Process., 2 ( 2 ) , 1 6 5( 1 9 9 2 )
7 8 M. F u j i y a m a , Int. Polym. Process., 2 ( 4 ) , 3 5 8( 1 9 9 2 )
7 9 G . M o n g e , M. V i n c e n t , a n d J . M. H a u d i n , Makromol. Chem.Macromol. Symp., 2 , 1 ( 1 9 8 7 )
8 0 S . H . L i m , a n d J . L . W h i t e , Int. Polym. Process., 2 , 8 1(1 9 9 3 )
Reproduced with permission of the copyright owner. Further reproduction prohibited without permission.

4788 1 S . H . L i m , D o c t o r i a l D i s s e r t a t i o n , " P a r t i c l e
o r i e n t a t i o n d e v e l o p m e n t a n d D i r e c t i o n a l g r o w t h p h e n o m e n a i n p r o c e s s e d f i l l e d t h e r m o p l a s t i c c o m p o u n d s " , 1 9 9 1 , U n i v . o f A k r o n
8 2 C . H . S u h a n d J . L . W h i t e , J. Non-Newtonian Fluid Mech. , £ 2 , 1 7 5 ( 1 9 9 6 )
8 3 C . H . S u h a n d J . L . W h i t e , Polym. Eng. Sci., 2 2 , 1 5 2 1 ( 1 9 9 6 )
8 4 C . H . S u h a n d J . L . W h i t e , Polym. Eng. Sci., 23., 2 1 8 8
( 1 9 9 6 )
8 5 C . H . S u h , D o c t o r i a l D i s s e r t a t i o n , " R h e o l o g y a n dp r o c e s s i n g o f t a l c f i l l e d t h e r m o p l a s t i c s " , 1 9 9 5 , U n i v .
o f A k r o n
8 6 F r i e d e l , A n n . d . Phys., 22, 3 5 8 ( 1 9 2 2 )
8 7 P . J . F l o r y , Proc. Roy. Soc., A 2 3 4 . 7 3 ( 1 9 5 6 )
8 8 J . D . B r o o k s a n d G . H . T a y l o r , Carbon, 2 , 1 8 5 ( 1 9 6 5 )
8 9 H . H o n d a , H . K i m u r a , Y . S a n a d a , S . S u g a e a r a a n d T .F u r u t a , Carbon, 2., 1 8 1 ( 1 9 7 0 )
9 0 J . B . B a r r , S . C h w a s t i a k , R . D i d c h e n k o , I . C . L e w i s ,R . T . L e w i s a n d L . S . S i n g e r , J. Appl. Polym. Sci. Appl.Polym. Symp. , 22., 1 6 1 ( 1 9 7 6 )
9 1 H . H o n d a , M o l . C r y s t . Liq. C r y s t . , 2 1 , 9 7 ( 1 9 8 3 ) , Ca r b o n , 2 3 , 1 3 9 ( 1 9 8 8 )
9 2 D a r k e , M c B a i n , a n d S a l m o n , Proc. Roy. Soc. London, 22, ( a ) 3 9 5 ( 1 9 2 1 )
9 3 A . E i n s t e i n , Ann. Phys., 1 2 , 2 8 9 ( 1 9 0 6 ) , 2 A, 5 9 1 ( 1 9 1 1 )
9 4 G . K. B a t c h e l o r , J. Fluid Mech. , 12, 8 1 3 ( 1 9 7 1 )
9 5 G . K. B a t c h e l o r a n d J . T . G r e e n , J. Fluid Mech., 2 2 ,4 0 1 ( 1 9 7 2 )
Reproduced with permission of the copyright owner. Further reproduction prohibited without permission.

4799 6 F . N a z e m a n d C . T . H i l l , Trans. Soc. R h e o l . , 1 5 , 8 7
( 1 9 7 4 )
9 7 J . L . W h i t e , L . C z a r n e c k i , a n d H . T a n a k a , Rubber Chem. Technol . , 5 5 , 8 2 3 ( 1 9 8 0 )
9 8 Y . C h a n , J . L . W h i t e , a n d Y . O y a n a g i , J. Rheol., 2 2 ,5 0 7 ( 1 9 7 8 )
9 9 L . C z a r n e c k i , a n d J . L . W h i t e , J. Appl. Polym. Sci.,2 5 . 1 2 1 7 ( 1 9 8 0 )
1 0 0 Y . O y a n a g i a n d Y . Y a m a g u c h i , Nihon Reoroji Gakkaishi ( J . Soc. Rheol. Japan), 1 , 6 4 ( 1 9 7 5 )
1 0 1 Y . M i k a m i , T . M a t s u m o t o , a n d S . O n o g i , Nihon Reoroji Gakkaishi (J . Soc. Rheol. Japan), 4 . , 1 4 9 ( 1 9 7 6 )
1 0 2 J . L . W h i t e a n d L . C z a r n e c k i , J. Rheol., 2A, 5 0 1 ( 1 9 8 0 )
1 0 3 J . D . G o d d a r d , J. Non-Newt. Fluid Mech., 1 , 1 ( 1 9 7 6 )
1 0 4 J . D . G o d d a r d , J. Rheology, 2 2 , 6 1 5 ( 1 9 7 8 )
1 0 5 F . M. C h a p m a n a n d T . S . L e e , SPE J . , 22, 3 7 ( 1 9 7 0 )
1 0 6 V . M. L o b e a n d J . L . W h i t e , Polym. Eng. Sci., 1 5 , 6 1 7( 1 9 7 9 )
1 0 7 H . T a n a k a a n d J . L . W h i t e , Polym. Eng. Sci., 22, 9 4 9( 1 9 8 0 )
1 0 8 H . F r e u n d l i c h , " K a p i l l a r c h e m i e " , B a n d 1 , 2 , A k a d e m i s c h e
V e r l a g s g e s e l l s c h s f t , L e i p z i g , 1 9 3 0 , 1 9 3 2
1 0 9 H . F r e u n d l i c h a n d F . J u l i u s b e r g e r , Trans. Faraday Soc., 5 1 , 9 2 0 ( 1 9 3 5 )
1 1 0 H . F r e u n d l i c h a n d A . D . J o h n s , J. Phys. Chem., Ml,1 2 1 7 ( 1 9 3 6 )
1 1 1 J . R . S c o t t , Trans. Inst. Rubber Ind., 2, 1 6 9 ( 1 9 3 1 )
R eproduced with permission of the copyright owner. Further reproduction prohibited without permission.

481 1 2 L . M u l l i n s , J. Phys. Colloid Chem., 1 4 . , 6 3 9 ( 1 9 5 0 ) :
L . M u l l i n s a n d R . W. W h o r l o w , Trans. ISI. , 2 2 , 5 5
( 1 9 5 1 )
1 1 3 N . V . Z a k h a r e n k o , F . S . T o l s t u k h i n a , a n d G . M. B a r t e n e v , Rubber Chem. Technol. , 2 1 , 3 2 ( 1 9 6 2 )
1 1 4 T . M a t s u m o t o , P h . D . D i s s e r t a t i o n , K y o t o U n i v e r s i t y , K y o t o J a p a n , 1 9 7 8
1 1 5 T . M a t s u m o t o , C . H i t o m i , a n d S . O n o g i , Trans. Soc. Rheol., 1 1 , 5 4 1 ( 1 9 7 5 )
1 1 6 T . M a t s u m o t o , T . M a s u d a , K . T s u t s u i , a n d S . O n o g i ,Nippon Kagaku Zasshi, 2 1 , 3 6 0 ( 1 9 6 9 )
1 1 7 T . M a t s u m o t o , A . T a k a s h i m a , T . M a s u d a , a n d S . O n o g i ,
Trans. Soc. Rheol., 1 4 . , 6 1 7 ( 1 9 7 0 )
1 1 8 G . V . V i n o g r a d o v , A . Y . M a l k i n , E . P . P l o t n i k o v a , 0 . YS a b s a i , a n d N . E . N i k o i a y e v a , I n t e r n . J P o l y m e r i c M a t e r . , 2 , 1 ( 1 9 7 2 )
1 1 9 T . K a t a o k a , T . K i t a n o , M. S a s a h a r a , a n d K . N i s h i j i m a ,
Rheol. Acta, 1 2 , 1 4 9 ( 1 9 7 9 )
1 2 0 T . K a t a o k a , T . K i t a n o , Y . O y a n a g i , a n d M S a s a h a r a ,
Rheol. Acta, 1 1 , 6 3 5 ( 1 9 7 9 )
1 2 1 N . M i n a g a w a a n d J . L . W h i t e , J. Appl. Polym. Sci., 2 1 ,
5 0 1 ( 1 9 7 6 )
1 2 2 J . L . W h i t e , Rubber Chem. Technol., 2 1 , 1 6 3 ( 1 9 7 7 )
1 2 3 C . Y . M a , J . L . W h i t e , F . C . W e i s s e r t , a n d K . M i n ,Polym. Composites, £., 2 1 5 ( 1 9 8 5 )
1 2 4 K . C . S h i n , J . L . W h i t e , a n d N . N a k a j i m a , J. Non-Newtonian Fluid Mech., 2 2 , 9 5 ( 1 9 9 0 )
1 2 5 K . C . S h i n , J . L . W h i t e , R . B r z o s k o w s k i , a n d N .N a k a j i m a , Kautschuk Gummi Kunststoffe, 4 1 , 1 8 1 ( 1 9 9 0 )
Reproduced with permission of the copyright owner. Further reproduction prohibited without permission.

4811 2 6 J . L . W h i t e , J. A p p l . P o l y m . S c i . : A p p l . P o l y m .
Sym., 5 5 , 1 0 9 ( 1 9 9 2 )
1 2 7 G . J . O s a n a i y e , A . I . L e o n o v , a n d J . L . W h i t e , J. Non-N e w t o n i a n Fluid M e c h . , 4 5 , 8 7 ( 1 9 9 3 )
1 2 8 S . T o k i a n d J . L . W h i t e , J . Appl. Polym. Sci., 23., 3 1 7 1
( 1 9 8 2 )
1 2 9 S . M o n t e s a n d J . L . W h i t e , R u b b e r Chem. T e c h n o l . , 55, 8 2 3 ( 1 9 8 2 )
1 3 0 C . Y . M a , J . L . W h i t e , F . C . W e i s s e r t , a n d K . M i n , J. N o n - N e w t o n i a n F l u i d M e c h . , 2 3 , 2 7 5 ( 1 9 8 5 )
1 3 1 J . L . W h i t e , Y . W a n g , A . I . I s a y e v , N . N a k a j i m a , F . C.W e i s s e r t , a n d K . M i n , R u b b e r Chem. T e c h n o l . , 5 5 , 3 3 7 ( 1 9 8 7 )
1 3 2 H . J . S o n g , J . L . W h i t e , K. M i n , N . N a k a j i m a , a n d F . C . W e i s s e r t , Adv. P o l y m . T e c h n o l . , 5 , 4 3 1 ( 1 9 8 8 )
1 3 3 Y . S u e t s u g u a n d J . L . W h i t e , J. A p p l . P o l y m . S c i . , 23.,1 4 8 1 ( 1 9 8 3 )
1 3 4 J . L . W h i t e a n d J . W. C r o w d e r , J. Appl. Polym. Sci.,1 5 , 1 0 1 3 ( 1 9 7 4 )
1 3 5 K . S h i m a m u r a , J . L . W h i t e a n d J . F . F e l l e r s , J. A p p l .P o l y m . S c i . , 2 3 , 2 1 6 5 ( 1 9 8 1 )
1 3 6 G . J . O s a n a i y e a n d J . L . W h i t e , R u b b e r Chem. and T e c h . , 3 3 , 5 0 ( 1 9 9 5 )
1 3 7 Y . S u e t s u g u a n d J . L . W h i t e , J. N o n - N e w t o n i a n F l u i dM e c h . , 1A., 1 2 1 ( 1 9 8 4 )
1 3 8 Y . S u e t s u g u a n d J . L . W h i t e , J. A p p l . P o l y m . S c i . 23 ,1 4 8 1 ( 1 9 8 3 )
1 3 9 S . M o n t e s , J . L . W h i t e , a n d N . N a k a j i m a , J. Non-N e w t o n i a n F l u i d M e c h . , 2 3 , 1 8 3 ( 1 9 8 8 )
R eproduced with permission of the copyright owner. Further reproduction prohibited without permission.

4821 4 0 K a n b e , T a k a n o , Proc. Int. Cong. Rheol. 4 t h p t 3 , p 5 5 7
W i l e y ( 1 9 6 5 )
1 4 1 T . S u g a m a , L . E . K u k a c k a , a n d W. H o r n , J. Mat. Sci.,1 6 . 3 4 5 ( 1 9 8 0 )
1 4 2 H . B r o d y a n d I . M. W a r d , Polym. Eng. Sci., 1_L, 1 3 9 ( 1 9 7 1 )
1 4 3 S . R . M o g h e , Rubber Chem. Technol., XL, 1 0 7 4 ( 1 9 7 4 )
1 4 4 L . A . G o e t t l e r , R . I . L e i b , a n d A . J . L a m b r i g h t ,Rubber Chem. Technol., 22/ 8 3 8 ( 1 9 7 9 )
1 4 5 Y . O y a n a g i , Y . Y a m a g u c h i , M. K i t a g a w a , K. T e r a o , a n d M. M o c h i z u k i , Kobunshi Robunshu, 2 8 . , 2 8 5 ( 1 9 8 1 )
1 4 6 R . B . P i p e s , R . L . M c C u l l o u g h , a n d D . G . T a g g a r t ,Polym. Composites, 2 , 3 4 ( 1 9 8 2 )
1 4 7 T . N o g a i , Seni Gakkaishi, 22 , T - 3 8 9 , T - 4 2 7 ( 1 9 8 0 ) ;
22, T - 4 1 3 ( 1 9 8 2 )
1 4 8 J . L . W h i t e a n d B . A . K n u t s s o n , Polym. Eng. Rev., 2 ,7 1 ( 1 9 8 2 )
1 4 9 J . M a r t i n s s o n a n d J . L . W h i t e , Polym. Composites,2, 3 0 2 ( 1 9 8 6 )
1 5 0 F . H . M u l l e r , Kolloid Z, 22 , 1 3 8 ( 1 9 4 1 )
1 5 1 F . H . M u l l e r , Kolloid Z, 22, 3 0 6 ( 1 9 4 1 )
1 5 2 P . H . H e r m a n s a n d P . P l a t z e k , Kolloid Z, 22/ 6 8 ( 1 9 3 9 )
1 5 3 P . H . H e r m a n s a n d J . d e B o u y s , Kolloid Z . , 22 / 7 3
( 1 9 3 9 )
1 5 4 J . J . H e r m a n s , P . H . H e r m a n s , D . V e r m a a s , a n d A .W e i d i n g e r , Rec. Trav. Chim., £2/ 4 2 7 ( 1 9 4 6 )
1 5 5 P . H . H e r m a n s , J . J . H e r m a n s , D . V e r m a a s , a n d A .W e i d i n g e r , J. Polym. Sci., 2/ 1 ( 1 9 4 8 )
R eproduced with permission of the copyright owner. Further reproduction prohibited without permission.

4831 5 6 P . H . H e r m a n s , " P h y s i c s a n d C h e m i s t r y o f C e l l u l o s e
F i b e r s " , E l s e v i e r , N e w Y o r k , 1 9 4 9
1 5 7 P . H . H e r m a n s , e d . , C o n t r i b u t i o n s t o t h e P h y s i c s o f C e l l u l o s e F i b e r s E l s e v i e r , A m s t e r d a m , T h e N e t h e r l a n d s ,
1 9 4 6
1 5 8 P . H . H e r m a n s a n d D . H e i k e n s , R e c . T r a v . Chim. P a y s - B a s , 7 1 , 4 9 ( 1 9 5 2 )
1 5 9 R . S . S t e i n , J. Po l ym . S c i . , 1 1 , 3 2 7 ( 1 9 5 8 )
1 6 0 S . N o m u r a , H . K a w a i , I . K i m u r a , a n d M. K a g i y a m a , J. p o l y m . S c i . P a r t A - 2 , 2 , 4 7 9 ( 1 9 6 9 )
1 6 1 H . K a w a i , P r o c e e d i n g s o f t h e 5 t h I n t e r n a t i o n a l R h e o l o g yC o n g r e s s , 1 , 9 7 , ( 1 9 6 9)
1 6 2 S . N o m u r a , H . K a w a i , I . K i m u r a , a n d M. K a g i y a m a , J. P o l y m . S c i . P a r t A - 2 , 1 , 3 8 3 ( 1 9 7 0 )
1 6 3 J . L . W h i t e a n d J . E . S p r u i e l l , P o l y m . Eng. S c i . , 21,8 5 9 ( 1 9 8 1 )
1 6 4 K . M a t s u m o t o , J . F . F e l l e r s , a n d J . L . W h i t e , J. Appl. P o l y m . S c i . 2 3 , 8 5 ( 1 9 8 1 )
1 6 5 K . J . C h o i , J . E . S p r u i e l l , a n d J . L . W h i t e , J. Pol ym. S c i . P o l y m . P h y s . E d . , 2 2 , 2 7 ( 1 9 8 2 )
1 6 6 M. C a k m a k , J . E . S p r u i e l l , a n d J . L . W h i t e , P o l y m . Eng.S c i . , 24., 1 3 9 0 ( 1 9 8 4 )
1 6 7 K . J . C h o i , J . L . W h i t e , a n d J . E . S p r u i e l l , J. A p p l .P o l y m . S c i . , 2 3 , 2 7 7 7 ( 1 9 8 0 )
1 6 8 Y . S h i m a m u r a , J . E . S p r u i e l l , J . L . W h i t e , J. A p p l . P o l y m . S c i . , 2 2 , 2 6 6 3 ( 1 9 8 2 )
1 6 9 M. C a k m a k , J . L . W h i t e , J . E . S p r u i e l l , J. P o l ym .Eng., 3, 2 9 1 ( 1 9 8 6 )
1 7 0 E . M a e m u r a , M. C a k m a k , J . L . W h i t e , P o l y m . Eng. S c i . , 2 2 , 1 4 0 ( 1 9 8 9 )
Reproduced with permission of the copyright owner. Further reproduction prohibited without permission.
484
1 7 1 H . J . K a n g , J . L . W h i t e , M. C a k m a k , Int. Polym.Process. , 5 . , 6 2 ( 1 9 9 0 )
1 7 2 H . J . K a n g , J . L . W h i t e , Polym. Eng. Sci., 3 3 , 1 2 2 8( 1 9 9 0 )
1 7 3 J . L . W h i t e a n d A . A g a r w a l , Polym. Eng. Rev. 1 , 2 6 7( 1 9 8 1 )
1 7 4 S . G . A d v a n i a n d C . L . T u c k e r I I I , J. Rheol., 2 1 , 7 5 1( 1 9 8 7 )
1 7 5 S . H . Me G e e a n d R . L . Me C u l l o u g h , J . A p p l . Phys., 53.,1 3 9 4 ( 1 9 8 4 )
1 7 6 M. K a k u d o a n d N . K a s a i , " X - r a y D i f f r a c t i o n b y
P o l y m e r s , " K o d a n s h a L t d . , T o k y o ( 1 9 7 2 )
1 7 7 A . W. H u l l , J. Am. Chem. Soc., 1 1 , 1 1 6 8 ( 1 9 1 9 )
1 7 8 L . C l a r k a n d D . H . R e y n o l d s , Anal. Chem., 3, 3 6 ( 1 9 3 6 )
1 7 9 T . G r o s s a n d D . E . M a r t i n , Anal. Chem., 1 £ , 9 5 ( 1 9 4 4 )
1 8 0 A . T a y l o r , Phil. Mag., 2 2 ( s e r . 7 ) , 6 3 2 ( 1 9 4 4 )
1 8 1 G . W. B r i n d l e y , Phil. Mag., 3 3 ( 7 ) , 3 4 7 ( 1 9 4 5 )
1 8 2 L . E . A l e x a n d e r , H . P . K l u g , Anal. Chem., 2 3 , 8 8 6( 1 9 4 8 )
1 8 3 G . L . C l a r k a n d H . C . T e r f o r d , Anal. Chem., 22.(6),8 8 8 ( 1 9 5 5 )
1 8 4 D . H . L e n n o x , Anal. Chem., 2 9 ( 5 ) . 7 6 6 ( 1 9 5 7 )
1 8 5 L . E . C o p e l a n d a n d R . H . B r a g g , Anal. Chem., 3 3 , 1 9 6( 1 9 5 8 )
1 8 6 L . E . C o p e l a n d , S . B r u n a u e r , D . L K a n t r o , E . G .S c h u l t z a n d C . H . W e i s e , Anal. Chem., 2 1 ( 9 ) , 1 5 2 1( 1 9 5 9 )
R eproduced with permission of the copyright owner. Further reproduction prohibited without permission.

4851 8 7 I . C . J a h a n b a g l o o , T . Z o l t a i , A n a l . Che w. , 412(11),
1 7 3 9 ( 1 9 6 8 )
1 8 8 L . E A l e x a n d e r , " X - r a y D i f f r a c t i o n M e t h o d s i n P o l y m e r S c i e n c e , W i l e y " , N e w Y o r k ( 1 9 6 9)
1 8 9 H . P . K l u g a n d L . E . A l e x a n d e r , " X - r a y D i f f r a c t i o n P r o c e d u r e s , " W i l e y - I n t e r s c i e n c e , N e w Y o r k ( 1 9 7 4 )
1 9 0 R . J . S a m u e l s , " S t r u c t u r e d P o l y m e r P r o p e r t i e s , " W i l e y - I n t e r s c i e n c e , N e w Y o r k ( 1 9 7 4 )
1 9 1 F . W e b e r , Z. P h y s i k , 2 2 , 6 9 ( 1 9 2 4 )
1 9 2 W. A . S i s s o n , J . P h y s . Chem. 4 2 , 3 4 3 ( 1 9 3 6 )
1 9 3 B . F . D e c k e r , E . T . A s p , a n d D . H a r k e r , J . A p p l .P h y s . , 1 2 , 3 8 8 ( 1 9 4 8 )
1 9 4 C . J . H e f f e l f i n g e r a n d R . L . B u r t o n , J . P o l y m .S c i . , 4 7 , 2 8 9 ( 1 9 6 0 )
1 9 5 C . R . D e s p e r , J . A p p l . P o l y m . S c i . , 1 2 , 1 6 9 ( 1 9 6 9 )
1 9 6 W. F . M a d d a m s a n d J . E . P r e e d y , J . A p p l . P o l y m . S c i . ,2 2 , 2 7 2 1 ( 1 9 7 8 )
1 9 7 E . M o r a l e s a n d J . R . W h i t e , J . M a t e r . S c i . , 2 2 , 3 6 1 2( 1 9 8 8 )
1 9 8 Z . C h e n , M. C . F i n e t , K . L i d d e l l , D . P . T h o m p s o n , a n d
J . R . W h i t e , J . A p p l . P o l y m . S c i . , 4 2 , 1 4 2 9 ( 1 9 9 2 )
1 9 9 Z . W. W i l c h i n s k y , J . A p p l . P h y s . , 2 2 / 7 9 2 ( 1 9 5 9 )
2 0 0 Z . W. W i l c h i n s k y , A d v . X R a y A n a l . , 2 , 2 3 1 ( 1 9 6 2 )
2 0 1 Z . W. W i l c h i n s k y , J . A p p l . P h y s . , 2 1 , 1 9 6 9 ( 1 9 6 0 )
2 0 2 J . I . G o l d s t e i n , D . E . N e w b u r y , e t a l . , " S c a n n i n gE l e c t r o n M i c r o s c o p y a n d X - r a y " , M i c r o a n a l y s i s 2 n d e d . ( 1 9 9 2 ) , P l e n u m p r e s s , N e w Y o r k a n d L o n d o n
2 0 3 H . B u s c h , Ann. P h y s . , 2 1 , 9 7 4 ( 1 9 2 6 )
Reproduced with permission of the copyright owner. Further reproduction prohibited without permission.

486
2 0 4 M. K n o l l , Z. T e c h . P h y s . , 1 1 , 4 6 7 ( 1 9 3 5 )
2 0 5 V . K. Z w o r y k i n , J . H i l l e r , a n d R . L . S n y d e r , ASTM B u l l . , 112, 1 5 ( 1 9 4 2 )
2 0 6 K . C . A . S m i t h , P h . D . D i s s e r t a t i o n , C a m b r i d g e
U n i v e r s i t y ( 1 9 5 6 )
2 0 7 R . F i t z g e r a l d , K . K e i l , a n d K. F . J . H e i n r i c h ,S c i e n c e , 1 5 2 , 5 2 8 ( 1 9 6 8 )
2 0 8 J . L . E r i c k s e n , T r a n s . S o c . R h e o l . , A , 2 9 ( 1 9 6 0 )
2 0 9 J . L . E r i c k s e n , T r a n s . S o c . R h e o l . , £ , 2 7 5 ( 1 9 6 2 )
2 1 0 J . L . E r i c k s e n , A r c h . R a t i . Mech. A n a l . , A, 2 3 1 ( 1 9 5 9 )
2 1 1 J . L . E r i c k s e n , K o l l o i d Z . , 1 7 3 , 1 1 7 ( 1 9 6 0 )
2 1 2 J . L . E r i c k s e n , J . P o l y m . S c i . , A l , 3 2 7 ( 1 9 6 0 )
2 1 3 J . L . E r i c k s e n , A r c h . R a t i . Mech. A n a l . , £ , 1 ( 1 9 6 1 )
2 1 4 J . L . E r i c k s e n , I n t . J . Eng. S c i . , 1 , 1 5 7 ( 1 9 6 3 )
2 1 5 G . L . H a n d , J . F l u i d M e c h . , 1 2 , 3 3 ( 1 9 6 2 )
2 1 6 A . E . G r e e n , P r o c . Camb. P h i l . S o c . , £ £ , 1 2 3 ( 1 9 6 4 )
2 1 7 A . E . G r e e n , P r o c . R o y . S o c . , A 2 7 9 , 4 3 7 ( 1 9 6 4 )
2 1 8 A . E . G r e e n , M a t h e m a t i k a , 12., 2 7 ( 1 9 6 5 )
2 1 9 R . S . R i v l i n , J . R a t . Mech. A n a l . , A, 6 8 1 ( 1 9 5 5 )
2 2 0 T . S c h w e d o f f , J . P h y s . , 2 , 3 4 ( 1 8 9 0 )
2 2 1 E . C . B i n g h a m , J . Wash. A c a d . S c i . , £ , 1 7 7 ( 1 9 1 6 ) ; " F l u i d i t y a n d P l a s t i c i t y " , Me G r a w H i l l , N e w Y o r k , 1 9 2 2
2 2 2 E . B u c k i n g h a m , P r o c . ASTM, 2 1 , 1 1 5 4 ( 1 9 2 1 )
Reproduced with permission of the copyright owner. Further reproduction prohibited without permission.

4872 2 3 K . H o h e n e m s e r a n d W. P r a g e r , Z. Ange w. M a t h . M e c h . ,
1 2 , 2 1 6 ( 1 9 3 2 )
2 2 4 R . H i l l , " T h e M a t h e m a t i c a l T h e o r y o f P l a s t i c i t y " ,O x f o r d U n i v e r s i t y , O x f o r d , 1 9 5 0
2 2 5 W. P r a g e r , " T h e o r y o f P e r f e c t l y P l a s t i c S o l i d s " , W i l e y ,
NY ( 1 9 5 1 )
2 2 6 W. P r a g e r , " I n t r o d u c t i o n t o M e c h a n i c s o f C o n t i n u a " , G i n n , B o s t o n ( 1 9 6 1 )
2 2 7 J . G . O l d r o y d , P r o c . Camb. P h i l . S o c . , 2 2 , 1 0 0( 1 9 4 7 )
2 2 8 J . G . O l d r o y d , P r o c . Camb. P h i l . S o c . , 22., 5 9 5( 1 9 4 9 )
2 2 9 A . S l i b a r a n d P . R . P a s l e y , i n " S e c o n d O r d e r E f f e c t s i n E l a s t i c i t y , P l a s t i c i t y a n d F l u i d D y n a m i c s " , M. R e i n e r a n d D . A b i r , E d s . , M a c M i l l a n , New Y o r k , 1 9 6 4
2 3 0 J . L . W h i t e a n d H . T a n a k a , J. N o n - N e w t o n i a n F l u i d M e c h . , 5., I l l ( 1 9 7 9 )
2 3 1 J . L . W h i t e , J. N o n - N e w t o n i a n F l u i d M e c h . , 2, 1 7 7( 1 9 7 9 )
2 3 2 J . L . W h i t e a n d H . T a n a k a , J. N o n - N e w t o n i a n F l u i d M e c h . , £ , 1 ( 1 9 8 1 )
2 3 3 J . L . W h i t e a n d V . M. L o b e , R h e o l . A c t a , 2 2 , 1 6 7 ( 1 9 8 2 )
2 3 4 S . M o n t e s a n d J . L . W h i t e , K a u t s c h u k Gummi K u n s t s t o f f e , 4 2 , 9 3 7 ( 1 9 9 1 )
2 3 5 S . M o n t e s a n d J . L . W h i t e , J. N o n - N e w t o n i a n F l u i d M e c h . , ± 2 , 2 7 7 ( 1 9 9 3 )
2 3 6 R . v o n M i s e s , G o t t i n g e r N a c h r i c h t e n , M a t h . - p h y s .K l a s s e , 5 8 2 ( 1 9 1 3 )
2 3 7 R . v o n M i s e s , Z. Angew. M a t h . M e c h . , 2, 1 6 1 ( 1 9 2 8 )
with permission of the copyright owner. Further reproduction prohibited without permission.

2 3 8
2 3 9
2 4 0
2 4 1
2 4 2
2 4 3
2 4 4
2 4 5
2 4 6
2 4 7
2 4 8
2 4 9
2 5 0
2 5 1
2 5 2
488R . H i l l , P r o c . R o y . S o c . L o n d o n , A 1 H 1 , 2 8 1 ( 1 9 4 8 )
R . H i l l , P r o c . R o y . S o c . L o n d o n , A 1 9 8 . 4 2 8 ( 1 9 4 9 )
J . L . W h i t e a n d C . H . S u h , J. N o n - N e w t o n i a n F l u i d M e c h . , £ £ , 1 5 ( 1 9 9 7 )
A . E . H . L o v e , " A T r e a t i e s o n t h e M a t h m a t i c a l T h e o t y o f E l a s t i c i t y " , 4 t h E d . , C a m b r i d g e U n i v . P r e s s ,
C a m b r i d g e ( 1 9 2 7 )
A . E . G r e e n a n d W. Z e r n a , " T h e o r e t i c a l E l a s t i c i t y " , 2 n d E d . , O x f o r d U n i v . P r e s s , O x f o r d ( 1 9 6 5 )
A . J . M. S p e n c e r , " C o n t i n u u m P h y s . " , 1 , A . C .E r i n g e n , e d . , A c a d e m i c P r e s s , O r l a n d o , F l a ( 1 9 7 1 ) .
A . J . M. S p e n c e r , " D e f o r m a t i o n s o f f i b e r - r e i n f o r c e d m a t e r i a l s " , C l a r e n d o n P r e s s , O x f o r d , E n g l a n d ( 1 9 7 2 ) .
A . J . M. S p e n c e r , " C o n s t i t u t i v e t h e o r y f o r s t r o n g l y
a n i s o t r o p i c s o l i d s " , " C o n t i n u u m t h e o r y o f f i b e r -
r e i n f o r c e d c o m p o s i t e s " , S p r i n g e r - V e r l a g , N e w Y o r k , N .Y . ( 1 9 8 4 )
D . N . R o b i n s o n , N u c l . E n e r g . D e s . , H I , 1 2 3 ( 1 9 8 4 )
D . N . R o b i n s o n , a n d R . W. S w i n d e m a n , O a k R i d g eN a t l . L a b . R e p . O R N L / T M - 8 4 4 4 ( 1 9 8 2 )
D . N . R o b i n s o n , S . F . D u f f y , a n d J . R . E l l i s , ASME-PVP,1 2 3 . 4 9 ( 1 9 8 7 )
D . N . R o b i n s o n a n d S . F . D u f f y , J. E n g r g . M e c h . , UL£, 8 3 2 ( 1 9 9 0 )
D . N . R o b i n s o n , W. K . B i n i e n d a a n d M. M i t i - K a v u m a ,J. E n g r g . M e c h . , l i a , 1 6 4 6 ( 1 9 9 2 )
D . N . R o b i n s o n a n d M. S . P a s t o r , C o m p o s i t e s E n g i n e e r i n g , 2. , 2 2 9 ( 1 9 9 3 )
D . N . R o b i n s o n a n d W. W e i , J. E n g r g . Mech. ,122. , 8 6 6 ( 1 9 9 6 )
with permission of the copyright owner. Further reproduction prohibited without permission.

489
2 5 3 D . P . H o f f m a n n , A . P r o c t o r , M. F a y , D . M. H e r c u l e s * ,
A n a l . C h e m . , £1 , 1 6 8 6 ( 1 9 8 9 )
2 5 4 R . D . A r n e l l , J . I r o n S t e e l I n s t . , 2 0 6 . 1 0 3 5 ( 1 9 6 8 )
2 5 5 J . D u r n i n a n d K . A . R i d a l , J . I r o n S t e e l I n s t . , 2 0 6 . 6 0
( 1 9 6 8 )
2 5 6 M. J . D i c k s o n , J . A p p l . C r i s t a l l o g r . , 2, 1 7 6 ( 1 9 6 9 )
2 5 7 T . A r a k i a n d J . L . W h i t e , P o l y m . Eng. S c i . , ( i n p r e s s ) N i h o n R e o r o j i G a k k a i s h i , 2 3 , 1 2 5 ( 1 9 9 7 )
2 5 8 N . B r o w n , R . A . D u c k e t t , a n d I . M. W a r d , P h i l . Mag. ,1 8 . 4 8 3 ( 1 9 6 8 )
2 5 9 C . B r i d l e , A . B u c k l e y , a n d J . S c a n l a n , J . M a t e r . S c i . , 1, 6 2 2 ( 1 9 6 8 )
2 6 0 J . G . R i d e r a n d E . H a n a n e a v e s , J . P o l y m . S c i . : A - 2 , 7 ,
8 2 9 ( 1 9 6 9 )
2 6 1 M. C o o k , J . I n s t . M e t a l s . , £ 0 . / 1 5 9 ( 1 9 3 7 )
2 6 2 W. P . C o x a n d E . H . M e r z , J . P o l y m . S c i . , 2 3 , 6 1 9( 1 9 5 8 )
2 6 3 Y . I d e a n d J . L . W h i t e , J . A p p l . P o l y m . S c i . , 22, 1 0 6 7
( 1 9 7 8 )
2 6 4 H . M u n s t e d t , R h e o l . A c t a , 14., 1 0 7 7 ( 1 9 7 5 ) ; J . R h e o l . ,2 3 , 4 2 1 ( 1 9 7 9 )
2 6 5 J . M e i s s n e r , R h e o l . A c t a , U 2 , 2 3 0 ( 1 9 7 1 )
2 6 6 G . V . V i n o g r a d o v , V . D . F i k h a m , B . V . R a d u s h k e v i c h , a n dA . Y . M a l k i n , J . P o l y m . S c i . , A - 2 ( 8 ) , 1 ( 1 9 7 0 )
2 6 7 G . V . V i n o g r a d o v , A . Y . M a l k i n , E . P . P l o t n i k o v a , 0 . Y .S a b s a i , a n d N . E . N i k o l a y e v a , I n t . J . P o l y m . M a t e r . , 2 ,1 ( 1 9 7 0 )
2 6 8 F . T . T r o u t o n , P r o c . Roy . S o c . , A l l . 4 2 6 ( 1 9 0 6 )
R eproduced with permission of the copyright owner. Further reproduction prohibited without permission.

490
2 6 9 E . B . B a g l e y , J. Appl. Phys., 2 3 , 6 2 4 ( 1 9 5 7 )
2 7 0 L i L i L i M a s t e r T h e s i s ' E f f e c t s o f P a r t i c u l a t eF i l l e r T y p e , S i z e , a n d S u r f a c e T r e a t m e n t o n R h e o l o g i c a l B e h a v i o r o f F i l l e d R u b b e r C o m p o u n d s ' U . A k r o n , 1 9 9 5
2 7 1 L . L . L i a n d J . L . W h i t e , Rubber Chem. Technol. , 6 9 .6 2 8 ( 1 9 9 6 )
2 7 2 H . T a n a k a a n d J . L . W h i t e , Polym. Eng. Sci., 23., 9 4 9( 1 9 8 0 )
2 7 3 M. S . B o a i r a a n d C . E . C h a f f e y , Polym. Eng. Sci., 1 7 , 7 1 5 ( 1 9 7 7 )
2 7 4 N . N a k a j i m a a n d E . A . C o l l i n s , Rubber Chem. Technol., ! £ , 6 1 5 ( 1 9 7 5 )
2 7 5 N . N a k a j i m a , H . H . B o w e r m a n , a n d E . A . C o l l i n s , J.Appl. Polym. Sci., 21, 3 0 6 3 ( 1 9 7 7 )
2 7 6 K . J . K i m a n d J . L . W h i t e , J. Non-Newtonian Fluid Mech., 3 3 , 2 5 7 ( 1 9 9 6 )
2 7 7 F . N . C o g s w e l l , Plast. Polym., 23., 1 0 9 ( 1 9 6 8 )
2 7 8 F . N . C o g s w e l l , Rheol. Acta, i l , 1 8 7 ( 1 9 6 9 )
2 7 9 Y . I d e a n d J . L . W h i t e , J. Appl. Polym. Sci., 1 2 . , 2 9 9 7( 1 9 7 4 )
2 8 0 B . R a b i n o w i t c h , Z. Phys. Chem., A 1 4 5 . 1 ( 1 9 2 9 )
2 8 1 R . E i s e n s c h i t z , B . R a b i n o w i t c h , a n d K . W e i s s e n b e r g ,Mitt, deutch. Materialprulf. Sonderh., 3 , 9 ( 1 9 2 9 )
2 8 2 R . E i s e n s c h i t z , Kolloid Z., 33, 1 8 4 ( 1 9 9 3 )
2 8 3 H . Y a m a n e a n d J . L . W h i t e , Polym. Eng. Rev., 2 , 1 6 7( 1 9 8 2 )
2 8 4 J . L . W h i t e , " P r i n c i p l e s o f P o l y m e r E n g i n e e r i n g R h e o l o g y " , W i l e y I n t e r - S c i e n c e , N e w Y o r k , 1 9 9 0
R eproduced with permission of the copyright owner. Further reproduction prohibited without permission.

491
2 8 5 J . M. D e a l y , " R h e o m e t e r s f o r M o l t e n P l a s t i c s " , N o s t r a n d R e i n h o l d , N e w Y o r k , 1 9 8 2
2 8 6 E . L . M c M i l l e n , J. Rheology, 2., 1 7 9 ( 1 9 3 2 )
2 8 7 W. N o l l , J. Rat. Mech. Anal., 4 . , 3 ( 1 9 5 5 )
V a n
R eproduced with permission of the copyright owner. Further reproduction prohibited without permission.

IMAGE EVALUATIONTEST TARGET (Q A -3 )
150mm
IIVMGE. Inc1653 East Main Street Rochester, NY 14609 USA Phone: 716/462-0300 Fax: 716/288-5989
C 1993. Applied Image. Inc.. Ail Rights Reserved
R eproduced with permission of the copyright owner. Further reproduction prohibited without permission.


![f]k~rjifL{o /0fgLlts of]h gf kl/b[io -Vision_ sfg"gL zf;gsf]](https://static.fdokumen.com/doc/165x107/631ebd761aedb9cd850fe4fe/fkrjiflo-0fgllts-ofh-gf-klbio-vision-sfggl-zfgsf.jpg)