BUNBURY HARBOUR CITY REDEVELOPMENT Rezoning ...
270
LRARY ENVJRONMETL PROTECTJON AUTHORITy WSTRALIA SQUARE 38 MOUNTS BAY ROAD, PERTH BUNBURY HARBOUR CITY REDEVELOPMENT Rezoning and Marina Complex Public Environmental Review Appendices SOUTH WEST DEVELOPMENT AUTHORITY August 1992 627.21 :797.1(94 UIIIIUIIIIUIM III I IllhI IllH I MIUII 1) WES 92051 8/2 Copy A Vol 2 Department of Environmental Protection Library
-
Upload
khangminh22 -
Category
Documents
-
view
0 -
download
0
Transcript of BUNBURY HARBOUR CITY REDEVELOPMENT Rezoning ...

LRARY ENVJRONMETL PROTECTJON AUTHORITy
WSTRALIA SQUARE 38 MOUNTS BAY ROAD, PERTH
BUNBURY HARBOUR CITY REDEVELOPMENT
Rezoning and Marina Complex
Public Environmental Review
Appendices
SOUTH WEST DEVELOPMENT AUTHORITY
August 1992
627.21 :797.1(94
UIIIIUIIIIUIM III I IllhI IllH I MIUII 1) WES 92051 8/2 Copy A Vol 2
Department of Environmental Protection Library

LMY VON!!P'TL r 71N AT!OT1
:- r 38 MU' RTH
BUNBURY HARBOUR CITY REDEVELOPMENT
Rezoning and
Marina Complex
Public Environmental Review
Appendices
Prepared by: Waterways Commission Jardine House 184 St Georges Terrace Perth WA 6000 Ph (09) 321 8677
Prepared for: South West Development Authority Bunbury Tower 61 Victoria Street Bunbury WA 6230 Ph (097) 212 355
August 1992

PREFACE The South West Development Authority proposes to develop an area of land in central Bunbury for tourist/recreational, commercial and residential purposes. Development will be in accordance with the recently prepared Bunbury Harbour City Redevelopment Plan and coordinated by the Bunbury Harbour City Development Implementation Committee.
To enable the implementation of the redevelopment plan an amendment to the City of Bunbury Town Planning Scheme No. 6 is required.
A Public Environmental Review (PER) has been prepared by the South West Development Authority to examine the environmental impacts associated with the proposed rezoning and the construction of a Marina Complex in Casuarina Harbour.
This document accompanies the PER document as a collection of appendices. The appendices contain technical information used in identification of environmental impacts and development of the PER. The appendices were prepared by a number of consultants with expertise in specific subject areas.

TABLE OF CONTENTS
Appendix 1 Industrial Risk Analysis
Appendix 2 Surface and Groundwater Study
Appendix 3 Biological and Physical Characteristics
Appendix 4 Historical Study
Appendix 5 Coastal Processes and Shoreline Stability

Appendix 1
Industrial Risk Analysis
Note: An Executive Summary of the Industrial Risk Analysis conducted is provided overleaf. This provided details of all industrial risks and hazards associated with the proposed Bunbury Harbour City Redevelopment proposal. The confidential nature of the study conducted prevents the publishing of the entire report.

Industrial Q) Risk Management
WATERWAYS COMMISSION
RISK ANALYSIS
OF THE
BUNBURY HARBOUR CITY DEVELOPMENT
EXECUTIVE SUMMARY
690548
DECEMBER, 1990
INDUSTRIAL RISK MANAGEMENT PlY LIMITED A.C.N. 006 495 709
SYDNEY
18-24 Chandos Street
St Leonards
NSW 2065
Tel 61-2-4374200
Fax 612-9063023
61-2-4384179
PERTH
1 SI Floor. Strategy I-louSe
661 NewcaStle Street
Leederville
WA 6007
Tel 61-9-22/8533
Fax 61-9-2278567
MELBOURNE
27 Flindem Lane
Melbourne
vlC 3000
Tel 61-3-6535529
Fax 61-3-6501490
HONG KONG
Suites 1201-3 Dah Sing Financial Centre
108 GlouceSter Road
Wancha', Hong Kong
Tel 852-5988131
Fax 852-5985201
SAN FRANCISCO
Suite 2110 Four Embarcadero Center
CA 94111
Tel 1-415-9565834
Fax 1-4159561186

EXECUTIVE SUMMARY
The risk analysis of the industry surrounding the Bunbury Outer Harbour and the
Leschenault Inlet has been carried Out by Industrial Risk Management Pty Limited to
determine the level of risk in the Bunbury Harbour Development Area. The risk
analysis was commissioned by the Waterways Commission to provide guidelines on
the following:
To enable the authority to determine the levels of development potential at the
present time;
To enable the authority to determine the potential for development if industry
is removed from the study area in stages.
The analysis provides a preliminary assessment of the major hazards present within
the harbour area that would have the potential to affect public safety beyond the
industrial site boundaries.
Well established hazard analysis techniques were used to:
identify potential hazards;
identify incidents that could lead to accidental release of hazardous material
to the environment;
estimate the magnitude of the associated consequences of those incidents;
estimate the frequency at which the incidents could occur;
estimate the resultant levels of risk and to generate cumulative risk contours
based upon study results.
Inspection of the study area revealed the following potential hazards to the planned
development:
Oil Storage Terminals of BP Australia, BP Distributor, Shell and Caltex;
yh690548 Bunbury Waterways Commission - Risk & Hazard Analysis I

.4
V I *A.10
Rail transport of petroleum products to the terminal of Caltex and distribution
from the BP Terminal;
Road transport of petroleum products from the terminals;
Cross country pipeline (underground) transporting petroleum products from the
inner harbour to BP Terminal;
Road transport of methanol from the storage facility in the northern end of the
outer harbour to Dymo Industries
Occasional loading and transportation of ammonium nitrate through the outer
harbour.
No other hazardous industry or large storage of hazardous goods was identified.
The risk contours developed for the Bunbury Harbour area are shown in Map Al.
The main potential hazards identified were those associated with the transport and
storage of petroleum products: particularly the oil terminals, the petroleum products
pipeline and the rail transport of petroleum products to and from the terminals. The
methanol storage facility located within the outer harbour was found not to influence
the study area in terms of industrial risk.
From the risk contours (Map Al) it can be seen that the oil terminals located in the
vicinity of the outer harbour (BP Australia, BP Distributor, Caltex and Shell) do have
an impact on the study area and will restrict development on the south side of the
outer harbour. To minimise the impact of industrial risk the development should be
set back from the identified risk contours associated with the oil terminals (Refer Map
Al) until those risks are removed to the satisfaction of the EPA.
The EPA has established guidelines (Bulletin 611) for the fatality risk acceptability
of new industrial installations as follows:
A risk level in residential zones of one in a million per year or less, is so
small as to be acceptable to the Environmental Protection Authority.
yh690548 Bunbury Waterways Commission - Risk & Hazard Analysis 2

A risk level in "sensitive developments", such as hospitals, schools, child care
facilities and aged care housing developments of between one half and one in
a million per year is so small as to be acceptable to the Environmental
Protection Authority.
Risk levels from industrial facilities should not exceed a target of fifty in a
million per year at the site boundary for each individual industry, and the
cumulative risk level imposed upon an industry should not exceed a target of
one hundred in a million per year.
A risk level for any non-industrial activity located in buffer zones between
industrial facilities and residential zones of ten in a million per year or lower,
is so small as to be acceptable to the Environmental Protection Authority.
Therefore on the basis of the preliminary risk assessment and provided that the
development is restricted to areas where the individual risk levels are within the
guidelines, the development of the harbour area should be acceptable to the EPA, with
regard to risk criteria.
Rail traffic of petroleum products presents an additional risk to the development in
areas close to the route indicated in Map A2 and effectively compromises any
proposed development around the wooden jetty and the area to the south of the jetty.
The risk associated with the rail lines is expected to be reduced in the near future as
BP intends to cease distribution but the main traffic flow to Caltex will remain.
Removal of the rail lines in conjunction with the relocation of the oil terminals is
planned. The removal will increase considerably the area available for development.
Development in close proximity to the rail lines should not occur until their
removal is complete.
yh'690548 Bunbury Waterways Commission - Risk & Hazard Analysis 3
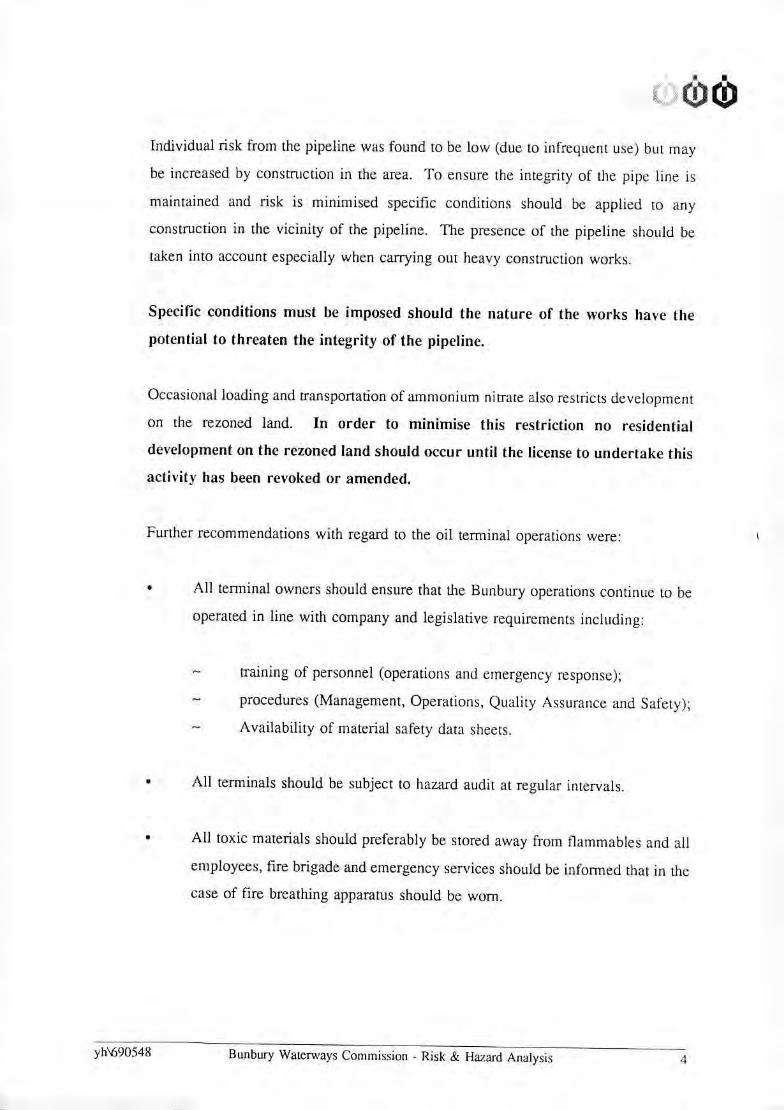
Individual risk from the pipeline was found to be low (due to infrequent use) but may
be increased by construction in the area. To ensure the integrity of the pipe line is
maintained and risk is minimised specific conditions should be applied to any
construction in the vicinity of the pipeline. The presence of the pipeline should be
taken into account especially when carrying out heavy construction works.
Specific conditions must be imposed should the nature of the works have the
potential to threaten the integrity of the pipeline.
Occasional loading and transportation of ammonium nitrate also restricts development
on the rezoned land. In order to minimise this restriction no residential
development on the rezoned land should occur until the license to undertake this
activity has been revoked or amended.
Further recommendations with regard to the oil terminal operations were:
All terminal owners should ensure that the Bunbury operations continue to be
operated in line with company and legislative requirements including:
training of personnel (operations and emergency response);
procedures (Management, Operations, Quality Assurance and Safety);
Availability of material safety data sheets.
All terminals should be subject to hazard audit at regular intervals.
All toxic materials should preferably be stored away from flammables and all
employees, fire brigade and emergency services should be informed that in the
case of fire breathing apparatus should be worn.
yh\690548 Bunbury Waterways Commission - Risk & Hazard Ana'ysis 4

The preliminary risk assessment also noted that investigation of owners, operators and
local emergency services indicated that in the many years of operation of the oil
terminals no serious incidents have occurred.
Contour map overleaf (Map Al).
yh690548 Bunbury Waterways Commission - Risk & Hazard Analysis 5

MAP A I HAZARDS AND RISK CONTOURS McKenraPomt
INDIAN 10-' OCEAN 09
GEOGRAPHE BLJNBLIRY
OUTER BAY HARBOUR
KOOMBANA
CASUARINA
Potnt Ca,uanna HARBOUR BAY
10-4
4
10-4
250 500m
1•0-• 0-
jQ.4
cli,ftm St
ulz

MAP A2 10-6
HAZARDS OVERVIEW
BUBURY JETTY KOOMBANA
HARBOUR
CASUARJNA
HARBOUR INDIAN
OCEAN
10
•' rve - - - -.•. - - -
LESCHENAULT INLET Legend
BP Pipeline Route
- - - Rail Route
Hazards with Risk Contours 250 500m
BUNBURY
TOWNSITE 10-6

Appendix 2
Surface and Groundwater Study

WATERWAYS COMMISSION
2383/1
MARCH 1991
BUNBURY HARBOUR CITY
PUBLIC ENVIRONMENTAL REVIEW
SURFACE AND GROUNDWATER STUDY
AGC Woodward-Clyde

C Mr WoodwardClyde Ply Limited 300 Albany Highway AGC Woodward-lyde Victoria Park Western Australia. 6100 Telephone: (09) 362 4322 Facsimile: (09) 361 4872
vp:tm:2383/ 1
20 March 1991
Waterways Commission 184 St. George's Terrace PERTH WA 6000
Attention: Mr C Chalmers
Dear Sir
BUNBURY HARBOUR CITY
PUBLIC ENVIRONMENTAL REVIEW
SURFACE AND GROUNDWATER STUDY
Please find attached our report on the surface andgroundwater study for the Bunbury Harbour City Development. If we can be of further assistance, please contact Mr Vince Piper.
Yours faithfully AGC Woodward-Clyde
1Senior Principal
enc.
V PIPER Supervising Civil Engineer
j\i. iIrr \i'.':isln iiiit F iiviiiiiiiylOiil 13()iiSijlldiits
()tlii;ti; ii(4tiiir Fiils;it);il(itiia; (tric: ui NI '/

AGC Woodward*Clyde
CONTENTS
I INTRODUCTION
1
2 EXISTING SURFACE WATER DRAINAGE CHARACTERISTICS 2
2.1 Introduction 2 2.2 Drainage Patterns 2 2.3 Drainage Water Quality 4
3 EXISTING GROUNDWATER ENVIRONMENT 6
3.1 Hydrogeology 6 3.2 Groundwater Movement 7 3.3 Groundwater Quality 8
4 POTENTIAL IMPACTS OF THE DEVELOPMENT UPON SURFACE WATER DRAINAGE 9
4.1 Drainage Patterns 9 4.2 Water Quality 9
5 POTENTIAL IMPACTS OF THE DEVELOPMENT ON THE GROUNDWATER ENVIRONMENT 11
6 RECOMMENDEI) GROUNDWATER MONITORING 13

0 AGC Woodward-Clyde e
INTROI)UCTION
The Bunbury Harbour City Plan was initiated by the City of Bunbury and the
South West Development Authority. The design concept reflects
development opportunities and the preferred alternative use of land in and
around the Port. Envisaged activities include recreation, boating, tourism,
residential and commercial developments.
The project area requires rezoning under the Bunbury Town Planning
Scheme and consequently EPA has determined that formal assessment of the
project is required. The level of assessment has been set at Public
Environmental Review (PER).
AGC Woodward-Clyde was commissioned in September 1990 to report on
the surface and groundwater aspects of the proposed development. In
particular the study was to:
Define surface and groundwater drainage into and within the
area covered by the PER.
Identif' any impacts associated with the proposed Bunbury
Harbour City development upon surface and groundwater
flows and quality.
Identify any existing bores which may be used for groundwater
sampling purposes.
The impact of the surface and groundwater flows and quality upon the
harbour waterways is not addressed by this report.
It is intended that this summary report forms an appendix to the PER
document.
- 1 -

La AGC Woodward-Clyde w
2 EXISTING SURFACE WATER DRAINAGE CHARACTERI STI CS
2.1 Introduction
The Bunbury region has a Mediterranean type climate with hot dry summers
and cool wet winters. The average annual rainfall recorded at Bunhury Post
Office, over 108 years, is 871 mm. The mean annual evaporation recorded at
the Wokalup Research Station (Harvey), over 19 years, is 1 800 mm.
Evaporation exceeds rainfall over eight months of the year.
Surface water flows within the study area (excluding estuary areas) are as a
response to rainfall and, as such, predominantly occur during the winter months.
The PER study area has been divided in four zones (I to IV) to facilitate the
surface water drainage characterisations. An additional two ZOOCS (V and VI) have been defined for the areas adjacent to the PER study area. These zonings are shown on Figure 1.
2.2 Drainage Patterns
Existing development along the Point Casuarina breakwater (Zone I)
includes ilmenite storage facilities, methanol storage tanks, harbour berth
facilities, fishing fleet facilities and associated services infrastructure. A
piped surface water drainage system has been installed through the main
development area which discharges into the harbour. However, this piped
system tends to he ineffective due to complete l)lOCkage by spilled ilmenite.
Surface water drainage along the whole breakwater area is typically achieved
by seepage into available pervious areas, by surface runoff into the harbour,
by direct evaporation, or by a combination of the above.
-2-

AGC Woodward-Clyde
The harbour and Koombana Bay foreshore area (Zone H) is a relatively flat
area containing Bunbury Port Authorities buildings, wheat storage facilities,
railway yards, recreational facilities and open space. Most of this area is
under the jurisdiction of the Port Authority. Apart from a drainage pipe
installed to discharge surface water from a small portion of the developed
area into the boat harbour (Figure 1), the area is without a formal drainage
system. Surface drainage waters would typically runoff from impervious
areas onto the pervious areas for infiltration into the sandy subsoils. In some
instances runoff would be directly into the harbour or bay.
Surface drainage waters from the areas containing the fuel storage depots
and the wastewater treatment plant (Zone III) are typically contained within
the individual sites. Drainage waters from the bulk fuel handling areas are
intercepted and discharged via oil separators to drainage sumps for disposal
by infiltration and evaporation. General drainage from the fuel depot yards
and from the wastewater treatment plant is collected into drainage sumps to
prevent site runoff. Much of the development within Zone III is terraced
into the north side of Marlston Hill. It is possible that during extreme rainfall
events runoff may occur from these areas.
Drainage from around the southern side of the PER study area (Zone IV)
which includes part of the existing Bunhury city commercial area, has
generally been formalised into a piped drainage system. This drainage
system operates under gravity and discharges into Leschenault Inlet. Existing
pipeline locations in this area are shown on Figure 1.
The area immediately to the south of Leschenault Inlet (Zone V) comprising
predominantly residential development is relatively low lying. Local drainage
from this area is conveyed by a system of pipelines and open channels and is
discharged into Leschenault Inlet via pumping stations. The four pumping
station sites, as shown on Figure 1, are necessary because of the relatively low
land levels as compared with the estuary water levels.
This low lying area has historically been liable to flooding from both ocean
surging into Leschenault Inlet and from Preston River floodwaters. Surge
gates have been installed on Koombana Channel (the entrance to
Leschenault Inlet) which are typically operated 15 to 20 times per year to
-3-

AGC Woodward-Clyde
prevent ocean surges penetrating into the Inlet. Adjacent to the Preston
River, similarly, flood levees have been installed which restrain floodwaters
from inundating these low lying areas. However, this area is still potentially
liable to flooding in the event of failure of these defences.
The area between Koombana Bay and Leschenault Inlet (Zone VI) is
predominantly without residential or commercial developments and, as such,
does not contain extensive pipe drainage systems. Development in the area
includes the power boat club, caravan park, sailing club and public beach.
The general area is underlain by POOUS sand deposits upon which surface
water runoff would not be expected to occur. Impervious roadways and
parking areas are typically drained into the adjacent Inlet or Bay or onto
undeveloped pervious areas. The only main pipe drainage system in this area
is at the power boat club's large carpark where the surface drainage waters
are collected and discharged into Koombana Channel, as indicated on
Figure 1.
2.3 Drainage Water Quality
No surface drainage water quality data is available from the PER study area,
however, water samples have recently been taken for nutrient analysis from
the drains on the residential south side of Leschenault Inlet (Zone V).
Results from this sampling study, undertaken by the Waterways Commission,
should become available over the next few months. Based on data collected
for the Big Swamp drainage study (located 1.5 km south) it is anticipated that
these waters would have low nutrient levels. Additionally, based on this
study, it is anticipated that these waters would have a neutral pH, a total
dissolved solids of approximately 1 000 mg/L and no detectable level of
heavy metals or pesticides.
Common to all zones within the PER study area, surface drainage waters
from roadways, railways and vehicle parking areas may contain traces of
hydrocarbons. Together with this, surface drainage waters from impervious
areas may contain salts accumulated from the maritime environment.
-4-

AGC Woodward-Clyde
All pipe drainage systems contain grids and silt traps to intercept sands, silts
and most litter which have been mobilized by the rainfall-runoff process.
Waste water discharges from air conditioner units (system bleeding) are
known to contain concentrations of chromium and zinc. Surface water runoff
from areas containing air conditioner units (predominently Zones III and IV)
could possibly contain concentrations of chromium and zinc.
All potential hydrocarbon contaminated runoff waters from bulk fuel storage
and handling areas (Zone III) are intercepted and discharged via oil
separators to on-site drainage sumps, as stated earlier. However, it is
possible that some hydrocarbon contaminated surface waters may seep into
the underlying groundwaters.
Associated with the bulk fuel depot activities is the risk of accidential
spillage, within the PER study area, from both rail and road fuel transport
vehicles.
The ilmenite stored within the Point Casuarina breakwater area (Zone 1) is a
rather inert and insoluable substance and not considered a pollution source.
The wheat handling and storage area (Zone III) has been active for over 50
years, however, CBH plan to cease operations there during 1991. The sites
receive wheat by road transport and deliver wheat onto Kwinana by rail
transport. Surface water runoff from the wheat handling areas could possibly
contain nutrients, an elevated BOD and some suspended solids.
-5-

AGC Woodward-Clyde 40
3 EXISTING GROUNDWATER ENVIRONMENT
3.1 Hydrogeology
The study area is located within the southern Perth Basin in the Bunbury
Trough. The geology comprises a predominantly sedimentary sequence of up
to 8 000 m in thickness. Within the study area, a volcanic unit (Bunbury
Basalt) is also present.
The general geologic succession is exhibited by bore GSWA BS3A, located at
the entrance to the power boat club off Koombana Drive, and given below:
Depth Geology
(mbgl)
0 - 5 Safety Bay Sand
5 - 27 Bunbury Basalt
27 - 100 Yarragadee Formation
All depths are given as metres below ground level (mbgl) with ground level
being 1.2 m above AHD.
The Leederville Formation, which stratigraphically lies above the
Yarragadee Formation, is absent beneath the entire study area. A
diagrammatic section showing the positional relationship of the units is given
on Figure 2.
The Safety Bay Sand is a superficial formation which in the study area
overlies the Bunbury Basalt. The unit locally consists of mixed alluvial,
aeohan and estliarine sediments comprising calcareous sands and clays.
-6-

AM AGC Woodward-Clyde 0
A water table is present locally in areas adjacent to Leschenault Inlet and the Indian Ocean. Recharge is by way of direct infiltration of rainfall and local runoff. A water table is possibly absent beneath most of Mariston Hill and Casuarina Point due to the outcrop or shallow occurrence of the Bunbury Basalt.
The Bunhury Basalt itself is relatively impermeable and locally confines the underlying Yarragadee Formation. The upper and lower surfaces are generally weathered towards clay. Movement of groundwater through this unit is small, limited to fissure flow along fractures and joints where present.
The Yarragadee Formation comprises interbedded sand, shale and siltstones to a cumulative thickness in excess of 1 000 m. The greatest groundwater resources of the area occur within this predominately sand unit which is a major source of municipal and industrial water supplies.
3.2 Groundwater Movement.
The local water table aquifer in the study area is recharged by direct infiltration of rainfall and urban runoff from the Mariston Hill area. Flow directions are generally northwards into Leschenault Inlet and Koombana Bay. Immediately to the north of the inlet, south of Koombana Drive, the flow is expected to be southwards into the Inlet. In the expected absence of a water table beneath Marlston Hill and Casuarina Point there would be no flow.
The Yarragadee Formation is regionally recharged by rainfall mainly on the
Blackwood Plateau and by hydraulic communication with the Leederville Formation and superficial formations along the coast. The flow directions are to the northwest beneath the study area with discharge into the sea west of Bunbury and to a niuch lesser degree Koombana Bay.
The general directions of groundwater flows are shown on Figure 3.
-7-
AGC Woodward-Clyde w
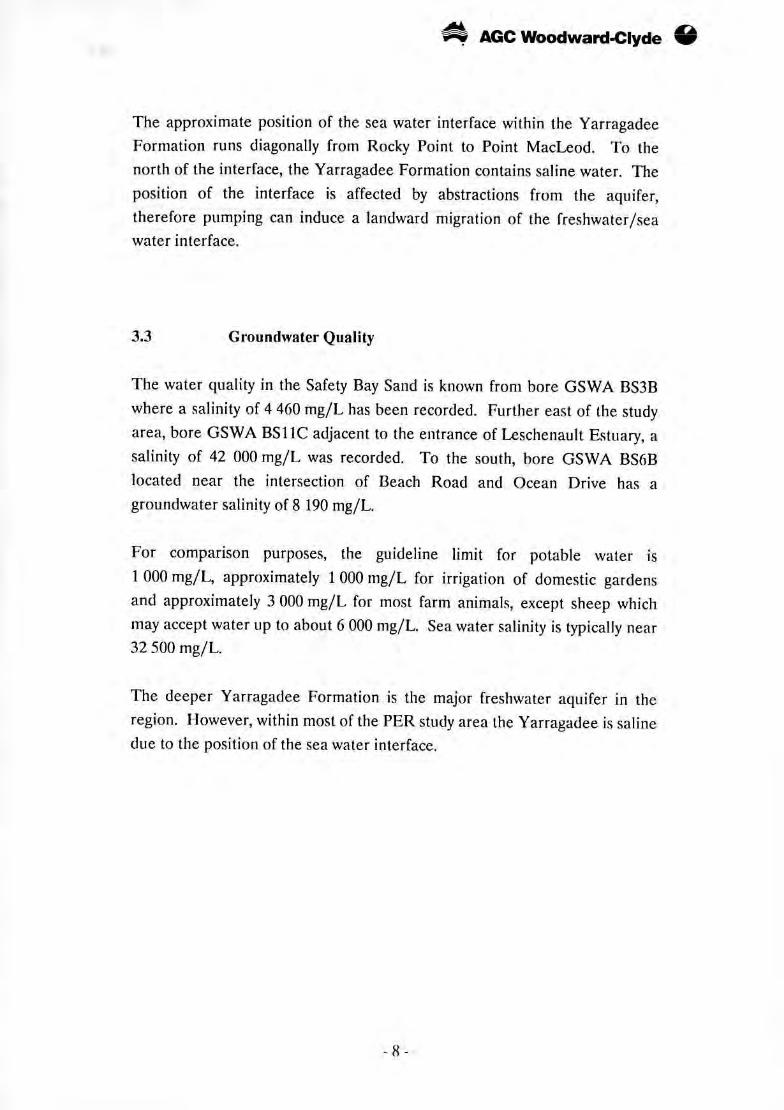
The approximate position of the sea water interface within the Yarragadee
Formation runs diagonally from Rocky Point to Point MacLeod. To the
north of the interface, the Yarragadee Formation contains saline water. The
position of the interface is affected by abstractions from the aquifer,
therefore pumping can induce a landward migration of the freshwater/sea water interface.
3.3 Groundwater Quality
The water quality in the Safety Bay Sand is known from bore GSWA BS3B
where a salinity of 4 460 mg/L has been recorded. Further east of the study
area, bore GSWA BS1 IC adjacent to the entrance of Leschenault Estuary, a
salinity of 42 000 mg/L was recorded. To the south, bore GSWA BS6B
located near the intersection of Beach Road and Ocean Drive has a groundwater salinity of 8 190 mg/L.
For comparison purposes, the guideline limit for potable water is
1 000 mg/L, approximately 1 000 mg/L for irrigation of domestic gardens
and approximately 3 000 mg/L for most farm animals, except sheep which
may accept water up to about 6 000 mg/L. Sea water salinity is typically near 32 500 mg/L.
The deeper Yarragadee Formation is the major freshwater aquifer in the
region. 1-lowever, within most of the PER study area the Yarragadee is saline
due to the position of the sea water interface.

AGC Woodward-Clyde
4 POTENTIAL IMPACTS OF THE DEVELOPMENT
UPON
SURFACE WATER DRAINAGE
4.1 Drainage Patterns
A large percentage of the PER study area currently contains a pervious ground surface where surface runoff water drains directly to groundwater. With the proposed developments, there would be a significant increase in impervious surface area and surface water runoff would increase in both volume and discharge rate. Piped drainage systems would need to be developed, and existing drainage systems improved to cater for the increased runoff. Construction of drainage compensation basins within the study area would reduce drainage discharge rates and possibly increase rainfall recharge to groundwater.
Surface water drainage outfalls into the proposed marina and inner bay areas would need to be strategically positioned to maximise tidal flushing and minimise backwater pockets.
4.2 Water Quality
With development there would be an increase in motor vehicle traffic and car parking requirements. Associated with this there would be an increased potential for hydrocarbon contamination of drainage waters arising from the roadways and car parking areas. However, at the same time, the existing hulk fuel storage depots located on Mariston Hill would be removed, together with the hulk fuel road and rail transport systems and the overall potential for hydrocarbon contamination within the PER study area would be substantially reduced.
AGC Woodward-Clyde
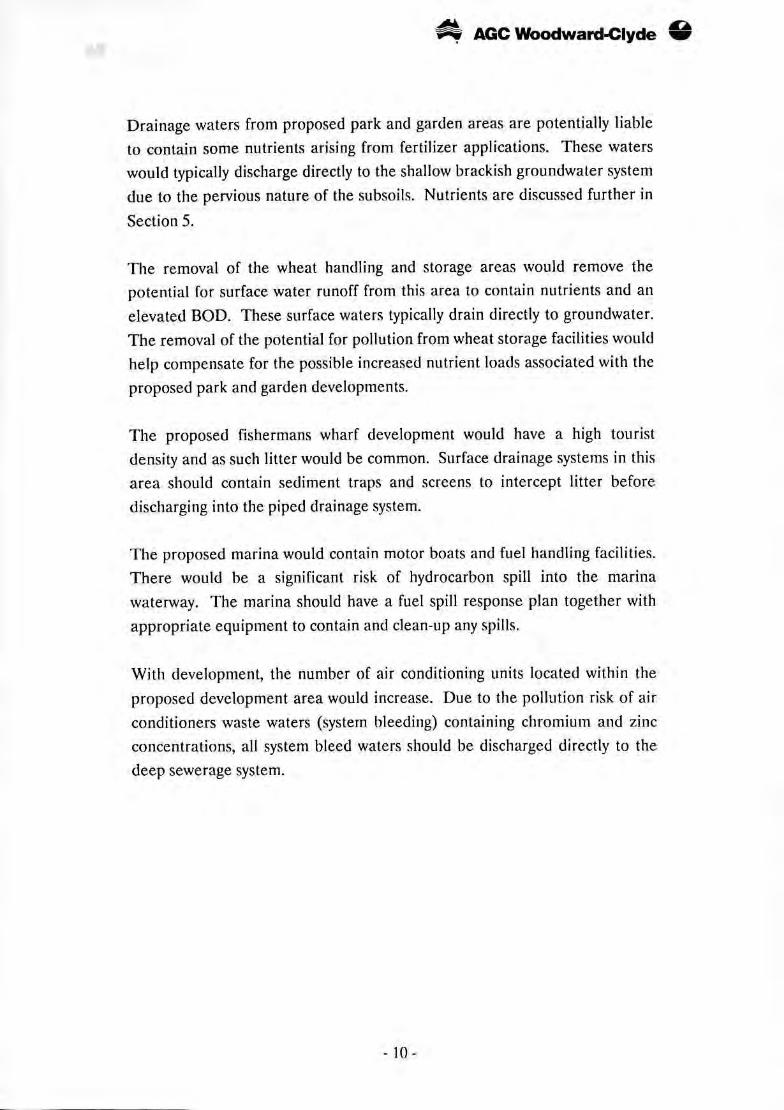
Drainage waters from proposed park and garden areas are potentially liable
to contain some nutrients arising from fertilizer applications. These waters
would typically discharge directly to the shallow brackish groundwater system
due to the pervious nature of the subsoils. Nutrients are discussed further in
Section 5.
The removal of the wheat handling and storage areas would remove the
potential for surface water runoff from this area to contain nutrients and an
elevated BOD. These surface waters typically drain directly to groundwater.
The removal of the potential for pollution from wheat storage facilities would
help compensate for the possible increased nutrient loads associated with the
proposed park and garden developments.
The proposed fishermans wharf development would have a high tourist
density and as such litter would be common. Surface drainage systems in this
area should contain sediment traps and screens to intercept litter before
discharging into the piped drainage system.
The proposed marina would contain motor boats and fuel handling facilities.
There would be a significant risk of hydrocarbon spill into the marina
waterway. The marina should have a fuel spill response plan together with
appropriate equipment to contain and clean-up any spills.
With development, the number of air conditioning units located within the
proposed development area would increase. Due to the pollution risk of air
conditioners waste waters (system bleeding) containing chromium and zinc
concentrations, all system bleed waters should be discharged directly to the
deep sewerage system.
-10-

AGC Woodward-Clyde 40
5 POTENTIAL IMPACTS OF THE DEVELOPMENT ON THE
GROUNDWATER ENVIRONMENT
A large portion of the area is underlain at shallow depth by the Bunbury
Basalt where a water table is believed to be absent. Where a local water
table does occur, the groundwaters are brackish to saline. As such, the
proposed development and runoff would have negligible impact upon the
quality of the existing groundwaters.
The areas requiring artificial fill soils are adjacent to Koombana Bay and
Leschenault Inlet. It is proposed that the fill would be sourced from dredging
spoils which will contain saline interstitial water and organic nutrients. Given
the existing groundwaters, where present, are brackish to saline and that the
organic nutrients do not represent a significant increase to the nutrient load,
the impact of the fill would not be significant.
1-lowever, the shallow groundwater immediately adjacent to Leschenault Inlet
would be discharging into the Inlet. If any of the proposed developments
result in large grassed areas requiring significant quantities of fertilizers, the
shallow brackish groundwater system could provide a pathway for nutrients
to reach the Inlet. A nutrient and irrigation management plan would be
appropriate to minimize the potential for nutrient irrigation. It is noted that
deep sewers are proposed for all of the development which will prevent the
contribution of nutrients which would arise from septic systems.
At the western toe of Mariston Hill there may locally be a sufficient thickness
of sands over the Bunbury Basalt to comprise a shallow aquifer. This
possible aquifer would require dewatering during construction (primarily for
large foundations and deep drains) and may contain hydrocarbon and organic
contaminants arising from the nearby fuel depots and grain silos. If such
contamination does exist, disposal and/or treatment of the dewatering
discharges would require specific consideration. All discharges should meet
the established water quality criteria of the receiving environment.
- 11-

AGC Woodward-Clyde 40
The possible occurrence of spilled hydrocarbons in the soils and/or groundwaters could also lead to dangerous accumulations of explosive vapours in drains, sewers, basements, etc. The occurrence or otherwise of these contaminants could be investigated in advance by shallow drilling, soil and water sampling, and vapour detection.
-12-

AGC Woodward..Clyde 40
6 RECOMMENDED GROUNDWATER MONITORING
Two existing GSWA bore sites (BS3 and BS6) are adjacent to the study area
and are constructed so as to discretely monitor both the Yarragadee
Formation and the Safety Bay Sand. These bores are part of a regional
monitoring network established by the GSWA.
Within the study area, only two bores are on record. Firstly, a bore located
on Symmons Street penetrates the Bunbury Basalt and is completed in the
underlying Yarragadee Formation, which is saline at this location. An older
bore, Land Bore No. 2, was drilled near the old Bunbury Railway Station
through the Safety Bay Sand to the top of the Bunbury Basalt. The internal
condition of this bore and its suitability for monitoring purposes is unknown.
Several new bores are recommended in the vicinity of the bulk fuel depots
and the grain silos to investigate the possible occurrence of soil and/or
groundwater contaminants (where a water table is present).
The area immediately north of Leschenault Inlet, adjacent to Koombana
Drive, historically had been artificially filled using mining waste and tailings
from the nearby mineral sands mining and processing operations. The
physical and geochemical nature of this fill material is uncertain, as is the
resulting chemical composition of any groundwaters. As these fill materials
may be in hydraulic connection with Leschenault Inlet and Koombana Bay,
one or more monitoring bores are recommended to investigate the current
subsurface environment and thereafter provide a permanent monitoring
facility.
- 13 -

Existing Pipe Drainage
System
In Drainage Pumping Station
Ko O MSAN
ONEI1E
------
ZONE M
/NIj1
Ii?
-I1
1',ii Ft
(lsi1rIn A flU. I
LEGEND SCALE 1 10000
0 100 200 300 400 500 I LONE it Surface Water Drainage
I Zones
M E T R E S
GEO&RAPHE BAY
INDIA N 'Y oI
ON \
ZONE OcEA Jv/r
/
PER STUDY AREA
POir'lI
JJçiI '
UM
BUNBURY HARBOUR CITY DEVELOPMENT
SURFACE WATER
DRAINAGE PLAN
fey. I)l C ItI P1' I () II
- ........... .
o 2S

WEST EAST
0 2km
Sofety 8.y Siad -.- Direction of froundwnler flow
EII1 Alluvium, Ectuarine mud __.
Tumal, I.imettont KI f.eidervill. Formation
t:i—Obii Bauendlan Sand Kb Runbury Batalt
EB Guildfotd Formation clay Juy Yarr,gad,i Formation tend
Yoganup Formation
From Commander, 1982
z 0
U)
Fr
t)F C Ill Pt f () II
Wo AGC
-Clyde DIAGRAMMATIC
f RELATIONSHIP OF
HYDROGEOLOGIC UNITS
f)nln flf.'
flwq.2383 2 jrl.2

STUDY
AREA 8.0
0.7
p 438
LEGEND
0.7
Water table elevation metres
above AHD, 1980
Groundwater flow path
After Commander, 1982
AGC - -
Woodward—Clyde GROUNDWATER
FLOW DIRECTION
UI(ulIIohI _____ EflTh..JQflg11Iq2383 ___

'J) WO
\\ \ 1 4 I \\\\ \•\ /
\"I> )) 61
S N OIS I A;

Appendix 3
Biological and Physical Characteristics

WATERWAYS COMMISSION
BIOLOGICAL AND PHYSICAL
CHARACTERISTICS
-Technical Report for the Bunbury Harbour City Redevelopment
Waterways Commission July1992

WATERWAYS COMMISSION
184 St Georges Terrace PERTH Western Australia 6000 Telephone: (09) 321 8677 Fax: (09) 322 7039
MANAGEMENT AUTHORITY OFFICES
Peel Inlet Management Authority
Sholl House Postal address: 21 Sholl Street Box 332, P0 MANDURAH MANDURAH Western Australia 6210 Western Australia 6210 Telephone: (09) 535 3411 Fax: (09) 535 3411
Leschenault Inlet Management Authority
Inner Harbour Road Postal address: BUNBURY Box 261, P0 Western Australia 623() BUNBURY Telephone: (097) 211875 Western Australia 6230 Fax: (097) 218 290
Albany Waterways Management Authority
Port Authority Building Postal Address: 85 Brunswick Road Box 525, P0 ALBANY ALBANY Western Australia 6330 WesternAustralia 6330 Telephone: (098) 414 988
Fax: (098) 421 204

BIOLOGICAL AND PHYSICAL
CHARACTERISTICS
-Technical Report for the Bunbury Harbour City Redevelopment
Report to the
South West Development Authority Caroline Seal
Waterways Commission
184 St Georges Terrace
Perth WA 6000
July, 1992


CONTENTS
1.0 Introduction 1
1.1 Background 1
1.1.1 Description of proposal 1
1.1.2 Modification to area 1
1.2 Study aims and objectives 3
1.3 Study area 4
1.3.1 Regional Setting 4
1 .3.2 Description of Study Area 6
2.0 Study Methodology 7
2.1 Introduction 7
2.2 Water quality sampling 7
2.3 Offshore sediment sampling 9
2.4 Offshore flora species and distribution survey 9
2.5 Mussel analysis 9
3.0 Collated Data and Results ii
3.1 Water quality 11
3.1.1 Salinity 11
3.1.2 Temperature 11
3.1.3 Dissolved oxygen 11
3.1.4 pH 11
3.1.5 Turbidity 12
3.1.6 Light penetration 12
3.1.7 Nutrients 12
3.1.7.1 Nutrients in the water column 12
3.1.7.2 Nutrients in the sediments 13
3.1.8 Chlorophyll 13
3.1.9 Bacteria 13
3.1.10 Radionuclides 14
3.1.11 Heavy metals 14
3.1.12 Tributyltin 14
3.1.13 Pesticides 14
3.1.14 Hydrocarbons 14
itt

3.1.15 Summary of Water Quality 15
3.2 Offshore flora 15
3.2.1 Seagrass 15
3.2.2 Macroalgae 15
3.2.3 Microalgae 15
3.3 Onshore flora 16
3.3.1 Mangroves -Systems 6 16
3.4 Offshore fauna 16
3.4.1 Invertebrates 16
3.4.2 Fish 17
3.4.3 Dolphins 18
3.5 Onshore fauna 18
3.5.1 Waterbirds 18
3.5.2 Mosquitoes 19
4.0 Preliminary Impact Assessment 21 4.1 Impacts on the physical environment 21
4.2 Impacts on the biological environment 22
5.0 References 25
6.0 Appendix 1: Graphical Representation of Water Quality Data Collected 27
LIST OF MAPS
Map 1 Bunbury Harbour City Redevelopment Locality Map 2
Map 2 Study Area for theAssessment of the Biological and Physical Characteristics 5
Map 3 Water Quality Sampling Sites 8
LIST OF TABLES
Table 1 Criteria for Water Quality with regard to E. co/i (Riggert 1978) 13
iv

1.0 INTRODUCTION The South West Development Authority proposes to redevelop and revitalize Bunbury's central area. Map 1 shows the location of the proposed redevelopment area. The South West Development Authority has therefore initiated a number of studies into the environmental impacts of the proposed redevelopment with the view to ultimately producing a Public Environmental Review (PER) for the proposed project.
As the redevelopment is centred around the Casuarina Harbour ,Bunbury Outer Harbour and Koombana Bay area, the South West Development Authority commissioned the Waterways Commission to conduct investigations into the physical and biological characteristics of both the onshore and offshore environments.
1.1 Background The Bunbury City Harbour Redevelopment plan was initiated by the City of Bunbury and the South West Development Authority. The design concept reflects development opportunities and the preferred alternative use of land in and around the Port of Bunbury. It also retlecis the findings of recent studies, development initiatives of the South West Development Authority and Bunbury City Council, and input from a community consultative group.
The design einphasises the need to establish a proper relationship l)etweCfl the city and the waters of the Casuarina Harbour, Koombana Bay and Leschenault Inlet. The design recognises the need to provide recreational, boating, tourism, residential and commercial elements essential to a coastal city. The architectural and landscape homes are intended to enhance the existing character of Bunbury and act as a guide to development of the study area and other parts of the city.
The Bunbury City Harbour Redevelopment Plan was prepared by Project Co-ordinator. Gianfranco Design Management and released for public comment in December 1988. The Environmental Protection Authority (EPA) has determined that the project wurants formal assessment under Pui IV of the Environmental Protection Act and has set the level of assessment at Public Environmental Review (PER). The PER at this stage will only address the impacts associated with the rezoning of land to Special Use (Bunbury Harbour City) Zoning to facilitiate the uses proposed in the plan and the construction of a Marina Complex in Casuarina Harbour.
1.1.1. Description of proposal
The proposed development involves the relocation of many of the existing port and port related facilities to alternative sites within the Bunbury Inner Harbour and the establishment of a major recreation and tourist complex. Following environmental approval of the rezoning, an amendernent to the City of Bunbury Town Planning Scheme No. 6will allow specitic features of the redevelopment plan to be developed. These include a harbourside lodge and beach village, a marina and fishernians' wharf, condominiums, naval cadet facilities, a resort hotel, park. office and commercial facilities and a residential development.
The primary area for development is the area west of Koombana Channel (The Plug) and bounded by Clifton Street, Koombana Drive, Victoria Street and Apex Drive. However for the purposes of environmental assessment this report will address environmental issues both within and outside this area in so far as the development proposal may impact on the integrity of the area.
1.1.2 Modification to the area
Since the formal declaration of Bunbury as a town in 1841 many changes have occurred to the waterways of the area. Major impacts on the physical and biological environment resulting from port developments, flood prevention measures and reclamation works in the Bunbury region date from the end of the nineteenth century. This was the time of construction of the llrst stage of the breakwater on Casuarina Point. Earlier construction of the shipping jetty in Koombana Bay, dating from the 1960s, is judged to have had limited impact on wave patterns and sediment movement within Koombana Bay (Le Provost Semenuik and Chalmer, 1983).
Since its establishment, the Casuarina Point breakwater has caused silting along Koombana Bay, necessitating its continual extension. The breakwater was extended five times up to 1961 and the shipping jetty has similarly been extended with the landward portion lxing replaced by a rock armoured, solid fill pier during the 1960s.

MAP 1. LOCALITY PLAN 115040'Easi
33015South /
- ERTH N
Li.
MANDURAH LESCHENAULT
BUNBUR ESTUARY C
9_3Okm
AUSTRALIND
INDIAN OCEAN I j
Samphii'e Bay
JCxmbmna ' EATON Vittoria
aay Bay
Inser
'B
33°2o BY
/1 wNsrrE
0 1 2km

The major impact of these structures has been in modifying the wave climate within Koombana Bay, considerably reducing ocean wave action in the southern part of the hay. Sediment supply to the shore of the bay has also been reduced, leading to changes in the pattern of erosion and deposition (Le Provost Semenuik and Chalmer 1983).
Nearby Leschcnault Estuary has also been affected by major modification works. In 1951 the estuary's natural outlet 10 the ocean at Point Macteod was closed to eliminate the deposition of rivcr sifts in the port area. At the same time, in order to compensate for the loss of this outlet to the ocean, The Cut was constructed through the sand dunes opposite the mouth of the Collie River.
Tidal exchange within the estuary was substantially increased by the new entrance, with the result that the estuary has subsequently developed the characteristics of a marine-dominated embayment. The groynes to protect The Cut have also had a major impact on local sediment supply and distribution (Le Provost Semenuik and Chalmer 1983).
In 1968 - 1969 the Preston River downstream of the Australind Road Bridge was realigned to allow for the construction of the new Inner Harbour. In 1971, work on the Inner Harbour commenced, cutting off the southernmost part of the Lcschcnault Estuary. This work resulted in the major destruction of saltmarsh, mangrove and shallow waler habitats.
On corn p let ion of the Inner Harbour, a c han net was cut at Poi ii t Mac leod to allow water circu tat ion to the southern portion of estuary (now known as Lcschenauht Inlet) and to allow the passage of boats out to Koombana Bay.
The dredging required to undertake much of this modification has resulted in the creation of new deep water habitats and produced large quantities of dredge spoil which have been dumped in Koombana Bay and on the seafloor in shallow (<12 m) water further to the north.
Disposal of tailings from mineral sands processing has also taken place in the saltmarshes adjacent to Anglesea Island where they have been used for fill.
The onshore and offshore environments of the area are therefore far from their pristine condition. In actual fact many of the biological habitats in the area part icu I arty in Koombana Bay are man -made.
1.2 Study aims and objectives It is the aim of this report to identify the physical and biological characteristics of the study area in order to determine any potential impacts of the proposed development.
Objectives
To collate and review existing knowledge on the biological and physical environments of the study area to provide a description of these environments.
To carry out a field survey to update knowledge of the biological and physical environments of the study
To carry out preliminary assessment of the impact of the proposed development on the physical and biological environments of the study area.
To provide baseline data in order to determine potential changes to the environment resulting from the development.

1.3 Study area
The area of primary conce in to the study comprises the waters of Kooni b: ii ia Bay, Lesc he na U I Inlet and Casuarina Harbour and the land immediately adjacent to these waters. Map 2 shows the study area for this report. This area includes the tank lum area and adjacent residential areas, port land abutting the Bunbury Outer Harbour and recreational facilities along Koombana Drive.
1.3.1 Regional setting The study area is located adjacent to the Central Business District (CBD) of the City of Bunbury. Bunbury is located in the South-West of Western Australia (33 21' S 115 42' E).
Landform
The Bunbury Region is situated on the southern part of the Swan Coaslal Plain. The Swan Coastal Plain is the Quaternary (1.5 million years to present) surface of it subsiding coastal lowland which adjoins an uplifted Archaean rock plateau (the Darling Plateau) along a scarp to the east (Le Provost, Semcniuk and Chalmer 1983). The region can be subdivided into a nuni her of land form on its consisting of a coastal belt extending 7 k ms inland and an alluvial plain bounded oti the cast by it ic W hid er ai id Darling Scaips. IS to 20 k in inland.
Parallel to the coast between the ocean and the plain lie (he Spearwood and Quindatup Dune systems, a series of sand dunes and limestone ridges with interdunal swamps, lagoons and inlets, inland of the coastal belt, the low, irregular sand dunes of the Bassendean sysem merge into the Pinjarra Plain and the Ridge Hill Shelf.
Soils
The coastal plain catchment consists largely of sand over clay soils, extending from the Darling Scarp to meet deep grey sands midway to the Leschenault Estuary. Brown and Yellow sands are located along the Brunswick, Collie and Preston river valleys.
Hydrology
The region contains several rivers, including the Collie and Preston, Welleslcy, Brunswick and Ferguson. All originate near the foot of the Darling Scaip and discharge into the Lcschenault Estuary. Groundwater resources of the area include the aquifers of the Perth Basin. Groundwater is currently being drawn from the Limestone and Yarragadec Forniations paralleling the coast.
In the Leschcnault Inlet water depths arc generally in excess of 1.5 in. however .sandbanks are cxlx)scd during low tide along the ca_stern and northern boundaries. The deepest area of the Inlet occurs midway along the Inlet towards the southern shore. The maximum depth recorded is 3.2 in. The tidal regime is similar to that of the ocean indicating good water exchange with the ocean. A storm surge barrier is present across the Inlet entrance channel.
Flora
The vegetation of the region is determined by the soil types and landform present. Much of the area has been cleared for agriculture. The main species along the coastline in the Quindalup Dunes are Wattles, Swan River Cypress and Rottnest Island Tea-Tree. One to two kilometres inland in the Spearwood Dunes the Eucalypis begin to emerge. These are initially tall open stands of Twins, with increasing numbers of Jarrah and Marri evident to the east on the deeper soils.
Growth and redevelopment of Bunbury and more recently reclamation for the Inner Harbour has resulted in the loss of most of the natural vegetation in the study area. This has been replaced either by buildings and roads or by walling and grassed areas around the Lcschcnault Inlet. Anglesea Island on the southern tip of the Lcschenault Inlet is still well vegetated and of regional conservation significance because of the existence of rare white mangrove communities (Watcrways Commission 1990).
4


Fauna
The fauna of the region has been greatly influence by modilicat ion of the landscape by man. Natural habitat destruction has resulted in the presence of' lew species of native fauna. Terrestrial mammals in the region include introduced SpCCiCS such as ro(Iellts and domestic cats and dogs. Waterbird populations are relatively large and diverse in species. These populations inhabit specitic areas which have been retained in their natural state including Anglesca Island and parts ot Lescheiiault Estuary. Botticnose dolphins arc common in Koombana Bay and other nearby marine areas. Other sea maui mats in the area include sea lions and whales.
Climate
The region experiences a Mediterranean climate Willi cool wet winters and hot dry summers. Rainfall is moderate and mainly occurs between May and August with the average annual rainfall being about 1000 mm. In winter the average maximum temperature br Bunbury in J iily is 16.8 C. Inland days can be warmer and nights cooler. In Comparison February is the hottest month with a mean daily maximum of 27.6° C and 15.1° C average minimum.
Easterly airliows predominate during summer months with a strong south-west breeze occurring on most afternoons.
1.3.2 Description of the study area
Koombana Bay has a mean depth ol'7 in and has a dredged channel which leads to the Inner Harbour. The channel is 200 to 300 in wide and its bottom is about 13 in below mean sea level. Redredging of the channel was completed in May 1990. The north-west corner of the Bay has also been dredged to create the Bunbury Outer Harbour. A small boat mooring area is located south of, the Outer Harbour. Access to this area is through the Outer Harbour.
The Leschenault Inlet enters Koombana Bay on its southern shoreline. The Inlet is approximately two kilometres long and about 200 metres wide. The Inlet is connected to Koombana Bay via a short entrance channel called 'The Plug.

2.0 STUDY METHODOLOGY
2.1 Introduction In order to meet the aims of this report Iwo areas of research were undertaken, these included:
Review of existing literature.
Fidel studies involving data collect 101) and surveys.
The literature pertaining to the study area at a local to regional scale was collated and review. The appropriate literature was summarised in order to determine time physical and biological characteristics of the area and modifications that have already occurred. This inloimation has been inCorl)orated into the collated data and results section of this document to give a more comprehensive Picture Of the physical and biological characteristics of the area.
A major field study was undeilaken ill August 1990 (Winter) in order to update and confirm existing information on the area and also proide baseline inlornialion br but nrc monitoring. The study concentrated on the offshore component of the study ;uea including the waters of Koombana Bay, Bunbury Outer Harbour. Casuarina Harbour and Leschenault Inlet. lo obtai ii Al necessary ii) torn)al ion requ I red tour i id i vidual surveys were undertaken, each with specific ai us and objectives. The tour surveys are listed below and detailed in the sections following.
\uv'ater Quality Sanipi il)iZ
0 llshore Sediment S; imp tin g
011shore Flora Species and Distribution Survey
Mussel Analysis
2.2 Water Quality Sampling In the field water quality );mrammmeters were tested to determiiiime tile condition of the water in Koombana Bay, Lcschenault Inlet and the ('asuariima Harbour. A 500 mu grid was used to determine locations for sampling stations and to ensure data obt:uued presented ii re presemltative sample of tile study area. Eleven sampling stations were selected. 7 in Koomb:mua Bay. 1 in Leschcn;mult Inlet (station pre'iously used for waler quali(y monitoring by the Waterways Conuinission) and 3 in Bumihmirv Outer Harbour and C;isuarina l-l;mrbour. These stations are shown on Map 3.
At each sanipling Station the 101 lowing physical p:uanieters were measured:
Salinity
Tempemmttmre
Dissolved Oxgeu
turbidity
l)11
Iigimt l)emietlaliomi
0.5 in intervals
0.5 in iiiteiv;mls
0.5 mu iutem'v;mls
estimated wih secchi disc
surface waters m iulv
0.2 ut intervals
Water samples were collected for nutrient ;mud chlorophyll 'ii ' analysis from both surface and bottom waters. Surface samples only were also collected br :in:mlysis for hydrocarbons, pesticides and niicroalgae.
Analysis of these samples for nutrients, chlorophyll 'a', Imvdroc;ubons and pesticides was undertaken by the Chemistry Centre ol Westeru Austraha. and uucroalg:me 1w Waterways Conuuission stall.
The physical parameters of salinity, temperature, dissolved oxygen aimd turbidity were measured a second time in December of 1990 in order to pros' ide coin;); uison bet ween winter and sum suer conditions.

MAP 3 WATER QUALITY SAMPLING STATIONS
McKenna Point
iN
MN
(c 1991
GEOGRAPHE BAY
KOOMBANA
BS 59
CAS
( UARNA
BAY
5
HBOUR
I
2
2 oint Busacc
1011__ N N I
INLET
r1r
500 250 0 1km
2.3 Offshore sediment sampling In the field sediment samples were collected to deteim inc the content of the sediments on the ocean floor of Koombana Bay, Lcschenault Inlet, Bwthury Outer Harbour and the Casuarina Harbour. Samples were analysed for nutrients, heavy metals, radionuclides. and Iributyltin. Sediment samples were obtained using a sediment sampling box.
In the case of sarnping for heavy metals nine sampling stations were selected within the Bunhury Outer Harbour and Casuarina Harbour. These are shown on Map 3 as sites AS, A, AN, BS, B, BN, CS, C, CN. These were selected to correspond and compare with data obtained by the Environmental Protection Authority from Sites within Koombana Bay. Sites A, B and C were also used for radionuclide and trihutyltin sampling. Samples for nutrient analysis were collected at the II water quality sampling stations outlined above and shown on Map 3.
Nutrient analysis was undertaken by the Chew istry Centre of Western Australia and the Centre for Water Research (M urdoch University). Ileavy metal analysis was undertaken by the Geology Department of the University of Western Australia, radionuclide analysis by Australian Radiation Laboratories and Iributyltin analysis by CSIRO.
2.4 Offshore flora species and distribution survey In the field a ground truthing exercise was carried Out to verify results obtained from aerial photographs on the species present and percentage coverage of vegetation in the offshore waters of the study area. The survey focused mainly on species of macroalgac present and percentage coverage of seagrass.
At each of the II stations used in the above two surveys, divers descended to the ocean floor and within .120 m radius of the station estimated percentage coverage of seagrass. Representative samples of macroalgae were also collected for identificalion.
2.5 Mussel analysis In the field mussels were collected for analysis to determine levels of heavy metals in shellfish in Bunbury Outer Harbour and Caswuina Harbour. Two samples of mussels were collected from two sites along the disused jetty.
Note: Following sediment sampling for radionuclides it was decided that mussel analysis for radiation was not necessary. Ret'er Section 4.1.10.
The accumulation of heavy metals in the body tissue of the mussel allows an accurate measure of levels in the water to he obtained. Analysis of body tissue was undertaken by the Geology Department of the University of Western Australia.
Note: This study was undertaken in December 1990 due to the lack of available mussels in August 1990


3.0 COLLATED DATA AND RESULTS
3.1 Water quality Results of water quality sampling undertaken in August 1990 indicate that the slate of the water in the study area is generally representative of a marine environment in an area supporting a fresh water outflow. Further physical data collected in December 1990 support this conclusion. Data collected in this sampling exercise can be complemented by water quality data collected by the Leschenault Inlet Management Authority (LIMA) in the Leschenault Inlet between 1976 and 1984 and reviewed by LIMA in 1985. There is however no evidence of past data collected for Koombana Bay and Casuarina Harbour.
3.1.1 Salinity
Salinity levels in Koombana Bay, Casuarina Harbour and Leschenault Inlet were seen to represent a marine situation. Winter measurements indicate a thin layer of fresh water on the surface supporting the influence of fresh water inflow li'om the Leschenault Inlet and Estuary. Salinity ranged from 28.5 ppt in surface waters to 35.1 ppt in bottom waters. Little stratification was evident in the water column. Summer measurements indicate the lack of fresh water influence and the existence of a totally marine environment. Salinity was constant between 35.5 ppt and 35.1 ppi in both surface and bottom waters. (See Appendix 1, Fig. 1 showing comparison between summer and winter salinity levels).
LIMA (1985) reports that the salinity levels in Leschenault Inlet appear to be very similar to those of sea water with little stratification between surface and bottom waters. Stratification only appears to occur when drainage discharge dilutes the surface waters. These data indicate good marine exchange between Leschenault Inlet and Koombana Bay.
3.1.2 Temperature
Winter temperature measurements indicate no real differences between sites and little stratification between surface and bottom waters. Temperatures ranged froml4.1 C to 14.7' C indicating that the water body is well mixed. Summer temperature measurements were constantly 5' C to 6' C warmer than winter temperatures with little stratification.(Scc Appendix 1, Fig 2 showing comparison between summer and winter temperature levels).
3.1.3 Dissolved Oxygen
Dissolved oxygen measurements recorded in winter were considered to be inaccurate due to instrument failure and therefore have been disregarded. Summer measurements, however, indicate dissolved oxygen levels to be satisfactory for a marine environment and it is expected that winter readings would be of a similar nature. The water body was fairly well mixed with little or no stratification. Levels ranged from 10.1 mg/L in surface waters down to 6.4 mg/L in bottom waters. (See Appendix 1, Fig. 3 showing only summer dissolved oxygen levels).
3.1.4 pH
pH measurements were taken at the winter sampling time only. This was to give an indication of the levels experienced in the area. pH levels were also no[ expected to vary to any great extent from sea water levels at any time of the year. pH levels were found to be relatively constant for a marine environment with the lowest reading being 8.0 and highest reading being 8.2. Sea water levels generally range between 8.1 and 8.2. (See Appendix 1. Fig. 4 showing only winter pH levels).
11

3.1.5 Turbidity Winter turbidity results obtained were found to be relatively low for a niarine environment. This however can be attributed to two factors:
Storm activity prior to sampling activity causing the suspension of sediment in the water column.
The prcscnee of a jet of fresh water entering K ioni hai ia Bay from Lesche nan It Est i iii ry and other fresh water inflow sources containing suspended material in the water column.
Results obtained ranged from 80 cm to 110 cm in Koombana Bay with Leschenauft Inlet indicating a slightly lower level of turbidity at 160 cm. The more turbid results obtained for Koombana Bay can be attributed to the influence of the fresh water jet stream, the inflow of rivers and the movement of vessels in the Bay.
Summer turbidity levels were significantly higher. This can be attributed to the absence of factors outlined above. Levels ranged from 150 cm to 45() cm. (See Appendix 1, Fig. 5 showing comparison between summer and winter turbidity levels).
3.1.6 Light Penetration
Light penetration measurements were obtained using a light meter. The slope of the line from a regression of the log of the light reading with depth was then used to calculate attenuation coefficients. The attenuation coefficients, calculated to a consistent depth of 2 in. ranged from -0.40 to .0.55 in the outer waters of Koombana Bay indicating little variation in light absorption.
Site BH I situated within Casuarmna Harbour was seen to have a higher attenuation coefficient of -0.29 indicating less turbid conditions. This can be attributed to the nature of the protected waters within the Harbour. Sites BH 6 and BH 7 situated in close proximity to the outflow from Leschenauli Inlet had lower values of -0.69 and -0.60 respectively indicating more turbid conditions. This can be attributed to fresh waler inflow sources from Leschenault Inlet containing suspended material in the water column.
3.1.7 Nutrients 3.1.7.1 Nutrients in the Water Column
Ammonium/Nitrogen levels
Little difference existed between surface and bottom levels with levels ranging from 0.02 mg/L to 0.06 mg/L (See Appendix 1, Fig.6). LIMA (1985) however reports bottom levels in Leschcnault Inlet to be generally higher than surface levels as a result of decomposition of organic matter in the sediment and bottom waters.
Nitrate/nitrogen levels
Levels were generally constant at 0.02 mg/L. Peaks above this level did occur which correspond to areas with an increased fresh water flow (See Appendix 1. Fig.7. LIMA (1985) reports bottom waters in Leschenault Inlet to be consistently lower than surface wafers d (IC to low I rat ion of fresh water in to bottom layers.
Total Nitrogen
Levels ranged from 0.16 mg/L to 0.62 nig/L (See Appendix 1. Fig 8). These levels are relatively low and indicate an oligotrophic state in temins of total nitrogen (Vollenweider classification system from Wood).
Inorganic Phosphorous (Sal. Reactive Phosphorous)
Levels are consistent at 0.01 mg/L or below indicating little free phosphorous in the water column.
Total Phosphorous
Levels were consistently between 0.01 and 0.03 mg/L n (See Appendix 1, Fig. 9). These levels are o average between an oligotrophic and mesotrophic state in terms of total phosphorous (Vollenweider classification system from Wood 1975). Sites 7 and 9 localed in Koonihana Bay had levels higher than this range at 0.07 and 0.06 mg/L respectively. This indicates some degree of nutrient enrichment in Koonihana Bay. LIMA (1985) however
12

reports that levels of these proportions are of little concern as alga) growth has failed to reach nuisance proportions due to the high degree of salt water flushing.
3.1.7.2 Nutrients in the sediments
Total Phosphorous
Levels ranged from 120 ppm to 860 ppm.
Note:Measuremenis of the wet to dry ratio (% moisture) of sediments were used to correlate levels of total phosphorous with particle size and organic content of the sample. The wet to dry ratio is directly related to the fineness of the sediment and the amount of organic content in the sediment (i.e. the higher the wet to dry ratio the finer the paulicle size and the higher the organic content of the sediment). There is ii direct cornlation between total phosphorous levels i a hca ltliy linct i( 01 iii g CIIV roni lieu it and wet to (by ratios. Au i y nueasurcuneiuts offolal phosphorous outside this correlation would appear to be outside the norm.
Sites 1 and 2 had a higher total P level than expected when relating levels to wet to dry ratio. These two sites are located in the Casuarina Harbour (see Appendix I. Fig. 12). These levels can be explained by the lack of adequate flushing to this area and therctore the higher likelihood of accumulation of phosphorous in the sediments.
Total Nitrogen
Levels ranged from 60 ppm to 5330 ppm. When relating these levels to the wet to dry ratio of the sediment, results obtained from sites in Casuarina Harbour indicate high levels of total nitrogen accumulated in the sediments. This too can be attributed to the lack of flushing to the area (see Appendix 1, Fig. 13).
3.1.8 Chlorophyll Levels ranged from 0.001 to 0.005 mngJL (see Appendix I. Fig. 10). This range indicates an oligotrophic to mnesotrophic state in tenhls of, chlorophyll (Vollcilweider classification system from Wood 1975).
3.1.9 Bacteria Bacteriological sampling is conducted monthly by the Bunbury City Council including sampling points in Koombana Bay, Leschenault Inlet and Casuarina Harbour. Two types of bacteria are tested Escheri rh/a co/i (E. co/i) and Streptococci. These bacteria are used as indicators of pathogenic organisms.
As no criteria for Slrc'ptococci levels are available they are excluded from this report. E. coil data was assessed according to the Health Department of Western Australia's classification outlined in Table 1 below. This classification indicates criteria for water i.ualily for human contact uses with regard toE, co/i.
Mean probable nutnber (cells! lOOmI) Classification
0-110 Good
110 - 350 Satisfactory
350 - 1100 Requires investigation
1110 + Unsatisfactory
TABLE 1:Criteria for water quality with regard to E.coli (Riggert, 1978)
13

Three sites were chosen from the Bunbury City Council data. These sites are Jetty Baths, Estuary Plug and Koombana Baths which correspond closely with the sites BHI. BH16 and BH 6 respectively used in the water sampling exercise. (Results for these sites are represented in Appendix 1, Fig. Ii).
During the sampling period between January 1990 and February 1991 all samples taken fell into the good category using the above classilication. This indicates a low health risk from iaecal coliform ingestion within the study area. The highest levels within this period were detected in the winter months. This can be attributed to the higher levels of storm water entering the system. Due to the reduced level ol water contact activities during these months the probability of users ingesting these organisms is low.
3.1 .10 Radionuclides Radionuclides were measured in sediment samples in Casuarina Harbour and compared with a control in Koombana Bay. (Results are shown Appendix I Fig. 14). Each of the sediment samples contained low levels of naturally occurring radionuclides of both the uranium and thorium series and potassiurn-40. Activities ranged from 40 Bqfkg of dried sediment to 200 Bqlkg for samples taken in Casuarina Harbour. The control sample had very much lower levels Of the uranium and thorium series nuclides. This can be attributed to the different nature of the sample i.e. the control sample being mainly coarse sand whereas the other three samples appeared to have high organic content. These difterences would explain the diliereni radionuclide levels.
From the magnitude of the radioactive concentrations in the sediments it is unlikely that there would he a significant build up of these radionuclides in shell fish or other 100(1 items present in the harbour (Cooper pers. comm. 1990).
3.1.11 Heavy Metals Heavy metal levels were measured in sediments in Casuarina Hubour. The mobility of heavy metals in aquatic sediments and their impact on the environment is influenced by the type of sediiitenis and the level of biological activity within the sediments. As yet no environmental criteria are available for the determination of the levels obtained. Results are shown in Appendix I. Fig. 16. Concentrations of each metal have been averaged over the 9 sites for case of representation.
Accumulation of heavy metals in mussel tissue were also measured. Mussels were collected from the jelly in Casuarina Harbour and a control on the Lc sc tienau It Pi l)C line within Lesc hen au It Est nary resu Its are shown in Appendix l,Fig. 17.
Maximum permitted concentrations for loodstu ffs are out Ii ned in the Heal Ii Act 1911 Health Regulations 1987 Section 12 for some of the heavy metals measured. Others have no set limits as yet. All metal.,, measured were found to be below the permitted limits where a limit exists. The health risk from ingesting heavy metals from mussel tissue is therefore low.
3.1.12 Tributyltin Levels ranged from <0.2 to 7 nfg (Sn) dry weight. (See Appendix I. Fig. 15). Preliminary consultation with the Fnvinuiinentiil l'i'utcctiun Authority lint icates ttiat these levels are low and ut little concern.
3.1.13 Pesticides
No organochlorine or organophosphate pesticides were detected in the samples taken. The limits of detection being 0.002 and 0.1 jig/L.
3.1.14 Hydrocarbons
No hydrocarbons were detected in the samples taken. The limit of detection being 25() pgIL.
14

3.1.15 Summary of Water Quality The quality of the water in the study area appears to be satisfactory and representative of a marine environment with a freshwater intiow influence. All water quality parameters are influenced in some way by the inflow of freshwater from the Collie and Preston Rivers via the Lcschenault Estuary and the jet stream which exists at the outlet of the Estuary to Koombana Bay (The Cut).
Nutrient levels in the water column and sediments appear to be slightly high at certain sites, especially within the Casuarina Harbour where salt water flushing is at its poorest. The level of salt water flushing in the area is however high enough that the likelihood of algal blooms resulting from these levels is extremely low. There is no history of algal blooms reaching nuisance proportions as yet.
Nutrient levels throughout the rest of the study area are relatively low . The jet stream entering Koombana Bay results in scouring of the sediments and consequently low accumulation of nutrients occurs.
Toxins in hot Ii the water co I Ut III and the sediments were in low levels and of little cot teem.
Generally the study area is a healthy functioning marine environment.
3.2 Offshore flora
3.2.1 Seagrass The offshore Ilora species and distribution survey indicated the presence of very little seagr.iss in Koombana Bay, Casuarina Harbour and Leschcnault Inlet. Site 3 revealed approximately 5% cover of scagrass (Zosiera and
Halophila) and nothing was sighted at any of the other sampling sitcs.The floor at all other areas appeared to be devoid of any vegetation. The lack of seagrass present can be attributed to the depth and consequence light penetration at most sanipling stations. Growth of seagrass is usuallyrestricled to apl)roXimalelY 3 m or less and most sites exceeded this depth.
Le Provost Semenuik and Chalmer (1982) reported the existence of seagrass meadows comprising of Posidonia
ostenfeidu and Atnphi boils antarcUra immediately north of Koombana Bay.
3.2.2. Macroalgae Few species of macroalgae were observed in the field survey. A red alga identified as Graei/aria sp. was found at a 1-2% coverage at site BH I. The shallow water at this site would allow for the growth of this alga.
Meagher (as cited by Le Provost Semenuik and Chalnier (1982)) recorded the floor of Koombana Bay as being barren of living macroscopic vegetation. Le Provost Semenuik and Chalmers investigations in 1982 have shown that although not widely distributed, there are henihic macrophyte assemblages present within the confines of the bay.
3.2.3 Microalgae Surface samples were collected from Leschcnault Inlet (BH 16) and Casuarina Harbour (B H2) and in the Koombana Bay area (131-19 and BH 10). The numeric hiomass of the phytoplanklon was low to moderate, ranging from 35 cells per ml in the Leschenault Inlet to a peak of 126 cells per ml in Casuarina Harbour. The two sites in Koombana Bay were similar with densities of 62 cells per ml (see Appendix I. Fig 18 & 19).
Marine diatoms were dominant and also the most diverse group represented in the phytoplankton with up to 28 species (site BH 9). Marine dinollagellates were the only other significant phytoplankton group present and accounted for 5-10 % of the numeric biomass. There were 15 dinoflagellate species present at site BH 10 in Koombana Bay. It was noted that the estuarine diatom species Chaetoee,os perpasilluin was abundant at sites BHIO and BH2. This could indicate the effect of the jet stream from the Leschenault Estuary.
These results indicate slightly higher levels of Plankton biomass than in sea water. This may be due to the kalised input of nutrients from the estuary during the winier runoff period. The high diversity of species present indicates that the area was not excessively nutrient enriched.
15

The majority of species present were largely indicative of the influence of marine salinities. The presence of Chaeweeros perpussillum in Koombana Bay and in Casuarina Harbour may indicate the circulation path of Leschenault Estuary water by the jet. If this is so it may indicate that deposition of organic materials and sediments into Casuarina Harbour are a possibility during peak rivertlow periods.
3.3 Onshore Flora
LIMA (1985) reported on the vegetation of the Leschenault Inlet environs and found that apart from established stands of Mangrove considered in Section 4.3.1 . vegetation of the area is relatively sparse and unimportant.
For the most part the area is sparsely populated by native species and consists of plantings of exotic trees i.e. poplars, coral trees, pines, brazilian peppers, hibiscus, palms and other species common to early twentieth century development.
Also evident are small areas of wattle, typha, introduced plants and grasses. Grass species are mainly kuikuyu, couch and some annual grasses.
Important native species adjoining the mangrove areas are l)al)erbarks and Casuarinas. However windpruning appears to be a substantial problem which restricts their growth.
3.3.1. Mangroves - System 6 Recommendation C68 Systems 6 Recommendation C68 (Anglesea Island) is silualed to the east of the study area. Part of the area has been vested in the City of Bunbury and part is vacant crown land. The area has been recommended for conservation because of the existence of rare mangrove communities and its value as a waterbird feeding and roosting area.
Apart from the very small stand in the north of the Leschenault Estuary, this is the only area south of Shark Bay where the White Mangrove occurs. It is an unusual plant, believed to be a relic of an earlier tropical period. There are associated salt marsh plants such as samptiire. an occasional swamp sheoak.
LIMA (1985) reports that the man grove plant coin in unity. (called a ni anga I) usually grows between high spring tide and mean sea level, in sheltered coastal environs where they are protected from strong currents and tides. They are dcpcndant upon a regular tidal interchange for their survival. Interruptions to the tidal regime of the area will alter the balance of processes essential to the survival of the mangal community. Disturbances such as prolonged inundation, extended ebb tides and changes in the rate of discharge of the ebb tide can cause degradation of the mangal.
LIMA (1985 ) reports that the likelihood of deterioration and the rate at which this may occur depends on the changes to the upper and lower limit of tidal inundation, time for each cycle and the frequency of the uninterupted cycles. The mangal on Anglesea Island may of course be able to accommodate some perturbation of the existing normal tidal cycle.
3.4 Offshore fauna
3.4.1 Invertebrates
Le Provost, Semenuik and Chalmer (1983) reported that the blue-manna crab (Poriunus peIa,i ens) population of the Bunhury area appears to be localised and generally restricted to the sheltered areas of waler provided by the Leschenault Estuary and Koombana Bay (including the Inner Harbour and the Anglesea Island area). Data indicate that the estuary provides an extensive area ol ideal habitat for crabs and supports large numbers of both juveniles and adults. Research by Le Provost Semenuik and C'halmer (1983) indicated that while the estuary is the main fishing area for crabs, Koo in ha ii a Bay is an i in purta ii t component ol the local fishery for the tol lowing reasons:
during the winter-spring l)eriod (June- November), up to 70% of the crabs in the study area are within Koombana Bay;
a resident population inhabits the bay throughout the year. The size of this population is up to 7% of the local crab population;
16

spawning of larval crabs, which form part of the subsequent adult crab population, occurs within the confines of Koonibana Bay in November;
it is possible that development of these crab larvae into juveniles occurs within the confines of Koombana Bay;
juvenile crabs recruit into Koombana Bay (as well as Leschenault Estuary) and use the bay as a nursery.
Le Provost Scinenuik and Chalmer (1983) indicate that it is unlikely larvae released locally are the sole source of subsequent recruitment to the local fishery. However, it is probable that larvae released in Koombana Bay contribute to recruitment not only locally but also regional as well.
3.4.2 Fish Le Provost Senienuik and Chalmer (1983) reported that Koombana Bay was a less important habitat for the major commercial fish species of the study area than the csluarine waters of the Leschenault Estuary and the Collie River, but more important than the nearby open coast.
During the study period. Koombana Bay did not act as a imuine salinity refuge for the estuarinc fish, although it did act as a nursery area for several species.
Five of the 11 major commercial species use the study area only as a nursery area. These fish are spawned in nearby coastal waters and small juveniles (1-2 cm) lind their way into Leschenault Estuary across Koombana Bay and through the Cut.
Pen (as cited by Le Provost Semenuik and Chalmer (1983)) reports that coastal embayments provide an alternative area to estuaries where sheltered waters and a food source are available. They are also believed to provide a temporary refuge from low salinitics in estuaries for some fish species.
Le Provost. Semenuik and Chalmer (1983) comment while there have been independent studies of estuaries, coastal embayments and open coastline in south-western Australia, no study to dale has made a comparative study of the uses of estuaries, coastal embayments and open coastline. The consequenCeS of this is that the relative importance and ic lat jonshi ps ott hese units is largely unsubstantiated.
Eleven commercially important species were collected by Le Provost Semenuik and Chalmer (1983):
Cobbler (CnidoIanis macioeep/ialiis)
Yclloweye Mullet (AIdrie!u'uafrsieri)
Sea Mullet (M,,,iI rep/iaIu.c)
Western Sand Whiting (Sillay,o .rr/umibur,tkii)
King George Whiting (SiIIainuth's pwui(l!us)
Tailor (Pomato,nus saliairi.v)
Black Bream (My/jo bulclieii)
Skipjack Trcvally (PseudocaraJL spp)
Australian Herring (Arriüs georgianus)
River Garfish (//vpor/iamp/i us ieuIaiis)
While Koombana Bay is not a large area, and lsuts of it are cxlx)sed to wave energy, the sheltered parts provide a significant nursery for Yelloweye Mullet, Western Sand Whiting and King George Whiting. Within the study area, it is also the major area used by i in mat tire A ustra I ian Heni ng and Skipjack Tie val ly. Further. extremely small Yellowcyc Mullet. Sea Mullet and Tailor were caught in lb is area, presumably as they move into Leschenault Estuary and Anglesea Island Channel. Some commercial fishing activity is also conducted in Koombana Bay.
17

Although only a small area, the Leschenault Inlet and Anglesea Island Channel support a wide range of species and is a significant nursery for Yelioweye Mullet. Sea Mullet, Western Sand Whiting, King George Whiting and Tailor.
The most iiii portan t componciiis wiihin I he SI 11(1 y aie I for t lie eleven corn rnerc ia I species arc Lesche na u It Estuary and the Collie River. The Leschenault Inlet is or lesser significance because of its snialler area. Koombana Bay is of lesser significance because it has only a I oh iled amount of shallow (less than 2 in) flats.
Koombana Bay was not seen to act as a refuge from estuarine salinities for fish which prefer marine salinities. This probably occurred because salinities in Leschenault Estuary remain high (above 25 ppm) throughout the estuary, and at marine salinities in some parts of the estuary throughout winter. In wetter winters, the salinity in Leschenault Estuary may be significantly lower that the fish are forced out of the Inlet into Koombana Bay. However the shallow waters of Koombana hay were seen to act as a nursery area for a variety of species.
Of the eleven commercial species. Yelloweyc Mullet, Sea Mullet, Western Sand Whiting, King George Whiting and Tailor use the study area, and particularly Leschenault Estuary and the Collie River, as a nursery area for small juveniles. The adults of these species inhabit coastal waters where eggs are spawned. The semiplanktonic larval phase or small juveniles (1-2 ciii) of these species migrate from the nearshore shelf through Koombana Bay into Leschenault Estuary and then into the Collie River.
3.4.3 Dolphins B ott lenose dolphins are coo nii on in Koombana Bay and the nearli y marine areas. They occasionally enter Leschenault Estuary and the lower reaches of the Collie River. Other marine mammals, such as sea lions and whales, occasionally occur in the study area but their presence in this area is temporary and of a transient nature (Le Provost Scmenuik and Chalnier, 1982).
3.5 Onshore fauna 3.5.1 Waterbirds
Le Provost Semenuik and Chalrner (1983) report that Leschenault Inlet is an important summer refuge for waterfowl and provides very rich feeding grounds for migrating and resident waders. The Pelican and White Egret are found in this aj'ea in the second largest populations in the south-west of Western Australia.
Le Provost Semen uik and Cli at mel (1 983) also report that oil II ie central area of Leschenault Inlet is the most important area for waterbirds in the Bunbury region with large numbers of birds utilising the area. Other important areas inc I ode the iii ud flats in t lie southern area of the Inlet, arou ii ii the mouth of the Preston River [)iversion, the Collie River and in V un nia Bay. The stiahlotv open waters, and sampliire flats and shah low tiouts in the northern end of the Inlet are also important to waterbiids particularly from spring 1hrough summer into autumn.
The Koom bana Bay area is probably the least iiii j)( rt tilt itrea in tile meg on for wat erh i rds wit Ii no unusual or restricted bird species evident. This is thought to be due to the extensive habitat modilication and human activity in the area.
A nglesea Island has poois of ertii ane it water and low - I y I Hg s:I ii 1)11 ic Ii ats vl iic Ii pro\' ide excel lent teed in g and roosting areas for waterbirds, mcI tiding green-shanL. whi ic-faced heron, w ii ite egret and corn mon sandpiper. Some of these species ni i grate an no ally from the nort hero hem isphcrc. and in all, over fifty species have been recorded here. One of t ii is areas greatest val ties is that it has a corn plete range (if t lie estuary's fliajOl' water bird species, right next to Bunbury. Therefore it rates highly horn the points of view of conservation, scientific interest and recreation (DCE,I983),
A survey by Ninox (1 989) indicated I lou t his area is the tourtli ihiost important waterbird site on these waterways and was of very high significance despite the high disturbance levels. Twenty-four waterbird species were recorded using the wetland area. An invertebrate survey recorded a lower density of species in the mangrove mud and tidal channel than in oilier habitats. However (lie intensity of waterbird use is evidence that ttie area is very Si go i ficant.
18

The mudliats adjacent to Kooni hana Park and Anglesea Island provide large numbers of worm.s, molluscs and crustacca, which are essential for most of the wading birds. The tidal hats are also nursery areas for commercial and angling species of tish.
3.5.2 Mosquitoes
Klcmm (1989) has reviewed the mosquito problem in the Blunders and Anglesea island area and determined appropriate methods of mosquito control considering the importance of the area to waterbirds and its proximity to inner city residential areas.
Wright (as cited by KIenim( 1989)) indicated that it was likely that a serious mosquito problem would be created by these mosquitoes to the inner residential areas of B u nhury dun ii g sunmier.
In December 1987 cx tells ye ci iai nd Ii ng was conducted in t lie Blunders area. The success of these channels wit ii respect to mosquito control, is uncertain because extensive and substantial wheel ruts were created during construction. These channels have the potential to impact on the viability of the wetland (salt marsh and mangrove) and in pailicular waterhird usage.
Kiem m (1989) rccoi ii ii iends that the existing wheel ruts created during the installation of the channels should be filled. Any further physical moditicat ion of this wetland will require a detailed survey of levels to determine the necessity for channelling. Monitoring of the wetland will still be necessary and opportunistic larviciding undertaken. The use of heavy machinery in this wetland is not favoured because the frequency of tidal inundation throughout the year means that this site is unlikely to completely dry out
19


4.0 PRELIMINARY IMPACT ASSESSMENT 4.1 Impacts on the physical environment The proposed rezoning of' land within the study area will have little effect on the physical environment of the area. Furturc development on this land may however impact on this environment. This impact is impossible to evaluate at this stage without clear definition of the the nature of development.
The Marina Complex on the other hand, has the potential to adversely impact on the physical environment of the area if not appropriately designed and managed.
The construction phase of the Marina Complex will impact on the landform and landscape of the area. To minimise this impact filling and any other alterations to the landform should be restricted to levels required for engineering purposes only . To maintain the visual amenity of the landscape any buildings should also be kept to a low level using in aicrials which cOIn ilemen t t lie existing landscape. Landscapi ii g with native species should also be carried out immediately tllowing completion of construction.
The operational phase of the marina could impact on the water quality in a number of ways if the correct design and management of the ficility is not employed. To ensure that the marina development has little or no impact on the water quality the development must be designed to minimise entry of pollutants to the harbour and nearby waters. The correct design of sewerage and drainage licilities in addition to careful monitoring of water quality changes will ensure this occur,,.
The following recommendations ue made to ensure degradation of the water quality does not occur.
The discharge of litter, sewage and hydrocarbons into the water should be prohibited from the Marina Complex.
Sewage t'rom the complex should be disposed of via a reticulated deep sewerage system to ensure that nutrient input and bacterial pollution of the water does not occur. Design and construction of this system and ancillary ttcilities should be in accordance with Water Authority requirements. including safeguards to prevent sewage input to the mamna in the event of a system failure. Should sullage pump out facilities be installed these should also be connecte(l to deep sewerage.
Storm water from roots and caq)ark areas which may contain nutrients, hydrocarbon and heavy metals should be directed away from the waters and discharged into surface sands to remove particulates, hydrocarbons and mitit rien ts prior to water entering the marina via groundwater.
The EPA has set strict rules for the use of TBT based anti fouling paints. This prohibits the use of these paints on vessels that are smaller than 25m. Where boats greater than 25 m are permitted, maintainence area which cater for these boats require specific management. If this were to be the case consultation with the EPA to deteimine the correct procedures would be required.
Maintenance areas developed within the marina for boat repairs should have drainage system whereby runoff from these areas should be passed through silt traps to prevent entry of particulate matter including heavy metals into the marina. Heavy metals ale also expected to accumulate in small amounts in the sediments within the marina from antitntling paints used on boats. This is expected to be a slow process and have little impact on the water quality. Heavy metals accumulating in the water column will be reduced by the increase in flushing expected from the marina design.
Refuelling stations may impact on water quality through spills. It is however expected due to the small amounts of fuel being dealt with and the light fractions involved that the impact of this activity will be low. However, contingency plans including emergency procedures and clean up operations should be developed to ensure the impact is minimised. Emergency procedures will be the primarily the responsibility of the Depamiment of Marina and Harbours once the marina is operational
In conclusion the present water quality of Casuarina Harbour is expected to have little or no impact on the proposed marina development. If the appropriate design is used for the marina the proposed development will also have little or no impact on existing water quality. However, a detailed water quality monitoring programme should be undertake ii to detect any ci mange in water quality paranmeters. The data collected in this study will provide a baseline against which changes can be determined.
21

4.2 Impacts on the biological environment Rezoning and future development of the subject land for tourist/recreational, commercial and residential purposes will increase the numl)er of people using the area. This increase may have an adverse impact on the l)iological environment and the regional conservation values of the area.
A major conservation area ( System Six Recommendation C 6) is located on the north shore of Leschenault Inlet and on Anglesea Island The area is valuable because of the existence of rare mangal communities and a large waterbird population.
It is not expected that the development at this stage will impact on this area, however it is recommended that if future development occurs in proximity to this area the area should be retained for conservation, education and passive recreation purposes as pail of the overall redevelopment. A management plan is currently being prepared for this area by LIMA and the Bunbury City Council. Development in the area should be in accordance with this management plan.
An increase in human use of the area also has the potential to adversely impact on the regional conservation values of the area. To minimise this impact educational information to raise l)UhliC awareness relating to use of the environment and protection of conservation values should be prepared.
The Marina Corn Ic x in ay in ii her impact on the bin tog cal environment. This impact will be of' t Ii ree main types including short terni distit rt):liices during construction, direct loss of species as a result ot construct ion, and ongoing disturbance as a consequence of change in use of the area.
Short term impacts
A short term increase in turbidity of the water is expected during construction of the marina. This is not expected to have an large impact on the seagrass and benthic communities that exist within the waters.
Construction of the marina may have an adverse impact on the dolphin communities of the area if not managed properly. Dolphins regularly enter Koombana Bay and are currently being studied by the Department of Conservation and Land Management who have a field station on the loreshore of the Bay. B lasting and pile driving for the construction of the marina is considered to have potential impact on these cOillillUnities as a result of the noise generated underwater.
To reduce the impact of these activities on the dolphin communities the Department of Conservation and Land Management should be consulted to determine the times of the day when these activities could be carried out. The marina should also be designed to require the ni in i ma I amount of blasting and pile driving.
Loss of species
The investigations undertaken on offshore tlora have indicated that the proposed marina site is virtually devoid of seagrass and niacroaglae. I - 2 % coverage of seagrass does exist in the inner Casuarina Harbour area. A permanent loss of this existing se;igrass will occur asaresult of construction of the marina if dredging is used. This loss is not considered sign i licant as the biological environment of the area is in a degraded condition as a result of existing harbour facilities.
Seagrass meadows have also been identified to the north of Koombana Bay. Due to the distance of these meadows from the development site it is considered unlikely that any loss of coverage will occur.
The onshore flora of the development site has been found to be relatively sparse and unimportant. Most species present are introduced species and of no conservational significance. During construction of borcshore facilities some of these species may be removed. It therefore is recommended that where possible areas of the development should be revegebated with native species eiidenuc to the site.
It is not expected that there will be any loss of onshore or otishtore fau tia species front the construction of the marina or foresliore works.
22
Ongoing impacts
An increase in people in the area as a result of the provision of a marina complex may put pressure on the fish populations of the area. An increase in fishing effort for edible species of fish, molluscs and crustacca may result in a decrease in diversity and abundance of species in the area. Management actions to minimise the impact of such a decrease should he iflq)lenlenled.
The marina development is not expected to increase boating traffic within the area to an extent where it will impact on the biological environment.
It is considered that the marina complex may have a long term beneficial impact on the biological environment by providing new habitats. The new causeway and jelly pile will provide an excellent habitat for the colonisation of species such as sponges, and mussels. The protected waters within the marina will also provide a suitable breeding ground for juvenile fish and crabs.
23

t)
5.0 REFERENCES
Cooper. Dr. M. (1990) Australian Radiation Laboratory, Victoria. Australia. Pers. Comm.
Department of Conservation and Environment (1983) Conservation Reserves for Western Australia- The Darling System - System 6. Government of Western Australia.
Klemm, V.V. (1989) Report on Mosquito Control in the Leschcnault Estuary Region. Government of Western Austra, lia.
Le Provost, Semcniuk and Chalnier (1982) Bunhury C Power Station, ERMP - Marine Environmental Study, Phase I - Review and Preliminary Assessment. State Energy Commission.W.A.
Le Provost, Senienuik and Clialnici (1983) I3unhuiy C Power Station, Marine Environmental Studies Volume 3 (Part 1).
Leschenault Inlet Management Authority (LIMA) (1985) An investigation into the Lower Inlet, Bunbury. Waterways Commission, W.A.
Ninox Wildlife Consulting (1989) The Significance of Mosquito Breeding Areas to the Waterbirds of Leschcnault Estuary. Western Australia. Waterways Commission Report No.14.
TD Meagher and Associates (1981) New Bunhury Power Station Development Environmental Study. State Energy Commission.
Waterways Commission (1990) Leschcnaul t Inlet Manageinen t Program me Review, Waterways Commission Report No 19.
25


6.0 APPENDIX 1 GRAPHICAL REPRESENTATION OF WATER QUALITY DATA COLLECTED
Part A: Physical Parameters
Part B: Nutrients, Chlorophyll and Bacteria in the Water Column
Part C: Nutrients in the Sediments
PartD: Toxins
Part E: Phytoplankton
27

IiI I. •11


N- CO 0) 0 CC) I I :i: 111111 ' cam co coca cam ca call
cam
Co CO LI) CC) N- 0) 0) 0 CD 111111111'- '--coca coca coca coca call
coca
FIGURE 3
FIGURE 4
Surface and Bottom Dissolved Oxygen pH
Summer (Dec 1990)
Winter (Aug 1990)
D surface DO
$ bottom DO
8
6
tM
tM >'
0
a) > 0 U) U)
2
0
site site
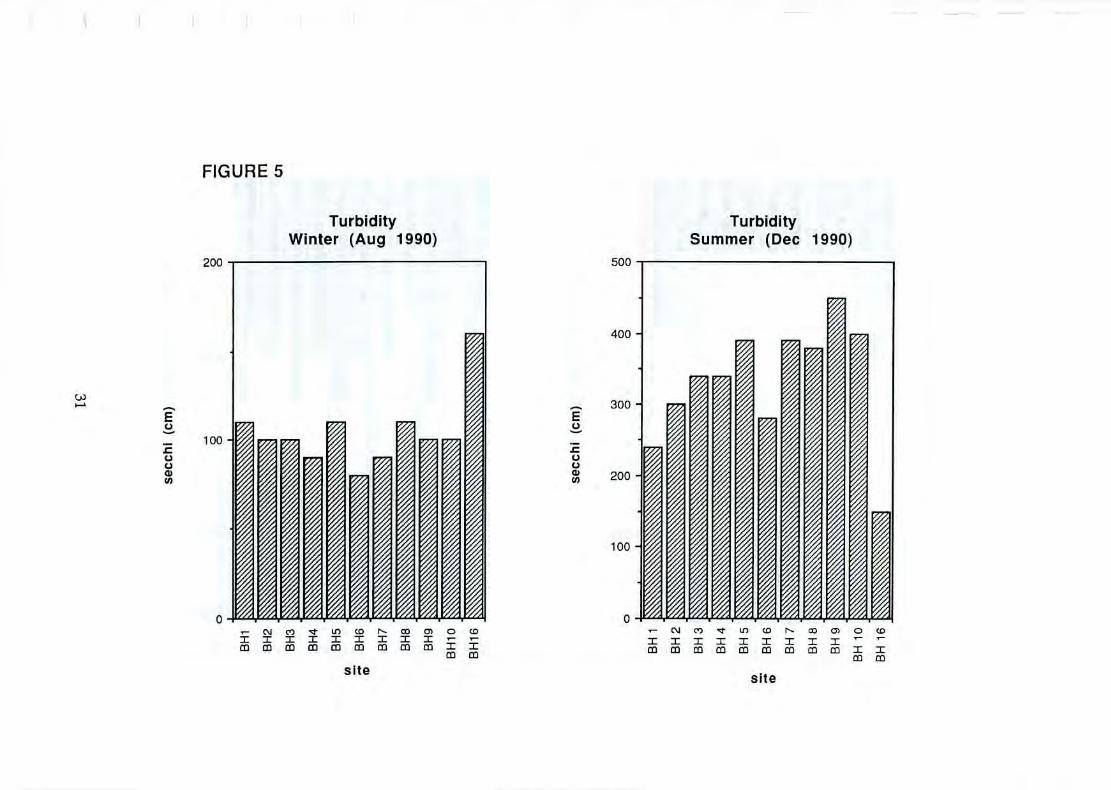
HGURE 5
Turbidity
Turbidity Winter (Aug 1990)
Summer (Dec 1990) 500
400
E C.) - 100 C.) C.) a) U)
- 300 E C.)
C.) C.) 200
100
"T'TTIIEC 0
1I1111111'_ - m mm mm mm mm J I
mm
site

60
50
40
20
10
0
FIGURE 10
FIGURE 11
0.006
0.005
0.004 0) E
ic 0.003
0. 0 0 .c 0.002 0
EM
[•ZII.II]
Surface and Bottom Chiorophyll'a'Leveis
Bacteriological levels during 1990 (Escherichia coil)
Jan Feb May June Sept Oct Nov
Site month

Part C: Nutrients in the Sediments
FIGURE 12
Wet to dry ratio vs total phosphorous Sediments from Casuarina harbour,
1000 , Koombana Bay and Leschenault Inlet
BH 1 + BH 2 800
y= - 116.92+ 10.737x RA2 = 0.745
JB BH 5
cm 600
BH 16++BH 4 C)
/+BH a. 9 + BH 8
0 400 +BH7 BH3
/ 6
200
10
.1 • I • I • I I
0 20 40 60 80
Wet to dry ratio (% moisture)
FIGURE 13
Wet to dry ratio vs total nitrogen Sediments from Casuarina harbour,
6000 , Koombana Bay and Leschenault Inlet
+ BH 2 5000 y = -2191.9 + 79.646x R'2 = 0.822
BH 5
B 4000 H 4 BH 1 C)
C)
3000
2000
BH/16 z
BH 9
1000 1+ BH 7
I BH1O /BH6
f I I
VI • I • I • I • I
0 20 40 60 80
Wet to dry ratio (% moisture)

N) C) 0 0 0 0
R.
DDDD. 7 -4:11 u . . Cr CD
CO 0
CD CI)
C, :CD
0
ct.. '0
CA
9
Radionuclide concentrations (Bq/kg)
0 0 0 0 0 0 0 0 0
TBT & metabolites (nglg)

FIGURE 16
FIGURE 17
Heavy metal concentrations in Casuarina Harbour
Heavy metal concentration in Mussel Tissue
100000
5000
Jetty
Leschenault Pipeline
10000 4000
E
E
1000
100
3000
2000
10
•0S
[óI AgAsCdCoCrGuFeMnNiPbSnTi V ZnLCC03
AgAsCdCoCrcuFeMnNiFbSnTi V Zn
Heavy metal Heavy metal

BH 2
BH 9
CD
BH 10
BH 16 '1'
Percentage Composition
N) 0) 0 0 0 0
BH 2
BH 9 Ca)
CD
BH 10
BH 16
Count (cells/mi)
N) 0 0
0 0 0

Appendix 4
Historical Study

European History and Historic Sites
-Technical Report for the Bunbury Harbour City Redevelopment
Report prepared by Andrew Pope B. A. (Hons.)
for the Waterways Commission on behalf of the
South West Development Authority
1990


Table of Contents
1.0 The growth of Bunbury as a port city 1
1.1 Period to ca.1864 1
1.2 Summary of period down to 1864 2
1.3 Period, ca.1664 to ca.1890 3
1.4 Summary of period 1864 to ca.1890 4
1.5 Period, ca.1890 to ca.1957 4
1.6 Summary of period ca.1890 to ca.1957 5
1.7 Period Ca. 1957 to the Present 6
1.8 Summary of Period ca.1957 to the present 6
1.9 Summary and Conclusion 7
2.0 Bunbury Wrecksites 9
2.1 Implications for development proposal 10
3.0 Landward sites of European significance 13
3.1 Sites of significance within proposed study area boundaries 13
3.2 Implications for development proposal 14
4.0 Bibliography 15
List of Maps
Map 1: Koombana Bay Wreck Sites and Shoreline Changes (from Chartts, Photographs and Personal Communications) 17
Map 2: Historical Sites 18
111


1.0 The growth of Bunbury as a port-city
The evolution of Bunbury from a semi-sheltered anchorage in the early nineteenth century to an important regional port-city in the 1990s has followed closely the processes of port-city development conceptualized by Broeze, Reeves and McPherson (1984:10-12). Port-cities generally evolve from being more or less safe anchorages or landing sites which may have a small settlement attached, through a stage where harbour facilities exist along with market facilities and a town. Finally they become well-developed poiis offering increased market facilities and a diverse infrastructure including financial, industrial, transport, social and educational institutions: the port-city.
It is essential that the European history of Bunbury be seen as an integrated process with emphasis on both the key role that the maritime economy played in its development and also the related landward infrastructural developments, both economic and social, which are essential elements in the subsequent social and economic development and growth of Bunbury. Thus, the land and sea elements must both be taken into consideration when evaluating Bunbury's heritage. This study will examine Bunbury's growth over four periods related to the development of the port. The first will be the period to 1864, when the timber jetty was constructed; the second period is 1864 to ca.1890, when railways extended Bunbury's hinterland and the breakwater was constructed; the third stage is ca.1890 to ca.1956, when the port was altered to accommodate the demands of the mineral sands industry; and lastly the period from ca. 1957 to the present.
1.1 Period to Ca. 1864 Although, Dutch and later English explorers had touched the coastline of Western Australia as early as the 1600s (Cape Leeuwin was named in 1622), the first tangible evidence of Europeans in the Bunbury region comes from the first years of the nineteenth century. The preponderance of French names for many of the geographical features of the south west of W.A. provides ample evidence of French interest in the region. The French gave the name Port Leschenault to the site of present-day Bunbury in 1803 in honour of the botanist on board the French vessel Geographe (Clarke, 1 946:7).
The French, however, were not interested in settling, although their presence raised sufficient British fears and perceptions of their intentions with the result that the western portion of Australia was claimed for the British in 1826. In that year a garrison was established at King Georges Sound and in 1829 the Swan River Colony was founded. The new colony struggled during its early years and suffered food shortages. These shortages led to searches for land suitable for agriculture which could meet the Colony's demand for foodstuffs.
In 1829 Dr Collie and Lt. Preston explored the Port Leschenault district, initially by boat on the newly-named Preston river, and then on foot. Port Leschenault was then inhabited for six months 1830 by a military post, which was soon transferred to Augusta (Sanders,1975:3). In 1836 Lieutenant Bunbury travelled overland from Pinjarra to Vasse and then to Port Leschenault where he and Governor Stirling inspected the Port Leschenault area. Stirling then honoured Lt. Bunbury by naming the proposed townsite after him (Sanders,1975:7). Bunbury was settled in 1838 and was proclaimed a town in 1841.
Bunbury was tied to the sea from its beginnings, as the early efforts at farming were supported by trading with the fleets of American whalers that used the bay for shelter, re-stocking and re-fitting from the 1840s. Shore-based whalimig, bay whaling, was established by local residents in the early 1840s (Heppingstone,1966:32-33). Bay whaling at Bunbury involved the use of
1

lookouts on higher ground, such as Mariston Hill, to spot whales as they moved along the coast. When the whales were sighted, vessels would set out from the bay to harpoon them.
The region received a short-lived boost in population and expectations when land to the north of Bunbury was set aside for the Australind settlement of the Western Australian Land Company. The first emigrants arrived from Great Britain in 1841 but the scheme soon collapsed under financial and management problems and the settlers drifted away, thus depriving the region of a much-needed infusion of capital and labour (Crowley, 1960:16).
The lack of adequate port facilities acted as a brake on Bunbury's early development as it proved difficult to transport heavy agricultural implements, not to mention settling families. Although other complementary reasons exist, the lack of an adequate port acted, at least in part, to keep production levels low. Even so, it is possible to see the beginnings of a maritime export trade develop in the 1840s. The odd bale of wool from the port's hinterland was exported by sea to Fremantle (Fyfe, 1 983:46) and in 1845 a cargo of horses was exported from Bunbury (Clarke, 1946:24-5).
The beginnings of a commercial infrastructure were also discernible in the 1840s. An American whaler, Captain Francis Coffin, whose vessel the Samuel Wright was blown ashore in Koombana Bay in 1840 (Henderson,1980:171), traded various stores which were obtained by barter from vessels in the Bay. Coffin appears to have supplied provisions, such as meat and vegetables, in return. Coffin also acted as a pilot for vessels entering the bay. This was an important aspect of improving port facilities as ships could be induced to call if a pilot service was available, even if that pilot was acting in that capacity because his ship had been wrecked in the Bay! (Clarke,1946:24). Other traders, such as J.K. Child, also commenced their operations in the early 1840s. Child apparently ran a store as well as engaging in whaling, farming, and brewing until his death in 1846 (Clarke,1946:24).
In addition to these commercial aspects, social and administrative infrastructure began to be developed. In 1842 the first church was completed and a Town Trust was established in 1843 with local interests in mind. Many of the other infrastructural roles were performed by the Resident Magistrate who was responsible for such aspects as recording shipping movements, mails and registering births, deaths and marriages (Sanders,1975:23 and Clarke,1946:27). Education was catered for spasmodically from 1843. The school closed and re-opened at least once due to fluctuating attendance (Clarke,1946:41). The community's demand for alcohol and also temporary accomodation was catered for by the several inns that were present from the early 1840s.
1.2 Summary of period down to 1864 Bunbury in this early period was clearly at the first stage of its development as a port-town. It had an anchorage that was moderately safe in summer but certainly not so in winter. The port had few facilities and the settlement was quite underdeveloped in terms of market and commercial infrastructure. The hinterland was slowly becoming productive in a few commodities and the foundations of its symbiotic relationship with the port-town were being laid. The maritime-based economy was in the initial years the lifeblood of the town. Whaling provided a moderate, if shaky, source of income both by creating a demand for local produce for supplies and as a means in itself. Maritime trade, however, was dependent on the production and demands of the hinterland.
2

1.3 Period, ca.1864 to ca.1890 The first major steps toward improving shipping facilities were taken in 1864 with the completion of a 1400ft timber jetty. This encouraged and facilitated shipping to use the port, which in turn boosted the development of the productive areas of the hinterland. The period from the 1 860s to the early 1890s was one of moderate growth and one where the foundations of Bunbury's later development as an important regional port-town were laid. The hinterland grew more productive and as inland transport systems improved the port of Bunbury was called upon to cater for increasing amounts of primary produce.
Sandalwood exports from the port to markets in Singapore played a significant role in the development of Bunbury. More important in terms of long-term benefit to Bunbury was the trade in jarrah. Bunbury was well situated to serve as the outlet for the hardwood trade which increased significantly over the 1880s and, especially, the 1890s, driven by worldwide demand for railway sleepers and mine and jetty construction (Crowley,1960:l39).
Wool exports were in their infancy in this period, and the amounts barely justified deliberate calls at Bunbury by wool ships. Indeed, wool exports were catered for by vessels that had called for other cargoes such as timber and took the wool that had accumulated over the season as additional cargo. This was to change in the 1890s (Fyfe,1983:215).
In order to improve shipping facilities, a wooden lighthouse equipped with flags was built on Mariston Hill in 1870 (Molyneux,1978:109) and the jetty was extended in 1875 and again in 1888. These extensions not only increased available berth length but, more importantly, provided facilities in deeper water which thus enabled larger vessels of greater draught to berth. Although facilities had been improved, shipping was still susceptible to gales from the north-west and owners remained reluctant to commit their vessels to Bunbury. With this hindrance on trade and the low population of the region Bunbury's development was slow.
Even though the rate of growth was slow, it appears that this period was a stable one and a period of consolidation for Bunbury. The town was further integrated with the Colony's capital, Perth, with the completion of the Perth-Bunbury telegraph in 1872. Communications were reinforced by the introduction of regular steamship services between the eastern states and Fremantle that called at intermediate ports including Bunbury. Bunbury became a municipality in 1871 and was upgraded into a mayorality in 1887. The commercial development of the town was boosted with the opening in 1887 of the Bunbury Building Society which provided local businesses with access to capital (Molyneux,1978:62-63).
Social infrastructure was also in evidence with societies and institutes being formed and the holding of such events as dances, exhibitions, regattas, and race meetings (Molyneux,1978:62-6), in addition several more hotels were built in this period (Clarke,1946:58-59). The educational foundations of the earlier period were built on and in 1869 the Bunbury School boasted 62 students, while schools at Picton and Australind had 30 and 14 students respectively (Clarke,1946:41). In the 1870s schooling was divided by sex and two separate schools operated.
The community's desire for religious institutions led to the building of a Roman Catholic church in 1862 which later had a convent and school attached. The Congregational Church, established in the earlier period of Bunbury's history continued to provide for religious needs of sections of the community. In 1884 a Methodist minister conducted services in Bunbury and a Methodist church was built the next year (Clarke,1946:39-40).
3

1.4 Summary of period 1864 to ca.1 890 The second stage of port-town development is clearly evident in this period. The construction of the timber jetty signified the shift from anchorage to harbour which although still seasonally unsafe, was able to provide shippers and traders with the means to facilitate trade. The subsequent and regular improvements made to the harbour further encouraged Bunbury's development as a port-town. It was also a period in which the landward side of the relationship evolved. A commercial, transport and social infrastructure began to grow in Bunbury with markets, capital and communications. The extension of the telegraph from Perth, and regular shipping services, meant that Bunbury was drawn closer to the economic and social sphere of Perth. Education and religious institutions also grew alongside the commercial institutions. The hinterland was demonstrably more productive in this period with the growth of sandalwood and jarrah exports as well as some wool and other agricultural products.
1.5 Period, ca.1890 to ca.1957 The 1890s were a boom period for the colony of Western Australia, due to the discovery of gold, firstly in the north of the state in the late 1880s and then in the central areas such as the Yilgarn and Kalgoorlie. It was an era of prosperity and of substantial population growth and one which had a positive effect on the development of Bunbury. The large amounts of capital that accumulated in the colony, or that entered from other areas, led to many public works projects being undertaken.
The construction of railways had a twofold benefit for Bunbury. Firstly, Bunbury was the main outlet for the timber producing areas and thus the resultant demand for hardwood timber for sleepers was directed through Bunbury, and secondly, Bunbury was soon linked by rail to other areas of the fertile south-west. The effect of this was that Bunbury became the port-town for a wider hinterland which spread along the lines of transport.
Local hardwood demand also came from the expansion of the telegraph and telephone systems. Poles were required over ever-increasing areas. The realisation that the major gold reserves were underground led to the development of large mining operations which also required hardwoods for construction pUIpOSeS in and around the minesites. There was also demand from overseas countries such as the U.K. and India and from colonies in eastern Australia for similar purposes and Bunbury supplied a lot of the timber exports to these areas.
The rapid growth of the timber industry placed the port of Bunbury under increasing pressure to improve facilities. The jetty was extended in 1897 and, to make the port safer, construction of a breakwater commenced in 1897 at Casuarina Point. When completed in 1899 it ran to over 3000ft. The incidence of major shipping accidents was reduced and there were no wrecks after 1903 (Lally,1961:53). Also in 1899, the jetty became connected to the States railway system. Extensions were made to the jetty in 1900 and 1902 and facilities such as goods sheds and water supplies were added. Further extension occurred in 1906 and 1907, the breakwater was lengthened in 1908 and another section was added to the jetty. The lighthouse also underwent improvement in this period, being replaced with a steel tower.
These improvements benefitted production in the hinterland. Wool exports grew in size during the 1890s and were sufficient to attract regular steamships, such as the Australind and the Sultan (Fyfe,1983:213-216). Wool exports, however, still lagged behind those of timber in terms of importance, but improved rapidly over the first two decades of the twentieth century and by 1915 the quantity of wool exported through Bunbury was 3500 bales, most of which went to Singapore. Local trading companies and firms, and of course the banks, benefitted from this increase in business (Fyfe,1983:229-230). Wheat was first exported from Bunbury in 1914 and soon became an important export commodity (Donaldson,1946:5).
4

Although the state's only productive coalfield was situated in Bunbury's hinterland, at Collie, the low quality of Collie coal and the fact that the State Government bought most of the supplies for railway use, meant that it played only a minor role in Bunbury's development. The expansion of mining at Collie did have some impact on Bunbury as it became a popular holiday destination for miners and their families.
The growth of Bunbury was set back with the outbreak of World War One. The farming and timber industries lost labour to the armed forces and also lost some of their markets due to the war. The trade of Bunbury, and most other places, was affected by a shortage of available shipping tonnage brought about by the diversion of vessels for military needs as well as the loss of ships by warfare. 1-lowever, the influx of returned soldiers to the region following the war on Group Settlement Schemes led to a rapid development of primary production, this was also assisted by drainage and irrigation schemes (Lally,1961 :69).
Increased production of fruit, timber, wheat, dairy products in Bunbury's hinterland brought a growing air of prosperity to Bunbury (Crowley,1960:218). This was matched and encouraged by the leaders of Bunbury who realised the importance of further upgrading of the port. The Harbour Board had been formed in 1909 (Blee, 1982:11) and it oversaw further development of the harbour. Extensions were made to the jetty in 1910 and 1921 and to the breakwater in 1918 and 1936.
The depression of the early 1930s hit Western Australia badly due to the dependence upon primary products such as wheat and wool. The depression severely affected the economic base of Bunbury. The fall in prices for primary products not only affected producers but also all those who were dependent on trade, such as shipping and commercial agents, transport operators, general merchants and their employees. Notwithstanding the economic conditions, a superphosphate plant was constructed at nearby Picton in 1930 (Blacker,197?:70). As well as supplying the agricultural hinterland with a means to improve production, the plant also created a demand for the import of the required raw materials (Donaldson,1946:6).
The period between the depression and the outbreak of World War Two saw local recovery and expansion of dairying and wheat production in the hinterland served by Bunbury's rail connections. In 1937 Bunbury's role as the regional outlet was enhanced by the construction of bulk wheat silos and loading facilities at the port. The harbour itself also underwent further, minor, improvements in this period.
World War Two saw trade and shipping at Bunbury dwindle. Total net register tonnages (nrt) of vessels using the harbour fell from 292,073 in 1938 to 114,734 in 1943 before recovering slightly to 174,771 in 1945. Raw materials such as phosphate and other requirements were denied to the hinterland areas, as was labour supply, and pre-war markets were disrupted, as was the case in World War One.
Population increased in the immediate post-war period and the hinterland recovered as it regained its pre-war markets and found some new ones but, as shipping tonnages indicate, the rate of recovery in sea-trade was slow. Net tonnages remained close to their war-time levels, and were certainly well below pre-war levels, throughout the late 1940s to the inid-1950s.
1.6 Summary of period ca.1890 to ca.1957 The period from 1890 to the mid-1950s saw Bunbury become a well-developed harbour with an equally well-developed infrastructure and the town took on the main attributes of a typical port-town. It was a period when the export economy of Bunbury was in full swing: hinterland production was becoming more diversified and the improvement of internal transport allowed the tapping of a wider hinterland while the improvements of the port meant also that a wider market could be tapped. The improvements allowed larger ships, particularly steamers, to call safely and take up cargoes from Bunbury. The extension of communications and transport from
5
Bunbury, and the improvements within the port re-inforced Bunbury as the commercial, social and business centre of the region (Lally,196l :67).
1.7 Period ca.1957 to the Present The mid to late 1950s marked a new phase in Bunbury's development when the economic base was broadened from almost sole reliance on primary products to include industrial and resource-based products. The first step toward the industrial base was the commencement of mineral-sand mining operations in 1957 at Cape! (Crowley,1960:347). Ilmenite was extracted from the beach sands and 1958 marked the first export of ilmenite from Bunbury (Blacker,197?:70). Following this a titanium oxide processing plant was established in 1963 to process the ilmenite which further strengthened the industrial base of the Bunbury region, as well as trade through the port. Shipping tonnages rose from 155,716 ml in 1956 to 213,030 nrt in 1957 and continued to rise. By 1964 net tonnages through Bunbury harbour had reached 600,376 nrt (Bruce,1965:45).
Other extractive industries became established in Bunburys hinterland and stimulated the maritime trade of Bunbury. The port became important for bauxite mining and alumina refining operations. Bauxite was mined in the Darling Ranges and refined into alumina at Pinjarra which was then exported through Bunbury. Further refineries have been constructed at Wagerup and Worsley which are also served by Bunbury port (Blee,1982:9).
The trade in timber products shifted in this period from hardwood trade to woodchips. These are railed to Bunbury from production areas in the south-west. The first cargo of woodchips was exported in 1976. Other industries have been established in Bunbury and the hinterland, such as the edible oil factory. At the same time Bunbury has retained its older role in catering for the products of the agricultural hinterland.
The harbour has played a significant and anticipatory role in the development of Bunbury's industrial trade base. The jetty underwent its final extension in 1956 and two land-backed berths were created on the breakwater, the first in 1963 and the second in 1966. These were designed to allow for road access to the berths for mineral sands exports and phosphate and sulphur imports. In 1963 extra grain silos were constructed creating greater storage capacity. Major modifications were made between 1969 and 1975 when the inner harbour was created and the approach channel dredged (Study of WA Ports,1982:appendix A).
The breakwater berths still cater for the ilmenite loading while alumina and woodchips are exported from the inner harbour. Imports of petroleum products and bunkering are also handled from the inner harbour. Improvements continued with an all-purpose berth being constructed in the inner harbour in 1980 and new grain loading facilities in the outer harbour following the closure of the jetty to commercial use in 1982 (Blee, 1982:9-10 and Study of WA Ports,1981 :63-63).
1.8 Summary of Period ca.1957 to the present In this period then, Bunbury not only operates as the regional outlet for an agricultural hinterland that produced wheat, timber, fruit and dairy produce, but it was also the outlet for the region's growing industrial base. The commencement of mining in the hinterland served by the port injected new life into Bunbury as it became the key outlet for mineral sands, alumina and woodchips. The growing population of region, in some part due to the establishment of these industries, was also served by Bunbury for shopping, financial, medical, social and educational needs, including now tertiary and technical education, so that in the 1990s, Bunbury is undoubtedly the major regional city. The key to this regional role has been the stimulatory role played by the harbour to cater for increased and varied demand from hinterland industries.

1.9 Summary and Conclusion The Bunbury region was initially settled as part of the plan to open more land to agriculture in the early years of the Swan River Colony. The maritime influence was an important aspect in the survival and subsequent prosperity of Bunbury. French explorers left their mark early in the nineteenth century but did not settle, whaling was crucial in the settlement's formative years, and later, as the hinterland developed, maritime trade became the lifeblood of the town.
The role of the port has been crucial in Bunbury's development. From the early days it was the interface between the isolated settlement and the rest of the Swan River Colony. The development of agriculture, and later the industrial base, would not have been possible without the port as the port allowed the products of the hinterland to be transported to markets ands also enabled necessary implements and supplies to be imported. Bunbury clearly evolved from an undeveloped hamlet with an unprotected anchorage, through various stages of development that were the product of the port / hinterland relationship, to become a well developed port-city that provided commercial, social and and educational infrastructure for the wider region.
The raison d'etre of Bunbury's development as an urban area has been the port. The other elements such as financial institutions, social needs and transport have all evolved as part of Bunbury's development as a centre for trade. These elements are all necessary for the primary function of the port-city, trade, but now also serve the interests of Bunbury and its hinterland that are not directly connected with trade and shipping. This is typical of a port-city, however, it is essential that foundations and symbols of Bunbury's development, the port and maritime trade, be preserved and enhanced as the city's identity.
7

rani

2.0 Bunbury Wrecksites This section on wrecks is based on a comprehensive survey undertaken by Mike McCarthy of the Western Australian Museum in 1982. The report, titled Koombanah Bay Wrecks. An Investigation of the Wrecks in the Bay for the State Energy Commission of W.A. was commissioned by the S.E.C. to determine the impact of the Phase C extension of the Bunbury power station on the wrecks in the bay. Also used is a list of known wrecks down to 1880 taken from Graeme Henderson Unfinished Voyages vols. 1 & 2. This section refers only to vessels that were actually wrecked and not those which were involved in minor accidents or refloated after minor strandings.
The anchorage at Bunbury proved to be unsafe, particularly in the winter months as it was exposed to north-westerly gales. The frequency of shipping accidents resulted in Bunbury gaining a poor reputation as a harbour, with the consequence that shipowners were reluctant to call at the port. This, in turn, hindered the development of trade through the port. The construction of the jetty in 1864 assisted shipping in terms of facilitating loading but provided little protection for vessels and they continued to be susceptible to bad weather. It wasn't until the turn of the century, with the construction of a protective breakwater, that Bunbury became a safer all-weather port. No major wrecks were reported after that of the Laughing Wave in 1903 (McCarthy,1982: 1).
McCarthy (1982:9) points out that the wrecked vessels often filled with sand quite rapidly and sank into the beach. The hulls often remained intact but timber and fittings that remained above the water and sand line were salvaged by the settlers, thus the remains of the wrecks are essentially the hulls. The considerable changes to the shoreline through harbour modifications and the siltation process means that the present sites of the wrecks are some way inland from the present day shoreline, and are also buried several metres below the sand. This is shown quite clearly by Map 1 (McCarthy,1982:3), It should also be noted that Map 1 includes some sites which have not been positively identified.
The wrecks listed below have been compiled from McCarthy (1982) and Henderson (1980 & 1988).
Samuel Wright, American whaler wrecked 8-7-1840. The Samuel Wright was blown ashore and wrecked in Koombana Bay.
2 North America. American whaler blown ashore 8-7-1840 in Koombana Bay and wrecked.
3 North America. American whaler blown ashore in Koombana Bay 15-4-1843. Not connected with North America wrecked in 1840. Salvaged and refloated in June 1843 but was subsequently blown ashore again and wrecked.
4 Elizabeth. Schooner blown ashore in Koombana Bay, 17-11-1843. Part of the cargo comprised material salvaged from the North America wrecked earlier that year.
5 Perseverance. A small cutter, it parted anchor in a gale 28-2-1845 and driven ashore and wrecked. Although included by Henderson as being wrecked ashore the Perseverance is not listed as a known wrecksite by McCarthy.
6 Midas. Barque, loading timber at Bunbury, in 1872. The Midas dragged her anchors in a storm and ran aground on 10-3-1872 and was condemned as a wreck. The wreck was a navigation hazard and was dynamited in 1874 but this failed to completely remove the wreck. Henderson (1988:104) notes that although it was reported in 1875 that the wreck "lay about 365 metres east-south-east of a bend in the jetty..." subsequent alterations to the harbour have disguised the wreck site, thus preventing an accurate position to be given.
9

7 Annie M. Young. Blown ashore in a gale 2-1 1-1876. The brig struck the north shore about 2.4 kilometres from the estuary mouth and was not refloated.
8 Citizen of London. Locally built schooner engaged in loading sandalwood for Fremantle. On the 20-8-1880 she was holed while at the jetty by the action of the swell and was run ashore by the crew at north beach approximately 2 miles from the jetty, near the wreck of the Annie M. Young. The hull was moved up the beach in order to repair it but in fact was dynamited shortly after to break it up.
9 Cingalee. wrecked ashore in 1887.
10 Star of the South. This vessel was stranded at the mouth of the estuary in 1888.
11 Carbet Castle. This was the largest ship to be wrecked at Bunbury. She was blown ashore in 1897. The site is outside the study area boundaries of this report as she lies off the power station under accreted sand.
12 Solglyt. The Solglvt was wrecked ashore in 1901.
13 Laughin' Wai'e. This vessel was wrecked whilst alongside the jetty in 1903, although the exact position is not clear.
2.1 Implications for development proposal Shipwrecks sites in Western Australia are protected by two Acts: the Maritime Archaeology Act, 1973 (Western Australia) and the Historic Shipwrecks Act, 1976 (Federal). Mike McCarthy (1982:11) outlined the legal position regarding to wrecks in Koombana Bay, Bunbury, in his 1982 report for the S.E.C. His outline is as follows:
Under the terms of the State Act all ships wrecked before 1900 are deemed to be protected sires and therefore, cannot be interfered with without the consent of the Trustees of the Western Australian Museum.
McCarthy indicated that the relevant clauses are:
"Historic Ship means any ship that before the year 1900 was lost, wrecked or abandoned, or was stranded on or off the coast of Western Australia.
"A Maritime Archaeological site may be situated below low water mark, on or between the tide marks, or on land, or partly in one place and partly in another."
"(1) A person who- without the consent of the Trustees, in any way alters, removes,
destroys, damages or in any way deals with, or assumes the possession, custody or control of, any maritime archaeological site, ship, relic or thing vested in the Museum on behalf of the crown pursuant to this Act; or
having the consent of the Trustees to do any of the things mentioned in paragraph (a) of this subsection, is in breach of any condition to which the giving of the consent was subject; or
10

(c) impedes or hinders, or endeavours in any way to impede or hinder, any member of the staff or employee of the Museum or any person acting with the authority of the Trustees who is inspecting, recovering or otherwise dealing with any such site, ship, relic, or thing, commits an offence.
Penalty: Two thousand dollars or imprisonment for twelve months or both the fine and imprisonment."
McCarthy (1982:11) concludes that
"Of the 12 known sites, therefore, 10 are automatically protected sites and have been so since the provisions of the 1973 Maritime Archaeology Act caine into force."
The Historic Shipwrecks Act, 1976, was amended in 1985 to cover all wreck remains in Australian waters that are at least 75 years old (Henderson,1986:68). However, wrecksites "...Iying above a State's high water mark or in a State's bays are not covered by the Historic Shipwrecks Act..." (Henderson,1986:77). The site of the Laughing Wave, wrecked alongside the jetty in 1903, would now appear to be covered by this amended Act, bringing to lithe number of protected sites. The Soiglyt, wrecked after 1900 and now situated above the high water mark, would appear to be the only unprotected wrecksite. It is recommended that Museum opinion be sought to clarify the legal position of the Soiglyt.
It must be stressed that the above is only an outline of the legal position. It is recommended that the developers consult the complete Acts to make themselves aware of their full rights and responsibilities under these Acts.
The proposal for the upgrading of the power boat club facilities, such as carparking, and the landscaping of Koombana Beach have implications for buried wrecks. Locations given by Mike McCarthy for sites indicate that the wrecks identified as Soiglyt, Star of the South and Citizen of London, lie in the vicinity of the power boat club (See Map 1). These sites could be disturbed by any excavation while landscaping of Koombana Beach has the potential to uncover a number of other wrecks indicated on Map 1. The proposals for a pleasure boat marina have a potential impact for the wiecksites of the Midas and the Laughing Wave, although the exact positions of these sites are not known.
It is therefore recommended that prior to any development work occurring in the vicinity of any wrecksite, the advice, and if necessary, the permission of the Western Australian Museum is sought. Should any relics or wrecks be uncovered during development work, it is recommended that the Western Australian Museum be notified immediately, so that advice can be given as to the significance of the find and to subsequent procedure required.
11

r')

3.0 Landward sites of European significance Many of Bunburys historically important sites have been destroyed by previous redevelopments. The present proposal appears to take into account the few remaining sites of European significance, with the exception of Nell's Cottages and the old rubbish dump. The following list has been compiled after examination of Ian Molyneux' 1978 Bunbury National Estate Study, the City of Bunbury Town Planning Scheme No. 6 amended to 11 March, 1988, and from a meeting with members of the Bunbury Historical Society, September, 1990.
3.1 Sites of significance within proposed study area boundaries (Refer Map 2).
Point Casuauina. Early landing site and site of a quarantine station in the 1860s. It also marks the start of the breakwater.
2 Breakwater. Significant as part of the development of the harbour as an anchorage and the subsequent growth of Bunbury.
3 North shore of the Estuary. The approximate site of many shipwrecks.
4 Timber Jetty. Represents the first step toward development of the harbour.
S Point Macleod on north shore. First site of European inhabitation in Bunbury area and later the site of the quarantine station. The Bunbury Historical Society have erected a monument to mark the occupation site.
6 Wheat elevator and silos. Significant as example of engineering, also as symbol of Bunbury as regional outlet for agricultural produce and as a part of the "industrial townscape of the harbour." (Molyneux, 1978:86).
7 Bunbury Hotel. Built Ca. turn of the century and listed by Molyneux as being significant in the evolution of Australian architecture. Known initially as Gordon's Hotel, it is now under the name Captain Bunbury, Victoria St.
8 Parade Hotel. Built in 1897 on the waterline of the estuary off Stirling St. Subsequent alterations, however, have led to a loss of original character.
9 Wooden cottages between Power Boat Club and Caravan Park. BHS members indicate that two of these cottages, known as Nell's cottages, were built in 1914 as holiday cottages and were owned by Nell Wallace. These two were of timber vertical slab construction.
10 Rubbish dump on the site now occupied by Queen's Gardens. This has proved to a source of artefacts, chiefly bottles, from earlier stages of Bunbury's history.
13
3.2 Implications for development proposal
Victoria St Residential Precinct. In the pedesu'ian precinct planned for Victoria St north of Clifton St, the Captain Bunbury Hotel is probably the only important remaining site. The hotel is listed as part of the Bunbury National Estate by Molyneux and should be incorporated into the project. Although project maps indicate the western side of Victoria St is not involved in the development there is a small group of buildings opposite Guppy Park, one of which, at number 5 and presently occupied by the Port Pottery, was built in 1903 and could be incorporated with other buildings at 7 and 9 Victoria St into the proposal.
Queens Gardens Area. The landscaping of this area will undoubtedly uncover bottles and similar artefacts that comprise the rubbish dump, referred to by members of the Bunbury Historical Society. Several digs have been undertaken on this site by members of the public and the local bottle collectors club.
Silo Precinct. The first four silos and the elevator were built in 1938 with further additions in the early 1940s. The complex was expanded with the construction of additional silos in 1963. Although subject to architectural, aesthetic and engineering considerations, from an historical perspective the initial silo complex, at least, is of significance. This was the first major use of the continual pour method of construction. The site is also a potent symbol of Bunburys role as a regional outlet for hinterland produce such as wheat and thus represents the main reason for the growth of Bunbury port and town. As Molyneux pointed out (1978:86) it is a part of the industrial townscape that is centred on the harbour. It is arguable that the complex helps to reinforce the concept of Bunbury as a harbour city.
The significance of the silo complex will increase with the passing of time in the same way that the buildings and engineering works of the earlier period of Bunburyts history are now considered significant contributions to the natural estate. It should also be pointed out that industrial museum concepts, such as the Powerhouse Museum in Sydney, are growing in popularity and can be a useful tool for raising community awareness in the history and identity of their town or city. The Bunbury Historical Society strongly support the retention of the silo complex.
Power Boat Club and Holiday Village. The wooden cottages known as Nells cottages that lie between the boat club and the present caravan park should be incorporated into the proposals for these adjacent sites due to their inherent character and local significance.
Other sites. Previous draft proposals have indicated that European sites of historical significance such as the jetty, lighthouse, Marlston Hill lookout and the Breakwater are to be incorporated into the development concept. The lighthouse is outside of the present study boundary, but the jetty, the breakwater and Marlston Hill, as the original lighthouse site, are of major significance to the development of Bunbury due to their role in enabling the harbour to safely cater for shipping and trade, as the lifeblood of the settlement. The importance of these sites to Bunburys development as a port city should be incorporated into the proposal where possible.
14

4.0 Bibliography A Study of Western Australian Ports. Bureau of Transport and Communications and Director General of Transport, Western Australia, 1981.
A Study of Western Australian Pans: an Alternative View. Engineering Division, Public Works Department, Western Australia, 1982.
Blacker, Kevin. "Bunbury Port Expansion and its Effects on the Hinterland and Local Industry." Unpublished paper, Carey Park School, Bunbury, 197?
Blee, Anthony. 'Port of Bunbury', Port of Fremantle, 7,3 (1982) pp8-1 1.
Broeze, Frank; Reeves, Peter; and McPherson, Kenneth, 'Port Cities in the Indian Ocean Region 1815-1939: Functional and Methodolgical Issues', International Conference on Indian Ocean Studies, Perth, 1984.
Bruce, Lois. "Bunbury Harbour: A Geographical Survey." Unpublished paper, Graylands Teachers College, 1965.
City of Bunbury, Town Planning Scheme, No.6 amended up to 11 March 1988.
Clarke, G.E. Early History of Bunbury, The author, 1946.
Crowley, F.K. Australia's Western Third. A Histoiy of Western Australia from the First Settlements to Modern Times. London: MacMillan & Co., 1960.
Donaldson, V.A. 'History of the Port of Bunbury'. Unpublished paper, 1946.
Fyfe, Christopher. The Bale Fillers. Western Australian Wool 1826-1916. Nedlands, W.A.; University of Western Australia Press, 1983.
Henderson, Graeme. Maritime Archaeology in Australia. Nedlands, W.A.; University of Western Australia Press, 1986.
Henderson, Graeme. Unfinished Voyages. Wesstern Australian Shipwrecks 1622-1850. Nedlands, W.A.; University of Western Australia Press, 1980.
Henderson, Graeme and Kandy-Jane. Unfinished Voyages. Western Australian Shipwrecks 1851-1880. Nedlands, W.A.; University of Western Australia Press, 1988.
Heppingstone, I.D. 'Bay Whaling in Western Australia', Early Days, Pt 5 (1966),pp29-41.
Lally, John. "Development of the Port of Bunbury.' Unpublished thesis, Claremont Teachers' College, 1961.
McCarthy, Mike. Koo,nbanah Bay Wrecks. A Study of the Wrecks in the Bay for the State Energy Commission of W.A. Perth; Western Australian Museum, Maritime Archaeology Department, 1982.
Molyneux, Ian. The Bunbury National Estate Study 1978. South Perth, W.A.; The Author, 1978.
Sanders, Theodora. Bunbury. Canbe....... Roebuck Press, 1975.
15

PER m

I MAP 1. KOOMBANA BAY I I LESCHENAULT WRECKS AND SHORELINE CHANGES / -. - (from CHARTS, PHOTOGRAPHS AND PERSONAL COMMUNICATIONS) -
/ ESTUARY 1. I /
I I
Shoreline before the construction / / of the breakwater ( Casuarins Point ), 1895. -_ / j
/
/ / ¼,
Shoreline after 1950 / (ncluding more recent harbour worki. -0/
I BREAKWATER / /
JFM 0 /
((I . POWERTi KOOMBANA STAON
OLD ANCHORAGE
MY
) / I 'I
1 '..
B /
INNER
PLUG / -
H F - L
HARBOUR / - ..-
IC K .,. /
1 DE '-I- -
% /
f POINT ' MAOD
LESCHENAULr INLET
1km
A Laughing Wave (1903). H Agra (refloated).
B MIdas (1872). I Unknown.
C Solglyt (1901). J Unknown.
D Star of the South (1888). K North America (1843).
E Citizen of London (1880). L Unknown. (Possibly Samuel Wright, 1840).
F Unknown. M Unknown.
C Unknown. N Carbett Castle (1897).

MAP 2 HISTORICAL SITES
/ fOUTER
INDIAN }
9 20 500m
/1 CLIFTON ST
JflDt;; iUD _ JDDLi
:57P - S..
S..
E3
1 Point Caaarina. 6 Silo Precinct.
2 Breakwater. 7 Bunbury Hotel.
3 North Shore (refer Map 1). 8 Parade Hotel.
4 Timber Jetty. 9 Wooden Cothges (NeWs Cotlages).
5 Point MacLeod. 10 Old Rubbish Dump.

Appendix 5
Coastal Processes and Shoreline Stability
BUNBURY HARBOUR CITY
Technical Report
For The
Public Environmental Review
February 1992

SUMMARY
This document considers technical aspects of the Public Environmental Review for the Bunbury Harbour City Boat Harbour including, coastal processes and shoreline stability, storm events and sea level variations and flushing of the proposed marina. The investigations have been based on available reports and State Government records. In addition consideration of flushing of the proposed marina has involved the application of a two dimensional vertically integrated hydrodynamic numerical model.
The work reported upon in this document shows that the beaches in Koombana Bay and on the ocean coast of the City of Bunbury will not be detrimentally influenced by construction or operation of the proposed marina.
The Bunbury Back Beaches are physically remote from the proposed marina site and the littoral system of sediment distribution, wave climate and nearshore current regime will not be changed. It is not therefore anticipated that construction or operation of the proposed marina will have any detrimental influences on the Bunbury Back Beaches.
Similarly, as the proposed marina does not intercept sediment supply to the Koombana Bay Beach, alter the wave climate impinging upon this beach or alter the nearshore current regime, it is not anticipated that construction or operation of the proposed marina will have any detrimental influences on Koombana Bay Beach.
It is proposed in the later stages of marina development to realign the existing beach at the western boundary of the marina area. The proposed realignment results in a slight decrease in the length of beach within the marina. It is planned that all of this beach will be available to the public. The design of the proposed beach slope and sediment grain size will ensure that the realigned beach is stable. Changes in current velocity due to construction of the proposed marina groyne are insignificant and will not initialise erosion of the existing beach or of the realigned beach.
The prime conclusion of investigations of the flushing of the proposed marina is that construction of the marina groyne will enhance flushing of the marina area in comparison with its present configuration. Flushing times for the marina are expected to be significantly less than six days and as low as one day for the typical diurnal wind and diurnal tidal condition.

CONTENTS
SUMMARY
1 INTRODUCTION 1
2 COASTAL PROCESSES AND SHORELINE STABILITY 2
2.1 Bunbury Ocean (Back) Beaches 2 2.2 Koombana Bay Beach 3 2.3 Beaches within the Proposed Marina 3
3 STORM EVENTS AND SEA LEVEL VARIATIONS 4
3.1 Wave Climate 4 3.1.1 Offshore 4 3.1.2 Proposed Marina Site 4
3.2 Astronomic Tides 5 3.3 Non-Astronomic Sea Level Variations 5
4 FLUSHING OF THE PROPOSED MARINA 6
4.1 Tidal Prism Method 6 4.2 Numerical Hydrodynamic Modelling 7
4.2.1 The Numerical Hydrodynamic Model 7 4.2.2 Bathymetry 7 4.2.3 Wind 12 4.2.4 Tides 13 4.2.5 Model Stability 15 4.2.6 Model Adjustment 15 4.2.7 Synopsis of Model Runs 16 4.2.8 Description of Model Runs 16 4.2.9 Results 16
4.2.9.1 Diurnal Tidal Flow, No Wind 16 -lOOmgrid 16 - 33.3m grid - Existing Geometry 18 - 33.3m grid - With Proposed Marina Groyne 19 - Interpretation of Results 19
4.2.9.2 Diurnal Tidal Flow, Prevailing South West Wind 22 -lOOmgrid 22 - 33.3m grid - Existing Geometry 24 - 33.3m grid - With Proposed Marina Groyne 24 - Interpretation of Results 24

CONTENTS - CONTINUED
4.2.9.3 Diurnal Tidal Flow, Diurnal Wind 28 -lO0mgrid 28 - 33.3m grid - Existing Geometry 28 - 33.3m grid - With Proposed Marina Groyne 28 - Interpretation of Results 28
4.2.9.4 No Tidal Flows, Prevailing South West Wind 33 -lOOmgrid 33 - 33.3m grid - Existing Geometry 33 - 33.3m grid - With Proposed Marina Groyne 33 - Interpretation of Results 33
4.2.9.5 Northwards Flowing Shelf Current - lOOm grid 34 4.2.9.6 No Tidal Flows, Diurnal Wind 35
-l0Omgrid 35 - 33.3m grid - Existing Geometry 35 - 33.3m grid - With Proposed Marina Groyne 35 - Interpretation of Results 36
4.3 Summary of Flushing of the Proposed Marina 40
S CONCLUSIONS 42
REFERENCES 43
APPENDICES - HYDRODYNAMIC MODELLING - VELOCITY FIELDS
A DIURNAL TIDAL FLOW, NO WIND Al lOOm Grid A2 33.3m Grid - Existing Geometry A3 33.3m Grid - With Proposed Marina Groyne
B DIURNAL TIDAL FLOW, PREVAILING SOUTH WEST WIND Bi lOOm Grid B2 33.3m Grid - Existing Geometry B3 33.3m Grid - With Proposed Marina Groyne
C DIURNAL TIDAL FLOW, DIURNAL WIND Cl lOOm Grid C2 33.3m Grid - Existing Geometry C3 33.3m Grid - With Proposed Marina Groyne
D NO TIDAL FLOWS, PREVAILING SOUTH WEST WIND Dl lOOm Grid D2 33.3m Grid - Existing Geometry D3 33.3m Grid - With Proposed Marina Groyne

CONTENTS CONTINUED
E NORTHWARDS FLOWING SHELF CURRENT El lOOm Grid
F NO TIDAL FLOWS, DIURNAL WIND Fl lOOm Grid F2 33.3m Grid - Existing Geometry F3 33.3m Grid - With Proposed Marina Groyne

TABLES
3.1 Bunbury Tidal Elevations 5
4.1 Synopsis of Hydrodynamic Model Runs 16
4.2 Summary of Predicted Flushing Times 41
FIGURES
4.1 Extent of lOOm grid Hydrodynamic Model 8 4.2 Extent of 33.3m grid Hydrodynamic Model 9 4.3 Contoured Depths for lOOm grid Hydrodynamic Model 10 4.4 Contoured Depths for 33.3m grid Hydrodynamic Model 11 4.5 Diurnal Wind Velocity and Direction Distribution 14 4.6 Drogue Trajectories - Diurnal Tidal Flow, No Wind 17 4.7 Recorded and Modelled Flows from The Cut 18
4.8 Advection Path from Marina Site - Diurnal Tidal Flow, No Wind 20
4.9 Rate of Advective Flushing from Marina Area - Diurnal Tidal Flow, No Wind 21
4.10 Drogue Trajectories - Diurnal Tidal Flow, Prevailing South West Wind 23
4.11 Advection Path from Marina Site - Diurnal Tidal Flow, Prevailing South West Wind 25
4.12 Advection Path from Proposed Marina - Diurnal Tidal Flow, Prevailing South West Wind 26
4.13 Rate of Advective Flushing from Marina Area - Diurnal Tidal Flow, Prevailing South West Wind 27
4.14 Advection Path from Marina Site - Diurnal Tidal Flow, Diurnal Wind 30
4.15 Advection Path from Proposed Marina - Diurnal Tidal Flow, Diurnal Wind 31
4.16 Rate of Advective Flushing from Marina Area - Diurnal Tidal Flow, Diurnal Wind 32
4.17 Advection Path from Marina Site - No Tidal Flow, Diurnal Wind 37
4.18 Advection Path from Proposed Marina - No Tidal Flow, Diurnal Wind 38
4.19 Rate of Advective Flushing from Marina Area - No Tidal Flow, Diurnal Wind 39

INTRODUCTION
This document addresses technical aspects of the Public Environmental Review for the Bunbury Harbour City Boat Harbour. Specifically, the technical aspects considered herein are -
- coastal processes and shoreline stability, - storm events and sea level variations, and, - flushing of the proposed marina.
Consideration in Section 2 of this Report of coastal processes and shoreline stability and in Section 3 of storm events and sea level variations has been based on available reports and State Government records. Consideration in Section 4 of this Report of flushing of the proposed marina involved the application of a two dimensional vertically integrated hydrodynarnic numerical model.

2 COASTAL PROCESSES AND SHORELINE STABILITY
2.1 Bunbury Back Beaches
The Bunbury Back Beaches have been extensively investigated by the Department of Marine and Harbours as part of the Department of Planning and Urban Development's Coastal Management Plan for the City of Bunbury. The Technical Report, DMH, 1990, which considered the coastline from the southern boundary of the City of Bunbury to the root of the main breakwater at the Port of Bunbury, had as its objectives -
- an assessment of the existing coastal processes, - the identification of areas of foreshore stability and instability, and, - the identification of, and costing for, engineering works appropriate to a comprehensive
coastal management strategy.
The Technical Report found that in the 5km northwards from the southern boundary of the City of Bunbury the vegetation line along the coast had remained effectively static or had advanced over the 46 years encompassed by controlled aerial photography. In the area known as the Bunbury Back Beaches no distinct trends in the movement of the vegetation line were apparent. In this area the erosion and accretion cycles were identified as being caused by local effects, in particular due to outcrops of beach rock.
Longshore sediment transport at the Bunbury Back Beaches is from south to north and driven by the predominant south westerly wave climate. DMH, 1990, summarised the various estimates which have been made of the volume of sediment transported. The estimates were based on accretion rates along the main breakwater of the Port of Bunbury and comparison of pre and post dredging soundings in both the lee and at the head of the main breakwater. A range of longshore sediment transport rates of between 50,000 and 70,000 cubic metres per year was established.
Sediments transported to the north past the Bunbury Back Beaches pass along the seawards face of the main breakwater where they can be retained in spur sand traps constructed from the breakwater. Sediments bypassing the sand traps and continuing north are either driven by wave action into the lee of the main breakwater or pass north eastwards across Koombana Bay. In passing north eastwards across Koombana Bay sediments are trapped in the shipping channel to Bunbury Inner Harbour. Since 1976 maintenance dredging of the shipping channel has been conducted every three years on average. It has been estimated that each maintenance dredging campaign removes the equivalent of approximately 50,000 cubic metres per annum of beach sands from the navigation areas of the Port, LeProvosr, Semeniuk and Chalmers, 1989.
Because of the physical remoteness of the proposed marina site from the littoral processes occurring on the Bunbury Back Beaches and along the main breakwater the construction and operation of the proposed marina will not have any detrimental influences on these processes.
'I

2.2 Koombana Bay Beach
Koombana Bay Beach, between Point Busaco at the south western entrance to the Inner Harbour and the Yacht Club Groyne 1km to its west, is important regionally as it provides the only area sheltered from ocean swells between Mandurah in the north and the Busselton - Dunsborough coast in the south. The beach is currently being monitored by the Department of Marine and Harbours as part of its ongoing foreshore monitoring program. The monitoring program involves surveying foreshore cross sections after the winter and summer seasons to ascertain the response of the beach to seasonal and other influences. This monitoring commenced in March 1991 and is planned to continue in an ongoing basis.
Prior to dredging of the shipping channel to the Inner Harbour, Koombana Bay Beach was supplied with sediment from the north but had a natural tendency to erosion, DMH, 1989. Dredging of the shipping channel to the Inner Harbour Cut this supply and although spoil from the Inner Harbour dredging was used to provide major renourishment of the beach in 1975 it has continued to erode. The work presented in DMH, 1989, indicates that between December 1982 and December 1989 the foreshore retreated at an average rate of 4m per year. The ongoing monitoring program was initiated in response to this erosion.
As shown in Section 4 changes in current velocity along Koombana Bay Beach due to construction of the proposed marina groyne are insignificant and will not initiate further erosion of the beach. The proposed marina does not intercept any sediment supply to Koombana Bay Beach or alter the wave climate impinging upon the beach. Accordingly, construction and operation of the proposed marina will not have any detrimental influences on Koombana Bay Beach.
2.3 Beaches within the Proposed Marina
It is proposed in the later stages of marina development to build a new beach at the western boundary of the marina area. The existing beach is presently captured between the existing causeway in its south and the Outer Harbour port area in its north. Apart from aeolian sands blown from the sand trap on the western side of the main breakwater the existing beach has no source of supply of sediments. The proposed construction results in a total length of beach of 400m which is slightly less than the length of existing beach. It is planned that all of this beach will be available to the public.
The design of the beach slope and sediment grain size will ensure that the new beach is stable. As shown in Section 4 the existing current velocities in the area of the beach are small. Changes in current velocity due to construction of the proposed marina groyne are insignificant and will not initiate erosion of the beach.

3 STORM EVENTS AND SEA LEVEL VARIATIONS
3.1 Wave Climate
3.1.1 Offshore
Over the period 1975 to 1981 a Waverider Buoy was deployed by the Department of Marine and Harbours in 1 6m water depth approximately 2km west of the head of the main breakwater of the Port of Bunbury. The recorded wave data provided wave heights and periods but not wave directions and was used to determine the probability of occurrence of various wave heights. As an example, the recorded wave data indicated that a 4m significant wave height had a one year return interval. In DMH, 1990, hindcast offshore wave data were propagated to a study area boundary in approximately 20m water depth 7km west of the head of the main breakwater. The hindcast data included wave direction as well as height and period and showed that -
- all wave periods were less than 18 seconds with 57% of 9 seconds or less, - 3% of wave heights were greater than 2m and 51% equal to or less than 0.5m, - wave directions were between 245 and 335 degrees with approximately 88% from between 255
and 275 degrees.
The hindcast wave data showed therefore, that to the west of the main breakwater, wave directions are primarily from the west south west to west with average wave periods and heights of approximately 9 seconds and 0.5m, respectively.
3.1.2 Proposed Marina Site
The proposed marina site is protected from the west south west to west offshore wave climate by the main breakwater and partially from the north by the Outer Harbour berths. The penetration of swell to the Outer Harbour Berths has been investigated, PWDWA, 1975, and can be used as a guide to the degree swells penetrate the proposed marina site. The work reported in PWDWA, 1975, involved construction of a physical model of the Outer Berth area and main breakwater to assess the penetration of long period swell. As calibration information wave heights were measured at the Port for sites extending from unprotected waters west of the head of the main breakwater to protected waters in the vicinity of the now proposed marina groyne. Although the field wave data was acknowledged as 'scanty' the results consistently showed wave heights at the proposed marina groyne of less than 15% of the wave heights in unprotected waters.
Because of the protection from west south west to north waves that the marina site receives from the main breakwater of the Port, the main source of storm waves which may impinge upon the proposed marina groyne are wind generated waves locally generated over the short fetch to the north north east. Based on the SMB Method of wave prediction, U.S. Corps of Engineers, 1984, a 50 knot wind is capable of generating a wave height of 1.2m over this fetch. This wave height has been used in the design of the proposed marina groyne.
4

3.2 Astronomic Tides
The ocean tidal range at Bunbury is small and astronomical variations can be masked by variations due to meteorological conditions. Tides are mixed, both diurnal and semi-diurnal, with the semi-diurnal range (circa 0.2m) being less than the diurnal range (circa 0.5m). Tidal elevations to Chart Datum for Bunbury are given in Table 3.1.
TABLE 3.1 BUNBURY TIDAL ELEVATIONS
LEVEL ELEVATION TO C.D.
Highest Astronomic Tide 1.32m Mean Higher High Water 0.91m Mean Lower High Water 0.61m Mean Sea Level 0.66m Mean Higher Low Water 0.67m Mean Lower Low Water 0.43m Lowest Astronomic Tide 0.09m
Note: Chart Datum is 0.64m below A.H.D
A discussed by Hearn, 1983, there is a seasonality in the occurrence of high and low waters for the diurnal tide. In summer the diurnal high water occurs between early evening and early morning such that ebb flow, from The Cut for example, is during darkness. In winter the diurnal high water occurs from early to late morning.
3.3 Non-Astronomic Sea Level Variations
Non-astronomically induced mean sea level variations of periods of a few days are apparent in the tidal record at Bunbury and can be attributed to meteorological phenomena such as winds and barometric pressure variations. Hearn, 1983, also noted that a 30 minute resonance is common in most tidal records for south western Australia, with, at Bunbury, an additional resonance of 3.5hrs period attributed to standing waves between Bunbury and Cape Naturaliste.
The standard deviation of water level attributable to normal annual meteorological conditions at Bunbury is 0.12m, Wallace (1992). This infers that there is a 16% likelihood that the recorded water level will be 0.12m higher (or lower) than predicted and a 1.0% likelihood that the recorded water level will be 0.28m higher (or lower) than predicted. For a predicted Mean Higher High Water of 0.91m CD there is then a 1.0% likelihood that the recorded water level will be at least l.19m CD.
The extreme water level recorded at Bunbury is 2.48m CD and occurred during the passage of Cyclone Alby in April 1978. The general development level for the marina jetties and hardstand areas adjacent to the jetties is 2.4m CD.
5

4 FLUSHING OF THE PROPOSED MARINA
4.1 Tidal Prism Method
An estimate of the tidally induced flushing time for the marina area has been made using the tidal prism method. This method assumes that a area is flushed only by the action of tidal fluctuations. The assumption is made that water, and hence a pollutant mass, which leaves the area on the ebb tide does not return on subsequent flood tides.
Using the tidal prism method the rate of tidal flushing is given by -
N - log e ( MN / M0 ) / loge ( V w / V,i ) Eqn. 1
where N is the number of tidal cycles,
M0 is the initial mass of pollutant in the marina area,
MN is the mass of pollutant remaining in the marina area
after N tidal cycles,
V11W is the volume of the marina area at High Water,
VLW is the volume of the marina area at Low Water.
A characteristic flushing time has been defined as the e-folding time or the time required for the initial concentration of pollutant to fall to concentration of lie, where e is Napier's Constant. The e-folding time is then the number of tidal cycles required for the initial concentration of pollutant to fall to a concentration of 37% of its initial concentration.
Water volumes of the marina area have been determined for a planform area of approximately 170,000 m2 and an average basin depth to Chart Datum of 2.4m. Tidal elevations are -
Mean Higher High Water 0.91m CD Mean Sea Level 0.66m CD Mean Lower Low Water 0.43m CD
Using the relative depths and planform areas results in water volumes within the marina area of 561,000m' at Mean Higher High Water and 476,000m' at Mean Lower Low Water. Hence the ratio VLW / VHW is 0.85 and the e-folding time through the solution of Equation 1 is 6 tidal cycles. As the tidal regime at Bunbury is predominantly diurnal this tidally induced flushing time is equivalent to approximately 6 days.
The e-folding time determined by the tidal prism method only includes the influence of tidal forcing and does not incorporate the effects of wind induced currents or density currents. In order to assess the influence of wind induced currents, which in a region with a small tidal range such as Bunbury can be an important forcing mechanism, a two dimensional numerical hydrodynamic model was employed. The following sections describe the hydrodynamic modelling.

4.2 Numerical Hydrodynamic Modelling
4.2.1 The Numerical Hydrodynamic Model
The numerical hydrodynamic model used in the work reported herein is a two dimensional vertically integrated model applicable to horizontal circulations which do not significantly vary in the vertical direction, Hunter, 1990. The model uses an explicit finite difference scheme to solve two dynamic and one continuity equation. The effects of non-linear advective terms, Coriolis acceleration and non-linear bottom friction are included in the formulation. The effects of surface slopes, surface wind stress and the direct injection of momentum at a point may also be included in data input. The model has been successfully applied in the past to modelling flows at Bunbury for feasibility investigations of cooling water discharge from the (then) proposed new power station in Koombana Bay, Hunter, 1983.
Two models were used for this report, one based on a lOOm grid system and the second on a 33.3m grid system. The lOOm model was used -
to determine the relative significance of the different forcing mechanisms of wind and tidal flows, and, to determine boundary conditions for the 33.3m model.
The 33.3m grid model was used -
to determine the influence of the marina groyne on flushing rates of the marina area, and, to determine the advective path of water flushed from the marina area across Koombana Bay.
4.2.2 Bathymetry
The two dynamic and one continuity equations of the numerical hydrodynamic model are solved on a rectilinear computational grid. Two computational grids were used for the hydrodynamic modelling, one with a lOOm grid, the extent of which is shown in Figure 4.1, and the other with a 33.3m grid, the extent of which is shown in Figure 4.2.
Depths used for both the lOOm and 33.3m grids were interpolated from DMH Charts and directly from the digital hydrographic survey data. The contoured depths used in the lOOm model are shown in Figure 4.3. and in Figure 4.4 for the 33.3m model.
7

-n
m x -I rn z -4 0 -n
0 0 3 0
0 I
C
0 0
z
C)
0 0 m I-
L

INDIA
Figure 4.2 EXTENT OF 33. 3m GRID HYDRODYNAMIC MODEL
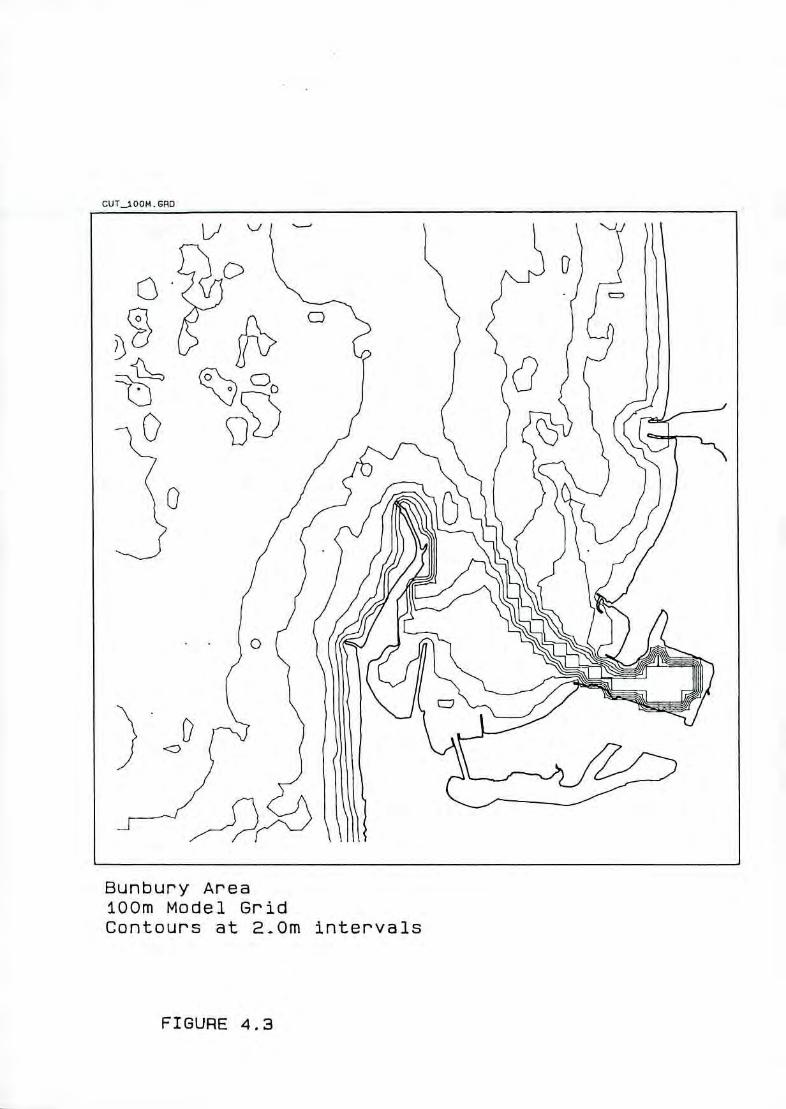
CUT 100M.GRD
Bunbury Area lOOm Model Grid Contours at 2.Om intervals
FIGURE 4.3

MAR33M GAD
Proposed Marina in Koombana Bay 33.3m Model Grid Contours at 2.Om intervals
C
m

4.2.3 Wind
Hearn, 1983, discusses the wind statistics for Koombana Bay. In summary of Hearn -
for 80% of the time the wind has a southerly component with the most frequent direction being from south east to south west. South west winds have a 50 percentile speed of 15.6 knots (8.Om/sec) whilst south east winds have a 50 percentile speed of 8.8 knots (4.5m/sec), for 14% of the time winds are from the North West with a 50 percentile speed of 15.6 knots (8.0m/sec),
C. diurnal winds, with directional variations from easterly to westerly, occur in both winter and summer. For the period 1st September 1982 to 23rd January 1983 diurnal winds, or the sea breeze cycle, occurred on 68% of the days. For the period 12th November 1982 to 23rd January 1983 the sea breeze cycle occurred on 85% of the thys.
d. for 3% of the time the wind may be classified as calm, being less than 4 knots (2.0m/sec) for at least 1.5hrs. The longest calm period recorded was 27 hours.
Steedman and Craig, 1983, showed that for Cockburn Sound, 130km north of Bunbury, diurnal winds occur throughout the year but are strongest in summer. The winter diurnal wind is mainly easterly winds at night and in the morning and westerly in the afternoon. The summer diurnal wind is modified to include a southerly component such that it is mainly south easterly at night and in the morning and south westerly in the afternoon.
The wind velocities used in the modelling were as determined by Hunter, 1983, and were -
the prevailing south west wind of 5.03 rn/sec (9.8 knot) from 227.9° a diurnal wind with a velocity and direction distribution as shown in Figure 4.5.
Wind stress was applied uniformly over the sea area of the model. A wind stress factor Hunter, 1983, was input as -
Pair Cd U 2 / Pwaer
where P il is the air density (1.20 kgm/m3),
P waser is the water density (1026 kgm/m3),
C is a drag coefficient given by
C, - (0.75 + 0.067 U. ) iO for 4 < U < 21 rn/S
C - 10 for U -< 4 rn/s
U,,, is the wind velocity.
12

4.2.4 Tides
The astronomic tides are described in Section 3.2 and Table 3.1.
For the both the lOOm and 33.3m grid models the influence of the tide was not represented as a vertical rise and fall in the sea level input at the model boundaries but as tidal flow from The Cut and from Koombana Channel.
Tidal flow from The Cut was represented as a sinusoidally varying flow with a range about Mean Sea Level of 0.7m. From Hunter, 1983, the flow is given by -
V - (Q/A) - 309.5 [ sin((o.t) + 0.04311 sin(2.(o.t) I / 400
where 0 is the diurnal angular tidal frequency (0.000072722 sec'),
t is the time in seconds after High Water in Leschenault Estuary.
For the 33.3m grid model tidal flow velocity from Koombana Channel was represented as a sinusoidally varying flow with a range about Mean Sea Level of 0.7m. The flow was given by -
V - 0.2525 R sin((.t)
where (0 is the diurnal angular tidal frequency (0.000072722 sec'),
t is the time in seconds after High Water in Leschenault Inlet,
R is the tidal range in Leschenault Inlet.
The tidal flows from The Cut and from Koombana Channel were input as a time varying flow velocity at the model land boundary at those grid points representing The Cut and Koombana Channel.
For one run of the lOOm grid model a northwards flowing shelf current was applied to the model boundaries. A northwards velocity of 7.0 rn/sec was applied at the southern boundary of the model and the flow at the northern boundary balanced to ensure zero inflow or outflow from the model. The resulting flow to the north west of the head of the Bunbury breakwater was 5.0 cm/sec which approximated the mean flow given by a current meter situated near the LaPorte Outfall, Wallis, 1983.
13

10
9 U'8
E7
w w (0 4
z3
240
U' 220
200 .!.
180
160 lm
140
0 2 4 6 8 10 12 14 16 18 20 22 24
HOUR OF DAY
FIGURE 4,
DIURNAL WIND VELOCITY AND DIRECTION

4.2.5 Model Stability
As the continuity of flow and mass equations of the model are solved explicitly the primary stability criterion is the time step. The stable time step is given by the CFL criterion, Courant, Friedrichs and Lewy, 1928, as -
6: < ( g Hmu ( 6x4 + 6y 2 ) )O.
where Hm is the deepest water depth in the model,
g is the acceleration due to gravity,
6x is the x direction grid spacing,
6y is the y direction grid spacing.
For small sea areas this criterion can lead to time steps so small that the modelling becomes impractical. This obstacle is overcome by the introduction of an adjustment to the continuity equations which increases the apparent value of the acceleration due to gravity, H earn and Hunter, 1986. For the two computational grids used the prototype time steps were -
100.Om grid 60 second time step
33.3m grid 45 second time step
4.2.6 Model Adjustment
The main variables requiring adjustment in the hydrodynamic model were those involving friction. As the model had been previously applied to the Bunbury area and Koombana Bay in particular, Hunter, 1983, the friction terms used in that modelling were adopted for the modelling reported herein. In particular a bottom drag coefficient of 0.0025 was used together with a "background" velocity, for the bottom friction term and associated with sea and swell waves, of 0.10 rn/sec.
15

4.2.7 Synopsis of Model Runs
Apart from test model runs a total of sixteen production model runs were completed. The objectives of the production model runs are as listed in Section 4.2.1. Table 4.1 gives a synopsis of the production model runs.
TABLE 4.1 SYNOPSIS OF HYDRODYNAMIC MODEL RUNS
Flow from - Run Wind Marina Number The Koombana in
Cut Channel Place
lOOm Grid
1 Yes No No No 2 Yes No S'west No 3 Yes No Diurnal No 4 No No S'west No 5 Shelf Current Only No No 6 No No Diurnal No
33.3m Grid
7 Yes Yes No No 8 Yes Yes S'west No 9 Yes Yes Diurnal No
10 No No S'west No 11 No No Diurnal No 12 Yes Yes No Yes 13 Yes Yes S'west Yes 14 Yes Yes Diurnal Yes 15 No No S'west Yes 16 No No Diurnal Yes
4.2.8 Description of Model Runs
The following Sections describe each model run summarised in Table 4.1. Results of the runs are presented in the Appendices as plots of velocity fields at three hour time steps through the diurnal tidal cycle or as a single plot for steady state conditions.
4.2.9 Results
4.2.9.1 Diurnal Tidal Flow, No Wind - lOOm Grid
The resulting velocity fields for this model run are shown in Appendix Al at three hour time steps related to High Water. The results show that on a falling tide a jet flow from The Cut extends across Koombana Bay to the head of the main breakwater. Eddies are generated off this ebb jet flow and persist into the flood tide. Figure 4.6 shows tracks of model "drogues" placed near The
16
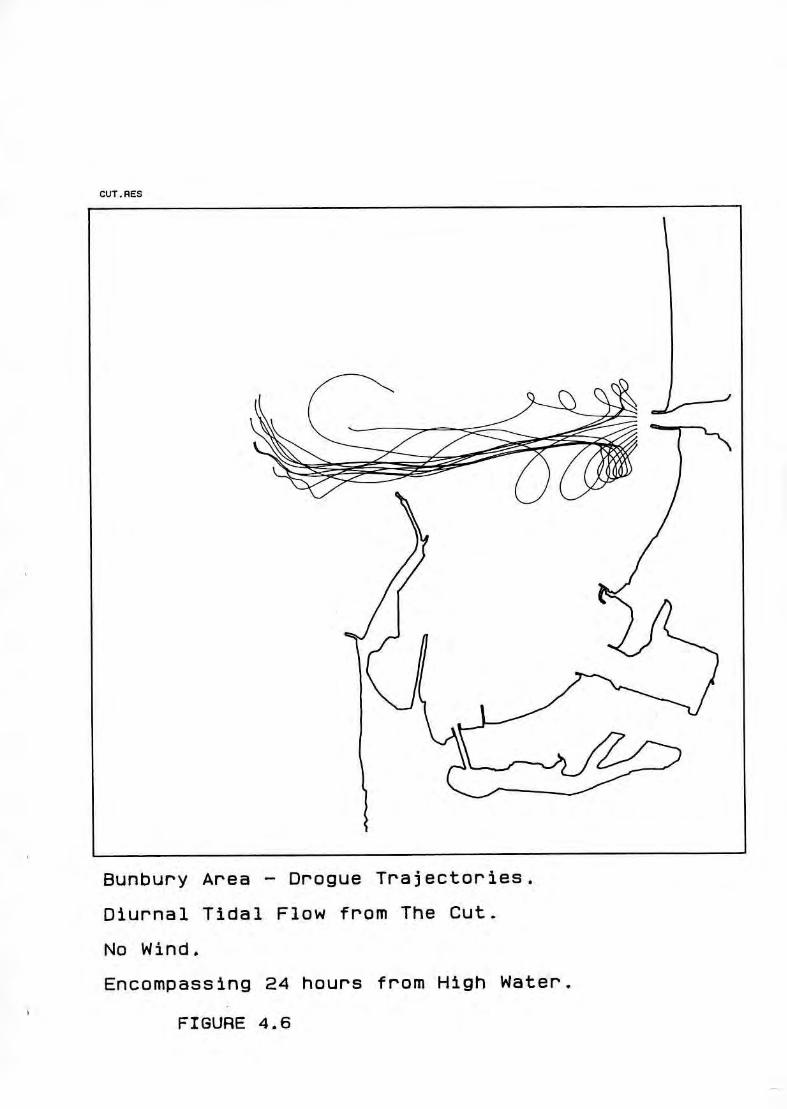
CUT.RES
Bunbury Area - Orogue Trajectories.
Diurnal Tidal Flow from The Cut.
No Wind.
Encompassing 24 hours from High Water.
FIGURE 4.6
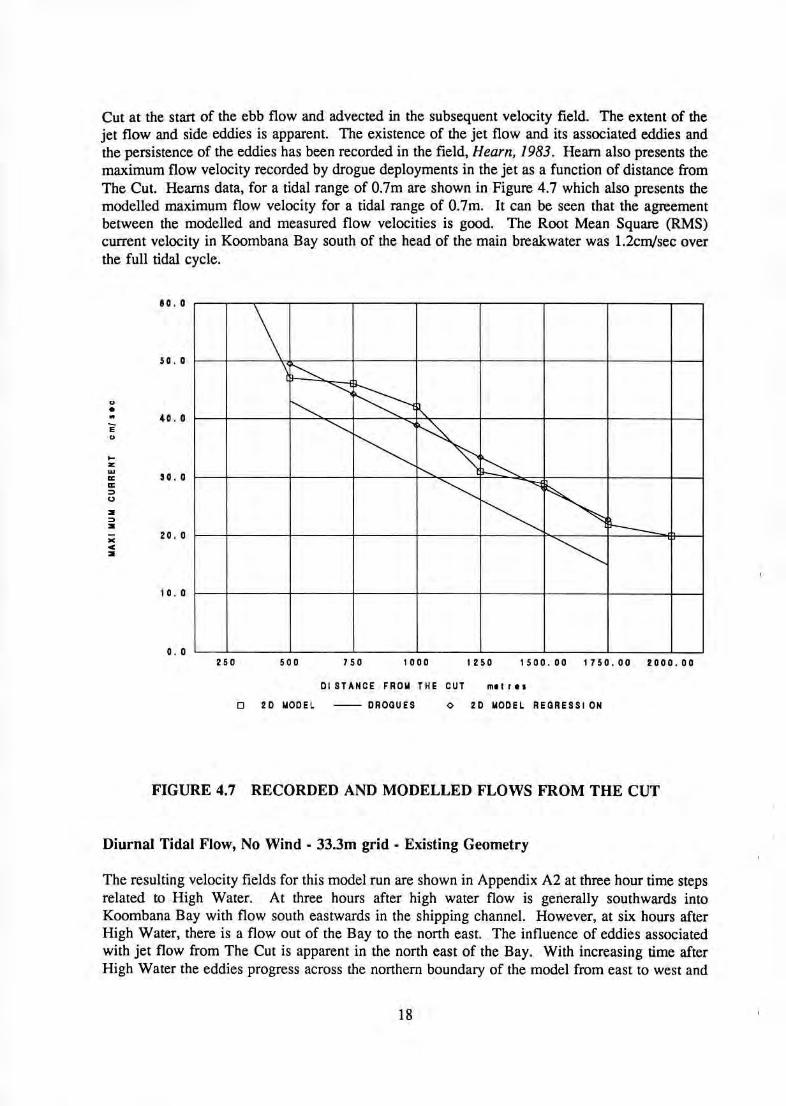
Cut at the start of the ebb flow and advected in the subsequent velocity field. The extent of the jet flow and side eddies is apparent. The existence of the jet flow and its associated eddies and the persistence of the eddies has been recorded in the field, Hearn, 1983. Hearn also presents the maximum flow velocity recorded by drogue deployments in the jet as a function of distance from The Cut. Hearns data, for a tidal range of 0.7m are shown in Figure 4.7 which also presents the modelled maximum flow velocity for a tidal range of 0.7m. It can be seen that the agreement between the modelled and measured flow velocities is good. The Root Mean Square (RMS) current velocity in Koombana Bay south of the head of the main breakwater was 1.2cm/sec over the full tidal cycle.
BC. 0
30.0
C,
40.0 E C,
I—UI cc 30.0 cc C.,
3
3
20.0
3
10.0
0.0 250 500 750 1000 1250 1500.00 1750.00 2000.00
DISTANCE FROM THE CUT mitris
0 20 MODEL DROGUES 0 20 MODEL REGRESSION
FIGURE 4.7 RECORDED AND MODELLED FLOWS FROM THE CUT
Diurnal Tidal Flow, No Wind - 33.3m grid - Existing Geometry
The resulting velocity fields for this model run are shown in Appendix A2 at three hour time steps related to High Water. At three hours after high water flow is generally southwards into Koombana Bay with flow south eastwards in the shipping channel. However, at six hours after High Water, there is a flow out of the Bay to the north east. The influence of eddies associated with jet flow from The Cut is apparent in the north east of the Bay. With increasing time after High Water the eddies progress across the northern boundary of the model from east to west and
18

persist for up to six hours into the flood tide. Currents in the Bay on the ebb tide are generally higher than on the flood as the Bay is influenced by jet flow from The Cut. The Root Mean Square (RMS) current velocity over all of the model for the ebb tide was 1.7cm/sec compared with 1 .0cm/sec for the flood tide. Currents in the vicinity of the proposed marina between the existing jetty approach embankment and the main breakwater vary semi-diurnally even though the input tidal flow from The Cut and Koombana Channel varies diurnally.
Diurnal Tidal Flow, No Wind - 33.3m grid - With Proposed Marina Groyne
The resulting velocity fields for this model run are shown in Appendix A3 at three hour time steps related to High Water. The marina groyne has no discernible influence on currents in the wider area of Koombana Bay. The groyne however constricts flow into the marina causing increased circulation in the marina. Flows through the marina entrance again tend towards varying with a semi-diurnal period rather than the input diurnal variations at The Cut and Koombana Channel.
Diurnal Tidal Flow, No Wind - Interpretation of Results
Figure 4.8 shows the advective path of particles originally placed within the proposed marina and allowed to advect with the modelled velocity field from High Water for 18 tidal cycles. As shown in Figure 4.8 the path from the marina for the condition modelled exits Koombana Bay to the north east. No particles approach Koombana Channel or enter the Inner Harbour.
A similar plot for the existing configuration without the marina groyne is not presented as no particles left the area of the proposed marina. A rate of flushing for the marina area, compared with the existing configuration, has been established by determining the rate of change of the number of particles inside and outside the marina area. Figure 4.9 shows the rate of advective flushing from the marina area for the condition of diurnal tidal flow from The Cut under no wind conditions. For this case flushing of the existing configuration does not occur. The change in current regime due to the proposed marina groyne only marginally enhances flushing resulting in over 90% of particles still being in the marina area after 18 tidal cycles (days).
19

-n G) C 13 m
Koombana Bay. Advection path from proposed marina. No Wind. Diurnal Tidal Flow from The Cut and Koombana Channel.

MAR_CUT.RES & 33CUT.RES
100—
90 -LLrcEEP 80 - - - - --
70-----
a) C-.
60 - - - - -
.4 L
7- 50
.4
C) c
40 c .4 I0 E 0.) - in
With Marina Groyne C) 0 C-0
Without Marina Groyne 0
4-' 10 - - - - - - - C 0) 0 C- a)
0 1 2 3 4 5 6 7 8 9 10 11 12 13 14 15 16 17 18
Diurnal Tidal Cycles (Days)
Koombana Bay.
Rate of Advective Flushing from Marina Area.
No Wind - Diurnal Tidal Flow from Thp Cut
and Koorqbana Channel.
FIGURE 4.9

4.2.9.2 Diurnal Tidal Flow, Prevailing South West Wind - lOOm grid
The resulting velocity fields for this model run are shown in Appendix Bi at three hour time steps related to High Water. The sea boundaries of the model for this (and other lOOm grid model) runs were closed. Hence at the boundaries of the lOOm grid model the velocity field should be treated with caution.
The results again show the ebb jet flow from The Cut which, because of the south west wind, turns to the north rather than extending across Koombana Bay to the head of the main breakwater. Figure 4.10 shows the tracks of model "drogues" placed near The Cut at the start of the ebb flow and advected in the subsequent velocity field. The turning of the ebb jet to the north is apparent as is the extent of the jet flow and side eddies.
Hearn, 1983, presents the results of field drogue tracking which clearly shows the ebb jet turning to the north. The modelled results also show a wind driven current close to the coast along the west shore of the main breakwater. The wind stress resulting from the south west wind has the effect of pushing water (particularly a surface layer) northwards out of Koombana Bay. To maintain continuity there must therefore be an inflow of water to Koombana Bay. Previous two dimensional hydrodynamic modelling of Koombana Bay, Hunter, 1983, identified the inflow as occurring in the deeper parts of the shipping channel, and field drogue studies, Hearn, 1983, confirmed this flow. Although the hydrodynamic model used in this work is vertically integrated the inflow can be clearly seen in the model results presented in Appendix B 1 at High Water and at three hours after High Water. The Root Mean Square (RMS) current velocity in Koombana Bay south of the head of the main breakwater was 1.6 cm/sec over the full tidal cycle.
22

CUTSW. AES
Bunbury Area - Dr'ogue Trajectories.
Diurnal Tidal Flow from The Cut.
Prevailing South West Wind.
Encompassing 24 hours from High Water.
FIGURE 4.10

Diurnal Tidal Flow, Prevailing South West Wind - 33.3m grid - Existing Geometry
The resulting velocity fields for this model run are shown in Appendix B2 at three hour time steps related to High Water. Flow into the Bay along the shipping channel is apparent in the results from High Water to 6 hours after High Water and from Low Water to 3 hours before High Water. Also apparent is a clockwise flowing gyre in the central portion of the Bay south of the shipping channel over most of the tidal cycle. An anti-clockwise gyre also forms in the marina area, and is strongest following Low Water.
The influence of eddies associated with the jet flow from The Cut is not apparent over the model area as the ebb jet is turned to the north by the south west wind. The Root Mean Square (RMS) current velocity over all of the model area for the full tidal cycle was 2.0 cm/sec.
Diurnal Tidal Flow, Prevailing South West Wind - 33.3m grid - With Proposed Marina Groyne
The resulting velocity fields for this model run are shown in Appendix B3 at three hour time steps related to High Water. The marina groyne has no discernible influence on currents in the wider area of Koombana Bay. The groyne constricts flow into the marina and the clockwise flowing gyre forms earlier in the tidal cycle.
Diurnal Tidal Flow, Prevailing South West Wind - Interpretation of Results
Figure 4.11 and Figure 4.12 show the advective path of particles originally placed within the proposed marina and allowed to advect with the modelled velocity field from High Water for 18 tidal cycles for the marina site and for the marina site with the proposed groyne, respectively. For both conditions the path exits Koombana Bay to the north east after following the shipping channel south eastwards to the entrance of the Inner Harbour. No particles approach Koombana Channel or enter the Inner Harbour.
Figure 4.13 shows the rate of advective flushing from the marina area for the condition of diurnal tidal flow from The Cut under a prevailing south west wind. Over the first six tidal cycles the existing marina area flushes more efficiently than the area with the proposed groyne but at times beyond six tidal cycles the existing marina area is less efficiently flushed.
The e-folding time, the time for the concentration of particles in the marina area to reduce to approximately 37% of the initial concentration, is approximately 17 tidal cycles (days) for the existing marina area and 12 tidal cycles (days) for the marina area with the proposed groyne when averaged over a tidal cycle. That is, the proposed groyne enhances flushing of the marina area for the conditions of diurnal tidal flow from The Cut with the prevailing south west wind.
24
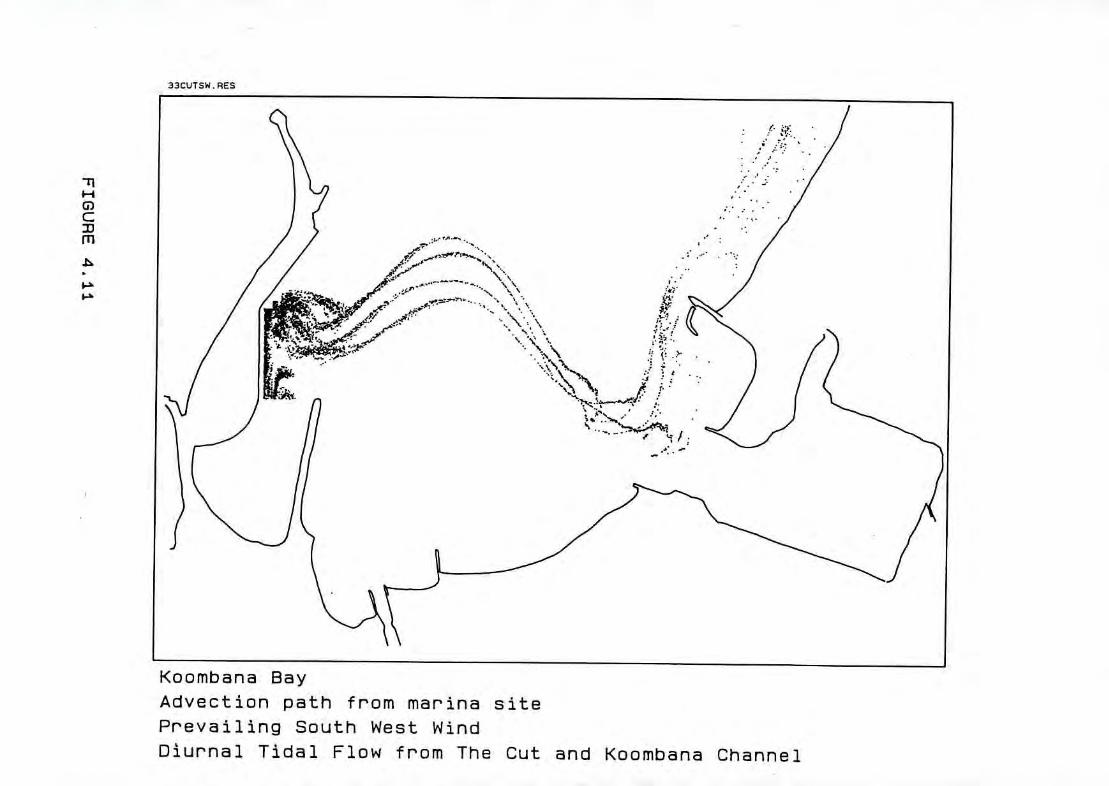
33CUTSW RES
Koombana Bay
Acivection path from marina site Prevailing South West Wind
Diurnal Tidal Flow from The Cut and Koombana Channel

f')
MR CSWRES
Koombana Bay Advection path from proposed marina Prevailing South West Wind Diurnal Tidal Flow from The Cut and Koombana Channel

- -
- ---
With Marina Groyne
Without Marina Groyne
100
'As]
Mrs C
c .r4 40
aao to a)
0)
20 a 4- 0
MAR_CSW.PES a 33CUTSW.RES
0 1 2 3 4 5 6 7 8 9 10 ii 12 13 14 15 16 17 18
Diurnal Tidal Cycles (Days)
Koombana Bay.
Rate of Advective Flushing from Marina Area.
Prevailing South West Wind - Diurnal Tidal
Flow from The Cut and Koombana Channel.
FIGURE 4.13

4.2.9.3 Diurnal Tidal Flow, Diurnal Wind - lOOm grid
The resulting velocity fields for this model run are shown in Appendix Cl at three hour time steps. As shown in Figure 4.5 High Water for this model run was set to occur at 1930hrs, a typical summer condition with the ebb jet from The Cut occurring overnight. The sea boundaries of the model for this (and other lOOm grid model) runs were closed. Hence at the boundaries of the lOOm grid model the velocity field should be treated with caution.
The results show the ebb jet flow from The Cut which, because of the southerly component in the diurnal wind, turns to the north. The general circulation about Koombana Bay is shown in the lOOm grid model, particularly the inflow into the Bay of water flowing along the coast from the south. This is most apparent in the results at 2100hrs after the diurnal wind has blown from west of south for nine hours. Outflow from the Bay over the full 24 hours is along the eastern shore of the Bay. Within the Bay, from 1200hrs to 1800hrs a northwards flow current is evident along the eastern face of the existing causeway and is due to the preceding 15 hours that the diurnal wind has blown from east of south. The Root Mean Square (RMS) current velocity in Koombana Bay south of the head of the main breakwater was 3.0 cm/sec over the full tidal cycle.
Diurnal Tidal Flow, Diurnal Wind - 33.3m grid - Existing Geometry
The resulting velocity fields for this model run are shown in Appendix C2 at three hour time steps. Although tidal forcing via flow from The Cut and from Koombana Channel and the wind field are diurnal, flow in the area of the proposed marina appears to be primarily driven by the wind field. The influence of ebb jet flow from The Cut is not apparent over the model area as the ebb jet is turned to the north by the southern component of the diurnal wind. There is a strong northwards flOW Out of the area of the proposed marina from 1 200hrs to I 800hrs associated with the southwards component of the wind and the increased wind velocity. The results show a weak anticlockwise flowing gyre in the proposed marina area at 0300hrs and a clockwise flowing gyre in the southern half of Koombana Bay beginning to form at lSOOhrs and weakening at 2100hrs. The Root Mean Square (RMS) current velocity over all of the model area was 3.4 cm/sec over the full tidal cycle.
Diurnal Tidal Flow, Diurnal Wind - 33.3m grid - With Proposed Marina Groyne
The resulting velocity fields for this model run are shown in Appendix C3 at three hour time steps. Although the marina groyne has no discernible influence on currents in the wider area of Koombana Bay the groyne constricts flow into the marina. The anticlockwise flowing gyre in the proposed marina persists for longer than for the existing geometry and currents out of the area are lower when the gyre breaks down.
Diurnal Tidal Flow, Diurnal Wind - Interpretation of Results
Figure 4.14 and Figure 4.15 show the advective path of particles originally placed within the proposed marina and allowed to advect with the modelled velocity field from High Water for 18 tidal cycles for the marina site and for the marina site with the proposed groyne, respectively. For both conditions the path from the marina exits Koombana Bay to the north east after following
28

trajectories over the southern 75% of Koombana Bay.
Figure 4.16 shows the rate of advective flushing from the marina area for the condition of diurnal tidal flow from The Cut and Koombana Channel with a diurnal wind. For the existing and proposed geometries the rate of flushing is high. With the proposed marina groyne in place particles leaving the marina do not re-enter the marina. This is particularly the case from 1200hrs to 1 800hrs where the wind generated current flowing northwards along the east face of the existing causeway carries outflow from the marina away from the marina. As a result the variation in concentration of particles in the marina over the tidal cycle is reduced such that the e-folding time is less than a tidal cycle (day). For the existing geometry particles re-enter the marina area over each tidal cycle. As a result the variation in concentration of particles in the marina area is substantial, particularly in the early tidal cycles. Notwithstanding, a e-folding time of not more than 2.0 tidal cycles (days) is indicated for the existing geometry when averaged over a tidal cycle.
29

UICUTOT - RS
Koombana Bay. Advecti.on path from marina site.
Diurnal Wind. Diurnal Tidal Flow from The Cut and Koombana Channel.
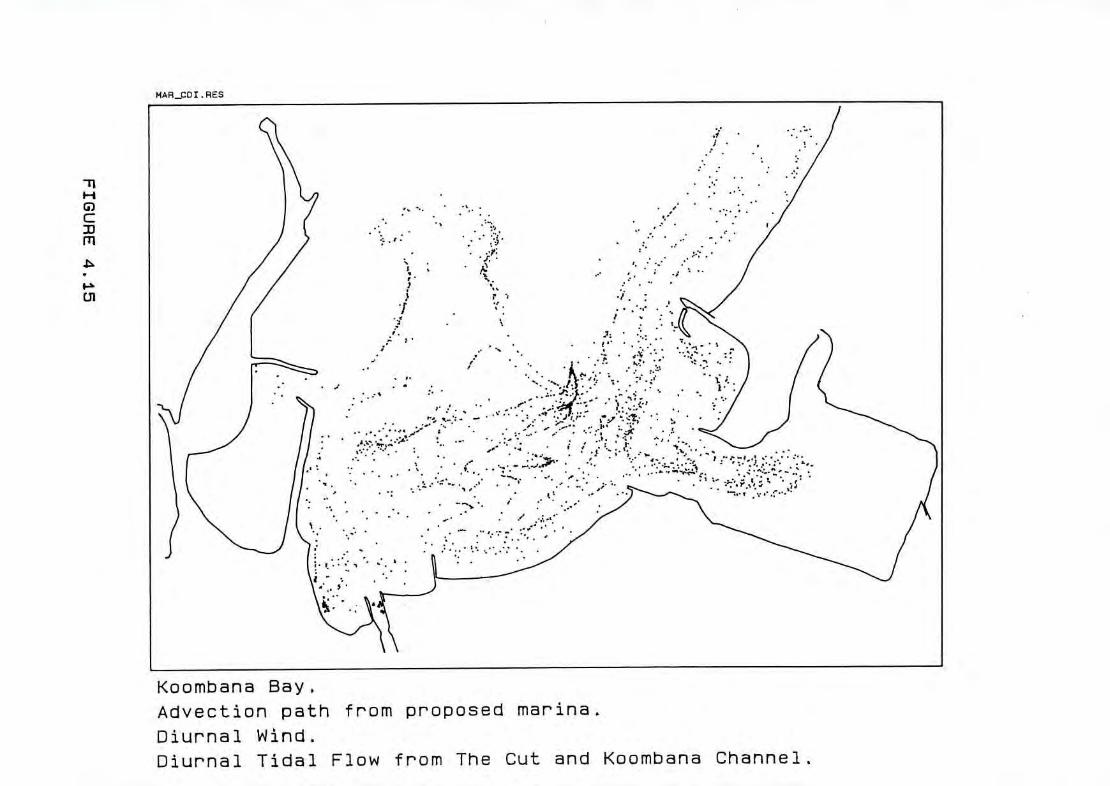
.1•
4. 1
I -
: — — -
- I
- .:
. a.
MAR_CDI ES
Koombana Bay1 Advection path from proposed marina.
Diurnal Wind. Diurnal Tidal Flow from The Cut and Koombana Channel.

MAR_CDI.RES & 33CUTDI.RS
90—
With Marina Groyne
80—
Without Marina Groyne
70—
(0 a) C-
60— - - (0 C
C-(U 150 - --C
U
C
U)
m
4J 10—
U
.11
E a) cr30— - - - -
0 1 2 3 4 5 6 7 8 9 10 11 12 13 14 15 16 17 18
Diurnal Tidal Cycles (Days)
Koombana Bay.
Rate of Advective Flushing from Marina Area.
Diurnal Wind - Diurnal Tidal Flow from
The Cut and Koombana Channel.
-
FIGURE 4.16

4.2.9.4 No Tidal Flows, Prevailing South West Wind - lOOm grid
The resulting velocity field for this model run is shown in Appendix Dl for the steady state condition. The sea boundaries of the model for this (and other lOOm grid model) runs were closed. Hence at the boundaries of the lOOm grid model the velocity field should be treated with caution. In the area of the north boundary of Koombana Bay, however, the flows are considered to be correct and appropriate to the objective of determining boundary conditions for the 33.3m grid model.
The velocity field shows a northwards flowing current along the ocean coast of Bunbury swinging south eastwards at the head of the main breakwater to enter Koombana Bay. This has been identified in field studies, Hearn, 1983, as mainly a deeply flowing current in the shipping channel. A clockwise flowing gyre is evident to the south west of the shipping channel whilst the main northwards flowing current leaves Koombana Bay in its north east. The Root Mean Square (RMS) current velocity in Koombana Bay south of the head of the main breakwater was 1.3 cm/sec.
No Tidal Flows, Prevailing South West Wind. 33.3m grid - Existing Geometry
The resulting velocity field for this model run is shown in Appendix D2 for the steady state condition. The gross features shown in the lOOm grid model, inflow in the shipping channel, outflow to the north east and a clockwise flowing gyre to the south west of the shipping channel, are shown in detail. An anticlockwise flowing gyre in the area of the proposed marina is also apparent together with a anticlockwise flowing gyre at Koombana Bay Beach in the south east of the Bay. Currents at the head of the existing causeway are to the west and approximately 0.5cm/sec. The Root Mean Square (RMS) current velocity over all of the model area was 1.6 cm/sec.
No Tidal Flows, Prevailing South West Wind - 33.3m grid - With Proposed Marina Groyne
The resulting velocity field for this model run is shown in Appendix D3 for the steady state condition. The marina groyne has no discernible influence on currents in the wider area of Koombana Bay and little influence on the anticlockwise flowing gyre in the proposed marina. Currents at the entrance to the proposed marina are westwards into the marina and approximately 0.5cm/sec.
No Tidal Flows, Prevailing South West Wind. Interpretation of Results
The results for both the existing and proposed configurations of the marina area show low current velocities entering the marina area. Accordingly, particles placed in the marina area and in the proposed marina are not predicted to flush from the area.
33

4.2.9.5 Northwards Flowing Shelf Current Only - lOOm grid
The resulting velocity field for this model run is shown in Appendix E for the steady state condition. The western sea boundary of the model for this run was closed. A northwards velocity of 7.0 cm/sec was applied at the southern boundary of the model and the flow at the northern boundary balanced to ensure zero inflow or outflow from the model. The resulting flow to the north west of the head of the Bunbury breakwater was 5.0 cm/sec which approximated the mean flow given by a current meter situated near the LaPorte Outfall, Wallis, 1983.
The Root Mean Square (RMS) current velocity in Koombana Bay south of the head of the main breakwater was 0.13 cm/sec. As this RMS current was an order of magnitude less than the RMS current in Koombana Bay south of the head of the main breakwater for model runs which included either wind or tidal forcing functions, or both, the effects of a shelf current were considered to be relatively unimportant in considering the impact of the proposed marina. As a result, the shelf current was not included in further modelling. The minor influence of shelf currents in Koombana Bay has also been established in previous modelling studies, Hunter, 1983.
34

4.2.9.6 No Tidal Flows, Diurnal Wind - lOOm grid
The resulting velocity fields for this model run are shown in Appendix Fl at three hour time steps. The sea boundaries of the model for this (and other lOOm grid model) runs were closed. Hence at the boundaries of the lOOm grid model the velocity field should be treated with caution.
The general circulation in Koombana Bay for this model run is similar to that described in Section 4.2.9.3 for the case of a diurnal wind with diurnal tidal flows from The Cut. This is due to the jet flow from The Cut being turned to the north by the southerly component in the diurnal wind and not significantly influencing flow in Koombana Bay compared with wind driven currents.
As similarly shown in the results for a diurnal wind with diurnal tidal flows water flowing along the coast from the south enters the Bay about the head of the main breakwater and leaves northwards along the eastern shore of the Bay. The inflow is strongest from I 800hrs to 2400hrs after the wind has been blowing from west of south for nine hours. Within the Bay, from 1200hrs to 1800hrs a northwards flow current is evident along the eastern face of the existing causeway and is due to the preceding 15 hours that the diurnal wind has blown from east of south. This same flow is apparent in the results which included diurnal tidal flows.
The Root Mean Square (RMS) current velocity in Koombana Bay south of the head of the main breakwater was 2.2 cm/sec over the full tidal cycle which compares with the RMS value of 3.0 cm/sec for the case of diurnal wind with diurnal tidal flows.
No Tidal Flows, Diurnal Wind - 33.3m grid - Existing Geometry
The resulting velocity fields for this model run are shown in Appendix F2 at three hour time steps. Flow in the area of the proposed marina appears to be primarily driven by the wind field with a strong northwards flow out of the area of the proposed marina from 0600hrs to 1500hrs associated with the southwards component of the wind and the increased wind velocity. For the case with diurnal tidal flow from The Cut and Koombana Channel this northwards flow occurred later in the day. A weak anticlockwise flowing gyre forms in the proposed marina area at 0900hrs and lasts until 1200hrs. A clockwise flowing gyre in the southern half of Koombana Bay begins to form at 0900hrs and weakens by 1200hrs. Both of these features occur with diurnal tidal flows but at different times.
The Root Mean Square (RMS) current velocity over the model area was 3.3 cm/sec over the full tidal cycle which compares with the RMS value of 3.4 cm/sec for the case of diurnal wind with diurnal tidal flows.
No Tidal Flows, Diurnal Wind - 33.3m grid - With Proposed Marina Groyne
The resulting velocity fields for this model run are shown in Appendix F3 at three hour time steps. Although the marina groyne has no discernible influence on currents in the wider area of Koombana Bay the groyne constricts flow into the marina. The anticlockwise flowing gyre in the proposed marina persists for longer than for the existing geometry.
35

No Tidal Flows, Diurnal Wind - Interpretation of Results
Figure 4.17 and Figure 4.18 show the advective path of particles originally placed within the proposed marina and allowed to advect with the modelled velocity field from High Water for 18 tidal cycles for the marina site and for the marina site with the proposed groyne, respectively. For both conditions the path from the marina exits Koombana Bay to the north east after following trajectories over the majority of Koombana Bay.
Figure 4.19 shows the rate of advective flushing from the marina area for the condition of no tidal flows and a diurnal wind. With the proposed marina groyne in place only a small percentage of particles leaving the marina re-enter the marina. As shown for the case of diurnal wind with diurnal tidal flows this particularly occurs when the wind generated current flowing northwards along the east face of the existing causeway carries outflow from the marina away from the marina. As a result the variation in concentration of particles in the marina over the tidal cycle is reduced such that the e-folding time, averaged over a tidal cycle, is approximately 4.0 tidal cycles (days). For the existing geometry particles re-enter the marina area over each tidal cycle. As a result the variation in concentration of particles in the marina area is substantial, particularly in the early tidal cycles. Notwithstanding, a e-folding time, averaged over a tidal cycle, of 5.5 days is indicated for the existing geometry.
36

SMOtJ tPU ON PUM leuinTo
GG euTiew WOJ. U9d UOT39APV
uqwoo
N
w cc
(1
Sab"UNKIUM

uArTwtJn c
Koomana Bay. Advection path from proposed marina. Diurnal Wind. No Tidal Flows.

ARDI'JD.AS & 33DIWND.RES
100-
90—
With Marina (Sroyne
80—
Without Marina Groyne
70— - to a, L
60 -
C .1-,
C- (0
50— - -
. 40
CD
j\
Im
10 j
0 1 2 3 4 5 6 7 8 9 10 Ii 12 13 14 15 16 17 18
Days
Koombana Bay.
Rate of Advective Flushing from Marina Area.
Diurnal Wind.
No Tidal Flows.
FIGURE 4.19

4.3 Summary of Flushing of the Proposed Marina
Application of the tidal prism method to assess flushing time of the marina area results in a tidally induced flushing time of 6 days. This flushing time should be treated with caution as the method assumes that flushing is driven by tidal fluctuations only and that all of the water, and hence a pollutant mass, which leaves the marina area on the ebb tide does not return into the marina area on subsequent flood tides.
The results of the hydrodynamic modelling primarily show that construction of the proposed marina groyne will enhance flushing of the marina area in comparison with its present configuration. This result is consistent with Nece and Richey, 1972, wherein it is shown that a marina planform which incorporates a single asymmetrically placed entrance is advantageous in promoting circulation within a marina.
It is also shown that a northwards flowing current, which is driven by the morning diurnal wind and passes the entrance of the marina, enhances flushing of the marina. The e-folding flushing time for the proposed marina with only a diurnal wind and no tidal flows is predicted to be four days while the inclusion of a diurnal tidal flow reduces the e-folding flushing time to one day. Hearn, 1983, has shown that diurnal winds occur in both winter and summer. For Bunbury, for the period 1st September 1982 to 23rd January 1983 diurnal winds occurred on 68% of the days and for the period 12th November 1982 to 23rd January 1983 diurnal winds occurred on 85% of the days. Steedman and Craig, 1983, showed that for Cockburn Sound, 130km north of Bunbury, diurnal winds occur throughout the year but are strongest in summer.
The model results indicate that flushing from the existing marina area does not occur for the condition of diurnal tidal flows with no wind. With the proposed marina groyne in place flushing is weak with over 90% of the original water mass still in the marina area after 18 days. This, however, is the condition represented by the tidal prism method which resulted in a tidal flushing time of 6 days. The modelled results must be considered in the context of the occurrence of calms at Bunbury, which from Hearn, 1983, is given as 3% of the time with the longest calm period recorded being 27 hours. Steedman and Craig, 1983, showed a similar occurrence of calms at Cockburn Sound with 4% of the time being classified as calm. Calm periods were of short duration from 5hrs to 2 days. Therefore, although under calm wind conditions flushing of the existing marina area and of the proposed marina is not indicated by the numerical modelling, the occurrence of calms of sufficient duration to sustain this condition has not been recorded.
The model results also indicate that flushing of the existing marina area and of the proposed marina does not occur for the condition of a prevailing south west wind and no tidal flows. For this steady state condition flow at the marina entrance with the proposed marina groyne in place is into the marina. With the prevailing south west wind and diurnal tidal flows the e-folding flushing time for the existing marina area is predicted to be seventeen days and twelve days for the proposed marina. These results pertain to vertically averaged currents. Hunter, 1983, has shown that the prevailing south west wind causes a surface outflow to the north from Koombana Bay with southwards inflow into the Bay along the deeper waters of the shipping channel. A similar mechanism could be expected to operate on a smaller scale over the area of the proposed marina. Given that as a steady state condition flow could not continue into the proposed marina it can be inferred that a counter flow must concurrently flow out of the proposed marina for this wind condition. This counter flow would serve to reduce the modelled e-folding time to less than

that predicted.
As the numerical hydrodynamic model is vertically integrated stratification resulting from fresh water inflows from The Cut during winter could not be modelled. Hunter, 1983, has shown, through application of a two layer model which simulated the effect of a surface layer of less dense water which originates from Leschenault Inlet in winter, that a south west wind slightly stronger than prevailing south west wind used in the modelling would cause a single layer to surface in the marina area and the south of Koombana Bay. This would infer that the single layer model used in this Report is appropriate in the south of Koombana Bay for the prevailing south west wind condition in winter.
The modelled predictions of flushing time have been based on advective movement of particles from the existing marina area and from the proposed marina. The diffusion process has not been included in the modelling. It can be expected that the inclusion of the secondary influences of stratification and diffusion would result in a reduced flushing time, Schwartz and Imberger, 1988.
Figure 4.2 presents a summary of the e-folding flushing times from the existing marina area and the marina area with the proposed groyne as predicted by the numerical modelling.
41

TABLE 4.2 SUMMARY OF PREDICTED FLUSHING TIMES
CONDITION CONFIGUBATION
CONTS EXISTING PROPOSED
Tidal Prism Method 6 days 6 days
Diurnal Wind - No Tide 5.5 days 4 days - Diurnal Tide 2 days 1 day
Prevailing S.W. Wind - No Tide Flushing not indicated for steady state
conditions. The single layer model does not allow definition of counter flows at the marina entrance which would enhance flushing.
- Diurnal Tide 17 days 12 days The single layer model does not allow definition of counter flows at marina entrance which would enhance flushing.
No Wind - Diurnal Tide Flushing not indicated, but six days from
tidal prism method with periods of calm too short to sustain this condition.
42

5 CONCLUSIONS
This document has considered technical aspects of the Public Environmental Review for the Bunbury Harbour City Boat Harbour. The work reported upon in this document shows that the beaches in Koombana Bay and on the ocean coast of the City of Bunbury will not be detrimentally influenced by construction or operation of the proposed marina.
The Bunbury Back Beaches are physically remote from the proposed marina site and the littoral system of grain size distribution, wave climate and nearshore current regime will not be changed. It is not therefore anticipated that construction or operation of the proposed marina will have any detrimental influences on the Bunbury Back Beaches.
Similarly, as the proposed marina does not intercept sediment supply to the Koombana Bay Beach, alter the wave climate impinging upon the beach or alter the nearshore current regime, it is not anticipated that construction or operation of the proposed marina will have any detrimental influences on Koombana Bay Beach.
It is proposed in the later stages of marina development to realign the existing beach at the western boundary of the marina area. The proposed realignment results in a slight decrease in the total length of beaches within the marina. It is planned that all of this beach will be available to the public. The design of the beach slope and sediment grain size will ensure that the realigned beach is stable. Changes in current velocity due to construction of the proposed marina groyne are insignificant and will not initialise erosion of the existing beach or of the realigned beach.
The prime result of investigations of the flushing of the proposed marina is that construction of the marina groyne will enhance flushing of the marina area in comparison with its present configuration. Flushing times for the marina with the proposed groyne are predicted to be significantly less than six days and as low as one day for the typical diurnal wind and diurnal tidal condition. By comparison, flushing times for the existing marina area are predicted to be two days for the typical diurnal wind and diurnal tidal condition.
43
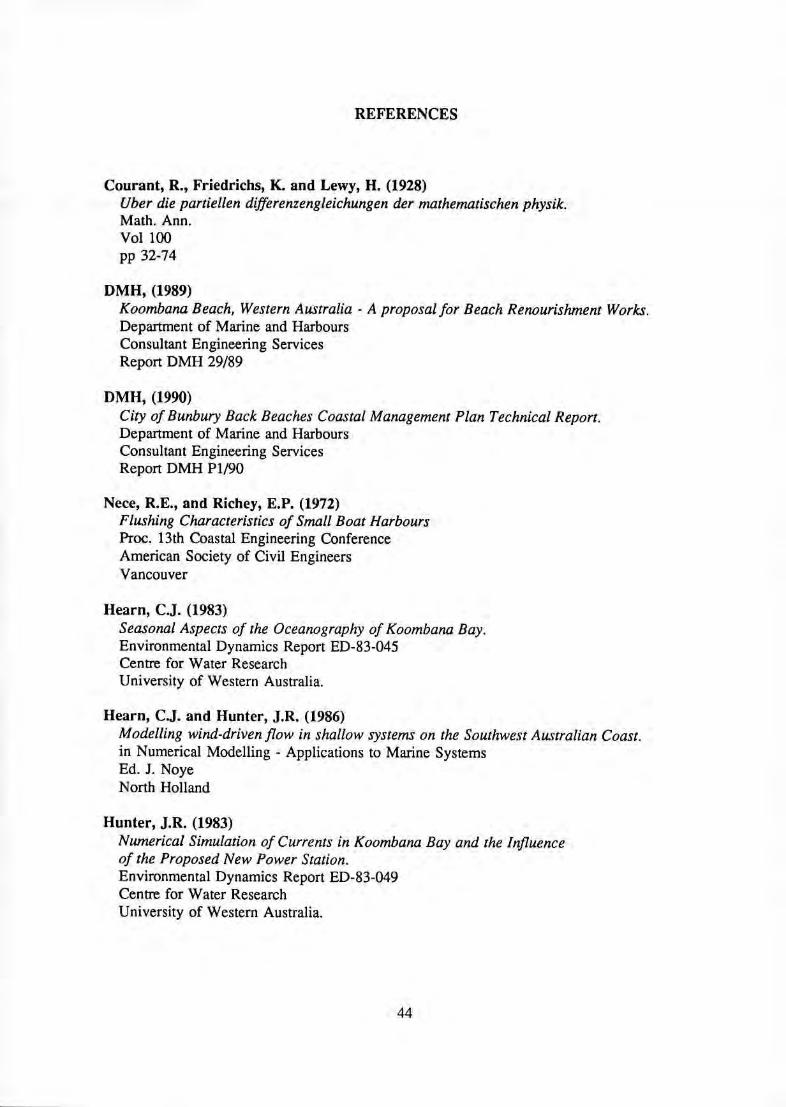
REFERENCES
Courant, R., Friedrichs, K. and Lewy, H. (1928) Uber die partiellen djfferenzengleichungen der marhematischen physik. Math. Ann. Vol 100 pp 32-74
DMH, (1989) Koombana Beach, Western Australia - A proposal for Beach Renourishment Works. Department of Marine and Harbours Consultant Engineering Services Report DMH 29/89
DMH, (1990) City of Bunbury Back Beaches Coastal Management Plan Technical Report. Department of Marine and Harbours Consultant Engineering Services Report DMH P 1/90
Nece, R.E., and Richey, E.P. (1972) Flushing Characteristics of Small Boat Harbours Proc. 13th Coastal Engineering Conference American Society of Civil Engineers Vancouver
Hearn, C.J. (1983) Seasonal Aspects of the Oceanography of Koombana Bay. Environmental Dynamics Report ED-83-045 Centre for Water Research University of Western Australia.
Hearn, C.J. and Hunter, J.R. (1986) Modelling wind-driven flow in shallow systems on the Southwest Australian Coast. in Numerical Modelling - Applications to Marine Systems Ed. J. Noye North Holland
Hunter, J.R. (1983) Nwnerical Simulation of Currents in Koombana Bay and the Influence of the Proposed New Power Station. Environmental Dynamics Report ED-83-049 Centre for Water Research University of Western Australia.
44

REFERENCES - CONTINUED
Hunter, J.R. (1990) User Manual for Numerical Hydrodynamic Models of Marine Systems and Associated Plotting Package. Report OMR - 14/00 CSIRO Division of Oceanography Hobart Tasmania
LeProvost, Semeniuk and Chalmers, (1989) Port of Bunbury - Maintenance Dredging Environmental Appraisal LeProvost, Semeniuk and Chalmers Environmental Consultants Report R259 Perth
PWDWA, (1975) Bunbury Harbour Breakwater Berths Model Study Public Works Department of Western Australia Planning, Design and Investigations Section Engineering Research Station Report DMH 10175
Schwartz, R.A. and Imberger, J. (1988) Flushing Behaviour of a Coastal Marina Proc. 21st Coastal Engineering Conference American Society of Civil Engineers Torremolinos
Steedman, R.K. and Craig, P.D., (1983) Wind Driven Circulation of Cockburn Sound Aust. J. Mar. Freshw. Res. Vol. 34 pp 187-212
U.S. Corps of Engineers, (1984) Shore Protection Manual U.S. Army Corps of Engineers Vicksburg Mississippi
Wallace, D.F. (1992) Department of Marine and Harbours Pers. Comm.
45

REFERENCES - CONTINUED
WaIlis, 1. (1983) Feasibility Study of Cooling Water Discharge from the Proposed New Power Station in Koombana Bay. I. Wallis and Associates. Melbourne
46

APPENDIX Al
DIURNAL TIDAL FLOW FROM THE CUT, NO WIND
lOOm Grid
Velocity Fields

CUT. RES
;LO.W 3V.V '4.V OV.',) /.V
Bunbury Area High Water Diurnal Tidal Flow from The Cut - No Wind
P

CUT. RES
- I 4'
I " ' i ,_.•\ '
, F
/ I 4
-. F - *I,,,
I V if? if llFllF f
Viii tilt P1111,/F-iti? tilt? ff
VI 111111 i?t1F/,
FFtfVlttiiVtl!I
filth hhh111
/?i 11111 l 'iII
I I V I I I I
I/_fl 11111? ft III II ?iIftfI VIII
i/(, /ltII?ItI llF ii
,-
CM / SEC - - - - 15.0 30.0 45.0 60.0 75.0
Bunbury Area 3 hrs after High Water Diurnal Tidal Flow from The Cut - No Wind
-
L...
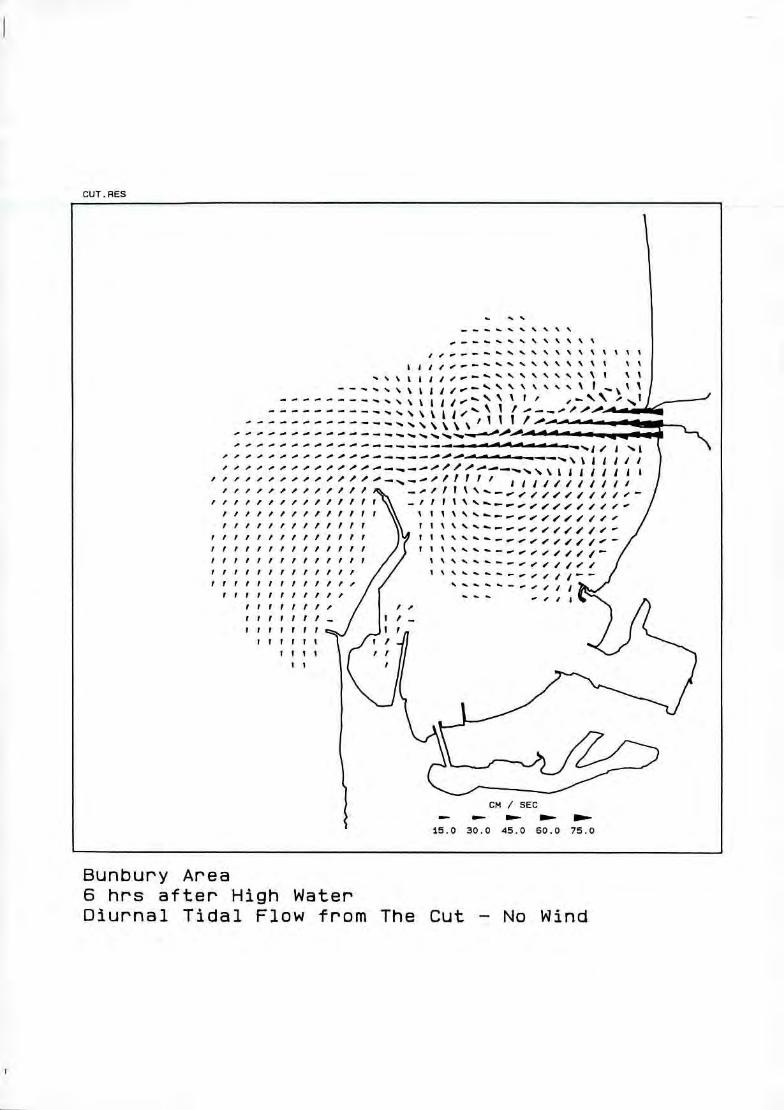
CUT. AES
CM / SEC .
15.0 30.0 45.0 60.0 75.0
Bunbury Area 6 hrs after High Water Diurnal Tidal Flow from The Cut - No Wind

CUT RES
-- — — — I
% I ......... _____.%•S •. •s •* .' \ ' ,'
'''''''Il,/--_''' I ,__•_•..\\ I
— .— .- .— — . \ ' — • I I /
IL £ I'' 1111111 —
,/1?I
''''liii 4 I II I I £I111/II1j4 11411
F ,
II- 1/lI III I /II LII
I I/h
I/b I/I
I I t
CM / SEC — - ..
15.0 30.0 45.0 60.0 75.0
Bunbury Area 3 hrs before Low Water Diurnal Tidal Flow from The Cut - No Wind

CUT RES
------____
_ - - — — — — — — — — — — — — — — — — - -- -- .S..-% S. S. S. S. .4 •
— -- — — — — — — — -- -
_ -----------..4.4.4..4.4S4•4.4
— — — — — — — — — — — —
-------------—"-"'
-- — — — — — — —
ISIS! I//Ill .
i — — — — — — — — — — 5.. 5454 I I
*414411 III?
/ — - . . . - — ...// 0.# — / -.
.4%%•. .4. .S..._.__.,,,_- ----------- -4-,----___•__•_'_-..\ 54
oo 4. .-.-____...--..
'4 '4 ..__._._,__•._.___.__-,, I
/1
1144 \\ 1?I?l
II —
CM / SEC — .
15.0 30.0 45.0 60.0 75.0
Bunbury Area Low Water Diurnal Tidal Flow from The Cut — No Wind

CUT. RES
-- - - - - - -
I I --- - - - - - - - - - - - -
-------
I - - - - - - - - -
--- - - - - - --- - -
-------\
-- - - - - - - - - -
------
4111111111/ -----------------------\s.\\ LIII 11141 "---- I
.. ' •\ '-.,------- III
'. ••s•.'• --- -------,/ F II ç , ---------._,/Fl
II III ill
/
CM / SEC — _
15.0 30.0 45.0 60.0 75.0
Bunbury Area 3 hrs after Low Water Diurnal Tidal Flow from The Cut — No Wind

CUT. RES
CM I SEC - - - - 15.0 30.0 45.0 60.0 75.0
Bunbury Area 6 hrs after Low Water Diurnal Tidal Flow from The Cut - No Wind
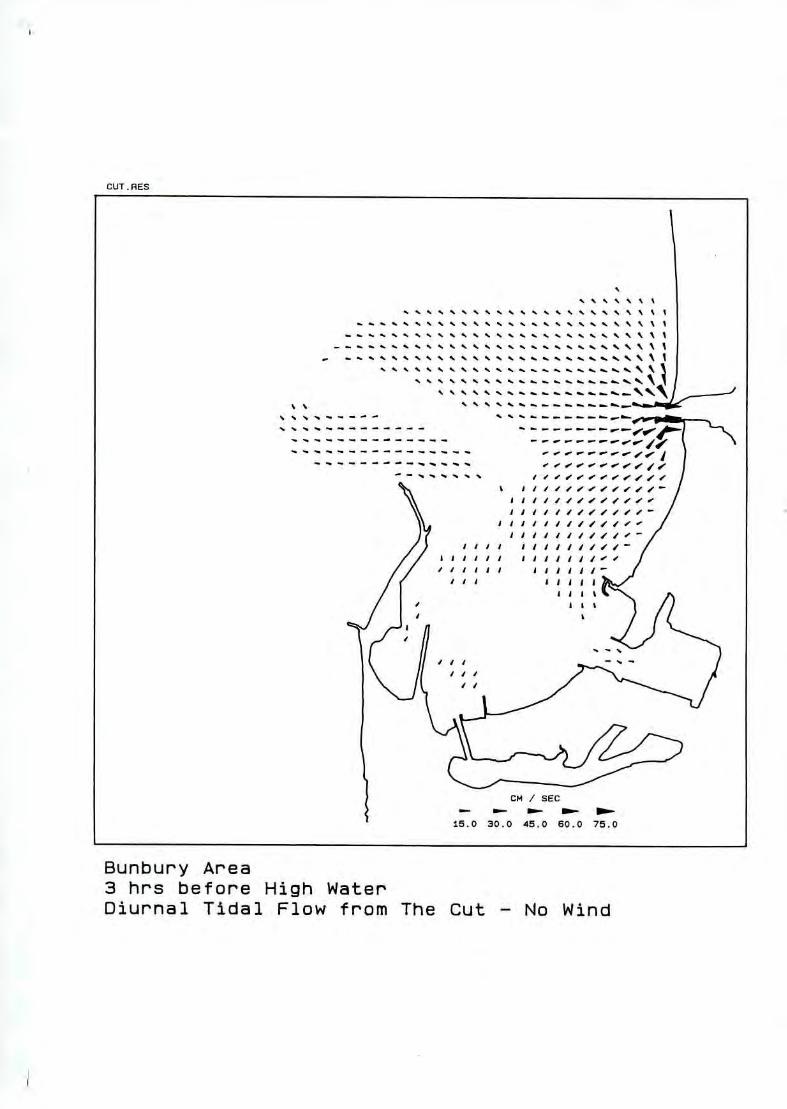
CUT. ACS
' ' * ' '
- I
S -.- -. s
S S •. - - -
- -------------
40,
-------.-.-..- /1 ---------------- - Oil,
--S-S--S
t I I /I/1l//# -
liii S SIIIII1 / I
I I I I I 11/1/1/ jI
Ill, S liii I
III, I
Slit
£ It
'II
CM / SEC - - - 15.0 30.0 45.0 60.0 75.0
Bunbury Area 3 hrs before High Water Diurnal Tidal Flow from The Cut - No Wind

APPENDIX A2
DIURNAL TIDAL FLOW FROM THE CUT, NO WIND
33.3m Grid - Existing Geometry
Velocity Fields

33CUT PES
S %S% I '''. _ ----------------------- 4S4 It t?i.
%% ' ' ''*''''''...-. ------------------------' %
ci %** - - - - - - - - --------------------
\ '4 -------------------------------------- \ \ - - - - - - -------------- s%444%lIlt%,
\ \ ..t.t.....s --------------------------------------.s444141tt111 I
\ \ ''''''' ------------------------------------------s,tII,t,,I,, /
\ \ ------------------------------------------ lIItIIrIt,./
\ 4%44%SS ----------------------------------------...I,ltfs1s./
I \ ' - - -
-
------------------------------ I [ /4I --------------------------------------------
I '..//.i,,s ------------------------------------------ i 1c,. •.... ------------------------------------- f _/is,. iss.... -------------------------------------,,uI,,?,, /
I '''.'s'-' --------------------------------------
J E444•4SS 1 / .................................. It -----------* 4
/ / .................................................tiis./
/ / I.,I,ss._ --------------------------II, ----------
/ / ,,,,,'.-- ------------------------FlIt__F, ------- 4,,,, I _________ F ------------- Stat,
- -------- - - - - - - - - - - - -------
/ ,. • I.., ......................................41_I ...........
liii, ------------------------------- ,,a,,,,,, I,
l,,aI , _ ._ *4*s ........................
'.._ I II, III' #1 -------------------------
/I,lii Jj4I* ..........................
11111 J • • 445s.s --------------------
41111 S £ I I I
................................. ..........-- ttit-I
....................... . .
Koombana Bay.
High Water
No Wind.
Diurnal Flow from The Cut and Koombana Channel.

'1UU9L13 euqwoo> pue qno @qi WOJj. mOTA TeujnTo
'PUM ON
i9M '-I5TH jaq4e SJ1 E 'A29 eueqwooN
,1lI I
Jill
ISIIIIIIIII III II//1/.II/III / I I I 'I
IIIIIIIlI 11111 hIll/h//I I hIll 141111 4JJJ IlIlillIlIl II IlilhhlI hillS I 414114$'
II 111441 4111 S $111114111/I/Il III II - I 411181'
11144411411II ShIll/il ,
-'.-.------'%tiI45lII 511111 1555 SIlISlhISIl II/I/,,. S SI IS I I I III SI III I £15111511 h1/ihI' - -
Ill I I II Ill S II 111111 h/JI///'•
I,, II 1111 II I 45'' III II I I III LI I £1111''
11:/f 14 I I III I I II II I I III 11 I
'I •'II48 444'* 444%4 III 11188 II II II 111 'I 44444444444441144 I I III III II II Ii ii I ___' 444 44444444441 1 I I SI I £ III 111l1 £1
4444 4444444414 III Ill I I III I sli/14 ii S 1444444441 I I I II I I I I I I II'hli JI
14844444441 III III II II 111111114 14 44444441 III I 4 I I I I i 111111 II
188 14 8444484 II I I £ II I 1111111
111 II 884444 I I II II IlIllill i
11 4 111 I 411444 I I II II JliIll1ll 1 1 8 11111111 I I £ II 111111114
I II 111141111 £ I III IllIlIll''
II II IIIt1l11I I II LII lIllIlli''
11 44 II 114411 £ III III illilli''
8 II II 114411 £ II 441 Illhhl'''
£4 Ii 44144 1 II LiiiIIlIlliI'
II II II 111 II Ill 1114 1/1111''
III II II III 1 4814 1144 41111''
--I/I/hi I ii II II III I 111114 Il/li'
III 11 11 I 4 i 11 It 4 4
411 11 I
I 584111 11111 I 1 1 4841414 1 1111'
'''hlIIiiI II £ II 41i III k I £ I j I 4814 141 I 1115
''il111144 III II II 4 III £ 4841 liii 1121
''lililil IIi i k II 41 11 £1 4111 1411 III'
' 85 551444 i I III I I k LI
I
II II
''$III III IA 5441 * 111 1 14141 41 111111 14'
SS%%%4444 441 III 111 111111141 44''
''4%4 411 11111111 141 1111111 I IS' '''' 411 411111111 III 1111111 III' 'I,,, 4 44444114 111111111 III 1111II1i Ill''' I S Ii 1111I111II1II IllillIl ISIS''
II1uII/1IIlI111I111li1
- I 1II//I1//IIhi//hhhhIIIl ii's''''
S*4 JJ13EE

33CUT ES
-- 111/11 1111 III! /////III/IIIII1Il1'•
11///II1/I11/l ii' 'a'' \a• a' II1//II/,,"'
14141
fl1j/1///////// /IIII "
It 1ff H 7!
v1///////I///// i/iiiiii,i,,-- 'a 4f,/,_--s
....f.f.f1/?//////////
%a a s
a "#.#//?1////////// ////'1//11--
- ______________________
—
.
- ----------- — — — — — — — — —
/1•0.-— — a, --------------- I_..______I a', --------------- _,l,,.ia / aa///I//111I /
a' -------—-------- Ii a',.............. -- -----
IS 5ljt - t~ lhl -'''''-ii / i,iuuuj 'iii
Sills .............. jill I I I I I I •S••Il' -
....a. - sS * S %IIf l#I1l 1/lI/ I S.II I I I i/lI i I a'
5'' '•*5 II •1/l//////ll#/l///1///##lIl 11111155 I%ta'%a'%')
Ill,, a S ItS IIIIIII?/II#I/I11/1I I IIlIIa.11115 5555 a' a. a's
I fits lass I
I I I I I Il555II 1111111/I /IIIIII$j$j/Il a 'S ...... a a a I
a. I iF I, ills,,,,,, I II#IIIIIII 'II,iIII ' ' - '. i''' " - Iii SttSIiiiii' S. I a' III IIIIIIIIIIIS''
)
I, ,,,,,,,,,,,,,,,,,,,, ssss.s iii gjj*.a /
lii 154111111 a iaii , SS8iS1i
ala a'a' • II S 5l555 • %sss
S I'
; ; ;_•s'
6.0 8.0 10.0
Koombana Bay. 6 hrs after High Water
-
No Wjnc
Diurnal Flow from The Cut and Koombana Channel.

8UU93 uqwoo pue 4no aqj WoJ MOld jeuinto
PUM ON
J 2M MOl ajoj.aq siq E
ueqwoo
OO 08 09 01, O
-. .. - -
tilt
tt , ii Il lit
lit lilt
s*ss I?IPl,i.
siFFIFI?liluii i*iIItt
,,,FFFFF?VPll,, tilt,,.------------
,,t?P?l11piiii ii?lt?,,i
, lift? l???llf,, SF11111,,
,,,,,,,,,,,,P,,,, ,F,,,,,,
S * * * I I I I I I I I•S$?IF#Ii It I VISIt I ..IFtti#
. s * * .. , t t t t t t p , , , , t .. .. i , , t I I , s • . I iFF/i 'I,, IlfFfi
St St St StSt%% St St S St St I I I I I I II I Sill fI III? IS I I I 777 Vt
:
I%StStSSS%S.SStStSt%%itittliIIIIIffltSSIIIIIIII 11111 till %IStStStStSSt%St%t tItlPlISIS St III?!? IS?? 11th 1711
liIIStStSttStSSt%t ill lIItS1t?I ill hub,,, . p177,1
It tlilISt%%tttSttt 111111? II lbt1tbI? ItbIt I, III ,tl llltI%St%ttt,ttiiiiiilt?IIli,b?Ih tu?,,,,,,..--,1 ItVt *I%*llIlllil%%t%tltl lil!tIlPI?IIppllI?I,,,,5.Ff?7l
- sill *1111 111111111 III lit $fff ii???? II ?,?I?,,,,ll Fill
* *111111 liii 11111111 I ti V fffffi? I I?Ili? 1111111?fItt
stilli Iii it It III %% liItlI?Il? Sill ?IIF?1 Iii, III? 171 ii 1111111111111*11111iptl iit 1111111 III 11111 llllI??llP hullS?? li?l?Fl lliIt ii tillilillI 17111111111 ItPP??ullF?FF??FF,I1,,FF,,it I
lilt lilt! V VII 1t7tllIiii1PI?!F I ?F FFFPIt! Fl F I I
illillilitI tlV,?VtllittVV?i FF FFFFFF F F I II 11111 ill? tIIlllllItilltV Ill,,,,,, F' F FF lFFII1,. II ' i 1111111111 VtI,,,,lltItV?,?F F Fl I F I P
ut, tPtillttttI77 7771ff 11111ff ?/F/F/F/t/t,//F,I PIP
tiitiff 111117111 lIl7l1ll 11111 ?FFIFFt,,t,/#,,,,I' I, I I VlhII7ll1II tIIVlIfll?P P P I tit1/ ttt,,,,,,, i'll,
'
,,,ftIllIIlIlIll? 71I???FPI IIIIIFF t#//It/,,,,, ,,,,t ii????? !77JJJ77I7I777?FF htIiF Ft.tt#t/'/F III.
- I tiifl,,P I 7111I17711 11111 P F F FF1 P F.' / //.#"-- -
.
ii lfl,,,f 11!III77111 7,IIP,FFF?F!/ t//'./--------- ittlI1!Ff 1117171111 7171!F,FF/F //'---------. - -
tittt F tfFF,,II7I7717fV11,IFF/F//
f ?
t',,,. .,.....55, tiIlI11FF 1777!! 711711111FF
,, t tillil lIF1I 111777 - s * tt11171 I I I III? IIIIIIU?IIP
I I '• tutu 1111? 1171I7111?IIPIFF I II I * ilillil I I F P I7II!III7V?,P1 I
tilt ii I V I 1I 7?II!17177717
S %%liiIIIII?7 iltiiIIltItl F,,,,. I I • • • * % ttItiIIIV,i VIII II,! P P 7
''''"'Ii I., ,,,..s.tiiit7I7f1llltI7l7t7ttI
S - / - - I S I* It iiPI,F1? FT Ill III 111 p ,p
SJI3 ifl3t

33CUT RES
f_••\ ......... ,,,,/,,,,I,t%,%ii,i, •_.%-%_
\\ '' llIISlII%s% \ \ \ -----—------
fr ''''
' ----------------- I I .. I '-1/I I t '.S.5 •S.S ----- - - .,,.- S 5 I I I s 1 I it ? P I * .5 I I I I I i ------ - ....•' s / I ! iittt'. _..Sss ss s. %s , iis5IIIS?PI ilIIlFFF?IF?F,'..J
/ i I I 55 % 's 5555% •• * * , , .5,,, , , , ,,,iip?p P F F.' F/
/ f.sISti*%%s ss.s sssss*si,ii...:;tstI*I?IIfIl??f_/ / /isssI;%*ss*. S5 ss
1 / /5. j .5.5%'''' 5 **sss**%tIIiI1IIII?tIIIItVIt%../ / if S5S Ss ******stttiii.iI,StIIIIIIIIII*. J /
5 ... s *s* S%%%*I%%lIiIilSlItItiII
( .__ . ..s** ,***s**,i,iuIIiiI,tI/7 I I *%%l,ilSfIltlt
.......................................%%%iuiiIiIItI 1,1 I. ------———------————————--------------%%%%,ju5,i,iuf .55 ------—---—————————--——-------Sss*
I **%%%IiiiI**%IISt•
---------------------------- - - - -- - - -- *SS%tI%iiIii ,,,,, --—--------------------—--—-----------*StiItiiiiI .....
----------—--—--———-—------——-—-----------
-------------—------------------------S*i5%tiuS,,,,..
Ii., ., ---------------------------------------S*%%iiiiIS I,... I hiss, ---------------------—------------------ •It%iI5tI.. t_. I Iijii,s* -----------------------------------S%%%iIIISs.
/11151 I *5*555 I I -----------—---------------—--------- sills -------------------------------------- 5*5555.
r
CM I SEC - — - -
2.0 4.0 6.0 8.0 10.0
Koombana Bay.
Low Water
No Wind.
Diurnal Flow from The Cut and Koombana Channel.

1auu9LJ eueqwooN pue 4no aj woj.j. MOt u.inccj PUM ON
J9M MOl Jae SJ(.l £
cg 9UWOO)4
'5,,-.-..
------------ „ ,,,, II,Jl I-.. -
- •SII1III
''•II''''''• .-.....s. •55j$e .-'
-5---- --s-'-.S-S'--S--- 5,,.,.,, ,,,,,,,,,,,II Ilii•jf
( I ... ••••.•..•• s....s'i..... II ts.asf I I 'SS SS 5S5%SSS%I ..........$lldIIJI$JJJIS fJ-a.aas
1' 5%S•S• ISt.III.II,Iu,IIJt.5t$$Jl5I
Slittiiiiii,,,,iii,,iliia#'s..ttjjjsf I p '/ I --- - ------ SSStSS%SSSit%SttIb%ililI , $. 11 iiilitlllJIt_ 5,, aaalI
_tI I ---- -------SSSSSSSSSS*SS%SSi%Iillallltllttttulu$SSS ,tt/,l,lI / SS*SStS*S*SSi%5%%IltattIalIi%llttiiiaa,,.,l,,,,5I
dl \_ ''-.sssttssst sSsssssailil;.sts%llstIla.s.sa.lss.alJ / ( • I I i S S - S. S S S S S S S S '. S S S '. S S S S S i i i i i i • a a s , a ', ' a a a li
' S S 5. S S S S S S S S S St 55 tills & I 551 $1aS#1 • /
I IIIIS5SSSSSSSSSSSSSSSSSSS%SSSI5%II i&IISIIIIISS'' I /
p tttIltsSSsSSSSSSSSSsSSsSSsSSSssIttls&l1lllls#' 1 /
... II StIIttSSSSSSSSSSSSSSSSSSS.SSSSStlllltllllliStaaS / I 1111 II$ISSSSSSSSSSSSS%SS%S%S%SS%S5IIIII1II1IISI
7 a11 IIIIISSSSSSSSSSSSSS.S%5%5%%55555551 15$j lllI5.../ / / ----- •a&Ip I SSSSSSSSSSSSSS.SSS'SS% 5555555 Ijljjilll''' I I I ---- •t...taaSSSSSSS%SSS%SS 5 s%%%sssssaaatitjj,,a,,i. / f
/ '%% 5 '' 5 '5%%55III,i , I ,, IISSSSSSSSSSSS%%%S.555SS5%5S55555551jjj11II/ /
/ ----IPS*ssSssS.sssssS5S55%%S5S5SS•SSSS\%55%IIIllia:./ / / ''' - .a.saass ssssss izsaf / / puss *SSSSSSSSSS SSS% s'''l I SSStSS*SSSSSS ..... 5311 / 11995111 ssss*.sss....ss..
55*SSSSSSSSSSSS%s•S -----
IS S S S S -------------------------- I I / III???? -- - ----- -----SSSSSS.sS ------------ --------------
----------------55*55*5* -------------- S5IIll -
-----------ssSs%sSsss ------------
-------------------S *5155555515 ------------ as S SitS tilt Ii Slit'
__SlS1ll,,, -------SSStllilsIIlIPI5, , Ill,PP._ * ,-.5*S * * ' ' ' i tsa
liii ilillIll” 1 ' S3ULfl3EE

33CUT RES
- * s s .. * * . s a a a a is stile I a a a a as,I I e/lsele,,,/I////I II a
\ \ a*a;iiiii
\ \ al*it%%ii•• S SSa*S*%**%%,,a,I,I,,,4s,,,,,/.l,////,////11111, -
\ \ aala*taaat%,%%I4I16,,t,1l/0,,,, /////1/1111,,
\ \ asaa** / \ \
*ss*s*** •,,,,, ii,, 4f 4F /
''S *'.—-e,
I ''''''-—-----
I / '''''----—----'-
I
I '''' -—.-' .... •.ttisSllisiiIIsIs#I/IIIjIii/
.---------•' it'...,
7 i a,, , I,,,,,, i•iSfiIjgI5lltg5Ij / s,s,s,ett,, I,
,9 ii If Soils,: #09(03111* l%,•_ IS~
9tSSfl ilI#l*3i I
-
Koombana Bay.
6 hrs after Low Water No Wind.
Diurnal Flow from The Cut and Koombana Channel.

*tauu9qo eueqwooN pue qno aqj wo.jj. MOIJ tuno PUM ON
t46cH aioj.aq sJu 6 4 Aeq eueqwooN
...____ .. . s . l . I . l . Il, Ii9fr , i:littsfs ,isssiS ,,s ,(
s*llfIfItllifIfffffPIiIiftgi,,,:,,lIJ/_?FlF,l J . S * % II , I I I I I I I I I I I I I I I I I tt i tiii, lJ,?l!FF, •
I IIIIIIII It fIllS If III II tiItS?IfI •fJ ??PlPi ,, f ' ._.s'%%%S*%%,S%%%a ItlIltIll, ill IllitlIttlI I titiJ Il?FI ,
J I%%%%%%%.55%%lIIIII,i,IIlIiIIJ,,,I,III,,,,,II 11111 f I' t%ISSS%%%%%IItIIIIIIIiIifiJifIfIIII,JIII, II 11111/
.Ilt%%s**s***%IIItIiiiiiIiiiii,iiiiiii,,i,fj_fiIi7/ I I
. J / I
liii I •.. II I --.--s %%%%lIIiIIIlt%lt1iItIiIIIllIll,,I,,IIIII ,,,,,,tiII 111 I ------ 1.1 ( .....S%%*I*tlItllitlIltllIIIiIIlIIIIIIIiIiI,,,i,,,,,,tSlII
.1 .....IItIItIuitlIlllIl%itIlIIItIiIIIttIIIII,I,SS,?tSItI
'S... ItIlIIItIlPIt%att%l,lIIliI,,IiI,iIIIIII,.,,,,,,,,I,J /
... J/IIIPIIIIIIIIIIIIIIIII,i tIll lull IIitiiIItIISItI,,, ) / /'S*IIIIHIt,II,IIIIIi'I,'It lIllill iSitIiItSSIIIItf,,
'/FFIf I I I' I I I I I I I I P PPIiIiIi Ill? 11111ff lII ./ J II I
P I I I I 11111ff JIltS It???? I??IIl?IIi. / /
/• ''F, FIF//////FF P F F F I F I PIIIFIPIPPI P I I I ftS I I I I I I I I I S I I I I I
f-'/lFFF/F///'/FFFlFFIlIFPFlIlIllIlP II t,,,,I,,I,I,,I Ill
I . ' ,F//////FFF////////FFFllFlFFIFpI F I I ?ItII F I PFI?I fill. F F F F F F F F F F ! 1 F F I I P I I I I S I I I I I I S S I I I I
I . 'i FFFF///FFl///i///////FFF//F,,F, F.' I FIllIP I I I 11111 I I Ill 1*1

APPENDIX A3
DIURNAL TIDAL FLOW FROM THE CUT, NO WIND
33.3m Grid - With Proposed Marina Groyne
Velocity Fields

MAR_CUT RES
I t % . '. % t % t * , I S S - - - - - ----- - - - - - - - - t S S I S I I V I f I I — 5555%5S 55 55* sssssss.* .. - - - - - - - - - - - - - - - - - - - - ---ssS 55% IS IS us.
--------------------------------------sss%%t%%ts ss.. .. ..s s**5%tII%t5%s*
\ \ - -- - - - ----------------- - - - - - - - - - - - - \ \ 5*55*55555 - % - - ---------------------------------...s*5%I%IIIIiI ) \ \ ,**ssss* --------------------------------------,,tuiutps. \ \ s*s --------------------------------__ ,,ttuiftlI, t -------------------------------------- / I \ II --------------------------------- ,,,_.. tIIilSIIt5/
I d'/.iits ..................................__ ,iIV?SIlfr_/
I / SIII **ss%.s ------------------------------ It fIII?l./' ----------------------------------------.111111, 1
I jiti I,, **SS• -----------------------------------*iitlIi#..J
/ 1..., ii ------------------------------------------ st t?llt.f / 1 , . ...........................................Still? , /
/ / Ill 1*5*555 -------------------------------------- ii
/ / ...............................,,t,.,,,,, ------ * 11 / /
sS..5*...... -- - -- l_l#tllt## i__* ,f I,- ----- --------------------ee,,_,ele_
--------ee.,t,,,,#_-- ills / / J'
' eeeeeeeeeeeeeeeeeeeeeeeeeeee teciggese,. I it (
-----------------------------%edet,,lge#-. S
1 - I i ,,__._.--..-- -------------------------. es--S.--. I ,
Ii, ii - -------------------------- S - S I S I t5St S I I
Iuusi. - ' ------------------------. I%% ------------------------/11111 JJIISS -- ------------------------- ------------------------ / lull! •'' --------—---------------- 114111 11 l'' ___ ____.- •'''''II•••' ''S. ----------------------- 5..
-------------------------------------- S..-.. -- -- i#i - J
Koombana Bay — with proposed marina. High Water No Wind. Diurnal Tidal Flow from The Cut and Koombana ChanneL

't3UU9UO 2U2qwOO> pU2 j.fl3 81 WOJJ. MOld 19J t2UJflO
PUM ON
JM U6TE-1 SJL1 £
uiw pesodod UM - A99 eueqwooN
o•o 0 09 0P
III
---------------
lii S Ill I
#111 I
* 5151111111 lll1/Ii/iIlI//I1l 11111115 I I I I IIII/I////IIl I I S S
I S titliSt IiIIIIIIII / / /11/11151 I sasisjsijtija a II,Ii,I//IIIlIiiItII
ssss august a iii,II,i1/I hull
Ii it 11451 11141 I''''''
I I S III IS II StIll lull '''
I I 11 II IS I I I I I S I 555 151115 $
I SI I I I III I I Si I 1111$ ' ' I I II I I Si I 11111 'IsIs'.
I II I I I II S 55115 5I511 • . S S I I I I I I 1 5 1£ S Sill S I S S
i i £ i ii •i'—--- •
''\SSII SIS%SSSSSStI & I I Ill II
tISSSS 5555 I I II III 55S%
III 5555555 1 II I $111 -- ' - -SI 555 511 55555555 I III I I k 1151 t 5555%'''
. I 11 II 5555 I II ii
I I III 11 I II I II SIIII'''
IL 5
11 I 555 I II I I I i
II t II III III 11 II II it 5iIS'• h -- /4 II LI LI IL I IS 11111'''
IL 11 II 55 II II ii Sill'''
I II II II I III SI iii''''
I I LI SI £ I I 514 liii''
''h//hi I I II LI hill 551 lilt' ''I/hIiI II LI S I II II II III 5J4 fjj'I
I I I I 111 hIllS ''IhIiIIl II £1 Ill ii III £1 Ii 114 III
'lIIiIJjj I LI 5£ III II £5 I 1111 1151 SI, •jjjjjjj II II I 151 I LI I liii IllS 'S. •'jjjj II I 5,,' l$IIIIII II 51 1 '1 £ I ii till Hi'
1 51 5 ii Alit Ill
I LI 44 1 S hit liii III -I,',-- ''tIII I 11 11
''%%5555 LII Ill ii hi 111155 $tI'
_SS%%S5S5I LI III Ii Ii iii IISi i iss
III 111 Iii III iii 11151
'5,,, ------'''' LI I lIIIIhIliiiiiIIiI hIS I II'' 5''' ''"'-'.•.\55555 I IIiiiiiiiiiiii'iiit iii It'
H IIIIIIIIIIhhhhhhlh/IIIl SIlls's
IIIII////hh/hhhh/h//1111i11i11''' --
S3$1

MAR_CUT. RES
3
-- pFfli.
III%ttt ¶I
1/1/I/I",' I'
l * i ---------
tt
_ '---S.'' ------------
'_''"_•._.•. _---------,-- #-11,,/,,,I,IIII/I/1,-.--.-_- ----------- ----- ------- _1_1,.l,,7/,I/IIII ------------ -—— ---- ————— ___•l4'l,/I,III,,i ---
S 5...'--- —-----------Il--I ----- _ ,,1/I ,,ll,1ia IIH
' _-s s.S**. I I 1,,,I1ll1144#..I11 ' - I I 1II IIII1I ' -
I I IS I1111//IIIlI/I/ 15111111 Sill ltt'.S 'Srn - it,,, Illti £ % ti till IIIIlI/II,,Il1I1IIIIlIl, I,,,, 15I1 11111*5 / I lilt £1111 ills giiII,,,,,,,,,,,,, S • / tilti hull 1111141 1111/Il 1/41111111, l5'' I •sll5l / tilt, S' lllli5SIIIllIlllIl1lIlI,#,,, 1555',,, • p " s j • a i s a a 5 1 I I I I I I I I I I I I I,,,,, lsslI,,,Il 111111111111111111l''.
.1_I,,,,, IllIli1lIIlISsIi,,III,,IIIII,III,,,,,, ,ftIFIt 45111115Ss511 115511 S SI 1151155 III lIllllSS5lISII'S ' ilttlIsIllI,,, ,I,luII 5lS IS ,lII** ttt*illIIIl ,l**
5_••. - - I I -
— — - - . 2.0 4.0 6.0 8.0 iO.0
Koombana Bay - with proposed marina.
6 hrs after High Water
No Wind,
Diurnal Tidal Flow from The Cut and Koombana Channel.

'1UUI43 eueqwooN pue qno aqi WOJ. moTA 1.2pj leuinTo
PUTM ON jaqeM MCi eojaq SJt C
'uçiew p3sodoJd q;çM - icg 9U9WOO)
O*OT oe
'II',, 'I
t I,,,
V',,,
'S
•iPFF,F,F? SI.. I P F !,FII Stti
-------------
i.4t,si,,,,,,t#IIIIttf???lIIi ISIS
ss*iIaIII,Stt,t#Ip1ff5515S5$II 1*95* * * S S I It I I I I I I I I S ISS,,I,,II I I I I I I I • ..
s S S S S S S S Ii I I I ISSSISSIS Sill Pill? S I S I I S I S S S S S S Sit I I I I S 5 S 11115? 115511*5 . S I I S S I
ss%S.%%%'%%%S%%%SSSSStiII5PlS5S?SSS??5lSIll,S 1155*1 • 5% % %%.sS,S.%%%5 S S S S S Si I I I I II lSISS?S ltI5II595 I I I I I
%SS%%'% 55% 5*555 I I I I I I I I11?IIIlI StIlls I I I
%% 5%' 555 II I I I I I I lSSISSSlt 11111 1 I I I I I
1i111 S.%%%%%% 5% 5*5 I IIIIlllPISltII I ISIS,,, - I I I S I
1 • IllS V I * V %.%%%% 5% 55% liii IIIIIISISSIItI I,,,, S I•__ Ill•i
,, I 1l*II1*a%%%sssatl luSh? hSllIIIIt ISIS Sl,._......#*I S I
$ i is 5*111*11% 555555 %IIIIII?II S1IIIlII1II I I I S
-i
•st*IVVij*Ills%%%%sss 11111?? IIISSIS?I llIIItllI .ssi5*51IIII5i%s,ssss,IIIIIf,5,5,s,,,,, IlIP• ssSV*1lIl1IIuIS5%S*SIuII?I?tSIfSFSlIjSI,I,,, --
- s%t*IIiI1illIII%I%5j5*If?5t55ll?I1?IIISIIII,s sI*II%IiliIlultI5*lI55hIr?v1lIr?plVSIlI,,,.is utui1ttItlIlutIItIIuIuppltIl?v?f1SrlIIl,,,,a,,,.. 1*11,1 Itll!Ii tlIIu*uIl t?ll?lI?II??IIS 11,5,. uuIIi1iil1l!PllpISI;IutIs1tpP,,,p,,,,,,,,,,,,,.,
1111111111! VIII 11111 II? h111P?FF?? IIIIPIISS ii lIIlilllili III IlViti till Il1I1FF?F/FFPPI??IIISs 'Is ? Vt? IIIII1IIVIVIIV P hut Ill? II! FFFF#I? PP II?,?,,,
ISSP,It VII 11111 VI VI VIIIVISI Ii I?
PF!F!!!
F/#,,'#'ss''. iS?l, ItTilil 11111 V VVP V?tlIh?I1
SSI??I?fV VIII!! JIII!IIVV PI?IPI,l lF!//,,,,,,,,,,, I''' 5i1l?I?Vi lIlt! 11111 V V V V V 11111111 I I / F/F/#,,,,,, ##,,ss,
S I I I I 1? Vt I V V I I I It Vt V VIII?? I 1l? ,,s#s 'SiIll,,V itt VIItV IVI?VVV II?II?IIF F1,,,#s### 115 I
'l F I I V VV! 11111 1ViVVI 1,1?? I I I I F .'.P',,..--.- - s S
. •
suit?,,, VIII! V V V F
I I 11FF?! IF! V VI1P,'FFFFF iI1 I FPF 1
1
5,. •i',i?IIPffVtVf V
, sit' tIll V V V V F I FFr r I I I I I I I /I I a '5,. ,t,,IIlPI1'IVVV''
,, • . ii _______ , • , iiiiI
Ills. *it,IIIPIVTIIVVVVJ!Vltl "I .tss%IIIIVVIIVVVVIIVI1I
, • iisiill! VIP1V I lIlt! V V I V V V
, * s s I *11t r V V V Vt 111111 -.s.. .ss*IIIiVVt1FIVI! I 11Th- S .5 1_S.'. •-sls%IIVVII?
s3u*inD—uvw

MAJR._CUT RES
t_••\ '.
a
--------------_/,,,,,,,,,,,,,,,,i-_. /
I .•---'
-- '..--,
I /• I I I '. '. -...-..-.---- FF1 j /t I .s•lt.I ,,,,pFPPlFIIF,- / II ssss.st
/ ii I IIIi\'.. •SSt I I ,tiittiit?IlPlFl!FF/../ J /lSItIt%t.. Ss ss ssssss**iiititt,ttiiIlIIlPIflFF!F/
/ /IISSSS%S%SSS.. **..SSSSS SS*5%il,I,SISiSSSIiI11I11PPI1tl/ jf jtIISi 1115.5.55 S5**SS SSSS%%5.5t iii s.,iiSIIIII??1PFlJ!*../
/" /5 •IISSlItS% %SS*55 5S* SS%SS5.%i% liii triiiiiIJI?l?III.. /
/ / ,,,,,,, ii •ssss 55S SSSSS%I%% till t*IiIItlIIII$l.. /
I' ssssssist*ItlsSSIIIIII?P..I gs
i '•- 15**SStt sss***SIIII,ISSIIIIIII t
/ i •SllII5*55SS • •••5555S s****sIIii,ttlI?IlIIII'\._. -
,( ( t,.t.s.ss. - - - - - - - - - - - - - -----------t.siesiuttiItiIfl
I littIsts -----------------------5.ssstillIIllII
I -------------------------- 5.*sS**itISlllIlll II
I ---------------------------------- tlIItlllS ill
I .snt,tiIttItss,,..
-----------------------------------,,lt,,,5.sI,,,,, I, ----------------------------- si*tIitIIItiISt., I.. - -------------- - - - - - -
ItiiIttiISS.e.
----------------------- (111,11 r•g,.
i S / ------------------------
hail --------------------------- 5.t1IIII15
' ------------------------------------*5.tII,I,,.
hail ,''- -----------------------------------
-------------------------------------sS%III__ Shill -----------------------------------------StIlt
111115 hills, 'hull
-------------------------------------------------------------
CM / SEC
2.0 4.0 6.0 8.0 10.0
Koombana Bay - with proposed marina. Low Water
No Wind.
Diurnal Tidal Flow from The Cut and Koombana Channel.
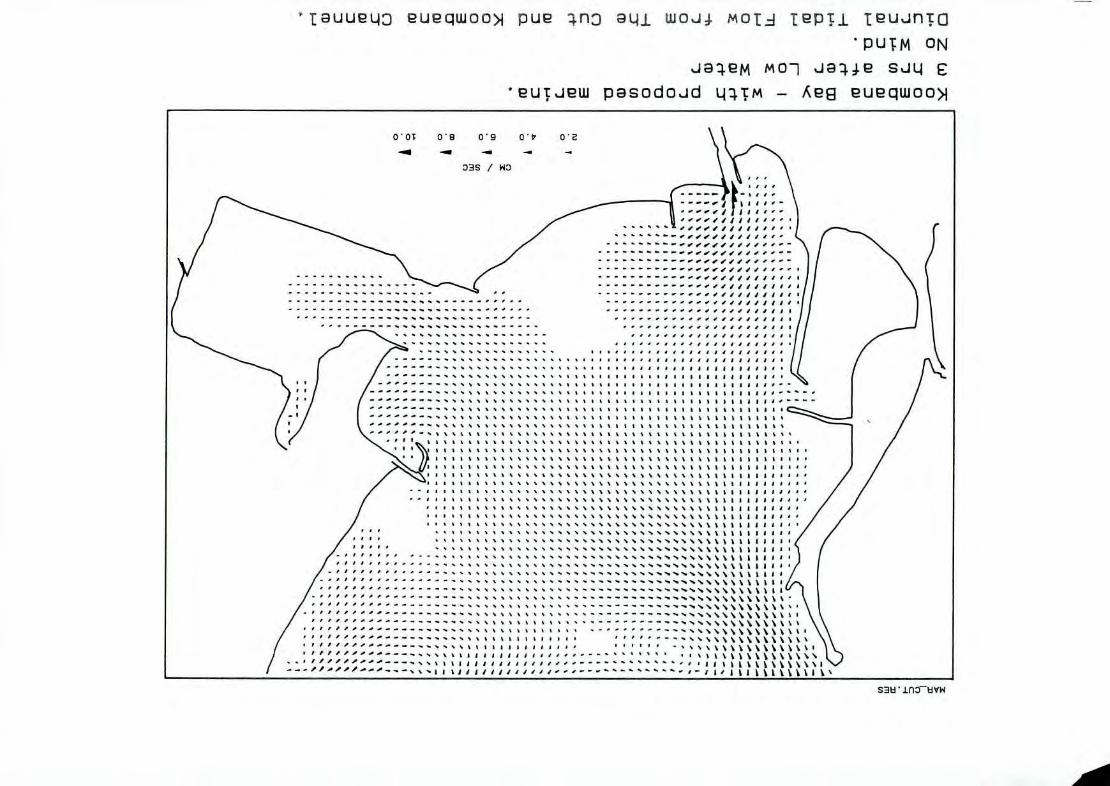
'iuuLj eueqwooN pue qno aqj woj molA 19Pçj 1UJflTO
pUM ON
JM MOl J944e SJU
uiw p3sodoJd qç - Aeg eueqwooN
001 09 09 0P 0
- - 33S / HO
---s---....-- -. - - -------------- __Illli SI
--
_,#_ _s.___.__. .................,,_,,,,,,,
A,-.-
I, I' ------------------------------- I I' -
---------------- - - - - - - - - - - - - - - I I 'SSSSSSSSSSSS% %,,,,II,,IISII$I$Jl,,,5l,.
I, SSS%SSSSSSSSSS III, %IIuIIIIIII 11111111 411
: :1 : : : :: : : : : : : : : : :
/ * * S SSSSSSSSSSSSS
I *5*5 *5 *55* sss *5 *5 *5*5 *5 *5*5555555 *551*111% Ills I * i * t * s s * * * S * S * S * S S S S S i I S S S I •
s * s S S S * * * * * * S S S I I I I I I I I * S S S S S S '* S S S S S S
151** *5 %SSSSSSSSSSSSSSSSIII
I' •I*III*SSSSSSSSSS55%55%5555555%55555IIIS$J5jI
/ •,II 11*555555*5 ssSSS5s5SSSS5S'.S555555IIijgS,S. I II**SSssss*SsssS***S*s*ss***sstSSiliii ,S. I • ISIS * S * S S * S S S S S . S S55%SSS*5 5 5 II S I SS' / ISSSSSSSSSSSSSSS55%%5%5S.%s55555%Iljli,•.
/ •'' ..* s.SsSssssssss
/ •S•• ..,sss sssss sssssss I ..sssss ss ssssssss I 7 .SSS*SSSSSSSSSSS%% ''''' SSSSSSSSSSSSS.S%S S% s5 Shill
/ .0i tt '''''' SS5sSSsSSSsSS-ss, ------------.'5555 555 Ill
------------ --------------------------------------- - --------------------- - ------------------
- --1 ---- - ---------- ------ ''.% 's's5S'i' ---------------15*5 * Ss . - - - - - - - -
- - 51
sit -------------------*5555*. ----------------
- Ittt# ---------------SSSS,, SI I I -------------- ' 5 - - I F F -------------- 5555 5111*11 II I •''' - S I F F F ------------ SSS 11111 IllII'' 1 1 - S.
SSSSIIIIISSISSFI' -----
-- - - - - ----------
SOhJ . ifloThYw
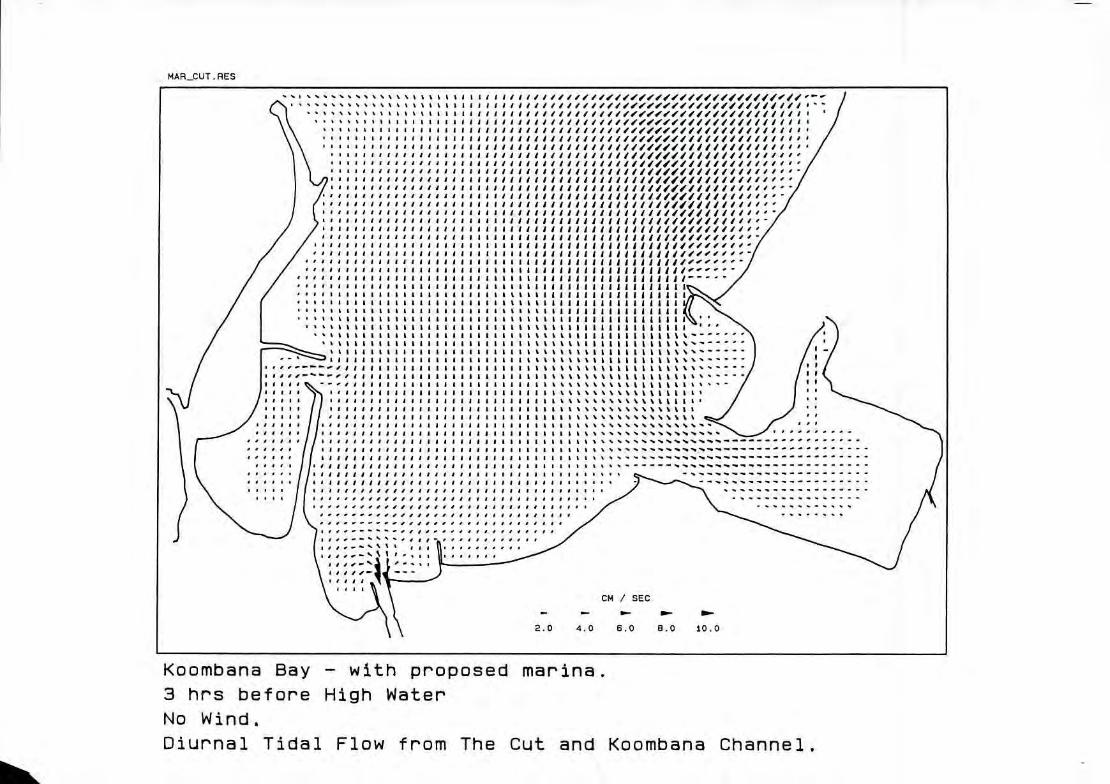
MAR_CUT AES
5.s ••. s '. '. ' a a a a a a a a a a I I II I/I//I i///11111/11//1////////./ --- /
s S S S '. S S S a a a a a a a a asia,,,,, IlI/I//////.1/1///7////////////I is /
.. * '. .. a a a a a a a a a a ii.,,, iiiii II1IIIIII//1//11//11//1//I/I/II I "assaa 'aa;aitaaa aasiaaaI,IaIII///ii/////,?1///////////IIIi 1 /
/ / / /11#'/l//Il/I/// / / I ' ' II , assssssj usia iiII,IaIIIIIIII/III///I/1//////////IIIIi I /
' 's,I,Iis, sail a a a a a a;aIIIIaIIa/IIIII//////////////II/III' /
,a,aaai as, a IIIIIIIIIIIIIIIIII//1///////I///I/l'''/
I/iI/1//i/i/Iii
/ , • a a a a a a s a a a a a a a a I I I I I I I I a a a a a a a / lI/I//I//I/I
/ a ,s a a a saaaaaagi a a a a a a a a al aija iii a a a ii aa a iiiii/i//i.'a I'' - I
/ / s as a aaiaia a,, a,, a a a a a a a a a a iii a a a a a ii a ii I/I//I//I//I' • / s's.saaaaaaasa , a , asaaaaaaa,,,aa,,aaIaaaa/////,,,,/,,'-/ sssaslaaasaaaaaaaaaaaaaua , jjJaaIgggajlaaJJ////,,/I// - /
/ / 'ssaasaaaaasaaa , aaaaaasaaa,a,jj,,,a,j,j,aaI,/ ,,1,,-— / / / • 'asa,assassaaaaaaaaaaaaatsaaaaaaaagjaaaaaaj/I/l ..aa ' -- /
/ • ' 5 Ia5asa,aiIaisaaaasasa,aaaaaaa,aaaagaa4j4ja,.. '--- / / •.a,as lad iaaasaaja aaaaa as aaataaaaIIiiijjJIjjajjj I f • . a ' i a a a a a a a a a a a a a a a a a a a a a a a a a a a a a a a a a a a a a a a a a ,'
( • , I,aI aaaaaa aaaaa a aaaaaaaaaaaaaaajjaaaaaaiaaji J •'. ataasstaaaaaaaa a aaaaa taaaataaaaaaaaaaaaaial I •''aatsaaaataaaaaaasaaaaaaalaalaaaaIaaaajaaaaaa I *'alaaaaa.aa,iaaaaaaaaaaaaaaaaaaalaaaaallllaaa
ala a a at a a a a a iii iiit a '-.-----... 'aaaatlatlttaaaaaaatattatltaataasltaalilit%t.
a at at a aaia a a a a a a a a a iii t a a a at at a at a a i iait aaa '---- — I --'--aaaaaaa,aaaaaaaaaaaaaaaaaaaaaaaaalaalIlIaaaaa s----- I ----', saaaaaiaaa , aaaaaaslaaaaaaaaaaaaaalaiiaaaaa ------- - ,,
a a IIasaa---aissaaaaaaaaaaaaaaaalaaaaaaaaaaaaaaaaaaaaaas*--
It JIiass 'S.5Iiaas5aa5aalalaaaaa,5aaiaatIt%SS%SaS%taa%tlIt 5 /,sa I I /J 'aasasaassaasa a a ass as aaaaa aaaaaaaaaaaaaaaallt'
Iiu ' // • sass,a ass a a a as a as ai asia a its aasaaasaaaaaaaaa 1111111 •I5,,s,lJaIaIaiaiiaIIasaasatsaaaa%a%5.'sa %a%%%a ,.a. II,1ssIIsaaaaalaasiaalIIIa,a,asaaaaa%aaa5.5.%%%.5.-5 Silas//s. situ a a, sass sass asaaia all a at a
f 'a.Ss../f.asaasaaaaaaassssaaaaaaaaaaaaaaaaasss.. -. -..-.-........
'' a J sassaaass,as asaas.aa saaassaa aaltaas '''5'' II ,ssaaaaas,saassaasaaaaaaiaaIa.ia'%sss ._--- .--- .'.----- -- -
------- i 45jI hIS ii I 1111 I IS I S I II I I I I I I I I S S S 5S -
Koombana Bay — with proposed marina. 3 hrs before High Water No Wind. Diurnal Tidal Flow from The Cut and Koombana Channel.

1auu9L3 euqwoo pue qno aqj woJJ. MOtd IPU tUJflO
PUM ON
MOl J;49 SJLl 9
'u'iuI pasodoJd UM — A99 9U2WOO>
is..,,., ,
J.••_ , I l I I I ...........
I•
I- •' I I I I I I 5 S S S S I I I S , s I - - .....................
/ - ISII?FIllF /F IFISItISI? SiSI,s,S / ,IIIIIFIIIFI/FFFFSIISIISSiISII,SiIt, --------
/ ,II???FP1FFFFF/F.5II,,I_SSIIIIII,I,III, .......... I I SIIF?1FIF/ F F I FFF/ .' is,,,,,, . , ,, , , , , , , ,, ...........
IISIIF 1FF!.5 F/FFFFIIIIIIIIIISJI II Ii IIt, ....... III IuliiiiI ii 'ill iI.. %s%%S% SI
p , I liii ii%%%it% ii,
•••••••••••••••••••• !IFt.F.'.e#, , Iii ii * * * S S S S S S%5S.._. ,,,j , • , ,
Ill **SSSSSSSS - — - .. / /# .', # .# - - * - - - # -, - - - , , . . 1 • . *
S3U JJ1OVW

MAR_CUT. RES
'a sss%%%s%t%ttaa IIII 4I$Il/1II//////11//#/1////#//."/1//" I * at
* I a ia,aa aaaaa as,,:, IIIIIIIIIIII1/i////////1////I//IlII 'I /
a IIllIallSj hail 1t1111111111111111///1//l//II/IIlI/IlIl 1
////l///Ij///I/,,l''' , I l::IIIIIjIIIJ/IIII///////j///I//////I/Il' /
I \ •. aies,,iss,t,aa:lIJIij1II/I/jIIIjj///////////////#i,i./
I /' 1111 '''''I''I'114111II11111I111111111////////////I/II'/ I /• a' a' ' I S I I a' I I I I 4 I 4 4 £ I I I I I I I I I I I II I I Ill/I /1//I/Il I / / I / I a' a' - /
J ( a a a • j a' a' j j a I I I I I I 4 4 I I I 8 1 1 I I I I I / I I I I I / / / I I / / 1/1/ / I / a" I I I -/ /
4) 4 5 54 I 45l11I ''411$ I I I I 411111111111 Ill/i / /1/I/I/I//Ill a' — I / / 4 4 • I 4 11111 Jill I I I I II I I 11111111 1111 111//I /1/1/11/11111 ' /
IIIsI4I4a'I4:lIIllIgaa4JIj,Ijjjjjjjj/////////////I-/ / / • .sI..IIIsaIIaI ,4,, aaaaaaI:I4Is4aIagjI1jJ////// ,,,,, / - / /' / ''saI.IIssIIsIIIIsIaauaaaaIaIIIlI:saIajiiIlII/l.a'.'II' --I / J' '''SIIII.IIII , IIaSIahllIalhlIjlIjjIIiIjIiiijIl/l'/ / J' •s'.sass4Ii,,4a,aaiIaai aaaaiiijaaas4saziliijjii------ / / / ,. ''IIIIIIaIaI , aaaaallaaaaaaaal,J,,,,g,ajJaJjjj,----- ,'
/ ,f • a s i a a a a a a a a a a a a a a i a a a a a a a I a I I 8 8 1 I I I I 4 1 4 1 I 1 8 la-.. / a a a ' a a a a a a a a a a a a a a a a a a a a a a a a a a a • a i I £ I I I I I I I 8 8 1ff
I I a a a a a a a a a a a a a a a a a a a a a a a a a a a a a a a I I I I I $ I I I £ £ I I I a' / I •ssaaataaaaaaa,aaaaaaa,a,aaaaaaaaal$LI$I hush I I sa a aLa a a a a ii a a a a a a a a a a a a a a at aaa; a a £1 £11111 aa
a a a a a a a a a ai a a a a a a a a a a a a a ala a at at a a 51111111 aaaa —
/ ( • - ' --aaaa,aa,,aaa,,,a,,aaaaaaaaaaaaaaaa1iahuuaaaa
I Ii''' -'IIaI,,aaaaaaa,,aaaaaallataaaaaaaaalaaaaaaa S'
a a a a a a a a a a a a a a a a a * a I I4Il4I t4a'IIaIaIIaaaIaI,,aaaaaaIaIaaa%%'*t%t%ataaaaaalI /a.. , a J 'aIisaa,aaIaal aaaa a i a ai 88l aaaaaataaaaa%aaIa '
/ a,,,. a i,sas,gaajaa,aaaa ii a a a a ala a a taaaaaaaaaaaaaaa / aa ala •iIIISIaalIaIIaaIal a a aaa, alaaatt****aaass%att
a.itstt,iiaaa,aaaa.aaaaaaaaaaaaaaaaaaaaaaaaa
____. ..ssa.I!..,a', SIIISIiaaII iaaasaaaa a a aaa a a 4'
(. .'.....1/slfaIia'III,SaII,aa,aaa,aa(a aaa J a ,,,, S aIIiss.I.sIIaIIII,a4aSSaaaaaaaaaass a-ss
aa,s,g,i,is,,,saaaaa4as,aaa,,,Iaisas.----—.-.
Koombana Bay — with proposed marina.
3 hrs before High Water
No Wind.
Diurnal Tidal Flow from The Cut and Koombana Channel,
FN
APPENDIX B!
DIURNAL TIDAL FLOW FROM THE CUT, PREVAILING SOUTH WEST WIND
lOOm Grid
Velocity Fields

CUTSW.RES
----..--.\ - •0 _____
I I '%IIII II II III I I I I Ill llt I IIII$$$ '111111 I I 1 14111$ 1 11411$
/111441 ''I/Ill I 1 1/11141
I-I--
-7,,--- - - 7,111/il
7 111_•_•_
I / /
I I
I
Ill/I, I/Ill, de
Ill/Il • /1111 1 Ill/I I/Il, I//Il 1,/I '7 ••_7/ I 11/ 17/
II I, I I
I I
II I' 4 I I I I I II I I I £ I £ 'I I I Il IL
CM / SEC
15.0 30.0 45.0 60.0 75.0
Bunbury Area High Water Diurnal Tidal Flow from The Cut with Prevailing South West Wind

CUTSW RES
- - - - - - --..'' - - - -.'''' .
I
-- - - - - - % I I - ________,__ - I I I - 11111£ I
'%IIIJjJIlj ---- I li//Ill -
- '
, I - - - •• ' , , , / / -. - .-, , - - -
" I .' I I I I ,,
,IIIII I/Ill
Ill/I, IIIIIItII, I/Il-
,,,lIII titIIIII?It II, 'lIVIlIlITI
Il/Ill,, ,,,,,IIIItI 'Ill/Ill
IIVfI II* VIII 11% 111/I//I
I I/Il/I
lull?' lull' au £1
I I IL I II II\
1/ I £ I IL -. 11111 -'/ 'jill
I,, 'il I ii I I I 'all I
Ill
I' CM/SEC
a - 15.0 30.0 45.0 60.0 75.0
Bunbury Area 3 hrs after High Water Diurnal Tidal Flow from The Cut with Prevailing South West Wind

C r-t- C:3 :--- o- 00J ) 3 l-0J<
CD —h < —rt> 0)i-CD3 $hCl ) CD 1.J0) 0)
(D1(D
(no oz C 0) r—hrt
0 -,
CD (n—I
CD z I1.0 JC ars
II 'p I I I! I I I I I I I,
I-
-------------------- -------------------------
- - - - 'S - - - - - -
'S - - - 'S 'S - - - 'S - •s 'S '. S S S 'S 'S
'S
'S 'S'S'S'S'S'S'S'S'S'S'S'S'S'S'S'S'S'S\
'S '.'s'. 'S •... 'S . 'S..''
.. 'S'S'S'S'S'S'S •.'S'S'S \ '. % .
--'S'SS'S'S'S'S'S'S'S'S'S'S'S ,...%..% %
S'S'S\'S%'SS'S'S'S\S
''S'S'S'S'S'SS\\ ii itttt 11111 illillil
ii%i%tt% I I III i%%it%itt tIll IIllIII
ii it '.1111114111111 iii it it 111111 illS Ill
till liii Li Sill Ill t till 114111 I 411111
ttttllllijjIil lull 'itt liIiiiii lilt Ill
41111 Ii Alt It 'S'-'.tlji1lIi jill ut 'S"S\\.tiIlIIIlI1 Jill I
'S.\'iII1/I''i lull Ill I I I
I II II
II II
S. .// PuItlitIt\.._,I \I1IIlI 'I
j
II
i!
II
'1 IA ----#5
S S. ............ S. _______________

I
CUTSW RES
lL - .-.....' .' .' a a
'Ill I
-
- II, -
''''I,,,,
LIII,' huh I //hll//
11411
lb/Il I,,,,
It ill,, 14141111
11111 LII- I1'hIlbII 114i1411 111%
III I I I II IL ill I
11111 / liii
lilt ill
'I Jill 114 II aa III i'Ll I
Ilk I I
I'll I
ill
'a I III
Ill 'I I I
CM / SEC - - - - . - 15.0 30.0 45.0 60.0 75.0
Bunbury Area 3 hrs before Low Water Diurnal Tidal Flow from The Cut with Prevailing South West Wind
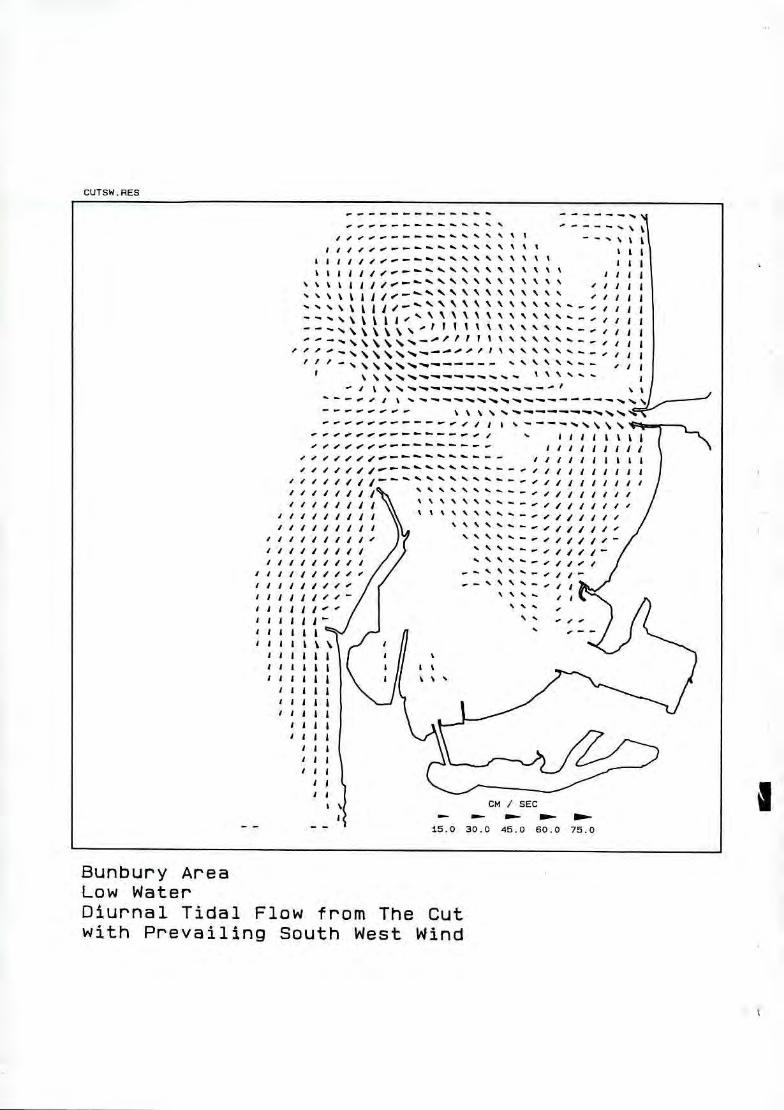
CUTSW RES
- - _ ----'i ... S. S. I
Ill lI1'• I & II IlI- 1144
'/144
--- ''Il 14
5 '5 '5 'S. - ' " '. '.
- -
- -. - - - - .- - S.• •5 •5 '5 • S. ' - - 'S. ' ' 5.
/ 4
- 111111111 l/llIjILt$ /1II,1,1i I
1 / 111111 I//Il/Il
'Ill//Ill -5-S.
'-5-.'- l/,III,,I 1111,11/I --5-'.'- li/I
11 S.S.%_. I4I111 - 44444 4 '41144 4441 I\
444144 I
Ill I I I I I S.
11 1444 I 5% ''441 4 4444 l4144
tiII 'Ill I 441
I Il 144 144 'I I I
CM/SEC - . - - - - - 15.0 30.0 45.0 60.0 75.0
Bunbury Area Low Water Diurnal Tidal Flow from The Cut with Prevailing South West Wind

Li
CUTSW AES
1l ' , --—
t
IIl 'Ill
III II I ' — $
- I I \ •.
- - - —
- — -. — - -
oe- - - - - - /
I \ I I, _—/,////— I I I I
I \\\ 1111111/I /I
,I 40,
t
1 I111//- /1 ol 1$
4I 4II I
/ 1414
''ILL I 111111
I 11 1144
1 4144 1 4444 ''III ''III
F 1444 'III 'Ill
'I CM/SEC — — — -
5.0 30.0 45.0 60.0 75.0
Bunbury Area 3 hrs after Low Water Diurnal Tidal Flow from The Cut with Prevailing South West Wind

CUTSW. RES
''%t I __•.\% I,,,,,
%
It I II I I I 41 It
111111*11 S 1 1144 I'll'
aF I I %.% -- I ' ' ___ - t \.
1,,I1.-I--4f1Ip- S.
11/1111 I'.
I 1 Ii,1ll /
I1I11II' //,,_ /
hIll//I 1,11/1/I I I Ill/I' I ••''I / j liii! , - 11 141
I I I I I
I 41£ I Ill I I
I I I
11£ I 'Ill II SI I'll
hi 'a
CM / SEC _ - . Dow-
15.0 30.0 45.0 60.0 75.0
Bunbury Area 6 hrs after Low Water Diurnal Tidal Flow from The Cut with Prevailing South West Wind
rA

CUTSW RES
'1
--I
..'.\ % ''ttII I I il
r 111111
it I I 111411 I,, III
-.--.,, 14
'I --------
I I / /1 ----------
-. e e - # i I .
I
40,
01
- - - -. - 1/luII ill/I/_I IlIIllj I I II I I I
11111111 "I•I1////// - I
1111111'
11111111 1111//I 'Ill/I
/
141111 / 1 1111/1 1 111 141,/h1 111111 '141
1'lIIlII II 4il 11111/ ( 41 11411 jj
I1\ I III 11111 1 III 'lIlt I I I III IL II 'Sill I 'III
'III 'III Ill Ill
I I I I
CM / SEC
— - . 15.0 30.0 45.0 60.0 75.0
Bunbury Area 3 hrs before High Water Diurnal Tidal Flow from The Cut with Prevailing South West Wind

APPENDIX B2
DIURNAL TIDAL FLOW FROM THE CUT, PREVAILING SOUTH WEST WIND
33.3m Grid - Existing Geometry
Velocity Fields

33CUTSW PES
/ ,-'••- / ( 1 • • .'' • • ''55' \ 4#1/ 4t/////lllllll
S ittttt - / ----- — — — — — — — ...•//4'//////////l1li / ' ' ' ' ' ' ' ' ' '' '' '4'1.11/ / / I II / I / I I - ' ' - / " " " ' •5 % '' ' ' - — — — — - e eee.111II / II / 0,
t %\•5%\%%•5%%%' -------- --------------- ._•,l111/III,II1,,,__i_/
-------- I * I /. •IIS5s* -------
1 1' • ' ' 's.'s* *. \\•*'.-. .•.------ 1itI///1111111//I / 5.5. 5.5..... .lt//////111.f111l/
' 1 ' '' •''"-.--- ----5. .........
/ _.------•.•. I / .......................................,I,///I// . " J / / ........................5\.5.% __ _ ,II ,IIlII_____ /
/f (f
5.--- -
- --
Itsi S.. IS 4*44 14t4 ••44*44IIIS%%5 SSSS ,ssg,g,, IIt#IIIISS% SS*_,
/51111 jjsi,s.i set... •tt#11t ttItl**S SSS# till, / 11111 511*44 lss#• •''' steel, ss*,,**s s5.5.--__t / '''''' II'''''''''' .••sttttt is ...................... .siiisiijtisi _'
,-- ..,a,eJJsiJJiJi. .. ...It, tttltttssse.e
,, III 5111115 S**• 115551 ItttSttt.
SIII If .Iii;s ........5I5?451t •..•. •••111J I/hutS'
Koombana Bay
High Water
Prevailing South West Wind
Diurnal Tidal Flow from The Cut and Koombana Channel

t8UUU3 eueqwooN PU9 4no aqi WOJJ. MOld ipj I2UJflT!
PUM 4saM 14flOS 5Ut9AaJd ja4eM UH J9l.9 SJI4 £
Ag 9U9WOO>4
0*01 08 09 0 .P 0•
— / / a.
EES
a 5581 , t Ill'
'8I I III
I lIl1l4ll11111Il1//1/1,I ''' • ' 1411441
••
I lIlll1I1l11l1/lI/I/lll//1' *
'" 'SSIISJIIIIIIIIIIIIIIIII,,,I a..•.'''- III IJII1llIl IllIllIllilsI '''''''' a' I l/// ' '.1 & Jill 111114 111I1' III a aa''' ll1/I a, a
1181£ liii1 4114441 5 a a a . jjjj4 1$l 411111111111188 1 1•'' 8848£
8 lIlIIIlil4iilsis'' 88418 o 8 II iiIl4SIlliI;i ss.s.' 88 4 iisalissss**ssso.. ,jjj
''' 88 I l8lIlIl1%%%SS /1j4 I
% 1 8l 111115% 5% *5*5% 51111/1144 Is %%% *81* IIls 5555*555551 IlIIIj I
%%%*5511I111144411 ll55S%%%SS%51llIl11IIl ,
I** 155*5S*%*%%511SIII,4I45 I
* 'S °° % I I 'I 1 'I 81 . II's I I I 'a I'. S 'a 'a I III Ill 81455
*0••a..5 5% *5 5.5 5.1.5.55. 1.'. 1%'. I 'a 'a I 11118181118I * 5 *55555.5. 5. 5.5.5.5.%1.'s's%5%I'a5%1IlII$lllIllSa' I
8a ' ''' '8'8 %%'8'sIIlbtIllSlI41II,IIS.
'''' ' 555.1. '8.'a.5.5.5.5.%5II5ltllI8S1l1lll,II.
-a.---,, I1IlIII141 jiii i
'85.'8 5.5.5.5.5.5.'attI&I4l1l4l1I1ll.' %'8'85.'8'8'85.5.5.'85.1.I tIll jlIi4l1I,11 I'
1.1. 5.5. '88 5.5.5. *1111 I IllIllIll' a
''I*%*%*55.5.'85. 85.8 5.5.5.5. 5.5.8 I 111$ 41111141
—Fl//Il,,,, 11liil1lilI• ''a'a'8'8'8 118 '85.8 5.88 1 81141444411
Ill I14II1111,III 5.88 I III lIlIIIlIl
88 88 81 884 1411414''
''•''%%I5.I88I 444 IllIllIl
81 18 11 481 IlillIll
II 18 18 81 8 IIII41II III II I I £111111 III II I & £11851'' III 111 II I 811111 1 '
*11 I LII II *8 111111' 18 I I III 11 II *1118''' I & I 11 II IllIlli'
l5I5 I LI I III 11 II ililill''''
118*11 11*8 *81188 III 1*11111'' 1111*18* *448811811 III I*IllI''l'
S3&* MSifl3

33CUTSW. RES
,-_ 4'_,,,l/,/I/II/I,lJiiiiIil,,,I , S.-.-..--.-- ''''''',,,,iiiiflj fl 111111 c * **%%
///II//////14JjjjIj . % % %'S. ••••-•••••••-• l/l////I///////II/JJJjJI/j/ll'
*''''' — __Il,,//,,,,////,//,J,,,,,,,/,,, I .4
...'•' I \ -'•---'' I I.' I /. . •''•--"-- ----' - çddI/////,,i- I ...........------.4
/ t•, I1TfTI/II/i'—I ........... 7"
___- --.-"•.•- •._ -.--I , l/1IIII,I II1i//'/i—I
/ / •,,,,,,,,, a A' .'' /
( ............. / Is ala I Is .......•. .4 ,,,,,,,,,, ----- i--s
Ii ......••iStSIlllIilli'' ,_.--_' %%%4.___,,lI4 __s_% I Ii S..., 44 IllI/IlIll ,,.--S all ILt% 5 % I ....... 'SIIIJ4III1I#I1 - - - - - - - %I. / I ii##ii#i' 0 441•_' $ 1 '''''%I$Si4lII1llI'' .........'''s.---
''' '' '1I41111411'' —'4_I j• 49 1ijjijjig'j' ''' ' IIljjjIIlll'
/ ' I!*IIiiilSlS1'h1 ........................... 44941 '''''. !Isiiiiiisii'.'' ........................... Ills.. r' '''''''JJijagis*ss. -------------------------------------- - -- - - - - - - - - - - - - -- - - - - - - - - - -
----------
-------------------------------------- %S ------------------------.•• ............
2.0 4.0 6.0 8.0 10.0
Koornbana Bay 6 hrs after High Water Prevailing South West Wind
Diurnal Tidal Flow from The Cut and Koombana Channel
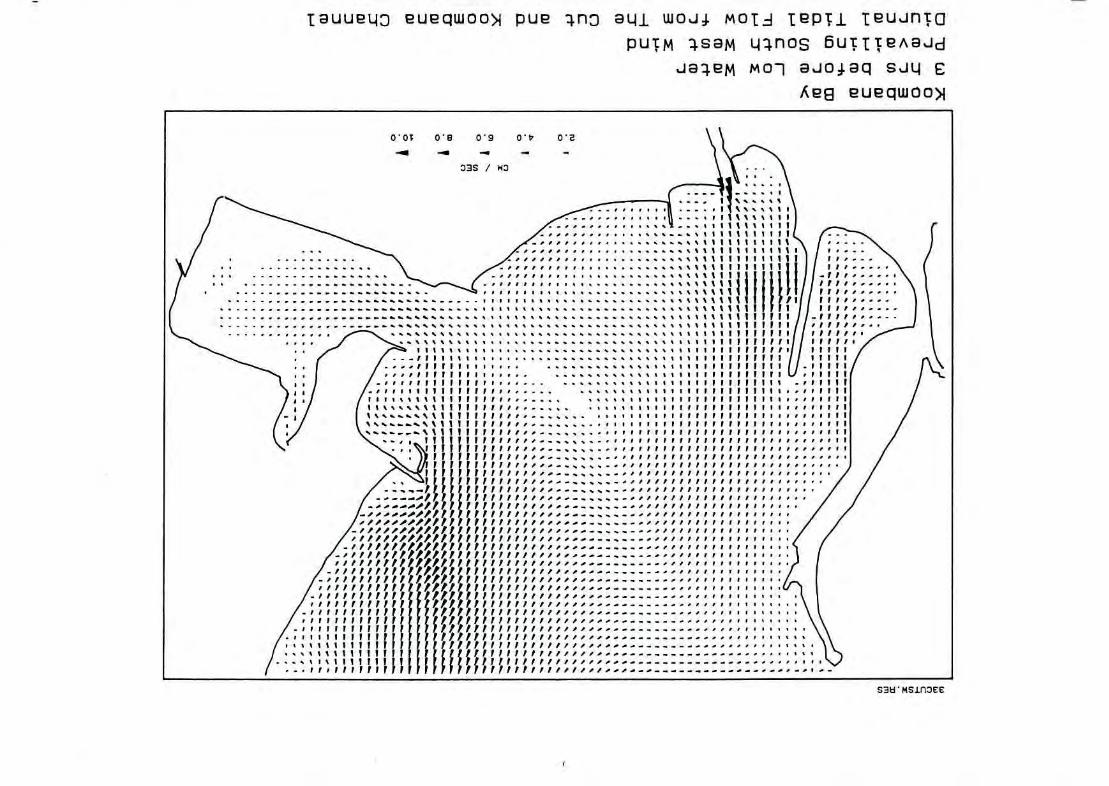
I8UU11O eUqWOO> pue 4no aqj WOJJ. MOld t2Pc.L tUJflO
PUM 4saM Lfl.flOS 6Ulç2A95Jd MOl ajo4eq sq
iS9 9uqwoo>J
00T 08 09 O O
- - - -
't It?I ~ •ItIlIt* j I,,,
ss
I' ''..._.''%''*S* SSSSSS.S*..S.S.SSSSS s*s*si%JIIJIIP1tIItttFij'
I' f.__ttti*it ............s.ss.SS sss**ist llIttlVI/I tTtTI/
.1 /.'',l1llil,i ...s.s.ss, ss*tiisi,tpittftyiL/.tttl(
\ls / /.ss'•tltIItllttss s s.*.s ,**%tItu , tlI'i''ttII..lIitItI I,.! /t.itsss5IIIllti ....... Is! f5sssstIItPPIsi .........,***i,iiislitiltlll'issil'tilI
ft ) /
/'t,! --- ..- ,,,,,,,,,,,,,,,,,,,,
.--••• / I
, ,
------------------------—-- f-ft F F ,F
FFF,P,,P.PF
/ -
----- - — - - - - - ''l's'''
/_,,l,I,,,,,,,,r -------------------------- f.**sti71lJJ7ff 1lFFPFF1FFFFll'/,,,
(11FP1IPFFFII,,,,... - - — — -
—
------------- -,
I .-.IrsIPfHIUV , ---------------------------—
MSiu13EE

33CUTSW RES
j
I I I'. '* •. \ ___l1/,//,, iiiiiiiii .s 's t I I 11/1l//1II111IIl1Illli , ' \ . • * I I I iats% \\\.'..'.'.'...-.
__._. I I • lilt% It ...-.----- '''I/////I/IIllIll!ll/l' / \ *1111111%%%
[ s,,tllItt I %%'..'.' .'"-- .,.I///////////////FII# I '/ 11511111%% I% % %\\ %'.%'.'. •...•.._...•.
tiiilits
I i ''''•' * * '''"''','*•.. .'..*.----- / Ll I I S I I I **SS*
/ I • I I I I I * I'-". -------
/ / I I I • • I
// 10,10, I ----------------- ..-...•---
I Ii .•_---- #1SSI is ''S I i •..-''..-- ----------—--—-**%% t* %.
Ii ........................ S*tItt%\t% '--- I i *sI*ttIt %%*•*.
.................*IIIIlIItt%*t.. ----- ,,,,,s,,,,# ,, II a....-. -----——---- ''.-- I
_I_ I I. . . ,, ---------I I • I Ill liSt Ii I**'., s *s.__ I IJI•' %%%% ------- / .. ,,,, ........t,,,,,,,l,ssSilIsts ss........,
/ ... 11..,,,,. .......•''I'l,l'','II' *S%S% -------St —'.5- hut''' ,..S ••i5l?t5PttS5I5t I•*
IS7iSSlSiltS?S#ltt ........................... IIeitsst* s.-'' I II iijttt *'''' III lljllII
— — . . 2.0 4.0 6.0 8.0 10.0
Koombana Bay
Low Water
Prevailing South West Wind
Diurnal Tidal Flow from The Cut and Koombana Channel

UU13 2U21WOO) pU2 qno 3L11 WOJI. MOtd lepTi leuinTo
PUM 3S3M UflOS 6utç2A9Jd
JM MOl J944e SJL
A29 eueqwoo>i
oo; 08 09 o o - - - - 3BS / 113
ll,#il,,,,,,,,,, ,,-_-- sllll#lll,,ll,,,,l
, 1lllllllllllllllll .....,III,,II,I.seeees. ______J SI,,Ii,illeleiiiie cc....' •5lIfIIf,,,,e,
.-ss ss,,,,,,,,,,,,,,, '5,... I #s____.. '-5,.. •11I• / 1 / s..*StI,IS,ii,,1,,
.'.stsiagss,,,,, ..........
I I --——- SIIIlJ.jgj,f
I 't\'t%%IIIISSS
? ,.J fP#??tfIiIlSs '''-- '''S.-.. --------•.-.- ,,.. i i 'I I '--- -------------- _,,'•J
.1/ I llt%*%5l,I,, 5____. •I / I I -
-—-------- - -——-------———-——-- - - - -- -
-
- 'I (I _.'__ I Ills, --—-- , • • 'I "._.s-, let,,,,, ••,,,,,,
)! ' - S%\ % . ---—---——-—---. . . . s . . •
-----------
/ z1 '''S •ISI• _._.._....
5I$IlIIl5l S
/ 5 1551555555•
/ _I,/,,,,,,,,,,,,,.. I IIlliiISSSl•
1111 SiSSI
F 1 I I I I I I I
Stl e I I I I I 5 -------
S3d MSin3EE

33CUTSW. RES
'I • I -
IS,,.. %% •.••*••••••••-..----___._1I,,,,i,/1//uII/IjJj
-__...-,.,",,,,,,,,,,,,Ifl '5- , -
of
41
,I,'5",
I \
i i•• •' ---•-' ç
I / '' •.'''''. ,------'%% —------ l/l/I1I/II/44'//j11///1/ 1' / ' S • S • 4,', '5.',,' 5._____
/ ...._..._ / •''''s' • s.i.ii -----5.5.%%5.5.__.....ijj,j, ---
/ •SS.S'S , ,,,, i,,,,i -----
5.%*,5.5.*...__ ,,,jjj 4
' 5. '5.5.----l1iill44jiiL
'''---#iliilgItlI 5._s II .......IIISIlIIIjlISII ,..SS
I' '•''. '51111111414115 '•'.' I' 1'''''' '''' 5.'-.- i'ltIlIIIiti•isi I'' 1155511155&i51
II- • IIIIIISISIJ*IS JS' It,ItttiJIiiI 55*5S' ...................'SJ44iIl•
I. • i!ititiiiIits I' ' II'illitiiis' .............................. ISIS.
II''ttt''''' ----------------------------- IIi'S_S
'''I!, tIISIii --------------------------------------- IIiIIItII ---------------------------------------------------
' I-IIItiII ................................................... Si IItjli' ---------------------------- .5 ,
IL
IIlj% 5. ------------------------- s., .......................
Koombana Bay 6 hrs after Low Water Prevailing South West Wind Diurnal Tidal Flow from The Cut and Koombana Channel

iuu9L -j eueqwoo>l pue ZnO aqi woij. MOld lepTi iuuncc PUM 4saM LflOS 5UTtc9AJd
J89M I-16cH aJOjaq s.iii ,ceg eueqwoo>l
0' OT 08 09 0P O
- - -0 - -
.
% ..
% .
SSSSS ..• •SSS ..I81tt1t8J_1P ?l
?? % * SSSSS * t % % * ***S% %* SS%S* I I I I I I I I Pill IjiPi. __••..J
%%S*S*********% sss.s .*.s**** ..IiIII1ItIIllIISt?i. _.- 1' SSSS****S**SS* I,, II iIIlIPll?lI lift?, f'
s,,,,IitlifitP,II 11188 / •••.I.ss'ss''ss•*
/.....F7fV8tIiI IIII•I**s sssss*.*IIIIIII?itiItIIl(J-IliI/ ,,f /.,.#?l?ITIIi,, IIII1IIIL/.IIllI1
.l /-,,,tI7IiPIt:i, •••••••***** ****,,,,,,,i?itlPiII*._,,I,tTI /—i,,,IiIIf?Il?i
I sI I lIl%IlI?Ir???,? .,,.,ii,pittriS?iitt.ssis:iltI I-il --------- ...i,tttfi?iit?tf?i?ti,,stIiT(
------- •.,i,ttptt,,?i??tt,st:s,,stPII I•.J .i,,stt,tt,,?t?tiiss,i,is,itI I
,,, ? ,,,,,,,,,,? ,,,? ,,,,,,,,,I / .._ II! • j
/ • - L ,,,,,,,,,,,,,,,,,,,,,,, . . / / I IF P I p I I I
------------------------ -------------------------#,//lFFFFIIP8?,,g
/AfrJJ/jPFF,'!//F//,,,- ft -...-....---#,, IFF I I ? I P I p
/ ,.''//,i// / .-- --- ,,,,,, , , , p •
/ ,,,,,,p,F,,,,,,
/lP -------- --------'' • .—.
/ p p•I I I *1*1*
--------- ,
I -.' -----------—-—
p. .• .5 -------I —PS P II P 'I I
S3H MSJ.fl3EE

APPENDIX B3
DIURNAL TIDAL FLOW FROM THE CUT, PREVAILING SOUTH WEST WIND
33.3m Grid - With Proposed Marina Groyne
Velocity Fields

MAR_CSW. RES
S .fl4i//l/lll/lll ,,,.' , - - I ---,,_,,,,,,u,,,,,,-- -,, J
•
41.4
% '\
\ \ • * 111% II%%
I \
I /siitii I ' ' ' S --.-..##1////////ff1, I I I /
/
/ I' ' I I , •, I, /• ' ' ' I I I**.....
.. _Il,////I/1_.._.__.•-_ , / / I IIIII*•*- . _ __ /
/ / • I I S S S S Is... __ ' ' •- _----1/,I,III/— •- •--- /
I I •,ss, t llSll
I I • $ ' * '''-.- _ l1l11I_ 1,/lila,, / I • • ' '' - ll#11l1 - _ .ili1,jjg 5
/ I •' ' --- _, l,,,,l,_ %S.-
- - - 1lliii11& 555
IL...__.._ ..,, ... / - 'S -----I,,,, • I ' t I is iii is t ,,... • . 1111% $ S
, / .-... -. - - , - ,,, - ,. • . S I I I I Z Z Z Z I- Iii t,,... 11111 1-- - • • • IIIII • 5'-. I lissis ' •,#,i#, .. -5,,, ISSS1III*%SS*. '-- is is is I •,,,,,i - '' ,,siisiltl *55*5 s..-._
s•,S,,,,,,,,,It,S* 5s.. 5. / 11111 ,SISIIISI??IISIssS
'iiss I si,,,,i#.-- ,•SIIS,,I#?,I,,,,S5s ,IIISI,II,,,,,,
I • •SIIIII ssiasass&s .,SSIISIIIIII,,,,. sss—I asziissi's -
'ISii i/jjt% 5-- ,_,,,SI,S,SS•. 1'5I1•
CM / SEC — — -.
2.0 4.0 6.0 8.0 10.0
Koombana Bay — with proposed marina High Water Prevailing South West Wind Diurnal Tidal Flow from The Cut and Koombana Channel

UU23 9U2QWOO)1 pue 4.fl3 9LJ WOJJ. molA I9PU t9UJflTO
PUTM qsaM q4noS6UIA8Jd
JO2M UöH j944e SJL E
uçuj pesodod UM - A9 eU9c4WOO>1
oo; oa o o o
. . - .- -
1lI '11l
0 F -
* I ---------------------------* I -
I/I/I 11v..#'.-- I I I - s ,
IIIIIIII/II/I//Il///I/#.•-• I ill I S • •
luau IIIIIIIIIIIIIIIIII-- - '''' '_____ 5• ----.5 i i i a a a a a a I I II I I I . I I I I I I I 5• ''
IIIIIIIIIII4IIISII '•.-'' ' uaaa ii, aaaauui.sss.
au ui ii lilIllill' ------- a ui I IIttIIII%II' 555''
LI I I l,?e I
II I I IlIllIllIll SI -- 1!?,, LI LII LIIIIISIIIIILII -
'%IIS\\SLLL LIII LLIIII\IIIIIIIIIII%'-'
IIIIIIIIIIIIILIIIIII'%I
- S S * I I I I liii,, , I '''*'5 I'IIIIII IIIIIIII\IILtI I IIIIIISS'
I- IIIILIIIII IIII%IIIIL I I liii 818''
IIIIIIL 111511!!''' 11 1111111''
111111 II IIIILL I ILl II II III!'' ILI LIII lliiIiIII''
ILL LLLI LIII iiaa:asas . ILL LII 11111 I I I a a a a us ILL ILL 11111 ii aaa auii LI LII LIII I I ill 444'
LIII LI ILL LIII I all Ill 1.111 II LI LIII I aaaiaas I
I I III a a a a au all * LI I ILL IIli 14 4558
LII LI I ILL k I I ia a I is uiiii ILL IL IL III IS liSa
ip III IL I III I ills' ILL II I I I I Ills' LII II I I £ I liii' 111111 1 1 & I III''
II 1 II I lIll' 'IIIIIIIIt,IF!P!#FIIP III I III I hil ls. :
I%IIII&I £& LII 1 hISI'' I
I L LIII I IIi'I'
I 1 I 11111 1111 liii I' I'
S3d MSOThYW

MAR_.CSW RES
j44Ji1s LI I 1 I itt 'ii'
I Ill/ui'- /
. I •... "/I//1/11IIIII/I/Iiii" / -'
•" mu '/I//////d-1/////////,,#.- I I ,,_.- I
---
I / / a • , a a I S • •• •• - ,' -.
- ' / I / I 1 1 1 - / - /
I I ''a,a all
/ I' ' . • a,, I -
/ I. • 'ii, f__a.
/ I SI '.111 jiili!ii#il1I ----- %%a.%a.__#,, It ' a.'''' ' a.
I' a._ \ Ii 1411111iIa a a a ' ' '' tilt,
"\
2
Koombana Bay — with proposed marina 6 hrs after High Water
Prevailing South West Wind
-
Diurnal Tidal Flow from The Cut and Koombana Channel
1~

tUU9U3 2u9qw00)j pue 4no aqj wo MOI.J jepTj iunpj PUrM qsaM LflOS 6UcIAJd
J9M MOl ajo4eq SJ14 E uçJ2w psodod UM — icg eueqwooN
O'Ot 0•8 09 O•P O - - - — —
till ia 111 lit
sss%%%a%i*iIlt huh ii, % 'a..' J *ssssss
••• il%taa,as a.... I ,• f f_....1IiIaaaa..a assss ssss haul
/'#'i?1hthitttta'.
''''a' * .. I. a t a * i t * i i t I I I I S I F F '.--...- - - • 'I
hi l,....,_, s.ataa***II,IIIIhhIhPIi s*--a ..ata*a*IIiIIIfJIIltIli
a i;tI IPIPuPI tIll illa
,,,s:SPPIViIIIIIIIIlaaa ,
/ tipaIls,
PPFFFFI,,, ,IIIFIi? p gaa a ,
-------------- / ---------- /_,F/F/FIFP,P,tFFPFFFIF/F//,,,, ----------
-- llsuauaal,,
f///IIFFFFF/F1FFFFFF,,,, ,,,, -----------.'ll?t?apall,,
F F I P P / FPF /FFFFFFFFFF
F,F,,FFI F I I F F F .'/ - ---------- - I - I I I a I I * • a / I
/..IIIIVII II — — — — - — — — — -
—--
/ .attlliI!IJ ----- — - — — — - — - - - ''II,,..., ------------------ ,,.
S3

MAA_CSW . RES
I
4. 1 • ------ -- l1,,/////II1IIIjIIlj ii (
-
I \ s
I I I
I I /1 Sf ft ii ii -..---.... ...//////////////// I
I I I tIfttltii ..,////////////////—/
I' / • ' ' ''''"- -5.-.--. -. -'5.-" -'-5----
/ / • a * * .. - - — ---..-.-. -''-'s'- ---- /
/ / •,••'s_ —-------
I / • iss -------- \.,, _,,,I,l,1 -
/ ( ' ------, -----------------\s.*_.____ / I. 'u_S__S )
I I - — — — — — — — — - - I I & I u''%%%t'\ - — — — — — — — - - / I / ------------------ I fi_ Ih--' - ----------------
--------------—- itit I lift lit %%\S_ . / _ 1 111111 i Sit Itt Iii ft I%% i
haiti I a., ----------ut,It,t,,ffriI*t\stu.s. --5-5-- -,,,, -——— /11111 I ss uiIiIfItfttffItItSS_S ...—...
/ hilt h11111 '' *%IltIttfSStttffItl*%S_.-'.. .-.-__
a it t a ISa III 5_5S * I I I t I Ifttl?S?t St 15h*% ------------
(..•__.___••'/ a
— — . M.- - 2.0 4.0 6.0 8.0 10,0
Koombana Bay — with proposed marina
Low Water
Prevailing South West Wind
Diurnal Tidal Flow from The Cut and Koombana Channel

uuj eueqwooN pue 4no etj wouj. MOld ipçj leuinTo PUTM 4s@M 11flOS BuTITeA8Jd
Je;9p MO J39 SJL £
UJ9W p9sodo1Jd LM — ceg eueqwooN
O*OT 08 09 O O
. .. . — 3S / WO
_ - - - /
: •
I I 114 1111111 ' I I i •
Ill//////////,/// _..__S% II Iii S.'g
I a, titI II l•
f' .s % igiai,iaiiiia,aa,,,,.- .I,ItS,1I
'%SIIliIIIIIIIIII#1I'l
- $11 14144111 II1ll*I I - 'ISIi #ISIii III
III Jul11 444 44 I 1tII •••_ •*•
$4441444 I ------- gil • • • still
41111115 ------------- -------- ''•
- III%%li
Sill. 5111 %---------------
z z S% '.i t
* S S II IIISJII' I -- I. 511 $414441 I I
Ill $44441141
$1I411414414 I
10
%% $111111 a a,s
14.
/If
-----
--
SJSi MSOThV$I

MAR_CSW RES
%tIS t... si 1 \'t '.'.'. • ' S liii
H1/ ''''S III '''''''---------",,,ccc'lIIIIiii,ii,'-/ I si ss'
I /SII%t%SS' II,1I_I/1/II1II,,1../ .'._I,,///////,/
/ . I I I I I I I I • --.--.. I I I I I I I I I I I' _,,,,I,IIII/1II1/I1I,I,I
I / • ' t.is it • _ —.- --,,I,I1II /.---- / I • ' • ' till Sitt
( I • a a a a
I' I
''''' 5--''ljJIII's''''tk I I ' ---stilsiiliiii.ilIs'' •' 11''''•' --'iiiJlIiIitiiiii I ''''%tIIlilJIlJlIIt Is''' I * ' ''' ¼ • I&litJjlilIIiI 'I''' lIljjIIIlll — I • ''''. .1 i11114tii11'I' ''s '
.1 ':- ---------------- -a.-- ''' IIi4iItIS ------------------------------
j/IllLI%sI. ------------------------...,,.,, II IIIIt'' ------------------------ 5*11 1 •SS%% ...............
''*t II iIi'' ---------------------- -- ''III,
' .'Il I1j%s. -------------------—--- 5 ' SlIt l SSs ...............
'p
Koombana Bay - with proposed marina 6 hrs after Low Water Prevailing South West Wind Diurnal Tidal Flow from The Cut and Koombana Channel

tUUUO eueqwoo>l PU9 qno eqi WO1J. MOld lepTi t9UJflQ
PUIM qS9M q4nOS 5UTlA9Ud
JM -15cH aoaq sit. E uçuw pasodod q;çM — Aeg eueqwooN
0' OT 08 09 O O
- - - —
. %llllit%tist* attlltt%sa* at%ttI1! Vu I a a a a aaa aaaa at ,Ilt IIII 11.111 ..
a a a a a a a a a a a a a as * a a a a s * a a S S S I I I I I I I I I S I I I I I ' ' 1 ,s..
'ass' *%IIIIftII?3J?l?7 ,,,,, tatt a a a a ttsssss*
,• ,- / I1 tattaaaaa*aasaas.aaaa*SsI.t,I,,?tl?1lplIIj 11111/ /._...JJIl1tliiiiaiaaaaasaaaaaaaaattgpgItIgtp?fIIj 11111/
_ /...l5?lIIIIIIIIs...aaaaaaaaaaatatIl,Ig,pp?F?1IJ( 11111/ II /#ll?1!IIIJpI,ii.,.s*aasaa*tttt,IIIItIgIt?l?FPII'.k,,,III , / /-',i?IIIIIIfIiis asattattill I ifIII1?l1lFIi_'i,iIII
It t
J,J i,5,,I*%iIII VVt,ts-. •IIIIlII,,*ft?lp1PlPF,..........._..,Il
// II**aa%l VI,,?, ,,.__ •'',,II,i,*,,?tl5plPlplf,..._......,I
'._a_• I I pp!, -------lISS1I1II,I1,1II,If*SI I
-- 7 ----.-..,
--------- --------------------------
-----------
I
- ------ - --
---- /
sa* V fuzz s.IISSIaa 7 A Z _....._.,.. .. ,
'-
S3* MS3ThV1*

APPENDIX Cl
DIURNAL TIDAL FLOW FROM THE CUT, DIURNAL WIND
lOOm Grid
Velocity Fields

CDI_WIND RES
'S'S•s'S \ ' - - — a - — — — 'S'S - a aaa a
- - ----a- - a - - - - — — — a — — — — — — -'S'\
S. S. 1111111$
— — — — — — — — - 'S \
11 -----——— -—--
' ' r I
de
4-1 Ooo
I I
'F,,,, £ S.
I'll/Il 4'" ' I F
'lill/Il , £ '1111/I/I
Ill i//I/I VII
1 111/I//I
IV
'Il/Ill- li/i
S. S. 'I—— '''S
'S S S
I, iijj a a a
# 1 /hill ''I/li Li
//Ill I
ii a a —— ---- I/hi
'1l1 -- I CM / SEC
I — — — - 15.0 30.0 45.0 60.0 75.0
Bunbury Area 0000 hrs Diurnal Tidal Flow from The Cut with Diurnal Wind

.. / { 4i \ Y--'-''
I
' — in — 10 '1l14II/ ,
I — • , - -------— .- .. I , I -- — — — — — — - 0 -------------------
z-------- - - - - - - -- — - — — •1
oo i I i I
------ -
--------
IIIII?ii,,?Iit* I1II?r,i,ii*t
-- — — — — — — — — — - I
I I I % ' \ % * •' .' '. \ I ' ' ' % •t ' '. % % ,
It I I I
\ S_s i 11111 II I - -
_________ I — — — — — — — — — — — — — — — — - - - - - - - - - / .. —
-— — — — — — — - - - — — — — — — — — — — — — — — — — - - - - - — -- — — — — --- s -- — — — — — — — — — — — — — — — — — — — — — — — - - -
————----------------------------——____ - I _______________________________________
rl
a.) C I-
0
IL

- - S S S - S S S S •. S S S •. S S
55555 %%%5 S S S S
'.SSSSSSSSSSS'.SS%SS%% I I I I I I 55555555555'.5\ S S S S S S I I I
'-- --..--- -. ill
5555 S S S S S I I I I I I
Ile
ISSIII%IIIII
_.-_______•S 7 555 ____.5•5%_
£ I/#f.._--_— _• _- _'- 1 /I
) 5)
(I ----55 -
---.-... 555• 55 s____
I, I, II I I II I I m
0

CDIWIND RES
% 1
S.--
£
oo - / / / / / / II I I
/1 / /
-- .-------- ////////f -01
le /
'-
gal— a
II/1I,I
f/I/I III,,
I S.
a * -I, a a a a 'S. a a a a
I I I I
I'll I I I £ I I Ia III I III' 'III It I I
II CM/SEC
— 15.0 30.0 45.0 50.0 75.0
-
Bunbury Area 0900 hrs Diurnal Tidal Flow from The Cut with Diurnal Wind

COI.WINO RES
..% .' '11 -
I I — .. ,'1lII,-_- til -
'II
ij IlI1lI,I/,_t,,!,t LI
Li , i1111lii 'I
tI1lIiIIIs --
I tIlIIIi,iI IIIIjj11 ILlijIlIl
IiIIjjJII lIlIii,,I
Ljjj4jjj 11111111111/1/
Ili,i1,IL ''% I , II1IIIII1/I/
LSIIII//J411% Itt 'IlIIIIIII// / LiiijIIIIIlI 11111 i1I111I/////'
Li i11jJ//// I till/Il Jill/I Li 1,1111//Il LI Iil1IJjjj1/
& Li lilIII///' iii illliJIjjl -- ill 111111/1' IIII 14111 LII IiiIlI' liii liii IJj 111111 ill' iiiii IlL 11111 I 1 iI1444j LI tilIilLLLIIIIIlL iiIIIlIll LI IIIIILLII&I&14 IiiIIIl / IIIILILIILIIII Iii$jIIIll £ IIiiiILLIIt''.
1 1 1111 iiiiIIjLl I tILL
1111111 1 It 'lull IL LI lii IIII I'Ill IL iii £111
11 1144j lllIIj
- IIj CM/SEC
15.0 30.0 45.0 60.0 75.0
Bunbury Area 1200 hrs Diurnal Tidal Flow from The Cut with Diurnal Wind

CDIWIND. RES
—
ill1/I//''' IgILI II1Ii
/11111//I// Ill/ill 1IIIlI/II/11 I'' '11/ha
1 1l1IlI1,Iia , 11/1111 I1II1ljjj I I1I1/IljI.%.
\'.%% /11/11#1 I I 11/Il i a I . % • % 11
. •. '
61
'Ill/Ill'' I I I I I / / #• -. - -. I I I I / / I I / //I/1P
il 'ilIlIll , 'lull 1/1/- —• - 17//////I/////J
a uiujjj—ii ,/•-1,1,////II///,/
I a uiijj // / 511 I/Il//I £h/III 1'1/Ii
01
I I
SaaIII///1 Il//II/II///IIII_:::/
t
I I 40, 11111111 1 / 1 /1/44 I, I , I111IIIh, ,, /1h1 I'll
aljaiI_. ' L/1hhIhhj4'''/11\i ' I III
I—Iaihha4It1IIh1Iu1 (( I * * I ' 4 1111 / IiIii1lIIaIIl I I I I
I,— Liial1I tII 11 4444/ IJ III I
I I I III I I I I
1 54444 44 11 I I I '11444
I I /14414 11
11 11444 l ''11444
1,/Ill 4 4
—--'III - '14 —- — — — CM / SEC
11 . — — 15.0 30.0 45.0 60.0 75.0
Bunbury Area 1500 hrs Diurnal Tidal Flow from The Cut with Diurnal Wind
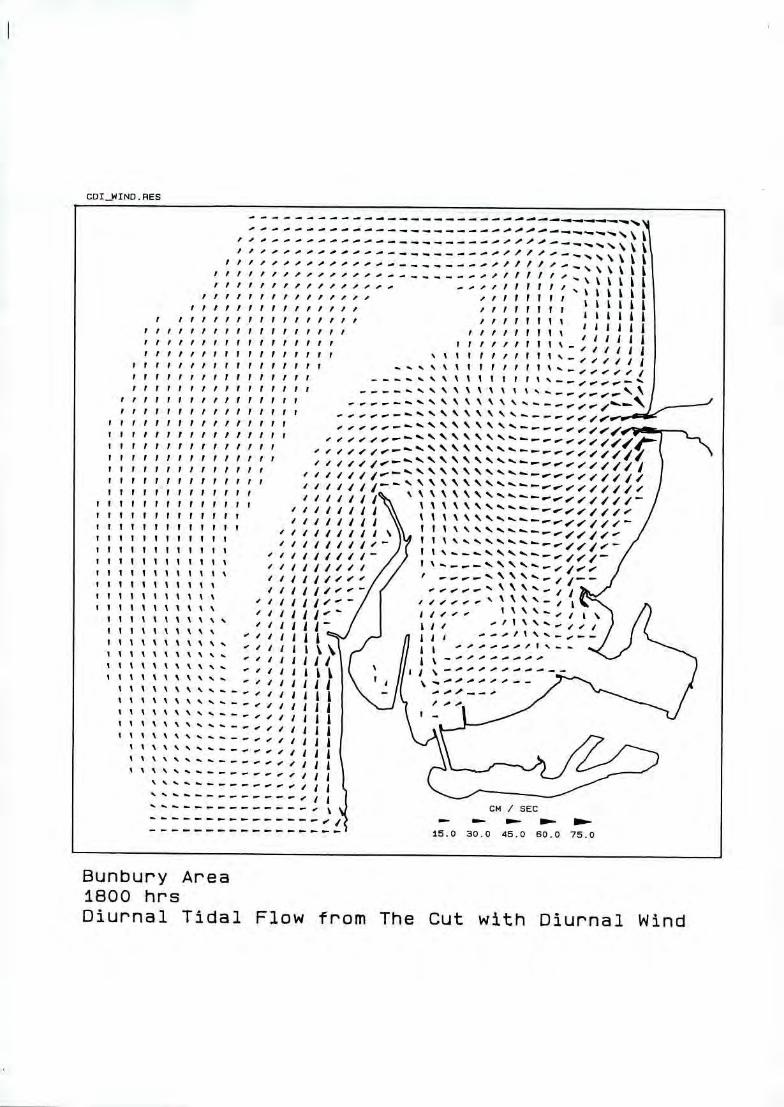
CDI_WINO RES
a a a
- - a - - a - - _ a / --
F
FPFIfFF//,/, ,/F?IItI tkIII II LtL 1 llFlllIl11FFF ,,,,!ti '''ill 1l,,FF,lIl 11fllII 'huh
IIIIFFII?I1I,?I,r
IVVVI1FII1Ipp
IIIIVVpFfIIVf, I ii V V IFFIIFI V V I V I F P F F I I
- I / .. / - — I I V I I P I I I
00,
- I / / .Ij/ • I I I P 1 1 1 I I F I F I I
I?VVIFFIIIPFI 11111 fF1111
40, /// IIIIIIVIVIIV 'I//Ill II IIIIVVIIV, 01 40,
/ I 11111?v I / iIllttt7tV,
If
41
/ II,, 11111 lliIIIIIl
iiIItttlti
iIIiilIii , / liii I I I 11*11111% Ii IIII% ,,,.....
I hhuja — Li ,
LI II I I I I '/iii1I L I I I I Il
I I I I _,/huuij t j '.-.-.- I I I I I a—, I I I
—Il/ ill I I I I III _. I I I I \
I 1/
I I t ' / Ii --
I ll
_ - - - - - -
CM I SEC -- -I — - - - ------------- 15.0 30.0 45.0 60.0 75.0
Bunbury Area 1800 hrs Diurnal Tidal Flow from The Cut with Diurnal Wind

c sr-I z r-1 (0 c L
0
r 4-)
-p
C
Cl) r I—
E 0 L 4-
0
Li-
I—I (0 (0 a) 0
sri 4 I—
(1) >sLrl LCCD D c
.QOL
rcu0
"=- = oo -~ ~ =--
, / --.--.- --.-_---.#F ,
_________.___.______._,,
Lu
to
/ / I - — - - - -. -. -. -. -. #_ / l• - - ' j
- -. - - _. 0- w-
-. -. 4, 4e I / / #' #'
. - -. -. I / I I / / I/1I• - -. - - -- - - - - -
,(/ ' " 11
-11I'II'iij1I —
I
I i ' . , , , ( • \ S. S. . 'S. . . S. S \ .- . -' I
' ' ' S.. s, S. -------- •'• - I I I '. •. S. S. S. '. . s 'S. . S. S. I
11 -------------_--_,I I I I I
- --- - - - - - - - - - - - - - - -
—- — — — — — — — • IIIIIIIIIIIIII I ,,,,i ,aIiiaILjI
- 111 #IIIIIIIdII 111111 ' ' l/l//II liii I III
---------------- -- - -
-
--,ll/IIII jill
-- - - / I - -
A I -- - - - - - - - - - - - - - - - -
- - - -. • / I

APPENDIX C2
DIURNAL TIDAL FLOW FROM THE CUT, DIURNAL WIND
33.3m Grid - Exisflng Geometry
Velocity Fields

33CUTDI RES
- ..
Sits i'
sss 5.'....' ee $5
.•it ,I
Jr
I $5 - ,,,l,lll 't 't t t t '5''
$ • . - / . , .' .' , r r itt it t t t t i t ' S S - - 'F, I I I 111111 '5 't '5'' 1 '5%' % \ s ._. S - ' / ' FFI I I III lit '5 '5 '5 '5 1 t '5 '5 % t ' 'h.. •S - -- . -'#/ I I I I I I lit '5 t '5 I I I '5 '5' % % - . - - '' ,,//F I I F I I I I II I I I '. I '5% 1 I '5 '. S Ss . .... - - .. , , • - - - .. ,/ /1/ / I I I 1 1 I I I I I '5 1 I I I '5 5 5 '. . *. 5.5 - -
-. / / // # - - ,,•.•.,,,,,,,,,,,,rI ,llIIIIt'5'5III'55S\____,,,,..............._ , ,/#.,,,//F,!FItt It lilt It St I,
S 0 #//FFIIIfI7llt%%t%%tt%t % 5\%....__,,, z I'. S S
I iiI ##,.p#i/ F F I I I I I I till t '5 Itt S S S S s I lilt! II '5 tt tS S 555%' ''s.
I III F/,/,,,,,,,,,,F ,I,,,,,,I IIt t '555555 • ' Ii' 55S. St I
S S S • • . , s & I I I 1111111 II lIlilt tt%SS
V ,it,,,,,,i I I?I11II1II lit 11111555
s.. S%Ssss % 5..
S S S S s ss
j
1/ i • II, IlifI/ipil ill till till * It .. . F - s I Il?#,P,ii IStilItI lilt It lit '55% 5-- - ,,, .. -
? It . ,# # ' i.i sllIIt?Itt lilt lilt S S 5.5% ........... iIF III p,,,,,,,,.,,,F,lIlIlittltllttltIlss ,F/F F i • .. i,#-.# , , , , , .. ii thu lilt, I 115% s. ...................
s - ------------- - - - - - - - - - - - -
- 11///Fl • ii ill? lglulitil * ._ -------------------------- ....
S I F /! F I, • ill I I I F F/####/ F 11111111'
IsI?IIFI,I • still, .##,//F,,/ Ii F I . $ t t I --''''F,,,, III,, lil S. still I I P IIF/P..,......... - 5.1155%.. • ,///....... . .
S ------------------ ...•_,,,, ol • I I I I I S
Ill,'
4.0 8.0 12.0 16.0 20.0
Koombana Bay.
0000 hrs
Diurnal Wind.
Diurnal Tidal Flow from The Cut and Koombana Channel.

tauu9LlO euqwoo> pue qno auj WOJj. molA tPU t9UJflO PUTM teuJnco
SJI.1 0060 ceg eueqwooN
O•O 09 O 08 0P
- - - - - OBS / W3
------------ ,,.a,.a,pi,,,..0 r•---..
-------------- Ills a '\ j - •
'-----.----( -,,,,,,,,,,.-,--------- 11 A A I
I illltttt#ta.. jJ *a,,., j s * p a lII//ItlIi, a siettititi lttliillt #1te
S * S S I SilIllillIPli I Itlill III? Ittlil Sill.. .ss..%%%p%%iPt1l/I/l/iilIligiglItltlSfIitsg.. .sS%SSS%%PtiPltlIIlt,,,,ili,,SSttSSSSSSSll,.
*%t%%%%%ttItI ltPSPI ills., / .p,itpsstttti,'sis,,,,.,,t,ssts,siiiaaai... / .11111 %%PP%%P%P Ill tilitlitil, SitS DSP ShIPS,,.. .. a
I
/ .*. iI ItI1lttt%%%tttl ,,t,,,,,,,SSSSSPSSIPIJSSSS.. .stppIIt1ltl*ptt%ttpt,iS,,,,g,iSsSiSpPSiitSSlh,,....,,.. s**ttttiiJiltPtttt%%i SIP ,S,,,SDsgt:pStp ItSlPiti,aaai'
J J /ssss*tttt 1111111 IPPP%%Pt P IShStSltl ISSIPPSt ISIS I lSl'ta'i. /
jr *s...s%tttlPPPIIlPtPttttIIbSSSlSSISiIIShIiIuliPP'li''''
%%t1lIIllIIlltttttPiihSP,IhS,hlPt1h5P11155,t,,,.. I L ----- ...%P1IlJlPlIIIttPtii%P,iPi,,tItSSlitIJ$IJSiiPP,i
'1 \, -----....11liPPIIIIl%tiiPii,,i,,hbSPPStSIiPlllIIIIP.s...., iiIIIPIIt?IIttitippp;i,,,,,ipIStIPItlSliPiIS,,...,.
I I I I I I I i s V I I I p p p p pp p p , p .. 1) 1 1 I I I I I p t t , : t t i • i i i t , p , , j p p p p p 1p p p p i p
IIIJIIIIVVSIIIS,lIIpsp PP illS PPPPIIPIIIPPPI P151,1..
,'ua TI fIfIl?III:ittppssippptppiIiIItitiIipitt,t.. , f??III!lIIi?ipppppi,pppPtPIt1$tPIPItsrt,s,,
I •,,,.',F!7 1IIIItIIp,I?sSpp,pp,p,ipIIpppttIppIItsl,,. I,,F/'/FFF llllliFIIIIIii,,.,i p,pipIIIItttttIPPSSIIl,p
I,///////,F P Flll1Ili .' .' .' situ, p , a p ut putt pppp p p p StIll
ass lIsa a pppttIIPtII SIP fj: p
I .,.IPPPI 111111 hIll
/ - - -' // / 1/ /,///t' F /1 F / , .' .' s , .. , .. , , a , , , . , , , . • , , p p p p p p p p a,... •1111 III 111111,1
/ -a,..--. asPI iPIPPP1IIP P ..............,,,pppp ppppppp
/ a I l!///////////////FIlll!!/FI#FF•# -- — — - - — — — — — - ,,itIPII p p
PP *
sawiainoes

33CUTDI . RS
-, a•I',ijSig$Sl ,. .,., as tllaijgg:,iiasg asia:, -a.--— —- / .,aI.a,Jaa,a,paI,at,,aag,t SI... / . • $ i ii , i, t,,'. .. - . a a a • a a a a a a a a as a: ass,. a-----
a / \ \ ' , laai,al,:a ....•---•-... Is,,agasaatasg,gsag:a,,,, ,. / \ \ '• •auia itt l5St.. .11isSgSl(jaagliiIsisg,i' - / \ \ .•,,a,,aa,a,, •--....' — / ' •aaaaai%ual$ ,,S,Isiii,ial,ill,1lll,,_, / I \'. •.saaa..aa a — I %i •6Ill8l '-s'ii,iigsga:giil/#,,,'''- —
I I • • a a a a a a a • a a.. a isiag liii, ggg gg' /1/Il i..l.--—J a..aa.aaaaapaa,a.s,,g, , I I ' , , ,,,,, .'
I '' •taaa.a.ai.a.aaaa:lillIIIiIjIllllgI1l/I/////////..,' / Il a. ,, , aa tap a a a a a a a asgigigi il 11111111 iII//l/111111/
/ /aa, 'asa,, al a pail,, a a., gill, illig Ill iii l/IIIIIi1iI, 1/
/ / I I a a a at, a p a a I tat a a a at,, 11g1111l1lg ilililili I hIlt a a I I I I i i , I I I I I I I I I I I I I I I I I I 1
/ J' aSSPS. •.a'aa,.as,aa,aaaaa,,,gJ,I/,gg,gsgj,I,a,tt / / / a '' S ' : ' • •. ...sIfa:.aiaa , aaa ,g,gg,/Iggjg,g,IJ,a%'a I' / /'aSItSIaaaa •.. , S 55 .S ,, aa ,,,apI ,Ij,J4IjI/ItgIIaI ..__ 'at a,Sta,ia 'asa.,.
/ ( •aaaatasa ------------ I I •.I'a'as ................
I' I aaa*%alaat,,$4,gaa,
I ............ ,a.a%at,a,,,t,,,:a,a,a • / %%'at'a'a'a '..a,..._.., 'a'atja,aa,,:a,,a, , a - 'a
/ I aas ,,_%'a%%t'att .............. 'ittIIlttSSISIS ,, ala I I '',''.a---..• a , lta%%II,aaa,, --------- S iS / %%'a'atttt%a ..............aaattt%itai,,S SI
IIliz,_..%S%%%ttttttts 'a's.a-....-.. ',I,aaatIa:,,,, at )i ,_ / It%tttItta** aa.s........, a,,a,taI,a,,, a ,,IJII.,JIItItI%I%att tta'as•..e, a,aaaa,aa.,, -------
V /iiiii /JaaIsaaIaaaaaaa --------------- _va,aa,a;aass /
1' ajjgj t_a•....._.__ —----- - ,If1,,,,jja
----------—------------____,I,,_ I%S'a ------—-----------------_..1_,,, — a s ------------------------. ,,,
— — — - . 4.0 8.0 12.0 16.0 20.0
Koombana Bay. 0600 hrs Diurnal Wind. Diurnal Tidal Flow from The Cut and Koombana Channel.

1auuq3 9uqwoo>. pue qno BLII WOJ4. molA t9PU t2UJflO
PUTM I2UJflTO
SJU 0060 c99 eueqwooN
OIOE 09 OIET 08 OP
- .. -.* — — 33S/W3
/// 1-
--
------sIii,
--------.
--'. ------------ -
------------%%%tI5 It%''
'%%%tI%.''
.0 A e A 00
%%S
- ' '. '. % % - * ''S S S S S 55% I I I is s I •
* * *SSS% S SI '.155 5th I - IIII * I
SSSSSS% '.tSSlSIIll • '-_,#_,, ' ,,,,_.__ ----------- * S 5'.
- ---------%*SSS%%tl III $555 SI 'IIIl*
*ss*%%%55%tiIIhIS,SI IlII* f ------------------------ S***S%S%5555511115S1
- ---------*S%%%%%%S%SiIIIJS• 1*111
/- --------------------------s*sSS*SS'.'.S%%%%tIII mliii I I ------------------------S5*SSSSSS%%'.%'.%%%551 11111 I I ....... -----------------*SS*SSSSS%'.%55%5%%%51
ml I I .......................***SS*%'.'.S'.'.S'.%SSSSS\* CIII , / / II * * I •** SSs**S%SS% ** I I I I
p • .1 / *** - • , - I - .............* ' * * '.5.. S%%S 55 55555*5% I II I I I I ..........- ''I, * ** *S*SSSSS5S*%S'.'.5\S%%5'*%%SSI Iii I I I *11 1#l* ••*._*s I t-sII*lt,tSFlt 0*?.. .._SS*s*%s*
S S I S S S S I I S J 5 5 1 1 ( '*. . •,IS,SI,,,000 II.....*.'.*s'.s SSS%'.'.%'.'.%%%55%itIIiJI,I
5*55*5*55 5*55* S 5 SI'. Slit I 111115*8'
*-.--.- I/,s*,,i#i,,,#o II?? •SSS**S*s SSS%*St%IIIIlI*sI51*S• **SS5%IItItIiIIISISIIi
I S * I * 1111111 55555? $
I
-------- * '. 11 1151*5ISlSSi
,,/,,I•_,,,,,,,,,,, - - - - - - - ----
- ---
'
S S S * * IIIIIlI 5*551555 I , ,##,,, 1/A A I I- - - - - - - - - - - - -
- * S S I I I I I 5 5 5 5 5 5 5 I, - - - - - - -
-------- * * S *tIiIi 11151111*1 I I_,,,,,,,,,,,•_,,•,#,#,. ------------- S S S "till, III 55555*55 , • I • •
------------------11111* 1551 S jSSS
,IIS*S 155?? ----------—-—-—-- ''.S SIllS 5511115115151 111511/ F/I/IF/F - - ---------S 5*555555555555 55 155155'.'.'
I II II I IS SI???? F F///F ----------—-- 5*' 55555151151'. 15555555*' I iIItIIIIIIIS?I?IF/ -----------—---—---''s' 555% * 11151$ till?,?,, / ///F/I I --------------*%%5S5S 5511511555551555 *
I I I Iii S%%555S S S SI %S'.S55SSI5 55 * 5 * - I F - 1 F I S S I I I I I I I I F I I F I I - F ----------- - '.5'. s s s '. s s s '. s S -
S3 IO1fl€

33CUTDI .RES 'I a..''' . - - - _ '''''ii'i'iI/iI/IIIII/IIIIIIIIIIIII'I/ /
a st '' ' '''''--•- _---'-' ,' l ,IiIii,iiIII/IIIIIlI,Il,Ii jilt tl t '' I -. .... , t jt J
a --- ------------''''i'i''/iiiiiiI////IuIJI/IjjiIjii \\ a a ..................'llllI,,i,,I,,/l//////JIjJjJjJjjjjtg gil_f
I I a * * a a ...............,l,l,l,i,,iiiiiIIlI/I/I1lIIII1IIIIIIiI—/
I L /71 S I I •'' I I I I I I I I I I I I I I I Il/I 1/1/11111111111! I /
I I • ' • I / I I I I I I I I I I I I I liii 111/11/1111 / lI/Il - I I ?'' aSaSIS a a ala ....... IIIIIIII1II1II11I/lI///////I/IIIII /
/ I • • ' a I S a I a I a I •'''l I I I I I I I I I I I I I I 11/I! Ill/Id//IllI a' / //#'////I —/
/ / a a I a S I a I I a , a I I S I I I I - - 11I1111111154 Il/Il //iii/IiI 7 / • a a a I I a a a a a I a t , a' i . - ' # I I I I I I 1 4 1 Ii 1 1 1 II 1a'1.a'/,/
,..a.aa.a1111155a'a'a'a',1 I,a',,1111,,jjjjj,jj//a'...a.'. / / ........aaals,aS,,,5I,l.II,IIIIIIIIIIIISJIIJI. -a'
I'' '''''',''''''''''a'''''''i:ggg1iIIttllg .5
I1t a' '- lisa'
lI , ;aIIsIaJa , s , a' , II ,,,,,aaaa , IaaaISaaaaalllIzIItIlIt%%tl 4 II Ia 5 saIa a aa , a ,,I,,,I,,,,, a , aal , II , aaaaaa. , IIIIIILIIIIIIIII , II III*a1I*5tl,g.,,I,,//,,aaaaIIaIII.IaaaaasaSilJlI&illgIIII/,
II
liIIasl a,.,,,,II,,,,a*aaaa,I,aIaIasIIaaa,sIgjIllj,I,,,,- )a , * aaa,'lIs , I , II, I ,ssssaaa , a.IaIIaIalaIaaIIIIl1sIiAiI/ ,/l
I it IIIII,a':,,, I.saaaaalIa,IaaIs,aaiIsaaattai$ljj ---
ataa lIa,i,,,,a',III.s.'' a atit liii 11111155 latSStt%%%Il a.a,aa usia'. ggia'a',sa, a aa a a a • aaivaa* siiis a a.. a a' a a a. Ji iIiIia'asa's gga, a a.,uaaa a a iii III 5I
( a..aaajJ5jgggggsIa , ..aaaaa.a.a.aaaara5sIs%sasasaa'a...'.'.. --------- 'ails-/I g ggggj ala.,. .•a..aa a .,Iaa 11111111 I S * aIa j IjjjI1i5III ........a,aaa,aaJJ.aIli(aa'----s -'.s. s'.---- ---------------- ''aig
lIJjtttt..t*t ...,a.., .,a,aI,,aaa*,liaa------'-
- 4.0 6.0 12.0 16,0 20.0
Koombana Bay. 1200 hrs Diurnal Wind. Diurnal Tidal Flow from The Cut and Koombana Channel.

Fil
tauui.ic 9ueqwoo>.I pue ;nj aj.. wojj MOld iPfl 19UJflcO
. PU .cM 1UJflTcj
SJL1 OOST 1c99 eueqwooN
O 09 O 08 O
OBS / w
-.11 Itt
-II Ill I
Ill If %tII 111111
'''II %
ii ititli / / I / S I S S II it it lit ii
,,,,,,,, '''Ill S S%SSI'SiI 11111 hit Iii
l%SS%% 11 ii I I IFiiI,iil 55$ It* S S S S 11111 ..f I
I If????: III I I I SI I siss S S S S S '. IIIt iI
s t Iii I! tilts sissis t s % i(I iF p
- , , .' .' , , , , .. , s : s , • i t . s '. s s . ' ¶ I 1111
%.SSS sIititi$
it itttiissiiiiiitst55lillff F
t ii sisis i i llI III? / ,:
%''5'5t%$55%%t%lti55t5%%l$lsitItliit%IItftff f
I t1 ttiSiss,ssissssis%%its,i,,i,,,,itttIfItfPP? t
.—F?i?s Ii., S a I 55555555% iiit titus,, I i1fIittPt StItI:zs. , l%s%t5%%t)ssipltIIpfffpffPIf?
, ._,, , , .. p p pgp p p , , , , s it i ; ii t ff 1 hut P P Ii Ill t / a Pt ill , ,,p 1111ff Fill!,,, 'its',,, iii ttIt?itlt P11111,1 Itt i,,prt Ill Ill liii II ftlhF!l , ,, , i,s,l Ill II??1?I? IF, P111111 fit,, it Ill J 15 S.\ I I I ff F,,,,, - sits tts:it: F 11FF! 7PFI:,i?1 fill s\ f I Fl/i, , - - is Slilill P II II FF,F,F 17th I iii It II
yrtrp,,,,,,, •1 ,:s,,iiiipiFpFiFpis,,,,p pill
t 77fFi,,.__, it, ?ltpPpFfFFFFFpFF!p///iF7I
* 1lFFF///, ..ii??h1ppFFFFFf/ppFFFF//////,i
I FF!!F.PFFFFF!F.PlF/////iF I
'"• b 417
P
I
, a
,,,,,/,/,,,•,,,,,,,,,,,,,,?,il',' 1FF , ,,
tilt,? lit hilt
iii:tt I555%55 s 11111 1 IllS i5Sttss
I 511111555551$
S . IOLflD€.E

33CUTDI . RES
g % %% I
-----..i.v,,,,,iijijj2I,, i I /////I/IjI),,,l' I 455455% %%
/ \\ / \ \
I \
I - ----- / L,• i . * . — /
/ j •' I#/ 5-, '"#1i,/// lib • /
I / / /
I II $ • 1 • j .4 .4 4 j // / / I / I I I S S S 4 • I ' ' - 'I / $ I £ % %. \'-'t I - I II • zill/IllI , , , , - , iss , , I I IIZI'''''lIISIiilIISSIs ''5----.
II'. I I II 45% I £1/Ill ' S I •. S S ' S ,j,,jj t I t X N - ------ - jiiiiii/ I
/ 14511 1111 4,' s S It
- 9 119
TT1
1EEi
Koombana Bay. 1800 hrs Diurnal Wind. Diurnal Tidal Flow from The Cut and Koombana Channel.

3uu2L3 9U2WOO> PU9 no aqi WOJi. mOTA 12pçj t9UJnTO
PUTM I2UJflcO
c99 Eueqwoo)J
OO 012T 08 0 ,17
It,'
/ 'IIIIts'
I I I1II1II///I1l1/1/1////////1' ''ti sits isis - ,,,,,,,,,,,,,,,,,,' , t , ,,/I,
41
,,,,
£41 I 4111!! 111111 I i i t i •
-
' : LIII iii 1 lill lull I I I I S S S S S * 45514 ' Ill i i S I I . S • I I 41 £
VL1lILIt1 ILL 4LSSS\S*%S%S I '11414 1$
.%,t ,, /1,,g I
4 lIllilil - ' . iiii a ass a S. S. I I I 11151 I I I 'St • S.S.SS.
S I s S. I I 4145111 i II a
'' S.\S.41tII1ll1iilIIII'' - LLL1tIllii1i1I1I''
LLllllii41Il!!''''
LLLIIIIIIIIII!''' L LIIIIIIHIIIIIJ'
}.L LIl1l411l111liI' LLIIt14I111II )LLLIIIIIIAII''I''
N N N}11L4IlI'ii''''i NN N )NUIIIIISII'l''''
NN N NNL1111IIlIIJ 1 ' -''1,,,,,, N S. I I 1111411111 1
N S.NN.S. 1111111 LII I
N S.S.tN1I111tItII'' *
"-—
S. S.
I'll II .sIsIIIIsi,#, -------
SBIJ IUifl3€

APPENDIX C3
DIURNAL TIDAL FLOW FROM THE CUT, DIURNAL WIND
33.3m Grid - With Proposed Marina Groyne
Velocity Fields
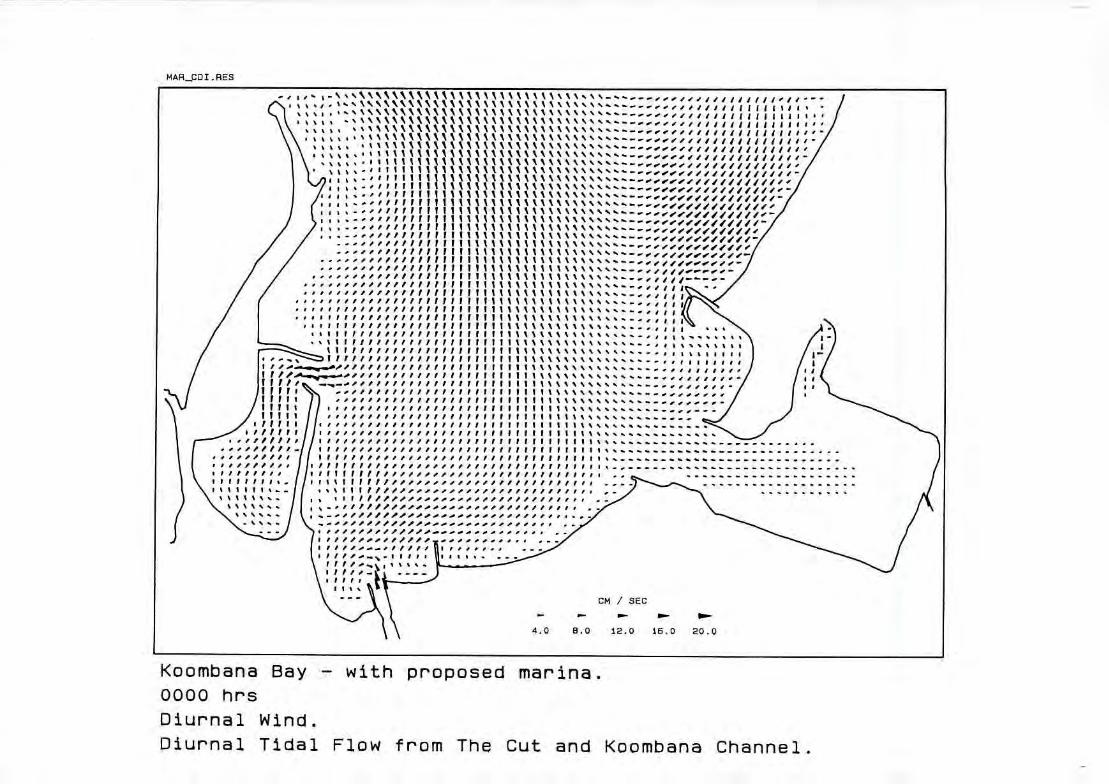
MAR_CDI . RES
's'' ''Il'lil till ltii'• .. .....---- 'lllliijj lillissi'
%''I-- ,. .• ,. .. , * '''' ''''
%' ' • % tt '''' % t %S*I* %tt., lt i ''' ''''
S .?ft 11 II •
II % , , - - ' I F V I 't % ' 't t 's's\ \ . — ---- III A I'I
41 ,..it?p7fV ill I'
V I *I .--i', jP iiFF, Ill ¶II
. - - - - , F / / / 1 1 P 1 I I I I I I I I I I I I - , / _- - —
..,.•,,,,,,,,,,I, VII III IIIIt
,,,.,....... III
,.,,iF#/I/Fp F I .,,lFFl/F/FFF1It F V ,•,,r,I,,/,I,,I,,,t I
ss s, •,,
*,lIIFF///F/IF I IIIII%I%%I%...._,,,,, %IIIFFF/FIP/I/If? I till s .•--''• '%$flIFIjP FFIFIrFFI I I I I I A %%Itss.'. sS._
S.%S.
I, S.S.S.% S.ss S.Sss_
. IFIIF?////FF?III V I I Ss..,, • j jgg
S.*s S.*.._ % _____ - - 1 - - - II%I%\ '....___ ----- I - I VII I ,,lF//IIFIF/PFFI V VIII I tIII%S.S.'% -- .....
1111* •,,,,ii,,,P,,I,i,It7II I *IIIIS.ss s..... thu I?#lIII#lIIII1I?I II IItIt%%%S... itttii I IItIII%sss ...........
I,,,,,, IIIFF#iiI?IiIIIlVt IIIIIIII%% ,/// lItItItII%s .......................
IF/FF/ .1 / / / F IF I/Ill?! I I I I III I I I S ............................ 1 1 J, J. /P 11 F 1P .................. '1 If /,# .. ,# , , , , , is, , . - ............................. I IIIlFF I Ill I V V I I// F//IF,IF,11 I I I I • IIiF//l// ,#,/I,i/F//,//,I
ShIlls. III
- • 'F///,..,,, I 111/ I I I/F
It'
— - . - - 4.0 8.0 12.0 16.0 20.0
Koombana Bay — with proposed marina. 0000 hrs
-
Diurnal Wind.
Diurnal Tidal Flow from The Cut and Koombana Channel.

'IUUL13 eueqwooN PU9 .fl3 aqi WOJJ. MOld !PU I9UJflTO
pUM l2UJfl
euç.iew psodo6.Jd q4Tm - Ae9 eueqwooN
OO O9 OT O'R 0t'
- - — — -
3S/ H3
------------•t ,'--.''tt'''s''I ___5__.__ _.,_---------------
--------------_,,,,iiipig.,s -
/ / -. ._\..
l#,PllIll j 5 %%%tS --------- JI S%%%t%
___•_____________ ---------- _,_,_,,,,,,,,,,II '' •t $
,,,,,,,,,,,,,l1,,,#,,,,__,_,__.
-----_-__S5 ••,,,,,/,/,li,,lsl,sllllll#I## 'I/I? '
- - - - 5.•. - ' S I I I I I F F F F . I P 5 1 1 I I I S I I I I S I P 5 . .' I I I I / J. . / - - -
__.....*tt,ij,1IIIIIIII,IPISSgIlShThhIIhuhIts' I, s%., t %%ttatIp5IIlpIISgI:IiIII ' II , /
j ,tttttt%tttttll,l,,,,,,5,ShIThh$ht$hl%t%%%% 1 5 I' 1r / ,%%tt%%tt%,,,IIIISSISIIlIltIltlltttt%t%1 I / ,p,,,ijt%%%%%%ta,,,,,,Ss,,siSIiIl$Ilaat%ttt%ltI/
,lPII I / .,,,,,IIii,t%ttttttt,Ig,IiasIIsIIII$$a;atatt%ttt$'5 . sijp!
, I / % a t i t t i i i i I I I I I I I I 6 6 I t
t ss %%t*aIlIPIiaaaatttIIIIIIII1III$I%%aaa*.__
I !.___**St111ttPT,tttaattttIIhhIhhhhhh1hll*ttt***,
/.. / I Il Illililt I at t iiiiiii siiiiii It Itt t%.s
t. I ____.._5..I%ItPlPIIIatataaa,t,,I,,$tlliIIatattt.*t5. 1 ...\ '. I P I I P P P I I I I I I a i a i i i i t I I I I I I $ I I I I I S I I I I S • • -
L ._,, ItpIIIpppIIprplII,,a,IIIIIIIIIIISIIatIIIIIIII '5* '5.___,,,"j7IIIIPPtPPIfVl11lhlhhhhhIhhuul*'I'%I''$'11115'
.__ f/I I I I I I I I I I I I I I I I I I i t I I • i i i i I I t a a a a a a i I I I i i • • • IIIIIIIfIrItfI?,,pIlaII ii IIlIIIaIaaaaaII IIIss,s
/1, IIJVIIIP1IIIIIIII,IIIIIII II ,at;,aaalalal III 115155 , .,,...1f7pVpI1lp,,I,,,.IIlIIIlaaIaIttaaaIIIIIII'1S16'
itI?t ?l1,lI??IF?I . i i at a i i i,s
/..//////#'F! 11IIII??IFII I F F S I I I i * i ata a a a a a, p p p • p
/ I F Ps1Il?FIIli I I I S a I I I IS Stt * * * I I I I I Ill /-I/F//////FFF F 11,111FF' F'i#'' • t • a issata i * I I I Slip,
IlIS'IIS$l I I 11*111ISI
I -,////////F P FF1l1FIF F F I I I , .. I 5 5 I I • I I I * I I I I I I I I V I f I /.._._-,,,,/////FFllFFFF,F/,ll,''' ,.,•• ,,,IIIIIIIIIII IF,
IS 1111111 III
a...' •iIIIII Il1*t ,//
/ • p l , - - - - - - - - - - - - -- ,ivi II *a a aa
-------------------,,,gIlIISStIs ( •,, I ill,! Fll//////.P///FF II,i,,I,,l_ -------------- ,IIII I I I St a
* IISIIIIF F!F////////F ll1I1I11 II -- - — - — — — — — — - — - -
lIlt lilt t S
-- - - - - - - - - - - - - - - lIl lit It'. I
I - -, - - - - - - - - - - - .Fl I ItS; I I I -
S3tIIC tlYPl

MAR_CD I. RES
ISSISISI4SIIIIIISIISII$ lS' . 'S$ISIIIIIlluIjIISiIlJaSt / S$SSIIIIIIII$IIISSISSSSSSS I - - .. S J
''ssslaissII4lsIIs4I'II''
\ \ •$lll•lll$S , ,,,,,,,,,,sg,s,,,,,,,,,,,,, - ..... ..... - '',,,,,,,,,,,,,,,i,,,i,,,', - / I \ ...,-- •SlISSISgSIl1!l'I#llII1 -/
I / S SIllI.I Ills 1111111 I / •• ''''''''''. .IIIlIIIIlIllllllltlIlI/l/Sl111ll--/
I (•'• , l ,,,,,,,IIlIllI,,llI,,,,,,/,//,,,,,, I iii Ill I
/ l I I S I I I I tlS4SIll5lllII 1l11I1/// /lI(l/// / / I I I * S I $ I I I SillS IlilIlIll liii / Il/Il 1/11111 / /
/1 iii S _....s. * s S S IS I I I liliiIlIl Il/I Il/Il! 11/111111 111 / /55?? ----------- I,,, P ............ •11$5 IIIliii z i -i I '''' . .. ......''' 114 $$IIIIiSililllllIIIIIiIIIIISiIi/ / IIPIIP $* , I4$5$III$$4$j5555,jj,g,$,j,4%( I / 111511? 115..5 S*$I$IIII$$S(ll5SjI5jjjj5j55jj5jS$ 7 / ll?5lII I...s.,, IllS lIIlI%lsIsIslSlISlItS4Sl It.... %
' IISlIIIlIII ( ,I,5$5,$55I •I •$,55 S , S$$45II4144$Sj5SSj4tl444/f I •,tIISIII,.I.. 111,I$I5*$$$IIISIISSlSlISIIlIi( I •I'l*S*%$$tI4i445555544IIII' S'
I' I •..lS**$%$44445544544j ( I ••I$*S*$%$IIjIIS4(StII s*St%*III$. I$I*I%$5$$I4j4454ll4II
••'**$St%lS4lIlStIl4' • I •s...S4$SI$lIl, .,,$I*SS%tII,lSiI44S ........I I 1$I***It*II44IiSII IS I........ '''''''' $IISItIIliSl II JIll,. '\ It%l%l,SII ..........•IISSI$4S$SII -------
/1111$ I ................. I•SI**t%SSS•I
--------------------. SSS*, - ------------- ------ - - -- IllIIt$$ 5*55/ 5t1 ---- - -------------------€/ttISI$S%%S --------------------- - ----------- - - - / ISSSSS - --------------- ------------------------_._,,,, .......................... I.,,. • .5* --------------------------_____1,,I-
- — .- - . . 4.0 8.0 12.0 16.0 20.0
Koombana Bay — with proposed marina. 0600 hrs Diur'nal Wind, Diurnal Tidal Flow from The Cut and Koombana Channel.

'UUeLI3 eueqwooN pue qno ej, woii.j. MOld iepçj 1PUJflT1
pUM tUJflTO
SSJLI 0060
seuTiew pasodod q;çM — Aeg eueqwooN
O*oa 09; o o 0,17
. -. - .— — 3S / WO
/ 71
.SSII %SSI ii
0' A - - - - - -
--II
-----
Si. Ulttitt%%titIi —
*555 Ilttl%%tttSI --------
%S%5% ttI it %SS%
------------S%S%%t%tt%%% I 1
------------'''s*S%ttSttlilsaasl _ss%S5%sttit ill lists
—S.. ----------- ''5''%i%tiit%liIIi,5I l•i. 7
'S.....s ----------------------- '''S*SS%%titllilIjisI 5* -------------------------%*Siitttilill,l / -
-----------------------.ssssssssistiitisiiil
I / -------------------------s%''%'%%SSitttttttlili
''1 / •' ---------------------- ---- SS''S%S55%%tt%%%%i%_ .,f / . ut. ------------- '' p • •1 I ...-' I'',' .............sS5ss55sS%SiSSStttt -------
I 1 s*.... I,, --------------
/ .1 5 SIJI?P? I I ............. * S 555 55555 St S 'itt S 55%
?iuu,, ---------------.sssS%5S'i%'i'isst'issss's i ' a' ' ...............S S S S S S S S S t I I •. '• 5 5 5 5 I I I I I I I I I , - -------- - - - - * *S* '. S t '. t t I i S S I I I
-•--.......... ssssitstitiitttiit.'. I a' ..................S S S S S S S S S II I I I I I I I I S I I Si'. itt Iii I lii Ill
----------------*5555555111111 $155555
I - 0 / / I a' I I I I It iit. - ---- - - - - - - - - - .. ... SS___tt I I I Ii ii ill ISIS S
A 11 A 11 IF 11 A p I I --------------5*55% ii it I I I S I I 15151 I I
s * *ii Si i i i i I ii I 555555 I
-------------sss it 15111 liii 5551 III S 'a 55555511 1 S I $ I I I I I I I I I 55*5% Sill S i S I * ii I I Ii S I_,,,,,,,,,,, , , , ,,,,/,# --------------- *5555555 StIll III tilt -
-- - - - - - - - - - - - * 5*i ii'. itt Still tilt liStS /Il, ------------- s '.%
/ ,slttt5gI,iia'a'a'a',sa'a', ---------- - - SSSSSillStittittItlt%ti - S
(_g5555$ ,,,,,, - ----------SSSSSSS S Stilt 15155555555
S I I I I I lilt ?II/Ia'Ia' 1 -------------*55555555% %%ti%t%%t'.ii S S 1111111 5*5555555% tilt 555555% liii'
S*%SSSSSS%tttS%StSSS%StSS' - I lit I I I lit 55*1 StIlt SIt %%StSSSSSSSS'
- ,i.,l,IIi 111111/,!,,, -- I ------------5%'St St I It StiltS it SitSt 555
S3H

MAR_CDI . RES
''it'' s — s ...- 5•l'5'- •.__, '' ,' ,,l ,liliIllIIII/III/III,I/I1,I,I1I,-_.. - 'I '''''lIlillIlI I/I4I 111/lit 111114 44 I'''
' % * St S * - 111111l ill/till 1/I//I 1111111111 141 II 4%'' a ,. .. a S * * 1 iiiilIII 11111/1/11111111111111 4 a St •. S * * • a i a I I llIIlIii/ lilIll/IlI 1111111111114 II' —
'S S -------—————--- '''''''''liIlIll1//d'/I11111ll/111111iiI S ................. a. •• 1111111111111111111111111111111111
a a S 5 ---------—---- a. I I 11111 111111/11111111111 111/1/1 a. III 111111 liii Il11/////1///11/111J/1l I
S 5 5 ISa's''''' --—--a - I I I I I I I I I 1 1 I / I I I 11/I//I IlIllIllIl / — S S 5 5 5 5 a a.. a - - - a. Ill/Ill I1I//////I//I/I1/ a a 5 5 , a a a 5 I • a I -------- ,1III11//,/II1
S S I S S I I t S a I I a. I I I I I I I I I I II I I I I 111111/I/I / liii S 5 5 5 5 I a a I I I a.''-'' a. - I I I I I I I I I I I I I I I 1 111111,111
/111I • S S S S a I S 5 I I I I S ------- a. I a' 1 I I I I I I I I I I 1111 111//I//I//i , I I a,, 551155 aSsS'a.a.IIIIIIIIIIIIIIIIII/////////// , , , , , , , , , , , a j , a , a. a.III5 I I 11114 111111/1/111,/I,,, • a * s I S S a a a a a i s I I I I.''' I I I I I I I I I I I I 1111 ////11///'
a..... a s a a a a a s s a a s I I a a. - a. I I lilt II I 4111 liii I1/ II ..., aaaaiaasasasag,sI,.I,IIII,jjIjIjjjjj1j/_
a a a a .5 gaits sass,, ss' , 111 141444111 IIlL1I - • a a , a a s , , a : a s i i s t S $ I ' ' a I 5 I I S 5 1 4 4 1 4 4 1 4 £ I 1 1 .a.saaIi$SIIISIIIII5;a.Ia.a.s51115544444441444
•I a StallS ii jig,,,,, sail, a. 'Ill £41141 4441% ::. Sal, a a,, ,,gi a,,,,, ai a at lag, a ,ia 15 IlillilI
a S I I as, Is 11511$ a I, a a a a a a a • a as a a$ 41 14£ 111% I
isa a a a,I,a, I I sias a a a a sass, a I liii II 44444 lillItti III s a a a ,ag,i asia,, a, isa I a a a • a's I I I 5 *15 41 III It I % Ill
a a a a a a islisis,, ii a as ii as a iii is a •sug 444444444441111 a 'IIala:ssaa,.,i.IIaIsssssIsI.,aass,IjlIg1ll1a:,I,,,- Ia Ilaaassss.'ssasaasaIuIlIsaIIsaassitIIl44444gl////- I. ia*IasiIssaIssIJItsIiIlIuIIuIasIsIaIIIj4444jl/..a.I
l4$J,iissssslaalasI.s Ii ass sass,, iIiSitsassllsIaaaIs lass
'a,, I,IlSltsasa,,I a.. a ,ssa sass is asia iS1I8ltsasa,,s.a.ss,s,aiIsasi,IiItta%stss % %\\% a.a.s
Ii4lIlaIaaIaIs,ss.saasaasI0IsI,,,atsSSssss%'a.s'.. ---------------------- 'ass,- IlIllIIIIsasss ..... 55555 asiisa,uastt% SS'
a I $ 4 4 4 4 4 4 4 5 * 5 5 5 5*...... a I I I I I I s a a I I 5 i -------------- a a
'' sIgggggdasassaIaa,s.IISI5,,Issi5%,aatttt%%%tII
a5 IIIlIlttt%tS%sa.. • ,,.,s,,,aaaaasassas—--——', 'au 'au IL11IlII\I%' 'II 4 i % % % a .iii4%44% a%'.
%%%s5s' tttt5*5'a'a',",
'I-', 44455* Ills' Ills'
lIla 45 a as I a%ta *%as
120 16.0 20.0
Koombana Bay - with proposed marina. 1200 hrs
Diurnal Wind.
Diurnal Tidal Flow from The Cut and Koombana Channel.

1auu13 eueqwooN pue 4no aqj WOaJJ. MOld t2PU E9UaJflTO
- puTM 1UJflçQ
sJ'_1 009T
uiw pasodo5d q;çM — A99 eueqwooN
o oa O9 O
itta _, tilt ita
tail ill t?
aiivtttll t,t. iF/SI,, 'DII% itt I I11 I
I P
iil1f,,s,t
iia a a a a S a a 'a'a'a111
_,,, i / F /?lt'I Itas a a I Ill
11t
I iiiI*
aitti,ti,,,a,,aatiaaaaataa'a'a'a11 P111,,....
.,,1, , iii,, is ii i taaaaa ' % Itfi II tigg , ,
/1,,lli s,1,,,liiat a 'a'a'a'a1111
I FP7P''' ',i
'a ass titta a aa iaa iii a a a a a a a a a , a t t tilt? I PP
llaaaaaaaaa,aaaaaaaaaaaaat,aa,,,,ItIIIVIP (l
iii,, Sas at a a a a a ta a a a a a a a a a a a a a a a i t t p I p I I I I V P t I I IF Is
-__F1
a;,aaaaaaataaaaaaaaaa,t,,,ppsstgililP tailt ,
_,'J
It,,,,,,,aataaaataaaa,,i,,,s,i7l1?1 I lit
'
iF fipg,sj $ a a a a a a a ii I $ a a is tiii??ll7? I 11171
VIII,,,,,, iaat I * Ilit alIsPt ,i71P1F) Fi_ hut —,, tutu a it I1F/i,,,, a, 1111111 I IIPFFFFFF1 F
1I?P,,'iii 111115 iii?IIFFFF?)F if '' I I I / I I ' it It Ills? I I F F s' FIll) Via
, isilllIl IFFFI???? Pilit''
P t I S S P.? 7F// #II 111?? 111111?? lIlt' . a
I
PFFF///i'---''i ?111I1FF1? fill Iris:....
YFFF//ii,,..#,i , I I F?1117IllI 11111,
F 1FF/F P///,..,..,,/ F/FF1I1IHII I, IIaa P ii
PP FPF,F,, I A 0 1 IF , / ii it , , t a a i a a a F F F! ,i,iit t p a a i a a a a t
—'F -'I I
Full ita * ata a a a a a till ,,,i tiatatas atas
S31J IO3VW
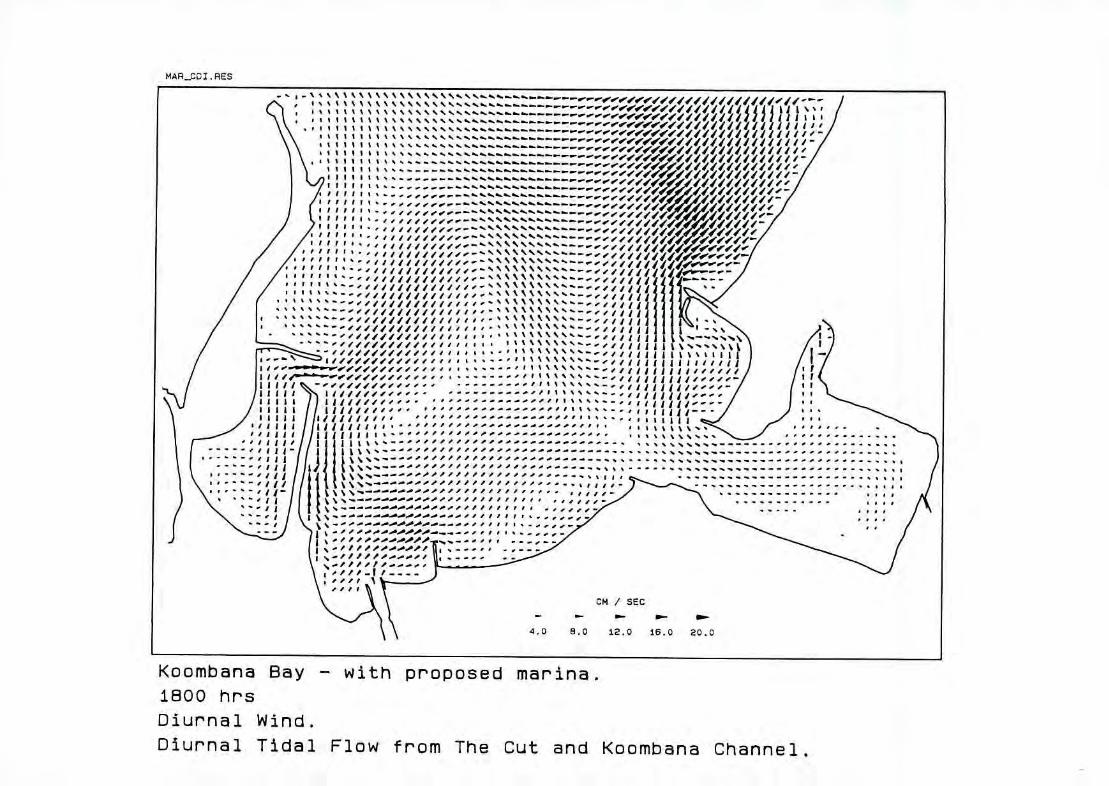
MAA_CI .RES
-'
•It t t t % '' ll I \
\\ '-•,f11f111///I/II///IIu,i-/ t * lit I t% '' ///////////i I
\ \ huh * I \ *%SS_ %,
/ II Iit.......
Ills,, / LI Ilil
/ /• I I It I . , , s---- / / I
/ /
/
I ' " .1////////////l#''
''S..". ..1,,,,,,111111111 ,.sS% \•.%__iiiijj & '
I 1////////////ll, •1'• '''''''''''jSlI It %%tI$
////
f/1/l - I!
it III UI/I/li''-- • __________,,II*.SS_.._lI,j,II1____
liii I iIII///,?. , ''F F------- .#t%S* .• If hut
'11111 jiJjI,,,,..'''''''' ,,,• - -- .........
- SSS
''---'.5-- -
'IU -
uir
CM / S6C
- . 4.0 8.0 12.0 16.0 20.0
Koombana Bay - with proposed marina. 1800 hrs Diurnal Wind.
Diurnal Tidal Flow from The Cut and Koombana Channel.

t9UUL3 2U2qUJOO).j pue 4no eqj WOJ. MO!d t9PU t2UJflcJ
PUTM t2uJnca
SJL1 o0va '9UJW p3sodod I.4M — c2g 9UWOON
0' oa 0'9; o oe 0*17
143 a,', 'II'' 11/I
---S .
I #_s I...ss
S1l1/////////////////1,f1..%I
IIIIII//lI//l/1///. /1//I/I .• S I I •• • — %IJI1IlII1II///I/////i//11i//I,, --------- tl1 SlI11IIIII/F1/1I1I//I//,,,i'
$1111 iiiiiiiitiii a a a a a a a a ' ' * - - I - - - - ' ' '
I III £11111 I I I I I I I I I I I I I I I I a a a - ..
II Il £ 111.41 £ .4 a a I I I I I I I I I I 'a
I,
I 'a
£44141 jj 'a 'a'a'a'a 'a a.
I 'a 'a 'I
''''•_—,.,''as ". 'a 'a 'a a-. - _%'a
III, a a.
' a "a'a\%'a'a'a'a'a'a'a'a'a'a'aILIIIIIhhht'' 'a '''a'a'a'a'a'a'a'a'a"a'a V'a"a"a'a'a'a'a'a 'a I 'a 1111111111.1
''a _'-'a'a'aS'a\'aV'a\ 'a'a.\'a'a'a'a'att'atII$&IIlaasaaias'
vs
'at 'a 'a 'a 'a 'a 'a LIII lIli a a a a a I --.------- -'-I- -----
\t'a'a'a'aIIIIIl111411'1' a
IIIl1114i,lII', $l1&li11I1i14 ' 11111411.414, a
1114 1411.41st llIli111I''' Al1i1i,i1'''
A £HI1iI4I a
hlii1i4lI'''
'a 'a IIIIIIIII'' . LII$I1IIa 1
'at 'a'aL'aI'aIIIa. -1I111I , ------
------

APPENDIX Dl
NO TIDAL FLOWS, PREVAILING SOUTH WEST WIND
lOOm Grid
Velocity Fields

-tJCDw ri
CDCD
l-'CJ)
rt(D (i) CD 0) 0
ri.
CD co I—p
z
0.
a ...
a .. ______ - - -
I I P F / •- - - - a - . ..a..
77 777 I I V V I IT I I I
711177
7 7 1 ' \ 'S 'SS -. - - S. • •S •._ \ 'S 'S 'S
7...
t\ \'s'S\7
,
AA
I I
S s ii 's
.\\7 lIlIIIII 71
i o
i P 771 40,
En I— i ISS °
______---...-_.11/I i __________
100,
,s._.
I

APPENDIX D2
NO TIDAL FLOWS, PREVAILING SOUTH WEST WIND
33.3m Grid - Existing Geometry
Velocity Fields

33SW.RES
- II jII ' - * Vk N N Vk 11AJ/fIfIIJ 111 / Li I%I I
1k 1k is. A N N N N N N N filla. I \
' \ • . - • ''''''''"-----.-,11j'/' 111111— / I \ ,.... •,. a a .I#/// 1 liii'' \
t 0 e ee e e I '\\"\ _..v__,,/,,,
iIIi I
ee III.— I
/ / • a a . - / I. 'a ,,,,.._ -- " -.-•----.-' ,// I111I iiiii—I / I ' 0'//!
I / - ( "--- I.--."' Ii ---'----
/• I I II/1/1II?I '''.
I ''IlIi1III''
I _ t jj ,,I,,'•.,''• I V Ii1 ,,jj a iiii i,— I II - •
/ .. lisli a a a a a I S • V * *s.._.__ , • - !!sIjjiaga,s - _/_••/// F__/#/_V*._ - a ,,.
ii .--- _,_____#,,__•._ . .
i . as II
Koombana Bay
Steady State
Prevailing South West Wind

APPENDIX D3
NO TIDAL FLOWS, PREVAILING SOUTH WEST WIND
33.3m Grid - With Proposed Marina Groyne
Velocity Fields

MARSW.RES
— --.------ I-
YYY
ci , , •aI , , a i ill! It I I II It
IIIIIIIIIIIIIIAA
/11111 90
400,
:
:;:::-:;;;:::::' '—
I' • - - - I I II I / I I I I I ' I * / I jj & j I I I I III /
/ - liii a---, lI$Ija&It S-—.- #11
11a - - ,-____ ''St•II II%'a' '.•
#_S%%•jJ
1S
$51
Koornbana Bay - with proposed marina. Steady State. Prevailing South West Wind.

APPENDIX E
NORTHWARDS FLOWING SHELF CURRENT
lOOm Grid
Velocity Fields

C-) C -3 -3 CD
rP
z 0
- _
- ..-• .-. -r--.- - rn-- - ------ — i-rn- U- a-- --- rn- - i--i- a- - U- - -.- — a-. - — — - - — - - -----_--_-- — — - P.- P.- I- — — — -
U- - 1..- P.- I.- _ - - -- -- 1.- U- I- U- I- U-
U- U- - P.- P.- U — U- U- ------- U---- ----U-a--rn- a- --- — —
— - ----------- —
0"0- -4
4.-.---
4-
/ '44
Pl \\\\\\\\\\'s
r '-4
f rt
i I
'1 1
, 4-
o \4 4-4-4-
-
4-4-4-4-

APPENDIX F!
NO TIDAL FLOWS, DIURNAL WIND
lOOm Grid
Velocity Fields

-- - - - -- - ----S.--.,-----,-
I — ———— — — — —
. . '% \ ¶• ). -——————————————————--
---------------
7II1I7II!lI?IIIIIItti
1 \ \ \ - -. - - -
k
II ' \ '. ... •... .. — .. — . - -.. — — -.. — -. - .- -. - .- .- .. - - - ,- " ' ' )I t
I • - -.-- — .- .- - - -' " ' ' p •. - - - •% \ \ \ ' ' '
I—.
\\
N. - .\j/#// / ii/'__• ,p,pr, 7!Itt LI I I
''shill
7 vI1\\ 44 C)
U) .-00) m
V II
0 1/ / I --..-------..- - — —_••___/ / I
I - - --.---- - #, /
I I -.-.-- --- — - - - - — 'I
0 J
1<
z 0

- - - ___ - •' L - - - -.- - ••., ., 'S / , - - - • 'S ' I AZ
0
Lu
C-) 0
Ill I/1-• ' , / ---,.'..'...' .1
I j Its,
--
$ !
\ I I
IN
___ - - - - I -
-- - - ' - ----- — — — — — — — — — — — — — — — — — — -------— ''' 1 IiII'41I4I4JI1IIII -- - - - - - - - - - - - - - - - - - - - - - -------------------------------
##II1/////// III I - -- - - - - - - - - - - - - - - - - - - - - - - - - / 111 - - -- - - - - - - - - - - - _______________ / I I _ _ - - - - - _ - ------ I -- - - - - - - - - - - - - - - ------------------_______ - 1*
U)
0
Ij
(0
I-
0 2

DI_WXND RES
ft ft ft ft ft ' P ? If ft ft
I
I I
F P?7PpP1ppF!F,Fpt I
- ----- - --— — — — — — — — — — I F F V F F I F V F F P Fl P F I -------------- /1 j 44444444 III I F F IFIVFllFps I I I 1 F F F F F F F F I I I I '....,
/ F F VIII?? III I V it 'I i i ii I I F F?I?FI?IP r
p f , ' , , I I f
V I I I I I ???FIFPFF1FI,
/
4e,
00,
FFFlIIIFI?,
?VIFFFFV1, IIIIVI?VtI VVl?FIIII 1/11/11/1
,
t17I 'i
1 -.
I I I
Ii 7I..•s_____, I' '• #/ /g / ' - - - - - - -- ' i CM SEC
-- - - - I 4 —
- - - - - - - ---------------
5.0 10.0 15.0 20.0 25.0
Bunbury Area 0600 hrs Diurnal Wind Only - No Tidal Flows

U) 0
v—I U- v-I (0 I
F- 0 z
>5. v-I C 0
(0 D (1) c L •r < z
C,, w Cr a z
— — , •0 • — — — _ a aa _
I / I F / I
I ' I I
0
£ 0 0
of I
%
S I 1 1 I I I II
V V PIPFF -'---S...,——
S.
PIP?7?F P111711 ___s*
V 111111 It I V V I V I I I I
S.
._..... I VI I I I I S. '.. - - — 5 5 5. 5.5..-. •5. -.•----.—•---• I
I I V V \s..•s.._ — - w.--.-.-.-.-.-.-.-.-..---------- I
t £ . s..----.- I £
. I I I I I \ - — — . — - — - - ' \ S. S.S.s....s.s.. ________ 5..
I I % 44
III I III 'SI I Ill .'.' — — — —
I • S. •. S..' •. S. ———————- - - , ,,,,,,,,,, . - - - - - -- ----- % ____/______ I I £ - .' S. •. S. S. —— — — — — — — — — — — — — — — — - - — — - — — — — — — — — — — — — — 5.5.5. —— — — — — — — — — — — — — _ - - — I
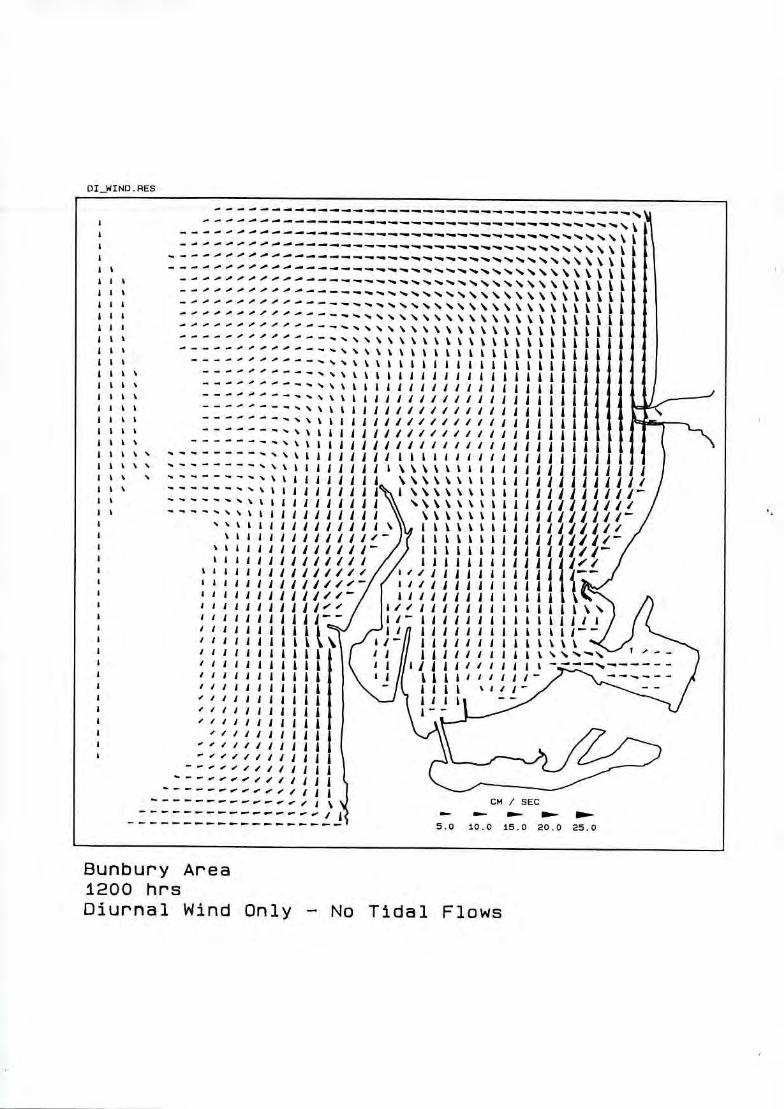
I I LI I I I I LII I I
IIItILI ill '1111114 III tI1III III 11141 III .14411 III 1141 4411 4441 1411 '5
4141 11114 444444 14141414 1111 144111 1114111111 411111 1 1/ 41111111/ 1111111/ 411111/' 1111/1/ -1111/1
I 41 III I 114414 I 11i — LIII
5".
'S .
'S .
I'
OX_WIND. RES
- - - a a ------------------------------- - - a a a - - - - - - - - - - - - - - - ---------------------- I I
a-- -- ---a- ______ _ '" 1LLIIII1LI11
I' ____ --- _.•••..s.tIIII11I,I1lIlj
—--— •''IIIgi1Il1///i11 I III 111//I//i/ill L LI II Ill//I//I/Il
Il -------"•.'.tIIa41111l1lIuuI1l I 1441 1 4 4 LIII III
—
"''ILIjjjjj4 \\%IILL
'."II1IljJjj44\\ t1I
I I I Ill! 111111' )( I I I II 'I£IIJj 111I111 /) I IL I 1411 ''II1i/1////1// 11144411,
I I £1 IIj 1111 / 1//f/I/i II 411 1 i IIJIIII 1111///( '''liii jig IIiIiiIIIlI/// I £111111414 , jI ,Ilj1l11,1 I II//IiIIilii '''iiiiiaiII I4144111111 'I' jjjj 44 iL'-' '4'I1 41111 lii ' 1 11144 I i-" il—il 11111114
1 11111114144 I 'i/ItjI,iiIi ''IAiIL444l I.. 'Ii!I141ii'i 'i,,jjiigiir \ ! f LIIIIJJ,
I
CM / SEC
-------------------
Bunbury Area 1200 hrs Diurnal Wind Only — No Tidal Flows
lI1i1iii•Lj i - 4141' /111111144
III h ''Il , 'iiLII' ''''lii 114 ',,,Illjj I
114 I dI1jj4
_______-•-__.-.-,l ii - - - -- -1 I) - - - -
5.0 10.0 15.0 20.0 25.0

U) 9 0 .1
Ii. H (0 4r1
I- 0 z
I >. r1 C 0
N
(0 •0 a) c C -rI <
U) >Lr1 LC(0
c 0OC C0
fl.r4 tn10
o
.-..--. ,-.--
__________
FF.'-........ V
V
_ • •%% \ .- '__ I \ N w V V F .__ ._,.I \ 0
I 1 1 1
111th lilt ?
I I I I I I
'-
II I - - - - -----._.---.-.--.--.----- ' . I
. - - ' •s I --- - - - - - - - ' ' ' ' - \ I I ' II I I I I It I I I
s____. - -.----- - - - - - -. -. - - -• -
-------------.--.-- - - - -. - -
I -------------------- ------- -. _ - I -- --------------- -/1/4 I S --------------------------- - - - I - -- - - - - - - - - - - - - - - - -----------

IDI_WIF'JD.RES
- - - a a a - - a - - a - a a a..a aa._a __- - p - - - .
PIPFF FFIIFF F F P ?Fi!f?F / I P P P F F P P r I A A N N N \\ '
ii
Fl F P PP I V / II
F,,•'FIt ,,,PFFFFPFI -
,,.., / ,,,,p,...........
IFlPlI, F F' P F I
rrrt \ Pr I '- - / / /
I I I I II//1' --
'rift'
I:7(
t I
'.- -- (
lb
.J _1 F/
CM / SEC - - - IND. 5.0 10.0 15.0 20.0 25.0
Bunbury Area 1.800 hrs Diurnal Wind Only - No Tidal Flows

I I I I
I I
J) I
11/Ilcu
.0
IiiI11////// ,"11,/.,, 10 U /f1/i1i1/1,
I11/1111 /cvj
1
1 i N L (0 0
, I4III///'/ ' I
I1% fe 0
- \•,•\\\ ,
\ \ "h1111IIII' fe
IiI 'I
01
I I --
t\\\.. IIII\\ s.4 ___— .,- _. ,,I1 % No 1.4
t\ \\L t ' / / I I ' / 1 1 % I 1
I 114k ' , / j I Il 14 14 411 4 ii liii 144144 11114414 \ \ S. __S*.S.__..._
- - - - - - - - - - - - - - s— S
S. .S .._ _/1,
- ____S._S.___ -- _ - ___ __ .
- — S__________ -
-. - - - - - - - - - - - - - - - - - - - __S.___ " - - - - - - - - - - - - — — — — — — — — -- — - — — — — — — — — — — — -- —
S. - — ---------- — — — — — -------- rr.rr - - -----------------------------nrnn r ------- - -
(I)
0 r1 IL
r-4 (0
rl I- 0 z
>' r1 C 0
(0 0 a) c L •r$ 4 3
U) >Lr1 LC(0
.00L c0
aioJo

APPENDIX F2
NO TIDAL FLOWS, DIURNAL WIND
33.3m Grid - Existing Geometry
Velocity Fields

33IDIWND ES
'I
Li I \' \ \\
\\ I
\ I \ I I 's/I LI ._--..__.__._._1l1l11,,.1II1,/__J I /SIL I I /4II / J
I /
f /
( ##IPP?IIIIIIS s'----s' '111444ff
I '' '--------- I'' lfrPlIIIII ,,IIIII -
I''t' eSiII%SSSSI
Ii,.,it ttttt?ttI 1_.ttttt SSàIISSS'SI'I IIiiFtj-----------------,,,tttt,,..,, --'''''• e.s.i.si.. & It,,li #e,ee--te.tt,,t #l#l#t,???• -cee,,,.,, 4111111
eJ,a,4e-
lvii'''--- ,,e,,e__ t,t,,t,,##?tp,,,,, ''''tee,, 5,55*- •1
-'-. I Jyie ,, •,,.., ,,,,,,, ,,,,,•,,,,,,, .,..,,,,
' \I unit-li ,,,,,,,••,,,. •....,,,, .....
V I viii, •..i# / TI,,, II seteetettet F,,, 1e?Ce?I4
_,? jj.?etsee ,,,,,..,,, ,,,,, •,,,,,
t?lt /jtse eeee.eteeee.ese else?,?,,
- Ptt ejJt,.,#. •,t ,..,e,,,e tee,,, - . .
jA I ttte II Ir,iiitiee
— — - . 3.0 6.0 9.0 12.0 15.0
Koombana Bay
0000 hr'
Diurnal Wind Only — No Tidal Flows

SMOId t9PU ON — AIUO PUW t9uJn!O SJLI OOO
Aeg eueqwoa)q
----------------- --S-S J IttI•
......J II,,,,,, •tiitui ii,,,,,, is,,,, —
1 IIII /'
( / I /
I J / •? iiitI
J ''I %s • ••.. II /
iJ \---- I
% % % S S S S S S S
. //1IVIIITI III II! 11115% 5 5555555555% 55' 5',,., , ) / Jr ItII?ITVtIVIlIIII'i'''s*''s''.555555S%SS%%''I'' I / /
/ -i#--.ø/P?TIVTVVVIIIIIIIIISS%ss*sss%sss%sssSSsssIII'.. I - ' I I#.,, F I P I V V V V V V I I I I I I I I S S * S S * S * S S S S 55%' 5' 5 5 5 5
5555555% ssss Ss.ssSSSIaIII./ / /I r I F I I I I Pill IS *55*555
I ' I I I I *5'''" - *% 55'..'' 7-, .' ' ' ' ? ' I ' ' ' ' '"" --- -5.5' '.5 s s i • i i 'p I
I 'IF! PPPFFPF,PPPFI I I I '5''''' '''' '
/ -1??? PIP PP PIP PlF,!FFF PIP'''' '''' • - - - - ' ' s s '. s s s I 'i V?1IPPPPPPP,,,,FFI??t, '' ''-••--... 'II '--'
/ • lilT? VP?PYPPPP,P,F,/FFPI,?,, , '''•---s ss.IliI Il--s *55555555555% • *555''' 555555.
'ss%5II?VVV?PPPPPFFFF/FP'I''?' ,,'SS 5*5555511. .l%55555555555 s*ssss
''',5,'
S3 CNMIOE€

330 IWNO RES
s - - - - --. - - I I I --
¶.. I • ''-----, i1llll/111111111141i1144
\ % • s----' %'''---- .'iiiiiii#i#iiii#iiiiiii-J •11 t I I 11111% S 55* *S #l1/1I11l1I//1IIIII1/
tI4l5It%S*S _4•1/1I1,III41 41,1_4f ,I,1, / .•.•,,,, •It %%55s .iI/1111Il/lil1/1l1I/l—/ \..•..•,,••. •511*51555 -
.s•.•.•...
I 4. • • • • • S S S S S S --i1/////////1///// 0, I
I I •*%S%55%S%% I • • • I I • • S S S S S S S S S .il111/////////1/1, I
J .•ss•••s• SSSS%
/ 45 •81I11I114 4'.* *555555 ,
/ / Ill 4444444 --- 5.5----- ,,,4
41
,,1//1111////// /
/ / •is4114a44 .---
/ --s 5. 5 \ . 5. - 1 ii II I I / 4'' 111i....111 / ''''
1I l#l#1lIIIlI#1I ----S IIIIIjjjj _' .- 5.%S...III/jJJjj -
' -------i#IIIIIi 1 Ii ------ I
i 41 ,, 1 I- £La ,,,,,,ll ,,II/I ,,, _ 41 II 4148S444414111JI 41 4, $ ''-------'
III 1111111 liiIIIIIIIII ''.' i4ii 44£ lull 514 414/1,1111..
£ £ 4 1 I • I I I i/Il 11/li 5. ...s...-- ,1, 4444411//li- 44 14 ' - 1444111111'I L. -------- .••,,,•_ -'.'llIIIIi__'
llli £ ' - - . - - ''- -- 'll1II/.-
44414 1Ii''' -------- ••••'-- --------
£4111 Il Il/hI --------- ••I••• --------
ii4i & 44,1,' --------- ,,,•,,•_ -------
j11444 * 4J4j, ........... '''• ------------ is... ..................................
Koombana Bay 0600 hrs Diurnal Wind Only - No Tidal Flows

smOTA TepTj ON — AIUO pUçf t9uJn.ca SJL. 0060
Aeg eueqwooN
0 , ST 0 1 2T 06 09 0E
3S / NO
• F--.
-I- •'1ll1I1ll __—.-._*.q
.'l.l,#1,11I1llV.. Ill 'S • • •
S -- •S%% t I l/# ee .'.Fl#v.'ll... '4.I. sit .-. • 51 11111
/ I I iI&IIl1l111f111F' S177
I / I Sill,, ---ii —
,li , ------ 1I I I I I I VT Ii I I ' TITI ' - ' •-- - - - - -F, , ------- I_It 5....---
Ill ------
-------------------------___,,,,,, IS.5.Sl
'-I ... ------------------------------------------
------F- -----------F,
• ------------------------------------- ------------------------------------
P?---- -- ---------------------i,i'.' '' -------------------
.P',.#frPp,ppp, i , , . • iii ------- . . .
,,,,,,,,,,,,P,,
P 1 ' ''-.' ill t iii i... - . . . •
V ? V ? S • ' • S S I S S I S I I ' % 5 r r , t , , • • ' iii','' i
i'FF1'PPPP7P7V Plus'' ,FtPPPPPP?I? iII5t1s
ii sit. ............ situ' ........... lk Ill u ........
suii.... 11ISI6I111.'. 'S
I ,JF/.i I I 5 1 5 5 5 5 5SSS lk ,4.
...............................
S3l CNMIOE

33DIWND. RES
% £ t %.%t t '. '. I'. '.i'. ii I ii I £111114 i144 i 44411141444411 £1144 11 ,1' 1% II'
tSSS'SSS 44444444 'III
IltIttIlIttlIt ''''5555-----.- 44' 4 ILL I I till I i s - I I I I I I I I Iv v IN. N £14111 11£ 1£-
*1414141444 I I I 155'-- - - - - - - -'' I '''44Ii I 1111£ 4 4414441114
' I ---- --- - - - - - - - - - - - -' '. '. I I I I 11$ 441 111411441
J - I Is...''-----.s '' I I I 1.11444 111111111
till 111$ £414 I1lL 111111111 I S lilt III I 5**•' .SS I I till £1441144 11111111i- IliltitIlil,, .s*t •...-ss* tttIlIt&1444444 11111111-
411!I1 /1
IIIIItIilIIlI i-s* tt*t• •S IIlIfLL1*441144 I tts*.' $ 1111 1444444444 I 'I/Ill
iiIIlIIIliiii....5SS%*ss..slIlj 41 j4444444 II 1111/- 11,11111111 I I I I 111114 I I Ii -- • I S S S S'.. .SI1JL14 £414444 4111 11111
SIi iIIIl44- S'' *'--' Ii •il141 • : i i I I I 4 44 1111-
111/ I 1 III - - s'--- ' ' £ 11 4441 S S I I I I I I II I / 11 I Il - S * S S 5 - 1 4 4 4 4 4 4 44 41 11 441/vf/1/ I I I I I I III / // II IlllI1I/I/I//II .'.%'s'"II44 1&1l444' S S I 1I1J1J4d.10 , I SttSs.., a 1111£ £ I I I I I 1 S
I / ''iIlIllII//1////1/ \tS-1I14 / ( i /// t\ 4s\S%' -'Ijjl
llIi-- -%\\\\'S'.-- £144 411I///I/III .'t's\S%'-'lI4 V
I £ I.. • slit I &i'---sstlljjjIIll1IIlII' 'S--s '\S'Ili1 I-
''''--ss4 114444114I111s •itI\\S.--i/l1 444 %tiI1 .'s--'s4 £lIljLIIIIlii' •lI%'tI4s5S..I144j 11111441 5 ''''--' iIllslIItItt ''-•' ''uiI'.ss---iI1114 1Il1il'-
- IllIttitIlt S.---- A A 44411,- _'5• 1 ;Il. II ILII%S' ------•ll P I*.Ss.---'1144 jIi#ii ,,, • It44%Ss-'. s---- ,,,lssss s----,ill 4115- Sill LI44.s- ------------- £1555
,,i, • -------- It _ S 51155 S. I F IS It ttS's''-'s-'-- - I F F F I- 4 '., -.___-_aa*
S S I F F - I '5__ ------------------------ * •tS.?,s1 5S I ,'{{'I'
I ____
Koombana Bay
1200 hrs
Diurnal Wind Only — No Tidal Flows

SMOtd tPU ON - ,cruo PUTM E2UJnTcI
sq OOT A9 eueqwoo>i
O OT 06 O'g OE
-. . -
???IIts s%*;,Iipp,i fil l Jj 7i J- 1?
,_____•••- % III '(I Iiii J ,, III ( / III I! I II I / ' I?t III ttij-i VI I /...tI?I? I '''i ss''. III III TII'P? IV
/ IllIlit? Vt 't' III IT 711--li Ill Vi T Itt--I, I
JisJ Ti Ill' '%'I*i III 7 It?#-friiI Ill VI III TI t?illlitV I— I I TV Vtl I • '' IIt1 I III Vt I Ill?lPIl
N' 11 ?IP' •tItIII 7 VVI PP ii,,,'' , st
11111 rip,'' ----S •'',,,,rr ii, ir
).. /RTI1 ?#i'' '----•. • ttrirrp rip pp i,,,,,'. , -cvrrr ii,,,, .------ ,,,,,,,p p,p !ppp,,,,,,, • / • pP?,, ----- ,,p,,,pp /
'I,,,,,, PPFPFPPFPlPI' •• / ---------- FFFFFF?FPP?,,.•/
I#'.' ,1F'.•- -------1I/ , ,FFF,FFpppl,,. / ,,,....___ ,
/ .'.PF.PF! FF P P P Is
/-PPF.'Ft / , PPFF.Pf
pit,I,I
I' ,FFPP ,,,,,P,,,,,,I , I •
PP 11111 Iii.
/ 'lFPPP t?lIl'l'••
/-i?PPF P P I tin?? F
, ii7iY p
sIII!!V P y?1iP?pl,,I,S,,,,I,III*IIIsss* J I ??iiPtiP,,,,II,,,,,IIIIIIIa*s*%*ss
F&I
S3 ONMIUt

33DIWNJ. RES
"" /4
'_'fllllilIIIIIIIll , . I I 1111 t II I* A A
' 1•11111I1II1/I/IIi -I 1111111//I / 11,'
11/.11I4'I1/''' //////111/iie i1111/11/1 -
- 111111111 / - - - --.- -------.-vvl11 1111//li"'
1 I I I I I S S * '-. Wl1l" 111111111. d'I1i11#'l--
I d'11111l- , I I I I I I I 5'- I ------------- -----iii11/1/111livv11- It I I I
5• , , I I 55------ - - - - - ---------- - , I I I * •. - - - - -----------.
1115555* fitlIll ---------V,l'l#ll/I///J/j I ,iii11/1l4j I
5• ll• ei,#,llllllIjj ----------ieee,,,.,, ,...''.. 11111114 11I 44
.......,..,i,iillll4j4i 4 II jj444444444 1-------
114 --------------,,el•gtIlIl is,., ..1I14444144441 I I ------- I, .............#ell*4lI•I Issititit , i11144414444 I S -------
sit1111444441 III Ss S *
Ill SI 5**5 1 •IØIIII ''' II I St I II 1114411 S .s LIII 11 *S SSS_tltStI#•tIIl ...... * 5*5 I55t1III4$I 111111 II
£444 ...............................•I*SI%55SILIII4I.,. ' I11I1 hISS IS'III I•hh•••II ,.tlI,*lltSSSlIlI$Sa'
11114 1111 ..................,l,,llII5tS51I1 I,' 111*1 'l' l,lleI,iIiIS*5S**I'
114444 '1w' ''•''•''''''''''' I#IIIIII4IISSSSSSS I14444 h,11• •'''''''''''''' I ililillIll ,,i, is sssss
.14444, II I 11111111/11/11
5 ..s4444 • • • ----------------------..ii,,II1,1/l#l-
:
— — . . -
3.0 6.0 9.0 12.0 15.0
Koornbana Bay 1800 hrs Diurnal Wind Only — No Tidal Flows

SMOtE E 9PLL ON — ictuo PUM t9uJnco
sJu OoTa A99 eueqwooN
O O 06 09 O
3S / P13
----------5*,,,
5*5111
ssst,la
--sssatai aaa a a a a a a
. . '..saa a a a ii a a - aa a a a a a a a a
'.'aa a a a ii a a a iii a ..aaaaaaaaaaaaaaa a a a a a a a a a a a a a
• . • a a a a a a ii a a a a a a a a a iii a a iii ii
• a a a a iii a a a a iii II
• • • 'I
'S
a5 a
- ,,,,,.•.___ - —
, , - 10 10 10,________ ,
Vt a 1
•s f.
* I I I Ii/I .•I 1 1
,l,I1,/11111j I
11l1I11i1l1i1 ,
—11jjI
a'
iI/IIIIlllIIla 11I•11I1111'1,I 11l1I141111I1' S
aI111II4liiI II' It --aa a liIIIIII4iaIaaa Jl .-saaaas
44l111A4W
ii a at asi14j4444 I/j •i:i a as' aiaaallllll a!! aaajjalIAIl Ill aLlii1A144 II i,,,iii aaaaaaaaiui II-iiiii'' a a a a a a a a aiii a I a a a a a a a aaiii jail,j iii, , aaaaaaIaAaaaus// a;aai' aaaaaaaaa aai.ii saaaa
aaaaaa]aa
II aaaaa aa li—aja
aaaaaiiaia 1111111 aaaaaaaaaa
a a a a a a a ii a a a ala iaaaaaaaaajaaaaaa II aaaa&aaaaiaaaaaa a ihL411iiiaaa'a'
1114111lIFlI s 4 1111111111'
I 1JIa441i1i1,,, I
I
4111111111'' 1l1'1I111'I•
1I'11'1IlI , l
11111111l I 11114ll111
IllIlil, 111114 1'.
I
111444 a 11114 aa 11111 at
!4I4i
I usia' iaaa''
t
a a a a a aaaas.
1111 a' a a a
S3 OUMIOE

APPENDIX F3
NO TIDAL FLOWS, DIURNAL WIND
33.3m Grid - With Proposed Marina Groyne
Velocity FieLds

HARD IWND RES
it..tl I" '$1
l%t
II
555
5e1% 'Sits------
4u i# 4t t . // / .1511 StIlts - - I I I/S/i I - - - - .4,,, ii lIlt'.'. - 11/1/4 I .. '09 _______.,.,,,, .4,,, 55 I I I'.'. -- - I •1f 5 5 , , .. jPS Putt'.'. -## las a a • * -
I9,. 9lIl# . 4',,,,, SIt'. * '.___ 4' II• i '.-- - -
S 4', 0 A I I P I I S I I/.4##.i.',##,,,,##iFifSii ' ----------.•,, .. s• I # -_— - - - - - I I - I 1 - I / / I 4' I F F I S I I I I '. ,, , g • • • • , , / I I 1 IFIIFIPI I S I S . • i , i,,,g,g , ''# - IS
I , ISIS • • . .•,,.,I,,,
I lit 4g4s IliI•S4 III I .e.a,.,,,.,.,,,,,,,,,,,# 5tit ,,,., ,tt,,,_-• 1115$ , i,,,,_._.,,#,.,,,,,,,,,, ISIS ut
IF/PSI It, ,,,,,,,,,,,,,g, Pitt?.
I,? IS,, • _.,,,,,F_ I? SIlt,#,,,,,,,,,,,, t4' t ._,,,, S St
)
I I . I /1I# - . I Sill I I I I S I tti6iIiiit .t 4 I I -
/t/• * lIppItti, •tStt itittit
, #III#i
s'.%'**%tIttIIii5iSiIii
'.51115.1 •....ss%%IISSlIusiI$,.,,. 9-,,,,,
j tIIIPPSStIti '.11
s%ss_ .,IIFS
itI?t
I,,,,
liii SI
ShIllS
II'S
IS,
II -
— — - . -
3.0 6.0 9.0 12.0 15.0
Koombana Bay - with proposed marira, 0000 hrs Diurnal Wind - No Tidal Flows.

'SMOI.J tPLL ON — PUcM tUJflO
suq OOEO '2U,çlJ2W pasodod UM — Aeg 9U2WOO)4
O• O• 06 09 O•
. . . — — oas / Ho
4'
Ill lit
I'll Ili'4 I%t%t
iii It lilt I __,,,,,,itS,,,lIll!
I I I I I I PP 1lil I il?P1i?l ,,
silg55ggiigiiggg,igs,,i,,ssgspiIFil?lI t,,,. tg5gtggiggli,ii,,,,liiilItllIlilI
__%........%55%jlIliiIfillIIIllIliIIItIItltIiiiiilI ppppp,
S Stil I It II III I I I I I III I I I I III I I I I I I I I it , , , , , , , s..S%S%%%SS SSS t%I I I I III I I III lIlt I I I S I II I I I I I I I I I ,
t'4tSSStS%SSt%iilIllIiIIt,tItItt%Stttt%IitIlIIi 1111* _il%SStStSSt%%St%tIIttttttttStt%ttt%ttIthuiII •11*1
. ,itli '4 '4 555 SSt% IIIs St.% ''g lIlt '4SSSSS S S S S S .4''''' '555555555' St S '.it Ill SI
5555 S5 55 5%' 5 ' ' ' S %SSSS SSS%% S S St St S S S S 4. S%% 5 SSSS St
l I I '. 4. 5 5 '4 '4 '4 '4 '4 '4 I I I S '45 '4 '4 5 4. 55 5 5 5 5 SSSS %S 5 5 5 SS 5 5 5 5 '. %S . IS 5i.'.SSS '4' '1 Itt S S S St S S S S S S S S S .45% 5555555 5.5 55% 5' - *
5555' 5t 5555% SS 555%'.'. 55555''.,..
.1 s-
11111111 1111 * iISStt's'sss 5.%%5.%%55.%5S5Sttt.44.* lII1I1*I1IIiii'4StStS5SS%s%%%%5.5.%5.5.%5'5'''5*''' Vt II 111111111 'S %SSS SS%%5.%S%%5%%S%5.SSS5 St
ttt lilt 1111* IllS St Ssss%%%%.5.%%5.%SSSS 554.t I * IlfflIttlI 1111111 ts s s%%%ss%5',5%5S55 S St
' . 7I1?77t71I II liilitsss %SS SS55%%%5%555. S S 5555111 tilt lIft 111)11% 1555 555%%*5*.%%%%55.\SSSSSSSII I,
- - 177tH! JIll I Ills 4... '.s .. % s5s5555\\'*S St.'. SIt I I sSsss%5%%5%%ssss St ItIg•
.-.'//'//FF1 I7IIHJII lilt I S S % % ssss*..,%%%%5%%5S Sills. , IIIIHISII it Itt t * s s %5..*,**,5%\% F .P.P////t/,FI F ??llIlttl II It * •. I.. * S % *%%.5S% 5.S'. I I I is.
iF!1///,PFFFF1? 77111 1,111$ I •. •. •. .% 555511111 _FFFFFF//FF?1lll7I!IIlII*.. .' ..S...%.5.5StI'4lII,
lilt, iFFFFFFF.FF.PFFP iii??,, tgiii*s .s'%55 lit III
i F F F F F F F F //,FF F I F I 11 I S I I S I I I • 55' '4%' 11 I I -------.s'.' ' '4
ii7? Slip l?!!!?FFFFu,,I ''''I -•' 111111 rpt1F,F?!F!,/,/IFFII * 4415111 ,,__...,s%%%%l'4S' '
,,lIl?Iltll7lF!FFFt//FF?I?,,# '* tttti1IIIfl?llP!F/F//FFF1?,,, '''S .4*S%SS%III sssS illiltItI P??FFF//FFF,,,ii sttttsss tit -'
S38 ONMIU1YH

MAROIWNO. RES
_••_,.,,I, I• ,% • %SSSSSStS%SS • %%%
%% S..,
\ % ''''-. ,#II,lI//41 ,1,,41 1I1111,1,, / ,,,,• S 555% 55
\\ , , • 5%'' 5 5*5 St%'. S S S %%s
S'--_.
I \ ii 55•• •I%%555%t*5%55%
41
J , • t5555%SS5S5 s'----- -
I I
/ ' •II$$5$$$, %5%%*. % _..,,,//,////////////,/
I''' lk '
/ / I I1IJI$$ISI l ' I • S •IllllIIIIl / • 111111 I iiii
/ I S Ii9
I I I jII/ III / / I/h .• ''-- , I I I I /
I I I 411/Ill / IIIlh''.• 11114 £ I Itt' S I I 1 t4/IIIll/lI/hhlh' .....- Il'-----/II/Illl///lhl 1''" '.'lI/IIH1i1/Illl S''''•'/1IIIlI1/l/'' I lii' •lIII1/lll/l''' ----..-. ,,"" ....---.--
- u.s Ij,JJ,///,,l -----------• ••-- ----- . ----------- .5, •_ 1
5, 1*555 Jj/l1i -------------- 1•4 I•• •--- JSSSI I/I 1IIl ,'' ----------- - .•i....- ------- tIll. j I/li'' ---------- - • ,•I.SII._•_ -----,liI%*
H111 J
Koombana Bay - with proposed marina. 0600 hrs
Diurnal Wind - No Tidal Flows.

*SMOTA IPU ON - PUTM iuunca S.J14 0060
u.iw pasodoJd UM - c29 eU2c1WOO)
O9 OT 06 09 0€ - - - — -
'I;--
/ I I 4.4
, ///////afI#I.-----
--I
TF%$a.
a ' - I I I I $
.........I # - I .. - , , , • . . p
r
1 - - -
I
, '
% I I '....
,/III,II,III,, ''
,,stI
- $ IT'
, I
% p
laa.a sijasa
I •jgj a
I I I I •• • . I I I a, , ,
' •• •• S 5 5 % $• • - - -, , I I a I I S . 5
l•I,,,,I 5.-., , ,
I ' • - //,FJH,, •'''iiiiiiiaists' ''''''''''' ,!FF!F1 I, II I I i - - , • i a a ----------
///////////J 11111 a' ----------- iFF IS'' '' •' '
-I 1 1 1 '5 '5 ' \ f// / I/I / I I I S I I I a a I • • '
'5'5\\\\4.4 / Iii I I I I I I I '5 '''"'• I S I
iiIII I a si I '55%' .............
-
sw aNMIa'5Jvw

MARDIWF4D .RES
•• I • ,.% % t I I I II I I I I I I I I I I 411111 Iii I liii 1111111 .. s ' .. '. '.% % N N. V k
I II I III I I III
* ' % ' ' ' ' ' ' * *'------ ----'' ' ' I I 'Ill I 111
I
1111I1l'
jJiJIILIIIlIs
%tttt%%ttt%%'' '' ---- __.st%%t%III14g44 1u1111I I I It I I - ' ' I 11441114 /111111 II%Itttt%tt%tI '''' S*%t %ItIj 4 4$44l14 I/II,,
IIttt%tIIII'' ''111I11114444444
. , , , i s , , i i ii' - - ' 1 I I I I I I
'Si I I I I I I $Il'' ' ' * ' I I I I II 444114414 1111/I,'
/
L'''''' 41444
lIII(tIIIIIIl 4 lS''''''SSiIIIJIIj1I11444 1/1111' — I '
I II IIIIII I II I 11 44444 144L//"/' 'SI S.
I / •' .'#'' i.-- "•"--'i'Ii
S S Ill II //
I I 1.-.• •SS1111///////j1/l " II4j I.
/ I' •' II ////111''"' '•'•--,,II I//i,i __'I'*\ \\*%., ,, ••_.___'-'••s I -
_t_\I/// 1Tn1T1T;:j11H1tlluullnhvd1llu' ----II,-- I
• / - '* I I I I ------------ ---------- - ' ' , ' - 1 '' s •.'. - -------------- - a - - a ------ * •
Koombana Bay — with proposed marina. 1200 hrs Diurnal Wind - No Tidal Flowsb

SMOId !9PLL ON — PUcM t2uJnTQ sJu OOT
ur.iw pasociod L.n.TM — AeS eueqwooN
0•9 O 06 09 0E
. - - — — 03S/ H3
.4
14i
S..
- - - * F,,,,,, I114
1'-.....
II Ii 4,4.4%
I I Pill 4I .4' S 1111111 %%S*
*.%%ss%.4% .4.4.4.4.4.4.4 s....*... .4% I Ill I Ill , I I I
. I .4 '. S S .4%'. .4.4 * .4*.%'. .4.4. .4''
: •
- I l I .4% .4S%S.4SS .4 * '.** *.4 .4*.%.4.% S . S S .4'
4. . • sIIII lIt % .. '. s ...4...4% % S .4'' .4.41 I III 7,111 I I I I I .,s•I
4 .4 .4 .4 .4 1 I I I I I I I I I I .4 .4 .4 S s .. .. - .4-..... 5 5 5 .4 .4 .4 .4 S I I I I I P P ? F .P ,....._' ' i i I
— it,,,,,, • s ' t rr vi''' - PP1?IP?• ..tI1lIli1IlIIPPPPPPPtI
--'II
1f7?Ptp,. '''11t11t1111'ir''''' Pi??ii#. •.4%'llIttI,P,I
1177' 1,IIl ,_.. .•II,,,I,,,,,, ,,,P,,,,,..
-------,:lP17i r rI t?Ii?7I7' s ,
At
.'.-..--_..-.'..' ' P 7171 t . • * * '. .4 11111111 tIPIlPIPI I s -
his..
/.',.-'','', ,.
,,,,.,,..,,, F F F F
F
I
!////s.#,, , / .. i / ,
-, ! F F / /,#F/ / .' I 1111111 I I II I .4 • #11151111111.4 * .4.44
-, F F Pill cU,
I P 5 11511 I I .4%t .4 .4
,,ppt?t1 11 7????? 11F ' ' ' ' ' t i P P P Pt P1! 1????? 1 7!1PIFFFF' I#lIIlIii I 11.4.4.4.4.4%
.4 .4 .4 .4 .4
.4.4.4.4%'
I ?tlIFI1Fp,,,,,,,,, tIII
S38 UNMIUIIYW

MARDXWN . RES
-..
'''i'
I I I J I I I¶ ¶ ''\ - #111////////Ii / - - 11 I 1 It' I I I I I I I I I A I It * I I I I 111/11/1////i" / It I fit i,,,,i,,,,,i,,,
I * I I I II * I I I,, I I I 1.
I I fills.._ I I I P t I I '
I 1ff f f I I .. - — — ---------------- I fffIfJlt w... I P Ifs •$% ___,_ I Pills • s - - - -
I $ . - - - - / _ 1 1 I - - - - I 11 / / / / / / / //. - - S I I I I I I I I - ............. .1111?! Ill SI 111,11 %___ ,,I,/,,I,I,, 'I-.-- /11//////////J I S tilt IIIs.. ,,.,,,,,,, , , , .•..--
511I1%1s.__ IIII/IIilIISSiilll#IlI///1J/Jjj 4 42 42
-'i''' Ii • • • • • • • 555* ------III/IffI ft I I I I I tlItIIIfj II4I 43 1 I
-• _// ,I''SslII, • sI%'I*t,I1,,,i,,, tI -
- ,#i#iiisssa.usittiittsj,,g,j IISS_S%
#llIS$SIIIIISIII%It%ItIlIIlSj I%SSS'***
IIlIlSSiSIIISSI5$;ttt%t%I13443 JIbIttlI I'
11111 llllff5II5ItIIIIl%t%%IIt$IJj5 IIII•I•
*2444 1155 •'ISSSIISSIISISI%II%I%%%IIIS JSII•
Ills
II II * ,,,,j I ISIS i*., • - - __,,l,,l . , Il/I/Ill I I I lIlt III,,, • I I - I - I - 1 - - 1 - II/////// lit I S I S S S
I I I I I I I I 1 11l'/II///IIlI 0114 j4 • * -------------- - - - - - - - - - ,,,,,,,,
-------------
'' 1 ------------—--------
- — -. . . 3.0 6.0 9.0 12.0 15.0
Koombana Bay — with proposed marina. 1800 hrs Diurnal Wind - No Tidal Flows.

SMOI.d tpci ON - PUM t2uJnço s_1u OOTE
uiew pasodod qqTM - Ag eueqwooN
I ,,,,III1lIIiI I ,,/IIIIII1I I
iIiI/IIIjIIIIl I ,i,I11II1III1I'' ,sii,1II1I1I!1I' JJiIlIIIIIIiiIII' S
Jij','III
Jjjii 3I144111 I 11i11111111 tIll
II&I11 111111 II III' ,,, j , 1111111, '5'
l&II&iljailIII : IIIIt&&I11'''''I
5•'••• liii I III&I
iJ1' .11111 II II II-
III
il---, 11111
1.11
It
tIIIIIIS
I
Ii IlltS lIIIstI,,
1• jiiIiil $
$ 114115
III'S' Lilt
lila'
I II'S' III S -
"III'S
O'ST OIBT 06 09 0E -. - - —
33$ / HO