Bulk and wet atmospheric deposition chemistry at pallanza (N. Italy
15
BULK AND WET ATMOSPHERIC DEPOSITION CHEMISTRY AT PALLANZA (N. ITALY) R. MOSELLO, A. MARCHETTO, and G. A. TARTARI C.N.R. lstituto Italiano di Idrobiologia, 1-28048 Verbania Pallanza, Italy (Received March 31, 1988; revised September 26, 1988) Abstract. The chemistry of wet only and bulk depositions collected weekly at Pallanza from May, 1984 to December, 1986 is compared and discussed in relation to the composition of dust fall. The comparison shows a very good agreement between pH values (volume weighted mean values of 4.35 and 4.36, respec- tively, for wet only and bulk samples) and differences between 6 and 12% for ammonium, sulphate, nitrate, and Na. For Ca, Mg, and K the difference range is 30 to 50%. The amount of precipitation over Pallanza (mean value 1951-1985, 1709 mm), together with the solute concentrations in atmospheric deposition, mean that there is high bulk deposition of acidifing substances. The values found during the study period were 76, 93, 143, and 81 meq m 2 yr-~ for H ÷ , ammonium, sulphate, and nitrate, respectively. 1. Introduction Bulk deposition chemistry has been studied at Pallanza since 1975. The original aim was to assess atmospheric contributions of solutes to lakes in the subalpine area (Mosello and Tartari, 1979; Calderoni etaL, 1978a, b). The results showed a high level of acidification of the precipitation and gave rise to further studies, aimed at assessing the extent of the area affected by acid rain (Mosello and Tartari, 1982, 1985; Mosello et al., 1987) and the susceptibility to acidification of subalpine and Alpine lakes in this region (Mosello and Tartari, 1983, 1985; Mosello, 1984). Results relating to the first subject have shown that the atmospheric deposition at Pallanza may be considered as representative of the subalpine territory in North Western Italy, including the North of Piedmont, the N-W of Lombardy and the Canton Ticino (Switzerland). A further subject of study which has been under consideration since 1983 is long term variation in the chemistry of atmospheric deposition (Mosello et aL, 1985a). In order to verify the validity of the results obtained from the bulk samples, a wet and dry collector has since 1984 been coupled to the bulk eqmpment operating at Pallanza. Bulk deposition chemistry is very susceptible to contamination from wind-blown dust, birds, and insects, so that the choice of the sampling site is crucial. It is essential to keep this in mind when evaluating the earlier data, collected in 1975-1976, which are of great importance for the study of the long term variations. At the same time as we were examining the wet samples, we also considered the chemistry of dust fall, collected in the polyethylene bucket of the wet and dry collector. Our aim was to characterize the dust interfering with the bulk samples rather than to quantify the dry deposition. Problems in estimating dry deposition are described by, e.g., Davidson et aL (1985), Hicks et aL (1980), Hicks (1986), and Feeley et aL (1985); the Water, Air, and Soil Pollution 42 (1988) 137-151. © 1988 by Kluwer Academic Publishers.
Transcript of Bulk and wet atmospheric deposition chemistry at pallanza (N. Italy
BULK AND W E T A T M O S P H E R I C D E P O S I T I O N C H E M I S T R Y
AT P A L L A N Z A (N. ITALY)
R. M O S E L L O , A. M A R C H E T T O , and G. A. T A R T A R I
C.N.R. lstituto Italiano di Idrobiologia, 1-28048 Verbania Pallanza, Italy
(Received March 31, 1988; revised September 26, 1988)
Abstract. The chemistry of wet only and bulk depositions collected weekly at Pallanza from May, 1984 to December, 1986 is compared and discussed in relation to the composition of dust fall. The comparison shows a very good agreement between pH values (volume weighted mean values of 4.35 and 4.36, respec- tively, for wet only and bulk samples) and differences between 6 and 12% for ammonium, sulphate, nitrate, and Na. For Ca, Mg, and K the difference range is 30 to 50%. The amount of precipitation over Pallanza (mean value 1951-1985, 1709 mm), together with the solute concentrations in atmospheric deposition, mean that there is high bulk deposition of acidifing substances. The values found during the study period were 76, 93, 143, and 81 meq m 2 yr-~ for H ÷ , ammonium, sulphate, and nitrate, respectively.
1. Introduction
Bulk deposition chemistry has been studied at Pallanza since 1975. The original aim was to assess atmospheric contributions of solutes to lakes in the subalpine area (Mosello and Tartari, 1979; Calderoni etaL, 1978a, b). The results showed a high level of acidification of the precipitation and gave rise to further studies, aimed at assessing the extent of the area affected by acid rain (Mosello and Tartari, 1982, 1985; Mosello et al.,
1987) and the susceptibility to acidification of subalpine and Alpine lakes in this region (Mosello and Tartari, 1983, 1985; Mosello, 1984).
Results relating to the first subject have shown that the atmospheric deposition at Pallanza may be considered as representative of the subalpine territory in North Western Italy, including the North of Piedmont, the N - W of Lombardy and the Canton Ticino (Switzerland).
A further subject of study which has been under consideration since 1983 is long term variation in the chemistry of atmospheric deposition (Mosello et aL, 1985a). In order to verify the validity of the results obtained from the bulk samples, a wet and dry collector has since 1984 been coupled to the bulk eqmpment operating at Pallanza. Bulk deposition chemistry is very susceptible to contamination from wind-blown dust, birds, and insects, so that the choice of the sampling site is crucial. It is essential to keep this in mind when evaluating the earlier data, collected in 1975-1976, which are of great importance for the study of the long term variations.
At the same time as we were examining the wet samples, we also considered the chemistry of dust fall, collected in the polyethylene bucket of the wet and dry collector. Our aim was to characterize the dust interfering with the bulk samples rather than to quantify the dry deposition. Problems in estimating dry deposition are described by, e.g., Davidson et aL (1985), Hicks et aL (1980), Hicks (1986), and Feeley et aL (1985); the
Water, Air, and Soil Pollution 42 (1988) 137-151. © 1988 by Kluwer Academic Publishers.
138 R. MOSELLO ET AL.
amount measured is a function of the type of collector used (Dash, 1985; Dolske and Gatz, 1985). The comparison we have made, then, between bulk, wet and dry fluxes of ions is a qualitative one, and we do not extend deposition values estimated from the bucket to any environmental compartment.
This paper also discusses the relationships between bulk and wet concentrations and the amount of precipitation, and the seasonal variations of bulk, wet, and dry concentra- tions.
2. Sampling and Methods
Pallanza is located on the shore of Lago Maggiore, in N-W Italy, south of the Alpine Chain, at 210 m a.s.1. This area receives orographic precipitation, with an annual amount (1709 mm yr-1, period 1951-1985, Ambrosetti etal., 1985) higher than the national average (970 mm yr- 1; Contessini, 1956). The town has a population of 30 000 to 35 000 and domestic central heating is used from October to March. The sampling site is in the garden of the Istituto Italiano di Idrobiologia: the surrounding ground is grassy and partly occupied by water-filled tanks used for experiments. A boundary wall and a 4 m high hedge divide the garden from two roads which carry a moderate amount of traffic. The bulk collector consists of a 20 L polyethylene container and a funnel, surface area 0.12 m 2, the mouth of which stands about 1.5 m above the ground. The wet and dry sampler is of the type manufactured by Aerochem Metrics; it has two poly- ethylene buckets, each with a surface area of 0.09 m 2 and a height of 0.20 m. Sampling
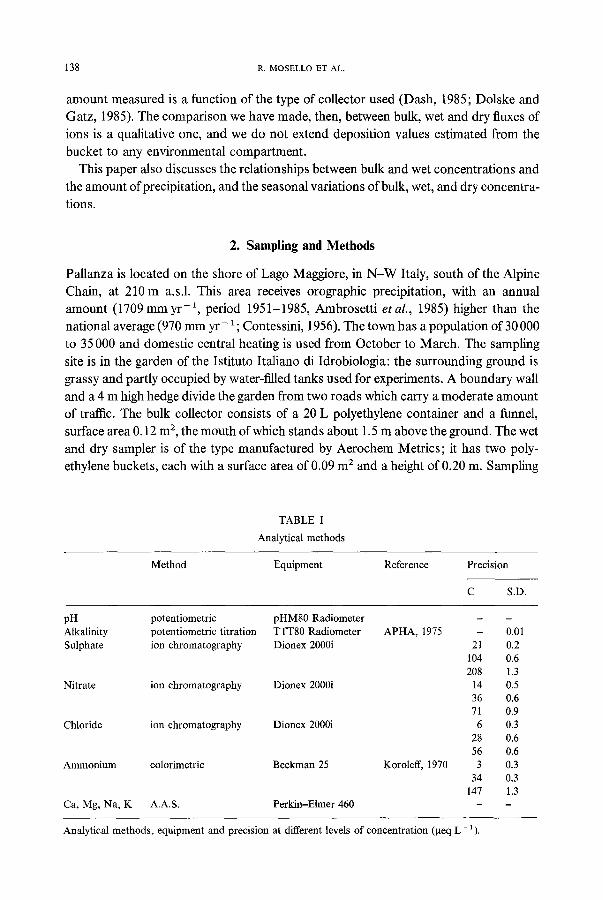
TABLE I
Analytical methods
Method Equipment Reference Precision
C S.D.
pH potentiometric priM80 Radiometer Alkalinity potentiometric titration TTT80 Radiometer Sulphate ion chromatography Dionex 2000i
Nitrate ion chromatography Dionex 2000i
Chloride ion chromatography Dionex 2000i
Ammonium colorimetric Beckman 25
Ca, Mg, Na, K A.A.S. Perkin-Elmer 460
APHA, 1975 - 0.01 21 0.2
104 0.6 208 1.3
14 0.5 36 0.6 71 0.9 6 0.3
28 0.6 56 0.6
Koroleff, 1970 3 0.3 34 0.3
147 1.3
Analytical methods, equipment and precision at different levels of concentration (geq L- 1 ).
BULK AND WET ATMOSPHERIC DEPOSITION CHEMISTRY AT PALLANZA 139
of bulk and wet deposition was carried out from May 1984 to December 1986, at the end of every precipitation event, pH and conductivity (at 18 °C) were measured immediately on unfiltered samples, while the other chemical variables were measured weekly on samples filtered and stored at 4 °C in a dark room.
When there was no precipitation the collecting equipment was washed weekly with deionized water. Dry deposition was collected monthly. Samples contaminated by bird droppings were rejected. The samples were treated with 1 L of deionized water and shaken for 12 hr; the resulting solution was filtered and analyzed for pH, conductivity and the main ions. This quantity of deionized water was chosen in order to obtain solutions with ionic concentrations in the same range as those found in bulk and wet samples.
Table I gives a concise description of the analytical methods and the instrumentation used, and the precision of the methods at different levels of concentration. A very small number of events (1 or 2 yr-1) showed a detectable alkalinity, measured using an TTT 80 Radiometer apparatus. All the analyses were performed by trained personnel who are permanent employees of the Institute.
3. Results
3.1. B U L K VS W E T D E P O S I T I O N C H E M I S T R Y
The mean amount of precipitation during the study period, measured at the Institute's meteorological station, was 1622 mm yr- 1, slightly lower than the mean value for the period 1951-1985 (1709 mm yr 1; Ambrosetti et al., 1985). The quantity of precipi- tation collected in the bulk sampler was 20 to 30~o higher than the values measured at the meteorological station.
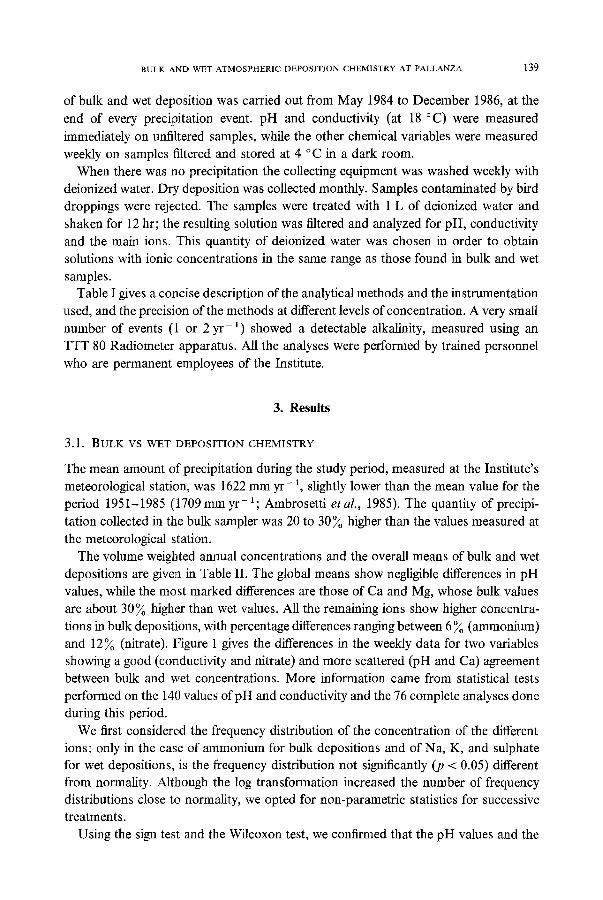
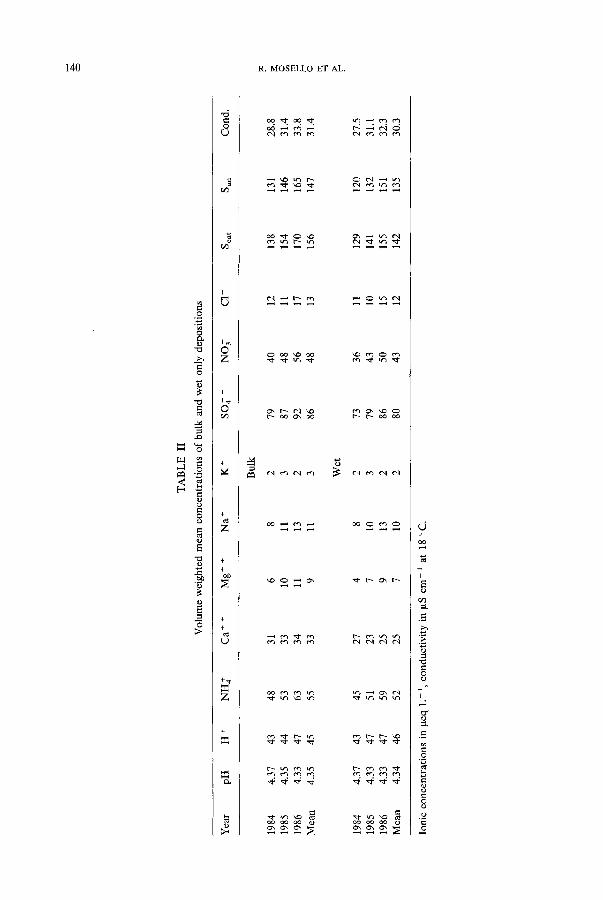
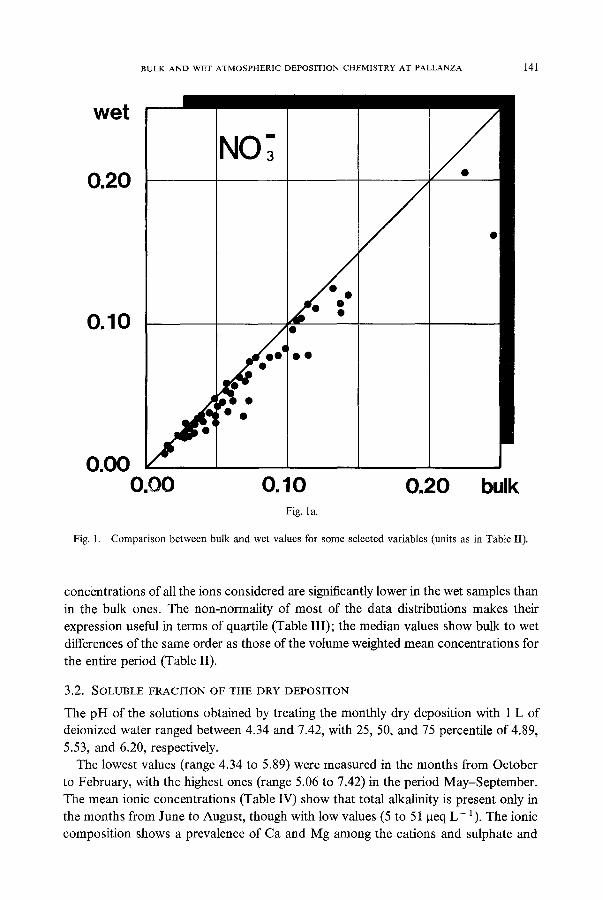
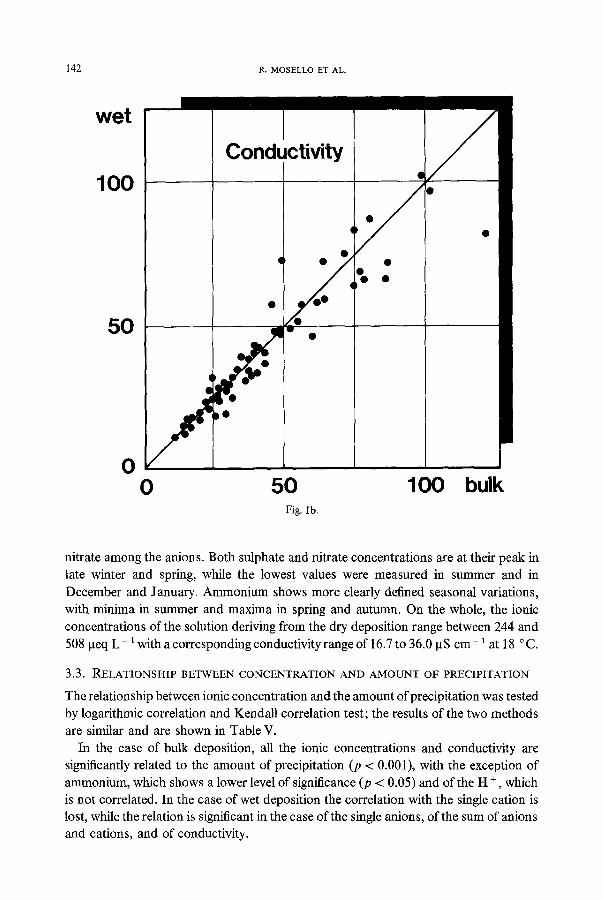
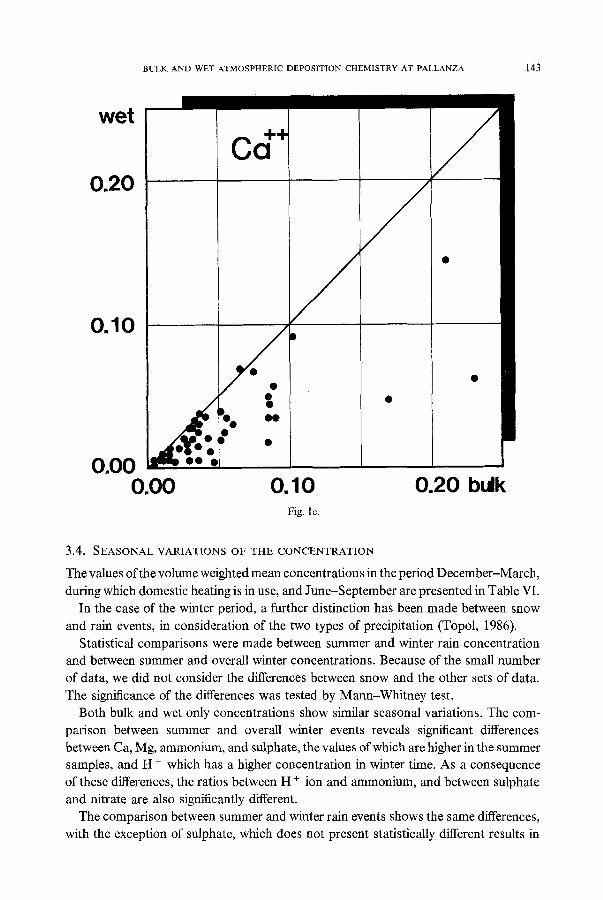
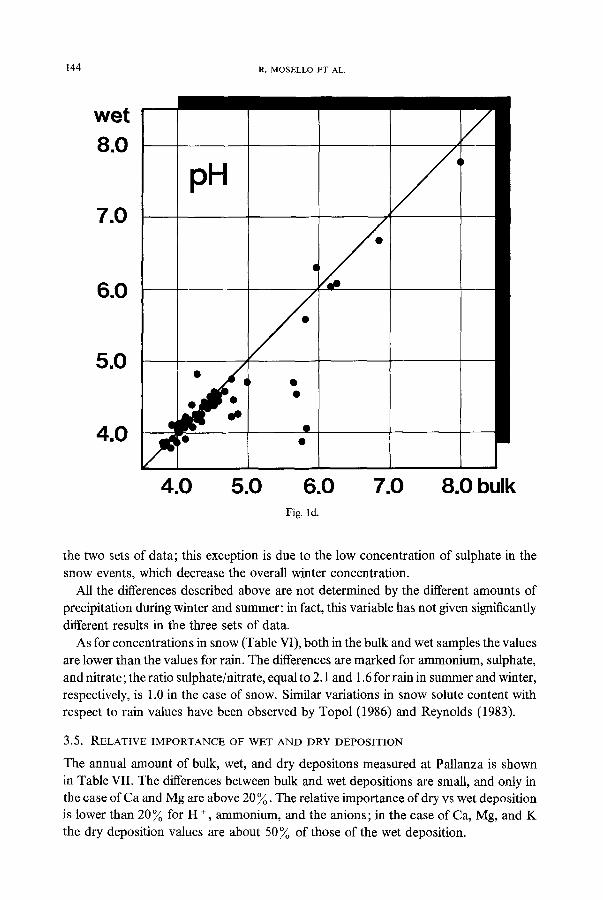
The volume weighted annual concentrations and the overall means of bulk and wet depositions are given in Table II. The global means show negligible differences in pH values, while the most marked differences are those of Ca and Mg, whose bulk values are about 30~o higher than wet values. All the remaining ions show higher concentra- tions in bulk depositions, with percentage differences ranging between 6~o (ammonium) and 12~o (nitrate). Figure 1 gives the differences in the weekly data for two variables showing a good (conductivity and nitrate) and more scattered (pH and Ca) agreement between bulk and wet concentrations. More information came from statistical tests performed on the 140 values ofpH and conductivity and the 76 complete analyses done during this period.
We first considered the frequency distribution of the concentration of the different ions: only in the case of ammonium for bulk depositions and of Na, K, and sulphate for wet depositions, is the frequency distribution not significantly (p < 0.05) different from normality. Although the log transformation increased the number of frequency distributions close to normality, we opted for non-parametric statistics for successive treatments.
Using the sign test and the Wilcoxon test, we confirmed that the pH values and the
140 R. M O S E L L O E T A L .
=
<
~5 O
r ~
t.~ I m
o
+ O +
z
+
c=
t",l e~ ¢q t 'q
o
I
:=L
8
T
o
8 r ,
o
BULK AND WET ATMOSPHERIC DEPOSITION CHEMISTRY AT PALLANZA 141
w e t
0.20 "
/ . "S
0 . 1 0
o . , o o. o Fig. la.
Fig. I. Compar ison between bulk and wet values for some selected variables (units as in Table II).
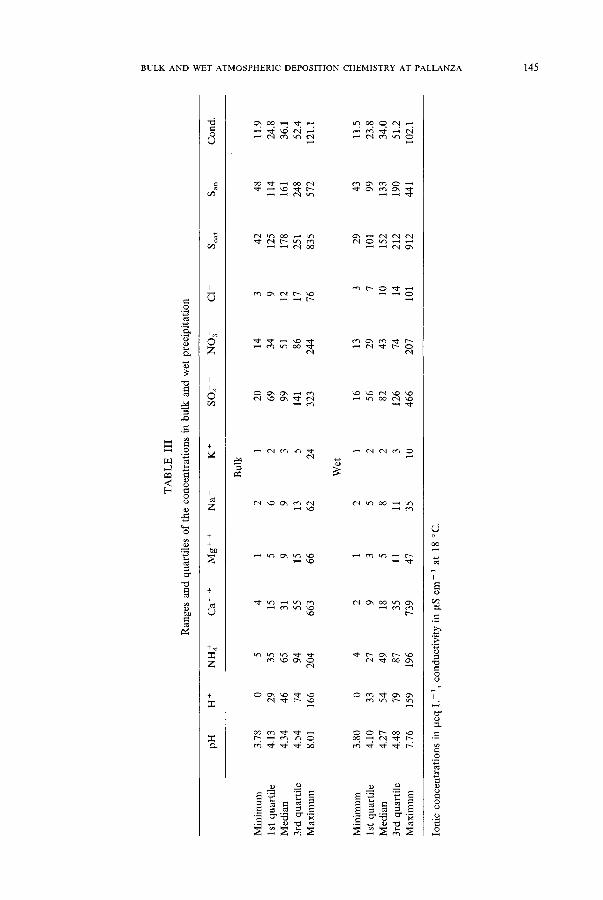
concentrations of all the ions considered are significantly lower in the wet samples than in the bulk ones. The non-normality of most of the data distributions makes their expression useful in terms of quartile (Table III); the median values show bulk to wet differences of the same order as those of the volume weighted mean concentrations for the entire period (Table II).
3.2. S O L U B L E F R A C T I O N O F T H E DRY D E P O S I T O N
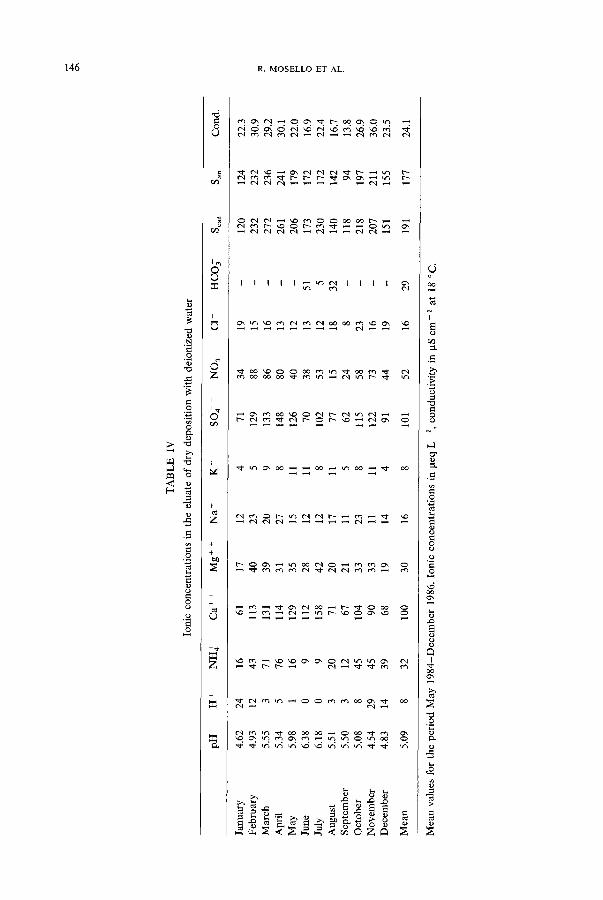
The pH of the solutions obtained by treating the monthly dry deposition with 1 L of deionized water ranged between 4.34 and 7.42, with 25, 50, and 75 percentile of 4.89, 5.53, and 6.20, respectively.
The lowest values (range 4.34 to 5.89) were measured in the months from October to February, with the highest ones (range 5.06 to 7.42) in the period May-September. The mean ionic concentrations (Table IV) show that total alkalinity is present only in the months from June to August, though with tow values (5 to 51 t~eq L- i). The ionic composition shows a prevalence of Ca and Mg among the cations and sulphate and
142 R. MOSELLO ET AL.
wet
Conductivity
100 • ,
•I
07 0 5 0 100 bul
Fig. lb.
nitrate among the anions. Both sulphate and nitrate concentrations are at their peak in late winter and spring, while the lowest values were measured in summer and in December and January. Ammonium shows more clearly defined seasonal variations, with minima in summer and maxima in spring and autumn. On the whole, the ionic concentrations of the solution deriving from the dry deposition range between 244 and 508 ~teq L - 1with a corresponding conductivity range of 16.7 to 36.0 ~tS cm- 1 at 18 o C.
3.3. RELATIONSHIP BETWEEN CONCENTRATION AND AMOUNT OF PRECIPITATION
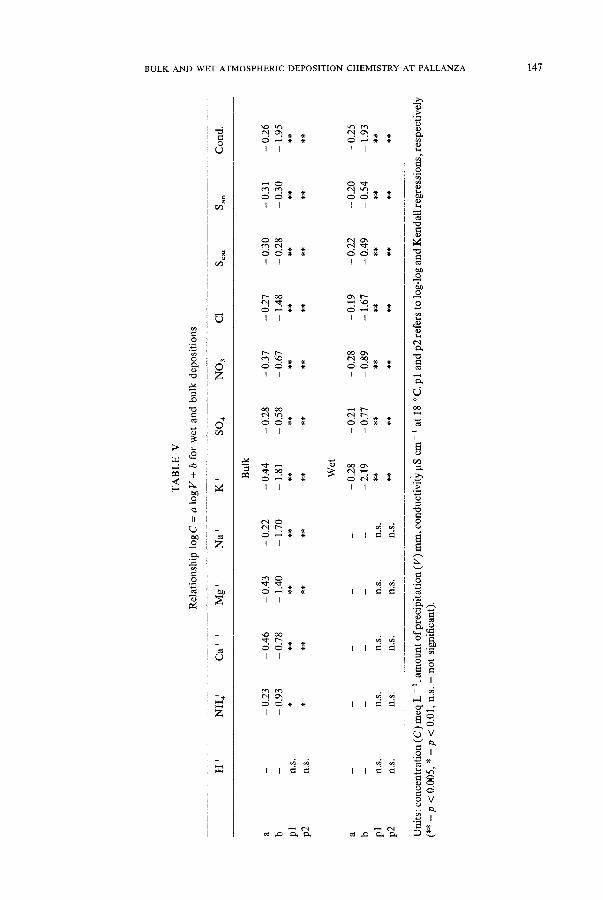
The relationship between ionic concentration and the amount of precipitation was tested by logarithmic correlation and Kendall correlation test; the results of the two methods are similar and are shown in Table V.
In the case of bulk deposition, all the ionic concentrations and conductivity are significantly related to the amount of precipitation (p < 0.001), with the exception of ammonium, which shows a lower level of significance (p < 0.05) and of the H +, which is not correlated. In the case of wet deposition the correlation with the single cation is lost, while the relation is significant in the case of the single anions, of the sum of anions and cations, and of conductivity.
BULK AND WET ATMOSPHERIC DEPOSITION CHEMISTRY AT PALLANZA 143
wet
cd 0.20
0.10 / D
/ 0
0
0.00 0.00 0.10 0.20 bulk
Fig. lc .
3.4. SEASONAL VARIATIONS OF THE CONCENTRATION
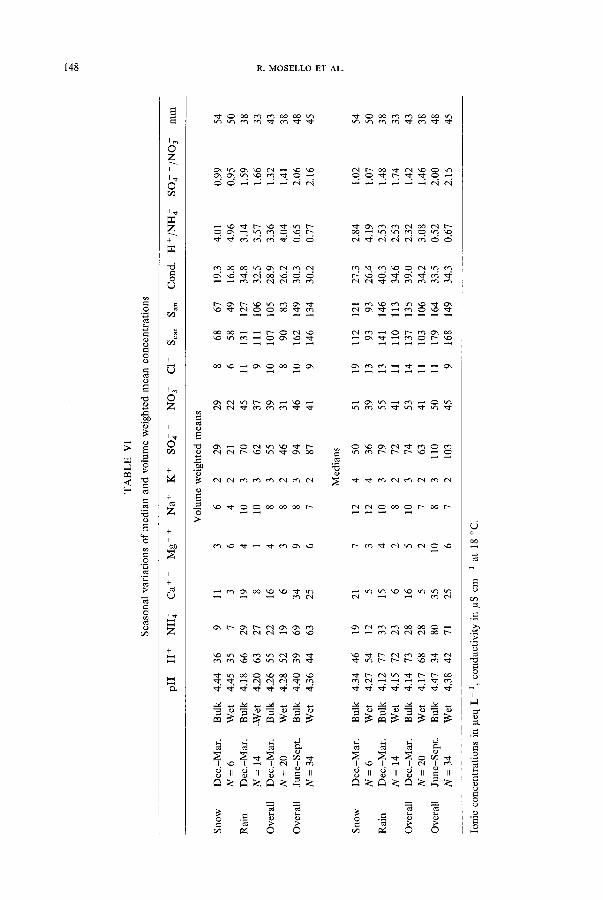
The values of the volume weighted mean concentrations in the period December-March, during which domestic heating is in use, and June-September are presented in Table VI.
In the case of the winter period, a further distinction has been made between snow and rain events, in consideration of the two types of precipitation (Topol, 1986).
Statistical comparisons were made between summer and winter rain concentration and between summer and overall winter concentrations. Because of the small number of data, we did not consider the differences between snow and the other sets of data. The significance of the differences was tested by Mann-Whitney test.
Both bulk and wet only concentrations show similar seasonal variations. The com- parison between summer and overall winter events reveals significant differences between Ca, Mg, ammonium, and sulphate, the values of which are higher in the summer samples, and H ÷ which has a higher concentration in winter time. As a consequence of these differences, the ratios between H ÷ ion and ammonium, and between sulphate and nitrate are also significantly different.
The comparison between summer and winter rain events shows the same differences, with the exception of sulphate, which does not present statistically different results in
144 R. MOSELLO ET AL.
wet 8.0
7.0
pH J' l I I
60 /X 5 . 0
o
4 . 0 q I : 1"
4.0 5.0 6.0 7.0 8.0 bulk Fig. ld.
the two sets of data; this exception is due to the low concentration of sulphate in the snow events, which decrease the overall winter concentration.
All the differences described above are not determined by the different amounts of precipitation during winter and summer: in fact, this variable has not given significantly different results in the three sets of data.
As for concentrations in snow (Table VI), both in the bulk and wet samples the values are lower than the values for rain. The differences are marked for ammonium, sulphate, and nitrate; the ratio sulphate/nitrate, equal to 2.1 and 1.6 for rain in summer and winter, respectively, is 1.0 in the case of snow. Similar variations in snow solute content with respect to rain values have been observed by Topol (1986) and Reynolds (1983).
3.5. RELATIVE IMPORTANCE OF WET AND DRY DEPOSITION
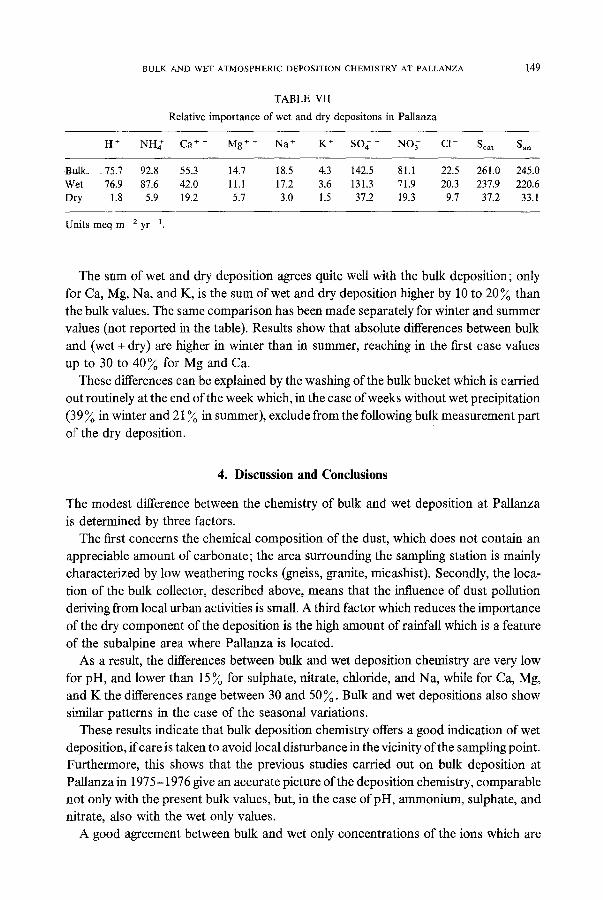
The annual amount of bulk, wet, and dry depositons measured at Pallanza is shown in Table VII. The differences between bulk and wet depositions are small, and only in the case of Ca and Mg are above 20 Yo. The relative importance of dry vs wet deposition is lower than 20~o for H + , ammonium, and the anions; in the case of Ca, Mg, and K the dry deposition values are about 50~/o of those of the wet deposition.
B U L K A N D W E T A T M O S P H E R I C D E P O S I T I O N C H E M I S T R Y AT P A L L A N Z A 145
.=
[...,
"6 O
C,
© z
o
....q
z
+
+,¢
o oo
I
.9
6
8 ?
.9
o
=
8
146 R. M O S E L L O E T AL.
ml
0
o
0
" 0
o
0
e)
oo
o
= 0
0 k~
I t .
0 z
I
0
z
+ +
+ + ml
o 0,o
I
- i
o
0
c~
oo
o
I
" 0 0
& g
B U L K A N D W E T A T M O S P H E R I C D E P O S I T I O N C H E M I S T R Y A T P A L L A N Z A 147
<
-15 O
k)
r/)
I
O
o
I
0
+
o
II
o Z
0 +
+ +
c,.)
Z
I I I I
t'~ t't3 Cq tt3
I I I I
I I I I
I I I I
I I I I
I I I I
I I
I I
I I
I I
I I
I
;>
t~
_o
£
t'N
o oc
:a.
8
E
O
¢~ ,..-k
o ' ~
O
, _ . o
V
*
1 4 8 R . M O S E L L O E T A L .
<
© z I
©
z + =
-0 ©
o
o ~
o o , _
0
I
~ e r ~
i g ~
+
~ N - ~ ~ +
"~ +
m Z
+
. . . . . . . ~ ~ ~ m
~ 0 0
, ~ . o I e ~
~ 0 0
G o 0~
7
%
' -a
o o
=k
o
o
BULK AND WET ATMOSPHERIC DEPOSITION CHEMISTRY AT PALLANZA
TABLE VII
Relative importance of wet and dry depositons in Pallanza
149
H + N H 4 + C a + + M g + + N a + K + S O 4 - N O £ C1 - Scat San
BulE ?5.7 92.8 55.3 14.7 18.5 4.3 142.5 81.1 22.5 261.0 245.0 Wet 76.9 87.6 42.0 11.! 17.2 3.6 131.3 71.9 20.3 237.9 220.6 Dry 1.8 5.9 19.2 5.7 3.0 1.5 37.2 19.3 9.7 37.2 33.1
Units meq m - 2 yr - 1.
The sum of wet and dry deposition agrees quite well with the bulk deposition; only for Ca, Mg, Na, and K, is the sum of wet and dry deposition higher by 10 to 20~ than the bulk values. The same comparison has been made separately for winter and summer values (not reported in the table). Results show that absolute differences between bulk and (wet + dry) are higher in winter than in summer, reaching in the first case values up to 30 to 40~o for Mg and Ca.
These differences can be explained by the washing of the bulk bucket which is carried out routinely at the end of the week which, in the case of weeks without wet precipitation (39 ~o in winter and 21 ~o in summer), exclude from the following bulk measurement part of the dry deposition.
4 . D i s c u s s i o n a n d C o n c l u s i o n s
The modest difference between the chemistry of bulk and wet deposition at Pallanza is determined by three factors.
The first concerns the chemical composition of the dust, which does not contain an appreciable amount of carbonate; the area surrounding the sampling station is mainly characterized by low weathering rocks (gneiss, granite, micashist). Secondly, the loca- tion of the bulk collector, described above, means that the influence of dust pollution deriving from local urban activities is small. A third factor which reduces the importance of the dry component of the deposition is the high amount of rainfall which is a feature of the subalpine area where Pallanza is located.
As a result, the differences between bulk and wet deposition chemistry are very low
for pH, and lower than 15 ~o for sulphate, nitrate, chloride, and Na, while for Ca, Mg, and K the differences range between 30 and 50~ . Bulk and wet depositions also show similar patterns in the case of the seasonal variations.
These results indicate that bulk deposition chemistry offers a good indication of wet deposition, if care is taken to avoid local disturbance in the vicinity of the sampling point. Furthermore, this shows that the previous studies carried out on bulk deposition at Pallanza in 1975-1976 give an accurate picture of the deposition chemistry, comparable not only with the present bulk values, but, in the case of pH, ammonium, sulphate, and nitrate, also with the wet only values.
A good agreement between bulk and wet only concentrations of the ions which are
150 R. MOSELLO ET AL.
most relevant in acidification may be assumed for the whole Western and North Western subalpine area, including Canton Ticino in Switzerland, and for a part of the Po Valley. Indeed, previous researches (Gruppo di Studio, 1985, 1987; Mosello et al., 1985b) have already indicated a general homogeneity in the deposition chemistry of this part of Italy, which, like Pallanza, is characterized by acid deposition.
However, notwithstanding the favorable conditions of the sampling station at Pallanza, all the bulk and wet concentrations show statistically significant differences, and variations are marked for all cations, except ammonium. Greater differences are to be expected in other Italian regions, considering that most of the country is formed of calcareous rocks and soils. This is confirmed by two studies concerning the com- parison of bulk and wet only chemistry, carried out at Piacenza and Bologna, south of the River Po (Bettinelli et aL, 1984; Morselli et aL, 1986).
For this reason, and in spite of the results relative to Pallanza, the use of wet only collectors is strongly recommended in the case of networks extending to the whole country.
Acknowledgments
We wish to thank Dr S. Cieslik, Chemistry Division, J.R.C. Euratom, Ispra, Italy, for a critical reading of this paper.
References
Ambrosetti, W., Arca, G., Barbanti, L, and Rolla, A.: 1985, in Commissione Internazionale per la protezione delle acque italo-svizzere. Ricerche sull'evoluzione del Lago Maggiore. Aspetti limnologici. Campagna 1985, 164 pp.
A.P.H.A., A.W.W.A., and W.P.C.F.: 1975, Standard Methods for the Examination of Water and Wastewater, American Public Health Association, Washington, 1134 pp.
Bettinelli, M., Ioannilli, E., and Ziliani, G.: 1984, Proc. "SEP Pollution', Padova, Italy, April 8-12, 1984, 125. Calderoni, A., Mosello, R., and Tartari, G.: 1978a, Verh. Internat. Verein. Limnol. 20, 1033. Calderoni, A., Mosello, R., and Tartari, G.: 1978b, Mere. Ist. Ital. ldrobiol. 36, 234. Contessini, F.: 1956, Impianti idroelettrici, Tamburini, Milano, 423 pp. Dash, J. M.: 1985, Environ. Sci. TechnoL 19, 721. Davidson, C. I., Lindberg, S. E., Schmidt, J. A., Cartwright, U G., and Landis, L. R.: 1985, J. Geophys. Res.
90, 2123. Dolske, D. A. and Gatz, D. F.: 1985, J. Geophys. Res. 90, 2076. Feely, H. W., Bogen, D. C., Nagourney, S. J., and Torquato, C. C.: 1985, J. Geophys. Res. 90, 2161. Gruppo di Studio delle caratteristiche chimiche delle precipitazioni dell'Italia Settentrionale: 1985,
Acqua-Aria 8, 63, Gruppo di Studio delle caratteristiche chimiche delle precipitazioni dell'Italia Settentrionale: 1987, Quaderni
Ingegneria Ambientale 6, 1. Hicks, B. B.: 1986, Water, Air, and Soil Pollut. 30, 75. Hicks, B. B., Wesely, M. L., and Durham, J. L.: 1980, Workshop Summary EPA Report, EPA-600/9-80-050,
NTIS PB81-126443. Koroleff: 1970, 1CES (Int. Council Explor. Sea), Interlaboratory Report 3, 19. Morselli, L., Carati, A., and Mattivi, F.: 1986, lnquinamento 10, 44. Mosello, R.: 1984, Schweiz. Z. Hydrol. 46, 86. Mosello, R. and Tartari, G.: 1979, Mem. 1st. Ital. ldrobiol. 37, 41. Mosello, R. and Tartari, G.: 1982, Mere. Ist. Ital. IdrobioL 40, 163.

BULK AND WET ATMOSPHERIC DEPOSITION CHEMISTRY AT PALLANZA 151
Mosello, R. and Tartari, G.: 1983, Water Quality Bulletin 8, 96. Mosello, R. and Tartari, G.: 1985,Proc. Int. Congr. "Lakes Pollution and Recovery', Rome, April 15-18, 1985,
p. 315. Mosello, R., Tartari, G., and Tartari, G. A.: 1985a, Mem. Ist. Ital. Idrobiol. 43, 311. Mosello, R., Tartari, G. A., Barbieri, A., Righetti, G., and Tartari, G.: 1985b, Acqua-Aria 8, 765. Mosello, R., Tartari, G. A., and Marchetto, A.: 1987, Documenta Ist. ItaL Idrobiol. 14, 1. Reynolds, B.: 1983, Atmospheric Environment 17, 1849. Topol, L. E.: 1986, Atmospheric Environment 20, 347.