Bringing evidence to policy to achieve health-related MDGs for all: justification and design of the...
10
Bringing evidence to policy to achieve health-related MDGs for all: justification and design of the EPI-4 project in China, India, Indonesia, and Vietnam Sarah Thomsen 1 *, Nawi Ng 2 , Xu Biao 3 , Go ¨ ran Bondjers 4 , Hari Kusnanto 5 , Nguyen Tanh Liem 6 , Dileep Mavalankar 7 , Mats Ma ˚ lqvist 8 and Vinod Diwan 1 1 Department of Public Health Sciences (Global health/IHCAR), Karolinska Institutet, Solna, Sweden; 2 Department of Public Health and Clinical Medicine, Umea ˚ Centre for Global Health Research, Umea ˚ University, Umea ˚ , Sweden; 3 Department of Epidemiology, School of Public Health, Fudan University, Shanghai, China; 4 Sahlgrenska Academy, Gothenburg University, Gothenburg, Sweden; 5 Department of Public Health, Faculty of Medicine, Gadjah Mada University, Yogyakarta, Indonesia; 6 National Pediatric Hospital, Hanoi, Vietnam; 7 Indian Institute of Public Health, Gandhinagar, Ahmedabad, India; 8 Department of Women’s and Children’s Health, International Maternal and Child Health, University Hospital, Uppsala University, Uppsala, Sweden Background: The Millennium Development Goals (MDGs) are monitored using national-level statistics, which have shown substantial improvements in many countries. These statistics may be misleading, however, and may divert resources from disadvantaged populations within the same countries that are showing progress. The purpose of this article is to set out the relevance and design of the ‘‘Evidence for Policy and Implementation project (EPI-4)’’. EPI-4 aims to contribute to the reduction of inequities in the achievement of health-related MDGs in China, India, Indonesia and Vietnam through the promotion of research- informed policymaking. Methods: Using a framework provided by the Commission on the Social Determinants of Health (CSDH), we compare national-level MDG targets and results, as well as their social and structural determinants, in China, India, Indonesia and Vietnam. Results: To understand country-level MDG achievements it is useful to analyze their social and structural determinants. This analysis is not sufficient, however, to understand within-country inequities. Specialized analyses are required for this purpose, as is discussion and debate of the results with policymakers, which is the aim of the EPI-4 project. Conclusion: Reducing health inequities requires sophisticated analyses to identify disadvantaged populations within and between countries, and to determine evidence-based solutions that will make a difference. The EPI-4 project hopes to contribute to this goal. Keywords: equity; Millennium Development Goals; social determinants of health; evidence to policy; network; Asia Received: 31 August 2012; Accepted: 10 February 2013; Published: 13 March 2013 T he purpose of this article is to provide the relevance and design of the ‘Evidence for Policy and Implementation project (EPI-4)’, which aims to reduce inequities in achievement of the health-related Millennium Development Goals (MDGs) in China, India, Indonesia, and Vietnam through the promotion of informing research evidence with policy in these four countries. Background According to the World Health Organization (WHO), while there is still much to achieve, there have been (page number not for citation purpose) æ STUDY DESIGN ARTICLE Glob Health Action 2013. # 2013 Sarah Thomsen et al. This is an Open Access article distributed under the terms of the Creative Commons Attribution- Noncommercial 3.0 Unported License (http://creativecommons.org/licenses/by-nc/3.0/), permitting all non-commercial use, distribution, and reproduction in any medium, provided the original work is properly cited. 1 Citation: Glob Health Action 2013, 6: 19650 - http://dx.doi.org/10.3402/gha.v6i0.19650
-
Upload
independent -
Category
Documents
-
view
1 -
download
0
Transcript of Bringing evidence to policy to achieve health-related MDGs for all: justification and design of the...
Bringing evidence to policy toachieve health-related MDGs for all:justification and design of the EPI-4project in China, India, Indonesia, andVietnamSarah Thomsen1*, Nawi Ng2, Xu Biao3, Goran Bondjers4,Hari Kusnanto5, Nguyen Tanh Liem6, Dileep Mavalankar7,Mats Malqvist8 and Vinod Diwan1
1Department of Public Health Sciences (Global health/IHCAR), Karolinska Institutet, Solna, Sweden;2Department of Public Health and Clinical Medicine, Umea Centre for Global Health Research, UmeaUniversity, Umea, Sweden; 3Department of Epidemiology, School of Public Health, Fudan University,Shanghai, China; 4Sahlgrenska Academy, Gothenburg University, Gothenburg, Sweden; 5Departmentof Public Health, Faculty of Medicine, Gadjah Mada University, Yogyakarta, Indonesia; 6NationalPediatric Hospital, Hanoi, Vietnam; 7Indian Institute of Public Health, Gandhinagar, Ahmedabad,India; 8Department of Women’s and Children’s Health, International Maternal and Child Health,University Hospital, Uppsala University, Uppsala, Sweden
Background: The Millennium Development Goals (MDGs) are monitored using national-level statistics,which have shown substantial improvements in many countries. These statistics may be misleading, however,and may divert resources from disadvantaged populations within the same countries that are showingprogress. The purpose of this article is to set out the relevance and design of the ‘‘Evidence for Policy andImplementation project (EPI-4)’’. EPI-4 aims to contribute to the reduction of inequities in the achievementof health-related MDGs in China, India, Indonesia and Vietnam through the promotion of research-informed policymaking.Methods: Using a framework provided by the Commission on the Social Determinants of Health (CSDH), wecompare national-level MDG targets and results, as well as their social and structural determinants, in China,India, Indonesia and Vietnam.Results: To understand country-level MDG achievements it is useful to analyze their social and structuraldeterminants. This analysis is not sufficient, however, to understand within-country inequities. Specializedanalyses are required for this purpose, as is discussion and debate of the results with policymakers, which is theaim of the EPI-4 project.Conclusion: Reducing health inequities requires sophisticated analyses to identify disadvantaged populationswithin and between countries, and to determine evidence-based solutions that will make a difference. The EPI-4project hopes to contribute to this goal.
Keywords: equity; Millennium Development Goals; social determinants of health; evidence to policy; network; Asia
Received: 31 August 2012; Accepted: 10 February 2013; Published: 13 March 2013
The purpose of this article is to provide the
relevance and design of the ‘Evidence for Policy
and Implementation project (EPI-4)’, which aims
to reduce inequities in achievement of the health-related
Millennium Development Goals (MDGs) in China,
India, Indonesia, and Vietnam through the promotion
of informing research evidence with policy in these fourcountries.
BackgroundAccording to the World Health Organization (WHO),while there is still much to achieve, there have been
(page number not for citation purpose)
!STUDY DESIGN ARTICLE
Glob Health Action 2013. # 2013 Sarah Thomsen et al. This is an Open Access article distributed under the terms of the Creative Commons Attribution-Noncommercial 3.0 Unported License (http://creativecommons.org/licenses/by-nc/3.0/), permitting all non-commercial use, distribution, and reproductionin any medium, provided the original work is properly cited.
1
Citation: Glob Health Action 2013, 6: 19650 - http://dx.doi.org/10.3402/gha.v6i0.19650
significant, positive changes in health-related MDGs on
the global and country levels since 1990 (1). Under-five
mortality has declined by 35%, maternal mortality has
decreased by 2.3% per year, skilled birth attendance
has increased from 55 to 65%, neonatal mortality
has decreased by 28%, mortality due to tuberculosis has
decreased by one-third, and the HIV epidemic has
stabilized. However, these achievements are often occur-
ring in an inequitable manner. In other words, while
overall progress has been made, gaps in achievements
between and within many countries have not decreased.
The poorest and most disadvantaged communities are
the least likely to have benefited from achievements.
For example: poor, rural children are less likely to have
received measles vaccination than their richer, urban
counterparts (2).Some regions are particularly affected by inequity
in the achievement of MDGs. In Southern Asia, the
wealthiest women are five times more likely than the
poorest to have been attended to by a trained health care
worker when giving birth (2). These health inequities have
been most marked in the countries where economic
growth has been particularly inequitable. For example,
in India, where the annual per capita growth rate has
hovered around 8% for the last decade, use of antenatal
care services increased by 12% from 1996 to 2008, but
only 0.1% among the poor. At the same time, 37% of the
population is living in poverty (in some states, over 50%
of the population) (3). The conclusion can only be that
economic growth may be necessary, but not sufficient
for improving the health of all. Governments must also
be prepared to invest the benefits of economic growth
in services that will actively promote reductions of
health inequity, such as public health care and publiceducation (4).
Unfortunately, the use of MDG targets has led toa focus on improving the proportion of people benefitingin a particular aspect of welfare ! increased income,education, health, sanitation, housing, etc. ! rather thanon equitable distribution of health. In the implementa-tion of MDGs, across these different areas, such targetinghas often led to efforts being placed on improving thewelfare of those most easily reached, otherwise referredto as ‘cherry-picking’ (5). Health interventions associatedwith MDGs 4, 5, and 6, for instance, are mainly appliedthrough established health services to which only aminority of the population have easy access, usually thesame fraction for all interventions (6). In effect, the goal-oriented approach of the millennium development ap-proach has created an incentive for governments toimplement utilitarian approaches to health as opposedto universalist ones, in the hopes of achieving ‘trickle-down’ effects (7). The result of this has been to create agreater disparity between those lifted ‘above the povertyline’ and those left behind (8). Therefore, while nationalMDG targets are approached in many countries, andaverage welfare increases, so does inequity (9).
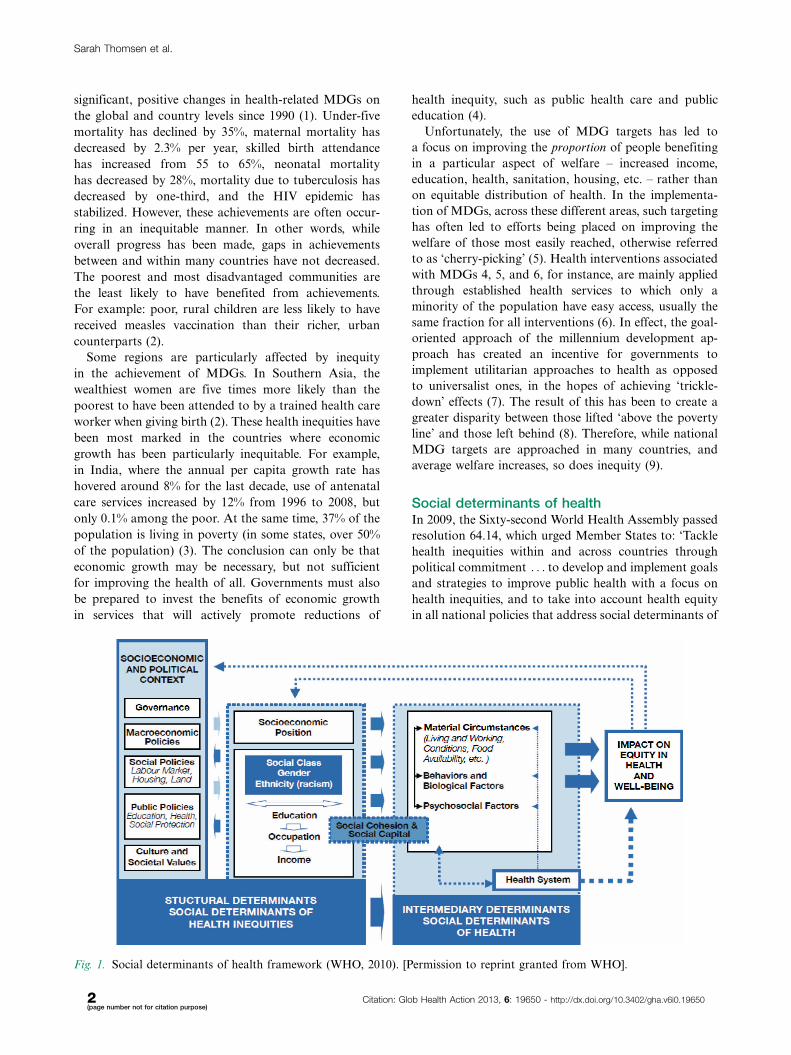
Social determinants of healthIn 2009, the Sixty-second World Health Assembly passedresolution 64.14, which urged Member States to: ‘Tacklehealth inequities within and across countries throughpolitical commitment . . . to develop and implement goalsand strategies to improve public health with a focus onhealth inequities, and to take into account health equityin all national policies that address social determinants of
Fig. 1. Social determinants of health framework (WHO, 2010). [Permission to reprint granted from WHO].
Sarah Thomsen et al.
2(page number not for citation purpose)
Citation: Glob Health Action 2013, 6: 19650 - http://dx.doi.org/10.3402/gha.v6i0.19650
health (10).’ The Commission on the Social Determi-
nants of Health (CSDH) has developed a framework forillustrating the mechanisms by which structural and
social factors affect equity in health. This frameworkrecognizes that there are multiple causes for health
outcomes besides individual behavior and health servicedelivery (11). The model specifies three types of determi-
nants of health: 1) the socioeconomic and politicalcontext, 2) structural determinants and socioeconomic
position, and 3) intermediary determinants such asindividual behavior and the health system (Fig. 1).
The socioeconomic and political context includes
governance issues, such as corruption, policies aroundwealth transfer, education and health care, and cultural
norms around men and women, and the acceptablebehavior of children and adolescents. This environment
generates or reinforces social stratification that definesindividual socioeconomic position, including social class
(often measured by proxy variables such as education,occupation and household income or wealth indices),gender, and ethnicity. Together, these make up the
structural determinants of health. These structural de-terminants do not affect health directly. Rather, they are
mediated by determinants such as material circumstance,individual behavior and biological factors, psychosocial
factors, and the health system. Equity in health andwell-being is proposed, in turn, to affect socioeconomic
position and the socioeconomic and political context.The majority of the world’s poor (approximately 1.3
billion) now live in middle-income countries (MICs),
such as China, Brazil, India, and Indonesia (12). This is adrastic change from 1990 when 93% of the world’s poor
were estimated to live in low-income countries (LICs).MICs today experience considerable inequity in the
distribution of health services, and other specific healthchallenges, such as those caused by effects of rapid
industrial and urban growth.Below we compare national-level MDG targets and
results for four emerging economies: China, India,
Indonesia, and Vietnam. Together, these four countriesrepresent about 42% of the world’s population, with GDP
growth rates of over 6% (13). At the same time, they havevaried results in terms of social and health outcomes,
including MDG targets. In order to illustrate the role ofsocial determinants of health, we contrast these results
with structural and intermediary determinants of healthand health inequity for these same countries.
The latest MDG statistics from 2010 show reductions of50% or more in under-five mortality and infant mortality
across the four countries (Table 1). Immunization againstmeasles is at nearly 100% in China and Vietnam. India
and Indonesia have also made great strides (32 and 53%improvements, respectively). Similarly, maternal mortality
rates have decreased by over 60% in each of thesecountries, although the overall rates are still unacceptably
high in India (200/100,000) and Indonesia (220/100,000),
in particular. When looking at some of the most importantintermediary determinants of maternal mortality, it be-
comes clear why India and Indonesia are, on the whole, farfrom reaching their targets. India has an inadequate
percentage of births attended by skilled health personnel(52.7%), low contraceptive use among married women
(54.8%), high levels of unmet need (20.5%), and fewwomen who have attended at least four antenatal care
visits (26.9%), although the latter has improved by 51% inthe last 20 years. Indonesia has better coverage of births by
skilled personnel (79.4%) and contraceptive use (61.4%),but low antenatal care coverage (at least 4 visits"55.4%)
and a very high adolescent birth rate (52.3%). There areother structural factors that also contribute to India and
Indonesia’s low performance in achieving MDGs that wewill explore below.
The status of tuberculosis is still very tenuous in three
of the four countries. While China has made significantadvances on a national level (TB prevalence 108/100,000),India, Indonesia, and Vietnam still have TB prevalence
rates of 256, 289, and 334/100,000, respectively. AlthoughTB treatment success rates area around 90% in all
countries (95% in China), the TB detection rate underDOTS is still worryingly low in India (59%), Indonesia
(66%), and Vietnam (54%).Table 2 also indicates another problem with country
reporting, which is that there is little national data for
some of the MDG indicators on HIV and malaria. Insome cases, the country reports, such as the UNAIDS
country progress reports (14), simply state that data on,for example, ‘sexual intercourse with more than one
partner in the past 12 months’ are ‘‘irrelevant’’.Moving backwards through the CSDH model, we
now turn to some selected ‘intermediary determinants’
of health (Table 3). Starting with the health system, Chinahas dedicated twice as much of its GDP on health as
Indonesia (5.1% vs. 2.6%), but less than Vietnam (6.8%).However, out-of-pocket expenditures (out of total expen-
ditures on health) are reportedly similar in China (36.6%)and Indonesia (38.3%). In India and Vietnam, approxi-
mately 60% of all expenditures on health are out-of-pocket. Coverage of community health workers, the first
line of primary health care, is below 1 per 1,000 in India(0.05), Indonesia (0.001), and China (0.83) (no informa-
tion available for Vietnam). Interestingly, there are morephysicians than nurses/midwives per 1,000 people in China(1.42 vs. 1.38) and Vietnam (1.22 vs. 1.0). In Indonesia
(0.29 vs. 2.04) and India (0.65 vs. 1), the ratio is moregeared toward the mid-level providers than physicians.
Individual behavioral and biological factors, psycho-
social factors and material circumstances also have aneffect on equity in health, both directly and through use
of health services. Smoking levels amongst men inIndonesia (61.3%), China (51.2%), and Vietnam (48.2%)
Evidence to policy for health-related MDGs for all
Citation: Glob Health Action 2013, 6: 19650 - http://dx.doi.org/10.3402/gha.v6i0.19650 3(page number not for citation purpose)
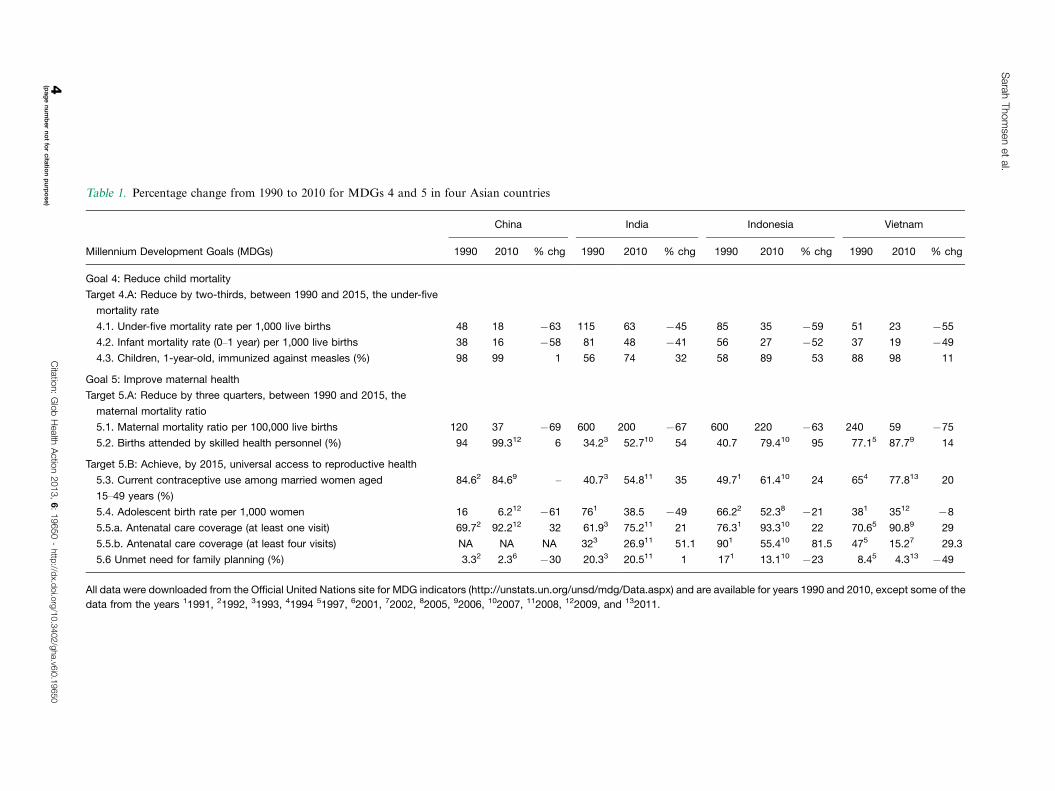
Table 1. Percentage change from 1990 to 2010 for MDGs 4 and 5 in four Asian countries
China India Indonesia Vietnam
Millennium Development Goals (MDGs) 1990 2010 % chg 1990 2010 % chg 1990 2010 % chg 1990 2010 % chg
Goal 4: Reduce child mortality
Target 4.A: Reduce by two-thirds, between 1990 and 2015, the under-five
mortality rate
4.1. Under-five mortality rate per 1,000 live births 48 18 #63 115 63 #45 85 35 #59 51 23 #55
4.2. Infant mortality rate (0!1 year) per 1,000 live births 38 16 #58 81 48 #41 56 27 #52 37 19 #49
4.3. Children, 1-year-old, immunized against measles (%) 98 99 1 56 74 32 58 89 53 88 98 11
Goal 5: Improve maternal health
Target 5.A: Reduce by three quarters, between 1990 and 2015, the
maternal mortality ratio
5.1. Maternal mortality ratio per 100,000 live births 120 37 #69 600 200 #67 600 220 #63 240 59 #75
5.2. Births attended by skilled health personnel (%) 94 99.312 6 34.23 52.710 54 40.7 79.410 95 77.15 87.79 14
Target 5.B: Achieve, by 2015, universal access to reproductive health
5.3. Current contraceptive use among married women aged
15!49 years (%)
84.62 84.69 ! 40.73 54.811 35 49.71 61.410 24 654 77.813 20
5.4. Adolescent birth rate per 1,000 women 16 6.212 #61 761 38.5 #49 66.22 52.38 #21 381 3512 #8
5.5.a. Antenatal care coverage (at least one visit) 69.72 92.212 32 61.93 75.211 21 76.31 93.310 22 70.65 90.89 29
5.5.b. Antenatal care coverage (at least four visits) NA NA NA 323 26.911 51.1 901 55.410 81.5 475 15.27 29.3
5.6 Unmet need for family planning (%) 3.32 2.36 #30 20.33 20.511 1 171 13.110 #23 8.45 4.313 #49
All data were downloaded from the Official United Nations site for MDG indicators (http://unstats.un.org/unsd/mdg/Data.aspx) and are available for years 1990 and 2010, except some of the
data from the years 11991, 21992, 31993, 41994 51997, 62001, 72002, 82005, 92006, 102007, 112008, 122009, and 132011.
Sarah
Thom
senet
al.
4(pag
en
um
ber
no
tfo
rcita
tion
pu
rpo
se)
Citatio
n:
Glo
bH
ealthA
ction
2013,
6:
19650
-http
://dx.d
oi.o
rg/1
0.3
402/g
ha.v6
i0.1
9650
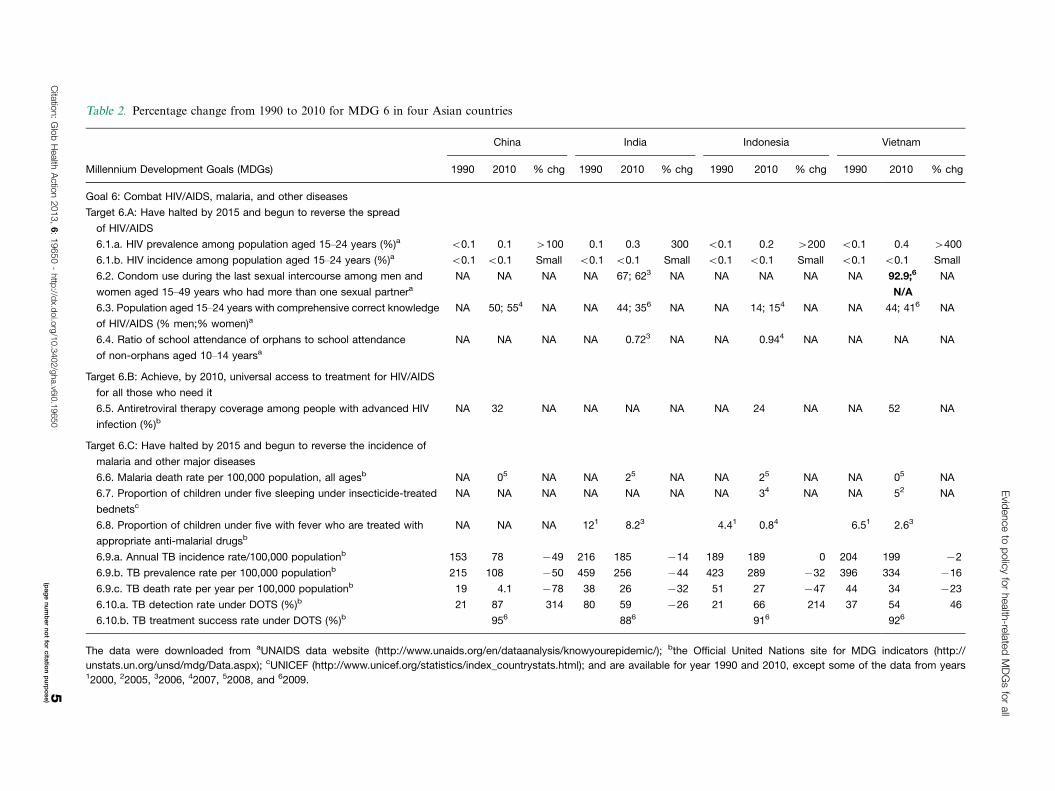
Table 2. Percentage change from 1990 to 2010 for MDG 6 in four Asian countries
China India Indonesia Vietnam
Millennium Development Goals (MDGs) 1990 2010 % chg 1990 2010 % chg 1990 2010 % chg 1990 2010 % chg
Goal 6: Combat HIV/AIDS, malaria, and other diseases
Target 6.A: Have halted by 2015 and begun to reverse the spread
of HIV/AIDS
6.1.a. HIV prevalence among population aged 15!24 years (%)a B0.1 0.1 !100 0.1 0.3 300 B0.1 0.2 !200 B0.1 0.4 !400
6.1.b. HIV incidence among population aged 15!24 years (%)a B0.1 B0.1 Small B0.1 B0.1 Small B0.1 B0.1 Small B0.1 B0.1 Small
6.2. Condom use during the last sexual intercourse among men and
women aged 15!49 years who had more than one sexual partneraNA NA NA NA 67; 623 NA NA NA NA NA 92.9;6
N/A
NA
6.3. Population aged 15!24 years with comprehensive correct knowledge
of HIV/AIDS (% men;% women)aNA 50; 554 NA NA 44; 356 NA NA 14; 154 NA NA 44; 416 NA
6.4. Ratio of school attendance of orphans to school attendance
of non-orphans aged 10!14 yearsa
NA NA NA NA 0.723 NA NA 0.944 NA NA NA NA
Target 6.B: Achieve, by 2010, universal access to treatment for HIV/AIDS
for all those who need it
6.5. Antiretroviral therapy coverage among people with advanced HIV
infection (%)bNA 32 NA NA NA NA NA 24 NA NA 52 NA
Target 6.C: Have halted by 2015 and begun to reverse the incidence of
malaria and other major diseases
6.6. Malaria death rate per 100,000 population, all agesb NA 05 NA NA 25 NA NA 25 NA NA 05 NA
6.7. Proportion of children under five sleeping under insecticide-treated
bednetsc
NA NA NA NA NA NA NA 34 NA NA 52 NA
6.8. Proportion of children under five with fever who are treated with
appropriate anti-malarial drugsb
NA NA NA 121 8.23 4.41 0.84 6.51 2.63
6.9.a. Annual TB incidence rate/100,000 populationb 153 78 #49 216 185 #14 189 189 0 204 199 #2
6.9.b. TB prevalence rate per 100,000 populationb 215 108 #50 459 256 #44 423 289 #32 396 334 #16
6.9.c. TB death rate per year per 100,000 populationb 19 4.1 #78 38 26 #32 51 27 #47 44 34 #23
6.10.a. TB detection rate under DOTS (%)b 21 87 314 80 59 #26 21 66 214 37 54 46
6.10.b. TB treatment success rate under DOTS (%)b 956 886 916 926
The data were downloaded from aUNAIDS data website (http://www.unaids.org/en/dataanalysis/knowyourepidemic/); bthe Official United Nations site for MDG indicators (http://
unstats.un.org/unsd/mdg/Data.aspx); cUNICEF (http://www.unicef.org/statistics/index_countrystats.html); and are available for year 1990 and 2010, except some of the data from years12000, 22005, 32006, 42007, 52008, and 62009.
Evid
ence
top
olicy
for
health
-relatedM
DG
sfo
rall
Citatio
n:
Glo
bH
ealthA
ction
2013,
6:
19650
-http
://dx.d
oi.o
rg/1
0.3
402/g
ha.v6
i0.1
9650
5(p
ag
en
um
ber
no
tfo
rcita
tion
pu
rpo
se)
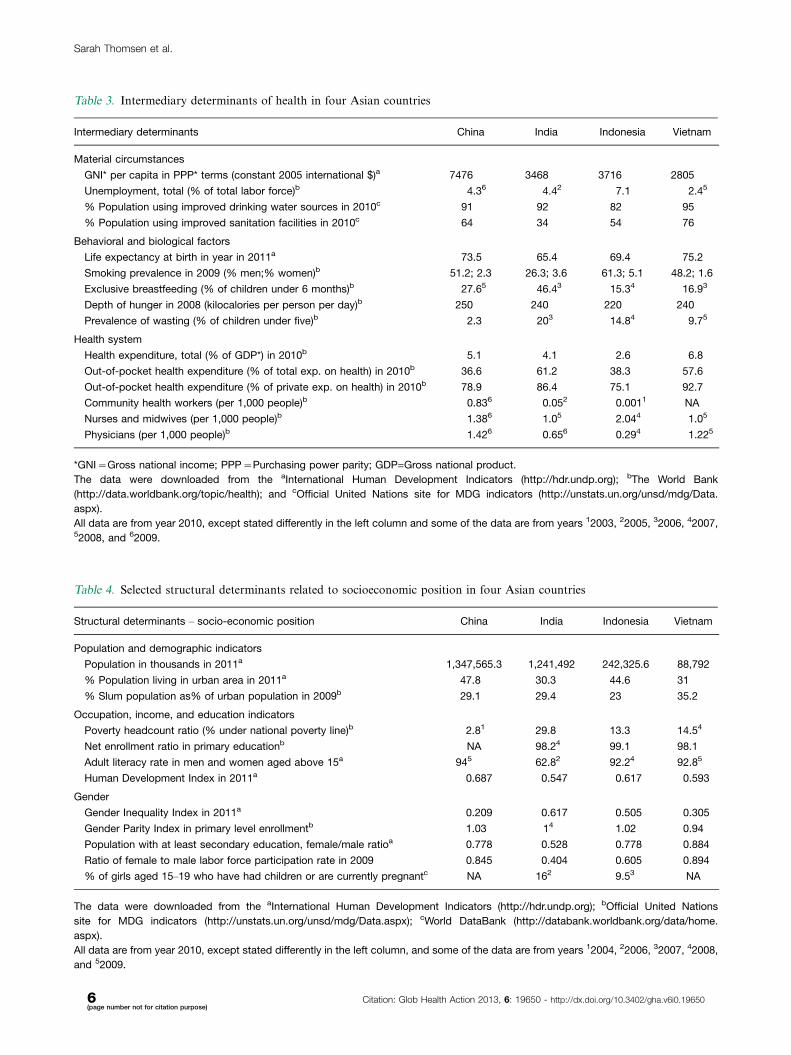
Table 3. Intermediary determinants of health in four Asian countries
Intermediary determinants China India Indonesia Vietnam
Material circumstances
GNI* per capita in PPP* terms (constant 2005 international $)a 7476 3468 3716 2805
Unemployment, total (% of total labor force)b 4.36 4.42 7.1 2.45
% Population using improved drinking water sources in 2010c 91 92 82 95
% Population using improved sanitation facilities in 2010c 64 34 54 76
Behavioral and biological factors
Life expectancy at birth in year in 2011a 73.5 65.4 69.4 75.2
Smoking prevalence in 2009 (% men;% women)b 51.2; 2.3 26.3; 3.6 61.3; 5.1 48.2; 1.6
Exclusive breastfeeding (% of children under 6 months)b 27.65 46.43 15.34 16.93
Depth of hunger in 2008 (kilocalories per person per day)b 250 240 220 240
Prevalence of wasting (% of children under five)b 2.3 203 14.84 9.75
Health system
Health expenditure, total (% of GDP*) in 2010b 5.1 4.1 2.6 6.8
Out-of-pocket health expenditure (% of total exp. on health) in 2010b 36.6 61.2 38.3 57.6
Out-of-pocket health expenditure (% of private exp. on health) in 2010b 78.9 86.4 75.1 92.7
Community health workers (per 1,000 people)b 0.836 0.052 0.0011 NA
Nurses and midwives (per 1,000 people)b 1.386 1.05 2.044 1.05
Physicians (per 1,000 people)b 1.426 0.656 0.294 1.225
*GNI"Gross national income; PPP"Purchasing power parity; GDP=Gross national product.
The data were downloaded from the aInternational Human Development Indicators (http://hdr.undp.org); bThe World Bank
(http://data.worldbank.org/topic/health); and cOfficial United Nations site for MDG indicators (http://unstats.un.org/unsd/mdg/Data.
aspx).
All data are from year 2010, except stated differently in the left column and some of the data are from years 12003, 22005, 32006, 42007,52008, and 62009.
Table 4. Selected structural determinants related to socioeconomic position in four Asian countries
Structural determinants ! socio-economic position China India Indonesia Vietnam
Population and demographic indicators
Population in thousands in 2011a 1,347,565.3 1,241,492 242,325.6 88,792
% Population living in urban area in 2011a 47.8 30.3 44.6 31
% Slum population as% of urban population in 2009b 29.1 29.4 23 35.2
Occupation, income, and education indicators
Poverty headcount ratio (% under national poverty line)b 2.81 29.8 13.3 14.54
Net enrollment ratio in primary educationb NA 98.24 99.1 98.1
Adult literacy rate in men and women aged above 15a 945 62.82 92.24 92.85
Human Development Index in 2011a 0.687 0.547 0.617 0.593
Gender
Gender Inequality Index in 2011a 0.209 0.617 0.505 0.305
Gender Parity Index in primary level enrollmentb 1.03 14 1.02 0.94
Population with at least secondary education, female/male ratioa 0.778 0.528 0.778 0.884
Ratio of female to male labor force participation rate in 2009 0.845 0.404 0.605 0.894
% of girls aged 15!19 who have had children or are currently pregnantc NA 162 9.53 NA
The data were downloaded from the aInternational Human Development Indicators (http://hdr.undp.org); bOfficial United Nations
site for MDG indicators (http://unstats.un.org/unsd/mdg/Data.aspx); cWorld DataBank (http://databank.worldbank.org/data/home.
aspx).
All data are from year 2010, except stated differently in the left column, and some of the data are from years 12004, 22006, 32007, 42008,
and 52009.
Sarah Thomsen et al.
6(page number not for citation purpose)
Citation: Glob Health Action 2013, 6: 19650 - http://dx.doi.org/10.3402/gha.v6i0.19650
are extremely high. Exclusive breastfeeding in the first 6
months of a child’s life is relatively high in India (46.4%),compared to China (27.6%), Vietnam (16.9%), or In-
donesia (15.3%). Use of ‘improved drinking sources’ is
fairly high on a national level: 90% in China, India, andVietnam, and 82% in Indonesia. However, ‘improved
sanitation’ is poor in all countries, with large variations:76% in Vietnam, 64% in China, 54% in Indonesia, and a
very low 34% in India. The prevalence of wasting inchildren under five ! an indicator of poor access to food !is very high in India (20%) and Indonesia (14.8%). InVietnam almost one in ten children exhibit wasting; in
China this figure is 2.3%.The CSDH framework, which is based on hundreds
of studies conducted over 20!30 years, posits that social
position is the most important determinant of health
inequity (11). The actual mechanism for this is notcompletely clear, but it is clear that education, ethnicity,
social status, gender, income, and occupation are linked tomany health outcomes. The link may be ‘social capital’,
which is represented by the resources that an individualhas access to through his or her social environment, which
is determined by the above variables. Living in an urbanslum environment is one indicator of socio-economic
position. The proportion of the population living in urban
populations in the four countries is highest in China(47.8%) and Indonesia (44.6%). India (30.3%) and
Vietnam (31%) have relatively smaller urban populations(Table 4).1 On the other hand, Vietnam has the highest
proportion of urban slum residents (35.2%). In China andIndia, urban slum populations are around 30% and it is
23% in Indonesia.The Human Development Index (HDI) is a composite
measure of: 1) education, 2) standard of living, and
3) length and quality of life, with 1 being the highest level
of human development according to these aspects. In2011, China (0.687) was considered to have a ‘medium!high’ human development level, whereas Indonesia(0.617), Vietnam (0.593), and India (0.547) were all con-
sidered to have ‘low!medium’ human development levels.These ‘scores’ on the HDI are reflected in poverty and
education statistics for the four countries. The povertyheadcount ratio is measured as the proportion of the
population that is living under the national poverty level.
The highest proportion of poor is found in India (29.8%),followed by Indonesia (13.3%) and China (2.8%). Net
enrollment in primary school is almost 100% in allcountries (data not available in China), and adult literacy
is over 90% except in India (62.8%).Attitudes and norms regarding men’s and women’s
roles and responsibilities in society are strongly related
to health behaviors and outcomes (15). The expression of
norms in a society can be measured in many different
ways. The Gender Inequality Index reflects inequalities in
achievement between men and women in reproductive
health, educational attainment, and the labor market,
with 0 indicating perfect equality. Gender inequality
in these areas is worst in India (0.617) and Indonesia
(0.505). China (0.209) and Vietnam (0.305) are much
closer to reaching equality.2 This index may go a long way
to explaining the differences in achievement in MDG
4 and 5 between the four countries. For example, labor
participation for men and women is an important indi-
cator of the ability of women to generate income, which is
related to how household resources are spent (on health
care costs for children or food, for example). The ratio of
female to male labor participation is fairly high in China
(0.845) and Vietnam (0.894), but low in Indonesia
(0.605), and very low in India (0.404).Education of girls is also a strong determinant of
health outcomes for the whole family. Gender parity in
primary school (enrolment of girls to boys) is at (or over)
1 in all countries but Vietnam (0.94), and the ratio of
females to males with a secondary education is much
lower in all four countries: 0.778 in China, 0.528 in India,
0.778 in Indonesia, and 0.884 in Vietnam, with 1 being
perfect parity. This means, for example, that for every
woman with a secondary school education in India there
are two men with at least that level of education.The reproductive health of women is partially deter-
mined by patterns of early marriage. The longer they wait
to marry, the longer they tend to wait to begin child-
bearing, and the longer they can stay in school, thus
increasing educational levels amongst women. The teen-
age pregnancy rates (aged 15!19) were 16% in India in
2006 and 9% in Indonesia in 2007 (data not available
in China and Vietnam). Thus, gender norms that are
reflected in low levels of women’s achievement in sec-
ondary school, low participation in the labor market,
high levels of teenage pregnancy, and the high levels of
poverty in India and Indonesia are likely strong social
determinants of the poor health results reported above.In the CSDH framework, the socioeconomic and
political structure of a country is purported to create
the conditions that make possible differences based on
socioeconomic position. For example, policies around
education and social protection can create an enabling
or disabling environment for different segments of the
population to attend school, or for women to work. Thus,
the high ratio of female to male participation in the labor
market in Vietnam discussed above (89%) is likely related
to the fact that the state subsidizes day care for children
below school age, which is not the case in the other
1Differences in the definition of ‘urban’ may also be somewhatresponsible for these differences.
2As a comparison, the country that was closest to reaching genderequality according to this definition in 2011 received a score of 0.049(Sweden).
Evidence to policy for health-related MDGs for all
Citation: Glob Health Action 2013, 6: 19650 - http://dx.doi.org/10.3402/gha.v6i0.19650 7(page number not for citation purpose)
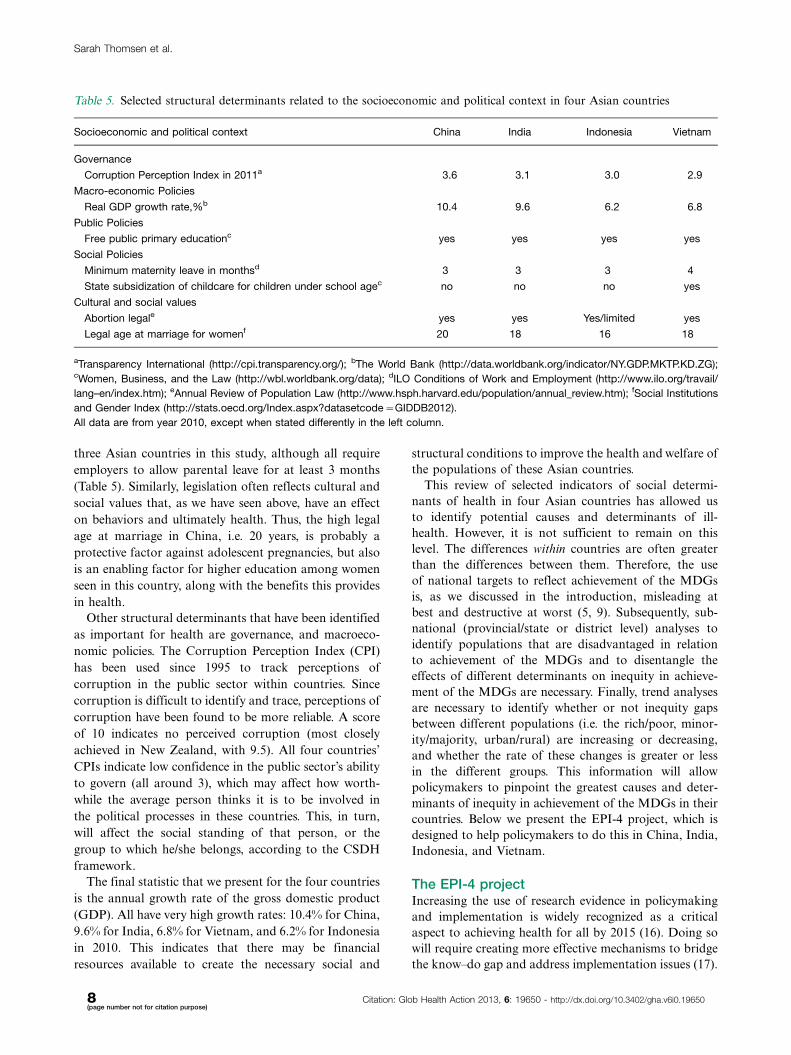
three Asian countries in this study, although all require
employers to allow parental leave for at least 3 months
(Table 5). Similarly, legislation often reflects cultural and
social values that, as we have seen above, have an effect
on behaviors and ultimately health. Thus, the high legal
age at marriage in China, i.e. 20 years, is probably a
protective factor against adolescent pregnancies, but also
is an enabling factor for higher education among women
seen in this country, along with the benefits this provides
in health.Other structural determinants that have been identified
as important for health are governance, and macroeco-
nomic policies. The Corruption Perception Index (CPI)
has been used since 1995 to track perceptions of
corruption in the public sector within countries. Since
corruption is difficult to identify and trace, perceptions of
corruption have been found to be more reliable. A score
of 10 indicates no perceived corruption (most closely
achieved in New Zealand, with 9.5). All four countries’
CPIs indicate low confidence in the public sector’s ability
to govern (all around 3), which may affect how worth-
while the average person thinks it is to be involved in
the political processes in these countries. This, in turn,
will affect the social standing of that person, or the
group to which he/she belongs, according to the CSDH
framework.The final statistic that we present for the four countries
is the annual growth rate of the gross domestic product
(GDP). All have very high growth rates: 10.4% for China,
9.6% for India, 6.8% for Vietnam, and 6.2% for Indonesia
in 2010. This indicates that there may be financial
resources available to create the necessary social and
structural conditions to improve the health and welfare ofthe populations of these Asian countries.
This review of selected indicators of social determi-nants of health in four Asian countries has allowed usto identify potential causes and determinants of ill-health. However, it is not sufficient to remain on thislevel. The differences within countries are often greaterthan the differences between them. Therefore, the useof national targets to reflect achievement of the MDGsis, as we discussed in the introduction, misleading atbest and destructive at worst (5, 9). Subsequently, sub-national (provincial/state or district level) analyses toidentify populations that are disadvantaged in relationto achievement of the MDGs and to disentangle theeffects of different determinants on inequity in achieve-ment of the MDGs are necessary. Finally, trend analysesare necessary to identify whether or not inequity gapsbetween different populations (i.e. the rich/poor, minor-ity/majority, urban/rural) are increasing or decreasing,and whether the rate of these changes is greater or lessin the different groups. This information will allowpolicymakers to pinpoint the greatest causes and deter-minants of inequity in achievement of the MDGs in theircountries. Below we present the EPI-4 project, which isdesigned to help policymakers to do this in China, India,Indonesia, and Vietnam.
The EPI-4 projectIncreasing the use of research evidence in policymakingand implementation is widely recognized as a criticalaspect to achieving health for all by 2015 (16). Doing sowill require creating more effective mechanisms to bridgethe know!do gap and address implementation issues (17).
Table 5. Selected structural determinants related to the socioeconomic and political context in four Asian countries
Socioeconomic and political context China India Indonesia Vietnam
Governance
Corruption Perception Index in 2011a 3.6 3.1 3.0 2.9
Macro-economic Policies
Real GDP growth rate,%b 10.4 9.6 6.2 6.8
Public Policies
Free public primary educationc yes yes yes yes
Social Policies
Minimum maternity leave in monthsd 3 3 3 4
State subsidization of childcare for children under school agec no no no yes
Cultural and social values
Abortion legale yes yes Yes/limited yes
Legal age at marriage for womenf 20 18 16 18
aTransparency International (http://cpi.transparency.org/); bThe World Bank (http://data.worldbank.org/indicator/NY.GDP.MKTP.KD.ZG);cWomen, Business, and the Law (http://wbl.worldbank.org/data); dILO Conditions of Work and Employment (http://www.ilo.org/travail/
lang–en/index.htm); eAnnual Review of Population Law (http://www.hsph.harvard.edu/population/annual_review.htm); fSocial Institutions
and Gender Index (http://stats.oecd.org/Index.aspx?datasetcode"GIDDB2012).
All data are from year 2010, except when stated differently in the left column.
Sarah Thomsen et al.
8(page number not for citation purpose)
Citation: Glob Health Action 2013, 6: 19650 - http://dx.doi.org/10.3402/gha.v6i0.19650
Facilitating factors to effectively link research to action
are personal contacts between researchers and policymakers, timeliness and relevance of the research, andproducing the research in a format that is actionable
with clear policy recommendations and implicationsfor implementation into practice (18, 19). Research
syntheses should be context-specific and include evi-dence, modifying factors, needs, values, costs, and avail-ability of resources. The research syntheses should
address both the know!do gap and optimal ways of effec-tive implementation (20).
The World Health Organization’s Task Force on
Research Priorities has called for more use of researchin identifying and evaluating policy options to reducehealth inequities (21). EPI-4 (Evidence for Policy and
Implementation) was designed to increase capacity tomake evidence-informed decisions on policies and im-
plementation for health for disadvantaged groups inrelation to MDGs 4, 5, and 6 in China, India, Indonesia,and Vietnam. The project will identify and use networks
in each country to discuss evidence on inequity inachievement of the health-related MDGs and to plan
for evidence-based interventions to reduce inequities. Theevidence will be gathered and analyzed by researchersbased at four Swedish universities: Karolinska Institutet,
Gothenburg University, Umea University, and UppsalaUniversity, working in conjunction with longstanding
partners in the four countries ! Fudan University andPeking University, China; University of Gadjah Mada,Indonesia; the Public Health Institute of India; and the
National Pediatric Hospital in Vietnam ! and theministries of health in these countries. The researchers
will conduct systematic reviews to identify the mostdisadvantaged groups in relation to MDGs 4, 5, and 6in each country (not all countries will look at each MDG
outcome). We will also conduct secondary data analysesof large, existing datasets in each country, using the
CSDH framework as a basis. These analyses will include:1) descriptive statistics to show discrepancies in MDGs 4,5, and 6 achievements across different population sub-
groups within each country to fill gaps identified in theliterature review; 2) regression analyses to identify the
most important sources of inequity for various healthoutcomes, stratified by different groups; and 3) trendanalyses of longitudinal or repeated cross-sectional data
to determine whether or not equity has increased ordecreased over time, and, if so, which groups have
benefited. These results will be discussed in small networkmeetings of 10!15 persons consisting of academicians,policymakers, and other civil society representatives (such
as non-governmental organizations) in each country.Results will be published in international, peer-reviewed,
open-access journals, and results will also be summarizedin research briefs. The project will end with a regionalconference with high-level policymakers convened to
discuss realistic approaches to reducing inequity inmaternal and child health and infectious disease controland treatment.
Acknowledgements
The EPI-4 project is funded by the Swedish International Develop-ment Cooperation Agency (Sida), project number AKT-2010-048.The purpose of EPI-4 is to build capacity in using evidence to informpolicies to improve equity in the achievement of MDGs 4, 5, and 6in China, India, Indonesia, and Vietnam.
Conflict of interest and fundingThe authors have not received funding from industry forthis paper and report no conflict of interests.
References
1. WHO (2011). Monitoring the achievement of the health-related Millennium Development Goals. Geneva: World HealthOrganization.
2. UN (2010). The Millennium Development Goals Report 2010.New York: United Nations.
3. Tendulkar S, Radhakrishna R, Sengupta S. Report of the expertgroup to review the methodology for estimation of poverty.New Delhi: Government of India, Planning Commission; 2009.
4. Dreze J, Sen A. Putting growth in its place. It has to be but ameans to development, not an end in itself. Available from:http://OutlookIndia.com [cited 14 November 2011].
5. Langford M. A poverty of rights: six ways to fix the MDGs. IDSBulletin 2010; 41: 83!91.
6. Mulholland EK, Smith L, Carneiro I, Becher H, Lehmann D.Equity and child-survival strategies. Bull World Health Organ2008; 86: 399!407.
7. Thomsen S, Hoa DT, Malqvist M, Sanneving L, Saxena D,Tana S, et al. Promoting equity to achieve maternal and childhealth. Reprod Health Matters 2011; 19: 176!82.
8. Gwatkin DR, Bhuiya A, Victora CG. Making health systemsmore equitable. Lancet 2004; 364: 1273!80.
9. Waage J, Banerji R, Campbell O, Chirwa E, Collender G,Dieltiens V, et al. The Millennium Development Goals:a cross-sectoral analysis and principles for goal setting after2015 Lancet and London International Development CentreCommission. Lancet 2010; 376: 991!1023.
10. World Health Assembly, resolution 64.14. Available from: http://apps.who.int/gb/ebwha/pdf_files/WHA62-REC1/WHA62_REC1-en-P2.pdf [cited 27 February 2013].
11. Solar O, Irwin A. A conceptual framework for action on thesocial determinants of health. Social determinants of healthDiscussion Paper 2 (Policy and Practice). Geneva: World HealthOrganization; 2010.
12. Sumner A. Global poverty and the new bottom billion: whatif three-quarters of the world’s poor live in middle-incomecountries? IDS Working Paper 349. Volume November.Brighton: Institute of Development Studies; 2010.
13. WorlddataBank. Availabe from: http://data.worldbank.org/indicator/NY.GDP.MKTP.KD.ZG [cited 27 February 2013].
14. Country Progress Reports. Available from: http://www.unaids.org/en/dataanalysis/knowyourresponse/countryprogressreports/2010countries/ [cited 27 February 2013].
Evidence to policy for health-related MDGs for all
Citation: Glob Health Action 2013, 6: 19650 - http://dx.doi.org/10.3402/gha.v6i0.19650 9(page number not for citation purpose)
15. World Health Organization: Women and health. Today’s evi-dence, tomorrow’s agenda. Geneva: World Health Organization;2009.
16. Wallin L. Evidence-based practice in a global context: the caseof neonatal mortality. Worldviews Evid Based Nurs 2008; 5:167!9.
17. Oxman AD, Bjørndal A, Becerra-Posada F, Gibson M, BlockMAG, Haines A, et al. A framework for mandatory impactevaluation to ensure well informed public policy decisions.Lancet 2010; 375: 427!31.
18. Innvaer S VG, Trommald M, Oxman A. Health policy-makers’perceptions of their use of evidence: a systematic review.J Health Serv Res Pol 2002; 7: 239.
19. Lavis J, Lomas J, Hamid M, Sewankambo NK. Assessingcountry-level efforts to link research to action. Bull WorldHealth Organ 2006; 84: 620!8.
20. Lavis J, Davies H, Gruen R. Working within and beyond the
Cochrane Collaboration to make systematic reviews more useful
to healthcare managers and policy makers. Healthcare Policy
2006; 1: 21!33.21. .Ostlin P, Schrecker T, Sadana R, Bonnefoy J, Gilson L,
Hertzman C, et al. Priorities for research on equity and health:
towards an equity-focused health research agenda. PLoS Med
2011; 8: e1001115.
*Sarah ThomsenDepartment of Public Health Sciences (Global Health/IHCAR)Karolinska InstitutetTomtebodavagen 18a SE-17077, Solna, SwedenTel: $46 70 280 6979Email: [email protected]
Sarah Thomsen et al.
10(page number not for citation purpose)
Citation: Glob Health Action 2013, 6: 19650 - http://dx.doi.org/10.3402/gha.v6i0.19650