Earthquakes: Isolation, energy dissipation and control of ...

ABSTRACT BOOK
September 10 - 12 Munich, Germany
Neuro Informatics 2012


Neuroinformatics 2012 3
Neuroinformatics 2012 5th INCF Congress
Program & Abstracts
September 10 - 12, 2012
Munich, Germany

4 Neuroinformatics 2012
The International Neuroinformatics Coordinating Facility, INCF, coordinates international activities for discovery and innovation in neuroscience and related fields.
The INCF develops and maintains database and computational infrastructure for neuroscientists. Software tools and standards for the international neuroinformatics community are being developed through the INCF Programs, which address infrastructural issues of high importance to the neuroscience community.
The INCF was established in 2005 through the Organization for Economic Co-operation and Development (OECD) Global Science Forum, and has its Secretariat at Karolinska Institutet and Royal Institute of Technology in Stockholm, Sweden. International outreach is achieved through its National Nodes in 17 current member countries across the globe.
Learn more: incf.org software.incf.org neuroinformatics2012.org
BelgiumCzech RepublicFinlandFrance
GermanyIndiaItalyJapan
SwedenSwitzerlandUnited KingdomUnited StatesVictoria, Australia
The NetherlandsNorwayPolandRepublic of Korea
INCF Member Countries as of August 2012
INCF SecretariatKarolinska InstitutetNobels väg 15A, SE-171 77Stockholm, Sweden
Tel: +46 8 524 870 93E-mail: [email protected]: www.incf.org
Neuroinformatics 2012 5
With the back-to-back arrangement of these two key meetings in their respective fields, this year presents an exciting opportunity for both neuroinformatics and computational neuroscience.
Neuroinformatics 2012 is organized by the INCF in cooperation with G-Node, the German INCF Node. As previous INCF Congresses (in Stockholm, Pilsen, Kobe, and Boston), the Munich Congress brings together neuroinformatics researchers from the whole world, covering a broad range of disciplines. The single-track program includes five keynote speakers, six scientific workshops, and various poster and demonstration sessions. Newcomers in the field will profit from the INCF Short Course “An Introduction to Neuroinformatics”, which will be held before the Congress.
The last half day of the INCF Congress will unify the traditional National Node session with the opening of the Bernstein Conference 2012 and highlight this year’s Bernstein Award and the newly created Braitenberg Award. Similar to the INCF Congress, the Bernstein Conference features invited lectures by leading scientists in computational neuroscience and related fields, as well as poster sessions. In addition, the Conference presents the Bernstein Movie Award, the Brains-for-Brains Award and an open lecture for the interested public.
Interactions between the INCF and Bernstein Community will be fostered not only by the scientific program but also by various social events, in particular the Joint INCF/Bernstein Conference Dinner. In all, we expect a unique scientific week that will further raise the level of neuroinformatics research and computational neuroscience worldwide. Please enjoy the many fine presentations, posters, and demos!
Jan Bjaalie (Chair, INCF Program Committee)Andreas Herz (Local Organizing Committee; Chair, Bernstein Program Committee)Sean Hill (Executive Director, INCF)Thomas Wachtler (Chair, Local Organizing Committee; Bernstein Program Committee)
Welcome to the 5th INCF Congress and Bernstein Conference in Munich, Germany!
INCF Program CommitteeJan Bjaalie (University of Oslo, Norway)Tim Clark (Harvard Med. School, USA)Andrew Davison (CNRS, Gif sur Yvette, France)Seth Grant (Edinburgh University, Great Britain)Nathaniel Heintz (Rockefeller University, USA)Mathew Abrams (INCF Secretariat, Sweden)Mary Kennedy (California Institute of Technology, USA)Jean-Baptiste Poline (Neurospin, Gif sur Yvette, France)Keiji Tanaka (Riken Brain Science Institute, Japan)Thomas Wachtler (Ludwig-Maximilians-Universität München, Germany)
Bernstein Program CommitteeHenning Bier (TU München)Alexander Borst (MPI Martinsried)Gordon Cheng (TU München)Stefan Glasauer (LMU München)Benedikt Grothe (LMU München)Andreas Herz (LMU München)Christian Leibold (LMU München)Harald Luksch (TU München)Thomas Wachtler (LMU München)
6 Neuroinformatics 2012

Neuroinformatics 2012 7
The Engineering in Medicine and Biology Society of the IEEE advances the application of engineering sciences and technology to medicine and biology, promotes the profession, and provides global leadership for the benefit of its members and humanity by disseminating knowledge, setting standards, fostering professional development, and recognizing excellence.
The EMBS field of interest is the development and application of engineering concepts and methods to biology, medicine and health sciences to provide effective solutions to biological, medical and healthcare problems. The field encompasses the development of mathematical theories, physical, biological and chemical principles, computational models and algorithms, devicesand systems for clinical, industrial and educational applications.
Engineering in Medicine and Biology Society 445 Hoes Lane
Piscataway, New Jersey, USA 08854 Telephone: +1 732 981 3433 Facsimile: +1 732 465 6435 E-mail: [email protected]
www.embs.org
PUBLICATIONS
IEEE PULSE: A Magazine of the IEEE Engineering in Medicine and Biology Society
Transactions on Biomedical Engineering Transactions on Information Technology in Biomedicine
Transactions on Neural Systems and Rehabilitation Engineering
Transactions on Medical Imaging
Transactions on NanoBioscience Transactions on Computational Biology and Bioinformatics
Transactions on Biomedical Circuits and Systems Reviews on Biomedical Engineering
IEEE Journal on Translational Engineering inHealth & Medicine (To be launched in 2013)
ELECTRONIC PRODUCTS EMBS Electronic Resource
CONFERENCES Annual International Conference of the IEEE Engineering in Medicine and Biology Society (EMBC)
IEEE EMBS Special Topic Conference on Neural Engineering (NER) International Symposium on Biomedical Imaging (ISBI)
International Conference on Biomedical Robotics and Biomechatronics (BIOROB) International Conference on Rehabilitation Robotics (ICORR)
Healthcare Innovation Conference (HIC) EMBS Micro and Nanotechnology in Medicine (MNM)
Grand Challenges Conference Series (GCBE) IEEE EMBS International Conference on Biomedical and Health Informatics (BHI)
AMA-IEEE Medical Technology Conference Series (MedTech) IEEE EMBS Point-Of-Care Healthcare Technologies
SUMMER SCHOOLS Technically Co-Sponsored by EMBS International Summer School on Biomedical Imaging
International Summer School on Biomedical Signal Processing International Summer School on Biocomplexity
International Summer School on Information Technology in Biomedicine
Technical co-sponsor

8 Neuroinformatics 2012
Sponsors and Exhibitors

Neuroinformatics 2012 9
Congress Program at a glance
WORKSHOP 1
Function-structure relationship in microcircuitry
Yasuo KawaguchiCarl PetersenHarald Luksch
KEYNOTE LECTUREGordon Shepherd
THE BERNSTEIN AND BRAITENBERG AWARDS 2012
OPENING STATEMENT
l u n c h
POSTER AND DEMO SESSION 2
POSTER AND DEMO SESSION 1
WELCOME RECEPTION
SPOTLIGHT PRESENTATIONS
Monday, Sept 10 Wednesday, Sept 12Tuesday, Sept 11
WORKSHOP 2
Systems biology of the neuron
Kim BlackwellThomas Bartol
Nicolas Le NovèreUpinder Bhalla
WORKSHOP 4 A-C
4A - Modeling what you can measure
4B - Measuring and modeling the development of retinotopic maps
4C - Macroconnectomes construction
SPOTLIGHT PRESENTATIONS
l u n c h l u n c h
KEYNOTE LECTURERussell Poldrack
KEYNOTE LECTUREMichael Brecht
KEYNOTE LECTURESonja Grün
KEYNOTE LECTUREAtushi Miyawaki
WORKSHOP 3If there is a data deluge,
where are the data?Cameron NeylonAmarnath Gupta
Mercè Crosas
9.00
12.30
17.00
10.20c o f f e e b r e a k c o f f e e b r e a k c o f f e e b r e a k
8.30
13.30
15.30
WELCOME FROM THE INCF DIRECTOR
8.40
12.10
KEYNOTE LECTUREMoritz Helmstaedter
KEYNOTE LECTUREGaute Einevoll
CLOSING REMARKS and OPENING of BCCN 2012
JOINT INCF/BCCN DINNER AT MÜNCHNER KÜNSTLERHAUS

10 Neuroinformatics 2012
Program
Monday, September 10, 2012
08:30 OPENING STATEMENT Sten Grillner, Karolinska Institute and INCF, Sweden, and Jan Bjaalie, University of Oslo, Norway
08:40 WELCOME FROM THE INCF DIRECTOR Sean Hill, INCF Secretariat
09:00 KEYNOTE The olfactory system as a model for building the tools of neuroinformatics
Gordon Sheperd, Yale Medical School, New Haven, USA 09:50 Coffee break
10:20 WORKSHOP 1 Function-structure relationship in microcircuitry
Chair: Keiji Tanaka, RIKEN Brain Institute, Japan
10:25 Yasuo Kawaguchi, National Institute for Physiological Sciences, Okazaki, Japan. Projection-specific subnetworks in rat frontal cortex
10:50 Carl Petersen, Brain Mind Institute, École Polytechnique Fédérale de Lausanne, Switzerland. Synaptic mechanisms of sensory perception
11:15 Harald Luksch, Technichal University of Munich, Germany. The vertebrate midbrain: Cells, Circuits, Concepts
11:40 Panel discussion
12:10 SPOTLIGHT PRESENTATIONS Daniel Haehn, Timothy O’Keefe, Rembrandt Bakker and Shreejoy Tripathy
12:30 Lunch
13:30 POSTER AND DEMO SESSION 1
15:00 Coffee served
15:30 KEYNOTE Data driven analysis of spatio-temporal cortical interaction
Sonja Grün, Systems biology and neuroinformatics Forschungszentrum Jülich, Germany
16:15 Frontiers in Neuroscience - Graeme Moffat
16:20 KEYNOTE New fluorescent probes and new perspectives in neuroscience Atsushi Miyawaki, Laboratory for Cell Function Dynamics RIKEN Brain Science Institute, Wako, Japan 18:00 WELCOME RECEPTION

Neuroinformatics 2012 11
Program
09:00 KEYNOTE Cognitive Neuroinformatics
Russell Poldrack, Imaging Research Center University of Texas at Austin, USA
09:50 Coffee break
10:20 WORKSHOP 2 Systems Biology of the Neuron Chair: Mary Kennedy, California Institute of Technology, Biology Division, USA
10:25 Kim “Avarama” Blackwell, George Mason University, Fairfax, USA. Simulating the long time scales and large molecules numbers involved in synaptic plasticity
10:50 Thomas Bartol, The Salk Institute for Biological Studies, San Diego, USA. How to build a synapse from molecules, membranes, and Monte Carlo methods
11:15 Nicolas Le Novère, EMBL-EBI, Computational Systems Neurobiology, University of Cambridge, Hinxton, UK. Relative activation of calcineurin and CaMKII by frequency, duration and amplitude of calcium signals
11:40 Upinder Bhalla, Neurobiology, Computational neuroscience and systems biology, National Centre for Biological Sciences, Bangalore, India. Synaptic learning rules from multiscale neuronal signaling
12:15 Panel discussion
12:30 Lunch
13:30 SPOTLIGHT PRESENTATIONS Stephen Larson, Amarnath Gupta, Yuko Okamura-Oho and Volodymyr Shcherbatyy
13:50 POSTER AND DEMO SESSION 2
15:00 Coffee served
15:50 WORKSHOP 3 If there is a data deluge, where are the data?
Chair: Tim Clark, Massachusetts General Hospital / Harvard Medical School, USA
15:55 Cameron Neylon, Rutherford Appleton Laboratory, ISIS, Oxford, UK. Data Deluge: Huge opportunity or damp squib?
16:20 Amarnath Gupta, San Diego Supercomputer Center University of California at San Diego, USA. In search of a missing link in the data deluge vs. data scarcity debate
16:45 Mercè Crosas , Institute for Quantitative Social Science , Poduct Development, Harvard University, Cambridge, USA. Data sharing with dataverse beyond social sciences
17:10 Panel discussion
Tuesday, September 11, 2012

12 Neuroinformatics 2012
Program
Wednesday, September 12, 2012
09:00 KEYNOTE Cognitive Neuroinformatics
Michael Brecht, Bernstein Center for Computational Neuroscience, Berlin, Germany
09:50 Coffee break
10:20 PARALLELL WORKSHOPS 4A ,B, AND C
4A) Modeling what you can measure Chair: Gaute T. Einevoll, Norwegian University of Life Sciences, Aas, Norway
10:25 Christof Koch, CalTech, Pasadena, USA. Modeling and recording from neurons in the human brain
10:50 Jason Kerr, Max Planck Institute Tuebingen, Germany. Two-photon imaging of neuronal populations in vivo: turning calcium bumps into spikes
11:15 Panel discussion
4B) Measuring and modelling the development of retinotopic maps Chair: Stephen Eglen, Cambridge University, UK
10:25 Ian Thompson, Kings College London, UK. Quantifying retinotopic map development in the mouse
10:50 Johannes Hjorth, Cambridge University, UK. Theoretical advances in understanding retinotopic map development
11:15 Andrew Huberman, UC San Diego, USA. Assembling circuits for delivering specific qualities of visual information to the brain
11:40 Panel discussion
4B) Measuring and modelling the development of retinotopic maps Chair: Mihail Bota, University of Southern California, Los Angeles, USA
10:25 Menno Witter, Kavli Institute for Neuroscience, Norway. Multiple approaches to database the entorhinal cortex
10:50 Trygve Leergaard, Faculty of Medicine, University of Oslo, Norway. Mapping system level connectivity in the rat brain: digital brain atlasing and (semi-) quantitative tract tracing
11:15 Rembrandt Bakker, Donders Institute for Brain, Cognition and Behavior, Netherlands. CoCoMac 2nd edition: open access made easy
11:40 Hong-Wei Dong, LONI, UCLA, USA. An open resource for mapping neural Networks
12:05 Oliver Schmitt, University of Rostock; Department of Anatomy, Germany. Connectomes of the rat nervous system

Neuroinformatics 2012 13
INCF/BCCN Symposium
12:30 Lunch
13:30 CLOSING REMARKS AND OPENING OF BERNSTEIN CONFERENCE 2012 Sean Hill, INCF, Sweden, and Thomas Wachtler, Biozentrum, Ludwig-Maximilians-Universität München, Germany
14:00 PRESENTATION OF THE BERNSTEIN AND BRAITENBERG AWARDS (full program: see reverse of this book)
16:20 G-NODE SPECIAL SESSION: NEuRAL CIRCuITS: STRuCTuRE AND SIGNALS
Wednesday, September 12, 2012, continued
Neuro Informatics 2012
INCF hopes to see you again on August 27-29, 2013, for the 6th Neuroinformatics Congress in Stockholm, Sweden!
www.neuroinformatics2013.org

14 Neuroinformatics 2012

Neuroinformatics 2012 15
Keynotes
Gordon M. ShepherdAtsushi Miyawaki
Michael BrechtSonja Grün
Russell Poldrack
16 Neuroinformatics 2012
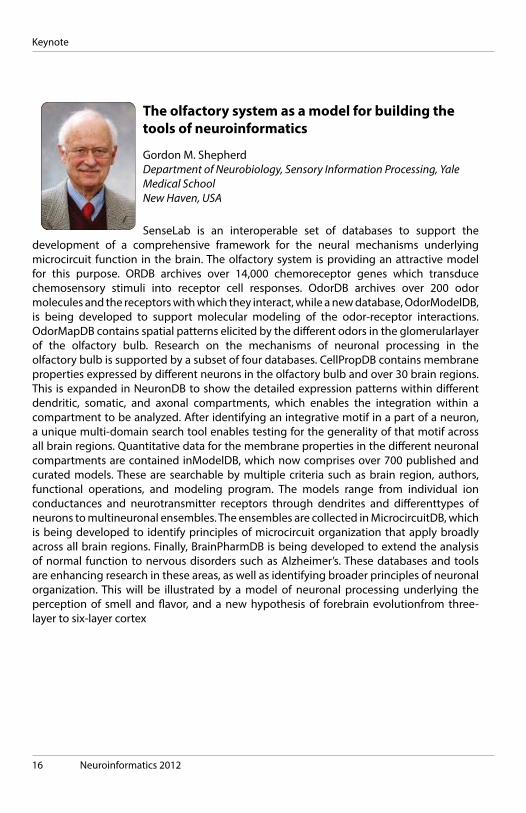
The olfactory system as a model for building the tools of neuroinformatics
Gordon M. ShepherdDepartment of Neurobiology, Sensory Information Processing, Yale Medical SchoolNew Haven, USA
SenseLab is an interoperable set of databases to support the development of a comprehensive framework for the neural mechanisms underlying microcircuit function in the brain. The olfactory system is providing an attractive model for this purpose. ORDB archives over 14,000 chemoreceptor genes which transduce chemosensory stimuli into receptor cell responses. OdorDB archives over 200 odor molecules and the receptors with which they interact, while a new database, OdorModelDB, is being developed to support molecular modeling of the odor-receptor interactions. OdorMapDB contains spatial patterns elicited by the different odors in the glomerularlayer of the olfactory bulb. Research on the mechanisms of neuronal processing in the olfactory bulb is supported by a subset of four databases. CellPropDB contains membrane properties expressed by different neurons in the olfactory bulb and over 30 brain regions. This is expanded in NeuronDB to show the detailed expression patterns within different dendritic, somatic, and axonal compartments, which enables the integration within a compartment to be analyzed. After identifying an integrative motif in a part of a neuron, a unique multi-domain search tool enables testing for the generality of that motif across all brain regions. Quantitative data for the membrane properties in the different neuronal compartments are contained inModelDB, which now comprises over 700 published and curated models. These are searchable by multiple criteria such as brain region, authors, functional operations, and modeling program. The models range from individual ion conductances and neurotransmitter receptors through dendrites and differenttypes of neurons to multineuronal ensembles. The ensembles are collected in MicrocircuitDB, which is being developed to identify principles of microcircuit organization that apply broadly across all brain regions. Finally, BrainPharmDB is being developed to extend the analysis of normal function to nervous disorders such as Alzheimer’s. These databases and tools are enhancing research in these areas, as well as identifying broader principles of neuronal organization. This will be illustrated by a model of neuronal processing underlying the perception of smell and flavor, and a new hypothesis of forebrain evolutionfrom three-layer to six-layer cortex
Keynote

Neuroinformatics 2012 17
New fluorescent probes and new perspectives in neuroscience
Atsushi MiyawakiLaboratory for Cell Function Dynamics, RIKEN Brain Science InstituteWako, Japan
In the nervous system, intracellular signaling events are closely linked with electrical activities, and play essential roles in information processing. To identify and characterize the mechanisms by which signals are organized inside cells, it is necessary to analyze spatiotemporal patterns of signaling pathways. On the other hand, neural circuitry operates as an ensemble in the nervous system. To investigate the patterns of neuronal firing, it is necessary to monitor multiple transmembrane voltages or signals that result from electrical activity in complex tissues or intact animals. Over the past decade, various probes have been generated principally using fluorescent proteins. I will discuss how the probes have advanced our understanding of the spatio-temporal regulation of biological functions inside neurons and brains, and their technical limitations. I will speculate on how these approaches will continue to improve due to the various features of fluorescent proteins. Finally, I will discuss in-depth brain imaging, which is one of the most sought-after themes of today’s optical technologies, as my laboratory has been and will be engaged in the development of new technologies that would advance the imaging depth limit.
Keynote

18 Neuroinformatics 2012
The making of spatial memories
Michael BrechtBernstein Center for Computational Neuroscience BerlinBerlin, Germany
Extracellular recordings have elucidated spatial neural representations without identifying underlying microcircuits. In my talk I will highlight findings from juxtacellular recordings in
entorhinal cortex and data from hippocampal whole-cell recordings in awake behaving animals. In particular I will discuss novel evidence from identified neurons in entorhinal cortex, which suggests that cortical lamination is tightly related memory formation. If time permits I will also discuss the idea that internal factors might contribute to hippocampal map formation and global remapping.
Keynote
Neuroinformatics 2012 19
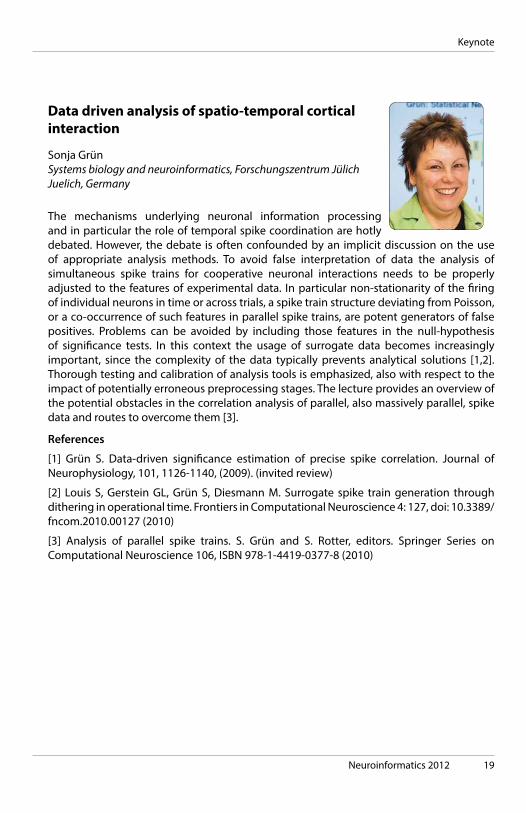
Data driven analysis of spatio-temporal cortical interaction
Sonja GrünSystems biology and neuroinformatics, Forschungszentrum JülichJuelich, Germany
The mechanisms underlying neuronal information processing and in particular the role of temporal spike coordination are hotly debated. However, the debate is often confounded by an implicit discussion on the use of appropriate analysis methods. To avoid false interpretation of data the analysis of simultaneous spike trains for cooperative neuronal interactions needs to be properly adjusted to the features of experimental data. In particular non-stationarity of the firing of individual neurons in time or across trials, a spike train structure deviating from Poisson, or a co-occurrence of such features in parallel spike trains, are potent generators of false positives. Problems can be avoided by including those features in the null-hypothesis of significance tests. In this context the usage of surrogate data becomes increasingly important, since the complexity of the data typically prevents analytical solutions [1,2]. Thorough testing and calibration of analysis tools is emphasized, also with respect to the impact of potentially erroneous preprocessing stages. The lecture provides an overview of the potential obstacles in the correlation analysis of parallel, also massively parallel, spike data and routes to overcome them [3].
References
[1] Grün S. Data-driven significance estimation of precise spike correlation. Journal of Neurophysiology, 101, 1126-1140, (2009). (invited review)
[2] Louis S, Gerstein GL, Grün S, Diesmann M. Surrogate spike train generation through dithering in operational time. Frontiers in Computational Neuroscience 4: 127, doi: 10.3389/ fncom.2010.00127 (2010)
[3] Analysis of parallel spike trains. S. Grün and S. Rotter, editors. Springer Series on Computational Neuroscience 106, ISBN 978-1-4419-0377-8 (2010)
Keynote
20 Neuroinformatics 2012
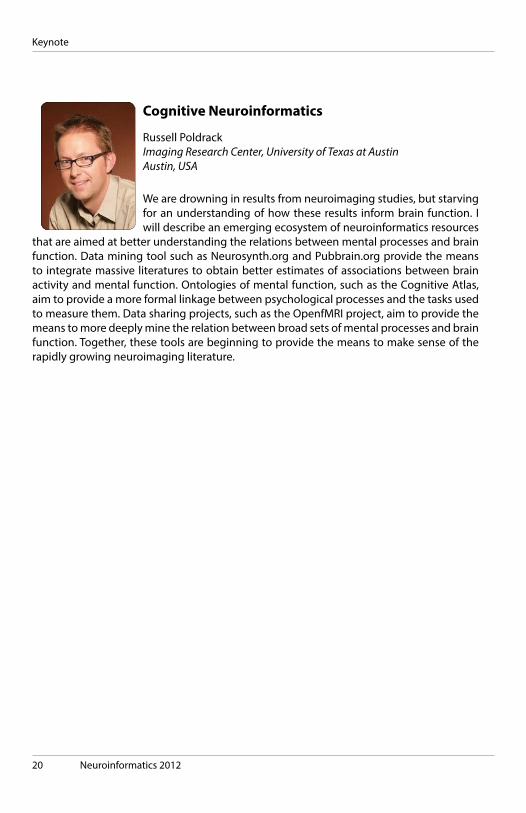
Cognitive Neuroinformatics
Russell PoldrackImaging Research Center, University of Texas at AustinAustin, USA
We are drowning in results from neuroimaging studies, but starving for an understanding of how these results inform brain function. I will describe an emerging ecosystem of neuroinformatics resources
that are aimed at better understanding the relations between mental processes and brain function. Data mining tool such as Neurosynth.org and Pubbrain.org provide the means to integrate massive literatures to obtain better estimates of associations between brain activity and mental function. Ontologies of mental function, such as the Cognitive Atlas, aim to provide a more formal linkage between psychological processes and the tasks used to measure them. Data sharing projects, such as the OpenfMRI project, aim to provide the means to more deeply mine the relation between broad sets of mental processes and brain function. Together, these tools are beginning to provide the means to make sense of the rapidly growing neuroimaging literature.
Keynote

Neuroinformatics 2012 21
WorKshops
1: Function-structure relationship in microcircuitry2: Systems Biology of the Neuron3: If there is a data deluge, where are the data?4a: Modeling what you can measure4b: Measuring and modelling the development of retinotopic maps4c: Workshop in Macroconnectomes Construction
22 Neuroinformatics 2012
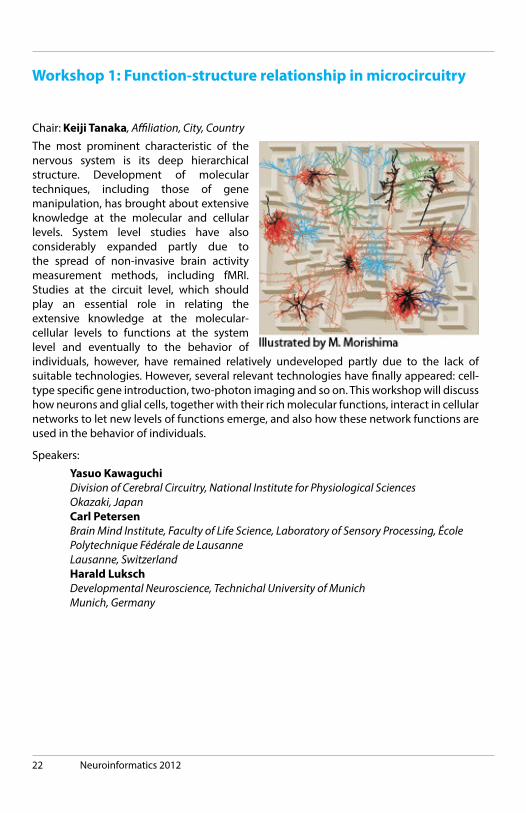
Chair: Keiji Tanaka, Affiliation, City, Country
The most prominent characteristic of the nervous system is its deep hierarchical structure. Development of molecular techniques, including those of gene manipulation, has brought about extensive knowledge at the molecular and cellular levels. System level studies have also considerably expanded partly due to the spread of non-invasive brain activity measurement methods, including fMRI. Studies at the circuit level, which should play an essential role in relating the extensive knowledge at the molecular-cellular levels to functions at the system level and eventually to the behavior of individuals, however, have remained relatively undeveloped partly due to the lack of suitable technologies. However, several relevant technologies have finally appeared: cell-type specific gene introduction, two-photon imaging and so on. This workshop will discuss how neurons and glial cells, together with their rich molecular functions, interact in cellular networks to let new levels of functions emerge, and also how these network functions are used in the behavior of individuals.
Speakers:
Yasuo Kawaguchi Division of Cerebral Circuitry, National Institute for Physiological SciencesOkazaki, JapanCarl Petersen Brain Mind Institute, Faculty of Life Science, Laboratory of Sensory Processing, École Polytechnique Fédérale de LausanneLausanne, SwitzerlandHarald Luksch Developmental Neuroscience, Technichal University of MunichMunich, Germany
Workshop 1: Function-structure relationship in microcircuitry
Neuroinformatics 2012 23
Projection-specific subnetworks in rat frontal cortex
Yasuo KawaguchiDivision of Cerebral Circuitry, National Institute for Physiological SciencesOkazaki, Japan
Neurons in the neocortex are stratified into multiple layers containing both excitatory glutamatergic (primarily “pyramidal”) neurons, and inhibitory GABAergic (“non-pyramidal”) neurons. Glutamatergic neurons in the cortex, especially those in layer 5 (L5), provide cortical output by sending axons to a variety of subcortical areas. However, the functional composition of pyramidal cells within individual cortical layers has not yet been fully elucidated. Subtypes of GABAergic neurons in the cortex are also morphologically, biochemically, and physiologically diverse, and exhibit preferentially innervate specific surface domains of postsynaptic neurons, including somatic, axonal, and dendritic compartments. However, little data exist regarding the targeting selectivity of GABAergic inputs toward specific pyramidal neuron subtypes.
In addition to providing cortical output, pyramidal neurons also form diverse excitatory recurrent subnetworks locally within the cortex. To understand how these excitatory subnetworks generate discreet and parallel output, and to reveal the connection selectivity of GABAergic neuron subtypes, it will first be necessary to characterize the organization principles of projection-specific subnetworks of pyramidal cells. To accomplish this, we are investigating the characteristics of L5 pyramidal neurons in the rat frontal cortex according to their subcortical projection targets, including crossed-corticostriatal (CCS) neurons that project to the contralateral striatum as well as ipsilateral one, and corticopontine (CPn) neurons that project to the ipsilateral pons. Experiments involving pairs of CCS and/or CPn neurons revealed distinct synaptic connectivity patterns in these two classes of L5 pyramidal neuron. CPn/CPn and CCS/CCS pairs had similar connection probabilities, but CPn/CPn pairs exhibited greater reciprocal connectivity, stronger unitary synaptic transmission, and more facilitation of paired-pulse responses. Further, we observed a unidirectional connectivity from CCS neurons to CPn neurons, with few, if any, connections in the opposite direction. Finally, CCS and CPn neurons had morphological differences in their apical dendritic trees, suggesting potential differences in afferent input and synaptic integration. Here we combine these results with recent findings from other laboratories studying corticostriatal and basal ganglia internal structures to propose a functional relationship between local intracortical excitatory subnetworks and more global cortico-basal ganglia-thalamic subnetworks.
Workshop 1: Function-structure relationship in microcircuitry

24 Neuroinformatics 2012
Synaptic mechanisms of sensory perception
Carl PetersenBrain Mind Institute, Faculty of Life Science, Laboratory of Sensory Processing, École Polytechnique Fédérale de LausanneLausanne, Switzerland
A key goal of modern neuroscience is to understand the neural circuits and synaptic mechanisms underlying sensory perception.
Here, I will discuss our efforts to characterise sensory processing in the mouse barrel cortex, a brain region known to process tactile information relating to the whiskers on the snout. Each whisker is individually represented in the primary somatosensory neocortex by an anatomical unit termed a ‘barrel’. The barrels are arranged in a stereotypical map, which allows recordings and manipulations to be targeted with remarkable precision. In this cortical region it may therefore be feasible to gain a quantitative understanding of neocortical function. We have begun experiments towards this goal using whole-cell recordings, voltage-sensitive dye imaging, viral manipulations, optogenetics and two-photon microscopy. Through combining these techniques with behavioral training, our experiments provide new insight into sensory perception at the level of individual neurons and their synaptic connections.
Workshop 1: Function-structure relationship in microcircuitry

Neuroinformatics 2012 25
The vertebrate midbrain: Cells, Circuits, Concepts
Harald LukschDevelopmental Neuroscience, Technichal University of MunichMunich, Germany
The vertebrate dorsal midbrain (superior colliculus in mammals, optic tectum in all other vertebrate classes) is a central interface between sensory stimuli and behavioral motor patterns. It receives a strong retinal projection that forms a map of visual space in the upper layers. This map acts as a master coordinate system for other sensory afferents (auditory, somatosensory etc.), leading to a multimodal representation of the sensory environment. With a high degree of structural order, identifiable cell types and known input and output connectivity, the analysis of the tectum with a combined experimental-computational approach can provide a mechanistic understanding of sensory computation.
Recent advances have been made in the analysis of feedback loops formed between the optic tectum and a group of nuclei in the isthmic area in several bird species. The function of these circuits is considered to be a bottom-up attentional system that identifies the most salient object and allows for both orienting movements as well as fast motor responses in, for example, escape behaviours. These functions are not restricted to visual computation, but (taking into account the tectal role as a multisensory spatial center) deals predominantly with spatial coordinates to identify potential targets through a saliency-based process. I will present data from intracellular work, imaging studies and modelling and discuss the functional implications of the circuits.
Workshop 1: Function-structure relationship in microcircuitry

26 Neuroinformatics 2012
Chair: Mary Kennedy, Affiliation, City, Country
Dynamic modeling of biochemical signaling pathways in neurons and synapses is a relatively new, but growing branch of molecular systems biology. This workshop will focus on understanding distinct approaches to modeling signal transduction pathways in neurons. The speakers use approaches that seek to represent the dynamics of signaling reactions in different, but overlapping, temporal and spatial domains. Each speaker will give a short presentation to introduce their modeling methods, the temporal domain they seek to understand, and the kind of data that informs their models. Approximately half of the workshop time will be devoted to a discussion among the speakers and the audience about the strengths and weaknesses of each approach.
Speakers:
Kim “Avrama” Blackwell Krasnow Institute , Computational and Experimental Neuroplasticity Laboratory, George Mason UniversityFairfax, USAThomas M. Bartol Computational Neurobiology Laboratory, The Salk Institute for Biological StudiesSan Diego, USANicolas Le Novère EMBL-EBI, Computational Systems Neurobiology, University of CambridgeHinxton, United KingdomUpinder BhallaNeurobiology, Computational neuroscience and systems biology, National Centre for Biological SciencesBangalore, India
Workshop 2: Systems Biology of the Neuron

Neuroinformatics 2012 27
Simulating the long time scales and large molecules numbers involved in synaptic plasticity
Kim “Avrama” BlackwellKrasnow Institute , Computational and Experimental Neuroplasticity Laboratory, George Mason UniversityFairfax, USA
The mechanisms underlying discrimination of temporal pattern and spatial specificity are some of the most critical, yet least understood aspects of synaptic plasticity, memory storage and information processing in neurons. Computer simulation of these mechanisms require tens of minutes of simulation time, because stimulation patterns for induction of synaptic plasticity often span minutes and the time course of activation of critical kinases range from seconds to 10s of minutes. Spatial specificity of various molecules has an equally large range, and investigations require simulation of large reaction-diffusion systems with many molecular populations in spiny dendrites of 10 to 100 or more microns in length. For example, though calcium elevations are limited to stimulated spines; other molecules, such as Ras, diffuse several microns, or even further. In order to simulate systems with these diverse spatial and temporal scales, we created NeuroRD, software that extends the Gillespie tau-leap algorithm for stochastic reactions into the diffusion domain. Using NeuroRD to efficiently simulate stochastic interactions both within spines and between spines arranged along a dendrite, we investigate the mechanisms controlling spatial specificity of diffusible second messengers and protein kinases. We address the role of buffers, both diffusible and immobile, as well as enzymatic degradation. These large scale reaction-diffusion models have potential utility multi-scale modeling that interfaces signaling pathways with models of neuronal electrical activity.
Workshop 2: Systems Biology of the Neuron

28 Neuroinformatics 2012
Realistic 3D simulation of neuronal cell signaling with MCell
Thomas M. BartolComputational Neurobiology Laboratory, The Salk Institute for Biological StudiesSan Diego, USA
Biochemical signaling pathways are integral to the information storage, transmission, and transformation roles played by neurons in the nervous system. Far from behaving as well-mixed bags of biochemical soup, the intra- and inter-cellular environments in and around neurons are highly organized reaction-diffusion systems, with some subcellular specializations consisting of just a few copies each of the various molecular species they contain. For example, glutamtergic synapses at dendritic spines in area CA1 hippocampal pyramidal cells contain perhaps 100 AMPA receptors, 10 NMDA receptors, around 200 CaMKII holoenzymes, and 5 free Ca++ ions in the spine head at rest. Much experimental data has been gathered about the neuronal signaling pathways involved in processes such as synaptic plasticity, especially recently, thanks to new molecular probes and advanced imaging techniques. Yet, fitting these observations into a clear and consistent picture that is more than just a cartoon but rather can provide biophysically accurate predictions of function has proven difficult due to the complexity of the interacting pieces and their relationships. MCell is a Monte Carlo simulator designed for the purpose of simulating exactly these sorts of cell signaling systems. Here, I will present how biophysically accurate computational experiments performed on the cell signaling pathways involved in synaptic transmission can be a powerful way to help formulate and test new hypotheses in conjunction with bench experiments. I will introduce fundamental concepts of cell signaling processes in the organized and compact spaces of synapses. We have gained some surprising new insights into the workings of the synapse through building realistic models of neurotransmission with MCell.
Workshop 2: Systems Biology of the Neuron

Neuroinformatics 2012 29
Allosteric calcium sensors and synaptic plasticity
Nicolas Le NovèreEMBL-EBI, Computational Systems Neurobiology, University of CambridgeHinxton, United Kingdom
Both long-term potentiation (LTP) and long-term depression (LTD) are modulated by post-synaptic calcium elevation. To understand how calcium selectively stimulates two opposing processes, we developed a detailed computational model and performed simulations with different calcium input frequencies, amplitudes, and durations. We show that with a total amount of calcium ions kept constant, high frequencies of calcium pulses stimulate calmodulin more efficiently. Calcium input activates both calcineurin and Ca\textsuperscript{2+}/__calmodulin-dependent protein kinase II (CaMKII) at all frequencies, but increased frequencies shift the relative activation from calcineurin to CaMKII. Irrespective of amplitude and duration of the inputs, the total amount of calcium ions injected adjusts the sensitivity of the system towards calcium input frequencies. At a given frequency, the quantity of CaMKII activated is proportional to the total amount of calcium. Thus, an input of a small amount of calcium at high frequencies can induce the same activation of CaMKII as a larger amount, at lower frequencies. Finally, the extent of activation of CaMKII signals with high calcium frequency is further controlled by other factors, including the availability of calmodulin, and by the potency of phosphatase inhibitors.
Workshop 2: Systems Biology of the Neuron
30 Neuroinformatics 2012
Synaptic learning rules from multiscale neuronal signaling
Upinder BhallaNeurobiology, Computational neuroscience and systems biology, National Centre for Biological SciencesBangalore, India
The synapse is at the intersection of many levels of neuronal function, including network, biophysical, molecular and genetic. Learning rules are an attempt to capture these interactions in a concise mathematical form. The complexity of these interactions means that learning rules are difficult to formulate with sufficient generality.
We have approached this problem from the systems viewpoint, by explicitly considering a diverse range of biological processes that contribute to synaptic plasticity. We are assembling a framework of multiscale interactions within which to analyze synaptic plasticity. This includes models of key signaling pathways, receptor traffic, cellular biophysics, network interactions and dendritic protein synthesis. All these models have been developed as biologically motivated, mechanistic formulations at the level of chemical kinetics, molecular transport, and electrophysiology. In this talk I will describe the addition of mRNA synthesis components to this framework. This closes an important feedback cycle involving cellular activity, genetic control, and dendritic protein synthesis. It also constitutes a key mechanism by which the activity of thousands of synapses is coordinated by the soma and nucleus. I will discuss how these combined, multiscale interactions contribute to synaptic learning rules.
Workshop 2: Systems Biology of the Neuron

Neuroinformatics 2012 31
Workshop 3: If there is a data deluge, where are the data?
Chair: Tim Clark, Affiliation, City, Country
Much attention has been focused on the so-called “data deluge” (see for example, McFedries 2011). But in fact, the rapid growth in size of experimental datasets being processed on a routine basis now presents itself to the average scientist as a publications deluge with inadequately referenced experimental results.
While neuroscientists in earlier generations could frequently publish their results in graphical tables contained in their publications, the sheer size of today’s datasets means that typically, only summarizations and figures representing the final results of data analysis, may be included in scientific articles. Where “supplemental data” is appended, it too often consists of figures summarizing an analysis of the original observations. And the computational processing steps (workflows) by which the data was reduced to the figures and charts seen in primary publications - that too is not typically stored in any robust persistent way.
This situation does not generate great confidence in the reproducibility of some experiments reported in the literature. And it certainly does not support the reuse of expensively produced data and computations. As a result several groups have now begun to take up the problem of persistently storing, citing, retrieving and reusing, both datasets and the computational workflows used to process them.
This workshop will spotlight presentations and a panel discussion on how to take these initial steps forward to produce a consistently verifiable and reproducible scientific literature derived from “big data”.
Speakers:
Cameron Neylon Rutherford Appleton Laboratory, ISISOxford, United KingdomAmarnath Gupta San Diego Supercomputer Center, University of California at San DiegoSan Diego, USAMercè Crosas Institute for Quantitative Social Science , Product Development , Harvard UniversityCambridge, USA

32 Neuroinformatics 2012
Data Deluge: Huge opportunity or damp squib?
Cameron NeylonRutherford Appleton Laboratory, ISISOxford, United Kingdom
The web is just the latest example of a network that has qualitatively changed what human society is capable of with a limited set of resources. Before the web networks of mobile phones, and before
that fixed telephony made qualitatively different forms of social interaction possible. Twenty years ago an impromptu meet up between local friends and someone visiting for a day would have been near to impossible. Today it is trivial.
We are only just beginning to see what network enabled research might make possible. Tim Gowers, one of the worlds great mathematicians, described the experience of the PolyMath project compared to his normal approach to mathematics as like a driving is to pushing a car. Examples can be multiplied but they are single isolated examples. The question must be how can we best exploit the capacity of networks across our research effort. The path remains at best obscure at the moment but an emerging understanding of how networks function can help to guide the way. The key aspects of an effective network are threefold:
• Thelargerandmoreconnectedthebetter:Networksthriveonconnectivity.Thelarger the network and the more connected it is, the greater the opportunity for critical information to reach the right person.
• The lower the friction the better:Transfer of non-rivalrous resources at speedand with low friction is the most important capacity of a network. Artificially introducing friction, or not acting to reduce friction means effectively breaking connections within the network, reducing its capacity.
• Highinformationflowrequireseffectivedemand-sidefiltering:Filteringatsourcecreates friction. Therefore the information flow necessitates the design of flexible and configurable filters that can be used to modulate resource flow on the user (demand) side.
In an ideal world we would utilise the near zero cost of dissemination to enlarge the scale and connectivity of our research network by making content free. We would actively reduce friction to sharing of research resources by focussing business models on generation of “web ready” content, charging for the first copy costs up front and competing on the basis of the service offering. In this world there are many services which currently don’t exist but look quite similar to thing that provided by many traditional players. The question is how to get there from here.
Workshop 3: If there is a data deluge, where are the data?
Neuroinformatics 2012 33
In Search of a Missing Link in the Data Deluge vs. Data Scarcity Debate
Amarnath GuptaSan Diego Supercomputer Center, University of California at San DiegoSan Diego, USA
Scientific data should be viewed at multiple levels -- the numbers produced by instruments, data observed and collected by humans, results of different levels of transformations applied to data, inferences made from the data, and claims about scientific reality or hypotheses -- are all “data” at some level. Scientists regularly share their claims and hypotheses through their publications; some share portions of data through databases, data sets contributed to public and private repositories, or supplements to publications. However, the proportion of unshared information is very high, especially when there is no publisher-driven mandate to make data public. Today, there is growing body of sharing technologies and repositories with a wide range of data ingestion, storage, sharing and retrieval capabilities. In our experience with the Neuroscience Information Framework (NIF), we notice a wide variation in the kind of data scientists do and do not want to share. I believe that the real solution to the data scarcity problem must be brought about by setting some “social accountability” measures that value the contributing scientist more than the non-contributing scientist. I propose that we create a set of “reputation scores” (like credit ratings) which might be computed from their “accountability scores” that measure data sharing and “influence scores” that measure use of shared data. Not surprisingly, the e-commerce and social network communities have developed reputation and trust management models which, with some specialization, can be applied toward tracking scientists’ contributions. These reputation engines will track the scientific activities of a scientist by analyzing and correlating their paper and data publications. It will also accept ratings and annotations on publication and data objects made by the users of scientific research products, and combine these ratings with the tracking results to compute contextual reputation scores. The ratings will be gathered and administered by independent 3rd parties, and used by the community to measure the trustworthiness of scientists, their experiments and their claims. The talk will sketch the structure and operating principles of a hypothetical reputation engine, and show that an organization like the NIF can already provide enough information to construct such an engine. We believe that the adoption of reputation management technologies by the Neuroscience community will be able to bring about a cultural shift in the domain of data and knowledge sharing.
Workshop 3: If there is a data deluge, where are the data?

34 Neuroinformatics 2012
Data Sharing with Dataverse beyond Social Sciences
Mercè CrosasInstitute for Quantitative Social Science , Product Development , Harvard UniversityCambridge, USA
The Dataverse Network is an open-source data repository developed at Harvard’s Institute for Quantitative Social Science (IQSS) for publishing, sharing, citing and archiving research data. It was initially designed for social science data and has been used extensively for this purpose. Recently, we have extended the metadata to enable support of research data from all scientific domains. We have launched the Dataverse Network for Astronomy at Harvard, and are exploring expanding to other disciplines. In this talk, we present use cases illustrating how individual Dataverses have been used, showing the benefits of a platform that facilitates sharing and archiving data.
Workshop 3: If there is a data deluge, where are the data?
Neuroinformatics 2012 35
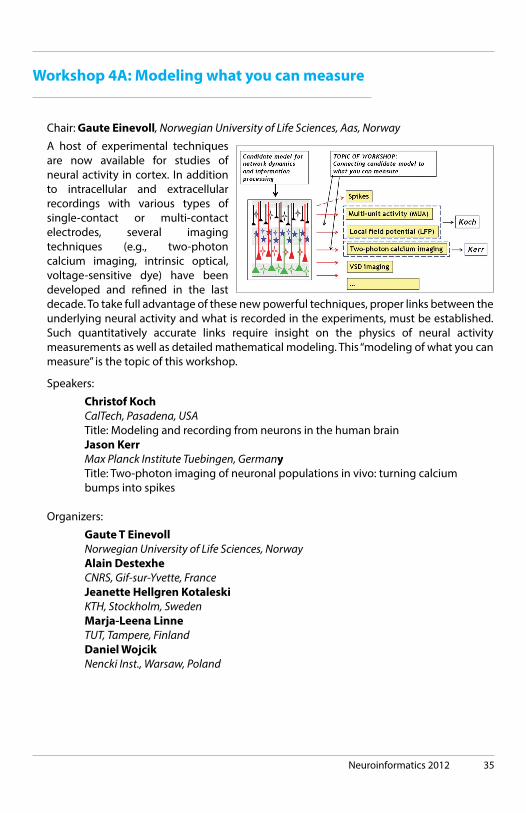
Chair: Gaute Einevoll, Norwegian University of Life Sciences, Aas, Norway
A host of experimental techniques are now available for studies of neural activity in cortex. In addition to intracellular and extracellular recordings with various types of single-contact or multi-contact electrodes, several imaging techniques (e.g., two-photon calcium imaging, intrinsic optical, voltage-sensitive dye) have been developed and refined in the last decade. To take full advantage of these new powerful techniques, proper links between the underlying neural activity and what is recorded in the experiments, must be established. Such quantitatively accurate links require insight on the physics of neural activity measurements as well as detailed mathematical modeling. This “modeling of what you can measure” is the topic of this workshop.
Speakers:
Christof KochCalTech, Pasadena, USATitle: Modeling and recording from neurons in the human brainJason KerrMax Planck Institute Tuebingen, GermanyTitle: Two-photon imaging of neuronal populations in vivo: turning calcium bumps into spikes
Organizers:
Gaute T EinevollNorwegian University of Life Sciences, NorwayAlain DestexheCNRS, Gif-sur-Yvette, FranceJeanette Hellgren KotaleskiKTH, Stockholm, SwedenMarja-Leena LinneTUT, Tampere, FinlandDaniel WojcikNencki Inst., Warsaw, Poland
Workshop 4A: Modeling what you can measure

36 Neuroinformatics 2012
Chair: Stephen Eglen, Cambridge University, UK
This workshop will highlight recent experimental and theoretical advances in assessing the developmental mechanisms underlying the formation of retinotopic maps in the mouse visual system. This has become the paradigm system for investigating mechanisms for the development of ordered nerve connections. We will explore the roles of both gradient-based and activity-based mechanisms. Looking forward, we will outline interesting recent experimental results from related systems, such as visual cortex. The challenge to the community will be to see if existing theories can account for these data, or whether they will drive the development of new theories. Issues of the availability of suitable modelling software will be addressed.
Speakers:
Ian ThompsonKings College London, UKTitle: Quantifying retinotopic map development in the mouseJohannes HjorthCambridge University, UKTitle: Theoretical advances in understanding retinotopic map development Andrew HubermanUC San Diego, USATitle: Assembling circuits for delivering specific qualities of visual information to the brain
Organizers:
David WillshawEdinburgh University, UKStephen EglenCambridge University, UK
Workshop 4B: Measuring and modelling the development of retinotopic maps

Neuroinformatics 2012 37
Chair: Mihail Bota, University of Southern California, Los Angeles, USA
Macroconnectomes (connectivity matrices at the brain regions level) are essential for understanding the structure-functional relationships of different parts of the mammalian central nervous system. They are also the starting point in construction of functionally relevant networks with different levels of complexity.
However, macroconnectomes construction is a complex and time consuming task involving combined efforts from experimental neuroanatomists and neuroinformaticians. There is no completed macroconnectome of any species to date, but a substantial amount of rat and macaque connectivity data is already collated by several neuroinformatics groups. The advent of more sophisticated axonal tracing techniques promises rapid production of high quality experimental connectivity data in (rodent) animal models. Moreover, improved tools for visualization, sharing, and analysis of tract tracing data, will expectedly facilitate extraction of knowledge and assembly of connectome matrices from such data.
The aim of this workshop is to communicate recent progress of well-established groups and researchers involved in assembly of connectomes in macaques, rats and mice. The workshop will bring together neuroanatomists and neuroinformaticians to discuss recent methodological advances and discoveries, and identify principal challenges in the field. These interactions may potentially induce and strengthen collaborations, and propel the field towards the establishment of complete mammalian connectomes.
Speakers:
Menno Witter, Kavli Institute for Neuroscience, NorwayTitle: Multiple approaches to database the entorhinal cortexTrygve Leergaard, Faculty of Medicine, University of Oslo, NorwayTitle: Mapping system level connectivity in the rat brain: digital brain atlasing and (semi-)quantitative tract tracingRembrandt Bakker, Donders Institute for Brain, Cognition and Behavior, NetherlandsTitle: CoCoMac 2nd edition: open access made easyHong-Wei Dong, LONI, UCLA, USATitle: An Open Resource for Mapping Neural NetworksOliver Schmitt, University of Rostock; Department of Anatomy, GermanyTitle: Connectomes of the rat nervous system
Workshop 4C: Workshop in Macroconnectomes Construction

38 Neuroinformatics 2012

Neuroinformatics 2012 39
Posters and demos stay up during the full meeting. Presentation of posters is however divided into
two sessions for practical reasons.
Poster session 1 (day 1): odd poster numbersPoster session 2 (day 2): even poster numbers
Demos & posters
Topics:
General neuroinformatics p. 40Computational neuroscience p. 75Digital atlasing p. 145Neuroimaging p. 167Genomics and genetics p. 191Large scale modeling p. 194Brain machine interface p. 203Electrophysiology p. 209Infrastructural and portal sevices p. 233Clinical neuroscience p. 250
Spotlight presentations:
12:10-12:30, September 10 Daniel Haehn, D23 Timothy O’Keefe, P089 Rembrandt Bakker, P109 Shreejoy Tripathy, P125
12:10-12:30, September 11 Tim Busbice, P010 Hitesh Sabnani, P080 Yuko Okamura-Oho, P104 Volodymyr Shcherbatyy, P116
40 Neuroinformatics 2012
General neuroinformatics
D09 Mindboggle 2: Automated human brain MRI feature extraction, identification, shape analysis, and labeling
Arno Klein1, Forrest Bao2, Eliezer Stavsky1, Yrjö Häme1, Joachim Giard3, Nolan Nichols4 and Satrajit Ghosh5
1. Columbia University2. Texas Tech University3. Universite Catholique de Louvain4. Washington University5. MIT
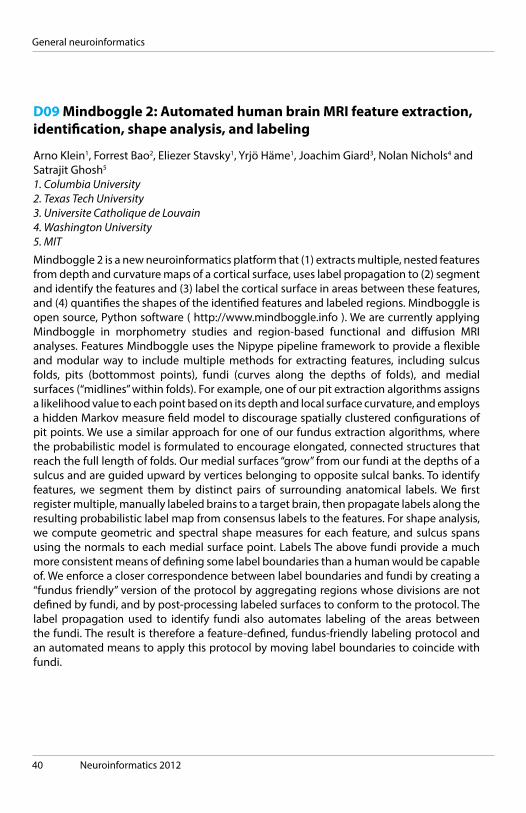
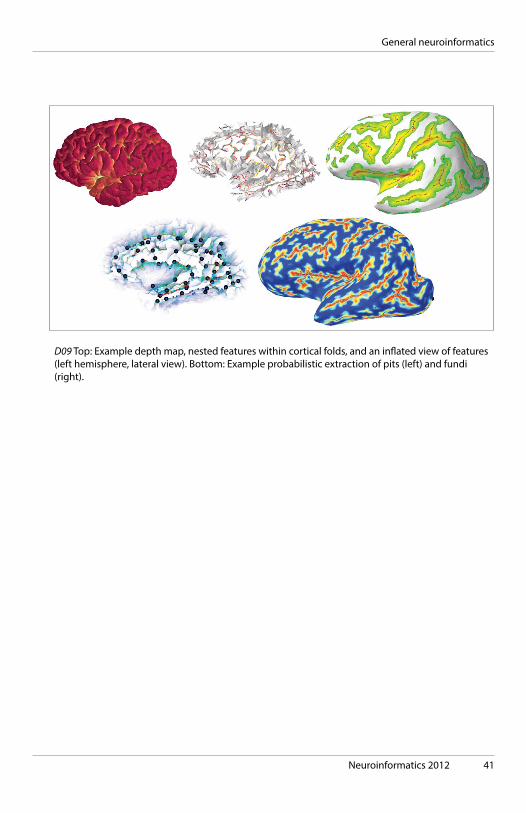
Mindboggle 2 is a new neuroinformatics platform that (1) extracts multiple, nested features from depth and curvature maps of a cortical surface, uses label propagation to (2) segment and identify the features and (3) label the cortical surface in areas between these features, and (4) quantifies the shapes of the identified features and labeled regions. Mindboggle is open source, Python software ( http://www.mindboggle.info ). We are currently applying Mindboggle in morphometry studies and region-based functional and diffusion MRI analyses. Features Mindboggle uses the Nipype pipeline framework to provide a flexible and modular way to include multiple methods for extracting features, including sulcus folds, pits (bottommost points), fundi (curves along the depths of folds), and medial surfaces (“midlines” within folds). For example, one of our pit extraction algorithms assigns a likelihood value to each point based on its depth and local surface curvature, and employs a hidden Markov measure field model to discourage spatially clustered configurations of pit points. We use a similar approach for one of our fundus extraction algorithms, where the probabilistic model is formulated to encourage elongated, connected structures that reach the full length of folds. Our medial surfaces “grow” from our fundi at the depths of a sulcus and are guided upward by vertices belonging to opposite sulcal banks. To identify features, we segment them by distinct pairs of surrounding anatomical labels. We first register multiple, manually labeled brains to a target brain, then propagate labels along the resulting probabilistic label map from consensus labels to the features. For shape analysis, we compute geometric and spectral shape measures for each feature, and sulcus spans using the normals to each medial surface point. Labels The above fundi provide a much more consistent means of defining some label boundaries than a human would be capable of. We enforce a closer correspondence between label boundaries and fundi by creating a “fundus friendly” version of the protocol by aggregating regions whose divisions are not defined by fundi, and by post-processing labeled surfaces to conform to the protocol. The label propagation used to identify fundi also automates labeling of the areas between the fundi. The result is therefore a feature-defined, fundus-friendly labeling protocol and an automated means to apply this protocol by moving label boundaries to coincide with fundi.
Neuroinformatics 2012 41
D09 Top: Example depth map, nested features within cortical folds, and an inflated view of features (left hemisphere, lateral view). Bottom: Example probabilistic extraction of pits (left) and fundi (right).
General neuroinformatics
42 Neuroinformatics 2012
General neuroinformatics
D10 Mindboggle 2 interface: online visualization of extracted brain features with XTK
Arno Klein1, Nolan Nichols2 and Daniel Haehn3
1. Columbia University2. Washington University3. Children’s Hospital Boston
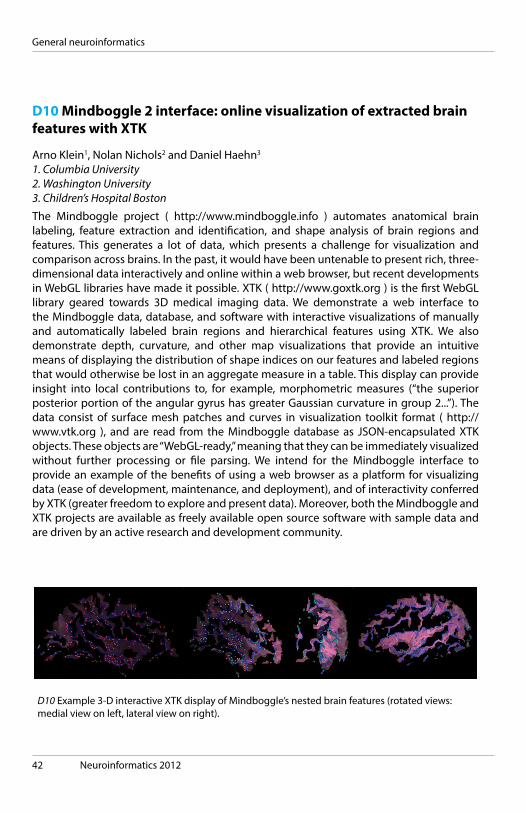
The Mindboggle project ( http://www.mindboggle.info ) automates anatomical brain labeling, feature extraction and identification, and shape analysis of brain regions and features. This generates a lot of data, which presents a challenge for visualization and comparison across brains. In the past, it would have been untenable to present rich, three-dimensional data interactively and online within a web browser, but recent developments in WebGL libraries have made it possible. XTK ( http://www.goxtk.org ) is the first WebGL library geared towards 3D medical imaging data. We demonstrate a web interface to the Mindboggle data, database, and software with interactive visualizations of manually and automatically labeled brain regions and hierarchical features using XTK. We also demonstrate depth, curvature, and other map visualizations that provide an intuitive means of displaying the distribution of shape indices on our features and labeled regions that would otherwise be lost in an aggregate measure in a table. This display can provide insight into local contributions to, for example, morphometric measures (“the superior posterior portion of the angular gyrus has greater Gaussian curvature in group 2...”). The data consist of surface mesh patches and curves in visualization toolkit format ( http://www.vtk.org ), and are read from the Mindboggle database as JSON-encapsulated XTK objects. These objects are “WebGL-ready,” meaning that they can be immediately visualized without further processing or file parsing. We intend for the Mindboggle interface to provide an example of the benefits of using a web browser as a platform for visualizing data (ease of development, maintenance, and deployment), and of interactivity conferred by XTK (greater freedom to explore and present data). Moreover, both the Mindboggle and XTK projects are available as freely available open source software with sample data and are driven by an active research and development community.
D10 Example 3-D interactive XTK display of Mindboggle’s nested brain features (rotated views: medial view on left, lateral view on right).
Neuroinformatics 2012 43
General neuroinformatics
D11 Neuroinformatics labs in Warsaw: free as in ‘freedom’
Jarosław Rybusiński, Anita Gardias, Karol Augustin, Rafał Kuś, Mateusz Kruszyński, Zbigniew Jędrzejewski-Szmek, Hubert Klekowicz and Piotr DurkaFaculty of Physics, University of Warsaw
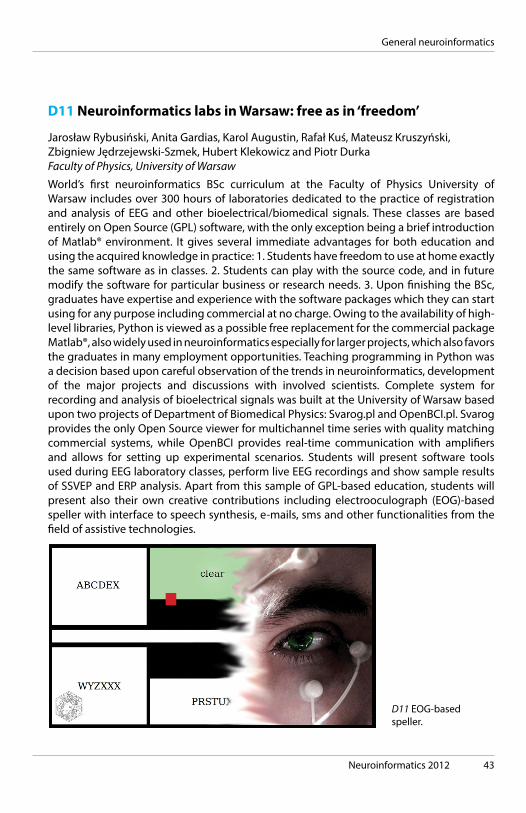
World’s first neuroinformatics BSc curriculum at the Faculty of Physics University of Warsaw includes over 300 hours of laboratories dedicated to the practice of registration and analysis of EEG and other bioelectrical/biomedical signals. These classes are based entirely on Open Source (GPL) software, with the only exception being a brief introduction of Matlab® environment. It gives several immediate advantages for both education and using the acquired knowledge in practice: 1. Students have freedom to use at home exactly the same software as in classes. 2. Students can play with the source code, and in future modify the software for particular business or research needs. 3. Upon finishing the BSc, graduates have expertise and experience with the software packages which they can start using for any purpose including commercial at no charge. Owing to the availability of high-level libraries, Python is viewed as a possible free replacement for the commercial package Matlab®, also widely used in neuroinformatics especially for larger projects, which also favors the graduates in many employment opportunities. Teaching programming in Python was a decision based upon careful observation of the trends in neuroinformatics, development of the major projects and discussions with involved scientists. Complete system for recording and analysis of bioelectrical signals was built at the University of Warsaw based upon two projects of Department of Biomedical Physics: Svarog.pl and OpenBCI.pl. Svarog provides the only Open Source viewer for multichannel time series with quality matching commercial systems, while OpenBCI provides real-time communication with amplifiers and allows for setting up experimental scenarios. Students will present software tools used during EEG laboratory classes, perform live EEG recordings and show sample results of SSVEP and ERP analysis. Apart from this sample of GPL-based education, students will present also their own creative contributions including electrooculograph (EOG)-based speller with interface to speech synthesis, e-mails, sms and other functionalities from the field of assistive technologies.
D11 EOG-based speller.

44 Neuroinformatics 2012
D12 SenseLab: Neuroinformatics tools to support multiscale and multidisciplinary integration
Gordon ShepherdYale
Data integration is a major challenge for neuroscience. The goal of SenseLab, launched in 1993 among the first programs in the Human Brain Project, is to provide tools to accomplish this across multiple scales and multiple data types, using the olfactory system as a model. It consists of 8 closely integrated databases and database tools. ORDB (Olfactory Receptor Database) was formed to support research on the largest family in the genome; it now contains over 14,000 genes and proteins. OdorDB is an archive of over 200 odor molecules that are known to interact with ORs. OdorMapDB archives 2-deoxyglucose and high field fMRI spatial activity patterns elicited by the odor molecules in the glomerular layer of the olfactory bulb of mice and rats. SenseLab also contains databases supporting functional studies of neurons and neural circuits. CellPropDB is an archive for synaptic receptors, ion channels, and neurotransmitters expressed by a given neuron type in 18 brain regions. NeuronDB archives these properties in relation to different dendritic and axonal compartments. Both include tools for identifying classes of properties across different neuron types. ModelDB now contains over 700 computational models for neurons and neuronal circuits, with tools for searching for different model types, and ability to the run the models as published or modify them by the user. MicrocircuitDB contains the models devoted specifically to circuits within different brain regions. Finally, BrainPharm is a new initiative to support research on drugs to treat neurological disorders. Rapid navigation of the databases will be demonstrated, and current research in neuroinformatics, dendritic function, and large-scale neural circuits, will be described. Supported by NIDCD.
General neuroinformatics

Neuroinformatics 2012 45
D13 Retistruct: A package to reconstruct flattened retinae
David C Sterratt1, Daniel Lyngholm2, David Willshaw1 and Ian D Thompson2
1. University of Edinburgh2. King’s College London
In the course of studying the function and development of the visual system, cells in the retina are often labelled; for example, to determine the distribution of various types of cell in the retina, to assess the location of retrograde tracer or to measure the distribution of a guidance molecule. Following labelling the retina is dissected and flattened, and the distribution of labels is measured in the flattened retina. The dissection requires a number of incisions to be made and tears in the rim and incisions can develop. This complicates analysis as some cells that were close neighbours are now separated by the incisions. We present a computational method, implemented as an R package (“Retistruct”), that overcomes this problem by reconstructing the 3D shape of the retina so that the positions of the labels in the intact retina can be inferred. The input to the algorithm is the line segments of the flattened retinal outline, with incisions and tears marked up by an expert. The retinal outline is split into triangular elements whose positions are then transformed so that they lie on a partial sphere with the expected dimensions of the intact retina. The transformation is adjusted so as to minimise a physically-inspired deformation energy function. Our validation studies indicate that the algorithm is able to estimate the position of a point on the intact retina to within 8 degrees of arc. Once reconstructed, the retina can be visualised as a 3D object or on polar or sinusoidal projections onto the plane. By inversion and rotating of the optic axis, an estimate of the projection of the reconstructed retina into visual space can be obtained. A number of insights can be gained by using the method. (1) Because retinae are now described in a standard space, it allows for comparison of retrograde tracer experiments from a number of animals and the construction of composite anatomical maps. (2) The regions of the retinae that project onto the left or right dorsal lateral geniculate nucleus (dLGN) can be determined by injecting retrograde tracer into the dLGN (Coleman et al. 2009, Neuroscience 161:561-571; doi: http://dx.doi.org/10.1016/j.neuroscience.2009.03.045 ). Reconstruction allows regions of visual space that correspond to the monocular and binocular regions of the dLGN to be identified. (3) The correspondence between the density of S-opsin receptors and visual space can be measured.
General neuroinformatics

46 Neuroinformatics 2012
P046 TissueStack: a new way to view your imaging data
Andrew Janke, Harald Waxenegger, Jeremy Ullmann and Graham GallowayCenter for Advanced Imaging
It’s no secret that the increases in resolution possible with modern imaging equipment has led to an explosion in data. This increase is not always something that is easy to deal with, especially in studies that involve multiple modalities and sites. University and research networks while continually improving still do not allow those in the neuroinformatics field to seamlessly share multi-terrabye images. This leads to the problem in multi-site studies and often in smaller projects in which no one is sure where or how to access the current version of all the data without having to download TB’s of data, make a small change and then upload again. This problem is not unique to the neuroimaging field and as such we have endeavoured to make use of techniques from the very closely related field of GIS (Graphical Information Systems) in this project. There has been some work done in this area, most notably with the web interfaces of the Allen Brain atlas and CATMAID. Both of these however are primarilly written for the viewing of multiple 2D images, typically of histology. TissueStack is an Open Source project that is currently available on GitHub ( http://github.com/NIF-au/TissueStack ) and at the time of this abstract is in alpha release phase for comment. Its purpose is to allow researchers to view multi-TB imaging datasets online vai an interface style that most people are familiar with (online mapping) at reasonable speed. The application uses HTML5 Canvas elements and thus will work equally well on mobile devices (tablets, phones, etc). The current proof of concept can be viewed at http://www.imaging.org.au/tissuestack and is displaying a 850MB 30um c57/bl mouse
General neuroinformatics
P046 An early release of TissueStack browsing a 850MB 15um mouse brain atlas.

Neuroinformatics 2012 47
model. The application generates multi-scale tiled images from an input dataset in order to optimise viewing speed for a given network connection. Data input formats currently include MINC, NiFTI and OpenSlide formats. Future versions of the application will allow the federation of data from multiple sites and the overlay of pre-aligned muti-modality data such Histology and MRI.
Acknowlegements: This project is supported by the Australian National Data Service (ANDS). ANDS is supported by the Australian Government through the National Collaborative Research Infrastructure Strategy Program and the Education Investment Fund (EIF) Super Science Initiative.
General neuroinformatics

48 Neuroinformatics 2012
P049 Orchestration of web services in the NIF project: using the Kepler workflow engine for data fusion
Vadim Astakhov, Anita Bandrowski, Amarnath Gupta, Jeffery Grethe and Maryann MartoneUCSD
We report on progress of employing the Kepler workflow engine and service oriented architecture (SOA) to prototype application integration workflows that integrate data and web services developed by the Neuroscience Information Framework (NIF). One prerequisite of the scientific enterprise consists of searching for effective and useful data and resources, i.e., reagents, neuro-anatomy features, genes, or proteins. Finding relevant resources is becoming not a challenge of scarcity, but one of overabundance; in fact relevant data can be found anywhere among thousands of neuroscience-relevant information resources created by a range of information providers including, research groups, funding agencies, vendor groups, and public data initiatives. NIF provides a graphical user interface, GUI, to locate and access ontologically aligned and semantically fused heterogeneous federated information. NIF also atomized the various functions that serve the user interface and put them out as services that can be used like “Lego blocks” to query the data, build entirely new interfaces or tools. Currently, we use Kepler to orchestrate communication among various NIF services and provide a transparent layer for data fusion. Kepler combines data and processes into a configurable, structured set of steps that helps to implement semi-automated workflows. Kepler provides a development environment with a graphical user interface for designing workflows composed of a linked set of components called Actors, which can be executed under different Models of Computation. In this work, we report on specific workflows that perform data fusion and orchestration of diverse web services.
This “Brain data flow” (See figures below) outputs categorized counts of information from 150 data sources about brain regions. Obtaining a similar set of data from the NIF GUI, requires manually writing down result counts that are the result values for each database for each query. Kepler, unencumbered by the current configuration of the user interface can be asked to pull a different set of data from the result set, in this case
General neuroinformatics
P049 The figure above shows a workflow, where individual web services called functions are used to transform the results and these are fed into other web services. Each component is configurable, and lines between components connect and transfer data obtained from one type of service, into another. These steps are graphics making conceptualization of a workflow relatively simple.

Neuroinformatics 2012 49
the number of results, and place that into a table. This table can then be easily turned into a graphic that helps users see which databases are information rich given a particular query. In this example, Kepler loops and recovers the same set of information for all of the brain parts and all databases, producing a massive matrix ( http://tinyurl.com/6nkfe9f ).
General neuroinformatics
50 Neuroinformatics 2012
P050 Exploring Mammalian Brain Connectivity using NeuroLex
Anita Bandrowski, Amarnath Gupta, Auroni Gupta, Stephen Larson and Maryann MartoneUniversity of California San Diego
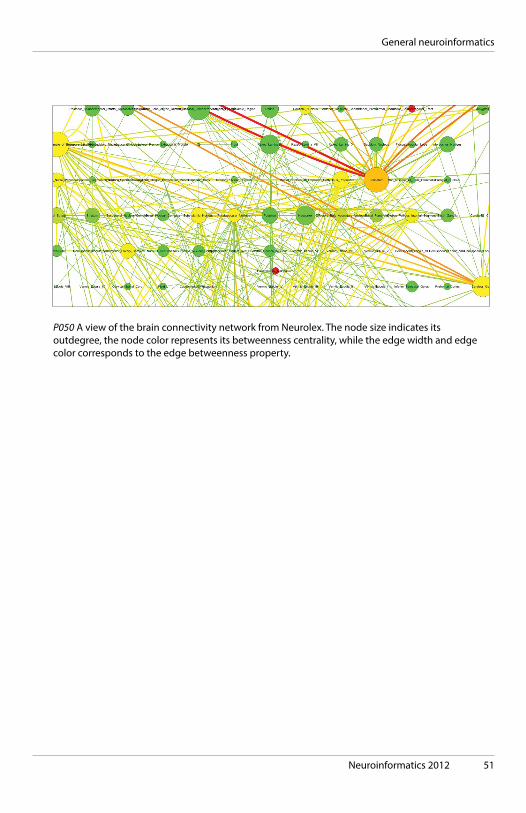
Supported by the Neuroscience Information Framework (NIF) and the International Neuroscience Coordination Facility (INCF), the NeuroLex is a dynamic lexicon of neuroscience terms and terminological relationships created by the neuroscience community. The terms in NeuroLex cover multiple spatial scales from the whole brain to subcellular structures to neuroscience-relevant molecules like neurotransmitters. It represents partonomic relationships in the brain and captures information such as cellular and subcellular synaptic targets of neurons. Herein, we describe the use of the NeuroLex as a graph-structured, ontological database and explore the connectivity structure of the mammalian brain as represented in this database. In some cases, the connections between two brain regions are represented directly. We allow the neuroscience community to fill in a property that asserts a direct brain region level connection such as the red nucleus is connected to the cerebellum, and references for this statement are encouraged. However due to the wealth of cellular data in the NeuroLex, we can also determine which neurons are defined as parts of brain regions, which properties they have, and add significant information about the projection. For example, a connection can be inferred to be inhibitory because a neuron within a brain region is a ‘projection neuron’ that releases GABA as a neurotransmitter, two properties provided in the neuron list. Using this approach, we can capture a great deal of information that does not need to be directly coded. These data will inform the NIF instance data search functions, such as individual connectivity statements made based on published reports aggregated in CoCoMac or BAMS, and resting MRI connectivity maps. We have computed several network characteristics of this connectivity network including its degree distribution, several centrality measures of its nodes and edges, as shown in the Figure. In the poster, we will also present a multiscale analysis of the network, by combining it with the ontological relationships representing the partonomy of the brain.
General neuroinformatics
Neuroinformatics 2012 51
P050 A view of the brain connectivity network from Neurolex. The node size indicates its outdegree, the node color represents its betweenness centrality, while the edge width and edge color corresponds to the edge betweenness property.
General neuroinformatics

52 Neuroinformatics 2012
P054 Modeling neuroanatomical experimental design using the Ontology of Experimental Variables and Values (OoEVV)
Gully A.P.C. Burns1, Marcelo Tallis1 and Jessica Turner2
1. Information Sciences Institute / University of Southern California2. Mind Research Network / University of New Mexico
The Knowledge Engineering from Experimental Design (KEfED) approach provides a tool-driven methodology for describing experimental observations based on dependency relationships between variables. We here describe ‘the Ontology of Experimental Variables and Values’ (OoEVV), a modular ‘Ontology Design Pattern’ (ODP) to provide a reusable set of components that enable the curation of terminologies for use within KEfED models that may be linked to formal ontological definitions where required. This system provides an ontology curation methodology for all semantic components of the KEfED modeling approach (including entities, processes and variables used in the experimental protocol). We present a particular type of variable for representing neuroanatomical data spatially. These variables can be used to describe injection sites, tracer labeling locations, or gene expression regions. We make available alternative metrics to express neuroanatomical locations for curators to choose the one that better fits their needs. For example, we provide one metric for describing locations qualitatively in relation to atlas based neuroanatomical subdivisions while we also provide another metric for describing locations quantitatively in relation to a stereotactic coordinate system. In any case, the referenced spatial framework is explicitly represented enabling bioinformatics systems to implement some means for comparing data expressed in different metric systems. Although the system is designed to offer the smallest possible ontological commitment for any given experimental variable, we provide a mechanism to link OoEVV elements to other ontologies. Finally, the system is consistent with ontological best practices in terms of providing good definitions and documentation, reuse of terminology wherever possible and compatibility with existing ontology formats and standards. We provide a practical curation toolset that may be used by domain experts to develop a structured lightweight terminology that may be accessed via the NCBO’s Bioportal.
General neuroinformatics

Neuroinformatics 2012 53
P055 Representation of the NeuroNames Ontology in OWL
Douglas Bowden1, Fahim Imam2 and Maryann Martone3
1. University of Washington - Seattle2. Fahim Imam [[email protected]]3. University of California at San Diego (UCSD)
The goal of this project is to make NeuroNames contents accessible and reusable via modern tools of Semantic Web technologies. It is an on-going project to convert the NeuroNames (NN) specification of relations between ~16000 structure names in eight languages, ~2800 neuroanatomical concepts and ~20 hierarchical models. NeuroNames, which supports the BrainInfo web portal ( http://braininfo.org ), is being translated into an ontology in W3C standard Web Ontology Language (OWL). Since the contents of NN in BrainInfo are under continuous development, this project will also develop a software tool that can automate the updating process of the corresponding OWL version on a regular basis. Major phases of the project include:
Development of Test Cases by which to demonstrate utility of the product, such as automated ways to generate human readable hierarchies from the ontology database; mediation of data exchange based on standardized metadata; exploitation of logical inference in responding to specific kinds of query.
Identification of Existing Protocols developed for NIFSTD that can be applied to the conversion and outline protocols to incorporate the remaining knowledge base of NN Use OWL API tools to develop a first draft of the ontology with simple constraints extracted from NN, augmenting more rigorous relations manually or semi-automatically and utilizing OBO-RO for object properties and IAO for annotation properties.
Integrate information on the presence or absence of structures in the four species most studied by neuroscientists: human, macaque, rat and mouse.
Integrate information from NN on brain structures that do not map to the boundaries of classical neuroanatomical structures but whose overlaps can be represented in OWL The OWL document will be made available from a permanent URL and will be accessible through the INCF portal via the PONS and the NCBO Bioportal.
This work supported by grants from INCF, Office of the Director (ORIP), NIH and USPHS grant RR00166.
General neuroinformatics
54 Neuroinformatics 2012
P059 Reducing duplication and redundancy in declarative model specifications
Robert Cannon1, Padraig Gleeson2, Sharon Crook3 and Angus Silver2
1. Textensor Limited2. University College London3. Arizona State University
Methods for storing and sharing biological models, whether by scripts, or with declarative languages such as SBML or CellML, tend to focus on directly encoding a model and its equations. However, many models share essentially the same equations, except for differences in parameter values or the number of instances of particular processes. We have therefore developed a mechanism within NeuroML[1] whereby the common structural and mathematical features of a family of models can be expressed separately from the parameter values that make up a particular member of the family. Specifications in this form correspond closely to the conceptual understanding that modelers have of the systems they work on. Supporting this style of description allows models to be expressed more concisely than if flatter structures are used since it avoids repeating common elements. It also enables a wide range of model related processing beyond simply executing them, including systematic comparisons, archiving, model composition, and sensitivity analysis. The resulting system, known as LEMS (Low Entropy Model Specification), has been developed to meet the needs of NeuroML but can also be applied to other declarative model specifications. It makes it possible to retro-fit most of the existing high level concepts ion NeuroML version 1 with domain independent definitions built out of the LEMS elements. This preserves the benefits of the existing semantically rich high-level concepts while adding the ability to extend it with new concepts at the user-level rather than requiring changes to the language. Simulator developers have a choice between directly supporting the library of core types in NeuroML or supporting the underlying LEMS definitions. Libraries are available in both Java and Python to allow simulator developers to work with LEMS models without having to implement the low level support themselves. These include options for flattening models into sets of simultaneous differential equations, and for code generation to create standalone executable units.
References 1. Gleeson P, Crook S, Cannon RC, Hines ML, Billings GO, et al. NeuroML: A Language for Describing Data Driven Models of Neurons and Networks with a High Degree of Biological Detail. PLoS Comput Biol 6(6): 2010, e1000815. doi:10.1371/journal.pcbi.1000815
General neuroinformatics
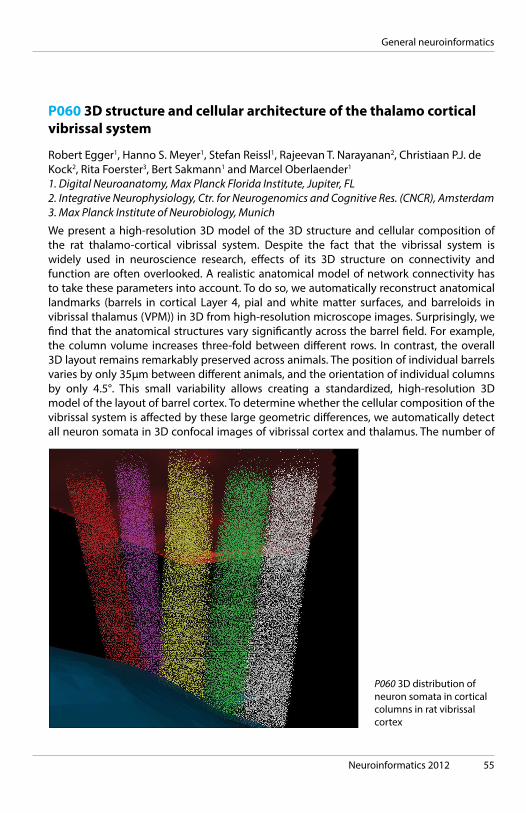
Neuroinformatics 2012 55
P060 3D structure and cellular architecture of the thalamo cortical vibrissal system
Robert Egger1, Hanno S. Meyer1, Stefan Reissl1, Rajeevan T. Narayanan2, Christiaan P.J. de Kock2, Rita Foerster3, Bert Sakmann1 and Marcel Oberlaender1
1. Digital Neuroanatomy, Max Planck Florida Institute, Jupiter, FL2. Integrative Neurophysiology, Ctr. for Neurogenomics and Cognitive Res. (CNCR), Amsterdam3. Max Planck Institute of Neurobiology, Munich
We present a high-resolution 3D model of the 3D structure and cellular composition of the rat thalamo-cortical vibrissal system. Despite the fact that the vibrissal system is widely used in neuroscience research, effects of its 3D structure on connectivity and function are often overlooked. A realistic anatomical model of network connectivity has to take these parameters into account. To do so, we automatically reconstruct anatomical landmarks (barrels in cortical Layer 4, pial and white matter surfaces, and barreloids in vibrissal thalamus (VPM)) in 3D from high-resolution microscope images. Surprisingly, we find that the anatomical structures vary significantly across the barrel field. For example, the column volume increases three-fold between different rows. In contrast, the overall 3D layout remains remarkably preserved across animals. The position of individual barrels varies by only 35μm between different animals, and the orientation of individual columns by only 4.5°. This small variability allows creating a standardized, high-resolution 3D model of the layout of barrel cortex. To determine whether the cellular composition of the vibrissal system is affected by these large geometric differences, we automatically detect all neuron somata in 3D confocal images of vibrissal cortex and thalamus. The number of
P060 3D distribution of neuron somata in cortical columns in rat vibrissal cortex
General neuroinformatics

56 Neuroinformatics 2012
neurons in a column varies from 9300 to 29000 across the vibrissal cortex. In contrast, the density of neurons and inhibitory interneurons is constant in all columns (81,000/mm^3 and 8,000/mm^3, respectively). The number of neurons in a barreloid varies from 90 to 400 across VPM. Despite these large variations, the number of cells in a cortical column correlates strongly with the number of cells in the corresponding barreloid in VPM. Further, because the number of neurons in individual columns is preserved between different animals, registration of individual 3D neuron distributions to the standardized 3D barrel cortex allows creating a standardized average 3D neuron distribution. These results show that despite large differences between different columns and barreloids, the 3D layout and cellular composition of individual columns and barreloids is well-preserved between different animals. This allows creating a standardized 3D model of the geometry and cellular composition of the vibrissal system. Further, these results indicate that a cortical column may not be the elementary functional unit of mammalian cortices, as is commonly believed.
General neuroinformatics
Neuroinformatics 2012 57
P063 XCEDE-DM: A neuroimaging extension to the W3C provenance data model
Satrajit Ghosh1, Nolan Nichols2, Syam Gadde3, Jason Steffener4 and David Keator5
1. Massachusetts Institute of Technology2. Integrated Brain Imaging Center, University of Washington, Seattle, WA3. Brain Imaging and Analysis Center, Duke University, Durham, NC4. Columbia University, New York, NY5. Department of Psychiatry and Human Behavior, Department of Computer Science; Univer-sity of California, Irvine
Sharing, querying, and analyzing neuroimaging data requires a standard description that provides information applicable to data reuse and exchange. Analysis tools and databases that can expose and consume data using a standard model become interoperable and thus more accessible to researchers. To date, data models have focused on a hierarchical syntax that maps well to the relational database world; however, the heterogeneous schemas utilized by neuroimaging databases (e.g., HID, IDA, LORIS, XNAT) have required significant data integration efforts; for example, complex mediators [1] to map schemas, rewrite database specific queries, and retrieve results across systems. The results from such systems conform to a schema, and in the case of mapping between XNAT and HID, query results are returned using XCEDE [2] formatted data. XCEDE serves as a specification for the exchange of scientific data between databases, analysis tools, and web services. It provides a structured metadata hierarchy for storing information relevant to various aspects of an experiment (e.g., project, subject, etc.) along with derived data and provenance. XCEDE-DM abstracts the implicit hierarchical data model described by the XCEDE schema into a technology agnostic syntax, which can then be serialized (e.g., into XML, JSON, RDF, etc.). Further, explicit data modeling facilitates broader use of web service specifications and database mediation services by defining a reusable representation of objects and their relationships, rather than re-creating new models for every data sharing activity. XCEDE-DM is derived from the W3C PROV model [3], captures provenance not as an afterthought but as explicitly modeled relationships between entities, activities and agents, and is related to other INCF efforts defining a common query api and lexicon for neuroimaging. XCEDE-DM can capture complete details of a neuroimaging process including people and their roles, acquisition and analyses. Although we focus on neuroimaging, the model is applicable to the entire domain of neuroinformatics.
This work was conducted with the Neuroimaging Task Force of the INCF Program on Standards for Datasharing.
References 1. Ashish et al. (2010) Neuroscience Data Integration through Mediation: An (F) BIRN Case Study. Front. Neuroinform. doi: http://dx.doi.org/10.3389/fninf.2010.00118 2. Gadde et al. (2012) XCEDE: an extensible schema for biomedical data. Neuroinformatics. doi:10.1007/s12021-011-9119-9 3. http://www.w3.org/TR/prov-dm
General neuroinformatics

58 Neuroinformatics 2012
P064 Connecting Brain Imaging Terms to Established Lexicons: a Precursor for Data Sharing and Querying
Karl Helmer1, Satrajit Ghosh2, B. Nolan Nichols3, David Keator4, Thomas Nichols5 and Jessica Turner6
1. Massachusetts General Hospital2. Massachusetts Institute of Technology3. University of Washington4. University of California, Irvine5. University of Warwick6. The Mind Institute
For data sharing to be useful, data must not only be stored in an organized fashion, but metadata that captures information about how the data was acquired, processed, and analyzed, must also be available. Additionally, metadata must describe data using unambiguously defined terms. Efforts are underway to provide lexicons of brain imaging terms to the neuroscience community. Two examples are NeuroLex[1] and RadLex[2]; lexicons for the domains of neuroscience and radiology, respectively. While NeuroLex follows the OBO[3] principle of always defining a term, RadLex identifies relationships among terms, but often without definitions. On the other side are data and tool repositories which may have a defined schema or a fixed set of terms, but do not provide definitions. Therefore, users may not know precisely what is meant by each term. The lack of standardized terms makes it difficult for query tools to search across collections at different institutions and makes data provenance information ambiguous. The goal of this project is to provide definitions for terms used in each stage of the data lifecycle of brain MRI-based experiments and place the terms within NeuroLex and RadLex. We have begun our efforts with terms used in the acquisition phase. The source of the terms are 1) the XCEDE schema[4], 2) common and private DICOM fields[5], 3) NITRC database query terms[6], and 4) BIRN’s Human Imaging Database (HID) terms[7]. In some cases, connecting terms were added to the lexicons to connect the new set of terms with those already in the lexicons. This work expands existing lexicons with terms commonly used in MRI-based neuroimaging and will enhance the ability to query across data and tool collections.
This work was conducted within the Derived Data Task Force of the International Neuroinformatics Coordinating Facility Program on Standards for Datasharing. KGH, DK, and JT are also supported by BIRN (1U24-RR025736, U24-RR021992) and KGH is supported by by the Collaborative Tools Support Network Award (1U24-RR026057-01).
References: 1) http://neurolex.org2) http://www.radlex.org3) http://www.obofoundry.org http://www.xcede.org4) http://medical.nema.org/5) http://www.nitrc.org6) http://www.birncommunity.org/[…]/
General neuroinformatics

Neuroinformatics 2012 59
P067 Simulator for Realistic High-Density Microelectrode Array Signals
David Jäckel1, Felix Franke1, Urs Frey2 and Andreas Hierlemann1
1. ETH Zurich, Department of Biosystems Science and Engineering2. RIKEN, Quantitative Biology Center
High-density microelectrode arrays (HD-MEAs), which allow for performing extracellular recordings at subcellular resolution, have become an important means to study the information processing of neuronal networks. The large number of recording electrodes and the highly redundant nature of HD-MEA data, however, pose challenges to the analysis so that appropriate strategies and novel spike-sorting techniques have to be developed. In order to evaluate the performance of spike sorting techniques for HD-MEA recordings, simulated data can be used, for which the spike trains of the neurons are known. Here we present a toolbox for simulating realistic neuronal HD-MEA signals, implemented in Matlab. The simulator uses a library of well-isolated templates (model templates), which were extracted from HD-MEA recordings using manually supervised spike sorting (see Figure 1). The spatial resolution of the model templates is increased by interpolating on a grid (typically 5 µm pitch). By modifying orientation, amplitude and spatial extension of the model templates, individual neuronal templates are simulated. The modified templates can be positioned over the array, allowing for simulating a wide range of neuronal arrangements. The positioning of the electrodes is arbitrarily set by the user, which allows evaluating the spike sorting performance for different electrode configurations. Individual spike trains are assigned to the simulated neurons. A noise signal, recorded under experimental conditions with a preparation on the array that had no visible spiking activity, is then added to the simulated spike data. Additionally, neuronal background noise can be simulated adding numerous neurons spiking with low amplitudes. The resulting signal is quantified to a least significant bit as the one used in the measurements. The presented simulator for neuronal high-density MEA recordings has been used in [1] to evaluate the performance of independent-component-analysis-based spike sorting for HD-MEA retinal recordings. It was also used to simulate activity of Purkinje cells in cerebellar brain slices, and can be used for other biological preparations.
[1] D. Jackel, U. Frey, M. Fiscella, F. Franke, and A. Hierlemann, “Applicability of Independent Component Analysis on High-Density Microelectrode Array Recordings,” J Neurophysiol, p. jn.01106.2011-, Apr. 2012.
General neuroinformatics

60 Neuroinformatics 2012
General neuroinformatics
P067 Extracting a neuronal template from retinal ganglion cell recordings. Left: Band-pass filtered (0.5-3 kHz) recordings on six selected electrodes (depicted on the right plot). The identified spikes from one neuronal unit are drawn in black. Center: Close-up view of one spike. Right: Spatial distribution of waveforms obtained by spike-triggered averaging.

Neuroinformatics 2012 61
P069 SignalML 2.0
Zbigniew Jędrzejewski-Szmek1, Aleksander Michalski2, Kamil Góźdź3, Jakub Hałun3, Grzegorz Stadnik3, Joanna Jędrzejewska-Szmek1, Paweł Kordowski1 and Piotr Durka1
1. Faculty of Physics, University of Warsaw2. Nencki Intitute of Experimental Biology3. Ericpol
SignalML is an XML-based language for description of biomedical time series formats, originally proposed in [1]. Independent of platform and programming language, it is a meta-format which describes other formats. SignalML acts as an import/export interface for other software: descriptions of formats are written once, without the need to write actual code to handle separate formats or employ SignalML in software written in different languages. SignalML 2.0 treats each file as a source of parameters (data of the ‘header-type’: sampling rate, number of channels, date of recording, etc.) and raw signal data. Format description provides information about the location of parameters within files, description of other parameters to be calculated using those read from files, and of the layout and format of samples. Notable new features of SignalML include: * a specification of the way that a description of a format in SignalML should be interpreted. This includes the most basic algebraic expressions, allowing to create a SignalML support library in any programming language, * generalization of the descriptions: o the ability to specify multiple files, with individual formats, o generalization of layouts due to a configurable mapping function calculating sample positions, o support for more binary representations (big-endian, little-endian, different widths, hexadecimal and octal prefixes in text representation), o ability to use convenient algebraic expressions referring to other parameters wherever a value must be provided, SignalML tries to reuse existing standards and conventions: * XML is used as the lexical layer of SignalML; * XPath is used to extract information from other XML files; * the expression language is largely based on Python; * regular expressions are Perl-compatible; * variable types (int, float, string, bytes) and the textual representation of numbers are taken directly from Python 3.x; *bit layout of values in binary files is described using dtype from NumPy; *units are represented using standard SI notation, including Greek prefixes. Svarog (Signal Viewer, Analyzer and Recorder on GPL, http://svarog.pl ) is using an implementation of SignalML 2.0.
[1] SignalML: metaformat for description of biomedical time series. Durka, P. J. and Ircha, D. Computer Meth Prog Biomedicine 2004, vol. 76, pp. 253-259
General neuroinformatics

62 Neuroinformatics 2012
General neuroinformatics
P069 signalml.org

Neuroinformatics 2012 63
P070 Spike sorting for large dense arrays
Shabnam N. Kadir1, Dan F.M. Goodman2, John Schulman3, Gyorgy Buzsaki4 and Kenneth D. Harris5
1. NYU Langone Medical Center, New York/Imperial College London2. Ecole Normale Superieure, Paris3. Berkeley, California4. NYU Langone Medical Center, New York5. Imperial College London
Recent developments in electrode manufacture allow simultaneous recording from hundreds of channels, allowing in principle the monitoring of thousands of neurons simultaneously. Existing automatic spike sorting algorithms, however, are not scalable to such high channel-count data. The greatest challenge is that of temporally overlapping spikes: Current spike detection and sorting methods fail when two spikes occur simultaneously. For small arrays such as 4-channel `tetrodes’, temporal overlaps were rare and thus only a minor source of error. For large, dense electrode arrays, however, this is the rule, not the exception. At present, the most common approach to sorting large array data in cortex is to arbitrarily divide the recording sites into `virtual tetrodes’, which are then sorted using standard methods. This ad-hoc approach is not only inconvenient, labour-intensive and subjective, but also introduces serious errors as spike waveforms inevitably cross the boundaries of the virtual tetrodes. We introduce a new system for sorting high channel count data. Firstly, a new spike detection system is implemented in the program `SpiKeDeTeKt’, which uses knowledge of the probe geometry to perform a space-fill algorithm that groups spatially and temporally contiguous superthreshold samples. It produces for each detected spike a list of adjacent `unmasked’ channels on which there are supra-threshold spike waveforms, and a list of `masked’ channels on which there is only noise. Temporally overlapping but spatially separated spikes are represented through different lists of masked channels. In the second step, we introduce a new version of KlustaKwik which implements a novel `distributional EM algorithm’ to deal with masked data. This is a modified version of a standard hard-EM algorithm for a mixtures of Gaussians, with the features on masked channels replaced with a fixed probabilistic model. This ensures that temporally overlapping spikes do not corrupt the sorting process, and that noise from the large number of subthreshold channels does not swamp the signal from the few suprathreshold channels. To test the efficacy of our algorithm we create a `hybrid data set’ where groundtruth is available through the addition of a set of spikes from one recording to a second recording made with the same probe. Performance of the new algorithm is comparable to that achieved by supervised learning based on groundtruth, suggesting that performance is close to optimal.
General neuroinformatics

64 Neuroinformatics 2012
P071 COINS (Collaborative Informatics Neuroimaging Suite): Give, Get, Collect
Margaret King, William Courtney, Jessica Turner, Runtang Wang, Dylan Wood and Vince CalhounThe Mind Research Network
Neuroimaging research produces vast amounts of data. This data needs to be well organized, collected efficiently and, if desired, prepared for sharing. The Collaborative Informatics Neuroimaging Suite (COINS) offers tools to: Give - share existing data with other researchers, Get - acquire data from other researchers, and Collect - manage studies from beginning to end. COINS currently manages more than 400 studies. It stores over 232,000 assessments and 23,000 scans collected from 16,000 subjects at the Mind Research Network, the Nathan Kline Institute, University of Colorado – Boulder, the Olin Neuropsychiatry Research Center, and other sites. Give - Legacy clinical assessment data is imported into COINS’ Assessment Manager through csv files. Legacy imaging data is uploaded to a restricted file system and COINS through a DICOM receiver. Get - All data in the system is made available for download. The Data Exchange is an interface for investigators to browse, request and share data. The Data Catalog is available for imaging data and clinical assessments. This tool gives the user an idea of the quantity and types of data that have been collected from participating investigators. The Data Exchange also tracks data requests and keeps an inventory of data that has already been shared between users. Collect - COINS has tools to make study management and data collection easier and more efficient. MICIS (Medical Imaging Computer Information System) is the PostgreSQL-based web application that manages participant enrollment, scan (MEG, EEG, MRI) data and annotation, behavioral data, radiology review reports, and scan billing. An automated DICOM receiver collects, archives, and imports imaging data. Assessment Manager (ASMT) collects assessment data through several different data entry options including; self assessment, single entry and double entry. The Query Builder supports secure ad-hoc querying of scan, demographic and assessment data. Study portals serve as a collaboratory for monitoring enrollment and data entry progress, document exchange, etc. My Security controls account creation for the MICIS, ASMT, Query Builder and study portals and manages user access using role-based granularity. The COINS user interface is designed to present research information in an efficient way that also does not expose PHI. Collected data is linked to each subject via a randomized unique research identifier, which is connected to encrypted subject identification data.
General neuroinformatics

Neuroinformatics 2012 65
P071 COINS Tools: MICIS - Participant enrollment and management, MRI imaging data import, Scan annotation and behavioral data management, Radiology review event reports, Scan time billing. DICOM Receiver - Automates image archiving to file system and storage of meta-data to MICIS. Assessment Manager - Single and double entry as well as self assessment. Query Builder - Secure, ad-hoc querying of single and cross-site studies for assessments, scans and demographics. Study Portals - Progress reports for subject tracking, shareable documents (study measures, meeting notes, etc.). Data Exchange with Data Catalog - Browse, request and share data, available for imaging data and clinical assessments, tracks data requests and keeps an inventory of data.
General neuroinformatics
66 Neuroinformatics 2012
P072 PCA-VisData - a new Evaluation and Visualization Tool Using the Database RodImAnD for Analysis of Rodents Brain Function in Drug Research
Laura Cristina Konerth1 and Andreas Hess2
1. Instit. of Pharmacology, FAU Erlangen-Nuremberg2. Instit. of Pharmacology, FAU Erlangen-Nuremberg, INCF: Digital Atlasing Infrastructure Task Force
Purpose: Functional brain imaging by MRI (fMRI) allows repetitive, non-invasive measurements of CNS functions. By combining it with mouse genomics, which provides mice with defined genetic deviations, gene-drug-interactions can be investigated. The huge amount of functional MR data can be administrated by the in-house developed relational database RodImAnD (Rodents Imaging and Analyses Database, L. Konerth, INCF, 2010), which permits the structured organization as well as a dynamic and interactive access to the data. To reduce the complexity of the data and to perform higher order statistical analysis with minimal interaction and calculation periods, we aimed at developing a software tool, which permits: (1) interactive access to the data stored in the database, (2) higher order statistical evaluation, starting with a Principal Component Analysis (PCA) and (3) the graphical 2D- or 3D- representation of the results.
Method: Our database RodImAnD uses the relational MySQL database management system. Its scheme reflects the workflow of our functional experiments (fig. 1). Both the major image analysis tool used in our working group, MagnAn, and our new developed evaluation and visualization tool, PCA-VisData, are based on IDL (® Exelis VIS), a high-level development environment for data analysis and visualization. Data exchange from the database to both analysis tools is made possible through a Java-based bridge. After the interactive selection of initial data (the time profiles of chosen brain structures), and the calculation of the average response parameters for the selected group of animals, the interactive sorting of the calculated data in variables and groups is made and the Principal Component Analysis (PCA) is performed. The obtained results can then be visualized in 2D- or 3D-graphics, as chosen by the user.
Results: We obtained a new evaluation and visualization tool which permits the interactive data selection from the database, allowing for more efficient data reading and much faster processing. By performing PCA, as a first step, it reduces the data dimensions and represents the data graphically along the principal axes defined by the eigenvectors. This allows for highlighting the similarities and differences within selected study-groups.
Conclusion: The presented tool allows for easy integration of databases with interactive high level statistical analysis of brain function and supports data sharing/collaboration with other users.
General neuroinformatics
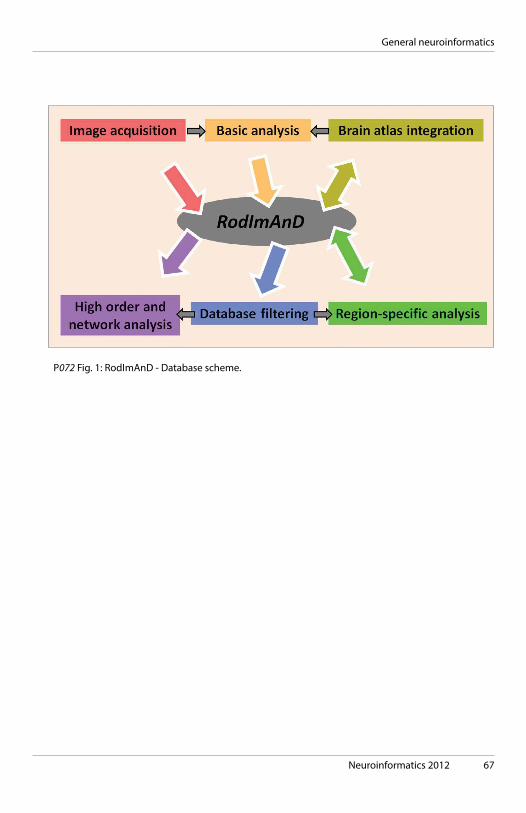
Neuroinformatics 2012 67
P072 Fig. 1: RodImAnD - Database scheme.
General neuroinformatics
68 Neuroinformatics 2012
P075 NIQuery: Neuroimaging Informatics Query Framework for Data Sharing, Discovery, and Analysis
B. Nolan Nichols1, Robert F. Dougherty2, Landon T. Detwiler1, Gunnar Schaefer2, Randall J. Frank1, James F. Brinkley1, Brian A. Wandell2 and Thomas J. Grabowski1
1. Integrated Brain Imaging Center, University of Washington, Seattle, WA2. Center for Cognitive and Neurobiological Imaging, Stanford University, Stanford, CA
Scientific discovery about the human brain will be accelerated by neuroinformatics services on the programmable web. Just as bioinformatics databases provide services for molecular data, a scalable service-oriented framework is needed to take advantage of the large number of human neuroimaging data sets now available online. We have developed a specification, NIQuery, for remote access to observation-level data in distributed and heterogeneous image-specialized databases. NIQuery integrates emerging open source standards for metadata description, access & query, and provides investigators with computational access to voxel-level data. The protocol supporting this functionality consists of: 1) a persistent Session object that wraps databases (e.g. XNAT[1], NIMS[2], Allen Institute[3]), exposes the NIQuery application programming interface, and serves objects and requests; 2) a Query object that provides a mechanism to interrogate databases with user defined and/or predefined web-accessible queries; 3) a Data object conforming to a supported ‘image’ data model (e.g., DICOM, NIfTI, etc.) that provides a mechanism to return pixel data to an application; and 4) a Workflow object through which a server provides a computational service on a Data object. A registry service (www.niquery.org) provides an index of available NIQuery servers, as well as the query, data, and workflow objects available on each server. NIQuery enables client applications to discover shared neuroimaging data using metadata-level distributed queries and then execute image processing workflows on discovered data at their source, on a cached copy in the cloud, or locally. A sample implementation of this framework involves exporting a snapshot of XNAT and NIMS databases into XCEDE XML files, indexing the snapshots with the NIQuery registry service, and remotely calculating quality control metrics on resting-state fMRI data. These informatics tools will support agile exploration and reuse of open access neuroimaging data.
References 1. Marcus DS, Olsen TR, Ramaratnam M, Buckner RL. The Extensible Neuroimaging Archive Toolkit: an informatics platform for managing, exploring, and sharing neuroimaging data. Neuroinformatics. 2. Neurobiological Image Management System. http://github.com/cni/nims 3. Zeng H, et. al. 2012. Large-Scale Cellular-Resolution Gene Profiling in Human Neocortex Reveals Species-Specific Molecular Signatures. Cell.
General neuroinformatics
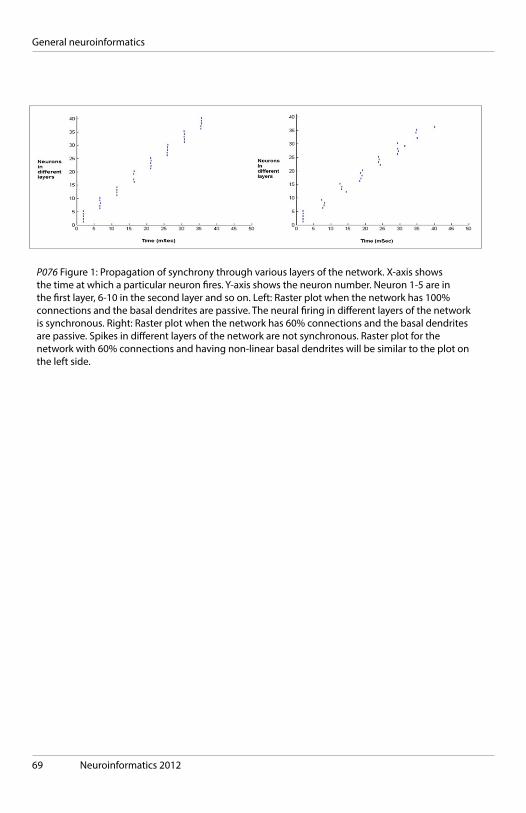
69 Neuroinformatics 2012
General neuroinformatics
P076 Figure 1: Propagation of synchrony through various layers of the network. X-axis shows the time at which a particular neuron fires. Y-axis shows the neuron number. Neuron 1-5 are in the first layer, 6-10 in the second layer and so on. Left: Raster plot when the network has 100% connections and the basal dendrites are passive. The neural firing in different layers of the network is synchronous. Right: Raster plot when the network has 60% connections and the basal dendrites are passive. Spikes in different layers of the network are not synchronous. Raster plot for the network with 60% connections and having non-linear basal dendrites will be similar to the plot on the left side.

Neuroinformatics 2012 70
General neuroinformatics
P079 The Informatics Backbone of the Brain Genomics Superstruct Project Open Data Release
Timothy O’Keefe1, Victor Petrov1, Gabriele Fariello1, Avram Holmes2 and Randy Buckner2
1. Harvard University, Neuroinformatics Research Group2. Harvard University, Center for Brain Science
Large scale imaging data sets are necessary to address complex questions regarding the relationship between brain and behavior. Generating, storing and analyzing the required data are a daunting enterprise for many independent research groups. In 2007, the Open Access Series of Imaging Studies (OASIS) sought to remove these obstacles by developing a distribution model for free and reusable magnetic resonance imaging data sets (Marcus et al., 2007). The community has benefited from these and other open data initiatives including the 1000 Functional Connectomes Project (Biswal et al., 2010) and the upcoming NIH Human Connectome Project data release (Van Essen et al., 2012). The availability of open data creates opportunities for researchers to contribute scientifically while spending less time and resources gathering independent, and often redundant, data. In the spirit of these initiatives, the Brain Genomics Superstruct Project Open Data Release presented here reflects the public release and informatics behind a uniform, high-quality collection of neuroimaging, cognitive, behavioral and derived data for 1,500 human participants. These data sets will be available from a hosted or downloadable installation of the eXtensible Neuroimaging Archive Toolkit (XNAT; Marcus et al., 2007). Each data set will contain T1-weighted and bandwidth-matched T2-weighted structural data, low-resolution DTI, resting state BOLD acquisitions and, for a subset of subjects, DSI data amenable to tractography. Demographic, cognitive (e.g., WAIS III, WMS III), personality (e.g., STAI-T, NEO) and lifestyle metrics will also be provided. Each data set will be accompanied by a fully-automated quality assessment of functional acquisitions, manual quality assessments of anatomical acquisitions, and pre-computed analyses of intrinsic connectivity (Van Dijk et al., 2010) and morphometrics (Fischl et al., 2000; 2004). We will present details regarding the underlying informatics needed to capture, vet and publicly expose these data. We expect that this Brain Genomics Superstruct Project Open Data Release will prove a valuable resource, fueling discoveries, particularly within the NIH Human Connectome Project.
71 Neuroinformatics 2012
P081 Datajongleur - controlling data objects and data models with Python at the neuroscientist’s workbench
Philipp Lothar Rautenberg1, Andrey Sobolev1, Michael Stransky2 and Thomas Wachtler1
1. Ludwig-Maximilans Universität München, Department of Biology, G-Node, Planegg-Martin-sried2. Ludwig-Maximilians-Universität München, Institute for Computer Science, Munich
Scientific progress depends increasingly on data management efforts that involve storing and structuring data, querying and analyzing data, exchange of data, and re-analysis of previously recorded data. This causes a major barrier to fully exploit the scientific potential of experimental data. In order to make data analysis, re-analysis, and data sharing efficient, data management has to start at the local workbench closely linked to the analysis methods used by the scientist. We present the python package Datajongleur which supports the scientist in controlling single data objects when writing scripts and software with Python for analyzing scientific data. Datajongleur provides predefined objects representing scientific data, such as recorded signals together with corresponding units – but also objects representing domain-specific measurements like spike trains (domain of electrophysiology) or morphological skeleton trees (domain of morphology) . These objects can be loaded from, changed, and stored within a relational database like PostgreSQL [1] (server based) or SQLite [2] (file based). Furthermore, single data objects can be arranged within domain specific data models, thus adding information about the relations between data objects. Datajongleur handles domain specific data models as extensions. Some recently evolving data models are already implemented at a corresponding stage of development, such as neo [3] which is a data model with objects for the domain of electrophysiology, or libNeuroML [4] with object for the damain of morphology. In addition, scientists can write their own extensions if necessary. Together, Datajongleur bridges a gap between persistent data storage realized with relational database technology on the one side and single data objects that can be arranged as data models on the other side. This facilitates data management for the scientist on the level of scripting and programming where data analysis takes place.
Supported by the Federal Ministry of Education and Research (BMBF, grant 01GQ0801 and grant 01GQ1116).
[1] http://www.postgresql.org/ [2] http://www.sqlite.org/ [3] http://neuralensemble.org/trac/neo [4] https://github.com/NeuralEnsemble/libNeuroML/
General neuroinformatics

Neuroinformatics 2012 72
P083 High-speed simulation of the dynamic neural responses of retinal and cortical simple neurons to complex visual scenes using general purpose computing on graphics processing units.
Osamu Shouno and Hiroshi TsujinoHonda Research Institute Japan Co., Ltd.
The spatiotemporal properties of single-cell responses to light have been investigated using simple visual stimuli in physiological experiments, and models of neuronal responses have been constructed on the basis of these experiments. However, incoming visual images from natural environments to the retina are spatiotemporally more complex. Therefore, these models are not enough to fully explain the visual functions of retinal and cortical neurons. To understand the visual functions of neurons in the neural visual processing system, the two-dimensional responses of neuronal models to time-varying scenes from natural environments should be studied through real-time observations.
The retinal bipolar and amacrine cells exhibit a center-surround antagonistic spatial receptive fields but they exhibit different temporal properties in responses to light, known as sustained and transient responses, respectively. The cortical simple cells have a Gabor-function spatial receptive fields with a temporal receptive fields varying over hundreds of milliseconds. These spatial properties of receptive fields are modeled as a spatial convolution with a large two-dimensional digital filter kernel, which requires large computational costs. Additionally, these temporal properties of receptive fields are often implemented as a temporal convolution using a lookup table,which also requires large computational costs. Therefore, the size and operation speed of a model are often limited by a finite amount of available computational power at a time of a conventional digital computing system based on sequential processing..
A general purpose computing on graphics processing units is a highly effective approach for speeding up simulations of visual processing systems. In the present study, we have developed a high-speed simulator running on a single GPU which reconstructed the corresponding neural images formed by retinal and cortical simple neurons with physiologically reasonable spatiotemporal properties by virtue of the efficacy of parallel processing of GPU. Here, we conducted simulations for computer-generated, time-varying visual scenes with 256 x 256 sustained and transient retinal neurons and eight sets of 128 x 128 cortical simple neurons of separable and non-separable space-time receptive fields of different preferred orientations at 80 frames per second using a NVIDIA Quadro 4000 for Mac.
General neuroinformatics
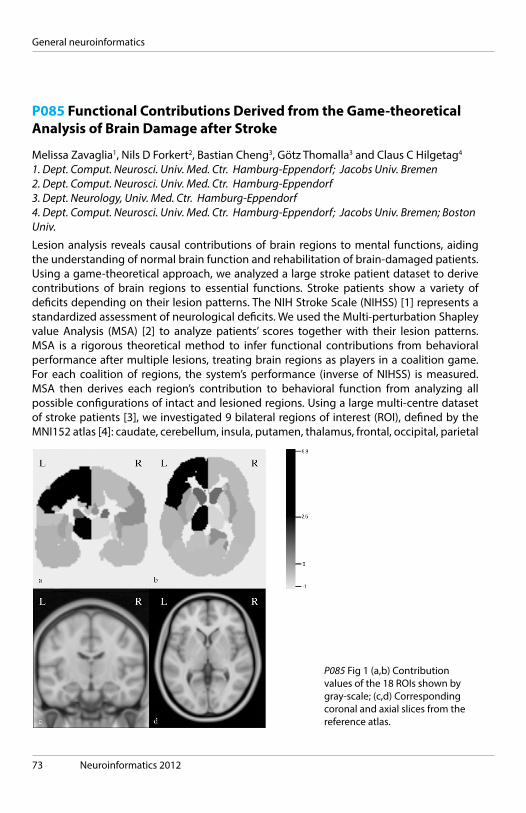
73 Neuroinformatics 2012
General neuroinformatics
P085 Functional Contributions Derived from the Game-theoretical Analysis of Brain Damage after Stroke
Melissa Zavaglia1, Nils D Forkert2, Bastian Cheng3, Götz Thomalla3 and Claus C Hilgetag4
1. Dept. Comput. Neurosci. Univ. Med. Ctr. Hamburg-Eppendorf; Jacobs Univ. Bremen2. Dept. Comput. Neurosci. Univ. Med. Ctr. Hamburg-Eppendorf3. Dept. Neurology, Univ. Med. Ctr. Hamburg-Eppendorf4. Dept. Comput. Neurosci. Univ. Med. Ctr. Hamburg-Eppendorf; Jacobs Univ. Bremen; Boston Univ.
Lesion analysis reveals causal contributions of brain regions to mental functions, aiding the understanding of normal brain function and rehabilitation of brain-damaged patients. Using a game-theoretical approach, we analyzed a large stroke patient dataset to derive contributions of brain regions to essential functions. Stroke patients show a variety of deficits depending on their lesion patterns. The NIH Stroke Scale (NIHSS) [1] represents a standardized assessment of neurological deficits. We used the Multi-perturbation Shapley value Analysis (MSA) [2] to analyze patients’ scores together with their lesion patterns. MSA is a rigorous theoretical method to infer functional contributions from behavioral performance after multiple lesions, treating brain regions as players in a coalition game. For each coalition of regions, the system’s performance (inverse of NIHSS) is measured. MSA then derives each region’s contribution to behavioral function from analyzing all possible configurations of intact and lesioned regions. Using a large multi-centre dataset of stroke patients [3], we investigated 9 bilateral regions of interest (ROI), defined by the MNI152 atlas [4]: caudate, cerebellum, insula, putamen, thalamus, frontal, occipital, parietal
P085 Fig 1 (a,b) Contribution values of the 18 ROIs shown by gray-scale; (c,d) Corresponding coronal and axial slices from the reference atlas.
Neuroinformatics 2012 74
and temporal lobes. The overlap (in %) between infarct lesions registered to the atlas and each ROI was calculated for each patient. The resulting dataset was composed of 159 cases with different patterns of lesioned ROIs and associated NIHSS. Lesion percentages were thresholded (eg, 0.16%) to obtain binary sets of lesioned and intact regions, and different classifiers (shown here: regtree) were trained on the available set of lesion configurations to predict the performance of the remaining, unknown configurations, required for MSA. Fig. 1 shows relative, unitless contribution values in a gray-scale map. Highest contributions are found in the left frontal lobe, left thalamus, followed by bilateral caudate, while other regions make weaker positive or negative contributions. The results are in line with the known pivotal role of these regions for basic brain function as measured by the NIHSS. Further contributions can be computed based on individual NIHSS components, to obtain a specific map for each task, such as language or attention, and provide detailed insights for rehabilitation.
Supported by ERA-NET NEURON (MZ, CCH)
[1] Brott 1989 Stroke [2] Keinan 2004 Neur Comp [3] Thomalla 2011 Lancet Neur [4] Collins 1995 HBM
General neuroinformatics
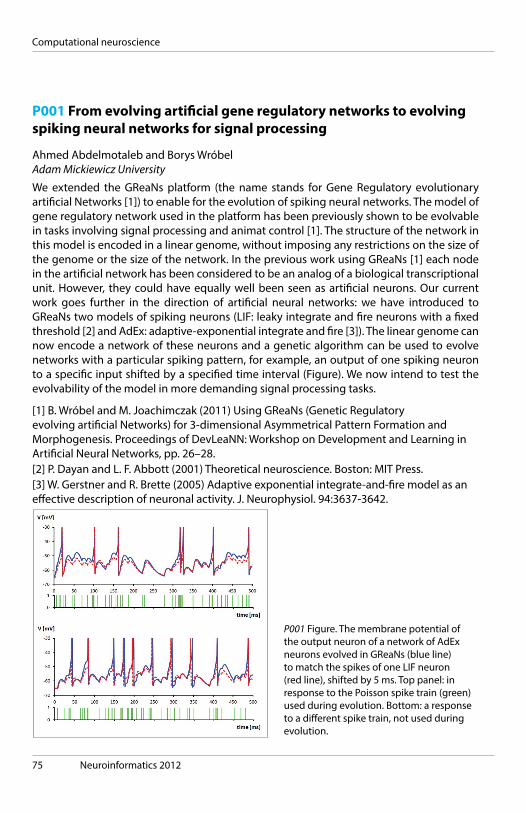
75 Neuroinformatics 2012
P001 From evolving artificial gene regulatory networks to evolving spiking neural networks for signal processing
Ahmed Abdelmotaleb and Borys WróbelAdam Mickiewicz University
We extended the GReaNs platform (the name stands for Gene Regulatory evolutionary artificial Networks [1]) to enable for the evolution of spiking neural networks. The model of gene regulatory network used in the platform has been previously shown to be evolvable in tasks involving signal processing and animat control [1]. The structure of the network in this model is encoded in a linear genome, without imposing any restrictions on the size of the genome or the size of the network. In the previous work using GReaNs [1] each node in the artificial network has been considered to be an analog of a biological transcriptional unit. However, they could have equally well been seen as artificial neurons. Our current work goes further in the direction of artificial neural networks: we have introduced to GReaNs two models of spiking neurons (LIF: leaky integrate and fire neurons with a fixed threshold [2] and AdEx: adaptive-exponential integrate and fire [3]). The linear genome can now encode a network of these neurons and a genetic algorithm can be used to evolve networks with a particular spiking pattern, for example, an output of one spiking neuron to a specific input shifted by a specified time interval (Figure). We now intend to test the evolvability of the model in more demanding signal processing tasks.
[1] B. Wróbel and M. Joachimczak (2011) Using GReaNs (Genetic Regulatory evolving artificial Networks) for 3-dimensional Asymmetrical Pattern Formation and Morphogenesis. Proceedings of DevLeaNN: Workshop on Development and Learning in Artificial Neural Networks, pp. 26–28. [2] P. Dayan and L. F. Abbott (2001) Theoretical neuroscience. Boston: MIT Press. [3] W. Gerstner and R. Brette (2005) Adaptive exponential integrate-and-fire model as an effective description of neuronal activity. J. Neurophysiol. 94:3637-3642.
P001 Figure. The membrane potential of the output neuron of a network of AdEx neurons evolved in GReaNs (blue line) to match the spikes of one LIF neuron (red line), shifted by 5 ms. Top panel: in response to the Poisson spike train (green) used during evolution. Bottom: a response to a different spike train, not used during evolution.
Computational neuroscience
Neuroinformatics 2012 76
P002 Robust automated protocol for extraction and comparison of single neuron morphology
Hiroyuki Ai1, Stephan Haupt2, Philipp Rautenberg3, Michael Stransky3, Thomas Wachtler3 and Hidetoshi Ikeno4
1. Fukuoka University2. University of Tokyo3. Ludwig-Maximilians-Universität München4. University of Hyogo
Neuronal morphology is highly individual and a key element determining information processing and transmission in the brain. In order to carry out a systematic and theoretical analysis of neural mechanisms and to understand the role of individual neurons, it is necessary to construct models based on experimentally acquired neuronal branching patterns. We have developed a robust automated protocol for producing neuron models based on real neural morphologies acquired from confocal laser scan microscope (LSM) data. LSM image stacks containing the entire morphology of single neurons are first subjected to a two-step segmentation. In the first step, brightness and contrast are adjusted to compensate for differences in noise and background levels among individual data sets, and binarization is applied. In the next step, extracted branching structures are traced based on the SSDT method using our software SIGEN (Yamazaki et al., 2008, doi: 10.1016/j.neucom.2005.12.042). SIGEN does not extract a wire model but also determines cylinder diameters for extracted segments. In this step, actual neuronal branch elements and false positive elements are still intermingled. Detected segments are then scrutinized and connected to the main branch based on two parameters, volume threshold (VT) and distance threshold (DT), finally resulting in cylinder models of the neurons. The final radius of cylinder elements corresponding to the thickness of a neurite segment is assigned by averaging the number of extracted pixels in a direction perpendicular to the skeleton center line within an element. We applied our method to an identified interneuron in the honeybee auditory system. We compared the number of branches and estimated axial resistances of cylinder segments of neuron models extracted manually to results from our automated extraction protocol. We also investigated the effect of VT and DT on branch extraction success. The number of branches, especially in the fine dendritic areas, was clearly increased (up to 23%) by tuning of DT and VT. Our findings demonstrate how using well-defined parameters permits repeated and reproducible extraction of neuron morphologies and minimizes variability in reconstruction resulting from differences in the extraction process.
This research was supported by Strategic International Cooperative Program, Japan Science and Technology Agency (JST) and the German Federal Ministry of Education and Research (BMBF, grant 01GQ1116).
Computational neuroscience

77 Neuroinformatics 2012
P003 Modeling axon outgrowth in an inhomogeneous environment
Pieter Laurens Baljon, Jaap van Pelt and Arjen van OoyenVU University Amsterdam
We present an extension of the network simulation model NETMORPH for the generation of axon morphologies. NETMORPH simulates neurite outgrowth based on principles of neuron development. The outgrowth rules initially implemented were developed for the outgrowth of dendrites, and did not include interactions of the outgrowing neurites with their environments. For the generation of realistic axon morphologies such interaction is crucial to be included in the outgrowth model. To this end two new features were added in addition to the recent developments regarding synapse formation. - Growth cones’ sensitivity to their environment allows for anisotropic outgrowth and targeted innervation of brain structures such as layers. - The added complexity of parameters in the growth model and their interactions necessitated a new parameter estimation procedure based on the likelihood of parameters. The validation of the model-generated neuronal structures requires optimization of growth parameters and statistical comparison with experimental data. The parameter estimation procedure also provides a way to formally compare two classes of morphologies based on the likelihood of their parameters, rather than on the statistics (shape properties) themselves. Intuitively a test in statistics space is more arbitrary, as there is a lot of freedom in the choice of statistics. By contrast, a comparison by confidence intervals for growth parameters incorporates the sensitivity of morphological statistics to those parameters. Furthermore, it allows to hypothesize the role of developmental mechanisms through the parameters using standard multivariate techniques. We found a marked similarity between parameters for different types of dendrites. The difference between axons and dendrites by contrast centers on only a subset of parameters which allows for hypothesizing on underlying mechanisms that can be tested in biophysical models (for instance in CX3D, Zubler et al.). In addition, we demonstrate a validation of this estimation procedure using synthetic data: maximum likelihood parameters are estimated to mimic morphologies that were themselves generated by NETMORPH with known parameters.
Computational neuroscience

Neuroinformatics 2012 78
P004 Simulating the Self-Organization of Winner-Take-All Networks
Roman Bauer, Sabina Pfister and Rodney DouglasInstitute of Neuroinformatics Zurich
Anatomical studies have shown that strong recurrence in local connectivity is a common feature of the superficial neocortical layers of cat visual cortex (Binzegger et al. 2004). The Winner-Take-All (WTA) network is a functional circuit that is in accordance with this type of connectivity (Douglas et al. 1989, Douglas et al. 1995, Douglas & Martin 2004), and is a hypothetical model for the canonical microcircuit. It has been shown to be powerful from a computational point of view (Maass 2000), and also been used in a wide range of applications (e.g. Indiveri 2001, Rutishauser & Douglas 2008, Nessler et al. 2010). We investigate, using the Java-based framework Cx3D (Zubler & Douglas 2009), how this type of network can develop and configure itself in a biologically plausible way. Our simulations begin from a single precursor cell, which encodes it’s developmental instructions in a ‘gene-like’ representation (Zubler et al. 2011). Based on processes such as gene regulation, cell proliferation, axonal outgrowth and Hebbian-type synaptic learning, we obtain neuronal connectivity matching experimental observations of pyramidal and basket cells in layer II/III of cat visual cortex, exhibiting electrophysiological features of WTA networks. The received signal is improved by selecting the strongest input and suppressing low-amplitude noise. Since the developmental rules we incorporate are entirely local, we have shown that WTA-like behaviour can self-organize and calibrate without the instructions of an external agent.
P004 A neuronal network grown in the framework Cx3D. Some of the cells including their neurites are labeled red for better visualization.
Computational neuroscience
79 Neuroinformatics 2012
Computational neuroscience
P005 The role of intra-striatal synaptic interactions for shaping cortico-striatal network dynamics
Jovana Belić1, Andreas Klaus2, Dietmar Plenz3 and Jeanette Hellgren Kotaleski4
1. Royal Institute of Technology (KTH), Stockholm and Bernstein Center Freiburg2. Karolinska Institutet (KI), Stockholm and National Institute of Mental Health (NIH), Bethes-da, USA3. National Institute of Mental Health (NIH), Bethesda, USA4. Royal Institute of Technology (KTH), Stockholm and Karolinska Institutet (KI), Stockholm
The basal ganglia consist of several interconnected subcortical nuclei that are supposedly involved in many motor and cognitive functions. The striatum, the input stage of the basal ganglia, is a major recipient of massive glutamatergic inputs from the cerebral cortex and thalamus. Medium spiny neurons (MSNs) dominate in the striatum (up to 95% in rodents). They are inhibitory (GABAergic) and have membrane properties that give them a high threshold for activation [1]. MSNs interact with each other through weak recurrent inhibitory synapses and with low connection probability [2]. Fast-spiking GABAergic interneurons (FSNs) can delay or prevent the emission of an action potential in MSNs [3]. FSNs receive convergent inputs from a wider range of distinct cortical regions compared to nearby MSNs, and despite the fact that they are relatively sparse elements (1-2%) it seems that they have very prominent role in shaping the output of the striatum [4]. Neuronal avalanches are a type of spontaneous activity first observed in vitro by recording local field potentials in cortical neural networks using slices of rat cortex as well as cultured networks [5]. Propagation of spontaneous activity is balanced and shows a branching parameter close to 1. In addition, the number of electrodes driven over threshold during activity is distributed approximately like a power law with an exponent of -3/2 for event sizes suggesting a critical dynamics [5]. Neural avalanches have been shown to provide: optimal information transmission [5, 6], maximal information capacity [6] and maximal dynamic range [7]. We are studying simultaneously striatal and cortical activity in vitro. Preliminary results show that neuronal avalanches in cortex induce activity clusters in striatum whose size distribution can be approximated by a steeper power law than observed in cortex. Based on this we have developed network models in order to determine the impact of different striatal neurons on the more negative exponent. In particular, we are investigating whether FS or MS neurons have any roles in shaping the striatal dynamics.
References 1. Grillner S, Hellgren Kotaleski J, Menard A, Saitoh K, Wikström: Mechanisms for selection of basic motor programs--roles for the striatum and pallidum. Trends in Neuroscience 2005, 28:364-70. 2. Tunstall MJ, Oorschot DE, Kean A, Wickens JR: Inhibitory Interactions Between Spiny Projection Neurons in the Rat Striatum. Journal of Neurophysiology 2002, 88: 1263–1269. 3. Tepper J, Koos T, Wilson C. GABAergic microcircuits in the neostriatum. Trends in Neuroscience 2004. 27:662–669.

Neuroinformatics 2012 80
4. Berke J: Functional properties of striatal fast-spiking interneurons. Frontiers in Systems Neuroscience 2011, 5:1-7. 5. Beggs J, Plenz D: Neural avalanches in neocortical circuits. The Journal of Neuroscience 2003, 23:11167-11177. 6. Shew W, Yang H, Yu S, Roy R, Plenz D: Information capacity and transmission are maximized in balanced cortical networks with neuronal avalanches. The Journal of Neuroscience 2011, 31:55-63. 7. Shew W, Yang H, Petermann T, Roy R, Plenz D: Neural avalanches imply maximum dynamic range in cortical networks at criticality. The Journal of Neuroscience 2009, 29:15595-15600.
Computational neuroscience
81 Neuroinformatics 2012
P009 Brain shape and thermoregulation: a quantitative approach
Emiliano Bruner1, José Manuel de la Cuétara1 and Fabio Musso2
1. Centro Nacional de Investigación sobre la Evolución Humana2. Universidad de Burgos
Brain thermoregulation is a debated topic in human physiology and evolution. Despite the high energy loadings associated with brain metabolism in humans, specific thermoregulatory mechanisms are unknown. Paleoneurological evidence based onto fossil record cannot give direct information on metabolism. However, correlations between thermoregulation and brain morphology can provide partial indications on this issue. Heat dissipation depends upon many factors, including geometry. Therefore, investigating the relationship between brain shape and heat dissipation patterns can supply indirect information on brain evolution in hominids. Here we present a computational approach to describe the patterns of heat dissipation in endocranial casts, providing tools to quantify species-specific differences. As case-study, we used samples from humans and chimpanzees, supplying results from intra-specific and inter-specific variation. Numerical modelling and thermic maps are used to describe the values of heat dissipation on the endocranial maps, and methods of comparison of the differences are evaluated accordingly. Absolute and relative variations are considered in terms of value distribution and residuals from expected models. The results show that this approach is effective in evidencing local and general differences between the species-specific heat dissipation patterns, providing a quantitative tool for investigating possible relationships between brain morphology and heat management in paleoneurology.
Keywords: brain metabolism, heat dissipation, paleoneurology
References Armstrong E. 1983. Relative brain size and metabolism in mammals. Science 220:1302-1204. Bruner E., Mantini S., Musso F., de la Cuétara J.M., Ripani M. & Sherkat S. 2011. The evolution of the meningeal vascular system in the human genus: from brain shape to thermoregulation. Am. J. Hum. Biol. 23: 35-43. Caputa M. 2004. Selective brain cooling: a multiple regulatory mechanism. J Therm Biol 29:691-702. Martin RD. 1981. Relative brain size and basal metabolic rate in terrestrial vertebrates. Nature 293:57-60. Nelson DA, Nunneley SA. 1998. Brain temperature and limits on transcranial cooling in humans: quantitative modeling results. Eur J Appl Physiol 78:353-359.
Computational neuroscience

Neuroinformatics 2012 82
P010 The NeuroML C. elegans Connectome
Tim Busbice1, Padraig Gleeson2, Sergey Khayrulin3, Matteo Cantarelli4, Alexander Dibert3, Giovanni Idili4, Andrey Palyanov3 and Stephen Larson4
1. Interintelligence Research2. University College London3. A.P. Ershov Institute of Informatics Systems4. OpenWorm.org
We have merged and extended the C. elegans connectome (Varshney et al., 2006) and a three-dimensional cellular anatomy model (Grove & Sternberg, 2011) in the context of the OpenWorm project, an open source project to build a data integration and simulation framework for the C. elegans. To do so, we have leveraged the NeuroML standard (Gleeson et al., 2010), a language for describing neuronal morphologies, ion channels, synapse models and position and network structure in a simulator independent format. It facilitates the exchange of these key model components between computational neuroscience applications. We have converted the neurons described as 3D objects into NeuroML multi-compartmental neuron models and populated the connection statements between these neurons with the Varshney et al. (2006) connection graph. We have used NeuroConstruct (Gleeson et al., 2007) as the rallying point for these data integration efforts and we have demonstrated a successful export from NeuroConstruct into a simulation engine. We have also made available a WebGL based browser that enables the neurons to be seen in the 3D context of the rest of the C. elegans anatomy ( http://browser.openworm.org ). While not yet sufficient to explain the activity of its neurons, we believe rthis is a necessary prerequisite for deep investigations into the non-linear dynamics and neuronal computation of the C. elegans neuronal network.
Supported by the Neurolinx Research Institute ( http://neurolinx.org )
References Gleeson, P., Steuber, V., & Silver, R. A. (2007). neuroConstruct: a tool for modeling networks of neurons in 3D space. Neuron, 54(2), 219-35. http://dx.doi.org/10.1016/j.neuron.2007.03.025 Gleeson, P., Crook, S., Cannon, R. C., Hines, M. L., Billings, G. O., Farinella, M., Morse, T. M., et al. (2010). NeuroML: A Language for Describing Data Driven Models of Neurons and Networks with a High Degree of Biological Detail. (K. J. Friston, Ed.)PLoS Computational Biology, 6(6), e1000815. http://dx.doi.org/10.1371/journal.pcbi.1000815 Grove, C.A., Sternberg, P.W.. (2011) The Virtual Worm: A Three-Dimensional Model of the Anatomy of Caenorhabditis elegans at Cellular Resolution. 18th International C. elegans meeting. Retrieved from http://www.celegans.org/2011/pdf/abstracts_web.pdf Varshney, L. R., Chen, B. L., Paniagua, E., Hall, D. H., & Chklovskii, D. B. (2009). Structural properties of the caenorhabditis elegans neuronal network. Arxiv preprint arXiv:0907.2373, 12596, 1-41.
Computational neuroscience

83 Neuroinformatics 2012
Computational neuroscience
P010 C. elegans connectome screenshot in NeuroConstruct

Neuroinformatics 2012 84
Computational neuroscience
P011 Novel self-organizing rules for retinotopic remapping
Markus Butz1 and Arjen van Ooyen2
1. Ruhr-University Bochum2. VU Amsterdam
Retinotopic maps in the primary visual cortex are plastic even in the mature brain. Particularly after permanent changes in external input, i.e. after focal retinal lesions, maps in the cortex adapt so that neurons deprived of input (lesion projection zone, LPZ) become responsive to adjacent input representations. This ‘filling-in’ process is currently explained by STDP. However, STDP is a fast process while the time course of reorganization continues over weeks up to one year [1]. Recent data indicate that structural plasticity (forming new synapses, breaking old ones) is involved in this reorganization [2,3] and acts very much on the same timescale. Therefore, we propose the first model investigating structural plasticity in application to cortical remapping. The model implements local activity-dependent rules for changes in the morphology of the neuron. In accordance with experimental findings, model neurons aim to maintain their electrical activity on average at a certain pre-defined set-point [4] by adapting the number of contact sites (axonal and dendritic elements). New (vacant) synaptic elements are offered to the network and connect to form synapses. The probability for synapse formation between two neurons depends on the amounts of vacant synaptic elements offered, and on the Euclidean distance between the two neurons. Network rewiring is therefore a reciprocal process between activity and network structure: Activity levels inside the LPZ (low) and outside the LPZ (high) locally induce the formation of axonal and dendritic elements, respectively, that in turn form synapses in a cooperative and compensatory manner leading to increasing activities in the LPZ again. The consequence of transporting activities via new synapses from the outside of the LPZ into the LPZ is an enlargement of input representation from intact areas and a sequential filling-in of the LPZ (Fig.1)—by contrast not obtained in self-organizing maps. The novelty of the model is to generate predictions how local cellular responses lead to rewiring and remapping on an anatomical network level.
Literature: [1] Giannikopoulos, D.V., Eysel, U.T. (2006) Proc Natl Acad Sci U S A, 103(28):10805-10. [2] Keck, T. et al. (2008) Nat. Neurosci. 11: 1162-1167. [3] Yamahachi, H. et al. (2009) Neuron 64:719-729. [4] Butz M et al. (2009) Front Comput Neurosci. 2009;3:10.
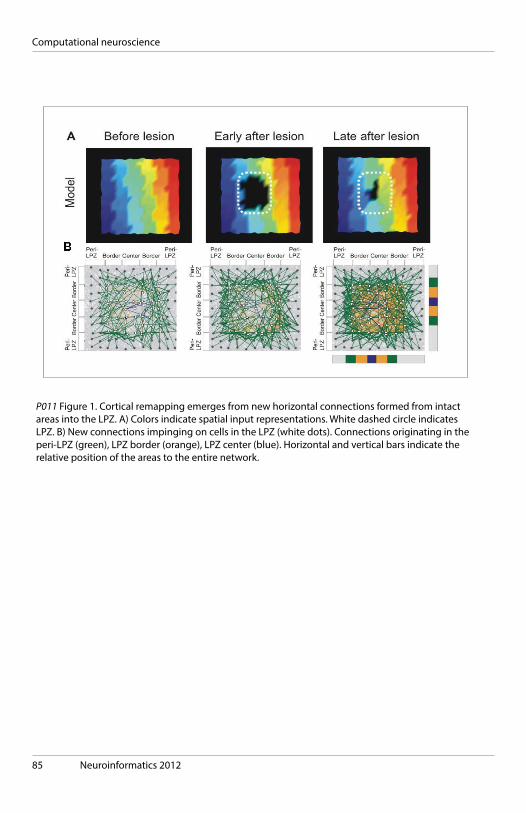
85 Neuroinformatics 2012
Computational neuroscience
P011 Figure 1. Cortical remapping emerges from new horizontal connections formed from intact areas into the LPZ. A) Colors indicate spatial input representations. White dashed circle indicates LPZ. B) New connections impinging on cells in the LPZ (white dots). Connections originating in the peri-LPZ (green), LPZ border (orange), LPZ center (blue). Horizontal and vertical bars indicate the relative position of the areas to the entire network.
Neuroinformatics 2012 86
P014 Modulation of Spontaneous Cortical Network Dynamics by Weak Global Perturbations
Flavio FrohlichUNC Chapel Hill, Dept. of Psychiatry
Transcranial current stimulation (TCS) represents a non-invasive brain stimulation paradigm that manipulates cortical networks by application of weak electric fields. Such stimulation causes very small changes in the membrane voltage of individual neurons (<1 mV) yet has pronounced effects on the overall rhythmic activity structure in cortex. For example, weak sine-wave electric fields enhanced slow oscillations during deep sleep in human EEGs [1] and modulated the rhythmic structure of network activity at the spiking level in vitro [2,3]. However, the underlying mechanisms that mediate this network effect remain poorly understood. We used large-scale computer simulations of cortical networks to probe how weak yet global perturbations shape macroscopic dynamics in network models with different topologies. Our computational model was comprised of 1 million pyramidal neurons and 250’000 fast spiking inhibitory interneurons that were connected with excitatory and inhibitory synapses. The model neurons were based on the Izhikevich model, which combines biological plausibility of spike initiation dynamics with high computational efficiency. We found that the stimulation waveform crucially determines the effect of TCS on network dynamics. Constant stimulation (tDCS, transcranial direct current stimulation) had a very limited effect on overall oscillation structure in comparison to sine-wave perturbations. For such periodic stimulation, we found that the presence of network level resonance depended on the underlying mechanisms that generated the spontaneous oscillations. We further found that both (1) network topology and (2) intrinsic excitability profiles crucially determined the effect magnitude of global weak perturbations applied to cortical networks. Together, our results indicate that weak global perturbations can represent effective network modulators and that they act through amplification at the level of individual neurons at spiking threshold and at the level of the entire network through propagation by synaptic connectivity. Our results provide mechanistic insights into how TCS can modulate spontaneous cortical network dynamics and therefore provide the starting point for pre-clinical trials of optimized, more dynamic stimulation waveforms.
[1] Marshall, L., et al.,Nature, 2006. 444(7119) [2] Fröhlich, F. and D. McCormick, Neuron, 2010. 67(1) [3] Reato, D., et al., J Neurosci, 2010. 30(45)
Computational neuroscience

87 Neuroinformatics 2012
P015 Modelling Realistic Neuron Shape Development in А Realistic Cellular Tissue Environment
Jordan GenoffTechnical University of Sofia at Plovdiv
Realistic neuron spatial shape development has proven to be a highly complex research topic in neurobiology. There exist several computational modeling methodologies with their mathematical foundations and software implementations for this subject. Though each of them approaches the problem in its individual and original way, they all have a basic common feature - they are neuron-centric, i.e. it is assumed that the neuron shape develops as a result of morphological changes mostly caused by intracellular processes. A significant number of these processes are initiated as reactions to extra-neuronal biochemical or mechanical impacts, but the latter two are usually considered in a generalized or, in the best case, probabilistic manner. The incontrovertible fact that neurons are not alone in space and their neighboring cells are not transparent at all is somehow disregarded. This paper proposes the idea that the exact geometric configuration of the surrounding cells plays a highly important role in the specific shape development of every single neuron. A modeling approach is suggested that aims at detailed investigation of how neuron growth cones are supervised by the neighboring cells and their contact properties. A Cellular Potts Model (CPM) is chosen as a simulation implementation technique. However, which is another contribution in the paper, CPM is utilized in an unusually hard parameter and input data setup, which reveals some avoidable disadvantages of this model.
Computational neuroscience

Neuroinformatics 2012 88
P019 Visual perception of circular arcs and straight lines by simple interaction between edge pixels
Wonil Chang1, Suh-Yeon Dong2 and Soo-Young Lee2
1. Department of Bio and Brain Engineering, KAIST2. Department of Electrical Engineering, KAIST
The extraction of shape primitives such as lines and curves from images is an important problem in the research of visual perception. The mechanism of grouping edge components of image into curves has been extensively explored in previous studies on perceptual organization. Co-circularity is a tendency of edge pixels to lie on a curve with regular curvature, or a circular arc. Field et al. proposed association field [1], a visual cortex model that explains the perceptual organization based on co-circularity. Conventional biological models of curve extraction [2, 3, 4] are based on association field. However, they have shown limited ability to discriminate strict circular arcs from long and salient curves since association field is not tuned to specific curvature. We propose a novel visual cortex model that groups the detected edge pixels into circular arcs. The core of the proposed method is to overcome the limitation of association field in detecting circular arcs by adding delicate inhibitions and co-linearity constraints. An oscillatory network [5] with the proposed neural connectivity groups edge pixels on a circular arc by synchronization of neural oscillation. The proposed network is robust against clutters and partial damage of edge pixels in real images. In addition, slight modifications to the network enable to perceive random curves and straight lines. This work provides a computational model on how the interaction between low-level image elements builds up meaningful high level image representations in visual perception.
References [1] D. J. Field et al., Vis. Res. (1993), DOI:10.1016/0042-6989(93)90156-Q [2] S. C. Yen and L. H. Finkel, Vis. Res. (1998), DOI:10.1016/S0042-6989(97)00197-1 [3] G. Yu and J. J. Slotine, IEEE TNN (2009), http://dx.doi.org/10.1109/TNN.2009.2031678 [4] J. Yuan et al., IEEE TGRS (2011), http://dx.doi.org/10.1109/TGRS.2011.2146785 [5] D. Wang and D. Terman, Neural Comput. (1997), http://dx.doi.org/10.1162/neco.1997.9.4.805
Computational neuroscience

89 Neuroinformatics 2012
P019 (a) The result of circular arc extraction from a set of edge pixels. The last figure is a superposition of first three figures.
(b) The result of straight line extraction from a set of edge pixels. The last figure is a superposition of first three figures.
Computational neuroscience

Neuroinformatics 2012 90
Computational neuroscience
P020 A spatial coding scheme to define the neuron types in the Drosophila brain
Chao-Chun Chuang1, Chang-Wei Yeh2, Chang-Huain Hsieh2, Hsiu-Ming Chang3 and Jenn-Kang Hwang4
1. National Center for High-Performance Computing; Institute of Bioinformatics, National Chiao Tung University2. National Center for High-Performance Computing3. Brain Research Center, National Tsing Hua University4. Institute of Bioinformatics and Systems Biology, National Chiao Tung University
A neuron type is an element to be manipulated for neuronal circuit analysis in the Drosophila brain. With classification and definition of neuron types, we will have a detailed look at how neurons work together. In this report, we provide a method to classify neuron types in the Drosophila brain from their spatial distributions in the brain: neurons exhibit the similar structure in the circuit belongs to the same neuron type. However, massive morphology alignment with direct 3D structural comparison is too difficult to be carried out in a high-throughput screening procedure. Thus, we developed a new approach to translate 3D neuronal morphology into the one-dimensional spatial sequence. By the alignment of the spatial sequences, we can find the neurons with similar morphology disregard their lateralization and gender differences. Finally, we have clustered 689 AL PNs in Flycircuit in to 76 neuron types and found that projection neurons with very similar morphology were formed at different developmental stages. Other cases, we found multiple genes were expressed neurons of similar morphology. In addition, sexual dimorphisms in neuron structures were detected. These results corresponded with the actual anatomy atlas, demonstrating our algorithm to be effective and accurate in a high-throughput screening procedure. In conclusion, we provide a novel approach to integrate anatomy and informatics. It can handle massive 3D neuronal image data collected in experiments from different research groups as well as manage bio-images with deeper neurological insight.

91 Neuroinformatics 2012
P020 Numerous PNs relaying sensory inputs—including olfactory, visual, auditory, and gustatory—to higher brain centers were discovered.
Computational neuroscience

Neuroinformatics 2012 92
P021 Brain heat dissipation patterns in modern humans, fossil hominids and great apes: A comparative study
José Manuel de la Cuétara1, Fabio Musso2 and Emiliano Bruner1
1. Centro Nacional de Investigación sobre la Evolución Humana2. Universidad de Burgos
Maintaining a constant temperature of the brain is a critical issue as slight variations in cerebral temperature may cause irreversible neural damage or even cause death of the individual. From an evolutionary perspective, when compared with other primates the human brain is not only bigger but it also consumes a larger amount of energy. Since brain size is constrained by the ability of an organism to efficiently remove the heat produced by neural metabolism, it has been proposed that brain size increase in humans was possible due to the coevolution of a complex vascular system able to efficiently dissipate heat. Searching for morphological correlates of brain metabolism, we performed numerical simulations to describe and to quantify the heat dissipation patterns within the brain volume as a function of the endocranial geometry in a comparative dataset of living and extinct hominoids. Our results show that brain size relates to general differences in the heat dissipation patterns among species, while thermic mapping evidence discrete differences localized on the parietal lobes, the temporal lobes and the motor cortex. Great apes display relatively high thermic values along this regions, with gorillas showing larger thermal loads than orangutans or chimpanzees. Australopithecines differ from great apes in showing lower loads at the frontal and parietal regions as the result of having taller brains. Extinct humans show a thermic gradient with low temperatures at the temporal lobes and higher values at the fronto-parietal surface related to their wider and flattened brains, while in modern humans this gradient is attenuated by relatively lower thermal loads at the parietal lobes, this being associated with parietal bulging and a more globular brain.
Keywords: brain evolution, hominoids, thermoregulation
References Bertolizio G, Mason L, Bissonnette B. 2011. Brain temperature: heat production, elimination and clinical relevance. Pediat Anesth 21: 347-358. Bruner E, Mantini S, Musso F, de la Cuétara JM, Ripani M, Sherkat S. 2011. The evolution of the meningeal vascular system in the human genus: From brain shape to thermoregulation. Am J Hum Biol 23: 35-43. Falk D. 2007. Constraints on brain size: the radiator hypothesis. In: The evolution of primate nervous systems (eds. Preuss T.M. and Kaas J.H.). Oxford: Academic Press, pp 347-354 Leonard WR, Robertson ML. 1992. Nutritional requirements and human evolution: A bioenergetics model. Am J Phys Anth 4:179-195.
Computational neuroscience

93 Neuroinformatics 2012
P022 Effective generators for superpositions of non-Poissonian spike trains
Moritz Deger1, Moritz Helias2 and Stefan Rotter3
1. Bernstein Center Freiburg, University of Freiburg2. Inst of Neuroscience and Medicine (INM-6), Research Center Juelich3. Bernstein Center Freiburg & Faculty of Biology, University of Freiburg
Networks of spiking neurons are widely studied in computational neuroscience. Simulations typically represent only a part of the brain in a network model. To compensate for the missing excitatory and inhibitory inputs from neurons external to the represented part, randomly generated spike trains are often injected to the simulated neurons. If all external spike trains are Poisson processes (PP), their superposition is again a PP, with a rate equal to the sum of the individual rates. To represent the sum of all external inputs, it is, therefore, only necessary to generate a single spike train with a higher rate. In most areas of the neocortex, however, neural spike trains are either more or less regular than a PP [1]. In this case, the superposition (pooled input) is not a PP any more [2]. In fact, our analyses of statistical properties of superpositions of non-Poissonian (NPP) processes, and of the dynamics of leaky-integrate-and-fire neurons driven by such inputs, showed that NPP superpositions exhibit profound differences to the PP, to which neurons are sensitive [2]. Suppose we can model the external input as N independent and identical renewal processes. To generate the superposition, the naive approach is to generate N realizations of the renewal process, and then collect all the spikes in a pooled spike train. Since this has to be repeated for each of M simulated neurons, the procedure results in computational costs proportional to M*N. Depending on the details of the modeled system, N can be on the order of 1000. In contrast, in the case of external PP inputs, it suffices to generate a single PP only. Using NPP external inputs thus can slow down a simulation by a factor of N, which is why PPs are commonly used. Here, we present two optimised algorithms to generate superpositions of NPP spike trains directly [2]: One for gamma processes with integer shape parameter, and one for PPs with dead time. Both generators have a computational cost which is independent of N. The generators exploit a population description of the superimposed processes, require time-discrete simulation, and have been implemented in NEST [3].
[1] Shinomoto et al. (2003), Neural Comput, http://dx.doi.org/10.1162/089976603322518759 [2] Deger et al. (2011), J Comput Neurosci, http://dx.doi.org/10.1007/s10827-011-0362-8 [3] Gewaltig & Diesmann (2007), Scholarpedia, http://dx.doi.org/10.4249/scholarpedia.1430
Computational neuroscience

Neuroinformatics 2012 94
P023 Numerical simulations of glutamate diffusion in a synaptic cleft. Dependence on the geometry and its possible interactions
Wojciech Goch and Wojciech BalInstitute of Biochemistry and Biophysics PAS
The mechanism of the chemical synapse has been intensively investigated, but the precise time-course of a neurotransmitter in the synaptic cleft is still to be determined. Many approaches to the study of the neurotransmitter flow can be found in the literature, but in most of them the assumption on the simplified geometry has been made. Our first goal was to investigate the possible influence of the cleft geometry on the diffusion rate of the neurotransmitter and the saturation of the receptors. The second issue we are interested in is a possible participation of zinc in Aβ peptide aggregation - one of the hallmarks of Alzheimer Disease. As the dysfunction of zinc homeostasis is considered, we aim to investigate the interactions of 〖Zn〖^(2+) ions with glutamate in the confined volume of the synapse. In order to achieve these goals we developed dedicated software within the Wolfram Mathematica environment. Our simulations illustrate the Brownian motion of glutamate molecules and zinc ions in a small volume, constrained by 2D surfaces (modeling the pre- and postsynaptic membrane) with an arbitrary chosen shape. The interactions between glutamate and 〖Zn〖^(2+) and receptors/transporters are defined by collision induced reactions. The electrostatic interactions between molecules and the membrane surface are also considered. The proposed model shows a dependence between the geometry of the synaptic cleft and the time-course of glutamate, thus providing an insight into the role of zinc in Alzheimer Disease.
Computational neuroscience
95 Neuroinformatics 2012
P024 Independent components of reconstructed current sources reflect activity of individual cell populations
Helena Głąbska, Jan Potworowski, Szymon Łęski and Daniel WójcikDepartment of Neurophysiology, Nencki Institute
Local field potential (LFP) – the low-frequency part of the potential recorded extracellularly in the brain – reflects neural activity at the population level. The interpretation of LFP is complicated because it can mix activity from remote cells, on the order of millimeters from the electrode. To understand better the connection between the recordings and the local cell activity we expanded the thalamocortical model of Traub et al. (2005)[1] to compute simultaneous LFP [2], transmembrane currents and spiking activity. We used this model to study the information contained in independent components obtained from the reconstructed Current Source Density (CSD) [3], which smooths transmembrane currents, decomposed with Independent Component Analysis (ICA) [4]. We found out that three components obtained reliably matched well the activity of two dominating cell populations: superior pyramidal cells in layer 2/3 (rhythmic spiking) and tufted pyramids from layer 5 (intrinsically bursting). Interestingly, the pyramidal population from layer 2/3 could not be well described as a product of spatial profile and temporal activation, but was matched well by a sum of two such products which we recovered in two of the ICA components in our analysis, which seem to reflect different inputs on dendritic trees within the population.
Research supported by grants 5428/B/P01/2010/39, POIG.02.03.00-00-003/09, POIG.02.03.00-00-018/08.
1. Traub RD, Contreras D, Cunningham MO, Murray H, LeBeau FEN, Roopun A, Bibbig A, Wilent WB, Higley MJ, Whittington MA: Single-Column Thalamocortical Network Model Exhibiting Gamma Oscillations, Sleep Spindles, and Epileptogenic Bursts. J Neurophysiol 2005, 93:2194-2232. 2.Holt GR, Koch C. Electrical interactions via the extracellular potential near cell bodies. J Comput Neurosci. 1999; 6:169‐184. 3.Potworowski J, Jakuczun W, Łęski S, Wójcik DK: Kernel current source density method. Neural Comput 2012, 24:541–575. 4. Łęski S, Kublik E, Świejkowski DA, Wróbel A, Wójcik DK: Extracting functional components of neural dynamics with Independent Component Analysis and inverse Current Source Density. J Comput Neurosci 2010, 29:459–473.
Computational neuroscience

Neuroinformatics 2012 96
P024 Figure1. Reconstructed CSD generated 20 ms from the onset of stimulation and ICA components. Notice that recorded activity is dominated by two populations of pyramidal neurons out of the total of 12 populations in the modeled column and that the population of layer 2/3 pyramidal cells is well described by ICA components 1. and 2.
Computational neuroscience

97 Neuroinformatics 2012
Computational neuroscience
P025 Modeling realistic extracellular recordings of neuronal populations for the purpose of evaluating automatic spike-sorting algorithms
Espen Hagen1, Torbjørn B Ness1, Amir Khosrowshahi1, Felix Franke2 and Gaute T Einevoll1
1. Dept. Mathematichal Sciences and Technology, UMB2. Bio Engineering Laboratory, ETH Zürich
Simultaneous recordings of thousands of extracellular spikes are now possible, using silicon-based recording devices with large numbers of electrode contacts, such as high-density multi-electrode arrays (MEA) or multi-shank laminar electrodes. With the associated increase of data amounts and complexity in such recordings, manual spike sorting is not viable. Hence, there is a dire need for validated automated spike sorting methods, able to correctly resolve spikes of single neurons, as recently reviewed [1]. Automated spike sorting methods should ideally be validated against test data with known ground truth, where spiking activity of all neurons in the neuronal population is known. Such details of the underlying activity can only to some extent be acquired experimentally. One remedy is model-based simulation of extracellular recordings, as electrode position-dependent spike shapes (Figure 1a) can conveniently be modeled in a biophysically realistic way using a recently released simulation tool, LFPy ( http://compneuro.umb.no/LFPy ). LFPy implements a forward modeling scheme for extracellular potentials [2] in Python integrated with NEURON [3]. Test data for arbitrary electrode layouts, neuron models, noise content and spike time correlations can be produced at wish, and test data mimicking tetrode and polytrode recordings in cortex and hippocampus with realistic noise features will be presented. Additionally, finite element methods (FEM) are employed to generate test data for cases where significant effects from inhomogeneous extracellular media are present, as in recordings from cell cultures or retinal slice recordings using MEAs. In order to facilitate usage of benchmark test data for evaluating spike sorting algorithms (Figure 1b), an algorithm evaluation website has been set up on http://www.g-node.org/spike
Acknowledgements: Supported by the Research Council of Norway (NevroNor, eScience, Notur), NIH (CRCNS) and INCF (G-Node, Norwegian Node).
References: 1. Einevoll GT, Franke F, Hagen E, Pouzat C, Harris KD: Towards reliable spike-train recordings from thousands of neurons with multielectrodes. Curr Opin Neurobiol 2011, 22:1–7. DOI:10.1016/j.conb.2011.10.001 2. Holt GR, Koch C. Electrical interactions via the extracellular potential near cell bodies. J Comp Neurosci 1999, 6:169-184. DOI:10.1023/A:1008832702585 3. Hines ML, Davison AP, Muller E: Neuron and Python. Front Neuroinformatics 2009, 3:1-12. DOI:10.3389/neuro.11.001.2009

Neuroinformatics 2012 98
P025 Figure 1. a) Location-dependent extracellular spike around a cat L5 pyramidal neuron. b) Evaluation of spike-sorting methods against ground-truth test data for a population of L5 pyramidal neurons in vicinity to a recording tetrode.
Computational neuroscience
99 Neuroinformatics 2012
P026 Electrodiffusion in neural tissue at long timescales
Geir Halnes1, Ivar Østby1, Klas Pettersen1, Stig W. Omholt2 and Gaute T. Einevoll1
1. Department of Mathematical Sciences and Technology, Norwegian University of Life Sci-ences, Ås, Norway2. Centre for Integrative Genetics (CIGENE), Department of Animal Science, Norwegian Univer-sity of Life Sciences, Ås, Norw
Electrical signaling in neurons is typically modeled at the timescales of integration of synaptic inputs, i.e., < 100 ms. In standard models based on the cable-equation, the key dynamical variable is the membrane potential. With the possible exception of the signal molecule Ca2+, intra- and extracellular ion concentrations are typically assumed to be constant. As synaptic activity and action-potential firing induce relatively small concentration changes of main charge carriers, this simplification is often warranted. Commonly used measurement techniques such as fMRI based on hemodynamics and vascular dynamics probe the system at timescales of seconds or more. At these longer timescales, other neural processes become relevant: Ion pumps and membrane co-transporters actively regulate ion concentrations in the neural tissue, and also diffusion becomes an important transport mechanism (e.g. for funneling out excess potassium from regions with high neural activity). In order to model key long-timescale neural processes, we need models that couple electrical dynamics and ionic diffusion, and that explicitly incorporate the ion concentrations in all parts of the neural tissue (neurons, astrocytes, extracellular space, vasculature). As a step in this direction, we here present an electrodiffusive scheme for modeling ion dynamics in a one-dimensional geometry for an astrocyte exchanging ions with the extracellular space through transmembrane currents. Our scheme essentially models the extra- and intracellular concentrations (C_k(x)) of all ion species (k), and the membrane potential that follows from the resulting charge densities (ρ(x)). Compared to previous, related approaches [e.g. 1,2], our framework ensures (i) global particle/charge conservation, (ii) consistency between charge density and concentration of ion concentrations (charge carriers), and (iii) that any constraint on charges/currents (such as, e.g., ρ(x)_outside = - ρ(x)_inside) is properly translated to corresponding constraints on concentrations/particle fluxes (and vice versa). We identify the conditions under which our framework can be reduced to standard cable theory without severely violating points (i-iii).
References: [1] Qian, N. & Sejnowski, TJ. (1989). Biological Cybernetics 62, 1-15. [2] Chen, KC & Nicholson, C. (2000). Biophysical journal 78(6), 2776-97. DOI:10.1016/S0006-3495(00)76822-6
Computational neuroscience

Neuroinformatics 2012 100
P027 Towards new model of neuronal growth: Comparison of models and tools for neuronal growth in vitro
Riikka Havela, Jugoslava Aćimović, Tuomo Mäki-Marttunen and Marja-Leena LinneDepartment of Signal Processing, Tampere University of Technology
The structural organization of a neuronal network partly defines its functional capabilities. Thus, understanding how neurons self-organize and form networks is an important step towards understanding the structure-function relationship in neuronal networks. The simplified in vitro setup allows convenient control of parameters and observation of a growing neuronal network. It provides an ideal system for modeling [1] and, consequently, for studies of structure-function relationship. Previously, we compared two tools, Netmorph [2] and Cx3D [3], for modeling growth and structural changes in neuronal networks in vitro [4]. We concluded that both simulators can reproduce typical experimental values for network growth when phenomenological model of growth and graph theoretic analysis measures are used. The main difference between the tools is that NETMORPH implements computationally inexpensive models and is therefore more useful in theoretical studies. The advantage of Cx3D simulator is its flexibility. Cx3D is valuable when modeling a small number of neurons equipped with intracellular and extracellular chemical species. It may as well be useful for constructing multilevel models that incorporate cellular and network levels. In this work, we propose a slightly modified model of neuronal growth with carefully assessed morphologies. The effects of different model components and parameters will be assessed using Sholl analysis to characterize the growth of axons and dendrites. The model is simulated using both Cx3D and its recently published parallelized version, Cx3Dp. We apply standard graph theoretic measures and Sholl analysis (see Fig. 1) to analyze and quantitatively compare the obtained morphologies and network structures. We also use analysis methods for weighted networks to assess the effects of synapse numbers. Our future aim is to present generic models of neuronal growth with relevant features of both in vitro and in vivo experiments. Such models, when incorporated with neuronal activity and known homeostatic mechanisms such as those provided by astrocytes, will help to decipher the role of network structure in the development of activity.
References: [1] Maheswaranathan N et al. Front Comput Neurosci. 2012, 6: 15. [2] Koene RA et al. Neuroinformatics. 2009, 7(3): 195-210. [3] Zubler F and Douglas R. Front Comput Neurosci. 2009, 3: 25 [4] Aćimović J et al. EURASIP J Bioinform Syst Biol. 2011, 2011: 616382
Computational neuroscience

101 Neuroinformatics 2012
P027 Figure 1. Example of Sholl analysis of a simulated culture of 100 neurons. X axis: Indices of individual neurons. Y axis: Distance from cell soma in micrometers. The color scale indicates the number of axons crossing the Sholl analysis circles at different distances.
Computational neuroscience
Neuroinformatics 2012 102
Computational neuroscience
P028 A Biologically Plausible, Computationally Efficient Model of the Primary Somatosensory Cortical Column in Mouse
Chao Huang, Andrey Resnik and Tansu CelikelLaboratory of Neural Circuits and Plasticity, University of Southern California
To understand how neural circuits perform their functions, it is necessary to quantify the interactions among each individual elements of the circuit, i.e. neurons. Thanks to the advances in high-density microelectrode array recordings and two-photon imaging it is now possible to observe tens to hundreds of neurons simultaneously in action. However, experimental study of every neuron in a functionally relevant circuit is still several decades away. Thus, establishing a biologically plausible and computationally efficient model of neural circuits has an outstanding potential to greatly advance our understanding on the neuronal basis of circuit behavior. Here we present such a model of the primary somatosensory cortex (S1) of the mouse. The location (i.e. columnar and laminar) and identity (i.e. excitatory vs inhibitory, including subclassification of the major inhibitory subclasses) of the nodes in this topological network of the canonical cortical column is based on cell body reconstructions of the somatosensory cortex using multifluorescence serial confocal microscopy (Huang et al, forthcoming; Fig.1A). The statistics and efficacy of functional connectivity between pairs of cells across and within Layer (L) 4 and L2/3 are modeled after previously published data (e.g.1-7). The mathematical model of individual neurons was based on the quadratic model neuron originally introduced by Izhikevich (8) with the exception that, to free the spike threshold parameter and ensure that spike timing is an emergent property of the network activity, we have derived the spike threshold from the first derivative of the membrane potential during synaptic input after experimentally determining the relationship between the two across membrane states in whole cell recordings in S1. Simulations showed that, in a network where spiking activity of the presynaptic model neurons are determined according to the probability of single neuron firing in the biological cortical column in vivo, the behavior of the postsynaptic model neurons was statistically comparable to biological neurons recorded in vivo in all paramaters tested. Subthreshold postsynaptic potentials and suprathreshold action potential statistics of the model neurons were comparable to their biological counterparts studied during whisker deflections (Fig.1B-D). These results are discussed in terms of emergent and state-dependent sensory representations in the somatosensory cortex.
References: 1. Feldmeyer et al 2006, doi:10.1113/jphysiol.2006.1051062. Holmgren et al 2003, doi:10.1113/jphysiol.2003.0447843. Blatow et al 2003, doi:10.1016/S0896-6273(03)00300-34. Helmstaedter et al 2008, doi:10.1523/JNEUROSCI.5701-07.20085. Lübke et al 2003, doi:10.1093/cercor/13.10.10516. Tamas et al 2003, doi:10.1126/science.10820537. Kapfer et al 2007, doi:10.1038/nn1909l8. Izhikevich 2003, doi:10.1109/TNN.2003.820440

103 Neuroinformatics 2012
P028 Figure 1. In-silico model of mouse barrel cortex. A) Reconstruction of the mouse barrel cortex at single-neuron resolution. Monoclonal antibodies raised against distinct targets were used to stain 5 classes of neurons in the mouse barrel cortex, and images were captured using serial confocal microscopy. An automated neuron identification algorithm was developed to reconstruct the entire column, combining neuron identities across different antibody channels. B) Simulated L2/3 network activity upon L4 spiking (gray), which was experimentally observed using silicon electrodes in vivo after principal whisker deflections. Peristimulus time histograms (PSTH) for excitatory (blue) and inhibitory neurons (red) along with the raster plot of action potentials exemplify stimulus evoked responses across L2/4. C-D) Spike count for excitatory and inhibitory neural populations. Note the sparse nature of sensory representations in L2/3 excitatory neurons and higher likelihood of inhibitory neuronal spiking.
Computational neuroscience

Neuroinformatics 2012 104
P029 Gamma --> beta frequency shift in the circuits with strongly facilitating synapses
Joanna Jędrzejewska-SzmekFaculty of Physics, University of Warsaw
Synapses exhibiting strong elevation of postsynaptic response due to paired pulse stimulus have been reported in literature [1]. Hereby we investigate the role of strongly facilitating synapses [1] in neural circuits. Using the non-linear short term facilitaion model presented in [2] and formalism developed in [3], we derive a Wilson-Cowan model of strongly facilitating synapse. Then we investigate the possible role of excitatory strong facilitating synapse [1,2] between the excitatory and inhibitory population, showing that it can play an important role in beta --> gamma frequency shift and possible generation of beta rebound, that can be seen in Figure below.
[1] Thomson AM. Journal of Physiology 1997 [2] Jędrzejewska-Szmek J, Michalski A, Żygierewicz J. BMC Neuroscience 2011 [3] Tsodyks MV, Pawelzik K, Markram H. Neural Computation 1998
Computational neuroscience
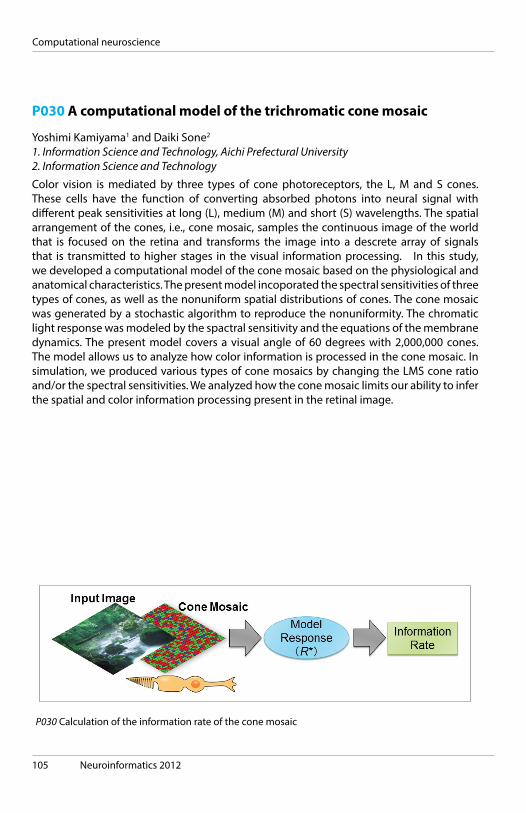
105 Neuroinformatics 2012
P030 A computational model of the trichromatic cone mosaic
Yoshimi Kamiyama1 and Daiki Sone2
1. Information Science and Technology, Aichi Prefectural University2. Information Science and Technology
Color vision is mediated by three types of cone photoreceptors, the L, M and S cones. These cells have the function of converting absorbed photons into neural signal with different peak sensitivities at long (L), medium (M) and short (S) wavelengths. The spatial arrangement of the cones, i.e., cone mosaic, samples the continuous image of the world that is focused on the retina and transforms the image into a descrete array of signals that is transmitted to higher stages in the visual information processing. In this study, we developed a computational model of the cone mosaic based on the physiological and anatomical characteristics. The present model incoporated the spectral sensitivities of three types of cones, as well as the nonuniform spatial distributions of cones. The cone mosaic was generated by a stochastic algorithm to reproduce the nonuniformity. The chromatic light response was modeled by the spactral sensitivity and the equations of the membrane dynamics. The present model covers a visual angle of 60 degrees with 2,000,000 cones. The model allows us to analyze how color information is processed in the cone mosaic. In simulation, we produced various types of cone mosaics by changing the LMS cone ratio and/or the spectral sensitivities. We analyzed how the cone mosaic limits our ability to infer the spatial and color information processing present in the retinal image.
P030 Calculation of the information rate of the cone mosaic
Computational neuroscience

Neuroinformatics 2012 106
P031 Roles played by depressing synapses in neural circuits
Joanna Jędrzejewska-Szmek1 and Jarosław Żygierewicz2
1. University of Warsaw Faculty of Physics2. University of Warsaw Faculty of Physics
Synapses exhibiting short-term synaptic depression can be found in different locations in neural circuits [1], e.g. pyramid-pyramid and interneuron-pyramid connections. Based on these findings, two Wilson-Cowan type models with depressing synapses were constructed, following formalism presented in [2]. First one comprised a depressing positive feedback, the second one comprised a depressing negative feedback (synapse is between the inhibitory and excitatory population). The models’ parameters were provided by [1,3]. Both models generated oscillatory signals as predicted by [2,3]. In case of both models a regime exists with high frequency oscillations (higher than 80 Hz) and high amplitude of oscillations corresponding to ‘high-gamma’ characteristics [4]. The model with depressing positive feedback showed three regimes: 1) oscillations in the theta band almost independent of external input of the excitatory population, 2) high-frequency oscillations with an envelope frequency in the theta band. In the third regime we observed oscillations in theta and ‘high-gamma band’. An increase of the external input can abruptly change the oscillation frequency from the theta band to ‘high-gamma’. Excitatory population firing rate is shown in the Figure below. One can see, that generated activity is similar to the theta/gamma oscillations [5] linked to short-term memory [5,6]. Short-term synaptic depression plays important role in generation of not only slow oscillations activity [3] and theta waves, but also higher frequency phenomena such as ‘high-gamma’. It might also serve as a basis for coupling between the high- and low-frequency bands of ongoing electrical activity in the human brain [5,6,7].
P031 Oscillations in the gamma band with modulation frequency in the theta band generated by the Wilson-Cowan type model with depressing synapse in the negative feedback loop (connections from inhibitory to excitatory population).
Computational neuroscience

107 Neuroinformatics 2012
[1] Bannister AP, Thomson AM. Cerebral Cortex 2007 [2] Tsodyks MV, Pawelzik K, Markram H. Neural Computation 1998 [3] Melamed O, Barak O, Silberberg G, Markram H, Tsodyks M. Journal of Computational Neuroscience 2008 [4] Ray S, Maunsell JHR. PloS Biology 2011 [5] Lisman J. Hippocampus 2005 [6] Lisman J, Idiart MA. Science 1995 [7] Canolty RT, Edwards E, Dalal SS, Soltani M, Nagarajan SS, Kirsch HE, Berger MS, Barbaro NM, Knight RT. Science 2006
Computational neuroscience
Neuroinformatics 2012 108
Computational neuroscience
P032 Optimizing Performance of Endogenous Neural Stem Cell Therapy for Ischemic Stroke: A Neuroinformatics and Neuroimaging Approach to Translational Medicine
Suhela Kapoor, VPS Rallabandi and Prasun RoyNational Brain Research Centre
Aim of study: To design an in-silico model to develop a translational-medicine basis of endogenous neural stem-cell-based therapy for ischemic stroke using pharmacological growth factors and by utilizing neuroimaging tools with in-vivo verification to translate the results to patients. Most stroke patients incur residual disability despite treatment, thus needing newer approaches of neurorestoration/regenerative medicine. In our study, the phenomena of neurogenesis, synaptogenesis and progenitor cell migration from the sub-ventricular zone of the brain towards the penumbra surrounding the ischemic lesion, under influence of therapeutic growth factor introduced interventionally, were employed as model parameters. Material & Methods: A predictive mathematical model was designed to discretize the steps involved in neural stem cell proliferation, migration and differentiation leading to neurorestorative recovery. MATLAB algorithms were run to compute the optimal dosage and time-point of drug administration. To verify the accuracy of the design, a robust rodent ischemia model using the Middle Cerebral Arterial Occlusion (MCAO) technique was established. The effect of multiple combinations such as erythropoeitin derivatives, brain-derived neurotrophic factor and insulin-like growth factor (IGF-1) versus control is checked. MRI & Diffusion-weighted imaging is done to ensure similar ischemic lesions across patients and also reduction of hypoxic volume post-therapy. Behavioral monitoring using a battery of sensory-motor tests is done to correlate with biochemical and cellular changes. Results: On analysis of the effect of applying the computed dose of therapeutic agent at an optimal time point, on neural progenitor dynamics, we observed a strong peak of synaptic recovery. Findings based on animal experiments, MRI and histopathology provide empirical corroboration, thus establishing this approach to be useful for optimizing recovery in ischemic stroke. Conclusions: Given that the ischemic brain has evolved an incisive way to partly recoup itself by increasing the production of endogenous stem cell niches, the proposed approach can enable maximal/optimal recovery. Our efforts can be seen as the 1st endeavour of incorporating endogenous stem-cell processing influenced by neuro-modulators as a robust neuroinformatics template that allows for incorporation of patient specific parameters, thereby enabling one to optimize recovery using image-guided drug-scheduling.

109 Neuroinformatics 2012
P032 The dynamics of stem cell proliferation, migration, and differentiation into neurons, followed by development of mature synapses.
Computational neuroscience

Neuroinformatics 2012 110
P033 Allometric scaling of brain energetics and hemodynamics in relation to capillary scaling
Jan KarbowskiPolish Academy of Sciences
Brain is one of the most energy demanding organs in mammals, and its total metabolic rate scales with brain volume raised to a power of around 5/6. This value is significantly higher than the more common exponent 3/4 relating whole body resting metabolism with body mass and several other physiological variables in animals and plants. This article investigates the reasons for brain allometric distinction on a level of its microvessels. Based on collected empirical data it is found that regional cerebral blood flow CBF across gray matter scales with cortical volume V with an exponent -1/6, brain capillary diameter scales with V with an exponent 1/12, and density of capillary length decreases with V with an exponent -1/6. It is predicted that velocity of capillary blood is almost invariant, capillary transit time scales with exponent 1/6, capillary length increases with V with power 1/6+epsilon, and capillary number with power 2/3-epsilon, where epsilon is typically a small correction for medium and large brains, due to blood viscosity dependence on capillary radius. It is shown that the amount of capillary length and blood flow per cortical neuron are essentially conserved across mammals. These results indicate that geometry and dynamics of global neuro-vascular coupling have a proportionate character. Moreover, cerebral metabolic, hemodynamic, and microvascular variables scale with allometric exponents that are simple multiples of 1/6, rather than 1/4, which suggests that brain metabolism is more similar to the metabolism of aerobic than resting body. Relation of these findings to brain functional imaging studies involving the link between cerebral metabolism and blood flow is also discussed.
References: 1) Karbowski J (2007) Global and regional brain metabolic scaling and its functional consequences.
BMC Biology 5: 18. http://dx.doi.org/10.1186/1741-7007-5-18 2) Karbowski J (2011) Scaling of brain metabolism and blood flow in relation to capillary and neural scaling.
PLoS ONE 6(10): e26709. http://dx.doi.org/10.1371/journal.pone.0026709
Computational neuroscience

111 Neuroinformatics 2012
P034 CAJAL3D: Towards A Fully Automatic Pipeline for Connectome Estimation from High-Resolution EM Data
Dean M. Kleissas1, William R. Gray2, James M. Burck1, Joshua T. Vogelstein3, Eric Perlman4, Philippe M. Burlina1, Randal Burns3 and R. Jacob Vogelstein2
1. Johns Hopkins University, Applied Physics Laboratory2. Johns Hopkins University, Applied Physics Laboratory; Johns Hopkins University3. Johns Hopkins University4. Janelia Farm Research Campus, HHMI
In recent years, technological advances have allowed for millions of cubic microns of cortical tissue to be imaged at very high resolution (e.g., 4x4x45 nm3) using electron microscopy. A variety of efforts have successfully applied 2- and 2.5-dimensional segmentation methods to identify major image features (e.g. vesicles, mitochondria) and neurite segments over a small number of brain slices in these samples. However, the data are too large and the problem space is too big for any one group to fully analyze. We have therefore developed a common language and data repository to facilitate the sharing of connectome data and results within the scientific community. More specifically, we are designing an ecosystem of standardized interfaces and services to facilitate large-scale, collaborative connectomics, called CAJAL3D (Connectome Annotation through Joint Analysis of Large 3-dimensional Data). Our design facilitates interoperability of algorithms and the interpretability of results, by standardizing algorithm inputs and outputs through defined annotation types at all processing stages. In addition to defining a common interface for connectomics, we developed a processing pipeline framework that implements our annotation standard and is integrated with the Open Connectome Project (OCP) web services. The framework is built on a client-server based infrastructure that facilitates scalable, distributed processing. The pipeline exchanges data and data products associated with various forms of connectomics information, ranging from raw images to processed graphs, with the OCP storage servers. The annotation standard, image processing algorithms, image and annotation storage databases and associated web services are being made available to the community as a free resource. We are in the process of soliciting feedback from the community for additional features and functionality. DMK and WRG contributed equally to this work.
P034 The CAJAL3D (Connectome Annotation through Joint Analysis of Large 3-dimensional Data) ecosystem, consisting of standard annotations, web services, and a machine vision pipeline to estimate connectomes from raw EM image data.
Computational neuroscience

Neuroinformatics 2012 112
P035 Metabolic energy per synapse is approximately conserved during development in mammalian brains.
Jan KarbowskiPolish Academy of Sciences
During mammalian development the cerebral metabolic rate correlates qualitatively with synaptogenesis, and both often exhibit bimodal temporal profiles. Despite these non-monotonic dependencies, it is found based on empirical data for different mammals that regional metabolic rate per synapse is approximately conserved from birth to adulthood for a given species (with a slight deviation from this constancy for human visual and temporal cortices during adolescence). A typical synapse uses about 7000 glucose molecules per second in primate cerebral cortex, and about 5 times of that amount in cat and rat visual cortices. A theoretical model for brain metabolic expenditure is used to estimate synaptic signaling and neural spiking activity during development. It is found that synaptic efficacy is generally inversely correlated with average firing rate, and additionally, synapses consume a bulk of metabolic energy, roughly 50-90% during most of the developmental process (except human temporal cortex < 50%). Overall, these results suggest a tight regulation of brain electrical and chemical activities during the formation and consolidation of neural connections. This presumably reflects strong energetic constraints on brain development.
References: 1) Karbowski J (2012) Approximate invariance of metabolic energy per synapse during development in mammalian brains. PLoS ONE 7(3): e33425. http://dx.doi.org/10.1371/journal.pone.0033425 2) Karbowski J (2009) Thermodynamic constraints on neural dimensions, firing rates, brain temperature, and size. J Comput Neurosci 27: 415-436. http://dx.doi.org/10.1007/s10827-009-0153-7
Computational neuroscience
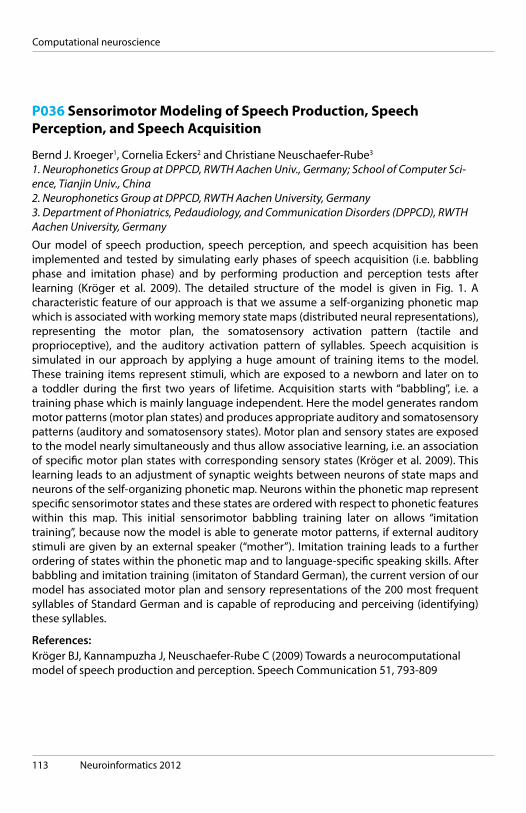
113 Neuroinformatics 2012
P036 Sensorimotor Modeling of Speech Production, Speech Perception, and Speech Acquisition
Bernd J. Kroeger1, Cornelia Eckers2 and Christiane Neuschaefer-Rube3
1. Neurophonetics Group at DPPCD, RWTH Aachen Univ., Germany; School of Computer Sci-ence, Tianjin Univ., China 2. Neurophonetics Group at DPPCD, RWTH Aachen University, Germany3. Department of Phoniatrics, Pedaudiology, and Communication Disorders (DPPCD), RWTH Aachen University, Germany
Our model of speech production, speech perception, and speech acquisition has been implemented and tested by simulating early phases of speech acquisition (i.e. babbling phase and imitation phase) and by performing production and perception tests after learning (Kröger et al. 2009). The detailed structure of the model is given in Fig. 1. A characteristic feature of our approach is that we assume a self-organizing phonetic map which is associated with working memory state maps (distributed neural representations), representing the motor plan, the somatosensory activation pattern (tactile and proprioceptive), and the auditory activation pattern of syllables. Speech acquisition is simulated in our approach by applying a huge amount of training items to the model. These training items represent stimuli, which are exposed to a newborn and later on to a toddler during the first two years of lifetime. Acquisition starts with “babbling”, i.e. a training phase which is mainly language independent. Here the model generates random motor patterns (motor plan states) and produces appropriate auditory and somatosensory patterns (auditory and somatosensory states). Motor plan and sensory states are exposed to the model nearly simultaneously and thus allow associative learning, i.e. an association of specific motor plan states with corresponding sensory states (Kröger et al. 2009). This learning leads to an adjustment of synaptic weights between neurons of state maps and neurons of the self-organizing phonetic map. Neurons within the phonetic map represent specific sensorimotor states and these states are ordered with respect to phonetic features within this map. This initial sensorimotor babbling training later on allows “imitation training”, because now the model is able to generate motor patterns, if external auditory stimuli are given by an external speaker (“mother”). Imitation training leads to a further ordering of states within the phonetic map and to language-specific speaking skills. After babbling and imitation training (imitaton of Standard German), the current version of our model has associated motor plan and sensory representations of the 200 most frequent syllables of Standard German and is capable of reproducing and perceiving (identifying) these syllables.
References: Kröger BJ, Kannampuzha J, Neuschaefer-Rube C (2009) Towards a neurocomputational model of speech production and perception. Speech Communication 51, 793-809
Computational neuroscience

Neuroinformatics 2012 114
P036 Figure 1: Structure of the model. The model comprises a feedforward pathway (motor) and three feedback pathways (lower and higher level somatosensory and auditory). Outlined boxes indicate neural maps; other boxes indicate neural processing modules, which are not specified in detail in the figure. Single arrows indicate neural pathways for forwarding information; double arrows indicate neural mappings which are involved in information processing. The light green area indicates higher processing levels which activate syllables as entire units; lower levels (primary cortical maps and subcortical sturcutres) are capable of processing smaller temporal units of production and perception. TS: map for trained sensory states (already acquired); ES: map for external sensory states (currently produced); Δau: auditory error signal; Δss: somatosensory error signal.
Computational neuroscience
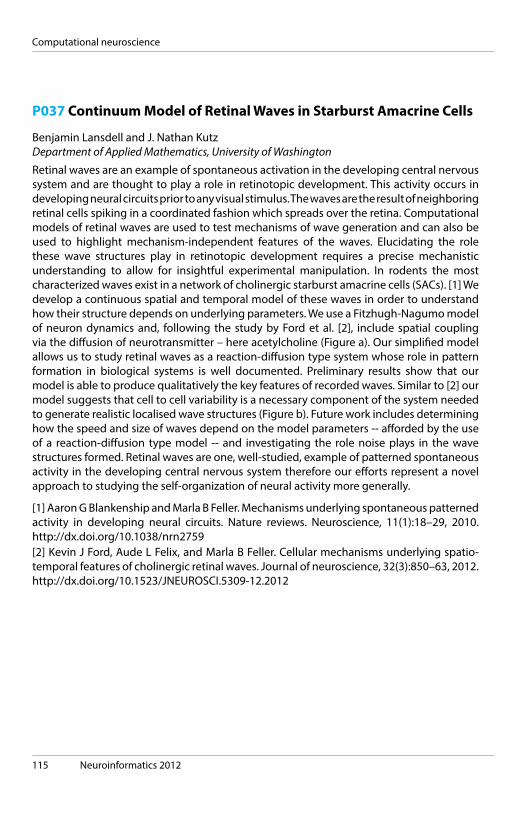
115 Neuroinformatics 2012
Computational neuroscience
P037 Continuum Model of Retinal Waves in Starburst Amacrine Cells
Benjamin Lansdell and J. Nathan KutzDepartment of Applied Mathematics, University of Washington
Retinal waves are an example of spontaneous activation in the developing central nervous system and are thought to play a role in retinotopic development. This activity occurs in developing neural circuits prior to any visual stimulus. The waves are the result of neighboring retinal cells spiking in a coordinated fashion which spreads over the retina. Computational models of retinal waves are used to test mechanisms of wave generation and can also be used to highlight mechanism-independent features of the waves. Elucidating the role these wave structures play in retinotopic development requires a precise mechanistic understanding to allow for insightful experimental manipulation. In rodents the most characterized waves exist in a network of cholinergic starburst amacrine cells (SACs). [1] We develop a continuous spatial and temporal model of these waves in order to understand how their structure depends on underlying parameters. We use a Fitzhugh-Nagumo model of neuron dynamics and, following the study by Ford et al. [2], include spatial coupling via the diffusion of neurotransmitter – here acetylcholine (Figure a). Our simplified model allows us to study retinal waves as a reaction-diffusion type system whose role in pattern formation in biological systems is well documented. Preliminary results show that our model is able to produce qualitatively the key features of recorded waves. Similar to [2] our model suggests that cell to cell variability is a necessary component of the system needed to generate realistic localised wave structures (Figure b). Future work includes determining how the speed and size of waves depend on the model parameters -- afforded by the use of a reaction-diffusion type model -- and investigating the role noise plays in the wave structures formed. Retinal waves are one, well-studied, example of patterned spontaneous activity in the developing central nervous system therefore our efforts represent a novel approach to studying the self-organization of neural activity more generally.
[1] Aaron G Blankenship and Marla B Feller. Mechanisms underlying spontaneous patterned activity in developing neural circuits. Nature reviews. Neuroscience, 11(1):18–29, 2010. http://dx.doi.org/10.1038/nrn2759 [2] Kevin J Ford, Aude L Felix, and Marla B Feller. Cellular mechanisms underlying spatio-temporal features of cholinergic retinal waves. Journal of neuroscience, 32(3):850–63, 2012. http://dx.doi.org/10.1523/JNEUROSCI.5309-12.2012

Neuroinformatics 2012 116
P037 (a) Dimensionless model equations. V represents voltage, R the refractory variable and E the concentration of neurotransmitter. Model is based on Fitzhugh-Nagumo dynamics with spatial coupling occurring via diffusion in the E field. (b) Simulation of wave phenomena following noise spiked in at t=0. Long and variable refractory time due to slow afterhyperpolarization in SACs creates localised wave structure.
Computational neuroscience

117 Neuroinformatics 2012
P038 The Scourge of Neuroanatomical Nomenclature: A Rational Strategy
Maryann E. Martone, Fahim T. Imam and Stephen D. LarsonUniversity of California, San Diego
The brain is perhaps unique among major organ systems in the multiplicity of naming schemes for its major and minor regions. The brain can be divided based on topology of major features, cyto- and myelo-architecture, developmental boundaries, evolutionary origins, histochemistry, gene expression and functional criteria. The gross anatomy of the brain reflects the underlying networks only superficially, and thus any parcellation reflects a somewhat arbitrary division based on one or more of these criteria. One of the core aims of the Neuroscience Information Framework (NIF; http://neuinfo.org ) is to establish an interoperable semantic framework for searching and integrating data across diverse systems. As for neuroanatomy, NIF and other projects, e.g., NeuroNames [1], BAMS, have established the means to translate among different available nomenclatures. The NIF project, in collaboration with the INCF Program on the Ontologies of Neural Structures (PONS), has established the NeuroLex ( http://neurolex.org ), a semantic wiki for developing a knowledgebase around the core concepts of neuroscience. As part of the NeuroLex, we have defined a standard reference vocabulary for mammalian neuroanatomical structures, based on the classical structure hierarchy of the NeuroNames and common terminology found in neuroanatomy textbooks. As verified by text mining of neuroanatomical names [2], these terms tend to be common across species. We have also defined “parcellation schemes”- delineations made on a particular species by a specific author in the context of an atlas or a paper - that reference these core structures. In order to relate brain regions and different parcels, we have defined the ‘overlap’ property in NeuroLex. The term ‘overlap’ in NeuroLex implies some degree of spatial co-localization, although it does not, at this point, specify the degree. We have worked with the PONS group to implement a reasonable strategy for defining brain structures and relating them with different parcellations that is useful for implementation within information systems like the NIF. This poster presentation will depict the overall NIF strategy in details.
References: [1] D. M. Bowden, E. Song, et al.: NeuroNames: An Ontology for the BrainInfo Portal to Neuroscience on the Web. Neuroinformatics 10 (1): 97-114, 2012 [2] L. French, P. Pavlidis: Using text mining to link journal articles to neuroanatomical databases. J Comp Neurol. 2011, doi: 10.1002/cne.23012
Computational neuroscience

Neuroinformatics 2012 118
P039 A simulation framework for acute extracellular recordings
Philipp Meier1, Felix Franke2, Espen Hagen3, Gaute Einevoll3 and Klaus Obermayer1
1. TU Berlin, Neural Information Processing Group2. ETH Zürich, D-BSSE, Bio Engineering Laboratory (BEL)3. UMB, Dept. Mathematichal Sciences and Technology
Extracellular recordings are a key tool to study the activity of neurons in vivo. Especially in the case of experiments with behaving animals, however, the procedure of electrode placement can take a considerable amount of expensive and restricted experimental time. Furthermore, due to tissue drifts and other sources of variability in the recording setup, the position of electrodes with respect to the neurons under study can change, causing degraded recording quality (non-stationarities). Here we devloped a simulation framework for acute extracellular recordings. Neurons and electrodes are modelled as objects in a spatio-temporal state space. A generative data model allows to construct putative voltage traces at electrode positions, as the superposition of time-and-distant-dependant characteristic waveforms of the simulated single neurons. All objects may be positioned arbitrarily during the simulation. This kind of framework allows to simulate acute experimental conditions and provides grounds to evaluate feedback-dependant algorithms (positioning systems, online/adaptive spikesorting). The simulated data was found to resemble data acquired from acute extracellular recordings from PFC of awake behaving maquac.
Computational neuroscience

119 Neuroinformatics 2012
P040 Estimation method for biophysical properties of insect neurons in the combination of suitable stimulation and multi-compartment simulation with supercomputers
Daisuke Miyamoto1, Tomoki Kazawa2, Stephan Haupt2, Masashi Tabuchi3, Tomoaki Mori1, Kei Nakatani4 and Ryohei Kanzaki2
1. Graduate School of Information Science and Technology, The University of Tokyo 2. Research Center for Advanced Science and Technology, The University of Tokyo 3. Graduate School of Engineering, The University of Tokyo 4. Graduate School of Life and Environmental Science, Tsukuba University
The importance of local dendritic activicty in information processing of single neurons has been generally recognized. Constructing multi-compartment simulation models that also reflect the distribution of active conductances in real neurons is the one of the big challenges to achieve realistic modeling due to the paucity of experimental data. As a remedy to this problem, we propose an estimation method combining suitable electrical stimulation and massively parallel computation using genetic algorithms. We applied this method to projection neurons in antennal lobes of silkmoth (Bombyx mori) as the first model neurons. We obtained morphological tree models containing about 4,000 cylindrical compartments from confocal microscopy images. We assumed the presence of known insect K+, Na+ and Ca2+ channels and used candidate distribution models to estimate the corresponding conductances. Several types of electrical stimuli (current ramps, optionally with added sine waves of different frequencies, and voltage clamp pulses) stimuli, were evaluated for their efficiency in providing multi-compartment models reproducing the electrophysiological data. Such estimation methods need to run multi-compartment simulations many times. To meet the computational demands of the method, we used the Real Coded Genetics Algorithm (RCGA) for parallel efficiency and MPI/OpenMP hybrid implementations on the K computer which has 640,000 SPARC64VIIIfx CPU cores and on the RIKEN Integrated Cluster of Clusters (RICC).For estimating the position of a high-conductance area in an axon, injecting a current ramp with added sine wave showed good performance even after a small number of generations of the genetic algorithm (Fig. 1). This could be related to the frequency transmission characteristics of the axon. With 32,768 genes and 200 generations per estimation, we achieved parallel efficiency as high as p=0.99987 comparing the 1,024 cores and 8,192 cores cases (Fig. 2). We showed here that 1) RCGA is suitable for estimating biophysical properties for realistic multi-compartment models with high efficiency in massively parallel computation and that 2) suitable choice of stimulation paradigms can improve the efficiency of estimation. The interaction between experimental data simulation and parameter estimation can be a useful tool to improve multi-compartment models.
Computational neuroscience
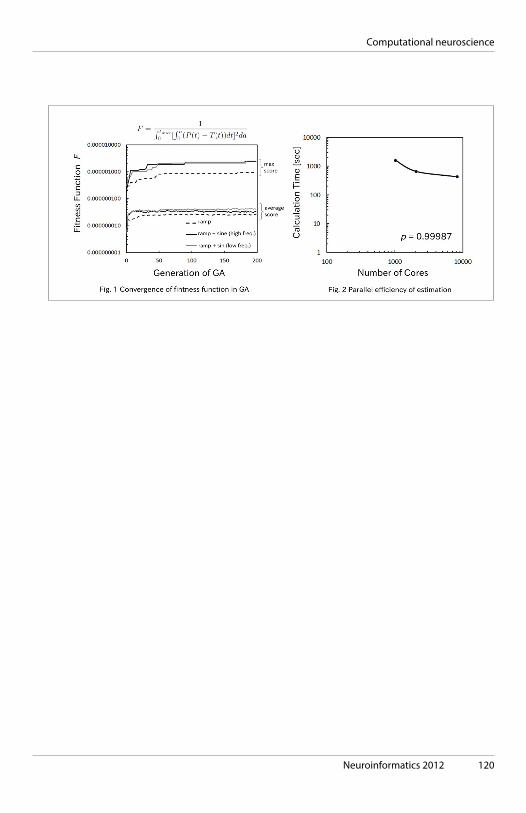
Neuroinformatics 2012 120
Computational neuroscience

121 Neuroinformatics 2012
Computational neuroscience
P041 Morphology and Synaptic Characteristics Based Prediction of Visual Cortex Spike Properties for Different Functions
Venkateswaran Nagarajan1, Vignesh Saptarishi Ramesh2, Ramprakash Srinivasan2, Dinesh Kannan Kabaleeswaran2, Vishal Raghu2, Sharan Srinivas Jagathrakshakan2, Sharath Navalpakkam Krishnan2 and Thiagarajan Thirupatchur Sanjayasarathy2
1. WAran Research FoundaTion2. Charaka Group - Computational Neuroscience, WAran Research FoundaTion
The need to improve understanding of cortical organization dependent functioning of visualcortex actuated this initiative where we are trying to establish a relationship across functions defined by visualcortex(edge detection,segment analysis,orientation specificity,motion processing)& morphological properties including dendritic arborization,soma geometry & synapse characteristics of regions involved in discharging these functions.Computer architectures like VonNeumann or Harvard model have separate memory for instructions & data & standalone functional units unlike the brain where the synapse with plasticity in addition to laying a foundation for long term & short term memory also plays a major role in functional aspects.Existing synapse models have accounted for synapse characteristics like plasticity only for single synapse whereas plasticity study for network of synapses & neurons has been minimal.We define RegionalSynapticPlasticity(RSP) for network of neurons which is essential to link synapse characteristics to functions performed by specific network through spatiotemporal spike distribution.Linking morphology & spike activity for single neuron is brought about by modeling postsynaptic current as stochastic function of concentration of neurotransmitter,state of receptors,membrane reversal potential,among structural parameters including dendritic spanning & synaptic geometry.Further improvements can be done by capturing spike activity of network as function of intracellular parameters1.This single neuron model is extended to network of neurons using ChapmanKolmogorov equation to relate independent probability densities which under appropriate assumptions is reduced to PDE thereby establishing link between RSP,morphology & spike activity of the network.The relationship is established independently for each region of the visualcortex by varying parameters for the network from empirical data.With this relationship an ongoing investigation is undertaken to link morphology & spike activity of separate regions of visualcortex to the functions they are responsible for, which can help in the fundamental understanding of visualcortex.We believe that this understanding of synapse & morphology can also contribute in replacing current VonNeumann & Harvard computer models with more efficient brain-inspired ones.
1:Venkateswaran,et al Energetics based spike generation of a single neuron:simulation results & analysis Front.Neuroenerg4:2doi10.3389/fnene.2012.00002
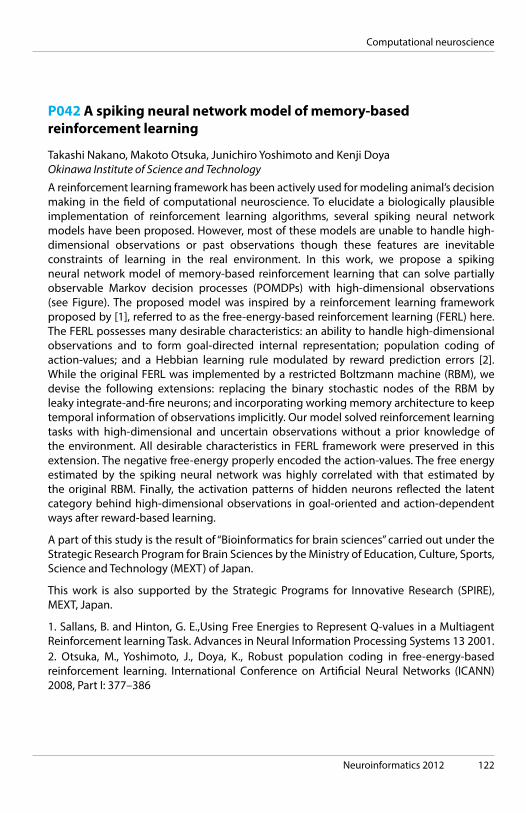
Neuroinformatics 2012 122
Computational neuroscience
P042 A spiking neural network model of memory-based reinforcement learning
Takashi Nakano, Makoto Otsuka, Junichiro Yoshimoto and Kenji DoyaOkinawa Institute of Science and Technology
A reinforcement learning framework has been actively used for modeling animal’s decision making in the field of computational neuroscience. To elucidate a biologically plausible implementation of reinforcement learning algorithms, several spiking neural network models have been proposed. However, most of these models are unable to handle high-dimensional observations or past observations though these features are inevitable constraints of learning in the real environment. In this work, we propose a spiking neural network model of memory-based reinforcement learning that can solve partially observable Markov decision processes (POMDPs) with high-dimensional observations (see Figure). The proposed model was inspired by a reinforcement learning framework proposed by [1], referred to as the free-energy-based reinforcement learning (FERL) here. The FERL possesses many desirable characteristics: an ability to handle high-dimensional observations and to form goal-directed internal representation; population coding of action-values; and a Hebbian learning rule modulated by reward prediction errors [2]. While the original FERL was implemented by a restricted Boltzmann machine (RBM), we devise the following extensions: replacing the binary stochastic nodes of the RBM by leaky integrate-and-fire neurons; and incorporating working memory architecture to keep temporal information of observations implicitly. Our model solved reinforcement learning tasks with high-dimensional and uncertain observations without a prior knowledge of the environment. All desirable characteristics in FERL framework were preserved in this extension. The negative free-energy properly encoded the action-values. The free energy estimated by the spiking neural network was highly correlated with that estimated by the original RBM. Finally, the activation patterns of hidden neurons reflected the latent category behind high-dimensional observations in goal-oriented and action-dependent ways after reward-based learning.
A part of this study is the result of “Bioinformatics for brain sciences” carried out under the Strategic Research Program for Brain Sciences by the Ministry of Education, Culture, Sports, Science and Technology (MEXT) of Japan.
This work is also supported by the Strategic Programs for Innovative Research (SPIRE), MEXT, Japan.
1. Sallans, B. and Hinton, G. E.,Using Free Energies to Represent Q-values in a Multiagent Reinforcement learning Task. Advances in Neural Information Processing Systems 13 2001. 2. Otsuka, M., Yoshimoto, J., Doya, K., Robust population coding in free-energy-based reinforcement learning. International Conference on Artificial Neural Networks (ICANN) 2008, Part I: 377–386

123 Neuroinformatics 2012
P042 A proposed architecture for handling memory-based reinforcement learning tasks. A network is composed of observation, memory, action, and hidden layers. All observation neurons are unidirectionally connected to all hidden neurons either directly or indirectly through the memory layer. Action neurons are bidirectionally connected to hidden neurons to reflect the selected action to the hidden activations.
Computational neuroscience
Neuroinformatics 2012 124
P043 Associating spontaneous with evoked activity in a neural mass model of cat visual cortex
Manh Nguyen Trong1, Ingo Bojak2 and Thomas Knösche1
1. Max Planck Institute for Human Cognitive and Brain Sciences, Leipzig2. School of Psychology (CN-CR), University of Birmingham
Spontaneous activity of the brain at rest frequently has been considered as a mere backdrop to the salient activity evoked by external stimuli or tasks. However, the resting state of the brain consumes most of its energy budget, which suggests a far more important role. An intriguing hint comes from the spontaneous activity patterns in visual area 18, which were observed with voltage sensitive dye in anaesthetized cat by Kenet et al. in 2003 (Nature 425:954-956). These spontaneous patterns closely resembled those evoked by visual stimulation with oriented gratings, except that cortex appeared to cycle between different orientation maps. Moreover, spontaneous patterns similar to those evoked by horizontal and vertical gratings, orientations presumed to be of particular relevance for behaviour, occurred more often than those corresponding to oblique angles. We hypothesize that this kind of spontaneous activity develops largely autonomously, providing a dynamical reservoir of cortical states, which are then associated with visual stimuli through learning. To test this hypothesis, we used a biologically inspired neural mass model to simulate a patch of visual cortex. Spontaneous transitions were induced by modest modifications of the neural connectivity, establishing a so-called stable heteroclinic channel. Significantly, the greater frequency of horizontal and vertical orientation maps emerged spontaneously. We then applied bar-shaped inputs to the model cortex and used simple Hebbian learning rules to modify the corresponding synaptic strengths. After unsupervised learning, different bar inputs reliably evoked their associated orientation state; whereas in the absence of input, the model cortex resumed its spontaneous cycling. We conclude that the experimentally observed similarities between spontaneous and evoked activity of cat visual cortex can be explained as the outcome of a learning process that associates external orientation stimuli with autonomous neural activity.
Computational neuroscience

125 Neuroinformatics 2012
P043 Figure 1: Orientation preference maps: A - observed (Kenet et al., 2003), angles as titles; B - simulated, spatial correlations with observed patterns as titles; C - relative frequency of occurrence.
Computational neuroscience

Neuroinformatics 2012 126
Computational neuroscience
P044 Beyond the Cortical Column - Structural Organization Principles in Rat Vibrissal Cortex
Marcel Oberlaender1, Rajeev Narayanan2, Robert Egger1, Hanno Meyer1, Lothar Baltruschat1, Vincent Dercksen3, Randy Bruno4, Christiaan de Kock2 and Bert Sakmann1
1. Max Planck Florida Institute2. Center for Neurogenomics and Cognitive Research3. Zuse Institute Berlin4. Columbia University
The cortical column is regarded as an elementary functional unit of the mammalian brain. In the vibrissal cortex of rodents, an anatomical equivalent has been described. The so called barrel columns primarily process the information obtained from a related principal whisker on the animal’s snout. We reconstructed the 3D geometry of the entire rat vibrissal cortex with high precision. We found that the location and orientation of all barrel columns, as well as the 3D layout of the vibrissal cortex was remarkably preserved across animals. In contrast, barrel columns differed substantially within the same animal (e.g., the column volume varied by a factor of 3). To investigate whether the differences in column geometry also result in structural differences at the network level, we determined (i) the number and 3D distribution of excitatory/inhibitory neurons in the entire vibrissal cortex, (ii) the number and 3D distribution of neurons in the entire vibrissal thalamus, (iii) the number and distribution of cell types in cortex and thalamus and (iv) reconstructed the 3D dendrite and axon innervation patterns of 160 neurons from all cell types. First, we found that the neuron density was similar in each barrel column, resulting in 3-fold differences in numbers of excitatory and inhibitory neurons between columns. Second, the number of thalamic input neurons correlated with the number of neurons per column (i.e., the ratio of whisker-specific neurons in thalamus and the respective column was constant). Third, the vibrissal cortex and thalamus contained 9 and 4 types of excitatory neurons, respectively. Forth, dendrite and axon morphologies were characteristic for each cell type. Further, neurons of most cell types projected the majority of their axon to surrounding cortical columns. Finally, we created a standardized 3D model of the entire vibrissal cortex and combined it with the 3D distributions of excitatory/inhibitory neurons and the 3D reconstructions of dendrites and axons from all cell types. Using this anatomically realistic model of the vibrissal cortex, we estimated the number and 3D distribution of synaptic contacts between approximately 600,000 neurons. The resultant average ‘connectome’ of the vibrissal cortex reveals structural organization principles beyond individual cortical columns and allows for interpretation or simulation of functional data, measured in vivo.

127 Neuroinformatics 2012
P044 Cell type-specific 3D reconstruction of five neighboring barrel columns in rat vibrissal cortex
Computational neuroscience

Neuroinformatics 2012 128
P045 EEG Analysis in PhysioDesigner
Hideki Oka1, Ken-ichiro Iwasaki2, Yoshiyuki Asai3, Taishin Nomura4 and Yoko Yamaguchi11. NIJC, RIKEN BSI2. NIJC,RIKEN BSI3. OIST4. Department of Mechanical Science and Bioengineering, Osaka University
PhysioDesigner is Integrated Development Environment for physiome biological modeling based on modeling description language PHML[1]. It can handle ODE, DDE, SDE and PDE. Here we will show how EEG (electroencephalogram) analysis can be done under this environment. EEG analysis PHML model is shown in Fig. 1. EEG model is composed of three parts, morphology module, Maxwell equation module and current source capsule module. Current source capsule module is composed of current strength module and frequency module. Morphology module gives cubic simulation region information in which brain structure is stored. Current source module gives information of rhythmic current source which is an origin of EEG signal. Maxwell equation module solves Maxwell equation which needs conductivity values extracted from brain image and gives EEG signal. Brain conductivity is extracted from CT image of grey, white, csf and skull images. For the purpose, image processing tool “Imageviewer” has been developed. Imageviewer has four functions, image, extract, smoothing and resolution. Conductivity matrix file is generated from Imageviewer and is used for Maxwell equation to get electric potentials. To solve partial differential equation, finite element method is used because of its adaptability to complex structure and high numerical accuracy. We adopt a script based solver FreeFem++[2]. Conductivity file is read from FreeFem++ and its values are assigned to each cubic point. Current source is a dipole whose current strength rhythmically vibrates at a decided frequency. Current strength q and angular frequency ω obey following two equations. In this case, αwave of 10Hz is assumed. EEG PHML model has two kinds of equations, Maxwell PDE and current source ODE. Each transient equation runs at different time step. In PhysioDesigner, FreeFem++ parser reads multi time step information and assigns it to each equation to run it at different time step. EEG signal is observed at standard configuration electrodes. In this case, 64 channel electrodes is adopted and MNI standard coordinates conversion is done automatically. This configuration is stored in one segment of cuboid.
[1] http://physiodesigner.org [2] http://www.frefem.org
Computational neuroscience
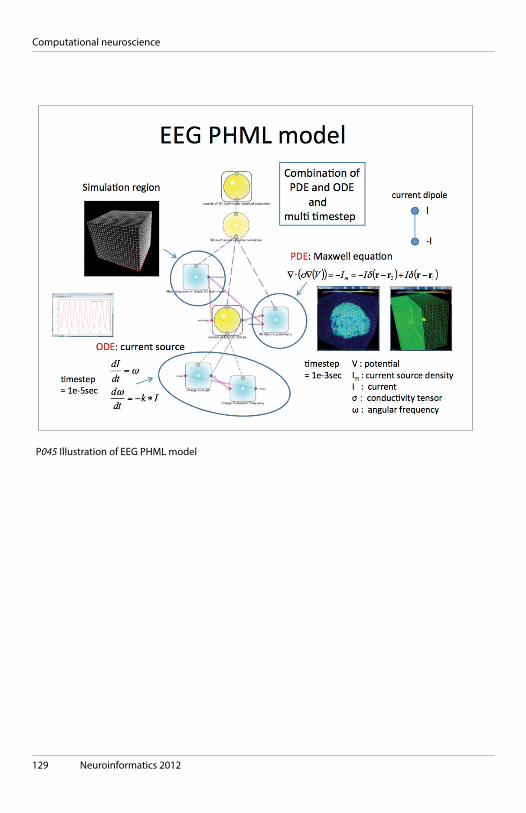
129 Neuroinformatics 2012
P045 Illustration of EEG PHML model
Computational neuroscience
Neuroinformatics 2012 130
Computational neuroscience
P047 Reciprocal inhibition and slow calcium decay in perigeniculate interneurons explain changes of spontaneous firing of thalamic cells caused by cortical inactivation
Jacek Rogala, Wioletta Waleszczyk, Szymon Łęski, Andrzej Wróbel and Daniel Krzysztof WójcikDept. of Neurophysiology, Nencki Institute, 02-093 Warsaw
The role of cortical feedback in thalamocortical processing loop has been extensively investigated over the last decades. With exception of several cases, these searches focused on cortical feedback exerted onto thalamo-cortical relay (TCR) cells of the dorsal lateral geniculate nucleus (LGN). In a previous, physiological study we showed in the cat visual system that cessation of cortical input, despite decrease of spontaneous activity of TCR cells, increased spontaneous firing of their recurrent inhibitory interneurons located in the perigeniculate neucleus (PGN). To identify mechanisms underlying such functional changes we conducted a modeling study in NEURON on several networks of point neurons with varied model parameters, such as membrane properties, synaptic weights and axonal delays. We considered six network topologies of the retino- geniculo-cortical system. All models were robust against changes of axonal delays except for the delay between LGN feed-forward interneuron and TCR cell. Models were manually tuned to achieve results closest to the experimental ones and than conformance of the models’ output was verified by systematic search in the parameter space . The best representation of physiological results was obtained with models containing reciprocally connected PGN cells driven by the cortex assuming relatively slow decay of intracellular calcium. This strongly indicates that the thalamic reticular nucleus plays an essential role in the cortical influence over thalamo-cortical relay cells while the thalamic feed-forward interneurons are not essential in this process. Further, we suggest that the dependence of the activity of PGN cells on the rate of calcium removal can be one of the key factors determining individual cell response to elimination of cortical input.
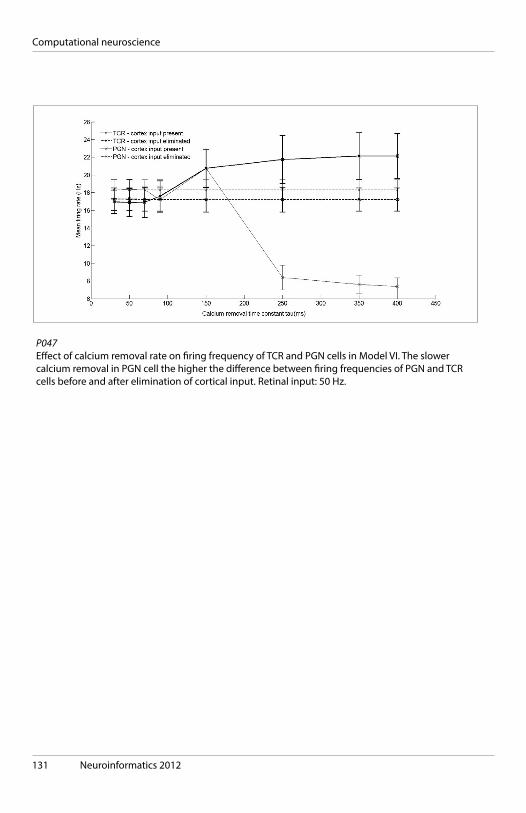
131 Neuroinformatics 2012
P047 Effect of calcium removal rate on firing frequency of TCR and PGN cells in Model VI. The slower calcium removal in PGN cell the higher the difference between firing frequencies of PGN and TCR cells before and after elimination of cortical input. Retinal input: 50 Hz.
Computational neuroscience

Neuroinformatics 2012 132
P048 The intrinsic and extrinsic connectome of subregions of the basal ganglia
Oliver Schmitt, Peter Eipert, Konstanze Philipp, Richard Kettlitz and Andreas WreeDepartment of Anatomy, Uni Rostock
The motoric part of the basal ganglia (BG) network in the rat receives input from the primary motor cortex and consists of the caudate putamen complex, lateral and medial globus pallidus, substantia nigra, subthalamic nucleus and some thalamic nuclei (parafascicular, ventromedial, mediodorsal, ventrolateral, lateral habenula). Most of these classical components are directly (monosynaptically) interconnected. In a metastudy of 2200 tract-tracing publications of the rat central nervous system much more regions were found that are directly connected to functionally important regions of the motoric BG. In this contribution extrinsic and intrinsic connectivity of the BG has been analyzed. Using conventional global and local graph evaluation methods, new approaches of vulnerability and pathway analysis as well as techniques of visual analytics revealed new patterns of reciprocal connections. The unilateral intrinsic BG consists of 14 nodes which are connected by 122 edges resulting in a line density of 67.033% and an average cluster coefficient of 0.735. The average path length is 1.335. It was found that the accumbens nucleus has most ipsilateral and contralateral inputs while the lateral agranular prefrontal cortex has most ipsi- and contralateral outputs. The caudate putamen complex has the largest eigenvector centrality and the lowest Shapley rate. This indicates its importance for the intrinsic network structure of the BG. The substantia nigra pars compacta has a relative high rank with regard to vulnerability, however, the substantia nigra reticular part and the medial globus pallidus are more important to preserve network structure following removal of these nuclei.
Computational neuroscience
133 Neuroinformatics 2012
P051 In silico docking reveals possible Riluzole binding sites on Nav1.6 sodium channel: implications for drug design strategy on Amyotrophic Lateral Sclerosis
Omar Sierra, Janneth González and George BarretoPontificia Universidad Javeriana
Amyotrophic Lateral Sclerosis (ALS) is a progressive neuromuscular disorder involving primarily motor neurons (Hoffman 2008). Glutamate excitotoxicity has been suggested to contribute to this progressive loss of motor neurons due to astrocytes reduced ability to uptake this neurotransmitter (Van Den Bosch 2006). Previous reports revealed that the Na+ channel blockade may increase motor neurons survival against excitotoxic death by targeting the Sodium channel protein Nav1.6 (Hebert et al. 1994). Riluzole interferes with glutamate-mediated transmission, thereby reducing excitotoxicity (Tavakoli 2002). These effects may be partly due to inactivation of voltage-dependent sodium channels Nav1.6 (Ajroud-Driss et al. 2007), suggesting an indirect effect of this drug on glutamate transporters. However many concerns are still unresolved due to experimental caveats, the lack of significant theoretical guidance (Fu et al. 2002) and experimental data on the structure of Riluzole-VGSc complexes. In this study, we have integrated a docking analysis and homology modeling to understand the association of Riluzole with the alpha subunit of voltage-gated sodium channel Nav 1.6. First, we have constructed the three-dimensional structure model for the voltage-gated sodium channel subunit alpha Nav1.6 via homology modeling. Our results demonstrate that Riluzole interacts with the Nav1.6 channel, more specifically in the key residues TYR 1787, LEU 1843 and GLN 1799, suggesting possible cellular implications driven by these amino acids on Riluzole-Nav1.6 interaction, which may serve as an important output for a more specific and experimental drug design therapy against ALS
References. Ajroud-Driss S, et al. 2007. Riluzole metabolism and CYP1A1/2 polymorphisms in patients with ALS. Amyotroph Lateral Scler 8: 305-309. Hebert T, Drapeau P, Pradier L, Dunn R. 1994. Block of the rat brain IIA sodium channel alpha subunit by the neuroprotective drug riluzole. Molecular pharmacology 45: 1055-1060. Hoffman JJ. 2008. Toward a better understanding of amyotrophic lateral sclerosis. Home Healthc Nurse 26: 337-342; quiz 343-334. Tavakoli M. 2002. Disease progression in amyotrophic lateral sclerosis. Identifying the cost-utility of riluzole by disease stage. The european journal health economycs 3: 156-165. Van Den Bosch L, Van Damme, P., Bogaert, E., & Robberecht, W. . 2006.amyotrophic lateral sclerosis. Biochimica Et Biophysica Acta - Mol ecular Basis of Disease: 1762(1711–1712) 1068-1082
Computational neuroscience

Neuroinformatics 2012 134
P052 Towards Automated Analysis of Connectomes: The Configurable Pipeline for the Analysis of Connectomes (C-PAC)
Sharad Sikka1, Brian Cheung2, Ranjit Khanuja2, Satra Ghosh3, Chao-gan Yan1, Qingyang Li2, Joshua Vogelstein4, Randal Burns4, Stanley Colcombe1, Cameron Craddock5, Maarten Mennes6, Clare Kelly7, Adriana Dimartino7, Francisco Castellanos7 and Michael Milham2
1. Nathan S Kline Institute2. Child Mind Institute3. Massachusetts Institute of Technology4. Johns Hopkins University5. Virginia Tech Carilion Reseach Institute6. Donders Centre for Cognitive Neuroimaging7. NYU Child Study Center
Once a distant goal, discovery science for the human connectome is now a reality. Researchers who previously struggled to obtain neuroimaging data from 20 – 30 participants are now exploring the functional connectome using data acquired from thousands of participants, made publicly available through the 1000 Functional Connectomes Project and its International Neuroimaging Data-sharing Initiative (INDI). Beyond access to data, scientists need access to appropriate tools to facilitate data exploration - particularly those who are inexperienced with the nuances of fMRI image analysis, or lack the programming support necessary for handling and analyzing large-scale datasets. Here, we announce the creation of the Configurable Pipeline for the Analysis of Connectomes (C-PAC) - a configurable, open-source, Nipype-based, automated processing pipeline for resting state fMRI (R-fMRI) data, for use by both novices and experts. C-PAC brings the power, flexibility and elegance of Nipype to users in a plug-and-play fashion – without any programming. Using an easy to read, text-editable configuration file, C-PAC users can rapidly orchestrate automated procedures central to R-fMRI analyses, including: •qualityassurancemeasurements•standardimage-preprocessingbasedonuserspecifiedpreferences •generation of connectivity maps (e.g., seed-based correlation analyses,independentcomponentanalysis)•customizableextractionoftimeseriesdata•generationof connectome graphs at various scales (e.g., voxel, parcellation unit) •generation oflocal R-fMRI measures (e.g. regional homogeneity, voxel-match homotopic connectivity, frequency amplitudes) C-PAC makes it possible to use a single configuration file to launch a product set of pipelines that differ with respect to specific parameters in each set (e.g., spatial/temporal filter setting, global correction strategies, motion correction strategies) though conserve computational and storage resources. Additionally, C-PAC can handle any systematic directory organization and distributed processing via Nipype. C-PAC maintains key Nipype strengths, including the ability to (i)interface with different software packages (e.g., FSL, AFNI), (ii)protect against redundant computation and/or storage. The C-PAC beta-release will be distributed via INDI in the summer 2012. Future updates will include a graphical user interface, advanced analytic features (e.g. support vector machines, cluster analysis) and diffusion tensor imaging.
Computational neuroscience

135 Neuroinformatics 2012
P053 Matching Pursuit Algorithm based on L1 norm
Tomasz Spustek, Rafał Kuś, Urszula Malinowska and Piotr DurkaUniversity of Warsaw, Faculty of Physics, ul. Hoża 69, 00-681 Warszawa, Poland
Matching pursuit algorithm (MP), introduced by Mallat and Zhang [1], is a greedy iterative algorithm used for adaptive decomposition of a given signal. The idea of Matching Pursuit is to provide a suboptimal solution to the problem of finding a best linear expansion of a signal in a redundant set of functions. In each of the consecutive steps, a waveform is matched to the signal. Choosing best matching function is most commonly done, by means of largest dot product (called L2 norm) with the residual signal, left after subtracting results of previous iterations [2]. In most cases MP provides a detailed description of structures present in EEG (electroencephalogram) time series. Signal patterns are described not only in terms of their frequency and amplitude, but also their exact time positions and durations are determined. However it is expected, that such procedure applied to a periodic signal would result in a Fourier expansion instead of preferred explicit parameterization of separate structures, as in Figure 1A. Due to the described problem new Matching Pursuit procedure has been implemented. The idea was to change function selection criterion in such way, to use L1 norm instead of L2. Pilot application of this algorithm to the EEG signal from EEG-fMRI (functional magnetic resonance imaging) coregistration allowed for a new approach dealing with EEG artifacts. Instead of filtering the signal before further processing, which may lead to a potential bias of further analyses, relevant structures of interest (in this case sleep spindles) have been detected directly in the raw signal (Figure 1B). Identification of the sleep spindle was made according to [3]: frequency 10-15 Hz, width 0.5-2.5 Hz, amplitude above 12 μV.
[1] S. Mallat and Z. Zhang. Matching pursuit with time-frequency dictionaries. IEE Transactions on Signal Processing, 41:3397-3415, 1993. [2] P. J. Durka. Matching Pursuit and Unification in EEG Analysis, Artech House 2007, ISBN 978-1-58053-304-1 [3] U. Malinowska, P. J. Durka, K. J. Blinowska, W. Szelenberger, A. Wakarow. Micro- and macrostructure of sleep EEG. IEEE Engineering in Medicine and Biology Magazine, 2005.
Computational neuroscience
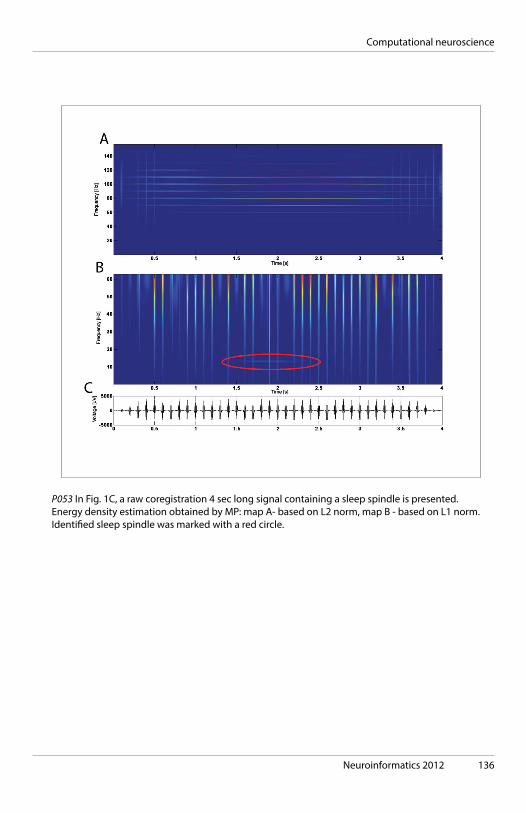
Neuroinformatics 2012 136
P053 In Fig. 1C, a raw coregistration 4 sec long signal containing a sleep spindle is presented. Energy density estimation obtained by MP: map A- based on L2 norm, map B - based on L1 norm. Identified sleep spindle was marked with a red circle.
Computational neuroscience

137 Neuroinformatics 2012
Computational neuroscience
P056 Modelling calcium-dependent proteins in the spine - challenges and solutions
Melanie I. Stefan1, Shirley Pepke1, Stefan Mihalas1, Thomas Bartol2, Terrence Sejnowki2 and Mary B. Kennedy1
1. California Institute of Technology, Biology Division2. Salk Institute
Synaptic plasticity is mediated by calcium signalling in the postsynaptic spine. One hypothesis suggests that the direction of plasticity is determined by the relative activation of two Ca2+-/calmodulin dependent proteins, CaMKII and calcineurin [Lisman. PNAS, 1989], and the subsequent activation of tightly regulated signalling pathways in the spine. Computational modelling allows us to gain an insight into how proteins within this complex signalling pathway may be regulated and in turn regulate each other. It can also improve understanding of its complex and often non-intuitive behaviour under varying conditions. Three features of this signalling system pose a challenge to computational modellers: First, the absolute number of molecules in a dendritic spine is small, which makes reactions stochastic and affects competition between proteins. Second, the constrained geometry within the dendritic spine affects diffusion and creates distinct, dynamic signalling microdomains. Third, the large number of possible modifications on signalling proteins such as CaMKII increases combinatorial complexity and requires modelling strategies that can work with large numbers of possible states. To manage all three of these challenges, we are using the spatial stochastic simulator MCell [Kerr et al. SIAM J Sci Comput, 2008]. MCell is an agent-based Monte-Carlo simulator that allows stochastic modelling in arbitrarily complex geometries. It is therefore ideally suited to model systems with small molecule numbers and spatial constraints. A realistic reconstruction of a portion of a dendrite has recently been used for modelling calcium transients within CA1 neurons using MCell [Keller et al. submitted]. We are currently combining this technology with an earlier kinetic model of calmodulin activation by calcium [Pepke et al. PLoS Comput Biol, 2010] to explore the relationship between calcium signalling, calmodulin activation and the regulation of calmodulin targets in the spine. As an agent-based simulator, MCell allows for simulation of multistate signalling systems which are so complex as to be intractable using ODE/PDE or the Gillespie algorithm. This allows us to use MCell to construct a detailed model of CaMKII activation that includes all the complexities of calmodulin binding [Stefan et al. PLoS ONE, 2012], phosphorylation [Miller and Kennedy. Cell, 1986], conformational change and intramolecular regulation [Chao et al. Nat Struct Mol Biol, 2010].

Neuroinformatics 2012 138
Computational neuroscience
P061 Computational model-based identification of the critical alterations in parkinsonian basal ganglia’s physiology
George Tsirogiannis1, Ioanna Chronaiou1, George Tagaris2 and Konstantina Nikita1
1. Biomedical Simulations and Imaging Laboratory, National Technical University of Athens2. Department of Neurology, “G. Gennimatas” Athens General Hospital
Parkinson’s disease (PD) is considered as a result of dopamine (DA) depletion in the basal ganglia. The objective of the present study is to contribute to the identification of the critical physiological alterations caused by DA depletion that lead to PD. Specifically it is assumed that DA modulates the power of postsynaptic potentials (PSPs) by altering not only their amplitude, but also their duration [Biol Cybern (2010) 102:155–176]. The validity of this hypothesis was assessed through a detailed multi-layer computational model of the basal ganglia, with the objective of reproducing the peak at the beta frequency range of the power spectral density function of subthalamic nucleus (STN) local field potential (LFP) activity, as the characteristic expression of PD. The model’s neurons of the STN and the external and the internal segments of the globus pallidus (GPe and GPi, respectively) were based on a previous computational model [J Neurosci. (2002) 22(7):2963-76]. Cortical and striatal activity were modeled as random processes. On the network level, not only the classic direct-indirect pathways were incorporated, but also cortical projections to both segments of the striatum, a cortical projection to the STN, a connection from the STN to the GPe, a projection from GPe to GPi and two intra-nuclear projections within the GPe and the STN. Simulated LFP from the STN was reproduced as an output of the model through calculations on neuronal currents. The model was simulated in supposed normal and parkinsonian conditions. The transition from the baseline, normal condition to the parkinsonian one was set by consistently modifying both the amplitude and the duration of the PSPs of all the synaptic connections of the model, according to our initial hypothesis. The model behavior was explored for different alteration magnitudes and the results were validated by considering only the plausible model states in terms of mean firing rates. The simulations showed that the peak at the beta frequency range occurred if, and only if, both the amplitude and the duration of PSPs were consistently altered. These results confirm the considered hypothesis indicating that both the amplitude and duration of PSPs play an important role in the pathophysiology of the basal ganglia that produces the symptoms of PD. Moreover, they suggest that the absence of proper modulation of the properties of the synaptic connections by DA might be the main cause of parkinsonian expressions.

139 Neuroinformatics 2012
Computational neuroscience
P062 Impact of Parkinson’s Disease’s Severity on Neuron Firing Pattern in Subthalamic Nucleus
Jiri Wild1, Dan Novak1, Eduard Bakstein1 and Robert Jech2
1. Dept. of Cybernetics, Faculty of Electrical Engineering, Czech Technical University2. Dept. of Neurology, 1st Faculty of Medicine and General Teaching Hospital, Charles Univer-sity in Prague
Introduction The Unified Parkinson’s Disease Rating Scale (UPDRS) is a standardized measure of parkinsonian patients’ abilities to perform basic motor skills, as well as the effect of the disease on activities of daily living and mental abilities. Although is UPDRS standardized it is still only a subjective measure depending on the experience and skills of the examiner. In this study, an objective analysis of the motor part of UPDRS is presented, based on the statistical properties of single-unit recordings gathered from Subthalamic Nucleus (STN) of parkinsonian patients during Deep Brain Stimulation (DBS) surgery. Methods For the total of 54 patients that underwent DBS surgery UPDRS score was assed prior to the surgery without any medication. During the DBS surgery 10s long signals were recorded from STN using parylenecoated tungsten microelectrodes with an exposed tip size of 15 − 25 μm. These signals were then processed using WaveClus [1] spike sorting software with carefully tuned parameters [2]. From the resulting neurons firing patterns inter spike interval (ISI) histograms (annotated with appropriate UPDRS score) were calculated. The inter-histogram distance were then computed using Kolmogorov-Smirnov (KS) statistic. Finally, ISI histograms were grouped based on their KS distance into three groups and the UPDRS scores of these groups were analyzed using standard ANOVA test. Results Grouping ISI histograms based on their KS statistic, resulted in groups of histograms with not only similar shape, but also a similar UPDRS scores. The UPDRS scores were significantly different (at level 0.05) between each group, thus forming groups of patients with low, medium and high motor UPDRS scores. Conclusion In this study, motor UPDRS scores of 54 parkinsonian patients were objectively analyzed with single-unit recordings obtained during DBS surgery. The analysis proved that there is a close relation between neuron firing patterns in STN and Parkinson disease motor symptoms.
References: [1] Quiroga RQ, Nadasdy Z, Ben-Shaul Y. Unsupervised spike detection and sorting with wavelets and superparamagnetic clustering. Neural Comput 2004;16(8):1661–87. [2] Wild J, Prekopcsak Z, Sieger T, Novák D, Jech R. Performance Comparison of Extracellular Spike Sorting Algorithms for Single-Channel Recordings. Journal of Neuroscience Methods. 2012, vol. 203, no. 2, p. 369-376. ISSN 0165-0270. http://dx.doi.org/10.1016/j.jneumeth.2011.10.013.

Neuroinformatics 2012 140
Computational neuroscience
P065 High-frequency oscillations simulated in axonal networks: role of loops, spike failures and axonal gap junctions
Nikita Vladimirov, Yuhai Tu and Roger TraubIBM TJ Watson Research Center
Fast ripples are high-frequency oscillations (250-600 Hz) often observed in epileptic hippocampus and they are believed to reflect the neuronal substrates of epileptogenesis. However, their neuronal mechanisms remain controversial. One possible mechanism depends on the presence of sparsely distributed gap junctions that electrically couple the axons of principal cells into a sparce network (axonal plexus). The axonal plexus is modeled as a random network. Under certain conditions the network can demonstrate one of two types of oscillatory activity. Type I oscillations (100-200 Hz) are predicted to be caused by spontaneously spiking axons in a network with strong gap junctions. Type II oscillations (200-300 Hz) require no spontaneous spiking and some weak gap junctions, across which spike propagation failures occur. The type II oscillations are reentrant and self-sustained. Here we examine what determines the frequency of type II (reentrant) oscillations. We show a simple rule that allows us to predict the frequency of reentrant oscillations. Namely, the shortest loop that contains a weak gap junction and can sustain reentry becomes the pacemaker of the random network, in most cases. In this case, firing of single units has the same period as the total network activity, and this period is determined by the length of pacemaker loop. The “rule of shortest loop” for the network pacemaker is remarkable, because random networks contain a large number of loops juxtaposed and superimposed, and they dynamically interact in our system. This rule allows us to predict the frequency of oscillations from network connectivity and visa versa. We further discuss possible experiments to validate our model.
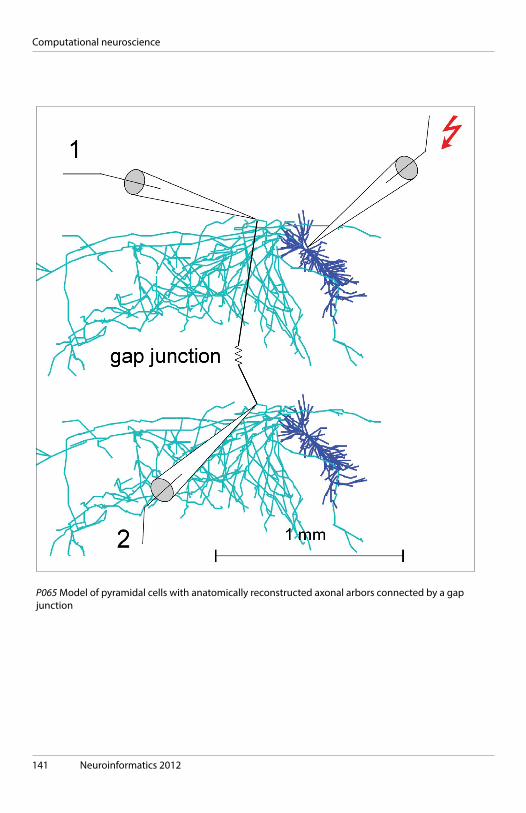
141 Neuroinformatics 2012
P065 Model of pyramidal cells with anatomically reconstructed axonal arbors connected by a gap junction
Computational neuroscience

Neuroinformatics 2012 142
P066 NeuGen 2.0 - Automatic generation of large neuron networks using anatomical data bases
Sergei Wolf, Stefan Grein and Gillian QueisserUniversity of Frankfurt
In Computational Neuroscience the simulation of single cells and neuron networks is becoming increasingly dependent on detailed morphology descriptions on the cell level. Great efforts have been undertaken to systematically record and store the anatomical data of cells. This effort is visible in data bases, such as NeuroMorpho.org. In order to make use of these fast growing data within computational models of networks, it is vital to include it when generating cell morphologies and network geometries. For this purpose we developed the Neuron Network Generator NeuGen 2.0, that is designed to include known and published anatomical data of cells and to automatically generate large networks of neurons. It offers export functionality to classic simulators, such as the NEURON Simulator. NeuGen 2.0 is designed in a modular way, so any new and available data can be included into NeuGen 2.0. Also, new brain areas and cell types can be defined and advanced by the user. Therefore, NeuGen 2.0 is a software package that grows with every new piece of anatomical data, which subsequently will continue to increase the morphological detail of automatically generated networks.
Computational neuroscience
143 Neuroinformatics 2012
P068 An indirect encoding scheme for artificial neural networks based on gene regulatory networks
Martin Pyka1, Sascha Hauke2 and Dominik Heider3
1. Department of Psychiatry, University of Marburg2. Telecooperation Group, Technische Universität Darmstadt3. Department of Bioinformatics, University of Duisburg-Essen
The architecture of natural neural networks evolved through a gradual complexification driven by evolutionary pressure and generated through a highly indirect encoding scheme. Although the development of organic structures (such as neural networks) from the genotype happens through local interactions of proteins and cells, global coordinated structures and patterns can be observed in the phenotype. A Compositional Pattern Producing Network (CPPN) is a model for building such patterns using principles of gene regulatory networks, while exploiting shortcuts in the simulated world (Stanley, 2007). The main idea behind CPPNs is that single genes are activated at a certain concentration level of proteins generated by other genes. Thus, the concentration gradient of a gene can be regarded as the activation function of another protein/gene concentration. Given that different genes have different activation functions and differing influences on other genes, pattern formation can be represented as a graph of concatenated activation functions. The output of the last function builds the pattern for a given substrate. CPPNs are a highly indirect encoding scheme. However, the phenotype is stable and robust against continues changes in the genotype, making it interesting for evolution-driven approaches. We present a model based on CPPNs, called Brain-in-a-box (BIB), that implements several mechanisms of natural developmental processes. Neurons are placed in space according to patterns generated by a BIB, potential connections between neurons are derived from axon- and dendrite cones whose properties are also controlled by the BIB. Thus, neural networks for controlling organisms can be generated and improved through evolutionary methods with indirect genotype-phenotype mechanisms, as they occur in biological systems. Several examples of this model are presented, demonstrating its functionality and how it can be extended to incorporate concepts, such as synaptic plasticity and neuromodulation. The framework and the demos are implemented in Python using the Briansimulator (Goodman and Brette, 2008).
Goodman D and Brette R (2008) Brian: a simulator for spiking neural networks in Python. Front. Neuroinform. http://dx.doi.org/10.3389/neuro.11.005.2008 Stanley K (2007) Compositional pattern producing networks: A novel abstraction of development. Genetic Programming and Evolvable Machines, 8(2):131–162
Computational neuroscience

Neuroinformatics 2012 144
P068 The BIB model: A CPPN generates 2D or 3D patterns that encode various neuron properties such as its placement, orientation and length and density of its axon- and dendrite cones. Connections between neurons are derived as a side-effect of these properties.
Computational neuroscience

145 Neuroinformatics 2012
Digital atlasing
D05 NeuroMaps: Map Data to the Waxholm Atlas for Presentation and Publication
Douglas Bowden1, Eider Moore1, Shanshan Sun1 and Mark Dubach2
1. University of Washington - Seattle2. University of Washington - Seattle
NeuroMaps (2010) is a Web-based application that enables investigators to map data from mouse and macaque studies to canonical brain atlases of the two species and to edit images for presentation, publication, and archival purposes. Eventually NeuroMaps will enable investigators to view and analyze quantitatively the overlap between their data and multimodality data, such as gene expression, fMRI activation, unit activity, effects of electrical stimulation and lesion effects stored in the atlases. For the mouse the canonical brain is a symmetrical version of the MRI-based Waxholm mouse brain atlas (Johnson 2010; Bowden et al. 2011). In this demonstration we shall: 1) Show how to operate the NeuroMaps Mapper (Fig. A) and Editor (Fig. B) on the Web and 2) Explain the rationale for semiautomatic mapping to digital brain atlases in which the two sides of the brain are identical. Major steps in the mapping and image editing procedures are:
1- Load a digital image of the brain section or surface containing the data into the right panel of NeuroMaps. 2- Load the Waxholm Atlas into the left panel. 3- Size, translate, rotate and tilt the Atlas brain (3D surface or cross section) to match the data image. 4- Click pairs of equivalent landmarks in the two images. 5- Draw the boundaries of data areas or points of data on the combined image (Fig. A). 6- Click ‘Map It’ to warp the image containing the data to the Atlas. 7- Edit colors and labels and set size and dpi parameters (Fig. B). 8- Download finished figure for publication or presentation.
NeuroMaps is freely accessible for mapping and editing figures at: http://braininfo.org
Johnson GA, Badea A, Brandenburg J, Cofer G, Fubara B, Liu S, et al. (2010) Space: an image-based reference for coordinating mouse brain research. Neuroimage;53(2):365–72. Bowden DM, Johnson GA, Zaborsky L, Green WDK, Moore E, Badea A, Dubach MF, Bookstein (2011) A symmetrical Waxholm canonical mouse brain for NeuroMaps. Journal of Neuroscience Methods 195: 170-175.
This work was supported by the INCF and by grants from the US National Institutes of Health, MH-069259 and RR-000166 to the University of Washington

Neuroinformatics 2012 146
D05 Two pages from the NeuroMaps website. A: The Mapper. Three cortical areas from the data image in the right panel have been mapped to the Waxholm brain in the left panel. B: The Editor. The User is editing the image size, colors, labels and dpi to download and submit for publication.
Digital atlasing
147 Neuroinformatics 2012
D06 High resolution volumetric atlas of the rat hippocampal region and its subdivisions
Lisa J Kjonigsen1, Trygve B Leergaard1, G Allan Johnson2, Menno P Witter3 and Jan G Bjaalie1
1. Centre for Molecular Biology and Neuroscience, Institute of Basic Medical Sciences, UIO, Oslo2. Center for In Vivo Microscopy, Duke University Medical Center, Durham, NC3. The Kavli Institute for Systems Neuroscience & Centre for the Biology of Memory, NTNU, Trondheim
Considering the complexity of the rat parahippocampal- and hippocampal region, precise neuroanatomical knowledge and access to high quality reference material are required for experimental planning as well as for data analysis. Several two-dimensional (2D) atlas resources exist (including The Rat Hippocampal Atlas, http://www.rodentbrainworkbench.org ), but these are typically insufficient for three-dimensional (3D) analysis of the region needed to fully comprehend spatial organization. Moreover, with increasing access to small animal magnetic resonance imaging (MRI) instruments, it is necessary to determine to which extent different hippocampal subregions can be defined from MRI data. We here present a 3D atlas of the rat hippocampus based on high-resolution ex vivo MRI anatomical (T2*) images with 39 μm isotropic voxels and diffusion tensor imaging (DTI) volumes with 78 μm isotropic voxels from an 80 day old male Sprague-Dawley rat. The boundaries of 18 hippocampal structures were identified and delineated based on image contrast in the volume data, and comparison with cyto- and chemoarchitectonic features in histological images present in an earlier 2D histological atlas of the rat hippocampus. We provide a comprehensive 3D atlas of the rat hippocampal region and describe several boundaries that can be identified on basis of T2* or DTI contrast. Spatial reference is provided by the application of Waxholm Space, a standard atlas space recently defined by the International Neuroinformatics Coordinating Facility (INCF). The use of Waxholm Space connects the atlas to an infrastructure of interoperable resources and services for multi-level data integration and analysis across reference spaces.
Digital atlasing

Neuroinformatics 2012 148
D07 Virtual Fly Brain - a data hub for Drosophila neurobiology
David Osumi-Sutherland1, Nestor Milyaev2, Marta Costa1, Gregory S.X.E. Jefferis3, Cahir J. O’Kane1 and J. Douglas Armstrong2
1. University of Cambridge2. Edinburgh University3. MRC Laboratory of Molecular Biology
Drosophila neurobiology is on the cusp of a data explosion that could facilitate significant advances in our understanding of basic neurobiology. Realizing this promise will require intuitive tools that allow queries across diverse data types from multiple sources, including the literature. Virtual Fly Brain (VFB) [1] already partially fulfills this role, integrating neuroanatomical data from the literature with genomic and genetic data in the FlyBase genetic database. We are beginning to integrate bulk data, including large sets of annotated 3D images.
An extensive ontology of Drosophila neuroanatomy provides the glue for data integration and the substrate for queries on VFB. This ontology is used by FlyBase to annotate expression and phenotype via a simple tagging model, but it also allows more sophisticated forms of data integration. The ontology uses the W3C standard ontology language OWL2 and a set of general relations for representing neuroanatomy [2], developed in coordination with the INCF funded Project for Ontologies in Neuroscience. The basic spatial reasoning that these relations allow is vital to VFB. It drives our queries of brain regions for innervating neurons, expression patterns and phenotypes and will soon drive our queries of annotated neuron images. Where individual annotated neurons can be mapped to known neuron classes, we can use information about the mapped class to enrich image queries. Conversely, we can use information extracted from neuron images about the location of neuron parts to enrich queryable information about mapped neuron classes. Our ontology also includes extensive use of relations for recording lineage, neurotransmitter and function and synaptic connections. The VFB query system will soon be extended to encompass these.
We work with data providers to annotate images in a form that we can easily integrate. Where this is not possible, we analyse bulk image data using a pipeline that registers images to a standard, extracts spatial information and clusters neurons by shape. Where clustering predicts new isomorphic neuron classes, we incorporate these into our ontology.
As well as providing a data integration hub for Drosophila neurobiology, our system has great potential for generalisation to other systems in neurobiology.
[1] http://www.virtualflybrain.org ; Milyaev et al., 2012 http://dx.doi.org/10.1093/bioinformatics/btr677 [2] Osumi-Sutherland et al., 2012 http://dx.doi.org/10.1093/bioinformatics/bts113
Digital atlasing

149 Neuroinformatics 2012
D07 Virtual Fly Brain Screen shot showing image browser and queries.
Digital atlasing

Neuroinformatics 2012 150
Digital atlasing
P096 Registration workflows for the creation of INCF digital atlas hubs
Jyl Boline1, Brian Avants2, Richard Baldock3, Rembrandt Bakker4, Albert Burger5, James Gee2, Christian Haselgrove6, Andreas Hess7, Luis Ibanez8, Stephen Larson9, Piotr Majka10, Yuko Okamura-Oho11, Seth Ruffins12 and Ilya Zaslavsky13
1. Informed Minds2. University of Pennsylvania3. MRC Human Genetics Unit and IGMM4. Radboud University5. MRC Human Genetics Unit and Heriot-Watt University6. University of Massachusetts Medical Center7. Institute of Experimental and Clinical Pharmacology and Toxicology8. Kitware Inc.9. University of California10. Nencki Institute of Experimental Biology11. Brain Research Network and RIKEN Advanced Science Institute12. Broad CIRM Center, USC13. San Diego Supercomputer Center, University of California
The International Neuroinformatics Coordinating Facility (INCF, http://incf.org/ ) Digital Atlasing Program is making strides towards the goal of making multidimensional data of the rodent brain more widely accessible and usable to the research community via a digital atlasing framework (Hawrylycz et al, 2011, PLoS Comput Biol 7[2]: e1001065. doi:10.1371/journal.pcbi.1001065). The approach employs standard spatial reference systems (principally Waxholm Space, WHS) with supporting data sharing infrastructure (Digital Atlasing Infrastructure, DAI). The current efforts of the group are on further development of this framework through these two areas, each of which is the main working area of a Task Force. The WHS task force creates and improves methods for people to bring their data into this framework, while the DAI task force concentrates on improving and expanding the DAI. A current focus on integrating image registration workflows to the underlying infrastructure requires contributions from both these groups, and crosses into the related areas of metadata, provenance, and ontologies. The workflows are being developed around specific data sharing use cases (see figure). At this time, the use cases focus on 2D brain slice images (some sparsely, others highly sampled) of various modalities. The goal is to create tools, recommendations, and standard operating procedures to aid in the registration of data to a known standard atlas space and creation of new atlas hubs. Atlas hubs register their data to a spatial reference system, publish their data and services with INCF Central and share their data via web services. With workflows that allow the creation of new atlas hubs such as one for ViBrism (illustrated in the figure), new datasets (here, a large unique microarray gene expression) will be able to be queried and compared to the data in other atlas hubs, such as EMAGE and Allen Brain Atlas. Project areas for the group include: *Registration fiducials and landmarks
151 Neuroinformatics 2012
*Standards for registration transformations *Data management and handling *Metadata *Provenance *Hub in a Box *WHS for the rat *PONS pan mammalian delineations of WHS dataset
These areas are integrated with DAI or are needed to integrate other components with DAI. This program welcomes input from the community, and requests expert recommendations in several of the project areas outside the original scope of this program. Please contact any of the authors for further information
Digital atlasing

Neuroinformatics 2012 152
P097 Application and evaluation of automated methods to extract brain connectivity statements from free text
Leon French, Suzanne Lane, Lydia Xu, Cathy Kwok, Celia Siu, YiQi Chen, Claudia Krebs and Paul PavlidisUniversity of British Columbia
Automated annotation of neuroanatomical connectivity statements from the neuroscience literature would enable accessible and large scale connectivity resources. Unfortunately, connectivity findings are not formally encoded, hindering aggregation, indexing, searching, and integration. Here we describe progress in developing an automated approach to extracting connectivity reports from free text, building on our previous work on extracting and normalizing brain region mentions. We manually annotated a set of 1,377 abstracts for connectivity relations to form a “gold standard” set. We evaluated a range of methods including simple algorithms (naïve co-occurrence) as well as sophisticated machine learning algorithms adapted from the protein interaction extraction domain that employ part-of-speech, dependency and syntax features. Co-occurrence based methods at various thresholds achieve higher recall and equal precision to techniques that employ complex features. A shallow linguistic kernel (SLK) method recalled 50% of the sentence level connectivity statements at 70% precision by employing a limited set of lexical features. We applied the SLK and co-occurrence approaches to 12,557 abstracts from the Journal of Comparative Neurology, resulting in 28,107 predicted connectivity relationships. We compared a normalized subset of 2,688 relationships to the Brain Architecture Management System (BAMS; an established database of rat tract tracing studies). The extracted connections were connected in BAMS at a rate of 63.5%, compared to 51.1% for co-occurring brain region pairs. Outside of the rat connections in BAMS, we estimated precision of 55.3% based on a manual evaluation of 2000 predicted connectivity statements (recall was not judged). We expanded our prediction set to an additional 5797 abstracts in other journals deemed to be connectivity related by the Mscanner method. By again employing BAMS for evaluation we found this new set of abstracts have similar levels of accuracy while extracting 1430 unique relationships that were not seen in the previous corpus. By aggregating these data into a connectivity matrix, we found that precision can be increased at the cost of recall by requiring predicted connections to occur more than once across the corpus. Further analyses of the predicted connectomes is under way.
Digital atlasing

153 Neuroinformatics 2012
P099 Integration of multimodal neuroanatomical data of gray short-tailed opossum
Piotr Majka1, Natalia Chlodzinska1, Tomasz Banasik2, Ruzanna L. Djavadian1, Władysław P. Węglarz2, Krzysztof Turlejski1 and Daniel K. Wójcik1
1. Nencki Institute of Experimental Biology2. H. Niewodniczański Institute of Nuclear Physics PAN
The gray short-tailed opossum (Monodelphis domestica) becomes increasingly popular laboratory animal. This species is particularly useful in developmental studies because of the precocious stage of development of newborns. Although a large number of neuroanatomical studies were performed on this species, a consistent and comprehensive digital neuroanatomical reference is not available. Digital brain atlases are very different from their traditional book predecessors. Conventional 2D atlases are based on collections of delineated microphotographs of series of stained brain slices. Digital three-dimensional brain atlases allow unconstrained navigation through brain volume and reslicing at arbitrary angles. Furthermore, combining data from different specimens or modalities, localizing and analyzing data within the context of brain volume e.g. performing morphometric analysis or assessing intergroup variances quantitatively, is far more natural in the 3D context. The aim of this study is to integrate multimodal neuroanatomical data of gray short-tailed opossum. The data include: (1) MRI images collected using Bruker BioSpec 9.4T imaging system: T2 weighted, 100um isotropic in vivo and T1/T2* weighted, 50um isotropic taken after 48 hours and 30 days post mortem. (2) Photographs of the tissue block taken during cryosectioning of the brains (‘blockface’ images). (3) Microphotographs of slices stained with histological methods including Nissl and Acetylocholinesterase. The collected data were processed to merge different modalities. In this process the blockface volume, as an intermediate modality between MRI and histology, was the key element. In the workflow, the first step is to reconstruct and segment blockface images. Then, to eliminate global deformations related to brain fixation and its extraction from skull, in vivo and ex vivo MRI images were brought into blockface volume. Afterwards, images of stained sections and corresponding blockface images were nonlinearly registered eliminating slice-specific deformations due to staining procedures. These steps fulfilled the task of converging multimodal data into a single volumetric template. The integrated data will be used for identification and delineation of anatomical structures eventually forming a digital atlas.
The project is partly supported by an infrastructural grant from the Polish Ministry of Regional Development POIG.02.03.00-00-003/09.
Digital atlasing
Neuroinformatics 2012 154
P101 Online repository of three-dimensional models of brain structures
Piotr Majka, Jakub M. Kowalski, Natalia Chlodzinska and Daniel K. WójcikNencki Institute of Experimental Biology
Brain atlases provide key reference frameworks for neuroscience. With the advancement of technology traditional 2D atlases are being complemented by digital 3D atlases, which are more flexible and better adapted to address modern computational, analytical and visualisation challenges of neuroscience. Although the number of available brain atlases grows, the set of tools facilitating systematic access to these data is limited. To provide an easy access to a range of neuroanatomical data we created the 3D Brain Atlas Reconstructor web service ( http://service.3dbar.org ) – an on-line repository of brain atlases and 3D models of brain structures. The essential part of the 3dBAR service is a browser-based interface providing a wide range of functionalities including: - Browsing and downloading of reconstructed 3D models of brain structures in form of polygonal mesh or a volumetric dataset; - Previewing and manipulating the models within the browser window using WebGL technology, without necessity of installing additional software; - Accessing and downloading brain atlas packages consisting of a series of SVG slices or labelled NIfTI volumes; - Generation and management of custom reconstructions (e.g. processed with non-standard pipeline or generating result in an additional file format) using on-line reconstruction wizard. Currently, there are several atlases available through the service, including various delineations of the INCF Waxholm Space mouse brain reference, Allen Brain Institute mouse reference atlas, and a collection of atlases distributed by the Scalable Brain Atlas project ( http://scalablebrainatlas.incf.org ). Some of them are intrinsically 3D atlases based on MRI scans while others are reconstructed from collections of 2D delineations. We can also host additional atlases. Modern data repository should provide a convenient interface for data exchange and allow integration of its services with other systems or software. To facilitate interoperability with third-party applications we offer a complete application programming interface consisting of a set of HTTP queries providing the developers with programmatic access to resources we provide. Currently this mechanism is used by ScalableBrainAtlas, Neurolex.org website and WaxML services developed by INCF DAI.
The project is supported by an infrastructural grant from the Polish Ministry of Regional Development POIG.02.03.00-00-003/09.
Digital atlasing
155 Neuroinformatics 2012
P104 Integrated Analysis of Anatomical Gene Expression Maps and Co-Expression Networks Using a Database, ViBrism
Yuko Okamura-Oho1, Kazuro Shimokawa2, Satoko Takemoto3, Gang Song4, James Gee4 and Hideo Yokota3
1. BReNt-Brain Research Network and Advanced Science Institute, RIKEN2. Department of Gene Diagnostics and Therapeutics, Research Institute, National Center for Global Health and Medicine3. Bio-research Infrastructure Construction Team, Advanced Science Institute, RIKEN 4. Penn Image Computing and Science Laboratory, University of Pennsylvania
Detection of gene expression-anatomy association in biological structure is crucial for understanding its function based on the molecular and genetic/genomic information. Particularly in the mammalian brain where there are estimated 25,000 genes expressed, systematic and comprehensive quantification of the expression densities in the whole three-dimensional (3D) anatomical context is critical. The combinatorial number of randomly selected genes is more than the cell number in the brain, which assumes that non-random combinatorial gene expression underlies the formation of a wide variety of functional brain regions composed of multiple cells.
To determine the association systematically, we have introduced a novel framework, Transcriptome Tomography, for spatially integrating comprehensive endogenous gene expression within an isotropic anatomical context. Using this rapid and unbiased 3D mapping technique, in the first instance, we have generated a dataset of 36,000 maps covering the whole mouse brain (ViBrism: http://vibrism.riken.jp/3dviewer/ex/index.html ) and validated them against existing data with respect to the expression location and density (paper submitted).
Here, we used an informatics approach to identify the combinatorial gene expression as a broad co-expression network. The gene network links covering the whole brain followed an inverse-power law and were rich in functional interaction and gene ontology terms. Developmentally conserved co-expression modules underlie the network structure. To demonstrate the relevance of the finding, we mined Huntington’s disease gene (Htt) and found a novel disease-related co-expression network containing genes potentially co-functioning with Htt in neural differentiation and modulating the disease specific differential vulnerability in brain regions.
The maps are spatially isotropic and well suited to analysis in the standard space for brain-atlas databases, e.g. Waxholm Space (PLoS Comput Biol 2011, 7[2]: e1001065) as shown in the related poster by J. Boline et., al. Our time and cost effective framework〖will facilitate research creating and using open-resources for a molecular-based understanding of complex structures.
A part of this work was conducted within the Waxholm Space Task Force of the International Neuroinformatics Coordinating Facility (INCF) Program on Digital Brain Atlasing. We thank the program members, particularly, R. Baldock, I. Zaslavsky, L.Ibanez and J. Boline.
Digital atlasing
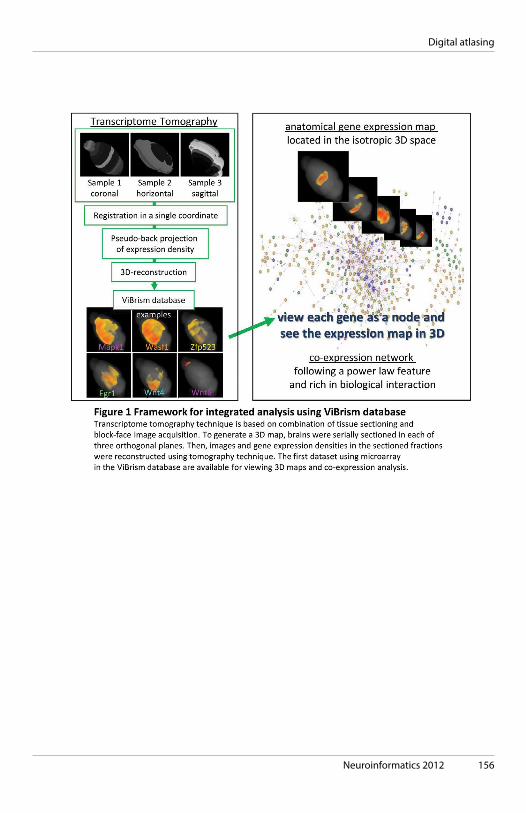
Neuroinformatics 2012 156
Digital atlasing
157 Neuroinformatics 2012
Digital atlasing
P106 16 landmarks of the mouse brain have been validated as fiducials for registration to WHS
Marina Sergejeva1, Rembrandt Bakker2, André Gaudnek1, Yuko Okamura-Oho3, Jyl Boline4 and Andreas Hess1
1. Institute of Pharmacology, FAU Erlangen2. Radboud University Nijmegen3. Brain Research Network and RIKEN Advanced Science Institute4. Informed Minds
A standard space for describing coordinate-based knowledge about the rodent brain is urgently needed. The INCF Digital Atlasing Program has yielded an open access 3D atlas reference system for the mouse brain - Waxholm Space (WHS) and a supporting Digital Atlasing Infrastructure (DAI) – for sharing of multimodal data (genomic, proteomic, imaging) from research groups around the world. We need convenient methods that permit researchers to register their own data to WHS. Existing automatic registration processes are rather complex. In addition, we propose an easier and faster approach: registration based on well recognizable brain landmarks (LMs) or fiducials. Here we present a set of LMs validated asfiducials,astheywerereliablyidentified•bydifferentindividuals(anatomyspecialistsandnovice)• indifferentMRimagingmodalities(T1,T2,T2*)• invariousspecimens•bydifferentcuttingdirections•bydifferent imageresolutions.OncoronalMRdatasets(T1,T2, T2*, 256x256x128, 80 μm) from an adult C57BL/6J male we defined an initial set of LMs recognizable in all 3 modalities and rendered descriptions how to find them. 15 guessers identified these LMs according to the descriptions on datasets from two C57BL/6J males, visualized in ImageJ as coronal slices. The probability of finding them, mean values for x, y and z coordinates and deviations from the mean were calculated for every LM. Finally, we excluded LMs with a deviation of more than 1,5 voxels in the x and y directions in both animals and ended up with 16 potential fiducials. Their average deviations were: 1,0 (x), 0,6 (y) and 1,5 (z), the probability of finding was > 95%. Further, we located these 16 LMs on the canonical WHS datasets, and presented them in the web-based atlasing tool Scalable Brain Atlas ( http://scalablebrainatlas.incf.org/WHS10 ). WHS images have a four times higher resolution and a different inclination than ours, but despite the differences all LMs were well identifiable according to our definitions. This supports their validity as fiducials. We also evaluated “the classical” LMs, Bregma and Lambda derived from the skull 3D µCT datasets coregistered to brain MRI datasets of five mice. We found that positions of these LMs with respect to brain anatomy vary considerably between the mice. The largest distance between Bregma z-positions was 1,2 mm, and between Lambda z-positions - 1,68 mm. Thus, we cannot accept these two LMs as fiducials.

Neuroinformatics 2012 158
P106 Fig 1
Digital atlasing

159 Neuroinformatics 2012
P110 A segmentation guide and probabilistic atlas of the C57BL/6J mouse brain from magnetic resonance imaging
Jeremy Ullmann1, Charles Watson2, Andrew Janke1, Marianne Keller1, Nyoman Kurniawan1, Zhengyi Yang1, Kay Richards3, George Paxinos4, Gary Egan5, Steven Petrou6, Perry Bartlett1, Graham Galloway1 and David Reutens1
1. The University of Queensland2. Curtin University3. Florey Neurosciences Institute4. The University of New South Wales, 5. Monash University6. Florey Neuroscience Institutes
The mouse has become a vital tool to elucidate the pathogenesis of human neurological diseases at a cellular and molecular. Its importance as a model is demonstrated by the multitude and diversity of projects including the Allen Brain Atlas, Waxholm Space, MBL and MBAP. To complement these projects research groups have utilized MRI to non-invasively map the brain and provide control data to compare with disease models. Despite using a variety of sample preparation protocols and image sequence these atlases have been of restricted use due to the limited number of segmented brain regions. The Australian Mouse Brain Mapping Consortium has endeavored to develop a high-resolution and highly detailed MRI-based mouse brain atlas. In this project we have concentrated on five primary brain regions, the hippocampus, cortex, cerebellum, thalamus, and basal ganglia and produced a segmentation guide and probabilistic atlas for over 200 structures. MRI data from 18 mice was acquired as per Janke et al.3. Images were placed in the stereotaxic Waxholm space3 and a symmetric model was created4. The components of the brain were then delineated, on the bases of differences in signal intensity and/or their location in reference to landmark structures, and partitioned using vector-based segmentation via a Cintiq tablet. We acquired 30µm3 data sets, which were averaged to create a model resolution of 15µm3. We developed a detailed parcellation scheme for segmenting the C57BL/6J mouse brain. It is based on MRI landmarks, which are reproducible, and visible as a consequence of the higher signal-to-noise ratio achieved during group averaging and the inter-subject stability of structures. The segmentation protocol creates standardized structural delineations that can be applied to studies examining mouse models of neurological disease. We also generated a digital atlas containing over 200 structures with mean region volumes, T2*-weighted signal intensities and probability maps for each of structure. This atlas offers a detailed template for cross modality applications and is online at www.imaging.org.au/AMBMC.
1 Dorr, et al. Neuroimage 42, 60-69 (2008).2 Franklin, K. & Paxinos, G. The mouse brain in stereotaxic coordinates. 3 edn, (Academic Press, 2008).3 Johnson, et al. Waxholm Space: Neuroimage 53, 365-372 (2010).4 Janke et al. 15um average mouse models in Waxholm space from 16.4T 30um images. In 20th Annual ISMRM Scientific Meeting and Exhibition, Melbourne, Australia (2012).
Digital atlasing
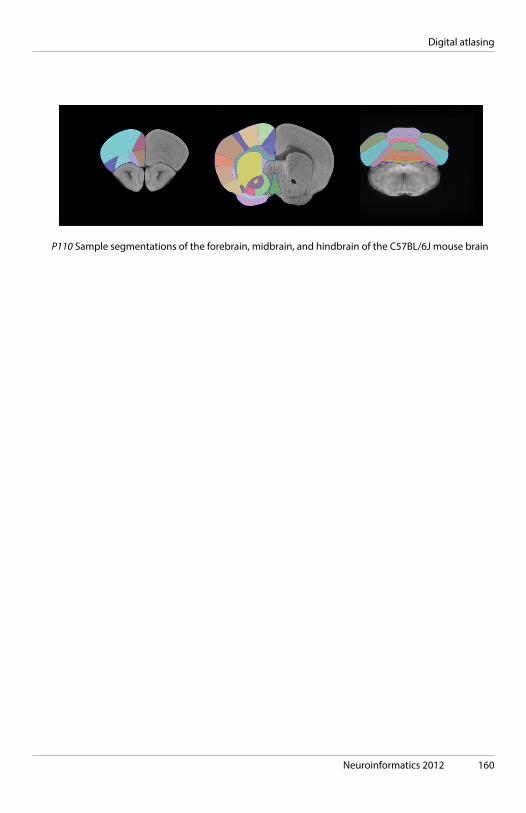
Neuroinformatics 2012 160
P110 Sample segmentations of the forebrain, midbrain, and hindbrain of the C57BL/6J mouse brain
Digital atlasing

161 Neuroinformatics 2012
Digital atlasing
P111 101 labeled brains and a new human cortical labeling protocol
Jason Tourville1 and Arno Klein2
1. Boston University2. Columbia University
Labeling the macroscopic anatomy of the human brain is instrumental in educating biologists and clinicians, visualizing biomedical data, and determining the locations and distribution of brain data. Examples of the latter include the analysis and reporting of brain imaging data with respect to landmarks or brain regions, which is routinely done for functional, diffusion, and structural magnetic resonance images (f/d/MRI) and positron emission tomography. Consistent labeling of the cerebral cortex is challenging due to the great anatomical variation in the cortical folds and difficulty in establishing robust, accurate reference landmarks across the brain. Accurate definitions for landmarks and label boundaries is important because they underlie our assumptions of correspondence across brain image data, and affect registration and region-based analyses. Hence an accurate, reproducible labeling protocol is crucial. Here we outline a new surface-based cortical labeling protocol based on the Desikan-Killiany (DK) protocol [1], the “Desikan-Killiany-Tourville” (DKT) protocol that promises to be more consistent and accurate with respect to macro-anatomical landmarks than previous protocols. We evaluate this protocol by comparing FreeSurfer-automated DK labels with manually edited versions of these labels according to our DKT protocol. We created this protocol to set a new standard of labeling accuracy and consistency for use by the scientific community, as well as to create the largest and most complete set of labeled brains ever released to the public, a manually edited label set of 101 human cortices from the T1-weighted MR images of publicly available multimodal data acquired from healthy individuals ( http://www.mindboggle.info/data/ ).
[1] RS Desikan, et al. 2006. An automated labeling system for subdividing the human cerebral cortex on MRI scans into gyral based regions of interest. Neuroimage, 31(3), 968-980.

Neuroinformatics 2012 162
Digital atlasing
P115 Online registration workflows for atlases of rodent brain and accuracy assessment of spatial translation
Ilya Zaslavsky1, Asif Memon2, Stephan Lamont2, David Valentine1, Luis Ibanez3, Gang Song4, Brian Avants4, James Gee4, Yang Liu4 and Jyl Boline5
1. San Diego Supercomputer Center, UCSD2. University of California, San Diego3. Kitware, Inc.4. University of Pennsylvania5. Informed Minds
Registration of diverse sources of brain atlas data to standard coordinate spaces, managing coordinate transformations between reference spaces, and assessing the degree of certainty of spatial location descriptions and coordinate transformations, are the key issues in enabling atlas data integration based on spatial location in the brain. The problem is complex, because: a) different atlases and image stacks present different reference models of rodent brain; b) different image modalities result in different delineations of features and functional areas; c) there are a number of coordinate systems developed for the brain, each with different spatial properties and associated error models; d) coordinate transformations computed between 2D and 3D brain atlases have different error models, with degrees of distortion depending on the transformation technique; and e) the “true” deformation is usually unknown. This issue becomes more challenging as we move to atlas data integration across species, where transformations based on brain coordinates are likely to be meaningless. To address this problem, the INCF Program on digital brain atlasing has developed a common reference space for mouse brain (Waxholm Space, or WHS), and a collection of atlas services, which support on-demand coordinate system description, coordinate transformations, and a range of requests based on point-of-interest queries. The atlas services have been deployed at several atlas hubs, initially supporting coordinate translation between WHS, reference plates and volume representations of the Allen Mouse Brain atlas, and the Paxinos-Watson atlas of the mouse brain. In addition, a mechanism has been developed to register additional image collections to the system of atlas hubs within INCF Digital Atlasing Infrastructure (INCF-DAI) and derive additional spatial reference system descriptions and transformations. This poster focuses on two extensions of the INCF-DAI work: (a) standardization of online spatial registration workflows and (b) addition of coordinate transformation and registration accuracy measures to atlas services. We demonstrate registration workflow steps, show derivation of certainty fields for transformations between known coordinate systems, and present methodology for reporting transformation accuracy derived over the course of spatial registration.
This work was conducted within the Digital Atlasing Infrastructure Task Force of the INCF Program on Digital Brain Atlasing.

163 Neuroinformatics 2012
Digital atlasing
P116 A Digital Atlas of Ion Channels Expression Patterns in the Two-Week-Old Rat Brain
Volodymyr Shcherbatyy1, James Carson2, Murat Yaylaoglu1, Katharina Jaeckle1, Frauke Grabbe1, Maren Brockmeyer1, Ezekiel Gomez2, Tao Ju3 and Gregor Eichele1
1. Department of Genes and Behavior, Max Plank Institute for Biophysical Chemistry, Göt-tingen2. Biological Sciences Division, Pacific Northwest National Laboratory, Richland, WA3. Department of Computer Science and Engineering, Washington University in St. Louis, St. Louis, MO
Numerous studies exist showing expression of ion channels in various species, stages, and planes of sectioning. However, it is difficult to directly compare levels and sites of expression of all channels (channelome) using this published data alone. Our aim is to put all this information into a common reference frame. This task requires a redetermination of expression patterns for the channelome in a particular species and stage, a systematic quantification of expression strength, and a method to place this information into a digital, searchable atlas. Once constructed, such an atlas would allow one to compare and contrast the expression patterns of hundreds of channels. The Allen Brain Atlas [1] provides a first important step towards the goal of standardization. It contains the expression patterns of ~300 ion channels in serial sections through the adult mouse brain. We have developed highly reproducible methods of brain orientation so that data obtained from different specimens can be used for comparative analysis. Moreover, we have re-determined the expression patterns of nearly all ion channels in the two-week-old rat brain, a specimen frequently used for electrophysiological studies. Furthermore, we used a previously developed atlasing method (subdivision meshes) to faithfully model the shape of the various brain regions [2] and quantified gene expression strength [3], following a previously established procedure ( http://www.geneatlas.org ). We illustrate our approach using inwardly rectifying potassium channels (Kir) and show some of the quantitative comparisons of the expression patterns and strengths to emphasize the usefulness of this new digital atlas.
References: 1. Lein, E.S., et al., Genome-wide atlas of gene expression in the adult mouse brain. Nature, 2007. 445(7124): p. 168-76. 2. Carson, J.P., et al., A digital atlas to characterize the mouse brain transcriptome. PLoS Comput Biol, 2005. 1(4): p. e41. 3. Carson, J.P., G. Eichele, and W. Chiu, A method for automated detection of gene expression required for the establishment of a digital transcriptome-wide gene expression atlas. J Microsc, 2005. 217(Pt 3): p. 275-81.

Neuroinformatics 2012 164
P116 Figure 1: Automated pipeline for atlas-based annotation of the channelome expression patterns.
Digital atlasing

165 Neuroinformatics 2012
P118 First generation Waxholm atlas of the Sprague-Dawley rat brain
Eszter A. Papp1, Trygve B. Leergaard1, G. Allan Johnson2 and Jan G. Bjaalie1
1. CMBN, Institute of Basic Medical Sciences, University of Oslo2. Center for in vivo Microscopy, Dept Radiology, Duke University Medical Center
Standardized brain atlas spaces provide key anchoring points for comparing heterogeneous datasets from different experimental animals in the context of structure - function analysis. The usability of such an atlas space depends on common access to high quality reference material, including delineations of anatomical structures (labels), and underlying original images (templates). Analysis of microscopic data of 3D nature, e.g. gene expression distributions and connectivity patterns, can to advantage make use of high resolution non-distorted volumetric templates and associated atlas labels for the rat brain. We present a first generation of such reference material for the standard Waxholm Space in the Sprague-Dawley rat. Microscopic resolution ex vivo magnetic resonance images (MRI) were acquired from an 80 day old male Sprague-Dawley rat, including T2* anatomical images with 39 μm isotropic voxels, and diffusion tensor images (DTI) with 78 μm isotropic voxels. Anatomical structures, including nuclei, areas, and fiber tracts, were delineated based on image contrast using ITK-SNAP software, resulting in 67 distinct labels along with detailed delineation criteria. Labels representing cortical areas have been transferred from an existing atlas (Hjornevik et al., http://dx.doi.org/10.3389/neuro.11.004.2007 ), warped into the volumetric template, and manually adjusted for shape differences. Validation of atlas labels was aided by collections of histological images from brains of comparable animals, and delineations from other rat brain atlases. The volumetric template, as well as the atlas labels, will be made open access through the INCF Software Center. Spatial reference is provided by the application of Waxholm Space, a standard atlas space recently defined by the International Neuroinformatics Coordinating Facility (INCF). The use of Waxholm Space connects the atlas to a growing infrastructure of interoperable resources and services for multi-level data integration and analysis across reference spaces. The presented atlas serves as a basis for a library of individual volumetric templates for different applications, e.g. different strains, disease models, and developmental stages. The atlas is to be included in a server-based registration pipeline as part of the INCF Digital Atlasing Infrastructure, allowing registration of both experimental data and new suitable templates to the atlas.
Digital atlasing

Neuroinformatics 2012 166
P118 3D overview of atlas labels, and example area showing the underlying high-resolution volumetric dataset (T2* and DTI fractional anisotropy images). Scalebar: 1 mm
Digital atlasing

167 Neuroinformatics 2012
Neuroimaging
D21 Manual Segmentation of Fiber Tracts with Bundles of Interest
Paolo Avesani1, Eleftherios Garyfallidis2, Emanuele Olivetti1 and Stephan Gerhard3
1. CIMeC Center for Mind/Brain Sciences2. University of Cambridge3. ETH Zurich
Brain connectivity analysis investigates the connections between different areas in the brain. Anatomical connectivity refers to the structural links within the white matter, which consists of billions of neuronal axons. Diffusion MRI (dMRI) is a magnetic resonance imaging technique which provides the information to reconstruct white matter fibers. A reconstructed fiber is called streamline or track. The set of all reconstructed tracks is called tractography. In neurological studies and presurgical planning, the segmentation of the network of white matter fibers into known anatomically structures, called fiber bundles or fiber tracts, is a task of growing interest. The current procedures and tools to manually segment a fiber tract are based on the notion of region of interest (ROI). The segmentation of the fiber tract of interest is performed by defining two or more ROIs in order to localize where the related tracks start and end. The anatomical fiber tract is obtained by filtering the streamlines that cross the ROIs. This approach has some important drawbacks. First, it tends to underestimate the fiber tract geometry since it does not retain the streamlines that are broken in one or more points in their path due to incorrect reconstruction. Second, the manual design of the ROIs is a challenging task which is based on the, possibly inaccurate, alignment of the tracks to a structural scan (e.g T1 or T2). Third, with ROIs the user has to face the complexity of navigating the full cluttered and densely packed tractography. We propose an alternative approach based on the notion of bundle of interest (BOI). A BOI is defined as a set of tracks sharing similar shape and spatial characteristics. The proposed approach for manual segmentation is based on direct interaction of the user with the tracks, in contrast with the indirect method based on ROIs. The intuitive idea is to provide the user with a summary of the tractography. This summary is defined by clustering the streamlines into a set of representative bundles and then showing one representative track per bundle. The task of manual segmentation is conceived as an iterative process where the user alternates a phase of bundle-representative selection to a phase of re-clustering the selected bundles into smaller bundles. The selection of bundles aims to best approximate the target fiber tract, while the bundle re-clustering step allows the user to work incrementally at finer detail.
Neuroinformatics 2012 168
Neuroimaging
D22 New perspectives in visualisation for neuroimaging
David Barnes1, Gary Egan2, Parnesh Raniga2 and Owen Kaluza3
1. Monash Biomedical Imaging & Monash e-Research Centre (Monash University)2. Monash Biomedical Imaging (Monash University)3. Monash e-Research Centre & Monash Biomedical Imaging (Monash University)
Scientific discovery depends critically on the visualisation of data. Visualisation has a special role in imaging experiments, specifically, the comprehension and analysis of data, and the communication of outcomes. Our ability to derive new knowledge from increasingly large and more detailed images depends on understanding, applying and advancing appropriate visualisation strategies to the data at hand. In neuroimaging, visualisation techniques are ordinarily applied to 3-dimensional images, or time-evolving (4-d) images, yet the communication and publication of study outcomes routinely depends on static, 2-d representations of 3-d or 4-d phenomena. This predicament is not unique to the neuroimaging discipline. However the constraints of 2-d display media have influenced the development of data analysis and visualisation techniques for neuroimaging. For example: (1) techniques for flattening the cortical surface (e.g. Fischl et al., 1999, http://dx.doi.org/10.1006/nimg.1998.0396 ) are in significant part motivated by the difficulty of visualising a highly folded and warped sheet; (2) the ubiquitous red, green, blue shading of diffusion tensor images to show left-right, anteroposterior and superior-inferior white matter fibre direction indeed allows the encoding of 3-d information in a 2-d figure, but the result cannot be fully interpreted by 5-10% of the community (the red-green colour-blind). We have developed tools that directly address the broad challenge of publishing 3-d and 4-d scientific data (including images) as fully-interactive figures within Adobe PDF documents (Barnes & Fluke, 2008, http://dx.doi.org/10.1016/j.newast.2008.03.008 ; Ruthensteiner et al., 2010, http://dx.doi.org/10.1016/j.micron.2010.03.010 ). No special viewing software is required, and 3-d PDF figures can now be generated using free software. Here, we present our technique applied to standard neuroimaging data: 3-d MR images, 4-d fMRI images, cortical surfaces, diffusion tensor images and derived datasets. We describe how publishing and communicating using interactive, 3-d figures, allows us to begin addressing some of the shortcomings evident in discipline-specific visualisation and analysis: is cortical flattening necessary when we can directly publish and visualise complex, 3-d surface structures as figures in PDF articles? Are RGB fibre maps appropriate when we can directly publish a less-derived, more meaningful 3-d tensor image within an academic paper?

169 Neuroinformatics 2012
Neuroimaging
D23 Neuroimaging in the Browser using the X Toolkit
Daniel Haehn, Nicolas Rannou, Banu Ahtam, Ellen Grant and Rudolph PienaarChildren’s Hospital Boston, Harvard Medical School
WebGL is recent technology that exposes a computer’s GPU to a browser, and allows for the native generation of rich three dimensional graphics [1]. Compatible web browsers can offer a graphical experience comparable to more traditional stand-alone programs. As such WebGL offers the potential of bringing the “web” to neuroscience, and has great potential to accelerate and support scientific research. Cognisant of these possibilities, we present ‘The X Toolkit’ (XTK), the first JavaScript-based framework for visualizing and interacting with medical imaging data using WebGL. The toolkit is geared towards powerful scientific visualization and provides a simple API (a 3D DICOM volume can be fully manipulated with three lines of code). Previous neuroimaging visualization using WebGL has been focused on specific data sets and is not easily generalizable [2],[3]. On the other hand, several frameworks for general WebGL development exist [4], but require a deep understanding of low-level computer graphics programming. Inspired by both approaches, we designed the XTK API to hide low-level elements of WebGL from users and offer native support of established neuroimaging file formats, e.g. supported files can be placed onto a web server and instantly rendered. XTK supports: surface meshes in the Visualization Toolkit, Standard Tessellation, and Freesurfer formats; single-file DICOM volumes and label maps in NRRD and Freesurfer formats; tractography files in the Diffusion Toolkit format; as well as curvature overlays. XTK is optimized to enable fast data processing and high rendering frame rates. The engine uses caching and optimized loops as well as asynchronous loading. The Google Closure compiler is connected to a CDash infrastructure to monitor the build process and track tests on different browsers. XTK, the build and test system, and all libraries are open sourced and hosted at GitHub [5].
[1] WebGL Specification, Khronos Group 2012, http://www.khronos.org/webgl [2] Ginsburg D. et al., Realtime Visualization of the Connectome in the Browser using WebGL. 4th INCF Congress of Neuroinformatics 2011. doi: 10.3389/conf.fninf.2011.08.00095 [3] Kelc R., Zygote Body: A New Interactive 3-Dimensional Didactical Tool for Teaching Anatomy. WebmedCentral ANATOMY 2012;3(1):WMC002903 [4] WebGL Frameworks, Khronos Group 2012, http://www.khronos.org/[…]/User_Contributions#Frameworks [5] XTK, https://github.com/xtk [6] XTK Visualization, http://demos.goXTK.com/teenager/

Neuroinformatics 2012 170
Neuroimaging
D23 Figure 1: Neuro MRI data, brain fibers, a reconstructed surface with curvature overlays as well as 3D volume rendering inside a web browser using WebGL based on XTK; in total 27 lines of code and running with 51-60 FPS in the current stable Chrome browser [6].

171 Neuroinformatics 2012
Neuroimaging
D24 Automated analysis of morphological and synaptic characteristics in neurons
Johannes Hjorth and Sabine SchmitzVrije Universiteit Amsterdam
Differences in morphology and distribution of synapses and proteins have implications for the function of neurons. Manual quantification of protein expression in immuno-fluorescence images is both time consuming and prone to observer bias. Here we present SynD, a MATLAB based program, developed to automatically analyze dendrite and synapse characteristics in immuno-fluorentscence images. The program uses a combination of steerable filters and deconvolution to detect dendrites and synapses. It reports dendrite morphology, synapse size, number and distribution, as well as protein expression at the soma, at synapses and as a function of distance from the soma. The dendritic tree is characterized using Sholl analysis. The automatic measures have been compared to manually traced neurons and synapses showing good accuracy. Results are exported as csv files readable by excel and to user-friendly summary figures.
Reference: Automated analysis of neuronal morphology, synapse number and synaptic recruitment. Schmitz SK, Hjorth JJJ, et al 2011, J Neurosci Methods 195(2):185-93 doi: http://dx.doi.org/10.1016/j.jneumeth.2010.12.011

Neuroinformatics 2012 172
Neuroimaging
D25 NITRC Phase 2 - Towards a Sustainable Resource
David Kennedy and Christian HaselgroveUniv. of Massachusetts Medical Center
We report on a neuroimaging informatics knowledge environment recently expanded from MR to PET, EEG, MEG, SPECT, CT and optical neuroimaging tools and resources: Neuroimaging Informatics Tools and Resources Clearinghouse (NITRC). Funded by the NIH Blueprint for Neuroscience Research, NIBIB, NIDA, NIMH, and NINDS, NITRC fosters a user-friendly clearinghouse environment for the neuroimaging informatics community. NITRC’s goal is to support researchers dedicated to enhancing, adopting, distributing, and contributing to the evolution of previously funded neuroimaging analysis tools and resources for broader community use. Located at www.nitrc.org, NITRC promotes software tools, workflows, resources, vocabularies, test data, and now, pre-processed, community-generated data sets (1000 Functional Connectomes, ADHD-200) through its Image Repository (NITRC-IR). NITRC gives researchers greater and more efficient access to the tools and resources they need; better categorizing and organizing existing tools and resources via a controlled vocabulary; facilitating interactions between researchers and developers through forums, direct email contact, ratings and reviews; and promoting better use through enhanced documentation. In Summary, NITRC facilitates access to a growing number of neuroimaging tools and resources (~450), and supports (~1 mil. hits monthly by ~142,750 unique visitors, initiating ~450,000 downloads). NITRC has established itself as a key resource for the advancement of neuroimaging research.
D25 NITRC Front Page
173 Neuroinformatics 2012
Neuroimaging
P086 A multi-modality neuroimaging research data informatics system
Gary Egan1, David Barnes1, Neil Killeen2, Jason Lohrey3, Wilson Liu2, Wojtek Goscinksi1 and Nicholas McPhee1
1. Monash University2. University of Melbourne3. Arcitecta Pty Ltd
Modern data-intensive, distributed and collaborative research depends critically on the ability to manage, move and interpret information. Monash Biomedical Imaging (MBI) operates five biomedical imaging scanners, and is linked to the Australian Synchrotron Imaging and Medical Beam Line. Our objective was to apply the Framework data [1] model and the Distributed and Reflective Informatics System (DaRIS) imaging data management tool to develop a multi-modality neuroinformatics system for use at MBI. DaRIS compels scientific users to adopt a data model that has been designed specifically for biomedical imaging research. The Framework object model draws on and extends pre-existing object models in the public domain (e.g. DICOM and XCEDE). The Java and “web 2.0” interfaces to the DaRIS system are driven by the data model so that they are reflective of the data tree, rather than hand-coding an interface to match the data and meta-data. The system supports federation through the underlying Digital Asset Management system Mediaflux™ (www.arcitecta.com) and a citable identification scheme so that data and queries can be distributed over multiple nodes. The MBI data management infrastructure is underpinned by a local “staging post” through which the acquired imaging data is routed. Imaging data tagged as belonging to a DaRIS project is automatically sent onwards (in DICOM format) to the server, and the data is ingested and attached to the appropriate research project. User-level access to data is then provided via the DaRIS web-based portal that provides browsing, viewing, download and transfer capabilities for biomedical imaging data. The MBI implementation of DaRIS is now operational for multi-modality biomedical imaging research applications, and has broader application to other fields of subject-centric research.
References: [1] J. Lohrey, N. Killeen, G.F. Egan, “An Integrated Object Model and Method Framework for Subject-Centric e-Research Applications”, Frontiers in Neuroinformatics 3 (2009) 19, 1-10.

Neuroinformatics 2012 174
Neuroimaging
P086 The Monash Biomedical Imaging implementation of the Distributed and Reflective Informatics System (DaRIS) for multi-modality biomedical imaging research applications.
175 Neuroinformatics 2012
Neuroimaging
P088 Textmining for cognitive paradigm annotation
Chayan Chakrabarti1, George Luger1, Angela Laird2 and Jessica Turner3
1. University of New Mexico, Albuquerque, NM2. University of Texas, San Antonio3. Mind Research Network, Albuquerque, NM
Background. This work explores automatic annotation of fMRI studies based on standard terms from the Cognitive Paradigm Ontology (CogPO). The ability to run large-scale meta-analyses demands the ability to easily identify studies using the same (or similar enough) experimental methods and subjects. The BrainMap method for describing experiments has evolved into a taxonomy composed chiefly of structured keywords that categorize the experimental question addressed, the imaging methods used, the behavioral conditions during which imaging was acquired, and the statistical contrasts performed. The schema that BrainMap uses to describe experiments has been used to form the backbone of the Cognitive Paradigm Ontology. That ontology (Turner & Laird 2012) uses the keywords from BrainMap and explicitly represents the implicit definitions and relationships among them. Methods. We have implemented an initial text mining approach on a subset of texts of abstracts from the BrainMap database ( http://www.brainmap.org ), to automate the expert annotations from the BrainMap schema and CogPO terms. We experiment with two categories of methods: methods emphasizing presence of high-entropy words, and methods emphasizing the sequence in which the words occur. High-entropy words are those, which add more discriminating information. These are likely to be technical terms relevant to the domain. In the second category, we examine the sequence in which certain words tend to occur in the corpus, rather than the words themselves. Results. We measured the performance of a basic K-nearest-neighbor (KNN) approach on the title and abstract text of the corpus, in predicting the correct annotations. The results are better than chance, which is promising given the high-dimensional nature of the problem. We also evaluated some initial n-gram models which on this sparse corpus were less successful. Our work points toward the use of semantic models more complex than simple distance among abstracts.
Citations: Turner JA, Laird AR. (2012) The cognitive paradigm ontology: design and application. Neuroinformatics. 10(1):57-66.DOI: http://dx.doi.org/10.1007/s12021-011-9126-x
Neuroinformatics 2012 176
Neuroimaging
P089 Automated Functional MRI Quality Assessment
Gabriele Fariello1, Victor Petrov2, Timothy O’Keefe3 and Garth Coombs2
1. Harvard University / Massachusetts General Hospital2. Massachusetts General Hospital3. Harvard University
Gabriele R. Fariello (1,2,3), Victor I. Petrov (1,3), Timothy M. O’Keefe (1,2), Garth Coombs (3), and Randy L. Buckner (1,2,3,4) 1. Harvard University, Neuroinformatics Research Group 2. Harvard University, Center for Brain Science 3. Athinoula A. Martinos Center for Biomedical Imaging, Massachusetts General Hospital 4. Howard Hughes Medical Institute The ability to quickly assess the quality of acquired functional imaging data within large data sets in an automated, reliable, and meaningful manner is of increasing importance. Automated quality assurance metrics are of particular value when managing multi-center imaging studies and also when studying patient populations where movement and degraded data quality can confound results (e.g., Van Dijk et al., 2012; Powers et a., 2012). With the release of large publicly accessible fMRI data sets such as the 1000 Functional Connectomes Project (Biswal et al., 2010), the future release of the NIH Human Connectome Project data (Van Essen et al., 2012), and the Brain Genomics Superstruct Project Open Data Set, having quantitative quality control metrics will be essential. Here we present an effective automated quality assessment method for BOLD fMRI images. It includes relevant metrics such as voxel and slice-intensity based SNR calculations, movement metrics, mean, standard deviation, SNR and slope images, as well as motion and mean-slice intensity plots in a convenient, one-page display format. The full display can be used for in depth vetting and four summary statistics can be used when extracted values are needed. Source code used to generate output images, reports, and values will be made available from a bitbucket repository.

177 Neuroinformatics 2012
Neuroimaging
P089 Example screen shot of XNAT-integrated output from the ExtendedBOLDQC Pipeline

Neuroinformatics 2012 178
Neuroimaging
P092 BIPS: A Framework for Curating and Executing Brain Imaging Pipelines
Satrajit Ghosh1, Anisha Keshavan1, John Salvatore1 and Arno Klein2
1. Massachusetts Institute of Technology2. Columbia University
Reproducible science requires publicly accessible data, analysis tools and scripts and the computational environment to repeat analyses. However, in brain imaging only a tiny fraction of publications include the associated data and analysis scripts. When available, such scripts often require specialized environments to execute. Shared data typically do not contain any provenance information and shared results and outputs of analysis are not in an electronic form that allows efficient querying in a database context. Only some of the existing neuroimaging database systems capture some of these systems but are not necessarily coupled with the analysis tools (however, see LONI and IDA/XNAT). For the vast majority of users with familiarity with FSL, SPM, AFNI and other brain imaging analysis software, there is no easily available route to store the information associated with their analyses into these databases. As such the time and resource expenditure necessary to curate the analyses simply outweighs the possible benefits to be gathered by sharing the data [1]. Brain Imaging Processing Services (BIPS), an opensource framework [2], was developed with the explicit aim of making electronic data capture easy by providing access to reusable tools and environments and providing tool-chains that allow users to execute analyses. The currently available tool-chains focus on dicom conversion, analyzing structural, “resting state” functional and diffusion data and providing quality assurance reports. At each stage of any analysis, provenance is captured and stored in a queriable database. The quality assurance scripts provide metrics in the context of other subjects and studies stored in the database. Every workflow in BIPS is associated with a unique identifier and once accepted into the package will not change. Much like version control systems, a modification to a workflow creates a new “commit” or workflow with its own unique identifier. The metadata associated with a workflow enables querying and configuring workflows. The framework and associated web services are being built to conform to the XCEDE data model.
This work was conducted with the Neuroimaging Task Force of the INCF Program on Standards for Datasharing and the Gabrieli Lab in McGovern Institute for Brain Research at MIT.
References: 1. Poline et al., (2012) Data sharing in neuroimaging research. Front. Neuroinform. doi: 10.3389/fninf.2012.00009 2. http://github.com/INCF/BrainImagingPipelines

179 Neuroinformatics 2012
Neuroimaging
P093 Correlation between 50-kHz band activity in primary auditory cortex and social interaction in rats
Hengjun J Kim1, Gyunggoo Cho1, Youngkyu Song1, Song-I Chun1, Dongwan Lim1, Jeong Kon Kim2 and Young Ro Kim3
1. Korea Basic Science Institute2. Radiology, Asan medical center3. Radiology, Massachusetts General Hospital
Ultrasonic vocalization (USV) reflects emotional state and the level of social interaction in rats. The USV in 50-kHz band are emitted in a positive affective state induced by food reward or rough-and-tumble play as well as by the approach behavior, whereas 22-kHz band relates to an anxious state. Primary auditory cortex (Aud1) of rat is tonotopic, in which spatial divisions of Aud1 corresponds to specific frequency bands. Based on the work of Rutkowski et al. (2003), we created probabilistic maps to display the 50-kHz or 22-kHz band responsivity in Aud1 (Figure A). Penetrating through the blood-brain barrier, manganese ions (Mn2+) enter and accumulate in the firing neurons via voltage-gated calcium channels, enhancing the MRI signal intensity. Thus, we applied manganese-enhanced magnetic resonance imaging (MEMRI) to investigate the relation between social behavior and 50-kHz band activity in Aud1 using MDEFT pulse sequence (TR/TE=15/3.8ms, Inversion delay=1100ms, 4 segments, FA=15°) and social interaction test (SIT). First, SIT was performed based on File et al. (1978)’s protocol. Female pairs of rats (6 pairs, n=12) were placed in the box for 10 min and SIT score was measured by the time spent in active social contacts including sniffing, grooming, and following. Secondly, we acquired high-resolution image before and after Mn2+ injection to rats to monitor the brain activity for one day. From the brain activity map and probabilistic map, we calculated Aud1 activities in 50-kHz band region, which were correlated with SIT score. Figure B showed the relation between brain activities and SIT score for left and right Aud1 regions. Only in the left Aud1, the neural activities receiving 50-kHz band had significant correlation with the SIT score (r=0.70, p=0.01), indicating that animals showing active social behavior had enhanced neural activities to 50-kHz calls in Aud1. Previous behavioral studies showed that the dominant rat had higher SIT score than subordinates, and high SIT score was known to represent low anxiety level. Our result revealed that the animals with low anxiety level had positive bias in the perception of ultrasonic calls. In addition, we suggest that the probabilistic map, if it was applied to functional brain imaging data, could be used to measure the affective valence in the auditory sensory cortex.
References RG Rutkowski et al. (2003) Hear. Res. 181, 116-130. SE File et al. (1978) Br. J. Pharmacol. 62, 19-24.

Neuroinformatics 2012 180
Neuroimaging
P03A. The probabilistic maps for frequency bands in left and right primary auditory cortices were made from tonotopic maps. Blue-lightblue color represents the region receiving 50-kHz band; Red-yellow color, 22-kHz band.
B. Scatter plots of auditory cortex 50-kHz band activities and social interaction score.

181 Neuroinformatics 2012
Neuroimaging
P094 Applying human brain image processing methods to honeybee calcium image data
Arno Klein1, Satrajit Ghosh2, Barrett Klein3, Lisa Rath3, Giovanni Galizia3 and Christoph Kleineidam3
1. Columbia University2. MIT3. University of Konstanz
Methods developed for analyzing human brain fMRI data have great potential for application to brain imaging data of different spatial and temporal scales, different imaging methods, and different species. In this work, we demonstrate a simple analysis of honeybee (Apis mellifera) brain image data using the Python programming language. To our knowledge, this is the first application of human brain imaging techniques to an invertebrate. These techniques provide advantages when analyzing intra-individual phenomena, and invertebrates such as the honeybee offer the advantage of harboring a simpler, experimentally more accessible nervous system. Data in invertebrate studies are commonly pooled across multiple specimens based on a segmentation of the neuropil of interest. For many applications, this approach is powerful because physiological measures are based on a population mean. However, traditional methods [1] are limited when insufficient neuroanatomical information prevents a reasonable segmentation. With the proposed method, no a priori segmentation is necessary and the independent intra-individual analysis is more powerful. In our study, we investigated odor information processing in the brains of honeybees while the bees were awake versus while they were asleep [2]. Using functional imaging with fluorescent dyes (calcium imaging), we measured neuronal activity during these two physiological states. We compare the power of an analysis based on the traditional approach of semi-automatic segmentation of functional units with our pixel-based analysis. The open source software will be made available through http://www.mindboggle.info , http://www.nitrc.org , and http://www.github.com .
1. Galizia CG, Szyszka P. 2008. Olfactory coding in the insect brain: molecular receptive ranges, spatial and temporal coding. Entomologia Experimentalis et Applicata. 128:81–92. 2. Kaiser W. 1988. Busy bees need rest, too: behavioural and electromyographical sleep signs in honeybees. J Comp Phys A. 163:565-584.
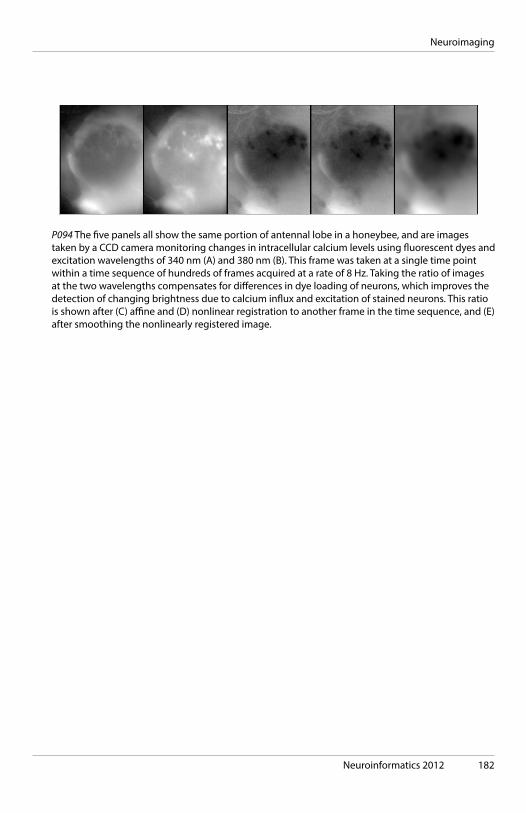
Neuroinformatics 2012 182
Neuroimaging
P094 The five panels all show the same portion of antennal lobe in a honeybee, and are images taken by a CCD camera monitoring changes in intracellular calcium levels using fluorescent dyes and excitation wavelengths of 340 nm (A) and 380 nm (B). This frame was taken at a single time point within a time sequence of hundreds of frames acquired at a rate of 8 Hz. Taking the ratio of images at the two wavelengths compensates for differences in dye loading of neurons, which improves the detection of changing brightness due to calcium influx and excitation of stained neurons. This ratio is shown after (C) affine and (D) nonlinear registration to another frame in the time sequence, and (E) after smoothing the nonlinearly registered image.

183 Neuroinformatics 2012
Neuroimaging
P095 Projectome: Set up and testing of a High Performance Computational Infrastructure for processing and visualizing neuro-anatomical information obtained using confocal ultra-microscopy techniques
Ludovico Silvestri1, Alessandro Bria2, Leonardo Sacconi1, Anna Letizia Allegra Mascaro1, Maria Chiara Pettenati3, Sanzio Bassini4, Carlo Cavazzoni4, Giovanni Erbacci4, Roberta Turra4, Giuseppe Fiameni4, Valeria Ruggiero5, Paolo Frasconi6, Simone Marinai6, Marco Gori7, Paolo Nesi6, Renato Corradetti8, Giulio Iannello2 and Francesco Saverio Pavone9
1. LENS2. UCBM3. ICON4. CINECA5. UNIFE6. DSI - UNIFI7. DiSI - UNISI8. Neuroscience - UNIFI9. ICON, LENS
In Projectome we set up an IT infrastructure to share both neuroscience data as well as high performance computational applications. Data handled in Projectome are mouse brain images obtained using conf-u [1], a confocal ultra-microscopy technique in which selectively labeled neurons are imaged by light-sheet based microscopy [2][3] with micron-scale resolution. Data obtained from an experiment conducted on a mouse brain (1 cubic cm) might be of a range of 1 Terabyte, or more. Specific processes have been implemented in a Projectome Tooolkit in order to allow: 1) fully automated 3D Stitching capability starting from acquired raw data and 2) semi-automatic extraction of some morphological characteristics (eg. neurons localization) [1][4]. The implementation plan of the project consists of two phases: phase I, in which the core data management functions are set up and phase II in which the data mining, knowledge extraction and visualization features are implemented. Projectome is running the final part of phase I: both raw and processed data as well as elaboration algorithms are made available through a dedicated storage and computational infrastructure operated by CINECA, the largest Italian computing center [5]. Data sets originated from the European Laboratory of Non-linear Spectroscopy LENS [6] are transferred to CINECA using high performance protocol (i.e. GridFTP) and successively stored using iRODS data grid [7]. The setup of a Workflow Management System for the execution of Projectome Toolkit applications is being implemented using UNICORE [8].
[1] Silvestri, Bria, Sacconi, Iannello and Pavone, Confocal ultramicroscopy: micron-scale neuroanatomy of the entire mouse brain (2012). Submitted paper [2] Dodt et al., Ultramicroscopy: three-dimensional visualization of neuronal networks in the whole mouse brain, Nat Methods (2007) [3] Keller and Dodt, Light sheet microscopy of living or cleared specimens, Curr Opin Neurobiol (2011) – REVIEW
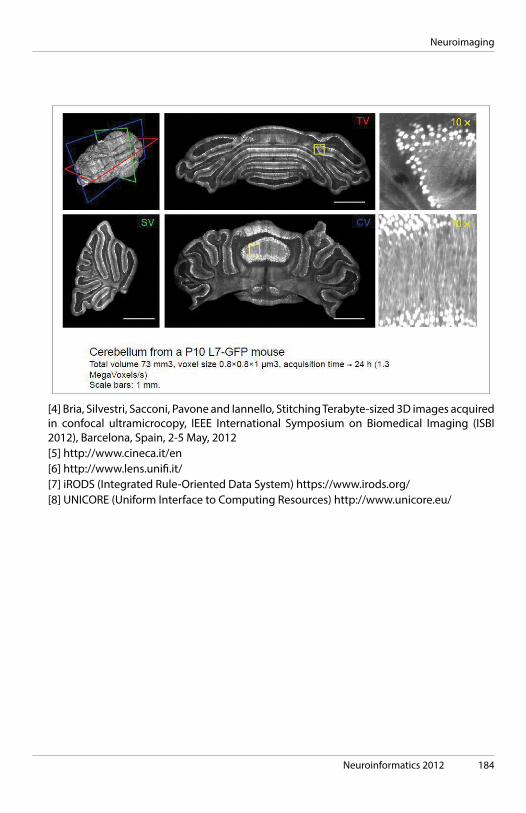
Neuroinformatics 2012 184
Neuroimaging
[4] Bria, Silvestri, Sacconi, Pavone and Iannello, Stitching Terabyte-sized 3D images acquired in confocal ultramicrocopy, IEEE International Symposium on Biomedical Imaging (ISBI 2012), Barcelona, Spain, 2-5 May, 2012 [5] http://www.cineca.it/en [6] http://www.lens.unifi.it/ [7] iRODS (Integrated Rule-Oriented Data System) https://www.irods.org/ [8] UNICORE (Uniform Interface to Computing Resources) http://www.unicore.eu/

185 Neuroinformatics 2012
Neuroimaging
P098 BRAINSTORM Towards Clinically and Scientifically Useful NeuroImaging Analytics
Joshua Vogelstein1, Sharad Sikka2, Brian Cheung2, Ranjit Khanuja3, Qinyang Li3, Yan Chao-Gan3, Carey Priebe1, Vince Calhoun4, R. Jacob Vogelstein1, Michael Milham3 and Randal Burns1
1. Johns Hopkins University2. Nathan Klein Institute3. Child Mind Institute4. Mind Research Network
We desire to transform clinical psychiatric practice to take advantage of the vast technological strides in contemporary neuroimaging. We propose three complementary steps will help facilitate this transformation. First, the construction of a computing platform to store and process large datasets. Second, methods to calibrate measurements across individuals and instruments. Third, tools to convert such measurements into clinically useful analytics. We are developing BRAINSTORM (Fig. 1) to address these three concerns.
First, a high-performance compute cluster and associated scientific database, called “BrainCloud”, for storing, managing, and efficiently querying both multi-modal neuroimaging and rich phenotypic data. BrainCloud will be seeded with data already available from the International NeuroImaging Data Initiative [1] as well as the Mind Research Network [2]. Moreover, BrainCloud will include a simple one-click upload interface so that additional research and clinical facilities can contribute to the growing data corpus.
Second, a robust pipeline optimized to pre-process multimodal image data to infer multi-modal attributed connectomes (MACs). We are developing a highly configurable pipeline [3] that enables us to search for an optimal representation of data for subsequent inference via non-parametric reliabilities estimates.
Third, streaming decision theoretic manifold learning algorithms [4] that yield clinically useful outputs, as well as provide insight into brain/behavior relationships. To date, most statistical and machine learning algorithms natively operate on vector valued data; but our data are far more complex: responses to psychological instruments and multimodal images. We are developing complementary tools that natively operate on non-Euclidean data and “stream”, meaning that they continue to learn as new data becomes available.
[1] http://fcon_1000.projects.nitrc.org [2] Scott, A et al. Front. NeuroInf., 2011 [3] Sikka, S. Resting-State, 2012 [4] Priebe, CE. arXiv:1112.5510

Neuroinformatics 2012 186
Neuroimaging
P100 3D Statistical Parametric Mapping of quiet sleep EEG in the first year of life
Pedro A. Valdes-Sosa1 and Jorge Bosch-Bayard2
1. Cuban Neuroscience Center2. Cuban Neurosceince Center
This work extends previously developed 3D SPM for Electrophysiological Source Imaging (Bosch et al., 2001) for neonate EEG. It builds on a prior paper by our group that established age dependent means and standard deviations for the scalp EEG Broad Band Spectral Parameters of children in the first year of life. We now present developmental equations for the narrow band log spectral power of EEG sources, obtained from a sample of 93 normal neonates from age 1 to 10months in quiet sleep. The main finding from these regressions is that EEG power from 0.78 to 7.5Hz decreases with age and also for 45-50Hz. By contrast, there is an increase with age in the frequency band of 19-32Hz localized to parietal, temporal and occipital areas. Deviations from the norm were analyzed for normal neonates and 17 with brain damage. The diagnostic accuracy (measured by the area under the ROC curve) of EEG source SPM is 0.80, 0.69 for average reference scalp EEG SPM, and 0.48 for Laplacian EEG SPM. This superior performance of 3D SPM over scalp qEEG suggests that it might be a promising approach for the evaluation of brain damage in the first year of life.
References Hernandez-Gonzalez, G., Bringas-Vega, M. L., Galan-García, L., Bosch-bayard, J., Melie-garcia, Y. L.-ceballos L., Valdes-Urrutia, L., Cobas-Ruiz, M., et al. (2011). Multimodal Quantitative Neuroimaging Databases and Methods: the Cuban Human Brain Mapping Project. Clinical Eeg and Neuroscience, 42(3), 1-11. Bosch-Bayard, J., Valdés-Sosa, P. a, Fernandez, T., Otero, G., Rivero, B. P., Ricardo-Garcell, J., González-Frankenberger, B., et al. (2011). 3D Statistical Parametric Mapping of quiet sleep EEG in the first year of life. NeuroImage. http://dx.doi.org/doi:10.1016/j.neuroimage.2011.11.001

187 Neuroinformatics 2012
Neuroimaging
P100 MIP of Z-scores in the delta band for both normal and pathological neonates.Maximum Intensity Projection (MIP), top view, of the Z-scores for the 17 pathological neonates (top of the figure, demarked by black lines) and the 93 normal subjects at the frequency (in the Delta band)most deviant from the norm. Z-scores for normal subject swere obtained by recalculating the norms each time using the leave one out procedure. All Z-scores were thresholded to a common value of±2.4 SD. Two of the pathological cases only showed Z-scores above the threshold in the Beta band between 15 and 24 Hz and appear in white in this figure. The third one was included as pathological due to clinical evidence of brain damage, but with visual EEG inside normal range. This case did not show Z-scores beyond the limits in any frequency of the whole frequency range.
Neuroinformatics 2012 188
Neuroimaging
P102 A Semi-automated Program for Axonal Reconstructions from Time-lapse 2-Photon Images
Zhilun Yang1, Qian Wang2, Ge Gao2, Xuesong Li2, Federico Grillo3, Valentina Ferretti3, Vincenzo De Paola3 and Sen Song2
1. School of Software, Tsinghua University2. Department of Biomedical Engineering, School of Medicine, Tsinghua University3. MRC Clinical Sciences Centre, Imperial College London, Du Cane road, London
Tracking individual axons and synapses over extended periods of time has recently become possible by combining time lapse two-photon microscopy and transgenic animals expressing fluorescent proteins in subsets of neurons. These live imaging studies are providing unique insights into the development and plasticity of neural circuits in both basal conditions and in the context of disease. However, the process of data analysis to extract morphological features of neuronal arbors and the strengths (i.e. size) of individual synapses is currently manual and tedious. Here we present a semi-automated reconstruction program called NeuronMatrix with a graphical GUI written in matlab (figure A). Neuron reconstruction typically follows four steps: 1) pre-processing, 2) tracing, 3) post-processing, and 4) measurement. We use two-photon time-lapse images of GFP-expressing axons from mouse barrel cortex taken in the De Paola lab. Firstly, we use median filtering to get rid of shot noise (figure B). To get rid of remaining unwanted background fluorescence and resolve individual neurites, we follow a recent machine learning approach proposed by the Sebastian Seung lab (Sumbul U et al, Neuroscience Abstracts 2011) and use a convolutional neural network for enhancement (figure C). Secondly, we incorporated the algorithm from the Simple Neuron Tracer Fiji plugin to automatically trace a path between two points (Figure B and C). The result shows that the convolutional neural network is able to help resolve junction points and reduce unspecific background. The much cleaner image led to a dramatic improvement in tracing speed (2.92±0.29s versus 15.7±4.7s for each axon), making the user experience more efficient. In some instances, tracing on the median filtered image gave the wrong result due to axons coming close to each other while the result from the enhanced image is correct (figure B versus C). Thirdly, we extract the axonal backbone intensity and align it over imaging sessions using fiducial points (figure D ). Lastly, we use local intensity peak finding to extract bouton strength values. We are currently using this software to analyze the synaptic strength changes underlying cortical remapping. Future improvements in over-day alignment are expected to further reduce the amount of user efforts. We plan to release NeuronMatrix to the general community as a Fiji plugin in the future.

189 Neuroinformatics 2012
Neuroimaging
P102 A Semi-automated Program for Axonal Reconstructions from Time-lapse 2-Photon Images
Neuroinformatics 2012 190
Neuroimaging
P103 CCS: A Connectome Computation System for Discovery Sciences
Xi-Nian Zuo, Lili Jiang, Zhi Yang, Ting Xu, Zhe Zhang, Feng-Mei Fan, Xiao-Yan Cao, Hui-Jie Li and Gao-Xia WeiInstitute of Psychology, Chinese Academy of Sciences
The discovery science has been proposed to study human brain function based upon large-scale neuroimaging data. However, until now, there still lacks an integrated software pipe line to explore the human brain connectome based on multi-modal neuroimaging data. Here, we developed the Connectome Computation System (CCS), which integrates the functionality from AFNI, FSL, Freesurfer and extends the FCP scripts (FCON\_1000: http://www.nitrc.org/frs/downloadlink.php/2628 ) by utilizing the information of brain surfaces reconstructed to provide a common platform for brain connectome analysis. It can preprocess data for both anatomical and functional processing. CCS anatomical processing steps consist of: 1) removal of MR image noise using a spatially adaptive non-local means filter (Xing et al., 2011; Zuo and Xing, 2011), 2) brain surface reconstruction via recon-all command in Freesurfer (Dale et al. 1999; Ségonne et al. 2004; Fischl et al. 2001; Ségonne et al. 2007; Fischl et al. 1999a, 1999b), 3) spatial normalization from an individual functional space to MNI152 standard brain space (FLIRT+FNIRT in FSL) (Andersson et al., 2007), 4) boundary-based registration between individual structural and functional images (Greve and Fischl 2009). CCS functional preprocessing steps include: 5) discarding some first EPI volumes from each scan to allow for signal equilibration, 6) slice timing correction, 7) 3D motion correction, 8) 4D global mean-based intensity normalization, 9) band-pass temporal filtering (0.01-0.1Hz), 10) removal of linear and quadratic trends, 11) Gaussian (FWHM=6mm) spatial smoothing. CCS also provides the ability of computing of various R-fMRI metrics such as RSFC, ICA, ALFF/FALFF, ReHo, Network Centrality, VMHC in 3D volume or on 2D surface spaces. This pipeline will be made publicly available soon.

191 Neuroinformatics 2012
Genomics and genetics
P087 Molecular systems biology models of the post synaptic density.
J Douglas ArmstrongSchool of Informatics, University of Edinburgh.
Information processing in the nervous system takes place at the synapses between neurons and in particular is mediated by some of the largest protein complexes described in biology. We have applied systems biology approaches to the glutamatergic post synaptic density (PSD) which is clearly associated with cognitive processes and human brain diseases. We have initially focused on exploiting protein-protein interaction data within static interaction models. These scale well and can capture the organisation of the 1000s of different proteins that can be found in synapses. However, to gain a more realistic understanding of such large complexes and of their influence on biology one must model their dynamics, their interactions with the cellular environment, as well the side effect of activity on their structure, state, and subsequent responses (e.g. through local translational control). We next applied a stochastic calculus of domain binding provided by the rule-based modelling approach (Kappa) to formalize the highly combinatorial signalling pathway in PSD and performed numerical analysis of the relative distribution of protein complexes and their sizes at steady state. We find that this approach allows us to model, in a much more biologically plausible manner, the molecular interactions at synapses. This modelling approach allows us to study the effect of different perturbations (mutated polypeptides, protein splice variants, etc) on structure and relative stability of multi-protein complexes. Analysis of the basic topological properties of the protein networks obtained in simulation with respect to relevant physiological phenotypes provides a direct link between them. For example we can use these models to predict the impact of genetic disruption on the availability of transmitter receptors - in other words we can use this approach to develop predictive models that link from molecular genetics through to physiological properties of synapses.

Neuroinformatics 2012 192
Genomics and genetics
P090 A sparse genetic code underlies the neuroanatomical organization of the brainstem
David W. Matthews, Harvey J. Karten and David KleinfeldUniversity of California, San Diego
A major challenge for neuroanatomy is the integration of classical characterizations of neuronal morphology, connectivity, and histochemistry, with recent characterizations of genetic expression. Large-scale genomic databases now provide a computational tool to understand brain organization both morphologically and genetically. Here, we combine neuroanatomical techniques with informatics and statistical learning to uncover principles of genetic organization. We focus on the mouse trigeminal brainstem because of its stereotyped connectivity, its highly conserved anatomy, and its primary importance to sensory inputs in all vertebrates. While most studies of spatially registered genomic data use global expression to infer anatomical differences, we examine the inverse problem: what are the fewest genes necessary to correctly identify regions defined by cytoarchitecture and innervation? We generated a micron-resolution atlas of inputs using a sensitive neuronal tracer injected into each branch of the adult mouse trigeminal nerve. Brains were sectioned, stained, imaged, registered, and reconstructed to produce a volumetric, vectorized map of innervation and morphology. We coregistered these data with the Allen Gene Expression Atlas, a dataset of 20,012 usable in situ hybridization probes with expression intensities at 200um3 spacing throughout the brain (~10^6 voxels). We next generated brain region classes according to their distinct anatomical attributes, and treated each gene expression set as a feature vector. Using supervised learning algorithms based on decision trees and L1-norm regularization, we find sets of gene pairs and triplets that uniquely specify classically described trigeminal nuclei. This uniqueness demonstrates that an extremely sparse representation from the large set of genes is sufficient to outline the anatomical substructure of the brainstem. The combination of classical tract tracing and modern imaging with novel informatics and statistical learning techniques thus 1) exploits and builds on existing registration infrastructure, 2) extends the quantitative tools available for assessing spatially-registered genomic data, and 3) is essentially generalizable to any neural system. More fundamentally, it provides a framework for identifying putative novel genes for developmental studies, and a strategy for targeting individual brain regions for manipulation with optogenetics and for imaging with genetically encoded sensors.

193 Neuroinformatics 2012
Genomics and genetics
P091 Neurocarta: online platform for integration and sharing of phenotypic and genomics information
Elodie Portales-Casamar, Carolyn Ch’ng, Frances Lui, Nicolas St-Georges, Anton Zoubarev and Paul PavlidisCentre for High-Throughput Biology, University of British Columbia, Vancouver, BC
This work is part of neuroinformatics core activities developed in support of NeuroDevNet, a large Canadian research network funded by the Networks of Centres of Excellence, devoted to the study of brain development with the goal to translate this knowledge into improved diagnosis, prevention and treatment of neurodevelopmental disorders. As part of the NeuroDevNet Neuroinformatics Core mission, we are developing an online platform that integrates information on genes for the analysis and interpretation of neurodevelopmental data produced within the network. The core concept of the “candidate gene manager” is to allow users to track information about genes in a flexible way, but with rich connections to other data. It is developed as an extension of Gemma ( http://www.chibi.ubc.ca/Gemma ), a database and software system for the meta-analysis of functional genomics data. On the screenshot provided, the top-left panel lists all phenotypes currently annotated, the top-right panel shows the list of genes that have been shown to be associated with the selected phenotype(s), and the bottom panel shows the list of evidence, each row being expandable to provide more details. Our system currently hosts 17,000 evidence linking 4,500 genes to 1,500 different phenotypes, annotated from the literature and public databases. A major goal is to build on existing and new knowledge emerging from the network to increase our understanding of neurodevelopmental disorders and the relationships among them at the genetic and phenotypic levels.
P091 Neurocarta interface screenshot

Neuroinformatics 2012 194
Large scale modeling
D03 Multiscale Modeling in MOOSE: Interfaces, Interoperability and Standards
Subhasis Ray, Niraj Dudani, Hanuma Chaitanya Chintaluri, Harsharani G. V. and Upinder BhallaNCBS
Introduction Multiscale Object Oriented Simulation Environment (MOOSE) is a general purpose biological simulator. It runs on multi-core as well as multi-node computer systems while making load-balancing and messaging transparent to the user. It is multiscale in the sense of handling simulations from molecular to large network scales, events from microseconds to days, and in terms of running on hardware scaling from laptops to large clusters. It provides a Python based interface and can be used synergistically with other libraries and simulators that use Python. It has a graphical-user interface that allows for easy plotting, and 3D visualization of complex models and their state. Multiple scales of modeling The scales in biology can range from a few molecules bouncing around in a vesicle to networks of thousands of neurons in brain regions. The times can be anywhere between microseconds to days (or millenia for evolutionary biologists). Fast solvers have been implemented/interfaced for reaction-diffusion chemical kinetics (GNU Scientific Library), stochastic chemical kinetics for small volumes (Gillespie algorithm), spatial Monte Carlo calculations for individual molecules (Smoldyn) and realistic compartmental modeling of neurons (Hines’ algorithm). A key area of development in MOOSE is to integrate models of signaling pathways with compartmental models for studying emergent properties at the interface between biochemical and electrical signaling. MOOSE presents an intuitive object-oriented interface to the user, while transparently handling fast calculations with specialized numerical engines for each level of detail. Impact on standards There are multiple standards for model specification at various levels and MOOSE supports three of them: the GENESIS scripting language, SBML and NeuroML. Moreover, it aims to support the Network Interchange format for NEuroscience (NineML) as the specification matures. In the absence of a common framework to combine model components specified in different formats, the user has to put significant effort in developing composite models and such models remain non-standard. However, as simulating composite models out of existing ones becomes easier, it will be important for the community to find a way to integrate the existing standards for maximum productivity. MOOSE is one of the first simulators with this cross-scale capability, and provides a key test-bed for implementations of multiscale model definition standards.

195 Neuroinformatics 2012
Large scale modeling
D03 Image text (see abstract on web). Screenshot of MOOSE simulating a model of the olfactory bulb Mitral cell

Neuroinformatics 2012 196
Large scale modeling
D04 Neurons to Algorithms neural circuit model development platform
Derek Trumbo, Christina Warrender, James Aimone, Corinne Teeter and Fred RothgangerSandia National Laboratories
We are developing a software package “Neurons to Algorithms”, or “N2A”. The scientific purpose of N2A is to facilitate biologically realistic neural network model development by 1) compiling (and referencing) neural data from many users and sources in a computable format, 2) automating the model development process by constructing models specific to an individual user’s research goals, and 3) integrating the process by which a model is simulated and analyzed.
A priority in the system’s design is maximizing both the utility and usability for neuroscientists. In contrast to many scientific tools with open source intentions, we have focused considerable effort towards user interface. Users are able to generate models at multiple levels of resolution (spiking or firing rate; point neuron or morphological; networks or individual neurons). The tool has been designed to operate in either a local mode, where the user creates their own database of biological information and details necessary for their modeling, or a distributed mode where users can create models from a community database. Our vision is that this community database will enable the generation and sharing of high fidelity model components across laboratories.
In order to take full advantage of the rapidly expanding neural data sets available, N2A will directly interface the modeling database (in which neuroscience data is represented in a computable format) with existing neuroinformatics databases on anatomy, gene expression, whose data is typically represented in a more conventional format. Furthermore, we plan to integrate N2A with existing simulation platforms that are widely used in the community for specific research questions (e.g., Neuron).
We will demonstrate the N2A platform using a model of the hippocampus (Aimone et al, 2009).

197 Neuroinformatics 2012
Large scale modeling
D04 Screenshot showing model design interface of N2A application. Graphical network summary of model of dentate gyrus composed of various neuron types with desired connectivity scheme.

Neuroinformatics 2012 198
Large scale modeling
P012 Combining simulator independent network descriptions with run-time interoperability based on PyNN and MUSIC
Jochen Martin Eppler1, Mikael Djurfeldt2, Eilif Muller3, Markus Diesmann1 and Andrew Davison4
1. Institute of Neuroscience and Medicine (INM-6), Computational and Systems Neuroscience, Research Center Jülich2. PDC Center for High Performance Computing, School of Computer Science and Communi-cation, KTH3. Blue Brain Project, Ecole Polytechnique Fédérale de Lausanne (EPFL)4. Unité de Neurosciences Intégratives et Computationnelles (UNIC), Centre National de la Recherche Scientifique
The Multi-Simulation Coordinator (MUSIC) is an INCF funded standard and library implementation that allows neuronal simulators or programs for stimulus generation, data analysis, or visualization to exchange data at run-time. To set up such a multi-simulation consisting of several simulators, the user has to specify the different parts of the network model in the native description or scripting languages of the respective simulators, and provide a configuration file that tells MUSIC what data has to be transported between which applications. This approach works well for connecting multiple already existing models written for different simulators. An example for using this is given in [1]. However, this approach requires the user to be familiar with the configuration languages of all simulators involved in the simulation. To alleviate this problem, we extended the application programming interface (API) of PyNN [2], to enable the simulator-independent specification of multi-simulator neuronal network models. In this contribution, we provide a detailed description of necessary changes to the existing software packages (i.e. NEST [3], NEURON [4] and PyNN) and the user experience for our prototype implementation of this API. The API allows the user to set up the network model using all of PyNN’s high-level language constructs and abstracts away from the technical aspects of using the simulator’s native MUSIC interfaces and setting up the multi-simulation.
Acknowledgments:Partially supported by the Helmholtz Alliance on Systems Biology, the Next-Generation Supercomputer Project of MEXT, and EU Grant 269921 (BrainScaleS).
References: [1] Mikael Djurfeldt et al (2010) Run-Time Interoperability between Neuronal Network Simulators based on the MUSIC Framework. Neuroinformatics 8:43–60. doi:10.1007/s12021-010-9064-z [2] Andrew Davison et al (2008) PyNN: A common interface for neuronal network simulators. Front. Neuroinform. 2:11. doi:10.3389/neuro.11.011.2008 [3] Marc-Oliver Gewaltig and Markus Diesmann (2007) NEST (Neural Simulation Tool), Scholarpedia 2 (4), p. 1430. [4] Michael Hines, Ted Carnevale (1997) The NEURON simulation environment. Neural Comp. 9: 178–1209.

199 Neuroinformatics 2012
Large scale modeling
P013 Spiking neuronal network simulation technology for contemporary supercomputers
Moritz Helias1, Susanne Kunkel2, Jochen Eppler3, Gen Masumoto4, Jun Igarashi5, Shin Ishii6, Tomoki Fukai5, Abigail Morrison2 and Markus Diesmann1
1. Inst of Neuroscience and Medicine (INM-6) Computational and Systems Neuroscience, Research Center Juelich2. Functional Neural Circuits Group Albert-Ludwig University of Freiburg3. Inst of Neuroscience and Medicine (INM-6), Computational and Systems Neuroscience, Research Center Juelich4. High-Performance Computing Team, RIKEN, Computational Science Research Program Kobe5. Laboratory for Neural Circuit Theory, RIKEN Brain Science Institute, Wako6. Integrated Systems Biology, Laboratory Department of Systems Science, Graduate School of Informatics, Kyoto University
Functional neuronal networks, like the visual cortex of primates, comprise on the order of 100 million neurons, consisting of areas that exceed 10 million neurons and 100 billion synapses. The memory demands of such simulations are only met by distributed simulation software and supercomputers, like the Jugene BG/P supercomputer in Juelich and the K computer in Kobe. Though connectivity between brain areas is sparse, there are fewer constraints within areas. A general simulation tool needs to be able to simulate networks of 10 million neurons with arbitrary connectivity, often assumed to be random. This presents the worst case scenario: Firstly, there is no redundancy that allows to compress the representation of synaptic connectivity. Secondly, communication between the compute nodes is potentially all-to-all. Here we quantitatively demonstrate the recent advances of neural simulation technology [2] on the example of the simulator NEST [1], which have lead to a readily usable tool for the neuroscientist. As the memory rather than run time limits the maximal size of a neuronal network, we explain the systematic improvements of the distributed data structures adapted to the sparse and random connectivity. High performance and good scaling of network setup and simulation are achieved with a hybrid code combining OpenMP threads and MPI, exploiting the multi-core architectures of K and Jugene. We parameterize and employ a model of memory consumption to estimate the machine size needed for a given neuroscientific question; a crucial tool not only to plan simulations, but also for computation time grant applications. Simulations of networks exceeding 10 million neurons on K and Jugene are shown to determine the limits of the current technology and computer architectures.
Partially supported by the Helmholtz Alliance on Systems Biology, the Next-Generation Supercomputer Project of MEXT, EU Grant 269921 (BrainScaleS), the VSR computation time grant JINB33 on the JUGENE supercomputer, and by early access to the K computer at the RIKEN Advanced Institute for Computational Science.
[1] Gewaltig M-O and Diesmann M (2007) NEST. Scholarpedia, 2(4):1430. [2] Kunkel S, Potjans TC, Eppler JM, Plesser HE, Morrison A and Diesmann M (2012) Front. Neuroinform. 5:35. doi: 10.3389/fninf.2011.00035
Neuroinformatics 2012 200
Large scale modeling
P016 Universal principles of topology governing both of structural and effective connectivity
Masanori Shimono1 and John Beggs2
1. University of Tokyo2. Indiana University
Since the era of Hebb, the importance and mysterious role that neuronal ensembles play in has been a main concern of the neuroscience [Hebb, 1949]. Recently, much work using structural connectivity has revealed patterns of synaptic connections in neuron ensembles [Bock et al., 2011]. Structural connectivity information is extremely valuable, as it indicates pathways through which one neuron could possibly influence spiking in another. In contrast, effective connectivity aims to describe the pathways through which influence actually occurs. The concept of “effective connectivity” was initially described in regard to local neuronal networks [Aertsen et al., 1989]. However, almost all research on “effective connectivity” has been done in macroscopic dynamics recorded using fMRI, MEG, and EEG [Friston, 1994]. Furthermore, even out of the studies on microcircuits, almost no work has been done on effective connectivity in local cortical networks at the timescale of typical synaptic delays within the cortex (1-20 ms). This is unfortunate, as direct influence between neurons would be expected to occur at these time delays. Structural connectivity studies have shown that groups of 3-7 cortical neurons are more likely than chance to be synaptically connected to each other if they have synapses onto a common neighbor neuron [Perin et al., 2011]. This led to the question whether effective connectivity also shows this pattern.
In order to investigate these topics, we used a 512 electrode array system to record spontaneous activity in 9 slice cultures that included neocortex and portions of hippocampus. On average, we recorded over ~120 neurons from each culture for 1 hr or more. Although many metrics of effective connectivity have been proposed, we selected transfer entropy because several studies found it to compare favorably in accuracy to other metrics. In the comparison between the topological properties of structural neuronal networks and the topological properties of the reconstructed effective connectivities, we could find universal principles of topology governing both of structural and effective connectivity.
201 Neuroinformatics 2012
Large scale modeling
P017 NeuroXyce: a highly parallelized simulator for biologically realistic neural networks
Christina Warrender, James Aimone, Corinne Teeter and Richard SchiekSandia National Laboratories
The increasing availability of high performance computing platforms, either through supercomputers or cloud computing, offers tremendous potential to computational neuroscientists interested in simulating biologically realistic networks at large scales. Unfortunately, tools that take full advantage of these platforms have been slow to develop, and the parallelization of neural simulations represents a non-trivial amount of work. In current network simulators the parallelization scheme is often specified by the user. This specification can be quite arduous and often the user is uninformed of which scheme is optimal. This is noteworthy since parallelization techniques can substantially influence the run time of large-scale neural network simulations, and a poorly parallelized model may offer little or no advantage over conventional approaches. We have created a simulator capable of simulating multicompartment, branched neurons with ion channels by building on the previously existing Xyce parallel electronic circuit simulator (xyce.sandia.gov). NeuroXyce uses advanced parallel integration and solver methods, and automatically handles load balancing among multiple processors, removing this burden from the user.
Here we demonstrate the scalability of NeuroXyce and compare the simulation run time and ease of use with other popular simulators (i.e. NEURON). Our simulation paradigm consists of a network of 80 percent excitatory neurons and 20 percent inhibitory neurons. Neurons have Hodgkin-Huxley sodium and potassium channel dynamics. The neurons are randomly connected with a probability of 0.02. The strength of the synapses scales depending on the size of the network (10,000 to 1,000,000 neurons). The excitatory connections simulate AMPA synapses and the inhibitory connections simulate GABA synapses. We measure simulation run time and network dynamics as the size of the network is increased.

Neuroinformatics 2012 202
Large scale modeling
P018 A cytoskeleton-based 3D morphological simulation method for detailed local structure of the developing neural cell
Naoto Yukinawa, Honda Naoki and Shin IshiiGraduate School of Informatics, Kyoto University
To simulate the detailed morphological diversities of a developing neural cell, it is required to construct a model considering the mutliscale and multiphysics aspects of various cellular processes that underlies the morphological diversity and complexity; and this accordingly requires large computational power and time. For this purpose, we have developed a distributed simulation framework which captures three different physical layers including reaction-diffusion processes, membrane dynamics, and F-actin-based cytoskeletal kinetics [1]. However the simulation scheme has two main drawbacks in the aspects of the biological plausibility for achieving to simulate complicated morphological processes such as formations of filopodia and neurites in neural development and the computational efficiency for large scale simulations: 1) the model limitations which are capable of only 2-dimensional morphological simulation and 2) poor performance scalability in cluster computers with over hundreds of cores due to a communication bottleneck during the filament kinetics computation. In this study, we extend our previous simulation model for incorporating the binding by an actin cross-linker Fascin and the elastic properties of actin filaments based on a 3-dimensional spring network model. We also propose a two-step approach for resolving the computational performance which incorporates a subspace distribution method for the filament kinetics computation and a three-layered hierarchical management〖of computational nodes which optimizes the communication load. We show that our simulation framework well reproduces the fine local structure in the filopodial formation in computationally effective way.
References [1] Nonaka. S., Naoki, H., and Ishii, S.: A multiphysical model of cell migration integrating reaction-diffusion, membrane and cytoskeleton. Neural Networks, Volume 24, Issue 9, November 2011, Pages 979–989, DOI: 10.1016/j.neunet.2011.06.009.
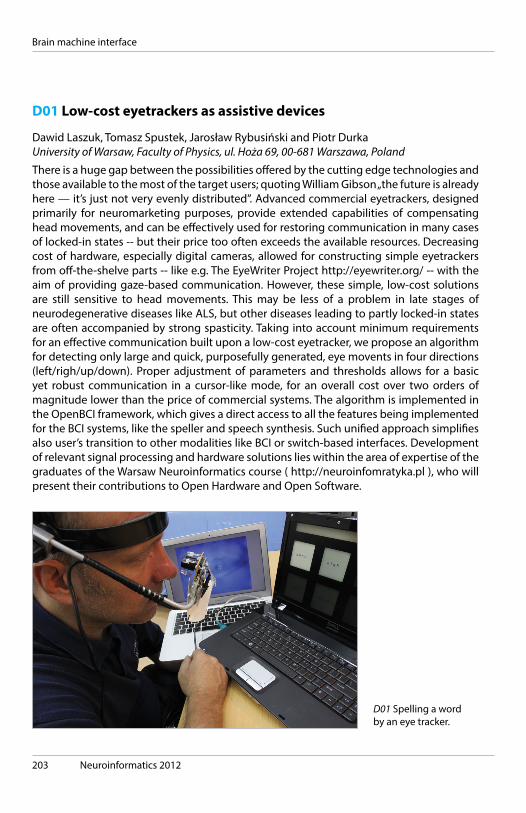
203 Neuroinformatics 2012
Brain machine interface
D01 Low-cost eyetrackers as assistive devices
Dawid Laszuk, Tomasz Spustek, Jarosław Rybusiński and Piotr DurkaUniversity of Warsaw, Faculty of Physics, ul. Hoża 69, 00-681 Warszawa, Poland
There is a huge gap between the possibilities offered by the cutting edge technologies and those available to the most of the target users; quoting William Gibson „the future is already here — it’s just not very evenly distributed”. Advanced commercial eyetrackers, designed primarily for neuromarketing purposes, provide extended capabilities of compensating head movements, and can be effectively used for restoring communication in many cases of locked-in states -- but their price too often exceeds the available resources. Decreasing cost of hardware, especially digital cameras, allowed for constructing simple eyetrackers from off-the-shelve parts -- like e.g. The EyeWriter Project http://eyewriter.org/ -- with the aim of providing gaze-based communication. However, these simple, low-cost solutions are still sensitive to head movements. This may be less of a problem in late stages of neurodegenerative diseases like ALS, but other diseases leading to partly locked-in states are often accompanied by strong spasticity. Taking into account minimum requirements for an effective communication built upon a low-cost eyetracker, we propose an algorithm for detecting only large and quick, purposefully generated, eye movents in four directions (left/righ/up/down). Proper adjustment of parameters and thresholds allows for a basic yet robust communication in a cursor-like mode, for an overall cost over two orders of magnitude lower than the price of commercial systems. The algorithm is implemented in the OpenBCI framework, which gives a direct access to all the features being implemented for the BCI systems, like the speller and speech synthesis. Such unified approach simplifies also user’s transition to other modalities like BCI or switch-based interfaces. Development of relevant signal processing and hardware solutions lies within the area of expertise of the graduates of the Warsaw Neuroinformatics course ( http://neuroinfomratyka.pl ), who will present their contributions to Open Hardware and Open Software.
D01 Spelling a word by an eye tracker.
Neuroinformatics 2012 204
Brain machine interface
D02 BCI Appliance
Tomasz Spustek1, Mateusz Kruszyński2, Dawid Laszuk1, Piotr Milanowski1, Maciej Łabęcki1, Karol Augustin1, Anna Duszyk3, Rafał Kuś1, Jarosław Żygierewicz1 and Piotr Durka1
1. University of Warsaw, Faculty of Physics, ul. Hoża 69, 00-681 Warszawa, Poland2. University of Warsaw, Faculty of Psychology, ul. Stawki 5/7, 00-183 Warszawa, Poland3. University of Social Sciences and Humanities, ul. Chodakowska 19/31, 03-815 Warszawa, Poland
Brain Computer-Interface (BCI) is a system that allows communication through direct measures of neural activity of the brain without muscle involvement. Such systems appear to be the only method of communication for people with severe neuromuscular disorders. There has been rapid development of BCI-systems for the last twenty years, but mostly in respect to accuracy and bit rate, rather than user convenience and ease of use. BCI Appliance, pioneering user-centered design of BCI systems, has been developped since 2009 at the University of Warsaw. The current prototype is a compact, tablet sized box with on/off button, which connects wirelessly to domotic and EEG acquisition devices. Presented hardware implements a unique design providing dynamic menus and stable delivery of SSVEP stimuli. The generation of stimuli is based upon an array of LEDs backlighting an LCD screen, where arbitrary symbols can be rendered within the designated fields. Each LED is independently driven by a micro-controller, which enables a precise control of its flickering frequency. The same system of fields can be used to deliver stimuli for the P300 based BCI. Software controlling the Appliance is based upon the OpenBCI framewok, developped at the University of Warsaw and released on terms of the GPL ( http://openbci.pl ). While the framework is multisystem and multilanguage, it is developped mostly in GNU/Linux which allows for a lightweight implementation of “Just Enough Operating System”. Using the flexible structure and centralized data flow of the OpenBCI, we implemented universal user interface, which can be operated with SSVEP or P300 BCI, as well as other assistive technologies like switches and eyetrackers, with the possibility of unassisted switching between modalities by the user. It is beneficial for these users whose abilities degrade with time or those who would like to switch between the paradigms to reduce fatigue. Calibration procedures are fully automated, thus there is no need for manual fine-tuning of the parameters. This is due to advanced signal processing for feature extraction like Blind Source Separation, Canonical Correlation Analysis and classifiers based on machine learning algorithms. In this sense the software minimizes the need for a highly train personnel assisting the end-user to operate the Appliance.
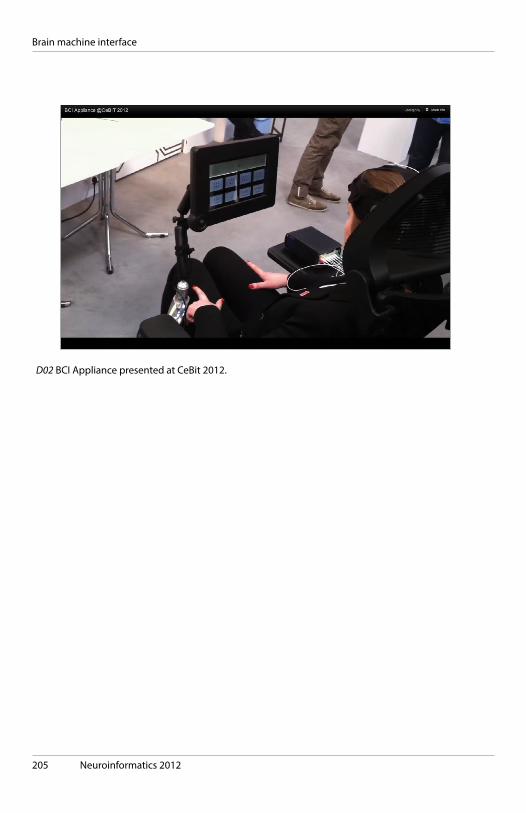
205 Neuroinformatics 2012
Brain machine interface
D02 BCI Appliance presented at CeBit 2012.

Neuroinformatics 2012 206
Brain machine interface
P006 Temporal characteristic of SSVEP response
Anna Duszyk1, Rafał Kuś2 and Piotr Durka2
1. University of Social Sciences and Humanities 2. University of Warsaw, Faculty of Physics
Temporal characteristics of SSVEP response Steady State Evoked Potentials (SSEP) are brain responses to repetitive stimulation with a certain frequency. Increase of power in frequency of the stimulation can be observed in brain activity, measured with electroencephalograph (EEG) from electrodes located above the primary area of the cortex corresponding to stimulation modalities. SSEP are commonly divided into three groups: Steady-State Visual Evoked Potentials (SSVEP), Steady-State Somatosensory Evoked Potentials (SSSEP) and Auditory Steady-State Responses (ASSR). Characterization of particular ERP components of the brain activity during such stimulation has been tested only in the case of ASSR. SSVEP frequency-specific responses are widely used in the technology of Brain-Computer Interfaces (BCI), so their spectral characteristics has been widely analyzed. However, temporal properties of SSVEP has not been adequately evaluated so far. The purpose of this experiment has been to examine SSVEP shape, its changes over time and its fading after the end of the stimulation. The study has involved five subjects. Four white squares displayed on LCD were backlighted by LEDs flashing with different frequencies. Subject was supposed to concentrate on the indicated square, while EEG data was recorded. We tested four frequencies: 14, 17, 25 and 30 Hz. The stimulation of each frequency was repeated over 30 trials, with each trial including five seconds of stimulation and five seconds of rest period. EEG registration was synchronized to the offset of stimulation epoch and then averaged over trials. Matching Pursuit Algorithm has been applied to the averaged EEG signal. Results indicate that brain activity during repetitive stimulation consist mostly of 3 stages. At the beginning (0-200 ms) ERP with typical components P1, N1, P2 is observed in EEG. Next part of the response reveal regular periodic shape with frequency of the stimulation and its harmonics. After the end the stimulation, SSVEP response and its harmonics last for two more periods. These results are consistent with the temporal characteristics of ASSR.

207 Neuroinformatics 2012
Brain machine interface
P007 Phase stability in the SSVEP responses
Maciej Labecki, Pawel Kordowski, Mateusz Kruszynski, Jakub Maciejewski, Rafal Kus and Piotr SuffczynskiUniversity of Warsaw
Steady State Visual Evoked Potentials (SSVEP) are natural brain responses to flicker stimuli. Stimulation within 5 – 50 Hz induces oscillations at corresponding frequency and its harmonics in the EEG over visual areas of the scalp. This phenomenon is used in Brain – Computer Interfaces (BCI). It is commonly assumed that SSVEP correspond to a true steady state signal with fixed properties over the whole stimulation signals. This assumption may be tested in amplitude and phase domain which in principle are two independent indicators of stationary of the response signal. Our initial results suggest that the amplitude of the subsequent responses is not constant and habituates with time. In the present study we investigated stability of phase of the SSVEP. We used EEG signal recorded during flickering stimulation. The Fourier Transform was computed and then phase of the stimulation frequency component was computed in a sliding overlaping window. Using these metods we have shown that the phase of the response signal is stabile during whole stimulation sequences and it’s value is aproximately constant among trials.

Neuroinformatics 2012 208
Brain machine interface
P008 Comodulation Masking Release provoked by direct electrical stimulation of auditory nerve fibers
Stefan Zirn1, John-Martin Hempel1, Maria Schuster1 and Werner Hemmert2
1. ENT clinics, Ludwig-Maximilians-University of Munich2. IMETUM, Technical University of Munich
Listeners with sensorineural hearing loss experience severe deficits when processing signals in modulated noise for both signal detection and speech understanding. An ability of the normal-hearing (NH) auditory system in this context is enhanced signal detection through centrally-mediated analysis of synchronous (comodulated) level fluctuations across-frequency. Such temporal characteristics exhibit many natural sounds, e.g. plosives. Comodulation masking release (CMR) illustrates across-frequency processing. This study focuses on CMR in cochlear-impaired listeners provided with a cochlear-implant (CI). Signal presentation was realized via direct stimulation with the nucleus implant communicator in 20 CI users. The mean CMR was 3.1 dB in CI users (p<0.05) and therefore much smaller than in NH (12 dB, p<0.01). CMR varied strongly with etiology: long-term sensorineural hearing loss with impact to the peripheral or central auditory pathway, like e.g. progressive hearing loss, led to small amounts of CMR. Whereas short-term sensorineural hearing loss, e.g. acute hearing loss or blast trauma, resulted in a considerable high CMR as have been found in vocoder simulations in NH. We assume that centrally mediated across-frequency processing in electric hearing depends on hearing loss history.

209 Neuroinformatics 2012
Electrophysiology
D08 Cloud Services and a Data API for Electrophysiology
Andrey Sobolev, Aljoscha Leonhardt, Philipp Rautenberg, Christian Kellner, Andreas Herz and Thomas WachtlerGerman INCF Node, Department Biology II, Ludwig-Maximilians-Universität München, Ger-many
Recent progress in neuroscience has lead to rapid proliferation of data. The problem of efficiently organizing and annotating this information while allowing effortless access from different platforms becomes crucial if scientists are to fully exploit available resources.
The G-Node services provide data management in the cloud, including tools for organization, annotation, search, and backup. Backbone is a central data storage system accessed through a common application interface (API). This API supports a common data model for electrophysiology and flexible data annotation[1], reported as NEO[2] and odML[3]. The interface is based on REST principles[4] and supports data transfer via JSON/BSON. Native client libraries in commonly used programming languages (including Python and Matlab[5]) enable researchers to perform computations in familiar analysis environments while retaining the advantages that cloud storage entails. Thus, scientists may select whatever technology is most suitable for their current research with their data being available at all times and from all locations. The platform also features powerful search and query capabilities from simple full-text search to specialized query and filter mechanisms such as data slicing or fine-grained recording channel selection.
These services are complemented by common tools for data access like neuroshare[6], NEO I/O[2], or odML[3], and provide convenient data conversion. Compatible files are automatically converted to native objects which may, in turn, be exported as needed. The platform encourages collaboration between both individual scientists and labs. Data sets, metadata, and files can be shared based on various criteria; simultaneous work on such data sets is supported. Furthermore, changes to stored objects are tracked continuously, which makes the reproduction of individual analysis steps effortless and transparent.
Our platform equips every electrophysiologist with the tools necessary for integrating sophisticated data management into day to day experimental workflow, thus fostering scientific progress through neuroinformatics.
[1] http://g-node.github.com/[…]/data_api_specification.html [2] http://packages.python.org/neo/ [3] https://github.com/G-Node/python-odml [4] http://en.wikipedia.org/[…]/Representational_state_transfer [5] https://github.com/G-Node/gnode-client-matlab [6] https://github.com/G-Node/python-neuroshare Supported by BMBF grant 01GQ0801.
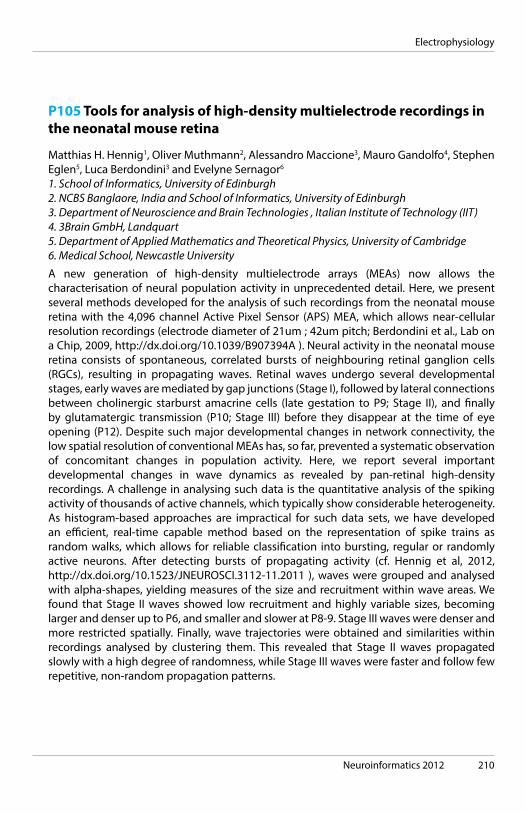
Neuroinformatics 2012 210
Electrophysiology
P105 Tools for analysis of high-density multielectrode recordings in the neonatal mouse retina
Matthias H. Hennig1, Oliver Muthmann2, Alessandro Maccione3, Mauro Gandolfo4, Stephen Eglen5, Luca Berdondini3 and Evelyne Sernagor6
1. School of Informatics, University of Edinburgh2. NCBS Banglaore, India and School of Informatics, University of Edinburgh3. Department of Neuroscience and Brain Technologies , Italian Institute of Technology (IIT)4. 3Brain GmbH, Landquart5. Department of Applied Mathematics and Theoretical Physics, University of Cambridge6. Medical School, Newcastle University
A new generation of high-density multielectrode arrays (MEAs) now allows the characterisation of neural population activity in unprecedented detail. Here, we present several methods developed for the analysis of such recordings from the neonatal mouse retina with the 4,096 channel Active Pixel Sensor (APS) MEA, which allows near-cellular resolution recordings (electrode diameter of 21um ; 42um pitch; Berdondini et al., Lab on a Chip, 2009, http://dx.doi.org/10.1039/B907394A ). Neural activity in the neonatal mouse retina consists of spontaneous, correlated bursts of neighbouring retinal ganglion cells (RGCs), resulting in propagating waves. Retinal waves undergo several developmental stages, early waves are mediated by gap junctions (Stage I), followed by lateral connections between cholinergic starburst amacrine cells (late gestation to P9; Stage II), and finally by glutamatergic transmission (P10; Stage III) before they disappear at the time of eye opening (P12). Despite such major developmental changes in network connectivity, the low spatial resolution of conventional MEAs has, so far, prevented a systematic observation of concomitant changes in population activity. Here, we report several important developmental changes in wave dynamics as revealed by pan-retinal high-density recordings. A challenge in analysing such data is the quantitative analysis of the spiking activity of thousands of active channels, which typically show considerable heterogeneity. As histogram-based approaches are impractical for such data sets, we have developed an efficient, real-time capable method based on the representation of spike trains as random walks, which allows for reliable classification into bursting, regular or randomly active neurons. After detecting bursts of propagating activity (cf. Hennig et al, 2012, http://dx.doi.org/10.1523/JNEUROSCI.3112-11.2011 ), waves were grouped and analysed with alpha-shapes, yielding measures of the size and recruitment within wave areas. We found that Stage II waves showed low recruitment and highly variable sizes, becoming larger and denser up to P6, and smaller and slower at P8-9. Stage III waves were denser and more restricted spatially. Finally, wave trajectories were obtained and similarities within recordings analysed by clustering them. This revealed that Stage II waves propagated slowly with a high degree of randomness, while Stage III waves were faster and follow few repetitive, non-random propagation patterns.
211 Neuroinformatics 2012
Electrophysiology
P105 Examples of retinal waves recorded in the mouse retina at P5 and P11. Panels on the left show raster plots of bursts extracted from the recorded spike trains and then grouped into individual waves, as indicated by different colours. Three individual waves are shown on the right (numbers in the left panels indicate the events shown). Waves propagation is indicated by a change from bright to dark colors. Grey areas indicate MEA channels where spikes were recorded during the experiment that did not participate in the waves shown.
Neuroinformatics 2012 212
Electrophysiology
P107 Integrating automated metadata handling into the laboratory workflow.
Jan Grewe, Adrian Stoewer, Andrey Sobolev, Hagen Fritsch , Thomas Wachtler and Jan BendaLudwig-Maximilians-Universität München
Metadata handling belongs to our scientific life as much as handling the data itself. We take notes about experimental conditions, the experimental subject, look up what the stimulus parameters were etc. Proper data annotation is crucial for data analysis, data management, reproducibility of scientific results. If the data is to be shared with other scientists appropriate annotation becomes even more important. Many metadata are known to the recording and analysis tools. Our aim is to incorporate annotation capability into these tools and thus to automatize the annotation process as far as possible. Here we show how metadata handling can be included into the researcher’s workflow using odML (open metadata markup language, www.g-node.org/odml). The odML is a rather simple and flexible hierarchical format of extended key-value pairs, enabling to enter any metadata necessary. Interoperability can be achieved by using specified terminologies (see www.g-node.org/odml/terminologies). We present the odML API and tool suite for data annotation supporting the odML format and terminologies. Furthermore we exemplify how data annotation can be incorporated into the neurophysiologists tool chain. Beginning at the time of recording the tool for data recording (relacs; www.relacs.net) writes the metadata it knows to a file along with the recorded data. This comprises for example information about stimulus settings, hardware configurations etc. During data analysis (e.g. using Matlab) further information about the analyses performed, or characteristics of the recorded cell that is extracted from the responses is added. Finally, the data is stored and needs to be kept available. Our data management/data sharing tools (LabLog, http://lablog.sourceforge.net ; G-Node portal, www.portal.g-node.org) help to keep track of the recorded data. This way the whole workflow can be traced from the final results back to the raw data. All information of both the original data and the analysis tools are kept together with the results thus increasing reproducibility. Eventually this will allow us to share data with other scientists in a very convenient way.
Supported by the German Federal Ministry of Education and Research (BMBF grants 01GQ0801 and 01GQ0802)

213 Neuroinformatics 2012
Electrophysiology
P108 A novel closest white-matter-contact-based referencing scheme for stereotactical EEG recordings
Gabriele Arnulfo1, Andrea Schenone1, Marcello Massimini2, Andrea Pigorini2, Lino Nobili3, Marco M. Fato1 and Matias J. Palva4
1. Department of Communication, Computer and System Sciences, Biolab University of Genoa2. Department of Clinical Sciences L. Sacco Università degli Studi di Milano, Milan, Italy.3. Niguarda Hospital Milan 4. Neuroscience Center, University of Helsinki
SEEG, due to its spatial resolution, offers a unique opportunity for studying neuronal activity in the human brain (Lachaux, 2003). SEEG recordings are typically analyzed with a bipolar referencing scheme to exclude common volume-conducted signals from neighboring electrode contact pairs. Nevertheless, the Local Field Potentials (LFPs) picked up by SEEG might not be that local (Kajikawa, 2011), hence the bipolar referencing may end up discarding also some of true larger-scale neuronal activity. In addition, it is critical to assess whether each contact is located in the white or in the gray matter. The classical approach relays on visual investigation on post-implant scans instead of automatic tools. However, aiming at analyzing large-scale neuronal dynamics, such as functional connectivity, at the group-level would clearly require an automated approach to accomplish this task. Here, we propose to use a closest white-matter-contact as a reference scheme and we propose an index that can be reliably used in automated identification of how likely a given contact is to pick up true neuronal signals. The Gray Matter Proximity Index (GMPI) has simple formulation which requires the knowledge of the position of the Contact and of its nearest points on both Gray and White matters (A). Each contact point is localized in Talairach space while gray and white vertices have been represented on the corresponding meshes resulting from a cortical segmentation algorithm (Freesurfer). With these information, GMPI can be formalized as follows: (C-W)·(G-W)/|G-W|. GMPI values between [0,1] are more likely to indicate contacts that record neuronal activity within cortical structures, while negative values indicate white matter ones. To test the GMPI reliability, we have acquired SEEG data from six subjects. Differences in spectral power densities (PSD) were highly correlated with GMPI, showing that white matter contacts record reduced power compared to cortical contacts (B). Moreover, GMPI is positively correlated (Spearman rank ~0.8) to PSDs differences in frequency bands among contacts assessing that GMPI variations reflect true changes in signal characteristics (C). We also evaluated the relationship between slow-wave amplitudes after iEEG stimulus onset and GMPI (D-E). Also here, the association contact-GMPI reflects true signal differences. GMPI is thus a promising starting point for moving from bipolar to white-matter based referencing schemes in SEEG data analyses.
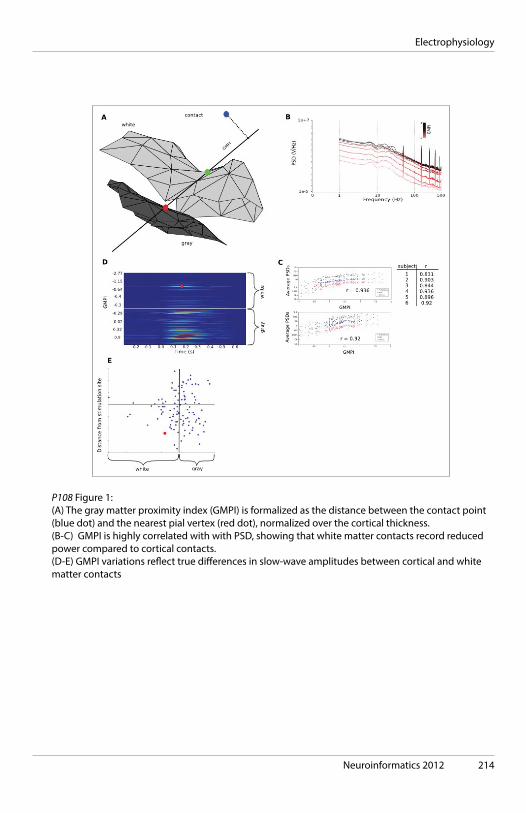
Neuroinformatics 2012 214
Electrophysiology
P108 Figure 1: (A) The gray matter proximity index (GMPI) is formalized as the distance between the contact point (blue dot) and the nearest pial vertex (red dot), normalized over the cortical thickness. (B-C) GMPI is highly correlated with with PSD, showing that white matter contacts record reduced power compared to cortical contacts. (D-E) GMPI variations reflect true differences in slow-wave amplitudes between cortical and white matter contacts
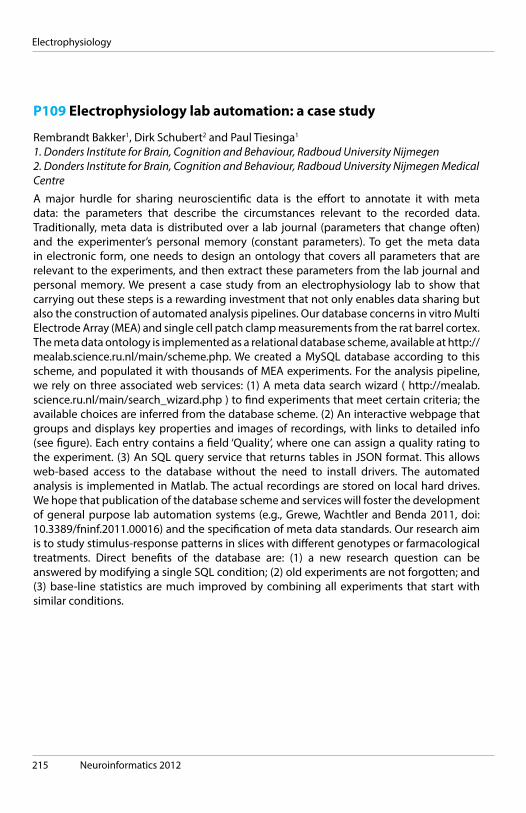
215 Neuroinformatics 2012
Electrophysiology
P109 Electrophysiology lab automation: a case study
Rembrandt Bakker1, Dirk Schubert2 and Paul Tiesinga1
1. Donders Institute for Brain, Cognition and Behaviour, Radboud University Nijmegen2. Donders Institute for Brain, Cognition and Behaviour, Radboud University Nijmegen Medical Centre
A major hurdle for sharing neuroscientific data is the effort to annotate it with meta data: the parameters that describe the circumstances relevant to the recorded data. Traditionally, meta data is distributed over a lab journal (parameters that change often) and the experimenter’s personal memory (constant parameters). To get the meta data in electronic form, one needs to design an ontology that covers all parameters that are relevant to the experiments, and then extract these parameters from the lab journal and personal memory. We present a case study from an electrophysiology lab to show that carrying out these steps is a rewarding investment that not only enables data sharing but also the construction of automated analysis pipelines. Our database concerns in vitro Multi Electrode Array (MEA) and single cell patch clamp measurements from the rat barrel cortex. The meta data ontology is implemented as a relational database scheme, available at http://mealab.science.ru.nl/main/scheme.php. We created a MySQL database according to this scheme, and populated it with thousands of MEA experiments. For the analysis pipeline, we rely on three associated web services: (1) A meta data search wizard ( http://mealab.science.ru.nl/main/search_wizard.php ) to find experiments that meet certain criteria; the available choices are inferred from the database scheme. (2) An interactive webpage that groups and displays key properties and images of recordings, with links to detailed info (see figure). Each entry contains a field ‘Quality’, where one can assign a quality rating to the experiment. (3) An SQL query service that returns tables in JSON format. This allows web-based access to the database without the need to install drivers. The automated analysis is implemented in Matlab. The actual recordings are stored on local hard drives. We hope that publication of the database scheme and services will foster the development of general purpose lab automation systems (e.g., Grewe, Wachtler and Benda 2011, doi: 10.3389/fninf.2011.00016) and the specification of meta data standards. Our research aim is to study stimulus-response patterns in slices with different genotypes or farmacological treatments. Direct benefits of the database are: (1) a new research question can be answered by modifying a single SQL condition; (2) old experiments are not forgotten; and (3) base-line statistics are much improved by combining all experiments that start with similar conditions.
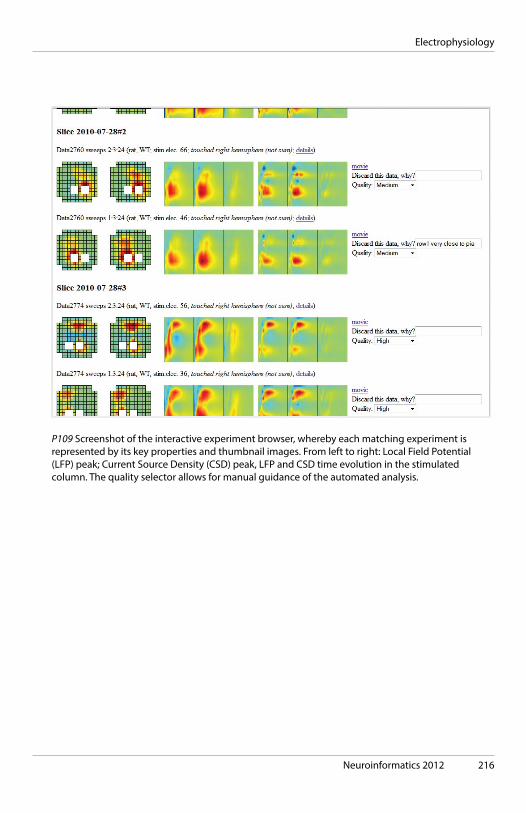
Neuroinformatics 2012 216
Electrophysiology
P109 Screenshot of the interactive experiment browser, whereby each matching experiment is represented by its key properties and thumbnail images. From left to right: Local Field Potential (LFP) peak; Current Source Density (CSD) peak, LFP and CSD time evolution in the stimulated column. The quality selector allows for manual guidance of the automated analysis.
217 Neuroinformatics 2012
Electrophysiology
P112 The adaptation of spike propagation delays in single and networks of neurones.
Yossi BuskilaMARCS Institute, University of Western Sydney
Neurons in the brain use action potentials (spikes) to communicate with each other. It is thought that the temporal and spatial summation of these signals is important in this communication,however, how the brain processes these signals is still an open question. In recent years, several studies have reported large variability of spike propagation delays in networks of neurons processing these signals, and it is thought that these delays enrich the storage capacity of the neuronal networks. Computational studies refer to the spike propagation delays as storage capacity units, and predict that the neuronal network use these delays to time signals and encode information. How these propagation delays are controlled and processed in cortical neurons has yet to be determined. We are using multisite patch clamp recordings along with photostimulation techniques to study how activity dependent protocols such as STDP affects spike propagation delays in both single and neuronal networks.
Neuroinformatics 2012 218
Electrophysiology
P113 Implementing Workflow Strategies to Handle the Analysis of Complex Electrophysiological Data Sets
Michael Denker1, Andrew Davison2, Markus Diesmann1 and Sonja Grün1
1. Institute of Neuroscience and Medicine (INM-6), Forschungszentrum Jülich2. Unité de Neurosciences, Information et Complexité (UNIC), CNRS UPR-3293
The complexity of managing electrophysiological experiments has grown considerably with the advent of modern recording setups. This complexity is firstly due to the interest in simultaneously recording the activity recorded from large numbers of channels to study the role of concerted neural activity. This scientific focus requires new analysis methods [1] that exploit the parallel aspect of such data sets [2]. A second source of complexity is the interest in increasingly natural stimulus protocols and behavioral responses. As an example, typical visual stimulation has progressed from simple moving bars to natural movies, Gabor noise, apparent motion stimuli. Taken together, this sophistication implies a level of complexity that encourages researchers to rethink their traditional workflows in electrophysiology. Here, we showcase experiences in establishing good-practice workflows and building corresponding tool-chains to facilitate the handling of electrophysiological data. We demonstrate how we combine and amend various software tools, both generic (e.g., version control systems, parallelization libraries [3]...) and specifically from the neuroinformatics community (e.g., lab journaling systems such as sumatra [4]), to achieve an efficient working style that is flexible, leads to reproducible results, and is open for collaboration. In parallel to our own efforts, we present results from two initiatives aimed at sampling the current state of maturation of workflows in the electrophysiology community. First, we analyze an on-line survey pinpointing the major problems encountered in the analysis of high-dimensional data sets. Second, we report hands-on insights sampled from several laboratories gained during a workshop on workflows in electrophysiology.
Acknowledgements: Supported by the European Union (FP7-ICT-2009-6, BrainScaleS).
References 1. Brown EN, Kass RE, Mitra PP: Multiple neural spike train data analysis: state-of-the-art and future challenges. Nat Neurosci 2004, 7:456-461. doi:10.1038/nn1228 2. Stevenson IH, Kording, KP: How advances in neural recording affect data analysis. Nat Neurosci 2011, 14:139-142. doi:10.1038/nn.2731 3. Denker M, Wiebelt B, Fliegner D, Diesmann M, Morrison A: Practically trivial parallel data processing in a neuroscience laboratory. In: Analysis of parallel spike trains. New York: Springer-Verlag; 2010. doi: 10.1007/978-1-4419-5675-0_20 4. Sumatra: automated electronic lab book [ http://neuralensemble.org/trac/sumatra ]

219 Neuroinformatics 2012
Electrophysiology
P114 FPGA implementation of a template matching-based real-time spike sorter for extracellular multi-electrode recordings of neural signals
Jelena Dragas, David Jaeckel, Felix Franke and Andreas HierlemannETH Zurich
Signals in neural networks are propagated by means of short voltage pulses (spikes) of the cell membrane potential. Typically, extracellular electrodes sense spikes of several cells, which need to be correctly detected and assigned to the individual cells they originate from (referred to as sorting). Several factors render spike sorting error-prone: Low signal to noise ratio and simultaneous activity of different cells overlapping in the recordings. Moreover, the speed of sorting becomes crucial in applications where a feedback loop is employed to perform stimulation based on recorded cell activity. This work describes an implementation and optimisation of a spike-sorting algorithm on a Field Programmable Gate Array (FPGA), targeting multi-electrode systems for extracellular neuronal recordings, where the activity of a single neuron is recorded on multiple electrodes. The algorithm relies on optimal linear filters (Franke‘11), matched to the prototypical multi-electrode spike waveforms (templates), where each neuron has one associated multi-electrode filter. Filter coefficients are calculated off-board, and are periodically loaded in the FPGA in order to adapt the filters to, e.g., changing spike templates caused by cell drift. The performance of the real-time spike sorter has been assessed using simulations of mouse retinal ganglion cell recordings in a microelectrode array (MEA) system (Jaeckel‘12). Limited resources of an FPGA call for a trade-off between the number of electrodes per template and the sorting performance. For a simpler algorithm implementation, excluding overlap treatment, the latency of the sorting corresponds to half of the single electrode template length in addition to the algorithm overhead. In the above-mentioned data set, single electrode templates are 3ms long (sampled at 20kHz), and the algorithm overhead is 15 sampling cycles, resulting in a total latency of 2.25ms. The total number of errors (including false negatives and false positives), normalised to the expected number of spikes, is shown in Fig.1 as a function of the number of electrodes per neuron. It can be seen that even a small number of electrodes per neuron ensures a good sorting performance. Low latency between spike occurrence and spike classification allows for real-time closed-loop stimulations with high spike-sorting performance. However, the spike sorter is not a stand-alone module and pre-processing needs to be done in order to obtain the filter coefficients.
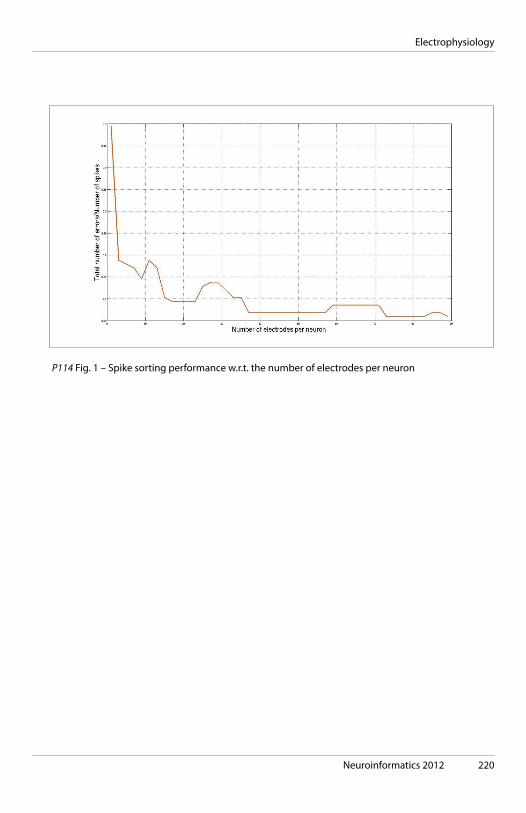
Neuroinformatics 2012 220
Electrophysiology
P114 Fig. 1 – Spike sorting performance w.r.t. the number of electrodes per neuron

221 Neuroinformatics 2012
Electrophysiology
P117 Detection of Neuronal Assemblies by Frequent Item Set Mining
Sonja Gruen1, David Picado-Muino2, Denise Berger3, George Gerstein4 and Christian Borgelt2
1. Institute of Neuroscience and Medicine (INM-6), Forschungszentrum Jülich; Theoretical Systems Neurobiology, RWTH Aachen2. European Centre for Soft Computing, c/ Gonzalo Gutiérrez Quirós s/n, 33600 Mieres, Asturias3. Lab. Neuromotor Physiology, IRCCS Fondazione Santa Lucia, Via Ardeatina 306, 00179 Roma4. Dept. of Neuroscience, University of Pennsylvania, Philadelphia PA 19104
Hebb (1949) suggested cell assemblies as the building blocks of information processing in the brain. The member neurons are assumed to show correlated activity. We present a data mining method that detects assemblies in massively parallel spike data both reliably and efficiently. Gerstein et al. [1] developed an accretion approach to detect joint spiking patterns in parallel spike trains. Starting from single neurons, this approach iteratively accretes neurons into sequences as long as another neuron shows significantly correlated activity with the accreted neurons. However, accretion suffers from several drawbacks: it works on sequences instead of sets, thus incurring high costs from redundant detections (memory consumption, speed) and may also miss assemblies. Here we present an alternative approach based on frequent item set mining (FIM) that amends these drawbacks and was developed for finding sets of items (here: neurons) that frequently occur (here: spike) together. FIM algorithms efficiently count joint spiking events that exceed a given minimum support (occurrence frequency) by efficiently exploring the complete search space without redundancy. The found patterns may be assessed statistically by taking the maximum p-value over all one-neuron-against-rest tests and by additional subset conditions. We examined (a) no subset conditions, (b) weak subset conditions (existence of a stepwise significant sequence as in accretion), and (c) strong subset conditions (all possible sequences must be stepwise significant). The false positive (FP) and false negative (FN) rates are evaluated under different subset conditions. Interestingly we found that FIM without any subset requirements and without any statistical test leads to the same or even better results as accretion or FIM with weak subset conditions. FIM with strong subset conditions reduces FPs but at the price of a considerable increase of FNs. This leaves us with a fast and reliable plain FIM algorithm (finding maximal frequent item sets), enabling a conclusive statistical test based on surrogate data (cf. [2]). Our next steps will be to test the method in cases where more than one assembly is present and to explore dynamic assembly processing.
Acknowledgements: Helmholtz Alliance Systems Biology, EU (FP7-ICT-2009-6, BrainScaleS)
References [1] Gerstein et al (1978) Brain Res 140: 43-62 [2] Gerstein et al (2012) J Neurosci Methods 206: 54-64

Neuroinformatics 2012 222
Electrophysiology
P119 Information Transfer and Recovery in the Somatosensory Cortex
Chao Huang, Andrey Resnik and Tansu CelikelLaboratory of Neural Circuits and Plasticity, University of Southern California
Information processing in the brain requires signal transformation every time information is transferred from one neuron to another. This transformation is performed by the postsynaptic neuron by integrating spatiotemporally distributed synaptic inputs and generating action potentials to inform its own postsynaptic partners. During this transformation how much information is retained, how much of it is transferred to postsynaptic neurons and how does the network reconstruct the lost information are unknown. Here we addressed these questions using Shannon information theory on simultaneously studied synaptic inputs, postsynaptic membrane potentials and action potentials, and network simulations. Whole cell current clamp recordings were performed in acute slices to study evoked responses in layer (L) 2/3 pyramidal neurons of the mouse primary somatosensory cortex. Electrical presynaptic stimulation, mimicking L4 responses studied during principal and surround whisker deflections in vivo, were delivered using a bipolar electrode in L4. Results show that while postsynaptic membrane potentials contain significant information about stimulus, roughly equivalent to the stimulus entropy, when subthreshold information is converted to spikes there is significant information loss (1.86±0.17 vs. 0.36±0.14 bit, p<0.001). This loss cannot be explained by the membrane state. Mutual information calculations between stimulus and spikes in simulations on the reconstructed barrel cortical column showed that although spikes from single L2/3 neurons are not information rich (0.28±0.15 bit) all the information about the stimulus can be successfully recovered by integrating responses from a pool of 8-20 local L2/3 neurons. The variance was explained by the different information encoding mechanisms that the network can hypothetically utilize; while the information in spike timing was significantly more than that of in firing-rate or the information in binary responses, minimum number of neurons required to reconstruct the lost information was significantly smaller if spike timing were used as the encoding mechanism (Figure 1). These results show that although significant amount of information is lost when a neuron converts information it receives into spikes, local networks are able to overcome the information loss by integrating residual information across a small number of neurons. These findings argue against the notion that sensory representations can be reconstructed from single cell responses and suggest that encoding information through spike timing is the most optimal solution for neural representation of the sensory information.
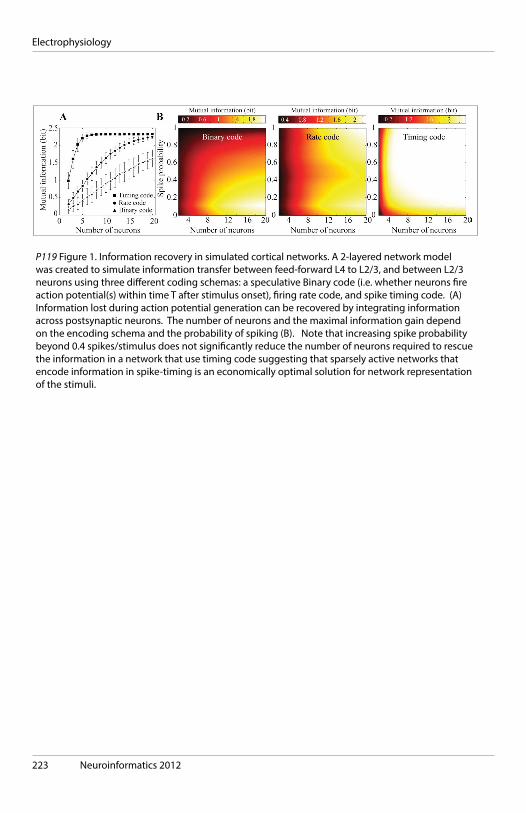
223 Neuroinformatics 2012
Electrophysiology
P119 Figure 1. Information recovery in simulated cortical networks. A 2-layered network model was created to simulate information transfer between feed-forward L4 to L2/3, and between L2/3 neurons using three different coding schemas: a speculative Binary code (i.e. whether neurons fire action potential(s) within time T after stimulus onset), firing rate code, and spike timing code. (A) Information lost during action potential generation can be recovered by integrating information across postsynaptic neurons. The number of neurons and the maximal information gain depend on the encoding schema and the probability of spiking (B). Note that increasing spike probability beyond 0.4 spikes/stimulus does not significantly reduce the number of neurons required to rescue the information in a network that use timing code suggesting that sparsely active networks that encode information in spike-timing is an economically optimal solution for network representation of the stimuli.
Neuroinformatics 2012 224
Electrophysiology
P120 Accessing electrophysiological data from Python
Christian Kellner and Thomas WachtlerGerman INCF Node, Department Biology II, Ludwig-Maximilians-Universität München, Ger-many
Electrophysiological data is often recorded and stored in vendor specific file formats that are mostly closed and proprietary. To accommodate the need for a common and format-agnostic way to access these data from different programs, the Neuroshare API ( http://neuroshare.org ) was created. Its main purpose is to provide a common programming interface for application developers to access the data and metadata in a unified way. To do so, format-specific libraries (“Neuroshare libraries”) are needed that are developed and maintained by the hardware manufacturers. Here we present Python Neuroshare, an interface to the Neuroshare libraries that enables Python users to take full advantage of the Neuroshare API while benefiting from the full power of the Python programming language. Its design focuses on convenience and on integrating tightly into the programming language: For example, the data is exposed in NumPy arrays, which allows quick and easy analysis of the data. Moreover, Python Neuroshare will detect and load automatically the correct library to use for a given file, thus removing the unnecessary step of manual library selection. Most Neuroshare libraries are provided as precompiled binaries for Microsoft Windows only. To overcome this limitation we also provide the “Neuroshare Wine Proxy” library which enables seamless use of Windows libraries on GNU/Linux and Mac OSX. Furthermore, a format conversion tool (“ns-convert”) is provided that converts neuroshare-compatible files into the HDF5 file format. Python Neuroshare is Open Source software and can be obtained as source code from the G-Node Github repository ( https://github.com/G-Node/python-neuroshare ). Precompiled binaries are also available via the Python Package Index. Recently, a Debian package (python-neuroshare) was created and has already been included into Debian “unstable” and “testing” distributions. Using the Python Neuroshare library and tool suite, researchers achieve flexible and convenient cross-platform access to recorded electrophysiological data.
Supported by the German Federal Ministry of Education and Research (grant 01GQ0801).
225 Neuroinformatics 2012
Electrophysiology
P121 Workflow automation of electrophysiological data analysis in receptive field mapping
Bengt LjungquistNeuronano Research Center, Lund University
When multichannel electrode array (MEA) systems are used in chronic recordings of neuronal activity in awake, behaving animals, the amount of data collected is daunting. Each electrode channel yields field potentials and spike trains that need to be analyzed. For the spike trains, this task is especially cumbersome since each spike has to be assigned to a specific neuron, a process called spike-sorting, before it may be analyzed. Spike-sorting has usually been performed manually, which takes many man-hours per recording and channel. To address this problem, a number of automatic spike-sorting methods have been suggested previously. However, their overall performance is relatively poor as they have been organized as single tasks. In this work we show how spike-sorting may be automated as one step of a larger workflow-like analysis using a computer program written in MATLAB. Further steps in this workflow include storing the recordings in a database to facilitate meta-data based analysis, peristimulus evoked potential and spike train analysis per stimulus site as well as visualization and plotting of the analysis. We have applied this analysis to a receptive field mapping of nociceptive and tactile stimuli in order to characterize changes in nociceptive and tactile input to neurons in primary somatosensory cortex (SI) during the development of hyperalgesia in awake, freely moving rats. The results have been checked manually and yield results in par with manual analysis and spike sorting. Single units are readily extracted from multi-unit spike trains. Remarkably, the time required to perform the analysis is reduced from a month to a couple of hours. The main benefits of this work are that we may now address complex research problems and perform data mining of the electrophysiological data, which has not been previously possible, thus providing a basis for rapid analysis and direct feedback to the experimental set-up in the context of performing electrophysiological recordings in future research.
Neuroinformatics 2012 226
Electrophysiology
P122 ERP experiment in children with developmental coordination disorder as use case for extending EEG/ERP domain ontology
Roman Mouček1, Pavel Mautner2, Ladislav Čepička3 and Irena Holečková4
1. Department of Computer Science and Eng..2. Department of Computer Science and Engineering3. Department of Physical Education and Sport Science4. University Hospital in Pilsen
Many children have problems with everyday skills. It can be caused by neurodevelopmental disorder known as developmental coordination disorder (DCD) [1]. DCD is described as a motor skill disorder characterized by a marked impairment in the development of motor coordination abilities that significantly interferes with performance of daily activities and/or academic achievement [2]. Some electrophysiological studies suggest differences between children with motor development problems and controls [3] but without diagnostics of coordination disorder. Our experimental protocol included a total of 24 children between the ages of 6 to 7 participated on the project as tested subjects. All tested subjects were elicited by three sound stimuli. EEG/ERP activity was recorded using standard tin electrodes placed on a 10-20 EEG cap. The recorded data were further processed and analyzed. To correct deformation of the ERP waveform ICA was applied to averaged data. Data and metadata were stored in the EEG/ERP Portal [4). The development of the Portal included definition of metadata and construction of ontology for EEG/ERP research. This ontology is currently expressed in several data models: entity relational model, object oriented model and semantic web model. The ontology was originally built using experience from a set of EEG/ERP experiments performed by our research group, expert knowledge from the University Hospital in Pilsen and detailed overview of scientific literature. Last but not least, the domain ontology was modified based on the experience with design of the experimental protocol described above and the forthcoming experiment modification.
References: [1] Polatajko, H. J. & Cantin, N.: Developmental Coordination Disorder (Dyspraxia): An Overview of the State of the Art. Seminars in Pediatric Neurology, vol. 12, p. 250-258, 2005. [2] American Psychiatric Association: Category 315.40 Developmental Coordination Disorder. Diagnostic and Statistical Manual of Mental Disorders (ed 4). Washington, DC: American Psychiatric Association, p. 53-55, 1994 [3] Monastra, V. J., Lubar, J. F., & Linden, M.: The development of quantitative EEG scanning process for ADHD: reliability and validity studies. Neuropsychology, 15. 136-144, 2001. [4] EEG/ERP Portal, http://eegdatabase.kiv.zcu.cz , retrieved April 20, 2012. Acknowledgements This work was supported by the Grant Agency of the Czech Republic under the grant P407/12/1525.

227 Neuroinformatics 2012
Electrophysiology
P123 Multiplexed, data structure-based enriched physiological event marker system
Derek Rollend and Marcos OsornoJHU/APL
As has been stressed by international scientific standards committees, event markers allow for the alignment of experiment events with their associated physiological data in the post-processing phase of an experiment and are crucial for providing context in recorded measurements [1]. Current physiological data file formats only afford rudimentary event encoding schemes, including hexadecimal event codes with a separate user-defined lookup table file, and time-stamped experiment annotations [2, 3]. The latter requires synchronizing the data acquisition system and annotation-generating software. It becomes desirable then to simultaneously generate and record both experiment events and metadata (annotations) from multiple subjects in a unified form that is compatible with existing physiological data file formats. To meet these goals, an alternative event marker method was developed. A data structure, loosely based on standard transmission protocol structures, was used in order to contain both an event description and a payload of associated event metadata or experiment behavioral data. This event marker system has been successfully demonstrated in an ongoing psychophysiological experiment where the total expected number of participants is between 100-200 volunteers. To alleviate the bookkeeping burden during the analysis phase of the experiment, participant identification, experiment identification, participant roles, and behavioral metadata have been packaged within event markers. This has enabled 1) human-readable, meaningful event descriptions to be overlaid on recorded EEG, ECG, EOG, and GSR signals, 2) quantifiable behavioral data for post-processing and machine learning based analysis, and 3) backup participant meta-data contained within the data file for information consistency checking during analysis.
1. Nuwer, Marc R. et al. “IFCN Standards IFCN standards for digital recording of clinical EEG.” Electroencephalography and Clinical Neurophysiology, Volume 106, Issue 3, 1998, Pages 259-261, ISSN 0168-5597. 2. Velde, Maarten van de et al. “Digital archival and exchange of events in a simple format for polygraphic recordings with application in event related potential studies.” ISSN 0013-4694, http://dx.doi.org/10.1016/S0013-4694 (98)00029-7. 3. Kemp, B. Olivan, J. “European data format ‘plus’ (EDF+).” ISSN 1388-2457, 10.1016/S1388-2457(03)00123-8.

Neuroinformatics 2012 228
Electrophysiology
P123 Experiment Setup and Event Marker Overview
229 Neuroinformatics 2012
Electrophysiology
P124 Mission and activities of the INCF Electrophysiology Data Sharing Task Force
Friedrich Sommer1, Thomas Wachtler2, Andrew Davison3, Michael Denker4, Jeffrey Grethe5, Sonja Grün6, Kenneth Harris7, Colin Ingram8, Marja-Leena Linne9, Bengt Ljungquist10, John Miller11, Roman Mouček12, Hyrum Sessions13, Gordon Shepherd14, Leslie Smith15, Jeff Teeters1 and Shiro Usui16
1. UC Berkeley2. LMU Munich3. CNRS, Gif-sur-Yvette4. INM-6, Research Center Jülich5. UCSD6. INM-6. Jülich7. Imperial College London8. University of Newcastle9. Tampere Institute of Technology10. Lund University11. Montana State University12. Univ. of West Bohemia, Pilsen13. Blackrock Microsystems14. Yale15. University of Stirling, Scotland16. RIKEN Brain Science Institute
Each year, an increasingly vast amount of neuroscience electrophysiology data is collected and reported in journal publications. However, almost none of these data are accessible to the community of theorists building integrative models of neuronal systems or to experimentalists planning new experiments. To help change this situation, the INCF Electrophysiology Data Sharing Task Force, was established in 2010 to develop recommendations that enable and expand the sharing of electrophysiology data. The issues the task force considers are the required metadata, data formats, object models for accessing data, unique identifiers for data, infrastructure and software, and how to promote data sharing. This poster summarizes the activities of the task force for the purpose of getting feedback and to publicize related resources.
MetadataA number of areas in bioscience have developed minimal metadata standards that have been adopted both by database curators and publishers. Our aim is to examine the issues around developing metadata standards for neurophysiology, including methods for efficient acquisition, description of stimuli and neural data, formats, and interoperability. Some of the current systems considered are: CARMEN’s MINI http://www.carmen.org.uk/standards, YOGO http://yogo.msu.montana.edu , odML http://www.g-node.org/projects/odml , and neurolex http://neurolex.org .
Neuroinformatics 2012 230
Electrophysiology
Data formatsThe large variety of data formats in electrophysiology poses great challenges to efficient data sharing. The task force has set up a web page on tools for reading and converting between formats http://datasharing.incf.org/ep/Converters and, in order to develop unifying standards, is examining techniques used by a variety of systems, including Neuroshare http://neuroshare.org , NDF http://www.carmen.org.uk/standards/CarmenDataSpecs.pdf , MIEN http://mien.msu.montana.edu/ , NEO http://packages.python.org/neo/ , and OMNI http://code.google.com/p/incf-omni/ .
Publisher statementsThe task force is collecting information about existing policies at publishers and funding agencies regarding requirements that data be made available and will coordinate with the INCF neuroimaging task force to form recommendations.
Data set identifiersThe task force has discussed systems of persistent identifiers for data that would allow shared data to be referenced in standardized ways. Two are DOIs using datacite, and Life Science Identifiers, which are used by the CARMEN project.
231 Neuroinformatics 2012
Electrophysiology
P125 NeuroElectro: A database describing the electrophysiology properties of different neuron types
Shreejoy Tripathy, Judith Savitskaya, Richard Gerkin and Nathaniel UrbanCarnegie Mellon University
Brains achieve efficient function through implementing a division of labor, in which different neurons serve distinct computational roles. One of the most striking ways in which neuron types differ is in their electrophysiology properties. These properties arise through combinations of ion channels that collectively define the computations that a neuron performs on its inputs. Though the electrophysiology of many neuron types has been previously characterized, these data exist across thousands of journal articles, making cross-study neuron-to-neuron comparisons difficult. Here, using a combination of manual and automated methods, we describe a methodology to curate neuron electrophysiology information into a centralized database. We developed methods to extract neuron electrophysiology information from formatted data tables contained within the journals Journal of Neuroscience and Journal of Neurophysiology, which contain the majority of the this published information. Using web searching and html parsing tools in Python, we found and stored 1600 electrophysiology data tables across 500 articles. Because authors often use different terms to refer to the same electrophysiology concept, e.g. “Vrest” and “RMP” both refer to a neuron’s resting membrane potential, we found the need to develop a basic electrophysiology ontology. Similarly, we used Neurolex’s existing neuron ontology ( http://neurolex.org ) to map different terminology to neuron concepts. We validated our automated methods through manual inspection of a subset of the data. While electrophysiology concept identification was highly reliable (>80%), we found that identifying the correct neuron was less accurate (<50%), in part because of the incompleteness of the neuron ontology, suggesting the need for a two-stage automatic and manual approach. We hope that this database will be of use to those interested in validating their own measurements on neuron electrophysiology. Furthermore, we plan to integrate this database with existing neuron databases on morphology or gene expression. We hope that these databases will lead to a quantitative understanding of the computational function of different neuron types.
Neuroinformatics 2012 232
Electrophysiology
P126 Specification of experiment stimuli for sharing electrophysiology data
Jeffrey L. Teeters, Wayne Christopher, Marvin Thielk and Friedrich T. SommerUC Berkeley
Sharing of electrophysiology data often requires not only the recorded neural data, but also an unambiguous specification of the stimuli that were used in the experiment. There have been a number of systems developed for storing electrophysiology data for data sharing, including CARMEN NDF, NEO, and Neuroshare. These systems support four main data types (spike times, analog signals, waveforms and events). The “event” type is the most natural data type to be used for specifying experimental stimuli. However, there is currently no generalizable strategy as to how this should be done. To develop a generalizable strategy for describing stimuli, we are using the data sets contributed to CRCNS.org as test cases. Specifically, we are developing methods to specify stimuli along with neural data using HDF5 as a storage container. The HDF5 schema we developed uses a hierarchy to organize the data into groups that correspond to the four main data types. The event type data consists of an array of event times, and an additional array containing parameter values that specify what event was at each time. For visual stimuli, the parameters must indicate which image frame has appeared at each time point in the experiment. For audio stimuli, the parameters must map time points to positions in a sound file. Some issues we are addressing are:
1. Image frames in contributed data sets are specified in many different ways (for example: jpeg files, 2-D matrices, a script that generates an image sequence). For effective data sharing, there needs to be a standardized representation. We are investigating converting everything into standard 3-D arrays (x, y and time axis) stored in HDF5.
2. If applicable, parameters describing a stimulus content (for example, orientation of a bar or frequency and length of a pure tone) must also be stored.
3. To allow the same stimuli to be referenced from different experiments, it is advantageous to store the actual stimulus files apart from the files containing neural data. The reference between data file and stimuli files must be explicit and unambiguous.
4. Repetitions of the same stimuli (start of a repeat of a stimulus sequence) should also be easy to detect in order to analyze average responses across trial repeats. Our goal is to develop generalizable schemes to store electrophysiology data and stimuli in HDF5 files so that both are accessible for online browsing and also for automated tools of machine learning.

233 Neuroinformatics 2012
Infrastructural and portal sevices
D14 Automatic spike sorting evaluation: A website based community approach
Felix Franke1, Philipp Meier2, Andrey Sobolev3, Espen Hagen4, Andreas Hierlemann1, Klaus Obermayer5, Gaute T Einevoll4 and Thomas Wachtler3
1. ETH Zürich, Bio Engineering Laboratory (BEL)2. School for Electrical Engineering and Computer Science, Berlin Institute of Technology, Germany3. Biologie II, Ludwig-Maximilians-Universität München, Planegg-Martinsried, Germany4. Department of Mathematical Sciences and Technology, Norwegian University of Life Sci-ences, 1432 Ås, Norway5. Bernstein Center for Computational Neuroscience, Berlin, Germany
The goal of spike sorting is to separate the spike trains of individual neurons from extracellular recordings. This step is crucial in many neuroscientific experiments since one extracellular electrode usually records the activity of several neurons. Despite the large effort to develop automatic algorithms (Lewicki, 1998) to solve the problem, spike sorting can be still considered as well an art as an exact science with a large manual component. For the quantitative evaluation of spike sorting algorithms the ground truth of the data analyzed, i.e. the number of neurons and their firing times, has to be known (Einevoll et al., 2011). Real extracellular recordings provide no suitable benchmark data because of the inherent absence (or at least very limited presence) of ground truth information. Thus, using simulated surrogate data is the traditional way to evaluate spike sorting algorithms. However, most scientists use their own simulated data, making comparisons between different publications very difficult. Here, we develop a framework for automated spike sorting evaluation based on several different benchmark datasets used in recent publications. The framework is implemented on a website that allows the user to download benchmark files, upload their sorting results, and compare the performance of their sorting algorithm to those of other users. Furthermore, users can also upload their own benchmark datasets and make them available to the community. We hope that the website will help in comparing the performance of different spike sorting algorithms and foster the development of new ones. The underlying framework, i.e., website frontend and evaluation backend, can be generalized to other, similar, algorithm evaluation problems, such as encountered in EEG data analysis. The website is available at http://www.g-node.org/spike.
Acknowledgements Supported by the Research Council of Norway (NevroNor, eScience, Notur), by INCF through its German Node (BMBF grant 01GQ0801), and by the Deutsche Forschungs Gemeinschaft (DFG) with grant GRK 1589/1.
References Einevoll, G. T., Franke, F., Hagen, E., Pouzat, C., and Harris, K. D. (2011). Towards reliable spike-train recordings from thousands of neurons with multielectrodes. Current Opinion in Neurobiology 27, 1–7.
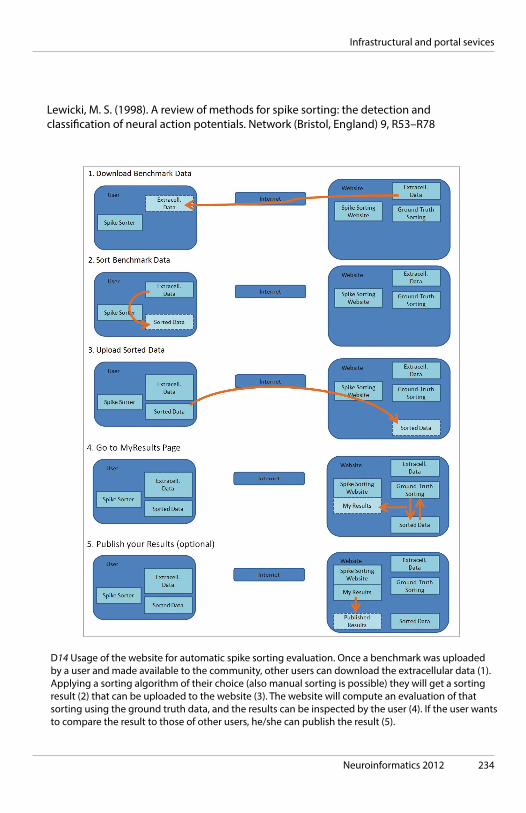
Neuroinformatics 2012 234
Infrastructural and portal sevices
Lewicki, M. S. (1998). A review of methods for spike sorting: the detection and classification of neural action potentials. Network (Bristol, England) 9, R53–R78
D14 Usage of the website for automatic spike sorting evaluation. Once a benchmark was uploaded by a user and made available to the community, other users can download the extracellular data (1). Applying a sorting algorithm of their choice (also manual sorting is possible) they will get a sorting result (2) that can be uploaded to the website (3). The website will compute an evaluation of that sorting using the ground truth data, and the results can be inspected by the user (4). If the user wants to compare the result to those of other users, he/she can publish the result (5).

235 Neuroinformatics 2012
D15 The Neuroscience Information Framework (NIF): A Unified Semantic Framework and Associated Tools for Discovery, Integration, and Utilization of Biomedical Data and Resources on the Web
Jeffrey Grethe1, Anita Bandrowski1, Jonathan Cachat1, Amarnath Gupta1, Fahim Imam1, Stephen Larson1, Luis Marenco2, Perry Miller2, Gordon Shepherd2, Maryann Martone1 and NIF Consortium1
1. University of California, San Diego2. Yale University
The Neuroscience Information Framework (NIF; http://neuinfo.org ) was launched in 2008 to address the problem of finding and integrating neuroscience-relevant resources through the establishment of a semantically enhanced framework. The NIF discovery portal provides simultaneous search across multiple types of information sources to connect neuroscientists and biomedical researchers to available resources. These sources include the: (1) NIF Registry: A human-curated registry of neuroscience-relevant resources annotated with the NIF vocabulary; (2) NIF Literature: A full text indexed corpus derived from the PubMed Open Access subset as well as an entire index of PubMed; (3) NIF Database Federation: A federation of independent databases that enables discovery and access to public research data, contained in databases and structured web resources (e.g. queryable web services) that are sometimes referred to as the deep or hidden web. Search and annotation of resources and resource content is enhanced through the utilization of a comprehensive ontology (NIFSTD) that covers major domains in neuroscience, including diseases, brain anatomy, cell types, subcellular anatomy, small molecules, techniques and resource descriptors. The NIFSTD ontologies are used to refine or expand queries by utilization of the relationships encoded in the ontology. Over the past year, NIF has continued to grow significantly in content, providing access to over 4800 resources through the Registry, and more than 150 independent databases in the data federation, making NIF the largest source of neuroscience information on the web. NIF’s tools help people find and utilize neuroscience related resources - provides a consistent and easy to implement framework for those who are providing such resources, e.g., data, and those looking to utilize these data and resources. In this demonstration we will provide a tour of NIF’s suite of services, tools, and data: *Search through NIF’s semantically-enhanced discovery portal *Services and tools that provide access to the NIF data federation - the largest collection of Neuroscience relevant information on the web *Contributing to the NeuroLex – a community resource for neuroscience terminology built on a semantic media-wiki platform *Curation and normalization of data utilizing NIF’s Google Refine services *NIF’s semantically enhanced linked data and tools for its maintenance *myNIF and the NIF Digest – personalized services for researchers
Infrastructural and portal sevices

Neuroinformatics 2012 236
D16 A Simple Tool for Neuroimaging Data Sharing
Christian HaselgroveUniversity of Massachusetts Medical School
Data sharing is becoming increasingly common, but despite encouragement and facilitation by funding agencies, journals [1], and some labs and larger research efforts, there remain political, financial, social, and technical barriers to sharing data [2]. In particular, technical solutions are few for researchers that are not a part of larger efforts with dedicated sharing infrastructures, and social excuses such as the time commitment required to share or the lack of motivation to share can keep data from becoming public [3]. We present a system for sharing neuroimaging data, designed to be simple to use and to provide benefit to the data provider. The system consists of a server at the International Neuroinformatics Coordinating Facility (INCF) and client tools for uploading data to the server. The primary design principle for the client side is ease of use: the user identifies a directory containing DICOM data and provides his INCF Portal user name and (public) identifiers for the subject and imaging session. The client probes the data for metadata and prompts the user for additional or missing information, then anonymizes the data and sends it to the server. The server first checks anonymization of incoming data, deleting data that is not property anonymized. The server then runs quality control routines on the data, and the data and the quality control reports are made public. The user is notified by e-mail when this is complete, and retains control of the data and may delete it from the server if necessary. The result is that in the time required for upload and quality control processing, including a scant minute or two of the user’s time, the data is anonymized, made publicly available, and quality control is performed. The client tools and access to the public image database are available at http://xnat.incf.org/.
Acknowledgment: This work was conducted within the Neuroimaging Datasharing Task Force of the INCF Program on Standards for Datasharing.
References: 1. Kennedy, DN, et al. Next Steps in Data Publishing. Neuroinformatics. 2011; 9: 317-320. 10.1007/s12021-011-9131-0. 2. Poline JB, et al. Data sharing in neuroimaging research. Frontiers in Neuroinformatics. April 2012; 6: 9. 10.3389/fninf.2012.00009. 3. Ascoli GA. The Ups and Downs of Neuroscience Shares. Neuroinformatics. 2006; 4: 213-6. 10.1385/NI:4:3:213.
Infrastructural and portal sevices

237 Neuroinformatics 2012
D16 Quality control report (top) and public download page (bottom) for shared data.
Infrastructural and portal sevices
Neuroinformatics 2012 238
D17 Improvement of Simulation Platform for providing reliable and easy use model simulation environment
Hidetoshi Ikeno1, Tadashi Yamazaki2, Yoshihiro Okumura3, Shunji Satoh2, Yoshimi Kamiyama4, Yutaka Hirata5, Keiichiro Inagaki3, Akito Ishihara6, Takayuki Kannon3, Hiroaki Wagatsuma7 and Shiro Usui3
1. University of Hyogo2. University of Electro-Communications3. RIKEN Brain Science Institute4. Aichi Prefectural University5. Chubu University6. Chukyo University7. Kyushu Institute of Technology
We are developing a web site to offer a virtual machine (VM) for simulating mathematical model. Visiters can execute model programs or scripts without installing any software and tools on own computer. In the Simulation Platform ( http://sim.neuroinf.jp/ ), VM is assigned and simulation is executed automatically on it. Each VM is run with Linux operation system, and installed basic software for computational neuroscience, including developer tools such as C++ compilers and libraries, popular neural simulators such as GENESIS, NEURON, and NEST, and scientific application software such as Gnuplot, R, and Octave. In this moment, our site is providing more than 250 contents, which are registered on the ModelDB and NIJC J-node platforms. The execution of contents is very simple, just selecting your choice and clicking the arrow mark on the screen shot of it. In the pre-release platform site, we have used our original software to manage VMs. It is work well for limited number of users and basic use, but it is considered to innovate more general VM technology for public release requested more stable and expandable operation. In this study, we have developed our new VM system based on the IaaS (Infrastructure as a Service) technology. We examined various open-source IaaS frameworks for our backend system, according to the stability, usability, implementation and activity of the development. As a result, we judged that OpenNebula ( http://opennebula.org/ ) was suitable for our purpose. OpenNebula has been actively developed for more than 4 years and is robust enough for large-scale public cloud systems. The system is composed of a small and efficient core written in C and a rich and friendly ecosystem written in Ruby that wraps the core. OpenNebula comes with a graphical user interface for system administration, which allows an administrator to add/delete hosts and VMs, monitor the system status, and manage users from a web browser (Fig.1). Owing to the new system, it is not only enhanced reliability for many user accesses, but also scalability of our platform. It could be realized new functions, such as offering various VMs, which run on non-Linux operating system and different version of software. Based on the new VM, we start our service publically with runnable contents and their documents from this year. We will increase the volume and also type of contents, for example, 2D and 3D brain image viewing function for large-scale image data in the NIJC platforms, such as Invertebrate brain and Neuro-Imaging platforms.
Infrastructural and portal sevices

239 Neuroinformatics 2012
Infrastructural and portal sevices
Neuroinformatics 2012 240
D18 The XNAT imaging informatics platform: Recent advances
Daniel Marcus, Rick Herrick, Timothy Olsen, Aditya Siram, Michael McKay and Jordan WoerndleWashington University
Neuroimaging is an important component of the biomedical research enterprise. As emphasis on translational science has increased, imaging based research has become more tightly coupled with clinical workflows. Similarly, the necessity of recruiting research subjects from geographically dispersed patient populations, along with the need for larger subject cohorts to identify genetic linkages, has led to multi-site image acquisition and an overall increase in the scale of studies. Informatics tools have the potential to provide critical support infrastructure to enable this type of research. We will demonstrate the XNAT imaging informatics platform, with a particular focus on recent features to support clinical research, institutional research imaging repositories, and multi-center studies. XNAT includes a complete DICOM workflow, supports all imaging modalities, is easily extensible to additional data types including derived images and non-imaging information, and includes a secure web services interface for programmatic access to hosted data. XNAT is open source software and freely available to the research community.
Infrastructural and portal sevices
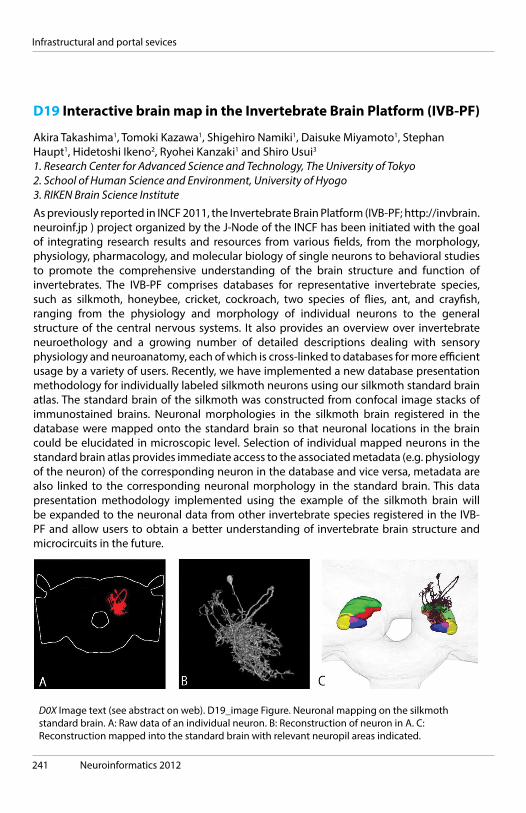
241 Neuroinformatics 2012
D19 Interactive brain map in the Invertebrate Brain Platform (IVB-PF)
Akira Takashima1, Tomoki Kazawa1, Shigehiro Namiki1, Daisuke Miyamoto1, Stephan Haupt1, Hidetoshi Ikeno2, Ryohei Kanzaki1 and Shiro Usui3
1. Research Center for Advanced Science and Technology, The University of Tokyo2. School of Human Science and Environment, University of Hyogo3. RIKEN Brain Science Institute
As previously reported in INCF 2011, the Invertebrate Brain Platform (IVB-PF; http://invbrain.neuroinf.jp ) project organized by the J-Node of the INCF has been initiated with the goal of integrating research results and resources from various fields, from the morphology, physiology, pharmacology, and molecular biology of single neurons to behavioral studies to promote the comprehensive understanding of the brain structure and function of invertebrates. The IVB-PF comprises databases for representative invertebrate species, such as silkmoth, honeybee, cricket, cockroach, two species of flies, ant, and crayfish, ranging from the physiology and morphology of individual neurons to the general structure of the central nervous systems. It also provides an overview over invertebrate neuroethology and a growing number of detailed descriptions dealing with sensory physiology and neuroanatomy, each of which is cross-linked to databases for more efficient usage by a variety of users. Recently, we have implemented a new database presentation methodology for individually labeled silkmoth neurons using our silkmoth standard brain atlas. The standard brain of the silkmoth was constructed from confocal image stacks of immunostained brains. Neuronal morphologies in the silkmoth brain registered in the database were mapped onto the standard brain so that neuronal locations in the brain could be elucidated in microscopic level. Selection of individual mapped neurons in the standard brain atlas provides immediate access to the associated metadata (e.g. physiology of the neuron) of the corresponding neuron in the database and vice versa, metadata are also linked to the corresponding neuronal morphology in the standard brain. This data presentation methodology implemented using the example of the silkmoth brain will be expanded to the neuronal data from other invertebrate species registered in the IVB-PF and allow users to obtain a better understanding of invertebrate brain structure and microcircuits in the future.
D0X Image text (see abstract on web). D19_image Figure. Neuronal mapping on the silkmoth standard brain. A: Raw data of an individual neuron. B: Reconstruction of neuron in A. C: Reconstruction mapped into the standard brain with relevant neuropil areas indicated.
Infrastructural and portal sevices

Neuroinformatics 2012 242
D20 BrainLiner: A Platform for Sharing and Searching Time-aligned Neural and Behavioral Data
Makoto Takemiya and Yukiyasu KamitaniDepartment of Neuroinformatics, ATR
Neuroscientists have used machine learning techniques in recent years to explore the representation of information in the brain to much success. Neural decoding models, for instance, have been developed that can predict behavioral parameters, stimuli, and mental states from measured brain activity. Unraveling more sophisticated neural representation or training generic statistical models will require large amounts of data across multiple subjects. To remedy the need for easy access to large data sets, we created BrainLiner.jp as part of the Japanese Strategic Research Program for Brain Science (SRPBS), as a web portal for searching for and sharing neurophysiological data. Real-time text-based search allows visitors to the site to find what they are looking for within seconds. We are also implementing a prototype data-driven search that quantizes time-series data for fast performance. Data files contain aligned neural and behavioral signal time series, and can be shared on the portal in the Neuroshare file format. Neuroshare files are then converted to a standard Matlab format on our servers and users can then choose to download either Neuroshare or Matlab files. The use of a standard file structure for all data sets enables efficient data sharing, since once a user learns the data format for one project, they can easily use data from another project, since they are all the same. This also enables automated analyses of data files across projects. Uploaded files are by default licenses under the Creative Commons CC-BY license, though uploading users can choose between using a CC-0 license or writing a custom license. This allows users to freely share their data in a readily comprehensible way. Additionally, as part of our project we have released open-source versions of our Neuroshare conversion tools [1], which include Matlab and Java-based reader and writers for Neuroshare files. Since neuroscientists do not perform their work alone in a vacuum, we added integration with Google+, Facebook, and Twitter, so users can express interest in and share data sets that are useful. Users can also log in to our site using their Google, Facebook, or Twitter accounts, in order to share data; no registration required.
[1] http://www.cns.atr.jp/[…]/
Infrastructural and portal sevices

243 Neuroinformatics 2012
D20 View of the data previewing ability on the download page for a project at http://brainliner.jp
Infrastructural and portal sevices
Neuroinformatics 2012 244
Infrastructural and portal sevices
P073 Development of a workflow system for the CARMEN Neuroscience Portal
Colin Ingram1, Mark Jessop2, Michael Weeks3, Jim Austin2 and Martyn Fletcher3
1. Newcastle university2. University of York3. University of York
We discuss the development of a workflow system for the CARMEN neuroscience portal. CARMEN is a virtual (browser- based) collaboration environment for the analysis and management of electrophysiology data. It has been designed to facilitate community based sharing of tools, services and data relating to neurophysiology research. To date, CARMEN has provided mechanisms to allow legacy software code and applications from the lab to be deployed, via a ligtweight wrapping process, as interactive services that run on the CARMEN cloud resource. This is a software as a service (SaaS) delivery model. This approach offers many benefits to the neuroscience community, including the reuse of software applications, the ability to compare processing algorithms and access to considerable computing CARMEN resource for high intensity computing tasks. However, many researchers would derive extra benefit from being able to string combine analysis services together in an orchestrated processing pipeline, or workflow. The CARMEN project has now addressed this requirement and developed a workflow generation and execution system within the platform. CARMEN has relatively specific workflow requirements due to its cloud execution model and the use of the it’s NDF data format (www.carmen.org.uk/standards/CarmenDataSpecs.pdf ). Hence, although we evaluated current workflow tools, such as Taverna (www.taverna.org.uk/) and E-Science Central (www.esciencecentral.co.uk/), it was found that neither met the functional requirements and a bespoke workflow service was developed. The CARMEN Workflow Tool is Java-based and designed to make use of CARMEN Services and NDF. The workflow tool supports both data and control flow, and allows parallel execution of services. Using a Service Invocation API to invoke CARMEN services simplifies the workflow infrastructure substantially. This API allows the workflow engine to make use of our dynamic service deployment and execution system, achieving scalable heterogeneous distributed processing. The complete workflow tool consists of a graphical design tool, a workflow engine, and access to a library of CARMEN services and common workflow tasks. The poster will provide an overview of the main design considerations for the workflow system and provide an overview of its use within CARMEN. We provide details of the workflow execution engine and describe the XML scripting approach that has been developed to control the workflow orchestration. The workflow description XML schema follows a similar form to myGrid’s SCUFL (Simple Conceptual Unified Flow Language - www.mygrid.org.uk/dev/wiki/display/developer/SCUFL2) script but modified to suit our service and data description formats. Example workflows for neurophysiology will be presented, demonstrating the flexibility of the workflow tool to support complex analysis pipelines.

245 Neuroinformatics 2012
Infrastructural and portal sevices
P074 Semantic Framework in EEG/ERP Portal
Petr Ježek and Roman MoučekUniversity of West Bohemia
Our research group specializes in research of brain activity. We widely use methods of encephalography (EEG) and event-related potentials (ERP). Since a collection of obtained data/metadata gradually grows we had to solve their long term storage and management. As a solution we developed the EEG/ERP Portal as a core of a complete software infrastructure supporting EEG/ERP research. Since we are working on the registration of the EEG/ERP Portal as a recognizable data source within NIF we provide the stored experiments in the form of the Semantic Web structures. Since the EEG/ERP Portal is a Java-based application with the data layer using common JavaBeans we are simultaneously developing the Semantic Framework that transforms input JavaBeans into the Semantic Web languages. The Semantic Framework is being developed as a single library. It is used as a black box with the input in the form of a set of JavaBeans and the output in the form of an ontology document. The ontology document can be serialized into several supported syntaxes. We currently support RDF/XML, OWL/XML, Turtle, and abbreviated OWL/XML formats. The Semantic Framework contains three subcomponents. The first subcomponent is the Extended JenaBean. Because of semantic gaps between object-oriented and Semantic Web models we proposed and implemented an extension of common JavaBean using Java Annotations. The output of the extended JenaBean component is an internal model representation. This representation is submitted to the second, Ontology Model Creator, subcomponent. This subcomponent creates an Ontology model. The internal JenaBean model is processed and an ontology document is created by calling Jena API methods. The result model can be further processed by the last subcomponent OWL API that transforms the ontology model into the supported ontology formats. The Semantic Framework is integrated in the EEG/ERP Portal where it is controlled by a build-in timer. The timer calls the Semantic Framework API in regular intervals. The API generates the ontology document from the stored experiments. The ontology document is stored in a temporary file. When any document request appears the temporary file containing the actual set of stored experiments is immediately available.
Acknowledgements This work was supported by the European Regional Development Fund (ERDF), Project “NTIS – New Technologies for Information Society”, European Centre of Excellence, CZ.1.05/1.1.00/02.0090.

Neuroinformatics 2012 246
Infrastructural and portal sevices
P077 Neuroimaging Data Access and Query through a Common Application Programming Interface
B. Nolan Nichols1, Christian Haselgrove2, Jean-Baptiste Poline3 and Satrajit S. Ghosh4
1. Integrated Brain Imaging Center, University of Washington, Seattle, WA2. University of Massachusetts Medical School, Worcester, MA3. Neurospin-I2BM-CEA, Gif sur Yvette4. McGovern Institute for Brain Research, Massachusetts Institute of Technology, Cambridge, MA
A large number of databases are developed to store and manage human neuroimaging data. While individual neuroscience databases provide mechanisms to query and download information within a given framework (e.g., Allen Institute, COINS, HID, IDA, LORIS, NIMS, XNAT), there is no standardized way to programmatically access related information stored in these heterogeneous systems. Creating a data exchange layer with a common interface to access and query shared brain imaging data will enable the development of interoperable client applications capable of consuming resources available across disparate brain imaging data management systems. We present a preliminary application programming interface (API) for providing uniform access to neuroimaging databases. Conceptually, the API is a service for accessing common entities (e.g., project, subject) and their relationships (e.g., subject wasAssociatedWith project) specified by the XCEDE data model [1] and defined in a lexicon [2]. Neuroimaging databases conforming to the API implement a mapping of their local resources to XCEDE entities and provide a mechanism to request resources. The API is not tied to a specific language or technology, but for web-accessible databases, REST is a natural fit. For example, a REST implementation of the API would respond to an HTTP request for a Subject URI (e.g., www.example.com/xcede_query/subject?uri={uri}) by listing the relationship and URI of related entiies (e.g, {wasAssociatedWith: projectURI} ). The response to an API request can return XCEDE XML or another format (e.g., JSON, RDF) conforming to the XCEDE data model [1]. Discussions with the developers of many neuroimaging databases are helping to refine this specification, and existing tools will speed the first implementation of the API [3]. Our goal is that in the near future, existing databases and those under development will implement this protocol and expose existing and newly acquired datasets in a common data access framework.
This work was conducted with the Neuroimaging Task Force of the INCF Program on Standards for Datasharing.
References [1] Gadde et al. 2012. XCEDE: an extensible schema for biomedical data. Neuroinformatics.doi:10.1007/s12021-011-9119-9 [2] Bug et al. 2008. The NIFSTD and BIRNLex Vocabularies: Building Comprehensive Ontologies for Neuroscience. Neuroinformatics.doi:10.1007/s12021-008-9032-z [3] Schwartz et al. 2012. PyXNAT: xnat in python. Front. Neuroinform.doi:10.3389/fninf.2012.00012
247 Neuroinformatics 2012
Infrastructural and portal sevices
P078 A Structure-Centered Portal for Child Psychiatry
Pallavi Rane, Christian Haselgrove and David KennedyUniversity of Massachusetts Medical School
Numerous web-based resources and databases are available and are being generated for today’s neuroscience researcher. We have developed a child-psychiatry oriented portal as an effort to deliver a knowledge environment wrapper that provides organization and integration of multiple information sources. Organized semantically as a Structure-Centered Database, following the conceptual design like introduced in the cell-centered database [1], the portal groups information sources by context and permits the user to interactively narrow or broaden the scope of the information resources that are available and relevant to the specific context. HTML5 and JavaScript are used to develop the user interface. The HTML5 canvas based clickable human brain atlas allows point-and-click feature to choose of different brain regions. The current atlas images are based on FreeSurfer segmented structural MRI scan of a normal fifteen-year-old female subject. Alternatively, a drop down list of different brain region is also provided in the search section along with a list of diagnoses, genders, age ranges, and species. Public web services are used to query various information resources such as the PubMed, Entrez Gene, and IBVD[2] and databases such as NIH pediatric database, CandiShare[3], PING[4], and OASIS datasets on XNAT central[5]. This portal aids an investigator find various child-psychiatry information resources available on the internet which are relevant to his/her research. The result of the database queries direct the user towards MRI data available for download that matches the search parameters. An inline frame enables the user to view the results from the different resources in the same screen or the user can choose to open each of the resources in separate tabs.
1 The cell centered database project: an update on building community resources for managing and sharing 3D imaging data. Martone ME, et. al. J Struct Biol. 2008; 161: 220-31. 2 The internet brain volume database: a public resource for storage and retrieval of volumetric data. Kennedy DN, et. al. Neuroinformatics. 2012; 10:129-40. 3 CANDIShare: A Resource for Pediatric Neuroimaging Data. Kennedy DN, et al. Neuroinformatics. 2011 Oct 18. 4 Association of common genetic variants in GPCPD1 with scaling of visual cortical surface area in humans. Bakken TE, et al. PNAS USA. 2012 Mar 6; 109: 3985-90. 5 Open Access Series of Imaging Studis (OASIS). Marcus DS, et al. J Cogn Neurosci. 2007; 19: 1498-1507.

Neuroinformatics 2012 248
P078 Child-psychiatry research portal. The search query generates a list of various information and data resources aiding the investigator in his research.
Infrastructural and portal sevices

249 Neuroinformatics 2012
P080 Using the NIFSTD Ontology to Improve PubMed Search Results
Hitesh Sabnani, Anita Bandrowski and Amarnath GuptaUniversity of California San Diego
The goal of the Neuroscience Information Framework (NIF) is to provide a comprehensive portal that enables neuroscientists to discover neuroscience resources, access and analyze neuroscience data. To achieve this goal, the NIF system uses a comprehensive OWL ontology that has over 60000 terms related to Neuroscience and a large number of relationships among them. The ontology connects all of NIF’s information content into a common fabric. One use of the NIF ontology is to perform a semantic search over NIF’s data and literature holdings which is a combination of PubMed abstracts and PubMed Central full-text articles. This abstract describes a recent advancement we have made to improve the quality of literature search in the NIF system. The standard NIF literature search facility deconstructs an article into its constituent parts (Title, Abstract etc.) and measures the relevance of a search query by combining partial scores of the match between the query term vector and each component term vector into a combined matching score. The ranking function produces better search results than PubMed, but provides no semantic context to interpret the search results. One can compute “clustered results” where an algorithm post-processes the results to partition the results groups so that results within a group a “similar” to each other (e.g., using a cosine-distance metric) than between groups. We show that this form of “blind” similarity-based clustered ranking gives no insight into the search results because the clusters often center around arbitrary concepts that often have no bearing on neuroscience. To improve the quality of results, we use the NIF ontology in a novel way. For every result (i.e., abstract) returned from the search, we perform an automatic mapping of terms to the NIF ontology such that each abstract maps to more than one ontology term. After all terms are mapped, we perform a novel graph clustering method on the mapped nodes of ontology from the entire result set. The method allows overlapping of clusters and takes into account taxonomic and partonomic relationships amongst terms such that the number of conceptual overlaps between related terms (e.g., hippocampus and CA1) is minimized. The cluster centers are assigned to terms with the largest betweenness centrality. Results within a cluster are ranked in the standard way. We show that this technique offers a deeper insight into the neuroscientific connection between the query and search results.
Infrastructural and portal sevices
Neuroinformatics 2012 250
P082 Intuitive and efficient deployment of neuroimaging pipelines in clinical research with BRICpipe
Andreas Glatz1, Colin R. Buchanan2, Maria C. Valdés Hernández1, Mark E. Bastin1 and Joanna M. Wardlaw1
1. BRIC, Division of Clinical Neurosciences, University of Edinburgh2. School of Informatics, University of Edinburgh
INTRODUCTION In clinical research, neuroimaging pipelines are mainly used to combine the strength of single analysis tools and to accelerate the data analysis. Pipeline frameworks, such as Nipype[1] or LONI[2] (Table 1), should be a researcher’s first choice to implement pipelines. However, clinical researchers often prefer Bash[3] scripts due to their simplicity and because pipeline frameworks still require specialist knowledge for setup and use. To encourage the use of pipeline frameworks in clinical research, we developed our own open source pipeline framework, BRICpipe. Here, we present BRICpipe’s design and some validation results to show how BRICpipe compares to Nipype and Bash scripts.
DESIGN Figure 1 shows the typical use-case of BRICpipe: the user has to supply a workflow graph consisting of input, output and processing nodes (e.g. Figure 2), a spreadsheet with paths to input data from all subjects, and command line applications for each processing node. The workflow graph is designed in a graph editor (e.g. yEd[4]) and converted to a Makefile with the Workflow2Makefile application. Lastly, the ExecWorkflow application starts the pipeline execution by invoking GNU make[3] as execution engine.
VALIDATION We validated BRICpipe with a two stage registration pipeline (Figure 2) for clinical T1- and T2*-weighted MR volumes from 10 subjects. We also implemented equivalent pipelines in Nipype and Bash and measured the execution times of all implementations after deleting (i) all and (ii) half of the intermediate and output files of each pipeline from a first pass. BRICpipe and Nipype pipelines were parallelized across 6 cores of our SMP Linux processing server. Our results show that BRICpipe is as flexible as Bash scripts and Nipype, and that BRICpipe’s execution times are within -5% and +10% of Nipype’s MultiCore engine.
DISCUSSION BRICpipe aims to bridge the gap between command line scripts and established pipeline frameworks by making structured pipeline development more intuitive. Unlike LONI and Nipype, BRICpipe can be applied in other fields, as its design is quite generic. We encourage the use of pipeline frameworks in clinical research, as they are an efficient way to communicate current needs and problems to Neuroinformatics tool developers.
REFERENCES [1] Gorgolewski K et al. Front. Neuroinform. 5:13. doi:10.3389/fninf.2011.00013 [2] Dinov I et al. PLoS ONE 5(9):e13070. doi:10.1371/journal.pone.0013070 [3] www.gnu.org [4] www.yworks.com
Clinical neuroscience
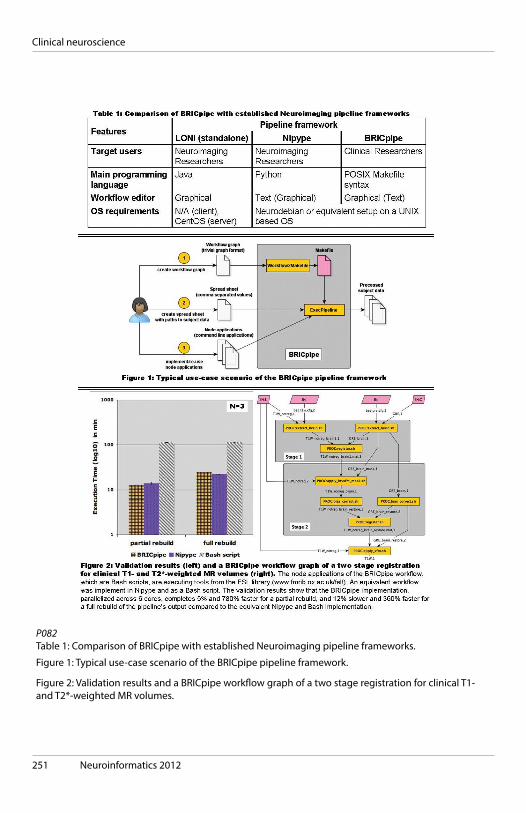
251 Neuroinformatics 2012
Clinical neuroscience
P082 Table 1: Comparison of BRICpipe with established Neuroimaging pipeline frameworks.
Figure 1: Typical use-case scenario of the BRICpipe pipeline framework.
Figure 2: Validation results and a BRICpipe workflow graph of a two stage registration for clinical T1- and T2*-weighted MR volumes.

Neuroinformatics 2012 252
Clinical neuroscience
P084 Neuroinformatics students helping paralysed and disabled people with self-made interfaces – with case studies
Tadeusz Czerniawski , Michal Czerwinski, Jerzy Grynczewski, Wioleta Kijewska, Natan Napiorkowski, Anja Ries, Karol Siek and Katarzyna TolubinskaFaculty of Physics, University of Warsaw
World’s first major in neuroinformatics (starting from the BSc) was launched in the academic year 2009/2010 at the Faculty of Physics of the University of Warsaw. For most of the last year, students had a new kind of apprenticeship: they went to help the disabled, for example, in an advanced state of Amyotrophic lateral sclerosis (ALS). They were there to try and find out what devices and interfaces are in the basic needs of a patient, with the help of the staff of the Biomedical Physics Division. It was more of an experiment and motivation than research or actual helping process, but the point is that the most basic neuroinformatic methods can help people. For the patients, even scrolling pages of a book, changing the channels in a TV or writing an email was impossible. We wanted to try and see if we can somehow help them to do that. The most basic way is to program an interface using a cursor to navigate in a menu, with a single button to confirm selection Other, more sophisticated methods we tried to apply, included low-cost, open-source eyetrackers and gazetrackers. Calibrating and customizing the interface to the needs of a patient is not the only problem. We also have to deal with physiological problems related to the patients’ disabilities (e.g., spastic attack).We want to present the methods, concepts and devices we used in the experiment, and also the conclusions we reached.. The people working on this project remembered all the time, that the most important goal is to help people. That is why the software we develop is provided as open-source, and the costs are kept at a minimum. This project is the first of – we hope – many to follow, all with the aim of making it easier to help people in need. Using a few use cases, we present the concepts of the devices and interfaces we used, why we used them, the problems we encountered while working with the patients, as well as our conclusions.

253 Neuroinformatics 2012

Neuroinformatics 2012 254
page InDex
Page index

255 Neuroinformatics 2012
Page index
KeynotesThe olfactory system as a model for building the tools of neuroinformatics 16
New fluorescent probes and new perspectives in neuroscience 17
The making of spatial memories 18
Data driven analysis of spatio-temporal cortical interaction 19
Cognitive Neuroinformatics 20
WorkshopsProjection-specific subnetworks in rat frontal cortex 23Synaptic mechanisms of sensory perception 24
The vertebrate midbrain: Cells, Circuits, Concepts 25
Simulating the long time scales and large molecules numbers involved in synaptic plasticity 27
Realistic 3D simulation of neuronal cell signaling with MCell 28
Allosteric calcium sensors and synaptic plasticity 29
Synaptic learning rules from multiscale neuronal signaling 30
Data Deluge: Huge opportunity or damp squib? 32
In Search of a Missing Link in the Data Deluge vs. Data Scarcity Debate 33
Data Sharing with Dataverse beyond Social Sciences 34
Demos and postersGeneral neuroinformatics
D09 Mindboggle 2: Automated human brain MRI feature extraction, identification, shape
analysis, and labeling 40
D10 Mindboggle 2 interface: online visualization of extracted brain features with XTK 42
D11 Neuroinformatics labs in Warsaw: free as in ‘freedom’ 43
D12 SenseLab: Neuroinformatics tools to support multiscale and multidisciplinary integration 44
D13 Retistruct: A package to reconstruct flattened retinae 45
P046 TissueStack: a new way to view your imaging data 46
P049 Orchestration of web services in the NIF project: using the Kepler workflow engine for data fusion 48
P050 Exploring Mammalian Brain Connectivity using NeuroLex 50
P054 Modeling neuroanatomical experimental design using the Ontology of ExperimentalVariables and Values (OoEVV) 52
P055 Representation of the NeuroNames Ontology in OWL 53
P059 Reducing duplication and redundancy in declarative model specifications 54
PAGE NUMBERS ARE CLICKABLE
Neuroinformatics 2012 256
Page index
P060 3D structure and cellular architecture of the thalamo cortical vibrissal system 55
P063 XCEDE-DM: A neuroimaging extension to the W3C provenance data model 57
P064 Connecting Brain Imaging Terms to Established Lexicons: a Precursor for Data Sharing and Querying 58
P067 Simulator for Realistic High-Density Microelectrode Array Signals 59
P069 SignalML 2.0 61
P070 Spike sorting for large dense arrays 63
P071 COINS (Collaborative Informatics Neuroimaging Suite): Give, Get, Collect 64
P072 PCA-VisData - a new Evaluation and Visualization Tool Using the Database RodImAnDfor Analysis of Rodents Brain Function in Drug Research 66
P075 NIQuery: Neuroimaging Informatics Query Framework for Data Sharing, Discovery, and Analysis 68
P079 The Informatics Backbone of the Brain Genomics Superstruct Project Open Data Release 70
P081 Datajongleur - controlling data objects and data models with Python at the neuroscien-tist’s workbench 71
P083 High-speed simulation of the dynamic neural responses of retinal and cortical simple neurons to complex visual scenes using general purpose computing on graphics processingunits. 72
P085 Functional Contributions Derived from the Game-theoretical Analysis of Brain Damageafter Stroke 73
Computational neuroscience
P001 From evolving artificial gene regulatory networks to evolving spiking neural networksfor signal processing 75
P002 Robust automated protocol for extraction and comparison of single neuron morphology 76
P003 Modeling axon outgrowth in an inhomogeneous environment 77
P004 Simulating the Self-Organization of Winner-Take-All Networks 78
P005 The role of intra-striatal synaptic interactions for shaping cortico-striatal network dynamics 79
P009 Brain shape and thermoregulation: a quantitative approach 81
P010 The NeuroML C. elegans Connectome 82
P011 Novel self-organizing rules for retinotopic remapping 84
P014 Modulation of Spontaneous Cortical Network Dynamics by Weak Global Perturbations 86
P015 Modelling Realistic Neuron Shape Development in А Realistic Cellular Tissue Environment 87
P019 Visual perception of circular arcs and straight lines by simple interaction between edgepixels 88
257 Neuroinformatics 2012
Page index
P020 A spatial coding scheme to define the neuron types in the Drosophila brain 90
P021 Brain heat dissipation patterns in modern humans, fossil hominids and great apes: A comparative study 92
P022 Effective generators for superpositions of non-Poissonian spike trains 93
P023 Numerical simulations of glutamate diffusion in a synaptic cleft. Dependence on thegeometry and its possible interactions 94
P024 Independent components of reconstructed current sources reflect activity of individualcell populations 95
P025 Modeling realistic extracellular recordings of neuronal populations for the purpose of evaluating automatic spike-sorting algorithms 97
P026 Electrodiffusion in neural tissue at long timescales 99
P027 Towards new model of neuronal growth: Comparison of models and tools for neuronal growth in vitro 100
P028 A Biologically Plausible, Computationally Efficient Model of the Primary Somatosensory Cortical Column in Mouse 102
P029 Gamma --> beta frequency shift in the circuits with strongly facilitating synapses 104
P030 A computational model of the trichromatic cone mosaic 105
P031 Roles played by depressing synapses in neural circuits 106
P032 Optimizing Performance of Endogenous Neural Stem Cell Therapy for Ischemic Stroke: A Neuroinformatics and Neuroimaging Approach to Translational Medicine 108
P033 Allometric scaling of brain energetics and hemodynamics in relation to capillary scaling 110
P034 CAJAL3D: Towards A Fully Automatic Pipeline for Connectome Estimation from High-Resolution EM Data 111
P035 Metabolic energy per synapse is approximately conserved during development in mammalian brains. 112
P036 Sensorimotor Modeling of Speech Production, Speech Perception, and Speech Acquisition 113
P037 Continuum Model of Retinal Waves in Starburst Amacrine Cells 115
P038 The Scourge of Neuroanatomical Nomenclature: A Rational Strategy 117
P039 A simulation framework for acute extracellular recordings 118
P040 Estimation method for biophysical properties of insect neurons in the combination of suitable stimulation and multi-compartment simulation with supercomputers 119
P041 Morphology and Synaptic Characteristics Based Prediction of Visual Cortex Spike Properties for Different Functions 121
P042 A spiking neural network model of memory-based reinforcement learning 122
P043 Associating spontaneous with evoked activity in a neural mass model of cat visualcortex 124
P044 Beyond the Cortical Column - Structural Organization Principles in Rat Vibrissal Cortex 126
Neuroinformatics 2012 258
Page index
P045 EEG Analysis in PhysioDesigner 128
P047 Reciprocal inhibition and slow calcium decay in perigeniculate interneurons explain changes of spontaneous firing of thalamic cells caused by cortical inactivation 130
P048 The intrinsic and extrinsic connectome of subregions of the basal ganglia 132
P051 In silico docking reveals possible Riluzole binding sites on Nav1.6 sodium channel: implications for drug design strategy on Amyotrophic Lateral Sclerosis 133
P052 Towards Automated Analysis of Connectomes: The Configurable Pipeline for the Analysis of Connectomes (C-PAC) 134
P053 Matching Pursuit Algorithm based on L1 norm 135
P056 Modelling calcium-dependent proteins in the spine - challenges and solutions 137
P061 Computational model-based identification of the critical alterations in parkinsonianbasal ganglia’s physiology 138
P062 Impact of Parkinson’s Disease’s Severity on Neuron Firing Pattern in Subthalamic Nucleus 139
P065 High-frequency oscillations simulated in axonal networks: role of loops, spike failures and axonal gap junctions 140
P066 NeuGen 2.0 - Automatic generation of large neuron networks using anatomical data bases 142
P068 An indirect encoding scheme for artificial neural networks based on gene regulatory networks 143
Digital atlasing
D05 NeuroMaps: Map Data to the Waxholm Atlas for Presentation and Publication 145
D06 High resolution volumetric atlas of the rat hippocampal region and its subdivisions 147
D07 Virtual Fly Brain - a data hub for Drosophila neurobiology 148
P096 Registration workflows for the creation of INCF digital atlas hubs 150
P097 Application and evaluation of automated methods to extract brain connectivity statements from free text 152
P099 Integration of multimodal neuroanatomical data of gray short-tailed opossum 153
P101 Online repository of three-dimensional models of brain structures 154
P104 Integrated Analysis of Anatomical Gene Expression Maps and Co-Expression Networks Using a Database, ViBrism 155
P106 16 landmarks of the mouse brain have been validated as fiducials for registration to WHS 157
P110 A segmentation guide and probabilistic atlas of the C57BL/6J mouse brain from magnetic resonance imaging 159
P111 101 labeled brains and a new human cortical labeling protocol 161
P115 Online registration workflows for atlases of rodent brain and accuracy assessment of spatial translation 162

259 Neuroinformatics 2012
Page index
P116 A Digital Atlas of Ion Channels Expression Patterns in the Two-Week-Old Rat Brain 163
P118 First generation Waxholm atlas of the Sprague-Dawley rat brain 165
Neuroimaging
D21 Manual Segmentation of Fiber Tracts with Bundles of Interest 167
D22 New perspectives in visualisation for neuroimaging 168
D23 Neuroimaging in the Browser using the X Toolkit 169
D24 Automated analysis of morphological and synaptic characteristics in neurons 171
D25 NITRC Phase 2 - Towards a Sustainable Resource 172
P086 A multi-modality neuroimaging research data informatics system 173
P088 Textmining for cognitive paradigm annotation 175
P089 Automated Functional MRI Quality Assessment 176
P092 BIPS: A Framework for Curating and Executing Brain Imaging Pipelines 178
P093 Correlation between 50-kHz band activity in primary auditory cortex and social interaction in rats 179
P094 Applying human brain image processing methods to honeybee calcium image data 181
P095 Projectome: Set up and testing of a High Performance Computational Infrastructure for processing and visualizing neuro-anatomical information obtained using confocal ultra-microscopy techniques 183
P098 BRAINSTORM Towards Clinically and Scientifically Useful NeuroImaging Analytics 185
P100 3D Statistical Parametric Mapping of quiet sleep EEG in the first year of life 186
P102 A Semi-automated Program for Axonal Reconstructions from Time-lapse 2-Photon Images 188
P103 CCS: A Connectome Computation System for Discovery Sciences 190
Genomics and genetics
P087 Molecular systems biology models of the post synaptic density. 191
P090 A sparse genetic code underlies the neuroanatomical organization of the brainstem 192
P091 Neurocarta: online platform for integration and sharing of phenotypic and genomicsinformation 193
Large scale modeling
D03 Multiscale Modeling in MOOSE: Interfaces, Interoperability and Standards 194
D04 Neurons to Algorithms neural circuit model development platform 196
P012 Combining simulator independent network descriptions with run-time interoperability based on PyNN and MUSIC 198

Neuroinformatics 2012 260
Page index
P013 Spiking neuronal network simulation technology for contemporary supercomputers 199
P016 Universal principles of topology governing both of structural and effective connectivity 200
P017 NeuroXyce: a highly parallelized simulator for biologically realistic neural networks 201
P018 A cytoskeleton-based 3D morphological simulation method for detailed local structureof the developing neural cell 202
Brain machine interface
D01 Low-cost eyetrackers as assistive devices 203
D02 BCI Appliance 204
P006 Temporal characteristic of SSVEP response 206
P007 Phase stability in the SSVEP responses 207
P008 Comodulation Masking Release provoked by direct electrical stimulation of auditorynerve fibers 208
Electrophysiology
D08 Cloud Services and a Data API for Electrophysiology 209
P105 Tools for analysis of high-density multielectrode recordings in the neonatal mouseretina 210
P107 Integrating automated metadata handling into the laboratory workflow. 212
P108 A novel closest white-matter-contact-based referencing scheme for stereotactical EEGrecordings 213
P109 Electrophysiology lab automation: a case study 215
P112 The adaptation of spike propagation delays in single and networks of neurones. 217
P113 Implementing Workflow Strategies to Handle the Analysis of Complex Electro-physiological Data Sets 218
P114 FPGA implementation of a template matching-based real-time spike sorter for extracellular multi-electrode recordings of neural signals 219
P117 Detection of Neuronal Assemblies by Frequent Item Set Mining 221
P119 Information Transfer and Recovery in the Somatosensory Cortex 222
P120 Accessing electrophysiological data from Python 224
P121 Workflow automation of electrophysiological data analysis in receptive field mapping 225
P122 ERP experiment in children with developmental coordination disorder as use case for extending EEG/ERP domain ontology 226
P123 Multiplexed, data structure-based enriched physiological event marker system 227
P124 Mission and activities of the INCF Electrophysiology Data Sharing Task Force 229
P125 NeuroElectro: A database describing the electrophysiology properties of different neuron types 231
P126 Specification of experiment stimuli for sharing electrophysiology data 232

261 Neuroinformatics 2012
Page index
Infrastructural and portal services
D14 Automatic spike sorting evaluation: A website based community approach 233
D15 The Neuroscience Information Framework (NIF): A Unified Semantic Framework and Associated Tools for Discovery, Integration, and Utilization of Biomedical Data and Resourceson the Web 235
D16 A Simple Tool for Neuroimaging Data Sharing 236
D17 Improvement of Simulation Platform for providing reliable and easy use model simulation environment 238
D18 The XNAT imaging informatics platform: Recent advances 240
D19 Interactive brain map in the Invertebrate Brain Platform (IVB-PF) 241
D20 BrainLiner: A Platform for Sharing and Searching Time-aligned Neural and Behavioral Data 242
P073 Development of a workflow system for the CARMEN Neuroscience Portal 244
P074 Semantic Framework in EEG/ERP Portal 245
P077 Neuroimaging Data Access and Query through a Common Application Programming Interface 246
P078 A Structure-Centered Portal for Child Psychiatry 247
P080 Using the NIFSTD Ontology to Improve PubMed Search Results 249
Clinical neuroscience
P082 Intuitive and efficient deployment of neuroimaging pipelines in clinical research with BRICpipe 250
P084 Neuroinformatics students helping paralysed and disabled people with self-made interfaces – with case studies 252

Neuro Informatics 2012
INCF Secretariat, Karolinska Institutet Nobels väg 15 ASE-171 77 Stockholm, SwedenTel: +46 8 524 870 93 Fax: +46 8 524 870 94E-mail: [email protected]
Web: incf.org incf.org/blog twitter.com/INCForg youtube.com/user/INCForg facebook.com/INCForg
© INCF 2011
Copyright © 2022 FDOKUMEN