BP Annual Report and Form 20-F 2017
302
4 A year of strong delivery and growth BP Annual Report and Form 20-F 2017
-
Upload
khangminh22 -
Category
Documents
-
view
1 -
download
0
Transcript of BP Annual Report and Form 20-F 2017

4
BP
Annual R
eport and Form 20-F 2017
A year of strong delivery and growth
BP Annual Report and Form 20-F 2017

Strategic reportOverview
2 BP at a glance4 How we run our business6 Chairman’s letter8 Group chief executive’s letter10 The changing world of energy
Strategy
12 Our strategy14 A year of delivery18 Measuring our progress
Performance
20 Global energy markets21 Group performance26 Upstream32 Downstream38 Rosneft41 Other businesses and corporate
41 Gulf of Mexico oil spill42 Alternative Energy
44 Innovation in BP47 Sustainability
47 Safety and security50 Climate change51 Managing our impacts51 Value to society52 Human rights52 Environment52 Ethical conduct53 Our people
55 How we manage risk57 Risk factors
Corporate governance
60 Board of directors66 Executive team70 Introduction from the chairman72 Board activity in 201776 Shareholder engagement76 International advisory board77 Audit committee84 Safety, ethics and environment
assurance committee86 Remuneration committee87 Geopolitical committee88 Chairman’s committee89 Nomination committee90 Directors’ remuneration report113 Directors’ statements
Financial statements
115 Consolidated financial statements of the BP group
130 Notes on financial statements
191 Supplementary information on oil and natural gas (unaudited)
219 Parent company financial statements of BP p.l.c.
Additional disclosures
247 Contents Including information on liquidity and capital resources, oil and gas disclosures, upstream regional analysis and legal proceedings.
Shareholder information
279 Contents Including information on dividends, our annual general meeting and share prices.
289 Glossary294 Non-GAAP measures reconciliations297 Signatures298 Cross-reference to Form 20-F299 Information about this report
Glossary Words with this symbol are defined in the glossary on page 289.
Cautionary statementThis document should be read in conjunction with the cautionary statement on page 277.
Contents
The energy we produce servesto power economic growthand lift people out of poverty.The way heat, light and mobility are delivered is changing. We aim to anchor our business in these changing patterns of demand,rather than in the quest for supply.We have a real contribution to make to the world’s ambition of a low carbon future.
BP Annual Report and Form 20-F 2017 1
Book 1.indb 1 03/04/2018 16:38:52
BP at a glance
See Glossary
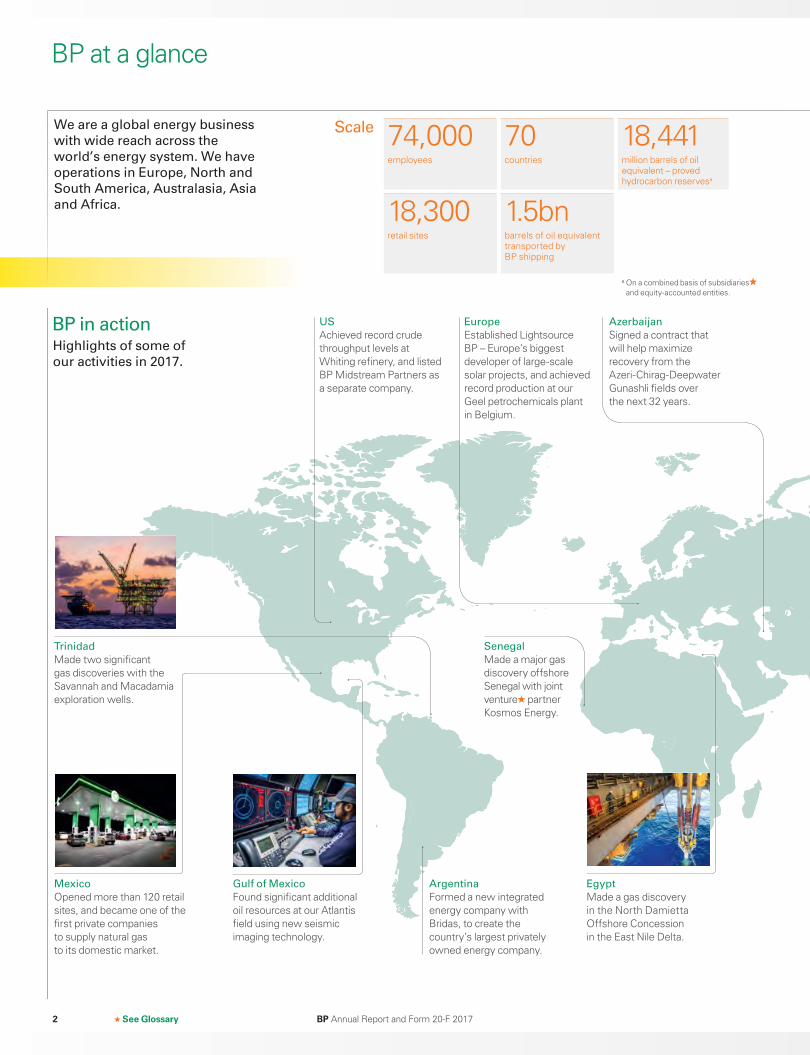
ScaleWe are a global energy business
with wide reach across the
world’s energy system. We have
operations in Europe, North and
South America, Australasia, Asia
and Africa.
74,000 70 18,441employees countries million barrels of oil
equivalent – proved hydrocarbon reservesa
18,300 1.5bnretail sites barrels of oil equivalent
transported by BP shipping
a On a combined basis of subsidiariesand equity-accounted entities.
Senegal
Made a major gas discovery offshore Senegal with joint venture partner Kosmos Energy.
US
Achieved record crude throughput levels at Whiting refinery, and listed BP Midstream Partners as a separate company.
Azerbaijan
Signed a contract that will help maximize recovery from the Azeri-Chirag-Deepwater Gunashli fields over the next 32 years.
Europe
Established Lightsource BP – Europe’s biggest developer of large-scale solar projects, and achieved record production at our Geel petrochemicals plant in Belgium.
Trinidad
Made two significant gas discoveries with the Savannah and Macadamia exploration wells.
BP in actionHighlights of some of
our activities in 2017.
Argentina
Formed a new integrated energy company with Bridas, to create the country’s largest privately owned energy company.
Egypt
Made a gas discovery in the North Damietta Offshore Concession in the East Nile Delta.
Mexico
Opened more than 120 retail sites, and became one of the first private companies to supply natural gas to its domestic market.
Gulf of Mexico
Found significant additional oil resources at our Atlantis field using new seismic imaging technology.
BP Annual Report and Form 20-F 20172
Book 1.indb 2 03/04/2018 16:39:08

See Glossary
PerformanceData as at or for the year ended 31 December 2017 unless otherwise stated.
More information
Group performancePage 21UpstreamPage 26 DownstreamPage 32 RosneftPage 38Alternative EnergyPage 42
$3.4bn 3.6 18profit attributable to BP shareholders
(2016 $115 million) KPI
million barrels of oil equivalent per day – hydrocarbon production (2016 3.3mmboe/d) KPI
tier 1 process safety events
(2016 16) KPI
$6.2bn 143%underlying replacement cost profit
(2016 $2.6 billion) KPI
group proved reserves replacement ratio a
(2016 109%) KPI
We delivered seven major
projects in 2017
1 Taurus and Libra
2 Trinidad onshore
compression
3 Quad 204
4 Persephone
5 Juniper
6 Khazzan Phase 1
7 Zohr
See A year of delivery on page 14.
a On a combined basis of subsidiaries and equity-accounted entities.
KPI See key performance indicators on page 18.
Russia
Agreed to develop resources in the Kharampurskoe and Festivalnoye licence areas jointly with Rosneft.
China
Sold our interest in SECCO petrochemical company to Sinopec.
Indonesia
Established a retail joint venture with AKR.
India
Agreed to work with Reliance Industries in areas such as differentiated fuels and lower carbon energy solutions.
Strategic report – overview
3BP Annual Report and Form 20-F 2017 3
Book 1.indb 3 03/04/2018 16:39:12
How we run our business
From the deep sea to the desert,
from rigs to retail, we deliver
energy products and services
to people around the world.
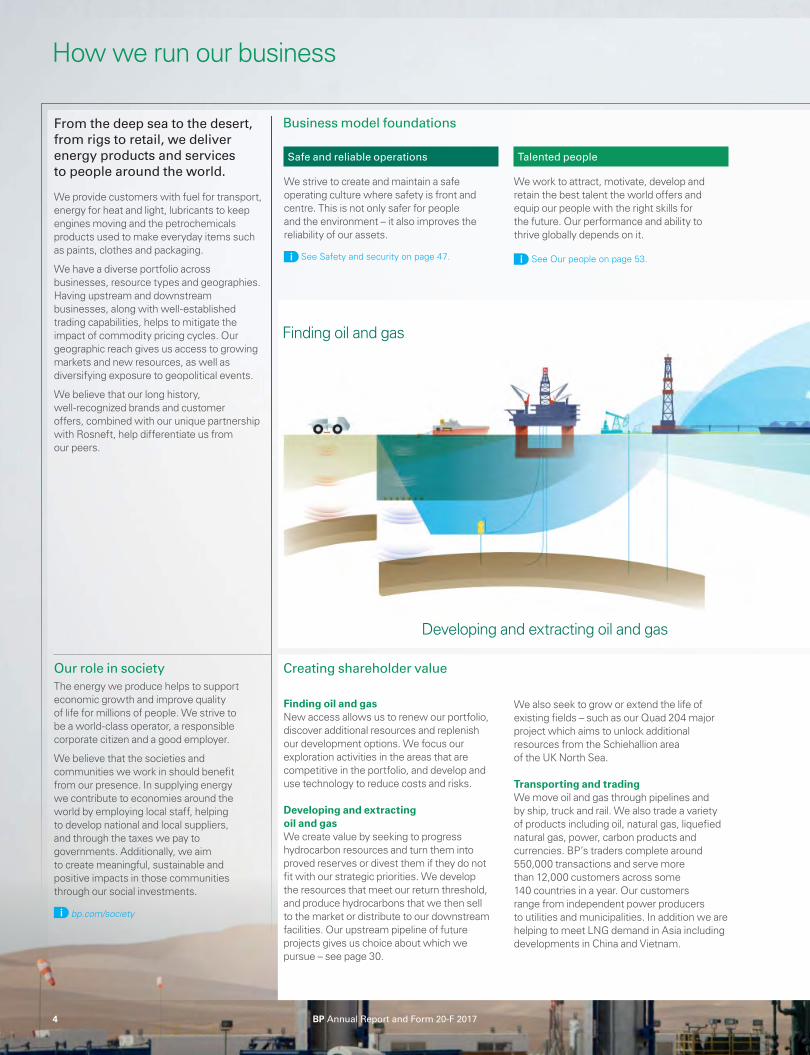
We provide customers with fuel for transport, energy for heat and light, lubricants to keep engines moving and the petrochemicals products used to make everyday items such as paints, clothes and packaging.
We have a diverse portfolio across businesses, resource types and geographies. Having upstream and downstream businesses, along with well-established trading capabilities, helps to mitigate the impact of commodity pricing cycles. Our geographic reach gives us access to growing markets and new resources, as well as diversifying exposure to geopolitical events.
We believe that our long history, well-recognized brands and customer offers, combined with our unique partnership with Rosneft, help differentiate us from our peers.
Our role in society
The energy we produce helps to support economic growth and improve quality of life for millions of people. We strive to be a world-class operator, a responsible corporate citizen and a good employer.
We believe that the societies and communities we work in should benefit from our presence. In supplying energy we contribute to economies around the world by employing local staff, helping to develop national and local suppliers, and through the taxes we pay to governments. Additionally, we aim to create meaningful, sustainable and positive impacts in those communities through our social investments.
bp.com/society
Business model foundations
We also seek to grow or extend the life of existing fields – such as our Quad 204 major project which aims to unlock additional resources from the Schiehallion area of the UK North Sea.
Transporting and tradingWe move oil and gas through pipelines and by ship, truck and rail. We also trade a variety of products including oil, natural gas, liquefied natural gas, power, carbon products and currencies. BP’s traders complete around 550,000 transactions and serve more than 12,000 customers across some 140 countries in a year. Our customers range from independent power producers to utilities and municipalities. In addition we are helping to meet LNG demand in Asia including developments in China and Vietnam.
Finding oil and gas New access allows us to renew our portfolio, discover additional resources and replenish our development options. We focus our exploration activities in the areas that are competitive in the portfolio, and develop and use technology to reduce costs and risks.
Developing and extracting oil and gas We create value by seeking to progress hydrocarbon resources and turn them into proved reserves or divest them if they do not fit with our strategic priorities. We develop the resources that meet our return threshold, and produce hydrocarbons that we then sell to the market or distribute to our downstream facilities. Our upstream pipeline of future projects gives us choice about which we pursue – see page 30.
Creating shareholder value
Safe and reliable operations
We strive to create and maintain a safe operating culture where safety is front and centre. This is not only safer for people and the environment – it also improves the reliability of our assets.
See Safety and security on page 47.
Talented people
We work to attract, motivate, develop and retain the best talent the world offers and equip our people with the right skills for the future. Our performance and ability to thrive globally depends on it.
See Our people on page 53.
Finding oil and gas
Developing and extracting oil and gas
4 BP Annual Report and Form 20-F 2017
Book 1.indb 4 03/04/2018 16:39:15
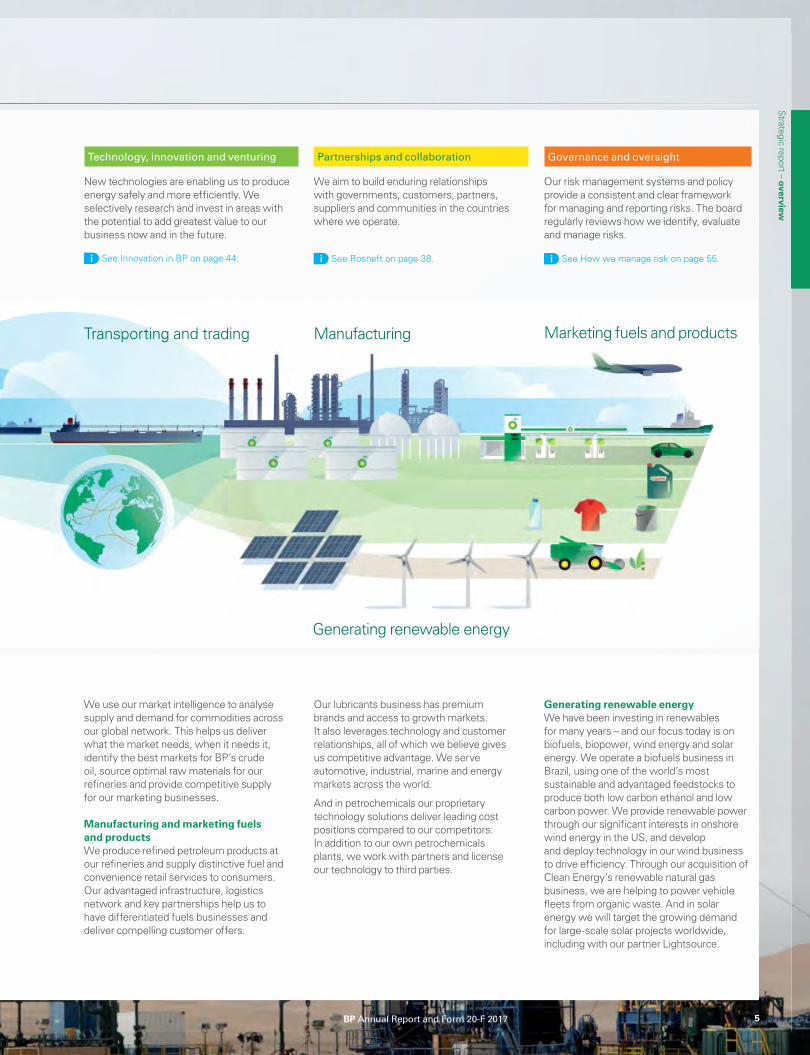
Generating renewable energyWe have been investing in renewables for many years – and our focus today is on biofuels, biopower, wind energy and solar energy. We operate a biofuels business in Brazil, using one of the world’s most sustainable and advantaged feedstocks to produce both low carbon ethanol and low carbon power. We provide renewable power through our significant interests in onshore wind energy in the US, and develop and deploy technology in our wind business to drive efficiency. Through our acquisition of Clean Energy’s renewable natural gas business, we are helping to power vehicle fleets from organic waste. And in solar energy we will target the growing demand for large-scale solar projects worldwide, including with our partner Lightsource.
Our lubricants business has premium brands and access to growth markets. It also leverages technology and customer relationships, all of which we believe gives us competitive advantage. We serve automotive, industrial, marine and energy markets across the world.
And in petrochemicals our proprietary technology solutions deliver leading cost positions compared to our competitors. In addition to our own petrochemicals plants, we work with partners and license our technology to third parties.
We use our market intelligence to analyse supply and demand for commodities across our global network. This helps us deliver what the market needs, when it needs it, identify the best markets for BP’s crude oil, source optimal raw materials for our refineries and provide competitive supply for our marketing businesses.
Manufacturing and marketing fuels and products We produce refined petroleum products at our refineries and supply distinctive fuel and convenience retail services to consumers. Our advantaged infrastructure, logistics network and key partnerships help us to have differentiated fuels businesses and deliver compelling customer offers.
Technology, innovation and venturing
New technologies are enabling us to produce energy safely and more efficiently. We selectively research and invest in areas with the potential to add greatest value to our business now and in the future.
See Innovation in BP on page 44.
Partnerships and collaboration
We aim to build enduring relationships with governments, customers, partners, suppliers and communities in the countries where we operate.
See Rosneft on page 38.
Governance and oversight
Our risk management systems and policy provide a consistent and clear framework for managing and reporting risks. The board regularly reviews how we identify, evaluate and manage risks.
See How we manage risk on page 55.
Manufacturing Transporting and trading Marketing fuels and products
Generating renewable energy
5
Strategic report – overview
BP Annual Report and Form 20-F 2017 5
Book 1.indb 5 03/04/2018 16:39:18

Chairman’s letter
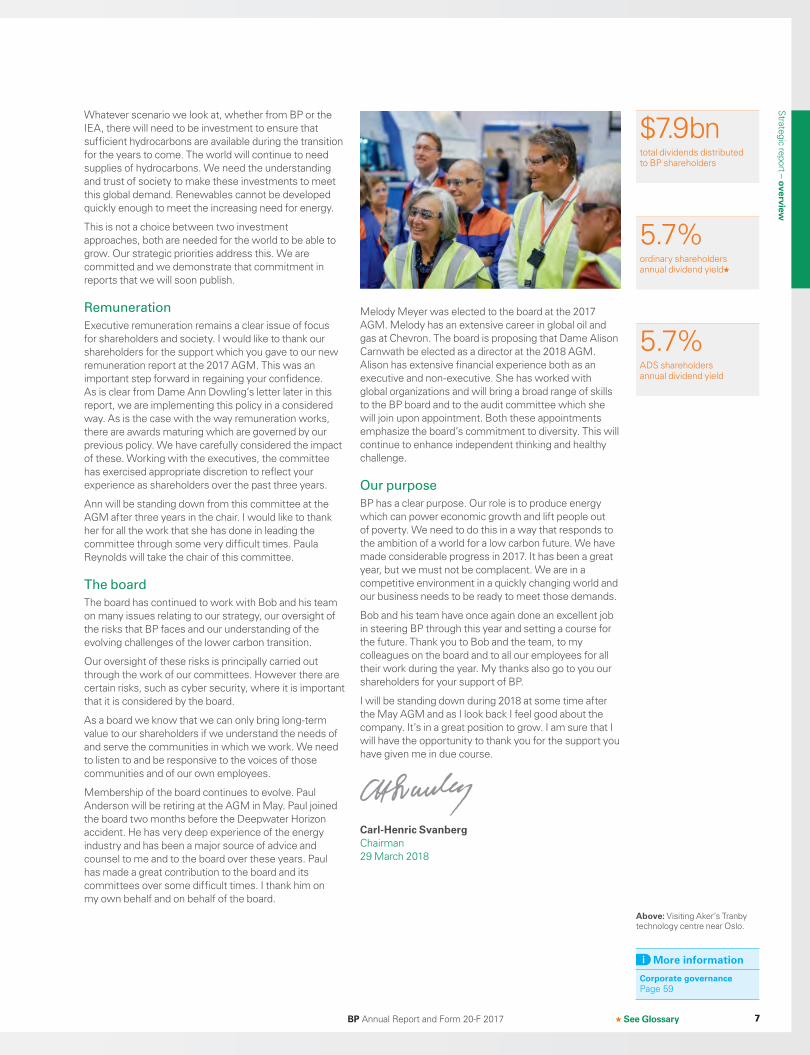
Above: Meeting with investors at the 2017 annual general meeting.
Dear fellow shareholder,
In 2017, the global economy continued to be strong and to grow while concerns around the geopolitical environment increased. For BP, as a global business, this was the backdrop to our operations.
Against this background we have had a strong year. A year in which there was delivery and growth across all our businesses as Bob describes later in his letter. This was achieved with continued strong focus on safety. It’s an impressive performance from a great team. They are now fully into their stride and are performing very well.
All of this gave us confidence to continue the dividend at 10 cents per ordinary share through 2017 and shareholders can still take dividends in shares rather than cash. In the fourth quarter we restarted share buybacks to offset the dilutive effects of the scrip shares.
It remains the board’s policy to grow sustainable free cash flow and distributions to shareholders.
So, a strong year and an important first year in the delivery of the commitment we made in 2016 to shareholders. So, I’d like to take stock and reflect on where BP is now and the progress that we’ve made over the past eight years.
BP’s path
We were faced with a crisis in 2010 that could have threatened the very being of the company. A crisis that should never have happened. It required resolute action on many fronts to see us through and it is a great tribute to everyone in BP that the foundations were laid for our recovery.
This involved doing things differently and thinking differently. We had to act simultaneously on many fronts. We had to address the issues in the US while restructuring our investments in Russia – and all the while ensuring that we had a clear strategy for delivering value for our shareholders. All of this in a world that is looking towards a transition to lower carbon.
In addressing these challenges, BP showed a deep resilience. With the leadership of Bob and his team the whole organization was engaged with the board playing a full role.
It is from this resilience that we have been able to set a clear strategy with goals out to 2021. A strategy which will grow BP and be responsive to the many changes that are happening in the world around us.
Our challenge for the future
Our goals aim to balance society’s need for more energy with our clear ambition of playing our part in the transition to a lower carbon world. We are investing for the future in both hydrocarbons and in technologies which will be important in that transition. The world is changing quickly, quicker than we have seen before. There is no one solution and no one right way ahead. Our approach is clearly aimed at being flexible and responsive.
Our goals aim to balance society’s need for more
energy with our clear ambition of playing our
part in the transition to a lower carbon world. We
are investing for the future in both hydrocarbons
and in technologies which will be important in
that transition.
BP Annual Report and Form 20-F 20176
Book 1.indb 6 03/04/2018 16:39:26
Above: Visiting Aker’s Tranby technology centre near Oslo.
More information
Corporate governancePage 59
Whatever scenario we look at, whether from BP or the IEA, there will need to be investment to ensure that sufficient hydrocarbons are available during the transition for the years to come. The world will continue to need supplies of hydrocarbons. We need the understanding and trust of society to make these investments to meet this global demand. Renewables cannot be developed quickly enough to meet the increasing need for energy.
This is not a choice between two investment approaches, both are needed for the world to be able to grow. Our strategic priorities address this. We are committed and we demonstrate that commitment in reports that we will soon publish.
Remuneration
Executive remuneration remains a clear issue of focus for shareholders and society. I would like to thank our shareholders for the support which you gave to our new remuneration report at the 2017 AGM. This was an important step forward in regaining your confidence. As is clear from Dame Ann Dowling’s letter later in this report, we are implementing this policy in a considered way. As is the case with the way remuneration works, there are awards maturing which are governed by our previous policy. We have carefully considered the impact of these. Working with the executives, the committee has exercised appropriate discretion to reflect your experience as shareholders over the past three years.
Ann will be standing down from this committee at the AGM after three years in the chair. I would like to thank her for all the work that she has done in leading the committee through some very difficult times. Paula Reynolds will take the chair of this committee.
The board
The board has continued to work with Bob and his team on many issues relating to our strategy, our oversight of the risks that BP faces and our understanding of the evolving challenges of the lower carbon transition.
Our oversight of these risks is principally carried out through the work of our committees. However there are certain risks, such as cyber security, where it is important that it is considered by the board.
As a board we know that we can only bring long-term value to our shareholders if we understand the needs of and serve the communities in which we work. We need to listen to and be responsive to the voices of those communities and of our own employees.
Membership of the board continues to evolve. Paul Anderson will be retiring at the AGM in May. Paul joined the board two months before the Deepwater Horizon accident. He has very deep experience of the energy industry and has been a major source of advice and counsel to me and to the board over these years. Paul has made a great contribution to the board and its committees over some difficult times. I thank him on my own behalf and on behalf of the board.
Melody Meyer was elected to the board at the 2017 AGM. Melody has an extensive career in global oil and gas at Chevron. The board is proposing that Dame Alison Carnwath be elected as a director at the 2018 AGM. Alison has extensive financial experience both as an executive and non-executive. She has worked with global organizations and will bring a broad range of skills to the BP board and to the audit committee which she will join upon appointment. Both these appointments emphasize the board’s commitment to diversity. This will continue to enhance independent thinking and healthy challenge.
Our purpose
BP has a clear purpose. Our role is to produce energy which can power economic growth and lift people out of poverty. We need to do this in a way that responds to the ambition of a world for a low carbon future. We have made considerable progress in 2017. It has been a great year, but we must not be complacent. We are in a competitive environment in a quickly changing world and our business needs to be ready to meet those demands.
Bob and his team have once again done an excellent job in steering BP through this year and setting a course for the future. Thank you to Bob and the team, to my colleagues on the board and to all our employees for all their work during the year. My thanks also go to you our shareholders for your support of BP.
I will be standing down during 2018 at some time after the May AGM and as I look back I feel good about the company. It’s in a great position to grow. I am sure that I will have the opportunity to thank you for the support you have given me in due course.
Carl-Henric SvanbergChairman 29 March 2018
$7.9 bntotal dividends distributed to BP shareholders
5.7%ordinary shareholders annual dividend yield
5.7%ADS shareholders annual dividend yield
See GlossaryBP Annual Report and Form 20-F 2017 7
Strategic report – overview
7
Book 1.indb 7 03/04/2018 16:39:30

Group chief executive’s letter
Dear fellow shareholder,
In this report last year, BP set out a five-year strategy and promised a story of growth. One year into that five-year plan I am pleased to report that your company has just delivered a significant year of both disciplined execution and exciting growth.
In many ways it was an extraordinary year for BP. Here are some of the headlines:
• Underlying profit $6.2 billion.
• Upstream production up 12%.
• Record earnings in Downstream.
• Our most successful year for exploration since 2004.
• Group reserves replacement ratio the highest in 10 years.
Of course, we were helped by an improving oil price. But that only tells part of the story. 2017 was a year where we again maintained our improved trend in safety performance for most of our main personal and process safety metrics, although we have seen a slight increase in our tier 1 events. Better safety and improved operational reliability, combined with strong discipline in our cash and capital costs, fed through into our financial performance.
In a complex and uncertain world this may seem like a simple equation – safe and reliable operations plus cost discipline is good for the bottom line. But it works and the numbers prove this.
We plan for the long term and we also measure our progress year on year and quarter by quarter.
We were disappointed that we had to increase the provision relating to claims associated with the Gulf of Mexico spill, although we made real progress during the year in our efforts to close out the remaining claims. The claims facility is now winding down although a number of claims remain to be resolved.
Our five-year plan
As I said, last year we set out our strategic priorities. Simply put, these are designed to meet the dual challenge: to produce more of the affordable energy that the world needs while producing and delivering it in new ways, with fewer emissions, that society wants.
The key to this dual challenge is to recognize that this is not just a race to renewables, it’s a race to lower greenhouse gas emissions. So, while we are fully committed to the energy transition that is underway, we also see a lot of uncertainty around the pace and path of how this will unfold.
Our aim is to build a strong and flexible strategy with a high-quality portfolio and the ability to adapt quickly as the pace and path become clearer.
That means in the Upstream we are focused on growing oil and gas in a way that offers us advantages in terms of margin and value, with the reduced emissions in mind.
In the Downstream we continue to develop advantaged manufacturing and marketing businesses that can create value from existing, new and emerging markets.
Above: Chairing the panel of the Oil and Gas Climate Initiative meeting in London.
We said that 2017 would be a very important
year for BP. We set out ambitious plans for the
year and we delivered on them.
$3.4bnprofit attributable to BP shareholders
BP Annual Report and Form 20-F 20178
Book 1.indb 8 03/04/2018 16:39:37
We are preparing for a low carbon future by investing in new companies and technologies across BP while also leveraging knowledge from the development of our existing Alternative Energy businesses.
And we are modernizing how BP works, using technology and data to work more efficiently and digitizing our processes.
Disciplined execution in 2017
We said that 2017 would be a very important year for BP. We set out ambitious plans for the year and we delivered on them.
We promised to start up seven major projects in the Upstream. We brought these online and under budget for the portfolio as a whole. These projects, along with the six we brought online in 2016, have contributed to a 12% increase in our production. That helps to put us on track to deliver 900,000 barrels of new production per day by 2021. We also strengthened our portfolio with our most successful year of exploration since 2004, sanctioned three exciting new projects in Trinidad, India and the Gulf of Mexico and added 143% reserves replacement for the group.
In the Downstream we promised to grow earnings. In fact, we had our best ever year, with a replacement cost profit of $7.2 billion, driven by strong earnings growth in our marketing and manufacturing businesses. This came from volume growth in our premium fuels and lubricants, the growth of our successful convenience retail partnerships around the world and strong performance in manufacturing.
Exciting growth opportunities
This is a time of transformational change for our industry. An era of abundant resources and a changing fuel mix mean that we must be competitive today and adapt fast to change for tomorrow. So, we must modernize how we work, embrace new advanced technologies and maintain our downward pressure on costs. We are already in action across BP.
In the Upstream we are growing gas and advantaged oil on many fronts: signing a 25-year extension to our ACG production-sharing agreement in Azerbaijan; strengthening our relationship with Petrobras and accessing the prolific Santos basin in Brazil; extending our innovative alliance with Kosmos in West Africa; growing in Norway though our Aker BP joint venture; and adding production from onshore Abu Dhabi following the deepening of our long-term strategic relationship with the Abu Dhabi National Oil Company (ADNOC) at the end of 2016.
In the Downstream we are building competitively advantaged businesses; extending our differentiated retail fuels offer in material new markets such as Mexico, India, Indonesia and China; entering into a new joint venture with DongMing Petrochemical as part of a focused growth strategy in China; renewing and creating new partnerships in lubricants with Renault Nissan, Ford, VW and Volvo.
At the same time, we must look to produce and deliver energy in new ways, with fewer emissions, to help meet the world’s climate goals. At BP we have been working on this challenge for over two decades and that has informed our approach today: working to reduce
emissions in our operations; improving the products our customers use to help them reduce their emissions; creating new low carbon businesses and offers that complement our existing portfolio.
In the low carbon space, we entered into a new partnership with Lightsource, a global leader in the development, acquisition and long-term management of large-scale solar projects. In new ventures, we have a pipeline of more than 40 active investments with more than 200 partners looking to exploit opportunities in advanced mobility, bio products, carbon management and low carbon power and storage.
These are a few examples that I believe show we are in great shape to act where we see opportunity to make a real difference to this transition and, at the same time, create value for our shareholders.
Strength in relationships
The world is changing fast and there is a lot of uncertainty of what the future will actually look like. To stay competitive a company needs to be in tune with society. While we are making progress with issues such as gender and ethnicity representation, we recognize we still have more to do. Beyond having the right strategy, to succeed and thrive in uncertainty requires strong and trusting relationships. I am grateful to our partners, host governments and other stakeholders who have stood by us in hard times and continue to work with us to help shape our future and the future energy landscape.
I am also grateful to you, our shareholders who have shown great patience while we stabilized BP and built up our resilience. I hope you see our recent performance as signs that this patience is being rewarded.
And last, but not least, I want to thank the global BP team. I don’t believe there is another company of our size and scale that can adapt and manage change better than we can. This spirit of invention and purpose has been alive across BP for over a century and will carry us forward into what, I believe, is a very bright future.
Bob DudleyGroup chief executive 29 March 2018
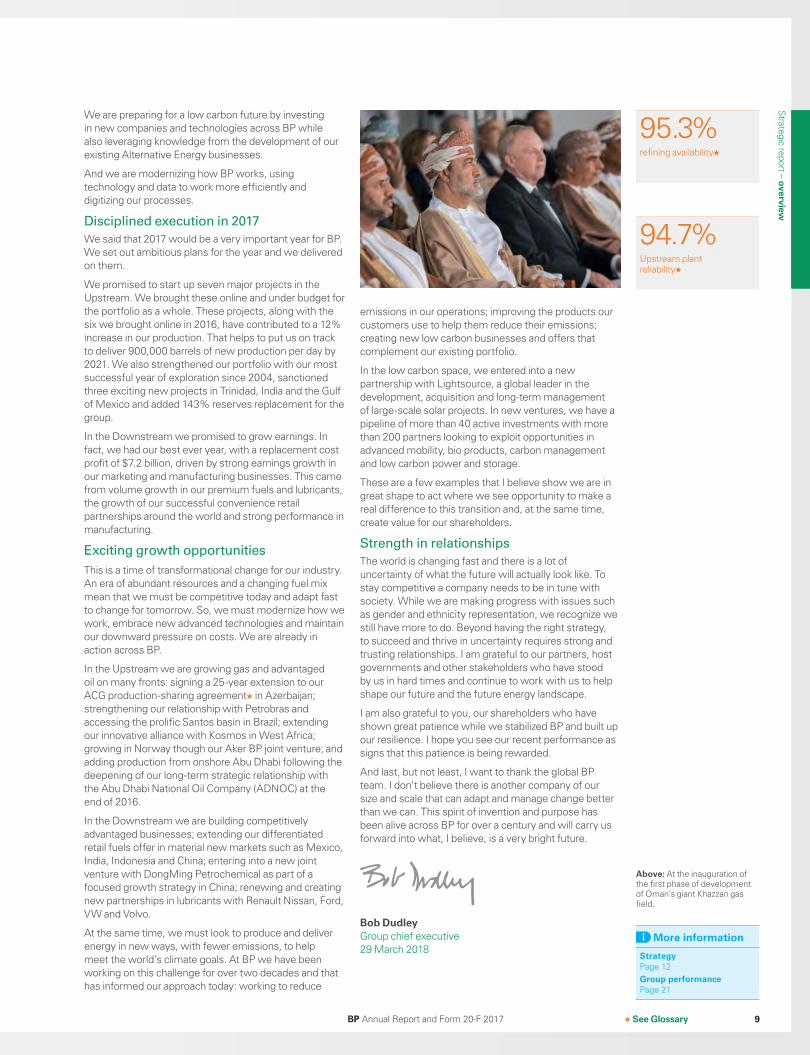
Above: At the inauguration of the first phase of development of Oman’s giant Khazzan gas field.
More information
StrategyPage 12Group performancePage 21
95.3%refining availability
94.7%Upstream plant reliability
See GlossaryBP Annual Report and Form 20-F 2017 9
Strategic report – overview
Book 1.indb 9 03/04/2018 16:39:41
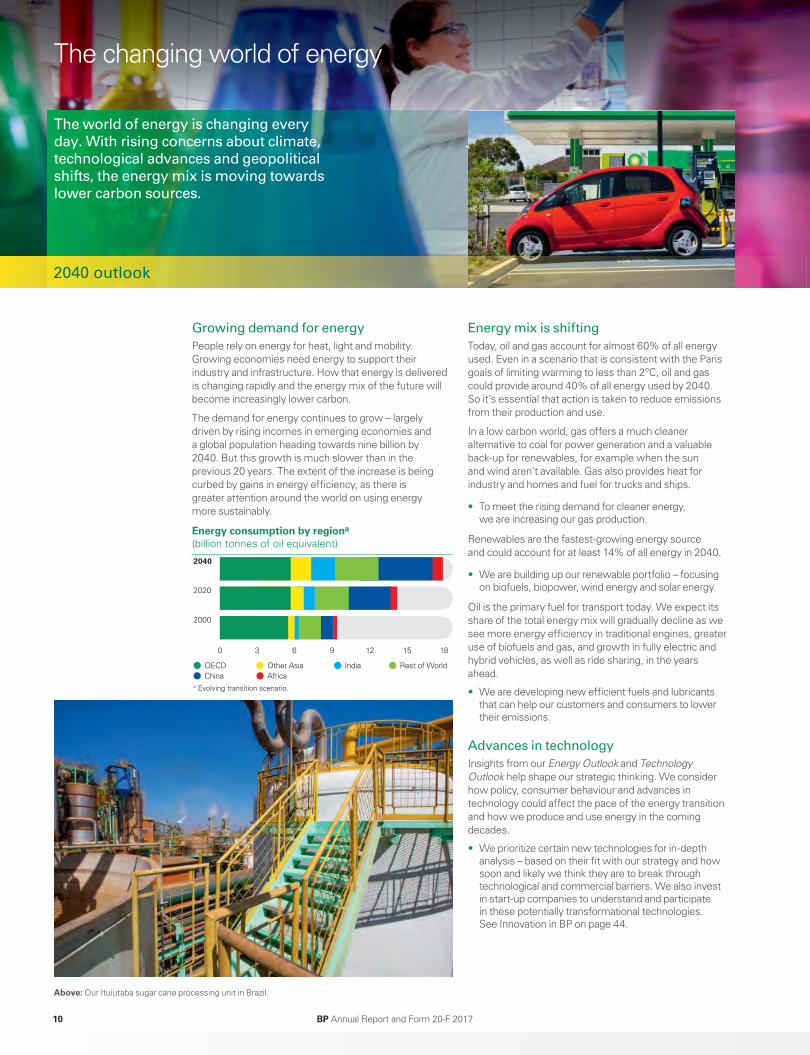
Above: Our Ituiutaba sugar cane processing unit in Brazil.
0 3 6 9 12 15 18
2020
2000
2040
Energy consumption by region (billion tonnes of oil equivalent)
OECD Other Asia Rest of World China Africa
India
a
a Evolving transition scenario.
The changing world of energy
The world of energy is changing every
day. With rising concerns about climate,
technological advances and geopolitical
shifts, the energy mix is moving towards
lower carbon sources.
Growing demand for energy
People rely on energy for heat, light and mobility. Growing economies need energy to support their industry and infrastructure. How that energy is delivered is changing rapidly and the energy mix of the future will become increasingly lower carbon.
The demand for energy continues to grow – largely driven by rising incomes in emerging economies and a global population heading towards nine billion by 2040. But this growth is much slower than in the previous 20 years. The extent of the increase is being curbed by gains in energy efficiency, as there is greater attention around the world on using energy more sustainably.
Energy mix is shifting
Today, oil and gas account for almost 60% of all energy used. Even in a scenario that is consistent with the Paris goals of limiting warming to less than 2ºC, oil and gas could provide around 40% of all energy used by 2040. So it’s essential that action is taken to reduce emissions from their production and use.
In a low carbon world, gas offers a much cleaner alternative to coal for power generation and a valuable back-up for renewables, for example when the sun and wind aren’t available. Gas also provides heat for industry and homes and fuel for trucks and ships.
• To meet the rising demand for cleaner energy, we are increasing our gas production.
Renewables are the fastest-growing energy source and could account for at least 14% of all energy in 2040.
• We are building up our renewable portfolio – focusing on biofuels, biopower, wind energy and solar energy.
Oil is the primary fuel for transport today. We expect its share of the total energy mix will gradually decline as we see more energy efficiency in traditional engines, greater use of biofuels and gas, and growth in fully electric and hybrid vehicles, as well as ride sharing, in the years ahead.
• We are developing new efficient fuels and lubricants that can help our customers and consumers to lower their emissions.
Advances in technology
Insights from our Energy Outlook and Technology Outlook help shape our strategic thinking. We consider how policy, consumer behaviour and advances in technology could affect the pace of the energy transition and how we produce and use energy in the coming decades.
• We prioritize certain new technologies for in-depth analysis – based on their fit with our strategy and how soon and likely we think they are to break through technological and commercial barriers. We also invest in start-up companies to understand and participate in these potentially transformational technologies. See Innovation in BP on page 44.
2040 outlook
BP Annual Report and Form 20-F 201710
Book 1.indb 10 03/04/2018 16:39:59
Emerging greenhouse gas policy and
regulation
Governments are putting in place taxes, carbon trading schemes and other measures to limit greenhouse gas (GHG) emissions. A fifth of the world’s GHG emissions are now covered by carbon pricing systems, double the coverage from just five years ago. We expect around two thirds of BP’s direct emissions will be in countries subject to emissions and carbon policies by 2020. And we have been active as a trader in the world’s current emissions trading systems since their inception.
To help anticipate greater regulatory requirements affecting our GHG emissions, we use a carbon cost when evaluating our plans for large new projects and those for which emissions costs would be a material part of the project. In industrialized countries, this is currently $40 per tonne of carbon dioxide equivalent.
• We also stress test at a carbon price of $80 per tonne.
Our carbon cost, along with energy efficiency considerations, encourages projects to be set up in a way that will have lower GHG emissions.
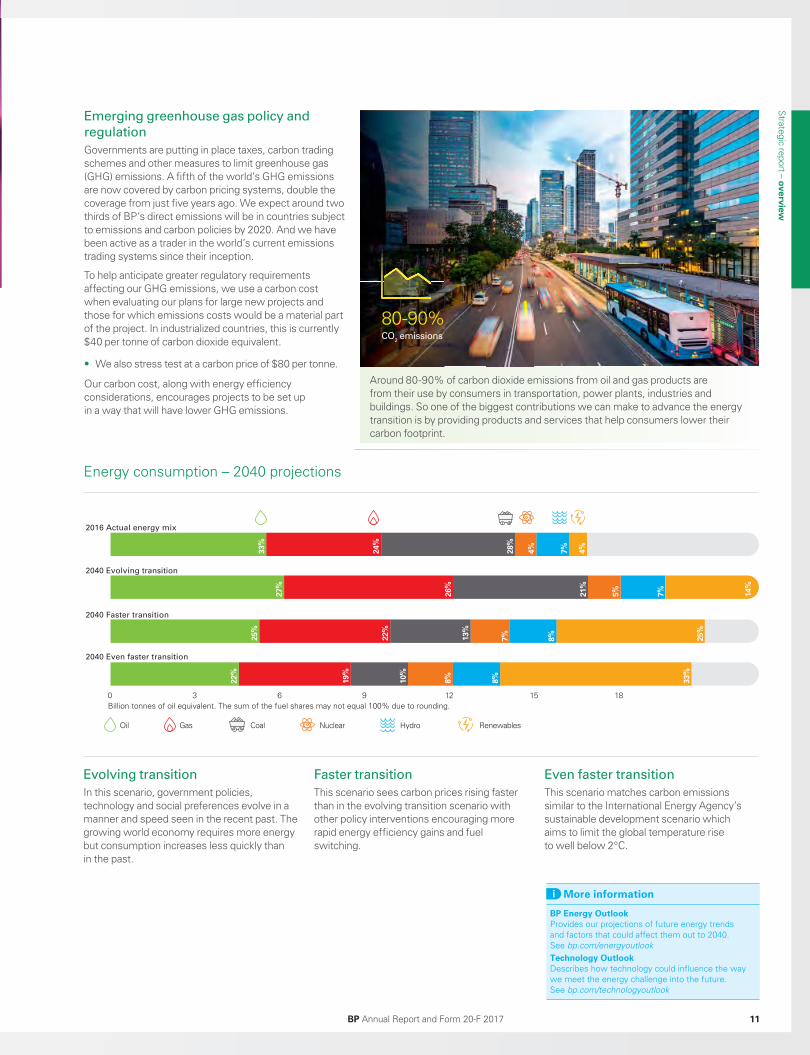
Around 80-90% of carbon dioxide emissions from oil and gas products are from their use by consumers in transportation, power plants, industries and buildings. So one of the biggest contributions we can make to advance the energy transition is by providing products and services that help consumers lower their carbon footprint.
More information
BP Energy Outlook Provides our projections of future energy trends and factors that could affect them out to 2040. See bp.com/energyoutlookTechnology OutlookDescribes how technology could influence the way we meet the energy challenge into the future. See bp.com/technologyoutlook
0 3 6 9 12 15 18
22%
19%
10%
8%
8%
33%
25%
22%
13%
7%
8%
25%
27%
26%
21%
5%
7%
14%
33%
24%
28%
4%
7% 4%
2040 Faster transition
2040 Even faster transition
2016 Actual energy mix
2040 Evolving transition
Oil
Billion tonnes of oil equivalent. The sum of the fuel shares may not equal 100% due to rounding.
Gas Coal Nuclear Hydro Renewables
Energy consumption – 2040 projections
Evolving transition
In this scenario, government policies, technology and social preferences evolve in a manner and speed seen in the recent past. The growing world economy requires more energy but consumption increases less quickly than in the past.
Faster transition
This scenario sees carbon prices rising faster than in the evolving transition scenario with other policy interventions encouraging more rapid energy efficiency gains and fuel switching.
Even faster transition
This scenario matches carbon emissions similar to the International Energy Agency’s sustainable development scenario which aims to limit the global temperature rise to well below 2°C.
80-90% CO
2 emissions
BP Annual Report and Form 20-F 2017 11
Strategic report – overview
Book 1.indb 11 03/04/2018 16:40:05
More information
Financial frameworkHow this underpins our commitment to sustain the dividend for our shareholders.See page 25
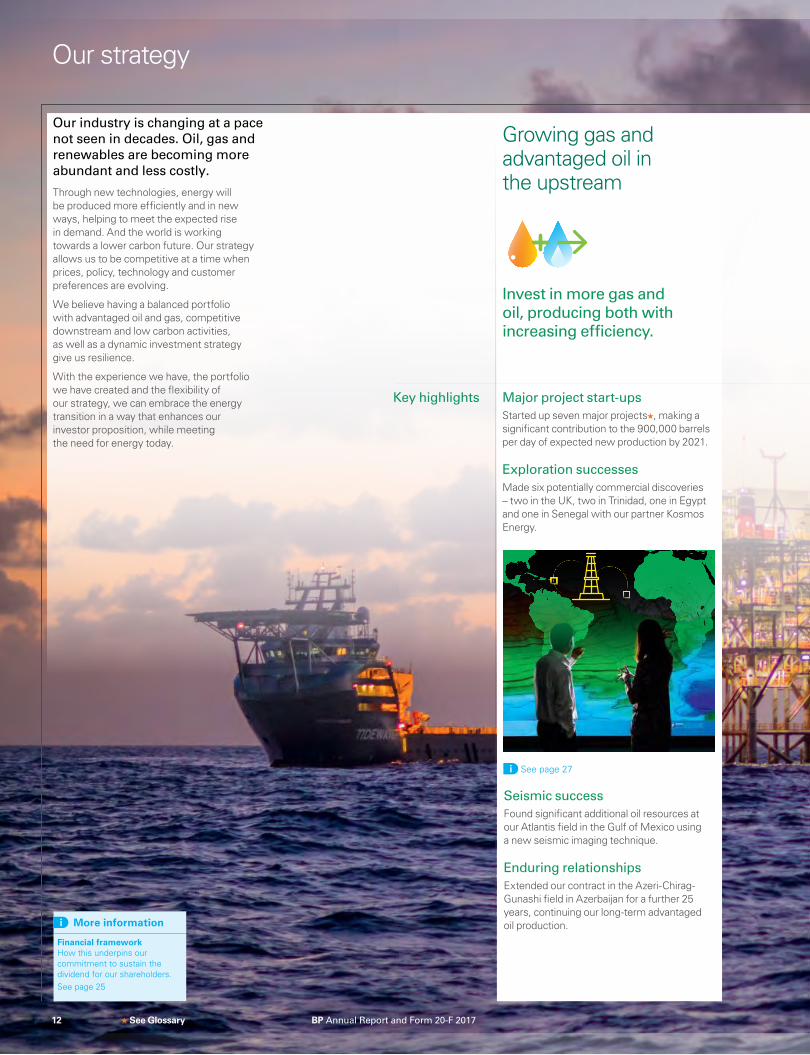
Growing gas and advantaged oil in the upstream
Our strategy
Seismic successFound significant additional oil resources at our Atlantis field in the Gulf of Mexico using a new seismic imaging technique.
Enduring relationships Extended our contract in the Azeri-Chirag-Gunashi field in Azerbaijan for a further 25 years, continuing our long-term advantaged oil production.
Invest in more gas and oil, producing both with increasing efficiency.
Key highlights
See page 27
Our industry is changing at a pace not seen in decades. Oil, gas and renewables are becoming more abundant and less costly.
Through new technologies, energy will be produced more efficiently and in new ways, helping to meet the expected rise in demand. And the world is working towards a lower carbon future. Our strategy allows us to be competitive at a time when prices, policy, technology and customer preferences are evolving.
We believe having a balanced portfolio with advantaged oil and gas, competitive downstream and low carbon activities, as well as a dynamic investment strategy give us resilience.
With the experience we have, the portfolio we have created and the flexibility of our strategy, we can embrace the energy transition in a way that enhances our investor proposition, while meeting the need for energy today.
Major project start-upsStarted up seven major projects , making a significant contribution to the 900,000 barrels per day of expected new production by 2021.
Exploration successesMade six potentially commercial discoveries – two in the UK, two in Trinidad, one in Egypt and one in Senegal with our partner Kosmos Energy.
See Glossary12 BP Annual Report and Form 20-F 2017

Modernizing the whole group
Market-led growth in the downstream
Venturing and low carbon across multiple fronts
Automating well construction
Launched DrillPlan® – a new technology to automate the entire well construction process – at our Khazzan field in Oman, in partnership with Schlumberger.
Serving customers digitally
Launched a range of digital apps to enhance our customers’ experiences, such as BPMe and in partnership with TomTom Telematics, BP FleetMove.
Speedier solutions
Began a multi-year project to move our electronic information from physical data centres to the cloud.
Carbon trading
Used our powerful market insights and innovative platforms to help generate over 12 million tonnes of CO2 reductions through carbon offsetting projects to help customers meet their emissions commitments.
Renewable gas
Acquired Clean Energy’s renewable natural gas business – giving BP access to its network of gas transport customers and helping to make biogas, made from organic waste, more accessible to natural gas powered vehicle fleets.
Generating solar energy
Partnered with Lightsource – Europe’s largest solar development company – to help propel its continuing and rapid expansion worldwide.
Advancing biofuel technology
Acquired the Nesika ethanol plant in Kansas, with joint venture partner DuPont, to commercialize Butamax® bio-isobutanol
technology.
Investing in artificial intelligence
Invested in AI software for the oil and gas industry with venture partner Beyond Limits.
Convenience partnerships
Continued the rollout of our convenience partnership model across our retail network – adding more than 220 sites in 2017, bringing the total to 1,100.
Retail sites in Mexico
Became the first global brand to enter the Mexican retail fuels market since deregulation – opening more than 120 BP-branded retail sites during the year.
Pursue new opportunities
to meet evolving technology,
consumer and policy trends.
Simplify our processes and
enhance our productivity
through digital solutions.
Innovate with advanced
products and strategic
retail partnerships.
See page 46
See page 23
Strategic report – strategy
Lower carbon products
Expanded our lower carbon products portfolio with Castrol EDGE BIO-SYNTHETIC now available in the US, the supply of jet biofuel in Sweden and Norway, and our PTAir brand – now available globally.
High-quality lubricants
Announced plans to build a high-quality lubricants blend plant in China.
See page 33
13BP Annual Report and Form 20-F 2017 See Glossary
Book 1.indb 13 03/04/2018 16:40:31
Fast facts
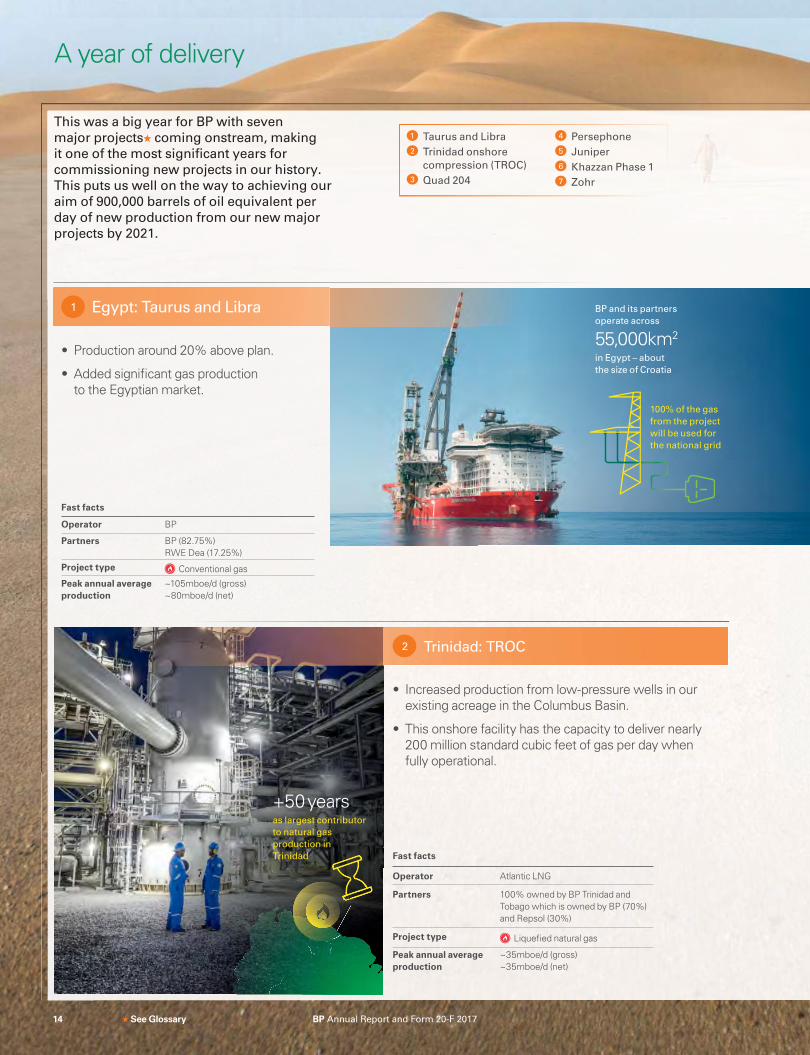
Operator BP
Partners BP (82.75%) RWE Dea (17.25%)
Project type Conventional gas
Peak annual average production
~105mboe/d (gross) ~80mboe/d (net)
Fast facts
Operator Atlantic LNG
Partners 100% owned by BP Trinidad and Tobago which is owned by BP (70%) and Repsol (30%)
Project type Liquefied natural gas
Peak annual average production
~35mboe/d (gross) ~35mboe/d (net)
2 Trinidad: TROC
• Increased production from low-pressure wells in our existing acreage in the Columbus Basin.
• This onshore facility has the capacity to deliver nearly 200 million standard cubic feet of gas per day when fully operational.
A year of delivery
This was a big year for BP with seven
major projects coming onstream, making
it one of the most significant years for
commissioning new projects in our history.
This puts us well on the way to achieving our
aim of 900,000 barrels of oil equivalent per
day of new production from our new major
projects by 2021.
1 Taurus and Libra
2 Trinidad onshore
compression (TROC)
3 Quad 204
4 Persephone
5 Juniper
6 Khazzan Phase 1
7 Zohr
See Glossary
1 Egypt: Taurus and Libra
• Production around 20% above plan.
• Added significant gas production to the Egyptian market.
+50 years as largest contributor
to natural gas
production in
Trinidad
100% of the gas
from the project
will be used for
the national grid
BP and its partners
operate across
55,000km2
in Egypt – about
the size of Croatia
14 BP Annual Report and Form 20-F 2017
Book 1.indb 14 03/04/2018 16:40:39
Fast facts
Operator Woodside
Partners BP (16.67%) BHP, Chevron, Shell, Woodside and Mitsubishi-Mitsui (16.67% each)
Project type Liquefied natural gas
Peak annual average production
~50mboe/d (gross) ~8mboe/d (net)
4 Australia: Persephone
• Increased gas production from the North West Shelf project – Australia’s largest oil and gas resource development.
• The North West Shelf project contributes around a third of Australia’s oil and gas production.
Fast facts
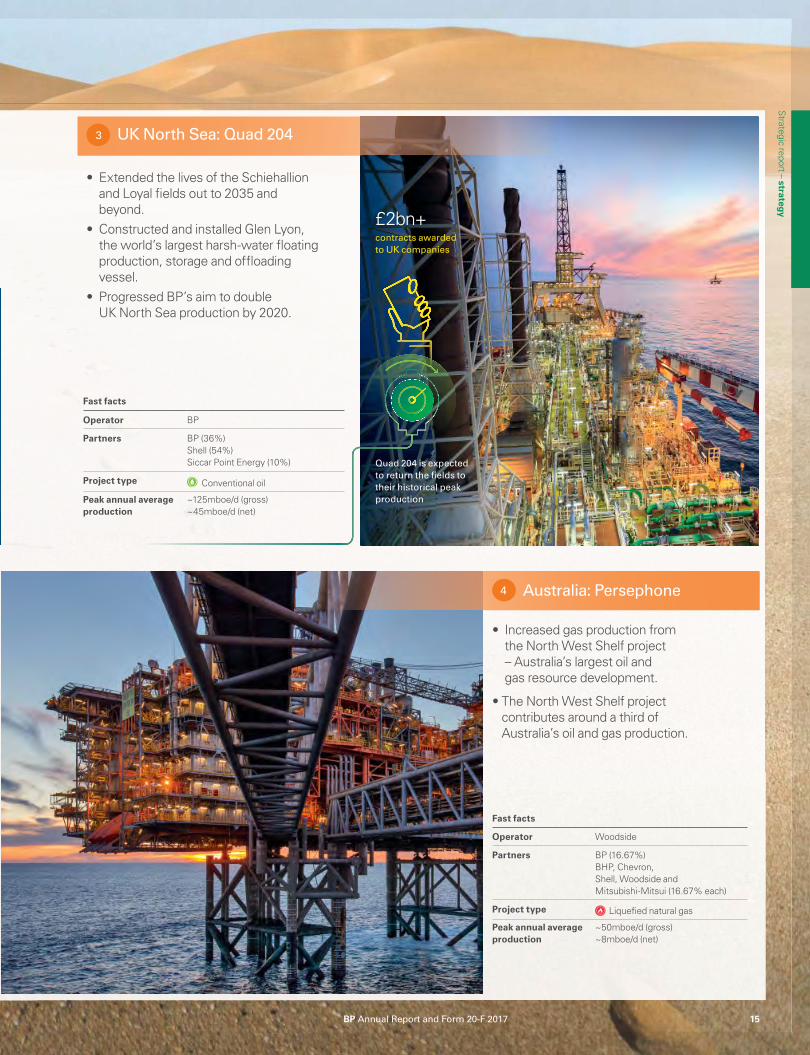
Operator BP
Partners BP (36%) Shell (54%) Siccar Point Energy (10%)
Project type Conventional oil
Peak annual average production
~125mboe/d (gross) ~45mboe/d (net)
3 UK North Sea: Quad 204
• Extended the lives of the Schiehallion and Loyal fields out to 2035 and beyond.
• Constructed and installed Glen Lyon, the world’s largest harsh-water floating production, storage and offloading vessel.
• Progressed BP’s aim to double UK North Sea production by 2020.
Quad 204 is expected
to return the fields to
their historical peak
production
£2bn+contracts awarded
to UK companies
Strategic report – strategy
15BP Annual Report and Form 20-F 2017
Book 1.indb 15 03/04/2018 16:40:49
Fast facts
Operator BP
Partners 100% owned by BP Trinidad and Tobago, which is owned by BP (70%) and Repsol (30%)
Project type Liquefied natural gas
Peak annual average production
~95mboe/d (gross) ~95mboe/d (net)
5 Trinidad: Juniper
• Our first subsea field development in Trinidad.
• We expect Juniper will make a significant contribution to Trinidad & Tobago’s national gas production.
Fast facts
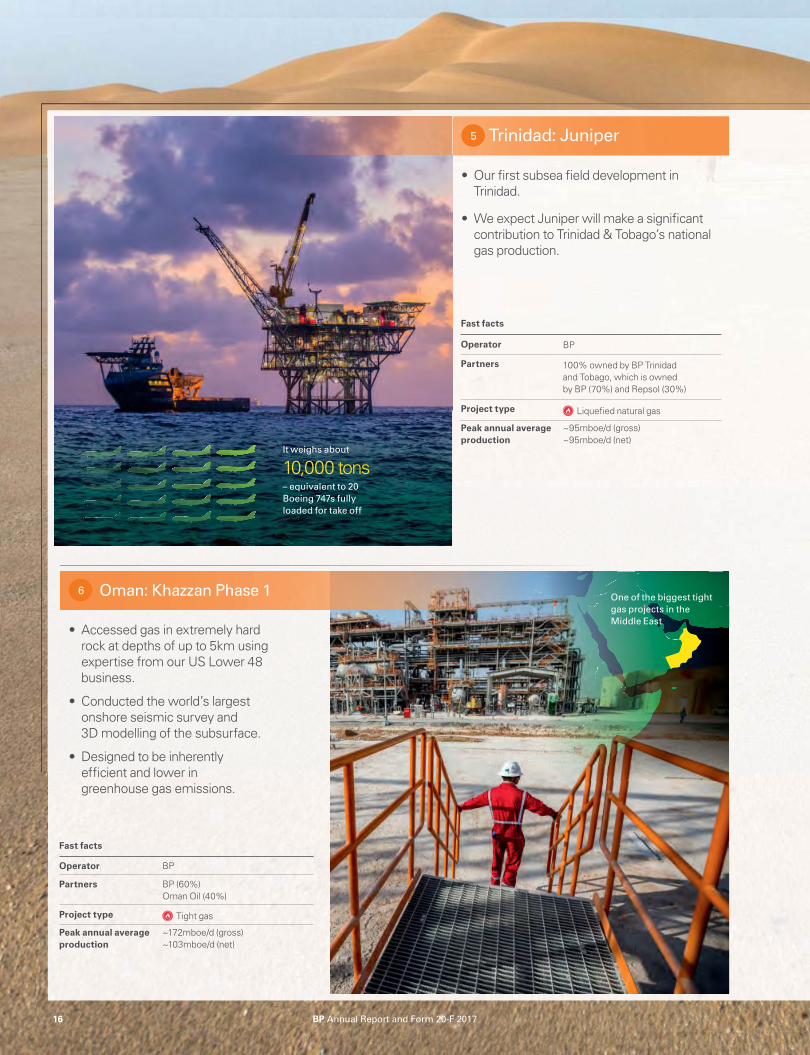
Operator BP
Partners BP (60%) Oman Oil (40%)
Project type Tight gas
Peak annual average production
~172mboe/d (gross) ~103mboe/d (net)
6 Oman: Khazzan Phase 1
• Accessed gas in extremely hard rock at depths of up to 5km using expertise from our US Lower 48 business.
• Conducted the world’s largest onshore seismic survey and 3D modelling of the subsurface.
• Designed to be inherently efficient and lower in greenhouse gas emissions.
It weighs about
10,000 tons – equivalent to 20
Boeing 747s fully
loaded for take off
One of the biggest tight
gas projects in the
Middle East
16 BP Annual Report and Form 20-F 2017
Book 1.indb 16 03/04/2018 16:40:57

BP’s net share from our seven major projects at peak production
(in thousand barrels of oil equivalent per day)
8
Taurus and Libra TROC Quad 204 Persephone Juniper Khazzan Phase 1 Zohr
80 35 95 103 3645
Fast facts
Operator ENI
Partners BP (10%) Eni (60%) Rosneft (30%)
Project type Dry gas
Peak annual average production
~364mboe/d (gross) ~36mboe/d (net)
7 Egypt: Zohr
• Started up in less than two and a half years from discovery – a record time for a field of this size in deepwater.
• Thought to be the largest gas discovery in the Mediterranean.
More information
Go to youtube.com/bp to watch the stories behind our seven major projects.
Looking aheadWe plan to start-up
six projects in 2018.
1 2 Egypt
3 UK North Sea
4 Azerbaijan
5 US
6 Russia More information
Upstream project pipelineSee page 30
~1.3 billionbarrels of proved
reserves
17BP Annual Report and Form 20-F 2017
Strategic report – strategy
Book 1.indb 17 03/04/2018 16:41:02
2016
2017
2015
2014
2013
Profit (loss) for the yearUnderlying RC profit for the year
3.812.1
13.4
5.9 (6.5)
2.6
3.4 6.2
0.1
0
Underlying replacement cost profit ($ billion)
23.5
REM
3,6003,4003,200 3,230
3,141
3,239
3,268
3,595
2016
2017
2015
2013
2014
Production (mboe/d)
2016
2017
2015
2014
2013
Operating cash flow excluding Gulf of Mexico oil spill paymentsa
Operating cash flow
32.8
21.2
17.6 18.9
24.1
20.3
32.8
21.1
19.1
10.7
Operating cash flow ($ billion)REM
8642 4
7
7
4
62016
2017
2015
2013
2014
Major project delivery REM
403010 20 20
28
20
16
18
REM
Tier 1 process safety eventsb
2016
2017
2015
2013
2014
REM
Reported recordable injury frequencyb
REM REM
0.40.2 0.30.1
2016
2017
2015
2013
2014
0.31
0.31
0.24
0.21
0.22
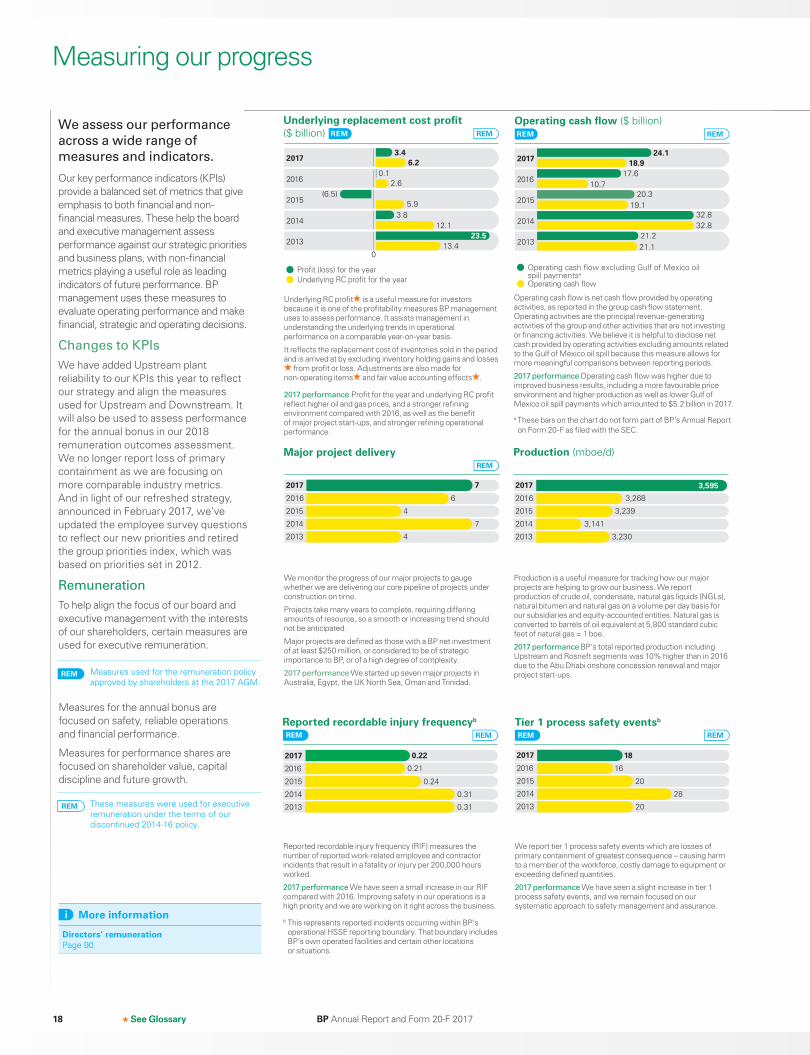
Measuring our progress
We monitor the progress of our major projects to gauge whether we are delivering our core pipeline of projects under construction on time.
Projects take many years to complete, requiring differing amounts of resource, so a smooth or increasing trend should not be anticipated.
Major projects are defined as those with a BP net investment of at least $250 million, or considered to be of strategic importance to BP, or of a high degree of complexity.
2017 performance We started up seven major projects in Australia, Egypt, the UK North Sea, Oman and Trinidad.
Operating cash flow is net cash flow provided by operating activities, as reported in the group cash flow statement. Operating activities are the principal revenue-generating activities of the group and other activities that are not investing or financing activities. We believe it is helpful to disclose net cash provided by operating activities excluding amounts related to the Gulf of Mexico oil spill because this measure allows for more meaningful comparisons between reporting periods.
2017 performance Operating cash flow was higher due to improved business results, including a more favourable price environment and higher production as well as lower Gulf of Mexico oil spill payments which amounted to $5.2 billion in 2017.
a These bars on the chart do not form part of BP’s Annual Report on Form 20-F as filed with the SEC.
Underlying RC profit is a useful measure for investors because it is one of the profitability measures BP management uses to assess performance. It assists management in understanding the underlying trends in operational performance on a comparable year-on-year basis.
It reflects the replacement cost of inventories sold in the period and is arrived at by excluding inventory holding gains and losses
from profit or loss. Adjustments are also made for non-operating items and fair value accounting effects .
2017 performance Profit for the year and underlying RC profit reflect higher oil and gas prices, and a stronger refining environment compared with 2016, as well as the benefit of major project start-ups, and stronger refining operational performance.
Production is a useful measure for tracking how our major projects are helping to grow our business. We report production of crude oil, condensate, natural gas liquids (NGLs), natural bitumen and natural gas on a volume per day basis for our subsidiaries and equity-accounted entities. Natural gas is converted to barrels of oil equivalent at 5,800 standard cubic feet of natural gas = 1 boe.
2017 performance BP’s total reported production including Upstream and Rosneft segments was 10% higher than in 2016 due to the Abu Dhabi onshore concession renewal and major project start-ups.
We report tier 1 process safety events which are losses of primary containment of greatest consequence – causing harm to a member of the workforce, costly damage to equipment or exceeding defined quantities.
2017 performance We have seen a slight increase in tier 1 process safety events, and we remain focused on our systematic approach to safety management and assurance.
We assess our performance
across a wide range of
measures and indicators.
Our key performance indicators (KPIs) provide a balanced set of metrics that give emphasis to both financial and non-financial measures. These help the board and executive management assess performance against our strategic priorities and business plans, with non-financial metrics playing a useful role as leading indicators of future performance. BP management uses these measures to evaluate operating performance and make financial, strategic and operating decisions.
Changes to KPIs
We have added Upstream plant reliability to our KPIs this year to reflect our strategy and align the measures used for Upstream and Downstream. It will also be used to assess performance for the annual bonus in our 2018 remuneration outcomes assessment. We no longer report loss of primary containment as we are focusing on more comparable industry metrics. And in light of our refreshed strategy, announced in February 2017, we’ve updated the employee survey questions to reflect our new priorities and retired the group priorities index, which was based on priorities set in 2012.
Remuneration
To help align the focus of our board and executive management with the interests of our shareholders, certain measures are used for executive remuneration.
Reported recordable injury frequency (RIF) measures the number of reported work-related employee and contractor incidents that result in a fatality or injury per 200,000 hours worked.
2017 performance We have seen a small increase in our RIF compared with 2016. Improving safety in our operations is a high priority and we are working on it right across the business.
b This represents reported incidents occurring within BP’s operational HSSE reporting boundary. That boundary includes BP’s own operated facilities and certain other locations or situations.
REM Measures used for the remuneration policy approved by shareholders at the 2017 AGM.
REM These measures were used for executive remuneration under the terms of our discontinued 2014-16 policy.
Measures for the annual bonus are focused on safety, reliable operations and financial performance.
Measures for performance shares are focused on shareholder value, capital discipline and future growth.
More information
Directors’ remunerationPage 90
BP Annual Report and Form 20-F 201718 See Glossary
Book 1.indb 18 03/04/2018 16:41:02

2016
2017
2015
2014
2013
REM
6040200-20
29.0
20.0 9.5
(11.6) (16.5)
14.0 14.7
(8.3) (12.8)
ADS basis Ordinary share basis
0
Total shareholder return (%)
55.5
REM
71
73
73
73
73
2016
2017
2015
2014
2013
Employee engagement (%)
9896949290
2016
2015
2013
2014
95.3
94.9
94.7
95.3
95.32017
Refining availability (%)REM
129
63
61
109
143
140 1601201008060
2016
2017
2015
2013
2014
Reserves replacement ratio (%) REM
2016
2017
2015
2014
2013
Women Non UK/USd
302520155 10
21
21
18
18
23
21 19
22
21 24
Diversity and inclusionc (%)
Return on average capital employed (%)
1284
2016
2015
2013
2014
10.2
9.6
5.5
2.8
5.82017
REM
2016
2015
2013
2014
50.3
48.7
49.0
50.1
49.42017
Greenhouse gas emissions
(million tonnes of CO2 equivalent)
604020
161284
2016
2015
2013
2014
13.16
12.75
10.46
8.46
7.112017
Upstream unit production costs ($/boe) REM
9896949290
95.0
91.7
93.4
95.3
94.7
2016
2015
2013
2014
2017
Upstream plant reliability (%)
Proved reserves replacement ratio is the extent to which the year’s production has been replaced by proved reserves added to our reserve base.
The ratio is expressed in oil-equivalent terms and includes changes resulting from discoveries, improved recovery and extensions and revisions to previous estimates, but excludes changes resulting from acquisitions and disposals. The ratio reflects both subsidiaries and equity-accounted entities. This measure helps to demonstrate our success in accessing, exploring and extracting resources.
2017 performance The ratio was higher due to development activity in Abu Dhabi and Rosneft, expansion of the Khazzan development in Oman and extension of the ACG licence.
Each year we report the percentage of women and individuals from countries other than the UK and the US among BP’s group leaders.
2017 performance While the percentage of our group leaders who are women decreased slightly, the number of non-UK/US people rose. We are developing mentoring, sponsorship and coaching programmes to help more women advance.
Total shareholder return (TSR) represents the change in value of a BP shareholding over a calendar year. It assumes that dividends are reinvested to purchase additional shares at the closing price on the ex-dividend date.
We are committed to maintaining a progressive and sustainable dividend policy.
2017 performance Reduced TSR reflects lower share price growth in 2017 compared with 2016, while the dividend per share was maintained at the same level.
We conduct an annual employee survey to understand and monitor levels of employee engagement and identify areas for improvement.
2017 performance The overall employee engagement score was up from two years ago, when we saw a decline that coincided with the uncertainties of a low oil price environment.
Return on average capital employed (ROACE) gives an indication of a company’s capital efficiency, dividing the underlying RC profit after adding back net interest by average capital employed, excluding cash and goodwill. See page 295 for more information including the nearest GAAP equivalent data.
In recent years, ROACE has been lower in the oil and gas sector, due to the impact of lower oil prices on earnings and the capital investment made during the preceding period of $100 per barrel oil prices.
2017 performance The 2017 increase in ROACE is due to a stronger environment and improved business performance.
Refining availability represents Solomon Associates’ operational availability. The measure shows the percentage of the year that a unit is available for processing after deducting the time spent on turnaround activity and all mechanical, process and regulatory downtime.
Refining availability is an important indicator of the operational performance of our Downstream businesses.
2017 performance Refining availability was similar to 2016, reflecting continued strong operational performance in our portfolio. This performance is underpinned by our global reliability improvement programme which provides our refineries with a more structured and systematic approach to improving availability.
The upstream unit production cost indicator shows how supply chain, headcount and scope optimization impact cost efficiency.
2017 performance The lower unit production costs in 2017 reflect further efficiency increases and the benefit of new production start-ups.
BP-operated Upstream plant reliability is calculated as 100% less the ratio of total unplanned plant deferrals divided by installed production capacity.
2017 performance The slight decrease in 2017 plant reliability was due in part to our new major projects ramping up, however this was partly offset by solid performance across existing assets.
We provide data on greenhouse gas (GHG) emissions material to our business on a carbon dioxide-equivalent basis. This includes carbon dioxide (CO2) and methane for direct emissions. Our GHG KPI encompasses all BP’s consolidated entities as well as our share of equity-accounted entities other than BP’s share of Rosneft.
2017 performance The primary reasons for the overall decrease include operational changes such as planned shutdowns at several of our refineries for maintenance, and actions taken by our businesses to reduce emissions in areas such as flaring, methane and energy efficiency.
c Relates to BP employees.d Figures for 2013-16 have been amended.
See GlossaryBP Annual Report and Form 20-F 2017 19
Strategic report – strategy
Book 1.indb 19 03/04/2018 16:41:03
BP Annual Report and Form 20-F 201720
Global energy markets
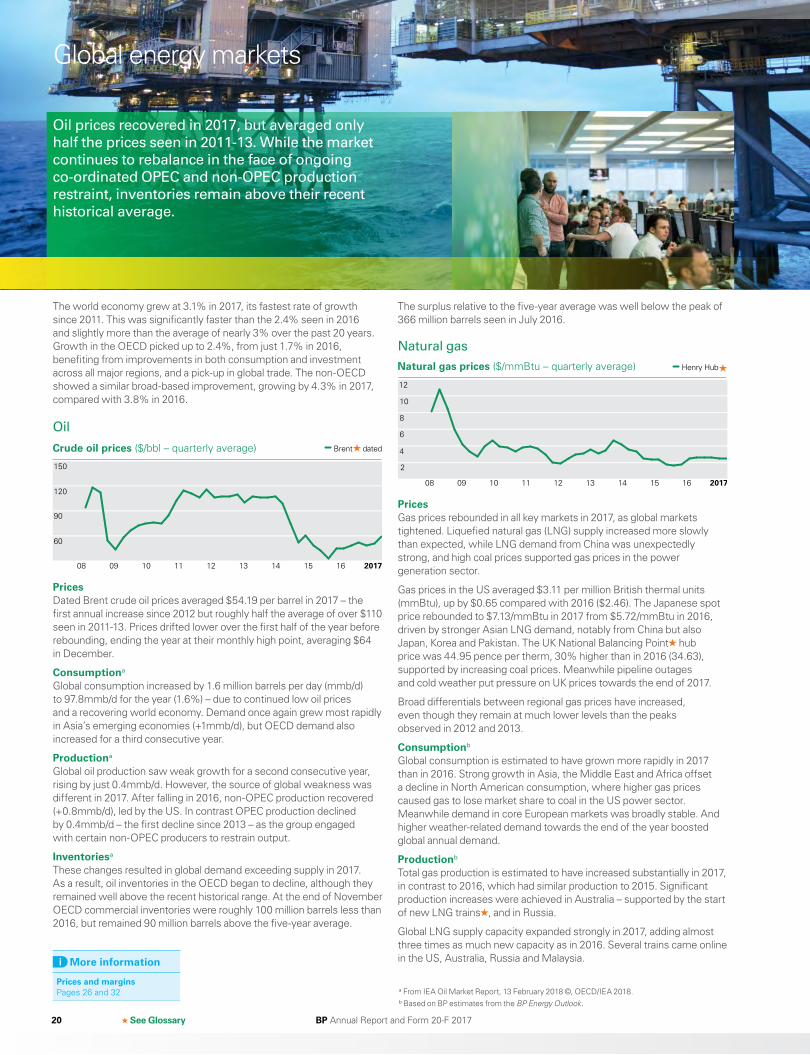
Oil prices recovered in 2017, but averaged only half the prices seen in 2011-13. While the market continues to rebalance in the face of ongoing co-ordinated OPEC and non-OPEC production restraint, inventories remain above their recent historical average.
The world economy grew at 3.1% in 2017, its fastest rate of growth since 2011. This was significantly faster than the 2.4% seen in 2016 and slightly more than the average of nearly 3% over the past 20 years. Growth in the OECD picked up to 2.4%, from just 1.7% in 2016, benefiting from improvements in both consumption and investment across all major regions, and a pick-up in global trade. The non-OECD showed a similar broad-based improvement, growing by 4.3% in 2017, compared with 3.8% in 2016.
Oil
Crude oil prices ($/bbl – quarterly average)
150
120
90
60
08 09 10 11 12 13 14 15 16 2017
Brent dated
PricesDated Brent crude oil prices averaged $54.19 per barrel in 2017 – the first annual increase since 2012 but roughly half the average of over $110 seen in 2011-13. Prices drifted lower over the first half of the year before rebounding, ending the year at their monthly high point, averaging $64 in December.
Consumptiona
Global consumption increased by 1.6 million barrels per day (mmb/d) to 97.8mmb/d for the year (1.6%) – due to continued low oil prices and a recovering world economy. Demand once again grew most rapidly in Asia’s emerging economies (+1mmb/d), but OECD demand also increased for a third consecutive year.
Productiona
Global oil production saw weak growth for a second consecutive year, rising by just 0.4mmb/d. However, the source of global weakness was different in 2017. After falling in 2016, non-OPEC production recovered (+0.8mmb/d), led by the US. In contrast OPEC production declined by 0.4mmb/d – the first decline since 2013 – as the group engaged with certain non-OPEC producers to restrain output.
Inventoriesa
These changes resulted in global demand exceeding supply in 2017. As a result, oil inventories in the OECD began to decline, although they remained well above the recent historical range. At the end of November OECD commercial inventories were roughly 100 million barrels less than 2016, but remained 90 million barrels above the five-year average.
The surplus relative to the five-year average was well below the peak of 366 million barrels seen in July 2016.
Natural gas
08 09 10 11 12 13 14 15 16
12
10
6
8
4
2
Henry HubNatural gas prices ($/mmBtu – quarterly average)
2017
PricesGas prices rebounded in all key markets in 2017, as global markets tightened. Liquefied natural gas (LNG) supply increased more slowly than expected, while LNG demand from China was unexpectedly strong, and high coal prices supported gas prices in the power generation sector.
Gas prices in the US averaged $3.11 per million British thermal units (mmBtu), up by $0.65 compared with 2016 ($2.46). The Japanese spot price rebounded to $7.13/mmBtu in 2017 from $5.72/mmBtu in 2016, driven by stronger Asian LNG demand, notably from China but also Japan, Korea and Pakistan. The UK National Balancing Point hub price was 44.95 pence per therm, 30% higher than in 2016 (34.63), supported by increasing coal prices. Meanwhile pipeline outages and cold weather put pressure on UK prices towards the end of 2017.
Broad differentials between regional gas prices have increased, even though they remain at much lower levels than the peaks observed in 2012 and 2013.
Consumptionb
Global consumption is estimated to have grown more rapidly in 2017 than in 2016. Strong growth in Asia, the Middle East and Africa offset a decline in North American consumption, where higher gas prices caused gas to lose market share to coal in the US power sector. Meanwhile demand in core European markets was broadly stable. And higher weather-related demand towards the end of the year boosted global annual demand.
Productionb
Total gas production is estimated to have increased substantially in 2017, in contrast to 2016, which had similar production to 2015. Significant production increases were achieved in Australia – supported by the start of new LNG trains , and in Russia.
Global LNG supply capacity expanded strongly in 2017, adding almost three times as much new capacity as in 2016. Several trains came online in the US, Australia, Russia and Malaysia.
See Glossary
More information
Prices and marginsPages 26 and 32 a From IEA Oil Market Report, 13 February 2018 ©, OECD/IEA 2018.
b Based on BP estimates from the BP Energy Outlook.
BP Annual Report and Form 20-F 2017 21
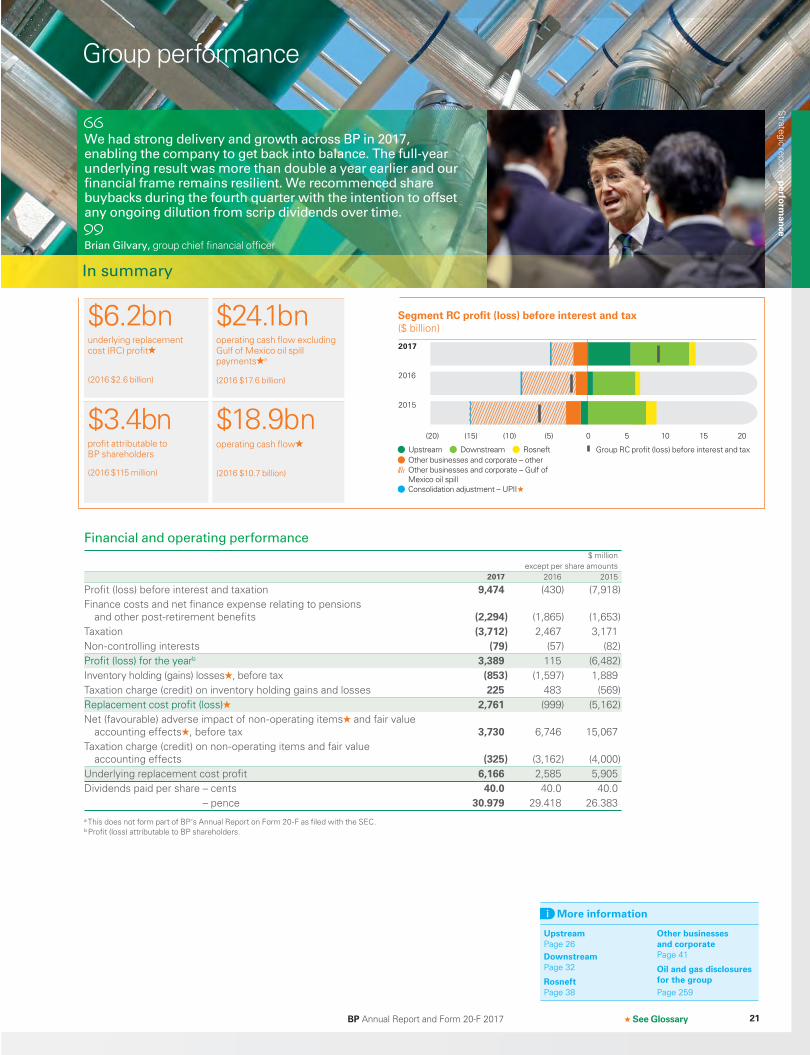
Group performance
We had strong delivery and growth across BP in 2017, enabling the company to get back into balance. The full-year underlying result was more than double a year earlier and our financial frame remains resilient. We recommenced share buybacks during the fourth quarter with the intention to offset any ongoing dilution from scrip dividends over time.
Brian Gilvary, group chief financial officer
In summary
(20) (10)(15) (5) 0 105 15 20
2016
2015
2017
Segment RC profit (loss) before interest and tax ($ billion)
Downstream Rosneft UpstreamOther businesses and corporate – otherOther businesses and corporate – Gulf of Mexico oil spillConsolidation adjustment – UPII
Group RC profit (loss) before interest and tax
Financial and operating performance
$ million except per share amounts
2017 2016 2015
Profit (loss) before interest and taxation 9,474 (430) (7,918)Finance costs and net finance expense relating to pensions
and other post-retirement benefits (2,294) (1,865) (1,653)Taxation (3,712) 2,467 3,171Non-controlling interests (79) (57) (82)Profit (loss) for the yearb 3,389 115 (6,482)Inventory holding (gains) losses , before tax (853) (1,597) 1,889Taxation charge (credit) on inventory holding gains and losses 225 483 (569)Replacement cost profit (loss) 2,761 (999) (5,162)Net (favourable) adverse impact of non-operating items and fair value
accounting effects , before tax 3,730 6,746 15,067 Taxation charge (credit) on non-operating items and fair value
accounting effects (325) (3,162) (4,000)Underlying replacement cost profit 6,166 2,585 5,905 Dividends paid per share – cents 40.0 40.0 40.0
– pence 30.979 29.418 26.383a This does not form part of BP’s Annual Report on Form 20-F as filed with the SEC.b Profit (loss) attributable to BP shareholders.
More information
UpstreamPage 26DownstreamPage 32
RosneftPage 38
Other businesses and corporatePage 41
Oil and gas disclosures for the groupPage 259
See Glossary
$6.2bn $24.1bnunderlying replacement cost (RC) profit
(2016 $2.6 billion)
operating cash flow excluding Gulf of Mexico oil spill payments a
(2016 $17.6 billion)
$3.4bn $18.9bnprofit attributable to BP shareholders
(2016 $115 million)
operating cash flow
(2016 $10.7 billion)
Strategic report – perfo
rman
ce
Book 1.indb 21 03/04/2018 16:41:10
BP Annual Report and Form 20-F 201722
ResultsProfit for the year ended 31 December 2017 was $3.4 billion, compared with $115 million in 2016. Excluding inventory holding gains, replacement cost (RC) profit was $2.8 billion, compared with a loss of $1.0 billion in 2016. After adjusting for non-operating items of $3.3 billion and net adverse fair value accounting effects of $96 million (both on a post-tax basis), underlying RC profit for the year ended 31 December 2017 was $6.2 billion, an increase of $3.6 billion compared with 2016. The increase was predominantly due to higher results in both Upstream and Downstream segments. The Upstream result reflected higher oil and gas prices and increased production. The Downstream result reflected strong refining performance, including an improved margin environment and growth in fuels marketing.
The profit for the year ended 31 December 2016 was $115 million, compared with a loss of $6.5 billion in 2015. Excluding inventory holding gains, RC loss was $1.0 billion, compared with a loss of $5.2 billion in 2015. After adjusting for non-operating items of $2.8 billion and net adverse fair value accounting effects of $0.8 billion (both on a post-tax basis), underlying RC profit for the year ended 31 December 2016 was $2.6 billion, a decrease of $3.3 billion compared with 2015. The reduction was predominantly due to lower results in both the Upstream and Downstream segments reflecting lower oil and gas prices and the weaker refining environment.
Non-operating itemsThe net charge for non-operating items was $3.6 billion pre-tax and $3.3 billion post tax in 2017. The post-tax non-operating charge includes a charge of $1.7 billion recognized in the fourth quarter relating to business economic loss and other claims associated with the Gulf of Mexico oil spill and a $0.9 billion deferred tax charge following the change in the US tax rate enacted in December 2017. In addition, the net charge also reflects an impairment charge in relation to upstream assets.
The net charge for non-operating items of $5.7 billion pre-tax and $2.8 billion post tax in 2016 mainly related to additional charges for the Gulf of Mexico oil spill which were partially offset by net impairment reversals. Non-operating items in 2016 also included a restructuring charge of $0.8 billion (2015 $1.1 billion).
More information on non-operating items and fair value accounting effects can be found on pages 250 and 294. See Financial statements – Note 2 for further information on the impact of the Gulf of Mexico oil spill on BP’s financial results.
TaxationThe charge for corporate income taxes in 2017 includes a one-off deferred tax charge of $0.9 billion in respect of the revaluation of deferred tax assets and liabilities following the reduction in the US federal corporate income tax rate from 35% to 21% enacted in December 2017. The effective tax rate (ETR) on the profit or loss for the year was 52% in 2017, 107% in 2016 and 33% in 2015. The ETR for all three years was impacted by various one-off items.
Adjusting for inventory holding impacts, non-operating items which include the impact of the US tax rate change, fair value accounting effects and the deferred tax adjustments as a result of the reductions in the UK North Sea supplementary charge in 2016 and 2015, the adjusted ETR on RC profit was 38% in 2017 (2016 23%, 2015 31%). The adjusted ETR for 2017 is higher than 2016 predominantly due to changes in the geographical mix of profits, notably the impact of the renewal of our interest in the Abu Dhabi onshore oil concession. The adjusted ETR for 2016 was lower than 2015 predominantly due to changes in the geographical mix of profits as a result of the lower oil price and the absence of foreign exchange impacts from the strengthening of the US dollar in 2015.
In the current environment, the adjusted ETR in 2018 is expected to be above 40%.
Cash flow and net debt information $ million
2017 2016 2015
Operating cash flow excluding Gulf of Mexico oil spill paymentsa 24,098 17,583 20,263
Operating cash flow 18,931 10,691 19,133Net cash used in investing
activities (14,077) (14,753) (17,300)Net cash provided by (used in)
financing activities (3,296) 1,977 (4,535)Cash and cash equivalents at
end of year 25,586 23,484 26,389Capital expenditure b
Organic capital expenditure (16,501) (16,675) N/AInorganic capital expenditure (1,339) (777) N/A
(17,840) (17,452) (20,202)Gross debt 63,230 58,300 53,168Net debt 37,819 35,513 27,158Gross debt ratio (%) 38.6% 37.6% 35.1%Net debt ratio (%) 27.4% 26.8% 21.6%
a This does not form part of BP’s Annual Report on Form 20-F as filed with the SEC.b From 2017 onwards we are reporting organic, inorganic and total capital expenditure on a cash basis which were previously reported on an accruals basis. This aligns with BP's financial framework and is now consistent with other financial metrics used when comparing sources and uses of cash. An analysis of capital expenditure on a cash basis for 2015 is not available.
Operating cash flowNet cash provided by operating activities for the year ended 31 December 2017 was $18.9 billion, $8.2 billion higher than the $10.7 billion reported in 2016. Operating cash flow in 2017 reflects $5.3 billion of pre-tax cash outflows related to the Gulf of Mexico oil spill (2016 $7.1 billion). Compared with 2016, operating cash flows in 2017 were impacted by improved business results, including a more favourable price environment and higher production, working capital effects, and a $2.5 billion increase in income taxes paid.
Movements in inventories and other current and non-current assets and liabilities adversely impacted cash flow in the year by $3.4 billion. There was an adverse impact on working capital from the Gulf of Mexico oil spill of $5.2 billion. Other working capital effects, arising from a variety of different factors had a favourable effect of $1.8 billion. Receivables and inventories increased during the year principally due to higher oil prices. The effect of this on operating cash flow was more than offset by a corresponding increase in payables. BP actively manages its working capital balances to optimize cash flow.
There was a decrease in net cash provided by operating activities of $8.4 billion in 2016 compared with 2015, of which $6.0 billion related to higher pre-tax cash outflows associated with the Gulf of Mexico oil spill. Cash flows were impacted by the continuing low oil price environment, with a lower average oil price in 2016 compared with 2015, working capital effects, and a reduction of $0.7 billion in income taxes paid.
Movements in inventories and other current and non-current assets and liabilities adversely impacted cash flow in 2016 by $3.2 billion. There was an adverse impact from the Gulf of Mexico oil spill of $4.8 billion. Other working capital effects, arising from a variety of different factors, had a favourable impact of $1.6 billion. Inventories increased during 2016 because volumes were increased in our trading business to benefit from market opportunities, and due to higher prices towards the end of the year. The increase in inventory was largely offset by a corresponding increase in payables, limiting the increase in working capital.
See Glossary

From our headquarters in
London to the underwater
facilities in Western Australia
– our modernization
programme is transforming
how we work across BP.
We are simplifying how we operate to create a more agile organization and working to change mindsets so that they fit the increasingly competitive and margin-dependent industry. At the same time, we're digitizing and automating more of our work.
We are in the process of systematically migrating our vast amounts of data from physical centres to the cloud, embracing the agility and power of cloud technologies, while maintaining necessary levels of data security.
We have already moved our corporate website to Amazon Web Services®, and we now plan to close all our physical datacentres over several years, fully embracing the agility and power of cloud technologies.
Microsoft Azure® is intended to become a group-wide platform for collaboration and data analytics, with services such as visualization and predictive tools to help us analyse data, gain insights and make decisions faster.
We are also piloting the use of blockchain database technology in our oil and gas trading business to help increase efficiency in terms of speed and verification of transactions. Blockchain is a digital ledger system that records online transactions and helps to streamline financial processes and cut back office costs.
Modernizing the whole group
Speedier solutions
Activity on
7,000servers in four datacentres moving to the cloud
Strategic report – perfo
rman
ce
BP Annual Report and Form 20-F 2017 23
Strategic report – perfo
rman
ce
Book 1.indb 23 03/04/2018 16:41:15
BP Annual Report and Form 20-F 201724
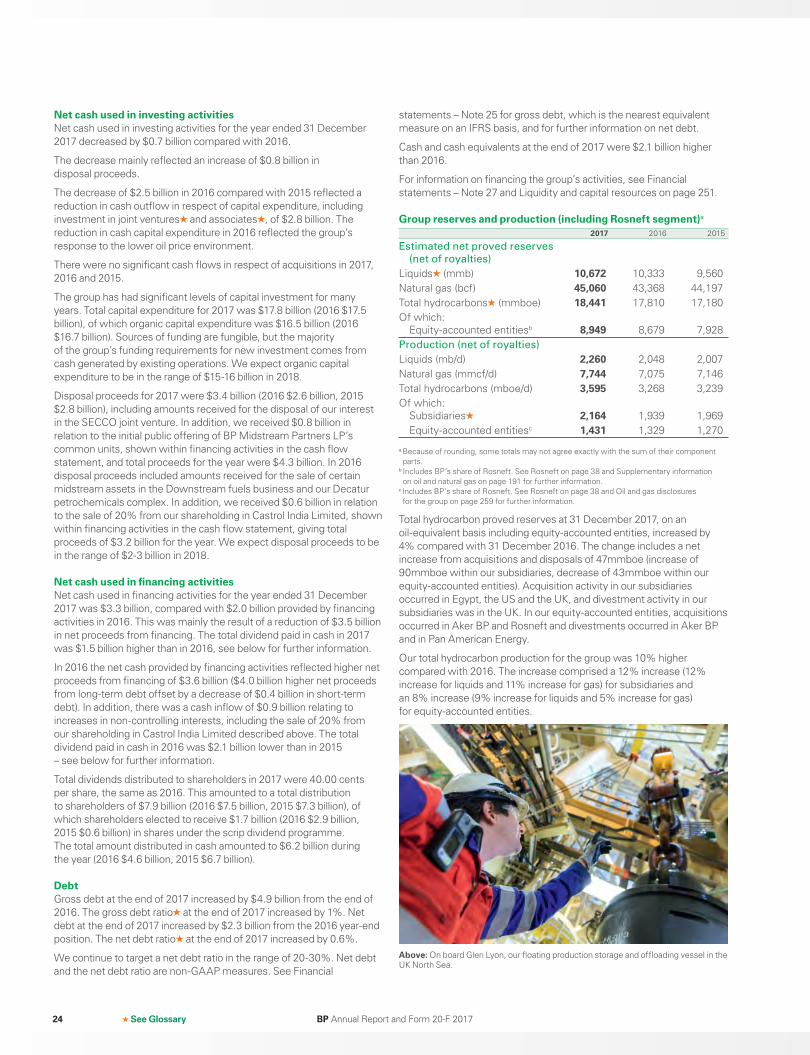
Net cash used in investing activitiesNet cash used in investing activities for the year ended 31 December 2017 decreased by $0.7 billion compared with 2016.
The decrease mainly reflected an increase of $0.8 billion in disposal proceeds.
The decrease of $2.5 billion in 2016 compared with 2015 reflected a reduction in cash outflow in respect of capital expenditure, including investment in joint ventures and associates , of $2.8 billion. The reduction in cash capital expenditure in 2016 reflected the group’s response to the lower oil price environment.
There were no significant cash flows in respect of acquisitions in 2017, 2016 and 2015.
The group has had significant levels of capital investment for many years. Total capital expenditure for 2017 was $17.8 billion (2016 $17.5 billion), of which organic capital expenditure was $16.5 billion (2016 $16.7 billion). Sources of funding are fungible, but the majority of the group’s funding requirements for new investment comes from cash generated by existing operations. We expect organic capital expenditure to be in the range of $15-16 billion in 2018.
Disposal proceeds for 2017 were $3.4 billion (2016 $2.6 billion, 2015 $2.8 billion), including amounts received for the disposal of our interest in the SECCO joint venture. In addition, we received $0.8 billion in relation to the initial public offering of BP Midstream Partners LP’s common units, shown within financing activities in the cash flow statement, and total proceeds for the year were $4.3 billion. In 2016 disposal proceeds included amounts received for the sale of certain midstream assets in the Downstream fuels business and our Decatur petrochemicals complex. In addition, we received $0.6 billion in relation to the sale of 20% from our shareholding in Castrol India Limited, shown within financing activities in the cash flow statement, giving total proceeds of $3.2 billion for the year. We expect disposal proceeds to be in the range of $2-3 billion in 2018.
Net cash used in financing activitiesNet cash used in financing activities for the year ended 31 December 2017 was $3.3 billion, compared with $2.0 billion provided by financing activities in 2016. This was mainly the result of a reduction of $3.5 billion in net proceeds from financing. The total dividend paid in cash in 2017 was $1.5 billion higher than in 2016, see below for further information.
In 2016 the net cash provided by financing activities reflected higher net proceeds from financing of $3.6 billion ($4.0 billion higher net proceeds from long-term debt offset by a decrease of $0.4 billion in short-term debt). In addition, there was a cash inflow of $0.9 billion relating to increases in non-controlling interests, including the sale of 20% from our shareholding in Castrol India Limited described above. The total dividend paid in cash in 2016 was $2.1 billion lower than in 2015 – see below for further information.
Total dividends distributed to shareholders in 2017 were 40.00 cents per share, the same as 2016. This amounted to a total distribution to shareholders of $7.9 billion (2016 $7.5 billion, 2015 $7.3 billion), of which shareholders elected to receive $1.7 billion (2016 $2.9 billion, 2015 $0.6 billion) in shares under the scrip dividend programme. The total amount distributed in cash amounted to $6.2 billion during the year (2016 $4.6 billion, 2015 $6.7 billion).
DebtGross debt at the end of 2017 increased by $4.9 billion from the end of 2016. The gross debt ratio at the end of 2017 increased by 1%. Net debt at the end of 2017 increased by $2.3 billion from the 2016 year-end position. The net debt ratio at the end of 2017 increased by 0.6%.
We continue to target a net debt ratio in the range of 20-30%. Net debt and the net debt ratio are non-GAAP measures. See Financial
statements – Note 25 for gross debt, which is the nearest equivalent measure on an IFRS basis, and for further information on net debt.
Cash and cash equivalents at the end of 2017 were $2.1 billion higher than 2016.
For information on financing the group’s activities, see Financial statements – Note 27 and Liquidity and capital resources on page 251.
Group reserves and production (including Rosneft segment)a
2017 2016 2015
Estimated net proved reserves
(net of royalties)
Liquids (mmb) 10,672 10,333 9,560Natural gas (bcf) 45,060 43,368 44,197Total hydrocarbons (mmboe) 18,441 17,810 17,180Of which:
Equity-accounted entitiesb 8,949 8,679 7,928Production (net of royalties)
Liquids (mb/d) 2,260 2,048 2,007Natural gas (mmcf/d) 7,744 7,075 7,146Total hydrocarbons (mboe/d) 3,595 3,268 3,239Of which:
Subsidiaries 2,164 1,939 1,969 Equity-accounted entitiesc 1,431 1,329 1,270
a Because of rounding, some totals may not agree exactly with the sum of their component parts.
b Includes BP’s share of Rosneft. See Rosneft on page 38 and Supplementary information on oil and natural gas on page 191 for further information.
c Includes BP’s share of Rosneft. See Rosneft on page 38 and Oil and gas disclosures for the group on page 259 for further information.
Total hydrocarbon proved reserves at 31 December 2017, on an oil-equivalent basis including equity-accounted entities, increased by 4% compared with 31 December 2016. The change includes a net increase from acquisitions and disposals of 47mmboe (increase of 90mmboe within our subsidiaries, decrease of 43mmboe within our equity-accounted entities). Acquisition activity in our subsidiaries occurred in Egypt, the US and the UK, and divestment activity in our subsidiaries was in the UK. In our equity-accounted entities, acquisitions occurred in Aker BP and Rosneft and divestments occurred in Aker BP and in Pan American Energy.
Our total hydrocarbon production for the group was 10% higher compared with 2016. The increase comprised a 12% increase (12% increase for liquids and 11% increase for gas) for subsidiaries and an 8% increase (9% increase for liquids and 5% increase for gas) for equity-accounted entities.
Above: On board Glen Lyon, our floating production storage and offloading vessel in the UK North Sea.
See Glossary
Book 1.indb 24 03/04/2018 16:41:22
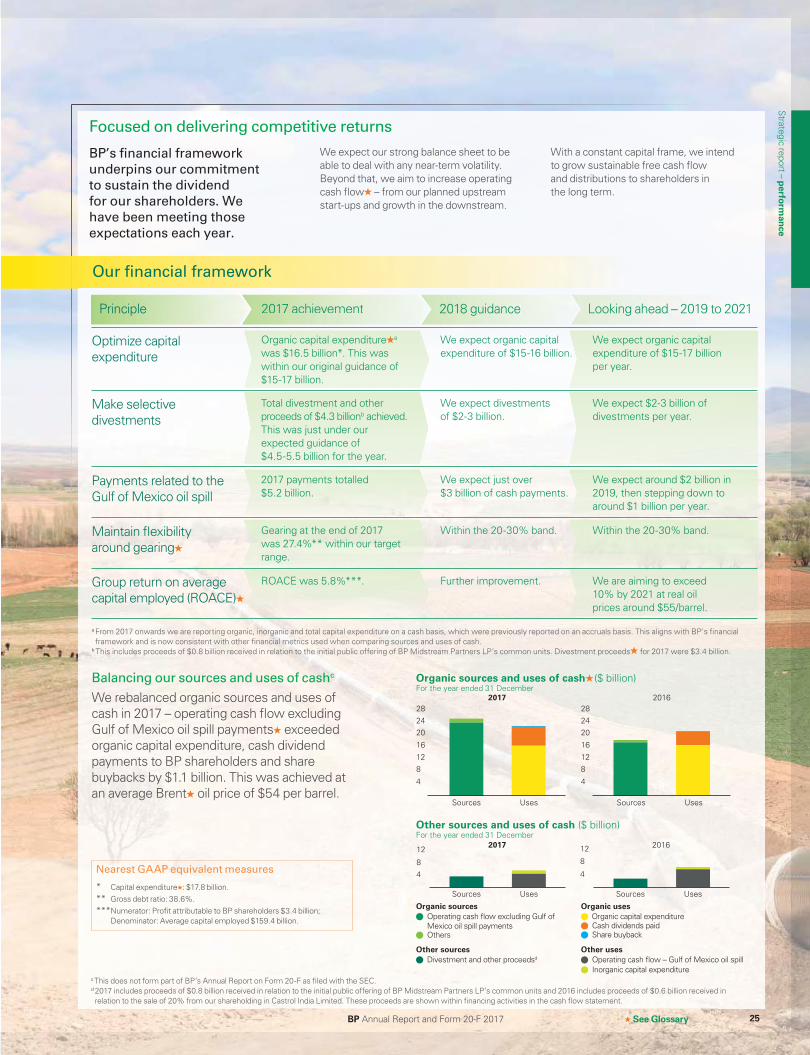
BP Annual Report and Form 20-F 2017 25 See Glossary
Principle 22022 117 aaaachhievveemeentnt 2020181 gguidadaaance Looking ahead – 2019 to 2021
Nearest GAAP equivalent measures
* Capital expenditure : $17.8 billion. ** Gross debt ratio: 38.6%.*** Numerator: Profit attributable to BP shareholders $3.4 billion;
Denominator: Average capital employed $159.4 billion.
Balancing our sources and uses of cashc
We rebalanced organic sources and uses of cash in 2017 – operating cash flow excluding Gulf of Mexico oil spill payments exceeded organic capital expenditure, cash dividend payments to BP shareholders and share buybacks by $1.1 billion. This was achieved at an average Brent oil price of $54 per barrel.
BP’s financial framework
underpins our commitment
to sustain the dividend
for our shareholders. We
have been meeting those
expectations each year.
We expect our strong balance sheet to be able to deal with any near-term volatility. Beyond that, we aim to increase operating cash flow – from our planned upstream start-ups and growth in the downstream.
With a constant capital frame, we intend to grow sustainable free cash flow and distributions to shareholders in the long term.
Our financial framework
Focused on delivering competitive returns
Optimize capitalexpenditure
Organic capital expenditure a was $16.5 billion*. This was within our original guidance of $15-17 billion.
We expect organic capital expenditure of $15-16 billion.
We expect organic capital expenditure of $15-17 billion per year.
Make selectivedivestments
Total divestment and other proceeds of $4.3 billionb achieved. This was just under our expected guidance of $4.5-5.5 billion for the year.
We expect divestments of $2-3 billion.
We expect $2-3 billion of divestments per year.
Payments related to the Gulf of Mexico oil spill
2017 payments totalled $5.2 billion.
We expect just over $3 billion of cash payments.
We expect around $2 billion in 2019, then stepping down to around $1 billion per year.
Maintain flexibilityaround gearing
Gearing at the end of 2017 was 27.4%** within our target range.
Within the 20-30% band. Within the 20-30% band.
Group return on average capital employed (ROACE)
ROACE was 5.8%***. Further improvement. We are aiming to exceed 10% by 2021 at real oil prices around $55/barrel.
a From 2017 onwards we are reporting organic, inorganic and total capital expenditure on a cash basis, which were previously reported on an accruals basis. This aligns with BP's financial framework and is now consistent with other financial metrics used when comparing sources and uses of cash.
b This includes proceeds of $0.8 billion received in relation to the initial public offering of BP Midstream Partners LP’s common units. Divestment proceeds for 2017 were $3.4 billion.
Strategic report – perfo
rman
ce
c This does not form part of BP’s Annual Report on Form 20-F as filed with the SEC.d 2017 includes proceeds of $0.8 billion received in relation to the initial public offering of BP Midstream Partners LP’s common units and 2016 includes proceeds of $0.6 billion received in relation to the sale of 20% from our shareholding in Castrol India Limited. These proceeds are shown within financing activities in the cash flow statement.
282017 2016
2017 2016
24
16
8
Sources Uses
4
20
12
12
8
4
Sources
Organic sources Organic uses
Uses Sources Uses
12
8
4
Share buybackCash dividends paidOrganic capital expenditure
Inorganic capital expenditure
Others
Operating cash flow excluding Gulf ofMexico oil spill payments
Other sources Other usesDivestment and other proceedsd Operating cash flow – Gulf of Mexico oil spill
Organic sources and uses of cash ($ billion)For the year ended 31 December
Other sources and uses of cash ($ billion)For the year ended 31 December
28
24
16
8
Sources Uses
4
20
12
Book 1.indb 25 03/04/2018 16:41:24
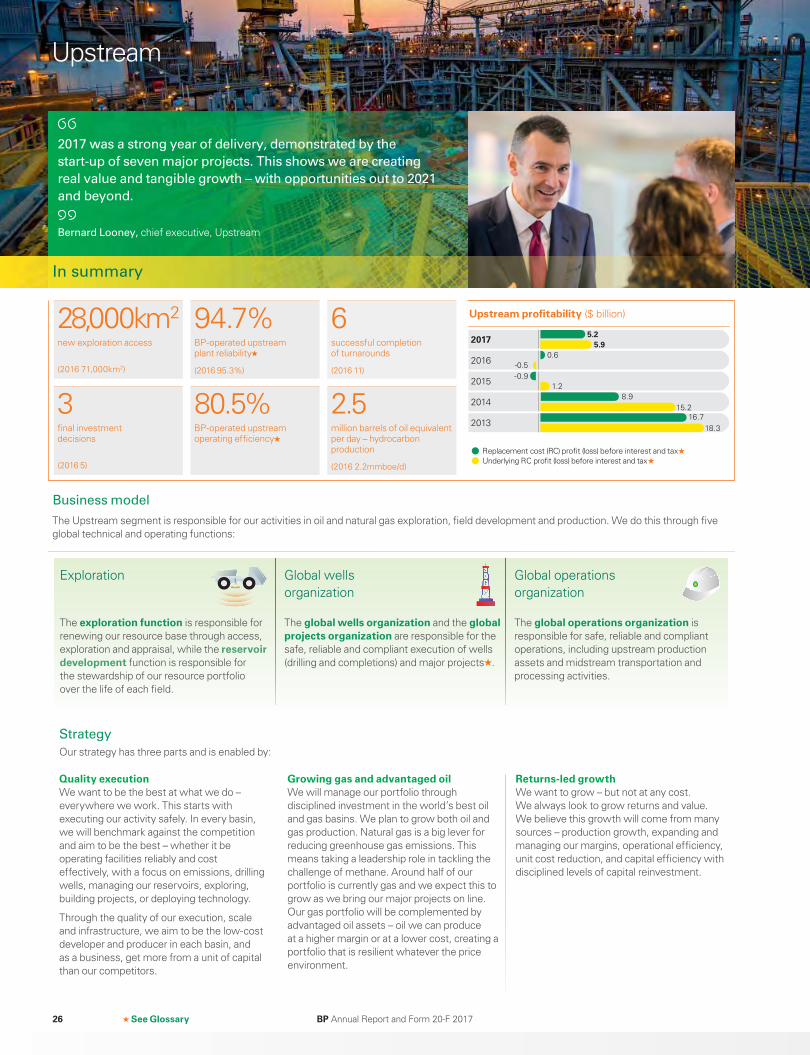
BP Annual Report and Form 20-F 201726
2017 was a strong year of delivery, demonstrated by the
start-up of seven major projects. This shows we are creating
real value and tangible growth – with opportunities out to 2021
and beyond.
Bernard Looney, chief executive, Upstream
28,000km2 94.7% 6new exploration access
(2016 71,000km2)
BP-operated upstream plant reliability
(2016 95.3%)
successful completion of turnarounds
(2016 11)
3 80.5% 2.5final investment decisions
(2016 5)
BP-operated upstream operating efficiency
million barrels of oil equivalent per day – hydrocarbon production
(2016 2.2mmboe/d)
Upstream
See Glossary
The global wells organization and the global projects organization are responsible for the safe, reliable and compliant execution of wells (drilling and completions) and major projects .
The exploration function is responsible for renewing our resource base through access, exploration and appraisal, while the reservoir development function is responsible for the stewardship of our resource portfolio over the life of each field.
The global operations organization is responsible for safe, reliable and compliant operations, including upstream production assets and midstream transportation and processing activities.
Quality executionWe want to be the best at what we do – everywhere we work. This starts with executing our activity safely. In every basin, we will benchmark against the competition and aim to be the best – whether it be operating facilities reliably and cost effectively, with a focus on emissions, drilling wells, managing our reservoirs, exploring, building projects, or deploying technology.
Through the quality of our execution, scale and infrastructure, we aim to be the low-cost developer and producer in each basin, and as a business, get more from a unit of capital than our competitors.
Growing gas and advantaged oilWe will manage our portfolio through disciplined investment in the world’s best oil and gas basins. We plan to grow both oil and gas production. Natural gas is a big lever for reducing greenhouse gas emissions. This means taking a leadership role in tackling the challenge of methane. Around half of our portfolio is currently gas and we expect this to grow as we bring our major projects on line. Our gas portfolio will be complemented by advantaged oil assets – oil we can produce at a higher margin or at a lower cost, creating a portfolio that is resilient whatever the price environment.
Returns-led growthWe want to grow – but not at any cost. We always look to grow returns and value. We believe this growth will come from many sources – production growth, expanding and managing our margins, operational efficiency, unit cost reduction, and capital efficiency with disciplined levels of capital reinvestment.
Strategy
Our strategy has three parts and is enabled by:
Exploration Global wells organization
Global operations organization
Business model
The Upstream segment is responsible for our activities in oil and natural gas exploration, field development and production. We do this through five global technical and operating functions:
2017
2016
2015
2014
2013
Replacement cost (RC) profit (loss) before interest and tax Underlying RC profit (loss) before interest and tax
Upstream profitability ($ billion)
-0.9
0.6
5.2 5.9
-0.5
1.2
15.2
18.3
8.9
16.7
In summary
Book 1.indb 26 03/04/2018 16:41:28
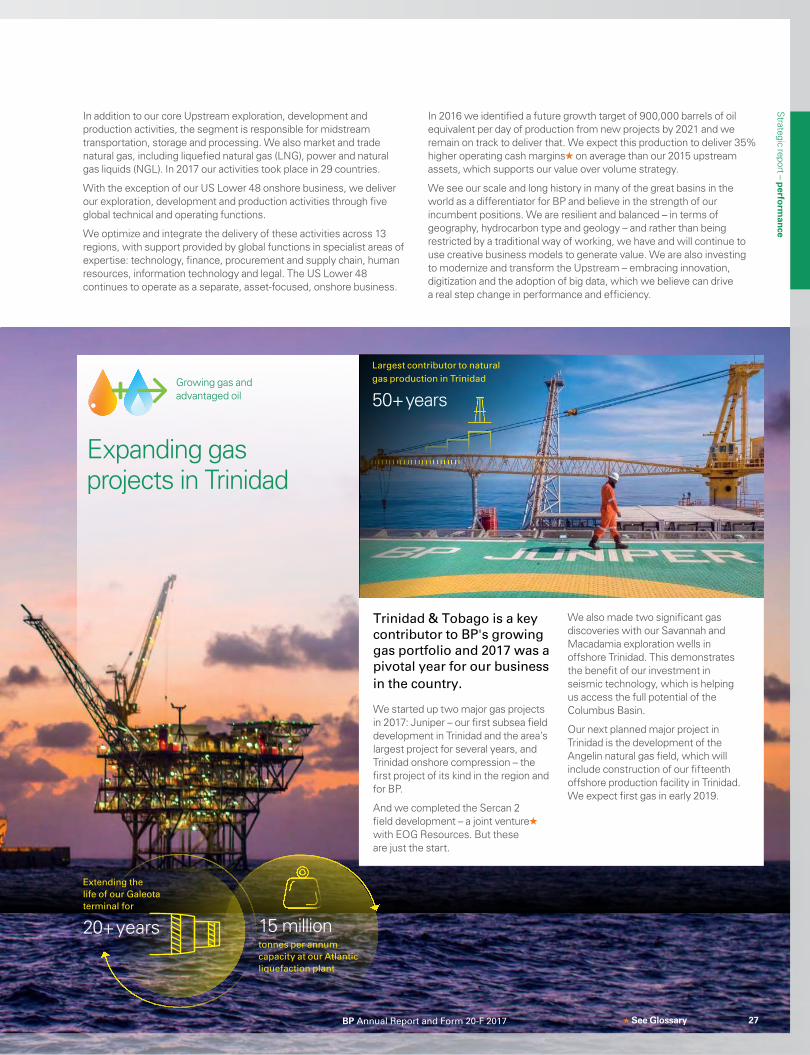
BP Annual Report and Form 20-F 2017 27
Expanding gas projects in Trinidad
Growing gas and advantaged oil
Trinidad & Tobago is a key contributor to BP's growing gas portfolio and 2017 was a pivotal year for our business in the country.
We started up two major gas projects in 2017: Juniper – our first subsea field development in Trinidad and the area’s largest project for several years, and Trinidad onshore compression – the first project of its kind in the region and for BP.
And we completed the Sercan 2 field development – a joint venture with EOG Resources. But these are just the start.
We also made two significant gas discoveries with our Savannah and Macadamia exploration wells in offshore Trinidad. This demonstrates the benefit of our investment in seismic technology, which is helping us access the full potential of the Columbus Basin.
Our next planned major project in Trinidad is the development of the Angelin natural gas field, which will include construction of our fifteenth offshore production facility in Trinidad. We expect first gas in early 2019.
Largest contributor to natural gas production in Trinidad
50+ years
In addition to our core Upstream exploration, development and production activities, the segment is responsible for midstream transportation, storage and processing. We also market and trade natural gas, including liquefied natural gas (LNG), power and natural gas liquids (NGL). In 2017 our activities took place in 29 countries.
With the exception of our US Lower 48 onshore business, we deliver our exploration, development and production activities through five global technical and operating functions.
We optimize and integrate the delivery of these activities across 13 regions, with support provided by global functions in specialist areas of expertise: technology, finance, procurement and supply chain, human resources, information technology and legal. The US Lower 48 continues to operate as a separate, asset-focused, onshore business.
In 2016 we identified a future growth target of 900,000 barrels of oil equivalent per day of production from new projects by 2021 and we remain on track to deliver that. We expect this production to deliver 35% higher operating cash margins on average than our 2015 upstream assets, which supports our value over volume strategy.
We see our scale and long history in many of the great basins in the world as a differentiator for BP and believe in the strength of our incumbent positions. We are resilient and balanced – in terms of geography, hydrocarbon type and geology – and rather than being restricted by a traditional way of working, we have and will continue to use creative business models to generate value. We are also investing to modernize and transform the Upstream – embracing innovation, digitization and the adoption of big data, which we believe can drive a real step change in performance and efficiency.
Extending the life of our Galeota terminal for
20+ years 15 milliontonnes per annum capacity at our Atlantic liquefaction plant
BP Annual Report and Form 20-F 2017 See Glossary
Strategic report – perfo
rman
ce
27
BP Annual Report and Form 20-F 201728
Financial performance
$ million
2017 2016 2015
Sales and other operating revenuesa 45,440 33,188 43,235
RC profit (loss) before interest and tax 5,221 574 (937)
Net (favourable) adverse impact of non-operating items and fair value accounting effects 644 (1,116) 2,130
Underlying RC profit (loss) before interest and tax 5,865 (542) 1,193
Organic capital expenditure b 13,763 14,344 N/ABP average realizationsc $ per barrel
Crude oild 51.71 39.99 49.72Natural gas liquids 26.00 17.31 20.75Liquids 49.92 38.27 47.32
$ per thousand cubic feet
Natural gas 3.19 2.84 3.80US natural gas 2.36 1.90 2.10
$ per barrel of oil equivalent
Total hydrocarbons 35.38 28.24 35.46Average oil marker pricese $ per barrel
Brent 54.19 43.73 52.39West Texas Intermediate 50.79 43.34 48.71Average natural gas
marker prices $ per million British thermal units
Average Henry Hub gas pricef 3.11 2.46 2.67pence per therm
Average UK National Balancing Point gas price e 44.95 34.63 42.61
a Includes sales to other segments.b A reconciliation to GAAP information at the group level is provided on page 249. Organic capital expenditure on a cash basis in 2015 is not available.
c Realizations are based on sales by consolidated subsidiaries only, which excludes equity-accounted entities.
d Includes condensate and bitumen.e All traded days average.f Henry Hub First of Month Index.
Market pricesBrent remains an integral marker to the production portfolio, from which a significant proportion of production is priced directly or indirectly. Certain regions use other local markers that are derived using differentials or a lagged impact from the Brent crude oil price.
90
60
30
120
150
Jan Feb Mar Apr May Jun Jul Aug Sep Oct Nov Dec
Brent ($/bbl)
2016 2017 2015 Five-year range
The dated Brent price in 2017 averaged $54.19 per barrel. Prices drifted lower over the first half of the year before rebounding, ending the year at their monthly high point, averaging $64 in December. After falling in 2016, non-OPEC production recovered (+0.8mmb/d), led by the US. In contrast OPEC production declined by 0.4mmb/d – the first decline since 2013 – as the group engaged with certain non-OPEC producers to restrain output.
6
3
9
Jan Feb Mar Apr May Jun Jul Aug Sep Oct Nov Dec
Henry Hub ($/mmBtu)
2016 2017 2015 Five-year range
The 2017 Henry Hub First of Month Index price was higher than 2016 ($2.46).
The UK National Balancing Point hub price was 44.95 pence per therm, 30% higher than in 2016 (34.63), supported by increasing coal prices. Meanwhile pipeline outages and cold weather put pressure on UK prices towards the end of 2017.
For more information on the global energy market in 2017 see page 20.
Financial resultsSales and other operating revenues for 2017 increased compared with 2016, primarily reflecting higher liquids realizations, higher production and higher gas marketing and trading revenues. The decrease in 2016 compared with 2015 primarily reflected lower liquids and gas realizations and lower gas marketing and trading revenues.
See Glossary
Above: Dolphin Island vessel overlooking our Atlantis platform in the Gulf of Mexico.
Book 1.indb 28 03/04/2018 16:41:32
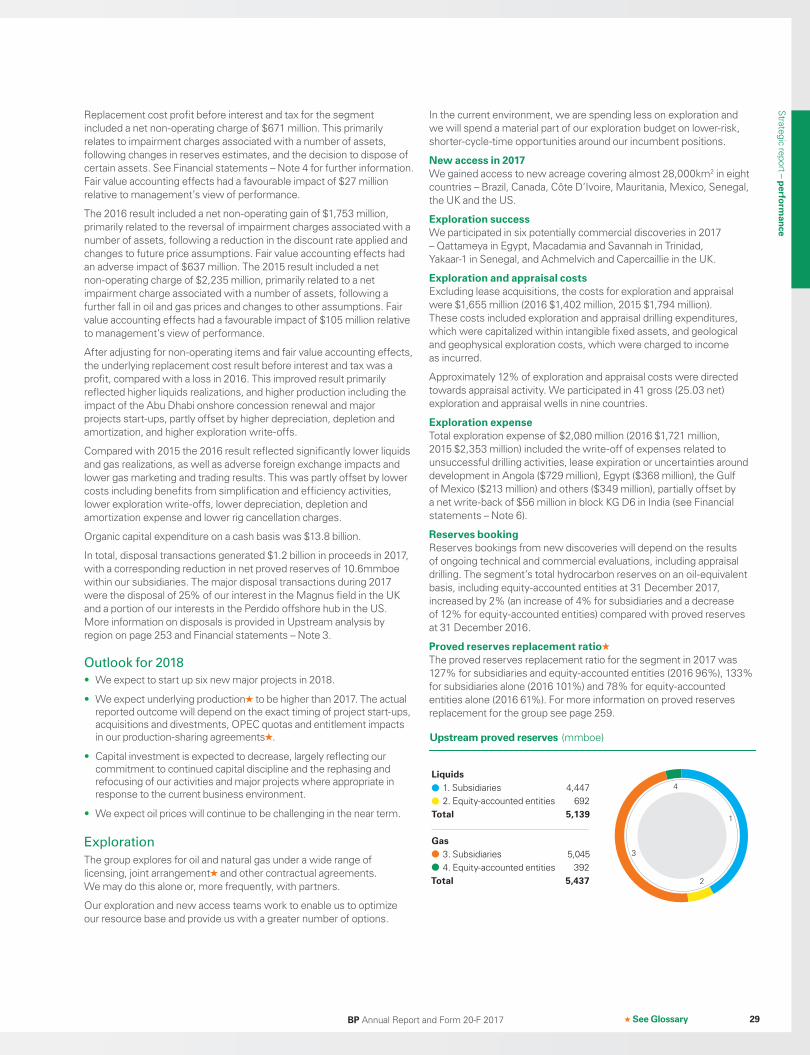
BP Annual Report and Form 20-F 2017 29
Replacement cost profit before interest and tax for the segment included a net non-operating charge of $671 million. This primarily relates to impairment charges associated with a number of assets, following changes in reserves estimates, and the decision to dispose of certain assets. See Financial statements – Note 4 for further information. Fair value accounting effects had a favourable impact of $27 million relative to management’s view of performance.
The 2016 result included a net non-operating gain of $1,753 million, primarily related to the reversal of impairment charges associated with a number of assets, following a reduction in the discount rate applied and changes to future price assumptions. Fair value accounting effects had an adverse impact of $637 million. The 2015 result included a net non-operating charge of $2,235 million, primarily related to a net impairment charge associated with a number of assets, following a further fall in oil and gas prices and changes to other assumptions. Fair value accounting effects had a favourable impact of $105 million relative to management’s view of performance.
After adjusting for non-operating items and fair value accounting effects, the underlying replacement cost result before interest and tax was a profit, compared with a loss in 2016. This improved result primarily reflected higher liquids realizations, and higher production including the impact of the Abu Dhabi onshore concession renewal and major projects start-ups, partly offset by higher depreciation, depletion and amortization, and higher exploration write-offs.
Compared with 2015 the 2016 result reflected significantly lower liquids and gas realizations, as well as adverse foreign exchange impacts and lower gas marketing and trading results. This was partly offset by lower costs including benefits from simplification and efficiency activities, lower exploration write-offs, lower depreciation, depletion and amortization expense and lower rig cancellation charges.
Organic capital expenditure on a cash basis was $13.8 billion.
In total, disposal transactions generated $1.2 billion in proceeds in 2017, with a corresponding reduction in net proved reserves of 10.6mmboe within our subsidiaries. The major disposal transactions during 2017 were the disposal of 25% of our interest in the Magnus field in the UK and a portion of our interests in the Perdido offshore hub in the US. More information on disposals is provided in Upstream analysis by region on page 253 and Financial statements – Note 3.
Outlook for 2018
• We expect to start up six new major projects in 2018.
• We expect underlying production to be higher than 2017. The actual reported outcome will depend on the exact timing of project start-ups, acquisitions and divestments, OPEC quotas and entitlement impacts in our production-sharing agreements .
• Capital investment is expected to decrease, largely reflecting our commitment to continued capital discipline and the rephasing and refocusing of our activities and major projects where appropriate in response to the current business environment.
• We expect oil prices will continue to be challenging in the near term.
Exploration
The group explores for oil and natural gas under a wide range of licensing, joint arrangement and other contractual agreements. We may do this alone or, more frequently, with partners.
Our exploration and new access teams work to enable us to optimize our resource base and provide us with a greater number of options.
In the current environment, we are spending less on exploration and we will spend a material part of our exploration budget on lower-risk, shorter-cycle-time opportunities around our incumbent positions.
New access in 2017We gained access to new acreage covering almost 28,000km2 in eight countries – Brazil, Canada, Côte D’Ivoire, Mauritania, Mexico, Senegal, the UK and the US.
Exploration successWe participated in six potentially commercial discoveries in 2017 – Qattameya in Egypt, Macadamia and Savannah in Trinidad, Yakaar-1 in Senegal, and Achmelvich and Capercaillie in the UK.
Exploration and appraisal costsExcluding lease acquisitions, the costs for exploration and appraisal were $1,655 million (2016 $1,402 million, 2015 $1,794 million). These costs included exploration and appraisal drilling expenditures, which were capitalized within intangible fixed assets, and geological and geophysical exploration costs, which were charged to income as incurred.
Approximately 12% of exploration and appraisal costs were directed towards appraisal activity. We participated in 41 gross (25.03 net) exploration and appraisal wells in nine countries.
Exploration expenseTotal exploration expense of $2,080 million (2016 $1,721 million, 2015 $2,353 million) included the write-off of expenses related to unsuccessful drilling activities, lease expiration or uncertainties around development in Angola ($729 million), Egypt ($368 million), the Gulf of Mexico ($213 million) and others ($349 million), partially offset by a net write-back of $56 million in block KG D6 in India (see Financial statements – Note 6).
Reserves bookingReserves bookings from new discoveries will depend on the results of ongoing technical and commercial evaluations, including appraisal drilling. The segment’s total hydrocarbon reserves on an oil-equivalent basis, including equity-accounted entities at 31 December 2017, increased by 2% (an increase of 4% for subsidiaries and a decrease of 12% for equity-accounted entities) compared with proved reserves at 31 December 2016.
Proved reserves replacement ratioThe proved reserves replacement ratio for the segment in 2017 was 127% for subsidiaries and equity-accounted entities (2016 96%), 133% for subsidiaries alone (2016 101%) and 78% for equity-accounted entities alone (2016 61%). For more information on proved reserves replacement for the group see page 259.
Liquids
Total 5,139
Total 5,437
Gas
1. Subsidiaries 4,447 2. Equity-accounted entities 692
3. Subsidiaries 5,045 4. Equity-accounted entities 392
2
4
3
1
Upstream proved reserves (mmboe)
See Glossary
Strategic report – perfo
rman
ce
Book 1.indb 29 03/04/2018 16:41:32
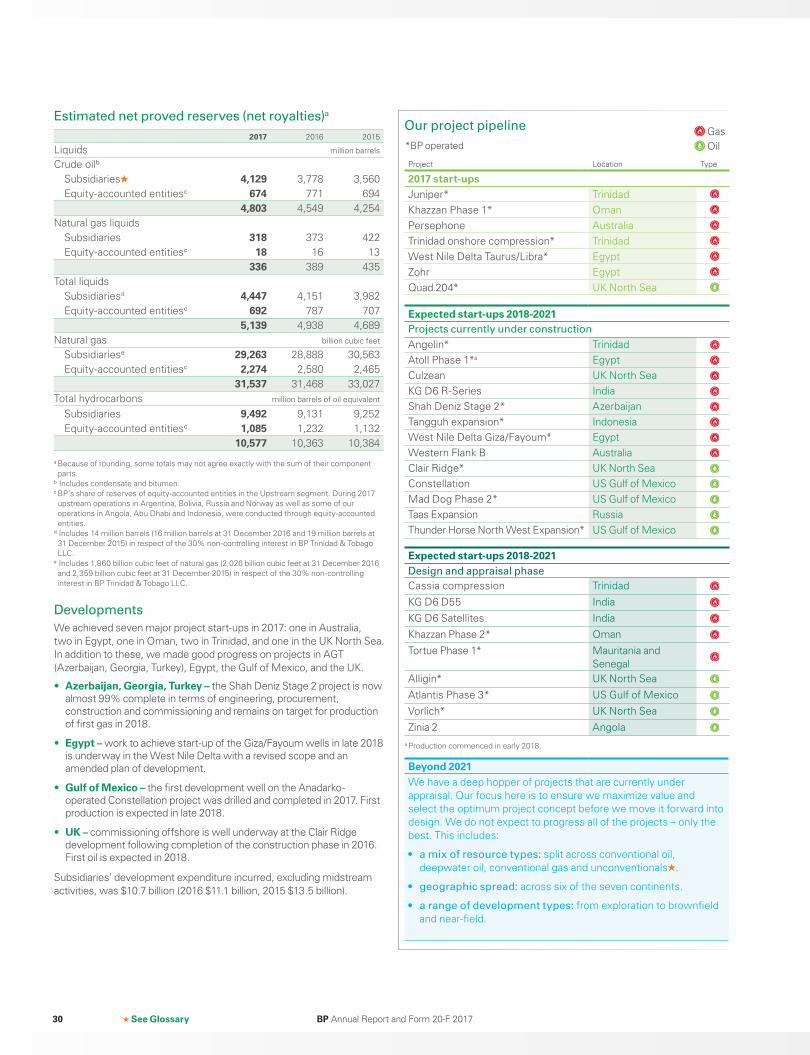
BP Annual Report and Form 20-F 201730
Estimated net proved reserves (net royalties)a
2017 2016 2015
Liquids million barrels
Crude oilb
Subsidiaries 4,129 3,778 3,560 Equity-accounted entitiesc 674 771 694
4,803 4,549 4,254Natural gas liquids Subsidiaries 318 373 422 Equity-accounted entitiesc 18 16 13
336 389 435Total liquids Subsidiariesd 4,447 4,151 3,982 Equity-accounted entitiesc 692 787 707
5,139 4,938 4,689Natural gas billion cubic feet
Subsidiariese 29,263 28,888 30,563 Equity-accounted entitiesc 2,274 2,580 2,465
31,537 31,468 33,027Total hydrocarbons million barrels of oil equivalent
Subsidiaries 9,492 9,131 9,252 Equity-accounted entitiesc 1,085 1,232 1,132
10,577 10,363 10,384
a Because of rounding, some totals may not agree exactly with the sum of their component parts.
b Includes condensate and bitumen. c BP’s share of reserves of equity-accounted entities in the Upstream segment. During 2017 upstream operations in Argentina, Bolivia, Russia and Norway as well as some of our operations in Angola, Abu Dhabi and Indonesia, were conducted through equity-accounted entities.
d Includes 14 million barrels (16 million barrels at 31 December 2016 and 19 million barrels at 31 December 2015) in respect of the 30% non-controlling interest in BP Trinidad & Tobago LLC.
e Includes 1,860 billion cubic feet of natural gas (2,026 billion cubic feet at 31 December 2016 and 2,359 billion cubic feet at 31 December 2015) in respect of the 30% non-controlling interest in BP Trinidad & Tobago LLC.
Developments
We achieved seven major project start-ups in 2017: one in Australia, two in Egypt, one in Oman, two in Trinidad, and one in the UK North Sea. In addition to these, we made good progress on projects in AGT (Azerbaijan, Georgia, Turkey), Egypt, the Gulf of Mexico, and the UK.
• Azerbaijan, Georgia, Turkey – the Shah Deniz Stage 2 project is now almost 99% complete in terms of engineering, procurement, construction and commissioning and remains on target for production of first gas in 2018.
• Egypt – work to achieve start-up of the Giza/Fayoum wells in late 2018 is underway in the West Nile Delta with a revised scope and an amended plan of development.
• Gulf of Mexico – the first development well on the Anadarko-operated Constellation project was drilled and completed in 2017. First production is expected in late 2018.
• UK – commissioning offshore is well underway at the Clair Ridge development following completion of the construction phase in 2016. First oil is expected in 2018.
Subsidiaries’ development expenditure incurred, excluding midstream activities, was $10.7 billion (2016 $11.1 billion, 2015 $13.5 billion).
Project Location Type
2017 start-upsJuniper* TrinidadKhazzan Phase 1* OmanPersephone AustraliaTrinidad onshore compression* TrinidadWest Nile Delta Taurus/Libra* Egypt Zohr Egypt Quad 204* UK North Sea
Expected start-ups 2018-2021Design and appraisal phase
Cassia compression Trinidad
KG D6 D55 India
KG D6 Satellites India
Khazzan Phase 2* Oman
Tortue Phase 1* Mauritania and Senegal
Alligin* UK North Sea
Atlantis Phase 3* US Gulf of Mexico
Vorlich* UK North Sea
Zinia 2 Angola
Expected start-ups 2018-2021Projects currently under construction
Angelin* Trinidad Atoll Phase 1*a EgyptCulzean UK North SeaKG D6 R-Series IndiaShah Deniz Stage 2* AzerbaijanTangguh expansion* IndonesiaWest Nile Delta Giza/Fayoum* EgyptWestern Flank B AustraliaClair Ridge* UK North SeaConstellation US Gulf of MexicoMad Dog Phase 2* US Gulf of MexicoTaas Expansion RussiaThunder Horse North West Expansion* US Gulf of Mexico
Beyond 2021We have a deep hopper of projects that are currently under appraisal. Our focus here is to ensure we maximize value and select the optimum project concept before we move it forward into design. We do not expect to progress all of the projects – only the best. This includes:
• a mix of resource types: split across conventional oil, deepwater oil, conventional gas and unconventionals .
• geographic spread: across six of the seven continents.
• a range of development types: from exploration to brownfield and near-field.
Our project pipeline
*BP operated Gas Oil
See Glossary
a Production commenced in early 2018.
Book 1.indb 30 03/04/2018 16:41:33
BP Annual Report and Form 20-F 2017 31
Gas marketing and trading activities
Our integrated supply and trading function markets and trades our own and third-party natural gas (including LNG), biogas, power and NGLs. This provides us with routes into liquid markets for the gas we produce and generates margins and fees from selling physical products and derivatives to third parties, together with income from asset optimization and trading. This means we have a single interface with gas trading markets and one consistent set of trading compliance and risk management processes, systems and controls. We are expanding our LNG portfolio, which includes global partnerships with utility companies, gas distributors and national oil and gas companies, and in 2017 we supplied the first commercial LNG contact based on offshore ship-to-ship transfer.
The activity primarily takes place in North America, Europe and Asia, and supports group LNG activities, managing market price risk and creating incremental trading opportunities through the use of commodity derivative contracts. It also enhances margins and generates fee income from sources such as the management of price risk on behalf of third-party customers.
Our trading financial risk governance framework is described in Financial statements – Note 27 and the range of contracts used is described in Glossary – commodity trading contracts on page 289.
Production
Our offshore and onshore oil and natural gas production assets include wells, gathering centres, in-field flow lines, processing facilities, storage facilities, offshore platforms, export systems (e.g. transit lines), pipelines and LNG plant facilities. These include production from conventional and unconventional (coalbed methane and shale) assets. Our principal areas of production are Angola, Argentina, Australia, Azerbaijan, Egypt, Iraq, Trinidad, the UAE, the UK and the US.
With BP-operated plant reliability increasing from around 86% in 2011 to 95% in 2017, efficient delivery of turnarounds and strong infill drilling performance, we have maintained base decline at less than 3% on average over the last five years. Our long-term expectation for managed base decline remains at the 3-5% per annum guidance we have previously given.
Production (net of royalties)a
2017 2016 2015
Liquids thousand barrels per day
Crude oilb
Subsidiaries 1,064 943 933 Equity-accounted entitiesc 199 179 165
1,263 1,122 1,099Natural gas liquids Subsidiaries 85 82 88 Equity-accounted entitiesc 8 4 7
93 86 95Total liquids Subsidiaries 1,149 1,025 1,022 Equity-accounted entitiesc 207 184 172
1,356 1,208 1,194Natural gas million cubic feet per day
Subsidiaries 5,889 5,302 5,495 Equity-accounted entitiesc 547 494 456
6,436 5,796 5,951Total hydrocarbons thousand barrels of oil equivalent per day
Subsidiaries 2,164 1,939 1,969 Equity-accounted entitiesc 302 269 251
2,466 2,208 2,220a Because of rounding, some totals may not agree exactly with the sum of their component parts.b Includes condensate and bitumen.c Includes BP’s share of production of equity-accounted entities in the Upstream segment.
Our total hydrocarbon production for the segment in 2017 was 11.7% higher compared with 2016. The increase comprised an 11.6% increase (12.1% for liquids and 11.1% for gas) for subsidiaries and a 12.2% increase (12.9% for liquids and 10.8% for gas) for equity-accounted entities compared with 2016. For more information on production see Oil and gas disclosures for the group on page 259.
In aggregate, underlying production increased versus 2016.
The group and its equity-accounted entities have numerous long-term sales commitments in their various business activities, all of which are expected to be sourced from supplies available to the group that are not subject to priorities, curtailments or other restrictions. No single contract or group of related contracts is material to the group.
Above: Smart glasses are used to share data with off-site technical experts at our Lower 48 operations in Colorado.
Strategic report – perfo
rman
ce
Book 1.indb 31 03/04/2018 16:41:33
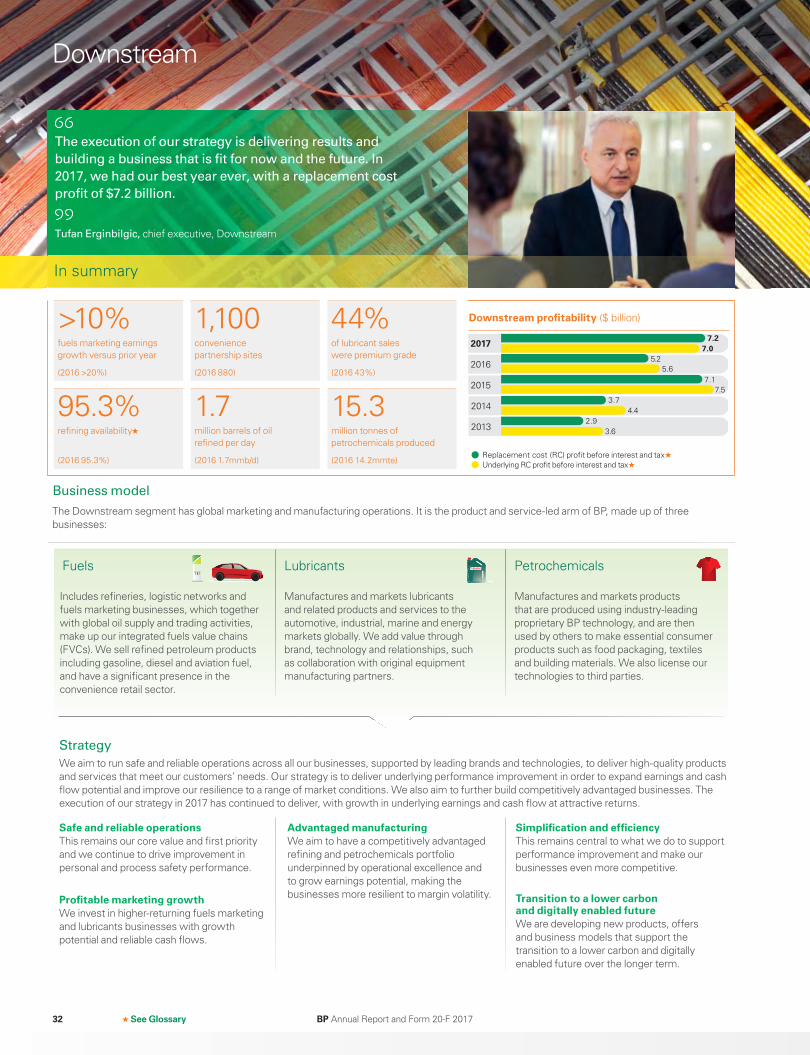
Safe and reliable operations This remains our core value and first priority and we continue to drive improvement in personal and process safety performance.
Profitable marketing growth We invest in higher-returning fuels marketing and lubricants businesses with growth potential and reliable cash flows.
Advantaged manufacturing We aim to have a competitively advantaged refining and petrochemicals portfolio underpinned by operational excellence and to grow earnings potential, making the businesses more resilient to margin volatility.
Simplification and efficiency This remains central to what we do to support performance improvement and make our businesses even more competitive.
Transition to a lower carbon and digitally enabled future We are developing new products, offers and business models that support the transition to a lower carbon and digitally enabled future over the longer term.
Business model
The Downstream segment has global marketing and manufacturing operations. It is the product and service-led arm of BP, made up of three businesses:
Manufactures and markets lubricants and related products and services to the automotive, industrial, marine and energy markets globally. We add value through brand, technology and relationships, such as collaboration with original equipment manufacturing partners.
Includes refineries, logistic networks and fuels marketing businesses, which together with global oil supply and trading activities, make up our integrated fuels value chains (FVCs). We sell refined petroleum products including gasoline, diesel and aviation fuel, and have a significant presence in the convenience retail sector.
Manufactures and markets products that are produced using industry-leading proprietary BP technology, and are then used by others to make essential consumer products such as food packaging, textiles and building materials. We also license our technologies to third parties.
Strategy
We aim to run safe and reliable operations across all our businesses, supported by leading brands and technologies, to deliver high-quality products and services that meet our customers’ needs. Our strategy is to deliver underlying performance improvement in order to expand earnings and cash flow potential and improve our resilience to a range of market conditions. We also aim to further build competitively advantaged businesses. The execution of our strategy in 2017 has continued to deliver, with growth in underlying earnings and cash flow at attractive returns.
Fuels
>10% 1,100 44%fuels marketing earnings growth versus prior year
(2016 >20%)
convenience partnership sites
(2016 880)
of lubricant sales were premium grade
(2016 43%)
95.3% 1.7 15.3refining availability
(2016 95.3%)
million barrels of oil refined per day
(2016 1.7mmb/d)
million tonnes of petrochemicals produced
(2016 14.2mmte)
Downstream
The execution of our strategy is delivering results and
building a business that is fit for now and the future. In
2017, we had our best year ever, with a replacement cost
profit of $7.2 billion.
Tufan Erginbilgic, chief executive, Downstream
See Glossary
Lubricants Petrochemicals
2017
2016
2015
2014
2013
Downstream profitability ($ billion)
Replacement cost (RC) profit before interest and tax Underlying RC profit before interest and tax
7.1
7.2 7.0
7.5 3.7
4.4 2.9
3.6
5.2 5.6
BP Annual Report and Form 20-F 201732
In summary
Book 1.indb 32 03/04/2018 16:41:36

Growing retail business
Every second of every day vehicles are filling up with BP fuel across 18,300 sites – making retail big business for BP.
Our premium fuel volumes grew by 6% in 2017 and generated margins that are higher than our standard grades. With a retail network that spans 19 countries, we have one of the top three positions in terms of market share in most of the markets where we operate.
But we’re not stopping there. We also have a significant and growing retail convenience partnership offer which we plan to continue to expand across our markets. This builds on the success we have had with other industry leading food retailers – like M&S Simply Food® and REWE to go®. Our loyalty schemes, such as PAYBACK® and Nectar®, are helping to strengthen customer relationships in key markets – with loyalty card customers tending to shop more frequently and spend more per visit.
We are also expanding our global portfolio into major growth markets such as Mexico, China and Indonesia. For the first time in 75 years, companies outside Mexico can invest in its fuels market. We were the first global brand to open retail sites there in early 2017 and by the end of the year we had more than 120 BP-branded sites, serving thousands of customers a day. Mexico is one of the world’s largest consumer gasoline and diesel markets globally and we plan to have around 1,500 sites by 2021.
Each day more than 250,000 consumers in Mexico are choosing BP’s differentiated offer.
Market-led growth
15 countries
is now available in
1,100 convenience partnership sites globally
Digital and advanced mobilityWe are rolling out new digital and advanced mobility customer offers. This includes our new BPme app, which helps customers find a convenient BP site, order coffee and pay for fuel from their vehicle, and our investment in FreeWire, a manufacturer of mobile electric vehicle rapid charging systems, which we plan to roll out to selected European retail sites in 2018.
Strategic report – perfo
rman
ce
33BP Annual Report and Form 20-F 2017
Some examples of our partnerships.
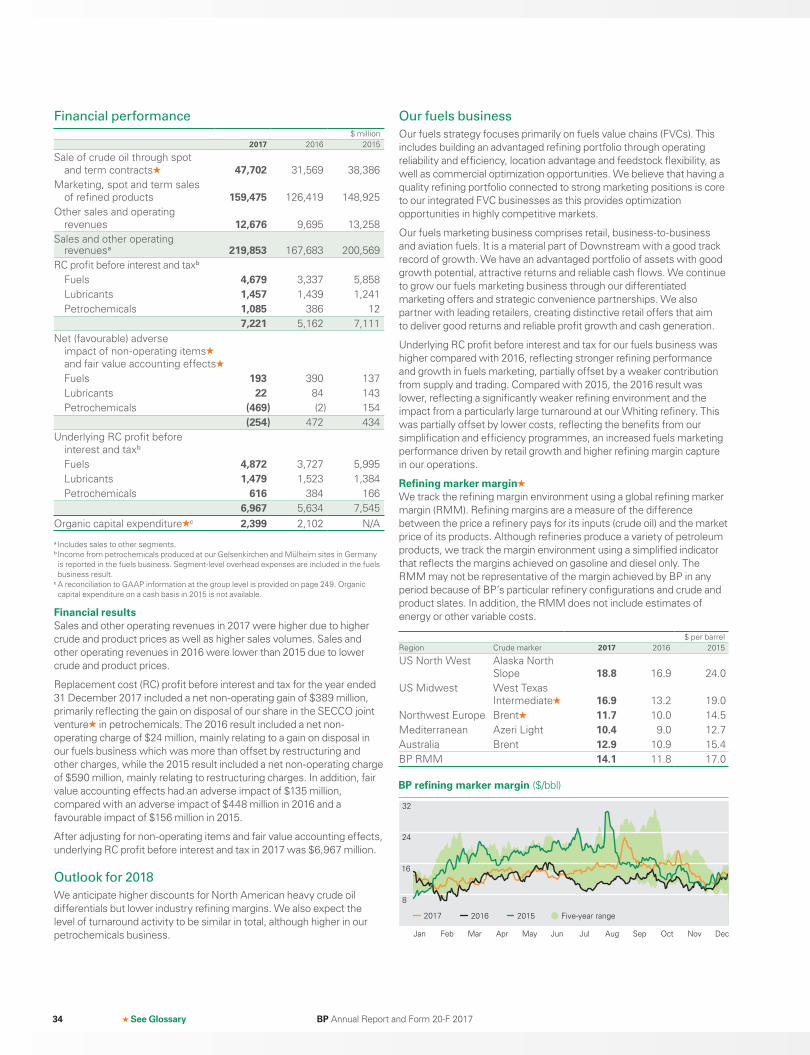
Financial performance
$ million 2017 2016 2015
Sale of crude oil through spot and term contracts 47,702 31,569 38,386
Marketing, spot and term sales of refined products 159,475 126,419 148,925
Other sales and operating revenues 12,676 9,695 13,258
Sales and other operating revenuesa 219,853 167,683 200,569
RC profit before interest and taxb
Fuels 4,679 3,337 5,858 Lubricants 1,457 1,439 1,241 Petrochemicals 1,085 386 12 7,221 5,162 7,111Net (favourable) adverse
impact of non-operating items and fair value accounting effects
Fuels 193 390 137 Lubricants 22 84 143 Petrochemicals (469) (2) 154
(254) 472 434Underlying RC profit before
interest and taxb
Fuels 4,872 3,727 5,995 Lubricants 1,479 1,523 1,384 Petrochemicals 616 384 166 6,967 5,634 7,545Organic capital expenditure c 2,399 2,102 N/A
a Includes sales to other segments.b Income from petrochemicals produced at our Gelsenkirchen and Mülheim sites in Germany is reported in the fuels business. Segment-level overhead expenses are included in the fuels business result.
c A reconciliation to GAAP information at the group level is provided on page 249. Organic capital expenditure on a cash basis in 2015 is not available.
Financial results Sales and other operating revenues in 2017 were higher due to higher crude and product prices as well as higher sales volumes. Sales and other operating revenues in 2016 were lower than 2015 due to lower crude and product prices.
Replacement cost (RC) profit before interest and tax for the year ended 31 December 2017 included a net non-operating gain of $389 million, primarily reflecting the gain on disposal of our share in the SECCO joint venture in petrochemicals. The 2016 result included a net non-operating charge of $24 million, mainly relating to a gain on disposal in our fuels business which was more than offset by restructuring and other charges, while the 2015 result included a net non-operating charge of $590 million, mainly relating to restructuring charges. In addition, fair value accounting effects had an adverse impact of $135 million, compared with an adverse impact of $448 million in 2016 and a favourable impact of $156 million in 2015.
After adjusting for non-operating items and fair value accounting effects, underlying RC profit before interest and tax in 2017 was $6,967 million.
Outlook for 2018
We anticipate higher discounts for North American heavy crude oil differentials but lower industry refining margins. We also expect the level of turnaround activity to be similar in total, although higher in our petrochemicals business.
Our fuels business
Our fuels strategy focuses primarily on fuels value chains (FVCs). This includes building an advantaged refining portfolio through operating reliability and efficiency, location advantage and feedstock flexibility, as well as commercial optimization opportunities. We believe that having a quality refining portfolio connected to strong marketing positions is core to our integrated FVC businesses as this provides optimization opportunities in highly competitive markets.
Our fuels marketing business comprises retail, business-to-business and aviation fuels. It is a material part of Downstream with a good track record of growth. We have an advantaged portfolio of assets with good growth potential, attractive returns and reliable cash flows. We continue to grow our fuels marketing business through our differentiated marketing offers and strategic convenience partnerships. We also partner with leading retailers, creating distinctive retail offers that aim to deliver good returns and reliable profit growth and cash generation.
Underlying RC profit before interest and tax for our fuels business was higher compared with 2016, reflecting stronger refining performance and growth in fuels marketing, partially offset by a weaker contribution from supply and trading. Compared with 2015, the 2016 result was lower, reflecting a significantly weaker refining environment and the impact from a particularly large turnaround at our Whiting refinery. This was partially offset by lower costs, reflecting the benefits from our simplification and efficiency programmes, an increased fuels marketing performance driven by retail growth and higher refining margin capture in our operations.
Refining marker marginWe track the refining margin environment using a global refining marker margin (RMM). Refining margins are a measure of the difference between the price a refinery pays for its inputs (crude oil) and the market price of its products. Although refineries produce a variety of petroleum products, we track the margin environment using a simplified indicator that reflects the margins achieved on gasoline and diesel only. The RMM may not be representative of the margin achieved by BP in any period because of BP’s particular refinery configurations and crude and product slates. In addition, the RMM does not include estimates of energy or other variable costs.
$ per barrelRegion Crude marker 2017 2016 2015
US North West Alaska North Slope 18.8 16.9 24.0
US Midwest West Texas Intermediate 16.9 13.2 19.0
Northwest Europe Brent 11.7 10.0 14.5Mediterranean Azeri Light 10.4 9.0 12.7Australia Brent 12.9 10.9 15.4BP RMM 14.1 11.8 17.0
16
8
24
32
Jan Feb Mar Apr May Jun Jul Aug Sep Oct Nov Dec
BP refining marker margin ($/bbl)
2016 2017 2015 Five-year range
See Glossary BP Annual Report and Form 20-F 201734
Book 1.indb 34 03/04/2018 16:41:45
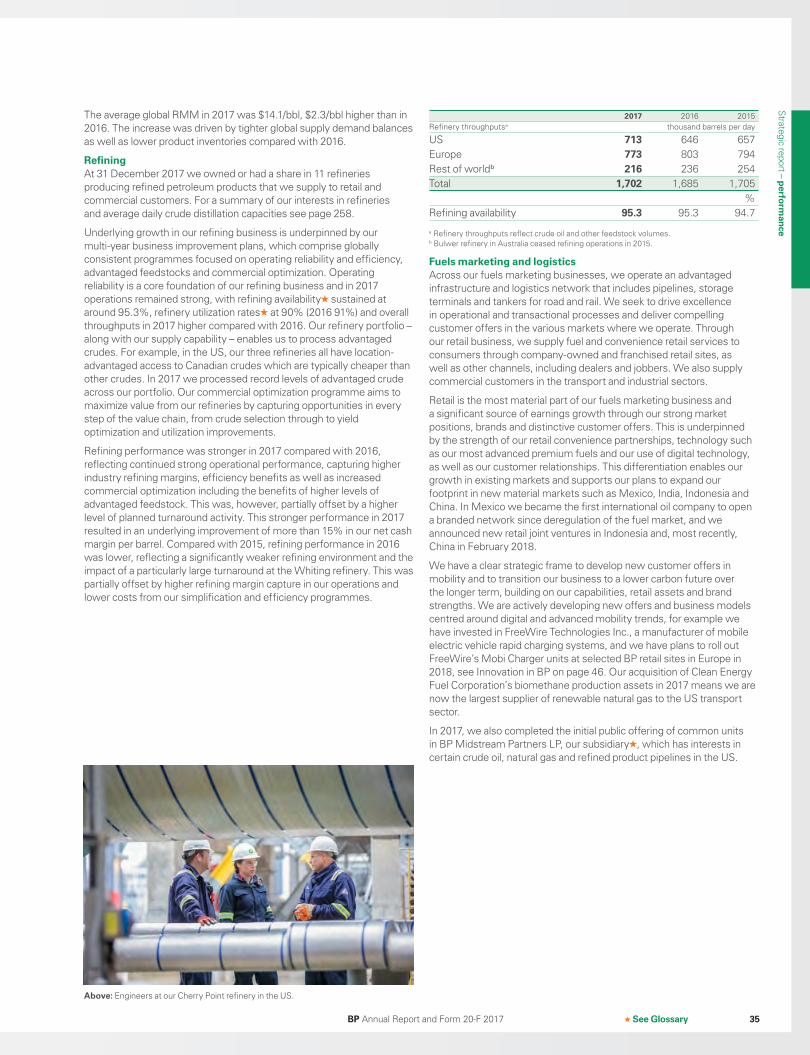
The average global RMM in 2017 was $14.1/bbl, $2.3/bbl higher than in 2016. The increase was driven by tighter global supply demand balances as well as lower product inventories compared with 2016.
RefiningAt 31 December 2017 we owned or had a share in 11 refineries producing refined petroleum products that we supply to retail and commercial customers. For a summary of our interests in refineries and average daily crude distillation capacities see page 258.
Underlying growth in our refining business is underpinned by our multi-year business improvement plans, which comprise globally consistent programmes focused on operating reliability and efficiency, advantaged feedstocks and commercial optimization. Operating reliability is a core foundation of our refining business and in 2017 operations remained strong, with refining availability sustained at around 95.3%, refinery utilization rates at 90% (2016 91%) and overall throughputs in 2017 higher compared with 2016. Our refinery portfolio – along with our supply capability – enables us to process advantaged crudes. For example, in the US, our three refineries all have location-advantaged access to Canadian crudes which are typically cheaper than other crudes. In 2017 we processed record levels of advantaged crude across our portfolio. Our commercial optimization programme aims to maximize value from our refineries by capturing opportunities in every step of the value chain, from crude selection through to yield optimization and utilization improvements.
Refining performance was stronger in 2017 compared with 2016, reflecting continued strong operational performance, capturing higher industry refining margins, efficiency benefits as well as increased commercial optimization including the benefits of higher levels of advantaged feedstock. This was, however, partially offset by a higher level of planned turnaround activity. This stronger performance in 2017 resulted in an underlying improvement of more than 15% in our net cash margin per barrel. Compared with 2015, refining performance in 2016 was lower, reflecting a significantly weaker refining environment and the impact of a particularly large turnaround at the Whiting refinery. This was partially offset by higher refining margin capture in our operations and lower costs from our simplification and efficiency programmes.
2017 2016 2015Refinery throughputsa thousand barrels per day
US 713 646 657Europe 773 803 794Rest of worldb 216 236 254Total 1,702 1,685 1,705
%Refining availability 95.3 95.3 94.7
a Refinery throughputs reflect crude oil and other feedstock volumes.b Bulwer refinery in Australia ceased refining operations in 2015.
Fuels marketing and logisticsAcross our fuels marketing businesses, we operate an advantaged infrastructure and logistics network that includes pipelines, storage terminals and tankers for road and rail. We seek to drive excellence in operational and transactional processes and deliver compelling customer offers in the various markets where we operate. Through our retail business, we supply fuel and convenience retail services to consumers through company-owned and franchised retail sites, as well as other channels, including dealers and jobbers. We also supply commercial customers in the transport and industrial sectors.
Retail is the most material part of our fuels marketing business and a significant source of earnings growth through our strong market positions, brands and distinctive customer offers. This is underpinned by the strength of our retail convenience partnerships, technology such as our most advanced premium fuels and our use of digital technology, as well as our customer relationships. This differentiation enables our growth in existing markets and supports our plans to expand our footprint in new material markets such as Mexico, India, Indonesia and China. In Mexico we became the first international oil company to open a branded network since deregulation of the fuel market, and we announced new retail joint ventures in Indonesia and, most recently, China in February 2018.
We have a clear strategic frame to develop new customer offers in mobility and to transition our business to a lower carbon future over the longer term, building on our capabilities, retail assets and brand strengths. We are actively developing new offers and business models centred around digital and advanced mobility trends, for example we have invested in FreeWire Technologies Inc., a manufacturer of mobile electric vehicle rapid charging systems, and we have plans to roll out FreeWire’s Mobi Charger units at selected BP retail sites in Europe in 2018, see Innovation in BP on page 46. Our acquisition of Clean Energy Fuel Corporation’s biomethane production assets in 2017 means we are now the largest supplier of renewable natural gas to the US transport sector.
In 2017, we also completed the initial public offering of common units in BP Midstream Partners LP, our subsidiary , which has interests in certain crude oil, natural gas and refined product pipelines in the US.
See Glossary
Above: Engineers at our Cherry Point refinery in the US.
BP Annual Report and Form 20-F 2017 35
Strategic report – perfo
rman
ce
Book 1.indb 35 03/04/2018 16:41:45
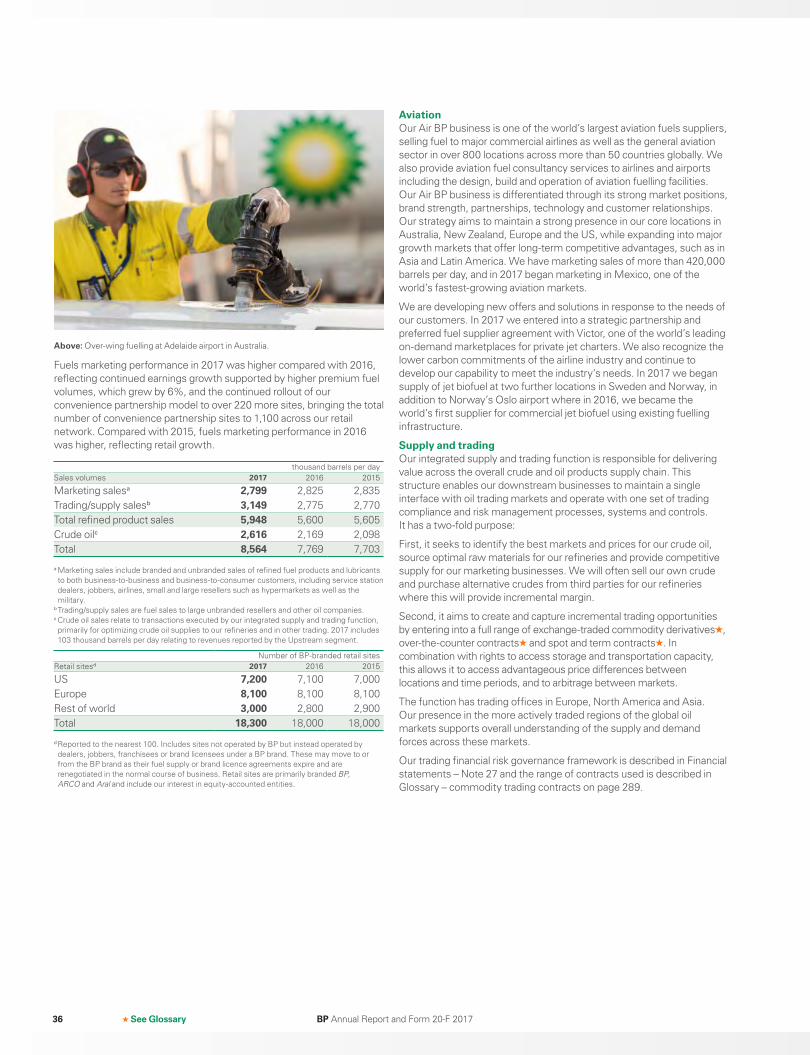
Above: Over-wing fuelling at Adelaide airport in Australia.
Fuels marketing performance in 2017 was higher compared with 2016, reflecting continued earnings growth supported by higher premium fuel volumes, which grew by 6%, and the continued rollout of our convenience partnership model to over 220 more sites, bringing the total number of convenience partnership sites to 1,100 across our retail network. Compared with 2015, fuels marketing performance in 2016 was higher, reflecting retail growth.
thousand barrels per daySales volumes 2017 2016 2015
Marketing salesa 2,799 2,825 2,835Trading/supply salesb 3,149 2,775 2,770Total refined product sales 5,948 5,600 5,605Crude oilc 2,616 2,169 2,098Total 8,564 7,769 7,703
a Marketing sales include branded and unbranded sales of refined fuel products and lubricants to both business-to-business and business-to-consumer customers, including service station dealers, jobbers, airlines, small and large resellers such as hypermarkets as well as the military.
b Trading/supply sales are fuel sales to large unbranded resellers and other oil companies.c Crude oil sales relate to transactions executed by our integrated supply and trading function, primarily for optimizing crude oil supplies to our refineries and in other trading. 2017 includes 103 thousand barrels per day relating to revenues reported by the Upstream segment.
Number of BP-branded retail sitesRetail sitesd 2017 2016 2015
US 7,200 7,100 7,000Europe 8,100 8,100 8,100Rest of world 3,000 2,800 2,900Total 18,300 18,000 18,000
d Reported to the nearest 100. Includes sites not operated by BP but instead operated by dealers, jobbers, franchisees or brand licensees under a BP brand. These may move to or from the BP brand as their fuel supply or brand licence agreements expire and are renegotiated in the normal course of business. Retail sites are primarily branded BP, ARCO and Aral and include our interest in equity-accounted entities.
AviationOur Air BP business is one of the world’s largest aviation fuels suppliers, selling fuel to major commercial airlines as well as the general aviation sector in over 800 locations across more than 50 countries globally. We also provide aviation fuel consultancy services to airlines and airports including the design, build and operation of aviation fuelling facilities. Our Air BP business is differentiated through its strong market positions, brand strength, partnerships, technology and customer relationships. Our strategy aims to maintain a strong presence in our core locations in Australia, New Zealand, Europe and the US, while expanding into major growth markets that offer long-term competitive advantages, such as in Asia and Latin America. We have marketing sales of more than 420,000 barrels per day, and in 2017 began marketing in Mexico, one of the world’s fastest-growing aviation markets.
We are developing new offers and solutions in response to the needs of our customers. In 2017 we entered into a strategic partnership and preferred fuel supplier agreement with Victor, one of the world’s leading on-demand marketplaces for private jet charters. We also recognize the lower carbon commitments of the airline industry and continue to develop our capability to meet the industry’s needs. In 2017 we began supply of jet biofuel at two further locations in Sweden and Norway, in addition to Norway’s Oslo airport where in 2016, we became the world’s first supplier for commercial jet biofuel using existing fuelling infrastructure.
Supply and tradingOur integrated supply and trading function is responsible for delivering value across the overall crude and oil products supply chain. This structure enables our downstream businesses to maintain a single interface with oil trading markets and operate with one set of trading compliance and risk management processes, systems and controls. It has a two-fold purpose:
First, it seeks to identify the best markets and prices for our crude oil, source optimal raw materials for our refineries and provide competitive supply for our marketing businesses. We will often sell our own crude and purchase alternative crudes from third parties for our refineries where this will provide incremental margin.
Second, it aims to create and capture incremental trading opportunities by entering into a full range of exchange-traded commodity derivatives , over-the-counter contracts and spot and term contracts . In combination with rights to access storage and transportation capacity, this allows it to access advantageous price differences between locations and time periods, and to arbitrage between markets.
The function has trading offices in Europe, North America and Asia. Our presence in the more actively traded regions of the global oil markets supports overall understanding of the supply and demand forces across these markets.
Our trading financial risk governance framework is described in Financial statements – Note 27 and the range of contracts used is described in Glossary – commodity trading contracts on page 289.
See Glossary BP Annual Report and Form 20-F 201736
Book 1.indb 36 03/04/2018 16:41:53
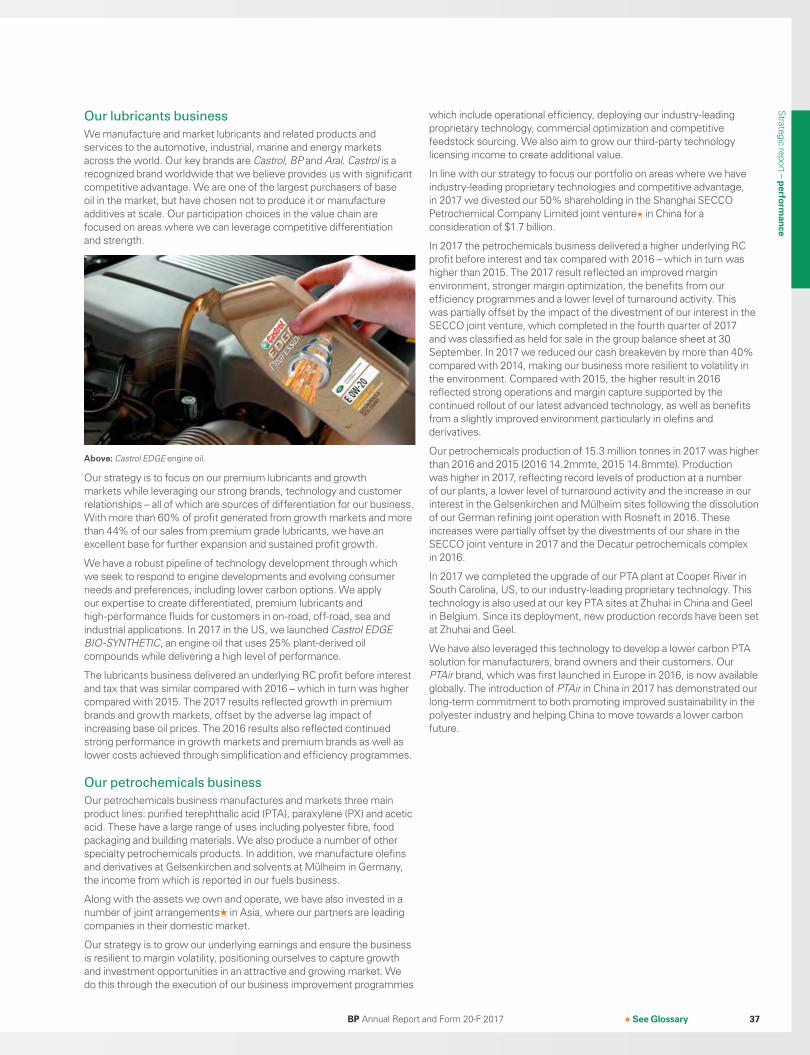
which include operational efficiency, deploying our industry-leading proprietary technology, commercial optimization and competitive feedstock sourcing. We also aim to grow our third-party technology licensing income to create additional value.
In line with our strategy to focus our portfolio on areas where we have industry-leading proprietary technologies and competitive advantage, in 2017 we divested our 50% shareholding in the Shanghai SECCO Petrochemical Company Limited joint venture in China for a consideration of $1.7 billion.
In 2017 the petrochemicals business delivered a higher underlying RC profit before interest and tax compared with 2016 – which in turn was higher than 2015. The 2017 result reflected an improved margin environment, stronger margin optimization, the benefits from our efficiency programmes and a lower level of turnaround activity. This was partially offset by the impact of the divestment of our interest in the SECCO joint venture, which completed in the fourth quarter of 2017 and was classified as held for sale in the group balance sheet at 30 September. In 2017 we reduced our cash breakeven by more than 40% compared with 2014, making our business more resilient to volatility in the environment. Compared with 2015, the higher result in 2016 reflected strong operations and margin capture supported by the continued rollout of our latest advanced technology, as well as benefits from a slightly improved environment particularly in olefins and derivatives.
Our petrochemicals production of 15.3 million tonnes in 2017 was higher than 2016 and 2015 (2016 14.2mmte, 2015 14.8mmte). Production was higher in 2017, reflecting record levels of production at a number of our plants, a lower level of turnaround activity and the increase in our interest in the Gelsenkirchen and Mülheim sites following the dissolution of our German refining joint operation with Rosneft in 2016. These increases were partially offset by the divestments of our share in the SECCO joint venture in 2017 and the Decatur petrochemicals complex in 2016.
In 2017 we completed the upgrade of our PTA plant at Cooper River in South Carolina, US, to our industry-leading proprietary technology. This technology is also used at our key PTA sites at Zhuhai in China and Geel in Belgium. Since its deployment, new production records have been set at Zhuhai and Geel.
We have also leveraged this technology to develop a lower carbon PTA solution for manufacturers, brand owners and their customers. Our PTAir brand, which was first launched in Europe in 2016, is now available globally. The introduction of PTAir in China in 2017 has demonstrated our long-term commitment to both promoting improved sustainability in the polyester industry and helping China to move towards a lower carbon future.
Our lubricants business
We manufacture and market lubricants and related products and services to the automotive, industrial, marine and energy markets across the world. Our key brands are Castrol, BP and Aral. Castrol is a recognized brand worldwide that we believe provides us with significant competitive advantage. We are one of the largest purchasers of base oil in the market, but have chosen not to produce it or manufacture additives at scale. Our participation choices in the value chain are focused on areas where we can leverage competitive differentiation and strength.
Above: Castrol EDGE engine oil.
Our strategy is to focus on our premium lubricants and growth markets while leveraging our strong brands, technology and customer relationships – all of which are sources of differentiation for our business. With more than 60% of profit generated from growth markets and more than 44% of our sales from premium grade lubricants, we have an excellent base for further expansion and sustained profit growth.
We have a robust pipeline of technology development through which we seek to respond to engine developments and evolving consumer needs and preferences, including lower carbon options. We apply our expertise to create differentiated, premium lubricants and high-performance fluids for customers in on-road, off-road, sea and industrial applications. In 2017 in the US, we launched Castrol EDGE BIO-SYNTHETIC, an engine oil that uses 25% plant-derived oil compounds while delivering a high level of performance.
The lubricants business delivered an underlying RC profit before interest and tax that was similar compared with 2016 – which in turn was higher compared with 2015. The 2017 results reflected growth in premium brands and growth markets, offset by the adverse lag impact of increasing base oil prices. The 2016 results also reflected continued strong performance in growth markets and premium brands as well as lower costs achieved through simplification and efficiency programmes.
Our petrochemicals business
Our petrochemicals business manufactures and markets three main product lines: purified terephthalic acid (PTA), paraxylene (PX) and acetic acid. These have a large range of uses including polyester fibre, food packaging and building materials. We also produce a number of other specialty petrochemicals products. In addition, we manufacture olefins and derivatives at Gelsenkirchen and solvents at Mülheim in Germany, the income from which is reported in our fuels business.
Along with the assets we own and operate, we have also invested in a number of joint arrangements in Asia, where our partners are leading companies in their domestic market.
Our strategy is to grow our underlying earnings and ensure the business is resilient to margin volatility, positioning ourselves to capture growth and investment opportunities in an attractive and growing market. We do this through the execution of our business improvement programmes
See GlossaryBP Annual Report and Form 20-F 2017 37
Strategic report – perfo
rman
ce
Book 1.indb 37 03/04/2018 16:41:53

Rosneft
2017 summary• Rosneft continued optimizing its portfolio and increased total
hydrocarbon production by 6.5%.
• BP received $190 million, net of withholding taxes, in July (2016 $332 million, 2015 $271 million), representing its share of Rosneft’s dividend of 5.98 Russian roubles per share. This dividend was 35% of Rosneft’s 2016 IFRS net profit.
• Rosneft implemented a new dividend policy in September, which provides for a target level of dividends of no less than 50% of IFRS net profit, and a target frequency of dividend payments of at least twice a year.
• BP received $124 million, net of withholding taxes, in October, representing its share of Rosneft’s interim dividend of 3.83 Russian roubles per share. This dividend was 50% of Rosneft’s IFRS net profit for the first half of 2017.
• Rosneft completed the acquisition of a 100% interest in the Kondaneft project in April, which is developing four licence areas in the Khanty-Mansiysk Autonomous District in West Siberia. The acquisition price was approximately $700 million.
• Rosneft completed the transaction for the sale of a 20% interest in its Verkhnechonskneftegaz subsidiary to the Beijing Gas Group in June, for around $1.1 billion.
• Rosneft completed the transaction to acquire a 49.13% stake in Essar Oil Limited (EOL), an Indian downstream business, from Essar Energy Holdings Limited and its affiliates (the Essar group) in August. As a result of this transaction, Rosneft acquired an interest in the Vadinar refinery and related infrastructure in India, which is among the top 10 refineries in terms of scale and complexity worldwide. EOL’s business also includes a network of Essar-branded retail outlets across India. The acquisition price totalled $3.9 billion.
• Rosneft completed the acquisition of a 30% stake in a concession agreement to develop the Zohr field in Egypt from the Italian company Eni S.p.A. (Eni) for $1.1 billion in October. Rosneft is also refunding its share in past project costs to Eni, which is estimated at $1.1 billion. Eni retains a 60% stake and BP holds the remaining 10%.
• Two BP nominees, Bob Dudley and Guillermo Quintero, serve on Rosneft’s Board. The number of directors on the Board increased from nine to 11 in September. Bob Dudley became chairman of its Strategic Planning Committee, and Guillermo Quintero is a member of its HR and Remuneration Committee.
• US and EU sanctions imposed in 2014 remain in place on certain Russian activities, individuals and entities, including Rosneft. In 2017 the US imposed additional sanctions on certain Russian and international activities and entities, including Rosneft.
About Rosneft• Rosneft is the largest oil company in Russia and the largest publicly
traded oil company in the world, based on hydrocarbon production volume. Rosneft has a major resource base of hydrocarbons onshore and offshore, with assets in all Russia’s key hydrocarbon regions. Rosneft’s hydrocarbon production reached a record of 5.7mmboe/d in 2017. Gas production for the year increased by 2% compared with 2016 to 68.4bcma or 6.62bcf/d.
Rosneft is the largest oil company in Russia, with a strong portfolio of current and future opportunities.
BP and Rosneft• BP’s 19.75% shareholding in Rosneft allows us to benefit from
a diversified set of existing and potential projects in the Russian oil and gas sector.
• Russia has one of the largest and lowest-cost hydrocarbon resource bases in the world and its resources play an important role in long-term energy supply to the global economy.
• BP’s strategy in Russia is to support Rosneft’s overall performance and growth through our participation in the Rosneft Board of Directors, collaboration on safety, technology and best practice, and to build a material business based on standalone projects with Rosneft in Russia and internationally. BP remains committed to our strategic investment in Rosneft, while complying with all relevant sanctions.
See Glossary BP Annual Report and Form 20-F 201738
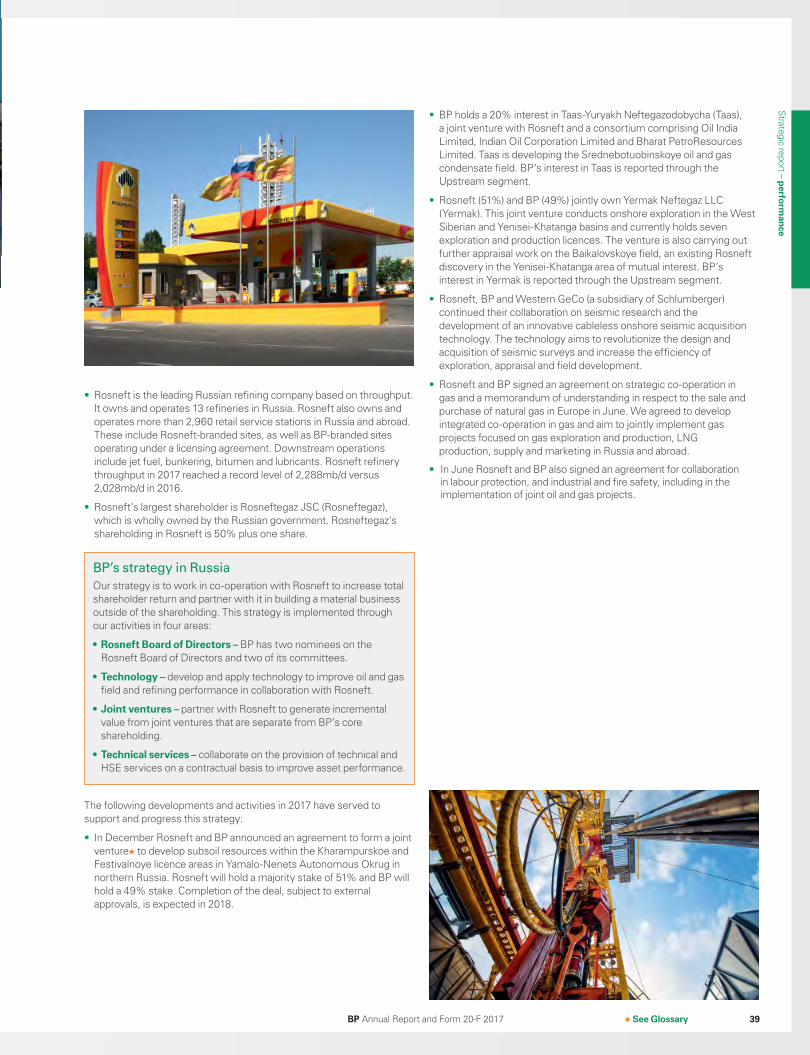
• Rosneft is the leading Russian refining company based on throughput. It owns and operates 13 refineries in Russia. Rosneft also owns and operates more than 2,960 retail service stations in Russia and abroad. These include Rosneft-branded sites, as well as BP-branded sites operating under a licensing agreement. Downstream operations include jet fuel, bunkering, bitumen and lubricants. Rosneft refinery throughput in 2017 reached a record level of 2,288mb/d versus 2,028mb/d in 2016.
• Rosneft’s largest shareholder is Rosneftegaz JSC (Rosneftegaz), which is wholly owned by the Russian government. Rosneftegaz's shareholding in Rosneft is 50% plus one share.
The following developments and activities in 2017 have served to support and progress this strategy:
• In December Rosneft and BP announced an agreement to form a joint venture to develop subsoil resources within the Kharampurskoe and Festivalnoye licence areas in Yamalo-Nenets Autonomous Okrug in northern Russia. Rosneft will hold a majority stake of 51% and BP will hold a 49% stake. Completion of the deal, subject to external approvals, is expected in 2018.
• BP holds a 20% interest in Taas-Yuryakh Neftegazodobycha (Taas), a joint venture with Rosneft and a consortium comprising Oil India Limited, Indian Oil Corporation Limited and Bharat PetroResources Limited. Taas is developing the Srednebotuobinskoye oil and gas condensate field. BP‘s interest in Taas is reported through the Upstream segment.
• Rosneft (51%) and BP (49%) jointly own Yermak Neftegaz LLC (Yermak). This joint venture conducts onshore exploration in the West Siberian and Yenisei-Khatanga basins and currently holds seven exploration and production licences. The venture is also carrying out further appraisal work on the Baikalovskoye field, an existing Rosneft discovery in the Yenisei-Khatanga area of mutual interest. BP’s interest in Yermak is reported through the Upstream segment.
• Rosneft, BP and Western GeCo (a subsidiary of Schlumberger) continued their collaboration on seismic research and the development of an innovative cableless onshore seismic acquisition technology. The technology aims to revolutionize the design and acquisition of seismic surveys and increase the efficiency of exploration, appraisal and field development.
• Rosneft and BP signed an agreement on strategic co-operation in gas and a memorandum of understanding in respect to the sale and purchase of natural gas in Europe in June. We agreed to develop integrated co-operation in gas and aim to jointly implement gas projects focused on gas exploration and production, LNG production, supply and marketing in Russia and abroad.
• In June Rosneft and BP also signed an agreement for collaboration in labour protection, and industrial and fire safety, including in the implementation of joint oil and gas projects.
See Glossary
BP’s strategy in Russia
Our strategy is to work in co-operation with Rosneft to increase total shareholder return and partner with it in building a material business outside of the shareholding. This strategy is implemented through our activities in four areas:
• Rosneft Board of Directors – BP has two nominees on the Rosneft Board of Directors and two of its committees.
• Technology – develop and apply technology to improve oil and gas field and refining performance in collaboration with Rosneft.
• Joint ventures – partner with Rosneft to generate incremental value from joint ventures that are separate from BP’s core shareholding.
• Technical services – collaborate on the provision of technical and HSE services on a contractual basis to improve asset performance.
BP Annual Report and Form 20-F 2017 39
Strategic report – perfo
rman
ce
Book 1.indb 39 03/04/2018 16:42:04
Rosneft segment performance
BP’s investment in Rosneft is managed and reported as a separate segment under IFRS. The segment result includes equity-accounted earnings, representing BP’s 19.75% share of the profit or loss of Rosneft, as adjusted for the accounting required under IFRS relating to BP’s purchase of its interest in Rosneft and the amortization of the deferred gain relating to the disposal of BP’s interest in TNK-BP. See Financial statements – Note 15 for further information.
$ million 2017 2016 2015
Profit before interest and taxa b 923 643 1,314Inventory holding (gains) losses (87) (53) (4)RC profit before interest and tax 836 590 1,310Net charge (credit) for non-operating items – (23) –Underlying RC profit before interest and tax 836 567 1,310Average oil marker prices $ per barrel
Urals (Northwest Europe – CIF) 52.84 41.68 50.97a BP’s share of Rosneft’s earnings after finance costs, taxation and non-controlling interests is included in the BP group income statement within profit before interest and taxation.
b Includes $(2) million (2016 $3 million, 2015 $16 million) of foreign exchange (gain)/losses arising on the dividend received.
Market price
The price of Urals delivered in North West Europe (Rotterdam) averaged $52.84/bbl in 2017, $1.35/bbl below dated Brent . The differential to Brent narrowed from $2.06/bbl in 2016 as OPEC production cuts tightened the market for medium sour crude.
Financial results
Replacement cost (RC) profit before interest and tax for the segment for 2016 included a non-operating gain of $23 million, whereas the 2017 and 2015 results did not include any non-operating items.
After adjusting for non-operating items, the increase in the underlying RC profit before interest and tax compared with 2016 primarily reflected higher oil prices. The result also benefited from a $163-million gain representing the BP share of a voluntary out-of-court settlement between Sistema, Sistema-Invest and the Rosneft subsidiary, Bashneft. These positive effects were partially offset by adverse foreign exchange effects. Compared with 2015, the 2016 result was primarily affected by lower oil prices and increased government take, partially offset by favourable duty lag effects. See also Financial statements – Notes 15 and 30 for other foreign exchange effects.
Balance sheet$ million
2017 2016 2015
Investments in associates c
(as at 31 December) 10,059 8,243 5,797
Production and reserves2017 2016 2015
Production (net of royalties) (BP share)Liquids (mb/d)
Crude oild
Natural gas liquidsTotal liquids
Natural gas (mmcf/d)Total hydrocarbons (mboe/d)
9004
9041,3081,129
8364
8401,2791,060
8094
8131,1951,019
Estimated net proved reservese
(net of royalties) (BP share)Liquids (million barrels)
Crude oild
Natural gas liquidsTotal liquidsf
5,402131
5,533
5,33065
5,395
4,82347
4,871Natural gas (billion cubic feet)g 13,522 11,900 11,169Total hydrocarbons (mmboe) 7,864 7,447 6,796c See Financial statements – Note 15 for further information.d Includes condensate.e Because of rounding, some totals may not agree exactly with the sum of their component parts.
f Includes 338 million barrels of crude oil (347 million barrels at 31 December 2016) in respect of the 6.31% non-controlling interest (6.58% at 31 December 2016) in Rosneft, held assets in Russia including 32 million barrels (28 million barrels at 31 December 2016) held through BP’s equity-accounted interest in Taas-Yuryakh Neftegazodobycha.
g Includes 306 billion cubic feet of natural gas (300 billion cubic feet at 31 December 2016) in respect of the 2.30% non-controlling interest (2.53% at 31 December 2016) in Rosneft held assets in Russia including 12 billion cubic feet (3 billion cubic feet at 31 December 2016) held through BP’s equity-accounted interest in Taas-Yuryakh Neftegazodobycha.
See Glossary BP Annual Report and Form 20-F 201740
Book 1.indb 40 03/04/2018 16:42:08
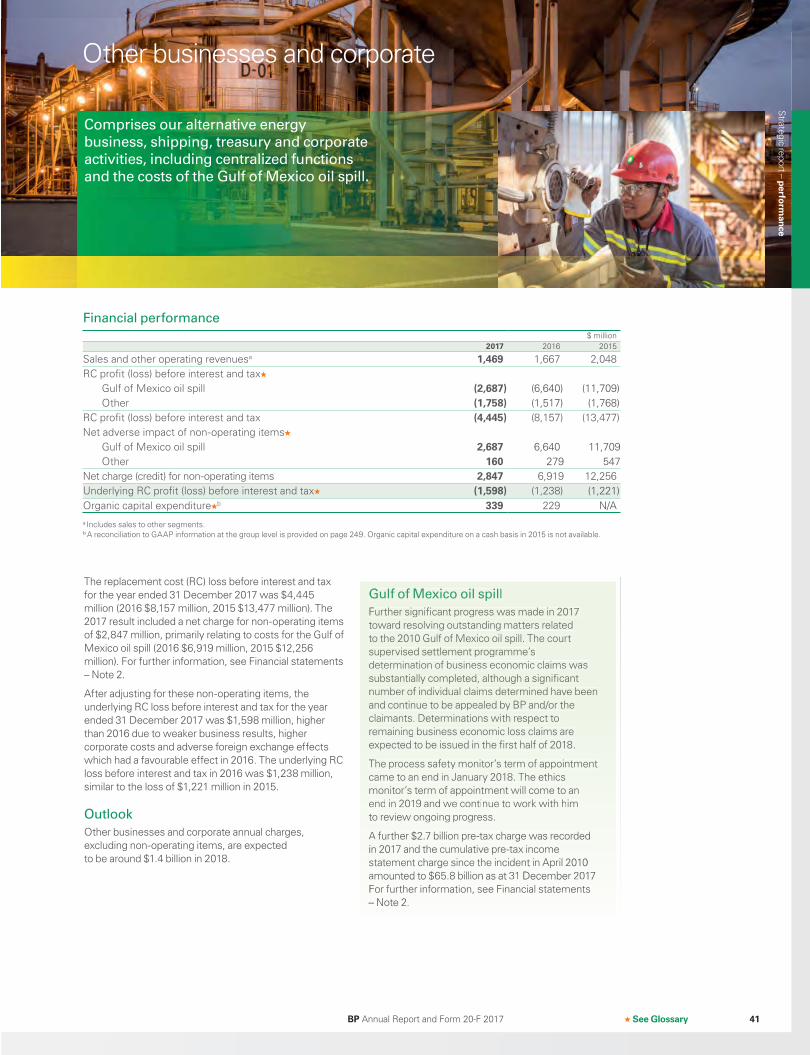
See Glossary
The replacement cost (RC) loss before interest and tax for the year ended 31 December 2017 was $4,445 million (2016 $8,157 million, 2015 $13,477 million). The 2017 result included a net charge for non-operating items of $2,847 million, primarily relating to costs for the Gulf of Mexico oil spill (2016 $6,919 million, 2015 $12,256 million). For further information, see Financial statements – Note 2.
After adjusting for these non-operating items, the underlying RC loss before interest and tax for the year ended 31 December 2017 was $1,598 million, higher than 2016 due to weaker business results, higher corporate costs and adverse foreign exchange effects which had a favourable effect in 2016. The underlying RC loss before interest and tax in 2016 was $1,238 million, similar to the loss of $1,221 million in 2015.
Outlook
Other businesses and corporate annual charges, excluding non-operating items, are expected to be around $1.4 billion in 2018.
Gulf of Mexico oil spill
Further significant progress was made in 2017 toward resolving outstanding matters related to the 2010 Gulf of Mexico oil spill. The court supervised settlement programme’s determination of business economic claims was substantially completed, although a significant number of individual claims determined have been and continue to be appealed by BP and/or the claimants. Determinations with respect to remaining business economic loss claims are expected to be issued in the first half of 2018.
The process safety monitor’s term of appointment came to an end in January 2018. The ethics monitor’s term of appointment will come to an end in 2019 and we continue to work with him to review ongoing progress.
A further $2.7 billion pre-tax charge was recorded in 2017 and the cumulative pre-tax income statement charge since the incident in April 2010 amounted to $65.8 billion as at 31 December 2017 For further information, see Financial statements – Note 2.
Financial performance
$ million 2017 2016 2015
Sales and other operating revenuesa 1,469 1,667 2,048RC profit (loss) before interest and tax
Gulf of Mexico oil spill (2,687) (6,640) (11,709)Other (1,758) (1,517) (1,768)
RC profit (loss) before interest and tax (4,445) (8,157) (13,477)Net adverse impact of non-operating items
Gulf of Mexico oil spill 2,687 6,640 11,709Other 160 279 547
Net charge (credit) for non-operating items 2,847 6,919 12,256Underlying RC profit (loss) before interest and tax (1,598) (1,238) (1,221)Organic capital expenditure b 339 229 N/Aa Includes sales to other segments.b A reconciliation to GAAP information at the group level is provided on page 249. Organic capital expenditure on a cash basis in 2015 is not available.
Gulf of Mexico oil spill
Further significant progress was made in 2017toward resolving outstanding matters related to the 2010 Gulf of Mexico oil spill. The courtsupervised settlement programme’s determination of business economic claims was substantially completed, although a significant number of individual claims determined have been and continue to be apppeap led byy BP and/or theclaimants. Determinations with respect toremainingg business economic loss claims areexpected to be issued in the first half of 2018.
The process safety monitor’s term of appointment came to an end in January 2018. The ethics monitor’s term of appointment will come to anendend inin 20201919 andand wewe cocontintinuenue toto woworkrk witwith hh himimto review ongoig ng g prop greg ss.
A further $2.7 billion pre-tax charge was recorded in 2017 and the cumulative pre-tax income statement charge since the incident in April 2010amounted to $65.8 billion as at 31 December 2017For further information, see Financial statements – Note 2.
Other businesses and corporate
Comprises our alternative energy
business, shipping, treasury and corporate
activities, including centralized functions
and the costs of the Gulf of Mexico oil spill.
BP Annual Report and Form 20-F 2017 41
Strategic report – perfo
rman
ce
Book 1.indb 41 03/04/2018 16:42:12

We have been investing in renewables
for many years – and our focus today
is on biofuels, biopower, wind energy
and solar energy.
Renewables are the fastest growing form of energy. They account for around 4% of energy demand today (excluding large-scale hydroelectricity). By 2040 that could grow to at least 14% – an exceptional rate of growth for the energy industry.
As part of our approach to building our alternative energy business, we are looking to grow our existing businesses and to develop further new businesses and partnerships to deliver sustainable value.
Biofuels
We believe that biofuels offer one of the best large-scale solutions to reduce emissions from transportation.
We produce ethanol from sugar cane in Brazil. This ethanol has life cycle greenhouse gas emissions that are 70% lower than conventional transport fuels. In 2017 our three sites produced 776 million litres of ethanol equivalent.
Brazil is one of the largest markets globally for ethanol fuel. To better connect our ethanol production with the country’s main fuels markets, we are partnering with Copersucar, the world’s leading ethanol and sugar trader, to operate a major ethanol storage terminal.
Our largest biofuels mill is certified to Bonsucro, an independent standard for sustainable sugar cane production.
Our strategy is enabled by:
• Safe and reliable operations – continuing to drive improvements in personal, process and transport safety.
• Competitive feedstock – concentrating our efforts in Brazil, which has one of the most cost-competitive biofuel sources currently available in the world.
• Domestic and international markets – selling bioethanol and sugar domestically in Brazil and also to international markets such as the US and Europe through our integrated supply and trading function.
Advanced biofuels
Butamax®, our 50/50 joint venture with DuPont, has developed technology that converts sugars from corn into an energy-rich biofuel known as bio-isobutanol. It can be blended with gasoline at higher concentrations than ethanol and transported through existing fuel pipelines and infrastructure. Butamax® plans to upgrade its recently acquired ethanol plant in Kansas to enable it to produce bio-isobutanol to demonstrate the technology to ethanol producers.
Biopower
We create biopower by burning bagasse, the fibre that remains after crushing sugar cane stalks. In 2017 our three biofuels manufacturing facilities produced around 850GWh of electricity – enough renewable energy to power all of these sites and export the remaining 70% to the local electricity grid.
This is a low carbon power source, with the CO2 emitted from burning bagasse offset by the CO2 absorbed by sugar cane during its growth.
Wind energy
We have interests in 14 sites in the US with a net generating capacity of 1,432MW, making BP one of the top wind energy producers in the country. We continue to optimize our business by seeking out technological advancements and finding ways to deliver power more efficiently.
Solar energy
BP has partnered with Lightsource, Europe’s largest solar development company, which focuses on the acquisition, development and long-term management of large- scale solar projects. We are bringing our global scale, relationships and trading capabilities to help accelerate Lightsource’s expansion worldwide. The company has been rebranded as Lightsource BP. We are investing $200 million in Lightsource BP over three years and will hold a 43% stake in the company with two seats on its board.
Left: Lightsource BP's floating solar farm on the Queen Elizabeth II reservoir, just outside London.
Alternative Energy
42 BP Annual Report and Form 20-F 2017
Book 1.indb 42 03/04/2018 16:42:18
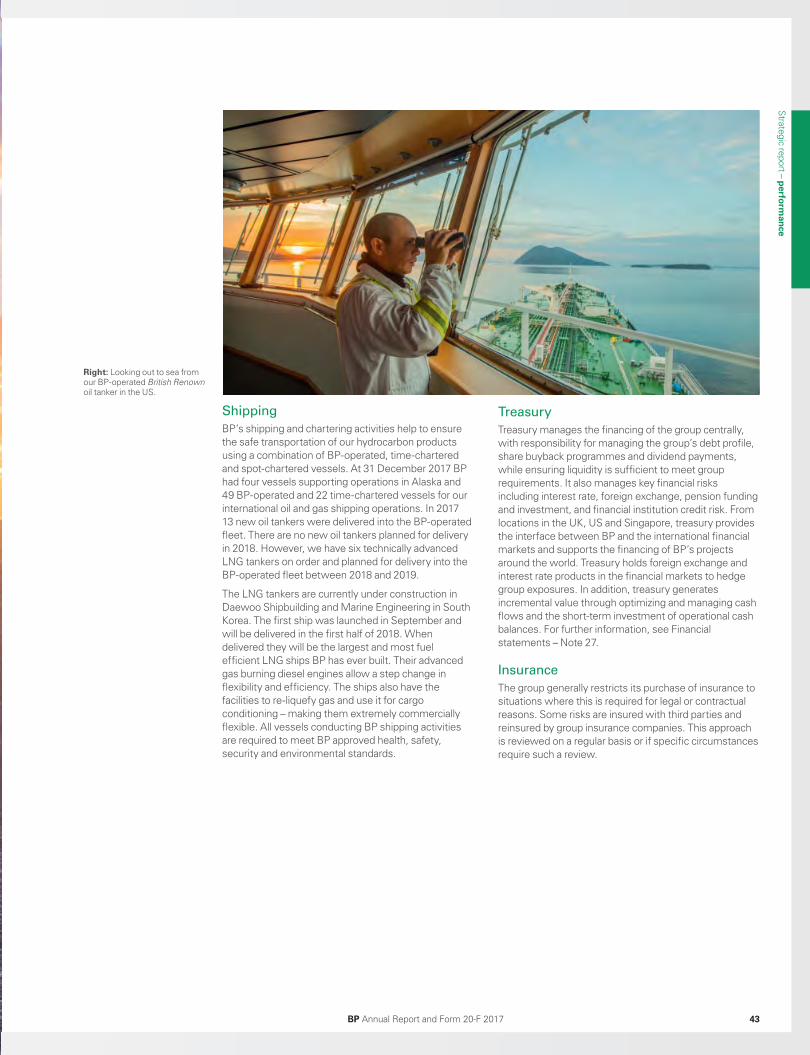
Shipping
BP’s shipping and chartering activities help to ensure the safe transportation of our hydrocarbon products using a combination of BP-operated, time-chartered and spot-chartered vessels. At 31 December 2017 BP had four vessels supporting operations in Alaska and 49 BP-operated and 22 time-chartered vessels for our international oil and gas shipping operations. In 2017 13 new oil tankers were delivered into the BP-operated fleet. There are no new oil tankers planned for delivery in 2018. However, we have six technically advanced LNG tankers on order and planned for delivery into the BP-operated fleet between 2018 and 2019.
The LNG tankers are currently under construction in Daewoo Shipbuilding and Marine Engineering in South Korea. The first ship was launched in September and will be delivered in the first half of 2018. When delivered they will be the largest and most fuel efficient LNG ships BP has ever built. Their advanced gas burning diesel engines allow a step change in flexibility and efficiency. The ships also have the facilities to re-liquefy gas and use it for cargo conditioning – making them extremely commercially flexible. All vessels conducting BP shipping activities are required to meet BP approved health, safety, security and environmental standards.
Treasury
Treasury manages the financing of the group centrally, with responsibility for managing the group’s debt profile, share buyback programmes and dividend payments, while ensuring liquidity is sufficient to meet group requirements. It also manages key financial risks including interest rate, foreign exchange, pension funding and investment, and financial institution credit risk. From locations in the UK, US and Singapore, treasury provides the interface between BP and the international financial markets and supports the financing of BP’s projects around the world. Treasury holds foreign exchange and interest rate products in the financial markets to hedge group exposures. In addition, treasury generates incremental value through optimizing and managing cash flows and the short-term investment of operational cash balances. For further information, see Financial statements – Note 27.
Insurance
The group generally restricts its purchase of insurance to situations where this is required for legal or contractual reasons. Some risks are insured with third parties and reinsured by group insurance companies. This approach is reviewed on a regular basis or if specific circumstances require such a review.
Right: Looking out to sea from our BP-operated British Renown oil tanker in the US.
BP Annual Report and Form 20-F 2017 43
Strategic report – perfo
rman
ce
Book 1.indb 43 03/04/2018 16:42:27
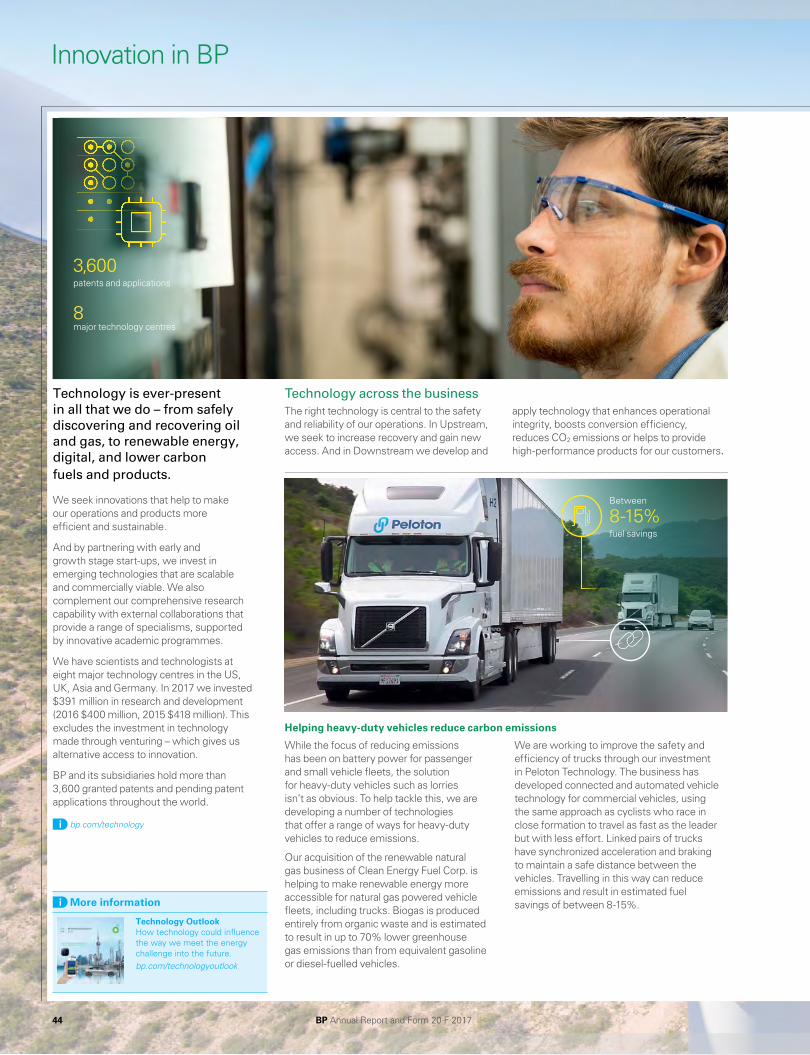
Innovation in BP
Technology is ever-present in all that we do – from safely discovering and recovering oil and gas, to renewable energy, digital, and lower carbon fuels and products.
We seek innovations that help to make our operations and products more efficient and sustainable.
And by partnering with early and growth stage start-ups, we invest in emerging technologies that are scalable and commercially viable. We also complement our comprehensive research capability with external collaborations that provide a range of specialisms, supported by innovative academic programmes.
We have scientists and technologists at eight major technology centres in the US, UK, Asia and Germany. In 2017 we invested $391 million in research and development (2016 $400 million, 2015 $418 million). This excludes the investment in technology made through venturing – which gives us alternative access to innovation.
BP and its subsidiaries hold more than 3,600 granted patents and pending patent applications throughout the world.
bp.com/technology
More information
Technology OutlookHow technology could influence the way we meet the energy challenge into the future.bp.com/technologyoutlook
While the focus of reducing emissions has been on battery power for passenger and small vehicle fleets, the solution for heavy-duty vehicles such as lorries isn’t as obvious. To help tackle this, we are developing a number of technologies that offer a range of ways for heavy-duty vehicles to reduce emissions.
Our acquisition of the renewable natural gas business of Clean Energy Fuel Corp. is helping to make renewable energy more accessible for natural gas powered vehicle fleets, including trucks. Biogas is produced entirely from organic waste and is estimated to result in up to 70% lower greenhouse gas emissions than from equivalent gasoline or diesel-fuelled vehicles.
We are working to improve the safety and efficiency of trucks through our investment in Peloton Technology. The business has developed connected and automated vehicle technology for commercial vehicles, using the same approach as cyclists who race in close formation to travel as fast as the leader but with less effort. Linked pairs of trucks have synchronized acceleration and braking to maintain a safe distance between the vehicles. Travelling in this way can reduce emissions and result in estimated fuel savings of between 8-15%.
Helping heavy-duty vehicles reduce carbon emissions
Technology across the businessThe right technology is central to the safety and reliability of our operations. In Upstream, we seek to increase recovery and gain new access. And in Downstream we develop and
apply technology that enhances operational integrity, boosts conversion efficiency, reduces CO2 emissions or helps to provide high-performance products for our customers.
Between
8-15%fuel savings
3,600patents and applications
8major technology centres
BP Annual Report and Form 20-F 201744
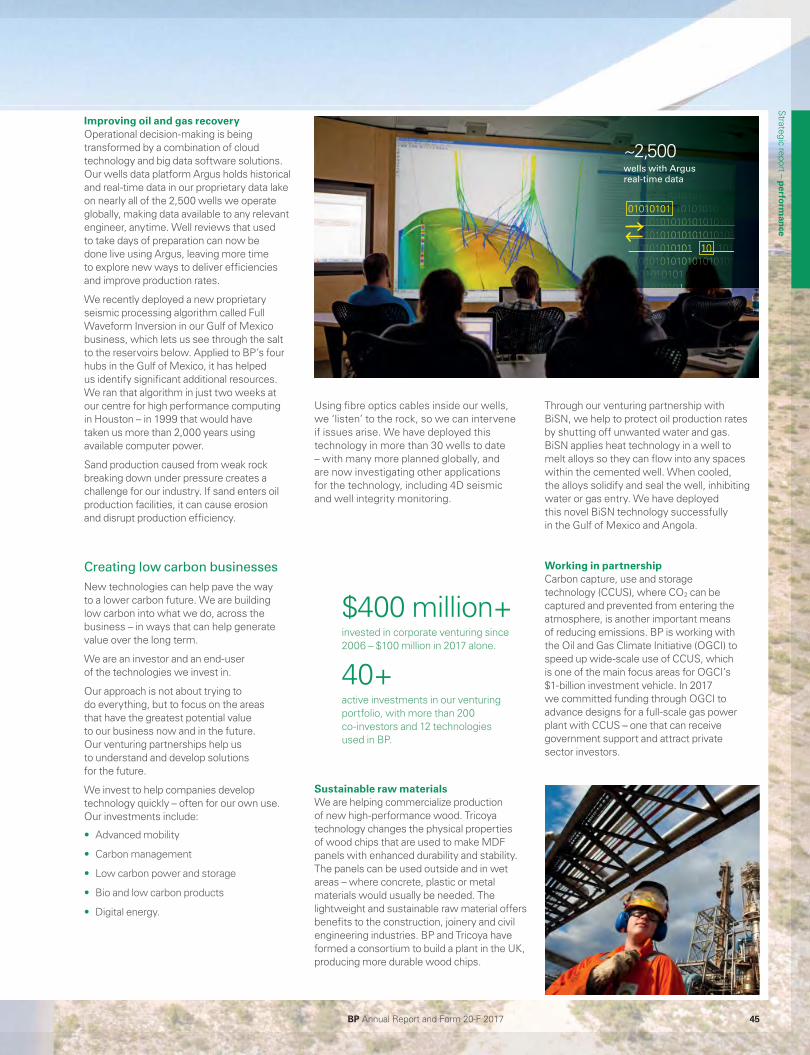
Using fibre optics cables inside our wells, we ‘listen’ to the rock, so we can intervene if issues arise. We have deployed this technology in more than 30 wells to date – with many more planned globally, and are now investigating other applications for the technology, including 4D seismic and well integrity monitoring.
Through our venturing partnership with BiSN, we help to protect oil production rates by shutting off unwanted water and gas. BiSN applies heat technology in a well to melt alloys so they can flow into any spaces within the cemented well. When cooled, the alloys solidify and seal the well, inhibiting water or gas entry. We have deployed this novel BiSN technology successfully in the Gulf of Mexico and Angola.
Improving oil and gas recoveryOperational decision-making is being transformed by a combination of cloud technology and big data software solutions. Our wells data platform Argus holds historical and real-time data in our proprietary data lake on nearly all of the 2,500 wells we operate globally, making data available to any relevant engineer, anytime. Well reviews that used to take days of preparation can now be done live using Argus, leaving more time to explore new ways to deliver efficiencies and improve production rates.
We recently deployed a new proprietary seismic processing algorithm called Full Waveform Inversion in our Gulf of Mexico business, which lets us see through the salt to the reservoirs below. Applied to BP’s four hubs in the Gulf of Mexico, it has helped us identify significant additional resources. We ran that algorithm in just two weeks at our centre for high performance computing in Houston – in 1999 that would have taken us more than 2,000 years using available computer power.
Sand production caused from weak rock breaking down under pressure creates a challenge for our industry. If sand enters oil production facilities, it can cause erosion and disrupt production efficiency.
$400 million+invested in corporate venturing since 2006 – $100 million in 2017 alone.
40+active investments in our venturing portfolio, with more than 200 co-investors and 12 technologies used in BP.
Creating low carbon businesses
New technologies can help pave the way to a lower carbon future. We are building low carbon into what we do, across the business – in ways that can help generate value over the long term.
We are an investor and an end-user of the technologies we invest in.
Our approach is not about trying to do everything, but to focus on the areas that have the greatest potential value to our business now and in the future. Our venturing partnerships help us to understand and develop solutions for the future.
We invest to help companies develop technology quickly – often for our own use. Our investments include:
• Advanced mobility
• Carbon management
• Low carbon power and storage
• Bio and low carbon products
• Digital energy.
Working in partnership Carbon capture, use and storage technology (CCUS), where CO2 can be captured and prevented from entering the atmosphere, is another important means of reducing emissions. BP is working with the Oil and Gas Climate Initiative (OGCI) to speed up wide-scale use of CCUS, which is one of the main focus areas for OGCI’s $1-billion investment vehicle. In 2017 we committed funding through OGCI to advance designs for a full-scale gas power plant with CCUS – one that can receive government support and attract private sector investors.
Sustainable raw materialsWe are helping commercialize production of new high-performance wood. Tricoya technology changes the physical properties of wood chips that are used to make MDF panels with enhanced durability and stability. The panels can be used outside and in wet areas – where concrete, plastic or metal materials would usually be needed. The lightweight and sustainable raw material offers benefits to the construction, joinery and civil engineering industries. BP and Tricoya have formed a consortium to build a plant in the UK, producing more durable wood chips.
~2,500wells with Argus real-time data
0000010010000000100100100 00 00000 0111101101101011011010010110101010101101100111110111110110010101010111011110010101010100100100100101001001010010110101001010101010 01010111010111011010110101111101010010101000010010001010100100000 1110101010101110101010100100101111111000111110111111011111010000101001000000 000010101010111011000000 0000000000000001110101111010111111101011110011100100101111001111010100001010001101101101 0000000000010101010101000000000000000000010100000000101000111100101100100000100000100000001010001010111 11111111100111111111101011111101011101011101101011101 010101010001000 00 1010110011 11 1 01000100011000000000 00000 0000 00000000011101010100010110111010110001100100110001110011101101001001010010010010000101000 1011011101101010010010000101001000 1000010111010111 000101110001000001011100000000 0010001100100011111010011001001100111111 110001010101010000111001 10110111011011010 01010111000011010110 100001011110 00001111110110100101110001101000 00011010010010111111000001 00011100000000000000 1011010101 1111 11100001111111 01001110000000000001011100001110101000101110100111111011100011000111 11 0101001101000001000 0000 00000000000 101010110101011110111011111111000010110000010101010000101010100010100000100 0100 0100 000 00100 111100010111111111101111111111 1010 00000101011111100111111000000010100101010100101000000000010000000010010011001000010001010 000000010100001010110001111000010011000000011110010110000100 00000 00 00000001000100010000010001110000 001100010110110110110101011101011011110001111010011011 10100101000100010000101011000010010101100001000 11111111000001010010101111111000000000000000111111000000111100000000001110000000111000000011001100001100010001100010010101000100111001100110110010 00100010010001001001000 00 1111111001000000111111000000000011000110011011001100001111000000000011000000 000 001 10110001111001111 1001001010010111
01010101
10
Strategic report – perfo
rman
ce
BP Annual Report and Form 20-F 2017 45
Book 1.indb 45 03/04/2018 16:42:42

Previously used in deep space exploration – our venturing partnership with Beyond Limits is using artificial intelligence (AI) technology to transform the way we manage reservoirs here on Earth.
Our investment in the start-up company is helping develop and commercialize the same technology that successfully supported NASA’s space programme for more than 20 years for the oil and gas industry.
Beyond Limits aims to adapt and deliver its AI software to tackle industrial and business challenges on Earth. The work uses machine learning and human
Going beyond the limits
Venturing and low carbon across multiple fronts
Turning carbon into concreteOur investment in Solidia, a cement and concrete company, is supporting a new technology to produce cement in a way that generates fewer emissions – using CO2 instead of water to cure the concrete. The technology has the potential to lower emissions in concrete production by up to 70%, and allows 80% of the water used in its production process to be recycled.
Rapid mobile charging BP has invested $5 million in FreeWire, a US manufacturer of mobile electric vehicle rapid charging systems, and we plan to roll out the charging facilities for use at selected BP retail sites in Europe during 2018. This investment will help to build our understanding of this fast-evolving market.
knowledge to simulate human reasoning, with the same exploration techniques that NASA’s Curiosity Rover used on the surface of Mars.
We are supporting this work to help accelerate its delivery and provide the energy sector with new levels of process automation and better insight and effectiveness across all operations.
The work supports BP’s vision of using digital technology to help transform our organization. And we believe that it could fundamentally change how we locate and develop reservoirs, produce and refine crude oil, market and supply refined products and make unmanned repairs possible for dangerous maintenance.
70%potential emissions reduction
$20 million invested in Beyond Limits
20+
years supporting NASA
New technologies
Alternative thinking
Disruptive business models
BP Annual Report and Form 20-F 201746
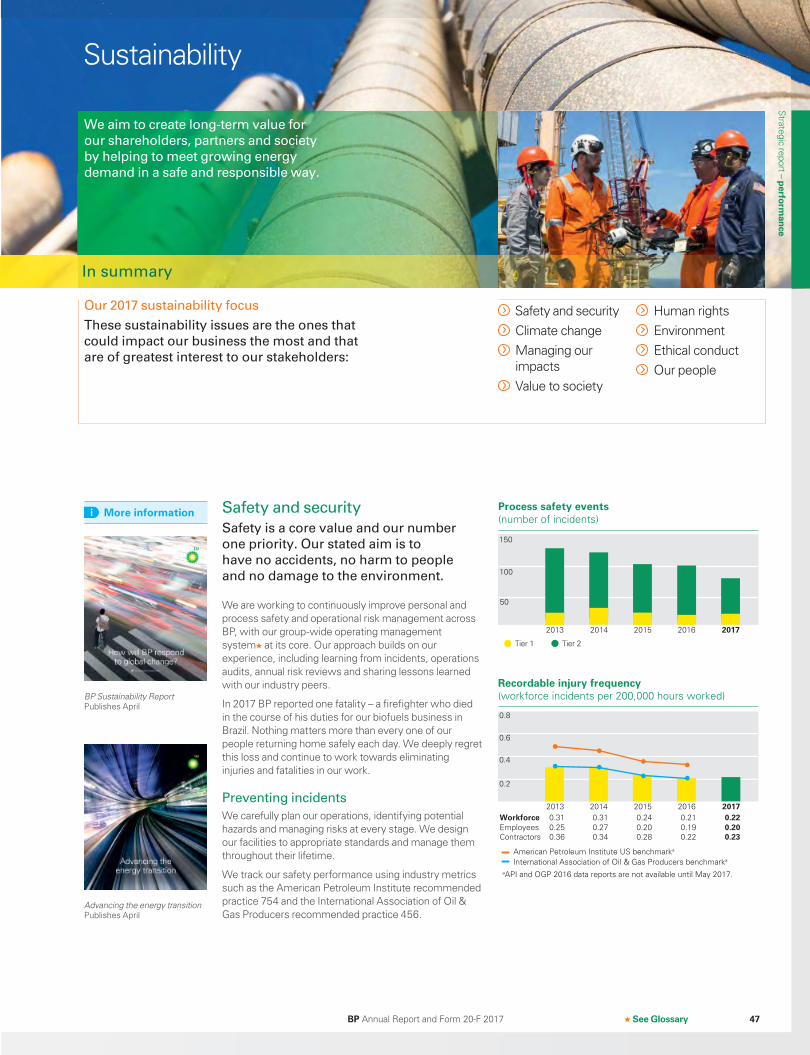
Sustainability
Safety and security
Safety is a core value and our number
one priority. Our stated aim is to
have no accidents, no harm to people
and no damage to the environment.
We are working to continuously improve personal and process safety and operational risk management across BP, with our group-wide operating management system at its core. Our approach builds on our experience, including learning from incidents, operations audits, annual risk reviews and sharing lessons learned with our industry peers.
In 2017 BP reported one fatality – a firefighter who died in the course of his duties for our biofuels business in Brazil. Nothing matters more than every one of our people returning home safely each day. We deeply regret this loss and continue to work towards eliminating injuries and fatalities in our work.
Preventing incidents
We carefully plan our operations, identifying potential hazards and managing risks at every stage. We design our facilities to appropriate standards and manage them throughout their lifetime.
We track our safety performance using industry metrics such as the American Petroleum Institute recommended practice 754 and the International Association of Oil & Gas Producers recommended practice 456.
We aim to create long-term value for
our shareholders, partners and society
by helping to meet growing energy
demand in a safe and responsible way.
Advancing the energy transition Publishes April
Our 2017 sustainability focus
These sustainability issues are the ones that
could impact our business the most and that
are of greatest interest to our stakeholders:
Safety and security Climate change Managing our impacts
Value to society
Human rights Environment Ethical conduct Our people
See Glossary
In summary
Tier 1 Tier 2
2014 2015 2016 20172013
100
Process safety events (number of incidents)
50
150
American Petroleum Institute US benchmarka
2014 2015 2016 20172013
0.8
0.4
0.6
0.2
Recordable injury frequency (workforce incidents per 200,000 hours worked)
0.25 0.27 0.20 0.19 0.20 Contractors Employees
0.31 0.31 0.24 0.21 0.22Workforce
0.36 0.34 0.28 0.22 0.23
International Association of Oil & Gas Producers benchmarka
aAPI and OGP 2016 data reports are not available until May 2017.
BP Sustainability Report Publishes April
More information
Strategic report – perfo
rman
ce
BP Annual Report and Form 20-F 2017 47
Book 1.indb 47 03/04/2018 16:42:55

2017 2016 2015
Tier 1 process safety events a 18 16 20Tier 2 process safety eventsb 61 84 83Oil spills – numberc 139 149 146 Oil spills contained 81 91 91 Oil spills reaching land and water 58 58 55Oil spilled – volume (thousand litres) 886 677 432 Oil unrecovered (thousand litres) 265 311 142
a Tier 1 process safety events are losses of primary containment of greater consequence – such as causing harm to a member of the workforce, costly damage to equipment or exceeding defined quantities.
b Tier 2 events are those of lesser consequence.c Number of spills greater than or equal to one barrel (159 litres, 42 US gallons).
In 2017 we continued to see a reduction in the overall number of process safety events, despite a slight increase in tier 1, the more serious events.
We investigate safety incidents and near misses, including low probability, high consequence events. And we use leading indicators, like inspections and equipment tests, to monitor the strength of controls to prevent incidents. What we learn from performance insights helps us focus our safety efforts. For example, we are introducing techniques for teams to analyse and redesign tasks to reduce the chance of mistakes occurring.
Proactively managing equipment corrosion is also a focus for us – and we believe this is helping to deliver improvements in process safety in our upstream and downstream businesses.
Keeping people safe
All members of our workforce have the responsibility and the authority to stop unsafe work. Our golden rules of safety guide our workers on staying safe while performing tasks with the potential to cause most harm. The rules are aligned with our operating management system and focus on areas such as working at heights, lifting operations and driving safety.
We monitor and report on key workforce personal safety metrics and include both employees and contractors in our data.
2017 2016 2015
Recordable injury frequencyd 0.22 0.21 0.24Day away from work case
frequencye 0.055 0.051 0.061Severe vehicle accident ratef 0.03 0.05 0.11
d Incidents that result in a fatality or injury per 200,000 hours worked.e Incidents that result in an injury where a person is unable to work for a day (shift) or more per 200,000 hours worked.
f The figures for 2016 and 2017 are based on our new definition which aligns with industry practice.
We have seen a small increase in our recordable injury frequency and day away from work case frequency compared to last year. Improving safety in our operations is a high priority and we are working on it right across the business.
Managing safety
BP-operated businesses are responsible for identifying and managing operating risks and bringing together people with the right skills and competencies to address them. They are required to carry out self-verification and are also subject to independent scrutiny and assurance. Our safety and operational risk team works alongside BP-operated businesses to provide oversight and technical guidance, while our group audit team visits sites on a risk-prioritized basis, to check how they are managing risks.
Operating management systemBP’s OMS is a group-wide framework designed to help us manage risks in our operating activities and drive performance improvements. It brings together BP requirements on health, safety, security, the environment, social responsibility and operational reliability, as well as related issues, such as maintenance, contractor relations and organizational learning, into a common management system.
We review and amend our group requirements within OMS from time to time to reflect BP’s priorities and experience. Any variations in the application of OMS, in order to meet local regulations or circumstances, are subject to a governance process.
OMS also helps us improve the quality of our activities by setting a common framework that our operations must work to. Recently acquired operations need to transition to OMS. See page 49 for information about contractors and joint arrangements .
See Glossary
Above: Monitoring global events at our 24-hour response information centre in the UK.
BP Annual Report and Form 20-F 201748
Book 1.indb 48 03/04/2018 16:42:59
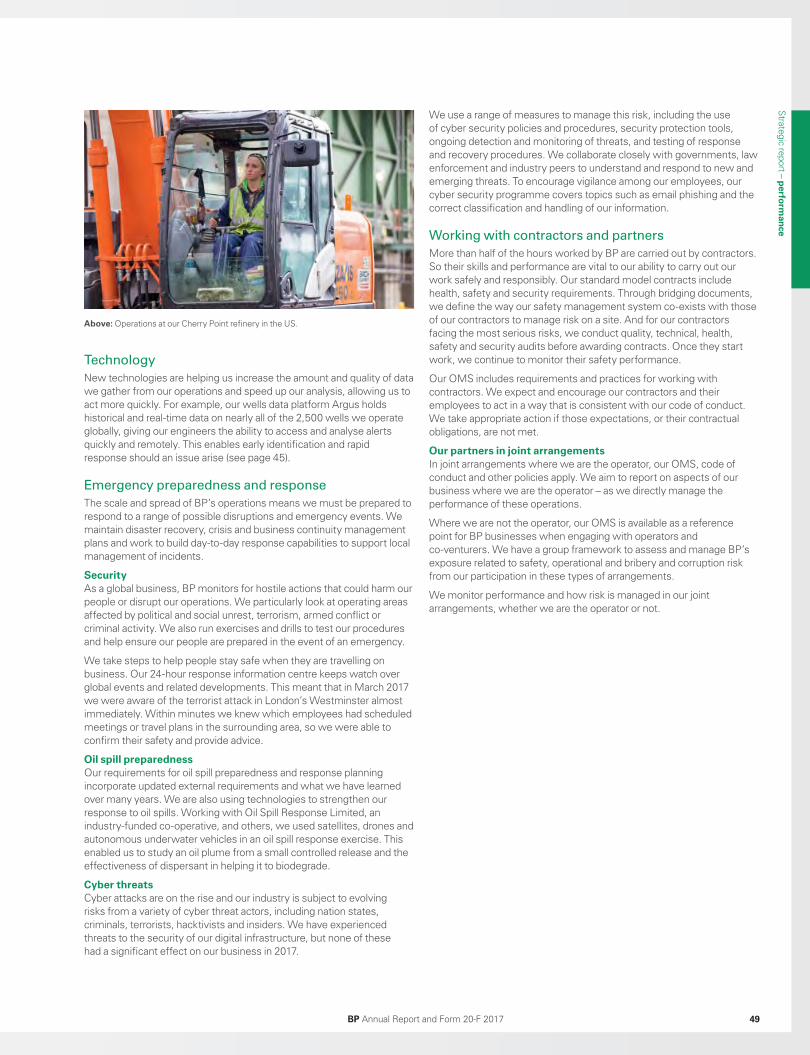
Technology
New technologies are helping us increase the amount and quality of data we gather from our operations and speed up our analysis, allowing us to act more quickly. For example, our wells data platform Argus holds historical and real-time data on nearly all of the 2,500 wells we operate globally, giving our engineers the ability to access and analyse alerts quickly and remotely. This enables early identification and rapid response should an issue arise (see page 45).
Emergency preparedness and response
The scale and spread of BP’s operations means we must be prepared to respond to a range of possible disruptions and emergency events. We maintain disaster recovery, crisis and business continuity management plans and work to build day-to-day response capabilities to support local management of incidents.
SecurityAs a global business, BP monitors for hostile actions that could harm our people or disrupt our operations. We particularly look at operating areas affected by political and social unrest, terrorism, armed conflict or criminal activity. We also run exercises and drills to test our procedures and help ensure our people are prepared in the event of an emergency.
We take steps to help people stay safe when they are travelling on business. Our 24-hour response information centre keeps watch over global events and related developments. This meant that in March 2017 we were aware of the terrorist attack in London’s Westminster almost immediately. Within minutes we knew which employees had scheduled meetings or travel plans in the surrounding area, so we were able to confirm their safety and provide advice.
Oil spill preparednessOur requirements for oil spill preparedness and response planning incorporate updated external requirements and what we have learned over many years. We are also using technologies to strengthen our response to oil spills. Working with Oil Spill Response Limited, an industry-funded co-operative, and others, we used satellites, drones and autonomous underwater vehicles in an oil spill response exercise. This enabled us to study an oil plume from a small controlled release and the effectiveness of dispersant in helping it to biodegrade.
Cyber threatsCyber attacks are on the rise and our industry is subject to evolving risks from a variety of cyber threat actors, including nation states, criminals, terrorists, hacktivists and insiders. We have experienced threats to the security of our digital infrastructure, but none of these had a significant effect on our business in 2017.
Above: Operations at our Cherry Point refinery in the US.
We use a range of measures to manage this risk, including the use of cyber security policies and procedures, security protection tools, ongoing detection and monitoring of threats, and testing of response and recovery procedures. We collaborate closely with governments, law enforcement and industry peers to understand and respond to new and emerging threats. To encourage vigilance among our employees, our cyber security programme covers topics such as email phishing and the correct classification and handling of our information.
Working with contractors and partners
More than half of the hours worked by BP are carried out by contractors. So their skills and performance are vital to our ability to carry out our work safely and responsibly. Our standard model contracts include health, safety and security requirements. Through bridging documents, we define the way our safety management system co-exists with those of our contractors to manage risk on a site. And for our contractors facing the most serious risks, we conduct quality, technical, health, safety and security audits before awarding contracts. Once they start work, we continue to monitor their safety performance.
Our OMS includes requirements and practices for working with contractors. We expect and encourage our contractors and their employees to act in a way that is consistent with our code of conduct. We take appropriate action if those expectations, or their contractual obligations, are not met.
Our partners in joint arrangementsIn joint arrangements where we are the operator, our OMS, code of conduct and other policies apply. We aim to report on aspects of our business where we are the operator – as we directly manage the performance of these operations.
Where we are not the operator, our OMS is available as a reference point for BP businesses when engaging with operators and co-venturers. We have a group framework to assess and manage BP’s exposure related to safety, operational and bribery and corruption risk from our participation in these types of arrangements.
We monitor performance and how risk is managed in our joint arrangements, whether we are the operator or not.
Strategic report – perfo
rman
ce
BP Annual Report and Form 20-F 2017 49
Book 1.indb 49 03/04/2018 16:42:59

Reporting on greenhouse gas emissions
We report on direct and indirect GHG emissions on a carbon dioxide equivalent (CO2e) basis. Direct emissions include CO2 and methane from the combustion of fuel and the operation of facilities, and indirect emissions include those resulting from the purchase of electricity and steam.
There was a slight decrease in our direct GHG emissions in 2017. The primary reasons for this include operational changes such as planned shutdowns at several of our refineries for maintenance, and actions taken by our businesses to reduce emissions in areas such as flaring, methane and energy efficiency.
Greenhouse gas emissions (MteCO2e) 2017 2016 2015
Operational controla
Direct emissions 50.5 51.4 51.2Indirect emissions 6.1 6.2 7.0BP equity shareb
Direct emissions 49.4 50.1 49.0Indirect emissions 6.8 6.2 6.9
a Operational control data comprises 100% of emissions from activities that are operated by BP, going beyond the IPIECA guidelines by including emissions from certain other activities such as contracted drilling activities.
b BP equity share comprises our share of BP’s consolidated entities and equity-accounted entities, other than BP’s share of Rosneft.
The ratio of our total GHG emissions reported on an operational control basis to gross production was 0.24teCO2e/te production in 2017 (2016 0.24 teCO2e/te, 2015 0.24teCO2e/te). Gross production comprises upstream production, refining throughput and petrochemicals produced.
Our approach to reporting GHG emissions broadly follows the IPIECA/API/IOGP Petroleum Industry Guidelines for Reporting GHG Emissions. We calculate CO2 emissions based on the fuel consumption and fuel properties for major sources. We do not include nitrous oxide, hydrofluorocarbons, perfluorocarbons and sulphur hexafluoride as they are not material and it is not practical to collect this data.
Task Force on Climate-related
Financial Disclosures
The TCFD was established by the Financial Stability Board with the aim of improving disclosure of climate-related risks and opportunities. Our reporting provides information relevant to each of the four TCFD recommendations.
GovernanceAnnual Report (page 70), Sustainability Report (page 73)
StrategyAnnual Report (page 12) and Sustainability Report (pages 4-5) and our Energy Outlook (pages 3-5)
Risk managementAnnual Report (page 55)
Metrics and targetsSustainability Report (pages 6 and 14)
Working with others
We are collaborating with others to help address this global challenge. As one example, the Oil and Gas Climate Initiative (OGCI) – currently chaired by our chief executive Bob Dudley – brings together 10 oil and gas companies working to reduce the GHG emissions from our industry’s operations and the use of our products. In 2017, OGCI announced its intent to provide technical and financial support for the world’s first global methane study.
Climate change
Our strategy sets us up to help advance the energy
transition, while meeting the needs for energy today.
To help drive the energy transition, we are working to reduce our operational emissions, produce new efficient fuels and lubricants for our customers and to build up our low carbon businesses.
Reducing emissions in our operations
We have set an emissions reduction target of 3.5 million tonnes out to 2025. Our operating businesses aim to deliver this through improved efficiency, less methane emissions and reduced flaring – leading to permanent, quantifiable GHG reductions.
Improving our products
We are increasing gas in our portfolio, helping to meet the rising demand for cleaner energy. We are continuing to innovate with efficient fuels, lubricants and chemicals that can help our customers and consumers lower their emissions – as well as exploring opportunities to use our retail network to support the electrification of transport.
Creating low carbon businesses
We are building up our renewable energy portfolio – focusing on biofuels, biopower, wind and solar. And we have established a dynamic venturing arm that is working on multiple fronts – through joint ventures , creative collaborations and new business models.
Advancing Low Carbon programmeBP's new Advancing Low Carbon accreditation programme is designed to motivate every part of BP to pursue lower carbon opportunities – by highlighting BP activities that demonstrate a better carbon outcome. The activities initially selected include emission reductions in our operations, carbon neutral products and investments in low carbon technologies.
See bp.com/advancinglowcarbon for more information.
Calling for a price on carbon
BP believes that carbon pricing by governments provides the right incentives for everyone – energy producers and consumers alike – to play their part in reducing emissions. It makes energy efficiency more attractive and makes lower carbon solutions, such as renewables and CCUS, more cost competitive.
To help anticipate greater regulatory requirements affecting our GHG emissions, we use a carbon cost when evaluating our plans for large new projects and those for which emissions costs would be a material part of the project. In industrialized countries, this is currently $40 per tonne of CO2 equivalent, and we also stress test at a carbon price of $80 per tonne.
See Glossary BP Annual Report and Form 20-F 201750
Book 1.indb 50 03/04/2018 16:42:59
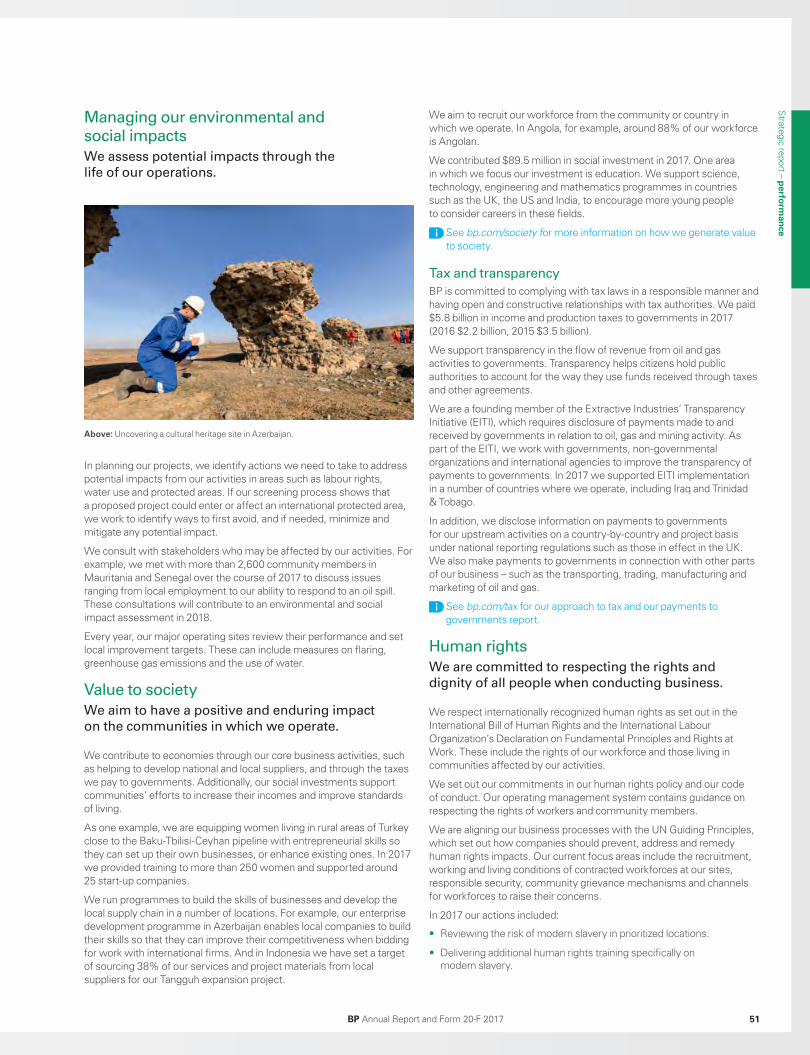
Managing our environmental and
social impacts
We assess potential impacts through the
life of our operations.
Above: Uncovering a cultural heritage site in Azerbaijan.
In planning our projects, we identify actions we need to take to address potential impacts from our activities in areas such as labour rights, water use and protected areas. If our screening process shows that a proposed project could enter or affect an international protected area, we work to identify ways to first avoid, and if needed, minimize and mitigate any potential impact.
We consult with stakeholders who may be affected by our activities. For example, we met with more than 2,600 community members in Mauritania and Senegal over the course of 2017 to discuss issues ranging from local employment to our ability to respond to an oil spill. These consultations will contribute to an environmental and social impact assessment in 2018.
Every year, our major operating sites review their performance and set local improvement targets. These can include measures on flaring, greenhouse gas emissions and the use of water.
Value to society
We aim to have a positive and enduring impact
on the communities in which we operate.
We contribute to economies through our core business activities, such as helping to develop national and local suppliers, and through the taxes we pay to governments. Additionally, our social investments support communities’ efforts to increase their incomes and improve standards of living.
As one example, we are equipping women living in rural areas of Turkey close to the Baku-Tbilisi-Ceyhan pipeline with entrepreneurial skills so they can set up their own businesses, or enhance existing ones. In 2017 we provided training to more than 250 women and supported around 25 start-up companies.
We run programmes to build the skills of businesses and develop the local supply chain in a number of locations. For example, our enterprise development programme in Azerbaijan enables local companies to build their skills so that they can improve their competitiveness when bidding for work with international firms. And in Indonesia we have set a target of sourcing 38% of our services and project materials from local suppliers for our Tangguh expansion project.
We aim to recruit our workforce from the community or country in which we operate. In Angola, for example, around 88% of our workforce is Angolan.
We contributed $89.5 million in social investment in 2017. One area in which we focus our investment is education. We support science, technology, engineering and mathematics programmes in countries such as the UK, the US and India, to encourage more young people to consider careers in these fields.
See bp.com/society for more information on how we generate value to society.
Tax and transparency
BP is committed to complying with tax laws in a responsible manner and having open and constructive relationships with tax authorities. We paid $5.8 billion in income and production taxes to governments in 2017 (2016 $2.2 billion, 2015 $3.5 billion).
We support transparency in the flow of revenue from oil and gas activities to governments. Transparency helps citizens hold public authorities to account for the way they use funds received through taxes and other agreements.
We are a founding member of the Extractive Industries’ Transparency Initiative (EITI), which requires disclosure of payments made to and received by governments in relation to oil, gas and mining activity. As part of the EITI, we work with governments, non-governmental organizations and international agencies to improve the transparency of payments to governments. In 2017 we supported EITI implementation in a number of countries where we operate, including Iraq and Trinidad & Tobago.
In addition, we disclose information on payments to governments for our upstream activities on a country-by-country and project basis under national reporting regulations such as those in effect in the UK. We also make payments to governments in connection with other parts of our business – such as the transporting, trading, manufacturing and marketing of oil and gas.
See bp.com/tax for our approach to tax and our payments to governments report.
Human rights
We are committed to respecting the rights and
dignity of all people when conducting business.
We respect internationally recognized human rights as set out in the International Bill of Human Rights and the International Labour Organization’s Declaration on Fundamental Principles and Rights at Work. These include the rights of our workforce and those living in communities affected by our activities.
We set out our commitments in our human rights policy and our code of conduct. Our operating management system contains guidance on respecting the rights of workers and community members.
We are aligning our business processes with the UN Guiding Principles, which set out how companies should prevent, address and remedy human rights impacts. Our current focus areas include the recruitment, working and living conditions of contracted workforces at our sites, responsible security, community grievance mechanisms and channels for workforces to raise their concerns.
In 2017 our actions included:
• Reviewing the risk of modern slavery in prioritized locations.
• Delivering additional human rights training specifically on modern slavery.
Strategic report – perfo
rman
ce
BP Annual Report and Form 20-F 2017 51
Book 1.indb 51 03/04/2018 16:43:08
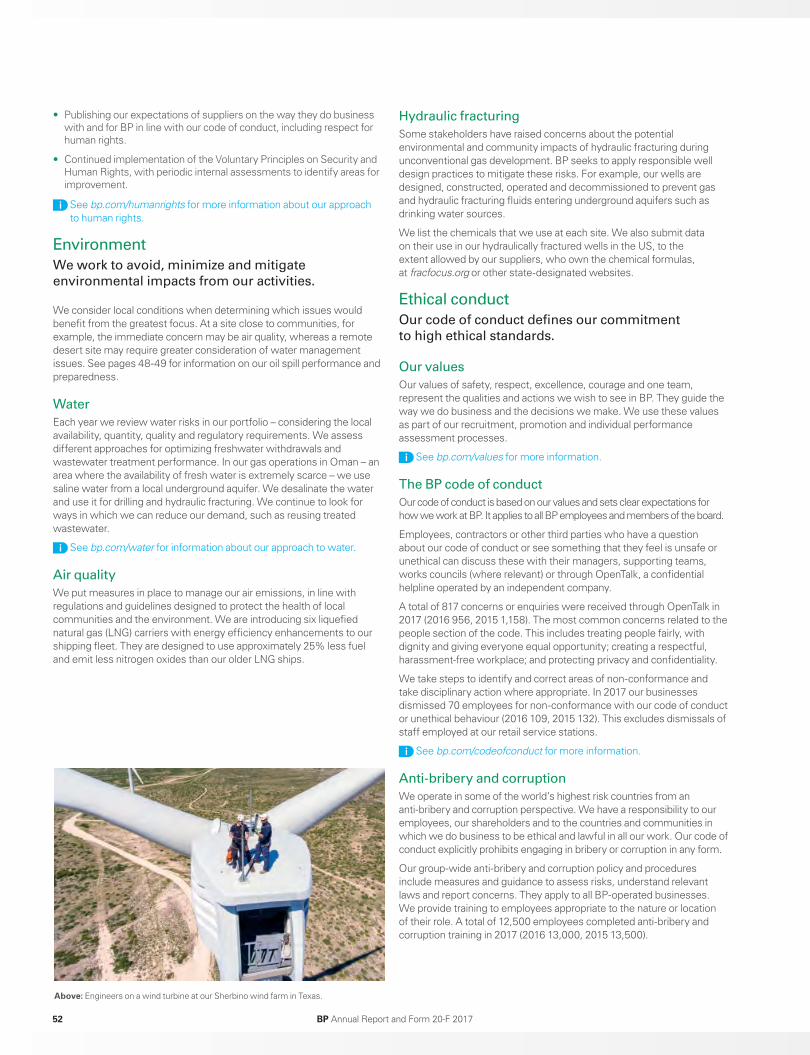
Hydraulic fracturing
Some stakeholders have raised concerns about the potential environmental and community impacts of hydraulic fracturing during unconventional gas development. BP seeks to apply responsible well design practices to mitigate these risks. For example, our wells are designed, constructed, operated and decommissioned to prevent gas and hydraulic fracturing fluids entering underground aquifers such as drinking water sources.
We list the chemicals that we use at each site. We also submit data on their use in our hydraulically fractured wells in the US, to the extent allowed by our suppliers, who own the chemical formulas, at fracfocus.org or other state-designated websites.
Ethical conduct
Our code of conduct defines our commitment
to high ethical standards.
Our values
Our values of safety, respect, excellence, courage and one team, represent the qualities and actions we wish to see in BP. They guide the way we do business and the decisions we make. We use these values as part of our recruitment, promotion and individual performance assessment processes.
See bp.com/values for more information.
The BP code of conduct
Our code of conduct is based on our values and sets clear expectations for how we work at BP. It applies to all BP employees and members of the board.
Employees, contractors or other third parties who have a question about our code of conduct or see something that they feel is unsafe or unethical can discuss these with their managers, supporting teams, works councils (where relevant) or through OpenTalk, a confidential helpline operated by an independent company.
A total of 817 concerns or enquiries were received through OpenTalk in 2017 (2016 956, 2015 1,158). The most common concerns related to the people section of the code. This includes treating people fairly, with dignity and giving everyone equal opportunity; creating a respectful, harassment-free workplace; and protecting privacy and confidentiality.
We take steps to identify and correct areas of non-conformance and take disciplinary action where appropriate. In 2017 our businesses dismissed 70 employees for non-conformance with our code of conduct or unethical behaviour (2016 109, 2015 132). This excludes dismissals of staff employed at our retail service stations.
See bp.com/codeofconduct for more information.
Anti-bribery and corruption
We operate in some of the world’s highest risk countries from an anti-bribery and corruption perspective. We have a responsibility to our employees, our shareholders and to the countries and communities in which we do business to be ethical and lawful in all our work. Our code of conduct explicitly prohibits engaging in bribery or corruption in any form.
Our group-wide anti-bribery and corruption policy and procedures include measures and guidance to assess risks, understand relevant laws and report concerns. They apply to all BP-operated businesses. We provide training to employees appropriate to the nature or location of their role. A total of 12,500 employees completed anti-bribery and corruption training in 2017 (2016 13,000, 2015 13,500).
• Publishing our expectations of suppliers on the way they do business with and for BP in line with our code of conduct, including respect for human rights.
• Continued implementation of the Voluntary Principles on Security and Human Rights, with periodic internal assessments to identify areas for improvement.
See bp.com/humanrights for more information about our approach to human rights.
Environment
We work to avoid, minimize and mitigate
environmental impacts from our activities.
We consider local conditions when determining which issues would benefit from the greatest focus. At a site close to communities, for example, the immediate concern may be air quality, whereas a remote desert site may require greater consideration of water management issues. See pages 48-49 for information on our oil spill performance and preparedness.
Water
Each year we review water risks in our portfolio – considering the local availability, quantity, quality and regulatory requirements. We assess different approaches for optimizing freshwater withdrawals and wastewater treatment performance. In our gas operations in Oman – an area where the availability of fresh water is extremely scarce – we use saline water from a local underground aquifer. We desalinate the water and use it for drilling and hydraulic fracturing. We continue to look for ways in which we can reduce our demand, such as reusing treated wastewater.
See bp.com/water for information about our approach to water.
Air quality
We put measures in place to manage our air emissions, in line with regulations and guidelines designed to protect the health of local communities and the environment. We are introducing six liquefied natural gas (LNG) carriers with energy efficiency enhancements to our shipping fleet. They are designed to use approximately 25% less fuel and emit less nitrogen oxides than our older LNG ships.
Above: Engineers on a wind turbine at our Sherbino wind farm in Texas.
BP Annual Report and Form 20-F 201752
Book 1.indb 52 03/04/2018 16:43:10

Above: A team meeting at the BP office in Baku, Azerbaijan.
We assess any exposure to bribery and corruption risk when working with suppliers and business partners. Where appropriate, we put in place a risk mitigation plan or we reject them if we conclude that risks are too high.
We also conduct anti-bribery compliance audits on selected suppliers when contracts are in place. For example, our upstream business conducts audits for a number of suppliers in higher-risk regions to assess their compliance with our anti-bribery and corruption contractual requirements. Potential areas for improvement are shared with our suppliers and we often work with them to find the best ways to strengthen their procedures, such as improvements to training and management of subcontractors. We issued a total of 36 audit reports in 2017 (2016 25, 2015 35). We take corrective action with suppliers and business partners who fail to meet our expectations, which may include terminating contracts.
Lobbying and political donations
We prohibit the use of BP funds or resources to support any political candidate or party.
We recognize the rights of our employees to participate in the political process and these rights are governed by the applicable laws in the countries in which we operate. For example, in the US we provide administrative support for the BP employee political action committee (PAC), which is a non-partisan committee that encourages voluntary employee participation in the political process. All BP employee PAC contributions are reviewed for compliance with federal and state law and are publicly reported in accordance with US election laws.
We work with governments on a range of issues that are relevant to our business, from regulatory compliance, to understanding our tax liabilities, to collaborating on community initiatives. The way in which we interact with those governments depends on the legal and regulatory framework in each country.
Our people
BP’s success depends on having a talented and
diverse workforce.
BP employeesNumber of employees at 31 Decembera 2017 2016 2015
Upstream 17,700 18,700 21,700Downstream 42,100 41,800 44,800Other businesses and corporate 14,200 14,000 13,300Total 74,000 74,500 79,800Service station staff 16,800 16,200 15,600Agricultural, operational and
seasonal workers in Brazil 4,300 4,600 4,800Total excluding service station
staff and workers in Brazil 52,900 53,700 59,400
a Reported to the nearest 100. For more information see Financial Statements – Note 33.
We have reshaped our organization over the past few years to adapt to a lower oil price environment. Our focus is on retaining the skills we require to maintain safe and reliable operations while developing and attracting individuals with capabilities we judge important to growing the business in new ways.
The group people committee helps facilitate the group chief executive’s oversight of policies relating to employees. In 2017 the committee discussed remuneration policy, progress in our diversity and inclusion programme, modernizing and strengthening our attractiveness as an employer, and long-term people priorities.
Attraction and retention
A total of 314 graduates joined BP in 2017 (2016 231, 2015 298). We were named the UK’s leading recruiter in the oil and gas sector in The Times newspaper’s Graduate Employer rankings in 2017.
We invest in our employees’ development – with an average spend of around $3,300 per person. This includes online and classroom-based courses and resources, supported by a wide range of on-the-job learning and mentoring programmes.
Diversity
We are committed to making our workplaces reflect the communities in which we are based.
The gender balance across BP as a whole is steadily improving, with women representing 34% of BP’s total population (2016 33%, 2015 32%). We are working to improve these numbers further by, for example, developing mentoring, sponsorship and coaching programmes to help more women advance. That said, we still have work to do at the executive and senior levels.
We have published 2017 data on our gender pay gap in the UK at bp.com/ukgenderpaygap.
Strategic report – perfo
rman
ce
BP Annual Report and Form 20-F 2017 53
Book 1.indb 53 03/04/2018 16:43:10
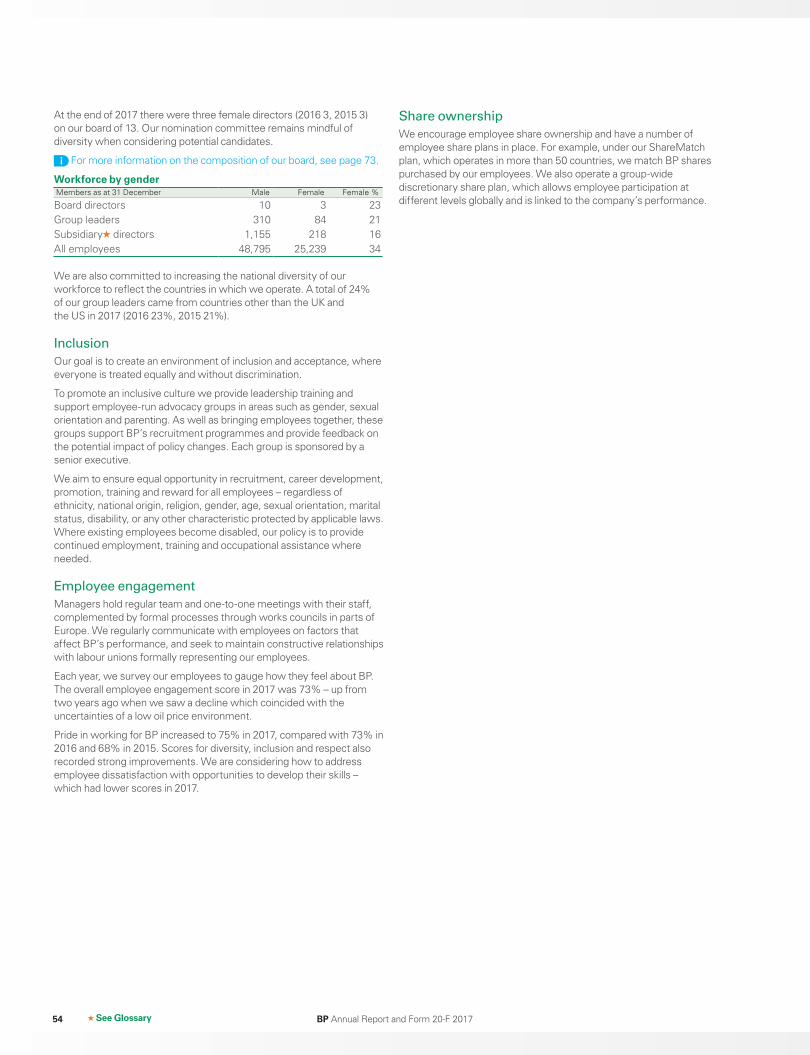
At the end of 2017 there were three female directors (2016 3, 2015 3) on our board of 13. Our nomination committee remains mindful of diversity when considering potential candidates.
For more information on the composition of our board, see page 73.
Workforce by gender Members as at 31 December Male Female Female %
Board directors 10 3 23Group leaders 310 84 21Subsidiary directors 1,155 218 16All employees 48,795 25,239 34
We are also committed to increasing the national diversity of our workforce to reflect the countries in which we operate. A total of 24% of our group leaders came from countries other than the UK and the US in 2017 (2016 23%, 2015 21%).
Inclusion
Our goal is to create an environment of inclusion and acceptance, where everyone is treated equally and without discrimination.
To promote an inclusive culture we provide leadership training and support employee-run advocacy groups in areas such as gender, sexual orientation and parenting. As well as bringing employees together, these groups support BP’s recruitment programmes and provide feedback on the potential impact of policy changes. Each group is sponsored by a senior executive.
We aim to ensure equal opportunity in recruitment, career development, promotion, training and reward for all employees – regardless of ethnicity, national origin, religion, gender, age, sexual orientation, marital status, disability, or any other characteristic protected by applicable laws. Where existing employees become disabled, our policy is to provide continued employment, training and occupational assistance where needed.
Employee engagement
Managers hold regular team and one-to-one meetings with their staff, complemented by formal processes through works councils in parts of Europe. We regularly communicate with employees on factors that affect BP’s performance, and seek to maintain constructive relationships with labour unions formally representing our employees.
Each year, we survey our employees to gauge how they feel about BP. The overall employee engagement score in 2017 was 73% – up from two years ago when we saw a decline which coincided with the uncertainties of a low oil price environment.
Pride in working for BP increased to 75% in 2017, compared with 73% in 2016 and 68% in 2015. Scores for diversity, inclusion and respect also recorded strong improvements. We are considering how to address employee dissatisfaction with opportunities to develop their skills – which had lower scores in 2017.
Share ownership
We encourage employee share ownership and have a number of employee share plans in place. For example, under our ShareMatch plan, which operates in more than 50 countries, we match BP shares purchased by our employees. We also operate a group-wide discretionary share plan, which allows employee participation at different levels globally and is linked to the company’s performance.
See Glossary BP Annual Report and Form 20-F 201754
Book 1.indb 54 03/04/2018 16:43:10
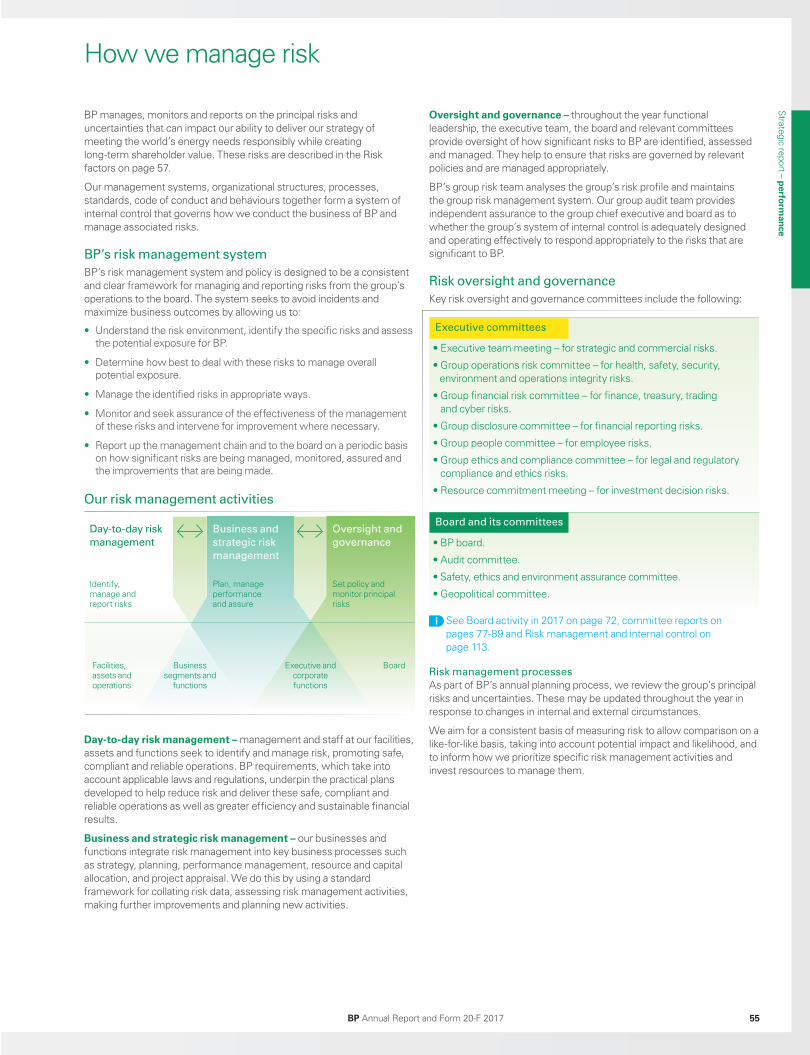
BP manages, monitors and reports on the principal risks and uncertainties that can impact our ability to deliver our strategy of meeting the world’s energy needs responsibly while creating long-term shareholder value. These risks are described in the Risk factors on page 57.
Our management systems, organizational structures, processes, standards, code of conduct and behaviours together form a system of internal control that governs how we conduct the business of BP and manage associated risks.
BP’s risk management system
BP’s risk management system and policy is designed to be a consistent and clear framework for managing and reporting risks from the group’s operations to the board. The system seeks to avoid incidents and maximize business outcomes by allowing us to:
• Understand the risk environment, identify the specific risks and assess the potential exposure for BP.
• Determine how best to deal with these risks to manage overall potential exposure.
• Manage the identified risks in appropriate ways.
• Monitor and seek assurance of the effectiveness of the management of these risks and intervene for improvement where necessary.
• Report up the management chain and to the board on a periodic basis on how significant risks are being managed, monitored, assured and the improvements that are being made.
Our risk management activities
Day-to-day risk
management
Business and
strategic risk
management
Oversight and
governance
Identify, manage and report risks
Plan, manage performance and assure
Set policy and monitor principal risks
Facilities, assets and operations
Business segments and
functions
Executive and corporate functions
Board
Day-to-day risk management – management and staff at our facilities, assets and functions seek to identify and manage risk, promoting safe, compliant and reliable operations. BP requirements, which take into account applicable laws and regulations, underpin the practical plans developed to help reduce risk and deliver these safe, compliant and reliable operations as well as greater efficiency and sustainable financial results.
Business and strategic risk management – our businesses and functions integrate risk management into key business processes such as strategy, planning, performance management, resource and capital allocation, and project appraisal. We do this by using a standard framework for collating risk data, assessing risk management activities, making further improvements and planning new activities.
Oversight and governance – throughout the year functional leadership, the executive team, the board and relevant committees provide oversight of how significant risks to BP are identified, assessed and managed. They help to ensure that risks are governed by relevant policies and are managed appropriately.
BP’s group risk team analyses the group’s risk profile and maintains the group risk management system. Our group audit team provides independent assurance to the group chief executive and board as to whether the group’s system of internal control is adequately designed and operating effectively to respond appropriately to the risks that are significant to BP.
Risk oversight and governance
Key risk oversight and governance committees include the following:
Executive committees
• Executive team meeting – for strategic and commercial risks.
• Group operations risk committee – for health, safety, security, environment and operations integrity risks.
• Group financial risk committee – for finance, treasury, trading and cyber risks.
• Group disclosure committee – for financial reporting risks.
• Group people committee – for employee risks.
• Group ethics and compliance committee – for legal and regulatory compliance and ethics risks.
• Resource commitment meeting – for investment decision risks.
Board and its committees
• BP board.
• Audit committee.
• Safety, ethics and environment assurance committee.
• Geopolitical committee.
See Board activity in 2017 on page 72, committee reports on pages 77-89 and Risk management and internal control on page 113.
Risk management processes
As part of BP’s annual planning process, we review the group’s principal risks and uncertainties. These may be updated throughout the year in response to changes in internal and external circumstances.
We aim for a consistent basis of measuring risk to allow comparison on a like-for-like basis, taking into account potential impact and likelihood, and to inform how we prioritize specific risk management activities and invest resources to manage them.
How we manage riskStrategic report – p
erform
ance
BP Annual Report and Form 20-F 2017 55
Book 1.indb 55 03/04/2018 16:43:10
Our risk profile
The nature of our business operations is long term, resulting in many of our risks being enduring in nature. Nonetheless, risks can develop and evolve over time and their potential impact or likelihood may vary in response to internal and external events.
We identify high priority risks for particular oversight by the board and its various committees in the coming year. Those identified for 2018 are listed in this section. These may be updated throughout the year in response to changes in internal and external circumstances. The oversight and management of other risks, for example technological change or the transition to a lower carbon economy, is undertaken in the normal course of business and in the executive team, the board and relevant committees.
There can be no certainty that our risk management activities will mitigate or prevent these, or other risks, from occurring.
Further details of the principal risks and uncertainties we face are set out in Risk factors on page 57.
Risks for particular oversight by the board and its
committees in 2018
The risks for particular oversight by the board and its committees in 2018 have been reviewed and updated. These risks remain the same as for 2017.
Strategic and commercial risks
Financial liquidity
External market conditions can impact our financial performance. Supply and demand and the prices achieved for our products can be affected by a wide range of factors including political developments, global economic conditions and the influence of OPEC.
We seek to manage this risk through BP’s diversified portfolio, our financial framework, liquidity stress testing, regular reviews of market conditions and our planning and investment processes.
Geopolitical
The diverse locations of our operations around the world expose us to a wide range of political developments and consequent changes to the economic and operating environment. Geopolitical risk is inherent to many regions in which we operate, and heightened political or social tensions or changes in key relationships could adversely affect the group.
We seek to manage this risk through development and maintenance of relationships with governments and stakeholders and by becoming trusted partners in each country and region. In addition, we closely monitor events and implement risk mitigation plans where appropriate.
Cyber security
The targeted and indiscriminate threats to the security of our digital infrastructure continue to evolve rapidly and are increasingly prevalent across industries worldwide. The oil and gas industry is subject to evolving risks from a variety of cyber threat actors, including nation states, criminals, terrorists, hacktivists and insiders. A cyber security breach could disrupt our business, injure people, harm the environment or our assets, or result in legal or regulatory breaches.
We seek to manage this risk through a range of measures, which include cyber security standards, security protection tools, ongoing detection and monitoring of threats and testing of cyber response and recovery procedures. We collaborate closely with governments, law enforcement agencies and industry peers to understand and respond to new and emerging cyber threats. We build awareness with our staff, share information on incidents with leadership for continuous learning and conduct regular exercises including with the executive team to test response and recovery procedures.
Safety and operational risks
Process safety, personal safety and environmental risks
The nature of the group’s operating activities exposes us to a wide range of significant health, safety and environmental risks such as incidents associated with releases of hydrocarbons when drilling wells, operating facilities and transporting hydrocarbons.
Our operating management system helps us manage these risks and drive performance improvements. It sets out the rules and principles which govern key risk management activities such as inspection, maintenance, testing, business continuity and crisis response planning and competency development. In addition, we conduct our drilling activity through a global wells organization in order to promote a consistent approach for designing, constructing and managing wells.
Security
Hostile acts such as terrorism or piracy could harm our people and disrupt our operations. We monitor for emerging threats and vulnerabilities to manage our physical and information security.
Our central security team provides guidance and support to our businesses through a network of regional security advisers who advise and conduct assurance with respect to the management of security risks affecting our people and operations. We continue to monitor threats globally and maintain disaster recovery, crisis and business continuity management plans.
Compliance and control risks
Ethical misconduct and legal or regulatory non-compliance
Ethical misconduct or breaches of applicable laws or regulations could damage our reputation, adversely affect operational results and shareholder value, and potentially affect our licence to operate.
Our code of conduct and our values and behaviours, applicable to all employees, are central to managing this risk. Additionally, we have various group requirements and training covering areas such as anti-bribery and corruption, anti-money laundering, competition/anti-trust law and international trade regulations. We seek to keep abreast of new regulations and legislation and plan our response to them. We offer an independent confidential helpline, OpenTalk, for employees, contractors and other third parties. Under the terms of the 2014 settlement with the US Environmental Protection Agency, an ethics monitor is reviewing and providing recommendations concerning BP’s ethics and compliance programme.
Trading non-compliance
In the normal course of business, we are subject to risks around our trading activities which could arise from shortcomings or failures in our systems, risk management methodology, internal control processes or employees.
We have specific operating standards and control processes to manage these risks, including guidelines specific to trading, and seek to monitor compliance through our dedicated compliance teams. We also seek to maintain a positive and collaborative relationship with regulators and the industry at large.
See Glossary BP Annual Report and Form 20-F 201756
Book 1.indb 56 03/04/2018 16:43:10
The risks discussed below, separately or in combination, could have a material adverse effect on the implementation of our strategy, our business, financial performance, results of operations, cash flows, liquidity, prospects, shareholder value and returns and reputation.
Strategic and commercial risksPrices and markets – our financial performance is impacted by fluctuating prices of oil, gas and refined products, technological change, exchange rate fluctuations, and the general macroeconomic outlook.
Oil, gas and product prices are subject to international supply and demand and margins can be volatile. Political developments, increased supply from new oil and gas sources, technological change, global economic conditions and the influence of OPEC can impact supply and demand and prices for our products. Decreases in oil, gas or product prices could have an adverse effect on revenue, margins, profitability and cash flows. If significant or for a prolonged period, we may have to write down assets and re-assess the viability of certain projects, which may impact future cash flows, profit, capital expenditure and ability to maintain our long-term investment programme. Conversely, an increase in oil, gas and product prices may not improve margin performance as there could be increased fiscal take, cost inflation and more onerous terms for access to resources. The profitability of our refining and petrochemicals activities can be volatile, with periodic over-supply or supply tightness in regional markets and fluctuations in demand.
Exchange rate fluctuations can create currency exposures and impact underlying costs and revenues. Crude oil prices are generally set in US dollars, while products vary in currency. Many of our major project development costs are denominated in local currencies, which may be subject to fluctuations against the US dollar.
Access, renewal and reserves progression – our inability to access, renew and progress upstream resources in a timely manner could adversely affect our long-term replacement of reserves.
Delivering our group strategy depends on our ability to continually replenish a strong exploration pipeline of future opportunities to access and produce oil and natural gas. Competition for access to investment opportunities, heightened political and economic risks in certain countries where significant hydrocarbon basins are located and increasing technical challenges and capital commitments may adversely affect our strategic progress. This, and our ability to progress upstream resources and sustain long-term reserves replacement, could impact our future production and financial performance.
Major project delivery – failure to invest in the best opportunities or deliver major projects successfully could adversely affect our financial performance.
We face challenges in developing major projects, particularly in geographically and technically challenging areas. Operational challenges and poor investment choice, efficiency or delivery at any major project that underpins production or production growth could adversely affect our financial performance.
Geopolitical – exposure to a range of political developments and consequent changes to the operating and regulatory environment could cause business disruption.
We operate and may seek new opportunities in countries and regions where political, economic and social transition may take place. Political instability, changes to the regulatory environment or taxation, international sanctions, expropriation or nationalization of property, civil strife, strikes, insurrections, acts of terrorism and acts of war may disrupt or curtail our operations or development activities. These may in turn cause production to decline, limit our ability to pursue new opportunities, affect the recoverability of our assets or cause us to incur additional costs, particularly due to the long-term nature of many of our projects and significant capital expenditure required.
Events in or relating to Russia, including trade restrictions and other sanctions, could adversely impact our income and investment in or relating to Russia. Our ability to pursue business objectives and to recognize production and reserves relating to these investments could also be adversely impacted.
Liquidity, financial capacity and financial, including credit, exposure – failure to work within our financial framework could impact our ability to operate and result in financial loss.
Failure to accurately forecast or work within our financial framework could impact our ability to operate and result in financial loss. Trade and other receivables, including overdue receivables, may not be recovered and a substantial and unexpected cash call or funding request could disrupt our financial framework or overwhelm our ability to meet our obligations.
An event such as a significant operational incident, legal proceedings or a geopolitical event in an area where we have significant activities, could reduce our credit ratings. This could potentially increase financing costs and limit access to financing or engagement in our trading activities on acceptable terms, which could put pressure on the group’s liquidity. Credit rating downgrades could also trigger a requirement for the company to review its funding arrangements with the BP pension trustees and may cause other impacts on financial performance. In the event of extended constraints on our ability to obtain financing, we could be required to reduce capital expenditure or increase asset disposals in order to provide additional liquidity. See Liquidity and capital resources on page 251 and Financial statements – Note 27.
Joint arrangements and contractors – varying levels of control over the standards, operations and compliance of our partners, contractors and sub-contractors could result in legal liability and reputational damage.
We conduct many of our activities through joint arrangements , associates or with contractors and sub-contractors where we may have limited influence and control over the performance of such operations. Our partners and contractors are responsible for the adequacy of the resources and capabilities they bring to a project. If these are found to be lacking, there may be financial, operational or safety risks for BP. Should an incident occur in an operation that BP participates in, our partners and contractors may be unable or unwilling to fully compensate us against costs we may incur on their behalf or on behalf of the arrangement. Where we do not have operational control of a venture, we may still be pursued by regulators or claimants in the event of an incident.
Digital infrastructure and cyber security – breach of our digital security or failure of our digital infrastructure including loss or misuse of sensitive information could damage our operations, increase costs and damage our reputation.
The oil and gas industry is subject to fast-evolving risks from cyber threat actors, including nation states, criminals, terrorists, hacktivists and insiders. A breach or failure of our digital infrastructure – including control systems – due to breaches of our cyber defences, or those of third parties, negligence, intentional misconduct or other reasons, could seriously disrupt our operations. This could result in the loss or misuse of data or sensitive information, injury to people, disruption to our business, harm to the environment or our assets, legal or regulatory breaches and legal liability. Furthermore, the rapid detection of attempts to gain unauthorized access to our digital infrastructure, often through the use of sophisticated and co-ordinated means, is a challenge and any delay or failure to detect could compound these potential harms. These could result in significant costs including the cost of remediation or reputational consequences.
Climate change and the transition to a lower carbon economy – policy, legal, regulatory, technology and market change related to the issue of climate change could increase costs, reduce demand for our products, reduce revenue and limit certain growth opportunities.
Changes in laws, regulations, policies, obligations, social attitudes and customer preferences relating to the transition to a lower carbon economy could have a cost impact on our business, including increasing compliance and litigation costs, and could impact our strategy. Such changes could lead to constraints on production and supply and access to new reserves. Technological improvements or innovations that support the transition to a lower carbon economy, and customer preferences or regulatory incentives related to such changes that alter fuel or power choices, such as towards low emission energy sources, could impact demand for oil and gas. Depending on the nature and speed of any such changes and our response, this could adversely affect the demand for our products, investor sentiment, our financial performance and our competitiveness. See Climate change on page 50.
Competition – inability to remain efficient, maintain a high quality portfolio of assets, innovate and retain an appropriately skilled workforce could negatively impact delivery of our strategy in a highly competitive market.
Our strategic progress and performance could be impeded if we are unable to control our development and operating costs and margins, or to sustain, develop and operate a high-quality portfolio of assets efficiently. We could be adversely affected if competitors offer superior terms for access rights or licences, or if our innovation in areas such as exploration, production, refining, manufacturing, renewable energy or new technologies lags the industry. Our performance could also be negatively impacted if we fail to protect our intellectual property.
Risk factors
See Glossary
Strategic report – perfo
rman
ce
BP Annual Report and Form 20-F 2017 57
Book 1.indb 57 03/04/2018 16:43:10
Our industry faces increasing challenge to recruit and retain skilled and experienced people in the fields of science, technology, engineering and mathematics. Successful recruitment, development and retention of specialist staff is essential to our plans.
Crisis management and business continuity – failure to address an incident effectively could potentially disrupt our business.
Our business activities could be disrupted if we do not respond, or are perceived not to respond, in an appropriate manner to any major crisis or if we are not able to restore or replace critical operational capacity.
Insurance – our insurance strategy could expose the group to material uninsured losses.
BP generally purchases insurance only in situations where this is legally and contractually required. Some risks are insured with third parties and reinsured by group insurance companies. Uninsured losses could have a material adverse effect on our financial position, particularly if they arise at a time when we are facing material costs as a result of a significant operational event which could put pressure on our liquidity and cash flows.
Safety and operational risksProcess safety, personal safety, and environmental risks – exposure to a wide range of health, safety, security and environmental risks could result in regulatory action, legal liability, business interruption, increased costs, damage to our reputation and potentially denial of our licence to operate.
Technical integrity failure, natural disasters, extreme weather or a change in its frequency or severity, human error and other adverse events or conditions could lead to loss of containment of hydrocarbons or other hazardous materials or constrained availability of resources used in our operating activities, as well as fires, explosions or other personal and process safety incidents, including when drilling wells, operating facilities and those associated with transportation by road, sea or pipeline.
There can be no certainty that our operating management system or other policies and procedures will adequately identify all process safety, personal safety and environmental risks or that all our operating activities will be conducted in conformance with these systems. See Safety and security on page 47.
Such events or conditions, including a marine incident, or inability to provide safe environments for our workforce and the public while at our facilities, premises or during transportation, could lead to injuries, loss of life or environmental damage. As a result we could face regulatory action and legal liability, including penalties and remediation obligations, increased costs and potentially denial of our licence to operate. Our activities are sometimes conducted in hazardous, remote or environmentally sensitive locations, where the consequences of such events or conditions could be greater than in other locations.
Drilling and production – challenging operational environments and other uncertainties could impact drilling and production activities.
Our activities require high levels of investment and are sometimes conducted in challenging environments such as those prone to natural disasters and extreme weather, which heightens the risks of technical integrity failure. The physical characteristics of an oil or natural gas field, and cost of drilling, completing or operating wells is often uncertain. We may be required to curtail, delay or cancel drilling operations because of a variety of factors, including unexpected drilling conditions, pressure or irregularities in geological formations, equipment failures or accidents, adverse weather conditions and compliance with governmental requirements.
Security – hostile acts against our staff and activities could cause harm to people and disrupt our operations.
Acts of terrorism, piracy, sabotage and similar activities directed against our operations and facilities, pipelines, transportation or digital infrastructure could cause harm to people and severely disrupt operations. Our activities could also be severely affected by conflict, civil strife or political unrest.
Product quality – supplying customers with off-specification products could damage our reputation, lead to regulatory action and legal liability, and impact our financial performance.
Failure to meet product quality standards could cause harm to people and the environment, damage our reputation, result in regulatory action and legal liability, and impact financial performance.
Compliance and control risksUS government settlements – failure to comply with the terms of our settlement with the US Environmental Protection Agency related to the Gulf of Mexico oil spill may expose us to further penalties or liabilities or could result in suspension or debarment of certain BP entities.
Failure to satisfy the requirements or comply with the terms of the administrative agreement with the US Environmental Protection Agency (EPA), under which BP agreed to a set of safety and operations, ethics and compliance and corporate governance requirements, could result in suspension or debarment of certain BP entities.
Regulation – changes in the regulatory and legislative environment could increase the cost of compliance, affect our provisions and limit our access to new growth opportunities.
Governments that award exploration and production interests may impose specific drilling obligations, environmental, health and safety controls, controls over the development and decommissioning of a field and possibly, nationalization, expropriation, cancellation or non-renewal of contract rights. Royalties and taxes tend to be high compared with those imposed on similar commercial activities, and in certain jurisdictions there is a degree of uncertainty relating to tax law interpretation and changes. Governments may change their fiscal and regulatory frameworks in response to public pressure on finances, resulting in increased amounts payable to them or their agencies.
Such factors could increase the cost of compliance, reduce our profitability in certain jurisdictions, limit our opportunities for new access, require us to divest or write down certain assets or curtail or cease certain operations, or affect the adequacy of our provisions for pensions, tax, decommissioning, environmental and legal liabilities. Potential changes to pension or financial market regulation could also impact funding requirements of the group. Following the Gulf of Mexico oil spill, we may be subjected to a higher level of fines or penalties imposed in relation to any alleged breaches of laws or regulations, which could result in increased costs.
Ethical misconduct and non-compliance – ethical misconduct or breaches of applicable laws by our businesses or our employees could be damaging to our reputation, and could result in litigation, regulatory action and penalties.
Incidents of ethical misconduct or non-compliance with applicable laws and regulations, including anti-bribery and corruption and anti-fraud laws, trade restrictions or other sanctions, or non-compliance with the recommendations of the ethics monitor appointed under the terms of the EPA settlements, could damage our reputation, result in litigation, regulatory action and penalties.
Treasury and trading activities – ineffective oversight of treasury and trading activities could lead to business disruption, financial loss, regulatory intervention or damage to our reputation.
We are subject to operational risk around our treasury and trading activities in financial and commodity markets, some of which are regulated. Failure to process, manage and monitor a large number of complex transactions across many markets and currencies while complying with all regulatory requirements could hinder profitable trading opportunities. There is a risk that a single trader or a group of traders could act outside of our delegations and controls, leading to regulatory intervention and resulting in financial loss, fines and potentially damaging our reputation. See Financial statements – Note 27.
Reporting – failure to accurately report our data could lead to regulatory action, legal liability and reputational damage.
External reporting of financial and non-financial data, including reserves estimates, relies on the integrity of systems and people. Failure to report data accurately and in compliance with applicable standards could result in regulatory action, legal liability and damage to our reputation.
See Glossary
The Strategic report was approved by the board and signed on its behalf by David J Jackson, company secretary on 29 March 2018.
BP Annual Report and Form 20-F 201758
Book 1.indb 58 03/04/2018 16:43:10
BP Annual Report and Form 20-F 2017 59
Co
rpo
rate
go
vern
an
ce
BP Annual Report and Form 20-F 2017 59
60 Board of directors
66 Executive team
68 Executive management teams
70 Introduction from the chairman
71 Governance framework 71 Board and committee attendance
72 Board activity in 2017
72 Role of the board 73 Skills and expertise 73 Diversity 73 Independence 73 Appointment and time commitment 74 Training and induction 74 Board evaluation 75 Site visits
76 Shareholder engagement
76 Institutional investors 76 Private investors 76 AGM 76 UK Corporate Governance Code compliance
76 International advisory board
77 Committee reports
77 Audit committee 84 Safety, ethics and environment assurance committee 86 Remuneration committee 87 Geopolitical committee 88 Chairman’s committee 89 Nomination committee
90 Directors’ remuneration report
93 Summary of pay and performance 94 Summary of policy approach 95 Single figure table 96 Alignment with strategy 98 Pay and performance for 2017 102 Implementation of policy for 2018 105 Stewardship 107 Non-executive directors 108 Executive directors’ interests 110 Policy summary tables
113 Directors’ statements 113 Statement of directors’ responsibilities 113 Risk management and internal control 114 Longer-term viability 114 Going concern 114 Fair, balanced and understandable
Corporate governance
Book 1.indb 59 03/04/2018 16:43:10

BP Annual Report and Form 20-F 201760
Board of directorsAs at 29 March 2018
Carl-Henric Svanberg
Chairman
Chair of the nomination and chairman’s committees; attends SEEAa, remuneration and geopolitical committees
Bob DudleyGroup chief executive
Brian GilvaryChief financial officer
Nils Andersen
Independent non-executive director
Member of the audit and chairman’s committees
Paul Anderson
Independent non-executive director
Member of the SEEA, geopolitical and chairman’s committees
Alan BoeckmannIndependent non-executive director
Chair of SEEA committee; member of the remuneration, nomination and chairman’s committees
Admiral Frank BowmanIndependent non-executive director
Member of the SEEA, geopolitical and chairman’s committees
Ian DavisSenior independent non-executive director
Member of the remuneration, geopolitical, nomination and chairman’s committees
Professor Dame Ann DowlingIndependent non-executive director
Chair of the remuneration committee; member of the SEEA, nomination and chairman’s committees
Melody MeyerIndependent non-executive director
Member of the SEEA, geopolitical and chairman’s committees
Brendan NelsonIndependent non-executive director
Chair of the audit committee; member of the chairman’s and remuneration committees
Paula Rosput ReynoldsIndependent non-executive director
Member of the audit, chairman’s and remuneration committees
Sir John SawersIndependent non-executive director
Chair of the geopolitical committee; member of the SEEA, nomination and chairman’s committees
David Jackson
Company secretary
See BP’s board governance principles relating to director independence on page 275.
a Safety, ethics and environment assurance
Book 1.indb 60 03/04/2018 16:43:25

BP Annual Report and Form 20-F 2017 61
Corporate governance
Carl-Henric SvanbergChairman
TenureAppointed 1 September 2009
Board and committee activitiesChair of the nomination and chairman’s committees; attends the safety, ethics and environment assurance, remuneration and geopolitical committees
Outside interests• Chairman of AB Volvo
Age 65 Nationality Swedish
Career
Carl-Henric Svanberg became chairman of the BP board on 1 January 2010.
He spent his early career at Asea Brown Boveri and the Securitas Group, before moving to the Assa Abloy Group as president and chief executive officer.
From 2003 until December 2009, he was president and chief executive officer of Ericsson, also serving as the chairman of Sony Ericsson Mobile Communications AB. He was a non-executive director of Ericsson between 2009 and 2012. He was appointed chairman and a member of the board of AB Volvo in April 2012.
He is a member of the External Advisory Board of the Earth Institute at Columbia University and a member of the Advisory Board of Harvard Kennedy School. He is also the recipient of the King of Sweden’s medal for his contribution to Swedish industry.
Relevant skills and experience
Carl-Henric Svanberg is a highly experienced leader of global corporations. He has served as chief executive officer and chairman to several high profile businesses, leading them through both periods of growth and restructuring. These experiences bring not only a deep understanding of international strategic and commercial issues, but the skills to co-ordinate the diverse range of knowledge and perspectives provided by the board. He therefore enables the board to present clear and united leadership on behalf of shareholders. Carl-Henric has successfully led the board for the past eight years and has announced his intention to stand down before the AGM in 2019.
Carl-Henric’s performance has been evaluated by the chairman’s committee, led by Ian Davis.
Bob DudleyGroup chief executive
TenureAppointed to the board 6 April 2009
Outside interests• Fellow of the Royal Academy of Engineering• Non-executive director of Rosneft• Member of the Tsinghua Management University Advisory Board,
Beijing, China• Member of the BritishAmerican Business International Advisory
Board• Member of the US Business Council• Member of the US Business Roundtable• Member of the UAE/UK CEO Forum• Member of the Emirates Foundation Board of Trustees• Member of the World Economic Forum (WEF) International
Business Council• Chair of the WEF Oil and Gas Climate Initiative• Member of the Russian Geographical Society Board of Trustees
Age 62 Nationality American and British
Career
Bob Dudley became group chief executive on 1 October 2010.
Bob joined Amoco Corporation in 1979, working in a variety of engineering and commercial posts. Between 1994 and 1997 he worked on corporate development in Russia. In 1997 he became general manager for strategy for Amoco and in 1999, following the merger between BP and Amoco, was appointed to a similar role in BP.
Between 1999 and 2000 he was executive assistant to the group chief executive, subsequently becoming group vice president for BP’s renewables and alternative energy activities. In 2002 he became group vice president responsible for BP’s upstream businesses in Russia, the Caspian region, Angola, Algeria and Egypt.
From 2003 to 2008 he was president and chief executive officer of TNK-BP. On his return to BP in 2009, he was appointed to the BP board and oversaw the group’s activities in the Americas and Asia. Between 23 June and 30 September 2010, he served as the president and chief executive officer of BP’s Gulf Coast Restoration Organization in the US. He was appointed a director of Rosneft in March 2013 following BP’s acquisition of a stake in Rosneft.
Relevant skills and experience
Bob Dudley has spent his whole career in the oil and gas industry. As group chief executive, Bob has transformed BP into a safer, stronger and simpler business. This approach, governed by a consistent set of values, has guided BP to a position of greater resilience, enabling it to continue delivering results in an uncertain economic environment. Bob has demonstrated excellent leadership and vision throughout. Bob continues to lead the development of the group’s strategy, as we adapt to the challenges of the transition to a lower carbon economy. Under Bob’s leadership, BP successfully delivered seven major projects in 2017.
Bob Dudley’s performance has been considered and evaluated by the chairman’s committee.
Brian GilvaryChief financial officer
TenureAppointed to the board 1 January 2012
Outside interests• Non-executive director and member of audit committee
of L’Air Liquide• Non-executive director and vice chair of audit committee
of the Navy Board• Vice chair of the 100 Group Committee• Member of Trilateral Commission• Visiting professor at Manchester University• Great Britain Age Group triathlete
Age 56 Nationality British
Career
Brian Gilvary was appointed chief financial officer on 1 January 2012. The role includes responsibility for finance, tax, treasury, mergers and acquisitions, investor relations, audit, global business services, information technology and procurement. He also has accountability for both integrated supply and trading, and the shipping division responsible for BP's tanker fleet.
Brian joined BP in 1986 after obtaining a PhD in mathematics from the University of Manchester. Following a broad range of roles in upstream, downstream and trading in Europe and the US, he became downstream’s commercial director from 2002 to 2005. From 2005 until 2009 he was chief executive of the integrated supply and trading function, BP’s commodity trading arm. In 2010 he was appointed deputy group chief financial officer with responsibility for the finance function.
Book 1.indb 61 03/04/2018 16:43:25
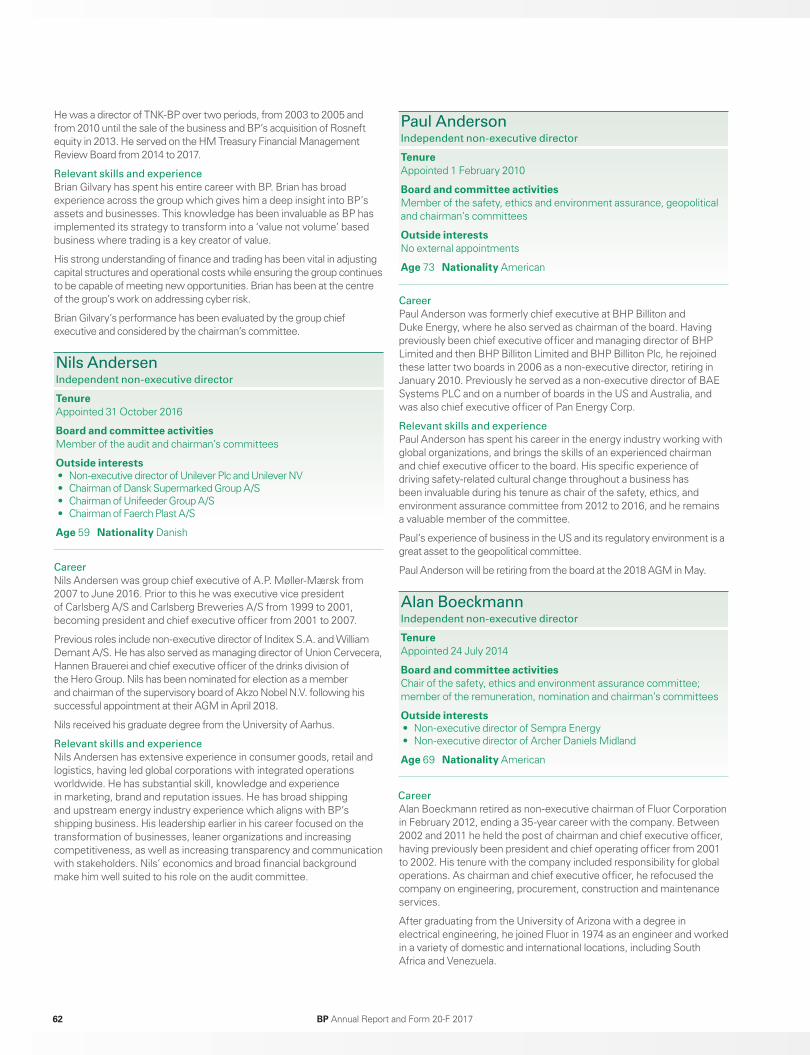
BP Annual Report and Form 20-F 201762
He was a director of TNK-BP over two periods, from 2003 to 2005 and from 2010 until the sale of the business and BP’s acquisition of Rosneft equity in 2013. He served on the HM Treasury Financial Management Review Board from 2014 to 2017.
Relevant skills and experience
Brian Gilvary has spent his entire career with BP. Brian has broad experience across the group which gives him a deep insight into BP’s assets and businesses. This knowledge has been invaluable as BP has implemented its strategy to transform into a ‘value not volume’ based business where trading is a key creator of value.
His strong understanding of finance and trading has been vital in adjusting capital structures and operational costs while ensuring the group continues to be capable of meeting new opportunities. Brian has been at the centre of the group’s work on addressing cyber risk.
Brian Gilvary’s performance has been evaluated by the group chief executive and considered by the chairman’s committee.
Nils AndersenIndependent non-executive director
TenureAppointed 31 October 2016
Board and committee activitiesMember of the audit and chairman’s committees
Outside interests• Non-executive director of Unilever Plc and Unilever NV• Chairman of Dansk Supermarked Group A/S• Chairman of Unifeeder Group A/S• Chairman of Faerch Plast A/S
Age 59 Nationality Danish
Career
Nils Andersen was group chief executive of A.P. Møller-Mærsk from 2007 to June 2016. Prior to this he was executive vice president of Carlsberg A/S and Carlsberg Breweries A/S from 1999 to 2001, becoming president and chief executive officer from 2001 to 2007.
Previous roles include non-executive director of Inditex S.A. and William Demant A/S. He has also served as managing director of Union Cervecera, Hannen Brauerei and chief executive officer of the drinks division of the Hero Group. Nils has been nominated for election as a member and chairman of the supervisory board of Akzo Nobel N.V. following his successful appointment at their AGM in April 2018.
Nils received his graduate degree from the University of Aarhus.
Relevant skills and experience
Nils Andersen has extensive experience in consumer goods, retail and logistics, having led global corporations with integrated operations worldwide. He has substantial skill, knowledge and experience in marketing, brand and reputation issues. He has broad shipping and upstream energy industry experience which aligns with BP’s shipping business. His leadership earlier in his career focused on the transformation of businesses, leaner organizations and increasing competitiveness, as well as increasing transparency and communication with stakeholders. Nils’ economics and broad financial background make him well suited to his role on the audit committee.
Paul AndersonIndependent non-executive director
TenureAppointed 1 February 2010
Board and committee activitiesMember of the safety, ethics and environment assurance, geopolitical and chairman’s committees
Outside interestsNo external appointments
Age 73 Nationality American
Career
Paul Anderson was formerly chief executive at BHP Billiton and Duke Energy, where he also served as chairman of the board. Having previously been chief executive officer and managing director of BHP Limited and then BHP Billiton Limited and BHP Billiton Plc, he rejoined these latter two boards in 2006 as a non-executive director, retiring in January 2010. Previously he served as a non-executive director of BAE Systems PLC and on a number of boards in the US and Australia, and was also chief executive officer of Pan Energy Corp.
Relevant skills and experience
Paul Anderson has spent his career in the energy industry working with global organizations, and brings the skills of an experienced chairman and chief executive officer to the board. His specific experience of driving safety-related cultural change throughout a business has been invaluable during his tenure as chair of the safety, ethics, and environment assurance committee from 2012 to 2016, and he remains a valuable member of the committee.
Paul’s experience of business in the US and its regulatory environment is a great asset to the geopolitical committee.
Paul Anderson will be retiring from the board at the 2018 AGM in May.
Alan BoeckmannIndependent non-executive director
TenureAppointed 24 July 2014
Board and committee activitiesChair of the safety, ethics and environment assurance committee; member of the remuneration, nomination and chairman’s committees
Outside interests• Non-executive director of Sempra Energy• Non-executive director of Archer Daniels Midland
Age 69 Nationality American
Career
Alan Boeckmann retired as non-executive chairman of Fluor Corporation in February 2012, ending a 35-year career with the company. Between 2002 and 2011 he held the post of chairman and chief executive officer, having previously been president and chief operating officer from 2001 to 2002. His tenure with the company included responsibility for global operations. As chairman and chief executive officer, he refocused the company on engineering, procurement, construction and maintenance services.
After graduating from the University of Arizona with a degree in electrical engineering, he joined Fluor in 1974 as an engineer and worked in a variety of domestic and international locations, including South Africa and Venezuela.
Book 1.indb 62 03/04/2018 16:43:25

BP Annual Report and Form 20-F 2017 63
Corporate governance
Alan was previously a non-executive director of BHP Billiton and the Burlington Santa Fe Corporation, and has served on the boards of the American Petroleum Institute, the National Petroleum Council, the Eisenhower Medical Center and the advisory board of Southern Methodist University’s Cox School of Business.
He led the formation of the World Economic Forum’s ‘Partnering Against Corruption’ initiative in 2004.
Relevant skills and experience
Alan Boeckmann has worked in a wide range of industries including engineering, construction, chemicals and the energy sector. He has been involved in delivering very large projects particularly in the energy industry. In his senior roles he directed the focus of global corporations towards the advanced technology needed to remain competitive in response to the growth of the internet, e-commerce and the globalization of the workforce. At the same time he actively promoted fairness, transparency, accountability and responsibility in business dealings through the ‘Partnering Against Corruption’ initiative.
This overall experience makes Alan ideal to lead the SEEAC. His remuneration experience on other boards means that he makes a strong contribution to the remuneration committee.
Admiral Frank BowmanIndependent non-executive director
TenureAppointed 8 November 2010
Board and committee activitiesMember of the safety, ethics and environment assurance, geopolitical and chairman’s committees
Outside interests• President of Strategic Decisions, LLC• Director of Morgan Stanley Mutual Funds• Director of Naval and Nuclear Technologies, LLP
Age 73 Nationality American
Career
Frank L Bowman served for more than 38 years in the US Navy, rising to the rank of Admiral. He commanded the nuclear submarine USS City of Corpus Christi and the submarine tender USS Holland. After promotion to flag officer, he served on the joint staff as director of political-military affairs and as the chief of naval personnel. He served over eight years as director of the Naval Nuclear Propulsion Program where he was responsible for the operations of more than 100 reactors aboard the US Navy’s aircraft carriers and submarines.
After his retirement as an Admiral in 2004, he was president and chief executive officer of the Nuclear Energy Institute until 2008. He served on the BP Independent Safety Review Panel and was a member of the BP America External Advisory Council. He holds two masters degrees in engineering from the Massachusetts Institute of Technology. He was appointed Honorary Knight Commander of the British Empire in 2005. He was elected to the US National Academy of Engineering in 2009.
Frank is a member of the US CNA military advisory board and has participated in studies of climate change and its impact on national security, and on future global energy solutions and water scarcity. Additionally he was co-chair of a National Academies study investigating the implications of climate change for naval forces.
Relevant skills and experience
Frank Bowman’s exemplary safety record in running the US Navy’s nuclear submarine program indicates his deep understanding of process safety and its implementation. Frank makes a substantial contribution to the safety culture within BP. Combined with his specific knowledge of BP’s safety goals from his work on the BP Independent Safety Review Panel and his special interest in climate change, he brings an important perspective to the board and the SEEAC. He has led the oversight of BP’s compliance with the agreements with the US government stemming from the Deepwater Horizon accident.
Frank’s experience of the US and global political and regulatory systems is a valuable asset to the geopolitical committee.
Ian DavisSenior independent non-executive director
TenureAppointed 2 April 2010
Board and committee activitiesMember of the remuneration, geopolitical, nomination and chairman’s committees
Outside interests• Chairman of Rolls-Royce Holdings plc• Non-executive director of Majid Al Futtaim Holding LLC• Non-executive director of Johnson & Johnson, Inc. • Non-executive director of Teach for All
Age 67 Nationality British
Career
Ian Davis is senior partner emeritus of McKinsey & Company. He was a partner at McKinsey for 31 years until 2010 and served as chairman and managing director between 2003 and 2009.
Ian has a MA in Politics, Philosophy and Economics from Balliol College, University of Oxford.
Relevant skills and experience
Ian Davis brings global financial and strategic experience to the board. He has worked with and advised global organizations and companies in a wide variety of sectors including oil and gas and the public sector. He is able to draw on knowledge of diverse issues and outcomes to assist the board and its committees.
Ian led the board’s oversight of the response in the Gulf and chaired the Gulf of Mexico committee from its formation in 2010 until it was stood down in 2016. He was previously a non-executive director in the Cabinet Office giving him an important perspective on government affairs which is an asset to both the board and the geopolitical committee.
In his role as the senior independent director, Ian is responsible for the annual evaluation of the chairman’s performance and is leading the search for the successor to the chairman.
Book 1.indb 63 03/04/2018 16:43:25
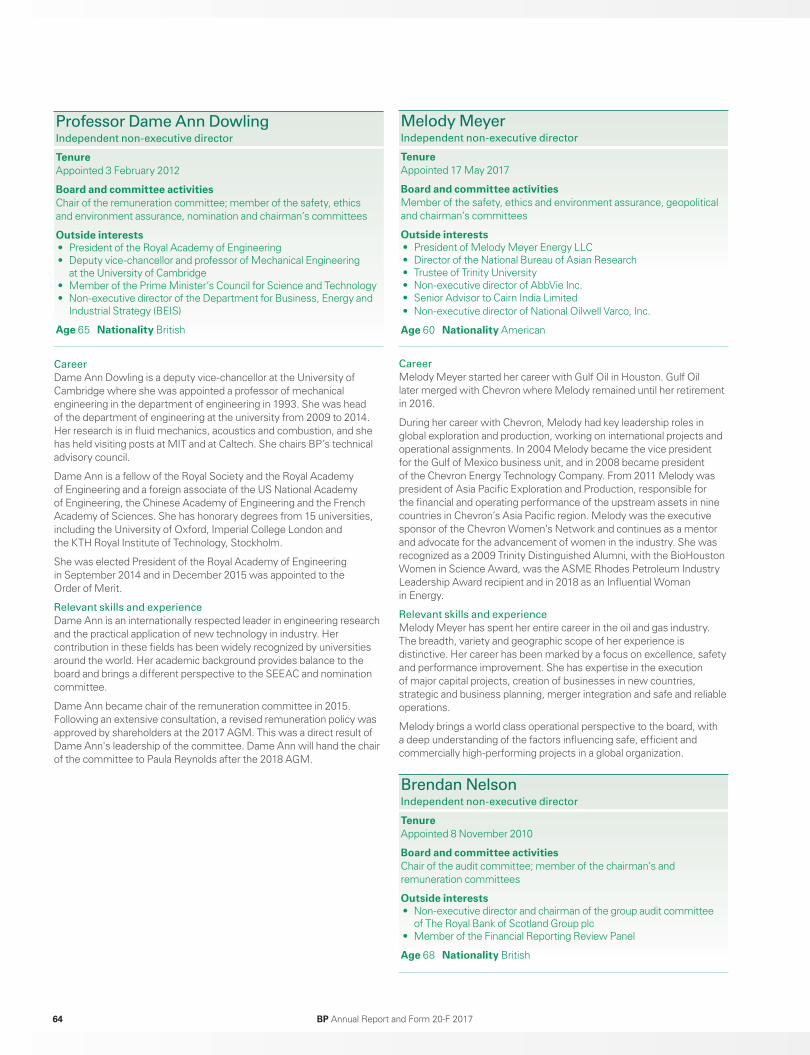
BP Annual Report and Form 20-F 201764
Professor Dame Ann DowlingIndependent non-executive director
TenureAppointed 3 February 2012
Board and committee activitiesChair of the remuneration committee; member of the safety, ethics and environment assurance, nomination and chairman’s committees
Outside interests• President of the Royal Academy of Engineering• Deputy vice-chancellor and professor of Mechanical Engineering
at the University of Cambridge• Member of the Prime Minister’s Council for Science and Technology• Non-executive director of the Department for Business, Energy and
Industrial Strategy (BEIS)
Age 65 Nationality British
Career
Dame Ann Dowling is a deputy vice-chancellor at the University of Cambridge where she was appointed a professor of mechanical engineering in the department of engineering in 1993. She was head of the department of engineering at the university from 2009 to 2014. Her research is in fluid mechanics, acoustics and combustion, and she has held visiting posts at MIT and at Caltech. She chairs BP’s technical advisory council.
Dame Ann is a fellow of the Royal Society and the Royal Academy of Engineering and a foreign associate of the US National Academy of Engineering, the Chinese Academy of Engineering and the French Academy of Sciences. She has honorary degrees from 15 universities, including the University of Oxford, Imperial College London and the KTH Royal Institute of Technology, Stockholm.
She was elected President of the Royal Academy of Engineering in September 2014 and in December 2015 was appointed to the Order of Merit.
Relevant skills and experience
Dame Ann is an internationally respected leader in engineering research and the practical application of new technology in industry. Her contribution in these fields has been widely recognized by universities around the world. Her academic background provides balance to the board and brings a different perspective to the SEEAC and nomination committee.
Dame Ann became chair of the remuneration committee in 2015. Following an extensive consultation, a revised remuneration policy was approved by shareholders at the 2017 AGM. This was a direct result of Dame Ann's leadership of the committee. Dame Ann will hand the chair of the committee to Paula Reynolds after the 2018 AGM.
Melody MeyerIndependent non-executive director
TenureAppointed 17 May 2017
Board and committee activitiesMember of the safety, ethics and environment assurance, geopolitical and chairman’s committees
Outside interests• President of Melody Meyer Energy LLC• Director of the National Bureau of Asian Research• Trustee of Trinity University• Non-executive director of AbbVie Inc.• Senior Advisor to Cairn India Limited• Non-executive director of National Oilwell Varco, Inc.
Age 60 Nationality American
Career
Melody Meyer started her career with Gulf Oil in Houston. Gulf Oil later merged with Chevron where Melody remained until her retirement in 2016.
During her career with Chevron, Melody had key leadership roles in global exploration and production, working on international projects and operational assignments. In 2004 Melody became the vice president for the Gulf of Mexico business unit, and in 2008 became president of the Chevron Energy Technology Company. From 2011 Melody was president of Asia Pacific Exploration and Production, responsible for the financial and operating performance of the upstream assets in nine countries in Chevron’s Asia Pacific region. Melody was the executive sponsor of the Chevron Women’s Network and continues as a mentor and advocate for the advancement of women in the industry. She was recognized as a 2009 Trinity Distinguished Alumni, with the BioHouston Women in Science Award, was the ASME Rhodes Petroleum Industry Leadership Award recipient and in 2018 as an Influential Woman in Energy.
Relevant skills and experience
Melody Meyer has spent her entire career in the oil and gas industry. The breadth, variety and geographic scope of her experience is distinctive. Her career has been marked by a focus on excellence, safety and performance improvement. She has expertise in the execution of major capital projects, creation of businesses in new countries, strategic and business planning, merger integration and safe and reliable operations.
Melody brings a world class operational perspective to the board, with a deep understanding of the factors influencing safe, efficient and commercially high-performing projects in a global organization.
Brendan NelsonIndependent non-executive director
TenureAppointed 8 November 2010
Board and committee activitiesChair of the audit committee; member of the chairman’s and remuneration committees
Outside interests• Non-executive director and chairman of the group audit committee
of The Royal Bank of Scotland Group plc• Member of the Financial Reporting Review Panel
Age 68 Nationality British
Book 1.indb 64 03/04/2018 16:43:25
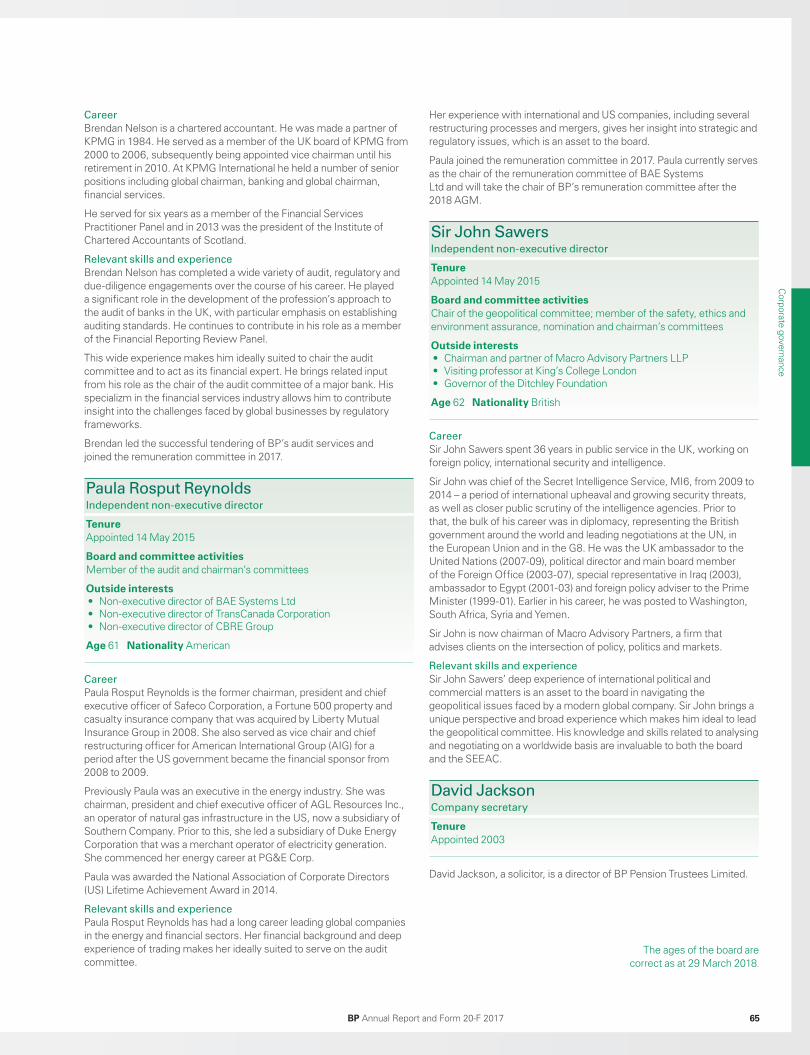
BP Annual Report and Form 20-F 2017 65
Corporate governance
Career
Brendan Nelson is a chartered accountant. He was made a partner of KPMG in 1984. He served as a member of the UK board of KPMG from 2000 to 2006, subsequently being appointed vice chairman until his retirement in 2010. At KPMG International he held a number of senior positions including global chairman, banking and global chairman, financial services.
He served for six years as a member of the Financial Services Practitioner Panel and in 2013 was the president of the Institute of Chartered Accountants of Scotland.
Relevant skills and experience
Brendan Nelson has completed a wide variety of audit, regulatory and due-diligence engagements over the course of his career. He played a significant role in the development of the profession’s approach to the audit of banks in the UK, with particular emphasis on establishing auditing standards. He continues to contribute in his role as a member of the Financial Reporting Review Panel.
This wide experience makes him ideally suited to chair the audit committee and to act as its financial expert. He brings related input from his role as the chair of the audit committee of a major bank. His specializm in the financial services industry allows him to contribute insight into the challenges faced by global businesses by regulatory frameworks.
Brendan led the successful tendering of BP’s audit services and joined the remuneration committee in 2017.
Paula Rosput ReynoldsIndependent non-executive director
TenureAppointed 14 May 2015
Board and committee activitiesMember of the audit and chairman’s committees
Outside interests• Non-executive director of BAE Systems Ltd• Non-executive director of TransCanada Corporation• Non-executive director of CBRE Group
Age 61 Nationality American
Career
Paula Rosput Reynolds is the former chairman, president and chief executive officer of Safeco Corporation, a Fortune 500 property and casualty insurance company that was acquired by Liberty Mutual Insurance Group in 2008. She also served as vice chair and chief restructuring officer for American International Group (AIG) for a period after the US government became the financial sponsor from 2008 to 2009.
Previously Paula was an executive in the energy industry. She was chairman, president and chief executive officer of AGL Resources Inc., an operator of natural gas infrastructure in the US, now a subsidiary of Southern Company. Prior to this, she led a subsidiary of Duke Energy Corporation that was a merchant operator of electricity generation. She commenced her energy career at PG&E Corp.
Paula was awarded the National Association of Corporate Directors (US) Lifetime Achievement Award in 2014.
Relevant skills and experience
Paula Rosput Reynolds has had a long career leading global companies in the energy and financial sectors. Her financial background and deep experience of trading makes her ideally suited to serve on the audit committee.
Her experience with international and US companies, including several restructuring processes and mergers, gives her insight into strategic and regulatory issues, which is an asset to the board.
Paula joined the remuneration committee in 2017. Paula currently serves as the chair of the remuneration committee of BAE Systems Ltd and will take the chair of BP’s remuneration committee after the 2018 AGM.
Sir John SawersIndependent non-executive director
TenureAppointed 14 May 2015
Board and committee activitiesChair of the geopolitical committee; member of the safety, ethics and environment assurance, nomination and chairman’s committees
Outside interests• Chairman and partner of Macro Advisory Partners LLP• Visiting professor at King’s College London• Governor of the Ditchley Foundation
Age 62 Nationality British
Career
Sir John Sawers spent 36 years in public service in the UK, working on foreign policy, international security and intelligence.
Sir John was chief of the Secret Intelligence Service, MI6, from 2009 to 2014 – a period of international upheaval and growing security threats, as well as closer public scrutiny of the intelligence agencies. Prior to that, the bulk of his career was in diplomacy, representing the British government around the world and leading negotiations at the UN, in the European Union and in the G8. He was the UK ambassador to the United Nations (2007-09), political director and main board member of the Foreign Office (2003-07), special representative in Iraq (2003), ambassador to Egypt (2001-03) and foreign policy adviser to the Prime Minister (1999-01). Earlier in his career, he was posted to Washington, South Africa, Syria and Yemen.
Sir John is now chairman of Macro Advisory Partners, a firm that advises clients on the intersection of policy, politics and markets.
Relevant skills and experience
Sir John Sawers’ deep experience of international political and commercial matters is an asset to the board in navigating the geopolitical issues faced by a modern global company. Sir John brings a unique perspective and broad experience which makes him ideal to lead the geopolitical committee. His knowledge and skills related to analysing and negotiating on a worldwide basis are invaluable to both the board and the SEEAC.
David JacksonCompany secretary
TenureAppointed 2003
David Jackson, a solicitor, is a director of BP Pension Trustees Limited.
The ages of the board are correct as at 29 March 2018.
Book 1.indb 65 03/04/2018 16:43:26
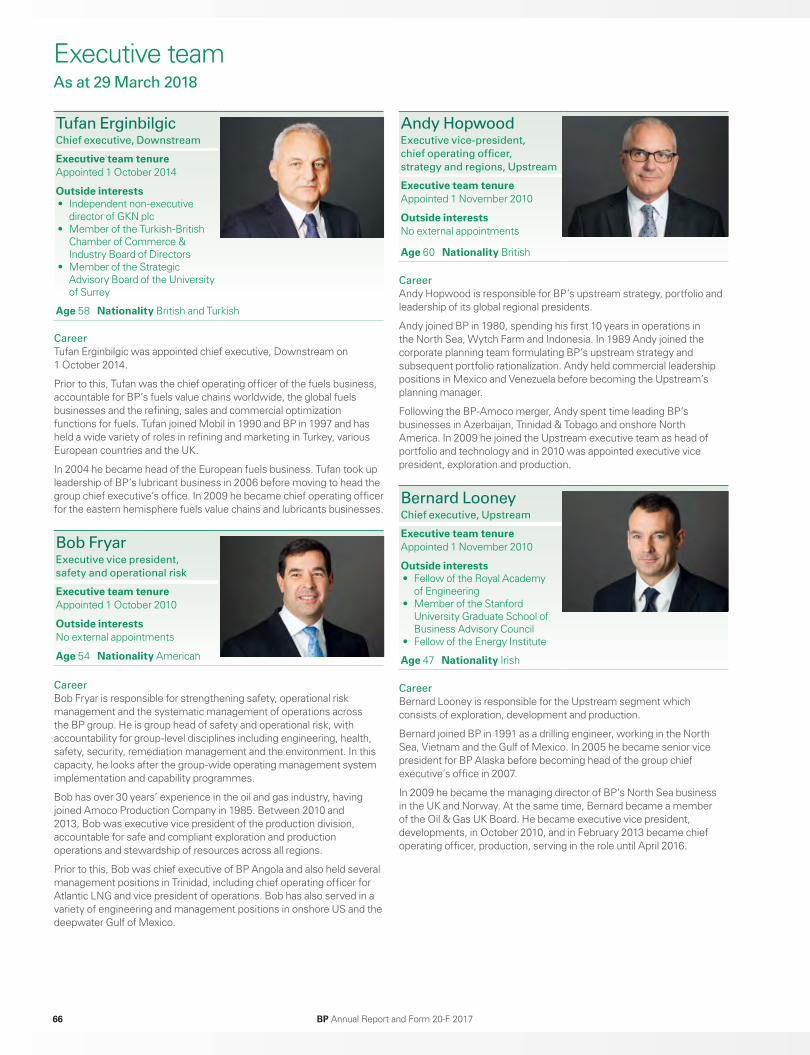
BP Annual Report and Form 20-F 201766
Tufan ErginbilgicChief executive, Downstream
Executive team tenureAppointed 1 October 2014
Outside interests• Independent non-executive
director of GKN plc• Member of the Turkish-British
Chamber of Commerce & Industry Board of Directors
• Member of the Strategic Advisory Board of the University of Surrey
Age 58 Nationality British and Turkish
Career
Tufan Erginbilgic was appointed chief executive, Downstream on 1 October 2014.
Prior to this, Tufan was the chief operating officer of the fuels business, accountable for BP’s fuels value chains worldwide, the global fuels businesses and the refining, sales and commercial optimization functions for fuels. Tufan joined Mobil in 1990 and BP in 1997 and has held a wide variety of roles in refining and marketing in Turkey, various European countries and the UK.
In 2004 he became head of the European fuels business. Tufan took up leadership of BP’s lubricant business in 2006 before moving to head the group chief executive’s office. In 2009 he became chief operating officer for the eastern hemisphere fuels value chains and lubricants businesses.
Bob FryarExecutive vice president,
safety and operational risk
Executive team tenureAppointed 1 October 2010
Outside interestsNo external appointments
Age 54 Nationality American
Career
Bob Fryar is responsible for strengthening safety, operational risk management and the systematic management of operations across the BP group. He is group head of safety and operational risk, with accountability for group-level disciplines including engineering, health, safety, security, remediation management and the environment. In this capacity, he looks after the group-wide operating management system implementation and capability programmes.
Bob has over 30 years’ experience in the oil and gas industry, having joined Amoco Production Company in 1985. Between 2010 and 2013, Bob was executive vice president of the production division, accountable for safe and compliant exploration and production operations and stewardship of resources across all regions.
Prior to this, Bob was chief executive of BP Angola and also held several management positions in Trinidad, including chief operating officer for Atlantic LNG and vice president of operations. Bob has also served in a variety of engineering and management positions in onshore US and the deepwater Gulf of Mexico.
Andy HopwoodExecutive vice-president,
chief operating officer,
strategy and regions, Upstream
Executive team tenureAppointed 1 November 2010
Outside interestsNo external appointments
Age 60 Nationality British
Career
Andy Hopwood is responsible for BP’s upstream strategy, portfolio and leadership of its global regional presidents.
Andy joined BP in 1980, spending his first 10 years in operations in the North Sea, Wytch Farm and Indonesia. In 1989 Andy joined the corporate planning team formulating BP’s upstream strategy and subsequent portfolio rationalization. Andy held commercial leadership positions in Mexico and Venezuela before becoming the Upstream’s planning manager.
Following the BP-Amoco merger, Andy spent time leading BP’s businesses in Azerbaijan, Trinidad & Tobago and onshore North America. In 2009 he joined the Upstream executive team as head of portfolio and technology and in 2010 was appointed executive vice president, exploration and production.
Bernard Looney Chief executive, Upstream
Executive team tenureAppointed 1 November 2010
Outside interests• Fellow of the Royal Academy
of Engineering• Member of the Stanford
University Graduate School of Business Advisory Council
• Fellow of the Energy Institute
Age 47 Nationality Irish
Career
Bernard Looney is responsible for the Upstream segment which consists of exploration, development and production.
Bernard joined BP in 1991 as a drilling engineer, working in the North Sea, Vietnam and the Gulf of Mexico. In 2005 he became senior vice president for BP Alaska before becoming head of the group chief executive’s office in 2007.
In 2009 he became the managing director of BP’s North Sea business in the UK and Norway. At the same time, Bernard became a member of the Oil & Gas UK Board. He became executive vice president, developments, in October 2010, and in February 2013 became chief operating officer, production, serving in the role until April 2016.
Executive teamAs at 29 March 2018
Book 1.indb 66 03/04/2018 16:43:30

Corporate governance
Corporate governance
BP Annual Report and Form 20-F 2017 67
Lamar McKayDeputy group chief executive
Executive team tenureAppointed 16 June 2008
Outside interestsNo external appointments
Age 59 Nationality American
Career
Lamar McKay is accountable for group strategy and long-term planning, safety and operational risk and group technology. In addition to supporting the group chief executive, he also focuses on various corporate governance activities including ethics and compliance.
Lamar started his career in 1980 with Amoco and held a range of technical and leadership roles.
During 1998 to 2000, he worked on the BP-Amoco merger and served as head of strategy and planning for the exploration and production business. In 2000 he became business unit leader for the central North Sea. In 2001 he became chief of staff for exploration and production, and subsequently for BP’s deputy group chief executive. Lamar became group vice president, Russia and Kazakhstan in 2003. He served as a member of the board of directors of TNK-BP between February 2004 and May 2007.
In 2007 he was appointed executive vice president, BP America. In 2008 he became executive vice president, special projects where he led BP’s efforts to restructure the governance framework for TNK-BP. In 2009 Lamar was appointed chairman and president of BP America, serving as BP’s chief representative in the US. In January 2013, he became chief executive, Upstream, responsible for exploration, development and production, serving in the role until April 2016.
Eric NitcherGroup general counsel
Executive team tenureAppointed 1 January 2017
Outside interestsNo external appointments
Age 55 Nationality American
Career
Eric Nitcher is responsible for legal matters across the BP group.
Eric began his career in the late 1980s working as a litigation and regulatory lawyer in Wichita, Kansas. He joined Amoco in 1990 and over the years has held a wide variety of roles, both within and outside the US.
In 2000, Eric moved to London to work in the mergers and acquisitions legal team where he played a key role in the formation of the Russian joint venture TNK-BP. Eric returned to Houston in 2007 where he served as special counsel and chief of staff to BP America’s chairman and president.
Most recently he played a leading role in the settlement of the Deepwater Horizon government claims and resolution of most of the remaining private claims being litigated in New Orleans.
Dev SanyalChief executive, alternative
energy and executive vice
president, regions
Executive team tenureAppointed 1 January 2012
Outside interests• Independent non-executive
director of Man Group plc• Member of the Accenture Global Energy Board• Member, International Advisory Board of the Ministry of Petroleum
and Natural Gas, Government of India• Member of the Board of Advisors of the Fletcher School of Law and
Diplomacy, Tufts University
Age 52 Nationality British and Indian
Career
Dev Sanyal is responsible for alternative energy and for the Europe and Asia regions and functionally for risk management, government and political affairs, economics and policy.
Dev joined BP in 1989 and has held a variety of international roles in London, Athens, Istanbul, Vienna and Dubai. He was general manager, Former Soviet Union and Eastern Europe, prior to being appointed chief executive, BP Eastern Mediterranean Fuels in 1999.
In November 2003 he was appointed chief executive officer of Air BP International and in June 2006 was appointed head of the group chief executive’s office. He was appointed group vice president and group treasurer in 2007. During this period, he was also chairman of BP Investment Management Ltd and was accountable for the group’s aluminium interests. Until April 2016, Dev was executive vice president, strategy and regions.
Helmut SchusterExecutive vice president,
group human resources
Executive team tenureAppointed 1 March 2011
Outside interests• Non-executive director of Ivoclar
Vivadent AG, Germany
Age 57 Nationality Austrian
Career
Helmut Schuster became group human resources (HR) director in March 2011. In this role he is accountable for the BP human resources function.
He completed his post graduate diploma in international relations and his PhD in economics at the University of Vienna and then began his career working for Henkel in a marketing capacity. Since joining BP in 1989 Helmut has held a number of leadership roles. He has worked in BP in the US, UK and continental Europe and within most parts of refining, marketing, trading and gas and power.
Before taking on his current role, his portfolio of responsibilities as vice president, HR included the refining and marketing segment of BP and corporate and functions. That role saw him leading the people agenda for roughly 60,000 people across the globe that included businesses such as petrochemicals, fuels value chains, lubricants and functional experts across the group.
Outside of his role, Helmut is a non-executive director of Ivoclar Vivadent. Additionally, he is an alumni and advocate of AFS, an international exchange organization.
The executive team represents the principal executive leadership of the BP group. Its members include BP’s executive directors (Bob Dudley and Dr Brian Gilvary whose biographies appear on pages 61-65) and the senior management listed on these pages. The ages of the executive team are correct as at 29 March 2018.
Book 1.indb 67 03/04/2018 16:43:35

BP Annual Report and Form 20-F 201768
Upstream
Other business and functions leaders
1. David EytonGroup head of technology
2. Dominic Emery Vice president, group strategic planning
3. Laura FolseChief executive officer, wind, alternative energy
4. Richard Hookway Chief operating officer of global business services and information technology and systems
5. David Jardine Group head of audit
6. Robert LawsonGlobal head of mergers and acquisitions
7. Dev SanyalChief executive, alternative energy and executive vice president, regions
8. Joan WalesHead of safety and operational risk, alternative energy
9. Craig MarshallGroup head of investor relations
10. Spencer DaleGroup chief economist
11. Geoff MorrellGroup head of communications and external affairs
12. Lucy KnightHuman resources vice president, corporate business activities and functions
13. Trudi CharlesAssociate general counsel, integrated supply and trading
1. Andy Hopwood Chief operating officer, strategy and regions
2. James Dupree Chief operating officer, developments and technology
3. Kerry DryburghHead of human resources
4. Tony BrockHead of safety and operational risk
5. Bernard LooneyChief executive
6. Murray AuchinclossChief financial officer
7. Nigel JonesAssociate general counsel
8. Gordon BirrellChief operating officer, production, transformation and carbon
1
24
56 8
3 7
512
6 813
Executive management teams
Book 1.indb 68 03/04/2018 16:43:43

Corporate governance
Corporate governance
BP Annual Report and Form 20-F 2017 69
Downstream1. Rita GriffinChief operating officer, petrochemicals
2. Mike O’SullivanChief financial officer
3. Michael SossoAssociate general counsel, downstream and BP shipping
4. Doug SparkmanChief operating officer, fuels, North America
5. Angela StrankHead of technology and BP chief scientist
6. Tufan ErginbilgicChief executive
7. Mandhir Singh Chief operating officer, lubricants
8. Evelyn Gardiner Head of human resources
9. Guy MoeyensChief operating officer, fuels, Europe and Southern Africa
10. Andy Holmes Chief operating officer, fuels ASPAC and Air BP
14. David AndersonChief financial officer, alternative energy
15. Ashok PillaiVice president, group reward
16. Kate ThomsonGroup treasurer
17. Rahul SaxenaGroup ethics and compliance officer
18. Mario LindenhaynChief executive officer, biofuels, alternative energy
19. Susan DioChief executive officer, shipping
20. Jan LyonsGroup head of tax
21. Alan Haywood Chief executive officer, integrated supply and trading
22. William LinHead of group chief executive’s office
23. Carol HowleHead of group chief executive’s office
24. Camille DrummondHead of global business services
25. David BucknallGroup controller and chief financial officer, other businesses and corporate
26. Nick WaythChief development officer, alternative energy
13 4 6 7
9
8102
5
1618
2224
25
Our diverse and talented leaders have a wide range of skills and disciplines that support our executive team’s work. These include experts in fields such as renewable energy, finance, trading, technology and digital, and tax and treasury. Job titles correct as at 1 January 2018.
Book 1.indb 69 03/04/2018 16:43:50
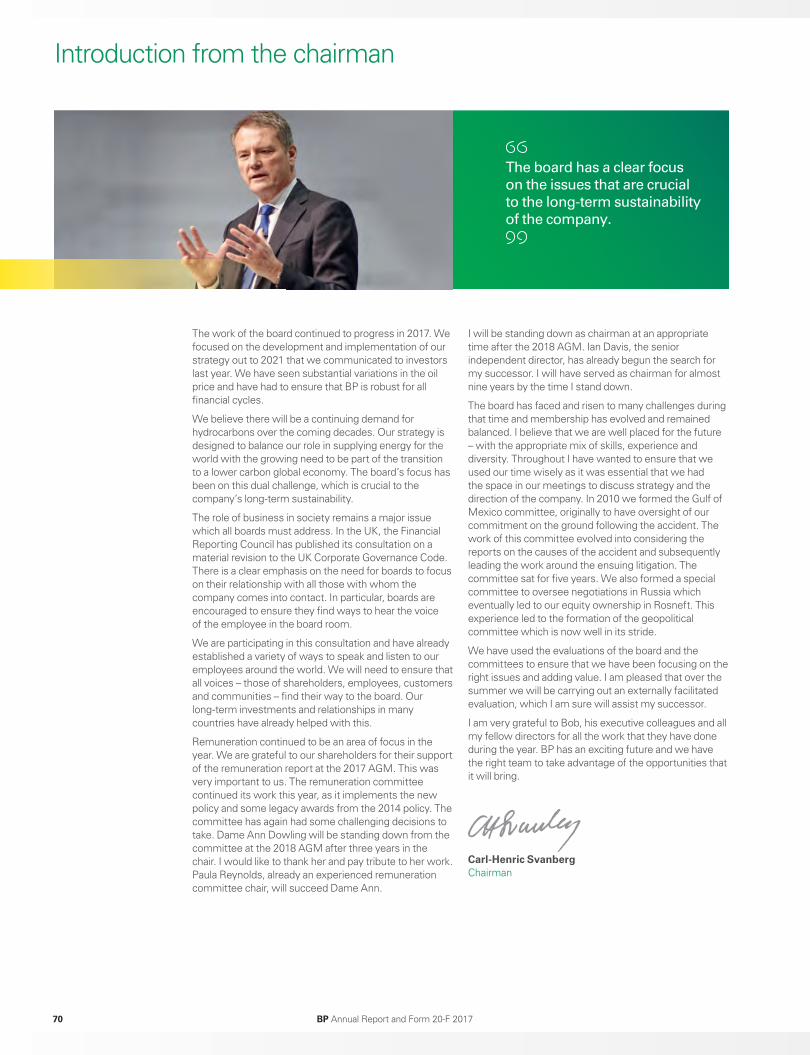
Introduction from the chairman
The work of the board continued to progress in 2017. We focused on the development and implementation of our strategy out to 2021 that we communicated to investors last year. We have seen substantial variations in the oil price and have had to ensure that BP is robust for all financial cycles.
We believe there will be a continuing demand for hydrocarbons over the coming decades. Our strategy is designed to balance our role in supplying energy for the world with the growing need to be part of the transition to a lower carbon global economy. The board’s focus has been on this dual challenge, which is crucial to the company’s long-term sustainability.
The role of business in society remains a major issue which all boards must address. In the UK, the Financial Reporting Council has published its consultation on a material revision to the UK Corporate Governance Code. There is a clear emphasis on the need for boards to focus on their relationship with all those with whom the company comes into contact. In particular, boards are encouraged to ensure they find ways to hear the voice of the employee in the board room.
We are participating in this consultation and have already established a variety of ways to speak and listen to our employees around the world. We will need to ensure that all voices – those of shareholders, employees, customers and communities – find their way to the board. Our long-term investments and relationships in many countries have already helped with this.
Remuneration continued to be an area of focus in the year. We are grateful to our shareholders for their support of the remuneration report at the 2017 AGM. This was very important to us. The remuneration committee continued its work this year, as it implements the new policy and some legacy awards from the 2014 policy. The committee has again had some challenging decisions to take. Dame Ann Dowling will be standing down from the committee at the 2018 AGM after three years in the chair. I would like to thank her and pay tribute to her work. Paula Reynolds, already an experienced remuneration committee chair, will succeed Dame Ann.
I will be standing down as chairman at an appropriate time after the 2018 AGM. Ian Davis, the senior independent director, has already begun the search for my successor. I will have served as chairman for almost nine years by the time I stand down.
The board has faced and risen to many challenges during that time and membership has evolved and remained balanced. I believe that we are well placed for the future – with the appropriate mix of skills, experience and diversity. Throughout I have wanted to ensure that we used our time wisely as it was essential that we had the space in our meetings to discuss strategy and the direction of the company. In 2010 we formed the Gulf of Mexico committee, originally to have oversight of our commitment on the ground following the accident. The work of this committee evolved into considering the reports on the causes of the accident and subsequently leading the work around the ensuing litigation. The committee sat for five years. We also formed a special committee to oversee negotiations in Russia which eventually led to our equity ownership in Rosneft. This experience led to the formation of the geopolitical committee which is now well in its stride.
We have used the evaluations of the board and the committees to ensure that we have been focusing on the right issues and adding value. I am pleased that over the summer we will be carrying out an externally facilitated evaluation, which I am sure will assist my successor.
I am very grateful to Bob, his executive colleagues and all my fellow directors for all the work that they have done during the year. BP has an exciting future and we have the right team to take advantage of the opportunities that it will bring.
Carl-Henric Svanberg Chairman
The board has a clear focus
on the issues that are crucial
to the long-term sustainability
of the company.
BP Annual Report and Form 20-F 201770
Book 1.indb 70 03/04/2018 16:43:50
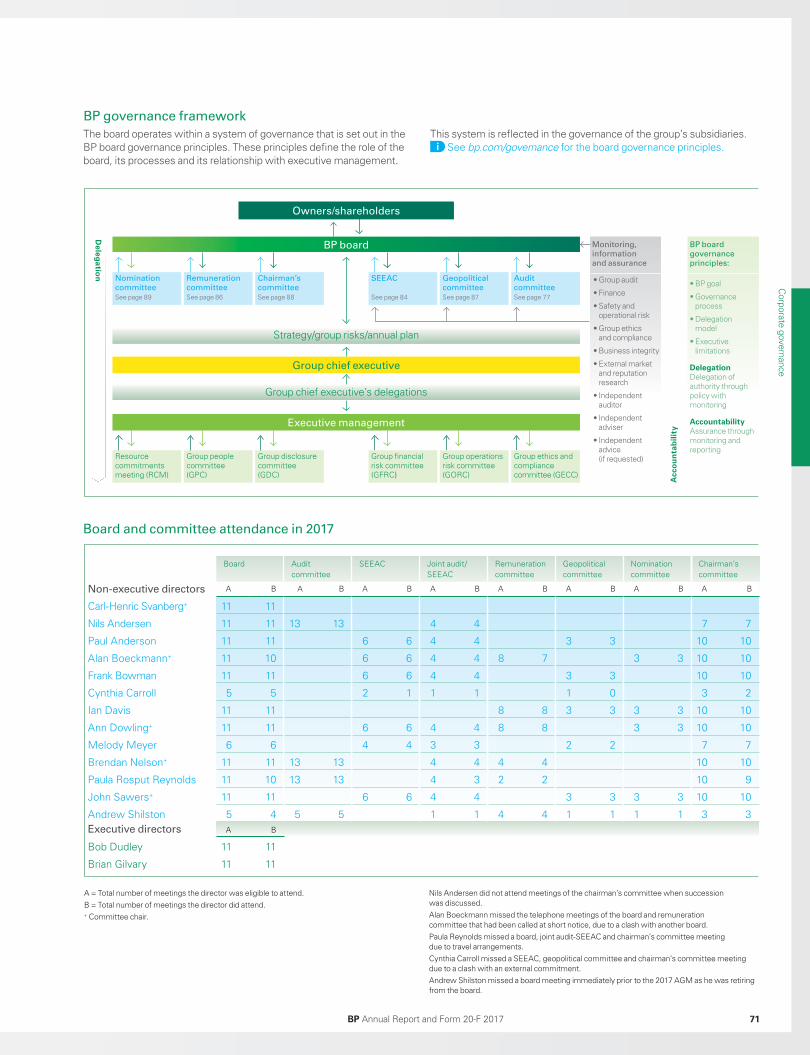
Board and committee attendance in 2017
BP board
Owners/shareholders
Group chief executive
Nomination
committee
See page 89
Deleg
ation
Remuneration
committee
See page 86
Chairman’s
committee
See page 88
SEEAC
See page 84
Geopolitical
committee
See page 87
Strategy/group risks/annual plan
Group chief executive’s delegations
Audit
committee
See page 77
Monitoring,
information
and assurance
BP board
governance
principles:
• Group audit
• Finance
• Safety and operational risk
• Group ethics and compliance
• Business integrity
• External market and reputation research
• Independent auditor
• Independent adviser
• Independent advice (if requested)
• BP goal
• Governance process
• Delegation model
• Executive limitations
Delegation Delegation of authority through policy with monitoring
Accountability
Assurance through monitoring and reporting
Acc
ou
nta
bili
ty
Resource commitments meeting (RCM)
Group people committee (GPC)
Group disclosure committee (GDC)
Executive management
Group financial risk committee (GFRC)
Group operations risk committee (GORC)
Group ethics and compliance committee (GECC)
Board Audit committee
SEEAC Joint audit/SEEAC
Remuneration committee
Geopolitical committee
Nomination committee
Chairman’s committee
Non-executive directors A B A B A B A B A B A B A B A B
Carl-Henric Svanberg+ 11 11
Nils Andersen 11 11 13 13 4 4 7 7
Paul Anderson 11 11 6 6 4 4 3 3 10 10
Alan Boeckmann+ 11 10 6 6 4 4 8 7 3 3 10 10
Frank Bowman 11 11 6 6 4 4 3 3 10 10
Cynthia Carroll 5 5 2 1 1 1 1 0 3 2
Ian Davis 11 11 8 8 3 3 3 3 10 10
Ann Dowling+ 11 11 6 6 4 4 8 8 3 3 10 10
Melody Meyer 6 6 4 4 3 3 2 2 7 7
Brendan Nelson+ 11 11 13 13 4 4 4 4 10 10
Paula Rosput Reynolds 11 10 13 13 4 3 2 2 10 9
John Sawers+ 11 11 6 6 4 4 3 3 3 3 10 10
Andrew Shilston 5 4 5 5 1 1 4 4 1 1 1 1 3 3Executive directors A B
Bob Dudley 11 11
Brian Gilvary 11 11
A = Total number of meetings the director was eligible to attend.B = Total number of meetings the director did attend.+ Committee chair.
Nils Andersen did not attend meetings of the chairman’s committee when succession was discussed.Alan Boeckmann missed the telephone meetings of the board and remuneration committee that had been called at short notice, due to a clash with another board.Paula Reynolds missed a board, joint audit-SEEAC and chairman’s committee meeting due to travel arrangements.Cynthia Carroll missed a SEEAC, geopolitical committee and chairman’s committee meeting due to a clash with an external commitment.Andrew Shilston missed a board meeting immediately prior to the 2017 AGM as he was retiring from the board.
BP governance framework
The board operates within a system of governance that is set out in the BP board governance principles. These principles define the role of the board, its processes and its relationship with executive management.
This system is reflected in the governance of the group’s subsidiaries. See bp.com/governance for the board governance principles.
Corporate governance
BP Annual Report and Form 20-F 2017 71
Book 1.indb 71 03/04/2018 16:43:51

Board activity in 2017
1
Role of the board
The board is responsible for the overall conduct of the group’s business. Directors have duties under both UK company law and BP’s Articles of Association. The primary tasks of the board include:
Active consideration and direction of long-term strategy and approval of the annual plan
Monitoring of BP’s performance against the strategy and plan
Ensuring that the principal risks and uncertainties to BP are identified and that systems of risk management and control are in place
Board and executive management succession
Performance and monitoring
The board reviews financial and operational performance at each meeting. It receives regular updates on the group’s performance for the year across a range of metrics as well as the latest view on expected full-year delivery against external scorecard measures. Updates are also given on various components of value delivery for BP’s business. Regular reports presented to the board include:
• Chief executive’s report.• Group performance report.• Group financial outlook.• Effectiveness of investment
review.• Quarterly and full-year results.• Shareholder distributions.
The board reviews the quarterly and full-year results, including the shareholder distribution policy. The 2017 annual report was assessed in terms of the directors’ obligations and appropriate regulatory requirements.
The board monitors employee opinion via an annual ‘pulse’ survey which includes measurement of how the BP values are incorporated into culture around our global operations.
Strategy
During the year the board provided input on the group’s strategy to senior management. This included a two-day strategy session in September where it examined developments in the wider environment and debated strategic themes relating to BP’s segments, key functions and the impact of the lower carbon transition on the group’s business model. The board discussed the transition to a lower carbon world frequently during the year.
It received regular reports on the progress and implementation of the strategy – through updates from management and by means of a strategic performance scorecard which is discussed at each full board meeting.
The board monitored the company’s performance against the annual plan for 2017 and approved the forward framework for the annual plan in 2018.
The board reviewed the BP Energy Outlook, updated in February 2018, which looks at long-term energy trends and projections for world energy markets.
Risk
The board, either directly or through its monitoring committees, regularly reviews the processes whereby risks are identified, evaluated and managed.
Activities include:• Assessing the effectiveness of
the group’s system of internal control and risk management as part of the review of the BP Annual Report and Form 20-F 2017.
• Identification and allocation of risks to the board and monitoring committees (the audit, SEEA and geopolitical committees) for 2017, and confirmation of the schedule for oversight.
The board reviewed the group risk of cyber security in 2017 – with the audit committee and SEEAC assessing elements of cyber security risk in their work programme for the year. The allocation of the group cyber security risk to the board (with additional monitoring by the audit and SEEA committees) remains unchanged for 2018.The group risks allocated to the committees for review over the year are outlined in the reports of the committees on pages 77-89.
Further information on BP’s system of risk management is outlined in How we manage risk on page 55. Information about BP’s system of internal control is on page 113.
Succession
The board, in conjunction with the nomination and chairman’s committees, reviews succession plans for executive and non-executive directors on a regular basis. The board needs to ensure that potential candidates are identified and evaluated as current directors reach the end of their recommended term of office, including in the event of a director leaving unexpectedly.
The board employs executive search firms when it concludes that this is an effective way of finding suitable candidates. In 2017 we appointed Egon Zehnder to assist in the search for non-executive directors.
• Cynthia Carroll and Andrew Shilston stood down from the board at the 2017 AGM.
• Melody Meyer was elected as a director at the 2017 AGM. On appointment she joined the SEEA and geopolitical committees.
• Brendan Nelson and Paula Reynolds joined the remuneration committee in May and September 2017 respectively.
• Paul Anderson will retire from the board at the 2018 AGM.
• Ann Dowling will step down from the remuneration committee after the 2018 AGM, having served three years as chair, and Paula Reynolds will then assume the role.
BP Annual Report and Form 20-F 201772
Book 1.indb 72 03/04/2018 16:43:51
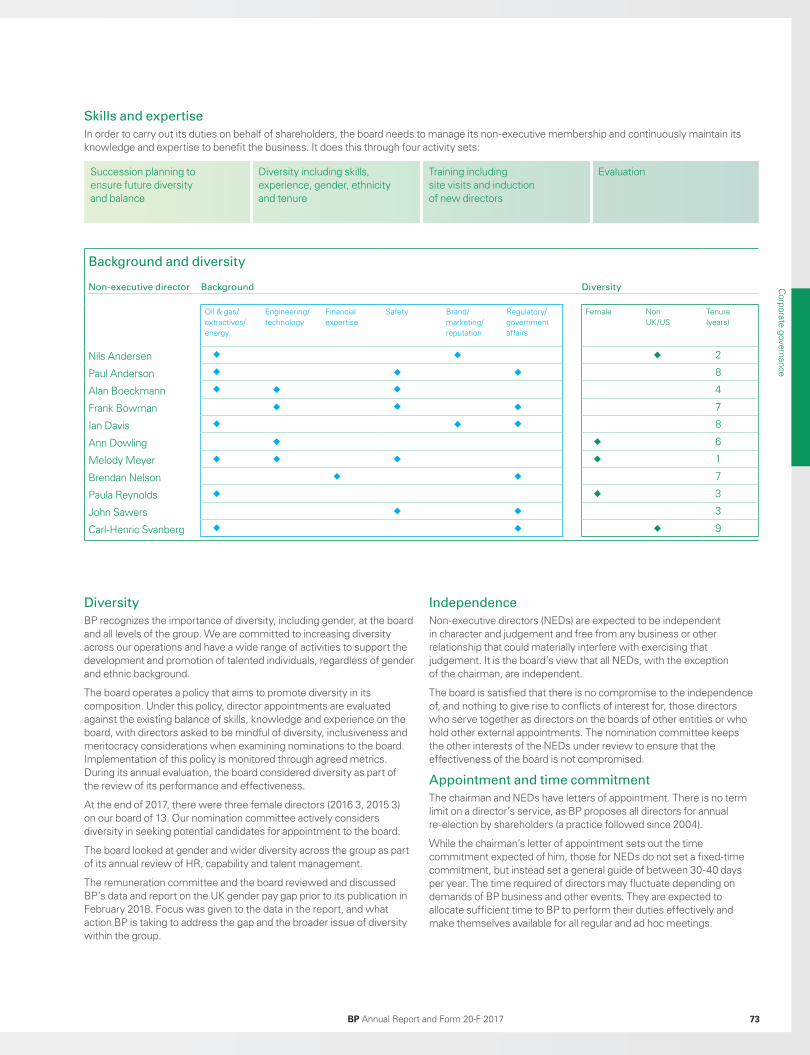
Skills and expertise
In order to carry out its duties on behalf of shareholders, the board needs to manage its non-executive membership and continuously maintain its knowledge and expertise to benefit the business. It does this through four activity sets:
Succession planning to ensure future diversity and balance
Diversity including skills, experience, gender, ethnicity and tenure
EvaluationTraining including site visits and induction of new directors
Diversity
BP recognizes the importance of diversity, including gender, at the board and all levels of the group. We are committed to increasing diversity across our operations and have a wide range of activities to support the development and promotion of talented individuals, regardless of gender and ethnic background.
The board operates a policy that aims to promote diversity in its composition. Under this policy, director appointments are evaluated against the existing balance of skills, knowledge and experience on the board, with directors asked to be mindful of diversity, inclusiveness and meritocracy considerations when examining nominations to the board. Implementation of this policy is monitored through agreed metrics. During its annual evaluation, the board considered diversity as part of the review of its performance and effectiveness.
At the end of 2017, there were three female directors (2016 3, 2015 3) on our board of 13. Our nomination committee actively considers diversity in seeking potential candidates for appointment to the board.
The board looked at gender and wider diversity across the group as part of its annual review of HR, capability and talent management.
The remuneration committee and the board reviewed and discussed BP’s data and report on the UK gender pay gap prior to its publication in February 2018. Focus was given to the data in the report, and what action BP is taking to address the gap and the broader issue of diversity within the group.
Independence
Non-executive directors (NEDs) are expected to be independent in character and judgement and free from any business or other relationship that could materially interfere with exercising that judgement. It is the board’s view that all NEDs, with the exception of the chairman, are independent.
The board is satisfied that there is no compromise to the independence of, and nothing to give rise to conflicts of interest for, those directors who serve together as directors on the boards of other entities or who hold other external appointments. The nomination committee keeps the other interests of the NEDs under review to ensure that the effectiveness of the board is not compromised.
Appointment and time commitment
The chairman and NEDs have letters of appointment. There is no term limit on a director’s service, as BP proposes all directors for annual re-election by shareholders (a practice followed since 2004).
While the chairman’s letter of appointment sets out the time commitment expected of him, those for NEDs do not set a fixed-time commitment, but instead set a general guide of between 30-40 days per year. The time required of directors may fluctuate depending on demands of BP business and other events. They are expected to allocate sufficient time to BP to perform their duties effectively and make themselves available for all regular and ad hoc meetings.
Background and diversity
Non-executive director Background Diversity
Oil & gas/ extractives/ energy
Engineering/ technology
Financial expertise
Safety Brand/ marketing/ reputation
Regulatory/ government affairs
Female Non UK/US
Tenure (years)
Nils Andersen 2
Paul Anderson 8
Alan Boeckmann 4
Frank Bowman 7
Ian Davis 8
Ann Dowling 6
Melody Meyer 1
Brendan Nelson 7
Paula Reynolds 3
John Sawers 3
Carl-Henric Svanberg 9
Corporate governance
BP Annual Report and Form 20-F 2017 73
Book 1.indb 73 03/04/2018 16:43:51

Executive directors are permitted to take up one external board appointment, subject to the agreement of the chairman. Fees received for an external appointment may be retained by the executive director and are reported in the directors’ remuneration report (see page 90).
Neither the chairman nor the senior independent director are employed as an executive of the group.
Training and induction
To help develop an understanding of BP’s business, the board continues to build its knowledge through briefings and site visits. In 2017 the board received training on ethics and compliance.
NEDs are expected to visit at least one business a year as part of their learning programme. In 2017 the board visited the group’s response information centre in Sunbury, operations of Aker in Norway and the trading business in London. Members of the SEEAC and other directors also visited the Cherry Point refinery in the US and the Glen Lyon FPSO vessel in the North Sea.
Newly appointed NEDs follow a structured induction process. This includes one-to-one meetings with management and the external auditors and also covers the board committees that they join.
Board evaluation
BP undertakes an annual review of the board, its committees and individual directors. The chairman’s performance is evaluated by the chairman’s committee and his evaluation is led by the senior independent director. The evaluation operates on a three-year cycle, with one externally led evaluation followed by two subsequent years of internal evaluations carried out using a questionnaire prepared by an external facilitator.
Activity following prior year evaluation
Actions arising from the 2016 evaluation and how these were addressed included:
• Focus on implementing the strategy, in particular the opportunities relating to the transition to a lower carbon economy: reporting on the implementation of the strategy was further developed and as a result the board receives updates from management and a strategic progress report at each meeting. The board held a number of discussions on the transition to a lower carbon economy, including a session at the strategy away day, with further sessions scheduled for 2018. The group’s quarterly results announcement was amended in 2017 to include narrative on the implementation of strategy.
• More detailed examination of the financial performance of the business, in particular capital allocation and returns: the board discusses financial performance at each board meeting and reviews the proposed disclosures and investor presentation for each quarter’s results. A return on average capital employed measure was included in the 2017 remuneration policy and the board reviews this as part of its performance monitoring. A review of the group’s capital allocation process and investment effectiveness was also held during the year.
• Obtaining a better understanding of the group’s ability to effectively deliver the strategy, including technology, digital and big data: this included a deep dive into technology trends and their potential impact on the group’s business model.
• Bringing wider perspectives into the board room and gaining deeper insight into shareholder views: the board considered output from BP’s remuneration engagement programme as well as broader governance issues from investor meetings held throughout the year. Feedback from institutional investors on the group’s performance and strategy – compiled by an independent third party – was discussed with the board following the strategy update.
• Continued emphasis on improving operational excellence: the board received data and commentary on BP’s operations through monthly reports and updates from management; and operational measures were included in the annual bonus scorecard as part of the remuneration assessment for the year.
2017 evaluation
The evaluation was undertaken through a questionnaire facilitated by an external consultant (Lintstock) and individual interviews between the chairman and each director. The results of the evaluation and feedback from the interviews were collectively discussed by the board including:
• Investment decisions: continue focusing on capital allocation and the way in which investment decisions are taken.
• Longer-term vision and strategy: extend the timeframe of strategic discussions, including challenges faced by BP’s core business and the lower carbon transition.
• Geopolitics: consider how to further optimize the output of the work undertaken by the board, geopolitical committee and the international advisory board.
• Improve the board’s understanding of employees’ views: expand the existing ways employee views are disseminated to the board to include more local and business based feedback.
Director induction programme
Melody Meyer, appointed in 2017, followed a
tailored induction process, which also covered
the SEEAC and geopolitical committee. The
programme of topics included:
Board and governance• BP’s board governance model,
directors’ duties, interests and potential conflicts.
Business introduction• BP’s business• Upstream (exploration,
development, production, overview of our operations)
• Downstream (refining, marketing and lubricants)
• Alternative Energy• Strategy and planning• Lower carbon transition• BP’s performance relative
to its competitors.
Functional input• Human resources, including
capability and reward• Ethics and compliance• Research and technology• Investor relations• Trading
• Communications and corporate reporting
• Group audit• External audit • BP women’s network• Legal.
SEEAC specific• Safety and operational risk
(S&OR), BP’s operating management system (OMS) and environmental performance
• Operational, safety and environmental reporting
• Group security and crisis management.
Geopolitical committee specific• BP’s regional businesses• Government affairs.
BP executives devoted
substantial time to ensure
a high quality induction.
Melody MeyerNon-executive director
See Glossary BP Annual Report and Form 20-F 201774
Book 1.indb 74 03/04/2018 16:43:51

Site visits
Washington state, US
Members of the SEEAC and other directors visited the Cherry Point refinery in Blaine, Washington in June. The visit focused on operating procedures and safety and risk mitigation. Investment was discussed, including technology enhancements to produce ultra-low sulphur diesel, increasing logistical optionality and a coker heater project. Other discussions included the cultural and environmental outreach projects in the area.
They also took a tour of the refinery, control room, the operator training simulator and dock area.
Global business
services, Hungary
The audit committee visited BP’s global business service (GBS) centre located in Budapest in September, where standardized business services including finance, procurement, HR, trading settlement and tax are delivered for businesses across the BP group.
The committee received presentations on the GBS strategy, business model and controls framework. They also met local staff across a range of job levels, including those involved in diversity and inclusion initiatives such as LGBT and working parent programmes.
Integrated supply
and trading, London
Members of the board visited BP’s trading operations in London in December to gain an insight into the group’s approach to trading, oil and gas market fundamentals, risk profile and strategy. Directors received presentations from traders and originators on the trading floor and deepened their understanding of the group’s oil products and LNG business models.
North Sea, UK
In July members of the SEEAC and other directors visited Glen Lyon – the floating, production, storage and offloading vessel for our Quad 204 major project start-up in the North Sea. The committee was the first to visit the vessel following production start-up.
Discussions on board the vessel covered project completion and future plans including reviews of production efficiency, operational management, safety, risk mitigation and OMS conformance. They also visited key areas of the vessel including the control room and riser tower.
Tranby, Norway
The board visited Aker’s Tranby technology centre near Oslo to see the manufacture of subsea well heads and the research and development centre. The Tranby site has been an established centre of excellence for subsea equipment manufacturing for over a decade.
The board heard about the research being undertaken in subsea trees, workover systems and subsea pumps and saw new digital technologies to integrate engineering and manufacturing processes being tested.
Non-executive directors are expected to visit at least one business per year, as part of their learning programme. In 2017 the board visited partner operations in Tranby, Norway and BP’s trading business in London. Members of the SEEAC and other directors visited operations in the North Sea and Washington state, and the audit committee visited our global business services offices in Hungary. The board met local management at each visit, and after each one, the board or appropriate committee was briefed on the impressions gained by the directors during the visit.
Corporate governance
BP Annual Report and Form 20-F 2017 75
Book 1.indb 75 03/04/2018 16:44:07
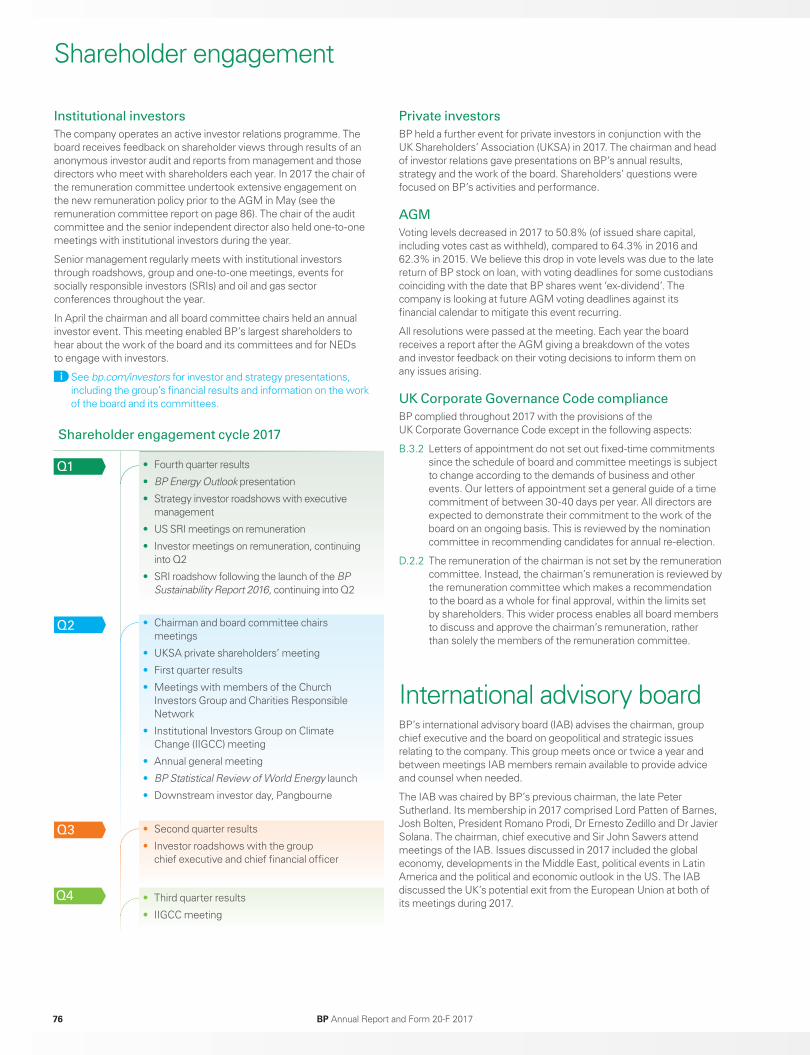
Shareholder engagement
Institutional investors
The company operates an active investor relations programme. The board receives feedback on shareholder views through results of an anonymous investor audit and reports from management and those directors who meet with shareholders each year. In 2017 the chair of the remuneration committee undertook extensive engagement on the new remuneration policy prior to the AGM in May (see the remuneration committee report on page 86). The chair of the audit committee and the senior independent director also held one-to-one meetings with institutional investors during the year.
Senior management regularly meets with institutional investors through roadshows, group and one-to-one meetings, events for socially responsible investors (SRIs) and oil and gas sector conferences throughout the year.
In April the chairman and all board committee chairs held an annual investor event. This meeting enabled BP’s largest shareholders to hear about the work of the board and its committees and for NEDs to engage with investors.
See bp.com/investors for investor and strategy presentations, including the group’s financial results and information on the work of the board and its committees.
Private investors
BP held a further event for private investors in conjunction with the UK Shareholders’ Association (UKSA) in 2017. The chairman and head of investor relations gave presentations on BP’s annual results, strategy and the work of the board. Shareholders’ questions were focused on BP’s activities and performance.
AGM
Voting levels decreased in 2017 to 50.8% (of issued share capital, including votes cast as withheld), compared to 64.3% in 2016 and 62.3% in 2015. We believe this drop in vote levels was due to the late return of BP stock on loan, with voting deadlines for some custodians coinciding with the date that BP shares went ‘ex-dividend’. The company is looking at future AGM voting deadlines against its financial calendar to mitigate this event recurring.
All resolutions were passed at the meeting. Each year the board receives a report after the AGM giving a breakdown of the votes and investor feedback on their voting decisions to inform them on any issues arising.
UK Corporate Governance Code compliance
BP complied throughout 2017 with the provisions of the UK Corporate Governance Code except in the following aspects:
B.3.2 Letters of appointment do not set out fixed-time commitments since the schedule of board and committee meetings is subject to change according to the demands of business and other events. Our letters of appointment set a general guide of a time commitment of between 30-40 days per year. All directors are expected to demonstrate their commitment to the work of the board on an ongoing basis. This is reviewed by the nomination committee in recommending candidates for annual re-election.
D.2.2 The remuneration of the chairman is not set by the remuneration committee. Instead, the chairman’s remuneration is reviewed by the remuneration committee which makes a recommendation to the board as a whole for final approval, within the limits set by shareholders. This wider process enables all board members to discuss and approve the chairman’s remuneration, rather than solely the members of the remuneration committee.
International advisory boardBP’s international advisory board (IAB) advises the chairman, group chief executive and the board on geopolitical and strategic issues relating to the company. This group meets once or twice a year and between meetings IAB members remain available to provide advice and counsel when needed.
The IAB was chaired by BP’s previous chairman, the late Peter Sutherland. Its membership in 2017 comprised Lord Patten of Barnes, Josh Bolten, President Romano Prodi, Dr Ernesto Zedillo and Dr Javier Solana. The chairman, chief executive and Sir John Sawers attend meetings of the IAB. Issues discussed in 2017 included the global economy, developments in the Middle East, political events in Latin America and the political and economic outlook in the US. The IAB discussed the UK’s potential exit from the European Union at both of its meetings during 2017.
Shareholder engagement cycle 2017
Q1 • Fourth quarter results
• BP Energy Outlook presentation
• Strategy investor roadshows with executive management
• US SRI meetings on remuneration
• Investor meetings on remuneration, continuing into Q2
• SRI roadshow following the launch of the BP Sustainability Report 2016, continuing into Q2
Q2 • Chairman and board committee chairs meetings
• UKSA private shareholders’ meeting
• First quarter results
• Meetings with members of the Church Investors Group and Charities Responsible Network
• Institutional Investors Group on Climate Change (IIGCC) meeting
• Annual general meeting
• BP Statistical Review of World Energy launch
• Downstream investor day, Pangbourne
Q3 • Second quarter results
• Investor roadshows with the group chief executive and chief financial officer
Q4 • Third quarter results
• IIGCC meeting
BP Annual Report and Form 20-F 201776
Book 1.indb 76 03/04/2018 16:44:07

Committee reports
Chairman’s introduction
Last year’s report highlighted our monitoring of the group’s financial performance in light of the demanding external environment. While this focus remains, the committee has continued to review the integrity of the group’s financial reporting by challenging and debating the judgements made by management, including the estimates which are made. We receive reports from management and the external auditor each quarter highlighting significant accounting issues and judgements and have used these to inform our debate on whether BP’s financial reporting is ‘fair, balanced and understandable’.
In 2017 the committee focused on the effectiveness of the group audit function. We reviewed its longer-term vision and capability and oversaw an externally facilitated review of its performance, the results of which we discussed in a joint session with colleagues from the SEEAC. We will continue to focus on the actions arising from the review in 2018.
Following the 2016 tender process for the statutory audit, the committee has overseen the transition to Deloitte from EY in time for 2018. We met with both EY and Deloitte during 2017 and monitored Deloitte’s progress towards independence in time for their ‘shadowing’ of the 2017 year-end audit.
The committee visited one of the group’s global business service centres, located in Budapest, enabling us to see first hand the work undertaken by this growing part of BP’s operations and to meet local staff. We found this direct contact added an important additional dimension to our review and understanding, and intend to hold further site visits in 2018.
Andrew Shilston retired from the committee in May 2017. I would like to thank Andrew for his service to the committee, and for the challenge and perspective he provided as a member.
Brendan Nelson Committee chair
The committee continued to review the
integrity of the group’s disclosures by
challenging and debating the
judgements made by management.
Audit committee Role of the committee
The committee monitors the effectiveness of the group’s financial reporting, systems of internal control and risk management and the integrity of the group’s external and internal audit processes.
Key responsibilities
• Monitoring and obtaining assurance that the management or mitigation of financial risks is appropriately addressed by the group chief executive and that the system of internal control is designed and implemented effectively in support of the limits imposed by the board (‘executive limitations’), as set out in the BP board governance principles.
• Reviewing financial statements and other financial disclosures and monitoring compliance with relevant legal and listing requirements.
• Reviewing the effectiveness of the group audit function, BP’s internal financial controls and systems of internal control and risk management.
• Overseeing the appointment, remuneration, independence and performance of the external auditor and the integrity of the audit process as a whole, including the engagement of the external auditor to supply non-audit services to BP.
• Reviewing the systems in place to enable those who work for BP to raise concerns about possible improprieties in financial reporting or other issues and for those matters to be investigated.
Members
Brendan Nelson Member since November 2010 and chair since April 2011
Nils Andersen Member since October 2016
Paula Reynolds Member since May 2015
Andrew Shilston Member since February 2012; retired May 2017
Brendan Nelson is chair of the audit committee. He was formerly vice chairman of KPMG and president of the Institute of Chartered Accountants of Scotland. Currently he is chairman of the group audit committee of The Royal Bank of Scotland Group plc and a member of the Financial Reporting Review Panel. The board is satisfied that he is the audit committee member with recent and relevant financial experience as outlined in the UK Corporate Governance Code and competence in accounting and auditing as required by the FCA’s Corporate Governance Rules in DTR7. It considers that the committee as a whole has an appropriate and experienced blend of commercial, financial and audit expertise to assess the issues it is required to address, as well as competence in the oil and gas sector. The board also determined that the audit committee meets the independence criteria provisions of Rule 10A-3 of the US Securities Exchange Act of 1934 and that Brendan may be regarded as an audit committee financial expert as defined in Item 16A of Form 20-F.
Meetings and attendance
There were 13 committee meetings in 2017, of which six were by teleconference. All directors attended every meeting during the period in which they were committee members.
Regular attendees at the meetings include the chief financial officer, group controller, chief accounting officer, group head of audit and external auditor.
Corporate governance
BP Annual Report and Form 20-F 2017 77
Book 1.indb 77 03/04/2018 16:44:10
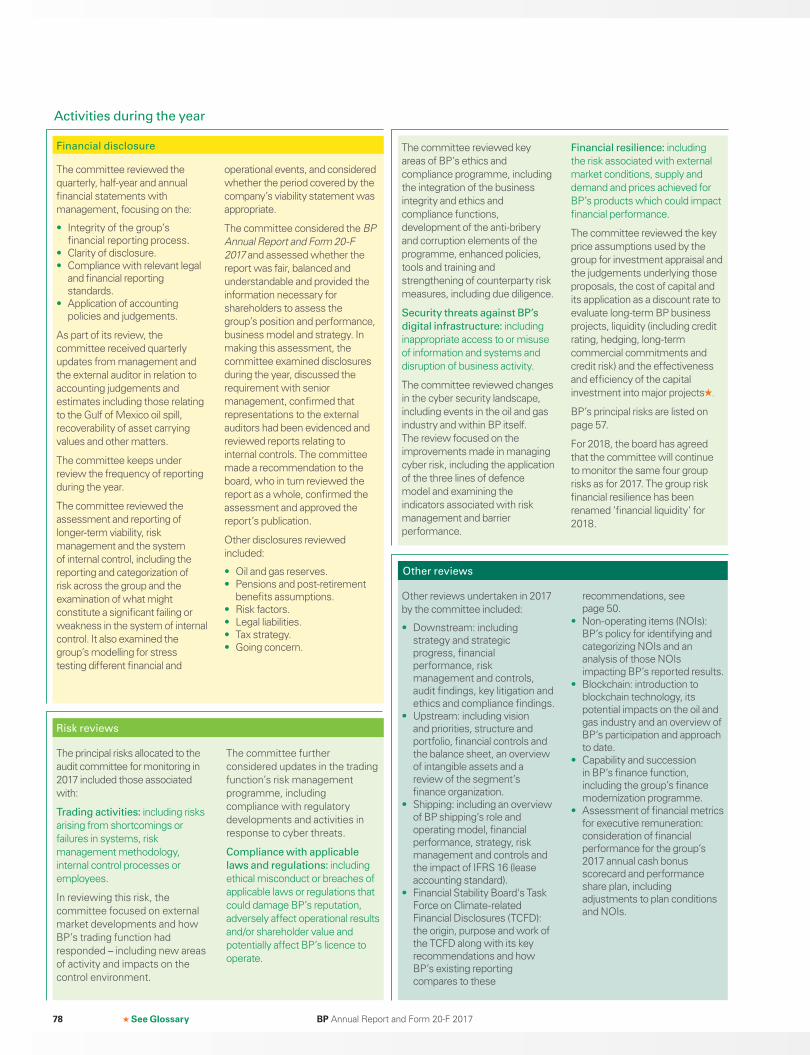
Activities during the year
Financial disclosure
The committee reviewed the quarterly, half-year and annual financial statements with management, focusing on the:
• Integrity of the group’s financial reporting process.
• Clarity of disclosure.• Compliance with relevant legal
and financial reporting standards.
• Application of accounting policies and judgements.
As part of its review, the committee received quarterly updates from management and the external auditor in relation to accounting judgements and estimates including those relating to the Gulf of Mexico oil spill, recoverability of asset carrying values and other matters.
The committee keeps under review the frequency of reporting during the year.
The committee reviewed the assessment and reporting of longer-term viability, risk management and the system of internal control, including the reporting and categorization of risk across the group and the examination of what might constitute a significant failing or weakness in the system of internal control. It also examined the group’s modelling for stress testing different financial and
operational events, and considered whether the period covered by the company’s viability statement was appropriate.
The committee considered the BP Annual Report and Form 20-F 2017 and assessed whether the report was fair, balanced and understandable and provided the information necessary for shareholders to assess the group’s position and performance, business model and strategy. In making this assessment, the committee examined disclosures during the year, discussed the requirement with senior management, confirmed that representations to the external auditors had been evidenced and reviewed reports relating to internal controls. The committee made a recommendation to the board, who in turn reviewed the report as a whole, confirmed the assessment and approved the report’s publication.
Other disclosures reviewed included:
• Oil and gas reserves.• Pensions and post-retirement
benefits assumptions.• Risk factors.• Legal liabilities.• Tax strategy.• Going concern.
Risk reviews
The principal risks allocated to the audit committee for monitoring in 2017 included those associated with:
Trading activities: including risks arising from shortcomings or failures in systems, risk management methodology, internal control processes or employees.
In reviewing this risk, the committee focused on external market developments and how BP’s trading function had responded – including new areas of activity and impacts on the control environment.
The committee further considered updates in the trading function’s risk management programme, including compliance with regulatory developments and activities in response to cyber threats.
Compliance with applicable
laws and regulations: including ethical misconduct or breaches of applicable laws or regulations that could damage BP’s reputation, adversely affect operational results and/or shareholder value and potentially affect BP’s licence to operate.
Other reviews
Other reviews undertaken in 2017 by the committee included:
• Downstream: including strategy and strategic progress, financial performance, risk management and controls, audit findings, key litigation and ethics and compliance findings.
• Upstream: including vision and priorities, structure and portfolio, financial controls and the balance sheet, an overview of intangible assets and a review of the segment’s finance organization.
• Shipping: including an overview of BP shipping’s role and operating model, financial performance, strategy, risk management and controls and the impact of IFRS 16 (lease accounting standard).
• Financial Stability Board's Task Force on Climate-related Financial Disclosures (TCFD): the origin, purpose and work of the TCFD along with its key recommendations and how BP’s existing reporting compares to these
recommendations, see page 50.
• Non-operating items (NOIs): BP’s policy for identifying and categorizing NOIs and an analysis of those NOIs impacting BP’s reported results.
• Blockchain: introduction to blockchain technology, its potential impacts on the oil and gas industry and an overview of BP’s participation and approach to date.
• Capability and succession in BP’s finance function, including the group’s finance modernization programme.
• Assessment of financial metrics for executive remuneration: consideration of financial performance for the group’s 2017 annual cash bonus scorecard and performance share plan, including adjustments to plan conditions and NOIs.
The committee reviewed key areas of BP’s ethics and compliance programme, including the integration of the business integrity and ethics and compliance functions, development of the anti-bribery and corruption elements of the programme, enhanced policies, tools and training and strengthening of counterparty risk measures, including due diligence.
Security threats against BP’s
digital infrastructure: including inappropriate access to or misuse of information and systems and disruption of business activity.
The committee reviewed changes in the cyber security landscape, including events in the oil and gas industry and within BP itself. The review focused on the improvements made in managing cyber risk, including the application of the three lines of defence model and examining the indicators associated with risk management and barrier performance.
Financial resilience: including the risk associated with external market conditions, supply and demand and prices achieved for BP’s products which could impact financial performance.
The committee reviewed the key price assumptions used by the group for investment appraisal and the judgements underlying those proposals, the cost of capital and its application as a discount rate to evaluate long-term BP business projects, liquidity (including credit rating, hedging, long-term commercial commitments and credit risk) and the effectiveness and efficiency of the capital investment into major projects .
BP’s principal risks are listed on page 57.
For 2018, the board has agreed that the committee will continue to monitor the same four group risks as for 2017. The group risk financial resilience has been renamed ‘financial liquidity’ for 2018.
See Glossary BP Annual Report and Form 20-F 201778
Book 1.indb 78 03/04/2018 16:44:10

In te rnal control and risk management
The committee received quarterly reports on the findings of group audit in 2017. It reviewed group audit’s vision for 2020, including the roadmap for 2017 and beyond. The committee met privately with the group head of audit and key members of his leadership team.
The committee oversaw an external review of the effectiveness of the group audit function, which was awarded to Deloitte in July 2017 following a competitive tender process. Fieldwork and interviews with management and board members was completed by September 2017 and the results of the assessment were reviewed at a joint meeting of the audit and safety, ethics and environment assurance committees in December.
The review concluded that the group audit function:
• Performed strongly across Deloitte’s assessment framework.
• Demonstrated a high level of maturity when assessed against internal audit functions within large FTSE (non-financial services) companies.
• Had a remit covering all risk categories (financial and operational) – a breadth seen as leading practice.
• Had areas where continuous improvement activity and continued dialogue with the business could result in an even stronger performance.
Implementation of the agreed actions arising from the review will be tracked during 2018.
The audit committee also held private meetings with the group ethics and compliance officer during the year.
Training
The committee held a deep dive on reserves, covering resource definition and estimation, the group’s governance processes, areas of focus for the regulator and how BP compared with its competitors in terms of approach. It received technical updates from the chief accounting officer on developments in financial reporting and accounting policy, including IFRS 9 ‘Financial Instruments’, IFRS 15 Revenues from Contracts with Customers and IFRS 16 ‘Leases’.
Site visits
In September, the committee visited BP’s global business services (GBS) centre in Hungary. During the visit the committee reviewed the function’s strategy, context, and how it has grown in scope and scale. It looked at its risk management and controls processes, including understanding the risks around transition of activity from the business and the standardization of global processes. It also reviewed capability and human resources issues, including talent attraction and retention, met a range of staff and heard about the various GBS diversity programmes including LGBT, working parents and disability awareness.
In December, members of the committee and wider board visited BP’s integrated supply and trading (IST) business in London for a day that covered oil and gas market fundamentals, finance and risk, IST’s strategy, and presentations on oil products and LNG trading.
Accounting judgements and estimates
Areas of significant judgement considered by the committee in 2017 and how these were addressed included:
Key judgements and estimates in financial reporting
Audit committee activity Conclusions/Outcomes
Gulf of Mexico oil spill
BP uses judgement in relation to the recognition of provisions relating to the Gulf of Mexico oil spill. The timing and amounts of the remaining cash flows are subject to uncertainty and estimation is required to determine the amounts provided for.
A review of the provisioning for and disclosure of uncertainties relating to the Gulf of Mexico oil spill was undertaken each quarter as part of the review of the stock exchange announcement.
Particular focus was given to updates to the provision related to business economic loss (BEL) and other claims related to the Gulf of Mexico oil spill, including the continuing effect of the Fifth Circuit May 2017 opinion on the matching of revenues with expenses when evaluating BEL claims.
Following significantly higher average claims determinations issued by the Court Supervised Settlement Program (CSSP) in the fourth quarter 2017 and the continuing effect arising from the Fifth Circuit May 2017 opinion, BP recognized a post-tax charge of $1.7 billion for BEL and other claims associated with the CSSP.
Disclosure includes information on remaining uncertainties.
Corporate governance
BP Annual Report and Form 20-F 2017 79
Book 1.indb 79 03/04/2018 16:44:10

Key judgements and estimates in financial reporting
Audit committee activity Conclusions/Outcomes
Oil and natural gas accounting, including reserves
BP uses technical and commercial judgements when accounting for oil and gas exploration, appraisal and development expenditure and in determining the group’s estimated oil and gas reserves.
Reserves estimates based on management’s assumptions for future commodity prices have a direct impact on the assessment of the recoverability of asset carrying values reported in the financial statements.
Judgement is required to determine whether it is appropriate to continue to carry intangible assets related to exploration costs on the balance sheet.
Held an in-depth review of BP’s policy and guidelines for compliance with oil and gas reserves disclosure regulation, including the group’s reserves governance framework and controls.
Reviewed exploration write-offs as part of the group’s quarterly due diligence process.
Received briefings on the status of upstream intangible assets, including the status of items on the intangibles assets ‘watch-list’.
Received the output of management’s annual intangible asset certification process used to ensure accounting criteria to continue to carry the exploration intangible balance are met.
Exploration write-offs totalling $1.6 billion were recognized during the year.
Exploration intangibles totalled $17.0 billion at 31 December 2017.
Recoverability of asset carrying values
Determination as to whether and how much an asset, cash generating unit (CGU) or group of CGUs containing goodwill is impaired involves management judgement and estimates on uncertain matters such as future commodity pricing, discount rates, production profiles, reserves and the impact of inflation on operating expenses.
Judgement is required in assessing the recoverability of overdue receivables, and deciding whether a provision is required.
Reviewed the group’s oil and gas price assumptions.
Reviewed the group’s discount rates for impairment testing purposes.
Upstream impairment charges, reversals and ‘watch-list’ items were reviewed as part of the quarterly due diligence process.
Reviewed the group’s credit risk management and reporting framework, including actual credit losses observed, expected loss delegations and utilization and changes in the credit portfolio quality.
The group’s long-term price assumptions for Brent oil, and Henry Hub gas were unchanged from 2016.
The group’s discount rates used for impairment testing were also unchanged.
Impairments of $1.0 billion were recorded in the year, net of impairment reversals.
The group had $1.5 billion of receivables which were not impaired but past due at 31 December 2017.
Investment in Rosneft
Judgement is required in assessing the level of control or influence over another entity in which the group holds an interest.
BP uses the equity method of accounting for its investment in Rosneft and BP’s share of Rosneft’s oil and natural gas reserves is included in the group’s estimated net proved reserves of equity-accounted entities.
The equity-accounting treatment of BP’s 19.75% interest in Rosneft continues to be dependent on the judgement that BP has significant influence over Rosneft.
Reviewed the judgement on whether the group continues to have significant influence over Rosneft.
Considered IFRS guidance on evidence of significant influence, including representation on the board and participation in policy-making processes.
Received reports from management and the external auditor which assessed the extent of significant influence, including BP’s participation in decision making through the continued service on the Rosneft board and key board committees of two BP-nominated directors and work on significant transactions and projects. This assessment considered the appointment of two additional non-BP directors to the Rosneft board but concluded that the assessment of significant influence remained unchanged.
BP has retained significant influence over Rosneft throughout 2017 as defined by IFRS.
See Glossary BP Annual Report and Form 20-F 201780
Book 1.indb 80 03/04/2018 16:44:10
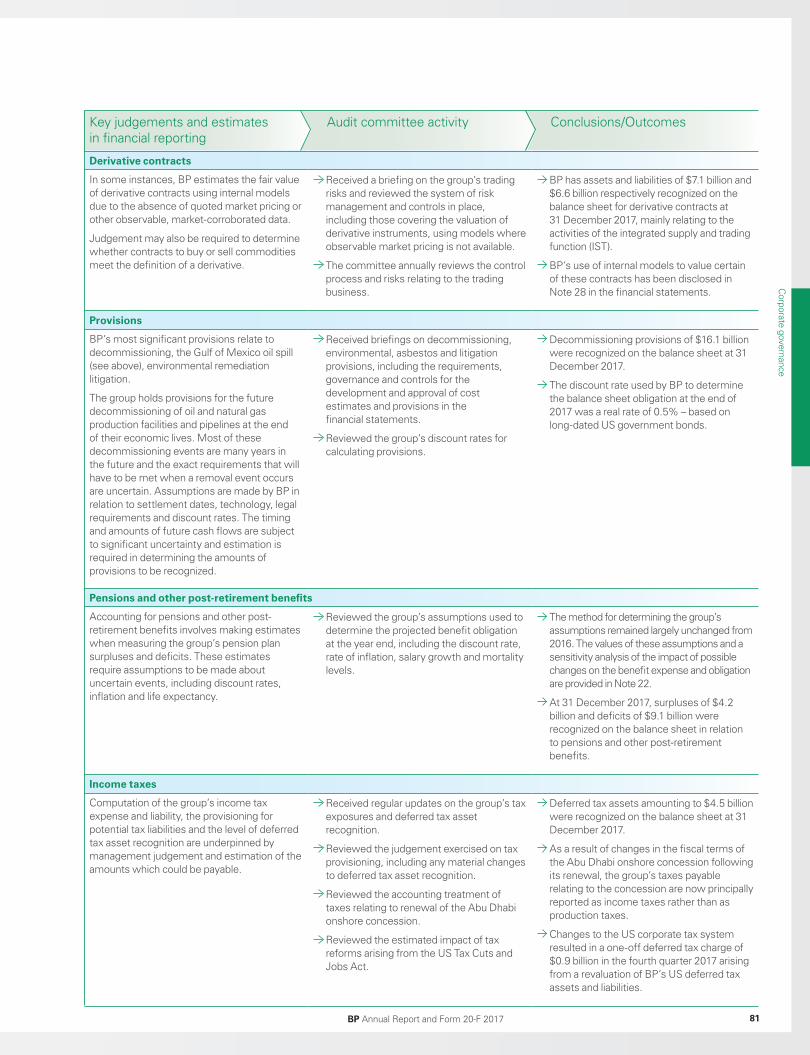
Key judgements and estimates in financial reporting
Audit committee activity Conclusions/Outcomes
Derivative contracts
In some instances, BP estimates the fair value of derivative contracts using internal models due to the absence of quoted market pricing or other observable, market-corroborated data.
Judgement may also be required to determine whether contracts to buy or sell commodities meet the definition of a derivative.
Received a briefing on the group’s trading risks and reviewed the system of risk management and controls in place, including those covering the valuation of derivative instruments, using models where observable market pricing is not available.
The committee annually reviews the control process and risks relating to the trading business.
BP has assets and liabilities of $7.1 billion and $6.6 billion respectively recognized on the balance sheet for derivative contracts at 31 December 2017, mainly relating to the activities of the integrated supply and trading function (IST).
BP’s use of internal models to value certain of these contracts has been disclosed in Note 28 in the financial statements.
Provisions
BP’s most significant provisions relate to decommissioning, the Gulf of Mexico oil spill (see above), environmental remediation litigation.
The group holds provisions for the future decommissioning of oil and natural gas production facilities and pipelines at the end of their economic lives. Most of these decommissioning events are many years in the future and the exact requirements that will have to be met when a removal event occurs are uncertain. Assumptions are made by BP in relation to settlement dates, technology, legal requirements and discount rates. The timing and amounts of future cash flows are subject to significant uncertainty and estimation is required in determining the amounts of provisions to be recognized.
Received briefings on decommissioning, environmental, asbestos and litigation provisions, including the requirements, governance and controls for the development and approval of cost estimates and provisions in the financial statements.
Reviewed the group’s discount rates for calculating provisions.
Decommissioning provisions of $16.1 billion were recognized on the balance sheet at 31 December 2017.
The discount rate used by BP to determine the balance sheet obligation at the end of 2017 was a real rate of 0.5% – based on long-dated US government bonds.
Pensions and other post-retirement benefits
Accounting for pensions and other post-retirement benefits involves making estimates when measuring the group’s pension plan surpluses and deficits. These estimates require assumptions to be made about uncertain events, including discount rates, inflation and life expectancy.
Reviewed the group’s assumptions used to determine the projected benefit obligation at the year end, including the discount rate, rate of inflation, salary growth and mortality levels.
The method for determining the group’s assumptions remained largely unchanged from 2016. The values of these assumptions and a sensitivity analysis of the impact of possible changes on the benefit expense and obligation are provided in Note 22.
At 31 December 2017, surpluses of $4.2 billion and deficits of $9.1 billion were recognized on the balance sheet in relation to pensions and other post-retirement benefits.
Income taxes
Computation of the group’s income tax expense and liability, the provisioning for potential tax liabilities and the level of deferred tax asset recognition are underpinned by management judgement and estimation of the amounts which could be payable.
Received regular updates on the group’s tax exposures and deferred tax asset recognition.
Reviewed the judgement exercised on tax provisioning, including any material changes to deferred tax asset recognition.
Reviewed the accounting treatment of taxes relating to renewal of the Abu Dhabi onshore concession.
Reviewed the estimated impact of tax reforms arising from the US Tax Cuts and Jobs Act.
Deferred tax assets amounting to $4.5 billion were recognized on the balance sheet at 31 December 2017.
As a result of changes in the fiscal terms of the Abu Dhabi onshore concession following its renewal, the group’s taxes payable relating to the concession are now principally reported as income taxes rather than as production taxes.
Changes to the US corporate tax system resulted in a one-off deferred tax charge of $0.9 billion in the fourth quarter 2017 arising from a revaluation of BP’s US deferred tax assets and liabilities.
Corporate governance
BP Annual Report and Form 20-F 2017 81
Book 1.indb 81 03/04/2018 16:44:10
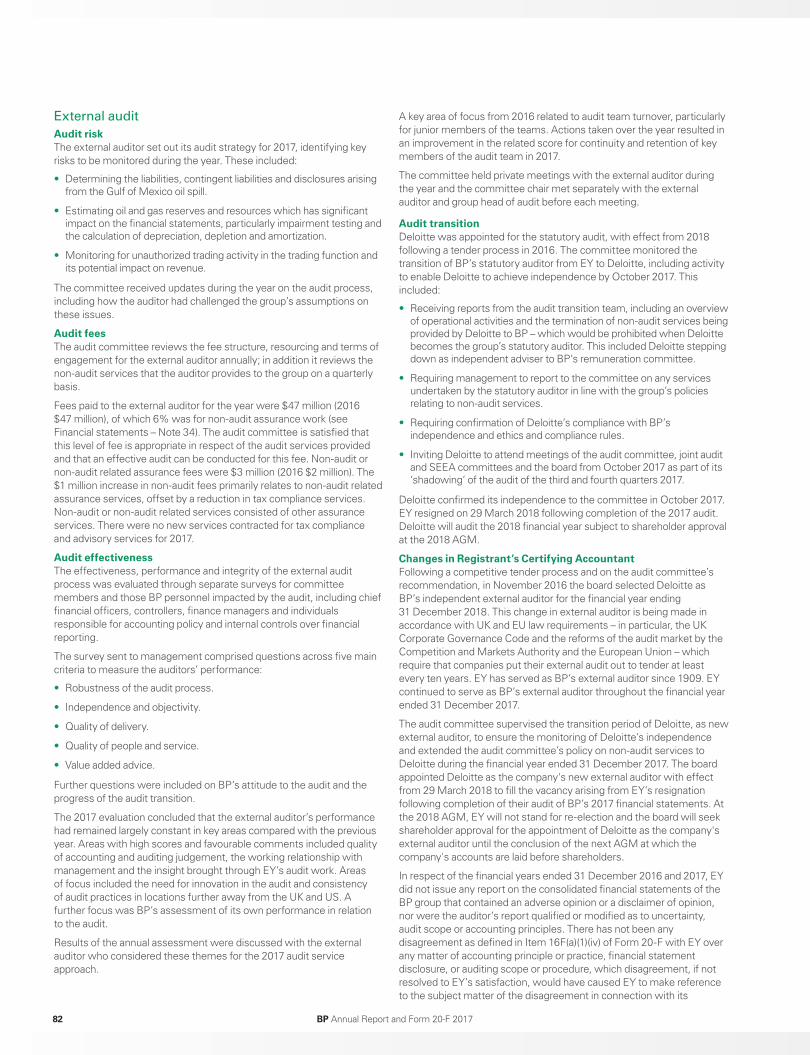
External audit
Audit riskThe external auditor set out its audit strategy for 2017, identifying key risks to be monitored during the year. These included:
• Determining the liabilities, contingent liabilities and disclosures arising from the Gulf of Mexico oil spill.
• Estimating oil and gas reserves and resources which has significant impact on the financial statements, particularly impairment testing and the calculation of depreciation, depletion and amortization.
• Monitoring for unauthorized trading activity in the trading function and its potential impact on revenue.
The committee received updates during the year on the audit process, including how the auditor had challenged the group’s assumptions on these issues.
Audit feesThe audit committee reviews the fee structure, resourcing and terms of engagement for the external auditor annually; in addition it reviews the non-audit services that the auditor provides to the group on a quarterly basis.
Fees paid to the external auditor for the year were $47 million (2016 $47 million), of which 6% was for non-audit assurance work (see Financial statements – Note 34). The audit committee is satisfied that this level of fee is appropriate in respect of the audit services provided and that an effective audit can be conducted for this fee. Non-audit or non-audit related assurance fees were $3 million (2016 $2 million). The $1 million increase in non-audit fees primarily relates to non-audit related assurance services, offset by a reduction in tax compliance services. Non-audit or non-audit related services consisted of other assurance services. There were no new services contracted for tax compliance and advisory services for 2017.
Audit effectivenessThe effectiveness, performance and integrity of the external audit process was evaluated through separate surveys for committee members and those BP personnel impacted by the audit, including chief financial officers, controllers, finance managers and individuals responsible for accounting policy and internal controls over financial reporting.
The survey sent to management comprised questions across five main criteria to measure the auditors’ performance:
• Robustness of the audit process.
• Independence and objectivity.
• Quality of delivery.
• Quality of people and service.
• Value added advice.
Further questions were included on BP’s attitude to the audit and the progress of the audit transition.
The 2017 evaluation concluded that the external auditor’s performance had remained largely constant in key areas compared with the previous year. Areas with high scores and favourable comments included quality of accounting and auditing judgement, the working relationship with management and the insight brought through EY’s audit work. Areas of focus included the need for innovation in the audit and consistency of audit practices in locations further away from the UK and US. A further focus was BP’s assessment of its own performance in relation to the audit.
Results of the annual assessment were discussed with the external auditor who considered these themes for the 2017 audit service approach.
A key area of focus from 2016 related to audit team turnover, particularly for junior members of the teams. Actions taken over the year resulted in an improvement in the related score for continuity and retention of key members of the audit team in 2017.
The committee held private meetings with the external auditor during the year and the committee chair met separately with the external auditor and group head of audit before each meeting.
Audit transitionDeloitte was appointed for the statutory audit, with effect from 2018 following a tender process in 2016. The committee monitored the transition of BP’s statutory auditor from EY to Deloitte, including activity to enable Deloitte to achieve independence by October 2017. This included:
• Receiving reports from the audit transition team, including an overview of operational activities and the termination of non-audit services being provided by Deloitte to BP – which would be prohibited when Deloitte becomes the group’s statutory auditor. This included Deloitte stepping down as independent adviser to BP’s remuneration committee.
• Requiring management to report to the committee on any services undertaken by the statutory auditor in line with the group’s policies relating to non-audit services.
• Requiring confirmation of Deloitte’s compliance with BP’s independence and ethics and compliance rules.
• Inviting Deloitte to attend meetings of the audit committee, joint audit and SEEA committees and the board from October 2017 as part of its ‘shadowing’ of the audit of the third and fourth quarters 2017.
Deloitte confirmed its independence to the committee in October 2017. EY resigned on 29 March 2018 following completion of the 2017 audit. Deloitte will audit the 2018 financial year subject to shareholder approval at the 2018 AGM.
Changes in Registrant’s Certifying AccountantFollowing a competitive tender process and on the audit committee’s recommendation, in November 2016 the board selected Deloitte as BP’s independent external auditor for the financial year ending 31 December 2018. This change in external auditor is being made in accordance with UK and EU law requirements – in particular, the UK Corporate Governance Code and the reforms of the audit market by the Competition and Markets Authority and the European Union – which require that companies put their external audit out to tender at least every ten years. EY has served as BP’s external auditor since 1909. EY continued to serve as BP’s external auditor throughout the financial year ended 31 December 2017.
The audit committee supervised the transition period of Deloitte, as new external auditor, to ensure the monitoring of Deloitte’s independence and extended the audit committee’s policy on non-audit services to Deloitte during the financial year ended 31 December 2017. The board appointed Deloitte as the company's new external auditor with effect from 29 March 2018 to fill the vacancy arising from EY’s resignation following completion of their audit of BP’s 2017 financial statements. At the 2018 AGM, EY will not stand for re-election and the board will seek shareholder approval for the appointment of Deloitte as the company's external auditor until the conclusion of the next AGM at which the company's accounts are laid before shareholders.
In respect of the financial years ended 31 December 2016 and 2017, EY did not issue any report on the consolidated financial statements of the BP group that contained an adverse opinion or a disclaimer of opinion, nor were the auditor’s report qualified or modified as to uncertainty, audit scope or accounting principles. There has not been any disagreement as defined in Item 16F(a)(1)(iv) of Form 20-F with EY over any matter of accounting principle or practice, financial statement disclosure, or auditing scope or procedure, which disagreement, if not resolved to EY’s satisfaction, would have caused EY to make reference to the subject matter of the disagreement in connection with its
BP Annual Report and Form 20-F 201782
Book 1.indb 82 03/04/2018 16:44:10

auditor’s reports, or any reportable event as defined in Item 16F(a)(1)(v) of Form 20-F.
BP has provided EY with a copy of the foregoing disclosure and has requested that they furnish BP with a letter addressed to the US Securities and Exchange Commission (SEC) stating whether or not they agree with such disclosure and, if not, stating the respects in which they do not agree. A copy of EY’s letter dated 29 March 2018, in which they stated that they agree with such disclosure, is filed as Exhibit 15.6.
During the financial years ended 31 December 2016 and 2017 BP did not consult with Deloitte regarding: (i) the application of accounting principles to any specified transaction, either completed or proposed, or the type of audit opinion that might be rendered on the consolidated financial statements of the BP group; or (ii) any matter that was either the subject of a disagreement as defined in Item 16F(a)(1)(iv) of Form 20-F or reportable event as defined in Item 16F(a)(1)(v) of Form 20-F.
Auditor appointment and independenceThe committee considers the reappointment of the external auditor each year before making a recommendation to the board. The committee assesses the independence of the external auditor on an ongoing basis and the external auditor is required to rotate the lead audit partner every five years and other senior audit staff every seven years. The current lead partner has been in place since the start of 2013. No partners or senior staff associated with the BP audit may transfer to the group.
Non-audit servicesThe audit committee is responsible for BP’s policy on non-audit services and the approval of non-audit services. Audit objectivity and independence is safeguarded through the prohibition of non-audit tax services and the limitation of audit-related work which falls within defined categories. BP’s policy on non-audit services states that the auditors may not perform non-audit services that are prohibited by the SEC, Public Company Accounting Oversight Board (PCAOB), UK Auditing Practices Board (APB) and the UK Financial Reporting Council (FRC).
The audit committee approves the terms of all audit services as well as permitted audit-related and non-audit services in advance. The external auditor is only considered for permitted non-audit services when its expertise and experience of the company is important.
For all other services which fall under the ‘permitted services’ categories, approval above a certain financial amount must be sought on a case-by-case basis. Any proposed service not included in the permitted services categories must be approved in advance either by the audit committee chairman or the audit committee before engagement commences. The audit committee, chief financial officer and group controller monitor overall compliance with BP’s policy on audit-related and non-audit services, including whether the necessary pre-approvals have been obtained. The categories of permitted and pre-approved services are outlined in Principal accountants’ fees and services on page 276. The committee’s policies were updated in 2017 to reflect the revised regulatory guidelines of the FRC, including:
• Adoption of the FRC’s prohibited non-audit services list.
• Prohibition of non-audit tax services by the audit firm.
• Reduction of the pre-approval requirements for non-audit services in line with FRC guidance on ‘non-trivial’ engagements with the audit firm.
Committee evaluation
The audit committee undertakes an annual evaluation of its performance and effectiveness.
2017 evaluationFor 2017 an internal questionnaire was used to evaluate the work of the committee. The review concluded that it had performed effectively. Areas of focus for 2018 include succession planning for membership of the committee and a further review of capital spending.
Actions from the 2016 evaluationPriorities arising from the 2016 evaluation included a review of and visit to one of BP’s global business service (GBS) centres, a focus on streamlining committee materials and further scrutiny on risk management when undertaking business or functional reviews. The committee visited GBS in Budapest in 2017, undertaking a review of the organization’s activities and strategy. It also focused on improving committee pre-read materials, which received improved evaluation scores for the 2017 review. And an overview of risk management and controls was included in all segment and functional reviews.
Corporate governance
BP Annual Report and Form 20-F 2017 83
Book 1.indb 83 03/04/2018 16:44:10

Safety, ethics and environment assurance committee (SEEAC)
On site visits we look for
ourselves and ask questions,
and then we engage with
management.
Chairman’s introduction
The committee continued its work with executive management to drive safe, ethical and reliable operations. It has reviewed the company’s management of the highest priority non-financial group risks and continues to provide constructive challenge to the risk management process. The risks under their remit remained the same as for 2016: marine, wells, pipelines, explosion or release at facilities and major security incidents and cyber security in process control network. The committee receives reports on each of these risks and monitors their management and mitigation.
Following publication of the company’s Modern Slavery Act (MSA) statement in 2017, the committee reviewed related work practices in BP and will continue to review progress in developing and embedding those practices. In 2017 it also reviewed the BP Sustainability Report 2017 and will review the annual update MSA statement to be published in 2018.
The committee made two site visits in the year (see page 75). In June, members of the committee visited the Cherry Point refinery in Washington, and in July members were among the first to visit the newly operating Glen Lyon floating production, storage and offloading vessel in the UK North Sea. Our level of access into the operational side is extensive and gives the committee unique insight. On site visits, we look for ourselves and ask questions, and then we engage with management on what this means for the objectives we set. The committee also continued its schedule of regular meetings with executive management.
In May, Cynthia Carroll retired from the board and the committee and in the same month Melody Meyer joined the committee. Melody brings with her valuable insight through many years of industry experience, and within a few weeks of joining, participated in her first committee site visit.
Alan Boeckmann Committee chair
Role of the committee
The role of the SEEAC is to look at the processes adopted by BP’s executive management to identify and mitigate significant non-financial risk. This includes monitoring the management of personal and process safety and receiving assurance that processes to identify and mitigate such non-financial risks are appropriate in their design and effective in implementation.
Key responsibilities
The committee receives specific reports from the business segments as well as cross-business information from the functions. These include, but are not limited to, the safety and operational risk function, group audit, group ethics and compliance, business integrity and group security. The SEEAC can access any other independent advice and counsel it requires on an unrestricted basis.
The SEEAC and audit committee worked together, through their chairs and secretaries, to ensure that agendas did not overlap or omit coverage of any key risks during the year.
Members
Alan Boeckmann Member since September 2014 and chair since May 2016
Paul Anderson Member since February 2010
Frank Bowman Member since November 2010
Cynthia Carroll Member since June 2007; retired May 2017
Ann Dowling Member since February 2012
Melody Meyer Member since May 2017
John Sawers Member since July 2015
Meetings and attendance
There were six committee meetings in 2017. All directors attended every meeting for which they were eligible, apart from Cynthia Carroll who missed one meeting due to a conflicting meeting.
In addition to the committee members, all SEEAC meetings were attended by the group chief executive, the executive vice president for safety and operational risk (S&OR) and the head of group audit or his delegate. The external auditor attended some of the meetings and was briefed on the other meetings by the chair and secretary to the committee. The group general counsel and group ethics and compliance officer also attended some of the meetings. At the conclusion of each meeting the committee scheduled private sessions for the committee members only, without the presence of executive management, to discuss any issues arising and the quality of the meeting. The group chief executive was invited to join the private meetings on an ad hoc basis.
BP Annual Report and Form 20-F 201784
Book 1.indb 84 03/04/2018 16:44:12
Committee evaluation
For its 2017 evaluation, the committee examined its performance and effectiveness through an internal questionnaire. Topics covered included the balance of skills and experience among its members, the quality and timeliness of information the committee receives, the level of challenge between committee members and management and how well the committee communicates its activities and findings to the board.
The evaluation results continued to be generally positive. Committee members considered that they continued to possess the right mix of skills and background, had an appropriate level of support and received open and transparent briefings from management.
All members emphasized that site visits remained an important element of the committee’s work, particularly because they gave members the opportunity to examine how risk management is being embedded in businesses and facilities, including in the management culture.
Joint meetings between the SEEAC and the audit committee were considered important in reviewing and gaining assurance around financial and operational risks where there was overlap between the committees, particularly in relation to ethics and compliance (see below).
Activities during the year
System of internal control and risk management
The review of operational risk and performance forms a large part of the committee’s agenda.
Group audit provided quarterly reports on their assurance work on the system to inform the review.
The committee also received regular reports from the group chief executive on operational risk, and from the system of internal control and risk management function, including quarterly reports prepared for executive management on the group’s health, safety and environmental performance and operational integrity. These included quarter-by-quarter measures of personal and process safety, environmental and regulatory compliance and audit findings, as well as quarterly reports from group audit.
In addition, the group ethics and compliance officer and the group auditor met in private with the chairman and other members of the committee over the course of the year.
During the year the committee received separate reports on the company’s management of risks relating to:
• Marine• Wells • Pipelines • Explosion or release
at our facilities• Major security incidents• Cyber security (process
control networks).
The committee reviewed these risks and their management and mitigation in depth with relevant executive management.
Corporate reporting
The committee is responsible for the overview of the BP Sustainability Report 2017.The committee reviewed content
and the revised presentation, and worked with the external auditor with respect to their assurance of the report.
Site visits
In June members of the committee, and other directors, visited the Cherry Point refinery in Blaine, Washington. The site visit included a tour of the dock, training simulator and control room. Meetings with senior leadership and representatives from across the site, including a local safety committee, were held. In July committee members, and other directors, visited the newly operational floating production, storage and offloading vessel, Glen Lyon, at our Quad 204 project in the UK North Sea. This was one of the seven major projects delivered during 2017 and the
committee’s visit was the first formal visit following its start-up.During visits committee members and other directors received briefings on operations, the status of conformance with BP’s operating management system , key business and operational risks and risk management and mitigation. Committee members then reported back in detail about each visit to the committee and subsequently to the board. See page 75 for further details.
Joint meetings of the audit and safety, ethics and environment assurance committeesThe audit committee and SEEAC hold joint meetings on a quarterly basis to simplify reporting of key issues that are within the remit of both committees and to make more effective use of the committees’ time. Each committee retains full discretion to require a full presentation and discussion on any joint meeting topic at their respective meeting if deemed appropriate.
The committees jointly met four times in 2017, with the chairmanship of the meetings alternating between the chairman of the audit committee and chairman of the SEEAC.
Topics discussed at the joint meetings were the quarterly ethics and compliance reports (including significant investigations and allegations) and the 2018 forward programmes for the group audit and ethics and compliance functions. The committees reviewed the approach and disclosure statement under the UK Modern Slavery Act and the results of an externally facilitated review of the effectiveness and performance of group audit.
See Glossary
Corporate governance
BP Annual Report and Form 20-F 2017 85
Book 1.indb 85 03/04/2018 16:44:13

Remuneration committee Key responsibilities
The committee undertakes its tasks in accordance with applicable regulations, including those made from time to time under the Companies Act 2006, the UK Corporate Governance Code and the UK Listing Authority’s Listing Rules in relation to the remuneration of directors of quoted companies.
• Determine the remuneration policy for the chairman and the executive directors.
• Review and determine the terms of engagement, remuneration and termination of employment for the chairman and the executive directors as appropriate and in accordance with the policy, and be responsible for compliance with all remuneration issues applicable to them.
• Prepare the annual remuneration report to shareholders to show how the policy has been implemented.
• Approve the principles of any equity plan that requires shareholder approval.
• Approve the terms of the remuneration of the executive team (including pension and termination arrangements) as proposed by the group chief executive.
• Approve changes to the design of remuneration, for BP group leaders as proposed by the group chief executive.
• Monitor implementation of remuneration for group leaders to ensure alignment and proportionality.
• Engage independent consultants or other advisers as the committee may from time to time deem necessary, at the expense of the company.
Members
Ann Dowling Member since July 2012 and chair since May 2015
Alan Boeckmann Member since May 2015
Ian Davis Member since July 2010
Brendan Nelson Member since May 2017
Paula Reynolds Member since September 2017
Andrew Shilston Member since May 2015; retired from the committee May 2017
Meetings and attendance
Carl-Henric Svanberg and Bob Dudley attend meetings of the committee except for matters relating to their own remuneration. Bob Dudley is consulted on the remuneration of other executive directors, the executive team and more broadly on remuneration across the wider employee population. Both the group chief executive and chief financial officer are consulted on matters relating to the group’s performance.
The group human resources director attends meetings and other executives may attend where necessary. The committee consults other board committees on the group’s performance and on issues relating to the exercise of judgement or discretion.
Chair’s introduction
I am pleased to report on the work of the committee in 2017. Following substantial engagement with our shareholders in 2016 and early 2017, we were pleased to receive their support at the 2017 AGM. We applied our new remuneration policy from the start of 2017 and during the year have been addressing some transitional arrangements from old to the new policies. We also reviewed BP pay below the executive team by region, job level and sector to give additional context to our decisions on executive pay.
Having served on this committee for six years, and as chair for the last three, I am stepping down from the committee after the 2018 AGM. Paula Reynolds, who joined the committee in September 2017, will take the chair. She is currently chair of the remuneration committee at BAE Systems plc and has served on that committee since 2015.
During the year, Deloitte LLP had to stand down as our independent adviser following their forthcoming appointment as auditor. Following a competitive tender process, we appointed PwC LLP in their place.
Professor Dame Ann Dowling Committee chair
Role of the committee
The role of the committee is to determine and recommend to the board the remuneration policy for the chairman and executive directors. In determining the policy, the committee takes into account various factors, including structuring the policy to promote the long-term success of the company and linking reward to business performance.
After extensive shareholder
engagement, we were pleased to
receive strong support for our new
remuneration policy at the 2017 AGM.
BP Annual Report and Form 20-F 201786
Book 1.indb 86 03/04/2018 16:44:16

The committee met eight times during the year. All directors attended each meeting that they were eligible to attend, either in person or by telephone, except that Alan Boeckman was not able to attend a telephone meeting on 27 February in 2017.
Activities during the year
In the period before the 2017 AGM, the committee focused on finalizing the proposed new remuneration policy and outcomes for 2016. This involved reviewing directors’ salaries and the group’s performance outcome which in turn determined the annual bonus and the performance share plan.
From the 2017 AGM, the committee focused on implementing the new policy, in particular looking more broadly at remuneration of employees below the executive team and the measures that could be used to reflect the transition to a lower carbon world. It also considered the implications of the transition from the 2014 to the 2017 policies, in particular aspects relating to share grants, and reviewed potential outcomes for 2017 at the end of the year.
Following the appointment of Deloitte as the group’s statutory auditor from 2018 (subject to shareholder approval) and the need for the firm to be independent prior to the transition of the audit, the committee appointed PwC as its independent adviser effective September 2017. The committee continued to monitor developments in potential regulation and legislation and held early discussions on the possible implications for its work. It also considered the company’s disclosure on the UK gender pay gap.
In each of its meetings, the committee focused on the overall quantum of executive director remuneration and its alignment to the broader group of employees in BP. It has sought to reflect the views of shareholders and the broader societal context in its decisions.
Shareholder engagement
There was substantial engagement with shareholders and proxy voting agencies ahead of the 2017 AGM, primarily carried out by the chair of the committee, supported by the chairman and company secretary. The committee chair tested proposals and sought support for the new policy put to shareholders at the 2017 AGM. In order to understand evolving issues – particularly around climate change – engagement continued throughout the year, primarily with larger shareholders and representative bodies.
Committee evaluation
We undertook an internally facilitated evaluation to examine the committee’s performance in 2017. The evaluation concluded that the committee had worked well and continued to evolve after its intense work leading up to the 2017 AGM.
Focus areas for 2018 included improving oversight of stakeholders’ views on remuneration and in particular, deepening the committee’s understanding of remuneration below the executive level. In addition, we focussed on staying up to date with external developments and emerging ‘best practice’ and improving remuneration reporting.
See page 90 for the Directors’ remuneration report.
Chairman’s introduction
I am pleased to report on the work of the geopolitical committee in 2017, which continued to develop and evolve during the year. In addition to our regular meetings, we visited the group’s response information centre in Sunbury, where we were briefed on the group’s practices and procedures. During 2017 I also joined discussions of the international advisory board.
Cynthia Carroll and Andrew Shilston stood down from the board at the 2017 AGM, and Melody Meyer joined the committee in May. Other board members joined our meetings from time to time.
Sir John Sawers Committee chair
Role of the committee
The committee monitors the company’s identification and management of geopolitical risk.
Key responsibilities
• Monitor the company’s identification and management of major and correlated geopolitical risk and consider reputational as well as financial consequences:
– Major geopolitical risks are those brought about by social, economic or political events that occur in countries where BP has material investments.
– Correlated geopolitical risks are those brought about by social, economic or political events that occur in countries where BP may or may not have a presence but that can lead to global political instability.
• Review BP’s activities in the context of political and economic developments on a regional basis and advise the board on these elements in its consideration of BP’s strategy and the annual plan.
Geopolitical committee
Corporate governance
BP Annual Report and Form 20-F 2017 87
Book 1.indb 87 03/04/2018 16:44:17

Members
John Sawers Member since September 2015 and chair since April 2016
Paul Anderson Member since September 2015
Frank Bowman Member since September 2015
Ian Davis Member since September 2016
Melody Meyer Member since May 2017
Cynthia Carroll Member from September 2016 to May 2017
Andrew Shilston Member from September 2015; retired May 2017
Meetings and attendance
Carl-Henric Svanberg and Bob Dudley attend all committee meetings. The executive vice president, regions and the vice president, government and political affairs attend meetings as required.
The committee met three times during the year. All directors attended each meeting that they were eligible to attend except that Cynthia Carroll was unable to attend the meeting on 1 February 2017.
Activities during the year
The committee developed and broadened its work over the year. It discussed BP’s involvement in the key countries where it has investment or is considering investment in detail. These included Angola, the US, Russia, Mexico, Brazil, India, Mauritania and Senegal.
It considered broader policy issues such as the US domestic and foreign policy under the new administration and the political and economic impact of a low price on producing countries.
We reviewed the geopolitical background to BP’s global investments and the politics around climate change.
Committee evaluation
The committee reviewed its performance by means of an internally facilitated questionnaire, and discussed the outcome of that evaluation at its meeting in January 2018.
The evaluation concluded that the committee was working well and considering the right issues, but stressed the importance of considering the geopolitics in a country before an investment is made. The committee currently meets three times a year and is considering additional meetings.
The committee and board felt that there should be greater integration between the work of the board, the committee and the international advisory board.
Chairman’s introduction
The chairman’s and the nomination committees were actively involved in the evolution of the board in 2017. In October, I announced that I would be standing down as chairman at an appropriate time after the 2018 AGM in May. As a result, the board has started the search for my successor. This is being carried out by the chairman’s committee led by Ian Davis, the senior independent director.
The nomination committee continues to focus on board renewal and diversity.
Carl-Henric Svanberg Chair of the committees
Chairman’s committee
Role of the committee
To provide a forum for matters to be discussed by the non-executive directors.
Key responsibilities
• Evaluate the performance and the effectiveness of the group chief executive.
• Review the structure and effectiveness of the business organization.
• Review the systems for senior executive development and determine succession plans for the group chief executive, executive directors and other senior members of executive management.
• Determine any other matter that is appropriate to be considered by non-executive directors.
• Opine on any matter referred to it by the chairman of any committees comprised solely of non-executive directors.
Members
The committee comprises all non-executive directors. Directors join the committee immediately on their appointment to the board. The group chief executive attends meetings of the committee when requested.
Chairman’s and nomination committees
BP Annual Report and Form 20-F 201788
Book 1.indb 88 03/04/2018 16:44:17
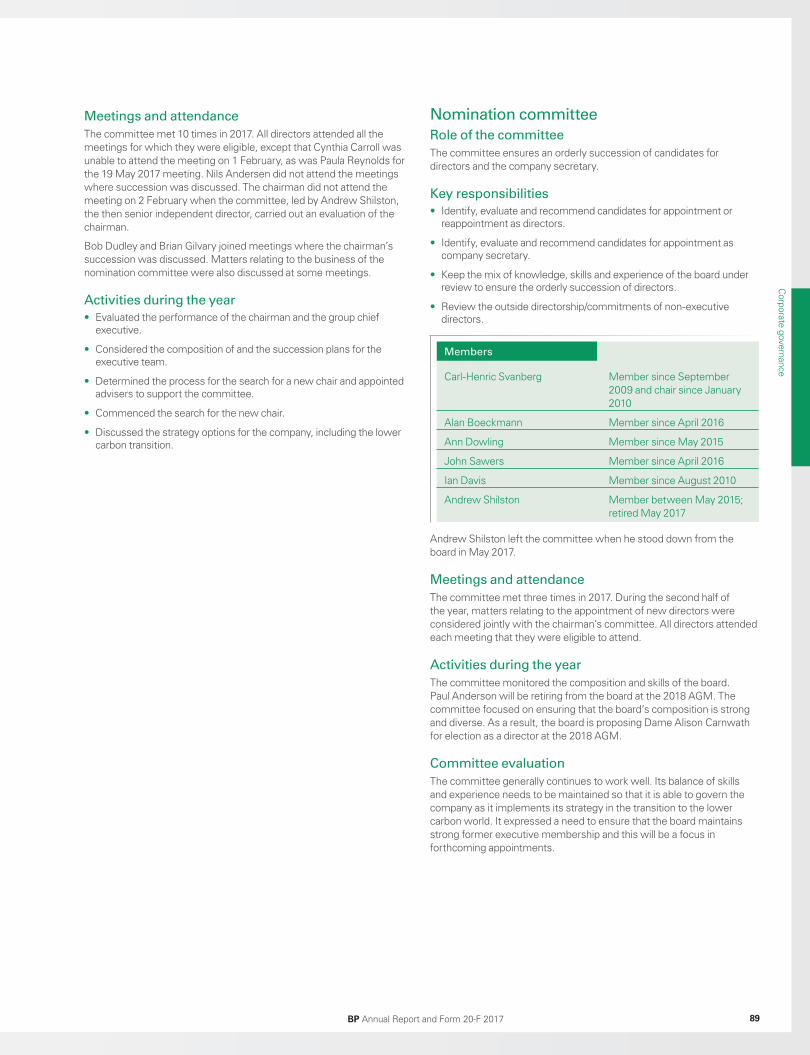
Meetings and attendance
The committee met 10 times in 2017. All directors attended all the meetings for which they were eligible, except that Cynthia Carroll was unable to attend the meeting on 1 February, as was Paula Reynolds for the 19 May 2017 meeting. Nils Andersen did not attend the meetings where succession was discussed. The chairman did not attend the meeting on 2 February when the committee, led by Andrew Shilston, the then senior independent director, carried out an evaluation of the chairman.
Bob Dudley and Brian Gilvary joined meetings where the chairman’s succession was discussed. Matters relating to the business of the nomination committee were also discussed at some meetings.
Activities during the year
• Evaluated the performance of the chairman and the group chief executive.
• Considered the composition of and the succession plans for the executive team.
• Determined the process for the search for a new chair and appointed advisers to support the committee.
• Commenced the search for the new chair.
• Discussed the strategy options for the company, including the lower carbon transition.
Nomination committee
Role of the committee
The committee ensures an orderly succession of candidates for directors and the company secretary.
Key responsibilities
• Identify, evaluate and recommend candidates for appointment or reappointment as directors.
• Identify, evaluate and recommend candidates for appointment as company secretary.
• Keep the mix of knowledge, skills and experience of the board under review to ensure the orderly succession of directors.
• Review the outside directorship/commitments of non-executive directors.
Members
Carl-Henric Svanberg Member since September 2009 and chair since January 2010
Alan Boeckmann Member since April 2016
Ann Dowling Member since May 2015
John Sawers Member since April 2016
Ian Davis Member since August 2010
Andrew Shilston Member between May 2015; retired May 2017
Andrew Shilston left the committee when he stood down from the board in May 2017.
Meetings and attendance
The committee met three times in 2017. During the second half of the year, matters relating to the appointment of new directors were considered jointly with the chairman’s committee. All directors attended each meeting that they were eligible to attend.
Activities during the year
The committee monitored the composition and skills of the board. Paul Anderson will be retiring from the board at the 2018 AGM. The committee focused on ensuring that the board’s composition is strong and diverse. As a result, the board is proposing Dame Alison Carnwath for election as a director at the 2018 AGM.
Committee evaluation
The committee generally continues to work well. Its balance of skills and experience needs to be maintained so that it is able to govern the company as it implements its strategy in the transition to the lower carbon world. It expressed a need to ensure that the board maintains strong former executive membership and this will be a focus in forthcoming appointments.
Corporate governance
BP Annual Report and Form 20-F 2017 89
Book 1.indb 89 03/04/2018 16:44:17
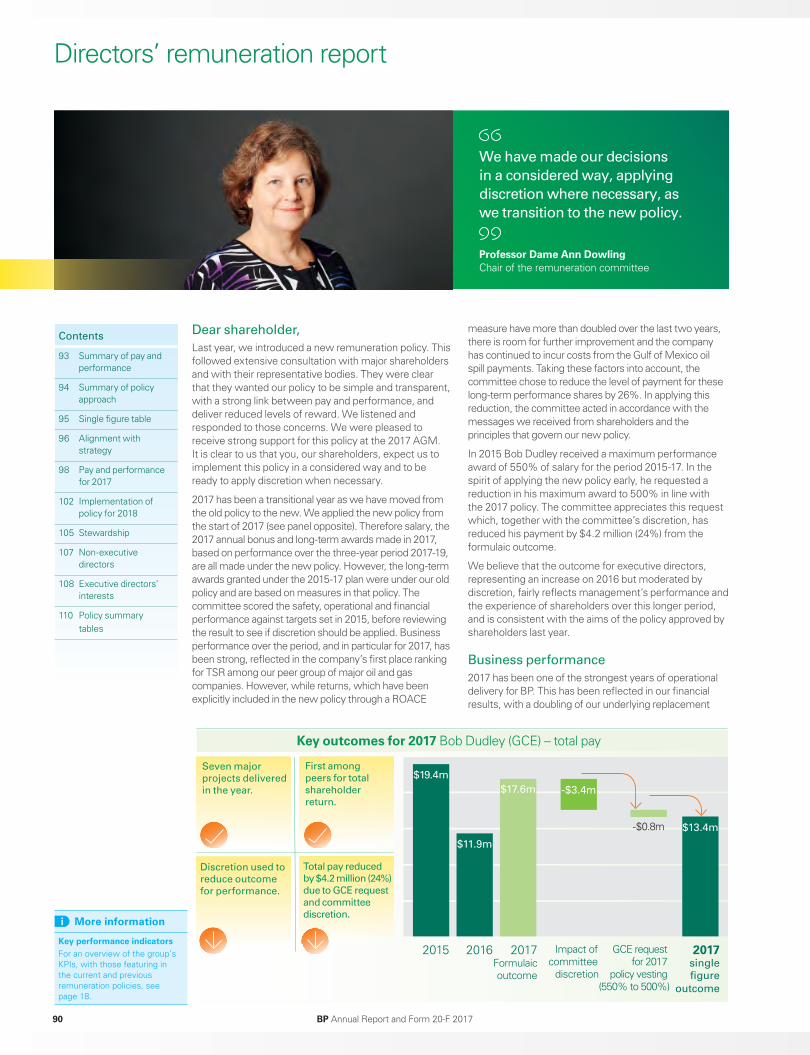
We have made our decisions
in a considered way, applying
discretion where necessary, as
we transition to the new policy.
Professor Dame Ann Dowling
Chair of the remuneration committee
Directors’ remuneration report
Dear shareholder,
Last year, we introduced a new remuneration policy. This followed extensive consultation with major shareholders and with their representative bodies. They were clear that they wanted our policy to be simple and transparent, with a strong link between pay and performance, and deliver reduced levels of reward. We listened and responded to those concerns. We were pleased to receive strong support for this policy at the 2017 AGM. It is clear to us that you, our shareholders, expect us to implement this policy in a considered way and to be ready to apply discretion when necessary.
2017 has been a transitional year as we have moved from the old policy to the new. We applied the new policy from the start of 2017 (see panel opposite). Therefore salary, the 2017 annual bonus and long-term awards made in 2017, based on performance over the three-year period 2017-19, are all made under the new policy. However, the long-term awards granted under the 2015-17 plan were under our old policy and are based on measures in that policy. The committee scored the safety, operational and financial performance against targets set in 2015, before reviewing the result to see if discretion should be applied. Business performance over the period, and in particular for 2017, has been strong, reflected in the company’s first place ranking for TSR among our peer group of major oil and gas companies. However, while returns, which have been explicitly included in the new policy through a ROACE
measure have more than doubled over the last two years, there is room for further improvement and the company has continued to incur costs from the Gulf of Mexico oil spill payments. Taking these factors into account, the committee chose to reduce the level of payment for these long-term performance shares by 26%. In applying this reduction, the committee acted in accordance with the messages we received from shareholders and the principles that govern our new policy.
In 2015 Bob Dudley received a maximum performance award of 550% of salary for the period 2015-17. In the spirit of applying the new policy early, he requested a reduction in his maximum award to 500% in line with the 2017 policy. The committee appreciates this request which, together with the committee’s discretion, has reduced his payment by $4.2 million (24%) from the formulaic outcome.
We believe that the outcome for executive directors, representing an increase on 2016 but moderated by discretion, fairly reflects management’s performance and the experience of shareholders over this longer period, and is consistent with the aims of the policy approved by shareholders last year.
Business performance
2017 has been one of the strongest years of operational delivery for BP. This has been reflected in our financial results, with a doubling of our underlying replacement
Contents
93 Summary of pay and performance
94 Summary of policy approach
95 Single figure table
96 Alignment with strategy
98 Pay and performance for 2017
102 Implementation of policy for 2018
105 Stewardship
107 Non-executive directors
108 Executive directors’ interests
110 Policy summary tables
More information
Key performance indicatorsFor an overview of the group’s KPIs, with those featuring in the current and previous remuneration policies, see page 18.
BP Annual Report and Form 20-F 201790
Key outcomes for 2017 Bob Dudley (GCE) – total pay
$13.4m
$19.4m
2015
$11.9m
2016
$17.6m
2017Formulaicoutcome
-$0.8m
GCE request for 2017
policy vesting (550% to 500%)
-$3.4m
Impact ofcommittee
discretion
2017single
figure
outcome
Discretion used to
reduce outcome
for performance.
Total pay reduced
by $4.2 million (24%)
due to GCE request
and committee
discretion.
First among
peers for total
shareholder
return.
Seven major
projects delivered
in the year.
Book 1.indb 90 03/04/2018 16:44:19
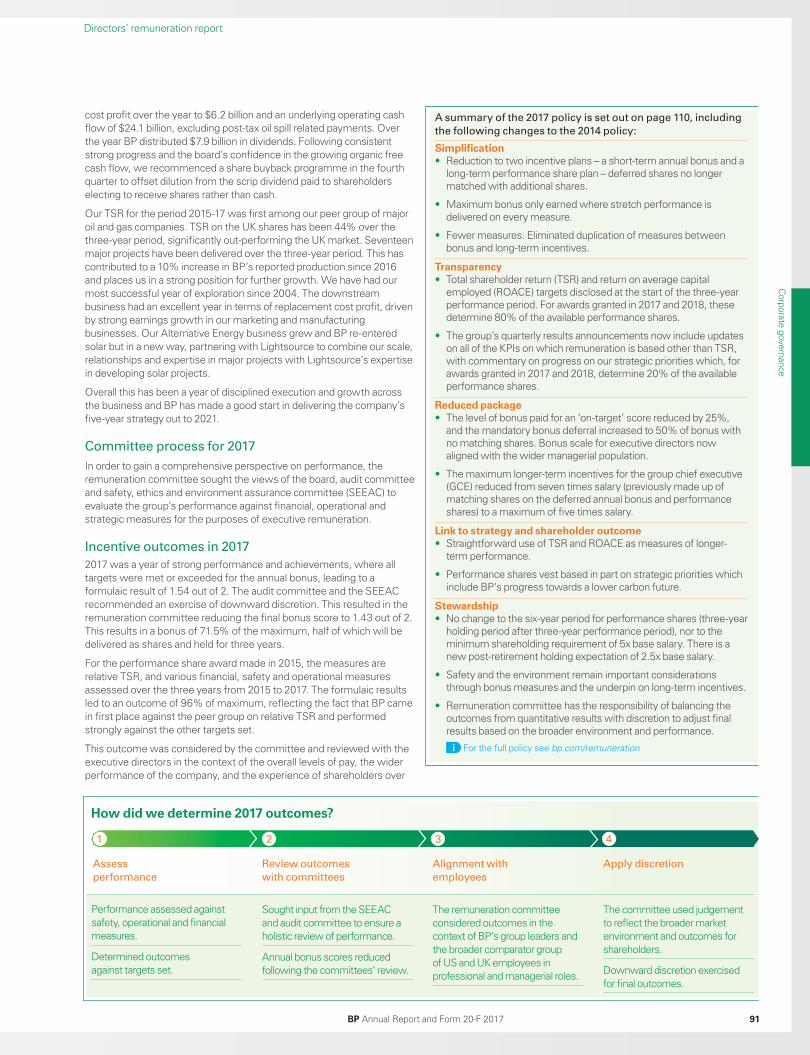
Directors’ remuneration report
cost profit over the year to $6.2 billion and an underlying operating cash flow of $24.1 billion, excluding post-tax oil spill related payments. Over the year BP distributed $7.9 billion in dividends. Following consistent strong progress and the board’s confidence in the growing organic free cash flow, we recommenced a share buyback programme in the fourth quarter to offset dilution from the scrip dividend paid to shareholders electing to receive shares rather than cash.
Our TSR for the period 2015-17 was first among our peer group of major oil and gas companies. TSR on the UK shares has been 44% over the three-year period, significantly out-performing the UK market. Seventeen major projects have been delivered over the three-year period. This has contributed to a 10% increase in BP’s reported production since 2016 and places us in a strong position for further growth. We have had our most successful year of exploration since 2004. The downstream business had an excellent year in terms of replacement cost profit, driven by strong earnings growth in our marketing and manufacturing businesses. Our Alternative Energy business grew and BP re-entered solar but in a new way, partnering with Lightsource to combine our scale, relationships and expertise in major projects with Lightsource’s expertise in developing solar projects.
Overall this has been a year of disciplined execution and growth across the business and BP has made a good start in delivering the company’s five-year strategy out to 2021.
Committee process for 2017
In order to gain a comprehensive perspective on performance, the remuneration committee sought the views of the board, audit committee and safety, ethics and environment assurance committee (SEEAC) to evaluate the group’s performance against financial, operational and strategic measures for the purposes of executive remuneration.
Incentive outcomes in 2017
2017 was a year of strong performance and achievements, where all targets were met or exceeded for the annual bonus, leading to a formulaic result of 1.54 out of 2. The audit committee and the SEEAC recommended an exercise of downward discretion. This resulted in the remuneration committee reducing the final bonus score to 1.43 out of 2. This results in a bonus of 71.5% of the maximum, half of which will be delivered as shares and held for three years.
For the performance share award made in 2015, the measures are relative TSR, and various financial, safety and operational measures assessed over the three years from 2015 to 2017. The formulaic results led to an outcome of 96% of maximum, reflecting the fact that BP came in first place against the peer group on relative TSR and performed strongly against the other targets set.
This outcome was considered by the committee and reviewed with the executive directors in the context of the overall levels of pay, the wider performance of the company, and the experience of shareholders over
Performance assessed against safety, operational and financial measures.
Determined outcomes against targets set.
Sought input from the SEEAC and audit committee to ensure a holistic review of performance.
Annual bonus scores reduced following the committees’ review.
The remuneration committee considered outcomes in the context of BP’s group leaders and the broader comparator group of US and UK employees in professional and managerial roles.
The committee used judgement to reflect the broader market environment and outcomes for shareholders.
Downward discretion exercised for final outcomes.
Assess
performance
Review outcomes
with committees
Alignment with
employees
Apply discretion
4321
How did we determine 2017 outcomes?
Simplification • Reduction to two incentive plans – a short-term annual bonus and a
long-term performance share plan – deferred shares no longer matched with additional shares.
• Maximum bonus only earned where stretch performance is delivered on every measure.
• Fewer measures. Eliminated duplication of measures between bonus and long-term incentives.
Transparency• Total shareholder return (TSR) and return on average capital
employed (ROACE) targets disclosed at the start of the three-year performance period. For awards granted in 2017 and 2018, these determine 80% of the available performance shares.
• The group’s quarterly results announcements now include updates on all of the KPIs on which remuneration is based other than TSR, with commentary on progress on our strategic priorities which, for awards granted in 2017 and 2018, determine 20% of the available performance shares.
Reduced package• The level of bonus paid for an ‘on-target’ score reduced by 25%,
and the mandatory bonus deferral increased to 50% of bonus with no matching shares. Bonus scale for executive directors now aligned with the wider managerial population.
• The maximum longer-term incentives for the group chief executive (GCE) reduced from seven times salary (previously made up of matching shares on the deferred annual bonus and performance shares) to a maximum of five times salary.
Link to strategy and shareholder outcome• Straightforward use of TSR and ROACE as measures of longer-
term performance.
• Performance shares vest based in part on strategic priorities which include BP’s progress towards a lower carbon future.
Stewardship• No change to the six-year period for performance shares (three-year
holding period after three-year performance period), nor to the minimum shareholding requirement of 5x base salary. There is a new post-retirement holding expectation of 2.5x base salary.
• Safety and the environment remain important considerations through bonus measures and the underpin on long-term incentives.
• Remuneration committee has the responsibility of balancing the outcomes from quantitative results with discretion to adjust final results based on the broader environment and performance.
For the full policy see bp.com/remuneration
A summary of the 2017 policy is set out on page 110, including
the following changes to the 2014 policy:
BP Annual Report and Form 20-F 2017 91
Corporate governance
Book 1.indb 91 03/04/2018 16:44:20

Directors’ remuneration report
the three-year period of the plan. In addition, the committee decided to incorporate early application of some of the principles of the new 2017 policy, for example the more stringent vesting scales. In light of these factors and an overall assessment of pay relative to performance, the committee applied its discretion to reduce the 2015 performance share award vesting from 96% to 70% of maximum.
The exercise of committee discretion on annual bonus and performance share outcomes reduced the amount of variable pay by $3.4 million for Bob Dudley and £1.2 million for Brian Gilvary.
Consistent with the approach of applying certain aspects of the new policy early, Bob Dudley has requested that his performance share vesting should be based on an award level of 500% of salary (from the 2017 policy), rather than the 550% of salary that applied for the 2014 policy.
Furthermore, demonstrating their commitment to delivering long-term sustainable value for BP shareholders, the executive directors have also voluntarily agreed to the extension of vesting periods for certain share awards under a discontinued plan as a transitional approach to the new policy. These share awards remain subject to continued application of a safety underpin.
Following these decisions, the total reported single figure of pay for Bob Dudley and Brian Gilvary was $13.4 and £6.5 million. These are substantially below formulaic outcomes for 2017 but, because the business performance is much improved, are higher than the single figure outcomes for 2016. The committee believes that these outcomes appropriately reflect the strong operational and financial performance of BP this year and over the past three years whilst demonstrating a commitment to a considered approach. This year’s single figure for Brian Gilvary is substantially affected by the inclusion of deferred bonus shares from 2014 which have now vested, and the 2017 bonus shares that are being deferred but we now report in the year the shares are granted.
Implementation of the policy for 2018
We plan to make two changes to the performance measures in 2018. For the annual bonus, the upstream measure for ‘reliable operations’ will be changed from ‘upstream operating efficiency’ to ‘BP-operated upstream plant reliability’, creating comparability between our upstream and downstream measures. For performance shares granted in 2017, the ROACE target was based on the final year of the performance period. In response to investor feedback, we are moving progressively towards a three-year evaluation period to encourage steady and sustainable growth. For the 2018 awards, we will average ROACE over the final two years (2019 and 2020) and then use a three-year average for 2019 awards onwards.
We reviewed base salaries for the Bob Dudley and Brian Gilvary, noting the salary increases for UK and US-based employees across the group. The committee has decided there should be no increase in annual salary for Bob Dudley. Brian Gilvary’s salary will be increased by 2%, which was below the general increases for the UK and US based employees across the group.
Alignment with strategy and the low carbon transition
In 2017 BP announced details of our five-year strategy to 2021, focusing on strategic and investment choices that are resilient to a range of future outcomes whilst considering the dual challenge of meeting society’s need for more energy while working to reduce carbon emissions. To reinforce the importance of the strategy for the group’s long-term success, the 2017 policy introduced a balanced but stretching set of measures into the incentives to reflect BP’s strategy. During the year we have included updates on our strategic progress in our quarterly results announcements.
We also introduced an underpin for performance shares which includes absolute TSR, safety performance and consideration of issues around carbon and climate change. This framework will allow the committee to monitor progress against the broader approach we outlined in February 2018 – reducing our emissions, improving our products and creating low carbon businesses. See ‘Advancing the energy transition’ on page 96.
Wider workforce pay
During the year the committee reviewed the group’s approach to reward below board level across job levels and geographies. This wider environment provided important context for the committee’s decisions on executive directors’ remuneration.
Last year, we voluntarily disclosed the GCE-to-employee pay ratio, using the employee comparator group of the professional/managerial grade employees based in the UK and US (representing some 30% of the global employee population). We are aware that regulations will be introduced to require companies to calculate and disclose a ratio. As the regulatory methodology is not yet final, we have continued the practice we adopted in 2017.
Work undertaken by the group in preparation for UK regulatory requirements on gender pay gap reporting was reviewed with the committee, who considered the distribution of employees by grade and gender. In that context the committee received assurance that there was equal pay for equal or like work.
Committee changes
There have been changes to the membership of the committee during the year: Andrew Shilston retired from the board at the AGM in May 2017, with Brendan Nelson and Paula Reynolds joining the committee during 2017. The chairs of both audit committee and SEEAC are now members of the remuneration committee which strengthens the committee’s ability to take a wider perspective on the group’s performance when discussing reward. I believe that we have a broad range of skills and experience amongst the membership upon which to draw on when looking at issues around remuneration.
Following six years on this committee, the last three as chair, I have decided to step down from the committee following the AGM in May 2018. Paula Reynolds will take the chair. I want to take the opportunity to thank my fellow committee members for their support and welcome Paula to the role of chair. I would also like to thank the executive directors for their positive engagement in the policy changes and exercise of discretion over the last two years.
Conclusion
The board continues to place a high priority on building confidence in the operation of our remuneration policy. This requires the remuneration committee to exercise discretion to align pay outcomes to performance, particularly as we navigate the transition from the pre-2017 policy to our new policy for the future. We have sought to do this in a considered way that reflects shareholder expectations, the performance of BP, and the commitments made to executives. In putting this report forward for an advisory vote at the AGM, we seek your support for the balance we have struck.
Professor Dame Ann Dowling
Chair of the remuneration committee 29 March 2018
BP Annual Report and Form 20-F 201792
Book 1.indb 92 03/04/2018 16:44:20
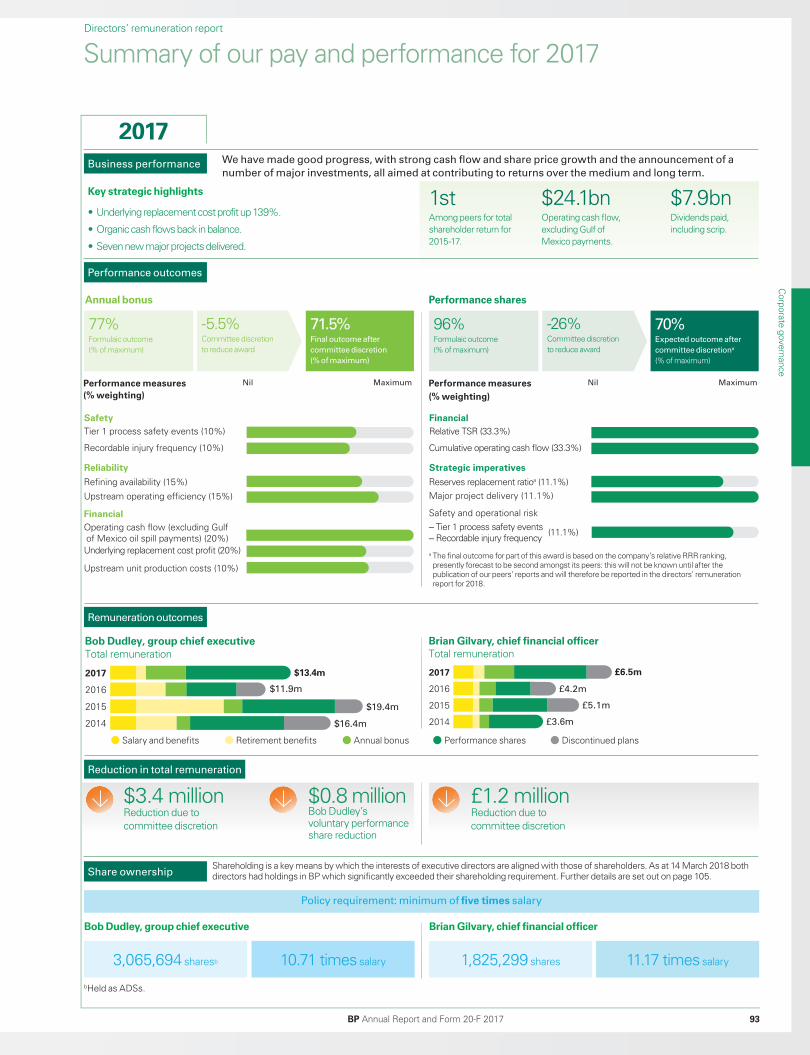
Directors’ remuneration report
Summary of our pay and performance for 2017
2017
2016
2015
$13.4m
$11.9m
$19.4m
2014 $16.4m
Bob Dudley, group chief executive Total remuneration
2017
2016
2015
2014
Brian Gilvary, chief financial officer Total remuneration
£6.5m
£4.2m
£5.1m
£3.6m
2017We have made good progress, with strong cash flow and share price growth and the announcement of a
number of major investments, all aimed at contributing to returns over the medium and long term.
$24.1bnOperating cash flow, excluding Gulf of Mexico payments.
1stAmong peers for total shareholder return for 2015-17.
Bob Dudley, group chief executive Brian Gilvary, chief financial officer
Business performance
Remuneration outcomes
Share ownership
Key strategic highlights
• Underlying replacement cost profit up 139%.
• Organic cash flows back in balance.
• Seven new major projects delivered.
a The final outcome for part of this award is based on the company’s relative RRR ranking, presently forecast to be second amongst its peers: this will not be known until after the publication of our peers’ reports and will therefore be reported in the directors’ remuneration report for 2018.
Salary and benefits Retirement benefits Annual bonus Performance shares Discontinued plans
$7.9bnDividends paid, including scrip.
Policy requirement: minimum of five times salary
3,065,694 sharesb 10.71 times salary 11.17 times salary1,825,299 shares
bHeld as ADSs.
Shareholding is a key means by which the interests of executive directors are aligned with those of shareholders. As at 14 March 2018 both directors had holdings in BP which significantly exceeded their shareholding requirement. Further details are set out on page 105.
Annual bonus Performance shares
Nil NilPerformance measures
(% weighting)Performance measures
(% weighting)
Maximum Maximum
Performance outcomes
77%Formulaic outcome (% of maximum)
-5.5%Committee discretion to reduce award
71.5%Final outcome after
committee discretion
(% of maximum)
96%Formulaic outcome (% of maximum)
-26%Committee discretion to reduce award
70%Expected outcome after
committee discretiona
(% of maximum)
FinancialRelative TSR (33.3%)
Cumulative operating cash flow (33.3%)
Reserves replacement ratioa (11.1%) Major project delivery (11.1%)
Safety and operational risk– Tier 1 process safety events – Recordable injury frequency
Strategic imperatives
(11.1%)
SafetyTier 1 process safety events (10%)
Recordable injury frequency (10%)
Refining availability (15%)
Upstream operating efficiency (15%)
FinancialOperating cash flow (excluding Gulf of Mexico oil spill payments) (20%)Underlying replacement cost profit (20%)
Upstream unit production costs (10%)
Reliability
Reduction in total remuneration
BP Annual Report and Form 20-F 2017 93
Corporate governance
$3.4 million Reduction due to committee discretion
$0.8 million Bob Dudley’s voluntary performance share reduction
£1.2 million Reduction due to committee discretion
Book 1.indb 93 03/04/2018 16:44:20
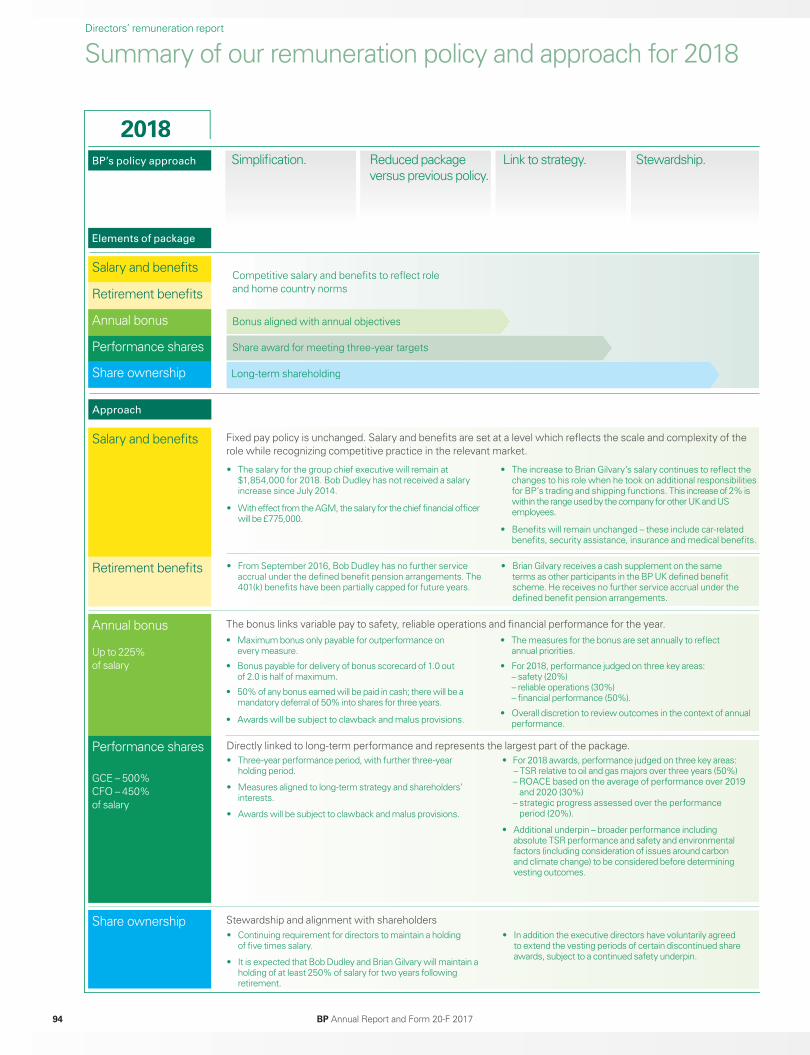
Summary of our remuneration policy and approach for 2018Directors’ remuneration report
2018
Competitive salary and benefits to reflect role and home country norms
• Continuing requirement for directors to maintain a holding of five times salary.
• It is expected that Bob Dudley and Brian Gilvary will maintain a holding of at least 250% of salary for two years following retirement.
• In addition the executive directors have voluntarily agreed to extend the vesting periods of certain discontinued share awards, subject to a continued safety underpin.
Share ownership
Long-term shareholding
Bonus aligned with annual objectives
Share award for meeting three-year targets
Fixed pay policy is unchanged. Salary and benefits are set at a level which reflects the scale and complexity of the role while recognizing competitive practice in the relevant market.
• From September 2016, Bob Dudley has no further service accrual under the defined benefit pension arrangements. The 401(k) benefits have been partially capped for future years.
• Brian Gilvary receives a cash supplement on the same terms as other participants in the BP UK defined benefit scheme. He receives no further service accrual under the defined benefit pension arrangements.
The bonus links variable pay to safety, reliable operations and financial performance for the year.
Stewardship and alignment with shareholders
• The salary for the group chief executive will remain at $1,854,000 for 2018. Bob Dudley has not received a salary increase since July 2014.
• With effect from the AGM, the salary for the chief financial officer will be £775,000.
• The increase to Brian Gilvary’s salary continues to reflect the changes to his role when he took on additional responsibilities for BP’s trading and shipping functions. This increase of 2% is within the range used by the company for other UK and US employees.
• Benefits will remain unchanged – these include car-related benefits, security assistance, insurance and medical benefits.
• Maximum bonus only payable for outperformance on every measure.
• Bonus payable for delivery of bonus scorecard of 1.0 out of 2.0 is half of maximum.
• 50% of any bonus earned will be paid in cash; there will be a mandatory deferral of 50% into shares for three years.
• Awards will be subject to clawback and malus provisions.
• The measures for the bonus are set annually to reflect annual priorities.
• For 2018, performance judged on three key areas: – safety (20%) – reliable operations (30%) – financial performance (50%).
• Overall discretion to review outcomes in the context of annual performance.
Directly linked to long-term performance and represents the largest part of the package.• Three-year performance period, with further three-year
holding period.
• Measures aligned to long-term strategy and shareholders’ interests.
• Awards will be subject to clawback and malus provisions.
• For 2018 awards, performance judged on three key areas: – TSR relative to oil and gas majors over three years (50%)
– ROACE based on the average of performance over 2019 and 2020 (30%)
– strategic progress assessed over the performance period (20%).
• Additional underpin – broader performance including absolute TSR performance and safety and environmental factors (including consideration of issues around carbon and climate change) to be considered before determining vesting outcomes.
Elements of package
BP’s policy approach
Salary and benefits
Retirement benefits
Annual bonus
Performance shares
Share ownership
Approach
Salary and benefits
Retirement benefits
Annual bonus
Up to 225% of salary
Performance shares
GCE – 500% CFO – 450% of salary
Share ownership
Simplification. Reduced package versus previous policy.
Link to strategy. Stewardship.
BP Annual Report and Form 20-F 201794
Book 1.indb 94 03/04/2018 16:44:20
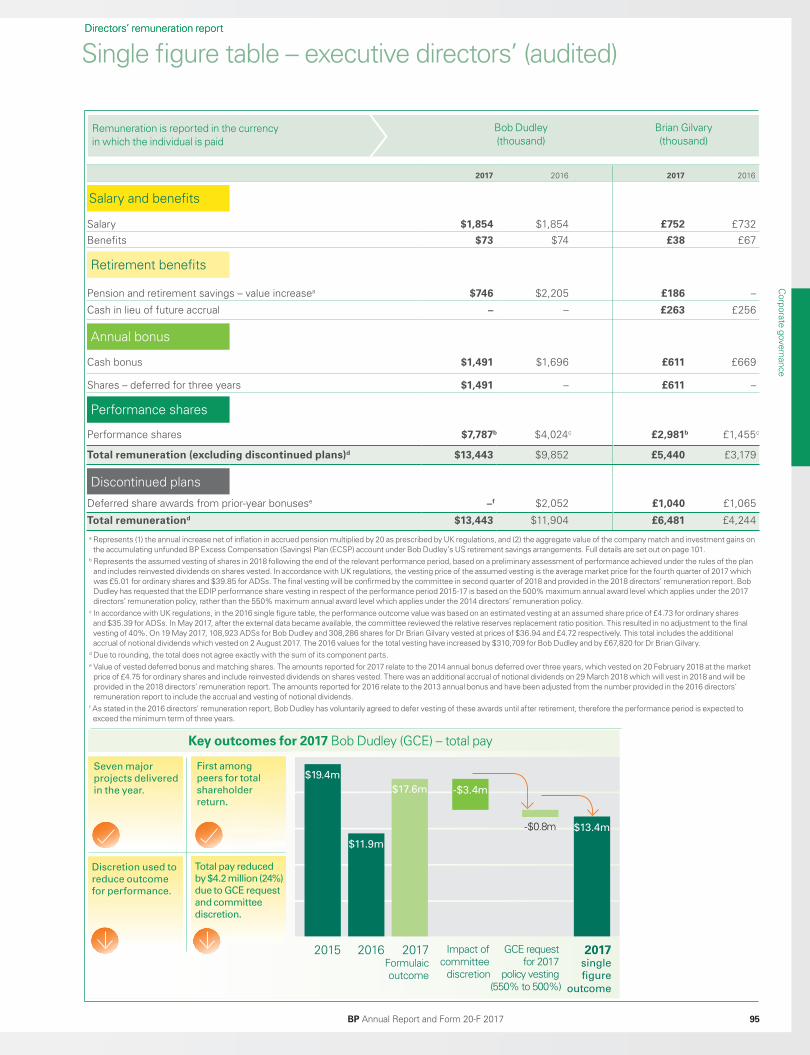
Directors’ remuneration report Directors’ remuneration report
Single figure table – executive directors’ (audited)
Bob Dudley(thousand)
Remuneration is reported in the currency in which the individual is paid
Brian Gilvary(thousand)
2017 2016 2017 2016
Salary and benefits
Salary $1,854 $1,854 £752 £732
Benefits $73 $74 £38 £67
Retirement benefits
Pension and retirement savings – value increasea $746 $2,205 £186 –
Cash in lieu of future accrual – – £263 £256
Annual bonus
Cash bonus $1,491 $1,696 £611 £669
Shares – deferred for three years $1,491 – £611 –
Performance shares
Performance shares $7,787b $4,024c £2,981b £1,455c
Total remuneration (excluding discontinued plans)d $13,443 $9,852 £5,440 £3,179
Discontinued plans
Deferred share awards from prior-year bonusese –f $2,052 £1,040 £1,065
Total remunerationd $13,443 $11,904 £6,481 £4,244 a Represents (1) the annual increase net of inflation in accrued pension multiplied by 20 as prescribed by UK regulations, and (2) the aggregate value of the company match and investment gains on
the accumulating unfunded BP Excess Compensation (Savings) Plan (ECSP) account under Bob Dudley’s US retirement savings arrangements. Full details are set out on page 101.b Represents the assumed vesting of shares in 2018 following the end of the relevant performance period, based on a preliminary assessment of performance achieved under the rules of the plan and includes reinvested dividends on shares vested. In accordance with UK regulations, the vesting price of the assumed vesting is the average market price for the fourth quarter of 2017 which was £5.01 for ordinary shares and $39.85 for ADSs. The final vesting will be confirmed by the committee in second quarter of 2018 and provided in the 2018 directors’ remuneration report. Bob Dudley has requested that the EDIP performance share vesting in respect of the performance period 2015-17 is based on the 500% maximum annual award level which applies under the 2017 directors’ remuneration policy, rather than the 550% maximum annual award level which applies under the 2014 directors’ remuneration policy.
c In accordance with UK regulations, in the 2016 single figure table, the performance outcome value was based on an estimated vesting at an assumed share price of £4.73 for ordinary shares and $35.39 for ADSs. In May 2017, after the external data became available, the committee reviewed the relative reserves replacement ratio position. This resulted in no adjustment to the final vesting of 40%. On 19 May 2017, 108,923 ADSs for Bob Dudley and 308,286 shares for Dr Brian Gilvary vested at prices of $36.94 and £4.72 respectively. This total includes the additional accrual of notional dividends which vested on 2 August 2017. The 2016 values for the total vesting have increased by $310,709 for Bob Dudley and by £67,820 for Dr Brian Gilvary.
d Due to rounding, the total does not agree exactly with the sum of its component parts.e Value of vested deferred bonus and matching shares. The amounts reported for 2017 relate to the 2014 annual bonus deferred over three years, which vested on 20 February 2018 at the market price of £4.75 for ordinary shares and include reinvested dividends on shares vested. There was an additional accrual of notional dividends on 29 March 2018 which will vest in 2018 and will be provided in the 2018 directors’ remuneration report. The amounts reported for 2016 relate to the 2013 annual bonus and have been adjusted from the number provided in the 2016 directors’ remuneration report to include the accrual and vesting of notional dividends.
f As stated in the 2016 directors' remuneration report, Bob Dudley has voluntarily agreed to defer vesting of these awards until after retirement, therefore the performance period is expected to exceed the minimum term of three years.
BP Annual Report and Form 20-F 2017 95
Corporate governance
Key outcomes for 2017 Bob Dudley (GCE) – total pay
$13.4m
$19.4m
2015
$11.9m
2016
$17.6m
2017Formulaicoutcome
-$0.8m
GCE request for 2017
policy vesting (550% to 500%)
-$3.4m
Impact ofcommittee
discretion
2017single
figure
outcome
Discretion used to
reduce outcome
for performance.
Total pay reduced
by $4.2 million (24%)
due to GCE request
and committee
discretion.
First among
peers for total
shareholder
return.
Seven major
projects delivered
in the year.
Book 1.indb 95 03/04/2018 16:44:20
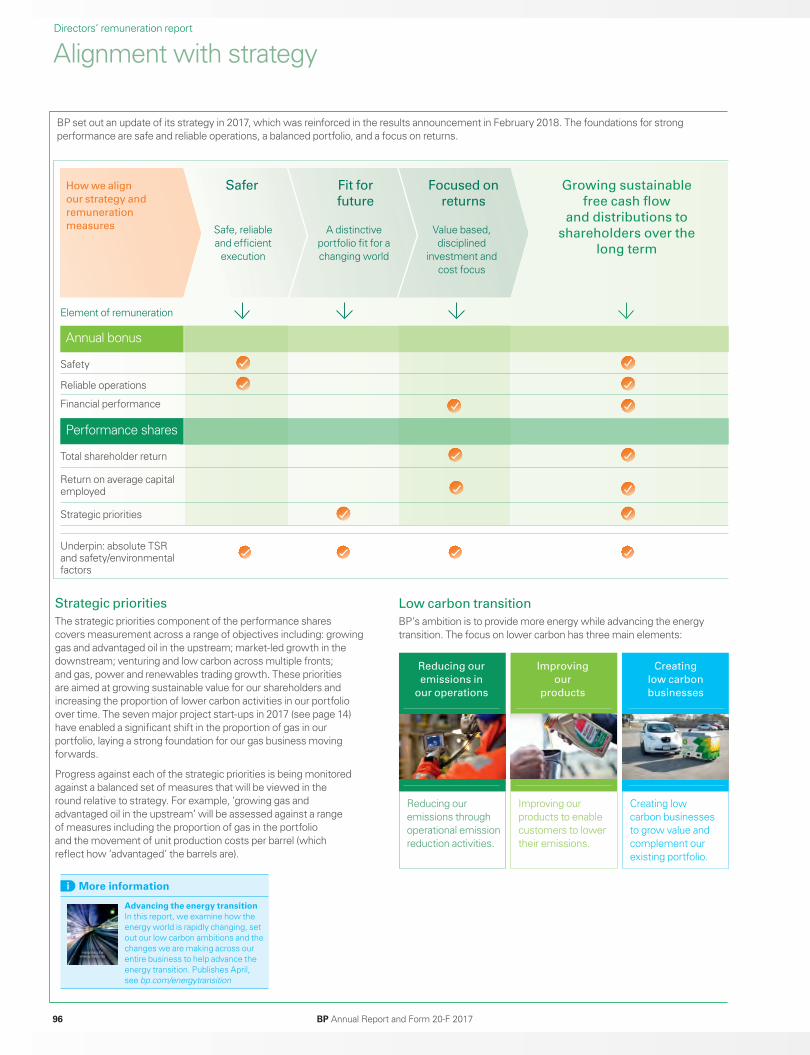
Alignment with strategyDirectors’ remuneration report
How we align
our strategy and
remuneration
measures Safe, reliable and efficient
execution
A distinctive portfolio fit for a changing world
Value based, disciplined
investment and cost focus
Growing sustainable
free cash flow
and distributions to
shareholders over the
long term
Safer Fit for
future
Focused on
returns
Element of remuneration
BP set out an update of its strategy in 2017, which was reinforced in the results announcement in February 2018. The foundations for strong performance are safe and reliable operations, a balanced portfolio, and a focus on returns.
Annual bonus
Safety
Reliable operations
Financial performance
Performance shares
Total shareholder return
Return on average capital employed
Strategic priorities
Underpin: absolute TSR and safety/environmental factors
Low carbon transition
BP’s ambition is to provide more energy while advancing the energy transition. The focus on lower carbon has three main elements:
Strategic priorities
The strategic priorities component of the performance shares covers measurement across a range of objectives including: growing gas and advantaged oil in the upstream; market-led growth in the downstream; venturing and low carbon across multiple fronts; and gas, power and renewables trading growth. These priorities are aimed at growing sustainable value for our shareholders and increasing the proportion of lower carbon activities in our portfolio over time. The seven major project start-ups in 2017 (see page 14)have enabled a significant shift in the proportion of gas in our portfolio, laying a strong foundation for our gas business moving forwards.
Progress against each of the strategic priorities is being monitored against a balanced set of measures that will be viewed in the round relative to strategy. For example, ‘growing gas and advantaged oil in the upstream’ will be assessed against a range of measures including the proportion of gas in the portfolio and the movement of unit production costs per barrel (which reflect how ‘advantaged’ the barrels are).
Reducing our
emissions in
our operations
Creating
low carbon
businesses
More information
Advancing the energy transitionIn this report, we examine how the energy world is rapidly changing, set out our low carbon ambitions and the changes we are making across our entire business to help advance the energy transition. Publishes April, see bp.com/energytransition
Improving
our
products
Reducing our emissions through operational emission reduction activities.
Improving our products to enable customers to lower their emissions.
Creating low carbon businesses to grow value and complement our existing portfolio.
BP Annual Report and Form 20-F 201796
Book 1.indb 96 03/04/2018 16:44:30
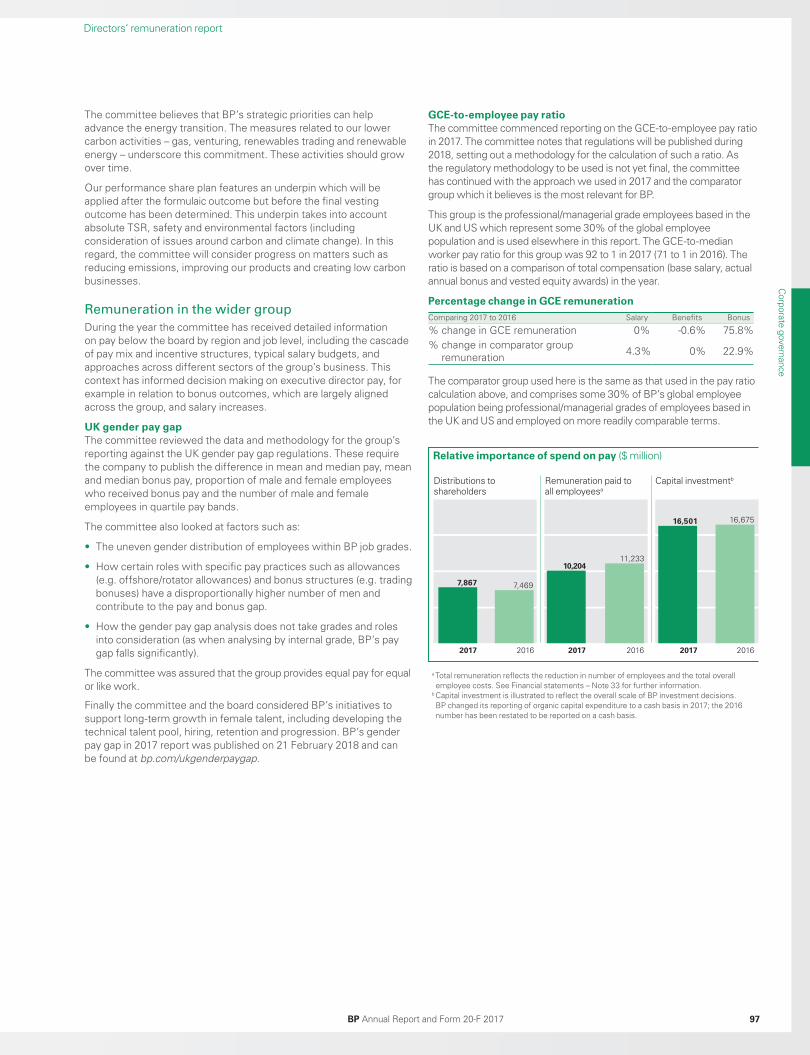
Directors’ remuneration report
The committee believes that BP’s strategic priorities can help advance the energy transition. The measures related to our lower carbon activities – gas, venturing, renewables trading and renewable energy – underscore this commitment. These activities should grow over time.
Our performance share plan features an underpin which will be applied after the formulaic outcome but before the final vesting outcome has been determined. This underpin takes into account absolute TSR, safety and environmental factors (including consideration of issues around carbon and climate change). In this regard, the committee will consider progress on matters such as reducing emissions, improving our products and creating low carbon businesses.
Remuneration in the wider group
During the year the committee has received detailed information on pay below the board by region and job level, including the cascade of pay mix and incentive structures, typical salary budgets, and approaches across different sectors of the group’s business. This context has informed decision making on executive director pay, for example in relation to bonus outcomes, which are largely aligned across the group, and salary increases.
UK gender pay gapThe committee reviewed the data and methodology for the group’s reporting against the UK gender pay gap regulations. These require the company to publish the difference in mean and median pay, mean and median bonus pay, proportion of male and female employees who received bonus pay and the number of male and female employees in quartile pay bands.
The committee also looked at factors such as:
• The uneven gender distribution of employees within BP job grades.
• How certain roles with specific pay practices such as allowances (e.g. offshore/rotator allowances) and bonus structures (e.g. trading bonuses) have a disproportionally higher number of men and contribute to the pay and bonus gap.
• How the gender pay gap analysis does not take grades and roles into consideration (as when analysing by internal grade, BP’s pay gap falls significantly).
The committee was assured that the group provides equal pay for equal or like work.
Finally the committee and the board considered BP’s initiatives to support long-term growth in female talent, including developing the technical talent pool, hiring, retention and progression. BP’s gender pay gap in 2017 report was published on 21 February 2018 and can be found at bp.com/ukgenderpaygap.
a Total remuneration reflects the reduction in number of employees and the total overall employee costs. See Financial statements – Note 33 for further information.
b Capital investment is illustrated to reflect the overall scale of BP investment decisions. BP changed its reporting of organic capital expenditure to a cash basis in 2017; the 2016 number has been restated to be reported on a cash basis.
GCE-to-employee pay ratioThe committee commenced reporting on the GCE-to-employee pay ratio in 2017. The committee notes that regulations will be published during 2018, setting out a methodology for the calculation of such a ratio. As the regulatory methodology to be used is not yet final, the committee has continued with the approach we used in 2017 and the comparator group which it believes is the most relevant for BP.
This group is the professional/managerial grade employees based in the UK and US which represent some 30% of the global employee population and is used elsewhere in this report. The GCE-to-median worker pay ratio for this group was 92 to 1 in 2017 (71 to 1 in 2016). The ratio is based on a comparison of total compensation (base salary, actual annual bonus and vested equity awards) in the year.
Percentage change in GCE remunerationComparing 2017 to 2016 Salary Benefits Bonus
% change in GCE remuneration 0% -0.6% 75.8%% change in comparator group
remuneration 4.3% 0% 22.9%
The comparator group used here is the same as that used in the pay ratio calculation above, and comprises some 30% of BP’s global employee population being professional/managerial grades of employees based in the UK and US and employed on more readily comparable terms.
Relative importance of spend on pay ($ million)
Distributions to shareholders
Remuneration paid to all employeesa
Capital investmentb
2017 2017 20172016
7,469
11,233
16,501 16,675
7,867
10,204
2016 2016
BP Annual Report and Form 20-F 2017 97
Corporate governance
Book 1.indb 97 03/04/2018 16:44:30
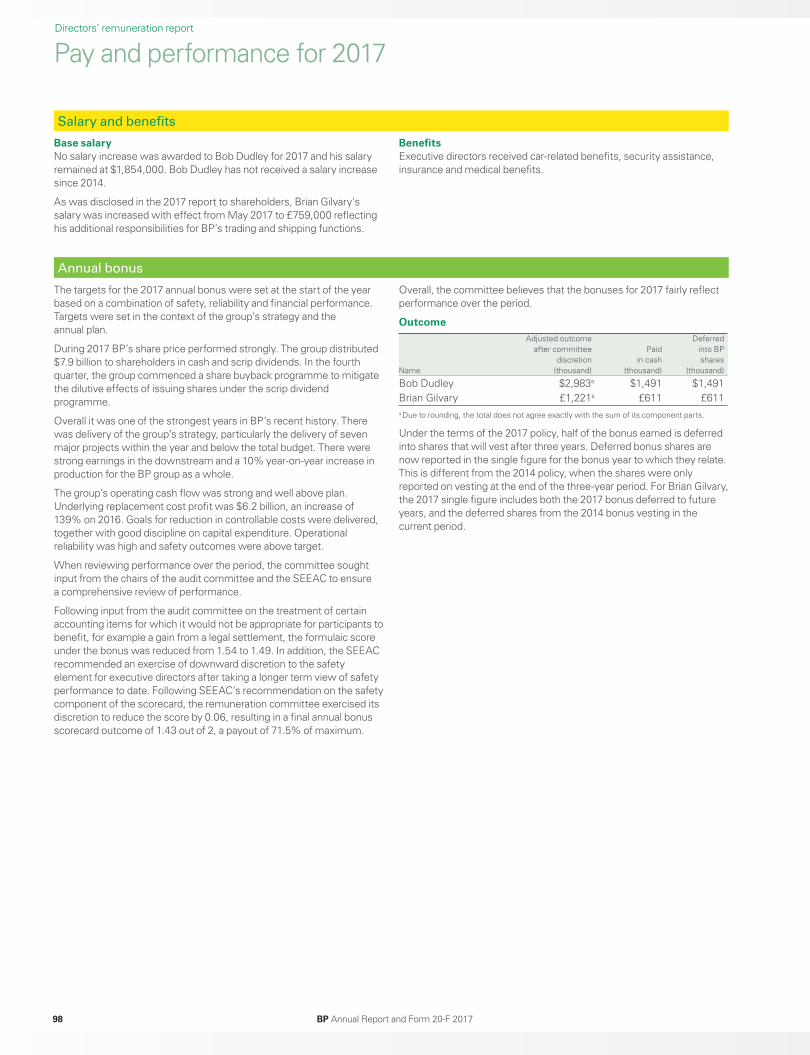
Pay and performance for 2017Directors’ remuneration report
Base salaryNo salary increase was awarded to Bob Dudley for 2017 and his salary remained at $1,854,000. Bob Dudley has not received a salary increase since 2014.
As was disclosed in the 2017 report to shareholders, Brian Gilvary’s salary was increased with effect from May 2017 to £759,000 reflecting his additional responsibilities for BP’s trading and shipping functions.
BenefitsExecutive directors received car-related benefits, security assistance, insurance and medical benefits.
Salary and benefits
The targets for the 2017 annual bonus were set at the start of the year based on a combination of safety, reliability and financial performance. Targets were set in the context of the group’s strategy and the annual plan.
During 2017 BP’s share price performed strongly. The group distributed $7.9 billion to shareholders in cash and scrip dividends. In the fourth quarter, the group commenced a share buyback programme to mitigate the dilutive effects of issuing shares under the scrip dividend programme.
Overall it was one of the strongest years in BP’s recent history. There was delivery of the group’s strategy, particularly the delivery of seven major projects within the year and below the total budget. There were strong earnings in the downstream and a 10% year-on-year increase in production for the BP group as a whole.
The group’s operating cash flow was strong and well above plan. Underlying replacement cost profit was $6.2 billion, an increase of 139% on 2016. Goals for reduction in controllable costs were delivered, together with good discipline on capital expenditure. Operational reliability was high and safety outcomes were above target.
When reviewing performance over the period, the committee sought input from the chairs of the audit committee and the SEEAC to ensure a comprehensive review of performance.
Following input from the audit committee on the treatment of certain accounting items for which it would not be appropriate for participants to benefit, for example a gain from a legal settlement, the formulaic score under the bonus was reduced from 1.54 to 1.49. In addition, the SEEAC recommended an exercise of downward discretion to the safety element for executive directors after taking a longer term view of safety performance to date. Following SEEAC’s recommendation on the safety component of the scorecard, the remuneration committee exercised its discretion to reduce the score by 0.06, resulting in a final annual bonus scorecard outcome of 1.43 out of 2, a payout of 71.5% of maximum.
Overall, the committee believes that the bonuses for 2017 fairly reflect performance over the period.
Outcome
Name
Adjusted outcome after committee
discretion (thousand)
Paid in cash
(thousand)
Deferred into BP shares
(thousand)
Bob Dudley $2,983a $1,491 $1,491Brian Gilvary £1,221a £611 £611a Due to rounding, the total does not agree exactly with the sum of its component parts.
Under the terms of the 2017 policy, half of the bonus earned is deferred into shares that will vest after three years. Deferred bonus shares are now reported in the single figure for the bonus year to which they relate. This is different from the 2014 policy, when the shares were only reported on vesting at the end of the three-year period. For Brian Gilvary, the 2017 single figure includes both the 2017 bonus deferred to future years, and the deferred shares from the 2014 bonus vesting in the current period.
Annual bonus
BP Annual Report and Form 20-F 201798
Book 1.indb 98 03/04/2018 16:44:30
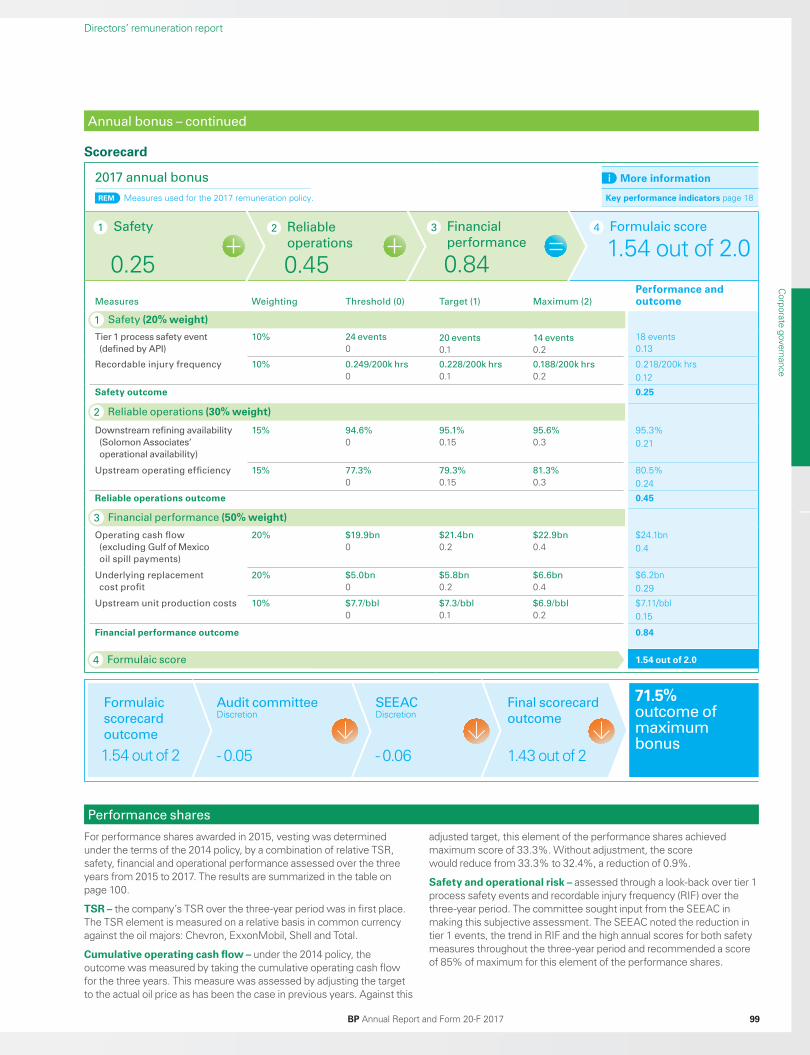
2017 annual bonus
Measures Weighting Threshold (0) Target (1) Maximum (2)
Performance and outcome
Tier 1 process safety event
(defined by API)
10% 24 events
020 events 0.1
14 events 0.2
18 events 0.13
Recordable injury frequency 10% 0.249/200k hrs
00.228/200k hrs
0.10.188/200k hrs
0.20.218/200k hrs 0.12
Safety outcome 0.25
Downstream refining availability
(Solomon Associates’
operational availability)
15% 94.6%
095.1%
0.1595.6%
0.395.3% 0.21
Upstream operating efficiency 15% 77.3%
079.3%
0.1581.3%
0.380.5% 0.24
Reliable operations outcome 0.45
Operating cash flow
(excluding Gulf of Mexico
oil spill payments)
20% $19.9bn
0$21.4bn
0.2$22.9bn
0.4$24.1bn 0.4
Underlying replacement
cost profit
20% $5.0bn
0$5.8bn
0.2$6.6bn
0.4$6.2bn 0.29
Upstream unit production costs 10% $7.7/bbl
0$7.3/bbl
0.1$6.9/bbl
0.2$7.11/bbl 0.15
Financial performance outcome 0.84
1.54 out of 2.0
Directors’ remuneration report
41 Safety
0.25
Reliable
operations
0.45
Financial
performance
0.84
Formulaic score
1.54 out of 2.02 3
Scorecard
Annual bonus – continued
More information
Key performance indicators page 18REM Measures used for the 2017 remuneration policy.
Safety (20% weight)1
Financial performance (50% weight)3
Reliable operations (30% weight)2
Formulaic score4
71.5% outcome of maximum bonus
Formulaic
scorecard
outcome
1.54 out of 2
Audit committeeDiscretion
- 0.05
SEEACDiscretion
- 0.06 1.43 out of 2
Final scorecard
outcome
For performance shares awarded in 2015, vesting was determined under the terms of the 2014 policy, by a combination of relative TSR, safety, financial and operational performance assessed over the three years from 2015 to 2017. The results are summarized in the table on page 100.
TSR – the company’s TSR over the three-year period was in first place. The TSR element is measured on a relative basis in common currency against the oil majors: Chevron, ExxonMobil, Shell and Total.
Cumulative operating cash flow – under the 2014 policy, the outcome was measured by taking the cumulative operating cash flow for the three years. This measure was assessed by adjusting the target to the actual oil price as has been the case in previous years. Against this
adjusted target, this element of the performance shares achieved maximum score of 33.3%. Without adjustment, the score would reduce from 33.3% to 32.4%, a reduction of 0.9%.
Safety and operational risk – assessed through a look-back over tier 1 process safety events and recordable injury frequency (RIF) over the three-year period. The committee sought input from the SEEAC in making this subjective assessment. The SEEAC noted the reduction in tier 1 events, the trend in RIF and the high annual scores for both safety measures throughout the three-year period and recommended a score of 85% of maximum for this element of the performance shares.
Performance shares
BP Annual Report and Form 20-F 2017 99
Corporate governance
Book 1.indb 99 03/04/2018 16:44:30
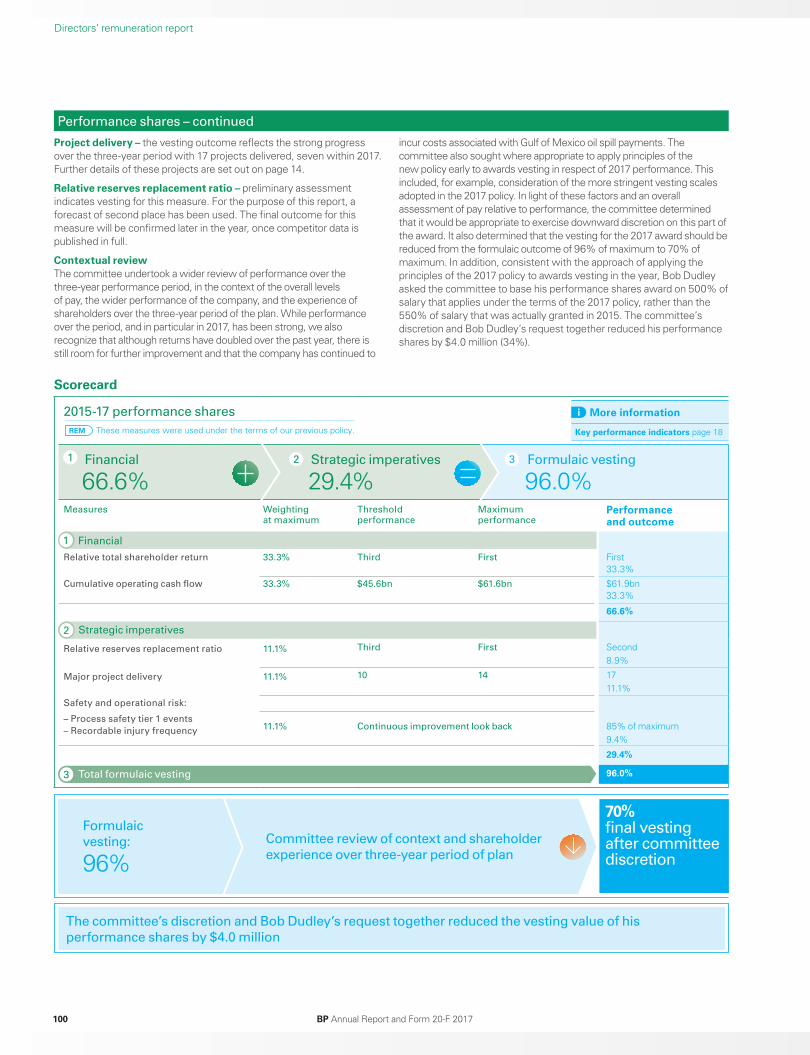
The committee’s discretion and Bob Dudley’s request together reduced the vesting value of his
performance shares by $4.0 million
Directors’ remuneration report
Project delivery – the vesting outcome reflects the strong progress over the three-year period with 17 projects delivered, seven within 2017. Further details of these projects are set out on page 14.
Relative reserves replacement ratio – preliminary assessment indicates vesting for this measure. For the purpose of this report, a forecast of second place has been used. The final outcome for this measure will be confirmed later in the year, once competitor data is published in full.
Contextual review The committee undertook a wider review of performance over the three-year performance period, in the context of the overall levels of pay, the wider performance of the company, and the experience of shareholders over the three-year period of the plan. While performance over the period, and in particular in 2017, has been strong, we also recognize that although returns have doubled over the past year, there is still room for further improvement and that the company has continued to
Scorecard
1 Financial
66.6%2 3 Strategic imperatives
29.4% Formulaic vesting
96.0%
More information
Key performance indicators page XX
More information
Key performance indicators page 18These measures were used under the terms of our previous policy.
1 Financial
Strategic imperatives2
Total formulaic vesting3
Performance shares – continued
REM
incur costs associated with Gulf of Mexico oil spill payments. The committee also sought where appropriate to apply principles of the new policy early to awards vesting in respect of 2017 performance. This included, for example, consideration of the more stringent vesting scales adopted in the 2017 policy. In light of these factors and an overall assessment of pay relative to performance, the committee determined that it would be appropriate to exercise downward discretion on this part of the award. It also determined that the vesting for the 2017 award should be reduced from the formulaic outcome of 96% of maximum to 70% of maximum. In addition, consistent with the approach of applying the principles of the 2017 policy to awards vesting in the year, Bob Dudley asked the committee to base his performance shares award on 500% of salary that applies under the terms of the 2017 policy, rather than the 550% of salary that was actually granted in 2015. The committee’s discretion and Bob Dudley’s request together reduced his performance shares by $4.0 million (34%).
BP Annual Report and Form 20-F 2017100
2015-17 performance shares
Measures Weighting at maximum
Thresholdperformance
Maximum performance
Performance and outcome
Relative total shareholder return 33.3% Third First First 33.3%
Cumulative operating cash flow 33.3% $45.6bn $61.6bn $61.9bn 33.3%
66.6%
Relative reserves replacement ratio 11.1% Third First Second 8.9%
Major project delivery 11.1% 10 14 17 11.1%
Safety and operational risk:
– Process safety tier 1 events
– Recordable injury frequency11.1% Continuous improvement look back 85% of maximum
9.4%
29.4%
96.0%
Formulaic
vesting:
96%Committee review of context and shareholder
experience over three-year period of plan
70% final vesting after committee discretion
Book 1.indb 100 03/04/2018 16:44:31
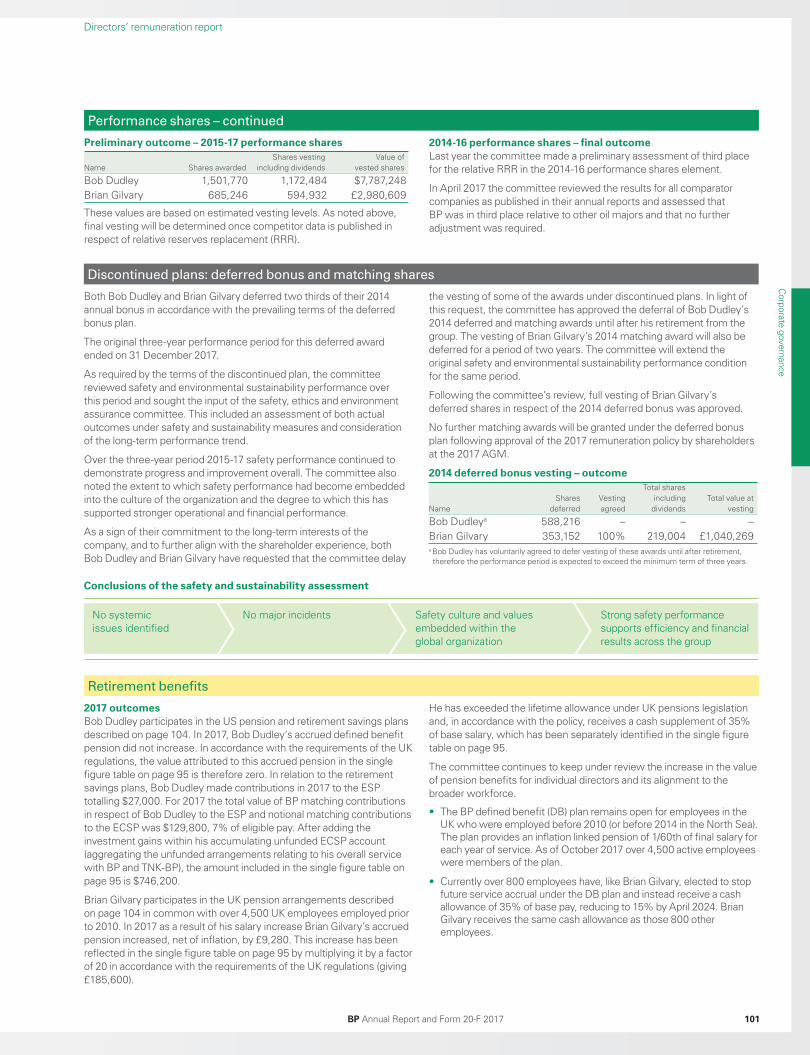
Directors’ remuneration report
Both Bob Dudley and Brian Gilvary deferred two thirds of their 2014 annual bonus in accordance with the prevailing terms of the deferred bonus plan.
The original three-year performance period for this deferred award ended on 31 December 2017.
As required by the terms of the discontinued plan, the committee reviewed safety and environmental sustainability performance over this period and sought the input of the safety, ethics and environment assurance committee. This included an assessment of both actual outcomes under safety and sustainability measures and consideration of the long-term performance trend.
Over the three-year period 2015-17 safety performance continued to demonstrate progress and improvement overall. The committee also noted the extent to which safety performance had become embedded into the culture of the organization and the degree to which this has supported stronger operational and financial performance.
As a sign of their commitment to the long-term interests of the company, and to further align with the shareholder experience, both Bob Dudley and Brian Gilvary have requested that the committee delay
the vesting of some of the awards under discontinued plans. In light of this request, the committee has approved the deferral of Bob Dudley’s 2014 deferred and matching awards until after his retirement from the group. The vesting of Brian Gilvary’s 2014 matching award will also be deferred for a period of two years. The committee will extend the original safety and environmental sustainability performance condition for the same period.
Following the committee’s review, full vesting of Brian Gilvary’s deferred shares in respect of the 2014 deferred bonus was approved.
No further matching awards will be granted under the deferred bonus plan following approval of the 2017 remuneration policy by shareholders at the 2017 AGM.
2014 deferred bonus vesting – outcome
NameShares
deferredVesting agreed
Total shares including
dividendsTotal value at
vesting
Bob Dudleya 588,216 – – –Brian Gilvary 353,152 100% 219,004 £1,040,269a Bob Dudley has voluntarily agreed to defer vesting of these awards until after retirement, therefore the performance period is expected to exceed the minimum term of three years.
Discontinued plans: deferred bonus and matching shares
2017 outcomes Bob Dudley participates in the US pension and retirement savings plans described on page 104. In 2017, Bob Dudley’s accrued defined benefit pension did not increase. In accordance with the requirements of the UK regulations, the value attributed to this accrued pension in the single figure table on page 95 is therefore zero. In relation to the retirement savings plans, Bob Dudley made contributions in 2017 to the ESP totalling $27,000. For 2017 the total value of BP matching contributions in respect of Bob Dudley to the ESP and notional matching contributions to the ECSP was $129,800, 7% of eligible pay. After adding the investment gains within his accumulating unfunded ECSP account (aggregating the unfunded arrangements relating to his overall service with BP and TNK-BP), the amount included in the single figure table on page 95 is $746,200.
Brian Gilvary participates in the UK pension arrangements described on page 104 in common with over 4,500 UK employees employed prior to 2010. In 2017 as a result of his salary increase Brian Gilvary’s accrued pension increased, net of inflation, by £9,280. This increase has been reflected in the single figure table on page 95 by multiplying it by a factor of 20 in accordance with the requirements of the UK regulations (giving £185,600).
He has exceeded the lifetime allowance under UK pensions legislation and, in accordance with the policy, receives a cash supplement of 35% of base salary, which has been separately identified in the single figure table on page 95.
The committee continues to keep under review the increase in the value of pension benefits for individual directors and its alignment to the broader workforce.
• The BP defined benefit (DB) plan remains open for employees in the UK who were employed before 2010 (or before 2014 in the North Sea). The plan provides an inflation linked pension of 1/60th of final salary for each year of service. As of October 2017 over 4,500 active employees were members of the plan.
• Currently over 800 employees have, like Brian Gilvary, elected to stop future service accrual under the DB plan and instead receive a cash allowance of 35% of base pay, reducing to 15% by April 2024. Brian Gilvary receives the same cash allowance as those 800 other employees.
Retirement benefits
No systemic issues identified
No major incidents Safety culture and values embedded within the global organization
Strong safety performance supports efficiency and financial results across the group
Conclusions of the safety and sustainability assessment
Performance shares – continued
Preliminary outcome – 2015-17 performance shares
Name Shares awardedShares vesting
including dividendsValue of
vested shares
Bob Dudley 1,501,770 1,172,484 $7,787,248Brian Gilvary 685,246 594,932 £2,980,609
These values are based on estimated vesting levels. As noted above, final vesting will be determined once competitor data is published in respect of relative reserves replacement (RRR).
2014-16 performance shares – final outcomeLast year the committee made a preliminary assessment of third place for the relative RRR in the 2014-16 performance shares element.
In April 2017 the committee reviewed the results for all comparator companies as published in their annual reports and assessed that BP was in third place relative to other oil majors and that no further adjustment was required.
BP Annual Report and Form 20-F 2017
Corporate governance
101
Book 1.indb 101 03/04/2018 16:44:31
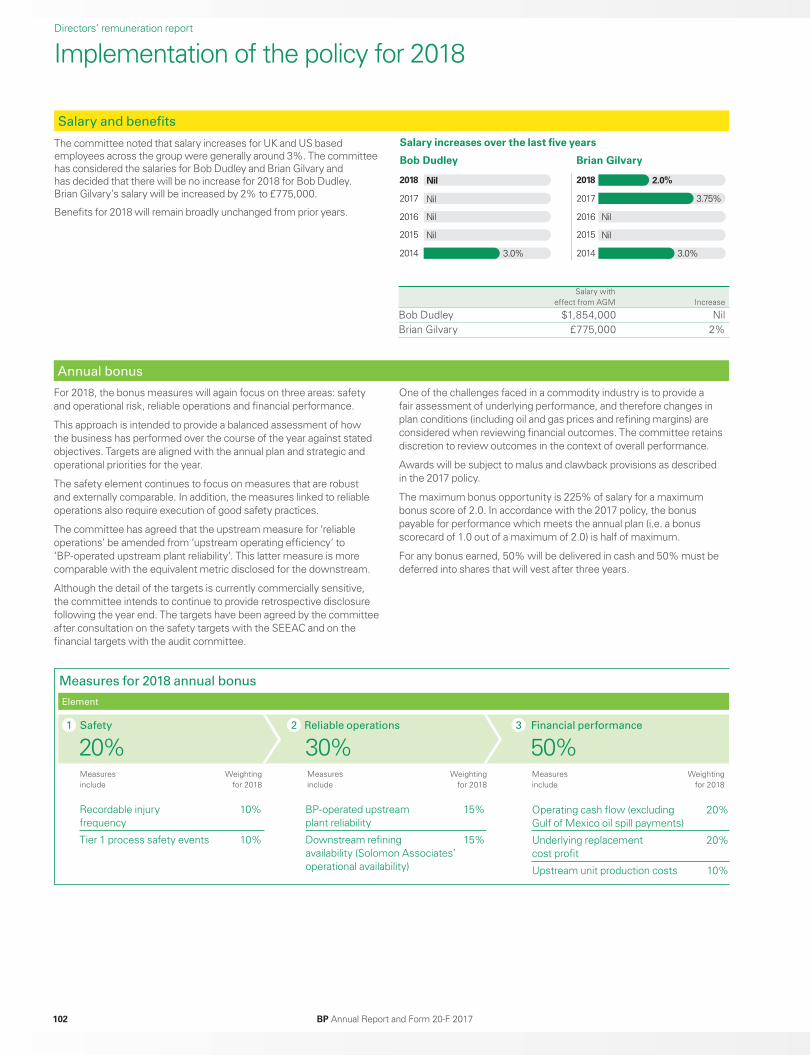
2018
2017
2016
2015
2014
2018
2017
2016
2015
2014
Bob Dudley
Salary increases over the last five years
Brian Gilvary
3.0%3.0%
Nil
Nil
Nil
Nil
Nil
Nil
3.75%
2.0%
Directors’ remuneration report
Salary with effect from AGM Increase
Bob Dudley $1,854,000 NilBrian Gilvary £775,000 2%
The committee noted that salary increases for UK and US based employees across the group were generally around 3%. The committee has considered the salaries for Bob Dudley and Brian Gilvary and has decided that there will be no increase for 2018 for Bob Dudley. Brian Gilvary’s salary will be increased by 2% to £775,000.
Benefits for 2018 will remain broadly unchanged from prior years.
Salary and benefits
For 2018, the bonus measures will again focus on three areas: safety and operational risk, reliable operations and financial performance.
This approach is intended to provide a balanced assessment of how the business has performed over the course of the year against stated objectives. Targets are aligned with the annual plan and strategic and operational priorities for the year.
The safety element continues to focus on measures that are robust and externally comparable. In addition, the measures linked to reliable operations also require execution of good safety practices.
The committee has agreed that the upstream measure for ‘reliable operations’ be amended from ‘upstream operating efficiency’ to ‘BP-operated upstream plant reliability’. This latter measure is more comparable with the equivalent metric disclosed for the downstream.
Although the detail of the targets is currently commercially sensitive, the committee intends to continue to provide retrospective disclosure following the year end. The targets have been agreed by the committee after consultation on the safety targets with the SEEAC and on the financial targets with the audit committee.
One of the challenges faced in a commodity industry is to provide a fair assessment of underlying performance, and therefore changes in plan conditions (including oil and gas prices and refining margins) are considered when reviewing financial outcomes. The committee retains discretion to review outcomes in the context of overall performance.
Awards will be subject to malus and clawback provisions as described in the 2017 policy.
The maximum bonus opportunity is 225% of salary for a maximum bonus score of 2.0. In accordance with the 2017 policy, the bonus payable for performance which meets the annual plan (i.e. a bonus scorecard of 1.0 out of a maximum of 2.0) is half of maximum.
For any bonus earned, 50% will be delivered in cash and 50% must be deferred into shares that will vest after three years.
Annual bonus
Recordable injury 10% frequency
Tier 1 process safety events 10%
Operating cash flow (excluding 20% Gulf of Mexico oil spill payments)
Underlying replacement 20% cost profit
Upstream unit production costs 10%
Safety
20%1 Reliable operations
30%2 Financial performance
50%3
Element
Measures for 2018 annual bonus
Measures include
Measures include
Measures include
Weighting for 2018
Weighting for 2018
Weighting for 2018
BP-operated upstream 15% plant reliability
Downstream refining 15% availability (Solomon Associates’ operational availability)
Implementation of the policy for 2018
BP Annual Report and Form 20-F 2017102
Book 1.indb 102 03/04/2018 16:44:31
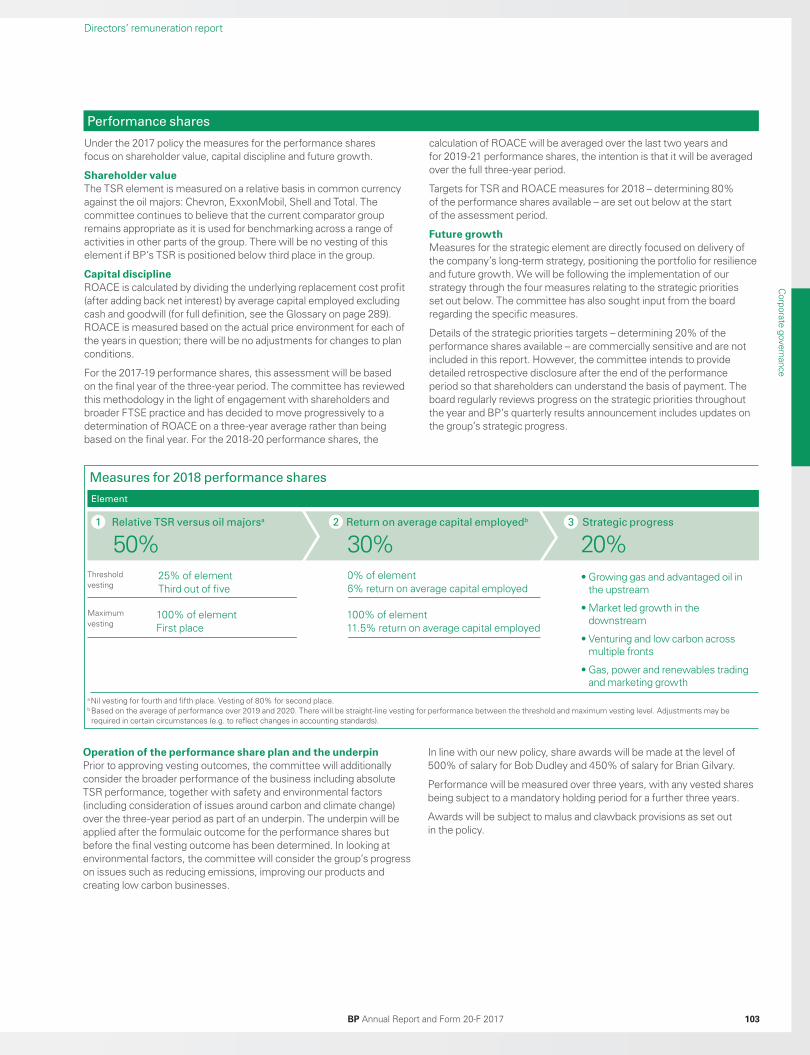
Directors’ remuneration report
Under the 2017 policy the measures for the performance shares focus on shareholder value, capital discipline and future growth.
Shareholder valueThe TSR element is measured on a relative basis in common currency against the oil majors: Chevron, ExxonMobil, Shell and Total. The committee continues to believe that the current comparator group remains appropriate as it is used for benchmarking across a range of activities in other parts of the group. There will be no vesting of this element if BP’s TSR is positioned below third place in the group.
Capital disciplineROACE is calculated by dividing the underlying replacement cost profit (after adding back net interest) by average capital employed excluding cash and goodwill (for full definition, see the Glossary on page 289). ROACE is measured based on the actual price environment for each of the years in question; there will be no adjustments for changes to plan conditions.
For the 2017-19 performance shares, this assessment will be based on the final year of the three-year period. The committee has reviewed this methodology in the light of engagement with shareholders and broader FTSE practice and has decided to move progressively to a determination of ROACE on a three-year average rather than being based on the final year. For the 2018-20 performance shares, the
calculation of ROACE will be averaged over the last two years and for 2019-21 performance shares, the intention is that it will be averaged over the full three-year period.
Targets for TSR and ROACE measures for 2018 – determining 80% of the performance shares available – are set out below at the start of the assessment period.
Future growthMeasures for the strategic element are directly focused on delivery of the company’s long-term strategy, positioning the portfolio for resilience and future growth. We will be following the implementation of our strategy through the four measures relating to the strategic priorities set out below. The committee has also sought input from the board regarding the specific measures.
Details of the strategic priorities targets – determining 20% of the performance shares available – are commercially sensitive and are not included in this report. However, the committee intends to provide detailed retrospective disclosure after the end of the performance period so that shareholders can understand the basis of payment. The board regularly reviews progress on the strategic priorities throughout the year and BP’s quarterly results announcement includes updates on the group’s strategic progress.
Performance shares
25% of element Third out of five
100% of element 11.5% return on average capital employed
0% of element 6% return on average capital employed
100% of element First place
Relative TSR versus oil majorsa
50%1 Return on average capital employedb
30%2 Strategic progress
20%3
Element
Measures for 2018 performance shares
Thresholdvesting
Maximumvesting
• Growing gas and advantaged oil in the upstream
• Market led growth in the downstream
• Venturing and low carbon across multiple fronts
• Gas, power and renewables trading and marketing growth
a Nil vesting for fourth and fifth place. Vesting of 80% for second place.b Based on the average of performance over 2019 and 2020. There will be straight-line vesting for performance between the threshold and maximum vesting level. Adjustments may be required in certain circumstances (e.g. to reflect changes in accounting standards).
Operation of the performance share plan and the underpinPrior to approving vesting outcomes, the committee will additionally consider the broader performance of the business including absolute TSR performance, together with safety and environmental factors (including consideration of issues around carbon and climate change) over the three-year period as part of an underpin. The underpin will be applied after the formulaic outcome for the performance shares but before the final vesting outcome has been determined. In looking at environmental factors, the committee will consider the group’s progress on issues such as reducing emissions, improving our products and creating low carbon businesses.
In line with our new policy, share awards will be made at the level of 500% of salary for Bob Dudley and 450% of salary for Brian Gilvary.
Performance will be measured over three years, with any vested shares being subject to a mandatory holding period for a further three years.
Awards will be subject to malus and clawback provisions as set out in the policy.
BP Annual Report and Form 20-F 2017 103
Corporate governance
Book 1.indb 103 03/04/2018 16:44:31

Both executive directors exceed the share ownership requirements of five times salary. It is expected that Bob Dudley and Brian Gilvary will maintain a shareholding of at least 250% of salary for two years following retirement.
Shareholding requirements
Bob Dudley
Bob Dudley is provided with pension benefits and retirement savings through a combination of tax-qualified and non-qualified benefit plans, consistent with applicable US tax regulations.
The BP supplemental executive retirement benefit plan (SERB) is a non-qualified pension plan which provides a pension of 1.3% of final average earnings (as defined in plan rules) for each year of service, less benefits paid under all other BP (US) tax-qualified and non-qualified pension plans. Final average earnings include base salary and annual bonus. Service, including service with TNK-BP, is limited to 37 years. Bob Dudley completed 37 years of service in September 2016 and therefore will not receive any further service accrual under these arrangements. There will be no additional payment in lieu of any further service accrual.
The benefit payable under the SERB is unreduced at age 60 or above.
Bob Dudley is also a member of other tax-qualified and non-qualified pension plans. However, the benefits from those plans are offset against the SERB benefit and so his benefit entitlement is determined by his participation in the SERB.
The BP Employee Savings Plan (ESP) is a US tax-qualified section 401(k) plan to which both Bob Dudley and BP contribute. BP matches contributions by Bob Dudley 1:1 up to 7% of eligible pay up to an IRS limit. The BP Excess Compensation (Savings) Plan (ECSP) is a non-qualified retirement savings plan under which BP provides a notional match in respect of eligible pay that exceeds the IRS limit. In common with other participants, Bob Dudley does not contribute to the ESCP. From 2017 onwards, for the purposes of both plans, eligible pay for Bob Dudley is base salary only.
Under both tax-qualified and non-qualified savings plans, Bob Dudley is entitled to make investment elections, involving an investment in the relevant fund in the case of the ESP and a notional investment (the return on which would be delivered by BP under its unfunded commitment) in the case of the ECSP.
Although investment returns on the ECSP relate to contributions made in previous years, UK disclosure rules for the single figure require these returns to be included in the single figure for the year. As Bob Dudley has a significant proportion of his notional ECSP investment in BP shares, an increase in the BP share price results in a contribution to the single figure through this component.
Benefits payable under the ECSP are unfunded and therefore paid from corporate assets. Benefits are generally paid as a lump sum, with any pension benefit being converted to a lump sum equivalent.
Retirement benefits
Brian Gilvary
Brian Gilvary participates in a UK final salary pension plan, the BP Pension Scheme (BPPS), along with over 4,500 other employees in service prior to 1 April 2011. The BPPS is closed to new hires but for existing participants the plan continues to provide a pension of one sixtieth of final base salary for each year of service, up to a maximum of two thirds of final base salary, and a dependant’s benefit of two thirds of the member’s pension.
BPPS participants can elect to stop future service pension accrual and instead receive a cash allowance. On 1 April 2011 Brian Gilvary elected to stop future service pension accrual and receive the cash allowance of 35% of base salary. It has been agreed for all participants who have elected to receive the cash allowance, including Brian Gilvary, that a transition will take effect from April 2021 when the level of cash allowance will progressively reduce to 15% of base salary by 2024.
Pension benefits in excess of the individual lifetime allowance set by legislation are provided to Brian Gilvary via an unapproved, unfunded pension arrangement provided directly by the company.
The rules of the BPPS were amended in 2006 to introduce a normal retirement age of 65, but in common with other BPPS participants in service on 30 November 2006, Brian Gilvary has a normal retirement age of 60.
If Brian Gilvary were to retire between age 55 and 60, then subject to the consent of the committee, he would be entitled to an immediate pension, with a reduction (currently 3%) for each year before normal retirement age in respect of the benefit that relates to service since 1 December 2006 and no reduction in respect of the remainder of his benefit.
Irrespective of this, on leaving in circumstances of total incapacity, an immediate unreduced pension would be payable as from his leaving date.
Directors’ remuneration report
BP Annual Report and Form 20-F 2017104
Book 1.indb 104 03/04/2018 16:44:31
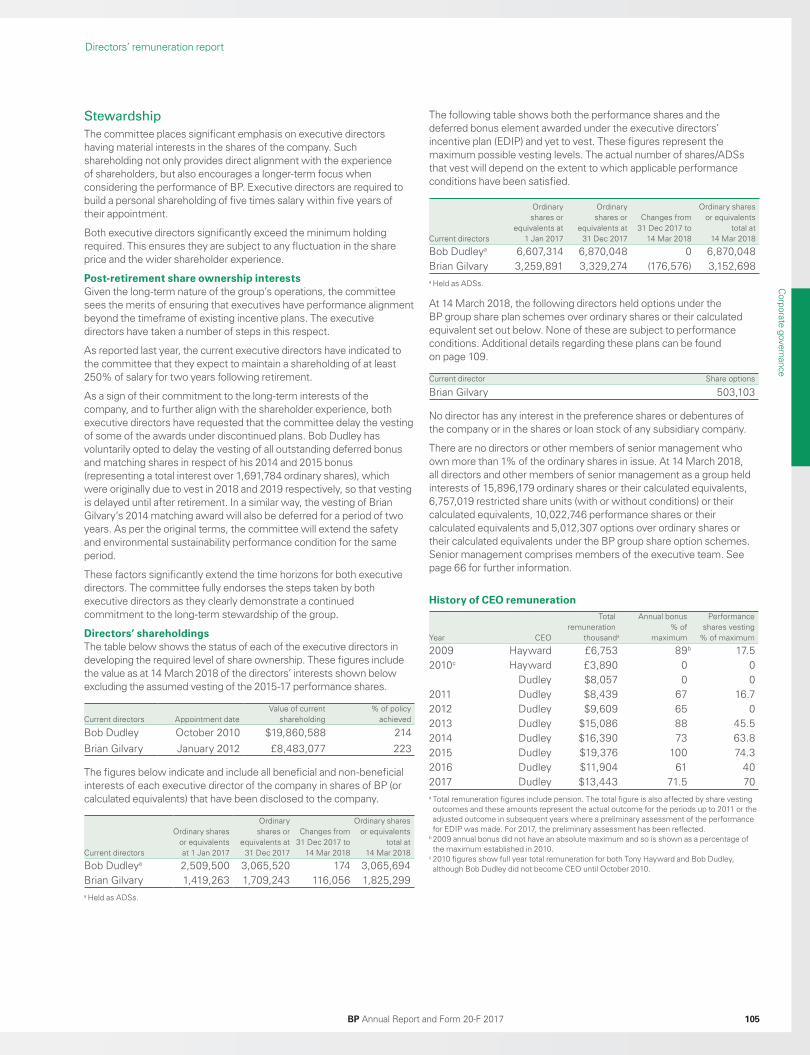
Stewardship
The committee places significant emphasis on executive directors having material interests in the shares of the company. Such shareholding not only provides direct alignment with the experience of shareholders, but also encourages a longer-term focus when considering the performance of BP. Executive directors are required to build a personal shareholding of five times salary within five years of their appointment.
Both executive directors significantly exceed the minimum holding required. This ensures they are subject to any fluctuation in the share price and the wider shareholder experience.
Post-retirement share ownership interests Given the long-term nature of the group’s operations, the committee sees the merits of ensuring that executives have performance alignment beyond the timeframe of existing incentive plans. The executive directors have taken a number of steps in this respect.
As reported last year, the current executive directors have indicated to the committee that they expect to maintain a shareholding of at least 250% of salary for two years following retirement.
As a sign of their commitment to the long-term interests of the company, and to further align with the shareholder experience, both executive directors have requested that the committee delay the vesting of some of the awards under discontinued plans. Bob Dudley has voluntarily opted to delay the vesting of all outstanding deferred bonus and matching shares in respect of his 2014 and 2015 bonus (representing a total interest over 1,691,784 ordinary shares), which were originally due to vest in 2018 and 2019 respectively, so that vesting is delayed until after retirement. In a similar way, the vesting of Brian Gilvary’s 2014 matching award will also be deferred for a period of two years. As per the original terms, the committee will extend the safety and environmental sustainability performance condition for the same period.
These factors significantly extend the time horizons for both executive directors. The committee fully endorses the steps taken by both executive directors as they clearly demonstrate a continued commitment to the long-term stewardship of the group.
Directors’ shareholdingsThe table below shows the status of each of the executive directors in developing the required level of share ownership. These figures include the value as at 14 March 2018 of the directors’ interests shown below excluding the assumed vesting of the 2015-17 performance shares.
Current directors Appointment dateValue of current
shareholding% of policy
achieved
Bob Dudley October 2010 $19,860,588 214Brian Gilvary January 2012 £8,483,077 223
The figures below indicate and include all beneficial and non-beneficial interests of each executive director of the company in shares of BP (or calculated equivalents) that have been disclosed to the company.
Current directors
Ordinary shares or equivalents at 1 Jan 2017
Ordinary shares or
equivalents at 31 Dec 2017
Changes from 31 Dec 2017 to
14 Mar 2018
Ordinary shares or equivalents
total at 14 Mar 2018
Bob Dudleya 2,509,500 3,065,520 174 3,065,694Brian Gilvary 1,419,263 1,709,243 116,056 1,825,299a Held as ADSs.
The following table shows both the performance shares and the deferred bonus element awarded under the executive directors’ incentive plan (EDIP) and yet to vest. These figures represent the maximum possible vesting levels. The actual number of shares/ADSs that vest will depend on the extent to which applicable performance conditions have been satisfied.
Current directors
Ordinary shares or
equivalents at 1 Jan 2017
Ordinary shares or
equivalents at 31 Dec 2017
Changes from 31 Dec 2017 to
14 Mar 2018
Ordinary shares or equivalents
total at 14 Mar 2018
Bob Dudleya 6,607,314 6,870,048 0 6,870,048Brian Gilvary 3,259,891 3,329,274 (176,576) 3,152,698a Held as ADSs.
At 14 March 2018, the following directors held options under the BP group share plan schemes over ordinary shares or their calculated equivalent set out below. None of these are subject to performance conditions. Additional details regarding these plans can be found on page 109.
Current director Share options
Brian Gilvary 503,103
No director has any interest in the preference shares or debentures of the company or in the shares or loan stock of any subsidiary company.
There are no directors or other members of senior management who own more than 1% of the ordinary shares in issue. At 14 March 2018, all directors and other members of senior management as a group held interests of 15,896,179 ordinary shares or their calculated equivalents, 6,757,019 restricted share units (with or without conditions) or their calculated equivalents, 10,022,746 performance shares or their calculated equivalents and 5,012,307 options over ordinary shares or their calculated equivalents under the BP group share option schemes. Senior management comprises members of the executive team. See page 66 for further information.
History of CEO remuneration
Year CEO
Total remuneration
thousanda
Annual bonus % of
maximum
Performance shares vesting
% of maximum
2009 Hayward £6,753 89b 17.52010c Hayward £3,890 0 0
Dudley $8,057 0 02011 Dudley $8,439 67 16.72012 Dudley $9,609 65 02013 Dudley $15,086 88 45.52014 Dudley $16,390 73 63.82015 Dudley $19,376 100 74.32016 Dudley $11,904 61 402017 Dudley $13,443 71.5 70a Total remuneration figures include pension. The total figure is also affected by share vesting outcomes and these amounts represent the actual outcome for the periods up to 2011 or the adjusted outcome in subsequent years where a preliminary assessment of the performance for EDIP was made. For 2017, the preliminary assessment has been reflected.
b 2009 annual bonus did not have an absolute maximum and so is shown as a percentage of the maximum established in 2010.
c 2010 figures show full year total remuneration for both Tony Hayward and Bob Dudley, although Bob Dudley did not become CEO until October 2010.
Directors’ remuneration report
BP Annual Report and Form 20-F 2017 105
Corporate governance
Book 1.indb 105 03/04/2018 16:44:31

Directors’ remuneration report
20092008 2010 2011 2012 2013 2014 2015 2016 2017
Valu
e of
hyp
othe
tical
£10
0 ho
ldin
g
FTSE 100 BPHistorical TSR performance
£50
£100
£150
£200
£250
This graph shows the growth in value of a hypothetical £100 holding in BP p.l.c. ordinary shares over nine years, relative to a hypothetical £100 holding in the FTSE 100 Index of which the company is a constituent.
Further information
Independence and advice
The board considers all committee members to be independent with no personal financial interest, other than as shareholders, in the committee’s decisions. Further detail on the activities of the committee, including activities during the year, advice received and shareholder engagement is set out in the remuneration committee report on page 86.
During 2017 David Jackson, the company secretary, who is employed by the company and reports to the chairman of the board, acted as secretary to the remuneration committee.
Deloitte LLP acted as independent adviser to the committee during the year until September 2017, when it stepped down as part of the transition process for its role as BP’s statutory auditor for the financial year 2018.
Following a competitive tender process, the committee appointed PwC as its independent adviser from September 2017. PwC is a member of the Remuneration Consulting Group and, as such, operates under the code of conduct in relation to executive remuneration consulting in the UK. The committee is satisfied that the advice received is objective and independent.
Freshfields Bruckhaus Deringer LLP provided legal advice on specific compliance matters to the committee.
Deloitte, PwC and Freshfields provide other advice in their respective areas to the group. During the year, Deloitte also provided BP with services including consulting on HR and upstream matters and PwC provided BP with services including subsidiary company secretarial support.
Total fees or other charges (based on an hourly rate) for the provision of remuneration advice to the committee in 2017 (save in respect of legal advice) are as follows:
Deloitte £164,280
PwC £62,213
Shareholder engagement
As set out in last year’s report, during 2017 we had extensive dialogue with many of our largest shareholders as well as representative bodies on remuneration matters, particularly in the run-up to the AGM.
The table below shows the votes on the report for the last three years.
AGM directors’ remuneration report vote resultsYear % vote ‘for’ % vote ‘against’ Votes withheld
2017 97.05% 2.95% 63,453,3832016 40.7% 59.3% 464,259,3402015 88.8% 11.2% 305,297,190
The remuneration policy was approved by shareholders at the 2017 AGM on 17 May 2017. The votes on the policy are shown below.
2017 AGM directors’ remuneration policy vote resultsYear % vote ‘for’ % vote ‘against’ Votes withheld
2017 97.28% 2.72% 36,563,886
External appointments
The board supports executive directors taking up appointments outside the company to broaden their knowledge and experience. Each executive director is permitted to accept one non-executive appointment, from which they may retain any fee. External appointments are subject to agreement by the chairman and reported to the board. Any external appointment must not conflict with a director’s duties and commitments to BP. Details of appointments as non-executive directors during 2017 are shown below.
DirectorAppointee company
Additional positionheld at appointee company Total fees
Bob Dudley Rosnefta Director 0Brian Gilvary L’Air Liquide Director Euros 64,310
a Bob Dudley holds this appointment as a result of the company’s shareholding in Rosneft.
BP Annual Report and Form 20-F 2017106
Book 1.indb 106 03/04/2018 16:44:31
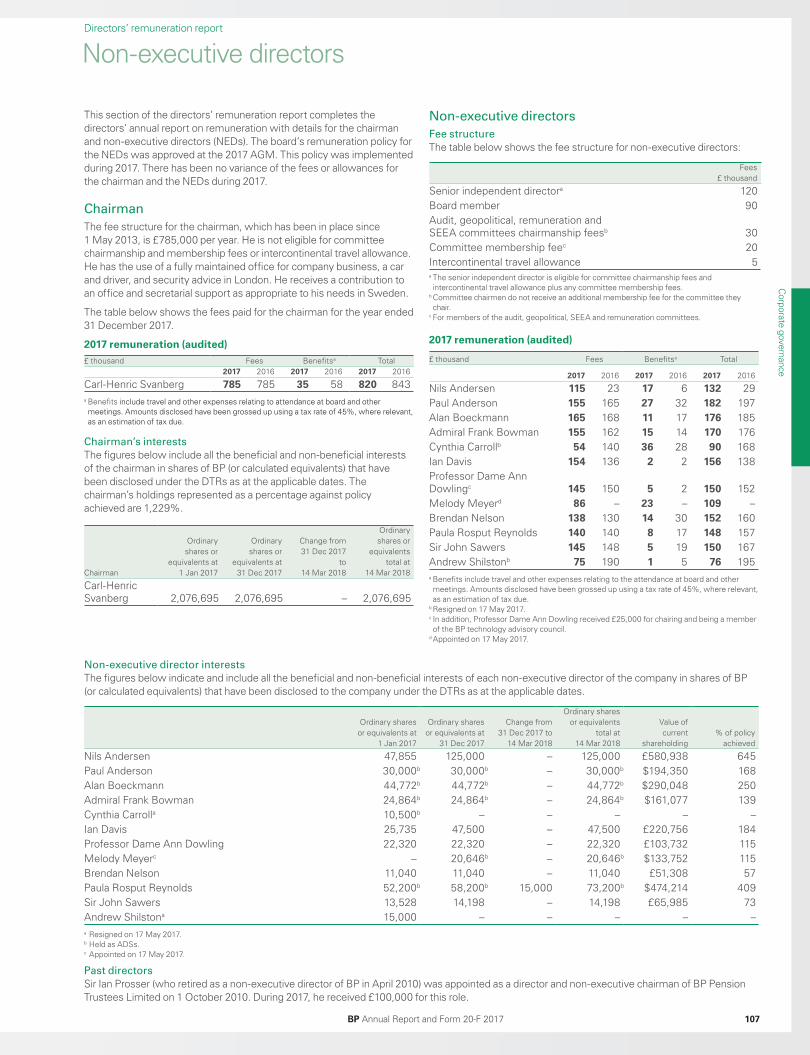
This section of the directors’ remuneration report completes the directors’ annual report on remuneration with details for the chairman and non-executive directors (NEDs). The board’s remuneration policy for the NEDs was approved at the 2017 AGM. This policy was implemented during 2017. There has been no variance of the fees or allowances for the chairman and the NEDs during 2017.
Chairman
The fee structure for the chairman, which has been in place since 1 May 2013, is £785,000 per year. He is not eligible for committee chairmanship and membership fees or intercontinental travel allowance. He has the use of a fully maintained office for company business, a car and driver, and security advice in London. He receives a contribution to an office and secretarial support as appropriate to his needs in Sweden.
The table below shows the fees paid for the chairman for the year ended 31 December 2017.
2017 remuneration (audited)£ thousand Fees Benefitsa Total
2017 2016 2017 2016 2017 2016
Carl-Henric Svanberg 785 785 35 58 820 843a Benefits include travel and other expenses relating to attendance at board and other meetings. Amounts disclosed have been grossed up using a tax rate of 45%, where relevant, as an estimation of tax due.
Chairman’s interests
The figures below include all the beneficial and non-beneficial interests of the chairman in shares of BP (or calculated equivalents) that have been disclosed under the DTRs as at the applicable dates. The chairman’s holdings represented as a percentage against policy achieved are 1,229%.
Chairman
Ordinaryshares or
equivalents at1 Jan 2017
Ordinaryshares or
equivalents at31 Dec 2017
Change from31 Dec 2017
to14 Mar 2018
Ordinaryshares or
equivalentstotal at
14 Mar 2018
Carl-Henric Svanberg 2,076,695 2,076,695 – 2,076,695
Non-executive directorsDirectors’ remuneration report
Non-executive director interests
The figures below indicate and include all the beneficial and non-beneficial interests of each non-executive director of the company in shares of BP (or calculated equivalents) that have been disclosed to the company under the DTRs as at the applicable dates.
Ordinary sharesor equivalents at
1 Jan 2017
Ordinary sharesor equivalents at
31 Dec 2017
Change from31 Dec 2017 to
14 Mar 2018
Ordinary sharesor equivalents
total at14 Mar 2018
Value ofcurrent
shareholding% of policy
achieved
Nils Andersen 47,855 125,000 – 125,000 £580,938 645Paul Anderson 30,000b 30,000b – 30,000b $194,350 168Alan Boeckmann 44,772b 44,772b – 44,772b $290,048 250Admiral Frank Bowman 24,864b 24,864b – 24,864b $161,077 139Cynthia Carrolla 10,500b – – – – –Ian Davis 25,735 47,500 – 47,500 £220,756 184Professor Dame Ann Dowling 22,320 22,320 – 22,320 £103,732 115Melody Meyerc – 20,646b – 20,646b $133,752 115Brendan Nelson 11,040 11,040 – 11,040 £51,308 57Paula Rosput Reynolds 52,200b 58,200b 15,000 73,200b $474,214 409Sir John Sawers 13,528 14,198 – 14,198 £65,985 73Andrew Shilstona 15,000 – – – – –a Resigned on 17 May 2017. b Held as ADSs. c Appointed on 17 May 2017.
Past directors
Sir Ian Prosser (who retired as a non-executive director of BP in April 2010) was appointed as a director and non-executive chairman of BP Pension Trustees Limited on 1 October 2010. During 2017, he received £100,000 for this role.
Non-executive directors
Fee structure
The table below shows the fee structure for non-executive directors:
Fees £ thousand
Senior independent directora 120Board member 90Audit, geopolitical, remuneration and SEEA committees chairmanship feesb 30Committee membership feec 20Intercontinental travel allowance 5a The senior independent director is eligible for committee chairmanship fees and intercontinental travel allowance plus any committee membership fees.
b Committee chairmen do not receive an additional membership fee for the committee they chair.
c For members of the audit, geopolitical, SEEA and remuneration committees.
2017 remuneration (audited)
£ thousand Fees Benefitsa Total
2017 2016 2017 2016 2017 2016
Nils Andersen 115 23 17 6 132 29Paul Anderson 155 165 27 32 182 197Alan Boeckmann 165 168 11 17 176 185Admiral Frank Bowman 155 162 15 14 170 176Cynthia Carrollb 54 140 36 28 90 168Ian Davis 154 136 2 2 156 138Professor Dame Ann Dowlingc 145 150 5 2 150 152Melody Meyerd 86 – 23 – 109 –Brendan Nelson 138 130 14 30 152 160Paula Rosput Reynolds 140 140 8 17 148 157Sir John Sawers 145 148 5 19 150 167Andrew Shilstonb 75 190 1 5 76 195a Benefits include travel and other expenses relating to the attendance at board and other meetings. Amounts disclosed have been grossed up using a tax rate of 45%, where relevant, as an estimation of tax due.
b Resigned on 17 May 2017.c In addition, Professor Dame Ann Dowling received £25,000 for chairing and being a member of the BP technology advisory council.
d Appointed on 17 May 2017.
BP Annual Report and Form 20-F 2017 107
Corporate governance
Book 1.indb 107 03/04/2018 16:44:31
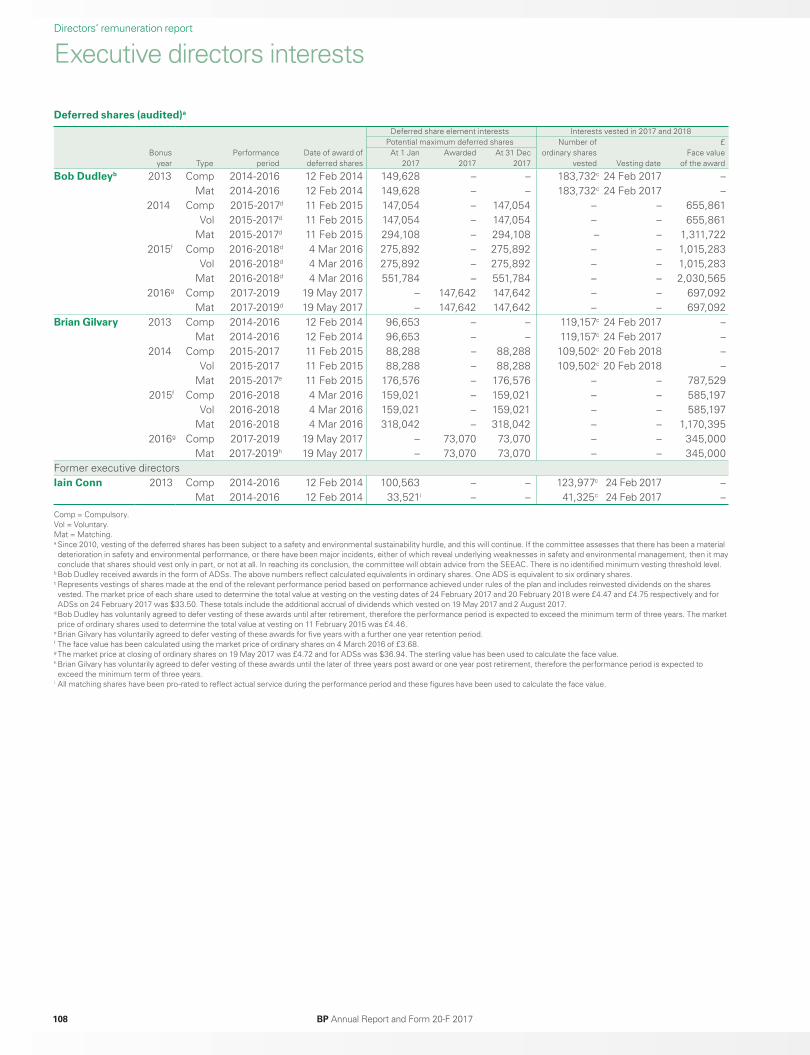
Directors’ remuneration report
Executive directors interests
Deferred shares (audited)a
Deferred share element interests Interests vested in 2017 and 2018
Bonus year Type
Performance period
Date of award of deferred shares
Potential maximum deferred shares Number of ordinary shares
vested Vesting date
£ Face value
of the awardAt 1 Jan
2017Awarded
2017At 31 Dec
2017
Bob Dudleyb 2013 Comp 2014-2016 12 Feb 2014 149,628 – – 183,732c 24 Feb 2017 –Mat 2014-2016 12 Feb 2014 149,628 – – 183,732c 24 Feb 2017 –
2014 Comp 2015-2017d 11 Feb 2015 147,054 – 147,054 – – 655,861 Vol 2015-2017d 11 Feb 2015 147,054 – 147,054 – – 655,861
Mat 2015-2017d 11 Feb 2015 294,108 – 294,108 – – 1,311,7222015f Comp 2016-2018d 4 Mar 2016 275,892 – 275,892 – – 1,015,283
Vol 2016-2018d 4 Mar 2016 275,892 – 275,892 – – 1,015,283Mat 2016-2018d 4 Mar 2016 551,784 – 551,784 – – 2,030,565
2016g Comp 2017-2019 19 May 2017 – 147,642 147,642 – – 697,092Mat 2017-2019d 19 May 2017 – 147,642 147,642 – – 697,092
Brian Gilvary 2013 Comp 2014-2016 12 Feb 2014 96,653 – – 119,157c 24 Feb 2017 –Mat 2014-2016 12 Feb 2014 96,653 – – 119,157c 24 Feb 2017 –
2014 Comp 2015-2017 11 Feb 2015 88,288 – 88,288 109,502c 20 Feb 2018 –Vol 2015-2017 11 Feb 2015 88,288 – 88,288 109,502c 20 Feb 2018 –
Mat 2015-2017e 11 Feb 2015 176,576 – 176,576 – – 787,5292015f Comp 2016-2018 4 Mar 2016 159,021 – 159,021 – – 585,197
Vol 2016-2018 4 Mar 2016 159,021 – 159,021 – – 585,197Mat 2016-2018 4 Mar 2016 318,042 – 318,042 – – 1,170,395
2016g Comp 2017-2019 19 May 2017 – 73,070 73,070 – – 345,000Mat 2017-2019h 19 May 2017 – 73,070 73,070 – – 345,000
Former executive directorsIain Conn 2013 Comp 2014-2016 12 Feb 2014 100,563 – – 123,977c 24 Feb 2017 –
Mat 2014-2016 12 Feb 2014 33,521i – – 41,325c 24 Feb 2017 –
Comp = Compulsory.Vol = Voluntary.Mat = Matching.a Since 2010, vesting of the deferred shares has been subject to a safety and environmental sustainability hurdle, and this will continue. If the committee assesses that there has been a material deterioration in safety and environmental performance, or there have been major incidents, either of which reveal underlying weaknesses in safety and environmental management, then it may conclude that shares should vest only in part, or not at all. In reaching its conclusion, the committee will obtain advice from the SEEAC. There is no identified minimum vesting threshold level.
b Bob Dudley received awards in the form of ADSs. The above numbers reflect calculated equivalents in ordinary shares. One ADS is equivalent to six ordinary shares.c Represents vestings of shares made at the end of the relevant performance period based on performance achieved under rules of the plan and includes reinvested dividends on the shares vested. The market price of each share used to determine the total value at vesting on the vesting dates of 24 February 2017 and 20 February 2018 were £4.47 and £4.75 respectively and for ADSs on 24 February 2017 was $33.50. These totals include the additional accrual of dividends which vested on 19 May 2017 and 2 August 2017.
d Bob Dudley has voluntarily agreed to defer vesting of these awards until after retirement, therefore the performance period is expected to exceed the minimum term of three years. The market price of ordinary shares used to determine the total value at vesting on 11 February 2015 was £4.46.
e Brian Gilvary has voluntarily agreed to defer vesting of these awards for five years with a further one year retention period.f The face value has been calculated using the market price of ordinary shares on 4 March 2016 of £3.68.g The market price at closing of ordinary shares on 19 May 2017 was £4.72 and for ADSs was $36.94. The sterling value has been used to calculate the face value.h Brian Gilvary has voluntarily agreed to defer vesting of these awards until the later of three years post award or one year post retirement, therefore the performance period is expected to exceed the minimum term of three years.
i All matching shares have been pro-rated to reflect actual service during the performance period and these figures have been used to calculate the face value.
108 BP Annual Report and Form 20-F 2017
Book 1.indb 108 03/04/2018 16:44:32
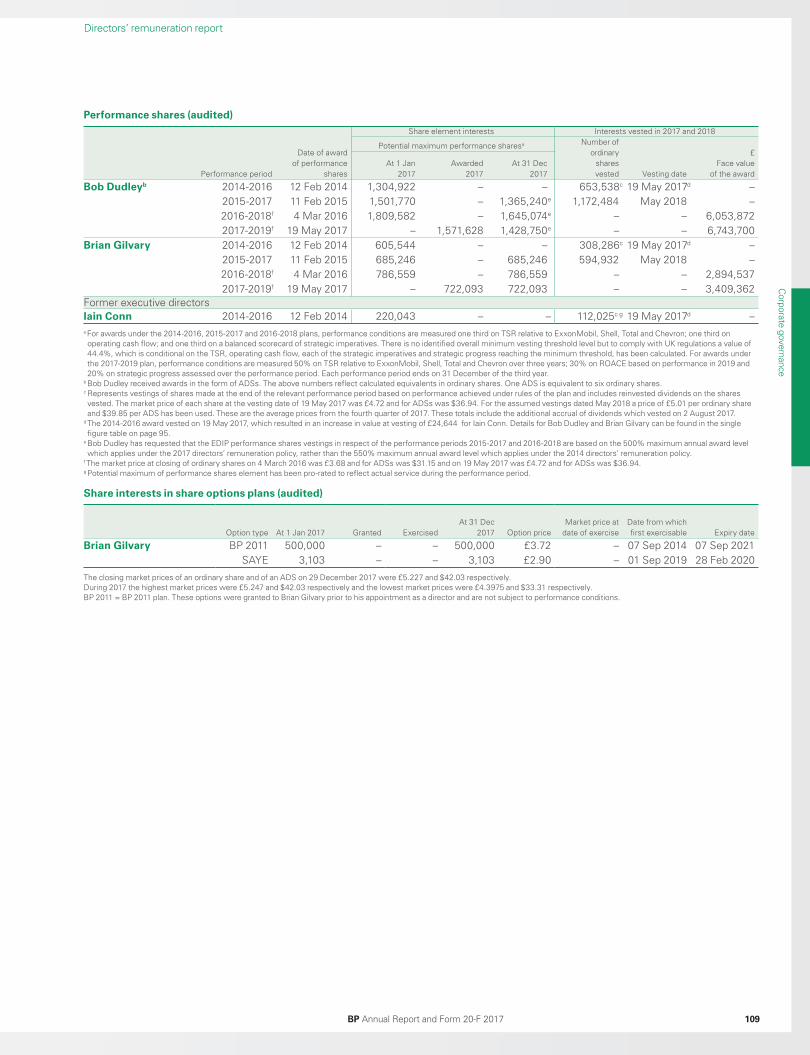
Directors’ remuneration report
Performance shares (audited)Share element interests Interests vested in 2017 and 2018
Performance period
Date of award of performance
shares
Potential maximum performance sharesa Number of ordinary
shares vested Vesting date
£ Face value
of the awardAt 1 Jan
2017Awarded
2017At 31 Dec
2017
Bob Dudleyb 2014-2016 12 Feb 2014 1,304,922 – – 653,538c 19 May 2017d –2015-2017 11 Feb 2015 1,501,770 – 1,365,240e 1,172,484 May 2018 –2016-2018f 4 Mar 2016 1,809,582 – 1,645,074e – – 6,053,8722017-2019f 19 May 2017 – 1,571,628 1,428,750e – – 6,743,700
Brian Gilvary 2014-2016 12 Feb 2014 605,544 – – 308,286c 19 May 2017d –2015-2017 11 Feb 2015 685,246 – 685,246 594,932 May 2018 –2016-2018f 4 Mar 2016 786,559 – 786,559 – – 2,894,5372017-2019f 19 May 2017 – 722,093 722,093 – – 3,409,362
Former executive directorsIain Conn 2014-2016 12 Feb 2014 220,043 – – 112,025c g 19 May 2017d –a For awards under the 2014-2016, 2015-2017 and 2016-2018 plans, performance conditions are measured one third on TSR relative to ExxonMobil, Shell, Total and Chevron; one third on operating cash flow; and one third on a balanced scorecard of strategic imperatives. There is no identified overall minimum vesting threshold level but to comply with UK regulations a value of 44.4%, which is conditional on the TSR, operating cash flow, each of the strategic imperatives and strategic progress reaching the minimum threshold, has been calculated. For awards under the 2017-2019 plan, performance conditions are measured 50% on TSR relative to ExxonMobil, Shell, Total and Chevron over three years; 30% on ROACE based on performance in 2019 and 20% on strategic progress assessed over the performance period. Each performance period ends on 31 December of the third year.
b Bob Dudley received awards in the form of ADSs. The above numbers reflect calculated equivalents in ordinary shares. One ADS is equivalent to six ordinary shares.c Represents vestings of shares made at the end of the relevant performance period based on performance achieved under rules of the plan and includes reinvested dividends on the shares vested. The market price of each share at the vesting date of 19 May 2017 was £4.72 and for ADSs was $36.94. For the assumed vestings dated May 2018 a price of £5.01 per ordinary share and $39.85 per ADS has been used. These are the average prices from the fourth quarter of 2017. These totals include the additional accrual of dividends which vested on 2 August 2017.
d The 2014-2016 award vested on 19 May 2017, which resulted in an increase in value at vesting of £24,644 for Iain Conn. Details for Bob Dudley and Brian Gilvary can be found in the single figure table on page 95.
e Bob Dudley has requested that the EDIP performance shares vestings in respect of the performance periods 2015-2017 and 2016-2018 are based on the 500% maximum annual award level which applies under the 2017 directors’ remuneration policy, rather than the 550% maximum annual award level which applies under the 2014 directors’ remuneration policy.
f The market price at closing of ordinary shares on 4 March 2016 was £3.68 and for ADSs was $31.15 and on 19 May 2017 was £4.72 and for ADSs was $36.94.g Potential maximum of performance shares element has been pro-rated to reflect actual service during the performance period.
Share interests in share options plans (audited)
Option type At 1 Jan 2017 Granted ExercisedAt 31 Dec
2017 Option priceMarket price at
date of exerciseDate from which first exercisable Expiry date
Brian Gilvary BP 2011 500,000 – – 500,000 £3.72 – 07 Sep 2014 07 Sep 2021SAYE 3,103 – – 3,103 £2.90 – 01 Sep 2019 28 Feb 2020
The closing market prices of an ordinary share and of an ADS on 29 December 2017 were £5.227 and $42.03 respectively.During 2017 the highest market prices were £5.247 and $42.03 respectively and the lowest market prices were £4.3975 and $33.31 respectively.BP 2011 = BP 2011 plan. These options were granted to Brian Gilvary prior to his appointment as a director and are not subject to performance conditions.
BP Annual Report and Form 20-F 2017 109
Corporate governance
Book 1.indb 109 03/04/2018 16:44:32
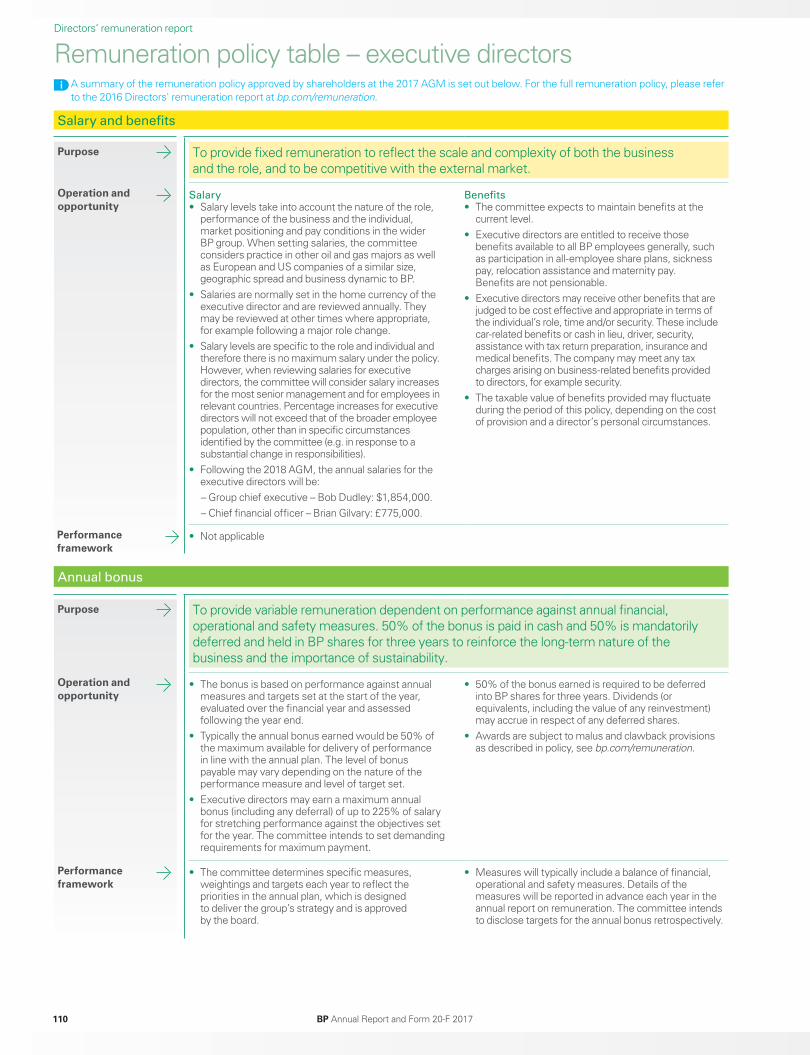
Directors’ remuneration report
Remuneration policy table – executive directors A summary of the remuneration policy approved by shareholders at the 2017 AGM is set out below. For the full remuneration policy, please refer to the 2016 Directors' remuneration report at bp.com/remuneration.
Salary and benefits
To provide fixed remuneration to reflect the scale and complexity of both the business and the role, and to be competitive with the external market.
Salary• Salary levels take into account the nature of the role,
performance of the business and the individual, market positioning and pay conditions in the wider BP group. When setting salaries, the committee considers practice in other oil and gas majors as well as European and US companies of a similar size, geographic spread and business dynamic to BP.
• Salaries are normally set in the home currency of the executive director and are reviewed annually. They may be reviewed at other times where appropriate, for example following a major role change.
• Salary levels are specific to the role and individual and therefore there is no maximum salary under the policy. However, when reviewing salaries for executive directors, the committee will consider salary increases for the most senior management and for employees in relevant countries. Percentage increases for executive directors will not exceed that of the broader employee population, other than in specific circumstances identified by the committee (e.g. in response to a substantial change in responsibilities).
• Following the 2018 AGM, the annual salaries for the executive directors will be:
– Group chief executive – Bob Dudley: $1,854,000. – Chief financial officer – Brian Gilvary: £775,000.
Benefits• The committee expects to maintain benefits at the
current level.• Executive directors are entitled to receive those
benefits available to all BP employees generally, such as participation in all-employee share plans, sickness pay, relocation assistance and maternity pay. Benefits are not pensionable.
• Executive directors may receive other benefits that are judged to be cost effective and appropriate in terms of the individual’s role, time and/or security. These include car-related benefits or cash in lieu, driver, security, assistance with tax return preparation, insurance and medical benefits. The company may meet any tax charges arising on business-related benefits provided to directors, for example security.
• The taxable value of benefits provided may fluctuate during the period of this policy, depending on the cost of provision and a director’s personal circumstances.
Performance framework
• Not applicable
Annual bonus
To provide variable remuneration dependent on performance against annual financial, operational and safety measures. 50% of the bonus is paid in cash and 50% is mandatorily deferred and held in BP shares for three years to reinforce the long-term nature of the business and the importance of sustainability.
• The bonus is based on performance against annual measures and targets set at the start of the year, evaluated over the financial year and assessed following the year end.
• Typically the annual bonus earned would be 50% of the maximum available for delivery of performance in line with the annual plan. The level of bonus payable may vary depending on the nature of the performance measure and level of target set.
• Executive directors may earn a maximum annual bonus (including any deferral) of up to 225% of salary for stretching performance against the objectives set for the year. The committee intends to set demanding requirements for maximum payment.
• 50% of the bonus earned is required to be deferred into BP shares for three years. Dividends (or equivalents, including the value of any reinvestment) may accrue in respect of any deferred shares.
• Awards are subject to malus and clawback provisions as described in policy, see bp.com/remuneration.
Performance framework
• The committee determines specific measures, weightings and targets each year to reflect the priorities in the annual plan, which is designed to deliver the group’s strategy and is approved by the board.
• Measures will typically include a balance of financial, operational and safety measures. Details of the measures will be reported in advance each year in the annual report on remuneration. The committee intends to disclose targets for the annual bonus retrospectively.
Purpose
Purpose
Operation and opportunity
Operation and opportunity
BP Annual Report and Form 20-F 2017110
Book 1.indb 110 03/04/2018 16:44:32
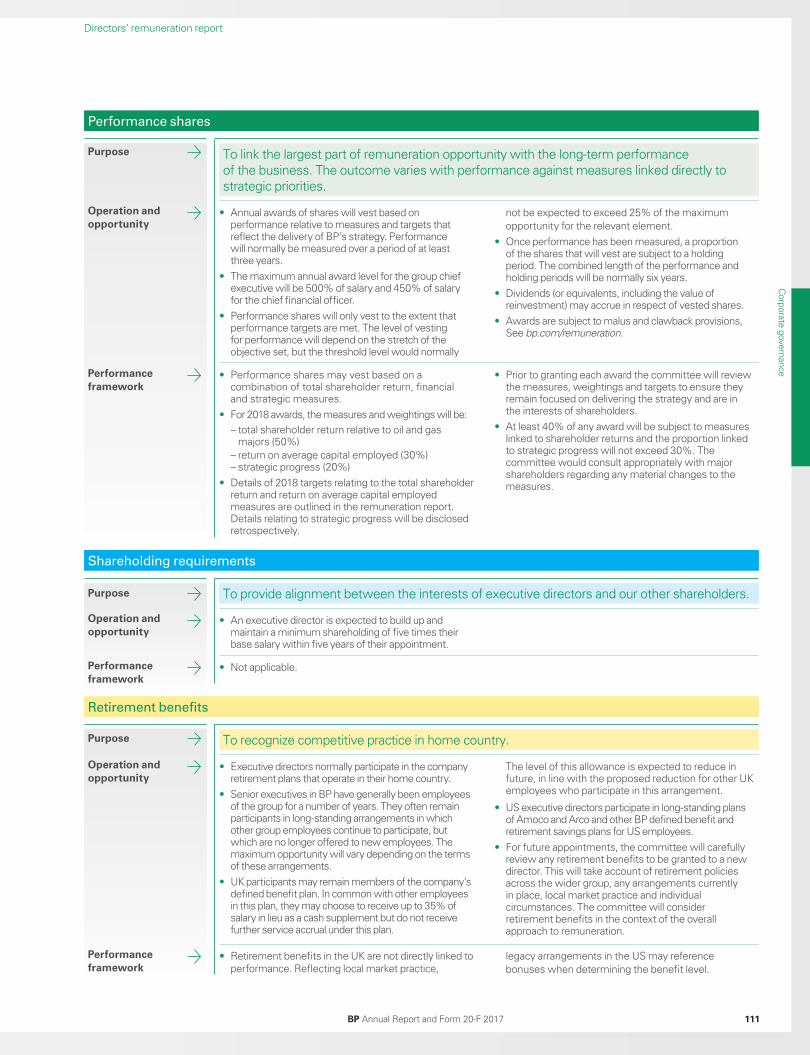
Directors’ remuneration report
Performance shares
Purpose To link the largest part of remuneration opportunity with the long-term performance of the business. The outcome varies with performance against measures linked directly to strategic priorities.
Operation and opportunity
• Annual awards of shares will vest based on performance relative to measures and targets that reflect the delivery of BP’s strategy. Performance will normally be measured over a period of at least three years.
• The maximum annual award level for the group chief executive will be 500% of salary and 450% of salary for the chief financial officer.
• Performance shares will only vest to the extent that performance targets are met. The level of vesting for performance will depend on the stretch of the objective set, but the threshold level would normally
not be expected to exceed 25% of the maximum opportunity for the relevant element.
• Once performance has been measured, a proportion of the shares that will vest are subject to a holding period. The combined length of the performance and holding periods will be normally six years.
• Dividends (or equivalents, including the value of reinvestment) may accrue in respect of vested shares.
• Awards are subject to malus and clawback provisions, See bp.com/remuneration.
Performance framework
• Performance shares may vest based on a combination of total shareholder return, financial and strategic measures.
• For 2018 awards, the measures and weightings will be:– total shareholder return relative to oil and gas
majors (50%)– return on average capital employed (30%)– strategic progress (20%)
• Details of 2018 targets relating to the total shareholder return and return on average capital employed measures are outlined in the remuneration report. Details relating to strategic progress will be disclosed retrospectively.
• Prior to granting each award the committee will review the measures, weightings and targets to ensure they remain focused on delivering the strategy and are in the interests of shareholders.
• At least 40% of any award will be subject to measures linked to shareholder returns and the proportion linked to strategic progress will not exceed 30%. The committee would consult appropriately with major shareholders regarding any material changes to the measures.
Retirement benefits
To recognize competitive practice in home country.
Operation and opportunity
• Executive directors normally participate in the company retirement plans that operate in their home country.
• Senior executives in BP have generally been employees of the group for a number of years. They often remain participants in long-standing arrangements in which other group employees continue to participate, but which are no longer offered to new employees. The maximum opportunity will vary depending on the terms of these arrangements.
• UK participants may remain members of the company’s defined benefit plan. In common with other employees in this plan, they may choose to receive up to 35% of salary in lieu as a cash supplement but do not receive further service accrual under this plan.
The level of this allowance is expected to reduce in future, in line with the proposed reduction for other UK employees who participate in this arrangement.
• US executive directors participate in long-standing plans of Amoco and Arco and other BP defined benefit and retirement savings plans for US employees.
• For future appointments, the committee will carefully review any retirement benefits to be granted to a new director. This will take account of retirement policies across the wider group, any arrangements currently in place, local market practice and individual circumstances. The committee will consider retirement benefits in the context of the overall approach to remuneration.
Performance framework
• Retirement benefits in the UK are not directly linked to performance. Reflecting local market practice,
legacy arrangements in the US may reference bonuses when determining the benefit level.
Shareholding requirements
To provide alignment between the interests of executive directors and our other shareholders.
Operation and opportunity
• An executive director is expected to build up and maintain a minimum shareholding of five times their base salary within five years of their appointment.
Performance framework
• Not applicable.
Purpose
Purpose
BP Annual Report and Form 20-F 2017 111
Corporate governance
Book 1.indb 111 03/04/2018 16:44:32
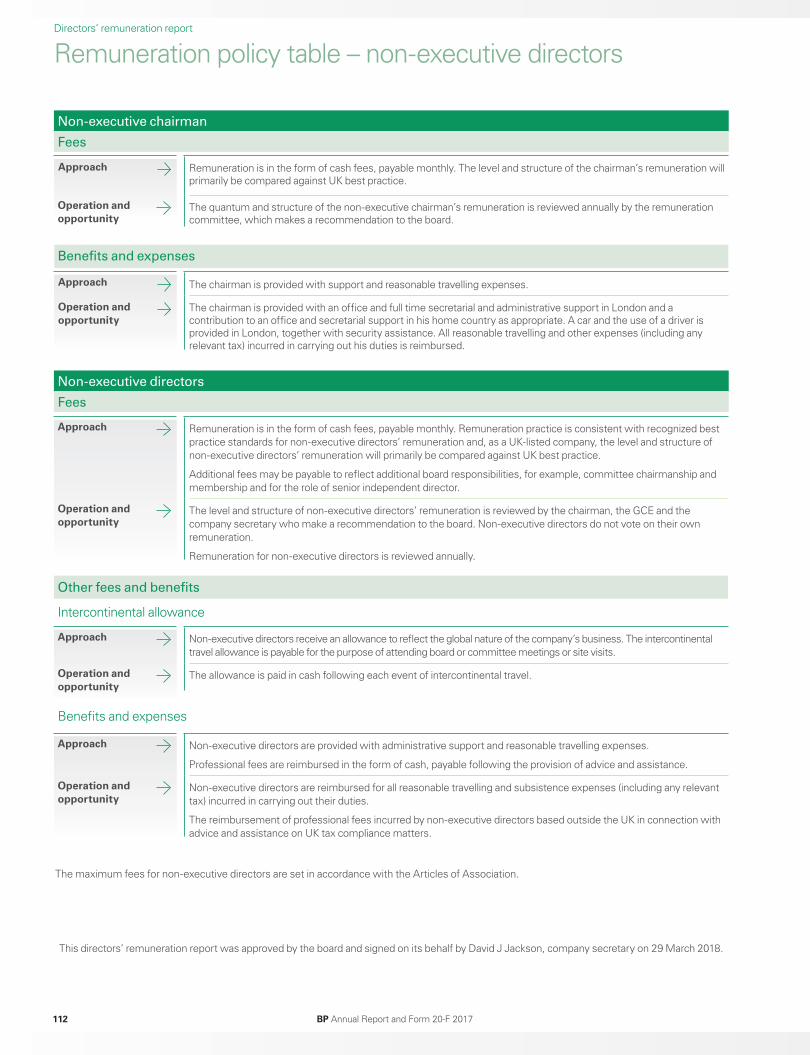
Directors’ remuneration report
Remuneration policy table – non-executive directors
The maximum fees for non-executive directors are set in accordance with the Articles of Association.
Non-executive chairman
Fees
Remuneration is in the form of cash fees, payable monthly. The level and structure of the chairman’s remuneration will primarily be compared against UK best practice.
Operation and opportunity
The quantum and structure of the non-executive chairman’s remuneration is reviewed annually by the remuneration committee, which makes a recommendation to the board.
Benefits and expenses
The chairman is provided with support and reasonable travelling expenses.
The chairman is provided with an office and full time secretarial and administrative support in London and a contribution to an office and secretarial support in his home country as appropriate. A car and the use of a driver is provided in London, together with security assistance. All reasonable travelling and other expenses (including any relevant tax) incurred in carrying out his duties is reimbursed.
Non-executive directors
Fees
Approach Remuneration is in the form of cash fees, payable monthly. Remuneration practice is consistent with recognized best practice standards for non-executive directors’ remuneration and, as a UK-listed company, the level and structure of non-executive directors’ remuneration will primarily be compared against UK best practice.
Additional fees may be payable to reflect additional board responsibilities, for example, committee chairmanship and membership and for the role of senior independent director.
Operation and opportunity
The level and structure of non-executive directors’ remuneration is reviewed by the chairman, the GCE and the company secretary who make a recommendation to the board. Non-executive directors do not vote on their own remuneration.
Remuneration for non-executive directors is reviewed annually.
Other fees and benefits
Intercontinental allowance
Approach Non-executive directors receive an allowance to reflect the global nature of the company’s business. The intercontinental travel allowance is payable for the purpose of attending board or committee meetings or site visits.
Operation and opportunity
The allowance is paid in cash following each event of intercontinental travel.
Benefits and expenses
Approach Non-executive directors are provided with administrative support and reasonable travelling expenses.
Professional fees are reimbursed in the form of cash, payable following the provision of advice and assistance.
Operation and opportunity
Non-executive directors are reimbursed for all reasonable travelling and subsistence expenses (including any relevant tax) incurred in carrying out their duties.
The reimbursement of professional fees incurred by non-executive directors based outside the UK in connection with advice and assistance on UK tax compliance matters.
Approach
Approach
Operation and opportunity
BP Annual Report and Form 20-F 2017112
This directors’ remuneration report was approved by the board and signed on its behalf by David J Jackson, company secretary on 29 March 2018.
Book 1.indb 112 03/04/2018 16:44:32
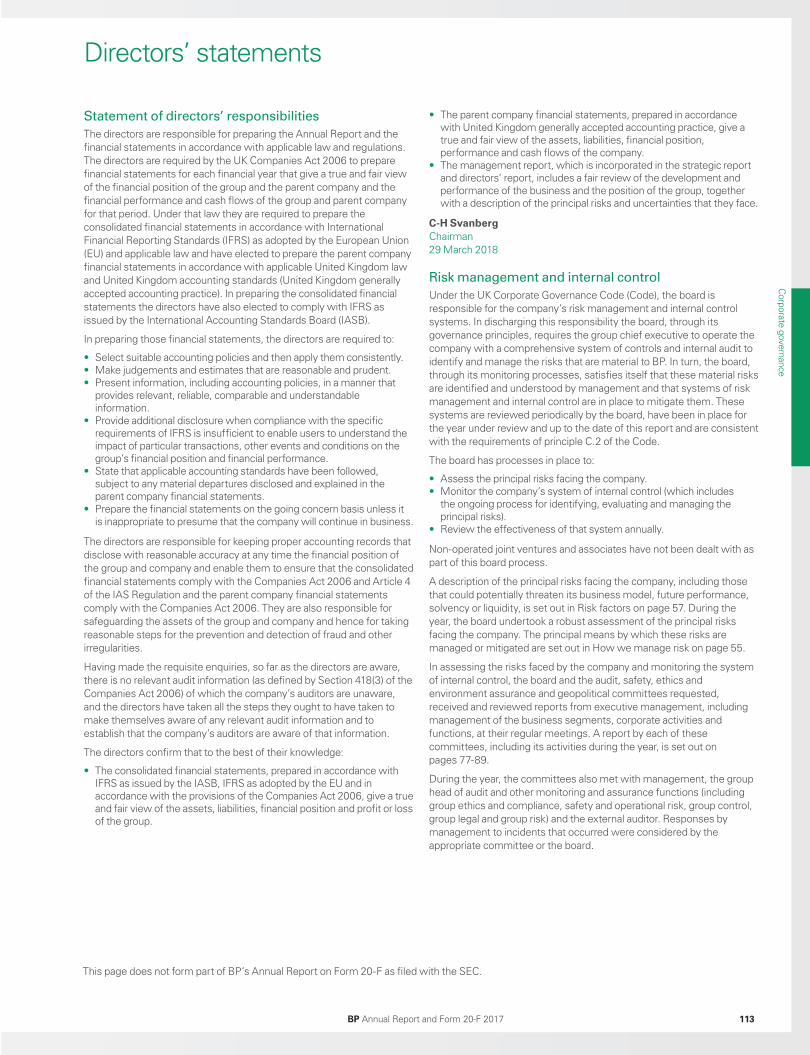
Directors’ statements
Statement of directors’ responsibilities
The directors are responsible for preparing the Annual Report and the financial statements in accordance with applicable law and regulations. The directors are required by the UK Companies Act 2006 to prepare financial statements for each financial year that give a true and fair view of the financial position of the group and the parent company and the financial performance and cash flows of the group and parent company for that period. Under that law they are required to prepare the consolidated financial statements in accordance with International Financial Reporting Standards (IFRS) as adopted by the European Union (EU) and applicable law and have elected to prepare the parent company financial statements in accordance with applicable United Kingdom law and United Kingdom accounting standards (United Kingdom generally accepted accounting practice). In preparing the consolidated financial statements the directors have also elected to comply with IFRS as issued by the International Accounting Standards Board (IASB).
In preparing those financial statements, the directors are required to:
• Select suitable accounting policies and then apply them consistently.• Make judgements and estimates that are reasonable and prudent.• Present information, including accounting policies, in a manner that
provides relevant, reliable, comparable and understandable information.
• Provide additional disclosure when compliance with the specific requirements of IFRS is insufficient to enable users to understand the impact of particular transactions, other events and conditions on the group’s financial position and financial performance.
• State that applicable accounting standards have been followed, subject to any material departures disclosed and explained in the parent company financial statements.
• Prepare the financial statements on the going concern basis unless it is inappropriate to presume that the company will continue in business.
The directors are responsible for keeping proper accounting records that disclose with reasonable accuracy at any time the financial position of the group and company and enable them to ensure that the consolidated financial statements comply with the Companies Act 2006 and Article 4 of the IAS Regulation and the parent company financial statements comply with the Companies Act 2006. They are also responsible for safeguarding the assets of the group and company and hence for taking reasonable steps for the prevention and detection of fraud and other irregularities.
Having made the requisite enquiries, so far as the directors are aware, there is no relevant audit information (as defined by Section 418(3) of the Companies Act 2006) of which the company’s auditors are unaware, and the directors have taken all the steps they ought to have taken to make themselves aware of any relevant audit information and to establish that the company’s auditors are aware of that information.
The directors confirm that to the best of their knowledge:
• The consolidated financial statements, prepared in accordance with IFRS as issued by the IASB, IFRS as adopted by the EU and in accordance with the provisions of the Companies Act 2006, give a true and fair view of the assets, liabilities, financial position and profit or loss of the group.
• The parent company financial statements, prepared in accordance with United Kingdom generally accepted accounting practice, give a true and fair view of the assets, liabilities, financial position, performance and cash flows of the company.
• The management report, which is incorporated in the strategic report and directors’ report, includes a fair review of the development and performance of the business and the position of the group, together with a description of the principal risks and uncertainties that they face.
C-H Svanberg Chairman 29 March 2018
Risk management and internal control
Under the UK Corporate Governance Code (Code), the board is responsible for the company’s risk management and internal control systems. In discharging this responsibility the board, through its governance principles, requires the group chief executive to operate the company with a comprehensive system of controls and internal audit to identify and manage the risks that are material to BP. In turn, the board, through its monitoring processes, satisfies itself that these material risks are identified and understood by management and that systems of risk management and internal control are in place to mitigate them. These systems are reviewed periodically by the board, have been in place for the year under review and up to the date of this report and are consistent with the requirements of principle C.2 of the Code.
The board has processes in place to:
• Assess the principal risks facing the company.• Monitor the company’s system of internal control (which includes
the ongoing process for identifying, evaluating and managing the principal risks).
• Review the effectiveness of that system annually.
Non-operated joint ventures and associates have not been dealt with as part of this board process.
A description of the principal risks facing the company, including those that could potentially threaten its business model, future performance, solvency or liquidity, is set out in Risk factors on page 57. During the year, the board undertook a robust assessment of the principal risks facing the company. The principal means by which these risks are managed or mitigated are set out in How we manage risk on page 55.
In assessing the risks faced by the company and monitoring the system of internal control, the board and the audit, safety, ethics and environment assurance and geopolitical committees requested, received and reviewed reports from executive management, including management of the business segments, corporate activities and functions, at their regular meetings. A report by each of these committees, including its activities during the year, is set out on pages 77-89.
During the year, the committees also met with management, the group head of audit and other monitoring and assurance functions (including group ethics and compliance, safety and operational risk, group control, group legal and group risk) and the external auditor. Responses by management to incidents that occurred were considered by the appropriate committee or the board.
This page does not form part of BP’s Annual Report on Form 20-F as filed with the SEC.
Corporate governance
BP Annual Report and Form 20-F 2017 113
Book 1.indb 113 03/04/2018 16:44:32

An audit committee meeting in February 2018 carried out an annual review of the effectiveness of the system of internal control. In considering this system, the audit committee noted that it is designed to manage, rather than eliminate, the risk of failure to achieve business objectives and can only provide reasonable, and not absolute, assurance against material misstatement or loss.
This review included a report from the group head of audit which summarized group audit’s consideration of the design and operation of elements of BP’s system of internal control over significant risks arising in the categories of strategic and commercial, safety and operational and compliance and control and considered the control environment for the group. The report also highlighted the results of internal audit work conducted during the year and the remedial actions taken by management in response to failings and weaknesses identified. Where failings or weaknesses were identified, the audit committee was satisfied that these were or are being appropriately addressed by the remedial actions proposed by management.
At its meeting in March 2018, the board considered the review undertaken by the audit committee and the proposed disclosures outlining the company’s risk management and internal control systems prior to publication of the annual report and accounts.
A statement regarding the company’s internal controls over financial reporting is set out on page 275.
Longer-term viability
In accordance with provision C.2.2 of the Code, the directors have assessed the prospects of the company over a period significantly longer than 12 months. The directors believe that an assessment period of three years is appropriate based on management’s reasonable expectations of the position and performance of the company over this period, taking account of its short-term and longer-range plans.
Taking into account the company’s current position and its principal risks on page 57, the directors have a reasonable expectation that the company will be able to continue in operation and meet its liabilities as they fall due over three years.
The directors’ assessment included a review of the financial impact of the most severe but plausible scenarios that could threaten the viability of the company and the likely effectiveness of the potential mitigations that management reasonably believes would be available to the company over this period.
In assessing the prospects of the company, the directors noted that such assessment is subject to a degree of uncertainty that can be expected to increase looking out over time and, accordingly, that future outcomes cannot be guaranteed or predicted with certainty.
Going concern
In accordance with provision C.1.3 of the Code, the directors consider it appropriate to adopt the going concern basis of accounting in preparing the financial statements.
Fair, balanced and understandable
The board considers the Annual Report and financial statements, taken as a whole, is fair, balanced and understandable and provides the information necessary for shareholders to assess the company’s position and performance, business model and strategy.
This page does not form part of BP’s Annual Report on Form 20-F as filed with the SEC.
BP Annual Report and Form 20-F 2017114
Book 1.indb 114 03/04/2018 16:44:32
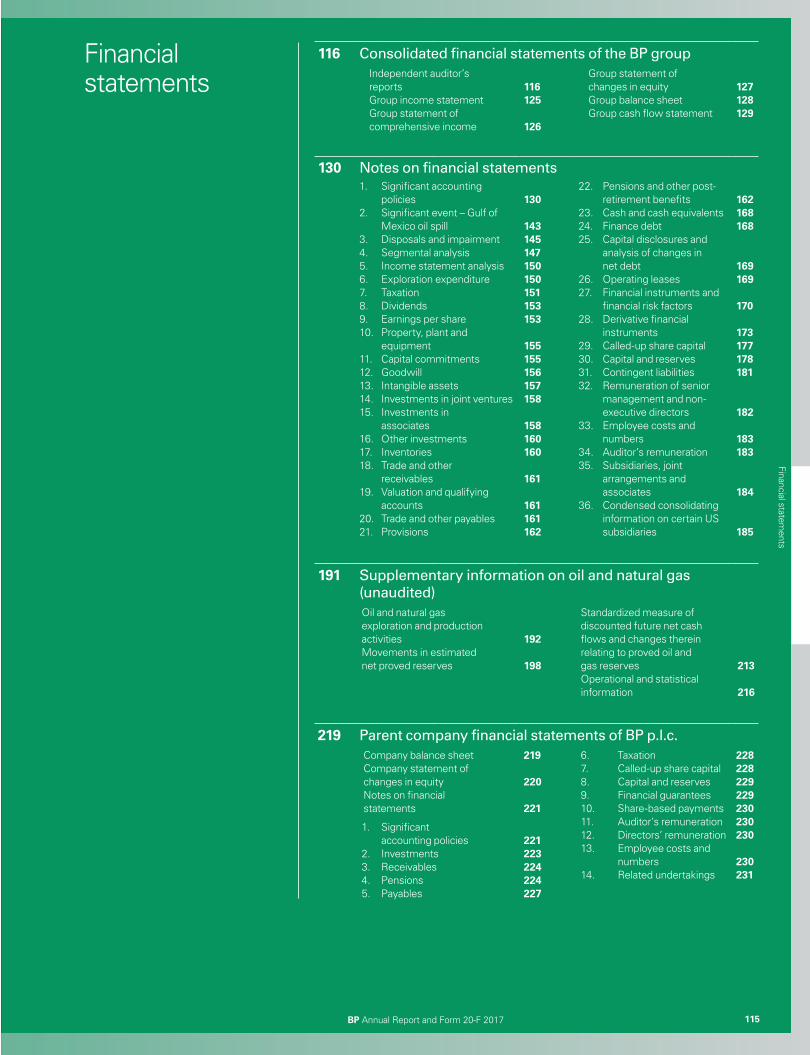
BP Annual Report and Form 20-F 2017 115
116 Consolidated financial statements of the BP groupIndependent auditor’s reports Group income statementGroup statement ofcomprehensive income
116 125
126
Group statement ofchanges in equityGroup balance sheetGroup cash flow statement
127 128129
130 Notes on financial statements1.
2.
3.4.5.6.7.8.9.10.
11.12.13.14.15.
16.17.18.
19.
20. 21.
Significant accountingpoliciesSignificant event – Gulf of Mexico oil spillDisposals and impairmentSegmental analysisIncome statement analysisExploration expenditureTaxationDividendsEarnings per shareProperty, plant and equipmentCapital commitmentsGoodwillIntangible assetsInvestments in joint venturesInvestments in associatesOther investmentsInventoriesTrade and other receivablesValuation and qualifying accountsTrade and other payablesProvisions
130
143145147150150151153153
155155156157158
158160160
161
161161162
22.
23.24.25.
26.27.
28.
29.30.31.32.
33.
34.35.
36.
Pensions and other post- retirement benefitsCash and cash equivalentsFinance debtCapital disclosures and analysis of changes in net debtOperating leasesFinancial instruments and financial risk factorsDerivative financial instrumentsCalled-up share capitalCapital and reservesContingent liabilitiesRemuneration of senior management and non- executive directorsEmployee costs and numbersAuditor’s remunerationSubsidiaries, joint arrangements and associatesCondensed consolidating information on certain US subsidiaries
162168168
169169
170
173177178181
182
183183
184
185
191 Supplementary information on oil and natural gas (unaudited)Oil and natural gasexploration and productionactivitiesMovements in estimatednet proved reserves
192
198
Standardized measure ofdiscounted future net cashflows and changes thereinrelating to proved oil andgas reservesOperational and statisticalinformation
213
216
219 Parent company financial statements of BP p.l.c.Company balance sheetCompany statement ofchanges in equityNotes on financialstatements
219
220
221
6.7.8.9.10.11.12.13.
14.
TaxationCalled-up share capitalCapital and reservesFinancial guaranteesShare-based paymentsAuditor’s remunerationDirectors’ remunerationEmployee costs and numbersRelated undertakings
228228229229230230230
230231
1.
2.3.4.5.
Significantaccounting policiesInvestmentsReceivablesPensionsPayables
221223224224227
BP Annual Report and Form 20-F 2017 115
Financial statements
Financial statements
26_BP_AR_Financial_statements_contents_p115.indd 115 27/03/2018 10:39
Consolidated financial statements of the BP group
This page does not form part of BP's Annual Report on Form 20-F as filed with the SEC.
116 BP Annual Report and Form 20-F 2017
Independent auditor’s report on the Annual Report and Accounts to the members of BPp.l.c. Opinion In our opinion:
• the financial statements give a true and fair view of the state of the group’s and of the parent company’s affairs as at 31 December 2017 andof the group’s profit for the year then ended;
• the group financial statements have been properly prepared in accordance with IFRS as adopted by the European Union; • the parent company financial statements have been properly prepared in accordance with United Kingdom generally accepted accounting
practice including FRS 101 ‘Reduced Disclosure Framework’; and • the financial statements have been prepared in accordance with the requirements of the Companies Act 2006 and, as regards the group
financial statements, Article 4 of the IAS Regulation.
Separate opinion in relation to IFRS as issued by the International Accounting Standards Board As explained in Note 1 to the consolidated financial statements, the group in addition to applying IFRS as adopted by the European Union, hasalso applied IFRS as issued by the International Accounting Standards Board (IASB). In our opinion the consolidated financial statementscomply with IFRS as issued by the IASB.
What we have audited We have audited the financial statements of BP p.l.c. which comprise:Group Parent company
Group balance sheet as at 31 December 2017. Balance sheet as at 31 December 2017.Group income statement for the year then ended. Statement of changes in equity for the year then ended.Group statement of comprehensive income for the year then ended. Related Notes 1 to 14 to the financial statements, including a
summary of significant accounting policies.Group statement of changes in equity for the year then ended.Group cash flow statement for the year then ended.Related Notes 1 to 36 to the financial statements, including a summary ofsignificant accounting policies.
The financial reporting framework that has been applied in the preparation of the group financial statements is applicable law and InternationalFinancial Reporting Standards (IFRS) as adopted by the European Union. The financial reporting framework that has been applied in thepreparation of the parent company financial statements is applicable law and United Kingdom accounting standards including FRS 101 (UnitedKingdom generally accepted accounting practice).
Basis for opinionWe conducted our audit in accordance with International Standards on Auditing (UK) (ISAs (UK)) and applicable law. Our responsibilities underthose standards are further described in the Auditor’s responsibilities for the audit of the financial statements section of our report below. Weare independent of the group and parent company in accordance with the ethical requirements that are relevant to our audit of the financialstatements in the UK, including the FRC’s Ethical Standard as applied to listed public interest entities, and we have fulfilled our other ethicalresponsibilities in accordance with these requirements.
We believe that the audit evidence we have obtained is sufficient and appropriate to provide a basis for our opinion.
Use of our reportThis report is made solely to the company’s members, as a body, in accordance with Chapter 3 of Part 16 of the Companies Act 2006. Ouraudit work has been undertaken so that we might state to the company’s members those matters we are required to state to them in anauditor’s report and for no other purpose. To the fullest extent permitted by law, we do not accept or assume responsibility to anyone otherthan the company and the company’s members as a body, for our audit work, for this report, or for the opinions we have formed.
Conclusions relating to principal risks, going concern and viability statementWe have nothing to report in respect of the following information in the annual report, in relation to which the ISAs (UK) require us to report toyou whether we have anything material to add or draw attention to:
• the disclosures in the annual report set out on page 57 that describe the principal risks and explain how they are being managed or mitigated;• the directors’ confirmation set out on page 113 in the annual report that they have carried out a robust assessment of the principal risks facing
the entity, including those that would threaten its business model, future performance, solvency or liquidity;• the directors’ statement set out on page 114 in the annual report about whether they considered it appropriate to adopt the going concern
basis of accounting in preparing the financial statements, and their identification of any material uncertainties to the entity’s ability to continueto do so over a period of at least twelve months from the date of approval of the financial statements;
• whether the directors’ statement in relation to going concern required under the Listing Rules in accordance with Listing Rule 9.8.6R(3) ismaterially inconsistent with our knowledge obtained in the audit; or
• the directors’ explanation set out on page 114 in the annual report as to how they have assessed the prospects of the entity, over what periodthey have done so and why they consider that period to be appropriate, and their statement as to whether they have a reasonableexpectation that the entity will be able to continue in operation and meet its liabilities as they fall due over the period of their assessment,including any related disclosures drawing attention to any necessary qualifications or assumptions.
Key audit mattersKey audit matters are those matters that, in our professional judgement, were of most significance in our audit of the financial statements ofthe current period and include the most significant assessed risks of material misstatement (whether or not due to fraud) that we identified.These matters included those which had the greatest effect on the overall audit strategy, the allocation of resources in the audit and indirecting the efforts of the engagement team. These matters were addressed in the context of our audit of the financial statements as awhole, and in our opinion thereon, and we do not provide a separate opinion on these matters.
Risk Our response to the risk
Key observationscommunicated to the AuditCommittee
The determination of the liabilities, contingentliabilities and disclosures arising from the Gulf ofMexico oil spill (as described on page 79 of the reportof the audit committee and Note 2 of the financialstatements).
There is particular uncertainty around estimating andvaluing the remaining outstanding business economicloss claims. The determination of the liability is subjectto judgement as to the amount that each remainingclaim will be settled at.
The total amount recognized as an increase inprovisions in relation to the Gulf of Mexico oil spillduring the year was $2,647 million relating to businesseconomic loss (‘BEL’) and other claims associated withthe Court Supervised Settlement Program ('CSSP').The increase is predominantly a result of significantlyhigher average BEL claims determinations issued bythe CSSP during the fourth quarter and the continuingeffect arising from the Policy 495 ruling. The remainingprovision as at 31 December 2017 was $2,580 million.
For the liabilities and contingent liabilities related tothe Gulf of Mexico oil spill the primary auditengagement team performed the following auditprocedures.
• We walked through and tested the controlsdesigned and operated by the group relating to theprovisions and payables for the Gulf of Mexico oilspill.
• We met with the group’s legal team to understanddevelopments across key remaining Gulf of Mexicooil spill matters and their status.
• We reviewed audit enquiry response letters fromexternal legal counsel and read determinations andjudgements made by the courts.
• In respect of the provision for the outstandingbusiness economic loss claims:• We compared the key assumptions that have
been used in the determination of the year endprovision, to historical experience.
• We reconciled the number of undeterminedclaims to third party claims management data.
• We performed a detailed review of the status andexpected outcome of the significant claimswithin appeals, which included discussion withthe group general counsel.
• We performed sensitivity analyses over averagecost per claim assumptions and assessed thepotential effect on the provision.
• We considered events that took place after thebalance sheet date and before the issuance ofthis report and ensured these were reflectedappropriately.
• We assessed the remaining economic loss andproperty damage claims from individuals andbusinesses that either opted out of the Plaintiffs’Steering Committee ('PSC') settlement and/or wereexcluded from that settlement. We validated asample of claims to third party data, assessing theyear end closing payable was appropriate.
• We considered the accounting treatment of theliabilities, contingent liabilities and disclosures underIFRS criteria, to conclude whether these wereappropriate in all circumstances.
There remainsuncertainty around theBEL provision, inparticular the unresolvedclaims and claims underappeal, as the amountspayable may differ fromthose provided.
Based on our procedureswe are satisfied that theamounts provided in thefinancial statements, asdisclosed in Note 2 ofthe financial statements,are supported by claimsexperience.
This page does not form part of BP's Annual Report on Form 20-F as filed with the SEC.
BP Annual Report and Form 20-F 2017 117

Risk Our response to the risk
Key observationscommunicated to the AuditCommittee
The estimate of oil and gas reserves and resourceshas a significant impact on the financialstatements, particularly impairment testing anddepreciation, depletion and amortization (‘DD&A’)charges (as described on page 80 of the report of theaudit committee and Note 1 of the financialstatements).
The estimation of oil and natural gas reserves andresources is a significant area of judgement due to thetechnical uncertainty in assessing quantities andcomplex contractual arrangements dictating thegroup’s share of reportable volumes.
Reserves and resources are also a fundamentalindicator of the future potential of the group’sperformance.
Our procedures were performed by team memberswith significant experience of the process ofestimating oil and gas reserves and resources,including the primary audit engagement team andcomponent teams at 9 Upstream components.
• We confirmed our understanding and tested keymanagement controls related to the reserves andresources estimation process. This includedmanagement's review and approval of estimatedvolumes.
• We tested the controls over the group'scertification process for internal technical andcommercial experts who are responsible forreserves and resources estimation.
• We assessed the competence and objectivity of thegroup’s internal and external experts, to satisfyourselves that these parties are appropriate in theirroles within the estimation process.
• We confirmed that significant changes in reservesand resources were made in the appropriate period,and were in compliance with BP's discoveredresources management policy (‘DRM’) and SECregulations.
• Where reserve and resources volumes have amaterial impact on the financial statements, wevalidated these volumes and assumptions againstunderlying information and documentation asrequired by the DRM.
• We validated that the updated reserves andresources estimates were included appropriately inthe group’s consideration of oil and gas assetimpairment valuations and in accounting for DD&A.
Based on our procedureswe consider that thereserves estimations arereasonable for use in theimpairment testing andcalculation of DD&A.
Unauthorized trading activity within the integratedsupply and trading function has the potential toimpact revenue and profits (as described within thegroup's principal risks on page 58 and Note 1 of thefinancial statements).
Unauthorized trading activity is a fraud risk associatedwith a potential deliberate misstatement of the group’strading positions or mis-marking of positions with anintention to:
• Minimize trading losses.• Maximize trading profits.• Understate profits or move profits to subsequent
periods when bonus ceilings have already beenreached, to maximize individual bonuses acrossfinancial years.
These acts would lead to a misstatement of thegroup’s revenue and profits.
Audit procedures on trading activities were performedby component teams and the primary engagementteam at 7 components across the UK, US andSingapore.
• We walked through and tested the controlsdesigned and operated by the group overunauthorized trading activity.
• We identified trades with the highest risk ofunauthorized activity so as to focus our testing onthese trades.
• We performed existence and completeness testingby independently confirming a sample of tradeswith third parties.
• We verified the fair value of a sample of derivativesusing contract and external market prices. Forderivative instruments where observable marketdata is not available we have independentlyvalidated the internal valuation modelsmanagement used to determine fair value.
• We tested the completeness of the amountsrecorded in the financial statements throughperforming procedures to detect unrecordedliabilities as well as detailed cut-off proceduresaround sales, purchases, trade receivables andtrade payables.
Based on our procedureswe identified no mattersto report to the AuditCommittee.
This page does not form part of BP's Annual Report on Form 20-F as filed with the SEC.
118 BP Annual Report and Form 20-F 2017
Risk Our response to the risk
Key observationscommunicated to the AuditCommittee
US Tax Reform (as described on page 81 of the reportof the Audit committee and Note 1 of the financialstatements).
On 22 December 2017, the US Tax Cuts and Jobs Act(‘TCJA’) was signed into law, enacting widespreadchanges to US fiscal law.
The group recognized a one-off taxation charge of $0.9billion for the year ended 31 December 2017, in respectof the remeasurement of deferred tax balances as aresult of the reduction in the US federal corporateincome tax rate from 35% to 21%.
We focused on this area due to the complexity andextent of the US tax reform package, the requirementfor the group to determine and account for the effectsof the change close to its year end and the materialimpact on the group’s profit for the year.
Audit procedures were performed by team membersand EY tax experts with significant experience of theUS corporate tax system.
• We verified that the internal controls over financialreporting were designed appropriately to enablethe accounting implications of US tax reform to beaccurately recorded in the financial statements.
• We assessed the tax accounting implications onexisting deferred tax assets and liabilities based onthe enacted 21% corporate rate. We tested andconfirmed that the methodology used bymanagement to calculate the estimated liabilitywas based on an acceptable interpretation of theTCJA legislation.
• We verified the analysis performed bymanagement to determine the appropriatepresentation, in accordance with IAS 12, of theimpact of tax changes recorded through theincome statement and statement of othercomprehensive income.
• We performed procedures to evaluatemanagement’s assessment of other key US taxreform changes which may affect the group’s 2017income tax position, including the one-timetransition tax, anti-base erosion measures andexpected realization of foreign tax credits.
Based on the auditprocedures specificallydesigned and performedto respond to the impactof US tax reform on thegroup, we concludedthat management’scomputation of the taxaccounting assessmentsand adjustments iscalculated in compliancewith IAS 12. Theappropriate presentationand disclosures aremade in the financialstatements at 31December 2017.
Due to the nature andcircumstances aroundUS tax reform, thepresentation of the $0.9billion charge as a non-operating item isappropriately disclosed.
Changes from the prior year Our risk assessment and audit approach evolve as circumstances which impact the group’s business or financial statements change. In theprior year, our auditor’s report included a key audit matter in relation to the macroeconomic environment at the time which had the potential tomaterially impact the carrying value of the Group Upstream’s non-current assets. This risk has been downgraded in 2017. In our view, themacroeconomic environment no longer represents a significant risk for our audit, given the fact that the impairment indicators identified in2016 have subsided through 2017, mainly as a result of sustained increases in oil prices. In the current year, our auditor’s report includes a keyaudit matter in relation to US Tax Reform due to the matters set out above.
An overview of the scope of our audit
Tailoring the scope Our assessment of audit risk, our evaluation of materiality and our allocation of performance materiality determine our audit scope for eachentity within the group. Taken together, this enables us to form an opinion on the consolidated financial statements. We take into account size,risk profile, the organization of the group and effectiveness of group-wide controls, changes in the business environment and other factorssuch as recent internal audit results when assessing the level of work to be performed at each component.
In scoping the audit we reflect the group’s structure (Upstream, Downstream, Rosneft and Other businesses and corporate), plus the group’sfunctions. In assessing the risk of material misstatement to the group financial statements, and to ensure we had adequate quantitativecoverage of significant accounts in the financial statements, we performed full or specific scope audit procedures over 55 componentscovering the UK, US, Abu Dhabi, Angola, Azerbaijan, Brazil, Egypt, Germany, India, Russia, Singapore, Trinidad and Tobago and the groupfunctions, representing the principal business units within the group.
Of the 55 components selected, we performed an audit of the complete financial information of 9 components (“full scope components”)which were selected based on their size or risk characteristics. For the remaining 46 components (“specific scope components”), weperformed audit procedures on specific accounts within that component that we considered had the potential for the greatest impact on thesignificant accounts in the financial statements either because of the size of these accounts or their risk profile.
For the current year, the full scope components contributed 30% of the group’s profit before tax (2016 29%), 42% of the group’s revenue (201641%) and 10% of the group’s property, plant and equipment (2016 10%). The specific scope components contributed 32% of the group’s profitbefore tax (2016 32%), 30% of the group’s revenue (2016 26%) and 52% of the group’s property, plant and equipment (2016 54%). The auditscope of the specific scope components may not have included testing of all significant accounts of the component but will have contributedto the coverage of significant accounts tested for the group. Of the 46 specific scope components, we instructed 14 of these locations toperform specified procedures over goodwill, intangible assets, the carrying value of certain investments held by the group, gain on sale ofbusinesses and fixed assets, interest and other income, exploration expenses, sales and other operating revenues and production taxes.
The remaining components not subject to full or specific group scoping are not significant individually or in the aggregate. They include manysmall, low risk components and balances; each remaining component represents an average of 0.13% of the total group profit before tax and0.13% of total group revenue. For these components, we performed other procedures, including evaluating and testing management’s groupwide controls across a range of geographies and segments, specifically testing the oversight and review controls that management has inplace to ensure there are no material misstatements in these locations. We performed analytical and enquiry procedures to address the risk ofresidual misstatement on a segment-wide and component basis. We tested consolidation journals to identify the existence of any further risksof misstatement that could have been material to the group financial statements.
This page does not form part of BP's Annual Report on Form 20-F as filed with the SEC.
BP Annual Report and Form 20-F 2017 119
Involvement with component teams In establishing our overall approach to the group audit, we determined the type of work that needed to be undertaken at each of thecomponents by us, as the primary audit engagement team, or by component auditors from other EY global network firms operating under ourinstruction. Of the 9 full scope components, audit procedures were performed on 5 of these directly by the primary audit engagement team.For the 46 specific scope components, audit procedures were performed on 24 of these directly by the primary audit engagement team.Testing of management’s group wide controls was performed by component auditors. Where work was performed by component auditors, wedetermined the appropriate level of involvement to enable us to determine that sufficient audit evidence had been obtained as a basis for ouropinion on the group as a whole.
The group audit team continued to follow a programme of planned visits designed to ensure that the Senior Statutory Auditor or his designatevisits significant locations to ensure the audit is executed and delivered in accordance with the planned approach and to confirm the quality ofthe audit work undertaken. During the current year’s audit cycle, visits were undertaken by the primary audit engagement team to thecomponent teams in Abu Dhabi, Azerbaijan, Egypt, Germany, India, Russia, Singapore, the UK and the US. Part of the purpose of these visits isto confirm that appropriate procedures have been performed by the auditors of the components and that the significant audit areas werecovered as communicated in the detailed audit instructions, including the risks of material misstatement as outlined above. The primary auditengagement team review included examining key working papers and conclusions where these related to areas of management and auditorjudgement with specific focus on the risks detailed above. The primary audit engagement team also participated in the component teams’planning, during visits made earlier in the audit period. Telephone and video meetings were held with the auditors at locations which theprimary audit engagement team did not visit in person. This, together with additional procedures performed at group level, gave us appropriateevidence for our opinion on the group financial statements.
One of the significant locations is Russia, which includes Rosneft, a material associate not controlled by BP. We were provided withappropriate access to Rosneft’s auditor in order to ensure they had completed the procedures required by ISA (UK) 600 on the financialstatements of Rosneft, used as the basis for BP’s equity accounting.
Our application of materiality We apply the concept of materiality in planning and performing the audit, in evaluating the effect of identified misstatements on the audit andin forming our audit opinion.
Materiality The magnitude of an omission or misstatement that, individually or in the aggregate, could reasonably be expected to influence the economicdecisions of the users of the financial statements. Materiality provides a basis for determining the nature and extent of our audit procedures.
We determined materiality for the group to be $0.5 billion (2016 $0.5 billion). For the 2017 audit, we deemed it appropriate to determine ourmateriality based on 5% of the group's underlying replacement cost profit (as defined on page 293) before interest and taxation for 2017. Dueto the recovery and stability in oil and gas prices through 2017 we no longer view it as necessary to determine materiality based on normalizingcurrent year expected underlying replacement cost profit before interest and taxation and how those results would look if oil and gas pricesforecast by the company for 2018 and 2019 had prevailed in the year.
Underlying replacement cost profit before interest and taxation remains the most appropriate measure upon which to calculate materiality, dueto the fact it excludes the impact of changes in crude oil, gas and product prices and items disclosed as non-operating items, which cansignificantly distort the group’s results in a given period. For details of non-operating items please see page 250 of the Annual Report andForm 20-F 2017.
We determined materiality for our audit of the standalone parent company financial statements to be $1,300 million (2016 $1,300 million),which is 1% (2016 1%) of equity. The materiality determined for the standalone parent company financial statements exceeds the groupmateriality as it is determined on a different basis given the nature of the operations. For the purposes of the audit of the group financialstatements, our procedures, including those on balances in the parent company, are undertaken with reference to the group materiality andperformance materiality set out in this report.
During the course of our audit, we re-assessed initial materiality in the context of the group’s performance and forward expectations and thisresulted in no change from our original assessment of materiality.
Performance materiality The application of materiality at the individual account or balance level. It is set at an amount to reduce to an appropriately low level theprobability that the aggregate of uncorrected and undetected misstatements exceeds materiality.
On the basis of our risk assessments, together with our assessment of the group’s overall control environment, our judgement was thatperformance materiality was 75% (2016 75%) of our materiality, namely $375 million (2016 $375 million). We have set performance materialityat this percentage to reduce to an appropriately low level the probability that the aggregate of uncorrected and undetected misstatementsexceeds materiality.
Audit work at component locations for the purpose of obtaining audit coverage over significant financial statement accounts is undertakenbased on a percentage of total performance materiality. The performance materiality set for each component is based on the relative scale andrisk of the component to the group as a whole and our assessment of the risk of misstatement at that component. In the current year, therange of performance materiality allocated to components was $75 million to $300 million (2016 $75 million to $281 million).
Reporting threshold An amount below which identified misstatements are considered as being clearly trivial.
We agreed with the audit committee that we would report to them all uncorrected audit differences in excess of $25 million (2016 $25 million),which is set at 5% of materiality, as well as differences below that threshold that, in our view, warranted reporting on qualitative grounds.
We evaluate any uncorrected misstatements against both the quantitative measures of materiality discussed above and in light of otherrelevant qualitative considerations in forming our opinion.
Other informationThe other information comprises the information included in the Annual Report other than the financial statements and our auditor’s reportthereon. The directors are responsible for the other information.
This page does not form part of BP's Annual Report on Form 20-F as filed with the SEC.
120 BP Annual Report and Form 20-F 2017
Our opinion on the financial statements does not cover the other information and, except to the extent otherwise explicitly stated in this report,we do not express any form of assurance conclusion thereon.
In connection with our audit of the financial statements, our responsibility is to read the other information and, in doing so, consider whetherthe other information is materially inconsistent with the financial statements or our knowledge obtained in the audit, or otherwise appears tobe materially misstated. If we identify such material inconsistencies or apparent material misstatements, we are required to determinewhether there is a material misstatement in the financial statements or a material misstatement of the other information. If, based on the workwe have performed, we conclude that there is a material misstatement of the other information, we are required to report that fact.
We have nothing to report in this regard.
In this context, we also have nothing to report in regard to our responsibility to specifically address the following items in the other informationand to report as uncorrected material misstatements of the other information where we conclude that those items meet the followingconditions:
• Fair, balanced and understandable set out on page 114 – the statement given by the directors that they consider the annual report andfinancial statements taken as a whole is fair, balanced and understandable and provides the information necessary for shareholders toassess the group’s performance, business model and strategy, is materially inconsistent with our knowledge obtained in the audit; or
• Audit committee reporting set out on pages 77-83 – the section describing the work of the audit committee does not appropriately addressmatters communicated by us to the audit committee; or
• Directors’ statement of compliance with the UK Corporate Governance Code set out on page 113 – the parts of the directors’ statementrequired under the Listing Rules relating to the company’s compliance with the UK Corporate Governance Code containing provisionsspecified for review by the auditor in accordance with Listing Rule 9.8.10R(2) do not properly disclose a departure from a relevant provisionof the UK Corporate Governance Code.
Opinions on other matters prescribed by the Companies Act 2006 In our opinion, the part of the Directors’ remuneration report to be audited has been properly prepared in accordance with the Companies Act2006.
In our opinion, based on the work undertaken in the course of the audit:
• the information given in the Strategic report and the Directors’ report for the financial year for which the financial statements are preparedis consistent with the financial statements; and
• the Strategic report and the Directors' report have been prepared in accordance with applicable legal requirements.
Matters on which we are required to report by exception
In light of the knowledge and understanding of the group and the parent company and its environment obtained in the course of the audit, wehave not identified material misstatements in the Strategic report or the Directors’ report.
We have nothing to report in respect of the following matters in relation to which the Companies Act 2006 requires us to report to you if, in ouropinion:
• adequate accounting records have not been kept by the parent company, or returns adequate for our audit have not been received frombranches not visited by us; or
• the parent company financial statements and the part of the Directors’ remuneration report to be audited are not in agreement with theaccounting records and returns; or
• certain disclosures of directors’ remuneration specified by law are not made; or• we have not received all the information and explanations we require for our audit.
Responsibilities of directors
As explained more fully in the Statement of directors’ responsibilities set out on page 113, the directors are responsible for the preparation ofthe financial statements and for being satisfied that they give a true and fair view, and for such internal control as the directors determine isnecessary to enable the preparation of financial statements that are free from material misstatement, whether due to fraud or error.
In preparing the financial statements, the directors are responsible for assessing the group and parent company’s ability to continue as a goingconcern, disclosing, as applicable, matters related to going concern and using the going concern basis of accounting unless the directors eitherintend to liquidate the group or the parent company or to cease operations, or have no realistic alternative but to do so.
Auditor’s responsibilities for the audit of the financial statements
Our objectives are to obtain reasonable assurance about whether the financial statements as a whole are free from material misstatement,whether due to fraud or error, and to issue an auditor’s report that includes our opinion. Reasonable assurance is a high level of assurance, butis not a guarantee that an audit conducted in accordance with ISAs (UK) will always detect a material misstatement when it exists.Misstatements can arise from fraud or error and are considered material if, individually or in the aggregate, they could reasonably be expectedto influence the economic decisions of users taken on the basis of these financial statements.
Explanation as to what extent the audit was considered capable of detecting irregularities, including fraud
The objectives of our audit, in respect to fraud, are; to identify and assess the risks of material misstatement of the financial statements due tofraud; to obtain sufficient appropriate audit evidence regarding the assessed risks of material misstatement due to fraud, through designingand implementing appropriate responses; and to respond appropriately to fraud or suspected fraud identified during the audit. However, theprimary responsibility for the prevention and detection of fraud rests with both those charged with governance of the entity and management.
Our approach was as follows:
• We obtained an understanding of the legal and regulatory frameworks that are applicable to the group and determined that the mostsignificant are those that relate to the reporting framework (IFRS, FRS 101, the Companies Act 2006, UK Corporate Governance Code andUS Securities Exchange Act of 1934) and the relevant tax compliance regulations in the jurisdictions in which the group operates. Inaddition, we concluded that there are certain significant laws and regulations which may have an effect on the determination of the
This page does not form part of BP's Annual Report on Form 20-F as filed with the SEC.
BP Annual Report and Form 20-F 2017 121
amounts and disclosures in the financial statements being the Listing Rules of the UK Listing Authority, and those laws and regulations asdisclosed within Regulation of the group’s business on pages 265-270 and International trade sanctions on pages 273-274.
• We understood how the group is complying with those frameworks by making enquiries of management, internal audit, thoseresponsible for legal and compliance procedures and the group general counsel. We corroborated our enquiries through the attendance atmeetings held by the audit, disclosure and safety, ethics and environment assurance committees. We designed our audit procedures toidentify non-compliance with such laws and regulations identified in the paragraph above. As well as enquiry and attendance at meetings,our procedures involved a review of the reporting to the above committees and a review of board meetings and other committee minutesto identify any non-compliance with laws and regulations.
• We assessed the susceptibility of the group’s financial statements to material misstatement, including how fraud might occur by meetingwith management to understand where they considered there was susceptibility to fraud. We also considered performance targets andtheir propensity to influence management to manage earnings and revenue by overriding internal controls. We considered the controlsthat the group has established to address risks identified, or that otherwise prevent, deter and detect fraud; and how senior managementmonitors those controls. We performed specific procedures to respond to the fraud risk of unauthorized trading as referred to in the keyaudit matters section above. Our procedures also included testing a risk-based sample of manual journals that may have been postedwith the intention of overriding internal controls to manipulate earnings. These procedures were designed to provide reasonableassurance that the financial statements were free from fraud or error.
• The group operates in the oil and gas industry which is a highly regulated environment. As such the Senior Statutory Auditor reviewed theexperience and expertise of the engagement team to ensure that the team had the appropriate competence and capabilities, whichincluded the use of an expert where appropriate.
A further description of our responsibilities for the audit of the financial statements is located on the Financial Reporting Council’s website athttps://www.frc.org.uk/auditorsresponsibilities. This description forms part of our auditor’s report.
Other matters we are required to address
• We were appointed by the company on 17 May 2017 to audit the financial statements for the year ended 31 December 2017.• The period of total uninterrupted engagement including previous renewals and reappointments is over 100 years, covering the year ended
1909 to the year ended 31 December 2017.• The non-audit services prohibited by the FRC’s Ethical Standard were not provided to the group or the parent company and we remain
independent of the group and the parent company in conducting the audit.• The audit opinion is consistent with the additional report to the audit committee.
John C. Flaherty (Senior Statutory Auditor) for and on behalf of Ernst & Young LLP, Statutory Auditor London 29 March 2018
1. The maintenance and integrity of the BP p.l.c. web site is the responsibility of BP p.l.c.; the work carried out by the auditors does notinvolve consideration of these matters and, accordingly, the auditors accept no responsibility for any changes that may have occurred tothe financial statements since they were initially presented on the web site.
2. Legislation in the United Kingdom governing the preparation and dissemination of financial statements may differ from legislation in otherjurisdictions.
This page does not form part of BP's Annual Report on Form 20-F as filed with the SEC.
122 BP Annual Report and Form 20-F 2017
Consolidated financial statements of the BP group Report of Independent Registered Public Accounting FirmTo the shareholders and board of directors of BP p.l.c.
Opinion on the financial statements We have audited the accompanying group balance sheets of BP p.l.c. (the Company) as of 31 December 2017 and 2016, and the related groupincome statement, group statement of comprehensive income, group statement of changes in equity and group cash flow statement for eachof the three years in the period ended 31 December 2017, and the related notes (collectively referred to as the "group financial statements"). Inour opinion, the group financial statements present fairly, in all material respects, the financial position of BP p.l.c. at 31 December 2017 and2016 and the results of its operations and its cash flows for each of the three years in the period ended 31 December 2017, in conformity withInternational Financial Reporting Standards ("IFRS") as adopted by the European Union and IFRS as issued by the International AccountingStandards Board.
We also have audited, in accordance with the standards of the Public Company Accounting Oversight Board (United States) (PCAOB), BPp.l.c.’s internal control over financial reporting as of 31 December 2017, based on criteria established in the UK Financial Reporting Council’sGuidance on Risk Management, Internal Control and Related Financial and Business Reporting and our report dated 29 March 2018 expressedan unqualified opinion thereon.
Basis for opinionThese financial statements are the responsibility of BP p.l.c.'s management. Our responsibility is to express an opinion on these financialstatements based on our audits. We are a public accounting firm registered with the PCAOB and are required to be independent with respectto BP p.l.c. in accordance with the U.S. federal securities laws and the applicable rules and regulations of the Securities and ExchangeCommission and the PCAOB.
We conducted our audits in accordance with the standards of the PCAOB. Those standards require that we plan and perform the audit toobtain reasonable assurance about whether the financial statements are free of material misstatement, whether due to error or fraud. Ouraudits included performing procedures to assess the risks of material misstatement of the financial statements, whether due to error or fraud,and performing procedures that respond to those risks. Such procedures included examining, on a test basis, evidence regarding the amountsand disclosures in the financial statements. Our audits also included evaluating the accounting principles used and significant estimates madeby management, as well as evaluating the overall presentation of the financial statements. We believe that our audits provide a reasonablebasis for our opinion.
/s/ Ernst & Young LLPWe have served as the Company's auditor since 1909.London, United Kingdom29 March 2018
1. The maintenance and integrity of the BP p.l.c. web site is the responsibility of BP p.l.c.; the work carried out by the auditors does notinvolve consideration of these matters and, accordingly, the auditors accept no responsibility for any changes that may have occurred tothe financial statements since they were initially presented on the web site.
2. Legislation in the United Kingdom governing the preparation and dissemination of financial statements may differ from legislation in otherjurisdictions.
BP Annual Report and Form 20-F 2017 123
Consolidated financial statements of the BP group Report of Independent Registered Public Accounting FirmTo the shareholders and board of directors of BP p.l.c.
Opinion on internal control over financial reporting We have audited BP p.l.c.’s internal control over financial reporting as of 31 December 2017, based on criteria established in the UK FinancialReporting Council’s Guidance on Risk Management, Internal Control and Related Financial and Business Reporting. In our opinion, BP p.l.c.maintained, in all material respects, effective internal control over financial reporting as of 31 December 2017, based on the UK FinancialReporting Council’s Guidance.
We also have audited, in accordance with the standards of the Public Company Accounting Oversight Board (United States) (PCAOB), thegroup balance sheets of BP p.l.c. as of 31 December 2017 and 2016, the related group income statement, group statement of comprehensiveincome, group statement of changes in equity and group cash flow statement for each of the three years in the period ended31 December 2017, and our report dated 29 March 2018 expressed an unqualified opinion thereon.
Basis for opinionBP p.l.c.’s management is responsible for maintaining effective internal control over financial reporting and for its assessment of theeffectiveness of internal control over financial reporting included in the accompanying Management’s report on internal control over financialreporting on page 275. Our responsibility is to express an opinion on the company’s internal control over financial reporting based on our audit.We are a public accounting firm registered with the PCAOB and are required to be independent with respect to the company in accordancewith the U.S. federal securities laws and the applicable rules and regulations of the Securities and Exchange Commission and the PCAOB.
We conducted our audit in accordance with the standards of the PCAOB. Those standards require that we plan and perform the audit to obtainreasonable assurance about whether effective internal control over financial reporting was maintained in all material respects.
Our audit included obtaining an understanding of internal control over financial reporting, assessing the risk that a material weakness exists,testing and evaluating the design and operating effectiveness of internal control based on the assessed risk, and performing such otherprocedures as we considered necessary in the circumstances. We believe that our audit provides a reasonable basis for our opinion.
Definition and limitations of internal control over financial reporting A company’s internal control over financial reporting is a process designed to provide reasonable assurance regarding the reliability of financialreporting and the preparation of financial statements for external purposes in accordance with generally accepted accounting principles. Acompany’s internal control over financial reporting includes those policies and procedures that (1) pertain to the maintenance of records that, inreasonable detail, accurately and fairly reflect the transactions and dispositions of the assets of the company; (2) provide reasonable assurancethat transactions are recorded as necessary to permit preparation of financial statements in accordance with generally accepted accountingprinciples, and that receipts and expenditures of the company are being made only in accordance with authorizations of management anddirectors of the company; and (3) provide reasonable assurance regarding prevention or timely detection of unauthorized acquisition, use, ordisposition of the company’s assets that could have a material effect on the financial statements.
Because of its inherent limitations, internal control over financial reporting may not prevent or detect misstatements. Also, projections of anyevaluation of effectiveness to future periods are subject to the risk that controls may become inadequate because of changes in conditions, orthat the degree of compliance with the policies or procedures may deteriorate.
/s/ Ernst & Young LLPLondon, United Kingdom29 March 2018
Consent of independent registered public accounting firmWe consent to the incorporation by reference of our reports dated 29 March 2018, with respect to the group financial statements of BP p.l.c.,and the effectiveness of internal control over financial reporting of BP p.l.c., included in this Annual Report and Form 20-F for the year ended31 December 2017 in the following Registration Statements:
Registration Statements on Form F-3 (File Nos. 333-208478 and 333-208478-01) of BP p.l.c. and BP Capital Markets p.l.c.; andRegistration Statements on Form S-8 (File Nos. 333-67206, 333-79399, 333-103924, 333-123482, 333-123483, 333-131583,333-131584, 333-132619, 333-146868, 333-146870, 333-146873, 333-173136, 333-177423, 333-179406, 333-186462, 333-186463,333-199015, 333-200794, 333-200795, 333-207188, 333-207189, 333-210316 and 333-210318) of BP p.l.c.
/s/ Ernst & Young LLPLondon, United Kingdom29 March 2018
1. The maintenance and integrity of the BP p.l.c. web site is the responsibility of BP p.l.c.; the work carried out by the auditors does notinvolve consideration of these matters and, accordingly, the auditors accept no responsibility for any changes that may have occurred tothe financial statements since they were initially presented on the web site.
2. Legislation in the United Kingdom governing the preparation and dissemination of financial statements may differ from legislation in otherjurisdictions.
124 BP Annual Report and Form 20-F 2017
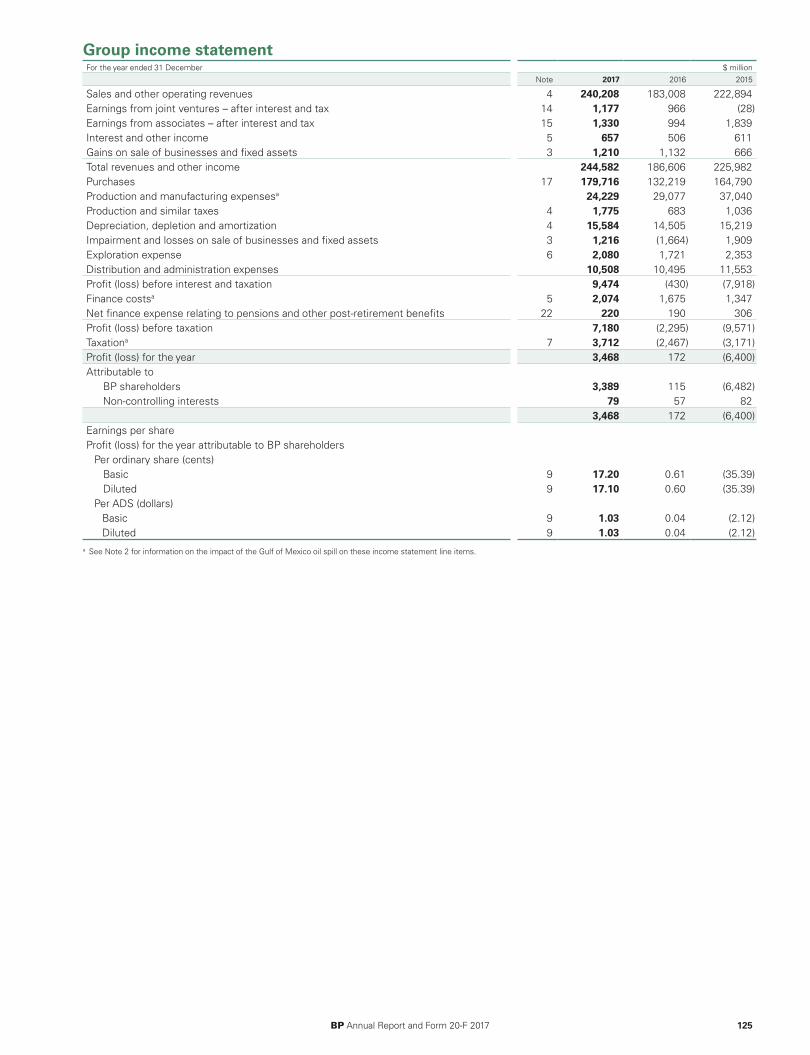
Group income statementFor the year ended 31 December $ million
Note 2017 2016 2015
Sales and other operating revenues 4 240,208 183,008 222,894Earnings from joint ventures – after interest and tax 14 1,177 966 (28)Earnings from associates – after interest and tax 15 1,330 994 1,839Interest and other income 5 657 506 611Gains on sale of businesses and fixed assets 3 1,210 1,132 666Total revenues and other income 244,582 186,606 225,982Purchases 17 179,716 132,219 164,790Production and manufacturing expensesa 24,229 29,077 37,040Production and similar taxes 4 1,775 683 1,036Depreciation, depletion and amortization 4 15,584 14,505 15,219Impairment and losses on sale of businesses and fixed assets 3 1,216 (1,664) 1,909Exploration expense 6 2,080 1,721 2,353Distribution and administration expenses 10,508 10,495 11,553Profit (loss) before interest and taxation 9,474 (430) (7,918)Finance costsa 5 2,074 1,675 1,347Net finance expense relating to pensions and other post-retirement benefits 22 220 190 306Profit (loss) before taxation 7,180 (2,295) (9,571)Taxationa 7 3,712 (2,467) (3,171)Profit (loss) for the year 3,468 172 (6,400)Attributable to
BP shareholders 3,389 115 (6,482) Non-controlling interests 79 57 82
3,468 172 (6,400)Earnings per shareProfit (loss) for the year attributable to BP shareholders
Per ordinary share (cents) Basic 9 17.20 0.61 (35.39) Diluted 9 17.10 0.60 (35.39)Per ADS (dollars)
Basic 9 1.03 0.04 (2.12)Diluted 9 1.03 0.04 (2.12)
a See Note 2 for information on the impact of the Gulf of Mexico oil spill on these income statement line items.
BP Annual Report and Form 20-F 2017 125
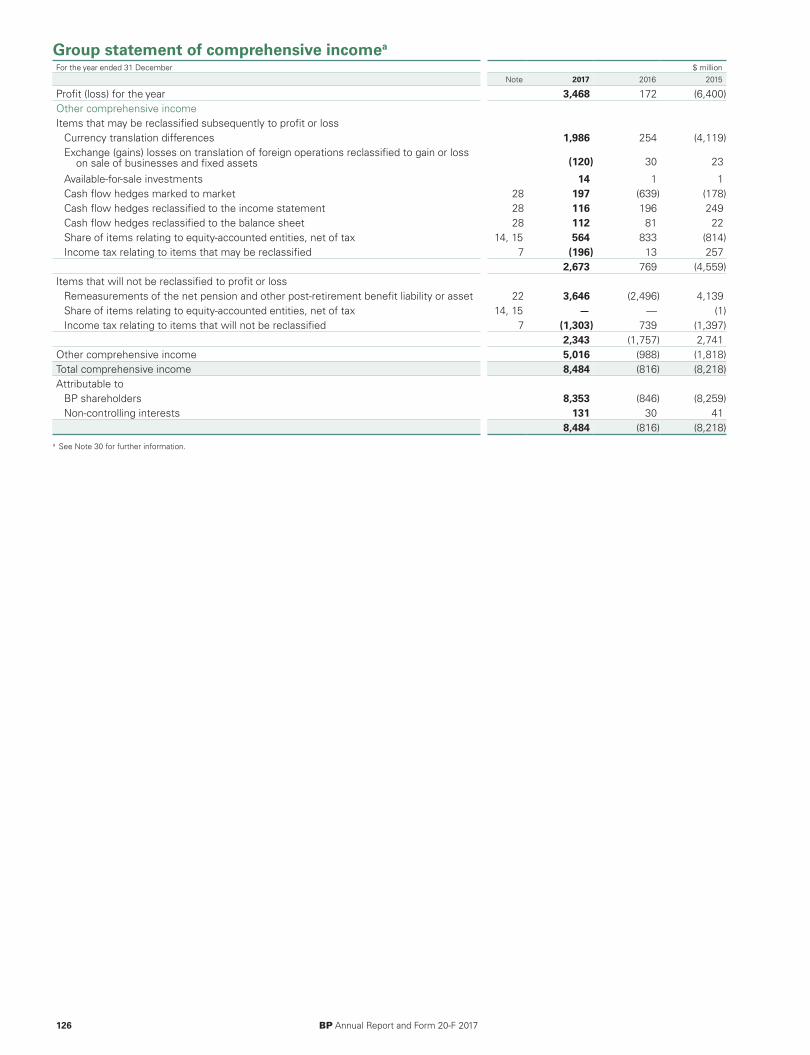
Group statement of comprehensive incomea
For the year ended 31 December $ million Note 2017 2016 2015
Profit (loss) for the year 3,468 172 (6,400)Other comprehensive incomeItems that may be reclassified subsequently to profit or loss
Currency translation differences 1,986 254 (4,119)Exchange (gains) losses on translation of foreign operations reclassified to gain or loss
on sale of businesses and fixed assets (120) 30 23
Available-for-sale investments 14 1 1Cash flow hedges marked to market 28 197 (639) (178)Cash flow hedges reclassified to the income statement 28 116 196 249Cash flow hedges reclassified to the balance sheet 28 112 81 22Share of items relating to equity-accounted entities, net of tax 14, 15 564 833 (814)Income tax relating to items that may be reclassified 7 (196) 13 257
2,673 769 (4,559)Items that will not be reclassified to profit or loss
Remeasurements of the net pension and other post-retirement benefit liability or asset 22 3,646 (2,496) 4,139Share of items relating to equity-accounted entities, net of tax 14, 15 — — (1)Income tax relating to items that will not be reclassified 7 (1,303) 739 (1,397)
2,343 (1,757) 2,741Other comprehensive income 5,016 (988) (1,818)Total comprehensive income 8,484 (816) (8,218)Attributable to
BP shareholders 8,353 (846) (8,259)Non-controlling interests 131 30 41
8,484 (816) (8,218)a See Note 30 for further information.
126 BP Annual Report and Form 20-F 2017

Group statement of changes in equitya
$ millionShare
capital andcapital
reservesTreasury
shares
Foreigncurrency
translationreserve
Fair valuereserves
Profit andloss
account
BPshareholders'
equity
Non-controlling
interests Total equity
At 1 January 2017 46,122 (18,443) (6,878) (1,153) 75,638 95,286 1,557 96,843Profit (loss) for the year — — — — 3,389 3,389 79 3,468Other comprehensive income — — 1,722 410 2,832 4,964 52 5,016Total comprehensive income — — 1,722 410 6,221 8,353 131 8,484Dividendsb — — — — (6,153) (6,153) (141) (6,294)Repurchase of ordinary share capital — — — — (343) (343) — (343)Share-based payments, net of tax — 1,485 — — (798) 687 — 687Share of equity-accounted entities’ changes in
equity, net of tax — — — — 215 215 — 215Transactions involving non-controlling interests,
net of tax — — — — 446 446 366 812At 31 December 2017 46,122 (16,958) (5,156) (743) 75,226 98,491 1,913 100,404
At 1 January 2016 43,902 (19,964) (7,267) (823) 81,368 97,216 1,171 98,387Profit (loss) for the year — — — — 115 115 57 172Other comprehensive income — — 389 (330) (1,020) (961) (27) (988)Total comprehensive income — — 389 (330) (905) (846) 30 (816)Dividendsb — — — — (4,611) (4,611) (107) (4,718)Share-based payments, net of tax 2,220 1,521 — — (750) 2,991 — 2,991Share of equity-accounted entities’ changes in
equity, net of tax — — — — 106 106 — 106
Transactions involving non-controlling interests,net of tax — — — — 430 430 463 893
At 31 December 2016 46,122 (18,443) (6,878) (1,153) 75,638 95,286 1,557 96,843
At 1 January 2015 43,902 (20,719) (3,409) (897) 92,564 111,441 1,201 112,642Profit (loss) for the year — — — — (6,482) (6,482) 82 (6,400)Other comprehensive income — — (3,858) 74 2,007 (1,777) (41) (1,818)Total comprehensive income — — (3,858) 74 (4,475) (8,259) 41 (8,218)Dividendsb — — — — (6,659) (6,659) (91) (6,750)Share-based payments, net of tax — 755 — — (99) 656 — 656Share of equity-accounted entities’ changes in
equity, net of tax — — — — 40 40 — 40
Transactions involving non-controlling interests,net of tax — — — — (3) (3) 20 17
At 31 December 2015 43,902 (19,964) (7,267) (823) 81,368 97,216 1,171 98,387a See Note 30 for further information.b See Note 8 for further information.
BP Annual Report and Form 20-F 2017 127
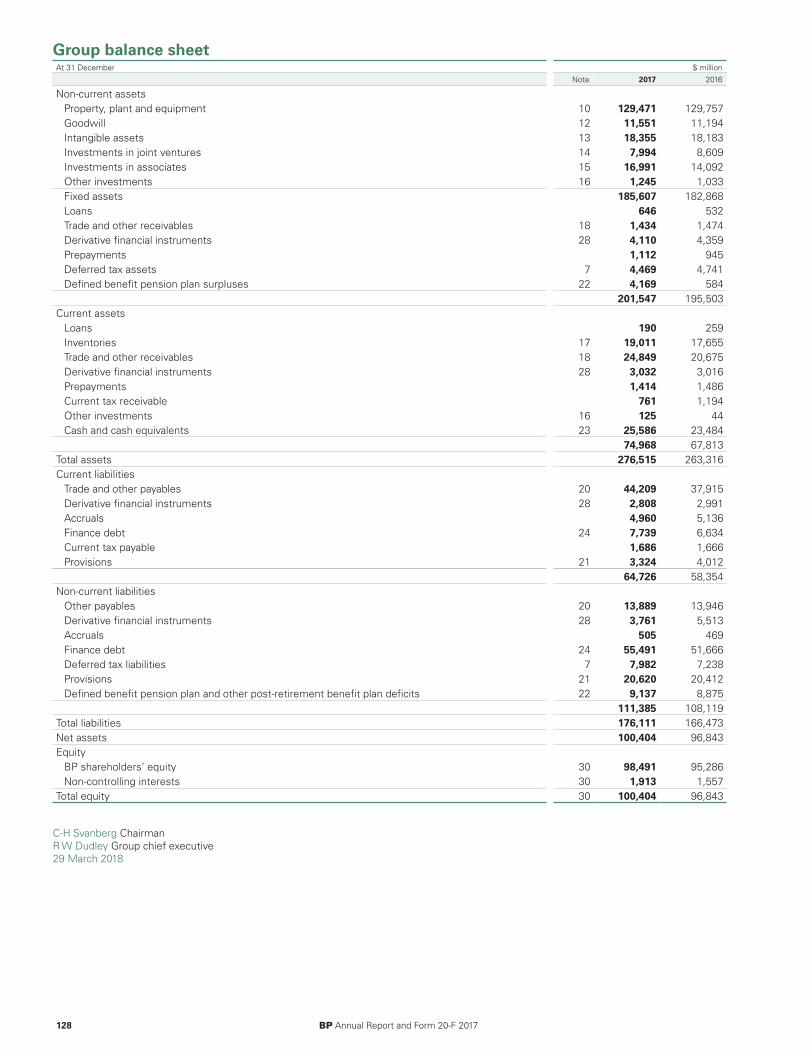
Group balance sheetAt 31 December $ million
Note 2017 2016
Non-current assetsProperty, plant and equipment 10 129,471 129,757Goodwill 12 11,551 11,194Intangible assets 13 18,355 18,183Investments in joint ventures 14 7,994 8,609Investments in associates 15 16,991 14,092Other investments 16 1,245 1,033Fixed assets 185,607 182,868Loans 646 532Trade and other receivables 18 1,434 1,474Derivative financial instruments 28 4,110 4,359Prepayments 1,112 945Deferred tax assets 7 4,469 4,741Defined benefit pension plan surpluses 22 4,169 584
201,547 195,503Current assets
Loans 190 259Inventories 17 19,011 17,655Trade and other receivables 18 24,849 20,675Derivative financial instruments 28 3,032 3,016Prepayments 1,414 1,486Current tax receivable 761 1,194Other investments 16 125 44Cash and cash equivalents 23 25,586 23,484
74,968 67,813Total assets 276,515 263,316Current liabilities
Trade and other payables 20 44,209 37,915Derivative financial instruments 28 2,808 2,991Accruals 4,960 5,136Finance debt 24 7,739 6,634Current tax payable 1,686 1,666Provisions 21 3,324 4,012
64,726 58,354Non-current liabilities
Other payables 20 13,889 13,946Derivative financial instruments 28 3,761 5,513Accruals 505 469Finance debt 24 55,491 51,666Deferred tax liabilities 7 7,982 7,238Provisions 21 20,620 20,412Defined benefit pension plan and other post-retirement benefit plan deficits 22 9,137 8,875
111,385 108,119Total liabilities 176,111 166,473Net assets 100,404 96,843Equity
BP shareholders’ equity 30 98,491 95,286Non-controlling interests 30 1,913 1,557
Total equity 30 100,404 96,843
C-H Svanberg ChairmanR W Dudley Group chief executive29 March 2018
128 BP Annual Report and Form 20-F 2017

Group cash flow statementFor the year ended 31 December $ million
Note 2017 2016 2015
Operating activitiesProfit (loss) before taxation 7,180 (2,295) (9,571)
Adjustments to reconcile profit (loss) before taxation to net cash provided byoperating activitiesExploration expenditure written off 6 1,603 1,274 1,829Depreciation, depletion and amortization 4 15,584 14,505 15,219Impairment and (gain) loss on sale of businesses and fixed assets 3 6 (2,796) 1,243Earnings from joint ventures and associates (2,507) (1,960) (1,811)Dividends received from joint ventures and associates 1,253 1,105 1,614Interest receivable (304) (200) (247)Interest received 375 267 176Finance costs 5 2,074 1,675 1,347Interest paid (1,572) (1,137) (1,080)Net finance expense relating to pensions and other post-retirement benefits 22 220 190 306Share-based payments 661 779 321Net operating charge for pensions and other post-retirement benefits, less
contributions and benefit payments for unfunded plans 22 (394) (467) (592)
Net charge for provisions, less payments 2,106 4,487 11,792(Increase) decrease in inventories (848) (3,681) 3,375(Increase) decrease in other current and non-current assets (4,848) (1,172) 6,796Increase (decrease) in other current and non-current liabilities 2,344 1,655 (9,328)Income taxes paid (4,002) (1,538) (2,256)
Net cash provided by operating activities 18,931 10,691 19,133Investing activities
Expenditure on property, plant and equipment, intangible and other assets (16,562) (16,701) (18,648)Acquisitions, net of cash acquired (327) (1) 23Investment in joint ventures (50) (50) (265)Investment in associates (901) (700) (1,312)Total cash capital expenditure (17,840) (17,452) (20,202)Proceeds from disposals of fixed assets 3 2,936 1,372 1,066Proceeds from disposals of businesses, net of cash disposed 3 478 1,259 1,726Proceeds from loan repayments 349 68 110
Net cash used in investing activities (14,077) (14,753) (17,300)Financing activities
Net issue (repurchase) of shares (343) — —Proceeds from long-term financing 8,712 12,442 8,173Repayments of long-term financing (6,276) (6,685) (6,426)Net increase (decrease) in short-term debt (158) 51 473Net increase (decrease) in non-controlling interests 1,063 887 (5)Dividends paid
BP shareholders 8 (6,153) (4,611) (6,659)Non-controlling interests (141) (107) (91)
Net cash provided by (used in) financing activities (3,296) 1,977 (4,535)Currency translation differences relating to cash and cash equivalents 544 (820) (672)Increase (decrease) in cash and cash equivalents 2,102 (2,905) (3,374)Cash and cash equivalents at beginning of year 23,484 26,389 29,763Cash and cash equivalents at end of year 25,586 23,484 26,389
BP Annual Report and Form 20-F 2017 129
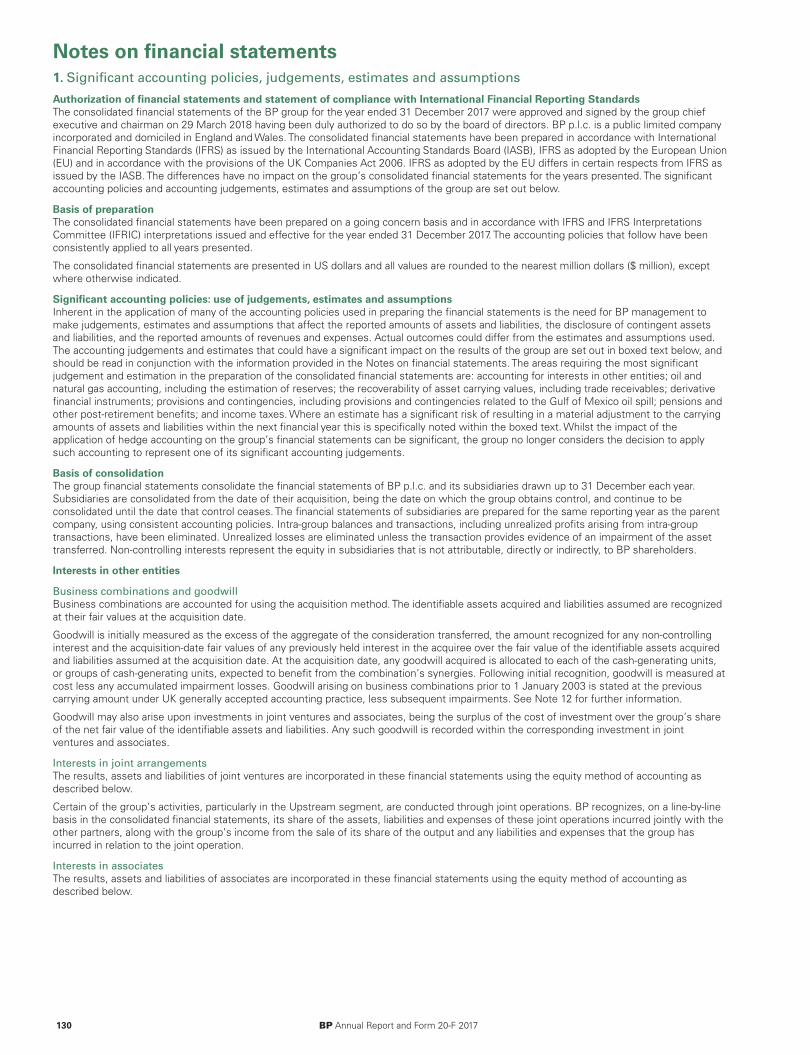
Notes on financial statements
130 BP Annual Report and Form 20-F 2017
1. Significant accounting policies, judgements, estimates and assumptions
Authorization of financial statements and statement of compliance with International Financial Reporting StandardsThe consolidated financial statements of the BP group for the year ended 31 December 2017 were approved and signed by the group chiefexecutive and chairman on 29 March 2018 having been duly authorized to do so by the board of directors. BP p.l.c. is a public limited companyincorporated and domiciled in England and Wales. The consolidated financial statements have been prepared in accordance with InternationalFinancial Reporting Standards (IFRS) as issued by the International Accounting Standards Board (IASB), IFRS as adopted by the European Union(EU) and in accordance with the provisions of the UK Companies Act 2006. IFRS as adopted by the EU differs in certain respects from IFRS asissued by the IASB. The differences have no impact on the group’s consolidated financial statements for the years presented. The significantaccounting policies and accounting judgements, estimates and assumptions of the group are set out below.
Basis of preparationThe consolidated financial statements have been prepared on a going concern basis and in accordance with IFRS and IFRS InterpretationsCommittee (IFRIC) interpretations issued and effective for the year ended 31 December 2017. The accounting policies that follow have beenconsistently applied to all years presented.
The consolidated financial statements are presented in US dollars and all values are rounded to the nearest million dollars ($ million), exceptwhere otherwise indicated.
Significant accounting policies: use of judgements, estimates and assumptionsInherent in the application of many of the accounting policies used in preparing the financial statements is the need for BP management tomake judgements, estimates and assumptions that affect the reported amounts of assets and liabilities, the disclosure of contingent assetsand liabilities, and the reported amounts of revenues and expenses. Actual outcomes could differ from the estimates and assumptions used.The accounting judgements and estimates that could have a significant impact on the results of the group are set out in boxed text below, andshould be read in conjunction with the information provided in the Notes on financial statements. The areas requiring the most significantjudgement and estimation in the preparation of the consolidated financial statements are: accounting for interests in other entities; oil andnatural gas accounting, including the estimation of reserves; the recoverability of asset carrying values, including trade receivables; derivativefinancial instruments; provisions and contingencies, including provisions and contingencies related to the Gulf of Mexico oil spill; pensions andother post-retirement benefits; and income taxes. Where an estimate has a significant risk of resulting in a material adjustment to the carryingamounts of assets and liabilities within the next financial year this is specifically noted within the boxed text. Whilst the impact of theapplication of hedge accounting on the group’s financial statements can be significant, the group no longer considers the decision to applysuch accounting to represent one of its significant accounting judgements.
Basis of consolidationThe group financial statements consolidate the financial statements of BP p.l.c. and its subsidiaries drawn up to 31 December each year.Subsidiaries are consolidated from the date of their acquisition, being the date on which the group obtains control, and continue to beconsolidated until the date that control ceases. The financial statements of subsidiaries are prepared for the same reporting year as the parentcompany, using consistent accounting policies. Intra-group balances and transactions, including unrealized profits arising from intra-grouptransactions, have been eliminated. Unrealized losses are eliminated unless the transaction provides evidence of an impairment of the assettransferred. Non-controlling interests represent the equity in subsidiaries that is not attributable, directly or indirectly, to BP shareholders.
Interests in other entities
Business combinations and goodwillBusiness combinations are accounted for using the acquisition method. The identifiable assets acquired and liabilities assumed are recognizedat their fair values at the acquisition date.
Goodwill is initially measured as the excess of the aggregate of the consideration transferred, the amount recognized for any non-controllinginterest and the acquisition-date fair values of any previously held interest in the acquiree over the fair value of the identifiable assets acquiredand liabilities assumed at the acquisition date. At the acquisition date, any goodwill acquired is allocated to each of the cash-generating units,or groups of cash-generating units, expected to benefit from the combination’s synergies. Following initial recognition, goodwill is measured atcost less any accumulated impairment losses. Goodwill arising on business combinations prior to 1 January 2003 is stated at the previouscarrying amount under UK generally accepted accounting practice, less subsequent impairments. See Note 12 for further information.
Goodwill may also arise upon investments in joint ventures and associates, being the surplus of the cost of investment over the group’s shareof the net fair value of the identifiable assets and liabilities. Any such goodwill is recorded within the corresponding investment in jointventures and associates.
Interests in joint arrangementsThe results, assets and liabilities of joint ventures are incorporated in these financial statements using the equity method of accounting asdescribed below.
Certain of the group’s activities, particularly in the Upstream segment, are conducted through joint operations. BP recognizes, on a line-by-linebasis in the consolidated financial statements, its share of the assets, liabilities and expenses of these joint operations incurred jointly with theother partners, along with the group’s income from the sale of its share of the output and any liabilities and expenses that the group hasincurred in relation to the joint operation.
Interests in associatesThe results, assets and liabilities of associates are incorporated in these financial statements using the equity method of accounting asdescribed below.
1. Significant accounting policies, judgements, estimates and assumptions – continuedSignificant judgement: investment in Rosneft
Judgement is required in assessing the level of control or influence over another entity in which the group holds an interest. For BP, thejudgement that the group has significant influence over Rosneft Oil Company (Rosneft), a Russian oil and gas company is significant. As aconsequence of this judgement, BP uses the equity method of accounting for its investment and BP's share of Rosneft's oil and natural gasreserves is included in the group's estimated net proved reserves of equity-accounted entities. If significant influence was not present, theinvestment would be accounted for as an available-for-sale financial asset as described under 'Financial assets' below and no share ofRosneft's oil and natural gas reserves would be reported.
Significant influence is defined in IFRS as the power to participate in the financial and operating policy decisions of the investee but is notcontrol or joint control of those policies. Significant influence is presumed when an entity owns 20% or more of the voting power of theinvestee. Significant influence is presumed not to be present when an entity owns less than 20% of the voting power of the investee.
BP owns 19.75% of the voting shares of Rosneft. The Russian federal government, through its investment company JSC Rosneftegaz,owned 50% plus one share of the voting shares of Rosneft at 31 December 2017. IFRS identifies several indicators that may provideevidence of significant influence, including representation on the board of directors of the investee and participation in policy-makingprocesses. BP’s group chief executive, Bob Dudley, has been a member of the board of directors of Rosneft since 2013 and he is chairman ofthe Rosneft board’s Strategic Planning Committee. A second BP-nominated director, Guillermo Quintero, has been a member of the Rosneftboard and its HR and Remuneration Committee since 2015. BP also holds the voting rights at general meetings of shareholders conferred byits 19.75% stake in Rosneft. BP's management consider, therefore, that the group has significant influence over Rosneft, as defined by IFRS.
The equity method of accountingUnder the equity method, an investment is carried on the balance sheet at cost plus post-acquisition changes in the group’s share of netassets of the entity, less distributions received and less any impairment in value of the investment. Loans advanced to equity-accountedentities that have the characteristics of equity financing are also included in the investment on the group balance sheet. The group incomestatement reflects the group’s share of the results after tax of the equity-accounted entity, adjusted to account for depreciation, amortizationand any impairment of the equity-accounted entity’s assets based on their fair values at the date of acquisition. The group statement ofcomprehensive income includes the group’s share of the equity-accounted entity’s other comprehensive income. The group’s share of amountsrecognized directly in equity by an equity-accounted entity is recognized directly in the group’s statement of changes in equity.
Financial statements of equity-accounted entities are prepared for the same reporting year as the group. Where material differences arise in theaccounting policies used by the equity-accounted entity and those used by BP, adjustments are made to those financial statements to bring theaccounting policies used into line with those of the group.
Unrealized gains on transactions between the group and its equity-accounted entities are eliminated to the extent of the group’s interest in theequity-accounted entity.
The group assesses investments in equity-accounted entities for impairment whenever events or changes in circumstances indicate that thecarrying value may not be recoverable. If any such indication of impairment exists, the carrying amount of the investment is compared with itsrecoverable amount, being the higher of its fair value less costs of disposal and value in use. If the carrying amount exceeds the recoverableamount, the investment is written down to its recoverable amount.
Segmental reportingThe group’s operating segments are established on the basis of those components of the group that are evaluated regularly by the group chiefexecutive, BP’s chief operating decision maker, in deciding how to allocate resources and in assessing performance.
The accounting policies of the operating segments are the same as the group’s accounting policies described in this note, except that IFRSrequires that the measure of profit or loss disclosed for each operating segment is the measure that is provided regularly to the chief operatingdecision maker. For BP, this measure of profit or loss is replacement cost profit before interest and tax which reflects the replacement cost ofinventories sold in the period and is arrived at by excluding inventory holding gains and losses from profit. Replacement cost profit for thegroup is not a recognized measure under IFRS. For further information see Note 4.
Foreign currency translationIn individual subsidiaries, joint ventures and associates, transactions in foreign currencies are initially recorded in the functional currency ofthose entities at the spot exchange rate on the date of the transaction. Monetary assets and liabilities denominated in foreign currencies areretranslated into the functional currency at the spot exchange rate on the balance sheet date. Any resulting exchange differences are includedin the income statement, unless hedge accounting is applied. Non-monetary assets and liabilities, other than those measured at fair value, arenot retranslated subsequent to initial recognition.
In the consolidated financial statements, the assets and liabilities of non-US dollar functional currency subsidiaries, joint ventures, associates,and related goodwill, are translated into US dollars at the spot exchange rate on the balance sheet date. The results and cash flows of non-USdollar functional currency subsidiaries, joint ventures and associates are translated into US dollars using average rates of exchange. In theconsolidated financial statements, exchange adjustments arising when the opening net assets and the profits for the year retained by non-USdollar functional currency subsidiaries, joint ventures and associates are translated into US dollars are recognized in a separate component ofequity and reported in other comprehensive income. Exchange gains and losses arising on long-term intra-group foreign currency borrowingsused to finance the group’s non-US dollar investments are also reported in other comprehensive income. On disposal or partial disposal of anon-US dollar functional currency subsidiary, joint venture or associate, the related accumulated exchange gains and losses recognized inequity are reclassified from equity to the income statement.
Non-current assets held for saleNon-current assets and disposal groups classified as held for sale are measured at the lower of carrying amount and fair value less costs tosell.
Non-current assets and disposal groups are classified as held for sale if their carrying amounts will be recovered through a sale transactionrather than through continuing use. This condition is regarded as met only when the sale is highly probable and the asset or disposal group isavailable for immediate sale in its present condition subject only to terms that are usual and customary for sales of such assets. Managementmust be committed to the sale, which should be expected to qualify for recognition as a completed sale within one year from the date ofclassification as held for sale, and actions required to complete the plan of sale should indicate that it is unlikely that significant changes to theplan will be made or that the plan will be withdrawn.
BP Annual Report and Form 20-F 2017 131
1. Significant accounting policies, judgements, estimates and assumptions – continuedProperty, plant and equipment and intangible assets are not depreciated or amortized once classified as held for sale.
Intangible assetsIntangible assets, other than goodwill, include expenditure on the exploration for and evaluation of oil and natural gas resources, computersoftware, patents, licences and trademarks and are stated at the amount initially recognized, less accumulated amortization and accumulatedimpairment losses.
Intangible assets acquired separately from a business are carried initially at cost. An intangible asset acquired as part of a businesscombination is measured at fair value at the date of acquisition and is recognized separately from goodwill if the asset is separable or arisesfrom contractual or other legal rights.
Intangible assets with a finite life, other than capitalized exploration and appraisal costs as described below, are amortized on a straight-linebasis over their expected useful lives. For patents, licences and trademarks, expected useful life is the shorter of the duration of the legalagreement and economic useful life, and can range from three to fifteen years. Computer software costs generally have a useful life of three tofive years.
The expected useful lives of assets are reviewed on an annual basis and, if necessary, changes in useful lives are accounted for prospectively.
Oil and natural gas exploration, appraisal and development expenditureOil and natural gas exploration, appraisal and development expenditure is accounted for using the principles of the successful efforts methodof accounting as described below.
Licence and property acquisition costsExploration licence and leasehold property acquisition costs are capitalized within intangible assets and are reviewed at each reporting date toconfirm that there is no indication that the carrying amount exceeds the recoverable amount. This review includes confirming that explorationdrilling is still under way or planned or that it has been determined, or work is under way to determine, that the discovery is economically viablebased on a range of technical and commercial considerations, and sufficient progress is being made on establishing development plans andtiming. If no future activity is planned, the remaining balance of the licence and property acquisition costs is written off. Lower value licencesare pooled and amortized on a straight-line basis over the estimated period of exploration. Upon recognition of proved reserves and internalapproval for development, the relevant expenditure is transferred to property, plant and equipment.
Exploration and appraisal expenditureGeological and geophysical exploration costs are recognized as an expense as incurred. Costs directly associated with an exploration well areinitially capitalized as an intangible asset until the drilling of the well is complete and the results have been evaluated. These costs includeemployee remuneration, materials and fuel used, rig costs and payments made to contractors. If potentially commercial quantities ofhydrocarbons are not found, the exploration well costs are written off. If hydrocarbons are found and, subject to further appraisal activity, arelikely to be capable of commercial development, the costs continue to be carried as an asset. If it is determined that development will notoccur then the costs are expensed.
Costs directly associated with appraisal activity undertaken to determine the size, characteristics and commercial potential of a reservoirfollowing the initial discovery of hydrocarbons, including the costs of appraisal wells where hydrocarbons were not found, are initiallycapitalized as an intangible asset. When proved reserves of oil and natural gas are determined and development is approved by management,the relevant expenditure is transferred to property, plant and equipment.
The determination of whether potentially economic oil and natural gas reserves have been discovered by an exploration well is usually madewithin one year of well completion, but can take longer, depending on the complexity of the geological structure. Exploration wells thatdiscover potentially economic quantities of oil and natural gas and are in areas where major capital expenditure (e.g. an offshore platform or apipeline) would be required before production could begin, and where the economic viability of that major capital expenditure depends on thesuccessful completion of further exploration or appraisal work in the area, remain capitalized on the balance sheet as long as such work isunder way or firmly planned.
Development expenditureExpenditure on the construction, installation and completion of infrastructure facilities such as platforms, pipelines and the drilling ofdevelopment wells, including service and unsuccessful development or delineation wells, is capitalized within property, plant and equipmentand is depreciated from the commencement of production as described below in the accounting policy for property, plant and equipment.
Significant judgement: oil and natural gas accounting
Judgement is required to determine whether it is appropriate to continue to carry costs associated with exploration wells and exploratory-type stratigraphic test wells on the balance sheet. It is not unusual to have such costs remaining suspended on the balance sheet for severalyears while additional appraisal drilling and seismic work on the potential oil and natural gas field is performed or while the optimumdevelopment plans and timing are established. All such carried costs are subject to regular technical, commercial and management review onat least an annual basis to confirm the continued intent to develop, or otherwise extract value from, the discovery. Where this is no longer thecase, the costs are immediately expensed.
One of the circumstances that indicate an entity should test such assets for impairment is that the period for which the entity has a right toexplore in the specific area has expired or will expire in the near future, and is not expected to be renewed. BP has leases in the Gulf ofMexico making up a prospect, some with terms that were scheduled to expire at the end of 2013 and some with terms that were scheduledto expire at the end of 2014. A significant proportion of our capitalized exploration and appraisal costs in the Gulf of Mexico relate to thisprospect. This prospect requires the development of subsea technology to ensure that the hydrocarbons can be extracted safely. BP is innegotiation with the US Bureau of Safety and Environmental Enforcement in relation to seeking extension of these leases so that thediscovered hydrocarbons can be developed. BP remains committed to developing this prospect and expects that the leases will be renewedand, therefore, continues to carry the capitalized costs on its balance sheet.
Property, plant and equipmentProperty, plant and equipment is stated at cost, less accumulated depreciation and accumulated impairment losses. The initial cost of an assetcomprises its purchase price or construction cost, any costs directly attributable to bringing the asset into the location and condition necessaryfor it to be capable of operating in the manner intended by management, the initial estimate of any decommissioning obligation, if any, and, forassets that necessarily take a substantial period of time to get ready for their intended use, directly attributable finance costs. The purchase
132 BP Annual Report and Form 20-F 2017
1. Significant accounting policies, judgements, estimates and assumptions – continuedprice or construction cost is the aggregate amount paid and the fair value of any other consideration given to acquire the asset. The capitalizedvalue of a finance lease is also included within property, plant and equipment.
Expenditure on major maintenance refits or repairs comprises the cost of replacement assets or parts of assets, inspection costs and overhaulcosts. Where an asset or part of an asset that was separately depreciated is replaced and it is probable that future economic benefitsassociated with the item will flow to the group, the expenditure is capitalized and the carrying amount of the replaced asset is derecognized.Inspection costs associated with major maintenance programmes are capitalized and amortized over the period to the next inspection.Overhaul costs for major maintenance programmes, and all other maintenance costs are expensed as incurred.
Oil and natural gas properties, including related pipelines, are depreciated using a unit-of-production method. The cost of producing wells isamortized over proved developed reserves. Licence acquisition, common facilities and future decommissioning costs are amortized over totalproved reserves. The unit-of-production rate for the depreciation of common facilities takes into account expenditures incurred to date,together with estimated future capital expenditure expected to be incurred relating to as yet undeveloped reserves expected to be processedthrough these common facilities.
Other property, plant and equipment is depreciated on a straight-line basis over its expected useful life. The typical useful lives of the group’sother property, plant and equipment are as follows:
Land improvements 15 to 25 yearsBuildings 20 to 50 yearsRefineries 20 to 30 yearsPetrochemicals plants 20 to 30 yearsPipelines 10 to 50 yearsService stations 15 yearsOffice equipment 3 to 7 yearsFixtures and fittings 5 to 15 years
The expected useful lives of property, plant and equipment are reviewed on an annual basis and, if necessary, changes in useful lives areaccounted for prospectively.
An item of property, plant and equipment is derecognized upon disposal or when no future economic benefits are expected to arise from thecontinued use of the asset. Any gain or loss arising on derecognition of the asset (calculated as the difference between the net disposalproceeds and the carrying amount of the item) is included in the income statement in the period in which the item is derecognized.
Significant estimate: estimation of oil and natural gas reserves
Significant technical and commercial judgements are required to determine the group’s estimated oil and natural gas reserves. Reservesestimates are regularly reviewed and updated. Factors such as the availability of geological and engineering data, reservoir performance data,acquisition and divestment activity, drilling of new wells, and commodity prices all impact on the determination of the group’s estimates of itsoil and natural gas reserves. BP bases its proved reserves estimates on the requirement of reasonable certainty with rigorous technical andcommercial assessments based on conventional industry practice and regulatory requirements.
The estimation of oil and natural gas reserves and BP’s process to manage reserves bookings is described in Supplementary information onoil and natural gas on page 191, which is unaudited. Details on BP’s proved reserves and production compliance and governance processesare provided on page 260. The 2017 movements in proved reserves are reflected in the tables showing movements in oil and natural gasreserves by region in Supplementary information on oil and natural gas (unaudited) on page 191.
Estimates of oil and natural gas reserves determined by applying US Securities and Exchange Commission regulations are used to calculatedepreciation, depletion and amortization charges for the group’s oil and gas properties. The impact of changes in estimated proved reservesis dealt with prospectively by amortizing the remaining carrying value of the asset over the expected future production.
Oil and natural gas reserves estimates based upon management's assumptions for future commodity prices have a direct impact on theassessment of the recoverability of asset carrying values reported in the financial statements. If proved reserves estimates determined byapplying management’s assumptions are revised downwards, earnings could be affected by changes in depreciation expense or animmediate write-down of the property’s carrying value. Changes in proved reserves, therefore, could result in a material change in thoseproperties' carrying values within the next financial year. See also Significant judgements and estimates: recoverability of asset carryingvalues.
Information on the carrying amounts of the group’s oil and natural gas properties, together with the amounts recognized in the incomestatement as depreciation, depletion and amortization is contained in Note 10 and Note 4 respectively.
Impairment of property, plant and equipment, intangible assets, and goodwillThe group assesses assets or groups of assets, called cash-generating units (CGUs), for impairment whenever events or changes incircumstances indicate that the carrying amount of an asset or CGU may not be recoverable; for example, changes in the group’s businessplans, changes in the group’s assumptions about commodity prices, low plant utilization, evidence of physical damage or, for oil and gasassets, significant downward revisions of estimated reserves or increases in estimated future development expenditure or decommissioningcosts. If any such indication of impairment exists, the group makes an estimate of the asset’s or CGU’s recoverable amount. Individual assetsare grouped into CGUs for impairment assessment purposes at the lowest level at which there are identifiable cash flows that are largelyindependent of the cash flows of other groups of assets. A CGU’s recoverable amount is the higher of its fair value less costs of disposal andits value in use. Where the carrying amount of a CGU exceeds its recoverable amount, the CGU is considered impaired and is written down toits recoverable amount.
The business segment plans, which are approved on an annual basis by senior management, are the primary source of information for thedetermination of value in use. They contain forecasts for oil and natural gas production, refinery throughputs, sales volumes for various types ofrefined products (e.g. gasoline and lubricants), revenues, costs and capital expenditure. As an initial step in the preparation of these plans,various assumptions regarding market conditions, such as oil prices, natural gas prices, refining margins, refined product margins and costinflation rates are set by senior management. These assumptions take account of existing prices, global supply-demand equilibrium for oil andnatural gas, other macroeconomic factors and historical trends and variability. In assessing value in use, the estimated future cash flows areadjusted for the risks specific to the asset group and are discounted to their present value using a pre-tax discount rate that reflects currentmarket assessments of the time value of money.
BP Annual Report and Form 20-F 2017 133

1. Significant accounting policies, judgements, estimates and assumptions – continuedFair value less costs of disposal is the price that would be received to sell the asset in an orderly transaction between market participants anddoes not reflect the effects of factors that may be specific to the group and not applicable to entities in general.
An assessment is made at each reporting date as to whether there is any indication that previously recognized impairment losses may nolonger exist or may have decreased. If such an indication exists, the recoverable amount is estimated. A previously recognized impairment lossis reversed only if there has been a change in the estimates used to determine the asset’s recoverable amount since the last impairment losswas recognized. If that is the case, the carrying amount of the asset is increased to the lower of its recoverable amount and the carryingamount that would have been determined, net of depreciation, had no impairment loss been recognized for the asset in prior years.Impairment reversals are recognized in profit or loss. After a reversal, the depreciation charge is adjusted in future periods to allocate theasset’s revised carrying amount, less any residual value, on a systematic basis over its remaining useful life.
Goodwill is reviewed for impairment annually or more frequently if events or changes in circumstances indicate the recoverable amount of thegroup of CGUs to which the goodwill relates should be assessed. In assessing whether goodwill has been impaired, the carrying amount ofthe group of CGUs to which goodwill has been allocated is compared with its recoverable amount. Where the recoverable amount of the groupof CGUs is less than the carrying amount (including goodwill), an impairment loss is recognized. An impairment loss recognized for goodwill isnot reversed in a subsequent period.
Significant judgements and estimates: recoverability of asset carrying values
Determination as to whether, and by how much, an asset, CGU, or group of CGUs containing goodwill is impaired involves managementestimates on highly uncertain matters such as the effects of inflation and deflation on operating expenses, discount rates, productionprofiles, reserves and resources, and future commodity prices, including the outlook for global or regional market supply-and-demandconditions for crude oil, natural gas and refined products. Judgement is required when determining the appropriate grouping of assets into aCGU or the appropriate grouping of CGUs for impairment testing purposes. See Note 12 for details on how these groupings have beendetermined in relation to the impairment testing of goodwill.
As disclosed above, the recoverable amount of an asset is the higher of its value in use and its fair value less costs of disposal. Fair value lesscosts of disposal may be determined based on similar recent market transaction data or, where recent market transactions for the asset arenot available for reference, using discounted cash flow techniques. Where discounted cash flow analyses are used to calculate fair value lesscosts of disposal, judgements are made about the assumptions market participants would use when pricing the asset, CGU or group ofCGUs containing goodwill and the test is performed on a post-tax basis.
Irrespective of whether there is any indication of impairment, BP is required to test annually for impairment of goodwill acquired in businesscombinations. The group carries goodwill of approximately $11.6 billion on its balance sheet (2016 $11.2 billion), principally relating to theAtlantic Richfield, Burmah Castrol, Devon Energy and Reliance transactions. In testing goodwill for impairment, the group uses the approachdescribed above to determine recoverable amount. If there are low oil or natural gas prices for an extended period, the group may need torecognize goodwill impairment charges against its Upstream segment goodwill. Sensitivities relating to impairment testing of goodwill in theUpstream segment are provided in Note 12.
Details of impairment charges and reversals recognized in the income statement are provided in Note 3 and details on the carrying amountsof assets are shown in Note 10, Note 12 and Note 13.
Assumptions made in impairment tests in 2017 relating to discount rates, oil and gas properties and oil and gas prices are discussed below.Changes in the economic environment or other facts and circumstances may necessitate revisions to these assumptions and could result ina material change to the carrying values of the group's assets within the next financial year.
Discount rates
For value-in-use calculations, future cash flows are adjusted for risks specific to the cash-generating unit and are discounted using a pre-taxdiscount rate. The pre-tax discount rate is based upon the cost of funding the group derived from an established model, adjusted to a pre-taxbasis. Fair value less costs of disposal calculations use the post-tax discount rate.
The discount rates applied in impairment tests are reassessed each year. In 2017 the discount rate used to determine recoverable amountsbased on fair value less costs of disposal was 6% (2016 6%). The discount rate used to determine recoverable amounts based on value inuse was 9% (2016 9%). In both cases, where the cash-generating unit is located in a country which is judged to be higher risk an additional2% premium was added to the discount rate (2016 2%).
Oil and natural gas properties
For oil and natural gas properties, expected future cash flows are estimated using management’s best estimate of future oil and natural gasprices and production and reserves volumes. The estimated future level of production in all impairment tests is based on assumptions aboutfuture commodity prices, production and development costs, field decline rates, current fiscal regimes and other factors.
Reserves assumptions for value-in-use tests are restricted to proved and probable reserves.
When estimating the fair value of our Upstream assets, assumptions reflect all reserves and resources that management believe a marketparticipant would consider when valuing the asset, which in some cases are broader in scope than the reserves used in a value-in-usetest. In determining a fair value, risk factors may be applied to reserves and resources which do not meet the criteria to be treated asproved. Depending upon the classification of the reserves and resources, this can result in associated forecast cash flows being reduced by afactor of between 10% and 90% from their estimated full potential value. Changing the risk factor applied will in some cases have an impactupon the carrying value of the asset concerned. Based on tests performed in 2016 and 2017, a 10% increase in the risk factors used in anysingle test could have an impact of up to $0.4 billion upon the carrying value of that asset.
The recoverability of intangible exploration and appraisal expenditure is covered under Oil and natural gas exploration, appraisal anddevelopment expenditure above.
Oil and gas prices
The long-term price assumptions used to determine recoverable amount based on fair value less costs of disposal from 2023 onwards arederived from $75 per barrel for Brent and $4/mmBtu for Henry Hub, both in 2015 prices, inflated for the remaining life of the asset (2016 $75per barrel and $4/mmBtu, both in 2015 prices, from 2022 onwards). To determine recoverable amount based on value in use, the priceassumptions were inflated to 2023 but from 2023 onwards were not inflated.
134 BP Annual Report and Form 20-F 2017
1. Significant accounting policies, judgements, estimates and assumptions – continuedFor both value-in-use and fair value less costs of disposal impairment tests, the price assumptions used for the five-year period to 2022 havebeen set such that there is a gradual transition from current market prices to the long-term price assumptions as noted above, with the rateof increase reducing in the later years.
Oil prices have firmed somewhat in the wake of the extension of OPEC and non-OPEC production cuts and the gradual adjustment in oilinventories from elevated levels. BP's long-term assumption for oil prices is higher than recent market prices reflecting the judgement thatrecent prices are not consistent with the market being able to produce sufficient oil to meet global demand sustainably in the longer term.
US gas prices have been affected by short-term volatility in winter demand although remain relatively muted. BP's long-term priceassumption for US gas is higher than recent market prices as US gas production is expected to grow strongly, supported by increasedexports of liquefied natural gas, absorbing the lowest cost resources and requiring increased investment in infrastructure.
InventoriesInventories, other than inventories held for short-term trading purposes, are stated at the lower of cost and net realizable value. Cost isdetermined by the first-in first-out method and comprises direct purchase costs, cost of production, transportation and manufacturingexpenses. Net realizable value is determined by reference to prices existing at the balance sheet date, adjusted where the sale of inventoriesafter the reporting period gives evidence about their net realizable value at the end of the period.
Inventories held for short-term trading purposes are stated at fair value less costs to sell and any changes in fair value are recognized in theincome statement.
Supplies are valued at the lower of cost on a weighted average basis and net realizable value.
LeasesAgreements under which payments are made to owners in return for the right to use a specific asset are accounted for as leases. Leases thattransfer substantially all the risks and rewards of ownership are recognized as finance leases. All other leases are accounted for as operatingleases.
Finance leases are capitalized at the commencement of the lease term at the fair value of the leased item or, if lower, at the present value ofthe minimum lease payments. Finance charges are allocated to each period so as to achieve a constant rate of interest on the remainingbalance of the liability and are charged directly against income. Capitalized leased assets are depreciated over the shorter of the estimateduseful life of the asset or the lease term.
Operating lease payments are recognized as an expense on a straight-line basis over the lease term.
Financial assetsFinancial assets are recognized initially at fair value, normally being the transaction price plus, in the case of financial assets not at fair valuethrough profit or loss, directly attributable transaction costs. The subsequent measurement of financial assets depends on their classification,as set out below. The group derecognizes financial assets when the contractual rights to the cash flows expire or the financial asset istransferred to a third party.
Loans and receivablesLoans and receivables are carried at amortized cost using the effective interest method if the time value of money is significant. Gains andlosses are recognized in income when the loans and receivables are derecognized or impaired and when interest is recognized using theeffective interest method. This category of financial assets includes trade and other receivables.
Financial assets at fair value through profit or lossFinancial assets at fair value through profit or loss are carried on the balance sheet at fair value with gains or losses recognized in the incomestatement. Derivatives, other than those designated as effective hedging instruments, are classified as held for trading and are included in thiscategory.
Derivatives designated as hedging instruments in an effective hedgeThese derivatives are carried on the balance sheet at fair value. The treatment of gains and losses arising from revaluation is described below inthe accounting policy for derivative financial instruments and hedging activities.
Held-to-maturity financial assetsHeld-to-maturity financial assets are measured at amortized cost, using the effective interest method, less any impairment.
Available-for-sale financial assetsAvailable-for-sale financial assets are measured at fair value, with gains or losses recognized within other comprehensive income, except forimpairment losses, and, for available-for-sale debt instruments, foreign exchange gains or losses, interest recognized using the effectiveinterest method, and any changes in fair value arising from revised estimates of future cash flows, which are recognized in profit or loss.
Cash equivalentsCash equivalents are short-term highly liquid investments that are readily convertible to known amounts of cash, are subject to insignificant riskof changes in value and generally have a maturity of three months or less from the date of acquisition. Cash equivalents are classified as loansand receivables, held-to-maturity financial assets or available-for-sale financial assets.
Impairment of loans and receivablesThe group assesses at each balance sheet date whether a financial asset or group of financial assets is impaired. If there is objective evidencethat an impairment loss on loans and receivables carried at amortized cost has been incurred, the amount of the loss is measured as thedifference between the asset’s carrying amount and the present value of estimated future cash flows discounted at the financial asset’soriginal effective interest rate. The carrying amount of the asset is reduced, with the amount of the loss recognized in the income statement.
Significant judgement: recoverability of trade receivables
Judgements are required in assessing the recoverability of overdue trade receivables and determining whether a provision against thosereceivables is required. In particular, judgements are required in the current oil and gas price environment relating to amounts due fromcountries that are reliant on revenues from hydrocarbon-producing activities. Factors considered include the credit rating of the counterparty,the amount and timing of anticipated future payments and any possible actions that can be taken to mitigate the risk of non-payment. SeeNote 27 for information on overdue receivables.
BP Annual Report and Form 20-F 2017 135
1. Significant accounting policies, judgements, estimates and assumptions – continued
Financial liabilitiesThe measurement of financial liabilities depends on their classification, as follows:
Financial liabilities at fair value through profit or lossFinancial liabilities at fair value through profit or loss are carried on the balance sheet at fair value with gains or losses recognized in the incomestatement. Derivatives, other than those designated as effective hedging instruments, are classified as held for trading and are included in thiscategory.
Derivatives designated as hedging instruments in an effective hedgeThese derivatives are carried on the balance sheet at fair value. The treatment of gains and losses arising from revaluation is described below inthe accounting policy for derivative financial instruments and hedging activities.
Financial liabilities measured at amortized costAll other financial liabilities are initially recognized at fair value, net of transaction costs. For interest-bearing loans and borrowings this is the fairvalue of the proceeds received net of issue costs associated with the borrowing.
After initial recognition, other financial liabilities are subsequently measured at amortized cost using the effective interest method. Amortizedcost is calculated by taking into account any issue costs and any discount or premium on settlement. Gains and losses arising on therepurchase, settlement or cancellation of liabilities are recognized in interest and other income and finance costs respectively.
This category of financial liabilities includes trade and other payables and finance debt, except finance debt designated in a fair value hedgerelationship.
Derivative financial instruments and hedging activitiesThe group uses derivative financial instruments to manage certain exposures to fluctuations in foreign currency exchange rates, interest ratesand commodity prices, as well as for trading purposes. These derivative financial instruments are recognized initially at fair value on the date onwhich a derivative contract is entered into and subsequently remeasured at fair value. Derivatives are carried as assets when the fair value ispositive and as liabilities when the fair value is negative.
Contracts to buy or sell a non-financial item (for example, oil, oil products, gas or power) that can be settled net in cash, with the exception ofcontracts that were entered into and continue to be held for the purpose of the receipt or delivery of a non-financial item in accordance withthe group’s expected purchase, sale or usage requirements, are accounted for as financial instruments. Gains or losses arising from changes inthe fair value of derivatives that are not designated as effective hedging instruments are recognized in the income statement.
If, at inception of a contract, the valuation cannot be supported by observable market data, any gain or loss determined by the valuationmethodology is not recognized in the income statement but is deferred on the balance sheet and is commonly known as ‘day-one gain or loss’.This deferred gain or loss is recognized in the income statement over the life of the contract until substantially all the remaining contract termcan be valued using observable market data at which point any remaining deferred gain or loss is recognized in the income statement.Changes in valuation subsequent to the initial valuation are recognized immediately in the income statement.
For the purpose of hedge accounting, hedges are classified as:
• fair value hedges when hedging exposure to changes in the fair value of a recognized asset or liability
• cash flow hedges when hedging exposure to variability in cash flows that is attributable to either a particular risk associated with arecognized asset or liability or a highly probable forecast transaction.
Hedge relationships are formally designated and documented at inception, together with the risk management objective and strategy forundertaking the hedge. The documentation includes identification of the hedging instrument, the hedged item or transaction, the nature of therisk being hedged, and how the entity will assess the hedging instrument effectiveness in offsetting the exposure to changes in the hedgeditem’s fair value or cash flows attributable to the hedged risk. Such hedges are expected at inception to be highly effective in achievingoffsetting changes in fair value or cash flows. Hedges meeting the criteria for hedge accounting are accounted for as follows:
Fair value hedgesThe change in fair value of a hedging derivative is recognized in profit or loss. The change in the fair value of the hedged item attributable to therisk being hedged is recorded as part of the carrying value of the hedged item and is also recognized in profit or loss. The group applies fairvalue hedge accounting when hedging interest rate risk and certain currency risks on fixed rate borrowings.
If the criteria for hedge accounting are no longer met, or if the group revokes the designation, the accumulated adjustment to the carryingamount of a hedged item at such time is then amortized to profit or loss over the remaining period to maturity.
Cash flow hedgesThe effective portion of the gain or loss on a cash flow hedging instrument is reported in other comprehensive income, while the ineffectiveportion is recognized in profit or loss. Amounts reported in other comprehensive income are reclassified to the income statement when thehedged transaction affects profit or loss.
Where the hedged item is a non-financial asset or liability, such as a forecast foreign currency transaction for the purchase of property, plantand equipment, the amounts recognized within other comprehensive income are reclassified to the initial carrying amount of the non-financialasset or liability. Where the hedged item is an equity investment, the amounts recognized in other comprehensive income remain in theseparate component of equity until the hedged cash flows affect profit or loss. Where the hedged item is recognized directly in profit or loss,the amounts recognized in other comprehensive income are reclassified to production and manufacturing expenses, except for cash flowhedges of variable interest rate risk which are reclassified to finance costs.
If the hedging instrument expires or is sold, terminated or exercised without replacement or rollover, or if its designation as a hedge is revoked,amounts previously recognized within other comprehensive income remain in equity until the forecast transaction occurs and are reclassifiedto the income statement or to the initial carrying amount of a non-financial asset or liability as above. If the forecast transaction is no longerexpected to occur, amounts previously recognized within other comprehensive income will be immediately reclassified to the incomestatement.
136 BP Annual Report and Form 20-F 2017
1. Significant accounting policies, judgements, estimates and assumptions – continued
Fair value measurementFair value is the price that would be received to sell an asset or paid to transfer a liability in an orderly transaction between market participants.The group categorizes assets and liabilities measured at fair value into one of three levels depending on the ability to observe inputs employedin their measurement. Level 1 inputs are quoted prices in active markets for identical assets or liabilities. Level 2 inputs are inputs that areobservable, either directly or indirectly, other than quoted prices included within level 1 for the asset or liability. Level 3 inputs are unobservableinputs for the asset or liability reflecting significant modifications to observable related market data or BP’s assumptions about pricing bymarket participants.
Significant judgement and estimate: derivative contracts
In some cases the fair values of derivatives are estimated using internal models due to the absence of quoted prices or other observable,market-corroborated data. This applies to the group’s longer-term derivative contracts. The majority of these contracts are valued usingmodels with inputs that include price curves for each of the different products that are built up from available active market pricing data andmodelled using the maximum available external pricing information. Additionally, where limited data exists for certain products, prices aredetermined using historic and long-term pricing relationships. Price volatility is also an input for options models. Changes in the keyassumptions could have a material impact on the carrying amounts of derivative assets and liabilities in the next financial year. For moreinformation see Note 28.
In some cases, judgement is required to determine whether contracts to buy or sell commodities meet the definition of a derivative.Contracts to buy and sell LNG are not considered to meet the definition as they are not considered capable of being net settled and so areaccounted for on an accruals basis.
Offsetting of financial assets and liabilitiesFinancial assets and liabilities are presented gross in the balance sheet unless both of the following criteria are met: the group currently has alegally enforceable right to set off the recognized amounts; and the group intends to either settle on a net basis or realize the asset and settlethe liability simultaneously. A right of set off is the group’s legal right to settle an amount payable to a creditor by applying against it an amountreceivable from the same counterparty. The relevant legal jurisdiction and laws applicable to the relationships between the parties areconsidered when assessing whether a current legally enforceable right to set off exists.
Provisions and contingenciesProvisions are recognized when the group has a present legal or constructive obligation as a result of a past event, it is probable that anoutflow of resources embodying economic benefits will be required to settle the obligation and a reliable estimate can be made of the amountof the obligation. Where appropriate, the future cash flow estimates are adjusted to reflect risks specific to the liability.
If the effect of the time value of money is material, provisions are determined by discounting the expected future cash flows at a pre-tax risk-free rate that reflects current market assessments of the time value of money. Where discounting is used, the increase in the provision due tothe passage of time is recognized within finance costs. A provision is discounted using either a nominal discount rate of 2.5% (2016 2%) or areal discount rate of 0.5% (2016 0.5%), as appropriate. Provisions are split between amounts expected to be settled within 12 months of thebalance sheet date (current) and amounts expected to be settled later (non-current).
Contingent liabilities are possible obligations whose existence will only be confirmed by future events not wholly within the control of thegroup, or present obligations where it is not probable that an outflow of resources will be required or the amount of the obligation cannot bemeasured with sufficient reliability. Contingent liabilities are not recognized in the financial statements but are disclosed unless the possibilityof an outflow of economic resources is considered remote.
DecommissioningLiabilities for decommissioning costs are recognized when the group has an obligation to plug and abandon a well, dismantle and remove afacility or an item of plant and to restore the site on which it is located, and when a reliable estimate of that liability can be made. Where anobligation exists for a new facility or item of plant, such as oil and natural gas production or transportation facilities, this liability will berecognized on construction or installation. Similarly, where an obligation exists for a well, this liability is recognized when it is drilled. Anobligation for decommissioning may also crystallize during the period of operation of a well, facility or item of plant through a change inlegislation or through a decision to terminate operations; an obligation may also arise in cases where an asset has been sold but thesubsequent owner is no longer able to fulfil its decommissioning obligations, for example due to bankruptcy. The amount recognized is thepresent value of the estimated future expenditure determined in accordance with local conditions and requirements. The provision for thecosts of decommissioning wells, production facilities and pipelines at the end of their economic lives is estimated using existing technology, atcurrent prices or future assumptions, depending on the expected timing of the activity, and discounted using the real discount rate. Theweighted average period over which these costs are generally expected to be incurred is estimated to be approximately 17 years.
An amount equivalent to the decommissioning provision is recognized as part of the corresponding intangible asset (in the case of anexploration or appraisal well) or property, plant and equipment. The decommissioning portion of the property, plant and equipment issubsequently depreciated at the same rate as the rest of the asset. Other than the unwinding of discount on the provision, any change in thepresent value of the estimated expenditure is reflected as an adjustment to the provision and the corresponding asset.
Environmental expenditures and liabilitiesEnvironmental expenditures that are required in order for the group to obtain future economic benefits from its assets are capitalized as part ofthose assets. Expenditures that relate to an existing condition caused by past operations that do not contribute to future earnings areexpensed.
Liabilities for environmental costs are recognized when a clean-up is probable and the associated costs can be reliably estimated. Generally,the timing of recognition of these provisions coincides with the commitment to a formal plan of action or, if earlier, on divestment or on closureof inactive sites.
The amount recognized is the best estimate of the expenditure required to settle the obligation. Provisions for environmental liabilities havebeen estimated using existing technology, at current prices and discounted using a real discount rate. The weighted average period over whichthese costs are generally expected to be incurred is estimated to be approximately five years.
BP Annual Report and Form 20-F 2017 137
1. Significant accounting policies, judgements, estimates and assumptions – continuedSignificant judgements and estimates: provisions
For information on estimates and judgements relating to the Gulf of Mexico oil spill, see Note 2.
The group holds provisions for the future decommissioning of oil and natural gas production facilities and pipelines at the end of theireconomic lives. The largest decommissioning obligations facing BP relate to the plugging and abandonment of wells and the removal anddisposal of oil and natural gas platforms and pipelines around the world. Most of these decommissioning events are many years in the futureand the precise requirements that will have to be met when the removal event occurs are uncertain. Decommissioning technologies andcosts are constantly changing, as are political, environmental, safety and public expectations. The timing and amounts of future cash flowsare subject to significant uncertainty and estimation is required in determining the amounts of provisions to be recognized. Any changes inthe expected future costs are reflected in both the provision and the asset.
If oil and natural gas production facilities and pipelines are sold to third parties, judgement is required to assess whether the new owner willbe unable to meet their decommissioning obligations, whether BP would then be responsible for decommissioning, and if so the extent ofthat responsibility.
Decommissioning provisions associated with downstream and petrochemicals facilities are generally not recognized, as the potentialobligations cannot be measured, given their indeterminate settlement dates. The group performs periodic reviews of its downstream andpetrochemicals long-lived assets for any changes in facts and circumstances that might require the recognition of a decommissioningprovision.
The provision for environmental liabilities is estimated based on current legal and constructive requirements, technology, price levels andexpected plans for remediation. Actual costs and cash outflows can differ from current estimates because of changes in laws andregulations, public expectations, prices, discovery and analysis of site conditions and changes in clean-up technology.
The timing and amount of future expenditures relating to decommissioning and environmental liabilities are reviewed annually, together withthe interest rate used in discounting the cash flows. The interest rate used to determine the balance sheet obligations at the end of 2017 wasa real rate of 0.5% (2016 0.5%), which was based on long-dated US government bonds.
Further information about the group’s provisions is provided in Note 21. Changes in assumptions in relation to the group's provisions couldresult in a material change in their carrying amounts within the next financial year.
As described in Note 31, the group is subject to further claims and actions for which no provisions have been recognized. The facts andcircumstances relating to particular cases are evaluated regularly in determining whether a provision relating to a specific litigation should berecognized or revised. Accordingly, significant management judgement relating to provisions and contingent liabilities is required, since theoutcome of litigation is difficult to predict.
Employee benefitsWages, salaries, bonuses, social security contributions, paid annual leave and sick leave are accrued in the period in which the associatedservices are rendered by employees of the group. Deferred bonus arrangements that have a vesting date more than 12 months after thebalance sheet date are valued on an actuarial basis using the projected unit credit method and amortized on a straight-line basis over theservice period until the award vests. The accounting policies for share-based payments and for pensions and other post-retirement benefits aredescribed below.
Share-based payments
Equity-settled transactionsThe cost of equity-settled transactions with employees is measured by reference to the fair value of the equity instruments on the date onwhich they are granted and is recognized as an expense over the vesting period, which ends on the date on which the employees become fullyentitled to the award. A corresponding credit is recognized within equity. Fair value is determined by using an appropriate, widely used,valuation model. In valuing equity-settled transactions, no account is taken of any vesting conditions, other than conditions linked to the price ofthe shares of the company (market conditions). Non-vesting conditions, such as the condition that employees contribute to a savings-relatedplan, are taken into account in the grant-date fair value, and failure to meet a non-vesting condition, where this is within the control of theemployee is treated as a cancellation and any remaining unrecognized cost is expensed.
For other equity-settled share-based payment transactions, the goods or services received and the corresponding increase in equity aremeasured at the fair value of the goods or services received unless their fair value cannot be reliably estimated. If the fair value of the goodsand services received cannot be reliably estimated, the transaction is measured by reference to the fair value of the equity instrumentsgranted.
Cash-settled transactionsThe cost of cash-settled transactions is recognized as an expense over the vesting period, measured by reference to the fair value of thecorresponding liability which is recognized on the balance sheet. The liability is remeasured at fair value at each balance sheet date untilsettlement, with changes in fair value recognized in the income statement.
Pensions and other post-retirement benefitsThe cost of providing benefits under the group’s defined benefit plans is determined separately for each plan using the projected unit creditmethod, which attributes entitlement to benefits to the current period to determine current service cost and to the current and prior periods todetermine the present value of the defined benefit obligation. Past service costs, resulting from either a plan amendment or a curtailment (areduction in future obligations as a result of a material reduction in the plan membership), are recognized immediately when the companybecomes committed to a change.
Net interest expense relating to pensions and other post-retirement benefits, which is recognized in the income statement, represents the netchange in present value of plan obligations and the value of plan assets resulting from the passage of time, and is determined by applying thediscount rate to the present value of the benefit obligation at the start of the year, and to the fair value of plan assets at the start of the year,taking into account expected changes in the obligation or plan assets during the year.
138 BP Annual Report and Form 20-F 2017
1. Significant accounting policies, judgements, estimates and assumptions – continuedRemeasurements of the defined benefit liability and asset, comprising actuarial gains and losses, and the return on plan assets (excludingamounts included in net interest described above) are recognized within other comprehensive income in the period in which they occur andare not subsequently reclassified to profit and loss.
The defined benefit pension plan surplus or deficit recognized on the balance sheet for each plan comprises the difference between thepresent value of the defined benefit obligation (using a discount rate based on high quality corporate bonds) and the fair value of plan assetsout of which the obligations are to be settled directly. Fair value is based on market price information and, in the case of quoted securities, isthe published bid price. Defined benefit pension plan surpluses are only recognized to the extent they are recoverable, typically by way ofrefund.
Contributions to defined contribution plans are recognized in the income statement in the period in which they become payable.
Significant estimate: pensions and other post-retirement benefits
Accounting for defined benefit pensions and other post-retirement benefits involves making significant estimates when measuring thegroup's pension plan surpluses and deficits. These estimates require assumptions to be made about many uncertainties.
Pensions and other post-retirement benefit assumptions are reviewed by management at the end of each year. These assumptions are usedto determine the projected benefit obligation at the year end and hence the surpluses and deficits recorded on the group's balance sheet,and pension and other post-retirement benefit expense for the following year.
The assumptions that are the most significant to the amounts reported are the discount rate, inflation rate, salary growth and mortality levels.Assumptions about these variables are based on the environment in each country. The assumptions used vary from year to year, withresultant effects on future net income and net assets. Changes to some of these assumptions, in particular the discount rate and inflationrate, could result in material changes to the carrying amounts of the group's pension and other post-retirement benefit obligations within thenext financial year. Any differences between these assumptions and the actual outcome will also affect future net income and net assets.
The values ascribed to these assumptions and a sensitivity analysis of the impact of changes in the assumptions on the benefit expense andobligation used are provided in Note 22.
Income taxesIncome tax expense represents the sum of current tax and deferred tax.
Income tax is recognized in the income statement, except to the extent that it relates to items recognized in other comprehensive income ordirectly in equity, in which case the related tax is recognized in other comprehensive income or directly in equity.
Current tax is based on the taxable profit for the period. Taxable profit differs from net profit as reported in the income statement because it isdetermined in accordance with the rules established by the applicable taxation authorities. It therefore excludes items of income or expensethat are taxable or deductible in other periods as well as items that are never taxable or deductible. The group’s liability for current tax iscalculated using tax rates and laws that have been enacted or substantively enacted by the balance sheet date.
Deferred tax is provided, using the liability method, on temporary differences at the balance sheet date between the tax bases of assets andliabilities and their carrying amounts for financial reporting purposes. Deferred tax liabilities are recognized for all taxable temporary differencesexcept:
• where the deferred tax liability arises on the initial recognition of goodwill
• where the deferred tax liability arises on the initial recognition of an asset or liability in a transaction that is not a business combination and,at the time of the transaction, affects neither accounting profit nor taxable profit or loss
• in respect of taxable temporary differences associated with investments in subsidiaries and associates and interests in joint arrangements,where the group is able to control the timing of the reversal of the temporary differences and it is probable that the temporary differenceswill not reverse in the foreseeable future.
Deferred tax assets are recognized for deductible temporary differences, carry-forward of unused tax credits and unused tax losses, to theextent that it is probable that taxable profit will be available against which the deductible temporary differences and the carry-forward ofunused tax credits and unused tax losses can be utilized except where the deferred tax asset relating to the deductible temporary differencearises from the initial recognition of an asset or liability in a transaction that is not a business combination and, at the time of the transaction,affects neither accounting profit nor taxable profit or loss. In respect of deductible temporary differences associated with investments insubsidiaries and associates and interests in joint arrangements, deferred tax assets are recognized only to the extent that it is probable that thetemporary differences will reverse in the foreseeable future and taxable profit will be available against which the temporary differences can beutilized.
The carrying amount of deferred tax assets is reviewed at each balance sheet date and reduced to the extent that it is no longer probable thatsufficient taxable profit will be available to allow all or part of the deferred tax asset to be utilized.
Deferred tax assets and liabilities are measured at the tax rates that are expected to apply in the period when the asset is realized or theliability is settled, based on tax rates (and tax laws) that have been enacted or substantively enacted at the balance sheet date. Deferred taxassets and liabilities are not discounted.
Deferred tax assets and liabilities are offset only when there is a legally enforceable right to set off current tax assets against current taxliabilities and when the deferred tax assets and liabilities relate to income taxes levied by the same taxation authority on either the sametaxable entity or different taxable entities where there is an intention to settle the current tax assets and liabilities on a net basis or to realizethe assets and settle the liabilities simultaneously.
Where tax treatments are uncertain, if it is considered probable that a taxation authority will accept the group's proposed tax treatment,income taxes are recognized consistent with the group's income tax filings. If it is not considered probable, the uncertainty is reflected usingeither the most likely amount or an expected value, depending on which method better predicts the resolution of the uncertainty.
BP Annual Report and Form 20-F 2017 139
1. Significant accounting policies, judgements, estimates and assumptions – continuedSignificant judgements and estimates: income taxes
The computation of the group’s income tax expense and liability involves the interpretation of applicable tax laws and regulations in manyjurisdictions throughout the world. The resolution of tax positions taken by the group, through negotiations with relevant tax authorities orthrough litigation, can take several years to complete and in some cases it is difficult to predict the ultimate outcome. Therefore, judgementis required to determine whether provisions for income taxes are required and, if so, estimation is required of the amounts that could bepayable.
In addition, the group has carry-forward tax losses and tax credits in certain taxing jurisdictions that are available to offset against futuretaxable profit. However, deferred tax assets are recognized only to the extent that it is probable that taxable profit will be available againstwhich the unused tax losses or tax credits can be utilized. Management judgement is exercised in assessing whether this is the case andestimates are required to be made of the amount of future taxable profits that will be available.
To the extent that actual outcomes differ from management’s estimates, income tax charges or credits, and changes in current and deferredtax assets or liabilities, may arise in future periods. For more information see Note 7.
The United States Tax Cuts and Jobs Act (‘the Act’) was signed into US law on 22 December 2017 and introduces significant modifications toincome tax rates and the overall basis for determining tax payable on the foreign earnings of US group companies. Changes to current anddeferred tax have been made based on the newly enacted law which is still subject to further clarification. Estimates and assumptions havebeen made where necessary to assess the impact of the Act on the group's tax balances and positions. These calculations will continue tobe refined as information and clarifications from US legislative and regulatory bodies become available. See Note 7 for further information onthe impact for the year ended 31 December 2017.
Judgement is also required when determining whether a particular tax is an income tax or another type of tax (for example a production tax).Accounting for deferred tax is applied to income taxes as described above, but is not applied to other types of taxes; rather such taxes arerecognized in the income statement on an appropriate basis. In December 2016 BP renewed its onshore concession in Abu Dhabi. As a resultof changes in the fiscal terms of the arrangement, the group's taxes payable relating to the concession are now principally reported asincome taxes rather than as production taxes.
Customs duties and sales taxesCustoms duties and sales taxes which are passed on to customers are excluded from revenues and expenses. Assets and liabilities arerecognized net of the amount of customs duties or sales tax except:
• Customs duties or sales taxes incurred on the purchase of goods and services which are not recoverable from the taxation authority arerecognized as part of the cost of acquisition of the asset.
• Receivables and payables are stated with the amount of customs duty or sales tax included.
The net amount of sales tax recoverable from, or payable to, the taxation authority is included within receivables or payables in the balancesheet.
Own equity instruments – treasury sharesThe group’s holdings in its own equity instruments are shown as deductions from shareholders’ equity at cost. Treasury shares represent BPshares repurchased and available for specific and limited purposes. For accounting purposes, shares held in Employee Share Ownership Plans(ESOPs) to meet the future requirements of the employee share-based payment plans are treated in the same manner as treasury shares andare, therefore, included in the financial statements as treasury shares. Consideration, if any, received for the sale of such shares is alsorecognized in equity, with any difference between the proceeds from sale and the original cost being taken to the profit and loss accountreserve. No gain or loss is recognized in the income statement on the purchase, sale, issue or cancellation of equity shares. Sharesrepurchased under the share buy-back programme which are immediately cancelled are not shown as treasury shares, but are shown as adeduction from the profit and loss account reserve in the group statement of changes in equity.
RevenueRevenue arising from the sale of goods is recognized when the significant risks and rewards of ownership have passed to the buyer, which istypically at the point that title passes, and the revenue can be reliably measured.
Revenue is measured at the fair value of the consideration received or receivable and represents amounts receivable for goods provided in thenormal course of business, net of discounts, customs duties and sales taxes.
Physical exchanges are reported net, as are sales and purchases made with a common counterparty, as part of an arrangement similar to aphysical exchange. Similarly, where the group acts as agent on behalf of a third party to procure or market energy commodities, any associatedfee income is recognized but no purchase or sale is recorded. Additionally, where forward sale and purchase contracts for oil, natural gas orpower have been determined to be for short-term trading purposes, the associated sales and purchases are reported net within sales andother operating revenues whether or not physical delivery has occurred.
Generally, revenues from the production of oil and natural gas properties in which the group has an interest with joint operation partners arerecognized on the basis of the group’s working interest in those properties (the entitlement method). Differences between the production soldand the group’s share of production are not significant.
Finance costsFinance costs directly attributable to the acquisition, construction or production of qualifying assets, which are assets that necessarily take asubstantial period of time to get ready for their intended use, are added to the cost of those assets until such time as the assets aresubstantially ready for their intended use. All other finance costs are recognized in the income statement in the period in which they areincurred.
Impact of new International Financial Reporting StandardsThe group adopted Disclosure Initiative: Amendments to IAS 7 ‘Statement of cash flows’ with effect from 1 January 2017. The amendmentsrequire the disclosure of information that enables users of the financial statements to evaluate changes in liabilities arising from financingactivities, including changes arising from cash flows and non-cash changes. The amendments do not have any impact upon the primaryfinancial statements. See Note 25 for further information.
140 BP Annual Report and Form 20-F 2017
1. Significant accounting policies, judgements, estimates and assumptions – continuedThere are no other new or amended standards or interpretations adopted during the year that have a significant impact on the financialstatements.
Not yet adoptedThe following three pronouncements from the IASB will become effective for future financial reporting periods and have not been adopted bythe group in these financial statements. Each of the standards has been adopted by the EU. There are no other standards and interpretations inissue but not yet adopted that the directors anticipate will have a material effect on the reported income or net assets of the group.
IFRS 9 'Financial Instruments' IFRS 9 ‘Financial Instruments’ was issued in July 2014 and replaces IAS 39 ‘Financial Instruments: Recognition and Measurement.’ BP willadopt IFRS 9 in the financial reporting period commencing 1 January 2018.
IFRS 9 provides a single classification and measurement approach for financial assets that reflects the business model in which they aremanaged and their cash flow characteristics. Under the new standard the group’s financial assets will be classified as measured at amortisedcost, fair value through profit or loss, or fair value through other comprehensive income. For financial liabilities the existing classification andmeasurement requirements of IAS 39 are largely retained. Whilst financial assets will be reclassified into the categories required by IFRS 9, thegroup has not identified any significant impacts on the measurement of its financial assets and financial liabilities as a result of theclassification and measurement requirements of the new standard. However, for existing equity instruments classified as available-for-saleinvestments under IAS 39, we intend to recognize fair value gains and losses in profit or loss under IFRS 9, rather than in other comprehensiveincome as was the case under IAS 39. An adjustment to the 2018 opening balance sheet is expected to be made to transfer $17 million of fairvalue gains net of related tax from the available-for-sale investments reserve to the profit and loss account reserve. Prospectively, fair valuegains and losses on new equity instruments may be recognized either in profit or loss or in other comprehensive income as an election on aninstrument-by-instrument basis on initial recognition.
The financial asset impairment requirements of IFRS 9 introduce a forward-looking expected credit loss model that results in earlier recognitionof credit losses than the incurred loss model of IAS 39. Given the short-term nature of the majority of its financial assets and the group’s activemanagement of credit risk, the group does not expect a significant impact on adoption of IFRS 9’s impairment requirements. The adjustment tothe 2018 opening balance sheet, which will reduce both the carrying amounts of financial assets and the profit and loss account reserve,makes up the majority of the adjustment on adoption of IFRS 9 in the table below. Subsequent movements in the expected loss reserve will berecognized in profit or loss.
The hedge accounting requirements of IFRS 9 have been simplified and are more closely aligned to an entity’s risk management strategy.Under IFRS 9 all existing hedging relationships will qualify as continuing hedging relationships and the group also intends to apply hedgeaccounting prospectively to certain of its commodity price risk management activities for which hedge accounting was not possible under IAS39. This will have no impact on the 2018 opening balance sheet.
IFRS 9 also introduces a new way of treating fair value movements on the time value and cross currency basis spreads of certain hedginginstruments. Whereas under IAS 39 these movements were recognized in profit or loss, the group is either required, or will elect, to initiallyrecognize these movements within equity to the extent that they relate to the hedged item. An adjustment to the 2018 opening balance sheetis expected to be made to transfer $37 million of losses net of related tax from the profit and loss account reserve to the costs of hedgingreserve for relevant hedging instruments existing on transition.
The expected overall impact of transition on 2018 opening net assets is summarized below. $ million
Net assets
At 31 December 2017 100,404Adjustment on adoption of IFRS 9 net of tax and including the group's share of equity-accounted entitiesa (180)At 1 January 2018 100,224
a The adjustment on adoption of IFRS 9 mainly relates to an increase in the credit reserve of financial assets in the scope of IFRS 9’s impairment requirements. IFRS 9 requires credit lossesto be recognized on an expected rather than incurred loss basis as was the case under IAS 39. The profit and loss account reserve is expected to reduce by an equivalent amount.
Other minor reserves adjustments, as described above, are expected to result in an increase to the profit and loss reserve of $54 million offsetby a reduction in the available-for-sale reserve of $17 million and creation of the costs of hedging reserve of $37 million.
Under IAS 39 the effective portion of the gain or loss on a cash flow hedging instrument is reported in other comprehensive income and isreclassified to the balance sheet as part of the initial carrying amount of the corresponding non-financial asset or liability. Under IFRS 9 theeffective portion of the gain or loss continues to be reported in the statement of other comprehensive income but the transfer to the balancesheet will be shown in the statement of changes in equity.
IFRS 15 ‘Revenue from Contracts with Customers’ IFRS 15 ‘Revenue from Contracts with Customers’ was issued in May 2014 and replaces IAS 18 ‘Revenue’ and certain other standards andinterpretations. IFRS 15 provides a single model of accounting for revenue arising from contracts with customers, focusing on the identificationand satisfaction of performance obligations. BP will adopt IFRS 15 in the financial reporting period commencing 1 January 2018 and has electedto apply the 'modified retrospective' transition approach to implementation.
Under IFRS 15, revenue from contracts with customers is recognized when or as the group satisfies a performance obligation by transferring apromised good or service to a customer. A good or service is transferred when the customer obtains control of that good or service. Thetransfer of control of oil, natural gas, natural gas liquids, LNG, petroleum and chemical products, and other items sold by the group usuallycoincides with title passing to the customer and the customer taking physical possession. The group principally satisfies its performanceobligations at a point in time and the amounts of revenue recognized relating to performance obligations satisfied over time are not significant.The accounting for revenue under IFRS 15 does not, therefore, represent a substantive change from the group’s current practice forrecognizing revenue from sales to customers.
Certain changes in accounting arising from the implementation of IFRS 15 have been identified but the new standard has had no materialeffect on the group’s net assets as at 1 January 2018 and so no transition adjustment will be presented.
The most significant change identified is the accounting for revenues relating to oil and natural gas properties in which the group has aninterest with joint operation partners. From 1 January 2018, BP ceased recognizing revenue in relation to the group's entitlement to theproduction from oil and gas properties based on its working interest, irrespective of whether the production was taken and sold to customers.
BP Annual Report and Form 20-F 2017 141
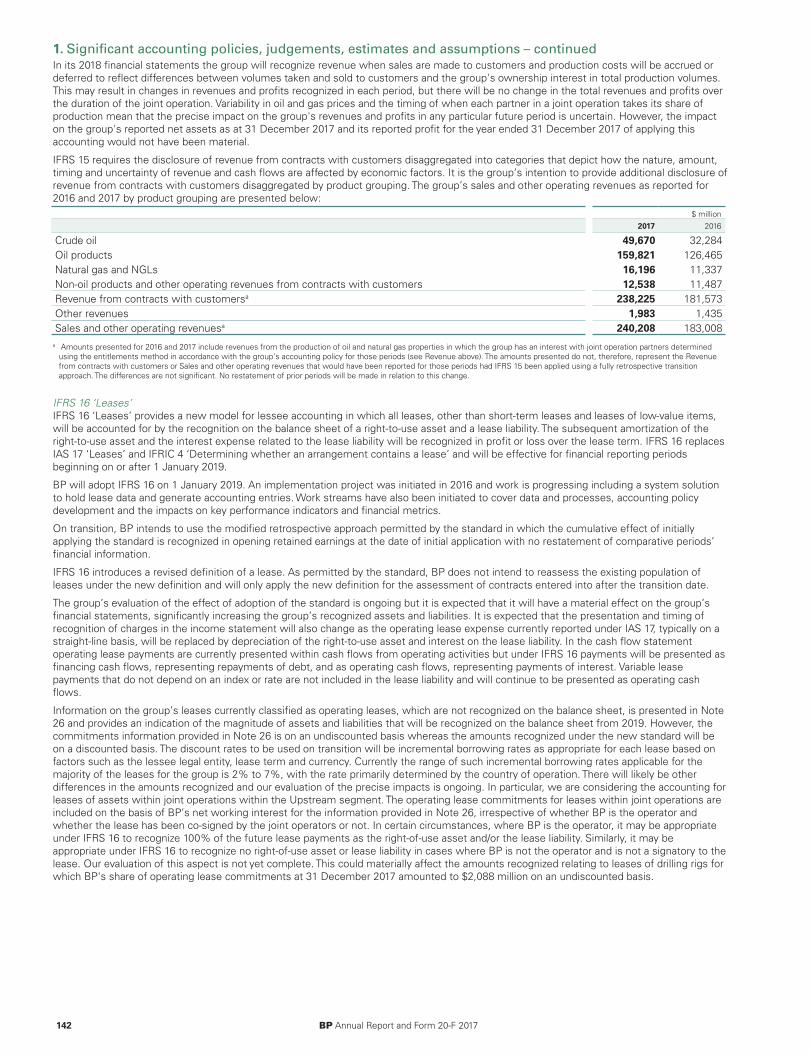
1. Significant accounting policies, judgements, estimates and assumptions – continuedIn its 2018 financial statements the group will recognize revenue when sales are made to customers and production costs will be accrued ordeferred to reflect differences between volumes taken and sold to customers and the group's ownership interest in total production volumes.This may result in changes in revenues and profits recognized in each period, but there will be no change in the total revenues and profits overthe duration of the joint operation. Variability in oil and gas prices and the timing of when each partner in a joint operation takes its share ofproduction mean that the precise impact on the group's revenues and profits in any particular future period is uncertain. However, the impacton the group's reported net assets as at 31 December 2017 and its reported profit for the year ended 31 December 2017 of applying thisaccounting would not have been material.
IFRS 15 requires the disclosure of revenue from contracts with customers disaggregated into categories that depict how the nature, amount,timing and uncertainty of revenue and cash flows are affected by economic factors. It is the group’s intention to provide additional disclosure ofrevenue from contracts with customers disaggregated by product grouping. The group’s sales and other operating revenues as reported for2016 and 2017 by product grouping are presented below:
$ million2017 2016
Crude oil 49,670 32,284Oil products 159,821 126,465Natural gas and NGLs 16,196 11,337Non-oil products and other operating revenues from contracts with customers 12,538 11,487Revenue from contracts with customersa 238,225 181,573Other revenues 1,983 1,435Sales and other operating revenuesa 240,208 183,008
a Amounts presented for 2016 and 2017 include revenues from the production of oil and natural gas properties in which the group has an interest with joint operation partners determinedusing the entitlements method in accordance with the group's accounting policy for those periods (see Revenue above). The amounts presented do not, therefore, represent the Revenuefrom contracts with customers or Sales and other operating revenues that would have been reported for those periods had IFRS 15 been applied using a fully retrospective transitionapproach. The differences are not significant. No restatement of prior periods will be made in relation to this change.
IFRS 16 ‘Leases’ IFRS 16 ‘Leases’ provides a new model for lessee accounting in which all leases, other than short-term leases and leases of low-value items,will be accounted for by the recognition on the balance sheet of a right-to-use asset and a lease liability. The subsequent amortization of theright-to-use asset and the interest expense related to the lease liability will be recognized in profit or loss over the lease term. IFRS 16 replacesIAS 17 ‘Leases’ and IFRIC 4 ‘Determining whether an arrangement contains a lease’ and will be effective for financial reporting periodsbeginning on or after 1 January 2019.
BP will adopt IFRS 16 on 1 January 2019. An implementation project was initiated in 2016 and work is progressing including a system solutionto hold lease data and generate accounting entries. Work streams have also been initiated to cover data and processes, accounting policydevelopment and the impacts on key performance indicators and financial metrics.
On transition, BP intends to use the modified retrospective approach permitted by the standard in which the cumulative effect of initiallyapplying the standard is recognized in opening retained earnings at the date of initial application with no restatement of comparative periods’financial information.
IFRS 16 introduces a revised definition of a lease. As permitted by the standard, BP does not intend to reassess the existing population ofleases under the new definition and will only apply the new definition for the assessment of contracts entered into after the transition date.
The group’s evaluation of the effect of adoption of the standard is ongoing but it is expected that it will have a material effect on the group’sfinancial statements, significantly increasing the group’s recognized assets and liabilities. It is expected that the presentation and timing ofrecognition of charges in the income statement will also change as the operating lease expense currently reported under IAS 17, typically on astraight-line basis, will be replaced by depreciation of the right-to-use asset and interest on the lease liability. In the cash flow statementoperating lease payments are currently presented within cash flows from operating activities but under IFRS 16 payments will be presented asfinancing cash flows, representing repayments of debt, and as operating cash flows, representing payments of interest. Variable leasepayments that do not depend on an index or rate are not included in the lease liability and will continue to be presented as operating cashflows.
Information on the group’s leases currently classified as operating leases, which are not recognized on the balance sheet, is presented in Note26 and provides an indication of the magnitude of assets and liabilities that will be recognized on the balance sheet from 2019. However, thecommitments information provided in Note 26 is on an undiscounted basis whereas the amounts recognized under the new standard will beon a discounted basis. The discount rates to be used on transition will be incremental borrowing rates as appropriate for each lease based onfactors such as the lessee legal entity, lease term and currency. Currently the range of such incremental borrowing rates applicable for themajority of the leases for the group is 2% to 7%, with the rate primarily determined by the country of operation. There will likely be otherdifferences in the amounts recognized and our evaluation of the precise impacts is ongoing. In particular, we are considering the accounting forleases of assets within joint operations within the Upstream segment. The operating lease commitments for leases within joint operations areincluded on the basis of BP’s net working interest for the information provided in Note 26, irrespective of whether BP is the operator andwhether the lease has been co-signed by the joint operators or not. In certain circumstances, where BP is the operator, it may be appropriateunder IFRS 16 to recognize 100% of the future lease payments as the right-of-use asset and/or the lease liability. Similarly, it may beappropriate under IFRS 16 to recognize no right-of-use asset or lease liability in cases where BP is not the operator and is not a signatory to thelease. Our evaluation of this aspect is not yet complete. This could materially affect the amounts recognized relating to leases of drilling rigs forwhich BP's share of operating lease commitments at 31 December 2017 amounted to $2,088 million on an undiscounted basis.
142 BP Annual Report and Form 20-F 2017
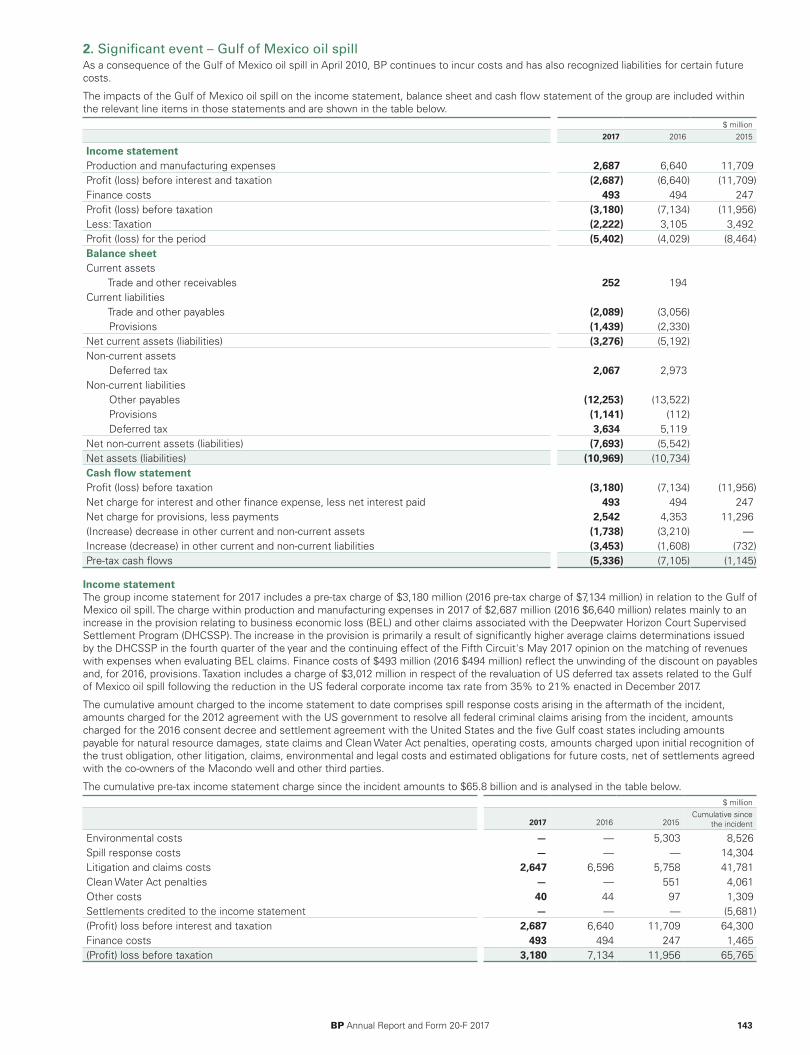
2. Significant event – Gulf of Mexico oil spill As a consequence of the Gulf of Mexico oil spill in April 2010, BP continues to incur costs and has also recognized liabilities for certain futurecosts.
The impacts of the Gulf of Mexico oil spill on the income statement, balance sheet and cash flow statement of the group are included withinthe relevant line items in those statements and are shown in the table below.
$ million2017 2016 2015
Income statementProduction and manufacturing expenses 2,687 6,640 11,709Profit (loss) before interest and taxation (2,687) (6,640) (11,709)Finance costs 493 494 247Profit (loss) before taxation (3,180) (7,134) (11,956)Less: Taxation (2,222) 3,105 3,492Profit (loss) for the period (5,402) (4,029) (8,464)Balance sheetCurrent assets
Trade and other receivables 252 194Current liabilities
Trade and other payables (2,089) (3,056) Provisions (1,439) (2,330)
Net current assets (liabilities) (3,276) (5,192)Non-current assets
Deferred tax 2,067 2,973Non-current liabilities
Other payables (12,253) (13,522) Provisions (1,141) (112) Deferred tax 3,634 5,119
Net non-current assets (liabilities) (7,693) (5,542)Net assets (liabilities) (10,969) (10,734)Cash flow statementProfit (loss) before taxation (3,180) (7,134) (11,956)Net charge for interest and other finance expense, less net interest paid 493 494 247Net charge for provisions, less payments 2,542 4,353 11,296(Increase) decrease in other current and non-current assets (1,738) (3,210) —Increase (decrease) in other current and non-current liabilities (3,453) (1,608) (732)Pre-tax cash flows (5,336) (7,105) (1,145)
Income statementThe group income statement for 2017 includes a pre-tax charge of $3,180 million (2016 pre-tax charge of $7,134 million) in relation to the Gulf ofMexico oil spill. The charge within production and manufacturing expenses in 2017 of $2,687 million (2016 $6,640 million) relates mainly to anincrease in the provision relating to business economic loss (BEL) and other claims associated with the Deepwater Horizon Court SupervisedSettlement Program (DHCSSP). The increase in the provision is primarily a result of significantly higher average claims determinations issuedby the DHCSSP in the fourth quarter of the year and the continuing effect of the Fifth Circuit's May 2017 opinion on the matching of revenueswith expenses when evaluating BEL claims. Finance costs of $493 million (2016 $494 million) reflect the unwinding of the discount on payablesand, for 2016, provisions. Taxation includes a charge of $3,012 million in respect of the revaluation of US deferred tax assets related to the Gulfof Mexico oil spill following the reduction in the US federal corporate income tax rate from 35% to 21% enacted in December 2017.
The cumulative amount charged to the income statement to date comprises spill response costs arising in the aftermath of the incident,amounts charged for the 2012 agreement with the US government to resolve all federal criminal claims arising from the incident, amountscharged for the 2016 consent decree and settlement agreement with the United States and the five Gulf coast states including amountspayable for natural resource damages, state claims and Clean Water Act penalties, operating costs, amounts charged upon initial recognition ofthe trust obligation, other litigation, claims, environmental and legal costs and estimated obligations for future costs, net of settlements agreedwith the co-owners of the Macondo well and other third parties.
The cumulative pre-tax income statement charge since the incident amounts to $65.8 billion and is analysed in the table below.$ million
2017 2016 2015Cumulative since
the incident
Environmental costs — — 5,303 8,526Spill response costs — — — 14,304Litigation and claims costs 2,647 6,596 5,758 41,781Clean Water Act penalties — — 551 4,061Other costs 40 44 97 1,309Settlements credited to the income statement — — — (5,681)(Profit) loss before interest and taxation 2,687 6,640 11,709 64,300Finance costs 493 494 247 1,465(Profit) loss before taxation 3,180 7,134 11,956 65,765
BP Annual Report and Form 20-F 2017 143
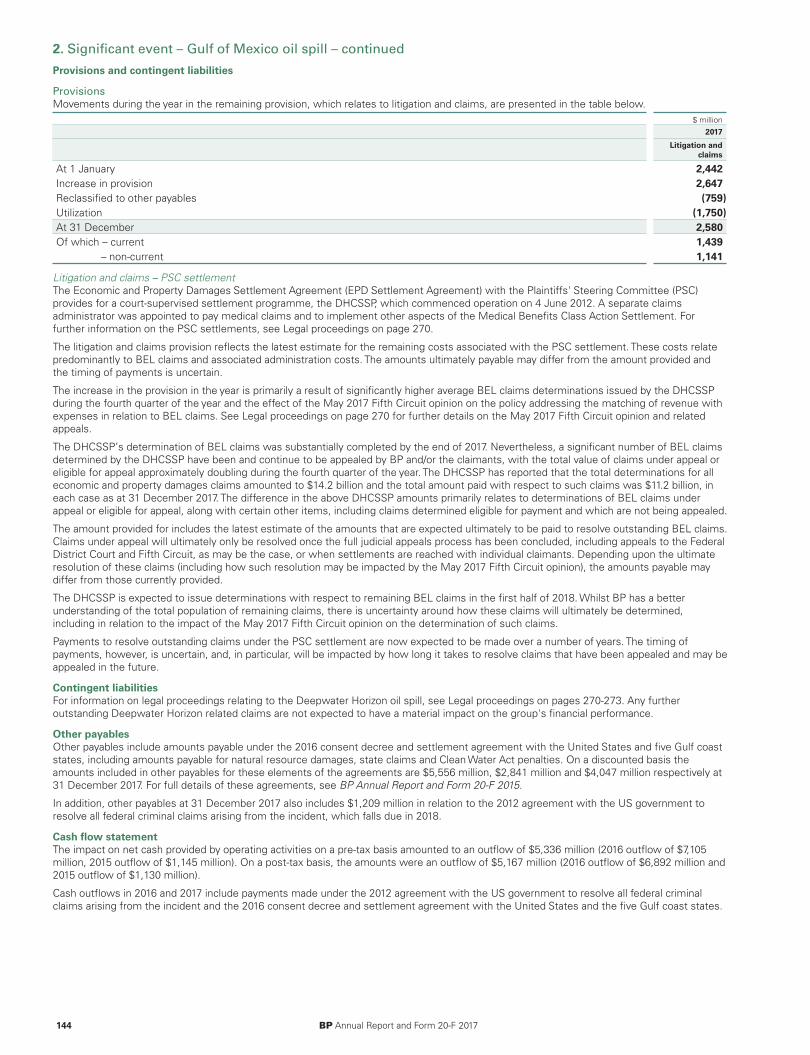
2. Significant event – Gulf of Mexico oil spill – continued
Provisions and contingent liabilities
ProvisionsMovements during the year in the remaining provision, which relates to litigation and claims, are presented in the table below.
$ million2017
Litigation andclaims
At 1 January 2,442Increase in provision 2,647Reclassified to other payables (759)Utilization (1,750)At 31 December 2,580Of which – current 1,439
– non-current 1,141
Litigation and claims – PSC settlement The Economic and Property Damages Settlement Agreement (EPD Settlement Agreement) with the Plaintiffs' Steering Committee (PSC)provides for a court-supervised settlement programme, the DHCSSP, which commenced operation on 4 June 2012. A separate claimsadministrator was appointed to pay medical claims and to implement other aspects of the Medical Benefits Class Action Settlement. Forfurther information on the PSC settlements, see Legal proceedings on page 270.
The litigation and claims provision reflects the latest estimate for the remaining costs associated with the PSC settlement. These costs relatepredominantly to BEL claims and associated administration costs. The amounts ultimately payable may differ from the amount provided andthe timing of payments is uncertain.
The increase in the provision in the year is primarily a result of significantly higher average BEL claims determinations issued by the DHCSSPduring the fourth quarter of the year and the effect of the May 2017 Fifth Circuit opinion on the policy addressing the matching of revenue withexpenses in relation to BEL claims. See Legal proceedings on page 270 for further details on the May 2017 Fifth Circuit opinion and relatedappeals.
The DHCSSP’s determination of BEL claims was substantially completed by the end of 2017. Nevertheless, a significant number of BEL claimsdetermined by the DHCSSP have been and continue to be appealed by BP and/or the claimants, with the total value of claims under appeal oreligible for appeal approximately doubling during the fourth quarter of the year. The DHCSSP has reported that the total determinations for alleconomic and property damages claims amounted to $14.2 billion and the total amount paid with respect to such claims was $11.2 billion, ineach case as at 31 December 2017. The difference in the above DHCSSP amounts primarily relates to determinations of BEL claims underappeal or eligible for appeal, along with certain other items, including claims determined eligible for payment and which are not being appealed.
The amount provided for includes the latest estimate of the amounts that are expected ultimately to be paid to resolve outstanding BEL claims.Claims under appeal will ultimately only be resolved once the full judicial appeals process has been concluded, including appeals to the FederalDistrict Court and Fifth Circuit, as may be the case, or when settlements are reached with individual claimants. Depending upon the ultimateresolution of these claims (including how such resolution may be impacted by the May 2017 Fifth Circuit opinion), the amounts payable maydiffer from those currently provided.
The DHCSSP is expected to issue determinations with respect to remaining BEL claims in the first half of 2018. Whilst BP has a betterunderstanding of the total population of remaining claims, there is uncertainty around how these claims will ultimately be determined,including in relation to the impact of the May 2017 Fifth Circuit opinion on the determination of such claims.
Payments to resolve outstanding claims under the PSC settlement are now expected to be made over a number of years. The timing ofpayments, however, is uncertain, and, in particular, will be impacted by how long it takes to resolve claims that have been appealed and may beappealed in the future.
Contingent liabilitiesFor information on legal proceedings relating to the Deepwater Horizon oil spill, see Legal proceedings on pages 270-273. Any furtheroutstanding Deepwater Horizon related claims are not expected to have a material impact on the group's financial performance.
Other payablesOther payables include amounts payable under the 2016 consent decree and settlement agreement with the United States and five Gulf coaststates, including amounts payable for natural resource damages, state claims and Clean Water Act penalties. On a discounted basis theamounts included in other payables for these elements of the agreements are $5,556 million, $2,841 million and $4,047 million respectively at31 December 2017. For full details of these agreements, see BP Annual Report and Form 20-F 2015.
In addition, other payables at 31 December 2017 also includes $1,209 million in relation to the 2012 agreement with the US government toresolve all federal criminal claims arising from the incident, which falls due in 2018.
Cash flow statementThe impact on net cash provided by operating activities on a pre-tax basis amounted to an outflow of $5,336 million (2016 outflow of $7,105million, 2015 outflow of $1,145 million). On a post-tax basis, the amounts were an outflow of $5,167 million (2016 outflow of $6,892 million and2015 outflow of $1,130 million).
Cash outflows in 2016 and 2017 include payments made under the 2012 agreement with the US government to resolve all federal criminalclaims arising from the incident and the 2016 consent decree and settlement agreement with the United States and the five Gulf coast states.
144 BP Annual Report and Form 20-F 2017
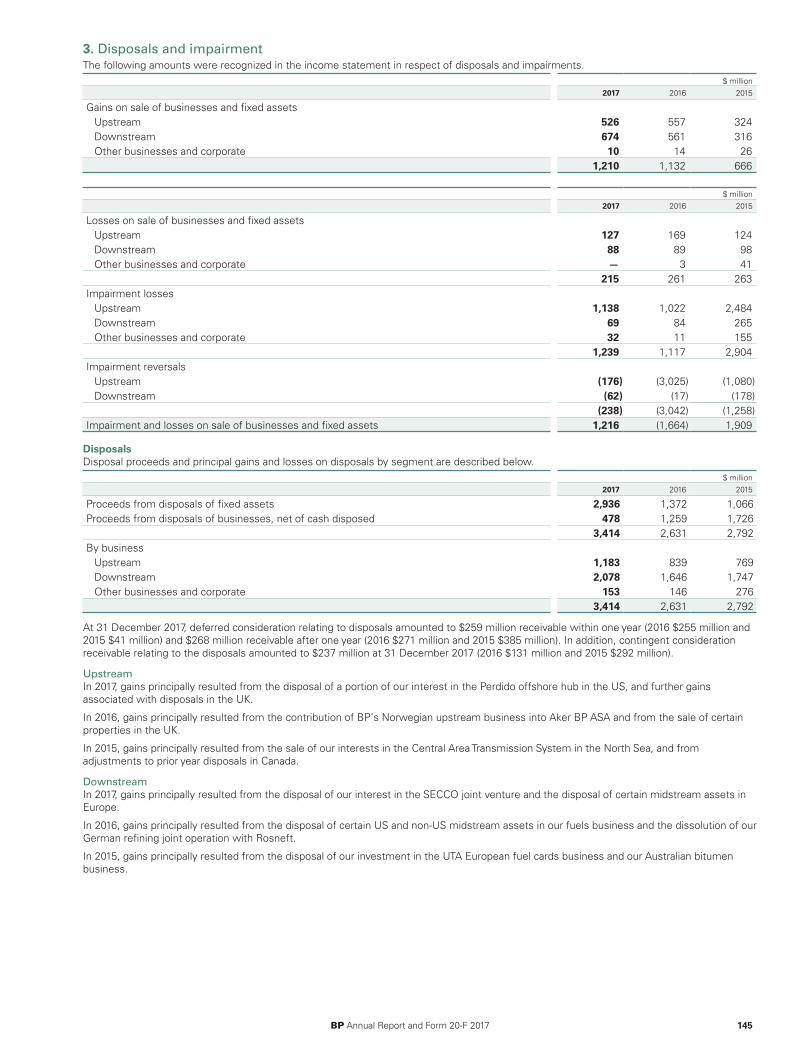
3. Disposals and impairment The following amounts were recognized in the income statement in respect of disposals and impairments.
$ million2017 2016 2015
Gains on sale of businesses and fixed assetsUpstream 526 557 324Downstream 674 561 316Other businesses and corporate 10 14 26
1,210 1,132 666
$ million2017 2016 2015
Losses on sale of businesses and fixed assetsUpstream 127 169 124Downstream 88 89 98Other businesses and corporate — 3 41
215 261 263Impairment losses
Upstream 1,138 1,022 2,484Downstream 69 84 265Other businesses and corporate 32 11 155
1,239 1,117 2,904Impairment reversals
Upstream (176) (3,025) (1,080)Downstream (62) (17) (178)
(238) (3,042) (1,258)Impairment and losses on sale of businesses and fixed assets 1,216 (1,664) 1,909
DisposalsDisposal proceeds and principal gains and losses on disposals by segment are described below.
$ million2017 2016 2015
Proceeds from disposals of fixed assets 2,936 1,372 1,066Proceeds from disposals of businesses, net of cash disposed 478 1,259 1,726
3,414 2,631 2,792By business
Upstream 1,183 839 769Downstream 2,078 1,646 1,747Other businesses and corporate 153 146 276
3,414 2,631 2,792
At 31 December 2017, deferred consideration relating to disposals amounted to $259 million receivable within one year (2016 $255 million and2015 $41 million) and $268 million receivable after one year (2016 $271 million and 2015 $385 million). In addition, contingent considerationreceivable relating to the disposals amounted to $237 million at 31 December 2017 (2016 $131 million and 2015 $292 million).
UpstreamIn 2017, gains principally resulted from the disposal of a portion of our interest in the Perdido offshore hub in the US, and further gainsassociated with disposals in the UK.
In 2016, gains principally resulted from the contribution of BP’s Norwegian upstream business into Aker BP ASA and from the sale of certainproperties in the UK.
In 2015, gains principally resulted from the sale of our interests in the Central Area Transmission System in the North Sea, and fromadjustments to prior year disposals in Canada.
DownstreamIn 2017, gains principally resulted from the disposal of our interest in the SECCO joint venture and the disposal of certain midstream assets inEurope.
In 2016, gains principally resulted from the disposal of certain US and non-US midstream assets in our fuels business and the dissolution of ourGerman refining joint operation with Rosneft.
In 2015, gains principally resulted from the disposal of our investment in the UTA European fuel cards business and our Australian bitumenbusiness.
BP Annual Report and Form 20-F 2017 145
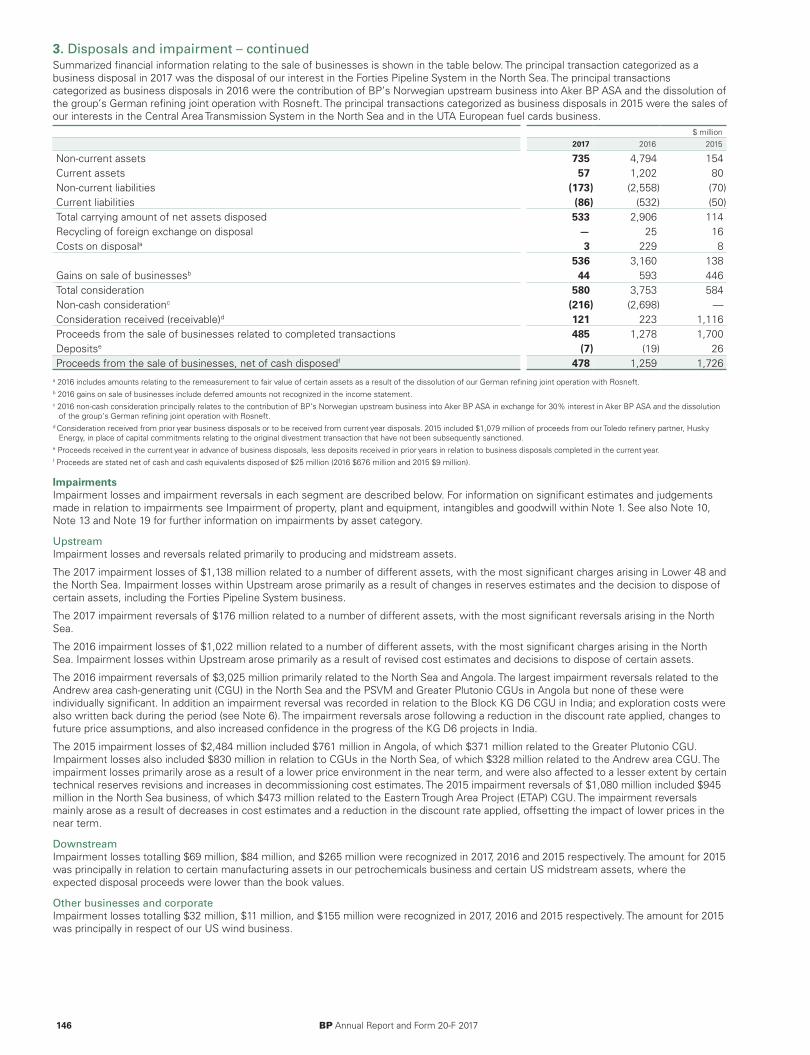
3. Disposals and impairment – continuedSummarized financial information relating to the sale of businesses is shown in the table below. The principal transaction categorized as abusiness disposal in 2017 was the disposal of our interest in the Forties Pipeline System in the North Sea. The principal transactionscategorized as business disposals in 2016 were the contribution of BP’s Norwegian upstream business into Aker BP ASA and the dissolution ofthe group’s German refining joint operation with Rosneft. The principal transactions categorized as business disposals in 2015 were the sales ofour interests in the Central Area Transmission System in the North Sea and in the UTA European fuel cards business.
$ million2017 2016 2015
Non-current assets 735 4,794 154Current assets 57 1,202 80Non-current liabilities (173) (2,558) (70)Current liabilities (86) (532) (50)Total carrying amount of net assets disposed 533 2,906 114Recycling of foreign exchange on disposal — 25 16Costs on disposala 3 229 8
536 3,160 138Gains on sale of businessesb 44 593 446Total consideration 580 3,753 584Non-cash considerationc (216) (2,698) —Consideration received (receivable)d 121 223 1,116Proceeds from the sale of businesses related to completed transactions 485 1,278 1,700Depositse (7) (19) 26Proceeds from the sale of businesses, net of cash disposedf 478 1,259 1,726
a 2016 includes amounts relating to the remeasurement to fair value of certain assets as a result of the dissolution of our German refining joint operation with Rosneft.b 2016 gains on sale of businesses include deferred amounts not recognized in the income statement.c 2016 non-cash consideration principally relates to the contribution of BP’s Norwegian upstream business into Aker BP ASA in exchange for 30% interest in Aker BP ASA and the dissolution
of the group’s German refining joint operation with Rosneft.d Consideration received from prior year business disposals or to be received from current year disposals. 2015 included $1,079 million of proceeds from our Toledo refinery partner, Husky
Energy, in place of capital commitments relating to the original divestment transaction that have not been subsequently sanctioned.e Proceeds received in the current year in advance of business disposals, less deposits received in prior years in relation to business disposals completed in the current year.f Proceeds are stated net of cash and cash equivalents disposed of $25 million (2016 $676 million and 2015 $9 million).
ImpairmentsImpairment losses and impairment reversals in each segment are described below. For information on significant estimates and judgementsmade in relation to impairments see Impairment of property, plant and equipment, intangibles and goodwill within Note 1. See also Note 10,Note 13 and Note 19 for further information on impairments by asset category.
UpstreamImpairment losses and reversals related primarily to producing and midstream assets.
The 2017 impairment losses of $1,138 million related to a number of different assets, with the most significant charges arising in Lower 48 andthe North Sea. Impairment losses within Upstream arose primarily as a result of changes in reserves estimates and the decision to dispose ofcertain assets, including the Forties Pipeline System business.
The 2017 impairment reversals of $176 million related to a number of different assets, with the most significant reversals arising in the NorthSea.
The 2016 impairment losses of $1,022 million related to a number of different assets, with the most significant charges arising in the NorthSea. Impairment losses within Upstream arose primarily as a result of revised cost estimates and decisions to dispose of certain assets.
The 2016 impairment reversals of $3,025 million primarily related to the North Sea and Angola. The largest impairment reversals related to theAndrew area cash-generating unit (CGU) in the North Sea and the PSVM and Greater Plutonio CGUs in Angola but none of these wereindividually significant. In addition an impairment reversal was recorded in relation to the Block KG D6 CGU in India; and exploration costs werealso written back during the period (see Note 6). The impairment reversals arose following a reduction in the discount rate applied, changes tofuture price assumptions, and also increased confidence in the progress of the KG D6 projects in India.
The 2015 impairment losses of $2,484 million included $761 million in Angola, of which $371 million related to the Greater Plutonio CGU.Impairment losses also included $830 million in relation to CGUs in the North Sea, of which $328 million related to the Andrew area CGU. Theimpairment losses primarily arose as a result of a lower price environment in the near term, and were also affected to a lesser extent by certaintechnical reserves revisions and increases in decommissioning cost estimates. The 2015 impairment reversals of $1,080 million included $945million in the North Sea business, of which $473 million related to the Eastern Trough Area Project (ETAP) CGU. The impairment reversalsmainly arose as a result of decreases in cost estimates and a reduction in the discount rate applied, offsetting the impact of lower prices in thenear term.
DownstreamImpairment losses totalling $69 million, $84 million, and $265 million were recognized in 2017, 2016 and 2015 respectively. The amount for 2015was principally in relation to certain manufacturing assets in our petrochemicals business and certain US midstream assets, where theexpected disposal proceeds were lower than the book values.
Other businesses and corporateImpairment losses totalling $32 million, $11 million, and $155 million were recognized in 2017, 2016 and 2015 respectively. The amount for 2015was principally in respect of our US wind business.
146 BP Annual Report and Form 20-F 2017
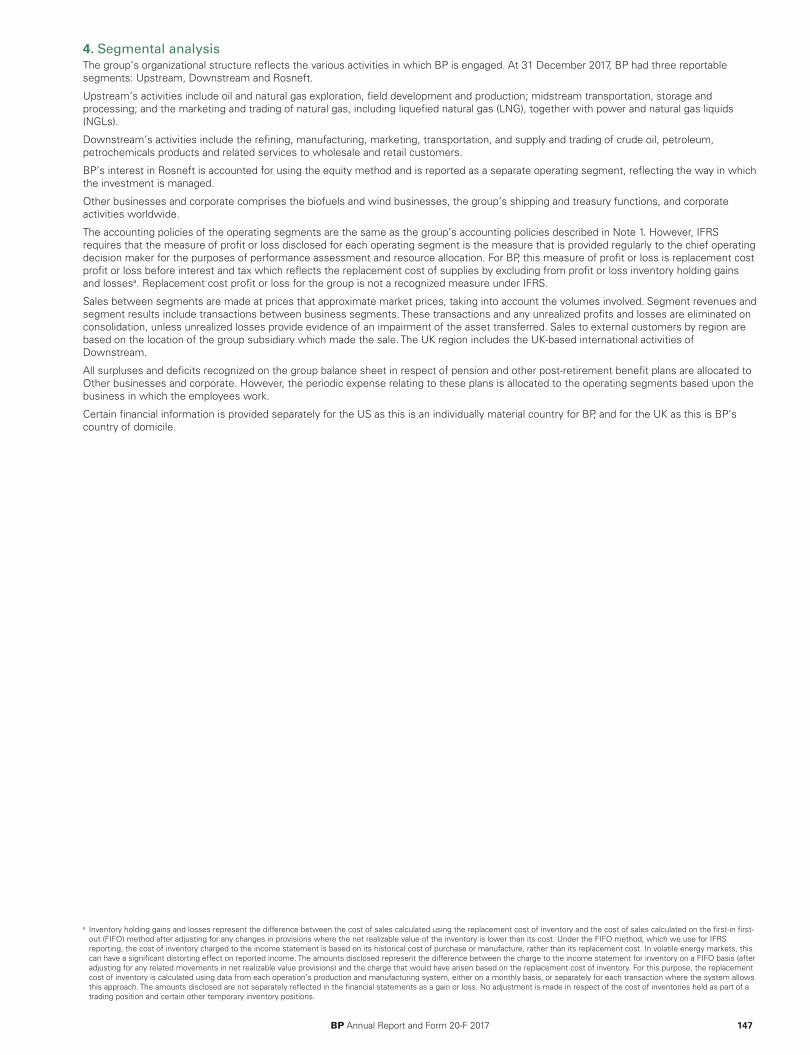
4. Segmental analysis The group’s organizational structure reflects the various activities in which BP is engaged. At 31 December 2017, BP had three reportablesegments: Upstream, Downstream and Rosneft.
Upstream’s activities include oil and natural gas exploration, field development and production; midstream transportation, storage andprocessing; and the marketing and trading of natural gas, including liquefied natural gas (LNG), together with power and natural gas liquids(NGLs).
Downstream’s activities include the refining, manufacturing, marketing, transportation, and supply and trading of crude oil, petroleum,petrochemicals products and related services to wholesale and retail customers.
BP’s interest in Rosneft is accounted for using the equity method and is reported as a separate operating segment, reflecting the way in whichthe investment is managed.
Other businesses and corporate comprises the biofuels and wind businesses, the group’s shipping and treasury functions, and corporateactivities worldwide.
The accounting policies of the operating segments are the same as the group’s accounting policies described in Note 1. However, IFRSrequires that the measure of profit or loss disclosed for each operating segment is the measure that is provided regularly to the chief operatingdecision maker for the purposes of performance assessment and resource allocation. For BP, this measure of profit or loss is replacement costprofit or loss before interest and tax which reflects the replacement cost of supplies by excluding from profit or loss inventory holding gainsand lossesa. Replacement cost profit or loss for the group is not a recognized measure under IFRS.
Sales between segments are made at prices that approximate market prices, taking into account the volumes involved. Segment revenues andsegment results include transactions between business segments. These transactions and any unrealized profits and losses are eliminated onconsolidation, unless unrealized losses provide evidence of an impairment of the asset transferred. Sales to external customers by region arebased on the location of the group subsidiary which made the sale. The UK region includes the UK-based international activities ofDownstream.
All surpluses and deficits recognized on the group balance sheet in respect of pension and other post-retirement benefit plans are allocated toOther businesses and corporate. However, the periodic expense relating to these plans is allocated to the operating segments based upon thebusiness in which the employees work.
Certain financial information is provided separately for the US as this is an individually material country for BP, and for the UK as this is BP’scountry of domicile.
a Inventory holding gains and losses represent the difference between the cost of sales calculated using the replacement cost of inventory and the cost of sales calculated on the first-in first-out (FIFO) method after adjusting for any changes in provisions where the net realizable value of the inventory is lower than its cost. Under the FIFO method, which we use for IFRSreporting, the cost of inventory charged to the income statement is based on its historical cost of purchase or manufacture, rather than its replacement cost. In volatile energy markets, thiscan have a significant distorting effect on reported income. The amounts disclosed represent the difference between the charge to the income statement for inventory on a FIFO basis (afteradjusting for any related movements in net realizable value provisions) and the charge that would have arisen based on the replacement cost of inventory. For this purpose, the replacementcost of inventory is calculated using data from each operation’s production and manufacturing system, either on a monthly basis, or separately for each transaction where the system allowsthis approach. The amounts disclosed are not separately reflected in the financial statements as a gain or loss. No adjustment is made in respect of the cost of inventories held as part of atrading position and certain other temporary inventory positions.
BP Annual Report and Form 20-F 2017 147
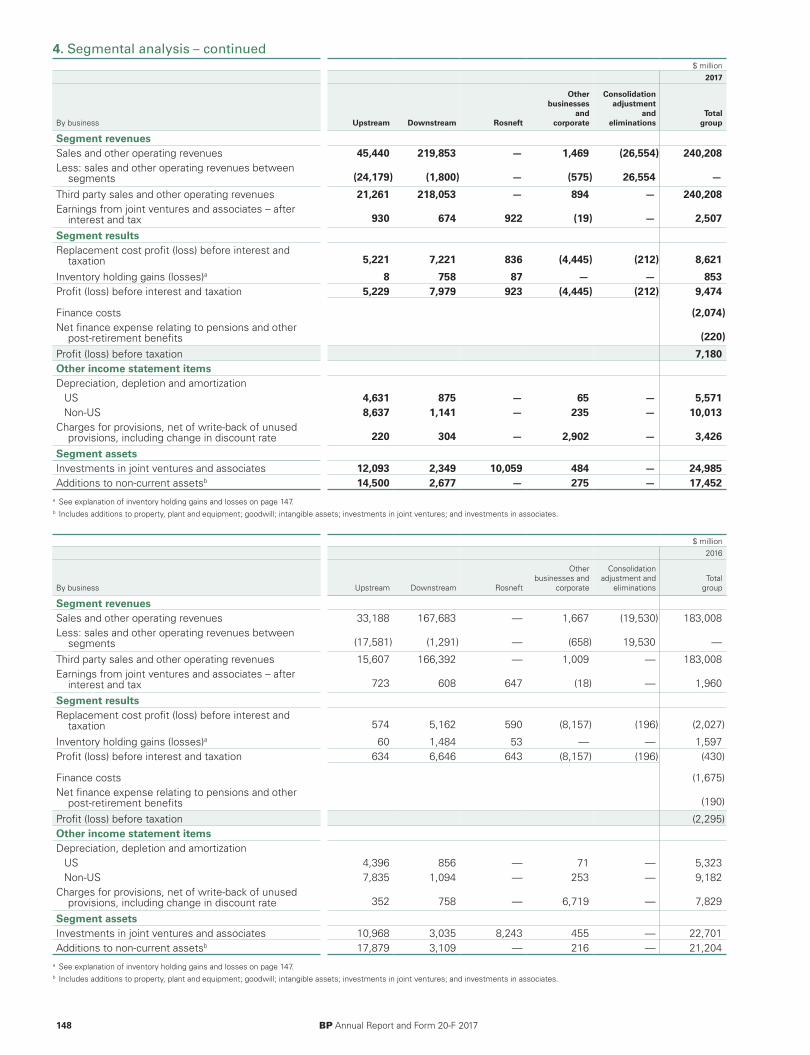
4. Segmental analysis – continued$ million
2017
By business Upstream Downstream Rosneft
Other businesses
and corporate
Consolidationadjustment
andeliminations
Total group
Segment revenuesSales and other operating revenues 45,440 219,853 — 1,469 (26,554) 240,208Less: sales and other operating revenues between
segments (24,179) (1,800) — (575) 26,554 —Third party sales and other operating revenues 21,261 218,053 — 894 — 240,208Earnings from joint ventures and associates – after
interest and tax 930 674 922 (19) — 2,507Segment resultsReplacement cost profit (loss) before interest and
taxation 5,221 7,221 836 (4,445) (212) 8,621Inventory holding gains (losses)a 8 758 87 — — 853Profit (loss) before interest and taxation 5,229 7,979 923 (4,445) (212) 9,474
Finance costs (2,074)Net finance expense relating to pensions and other
post-retirement benefits (220)Profit (loss) before taxation 7,180Other income statement itemsDepreciation, depletion and amortization
US 4,631 875 — 65 — 5,571Non-US 8,637 1,141 — 235 — 10,013
Charges for provisions, net of write-back of unusedprovisions, including change in discount rate 220 304 — 2,902 — 3,426
Segment assetsInvestments in joint ventures and associates 12,093 2,349 10,059 484 — 24,985Additions to non-current assetsb 14,500 2,677 — 275 — 17,452
a See explanation of inventory holding gains and losses on page 147.b Includes additions to property, plant and equipment; goodwill; intangible assets; investments in joint ventures; and investments in associates.
$ million2016
By business Upstream Downstream Rosneft
Otherbusinesses and
corporate
Consolidationadjustment and
eliminationsTotal
group
Segment revenuesSales and other operating revenues 33,188 167,683 — 1,667 (19,530) 183,008Less: sales and other operating revenues between
segments (17,581) (1,291) — (658) 19,530 —
Third party sales and other operating revenues 15,607 166,392 — 1,009 — 183,008Earnings from joint ventures and associates – after
interest and tax 723 608 647 (18) — 1,960
Segment resultsReplacement cost profit (loss) before interest and
taxation 574 5,162 590 (8,157) (196) (2,027)
Inventory holding gains (losses)a 60 1,484 53 — — 1,597Profit (loss) before interest and taxation 634 6,646 643 (8,157) (196) (430)
Finance costs (1,675)Net finance expense relating to pensions and other
post-retirement benefits (190)
Profit (loss) before taxation (2,295)Other income statement itemsDepreciation, depletion and amortization
US 4,396 856 — 71 — 5,323Non-US 7,835 1,094 — 253 — 9,182
Charges for provisions, net of write-back of unusedprovisions, including change in discount rate 352 758 — 6,719 — 7,829
Segment assetsInvestments in joint ventures and associates 10,968 3,035 8,243 455 — 22,701Additions to non-current assetsb 17,879 3,109 — 216 — 21,204
a See explanation of inventory holding gains and losses on page 147.b Includes additions to property, plant and equipment; goodwill; intangible assets; investments in joint ventures; and investments in associates.
148 BP Annual Report and Form 20-F 2017
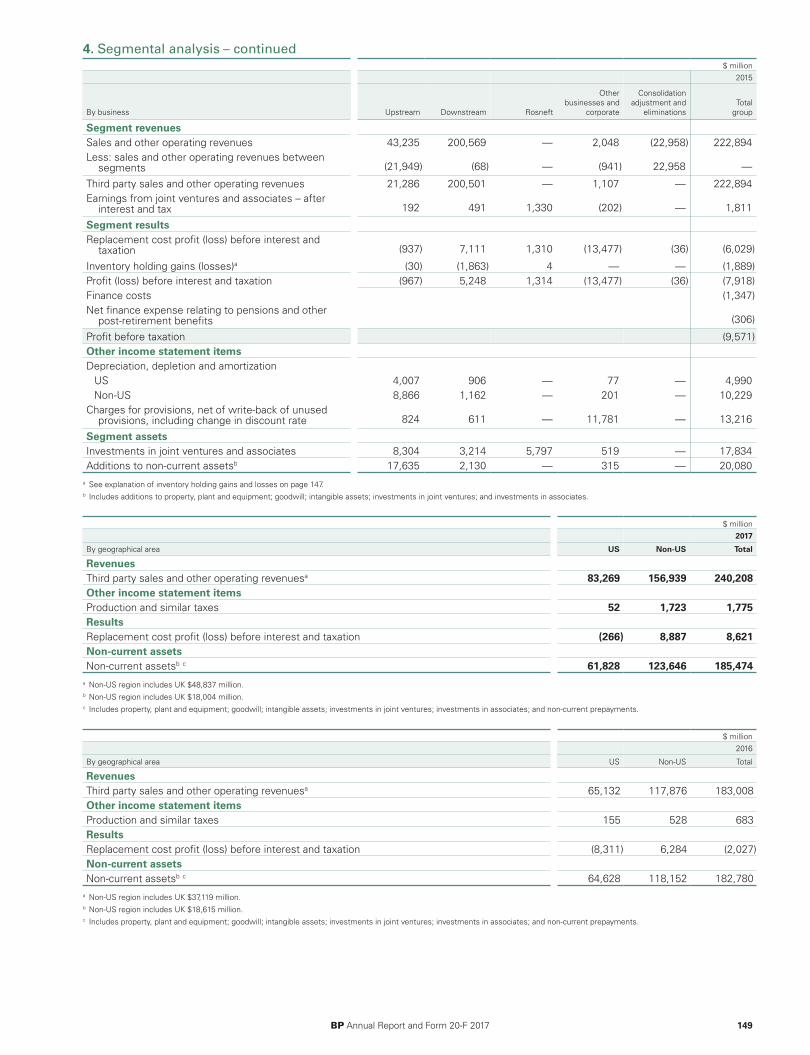
4. Segmental analysis – continued$ million
2015
By business Upstream Downstream Rosneft
Otherbusinesses and
corporate
Consolidationadjustment and
eliminationsTotal
group
Segment revenuesSales and other operating revenues 43,235 200,569 — 2,048 (22,958) 222,894Less: sales and other operating revenues between
segments (21,949) (68) — (941) 22,958 —
Third party sales and other operating revenues 21,286 200,501 — 1,107 — 222,894Earnings from joint ventures and associates – after
interest and tax 192 491 1,330 (202) — 1,811
Segment resultsReplacement cost profit (loss) before interest and
taxation (937) 7,111 1,310 (13,477) (36) (6,029)
Inventory holding gains (losses)a (30) (1,863) 4 — — (1,889)Profit (loss) before interest and taxation (967) 5,248 1,314 (13,477) (36) (7,918)Finance costs (1,347)Net finance expense relating to pensions and other
post-retirement benefits (306)
Profit before taxation (9,571)Other income statement itemsDepreciation, depletion and amortization
US 4,007 906 — 77 — 4,990Non-US 8,866 1,162 — 201 — 10,229
Charges for provisions, net of write-back of unusedprovisions, including change in discount rate 824 611 — 11,781 — 13,216
Segment assetsInvestments in joint ventures and associates 8,304 3,214 5,797 519 — 17,834Additions to non-current assetsb 17,635 2,130 — 315 — 20,080
a See explanation of inventory holding gains and losses on page 147.b Includes additions to property, plant and equipment; goodwill; intangible assets; investments in joint ventures; and investments in associates.
$ million2017
By geographical area US Non-US Total
RevenuesThird party sales and other operating revenuesa 83,269 156,939 240,208Other income statement itemsProduction and similar taxes 52 1,723 1,775ResultsReplacement cost profit (loss) before interest and taxation (266) 8,887 8,621Non-current assetsNon-current assetsb c 61,828 123,646 185,474
a Non-US region includes UK $48,837 million. b Non-US region includes UK $18,004 million. c Includes property, plant and equipment; goodwill; intangible assets; investments in joint ventures; investments in associates; and non-current prepayments.
$ million2016
By geographical area US Non-US Total
RevenuesThird party sales and other operating revenuesa 65,132 117,876 183,008Other income statement itemsProduction and similar taxes 155 528 683ResultsReplacement cost profit (loss) before interest and taxation (8,311) 6,284 (2,027)Non-current assetsNon-current assetsb c 64,628 118,152 182,780
a Non-US region includes UK $37,119 million. b Non-US region includes UK $18,615 million. c Includes property, plant and equipment; goodwill; intangible assets; investments in joint ventures; investments in associates; and non-current prepayments.
BP Annual Report and Form 20-F 2017 149
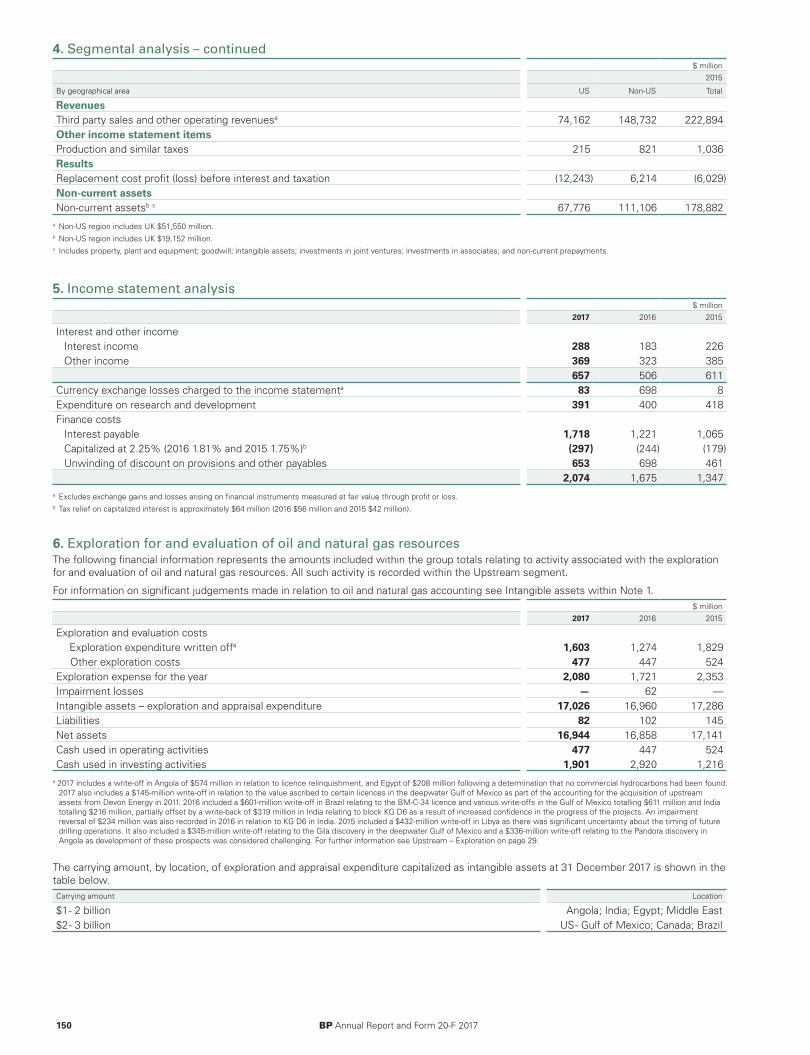
4. Segmental analysis – continued$ million
2015
By geographical area US Non-US Total
RevenuesThird party sales and other operating revenuesa 74,162 148,732 222,894Other income statement itemsProduction and similar taxes 215 821 1,036ResultsReplacement cost profit (loss) before interest and taxation (12,243) 6,214 (6,029)Non-current assetsNon-current assetsb c 67,776 111,106 178,882
a Non-US region includes UK $51,550 million. b Non-US region includes UK $19,152 million.c Includes property, plant and equipment; goodwill; intangible assets; investments in joint ventures; investments in associates; and non-current prepayments.
150 BP Annual Report and Form 20-F 2017
5. Income statement analysis $ million
2017 2016 2015
Interest and other incomeInterest income 288 183 226Other income 369 323 385
657 506 611Currency exchange losses charged to the income statementa 83 698 8Expenditure on research and development 391 400 418Finance costs
Interest payable 1,718 1,221 1,065Capitalized at 2.25% (2016 1.81% and 2015 1.75%)b (297) (244) (179)Unwinding of discount on provisions and other payables 653 698 461
2,074 1,675 1,347a Excludes exchange gains and losses arising on financial instruments measured at fair value through profit or loss.b Tax relief on capitalized interest is approximately $64 million (2016 $56 million and 2015 $42 million).
6. Exploration for and evaluation of oil and natural gas resources The following financial information represents the amounts included within the group totals relating to activity associated with the explorationfor and evaluation of oil and natural gas resources. All such activity is recorded within the Upstream segment.
For information on significant judgements made in relation to oil and natural gas accounting see Intangible assets within Note 1.$ million
2017 2016 2015
Exploration and evaluation costsExploration expenditure written offa 1,603 1,274 1,829Other exploration costs 477 447 524
Exploration expense for the year 2,080 1,721 2,353Impairment losses — 62 —Intangible assets – exploration and appraisal expenditure 17,026 16,960 17,286Liabilities 82 102 145Net assets 16,944 16,858 17,141Cash used in operating activities 477 447 524Cash used in investing activities 1,901 2,920 1,216
a 2017 includes a write-off in Angola of $574 million in relation to licence relinquishment, and Egypt of $208 million following a determination that no commercial hydrocarbons had been found.2017 also includes a $145-million write-off in relation to the value ascribed to certain licences in the deepwater Gulf of Mexico as part of the accounting for the acquisition of upstreamassets from Devon Energy in 2011. 2016 included a $601-million write-off in Brazil relating to the BM-C-34 licence and various write-offs in the Gulf of Mexico totalling $611 million and Indiatotalling $216 million, partially offset by a write-back of $319 million in India relating to block KG D6 as a result of increased confidence in the progress of the projects. An impairmentreversal of $234 million was also recorded in 2016 in relation to KG D6 in India. 2015 included a $432-million write-off in Libya as there was significant uncertainty about the timing of futuredrilling operations. It also included a $345-million write-off relating to the Gila discovery in the deepwater Gulf of Mexico and a $336-million write-off relating to the Pandora discovery inAngola as development of these prospects was considered challenging. For further information see Upstream – Exploration on page 29.
The carrying amount, by location, of exploration and appraisal expenditure capitalized as intangible assets at 31 December 2017 is shown in thetable below.Carrying amount Location
$1 - 2 billion Angola; India; Egypt; Middle East$2 - 3 billion US - Gulf of Mexico; Canada; Brazil

7. Taxation
Tax on profit$ million
2017 2016 2015
Current taxCharge for the year 4,208 1,762 1,910Adjustment in respect of prior yearsa 58 (123) (329)
4,266 1,639 1,581Deferred taxb
Origination and reversal of temporary differences in the current year (503) (3,709) (5,090)Adjustment in respect of prior yearsc (51) (397) 338
(554) (4,106) (4,752)Tax charge (credit) on profit or loss 3,712 (2,467) (3,171)
a The adjustments in respect of prior years reflect the reassessment of the current tax balances for prior years in light of changes in facts and circumstances during the year.b Origination and reversal of temporary differences in the current year include the impact of tax rate changes on deferred tax balances. 2017 includes a charge of $859 million in respect of the
reduction in the US federal corporate income tax rate from 35% to 21%, effective from 1 January 2018; this has been calculated as the change in deferred tax balances at 31 December2017, excluding the increase in the provision in the fourth quarter for business economic loss and other claims associated with the Deepwater Horizon Court Supervised Settlement Program(DHCSSP). The adjustments in respect of prior periods reflect the reassessment of deferred tax balances for prior years in light of all other changes in facts and circumstances during theyear.
c 2016 included the reassessment of the recognition of deferred tax assets in relation to foreign tax credits in the US.
In 2017, the total tax charge recognized within other comprehensive income was $1,499 million (2016 $752 million credit and 2015 $1,140million charge), primarily comprising the deferred tax impact of the remeasurements of the net pension and other post-retirement benefitliability or asset. See Note 30 for further information.
The total tax charge recognized directly in equity was $263 million (2016 $5 million credit and 2015 $9 million charge); for 2017 this relates tocurrent tax on transactions with non-controlling interests.
For information on significant estimates and judgements made in relation to taxation see Income taxes within Note 1.
Reconciliation of the effective tax rateThe following table provides a reconciliation of the group weighted average statutory corporate income tax rate to the effective tax rate of thegroup on profit or loss before taxation.
For 2016 and 2015, the items presented in the reconciliation are affected as a result of the overall tax credit for the year and the loss beforetaxation. In order to provide a more meaningful analysis of the effective tax rate, the table also presents separate reconciliations for the groupexcluding the impacts of the Gulf of Mexico oil spill and impairment losses and reversals, and for the impacts of the Gulf of Mexico oil spill andimpairment losses and reversals in isolation.
$ million
2017
2016excluding
impacts ofGulf of
Mexico oilspill and
impairments
2016impacts of
Gulf ofMexico oil
spill andimpairments 2016
2015excluding
impacts ofGulf of
Mexico oilspill and
impairments
2015impacts of
Gulf ofMexico oil
spill andimpairments 2015
Profit (loss) before taxation 7,180 2,914 (5,209) (2,295) 4,031 (13,602) (9,571)Tax charge (credit) on profit or loss 3,712 (117) (2,350) (2,467) 945 (4,116) (3,171)Effective tax rate 52% (4)% 45% 107% 23% 30% 33%
% of profit or loss before taxation
Tax rate computed at the weighted average statutory ratea 44 18 33 52 17 38 46Increase (decrease) resulting from
Tax reported in equity-accounted entities (7) (15) — 19 (7) — 3Adjustments in respect of prior years — 5 13 23 1 — —Deferred tax not recognized 9 26 3 (27) 17 (5) (14)Tax incentives for investmentb (6) (9) — 11 (10) — 4Gulf of Mexico oil spill non-deductible costs 1 — (2) (4) — (2) (3)Disposal impactsc (1) (24) — 30 (3) — 1Foreign exchange (4) 1 — (2) 18 — (8)Items not deductible for tax purposes 5 8 — (11) 10 — (4)Impact of US tax reformd 12 — — — — — —Decrease in rate of UK supplementary chargee — (15) — 19 (23) — 10Otherb (1) 1 (2) (3) 3 (1) (2)
Effective tax rate 52 (4) 45 107 23 30 33a Calculated based on the statutory corporate income tax rate applicable in the countries in which the group operates, weighted by the profits and losses before tax in the respective
countries. It reflects the mix of profits and losses arising in higher tax rate jurisdictions (primarily the Upstream segment) and lower tax rate jurisdictions (primarily the Downstreamsegment).
b A minor amendment has been made to 2015 to conform with current year presentation. There is no impact on 2016.c In 2016 this related primarily to the tax impact on the contribution of BP’s Norwegian upstream business into Aker BP ASA.d Relates to the deferred tax impact of the reduction in the US federal corporate income tax rate from 35% to 21%, effective from 1 January 2018.e Relates to the deferred tax impact of the reductions in the UK supplementary charge rate applicable to profits arising in the North Sea from 20% to 10% in 2016 and from 32% to 20% in
2015.
BP Annual Report and Form 20-F 2017 151
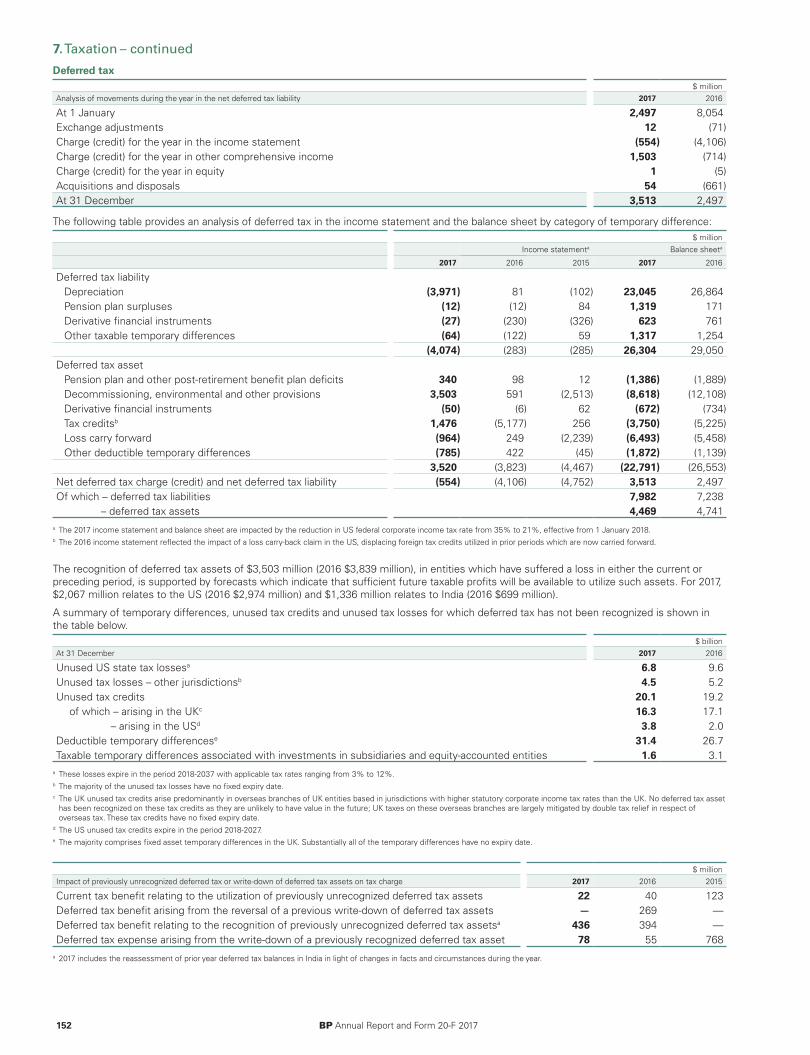
7. Taxation – continued
Deferred tax$ million
Analysis of movements during the year in the net deferred tax liability 2017 2016
At 1 January 2,497 8,054Exchange adjustments 12 (71)Charge (credit) for the year in the income statement (554) (4,106)Charge (credit) for the year in other comprehensive income 1,503 (714)Charge (credit) for the year in equity 1 (5)Acquisitions and disposals 54 (661)At 31 December 3,513 2,497
The following table provides an analysis of deferred tax in the income statement and the balance sheet by category of temporary difference:$ million
Income statementa Balance sheeta
2017 2016 2015 2017 2016
Deferred tax liabilityDepreciation (3,971) 81 (102) 23,045 26,864Pension plan surpluses (12) (12) 84 1,319 171Derivative financial instruments (27) (230) (326) 623 761Other taxable temporary differences (64) (122) 59 1,317 1,254
(4,074) (283) (285) 26,304 29,050Deferred tax asset
Pension plan and other post-retirement benefit plan deficits 340 98 12 (1,386) (1,889)Decommissioning, environmental and other provisions 3,503 591 (2,513) (8,618) (12,108)Derivative financial instruments (50) (6) 62 (672) (734)Tax creditsb 1,476 (5,177) 256 (3,750) (5,225)Loss carry forward (964) 249 (2,239) (6,493) (5,458)Other deductible temporary differences (785) 422 (45) (1,872) (1,139)
3,520 (3,823) (4,467) (22,791) (26,553)Net deferred tax charge (credit) and net deferred tax liability (554) (4,106) (4,752) 3,513 2,497Of which – deferred tax liabilities 7,982 7,238
– deferred tax assets 4,469 4,741a The 2017 income statement and balance sheet are impacted by the reduction in US federal corporate income tax rate from 35% to 21%, effective from 1 January 2018.b The 2016 income statement reflected the impact of a loss carry-back claim in the US, displacing foreign tax credits utilized in prior periods which are now carried forward.
The recognition of deferred tax assets of $3,503 million (2016 $3,839 million), in entities which have suffered a loss in either the current orpreceding period, is supported by forecasts which indicate that sufficient future taxable profits will be available to utilize such assets. For 2017,$2,067 million relates to the US (2016 $2,974 million) and $1,336 million relates to India (2016 $699 million).
A summary of temporary differences, unused tax credits and unused tax losses for which deferred tax has not been recognized is shown inthe table below.
$ billionAt 31 December 2017 2016
Unused US state tax lossesa 6.8 9.6Unused tax losses – other jurisdictionsb 4.5 5.2Unused tax credits 20.1 19.2
of which – arising in the UKc 16.3 17.1 – arising in the USd 3.8 2.0
Deductible temporary differencese 31.4 26.7Taxable temporary differences associated with investments in subsidiaries and equity-accounted entities 1.6 3.1
a These losses expire in the period 2018-2037 with applicable tax rates ranging from 3% to 12%.b The majority of the unused tax losses have no fixed expiry date.c The UK unused tax credits arise predominantly in overseas branches of UK entities based in jurisdictions with higher statutory corporate income tax rates than the UK. No deferred tax asset
has been recognized on these tax credits as they are unlikely to have value in the future; UK taxes on these overseas branches are largely mitigated by double tax relief in respect ofoverseas tax. These tax credits have no fixed expiry date.
d The US unused tax credits expire in the period 2018-2027.e The majority comprises fixed asset temporary differences in the UK. Substantially all of the temporary differences have no expiry date.
$ millionImpact of previously unrecognized deferred tax or write-down of deferred tax assets on tax charge 2017 2016 2015
Current tax benefit relating to the utilization of previously unrecognized deferred tax assets 22 40 123Deferred tax benefit arising from the reversal of a previous write-down of deferred tax assets — 269 —Deferred tax benefit relating to the recognition of previously unrecognized deferred tax assetsa 436 394 —Deferred tax expense arising from the write-down of a previously recognized deferred tax asset 78 55 768
a 2017 includes the reassessment of prior year deferred tax balances in India in light of changes in facts and circumstances during the year.
152 BP Annual Report and Form 20-F 2017

8. Dividends The quarterly dividend paid on 29 March 2018 in respect of the fourth quarter 2017 was 10 cents per ordinary share ($0.60 per AmericanDepositary Share (ADS)). The corresponding amount in sterling was announced on 19 March 2018. A scrip dividend alternative is available,allowing shareholders to elect to receive their dividend in the form of new ordinary shares and ADS holders in the form of new ADSs.
Pence per share Cents per share $ million2017 2016 2015 2017 2016 2015 2017 2016 2015
Dividends announced and paid in cashPreference shares 1 1 2Ordinary shares
March 8.1587 7.0125 6.6699 10.00 10.00 10.00 1,303 1,099 1,708June 7.7563 6.9167 6.5295 10.00 10.00 10.00 1,546 1,168 1,691September 7.6213 7.5578 6.5488 10.00 10.00 10.00 1,676 1,161 1,717December 7.4435 7.9313 6.6342 10.00 10.00 10.00 1,627 1,182 1,541
30.9798 29.4183 26.3824 40.00 40.00 40.00 6,153 4,611 6,659Dividend announced, paid in March2018 10.00 1,828
The details of the scrip dividends issued are shown in the table below.2017 2016 2015
Number of shares issued (thousand) 289,789 548,005 102,810Value of shares issued ($ million) 1,714 2,858 642
The financial statements for the year ended 31 December 2017 do not reflect the dividend announced on 6 February 2018 and paid in March2018; this will be treated as an appropriation of profit in the year ending 31 December 2018.
BP Annual Report and Form 20-F 2017 153
9. Earnings per share Cents per share
Per ordinary share 2017 2016 2015
Basic earnings per share 17.20 0.61 (35.39)Diluted earnings per share 17.10 0.60 (35.39)
Dollars per sharePer American Depositary Share (ADS) 2017 2016 2015
Basic earnings per share 1.03 0.04 (2.12)Diluted earnings per share 1.03 0.04 (2.12)
Basic earnings per ordinary share amounts are calculated by dividing the profit (loss) for the year attributable to ordinary shareholders by theweighted average number of ordinary shares outstanding during the year.
The average number of shares outstanding includes certain shares that will be issuable in the future under employee share-based paymentplans and excludes treasury shares, which includes shares held by the Employee Share Ownership Plan trusts (ESOPs).
For the diluted earnings per share calculation, the weighted average number of shares outstanding during the year is adjusted for the averagenumber of shares that are potentially issuable in connection with employee share-based payment plans. If the inclusion of potentially issuableshares would decrease loss per share, the potentially issuable shares are excluded from the weighted average number of shares outstandingused to calculate diluted earnings per share. A dilutive effect relating to potentially issuable shares has not been included, therefore, in thecalculation of diluted earnings per share for 2015.
$ million
2017 2016 2015
Profit (loss) attributable to BP shareholders 3,389 115 (6,482)Less: dividend requirements on preference shares 1 1 2Profit (loss) for the year attributable to BP ordinary shareholders 3,388 114 (6,484)
Shares thousand2017 2016 2015
Basic weighted average number of ordinary shares 19,692,613 18,744,800 18,323,646Potential dilutive effect of ordinary shares issuable under employee share-based payment
plans 123,829 110,519 —
Weighted average number of ordinary shares outstanding used to calculate dilutedearnings per share 19,816,442 18,855,319 18,323,646
Shares thousand2017 2016 2015
Basic weighted average number of ordinary shares - ADS equivalent 3,282,102 3,124,133 3,053,941Potential dilutive effect of ordinary shares (ADS equivalent) issuable under employee
share-based payment plans 20,638 18,420 —
Weighted average number of ordinary shares (ADS equivalent) outstanding used tocalculate diluted earnings per share 3,302,740 3,142,553 3,053,941
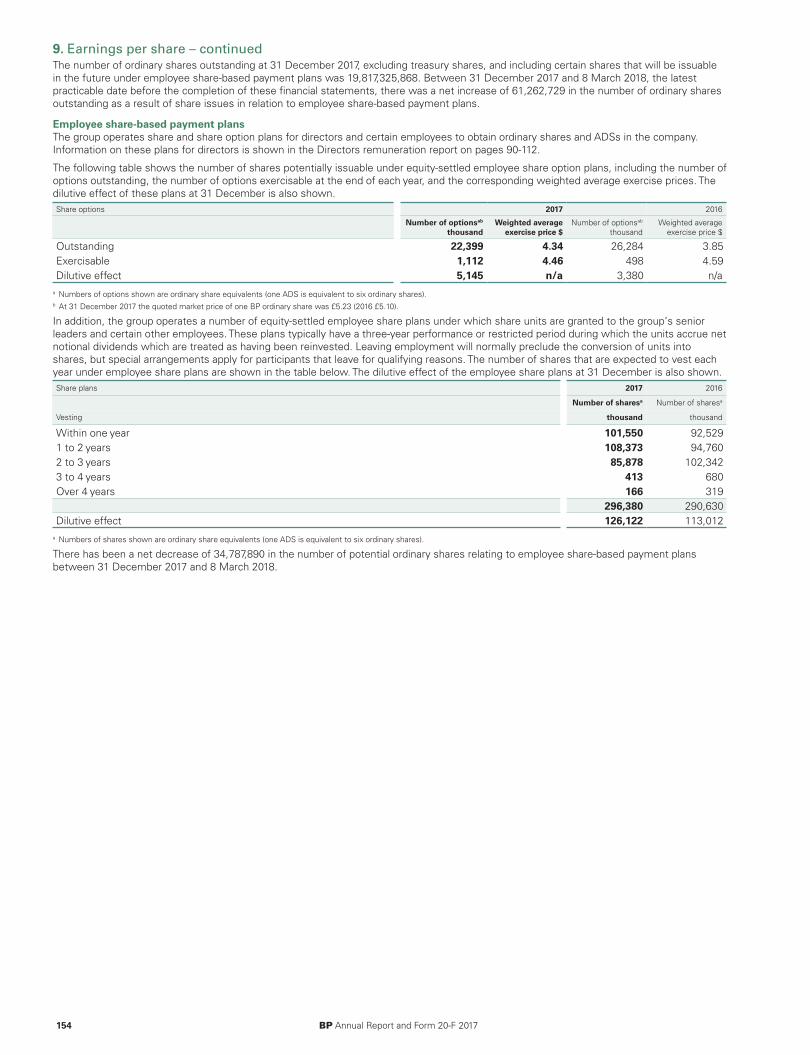
9. Earnings per share – continuedThe number of ordinary shares outstanding at 31 December 2017, excluding treasury shares, and including certain shares that will be issuablein the future under employee share-based payment plans was 19,817,325,868. Between 31 December 2017 and 8 March 2018, the latestpracticable date before the completion of these financial statements, there was a net increase of 61,262,729 in the number of ordinary sharesoutstanding as a result of share issues in relation to employee share-based payment plans.
Employee share-based payment plansThe group operates share and share option plans for directors and certain employees to obtain ordinary shares and ADSs in the company.Information on these plans for directors is shown in the Directors remuneration report on pages 90-112.
The following table shows the number of shares potentially issuable under equity-settled employee share option plans, including the number ofoptions outstanding, the number of options exercisable at the end of each year, and the corresponding weighted average exercise prices. Thedilutive effect of these plans at 31 December is also shown.Share options 2017 2016
Number of optionsab
thousandWeighted average
exercise price $Number of optionsab
thousandWeighted average
exercise price $
Outstanding 22,399 4.34 26,284 3.85Exercisable 1,112 4.46 498 4.59Dilutive effect 5,145 n/a 3,380 n/a
a Numbers of options shown are ordinary share equivalents (one ADS is equivalent to six ordinary shares).b At 31 December 2017 the quoted market price of one BP ordinary share was £5.23 (2016 £5.10).
In addition, the group operates a number of equity-settled employee share plans under which share units are granted to the group’s seniorleaders and certain other employees. These plans typically have a three-year performance or restricted period during which the units accrue netnotional dividends which are treated as having been reinvested. Leaving employment will normally preclude the conversion of units intoshares, but special arrangements apply for participants that leave for qualifying reasons. The number of shares that are expected to vest eachyear under employee share plans are shown in the table below. The dilutive effect of the employee share plans at 31 December is also shown.Share plans 2017 2016
Number of sharesa Number of sharesa
Vesting thousand thousand
Within one year 101,550 92,5291 to 2 years 108,373 94,7602 to 3 years 85,878 102,3423 to 4 years 413 680Over 4 years 166 319
296,380 290,630Dilutive effect 126,122 113,012
a Numbers of shares shown are ordinary share equivalents (one ADS is equivalent to six ordinary shares).
There has been a net decrease of 34,787,890 in the number of potential ordinary shares relating to employee share-based payment plansbetween 31 December 2017 and 8 March 2018.
154 BP Annual Report and Form 20-F 2017

10. Property, plant and equipment$ million
Land and landimprovements Buildings
Oil and gaspropertiesa
Plant,machinery
andequipment
Fittings,fixtures and
officeequipment Transportation
Oil depots,storage tanks
and servicestations Total
CostAt 1 January 2017 3,066 2,235 215,564 43,725 2,670 14,000 7,623 288,883Exchange adjustments 264 42 — 1,251 91 28 772 2,448Additions 264 94 12,366 1,890 240 347 575 15,776Acquisitions — — — 41 — 228 1 270Transfers — — 451 — — — — 451Deletions (120) (798) (2,327) (245) (148) (3,829) (223) (7,690)
At 31 December 2017 3,474 1,573 226,054 46,662 2,853 10,774 8,748 300,138Depreciation
At 1 January 2017 584 1,062 122,428 18,686 2,022 9,823 4,521 159,126Exchange adjustments 33 27 — 647 67 19 466 1,259Charge for the year 90 94 12,385 1,764 185 381 350 15,249Impairment losses 3 35 624 35 — 479 17 1,193Impairment reversals — — (135) — — (72) — (207)Deletions (27) (400) (1,976) (136) (138) (3,107) (169) (5,953)
At 31 December 2017 683 818 133,326 20,996 2,136 7,523 5,185 170,667Net book amount at 31 December 2017 2,791 755 92,728 25,666 717 3,251 3,563 129,471Cost
At 1 January 2016 3,194 2,877 215,566 45,744 2,866 14,038 8,418 292,703Exchange adjustments (119) (37) — (342) (127) (9) (375) (1,009)Additions 106 24 12,036 1,699 192 156 568 14,781Acquisitions 46 — — 793 — — — 839Remeasurementsb — — — (1,505) — — — (1,505)Transfers — — 1,629 — — — — 1,629Deletions (161) (629) (13,667) (2,664) (261) (185) (988) (18,555)
At 31 December 2016 3,066 2,235 215,564 43,725 2,670 14,000 7,623 288,883Depreciation
At 1 January 2016 642 1,157 123,831 20,652 2,084 9,439 5,140 162,945Exchange adjustments (9) (44) — (264) (96) (6) (218) (637)Charge for the year 40 166 11,213 1,740 214 397 384 14,154Remeasurementsb — — — (1,319) — — — (1,319)Impairment losses 9 123 518 11 79 256 4 1,000Impairment reversals (2) — (2,923) (12) — (101) (4) (3,042)Transfers — — 5 — — — — 5Deletions (96) (340) (10,216) (2,122) (259) (162) (785) (13,980)
At 31 December 2016 584 1,062 122,428 18,686 2,022 9,823 4,521 159,126Net book amount at 31 December 2016 2,482 1,173 93,136 25,039 648 4,177 3,102 129,757
Assets held under finance leases at net bookamount included above
At 31 December 2017 — 2 16 238 — 233 7 496At 31 December 2016 — 2 21 266 — 241 — 530Assets under construction included above
At 31 December 2017 23,789At 31 December 2016 29,177
a For information on significant estimates and judgements made in relation to the estimation of oil and natural reserves see Property, plant and equipment within Note 1.b Relates to the remeasurement to fair value of previously held interests in certain assets as a result of the dissolution on 31 December 2016 of the group’s German refining joint operation
with Rosneft.
BP Annual Report and Form 20-F 2017 155
11. Capital commitments Authorized future capital expenditure for property, plant and equipment by group companies for which contracts had been signed at31 December 2017 amounted to $11,340 million (2016 $11,207 million). BP’s share of capital commitments of joint ventures amounted to $483million (2016 $522 million).
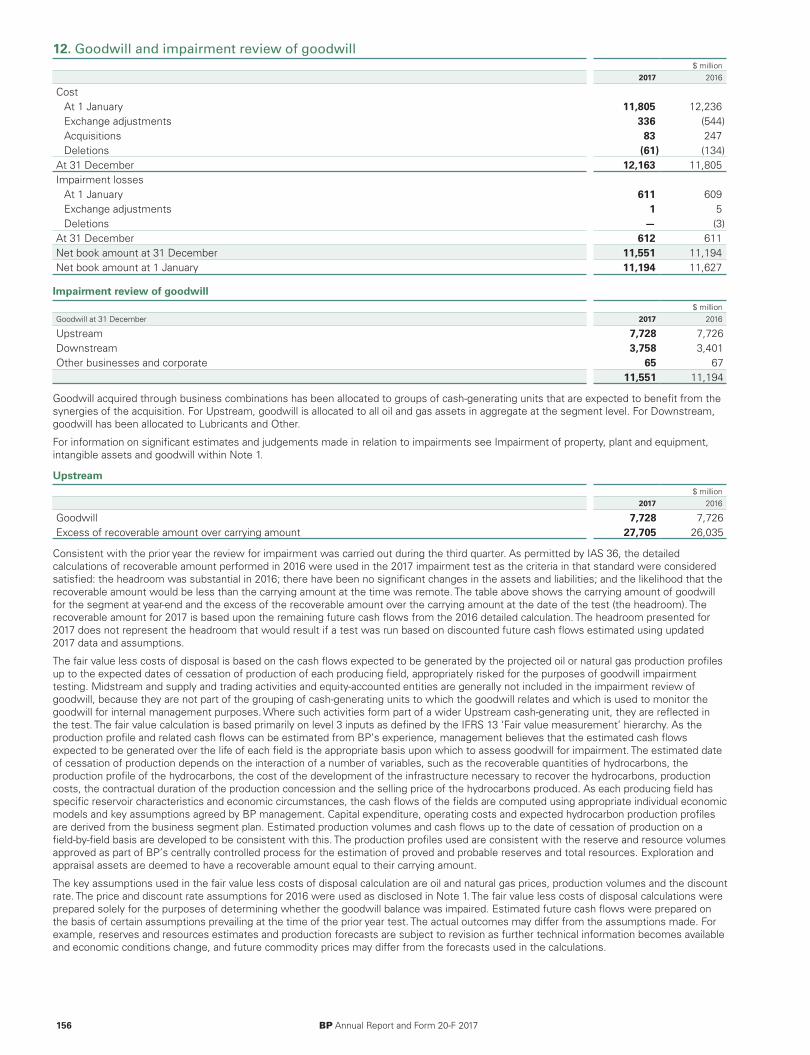
12. Goodwill and impairment review of goodwill $ million
2017 2016
CostAt 1 January 11,805 12,236Exchange adjustments 336 (544)Acquisitions 83 247Deletions (61) (134)
At 31 December 12,163 11,805Impairment losses
At 1 January 611 609Exchange adjustments 1 5Deletions — (3)
At 31 December 612 611Net book amount at 31 December 11,551 11,194Net book amount at 1 January 11,194 11,627
Impairment review of goodwill$ million
Goodwill at 31 December 2017 2016
Upstream 7,728 7,726Downstream 3,758 3,401Other businesses and corporate 65 67
11,551 11,194
Goodwill acquired through business combinations has been allocated to groups of cash-generating units that are expected to benefit from thesynergies of the acquisition. For Upstream, goodwill is allocated to all oil and gas assets in aggregate at the segment level. For Downstream,goodwill has been allocated to Lubricants and Other.
For information on significant estimates and judgements made in relation to impairments see Impairment of property, plant and equipment,intangible assets and goodwill within Note 1.
Upstream$ million
2017 2016
Goodwill 7,728 7,726Excess of recoverable amount over carrying amount 27,705 26,035
Consistent with the prior year the review for impairment was carried out during the third quarter. As permitted by IAS 36, the detailedcalculations of recoverable amount performed in 2016 were used in the 2017 impairment test as the criteria in that standard were consideredsatisfied: the headroom was substantial in 2016; there have been no significant changes in the assets and liabilities; and the likelihood that therecoverable amount would be less than the carrying amount at the time was remote. The table above shows the carrying amount of goodwillfor the segment at year-end and the excess of the recoverable amount over the carrying amount at the date of the test (the headroom). Therecoverable amount for 2017 is based upon the remaining future cash flows from the 2016 detailed calculation. The headroom presented for2017 does not represent the headroom that would result if a test was run based on discounted future cash flows estimated using updated2017 data and assumptions.
The fair value less costs of disposal is based on the cash flows expected to be generated by the projected oil or natural gas production profilesup to the expected dates of cessation of production of each producing field, appropriately risked for the purposes of goodwill impairmenttesting. Midstream and supply and trading activities and equity-accounted entities are generally not included in the impairment review ofgoodwill, because they are not part of the grouping of cash-generating units to which the goodwill relates and which is used to monitor thegoodwill for internal management purposes. Where such activities form part of a wider Upstream cash-generating unit, they are reflected inthe test. The fair value calculation is based primarily on level 3 inputs as defined by the IFRS 13 ‘Fair value measurement’ hierarchy. As theproduction profile and related cash flows can be estimated from BP’s experience, management believes that the estimated cash flowsexpected to be generated over the life of each field is the appropriate basis upon which to assess goodwill for impairment. The estimated dateof cessation of production depends on the interaction of a number of variables, such as the recoverable quantities of hydrocarbons, theproduction profile of the hydrocarbons, the cost of the development of the infrastructure necessary to recover the hydrocarbons, productioncosts, the contractual duration of the production concession and the selling price of the hydrocarbons produced. As each producing field hasspecific reservoir characteristics and economic circumstances, the cash flows of the fields are computed using appropriate individual economicmodels and key assumptions agreed by BP management. Capital expenditure, operating costs and expected hydrocarbon production profilesare derived from the business segment plan. Estimated production volumes and cash flows up to the date of cessation of production on afield-by-field basis are developed to be consistent with this. The production profiles used are consistent with the reserve and resource volumesapproved as part of BP’s centrally controlled process for the estimation of proved and probable reserves and total resources. Exploration andappraisal assets are deemed to have a recoverable amount equal to their carrying amount.
The key assumptions used in the fair value less costs of disposal calculation are oil and natural gas prices, production volumes and the discountrate. The price and discount rate assumptions for 2016 were used as disclosed in Note 1. The fair value less costs of disposal calculations wereprepared solely for the purposes of determining whether the goodwill balance was impaired. Estimated future cash flows were prepared onthe basis of certain assumptions prevailing at the time of the prior year test. The actual outcomes may differ from the assumptions made. Forexample, reserves and resources estimates and production forecasts are subject to revision as further technical information becomes availableand economic conditions change, and future commodity prices may differ from the forecasts used in the calculations.
156 BP Annual Report and Form 20-F 2017
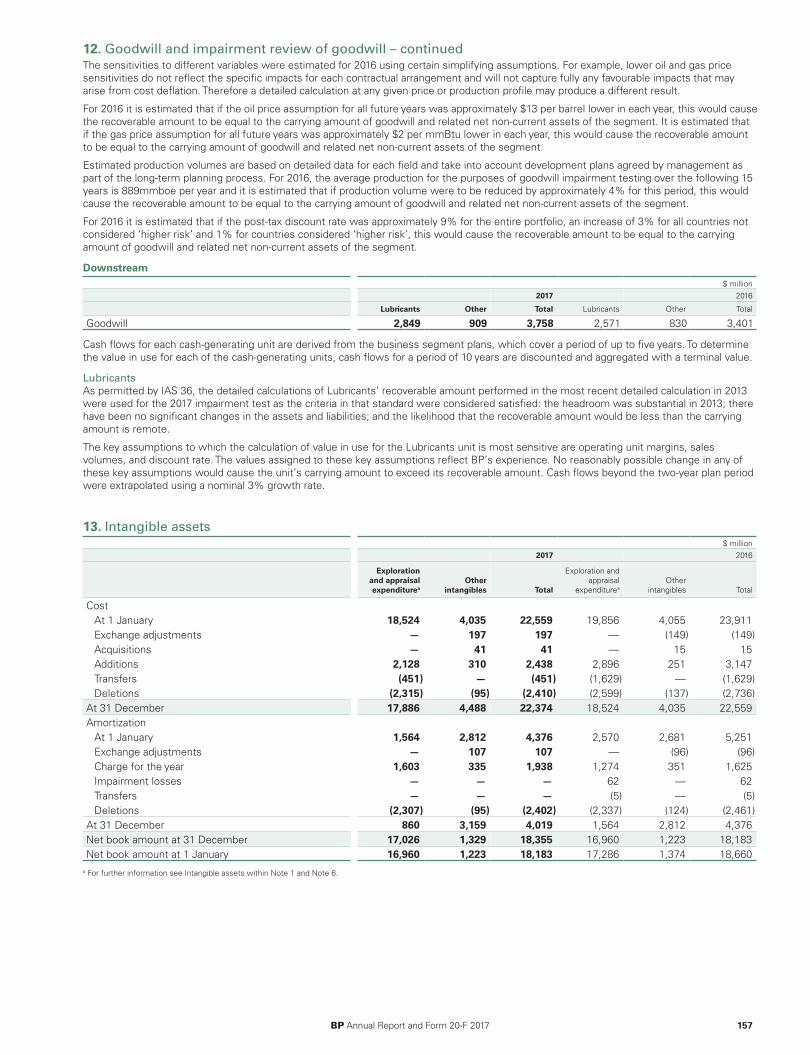
12. Goodwill and impairment review of goodwill – continuedThe sensitivities to different variables were estimated for 2016 using certain simplifying assumptions. For example, lower oil and gas pricesensitivities do not reflect the specific impacts for each contractual arrangement and will not capture fully any favourable impacts that mayarise from cost deflation. Therefore a detailed calculation at any given price or production profile may produce a different result.
For 2016 it is estimated that if the oil price assumption for all future years was approximately $13 per barrel lower in each year, this would causethe recoverable amount to be equal to the carrying amount of goodwill and related net non-current assets of the segment. It is estimated thatif the gas price assumption for all future years was approximately $2 per mmBtu lower in each year, this would cause the recoverable amountto be equal to the carrying amount of goodwill and related net non-current assets of the segment.
Estimated production volumes are based on detailed data for each field and take into account development plans agreed by management aspart of the long-term planning process. For 2016, the average production for the purposes of goodwill impairment testing over the following 15years is 889mmboe per year and it is estimated that if production volume were to be reduced by approximately 4% for this period, this wouldcause the recoverable amount to be equal to the carrying amount of goodwill and related net non-current assets of the segment.
For 2016 it is estimated that if the post-tax discount rate was approximately 9% for the entire portfolio, an increase of 3% for all countries notconsidered ‘higher risk’ and 1% for countries considered ‘higher risk’, this would cause the recoverable amount to be equal to the carryingamount of goodwill and related net non-current assets of the segment.
Downstream$ million
2017 2016
Lubricants Other Total Lubricants Other Total
Goodwill 2,849 909 3,758 2,571 830 3,401
Cash flows for each cash-generating unit are derived from the business segment plans, which cover a period of up to five years. To determinethe value in use for each of the cash-generating units, cash flows for a period of 10 years are discounted and aggregated with a terminal value.
LubricantsAs permitted by IAS 36, the detailed calculations of Lubricants’ recoverable amount performed in the most recent detailed calculation in 2013were used for the 2017 impairment test as the criteria in that standard were considered satisfied: the headroom was substantial in 2013; therehave been no significant changes in the assets and liabilities; and the likelihood that the recoverable amount would be less than the carryingamount is remote.
The key assumptions to which the calculation of value in use for the Lubricants unit is most sensitive are operating unit margins, salesvolumes, and discount rate. The values assigned to these key assumptions reflect BP’s experience. No reasonably possible change in any ofthese key assumptions would cause the unit’s carrying amount to exceed its recoverable amount. Cash flows beyond the two-year plan periodwere extrapolated using a nominal 3% growth rate.
BP Annual Report and Form 20-F 2017 157
13. Intangible assets$ million
2017 2016
Explorationand appraisalexpenditurea
Otherintangibles Total
Exploration andappraisal
expenditureaOther
intangibles Total
CostAt 1 January 18,524 4,035 22,559 19,856 4,055 23,911Exchange adjustments — 197 197 — (149) (149)Acquisitions — 41 41 — 15 15Additions 2,128 310 2,438 2,896 251 3,147Transfers (451) — (451) (1,629) — (1,629)Deletions (2,315) (95) (2,410) (2,599) (137) (2,736)
At 31 December 17,886 4,488 22,374 18,524 4,035 22,559Amortization
At 1 January 1,564 2,812 4,376 2,570 2,681 5,251Exchange adjustments — 107 107 — (96) (96)Charge for the year 1,603 335 1,938 1,274 351 1,625Impairment losses — — — 62 — 62Transfers — — — (5) — (5)Deletions (2,307) (95) (2,402) (2,337) (124) (2,461)
At 31 December 860 3,159 4,019 1,564 2,812 4,376Net book amount at 31 December 17,026 1,329 18,355 16,960 1,223 18,183Net book amount at 1 January 16,960 1,223 18,183 17,286 1,374 18,660
a For further information see Intangible assets within Note 1 and Note 6.
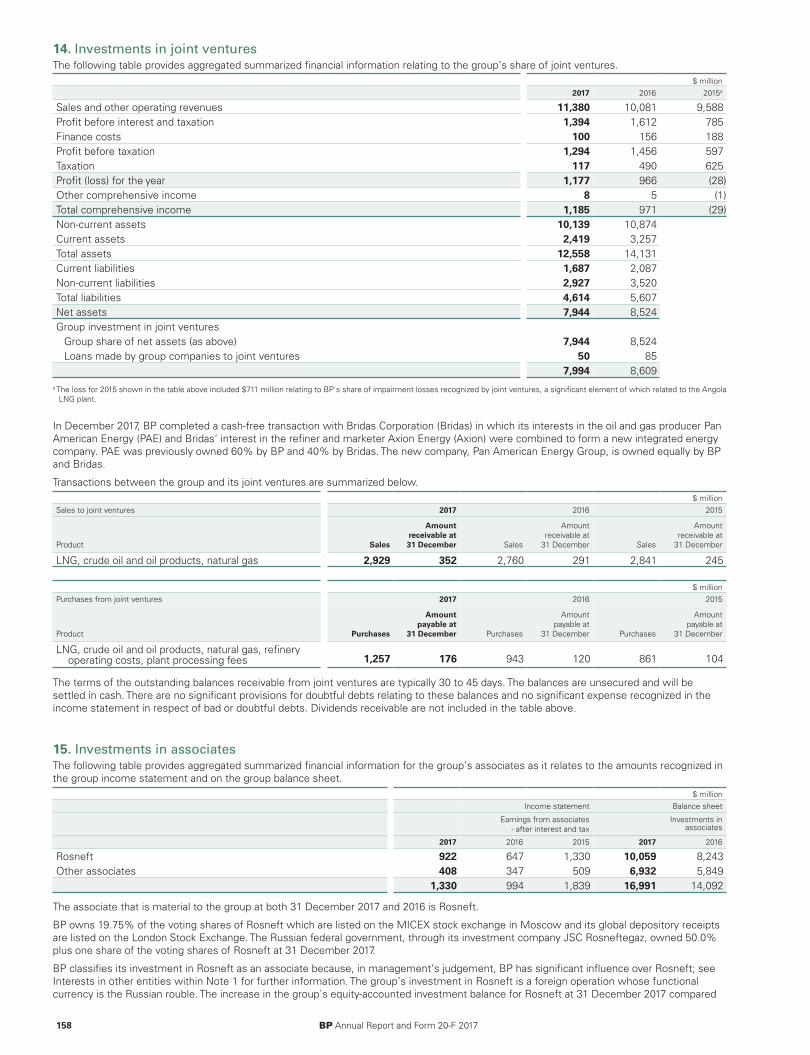
14. Investments in joint ventures The following table provides aggregated summarized financial information relating to the group’s share of joint ventures.
$ million2017 2016 2015a
Sales and other operating revenues 11,380 10,081 9,588Profit before interest and taxation 1,394 1,612 785Finance costs 100 156 188Profit before taxation 1,294 1,456 597Taxation 117 490 625Profit (loss) for the year 1,177 966 (28)Other comprehensive income 8 5 (1)Total comprehensive income 1,185 971 (29)Non-current assets 10,139 10,874Current assets 2,419 3,257Total assets 12,558 14,131Current liabilities 1,687 2,087Non-current liabilities 2,927 3,520Total liabilities 4,614 5,607Net assets 7,944 8,524Group investment in joint ventures
Group share of net assets (as above) 7,944 8,524Loans made by group companies to joint ventures 50 85
7,994 8,609a The loss for 2015 shown in the table above included $711 million relating to BP`s share of impairment losses recognized by joint ventures, a significant element of which related to the Angola
LNG plant.
In December 2017, BP completed a cash-free transaction with Bridas Corporation (Bridas) in which its interests in the oil and gas producer PanAmerican Energy (PAE) and Bridas’ interest in the refiner and marketer Axion Energy (Axion) were combined to form a new integrated energycompany. PAE was previously owned 60% by BP and 40% by Bridas. The new company, Pan American Energy Group, is owned equally by BPand Bridas.
Transactions between the group and its joint ventures are summarized below.$ million
Sales to joint ventures 2017 2016 2015
Product Sales
Amountreceivable at 31 December Sales
Amountreceivable at
31 December Sales
Amountreceivable at
31 December
LNG, crude oil and oil products, natural gas 2,929 352 2,760 291 2,841 245
$ millionPurchases from joint ventures 2017 2016 2015
Product Purchases
Amountpayable at
31 December Purchases
Amount payable at
31 December Purchases
Amount payable at
31 December
LNG, crude oil and oil products, natural gas, refineryoperating costs, plant processing fees 1,257 176 943 120 861 104
The terms of the outstanding balances receivable from joint ventures are typically 30 to 45 days. The balances are unsecured and will besettled in cash. There are no significant provisions for doubtful debts relating to these balances and no significant expense recognized in theincome statement in respect of bad or doubtful debts. Dividends receivable are not included in the table above.
158 BP Annual Report and Form 20-F 2017
15. Investments in associatesThe following table provides aggregated summarized financial information for the group’s associates as it relates to the amounts recognized inthe group income statement and on the group balance sheet.
$ millionIncome statement Balance sheet
Earnings from associates - after interest and tax
Investments inassociates
2017 2016 2015 2017 2016
Rosneft 922 647 1,330 10,059 8,243Other associates 408 347 509 6,932 5,849
1,330 994 1,839 16,991 14,092
The associate that is material to the group at both 31 December 2017 and 2016 is Rosneft.
BP owns 19.75% of the voting shares of Rosneft which are listed on the MICEX stock exchange in Moscow and its global depository receiptsare listed on the London Stock Exchange. The Russian federal government, through its investment company JSC Rosneftegaz, owned 50.0%plus one share of the voting shares of Rosneft at 31 December 2017.
BP classifies its investment in Rosneft as an associate because, in management’s judgement, BP has significant influence over Rosneft; seeInterests in other entities within Note 1 for further information. The group’s investment in Rosneft is a foreign operation whose functionalcurrency is the Russian rouble. The increase in the group`s equity-accounted investment balance for Rosneft at 31 December 2017 compared
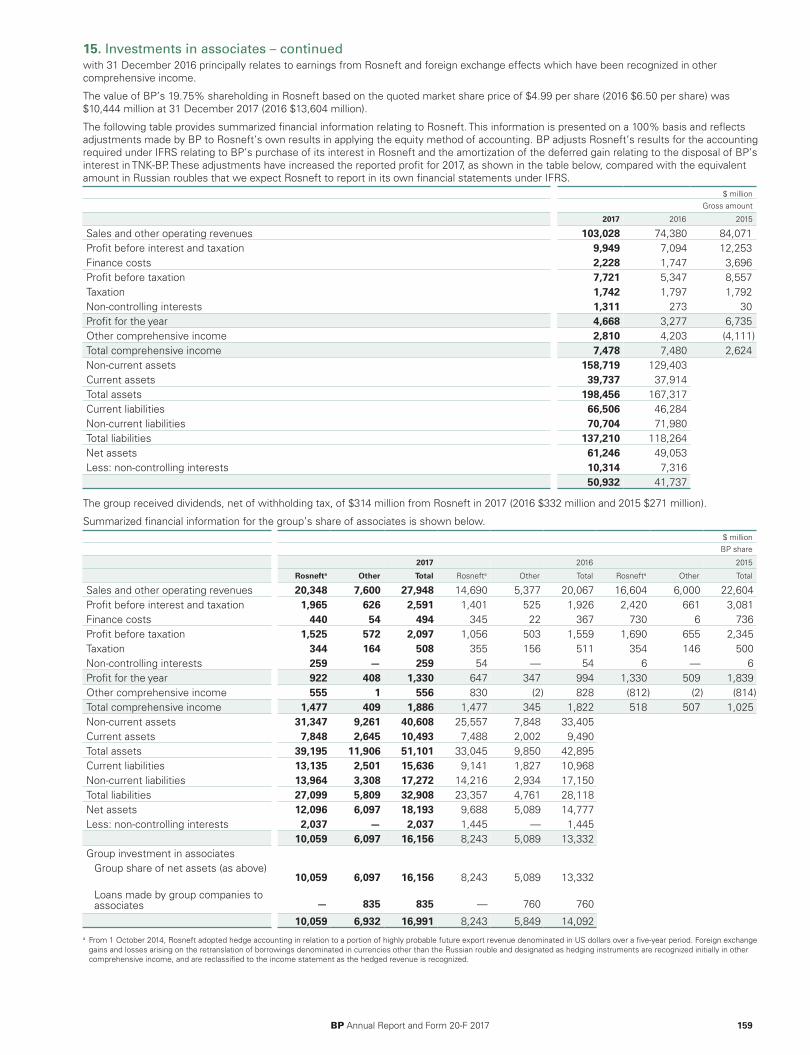
15. Investments in associates – continuedwith 31 December 2016 principally relates to earnings from Rosneft and foreign exchange effects which have been recognized in othercomprehensive income.
The value of BP’s 19.75% shareholding in Rosneft based on the quoted market share price of $4.99 per share (2016 $6.50 per share) was$10,444 million at 31 December 2017 (2016 $13,604 million).
The following table provides summarized financial information relating to Rosneft. This information is presented on a 100% basis and reflectsadjustments made by BP to Rosneft’s own results in applying the equity method of accounting. BP adjusts Rosneft’s results for the accountingrequired under IFRS relating to BP’s purchase of its interest in Rosneft and the amortization of the deferred gain relating to the disposal of BP’sinterest in TNK-BP. These adjustments have increased the reported profit for 2017, as shown in the table below, compared with the equivalentamount in Russian roubles that we expect Rosneft to report in its own financial statements under IFRS.
$ millionGross amount
2017 2016 2015
Sales and other operating revenues 103,028 74,380 84,071Profit before interest and taxation 9,949 7,094 12,253Finance costs 2,228 1,747 3,696Profit before taxation 7,721 5,347 8,557Taxation 1,742 1,797 1,792Non-controlling interests 1,311 273 30Profit for the year 4,668 3,277 6,735Other comprehensive income 2,810 4,203 (4,111)Total comprehensive income 7,478 7,480 2,624Non-current assets 158,719 129,403Current assets 39,737 37,914Total assets 198,456 167,317Current liabilities 66,506 46,284Non-current liabilities 70,704 71,980Total liabilities 137,210 118,264Net assets 61,246 49,053Less: non-controlling interests 10,314 7,316
50,932 41,737
The group received dividends, net of withholding tax, of $314 million from Rosneft in 2017 (2016 $332 million and 2015 $271 million).
Summarized financial information for the group’s share of associates is shown below.$ millionBP share
2017 2016 2015
Rosnefta Other Total Rosnefta Other Total Rosnefta Other Total
Sales and other operating revenues 20,348 7,600 27,948 14,690 5,377 20,067 16,604 6,000 22,604Profit before interest and taxation 1,965 626 2,591 1,401 525 1,926 2,420 661 3,081Finance costs 440 54 494 345 22 367 730 6 736Profit before taxation 1,525 572 2,097 1,056 503 1,559 1,690 655 2,345Taxation 344 164 508 355 156 511 354 146 500Non-controlling interests 259 — 259 54 — 54 6 — 6Profit for the year 922 408 1,330 647 347 994 1,330 509 1,839Other comprehensive income 555 1 556 830 (2) 828 (812) (2) (814)Total comprehensive income 1,477 409 1,886 1,477 345 1,822 518 507 1,025Non-current assets 31,347 9,261 40,608 25,557 7,848 33,405Current assets 7,848 2,645 10,493 7,488 2,002 9,490Total assets 39,195 11,906 51,101 33,045 9,850 42,895Current liabilities 13,135 2,501 15,636 9,141 1,827 10,968Non-current liabilities 13,964 3,308 17,272 14,216 2,934 17,150Total liabilities 27,099 5,809 32,908 23,357 4,761 28,118Net assets 12,096 6,097 18,193 9,688 5,089 14,777Less: non-controlling interests 2,037 — 2,037 1,445 — 1,445
10,059 6,097 16,156 8,243 5,089 13,332Group investment in associates
Group share of net assets (as above)10,059 6,097 16,156 8,243 5,089 13,332
Loans made by group companies toassociates — 835 835 — 760 760
10,059 6,932 16,991 8,243 5,849 14,092a From 1 October 2014, Rosneft adopted hedge accounting in relation to a portion of highly probable future export revenue denominated in US dollars over a five-year period. Foreign exchange
gains and losses arising on the retranslation of borrowings denominated in currencies other than the Russian rouble and designated as hedging instruments are recognized initially in othercomprehensive income, and are reclassified to the income statement as the hedged revenue is recognized.
BP Annual Report and Form 20-F 2017 159
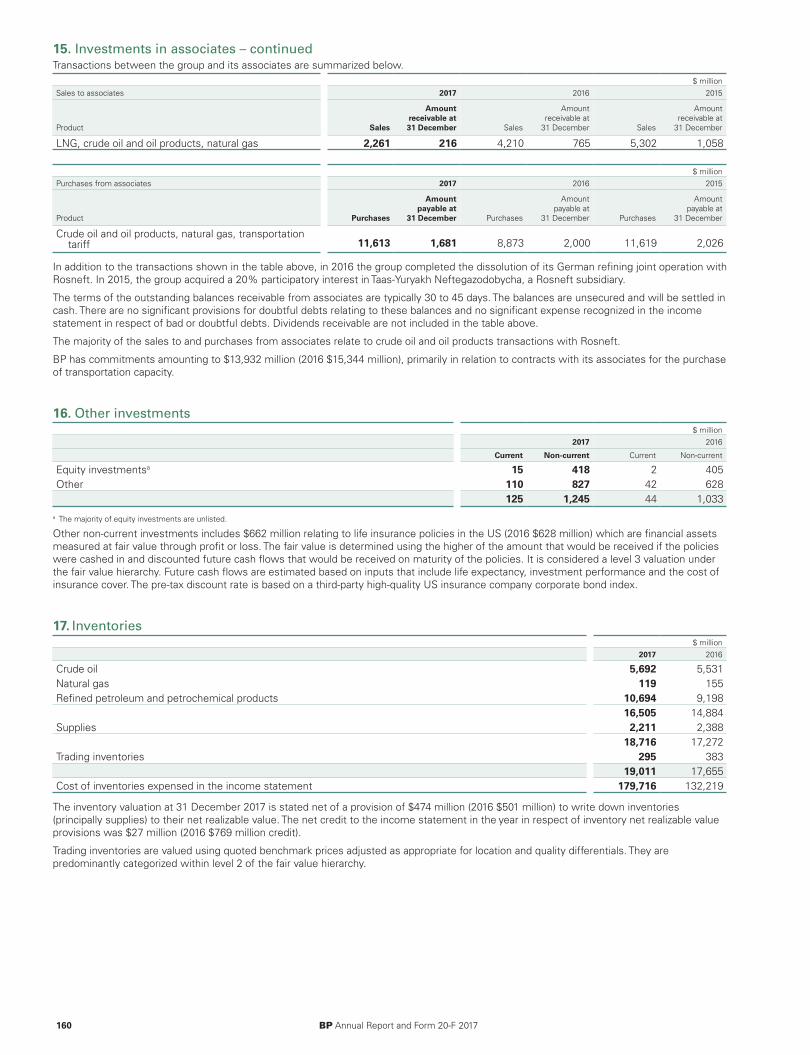
15. Investments in associates – continuedTransactions between the group and its associates are summarized below.
$ millionSales to associates 2017 2016 2015
Product Sales
Amountreceivable at 31 December Sales
Amountreceivable at
31 December Sales
Amountreceivable at
31 December
LNG, crude oil and oil products, natural gas 2,261 216 4,210 765 5,302 1,058
$ millionPurchases from associates 2017 2016 2015
Product Purchases
Amountpayable at
31 December Purchases
Amount payable at
31 December Purchases
Amount payable at
31 December
Crude oil and oil products, natural gas, transportationtariff 11,613 1,681 8,873 2,000 11,619 2,026
In addition to the transactions shown in the table above, in 2016 the group completed the dissolution of its German refining joint operation withRosneft. In 2015, the group acquired a 20% participatory interest in Taas-Yuryakh Neftegazodobycha, a Rosneft subsidiary.
The terms of the outstanding balances receivable from associates are typically 30 to 45 days. The balances are unsecured and will be settled incash. There are no significant provisions for doubtful debts relating to these balances and no significant expense recognized in the incomestatement in respect of bad or doubtful debts. Dividends receivable are not included in the table above.
The majority of the sales to and purchases from associates relate to crude oil and oil products transactions with Rosneft.
BP has commitments amounting to $13,932 million (2016 $15,344 million), primarily in relation to contracts with its associates for the purchaseof transportation capacity.
160 BP Annual Report and Form 20-F 2017
16. Other investments$ million
2017 2016
Current Non-current Current Non-current
Equity investmentsa 15 418 2 405Other 110 827 42 628
125 1,245 44 1,033
a The majority of equity investments are unlisted.
Other non-current investments includes $662 million relating to life insurance policies in the US (2016 $628 million) which are financial assetsmeasured at fair value through profit or loss. The fair value is determined using the higher of the amount that would be received if the policieswere cashed in and discounted future cash flows that would be received on maturity of the policies. It is considered a level 3 valuation underthe fair value hierarchy. Future cash flows are estimated based on inputs that include life expectancy, investment performance and the cost ofinsurance cover. The pre-tax discount rate is based on a third-party high-quality US insurance company corporate bond index.
17. Inventories$ million
2017 2016
Crude oil 5,692 5,531Natural gas 119 155Refined petroleum and petrochemical products 10,694 9,198
16,505 14,884Supplies 2,211 2,388
18,716 17,272Trading inventories 295 383
19,011 17,655Cost of inventories expensed in the income statement 179,716 132,219
The inventory valuation at 31 December 2017 is stated net of a provision of $474 million (2016 $501 million) to write down inventories(principally supplies) to their net realizable value. The net credit to the income statement in the year in respect of inventory net realizable valueprovisions was $27 million (2016 $769 million credit).
Trading inventories are valued using quoted benchmark prices adjusted as appropriate for location and quality differentials. They arepredominantly categorized within level 2 of the fair value hierarchy.
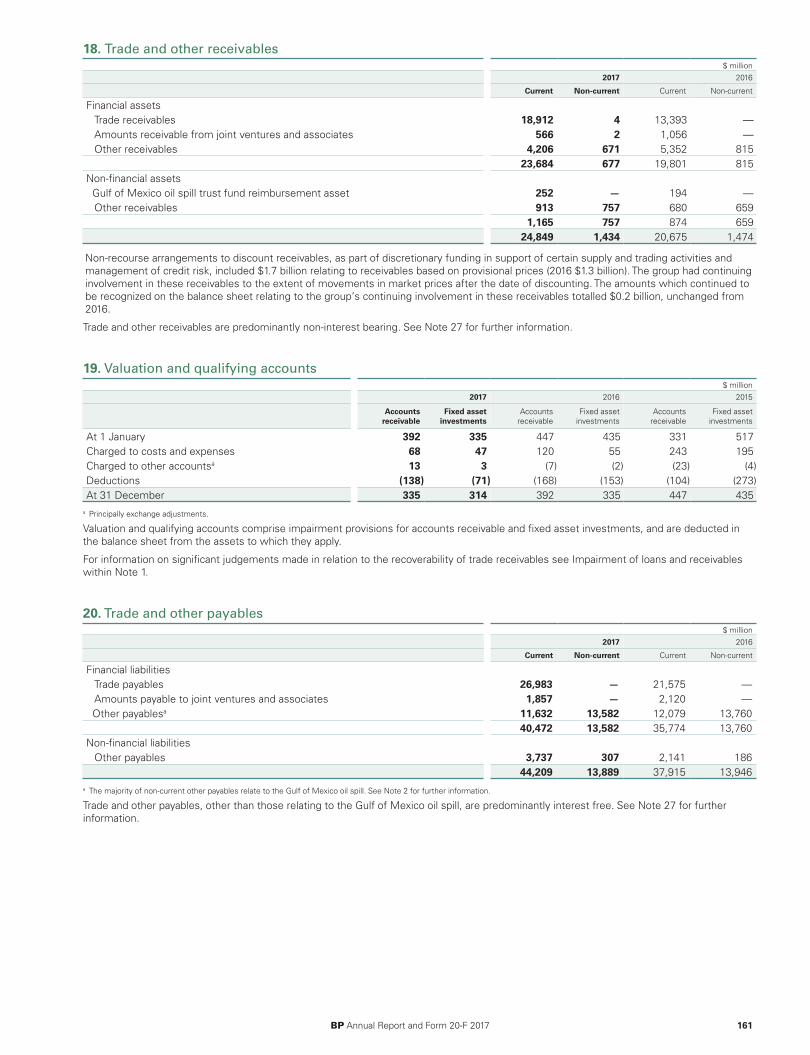
18. Trade and other receivables$ million
2017 2016
Current Non-current Current Non-current
Financial assetsTrade receivables 18,912 4 13,393 —Amounts receivable from joint ventures and associates 566 2 1,056 —Other receivables 4,206 671 5,352 815
23,684 677 19,801 815Non-financial assets
Gulf of Mexico oil spill trust fund reimbursement asset 252 — 194 —Other receivables 913 757 680 659
1,165 757 874 65924,849 1,434 20,675 1,474
Non-recourse arrangements to discount receivables, as part of discretionary funding in support of certain supply and trading activities andmanagement of credit risk, included $1.7 billion relating to receivables based on provisional prices (2016 $1.3 billion). The group had continuinginvolvement in these receivables to the extent of movements in market prices after the date of discounting. The amounts which continued tobe recognized on the balance sheet relating to the group’s continuing involvement in these receivables totalled $0.2 billion, unchanged from2016.
Trade and other receivables are predominantly non-interest bearing. See Note 27 for further information.
BP Annual Report and Form 20-F 2017 161
19. Valuation and qualifying accounts$ million
2017 2016 2015
Accountsreceivable
Fixed assetinvestments
Accountsreceivable
Fixed assetinvestments
Accountsreceivable
Fixed assetinvestments
At 1 January 392 335 447 435 331 517Charged to costs and expenses 68 47 120 55 243 195Charged to other accountsa 13 3 (7) (2) (23) (4)Deductions (138) (71) (168) (153) (104) (273)At 31 December 335 314 392 335 447 435
a Principally exchange adjustments.
Valuation and qualifying accounts comprise impairment provisions for accounts receivable and fixed asset investments, and are deducted inthe balance sheet from the assets to which they apply.
For information on significant judgements made in relation to the recoverability of trade receivables see Impairment of loans and receivableswithin Note 1.
20. Trade and other payables $ million
2017 2016
Current Non-current Current Non-current
Financial liabilitiesTrade payables 26,983 — 21,575 —Amounts payable to joint ventures and associates 1,857 — 2,120 —Other payablesa 11,632 13,582 12,079 13,760
40,472 13,582 35,774 13,760Non-financial liabilities
Other payables 3,737 307 2,141 18644,209 13,889 37,915 13,946
a The majority of non-current other payables relate to the Gulf of Mexico oil spill. See Note 2 for further information.
Trade and other payables, other than those relating to the Gulf of Mexico oil spill, are predominantly interest free. See Note 27 for furtherinformation.
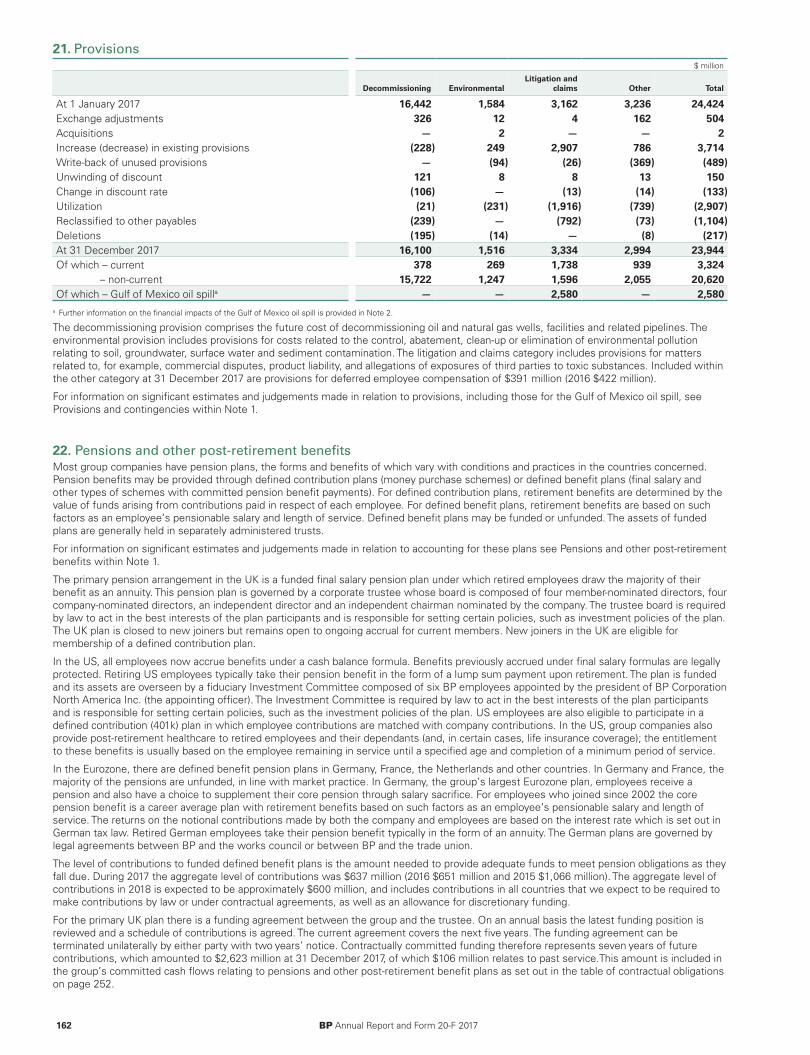
21. Provisions $ million
Decommissioning EnvironmentalLitigation and
claims Other Total
At 1 January 2017 16,442 1,584 3,162 3,236 24,424Exchange adjustments 326 12 4 162 504Acquisitions — 2 — — 2Increase (decrease) in existing provisions (228) 249 2,907 786 3,714Write-back of unused provisions — (94) (26) (369) (489)Unwinding of discount 121 8 8 13 150Change in discount rate (106) — (13) (14) (133)Utilization (21) (231) (1,916) (739) (2,907)Reclassified to other payables (239) — (792) (73) (1,104)Deletions (195) (14) — (8) (217)At 31 December 2017 16,100 1,516 3,334 2,994 23,944Of which – current 378 269 1,738 939 3,324
– non-current 15,722 1,247 1,596 2,055 20,620Of which – Gulf of Mexico oil spilla — — 2,580 — 2,580
a Further information on the financial impacts of the Gulf of Mexico oil spill is provided in Note 2.
The decommissioning provision comprises the future cost of decommissioning oil and natural gas wells, facilities and related pipelines. Theenvironmental provision includes provisions for costs related to the control, abatement, clean-up or elimination of environmental pollutionrelating to soil, groundwater, surface water and sediment contamination. The litigation and claims category includes provisions for mattersrelated to, for example, commercial disputes, product liability, and allegations of exposures of third parties to toxic substances. Included withinthe other category at 31 December 2017 are provisions for deferred employee compensation of $391 million (2016 $422 million).
For information on significant estimates and judgements made in relation to provisions, including those for the Gulf of Mexico oil spill, seeProvisions and contingencies within Note 1.
162 BP Annual Report and Form 20-F 2017
22. Pensions and other post-retirement benefits Most group companies have pension plans, the forms and benefits of which vary with conditions and practices in the countries concerned.Pension benefits may be provided through defined contribution plans (money purchase schemes) or defined benefit plans (final salary andother types of schemes with committed pension benefit payments). For defined contribution plans, retirement benefits are determined by thevalue of funds arising from contributions paid in respect of each employee. For defined benefit plans, retirement benefits are based on suchfactors as an employee’s pensionable salary and length of service. Defined benefit plans may be funded or unfunded. The assets of fundedplans are generally held in separately administered trusts.
For information on significant estimates and judgements made in relation to accounting for these plans see Pensions and other post-retirementbenefits within Note 1.
The primary pension arrangement in the UK is a funded final salary pension plan under which retired employees draw the majority of theirbenefit as an annuity. This pension plan is governed by a corporate trustee whose board is composed of four member-nominated directors, fourcompany-nominated directors, an independent director and an independent chairman nominated by the company. The trustee board is requiredby law to act in the best interests of the plan participants and is responsible for setting certain policies, such as investment policies of the plan.The UK plan is closed to new joiners but remains open to ongoing accrual for current members. New joiners in the UK are eligible formembership of a defined contribution plan.
In the US, all employees now accrue benefits under a cash balance formula. Benefits previously accrued under final salary formulas are legallyprotected. Retiring US employees typically take their pension benefit in the form of a lump sum payment upon retirement. The plan is fundedand its assets are overseen by a fiduciary Investment Committee composed of six BP employees appointed by the president of BP CorporationNorth America Inc. (the appointing officer). The Investment Committee is required by law to act in the best interests of the plan participantsand is responsible for setting certain policies, such as the investment policies of the plan. US employees are also eligible to participate in adefined contribution (401k) plan in which employee contributions are matched with company contributions. In the US, group companies alsoprovide post-retirement healthcare to retired employees and their dependants (and, in certain cases, life insurance coverage); the entitlementto these benefits is usually based on the employee remaining in service until a specified age and completion of a minimum period of service.
In the Eurozone, there are defined benefit pension plans in Germany, France, the Netherlands and other countries. In Germany and France, themajority of the pensions are unfunded, in line with market practice. In Germany, the group’s largest Eurozone plan, employees receive apension and also have a choice to supplement their core pension through salary sacrifice. For employees who joined since 2002 the corepension benefit is a career average plan with retirement benefits based on such factors as an employee’s pensionable salary and length ofservice. The returns on the notional contributions made by both the company and employees are based on the interest rate which is set out inGerman tax law. Retired German employees take their pension benefit typically in the form of an annuity. The German plans are governed bylegal agreements between BP and the works council or between BP and the trade union.
The level of contributions to funded defined benefit plans is the amount needed to provide adequate funds to meet pension obligations as theyfall due. During 2017 the aggregate level of contributions was $637 million (2016 $651 million and 2015 $1,066 million). The aggregate level ofcontributions in 2018 is expected to be approximately $600 million, and includes contributions in all countries that we expect to be required tomake contributions by law or under contractual agreements, as well as an allowance for discretionary funding.
For the primary UK plan there is a funding agreement between the group and the trustee. On an annual basis the latest funding position isreviewed and a schedule of contributions is agreed. The current agreement covers the next five years. The funding agreement can beterminated unilaterally by either party with two years’ notice. Contractually committed funding therefore represents seven years of futurecontributions, which amounted to $2,623 million at 31 December 2017, of which $106 million relates to past service.This amount is included inthe group’s committed cash flows relating to pensions and other post-retirement benefit plans as set out in the table of contractual obligationson page 252.
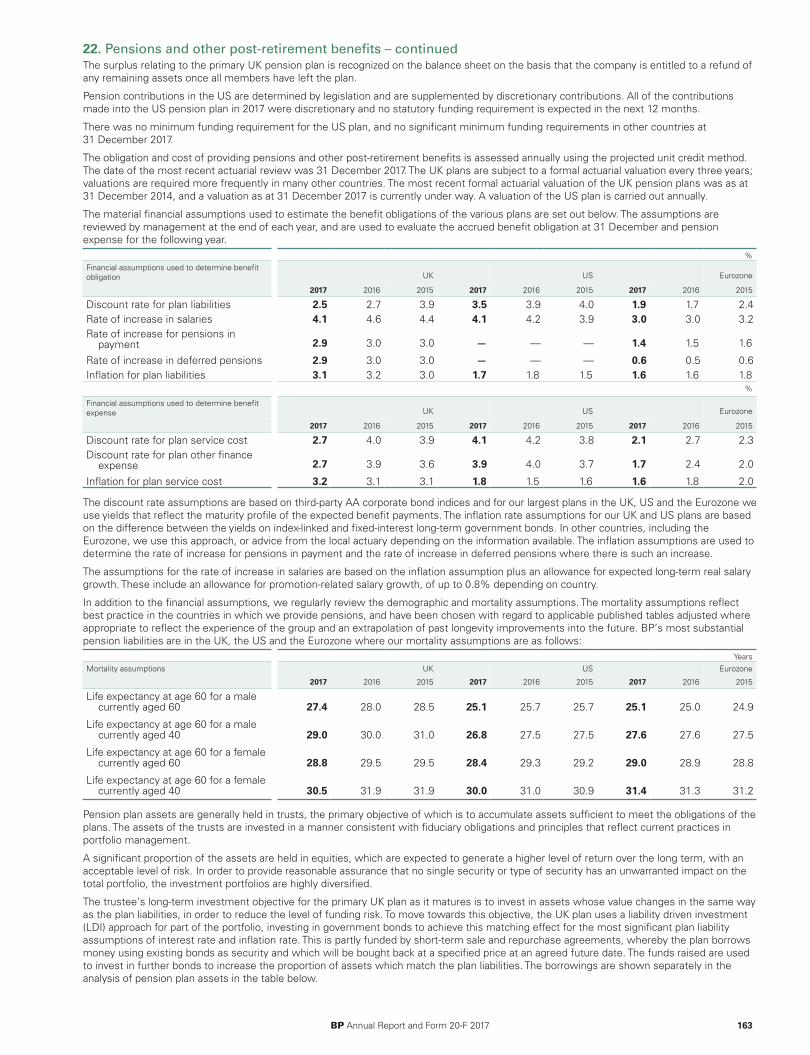
22. Pensions and other post-retirement benefits – continuedThe surplus relating to the primary UK pension plan is recognized on the balance sheet on the basis that the company is entitled to a refund ofany remaining assets once all members have left the plan.
Pension contributions in the US are determined by legislation and are supplemented by discretionary contributions. All of the contributionsmade into the US pension plan in 2017 were discretionary and no statutory funding requirement is expected in the next 12 months.
There was no minimum funding requirement for the US plan, and no significant minimum funding requirements in other countries at31 December 2017.
The obligation and cost of providing pensions and other post-retirement benefits is assessed annually using the projected unit credit method.The date of the most recent actuarial review was 31 December 2017. The UK plans are subject to a formal actuarial valuation every three years;valuations are required more frequently in many other countries. The most recent formal actuarial valuation of the UK pension plans was as at31 December 2014, and a valuation as at 31 December 2017 is currently under way. A valuation of the US plan is carried out annually.
The material financial assumptions used to estimate the benefit obligations of the various plans are set out below. The assumptions arereviewed by management at the end of each year, and are used to evaluate the accrued benefit obligation at 31 December and pensionexpense for the following year.
%Financial assumptions used to determine benefitobligation UK US Eurozone
2017 2016 2015 2017 2016 2015 2017 2016 2015
Discount rate for plan liabilities 2.5 2.7 3.9 3.5 3.9 4.0 1.9 1.7 2.4Rate of increase in salaries 4.1 4.6 4.4 4.1 4.2 3.9 3.0 3.0 3.2Rate of increase for pensions in
payment 2.9 3.0 3.0 — — — 1.4 1.5 1.6
Rate of increase in deferred pensions 2.9 3.0 3.0 — — — 0.6 0.5 0.6Inflation for plan liabilities 3.1 3.2 3.0 1.7 1.8 1.5 1.6 1.6 1.8
%
Financial assumptions used to determine benefitexpense UK US Eurozone
2017 2016 2015 2017 2016 2015 2017 2016 2015
Discount rate for plan service cost 2.7 4.0 3.9 4.1 4.2 3.8 2.1 2.7 2.3Discount rate for plan other finance
expense 2.7 3.9 3.6 3.9 4.0 3.7 1.7 2.4 2.0
Inflation for plan service cost 3.2 3.1 3.1 1.8 1.5 1.6 1.6 1.8 2.0
The discount rate assumptions are based on third-party AA corporate bond indices and for our largest plans in the UK, US and the Eurozone weuse yields that reflect the maturity profile of the expected benefit payments. The inflation rate assumptions for our UK and US plans are basedon the difference between the yields on index-linked and fixed-interest long-term government bonds. In other countries, including theEurozone, we use this approach, or advice from the local actuary depending on the information available. The inflation assumptions are used todetermine the rate of increase for pensions in payment and the rate of increase in deferred pensions where there is such an increase.
The assumptions for the rate of increase in salaries are based on the inflation assumption plus an allowance for expected long-term real salarygrowth. These include an allowance for promotion-related salary growth, of up to 0.8% depending on country.
In addition to the financial assumptions, we regularly review the demographic and mortality assumptions. The mortality assumptions reflectbest practice in the countries in which we provide pensions, and have been chosen with regard to applicable published tables adjusted whereappropriate to reflect the experience of the group and an extrapolation of past longevity improvements into the future. BP’s most substantialpension liabilities are in the UK, the US and the Eurozone where our mortality assumptions are as follows:
YearsMortality assumptions UK US Eurozone
2017 2016 2015 2017 2016 2015 2017 2016 2015
Life expectancy at age 60 for a malecurrently aged 60 27.4 28.0 28.5 25.1 25.7 25.7 25.1 25.0 24.9
Life expectancy at age 60 for a malecurrently aged 40 29.0 30.0 31.0 26.8 27.5 27.5 27.6 27.6 27.5
Life expectancy at age 60 for a femalecurrently aged 60 28.8 29.5 29.5 28.4 29.3 29.2 29.0 28.9 28.8
Life expectancy at age 60 for a femalecurrently aged 40 30.5 31.9 31.9 30.0 31.0 30.9 31.4 31.3 31.2
Pension plan assets are generally held in trusts, the primary objective of which is to accumulate assets sufficient to meet the obligations of theplans. The assets of the trusts are invested in a manner consistent with fiduciary obligations and principles that reflect current practices inportfolio management.
A significant proportion of the assets are held in equities, which are expected to generate a higher level of return over the long term, with anacceptable level of risk. In order to provide reasonable assurance that no single security or type of security has an unwarranted impact on thetotal portfolio, the investment portfolios are highly diversified.
The trustee’s long-term investment objective for the primary UK plan as it matures is to invest in assets whose value changes in the same wayas the plan liabilities, in order to reduce the level of funding risk. To move towards this objective, the UK plan uses a liability driven investment(LDI) approach for part of the portfolio, investing in government bonds to achieve this matching effect for the most significant plan liabilityassumptions of interest rate and inflation rate. This is partly funded by short-term sale and repurchase agreements, whereby the plan borrowsmoney using existing bonds as security and which will be bought back at a specified price at an agreed future date. The funds raised are usedto invest in further bonds to increase the proportion of assets which match the plan liabilities. The borrowings are shown separately in theanalysis of pension plan assets in the table below.
BP Annual Report and Form 20-F 2017 163
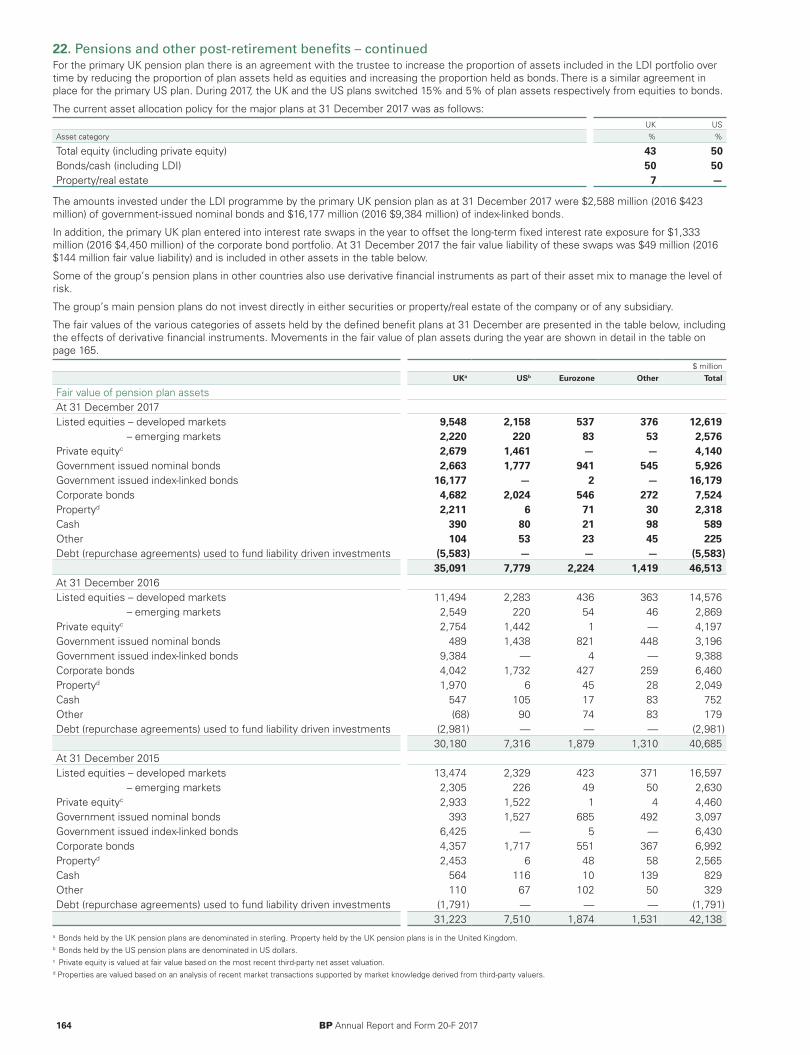
22. Pensions and other post-retirement benefits – continuedFor the primary UK pension plan there is an agreement with the trustee to increase the proportion of assets included in the LDI portfolio overtime by reducing the proportion of plan assets held as equities and increasing the proportion held as bonds. There is a similar agreement inplace for the primary US plan. During 2017, the UK and the US plans switched 15% and 5% of plan assets respectively from equities to bonds.
The current asset allocation policy for the major plans at 31 December 2017 was as follows:UK US
Asset category % %
Total equity (including private equity) 43 50Bonds/cash (including LDI) 50 50Property/real estate 7 —
The amounts invested under the LDI programme by the primary UK pension plan as at 31 December 2017 were $2,588 million (2016 $423million) of government-issued nominal bonds and $16,177 million (2016 $9,384 million) of index-linked bonds.
In addition, the primary UK plan entered into interest rate swaps in the year to offset the long-term fixed interest rate exposure for $1,333million (2016 $4,450 million) of the corporate bond portfolio. At 31 December 2017 the fair value liability of these swaps was $49 million (2016$144 million fair value liability) and is included in other assets in the table below.
Some of the group’s pension plans in other countries also use derivative financial instruments as part of their asset mix to manage the level ofrisk.
The group’s main pension plans do not invest directly in either securities or property/real estate of the company or of any subsidiary.
The fair values of the various categories of assets held by the defined benefit plans at 31 December are presented in the table below, includingthe effects of derivative financial instruments. Movements in the fair value of plan assets during the year are shown in detail in the table onpage 165.
$ millionUKa USb Eurozone Other Total
Fair value of pension plan assetsAt 31 December 2017Listed equities – developed markets 9,548 2,158 537 376 12,619
– emerging markets 2,220 220 83 53 2,576Private equityc 2,679 1,461 — — 4,140Government issued nominal bonds 2,663 1,777 941 545 5,926Government issued index-linked bonds 16,177 — 2 — 16,179Corporate bonds 4,682 2,024 546 272 7,524Propertyd 2,211 6 71 30 2,318Cash 390 80 21 98 589Other 104 53 23 45 225Debt (repurchase agreements) used to fund liability driven investments (5,583) — — — (5,583)
35,091 7,779 2,224 1,419 46,513At 31 December 2016Listed equities – developed markets 11,494 2,283 436 363 14,576
– emerging markets 2,549 220 54 46 2,869Private equityc 2,754 1,442 1 — 4,197Government issued nominal bonds 489 1,438 821 448 3,196Government issued index-linked bonds 9,384 — 4 — 9,388Corporate bonds 4,042 1,732 427 259 6,460Propertyd 1,970 6 45 28 2,049Cash 547 105 17 83 752Other (68) 90 74 83 179Debt (repurchase agreements) used to fund liability driven investments (2,981) — — — (2,981)
30,180 7,316 1,879 1,310 40,685At 31 December 2015Listed equities – developed markets 13,474 2,329 423 371 16,597
– emerging markets 2,305 226 49 50 2,630Private equityc 2,933 1,522 1 4 4,460Government issued nominal bonds 393 1,527 685 492 3,097Government issued index-linked bonds 6,425 — 5 — 6,430Corporate bonds 4,357 1,717 551 367 6,992Propertyd 2,453 6 48 58 2,565Cash 564 116 10 139 829Other 110 67 102 50 329Debt (repurchase agreements) used to fund liability driven investments (1,791) — — — (1,791)
31,223 7,510 1,874 1,531 42,138a Bonds held by the UK pension plans are denominated in sterling. Property held by the UK pension plans is in the United Kingdom.b Bonds held by the US pension plans are denominated in US dollars.c Private equity is valued at fair value based on the most recent third-party net asset valuation.d Properties are valued based on an analysis of recent market transactions supported by market knowledge derived from third-party valuers.
164 BP Annual Report and Form 20-F 2017

22. Pensions and other post-retirement benefits – continued$ million
2017
UK US Eurozone Other Total
Analysis of the amount charged to profit (loss) before interest and taxationCurrent service costa 357 292 85 46 780Past service costb 12 — 5 (1) 16Settlementb — — 13 — 13Operating charge relating to defined benefit plans 369 292 103 45 809Payments to defined contribution plans 31 191 7 38 267Total operating charge 400 483 110 83 1,076Interest income on plan assetsa (845) (266) (37) (48) (1,196)Interest on plan liabilities 831 393 121 71 1,416Other finance (income) expense (14) 127 84 23 220Analysis of the amount recognized in other comprehensive incomeActual asset return less interest income on plan assets 2,396 826 30 43 3,295Change in financial assumptions underlying the present value of the plan liabilities (236) (514) 336 (47) (461)Change in demographic assumptions underlying the present value of the plan liabilities 734 72 — (23) 783Experience gains and losses arising on the plan liabilities 91 (40) (36) 14 29Remeasurements recognized in other comprehensive income 2,985 344 330 (13) 3,646Movements in benefit obligation during the yearBenefit obligation at 1 January 29,908 10,533 6,820 1,715 48,976Exchange adjustments 2,886 — 915 89 3,890Operating charge relating to defined benefit plans 369 292 103 45 809Interest cost 831 393 121 71 1,416Contributions by plan participantsc 16 — 2 6 24Benefit payments (funded plans)d (1,903) (641) (75) (89) (2,708)Benefit payments (unfunded plans)d (5) (239) (302) (20) (566)Acquisitions — 1 — — 1Disposals — (1) (9) — (10)Remeasurements (589) 482 (300) 56 (351)Benefit obligation at 31 Decembera e 31,513 10,820 7,275 1,873 51,481Movements in fair value of plan assets during the yearFair value of plan assets at 1 January 30,180 7,316 1,879 1,310 40,685Exchange adjustments 3,048 — 264 72 3,384Interest income on plan assetsa f 845 266 37 48 1,196Contributions by plan participantsc 16 — 2 6 24Contributions by employers (funded plans) 509 12 87 29 637Benefit payments (funded plans)d (1,903) (641) (75) (89) (2,708)Remeasurementsf 2,396 826 30 43 3,295Fair value of plan assets at 31 Decemberg 35,091 7,779 2,224 1,419 46,513Surplus (deficit) at 31 December 3,578 (3,041) (5,051) (454) (4,968)Represented by
Asset recognized 3,838 260 43 28 4,169Liability recognized (260) (3,301) (5,094) (482) (9,137)
3,578 (3,041) (5,051) (454) (4,968)The surplus (deficit) may be analysed between funded and unfunded plans as follows
Funded 3,838 238 (106) (101) 3,869Unfunded (260) (3,279) (4,945) (353) (8,837)
3,578 (3,041) (5,051) (454) (4,968)The defined benefit obligation may be analysed between funded and unfunded plans as
followsFunded (31,253) (7,541) (2,330) (1,520) (42,644)Unfunded (260) (3,279) (4,945) (353) (8,837)
(31,513) (10,820) (7,275) (1,873) (51,481)a The costs of managing plan investments are offset against the investment return, the costs of administering pension plan benefits are generally included in current service cost and the
costs of administering other post-retirement benefit plans are included in the benefit obligation.b Past service costs and settlements have arisen from restructuring programmes and represent charges for special termination benefits representing the increased liability arising as a result
of early retirements mostly in the UK and Eurozone.c Most of the contributions made by plan participants into UK pension plans were made under salary sacrifice.d The benefit payments amount shown above comprises $3,235 million benefits and $2 million settlements, plus $37 million of plan expenses incurred in the administration of the benefit.e The benefit obligation for the US is made up of $8,085 million for pension liabilities and $2,735 million for other post-retirement benefit liabilities (which are unfunded and are primarily retiree
medical liabilities). The benefit obligation for the Eurozone includes $4,586 million for pension liabilities in Germany which is largely unfunded.f The actual return on plan assets is made up of the sum of the interest income on plan assets and the remeasurement of plan assets as disclosed above.g The fair value of plan assets includes borrowings related to the LDI programme as described on page 164.
BP Annual Report and Form 20-F 2017 165

22. Pensions and other post-retirement benefits – continued$ million
2016
UK US Eurozone Other Total
Analysis of the amount charged to profit (loss) before interest and taxationCurrent service costa 333 310 76 71 790Past service costb 17 (24) 7 1 1Settlement — — 9 (1) 8Operating charge relating to defined benefit plans 350 286 92 71 799Payments to defined contribution plans 30 194 7 33 264Total operating charge 380 480 99 104 1,063Interest income on plan assetsa (1,086) (287) (47) (51) (1,471)Interest on plan liabilities 1,005 417 159 80 1,661Other finance (income) expense (81) 130 112 29 190Analysis of the amount recognized in other comprehensive incomeActual asset return less interest income on plan assets 4,422 330 53 8 4,813Change in financial assumptions underlying the present value of the plan liabilities (6,932) (239) (622) 4 (7,789)Change in demographic assumptions underlying the present value of the plan liabilities 430 9 12 (5) 446Experience gains and losses arising on the plan liabilities 55 (62) 26 15 34Remeasurements recognized in other comprehensive income (2,025) 38 (531) 22 (2,496)Movements in benefit obligation during the yearBenefit obligation at 1 January 28,974 10,643 6,640 2,089 48,346Exchange adjustments (5,688) — (282) 23 (5,947)Operating charge relating to defined benefit plans 350 286 92 71 799Interest cost 1,005 417 159 80 1,661Contributions by plan participantsc 18 — 2 6 26Benefit payments (funded plans)d (1,192) (821) (78) (117) (2,208)Benefit payments (unfunded plans)d (6) (284) (301) (24) (615)Acquisitions — — 4 — 4Disposals — — — (399) (399)Remeasurements 6,447 292 584 (14) 7,309Benefit obligation at 31 Decembera e 29,908 10,533 6,820 1,715 48,976Movements in fair value of plan assets during the yearFair value of plan assets at 1 January 31,223 7,510 1,874 1,531 42,138Exchange adjustments (5,916) — (76) 15 (5,977)Interest income on plan assetsa f 1,086 287 47 51 1,471Contributions by plan participantsc 18 — 2 6 26Contributions by employers (funded plans) 539 10 57 45 651Benefit payments (funded plans)d (1,192) (821) (78) (117) (2,208)Disposals — — — (229) (229)Remeasurementsf 4,422 330 53 8 4,813Fair value of plan assets at 31 Decemberg 30,180 7,316 1,879 1,310 40,685Surplus (deficit) at 31 December 272 (3,217) (4,941) (405) (8,291)Represented by
Asset recognized 530 — 22 32 584Liability recognized (258) (3,217) (4,963) (437) (8,875)
272 (3,217) (4,941) (405) (8,291)The surplus (deficit) may be analysed between funded and unfunded plans as follows
Funded 519 (36) (316) (83) 84Unfunded (247) (3,181) (4,625) (322) (8,375)
272 (3,217) (4,941) (405) (8,291)The defined benefit obligation may be analysed between funded and unfunded plans as
followsFunded (29,661) (7,352) (2,195) (1,393) (40,601)Unfunded (247) (3,181) (4,625) (322) (8,375)
(29,908) (10,533) (6,820) (1,715) (48,976)a The costs of managing plan investments are offset against the investment return, the costs of administering pension plan benefits are generally included in current service cost and the
costs of administering other post-retirement benefit plans are included in the benefit obligation.b Past service costs have arisen from restructuring programmes and represent a combination of credits as a result of the curtailment in the pension arrangements of a number of employees
mostly in the US and charges for special termination benefits representing the increased liability arising as a result of early retirements mostly in the UK and Eurozone. The UK also includes$12 million of cost resulting from benefit harmonization within the primary plan.
c Most of the contributions made by plan participants into UK pension plans were made under salary sacrifice.d The benefit payments amount shown above comprises $2,754 million benefits and $14 million settlements, plus $55 million of plan expenses incurred in the administration of the benefit.e The benefit obligation for the US is made up of $7,902 million for pension liabilities and $2,631 million for other post-retirement benefit liabilities (which are unfunded and are primarily retiree
medical liabilities). The benefit obligation for the Eurozone includes $4,289 million for pension liabilities in Germany which is largely unfunded.f The actual return on plan assets is made up of the sum of the interest income on plan assets and the remeasurement of plan assets as disclosed above.g The fair value of plan assets includes borrowings related to the LDI programme as described on page 164.
166 BP Annual Report and Form 20-F 2017
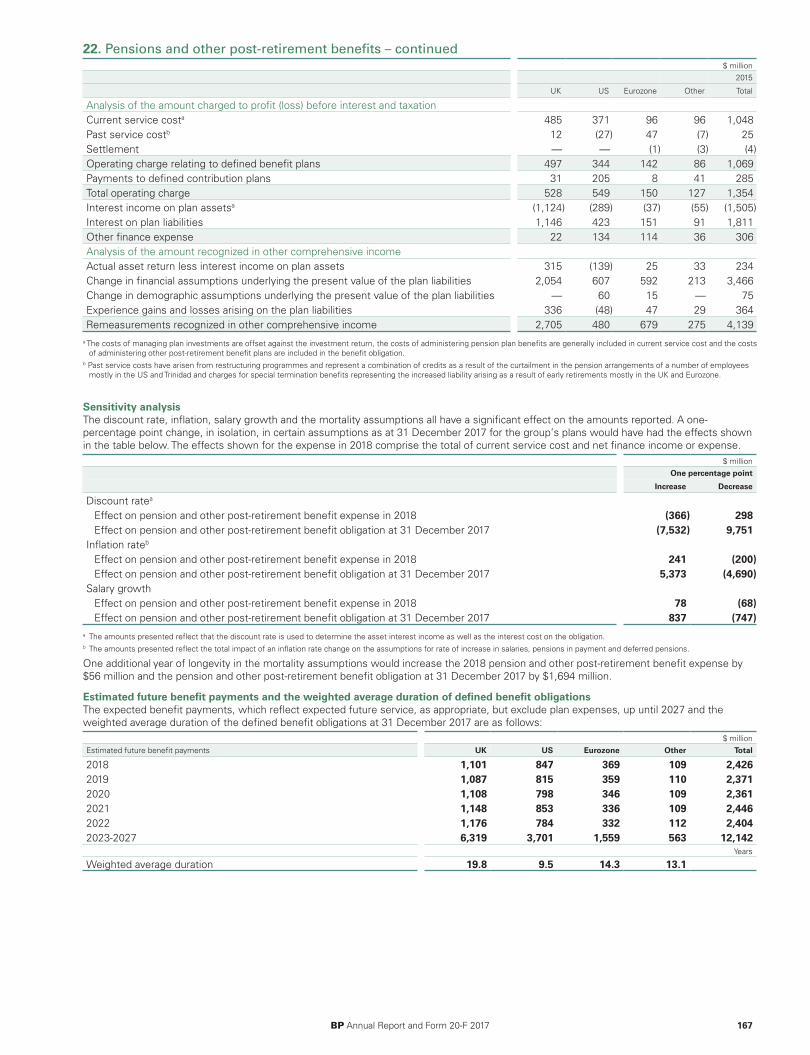
22. Pensions and other post-retirement benefits – continued$ million
2015
UK US Eurozone Other Total
Analysis of the amount charged to profit (loss) before interest and taxationCurrent service costa 485 371 96 96 1,048Past service costb 12 (27) 47 (7) 25Settlement — — (1) (3) (4)Operating charge relating to defined benefit plans 497 344 142 86 1,069Payments to defined contribution plans 31 205 8 41 285Total operating charge 528 549 150 127 1,354Interest income on plan assetsa (1,124) (289) (37) (55) (1,505)Interest on plan liabilities 1,146 423 151 91 1,811Other finance expense 22 134 114 36 306Analysis of the amount recognized in other comprehensive incomeActual asset return less interest income on plan assets 315 (139) 25 33 234Change in financial assumptions underlying the present value of the plan liabilities 2,054 607 592 213 3,466Change in demographic assumptions underlying the present value of the plan liabilities — 60 15 — 75Experience gains and losses arising on the plan liabilities 336 (48) 47 29 364Remeasurements recognized in other comprehensive income 2,705 480 679 275 4,139
a The costs of managing plan investments are offset against the investment return, the costs of administering pension plan benefits are generally included in current service cost and the costsof administering other post-retirement benefit plans are included in the benefit obligation.
b Past service costs have arisen from restructuring programmes and represent a combination of credits as a result of the curtailment in the pension arrangements of a number of employeesmostly in the US and Trinidad and charges for special termination benefits representing the increased liability arising as a result of early retirements mostly in the UK and Eurozone.
Sensitivity analysisThe discount rate, inflation, salary growth and the mortality assumptions all have a significant effect on the amounts reported. A one-percentage point change, in isolation, in certain assumptions as at 31 December 2017 for the group’s plans would have had the effects shownin the table below. The effects shown for the expense in 2018 comprise the total of current service cost and net finance income or expense.
$ millionOne percentage point
Increase Decrease
Discount ratea
Effect on pension and other post-retirement benefit expense in 2018 (366) 298Effect on pension and other post-retirement benefit obligation at 31 December 2017 (7,532) 9,751
Inflation rateb
Effect on pension and other post-retirement benefit expense in 2018 241 (200)Effect on pension and other post-retirement benefit obligation at 31 December 2017 5,373 (4,690)
Salary growthEffect on pension and other post-retirement benefit expense in 2018 78 (68)Effect on pension and other post-retirement benefit obligation at 31 December 2017 837 (747)
a The amounts presented reflect that the discount rate is used to determine the asset interest income as well as the interest cost on the obligation.b The amounts presented reflect the total impact of an inflation rate change on the assumptions for rate of increase in salaries, pensions in payment and deferred pensions.
One additional year of longevity in the mortality assumptions would increase the 2018 pension and other post-retirement benefit expense by$56 million and the pension and other post-retirement benefit obligation at 31 December 2017 by $1,694 million.
Estimated future benefit payments and the weighted average duration of defined benefit obligationsThe expected benefit payments, which reflect expected future service, as appropriate, but exclude plan expenses, up until 2027 and theweighted average duration of the defined benefit obligations at 31 December 2017 are as follows:
$ millionEstimated future benefit payments UK US Eurozone Other Total
2018 1,101 847 369 109 2,4262019 1,087 815 359 110 2,3712020 1,108 798 346 109 2,3612021 1,148 853 336 109 2,4462022 1,176 784 332 112 2,4042023-2027 6,319 3,701 1,559 563 12,142
Years
Weighted average duration 19.8 9.5 14.3 13.1
BP Annual Report and Form 20-F 2017 167
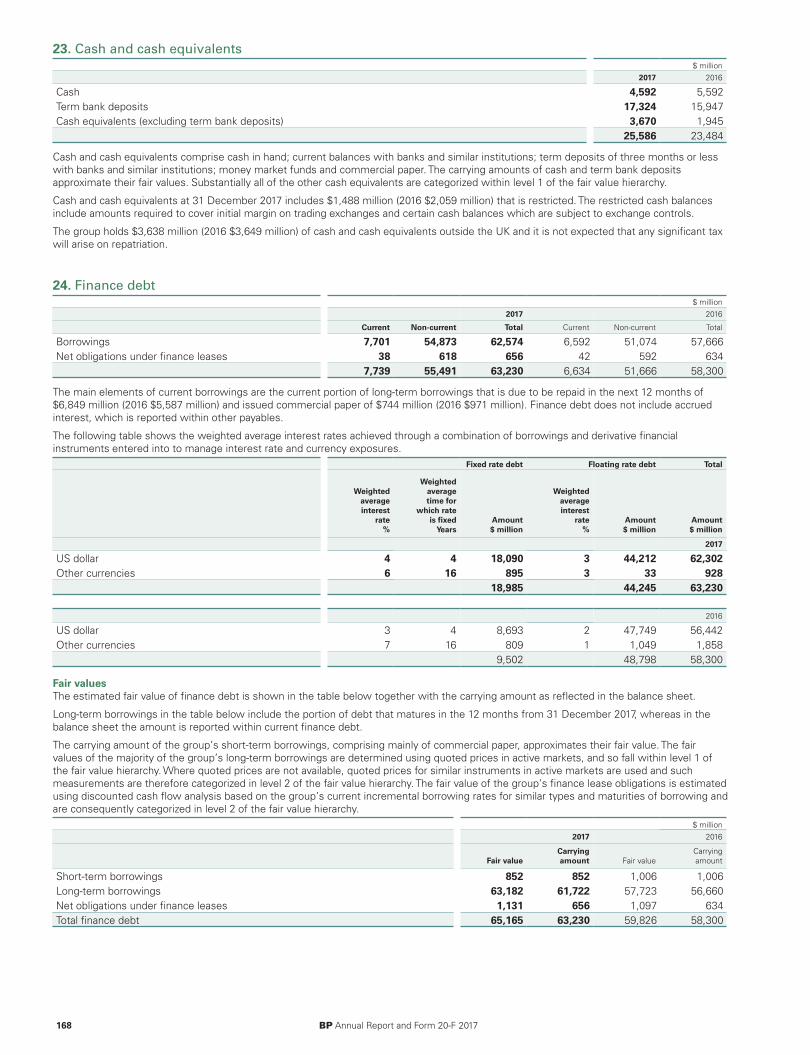
23. Cash and cash equivalents $ million
2017 2016
Cash 4,592 5,592Term bank deposits 17,324 15,947Cash equivalents (excluding term bank deposits) 3,670 1,945
25,586 23,484
Cash and cash equivalents comprise cash in hand; current balances with banks and similar institutions; term deposits of three months or lesswith banks and similar institutions; money market funds and commercial paper. The carrying amounts of cash and term bank depositsapproximate their fair values. Substantially all of the other cash equivalents are categorized within level 1 of the fair value hierarchy.
Cash and cash equivalents at 31 December 2017 includes $1,488 million (2016 $2,059 million) that is restricted. The restricted cash balancesinclude amounts required to cover initial margin on trading exchanges and certain cash balances which are subject to exchange controls.
The group holds $3,638 million (2016 $3,649 million) of cash and cash equivalents outside the UK and it is not expected that any significant taxwill arise on repatriation.
168 BP Annual Report and Form 20-F 2017
24. Finance debt$ million
2017 2016
Current Non-current Total Current Non-current Total
Borrowings 7,701 54,873 62,574 6,592 51,074 57,666Net obligations under finance leases 38 618 656 42 592 634
7,739 55,491 63,230 6,634 51,666 58,300
The main elements of current borrowings are the current portion of long-term borrowings that is due to be repaid in the next 12 months of$6,849 million (2016 $5,587 million) and issued commercial paper of $744 million (2016 $971 million). Finance debt does not include accruedinterest, which is reported within other payables.
The following table shows the weighted average interest rates achieved through a combination of borrowings and derivative financialinstruments entered into to manage interest rate and currency exposures.
Fixed rate debt Floating rate debt Total
Weightedaverageinterest
rate%
Weightedaveragetime for
which rateis fixed
YearsAmount$ million
Weightedaverageinterest
rate%
Amount$ million
Amount$ million
2017
US dollar 4 4 18,090 3 44,212 62,302Other currencies 6 16 895 3 33 928
18,985 44,245 63,230
2016
US dollar 3 4 8,693 2 47,749 56,442Other currencies 7 16 809 1 1,049 1,858
9,502 48,798 58,300
Fair valuesThe estimated fair value of finance debt is shown in the table below together with the carrying amount as reflected in the balance sheet.
Long-term borrowings in the table below include the portion of debt that matures in the 12 months from 31 December 2017, whereas in thebalance sheet the amount is reported within current finance debt.
The carrying amount of the group’s short-term borrowings, comprising mainly of commercial paper, approximates their fair value. The fairvalues of the majority of the group’s long-term borrowings are determined using quoted prices in active markets, and so fall within level 1 ofthe fair value hierarchy. Where quoted prices are not available, quoted prices for similar instruments in active markets are used and suchmeasurements are therefore categorized in level 2 of the fair value hierarchy. The fair value of the group’s finance lease obligations is estimatedusing discounted cash flow analysis based on the group’s current incremental borrowing rates for similar types and maturities of borrowing andare consequently categorized in level 2 of the fair value hierarchy.
$ million2017 2016
Fair valueCarryingamount Fair value
Carryingamount
Short-term borrowings 852 852 1,006 1,006Long-term borrowings 63,182 61,722 57,723 56,660Net obligations under finance leases 1,131 656 1,097 634Total finance debt 65,165 63,230 59,826 58,300
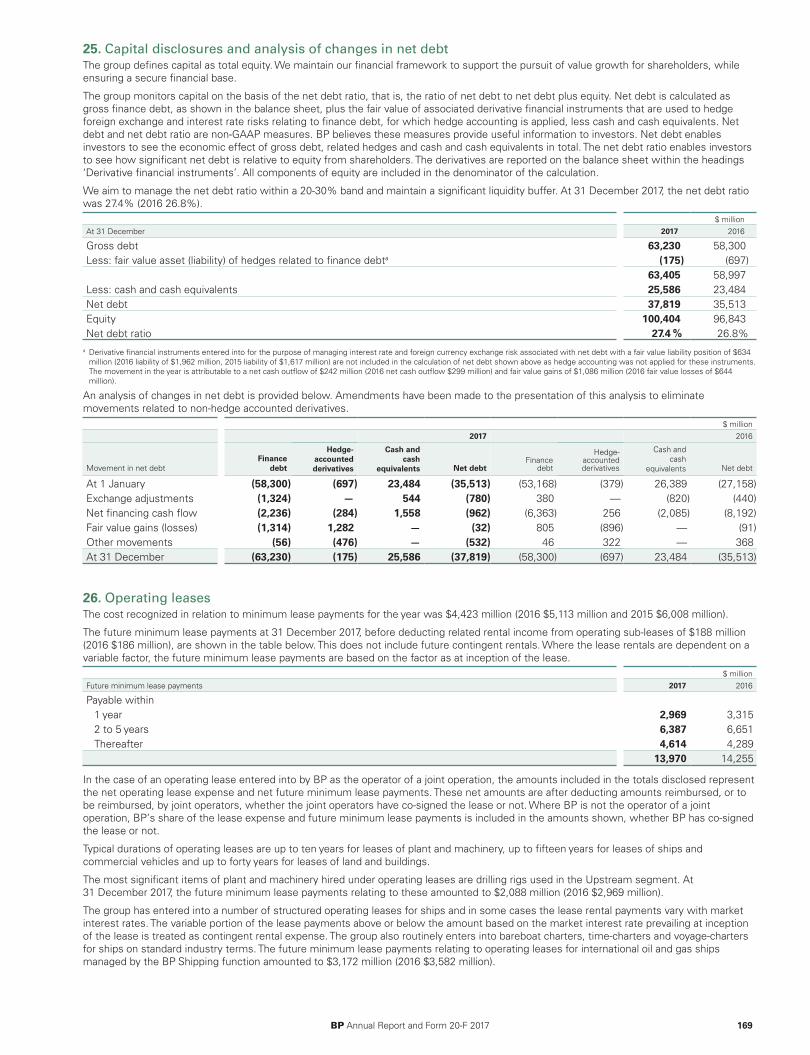
25. Capital disclosures and analysis of changes in net debt The group defines capital as total equity. We maintain our financial framework to support the pursuit of value growth for shareholders, whileensuring a secure financial base.
The group monitors capital on the basis of the net debt ratio, that is, the ratio of net debt to net debt plus equity. Net debt is calculated asgross finance debt, as shown in the balance sheet, plus the fair value of associated derivative financial instruments that are used to hedgeforeign exchange and interest rate risks relating to finance debt, for which hedge accounting is applied, less cash and cash equivalents. Netdebt and net debt ratio are non-GAAP measures. BP believes these measures provide useful information to investors. Net debt enablesinvestors to see the economic effect of gross debt, related hedges and cash and cash equivalents in total. The net debt ratio enables investorsto see how significant net debt is relative to equity from shareholders. The derivatives are reported on the balance sheet within the headings‘Derivative financial instruments’. All components of equity are included in the denominator of the calculation.
We aim to manage the net debt ratio within a 20-30% band and maintain a significant liquidity buffer. At 31 December 2017, the net debt ratiowas 27.4% (2016 26.8%).
$ millionAt 31 December 2017 2016
Gross debt 63,230 58,300Less: fair value asset (liability) of hedges related to finance debta (175) (697)
63,405 58,997Less: cash and cash equivalents 25,586 23,484Net debt 37,819 35,513Equity 100,404 96,843Net debt ratio 27.4 % 26.8%
a Derivative financial instruments entered into for the purpose of managing interest rate and foreign currency exchange risk associated with net debt with a fair value liability position of $634million (2016 liability of $1,962 million, 2015 liability of $1,617 million) are not included in the calculation of net debt shown above as hedge accounting was not applied for these instruments.The movement in the year is attributable to a net cash outflow of $242 million (2016 net cash outflow $299 million) and fair value gains of $1,086 million (2016 fair value losses of $644million).
An analysis of changes in net debt is provided below. Amendments have been made to the presentation of this analysis to eliminatemovements related to non-hedge accounted derivatives.
$ million2017 2016
Movement in net debtFinance
debt
Hedge-accounted derivatives
Cash andcash
equivalents Net debtFinance
debt
Hedge-accountedderivatives
Cash andcash
equivalents Net debt
At 1 January (58,300) (697) 23,484 (35,513) (53,168) (379) 26,389 (27,158)Exchange adjustments (1,324) — 544 (780) 380 — (820) (440)Net financing cash flow (2,236) (284) 1,558 (962) (6,363) 256 (2,085) (8,192)Fair value gains (losses) (1,314) 1,282 — (32) 805 (896) — (91)Other movements (56) (476) — (532) 46 322 — 368At 31 December (63,230) (175) 25,586 (37,819) (58,300) (697) 23,484 (35,513)
BP Annual Report and Form 20-F 2017 169
26. Operating leases The cost recognized in relation to minimum lease payments for the year was $4,423 million (2016 $5,113 million and 2015 $6,008 million).
The future minimum lease payments at 31 December 2017, before deducting related rental income from operating sub-leases of $188 million(2016 $186 million), are shown in the table below. This does not include future contingent rentals. Where the lease rentals are dependent on avariable factor, the future minimum lease payments are based on the factor as at inception of the lease.
$ millionFuture minimum lease payments 2017 2016
Payable within1 year 2,969 3,3152 to 5 years 6,387 6,651Thereafter 4,614 4,289
13,970 14,255
In the case of an operating lease entered into by BP as the operator of a joint operation, the amounts included in the totals disclosed representthe net operating lease expense and net future minimum lease payments. These net amounts are after deducting amounts reimbursed, or tobe reimbursed, by joint operators, whether the joint operators have co-signed the lease or not. Where BP is not the operator of a jointoperation, BP’s share of the lease expense and future minimum lease payments is included in the amounts shown, whether BP has co-signedthe lease or not.
Typical durations of operating leases are up to ten years for leases of plant and machinery, up to fifteen years for leases of ships andcommercial vehicles and up to forty years for leases of land and buildings.
The most significant items of plant and machinery hired under operating leases are drilling rigs used in the Upstream segment. At31 December 2017, the future minimum lease payments relating to these amounted to $2,088 million (2016 $2,969 million).
The group has entered into a number of structured operating leases for ships and in some cases the lease rental payments vary with marketinterest rates. The variable portion of the lease payments above or below the amount based on the market interest rate prevailing at inceptionof the lease is treated as contingent rental expense. The group also routinely enters into bareboat charters, time-charters and voyage-chartersfor ships on standard industry terms. The future minimum lease payments relating to operating leases for international oil and gas shipsmanaged by the BP Shipping function amounted to $3,172 million (2016 $3,582 million).
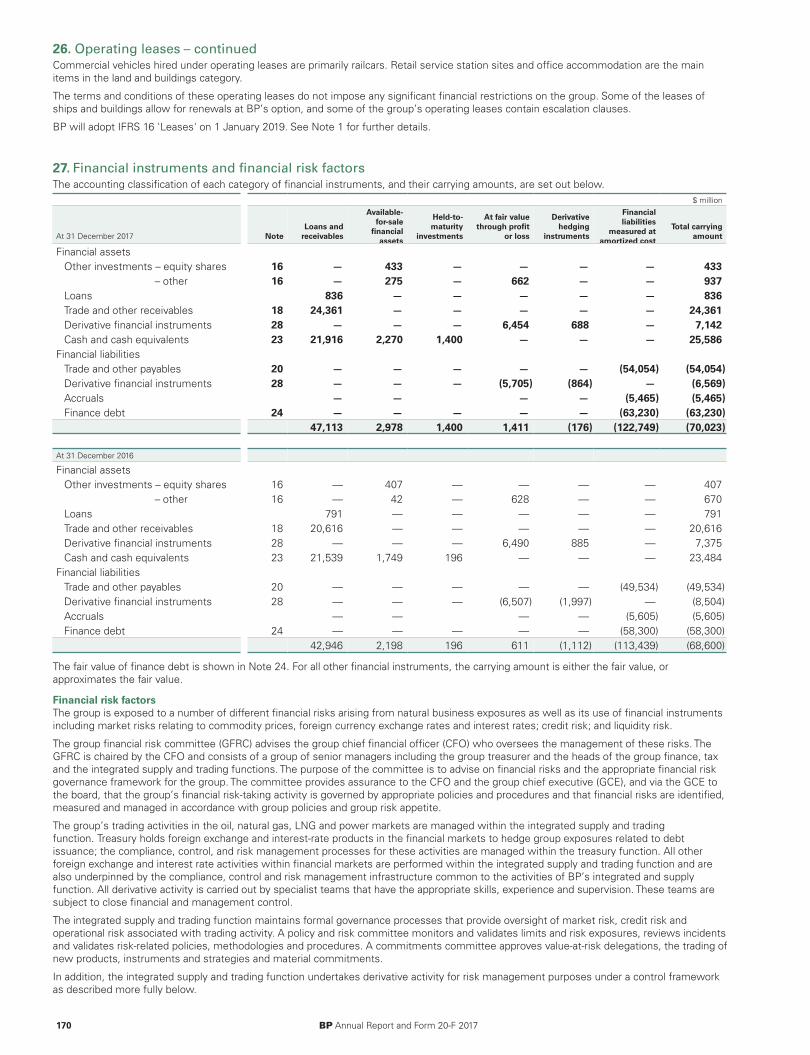
26. Operating leases – continuedCommercial vehicles hired under operating leases are primarily railcars. Retail service station sites and office accommodation are the mainitems in the land and buildings category.
The terms and conditions of these operating leases do not impose any significant financial restrictions on the group. Some of the leases ofships and buildings allow for renewals at BP’s option, and some of the group’s operating leases contain escalation clauses.
BP will adopt IFRS 16 'Leases' on 1 January 2019. See Note 1 for further details.
170 BP Annual Report and Form 20-F 2017
27. Financial instruments and financial risk factors The accounting classification of each category of financial instruments, and their carrying amounts, are set out below.
$ million
At 31 December 2017 NoteLoans and
receivables
Available-for-sale
financialassets
Held-to-maturity
investments
At fair valuethrough profit
or loss
Derivativehedging
instruments
Financialliabilities
measured atamortized cost
Total carryingamount
Financial assetsOther investments – equity shares 16 — 433 — — — — 433
– other 16 — 275 — 662 — — 937Loans 836 — — — — — 836Trade and other receivables 18 24,361 — — — — — 24,361Derivative financial instruments 28 — — — 6,454 688 — 7,142Cash and cash equivalents 23 21,916 2,270 1,400 — — — 25,586
Financial liabilitiesTrade and other payables 20 — — — — — (54,054) (54,054)Derivative financial instruments 28 — — — (5,705) (864) — (6,569)Accruals — — — — (5,465) (5,465)Finance debt 24 — — — — — (63,230) (63,230)
47,113 2,978 1,400 1,411 (176) (122,749) (70,023)
At 31 December 2016
Financial assetsOther investments – equity shares 16 — 407 — — — — 407
– other 16 — 42 — 628 — — 670Loans 791 — — — — — 791Trade and other receivables 18 20,616 — — — — — 20,616Derivative financial instruments 28 — — — 6,490 885 — 7,375Cash and cash equivalents 23 21,539 1,749 196 — — — 23,484
Financial liabilitiesTrade and other payables 20 — — — — — (49,534) (49,534)Derivative financial instruments 28 — — — (6,507) (1,997) — (8,504)Accruals — — — — (5,605) (5,605)Finance debt 24 — — — — — (58,300) (58,300)
42,946 2,198 196 611 (1,112) (113,439) (68,600)
The fair value of finance debt is shown in Note 24. For all other financial instruments, the carrying amount is either the fair value, orapproximates the fair value.
Financial risk factorsThe group is exposed to a number of different financial risks arising from natural business exposures as well as its use of financial instrumentsincluding market risks relating to commodity prices, foreign currency exchange rates and interest rates; credit risk; and liquidity risk.
The group financial risk committee (GFRC) advises the group chief financial officer (CFO) who oversees the management of these risks. TheGFRC is chaired by the CFO and consists of a group of senior managers including the group treasurer and the heads of the group finance, taxand the integrated supply and trading functions. The purpose of the committee is to advise on financial risks and the appropriate financial riskgovernance framework for the group. The committee provides assurance to the CFO and the group chief executive (GCE), and via the GCE tothe board, that the group’s financial risk-taking activity is governed by appropriate policies and procedures and that financial risks are identified,measured and managed in accordance with group policies and group risk appetite.
The group’s trading activities in the oil, natural gas, LNG and power markets are managed within the integrated supply and tradingfunction. Treasury holds foreign exchange and interest-rate products in the financial markets to hedge group exposures related to debtissuance; the compliance, control, and risk management processes for these activities are managed within the treasury function. All otherforeign exchange and interest rate activities within financial markets are performed within the integrated supply and trading function and arealso underpinned by the compliance, control and risk management infrastructure common to the activities of BP’s integrated and supplyfunction. All derivative activity is carried out by specialist teams that have the appropriate skills, experience and supervision. These teams aresubject to close financial and management control.
The integrated supply and trading function maintains formal governance processes that provide oversight of market risk, credit risk andoperational risk associated with trading activity. A policy and risk committee monitors and validates limits and risk exposures, reviews incidentsand validates risk-related policies, methodologies and procedures. A commitments committee approves value-at-risk delegations, the trading ofnew products, instruments and strategies and material commitments.
In addition, the integrated supply and trading function undertakes derivative activity for risk management purposes under a control frameworkas described more fully below.
27. Financial instruments and financial risk factors – continued
(a) Market riskMarket risk is the risk or uncertainty arising from possible market price movements and their impact on the future performance of a business.The primary commodity price risks that the group is exposed to include oil, natural gas and power prices that could adversely affect the valueof the group’s financial assets, liabilities or expected future cash flows. The group enters into derivatives in a well-established entrepreneurialtrading operation. In addition, the group has developed a control framework aimed at managing the volatility inherent in certain of its naturalbusiness exposures. In accordance with the control framework the group enters into various transactions using derivatives for riskmanagement purposes.
The major components of market risk are commodity price risk, foreign currency exchange risk and interest rate risk, each of which isdiscussed below.
(i) Commodity price riskThe group’s integrated supply and trading function uses conventional financial and commodity instruments and physical cargoes and pipelinepositions available in the related commodity markets. Oil and natural gas swaps, options and futures are used to mitigate price risk. Powertrading is undertaken using a combination of over-the-counter forward contracts and other derivative contracts, including options and futures.This activity is on both a standalone basis and in conjunction with gas derivatives in relation to gas-generated power margin. In addition, NGLsare traded around certain US inventory locations using over-the-counter forward contracts in conjunction with over-the-counter swaps, optionsand physical inventories.
The group measures market risk exposure arising from its trading positions in liquid periods using value-at-risk techniques. These techniquesmake a statistical assessment of the market risk arising from possible future changes in market prices over a one-day holding period. The value-at-risk measure is supplemented by stress testing. Trading activity occurring in liquid periods is subject to value-at-risk limits for each tradingactivity and for this trading activity in total. The board has delegated a limit of $100 million value at risk in support of this trading activity.Alternative measures are used to monitor exposures which are outside liquid periods and which cannot be actively risk-managed.
(ii) Foreign currency exchange riskSince BP has global operations, fluctuations in foreign currency exchange rates can have a significant effect on the group’s reported results andfuture expenditure commitments. The effects of most exchange rate fluctuations are absorbed in business operating results through changingcost competitiveness, lags in market adjustment to movements in rates and translation differences accounted for on specific transactions. Forthis reason, the total effect of exchange rate fluctuations is not identifiable separately in the group’s reported results. The main underlyingeconomic currency of the group’s cash flows is the US dollar. This is because BP’s major product, oil, is priced internationally in US dollars. BP’sforeign currency exchange management policy is to limit economic and material transactional exposures arising from currency movementsagainst the US dollar. The group co-ordinates the handling of foreign currency exchange risks centrally, by netting off naturally-occurringopposite exposures wherever possible and then managing any material residual foreign currency exchange risks.
Most of the group’s borrowings are in US dollars or are hedged with respect to the US dollar. At 31 December 2017, the total foreign currencyborrowings not swapped into US dollars amounted to $928 million (2016 $809 million).
The group manages the net residual foreign currency exposures by constantly reviewing the foreign currency economic value at risk and aimsto manage such risk to keep the 12-month foreign currency value at risk below $400 million. At no point over the past three years did the valueat risk exceed the maximum risk limit. The most significant exposures relate to capital expenditure commitments and other UK, Eurozone andAustralian operational requirements, for which hedging programmes are in place and hedge accounting is applied.
For highly probable forecast capital expenditures the group fixes the US dollar cost of non-US dollar supplies by using currency forwards. Theexposures are sterling, euro, Australian dollar, Norwegian krone and Korean Won. At 31 December 2017 the most significant open contracts inplace were for $437 million sterling (2016 $1,204 million sterling).
For UK, Eurozone and Australian operational requirements the group uses cylinders (purchased call and sold put options) to manage theestimated exposures. At 31 December 2017, there are no open positions hedging these exposures (2016 cylinders consisted of receive sterling,pay US dollar cylinders $1,885 million; receive euro, pay US dollar cylinders for $585 million; receive Australian dollar, pay US dollar cylinders for$274 million).
Where the group enters into foreign currency exchange contracts for entrepreneurial trading purposes the activity is controlled using tradingvalue-at-risk techniques as explained in (i) commodity price risk above.
(iii) Interest rate riskBP is also exposed to interest rate risk from the possibility that changes in interest rates will affect future cash flows or the fair values of itsfinancial instruments, principally finance debt. Whilst the group issues debt in a variety of currencies based on market opportunities, it usesderivatives to swap the debt to a floating rate exposure, mainly to US dollar floating, but in certain defined circumstances maintains a US dollarfixed rate exposure for a proportion of debt. The proportion of floating rate debt net of interest rate swaps at 31 December 2017 was 70% oftotal finance debt outstanding (2016 84%). The weighted average interest rate on finance debt at 31 December 2017 was 3% (2016 2%) andthe weighted average maturity of fixed rate debt was five years (2016 five years).
The group’s earnings are sensitive to changes in interest rates on the floating rate element of the group’s finance debt. If the interest ratesapplicable to floating rate instruments were to have increased by one percentage point on 1 January 2018, it is estimated that the group’sfinance costs for 2018 would increase by approximately $442 million (2016 $488 million increase).
(b) Credit riskCredit risk is the risk that a customer or counterparty to a financial instrument will fail to perform or fail to pay amounts due causing financialloss to the group and arises from cash and cash equivalents, derivative financial instruments and deposits with financial institutions andprincipally from credit exposures to customers relating to outstanding receivables. Credit exposure also exists in relation to guarantees issuedby group companies under which the outstanding exposure incremental to that recognized on the balance sheet at 31 December 2017 was$656 million (2016 $309 million) in respect of liabilities of joint ventures and associates and $382 million (2016 $370 million) in respect ofliabilities of other third parties.
BP Annual Report and Form 20-F 2017 171
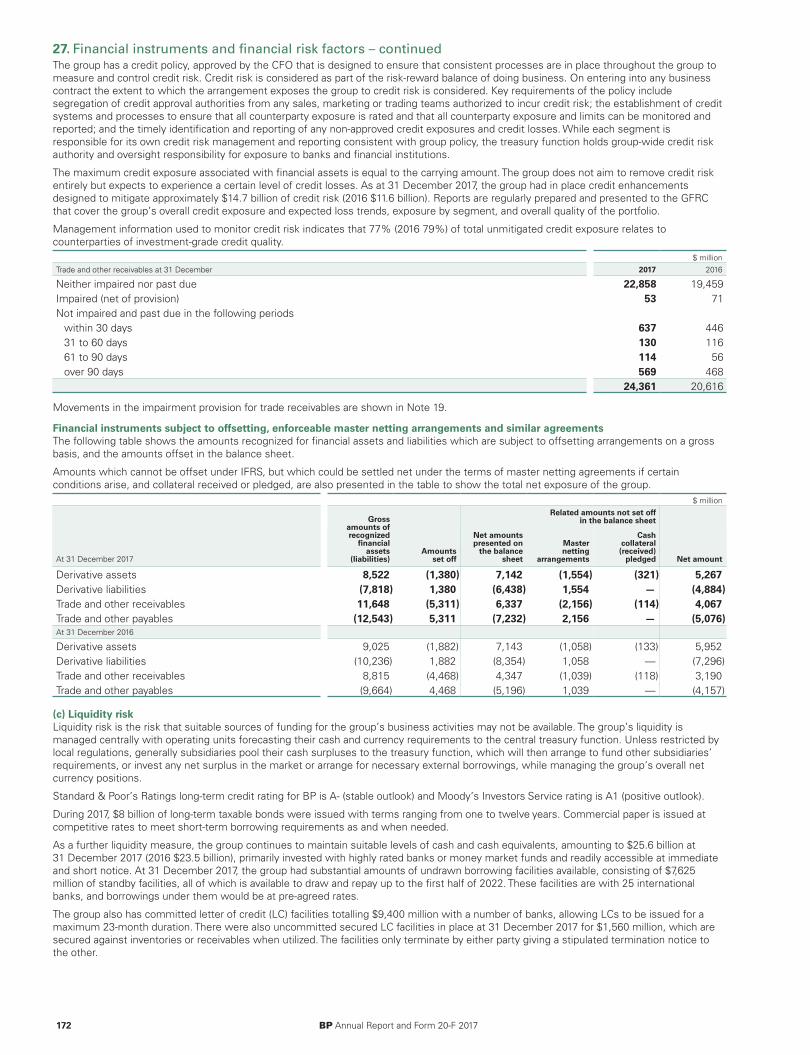
27. Financial instruments and financial risk factors – continuedThe group has a credit policy, approved by the CFO that is designed to ensure that consistent processes are in place throughout the group tomeasure and control credit risk. Credit risk is considered as part of the risk-reward balance of doing business. On entering into any businesscontract the extent to which the arrangement exposes the group to credit risk is considered. Key requirements of the policy includesegregation of credit approval authorities from any sales, marketing or trading teams authorized to incur credit risk; the establishment of creditsystems and processes to ensure that all counterparty exposure is rated and that all counterparty exposure and limits can be monitored andreported; and the timely identification and reporting of any non-approved credit exposures and credit losses. While each segment isresponsible for its own credit risk management and reporting consistent with group policy, the treasury function holds group-wide credit riskauthority and oversight responsibility for exposure to banks and financial institutions.
The maximum credit exposure associated with financial assets is equal to the carrying amount. The group does not aim to remove credit riskentirely but expects to experience a certain level of credit losses. As at 31 December 2017, the group had in place credit enhancementsdesigned to mitigate approximately $14.7 billion of credit risk (2016 $11.6 billion). Reports are regularly prepared and presented to the GFRCthat cover the group’s overall credit exposure and expected loss trends, exposure by segment, and overall quality of the portfolio.
Management information used to monitor credit risk indicates that 77% (2016 79%) of total unmitigated credit exposure relates tocounterparties of investment-grade credit quality.
$ millionTrade and other receivables at 31 December 2017 2016
Neither impaired nor past due 22,858 19,459Impaired (net of provision) 53 71Not impaired and past due in the following periods
within 30 days 637 44631 to 60 days 130 11661 to 90 days 114 56over 90 days 569 468
24,361 20,616
Movements in the impairment provision for trade receivables are shown in Note 19.
Financial instruments subject to offsetting, enforceable master netting arrangements and similar agreementsThe following table shows the amounts recognized for financial assets and liabilities which are subject to offsetting arrangements on a grossbasis, and the amounts offset in the balance sheet.
Amounts which cannot be offset under IFRS, but which could be settled net under the terms of master netting agreements if certainconditions arise, and collateral received or pledged, are also presented in the table to show the total net exposure of the group.
$ million
Grossamounts ofrecognized
financialassets
(liabilities)Amounts
set off
Net amountspresented on
the balancesheet
Related amounts not set offin the balance sheet
Net amountAt 31 December 2017
Masternetting
arrangements
Cashcollateral(received)
pledged
Derivative assets 8,522 (1,380) 7,142 (1,554) (321) 5,267Derivative liabilities (7,818) 1,380 (6,438) 1,554 — (4,884)Trade and other receivables 11,648 (5,311) 6,337 (2,156) (114) 4,067Trade and other payables (12,543) 5,311 (7,232) 2,156 — (5,076)At 31 December 2016
Derivative assets 9,025 (1,882) 7,143 (1,058) (133) 5,952Derivative liabilities (10,236) 1,882 (8,354) 1,058 — (7,296)Trade and other receivables 8,815 (4,468) 4,347 (1,039) (118) 3,190Trade and other payables (9,664) 4,468 (5,196) 1,039 — (4,157)
(c) Liquidity riskLiquidity risk is the risk that suitable sources of funding for the group’s business activities may not be available. The group’s liquidity ismanaged centrally with operating units forecasting their cash and currency requirements to the central treasury function. Unless restricted bylocal regulations, generally subsidiaries pool their cash surpluses to the treasury function, which will then arrange to fund other subsidiaries’requirements, or invest any net surplus in the market or arrange for necessary external borrowings, while managing the group’s overall netcurrency positions.
Standard & Poor’s Ratings long-term credit rating for BP is A- (stable outlook) and Moody’s Investors Service rating is A1 (positive outlook).
During 2017, $8 billion of long-term taxable bonds were issued with terms ranging from one to twelve years. Commercial paper is issued atcompetitive rates to meet short-term borrowing requirements as and when needed.
As a further liquidity measure, the group continues to maintain suitable levels of cash and cash equivalents, amounting to $25.6 billion at31 December 2017 (2016 $23.5 billion), primarily invested with highly rated banks or money market funds and readily accessible at immediateand short notice. At 31 December 2017, the group had substantial amounts of undrawn borrowing facilities available, consisting of $7,625million of standby facilities, all of which is available to draw and repay up to the first half of 2022. These facilities are with 25 internationalbanks, and borrowings under them would be at pre-agreed rates.
The group also has committed letter of credit (LC) facilities totalling $9,400 million with a number of banks, allowing LCs to be issued for amaximum 23-month duration. There were also uncommitted secured LC facilities in place at 31 December 2017 for $1,560 million, which aresecured against inventories or receivables when utilized. The facilities only terminate by either party giving a stipulated termination notice tothe other.
172 BP Annual Report and Form 20-F 2017
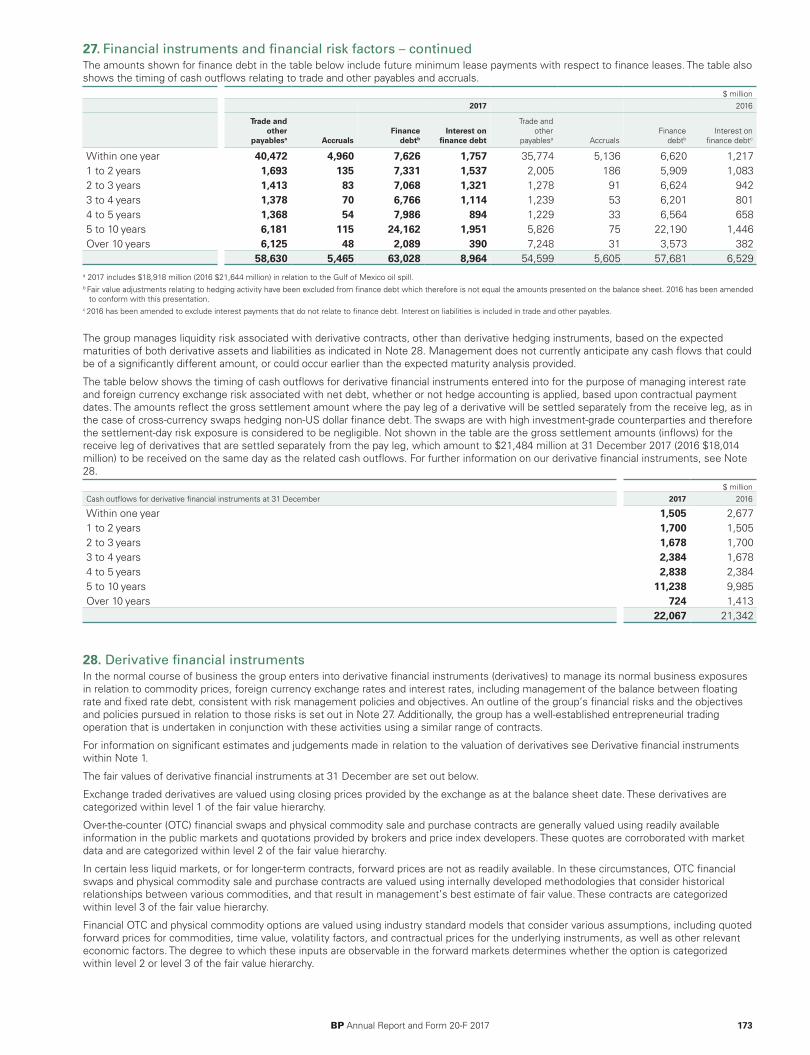
27. Financial instruments and financial risk factors – continuedThe amounts shown for finance debt in the table below include future minimum lease payments with respect to finance leases. The table alsoshows the timing of cash outflows relating to trade and other payables and accruals.
$ million2017 2016
Trade andother
payablesa AccrualsFinance
debtbInterest on
finance debt
Trade andother
payablesa AccrualsFinance
debtbInterest on
finance debtc
Within one year 40,472 4,960 7,626 1,757 35,774 5,136 6,620 1,2171 to 2 years 1,693 135 7,331 1,537 2,005 186 5,909 1,0832 to 3 years 1,413 83 7,068 1,321 1,278 91 6,624 9423 to 4 years 1,378 70 6,766 1,114 1,239 53 6,201 8014 to 5 years 1,368 54 7,986 894 1,229 33 6,564 6585 to 10 years 6,181 115 24,162 1,951 5,826 75 22,190 1,446Over 10 years 6,125 48 2,089 390 7,248 31 3,573 382
58,630 5,465 63,028 8,964 54,599 5,605 57,681 6,529a 2017 includes $18,918 million (2016 $21,644 million) in relation to the Gulf of Mexico oil spill.b Fair value adjustments relating to hedging activity have been excluded from finance debt which therefore is not equal the amounts presented on the balance sheet. 2016 has been amended
to conform with this presentation.c 2016 has been amended to exclude interest payments that do not relate to finance debt. Interest on liabilities is included in trade and other payables.
The group manages liquidity risk associated with derivative contracts, other than derivative hedging instruments, based on the expectedmaturities of both derivative assets and liabilities as indicated in Note 28. Management does not currently anticipate any cash flows that couldbe of a significantly different amount, or could occur earlier than the expected maturity analysis provided.
The table below shows the timing of cash outflows for derivative financial instruments entered into for the purpose of managing interest rateand foreign currency exchange risk associated with net debt, whether or not hedge accounting is applied, based upon contractual paymentdates. The amounts reflect the gross settlement amount where the pay leg of a derivative will be settled separately from the receive leg, as inthe case of cross-currency swaps hedging non-US dollar finance debt. The swaps are with high investment-grade counterparties and thereforethe settlement-day risk exposure is considered to be negligible. Not shown in the table are the gross settlement amounts (inflows) for thereceive leg of derivatives that are settled separately from the pay leg, which amount to $21,484 million at 31 December 2017 (2016 $18,014million) to be received on the same day as the related cash outflows. For further information on our derivative financial instruments, see Note28.
$ millionCash outflows for derivative financial instruments at 31 December 2017 2016
Within one year 1,505 2,6771 to 2 years 1,700 1,5052 to 3 years 1,678 1,7003 to 4 years 2,384 1,6784 to 5 years 2,838 2,3845 to 10 years 11,238 9,985Over 10 years 724 1,413
22,067 21,342
BP Annual Report and Form 20-F 2017 173
28. Derivative financial instruments In the normal course of business the group enters into derivative financial instruments (derivatives) to manage its normal business exposuresin relation to commodity prices, foreign currency exchange rates and interest rates, including management of the balance between floatingrate and fixed rate debt, consistent with risk management policies and objectives. An outline of the group’s financial risks and the objectivesand policies pursued in relation to those risks is set out in Note 27. Additionally, the group has a well-established entrepreneurial tradingoperation that is undertaken in conjunction with these activities using a similar range of contracts.
For information on significant estimates and judgements made in relation to the valuation of derivatives see Derivative financial instrumentswithin Note 1.
The fair values of derivative financial instruments at 31 December are set out below.
Exchange traded derivatives are valued using closing prices provided by the exchange as at the balance sheet date. These derivatives arecategorized within level 1 of the fair value hierarchy.
Over-the-counter (OTC) financial swaps and physical commodity sale and purchase contracts are generally valued using readily availableinformation in the public markets and quotations provided by brokers and price index developers. These quotes are corroborated with marketdata and are categorized within level 2 of the fair value hierarchy.
In certain less liquid markets, or for longer-term contracts, forward prices are not as readily available. In these circumstances, OTC financialswaps and physical commodity sale and purchase contracts are valued using internally developed methodologies that consider historicalrelationships between various commodities, and that result in management’s best estimate of fair value. These contracts are categorizedwithin level 3 of the fair value hierarchy.
Financial OTC and physical commodity options are valued using industry standard models that consider various assumptions, including quotedforward prices for commodities, time value, volatility factors, and contractual prices for the underlying instruments, as well as other relevanteconomic factors. The degree to which these inputs are observable in the forward markets determines whether the option is categorizedwithin level 2 or level 3 of the fair value hierarchy.
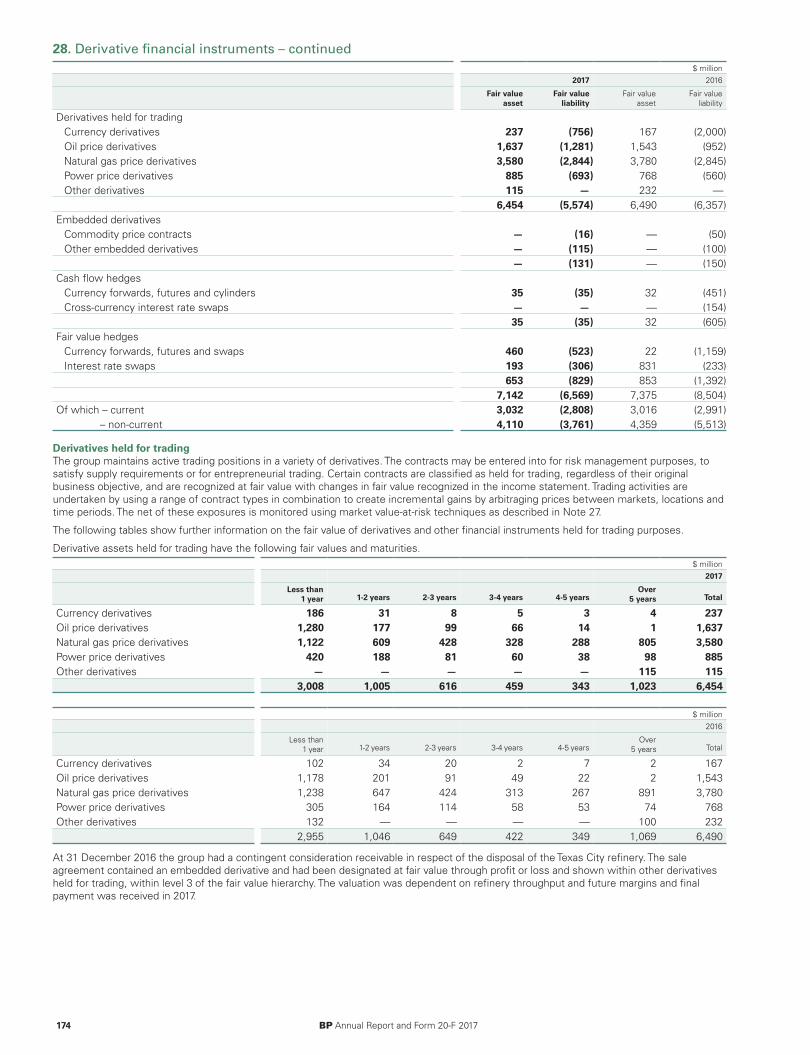
28. Derivative financial instruments – continued$ million
2017 2016
Fair valueasset
Fair valueliability
Fair valueasset
Fair valueliability
Derivatives held for tradingCurrency derivatives 237 (756) 167 (2,000)Oil price derivatives 1,637 (1,281) 1,543 (952)Natural gas price derivatives 3,580 (2,844) 3,780 (2,845)Power price derivatives 885 (693) 768 (560)Other derivatives 115 — 232 —
6,454 (5,574) 6,490 (6,357)Embedded derivatives
Commodity price contracts — (16) — (50)Other embedded derivatives — (115) — (100)
— (131) — (150)Cash flow hedges
Currency forwards, futures and cylinders 35 (35) 32 (451)Cross-currency interest rate swaps — — — (154)
35 (35) 32 (605)Fair value hedges
Currency forwards, futures and swaps 460 (523) 22 (1,159)Interest rate swaps 193 (306) 831 (233)
653 (829) 853 (1,392)7,142 (6,569) 7,375 (8,504)
Of which – current 3,032 (2,808) 3,016 (2,991)– non-current 4,110 (3,761) 4,359 (5,513)
Derivatives held for tradingThe group maintains active trading positions in a variety of derivatives. The contracts may be entered into for risk management purposes, tosatisfy supply requirements or for entrepreneurial trading. Certain contracts are classified as held for trading, regardless of their originalbusiness objective, and are recognized at fair value with changes in fair value recognized in the income statement. Trading activities areundertaken by using a range of contract types in combination to create incremental gains by arbitraging prices between markets, locations andtime periods. The net of these exposures is monitored using market value-at-risk techniques as described in Note 27.
The following tables show further information on the fair value of derivatives and other financial instruments held for trading purposes.
Derivative assets held for trading have the following fair values and maturities.$ million
2017
Less than1 year 1-2 years 2-3 years 3-4 years 4-5 years
Over5 years Total
Currency derivatives 186 31 8 5 3 4 237Oil price derivatives 1,280 177 99 66 14 1 1,637Natural gas price derivatives 1,122 609 428 328 288 805 3,580Power price derivatives 420 188 81 60 38 98 885Other derivatives — — — — — 115 115
3,008 1,005 616 459 343 1,023 6,454
$ million2016
Less than1 year 1-2 years 2-3 years 3-4 years 4-5 years
Over5 years Total
Currency derivatives 102 34 20 2 7 2 167Oil price derivatives 1,178 201 91 49 22 2 1,543Natural gas price derivatives 1,238 647 424 313 267 891 3,780Power price derivatives 305 164 114 58 53 74 768Other derivatives 132 — — — — 100 232
2,955 1,046 649 422 349 1,069 6,490
At 31 December 2016 the group had a contingent consideration receivable in respect of the disposal of the Texas City refinery. The saleagreement contained an embedded derivative and had been designated at fair value through profit or loss and shown within other derivativesheld for trading, within level 3 of the fair value hierarchy. The valuation was dependent on refinery throughput and future margins and finalpayment was received in 2017.
174 BP Annual Report and Form 20-F 2017
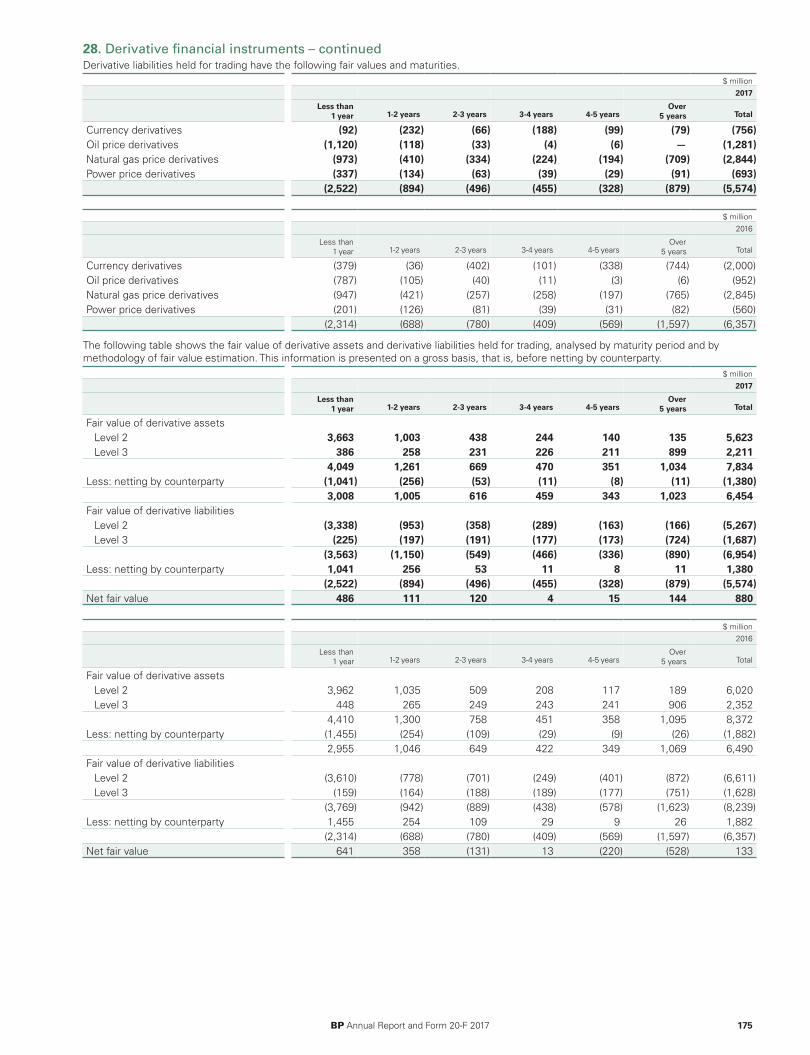
28. Derivative financial instruments – continuedDerivative liabilities held for trading have the following fair values and maturities.
$ million2017
Less than1 year 1-2 years 2-3 years 3-4 years 4-5 years
Over5 years Total
Currency derivatives (92) (232) (66) (188) (99) (79) (756)Oil price derivatives (1,120) (118) (33) (4) (6) — (1,281)Natural gas price derivatives (973) (410) (334) (224) (194) (709) (2,844)Power price derivatives (337) (134) (63) (39) (29) (91) (693)
(2,522) (894) (496) (455) (328) (879) (5,574)
$ million2016
Less than1 year 1-2 years 2-3 years 3-4 years 4-5 years
Over5 years Total
Currency derivatives (379) (36) (402) (101) (338) (744) (2,000)Oil price derivatives (787) (105) (40) (11) (3) (6) (952)Natural gas price derivatives (947) (421) (257) (258) (197) (765) (2,845)Power price derivatives (201) (126) (81) (39) (31) (82) (560)
(2,314) (688) (780) (409) (569) (1,597) (6,357)
The following table shows the fair value of derivative assets and derivative liabilities held for trading, analysed by maturity period and bymethodology of fair value estimation. This information is presented on a gross basis, that is, before netting by counterparty.
$ million2017
Less than1 year 1-2 years 2-3 years 3-4 years 4-5 years
Over5 years Total
Fair value of derivative assetsLevel 2 3,663 1,003 438 244 140 135 5,623Level 3 386 258 231 226 211 899 2,211
4,049 1,261 669 470 351 1,034 7,834Less: netting by counterparty (1,041) (256) (53) (11) (8) (11) (1,380)
3,008 1,005 616 459 343 1,023 6,454Fair value of derivative liabilities
Level 2 (3,338) (953) (358) (289) (163) (166) (5,267)Level 3 (225) (197) (191) (177) (173) (724) (1,687)
(3,563) (1,150) (549) (466) (336) (890) (6,954)Less: netting by counterparty 1,041 256 53 11 8 11 1,380
(2,522) (894) (496) (455) (328) (879) (5,574)Net fair value 486 111 120 4 15 144 880
$ million2016
Less than1 year 1-2 years 2-3 years 3-4 years 4-5 years
Over5 years Total
Fair value of derivative assetsLevel 2 3,962 1,035 509 208 117 189 6,020Level 3 448 265 249 243 241 906 2,352
4,410 1,300 758 451 358 1,095 8,372Less: netting by counterparty (1,455) (254) (109) (29) (9) (26) (1,882)
2,955 1,046 649 422 349 1,069 6,490Fair value of derivative liabilities
Level 2 (3,610) (778) (701) (249) (401) (872) (6,611)Level 3 (159) (164) (188) (189) (177) (751) (1,628)
(3,769) (942) (889) (438) (578) (1,623) (8,239)Less: netting by counterparty 1,455 254 109 29 9 26 1,882
(2,314) (688) (780) (409) (569) (1,597) (6,357)Net fair value 641 358 (131) 13 (220) (528) 133
BP Annual Report and Form 20-F 2017 175
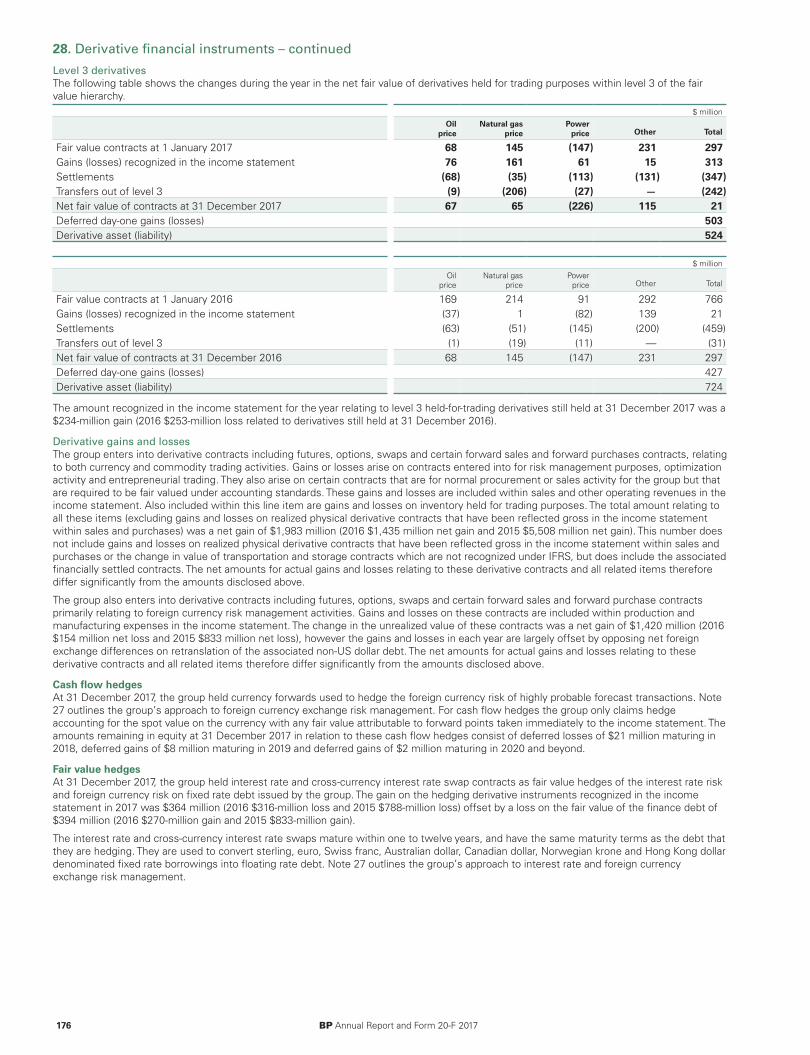
28. Derivative financial instruments – continued
Level 3 derivativesThe following table shows the changes during the year in the net fair value of derivatives held for trading purposes within level 3 of the fairvalue hierarchy.
$ millionOil
priceNatural gas
pricePower
price Other Total
Fair value contracts at 1 January 2017 68 145 (147) 231 297Gains (losses) recognized in the income statement 76 161 61 15 313Settlements (68) (35) (113) (131) (347)Transfers out of level 3 (9) (206) (27) — (242)Net fair value of contracts at 31 December 2017 67 65 (226) 115 21Deferred day-one gains (losses) 503Derivative asset (liability) 524
$ millionOil
priceNatural gas
pricePower
price Other Total
Fair value contracts at 1 January 2016 169 214 91 292 766Gains (losses) recognized in the income statement (37) 1 (82) 139 21Settlements (63) (51) (145) (200) (459)Transfers out of level 3 (1) (19) (11) — (31)Net fair value of contracts at 31 December 2016 68 145 (147) 231 297Deferred day-one gains (losses) 427Derivative asset (liability) 724
The amount recognized in the income statement for the year relating to level 3 held-for-trading derivatives still held at 31 December 2017 was a$234-million gain (2016 $253-million loss related to derivatives still held at 31 December 2016).
Derivative gains and lossesThe group enters into derivative contracts including futures, options, swaps and certain forward sales and forward purchases contracts, relatingto both currency and commodity trading activities. Gains or losses arise on contracts entered into for risk management purposes, optimizationactivity and entrepreneurial trading. They also arise on certain contracts that are for normal procurement or sales activity for the group but thatare required to be fair valued under accounting standards. These gains and losses are included within sales and other operating revenues in theincome statement. Also included within this line item are gains and losses on inventory held for trading purposes. The total amount relating toall these items (excluding gains and losses on realized physical derivative contracts that have been reflected gross in the income statementwithin sales and purchases) was a net gain of $1,983 million (2016 $1,435 million net gain and 2015 $5,508 million net gain). This number doesnot include gains and losses on realized physical derivative contracts that have been reflected gross in the income statement within sales andpurchases or the change in value of transportation and storage contracts which are not recognized under IFRS, but does include the associatedfinancially settled contracts. The net amounts for actual gains and losses relating to these derivative contracts and all related items thereforediffer significantly from the amounts disclosed above.
The group also enters into derivative contracts including futures, options, swaps and certain forward sales and forward purchase contractsprimarily relating to foreign currency risk management activities. Gains and losses on these contracts are included within production andmanufacturing expenses in the income statement. The change in the unrealized value of these contracts was a net gain of $1,420 million (2016$154 million net loss and 2015 $833 million net loss), however the gains and losses in each year are largely offset by opposing net foreignexchange differences on retranslation of the associated non-US dollar debt. The net amounts for actual gains and losses relating to thesederivative contracts and all related items therefore differ significantly from the amounts disclosed above.
Cash flow hedgesAt 31 December 2017, the group held currency forwards used to hedge the foreign currency risk of highly probable forecast transactions. Note27 outlines the group’s approach to foreign currency exchange risk management. For cash flow hedges the group only claims hedgeaccounting for the spot value on the currency with any fair value attributable to forward points taken immediately to the income statement. Theamounts remaining in equity at 31 December 2017 in relation to these cash flow hedges consist of deferred losses of $21 million maturing in2018, deferred gains of $8 million maturing in 2019 and deferred gains of $2 million maturing in 2020 and beyond.
Fair value hedgesAt 31 December 2017, the group held interest rate and cross-currency interest rate swap contracts as fair value hedges of the interest rate riskand foreign currency risk on fixed rate debt issued by the group. The gain on the hedging derivative instruments recognized in the incomestatement in 2017 was $364 million (2016 $316-million loss and 2015 $788-million loss) offset by a loss on the fair value of the finance debt of$394 million (2016 $270-million gain and 2015 $833-million gain).
The interest rate and cross-currency interest rate swaps mature within one to twelve years, and have the same maturity terms as the debt thatthey are hedging. They are used to convert sterling, euro, Swiss franc, Australian dollar, Canadian dollar, Norwegian krone and Hong Kong dollardenominated fixed rate borrowings into floating rate debt. Note 27 outlines the group’s approach to interest rate and foreign currencyexchange risk management.
176 BP Annual Report and Form 20-F 2017
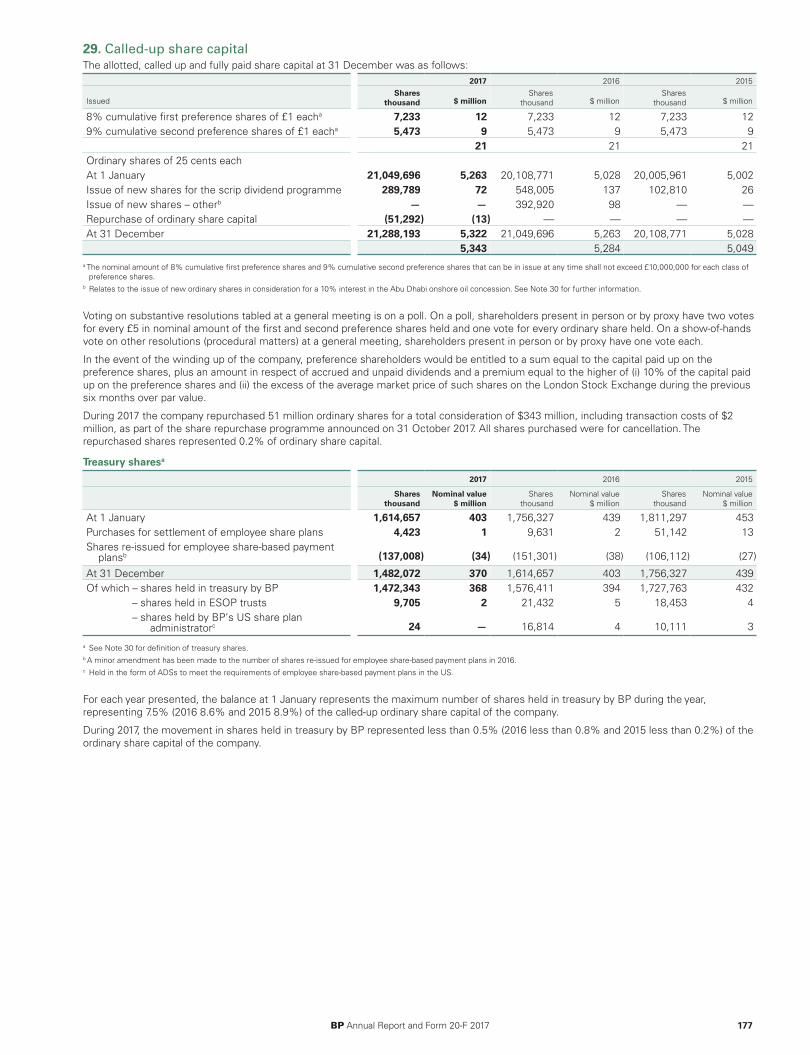
29. Called-up share capital The allotted, called up and fully paid share capital at 31 December was as follows:
2017 2016 2015
IssuedShares
thousand $ millionShares
thousand $ millionShares
thousand $ million
8% cumulative first preference shares of £1 eacha 7,233 12 7,233 12 7,233 129% cumulative second preference shares of £1 eacha 5,473 9 5,473 9 5,473 9
21 21 21Ordinary shares of 25 cents eachAt 1 January 21,049,696 5,263 20,108,771 5,028 20,005,961 5,002Issue of new shares for the scrip dividend programme 289,789 72 548,005 137 102,810 26Issue of new shares – otherb — — 392,920 98 — —Repurchase of ordinary share capital (51,292) (13) — — — —At 31 December 21,288,193 5,322 21,049,696 5,263 20,108,771 5,028
5,343 5,284 5,049a The nominal amount of 8% cumulative first preference shares and 9% cumulative second preference shares that can be in issue at any time shall not exceed £10,000,000 for each class of
preference shares.b Relates to the issue of new ordinary shares in consideration for a 10% interest in the Abu Dhabi onshore oil concession. See Note 30 for further information.
Voting on substantive resolutions tabled at a general meeting is on a poll. On a poll, shareholders present in person or by proxy have two votesfor every £5 in nominal amount of the first and second preference shares held and one vote for every ordinary share held. On a show-of-handsvote on other resolutions (procedural matters) at a general meeting, shareholders present in person or by proxy have one vote each.
In the event of the winding up of the company, preference shareholders would be entitled to a sum equal to the capital paid up on thepreference shares, plus an amount in respect of accrued and unpaid dividends and a premium equal to the higher of (i) 10% of the capital paidup on the preference shares and (ii) the excess of the average market price of such shares on the London Stock Exchange during the previoussix months over par value.
During 2017 the company repurchased 51 million ordinary shares for a total consideration of $343 million, including transaction costs of $2million, as part of the share repurchase programme announced on 31 October 2017. All shares purchased were for cancellation. Therepurchased shares represented 0.2% of ordinary share capital.
Treasury sharesa
2017 2016 2015
Sharesthousand
Nominal value$ million
Sharesthousand
Nominal value$ million
Sharesthousand
Nominal value$ million
At 1 January 1,614,657 403 1,756,327 439 1,811,297 453Purchases for settlement of employee share plans 4,423 1 9,631 2 51,142 13Shares re-issued for employee share-based payment
plansb (137,008) (34) (151,301) (38) (106,112) (27)
At 31 December 1,482,072 370 1,614,657 403 1,756,327 439Of which – shares held in treasury by BP 1,472,343 368 1,576,411 394 1,727,763 432
– shares held in ESOP trusts 9,705 2 21,432 5 18,453 4– shares held by BP’s US share plan
administratorc 24 — 16,814 4 10,111 3
a See Note 30 for definition of treasury shares.b A minor amendment has been made to the number of shares re-issued for employee share-based payment plans in 2016.c Held in the form of ADSs to meet the requirements of employee share-based payment plans in the US.
For each year presented, the balance at 1 January represents the maximum number of shares held in treasury by BP during the year,representing 7.5% (2016 8.6% and 2015 8.9%) of the called-up ordinary share capital of the company.
During 2017, the movement in shares held in treasury by BP represented less than 0.5% (2016 less than 0.8% and 2015 less than 0.2%) of theordinary share capital of the company.
BP Annual Report and Form 20-F 2017 177
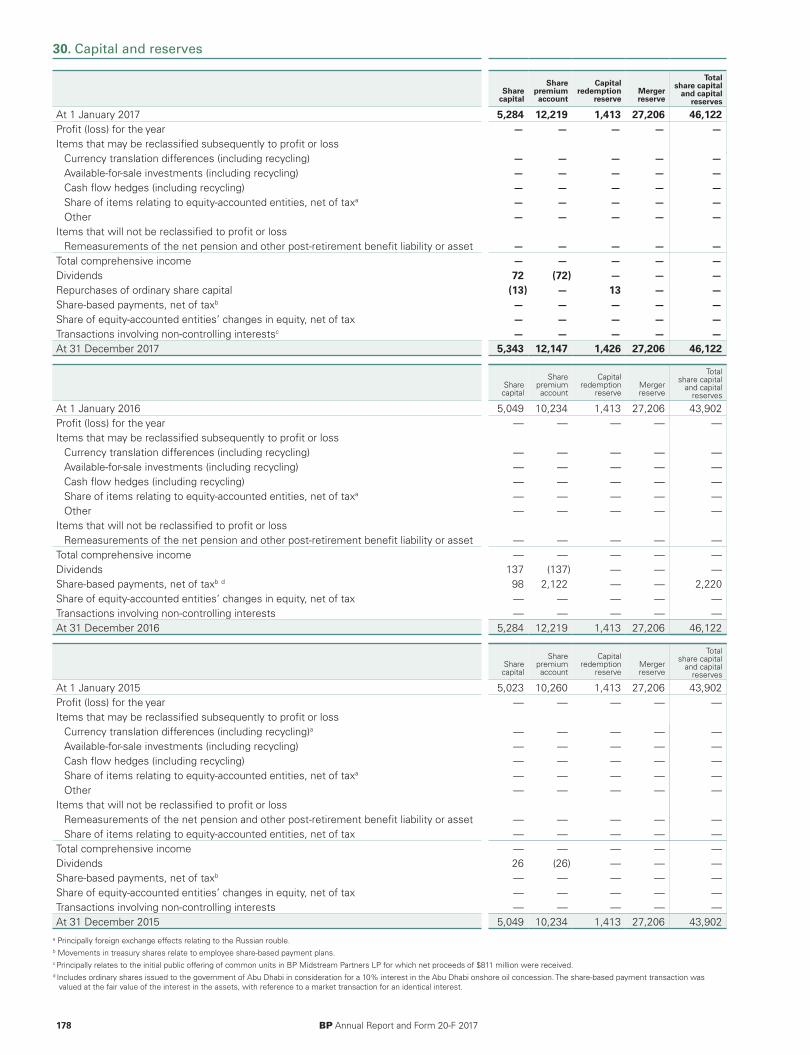
30. Capital and reserves
Sharecapital
Sharepremiumaccount
Capitalredemption
reserveMergerreserve
Totalshare capital
and capitalreserves
At 1 January 2017 5,284 12,219 1,413 27,206 46,122Profit (loss) for the year — — — — —Items that may be reclassified subsequently to profit or loss
Currency translation differences (including recycling) — — — — —Available-for-sale investments (including recycling) — — — — —Cash flow hedges (including recycling) — — — — —Share of items relating to equity-accounted entities, net of taxa — — — — —Other — — — — —
Items that will not be reclassified to profit or lossRemeasurements of the net pension and other post-retirement benefit liability or asset — — — — —
Total comprehensive income — — — — —Dividends 72 (72) — — —Repurchases of ordinary share capital (13) — 13 — —Share-based payments, net of taxb — — — — —Share of equity-accounted entities’ changes in equity, net of tax — — — — —Transactions involving non-controlling interestsc — — — — —At 31 December 2017 5,343 12,147 1,426 27,206 46,122
Sharecapital
Sharepremiumaccount
Capitalredemption
reserveMergerreserve
Totalshare capital
and capitalreserves
At 1 January 2016 5,049 10,234 1,413 27,206 43,902Profit (loss) for the year — — — — —Items that may be reclassified subsequently to profit or loss
Currency translation differences (including recycling) — — — — —Available-for-sale investments (including recycling) — — — — —Cash flow hedges (including recycling) — — — — —Share of items relating to equity-accounted entities, net of taxa — — — — —Other — — — — —
Items that will not be reclassified to profit or lossRemeasurements of the net pension and other post-retirement benefit liability or asset — — — — —
Total comprehensive income — — — — —Dividends 137 (137) — — —Share-based payments, net of taxb d 98 2,122 — — 2,220Share of equity-accounted entities’ changes in equity, net of tax — — — — —Transactions involving non-controlling interests — — — — —At 31 December 2016 5,284 12,219 1,413 27,206 46,122
Sharecapital
Sharepremiumaccount
Capitalredemption
reserveMergerreserve
Totalshare capital
and capitalreserves
At 1 January 2015 5,023 10,260 1,413 27,206 43,902Profit (loss) for the year — — — — —Items that may be reclassified subsequently to profit or loss
Currency translation differences (including recycling)a — — — — —Available-for-sale investments (including recycling) — — — — —Cash flow hedges (including recycling) — — — — —Share of items relating to equity-accounted entities, net of taxa — — — — —Other — — — — —
Items that will not be reclassified to profit or lossRemeasurements of the net pension and other post-retirement benefit liability or asset — — — — —Share of items relating to equity-accounted entities, net of tax — — — — —
Total comprehensive income — — — — —Dividends 26 (26) — — —Share-based payments, net of taxb — — — — —Share of equity-accounted entities’ changes in equity, net of tax — — — — —Transactions involving non-controlling interests — — — — —At 31 December 2015 5,049 10,234 1,413 27,206 43,902
a Principally foreign exchange effects relating to the Russian rouble.b Movements in treasury shares relate to employee share-based payment plans.c Principally relates to the initial public offering of common units in BP Midstream Partners LP for which net proceeds of $811 million were received.d Includes ordinary shares issued to the government of Abu Dhabi in consideration for a 10% interest in the Abu Dhabi onshore oil concession. The share-based payment transaction was
valued at the fair value of the interest in the assets, with reference to a market transaction for an identical interest.
178 BP Annual Report and Form 20-F 2017

30. Capital and reserves – continued$ million
Treasuryshares
Foreigncurrency
translationreserve
Available-for-sale
investmentsCash flow
hedges
Totalfair valuereserves
Profit andloss
account
BPshareholders’
equity
Non-controlling
interests Total equity
(18,443) (6,878) 3 (1,156) (1,153) 75,638 95,286 1,557 96,843— — — — — 3,389 3,389 79 3,468
— 1,722 — — — (3) 1,719 52 1,771— — 14 — 14 — 14 — 14— — — 396 396 — 396 — 396— — — — — 564 564 — 564— — — — — (72) (72) — (72)
— — — — — 2,343 2,343 — 2,343— 1,722 14 396 410 6,221 8,353 131 8,484— — — — — (6,153) (6,153) (141) (6,294)— — — — — (343) (343) — (343)
1,485 — — — — (798) 687 — 687— — — — — 215 215 — 215— — — — — 446 446 366 812
(16,958) (5,156) 17 (760) (743) 75,226 98,491 1,913 100,404
Treasuryshares
Foreigncurrency
translationreserve
Available-for-sale
investmentsCash flow
hedges
Totalfair valuereserves
Profit andloss
account
BPshareholders’
equity
Non-controlling
interests Total equity
(19,964) (7,267) 2 (825) (823) 81,368 97,216 1,171 98,387— — — — — 115 115 57 172
— 389 — — — — 389 (27) 362— — 1 — 1 — 1 — 1— — — (331) (331) — (331) — (331)— — — — — 833 833 — 833— — — — — (96) (96) — (96)
— — — — — (1,757) (1,757) — (1,757)— 389 1 (331) (330) (905) (846) 30 (816)— — — — — (4,611) (4,611) (107) (4,718)
1,521 — — — — (750) 2,991 — 2,991— — — — — 106 106 — 106— — — — — 430 430 463 893
(18,443) (6,878) 3 (1,156) (1,153) 75,638 95,286 1,557 96,843
Treasuryshares
Foreigncurrency
translationreserve
Available-for-sale
investmentsCash flow
hedges
Totalfair valuereserves
Profit andloss
account
BPshareholders’
equity
Non-controlling
interests Total equity
(20,719) (3,409) 1 (898) (897) 92,564 111,441 1,201 112,642— — — — — (6,482) (6,482) 82 (6,400)
— (3,858) — — — — (3,858) (41) (3,899)— — 1 — 1 — 1 — 1— — — 73 73 — 73 — 73— — — — — (814) (814) — (814)— — — — — 80 80 — 80
— — — — — 2,742 2,742 — 2,742— — — — — (1) (1) — (1)— (3,858) 1 73 74 (4,475) (8,259) 41 (8,218)— — — — — (6,659) (6,659) (91) (6,750)
755 — — — — (99) 656 — 656— — — — — 40 40 — 40— — — — — (3) (3) 20 17
(19,964) (7,267) 2 (825) (823) 81,368 97,216 1,171 98,387
BP Annual Report and Form 20-F 2017 179

30. Capital and reserves – continued
Share capitalThe balance on the share capital account represents the aggregate nominal value of all ordinary and preference shares in issue, includingtreasury shares.
Share premium accountThe balance on the share premium account represents the amounts received in excess of the nominal value of the ordinary and preferenceshares.
Capital redemption reserveThe balance on the capital redemption reserve represents the aggregate nominal value of all the ordinary shares repurchased and cancelled.
Merger reserveThe balance on the merger reserve represents the fair value of the consideration given in excess of the nominal value of the ordinary sharesissued in an acquisition made by the issue of shares.
Treasury sharesTreasury shares represent BP shares repurchased and available for specific and limited purposes. For accounting purposes shares held inEmployee Share Ownership Plans (ESOPs) and BP’s US share plan administrator to meet the future requirements of the employee share-based payment plans are treated in the same manner as treasury shares and are, therefore, included in the financial statements as treasuryshares. The ESOPs are funded by the group and have waived their rights to dividends in respect of such shares held for future awards. Untilsuch time as the shares held by the ESOPs vest unconditionally to employees, the amount paid for those shares is shown as a reduction inshareholders’ equity. Assets and liabilities of the ESOPs are recognized as assets and liabilities of the group.
Foreign currency translation reserveThe foreign currency translation reserve records exchange differences arising from the translation of the financial statements of foreignoperations. Upon disposal of foreign operations, the related accumulated exchange differences are recycled to the income statement.
Available-for-sale investmentsThis reserve records the changes in fair value of available-for-sale investments except for impairment losses, foreign exchange gains or losses,or changes arising from revised estimates of future cash flows. On disposal or impairment of the investments, the cumulative changes in fairvalue are recycled to the income statement.
Cash flow hedgesThis reserve records the portion of the gain or loss on a hedging instrument in a cash flow hedge that is determined to be an effective hedge.It includes $651 million relating to the acquisition of an 18.5% interest in Rosneft in 2013 which will only be reclassified to the incomestatement if the investment in Rosneft is either sold or impaired. For further information on the accounting for cash flow hedges see Note 1 -Derivative financial instruments and hedging activities.
Profit and loss accountThe balance held on this reserve is the accumulated retained profits of the group.
180 BP Annual Report and Form 20-F 2017
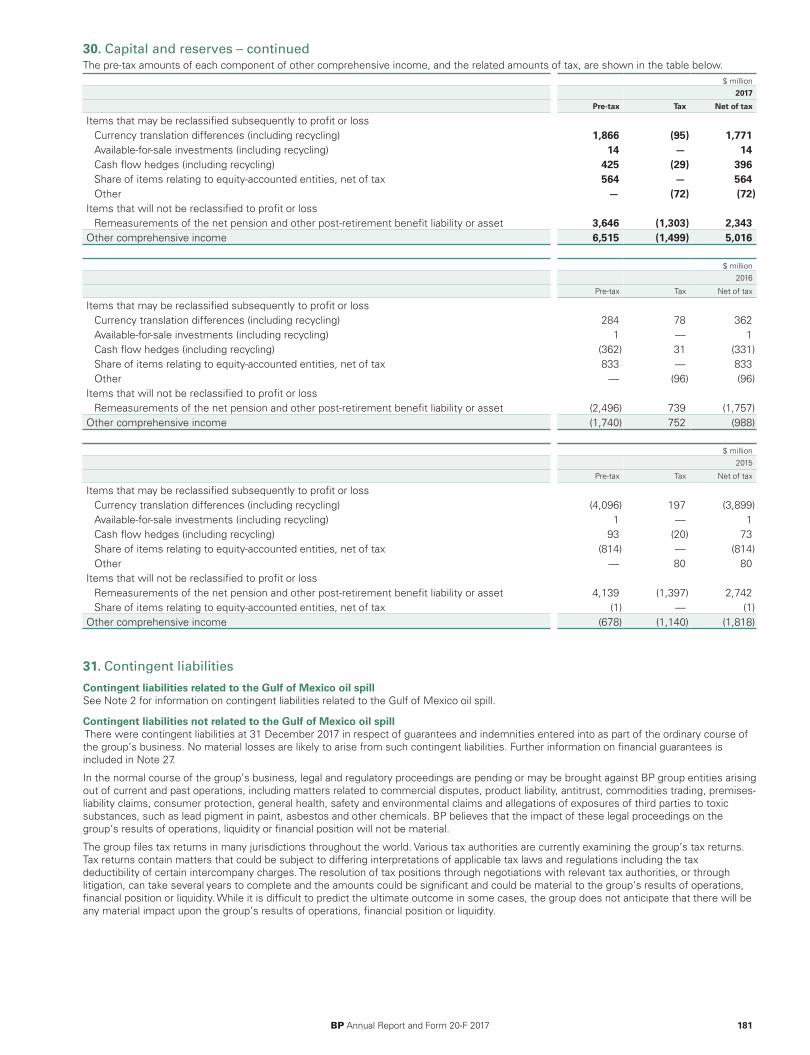
30. Capital and reserves – continuedThe pre-tax amounts of each component of other comprehensive income, and the related amounts of tax, are shown in the table below.
$ million2017
Pre-tax Tax Net of tax
Items that may be reclassified subsequently to profit or lossCurrency translation differences (including recycling) 1,866 (95) 1,771Available-for-sale investments (including recycling) 14 — 14Cash flow hedges (including recycling) 425 (29) 396Share of items relating to equity-accounted entities, net of tax 564 — 564Other — (72) (72)
Items that will not be reclassified to profit or lossRemeasurements of the net pension and other post-retirement benefit liability or asset 3,646 (1,303) 2,343
Other comprehensive income 6,515 (1,499) 5,016
$ million2016
Pre-tax Tax Net of tax
Items that may be reclassified subsequently to profit or lossCurrency translation differences (including recycling) 284 78 362Available-for-sale investments (including recycling) 1 — 1Cash flow hedges (including recycling) (362) 31 (331)Share of items relating to equity-accounted entities, net of tax 833 — 833Other — (96) (96)
Items that will not be reclassified to profit or lossRemeasurements of the net pension and other post-retirement benefit liability or asset (2,496) 739 (1,757)
Other comprehensive income (1,740) 752 (988)
$ million2015
Pre-tax Tax Net of tax
Items that may be reclassified subsequently to profit or lossCurrency translation differences (including recycling) (4,096) 197 (3,899)Available-for-sale investments (including recycling) 1 — 1Cash flow hedges (including recycling) 93 (20) 73Share of items relating to equity-accounted entities, net of tax (814) — (814)Other — 80 80
Items that will not be reclassified to profit or lossRemeasurements of the net pension and other post-retirement benefit liability or asset 4,139 (1,397) 2,742Share of items relating to equity-accounted entities, net of tax (1) — (1)
Other comprehensive income (678) (1,140) (1,818)
BP Annual Report and Form 20-F 2017 181
31. Contingent liabilities Contingent liabilities related to the Gulf of Mexico oil spillSee Note 2 for information on contingent liabilities related to the Gulf of Mexico oil spill.
Contingent liabilities not related to the Gulf of Mexico oil spill There were contingent liabilities at 31 December 2017 in respect of guarantees and indemnities entered into as part of the ordinary course ofthe group’s business. No material losses are likely to arise from such contingent liabilities. Further information on financial guarantees isincluded in Note 27.
In the normal course of the group’s business, legal and regulatory proceedings are pending or may be brought against BP group entities arisingout of current and past operations, including matters related to commercial disputes, product liability, antitrust, commodities trading, premises-liability claims, consumer protection, general health, safety and environmental claims and allegations of exposures of third parties to toxicsubstances, such as lead pigment in paint, asbestos and other chemicals. BP believes that the impact of these legal proceedings on thegroup‘s results of operations, liquidity or financial position will not be material.
The group files tax returns in many jurisdictions throughout the world. Various tax authorities are currently examining the group’s tax returns.Tax returns contain matters that could be subject to differing interpretations of applicable tax laws and regulations including the taxdeductibility of certain intercompany charges. The resolution of tax positions through negotiations with relevant tax authorities, or throughlitigation, can take several years to complete and the amounts could be significant and could be material to the group’s results of operations,financial position or liquidity. While it is difficult to predict the ultimate outcome in some cases, the group does not anticipate that there will beany material impact upon the group‘s results of operations, financial position or liquidity.
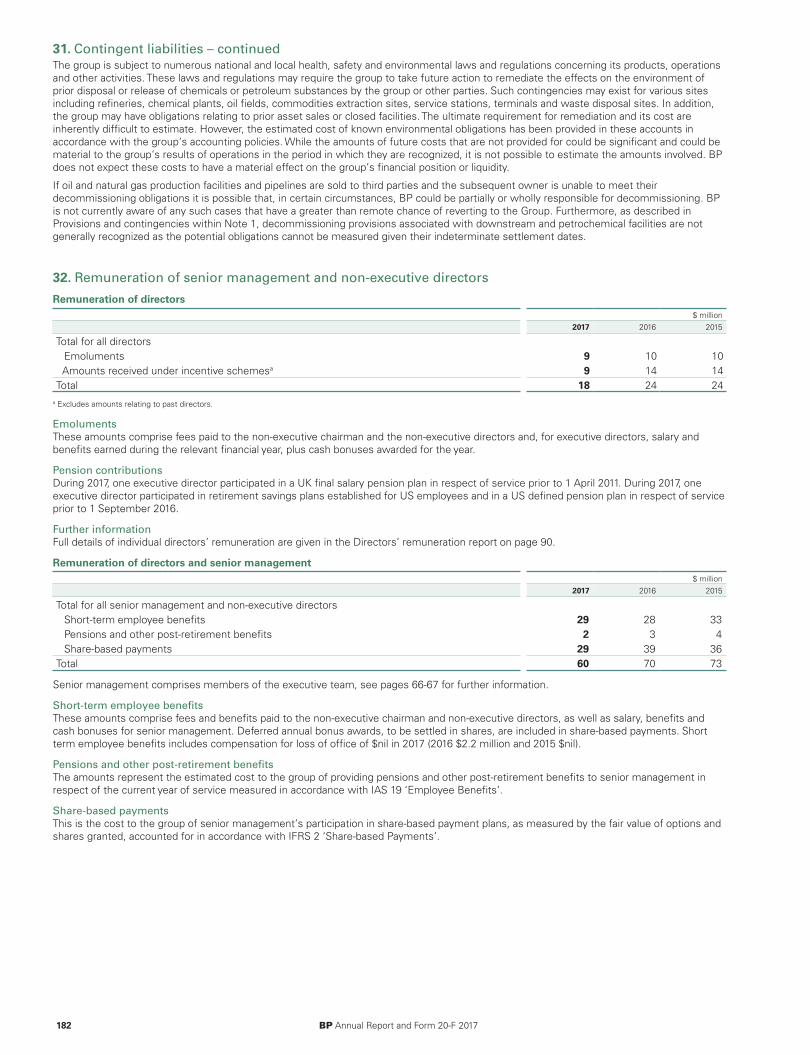
31. Contingent liabilities – continuedThe group is subject to numerous national and local health, safety and environmental laws and regulations concerning its products, operationsand other activities. These laws and regulations may require the group to take future action to remediate the effects on the environment ofprior disposal or release of chemicals or petroleum substances by the group or other parties. Such contingencies may exist for various sitesincluding refineries, chemical plants, oil fields, commodities extraction sites, service stations, terminals and waste disposal sites. In addition,the group may have obligations relating to prior asset sales or closed facilities. The ultimate requirement for remediation and its cost areinherently difficult to estimate. However, the estimated cost of known environmental obligations has been provided in these accounts inaccordance with the group‘s accounting policies. While the amounts of future costs that are not provided for could be significant and could bematerial to the group‘s results of operations in the period in which they are recognized, it is not possible to estimate the amounts involved. BPdoes not expect these costs to have a material effect on the group’s financial position or liquidity.
If oil and natural gas production facilities and pipelines are sold to third parties and the subsequent owner is unable to meet theirdecommissioning obligations it is possible that, in certain circumstances, BP could be partially or wholly responsible for decommissioning. BPis not currently aware of any such cases that have a greater than remote chance of reverting to the Group. Furthermore, as described inProvisions and contingencies within Note 1, decommissioning provisions associated with downstream and petrochemical facilities are notgenerally recognized as the potential obligations cannot be measured given their indeterminate settlement dates.
182 BP Annual Report and Form 20-F 2017
32. Remuneration of senior management and non-executive directors Remuneration of directors
$ million2017 2016 2015
Total for all directorsEmoluments 9 10 10Amounts received under incentive schemesa 9 14 14
Total 18 24 24a Excludes amounts relating to past directors.
EmolumentsThese amounts comprise fees paid to the non-executive chairman and the non-executive directors and, for executive directors, salary andbenefits earned during the relevant financial year, plus cash bonuses awarded for the year.
Pension contributionsDuring 2017, one executive director participated in a UK final salary pension plan in respect of service prior to 1 April 2011. During 2017, oneexecutive director participated in retirement savings plans established for US employees and in a US defined pension plan in respect of serviceprior to 1 September 2016.
Further informationFull details of individual directors’ remuneration are given in the Directors’ remuneration report on page 90.
Remuneration of directors and senior management$ million
2017 2016 2015
Total for all senior management and non-executive directorsShort-term employee benefits 29 28 33Pensions and other post-retirement benefits 2 3 4Share-based payments 29 39 36
Total 60 70 73
Senior management comprises members of the executive team, see pages 66-67 for further information.
Short-term employee benefitsThese amounts comprise fees and benefits paid to the non-executive chairman and non-executive directors, as well as salary, benefits andcash bonuses for senior management. Deferred annual bonus awards, to be settled in shares, are included in share-based payments. Shortterm employee benefits includes compensation for loss of office of $nil in 2017 (2016 $2.2 million and 2015 $nil).
Pensions and other post-retirement benefitsThe amounts represent the estimated cost to the group of providing pensions and other post-retirement benefits to senior management inrespect of the current year of service measured in accordance with IAS 19 ‘Employee Benefits’.
Share-based paymentsThis is the cost to the group of senior management’s participation in share-based payment plans, as measured by the fair value of options andshares granted, accounted for in accordance with IFRS 2 ‘Share-based Payments’.
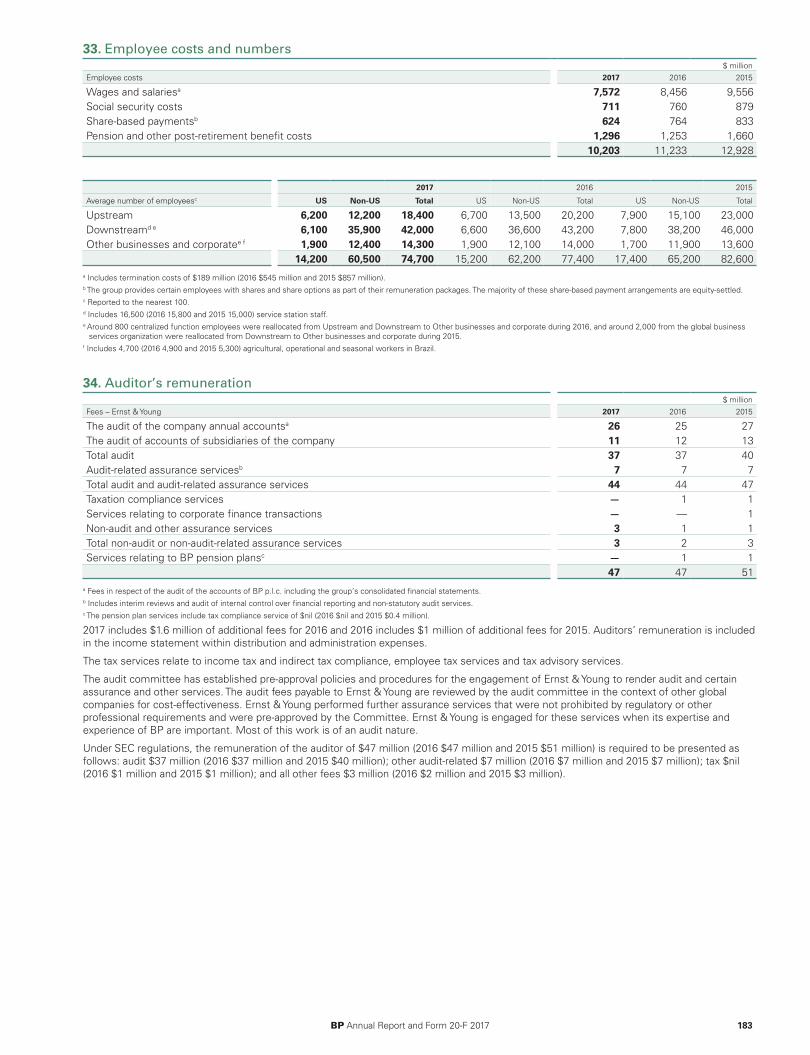
33. Employee costs and numbers $ million
Employee costs 2017 2016 2015
Wages and salariesa 7,572 8,456 9,556Social security costs 711 760 879Share-based paymentsb 624 764 833Pension and other post-retirement benefit costs 1,296 1,253 1,660
10,203 11,233 12,928
2017 2016 2015
Average number of employeesc US Non-US Total US Non-US Total US Non-US Total
Upstream 6,200 12,200 18,400 6,700 13,500 20,200 7,900 15,100 23,000Downstreamd e 6,100 35,900 42,000 6,600 36,600 43,200 7,800 38,200 46,000Other businesses and corporatee f 1,900 12,400 14,300 1,900 12,100 14,000 1,700 11,900 13,600
14,200 60,500 74,700 15,200 62,200 77,400 17,400 65,200 82,600a Includes termination costs of $189 million (2016 $545 million and 2015 $857 million).b The group provides certain employees with shares and share options as part of their remuneration packages. The majority of these share-based payment arrangements are equity-settled.c Reported to the nearest 100.d Includes 16,500 (2016 15,800 and 2015 15,000) service station staff.e Around 800 centralized function employees were reallocated from Upstream and Downstream to Other businesses and corporate during 2016, and around 2,000 from the global business
services organization were reallocated from Downstream to Other businesses and corporate during 2015.f Includes 4,700 (2016 4,900 and 2015 5,300) agricultural, operational and seasonal workers in Brazil.
BP Annual Report and Form 20-F 2017 183
34. Auditor’s remuneration $ million
Fees – Ernst & Young 2017 2016 2015
The audit of the company annual accountsa 26 25 27The audit of accounts of subsidiaries of the company 11 12 13Total audit 37 37 40Audit-related assurance servicesb 7 7 7Total audit and audit-related assurance services 44 44 47Taxation compliance services — 1 1Services relating to corporate finance transactions — — 1Non-audit and other assurance services 3 1 1Total non-audit or non-audit-related assurance services 3 2 3Services relating to BP pension plansc — 1 1
47 47 51a Fees in respect of the audit of the accounts of BP p.l.c. including the group’s consolidated financial statements.b Includes interim reviews and audit of internal control over financial reporting and non-statutory audit services.c The pension plan services include tax compliance service of $nil (2016 $nil and 2015 $0.4 million).
2017 includes $1.6 million of additional fees for 2016 and 2016 includes $1 million of additional fees for 2015. Auditors’ remuneration is includedin the income statement within distribution and administration expenses.
The tax services relate to income tax and indirect tax compliance, employee tax services and tax advisory services.
The audit committee has established pre-approval policies and procedures for the engagement of Ernst & Young to render audit and certainassurance and other services. The audit fees payable to Ernst & Young are reviewed by the audit committee in the context of other globalcompanies for cost-effectiveness. Ernst & Young performed further assurance services that were not prohibited by regulatory or otherprofessional requirements and were pre-approved by the Committee. Ernst & Young is engaged for these services when its expertise andexperience of BP are important. Most of this work is of an audit nature.
Under SEC regulations, the remuneration of the auditor of $47 million (2016 $47 million and 2015 $51 million) is required to be presented asfollows: audit $37 million (2016 $37 million and 2015 $40 million); other audit-related $7 million (2016 $7 million and 2015 $7 million); tax $nil(2016 $1 million and 2015 $1 million); and all other fees $3 million (2016 $2 million and 2015 $3 million).

35. Subsidiaries, joint arrangements and associates The more important subsidiaries and associates of the group at 31 December 2017 and the group percentage of ordinary share capital (tonearest whole number) are set out below. There are no individually significant joint arrangements. Those held directly by the parent companyare marked with an asterisk (*), the percentage owned being that of the group unless otherwise indicated. A complete list of undertakings ofthe group is included in Note 14 in the parent company financial statements of BP p.l.c. which are filed with the Registrar of Companies in theUK, along with the group’s annual report.
Subsidiaries %Country ofincorporation Principal activities
International BP Corporate Holdings 100 England & Wales Investment holding BP Exploration Operating Company 100 England & Wales Exploration and production*BP Global Investments 100 England & Wales Investment holding*BP International 100 England & Wales Integrated oil operations BP Oil International 100 England & Wales Integrated oil operations*Burmah Castrol 100 Scotland Lubricants
Angola BP Exploration (Angola) 100 England & Wales Exploration and production
Azerbaijan BP Exploration (Caspian Sea) 100 England & Wales Exploration and production BP Exploration (Azerbaijan) 100 England & Wales Exploration and production
Canada*BP Holdings Canada 100 England & Wales Investment holding
Egypt BP Exploration (Delta) 100 England & Wales Exploration and production
Germany BP Europa SE 100 Germany Refining and marketing
India BP Exploration (Alpha) 100 England & Wales Exploration and production
Trinidad & Tobago BP Trinidad and Tobago 70 US Exploration and production
UK BP Capital Markets 100 England & Wales Finance
US*BP Holdings North America 100 England & Wales Investment holding Atlantic Richfield Company 100 US
Exploration and production, refining andmarketing
BP America 100 US BP America Production Company 100 US BP Company North America 100 US BP Corporation North America 100 US BP Exploration (Alaska) 100 US BP Products North America 100 US Standard Oil Company 100 US BP Capital Markets America 100 US Finance
Associates %Country ofincorporation Principal activities
Russia Rosneft 20 Russia Integrated oil operations
184 BP Annual Report and Form 20-F 2017
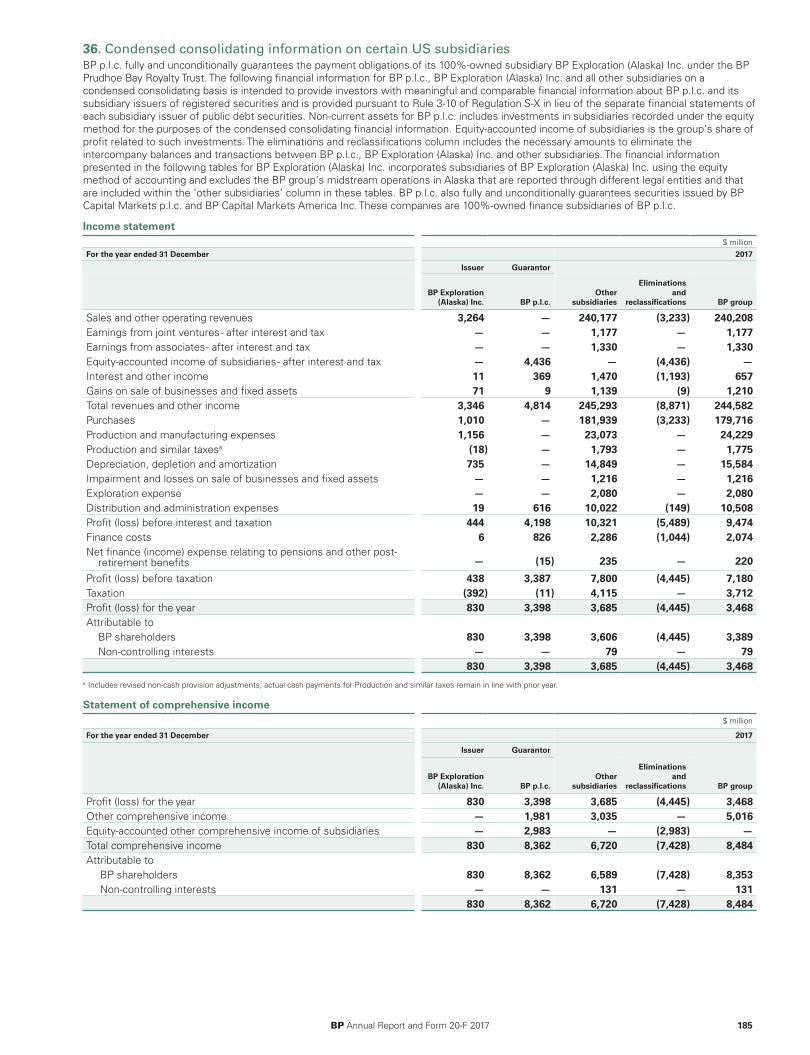
36. Condensed consolidating information on certain US subsidiariesBP p.l.c. fully and unconditionally guarantees the payment obligations of its 100%-owned subsidiary BP Exploration (Alaska) Inc. under the BPPrudhoe Bay Royalty Trust. The following financial information for BP p.l.c., BP Exploration (Alaska) Inc. and all other subsidiaries on acondensed consolidating basis is intended to provide investors with meaningful and comparable financial information about BP p.l.c. and itssubsidiary issuers of registered securities and is provided pursuant to Rule 3-10 of Regulation S-X in lieu of the separate financial statements ofeach subsidiary issuer of public debt securities. Non-current assets for BP p.l.c. includes investments in subsidiaries recorded under the equitymethod for the purposes of the condensed consolidating financial information. Equity-accounted income of subsidiaries is the group’s share ofprofit related to such investments. The eliminations and reclassifications column includes the necessary amounts to eliminate theintercompany balances and transactions between BP p.l.c., BP Exploration (Alaska) Inc. and other subsidiaries. The financial informationpresented in the following tables for BP Exploration (Alaska) Inc. incorporates subsidiaries of BP Exploration (Alaska) Inc. using the equitymethod of accounting and excludes the BP group’s midstream operations in Alaska that are reported through different legal entities and thatare included within the ‘other subsidiaries’ column in these tables. BP p.l.c. also fully and unconditionally guarantees securities issued by BPCapital Markets p.l.c. and BP Capital Markets America Inc. These companies are 100%-owned finance subsidiaries of BP p.l.c.
Income statement$ million
For the year ended 31 December 2017
Issuer Guarantor
BP Exploration(Alaska) Inc. BP p.l.c.
Othersubsidiaries
Eliminationsand
reclassifications BP group
Sales and other operating revenues 3,264 — 240,177 (3,233) 240,208Earnings from joint ventures - after interest and tax — — 1,177 — 1,177Earnings from associates - after interest and tax — — 1,330 — 1,330Equity-accounted income of subsidiaries - after interest and tax — 4,436 — (4,436) —Interest and other income 11 369 1,470 (1,193) 657Gains on sale of businesses and fixed assets 71 9 1,139 (9) 1,210Total revenues and other income 3,346 4,814 245,293 (8,871) 244,582Purchases 1,010 — 181,939 (3,233) 179,716Production and manufacturing expenses 1,156 — 23,073 — 24,229Production and similar taxesa (18) — 1,793 — 1,775Depreciation, depletion and amortization 735 — 14,849 — 15,584Impairment and losses on sale of businesses and fixed assets — — 1,216 — 1,216Exploration expense — — 2,080 — 2,080Distribution and administration expenses 19 616 10,022 (149) 10,508Profit (loss) before interest and taxation 444 4,198 10,321 (5,489) 9,474Finance costs 6 826 2,286 (1,044) 2,074Net finance (income) expense relating to pensions and other post-
retirement benefits — (15) 235 — 220Profit (loss) before taxation 438 3,387 7,800 (4,445) 7,180Taxation (392) (11) 4,115 — 3,712Profit (loss) for the year 830 3,398 3,685 (4,445) 3,468Attributable to
BP shareholders 830 3,398 3,606 (4,445) 3,389Non-controlling interests — — 79 — 79
830 3,398 3,685 (4,445) 3,468a Includes revised non-cash provision adjustments; actual cash payments for Production and similar taxes remain in line with prior year.
Statement of comprehensive income$ million
For the year ended 31 December 2017
Issuer Guarantor
BP Exploration(Alaska) Inc. BP p.l.c.
Othersubsidiaries
Eliminationsand
reclassifications BP group
Profit (loss) for the year 830 3,398 3,685 (4,445) 3,468Other comprehensive income — 1,981 3,035 — 5,016Equity-accounted other comprehensive income of subsidiaries — 2,983 — (2,983) —Total comprehensive income 830 8,362 6,720 (7,428) 8,484Attributable to
BP shareholders 830 8,362 6,589 (7,428) 8,353 Non-controlling interests — — 131 — 131
830 8,362 6,720 (7,428) 8,484
BP Annual Report and Form 20-F 2017 185
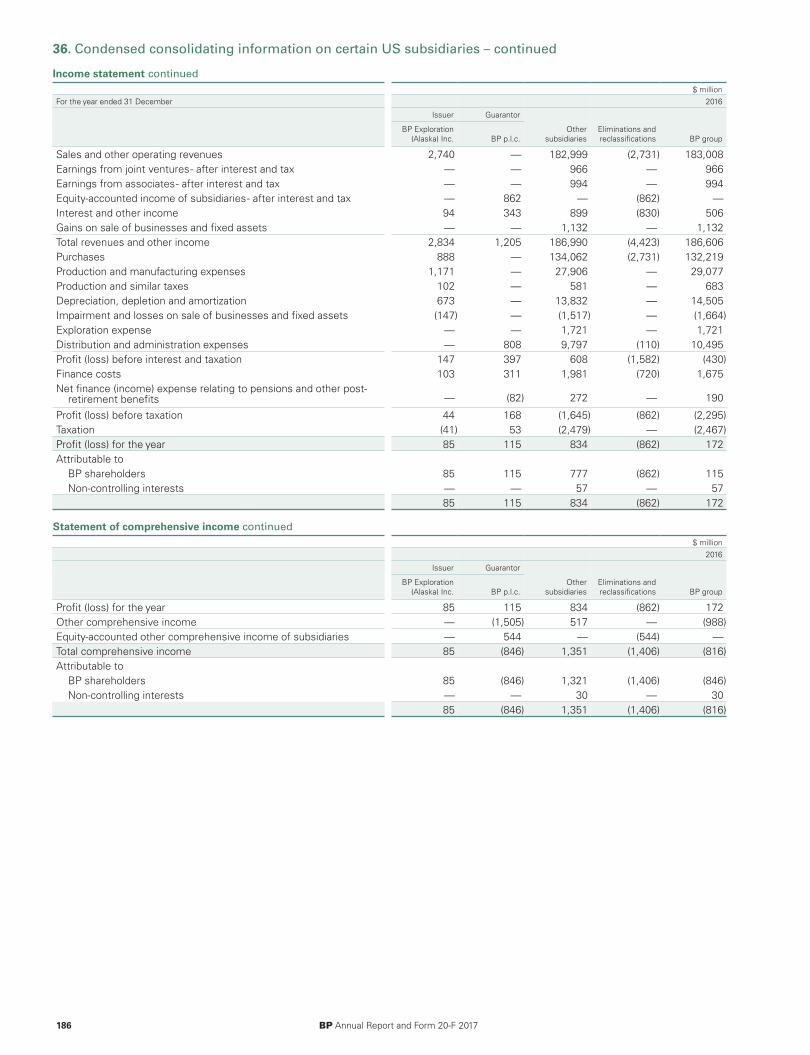
36. Condensed consolidating information on certain US subsidiaries – continued
Income statement continued $ million
For the year ended 31 December 2016
Issuer Guarantor
BP Exploration(Alaska) Inc. BP p.l.c.
Othersubsidiaries
Eliminations andreclassifications BP group
Sales and other operating revenues 2,740 — 182,999 (2,731) 183,008Earnings from joint ventures - after interest and tax — — 966 — 966Earnings from associates - after interest and tax — — 994 — 994Equity-accounted income of subsidiaries - after interest and tax — 862 — (862) —Interest and other income 94 343 899 (830) 506Gains on sale of businesses and fixed assets — — 1,132 — 1,132Total revenues and other income 2,834 1,205 186,990 (4,423) 186,606Purchases 888 — 134,062 (2,731) 132,219Production and manufacturing expenses 1,171 — 27,906 — 29,077Production and similar taxes 102 — 581 — 683Depreciation, depletion and amortization 673 — 13,832 — 14,505Impairment and losses on sale of businesses and fixed assets (147) — (1,517) — (1,664)Exploration expense — — 1,721 — 1,721Distribution and administration expenses — 808 9,797 (110) 10,495Profit (loss) before interest and taxation 147 397 608 (1,582) (430)Finance costs 103 311 1,981 (720) 1,675Net finance (income) expense relating to pensions and other post-
retirement benefits — (82) 272 — 190
Profit (loss) before taxation 44 168 (1,645) (862) (2,295)Taxation (41) 53 (2,479) — (2,467)Profit (loss) for the year 85 115 834 (862) 172Attributable to
BP shareholders 85 115 777 (862) 115Non-controlling interests — — 57 — 57
85 115 834 (862) 172
Statement of comprehensive income continued $ million
2016
Issuer Guarantor
BP Exploration(Alaska) Inc. BP p.l.c.
Othersubsidiaries
Eliminations andreclassifications BP group
Profit (loss) for the year 85 115 834 (862) 172Other comprehensive income — (1,505) 517 — (988)Equity-accounted other comprehensive income of subsidiaries — 544 — (544) —Total comprehensive income 85 (846) 1,351 (1,406) (816)Attributable to
BP shareholders 85 (846) 1,321 (1,406) (846)Non-controlling interests — — 30 — 30
85 (846) 1,351 (1,406) (816)
186 BP Annual Report and Form 20-F 2017
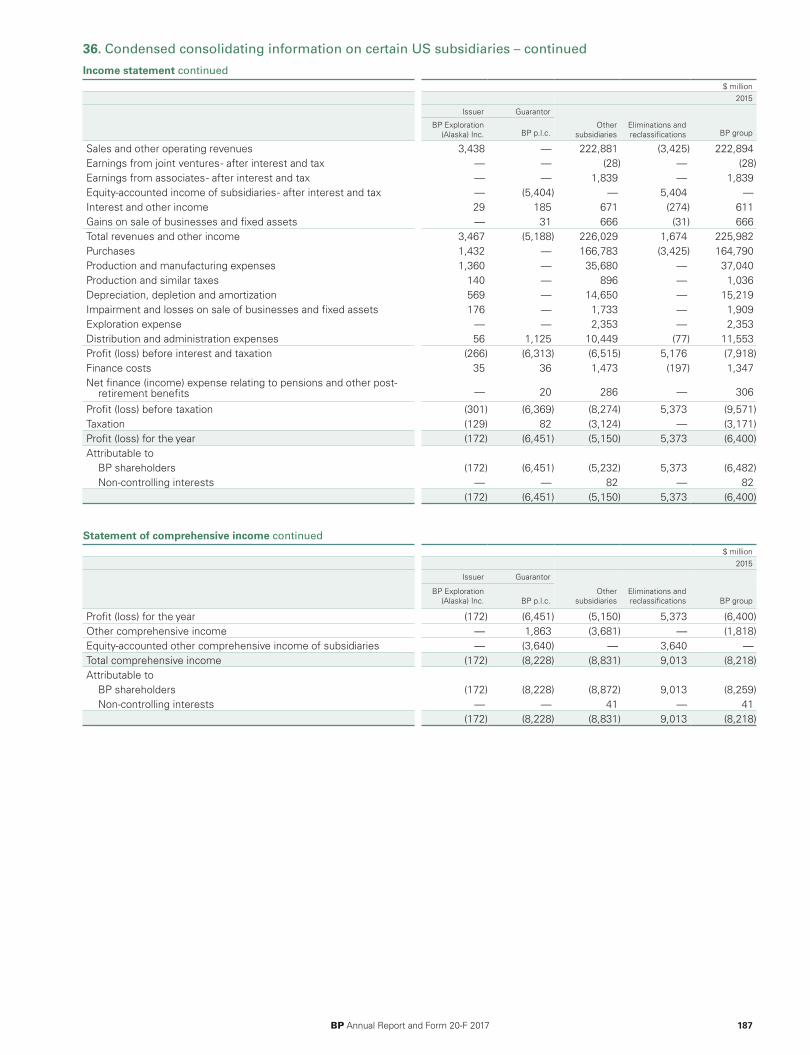
36. Condensed consolidating information on certain US subsidiaries – continued
Income statement continued $ million
2015
Issuer Guarantor
BP Exploration(Alaska) Inc. BP p.l.c.
Othersubsidiaries
Eliminations andreclassifications BP group
Sales and other operating revenues 3,438 — 222,881 (3,425) 222,894Earnings from joint ventures - after interest and tax — — (28) — (28)Earnings from associates - after interest and tax — — 1,839 — 1,839Equity-accounted income of subsidiaries - after interest and tax — (5,404) — 5,404 —Interest and other income 29 185 671 (274) 611Gains on sale of businesses and fixed assets — 31 666 (31) 666Total revenues and other income 3,467 (5,188) 226,029 1,674 225,982Purchases 1,432 — 166,783 (3,425) 164,790Production and manufacturing expenses 1,360 — 35,680 — 37,040Production and similar taxes 140 — 896 — 1,036Depreciation, depletion and amortization 569 — 14,650 — 15,219Impairment and losses on sale of businesses and fixed assets 176 — 1,733 — 1,909Exploration expense — — 2,353 — 2,353Distribution and administration expenses 56 1,125 10,449 (77) 11,553Profit (loss) before interest and taxation (266) (6,313) (6,515) 5,176 (7,918)Finance costs 35 36 1,473 (197) 1,347Net finance (income) expense relating to pensions and other post-
retirement benefits — 20 286 — 306
Profit (loss) before taxation (301) (6,369) (8,274) 5,373 (9,571)Taxation (129) 82 (3,124) — (3,171)Profit (loss) for the year (172) (6,451) (5,150) 5,373 (6,400)Attributable to
BP shareholders (172) (6,451) (5,232) 5,373 (6,482)Non-controlling interests — — 82 — 82
(172) (6,451) (5,150) 5,373 (6,400)
Statement of comprehensive income continued $ million
2015
Issuer Guarantor
BP Exploration(Alaska) Inc. BP p.l.c.
Othersubsidiaries
Eliminations andreclassifications BP group
Profit (loss) for the year (172) (6,451) (5,150) 5,373 (6,400)Other comprehensive income — 1,863 (3,681) — (1,818)Equity-accounted other comprehensive income of subsidiaries — (3,640) — 3,640 —Total comprehensive income (172) (8,228) (8,831) 9,013 (8,218)Attributable to
BP shareholders (172) (8,228) (8,872) 9,013 (8,259)Non-controlling interests — — 41 — 41
(172) (8,228) (8,831) 9,013 (8,218)
BP Annual Report and Form 20-F 2017 187
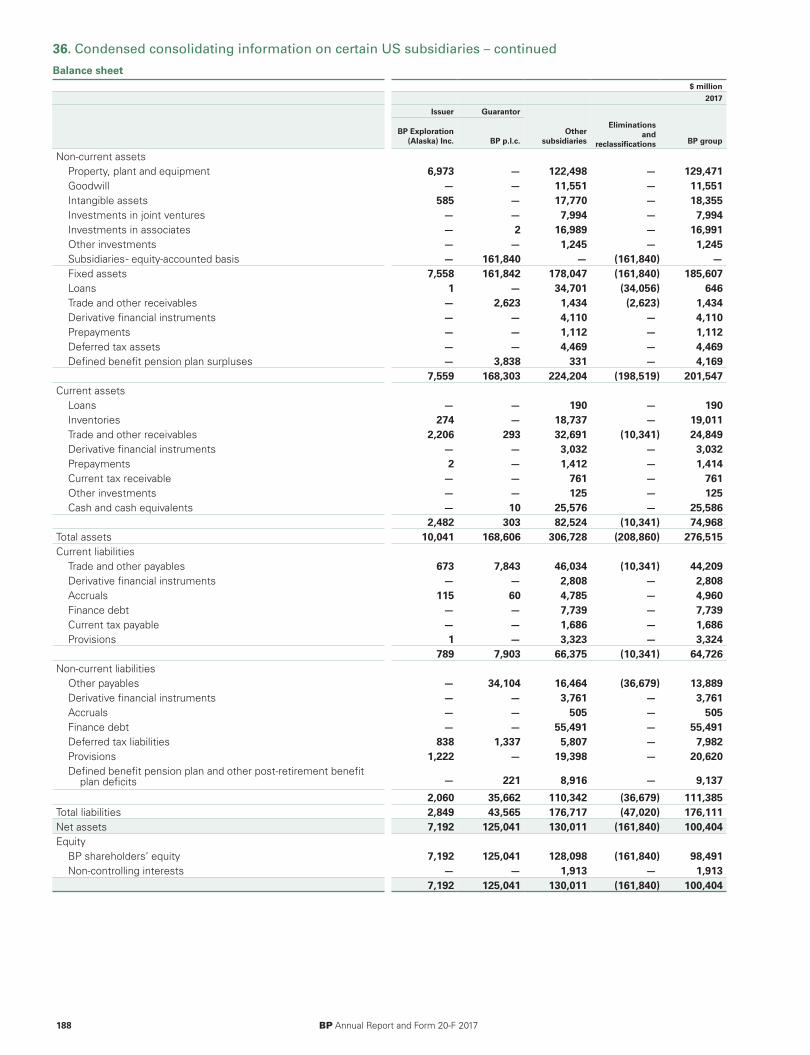
36. Condensed consolidating information on certain US subsidiaries – continued
Balance sheet$ million
2017
Issuer Guarantor
BP Exploration(Alaska) Inc. BP p.l.c.
Othersubsidiaries
Eliminationsand
reclassifications BP group
Non-current assetsProperty, plant and equipment 6,973 — 122,498 — 129,471Goodwill — — 11,551 — 11,551Intangible assets 585 — 17,770 — 18,355Investments in joint ventures — — 7,994 — 7,994Investments in associates — 2 16,989 — 16,991Other investments — — 1,245 — 1,245Subsidiaries - equity-accounted basis — 161,840 — (161,840) —Fixed assets 7,558 161,842 178,047 (161,840) 185,607Loans 1 — 34,701 (34,056) 646Trade and other receivables — 2,623 1,434 (2,623) 1,434Derivative financial instruments — — 4,110 — 4,110Prepayments — — 1,112 — 1,112Deferred tax assets — — 4,469 — 4,469Defined benefit pension plan surpluses — 3,838 331 — 4,169
7,559 168,303 224,204 (198,519) 201,547Current assets
Loans — — 190 — 190Inventories 274 — 18,737 — 19,011Trade and other receivables 2,206 293 32,691 (10,341) 24,849Derivative financial instruments — — 3,032 — 3,032Prepayments 2 — 1,412 — 1,414Current tax receivable — — 761 — 761Other investments — — 125 — 125Cash and cash equivalents — 10 25,576 — 25,586
2,482 303 82,524 (10,341) 74,968Total assets 10,041 168,606 306,728 (208,860) 276,515Current liabilities
Trade and other payables 673 7,843 46,034 (10,341) 44,209Derivative financial instruments — — 2,808 — 2,808Accruals 115 60 4,785 — 4,960Finance debt — — 7,739 — 7,739Current tax payable — — 1,686 — 1,686Provisions 1 — 3,323 — 3,324
789 7,903 66,375 (10,341) 64,726Non-current liabilities
Other payables — 34,104 16,464 (36,679) 13,889Derivative financial instruments — — 3,761 — 3,761Accruals — — 505 — 505Finance debt — — 55,491 — 55,491Deferred tax liabilities 838 1,337 5,807 — 7,982Provisions 1,222 — 19,398 — 20,620Defined benefit pension plan and other post-retirement benefit
plan deficits — 221 8,916 — 9,1372,060 35,662 110,342 (36,679) 111,385
Total liabilities 2,849 43,565 176,717 (47,020) 176,111Net assets 7,192 125,041 130,011 (161,840) 100,404Equity
BP shareholders’ equity 7,192 125,041 128,098 (161,840) 98,491Non-controlling interests — — 1,913 — 1,913
7,192 125,041 130,011 (161,840) 100,404
188 BP Annual Report and Form 20-F 2017

36. Condensed consolidating information on certain US subsidiaries – continued
Balance sheet continued$ million
2016
Issuer Guarantor
BP Exploration(Alaska) Inc. BP p.l.c.
Othersubsidiaries
Eliminations andreclassifications BP group
Non-current assetsProperty, plant and equipment 7,405 — 122,352 — 129,757Goodwill — — 11,194 — 11,194Intangible assets 578 — 17,605 — 18,183Investments in joint ventures — — 8,609 — 8,609Investments in associates — 2 14,090 — 14,092Other investments — — 1,033 — 1,033Subsidiaries - equity-accounted basis — 156,864 — (156,864) —Fixed assets 7,983 156,866 174,883 (156,864) 182,868Loans 9 — 34,941 (34,418) 532Trade and other receivables — 2,951 1,474 (2,951) 1,474Derivative financial instruments — — 4,359 — 4,359Prepayments — — 945 — 945Deferred tax assets — — 4,741 — 4,741Defined benefit pension plan surpluses — 528 56 — 584
7,992 160,345 221,399 (194,233) 195,503Current assets
Loans — — 259 — 259Inventories 249 — 17,406 — 17,655Trade and other receivablesa 1,593 487 24,610 (6,015) 20,675Derivative financial instruments — — 3,016 — 3,016Prepayments 7 — 1,479 — 1,486Current tax receivable — — 1,194 — 1,194Other investments — — 44 — 44Cash and cash equivalents — 50 23,434 — 23,484
1,849 537 71,442 (6,015) 67,813Total assets 9,841 160,882 292,841 (200,248) 263,316Current liabilities
Trade and other payablesa 672 4,096 39,162 (6,015) 37,915Derivative financial instruments — — 2,991 — 2,991Accruals 116 129 4,891 — 5,136Finance debt — — 6,634 — 6,634Current tax payablea — — 1,666 — 1,666Provisions 2 — 4,010 — 4,012
790 4,225 59,354 (6,015) 58,354Non-current liabilities
Other payables 20 34,389 16,906 (37,369) 13,946Derivative financial instruments — — 5,513 — 5,513Accruals — 43 426 — 469Finance debt — — 51,666 — 51,666Deferred tax liabilities 1,279 179 5,780 — 7,238Provisions 1,390 — 19,022 — 20,412Defined benefit pension plan and other post-retirement benefit
plan deficits — 219 8,656 — 8,875
2,689 34,830 107,969 (37,369) 108,119Total liabilities 3,479 39,055 167,323 (43,384) 166,473Net assets 6,362 121,827 125,518 (156,864) 96,843Equity
BP shareholders’ equitya 6,362 121,827 123,961 (156,864) 95,286Non-controlling interests — — 1,557 — 1,557
6,362 121,827 125,518 (156,864) 96,843a Amendments have been made to previously reported amounts for BP Exploration (Alaska) Inc., reducing current trade and other receivables by $990 million, current trade and other payables
by $50 million and current tax payable by $11 million, with offsetting amendments to BP shareholders' equity. This relates to intra-BP group balances and, as such, amendments have alsobeen made to the same line items presented for Other subsidiaries as well as eliminations amounts. The amendments represent the adjustment of amounts recorded in earlier periods byBP Exploration (Alaska) Inc. as intra-BP group balances relating to group re-organizations and the tax consequences thereon which are now considered to be more appropriately treated asshown by the amended amounts above.
BP Annual Report and Form 20-F 2017 189

36. Condensed consolidating information on certain US subsidiaries – continued
Cash flow statement$ million
2017
Issuer Guarantor
BP Exploration(Alaska) Inc. BP p.l.c.
Othersubsidiaries BP group
Net cash provided by operating activities 227 6,456 12,248 18,931Net cash provided by (used in) investing activities (227) — (13,850) (14,077)Net cash provided by (used in) financing activities — (6,496) 3,200 (3,296)Currency translation differences relating to cash and cash equivalents — — 544 544Increase (decrease) in cash and cash equivalents — (40) 2,142 2,102Cash and cash equivalents at beginning of year — 50 23,434 23,484Cash and cash equivalents at end of year — 10 25,576 25,586
$ millionFor the year ended 31 December 2016
Issuer Guarantor
BP Exploration(Alaska) Inc. BP p.l.c.
Othersubsidiaries BP group
Net cash provided by operating activities 699 4,661 5,331 10,691Net cash provided by (used in) investing activities (699) — (14,054) (14,753)Net cash provided by (used in) financing activities — (4,611) 6,588 1,977Currency translation differences relating to cash and cash equivalents — — (820) (820)Increase (decrease) in cash and cash equivalents — 50 (2,955) (2,905)Cash and cash equivalents at beginning of year — — 26,389 26,389Cash and cash equivalents at end of year — 50 23,434 23,484
$ millionFor the year ended 31 December 2015
Issuer Guarantor
BP Exploration(Alaska) Inc. BP p.l.c.
Othersubsidiaries BP group
Net cash provided by operating activities 925 6,628 11,580 19,133Net cash provided by (used in) investing activities (925) — (16,375) (17,300)Net cash provided by (used in) financing activities — (6,659) 2,124 (4,535)Currency translation differences relating to cash and cash equivalents — — (672) (672)Increase (decrease) in cash and cash equivalents — (31) (3,343) (3,374)Cash and cash equivalents at beginning of year — 31 29,732 29,763Cash and cash equivalents at end of year — — 26,389 26,389
190 BP Annual Report and Form 20-F 2017
Supplementary information on oil and natural gas (unaudited)The regional analysis presented below is on a continent basis, with separate disclosure for countries that contain 15% or more of the totalproved reserves (for subsidiaries plus equity-accounted entities), in accordance with SEC and FASB requirements.
Oil and gas reserves – certain definitionsUnless the context indicates otherwise, the following terms have the meanings shown below:
Proved oil and gas reservesProved oil and gas reserves are those quantities of oil and gas, which, by analysis of geoscience and engineering data, can be estimated withreasonable certainty to be economically producible – from a given date forward, from known reservoirs, and under existing economicconditions, operating methods, and government regulations – prior to the time at which contracts providing the right to operate expire, unlessevidence indicates that renewal is reasonably certain, regardless of whether deterministic or probabilistic methods are used for the estimation.The project to extract the hydrocarbons must have commenced or the operator must be reasonably certain that it will commence the projectwithin a reasonable time.
(i) The area of the reservoir considered as proved includes:
(A) The area identified by drilling and limited by fluid contacts, if any; and
(B) Adjacent undrilled portions of the reservoir that can, with reasonable certainty, be judged to be continuous with it and to containeconomically producible oil or gas on the basis of available geoscience and engineering data.
(ii) In the absence of data on fluid contacts, proved quantities in a reservoir are limited by the lowest known hydrocarbons (LKH) as seen ina well penetration unless geoscience, engineering, or performance data and reliable technology establishes a lower contact withreasonable certainty.
(iii) Where direct observation from well penetrations has defined a highest known oil (HKO) elevation and the potential exists for anassociated gas cap, proved oil reserves may be assigned in the structurally higher portions of the reservoir only if geoscience,engineering, or performance data and reliable technology establish the higher contact with reasonable certainty.
(iv) Reserves which can be produced economically through application of improved recovery techniques (including, but not limited to, fluidinjection) are included in the proved classification when:
(A) Successful testing by a pilot project in an area of the reservoir with properties no more favourable than in the reservoir as awhole, the operation of an installed programme in the reservoir or an analogous reservoir, or other evidence using reliabletechnology establishes the reasonable certainty of the engineering analysis on which the project or programme was based; and
(B) The project has been approved for development by all necessary parties and entities, including governmental entities.
(v) Existing economic conditions include prices and costs at which economic producibility from a reservoir is to be determined. The priceshall be the average price during the 12-month period prior to the ending date of the period covered by the report, determined as anunweighted arithmetic average of the first-day-of-the-month price for each month within such period, unless prices are defined bycontractual arrangements, excluding escalations based upon future conditions.
Undeveloped oil and gas reservesUndeveloped oil and gas reserves are reserves of any category that are expected to be recovered from new wells on undrilled acreage, or fromexisting wells where a relatively major expenditure is required for recompletion.
(i) Reserves on undrilled acreage shall be limited to those directly offsetting development spacing areas that are reasonably certain ofproduction when drilled, unless evidence using reliable technology exists that establishes reasonable certainty of economic producibilityat greater distances.
(ii) Undrilled locations can be classified as having undeveloped reserves only if a development plan has been adopted indicating that theyare scheduled to be drilled within five years, unless the specific circumstances, justify a longer time.
(iii) Under no circumstances shall estimates for undeveloped reserves be attributable to any acreage for which an application of fluidinjection or other improved recovery technique is contemplated, unless such techniques have been proved effective by actual projectsin the same reservoir or an analogous reservoir, or by other evidence using reliable technology establishing reasonable certainty.
Developed oil and gas reservesDeveloped oil and gas reserves are reserves of any category that can be expected to be recovered:
(i) Through existing wells with existing equipment and operating methods or in which the cost of the required equipment is relativelyminor compared to the cost of a new well; and
(ii) Through installed extraction equipment and infrastructure operational at the time of the reserves estimate if the extraction is by meansnot involving a well.
For details on BP’s proved reserves and production compliance and governance processes, see pages 259-264.
BP Annual Report and Form 20-F 2017 191
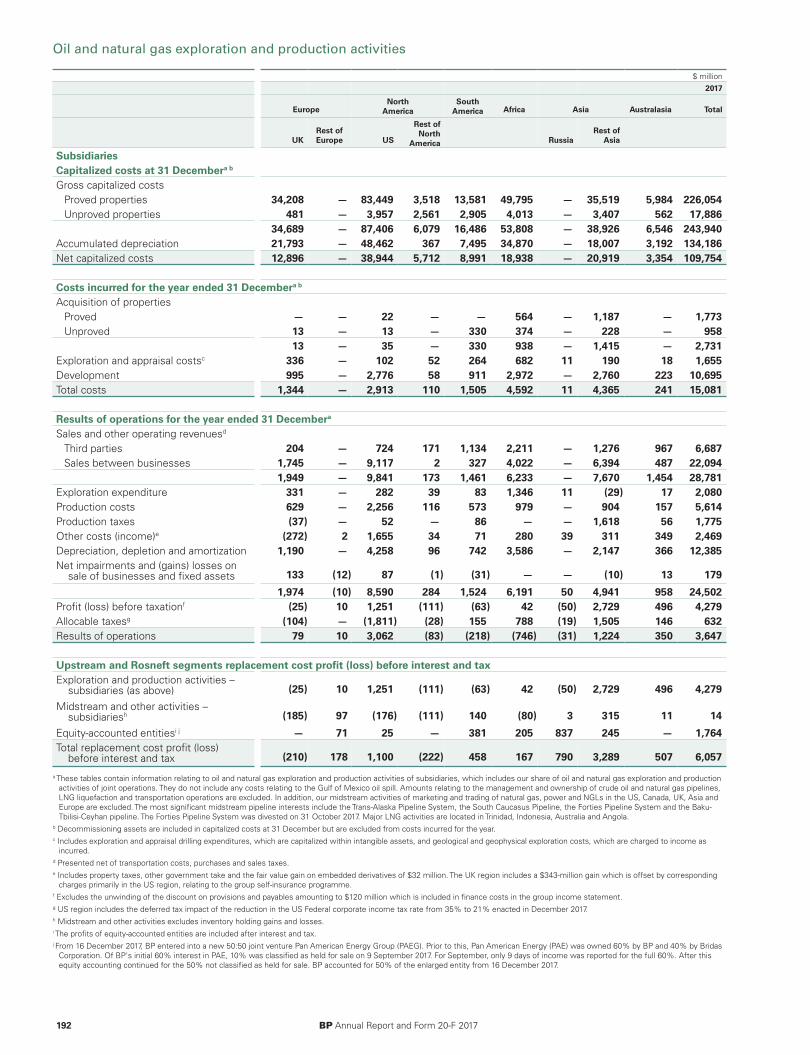
Oil and natural gas exploration and production activities
$ million2017
EuropeNorth
AmericaSouth
America Africa Asia Australasia Total
UKRest ofEurope US
Rest ofNorth
America RussiaRest of
Asia
SubsidiariesCapitalized costs at 31 Decembera b
Gross capitalized costsProved properties 34,208 — 83,449 3,518 13,581 49,795 — 35,519 5,984 226,054Unproved properties 481 — 3,957 2,561 2,905 4,013 — 3,407 562 17,886
34,689 — 87,406 6,079 16,486 53,808 — 38,926 6,546 243,940Accumulated depreciation 21,793 — 48,462 367 7,495 34,870 — 18,007 3,192 134,186Net capitalized costs 12,896 — 38,944 5,712 8,991 18,938 — 20,919 3,354 109,754
Costs incurred for the year ended 31 Decembera b
Acquisition of propertiesProved — — 22 — — 564 — 1,187 — 1,773Unproved 13 — 13 — 330 374 — 228 — 958
13 — 35 — 330 938 — 1,415 — 2,731Exploration and appraisal costsc 336 — 102 52 264 682 11 190 18 1,655Development 995 — 2,776 58 911 2,972 — 2,760 223 10,695Total costs 1,344 — 2,913 110 1,505 4,592 11 4,365 241 15,081
Results of operations for the year ended 31 Decembera
Sales and other operating revenuesd
Third parties 204 — 724 171 1,134 2,211 — 1,276 967 6,687Sales between businesses 1,745 — 9,117 2 327 4,022 — 6,394 487 22,094
1,949 — 9,841 173 1,461 6,233 — 7,670 1,454 28,781Exploration expenditure 331 — 282 39 83 1,346 11 (29) 17 2,080Production costs 629 — 2,256 116 573 979 — 904 157 5,614Production taxes (37) — 52 — 86 — — 1,618 56 1,775Other costs (income)e (272) 2 1,655 34 71 280 39 311 349 2,469Depreciation, depletion and amortization 1,190 — 4,258 96 742 3,586 — 2,147 366 12,385Net impairments and (gains) losses on
sale of businesses and fixed assets 133 (12) 87 (1) (31) — — (10) 13 1791,974 (10) 8,590 284 1,524 6,191 50 4,941 958 24,502
Profit (loss) before taxationf (25) 10 1,251 (111) (63) 42 (50) 2,729 496 4,279Allocable taxesg (104) — (1,811) (28) 155 788 (19) 1,505 146 632Results of operations 79 10 3,062 (83) (218) (746) (31) 1,224 350 3,647
Upstream and Rosneft segments replacement cost profit (loss) before interest and taxExploration and production activities –
subsidiaries (as above) (25) 10 1,251 (111) (63) 42 (50) 2,729 496 4,279Midstream and other activities –
subsidiariesh (185) 97 (176) (111) 140 (80) 3 315 11 14Equity-accounted entitiesi j — 71 25 — 381 205 837 245 — 1,764Total replacement cost profit (loss)
before interest and tax (210) 178 1,100 (222) 458 167 790 3,289 507 6,057
a These tables contain information relating to oil and natural gas exploration and production activities of subsidiaries, which includes our share of oil and natural gas exploration and productionactivities of joint operations. They do not include any costs relating to the Gulf of Mexico oil spill. Amounts relating to the management and ownership of crude oil and natural gas pipelines,LNG liquefaction and transportation operations are excluded. In addition, our midstream activities of marketing and trading of natural gas, power and NGLs in the US, Canada, UK, Asia andEurope are excluded. The most significant midstream pipeline interests include the Trans-Alaska Pipeline System, the South Caucasus Pipeline, the Forties Pipeline System and the Baku-Tbilisi-Ceyhan pipeline. The Forties Pipeline System was divested on 31 October 2017. Major LNG activities are located in Trinidad, Indonesia, Australia and Angola.
b Decommissioning assets are included in capitalized costs at 31 December but are excluded from costs incurred for the year.c Includes exploration and appraisal drilling expenditures, which are capitalized within intangible assets, and geological and geophysical exploration costs, which are charged to income as
incurred.d Presented net of transportation costs, purchases and sales taxes.e Includes property taxes, other government take and the fair value gain on embedded derivatives of $32 million. The UK region includes a $343-million gain which is offset by corresponding
charges primarily in the US region, relating to the group self-insurance programme.f Excludes the unwinding of the discount on provisions and payables amounting to $120 million which is included in finance costs in the group income statement.g US region includes the deferred tax impact of the reduction in the US Federal corporate income tax rate from 35% to 21% enacted in December 2017. h Midstream and other activities excludes inventory holding gains and losses.i The profits of equity-accounted entities are included after interest and tax.j From 16 December 2017, BP entered into a new 50:50 joint venture Pan American Energy Group (PAEG). Prior to this, Pan American Energy (PAE) was owned 60% by BP and 40% by Bridas
Corporation. Of BP's initial 60% interest in PAE, 10% was classified as held for sale on 9 September 2017. For September, only 9 days of income was reported for the full 60%. After thisequity accounting continued for the 50% not classified as held for sale. BP accounted for 50% of the enlarged entity from 16 December 2017.
192 BP Annual Report and Form 20-F 2017
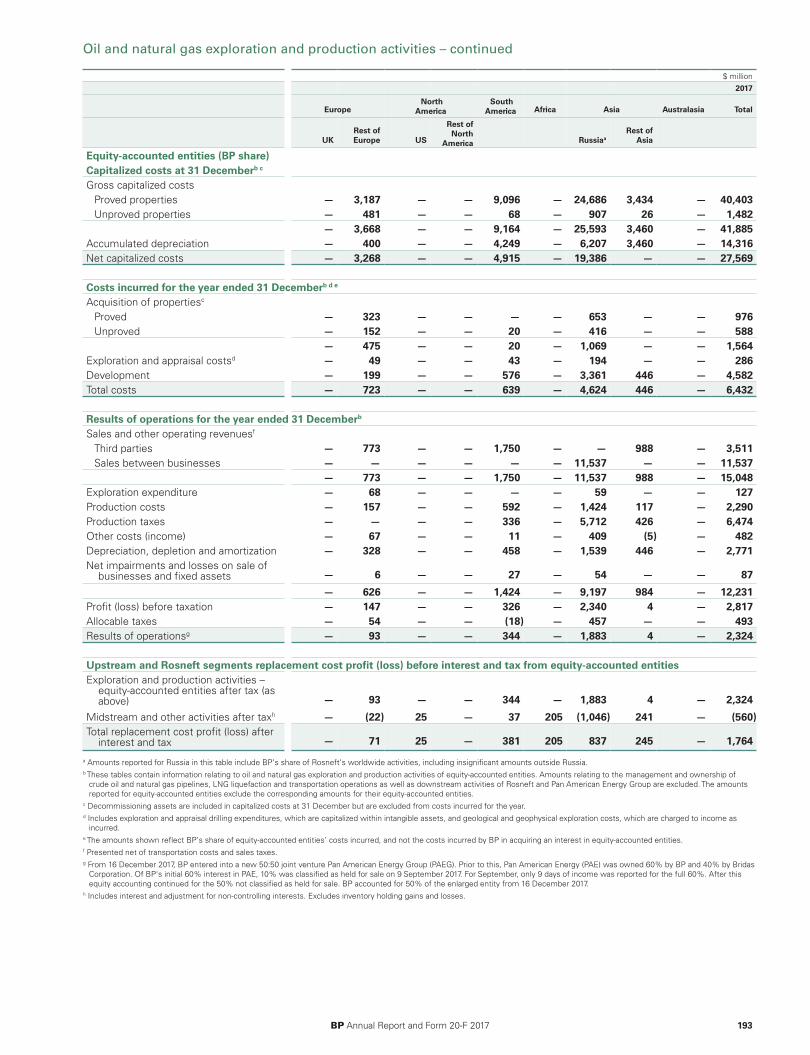
Oil and natural gas exploration and production activities – continued
$ million2017
Europe North
America South
America Africa Asia Australasia Total
UKRest ofEurope US
Rest ofNorth
America RussiaaRest of
Asia
Equity-accounted entities (BP share)Capitalized costs at 31 Decemberb c
Gross capitalized costsProved properties — 3,187 — — 9,096 — 24,686 3,434 — 40,403Unproved properties — 481 — — 68 — 907 26 — 1,482
— 3,668 — — 9,164 — 25,593 3,460 — 41,885Accumulated depreciation — 400 — — 4,249 — 6,207 3,460 — 14,316Net capitalized costs — 3,268 — — 4,915 — 19,386 — — 27,569
Costs incurred for the year ended 31 Decemberb d e
Acquisition of propertiesc
Proved — 323 — — — — 653 — — 976Unproved — 152 — — 20 — 416 — — 588
— 475 — — 20 — 1,069 — — 1,564Exploration and appraisal costsd — 49 — — 43 — 194 — — 286Development — 199 — — 576 — 3,361 446 — 4,582Total costs — 723 — — 639 — 4,624 446 — 6,432
Results of operations for the year ended 31 Decemberb
Sales and other operating revenuesf
Third parties — 773 — — 1,750 — — 988 — 3,511Sales between businesses — — — — — — 11,537 — — 11,537
— 773 — — 1,750 — 11,537 988 — 15,048Exploration expenditure — 68 — — — — 59 — — 127Production costs — 157 — — 592 — 1,424 117 — 2,290Production taxes — — — — 336 — 5,712 426 — 6,474Other costs (income) — 67 — — 11 — 409 (5) — 482Depreciation, depletion and amortization — 328 — — 458 — 1,539 446 — 2,771Net impairments and losses on sale of
businesses and fixed assets — 6 — — 27 — 54 — — 87— 626 — — 1,424 — 9,197 984 — 12,231
Profit (loss) before taxation — 147 — — 326 — 2,340 4 — 2,817Allocable taxes — 54 — — (18) — 457 — — 493Results of operationsg — 93 — — 344 — 1,883 4 — 2,324
Upstream and Rosneft segments replacement cost profit (loss) before interest and tax from equity-accounted entitiesExploration and production activities –
equity-accounted entities after tax (asabove) — 93 — — 344 — 1,883 4 — 2,324
Midstream and other activities after taxh — (22) 25 — 37 205 (1,046) 241 — (560)Total replacement cost profit (loss) after
interest and tax — 71 25 — 381 205 837 245 — 1,764
a Amounts reported for Russia in this table include BP’s share of Rosneft’s worldwide activities, including insignificant amounts outside Russia.b These tables contain information relating to oil and natural gas exploration and production activities of equity-accounted entities. Amounts relating to the management and ownership of
crude oil and natural gas pipelines, LNG liquefaction and transportation operations as well as downstream activities of Rosneft and Pan American Energy Group are excluded. The amountsreported for equity-accounted entities exclude the corresponding amounts for their equity-accounted entities.
c Decommissioning assets are included in capitalized costs at 31 December but are excluded from costs incurred for the year.d Includes exploration and appraisal drilling expenditures, which are capitalized within intangible assets, and geological and geophysical exploration costs, which are charged to income as
incurred.e The amounts shown reflect BP’s share of equity-accounted entities’ costs incurred, and not the costs incurred by BP in acquiring an interest in equity-accounted entities.f Presented net of transportation costs and sales taxes.g From 16 December 2017, BP entered into a new 50:50 joint venture Pan American Energy Group (PAEG). Prior to this, Pan American Energy (PAE) was owned 60% by BP and 40% by Bridas
Corporation. Of BP's initial 60% interest in PAE, 10% was classified as held for sale on 9 September 2017. For September, only 9 days of income was reported for the full 60%. After thisequity accounting continued for the 50% not classified as held for sale. BP accounted for 50% of the enlarged entity from 16 December 2017.
h Includes interest and adjustment for non-controlling interests. Excludes inventory holding gains and losses.
BP Annual Report and Form 20-F 2017 193
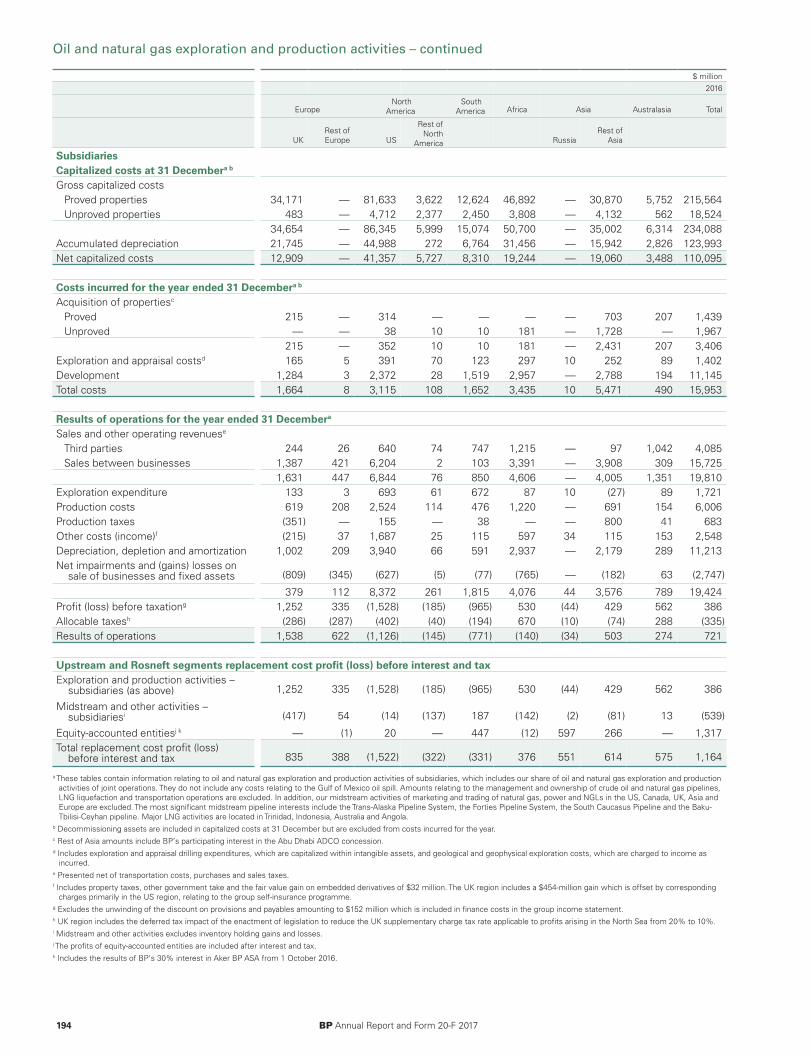
Oil and natural gas exploration and production activities – continued
$ million2016
Europe North
America South
America Africa Asia Australasia Total
UKRest ofEurope US
Rest ofNorth
America RussiaRest of
Asia
SubsidiariesCapitalized costs at 31 Decembera b
Gross capitalized costsProved properties 34,171 — 81,633 3,622 12,624 46,892 — 30,870 5,752 215,564Unproved properties 483 — 4,712 2,377 2,450 3,808 — 4,132 562 18,524
34,654 — 86,345 5,999 15,074 50,700 — 35,002 6,314 234,088Accumulated depreciation 21,745 — 44,988 272 6,764 31,456 — 15,942 2,826 123,993Net capitalized costs 12,909 — 41,357 5,727 8,310 19,244 — 19,060 3,488 110,095
Costs incurred for the year ended 31 Decembera b
Acquisition of propertiesc
Proved 215 — 314 — — — — 703 207 1,439Unproved — — 38 10 10 181 — 1,728 — 1,967
215 — 352 10 10 181 — 2,431 207 3,406Exploration and appraisal costsd 165 5 391 70 123 297 10 252 89 1,402Development 1,284 3 2,372 28 1,519 2,957 — 2,788 194 11,145Total costs 1,664 8 3,115 108 1,652 3,435 10 5,471 490 15,953
Results of operations for the year ended 31 Decembera
Sales and other operating revenuese
Third parties 244 26 640 74 747 1,215 — 97 1,042 4,085Sales between businesses 1,387 421 6,204 2 103 3,391 — 3,908 309 15,725
1,631 447 6,844 76 850 4,606 — 4,005 1,351 19,810Exploration expenditure 133 3 693 61 672 87 10 (27) 89 1,721Production costs 619 208 2,524 114 476 1,220 — 691 154 6,006Production taxes (351) — 155 — 38 — — 800 41 683Other costs (income)f (215) 37 1,687 25 115 597 34 115 153 2,548Depreciation, depletion and amortization 1,002 209 3,940 66 591 2,937 — 2,179 289 11,213Net impairments and (gains) losses on
sale of businesses and fixed assets (809) (345) (627) (5) (77) (765) — (182) 63 (2,747)
379 112 8,372 261 1,815 4,076 44 3,576 789 19,424Profit (loss) before taxationg 1,252 335 (1,528) (185) (965) 530 (44) 429 562 386Allocable taxesh (286) (287) (402) (40) (194) 670 (10) (74) 288 (335)Results of operations 1,538 622 (1,126) (145) (771) (140) (34) 503 274 721
Upstream and Rosneft segments replacement cost profit (loss) before interest and taxExploration and production activities –
subsidiaries (as above) 1,252 335 (1,528) (185) (965) 530 (44) 429 562 386
Midstream and other activities –subsidiariesi (417) 54 (14) (137) 187 (142) (2) (81) 13 (539)
Equity-accounted entitiesj k — (1) 20 — 447 (12) 597 266 — 1,317Total replacement cost profit (loss)
before interest and tax 835 388 (1,522) (322) (331) 376 551 614 575 1,164
a These tables contain information relating to oil and natural gas exploration and production activities of subsidiaries, which includes our share of oil and natural gas exploration and productionactivities of joint operations. They do not include any costs relating to the Gulf of Mexico oil spill. Amounts relating to the management and ownership of crude oil and natural gas pipelines,LNG liquefaction and transportation operations are excluded. In addition, our midstream activities of marketing and trading of natural gas, power and NGLs in the US, Canada, UK, Asia andEurope are excluded. The most significant midstream pipeline interests include the Trans-Alaska Pipeline System, the Forties Pipeline System, the South Caucasus Pipeline and the Baku-Tbilisi-Ceyhan pipeline. Major LNG activities are located in Trinidad, Indonesia, Australia and Angola.
b Decommissioning assets are included in capitalized costs at 31 December but are excluded from costs incurred for the year.c Rest of Asia amounts include BP’s participating interest in the Abu Dhabi ADCO concession.d Includes exploration and appraisal drilling expenditures, which are capitalized within intangible assets, and geological and geophysical exploration costs, which are charged to income as
incurred.e Presented net of transportation costs, purchases and sales taxes.f Includes property taxes, other government take and the fair value gain on embedded derivatives of $32 million. The UK region includes a $454-million gain which is offset by corresponding
charges primarily in the US region, relating to the group self-insurance programme.g Excludes the unwinding of the discount on provisions and payables amounting to $152 million which is included in finance costs in the group income statement.h UK region includes the deferred tax impact of the enactment of legislation to reduce the UK supplementary charge tax rate applicable to profits arising in the North Sea from 20% to 10%.i Midstream and other activities excludes inventory holding gains and losses.j The profits of equity-accounted entities are included after interest and tax.k Includes the results of BP’s 30% interest in Aker BP ASA from 1 October 2016.
194 BP Annual Report and Form 20-F 2017
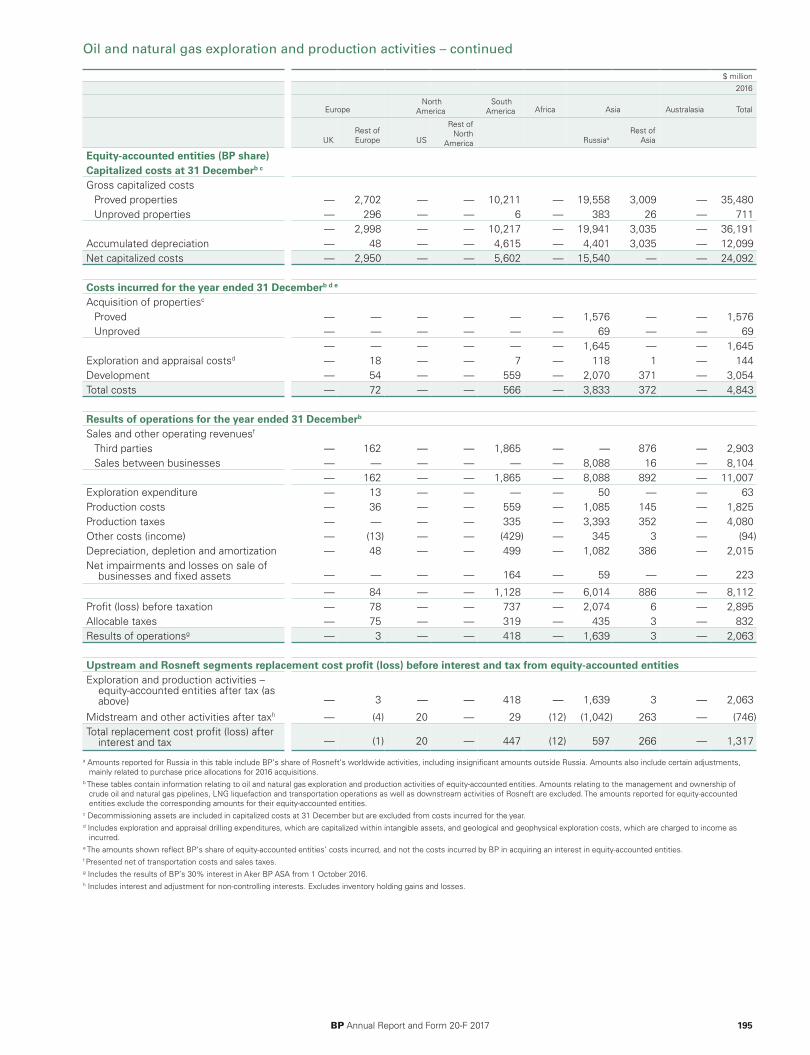
Oil and natural gas exploration and production activities – continued
$ million2016
Europe North
America South
America Africa Asia Australasia Total
UKRest ofEurope US
Rest ofNorth
America RussiaaRest of
Asia
Equity-accounted entities (BP share)Capitalized costs at 31 Decemberb c
Gross capitalized costsProved properties — 2,702 — — 10,211 — 19,558 3,009 — 35,480Unproved properties — 296 — — 6 — 383 26 — 711
— 2,998 — — 10,217 — 19,941 3,035 — 36,191Accumulated depreciation — 48 — — 4,615 — 4,401 3,035 — 12,099Net capitalized costs — 2,950 — — 5,602 — 15,540 — — 24,092
Costs incurred for the year ended 31 Decemberb d e
Acquisition of propertiesc
Proved — — — — — — 1,576 — — 1,576Unproved — — — — — — 69 — — 69
— — — — — — 1,645 — — 1,645Exploration and appraisal costsd — 18 — — 7 — 118 1 — 144Development — 54 — — 559 — 2,070 371 — 3,054Total costs — 72 — — 566 — 3,833 372 — 4,843
Results of operations for the year ended 31 Decemberb
Sales and other operating revenuesf
Third parties — 162 — — 1,865 — — 876 — 2,903Sales between businesses — — — — — — 8,088 16 — 8,104
— 162 — — 1,865 — 8,088 892 — 11,007Exploration expenditure — 13 — — — — 50 — — 63Production costs — 36 — — 559 — 1,085 145 — 1,825Production taxes — — — — 335 — 3,393 352 — 4,080Other costs (income) — (13) — — (429) — 345 3 — (94)Depreciation, depletion and amortization — 48 — — 499 — 1,082 386 — 2,015Net impairments and losses on sale of
businesses and fixed assets — — — — 164 — 59 — — 223
— 84 — — 1,128 — 6,014 886 — 8,112Profit (loss) before taxation — 78 — — 737 — 2,074 6 — 2,895Allocable taxes — 75 — — 319 — 435 3 — 832Results of operationsg — 3 — — 418 — 1,639 3 — 2,063
Upstream and Rosneft segments replacement cost profit (loss) before interest and tax from equity-accounted entitiesExploration and production activities –
equity-accounted entities after tax (asabove) — 3 — — 418 — 1,639 3 — 2,063
Midstream and other activities after taxh — (4) 20 — 29 (12) (1,042) 263 — (746)Total replacement cost profit (loss) after
interest and tax — (1) 20 — 447 (12) 597 266 — 1,317
a Amounts reported for Russia in this table include BP’s share of Rosneft’s worldwide activities, including insignificant amounts outside Russia. Amounts also include certain adjustments,mainly related to purchase price allocations for 2016 acquisitions.
b These tables contain information relating to oil and natural gas exploration and production activities of equity-accounted entities. Amounts relating to the management and ownership ofcrude oil and natural gas pipelines, LNG liquefaction and transportation operations as well as downstream activities of Rosneft are excluded. The amounts reported for equity-accountedentities exclude the corresponding amounts for their equity-accounted entities.
c Decommissioning assets are included in capitalized costs at 31 December but are excluded from costs incurred for the year.d Includes exploration and appraisal drilling expenditures, which are capitalized within intangible assets, and geological and geophysical exploration costs, which are charged to income as
incurred.e The amounts shown reflect BP’s share of equity-accounted entities’ costs incurred, and not the costs incurred by BP in acquiring an interest in equity-accounted entities.f Presented net of transportation costs and sales taxes.g Includes the results of BP’s 30% interest in Aker BP ASA from 1 October 2016.h Includes interest and adjustment for non-controlling interests. Excludes inventory holding gains and losses.
BP Annual Report and Form 20-F 2017 195
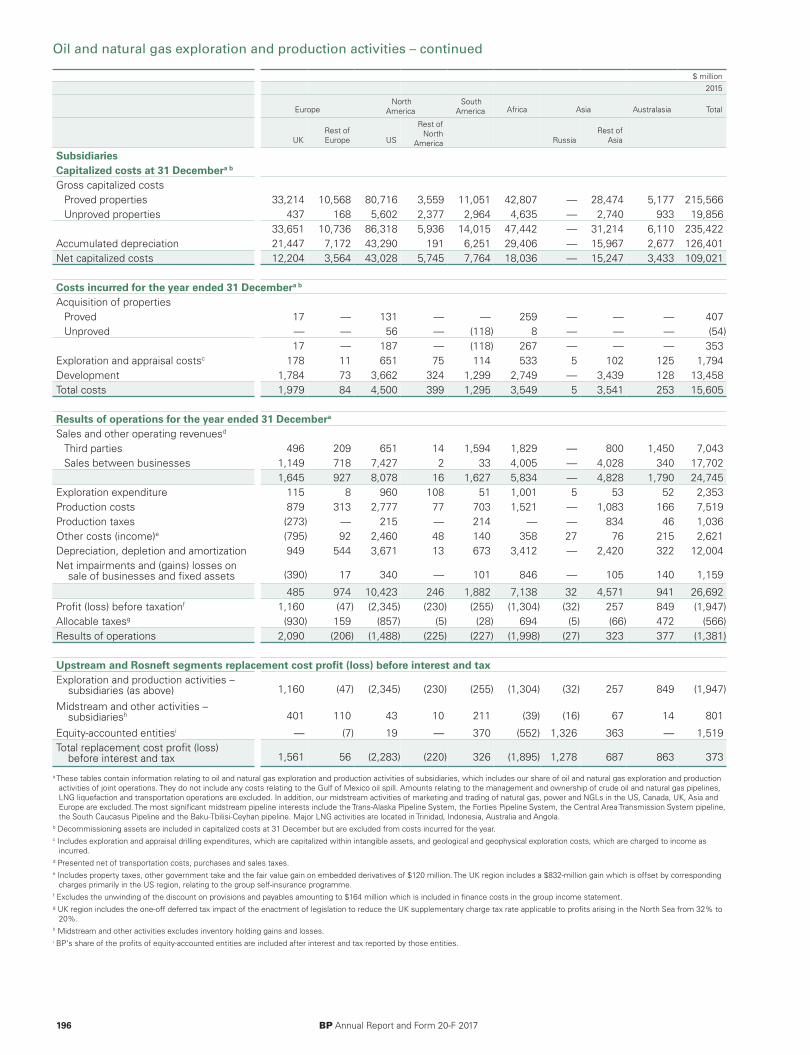
Oil and natural gas exploration and production activities – continued
$ million2015
Europe North
America South
America Africa Asia Australasia Total
UKRest ofEurope US
Rest ofNorth
America RussiaRest of
Asia
SubsidiariesCapitalized costs at 31 Decembera b
Gross capitalized costsProved properties 33,214 10,568 80,716 3,559 11,051 42,807 — 28,474 5,177 215,566Unproved properties 437 168 5,602 2,377 2,964 4,635 — 2,740 933 19,856
33,651 10,736 86,318 5,936 14,015 47,442 — 31,214 6,110 235,422Accumulated depreciation 21,447 7,172 43,290 191 6,251 29,406 — 15,967 2,677 126,401Net capitalized costs 12,204 3,564 43,028 5,745 7,764 18,036 — 15,247 3,433 109,021
Costs incurred for the year ended 31 Decembera b
Acquisition of propertiesProved 17 — 131 — — 259 — — — 407Unproved — — 56 — (118) 8 — — — (54)
17 — 187 — (118) 267 — — — 353Exploration and appraisal costsc 178 11 651 75 114 533 5 102 125 1,794Development 1,784 73 3,662 324 1,299 2,749 — 3,439 128 13,458Total costs 1,979 84 4,500 399 1,295 3,549 5 3,541 253 15,605
Results of operations for the year ended 31 Decembera
Sales and other operating revenuesd
Third parties 496 209 651 14 1,594 1,829 — 800 1,450 7,043Sales between businesses 1,149 718 7,427 2 33 4,005 — 4,028 340 17,702
1,645 927 8,078 16 1,627 5,834 — 4,828 1,790 24,745Exploration expenditure 115 8 960 108 51 1,001 5 53 52 2,353Production costs 879 313 2,777 77 703 1,521 — 1,083 166 7,519Production taxes (273) — 215 — 214 — — 834 46 1,036Other costs (income)e (795) 92 2,460 48 140 358 27 76 215 2,621Depreciation, depletion and amortization 949 544 3,671 13 673 3,412 — 2,420 322 12,004Net impairments and (gains) losses on
sale of businesses and fixed assets (390) 17 340 — 101 846 — 105 140 1,159
485 974 10,423 246 1,882 7,138 32 4,571 941 26,692Profit (loss) before taxationf 1,160 (47) (2,345) (230) (255) (1,304) (32) 257 849 (1,947)Allocable taxesg (930) 159 (857) (5) (28) 694 (5) (66) 472 (566)Results of operations 2,090 (206) (1,488) (225) (227) (1,998) (27) 323 377 (1,381)
Upstream and Rosneft segments replacement cost profit (loss) before interest and taxExploration and production activities –
subsidiaries (as above) 1,160 (47) (2,345) (230) (255) (1,304) (32) 257 849 (1,947)
Midstream and other activities –subsidiariesh 401 110 43 10 211 (39) (16) 67 14 801
Equity-accounted entitiesi — (7) 19 — 370 (552) 1,326 363 — 1,519Total replacement cost profit (loss)
before interest and tax 1,561 56 (2,283) (220) 326 (1,895) 1,278 687 863 373
a These tables contain information relating to oil and natural gas exploration and production activities of subsidiaries, which includes our share of oil and natural gas exploration and productionactivities of joint operations. They do not include any costs relating to the Gulf of Mexico oil spill. Amounts relating to the management and ownership of crude oil and natural gas pipelines,LNG liquefaction and transportation operations are excluded. In addition, our midstream activities of marketing and trading of natural gas, power and NGLs in the US, Canada, UK, Asia andEurope are excluded. The most significant midstream pipeline interests include the Trans-Alaska Pipeline System, the Forties Pipeline System, the Central Area Transmission System pipeline,the South Caucasus Pipeline and the Baku-Tbilisi-Ceyhan pipeline. Major LNG activities are located in Trinidad, Indonesia, Australia and Angola.
b Decommissioning assets are included in capitalized costs at 31 December but are excluded from costs incurred for the year.c Includes exploration and appraisal drilling expenditures, which are capitalized within intangible assets, and geological and geophysical exploration costs, which are charged to income as
incurred.d Presented net of transportation costs, purchases and sales taxes.e Includes property taxes, other government take and the fair value gain on embedded derivatives of $120 million. The UK region includes a $832-million gain which is offset by corresponding
charges primarily in the US region, relating to the group self-insurance programme.f Excludes the unwinding of the discount on provisions and payables amounting to $164 million which is included in finance costs in the group income statement.g UK region includes the one-off deferred tax impact of the enactment of legislation to reduce the UK supplementary charge tax rate applicable to profits arising in the North Sea from 32% to
20%.h Midstream and other activities excludes inventory holding gains and losses.i BP’s share of the profits of equity-accounted entities are included after interest and tax reported by those entities.
196 BP Annual Report and Form 20-F 2017
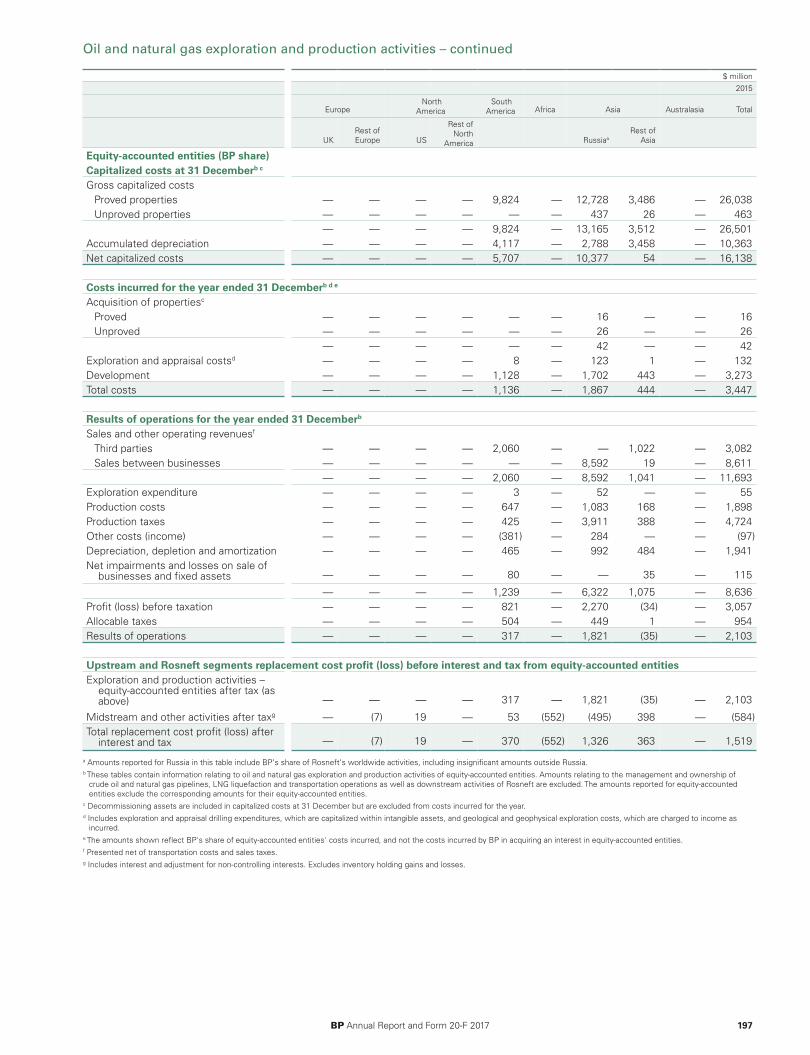
Oil and natural gas exploration and production activities – continued
$ million2015
Europe North
America South
America Africa Asia Australasia Total
UKRest ofEurope US
Rest ofNorth
America RussiaaRest of
Asia
Equity-accounted entities (BP share)Capitalized costs at 31 Decemberb c
Gross capitalized costsProved properties — — — — 9,824 — 12,728 3,486 — 26,038Unproved properties — — — — — — 437 26 — 463
— — — — 9,824 — 13,165 3,512 — 26,501Accumulated depreciation — — — — 4,117 — 2,788 3,458 — 10,363Net capitalized costs — — — — 5,707 — 10,377 54 — 16,138
Costs incurred for the year ended 31 Decemberb d e
Acquisition of propertiesc
Proved — — — — — — 16 — — 16Unproved — — — — — — 26 — — 26
— — — — — — 42 — — 42Exploration and appraisal costsd — — — — 8 — 123 1 — 132Development — — — — 1,128 — 1,702 443 — 3,273Total costs — — — — 1,136 — 1,867 444 — 3,447
Results of operations for the year ended 31 Decemberb
Sales and other operating revenuesf
Third parties — — — — 2,060 — — 1,022 — 3,082Sales between businesses — — — — — — 8,592 19 — 8,611
— — — — 2,060 — 8,592 1,041 — 11,693Exploration expenditure — — — — 3 — 52 — — 55Production costs — — — — 647 — 1,083 168 — 1,898Production taxes — — — — 425 — 3,911 388 — 4,724Other costs (income) — — — — (381) — 284 — — (97)Depreciation, depletion and amortization — — — — 465 — 992 484 — 1,941Net impairments and losses on sale of
businesses and fixed assets — — — — 80 — — 35 — 115
— — — — 1,239 — 6,322 1,075 — 8,636Profit (loss) before taxation — — — — 821 — 2,270 (34) — 3,057Allocable taxes — — — — 504 — 449 1 — 954Results of operations — — — — 317 — 1,821 (35) — 2,103
Upstream and Rosneft segments replacement cost profit (loss) before interest and tax from equity-accounted entitiesExploration and production activities –
equity-accounted entities after tax (asabove) — — — — 317 — 1,821 (35) — 2,103
Midstream and other activities after taxg — (7) 19 — 53 (552) (495) 398 — (584)Total replacement cost profit (loss) after
interest and tax — (7) 19 — 370 (552) 1,326 363 — 1,519
a Amounts reported for Russia in this table include BP’s share of Rosneft’s worldwide activities, including insignificant amounts outside Russia.b These tables contain information relating to oil and natural gas exploration and production activities of equity-accounted entities. Amounts relating to the management and ownership of
crude oil and natural gas pipelines, LNG liquefaction and transportation operations as well as downstream activities of Rosneft are excluded. The amounts reported for equity-accountedentities exclude the corresponding amounts for their equity-accounted entities.
c Decommissioning assets are included in capitalized costs at 31 December but are excluded from costs incurred for the year.d Includes exploration and appraisal drilling expenditures, which are capitalized within intangible assets, and geological and geophysical exploration costs, which are charged to income as
incurred.e The amounts shown reflect BP's share of equity-accounted entities' costs incurred, and not the costs incurred by BP in acquiring an interest in equity-accounted entities.f Presented net of transportation costs and sales taxes.g Includes interest and adjustment for non-controlling interests. Excludes inventory holding gains and losses.
BP Annual Report and Form 20-F 2017 197
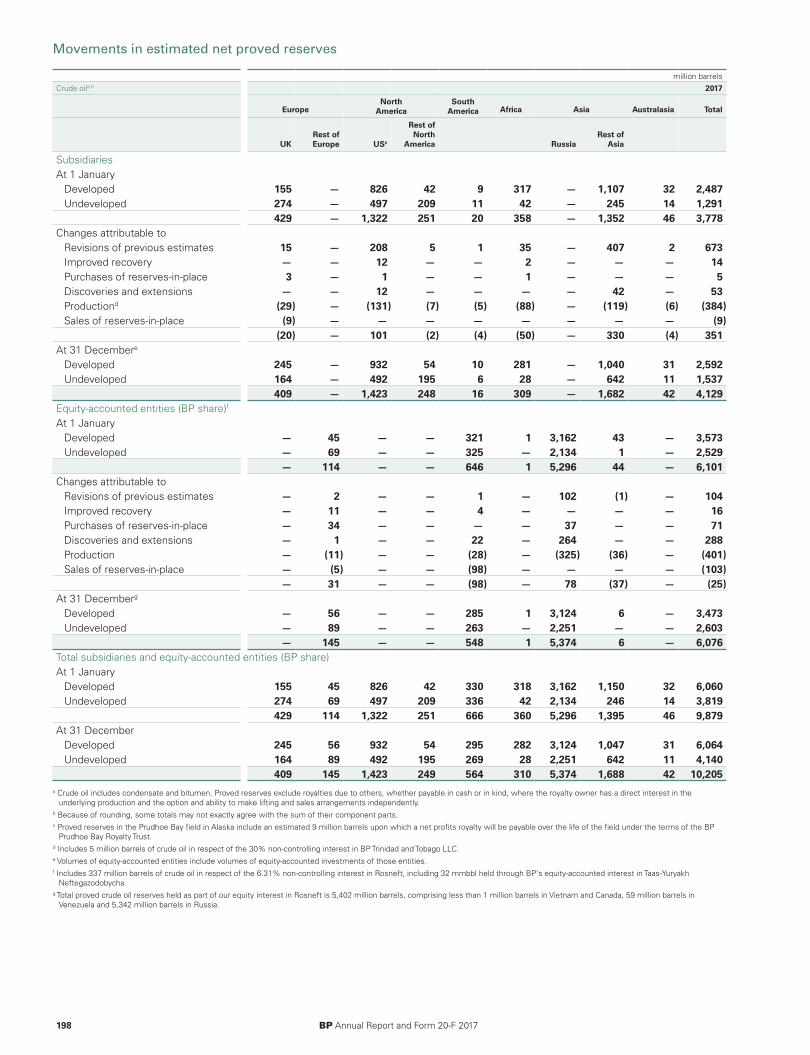
Movements in estimated net proved reserves
million barrelsCrude oila b 2017
EuropeNorth
AmericaSouth
America Africa Asia Australasia Total
UKRest ofEurope USc
Rest ofNorth
America RussiaRest of
Asia
SubsidiariesAt 1 January
Developed 155 — 826 42 9 317 — 1,107 32 2,487Undeveloped 274 — 497 209 11 42 — 245 14 1,291
429 — 1,322 251 20 358 — 1,352 46 3,778Changes attributable to
Revisions of previous estimates 15 — 208 5 1 35 — 407 2 673Improved recovery — — 12 — — 2 — — — 14Purchases of reserves-in-place 3 — 1 — — 1 — — — 5Discoveries and extensions — — 12 — — — — 42 — 53Productiond (29) — (131) (7) (5) (88) — (119) (6) (384)Sales of reserves-in-place (9) — — — — — — — — (9)
(20) — 101 (2) (4) (50) — 330 (4) 351At 31 Decembere
Developed 245 — 932 54 10 281 — 1,040 31 2,592Undeveloped 164 — 492 195 6 28 — 642 11 1,537
409 — 1,423 248 16 309 — 1,682 42 4,129Equity-accounted entities (BP share)f
At 1 JanuaryDeveloped — 45 — — 321 1 3,162 43 — 3,573Undeveloped — 69 — — 325 — 2,134 1 — 2,529
— 114 — — 646 1 5,296 44 — 6,101Changes attributable to
Revisions of previous estimates — 2 — — 1 — 102 (1) — 104Improved recovery — 11 — — 4 — — — — 16Purchases of reserves-in-place — 34 — — — — 37 — — 71Discoveries and extensions — 1 — — 22 — 264 — — 288Production — (11) — — (28) — (325) (36) — (401)Sales of reserves-in-place — (5) — — (98) — — — — (103)
— 31 — — (98) — 78 (37) — (25)At 31 Decemberg
Developed — 56 — — 285 1 3,124 6 — 3,473Undeveloped — 89 — — 263 — 2,251 — — 2,603
— 145 — — 548 1 5,374 6 — 6,076Total subsidiaries and equity-accounted entities (BP share)At 1 January
Developed 155 45 826 42 330 318 3,162 1,150 32 6,060Undeveloped 274 69 497 209 336 42 2,134 246 14 3,819
429 114 1,322 251 666 360 5,296 1,395 46 9,879At 31 December
Developed 245 56 932 54 295 282 3,124 1,047 31 6,064Undeveloped 164 89 492 195 269 28 2,251 642 11 4,140
409 145 1,423 249 564 310 5,374 1,688 42 10,205a Crude oil includes condensate and bitumen. Proved reserves exclude royalties due to others, whether payable in cash or in kind, where the royalty owner has a direct interest in the
underlying production and the option and ability to make lifting and sales arrangements independently.b Because of rounding, some totals may not exactly agree with the sum of their component parts.c Proved reserves in the Prudhoe Bay field in Alaska include an estimated 9 million barrels upon which a net profits royalty will be payable over the life of the field under the terms of the BP
Prudhoe Bay Royalty Trust.d Includes 5 million barrels of crude oil in respect of the 30% non-controlling interest in BP Trinidad and Tobago LLC.e Volumes of equity-accounted entities include volumes of equity-accounted investments of those entities.f Includes 337 million barrels of crude oil in respect of the 6.31% non-controlling interest in Rosneft, including 32 mmbbl held through BP’s equity-accounted interest in Taas-Yuryakh
Neftegazodobycha.g Total proved crude oil reserves held as part of our equity interest in Rosneft is 5,402 million barrels, comprising less than 1 million barrels in Vietnam and Canada, 59 million barrels in
Venezuela and 5,342 million barrels in Russia.
198 BP Annual Report and Form 20-F 2017
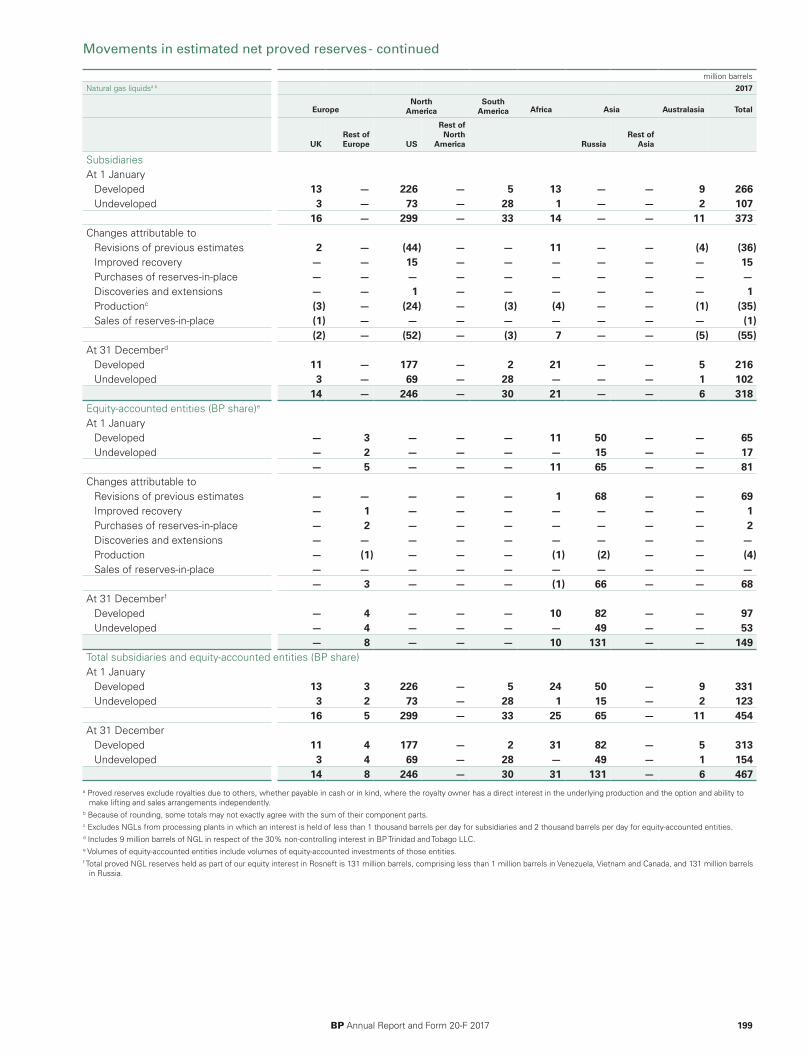
Movements in estimated net proved reserves - continued
million barrelsNatural gas liquidsa b 2017
EuropeNorth
AmericaSouth
America Africa Asia Australasia Total
UKRest ofEurope US
Rest ofNorth
America RussiaRest of
Asia
SubsidiariesAt 1 January
Developed 13 — 226 — 5 13 — — 9 266Undeveloped 3 — 73 — 28 1 — — 2 107
16 — 299 — 33 14 — — 11 373Changes attributable to
Revisions of previous estimates 2 — (44) — — 11 — — (4) (36)Improved recovery — — 15 — — — — — — 15Purchases of reserves-in-place — — — — — — — — — —Discoveries and extensions — — 1 — — — — — — 1Productionc (3) — (24) — (3) (4) — — (1) (35)Sales of reserves-in-place (1) — — — — — — — — (1)
(2) — (52) — (3) 7 — — (5) (55)At 31 Decemberd
Developed 11 — 177 — 2 21 — — 5 216Undeveloped 3 — 69 — 28 — — — 1 102
14 — 246 — 30 21 — — 6 318Equity-accounted entities (BP share)e
At 1 JanuaryDeveloped — 3 — — — 11 50 — — 65Undeveloped — 2 — — — — 15 — — 17
— 5 — — — 11 65 — — 81Changes attributable to
Revisions of previous estimates — — — — — 1 68 — — 69Improved recovery — 1 — — — — — — — 1Purchases of reserves-in-place — 2 — — — — — — — 2Discoveries and extensions — — — — — — — — — —Production — (1) — — — (1) (2) — — (4)Sales of reserves-in-place — — — — — — — — — —
— 3 — — — (1) 66 — — 68At 31 Decemberf
Developed — 4 — — — 10 82 — — 97Undeveloped — 4 — — — — 49 — — 53
— 8 — — — 10 131 — — 149Total subsidiaries and equity-accounted entities (BP share)At 1 January
Developed 13 3 226 — 5 24 50 — 9 331Undeveloped 3 2 73 — 28 1 15 — 2 123
16 5 299 — 33 25 65 — 11 454At 31 December
Developed 11 4 177 — 2 31 82 — 5 313Undeveloped 3 4 69 — 28 — 49 — 1 154
14 8 246 — 30 31 131 — 6 467a Proved reserves exclude royalties due to others, whether payable in cash or in kind, where the royalty owner has a direct interest in the underlying production and the option and ability to
make lifting and sales arrangements independently.b Because of rounding, some totals may not exactly agree with the sum of their component parts.c Excludes NGLs from processing plants in which an interest is held of less than 1 thousand barrels per day for subsidiaries and 2 thousand barrels per day for equity-accounted entities.d Includes 9 million barrels of NGL in respect of the 30% non-controlling interest in BP Trinidad and Tobago LLC.e Volumes of equity-accounted entities include volumes of equity-accounted investments of those entities.f Total proved NGL reserves held as part of our equity interest in Rosneft is 131 million barrels, comprising less than 1 million barrels in Venezuela, Vietnam and Canada, and 131 million barrels
in Russia.
BP Annual Report and Form 20-F 2017 199
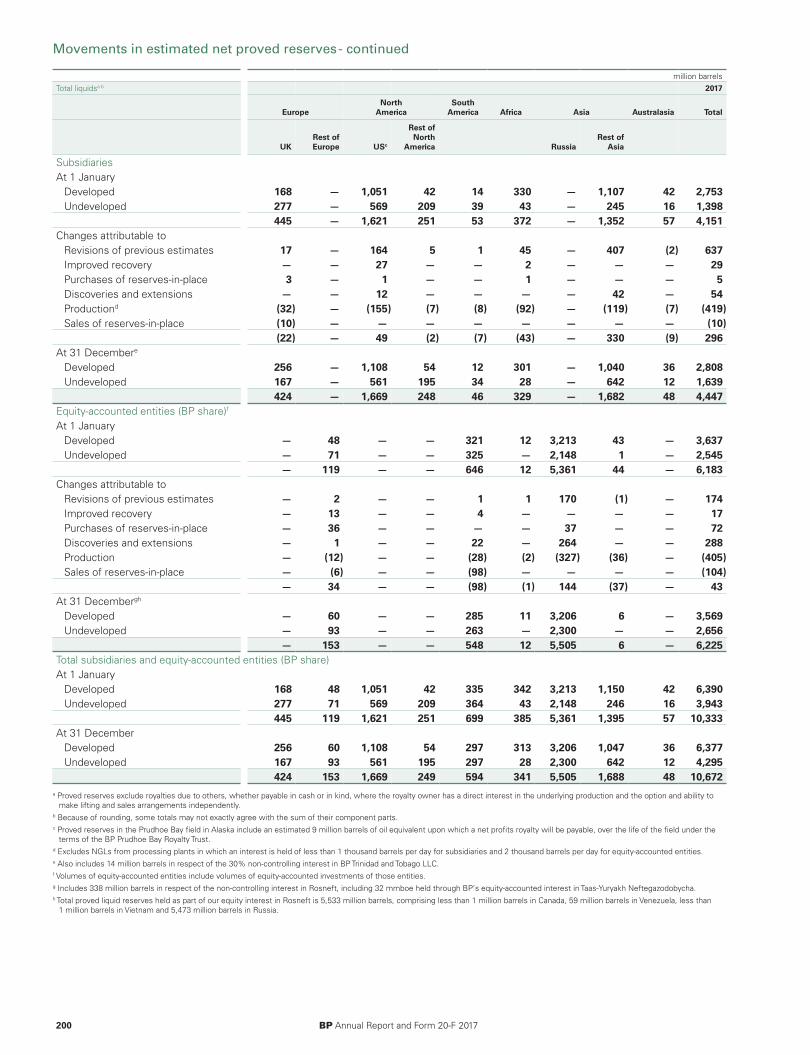
Movements in estimated net proved reserves - continued
million barrelsTotal liquidsa b 2017
EuropeNorth
AmericaSouth
America Africa Asia Australasia Total
UKRest ofEurope USc
Rest ofNorth
America RussiaRest of
Asia
SubsidiariesAt 1 January
Developed 168 — 1,051 42 14 330 — 1,107 42 2,753Undeveloped 277 — 569 209 39 43 — 245 16 1,398
445 — 1,621 251 53 372 — 1,352 57 4,151Changes attributable to
Revisions of previous estimates 17 — 164 5 1 45 — 407 (2) 637Improved recovery — — 27 — — 2 — — — 29Purchases of reserves-in-place 3 — 1 — — 1 — — — 5Discoveries and extensions — — 12 — — — — 42 — 54Productiond (32) — (155) (7) (8) (92) — (119) (7) (419)Sales of reserves-in-place (10) — — — — — — — — (10)
(22) — 49 (2) (7) (43) — 330 (9) 296At 31 Decembere
Developed 256 — 1,108 54 12 301 — 1,040 36 2,808Undeveloped 167 — 561 195 34 28 — 642 12 1,639
424 — 1,669 248 46 329 — 1,682 48 4,447Equity-accounted entities (BP share)f
At 1 JanuaryDeveloped — 48 — — 321 12 3,213 43 — 3,637Undeveloped — 71 — — 325 — 2,148 1 — 2,545
— 119 — — 646 12 5,361 44 — 6,183Changes attributable to
Revisions of previous estimates — 2 — — 1 1 170 (1) — 174Improved recovery — 13 — — 4 — — — — 17Purchases of reserves-in-place — 36 — — — — 37 — — 72Discoveries and extensions — 1 — — 22 — 264 — — 288Production — (12) — — (28) (2) (327) (36) — (405)Sales of reserves-in-place — (6) — — (98) — — — — (104)
— 34 — — (98) (1) 144 (37) — 43At 31 Decembergh
Developed — 60 — — 285 11 3,206 6 — 3,569Undeveloped — 93 — — 263 — 2,300 — — 2,656
— 153 — — 548 12 5,505 6 — 6,225Total subsidiaries and equity-accounted entities (BP share)At 1 January
Developed 168 48 1,051 42 335 342 3,213 1,150 42 6,390Undeveloped 277 71 569 209 364 43 2,148 246 16 3,943
445 119 1,621 251 699 385 5,361 1,395 57 10,333At 31 December
Developed 256 60 1,108 54 297 313 3,206 1,047 36 6,377Undeveloped 167 93 561 195 297 28 2,300 642 12 4,295
424 153 1,669 249 594 341 5,505 1,688 48 10,672a Proved reserves exclude royalties due to others, whether payable in cash or in kind, where the royalty owner has a direct interest in the underlying production and the option and ability to
make lifting and sales arrangements independently.b Because of rounding, some totals may not exactly agree with the sum of their component parts.c Proved reserves in the Prudhoe Bay field in Alaska include an estimated 9 million barrels of oil equivalent upon which a net profits royalty will be payable, over the life of the field under the
terms of the BP Prudhoe Bay Royalty Trust.d Excludes NGLs from processing plants in which an interest is held of less than 1 thousand barrels per day for subsidiaries and 2 thousand barrels per day for equity-accounted entities.e Also includes 14 million barrels in respect of the 30% non-controlling interest in BP Trinidad and Tobago LLC.f Volumes of equity-accounted entities include volumes of equity-accounted investments of those entities.g Includes 338 million barrels in respect of the non-controlling interest in Rosneft, including 32 mmboe held through BP’s equity-accounted interest in Taas-Yuryakh Neftegazodobycha.h Total proved liquid reserves held as part of our equity interest in Rosneft is 5,533 million barrels, comprising less than 1 million barrels in Canada, 59 million barrels in Venezuela, less than
1 million barrels in Vietnam and 5,473 million barrels in Russia.
200 BP Annual Report and Form 20-F 2017
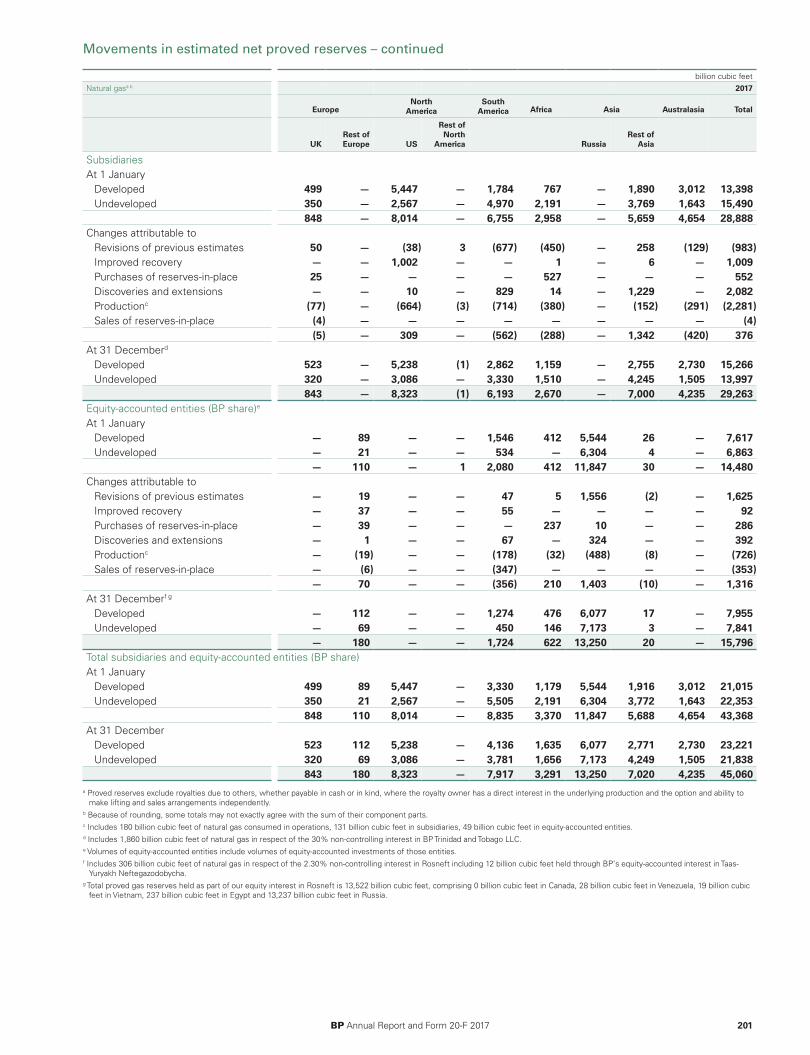
Movements in estimated net proved reserves – continued
billion cubic feetNatural gasa b 2017
EuropeNorth
AmericaSouth
America Africa Asia Australasia Total
UKRest ofEurope US
Rest ofNorth
America RussiaRest of
Asia
SubsidiariesAt 1 January
Developed 499 — 5,447 — 1,784 767 — 1,890 3,012 13,398Undeveloped 350 — 2,567 — 4,970 2,191 — 3,769 1,643 15,490
848 — 8,014 — 6,755 2,958 — 5,659 4,654 28,888Changes attributable to
Revisions of previous estimates 50 — (38) 3 (677) (450) — 258 (129) (983)Improved recovery — — 1,002 — — 1 — 6 — 1,009Purchases of reserves-in-place 25 — — — — 527 — — — 552Discoveries and extensions — — 10 — 829 14 — 1,229 — 2,082Productionc (77) — (664) (3) (714) (380) — (152) (291) (2,281)Sales of reserves-in-place (4) — — — — — — — — (4)
(5) — 309 — (562) (288) — 1,342 (420) 376At 31 Decemberd
Developed 523 — 5,238 (1) 2,862 1,159 — 2,755 2,730 15,266Undeveloped 320 — 3,086 — 3,330 1,510 — 4,245 1,505 13,997
843 — 8,323 (1) 6,193 2,670 — 7,000 4,235 29,263Equity-accounted entities (BP share)e
At 1 JanuaryDeveloped — 89 — — 1,546 412 5,544 26 — 7,617Undeveloped — 21 — — 534 — 6,304 4 — 6,863
— 110 — 1 2,080 412 11,847 30 — 14,480Changes attributable to
Revisions of previous estimates — 19 — — 47 5 1,556 (2) — 1,625Improved recovery — 37 — — 55 — — — — 92Purchases of reserves-in-place — 39 — — — 237 10 — — 286Discoveries and extensions — 1 — — 67 — 324 — — 392Productionc — (19) — — (178) (32) (488) (8) — (726)Sales of reserves-in-place — (6) — — (347) — — — — (353)
— 70 — — (356) 210 1,403 (10) — 1,316At 31 Decemberf g
Developed — 112 — — 1,274 476 6,077 17 — 7,955Undeveloped — 69 — — 450 146 7,173 3 — 7,841
— 180 — — 1,724 622 13,250 20 — 15,796Total subsidiaries and equity-accounted entities (BP share)At 1 January
Developed 499 89 5,447 — 3,330 1,179 5,544 1,916 3,012 21,015Undeveloped 350 21 2,567 — 5,505 2,191 6,304 3,772 1,643 22,353
848 110 8,014 — 8,835 3,370 11,847 5,688 4,654 43,368At 31 December
Developed 523 112 5,238 — 4,136 1,635 6,077 2,771 2,730 23,221Undeveloped 320 69 3,086 — 3,781 1,656 7,173 4,249 1,505 21,838
843 180 8,323 — 7,917 3,291 13,250 7,020 4,235 45,060a Proved reserves exclude royalties due to others, whether payable in cash or in kind, where the royalty owner has a direct interest in the underlying production and the option and ability to
make lifting and sales arrangements independently.b Because of rounding, some totals may not exactly agree with the sum of their component parts.c Includes 180 billion cubic feet of natural gas consumed in operations, 131 billion cubic feet in subsidiaries, 49 billion cubic feet in equity-accounted entities.d Includes 1,860 billion cubic feet of natural gas in respect of the 30% non-controlling interest in BP Trinidad and Tobago LLC.e Volumes of equity-accounted entities include volumes of equity-accounted investments of those entities.f Includes 306 billion cubic feet of natural gas in respect of the 2.30% non-controlling interest in Rosneft including 12 billion cubic feet held through BP’s equity-accounted interest in Taas-
Yuryakh Neftegazodobycha.g Total proved gas reserves held as part of our equity interest in Rosneft is 13,522 billion cubic feet, comprising 0 billion cubic feet in Canada, 28 billion cubic feet in Venezuela, 19 billion cubic
feet in Vietnam, 237 billion cubic feet in Egypt and 13,237 billion cubic feet in Russia.
BP Annual Report and Form 20-F 2017 201
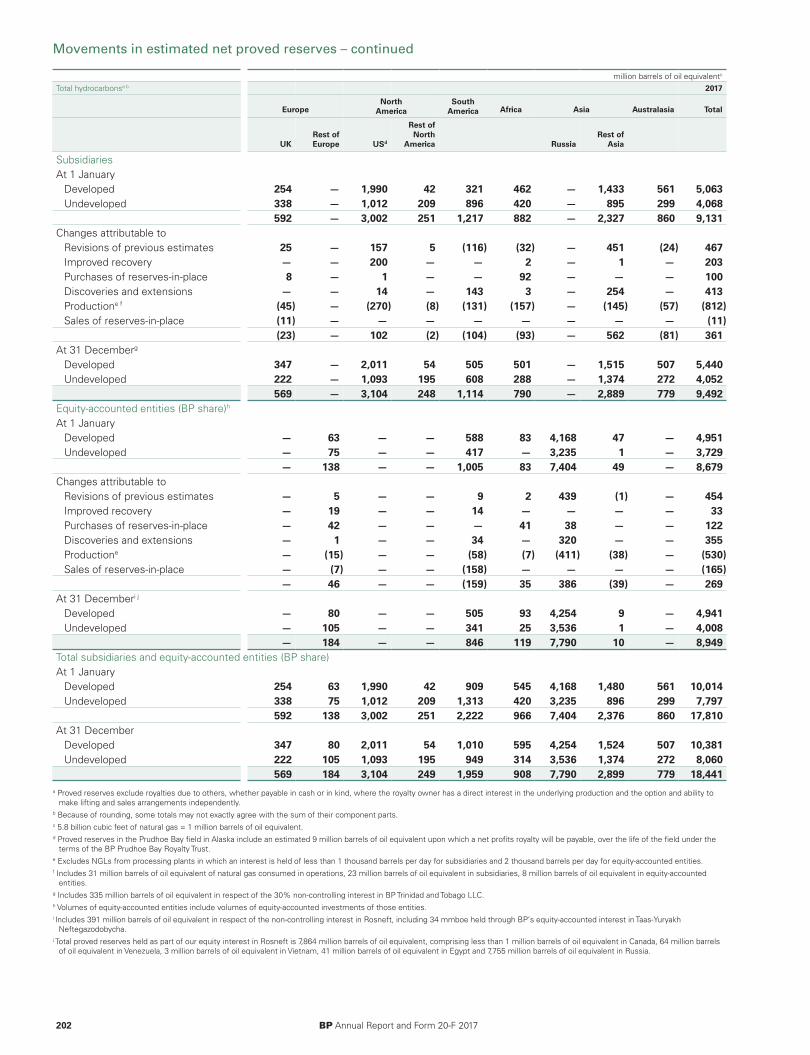
Movements in estimated net proved reserves – continued
million barrels of oil equivalentc
Total hydrocarbonsa b 2017
EuropeNorth
AmericaSouth
America Africa Asia Australasia Total
UKRest ofEurope USd
Rest ofNorth
America RussiaRest of
Asia
SubsidiariesAt 1 January
Developed 254 — 1,990 42 321 462 — 1,433 561 5,063Undeveloped 338 — 1,012 209 896 420 — 895 299 4,068
592 — 3,002 251 1,217 882 — 2,327 860 9,131Changes attributable to
Revisions of previous estimates 25 — 157 5 (116) (32) — 451 (24) 467Improved recovery — — 200 — — 2 — 1 — 203Purchases of reserves-in-place 8 — 1 — — 92 — — — 100Discoveries and extensions — — 14 — 143 3 — 254 — 413Productione f (45) — (270) (8) (131) (157) — (145) (57) (812)Sales of reserves-in-place (11) — — — — — — — — (11)
(23) — 102 (2) (104) (93) — 562 (81) 361At 31 Decemberg
Developed 347 — 2,011 54 505 501 — 1,515 507 5,440Undeveloped 222 — 1,093 195 608 288 — 1,374 272 4,052
569 — 3,104 248 1,114 790 — 2,889 779 9,492Equity-accounted entities (BP share)h
At 1 JanuaryDeveloped — 63 — — 588 83 4,168 47 — 4,951Undeveloped — 75 — — 417 — 3,235 1 — 3,729
— 138 — — 1,005 83 7,404 49 — 8,679Changes attributable to
Revisions of previous estimates — 5 — — 9 2 439 (1) — 454Improved recovery — 19 — — 14 — — — — 33Purchases of reserves-in-place — 42 — — — 41 38 — — 122Discoveries and extensions — 1 — — 34 — 320 — — 355Productione — (15) — — (58) (7) (411) (38) — (530)Sales of reserves-in-place — (7) — — (158) — — — — (165)
— 46 — — (159) 35 386 (39) — 269At 31 Decemberi j
Developed — 80 — — 505 93 4,254 9 — 4,941Undeveloped — 105 — — 341 25 3,536 1 — 4,008
— 184 — — 846 119 7,790 10 — 8,949Total subsidiaries and equity-accounted entities (BP share)At 1 January
Developed 254 63 1,990 42 909 545 4,168 1,480 561 10,014Undeveloped 338 75 1,012 209 1,313 420 3,235 896 299 7,797
592 138 3,002 251 2,222 966 7,404 2,376 860 17,810At 31 December
Developed 347 80 2,011 54 1,010 595 4,254 1,524 507 10,381Undeveloped 222 105 1,093 195 949 314 3,536 1,374 272 8,060
569 184 3,104 249 1,959 908 7,790 2,899 779 18,441a Proved reserves exclude royalties due to others, whether payable in cash or in kind, where the royalty owner has a direct interest in the underlying production and the option and ability to
make lifting and sales arrangements independently.b Because of rounding, some totals may not exactly agree with the sum of their component parts.c 5.8 billion cubic feet of natural gas = 1 million barrels of oil equivalent.d Proved reserves in the Prudhoe Bay field in Alaska include an estimated 9 million barrels of oil equivalent upon which a net profits royalty will be payable, over the life of the field under the
terms of the BP Prudhoe Bay Royalty Trust.e Excludes NGLs from processing plants in which an interest is held of less than 1 thousand barrels per day for subsidiaries and 2 thousand barrels per day for equity-accounted entities.f Includes 31 million barrels of oil equivalent of natural gas consumed in operations, 23 million barrels of oil equivalent in subsidiaries, 8 million barrels of oil equivalent in equity-accounted
entities.g Includes 335 million barrels of oil equivalent in respect of the 30% non-controlling interest in BP Trinidad and Tobago LLC.h Volumes of equity-accounted entities include volumes of equity-accounted investments of those entities.i Includes 391 million barrels of oil equivalent in respect of the non-controlling interest in Rosneft, including 34 mmboe held through BP’s equity-accounted interest in Taas-Yuryakh
Neftegazodobycha.j Total proved reserves held as part of our equity interest in Rosneft is 7,864 million barrels of oil equivalent, comprising less than 1 million barrels of oil equivalent in Canada, 64 million barrels
of oil equivalent in Venezuela, 3 million barrels of oil equivalent in Vietnam, 41 million barrels of oil equivalent in Egypt and 7,755 million barrels of oil equivalent in Russia.
202 BP Annual Report and Form 20-F 2017

Movements in estimated net proved reserves – continued
million barrelsCrude oila b 2016
Europe North
America South
America Africa Asia Australasia Total
UKRest ofEurope USc
Rest ofNorth
America RussiaRest of
Asiad
SubsidiariesAt 1 January
Developed 141 86 890 46 8 340 — 598 35 2,146Undeveloped 298 19 577 205 18 89 — 192 16 1,414
440 106 1,467 252 26 429 — 790 51 3,560Changes attributable to
Revisions of previous estimatesd 13 — (30) — (2) 22 — 543 2 548Improved recovery — — 1 — — 3 — 70 — 74Purchases of reserves-in-place 3 — 3 — — — — 25 1 32Discoveries and extensions 2 — — 4 — — — — — 6Productione (29) (9) (119) (5) (4) (96) — (75) (6) (341)Sales of reserves-in-place — (97) (1) — — — — (1) (2) (102)
(11) (106) (145) (1) (6) (71) — 562 (5) 218At 31 Decemberf
Developed 155 — 826 42 9 317 — 1,107 32 2,487Undeveloped 274 — 497 209 11 42 — 245 14 1,291
429 — 1,322 251 20 358 — 1,352 46 3,778Equity-accounted entities (BP share)g
At 1 JanuaryDeveloped — — — — 311 2 2,844 68 — 3,225Undeveloped — — — — 311 — 1,981 — — 2,292
— — — — 622 2 4,825 68 — 5,517Changes attributable to
Revisions of previous estimates — — — — (2) — 33 13 — 45Improved recovery — — — — 1 — 4 — — 5Purchases of reserves-in-place — 116 — — 36 — 456 — — 609Discoveries and extensions — — — — 16 — 285 — — 301Production — (3) — — (28) — (305) (37) — (373)Sales of reserves-in-place — — — — — — (2) (1) — (2)
— 114 — — 24 — 471 (25) — 584At 31 Decemberh
Developed — 45 — — 321 1 3,162 43 — 3,573Undeveloped — 69 — — 325 — 2,134 1 — 2,529
— 114 — — 646 1 5,296 44 — 6,101Total subsidiaries and equity-accounted entities (BP share)At 1 January
Developed 141 86 890 47 319 342 2,844 666 35 5,371Undeveloped 298 19 577 205 329 89 1,981 192 16 3,707
440 106 1,467 252 648 431 4,825 858 51 9,078At 31 December
Developed 155 45 826 42 330 318 3,162 1,150 32 6,060Undeveloped 274 69 497 209 336 42 2,134 246 14 3,819
429 114 1,322 251 666 360 5,296 1,395 46 9,879a Crude oil includes condensate and bitumen. Proved reserves exclude royalties due to others, whether payable in cash or in kind, where the royalty owner has a direct interest in the
underlying production and the option and ability to make lifting and sales arrangements independently.b Because of rounding, some totals may not exactly agree with the sum of their component parts.c Proved reserves in the Prudhoe Bay field in Alaska include an estimated 9 million barrels upon which a net profits royalty will be payable over the life of the field under the terms of the BP
Prudhoe Bay Royalty Trust.d Rest of Asia includes additions from Abu Dhabi ADCO concession.e Includes 6 million barrels of crude oil in respect of the 30% non-controlling interest in BP Trinidad and Tobago LLC.f Volumes of equity-accounted entities include volumes of equity-accounted investments of those entities.g Includes 347 million barrels of crude oil in respect of the 6.58% non-controlling interest in Rosneft, including 28 mmbbl held through BP’s equity-accounted interest in Taas-Yuryakh
Neftegazodobycha.h Total proved crude oil reserves held as part of our equity interest in Rosneft is 5,330 million barrels, comprising less than 1 million barrels in Vietnam and Canada, 62 million barrels in
Venezuela and 5,268 million barrels in Russia.
BP Annual Report and Form 20-F 2017 203
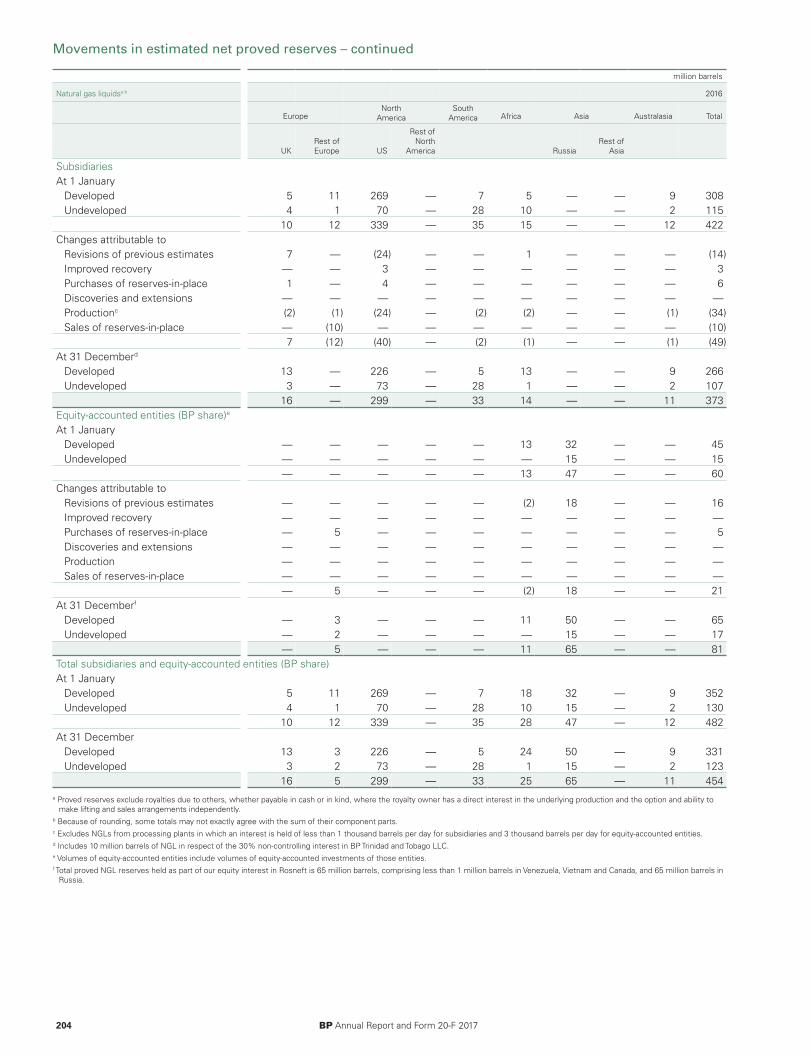
Movements in estimated net proved reserves – continued
million barrels
Natural gas liquidsa b 2016
EuropeNorth
AmericaSouth
America Africa Asia Australasia Total
UKRest ofEurope US
Rest ofNorth
America RussiaRest of
Asia
SubsidiariesAt 1 January
Developed 5 11 269 — 7 5 — — 9 308Undeveloped 4 1 70 — 28 10 — — 2 115
10 12 339 — 35 15 — — 12 422Changes attributable to
Revisions of previous estimates 7 — (24) — — 1 — — — (14)Improved recovery — — 3 — — — — — — 3Purchases of reserves-in-place 1 — 4 — — — — — — 6Discoveries and extensions — — — — — — — — — —Productionc (2) (1) (24) — (2) (2) — — (1) (34)Sales of reserves-in-place — (10) — — — — — — — (10)
7 (12) (40) — (2) (1) — — (1) (49)At 31 Decemberd
Developed 13 — 226 — 5 13 — — 9 266Undeveloped 3 — 73 — 28 1 — — 2 107
16 — 299 — 33 14 — — 11 373Equity-accounted entities (BP share)e
At 1 JanuaryDeveloped — — — — — 13 32 — — 45Undeveloped — — — — — — 15 — — 15
— — — — — 13 47 — — 60Changes attributable to
Revisions of previous estimates — — — — — (2) 18 — — 16Improved recovery — — — — — — — — — —Purchases of reserves-in-place — 5 — — — — — — — 5Discoveries and extensions — — — — — — — — — —Production — — — — — — — — — —Sales of reserves-in-place — — — — — — — — — —
— 5 — — — (2) 18 — — 21At 31 Decemberf
Developed — 3 — — — 11 50 — — 65Undeveloped — 2 — — — — 15 — — 17
— 5 — — — 11 65 — — 81Total subsidiaries and equity-accounted entities (BP share)At 1 January
Developed 5 11 269 — 7 18 32 — 9 352Undeveloped 4 1 70 — 28 10 15 — 2 130
10 12 339 — 35 28 47 — 12 482At 31 December
Developed 13 3 226 — 5 24 50 — 9 331Undeveloped 3 2 73 — 28 1 15 — 2 123
16 5 299 — 33 25 65 — 11 454a Proved reserves exclude royalties due to others, whether payable in cash or in kind, where the royalty owner has a direct interest in the underlying production and the option and ability to
make lifting and sales arrangements independently.b Because of rounding, some totals may not exactly agree with the sum of their component parts.c Excludes NGLs from processing plants in which an interest is held of less than 1 thousand barrels per day for subsidiaries and 3 thousand barrels per day for equity-accounted entities.d Includes 10 million barrels of NGL in respect of the 30% non-controlling interest in BP Trinidad and Tobago LLC.e Volumes of equity-accounted entities include volumes of equity-accounted investments of those entities.f Total proved NGL reserves held as part of our equity interest in Rosneft is 65 million barrels, comprising less than 1 million barrels in Venezuela, Vietnam and Canada, and 65 million barrels in
Russia.
204 BP Annual Report and Form 20-F 2017
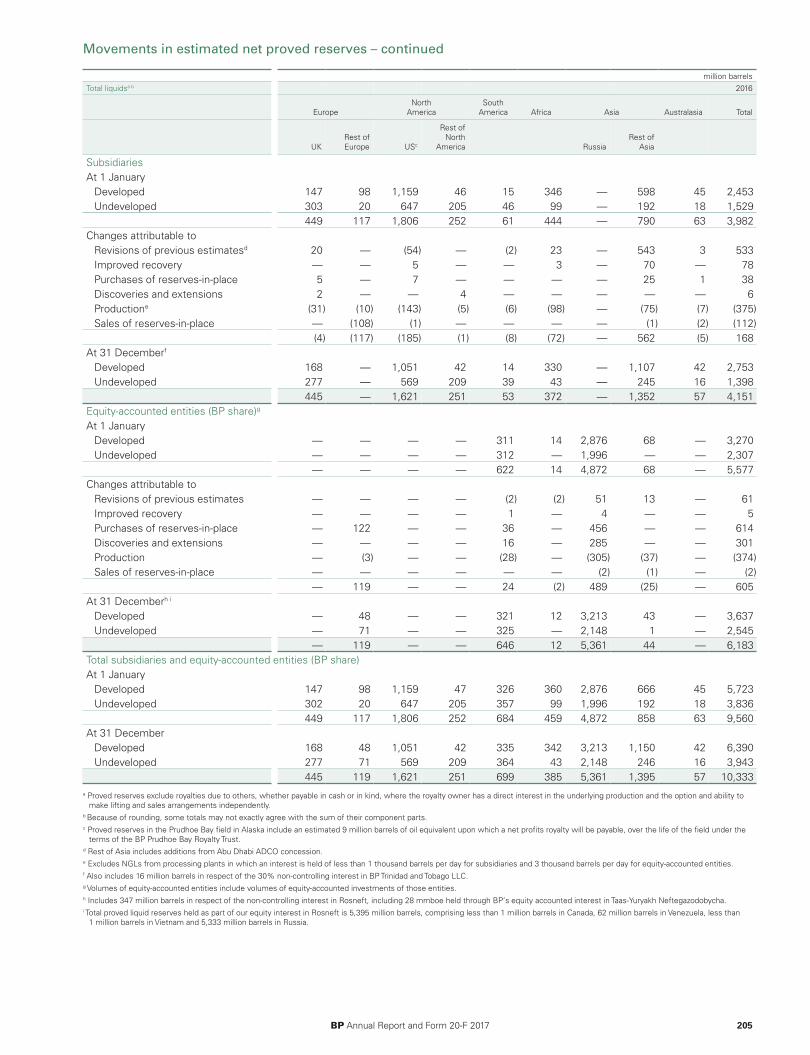
Movements in estimated net proved reserves – continued
million barrelsTotal liquidsa b 2016
EuropeNorth
AmericaSouth
America Africa Asia Australasia Total
UKRest ofEurope USc
Rest ofNorth
America RussiaRest of
Asia
SubsidiariesAt 1 January
Developed 147 98 1,159 46 15 346 — 598 45 2,453Undeveloped 303 20 647 205 46 99 — 192 18 1,529
449 117 1,806 252 61 444 — 790 63 3,982Changes attributable to
Revisions of previous estimatesd 20 — (54) — (2) 23 — 543 3 533Improved recovery — — 5 — — 3 — 70 — 78Purchases of reserves-in-place 5 — 7 — — — — 25 1 38Discoveries and extensions 2 — — 4 — — — — — 6Productione (31) (10) (143) (5) (6) (98) — (75) (7) (375)Sales of reserves-in-place — (108) (1) — — — — (1) (2) (112)
(4) (117) (185) (1) (8) (72) — 562 (5) 168At 31 Decemberf
Developed 168 — 1,051 42 14 330 — 1,107 42 2,753Undeveloped 277 — 569 209 39 43 — 245 16 1,398
445 — 1,621 251 53 372 — 1,352 57 4,151Equity-accounted entities (BP share)g
At 1 JanuaryDeveloped — — — — 311 14 2,876 68 — 3,270Undeveloped — — — — 312 — 1,996 — — 2,307
— — — — 622 14 4,872 68 — 5,577Changes attributable to
Revisions of previous estimates — — — — (2) (2) 51 13 — 61Improved recovery — — — — 1 — 4 — — 5Purchases of reserves-in-place — 122 — — 36 — 456 — — 614Discoveries and extensions — — — — 16 — 285 — — 301Production — (3) — — (28) — (305) (37) — (374)Sales of reserves-in-place — — — — — — (2) (1) — (2)
— 119 — — 24 (2) 489 (25) — 605At 31 Decemberh i
Developed — 48 — — 321 12 3,213 43 — 3,637Undeveloped — 71 — — 325 — 2,148 1 — 2,545
— 119 — — 646 12 5,361 44 — 6,183Total subsidiaries and equity-accounted entities (BP share)At 1 January
Developed 147 98 1,159 47 326 360 2,876 666 45 5,723Undeveloped 302 20 647 205 357 99 1,996 192 18 3,836
449 117 1,806 252 684 459 4,872 858 63 9,560At 31 December
Developed 168 48 1,051 42 335 342 3,213 1,150 42 6,390Undeveloped 277 71 569 209 364 43 2,148 246 16 3,943
445 119 1,621 251 699 385 5,361 1,395 57 10,333a Proved reserves exclude royalties due to others, whether payable in cash or in kind, where the royalty owner has a direct interest in the underlying production and the option and ability to
make lifting and sales arrangements independently.b Because of rounding, some totals may not exactly agree with the sum of their component parts.c Proved reserves in the Prudhoe Bay field in Alaska include an estimated 9 million barrels of oil equivalent upon which a net profits royalty will be payable, over the life of the field under the
terms of the BP Prudhoe Bay Royalty Trust.d Rest of Asia includes additions from Abu Dhabi ADCO concession.e Excludes NGLs from processing plants in which an interest is held of less than 1 thousand barrels per day for subsidiaries and 3 thousand barrels per day for equity-accounted entities.f Also includes 16 million barrels in respect of the 30% non-controlling interest in BP Trinidad and Tobago LLC.g Volumes of equity-accounted entities include volumes of equity-accounted investments of those entities.h Includes 347 million barrels in respect of the non-controlling interest in Rosneft, including 28 mmboe held through BP’s equity accounted interest in Taas-Yuryakh Neftegazodobycha.i Total proved liquid reserves held as part of our equity interest in Rosneft is 5,395 million barrels, comprising less than 1 million barrels in Canada, 62 million barrels in Venezuela, less than
1 million barrels in Vietnam and 5,333 million barrels in Russia.
BP Annual Report and Form 20-F 2017 205
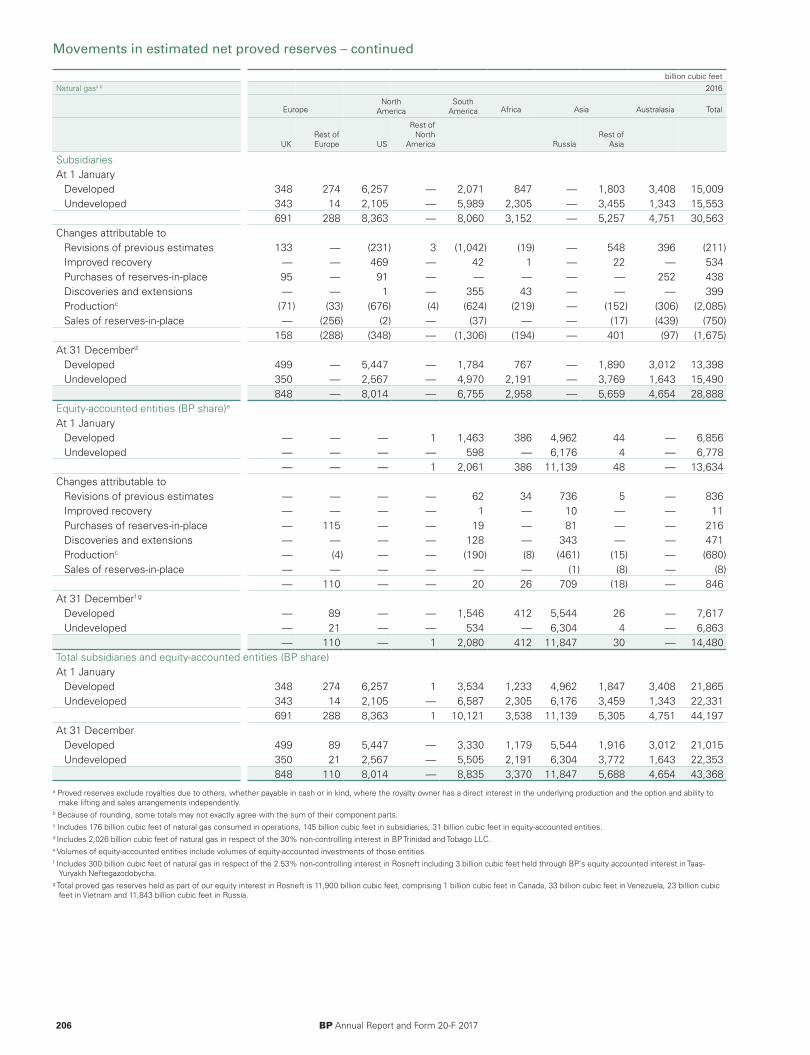
Movements in estimated net proved reserves – continued
billion cubic feetNatural gasa b 2016
EuropeNorth
AmericaSouth
America Africa Asia Australasia Total
UKRest ofEurope US
Rest ofNorth
America RussiaRest of
Asia
SubsidiariesAt 1 January
Developed 348 274 6,257 — 2,071 847 — 1,803 3,408 15,009Undeveloped 343 14 2,105 — 5,989 2,305 — 3,455 1,343 15,553
691 288 8,363 — 8,060 3,152 — 5,257 4,751 30,563Changes attributable to
Revisions of previous estimates 133 — (231) 3 (1,042) (19) — 548 396 (211)Improved recovery — — 469 — 42 1 — 22 — 534Purchases of reserves-in-place 95 — 91 — — — — — 252 438Discoveries and extensions — — 1 — 355 43 — — — 399Productionc (71) (33) (676) (4) (624) (219) — (152) (306) (2,085)Sales of reserves-in-place — (256) (2) — (37) — — (17) (439) (750)
158 (288) (348) — (1,306) (194) — 401 (97) (1,675)At 31 Decemberd
Developed 499 — 5,447 — 1,784 767 — 1,890 3,012 13,398Undeveloped 350 — 2,567 — 4,970 2,191 — 3,769 1,643 15,490
848 — 8,014 — 6,755 2,958 — 5,659 4,654 28,888Equity-accounted entities (BP share)e
At 1 JanuaryDeveloped — — — 1 1,463 386 4,962 44 — 6,856Undeveloped — — — — 598 — 6,176 4 — 6,778
— — — 1 2,061 386 11,139 48 — 13,634Changes attributable to
Revisions of previous estimates — — — — 62 34 736 5 — 836Improved recovery — — — — 1 — 10 — — 11Purchases of reserves-in-place — 115 — — 19 — 81 — — 216Discoveries and extensions — — — — 128 — 343 — — 471Productionc — (4) — — (190) (8) (461) (15) — (680)Sales of reserves-in-place — — — — — — (1) (8) — (8)
— 110 — — 20 26 709 (18) — 846At 31 Decemberf g
Developed — 89 — — 1,546 412 5,544 26 — 7,617Undeveloped — 21 — — 534 — 6,304 4 — 6,863
— 110 — 1 2,080 412 11,847 30 — 14,480Total subsidiaries and equity-accounted entities (BP share)At 1 January
Developed 348 274 6,257 1 3,534 1,233 4,962 1,847 3,408 21,865Undeveloped 343 14 2,105 — 6,587 2,305 6,176 3,459 1,343 22,331
691 288 8,363 1 10,121 3,538 11,139 5,305 4,751 44,197At 31 December
Developed 499 89 5,447 — 3,330 1,179 5,544 1,916 3,012 21,015Undeveloped 350 21 2,567 — 5,505 2,191 6,304 3,772 1,643 22,353
848 110 8,014 — 8,835 3,370 11,847 5,688 4,654 43,368a Proved reserves exclude royalties due to others, whether payable in cash or in kind, where the royalty owner has a direct interest in the underlying production and the option and ability to
make lifting and sales arrangements independently.b Because of rounding, some totals may not exactly agree with the sum of their component parts.c Includes 176 billion cubic feet of natural gas consumed in operations, 145 billion cubic feet in subsidiaries, 31 billion cubic feet in equity-accounted entities.d Includes 2,026 billion cubic feet of natural gas in respect of the 30% non-controlling interest in BP Trinidad and Tobago LLC.e Volumes of equity-accounted entities include volumes of equity-accounted investments of those entities.f Includes 300 billion cubic feet of natural gas in respect of the 2.53% non-controlling interest in Rosneft including 3 billion cubic feet held through BP’s equity accounted interest in Taas-
Yuryakh Neftegazodobycha.g Total proved gas reserves held as part of our equity interest in Rosneft is 11,900 billion cubic feet, comprising 1 billion cubic feet in Canada, 33 billion cubic feet in Venezuela, 23 billion cubic
feet in Vietnam and 11,843 billion cubic feet in Russia.
206 BP Annual Report and Form 20-F 2017
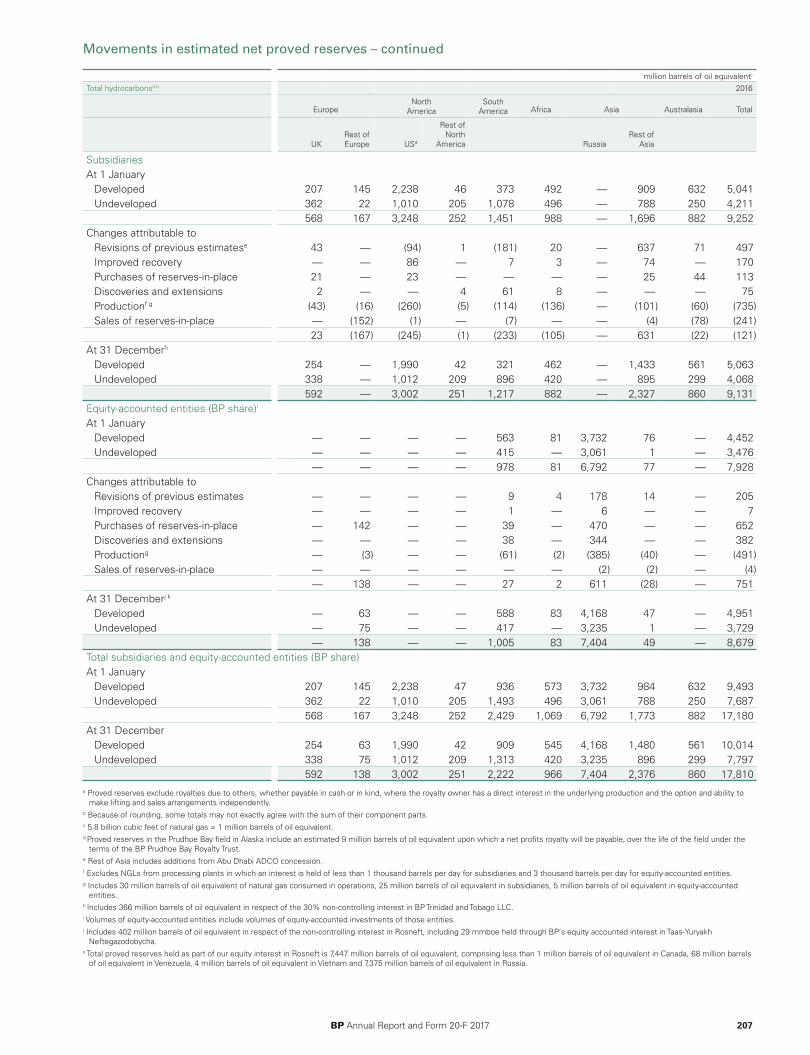
Movements in estimated net proved reserves – continued
million barrels of oil equivalentc
Total hydrocarbonsa b 2016
EuropeNorth
AmericaSouth
America Africa Asia Australasia Total
UKRest ofEurope USd
Rest ofNorth
America RussiaRest of
Asia
SubsidiariesAt 1 January
Developed 207 145 2,238 46 373 492 — 909 632 5,041Undeveloped 362 22 1,010 205 1,078 496 — 788 250 4,211
568 167 3,248 252 1,451 988 — 1,696 882 9,252Changes attributable to
Revisions of previous estimatese 43 — (94) 1 (181) 20 — 637 71 497Improved recovery — — 86 — 7 3 — 74 — 170Purchases of reserves-in-place 21 — 23 — — — — 25 44 113Discoveries and extensions 2 — — 4 61 8 — — — 75Productionf g (43) (16) (260) (5) (114) (136) — (101) (60) (735)Sales of reserves-in-place — (152) (1) — (7) — — (4) (78) (241)
23 (167) (245) (1) (233) (105) — 631 (22) (121)At 31 Decemberh
Developed 254 — 1,990 42 321 462 — 1,433 561 5,063Undeveloped 338 — 1,012 209 896 420 — 895 299 4,068
592 — 3,002 251 1,217 882 — 2,327 860 9,131Equity-accounted entities (BP share)i
At 1 JanuaryDeveloped — — — — 563 81 3,732 76 — 4,452Undeveloped — — — — 415 — 3,061 1 — 3,476
— — — — 978 81 6,792 77 — 7,928Changes attributable to
Revisions of previous estimates — — — — 9 4 178 14 — 205Improved recovery — — — — 1 — 6 — — 7Purchases of reserves-in-place — 142 — — 39 — 470 — — 652Discoveries and extensions — — — — 38 — 344 — — 382Productiong — (3) — — (61) (2) (385) (40) — (491)Sales of reserves-in-place — — — — — — (2) (2) — (4)
— 138 — — 27 2 611 (28) — 751At 31 Decemberj k
Developed — 63 — — 588 83 4,168 47 — 4,951Undeveloped — 75 — — 417 — 3,235 1 — 3,729
— 138 — — 1,005 83 7,404 49 — 8,679Total subsidiaries and equity-accounted entities (BP share)At 1 January
Developed 207 145 2,238 47 936 573 3,732 984 632 9,493Undeveloped 362 22 1,010 205 1,493 496 3,061 788 250 7,687
568 167 3,248 252 2,429 1,069 6,792 1,773 882 17,180At 31 December
Developed 254 63 1,990 42 909 545 4,168 1,480 561 10,014Undeveloped 338 75 1,012 209 1,313 420 3,235 896 299 7,797
592 138 3,002 251 2,222 966 7,404 2,376 860 17,810a Proved reserves exclude royalties due to others, whether payable in cash or in kind, where the royalty owner has a direct interest in the underlying production and the option and ability to
make lifting and sales arrangements independently.b Because of rounding, some totals may not exactly agree with the sum of their component parts.c 5.8 billion cubic feet of natural gas = 1 million barrels of oil equivalent.d Proved reserves in the Prudhoe Bay field in Alaska include an estimated 9 million barrels of oil equivalent upon which a net profits royalty will be payable, over the life of the field under the
terms of the BP Prudhoe Bay Royalty Trust.e Rest of Asia includes additions from Abu Dhabi ADCO concession.f Excludes NGLs from processing plants in which an interest is held of less than 1 thousand barrels per day for subsidiaries and 3 thousand barrels per day for equity-accounted entities.g Includes 30 million barrels of oil equivalent of natural gas consumed in operations, 25 million barrels of oil equivalent in subsidiaries, 5 million barrels of oil equivalent in equity-accounted
entities.h Includes 366 million barrels of oil equivalent in respect of the 30% non-controlling interest in BP Trinidad and Tobago LLC.i Volumes of equity-accounted entities include volumes of equity-accounted investments of those entities.j Includes 402 million barrels of oil equivalent in respect of the non-controlling interest in Rosneft, including 29 mmboe held through BP’s equity accounted interest in Taas-Yuryakh
Neftegazodobycha.k Total proved reserves held as part of our equity interest in Rosneft is 7,447 million barrels of oil equivalent, comprising less than 1 million barrels of oil equivalent in Canada, 68 million barrels
of oil equivalent in Venezuela, 4 million barrels of oil equivalent in Vietnam and 7,375 million barrels of oil equivalent in Russia.
BP Annual Report and Form 20-F 2017 207
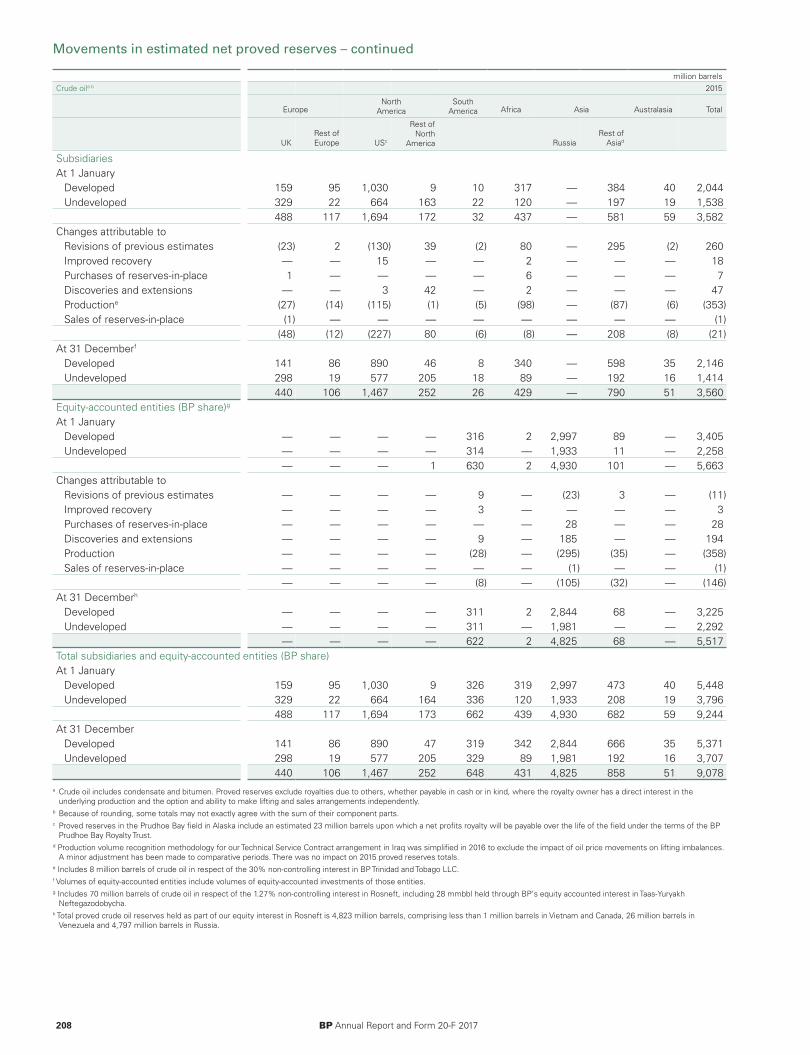
Movements in estimated net proved reserves – continued
million barrelsCrude oila b 2015
EuropeNorth
AmericaSouth
America Africa Asia Australasia Total
UKRest ofEurope USc
Rest ofNorth
America RussiaRest of
Asiad
SubsidiariesAt 1 January
Developed 159 95 1,030 9 10 317 — 384 40 2,044Undeveloped 329 22 664 163 22 120 — 197 19 1,538
488 117 1,694 172 32 437 — 581 59 3,582Changes attributable to
Revisions of previous estimates (23) 2 (130) 39 (2) 80 — 295 (2) 260Improved recovery — — 15 — — 2 — — — 18Purchases of reserves-in-place 1 — — — — 6 — — — 7Discoveries and extensions — — 3 42 — 2 — — — 47Productione (27) (14) (115) (1) (5) (98) — (87) (6) (353)Sales of reserves-in-place (1) — — — — — — — — (1)
(48) (12) (227) 80 (6) (8) — 208 (8) (21)At 31 Decemberf
Developed 141 86 890 46 8 340 — 598 35 2,146Undeveloped 298 19 577 205 18 89 — 192 16 1,414
440 106 1,467 252 26 429 — 790 51 3,560Equity-accounted entities (BP share)g
At 1 JanuaryDeveloped — — — — 316 2 2,997 89 — 3,405Undeveloped — — — — 314 — 1,933 11 — 2,258
— — — 1 630 2 4,930 101 — 5,663Changes attributable to
Revisions of previous estimates — — — — 9 — (23) 3 — (11)Improved recovery — — — — 3 — — — — 3Purchases of reserves-in-place — — — — — — 28 — — 28Discoveries and extensions — — — — 9 — 185 — — 194Production — — — — (28) — (295) (35) — (358)Sales of reserves-in-place — — — — — — (1) — — (1)
— — — — (8) — (105) (32) — (146)At 31 Decemberh
Developed — — — — 311 2 2,844 68 — 3,225Undeveloped — — — — 311 — 1,981 — — 2,292
— — — — 622 2 4,825 68 — 5,517Total subsidiaries and equity-accounted entities (BP share)At 1 January
Developed 159 95 1,030 9 326 319 2,997 473 40 5,448Undeveloped 329 22 664 164 336 120 1,933 208 19 3,796
488 117 1,694 173 662 439 4,930 682 59 9,244At 31 December
Developed 141 86 890 47 319 342 2,844 666 35 5,371Undeveloped 298 19 577 205 329 89 1,981 192 16 3,707
440 106 1,467 252 648 431 4,825 858 51 9,078a Crude oil includes condensate and bitumen. Proved reserves exclude royalties due to others, whether payable in cash or in kind, where the royalty owner has a direct interest in the
underlying production and the option and ability to make lifting and sales arrangements independently.b Because of rounding, some totals may not exactly agree with the sum of their component parts.c Proved reserves in the Prudhoe Bay field in Alaska include an estimated 23 million barrels upon which a net profits royalty will be payable over the life of the field under the terms of the BP
Prudhoe Bay Royalty Trust.d Production volume recognition methodology for our Technical Service Contract arrangement in Iraq was simplified in 2016 to exclude the impact of oil price movements on lifting imbalances.
A minor adjustment has been made to comparative periods. There was no impact on 2015 proved reserves totals.e Includes 8 million barrels of crude oil in respect of the 30% non-controlling interest in BP Trinidad and Tobago LLC.f Volumes of equity-accounted entities include volumes of equity-accounted investments of those entities.g Includes 70 million barrels of crude oil in respect of the 1.27% non-controlling interest in Rosneft, including 28 mmbbl held through BP’s equity accounted interest in Taas-Yuryakh
Neftegazodobycha.h Total proved crude oil reserves held as part of our equity interest in Rosneft is 4,823 million barrels, comprising less than 1 million barrels in Vietnam and Canada, 26 million barrels in
Venezuela and 4,797 million barrels in Russia.
208 BP Annual Report and Form 20-F 2017

Movements in estimated net proved reserves – continued
million barrelsNatural gas liquidsa b 2015
EuropeNorth
AmericaSouth
America Africa Asia Australasia Total
UKRest ofEurope US
Rest ofNorth
America RussiaRest of
Asia
SubsidiariesAt 1 January
Developed 6 13 323 — 11 5 — — 6 364Undeveloped 3 1 104 — 28 7 — — 3 146
9 14 427 — 39 12 — — 10 510Changes attributable to
Revisions of previous estimates 2 — (80) — — 6 — — 3 (69)Improved recovery — — 12 — — — — — — 12Purchases of reserves-in-place — — 3 — — — — — — 4Discoveries and extensions — — — — — — — — — —Productionc (2) (2) (23) — (4) (3) — — (1) (34)Sales of reserves-in-place — — (1) — — — — — — (1)
— (2) (88) — (4) 3 — — 2 (88)At 31 Decemberd
Developed 5 11 269 — 7 5 — — 9 308Undeveloped 4 1 70 — 28 10 — — 2 115
10 12 339 — 35 15 — — 12 422Equity-accounted entities (BP share)e
At 1 JanuaryDeveloped — — — — — 15 30 — — 46Undeveloped — — — — — — 16 — — 16
— — — — — 15 46 — — 62Changes attributable to
Revisions of previous estimates — — — — — (3) 1 — — (2)Improved recovery — — — — — — — — — —Purchases of reserves-in-place — — — — — — — — — —Discoveries and extensions — — — — — — — — — —Production — — — — — — — — — —Sales of reserves-in-place — — — — — — — — — —
— — — — — (3) 1 — — (2)At 31 Decemberf
Developed — — — — — 13 32 — — 45Undeveloped — — — — — — 15 — — 15
— — — — — 13 47 — — 60Total subsidiaries and equity-accounted entities (BP share)At 1 January
Developed 6 13 323 — 11 20 30 — 6 410Undeveloped 3 1 104 — 28 7 16 — 3 163
9 14 427 — 39 27 46 — 10 572At 31 December
Developed 5 11 269 — 7 18 32 — 9 352Undeveloped 4 1 70 — 28 10 15 — 2 130
10 12 339 — 35 28 47 — 12 482a Proved reserves exclude royalties due to others, whether payable in cash or in kind, where the royalty owner has a direct interest in the underlying production and the option and ability to
make lifting and sales arrangements independently.b Because of rounding, some totals may not exactly agree with the sum of their component parts.c Excludes NGLs from processing plants in which an interest is held of less than 1 thousand barrels per day for subsidiaries and 4 thousand barrels per day for equity-accounted entities.d Includes 11 million barrels of NGL in respect of the 30% non-controlling interest in BP Trinidad and Tobago LLC.e Volumes of equity-accounted entities include volumes of equity-accounted investments of those entities.f Total proved NGL reserves held as part of our equity interest in Rosneft is 47 million barrels, comprising less than 1 million barrels in Venezuela, Vietnam and Canada, and 47 million barrels in
Russia.
BP Annual Report and Form 20-F 2017 209
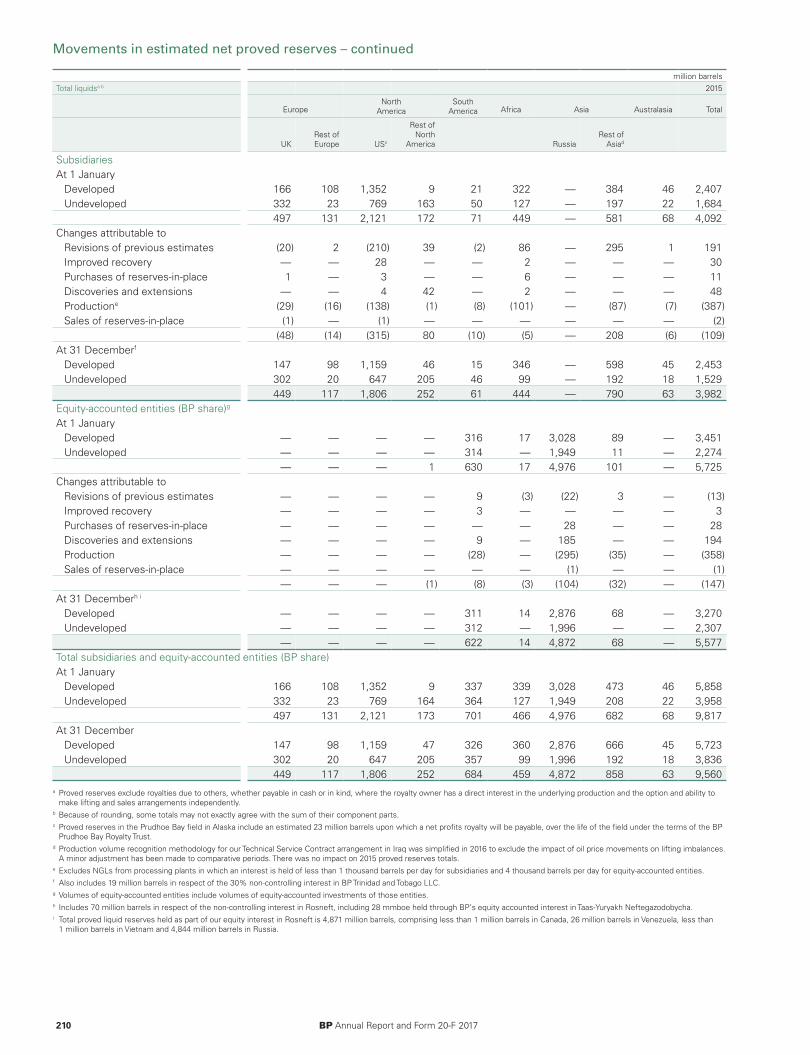
Movements in estimated net proved reserves – continued
million barrelsTotal liquidsa b 2015
EuropeNorth
AmericaSouth
America Africa Asia Australasia Total
UKRest ofEurope USc
Rest ofNorth
America RussiaRest of
Asiad
SubsidiariesAt 1 January
Developed 166 108 1,352 9 21 322 — 384 46 2,407Undeveloped 332 23 769 163 50 127 — 197 22 1,684
497 131 2,121 172 71 449 — 581 68 4,092Changes attributable to
Revisions of previous estimates (20) 2 (210) 39 (2) 86 — 295 1 191Improved recovery — — 28 — — 2 — — — 30Purchases of reserves-in-place 1 — 3 — — 6 — — — 11Discoveries and extensions — — 4 42 — 2 — — — 48Productione (29) (16) (138) (1) (8) (101) — (87) (7) (387)Sales of reserves-in-place (1) — (1) — — — — — — (2)
(48) (14) (315) 80 (10) (5) — 208 (6) (109)At 31 Decemberf
Developed 147 98 1,159 46 15 346 — 598 45 2,453Undeveloped 302 20 647 205 46 99 — 192 18 1,529
449 117 1,806 252 61 444 — 790 63 3,982Equity-accounted entities (BP share)g
At 1 JanuaryDeveloped — — — — 316 17 3,028 89 — 3,451Undeveloped — — — — 314 — 1,949 11 — 2,274
— — — 1 630 17 4,976 101 — 5,725Changes attributable to
Revisions of previous estimates — — — — 9 (3) (22) 3 — (13)Improved recovery — — — — 3 — — — — 3Purchases of reserves-in-place — — — — — — 28 — — 28Discoveries and extensions — — — — 9 — 185 — — 194Production — — — — (28) — (295) (35) — (358)Sales of reserves-in-place — — — — — — (1) — — (1)
— — — (1) (8) (3) (104) (32) — (147)At 31 Decemberh i
Developed — — — — 311 14 2,876 68 — 3,270Undeveloped — — — — 312 — 1,996 — — 2,307
— — — — 622 14 4,872 68 — 5,577Total subsidiaries and equity-accounted entities (BP share)At 1 January
Developed 166 108 1,352 9 337 339 3,028 473 46 5,858Undeveloped 332 23 769 164 364 127 1,949 208 22 3,958
497 131 2,121 173 701 466 4,976 682 68 9,817At 31 December
Developed 147 98 1,159 47 326 360 2,876 666 45 5,723Undeveloped 302 20 647 205 357 99 1,996 192 18 3,836
449 117 1,806 252 684 459 4,872 858 63 9,560a Proved reserves exclude royalties due to others, whether payable in cash or in kind, where the royalty owner has a direct interest in the underlying production and the option and ability to
make lifting and sales arrangements independently.b Because of rounding, some totals may not exactly agree with the sum of their component parts.c Proved reserves in the Prudhoe Bay field in Alaska include an estimated 23 million barrels upon which a net profits royalty will be payable, over the life of the field under the terms of the BP
Prudhoe Bay Royalty Trust.d Production volume recognition methodology for our Technical Service Contract arrangement in Iraq was simplified in 2016 to exclude the impact of oil price movements on lifting imbalances.
A minor adjustment has been made to comparative periods. There was no impact on 2015 proved reserves totals.e Excludes NGLs from processing plants in which an interest is held of less than 1 thousand barrels per day for subsidiaries and 4 thousand barrels per day for equity-accounted entities.f Also includes 19 million barrels in respect of the 30% non-controlling interest in BP Trinidad and Tobago LLC.g Volumes of equity-accounted entities include volumes of equity-accounted investments of those entities.h Includes 70 million barrels in respect of the non-controlling interest in Rosneft, including 28 mmboe held through BP’s equity accounted interest in Taas-Yuryakh Neftegazodobycha.i Total proved liquid reserves held as part of our equity interest in Rosneft is 4,871 million barrels, comprising less than 1 million barrels in Canada, 26 million barrels in Venezuela, less than
1 million barrels in Vietnam and 4,844 million barrels in Russia.
210 BP Annual Report and Form 20-F 2017

Movements in estimated net proved reserves – continued
billion cubic feetNatural gasa b 2015
EuropeNorth
AmericaSouth
America Africa Asia Australasia Total
UKRest ofEurope US
Rest ofNorth
America RussiaRest of
Asia
SubsidiariesAt 1 January
Developed 382 300 7,168 17 2,352 901 — 1,688 3,316 16,124Undeveloped 386 19 2,447 — 6,313 1,597 — 3,892 1,719 16,372
768 318 9,615 17 8,666 2,497 — 5,580 5,035 32,496Changes attributable to
Revisions of previous estimates (12) 14 (1,120) (13) 132 203 — (165) 13 (948)Improved recovery 4 — 432 — — 7 — — — 443Purchases of reserves-in-place — — 65 — 29 554 — — — 648Discoveries and extensions — — 5 — — 174 — — — 179Productionc (65) (44) (628) (4) (709) (248) — (157) (297) (2,151)Sales of reserves-in-place (5) — (6) — (58) (35) — — — (104)
(77) (30) (1,252) (17) (605) 654 — (322) (284) (1,933)At 31 Decemberd
Developed 348 274 6,257 — 2,071 847 — 1,803 3,408 15,009Undeveloped 343 14 2,105 — 5,989 2,305 — 3,455 1,343 15,553
691 288 8,363 — 8,060 3,152 — 5,257 4,751 30,563Equity-accounted entities (BP share)e
At 1 JanuaryDeveloped — — — 1 1,228 400 4,674 60 — 6,363Undeveloped — — — 1 717 — 5,111 9 — 5,837
— — — 1 1,945 400 9,785 69 — 12,200Changes attributable to
Revisions of previous estimates — — — (1) 81 (14) 1,604 (2) — 1,669Improved recovery — — — — 8 — — — — 8Purchases of reserves-in-place — — — — — — 5 — — 5Discoveries and extensions — — — — 209 — 175 — — 384Productionc — — — — (182) — (430) (19) — (632)Sales of reserves-in-place — — — — (1) — — — — (1)
— — — (1) 116 (14) 1,354 (21) — 1,434At 31 Decemberf g
Developed — — — 1 1,463 386 4,962 44 — 6,856Undeveloped — — — — 598 — 6,176 4 — 6,778
— — — 1 2,061 386 11,139 48 — 13,634Total subsidiaries and equity-accounted entities (BP share)At 1 January
Developed 382 300 7,168 18 3,581 1,301 4,674 1,748 3,316 22,487Undeveloped 386 19 2,447 1 7,030 1,597 5,111 3,901 1,719 22,209
768 318 9,615 18 10,610 2,897 9,785 5,648 5,035 44,695At 31 December
Developed 348 274 6,257 1 3,534 1,233 4,962 1,847 3,408 21,865Undeveloped 343 14 2,105 — 6,587 2,305 6,176 3,459 1,343 22,331
691 288 8,363 1 10,121 3,538 11,139 5,305 4,751 44,197a Proved reserves exclude royalties due to others, whether payable in cash or in kind, where the royalty owner has a direct interest in the underlying production and the option and ability to
make lifting and sales arrangements independently.b Because of rounding, some totals may not exactly agree with the sum of their component parts.c Includes 175 billion cubic feet of natural gas consumed in operations, 146 billion cubic feet in subsidiaries, 29 billion cubic feet in equity-accounted entities.d Includes 2,359 billion cubic feet of natural gas in respect of the 30% non-controlling interest in BP Trinidad and Tobago LLC.e Volumes of equity-accounted entities include volumes of equity-accounted investments of those entities.f Includes 129 billion cubic feet of natural gas in respect of the 0.23% non-controlling interest in Rosneft including 5 billion cubic feet held through BP’s equity accounted interest in Taas-
Yuryakh Neftegazodobycha.g Total proved gas reserves held as part of our equity interest in Rosneft is 11,169 billion cubic feet, comprising 1 billion cubic feet in Canada, 13 billion cubic feet in Venezuela, 22 billion cubic
feet in Vietnam and 11,133 billion cubic feet in Russia.
BP Annual Report and Form 20-F 2017 211
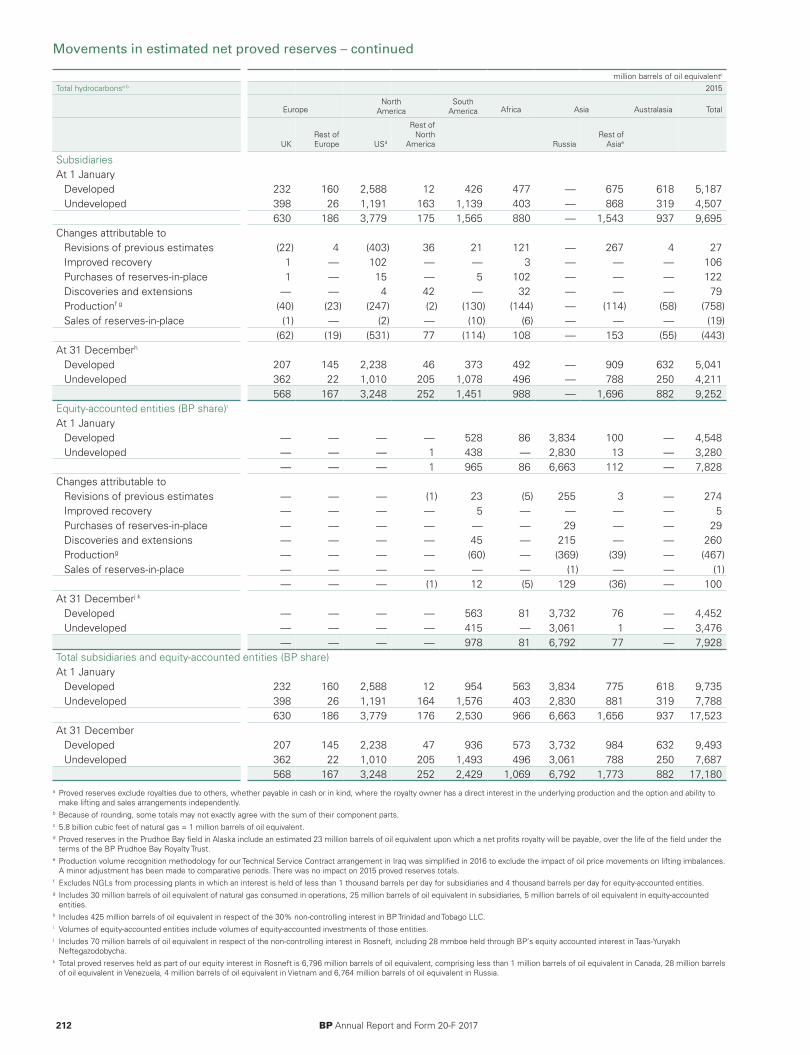
Movements in estimated net proved reserves – continued
million barrels of oil equivalentc
Total hydrocarbonsa b 2015
EuropeNorth
AmericaSouth
America Africa Asia Australasia Total
UKRest ofEurope USd
Rest ofNorth
America RussiaRest of
Asiae
SubsidiariesAt 1 January
Developed 232 160 2,588 12 426 477 — 675 618 5,187Undeveloped 398 26 1,191 163 1,139 403 — 868 319 4,507
630 186 3,779 175 1,565 880 — 1,543 937 9,695Changes attributable to
Revisions of previous estimates (22) 4 (403) 36 21 121 — 267 4 27Improved recovery 1 — 102 — — 3 — — — 106Purchases of reserves-in-place 1 — 15 — 5 102 — — — 122Discoveries and extensions — — 4 42 — 32 — — — 79Productionf g (40) (23) (247) (2) (130) (144) — (114) (58) (758)Sales of reserves-in-place (1) — (2) — (10) (6) — — — (19)
(62) (19) (531) 77 (114) 108 — 153 (55) (443)At 31 Decemberh
Developed 207 145 2,238 46 373 492 — 909 632 5,041Undeveloped 362 22 1,010 205 1,078 496 — 788 250 4,211
568 167 3,248 252 1,451 988 — 1,696 882 9,252Equity-accounted entities (BP share)i
At 1 JanuaryDeveloped — — — — 528 86 3,834 100 — 4,548Undeveloped — — — 1 438 — 2,830 13 — 3,280
— — — 1 965 86 6,663 112 — 7,828Changes attributable to
Revisions of previous estimates — — — (1) 23 (5) 255 3 — 274Improved recovery — — — — 5 — — — — 5Purchases of reserves-in-place — — — — — — 29 — — 29Discoveries and extensions — — — — 45 — 215 — — 260Productiong — — — — (60) — (369) (39) — (467)Sales of reserves-in-place — — — — — — (1) — — (1)
— — — (1) 12 (5) 129 (36) — 100At 31 Decemberj k
Developed — — — — 563 81 3,732 76 — 4,452Undeveloped — — — — 415 — 3,061 1 — 3,476
— — — — 978 81 6,792 77 — 7,928Total subsidiaries and equity-accounted entities (BP share)At 1 January
Developed 232 160 2,588 12 954 563 3,834 775 618 9,735Undeveloped 398 26 1,191 164 1,576 403 2,830 881 319 7,788
630 186 3,779 176 2,530 966 6,663 1,656 937 17,523At 31 December
Developed 207 145 2,238 47 936 573 3,732 984 632 9,493Undeveloped 362 22 1,010 205 1,493 496 3,061 788 250 7,687
568 167 3,248 252 2,429 1,069 6,792 1,773 882 17,180a Proved reserves exclude royalties due to others, whether payable in cash or in kind, where the royalty owner has a direct interest in the underlying production and the option and ability to
make lifting and sales arrangements independently.b Because of rounding, some totals may not exactly agree with the sum of their component parts.c 5.8 billion cubic feet of natural gas = 1 million barrels of oil equivalent.d Proved reserves in the Prudhoe Bay field in Alaska include an estimated 23 million barrels of oil equivalent upon which a net profits royalty will be payable, over the life of the field under the
terms of the BP Prudhoe Bay Royalty Trust.e Production volume recognition methodology for our Technical Service Contract arrangement in Iraq was simplified in 2016 to exclude the impact of oil price movements on lifting imbalances.
A minor adjustment has been made to comparative periods. There was no impact on 2015 proved reserves totals.f Excludes NGLs from processing plants in which an interest is held of less than 1 thousand barrels per day for subsidiaries and 4 thousand barrels per day for equity-accounted entities.g Includes 30 million barrels of oil equivalent of natural gas consumed in operations, 25 million barrels of oil equivalent in subsidiaries, 5 million barrels of oil equivalent in equity-accounted
entities.h Includes 425 million barrels of oil equivalent in respect of the 30% non-controlling interest in BP Trinidad and Tobago LLC.i Volumes of equity-accounted entities include volumes of equity-accounted investments of those entities.j Includes 70 million barrels of oil equivalent in respect of the non-controlling interest in Rosneft, including 28 mmboe held through BP’s equity accounted interest in Taas-Yuryakh
Neftegazodobycha.k Total proved reserves held as part of our equity interest in Rosneft is 6,796 million barrels of oil equivalent, comprising less than 1 million barrels of oil equivalent in Canada, 28 million barrels
of oil equivalent in Venezuela, 4 million barrels of oil equivalent in Vietnam and 6,764 million barrels of oil equivalent in Russia.
212 BP Annual Report and Form 20-F 2017

Standardized measure of discounted future net cash flows and changes therein relating to proved oil andgas reservesThe following tables set out the standardized measure of discounted future net cash flows, and changes therein, relating to crude oil andnatural gas production from the group’s estimated proved reserves. This information is prepared in compliance with FASB Oil and GasDisclosures requirements.
Future net cash flows have been prepared on the basis of certain assumptions which may or may not be realized. These include the timing offuture production, the estimation of crude oil and natural gas reserves and the application of average crude oil and natural gas prices andexchange rates from the previous 12 months. Furthermore, both proved reserves estimates and production forecasts are subject to revision asfurther technical information becomes available and economic conditions change. BP cautions against relying on the information presentedbecause of the highly arbitrary nature of the assumptions on which it is based and its lack of comparability with the historical cost informationpresented in the financial statements.
$ million2017
Europe North America
South America
Africa Asia Australasia Total
UKRest ofEurope US
Rest ofNorth
America RussiaRest of
Asia
At 31 DecemberSubsidiariesFuture cash inflowsa 26,300 — 99,200 7,100 15,200 27,000 — 118,800 26,200 319,800Future production costb 13,800 — 46,700 4,100 7,100 8,600 — 52,600 8,400 141,300Future development costb 1,700 — 12,100 1,100 2,400 3,400 — 18,200 3,200 42,100Future taxationc 4,200 — 6,500 — 1,700 3,800 — 33,200 4,800 54,200Future net cash flows 6,600 — 33,900 1,900 4,000 11,200 — 14,800 9,800 82,20010% annual discountd e 2,100 — 13,100 1,100 500 3,400 — 5,500 4,800 30,500Standardized measure of discounted
future net cash flowse 4,500 — 20,800 800 3,500 7,800 — 9,300 5,000 51,700Equity-accounted entities (BP share)f
Future cash inflowsa — 9,000 — — 32,900 — 205,100 400 — 247,400Future production costb — 4,100 — — 15,500 — 114,900 300 — 134,800Future development costb — 800 — — 3,400 — 17,600 100 — 21,900Future taxationc — 3,100 — — 3,100 — 12,400 — — 18,600Future net cash flows — 1,000 — — 10,900 — 60,200 — — 72,10010% annual discountd — 400 — — 6,400 — 34,900 — — 41,700Standardized measure of discounted
future net cash flowsg h — 600 — — 4,500 — 25,300 — — 30,400Total subsidiaries and equity-accounted entitiesStandardized measure of discounted
future net cash flows 4,500 600 20,800 800 8,000 7,800 25,300 9,300 5,000 82,100
The following are the principal sources of change in the standardized measure of discounted future net cash flows:$ million
SubsidiariesEquity-accounted
entities (BP share)
Total subsidiaries andequity-accounted
entities
Sales and transfers of oil and gas produced, net of production costs (12,800) (5,500) (18,300)Development costs for the current year as estimated in previous year 9,800 4,200 14,000Extensions, discoveries and improved recovery, less related costs 2,300 1,300 3,600Net changes in prices and production cost 33,100 7,300 40,400Revisions of previous reserves estimates 2,800 1,000 3,800Net change in taxation (12,500) (1,500) (14,000)Future development costs 3,000 (4,600) (1,600)Net change in purchase and sales of reserves-in-place 800 (600) 200Addition of 10% annual discount 2,300 2,600 4,900Total change in the standardized measure during the yearj 28,800 4,200 33,000
a The marker prices used were Brent $54.36/bbl, Henry Hub $2.96/mmBtu. b Production costs, which include production taxes, and development costs relating to future production of proved reserves are based on the continuation of existing economic conditions.
Future decommissioning costs are included.c Taxation is computed with reference to appropriate year-end statutory corporate income tax rates.d Future net cash flows from oil and natural gas production are discounted at 10% regardless of the group assessment of the risk associated with its producing activities.e Non-controlling interests in BP Trinidad and Tobago LLC amounted to $1,100 million.f The standardized measure of discounted future net cash flows of equity-accounted entities includes standardized measure of discounted future net cash flows of equity-accounted
investments of those entities.g Non-controlling interests in Rosneft amounted to $1,963 million in Russia.h No equity-accounted future cash flows in Africa because proved reserves are received as a result of contractual arrangements, with no associated costs.i Total change in the standardized measure during the year includes the effect of exchange rate movements. Exchange rate effects arising from the translation of our share of Rosneft changes
to US dollars are included within ‘Net changes in prices and production cost’.
BP Annual Report and Form 20-F 2017 213
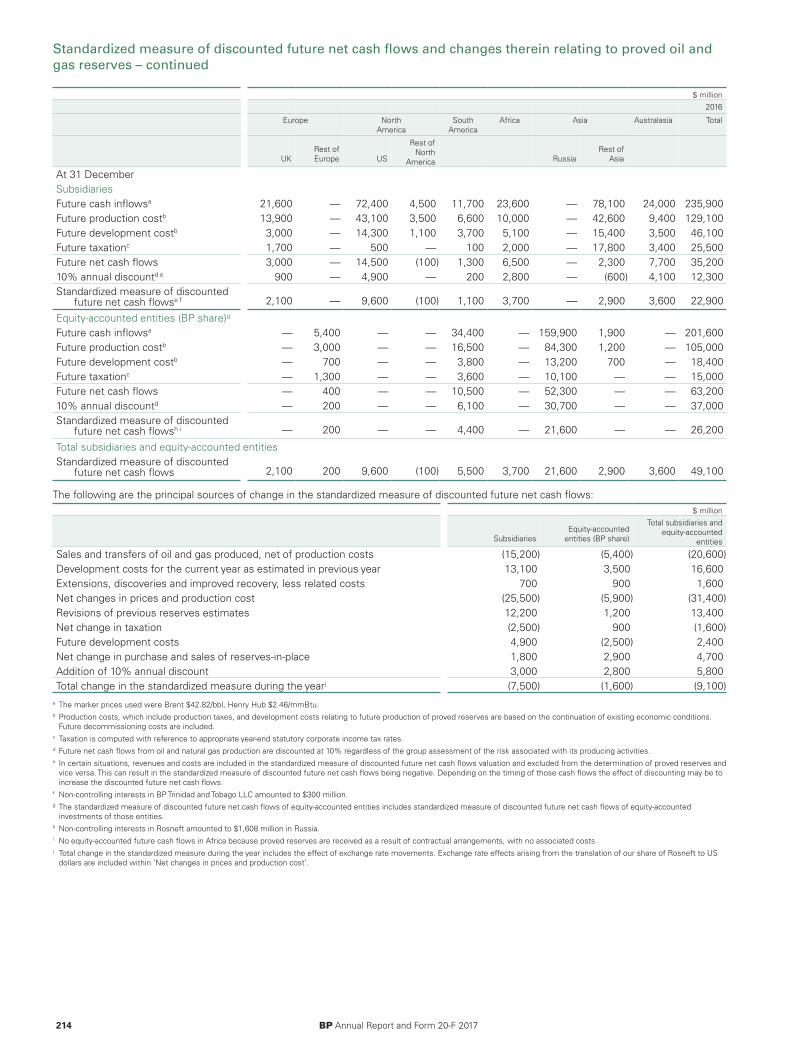
Standardized measure of discounted future net cash flows and changes therein relating to proved oil andgas reserves – continued
$ million2016
Europe North America
South America
Africa Asia Australasia Total
UKRest ofEurope US
Rest ofNorth
America RussiaRest of
Asia
At 31 DecemberSubsidiariesFuture cash inflowsa 21,600 — 72,400 4,500 11,700 23,600 — 78,100 24,000 235,900Future production costb 13,900 — 43,100 3,500 6,600 10,000 — 42,600 9,400 129,100Future development costb 3,000 — 14,300 1,100 3,700 5,100 — 15,400 3,500 46,100Future taxationc 1,700 — 500 — 100 2,000 — 17,800 3,400 25,500Future net cash flows 3,000 — 14,500 (100) 1,300 6,500 — 2,300 7,700 35,20010% annual discountd e 900 — 4,900 — 200 2,800 — (600) 4,100 12,300Standardized measure of discounted
future net cash flowse f 2,100 — 9,600 (100) 1,100 3,700 — 2,900 3,600 22,900
Equity-accounted entities (BP share)g
Future cash inflowsa — 5,400 — — 34,400 — 159,900 1,900 — 201,600Future production costb — 3,000 — — 16,500 — 84,300 1,200 — 105,000Future development costb — 700 — — 3,800 — 13,200 700 — 18,400Future taxationc — 1,300 — — 3,600 — 10,100 — — 15,000Future net cash flows — 400 — — 10,500 — 52,300 — — 63,20010% annual discountd — 200 — — 6,100 — 30,700 — — 37,000Standardized measure of discounted
future net cash flowsh i — 200 — — 4,400 — 21,600 — — 26,200
Total subsidiaries and equity-accounted entitiesStandardized measure of discounted
future net cash flows 2,100 200 9,600 (100) 5,500 3,700 21,600 2,900 3,600 49,100
The following are the principal sources of change in the standardized measure of discounted future net cash flows:$ million
SubsidiariesEquity-accounted
entities (BP share)
Total subsidiaries andequity-accounted
entities
Sales and transfers of oil and gas produced, net of production costs (15,200) (5,400) (20,600)Development costs for the current year as estimated in previous year 13,100 3,500 16,600Extensions, discoveries and improved recovery, less related costs 700 900 1,600Net changes in prices and production cost (25,500) (5,900) (31,400)Revisions of previous reserves estimates 12,200 1,200 13,400Net change in taxation (2,500) 900 (1,600)Future development costs 4,900 (2,500) 2,400Net change in purchase and sales of reserves-in-place 1,800 2,900 4,700Addition of 10% annual discount 3,000 2,800 5,800Total change in the standardized measure during the yearj (7,500) (1,600) (9,100)
a The marker prices used were Brent $42.82/bbl, Henry Hub $2.46/mmBtu.b Production costs, which include production taxes, and development costs relating to future production of proved reserves are based on the continuation of existing economic conditions.
Future decommissioning costs are included.c Taxation is computed with reference to appropriate year-end statutory corporate income tax rates.d Future net cash flows from oil and natural gas production are discounted at 10% regardless of the group assessment of the risk associated with its producing activities.e In certain situations, revenues and costs are included in the standardized measure of discounted future net cash flows valuation and excluded from the determination of proved reserves and
vice versa. This can result in the standardized measure of discounted future net cash flows being negative. Depending on the timing of those cash flows the effect of discounting may be toincrease the discounted future net cash flows.
f Non-controlling interests in BP Trinidad and Tobago LLC amounted to $300 million.g The standardized measure of discounted future net cash flows of equity-accounted entities includes standardized measure of discounted future net cash flows of equity-accounted
investments of those entities.h Non-controlling interests in Rosneft amounted to $1,608 million in Russia.i No equity-accounted future cash flows in Africa because proved reserves are received as a result of contractual arrangements, with no associated costs.j Total change in the standardized measure during the year includes the effect of exchange rate movements. Exchange rate effects arising from the translation of our share of Rosneft to US
dollars are included within ‘Net changes in prices and production cost’.
214 BP Annual Report and Form 20-F 2017
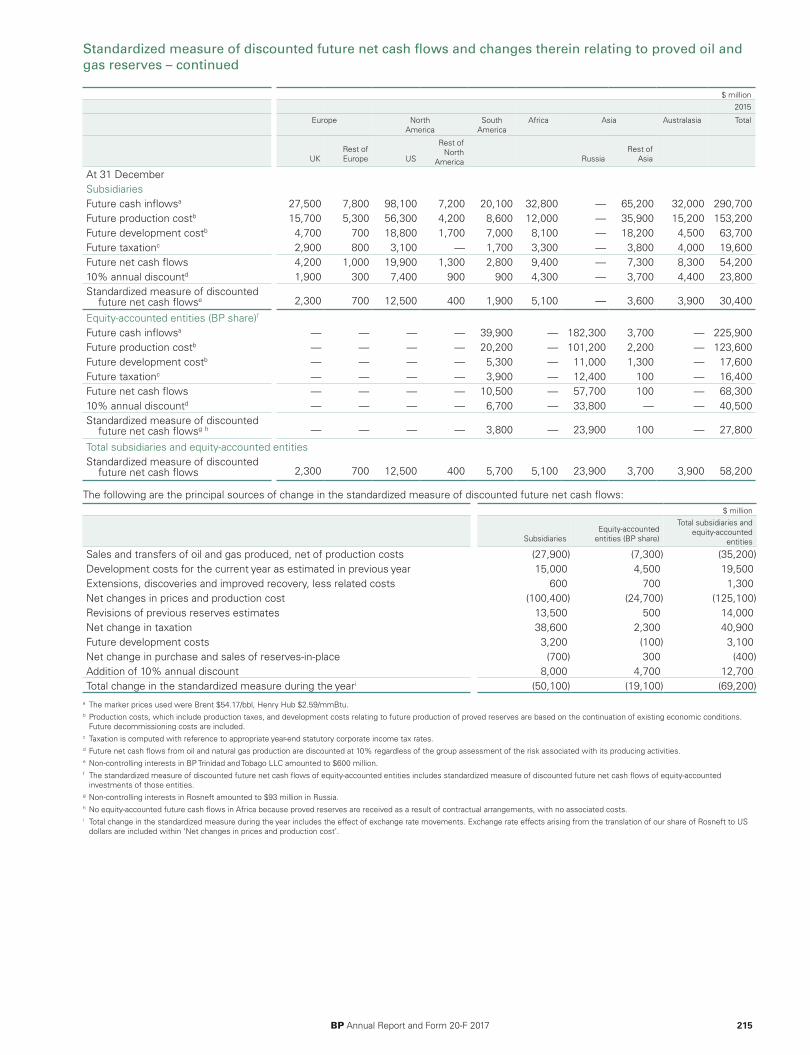
Standardized measure of discounted future net cash flows and changes therein relating to proved oil andgas reserves – continued
$ million2015
Europe North America
South America
Africa Asia Australasia Total
UKRest ofEurope US
Rest ofNorth
America RussiaRest of
Asia
At 31 DecemberSubsidiariesFuture cash inflowsa 27,500 7,800 98,100 7,200 20,100 32,800 — 65,200 32,000 290,700Future production costb 15,700 5,300 56,300 4,200 8,600 12,000 — 35,900 15,200 153,200Future development costb 4,700 700 18,800 1,700 7,000 8,100 — 18,200 4,500 63,700Future taxationc 2,900 800 3,100 — 1,700 3,300 — 3,800 4,000 19,600Future net cash flows 4,200 1,000 19,900 1,300 2,800 9,400 — 7,300 8,300 54,20010% annual discountd 1,900 300 7,400 900 900 4,300 — 3,700 4,400 23,800Standardized measure of discounted
future net cash flowse 2,300 700 12,500 400 1,900 5,100 — 3,600 3,900 30,400
Equity-accounted entities (BP share)f
Future cash inflowsa — — — — 39,900 — 182,300 3,700 — 225,900Future production costb — — — — 20,200 — 101,200 2,200 — 123,600Future development costb — — — — 5,300 — 11,000 1,300 — 17,600Future taxationc — — — — 3,900 — 12,400 100 — 16,400Future net cash flows — — — — 10,500 — 57,700 100 — 68,30010% annual discountd — — — — 6,700 — 33,800 — — 40,500Standardized measure of discounted
future net cash flowsg h — — — — 3,800 — 23,900 100 — 27,800
Total subsidiaries and equity-accounted entitiesStandardized measure of discounted
future net cash flows 2,300 700 12,500 400 5,700 5,100 23,900 3,700 3,900 58,200
The following are the principal sources of change in the standardized measure of discounted future net cash flows:$ million
SubsidiariesEquity-accounted
entities (BP share)
Total subsidiaries andequity-accounted
entities
Sales and transfers of oil and gas produced, net of production costs (27,900) (7,300) (35,200)Development costs for the current year as estimated in previous year 15,000 4,500 19,500Extensions, discoveries and improved recovery, less related costs 600 700 1,300Net changes in prices and production cost (100,400) (24,700) (125,100)Revisions of previous reserves estimates 13,500 500 14,000Net change in taxation 38,600 2,300 40,900Future development costs 3,200 (100) 3,100Net change in purchase and sales of reserves-in-place (700) 300 (400)Addition of 10% annual discount 8,000 4,700 12,700Total change in the standardized measure during the yeari (50,100) (19,100) (69,200)
a The marker prices used were Brent $54.17/bbl, Henry Hub $2.59/mmBtu.b Production costs, which include production taxes, and development costs relating to future production of proved reserves are based on the continuation of existing economic conditions.
Future decommissioning costs are included.c Taxation is computed with reference to appropriate year-end statutory corporate income tax rates.d Future net cash flows from oil and natural gas production are discounted at 10% regardless of the group assessment of the risk associated with its producing activities.e Non-controlling interests in BP Trinidad and Tobago LLC amounted to $600 million.f The standardized measure of discounted future net cash flows of equity-accounted entities includes standardized measure of discounted future net cash flows of equity-accounted
investments of those entities.g Non-controlling interests in Rosneft amounted to $93 million in Russia.h No equity-accounted future cash flows in Africa because proved reserves are received as a result of contractual arrangements, with no associated costs.i Total change in the standardized measure during the year includes the effect of exchange rate movements. Exchange rate effects arising from the translation of our share of Rosneft to US
dollars are included within ‘Net changes in prices and production cost’.
BP Annual Report and Form 20-F 2017 215
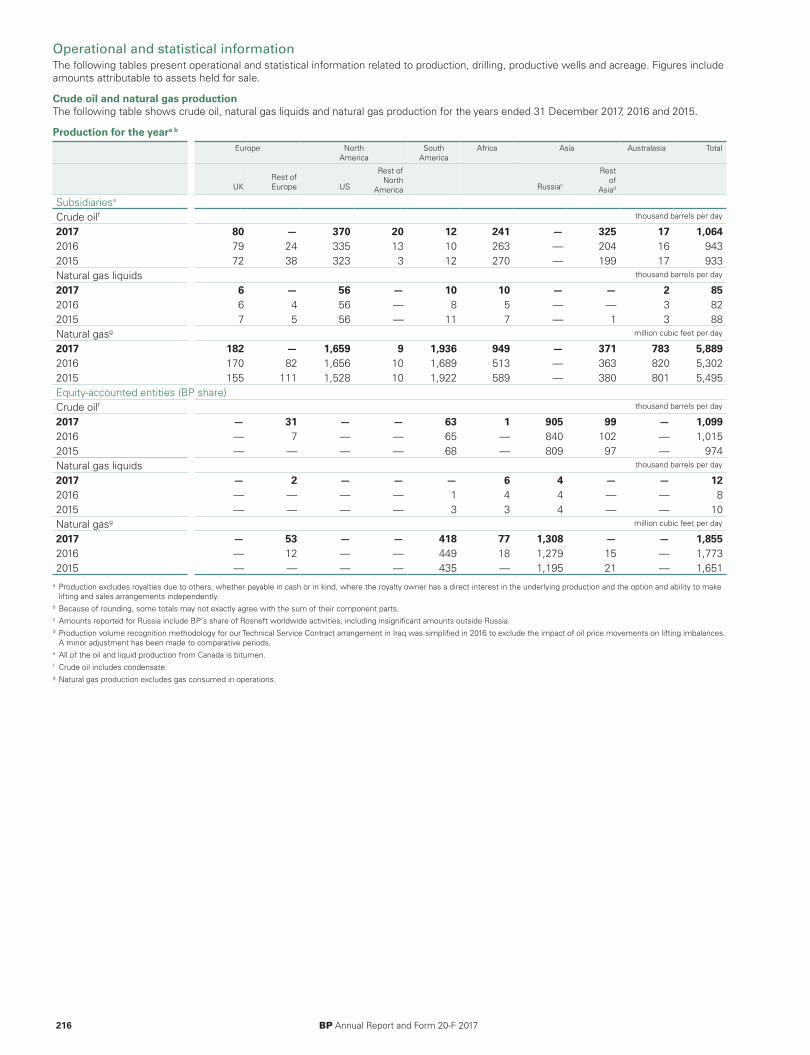
Operational and statistical informationThe following tables present operational and statistical information related to production, drilling, productive wells and acreage. Figures includeamounts attributable to assets held for sale.
Crude oil and natural gas productionThe following table shows crude oil, natural gas liquids and natural gas production for the years ended 31 December 2017, 2016 and 2015.
Production for the yeara b
Europe North America
South America
Africa Asia Australasia Total
UKRest ofEurope US
Rest ofNorth
America Russiac
Restof
Asiad
Subsidiariese
Crude oilf thousand barrels per day
2017 80 — 370 20 12 241 — 325 17 1,0642016 79 24 335 13 10 263 — 204 16 9432015 72 38 323 3 12 270 — 199 17 933Natural gas liquids thousand barrels per day
2017 6 — 56 — 10 10 — — 2 852016 6 4 56 — 8 5 — — 3 822015 7 5 56 — 11 7 — 1 3 88Natural gasg million cubic feet per day
2017 182 — 1,659 9 1,936 949 — 371 783 5,8892016 170 82 1,656 10 1,689 513 — 363 820 5,3022015 155 111 1,528 10 1,922 589 — 380 801 5,495Equity-accounted entities (BP share)Crude oilf thousand barrels per day
2017 — 31 — — 63 1 905 99 — 1,0992016 — 7 — — 65 — 840 102 — 1,0152015 — — — — 68 — 809 97 — 974Natural gas liquids thousand barrels per day
2017 — 2 — — — 6 4 — — 122016 — — — — 1 4 4 — — 82015 — — — — 3 3 4 — — 10Natural gasg million cubic feet per day
2017 — 53 — — 418 77 1,308 — — 1,8552016 — 12 — — 449 18 1,279 15 — 1,7732015 — — — — 435 — 1,195 21 — 1,651
a Production excludes royalties due to others, whether payable in cash or in kind, where the royalty owner has a direct interest in the underlying production and the option and ability to makelifting and sales arrangements independently.
b Because of rounding, some totals may not exactly agree with the sum of their component parts.c Amounts reported for Russia include BP’s share of Rosneft worldwide activities, including insignificant amounts outside Russia.d Production volume recognition methodology for our Technical Service Contract arrangement in Iraq was simplified in 2016 to exclude the impact of oil price movements on lifting imbalances.
A minor adjustment has been made to comparative periods.e All of the oil and liquid production from Canada is bitumen.f Crude oil includes condensate.g Natural gas production excludes gas consumed in operations.
216 BP Annual Report and Form 20-F 2017
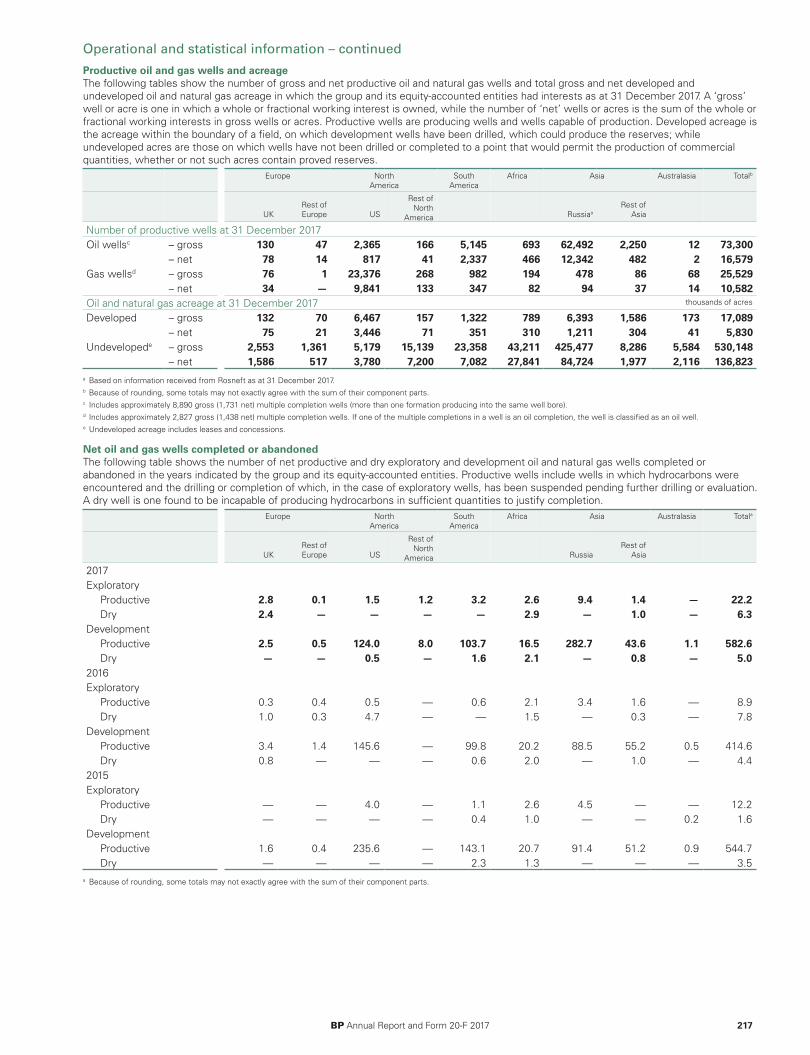
Operational and statistical information – continued
Productive oil and gas wells and acreageThe following tables show the number of gross and net productive oil and natural gas wells and total gross and net developed andundeveloped oil and natural gas acreage in which the group and its equity-accounted entities had interests as at 31 December 2017. A ‘gross’well or acre is one in which a whole or fractional working interest is owned, while the number of ‘net’ wells or acres is the sum of the whole orfractional working interests in gross wells or acres. Productive wells are producing wells and wells capable of production. Developed acreage isthe acreage within the boundary of a field, on which development wells have been drilled, which could produce the reserves; whileundeveloped acres are those on which wells have not been drilled or completed to a point that would permit the production of commercialquantities, whether or not such acres contain proved reserves.
Europe North America
South America
Africa Asia Australasia Totalb
UKRest ofEurope US
Rest ofNorth
America RussiaaRest of
Asia
Number of productive wells at 31 December 2017Oil wellsc – gross 130 47 2,365 166 5,145 693 62,492 2,250 12 73,300
– net 78 14 817 41 2,337 466 12,342 482 2 16,579Gas wellsd – gross 76 1 23,376 268 982 194 478 86 68 25,529
– net 34 — 9,841 133 347 82 94 37 14 10,582Oil and natural gas acreage at 31 December 2017 thousands of acres
Developed – gross 132 70 6,467 157 1,322 789 6,393 1,586 173 17,089– net 75 21 3,446 71 351 310 1,211 304 41 5,830
Undevelopede – gross 2,553 1,361 5,179 15,139 23,358 43,211 425,477 8,286 5,584 530,148– net 1,586 517 3,780 7,200 7,082 27,841 84,724 1,977 2,116 136,823
a Based on information received from Rosneft as at 31 December 2017.b Because of rounding, some totals may not exactly agree with the sum of their component parts.c Includes approximately 8,890 gross (1,731 net) multiple completion wells (more than one formation producing into the same well bore).d Includes approximately 2,827 gross (1,438 net) multiple completion wells. If one of the multiple completions in a well is an oil completion, the well is classified as an oil well.e Undeveloped acreage includes leases and concessions.
Net oil and gas wells completed or abandonedThe following table shows the number of net productive and dry exploratory and development oil and natural gas wells completed orabandoned in the years indicated by the group and its equity-accounted entities. Productive wells include wells in which hydrocarbons wereencountered and the drilling or completion of which, in the case of exploratory wells, has been suspended pending further drilling or evaluation.A dry well is one found to be incapable of producing hydrocarbons in sufficient quantities to justify completion.
Europe North America
South America
Africa Asia Australasia Totala
UKRest ofEurope US
Rest ofNorth
America RussiaRest of
Asia
2017Exploratory
Productive 2.8 0.1 1.5 1.2 3.2 2.6 9.4 1.4 — 22.2Dry 2.4 — — — — 2.9 — 1.0 — 6.3
DevelopmentProductive 2.5 0.5 124.0 8.0 103.7 16.5 282.7 43.6 1.1 582.6Dry — — 0.5 — 1.6 2.1 — 0.8 — 5.0
2016Exploratory
Productive 0.3 0.4 0.5 — 0.6 2.1 3.4 1.6 — 8.9Dry 1.0 0.3 4.7 — — 1.5 — 0.3 — 7.8
DevelopmentProductive 3.4 1.4 145.6 — 99.8 20.2 88.5 55.2 0.5 414.6Dry 0.8 — — — 0.6 2.0 — 1.0 — 4.4
2015Exploratory
Productive — — 4.0 — 1.1 2.6 4.5 — — 12.2Dry — — — — 0.4 1.0 — — 0.2 1.6
DevelopmentProductive 1.6 0.4 235.6 — 143.1 20.7 91.4 51.2 0.9 544.7Dry — — — — 2.3 1.3 — — — 3.5
a Because of rounding, some totals may not exactly agree with the sum of their component parts.
BP Annual Report and Form 20-F 2017 217
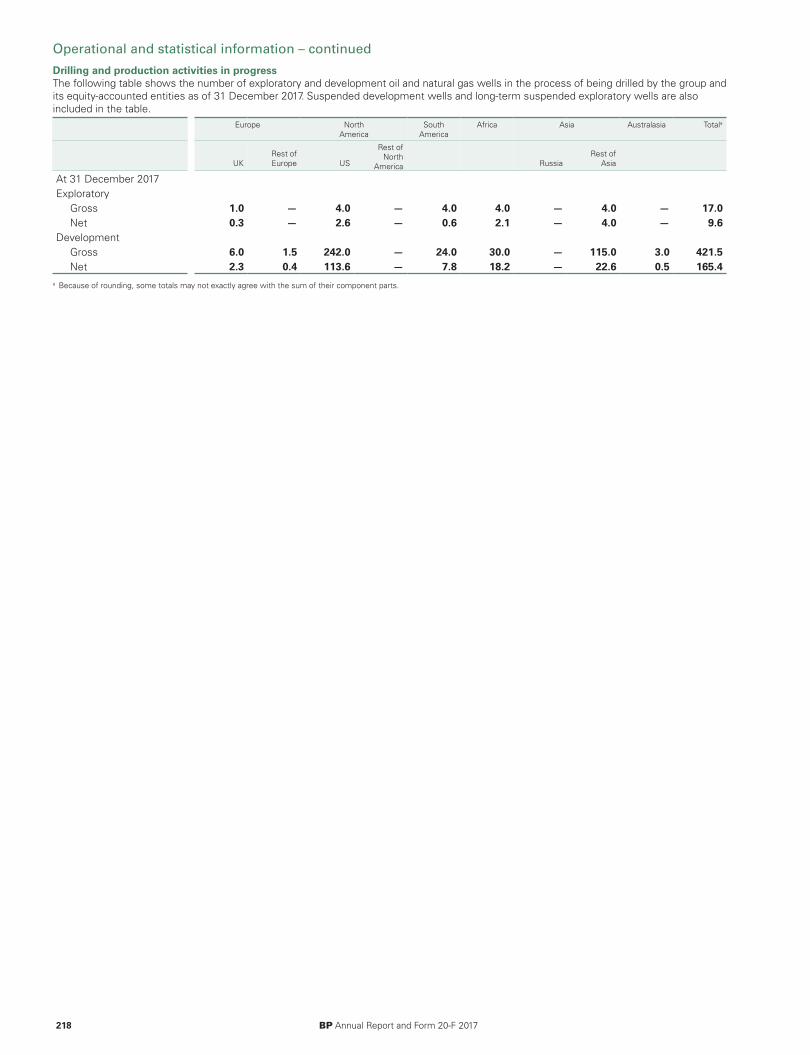
Operational and statistical information – continued
Drilling and production activities in progressThe following table shows the number of exploratory and development oil and natural gas wells in the process of being drilled by the group andits equity-accounted entities as of 31 December 2017. Suspended development wells and long-term suspended exploratory wells are alsoincluded in the table.
Europe North America
South America
Africa Asia Australasia Totala
UKRest ofEurope US
Rest ofNorth
America RussiaRest of
Asia
At 31 December 2017Exploratory
Gross 1.0 — 4.0 — 4.0 4.0 — 4.0 — 17.0Net 0.3 — 2.6 — 0.6 2.1 — 4.0 — 9.6
DevelopmentGross 6.0 1.5 242.0 — 24.0 30.0 — 115.0 3.0 421.5Net 2.3 0.4 113.6 — 7.8 18.2 — 22.6 0.5 165.4
a Because of rounding, some totals may not exactly agree with the sum of their component parts.
218 BP Annual Report and Form 20-F 2017

Parent company financial statements of BP p.l.c.
The parent company financial statements of BP p.l.c. on pages 219-245 do not form part of BP’s Annual Report on Form 20-F as filed withthe SEC.
BP Annual Report and Form 20-F 2017 219
Company balance sheet At 31 December $ million
Note 2017 2016
Non-current assetsInvestments 2 166,276 166,283Receivables 3 2,623 2,951Defined benefit pension plan surpluses 4 3,838 528
172,737 169,762Current assets
Receivables 3 293 487Cash and cash equivalents 10 50
303 537Total assets 173,040 170,299Current liabilities
Payables 5 7,903 4,225Non-current liabilities
Payables 5 34,104 34,432Deferred tax liabilities 6 1,337 179Defined benefit pension plan deficits 4 221 219
35,662 34,830Total liabilities 43,565 39,055Net assets 129,475 131,244Capital and reservesa
Profit and loss accountBrought forward 104,498 111,521Profit (loss) for the year 2,145 (375)Other movements (5,565) (6,648)
101,078 104,498Called-up share capital 7 5,343 5,284Share premium account 12,147 12,219Other capital and reserves 10,907 9,243
129,475 131,244a See Statement of changes in equity on page 220 for further information.
The financial statements on pages 219-245 were approved and signed by the group chief executive on 29 March 2018 having been dulyauthorized to do so by the board of directors:
R W Dudley Group chief executive
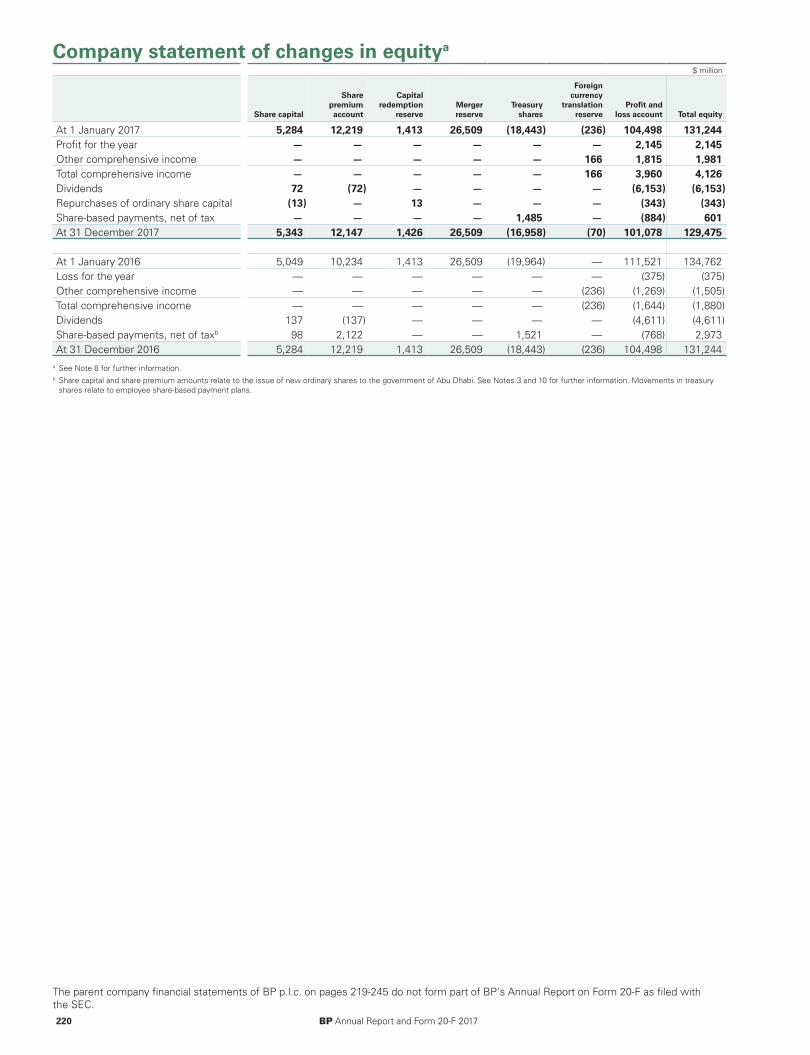
Company statement of changes in equitya
$ million
Share capital
Sharepremiumaccount
Capitalredemption
reserveMergerreserve
Treasuryshares
Foreigncurrency
translationreserve
Profit andloss account Total equity
At 1 January 2017 5,284 12,219 1,413 26,509 (18,443) (236) 104,498 131,244Profit for the year — — — — — — 2,145 2,145Other comprehensive income — — — — — 166 1,815 1,981Total comprehensive income — — — — — 166 3,960 4,126Dividends 72 (72) — — — — (6,153) (6,153)Repurchases of ordinary share capital (13) — 13 — — — (343) (343)Share-based payments, net of tax — — — — 1,485 — (884) 601At 31 December 2017 5,343 12,147 1,426 26,509 (16,958) (70) 101,078 129,475
At 1 January 2016 5,049 10,234 1,413 26,509 (19,964) — 111,521 134,762Loss for the year — — — — — — (375) (375)Other comprehensive income — — — — — (236) (1,269) (1,505)Total comprehensive income — — — — — (236) (1,644) (1,880)Dividends 137 (137) — — — — (4,611) (4,611)Share-based payments, net of taxb 98 2,122 — — 1,521 — (768) 2,973At 31 December 2016 5,284 12,219 1,413 26,509 (18,443) (236) 104,498 131,244
a See Note 8 for further information. b Share capital and share premium amounts relate to the issue of new ordinary shares to the government of Abu Dhabi. See Notes 3 and 10 for further information. Movements in treasury
shares relate to employee share-based payment plans.
The parent company financial statements of BP p.l.c. on pages 219-245 do not form part of BP’s Annual Report on Form 20-F as filed withthe SEC. 220 BP Annual Report and Form 20-F 2017
Notes on financial statements
The parent company financial statements of BP p.l.c. on pages 219-245 do not form part of BP’s Annual Report on Form 20-F as filed withthe SEC.
BP Annual Report and Form 20-F 2017 221
1. Significant accounting policies, judgements, estimates and assumptions
Authorization of financial statements and statement of compliance with Financial Reporting Standard 101 ‘Reduced DisclosureFramework’ (FRS 101) The financial statements of BP p.l.c. for the year ended 31 December 2017 were approved and signed by the group chief executive on29 March 2018 having been duly authorized to do so by the board of directors. The company meets the definition of a qualifying entity underFinancial Reporting Standard 100 ‘Application of Financial Reporting Requirements’ (FRS 100) issued by the Financial Reporting Council.Accordingly, these financial statements have been prepared in accordance with FRS 101 and in accordance with the provisions of the UKCompanies Act 2006.
Basis of preparation The financial statements have been prepared on a going concern basis and in accordance with the Companies Act 2006 and applicable UKaccounting standards.
The financial statements have been prepared under the historical cost convention. Historical cost is generally based on the fair value of theconsideration given in exchange for the assets.
As permitted by FRS 101, the company has taken advantage of the disclosure exemptions available in relation to:
(a) the requirements of IFRS 7 ‘Financial Instruments: Disclosures’;
(b) the requirements of paragraphs 10(d), 10(f), 16, 38A, 38B, 38C, 38D, 40A, 40B, 40C, 40D, 111 and 134 to 136 of IAS 1 ‘Presentation ofFinancial Statements’;
(c) the requirements of IAS 7 ‘Statement of Cash Flows’;
(d) the requirements of paragraphs 30 and 31 of IAS 8 ‘Accounting Policies, Changes in Accounting Estimates and Errors’ in relation tostandards not yet effective;
(e) the requirements of paragraphs 17 and 18A of IAS 24 ‘Related Party Disclosures’; and
(f) the requirements of IAS 24 ‘Related Party Disclosures’ to disclose related party transactions entered into between two or more membersof a group, provided that any subsidiary which is a party to the transaction is wholly owned by such a member.
Where required, equivalent disclosures are given in the consolidated financial statements of BP p.l.c.
As permitted by Section 408 of the Companies Act 2006, the income statement of the company is not presented as part of these financialstatements.
The financial statements are presented in US dollars and all values are rounded to the nearest million dollars ($ million), except whereotherwise indicated.
Significant accounting policies: use of judgements, estimates and assumptions Inherent in the application of many of the accounting policies used in preparing the financial statements is the need for management to makejudgements, estimates and assumptions that affect the reported amounts of assets and liabilities, the disclosure of contingent assets andliabilities, and the reported amounts of revenues and expenses. Actual outcomes could differ from the estimates and assumptions used. Theaccounting judgements and estimates that could have a significant impact on the results of the company are set out in boxed text below, andshould be read in conjunction with the information provided in the Notes on financial statements.
InvestmentsInvestments in subsidiaries are recorded at cost. The company assesses investments for impairment whenever events or changes incircumstances indicate that the carrying amount may not be recoverable. If any such indication of impairment exists, the company makes anestimate of its recoverable amount. Where the carrying amount of an investment exceeds its recoverable amount, the investment isconsidered impaired and is written down to its recoverable amount. Where these circumstances have reversed, the impairment previouslymade is reversed to the extent of the original cost of the investment.
Significant estimate or judgement: investments
The recoverable amount, which is often the fair value less costs to sell, may be based upon discounted future cash flows. The assumptionsunderlying these calculations, such as the discount rate, future oil and gas prices, and other asset specific factors, are judgemental. Furtherinformation on the assumptions that are used in such calculations is included in Note 1 to the consolidated financial statements.
Foreign currency translation The functional and presentation currency of the financial statements is US dollars. Transactions in foreign currencies are initially recorded in thefunctional currency by applying the spot exchange rate on the date of the transaction. Monetary assets and liabilities denominated in foreigncurrencies are retranslated into the functional currency at the spot exchange rate on the balance sheet date. Any resulting exchangedifferences are included in the income statement. Non-monetary assets and liabilities, other than those measured at fair value, are notretranslated subsequent to initial recognition.
Exchange adjustments arising when the opening net assets and the profits for the year retained by a non-US dollar functional currency branchare translated into US dollars are recognized in a separate component of equity and reported in other comprehensive income. Incomestatement transactions are translated into US dollars using the average exchange rate for the reporting period.
Financial guaranteesThe company enters into financial guarantee contracts with its subsidiaries. At the inception of a financial guarantee contract, a liability isrecognized initially at fair value and then subsequently at the higher of the estimated loss and amortized cost. Where a guarantee is issued fora premium, a receivable of an amount equal to the liability is initially recognized. Subsequently, the liability and receivable reduce by the amountof consideration received, which is recognized in the income statement. Where a guarantee is issued without a premium, the fair value isrecognized as additional investment in the entity to which the guarantee relates.
1. Significant accounting policies, judgements, estimates and assumptions – continued
Share-based payments
Equity-settled transactions The cost of equity-settled transactions with employees of the company and other members of the group is measured by reference to the fairvalue of the equity instruments on the date on which they are granted and is recognized as an expense over the vesting period, which ends onthe date on which the employees become fully entitled to the award. A corresponding credit is recognized within equity. Fair value isdetermined by using an appropriate, widely used, valuation model. In valuing equity-settled transactions, no account is taken of any vestingconditions, other than conditions linked to the price of the shares of the company (market conditions). Non-vesting conditions, such as thecondition that employees contribute to a savings-related plan, are taken into account in the grant-date fair value, and failure to meet a non-vesting condition, where this is within the control of the employee, is treated as a cancellation and any remaining unrecognized cost isexpensed.
For other equity-settled share-based payment transactions, the goods or services received and the corresponding increase in equity aremeasured at the fair value of the goods or services received, unless their fair value cannot be reliably estimated. If the fair value of the goodsand services received cannot be reliably estimated, the transaction is measured by reference to the fair value of the equity instrumentsgranted.
Cash-settled transactions The cost of cash-settled transactions is recognized as an expense over the vesting period, measured by reference to the fair value of thecorresponding liability which is recognized on the balance sheet. The liability is remeasured at fair value at each balance sheet date untilsettlement, with changes in fair value recognized in the income statement.
Pensions The cost of providing benefits under the company’s defined benefit plans is determined separately for each plan using the projected unit creditmethod, which attributes entitlement to benefits to the current period to determine current service cost and to the current and prior periods todetermine the present value of the defined benefit obligation. Past service costs, resulting from either a plan amendment or a curtailment (areduction in future obligations as a result of a material reduction in the plan membership), are recognized immediately when the companybecomes committed to a change.
Net interest expense relating to pensions, which is recognized in the income statement, represents the net change in present value of planobligations and the value of plan assets resulting from the passage of time, and is determined by applying the discount rate to the presentvalue of the benefit obligation at the start of the year, and to the fair value of plan assets at the start of the year, taking into account expectedchanges in the obligation or plan assets during the year.
Remeasurements of the defined benefit liability and asset, comprising actuarial gains and losses, and the return on plan assets (excludingamounts included in net interest described above) are recognized within other comprehensive income in the period in which they occur andare not subsequently reclassified to profit and loss.
The defined benefit pension plan surplus or deficit recognized on the balance sheet for each plan comprises the difference between thepresent value of the defined benefit obligation (using a discount rate based on high quality corporate bonds) and the fair value of plan assetsout of which the obligations are to be settled directly. Fair value is based on market price information and, in the case of quoted securities, isthe published bid price. Defined benefit pension plan surpluses are only recognized to the extent they are recoverable, typically by way ofrefund.
Contributions to defined contribution plans are recognized in the income statement in the period in which they become payable.
Significant estimate: pensions
Accounting for defined benefit pensions involves making significant estimates when measuring the company's pension plan surpluses anddeficits. These estimates require assumptions to be made about many uncertainties.
Pension assumptions are reviewed by management at the end of each year. These assumptions are used to determine the projected benefitobligation at the year end and hence the surpluses and deficits recorded on the company’s balance sheet, and pension expense for thefollowing year. The assumptions used are provided in Note 4.
The assumptions that are the most significant to the amounts reported are the discount rate, inflation rate, salary growth and mortality levels.Assumptions about these variables are based on the environment in each country. The assumptions used vary from year to year, withresultant effects on future net income and net assets. Changes to some of these assumptions, in particular the discount rate and inflationrate, could result in material changes to the carrying amounts of the company’s pension obligations within the next financial year. Anydifferences between these assumptions and the actual outcome will also affect future net income and net assets.
The values ascribed to these assumptions and a sensitivity analysis of the impact of changes in the assumptions on the benefit expenseand obligation used are provided in Note 4.
Income taxes Income tax expense represents the sum of current tax and deferred tax.
Income tax is recognized in the income statement, except to the extent that it relates to items recognized in other comprehensive income ordirectly in equity, in which case the related tax is recognized in other comprehensive income or directly in equity.
Current tax is based on the taxable profit for the period. Taxable profit differs from net profit as reported in the income statement because it isdetermined in accordance with the rules established by the applicable taxation authorities. It therefore excludes items of income or expensethat are taxable or deductible in other periods as well as items that are never taxable or deductible. The company’s liability for current tax iscalculated using tax rates and laws that have been enacted or substantively enacted by the balance sheet date.
Deferred tax is provided, using the liability method, on temporary differences at the balance sheet date between the tax bases of assets andliabilities and their carrying amounts for financial reporting purposes. Deferred tax liabilities are recognized for taxable temporary differences.
Deferred tax assets are only recognized to the extent that it is probable that they will be realized in the future.
The parent company financial statements of BP p.l.c. on pages 219-245 do not form part of BP’s Annual Report on Form 20-F as filed withthe SEC. 222 BP Annual Report and Form 20-F 2017
1. Significant accounting policies, judgements, estimates and assumptions – continuedDeferred tax assets and liabilities are measured at the tax rates that are expected to apply in the period when the asset is realized or theliability is settled, based on tax rates (and tax laws) that have been enacted or substantively enacted at the balance sheet date. Deferred taxassets and liabilities are not discounted.
Significant estimate or judgement: deferred tax
Management judgement is required to determine the amount of deferred tax assets that can be recognized, based upon the likely timing andlevel of future taxable profits.
Financial assets All financial assets held by the company are classified as loans and receivables. Financial assets include cash and cash equivalents, receivablesand other investments. The company determines the classification of its financial assets at initial recognition. Financial assets are recognizedinitially at fair value, normally being the transaction price plus directly attributable transaction costs. The company derecognizes financial assetswhen the contractual rights to the cash flows expire or the financial asset is transferred to a third party.
Loans and receivables Loans and receivables are carried at amortized cost using the effective interest method if the time value of money is significant. Gains andlosses are recognized in income when the loans and receivables are derecognized or impaired, and when interest is recognized using theeffective interest method. This category of financial assets includes trade and other receivables. Cash equivalents are short-term highly liquidinvestments that are readily convertible to known amounts of cash, are subject to insignificant risk of changes in value and have a maturity ofthree months or less from the date of acquisition.
Financial liabilities All financial liabilities held by the company are classified as financial liabilities measured at amortized cost. Financial liabilities include otherpayables, accruals, and most items of finance debt. The company determines the classification of its financial liabilities at initial recognition.
Financial liabilities measured at amortized cost All financial liabilities are initially recognized at fair value, net of transaction costs. For interest-bearing loans and borrowings this is the fair valueof the proceeds received net of issue costs associated with the borrowing.
After initial recognition, financial liabilities are subsequently measured at amortized cost using the effective interest method. Amortized cost iscalculated by taking into account any issue costs and any discount or premium on settlement. Gains and losses arising on the repurchase,settlement or cancellation of liabilities are recognized in interest and other income and finance costs respectively. This category of financialliabilities includes trade and other payables and finance debt.
The parent company financial statements of BP p.l.c. on pages 219-245 do not form part of BP’s Annual Report on Form 20-F as filed withthe SEC.
BP Annual Report and Form 20-F 2017 223
2. Investments $ million
Subsidiaries Associates
Shares Shares Total
CostAt 1 January 2017 166,355 2 166,357Disposals (41) — (41)Other movements (7) — (7)
At 31 December 2017 166,307 2 166,309Amounts provided
At 1 January 2017 74 — 74Disposals (41) — (41)
At 31 December 2017 33 — 33Cost
At 1 January 2016 139,313 2 139,315Additions 32,833 — 32,833Disposals (5,791) — (5,791)
At 31 December 2016 166,355 2 166,357Amounts provided
At 1 January 2016 74 — 74At 31 December 2016 74 — 74
At 31 December 2017 166,274 2 166,276At 31 December 2016 166,281 2 166,283
The more important subsidiaries of the company at 31 December 2017 and the percentage holding of ordinary share capital (to the nearestwhole number) are set out below. For a full list of related undertakings see Note 14.

2. Investments – continuedSubsidiaries % Country of incorporation Principal activities
InternationalBP Global Investments 100 England & Wales Investment holdingBP International 100 England & Wales Integrated oil operationsBurmah Castrol 100 Scotland Lubricants
CanadaBP Holdings Canada 100 England & Wales Investment holding
USBP Holdings North America 100 England & Wales Investment holding
The carrying value of the investment in BP International Limited at 31 December 2017 was $76,152 million (2016 $76,152 million).
The parent company financial statements of BP p.l.c. on pages 219-245 do not form part of BP’s Annual Report on Form 20-F as filed withthe SEC. 224 BP Annual Report and Form 20-F 2017
3. Receivables $ million
2017 2016
Current Non-current Current Non-current
Amounts receivable from subsidiariesa 289 2,623 480 2,951Amounts receivable from associates 4 — 4 —Other receivables — — 3 —
293 2,623 487 2,951a Non-current receivables includes a promissory note issued by BP (Abu Dhabi) Limited in 2016 in consideration for the issue of BP p.l.c. ordinary shares to the government of Abu Dhabi. See
Note 10 for further information.
4. Pensions The primary pension arrangement is a funded final salary pension plan in the UK under which retired employees draw the majority of theirbenefit as an annuity. This pension plan is governed by a corporate trustee whose board is composed of four member-nominated directors, fourcompany-nominated directors, an independent director, and an independent chairman nominated by the company. The trustee board is requiredby law to act in the best interests of the plan participants and is responsible for setting certain policies, such as investment policies of the plan.The plan is closed to new joiners but remains open to ongoing accrual for current members. New joiners are eligible for membership of adefined contribution plan.
The level of contributions to funded defined benefit plans is the amount needed to provide adequate funds to meet pension obligations as theyfall due. During 2017 the aggregate level of contributions was $509 million (2016 $539 million). The aggregate level of contributions in 2018 isexpected to be approximately $483 million, and includes contributions we expect to be required to make by law or under contractualagreements, as well as an allowance for discretionary funding.
For the primary plan there is a funding agreement between the company and the trustee. On an annual basis the latest funding position isreviewed and a schedule of contributions covering the next five years has been agreed. The funding agreement can be terminated unilaterallyby either party with two years’ notice. Contractually committed funding therefore represents seven years of future contributions, whichamounted to $2,623 million at 31 December 2017, of which $106 million relates to past service. The surplus relating to the primary pension planis recognized on the balance sheet on the basis that the company is entitled to a refund of any remaining assets once all members have leftthe plan.
The obligation and cost of providing the pension benefits is assessed annually using the projected unit credit method. The date of the mostrecent actuarial review was 31 December 2017. The principal plans are subject to a formal actuarial valuation every three years in the UK. Themost recent formal actuarial valuation of the primary pension plan was as at 31 December 2014, and a valuation as at 31 December 2017 iscurrently under way.
The material financial assumptions used to estimate the benefit obligations of the plans are set out below. The assumptions are reviewed bymanagement at the end of each year, and are used to evaluate accrued pension benefits at 31 December and pension expense for thefollowing year. Financial assumptions used to determine benefit obligation %
2017 2016
Discount rate for pension plan liabilities 2.5 2.7Rate of increase in salaries 4.1 4.6Rate of increase for pensions in payment 2.9 3.0Rate of increase in deferred pensions 2.9 3.0Inflation for pension plan liabilities 3.1 3.2
Financial assumptions used to determine benefit expense %2017 2016
Discount rate for pension plan service costs 2.7 4.0Discount rate for pension plan other finance expense 2.7 3.9Inflation for pension plan service costs 3.2 3.1
4. Pensions – continuedThe discount rate assumption is based on third-party AA corporate bond indices and we use yields that reflect the maturity profile of theexpected benefit payments. The inflation rate assumption is based on the difference between the yields on index-linked and fixed-interest long-term government bonds. The inflation assumption is used to determine the rate of increase for pensions in payment and the rate of increase indeferred pensions.
The assumption for the rate of increase in salaries is based on our inflation assumption plus an allowance for expected long-term real salarygrowth. This includes an allowance for promotion-related salary growth of 0.7%.
In addition to the financial assumptions, we regularly review the demographic and mortality assumptions. The mortality assumptions reflectbest practice in the UK, and have been chosen with regard to applicable published tables adjusted to reflect the experience of the plans and anextrapolation of past longevity improvements into the future. For the primary pension plan the mortality assumptions are as follows: Mortality assumptions Years
2017 2016
Life expectancy at age 60 for a male currently aged 60 27.4 28.0Life expectancy at age 60 for a male currently aged 40 29.0 30.0Life expectancy at age 60 for a female currently aged 60 28.8 29.5Life expectancy at age 60 for a female currently aged 40 30.5 31.9
The assets of the primary plan are held in a trust, the primary objective of which is to accumulate assets sufficient to meet the obligations ofthe plan. The assets of the trusts are invested in a manner consistent with fiduciary obligations and principles that reflect current practices inportfolio management.
A significant proportion of the assets are held in equities, owing to a higher expected level of return over the long term of such assets with anacceptable level of risk. In order to provide reasonable assurance that no single security or type of security has an unwarranted impact on thetotal portfolio, the investment portfolios are highly diversified.
The trustee’s long-term investment objective for the primary UK plan as it matures is to invest in assets whose value changes in the same wayas the plan liabilities, in order to reduce the level of funding risk. To move towards this objective, the plan uses a liability driven investment (LDI)approach for part of the portfolio, investing in government bonds to achieve this matching effect for the most significant plan liability assumptionsof interest rate and inflation rate. This is partly funded by short-term sale and repurchase agreements, whereby the plan borrows money usingexisting bonds as security and which will be bought back at a specified price at an agreed future date. The funds raised are used to invest in furtherbonds to increase the proportion of assets which match the plan liabilities. The borrowings are shown separately in the analysis of pension planassets in the table below.
The primary UK pension plan has an agreement with the trustee to increase the proportion of assets included in the LDI portfolio over time byreducing the proportion of plan assets held as equities and increasing the proportion held as bonds. During 2017, the plan switched 15% of planassets from equities to bonds.
The company’s asset allocation policy for the primary plan is as follows:Asset category %
Total equity (including private equity) 43Bonds/cash (including LDI) 50Property/real estate 7
The amounts invested under the LDI programme by the primary UK pension plan as at 31 December 2017 were $2,588 million (2016 $423million) of government-issued nominal bonds and $16,177 million (2016 $9,384 million) of index-linked bonds.
In addition, the primary plan has entered into interest rate swaps in the year to offset the long-term fixed interest rate exposure for $1,333million (2016 $4,450 million) of the corporate bond portfolio. At 31 December 2017 the fair value liability of these swaps was $49 million (2016$144 million fair value liability) and is included in other assets in the table below.
The primary plan does not invest directly in either securities or property/real estate of the company or of any subsidiary.
The fair values of the various categories of assets held by the defined benefit plans at 31 December are presented in the table below, includingthe effects of derivative financial instruments. Movements in the fair value of plan assets during the year are shown in detail in the table onpage 226.
$ million2017 2016
Fair value of pension plan assetsListed equities - developed markets 9,548 11,494
- emerging markets 2,220 2,549Private equitya 2,679 2,754Government issued nominal bondsb 2,663 489Government issued index-linked bondsb 16,177 9,384Corporate bondsb 4,682 4,042Propertyc 2,211 1,970Cash 390 547Other 104 (68)Debt (repurchase agreements) used to fund liability driven investments (5,583) (2,981)
35,091 30,180a Private equity is valued at fair value based on the most recent third-party net asset valuation.b Bonds held are denominated in sterling. c Property held is all located in the United Kingdom and are valued based on an analysis of recent market transactions supported by market knowledge derived from third-party valuers.
The parent company financial statements of BP p.l.c. on pages 219-245 do not form part of BP’s Annual Report on Form 20-F as filed withthe SEC.
BP Annual Report and Form 20-F 2017 225
4. Pensions – continued$ million
2017 2016
Analysis of the amount charged to profit before interest and taxationCurrent service costa 357 333Past service costb 12 17Operating charge relating to defined benefit plans 369 350Payments to defined contribution plan 31 30Total operating charge 400 380Interest income on plan assetsc 845 1,086Interest on plan liabilities (830) (1,004)Other finance income (expense) 15 82Analysis of the amount recognized in other comprehensive incomeActual asset return less interest income on pension plan assets 2,396 4,422Change in financial assumptions underlying the present value of the plan liabilities (237) (6,926)Change in demographic assumptions underlying the present value of plan liabilities 734 430Experience gains and losses arising on the plan liabilities 91 55Remeasurements recognized in other comprehensive income 2,984 (2,019)
a The costs of managing the fund’s investments are treated as being part of the investment return, the costs of administering our pensions plan benefits are included in current service cost. b Past service cost represents the increased liability arising as a result of early retirements occurring as part of restructuring programmes. c The actual return on plan assets is made up of the sum of the interest income on plan assets and the remeasurement of plan assets as disclosed above.
$ million2017 2016
Movements in benefit obligation during the yearBenefit obligation at 1 January 29,871 28,934Exchange adjustments 2,882 (5,680)Operating charge relating to defined benefit plans 369 350Interest cost 830 1,004Contributions by plan participantsa 16 18Benefit payments (funded plans)b (1,903) (1,192)Benefit payments (unfunded plans)b (3) (4)Remeasurements (588) 6,441Benefit obligation at 31 December 31,474 29,871Movements in fair value of plan assets during the yearFair value of plan assets at 1 January 30,180 31,223Exchange adjustments 3,048 (5,916)Interest income on plan assetsc 845 1,086Contributions by plan participantsa 16 18Contributions by employers (funded plans) 509 539Benefit payments (funded plans)b (1,903) (1,192)Remeasurementsc 2,396 4,422Fair value of plan assets at 31 Decemberd e 35,091 30,180Surplus at 31 December 3,617 309Represented by
Asset recognized 3,838 528Liability recognized (221) (219)
3,617 309The surplus may be analysed between funded and unfunded plans as follows
Funded 3,838 519Unfunded (221) (210)
3,617 309The defined benefit obligation may be analysed between funded and unfunded plans as follows
Funded (31,253) (29,661)Unfunded (221) (210)
(31,474) (29,871)a Most of the contributions made by plan participants were made under salary sacrifice. b The benefit payments amount shown above comprises $1,888 million benefits plus $18 million of plan expenses incurred in the administration of the benefit. c The actual return on plan assets is made up of the sum of the interest income on plan assets and the remeasurement of plan assets as disclosed above. d Reflects $34,841 million of assets held in the BP Pension Fund (2016 $29,970 million) and $183 million held in the BP Global Pension Trust (2016 $165 million), with $53 million representing
the company’s share of Merchant Navy Officers Pension Fund (2016 $38 million) and $14 million of Merchant Navy Ratings Pension Fund (2016 $7 million). e The fair value of plan assets includes borrowings related to the LDI programme as described on page 225.
The parent company financial statements of BP p.l.c. on pages 219-245 do not form part of BP’s Annual Report on Form 20-F as filed withthe SEC. 226 BP Annual Report and Form 20-F 2017
4. Pensions – continued
Sensitivity analysis The discount rate, inflation, salary growth and the mortality assumptions all have a significant effect on the amounts reported. A one-percentage point change, in isolation, in certain assumptions as at 31 December 2017 for the company’s plans would have had the effectsshown in the table below. The effects shown for the expense in 2018 comprise the total of current service cost and net finance income orexpense.
$ millionOne percentage point
Increase Decrease
Discount ratea
Effect on pension expense in 2018 (292) 241Effect on pension obligation at 31 December 2017 (5,166) 6,789
Inflation rateb
Effect on pension expense in 2018 185 (156)Effect on pension obligation at 31 December 2017 4,316 (3,795)
Salary growthEffect on pension expense in 2018 50 (45)Effect on pension obligation at 31 December 2017 578 (525)
a The amounts presented reflect that the discount rate is used to determine the asset interest income as well as the interest cost on the obligation. b The amounts presented reflect the total impact of an inflation rate change on the assumptions for rate of increase in salaries, pensions in payment and deferred pensions.
One additional year of longevity in the mortality assumptions would increase the 2018 pension expense by $39 million and the pensionobligation at 31 December 2017 by $1,192 million.
Estimated future benefit payments and the weighted average duration of defined benefit obligations The expected benefit payments, which reflect expected future service, as appropriate, but exclude plan expenses, up until 2027 and theweighted average duration of the defined benefit obligations at 31 December 2017 are as follows:
$ millionEstimated future benefit payments
2018 1,0982019 1,0852020 1,1062021 1,1462022 1,1732023-2027 6,308
Years
Weighted average duration 19.8
The parent company financial statements of BP p.l.c. on pages 219-245 do not form part of BP’s Annual Report on Form 20-F as filed withthe SEC.
BP Annual Report and Form 20-F 2017 227
5. Payables$ million
2017 2016
Current Non-current Current Non-current
Amounts payable to subsidiaries 7,770 34,055 3,904 34,389Accruals and deferred income 60 — 129 43Other payables 73 49 192 —
7,903 34,104 4,225 34,432
Included in non-current amounts payable to subsidiaries is an interest-bearing payable of $4,236 million (2016 $4,236 million) withBP International Limited, with interest being charged based on a 3-month USD LIBOR rate plus 55 basis points and a maturity date ofDecember 2021. Also included is an interest-bearing payable of $27,100 million (2016 $27,100 million) with BP International Limited, withinterest being charged based on a 3-month USD LIBOR rate plus 65 basis points and a maturity date of May 2023. Non-current amountspayable to subsidiaries also includes an interest-bearing payable of $2,300 million (2016 $2,300 million) with BP Finance plc, with interest beingcharged based on a 1-year USD LIBOR rate and a maturity date of April 2020.
The maturity profile of the financial liabilities included in the balance sheet at 31 December is shown in the table below. These amounts areincluded within payables.
$ million2017 2016
Due within1 to 2 years 73 2062 to 5 years 6,830 6,936More than 5 years 27,201 27,290
34,104 34,432

6. Taxation$ million
Tax charge included in total comprehensive income 2017 2016
Deferred taxOrigination and reversal of timing differences in the current year 1,158 (698)
This comprises:Taxable temporary differences relating to pensions 1,158 (698)
Deferred taxDeferred tax liability
Pensions 1,337 179Net deferred tax liability 1,337 179Analysis of movements during the year
At 1 January 179 877Charge (credit) for the year on ordinary activities (11) 52Charge (credit) for the year in other comprehensive income 1,169 (750)
At 31 December 1,337 179
At 31 December 2017, deferred tax assets of $92 million on other temporary differences and $8 million relating to pensions (2016 $82 millionrelating to other temporary differences and $8 million relating to pensions) were not recognized as it is not considered probable that suitabletaxable profits will be available in the company from which the future reversal of the underlying temporary differences can be deducted. It isanticipated that the reversal of these temporary differences will benefit other group companies in the future.
The parent company financial statements of BP p.l.c. on pages 219-245 do not form part of BP’s Annual Report on Form 20-F as filed withthe SEC. 228 BP Annual Report and Form 20-F 2017
7. Called-up share capital The allotted, called-up and fully paid share capital at 31 December was as follows:
2017 2016
IssuedShares
thousand $ millionShares
thousand $ million
8% cumulative first preference shares of £1 eacha 7,233 12 7,233 129% cumulative second preference shares of £1 eacha 5,473 9 5,473 9
21 21Ordinary shares of 25 cents each
At 1 January 21,049,696 5,263 20,108,771 5,028Issue of new shares for the scrip dividend programme 289,789 72 548,005 137Issue of new shares - otherb — — 392,920 98Repurchase of ordinary share capital (51,292) (13) — —
At 31 December 21,288,193 5,322 21,049,696 5,2635,343 5,284
a The nominal amount of 8% cumulative first preference shares and 9% cumulative second preference shares that can be in issue at any time shall not exceed £10,000,000 for each class ofpreference shares.
b Relates to the issue of new ordinary shares to the government of Abu Dhabi. See Notes 3 and 10 for further information.
Voting on substantive resolutions tabled at a general meeting is on a poll. On a poll, shareholders present in person or by proxy have two votesfor every £5 in nominal amount of the first and second preference shares held and one vote for every ordinary share held. On a show-of-handsvote on other resolutions (procedural matters) at a general meeting, shareholders present in person or by proxy have one vote each.
In the event of the winding up of the company, preference shareholders would be entitled to a sum equal to the capital paid up on thepreference shares, plus an amount in respect of accrued and unpaid dividends and a premium equal to the higher of (i) 10% of the capital paidup on the preference shares and (ii) the excess of the average market price of such shares on the London Stock Exchange during the previoussix months over par value.
During 2017 the company repurchased 51 million ordinary shares at a cost of $343 million, including transaction costs of $2 million, as part ofthe share repurchase programme announced on 31 October 2017. All shares purchased were for cancellation. The repurchased sharesrepresented 0.2% of ordinary share capital.
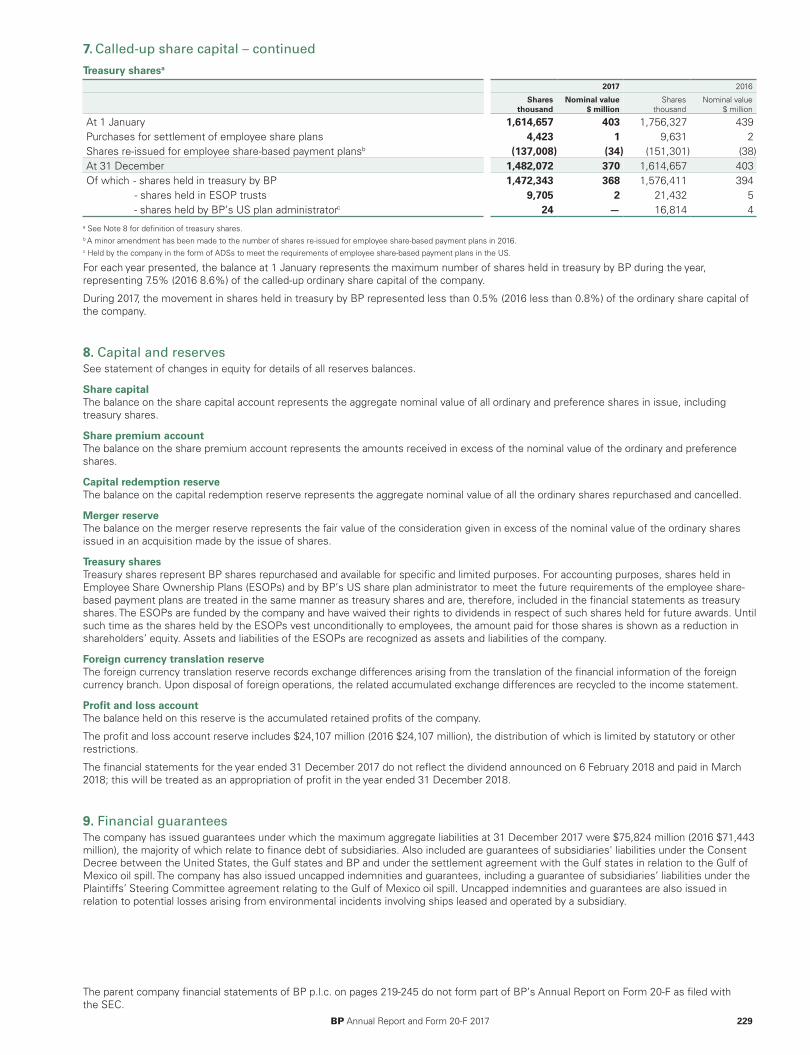
7. Called-up share capital – continued
Treasury sharesa 2017 2016
Sharesthousand
Nominal value$ million
Sharesthousand
Nominal value$ million
At 1 January 1,614,657 403 1,756,327 439Purchases for settlement of employee share plans 4,423 1 9,631 2Shares re-issued for employee share-based payment plansb (137,008) (34) (151,301) (38)At 31 December 1,482,072 370 1,614,657 403Of which - shares held in treasury by BP 1,472,343 368 1,576,411 394 - shares held in ESOP trusts 9,705 2 21,432 5
- shares held by BP’s US plan administratorc 24 — 16,814 4a See Note 8 for definition of treasury shares. b A minor amendment has been made to the number of shares re-issued for employee share-based payment plans in 2016.c Held by the company in the form of ADSs to meet the requirements of employee share-based payment plans in the US.
For each year presented, the balance at 1 January represents the maximum number of shares held in treasury by BP during the year,representing 7.5% (2016 8.6%) of the called-up ordinary share capital of the company.
During 2017, the movement in shares held in treasury by BP represented less than 0.5% (2016 less than 0.8%) of the ordinary share capital ofthe company.
The parent company financial statements of BP p.l.c. on pages 219-245 do not form part of BP’s Annual Report on Form 20-F as filed withthe SEC.
BP Annual Report and Form 20-F 2017 229
8. Capital and reserves See statement of changes in equity for details of all reserves balances.
Share capital The balance on the share capital account represents the aggregate nominal value of all ordinary and preference shares in issue, includingtreasury shares.
Share premium account The balance on the share premium account represents the amounts received in excess of the nominal value of the ordinary and preferenceshares.
Capital redemption reserve The balance on the capital redemption reserve represents the aggregate nominal value of all the ordinary shares repurchased and cancelled.
Merger reserve The balance on the merger reserve represents the fair value of the consideration given in excess of the nominal value of the ordinary sharesissued in an acquisition made by the issue of shares.
Treasury shares Treasury shares represent BP shares repurchased and available for specific and limited purposes. For accounting purposes, shares held inEmployee Share Ownership Plans (ESOPs) and by BP’s US share plan administrator to meet the future requirements of the employee share-based payment plans are treated in the same manner as treasury shares and are, therefore, included in the financial statements as treasuryshares. The ESOPs are funded by the company and have waived their rights to dividends in respect of such shares held for future awards. Untilsuch time as the shares held by the ESOPs vest unconditionally to employees, the amount paid for those shares is shown as a reduction inshareholders’ equity. Assets and liabilities of the ESOPs are recognized as assets and liabilities of the company.
Foreign currency translation reserve The foreign currency translation reserve records exchange differences arising from the translation of the financial information of the foreigncurrency branch. Upon disposal of foreign operations, the related accumulated exchange differences are recycled to the income statement.
Profit and loss account The balance held on this reserve is the accumulated retained profits of the company.
The profit and loss account reserve includes $24,107 million (2016 $24,107 million), the distribution of which is limited by statutory or otherrestrictions.
The financial statements for the year ended 31 December 2017 do not reflect the dividend announced on 6 February 2018 and paid in March2018; this will be treated as an appropriation of profit in the year ended 31 December 2018.
9. Financial guarantees The company has issued guarantees under which the maximum aggregate liabilities at 31 December 2017 were $75,824 million (2016 $71,443million), the majority of which relate to finance debt of subsidiaries. Also included are guarantees of subsidiaries' liabilities under the ConsentDecree between the United States, the Gulf states and BP and under the settlement agreement with the Gulf states in relation to the Gulf ofMexico oil spill. The company has also issued uncapped indemnities and guarantees, including a guarantee of subsidiaries’ liabilities under thePlaintiffs’ Steering Committee agreement relating to the Gulf of Mexico oil spill. Uncapped indemnities and guarantees are also issued inrelation to potential losses arising from environmental incidents involving ships leased and operated by a subsidiary.
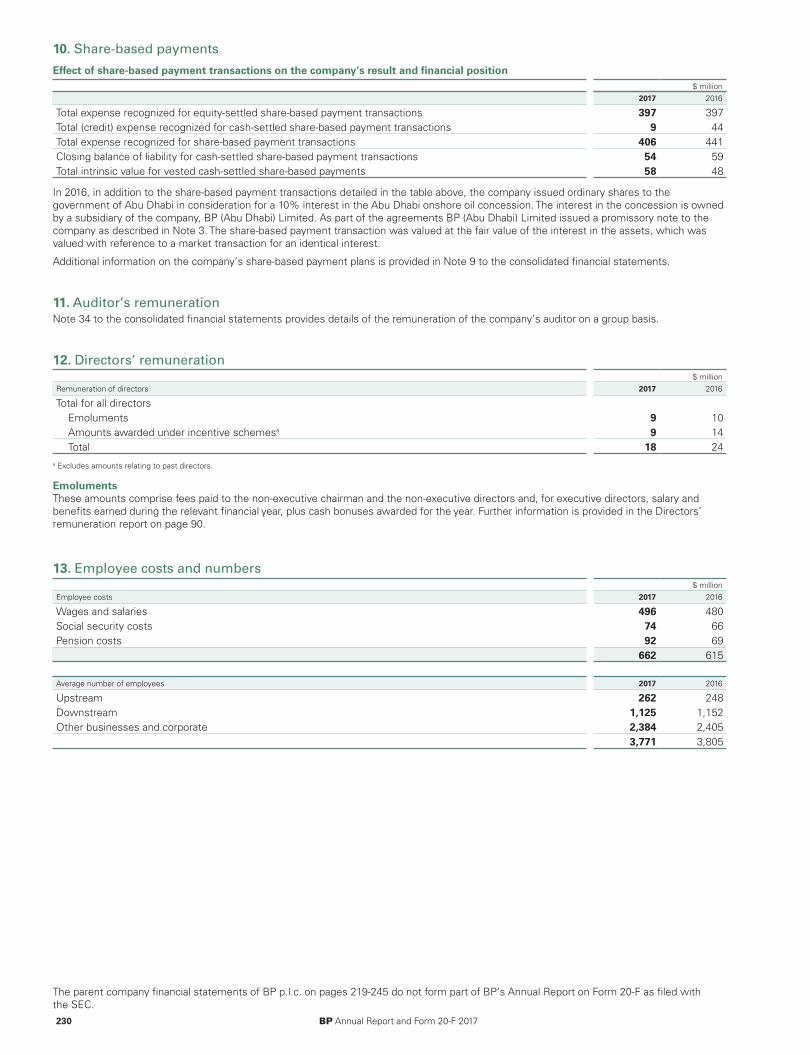
10. Share-based payments
Effect of share-based payment transactions on the company’s result and financial position $ million
2017 2016
Total expense recognized for equity-settled share-based payment transactions 397 397Total (credit) expense recognized for cash-settled share-based payment transactions 9 44Total expense recognized for share-based payment transactions 406 441Closing balance of liability for cash-settled share-based payment transactions 54 59Total intrinsic value for vested cash-settled share-based payments 58 48
In 2016, in addition to the share-based payment transactions detailed in the table above, the company issued ordinary shares to thegovernment of Abu Dhabi in consideration for a 10% interest in the Abu Dhabi onshore oil concession. The interest in the concession is ownedby a subsidiary of the company, BP (Abu Dhabi) Limited. As part of the agreements BP (Abu Dhabi) Limited issued a promissory note to thecompany as described in Note 3. The share-based payment transaction was valued at the fair value of the interest in the assets, which wasvalued with reference to a market transaction for an identical interest.
Additional information on the company’s share-based payment plans is provided in Note 9 to the consolidated financial statements.
The parent company financial statements of BP p.l.c. on pages 219-245 do not form part of BP’s Annual Report on Form 20-F as filed withthe SEC. 230 BP Annual Report and Form 20-F 2017
11. Auditor’s remuneration Note 34 to the consolidated financial statements provides details of the remuneration of the company’s auditor on a group basis.
12. Directors’ remuneration$ million
Remuneration of directors 2017 2016
Total for all directorsEmoluments 9 10Amounts awarded under incentive schemesa 9 14Total 18 24
a Excludes amounts relating to past directors.
Emoluments These amounts comprise fees paid to the non-executive chairman and the non-executive directors and, for executive directors, salary andbenefits earned during the relevant financial year, plus cash bonuses awarded for the year. Further information is provided in the Directors’remuneration report on page 90.
13. Employee costs and numbers $ million
Employee costs 2017 2016
Wages and salaries 496 480Social security costs 74 66Pension costs 92 69
662 615
Average number of employees 2017 2016
Upstream 262 248Downstream 1,125 1,152Other businesses and corporate 2,384 2,405
3,771 3,805
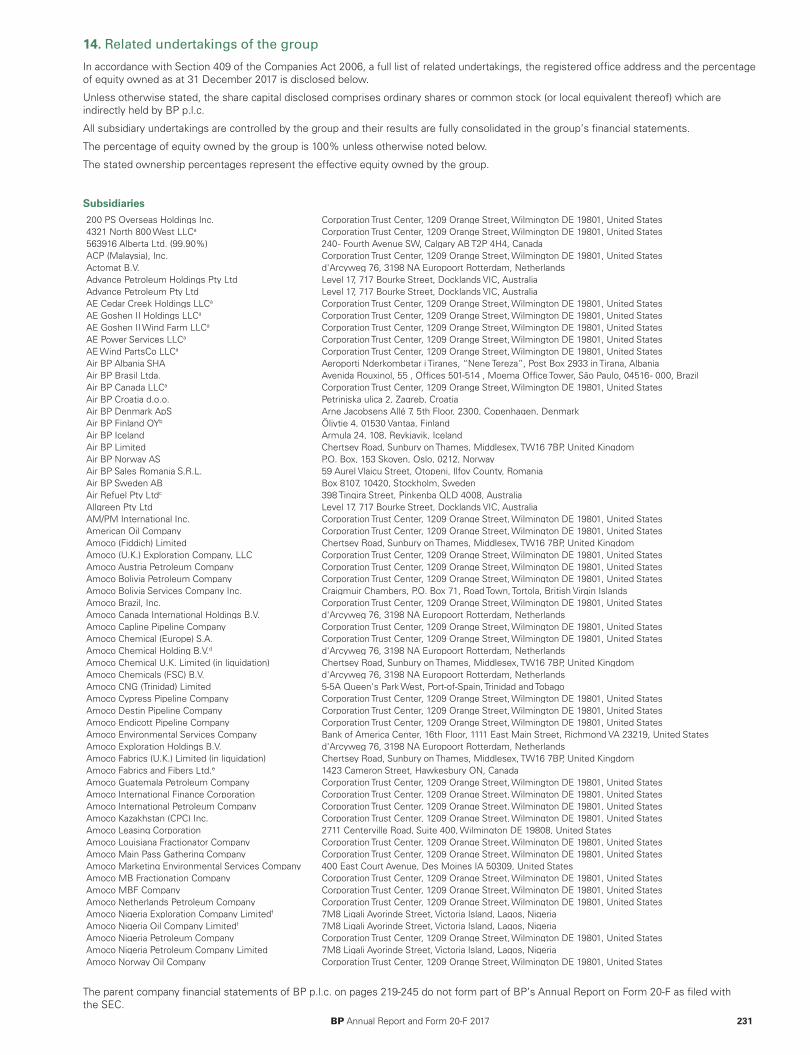
In accordance with Section 409 of the Companies Act 2006, a full list of related undertakings, the registered office address and the percentageof equity owned as at 31 December 2017 is disclosed below.
Unless otherwise stated, the share capital disclosed comprises ordinary shares or common stock (or local equivalent thereof) which areindirectly held by BP p.l.c.
All subsidiary undertakings are controlled by the group and their results are fully consolidated in the group’s financial statements.
The percentage of equity owned by the group is 100% unless otherwise noted below.
The stated ownership percentages represent the effective equity owned by the group.
Subsidiaries200 PS Overseas Holdings Inc. Corporation Trust Center, 1209 Orange Street, Wilmington DE 19801, United States4321 North 800 West LLCa Corporation Trust Center, 1209 Orange Street, Wilmington DE 19801, United States563916 Alberta Ltd. (99.90%) 240 - Fourth Avenue SW, Calgary AB T2P 4H4, CanadaACP (Malaysia), Inc. Corporation Trust Center, 1209 Orange Street, Wilmington DE 19801, United StatesActomat B.V. d'Arcyweg 76, 3198 NA Europoort Rotterdam, NetherlandsAdvance Petroleum Holdings Pty Ltd Level 17, 717 Bourke Street, Docklands VIC, AustraliaAdvance Petroleum Pty Ltd Level 17, 717 Bourke Street, Docklands VIC, AustraliaAE Cedar Creek Holdings LLCa Corporation Trust Center, 1209 Orange Street, Wilmington DE 19801, United StatesAE Goshen II Holdings LLCa Corporation Trust Center, 1209 Orange Street, Wilmington DE 19801, United StatesAE Goshen II Wind Farm LLCa Corporation Trust Center, 1209 Orange Street, Wilmington DE 19801, United StatesAE Power Services LLCa Corporation Trust Center, 1209 Orange Street, Wilmington DE 19801, United StatesAE Wind PartsCo LLCa Corporation Trust Center, 1209 Orange Street, Wilmington DE 19801, United StatesAir BP Albania SHA Aeroporti Nderkombetar i Tiranes, “Nene Tereza”, Post Box 2933 in Tirana, AlbaniaAir BP Brasil Ltda. Avenida Rouxinol, 55 , Offices 501-514 , Moema Office Tower, São Paulo, 04516 - 000, BrazilAir BP Canada LLCa Corporation Trust Center, 1209 Orange Street, Wilmington DE 19801, United StatesAir BP Croatia d.o.o. Petrinjska ulica 2, Zagreb, CroatiaAir BP Denmark ApS Arne Jacobsens Allé 7, 5th Floor, 2300, Copenhagen, DenmarkAir BP Finland OYb Öljytie 4, 01530 Vantaa, FinlandAir BP Iceland Armula 24, 108, Reykjavik, IcelandAir BP Limited Chertsey Road, Sunbury on Thames, Middlesex, TW16 7BP, United KingdomAir BP Norway AS P.O. Box, 153 Skoyen, Oslo, 0212, NorwayAir BP Sales Romania S.R.L. 59 Aurel Vlaicu Street, Otopeni, Ilfov County, RomaniaAir BP Sweden AB Box 8107, 10420, Stockholm, SwedenAir Refuel Pty Ltdc 398 Tingira Street, Pinkenba QLD 4008, AustraliaAllgreen Pty Ltd Level 17, 717 Bourke Street, Docklands VIC, AustraliaAM/PM International Inc. Corporation Trust Center, 1209 Orange Street, Wilmington DE 19801, United StatesAmerican Oil Company Corporation Trust Center, 1209 Orange Street, Wilmington DE 19801, United StatesAmoco (Fiddich) Limited Chertsey Road, Sunbury on Thames, Middlesex, TW16 7BP, United KingdomAmoco (U.K.) Exploration Company, LLC Corporation Trust Center, 1209 Orange Street, Wilmington DE 19801, United StatesAmoco Austria Petroleum Company Corporation Trust Center, 1209 Orange Street, Wilmington DE 19801, United StatesAmoco Bolivia Petroleum Company Corporation Trust Center, 1209 Orange Street, Wilmington DE 19801, United StatesAmoco Bolivia Services Company Inc. Craigmuir Chambers, P.O. Box 71, Road Town, Tortola, British Virgin IslandsAmoco Brazil, Inc. Corporation Trust Center, 1209 Orange Street, Wilmington DE 19801, United StatesAmoco Canada International Holdings B.V. d'Arcyweg 76, 3198 NA Europoort Rotterdam, NetherlandsAmoco Capline Pipeline Company Corporation Trust Center, 1209 Orange Street, Wilmington DE 19801, United StatesAmoco Chemical (Europe) S.A. Corporation Trust Center, 1209 Orange Street, Wilmington DE 19801, United StatesAmoco Chemical Holding B.V.d d'Arcyweg 76, 3198 NA Europoort Rotterdam, NetherlandsAmoco Chemical U.K. Limited (in liquidation) Chertsey Road, Sunbury on Thames, Middlesex, TW16 7BP, United KingdomAmoco Chemicals (FSC) B.V. d'Arcyweg 76, 3198 NA Europoort Rotterdam, NetherlandsAmoco CNG (Trinidad) Limited 5-5A Queen's Park West, Port-of-Spain, Trinidad and TobagoAmoco Cypress Pipeline Company Corporation Trust Center, 1209 Orange Street, Wilmington DE 19801, United StatesAmoco Destin Pipeline Company Corporation Trust Center, 1209 Orange Street, Wilmington DE 19801, United StatesAmoco Endicott Pipeline Company Corporation Trust Center, 1209 Orange Street, Wilmington DE 19801, United StatesAmoco Environmental Services Company Bank of America Center, 16th Floor, 1111 East Main Street, Richmond VA 23219, United StatesAmoco Exploration Holdings B.V. d'Arcyweg 76, 3198 NA Europoort Rotterdam, NetherlandsAmoco Fabrics (U.K.) Limited (in liquidation) Chertsey Road, Sunbury on Thames, Middlesex, TW16 7BP, United KingdomAmoco Fabrics and Fibers Ltd.e 1423 Cameron Street, Hawkesbury ON, CanadaAmoco Guatemala Petroleum Company Corporation Trust Center, 1209 Orange Street, Wilmington DE 19801, United StatesAmoco International Finance Corporation Corporation Trust Center, 1209 Orange Street, Wilmington DE 19801, United StatesAmoco International Petroleum Company Corporation Trust Center, 1209 Orange Street, Wilmington DE 19801, United StatesAmoco Kazakhstan (CPC) Inc. Corporation Trust Center, 1209 Orange Street, Wilmington DE 19801, United StatesAmoco Leasing Corporation 2711 Centerville Road, Suite 400, Wilmington DE 19808, United StatesAmoco Louisiana Fractionator Company Corporation Trust Center, 1209 Orange Street, Wilmington DE 19801, United StatesAmoco Main Pass Gathering Company Corporation Trust Center, 1209 Orange Street, Wilmington DE 19801, United StatesAmoco Marketing Environmental Services Company 400 East Court Avenue, Des Moines IA 50309, United StatesAmoco MB Fractionation Company Corporation Trust Center, 1209 Orange Street, Wilmington DE 19801, United StatesAmoco MBF Company Corporation Trust Center, 1209 Orange Street, Wilmington DE 19801, United StatesAmoco Netherlands Petroleum Company Corporation Trust Center, 1209 Orange Street, Wilmington DE 19801, United StatesAmoco Nigeria Exploration Company Limitedf 7M8 Ligali Ayorinde Street, Victoria Island, Lagos, NigeriaAmoco Nigeria Oil Company Limitedf 7M8 Ligali Ayorinde Street, Victoria Island, Lagos, NigeriaAmoco Nigeria Petroleum Company Corporation Trust Center, 1209 Orange Street, Wilmington DE 19801, United StatesAmoco Nigeria Petroleum Company Limited 7M8 Ligali Ayorinde Street, Victoria Island, Lagos, NigeriaAmoco Norway Oil Company Corporation Trust Center, 1209 Orange Street, Wilmington DE 19801, United States
14. Related undertakings of the group
The parent company financial statements of BP p.l.c. on pages 219-245 do not form part of BP’s Annual Report on Form 20-F as filed withthe SEC.
BP Annual Report and Form 20-F 2017 231
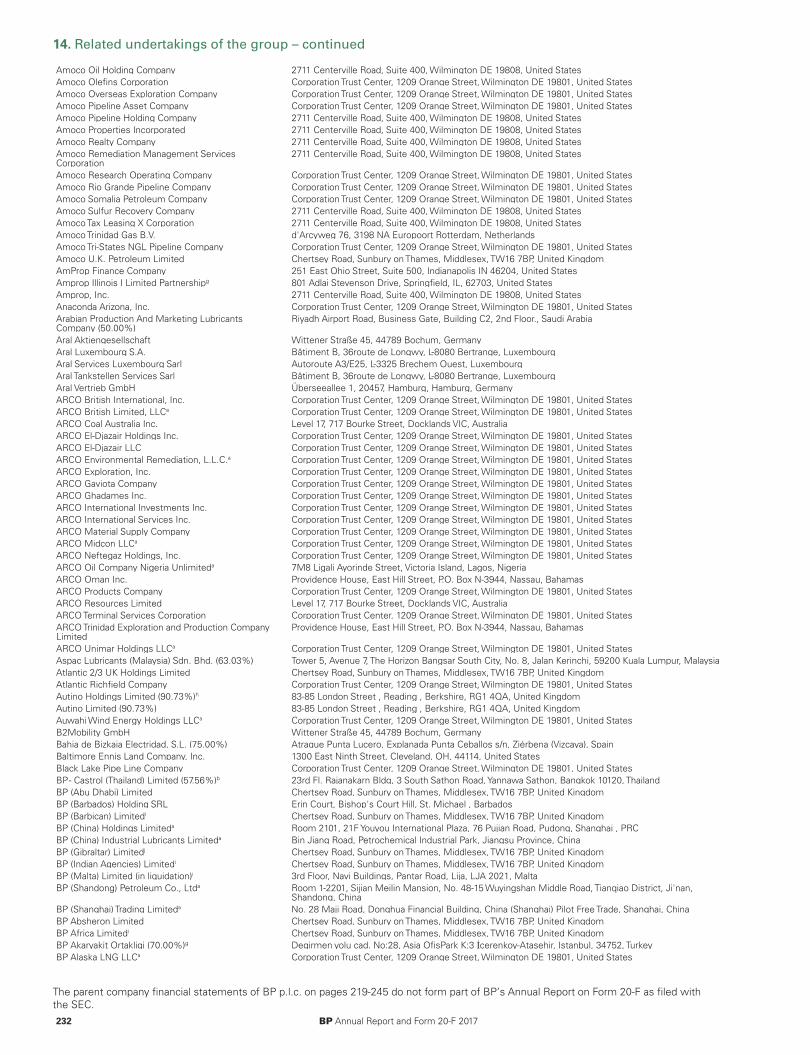
Amoco Oil Holding Company 2711 Centerville Road, Suite 400, Wilmington DE 19808, United StatesAmoco Olefins Corporation Corporation Trust Center, 1209 Orange Street, Wilmington DE 19801, United StatesAmoco Overseas Exploration Company Corporation Trust Center, 1209 Orange Street, Wilmington DE 19801, United StatesAmoco Pipeline Asset Company Corporation Trust Center, 1209 Orange Street, Wilmington DE 19801, United StatesAmoco Pipeline Holding Company 2711 Centerville Road, Suite 400, Wilmington DE 19808, United StatesAmoco Properties Incorporated 2711 Centerville Road, Suite 400, Wilmington DE 19808, United StatesAmoco Realty Company 2711 Centerville Road, Suite 400, Wilmington DE 19808, United StatesAmoco Remediation Management ServicesCorporation
2711 Centerville Road, Suite 400, Wilmington DE 19808, United States
Amoco Research Operating Company Corporation Trust Center, 1209 Orange Street, Wilmington DE 19801, United StatesAmoco Rio Grande Pipeline Company Corporation Trust Center, 1209 Orange Street, Wilmington DE 19801, United StatesAmoco Somalia Petroleum Company Corporation Trust Center, 1209 Orange Street, Wilmington DE 19801, United StatesAmoco Sulfur Recovery Company 2711 Centerville Road, Suite 400, Wilmington DE 19808, United StatesAmoco Tax Leasing X Corporation 2711 Centerville Road, Suite 400, Wilmington DE 19808, United StatesAmoco Trinidad Gas B.V. d'Arcyweg 76, 3198 NA Europoort Rotterdam, NetherlandsAmoco Tri-States NGL Pipeline Company Corporation Trust Center, 1209 Orange Street, Wilmington DE 19801, United StatesAmoco U.K. Petroleum Limited Chertsey Road, Sunbury on Thames, Middlesex, TW16 7BP, United KingdomAmProp Finance Company 251 East Ohio Street, Suite 500, Indianapolis IN 46204, United StatesAmprop Illinois I Limited Partnershipg 801 Adlai Stevenson Drive, Springfield, IL, 62703, United StatesAmprop, Inc. 2711 Centerville Road, Suite 400, Wilmington DE 19808, United StatesAnaconda Arizona, Inc. Corporation Trust Center, 1209 Orange Street, Wilmington DE 19801, United StatesArabian Production And Marketing LubricantsCompany (50.00%)
Riyadh Airport Road, Business Gate, Building C2, 2nd Floor., Saudi Arabia
Aral Aktiengesellschaft Wittener Straße 45, 44789 Bochum, GermanyAral Luxembourg S.A. Bâtiment B, 36route de Longwy, L-8080 Bertrange, LuxembourgAral Services Luxembourg Sarl Autoroute A3/E25, L-3325 Brechem Ouest, LuxembourgAral Tankstellen Services Sarl Bâtiment B, 36route de Longwy, L-8080 Bertrange, LuxembourgAral Vertrieb GmbH Überseeallee 1, 20457, Hamburg, Hamburg, GermanyARCO British International, Inc. Corporation Trust Center, 1209 Orange Street, Wilmington DE 19801, United StatesARCO British Limited, LLCa Corporation Trust Center, 1209 Orange Street, Wilmington DE 19801, United StatesARCO Coal Australia Inc. Level 17, 717 Bourke Street, Docklands VIC, AustraliaARCO El-Djazair Holdings Inc. Corporation Trust Center, 1209 Orange Street, Wilmington DE 19801, United StatesARCO El-Djazair LLC Corporation Trust Center, 1209 Orange Street, Wilmington DE 19801, United StatesARCO Environmental Remediation, L.L.C.a Corporation Trust Center, 1209 Orange Street, Wilmington DE 19801, United StatesARCO Exploration, Inc. Corporation Trust Center, 1209 Orange Street, Wilmington DE 19801, United StatesARCO Gaviota Company Corporation Trust Center, 1209 Orange Street, Wilmington DE 19801, United StatesARCO Ghadames Inc. Corporation Trust Center, 1209 Orange Street, Wilmington DE 19801, United StatesARCO International Investments Inc. Corporation Trust Center, 1209 Orange Street, Wilmington DE 19801, United StatesARCO International Services Inc. Corporation Trust Center, 1209 Orange Street, Wilmington DE 19801, United StatesARCO Material Supply Company Corporation Trust Center, 1209 Orange Street, Wilmington DE 19801, United StatesARCO Midcon LLCa Corporation Trust Center, 1209 Orange Street, Wilmington DE 19801, United StatesARCO Neftegaz Holdings, Inc. Corporation Trust Center, 1209 Orange Street, Wilmington DE 19801, United StatesARCO Oil Company Nigeria Unlimiteda 7M8 Ligali Ayorinde Street, Victoria Island, Lagos, NigeriaARCO Oman Inc. Providence House, East Hill Street, P.O. Box N-3944, Nassau, BahamasARCO Products Company Corporation Trust Center, 1209 Orange Street, Wilmington DE 19801, United StatesARCO Resources Limited Level 17, 717 Bourke Street, Docklands VIC, AustraliaARCO Terminal Services Corporation Corporation Trust Center, 1209 Orange Street, Wilmington DE 19801, United StatesARCO Trinidad Exploration and Production CompanyLimited
Providence House, East Hill Street, P.O. Box N-3944, Nassau, Bahamas
ARCO Unimar Holdings LLCa Corporation Trust Center, 1209 Orange Street, Wilmington DE 19801, United StatesAspac Lubricants (Malaysia) Sdn. Bhd. (63.03%) Tower 5, Avenue 7, The Horizon Bangsar South City, No. 8, Jalan Kerinchi, 59200 Kuala Lumpur, MalaysiaAtlantic 2/3 UK Holdings Limited Chertsey Road, Sunbury on Thames, Middlesex, TW16 7BP, United KingdomAtlantic Richfield Company Corporation Trust Center, 1209 Orange Street, Wilmington DE 19801, United StatesAutino Holdings Limited (90.73%)h 83-85 London Street , Reading , Berkshire, RG1 4QA, United KingdomAutino Limited (90.73%) 83-85 London Street , Reading , Berkshire, RG1 4QA, United KingdomAuwahi Wind Energy Holdings LLCa Corporation Trust Center, 1209 Orange Street, Wilmington DE 19801, United StatesB2Mobility GmbH Wittener Straße 45, 44789 Bochum, GermanyBahia de Bizkaia Electridad, S.L. (75.00%) Atraque Punta Lucero, Explanada Punta Ceballos s/n, Ziérbena (Vizcaya), SpainBaltimore Ennis Land Company, Inc. 1300 East Ninth Street, Cleveland, OH, 44114, United StatesBlack Lake Pipe Line Company Corporation Trust Center, 1209 Orange Street, Wilmington DE 19801, United StatesBP - Castrol (Thailand) Limited (57.56%)b 23rd Fl. Rajanakarn Bldg, 3 South Sathon Road, Yannawa Sathon, Bangkok 10120, ThailandBP (Abu Dhabi) Limited Chertsey Road, Sunbury on Thames, Middlesex, TW16 7BP, United KingdomBP (Barbados) Holding SRL Erin Court, Bishop's Court Hill, St. Michael , BarbadosBP (Barbican) Limitedi Chertsey Road, Sunbury on Thames, Middlesex, TW16 7BP, United KingdomBP (China) Holdings Limiteda Room 2101, 21F Youyou International Plaza, 76 Pujian Road, Pudong, Shanghai , PRCBP (China) Industrial Lubricants Limiteda Bin Jiang Road, Petrochemical Industrial Park, Jiangsu Province, ChinaBP (Gibraltar) Limitedj Chertsey Road, Sunbury on Thames, Middlesex, TW16 7BP, United KingdomBP (Indian Agencies) Limitedi Chertsey Road, Sunbury on Thames, Middlesex, TW16 7BP, United KingdomBP (Malta) Limited (in liquidation)i 3rd Floor, Navi Buildings, Pantar Road, Lija, LJA 2021, MaltaBP (Shandong) Petroleum Co., Ltda Room 1-2201, Sijian Meilin Mansion, No. 48-15 Wuyingshan Middle Road, Tianqiao District, Ji'nan,
Shandong, ChinaBP (Shanghai) Trading Limiteda No. 28 Maji Road, Donghua Financial Building, China (Shanghai) Pilot Free Trade, Shanghai, ChinaBP Absheron Limited Chertsey Road, Sunbury on Thames, Middlesex, TW16 7BP, United KingdomBP Africa Limitedi Chertsey Road, Sunbury on Thames, Middlesex, TW16 7BP, United KingdomBP Akaryakit Ortakligi (70.00%)g Degirmen yolu cad. No:28, Asia OfisPark K:3 İcerenkoy-Atasehir, Istanbul, 34752, TurkeyBP Alaska LNG LLCa Corporation Trust Center, 1209 Orange Street, Wilmington DE 19801, United States
14. Related undertakings of the group – continued
The parent company financial statements of BP p.l.c. on pages 219-245 do not form part of BP’s Annual Report on Form 20-F as filed withthe SEC. 232 BP Annual Report and Form 20-F 2017
BP Alternative Energy Holdings Limited Chertsey Road, Sunbury on Thames, Middlesex, TW16 7BP, United KingdomBP Alternative Energy Investments Limited Chertsey Road, Sunbury on Thames, Middlesex, TW16 7BP, United KingdomBP Alternative Energy North America Inc. Corporation Trust Center, 1209 Orange Street, Wilmington DE 19801, United StatesBP America Chembel Holding LLC Corporation Trust Center, 1209 Orange Street, Wilmington DE 19801, United StatesBP America Chemicals Company Corporation Trust Center, 1209 Orange Street, Wilmington DE 19801, United StatesBP America Foreign Investments Inc. Corporation Trust Center, 1209 Orange Street, Wilmington DE 19801, United StatesBP America Inc. Corporation Trust Center, 1209 Orange Street, Wilmington DE 19801, United StatesBP America Limited Chertsey Road, Sunbury on Thames, Middlesex, TW16 7BP, United KingdomBP America Production Company Corporation Trust Center, 1209 Orange Street, Wilmington DE 19801, United StatesBP AMI Leasing, Inc. Corporation Trust Center, 1209 Orange Street, Wilmington DE 19801, United StatesBP Amoco Chemical Company Corporation Trust Center, 1209 Orange Street, Wilmington DE 19801, United StatesBP Amoco Chemical Holding Company Corporation Trust Center, 1209 Orange Street, Wilmington DE 19801, United StatesBP Amoco Chemical Indonesia Limited 2711 Centerville Road, Suite 400, Wilmington DE 19808, United StatesBP Amoco Chemical Malaysia Holding Company Corporation Trust Center, 1209 Orange Street, Wilmington DE 19801, United StatesBP Amoco Chemical Singapore Holding Company 2711 Centerville Road, Suite 400, Wilmington DE 19808, United StatesBP Amoco Exploration (Faroes) Limited Chertsey Road, Sunbury on Thames, Middlesex, TW16 7BP, United KingdomBP Amoco Exploration (In Amenas) Limited 1 Wellheads Avenue, Dyce, Aberdeen, AB21 7PB, United KingdomBP Amoco Neighborhood Development Corporation 2711 Centerville Road, Suite 400, Wilmington DE 19808, United StatesBP Angola (Block 18) B.V. d'Arcyweg 76, 3198 NA Europoort Rotterdam, NetherlandsBP Argentina Exploration Company Corporation Trust Center, 1209 Orange Street, Wilmington DE 19801, United StatesBP Argentina Holdings LLCa Corporation Trust Center, 1209 Orange Street, Wilmington DE 19801, United StatesBP Aromatics Holdings Limited Chertsey Road, Sunbury on Thames, Middlesex, TW16 7BP, United KingdomBP Aromatics Limited Chertsey Road, Sunbury on Thames, Middlesex, TW16 7BP, United KingdomBP Aromatics Limited N.V. Amocolaan 2 2440 Geel , BelgiumBP Asia Limited Unit 807, Tower B, Manulife Financial Centre, 223 Wai Yip Street, Kwun Tong, Kowloon, Hong KongBP Asia Pacific (Malaysia) Sdn. Bhd. Tower 5, Avenue 7, The Horizon Bangsar South City, No. 8, Jalan Kerinchi, 59200 Kuala Lumpur, MalaysiaBP Asia Pacific Holdings Limited Chertsey Road, Sunbury on Thames, Middlesex, TW16 7BP, United KingdomBP Asia Pacific Pte Ltdi 7 Straits View #26-01, Marina One East Tower, Singapore, 018936, SingaporeBP Australia Capital Markets Limited Level 17, 717 Bourke Street, Docklands VIC, AustraliaBP Australia Employee Share Plan ProprietaryLimited
Level 17, 717 Bourke Street, Docklands VIC, Australia
BP Australia Group Pty Ltdf Level 17, 717 Bourke Street, Docklands VIC, AustraliaBP Australia Investments Pty Ltd Level 17, 717 Bourke Street, Docklands VIC, AustraliaBP Australia Nominees Proprietary Limited Level 17, 717 Bourke Street, Docklands VIC, AustraliaBP Australia Pty Ltd Level 17, 717 Bourke Street, Docklands VIC, AustraliaBP Australia Shipping Pty Ltdk Level 17, 717 Bourke Street, Docklands VIC, AustraliaBP Australia Swaps Management Limited Chertsey Road, Sunbury on Thames, Middlesex, TW16 7BP, United KingdomBP Aviation A/S c/o Danish Refuelling Services, Kastrup Lufthavn, 2770 Kastrup, DenmarkBP Benevolent Fund Trustees Limitedi Chertsey Road, Sunbury on Thames, Middlesex, TW16 7BP, United KingdomBP Berau Ltd. Corporation Trust Center, 1209 Orange Street, Wilmington DE 19801, United StatesBP Biocombustíveis S.A. (99.96%) Avenida das Nações Unidas, 12399, 4fl, Sao Paulo, BrazilBP Bioenergia Campina Verde Ltda. (99.96%) Rua Principal, Fazenda Recanto, Caixa Postal 01, Ituiutaba, Minas Gerais, 38.300-898, BrazilBP Bioenergia Ituiutaba Ltda. (99.96%) Fazenda Recanto, Zona Rural, CEP 38.300-898, Ituiutaba, Minas Gerais, BrazilBP Bioenergia Itumbiara S.A. (99.96%) Estrada Municipal Itumbiara, Chacoeira Dourada, Fazenda Jandaia, Itumbiara, Goiás, 75516-126, BrazilBP Bioenergia Tropical S.A. (99.97%) Rodovia GO 410, km 51 à esquerda, Fazenda Canadá, s/n, Zona Rural, Edéia, Goiás, 75940-000, BrazilBP Biofuels Advanced Technology Inc. Corporation Trust Center, 1209 Orange Street, Wilmington DE 19801, United StatesBP Biofuels Brazil Investments Limited Chertsey Road, Sunbury on Thames, Middlesex, TW16 7BP, United KingdomBP Biofuels Louisiana LLCa 5615 Corporate Blvd., Suite 400B, Baton Rouge LA 70808, United StatesBP Biofuels North America LLCa Corporation Trust Center, 1209 Orange Street, Wilmington DE 19801, United StatesBP Biofuels Trading Comércio, Importação eExportação Ltda. (99.96%)
Avenida das Nações Unidas, 12.399 , 4º andar, cj. 41B, sala 01, São Paulo, Brazil
BP Bomberai Ltd. Corporation Trust Center, 1209 Orange Street, Wilmington DE 19801, United StatesBP Brasil Ltda. Avenida das Américas, no. 3434, Salas 301 a 308, Barra da Tijuca, Rio de Janeiro, RJ, 22640-102, BrazilBP Brazil Tracking L.L.C.a Corporation Trust Center, 1209 Orange Street, Wilmington DE 19801, United StatesBP Bulwer Island Pty Ltdl Level 17, 717 Bourke Street, Docklands VIC, AustraliaBP Business Service Centre Asia Sdn Bhd Tower 5, Avenue 7, The Horizon Bangsar South City, No. 8, Jalan Kerinchi, 59200 Kuala Lumpur, MalaysiaBP Business Service Centre KFTa BP Business Service Centre KFT, 32-34 Soroksári út, H-1095 Budapest, HungaryBP Canada Energy Development Company Stewart McKelvey, 900, 1959 Upper Water Street, Halifax NS B3J 3N2, CanadaBP Canada Energy Group ULC Stewart McKelvey, 900, 1959 Upper Water Street, Halifax NS B3J 3N2, CanadaBP Canada Energy Marketing Corp. Corporation Trust Center, 1209 Orange Street, Wilmington DE 19801, United StatesBP Canada International Holdings B.V. d'Arcyweg 76, 3198 NA Europoort Rotterdam, NetherlandsBP Canada Investments Inc. Corporation Trust Center, 1209 Orange Street, Wilmington DE 19801, United StatesBP Capellen Sarl Aire de Capellen, L-8309 Capellen, LuxembourgBP Capital Markets America Inc. Corporation Trust Center, 1209 Orange Street, Wilmington DE 19801, United StatesBP Capital Markets p.l.c. Chertsey Road, Sunbury on Thames, Middlesex, TW16 7BP, United KingdomBP Car Fleet Limitedi Chertsey Road, Sunbury on Thames, Middlesex, TW16 7BP, United KingdomBP Caribbean Company Corporation Trust Center, 1209 Orange Street, Wilmington DE 19801, United StatesBP Castrol KK (64.84%) East Tower 20F, Gate CIty Ohsaki, 1-11-2 Osaki, Shinagawa-ku, Tokyo, JapanBP Castrol Lubricants (Malaysia) Sdn. Bhd. (63.03%) Tower 5, Avenue 7, The Horizon Bangsar South City, No. 8, Jalan Kerinchi, 59200 Kuala Lumpur, MalaysiaBP Chembel N.V. Amocolaan 2 2440 Geel , BelgiumBP Chemical US Sales Company Corporation Trust Center, 1209 Orange Street, Wilmington DE 19801, United StatesBP Chemicals (Korea) Limited Chertsey Road, Sunbury on Thames, Middlesex, TW16 7BP, United KingdomBP Chemicals East China Investments Limited Chertsey Road, Sunbury on Thames, Middlesex, TW16 7BP, United KingdomBP Chemicals Investments Limited Chertsey Road, Sunbury on Thames, Middlesex, TW16 7BP, United KingdomBP Chemicals Limited Chertsey Road, Sunbury on Thames, Middlesex, TW16 7BP, United KingdomBP Chemicals Trading Limited (In Liquidation) Chertsey Road, Sunbury on Thames, Middlesex, TW16 7BP, United Kingdom
14. Related undertakings of the group – continued
The parent company financial statements of BP p.l.c. on pages 219-245 do not form part of BP’s Annual Report on Form 20-F as filed withthe SEC.
BP Annual Report and Form 20-F 2017 233

BP Chile Petrolera Limitada Patricio Raby Benavente, Moneda N° 920 Of 205, Santiago, ChileBP China Exploration and Production Company Corporation Trust Center, 1209 Orange Street, Wilmington DE 19801, United StatesBP China Limited (In Liquidation)i 55 Baker Street, London, W1U 7EU, United KingdomBP Commodities Trading Limited Chertsey Road, Sunbury on Thames, Middlesex, TW16 7BP, United KingdomBP Company North America Inc. 2711 Centerville Road, Suite 400, Wilmington DE 19808, United StatesBP Containment Response Limited Chertsey Road, Sunbury on Thames, Middlesex, TW16 7BP, United KingdomBP Containment Response System Holdings LLCa Corporation Trust Center, 1209 Orange Street, Wilmington DE 19801, United StatesBP Continental Holdings Limited Chertsey Road, Sunbury on Thames, Middlesex, TW16 7BP, United KingdomBP Corporate Holdings Limited Chertsey Road, Sunbury on Thames, Middlesex, TW16 7BP, United KingdomBP Corporation North America Inc. 150 West Market Street, Suite 800, Indianapolis IN 46204, United StatesBP Danmark A/S Arne Jacobsens Allé 7, 5th Floor, 2300, Copenhagen, DenmarkBP D-B Pipeline Company LLCa Corporation Trust Center, 1209 Orange Street, Wilmington DE 19801, United StatesBP Developments Australia Pty. Ltd. Level 8, 250 St Georges Terrace, Perth WA 6000, AustraliaBP Dogal Gaz Ticaret Anonim Sirketi Degirmen yolu cad. No:28, Asia OfisPark K:3 İcerenkoy-Atasehir, Istanbul, 34752, TurkeyBP East Kalimantan CBM Limited Chertsey Road, Sunbury on Thames, Middlesex, TW16 7BP, United KingdomBP Eastern Mediterranean Limited Chertsey Road, Sunbury on Thames, Middlesex, TW16 7BP, United KingdomBP Egypt Company Corporation Trust Center, 1209 Orange Street, Wilmington DE 19801, United StatesBP Egypt East Delta Marine Corporation Craigmuir Chambers, P.O. Box 71, Road Town, Tortola, British Virgin IslandsBP Egypt East Tanka B.V. d'Arcyweg 76, 3198 NA Europoort Rotterdam, NetherlandsBP Egypt Production B.V. d'Arcyweg 76, 3198 NA Europoort Rotterdam, NetherlandsBP Egypt Ras El Barr B.V. d'Arcyweg 76, 3198 NA Europoort Rotterdam, NetherlandsBP Egypt West Mediterranean (Block B) B.V. d'Arcyweg 76, 3198 NA Europoort Rotterdam, NetherlandsBP Energía México, S. de R.L. de C.V. Avenida Santa Fe 505, Col. Cruz Manca Santa Fe, Delegacion Cuajimalpa, MexicoBP Energy Asia Pte. Limited 7 Straits View #26-01, Marina One East Tower, Singapore, 018936, SingaporeBP Energy Colombia Limited Chertsey Road, Sunbury on Thames, Middlesex, TW16 7BP, United KingdomBP Energy Company Corporation Trust Center, 1209 Orange Street, Wilmington DE 19801, United StatesBP Energy do Brasil Ltda. Avenida das Américas, no. 3434, Salas 301 a 308, Barra da Tijuca, Rio de Janeiro, RJ, 22640-102, BrazilBP Energy Europe Limited 1 Wellheads Avenue, Dyce, Aberdeen, AB21 7PB, United KingdomBP Espana, S.A. Unipersonall Avenida de Barajas 30, Parque Empresarial Omega, Edificio D. 28108 Alcobendas, Madrid, SpainBP Estaciones y Servicios Energéticos, SociedadAnónima de Capital Variablec
Avenida Santa Fe 505, Piso 10, Distrito Federal, Mexico C.P. 0534, Mexico
BP Europa SEm Überseeallee 1, 20457, Hamburg, Hamburg, GermanyBP Exploracion de Venezuela S.A. Av. Francisco de Miranda, Edif Cavendes, Los Palos Grandes, Chacao, Caracas Miranda, 1060, VenezuelaBP Exploration & Production Inc.e Corporation Trust Center, 1209 Orange Street, Wilmington DE 19801, United StatesBP Exploration (Absheron) Limited Chertsey Road, Sunbury on Thames, Middlesex, TW16 7BP, United KingdomBP Exploration (Alaska) Inc. Corporation Trust Center, 1209 Orange Street, Wilmington DE 19801, United StatesBP Exploration (Algeria) Limited Chertsey Road, Sunbury on Thames, Middlesex, TW16 7BP, United KingdomBP Exploration (Alpha) Limited Chertsey Road, Sunbury on Thames, Middlesex, TW16 7BP, United KingdomBP Exploration (Angola) Limited Chertsey Road, Sunbury on Thames, Middlesex, TW16 7BP, United KingdomBP Exploration (Azerbaijan) Limited Chertsey Road, Sunbury on Thames, Middlesex, TW16 7BP, United KingdomBP Exploration (Canada) Limited Chertsey Road, Sunbury on Thames, Middlesex, TW16 7BP, United KingdomBP Exploration (Caspian Sea) Limited Chertsey Road, Sunbury on Thames, Middlesex, TW16 7BP, United KingdomBP Exploration (Delta) Limited Chertsey Road, Sunbury on Thames, Middlesex, TW16 7BP, United KingdomBP Exploration (El Djazair) Limited Providence House, East Hill Street, P.O. Box N-3910, Nassau, BahamasBP Exploration (Epsilon) Limited Chertsey Road, Sunbury on Thames, Middlesex, TW16 7BP, United KingdomBP Exploration (Finance) Limited (In Liquidation) Chertsey Road, Sunbury on Thames, Middlesex, TW16 7BP, United KingdomBP Exploration (Greenland) Limited Chertsey Road, Sunbury on Thames, Middlesex, TW16 7BP, United KingdomBP Exploration (Madagascar) Limited Chertsey Road, Sunbury on Thames, Middlesex, TW16 7BP, United KingdomBP Exploration (Morocco) Limited Chertsey Road, Sunbury on Thames, Middlesex, TW16 7BP, United KingdomBP Exploration (Namibia) Limited Chertsey Road, Sunbury on Thames, Middlesex, TW16 7BP, United KingdomBP Exploration (Nigeria Finance) Limited Chertsey Road, Sunbury on Thames, Middlesex, TW16 7BP, United KingdomBP Exploration (Nigeria) Limited Landmark Towers - 5B, Water Corporation Road, Victoria Island, Lagos, NigeriaBP Exploration (Shafag-Asiman) Limited Chertsey Road, Sunbury on Thames, Middlesex, TW16 7BP, United KingdomBP Exploration (Shah Deniz) Limited Chertsey Road, Sunbury on Thames, Middlesex, TW16 7BP, United KingdomBP Exploration (South Atlantic) Limited Chertsey Road, Sunbury on Thames, Middlesex, TW16 7BP, United KingdomBP Exploration (Vietnam) Limited (In Liquidation) Chertsey Road, Sunbury on Thames, Middlesex, TW16 7BP, United KingdomBP Exploration (Xazar) PTE. Limited 7 Straits View #26-01, Marina One East Tower, Singapore, 018936, SingaporeBP Exploration Angola (Kwanza Benguela) Limited Chertsey Road, Sunbury on Thames, Middlesex, TW16 7BP, United KingdomBP Exploration Australia Pty Ltd Level 8, 250 St Georges Terrace, Perth WA 6000, AustraliaBP Exploration Beta Limited Chertsey Road, Sunbury on Thames, Middlesex, TW16 7BP, United KingdomBP Exploration China Limited Chertsey Road, Sunbury on Thames, Middlesex, TW16 7BP, United KingdomBP Exploration Company (Middle East) Limited Chertsey Road, Sunbury on Thames, Middlesex, TW16 7BP, United KingdomBP Exploration Company Limitedn 1 Wellheads Avenue, Dyce, Aberdeen, AB21 7PB, United KingdomBP Exploration Indonesia Limited Chertsey Road, Sunbury on Thames, Middlesex, TW16 7BP, United KingdomBP Exploration Libya Limited Chertsey Road, Sunbury on Thames, Middlesex, TW16 7BP, United KingdomBP Exploration Mexico Limited Chertsey Road, Sunbury on Thames, Middlesex, TW16 7BP, United KingdomBP Exploration Mexico, S.A. DE C.V.b Avenida Santa Fe 505, Col. Cruz Manca Santa Fe, Delegacion Cuajimalpa, MexicoBP Exploration North Africa Limited Chertsey Road, Sunbury on Thames, Middlesex, TW16 7BP, United KingdomBP Exploration Operating Company Limitedl Chertsey Road, Sunbury on Thames, Middlesex, TW16 7BP, United KingdomBP Exploration Orinoco Limited Chertsey Road, Sunbury on Thames, Middlesex, TW16 7BP, United KingdomBP Exploration Personnel Company Limited Chertsey Road, Sunbury on Thames, Middlesex, TW16 7BP, United KingdomBP Express Shopping Limited Chertsey Road, Sunbury on Thames, Middlesex, TW16 7BP, United KingdomBP Finance Australia Pty Ltd Level 17, 717 Bourke Street, Docklands VIC, AustraliaBP Finance p.l.c. Chertsey Road, Sunbury on Thames, Middlesex, TW16 7BP, United KingdomBP Foundation Incorporateda 251 East Ohio Street, Suite 500, Indianapolis IN 46204, United States
14. Related undertakings of the group – continued
The parent company financial statements of BP p.l.c. on pages 219-245 do not form part of BP’s Annual Report on Form 20-F as filed withthe SEC. 234 BP Annual Report and Form 20-F 2017
BP France Immeuble Le Cervier, 12 Avenue des Béguines, Cergy Saint Christophe, 95866, Cergy Pontoise, FranceBP Fuels & Lubricants AS P.O.Box 153 Skøyen, 0212 Oslo, NorwayBP Fuels Deutschland GmbH Wittener Straße 45, 44789 Bochum, GermanyBP Gas Europe, S.A.U. Avenida de Barajas 30, Parque Empresarial Omega, Edificio D. 28108 Alcobendas, Madrid, SpainBP Gas Marketing Limited Chertsey Road, Sunbury on Thames, Middlesex, TW16 7BP, United KingdomBP Gas Supply (Angola) LLCa Corporation Trust Center, 1209 Orange Street, Wilmington DE 19801, United StatesBP Ghana Limited Number 12, Aviation Road, Una Home 3rd Floor, Airport City , Accra, Greater Accra, PMB CT 42, GhanaBP Global Investments Limitedi Chertsey Road, Sunbury on Thames, Middlesex, TW16 7BP, United KingdomBP Global Investments Salalah & Co LLC PO Box 2309, Salalah, 211, OmanBP Global West Africa Limited Heritage Place, 7th Floor, Left Wing, 21 Lugard Avenue, Ikoyi, Lagos, NigeriaBP GOM Logistics LLCa Corporation Trust Center, 1209 Orange Street, Wilmington DE 19801, United StatesBP Greece Limited Chertsey Road, Sunbury on Thames, Middlesex, TW16 7BP, United KingdomBP Guangdong Limited (90.00%)a Rm 2710Guangfa Bank Plaza, No. 83 Nonglin Xia Road, Yuexiu District, Guangzhou, ChinaBP High Density Polyethylene France - BP HDPE Immeuble Le Cervier, 12 Avenue des Béguines, Cergy Saint Christophe, 95866, Cergy Pontoise, FranceBP Holdings (Thailand) Limited (81.01%)o 39/77-78 Moo 2 Rama II Road, Tambon Bangkrachao, Amphur Muang, Samutsakorn 74000, ThailandBP Holdings B.V. d'Arcyweg 76, 3198 NA Europoort Rotterdam, NetherlandsBP Holdings Canada Limitedi Chertsey Road, Sunbury on Thames, Middlesex, TW16 7BP, United KingdomBP Holdings International B.V. d'Arcyweg 76, 3198 NA Europoort Rotterdam, NetherlandsBP Holdings North America Limitedi Chertsey Road, Sunbury on Thames, Middlesex, TW16 7BP, United KingdomBP Hong Kong Limited Unit 807, Tower B, Manulife Financial Centre, 223 Wai Yip Street, Kwun Tong, Kowloon, Hong KongBP India Limited Technopolis Knowledge Park, Mahakali Caves Road, Andheri (East), Mumbai 400 093, IndiaBP India Services Private Limited Technopolis Knowledge Park, Mahakali Caves Road, Andheri (East), Mumbai 400 093, IndiaBP Indonesia Investment Limited Chertsey Road, Sunbury on Thames, Middlesex, TW16 7BP, United KingdomBP International Limitedi Chertsey Road, Sunbury on Thames, Middlesex, TW16 7BP, United KingdomBP International Services Company 2711 Centerville Road, Suite 400, Wilmington DE 19808, United StatesBP Investment Management Limited Chertsey Road, Sunbury on Thames, Middlesex, TW16 7BP, United KingdomBP Investments Asia Limited Chertsey Road, Sunbury on Thames, Middlesex, TW16 7BP, United KingdomBP Iran Limited Chertsey Road, Sunbury on Thames, Middlesex, TW16 7BP, United KingdomBP IRAQ N.V. Amocolaan 2 2440 Geel , BelgiumBP Italia SpA Via Verona 12, Cornaredo, 20010, Milan, ItalyBP Japan K.K. Roppongi Hills Mori Tower, 10-1 Roppongi 6-chome, Minato-ku, Tokyo106-6115, JapanBP Kapuas I Limited Chertsey Road, Sunbury on Thames, Middlesex, TW16 7BP, United KingdomBP Kapuas II Limited Chertsey Road, Sunbury on Thames, Middlesex, TW16 7BP, United KingdomBP Kapuas III Limited Chertsey Road, Sunbury on Thames, Middlesex, TW16 7BP, United KingdomBP Korea Limited 2nd Floor, Woojin Bldg., 76-4, Jamwon-dong, Seocho-gu, Seoul 137-909, Republic of KoreaBP Kuwait Limited Chertsey Road, Sunbury on Thames, Middlesex, TW16 7BP, United KingdomBP Latin America LLCa Corporation Trust Center, 1209 Orange Street, Wilmington DE 19801, United StatesBP Lesotho (Pty) Limitedi BP House, Motsoene Road, Industrial Area, Maseru, LesothoBP Lingen GmbH Raffineriestraße, 49808 Lingen, GermanyBP LNG Shipping Limited Clarendon House, 2 Church Street, P.O. Box HM 1022, Hamilton, HM DX, BermudaBP Lubes Marketing GmbH Überseeallee 1, 20457, Hamburg, Hamburg, GermanyBP Lubricants KK (64.84%) East Tower 20F, Gate CIty Ohsaki, 1-11-2 Osaki, Shinagawa-ku, Tokyo, JapanBP Lubricants USA Inc. Corporation Trust Center, 1209 Orange Street, Wilmington DE 19801, United StatesBP Luxembourg S.A. Aire de Capellen, L-8309 Capellen, LuxembourgBP Malaysia Holdings Sdn. Bhd. (70.00%) Tower 5, Avenue 7, The Horizon Bangsar South City, No. 8, Jalan Kerinchi, 59200 Kuala Lumpur, MalaysiaBP Management International B.V. d'Arcyweg 76, 3198 NA Europoort Rotterdam, NetherlandsBP Management Netherlands B.V. d'Arcyweg 76, 3198 NA Europoort Rotterdam, NetherlandsBP Marine Limited Chertsey Road, Sunbury on Thames, Middlesex, TW16 7BP, United KingdomBP Mariner Holding Company LLCa Corporation Trust Center, 1209 Orange Street, Wilmington DE 19801, United StatesBP Maritime Services (Isle of Man) Limited Samuel Harris House, 5-11 St Georges Street, Douglas, Isle of Man, IM1 1AJ, Isle of ManBP Maritime Services (Singapore) Pte. Limited 7 Straits View #26-01, Marina One East Tower, Singapore, 018936, SingaporeBP Marketing Egypt LLC Plot 28, North 90 Road, Housing & Construction Bank Building, New Cairo, Cairo, 11835, EgyptBP Mauritania Investments Limited Chertsey Road, Sunbury on Thames, Middlesex, TW16 7BP, United KingdomBP Mauritius Limited 5th Floor, Ebene Esplanade, 24 Cybercity, Ebene, MauritiusBP Middle East Enterprises Corporation Craigmuir Chambers, P.O. Box 71, Road Town, Tortola, British Virgin IslandsBP Middle East Limitedi Chertsey Road, Sunbury on Thames, Middlesex, TW16 7BP, United KingdomBP Middle East LLC P.O.Box 1699, Dubai, 1699, United Arab EmiratesBP Midstream Partners GP LLCa Corporation Trust Center, 1209 Orange Street, Wilmington DE 19801, United StatesBP Midstream Partners Holdings LLCa Corporation Trust Center, 1209 Orange Street, Wilmington DE 19801, United StatesBP Midstream Partners LPg Corporation Trust Center, 1209 Orange Street, Wilmington DE 19801, United StatesBP Mocambique Limitada Society and Geography Avenue, Plot No. 269 , Third floor, Maputo, MozambiqueBP Mocambique Limited Chertsey Road, Sunbury on Thames, Middlesex, TW16 7BP, United KingdomBP Muturi Holdings B.V. d'Arcyweg 76, 3198 NA Europoort Rotterdam, NetherlandsBP Nederland Holdings BV d'Arcyweg 76, 3198 NA Europoort Rotterdam, NetherlandsBP Netherlands Exploration Holding B.V. d'Arcyweg 76, 3198 NA Europoort Rotterdam, NetherlandsBP Netherlands Upstream B.V. d'Arcyweg 76, 3198 NA Europoort Rotterdam, NetherlandsBP New Ventures Middle East Limited Chertsey Road, Sunbury on Thames, Middlesex, TW16 7BP, United KingdomBP New Zealand Holdings Limited Watercare House, 73 Remuera Road, Newmarket, Auckland, 1050, New ZealandBP New Zealand Share Scheme Limited Watercare House, 73 Remuera Road, Newmarket, Auckland, 1050, New ZealandBP Nutrition Inc. Corporation Trust Center, 1209 Orange Street, Wilmington DE 19801, United StatesBP Offshore Gathering Systems Inc. Corporation Trust Center, 1209 Orange Street, Wilmington DE 19801, United StatesBP Offshore Pipelines Company LLCa Corporation Trust Center, 1209 Orange Street, Wilmington DE 19801, United StatesBP Offshore Response Company LLCa Corporation Trust Center, 1209 Orange Street, Wilmington DE 19801, United StatesBP Oil (Thailand) Limited (90.32%)p 39/77-78 Moo 2 Rama II Road, Tambon Bangkrachao, Amphur Muang, Samutsakorn 74000, ThailandBP Oil and Chemicals International Philippines Inc. 30/F LKGTower, 6801 Ayala Avenue, Makati City 1226, Philippines
14. Related undertakings of the group – continued
The parent company financial statements of BP p.l.c. on pages 219-245 do not form part of BP’s Annual Report on Form 20-F as filed withthe SEC.
BP Annual Report and Form 20-F 2017 235

BP Oil Australia Pty Ltd Level 17, 717 Bourke Street, Docklands VIC, AustraliaBP Oil Espana, S.A. Unipersonal Polígono Industrial "El Serrallo", s/n 12100 Grao de Castellón, Castellón de la Plana, SpainBP Oil Hellenic S.A. 26 Kifissias Ave. and 2 Paradissou st., 15125 Maroussi, Athens, GreeceBP Oil International Limited Chertsey Road, Sunbury on Thames, Middlesex, TW16 7BP, United KingdomBP Oil Kent Refinery Limited (in liquidation) Chertsey Road, Sunbury on Thames, Middlesex, TW16 7BP, United KingdomBP Oil Llandarcy Refinery Limited Chertsey Road, Sunbury on Thames, Middlesex, TW16 7BP, United KingdomBP Oil Logistics UK Limited Chertsey Road, Sunbury on Thames, Middlesex, TW16 7BP, United KingdomBP Oil Marketing GmbH Wittener Straße 45, 44789 Bochum, GermanyBP Oil New Zealand Limited Watercare House, 73 Remuera Road, Newmarket, Auckland, 1050, New ZealandBP Oil Pipeline Company Corporation Trust Center, 1209 Orange Street, Wilmington DE 19801, United StatesBP Oil Shipping Company, USA Corporation Trust Center, 1209 Orange Street, Wilmington DE 19801, United StatesBP Oil UK Limited Chertsey Road, Sunbury on Thames, Middlesex, TW16 7BP, United KingdomBP Oil Venezuela Limited Chertsey Road, Sunbury on Thames, Middlesex, TW16 7BP, United KingdomBP Oil Vietnam Limited Chertsey Road, Sunbury on Thames, Middlesex, TW16 7BP, United KingdomBP Oil Yemen Limited Chertsey Road, Sunbury on Thames, Middlesex, TW16 7BP, United KingdomBP Olex Fanal Mineralol GmbH Überseeallee 1, 20457, Hamburg, Hamburg, GermanyBP Pacific Investments Ltd Watercare House, 73 Remuera Road, Newmarket, Auckland, 1050, New ZealandBP Pakistan (Badin) Inc. Corporation Trust Center, 1209 Orange Street, Wilmington DE 19801, United StatesBP Pakistan Exploration and Production, Inc. Corporation Trust Center, 1209 Orange Street, Wilmington DE 19801, United StatesBP Pension Trustees Limitedi Chertsey Road, Sunbury on Thames, Middlesex, TW16 7BP, United KingdomBP Pensions (Overseas) Limitedj Albert House, South Esplanade, St. Peter Port, GY1 1AW, GuernseyBP Pensions Limitedi Chertsey Road, Sunbury on Thames, Middlesex, TW16 7BP, United KingdomBP Petrochemicals India Investments Limited Chertsey Road, Sunbury on Thames, Middlesex, TW16 7BP, United KingdomBP Petroleo y Gas, S.A. Av. Francisco de Miranda, Edif Cavendes, Los Palos Grandes, Chacao, Caracas Miranda, 1060, VenezuelaBP Petrolleri Anonim Sirketi (24.89%) Degirmen yolu cad. No:28, Asia OfisPark K:3 İcerenkoy-Atasehir, Istanbul, 34752, TurkeyBP Pipelines (Alaska) Inc. Corporation Trust Center, 1209 Orange Street, Wilmington DE 19801, United StatesBP Pipelines (BTC) Limited Chertsey Road, Sunbury on Thames, Middlesex, TW16 7BP, United KingdomBP Pipelines (North America) Inc. 45 Memorial Circle, Augusta ME 04330, United StatesBP Pipelines (SCP) Limited Chertsey Road, Sunbury on Thames, Middlesex, TW16 7BP, United KingdomBP Pipelines (TANAP) Limited Chertsey Road, Sunbury on Thames, Middlesex, TW16 7BP, United KingdomBP Pipelines TAP Limited Chertsey Road, Sunbury on Thames, Middlesex, TW16 7BP, United KingdomBP Polska Services Sp. z o.o. Ul. Jasnogórska 1, 31-358 Kraków, Malopolskie, PolandBP Portugal -Comercio de Combustiveis e LubrificantesSA
Lagoas Park, Edificio 3, Porto Salvo, Oeiras, Portugal
BP Poseidon Limited Chertsey Road, Sunbury on Thames, Middlesex, TW16 7BP, United KingdomBP Products North America Inc. 351 West Camden Street, Baltimore MD 21201, United StatesBP Properties Limitedi Chertsey Road, Sunbury on Thames, Middlesex, TW16 7BP, United KingdomBP Raffinaderij Rotterdam B.V. d'Arcyweg 76, 3198 NA Europoort Rotterdam, NetherlandsBP Refinery (Kwinana) Proprietary Limited Level 17, 717 Bourke Street, Docklands VIC, AustraliaBP Refining & Petrochemicals GmbH Wittener Straße 45, 44789 Bochum, GermanyBP Regional Australasia Holdings Pty Ltd Level 17, 717 Bourke Street, Docklands VIC, AustraliaBP River Rouge Pipeline Company LLCa Corporation Trust Center, 1209 Orange Street, Wilmington DE 19801, United StatesBP Russian Investments Limited Chertsey Road, Sunbury on Thames, Middlesex, TW16 7BP, United KingdomBP SC Holdings LLCa Corporation Trust Center, 1209 Orange Street, Wilmington DE 19801, United StatesBP Senegal Investments Limited Chertsey Road, Sunbury on Thames, Middlesex, TW16 7BP, United KingdomBP Services International Limited Chertsey Road, Sunbury on Thames, Middlesex, TW16 7BP, United KingdomBP Servicios de combustibles SA de CV Avenida Santa Fe 505, Col. Cruz Manca Santa Fe, Delegacion Cuajimalpa, MexicoBP Servicios territoriales, S.A. de C.V. Avenida Santa Fe 505, Col. Cruz Manca Santa Fe, Delegacion Cuajimalpa, MexicoBP Shafag-Asiman Limited Chertsey Road, Sunbury on Thames, Middlesex, TW16 7BP, United KingdomBP Shipping Limited Chertsey Road, Sunbury on Thames, Middlesex, TW16 7BP, United KingdomBP Singapore Pte. Limited 7 Straits View #26-01, Marina One East Tower, Singapore, 018936, SingaporeBP Solar Energy North America LLCa Corporation Trust Center, 1209 Orange Street, Wilmington DE 19801, United StatesBP Solar Espana, S.A. Unipersonalc Avenida de Barajas 30, Parque Empresarial Omega, Edificio D. 28108 Alcobendas, Madrid, SpainBP Solar International Inc. Corporation Trust Center, 1209 Orange Street, Wilmington DE 19801, United StatesBP Solar Pty Ltd Level 17, 717 Bourke Street, Docklands VIC, AustraliaBP South East Asia Limitedi Chertsey Road, Sunbury on Thames, Middlesex, TW16 7BP, United KingdomBP Southern Africa Proprietary Limited (75.00%) BP House, 10 Junction Avenue, Parktown, Johannesburg, 2193, South AfricaBP Southern Cone Company Corporation Trust Center, 1209 Orange Street, Wilmington DE 19801, United StatesBP Subsea Well Response (Brazil) Limited Chertsey Road, Sunbury on Thames, Middlesex, TW16 7BP, United KingdomBP Subsea Well Response Limited Chertsey Road, Sunbury on Thames, Middlesex, TW16 7BP, United KingdomBP Taiwan Marketing Limited 7FNo. 71Sec. 3Min Sheng East Road, Taipei, TaiwanBP Tanjung IV Limited Chertsey Road, Sunbury on Thames, Middlesex, TW16 7BP, United KingdomBP Technology Ventures Inc. Corporation Trust Center, 1209 Orange Street, Wilmington DE 19801, United StatesBP Technology Ventures Limited Chertsey Road, Sunbury on Thames, Middlesex, TW16 7BP, United KingdomBP Toplivnaya Kompanya LLCa 2 Paveletskaya sq, Building1, 115054 Moscow, Russian FederationBP Trade and Supply (Germany) GmbH,Hamburg Überseeallee 1, 20457, Hamburg, Hamburg, GermanyBP Trading Limited Chertsey Road, Sunbury on Thames, Middlesex, TW16 7BP, United KingdomBP Train 2/3 Holding SRL Erin Court, Bishop's Court Hill, St. Michael , BarbadosBP Transportation (Alaska) Inc. Corporation Trust Center, 1209 Orange Street, Wilmington DE 19801, United StatesBP Trinidad and Tobago LLC (70.00%)a Corporation Trust Center, 1209 Orange Street, Wilmington DE 19801, United StatesBP Trinidad Processing Limited 5-5A Queen's Park West, Port-of-Spain, Trinidad and TobagoBP Turkey Refining Limitedi Chertsey Road, Sunbury on Thames, Middlesex, TW16 7BP, United KingdomBP Two Pipeline Company LLCa Corporation Trust Center, 1209 Orange Street, Wilmington DE 19801, United StatesBP Venezuela Investments B.V. d'Arcyweg 76, 3198 NA Europoort Rotterdam, NetherlandsBP West Aru I Limited Chertsey Road, Sunbury on Thames, Middlesex, TW16 7BP, United Kingdom
14. Related undertakings of the group – continued
The parent company financial statements of BP p.l.c. on pages 219-245 do not form part of BP’s Annual Report on Form 20-F as filed withthe SEC. 236 BP Annual Report and Form 20-F 2017

BP West Aru II Limited Chertsey Road, Sunbury on Thames, Middlesex, TW16 7BP, United KingdomBP West Coast Products LLCa Corporation Trust Center, 1209 Orange Street, Wilmington DE 19801, United StatesBP West Papua I Limited Chertsey Road, Sunbury on Thames, Middlesex, TW16 7BP, United KingdomBP West Papua III Limited Chertsey Road, Sunbury on Thames, Middlesex, TW16 7BP, United KingdomBP Wind Energy North America Inc. Corporation Trust Center, 1209 Orange Street, Wilmington DE 19801, United StatesBP Wiriagar Ltd. Corporation Trust Center, 1209 Orange Street, Wilmington DE 19801, United StatesBP World-Wide Technical Services Limited Chertsey Road, Sunbury on Thames, Middlesex, TW16 7BP, United KingdomBP Zhuhai Chemical Company Limited (85.00%)a Da Ping Harbour, Lin Gang Industrial Zone, Zhuhai City, Guangdong Province, ChinaBP+Amoco International Limitedi Chertsey Road, Sunbury on Thames, Middlesex, TW16 7BP, United KingdomBPA Investment Holding Company Corporation Trust Center, 1209 Orange Street, Wilmington DE 19801, United StatesBP-AIOC Exploration (TISA) LLC (70.84%)a 153 Neftchilar Avenue, Baku, AZ1010, AzerbaijanBPNE International B.V. d'Arcyweg 76, 3198 NA Europoort Rotterdam, NetherlandsBPRY Caribbean Ventures LLC (70.00%)a RL&F Service Corp, 920 North King Street, 2nd Floor, Wilmington DE 19801, United StatesBPX Energy Inc. Corporation Trust Center, 1209 Orange Street, Wilmington DE 19801, United StatesBrian Jasper Nominees Pty Ltd Level 17, 717 Bourke Street, Docklands VIC, AustraliaBritannic Energy Trading Limited Chertsey Road, Sunbury on Thames, Middlesex, TW16 7BP, United KingdomBritannic Investments Iraq Limited (90.00%) Chertsey Road, Sunbury on Thames, Middlesex, TW16 7BP, United KingdomBritannic Marketing Limited Chertsey Road, Sunbury on Thames, Middlesex, TW16 7BP, United KingdomBritannic Strategies Limited 1 Wellheads Avenue, Dyce, Aberdeen, AB21 7PB, United KingdomBritannic Trading Limited Chertsey Road, Sunbury on Thames, Middlesex, TW16 7BP, United KingdomBritish Pipeline Agency Limited (50.00%)b q 5-7 Alexandra Road, Hemel Hempstead, Hertfordshire, HP2 5BS, United KingdomBritoil Limited 1 Wellheads Avenue, Dyce, Aberdeen, AB21 7PB, United KingdomBTC Pipeline Holding Company Limited Chertsey Road, Sunbury on Thames, Middlesex, TW16 7BP, United KingdomBurmah Castrol Australia Pty Ltdr Level 17, 717 Bourke Street, Docklands VIC, AustraliaBurmah Castrol Holdings Inc. Corporation Trust Center, 1209 Orange Street, Wilmington DE 19801, United StatesBurmah Castrol PLCi 1 Wellheads Avenue, Dyce, Aberdeen, AB21 7PB, United KingdomBurmah Castrol South Africa (Pty) Limited BP House, 10 Junction Avenue, Parktown, Johannesburg, 2193, South AfricaBurmah Chile S.A. José Musalen Saffie, Huerfanos N° 770 Of. 301, Santiago, ChileBurmah Fuels Australia Pty Ltdl Level 17, 717 Bourke Street, Docklands VIC, AustraliaBXL Plastics Limited Chertsey Road, Sunbury on Thames, Middlesex, TW16 7BP, United KingdomCadman DBP Limited Chertsey Road, Sunbury on Thames, Middlesex, TW16 7BP, United KingdomCape Vincent Wind Power, LLCa 111 Eighth Avenue, New York, New York, 10011, United StatesCasitas Pipeline Company Corporation Trust Center, 1209 Orange Street, Wilmington DE 19801, United StatesCastrol (China) Limited Unit 807, Tower B, Manulife Financial Centre, 223 Wai Yip Street, Kwun Tong, Kowloon, Hong KongCastrol (Ireland) Limited 2 Grand Canal Square, Dublin 2, Dublin, IrelandCastrol (Shenzhen) Company Limiteda No.1120 Mawan Road, Nanshan District, ChinaCastrol (Tianjin) Lubricants Co., Ltda Tianjin Economic Development Area, ChinaCastrol (U.K.) Limited Chertsey Road, Sunbury on Thames, Middlesex, TW16 7BP, United KingdomCastrol Australia Pty. Limited Level 17, 717 Bourke Street, Docklands VIC, AustraliaCastrol Austria GmbHa Straße 6, Objekt 17, Industriezentrum NÖ-Süd, 2355 Wr. Neudorf, AustriaCastrol B.V. d'Arcyweg 76, 3198 NA Europoort Rotterdam, NetherlandsCastrol BP Petco Limited Liability Company (65.00%)a 22-36 Nguyen Hue Street, 57-69F Dong Khoi Street, District 1, Ho Chi Minh City, VietnamCastrol Brasil Ltda. Avenida das Américas, no. 3434, Salas 301 a 308, Barra da Tijuca, Rio de Janeiro, RJ, 22640-102, BrazilCastrol Caribbean & Central America Inc. Corporation Trust Center, 1209 Orange Street, Wilmington DE 19801, United StatesCastrol Colombia Limitada KR 7 NO. 74 09, Bogota D.C., ColombiaCastrol Del Peru S.A. (99.49%) Av. Camino Real, 111 Torre B Oficina, 603 San Isidro, Lima, PeruCastrol Hungária Trading Co. LLC "u.d." (CastrolHungária Kereskedelmi Kft. "v.a.")a
32-34 Soroksári út, Budapest, 1095, Hungary
Castrol India Limited (51.00%) Technopolis Knowledge Park, Mahakali Caves Road, Andheri (East), Mumbai 400 093, IndiaCastrol Industrial North America Inc. Corporation Trust Center, 1209 Orange Street, Wilmington DE 19801, United StatesCastrol Industrie und Service GmbH Erkelenzer Straße 20, 41179 Mönchengladbach, GermanyCastrol KK (64.84%) East Tower 20F, Gate CIty Ohsaki, 1-11-2 Osaki, Shinagawa-ku, Tokyo, JapanCastrol Limited Technology Centre, Whitchurch Hill, Pangbourne, Reading, RG8 7QR, United KingdomCastrol Lubricants (CR), s.r.o. (v likvidaci)a Na strži 1702/65, 14800 Praha 4 Nusle, Czech RepublicCastrol Lubricants RO S.R.L 5th Floor, 92-96 Izvor St, 5th District, Bucharest, RomaniaCastrol Mexico, S.A. de C.V.c Avenida Santa Fe 505, Col. Cruz Manca Santa Fe, Delegacion Cuajimalpa, MexicoCastrol Namibia (Pty) Limited BP House, 10 Junction Avenue, Parktown, Johannesburg, 2193, South AfricaCastrol Offshore Limited Chertsey Road, Sunbury on Thames, Middlesex, TW16 7BP, United KingdomCastrol Pakistan (Private) Limited D-67/1, Block # 4, Scheme # 5, , Clifton, Karachi, Pakistan, Karachi, PakistanCastrol Philippines, Inc. 32/F LKG Tower, Ayala Avenue, Makati City, 6801, PhilippinesCastrol Servicos Ltda. Avenida Tamboré, 448, Barueri, Sao Paulo, BrazilCastrol Slovensko, s.r.o. (v likvidácii)a Rožnavská 24, 821 04 Bratislava 2, SlovakiaCastrol South Africa Proprietary Limited BP House, 10 Junction Avenue, Parktown, Johannesburg, 2193, South AfricaCastrol Ukraine LLCa 2a Konstiantynivskay Street, Kyiv, 04071, UkraineCastrol Zimbabwe (Private) Limited Barking Road, Willowvale, Harare, ZimbabweCentrel Pty Ltd Level 17, 717 Bourke Street, Docklands VIC, AustraliaCH-Twenty Holdings LLCa Corporation Trust Center, 1209 Orange Street, Wilmington DE 19801, United StatesCH-Twenty, Inc. Corporation Trust Center, 1209 Orange Street, Wilmington DE 19801, United StatesClarisse Holdings Pty Ltd Level 17, 717 Bourke Street, Docklands VIC, AustraliaCoastwise Trading Company, Inc. Corporation Trust Center, 1209 Orange Street, Wilmington DE 19801, United StatesConsolidada de Energia y Lubricantes, (CENERLUB)C.A.
Av. Eugenio Mendoza, San Felipe Edificio Centro Letonia, La Castellana, Caracas, 1060, Venezuela
Conti Cross Keys Inn, Inc. Easton and Swamp Roads, Buckinham Township, Bucks County, Pennsylvania, United StatesCoro Trading NZ Limited Watercare House, 73 Remuera Road, Newmarket, Auckland, 1050, New ZealandCuyama Pipeline Company Corporation Trust Center, 1209 Orange Street, Wilmington DE 19801, United StatesDelta Housing Inc. Corporation Trust Center, 1209 Orange Street, Wilmington DE 19801, United States
14. Related undertakings of the group – continued
The parent company financial statements of BP p.l.c. on pages 219-245 do not form part of BP’s Annual Report on Form 20-F as filed withthe SEC.
BP Annual Report and Form 20-F 2017 237

Dermody Developments Pty Ltd Level 17, 717 Bourke Street, Docklands VIC, AustraliaDermody Holdings Pty Ltd Level 17, 717 Bourke Street, Docklands VIC, AustraliaDermody Investments Pty Ltd Level 17, 717 Bourke Street, Docklands VIC, AustraliaDermody Petroleum Pty. Ltd. Level 17, 717 Bourke Street, Docklands VIC, AustraliaDHC Solvent Chemie GmbH Timmerhellstsr. 28, 45478, Mülheim/Ruhr, GermanyDome Beaufort Petroleum Limited 240 - 4th Avenue SW, Calgary AB T2P 4H4, CanadaDome Beaufort Petroleum Limited (March 1980)Limited Partnershipg
240 - Fourth Avenue SW, Calgary AB T2P 4H4, Canada
Dome Beaufort Petroleum Limited 1979 PartnershipNo. 1g
240 - Fourth Avenue SW, Calgary AB T2P 4H4, Canada
Dome Wallis (1980) Limited Partnership (92.50%)g 240 - Fourth Avenue SW, Calgary AB T2P 4H4, CanadaDradnats, Inc. 2711 Centerville Road, Suite 400, Wilmington DE 19808, United StatesECM Markets SA (Pty) Ltd (75.00%) BP House, 10 Junction Avenue, Parktown, Johannesburg, 2193, South AfricaElite Customer Solutions Pty Ltd Level 17, 717 Bourke Street, Docklands VIC, AustraliaElm Holdings Inc. Corporation Trust Center, 1209 Orange Street, Wilmington DE 19801, United StatesEnergy Global Investments (USA) Inc. Corporation Trust Center, 1209 Orange Street, Wilmington DE 19801, United StatesEnstar LLCa Corporation Trust Center, 1209 Orange Street, Wilmington DE 19801, United StatesEuropa Oil NZ Limited Watercare House, 73 Remuera Road, Newmarket, Auckland, 1050, New ZealandExomet, Inc. 1300 East Ninth Street, Cleveland, OH, 44114, United StatesExpandite Contract Services Limited Chertsey Road, Sunbury on Thames, Middlesex, TW16 7BP, United KingdomExploration (Luderitz Basin) Limited Chertsey Road, Sunbury on Thames, Middlesex, TW16 7BP, United KingdomExploration Service Company Limited Chertsey Road, Sunbury on Thames, Middlesex, TW16 7BP, United KingdomFlat Ridge 2 Holdings LLCa Corporation Trust Center, 1209 Orange Street, Wilmington DE 19801, United StatesFlat Ridge Wind Energy, LLCa 112 SW 7th Street, Suite 3C, Topeka, Kansas, 66603, United StatesFoseco Chile Ltda. Avenida Eliodoro Yañez N° 1572, Providencia , Santiago, Chile, ChileFoseco Holding International B.V. d'Arcyweg 76, 3198 NA Europoort Rotterdam, NetherlandsFoseco Holding, Inc. Corporation Trust Center, 1209 Orange Street, Wilmington DE 19801, United StatesFoseco, Inc. Corporation Trust Center, 1209 Orange Street, Wilmington DE 19801, United StatesFosroc Expandite Limited Chertsey Road, Sunbury on Thames, Middlesex, TW16 7BP, United KingdomFosven, CA Av. Francisco de Miranda, Edif Cavendes, Los Palos Grandes, Chacao, Caracas Miranda, 1060, VenezuelaFowler Ridge Holdings LLCa Corporation Trust Center, 1209 Orange Street, Wilmington DE 19801, United StatesFowler Ridge I Land Investments LLCa Corporation Trust Center, 1209 Orange Street, Wilmington DE 19801, United StatesFowler Ridge II Holdings LLCa Corporation Trust Center, 1209 Orange Street, Wilmington DE 19801, United StatesFowler Ridge III Wind Farm LLCa Corporation Trust Center, 1209 Orange Street, Wilmington DE 19801, United StatesFreeBees B.V. d'Arcyweg 76, 3198 NA Europoort Rotterdam, NetherlandsFuel & Retail Aviation Sweden AB Box 8107, 10420, Stockholm, SwedenFUELPLANE- Sociedade Abastecedora de Aeronaves,Unipessoal, Lda
Lagoas Park, Edificio 3, Porto Salvo, Oeiras, Portugal
FWK (2017) Limitedt Chertsey Road, Sunbury on Thames, Middlesex, TW16 7BP, United KingdomFWK Holdings (2017) LTDt Chertsey Road , Sunbury on Thames , TW16 7BP, United KingdomGardena Holdings Inc. Corporation Trust Center, 1209 Orange Street, Wilmington DE 19801, United StatesGasolin GmbH Wittener Straße 45, 44789 Bochum, GermanyGOAM 1 C.I S. A .S Calle 80 No.11-42, Bogota, 110111, ColombiaGrampian Aviation Fuelling Services Limited Chertsey Road, Sunbury on Thames, Middlesex, TW16 7BP, United KingdomGuangdong Investments Limited Chertsey Road, Sunbury on Thames, Middlesex, TW16 7BP, United KingdomHighlands Ethanol, LLCa Corporation Trust Center, 1209 Orange Street, Wilmington DE 19801, United StatesHydrogen Energy International Limited Chertsey Road, Sunbury on Thames, Middlesex, TW16 7BP, United KingdomIGI Resources, Inc. 12550 W. Explorer Dr., Suite 100, Boise, Idaho, 83713, United StatesInsight Analytics Solutions Holdings Limited (74.50%) Romax Technology Centre , University of Nottingham Innovation Park, Triumph Road, Nottingham, NG7
2TU, United KingdomInsight Analytics Solutions Limited (74.50%) Romax Technology Centre , University of Nottingham Innovation Park, Triumph Road, Nottingham, NG7
2TU, United KingdomInsight Analytics Solutions USA, Inc (74.50%) 2108 55th Street, Suite 105, Boulder CO 80301, United StatesInternational Bunker Supplies Pty Ltd Level 17, 717 Bourke Street, Docklands VIC, AustraliaInternational Card Centre Limited Chertsey Road, Sunbury on Thames, Middlesex, TW16 7BP, United KingdomIraq Petroleum Company Limited Chertsey Road, Sunbury on Thames, Middlesex, TW16 7BP, United KingdomJupiter Insurance Limited The Albany, South Esplanade, St Peter Port, GY1 4NF, GuernseyKabulonga Properties Limited 3rd floor Mukuba Pension House, Dedan Kimathi Road, Lusaka 10101, ZambiaKen-Chas Reserve Company Corporation Trust Center, 1209 Orange Street, Wilmington DE 19801, United StatesKenilworth Oil Company Limitedi Chertsey Road, Sunbury on Thames, Middlesex, TW16 7BP, United KingdomLatin Energy Argentina S.A. Av. Cordoba 315 Piso 8, Buenos Aires, 1054, ArgentinaLebanese Aviation Technical Services S.A.L. P O Box - 11 -5814c/o Coral Oil Building, 583Avenue de Gaulle, Raoucheh, Beirut, LebanonLubricants UK Limited Chertsey Road, Sunbury on Thames, Middlesex, TW16 7BP, United KingdomMardi Gras Transportation System Company LLCa Corporation Trust Center, 1209 Orange Street, Wilmington DE 19801, United StatesMarkoil, S.A. Unipersonal Avenida de Barajas 30, Parque Empresarial Omega, Edificio D. 28108 Alcobendas, Madrid, SpainMasana Petroleum Solutions (Pty) Ltd (37.88%) BP House, 10 Junction Avenue, Parktown, Johannesburg, 2193, South AfricaMayaro Initiative for Private Enterprise Development(70.00%)a
5-5A Queen's Park West, Port-of-Spain, Trinidad and Tobago
Mehoopany Holdings LLCa Corporation Trust Center, 1209 Orange Street, Wilmington DE 19801, United StatesMes Tecnologia en Servicios y Energia, S.A. DE C.V.(99.92%)c
Avenida Santa Fe 505, Col. Cruz Manca Santa Fe, Delegacion Cuajimalpa, Mexico
Minza Pty. Ltd. Level 17, 717 Bourke Street, Docklands VIC, AustraliaMountain City Remediation, LLCa Corporation Trust Center, 1209 Orange Street, Wilmington DE 19801, United StatesNo. 1 Riverside Quay Proprietary Limited Level 17, 717 Bourke Street, Docklands VIC, AustraliaNordic Lubricants A/S Arne Jacobsens Allé 7, 5th Floor, 2300, Copenhagen, DenmarkNordic Lubricants AB Hemvärnsgatan , 171 54, Solna, Sweden
14. Related undertakings of the group – continued
The parent company financial statements of BP p.l.c. on pages 219-245 do not form part of BP’s Annual Report on Form 20-F as filed withthe SEC. 238 BP Annual Report and Form 20-F 2017
Nordic Lubricants Oy (in liquidation) Teknobulevardi 3-5, 01530 Vantaa, FinlandNorth America Funding Company Corporation Trust Center, 1209 Orange Street, Wilmington DE 19801, United StatesOelwerke Julius Schindler GmbH Überseeallee 1, 20457, Hamburg, Hamburg, GermanyOMD87, Inc. 111 Eighth Avenue, New York, New York, 10011, United StatesOmega Oil Company 2711 Centerville Road, Suite 400, Wilmington DE 19808, United StatesOnSight Analytics Solutions India Private Ltd. (74.50%) #11, Platinum Tower, Ground Floor, Old Trunk Road, Pallavaram Chennai, IndiaOOO BP STLa Novinskiy blvd.8, 17th floor, office 11, 121099, Moscow, Russian FederationOrion Delaware Mountain Wind Farm LPa 2711 Centerville Road, Suite 400, Wilmington DE 19808, United StatesOrion Energy Holdings, LLCa Corporation Trust Center, 1209 Orange Street, Wilmington DE 19801, United StatesOrion Energy L.L.C.a Corporation Trust Center, 1209 Orange Street, Wilmington DE 19801, United StatesOrion Post Land Investments, LLCa 2711 Centerville Road, Suite 400, Wilmington DE 19808, United StatesPacroy (Thailand) Co., Ltd. (39.00%) 23rd Fl. Rajanakarn Bldg, 3 South Sathon Road, Yannawa Sathon, Bangkok 10120, ThailandPan American Petroleum Company of California 818 West Seventh Street, 2nd Floor, Los Angeles, CA, 90017, United StatesPeaks America Inc. Corporation Trust Center, 1209 Orange Street, Wilmington DE 19801, United StatesPearl River Delta Investments Limited Chertsey Road, Sunbury on Thames, Middlesex, TW16 7BP, United KingdomPhoenix Petroleum Services, Limited LiabilityCompany
Baghdad International Airport, Al-Burhan Commercial Complex , First floor, Baghdad, Iraq
Products Cogeneration Company Corporation Trust Center, 1209 Orange Street, Wilmington DE 19801, United StatesProduits Métallurgie Doittau SA - PROMEDO Immeuble Le Cervier, 12 Avenue des Béguines, Cergy Saint Christophe, 95866, Cergy Pontoise, FranceProspect International, C.A. Av. Eugenio Mendoza, San Felipe Edificio Centro Letonia, La Castellana, Caracas, 1060, VenezuelaPT BP Petrochemicals Indonesia 20th Floor Summitmas II Jl., Jend. Sudirman Kav. 61 - 62, Jakarta, Selatan, IndonesiaPT Castrol Indonesia (68.30%) Perkantoran Hijau Arkadia, Tower B, Jl. Let. Jenderal TB. Simatupang Kav. 88, Jakarta12520, IndonesiaPT Jasatama Petroindoc Perkantoran Hijau Arkadia, Tower B, Jl. Let. Jenderal TB. Simatupang Kav. 88, Jakarta12520, IndonesiaReading Investment (Nominee) Limited Chertsey Road, Sunbury on Thames, Middlesex, TW16 7BP, United KingdomReax Industria e Comercio Ltda. Estrada São Lourenço, 751, part, Duque de Caxias, Rio Janeiro, BrazilRemediation Management Services Company Corporation Trust Center, 1209 Orange Street, Wilmington DE 19801, United StatesRichfield Oil Corporation Corporation Trust Center, 1209 Orange Street, Wilmington DE 19801, United StatesRolling Thunder I Power Partners, LLCa Corporation Trust Center, 1209 Orange Street, Wilmington DE 19801, United StatesRomax Insight Korea Limited (74.50%) 504 Cheong dan ro-213-3, Young pyung dong 2170-1 Jeju Science Park Smart Building, Jeju City, Jeju-do,
Korea, Republic ofRopemaker Deansgate Limited Chertsey Road, Sunbury on Thames, Middlesex, TW16 7BP, United KingdomRopemaker Properties Limited Chertsey Road, Sunbury on Thames, Middlesex, TW16 7BP, United KingdomRuehl Gesellschaft m.b.H. & Co KG.g Straße 6, Objekt 17, Industriezentrum NÖ-Süd, 2355 Wr. Neudorf, AustriaRuhr Oel GmbH (ROG) Johannastraße 2-8, 45899 Gelsenkirchen-Horst, GermanyRural Fuel Limited (49.00%) AR Short & Co, Level 8, FMG Building, 55 The Square, Palmerston North, New ZealandRusdene GSS Limitedt 4 High Street, Alton, Hampshire, GU34 1BU, United KingdomSaltend Chemicals Park Limited Chertsey Road, Sunbury on Thames, Middlesex, TW16 7BP, United KingdomSaturn Insurance Inc. 400 Cornerstone Drive, Suite 240, Williston VT 05495, United StatesSetra Lubricantsa 2 Paveletskaya sq, Building1, 115054 Moscow, Russian FederationSetra Lubricants Kazakhstan LLPg 98 Panfilov Street, office 809, Almaty, 05000, KazakhstanSherbino I Holdings LLCa Corporation Trust Center, 1209 Orange Street, Wilmington DE 19801, United StatesSherbino II Wind Farm LLCa Corporation Trust Center, 1209 Orange Street, Wilmington DE 19801, United StatesSherbino Mesa I Land Investments LLCa Corporation Trust Center, 1209 Orange Street, Wilmington DE 19801, United StatesShine Top International Investment Limited Unit 807, Tower B, Manulife Financial Centre, 223 Wai Yip Street, Kwun Tong, Kowloon, Hong KongSilver Star I Power Partners, LLCa Corporation Trust Center, 1209 Orange Street, Wilmington DE 19801, United StatesSociedade de Promocao Imobiliaria Quinta do Loureiro,SA
Lagoas Park, Edificio 3, Porto Salvo, Oeiras, Portugal
Société de Gestion de Dépots d'Hydrocarbures - GDHa Immeuble Le Cervier, 12 Avenue des Béguines, Cergy Saint Christophe, 95866, Cergy Pontoise, FranceSOFAST Limited (62.77%)u 23rd Fl. Rajanakarn Bldg, 3 South Sathon Road, Yannawa Sathon, Bangkok 10120, ThailandSoutheast Texas Biofuels LLCa Corporation Trust Center, 1209 Orange Street, Wilmington DE 19801, United StatesSouthern Ridge Pipeline Holding Company Corporation Trust Center, 1209 Orange Street, Wilmington DE 19801, United StatesSouthern Ridge Pipeline LP LLCa Corporation Trust Center, 1209 Orange Street, Wilmington DE 19801, United StatesSp/f Decision3 (GreenSteam) Company (61.68%)v Krosslíð 11, FO-100 Tórshavn , Faroe IslandsSRHP (99.99%)a Immeuble Le Cervier, 12 Avenue des Béguines, Cergy Saint Christophe, 95866, Cergy Pontoise, FranceStandard Oil Company, Inc. 251 East Ohio Street, Suite 500, Indianapolis IN 46204, United StatesTaradadis Pty. Ltd. Level 17, 717 Bourke Street, Docklands VIC, AustraliaTelcom General Corporation (99.96%)e 818 West Seventh Street, 2nd Floor, Los Angeles, CA, 90017, United StatesTerre de Grace Partnership (75.00%)g 1100, 635 - 8th Avenue SW, Calgary AB T2P 3M3, CanadaThe Anaconda Company 814 Thayer Avenue, Bismarck, ND, 58501-4018, United StatesThe BP Share Plans Trustees Limitedi Chertsey Road, Sunbury on Thames, Middlesex, TW16 7BP, United KingdomThe Burmah Oil Company (Pakistan Trading) Limited 1 Wellheads Avenue, Dyce, Aberdeen, AB21 7PB, United KingdomThe Shorebank Corporation 7054 S. Jeffery Blvd., Chicago IL 60649, United StatesThe Standard Oil Company 4400 Easton Commons Way , Suite 125, Columbus OH 43219, United StatesTISA Education Complex LLC (70.84%)a 153 Neftchilar Avenue, Baku, AZ1010, AzerbaijanTJKK Roppongi Hills Mori Tower, 10-1 Roppongi 6-chome, Minato-ku, Tokyo106-6115, JapanToledo Refinery Holding Company LLCa Corporation Trust Center, 1209 Orange Street, Wilmington DE 19801, United StatesTrinity Hills Wind Farm LLCa Corporation Trust Center, 1209 Orange Street, Wilmington DE 19801, United StatesUnion Texas International Corporation Corporation Trust Center, 1209 Orange Street, Wilmington DE 19801, United StatesUT Petroleum Services, LLCa Corporation Trust Center, 1209 Orange Street, Wilmington DE 19801, United StatesVastar Energy, Inc. Corporation Trust Center, 1209 Orange Street, Wilmington DE 19801, United StatesVastar Gas Marketing, Inc. Corporation Trust Center, 1209 Orange Street, Wilmington DE 19801, United StatesVastar Holdings, Inc. Corporation Trust Center, 1209 Orange Street, Wilmington DE 19801, United StatesVastar Pipeline, LLCa Corporation Trust Center, 1209 Orange Street, Wilmington DE 19801, United StatesVastar Power Marketing, Inc. Corporation Trust Center, 1209 Orange Street, Wilmington DE 19801, United StatesViceroy Investments Limited Chertsey Road, Sunbury on Thames, Middlesex, TW16 7BP, United KingdomWarrenville Development Limited Partnershipa 33 North LaSalle Street, Chicago, Illinois 60602, United States
14. Related undertakings of the group – continued
The parent company financial statements of BP p.l.c. on pages 219-245 do not form part of BP’s Annual Report on Form 20-F as filed withthe SEC.
BP Annual Report and Form 20-F 2017 239

Water Way Trading and Petroleum Services LLC(90.00%)
Hay Al Wihda, Q904, Alley 68, H32, Korodha, Baghdad, Iraq
Welchem, Inc. 2711 Centerville Road, Suite 400, Wilmington DE 19808, United StatesWest Kimberley Fuels Pty Ltd Level 17, 717 Bourke Street, Docklands VIC, AustraliaWestlake Houston Development, LLCa Corporation Trust Center, 1209 Orange Street, Wilmington DE 19801, United StatesWhiting Clean Energy, Inc. Corporation Trust Center, 1209 Orange Street, Wilmington DE 19801, United StatesWindpark Energy Nederland B.V. d'Arcyweg 76, 3198 NA Europoort Rotterdam, NetherlandsWiriagar Overseas Ltd Jayla Place, Wickhams Cay 1, PO Box 3190, Road Town, Tortola, VG1110, British Virgin Islands
14. Related undertakings of the group – continued
The parent company financial statements of BP p.l.c. on pages 219-245 do not form part of BP’s Annual Report on Form 20-F as filed withthe SEC. 240 BP Annual Report and Form 20-F 2017
Related undertakings other than subsidiariesA Flygbranslehantering AB (AFAB) (25.00%) Box 135, 190 46 Arlanda, SwedenABG Autobahn-Betriebe GmbH (32.58%)a Brucknerstraße 4, 1041 Wien, AustriaAbu Dhabi Marine Areas Limited (33.33%)b Chertsey Road, Sunbury on Thames, Middlesex, TW16 7BP, United KingdomAdvanced Biocatalytics Corporation (24.20%)w 18010 Skypark Circle , #130 , Irvine CA 92614, United StatesAGES International GmbH & Co. KG, Langenfeld(24.70%)g
Berghausener Straße 96, 40764 Langenfeld, Germany
AGES Maut System GmbH & Co. KG, Langenfeld(24.70%)g
Berghausener Straße 96, 40764 Langenfeld, Germany
Air BP Copec S.A. (51.00%) Patricio Raby Benavente, Moneda N° 920 Of 205, Santiago, ChileAir BP Italia Spa (50.00%) Via Lazio 20/C, 00187 Roma, ItalyAir BP PBF del Peru S.A.C. (50.00%) Avenida Ricardo Rivera Navarrete n.501 / room 1602, Lima, PeruAir BP Petrobahia Ltda. (50.00%) Av. Anita Garibaldi, n.252, 2o floor, Ala Sul, Federação, Salvador, Bahia, 40210-750, BrazilAircraft Fuel Supply B.V. (28.57%) Oude Vijfhuizerweg 6, 1118LV Luchthaven, Schiphol, NetherlandsAircraft Refuelling Company GmbH (33.33%)a Trabrennstraße 6-8 3, A-1020, Wien, AustriaAirport Fuel Services Pty. Limited (20.00%) Level 12, 680 George Street, Sydney NSW 2000, AustraliaAker BP ASA (30.00%) Oksenoyveien 10, , 1366 Lysaker, NorwayAlaska Tanker Company, LLC (25.00%)a Corporation Trust Center, 1209 Orange Street, Wilmington DE 19801, United StatesAlyeska Pipeline Service Company (48.44%) 9360 Glacier Highway, Suite 202, Juneau AK 99801, United StatesAmbarli Depolama Hizmetleri Limited Sirketi (50.00%) Yakuplu Mahallesi Genc, Osman Caddesi, No.7 Beylikdüzü, Istanbul, TurkeyAmmenn GmbH (75.00%) Luisenstraße 5 a, 26382 Wilhelmshaven, GermanyARCO Solar Nigeria Ltd. (40.00%) 7M8 Ligali Ayorinde Street, Victoria Island, Lagos, NigeriaATAS Anadolu Tasfiyehanesi Anonim Sirketi (68.00%) Degirmen yolu cad. No:28, Asia OfisPark K:3 İcerenkoy-Atasehir, Istanbul, 34752, TurkeyAtlantic 1 Holdings LLC (34.00%)a RL&F Service Corp, 920 North King Street, 2nd Floor, Wilmington DE 19801, United StatesAtlantic 2/3 Holdings LLC (42.50%)a RL&F Service Corp, 920 North King Street, 2nd Floor, Wilmington DE 19801, United StatesAtlantic 4 Holdings LLC (37.78%)a RL&F Service Corp, 920 North King Street, 2nd Floor, Wilmington DE 19801, United StatesAtlantic LNG 2/3 Company of Trinidad and TobagoUnlimited (42.50%)
Princes Court, Cor. Pembroke & Keate Street, Port-of-Spain, Trinidad and Tobago
Atlantic LNG 4 Company of Trinidad and TobagoUnlimited (37.78%)
Princes Court, Cor. Pembroke & Keate Street, Port-of-Spain, Trinidad and Tobago
Atlantic LNG Company of Trinidad and Tobago(34.00%)
Princes Court, Cor. Pembroke & Keate Street, Port-of-Spain, Trinidad and Tobago
Atlas Methanol Company Unlimited (36.90%) Maracaibo Drive, Point Lisas Industrial Estate, Point Lisas, Trinidad and TobagoAustralasian Lubricants Manufacturing Company PtyLtd (50.00%)b
Building 1, 747 Lytton Road, Murarrie QLD 4172, Australia
Australian Terminal Operations Management Pty Ltd(50.00%)
Level 3, Unit 3, 22 Albert Road, South Melbourne VIC 3205, Australia
Auwahi Holdings, LLC (50.00%)a 2711 Centerville Road, Suite 400, Wilmington DE 19808, United StatesAuwahi Wind Energy LLC (50.00%)a National Registered Agents, Inc., 160 Greentree Dr., Dover, Delaware, 19904, United StatesAviation Fuel Services Limited (25.00%) Calshot Way Central Area, Heathrow Airport, Hounslow, Middlesex, TW6 1PY, United KingdomAxion Comercializacion de Combustibles yLubricantes S.A. (50.00%)
Luis A de Herrera 1248, Torre II, Piso 22 (Edificio World Trade Center), Montevideo, Uruguay
Axion Energy Argentina S.A. (50.00%) Carlos María Della Paolera 265, Piso 22, Ciudad Autónoma de Buenos Aires, ArgentinaAxion Energy Holding S.L. (50.00%)a Campus Empresarial Arbea - Edificio No 1, Carretera Fuencarral a Alcobendas, Alcobendas, Madrid,
SpainAxion Energy Paraguay S.R.L. (50.00%)a Av. España 1369 esquina San Rafael, Asunción, ParaguayAxuy Energy Holdings S.R.L. (50.00%)a Avenida Luis Alberto de Herrera 1248, Oficina 1901, Montevideo, UruguayAxuy Energy Investments S.R.L. (50.00%)a Avenida Luis Alberto de Herrera 1248, Oficina 1901, Montevideo, UruguayAzerbaijan Gas Supply Company Limited (23.06%)b P.O. Box 309, Ugland House, 113 South Church Street, George Town, Grand Cayman, Cayman IslandsAzerbaijan International Operating Company (40.50%)x 190 Elgin Avenue, George Town, Grand Cayman , KY1-9005, Cayman IslandsBaplor S.A. (50.00%) Colonia 810, Oficina 403, Montevideo, UruguayBarranca Sur Minera S.A. (50.00%) Calle 14, No 781, Piso 2, Oficina 3, Ciudad de La Plata, Provincia de Buenos Aires, ArgentinaBayernoil Raffineriegesellschaft mbH (35.00%) Postfach 10 08 58, 85008 Ingolstadt, GermanyBeer GmbH (50.00%) Saganer Straße 31, 90475 Nürnberg, GermanyBeer GmbH & Co. Mineralol-Vertriebs-KG (50.00%)g Saganer Straße 31, 90475 Nürnberg, GermanyBGFH Betankungs-Gesellschaft Frankfurt-Hahn GbR(50.00%)g
Sportallee 6, 22335 Hamburg, Germany
Billund Refuelling I/S (50.00%) GA Centervej 1, DK-7190, Billund, DenmarkBlendcor (Pty) Limited (37.50%)s 135 Honshu Road, Islandview, Durban, 4052, South AfricaBlue Marble Holdings Limited (23.58%)y Desklodge - 5th Floor, 1 Temple Way, Bristol, BS2 0BY, United KingdomBP AOC Pumpstation Maatschap (50.00%)g Rijndwarsweg 3, 3198 LK Europoort, Rotterdam, NetherlandsBP Dhofar LLC (49.00%) P.O.Box 20302/211, 20302, OmanBP Esso AOC Maatschap (22.80%)g Rijndwarsweg 3, 3198 LK Europoort, Rotterdam, NetherlandsBP Esso Pipeline Maatschap (50.00%)g Rijndwarsweg 3, 3198 LK Europoort, Rotterdam, NetherlandsBP Guangzhou Development Oil Product Co., Ltd(40.00%)a
No.13 Longxue Road, Longxue Island, Nansha District, Guangzhou, Guangdong, 511450, China
BP PetroChina Petroleum Co., Ltd (49.00%)a Room A17th Floor, No.22 Gangkou Road, Jiangmen, Guangdong Province, ChinaBP PETRONAS Acetyls Sdn. Bhd. (70.00%) Symphony House, Pusat Dagangan Dana 1, Jalan PJU 1A/46, 47301 Petaling Jaya, Selangor, MalaysiaBP Sinopec (ZheJiang) Petroleum Co., Ltd (40.00%)a
12 Hua Zhe Plaza, 1 Hua Zhe Square, Hang Zhou City, Zhe Jiang Province, China
BP Sinopec Marine Fuels Pte. Ltd. (50.00%) 112 Robinson Road, #05-01, Robinson 112, 068902, SingaporeBP West Africa Supply Limited (50.00%) Number 1, Rehoboth Place, Dade Street, North Labone Estates, Accra, Accra Metropolitan, Greater
Accra, P. O. BOX CT3278, GhanaBP YPC Acetyls Company (Nanjing) Limited(50.00%)a
9# Huo Ju Road, Liu He District, Nanjing, Jiangsu Province, China
BP-Husky Refining LLC (50.00%)a Corporation Trust Center, 1209 Orange Street, Wilmington DE 19801, United StatesBP-Japan Oil Development Company Limited(50.00%)b
1 Wellheads Avenue, Dyce, Aberdeen, AB21 7PB, United Kingdom
14. Related undertakings of the group – continued
The parent company financial statements of BP p.l.c. on pages 219-245 do not form part of BP’s Annual Report on Form 20-F as filed withthe SEC.
BP Annual Report and Form 20-F 2017 241
Braendstoflageret Kobenhavns Lufthavn I/S (20.83%) Københavns, Lufthavn, 2770 Kastrup, DenmarkBTC International Investment Co. (30.10%)z P.O. Box 309, Ugland House, 113 South Church Street, George Town, Grand Cayman, Cayman IslandsButamax™ Advanced Biofuels LLC (50.00%)a Corporation Trust Center, 1209 Orange Street, Wilmington DE 19801, United StatesCaesar Oil Pipeline Company, LLC (56.00%)a Corporation Trust Center, 1209 Orange Street, Wilmington DE 19801, United StatesCairns Airport Refuelling Service Pty Ltd (33.33%) 680 George Street, Sydney NSW 2000, AustraliaCantera K-3 Limited Partnership (39.00%)g 6400 Shafer Ct., Suite 400, Rosemont IL 60018-4927, United StatesCanton Renewables, LLC (50.00%)a 30600 Telegraph Road, Suite 2345, Bingham Farms MI 48025, United StatesCastrol Cuba S.A. (50.00%) Calle 6 No 319, esq 5ta. Ave., Miramar, Playa, La Habana, CubaCastrol DongFeng Lubricant Co., Ltd (50.00%)a Room 1404-1405, Donghe Centre Tower B, 3 Sanjiao Hu Road, Wuhan, Hubei Province, ChinaCedar Creek II Holdings LLC (50.00%)a Corporation Trust Center, 1209 Orange Street, Wilmington DE 19801, United StatesCedar Creek II, LLC (50.00%)a 1560 Broadway, Suite 2090, Denver, Colorado, 80202, United StatesCEFARI RNG OKC, LLC (50.00%)a Corporation Trust Center, 1209 Orange Street, Wilmington DE 19801, United StatesCekisan Depolama Hizmetleri Limited Sirketi (35.00%) Yakuplu Ambarli Mevkii, 9 Ada2-3-6-7 Parsel, Büyükçekmece, Istanbul, TurkeyCentral African Petroleum Refineries (Pvt) Ltd Block 1Tendeseka Office Park, Samora Machel Av/Renfrew Road, Harare, ZimbabweCERF Shelby, LLC (50.00%)a 800 S. Gay Street, Suite 2021, Knoxville TN 37929, United StatesChicap Pipe Line Company (56.17%)a Corporation Trust Center, 1209 Orange Street, Wilmington DE 19801, United StatesChina American Petrochemical Company, Ltd.(CAPCO) (61.36%)
6th Floor, No. 413 Section 2 Ruei Kuang Road, Neihhu, Taipei, 11493, Taiwan
China Aviation Oil (Singapore) Corporation Ltd 8 Temasek Boulevard #31-02, Suntec City Tower 3, Singapore 038988, SingaporeClean Eagle RNG, LLC (50.00%)a Corporation Trust Center, 1209 Orange Street, Wilmington DE 19801, United StatesCleopatra Gas Gathering Company, LLC (53.00%)a Corporation Trust Center, 1209 Orange Street, Wilmington DE 19801, United StatesCoastal Oil Logistics Limited (25.00%) 10th Floor, The Bayleys Building, Cnr Brandon St and Lambton Quay, Wellington, 6011, New ZealandCombined Refuelling Service VOF (25.00%)g Anchoragelaan 4, 1118 LD, Schipol, NetherlandsCompania de Inversiones El Condor Limitada(99.00%)
Av. Andrés Bello 2711, Piso 24, Las Condes, Santiago, Chile
Concessionaria Stalvedro SA (50.00%) San Gottardo Sud, 6780, Airolo, SwitzerlandCSG Convenience Service GmbH (24.80%) Wittener Straße 45, 44789 Bochum, GermanyDanish Refuelling Service I/S (33.33%)g Kastrup Lufthavn, 2770 Kastrup, DenmarkDanish Tankage Services I/S (50.00%)g Kastrup Lufthavn, 2770 Kastrup, DenmarkDinarel S.A. (20.00%) La Cumparsita 1373, piso 4°, Montevideo, UruguayDOPARK GmbH (25.00%) Westfalendamm 166, 44141 Dortmund, GermanyDusseldorf Fuelling Services GbR (33.00%)g Sportallee 6, 22335 Hamburg, GermanyDusseldorf Tank Services GbR (33.00%)g Sportallee 6, 22335 Hamburg, GermanyEast Tanka Petroleum Company "ETAPCO" (50.00%) 4 Palestine Road, 4th District, New Maadi, Cairo, EgyptEkma Oil Company "EKMA" (50.00%) 4 Palestine Road, 4th District, New Maadi, Cairo, EgyptEl Temsah Petroleum Company"PETROTEMSAH" (25.00%)
5 El Mokhayam El Daiem St, 6th Sector, Nasr City, Egypt
EMDAD Aviation Fuel Storage FZCO (33.33%) P.O.Box 261781, Dubai, United Arab EmiratesEmoil Storage Company FZCO (20.00%) Plot No. B003R04, Box No. 9400, Dubai, United Arab Emirates, Dubai, United Arab EmiratesEndymion Oil Pipeline Company, LLC (65.00%)a Corporation Trust Center, 1209 Orange Street, Wilmington DE 19801, United StatesEnergenomics LLC (50.00%)a Corporation Trust Center, 1209 Orange Street, Wilmington DE 19801, United StatesEnergy Emerging Investments, LLC (50.00%)a 2711 Centerville Road, Suite 400, Wilmington DE 19808, United StatesEntrepot petrolier de Chambery (32.00%) 562 Avenue du Parc de l'Ile, 92000, Nanterre, FranceEntrepôt Pétrolier de Puget sur Argens - EPPA(58.25%)
Immeuble Le Cervier, 12 Avenue des Béguines, Cergy Saint Christophe, 95866, Cergy Pontoise, France
Erdol-Lagergesellschaft m.b.H. (23.00%)a Radlpaßstraße 6, 8502 Lannach, AustriaEroil Mineraloel GmbH - Diehl (50.00%) Schillerstraße 10, 66482 Zweibrücken, GermanyEsma Petroleum Company "ESMA" (50.00%) 4 Palestine Road, 4th District, New Maadi, Cairo, EgyptEstonian Aviation Fuelling Services (49.00%) Lennujaama tee 2, Tallinn EE0011, EstoniaEtzel-Kavernenbetriebsgesellschaft mbH & Co. KG(33.00%)g
Bertrand-Russell-Straße 3, 22761 Hamburg, Germany
Etzel-Kavernenbetriebs-Verwaltungsgesellschaft mbH(33.33%)
Bertrand-Russell-Straße 3, 22761 Hamburg, Germany
FFS Frankfurt Fuelling Services (GmbH & Co.) OHG(33.00%)g
Sportallee 6, 22335 Hamburg, Germany
Field Services Enterprise S.A. (50.00%) Av. Leandro N. Alem 1180, piso 11, Buenos Aires, ArgentinaFinite Carbon, Inc. (50.00%) 2711 Centerville Road, Suite 400, Wilmington, County of New Castle, Delaware 19808Finite Resources, Inc. (50.00%) 2711 Centerville Road, Suite 400, Wilmington, County of New Castle, Delaware 19808Fip Verwaltungs GmbH (50.00%) Rheinstraße 36, 49090 Osnabrück, GermanyFlat Ridge 2 Wind Energy LLC (50.00%)a Corporation Trust Center, 1209 Orange Street, Wilmington DE 19801, United StatesFlat Ridge 2 Wind Holdings LLC (50.00%)a Corporation Trust Center, 1209 Orange Street, Wilmington DE 19801, United StatesFlughafen Hannover PipelineVerwaltungsgesellschaft mbH (50.00%)
Überseeallee 1, 20457, Hamburg, Germany
Flughafen Hannover Pipelinegesellschaft mbH &Co. KG (50.00%)g
Überseeallee 1, 20457, Hamburg, Hamburg, Germany
Flytanking AS (50.00%) Postboks 36, Stjordal, NO-7501, NorwayForeseer Ltd (25.00%) 121A Thoday Street, Cambridge , Cambridgeshire, CB1 3AT , United KingdomFormosa BP Chemicals Corporation (50.00%) No. 1-1Formosa Industrial Comples, Mailiao, Yunlin Hsien, TaiwanFowler I Holdings LLC (50.00%)a Corporation Trust Center, 1209 Orange Street, Wilmington DE 19801, United StatesFowler II Holdings LLC (50.00%)a Corporation Trust Center, 1209 Orange Street, Wilmington DE 19801, United StatesFowler Ridge II Wind Farm LLC (50.00%)a Corporation Trust Center, 1209 Orange Street, Wilmington DE 19801, United StatesFowler Ridge Wind Farm LLC (50.00%)a Corporation Trust Center, 1209 Orange Street, Wilmington DE 19801, United StatesFuelling Aviation Service - FAS (50.00%)a 3 Rue des Vignes, Aéroport Charles de Gaulle, 93290, Tremblay en France, FranceFundación para la Eficiencia Energética de laComunidad Valenciana (33.33%)a
Calle Lituania nº 10, Castellón de la Plana, Spain
Gardermeon Fuelling Services AS (33.33%) Postboks 133, Gardermoen, NO-2061, NorwayGemalsur S.A. (50.00%) Colonia 810, Oficina 403, Montevideo, Uruguay
14. Related undertakings of the group – continued
The parent company financial statements of BP p.l.c. on pages 219-245 do not form part of BP’s Annual Report on Form 20-F as filed withthe SEC. 242 BP Annual Report and Form 20-F 2017

Georg Reitberger Mineralöle Verwaltungs GmbH Bahnhofstraße 25, 86551 Aichach, GermanyGeorgian Pipeline Company (40.50%)x 190 Elgin Avenue, George Town, Grand Cayman , KY1-9005, Cayman IslandsGezamenlijke Tankdienst Schiphol B.V. (50.00%) Anchoragelaan 6, 1118 LD Schiphol, NetherlandsGISSCO S.A. (50.00%) 2,Vouliagmenis Ave & Papaflessa, 16777 Elliniko, Athens, Attika, GreeceGoshen Phase II LLC (50.00%)a Corporation Trust Center, 1209 Orange Street, Wilmington DE 19801, United StatesGothenburgh Fuelling Company AB (GFC) (33.33%) Box 2154, 438 14, LANDVETTER, SwedenGravcap, Inc. (25.00%) Corporation Trust Center, 1209 Orange Street, Wilmington DE 19801, United StatesGroupement Pétrolier de Saint Pierre des Corps -GPSPC (20.00%)a
150 Avenue Yves Farge, 37700, Saint Pierre des Corps, France
Groupement Pétrolier de Strasbourg (33.33%)a 562 Avenue du Parc de l'Ile, 92000, Nanterre, FranceGuangdong Dapeng LNG Company Limited(30.00%)a
10-11/FTime Finance Center, No.4001 Shennan Dadao, Shenzhen, Guangdong Province, China
Gulf Of Suez Petroleum Company"GUPCO" (50.00%)
4 Palestine Road, 4th District, New Maadi, Cairo, Egypt
GVÖ Gebinde-Verwertungsgesellschaft derMineralölwirtschaft mbH (21.00%)
Steindamm 55, 20099 Hamburg, Germany
Hamburg Tank Service (HTS) GbR (33.00%)g Sportallee 6, 22335 Hamburg, GermanyHeinrich Fip GmbH & Co. KG (50.00%)g Rheinstraße 36, 49090 Osnabrück, GermanyHeliex Power Limited (32.40%)w Kelvin Building , Bramah Avenue , East Kilbride, Glasgow , Scotland, G75 0RD, United KingdomHFS Hamburg Fuelling Services GbR (25.00%)g Sportallee 6, 22335 Hamburg, GermanyHiergeist Heizolhandel GmbH & Co. KG (50.00%)g Grubenweg 4, 83666 Waakirchen-Marienstein, GermanyHiergeist Verwaltung GmbH (50.00%) Grubenweg 4, 83666 Waakirchen-Marienstein, GermanyHokchi Energy S.A. de C.V. (50.00%) Torre A, Calzada Legaria 549, Colonia 10 de Abril, Ciudad de Mexico, C. P. 11250, MexicoHokchi Iberica S.L. (50.00%) Campus Empresarial Arbea - Edificio No 1, Carretera Fuencarral a Alcobendas, Alcobendas, Madrid,
SpainHydrogen Energy International LLC (50.00%)a Corporation Trust Center, 1209 Orange Street, Wilmington DE 19801, United StatesIn Salah Gas Ltd (25.50%)s 22 Grenville Street, St Helier, JE4 8PX, JerseyIn Salah Gas Services Ltd (25.50%)s 22 Grenville Street, St Helier, JE4 8PX, JerseyIndia Gas Solutions Private Limited (50.00%) 2nd North Avenue, Bandra - Kurla Complex, Bandra (East), Mumbai 400 051, Maharashtra, IndiaJamaica Aircraft Refuelling Services Limited (51.00%)b PCJ Building36 Trafalgar Road, Kingston 10, JamaicaKingston Research Limited (50.00%) C/O Banks Cooper Associates, 21 Marina Court, Hull, HU1 1TJ, United KingdomKlaus Köhn GmbH (50.00%) An der Braker Bahn 22, 26122 Oldenburg, GermanyKM Phoenix Holdings LLC (25.00%)a Corporation Trust Center, 1209 Orange Street, Wilmington DE 19801, United StatesKöhn & Plambeck GmbH & Co. KG (50.00%)g An der Braker Bahn 22, 26122 Oldenburg, GermanyKosmos Energy Investments Senegal Limited(49.99%)b
6th Floor, 65 Gresham Street, London, England and Wales, EC2V 7NQ, United Kingdom
Kurt Ammenn GmbH & Co. KG (50.00%)g Luisenstraße 5 a, 26382 Wilhelmshaven, GermanyLFS Langenhagen Fuelling Services GbR (50.00%)g Sportallee 6, 22335 Hamburg, GermanyLimited Liability Company TYNGD (20.00%)a Pervomayskaya street, 32A, 678144, Lensk, Sakha (Yakutiya) Republic, Russian FederationLotos - Air BP Polska Spółka z ograniczonąodpowiedzialnością (50.00%)
Grunwaldzka 472B, 80-309, Gdansk, Poland
LOTTE BP Chemical Co., Ltd (50.94%) 2-2 Sangnam-ri, Chungryang-myun, Ulju-gun, Ulsan 689-863, Republic of KoreaMaasvlakte Europoort Pipeline Maatschap (50.00%)g Rijndwarsweg 3, 3198 LK Europoort, Rotterdam, NetherlandsMaatschap Europoort Terminal (50.00%)g Moezelweg 101, 3198LS Europoort, Rotterdam, NetherlandsMach Monument Aviation Fuelling Co. Ltd.(70.00%)
Naz City, Building J, Suite 10 Erbil, Iraq
Malmo Fuelling Services AB (33.33%) Box 22, SE 230 32 Malmö-Sturup, SwedenManchester Airport Storage and Hydrant Company Bircham Dyson Bell, 50 Broadway, London, SW1H 0BL , United KingdomManpetrol S.A. (50.00%) Francisco Behr 20, Barrio Pueyrredon, Comodoro Rivadavia, Provincia del Chubut, ArgentinaMars Oil Pipeline Company LLC (28.50%)a Corporation Trust Center, 1209 Orange Street, Wilmington DE 19801, United StatesMasana Employee Share Trust No. 1 (37.88%)a Block B, 2nd Floor, BP House, 10 Junction Avenue, Parktown, 2193, South AfricaMATELUB S.A.R.L. (Baldersheim/Frankreich) (80.00%) 20 Rue Contades, 67300, Schiltigheim, FranceMavrix, LLC (50.00%)a Corporation Trust Center, 1209 Orange Street, Wilmington DE 19801, United StatesMcFall Fuel Limited (49.00%) 700 Bond Street, Te Awamutu, New ZealandMediteranean Gas Co. "MEDGAS" (25.00%) 5 El Mokhayam El Daiem St, 6th Sector, Nasr City, EgyptMehoopany Wind Energy LLC (50.00%)a Corporation Trust Center, 1209 Orange Street, Wilmington DE 19801, United StatesMehoopany Wind Holdings LLC (50.00%)a Corporation Trust Center, 1209 Orange Street, Wilmington DE 19801, United StatesMiddle East Lubricants Company LLC (40.00%) 6th Flr City Tower, 2 - Sheikh Zayed Road, PO Box 1699, Dubai, United Arab EmiratesMilne Point Pipeline, LLC (50.00%)a 900 E. Benson Boulevard, Anchorage, Alaska, 99508, United StatesMineralol-Handels-Gesellschaft mbH, Celle (50.00%) Kronestraße 22-23, 29221 Celle, GermanyMobene GmbH & Co. KG (50.00%)g Spaldingstraße 64, 20097 Hamburg, GermanyMobene Verwaltungs-GmbH (50.00%) Spaldingstraße 64, 20097 Hamburg, GermanyN.V. Rotterdam-Rijn-Pijpleiding Maatschappij (RRP)(44.40%)
Butaanweg 215, NL-3196 KC Vondelingenplaat, Rotterdam, 3045, Havennummer , Netherlands
Natural Gas Vehicles Company "NGVC" (40.00%) 85 El Nasr Road, Cairo, Cairo, EgyptNew Zealand Oil Services Limited (50.00%) Level 3, 139 The Terrace, Wellington, 6011, New ZealandNewshelf 1310 (RF) Proprietary Limited (37.88%) Block B, 2nd Floor, BP House, 10 Junction Avenue, Parktown, 2193, South AfricaNFX Combustíveis Marítimos Ltda. (50.00%) Avenida Atlântica, no. 1.130, 2nd floor (part), Copacabana, Rio de Janeiro, RJ, 22021-000, BrazilNord-West Oelleitung GmbH (59.33%) Zum Ölhafen 207, 26384 Wilhelmshaven, GermanyNorth Ghara Petroleum Company (NOGHCO)(30.00%)
4 Palestine Road, 4th District, New Maadi, Cairo, Egypt
North October Petroleum Company"NOPCO" (50.00%)
4 Palestine Road, 4th District, New Maadi, Cairo, Egypt
Ocwen Energy Pty Ltd (49.50%) GTH Accounting Group Pty Ltd '2', 1A Kitchener Street, Toowoomba QLD 4350, AustraliaOleoductos Canarios, S.A. (20.00%) C/ Explanada Tomas Quevedo S/N, 35008 Puerto De La Luz, Las Palmas De G.C, SpainOptis, LLC (50.00%)a 6705 Steger Drive, Cincinnati OH 45237-3097, United StatesOslo Lufthaven Tankanlegg AS (33.33%) Postboks 134, Gardermoen, NO-2061, NorwayPAE E & P Bolivia Limited (50.00%) Trinity Place Annex, Corner of Frederick & Shirley Streets, P.O. Box N-4805, Nassau, Bahamas
14. Related undertakings of the group – continued
The parent company financial statements of BP p.l.c. on pages 219-245 do not form part of BP’s Annual Report on Form 20-F as filed withthe SEC.
BP Annual Report and Form 20-F 2017 243
PAE Oil & Gas Bolivia Ltda. (50.00%) Cuarto anillo, Avda. Ovidio Barbery N° 4200,Equipetrol Norte, Santa Cruz de la Sierra, BoliviaPan American Energy Chile Limitada (50.00%) Nueva de Lyon Nº 145, piso 12, oficina 1203, Edificio Costa, Santiago de Chile, ChilePan American Energy do Brasil Ltda. (50.00%)a Rua Manoel da Nóbrega n°1280, 10° andar, Sao Paulo, Sao Paulo, 04001-902, BrazilPan American Energy Group, S.L. (50.00%)s Campus Empresarial Arbea - Edificio No 1, Carretera Fuencarral a Alcobendas, Alcobendas, Madrid,
SpainPan American Energy Holdings Ltd. (50.00%) Palm Grove House, P.O. Box 438, Road Town, Tortola, British Virgin IslandsPan American Energy Iberica S.L. (50.00%) Campus Empresarial Arbea - Edificio No 1, Carretera Fuencarral a Alcobendas, Alcobendas, Madrid,
SpainPan American Energy Investments Ltd. (50.00%) Palm Grove House, P.O. Box 438, Road Town, Tortola, British Virgin IslandsPan American Energy LLC (50.00%)a 2711 Centerville Road, Suite 400, Wilmington DE 19808, United StatesPan American Energy Uruguay S.A. (50.00%) Colonia 810, Oficina 403, Montevideo, UruguayPan American Fueguina S.A. (50.00%) O´Higgins N° 194, Rio Grande, ArgentinaPan American Sur S.A. (50.00%) O´Higgins N° 194, Rio Grande, ArgentinaPaul Harling Mineralole GmbH & Co. KG (50.00%)g Kronestraße 22-23, 29221 Celle, GermanyPeninsular Aviation Services Company Limited(25.00%)i
P O Box 6369, Jeddah 21442, Saudi Arabia
Pentland Aviation Fuelling Services Limited (50.00%)c 6th Floor (c/o Q8 Aviation), Dukes Court, Duke Street, Woking, GU21 5BH, United KingdomPetrostock SA (50.00%) route de Pré-Bois 2, 1214, Vernier, SwitzerlandPharaonic Petroleum Company "PhPC" (25.00%) 70/72 Road 200, Maadi, Cairo, EgyptPrince William Sound Oil Spill Response Corporation(25.00%)
9360 Glacier Highway, Suite 202, Juneau AK 99801, United States
Proteus Oil Pipeline Company, LLC (65.00%)a Corporation Trust Center, 1209 Orange Street, Wilmington DE 19801, United StatesPT Petro Storindo Energi (30.00%) Bakrie Tower 17th Floor, Rasuna Epicentrum Complex Jl. H.R Rasuna Said, Jakarta, 12940, IndonesiaPT. Aneka Petroindo Raya (49.90%) AKR Tower 25th floor, Jalan Panjang No.5, Kebon Jeruk, Jakarta, 11530, IndonesiaPT. Dirgantara Petroindo Raya (49.90%) Wisma AKR, 25th floor, Jalan Panjang No.5, Kebon Jeruk, , Jakarta Barat, 11530, IndonesiaPTE Pipeline LLC (32.00%)a 2711 Centerville Road, Suite 400, Wilmington DE 19808, United StatesRaffinerie de Strasbourg (33.33%) 24 Cours Michelet, 92800, Puteaux, FranceRahamat Petroleum Company (PETRORAHAMAT)(50.00%)
70/72 Road 200, Maadi, Cairo, Egypt
Raimund Mineraloel GmbH (50.00%) Hörhof 1, 95473 Creußen, GermanyRAPI SA (62.51%) 26 Kifissias Ave. and 2 Paradissou st., 15125 Maroussi, Athens, GreeceRaststaette Glarnerland AG, Niederurnen (20.00%) Nideracher 1, 8867, Niederurnen, SwitzerlandRD Petroleum Limited (49.00%) Albert Alloo & Sons, 67 Princes Street, Dunedin, New ZealandResolution Partners LLP (68.00%)g 1675 Broadway, Denver CO 80202, United StatesRhein-Main-Rohrleitungstransportgesellschaft mbH(35.00%)
Godorfer Hauptstraße 186, 50997 Köln, Germany
Rio Grande Pipeline Company (30.00%)g Corporation Trust Center, 1209 Orange Street, Wilmington DE 19801, United StatesRMF Holdings Limited (49.00%) KPMG, 247 Cameron Road, Tauranga, 3110, New ZealandRocketRoute Limited (36.00%)w Barttelot Court , Barttelot Road , Horsham, West Sussex, RG12 1DQ, United KingdomRomanian Fuelling Services S.R.L. (50.00%) 59 Aurel Vlaicu Street, Otopeni, Ilfov County, RomaniaRosneft Oil Company (19.75%) 26/1 Sofiyskaya Embankment, 115035, Moscow, Russian FederationRoutex B.V. (25.00%) Strawinskylaan 1725, 1077XX Amsterdam, NetherlandsRudeis Oil Company "RUDOCO" (50.00%) 4 Palestine Road, 4th District, New Maadi, Cairo, EgyptRundel Mineraloelvertrieb GmbH (50.00%) Am Güterbahnhof 4, 78224 Singen, GermanyS&JD Robertson North Air Limited (49.00%) 1 Wellheads Avenue, Dyce, Aberdeen, AB21 7PB, United KingdomSABA- Sociedade Abastecedora de Aeronaves, Lda(25.00%)
Grupo Operacional de Combustiveis do Aeroporto de Lisboa, Edificio 19, 1.º Sala Saba, Lisboa, Portugal
SAFCO SA (33.33%) International airport "El. Venizelos", Athens, GreeceSalzburg Fuelling GmbH (33.00%)a Innsbrucker Bundesstraße 95, 5020 Salzburg, AustriaSaraco SA (20.00%) route de Pré-Bois 17, 1216, Cointrin, SwitzerlandSeaPort Midstream Partners, LLC (49.00%)a Cogency Global Inc., 850 New Burton road, Suite 201, Dover, Delaware, 19904, Uunited StatesServicios Logísticos de Combustibles de Aviación,S.L (50.00%)
Vía de los Poblados1, Madrid, Spain
Sharjah Aviation Services Co. LLC (49.00%)s P O Box- 97, Sharjah, United Arab EmiratesSharjah Pipeline Company LLC (49.00%) Sharjah 42244, Sharjah, UAE, Sharjah, United Arab EmiratesShell and BP South African Petroleum Refineries(Pty) Ltd (37.50%)b
1 Refinery Road, Prospecton, 4110, South Africa
Shell Mex and B.P. Limited (40.00%)s Shell Centre, London, SE1 7NA, United KingdomShenzhen Cheng Yuan Aviation Oil Company Limited(25.00%)a
Fu Yong Town, Bao An county, ShenZhen Airport, Guangdong Province, China
Shenzhen Dapeng LNG Marketing CompanyLimited (30.00%)a
Room 316 Excellence Mansion, No.98 Fuhua 1Rd, Futian District, Shenzhen, China
Sherbino I Wind Farm LLC (50.00%)a Corporation Trust Center, 1209 Orange Street, Wilmington DE 19801, United StatesSKA ENERGY HOLDINGS LIMITED (50.00%) LOB 16, Suite #309, Jebel Ali Free Zone, Dubai, PO BOX 262794, United Arab EmiratesSM Realisations Limited (In Liquidation) (40.00%) Shell International Petroleum, Co Ltd, Shell Centre, 8 York Road, London, SE1 7NA , United KingdomSociété d'Avitaillement et de Stockage de CarburantsAviation "SASCA" (40.00%)a
1 Place Gustave Eiffel, 94150, Rungis, France
Société de Gestion de Produits Pétroliers - SOGEPP(37.00%)
27 Route du Bassin Numéro 6, 92230, Gennevilliers, France
South Caucasus Pipeline Company Limited (28.83%)s P.O. Box 309, Ugland House, 113 South Church Street, George Town, Grand Cayman, Cayman IslandsSouth Caucasus Pipeline Holding Company Limited(28.83%)
P.O. Box 309, Ugland House, 113 South Church Street, George Town, Grand Cayman, Cayman Islands
South Caucasus Pipeline Option Gas CompanyLimited (28.83%)
P.O. Box 309, Ugland House, 113 South Church Street, George Town, Grand Cayman, Cayman Islands
South China Bluesky Aviation Oil Company Limited(24.50%)a
Baiyun Internation Airport, Guangzhou, China
Stansted Intoplane Company Limited (20.00%) Causeway House, 1 Dane Street, Bishop's Stortford, Hertfordshire, CM23 3BT, United KingdomSTDG Strassentransport Dispositions GesellschaftmbH (50.00%)
Holstenhofweg 47, 22043 Hamburg, Germany
14. Related undertakings of the group – continued
The parent company financial statements of BP p.l.c. on pages 219-245 do not form part of BP’s Annual Report on Form 20-F as filed withthe SEC. 244 BP Annual Report and Form 20-F 2017
a Member interest b A shares c A and B shares d Ordinary, B shares, preference shares e Common stock and preference shares f Ordinary shares and preference shares g Partnership interest h A, B and D shares i Interest held directly by BP p.l.c. j 99% held directly by BP p.l.c. k 1% held directly by BP p.l.c. l Ordinary, A and B shares m 0.008% held directly by BP p.l.c.
n Ordinary shares and cumulative redeemable preference shares o 79.93% ordinary shares and 99.06% preference shares p 93.59% ordinary shares and 81.01% preference shares q Subsidiary in which the group does not hold a majority of the voting rights but exercises control over it r Ordinary shares and redeemable preference shares s B shares t Subsidiary undertaking pursuant to sections 1162(2), 1162(3)(b) and Paragraph 6 of Schedule 7 of the Companies Act 2006 u 100% ordinary shares and 58.63% preference shares v 92.31% B shares and 78.43% D shares w Preference shares x Unlimited redeemable shares y 96.52% C shares
z 1.89% A shares and 40.80% B shares
Stockholm Fuelling Services Aktiebolag (25.00%) Box 7, 190 45 Arlanda, SwedenStonewall Resources Ltd. (50.00%) Palm Grove House, P.O. Box 438, Road Town, Tortola, British Virgin IslandsSunrise Oil Sands Partnership (50.00%)g c/o Husky Oil Operations Limited, 707 - 8th Avenue SW, Calgary AB T2P 1H5, CanadaTankanlage AG Mellingen (33.33%) Birmenstorferstrasse 2, 5507, Mellingen, SwitzerlandTAR - Tankanlage Ruemlang AG (27.32%) Zwüscheteich, 8153, Rümlang, SwitzerlandTAU Tanklager Auhafen AG (50.00%) Auhafenstrasse 10a, 4132, Muttenz, SwitzerlandTeam Terminal B.V. (22.80%) Rijndwarsweg 3, 3198 LK Europoort, Rotterdam, NetherlandsTecklenburg GmbH (50.00%) Wesermünder Straße 1, 27729 Hambergen, GermanyTecklenburg GmbH & Co. Energiebedarf KG(50.00%)g
Wesermünder Straße 1, 27729 Hambergen, Germany
Terminales Canarios, S.L. (50.00%) Carretera de San Andréss/n, La Jurada-María Jiménez, Santa Cruz de Tenerife, SpainTFSS Turbo Fuel Services Sachsen GbR (20.00%)g Sportallee 6, 22335 Hamburg, GermanyTGFH Tanklager-Gesellschaft Frankfurt-Hahn GbR(50.00%)g
Sportallee 6, 22335 Hamburg, Germany
TGH Tankdienst-Gesellschaft Hamburg GbR(33.33%)g
Sportallee 6, 22335 Hamburg, Germany
TGHL Tanklager-Gesellschaft Hannover-Langenhagen GbR (50.00%)g
Sportallee 6, 22335 Hamburg, Germany
TGK Tanklagergesellschaft Koln-Bonn (25.00%)g Sportallee 6, 22335 Hamburg, GermanyThe Baku-Tbilisi-Ceyhan Pipeline Company (30.10%)z P.O. Box 309, Ugland House, 113 South Church Street, George Town, Grand Cayman, Cayman IslandsThe Consolidated Petroleum Company Limited(50.00%)s
Shell Centre, London, SE1 7NA, United Kingdom
The Consolidated Petroleum Supply CompanyLimited (50.00%)
Shell Centre, London, SE1 7NA, United Kingdom
The Sullom Voe Association Limited (33.33%)s Town Hall, Lerwick, Shetland, ZE1 0HB, United KingdomTLM Tanklager Management GmbH (49.00%)a Am Tankhafen 4, 4020 Linz, AustriaTLS Tanklager Stuttgart GmbH (45.00%) Zum Ölhafen 49, 70327 Stuttgart, GermanyTorsina Oil Company "TORSINA" (37.50%) 4 Palestine Road, 4th District, New Maadi, Cairo, EgyptTRaBP GbR (75.00%)g Huestraße 25, 44787, Bochum, GermanyTrafineo GmbH & Co. KG (75.00%)g Wittener Straße 56, Bochum, GermanyTrafineo Verwaltungs-GmbH (75.00%) Wittener Straße 56, Bochum, GermanyTransTank GmbH (50.00%) Am Stadthafen 60, 45881 Gelsenkirchen, GermanyTricoya Ventures UK Limited (35.56%) Brettenham House, 19 Lancaster Place, London, WC2E 7EN, United KingdomUnited Gas Derivatives Company "UGDC" (33.33%) 55 Road 18, Maadi, Cairo, EgyptUnited Kingdom Oil Pipelines Limited (33.50%) 5-7 Alexandra Road, Hemel Hempstead, Hertfordshire, HP2 5BS, United KingdomUrsa Oil Pipeline Company LLC (22.69%)a Corporation Trust Center, 1209 Orange Street, Wilmington DE 19801, United StatesVIC CBM Limited (50.00%) Eni House, 10 Ebury Bridge Road, London, SW1W 8PZ, United KingdomVirginia Indonesia Co. CBM Limited (50.00%) Eni House, 10 Ebury Bridge Road, London, SW1W 8PZ, United KingdomWalton-Gatwick Pipeline Company Limited 5-7 Alexandra Road, Hemel Hempstead, Hertfordshire, HP2 5BS, United KingdomWest London Pipeline and Storage Limited (30.50%) 5-7 Alexandra Road, Hemel Hempstead, Hertfordshire, HP2 5BS, United KingdomWest Morgan Petroleum Company (PETROMORGAN)(50.00%)
4 Palestine Road, 4th District, New Maadi, Cairo, Egypt
Wiri Oil Services Limited (27.78%) 303 Parnell Rd, Parnell, Auckland, New ZealandXact Downhole Telemetry Inc (27.00%)w 906 55th Avenue NE, Calgary AB, CanadaYangtze River Acetyls Co., Ltd (51.00%)a 97 Weijiang Road (in the Petrochemical Park), Changshou District, Chongqing, ChinaYermak Neftegaz LLC (49.00%)a Kosmodamianskaya nab, 52/3, 115035, Moscow, Russian Federation
14. Related undertakings of the group – continued
The parent company financial statements of BP p.l.c. on pages 219-245 do not form part of BP’s Annual Report on Form 20-F as filed withthe SEC.
BP Annual Report and Form 20-F 2017 245

THIS PAGE HAS BEEN LEFT BLANK INTENTIONALLY
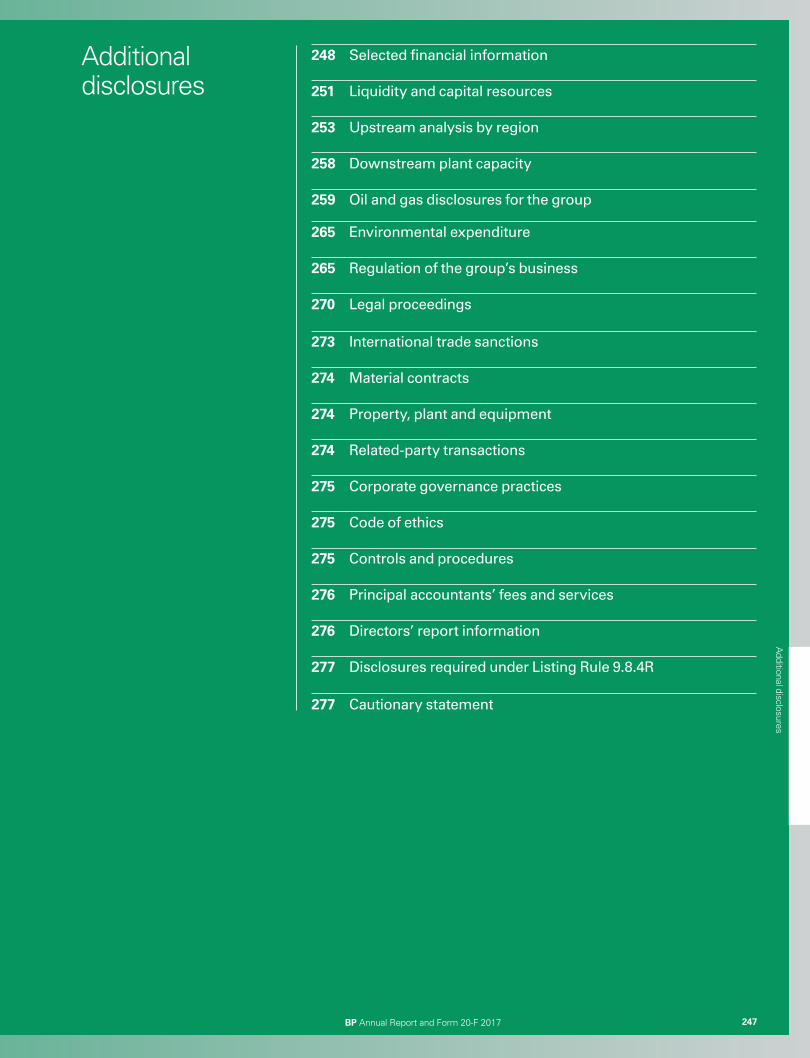
BP Annual Report and Form 20-F 2017 247
248 Selected financial information
251 Liquidity and capital resources
253 Upstream analysis by region
258 Downstream plant capacity
259 Oil and gas disclosures for the group
265 Environmental expenditure
265 Regulation of the group’s business
270 Legal proceedings
273 International trade sanctions
274 Material contracts
274 Property, plant and equipment
274 Related-party transactions
275 Corporate governance practices
275 Code of ethics
275 Controls and procedures
276 Principal accountants’ fees and services
276 Directors’ report information
277 Disclosures required under Listing Rule 9.8.4R
277 Cautionary statement
BP Annual Report and Form 20-F 2017 247
Additional disclosures
Additional disclosures
26_BP_AR_Financial_statements_contents_p115.indd 247 27/03/2018 10:39
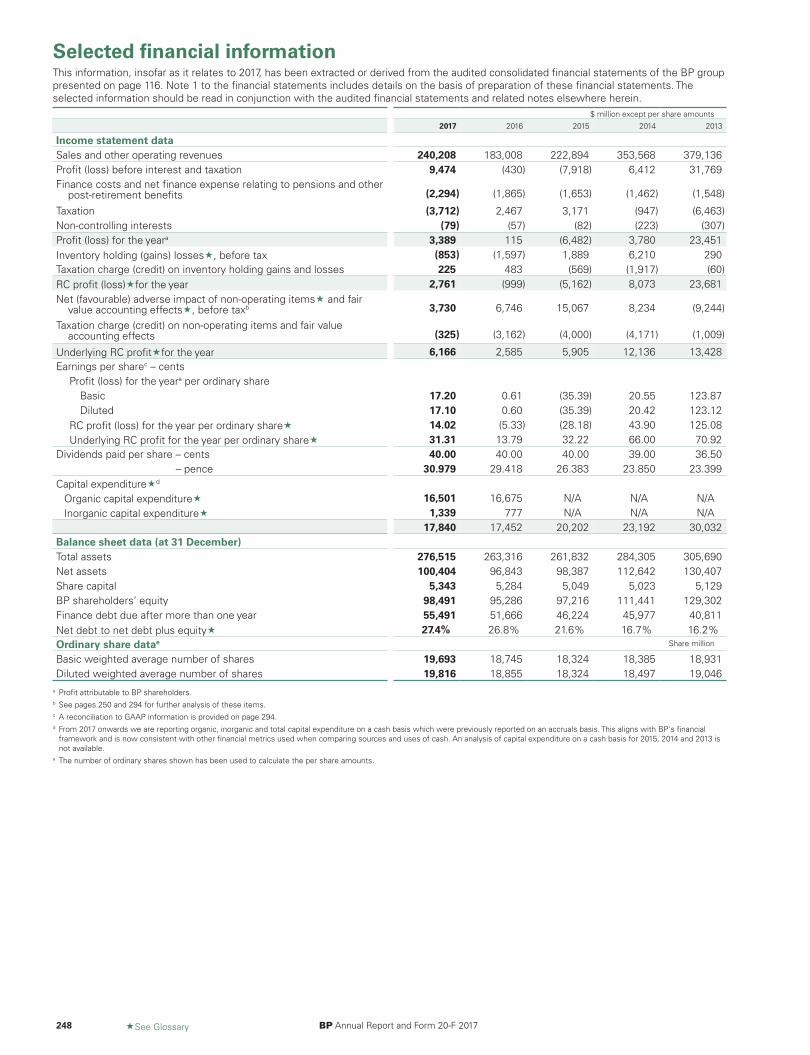
Selected financial informationThis information, insofar as it relates to 2017, has been extracted or derived from the audited consolidated financial statements of the BP grouppresented on page 116. Note 1 to the financial statements includes details on the basis of preparation of these financial statements. Theselected information should be read in conjunction with the audited financial statements and related notes elsewhere herein.
$ million except per share amounts2017 2016 2015 2014 2013
Income statement dataSales and other operating revenues 240,208 183,008 222,894 353,568 379,136Profit (loss) before interest and taxation 9,474 (430) (7,918) 6,412 31,769Finance costs and net finance expense relating to pensions and other
post-retirement benefits (2,294) (1,865) (1,653) (1,462) (1,548)
Taxation (3,712) 2,467 3,171 (947) (6,463)Non-controlling interests (79) (57) (82) (223) (307)Profit (loss) for the yeara 3,389 115 (6,482) 3,780 23,451Inventory holding (gains) losses«, before tax (853) (1,597) 1,889 6,210 290Taxation charge (credit) on inventory holding gains and losses 225 483 (569) (1,917) (60)RC profit (loss)«for the year 2,761 (999) (5,162) 8,073 23,681Net (favourable) adverse impact of non-operating items« and fair
value accounting effects«, before taxb 3,730 6,746 15,067 8,234 (9,244)
Taxation charge (credit) on non-operating items and fair valueaccounting effects (325) (3,162) (4,000) (4,171) (1,009)
Underlying RC profit«for the year 6,166 2,585 5,905 12,136 13,428Earnings per sharec – cents
Profit (loss) for the yeara per ordinary shareBasic 17.20 0.61 (35.39) 20.55 123.87Diluted 17.10 0.60 (35.39) 20.42 123.12
RC profit (loss) for the year per ordinary share« 14.02 (5.33) (28.18) 43.90 125.08Underlying RC profit for the year per ordinary share« 31.31 13.79 32.22 66.00 70.92
Dividends paid per share – cents 40.00 40.00 40.00 39.00 36.50– pence 30.979 29.418 26.383 23.850 23.399
Capital expenditure«d
Organic capital expenditure« 16,501 16,675 N/A N/A N/AInorganic capital expenditure« 1,339 777 N/A N/A N/A
17,840 17,452 20,202 23,192 30,032Balance sheet data (at 31 December)Total assets 276,515 263,316 261,832 284,305 305,690Net assets 100,404 96,843 98,387 112,642 130,407Share capital 5,343 5,284 5,049 5,023 5,129BP shareholders’ equity 98,491 95,286 97,216 111,441 129,302Finance debt due after more than one year 55,491 51,666 46,224 45,977 40,811Net debt to net debt plus equity« 27.4% 26.8% 21.6% 16.7% 16.2%Ordinary share datae Share million
Basic weighted average number of shares 19,693 18,745 18,324 18,385 18,931Diluted weighted average number of shares 19,816 18,855 18,324 18,497 19,046
a Profit attributable to BP shareholders.b See pages 250 and 294 for further analysis of these items.c A reconciliation to GAAP information is provided on page 294.d From 2017 onwards we are reporting organic, inorganic and total capital expenditure on a cash basis which were previously reported on an accruals basis. This aligns with BP's financial
framework and is now consistent with other financial metrics used when comparing sources and uses of cash. An analysis of capital expenditure on a cash basis for 2015, 2014 and 2013 isnot available.
e The number of ordinary shares shown has been used to calculate the per share amounts.
248 «See Glossary BP Annual Report and Form 20-F 2017
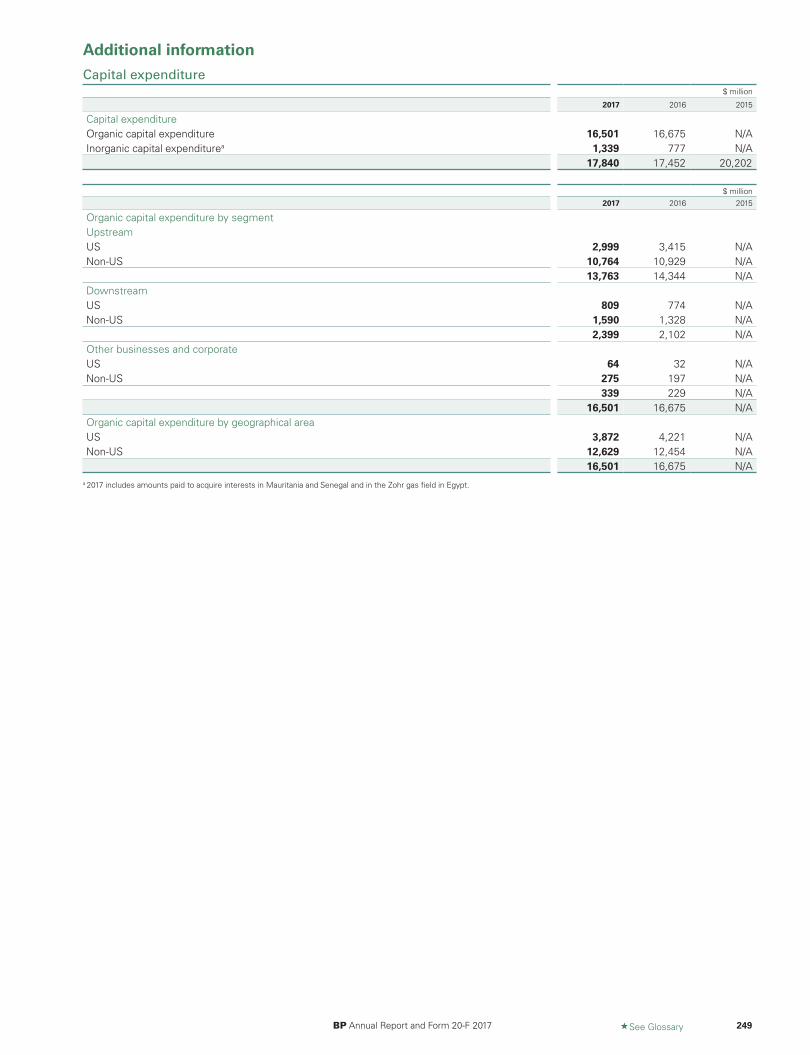
Additional informationCapital expenditure
$ million
2017 2016 2015
Capital expenditureOrganic capital expenditure 16,501 16,675 N/AInorganic capital expenditurea 1,339 777 N/A
17,840 17,452 20,202
$ million2017 2016 2015
Organic capital expenditure by segmentUpstreamUS 2,999 3,415 N/ANon-US 10,764 10,929 N/A
13,763 14,344 N/ADownstreamUS 809 774 N/ANon-US 1,590 1,328 N/A
2,399 2,102 N/AOther businesses and corporateUS 64 32 N/ANon-US 275 197 N/A
339 229 N/A16,501 16,675 N/A
Organic capital expenditure by geographical areaUS 3,872 4,221 N/ANon-US 12,629 12,454 N/A
16,501 16,675 N/Aa 2017 includes amounts paid to acquire interests in Mauritania and Senegal and in the Zohr gas field in Egypt.
BP Annual Report and Form 20-F 2017 «See Glossary 249
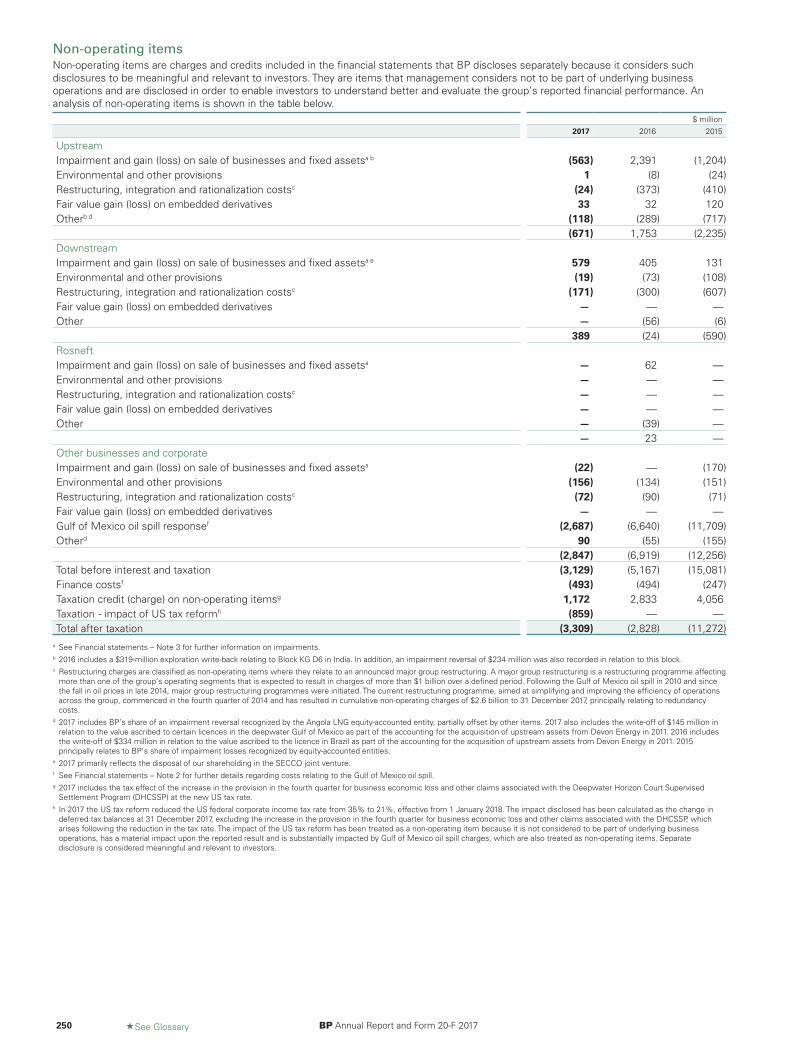
Non-operating itemsNon-operating items are charges and credits included in the financial statements that BP discloses separately because it considers suchdisclosures to be meaningful and relevant to investors. They are items that management considers not to be part of underlying businessoperations and are disclosed in order to enable investors to understand better and evaluate the group’s reported financial performance. Ananalysis of non-operating items is shown in the table below.
$ million2017 2016 2015
UpstreamImpairment and gain (loss) on sale of businesses and fixed assetsa b (563) 2,391 (1,204)Environmental and other provisions 1 (8) (24)Restructuring, integration and rationalization costsc (24) (373) (410)Fair value gain (loss) on embedded derivatives 33 32 120Otherb d (118) (289) (717)
(671) 1,753 (2,235)DownstreamImpairment and gain (loss) on sale of businesses and fixed assetsa e 579 405 131Environmental and other provisions (19) (73) (108)Restructuring, integration and rationalization costsc (171) (300) (607)Fair value gain (loss) on embedded derivatives — — —Other — (56) (6)
389 (24) (590)RosneftImpairment and gain (loss) on sale of businesses and fixed assetsa — 62 —Environmental and other provisions — — —Restructuring, integration and rationalization costsc — — —Fair value gain (loss) on embedded derivatives — — —Other — (39) —
— 23 —Other businesses and corporateImpairment and gain (loss) on sale of businesses and fixed assetsa (22) — (170)Environmental and other provisions (156) (134) (151)Restructuring, integration and rationalization costsc (72) (90) (71)Fair value gain (loss) on embedded derivatives — — —Gulf of Mexico oil spill responsef (2,687) (6,640) (11,709)Otherd 90 (55) (155)
(2,847) (6,919) (12,256)Total before interest and taxation (3,129) (5,167) (15,081)Finance costsf (493) (494) (247)Taxation credit (charge) on non-operating itemsg 1,172 2,833 4,056Taxation - impact of US tax reformh (859) — —Total after taxation (3,309) (2,828) (11,272)
a See Financial statements – Note 3 for further information on impairments.b 2016 includes a $319-million exploration write-back relating to Block KG D6 in India. In addition, an impairment reversal of $234 million was also recorded in relation to this block.c Restructuring charges are classified as non-operating items where they relate to an announced major group restructuring. A major group restructuring is a restructuring programme affecting
more than one of the group’s operating segments that is expected to result in charges of more than $1 billion over a defined period. Following the Gulf of Mexico oil spill in 2010 and sincethe fall in oil prices in late 2014, major group restructuring programmes were initiated. The current restructuring programme, aimed at simplifying and improving the efficiency of operationsacross the group, commenced in the fourth quarter of 2014 and has resulted in cumulative non-operating charges of $2.6 billion to 31 December 2017, principally relating to redundancycosts.
d 2017 includes BP’s share of an impairment reversal recognized by the Angola LNG equity-accounted entity, partially offset by other items. 2017 also includes the write-off of $145 million inrelation to the value ascribed to certain licences in the deepwater Gulf of Mexico as part of the accounting for the acquisition of upstream assets from Devon Energy in 2011. 2016 includesthe write-off of $334 million in relation to the value ascribed to the licence in Brazil as part of the accounting for the acquisition of upstream assets from Devon Energy in 2011. 2015principally relates to BP’s share of impairment losses recognized by equity-accounted entities.
e 2017 primarily reflects the disposal of our shareholding in the SECCO joint venture.f See Financial statements – Note 2 for further details regarding costs relating to the Gulf of Mexico oil spill.g 2017 includes the tax effect of the increase in the provision in the fourth quarter for business economic loss and other claims associated with the Deepwater Horizon Court Supervised
Settlement Program (DHCSSP) at the new US tax rate.h In 2017 the US tax reform reduced the US federal corporate income tax rate from 35% to 21%, effective from 1 January 2018. The impact disclosed has been calculated as the change in
deferred tax balances at 31 December 2017, excluding the increase in the provision in the fourth quarter for business economic loss and other claims associated with the DHCSSP, whicharises following the reduction in the tax rate. The impact of the US tax reform has been treated as a non-operating item because it is not considered to be part of underlying businessoperations, has a material impact upon the reported result and is substantially impacted by Gulf of Mexico oil spill charges, which are also treated as non-operating items. Separatedisclosure is considered meaningful and relevant to investors.
250 «See Glossary BP Annual Report and Form 20-F 2017
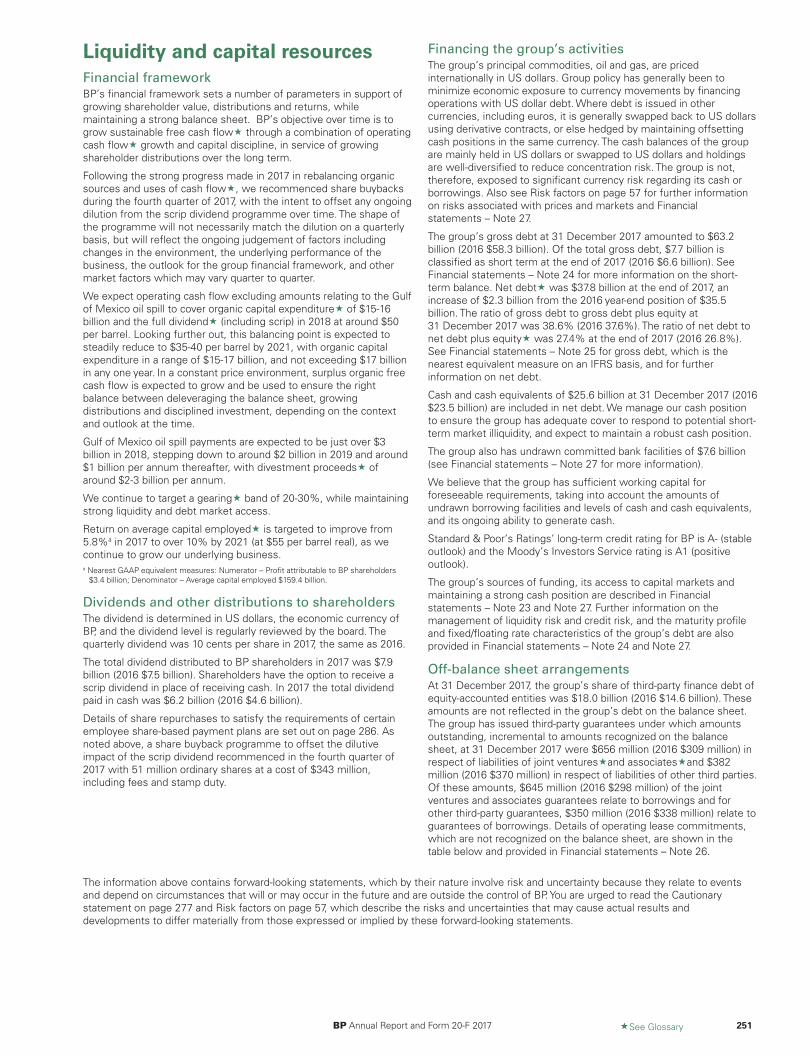
Liquidity and capital resourcesFinancial frameworkBP’s financial framework sets a number of parameters in support ofgrowing shareholder value, distributions and returns, whilemaintaining a strong balance sheet. BP’s objective over time is togrow sustainable free cash flow« through a combination of operatingcash flow« growth and capital discipline, in service of growingshareholder distributions over the long term.
Following the strong progress made in 2017 in rebalancing organicsources and uses of cash flow«, we recommenced share buybacksduring the fourth quarter of 2017, with the intent to offset any ongoingdilution from the scrip dividend programme over time. The shape ofthe programme will not necessarily match the dilution on a quarterlybasis, but will reflect the ongoing judgement of factors includingchanges in the environment, the underlying performance of thebusiness, the outlook for the group financial framework, and othermarket factors which may vary quarter to quarter.
We expect operating cash flow excluding amounts relating to the Gulfof Mexico oil spill to cover organic capital expenditure« of $15-16billion and the full dividend« (including scrip) in 2018 at around $50per barrel. Looking further out, this balancing point is expected tosteadily reduce to $35-40 per barrel by 2021, with organic capitalexpenditure in a range of $15-17 billion, and not exceeding $17 billionin any one year. In a constant price environment, surplus organic freecash flow is expected to grow and be used to ensure the rightbalance between deleveraging the balance sheet, growingdistributions and disciplined investment, depending on the contextand outlook at the time.
Gulf of Mexico oil spill payments are expected to be just over $3billion in 2018, stepping down to around $2 billion in 2019 and around$1 billion per annum thereafter, with divestment proceeds« ofaround $2-3 billion per annum.
We continue to target a gearing« band of 20-30%, while maintainingstrong liquidity and debt market access.
Return on average capital employed« is targeted to improve from5.8%a in 2017 to over 10% by 2021 (at $55 per barrel real), as wecontinue to grow our underlying business.a Nearest GAAP equivalent measures: Numerator – Profit attributable to BP shareholders
$3.4 billion; Denominator – Average capital employed $159.4 billion.
Dividends and other distributions to shareholdersThe dividend is determined in US dollars, the economic currency ofBP, and the dividend level is regularly reviewed by the board. Thequarterly dividend was 10 cents per share in 2017, the same as 2016.
The total dividend distributed to BP shareholders in 2017 was $7.9billion (2016 $7.5 billion). Shareholders have the option to receive ascrip dividend in place of receiving cash. In 2017 the total dividendpaid in cash was $6.2 billion (2016 $4.6 billion).
Details of share repurchases to satisfy the requirements of certainemployee share-based payment plans are set out on page 286. Asnoted above, a share buyback programme to offset the dilutiveimpact of the scrip dividend recommenced in the fourth quarter of2017 with 51 million ordinary shares at a cost of $343 million,including fees and stamp duty.
Financing the group’s activitiesThe group’s principal commodities, oil and gas, are pricedinternationally in US dollars. Group policy has generally been tominimize economic exposure to currency movements by financingoperations with US dollar debt. Where debt is issued in othercurrencies, including euros, it is generally swapped back to US dollarsusing derivative contracts, or else hedged by maintaining offsettingcash positions in the same currency. The cash balances of the groupare mainly held in US dollars or swapped to US dollars and holdingsare well-diversified to reduce concentration risk. The group is not,therefore, exposed to significant currency risk regarding its cash orborrowings. Also see Risk factors on page 57 for further informationon risks associated with prices and markets and Financialstatements – Note 27.
The group’s gross debt at 31 December 2017 amounted to $63.2billion (2016 $58.3 billion). Of the total gross debt, $7.7 billion isclassified as short term at the end of 2017 (2016 $6.6 billion). SeeFinancial statements – Note 24 for more information on the short-term balance. Net debt« was $37.8 billion at the end of 2017, anincrease of $2.3 billion from the 2016 year-end position of $35.5billion. The ratio of gross debt to gross debt plus equity at31 December 2017 was 38.6% (2016 37.6%). The ratio of net debt tonet debt plus equity« was 27.4% at the end of 2017 (2016 26.8%).See Financial statements – Note 25 for gross debt, which is thenearest equivalent measure on an IFRS basis, and for furtherinformation on net debt.
Cash and cash equivalents of $25.6 billion at 31 December 2017 (2016$23.5 billion) are included in net debt. We manage our cash positionto ensure the group has adequate cover to respond to potential short-term market illiquidity, and expect to maintain a robust cash position.
The group also has undrawn committed bank facilities of $7.6 billion(see Financial statements – Note 27 for more information).
We believe that the group has sufficient working capital forforeseeable requirements, taking into account the amounts ofundrawn borrowing facilities and levels of cash and cash equivalents,and its ongoing ability to generate cash.
Standard & Poor’s Ratings’ long-term credit rating for BP is A- (stableoutlook) and the Moody’s Investors Service rating is A1 (positiveoutlook).
The group’s sources of funding, its access to capital markets andmaintaining a strong cash position are described in Financialstatements – Note 23 and Note 27. Further information on themanagement of liquidity risk and credit risk, and the maturity profileand fixed/floating rate characteristics of the group’s debt are alsoprovided in Financial statements – Note 24 and Note 27.
Off-balance sheet arrangementsAt 31 December 2017, the group’s share of third-party finance debt ofequity-accounted entities was $18.0 billion (2016 $14.6 billion). Theseamounts are not reflected in the group’s debt on the balance sheet.The group has issued third-party guarantees under which amountsoutstanding, incremental to amounts recognized on the balancesheet, at 31 December 2017 were $656 million (2016 $309 million) inrespect of liabilities of joint ventures«and associates«and $382million (2016 $370 million) in respect of liabilities of other third parties.Of these amounts, $645 million (2016 $298 million) of the jointventures and associates guarantees relate to borrowings and forother third-party guarantees, $350 million (2016 $338 million) relate toguarantees of borrowings. Details of operating lease commitments,which are not recognized on the balance sheet, are shown in thetable below and provided in Financial statements – Note 26.
The information above contains forward-looking statements, which by their nature involve risk and uncertainty because they relate to eventsand depend on circumstances that will or may occur in the future and are outside the control of BP. You are urged to read the Cautionarystatement on page 277 and Risk factors on page 57, which describe the risks and uncertainties that may cause actual results anddevelopments to differ materially from those expressed or implied by these forward-looking statements.
BP Annual Report and Form 20-F 2017 «See Glossary 251
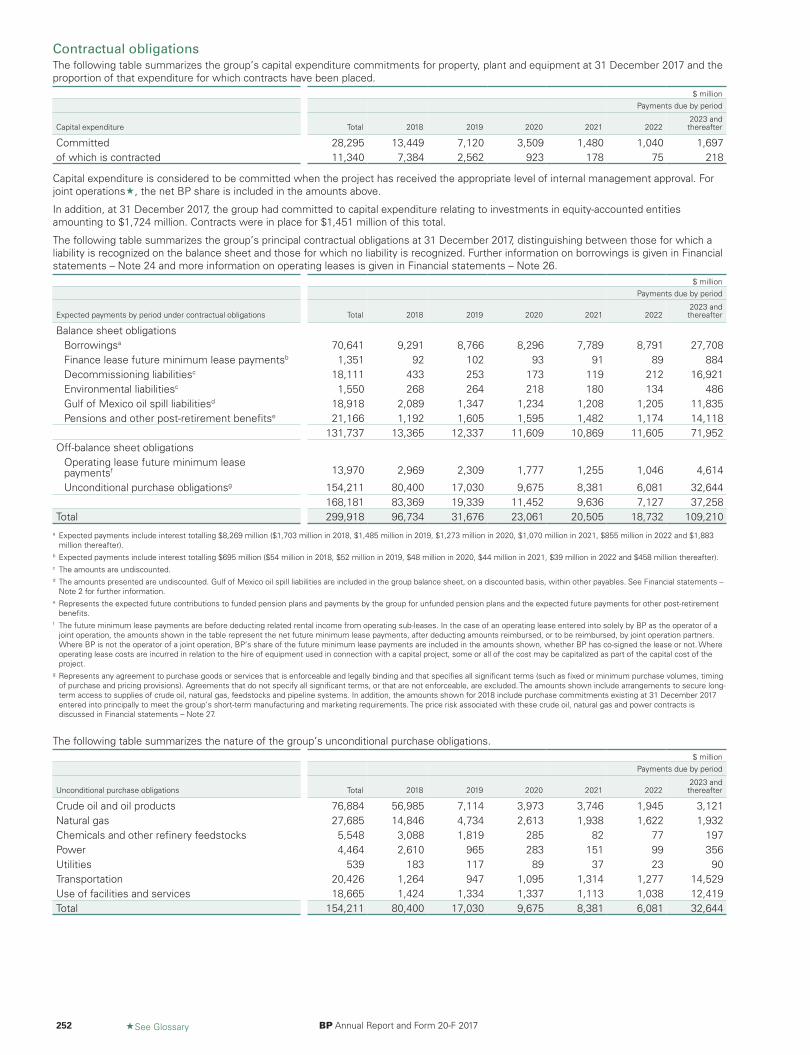
Contractual obligationsThe following table summarizes the group’s capital expenditure commitments for property, plant and equipment at 31 December 2017 and theproportion of that expenditure for which contracts have been placed.
$ millionPayments due by period
Capital expenditure Total 2018 2019 2020 2021 20222023 andthereafter
Committed 28,295 13,449 7,120 3,509 1,480 1,040 1,697of which is contracted 11,340 7,384 2,562 923 178 75 218
Capital expenditure is considered to be committed when the project has received the appropriate level of internal management approval. Forjoint operations«, the net BP share is included in the amounts above.
In addition, at 31 December 2017, the group had committed to capital expenditure relating to investments in equity-accounted entitiesamounting to $1,724 million. Contracts were in place for $1,451 million of this total.
The following table summarizes the group’s principal contractual obligations at 31 December 2017, distinguishing between those for which aliability is recognized on the balance sheet and those for which no liability is recognized. Further information on borrowings is given in Financialstatements – Note 24 and more information on operating leases is given in Financial statements – Note 26.
$ millionPayments due by period
Expected payments by period under contractual obligations Total 2018 2019 2020 2021 20222023 andthereafter
Balance sheet obligationsBorrowingsa 70,641 9,291 8,766 8,296 7,789 8,791 27,708Finance lease future minimum lease paymentsb 1,351 92 102 93 91 89 884Decommissioning liabilitiesc 18,111 433 253 173 119 212 16,921Environmental liabilitiesc 1,550 268 264 218 180 134 486Gulf of Mexico oil spill liabilitiesd 18,918 2,089 1,347 1,234 1,208 1,205 11,835Pensions and other post-retirement benefitse 21,166 1,192 1,605 1,595 1,482 1,174 14,118
131,737 13,365 12,337 11,609 10,869 11,605 71,952Off-balance sheet obligations
Operating lease future minimum leasepaymentsf 13,970 2,969 2,309 1,777 1,255 1,046 4,614
Unconditional purchase obligationsg 154,211 80,400 17,030 9,675 8,381 6,081 32,644168,181 83,369 19,339 11,452 9,636 7,127 37,258
Total 299,918 96,734 31,676 23,061 20,505 18,732 109,210a Expected payments include interest totalling $8,269 million ($1,703 million in 2018, $1,485 million in 2019, $1,273 million in 2020, $1,070 million in 2021, $855 million in 2022 and $1,883
million thereafter).b Expected payments include interest totalling $695 million ($54 million in 2018, $52 million in 2019, $48 million in 2020, $44 million in 2021, $39 million in 2022 and $458 million thereafter).c The amounts are undiscounted.d The amounts presented are undiscounted. Gulf of Mexico oil spill liabilities are included in the group balance sheet, on a discounted basis, within other payables. See Financial statements –
Note 2 for further information.e Represents the expected future contributions to funded pension plans and payments by the group for unfunded pension plans and the expected future payments for other post-retirement
benefits.f The future minimum lease payments are before deducting related rental income from operating sub-leases. In the case of an operating lease entered into solely by BP as the operator of a
joint operation, the amounts shown in the table represent the net future minimum lease payments, after deducting amounts reimbursed, or to be reimbursed, by joint operation partners.Where BP is not the operator of a joint operation, BP’s share of the future minimum lease payments are included in the amounts shown, whether BP has co-signed the lease or not. Whereoperating lease costs are incurred in relation to the hire of equipment used in connection with a capital project, some or all of the cost may be capitalized as part of the capital cost of theproject.
g Represents any agreement to purchase goods or services that is enforceable and legally binding and that specifies all significant terms (such as fixed or minimum purchase volumes, timingof purchase and pricing provisions). Agreements that do not specify all significant terms, or that are not enforceable, are excluded. The amounts shown include arrangements to secure long-term access to supplies of crude oil, natural gas, feedstocks and pipeline systems. In addition, the amounts shown for 2018 include purchase commitments existing at 31 December 2017entered into principally to meet the group’s short-term manufacturing and marketing requirements. The price risk associated with these crude oil, natural gas and power contracts isdiscussed in Financial statements – Note 27.
The following table summarizes the nature of the group’s unconditional purchase obligations.$ million
Payments due by period
Unconditional purchase obligations Total 2018 2019 2020 2021 20222023 andthereafter
Crude oil and oil products 76,884 56,985 7,114 3,973 3,746 1,945 3,121Natural gas 27,685 14,846 4,734 2,613 1,938 1,622 1,932Chemicals and other refinery feedstocks 5,548 3,088 1,819 285 82 77 197Power 4,464 2,610 965 283 151 99 356Utilities 539 183 117 89 37 23 90Transportation 20,426 1,264 947 1,095 1,314 1,277 14,529Use of facilities and services 18,665 1,424 1,334 1,337 1,113 1,038 12,419Total 154,211 80,400 17,030 9,675 8,381 6,081 32,644
252 «See Glossary BP Annual Report and Form 20-F 2017
Upstream analysis by regionOur upstream operations are set out below by geographical area, withassociated significant events for 2017. BP’s percentage workinginterest in oil and gas assets is shown in brackets. Working interest isthe cost-bearing ownership share of an oil or gas lease. Consequently,the percentages disclosed for certain agreements do not necessarilyreflect the percentage interests in proved reserves and production.
In addition to exploration, development and production activities, ourupstream business also includes midstream and LNG supplyactivities. Midstream activities involve the ownership andmanagement of crude oil and natural gas pipelines, processingfacilities and export terminals, LNG processing facilities andtransportation, and our natural gas liquids (NGLs) processingbusiness.
Our LNG supply activities are located in Abu Dhabi, Angola, Australia,Indonesia and Trinidad. We market around 20% of our LNG productionusing BP LNG shipping and contractual rights to access importterminal capacity in the liquid markets of Italy (in Rovigo), Spain (inBilbao), the UK (via the Isle of Grain) and the US (via Cove Point), withthe remainder marketed directly to customers. LNG is supplied tocustomers in markets including Argentina, Chile, China, theDominican Republic, India, Israel, Japan, Kuwait, South Korea andTaiwan.
EuropeBP is active in the North Sea and the Norwegian Sea. Our activitiesfocus on maximizing recovery from existing producing fields and newfield developments. BP’s production in 2017 was generated fromthree key areas: the Shetland area - comprising the Clair, Foinaven,Magnus, and Schiehallion fields; the central area - comprising theAndrew, Bruce, ETAP, Keith, Kinnoull and Rhum fields; and Norway,through our equity accounted 30% interest in Aker BP established in2016 (see below).
• In January 2017 we announced that we had agreed to sell 25% ofour 100% stake in Magnus, a 25% interest in a number ofassociated pipelines and a 3% interest in the Sullom Voe Terminal(SVT) on Shetland to EnQuest. BP also agreed to transferoperatorship of these assets to EnQuest. The sale price of$85 million is expected to be met by EnQuest from future cashflows from the assets, without any upfront payment to BP. Thetransfer completed on 1 December. Under the terms of theagreement, EnQuest has an option, exercisable between 1 July2018 and 15 January 2019, to purchase BP’s remaining 75%interest in Magnus, a further 9% interest in SVT and the remainderof BP’s interests in the associated pipelines for a consideration of$300 million.
• We were awarded 25 blocks or part blocks in the UK’s 29thOffshore Licensing Round in March 2017, representing the largestacreage award for BP in the North Sea since the late 1990s. Thelicence award includes three exploration wells.
• We announced in April that we had agreed to sell our FortiesPipeline System (FPS) business (BP 100%) to INEOS for an upfrontcash consideration at the economic date of $125 million, adjustedfor net cash flows in the interim period, followed by contingentpayments between 2022 and 2024 of up to a further $125 million.FPS is an integrated oil and NGLs transportation and processingsystem that handles production from around 80 fields in the centralNorth Sea. As a result of this decision to sell, an impairment chargeof $387 million was recorded. The sale completed on 31 October.BP’s existing transportation and processing rights in the system arenot affected by the divestment.
• Production from the redeveloped Schiehallion area started in May,following completion of the multi-billion-dollar Quad 204 project,designed to extend the life of the fields and unlock furtherresources. The Schiehallion area comprises the Schiehallion (BP33%) and Loyal (BP 50%) fields. The project included theconstruction and installation of a floating, production, storage andoffloading (FPSO) vessel, a major upgrade and replacement ofsubsea facilities and a continuous drilling programme of up to 20new wells to enable full development of the associated reserves.
• We continued to progress development at the Maersk-operatedCulzean field (BP 32%) during the year. The installation of the gasexport pipeline and fixed jackets was completed in 2017, withdevelopment drilling ongoing. First production is expected in 2019.The field will be developed with three fixed platforms and a floatingstorage unit.
• Aker BP announced an agreement to acquire Hess Norge AS inOctober. On completion of the transaction in December, Aker BPbecame the sole owner of the Valhall and Hod fields butsubsequently sold a 10% interest in each of these fields to PandionEnergy AS. BP subscribed for additional new shares in Aker BP aspart of the financing of the acquisition of Hess Norge AS, andremains an owner of 30% of the issued share capital in Aker BP.
• In November, we announced that we had agreed to sell a packageof our interests in the Bruce assets in the North Sea to SericaEnergy plc. We currently operate the assets, which comprise theBruce (BP 37%), Keith (BP 35%) and Rhum (BP 50%) fields, threebridge-linked platforms and associated subsea infrastructure.Under the terms of the agreement, Serica will pay BP an upfrontpayment of £12.8 million (equivalent to $17.2 million), a share ofcash flows over the next four years, a consideration equivalent to30% of our post-tax decommissioning costs and several contingentpayments dependent on future asset performance and productprices. Overall, we expect to receive payments of around £300million (equivalent to $403 million), the majority of which will bereceived over the next four years. Subject to the receipt ofregulatory and other third-party approvals, we expect to completethe sale and transfer of operatorship in the third quarter of 2018.
• The Clair field (BP 29% and operator) is the largest oilfield on theUK Continental Shelf. Production began at the field, located 75kilometres west of the Shetland Islands, in 2005. Its physical sizedictates development via a phased approach, with Clair Ridge asthe second phase of development. This has involved theconstruction and installation of two new bridge-linked platforms,the legs of which were installed in 2013. The final topside moduleswere safely installed in 2016, completing the construction phase.Commissioning offshore is well under way, with first oil expectedin late 2018.
• In September the US Office of Foreign Asset Control renewed BP’slicence permitting certain US persons and US owned andcontrolled companies to support Rhum activities in compliancewith US primary sanctions. The licence expires on 30 September2018. The Rhum field is owned by BP (50%) and the Iranian OilCompany (IOC, 50%) under a joint operating agreement. EUsanctions and certain US secondary sanctions in respect of Iranhave been lifted or suspended as part of the Joint ComprehensivePlan of Action. See International trade sanctions on page 273.
• During the year an exploration write-off of $178 million relating tothe Southern North Sea Carboniferous appraisal programme,including the Ravenspurn North Deep well, was recognized. Therewere two exploration discoveries in 2017, namely Achmelvich andCapercaillie, both of which are currently being evaluated.
North AmericaOur upstream activities in North America are located in five areas:deepwater Gulf of Mexico, the Lower 48 states, Alaska, Canada andMexico.
BP has around 260 lease blocks in the deepwater Gulf of Mexico, andwe operate four production hubs.
• We announced the start-up of the South Expansion major project atour Thunder Horse platform in January 2017. Three producing wellscame online in 2017 and the final well followed in early 2018. Theproject scope includes a new subsea production system two milesto the south of the existing Thunder Horse platform. The system isa collection of four wells connected to the platform by two linesinstalled on the seabed.
• During the year, a $68-million charge was recognized for the WestCapricorn rig while it was warm stacked awaiting transfer to otherprojects. The rig returned to drilling operations in the fourth quarterof 2017.
BP Annual Report and Form 20-F 2017 «See Glossary 253
• In December BP completed the disposal of 26.5% of its 27.5%non-operated interest in the Perdido Regional Host to AL-PerdidoHoldings LLC. Perdido is a regional floating production hub forthree fields including Great White (BP 33%) in the Gulf of Mexico.
• In March 2017, we were awarded three leases in the OCS CentralSale 247, in Mississippi Canyon Block 867 and Green CanyonBlocks 738 and 870.
• We were also awarded three leases in the Gulf of Mexico WideSale 249, in Green Canyon Block 451 and Mississippi CanyonBlocks 820 and 864 in August.
• During the year exploration write-offs totalling $213 million wererecognised, the most significant being $148 million in connectionwith the expiration of the Gila lease.
• See also Financial statements Note 1 for further information onexploration leases.
The US Lower 48 onshore business has significant operated and non-operated activities across Arkansas, Colorado, New Mexico,Oklahoma, Texas and Wyoming producing natural gas, oil, NGLs andcondensate. It has a 1.4 billion boe proved reserve base as at31 December 2017, predominantly in unconventional reservoirs (tightgas«, shale gas and coalbed methane). This resource spans 3.1million net developed acres and has approximately 9,400 operatedgross wells, with daily net production around 300mboe/d.
Since the beginning of 2015, our US Lower 48 onshore business hasoperated as a separate business while remaining part of ourUpstream segment. It has its own governance, systems andprocesses, and was established to increase competitive performancethrough swift decision-making and innovation, while maintaining BP’scommitment to safe, reliable and compliant operations.
• In East Texas the Haynesville and Bossier development isunderway. This material development increased BP’s net naturalgas production for the fourth quarter of 2017 in the East BusinessUnit by around 50% compared to the previous year.
• In August, we announced that a natural gas well in the MancosShale, New Mexico (BP 100%) had been brought on line. Webelieve the field has the potential to be a significant new source ofUS gas supply.
• In the fourth quarter an impairment charge of $321 million wasrecognized as a result of changes in reserves estimates.
BP’s onshore US crude oil and product pipelines and relatedtransportation assets are included in the Downstream segment.
In Alaska, BP Exploration (Alaska) Inc. (BPXA) operated nine NorthSlope oilfields in the Greater Prudhoe Bay area at the end of the year.Our focus continues to be on safe and reliable operations, renewingPrudhoe Bay infrastructure and minimizing oil production decline. Forthe past three years BP has successfully combated decline atPrudhoe Bay through wellwork and improved operating fieldefficiencies, with production being largely maintained. Infrastructurerenewal activities in 2017 included compressor replacements, fire andgas system upgrades, safety system upgrades, pipeline renewal,facility piping upgrades and facility-siting projects. BP also ownssignificant interests in eight producing fields operated by others, aswell as a non-operating interest in the Liberty prospect.
• The Alaska LNG project concept includes a planned three-trainNorth Slope gas treatment plant, approximately 800 miles ofpipeline to tidewater and a three-train liquefaction facility, with anestimated capacity of 3 billion cubic feet per day (bcf/d) (up to 20million tonnes per annum) supplied from the Prudhoe Bay andPoint Thomson fields. In April, the Alaska Gasline DevelopmentCorporation (AGDC), a state entity which has led the project sinceDecember 2016, submitted a formal application for an authorizationto site, construct, and operate an integrated LNG project. AGDCalso conducted extensive marketing activities in Asia in 2017including signing a memorandum of understanding with the KoreaGas Corporation (KOGAS), signing a joint development agreementwith China Petroleum and Chemical Corporation (Sinopec), Bank ofChina, and the Chinese Investment Corporation, signing amemorandum of understanding with PetroVietnam and signing aLetter of Intent with Tokyo Gas Company. In January 2017 BP
Alaska LNG LLC (BPAL) executed a co-operation agreement withAGDC detailing BPAL's commitment to helping the state furtherdevelop Alaska LNG. This agreement has been extended to 30June 2018.
• The Prudhoe Bay oil field (BP 26% and operator) on Alaska’s NorthSlope reached 40 years of production in 2017, a milestone thathighlights its important contribution to US energy security and theeconomy of the state. Since the field began production in 1977, ithas recovered more than 12.5 billion barrels of oil. The originalestimated recovery for Prudhoe Bay was 9.6 billion barrels, with anadditional 3 billion barrels so far unlocked through innovations inoilfield technology. Prudhoe Bay remains the third largest oil field inthe US on a proved reserves basis.
BP Pipelines (Alaska) Inc. (BPPA) owns a 49% interest in the Trans-Alaska Pipeline System (TAPS). TAPS transports crude oil fromPrudhoe Bay on the Alaska North Slope to the port of Valdez in south-east Alaska. In April 2012 Unocal (1.37%) gave notice to the otherTAPS owners of their intention to withdraw as an owner of TAPS. Theremaining owners and Unocal have not yet reached agreementregarding the terms for the transfer of Unocal’s interest in TAPS.
• In 2017, the parties involved in TAPS tariff matters at the FederalEnergy Regulatory Commission (FERC) and the RegulatoryCommission of Alaska (RCA) reached an agreement to settle allchallenges pending before FERC involving TAPS interstate rates forthe years 2009-2015 and establish a mechanism for calculatinginterstate rate ceilings for TAPS for the period from 2016 through2021, as well as subsequent years unless otherwise terminated.The agreement resolves all challenges pending before the RCAinvolving TAPS intrastate rates from 2008 to the present, andestablish intrastate rate ceilings for the future through 30 June2019. RCA approval was granted in January 2018 and FERCapproval in February 2018. Once all appeal periods have run, if theagreements are approved, the parties will proceed withimplementing the settlement agreements, including issuing tariffrefunds. Implementation will result in production tax and royaltypayments to the State of Alaska while releasing some previouslyaccrued liability provisions within BP Alaska.
In Canada, BP is focused on oil sands development as well aspursuing offshore exploration opportunities. We utilize in-situ steam-assisted gravity drainage (SAGD) technology in our oil sandsdevelopments, which uses the injection of steam into the reservoir towarm the bitumen so that it can flow to the surface throughproducing wells. We hold interests in three oil sands lease areasthrough the Sunrise Oil Sands and Terre de Grace partnerships andthe Pike Oil Sands joint operation«. In addition, we have significantoffshore exploration licences in Nova Scotia, Newfoundland andLabrador and the Canadian Beaufort Sea.
In Mexico, we have interests in two exploration joint ventures« in theSaline Basin with Statoil and Total, Block 1 (BP 33% and operator) andBlock 3 (BP 33%). Both properties have submitted an exploration planto Comisión Nacional de Hidrocarburos (CNH), the Mexican regulator,and approval was received in March 2018.
South AmericaBP has upstream activities in Brazil and Trinidad & Tobago, andthrough Pan American Energy Group (PAEG), in Argentina and Bolivia.
In Brazil BP has interests in 21 exploration concessions across fivebasins.
• In October, we won two licences in the third Pre-Salt Bid Round inBrazil, the Alto De Cabo Frio Central block (BP 50%), and thePeroba block (BP 40%).
• In the North Campos basin, we continue work on the BM-C-32(Itaipu) and BM-C-30 (Wahoo) projects with the potential for a jointdevelopment or tie back between them. A decision to move intofront-end engineering for a potential long-term test is planned forNovember 2018.
• Following the licence extension to 2019 which was approved in2016, seismic processing and prospect inventory developmentprogressed in 2017 in Block BAR-M-346 in the Barreirinhas basin.
254 «See Glossary BP Annual Report and Form 20-F 2017
• BP continues to progress the preparatory activities for drillingexploration wells in the Foz do Amazonas Basin, with a BP-operated well scheduled to spud in 2020. An extension requestwas submitted to the Brazilian National Petroleum Agency (ANP)regarding BP-operated block FZA-M-59. We also expect drillingactivity to commence in 2019 on our other non-operated interestsin Foz de Amazonas (BP 30%).
• In the South Campos basin, following approval of the revisedappraisal plan by ANP in 2016, in Block BM-C-35 we havepostponed the decision to move into Appraisal Plan Stage II andcommit to an additional pre-salt well or relinquish the area, untilOctober 2018.
In Argentina and Bolivia BP conducts activity through PAEG, whichalso has activities in Mexico.
• In December, we confirmed that the formation of Pan AmericanEnergy Group (PAEG) had completed. The new company, owned byBP (50%) and Bridas Corporation (50%), is now the largestprivately owned integrated energy company operating in Argentina.PAEG was formed in a cash free transaction by the combination ofPan American Energy and Axion Energy (Axion). Pan AmericanEnergy had been owned 60:40 by BP and Bridas Corporation andAxion had been wholly-owned by Bridas Corporation.
In Trinidad & Tobago BP holds exploration and production licences andproduction-sharing agreements«(PSAs) covering 1.8 million acresoffshore of the east and north-east coast. Facilities include 14offshore platforms and two onshore processing facilities. Productioncomprises gas and associated liquids.
BP also has a shareholding in the Atlantic LNG liquefaction plant, BP’sshareholding averages 39% across four LNG trains« with acombined capacity of 15 million tonnes per annum. We sell gas toeach of the LNG trains, supplying 100% of the gas for train 1, 50%for train 2, 75% for train 3 and around 67% of the gas for train 4. AllLNG from train 1 and most of the LNG from trains 2 and 3 is sold tothird parties in the US and Europe under long-term contracts. Wemarket the remaining equity LNG entitlement from trains 2, 3 and 4to the US, UK, Spain and South America.
• The Trinidad onshore compression project (BP 70%) started up inApril. The facility is expected to improve production capacity byincreasing production from low-pressure wells in BP’s existingacreage in the Columbus Basin using an additional inletcompressor at the Point Fortin Atlantic LNG plant.
• We announced the Savannah and Macadamia gas discoveries inJune (both BP 70%). The Savannah exploration well was drilled eastof the Juniper field into an untested fault block using a semi-submersible rig, and penetrated two hydrocarbon-bearingreservoirs. Based on the success of this well BP expects to developthese reservoirs through future tie-backs to the Juniper platform.The Macadamia well was drilled to test exploration and appraisalsegments below the existing SEQB discovery south of theproducing Cashima field. This discovery is expected to support anew platform in the future.
• Also in June, we announced that development of the Angelinoffshore gas project had been sanctioned. The project will involveconstruction of a new platform, BP’s 15th offshore productionfacility, 60 kilometres off the south-east coast of Trinidad in waterdepths of approximately 65 metres. The development will includefour wells, with gas from Angelin flowing to the Cassia B hub forprocessing via a new pipeline to the Serrette platform. Drilling isexpected to start in late 2018 with first gas expected in 2019.
• In August, we announced the start of production from our Juniperproject. Juniper is BP’s first subsea development in Trinidad and isexpected to boost our gas production capacity by around 590mmscf per day. The development produces gas from the Corallitaand Lantana fields via the new Juniper platform, 80 kilometres offthe south-east coast of Trinidad.
AfricaBP’s upstream activities in Africa are located in Algeria, Angola, Côted'Ivoire, Egypt, Libya, and Mauritania and Senegal.
In Algeria BP, Sonatrach and Statoil are partners in the In Salah (BP33.15%) and In Amenas (BP 45.89%) projects that supply gas to thedomestic and European markets.
• The Bourarhat production-sharing contract (PSC) expired inSeptember 2014 and our exit concluded in 2017.
• In December, BP and Statoil signed an extension agreement forthe In Amenas PSC with Sonatrach, the Algerian state-ownedenergy company. The agreement has been submitted to theAlgerian authorities for ratification.
In Angola, BP owns an interest in six major deepwater offshorelicences and is operator in two of these, blocks 18 and 31, that areproducing. We also have an equity interest in the Angola LNG plant(BP 13.6%).
• In June, we announced that as part of our ongoing portfolioevaluation we would relinquish our 50% interest in block 24/11offshore. The Katambi gas discovery made in 2014 has not beendetermined to be commercial. As a result of this, and otherexploration write-offs, a total of $729 million was recognized duringthe year.
In December, BP and Kosmos Energy (KE) announced that they hadbeen awarded five new offshore oil blocks in Côte d’Ivoire, underagreements with the government of Côte d'Ivoire and the state oilcompany Société Nationale d'Operations Pétrolières de la Côted'Ivoire (PETROCI) (BP 45%, KE 45%, PETROCI 10%).
In Egypt, BP and its partners currently produce 10% of Egypt’sliquids« production and almost 40% of its gas production.
• We announced the Qattameya discovery in March 2017, the thirdgas discovery in the North Damietta offshore concession in theEast Nile Delta. Options to tie the discovery back to nearbyinfrastructure are being studied.
• In 2017 exploration write-offs of $368 million were recognized for anumber of wells including GEB East, Mocha and Tarif Deep, as aresult of unsuccessful exploration drilling and the relinquishment ofexploration blocks.
• BP announced the start-up of gas production from the Taurus andLibra fields in the West Nile Delta development (BP 82.75%) inMay. This development comprises five fields across the NorthAlexandria and West Mediterranean Deepwater offshore blocksand is being developed as three separate projects to enable BP andits partners to accelerate gas production commitments to Egypt.All projects are expected to be onstream by 2019. Development ofthe Taurus and Libra fields were fast-tracked following approval in2015. It is a subsea greenfield development including nine wellsand 42 kilometre tieback to existing onshore processing facilities.
• Also in May, development of the Baltim South West field wassanctioned. A dedicated mobile offshore production unit will beinstalled and tied back to existing infrastructure through a newoffshore/onshore pipeline.
• In February 2018, we announced the start-up of the Atoll field inthe North Damietta concession following the drilling of threedeepwater wells 950 metres below the water’s surface. Earlyproduction first started in December before the field came fully online in January.
• In December, the first phase of well drilling operations at the Zohrgas field concluded and production has commenced. Productionhad reached 350 million cubic feet per day at year end. BP did notexercise the option to purchase an additional 5% interest in thefield by the end of 2017. The final purchase consideration on theZohr acquisition was $564 million. During 2017 Rosneft completedthe acquisition of a 30% stake in a concession agreement todevelop the Zohr field.
In Libya, BP partners with the Libyan Investment Authority (LIA) in anexploration and production-sharing agreement (EPSA) to exploreacreage in the onshore Ghadames and offshore Sirt basins (BP 85%).The EPSA continues to be in force majeure. BP wrote off all balancesassociated with the Libya EPSA in 2015.
In Mauritania and Senegal, BP has partnered with Kosmos Energyand has a 62% participating interest in the C-6, C-8, C-12 and C-13
BP Annual Report and Form 20-F 2017 «See Glossary 255
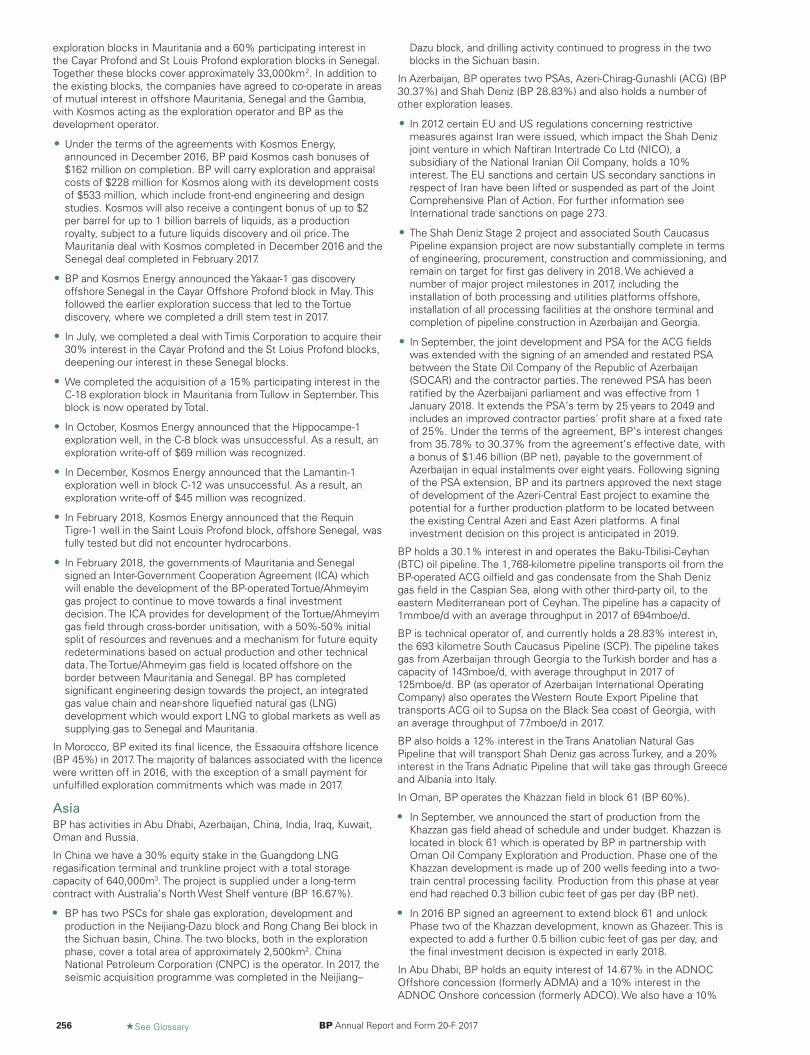
exploration blocks in Mauritania and a 60% participating interest inthe Cayar Profond and St Louis Profond exploration blocks in Senegal.Together these blocks cover approximately 33,000km2. In addition tothe existing blocks, the companies have agreed to co-operate in areasof mutual interest in offshore Mauritania, Senegal and the Gambia,with Kosmos acting as the exploration operator and BP as thedevelopment operator.
• Under the terms of the agreements with Kosmos Energy,announced in December 2016, BP paid Kosmos cash bonuses of$162 million on completion. BP will carry exploration and appraisalcosts of $228 million for Kosmos along with its development costsof $533 million, which include front-end engineering and designstudies. Kosmos will also receive a contingent bonus of up to $2per barrel for up to 1 billion barrels of liquids, as a productionroyalty, subject to a future liquids discovery and oil price. TheMauritania deal with Kosmos completed in December 2016 and theSenegal deal completed in February 2017.
• BP and Kosmos Energy announced the Yakaar-1 gas discoveryoffshore Senegal in the Cayar Offshore Profond block in May. Thisfollowed the earlier exploration success that led to the Tortuediscovery, where we completed a drill stem test in 2017.
• In July, we completed a deal with Timis Corporation to acquire their30% interest in the Cayar Profond and the St Loius Profond blocks,deepening our interest in these Senegal blocks.
• We completed the acquisition of a 15% participating interest in theC-18 exploration block in Mauritania from Tullow in September. Thisblock is now operated by Total.
• In October, Kosmos Energy announced that the Hippocampe-1exploration well, in the C-8 block was unsuccessful. As a result, anexploration write-off of $69 million was recognized.
• In December, Kosmos Energy announced that the Lamantin-1exploration well in block C-12 was unsuccessful. As a result, anexploration write-off of $45 million was recognized.
• In February 2018, Kosmos Energy announced that the RequinTigre-1 well in the Saint Louis Profond block, offshore Senegal, wasfully tested but did not encounter hydrocarbons.
• In February 2018, the governments of Mauritania and Senegalsigned an Inter-Government Cooperation Agreement (ICA) whichwill enable the development of the BP-operated Tortue/Ahmeyimgas project to continue to move towards a final investmentdecision. The ICA provides for development of the Tortue/Ahmeyimgas field through cross-border unitisation, with a 50%-50% initialsplit of resources and revenues and a mechanism for future equityredeterminations based on actual production and other technicaldata. The Tortue/Ahmeyim gas field is located offshore on theborder between Mauritania and Senegal. BP has completedsignificant engineering design towards the project, an integratedgas value chain and near-shore liquefied natural gas (LNG)development which would export LNG to global markets as well assupplying gas to Senegal and Mauritania.
In Morocco, BP exited its final licence, the Essaouira offshore licence(BP 45%) in 2017. The majority of balances associated with the licencewere written off in 2016, with the exception of a small payment forunfulfilled exploration commitments which was made in 2017.
AsiaBP has activities in Abu Dhabi, Azerbaijan, China, India, Iraq, Kuwait,Oman and Russia.
In China we have a 30% equity stake in the Guangdong LNGregasification terminal and trunkline project with a total storagecapacity of 640,000m3. The project is supplied under a long-termcontract with Australia’s North West Shelf venture (BP 16.67%).
• BP has two PSCs for shale gas exploration, development andproduction in the Neijiang-Dazu block and Rong Chang Bei block inthe Sichuan basin, China. The two blocks, both in the explorationphase, cover a total area of approximately 2,500km2. ChinaNational Petroleum Corporation (CNPC) is the operator. In 2017, theseismic acquisition programme was completed in the Neijiang–
Dazu block, and drilling activity continued to progress in the twoblocks in the Sichuan basin.
In Azerbaijan, BP operates two PSAs, Azeri-Chirag-Gunashli (ACG) (BP30.37%) and Shah Deniz (BP 28.83%) and also holds a number ofother exploration leases.
• In 2012 certain EU and US regulations concerning restrictivemeasures against Iran were issued, which impact the Shah Denizjoint venture in which Naftiran Intertrade Co Ltd (NICO), asubsidiary of the National Iranian Oil Company, holds a 10%interest. The EU sanctions and certain US secondary sanctions inrespect of Iran have been lifted or suspended as part of the JointComprehensive Plan of Action. For further information seeInternational trade sanctions on page 273.
• The Shah Deniz Stage 2 project and associated South CaucasusPipeline expansion project are now substantially complete in termsof engineering, procurement, construction and commissioning, andremain on target for first gas delivery in 2018. We achieved anumber of major project milestones in 2017, including theinstallation of both processing and utilities platforms offshore,installation of all processing facilities at the onshore terminal andcompletion of pipeline construction in Azerbaijan and Georgia.
• In September, the joint development and PSA for the ACG fieldswas extended with the signing of an amended and restated PSAbetween the State Oil Company of the Republic of Azerbaijan(SOCAR) and the contractor parties. The renewed PSA has beenratified by the Azerbaijani parliament and was effective from 1January 2018. It extends the PSA’s term by 25 years to 2049 andincludes an improved contractor parties’ profit share at a fixed rateof 25%. Under the terms of the agreement, BP’s interest changesfrom 35.78% to 30.37% from the agreement’s effective date, witha bonus of $1.46 billion (BP net), payable to the government ofAzerbaijan in equal instalments over eight years. Following signingof the PSA extension, BP and its partners approved the next stageof development of the Azeri-Central East project to examine thepotential for a further production platform to be located betweenthe existing Central Azeri and East Azeri platforms. A finalinvestment decision on this project is anticipated in 2019.
BP holds a 30.1% interest in and operates the Baku-Tbilisi-Ceyhan(BTC) oil pipeline. The 1,768-kilometre pipeline transports oil from theBP-operated ACG oilfield and gas condensate from the Shah Denizgas field in the Caspian Sea, along with other third-party oil, to theeastern Mediterranean port of Ceyhan. The pipeline has a capacity of1mmboe/d with an average throughput in 2017 of 694mboe/d.
BP is technical operator of, and currently holds a 28.83% interest in,the 693 kilometre South Caucasus Pipeline (SCP). The pipeline takesgas from Azerbaijan through Georgia to the Turkish border and has acapacity of 143mboe/d, with average throughput in 2017 of125mboe/d. BP (as operator of Azerbaijan International OperatingCompany) also operates the Western Route Export Pipeline thattransports ACG oil to Supsa on the Black Sea coast of Georgia, withan average throughput of 77mboe/d in 2017.
BP also holds a 12% interest in the Trans Anatolian Natural GasPipeline that will transport Shah Deniz gas across Turkey, and a 20%interest in the Trans Adriatic Pipeline that will take gas through Greeceand Albania into Italy.
In Oman, BP operates the Khazzan field in block 61 (BP 60%).
• In September, we announced the start of production from theKhazzan gas field ahead of schedule and under budget. Khazzan islocated in block 61 which is operated by BP in partnership withOman Oil Company Exploration and Production. Phase one of theKhazzan development is made up of 200 wells feeding into a two-train central processing facility. Production from this phase at yearend had reached 0.3 billion cubic feet of gas per day (BP net).
• In 2016 BP signed an agreement to extend block 61 and unlockPhase two of the Khazzan development, known as Ghazeer. This isexpected to add a further 0.5 billion cubic feet of gas per day, andthe final investment decision is expected in early 2018.
In Abu Dhabi, BP holds an equity interest of 14.67% in the ADNOCOffshore concession (formerly ADMA) and a 10% interest in theADNOC Onshore concession (formerly ADCO). We also have a 10%
256 «See Glossary BP Annual Report and Form 20-F 2017
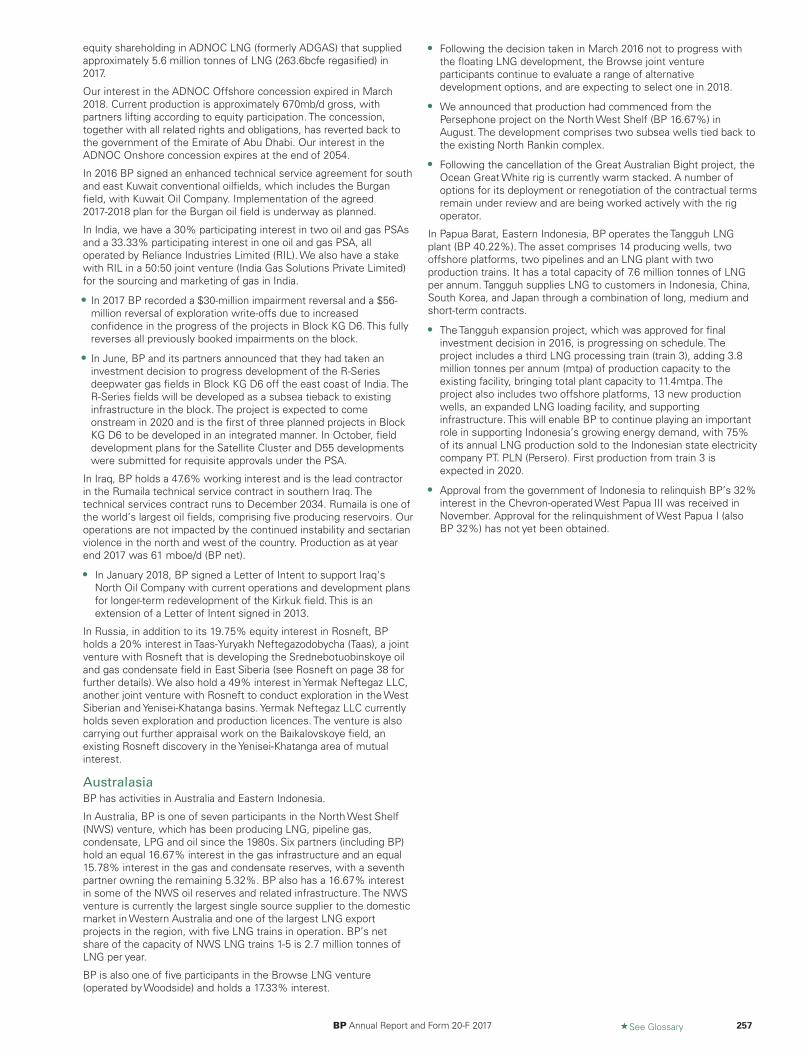
equity shareholding in ADNOC LNG (formerly ADGAS) that suppliedapproximately 5.6 million tonnes of LNG (263.6bcfe regasified) in2017.
Our interest in the ADNOC Offshore concession expired in March2018. Current production is approximately 670mb/d gross, withpartners lifting according to equity participation. The concession,together with all related rights and obligations, has reverted back tothe government of the Emirate of Abu Dhabi. Our interest in theADNOC Onshore concession expires at the end of 2054.
In 2016 BP signed an enhanced technical service agreement for southand east Kuwait conventional oilfields, which includes the Burganfield, with Kuwait Oil Company. Implementation of the agreed2017-2018 plan for the Burgan oil field is underway as planned.
In India, we have a 30% participating interest in two oil and gas PSAsand a 33.33% participating interest in one oil and gas PSA, alloperated by Reliance Industries Limited (RIL). We also have a stakewith RIL in a 50:50 joint venture (India Gas Solutions Private Limited)for the sourcing and marketing of gas in India.
• In 2017 BP recorded a $30-million impairment reversal and a $56-million reversal of exploration write-offs due to increasedconfidence in the progress of the projects in Block KG D6. This fullyreverses all previously booked impairments on the block.
• In June, BP and its partners announced that they had taken aninvestment decision to progress development of the R-Seriesdeepwater gas fields in Block KG D6 off the east coast of India. TheR-Series fields will be developed as a subsea tieback to existinginfrastructure in the block. The project is expected to comeonstream in 2020 and is the first of three planned projects in BlockKG D6 to be developed in an integrated manner. In October, fielddevelopment plans for the Satellite Cluster and D55 developmentswere submitted for requisite approvals under the PSA.
In Iraq, BP holds a 47.6% working interest and is the lead contractorin the Rumaila technical service contract in southern Iraq. Thetechnical services contract runs to December 2034. Rumaila is one ofthe world’s largest oil fields, comprising five producing reservoirs. Ouroperations are not impacted by the continued instability and sectarianviolence in the north and west of the country. Production as at yearend 2017 was 61 mboe/d (BP net).
• In January 2018, BP signed a Letter of Intent to support Iraq'sNorth Oil Company with current operations and development plansfor longer-term redevelopment of the Kirkuk field. This is anextension of a Letter of Intent signed in 2013.
In Russia, in addition to its 19.75% equity interest in Rosneft, BPholds a 20% interest in Taas-Yuryakh Neftegazodobycha (Taas), a jointventure with Rosneft that is developing the Srednebotuobinskoye oiland gas condensate field in East Siberia (see Rosneft on page 38 forfurther details). We also hold a 49% interest in Yermak Neftegaz LLC,another joint venture with Rosneft to conduct exploration in the WestSiberian and Yenisei-Khatanga basins. Yermak Neftegaz LLC currentlyholds seven exploration and production licences. The venture is alsocarrying out further appraisal work on the Baikalovskoye field, anexisting Rosneft discovery in the Yenisei-Khatanga area of mutualinterest.
AustralasiaBP has activities in Australia and Eastern Indonesia.
In Australia, BP is one of seven participants in the North West Shelf(NWS) venture, which has been producing LNG, pipeline gas,condensate, LPG and oil since the 1980s. Six partners (including BP)hold an equal 16.67% interest in the gas infrastructure and an equal15.78% interest in the gas and condensate reserves, with a seventhpartner owning the remaining 5.32%. BP also has a 16.67% interestin some of the NWS oil reserves and related infrastructure. The NWSventure is currently the largest single source supplier to the domesticmarket in Western Australia and one of the largest LNG exportprojects in the region, with five LNG trains in operation. BP’s netshare of the capacity of NWS LNG trains 1-5 is 2.7 million tonnes ofLNG per year.
BP is also one of five participants in the Browse LNG venture(operated by Woodside) and holds a 17.33% interest.
• Following the decision taken in March 2016 not to progress withthe floating LNG development, the Browse joint ventureparticipants continue to evaluate a range of alternativedevelopment options, and are expecting to select one in 2018.
• We announced that production had commenced from thePersephone project on the North West Shelf (BP 16.67%) inAugust. The development comprises two subsea wells tied back tothe existing North Rankin complex.
• Following the cancellation of the Great Australian Bight project, theOcean Great White rig is currently warm stacked. A number ofoptions for its deployment or renegotiation of the contractual termsremain under review and are being worked actively with the rigoperator.
In Papua Barat, Eastern Indonesia, BP operates the Tangguh LNGplant (BP 40.22%). The asset comprises 14 producing wells, twooffshore platforms, two pipelines and an LNG plant with twoproduction trains. It has a total capacity of 7.6 million tonnes of LNGper annum. Tangguh supplies LNG to customers in Indonesia, China,South Korea, and Japan through a combination of long, medium andshort-term contracts.
• The Tangguh expansion project, which was approved for finalinvestment decision in 2016, is progressing on schedule. Theproject includes a third LNG processing train (train 3), adding 3.8million tonnes per annum (mtpa) of production capacity to theexisting facility, bringing total plant capacity to 11.4mtpa. Theproject also includes two offshore platforms, 13 new productionwells, an expanded LNG loading facility, and supportinginfrastructure. This will enable BP to continue playing an importantrole in supporting Indonesia’s growing energy demand, with 75%of its annual LNG production sold to the Indonesian state electricitycompany PT. PLN (Persero). First production from train 3 isexpected in 2020.
• Approval from the government of Indonesia to relinquish BP’s 32%interest in the Chevron-operated West Papua III was received inNovember. Approval for the relinquishment of West Papua I (alsoBP 32%) has not yet been obtained.
BP Annual Report and Form 20-F 2017 «See Glossary 257
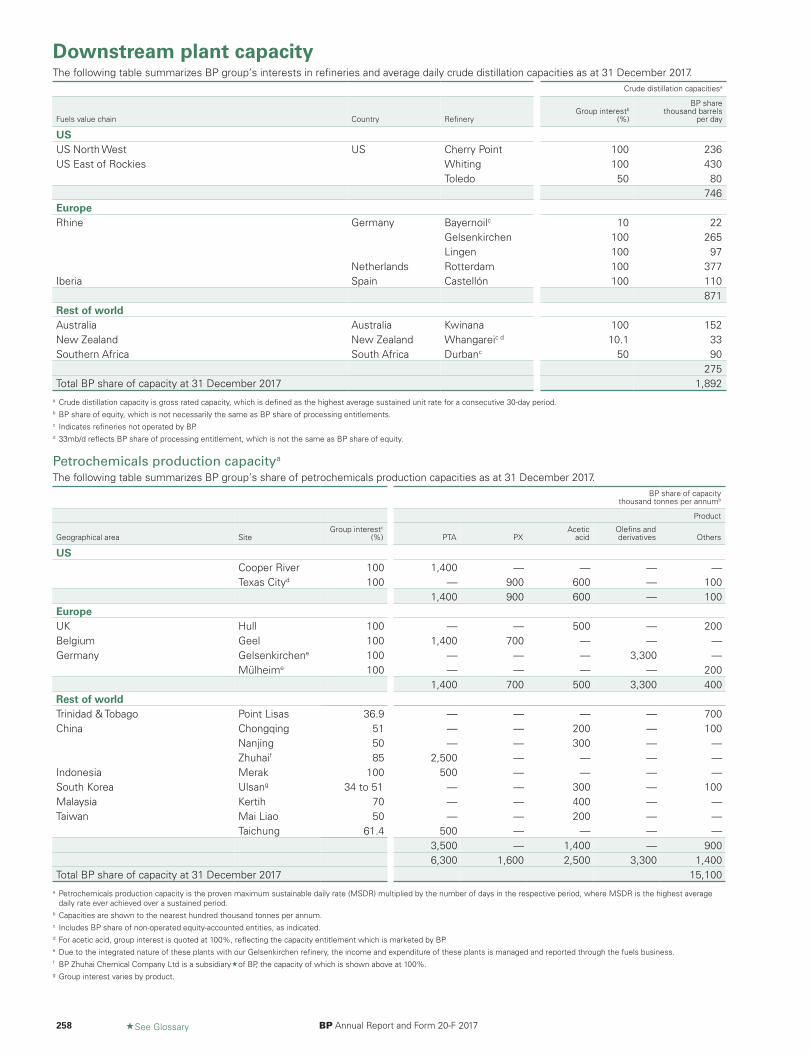
Downstream plant capacityThe following table summarizes BP group’s interests in refineries and average daily crude distillation capacities as at 31 December 2017.
Crude distillation capacitiesa
Fuels value chain Country RefineryGroup interestb
(%)
BP sharethousand barrels
per day
USUS North West US Cherry Point 100 236US East of Rockies Whiting 100 430
Toledo 50 80746
EuropeRhine Germany Bayernoilc 10 22
Gelsenkirchen 100 265Lingen 100 97
Netherlands Rotterdam 100 377Iberia Spain Castellón 100 110
871Rest of worldAustralia Australia Kwinana 100 152New Zealand New Zealand Whangareic d 10.1 33Southern Africa South Africa Durbanc 50 90
275Total BP share of capacity at 31 December 2017 1,892
a Crude distillation capacity is gross rated capacity, which is defined as the highest average sustained unit rate for a consecutive 30-day period.b BP share of equity, which is not necessarily the same as BP share of processing entitlements.c Indicates refineries not operated by BP.d 33mb/d reflects BP share of processing entitlement, which is not the same as BP share of equity.
Petrochemicals production capacitya
The following table summarizes BP group’s share of petrochemicals production capacities as at 31 December 2017.BP share of capacity
thousand tonnes per annumb
Product
Geographical area SiteGroup interestc
(%) PTA PXAcetic
acidOlefins andderivatives Others
USCooper River 100 1,400 — — — —Texas Cityd 100 — 900 600 — 100
1,400 900 600 — 100EuropeUK Hull 100 — — 500 — 200Belgium Geel 100 1,400 700 — — —Germany Gelsenkirchene 100 — — — 3,300 —
Mülheime 100 — — — — 2001,400 700 500 3,300 400
Rest of worldTrinidad & Tobago Point Lisas 36.9 — — — — 700China Chongqing 51 — — 200 — 100
Nanjing 50 — — 300 — —Zhuhaif 85 2,500 — — — —
Indonesia Merak 100 500 — — — —South Korea Ulsang 34 to 51 — — 300 — 100Malaysia Kertih 70 — — 400 — —Taiwan Mai Liao 50 — — 200 — —
Taichung 61.4 500 — — — —3,500 — 1,400 — 9006,300 1,600 2,500 3,300 1,400
Total BP share of capacity at 31 December 2017 15,100a Petrochemicals production capacity is the proven maximum sustainable daily rate (MSDR) multiplied by the number of days in the respective period, where MSDR is the highest average
daily rate ever achieved over a sustained period.b Capacities are shown to the nearest hundred thousand tonnes per annum.c Includes BP share of non-operated equity-accounted entities, as indicated.d For acetic acid, group interest is quoted at 100%, reflecting the capacity entitlement which is marketed by BP.e Due to the integrated nature of these plants with our Gelsenkirchen refinery, the income and expenditure of these plants is managed and reported through the fuels business. f BP Zhuhai Chemical Company Ltd is a subsidiary«of BP, the capacity of which is shown above at 100%.g Group interest varies by product.
258 «See Glossary BP Annual Report and Form 20-F 2017
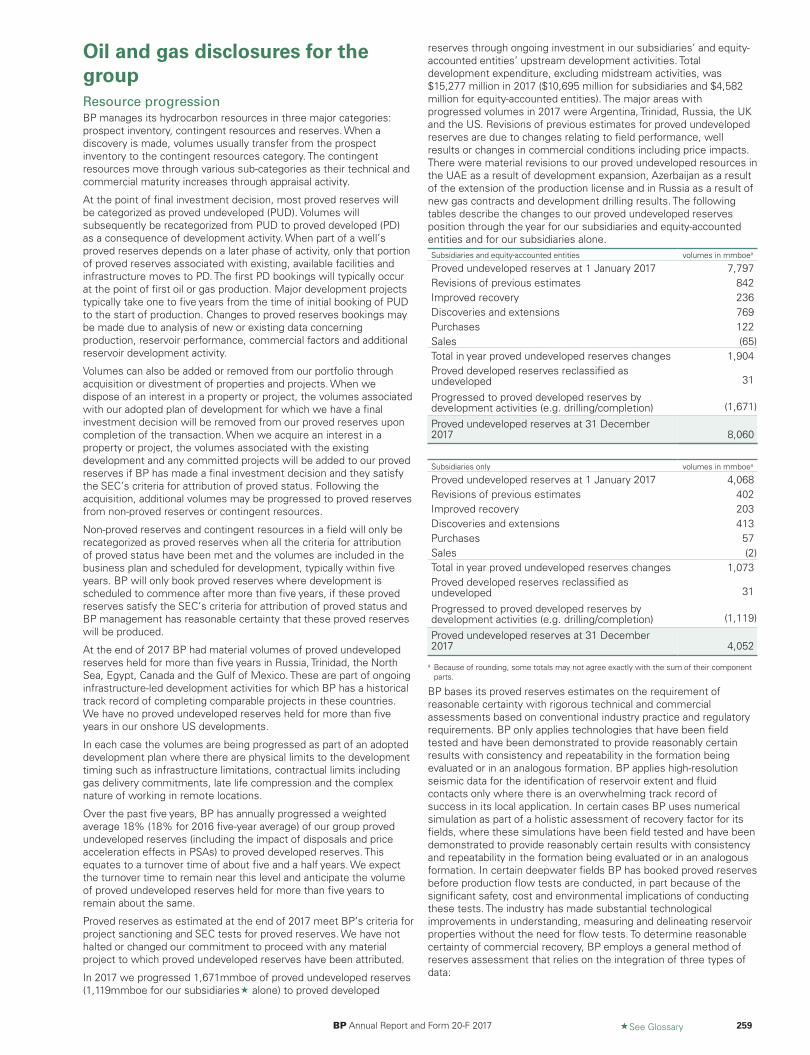
Oil and gas disclosures for thegroupResource progressionBP manages its hydrocarbon resources in three major categories:prospect inventory, contingent resources and reserves. When adiscovery is made, volumes usually transfer from the prospectinventory to the contingent resources category. The contingentresources move through various sub-categories as their technical andcommercial maturity increases through appraisal activity.
At the point of final investment decision, most proved reserves willbe categorized as proved undeveloped (PUD). Volumes willsubsequently be recategorized from PUD to proved developed (PD)as a consequence of development activity. When part of a well’sproved reserves depends on a later phase of activity, only that portionof proved reserves associated with existing, available facilities andinfrastructure moves to PD. The first PD bookings will typically occurat the point of first oil or gas production. Major development projectstypically take one to five years from the time of initial booking of PUDto the start of production. Changes to proved reserves bookings maybe made due to analysis of new or existing data concerningproduction, reservoir performance, commercial factors and additionalreservoir development activity.
Volumes can also be added or removed from our portfolio throughacquisition or divestment of properties and projects. When wedispose of an interest in a property or project, the volumes associatedwith our adopted plan of development for which we have a finalinvestment decision will be removed from our proved reserves uponcompletion of the transaction. When we acquire an interest in aproperty or project, the volumes associated with the existingdevelopment and any committed projects will be added to our provedreserves if BP has made a final investment decision and they satisfythe SEC’s criteria for attribution of proved status. Following theacquisition, additional volumes may be progressed to proved reservesfrom non-proved reserves or contingent resources.
Non-proved reserves and contingent resources in a field will only berecategorized as proved reserves when all the criteria for attributionof proved status have been met and the volumes are included in thebusiness plan and scheduled for development, typically within fiveyears. BP will only book proved reserves where development isscheduled to commence after more than five years, if these provedreserves satisfy the SEC’s criteria for attribution of proved status andBP management has reasonable certainty that these proved reserveswill be produced.
At the end of 2017 BP had material volumes of proved undevelopedreserves held for more than five years in Russia, Trinidad, the NorthSea, Egypt, Canada and the Gulf of Mexico. These are part of ongoinginfrastructure-led development activities for which BP has a historicaltrack record of completing comparable projects in these countries.We have no proved undeveloped reserves held for more than fiveyears in our onshore US developments.
In each case the volumes are being progressed as part of an adopteddevelopment plan where there are physical limits to the developmenttiming such as infrastructure limitations, contractual limits includinggas delivery commitments, late life compression and the complexnature of working in remote locations.
Over the past five years, BP has annually progressed a weightedaverage 18% (18% for 2016 five-year average) of our group provedundeveloped reserves (including the impact of disposals and priceacceleration effects in PSAs) to proved developed reserves. Thisequates to a turnover time of about five and a half years. We expectthe turnover time to remain near this level and anticipate the volumeof proved undeveloped reserves held for more than five years toremain about the same.
Proved reserves as estimated at the end of 2017 meet BP’s criteria forproject sanctioning and SEC tests for proved reserves. We have nothalted or changed our commitment to proceed with any materialproject to which proved undeveloped reserves have been attributed.
In 2017 we progressed 1,671mmboe of proved undeveloped reserves(1,119mmboe for our subsidiaries« alone) to proved developed
reserves through ongoing investment in our subsidiaries’ and equity-accounted entities’ upstream development activities. Totaldevelopment expenditure, excluding midstream activities, was$15,277 million in 2017 ($10,695 million for subsidiaries and $4,582million for equity-accounted entities). The major areas withprogressed volumes in 2017 were Argentina, Trinidad, Russia, the UKand the US. Revisions of previous estimates for proved undevelopedreserves are due to changes relating to field performance, wellresults or changes in commercial conditions including price impacts.There were material revisions to our proved undeveloped resources inthe UAE as a result of development expansion, Azerbaijan as a resultof the extension of the production license and in Russia as a result ofnew gas contracts and development drilling results. The followingtables describe the changes to our proved undeveloped reservesposition through the year for our subsidiaries and equity-accountedentities and for our subsidiaries alone.Subsidiaries and equity-accounted entities volumes in mmboea
Proved undeveloped reserves at 1 January 2017 7,797Revisions of previous estimates 842Improved recovery 236Discoveries and extensions 769Purchases 122Sales (65)Total in year proved undeveloped reserves changes 1,904Proved developed reserves reclassified asundeveloped 31
Progressed to proved developed reserves bydevelopment activities (e.g. drilling/completion) (1,671)
Proved undeveloped reserves at 31 December2017 8,060
Subsidiaries only volumes in mmboea
Proved undeveloped reserves at 1 January 2017 4,068Revisions of previous estimates 402Improved recovery 203Discoveries and extensions 413Purchases 57Sales (2)Total in year proved undeveloped reserves changes 1,073Proved developed reserves reclassified asundeveloped 31
Progressed to proved developed reserves bydevelopment activities (e.g. drilling/completion) (1,119)
Proved undeveloped reserves at 31 December2017 4,052
a Because of rounding, some totals may not agree exactly with the sum of their componentparts.
BP bases its proved reserves estimates on the requirement ofreasonable certainty with rigorous technical and commercialassessments based on conventional industry practice and regulatoryrequirements. BP only applies technologies that have been fieldtested and have been demonstrated to provide reasonably certainresults with consistency and repeatability in the formation beingevaluated or in an analogous formation. BP applies high-resolutionseismic data for the identification of reservoir extent and fluidcontacts only where there is an overwhelming track record ofsuccess in its local application. In certain cases BP uses numericalsimulation as part of a holistic assessment of recovery factor for itsfields, where these simulations have been field tested and have beendemonstrated to provide reasonably certain results with consistencyand repeatability in the formation being evaluated or in an analogousformation. In certain deepwater fields BP has booked proved reservesbefore production flow tests are conducted, in part because of thesignificant safety, cost and environmental implications of conductingthese tests. The industry has made substantial technologicalimprovements in understanding, measuring and delineating reservoirproperties without the need for flow tests. To determine reasonablecertainty of commercial recovery, BP employs a general method ofreserves assessment that relies on the integration of three types ofdata:
BP Annual Report and Form 20-F 2017 «See Glossary 259
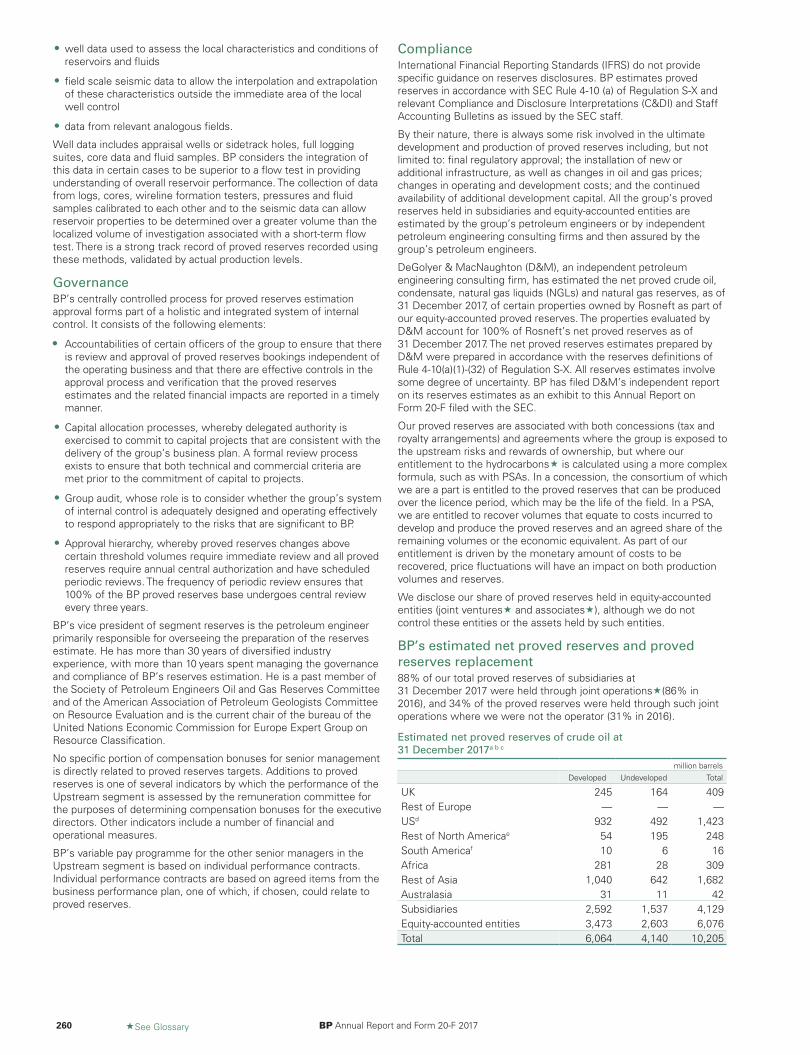
• well data used to assess the local characteristics and conditions ofreservoirs and fluids
• field scale seismic data to allow the interpolation and extrapolationof these characteristics outside the immediate area of the localwell control
• data from relevant analogous fields.
Well data includes appraisal wells or sidetrack holes, full loggingsuites, core data and fluid samples. BP considers the integration ofthis data in certain cases to be superior to a flow test in providingunderstanding of overall reservoir performance. The collection of datafrom logs, cores, wireline formation testers, pressures and fluidsamples calibrated to each other and to the seismic data can allowreservoir properties to be determined over a greater volume than thelocalized volume of investigation associated with a short-term flowtest. There is a strong track record of proved reserves recorded usingthese methods, validated by actual production levels.
GovernanceBP’s centrally controlled process for proved reserves estimationapproval forms part of a holistic and integrated system of internalcontrol. It consists of the following elements:
• Accountabilities of certain officers of the group to ensure that thereis review and approval of proved reserves bookings independent ofthe operating business and that there are effective controls in theapproval process and verification that the proved reservesestimates and the related financial impacts are reported in a timelymanner.
• Capital allocation processes, whereby delegated authority isexercised to commit to capital projects that are consistent with thedelivery of the group’s business plan. A formal review processexists to ensure that both technical and commercial criteria aremet prior to the commitment of capital to projects.
• Group audit, whose role is to consider whether the group’s systemof internal control is adequately designed and operating effectivelyto respond appropriately to the risks that are significant to BP.
• Approval hierarchy, whereby proved reserves changes abovecertain threshold volumes require immediate review and all provedreserves require annual central authorization and have scheduledperiodic reviews. The frequency of periodic review ensures that100% of the BP proved reserves base undergoes central reviewevery three years.
BP’s vice president of segment reserves is the petroleum engineerprimarily responsible for overseeing the preparation of the reservesestimate. He has more than 30 years of diversified industryexperience, with more than 10 years spent managing the governanceand compliance of BP’s reserves estimation. He is a past member ofthe Society of Petroleum Engineers Oil and Gas Reserves Committeeand of the American Association of Petroleum Geologists Committeeon Resource Evaluation and is the current chair of the bureau of theUnited Nations Economic Commission for Europe Expert Group onResource Classification.
No specific portion of compensation bonuses for senior managementis directly related to proved reserves targets. Additions to provedreserves is one of several indicators by which the performance of theUpstream segment is assessed by the remuneration committee forthe purposes of determining compensation bonuses for the executivedirectors. Other indicators include a number of financial andoperational measures.
BP’s variable pay programme for the other senior managers in theUpstream segment is based on individual performance contracts.Individual performance contracts are based on agreed items from thebusiness performance plan, one of which, if chosen, could relate toproved reserves.
ComplianceInternational Financial Reporting Standards (IFRS) do not providespecific guidance on reserves disclosures. BP estimates provedreserves in accordance with SEC Rule 4-10 (a) of Regulation S-X andrelevant Compliance and Disclosure Interpretations (C&DI) and StaffAccounting Bulletins as issued by the SEC staff.
By their nature, there is always some risk involved in the ultimatedevelopment and production of proved reserves including, but notlimited to: final regulatory approval; the installation of new oradditional infrastructure, as well as changes in oil and gas prices;changes in operating and development costs; and the continuedavailability of additional development capital. All the group’s provedreserves held in subsidiaries and equity-accounted entities areestimated by the group’s petroleum engineers or by independentpetroleum engineering consulting firms and then assured by thegroup’s petroleum engineers.
DeGolyer & MacNaughton (D&M), an independent petroleumengineering consulting firm, has estimated the net proved crude oil,condensate, natural gas liquids (NGLs) and natural gas reserves, as of31 December 2017, of certain properties owned by Rosneft as part ofour equity-accounted proved reserves. The properties evaluated byD&M account for 100% of Rosneft’s net proved reserves as of31 December 2017. The net proved reserves estimates prepared byD&M were prepared in accordance with the reserves definitions ofRule 4-10(a)(1)-(32) of Regulation S-X. All reserves estimates involvesome degree of uncertainty. BP has filed D&M’s independent reporton its reserves estimates as an exhibit to this Annual Report onForm 20-F filed with the SEC.
Our proved reserves are associated with both concessions (tax androyalty arrangements) and agreements where the group is exposed tothe upstream risks and rewards of ownership, but where ourentitlement to the hydrocarbons« is calculated using a more complexformula, such as with PSAs. In a concession, the consortium of whichwe are a part is entitled to the proved reserves that can be producedover the licence period, which may be the life of the field. In a PSA,we are entitled to recover volumes that equate to costs incurred todevelop and produce the proved reserves and an agreed share of theremaining volumes or the economic equivalent. As part of ourentitlement is driven by the monetary amount of costs to berecovered, price fluctuations will have an impact on both productionvolumes and reserves.
We disclose our share of proved reserves held in equity-accountedentities (joint ventures« and associates«), although we do notcontrol these entities or the assets held by such entities.
BP’s estimated net proved reserves and provedreserves replacement88% of our total proved reserves of subsidiaries at31 December 2017 were held through joint operations«(86% in2016), and 34% of the proved reserves were held through such jointoperations where we were not the operator (31% in 2016).
Estimated net proved reserves of crude oil at31 December 2017a b c
million barrelsDeveloped Undeveloped Total
UK 245 164 409Rest of Europe — — —USd 932 492 1,423Rest of North Americae 54 195 248South Americaf 10 6 16Africa 281 28 309Rest of Asia 1,040 642 1,682Australasia 31 11 42Subsidiaries 2,592 1,537 4,129Equity-accounted entities 3,473 2,603 6,076Total 6,064 4,140 10,205
260 «See Glossary BP Annual Report and Form 20-F 2017
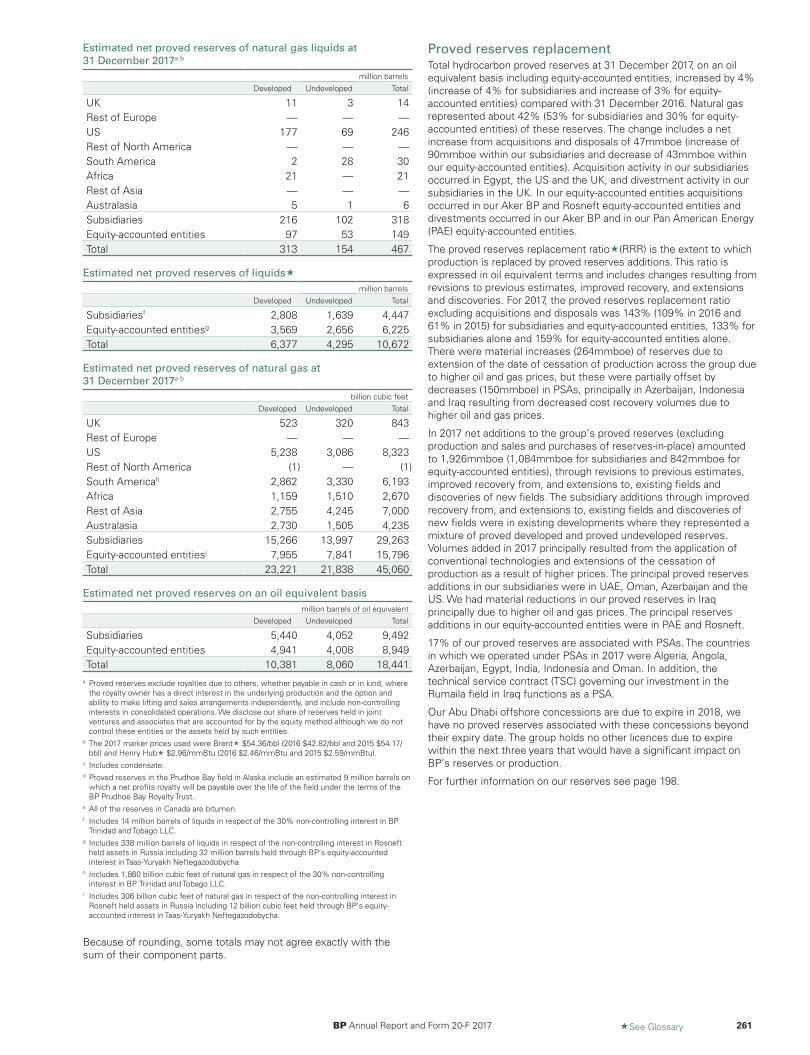
Estimated net proved reserves of natural gas liquids at31 December 2017a b
million barrelsDeveloped Undeveloped Total
UK 11 3 14Rest of Europe — — —US 177 69 246Rest of North America — — —South America 2 28 30Africa 21 — 21Rest of Asia — — —Australasia 5 1 6Subsidiaries 216 102 318Equity-accounted entities 97 53 149Total 313 154 467
Estimated net proved reserves of liquids«million barrels
Developed Undeveloped Total
Subsidiariesf 2,808 1,639 4,447Equity-accounted entitiesg 3,569 2,656 6,225Total 6,377 4,295 10,672
Estimated net proved reserves of natural gas at31 December 2017a b
billion cubic feetDeveloped Undeveloped Total
UK 523 320 843Rest of Europe — — —US 5,238 3,086 8,323Rest of North America (1) — (1)South Americah 2,862 3,330 6,193Africa 1,159 1,510 2,670Rest of Asia 2,755 4,245 7,000Australasia 2,730 1,505 4,235Subsidiaries 15,266 13,997 29,263Equity-accounted entitiesi 7,955 7,841 15,796Total 23,221 21,838 45,060
Estimated net proved reserves on an oil equivalent basismillion barrels of oil equivalent
Developed Undeveloped Total
Subsidiaries 5,440 4,052 9,492Equity-accounted entities 4,941 4,008 8,949Total 10,381 8,060 18,441
a Proved reserves exclude royalties due to others, whether payable in cash or in kind, wherethe royalty owner has a direct interest in the underlying production and the option andability to make lifting and sales arrangements independently, and include non-controllinginterests in consolidated operations. We disclose our share of reserves held in jointventures and associates that are accounted for by the equity method although we do notcontrol these entities or the assets held by such entities.
b The 2017 marker prices used were Brent« $54.36/bbl (2016 $42.82/bbl and 2015 $54.17/bbl) and Henry Hub« $2.96/mmBtu (2016 $2.46/mmBtu and 2015 $2.59/mmBtu).
c Includes condensate.d Proved reserves in the Prudhoe Bay field in Alaska include an estimated 9 million barrels on
which a net profits royalty will be payable over the life of the field under the terms of theBP Prudhoe Bay Royalty Trust.
e All of the reserves in Canada are bitumen.f Includes 14 million barrels of liquids in respect of the 30% non-controlling interest in BP
Trinidad and Tobago LLC.g Includes 338 million barrels of liquids in respect of the non-controlling interest in Rosneft
held assets in Russia including 32 million barrels held through BP’s equity-accountedinterest in Taas-Yuryakh Neftegazodobycha.
h Includes 1,860 billion cubic feet of natural gas in respect of the 30% non-controllinginterest in BP Trinidad and Tobago LLC.
i Includes 306 billion cubic feet of natural gas in respect of the non-controlling interest inRosneft held assets in Russia including 12 billion cubic feet held through BP’s equity-accounted interest in Taas-Yuryakh Neftegazodobycha.
Because of rounding, some totals may not agree exactly with thesum of their component parts.
Proved reserves replacementTotal hydrocarbon proved reserves at 31 December 2017, on an oilequivalent basis including equity-accounted entities, increased by 4%(increase of 4% for subsidiaries and increase of 3% for equity-accounted entities) compared with 31 December 2016. Natural gasrepresented about 42% (53% for subsidiaries and 30% for equity-accounted entities) of these reserves. The change includes a netincrease from acquisitions and disposals of 47mmboe (increase of90mmboe within our subsidiaries and decrease of 43mmboe withinour equity-accounted entities). Acquisition activity in our subsidiariesoccurred in Egypt, the US and the UK, and divestment activity in oursubsidiaries in the UK. In our equity-accounted entities acquisitionsoccurred in our Aker BP and Rosneft equity-accounted entities anddivestments occurred in our Aker BP and in our Pan American Energy(PAE) equity-accounted entities.
The proved reserves replacement ratio«(RRR) is the extent to whichproduction is replaced by proved reserves additions. This ratio isexpressed in oil equivalent terms and includes changes resulting fromrevisions to previous estimates, improved recovery, and extensionsand discoveries. For 2017, the proved reserves replacement ratioexcluding acquisitions and disposals was 143% (109% in 2016 and61% in 2015) for subsidiaries and equity-accounted entities, 133% forsubsidiaries alone and 159% for equity-accounted entities alone.There were material increases (264mmboe) of reserves due toextension of the date of cessation of production across the group dueto higher oil and gas prices, but these were partially offset bydecreases (150mmboe) in PSAs, principally in Azerbaijan, Indonesiaand Iraq resulting from decreased cost recovery volumes due tohigher oil and gas prices.
In 2017 net additions to the group’s proved reserves (excludingproduction and sales and purchases of reserves-in-place) amountedto 1,926mmboe (1,084mmboe for subsidiaries and 842mmboe forequity-accounted entities), through revisions to previous estimates,improved recovery from, and extensions to, existing fields anddiscoveries of new fields. The subsidiary additions through improvedrecovery from, and extensions to, existing fields and discoveries ofnew fields were in existing developments where they represented amixture of proved developed and proved undeveloped reserves.Volumes added in 2017 principally resulted from the application ofconventional technologies and extensions of the cessation ofproduction as a result of higher prices. The principal proved reservesadditions in our subsidiaries were in UAE, Oman, Azerbaijan and theUS. We had material reductions in our proved reserves in Iraqprincipally due to higher oil and gas prices. The principal reservesadditions in our equity-accounted entities were in PAE and Rosneft.
17% of our proved reserves are associated with PSAs. The countriesin which we operated under PSAs in 2017 were Algeria, Angola,Azerbaijan, Egypt, India, Indonesia and Oman. In addition, thetechnical service contract (TSC) governing our investment in theRumaila field in Iraq functions as a PSA.
Our Abu Dhabi offshore concessions are due to expire in 2018, wehave no proved reserves associated with these concessions beyondtheir expiry date. The group holds no other licences due to expirewithin the next three years that would have a significant impact onBP’s reserves or production.
For further information on our reserves see page 198.
BP Annual Report and Form 20-F 2017 «See Glossary 261

BP’s net production by country – crude oila and natural gas liquidsthousand barrels per day
BP net share of productionb
Crude oilNatural gas
liquids
2017 2016 2015 2017 2016 2015
SubsidiariesUKc d 80 79 72 6 6 7Norwayc — 24 38 — 4 5Total Rest of Europe — 24 38 — 4 5Total Europe 80 102 110 6 10 11Alaskac 109 107 107 — — —Lower 48 onshorec 10 12 14 34 36 37Gulf of Mexico deepwater 251 216 203 21 20 19Total US 370 335 323 56 56 56Canadae 20 13 3 — — —Total Rest of North America 20 13 3 — — —Total North America 390 347 327 56 56 56Trinidad & Tobagoc 12 10 12 10 8 11Total South America 12 10 12 10 8 11Angola 192 219 221 — — —Egyptc 40 39 42 — — —Algeria 9 5 6 10 5 7Total Africa 241 263 270 10 5 7Abu Dhabic 158 — — — — —Azerbaijan 90 105 111 — — —Western Indonesiac — 2 2 — — —Iraq 73 96 85 — — —India 1 1 1 — — —Oman 2 — — — — —Total Rest of Asia 325 204 199 — — 1Total Asia 325 204 199 — — 1Australiac 15 15 15 2 3 3Eastern Indonesiac 1 2 2 — — —Total Australasia 17 16 17 2 3 3Total subsidiaries 1,064 943 933 85 82 88Equity-accounted entities (BP share)Rosneft (Russia, Canada, Venezuela, Vietnam) 900 836 809 4 4 4Abu Dhabif 99 101 96 — — —Argentinac 60 62 65 — 1 3Boliviac 3 4 4 — — —Egypt — — — 2 3 3Norwayc 31 7 — 2 — —Russiac 5 4 — — — —Angola 1 — — 4 1 —Other — 1 1 — — —Total equity-accounted entities 1,099 1,015 974 12 8 10Total subsidiaries and equity-accounted entitiesg 2,163 1,958 1,908 97 90 99
a Includes condensate.b Production excludes royalties due to others whether payable in cash or in kind where the royalty owner has a direct interest in the underlying production and the option and ability to make
lifting and sales arrangements independently.c In 2017, BP renewed its onshore concession of the United Arab Emirates that grants BP 10% interest in ADCO onshore concession. It also decreased its interest in Magnus field in North
Sea and completed the formation of Pan American Energy Group (PAEG) (BP 50%, Bridas Corporation 50%), which is a combination of Pan American Energy and Axion Energy with aneffective decrease in interest. In 2016, BP increased its interests in Tangguh in Indonesia and the Culzean asset in the UK North Sea, and in certain US onshore assets. It disposed of itsinterests in the Valhall, Skarv and Ula assets in the Norwegian North Sea and in return received an interest in Aker BP ASA, which operates in Norway. It also disposed of its interests in theJansz-Io asset in Australia, and the Sanga Sanga conventional concession in Indonesia. It also decreased its interests in certain Trinidad and US onshore assets. In 2015, BP acquired aninterest in Taas-Yuryakh Neftegazodobycha. It also increased its interest in the North Alexandria and West Mediterranean Deep Water Concessions of the West Nile Delta project in Egypt. Itincreased its interest in certain UK North Sea, Trinidad, and US onshore assets. It also decreased its interest in certain other assets in the same regions.
d Volumes relate to six BP-operated fields within ETAP. BP has no interests in the remaining three ETAP fields, which are operated by Shell.e All of the production from Canada in Subsidiaries is bitumen.f BP holds interests, through associates, in offshore concessions in Abu Dhabi which expire in 2018.g Includes 3 net mboe/d of NGLs from processing plants in which BP has an interest (2016 3mboe/d and 2015 4mboe/d).
Because of rounding, some totals may not agree exactly with the sum of their component parts.
262 «See Glossary BP Annual Report and Form 20-F 2017
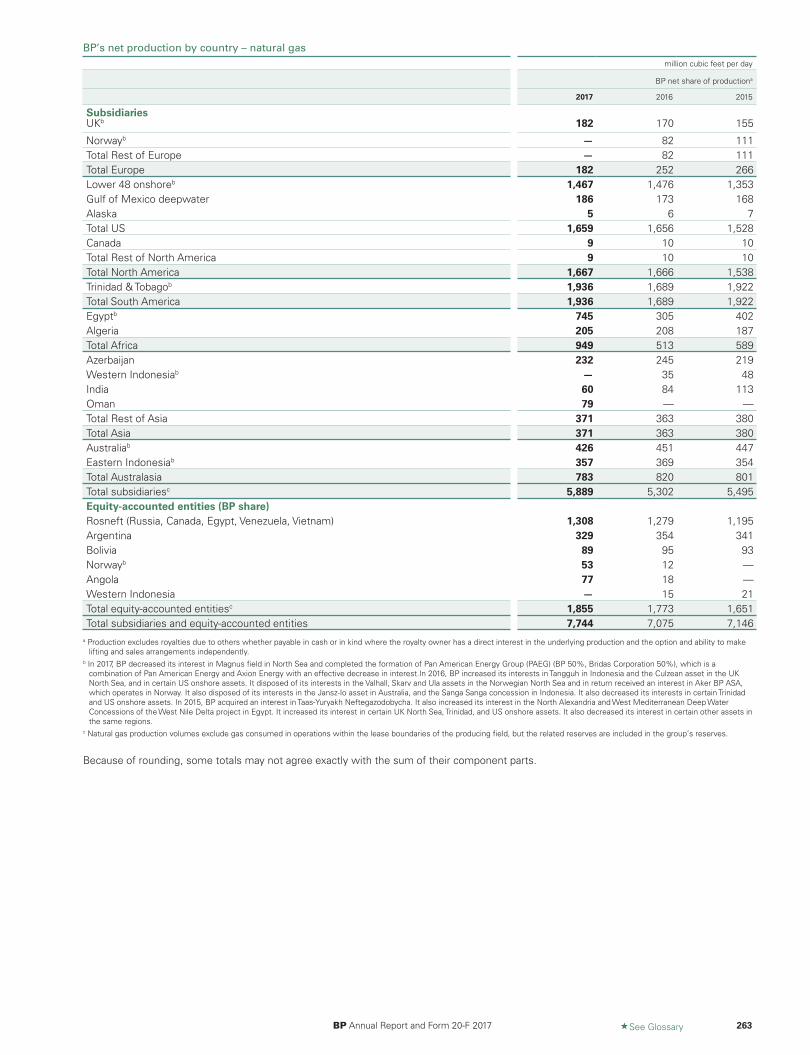
BP’s net production by country – natural gasmillion cubic feet per day
BP net share of productiona
2017 2016 2015
SubsidiariesUKb 182 170 155
Norwayb — 82 111Total Rest of Europe — 82 111Total Europe 182 252 266Lower 48 onshoreb 1,467 1,476 1,353Gulf of Mexico deepwater 186 173 168Alaska 5 6 7Total US 1,659 1,656 1,528Canada 9 10 10Total Rest of North America 9 10 10Total North America 1,667 1,666 1,538Trinidad & Tobagob 1,936 1,689 1,922Total South America 1,936 1,689 1,922Egyptb 745 305 402Algeria 205 208 187Total Africa 949 513 589Azerbaijan 232 245 219Western Indonesiab — 35 48India 60 84 113Oman 79 — —Total Rest of Asia 371 363 380Total Asia 371 363 380Australiab 426 451 447Eastern Indonesiab 357 369 354Total Australasia 783 820 801Total subsidiariesc 5,889 5,302 5,495Equity-accounted entities (BP share)Rosneft (Russia, Canada, Egypt, Venezuela, Vietnam) 1,308 1,279 1,195Argentina 329 354 341Bolivia 89 95 93Norwayb 53 12 —Angola 77 18 —Western Indonesia — 15 21Total equity-accounted entitiesc 1,855 1,773 1,651Total subsidiaries and equity-accounted entities 7,744 7,075 7,146
a Production excludes royalties due to others whether payable in cash or in kind where the royalty owner has a direct interest in the underlying production and the option and ability to makelifting and sales arrangements independently.
b In 2017, BP decreased its interest in Magnus field in North Sea and completed the formation of Pan American Energy Group (PAEG) (BP 50%, Bridas Corporation 50%), which is acombination of Pan American Energy and Axion Energy with an effective decrease in interest.In 2016, BP increased its interests in Tangguh in Indonesia and the Culzean asset in the UKNorth Sea, and in certain US onshore assets. It disposed of its interests in the Valhall, Skarv and Ula assets in the Norwegian North Sea and in return received an interest in Aker BP ASA,which operates in Norway. It also disposed of its interests in the Jansz-Io asset in Australia, and the Sanga Sanga concession in Indonesia. It also decreased its interests in certain Trinidadand US onshore assets. In 2015, BP acquired an interest in Taas-Yuryakh Neftegazodobycha. It also increased its interest in the North Alexandria and West Mediterranean Deep WaterConcessions of the West Nile Delta project in Egypt. It increased its interest in certain UK North Sea, Trinidad, and US onshore assets. It also decreased its interest in certain other assets inthe same regions.
c Natural gas production volumes exclude gas consumed in operations within the lease boundaries of the producing field, but the related reserves are included in the group’s reserves.
Because of rounding, some totals may not agree exactly with the sum of their component parts.
BP Annual Report and Form 20-F 2017 «See Glossary 263
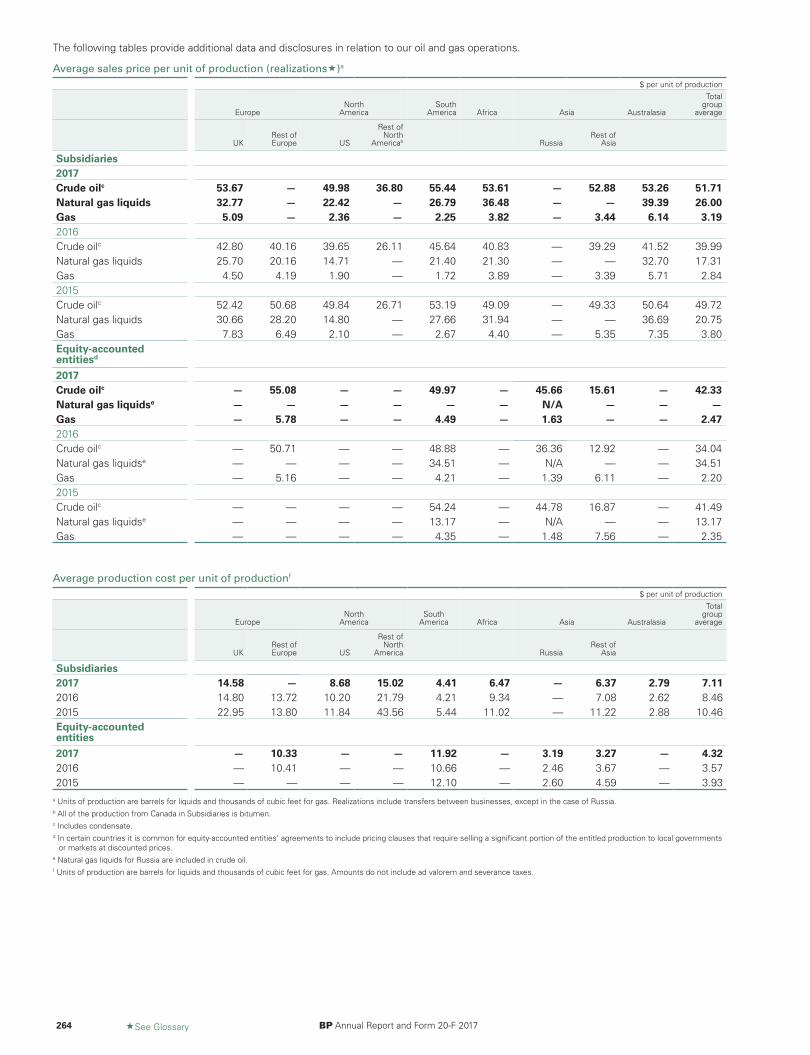
The following tables provide additional data and disclosures in relation to our oil and gas operations.
Average sales price per unit of production (realizations«)a
$ per unit of production
EuropeNorth
AmericaSouth
America Africa Asia Australasia
Totalgroup
average
UKRest ofEurope US
Rest ofNorth
Americab RussiaRest of
Asia
Subsidiaries2017Crude oilc 53.67 — 49.98 36.80 55.44 53.61 — 52.88 53.26 51.71Natural gas liquids 32.77 — 22.42 — 26.79 36.48 — — 39.39 26.00Gas 5.09 — 2.36 — 2.25 3.82 — 3.44 6.14 3.192016Crude oilc 42.80 40.16 39.65 26.11 45.64 40.83 — 39.29 41.52 39.99Natural gas liquids 25.70 20.16 14.71 — 21.40 21.30 — — 32.70 17.31Gas 4.50 4.19 1.90 — 1.72 3.89 — 3.39 5.71 2.842015Crude oilc 52.42 50.68 49.84 26.71 53.19 49.09 — 49.33 50.64 49.72Natural gas liquids 30.66 28.20 14.80 — 27.66 31.94 — — 36.69 20.75Gas 7.83 6.49 2.10 — 2.67 4.40 — 5.35 7.35 3.80Equity-accountedentitiesd
2017Crude oilc — 55.08 — — 49.97 — 45.66 15.61 — 42.33Natural gas liquidse — — — — — — N/A — — —Gas — 5.78 — — 4.49 — 1.63 — — 2.472016Crude oilc — 50.71 — — 48.88 — 36.36 12.92 — 34.04Natural gas liquidse — — — — 34.51 — N/A — — 34.51Gas — 5.16 — — 4.21 — 1.39 6.11 — 2.202015Crude oilc — — — — 54.24 — 44.78 16.87 — 41.49Natural gas liquidse — — — — 13.17 — N/A — — 13.17Gas — — — — 4.35 — 1.48 7.56 — 2.35
Average production cost per unit of productionf
$ per unit of production
EuropeNorth
AmericaSouth
America Africa Asia Australasia
Totalgroup
average
UKRest ofEurope US
Rest ofNorth
America RussiaRest of
Asia
Subsidiaries2017 14.58 — 8.68 15.02 4.41 6.47 — 6.37 2.79 7.112016 14.80 13.72 10.20 21.79 4.21 9.34 — 7.08 2.62 8.462015 22.95 13.80 11.84 43.56 5.44 11.02 — 11.22 2.88 10.46Equity-accountedentities2017 — 10.33 — — 11.92 — 3.19 3.27 — 4.322016 — 10.41 — — 10.66 — 2.46 3.67 — 3.572015 — — — — 12.10 — 2.60 4.59 — 3.93
a Units of production are barrels for liquids and thousands of cubic feet for gas. Realizations include transfers between businesses, except in the case of Russia.b All of the production from Canada in Subsidiaries is bitumen.c Includes condensate.d In certain countries it is common for equity-accounted entities’ agreements to include pricing clauses that require selling a significant portion of the entitled production to local governments
or markets at discounted prices.e Natural gas liquids for Russia are included in crude oil.f Units of production are barrels for liquids and thousands of cubic feet for gas. Amounts do not include ad valorem and severance taxes.
264 «See Glossary BP Annual Report and Form 20-F 2017
Environmental expenditure$ million
2017 2016 2015
Environmental expenditurerelating to the Gulf of Mexicooil spill — — 5,452
Operating expenditure 441 487 521Capital expenditure 487 564 733Clean-ups 22 27 34Additions to environmental
remediation provision 249 262 305
Increase (decrease) indecommissioning provision (228) (804) 972
Operating and capital expenditure on the prevention, control,treatment or elimination of air and water emissions and solid waste isoften not incurred as a separately identifiable transaction. Instead, itforms part of a larger transaction that includes, for example, normaloperations and maintenance expenditure. The figures forenvironmental operating and capital expenditure in the table aretherefore estimates, based on the definitions and guidelines of theAmerican Petroleum Institute.
Environmental operating expenditure of $441 million in 2017 (2016$487 million) showed an overall decrease of 9% which was primarilydue to lower expenditures associated with BP's share of the TAPSpipeline.
Environmental capital expenditure in 2017 was lower overall than in2016, largely due to lower spend as a result of the completion of theinstallation of the new LPG refrigeration plant for the North SeaForties Pipeline System in the previous year and lower spend onKuparuk field in Alaska driven by lower activity.
Clean-up costs decreased to $22 million in 2017 compared with $27million in 2016, primarily due to decreased contractual rates andoverall cost reductions. The numbers of oil spills are broadly similarand while the volume of oil has increased, this includes releases tosecondary containment which do not reach the environment.
In addition to operating and capital expenditure, we also establishprovisions for future environmental remediation work. Expenditureagainst such provisions normally occurs in subsequent periods and isnot included in environmental operating expenditure reported for suchperiods.
Provisions for environmental remediation are made when a clean-upis probable and the amount of the obligation can be reliablyestimated. Generally, this coincides with the commitment to a formalplan of action or, if earlier, on divestment or on closure of inactivesites.
The extent and cost of future environmental restoration, remediationand abatement programmes are inherently difficult to estimate. Theyoften depend on the extent of contamination, and the associatedimpact and timing of the corrective actions required, technologicalfeasibility and BP’s share of liability. Though the costs of futureprogrammes could be significant and may be material to the resultsof operations in the period in which they are recognized, it is notexpected that such costs will be material to the group’s overall resultsof operations or financial position.
Additions to our environmental remediation provision was similar toprior years and also reflects scope reassessments of the remediationplans of a number of our sites in the US and Canada. The charge forenvironmental remediation provisions in 2017 included $8 million inrespect of provisions for new sites (2016 $7 million and 2015 $6million).
In addition, we make provisions on installation of our oil and gasproducing assets and related pipelines to meet the cost of eventualdecommissioning. On installation of an oil or natural gas productionfacility, a provision is established that represents the discounted valueof the expected future cost of decommissioning the asset.
In 2017, the net decrease in the decommissioning provision, similar tothe decrease in 2016, was a result of detailed reviews of expectedfuture costs, partially offset by increases to the asset base.
We undertake periodic reviews of existing provisions. These reviewstake account of revised cost assumptions, changes indecommissioning requirements and any technological developments.
Provisions for environmental remediation and decommissioning areusually established on a discounted basis, as required by IAS 37‘Provisions, Contingent Liabilities and Contingent Assets’.
Further details of decommissioning and environmental provisionsappear in Financial statements – Note 21.
Environmental expenditure relating to the Gulf ofMexico oil spillFor full details of all environmental activities in relation to the Gulf ofMexico oil spill, see Financial statements – Note 2.
BP Annual Report and Form 20-F 2017 «See Glossary 265
Regulation of the group’s businessBP’s activities, including its oil and gas exploration and production,pipelines and transportation, refining and marketing, petrochemicalsproduction, trading, biofuels, wind and shipping activities, areconducted in 70 countries and are subject to a broad range of EU, US,international, regional and local legislation and regulations, includinglegislation that implements international conventions and protocols.These cover virtually all aspects of BP’s activities and include matterssuch as licence acquisition, production rates, royalties, environmental,health and safety protection, fuel specifications and transportation,trading, pricing, anti-trust, export, taxes and foreign exchange.
Upstream contractual and regulatory frameworkThe terms and conditions of the leases, licences and contracts underwhich our oil and gas interests are held vary from country to country.These leases, licences and contracts are generally granted by orentered into with a government entity or state-owned or controlledcompany and are sometimes entered into with private propertyowners. Arrangements with governmental or state entities usuallytake the form of licences or production-sharing agreements«(PSAs),although arrangements with the US government can be by lease.Arrangements with private property owners are usually in the form ofleases.
Licences (or concessions) give the holder the right to explore for andexploit a commercial discovery. Under a licence, the holder bears therisk of exploration, development and production activities andprovides the financing for these operations. In principle, the licenceholder is entitled to all production, minus any royalties that arepayable in kind. A licence holder is generally required to payproduction taxes or royalties, which may be in cash or in kind. Lesstypically, BP may explore for and exploit hydrocarbons« under aservice agreement with the host entity in exchange forreimbursement of costs and/or a fee paid in cash rather thanproduction.
PSAs entered into with a government entity or state-owned orcontrolled company generally require BP (alone or with othercontracting companies) to provide all the financing and bear the riskof exploration and production activities in exchange for a share of theproduction remaining after royalties, if any.
In certain countries, separate licences are required for exploration andproduction activities, and in some cases production licences arelimited to only a portion of the area covered by the original explorationlicence. Both exploration and production licences are generally for aspecified period of time. In the US, leases from the US governmenttypically remain in effect for a specified term, but may be extendedbeyond that term as long as there is production in paying quantities.The term of BP’s licences and the extent to which these licences maybe renewed vary from country to country.
BP frequently conducts its exploration and production activities injoint arrangements« or co-ownership arrangements with otherinternational oil companies, state-owned or controlled companiesand/or private companies. These joint arrangements may beincorporated or unincorporated arrangements, while the co-ownerships are typically unincorporated. Whether incorporated orunincorporated, relevant agreements set out each party’s level ofparticipation or ownership interest in the joint arrangement or co-ownership. Conventionally, all costs, benefits, rights, obligations,
liabilities and risks incurred in carrying out joint arrangement or co-ownership operations under a lease or licence are shared among thejoint arrangement or co-owning parties according to these agreedownership interests. Ownership of joint arrangement or co-ownedproperty and hydrocarbons to which the joint arrangement or co-ownership is entitled is also shared in these proportions. To the extentthat any liabilities arise, whether to governments or third parties, or asbetween the joint arrangement parties or co-owners themselves,each joint arrangement party or co-owner will generally be liable tomeet these in proportion to its ownership interest. In many upstreamoperations, a party (known as the operator) will be appointed(pursuant to a joint operating agreement) to carry out day-to-dayoperations on behalf of the joint arrangement or co-ownership. Theoperator is typically one of the joint arrangement parties or a co-owner and will carry out its duties either through its own staff, or bycontracting out various elements to third-party contractors or serviceproviders. BP acts as operator on behalf of joint arrangements and co-ownerships in a number of countries where it has exploration andproduction activities.
Frequently, work (including drilling and related activities) will becontracted out to third-party service providers who have the relevantexpertise and equipment not available within the joint arrangement orthe co-owning operator’s organization. The relevant contract willspecify the work to be done and the remuneration to be paid and willtypically set out how major risks will be allocated between the jointarrangement or co-ownership and the service provider. Generally, thejoint arrangement or co-owner and the contractor would respectivelyallocate responsibility for and provide reciprocal indemnities to eachother for harm caused to and by their respective staff and property.Depending on the service to be provided, an oil and gas industryservice contract may also contain provisions allocating risks andliabilities associated with pollution and environmental damage,damage to a well or hydrocarbon reservoirs and for claims from thirdparties or other losses. The allocation of those risks vary amongcontracts and are determined through negotiation between theparties.
In general, BP incurs income tax on income generated fromproduction activities (whether under a licence or PSA). In addition,depending on the area, BP’s production activities may be subject to arange of other taxes, levies and assessments, including specialpetroleum taxes and revenue taxes. The taxes imposed on oil and gasproduction profits and activities may be substantially higher thanthose imposed on other activities, for example in Abu Dhabi, Angola,Egypt, Norway, the UK, the US, Russia and Trinidad & Tobago.
Greenhouse gas regulationIn December 2015, nearly 200 nations at the United Nations climatechange conference in Paris (COP21) agreed the Paris Agreement, forimplementation post-2020. The agreement came into force on4 November 2016. For the first time this agreement applies to allcountries, both developing and developed, although in someinstances allowances or flexibilities are provided for developingnations. The Paris Agreement aims to hold global averagetemperature rise to well below 2°C above pre-industrial levels and topursue efforts to limit temperature rise to 1.5°C above pre-industriallevels. There is no quantitative long-term emissions goal. However,countries aim to reach global peaking of greenhouse gas (GHG)emissions as soon as possible and to undertake rapid reductionsthereafter, so as to achieve a balance between human causedemissions by sources and removals by sinks of GHGs in the secondhalf of this century. The Paris Agreement commits all parties tosubmit Nationally Determined Contributions (NDCs) (i.e. pledges orplans of climate action) and pursue domestic measures aimed atachieving the objectives of their NDCs. Developed country NDCsshould include absolute emission reduction targets, and developingcountries are encouraged to move over time towards them. The ParisAgreement places binding commitments on countries to report ontheir emissions and progress made on their NDCs and to undergointernational review of collective progress. It also requires countriesto submit revised NDCs every five years, which are expected to bemore ambitious with each revision. Global assessments of progresswill occur every five years, starting in 2023. In the decision adoptingthe Paris Agreement, an earlier commitment by developed countriesto mobilize $100 billion a year by 2020 was extended through 2025,
with a further goal with a floor of $100 billion to be set before 2025.On 1 June 2017, the US announced that it will withdraw from theParis Agreement. This includes suspending the implementation of theUS’s NDC and funding for the Green Climate Fund. The process forwithdrawal can be completed no earlier than 4 November 2020.
The United Nations climate change conference in Marrakech(COP22), held in November 2016, agreed a deadline of 2018 forcountries to agree on the guidelines and rules that are needed tosupport implementation of the Paris Agreement. At COP23, held inNovember 2017 in Bonn, the parties met to continue the negotiations;amongst other things, the parties agreed to launch the 2018 TalanoaDialogue to review collective efforts in relation to progress towardsthe Paris Agreement objectives and to inform the preparation ofNDCs, and to convene stocktakes on pre-2020 implementation andambition at COP24 and 25.
More stringent national and regional measures relating to thetransition to a lower carbon economy can be expected in the future.These measures could increase BP’s production costs for certainproducts, increase compliance and litigation costs, increase demandfor competing energy alternatives or products with lower-carbonintensity, and affect the sales and specifications of many of BP’sproducts. Further, such measures could lead to constraints onproduction and supply and access to new reserves, particularly due tothe long term nature of many of BP’s projects. Current andannounced measures and developments potentially affecting BP’sbusinesses include the following:
United StatesIn the US, the Obama administration adopted its Climate Action Planin 2013 and had been using existing statutory authority to implementthat plan, including the Clean Air Act (CAA) and the Mineral LeasingAct (MLA). On 28 March 2017 the Trump administration issuedExecutive Order (EO) 13783 rescinding major elements of the ClimateAction Plan, and instructing the Environmental Protection Agency(EPA) to review and then commence the process of suspending,revising or rescinding certain regulations, including the Clean PowerPlan and the EPA new source methane rule. EO 13783 also instructedthe Department of Interior (DOI) to review and possibly suspend,revise or rescind the Bureau of Land Management (BLM) methanerule. The EPA and the DOI are taking steps to implement theseaspects of EO 13783 and legal challenges have been brought bysome US states and private parties regarding these proposedchanges.
• Greenhouse gas (GHG) emissions are currently regulated in anumber of ways under the CAA. As noted above, as a result of EO13783, some of these regulations may be suspended, revised orrescinded resulting in complex compliance challenges for ouraffected businesses.
– Stricter GHG regulations, stricter limits on sulphur in fuels,emissions regulations in the refinery sector and a revised lowerambient air quality standard for ozone, finalized by the EPA inOctober 2015, are affecting our US operations.
– EPA regulations aimed at methane emissions are in place fornew and modified sources and the BLM has issued methaneregulations for existing sites located on federal lands. The Trumpadministration is seeking to rescind both of these rules but thetiming of any rescission is subject to legal challenges andregulatory requirements.
– It is possible that EPA will be required by statute to proposeregulations on existing sources of methane from onshore oil andnatural gas sector activities, unless the EPA new sourcemethane rule is revised or rescinded.
– States may also have separate, stricter air emission laws inaddition to the CAA. Despite the US withdrawal from the ParisAgreement, a number of US states, cities and privateorganizations remain committed to meeting Paris Agreementgoals. A number of states also belong to or are consideringjoining carbon trading markets (e.g. California).
• The Energy Policy Act of 2005 and the Energy Independence andSecurity Act of 2007 impose a renewable fuel mandate (the federalRenewable Fuel Standard) as well as state initiatives that imposelow GHG emissions thresholds for transportation fuels (currently
266 «See Glossary BP Annual Report and Form 20-F 2017
adopted in California, through the California Low Carbon FuelStandard and Oregon).
• EPA regulations impose light, medium and heavy duty vehicleemissions standards for GHGs and permitting requirements forcertain large GHG stationary emission sources. California and anumber of other states impose different, stricter GHG emissionlimits on vehicles. These varying standards impact BP’s product mixand overall demand.
• Under the GHG mandatory reporting rule (GHGMRR), annualreports on GHG emissions must be filed. In addition to directemissions from affected facilities, producers and importers/exporters of petroleum products, certain natural gas liquids andGHG products are required to report product volumes and notionalGHG emissions as if these products were fully combusted.
• On 9 October 2017 the EPA announced its intention to repeal theClean Power Plan (CPP) which was an important element of theObama administration’s Climate Action Plan. The CCP regulationsare currently stayed pending resolution of existing legal challenges;the EPA may decline to defend certain of these legal challenges.The EPA’s repeal proposal is likely to face legal challenges as welland repeal of the CPP regulations, or adoption of a narrowerreplacement rule, may not occur until well after 2018. The outcomewith respect to these rules will affect electricity generationpractices and prices, reliability of electricity supply, and regulatoryrequirements affecting other GHG emission sources in othersectors and have potential impacts on combined heat and powerinstallations.
• In June 2016 the EPA finalized rules aimed at limiting methaneemissions from new and modified sources in the oil and naturalgas sector in the US by 40-45% from 2012 levels by 2025 thatwould apply to existing sources in the sector. In January 2017 theBLM’s methane rule, aimed at limiting methane emissions from oiland gas operations on federal lands also came into effect.Following the Trump administration’s EO 13783, on 16 June 2017the EPA proposed a two-year stay of portions of the methaneregulations for new and modified oil and gas sources. In December2017, the BLM proposed a 13 month delay of its methane rule. InFebruary 2018, a federal court in California ruled against that 13month delay. Also in February 2018, the BLM proposed to revise itsmethane rule. The final outcome of the rule revisions and legalchallenges with respect to implementation of EO 13783 regardingthese EPA and BLM rules is uncertain, but may affect our USupstream businesses’ management of methane emissions in theUS.
• A number of states, municipalities and regional organizations haveresponded to current and proposed federal changes inenvironmental regulation and a number of additional state andregional initiatives in the US will affect our operations. TheCalifornia cap and trade programme started in January 2012 andexpanded to cover emissions from transportation fuels in 2015, andthe State of Washington adopted a carbon cap rule in 2017.
European Union• The EU has agreed to an overall GHG reduction target of 20% by
2020. To meet this, a ‘Climate and Energy Package’ of regulatorymeasures was adopted that includes: a collective nationalreduction target for emissions not covered by the EU EmissionsTrading System (EU ETS) Directive; binding national renewableenergy targets to double usage of renewable energy sources in theEU, including at least a 10% share of renewable energy in thetransport sector under the Renewable Energy Directive (a revisionto which was proposed by the European Commission in November2016); a legal framework to promote carbon capture and storage(CCS); and a revised EU ETS Phase 3. EU ETS revisions included aGHG reduction of 21% from 2005 levels; a significant increase inallowance auctioning; an expansion in the scope of the EU ETS toencompass more industrial sectors (including the petrochemicalssector) and gases; no free allocation for electricity generation(including that which is self-generated off-shore) or production, butsector benchmarked free allocation for all other installations, withsharply declining allocation for sectors deemed not exposed tocarbon leakage. EU ETS revisions also included the adoption of aMarket Stability Reserve to adjust the supply of auctionedallowances. This will take effect in 2019 and could potentially lead
to higher carbon costs. EU Energy efficiency policy is currentlyimplemented via national energy efficiency action plans and theEnergy Efficiency Directive adopted in 2012.
• The EU Fuel Quality Directive affects our production and marketingof transport fuels. Revisions adopted in 2009 mandate reductionsin the life cycle GHG emissions per unit of energy and tighterenvironmental fuel quality standards for petrol and diesel.
• In October 2014 the EU also agreed to the 2030 Climate andEnergy Policy framework with a goal of at least a 40% reduction inGHGs from 1990 and measures to achieve a 27% share ofrenewable energy and a 27% increase in energy efficiency. TheGHG reduction target is to be achieved by a 43% reduction ofemissions from sectors covered by the EU ETS, and a 30% GHGreduction by Member States for all other GHG emissions. While theEuropean Commission has made legislative proposals, includingproposed amended targets, specific EU legislation and agreementsrequired to achieve these goals are still under discussion in theEuropean Council and European Parliament.
• European regulations also establish passenger car performancestandards for CO2 tailpipe emissions (European Regulation (EC)No 443/2009). By 2021, the European passenger fleet emissionstarget for new vehicles will be 95 grams of CO2 per kilometre. Thistarget will be achieved by manufacturing fuel efficient vehicles andvehicles using alternative, low carbon fuels such as hydrogen andelectricity. In addition, vehicle emission test cycles and vehicle typeapproval procedures are being updated to improve accuracy ofemission and efficiency measurements.
• European vehicle CO2 emission regulations also impact the fuelefficiency of vans. By 2020, the EU fleet of newly registered vansmust meet a target of 147 grams of CO2 per kilometre, which is19% below the 2012 fleet average.
• In addition, the Energy Efficiency Directive (EED), IndustrialEmissions Directive (IED) 2010, Medium Combustion PlantsDirective (MCPD) 2015 and EU regulation on ozone depletingsubstances 2009 (ODS Regulation) referenced below under ‘Otherenvironmental regulation’ will also directly or indirectly requirereductions in GHG emissions.
Other• Canada’s highest emitting province, Alberta, has regulations
targeting large final emitters (sites with over 100,000 tonnes ofcarbon dioxide equivalent per annum) with intensity targets of 2%improvement per year up to 20%. Compliance is possible via directreductions, the purchase of offsets or the payment of C$30/tonneto a technology fund. In addition, the Alberta governmentimplemented an economy-wide price of carbon policy that coversemissions not in the scope of the existing regulations for large finalemitters (C$20/tonne in 2017; C$30/tonne in 2018 then escalatingin line with Federal backstop pricing). Changes were also made toelectricity generation sources, limits on overall oil sands emissions,and sector specific output-based-allocations (performancestandards) have been set such that compliance requirements willnow be based on emission intensity relative to top quartileperformance in each sector. Compliance obligations, if required,can be satisfied through emission reductions, payments to thegovernment or use of offsets. The Canadian federal governmenthas announced climate change policy goals including a nationalbackstop carbon price starting at C$10/tonne in 2018 and escalatingto C$50/tonne by 2022 (or equivalent system for provinces withcap-and-trade systems), with implementation of the price andassociated large emitters pricing system (modelled on the Albertaoutput-based-allocation system), use of any funds generated andoutcome reporting being managed by each province.
• China is operating emission trading pilot programmes in five citiesand two provinces and some selected non-pilot provinces have alsobeen approved to engage in emission trading. One of BP'ssubsidiaries and one of BP’s joint venture« companies in China areparticipating in these schemes. A plan on establishing thenationwide carbon emissions trading market (covering powersector only) was promulgated in December 2017 by the NationalDevelopment and Reform Commission, which will not supersedethe above seven pilot programmes immediately but allow thosepilot schemes to be incorporated into the national schemegradually. In July 2016, China carried out pilot programmes on
BP Annual Report and Form 20-F 2017 «See Glossary 267

compensation for and trading of energy quotas in four provinceswhich may be further expanded in or after 2020. In January 2017, anationwide pilot scheme on the issuance and voluntary purchaseand trading of renewable energy green power certificates waslaunched and it is expected that the evaluation on renewableenergy power quotas and mandatory trading of green powercertificates will be launched in 2018.
• China has also adopted more stringent vehicle tailpipe emissionstandards and vehicle efficiency standards to address air pollutionand GHG emissions. These standards will have an impact ontransportation fuel product mix and overall demand. In addition,China has also introduced a mandate for sales of new energyvehicles (NEVs) commencing in 2020. This will accelerate NEVpenetration into the light vehicle sector and impact light fueldemand.
For information on the steps that BP is taking in relation to climatechange issues and for details of BP’s GHG reporting, seeSustainability – Climate change on page 50.
Other environmental regulationCurrent and proposed fuel and product specifications, emissioncontrols (including control of vehicle emissions), climate changeprogrammes and regulation of unconventional oil and gas extractionunder a number of environmental laws may have a significant effecton the production, sale and profitability of many of BP’s products.
There are also environmental laws that require BP to remediate andrestore areas affected by the release of hazardous substances orhydrocarbons associated with our operations or properties. Theselaws may apply to sites that BP currently owns or operates, sites thatit previously owned or operated, or sites used for the disposal of itsand other parties’ waste. See Financial Statements – Note 21 forinformation on provisions for environmental restoration andremediation.
A number of pending or anticipated governmental proceedingsagainst certain BP group companies under environmental laws couldresult in monetary or other sanctions. Group companies are alsosubject to environmental claims for personal injury and propertydamage alleging the release of, or exposure to, hazardoussubstances. The costs associated with future environmentalremediation obligations, governmental proceedings and claims couldbe significant and may be material to the results of operations in theperiod in which they are recognized. We cannot accurately predict theeffects of future developments, such as stricter environmental lawsor enforcement policies, or future events at our facilities, on thegroup, and there can be no assurance that material liabilities andcosts will not be incurred in the future. For a discussion of the group’senvironmental expenditure, see page 265.
A significant proportion of our fixed assets are located in the US andthe EU. US and EU environmental, health and safety regulationssignificantly affect BP’s operations. Significant legislation andregulation in the US and the EU affecting our businesses andprofitability includes the following:
United States• Since taking office in January 2017, the Trump administration has
issued a number of Executive Orders (EO) intended to reform thefederal permitting and rulemaking processes to reduce regulatoryburdens placed on manufacturing generally and the energy industryspecifically. These EOs immediately rescind certain policies andprocedures and order the commencement of a broad process toidentify other actions that may be taken to further reduce theseregulatory requirements. It is not clear how much or how quicklythese regulatory requirements will be reduced given statutory andrulemaking constraints and the likely legal challenges to some ofthese initiatives.
• The National Environmental Policy Act (NEPA) requires that thefederal government gives proper consideration to the environmentprior to undertaking any major federal action that significantlyaffects the environment, which includes the issuance of federalpermits. The environmental reviews required by NEPA can delayprojects. State law analogues to NEPA could also limit or delay ourprojects. On 15 August 2017 the Trump administration issued EO13807 which directs federal agencies to take certain actions to
streamline the NEPA process although the effect of EO 13807 onour operations remains uncertain.
• The CAA regulates air emissions, permitting, fuel specificationsand other aspects of our production, distribution and marketingactivities.
• The Energy Policy Act of 2005 and the Energy Independence andSecurity Act of 2007 affect our US fuel markets by, among otherthings, imposing the limitations discussed above under‘Greenhouse gas regulation’. California also imposes Low EmissionVehicle (LEV) and Zero Emission Vehicle (ZEV) standards on vehiclemanufacturers. These regulations will have an impact on fueldemand and product mix in California and those states adoptingLEV and ZEV standards. The EPA is currently reassessing theObama Administration’s mid-term evaluation (MTE) of the 2022-25automobile fuel economy (CAFE) standards. A reassessment of thestandards could change original equipment manufacturer (OEM)compliance plans and consequently motor fuel demand. The EPA isexpected to complete its assessment in April 2018.
• The Clean Water Act regulates wastewater and other effluentdischarges from BP’s facilities, and BP is required to obtaindischarge permits, install control equipment and implementoperational controls and preventative measures.
• The Resource Conservation and Recovery Act regulates thegeneration, storage, transportation and disposal of wastesassociated with our operations and can require corrective action atlocations where such wastes have been disposed of or released.
• The Comprehensive Environmental Response, Compensation, andLiability Act (CERCLA) can, in certain circumstances, impose theentire cost of investigation and remediation on a party who ownedor operated a site contaminated with a hazardous substance, orarranged for disposal of a hazardous substance at a site. BP hasincurred, or is likely to incur, liability under CERCLA or similar statelaws, including costs attributed to insolvent or unidentified parties.BP is also subject to claims for remediation costs under otherfederal and state laws, and to claims for natural resource damagesunder CERCLA, the Oil Pollution Act of 1990 (OPA 90) (discussedbelow) and other federal and state laws. CERCLA also requiresnotification of releases of hazardous substances to national, stateand local government agencies, as applicable. In addition, theEmergency Planning and Community Right-to-Know Act requiresnotification of releases of designated quantities of certain listedhazardous substances to state and local government agencies, asapplicable.
• The Toxic Substances Control Act (TSCA) regulates BP’smanufacture, import, export, sale and use of chemical substancesand products. In June 2016, the US enacted legislation tomodernize and reform TSCA. The EPA has promulgated rules,processes and guidance to implement the reforms. Keycomponents of the reform legislation include: (1) a reset of theTSCA chemical inventory, (2) new chemical managementprioritization efforts expanding risk assessment and riskmanagement practices, (3) new confidentiality provisions, and(4) new authority for the EPA to impose a fee structure. In 2017, theEPA finalized details regarding the process and requirements forexecution of the TSCA inventory reset. BP is currently collectingthe requisite information for submission to the EPA to assure thatthe chemical substances that are: (i) contained in our manufacturedor imported products; (ii) used to manufacture our products; and(iii) used in our operations, continue to be included in the US TSCAinventory.
• The Occupational Safety and Health Act imposes workplace safetyand health requirements on BP operations along with significantprocess safety management obligations, requiring continuousevaluation and improvement of operational practices to enhancesafety and reduce workplace emissions at gas processing, refiningand other regulated facilities. In 2016 the Obama administrationannounced that the US Occupational Safety and HealthAdministration (OSHA) would implement a ‘National EmphasisProgram’ set of inspections aimed at refineries and petrochemicalfacilities. The Trump administration has not made anyannouncement regarding its intentions for this program.
• The US Department of Transportation (DOT) regulates the transportof BP’s petroleum products such as crude oil, gasoline,petrochemicals and other hydrocarbon liquids.
268 «See Glossary BP Annual Report and Form 20-F 2017
• The Maritime Transportation Security Act and the DOT HazardousMaterials (HAZMAT) regulations impose security complianceregulations on certain BP facilities.
• OPA 90 is implemented through regulations issued by the EPA, theUS Coast Guard, the DOT, the OSHA, the Bureau of Safety andEnvironmental Enforcement and various states. Alaska and theWest Coast states currently have the most demanding staterequirements.
• The Outer Continental Shelf Land Act, the MLA and other statutesgive the Department of Interior (DOI) and the BLM authority toregulate operations and air emissions on offshore and onshoreoperations on federal lands subject to DOI authority. New stricterregulations on operational practices, equipment and testing havebeen imposed on our operations in the Gulf of Mexico andelsewhere following the Deepwater Horizon oil spill.
• The Endangered Species Act and Marine Mammal Protection Actprotect certain species from adverse human impacts. The speciesand their habitat may be protected thereby restricting operations ordevelopment at certain times and in certain places. With anincreasing number of species being protected, we have increasingrestrictions on our activities.
European Union• The Energy Efficiency Directive (EED) was adopted in 2012. It
requires EU member states to implement an indicative 2020energy saving target and apply a framework of measures as part ofa national energy efficiency programme, including mandatoryenergy efficiency audits. This directive has been implemented inthe UK by the Energy Savings Opportunity Scheme Regulations2014, which affects our offshore and onshore assets. TheISO50001 standard is being implemented by organizations in someEU states to meet some elements of the EED. A revision to theEED was proposed by the European Commission in November2016, which includes a new energy efficiency target for 2030.
• The Industrial Emissions Directive (IED) 2010 provides theframework for granting permits for major industrial sites. It laysdown rules on integrated prevention and control of air, water andsoil pollution arising from industrial activities. As part of the IEDframework, additional emission limit values are informed by sectorspecific and cross-sector Best Available Technology (BAT)Conclusions, such as the BAT Conclusions for the refining sector,for large combustion plants as well as common waste water andwaste gas treatment and management systems in the chemicalsector. These may result in requirements for BP to further reduceits emissions, particularly its air and water emissions.
• The Medium Combustion Plants Directive (MCPD) came into forceon 18 December 2015, with a deadline for implementation bymember states of 19 December 2017. It applies to air emissions ofsulphur dioxide (SO2), nitrogen oxides (NOx) and particulates fromthe combustion of fuels in plants with a rated thermal inputbetween one and 50MW. It also includes requirements to monitoremissions of carbon monoxide (CO) from such plant. Itsrequirements will be phased in – the emission limit values set inthe Directive will apply from 20 December 2018 for new plants andby 2025 or 2030 for existing plants, depending on their size.
• The National Emission Ceiling Directive 2016 entered into force on31 December 2016, replacing earlier legislation. It introducesstricter emissions limits from 2020 and 2030, with new indicativenational targets applying from 2025. The new Directive must beimplemented by EU member states by 1 July 2018.
• The EU regulation on ozone depleting substances 2009 (ODSRegulation) requires BP to reduce the use of ozone depletingsubstances (ODSs) and phase out use of certain ODSs. BPcontinues to replace ODSs in refrigerants and/or equipment in theEU and elsewhere, in accordance with the Montreal Protocol andrelated legislation. The Kigali Amendment to the Montreal Protocol(which aims to reduce hydrofluorocarbons) will come into forcefrom 1 January 2019. In addition, the EU regulation on fluorinatedGHGs with high global warming potential (the F-gas Regulations)require a phase-out of certain hydrofluorocarbons, based on globalwarming potential.
• The EU Registration, Evaluation Authorization and Restriction ofChemicals (REACH) Regulation 2006 requires registration ofchemical substances manufactured in or imported into the EU,
together with the submission of relevant hazard and risk data.REACH affects our manufacturing or trading/import operations inthe EU. Since coming into force in 2007, REACH implementationhas followed a phase-in schedule defined by the EU. The finalphase-in implementation deadline requires registration ofsubstances manufactured or imported in the tonnage-band of 1-100tonnes per annum per legal entity by 31 May 2018. BP is in theprocess of preparing and submitting registration dossiers to meetthis final REACH implementation milestone. For higher tonnage-band substances (i.e. 100 tonnes per annum or greater), BPmaintains compliance by checking whether imports are covered bythe registrations of non-EU suppliers’ representatives, preparingand submitting registration dossiers to cover new manufacturedand imported substances, and updating previously submittedregistrations as required. Some substances registered previously,including substances supplied to us by third parties for our use, arenow subject to evaluation and review for potential authorization orrestriction procedures, and possible banning, by the EuropeanChemicals Agency and EU member state authorities. In addition,BP’s facilities and operations in several EU countries haveundergone REACH compliance inspections by the competentauthority for the respective EU member state.
• The EU Offshore Safety Directive was adopted in 2013. Its purposeis to introduce a harmonized regime aimed at reducing thepotential environmental, health and safety impacts of the offshoreoil and gas industry throughout EU waters. The Directive has beenimplemented in the UK primarily through the Offshore Installations(Offshore Safety Directive) (Safety Case etc.) Regulations 2015.
• The Water Framework Directive (WFD) published in 2000 aims toprotect the quantity and quality of ground and surface waters ofthe EU member states. The ongoing implementation of the WFDand the related Environmental Quality Standards Directive 2008 aswell as the planned review of the WFD in 2019 is likely to requireadditional compliance efforts and increased costs for managingfreshwater withdrawals and discharges from BP’s EU operations.
Regulations governing the discharge of treated water have also beendeveloped in countries outside of the US and EU. This includesregulations in Trinidad and Angola. In Trinidad, BP is upgrading itswater treatment facilities to meet consent levels agreed with theregulators to apply water discharge rules arising from the Certificateof Environmental Clearance (CEC) Regulations 2001 and associatedWater Pollution Rules 2007. In Angola, BP has upgraded producedwater treatment systems to meet revised oil in water limits forproduced water discharge under Executive Decree ED 97-14(superseded ED 12/05 on 1 January 2016).
Environmental maritime regulationsBP’s shipping operations are subject to extensive national andinternational regulations governing liability, operations, training, spillprevention and insurance. These include:
• Liability and spill prevention and planning requirements governing,among others, tankers, barges and offshore facilities are imposedby OPA in US waters. It also mandates a levy on imported anddomestically produced oil to fund oil spill responses. Some states,including Alaska, Washington, Oregon and California, imposeadditional liability for oil spills. Outside US territorial waters, BPShipping tankers are subject to international liability, spill responseand preparedness regulations under the UN’s InternationalMaritime Organization (IMO), including the InternationalConvention on Civil Liability for Oil Pollution Damage, theInternational Convention for the Prevention of Pollution from Ships(MARPOL), the International Convention on Oil Pollution,Preparedness, Response and Co-operation and the InternationalConvention on Civil Liability for Bunker Oil Pollution Damage. InApril 2010, the Hazardous and Noxious Substance (HNS) Protocol2010 was adopted to address issues that have inhibited ratificationof the International Convention on Liability and Compensation forDamage in Connection with the Carriage of Hazardous and NoxiousSubstances by Sea 1996. As at 31 December 2017, as the requiredminimum number of contracting states had not been achieved, theHNS Convention had not entered into force.
• A global sulphur cap of 0.5% will apply to marine fuel from January2020 under MARPOL. In order to comply, ships will either need to
BP Annual Report and Form 20-F 2017 «See Glossary 269
consume low sulphur marine fuels or implement approvedabatement technology to enable them to meet the low sulphuremissions requirements whilst continuing to use higher sulphurfuel. This new global cap will not alter the lower limits that apply inthe sulphur oxides Emissions Control Areas established by theIMO.
• Ships are required to have ballast water treatment systems in placewithin the time frame prescribed by the International Conventionfor the Control and Management of Ships’ Ballast Water andSediments 2004, which entered into force in September 2017.
• The Convention for the Protection of the Marine Environment ofthe North-East Atlantic (OSPAR), entered into force in March 1998,is an international convention which aims to protect the marineenvironment of the North-East Atlantic. OSPAR has 16 contractingparties, including the UK Government. Work carried out inaccordance with OSPAR is managed by the OSPAR Commission,which is made up of government representatives of the 15contracting parties and the European Union. OSPARRecommendation 2001/1 relates to the management of producedwater from offshore installations in the North Sea. The OSPARCommission has set a target of a 15% reduction in the totalquantity of oil in produced water discharged, and more recently,guidelines for the implementation of a risk-based approach to themanagement of produced water discharges from offshoreinstallations were adopted (OSPAR Recommendation 2012/5).
• The EU shipping monitoring, reporting and verification (MRV)regulation entered into force in July 2015 and is aimed at gatheringdata on CO2 emissions based on ships’ fuel consumption. It isconsidered the first step of a staged approach for the inclusion ofmaritime transport emissions in the EU’s GHG reductioncommitment. In parallel, through amendments to MARPOL AnnexVI, the IMO Data Collection System (DCS) for collecting andanalysing fuel consumption data is due to come into effect inMarch 2018.
To meet its financial responsibility requirements, BP Shippingmaintains marine pollution liability insurance in respect of its operatedships to a maximum limit of $1 billion for each occurrence throughmutual insurance associations (P&I Clubs), although there can be noassurance that a spill will necessarily be adequately covered byinsurance or that liabilities will not exceed insurance recoveries.
270 «See Glossary BP Annual Report and Form 20-F 2017
Legal proceedingsProceedings relating to the Deepwater Horizon oilspill
IntroductionBP Exploration & Production Inc. (BPXP) was lease operator ofMississippi Canyon, Block 252 in the Gulf of Mexico (Macondo),where the semi-submersible rig Deepwater Horizon wasdeployed at the time of the 20 April 2010 explosions and fire andresulting oil spill (the Incident). Lawsuits and claims arising fromthe Incident have generally been brought in US federal and statecourts.
Many of the lawsuits in federal court relating to the Incident wereconsolidated by the Federal Judicial Panel on Multidistrict Litigationinto two multi-district litigation proceedings, one in federal districtcourt in Houston for the securities, derivative and EmployeeRetirement Income Security Act (ERISA) cases (MDL 2185) andanother in federal district court in New Orleans for the remainingcases (MDL 2179). A Plaintiffs’ Steering Committee (PSC) wasestablished to act on behalf of individual and business plaintiffs inMDL 2179. All federal and state claims in relation to the Incident havenow been settled or dismissed and the five-year probation periodunder the criminal plea agreement with the US Department of Justicecame to an end in January 2018. The remaining proceedings arisingfrom the Incident are discussed below. For further details of theconsent decree and settlement agreement with the United Statesfederal government and five Gulf Coast states, see ‘Legalproceedings’ in BP Annual Report and Form 20-F 2015.
PSC settlements
PSC settlements – Economic and Property Damages SettlementAgreementThe Economic and Property Damages Settlement resolvedcertain economic and property damage claims. It also resolvedproperty damage in certain areas along the Gulf Coast, as well asclaims for additional payments under certain Master VesselCharter Agreements entered into in the course of the Vessels ofOpportunity Program implemented as part of the response to theIncident.
The economic and property damages claims process is undercourt supervision through the settlement claims processestablished by the Economic and Property Damages Settlement.This provides that class members release and dismiss theirclaims against BP not expressly reserved by that agreement. Thefinal deadline for filing all claims was 8 June 2015.
Following numerous court decisions, on 31 March 2015 thedistrict court denied the PSC’s motion seeking to alter or amend arevised policy, addressing the matching of revenue and expensesfor business economic loss claims, which required the matchingof revenue with the expenses incurred by claimants to generatethat revenue, even where the revenue and expenses wererecorded at different times. The PSC appealed this decision and,on 22 May 2017, the Fifth Circuit issued an opinion upholding thepolicy in part and reversing the policy in part. The Fifth Circuitordered that the portion of the policy upheld, which covers thesubstantial majority of the remaining business economic lossclaims, be applied as the governing methodology for all applicablebusiness economic loss claims. On 25 May 2017, 13 June 2017,and 5 July 2017, the district court issued a series of ordersinstructing the court supervised settlement programme on howto implement the Fifth Circuit’s opinion. On 10 August 2017, thedistrict court denied BP’s motion to clarify or reconsider itsorders. BP appealed all of these orders and decisions on 8September 2017 and that appeal has been consolidated with fourappeals filed by claimants in early to mid-September 2017. Thosefour claimant appeals also challenge the same set of district courtorders and decisions, albeit raising different issues than are raisedby BP’s appeal. These appeals are currently pending before theFifth Circuit.
On 17 March 2017, the district court issued an order regardingapproximately 150 claimants in the economic and propertydamages claims process whose claims had been subject to a
hold pending the development of agreed-upon guidance that theclaims administrator shall apply in making compensationdeterminations that adhere to the moratoria exclusion in theEconomic and Property Damages Settlement. The court orderedthat those claimants with claims remaining in moratoria holdwithout a resolution of their claims had the opportunity to opt thatclaim out from the claims process by 24 April 2017 and pursuethe claim in litigation. On 19 July 2017 the district court issued anorder finding that 13 plaintiffs validly opted claims out ofmoratoria hold and complied with the relevant court order, andthat those plaintiffs’ claims under the Oil Pollution Act of 1990(OPA 90) would be subject to further proceedings in MDL 2179(see ‘Other civil complaints - economic loss’ below).
As a result of significantly higher average claims determinationsissued by the court supervised settlement programme in thefourth quarter of 2017 and the continuing effect of the May 2017Fifth Circuit opinion, the provision for the costs associated withthe Economic and Property Damages Settlement was increasedin the fourth quarter of 2017. The amounts ultimately payable maydiffer from the amount provided and the timing of payments isuncertain. For more information about BP’s current estimate ofthe total cost of the Economic and Property DamagesSettlement, see Financial statements – Note 2.
PSC settlements – Medical Benefits Class Action SettlementThe Medical Benefits Class Action Settlement (MedicalSettlement) involves payments to qualifying class membersbased on a matrix for certain Specified Physical Conditions(SPCs), as well as a 21-year Periodic Medical ConsultationProgram (PMCP) for qualifying class members, and also includesprovisions regarding class members pursuing claims for later-manifested physical conditions (LMPCs).
The deadline for submitting SPC and PMCP claims was 12February 2015. The Medical Claims Administrator has reportedthe total number of claims submitted is 37,225. As of 26 January2018, 27,592 claims (comprising 22,796 SPC and 4,796 PMPConly) have been approved for compensation totallingapproximately $67 million; 9,546 claims have been denied; and87 claims are pending determination. In addition, there are 16pending lawsuits brought by class members claiming LMPCs.
For further details of the Medical Settlement, see ‘Legal proceedings’in BP Annual Report and Form 20-F 2015.
Other civil complaints – economic lossFollowing various court orders by the district court in MDL 2179 in2016, the vast majority of economic loss and property damageclaims from individuals and businesses that either opted out ofthe 2012 settlement with the Plaintiffs’ Steering Committee and/or were excluded from that settlement have either been resolvedor dismissed. However, several groups of plaintiffs whose claimswere dismissed by the district court have four appeals pending inthe Fifth Circuit, and briefing of those appeals is currentlyunderway. In addition, on 22 March 2017, BP moved to dismissthe claims of certain plaintiffs with economic loss claims on thegrounds that they had previously released their claims or hadfailed to meet the OPA 90 requirement that plaintiffs present theirclaims to the Responsible Party prior to filing suit. On 21September 2017, the district court granted in part BP’s motionregarding presentment and, on 20 October 2017, the district courtgranted in part BP’s motion regarding release; certain of theplaintiffs have brought appeals challenging these orders. On 11January 2018, the district court issued an order requiring allremaining plaintiffs in MDL 2179 with economic loss or propertydamage claims to file by 11 April 2018 a verified sworn statementregarding the actual damages each such plaintiff seeks in itspending litigation and an explanation of how those allegeddamages were causally related to the Incident.
Following the resolution in 2016 of the vast majority of thoseeconomic claims opted out of and/or excluded from of the 2012PSC settlement, referred to above, in 2017 the district courtaddressed the maritime claims. On 22 February 2017 the districtcourt in MDL 2179 ordered that any remaining plaintiffs who wishto pursue a general maritime law claim must file and serve on BPa sworn statement as to their proprietary interest in property
physically damaged by oil, and whether they worked ascommercial fishermen, by 5 April 2017. On 19 July 2017 the districtcourt issued an order finding that 215 plaintiffs, who had compliedwith the court’s previous orders, had also complied with thecourt’s 22 February 2017 order. The district court held that thoseplaintiffs' claims would be subject to further proceedings in MDL2179 under OPA 90 and under general maritime law. The courtdismissed with prejudice all other claims for economic lossbrought by private plaintiffs under general maritime law andcertain of these plaintiffs moved for reconsideration. On 8November 2017, the district court denied most of the motions forreconsideration of the 19 July 2017 order but granted in partseveral of the motions, ruling that an additional six plaintiffs hadcomplied with the 22 February 2017 order regarding generalmaritime law claims and thus that their claims under generalmaritime law were not dismissed. The district court also ruled thatan additional five plaintiffs had complied with previous of thecourt’s orders but not the 22 February 2017 order regardinggeneral maritime law claims and thus would be subject to furtherproceedings in MDL 2179 on their claims under OPA 90, but nottheir claims under general maritime law. Five groups of plaintiffswhose motions were denied by the 8 November 2017 order filedappeals in the Fifth Circuit, and those appeals remain pending.
Other civil complaints – personal injuryOn 18 July 2017, the district court in MDL 2179 issued an orderidentifying 960 plaintiffs whose claims for post-explosion clean-up, medical monitoring and personal injury claims occurring afterthe Incident will be subject to further proceedings in MDL 2179.The court dismissed with prejudice any other private plaintiffs’post-explosion clean-up, medical monitoring and personal injuryclaims and certain of these plaintiffs moved for reconsideration.On 6 December 2017, the district court denied most of themotions for reconsideration, granting some in part, and certaingroups of plaintiffs whose motions were denied have appealedthe order to the Fifth Circuit. Accordingly the vast majority ofpost-explosion clean-up, medical monitoring and personal injuryclaims from individuals that either opted out of the 2012settlement with the Plaintiffs’ Steering Committee and/or wereexcluded from that settlement have been dismissed.
MDL 2185 and other securities-related litigationSince the Incident, shareholders have sued BP and various of itscurrent and former officers and directors asserting shareholderderivative claims and class and individual securities fraud claims.Many of these lawsuits have been consolidated or co-ordinated infederal district court in Houston (MDL 2185).
Securities class actionFollowing various legal proceedings, a class of post-explosion ADSpurchasers from 26 April 2010 to 28 May 2010 was certified, and inJune 2016, BP agreed with plaintiffs’ representatives to settle theclass claims for $175 million, subject to approval by the court. Theparties filed the settlement agreement and other papers in support ofapproval with the court on 15 September 2016 and a class notice wasissued on 14 November 2016. On 13 February 2017 the court grantedfinal approval of the class settlement, and all settlement paymentswere made in 2017.
Individual securities litigationFrom April 2012 to April 2016, 37 cases were filed in state and federalcourts by pension funds, investment funds and advisers against BPentities and several current and former officers and directors seekingdamages for alleged losses those funds suffered because of theirpurchases and/or holdings of BP ordinary shares and, in certain cases,ADSs. The funds assert claims under English law and, for plaintiffspurchasing ADSs, federal securities law, and seek damages foralleged losses that those funds suffered because of their purchasesand holdings of BP ordinary shares and/or ADSs. All of the cases,with the exception of one case that has been stayed, have beentransferred to MDL 2185. On 28 September 2016, defendants filed amotion to dismiss certain claims against certain defendants in 20 ofthe individual securities cases. In a decision issued on 30 June 2017,the district court dismissed many of plaintiffs’ claims based onalleged losses from holdings (as opposed to purchases) of BPordinary shares and dismissed claims based on all but one of the
BP Annual Report and Form 20-F 2017 «See Glossary 271
alleged misstatements that had not been addressed by the court’sprior decisions. On 17 July 2017, defendants moved forreconsideration on the one alleged misstatement that the districtcourt did not dismiss; on 28 July 2017, plaintiffs opposed that motionand cross-moved for reconsideration on three alleged misstatementsthat the court dismissed. On 19 January 2018, the court denieddefendants’ motion and plaintiffs’ cross-motion. On 2 June 2017,defendants moved to dismiss one action in which plaintiffs seek topursue an English law negligent misstatement claim based uponseven meetings with BP employees, on behalf of a class of allinstitutional investors who engaged and delegated full investmentauthority to Mondrian Investment Partners.
On 7 December 2017, plaintiffs filed an amended complaint. On 9February 2018, defendants filed a renewed motion to dismiss thatamended complaint. The plaintiffs in an individual action assertingonly Exchange Act claims voluntarily dismissed their case on 15February 2018. Further, on 16 February 2018, defendants moved forjudgment on the pleadings dismissing, as time-barred, all ExchangeAct claims in the remaining individual actions based on allegedmisstatements made more than five years before the filing of theactions. The plaintiffs in three cases have elected to participate in theADS securities class action settlement and, accordingly, theirindividual cases were dismissed.
Canadian class actionsFollowing various legal proceedings, on 26 February 2016, a plaintiffseeking to assert claims under Canadian law against BP on behalf of aclass of Canadian residents who allegedly suffered losses because oftheir purchase of BP ordinary shares and ADSs filed a motion in theCourt of Appeal for Ontario to lift a stay on the action. The plaintiff’smotion was granted on 29 July 2016. On 23 June 2017, BP moved forsummary judgment and on 1 September 2017 the court granted inpart and denied in part that motion, limiting the case to three allegedmisstatements and narrowing the class period. On 29 September2017, plaintiff filed a notice of appeal of that decision.
On 15 December 2017, plaintiffs in a purported class action that wasfiled in 2012 in Alberta, Canada, and not pursued, filed an applicationseeking advice and directions regarding continuing their action; aconference on that application has not yet been scheduled.
Non-US government lawsuitsOn 5 April 2011, the Mexican State of Yucatan submitted a claimto the Gulf Coast Claims Facility (GCCF) alleging potentialdamage to its natural resources and environment, and seeking torecover the cost of assessing the alleged damage. This wasfollowed by a suit against BP which was transferred to MDL2179. On 5 April 2017, BP moved to dismiss the State of Yucatan’sclaims, and the court granted BP's motion to dismiss on 6 March2018.
On 19 April 2013, the Mexican federal government filed a civil actionagainst BP and others in MDL 2179. The complaint seeks adetermination that each defendant bears liability under OPA 90 fordamages that include the costs of responding to the spill, naturalresource damages allegedly recoverable by Mexico as an OPA 90trustee and the net loss of taxes, royalties, fees or net profits. Theclaims in this civil action were resolved by agreement effective 15February 2018.
On 18 October 2012, before a Mexican Federal District Court locatedin Mexico City, a class action complaint was filed against BPXP,BPAPC and other BP subsidiaries. BPXP has since been dismissed.The plaintiffs, who allegedly are fishermen, are seeking, among otherthings, compensatory damages for the class members who allegedlysuffered economic losses, as well as an order requiring BP toremediate environmental damage resulting from the Incident, toprovide funding for the preservation of the environment and toconduct environmental impact studies in the Gulf of Mexico for thenext 10 years. BP has not been formally served with the action.However, after learning that the Mexican Federal District Court issueda resolution certifying the class on 2 December 2015, BP filed aconstitutional challenge (amparo) in Mexico on 13 April 2016 assertingthat BP has never been formally served with process in the classaction. This amparo was denied on 22 November 2016 and the appealwas also denied on 17 August 2017. BP has not been formally servedwith the class certification decision, which is required before the
action can go forward.
On 3 December 2015 and 29 March 2016, Acciones Colectivas deSinaloa (ACS) filed two class actions (which have since beenconsolidated) in a Mexican Federal District Court on behalf of severalMexican states against BPXP, BPAPC, and other purported BPsubsidiaries. In these class actions, plaintiffs seek an order requiringthe BP defendants to repair the damage to the Gulf of Mexico, to paypenalties, and to compensate plaintiffs for damage to property, tohealth and for economic loss. A Mexican BP entity was served withthe complaint on 23 January 2018 and opposed class certification andsought dismissal on 30 January 2018 on the basis that the entity didnot exist at the time of the spill. BPXP was formally served with theaction on 8 December 2017. BPXP opposed class certification andsought dismissal on 1 February 2018, principally on the basis that thatno oil reached Mexican waters or land and there was no economic orenvironmental harm in Mexico.
Other legal proceedings
FERC and CFTC mattersFollowing an investigation by the US Federal Energy RegulatoryCommission (FERC) and the US Commodity Futures TradingCommission (CFTC) of several BP entities, the AdministrativeLaw Judge of the FERC ruled on 13 August 2015 that BPmanipulated the market by selling next-day, fixed price naturalgas at Houston Ship Channel in 2008 in order to suppress theGas Daily index and benefit its financial position. On 11 July 2016the FERC issued an Order affirming the initial decision anddirecting BP to pay a civil penalty of $20.16 million and todisgorge $207,169 in unjust profits. On 10 August 2016, BP filed arequest for rehearing with the FERC. BP strongly disagrees withthe FERC’s decision and will ultimately appeal to the US Court ofAppeals if necessary.
Investigations by the FERC and CFTC into BP’s trading activitiescontinue to be conducted from time to time.
OSHA mattersOn 8 March 2010, the US Occupational Safety and HealthAdministration (OSHA) issued 65 citations to BP Products NorthAmerica Inc. (BP Products) and BP-Husky Refining LLC (BP-Husky) for alleged violations of the Process Safety Management(PSM) standard at the Toledo refinery, with penalties ofapproximately $3 million. These citations resulted from aninspection conducted pursuant to OSHA’s Petroleum RefineryProcess Safety Management National Emphasis Program. BothBP Products and BP-Husky contested the citations. The outcomeof a pre-trial settlement of a number of the citations and a trial ofthe remainder was a reduction in the total penalty in respect ofthe citations from the original amount of approximately $3 millionto $80,000. The OSH Review Commission granted OSHA’spetition for review and briefing was completed in the first half of2014. Timing for the issuance of a decision by the ReviewCommission is currently uncertain. Depending on the outcome ofthis review, BP may also pay a penalty not to exceed $1 million inrespect of similar issues at the BP Texas City refinery.
Prudhoe Bay leakIn March and August 2006, oil leaked from oil transit pipelinesoperated by BP Exploration (Alaska) Inc. (BPXA) at the PrudhoeBay unit on the North Slope of Alaska. On 12 May 2008, a BPp.l.c. shareholder filed a consolidated complaint allegingviolations of federal securities law on behalf of a putative class ofBP p.l.c. shareholders, based on alleged misrepresentationsconcerning the integrity of the Prudhoe Bay pipeline before itsshutdown on 6 August 2006. On 7 December 2015, thecomplaint was dismissed with prejudice. On 5 January 2016,plaintiffs filed a notice of appeal of that decision to the NinthCircuit Court of Appeals, and briefing was completed on thatappeal on 14 October 2016.
Lead paint mattersSince 1987, Atlantic Richfield Company (Atlantic Richfield), asubsidiary« of BP, has been named as a co-defendant innumerous lawsuits brought in the US alleging injury to personsand property caused by lead pigment in paint. The majority of thelawsuits have been abandoned or dismissed against Atlantic
272 «See Glossary BP Annual Report and Form 20-F 2017

Richfield. Atlantic Richfield is named in these lawsuits as allegedsuccessor to International Smelting and Refining and anothercompany that manufactured lead pigment during the period1920-1946. The plaintiffs include individuals and governmentalentities. Several of the lawsuits purport to be class actions. Thelawsuits seek various remedies including compensation to lead-poisoned children, cost to find and remove lead paint frombuildings, medical monitoring and screening programmes, publicwarning and education of lead hazards, reimbursement ofgovernment healthcare costs and special education for lead-poisoned citizens and punitive damages. No lawsuit againstAtlantic Richfield has been settled nor has Atlantic Richfield beensubject to a final adverse judgment in any proceeding. Theamounts claimed and, if such suits were successful, the costs ofimplementing the remedies sought in the various cases could besubstantial. While it is not possible to predict the outcome ofthese legal actions, Atlantic Richfield believes that it has validdefences. It intends to defend such actions vigorously andbelieves that the incurrence of liability is remote. Consequently,BP believes that the impact of these lawsuits on the group’sresults, financial position or liquidity will not be material.
California False Claims Act mattersOn 4 November 2014, the California Attorney General filed a notice inCalifornia state court that it was intervening in a previously-sealedCalifornia False Claims Act (CFCA) lawsuit filed by relator ChristopherSchroen against BP, BP Energy Company, BP Corporation NorthAmerica Inc., BP Products and BPAPC. On 7 January 2015, theCalifornia Attorney General filed a complaint in intervention allegingthat BP violated the CFCA and the California Unfair Competition Lawby falsely and fraudulently overcharging California state entities fornatural gas. The relator’s complaint made similar allegations inaddition to individual claims. In January 2018 the parties reached asettlement pursuant to which BP, while denying liability, agreed to pay$102 million to the state of California.
Scharfstein v. BP West Coast Products, LLCA class action lawsuit was filed against BP West Coast Products, LLCin Oregon State Court under the Oregon Unlawful Trade Practices Acton behalf of customers who used a debit card at ARCO gasolinestations in Oregon during the period 1 January 2011 to 30 August2013, alleging that ARCO sites in Oregon failed to provide sufficientnotice of the 35 cents per transaction debit card fee. In January 2014,the jury rendered a verdict against BP and awarded statutorydamages of $200 per class member. On 25 August 2015, the trialcourt determined the size of the class to be slightly in excess of twomillion members. On 31 May 2016 the trial court entered a judgmentfor the amount of $417.3 million. BP appealed and oral argument washeard in August 2017. The Oregon Court of Appeal has not yet issuedits decision. No provision has been made for damages arising out ofthis class action.
BP Annual Report and Form 20-F 2017 «See Glossary 273
International trade sanctionsDuring the period covered by this report, non-US subsidiaries«, orother non-US entities of BP, conducted limited activities in, or withpersons from, certain countries identified by the US Department ofState as State Sponsors of Terrorism or otherwise subject to US andEU sanctions (Sanctioned Countries). Sanctions restrictions continueto be insignificant to the group’s financial condition and results ofoperations. BP monitors its activities with Sanctioned Countries,persons from Sanctioned Countries and individuals and companiessubject to US and EU sanctions and seeks to comply with applicablesanctions laws and regulations.
The US and the EU implemented temporary, limited and reversiblerelief of certain sanctions related to Iran pursuant to a JointComprehensive Plan of Action (JCPOA). As a result of the JCPOA, BPhas considered and developed possible business opportunities inrelation to Iran, engaged in discussions with Iranian governmentofficials and other Iranian nationals and attended conferences, andwill continue to do so.
The North Sea Rhum field (Rhum) is owned under a 50:50unincorporated joint arrangement between BP and Iranian OilCompany (U.K.) Limited (IOC). BP obtained an updated OFAC licencein relation to the continued operation of Rhum on 29 September 2017.On 21 November 2017, BP announced that it has agreed to sellcertain of its assets in the North Sea, including its ownership stake,and the transfer of its role as operator, in the Rhum joint arrangementto Serica Energy plc. The sale and transfer of ownership is subject toregulatory and third-party approvals and is expected to complete inthe third quarter of 2018.
BP has a 28.8% interest in and operates the Azerbaijan Shah Denizfield (Shah Deniz) and a related gas pipeline entity, South CaucasusPipeline Company Limited (SCPC), and has a 23% non-operatedinterest in a related gas marketing entity, Azerbaijan Gas SupplyCompany Limited (AGSC). Naftiran Intertrade Co. Limited and NICOSPV Limited (collectively, NICO) have a 10% non-operating interest ineach of Shah Deniz and SCPC and an 8% non-operating interest inAGSC. Shah Deniz, SCPC and AGSC continue in operation as theywere excluded from the main operative provisions of the EUregulations as well as from the application of the US sanctions, andfall within the exception for certain natural gas projects underSection 603 of the Iran Threat Reduction and Syria Human Rights Actof 2012 (ITRA).
BP holds an interest in a non-BP operated Indian joint venture«andsold produced crude oil to an Indian entity in which NICO holds aminority, non-controlling stake.
Both the US and the EU have enacted strong sanctions against Syria,including a prohibition on the purchase of Syrian-origin crude and a USprohibition on the provision of services to Syria by US persons. TheEU sanctions against Syria include a prohibition on supplying certainequipment used in the production, refining, or liquefaction ofpetroleum resources, as well as restrictions on dealing with theCentral Bank of Syria and numerous other Syrian financial institutions.
Following the imposition in 2011 of further US and EU sanctionsagainst Syria, BP terminated all sales of crude oil and petroleumproducts into Syria, though BP continues to supply aviation fuel tonon-governmental Syrian resellers outside of Syria.
BP sells lubricants in Cuba through a 50:50 joint arrangement andtrades in small quantities of lubricants.
During 2014 the US and the EU imposed sanctions on certain Russianactivities, individuals and entities, including Rosneft. Certain sectoralsanctions also apply to entities owned 50% or more by entities on therelevant sectoral sanctions list. In August 2017, new Russia relatedsanctions were passed in the US which target among other things: (i)Russian energy export pipelines; (ii) privatisation of state ownedassets in Russia; and (iii) certain international offshore Arctic,deepwater and/or shale E&P oil projects. We are not aware of anymaterial adverse effect on our current income and investment inRussia or elsewhere.
BP has registered and paid required fees to maintain registrations ofpatents and trade marks in Sanctioned Countries.
BP has equity interests in non-operated joint arrangements«with airfuel sellers, resellers, and fuel delivery services around the world.From time to time, the joint arrangement operator or other partnersmay sell or deliver fuel to airlines from Sanctioned Countries or flightsto Sanctioned Countries, without BP's involvement.
BP has no control over the activities non-controlled associates mayundertake in Sanctioned Countries or with persons from SanctionedCountries.
Disclosure pursuant to Section 219 of ITRATo our knowledge, none of BP’s activities, transactions or dealings arerequired to be disclosed pursuant to ITRA Section 219, with thefollowing possible exceptions:
• Rhum, located in the UK sector of the North Sea, is operated by BPExploration Operating Company Limited (BPEOC), a non-USsubsidiary of BP. Rhum is owned under a 50:50 unincorporatedjoint arrangement between BPEOC and Iranian Oil Company (U.K.)Limited (IOC). During 2017, BP recorded gross revenues of $124million related to its interests in Rhum. BP had a net profit of $42million for the year ended 31 December 2017, including animpairment reversal of $16.7 million in the second quarter of 2017.As noted above, BP has agreed to sell its ownership stake in theRhum joint arrangement and transfer its role as operator to SericaEnergy plc.
• In November 2017, BPEOC entered into an agreement with IOC forthe sale and purchase of an IOC entitlement to Forties blend crudeoil. The parties agreed to set off the purchase price – £29.89 million($40.2 million equivalent) – against IOC’s share of operating costsincurred or to be incurred by BPEOC as operator of the Rhum fieldunder the Rhum joint operating agreement. 604,976 net barrels ofForties blend crude oil was loaded at a North Sea terminal inJanuary 2018 and delivered to BP’s Rotterdam refinery. Upondelivery at BP’s Rotterdam refinery, the Forties blend crude oil wascomingled with other products for refining, and therefore BP isunable to ascertain an amount of gross revenue or gross profitattributable to it. BP does not expect to enter into any furthersimilar arrangements with IOC in relation to the Rhum field.
• A third-party UK entity’s purchase of IOC’s share of Rhum naturalgas was settled by an assignment of receivables on 13 October2017 pursuant to which BPEOC received £15 million ($19.3 millionequivalent) from the UK entity, which would otherwise have beenpayable to Naftiran Intertrade Company (NICO) Limited. The £15million ($19.3 million equivalent) has also been set off against IOC’sshare of operating costs incurred by BPEOC as operator of theRhum field under the Rhum joint operating agreement. BP doesnot expect to enter into any further arrangements with NICO inrelation to the Rhum field.
• In December 2016, BP Singapore Pte. Limited (BPS) purchased ashipment of South Pars condensate from the National Iranian OilCompany (NIOC), which was loaded in Iran on 23 December 2016and delivered to BP’s Rotterdam refinery on 15 January 2017. BPSmade a payment ($52 million equivalent) in consideration for thecondensate on 19 January 2017. Upon delivery, the condensate wascomingled with other products for refining, and therefore BP isunable to ascertain an amount of gross revenue or gross profitattributable to it. BP intends to continue to explore commercialopportunities with NIOC (or its subsidiaries).
• BP Iran Limited leases an office in Tehran. The office is used foradministrative activities. In 2017, rental tax payments associatedwith the Tehran office, with an aggregate US dollar equivalent valueof approximately $19,000, were paid from a BP trust account heldwith Tadvin Co. to Iranian public entities. No gross revenues or netprofits were attributable to these activities. BP intends to continueto maintain an office in Tehran.
• During 2017, certain BP employees visited Iran for the purpose ofmeetings with Iranian government officials and other Iraniannationals and attending conferences. Payments were made toIranian public entities for visas and taxes in relation to such visitswith an aggregate US dollar equivalent value of approximately$12,000. In addition, certain BP employees met with Iraniangovernment officials and other Iranian nationals outside of Iran. Nogross revenues or net profits were attributable to these activities,save where otherwise disclosed, and BP intends to continue visits
to Iran and other meetings in connection with various businessopportunities.
274 «See Glossary BP Annual Report and Form 20-F 2017
Material contractsOn 13 March 2014, BP, BP Exploration & Production Inc., and otherBP entities entered into an administrative agreement with the USEnvironmental Protection Agency, which resolved all issues related tothe suspension or debarment of BP entities arising from the 20 April2010 explosions and fire on the semi-submersible rig DeepwaterHorizon and resulting oil spill. The administrative agreement allows BPentities to enter into new contracts or leases with the USgovernment. Under the terms and conditions of this agreement,which will apply for five years, BP has agreed to a set of safety andoperations, ethics and compliance and corporate governancerequirements. The agreement is governed by federal law.
On 4 April 2016 the district court approved the Consent Decreeamong BP Exploration & Production Inc., BP Corporation NorthAmerica Inc., BP p.l.c., the United States and the states of Alabama,Florida, Louisiana, Mississippi and Texas (the Gulf states) which fullyand finally resolves any and all natural resource damages (NRD)claims of the United States, the Gulf states, and their respectivenatural resource trustees and all Clean Water Act (CWA) penaltyclaims, and certain other claims of the United States and the Gulfstates.
Concurrently, the definitive Settlement Agreement that BP enteredinto with the Gulf states (Settlement Agreement) with respect toState claims for economic, property and other losses becameeffective.
BP has filed the Consent Decree and the Settlement Agreement asexhibits to its Annual Report on Form 20-F 2017 filed with the SEC.For further details of the Consent Decree and the SettlementAgreement, see Legal proceedings in BP Annual Report and Form 20-F 2015.
Property, plant and equipmentBP has freehold and leasehold interests in real estate and othertangible assets in numerous countries, but no individual property issignificant to the group as a whole. For more on the significantsubsidiaries of the group at 31 December 2017 and the grouppercentage of ordinary share capital see Financial statements – Note35. For information on significant joint ventures« and associates« ofthe group see Financial statements – Notes 14 and 15.
Related-party transactionsTransactions between the group and its significant joint ventures andassociates are summarized in Financial statements – Note 14 andNote 15. In the ordinary course of its business, the group enters intotransactions with various organizations with which some of itsdirectors or executive officers are associated. Except as described inthis report, the group did not have any material transactions ortransactions of an unusual nature with, and did not make loans to,related parties in the period commencing 1 January 2017 to 14 March2018.
Corporate governance practicesIn the US, BP ADSs are listed on the New York Stock Exchange(NYSE). The significant differences between BP’s corporategovernance practices as a UK company and those required by NYSElisting standards for US companies are listed as follows:
IndependenceBP has adopted a robust set of board governance principles, whichreflect the UK Corporate Governance Code and its principles-basedapproach to corporate governance. As such, the way in which BPmakes determinations of directors’ independence differs from theNYSE rules.
BP’s board governance principles require that all non-executivedirectors be determined by the board to be ‘independent in characterand judgement and free from any business or other relationshipwhich could materially interfere with the exercise of their judgement’.The BP board has determined that, in its judgement, all of the non-executive directors are independent, with the exception of thechairman. In doing so, however, the board did not explicitly take intoconsideration the independence requirements outlined in the NYSE’slisting standards.
CommitteesBP has a number of board committees that are broadly comparable inpurpose and composition to those required by NYSE rules fordomestic US companies. For instance, BP has a chairman’s (ratherthan executive) committee, nomination (rather than nominating/corporate governance) committee and remuneration (rather thancompensation) committee. BP also has an audit committee, whichNYSE rules require for both US companies and foreign privateissuers. These committees are composed solely of non-executivedirectors whom the board has determined to be independent, in themanner described above.
The BP board governance principles prescribe the composition, maintasks and requirements of each of the committees (see the boardcommittee reports on pages 77-89). BP has not, therefore, adoptedseparate charters for each committee.
Under US securities law and the listing standards of the NYSE, BP isrequired to have an audit committee that satisfies the requirementsof Rule 10A-3 under the Exchange Act and Section 303A.06 of theNYSE Listed Company Manual. BP’s audit committee complies withthese requirements. The BP audit committee does not have directresponsibility for the appointment, reappointment or removal of theindependent auditors instead, it follows the UK Companies Act 2006by making recommendations to the board on these matters for it toput forward for shareholder approval at the AGM.
One of the NYSE’s additional requirements for the audit committeestates that at least one member of the audit committee is to have‘accounting or related financial management expertise’. The boarddetermined that Brendan Nelson possesses such expertise and alsopossesses the financial and audit committee experiences set forth inboth the UK Corporate Governance Code and SEC rules (see Auditcommittee report on page 77). Mr Nelson is the audit committeefinancial expert as defined in Item 16A of Form 20-F.
Shareholder approval of equity compensation plansThe NYSE rules for US companies require that shareholders must begiven the opportunity to vote on all equity-compensation plans andmaterial revisions to those plans. BP complies with UK requirementsthat are similar to the NYSE rules. The board, however, does notexplicitly take into consideration the NYSE’s detailed definition ofwhat are considered ‘material revisions’.
Code of ethicsThe NYSE rules require that US companies adopt and disclose a codeof business conduct and ethics for directors, officers and employees.BP has adopted a code of conduct, which applies to all employeesand members of the board, and has board governance principles thataddress the conduct of directors. In addition BP has adopted a codeof ethics for senior financial officers as required by the SEC. BPconsiders that these codes and policies address the mattersspecified in the NYSE rules for US companies.
BP Annual Report and Form 20-F 2017 «See Glossary 275
Code of ethicsThe company has adopted a code of ethics for its group chiefexecutive, chief financial officer, group controller, group head of auditand chief accounting officer as required by the provisions ofSection 406 of the Sarbanes-Oxley Act of 2002 and the rules issuedby the SEC. There have been no waivers from the code of ethicsrelating to any officers.
BP also has a code of conduct, which is applicable to all employees,officers and members of the board. This was updated (and published)in July 2014.
Controls and proceduresEvaluation of disclosure controls and proceduresThe company maintains ‘disclosure controls and procedures’, as suchterm is defined in Exchange Act Rule 13a-15(e), that are designed toensure that information required to be disclosed in reports thecompany files or submits under the Exchange Act is recorded,processed, summarized and reported within the time periodsspecified in the Securities and Exchange Commission rules andforms, and that such information is accumulated and communicatedto management, including the company’s group chief executive andchief financial officer, as appropriate, to allow timely decisionsregarding required disclosure.
In designing and evaluating our disclosure controls and procedures,our management, including the group chief executive and chieffinancial officer, recognize that any controls and procedures, nomatter how well designed and operated, can provide only reasonable,not absolute, assurance that the objectives of the disclosure controlsand procedures are met. Because of the inherent limitations in allcontrol systems, no evaluation of controls can provide absoluteassurance that all control issues and instances of fraud, if any, withinthe company have been detected. Further, in the design andevaluation of our disclosure controls and procedures our managementnecessarily was required to apply its judgement in evaluating thecost-benefit relationship of possible controls and procedures. Also,we have investments in certain unconsolidated entities. As we do notcontrol these entities, our disclosure controls and procedures withrespect to such entities are necessarily substantially more limitedthan those we maintain with respect to our consolidated subsidiaries.Because of the inherent limitations in a cost-effective control system,misstatements due to error or fraud may occur and not be detected.The company’s disclosure controls and procedures have beendesigned to meet, and management believes that they meet,reasonable assurance standards.
The company’s management, with the participation of the company’sgroup chief executive and chief financial officer, has evaluated theeffectiveness of the company’s disclosure controls and procedurespursuant to Exchange Act Rule 13a-15(b) as of the end of the periodcovered by this annual report. Based on that evaluation, the groupchief executive and chief financial officer have concluded that thecompany’s disclosure controls and procedures were effective at areasonable assurance level.
Management’s report on internal control overfinancial reportingManagement of BP is responsible for establishing and maintainingadequate internal control over financial reporting. BP’s internal controlover financial reporting is a process designed under the supervisionof the principal executive and financial officers to provide reasonableassurance regarding the reliability of financial reporting and thepreparation of BP’s financial statements for external reportingpurposes in accordance with IFRS.
As of the end of the 2017 fiscal year, management conducted anassessment of the effectiveness of internal control over financialreporting in accordance with the UK Financial Reporting Council’sGuidance on Risk Management, Internal Control and Related Financialand Business Reporting. Based on this assessment, managementhas determined that BP’s internal control over financial reporting as of31 December 2017 was effective.
The company’s internal control over financial reporting includespolicies and procedures that pertain to the maintenance of recordsthat, in reasonable detail, accurately and fairly reflect transactions anddispositions of assets; provide reasonable assurances thattransactions are recorded as necessary to permit preparation offinancial statements in accordance with IFRS and that receipts andexpenditures are being made only in accordance with authorizationsof management and the directors of BP; and provide reasonableassurance regarding prevention or timely detection of unauthorizedacquisition, use or disposition of BP’s assets that could have amaterial effect on our financial statements. BP’s internal control overfinancial reporting as of 31 December 2017 has been audited byErnst & Young, an independent registered public accounting firm, asstated in their report appearing on page 124 of BP Annual Report andForm 20-F 2017.
Changes in internal control over financial reportingThere were no changes in the group’s internal control over financialreporting that occurred during the period covered by the Form 20-Fthat have materially affected or are reasonably likely to materiallyaffect our internal controls over financial reporting.
276 «See Glossary BP Annual Report and Form 20-F 2017
Principal accountants’ fees andservicesThe audit committee has established policies and procedures for theengagement of the independent registered public accounting firm,Ernst & Young LLP, to render audit and certain assurance services. Thepolicies provide for pre-approval by the audit committee of specificallydefined audit, audit-related, non-audit and other services that are notprohibited by regulatory or other professional requirements. Ernst &Young are engaged for these services when its expertise andexperience of BP are important. Most of this work is of an auditnature. The policy has been updated such that non-audit tax servicesprovided by the audit firm from 2017 onwards are prohibited.
Under the policy, pre-approval is given for specific services within thefollowing categories: advice on accounting, auditing and financialreporting matters; internal accounting and risk management controlreviews (excluding any services relating to information systemsdesign and implementation); non-statutory audit; project assuranceand advice on business and accounting process improvement(excluding any services relating to information systems design andimplementation relating to BP’s financial statements or accountingrecords); due diligence in connection with acquisitions, disposals andjoint arrangements« (excluding valuation or involvement inprospective financial information); provision of, or access to, Ernst &Young publications, workshops, seminars and other training materials;provision of reports from data gathered on non-financial policies andinformation; provision of the independent third party audit inaccordance with US Generally Accepted Government AuditingStandards, over the company’s Conflict Minerals Report - where sucha report is required under the SEC rule ‘Conflict Minerals’, issued inaccordance with Section 1502 of the Dodd Frank Act; and assistancewith understanding non-financial regulatory requirements. BPoperates a two-tier system for audit and non-audit services. For auditrelated services, the audit committee has a pre-approved aggregatelevel, within which specific work may be approved by management.Non-audit services, are pre-approved for management to authorizeper individual engagement, but above a defined level must beapproved by the chairman of the audit committee or the fullcommittee. In response to the revised regulatory guidelines of the UKFinancial Reporting Council, the audit committee reviewed andupdated its policies with effect from 1 January 2017. The definedmaximum level for pre-approval has been reduced in line with FRCguidance on ‘non-trivial’ engagements. The audit committee hasdelegated to the chairman of the audit committee authority toapprove permitted services provided that the chairman reports anydecisions to the committee at its next scheduled meeting. Anyproposed service not included in the approved service list must beapproved in advance by the audit committee chairman and reportedto the committee, or approved by the full audit committee in advanceof commencement of the engagement.
The audit committee evaluates the performance of the auditors eachyear. The audit fees payable to Ernst & Young are reviewed by thecommittee in the context of other global companies for costeffectiveness. The committee keeps under review the scope andresults of audit work and the independence and objectivity of theauditors. External regulation and BP policy requires the auditors torotate their lead audit partner every five years. See Financialstatements – Note 34 and Audit committee report on page 82 fordetails of fees for services provided by auditors.
Directors’ report informationThis section of BP Annual Report and Form 20-F 2017 forms part of,and includes certain disclosures which are required by law to beincluded in, the Directors’ report.
Indemnity provisionsIn accordance with BP’s Articles of Association, on appointment eachdirector is granted an indemnity from the company in respect ofliabilities incurred as a result of their office, to the extent permitted bylaw. These indemnities were in force throughout the financial year andat the date of this report. In respect of those liabilities for whichdirectors may not be indemnified, the company maintained adirectors’ and officers’ liability insurance policy throughout 2017.During the year, a review of the terms and scope of the policy wasundertaken. The policy was renewed during 2017 and continued into2018. Although their defence costs may be met, neither thecompany’s indemnity nor insurance provides cover in the event thatthe director is proved to have acted fraudulently or dishonestly.Certain subsidiaries are trustees of the group’s pension schemes.Each director of these subsidiaries«is granted an indemnity from thecompany in respect of liabilities incurred as a result of such asubsidiary’s activities as a trustee of the pension scheme, to theextent permitted by law. These indemnities were in force throughoutthe financial year and at the date of this report.
Financial risk management objectives and policiesThe disclosures in relation to financial risk management objectivesand policies, including the policy for hedging, are included in How wemanage risk on page 55, Liquidity and capital resources on page 251and Financial statements – Notes 27 and 28.
Exposure to price risk, credit risk, liquidity risk andcash flow riskThe disclosures in relation to exposure to price risk, credit risk,liquidity risk and cash flow risk are included in Financial statements –Note 27.
Important events since the end of the financial yearDisclosures of the particulars of the important events affecting BPwhich have occurred since the end of the financial year are included inthe Strategic report as well as in other places in the Directors’ report.
Likely future developments in the businessAn indication of the likely future developments of the business isincluded in the Strategic report.
Research and developmentAn indication of the activities of the company in the field of researchand development is included in Innovation in BP on page 44.
BranchesAs a global group our interests and activities are held or operatedthrough subsidiaries, branches, joint arrangements« or associates«established in – and subject to the laws and regulations of – manydifferent jurisdictions.
EmployeesThe disclosures concerning policies in relation to the employment ofdisabled persons and employee involvement are included inSustainability – Our people on page 53.
Employee share schemesCertain shares held as a result of participation in some employeeshare plans carry voting rights. Voting rights in respect of such sharesare exercisable via a nominee. Dividend waivers are in place inrespect of unallocated shares held in employee share plan trusts.
Change of control provisionsOn 5 October 2015, the United States lodged with the district court inMDL 2179 a proposed Consent Decree between the United States,the Gulf states, BP Exploration & Production Inc., BP CorporationNorth America Inc. and BP p.l.c., to fully and finally resolve any and allnatural resource damages claims of the United States, the Gulf statesand their respective natural resource trustees and all Clean Water Actpenalty claims, and certain other claims of the United States and theGulf states. Concurrently, BP entered into a definitive SettlementAgreement with the five Gulf states (Settlement Agreement) withrespect to state claims for economic, property and other losses. On4 April 2016, the district court approved the Consent Decree, at whichtime the Consent Decree and Settlement Agreement becameeffective. The federal government and the Gulf states may jointlyelect to accelerate the payments under the Consent Decree in theevent of a change of control or insolvency of BP p.l.c., and the Gulfstates individually have similar acceleration rights under theSettlement Agreement. For further details of the Consent Decree andthe Settlement Agreement, see Legal proceedings in BP AnnualReport and Form 20-F 2015.
Greenhouse gas emissionsThe disclosures in relation to greenhouse gas emissions are includedin Sustainability – Climate change on page 50.
BP Annual Report and Form 20-F 2017 «See Glossary 277
Disclosures required under ListingRule 9.8.4RThe information required to be disclosed by Listing Rule 9.8.4R canbe located as set out below:Information required Page
(1) Amount of interest capitalized 150(2) – (11) Not applicable(12), (13) Dividend waivers 277(14) Not applicable
Cautionary statementIn order to utilize the ‘safe harbor’ provisions of the United StatesPrivate Securities Litigation Reform Act of 1995 (the ‘PSLRA’), BP isproviding the following cautionary statement. This document containscertain forecasts, projections and forward-looking statements - that is,statements related to future, not past, events and circumstances -with respect to the financial condition, results of operations andbusinesses of BP and certain of the plans and objectives of BP withrespect to these items. These statements may generally, but notalways, be identified by the use of words such as ‘will’, ‘expects’, ‘isexpected to’, ‘aims’, ‘should’, ‘may’, ‘objective’, ‘is likely to’, ‘intends’,‘believes’, ‘anticipates’, ‘plans’, ‘we see’ or similar expressions. Inparticular, among other statements, (i) certain statements in theChairman’s letter (pages 6-7), the Group chief executive’s letter(pages 8-9), the Strategic report (inside cover and pages 1- 58),Additional disclosures (pages 247-278) and Shareholder information(pages 279 - 288), including but not limited to statements under theheadings ‘The changing world of energy’, ‘How we run our business’,‘Our strategy’ and ‘Global energy markets’ and including, but notlimited to, statements regarding plans and prospects relating tofuture value creation, near and long-term growth, organic capitalexpenditure, balance sheet strength, maintaining a robust cashposition, operating cash flow and margins, capital discipline, growthin sustainable free cash flow and shareholder distributions and futuredividend and optional scrip dividend payments; expectationsregarding world energy demand, including the growth in relativedemand for renewables, oil and gas, and the proportional growth ofrenewables; plans and expectations regarding BP’s portfolio includingto grow oil and gas; plans to be the low-cost developer and producerin each basin; plans and expectations with regard to newtechnologies including their efficiency and impact on production;plans to close all physical datacentres over several years; expectationsregarding carbon regulations in 2020 and the share of BP’s directemissions subject to such regulations; plans and expectations toreduce emissions by 3.5 million tonnes by 2025; plans to build alubricants blend plant in China; plans to grow third-party technologylicensing income; plans and expectations with regard to the Butamaxjoint venture and partnership with Lightsource; plans andexpectations regarding annual charges in Other businesses andcorporate, proceeds from divestments and disposals; expectationsregarding the determination of business economic loss claims inrespect of the 2012 PSC settlement and expectations with respect tothe timing and amount of future payments relating to the Gulf ofMexico oil spill including 2012 PSC settlement payments; plans andexpectations regarding sales commitments of BP and its equity-accounted entities; expectations regarding underlying production andcapital investment; plans and expectations with respect to gearingincluding to target gearing within a 20-30% band; expectationsregarding oil prices; expectations regarding the return on averagecapital employed; plans with regard to BP’s exploration budget;expectations that managed base decline remains between 3-5%;plans and expectations regarding resiliency of downstreambusinesses; plans and expectations with respect to BP’s retailnetwork including to have 1,500 sites in Mexico by 2021;expectations regarding the effective tax rate in 2018; plans to produce900,000 boe/d from new projects by 2021 and expectations regardingoperating cash margins of this production; plans to start up sixprojects in 2018; plans and expectations regarding investment,development, and production levels and the timing thereof withrespect to projects and partnerships in Alaska, Angola, Argentina,Australia, Azerbaijan, Brazil, China, Egypt, Georgia, India, Indonesia,Mexico, Mauritania, Russia, Senegal, Turkey, Trinidad & Tobago, Oman,the UK North Sea, the Gulf of Mexico, and the continental UnitedStates; expectations regarding the Trans Anatolian Natural GasPipeline; plans and expectations regarding social investment; plansand expectations regarding relationships with governments,customers, partners, suppliers and communities; plans andexpectations regarding renewable energy, including plannedinvestments; plans and expectations regarding plant reliability andbase decline; plans and expectations regarding the Tangguh gasfacility, including the facility’s role in supporting Indonesia’s energydemands, production from train 3, and the target to source 38% ofservices and materials from local suppliers; expectations regardingdiscounts for North American heavy crude oil, refining margins and
refining turnarounds; plans to undertake joint exploration anddevelopment with Rosneft; expectations regarding payments undercontractual obligations; plans and expectations with regard to thestrategic aims of Air BP and the lubricants business; plans andexpectations regarding additions to BP’s fleet of oil tankers and LNGtankers; expectations regarding the actions of contractors andpartners and their terms of service; BP’s aim to maintain a diverseworkforce, create an inclusive environment and ensure equalopportunity; policies and goals related to risk management plans;plans regarding activities, dealings, transactions relating to Iran; plansand expectations regarding the timing and payment of proceeds fromthe sale of BP’s stake in Magnus, Sullom Voe Terminal and Bruceassets; plans and projections regarding oil and gas reserves, includingthe turnover time of proved undeveloped reserves to proveddeveloped reserves; expectations regarding the costs ofenvironmental restoration programmes; plans and expectationsregarding the renewal of leases; expectations regarding the futurevalue of assets; expectations regarding future regulations and policy,their impact on BP’s business and plans regarding compliance withsuch regulations; and expectations regarding legal and trialproceedings, court decisions, potential investigations and civil actionsby regulators, government entities and/or other entities or parties, andthe timing of such proceedings and BP’s intentions in respectthereof; and (ii) certain statements in Corporate governance (pages59-89) and the Directors’ remuneration report (pages 90-112) withregard to the anticipated future composition of the board of directorsand the effects thereof; the board’s goals and areas of focusstemming from the board’s annual evaluation; plans regarding theappointment of Deloitte as auditor from 2018; plans and expectationsregarding directors’ share ownership and remuneration; plansregarding the implementation of the remuneration policy in 2018; andgoals, activities and areas of focus of board committees, are allforward looking in nature. By their nature, forward-looking statementsinvolve risk and uncertainty because they relate to events and dependon circumstances that will or may occur in the future and are outsidethe control of BP. Actual results may differ materially from thoseexpressed in such statements, depending on a variety of factors,including: the specific factors identified in the discussionsaccompanying such forward-looking statements; the receipt ofrelevant third party and/or regulatory approvals; the timing and level ofmaintenance and/or turnaround activity; the timing and volume ofrefinery additions and outages; the timing of bringing new fieldsonstream; the timing, quantum and nature of certain divestments;future levels of industry product supply, demand and pricing, includingsupply growth in North America; OPEC quota restrictions; production-sharing agreements effects; operational and safety problems;potential lapses in product quality; economic and financial marketconditions generally or in various countries and regions; politicalstability and economic growth in relevant areas of the world; changesin laws and governmental regulations and policies, including relatedto climate change; changes in social attitudes and customerpreferences; regulatory or legal actions including the types ofenforcement action pursued and the nature of remedies sought orimposed; the actions of prosecutors, regulatory authorities andcourts; delays in the processes for resolving claims; amountsultimately determined to be payable and the timing of paymentsrelating to the Gulf of Mexico oil spill; exchange rate fluctuations;development and use of new technology; recruitment and retentionof a skilled workforce; the success or otherwise of partnering; theactions of competitors, trading partners, contractors, subcontractors,creditors, rating agencies and others; our access to future creditresources; business disruption and crisis management; the impact onour reputation of ethical misconduct and non-compliance withregulatory obligations; trading losses; major uninsured losses;decisions by Rosneft’s management and board of directors; theactions of contractors; natural disasters and adverse weatherconditions; changes in public expectations and other changes tobusiness conditions; wars and acts of terrorism; cyber attacks orsabotage; and other factors discussed elsewhere in this reportincluding under Risk factors (pages 57-58). In addition to factors setforth elsewhere in this report, those set out above are importantfactors, although not exhaustive, that may cause actual results anddevelopments to differ materially from those expressed or implied bythese forward-looking statements.
Statements regarding competitive positionStatements referring to BP’s competitive position are based on thecompany’s belief and, in some cases, rely on a range of sources,including investment analysts’ reports, independent market studiesand BP’s internal assessments of market share based on publiclyavailable information about the financial results and performance ofmarket participants.
278 «See Glossary BP Annual Report and Form 20-F 2017
BP Annual Report and Form 20-F 2017 279
280 Share pricings and listings
280 Dividends
281 Shareholder taxation information
283 Major shareholders
284 Annual general meeting
284 Memoradum and Articles of Association
286 Purchases of equity securities by the issuer and affiliated purchasers
287 Fees and charges payable by ADS holders
287 Fees and payments made by the Depositary to the issuer
287 Documents on display
288 Shareholding administration
288 Exhibits
BP Annual Report and Form 20-F 2017 279
Shareholder information
Shareholder information
26_BP_AR_Financial_statements_contents_p115.indd 279 27/03/2018 10:39
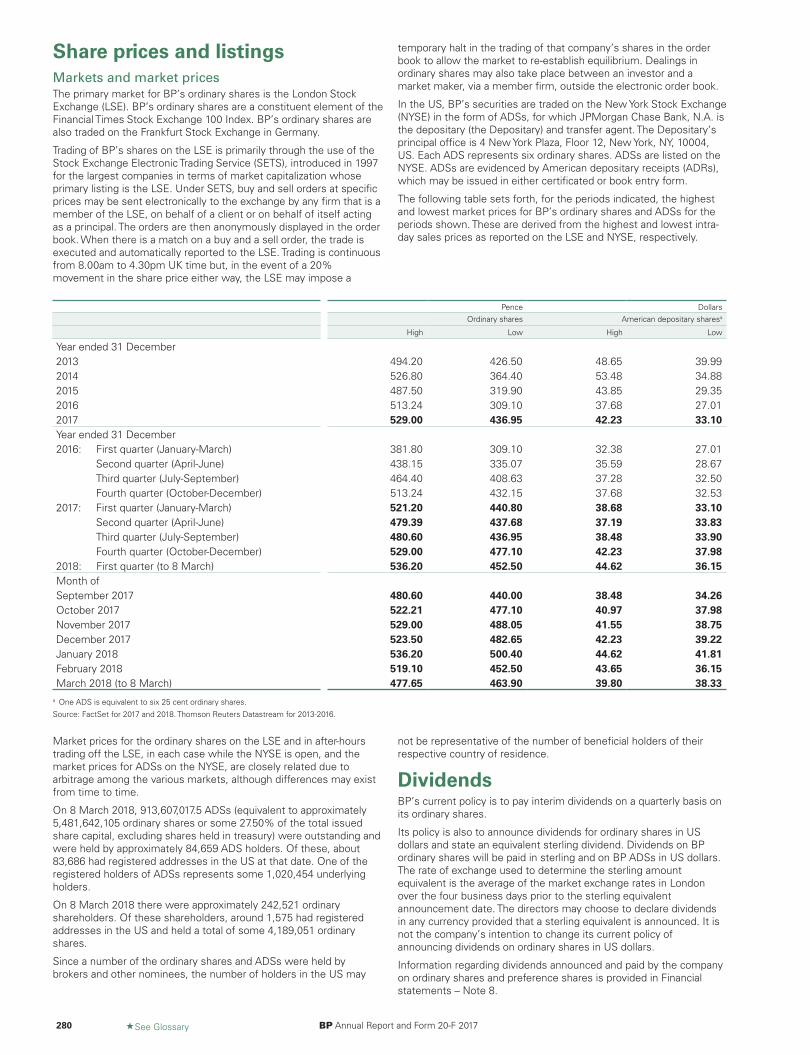
Share prices and listingsMarkets and market pricesThe primary market for BP’s ordinary shares is the London StockExchange (LSE). BP’s ordinary shares are a constituent element of theFinancial Times Stock Exchange 100 Index. BP’s ordinary shares arealso traded on the Frankfurt Stock Exchange in Germany.
Trading of BP’s shares on the LSE is primarily through the use of theStock Exchange Electronic Trading Service (SETS), introduced in 1997for the largest companies in terms of market capitalization whoseprimary listing is the LSE. Under SETS, buy and sell orders at specificprices may be sent electronically to the exchange by any firm that is amember of the LSE, on behalf of a client or on behalf of itself actingas a principal. The orders are then anonymously displayed in the orderbook. When there is a match on a buy and a sell order, the trade isexecuted and automatically reported to the LSE. Trading is continuousfrom 8.00am to 4.30pm UK time but, in the event of a 20%movement in the share price either way, the LSE may impose a
temporary halt in the trading of that company’s shares in the orderbook to allow the market to re-establish equilibrium. Dealings inordinary shares may also take place between an investor and amarket maker, via a member firm, outside the electronic order book.
In the US, BP’s securities are traded on the New York Stock Exchange(NYSE) in the form of ADSs, for which JPMorgan Chase Bank, N.A. isthe depositary (the Depositary) and transfer agent. The Depositary’sprincipal office is 4 New York Plaza, Floor 12, New York, NY, 10004,US. Each ADS represents six ordinary shares. ADSs are listed on theNYSE. ADSs are evidenced by American depositary receipts (ADRs),which may be issued in either certificated or book entry form.
The following table sets forth, for the periods indicated, the highestand lowest market prices for BP’s ordinary shares and ADSs for theperiods shown. These are derived from the highest and lowest intra-day sales prices as reported on the LSE and NYSE, respectively.
Pence DollarsOrdinary shares American depositary sharesa
High Low High Low
Year ended 31 December2013 494.20 426.50 48.65 39.992014 526.80 364.40 53.48 34.882015 487.50 319.90 43.85 29.352016 513.24 309.10 37.68 27.012017 529.00 436.95 42.23 33.10Year ended 31 December2016: First quarter (January-March) 381.80 309.10 32.38 27.01
Second quarter (April-June) 438.15 335.07 35.59 28.67Third quarter (July-September) 464.40 408.63 37.28 32.50Fourth quarter (October-December) 513.24 432.15 37.68 32.53
2017: First quarter (January-March) 521.20 440.80 38.68 33.10Second quarter (April-June) 479.39 437.68 37.19 33.83Third quarter (July-September) 480.60 436.95 38.48 33.90Fourth quarter (October-December) 529.00 477.10 42.23 37.98
2018: First quarter (to 8 March) 536.20 452.50 44.62 36.15Month ofSeptember 2017 480.60 440.00 38.48 34.26October 2017 522.21 477.10 40.97 37.98November 2017 529.00 488.05 41.55 38.75December 2017 523.50 482.65 42.23 39.22January 2018 536.20 500.40 44.62 41.81February 2018 519.10 452.50 43.65 36.15March 2018 (to 8 March) 477.65 463.90 39.80 38.33
a One ADS is equivalent to six 25 cent ordinary shares.
Source: FactSet for 2017 and 2018. Thomson Reuters Datastream for 2013-2016.
Market prices for the ordinary shares on the LSE and in after-hourstrading off the LSE, in each case while the NYSE is open, and themarket prices for ADSs on the NYSE, are closely related due toarbitrage among the various markets, although differences may existfrom time to time.
On 8 March 2018, 913,607,017.5 ADSs (equivalent to approximately5,481,642,105 ordinary shares or some 27.50% of the total issuedshare capital, excluding shares held in treasury) were outstanding andwere held by approximately 84,659 ADS holders. Of these, about83,686 had registered addresses in the US at that date. One of theregistered holders of ADSs represents some 1,020,454 underlyingholders.
On 8 March 2018 there were approximately 242,521 ordinaryshareholders. Of these shareholders, around 1,575 had registeredaddresses in the US and held a total of some 4,189,051 ordinaryshares.
Since a number of the ordinary shares and ADSs were held bybrokers and other nominees, the number of holders in the US may
not be representative of the number of beneficial holders of theirrespective country of residence.
280 «See Glossary BP Annual Report and Form 20-F 2017
DividendsBP’s current policy is to pay interim dividends on a quarterly basis onits ordinary shares.
Its policy is also to announce dividends for ordinary shares in USdollars and state an equivalent sterling dividend. Dividends on BPordinary shares will be paid in sterling and on BP ADSs in US dollars.The rate of exchange used to determine the sterling amountequivalent is the average of the market exchange rates in Londonover the four business days prior to the sterling equivalentannouncement date. The directors may choose to declare dividendsin any currency provided that a sterling equivalent is announced. It isnot the company’s intention to change its current policy ofannouncing dividends on ordinary shares in US dollars.
Information regarding dividends announced and paid by the companyon ordinary shares and preference shares is provided in Financialstatements – Note 8.
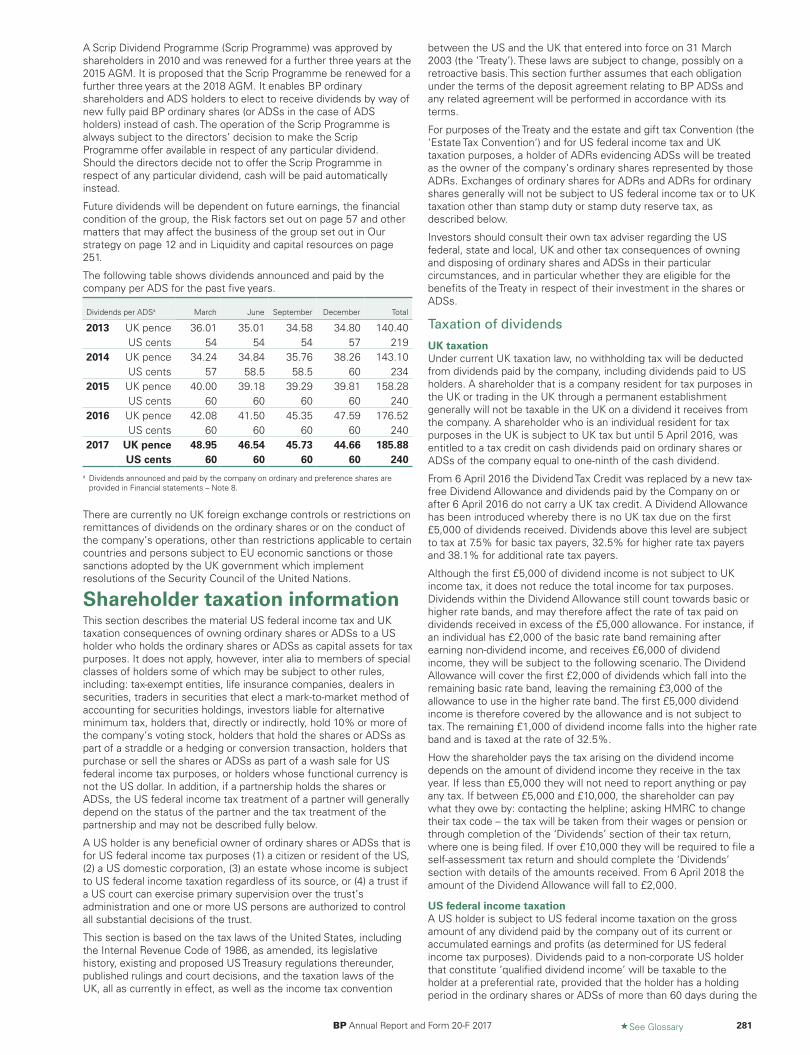
A Scrip Dividend Programme (Scrip Programme) was approved byshareholders in 2010 and was renewed for a further three years at the2015 AGM. It is proposed that the Scrip Programme be renewed for afurther three years at the 2018 AGM. It enables BP ordinaryshareholders and ADS holders to elect to receive dividends by way ofnew fully paid BP ordinary shares (or ADSs in the case of ADSholders) instead of cash. The operation of the Scrip Programme isalways subject to the directors’ decision to make the ScripProgramme offer available in respect of any particular dividend.Should the directors decide not to offer the Scrip Programme inrespect of any particular dividend, cash will be paid automaticallyinstead.
Future dividends will be dependent on future earnings, the financialcondition of the group, the Risk factors set out on page 57 and othermatters that may affect the business of the group set out in Ourstrategy on page 12 and in Liquidity and capital resources on page251.
The following table shows dividends announced and paid by thecompany per ADS for the past five years.
Dividends per ADSa March June September December Total
2013 UK pence 36.01 35.01 34.58 34.80 140.40US cents 54 54 54 57 219
2014 UK pence 34.24 34.84 35.76 38.26 143.10US cents 57 58.5 58.5 60 234
2015 UK pence 40.00 39.18 39.29 39.81 158.28US cents 60 60 60 60 240
2016 UK pence 42.08 41.50 45.35 47.59 176.52US cents 60 60 60 60 240
2017 UK pence 48.95 46.54 45.73 44.66 185.88US cents 60 60 60 60 240
a Dividends announced and paid by the company on ordinary and preference shares areprovided in Financial statements – Note 8.
There are currently no UK foreign exchange controls or restrictions onremittances of dividends on the ordinary shares or on the conduct ofthe company’s operations, other than restrictions applicable to certaincountries and persons subject to EU economic sanctions or thosesanctions adopted by the UK government which implementresolutions of the Security Council of the United Nations.
BP Annual Report and Form 20-F 2017 «See Glossary 281
Shareholder taxation informationThis section describes the material US federal income tax and UKtaxation consequences of owning ordinary shares or ADSs to a USholder who holds the ordinary shares or ADSs as capital assets for taxpurposes. It does not apply, however, inter alia to members of specialclasses of holders some of which may be subject to other rules,including: tax-exempt entities, life insurance companies, dealers insecurities, traders in securities that elect a mark-to-market method ofaccounting for securities holdings, investors liable for alternativeminimum tax, holders that, directly or indirectly, hold 10% or more ofthe company’s voting stock, holders that hold the shares or ADSs aspart of a straddle or a hedging or conversion transaction, holders thatpurchase or sell the shares or ADSs as part of a wash sale for USfederal income tax purposes, or holders whose functional currency isnot the US dollar. In addition, if a partnership holds the shares orADSs, the US federal income tax treatment of a partner will generallydepend on the status of the partner and the tax treatment of thepartnership and may not be described fully below.
A US holder is any beneficial owner of ordinary shares or ADSs that isfor US federal income tax purposes (1) a citizen or resident of the US,(2) a US domestic corporation, (3) an estate whose income is subjectto US federal income taxation regardless of its source, or (4) a trust ifa US court can exercise primary supervision over the trust’sadministration and one or more US persons are authorized to controlall substantial decisions of the trust.
This section is based on the tax laws of the United States, includingthe Internal Revenue Code of 1986, as amended, its legislativehistory, existing and proposed US Treasury regulations thereunder,published rulings and court decisions, and the taxation laws of theUK, all as currently in effect, as well as the income tax convention
between the US and the UK that entered into force on 31 March2003 (the ‘Treaty’). These laws are subject to change, possibly on aretroactive basis. This section further assumes that each obligationunder the terms of the deposit agreement relating to BP ADSs andany related agreement will be performed in accordance with itsterms.
For purposes of the Treaty and the estate and gift tax Convention (the‘Estate Tax Convention’) and for US federal income tax and UKtaxation purposes, a holder of ADRs evidencing ADSs will be treatedas the owner of the company’s ordinary shares represented by thoseADRs. Exchanges of ordinary shares for ADRs and ADRs for ordinaryshares generally will not be subject to US federal income tax or to UKtaxation other than stamp duty or stamp duty reserve tax, asdescribed below.
Investors should consult their own tax adviser regarding the USfederal, state and local, UK and other tax consequences of owningand disposing of ordinary shares and ADSs in their particularcircumstances, and in particular whether they are eligible for thebenefits of the Treaty in respect of their investment in the shares orADSs.
Taxation of dividends
UK taxationUnder current UK taxation law, no withholding tax will be deductedfrom dividends paid by the company, including dividends paid to USholders. A shareholder that is a company resident for tax purposes inthe UK or trading in the UK through a permanent establishmentgenerally will not be taxable in the UK on a dividend it receives fromthe company. A shareholder who is an individual resident for taxpurposes in the UK is subject to UK tax but until 5 April 2016, wasentitled to a tax credit on cash dividends paid on ordinary shares orADSs of the company equal to one-ninth of the cash dividend.
From 6 April 2016 the Dividend Tax Credit was replaced by a new tax-free Dividend Allowance and dividends paid by the Company on orafter 6 April 2016 do not carry a UK tax credit. A Dividend Allowancehas been introduced whereby there is no UK tax due on the first£5,000 of dividends received. Dividends above this level are subjectto tax at 7.5% for basic tax payers, 32.5% for higher rate tax payersand 38.1% for additional rate tax payers.
Although the first £5,000 of dividend income is not subject to UKincome tax, it does not reduce the total income for tax purposes.Dividends within the Dividend Allowance still count towards basic orhigher rate bands, and may therefore affect the rate of tax paid ondividends received in excess of the £5,000 allowance. For instance, ifan individual has £2,000 of the basic rate band remaining afterearning non-dividend income, and receives £6,000 of dividendincome, they will be subject to the following scenario. The DividendAllowance will cover the first £2,000 of dividends which fall into theremaining basic rate band, leaving the remaining £3,000 of theallowance to use in the higher rate band. The first £5,000 dividendincome is therefore covered by the allowance and is not subject totax. The remaining £1,000 of dividend income falls into the higher rateband and is taxed at the rate of 32.5%.
How the shareholder pays the tax arising on the dividend incomedepends on the amount of dividend income they receive in the taxyear. If less than £5,000 they will not need to report anything or payany tax. If between £5,000 and £10,000, the shareholder can paywhat they owe by: contacting the helpline; asking HMRC to changetheir tax code – the tax will be taken from their wages or pension orthrough completion of the ‘Dividends’ section of their tax return,where one is being filed. If over £10,000 they will be required to file aself-assessment tax return and should complete the ‘Dividends’section with details of the amounts received. From 6 April 2018 theamount of the Dividend Allowance will fall to £2,000.
US federal income taxationA US holder is subject to US federal income taxation on the grossamount of any dividend paid by the company out of its current oraccumulated earnings and profits (as determined for US federalincome tax purposes). Dividends paid to a non-corporate US holderthat constitute ‘qualified dividend income’ will be taxable to theholder at a preferential rate, provided that the holder has a holdingperiod in the ordinary shares or ADSs of more than 60 days during the
121-day period beginning 60 days before the ex-dividend date andmeets other holding period requirements. Dividends paid by thecompany with respect to the ordinary shares or ADSs will generallybe qualified dividend income.
For US federal income tax purposes, a dividend must be included inincome when the US holder, in the case of ordinary shares, or theDepositary, in the case of ADSs, actually or constructively receivesthe dividend and will not be eligible for the dividends-receiveddeduction generally allowed to US corporations in respect ofdividends received from other US corporations. US ADS holdersshould consult their own tax adviser regarding the US tax treatmentof the dividend fee in respect of dividends. Dividends will be incomefrom sources outside the US and generally will be ‘passive categoryincome’ or, in the case of certain US holders, ‘general categoryincome’, each of which is treated separately for purposes ofcomputing a US holder’s foreign tax credit limitation.
As noted above in UK taxation, a US holder will not be subject to UKwithholding tax. Accordingly, the receipt of a dividend will not entitlethe US holder to a foreign tax credit.
The amount of the dividend distribution on the ordinary shares that ispaid in pounds sterling will be the US dollar value of the poundssterling payments made, determined at the spot pounds sterling/USdollar rate on the date the dividend distribution is includible in income,regardless of whether the payment is, in fact, converted into USdollars. Generally, any gain or loss resulting from currency exchangefluctuations during the period from the date the pounds sterlingdividend payment is includible in income to the date the payment isconverted into US dollars will be treated as ordinary income or lossand will not be eligible for the preferential tax rate on qualifieddividend income. The gain or loss generally will be income or lossfrom sources within the US for foreign tax credit limitation purposes.
Distributions in excess of the company’s earnings and profits, asdetermined for US federal income tax purposes, will be treated as areturn of capital to the extent of the US holder’s basis in the ordinaryshares or ADSs and thereafter as capital gain, subject to taxation asdescribed in Taxation of capital gains – US federal income taxationsection below.
In addition, the taxation of dividends may be subject to the rules forpassive foreign investment companies (PFIC), described below under‘Taxation of capital gains – US federal income taxation’. Distributionsmade by a PFIC do not constitute qualified dividend income and arenot eligible for the preferential tax rate applicable to such income.
Taxation of capital gains
UK taxationA US holder may be liable for both UK and US tax in respect of a gainon the disposal of ordinary shares or ADSs if the US holder is(1) resident for tax purposes in the United Kingdom at the date ofdisposal, (2) if he or she has left the UK for a period not exceedingfive complete tax years between the year of departure from and theyear of return to the UK and acquired the shares before leaving theUK and was resident in the UK in the previous four out of seven taxyears before the year of departure, (3) a US domestic corporationresident in the UK by reason of its business being managed orcontrolled in the UK or (4) a citizen of the US that carries on a trade orprofession or vocation in the UK through a branch or agency or acorporation that carries on a trade, profession or vocation in the UK,through a permanent establishment, and that has used, held, oracquired the ordinary shares or ADSs for the purposes of such trade,profession or vocation of such branch, agency or permanentestablishment. However, such persons may be entitled to a tax creditagainst their US federal income tax liability for the amount of UKcapital gains tax or UK corporation tax on chargeable gains (as thecase may be) that is paid in respect of such gain.
Under the Treaty, capital gains on dispositions of ordinary shares orADSs generally will be subject to tax only in the jurisdiction ofresidence of the relevant holder as determined under both the lawsof the UK and the US and as required by the terms of the Treaty.
Under the Treaty, individuals who are residents of either the UK or theUS and who have been residents of the other jurisdiction (the US orthe UK, as the case may be) at any time during the six years
immediately preceding the relevant disposal of ordinary shares orADSs may be subject to tax with respect to capital gains arising froma disposition of ordinary shares or ADSs of the company not only inthe jurisdiction of which the holder is resident at the time of thedisposition but also in the other jurisdiction.
US federal income taxationA US holder who sells or otherwise disposes of ordinary shares orADSs will recognize a capital gain or loss for US federal income taxpurposes equal to the difference between the US dollar value of theamount realized on the disposition and the US holder’s tax basis,determined in US dollars, in the ordinary shares or ADSs. Any suchcapital gain or loss generally will be long-term gain or loss, subject totax at a preferential rate for a non-corporate US holder, if the USholder’s holding period for such ordinary shares or ADSs exceeds oneyear.Gain or loss from the sale or other disposition of ordinary shares orADSs will generally be income or loss from sources within the US forforeign tax credit limitation purposes. The deductibility of capitallosses is subject to limitations.
We do not believe that ordinary shares or ADSs will be treated asstock of a passive foreign investment company, or PFIC, for USfederal income tax purposes, but this conclusion is a factualdetermination that is made annually and thus is subject to change. Ifwe are treated as a PFIC, unless a US holder elects to be taxedannually on a mark-to-market basis with respect to ordinary shares orADSs, any gain realized on the sale or other disposition of ordinaryshares or ADSs would in general not be treated as capital gain.Instead, a US holder would be treated as if he or she had realizedsuch gain rateably over the holding period for ordinary shares or ADSsand would be taxed at the highest tax rate in effect for each such yearto which the gain was allocated, in addition to which an interestcharge in respect of the tax attributable to each such year wouldapply. Certain ‘excess distributions’ would be similarly treated if wewere treated as a PFIC.
Additional tax considerations
Scrip ProgrammeThe company has an optional Scrip Programme, wherein holders ofBP ordinary shares or ADSs may elect to receive any dividends in theform of new fully paid ordinary shares or ADSs of the companyinstead of cash. Please consult your tax adviser for the consequencesto you.
UK inheritance taxThe Estate Tax Convention applies to inheritance tax. ADSs held by anindividual who is domiciled for the purposes of the Estate TaxConvention in the US and is not for the purposes of the Estate TaxConvention a national of the UK will not be subject to UK inheritancetax on the individual’s death or on transfer during the individual’slifetime unless, among other things, the ADSs are part of thebusiness property of a permanent establishment situated in the UKused for the performance of independent personal services. In theexceptional case where ADSs are subject to both inheritance tax andUS federal gift or estate tax, the Estate Tax Convention generallyprovides for tax payable in the US to be credited against tax payablein the UK or for tax paid in the UK to be credited against tax payablein the US, based on priority rules set forth in the Estate TaxConvention.
UK stamp duty and stamp duty reserve taxThe statements below relate to what is understood to be the currentpractice of HM Revenue & Customs in the UK under existing law.
Provided that any instrument of transfer is not executed in the UK andremains at all times outside the UK and the transfer does not relate toany matter or thing done or to be done in the UK, no UK stamp dutyis payable on the acquisition or transfer of ADSs. Neither will anagreement to transfer ADSs in the form of ADRs give rise to a liabilityto stamp duty reserve tax.
Purchases of ordinary shares, as opposed to ADSs, through theCREST system of paperless share transfers will be subject to stampduty reserve tax at 0.5%. The charge will arise as soon as there is anagreement for the transfer of the shares (or, in the case of aconditional agreement, when the condition is fulfilled). The stamp
282 «See Glossary BP Annual Report and Form 20-F 2017
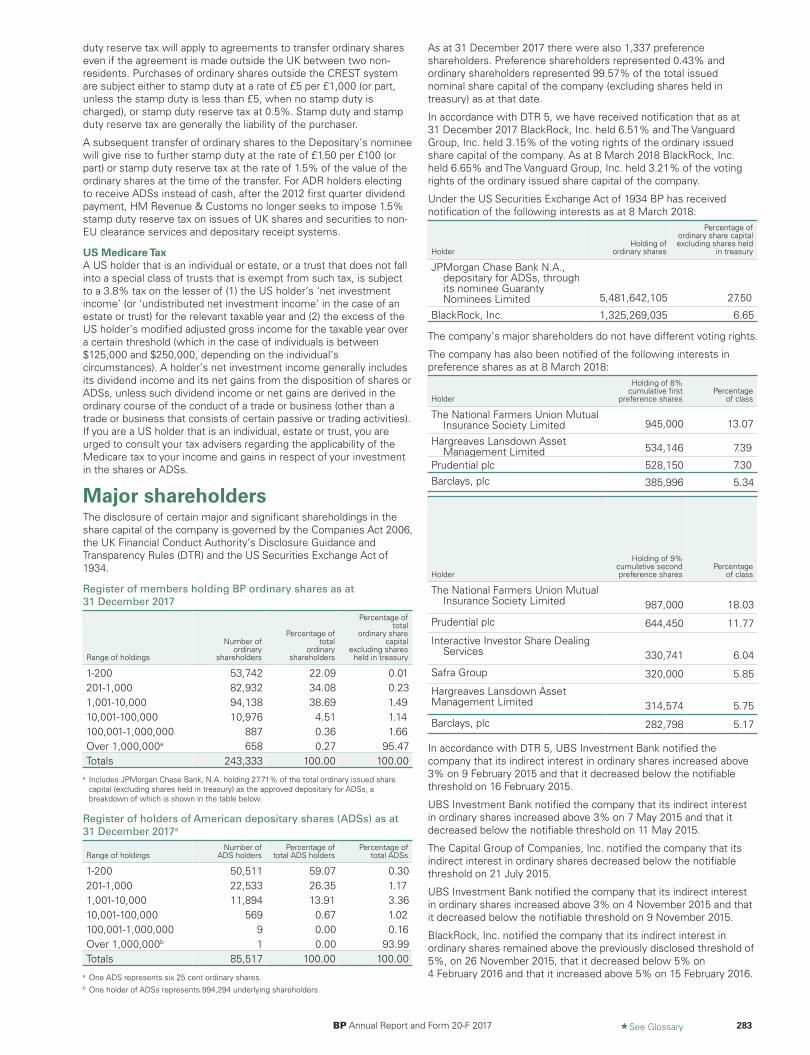
duty reserve tax will apply to agreements to transfer ordinary shareseven if the agreement is made outside the UK between two non-residents. Purchases of ordinary shares outside the CREST systemare subject either to stamp duty at a rate of £5 per £1,000 (or part,unless the stamp duty is less than £5, when no stamp duty ischarged), or stamp duty reserve tax at 0.5%. Stamp duty and stampduty reserve tax are generally the liability of the purchaser.
A subsequent transfer of ordinary shares to the Depositary’s nomineewill give rise to further stamp duty at the rate of £1.50 per £100 (orpart) or stamp duty reserve tax at the rate of 1.5% of the value of theordinary shares at the time of the transfer. For ADR holders electingto receive ADSs instead of cash, after the 2012 first quarter dividendpayment, HM Revenue & Customs no longer seeks to impose 1.5%stamp duty reserve tax on issues of UK shares and securities to non-EU clearance services and depositary receipt systems.
US Medicare TaxA US holder that is an individual or estate, or a trust that does not fallinto a special class of trusts that is exempt from such tax, is subjectto a 3.8% tax on the lesser of (1) the US holder’s ‘net investmentincome’ (or ‘undistributed net investment income’ in the case of anestate or trust) for the relevant taxable year and (2) the excess of theUS holder’s modified adjusted gross income for the taxable year overa certain threshold (which in the case of individuals is between$125,000 and $250,000, depending on the individual’scircumstances). A holder’s net investment income generally includesits dividend income and its net gains from the disposition of shares orADSs, unless such dividend income or net gains are derived in theordinary course of the conduct of a trade or business (other than atrade or business that consists of certain passive or trading activities).If you are a US holder that is an individual, estate or trust, you areurged to consult your tax advisers regarding the applicability of theMedicare tax to your income and gains in respect of your investmentin the shares or ADSs.
BP Annual Report and Form 20-F 2017 «See Glossary 283
Major shareholdersThe disclosure of certain major and significant shareholdings in theshare capital of the company is governed by the Companies Act 2006,the UK Financial Conduct Authority’s Disclosure Guidance andTransparency Rules (DTR) and the US Securities Exchange Act of1934.
Register of members holding BP ordinary shares as at31 December 2017
Range of holdings
Number ofordinary
shareholders
Percentage oftotal
ordinaryshareholders
Percentage oftotal
ordinary sharecapital
excluding sharesheld in treasury
1-200 53,742 22.09 0.01201-1,000 82,932 34.08 0.231,001-10,000 94,138 38.69 1.4910,001-100,000 10,976 4.51 1.14100,001-1,000,000 887 0.36 1.66Over 1,000,000a 658 0.27 95.47Totals 243,333 100.00 100.00
a Includes JPMorgan Chase Bank, N.A. holding 27.71% of the total ordinary issued sharecapital (excluding shares held in treasury) as the approved depositary for ADSs, abreakdown of which is shown in the table below.
Register of holders of American depositary shares (ADSs) as at31 December 2017a
Range of holdingsNumber of
ADS holdersPercentage of
total ADS holdersPercentage of
total ADSs
1-200 50,511 59.07 0.30201-1,000 22,533 26.35 1.171,001-10,000 11,894 13.91 3.3610,001-100,000 569 0.67 1.02100,001-1,000,000 9 0.00 0.16Over 1,000,000b 1 0.00 93.99Totals 85,517 100.00 100.00
a One ADS represents six 25 cent ordinary shares.b One holder of ADSs represents 994,294 underlying shareholders.
As at 31 December 2017 there were also 1,337 preferenceshareholders. Preference shareholders represented 0.43% andordinary shareholders represented 99.57% of the total issuednominal share capital of the company (excluding shares held intreasury) as at that date.
In accordance with DTR 5, we have received notification that as at31 December 2017 BlackRock, Inc. held 6.51% and The VanguardGroup, Inc. held 3.15% of the voting rights of the ordinary issuedshare capital of the company. As at 8 March 2018 BlackRock, Inc.held 6.65% and The Vanguard Group, Inc. held 3.21% of the votingrights of the ordinary issued share capital of the company.
Under the US Securities Exchange Act of 1934 BP has receivednotification of the following interests as at 8 March 2018:
HolderHolding of
ordinary shares
Percentage ofordinary share capitalexcluding shares held
in treasury
JPMorgan Chase Bank N.A.,depositary for ADSs, throughits nominee GuarantyNominees Limited 5,481,642,105 27.50
BlackRock, Inc. 1,325,269,035 6.65
The company’s major shareholders do not have different voting rights.
The company has also been notified of the following interests inpreference shares as at 8 March 2018:
Holder
Holding of 8%cumulative first
preference sharesPercentage
of class
The National Farmers Union MutualInsurance Society Limited 945,000 13.07
Hargreaves Lansdown AssetManagement Limited 534,146 7.39
Prudential plc 528,150 7.30Barclays, plc 385,996 5.34
Holder
Holding of 9%cumulative secondpreference shares
Percentageof class
The National Farmers Union MutualInsurance Society Limited 987,000 18.03
Prudential plc 644,450 11.77
Interactive Investor Share DealingServices 330,741 6.04
Safra Group 320,000 5.85
Hargreaves Lansdown AssetManagement Limited 314,574 5.75
Barclays, plc 282,798 5.17
In accordance with DTR 5, UBS Investment Bank notified thecompany that its indirect interest in ordinary shares increased above3% on 9 February 2015 and that it decreased below the notifiablethreshold on 16 February 2015.
UBS Investment Bank notified the company that its indirect interestin ordinary shares increased above 3% on 7 May 2015 and that itdecreased below the notifiable threshold on 11 May 2015.
The Capital Group of Companies, Inc. notified the company that itsindirect interest in ordinary shares decreased below the notifiablethreshold on 21 July 2015.
UBS Investment Bank notified the company that its indirect interestin ordinary shares increased above 3% on 4 November 2015 and thatit decreased below the notifiable threshold on 9 November 2015.
BlackRock, Inc. notified the company that its indirect interest inordinary shares remained above the previously disclosed threshold of5%, on 26 November 2015, that it decreased below 5% on4 February 2016 and that it increased above 5% on 15 February 2016.
During 2016, BlackRock, Inc. notified the company that its indirectinterest in ordinary shares moved as follows: decreased below thepreviously disclosed threshold of 5% on 28 April 2016; increasedabove 5% on 9 May 2016; decreased below 5% on 29 July 2016;increased above 5% on 8 August 2016; decreased below 5% on4 November 2016 and increased above 5% on 14 November 2016.
During 2017, BlackRock Inc. notified the company that its indirectinterest in ordinary shares moved as follows: decreased below 5% on9 February 2017; increased above 5% on 22 February 2017;decreased below 5% on 8 May 2017; increased above 5% on 15 May2017; increased above 5% on 14 August 2017; decreased below 5%on 3 November 2017 and increased above 5% on 13 November 2017.
During 2018, BlackRock, Inc. notified the company that its indirectinterest in ordinary shares decreased below 5% on 12 February 2018.
As at 8 March 2018, the total preference shares in issue comprisedonly 0.42% of the company’s total issued nominal share capital(excluding shares held in treasury), the rest being ordinary shares.
284 «See Glossary BP Annual Report and Form 20-F 2017
Annual general meetingThe 2018 AGM will be held on Monday 21 May 2018 at 11.30am. Aseparate notice convening the meeting is distributed to shareholders,which includes an explanation of the items of business to beconsidered at the meeting.
The board appointed Deloitte LLP as the company's new auditor witheffect from 29 March 2018 to fill the vacancy arising from Ernst &Young LLP's resignation following completion of their audit of BP’s2017 financial statements. At the 2018 AGM, the board will seekshareholder approval for the appointment of Deloitte LLP as thecompany's auditor until the conclusion of the next AGM at which thecompany's accounts are laid before shareholders.
Memorandum and Articles ofAssociationThe following summarizes certain provisions of the company’sMemorandum and Articles of Association and applicable English law.This summary is qualified in its entirety by reference to the UKCompanies Act 2006 (the Act) and the company’s Memorandum andArticles of Association. For information on where investors can obtaincopies of the Memorandum and Articles of Association seeDocuments on display on page 287.
The company’s Articles of Association may be amended by a specialresolution at a general meeting of the shareholders. At the annualgeneral meeting (AGM) held on 17 April 2008 shareholders voted toadopt new Articles of Association, largely to take account of changesin UK company law brought about by the Act. Further amendments tothe Articles of Association were approved by shareholders at theAGM held on 15 April 2010. At the AGM held on 16 April 2015shareholders voted to adopt new Articles of Association to reflectdevelopments in practice and to provide clarification and additionalflexibility. New Articles of Association are being proposed at the AGMin 2018.
Objects and purposesBP is a public company limited by shares, incorporated under thename BP p.l.c. and is registered in England and Wales with theregistered number 102498. The provisions regulating the operationsof the company, known as its ‘objects’, were historically stated in acompany’s memorandum. The Act abolished the need to have objectprovisions and so at the AGM held on 15 April 2010 shareholdersapproved the removal of its objects clause together with all otherprovisions of its Memorandum that, by virtue of the Act, are treatedas forming part of the company’s Articles of Association.
DirectorsThe business and affairs of BP shall be managed by the directors. Thecompany’s Articles of Association provide that directors may beappointed by the existing directors or by the shareholders in a generalmeeting. Any person appointed by the directors will hold office onlyuntil the next general meeting, notice of which is first given after theirappointment and will then be eligible for re-election by the
shareholders. A director may be removed by BP as provided for byapplicable law and shall vacate office in certain circumstances as setout in the Articles of Association. In addition, the company may byspecial resolution remove a director before the expiration of his/herperiod of office and, subject to the Articles of Association, may byordinary resolution appoint another person to be a director instead.There is no requirement for a director to retire on reaching any age.
The Articles of Association place a general prohibition on a directorvoting in respect of any contract or arrangement in which the directorhas a material interest other than by virtue of such director’s interestin shares in the company. However, in the absence of some othermaterial interest not indicated below, a director is entitled to vote andto be counted in a quorum for the purpose of any vote relating to aresolution concerning the following matters:
• The giving of security or indemnity with respect to any money lentor obligation taken by the director at the request or benefit of thecompany or any of its subsidiaries.
• Any proposal in which the director is interested, concerning theunderwriting of company securities or debentures or the giving ofany security to a third party for a debt or obligation of the companyor any of its subsidiaries.
• Any proposal concerning any other company in which the directoris interested, directly or indirectly (whether as an officer orshareholder or otherwise) provided that the director and personsconnected with such director are not the holder or holders of 1%or more of the voting interest in the shares of such company.
• Any proposal concerning the purchase or maintenance of anyinsurance policy under which the director may benefit.
• Any proposal concerning the giving to the director of any otherindemnity which is on substantially the same terms as indemnitiesgiven or to be given to all of the other directors or to the funding bythe company of his expenditure on defending proceedings or thedoing by the company of anything to enable the director to avoidincurring such expenditure where all other directors have beengiven or are to be given substantially the same arrangements.
• Any proposal concerning an arrangement for the benefit of theemployees and directors or former employees and former directorsof the company or any of its subsidiary undertakings, including butwithout being limited to a retirement benefits scheme and anemployees’ share scheme, which does not accord to any directorany privilege or advantage not generally accorded to the employeesor former employees to whom the arrangement relates.
The Act requires a director of a company who is in any way interestedin a contract or proposed contract with the company to declare thenature of the director’s interest at a meeting of the directors of thecompany. The definition of ‘interest’ includes the interests ofspouses, children, companies and trusts. The Act also requires that adirector must avoid a situation where a director has, or could have, adirect or indirect interest that conflicts, or possibly may conflict, withthe company’s interests. The Act allows directors of public companiesto authorize such conflicts where appropriate, if a company’s Articlesof Association so permit. BP’s Articles of Association permit theauthorization of such conflicts. The directors may exercise all thepowers of the company to borrow money, except that the amountremaining undischarged of all moneys borrowed by the company shallnot, without approval of the shareholders, exceed two times theamount paid up on the share capital plus the aggregate of the amountof the capital and revenue reserves of the company. Variation of theborrowing power of the board may only be affected by amending theArticles of Association.
Remuneration of non-executive directors shall be determined in theaggregate by resolution of the shareholders. Remuneration ofexecutive directors is determined by the remuneration committee.This committee is made up of non-executive directors only. There isno requirement of share ownership for a director’s qualification.
Dividend rights; other rights to share in company profits;capital callsIf recommended by the directors of BP, BP shareholders may, byresolution, declare dividends but no such dividend may be declared inexcess of the amount recommended by the directors. The directorsmay also pay interim dividends without obtaining shareholderapproval. No dividend may be paid other than out of profits availablefor distribution, as determined under IFRS and the Act. Dividends onordinary shares are payable only after payment of dividends on BPpreference shares. Any dividend unclaimed after a period of 12 yearsfrom the date of declaration of such dividend shall be forfeited andreverts to BP. If the company exercises its right to forfeit shares andsells shares belonging to an untraced shareholder then any dividendsor other monies unclaimed in respect of those shares will be forfeitedafter a period of two years.
The directors have the power to declare and pay dividends in anycurrency provided that a sterling equivalent is announced. It is not thecompany’s intention to change its current policy of paying dividendsin US dollars. At the company’s AGM held on 15 April 2010,shareholders approved the introduction of a Scrip DividendProgramme (Scrip Programme) and to include provisions in theArticles of Association to enable the company to operate the ScripProgramme. The Scrip Programme was renewed at the company’sAGM held on 16 April 2015 for a further three years. The ScripProgramme enables ordinary shareholders and BP ADS holders toelect to receive new fully paid ordinary shares (or BP ADSs in thecase of BP ADS holders) instead of cash. The operation of the ScripProgramme is always subject to the directors’ decision to make thescrip offer available in respect of any particular dividend. Should thedirectors decide not to offer the scrip in respect of any particulardividend, cash will automatically be paid instead.
Apart from shareholders’ rights to share in BP’s profits by dividend (ifany is declared or announced), the Articles of Association provide thatthe directors may set aside:
• A special reserve fund out of the balance of profits each year tomake up any deficit of cumulative dividend on the BP preferenceshares.
• A general reserve out of the balance of profits each year, whichshall be applicable for any purpose to which the profits of thecompany may properly be applied. This may include capitalization ofsuch sum, pursuant to an ordinary shareholders’ resolution, anddistribution to shareholders as if it were distributed by way of adividend on the ordinary shares or in paying up in full unissuedordinary shares for allotment and distribution as bonus shares.
Any such sums so deposited may be distributed in accordance withthe manner of distribution of dividends as described above.
Holders of shares are not subject to calls on capital by the company,provided that the amounts required to be paid on issue have beenpaid off. All shares are fully paid.
Voting rightsThe Articles of Association of the company provide that voting onresolutions at a shareholders’ meeting will be decided on a poll otherthan resolutions of a procedural nature, which may be decided on ashow of hands. If voting is on a poll, every shareholder who is presentin person or by proxy has one vote for every ordinary share held andtwo votes for every £5 in nominal amount of BP preference sharesheld. If voting is on a show of hands, each shareholder who ispresent at the meeting in person or whose duly appointed proxy ispresent in person will have one vote, regardless of the number ofshares held, unless a poll is requested.
Shareholders do not have cumulative voting rights.
For the purposes of determining which persons are entitled to attendor vote at a shareholders’ meeting and how many votes such personsmay cast, the company may specify in the notice of the meeting atime, not more than 48 hours before the time of the meeting, bywhich a person who holds shares in registered form must be enteredon the company’s register of members in order to have the right toattend or vote at the meeting or to appoint a proxy to do so.
Holders on record of ordinary shares may appoint a proxy, including abeneficial owner of those shares, to attend, speak and vote on their
behalf at any shareholders’ meeting, provided that a duly completedproxy form is received not less than 48 hours (or such shorter time asthe directors may determine) before the time of the meeting oradjourned meeting or, where the poll is to be taken after the date ofthe meeting, not less than 24 hours (or such shorter time as thedirectors may determine) before the time of the poll.
Record holders of BP ADSs are also entitled to attend, speak andvote at any shareholders’ meeting of BP by the appointment by theapproved depositary, JPMorgan Chase Bank N.A., of them as proxiesin respect of the ordinary shares represented by their ADSs. Eachsuch proxy may also appoint a proxy. Alternatively, holders of BPADSs are entitled to vote by supplying their voting instructions to thedepositary, who will vote the ordinary shares represented by theirADSs in accordance with their instructions.
Proxies may be delivered electronically.
Corporations who are members of the company may appoint one ormore persons to act as their representative or representatives at anyshareholders’ meeting provided that the company may require acorporate representative to produce a certified copy of the resolutionappointing them before they are permitted to exercise their powers.
Matters are transacted at shareholders’ meetings by the proposingand passing of resolutions, of which there are two types: ordinary orspecial.
An ordinary resolution requires the affirmative vote of a majority ofthe votes of those persons voting at a meeting at which there is aquorum. A special resolution requires the affirmative vote of not lessthan three quarters of the persons voting at a meeting at which thereis a quorum. Any AGM requires 21 clear days’ notice. The noticeperiod for any other general meeting is 14 clear days subject to thecompany obtaining annual shareholder approval, failing which, a 21clear day notice period will apply.
Liquidation rights; redemption provisionsIn the event of a liquidation of BP, after payment of all liabilities andapplicable deductions under UK laws and subject to the payment ofsecured creditors, the holders of BP preference shares would beentitled to the sum of (1) the capital paid up on such shares plus,(2) accrued and unpaid dividends and (3) a premium equal to thehigher of (a) 10% of the capital paid up on the BP preference sharesand (b) the excess of the average market price over par value of suchshares on the LSE during the previous six months. The remainingassets (if any) would be divided pro rata among the holders ofordinary shares.
Without prejudice to any special rights previously conferred on theholders of any class of shares, BP may issue any share with suchpreferred, deferred or other special rights, or subject to suchrestrictions as the shareholders by resolution determine (or, in theabsence of any such resolutions, by determination of the directors),and may issue shares that are to be or may be redeemed.
Variation of rightsThe rights attached to any class of shares may be varied with theconsent in writing of holders of 75% of the shares of that class or onthe adoption of a special resolution passed at a separate meeting ofthe holders of the shares of that class. At every such separatemeeting, all of the provisions of the Articles of Association relating toproceedings at a general meeting apply, except that the quorum withrespect to a meeting to change the rights attached to the preferenceshares is 10% or more of the shares of that class, and the quorum tochange the rights attached to the ordinary shares is one third or moreof the shares of that class.
Shareholders’ meetings and noticesShareholders must provide BP with a postal or electronic address inthe UK to be entitled to receive notice of shareholders’ meetings.Holders of BP ADSs are entitled to receive notices under the terms ofthe deposit agreement relating to BP ADSs. The substance andtiming of notices are described above under the heading Voting rights.
Under the Act, the AGM of shareholders must be held once everyyear, within each six month period beginning with the day followingthe company’s accounting reference date. All general meetings shallbe held at a time and place (in England) determined by the directors.
BP Annual Report and Form 20-F 2017 «See Glossary 285
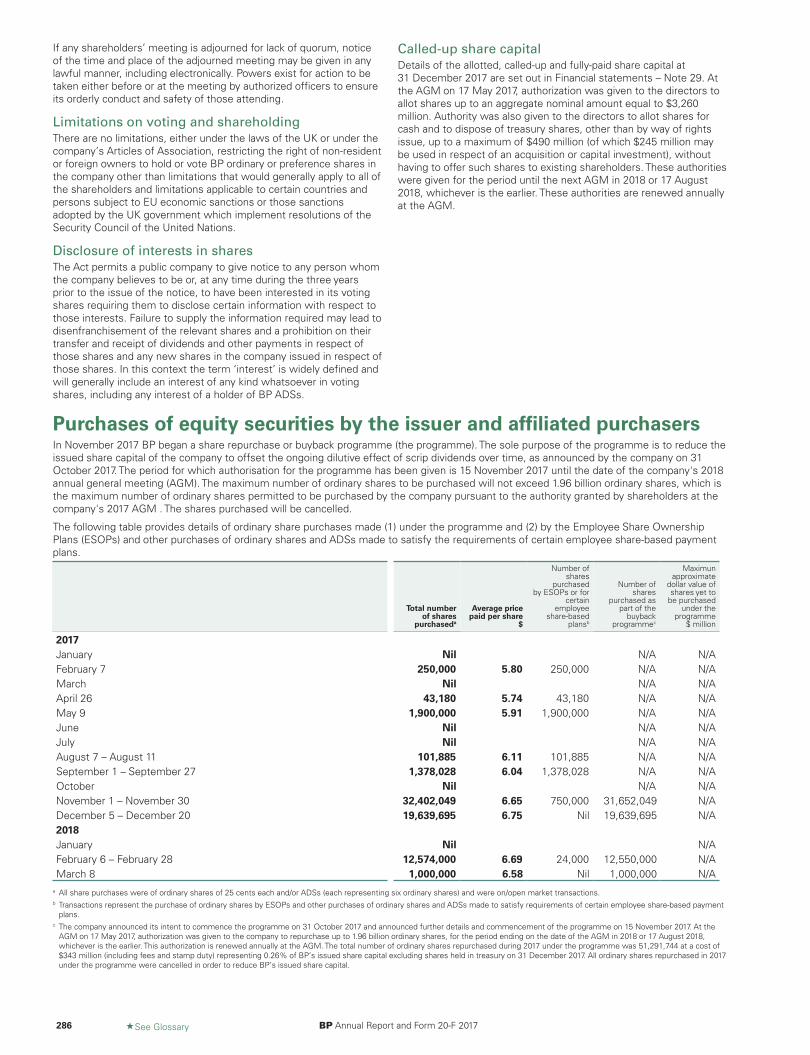
If any shareholders’ meeting is adjourned for lack of quorum, noticeof the time and place of the adjourned meeting may be given in anylawful manner, including electronically. Powers exist for action to betaken either before or at the meeting by authorized officers to ensureits orderly conduct and safety of those attending.
Limitations on voting and shareholdingThere are no limitations, either under the laws of the UK or under thecompany’s Articles of Association, restricting the right of non-residentor foreign owners to hold or vote BP ordinary or preference shares inthe company other than limitations that would generally apply to all ofthe shareholders and limitations applicable to certain countries andpersons subject to EU economic sanctions or those sanctionsadopted by the UK government which implement resolutions of theSecurity Council of the United Nations.
Disclosure of interests in sharesThe Act permits a public company to give notice to any person whomthe company believes to be or, at any time during the three yearsprior to the issue of the notice, to have been interested in its votingshares requiring them to disclose certain information with respect tothose interests. Failure to supply the information required may lead todisenfranchisement of the relevant shares and a prohibition on theirtransfer and receipt of dividends and other payments in respect ofthose shares and any new shares in the company issued in respect ofthose shares. In this context the term ‘interest’ is widely defined andwill generally include an interest of any kind whatsoever in votingshares, including any interest of a holder of BP ADSs.
Called-up share capitalDetails of the allotted, called-up and fully-paid share capital at31 December 2017 are set out in Financial statements – Note 29. Atthe AGM on 17 May 2017, authorization was given to the directors toallot shares up to an aggregate nominal amount equal to $3,260million. Authority was also given to the directors to allot shares forcash and to dispose of treasury shares, other than by way of rightsissue, up to a maximum of $490 million (of which $245 million maybe used in respect of an acquisition or capital investment), withouthaving to offer such shares to existing shareholders. These authoritieswere given for the period until the next AGM in 2018 or 17 August2018, whichever is the earlier. These authorities are renewed annuallyat the AGM.
286 «See Glossary BP Annual Report and Form 20-F 2017
Purchases of equity securities by the issuer and affiliated purchasersIn November 2017 BP began a share repurchase or buyback programme (the programme). The sole purpose of the programme is to reduce theissued share capital of the company to offset the ongoing dilutive effect of scrip dividends over time, as announced by the company on 31October 2017. The period for which authorisation for the programme has been given is 15 November 2017 until the date of the company's 2018annual general meeting (AGM). The maximum number of ordinary shares to be purchased will not exceed 1.96 billion ordinary shares, which isthe maximum number of ordinary shares permitted to be purchased by the company pursuant to the authority granted by shareholders at thecompany's 2017 AGM . The shares purchased will be cancelled.
The following table provides details of ordinary share purchases made (1) under the programme and (2) by the Employee Share OwnershipPlans (ESOPs) and other purchases of ordinary shares and ADSs made to satisfy the requirements of certain employee share-based paymentplans.
Total numberof shares
purchaseda
Average pricepaid per share
$
Number ofshares
purchasedby ESOPs or for
certainemployee
share-basedplansb
Number ofshares
purchased aspart of the
buybackprogrammec
Maximunapproximate
dollar value ofshares yet to
be purchasedunder the
programme $ million
2017January Nil N/A N/AFebruary 7 250,000 5.80 250,000 N/A N/AMarch Nil N/A N/AApril 26 43,180 5.74 43,180 N/A N/AMay 9 1,900,000 5.91 1,900,000 N/A N/AJune Nil N/A N/AJuly Nil N/A N/AAugust 7 – August 11 101,885 6.11 101,885 N/A N/ASeptember 1 – September 27 1,378,028 6.04 1,378,028 N/A N/AOctober Nil N/A N/ANovember 1 – November 30 32,402,049 6.65 750,000 31,652,049 N/ADecember 5 – December 20 19,639,695 6.75 Nil 19,639,695 N/A2018January Nil N/AFebruary 6 – February 28 12,574,000 6.69 24,000 12,550,000 N/AMarch 8 1,000,000 6.58 Nil 1,000,000 N/A
a All share purchases were of ordinary shares of 25 cents each and/or ADSs (each representing six ordinary shares) and were on/open market transactions.b Transactions represent the purchase of ordinary shares by ESOPs and other purchases of ordinary shares and ADSs made to satisfy requirements of certain employee share-based payment
plans.c The company announced its intent to commence the programme on 31 October 2017 and announced further details and commencement of the programme on 15 November 2017. At the
AGM on 17 May 2017, authorization was given to the company to repurchase up to 1.96 billion ordinary shares, for the period ending on the date of the AGM in 2018 or 17 August 2018,whichever is the earlier. This authorization is renewed annually at the AGM. The total number of ordinary shares repurchased during 2017 under the programme was 51,291,744 at a cost of$343 million (including fees and stamp duty) representing 0.26% of BP’s issued share capital excluding shares held in treasury on 31 December 2017. All ordinary shares repurchased in 2017under the programme were cancelled in order to reduce BP’s issued share capital.
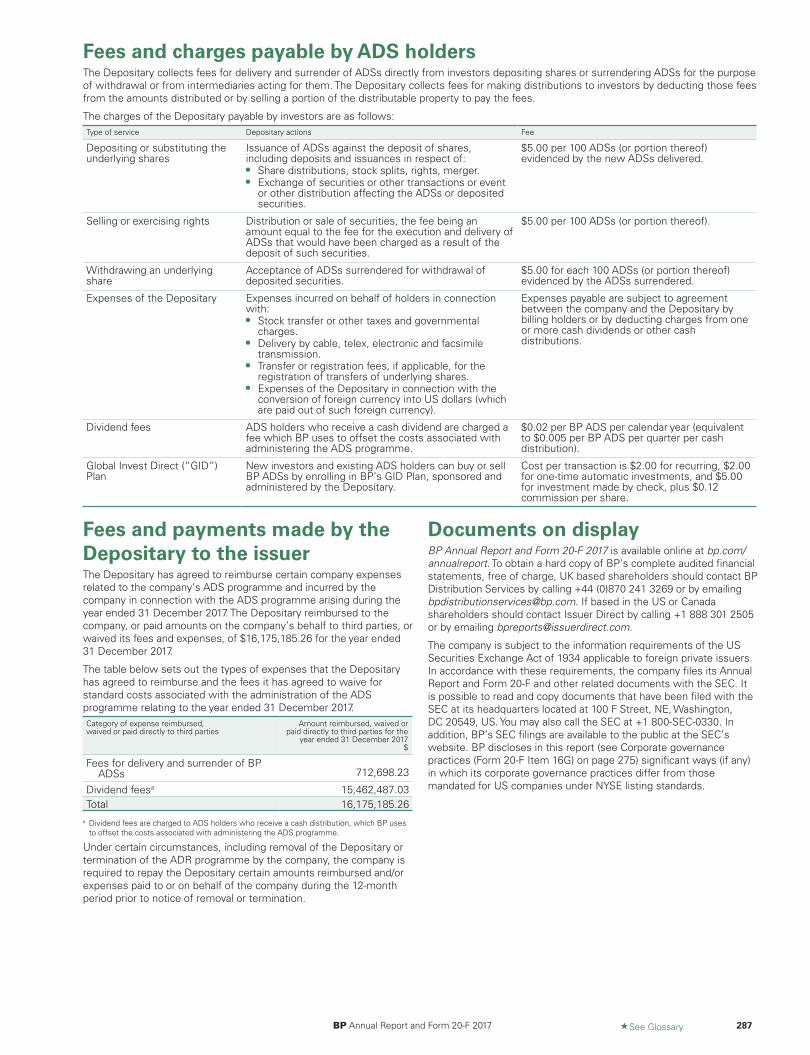
Fees and charges payable by ADS holdersThe Depositary collects fees for delivery and surrender of ADSs directly from investors depositing shares or surrendering ADSs for the purposeof withdrawal or from intermediaries acting for them. The Depositary collects fees for making distributions to investors by deducting those feesfrom the amounts distributed or by selling a portion of the distributable property to pay the fees.
The charges of the Depositary payable by investors are as follows:Type of service Depositary actions Fee
Depositing or substituting theunderlying shares
Issuance of ADSs against the deposit of shares,including deposits and issuances in respect of:• Share distributions, stock splits, rights, merger.• Exchange of securities or other transactions or event
or other distribution affecting the ADSs or depositedsecurities.
$5.00 per 100 ADSs (or portion thereof)evidenced by the new ADSs delivered.
Selling or exercising rights Distribution or sale of securities, the fee being anamount equal to the fee for the execution and delivery ofADSs that would have been charged as a result of thedeposit of such securities.
$5.00 per 100 ADSs (or portion thereof).
Withdrawing an underlyingshare
Acceptance of ADSs surrendered for withdrawal ofdeposited securities.
$5.00 for each 100 ADSs (or portion thereof)evidenced by the ADSs surrendered.
Expenses of the Depositary Expenses incurred on behalf of holders in connectionwith:• Stock transfer or other taxes and governmental
charges.• Delivery by cable, telex, electronic and facsimile
transmission.• Transfer or registration fees, if applicable, for the
registration of transfers of underlying shares.• Expenses of the Depositary in connection with the
conversion of foreign currency into US dollars (whichare paid out of such foreign currency).
Expenses payable are subject to agreementbetween the company and the Depositary bybilling holders or by deducting charges from oneor more cash dividends or other cashdistributions.
Dividend fees ADS holders who receive a cash dividend are charged afee which BP uses to offset the costs associated withadministering the ADS programme.
$0.02 per BP ADS per calendar year (equivalentto $0.005 per BP ADS per quarter per cashdistribution).
Global Invest Direct (“GID”)Plan
New investors and existing ADS holders can buy or sellBP ADSs by enrolling in BP’s GID Plan, sponsored andadministered by the Depositary.
Cost per transaction is $2.00 for recurring, $2.00for one-time automatic investments, and $5.00for investment made by check, plus $0.12commission per share.
BP Annual Report and Form 20-F 2017 «See Glossary 287
Fees and payments made by theDepositary to the issuerThe Depositary has agreed to reimburse certain company expensesrelated to the company’s ADS programme and incurred by thecompany in connection with the ADS programme arising during theyear ended 31 December 2017. The Depositary reimbursed to thecompany, or paid amounts on the company’s behalf to third parties, orwaived its fees and expenses, of $16,175,185.26 for the year ended31 December 2017.
The table below sets out the types of expenses that the Depositaryhas agreed to reimburse and the fees it has agreed to waive forstandard costs associated with the administration of the ADSprogramme relating to the year ended 31 December 2017.Category of expense reimbursed,waived or paid directly to third parties
Amount reimbursed, waived orpaid directly to third parties for the
year ended 31 December 2017$
Fees for delivery and surrender of BPADSs 712,698.23
Dividend feesa 15,462,487.03Total 16,175,185.26
a Dividend fees are charged to ADS holders who receive a cash distribution, which BP usesto offset the costs associated with administering the ADS programme.
Under certain circumstances, including removal of the Depositary ortermination of the ADR programme by the company, the company isrequired to repay the Depositary certain amounts reimbursed and/orexpenses paid to or on behalf of the company during the 12-monthperiod prior to notice of removal or termination.
Documents on displayBP Annual Report and Form 20-F 2017 is available online at bp.com/annualreport. To obtain a hard copy of BP’s complete audited financialstatements, free of charge, UK based shareholders should contact BPDistribution Services by calling +44 (0)870 241 3269 or by [email protected]. If based in the US or Canadashareholders should contact Issuer Direct by calling +1 888 301 2505or by emailing [email protected].
The company is subject to the information requirements of the USSecurities Exchange Act of 1934 applicable to foreign private issuers.In accordance with these requirements, the company files its AnnualReport and Form 20-F and other related documents with the SEC. Itis possible to read and copy documents that have been filed with theSEC at its headquarters located at 100 F Street, NE, Washington,DC 20549, US. You may also call the SEC at +1 800-SEC-0330. Inaddition, BP’s SEC filings are available to the public at the SEC’swebsite. BP discloses in this report (see Corporate governancepractices (Form 20-F Item 16G) on page 275) significant ways (if any)in which its corporate governance practices differ from thosemandated for US companies under NYSE listing standards.

Shareholding administrationIf you have any queries about the administration of shareholdings,such as change of address, change of ownership, dividend payments,the Scrip Programme or to change the way you receive your companydocuments (such as the BP Annual Report and Form 20-F and Noticeof BP Annual General Meeting) please contact the BP Registrar or theBP ADS Depositary.
Ordinary and preference shareholdersThe BP Registrar, Link Asset ServicesThe Registry, 34 Beckenham Road, Beckenham, Kent BR3 4TU, UKFreephone in UK 0800 701107From outside the UK +44 (0)20 3170 3678Fax +44 (0)1484 601512
ADS holdersThe BP ADS Depositary, JPMorgan Chase Bank, N.A.PO Box 64504, St Paul, MN 55164-0504, USToll-free in US and Canada +1 877 638 5672From outside the US and Canada +1 651 306 4383
288 «See Glossary BP Annual Report and Form 20-F 2017
2018 shareholder calendara 29 Mar 2018 Fourth quarter interim dividend payment for 2017
1 May 2018 First quarter results announced
11 May 2018 Record date (to be eligible for the first quarterinterim dividend)
21 May 2018 Annual general meeting
22 Jun 2018 First quarter interim dividend payment for 2018
6 Jul 2018 8% and 9% preference shares record date
31 Jul 2018 Second quarter results announced
31 Jul 2018 8% and 9% preference shares dividend payment
10 Aug 2018 Record date (to be eligible for the second quarterinterim dividend)
21 Sep 2018 Second quarter interim dividend payment for 2018
30 Oct 2018 Third quarter results announced
9 Nov 2018 Record date (to be eligible for the third quarterinterim dividend)
21 Dec 2018 Third quarter interim dividend payment for 2018
a All future dates are provisional and may be subject to change. For the full calendar seebp.com/financialcalendar.
ExhibitsThe following documents are filed in the Securities and ExchangeCommission (SEC) EDGAR system, as part of this Annual Report onForm 20-F, and can be viewed on the SEC’s website.
Exhibit 1 Memorandum and Articles of Associationof BP p.l.c.*******†
Exhibit 4.1 The BP Executive Directors’ IncentivePlan******†
Exhibit 4.3 Amended Director’s SecondmentAgreement forR W Dudley*****†
Exhibit 4.4 Amended Director’s Service Contract andSecondment Agreement for R WDudley**†
Exhibit 4.7 Director’s Service Contract for Dr BGilvary***†
Exhibit 4.10 The BP Share Award Plan 2015*******†
Exhibit 7 Computation of Ratio of Earnings to FixedCharges (Unaudited)†
Exhibit 8 Subsidiaries (included as Note 35 to theFinancial Statements)
Exhibit 11 Code of Ethics*†
Exhibit 12 Rule 13a – 14(a) Certifications†
Exhibit 13 Rule 13a – 14(b) Certifications#†
Exhibit 15.1 Consent of DeGolyer and MacNaughton†
Exhibit 15.2 Report of DeGolyer and MacNaughton†
Exhibit 15.3 Administrative Agreement dated as of13 March 2014 among the USEnvironmental Protection Agency, BP p.l.c.,and other BP subsidiaries******†
Exhibit 15.4 Consent Decree*******†
Exhibit 15.5 Gulf states SettlementAgreement*******†
Exhibit 15.6 Letter of Ernst & Young LLP dated 29March 2018 pursuant to Item 16F of Form20-F†
Exhibit 101 Interactive data files
* Incorporated by reference to the company’s Annual Report on Form 20-F forthe year ended 31 December 2009.
** Incorporated by reference to the company’s Annual Report on Form 20-F forthe year ended 31 December 2010.
*** Incorporated by reference to the company’s Annual Report on Form 20-F forthe year ended 31 December 2011.
***** Incorporated by reference to the company’s Annual Report on Form 20-F forthe year ended 31 December 2013.
****** Incorporated by reference to the company’s Annual Report on Form 20-F forthe year ended 31 December 2014.
******* Incorporated by reference to the company’s Annual Report on Form 20-F forthe year ended 31 December 2015.
# Furnished only.
† Included only in the annual report filed in the Securities and ExchangeCommission EDGAR system.
The total amount of long-term securities of the Registrant and itssubsidiaries authorized under any one instrument does not exceed10% of the total assets of BP p.l.c. and its subsidiaries on aconsolidated basis. The company agrees to furnish copies of any or allsuch instruments to the SEC on request.
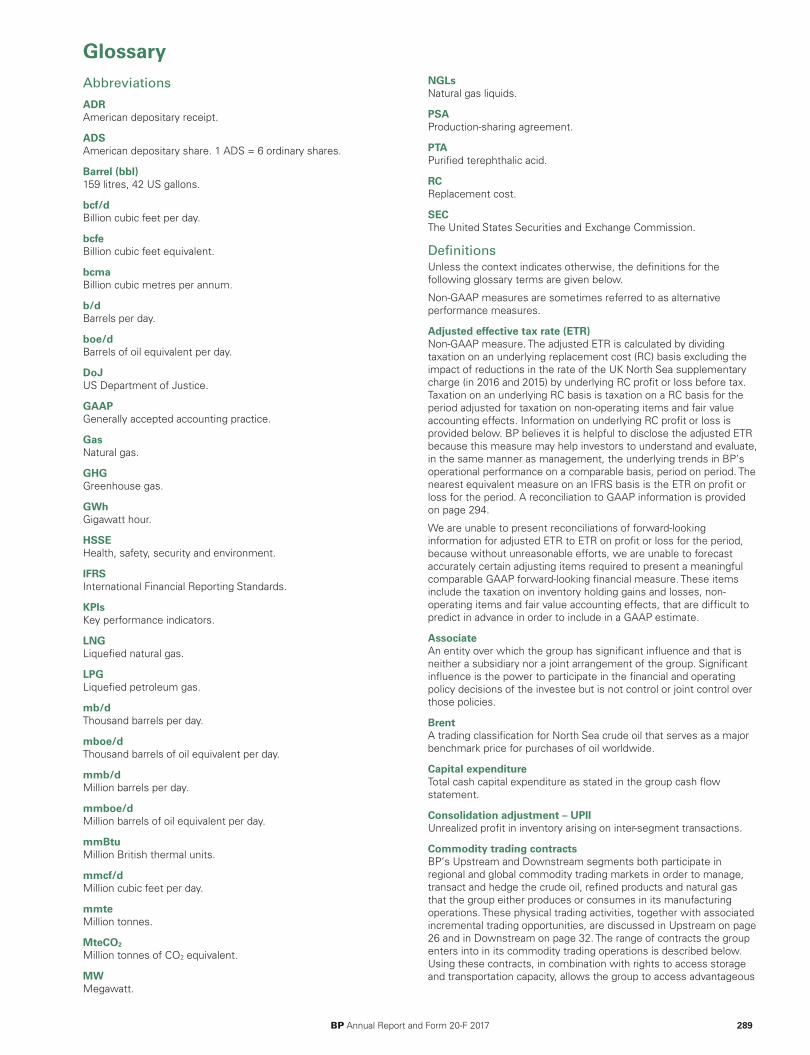
GlossaryAbbreviations
ADRAmerican depositary receipt.
ADSAmerican depositary share. 1 ADS = 6 ordinary shares.
Barrel (bbl)159 litres, 42 US gallons.
bcf/dBillion cubic feet per day.
bcfeBillion cubic feet equivalent.
bcmaBillion cubic metres per annum.
b/dBarrels per day.
boe/dBarrels of oil equivalent per day.
DoJUS Department of Justice.
GAAPGenerally accepted accounting practice.
GasNatural gas.
GHGGreenhouse gas.
GWhGigawatt hour.
HSSEHealth, safety, security and environment.
IFRSInternational Financial Reporting Standards.
KPIsKey performance indicators.
LNGLiquefied natural gas.
LPGLiquefied petroleum gas.
mb/dThousand barrels per day.
mboe/dThousand barrels of oil equivalent per day.
mmb/dMillion barrels per day.
mmboe/dMillion barrels of oil equivalent per day.
mmBtuMillion British thermal units.
mmcf/dMillion cubic feet per day.
mmteMillion tonnes.
MteCO2
Million tonnes of CO2 equivalent.
MWMegawatt.
NGLsNatural gas liquids.
PSAProduction-sharing agreement.
PTAPurified terephthalic acid.
RCReplacement cost.
SECThe United States Securities and Exchange Commission.
DefinitionsUnless the context indicates otherwise, the definitions for thefollowing glossary terms are given below.
Non-GAAP measures are sometimes referred to as alternativeperformance measures.
Adjusted effective tax rate (ETR) Non-GAAP measure. The adjusted ETR is calculated by dividingtaxation on an underlying replacement cost (RC) basis excluding theimpact of reductions in the rate of the UK North Sea supplementarycharge (in 2016 and 2015) by underlying RC profit or loss before tax.Taxation on an underlying RC basis is taxation on a RC basis for theperiod adjusted for taxation on non-operating items and fair valueaccounting effects. Information on underlying RC profit or loss isprovided below. BP believes it is helpful to disclose the adjusted ETRbecause this measure may help investors to understand and evaluate,in the same manner as management, the underlying trends in BP’soperational performance on a comparable basis, period on period. Thenearest equivalent measure on an IFRS basis is the ETR on profit orloss for the period. A reconciliation to GAAP information is providedon page 294.
We are unable to present reconciliations of forward-lookinginformation for adjusted ETR to ETR on profit or loss for the period,because without unreasonable efforts, we are unable to forecastaccurately certain adjusting items required to present a meaningfulcomparable GAAP forward-looking financial measure. These itemsinclude the taxation on inventory holding gains and losses, non-operating items and fair value accounting effects, that are difficult topredict in advance in order to include in a GAAP estimate.
AssociateAn entity over which the group has significant influence and that isneither a subsidiary nor a joint arrangement of the group. Significantinfluence is the power to participate in the financial and operatingpolicy decisions of the investee but is not control or joint control overthose policies.
BrentA trading classification for North Sea crude oil that serves as a majorbenchmark price for purchases of oil worldwide.
Capital expenditureTotal cash capital expenditure as stated in the group cash flowstatement.
Consolidation adjustment – UPIIUnrealized profit in inventory arising on inter-segment transactions.
Commodity trading contractsBP’s Upstream and Downstream segments both participate inregional and global commodity trading markets in order to manage,transact and hedge the crude oil, refined products and natural gasthat the group either produces or consumes in its manufacturingoperations. These physical trading activities, together with associatedincremental trading opportunities, are discussed in Upstream on page26 and in Downstream on page 32. The range of contracts the groupenters into in its commodity trading operations is described below.Using these contracts, in combination with rights to access storageand transportation capacity, allows the group to access advantageous
BP Annual Report and Form 20-F 2017 289
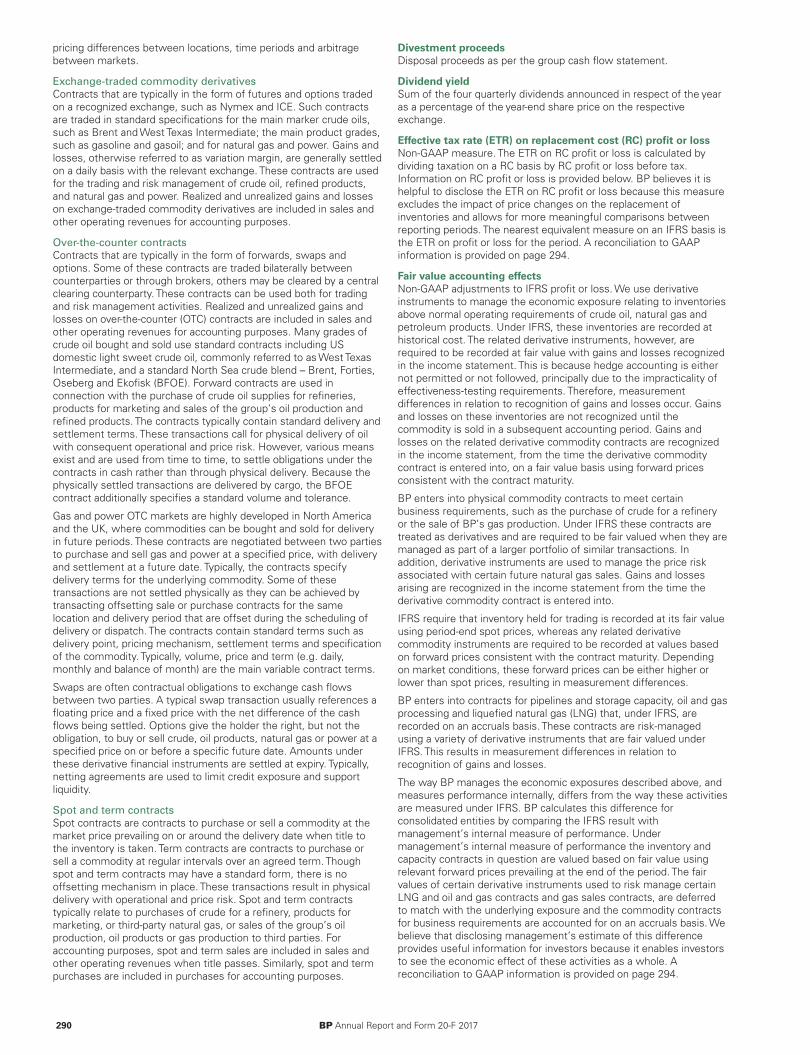
pricing differences between locations, time periods and arbitragebetween markets.
Exchange-traded commodity derivativesContracts that are typically in the form of futures and options tradedon a recognized exchange, such as Nymex and ICE. Such contractsare traded in standard specifications for the main marker crude oils,such as Brent and West Texas Intermediate; the main product grades,such as gasoline and gasoil; and for natural gas and power. Gains andlosses, otherwise referred to as variation margin, are generally settledon a daily basis with the relevant exchange. These contracts are usedfor the trading and risk management of crude oil, refined products,and natural gas and power. Realized and unrealized gains and losseson exchange-traded commodity derivatives are included in sales andother operating revenues for accounting purposes.
Over-the-counter contracts Contracts that are typically in the form of forwards, swaps andoptions. Some of these contracts are traded bilaterally betweencounterparties or through brokers, others may be cleared by a centralclearing counterparty. These contracts can be used both for tradingand risk management activities. Realized and unrealized gains andlosses on over-the-counter (OTC) contracts are included in sales andother operating revenues for accounting purposes. Many grades ofcrude oil bought and sold use standard contracts including USdomestic light sweet crude oil, commonly referred to as West TexasIntermediate, and a standard North Sea crude blend – Brent, Forties,Oseberg and Ekofisk (BFOE). Forward contracts are used inconnection with the purchase of crude oil supplies for refineries,products for marketing and sales of the group’s oil production andrefined products. The contracts typically contain standard delivery andsettlement terms. These transactions call for physical delivery of oilwith consequent operational and price risk. However, various meansexist and are used from time to time, to settle obligations under thecontracts in cash rather than through physical delivery. Because thephysically settled transactions are delivered by cargo, the BFOEcontract additionally specifies a standard volume and tolerance.
Gas and power OTC markets are highly developed in North Americaand the UK, where commodities can be bought and sold for deliveryin future periods. These contracts are negotiated between two partiesto purchase and sell gas and power at a specified price, with deliveryand settlement at a future date. Typically, the contracts specifydelivery terms for the underlying commodity. Some of thesetransactions are not settled physically as they can be achieved bytransacting offsetting sale or purchase contracts for the samelocation and delivery period that are offset during the scheduling ofdelivery or dispatch. The contracts contain standard terms such asdelivery point, pricing mechanism, settlement terms and specificationof the commodity. Typically, volume, price and term (e.g. daily,monthly and balance of month) are the main variable contract terms.
Swaps are often contractual obligations to exchange cash flowsbetween two parties. A typical swap transaction usually references afloating price and a fixed price with the net difference of the cashflows being settled. Options give the holder the right, but not theobligation, to buy or sell crude, oil products, natural gas or power at aspecified price on or before a specific future date. Amounts underthese derivative financial instruments are settled at expiry. Typically,netting agreements are used to limit credit exposure and supportliquidity.
Spot and term contracts Spot contracts are contracts to purchase or sell a commodity at themarket price prevailing on or around the delivery date when title tothe inventory is taken. Term contracts are contracts to purchase orsell a commodity at regular intervals over an agreed term. Thoughspot and term contracts may have a standard form, there is nooffsetting mechanism in place. These transactions result in physicaldelivery with operational and price risk. Spot and term contractstypically relate to purchases of crude for a refinery, products formarketing, or third-party natural gas, or sales of the group’s oilproduction, oil products or gas production to third parties. Foraccounting purposes, spot and term sales are included in sales andother operating revenues when title passes. Similarly, spot and termpurchases are included in purchases for accounting purposes.
Divestment proceedsDisposal proceeds as per the group cash flow statement.
Dividend yieldSum of the four quarterly dividends announced in respect of the yearas a percentage of the year-end share price on the respectiveexchange.
Effective tax rate (ETR) on replacement cost (RC) profit or lossNon-GAAP measure. The ETR on RC profit or loss is calculated bydividing taxation on a RC basis by RC profit or loss before tax.Information on RC profit or loss is provided below. BP believes it ishelpful to disclose the ETR on RC profit or loss because this measureexcludes the impact of price changes on the replacement ofinventories and allows for more meaningful comparisons betweenreporting periods. The nearest equivalent measure on an IFRS basis isthe ETR on profit or loss for the period. A reconciliation to GAAPinformation is provided on page 294.
Fair value accounting effects Non-GAAP adjustments to IFRS profit or loss. We use derivativeinstruments to manage the economic exposure relating to inventoriesabove normal operating requirements of crude oil, natural gas andpetroleum products. Under IFRS, these inventories are recorded athistorical cost. The related derivative instruments, however, arerequired to be recorded at fair value with gains and losses recognizedin the income statement. This is because hedge accounting is eithernot permitted or not followed, principally due to the impracticality ofeffectiveness-testing requirements. Therefore, measurementdifferences in relation to recognition of gains and losses occur. Gainsand losses on these inventories are not recognized until thecommodity is sold in a subsequent accounting period. Gains andlosses on the related derivative commodity contracts are recognizedin the income statement, from the time the derivative commoditycontract is entered into, on a fair value basis using forward pricesconsistent with the contract maturity.
BP enters into physical commodity contracts to meet certainbusiness requirements, such as the purchase of crude for a refineryor the sale of BP’s gas production. Under IFRS these contracts aretreated as derivatives and are required to be fair valued when they aremanaged as part of a larger portfolio of similar transactions. Inaddition, derivative instruments are used to manage the price riskassociated with certain future natural gas sales. Gains and lossesarising are recognized in the income statement from the time thederivative commodity contract is entered into.
IFRS require that inventory held for trading is recorded at its fair valueusing period-end spot prices, whereas any related derivativecommodity instruments are required to be recorded at values basedon forward prices consistent with the contract maturity. Dependingon market conditions, these forward prices can be either higher orlower than spot prices, resulting in measurement differences.
BP enters into contracts for pipelines and storage capacity, oil and gasprocessing and liquefied natural gas (LNG) that, under IFRS, arerecorded on an accruals basis. These contracts are risk-managedusing a variety of derivative instruments that are fair valued underIFRS. This results in measurement differences in relation torecognition of gains and losses.
The way BP manages the economic exposures described above, andmeasures performance internally, differs from the way these activitiesare measured under IFRS. BP calculates this difference forconsolidated entities by comparing the IFRS result withmanagement’s internal measure of performance. Undermanagement’s internal measure of performance the inventory andcapacity contracts in question are valued based on fair value usingrelevant forward prices prevailing at the end of the period. The fairvalues of certain derivative instruments used to risk manage certainLNG and oil and gas contracts and gas sales contracts, are deferredto match with the underlying exposure and the commodity contractsfor business requirements are accounted for on an accruals basis. Webelieve that disclosing management’s estimate of this differenceprovides useful information for investors because it enables investorsto see the economic effect of these activities as a whole. Areconciliation to GAAP information is provided on page 294.
290 BP Annual Report and Form 20-F 2017
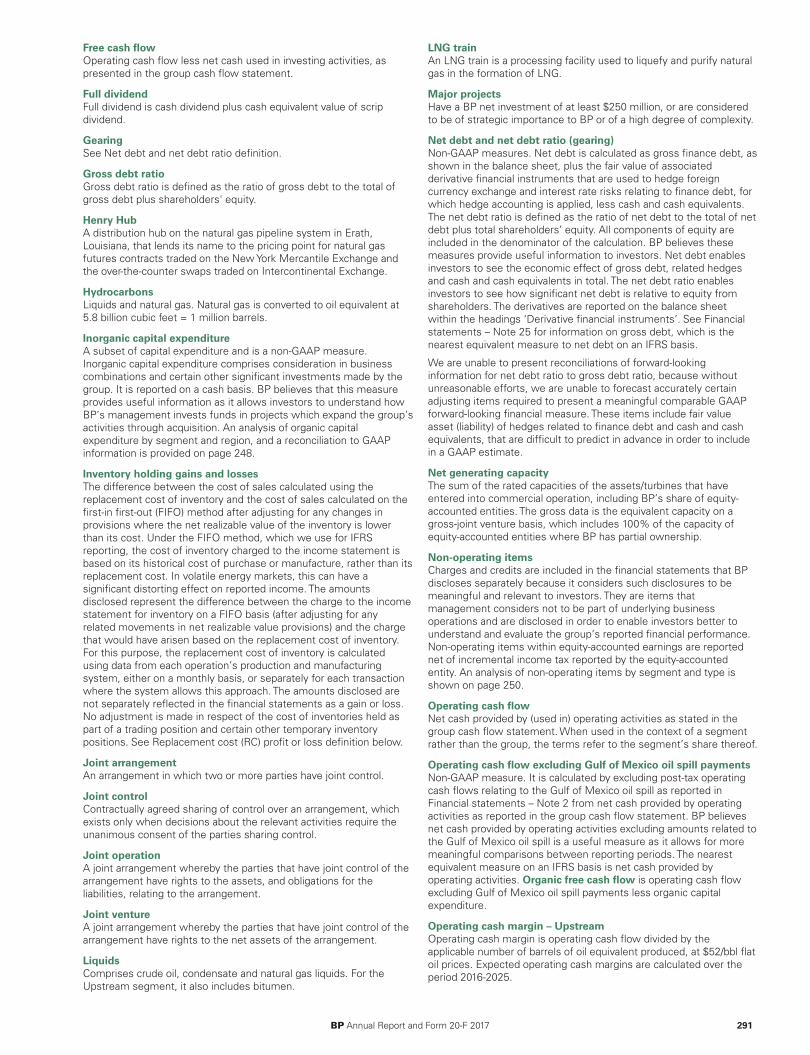
Free cash flowOperating cash flow less net cash used in investing activities, aspresented in the group cash flow statement.
Full dividend Full dividend is cash dividend plus cash equivalent value of scripdividend.
Gearing See Net debt and net debt ratio definition.
Gross debt ratioGross debt ratio is defined as the ratio of gross debt to the total ofgross debt plus shareholders' equity.
Henry HubA distribution hub on the natural gas pipeline system in Erath,Louisiana, that lends its name to the pricing point for natural gasfutures contracts traded on the New York Mercantile Exchange andthe over-the-counter swaps traded on Intercontinental Exchange.
HydrocarbonsLiquids and natural gas. Natural gas is converted to oil equivalent at5.8 billion cubic feet = 1 million barrels.
Inorganic capital expenditureA subset of capital expenditure and is a non-GAAP measure.Inorganic capital expenditure comprises consideration in businesscombinations and certain other significant investments made by thegroup. It is reported on a cash basis. BP believes that this measureprovides useful information as it allows investors to understand howBP’s management invests funds in projects which expand the group’sactivities through acquisition. An analysis of organic capitalexpenditure by segment and region, and a reconciliation to GAAPinformation is provided on page 248.
Inventory holding gains and lossesThe difference between the cost of sales calculated using thereplacement cost of inventory and the cost of sales calculated on thefirst-in first-out (FIFO) method after adjusting for any changes inprovisions where the net realizable value of the inventory is lowerthan its cost. Under the FIFO method, which we use for IFRSreporting, the cost of inventory charged to the income statement isbased on its historical cost of purchase or manufacture, rather than itsreplacement cost. In volatile energy markets, this can have asignificant distorting effect on reported income. The amountsdisclosed represent the difference between the charge to the incomestatement for inventory on a FIFO basis (after adjusting for anyrelated movements in net realizable value provisions) and the chargethat would have arisen based on the replacement cost of inventory.For this purpose, the replacement cost of inventory is calculatedusing data from each operation’s production and manufacturingsystem, either on a monthly basis, or separately for each transactionwhere the system allows this approach. The amounts disclosed arenot separately reflected in the financial statements as a gain or loss.No adjustment is made in respect of the cost of inventories held aspart of a trading position and certain other temporary inventorypositions. See Replacement cost (RC) profit or loss definition below.
Joint arrangementAn arrangement in which two or more parties have joint control.
Joint controlContractually agreed sharing of control over an arrangement, whichexists only when decisions about the relevant activities require theunanimous consent of the parties sharing control.
Joint operationA joint arrangement whereby the parties that have joint control of thearrangement have rights to the assets, and obligations for theliabilities, relating to the arrangement.
Joint ventureA joint arrangement whereby the parties that have joint control of thearrangement have rights to the net assets of the arrangement.
LiquidsComprises crude oil, condensate and natural gas liquids. For theUpstream segment, it also includes bitumen.
LNG trainAn LNG train is a processing facility used to liquefy and purify naturalgas in the formation of LNG.
Major projectsHave a BP net investment of at least $250 million, or are consideredto be of strategic importance to BP or of a high degree of complexity.
Net debt and net debt ratio (gearing)Non-GAAP measures. Net debt is calculated as gross finance debt, asshown in the balance sheet, plus the fair value of associatedderivative financial instruments that are used to hedge foreigncurrency exchange and interest rate risks relating to finance debt, forwhich hedge accounting is applied, less cash and cash equivalents.The net debt ratio is defined as the ratio of net debt to the total of netdebt plus total shareholders’ equity. All components of equity areincluded in the denominator of the calculation. BP believes thesemeasures provide useful information to investors. Net debt enablesinvestors to see the economic effect of gross debt, related hedgesand cash and cash equivalents in total. The net debt ratio enablesinvestors to see how significant net debt is relative to equity fromshareholders. The derivatives are reported on the balance sheetwithin the headings ‘Derivative financial instruments’. See Financialstatements – Note 25 for information on gross debt, which is thenearest equivalent measure to net debt on an IFRS basis.
We are unable to present reconciliations of forward-lookinginformation for net debt ratio to gross debt ratio, because withoutunreasonable efforts, we are unable to forecast accurately certainadjusting items required to present a meaningful comparable GAAPforward-looking financial measure. These items include fair valueasset (liability) of hedges related to finance debt and cash and cashequivalents, that are difficult to predict in advance in order to includein a GAAP estimate.
Net generating capacityThe sum of the rated capacities of the assets/turbines that haveentered into commercial operation, including BP’s share of equity-accounted entities. The gross data is the equivalent capacity on agross-joint venture basis, which includes 100% of the capacity ofequity-accounted entities where BP has partial ownership.
Non-operating itemsCharges and credits are included in the financial statements that BPdiscloses separately because it considers such disclosures to bemeaningful and relevant to investors. They are items thatmanagement considers not to be part of underlying businessoperations and are disclosed in order to enable investors better tounderstand and evaluate the group’s reported financial performance.Non-operating items within equity-accounted earnings are reportednet of incremental income tax reported by the equity-accountedentity. An analysis of non-operating items by segment and type isshown on page 250.
Operating cash flowNet cash provided by (used in) operating activities as stated in thegroup cash flow statement. When used in the context of a segmentrather than the group, the terms refer to the segment’s share thereof.
Operating cash flow excluding Gulf of Mexico oil spill paymentsNon-GAAP measure. It is calculated by excluding post-tax operatingcash flows relating to the Gulf of Mexico oil spill as reported inFinancial statements – Note 2 from net cash provided by operatingactivities as reported in the group cash flow statement. BP believesnet cash provided by operating activities excluding amounts related tothe Gulf of Mexico oil spill is a useful measure as it allows for moremeaningful comparisons between reporting periods. The nearestequivalent measure on an IFRS basis is net cash provided byoperating activities. Organic free cash flow is operating cash flowexcluding Gulf of Mexico oil spill payments less organic capitalexpenditure.
Operating cash margin – UpstreamOperating cash margin is operating cash flow divided by theapplicable number of barrels of oil equivalent produced, at $52/bbl flatoil prices. Expected operating cash margins are calculated over theperiod 2016-2025.
BP Annual Report and Form 20-F 2017 291
Operating management system (OMS)BP’s OMS helps us manage risks in our operating activities by settingout BP’s principles for good operating practice. It brings together BPrequirements on health, safety, security, the environment, socialresponsibility and operational reliability, as well as related issues,such as maintenance, contractor relations and organizational learning,into a common management system.
Organic capital expenditureA subset of capital expenditure and is a non-GAAP measure. Organiccapital expenditure comprises capital expenditure less inorganiccapital expenditure. BP believes that this measure provides usefulinformation as it allows investors to understand how BP’smanagement invests funds in developing and maintaining the group’sassets. An analysis of organic capital expenditure by segment andregion, and a reconciliation to GAAP information is provided on page248.
We are unable to present reconciliations of forward-lookinginformation for organic capital expenditure to total cash capitalexpenditure, because without unreasonable efforts, we are unable toforecast accurately the adjusting item, inorganic capital expenditure,that is difficult to predict in advance in order to derive the nearestGAAP estimate.
Organic sources of cash and organic uses of cashNon-GAAP measure. Organic sources of cash is the sum of operatingcash flow, excluding Gulf of Mexico oil spill payments, and proceedsof loan repayments. Organic uses of cash is the sum of organiccapital expenditure, dividends and share buybacks. Organic sourcesof cash and organic uses of cash are referred to as organic cashflows which is also a non-GAAP measure. The nearest equivalentmeasure on an IFRS basis for organic sources of cash is net cashprovided by operating activities and the nearest equivalent measureson an IFRS basis for organic uses of cash are total cash capitalexpenditure, dividends paid to BP shareholders and net issue(repurchase) of shares.
Production-sharing agreement (PSA) / Production-sharingcontractAn arrangement through which an oil and gas company bears therisks and costs of exploration, development and production. In return,if exploration is successful, the oil company receives entitlement tovariable physical volumes of hydrocarbons, representing recovery ofthe costs incurred and a stipulated share of the production remainingafter such cost recovery.
Readily marketable inventory (RMI)RMI is inventory held and price risk-managed by our integrated supplyand trading function (IST) which could be sold to generate funds ifrequired. It comprises oil and oil products for which liquid markets areavailable and excludes inventory which is required to meet operationalrequirements and other inventory which is not price risk-managed.RMI is reported at fair value. Inventory held by the Downstream fuelsbusiness for the purpose of sales and marketing, and all inventoriesrelating to the lubricants and petrochemicals businesses, are notincluded in RMI. BP believes that disclosing the amounts of RMI andpaid-up RMI is useful to investors as it enables them to betterunderstand and evaluate the group’s inventories and liquidity positionby enabling them to see the level of discretionary inventory held byIST and to see builds or releases of liquid trading inventory.
Paid-up RMI excludes RMI which has not yet been paid for. Forinventory that is held in storage, a first-in first-out (FIFO) approach isused to determine whether inventory has been paid for or not. UnpaidRMI is RMI which has not yet been paid for by BP. RMI, RMI at fairvalue, Paid-up RMI and Unpaid RMI are non-GAAP measures. Areconciliation of total inventory as reported on the group balancesheet to paid-up RMI is provided on page 296.
RealizationsRealizations are the result of dividing revenue generated fromhydrocarbon sales, excluding revenue generated from purchasesmade for resale and royalty volumes, by revenue generatinghydrocarbon production volumes. Revenue generating hydrocarbonproduction reflects the BP share of production as adjusted for anyproduction which does not generate revenue. Adjustments mayinclude losses due to shrinkage, amounts consumed duringprocessing, and contractual or regulatory host committed volumessuch as royalties. For the Upstream segment, realizations includetransfers between businesses.
Refining availabilityRepresents Solomon Associates’ operational availability, which isdefined as the percentage of the year that a unit is available forprocessing after subtracting the annualized time lost due toturnaround activity and all planned mechanical, process andregulatory downtime.
Refining marker margin (RMM)The average of regional indicator margins weighted for BP’s cruderefining capacity in each region. Each regional marker margin is basedon product yields and a marker crude oil deemed appropriate for theregion. The regional indicator margins may not be representative ofthe margins achieved by BP in any period because of BP’s particularrefinery configurations and crude and product slate.
Refining net cash margin per barrelRefining net cash margin is defined by Solomon Associates as the netmargin achieved after subtracting cash operating expenses andadding any refinery revenue from other sources. Net cash margin isexpressed in US dollars per barrel of net refinery input.
Refinery utilizationRefinery utilization is calculated as annual throughput (thousands ofbarrels per day) divided by crude distillation capacity.
Replacement cost (RC) profit or lossReflects the replacement cost of inventories sold in the period and isarrived at by excluding inventory holding gains and losses from profitor loss. RC profit or loss is the measure of profit or loss that isrequired to be disclosed for each operating segment under IFRS.RC profit or loss for the group is a non-GAAP measure. Managementbelieves this measure is useful to illustrate to investors the fact thatcrude oil and product prices can vary significantly from period toperiod and that the impact on our reported result under IFRS can besignificant. Inventory holding gains and losses vary from period toperiod due to changes in prices as well as changes in underlyinginventory levels. In order for investors to understand the operatingperformance of the group excluding the impact of price changes onthe replacement of inventories, and to make comparisons ofoperating performance between reporting periods, BP’s managementbelieves it is helpful to disclose this measure. The nearest equivalentmeasure on an IFRS basis is profit or loss attributable to BPshareholders. See Financial statements – Note 4. A reconciliation toGAAP information is provided on page 248.
RC profit or loss per shareNon-GAAP measure. Earnings per share is defined in Financialstatements – Note 9. RC profit or loss per share is calculated usingthe same denominator. The numerator used is RC profit or lossattributable to BP shareholders rather than profit or loss attributableto BP shareholders. BP believes it is helpful to disclose the RC profitor loss per share because this measure excludes the impact of pricechanges on the replacement of inventories and allows for moremeaningful comparisons between reporting periods. The nearestequivalent measure on an IFRS basis is basic earnings per sharebased on profit or loss for the period attributable to BP shareholders.A reconciliation to GAAP information is provided on page 294.
Reserves replacement ratioThe extent to which production is replaced by proved reservesadditions. This ratio is expressed in oil equivalent terms and includeschanges resulting from revisions to previous estimates, improvedrecovery, and extensions and discoveries.
292 BP Annual Report and Form 20-F 2017
Return on average capital employedNon-GAAP measure. Return on average capital employed (ROACE) isunderlying replacement cost profit, after adding back non-controllinginterest and interest expense net of notional tax at an assumed 35%,divided by average capital employed, excluding cash and cashequivalents and goodwill. Interest expense is finance costs excludingthe unwinding of the discount on provisions and other payables. BPbelieves it is helpful to disclose the ROACE because this measuregives an indication of the company’s capital efficiency. The nearestGAAP measures of the numerator and denominator are profit or lossfor the period attributable to BP shareholders and average capitalemployed respectively. The reconciliation of the numerator anddenominator is provided on page 295.
We are unable to present forward-looking information of the nearestGAAP measures of the numerator and denominator for ROACE,because without unreasonable efforts, we are unable to forecastaccurately certain adjusting items required to calculate a meaningfulcomparable GAAP forward-looking financial measure. These itemsinclude inventory holding gains or losses and interest net of tax, thatare difficult to predict in advance in order to include in a GAAPestimate.
SubsidiaryAn entity that is controlled by the BP group. Control of an investeeexists when an investor is exposed, or has rights, to variable returnsfrom its involvement with the investee and has the ability to affectthose returns through its power over the investee.
Tier 1 process safety eventsLosses of primary containment from a process of greatestconsequence - causing harm to a member of the workforce, costlydamage to equipment or exceeding defined quantities. Thisrepresents reported incidents occurring within BP’s operational HSSEreporting boundary. That boundary includes BP’s own operatedfacilities and certain other locations or situations.
Tight oil and gasNatural oil and gas reservoirs locked in hard sandstone rocks with lowpermeability, making the underground formation extremely tight.
UK National Balancing PointA virtual trading location for sale, purchase and exchange of UKnatural gas. It is the pricing and delivery point for the IntercontinentalExchange natural gas futures contract.
UnconventionalsResources found in geographic accumulations over a large area, thatusually present additional challenges to development such as lowpermeability or high viscosity. Examples include shale gas and oil,coalbed methane, gas hydrates and natural bitumen deposits. Thesetypically require specialized extraction technology such as hydraulicfracturing or steam injection.
Underlying productionProduction after adjusting for divestments and entitlement impacts inour production-sharing agreements. 2017 underlying production doesnot include the Abu Dhabi onshore concession renewal.
Underlying RC profit or loss Non-GAAP measure. RC profit or loss after adjusting for non-operating items and fair value accounting effects. See page 250 and294 for additional information on the non-operating items and fairvalue accounting effects that are used to arrive at underlying RC profitor loss in order to enable a full understanding of the events and theirfinancial impact. BP believes that underlying RC profit or loss is auseful measure for investors because it is a measure closely trackedby management to evaluate BP’s operating performance and to makefinancial, strategic and operating decisions and because it may helpinvestors to understand and evaluate, in the same manner asmanagement, the underlying trends in BP’s operational performanceon a comparable basis, year on year, by adjusting for the effects ofthese non-operating items and fair value accounting effects.
The nearest equivalent measure on an IFRS basis for the group isprofit or loss for the year attributable to BP shareholders. The nearestequivalent measure on an IFRS basis for segments is RC profit or lossbefore interest and taxation. Underlying profit in the group chiefexecutive’s letter on page 8 refers to full year underlying RC profit forthe group. A reconciliation to GAAP information is provided on page248.
Underlying RC profit or loss per shareNon-GAAP measure. Earnings per share is defined Financialstatements – Note 9. Underlying RC profit or loss per share iscalculated using the same denominator. The numerator used isunderlying RC profit or loss attributable to BP shareholders ratherthan profit or loss attributable to BP shareholders. BP believes it ishelpful to disclose the underlying RC profit or loss per share becausethis measure may help investors to understand and evaluate, in thesame manner as management, the underlying trends in BP’soperational performance on a comparable basis, period on period. Thenearest equivalent measure on an IFRS basis is basic earnings pershare based on profit or loss for the period attributable to BPshareholders. A reconciliation to GAAP information is provided onpage 294.
Upstream operating efficiencyUpstream operating efficiency is calculated as production for BPoperated sites, excluding US Lower 48 and adjusted for certain itemsincluding entitlement impacts in our production-sharing agreementsdivided by installed production capacity for BP operated sites,excluding US Lower 48. Installed production capacity is the agreedrate achievable (measured at the export end of the system) when theinstalled production system (reservoir, wells, plant and export) is fullyoptimized and operated at full rate with no planned or unplanneddeferrals.
Upstream plant reliabilityBP-operated Upstream plant reliability is calculated taking 100% lessthe ratio of total unplanned plant deferrals divided by installedproduction capacity. Unplanned plant deferrals are associated withthe topside plant and where applicable the subsea equipment(excluding wells and reservoir). Unplanned plant deferrals includebreakdowns, which does not include Gulf of Mexico weather relateddowntime.
Upstream unit production costUpstream unit production cost is calculated as production costdivided by units of production. Production cost does not include advalorem and severance taxes. Units of production are barrels forliquids and thousands of cubic feet for gas. Amounts disclosed are forBP subsidiaries only and do not include BP’s share of equity-accounted entities.
West Texas Intermediate (WTI) A light sweet crude oil, priced at Cushing, Oklahoma, which serves asa benchmark price for purchases of oil in the US.
Trade marksTrade marks of the BP group appear throughout this report. Theyinclude: ACTIVE, ampm, Aral, ARCO, BP, BP Fleetmove, BPme, BPUltimate, Castrol, EDGE BIO-SYNTHETIC, PTAir
Trade marks:
Amazon Web Services is a registered trade mark of AmazonTechnologies, Inc.
Butamax is a registered trade mark of Butamax Advance BiofuelsLLC.
DrillPlan is a registered trade mark of Schlumberger TechnologyCorporation.
M&S Simply Food is a registered trade mark of Marks & Spencer plc.
Microsoft Azure a registered trade mark of Microsoft Corporation.
Nectar is a registered trade mark of Aimia US Inc.
PAYBACK is a registered trade mark of PAYBACK GmbH.
Pick n Pay is a registered trade mark of Pick n Pay Stores Limited.
REWE to go is a registered trade mark of REWE.
BP Annual Report and Form 20-F 2017 293
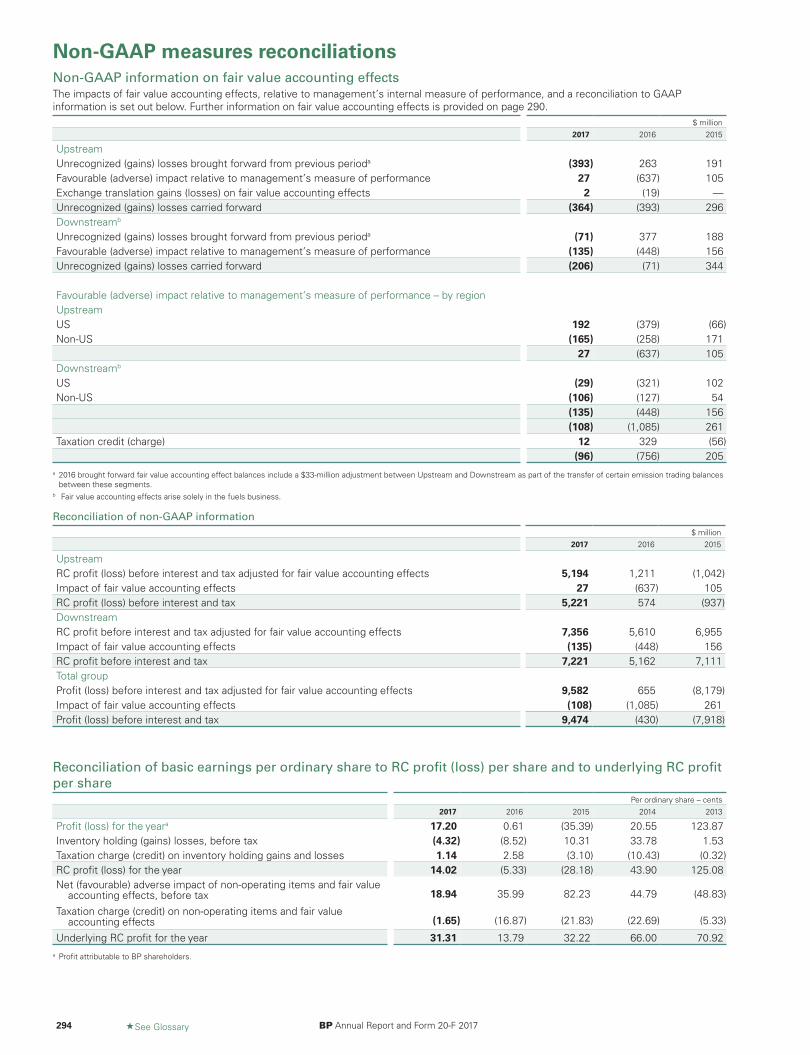
Non-GAAP measures reconciliationsNon-GAAP information on fair value accounting effectsThe impacts of fair value accounting effects, relative to management’s internal measure of performance, and a reconciliation to GAAPinformation is set out below. Further information on fair value accounting effects is provided on page 290.
$ million2017 2016 2015
UpstreamUnrecognized (gains) losses brought forward from previous perioda (393) 263 191Favourable (adverse) impact relative to management’s measure of performance 27 (637) 105Exchange translation gains (losses) on fair value accounting effects 2 (19) —Unrecognized (gains) losses carried forward (364) (393) 296Downstreamb
Unrecognized (gains) losses brought forward from previous perioda (71) 377 188Favourable (adverse) impact relative to management’s measure of performance (135) (448) 156Unrecognized (gains) losses carried forward (206) (71) 344
Favourable (adverse) impact relative to management’s measure of performance – by regionUpstreamUS 192 (379) (66)Non-US (165) (258) 171
27 (637) 105Downstreamb
US (29) (321) 102Non-US (106) (127) 54
(135) (448) 156(108) (1,085) 261
Taxation credit (charge) 12 329 (56)(96) (756) 205
a 2016 brought forward fair value accounting effect balances include a $33-million adjustment between Upstream and Downstream as part of the transfer of certain emission trading balancesbetween these segments.
b Fair value accounting effects arise solely in the fuels business.
Reconciliation of non-GAAP information$ million
2017 2016 2015
UpstreamRC profit (loss) before interest and tax adjusted for fair value accounting effects 5,194 1,211 (1,042)Impact of fair value accounting effects 27 (637) 105RC profit (loss) before interest and tax 5,221 574 (937)DownstreamRC profit before interest and tax adjusted for fair value accounting effects 7,356 5,610 6,955Impact of fair value accounting effects (135) (448) 156RC profit before interest and tax 7,221 5,162 7,111Total groupProfit (loss) before interest and tax adjusted for fair value accounting effects 9,582 655 (8,179)Impact of fair value accounting effects (108) (1,085) 261Profit (loss) before interest and tax 9,474 (430) (7,918)
Reconciliation of basic earnings per ordinary share to RC profit (loss) per share and to underlying RC profitper share
Per ordinary share – cents2017 2016 2015 2014 2013
Profit (loss) for the yeara 17.20 0.61 (35.39) 20.55 123.87Inventory holding (gains) losses, before tax (4.32) (8.52) 10.31 33.78 1.53Taxation charge (credit) on inventory holding gains and losses 1.14 2.58 (3.10) (10.43) (0.32)RC profit (loss) for the year 14.02 (5.33) (28.18) 43.90 125.08Net (favourable) adverse impact of non-operating items and fair value
accounting effects, before tax 18.94 35.99 82.23 44.79 (48.83)
Taxation charge (credit) on non-operating items and fair valueaccounting effects (1.65) (16.87) (21.83) (22.69) (5.33)
Underlying RC profit for the year 31.31 13.79 32.22 66.00 70.92a Profit attributable to BP shareholders.
294 «See Glossary BP Annual Report and Form 20-F 2017
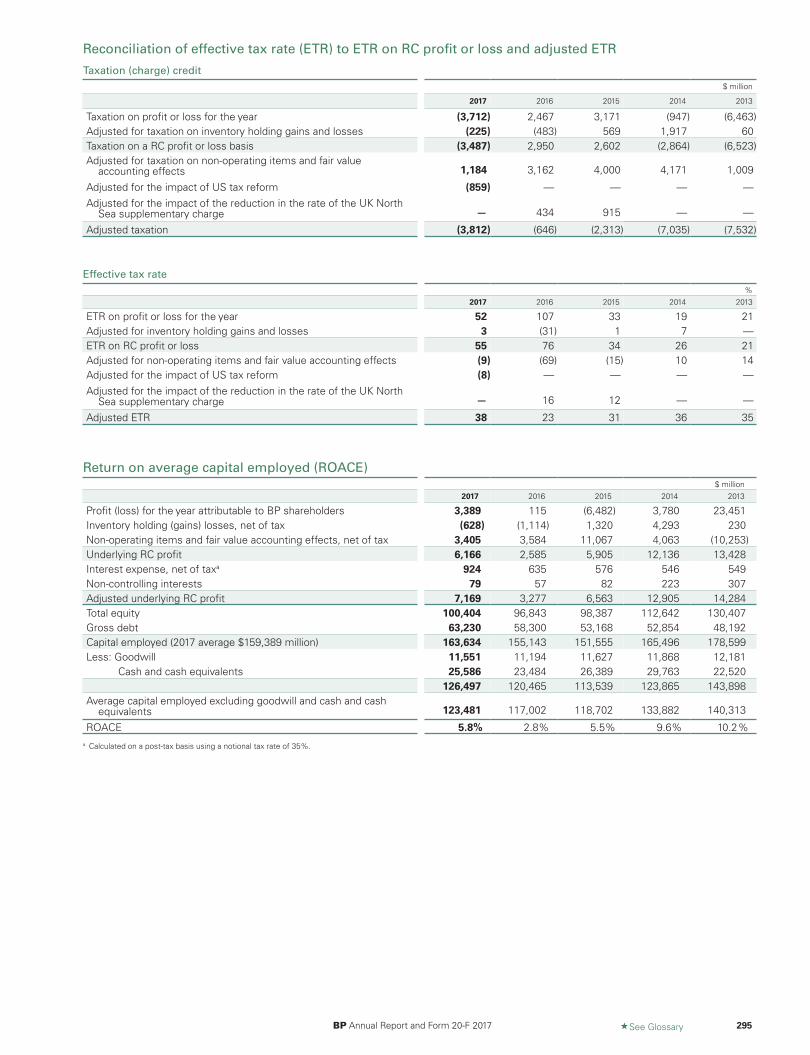
Reconciliation of effective tax rate (ETR) to ETR on RC profit or loss and adjusted ETR
Taxation (charge) credit$ million
2017 2016 2015 2014 2013
Taxation on profit or loss for the year (3,712) 2,467 3,171 (947) (6,463)Adjusted for taxation on inventory holding gains and losses (225) (483) 569 1,917 60Taxation on a RC profit or loss basis (3,487) 2,950 2,602 (2,864) (6,523)Adjusted for taxation on non-operating items and fair value
accounting effects 1,184 3,162 4,000 4,171 1,009
Adjusted for the impact of US tax reform (859) — — — —Adjusted for the impact of the reduction in the rate of the UK North
Sea supplementary charge — 434 915 — —
Adjusted taxation (3,812) (646) (2,313) (7,035) (7,532)
Effective tax rate%
2017 2016 2015 2014 2013
ETR on profit or loss for the year 52 107 33 19 21Adjusted for inventory holding gains and losses 3 (31) 1 7 —ETR on RC profit or loss 55 76 34 26 21Adjusted for non-operating items and fair value accounting effects (9) (69) (15) 10 14Adjusted for the impact of US tax reform (8) — — — —Adjusted for the impact of the reduction in the rate of the UK North
Sea supplementary charge — 16 12 — —
Adjusted ETR 38 23 31 36 35
Return on average capital employed (ROACE)$ million
2017 2016 2015 2014 2013
Profit (loss) for the year attributable to BP shareholders 3,389 115 (6,482) 3,780 23,451Inventory holding (gains) losses, net of tax (628) (1,114) 1,320 4,293 230Non-operating items and fair value accounting effects, net of tax 3,405 3,584 11,067 4,063 (10,253)Underlying RC profit 6,166 2,585 5,905 12,136 13,428Interest expense, net of taxa 924 635 576 546 549Non-controlling interests 79 57 82 223 307Adjusted underlying RC profit 7,169 3,277 6,563 12,905 14,284Total equity 100,404 96,843 98,387 112,642 130,407Gross debt 63,230 58,300 53,168 52,854 48,192Capital employed (2017 average $159,389 million) 163,634 155,143 151,555 165,496 178,599Less: Goodwill 11,551 11,194 11,627 11,868 12,181
Cash and cash equivalents 25,586 23,484 26,389 29,763 22,520126,497 120,465 113,539 123,865 143,898
Average capital employed excluding goodwill and cash and cashequivalents 123,481 117,002 118,702 133,882 140,313
ROACE 5.8% 2.8% 5.5% 9.6% 10.2%a Calculated on a post-tax basis using a notional tax rate of 35%.
BP Annual Report and Form 20-F 2017 «See Glossary 295
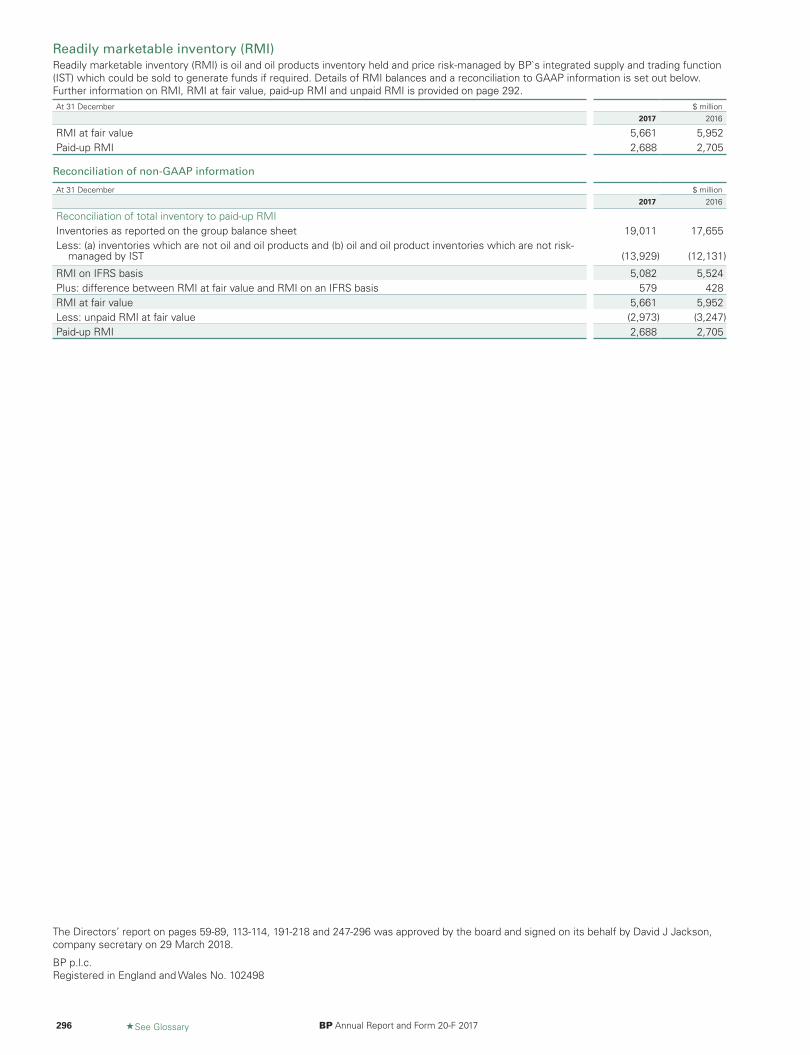
Readily marketable inventory (RMI)Readily marketable inventory (RMI) is oil and oil products inventory held and price risk-managed by BP`s integrated supply and trading function(IST) which could be sold to generate funds if required. Details of RMI balances and a reconciliation to GAAP information is set out below.Further information on RMI, RMI at fair value, paid-up RMI and unpaid RMI is provided on page 292.At 31 December $ million
2017 2016
RMI at fair value 5,661 5,952Paid-up RMI 2,688 2,705
Reconciliation of non-GAAP information
At 31 December $ million2017 2016
Reconciliation of total inventory to paid-up RMIInventories as reported on the group balance sheet 19,011 17,655Less: (a) inventories which are not oil and oil products and (b) oil and oil product inventories which are not risk-
managed by IST (13,929) (12,131)
RMI on IFRS basis 5,082 5,524Plus: difference between RMI at fair value and RMI on an IFRS basis 579 428RMI at fair value 5,661 5,952Less: unpaid RMI at fair value (2,973) (3,247)Paid-up RMI 2,688 2,705
The Directors’ report on pages 59-89, 113-114, 191-218 and 247-296 was approved by the board and signed on its behalf by David J Jackson,company secretary on 29 March 2018.
BP p.l.c.Registered in England and Wales No. 102498
296 «See Glossary BP Annual Report and Form 20-F 2017

SignaturesThe registrant hereby certifies that it meets all of the requirements for filing on Form 20-F and that it has duly caused and authorized theundersigned to sign this annual report on its behalf.
BP p.l.c.(Registrant)
/s/ David J JacksonCompany secretary29 March 2018
BP Annual Report and Form 20-F 2017 297
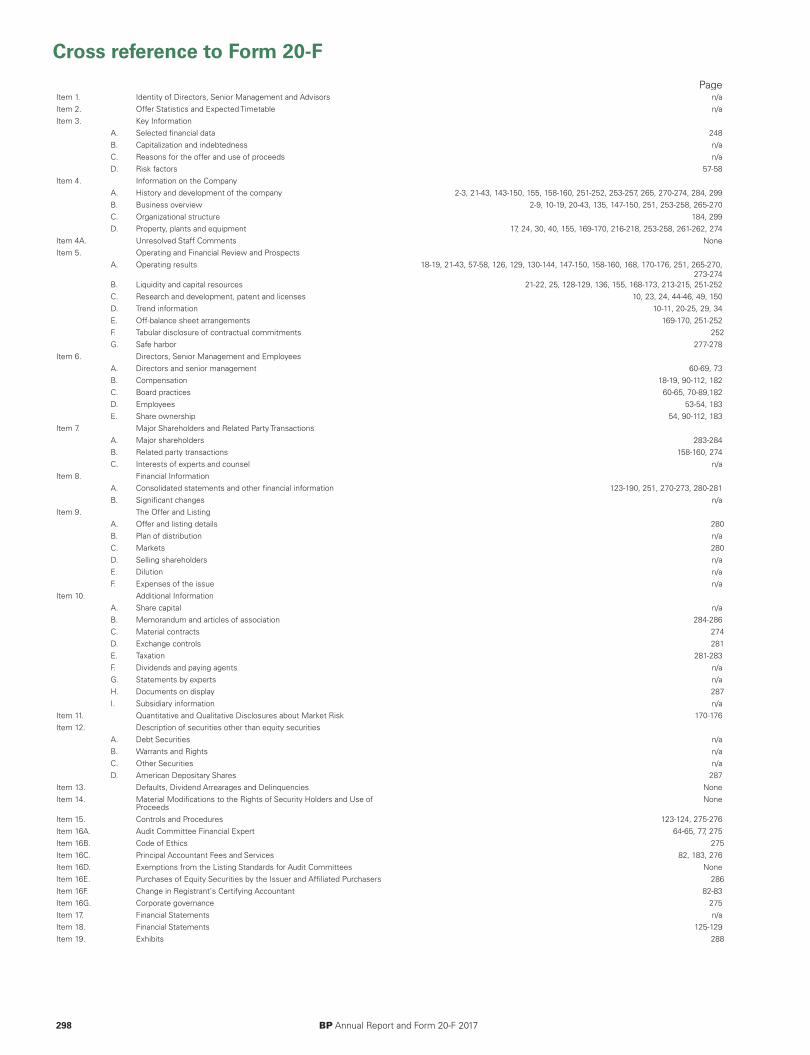
Cross reference to Form 20-FPage
Item 1. Identity of Directors, Senior Management and Advisors n/aItem 2. Offer Statistics and Expected Timetable n/aItem 3. Key Information
A. Selected financial data 248B. Capitalization and indebtedness n/aC. Reasons for the offer and use of proceeds n/aD. Risk factors 57-58
Item 4. Information on the CompanyA. History and development of the company 2-3, 21-43, 143-150, 155, 158-160, 251-252, 253-257, 265, 270-274, 284, 299B. Business overview 2-9, 10-19, 20-43, 135, 147-150, 251, 253-258, 265-270C. Organizational structure 184, 299D. Property, plants and equipment 17, 24, 30, 40, 155, 169-170, 216-218, 253-258, 261-262, 274
Item 4A. Unresolved Staff Comments NoneItem 5. Operating and Financial Review and Prospects
A. Operating results 18-19, 21-43, 57-58, 126, 129, 130-144, 147-150, 158-160, 168, 170-176, 251, 265-270,273-274
B. Liquidity and capital resources 21-22, 25, 128-129, 136, 155, 168-173, 213-215, 251-252C. Research and development, patent and licenses 10, 23, 24, 44-46, 49, 150D. Trend information 10-11, 20-25, 29, 34E. Off-balance sheet arrangements 169-170, 251-252F. Tabular disclosure of contractual commitments 252G. Safe harbor 277-278
Item 6. Directors, Senior Management and EmployeesA. Directors and senior management 60-69, 73B. Compensation 18-19, 90-112, 182C. Board practices 60-65, 70-89,182D. Employees 53-54, 183E. Share ownership 54, 90-112, 183
Item 7. Major Shareholders and Related Party TransactionsA. Major shareholders 283-284B. Related party transactions 158-160, 274C. Interests of experts and counsel n/a
Item 8. Financial InformationA. Consolidated statements and other financial information 123-190, 251, 270-273, 280-281B. Significant changes n/a
Item 9. The Offer and ListingA. Offer and listing details 280B. Plan of distribution n/aC. Markets 280D. Selling shareholders n/aE. Dilution n/aF. Expenses of the issue n/a
Item 10. Additional InformationA. Share capital n/aB. Memorandum and articles of association 284-286C. Material contracts 274D. Exchange controls 281E. Taxation 281-283F. Dividends and paying agents n/aG. Statements by experts n/aH. Documents on display 287I. Subsidiary information n/a
Item 11. Quantitative and Qualitative Disclosures about Market Risk 170-176Item 12. Description of securities other than equity securities
A. Debt Securities n/aB. Warrants and Rights n/aC. Other Securities n/aD. American Depositary Shares 287
Item 13. Defaults, Dividend Arrearages and Delinquencies NoneItem 14. Material Modifications to the Rights of Security Holders and Use of
ProceedsNone
Item 15. Controls and Procedures 123-124, 275-276Item 16A. Audit Committee Financial Expert 64-65, 77, 275Item 16B. Code of Ethics 275Item 16C. Principal Accountant Fees and Services 82, 183, 276Item 16D. Exemptions from the Listing Standards for Audit Committees NoneItem 16E. Purchases of Equity Securities by the Issuer and Affiliated Purchasers 286Item 16F. Change in Registrant’s Certifying Accountant 82-83Item 16G. Corporate governance 275Item 17. Financial Statements n/aItem 18. Financial Statements 125-129Item 19. Exhibits 288
298 BP Annual Report and Form 20-F 2017

Information about this report
Registered office and our worldwideheadquarters:
BP p.l.c.1 St James’s SquareLondon SW1Y 4PDUKTel +44 (0)20 7496 4000
Registered in England and WalesNo. 102498.London Stock Exchange symbol ‘BP.’
Our agent in the US:
BP America Inc.501 Westlake Park BoulevardHouston, Texas 77079USTel +1 281 366 2000
This document constitutes the Annual Report and Accounts in accordance with UK requirementsand the Annual Report on Form 20-F in accordance with the US Securities Exchange Act of 1934,for BP p.l.c. for the year ended 31 December 2017. A cross reference to Form 20-F requirementsis included on page 298.
This document contains the Strategic report on the inside front cover and pages 1-58 and theDirectors’ report on pages 59-89, 113-114, 191-218 and 247-296. The Strategic report and theDirectors’ report together include the management report required by DTR 4.1 of the UKFinancial Conduct Authority’s Disclosure Guidance and Transparency Rules. The Directors’remuneration report is on pages 90-112. The consolidated financial statements of the group areon pages 115-190 and the corresponding reports of the auditor are on pages 116-124. The parentcompany financial statements of BP p.l.c. are on pages 219-245.
The Directors’ statements (comprising the Statement of directors’ responsibilities; Riskmanagement and internal control; Longer-term viability; Going concern; and Fair, balanced andunderstandable), the independent auditor’s report on the annual report and accounts to themembers of BP p.l.c., the parent company financial statements of BP p.l.c. and correspondingauditor’s report and a non-GAAP measure of operating cash flow excluding Gulf of Mexico oilspill payments in the tables on pages 18, 21, 22 and 25 do not form part of BP’s Annual Reporton Form 20-F as filed with the SEC.
BP Annual Report and Form 20-F 2017 may be downloaded from bp.com/annualreport. Nomaterial on the BP website, other than the items identified as BP Annual Report and Form 20-F2017, forms any part of this document. References in this document to other documents on theBP website, such as BP Energy Outlook, BP Sustainability Report, Advancing the energytransition, BP Statistical Review of World Energy and BP Technology Outlook are included as anaid to their location and are not incorporated by reference into this document.
BP p.l.c. is the parent company of the BP group of companies. The company was incorporated in1909 in England and Wales and changed its name to BP p.l.c. in 2001. Where we refer to thecompany, we mean BP p.l.c. Unless otherwise stated, the text does not distinguish between theactivities and operations of the parent company and those of its subsidiaries«, and informationin this document reflects 100% of the assets and operations of the company and its subsidiariesthat were consolidated at the date or for the periods indicated, including non-controllinginterests.
BP’s primary share listing is the London Stock Exchange. Ordinary shares are also traded on theFrankfurt Stock Exchange in Germany and, in the US, the company’s securities are traded on theNew York Stock Exchange (NYSE) in the form of ADSs (see page 280 for more details).
The term ‘shareholder’ in this report means, unless the context otherwise requires, investors inthe equity capital of BP p.l.c., both direct and indirect. As BP shares, in the form of ADSs, arelisted on the NYSE, an Annual Report on Form 20-F is filed with the SEC. Ordinary shares areordinary fully paid shares in BP p.l.c. of 25 cents each. Preference shares are cumulative firstpreference shares and cumulative second preference shares in BP p.l.c. of £1 each.
Acknowledgements
Design: SALTERBAXTER MSLGROUP
Typesetting: BP and Donnelley Financial Solutions
Printing: Pureprint Group Limited, UK, ISO 14001, FSC® certified and CarbonNeutral®
Photography: Aaron Tait, Bård Gudim, Bob Wheeler, Christian Sprogoe, Graham Trott, JoshuaDrake, Marc Morrison, Mehmet Binay, Richard Davies, Simon Kreitem, Stuart Conway
Paper: This document is printed on Oxygen paper and board. Oxygen is made using 100%recycled pulp, a large percentage of which is de-inked. It is manufactured at a mill with ISO 9001and 14001 accreditation and is FSC® (Forest Stewardship Council) certified. This document hasbeen printed using vegetable inks.
BP Annual Report and Form 20-F 2017 «See Glossary 299
You can order BP’s printed publications free of charge from bp.com/papercopies
US and Canada Issuer Direct Toll-free: +1 888 301 2505 [email protected]
UK and rest of world BP Distribution Services Tel: +44 (0)870 241 3269 Fax: +44 (0)870 240 5753 [email protected]
Feedback Your feedback is important to us. You can email the corporate reporting team at [email protected]
You can also telephone +44 (0)20 7496 4000
or write to Corporate reporting BP p.l.c. 1 St James’s Square London SW1Y 4PD, UK
BP’s corporate reporting suite includes information about our financial and operating performance, sustainability performance and also on global energy trends and projections.
Statistical Review of World Energy 2018
An objective review of key global energy trends.
bp.com/statisticalreview
Technology Outlook
How technology could influence the way we meet the energy challenge into the future.
bp.com/technologyoutlook
BP social media
Join the conversation, get the latest news, see photos and films from the field and find out about working with us.
Annual Report and Form 20-F 2017
Details of our financial and operating performance in print and online.
bp.com/annualreport
Sustainability Report 2017
Details of our sustainability performance with additional information online.
bp.com/sustainability
© BP p.l.c. 2018
Advancing the energy transition
How the energy world is changing, our low carbon ambitions and how we're helping advance the transition.
bp.com/energytransition
Financial and Operating Information 2013-2017
Five-year financial and operating data in PDF and Excel format.
bp.com/financialandoperating
BP Energy Outlook
Provides our projections of future energy trends and factors that could affect them out to 2040.
bp.com/energyoutlook
BP A
nnual Report and Form
20-F 2017